 Deutsch
 English
 Español
 Français
 Italiano
 Nederlands
 Polski
 Português
 Русский
 Türkçe
 Svenska
 Chinese
 Magyar
Intel Core i3-370M vs Intel Core i3-380UM
Intel Core i3-370M
► remove from comparison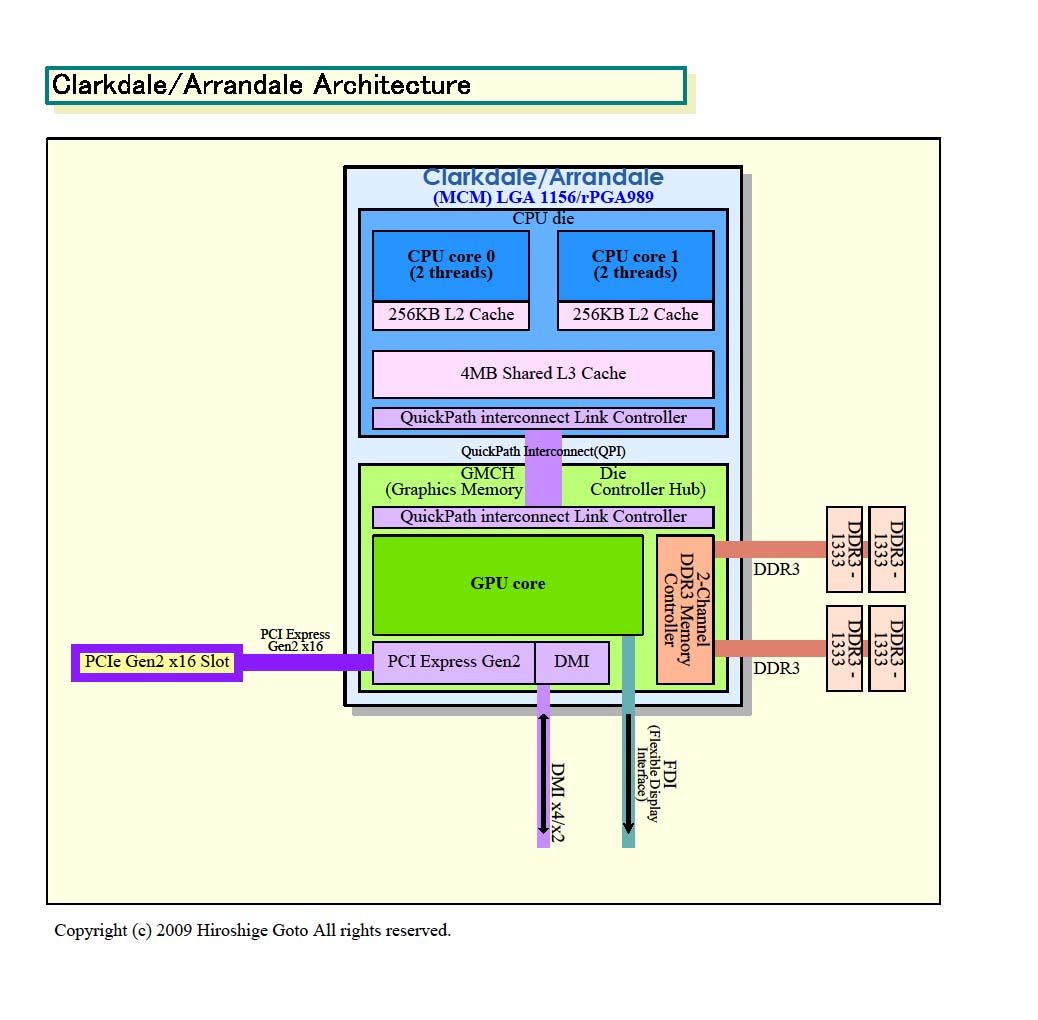
The Intel Core i3-370M is a middle class dual core CPU for laptops and clocks with 2.4 GHz. The difference to the Core i5 and i7 series is the lacking TurboBoost overclocking, and the missing AES, VT-d and Trusted Execution functions. Each core is based on the Nehalem (Westmere) micro-architecture. Hyperthreading enables the Dual Core CPU to handle 4 threads at once (for a better usage of the pipeline).
A feature of the new Core i3-370M is the integrated graphics card called GMA HD and the memory controller. Both are on a separate die that is still manufactured in 45nm whereas the CPU die is already manufactured in the new 32nm process.
The performance of the Core i3-370M should be between a 2.5 and 2.6 GHz Core 2 Duo (upper class CPUs in the last year). This is mainly due to the efficient HyperThreading function and the integrated memory controller. In single threaded applications it should be at least as fast, as a similar clocked Core 2 Duo.
The integrated Intel Graphics Media Accelerator HD (GMA HD) graphics card is known to be clocked up to 500-667 MHz (due to Turbo Boost) and should be clearly faster than the old GMA 4500MHD. The Core i5 and i7 models should still be a bit faster because of the higher max. clock speed of the GPU. The performance of the graphics in 3D should be on par with a Radeon HD 4200 but the driver support is usually worse.
The power consumption of 35 Watt TDP (max.) counts for the whole package and therefore it is clearly better than the 35 Watt TDP of the Core 2 Duo T-series (CPU alone).
Intel Core i3-380UM
► remove from comparisonThe Intel Core i3-380UM is a Ultra Low Voltage dual-core processor for small and light laptops. It is clocked with 1.3 GHz and does not feature Turbo Boost to overclock the CPU cores. Another feature missing compared to the i5 and i7 lineup is the AES function block. Each core is based on the Nehalem (Westmere) micro-architecture. Hyperthreading enables the Dual Core CPU to handle 4 threads at once (for a better usage of the pipeline).
The similar Core i5-470UM, i5-560UM, and i7-660UM are also clocked at a base speed of 1.3 GHz, but feature Turbo Boost and are therefore faster.
A feature of the new Core i3-380UM is the integrated graphics card (called Intel HD Graphics) and memory controller. Both are on a separate die that is still manufactured in 45nm whereas the CPU die is already manufactured in the new 32nm process. The also called GMA HD is able to use Turbo Boost to overclock from 133 to 500 MHz.
Due to the integrated memory controller and HyperThreading, the Core i3-380UM is faster than a similar clocked Core 2 Duo (1.3 GHz) in all (us known) applications and benchmarks. Therefore it beats the 1.3 GHz Pentium SU7300 and performs in some areas even as fast as a 2 GHz Core 2 Duo. Still the gaming performance can suffer from the low clock speed.
The power consumption of 18 Watt TDP (max.) counts for the whole package and therefore it is clearly better than the 17 Watt TDP of the Core 2 Duo SL-series (CPU alone).
| Model | Intel Core i3-370M | Intel Core i3-380UM | ||||||||||||||||||||||||||||||||||||||||||||||||||||||||
| Series | Intel Core i3 | Intel Core i3 | ||||||||||||||||||||||||||||||||||||||||||||||||||||||||
| Codename | Arrandale | Arrandale | ||||||||||||||||||||||||||||||||||||||||||||||||||||||||
| Series: Core i3 Arrandale |
|
| ||||||||||||||||||||||||||||||||||||||||||||||||||||||||
| Clock | 2400 MHz | 1333 MHz | ||||||||||||||||||||||||||||||||||||||||||||||||||||||||
| FSB | 2500 | 2500 | ||||||||||||||||||||||||||||||||||||||||||||||||||||||||
| L2 Cache | 512 KB | 512 KB | ||||||||||||||||||||||||||||||||||||||||||||||||||||||||
| L3 Cache | 3 MB | 3 MB | ||||||||||||||||||||||||||||||||||||||||||||||||||||||||
| Cores / Threads | 2 / 4 | 2 / 4 | ||||||||||||||||||||||||||||||||||||||||||||||||||||||||
| TDP | 35 Watt | 18 Watt | ||||||||||||||||||||||||||||||||||||||||||||||||||||||||
| Transistors | 382+177 Million | 382+177 Million | ||||||||||||||||||||||||||||||||||||||||||||||||||||||||
| Technology | 32 nm | 32 nm | ||||||||||||||||||||||||||||||||||||||||||||||||||||||||
| Die Size | 81+114 mm2 | 81+114 mm2 | ||||||||||||||||||||||||||||||||||||||||||||||||||||||||
| max. Temp. | 105 °C | |||||||||||||||||||||||||||||||||||||||||||||||||||||||||
| Socket | BGA1288, PGA988 | BGA1288 | ||||||||||||||||||||||||||||||||||||||||||||||||||||||||
| Features | Hyper Threading, Enhanced Speedstep, integrierte GMA HD 667MHz, | Intel HD Graphics 166-500MHz, DDR3-800 Memory Controller (max 8GB), Hyper-Threading, Virtualization Technology VT-x, Intel 64, Idle States, Enhanced Speedstep, Thermal Monitoring, Fast Memory Access, Flex Memory Access, Execute Disable Bit | ||||||||||||||||||||||||||||||||||||||||||||||||||||||||
| Architecture | x86 | x86 | ||||||||||||||||||||||||||||||||||||||||||||||||||||||||
| Announced | ||||||||||||||||||||||||||||||||||||||||||||||||||||||||||
| Manufacturer | ark.intel.com | ark.intel.com |

