 Deutsch
 English
 Español
 Français
 Italiano
 Nederlands
 Polski
 Português
 Русский
 Türkçe
 Svenska
 Chinese
 Magyar
Intel Core i7-2670QM vs Intel Core i7-2920XM
Intel Core i7-2670QM
► remove from comparison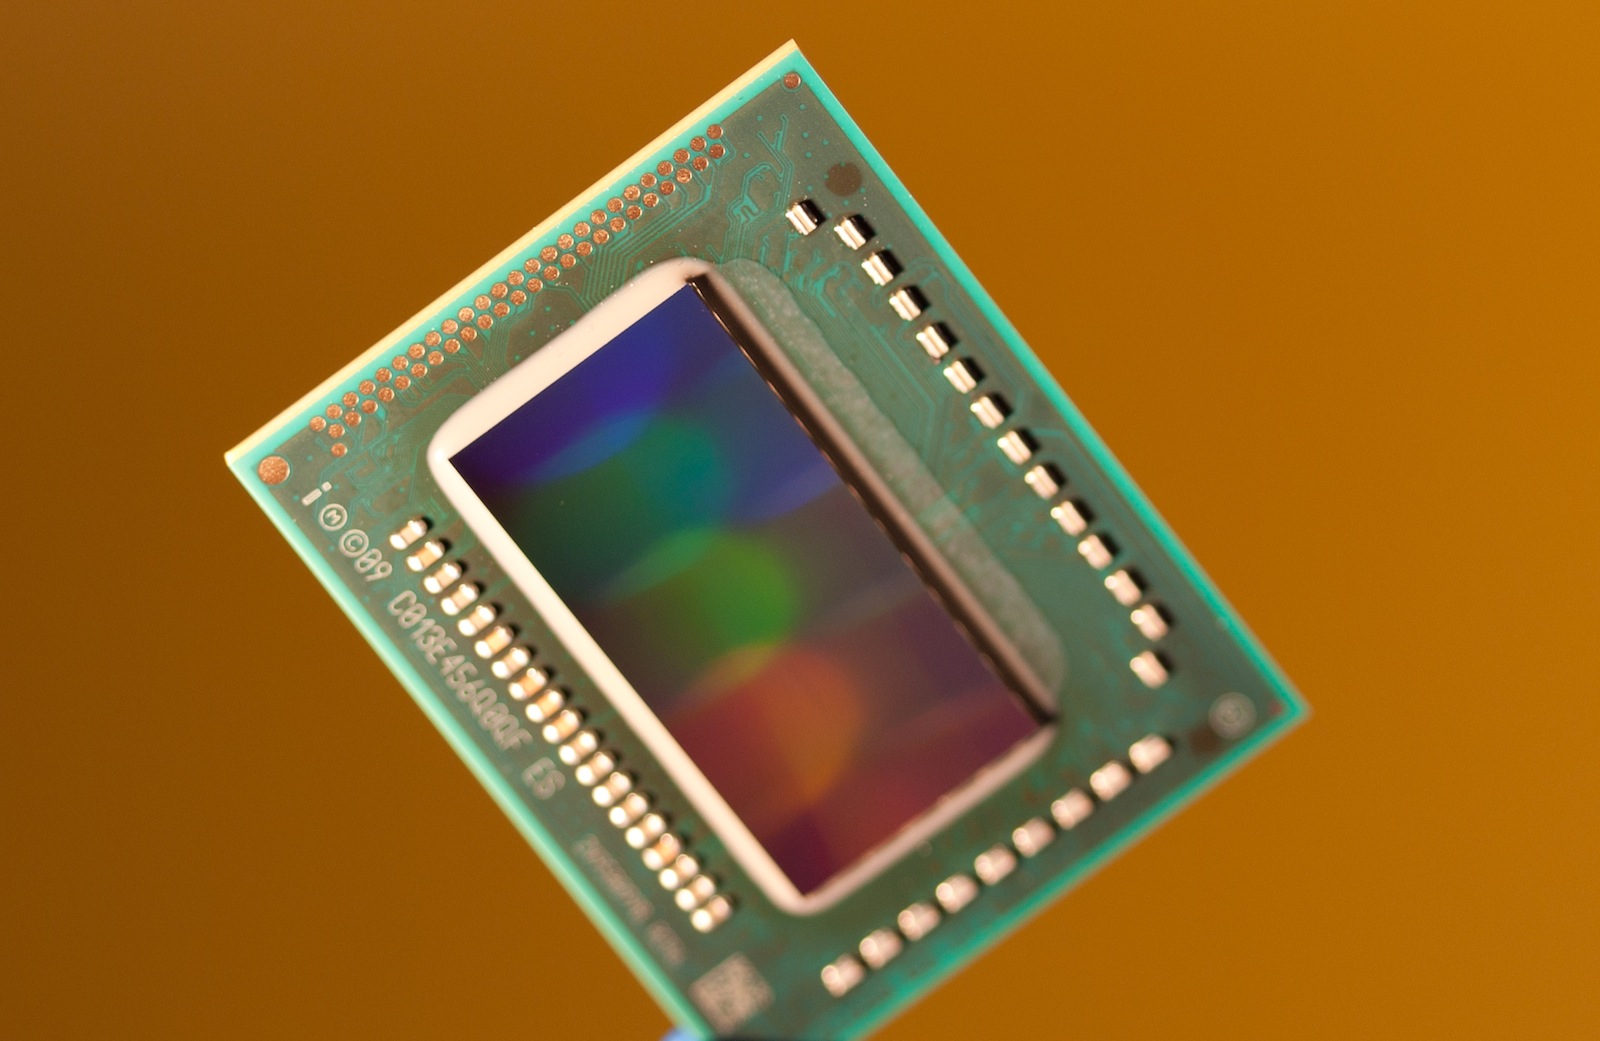
The Intel Core i7-2670QM is a fast quad core processor for laptops and successor to the popular i7-2630QM. It is based on the Sandy Bridge architecture and offers Hyperthreading to handle 8 threads at once (for a better usage of the pipeline). Compared to the 2630QM, the 2670QM offers higher base and turbo frequencies by 200MHz. Compared to the faster Core i7, the 2670QM does not feature the Trusted Execution and the VT-d functions.
Sandy Bridge is the evolutionary successor of the Arrandale architecture. The most noteable improvements are the new 265Bit AVX instructions, the improved Turbo 2.0 and the integration of the graphics card into the 32nm CPU core.
Der i7-2630QM offers an integrated graphics card (Intel HD Graphics 3000) which is clearly faster then the older Intel HD Graphics in the Arrandale CPUs. As the new GPU is included in the CPU, it is also manufactured in 32nm and shares the fast level 3 cache with the CPU cores (using a new ring bus). In the 2670QM it is clocked from 650-1100MHz (Turbo Boost). The Core i7-2675QM in comparison offers a higher Turbo Boost frequency of 1200MHz for the GPU part.
Furthermore, an improved (compared to Clarkdale) dual-channel DDR3 memory controller is included on the CPU die that is used by the CPU and GPU part.
The performance of the Core i7-2670QM should be only slightly slower than the old Core i7-2720QM that offers only a slightly higher Turbo Boost frequencies. Therefore, even demanding applications and games should run without performance problems.
The quad core CPU is still rated at 45 Watt TDP but now the integrated graphics card is also included (compared to the old Clarksfield Quad Core processors).
Intel Core i7-2920XM
► remove from comparison
The Intel Core i7-2920XM is the fastest quad-core processor for laptops in Q1-2011. Due to the Extreme Edition branding, the CPU should be easy to overclock (unlocked multiplicator). It is based on the Sandy Bridge architecture and offers Hyperthreading to handle 8 threads at once (for a better usage of the pipeline). Compared to the previous Clarksdale quad-cores, the i7-2920XM is now manufactured in 32nm, offers an integrated graphics card and AES functions. Compared to the slower clocked 2820QM, the 2920XM is specified with a higher TDP.
Sandy Bridge is the evolutionary successor of the Arrandale architecture. The most noteable improvements are the new 256Bit AVX instructions, the improved Turbo Boost and the integration of the graphics card into the 32nm CPU core. Furthermore, the integrated memory controller was improved and supports up to 8 GB DDR3-1333.
The Core i7-2920XM offers an integrated graphics card (Intel HD Graphics 3000) which proved to be clearly faster than the old Intel HD Graphics in the Arrandale CPUs and on a level with entry level dedicated graphics cards like the GeForce 310M. The HD Graphics 3000 also supports Turbo Boost and clocks between 650 MHz and 1300 MHz. As the graphics card shares the fast last level cache, the processor is a bit slower with activated GPU.
Due to the high Turbo Boost and Hyperthreading, the performance of the Core i7-2920XM can reach levels of the fast desktop Core i5-2500K processor. Compared to the previous generation, the i7-2920XM is up to 42% faster than the old Core i7-940XM processor. Therefore, the performance should be sufficient for even the most demanding tasks like HD video editing or 3D games. Extensive benchmarks can be found at the end of this page and in our review of the new Sandy Bridge quad core processors.
The high TDP rating of the 2920XM enables the usage of the quad core only in large and heavy laptops (usually 15" and up). Compared to the previous generation of quad-cores, however, the TDP improved, as the integrated GPU is now included.
| Model | Intel Core i7-2670QM | Intel Core i7-2920XM | ||||||||||||||||||||||||||||||||||||||||||||||||||||||||||||||||||||||||||||||||||||||||||||||||||||||||||||||||||||||||||||||||||||||||||||||||
| Series | Intel Core i7 | Intel Core i7 | ||||||||||||||||||||||||||||||||||||||||||||||||||||||||||||||||||||||||||||||||||||||||||||||||||||||||||||||||||||||||||||||||||||||||||||||||
| Codename | Sandy Bridge | Sandy Bridge | ||||||||||||||||||||||||||||||||||||||||||||||||||||||||||||||||||||||||||||||||||||||||||||||||||||||||||||||||||||||||||||||||||||||||||||||||
| Series: Core i7 Sandy Bridge |
|
| ||||||||||||||||||||||||||||||||||||||||||||||||||||||||||||||||||||||||||||||||||||||||||||||||||||||||||||||||||||||||||||||||||||||||||||||||
| Clock | 2200 - 3100 MHz | 2500 - 3500 MHz | ||||||||||||||||||||||||||||||||||||||||||||||||||||||||||||||||||||||||||||||||||||||||||||||||||||||||||||||||||||||||||||||||||||||||||||||||
| L1 Cache | 256 KB | 256 KB | ||||||||||||||||||||||||||||||||||||||||||||||||||||||||||||||||||||||||||||||||||||||||||||||||||||||||||||||||||||||||||||||||||||||||||||||||
| L2 Cache | 1 MB | 1 MB | ||||||||||||||||||||||||||||||||||||||||||||||||||||||||||||||||||||||||||||||||||||||||||||||||||||||||||||||||||||||||||||||||||||||||||||||||
| L3 Cache | 6 MB | 8 MB | ||||||||||||||||||||||||||||||||||||||||||||||||||||||||||||||||||||||||||||||||||||||||||||||||||||||||||||||||||||||||||||||||||||||||||||||||
| Cores / Threads | 4 / 8 | 4 / 8 | ||||||||||||||||||||||||||||||||||||||||||||||||||||||||||||||||||||||||||||||||||||||||||||||||||||||||||||||||||||||||||||||||||||||||||||||||
| TDP | 45 Watt | 55 Watt | ||||||||||||||||||||||||||||||||||||||||||||||||||||||||||||||||||||||||||||||||||||||||||||||||||||||||||||||||||||||||||||||||||||||||||||||||
| Transistors | 995 Million | 995 Million | ||||||||||||||||||||||||||||||||||||||||||||||||||||||||||||||||||||||||||||||||||||||||||||||||||||||||||||||||||||||||||||||||||||||||||||||||
| Technology | 32 nm | 32 nm | ||||||||||||||||||||||||||||||||||||||||||||||||||||||||||||||||||||||||||||||||||||||||||||||||||||||||||||||||||||||||||||||||||||||||||||||||
| Die Size | 216 mm2 | 216 mm2 | ||||||||||||||||||||||||||||||||||||||||||||||||||||||||||||||||||||||||||||||||||||||||||||||||||||||||||||||||||||||||||||||||||||||||||||||||
| Features | HD Graphics 3000, DDR-1333 Memory Controller, HyperThreading, AVX, Quick Sync, Virtualization (VT-x) | HD Graphics 3000 (650-1300MHz), DDR3-1066/1333/1600 Memory Controller, HyperThreading, AVX, Quick Sync, Virtualization | ||||||||||||||||||||||||||||||||||||||||||||||||||||||||||||||||||||||||||||||||||||||||||||||||||||||||||||||||||||||||||||||||||||||||||||||||
| iGPU | Intel HD Graphics 3000 (650 - 1100 MHz) | Intel HD Graphics 3000 (650 - 1300 MHz) | ||||||||||||||||||||||||||||||||||||||||||||||||||||||||||||||||||||||||||||||||||||||||||||||||||||||||||||||||||||||||||||||||||||||||||||||||
| Architecture | x86 | x86 | ||||||||||||||||||||||||||||||||||||||||||||||||||||||||||||||||||||||||||||||||||||||||||||||||||||||||||||||||||||||||||||||||||||||||||||||||
| Announced | ||||||||||||||||||||||||||||||||||||||||||||||||||||||||||||||||||||||||||||||||||||||||||||||||||||||||||||||||||||||||||||||||||||||||||||||||||
| max. Temp. | 100 °C | |||||||||||||||||||||||||||||||||||||||||||||||||||||||||||||||||||||||||||||||||||||||||||||||||||||||||||||||||||||||||||||||||||||||||||||||||
| Socket | FCPGA988 | |||||||||||||||||||||||||||||||||||||||||||||||||||||||||||||||||||||||||||||||||||||||||||||||||||||||||||||||||||||||||||||||||||||||||||||||||
| $1096 U.S. | ||||||||||||||||||||||||||||||||||||||||||||||||||||||||||||||||||||||||||||||||||||||||||||||||||||||||||||||||||||||||||||||||||||||||||||||||||
| Manufacturer | ark.intel.com |
