 Deutsch
 English
 Español
 Français
 Italiano
 Nederlands
 Polski
 Português
 Русский
 Türkçe
 Svenska
 Chinese
 Magyar
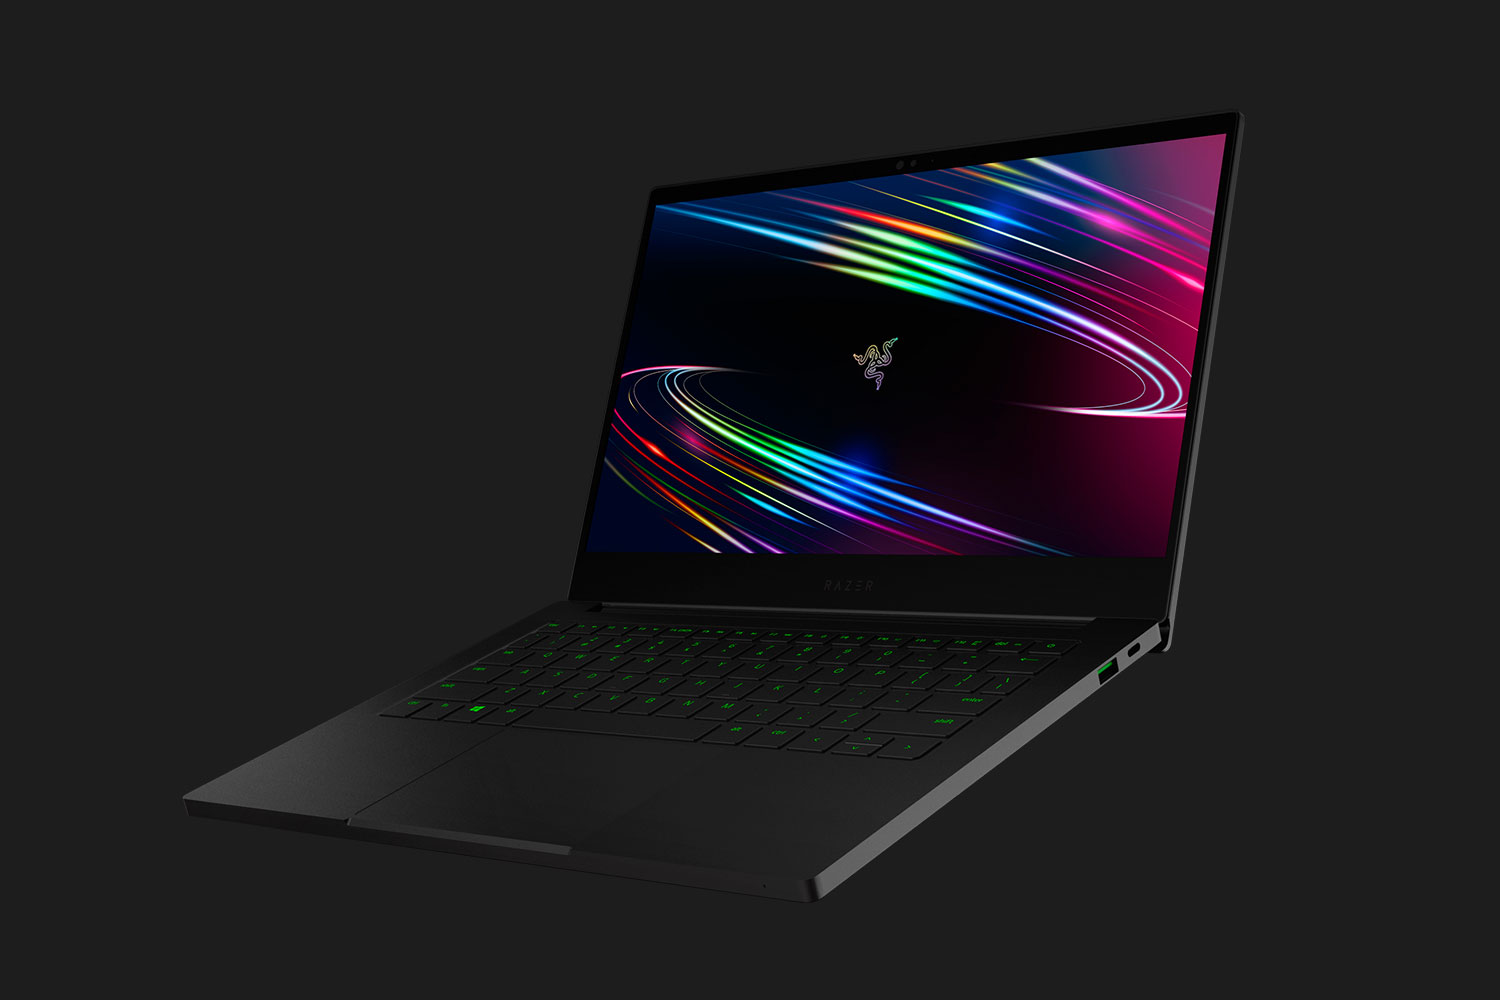
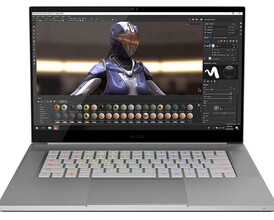
2020 Razer Blade Stealth GTX 1650 Ti Max-Q Laptop Review: Like the 2019 Version, But Done Right

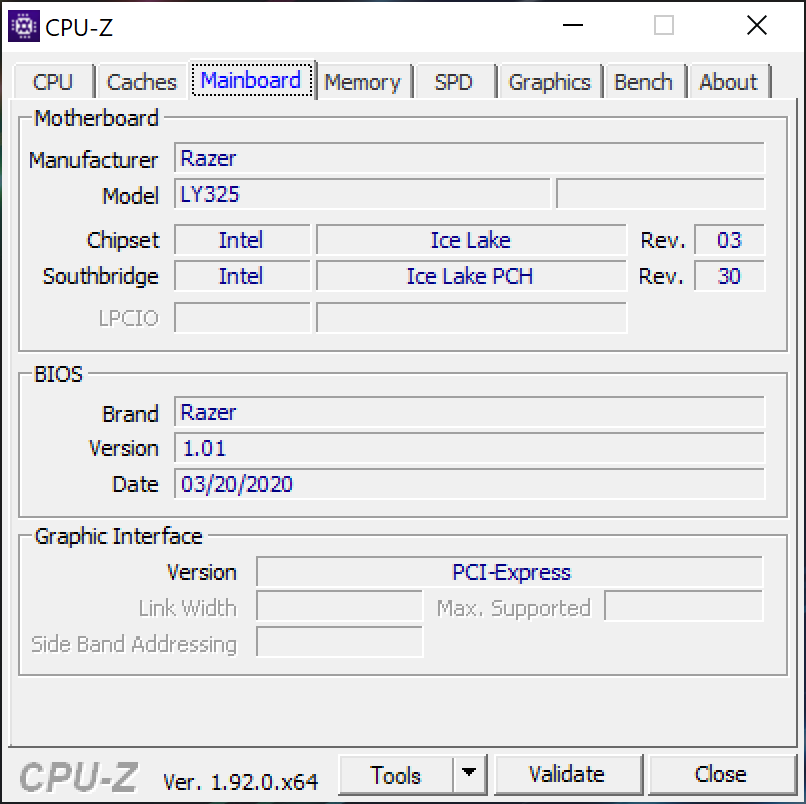
Razer introduced two Blade Stealth Core i7-1065G7 Ice Lake options last year: one 10 W version with GeForce GTX 1650 Max-Q graphics and one 25 W version with integrated Intel UHD Graphics. If you wanted the faster 25 W processor, you would have to sacrifice graphics performance and vice versa.
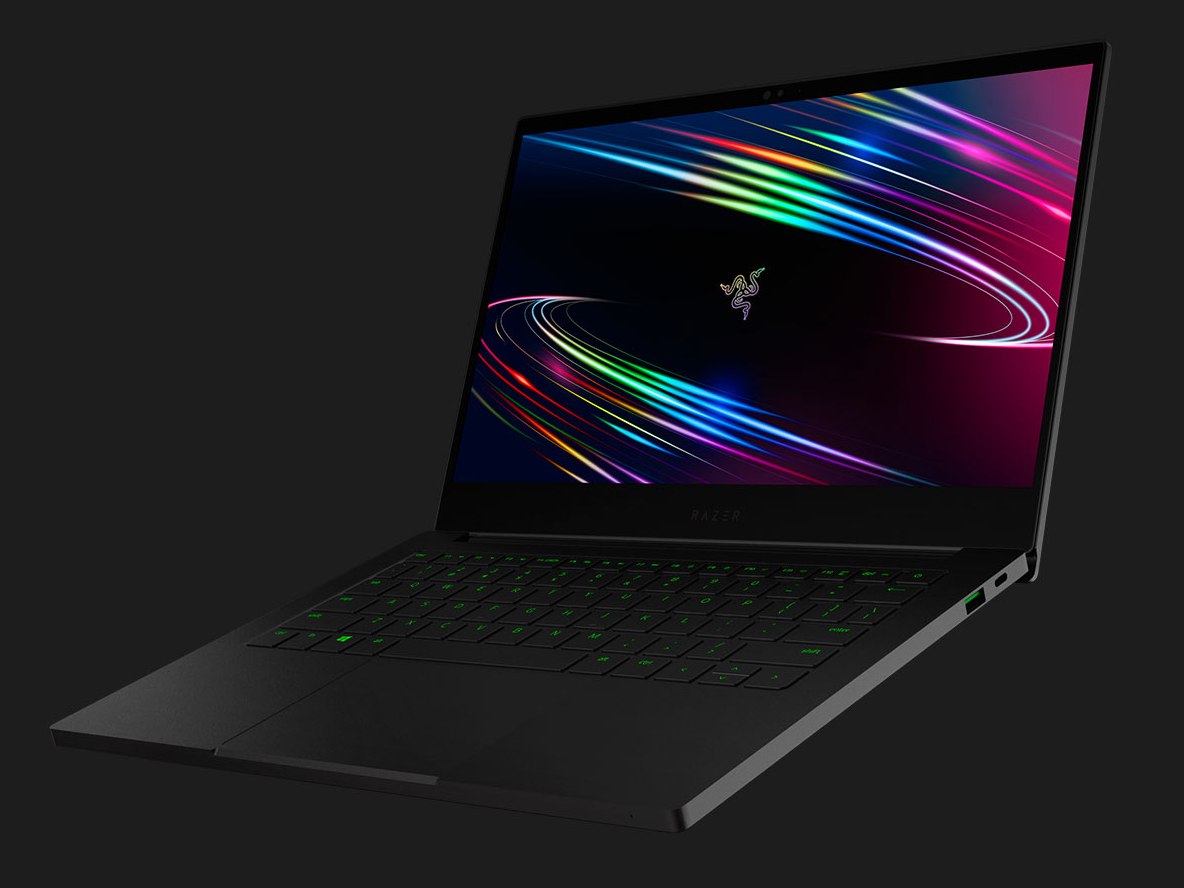
The 2020 version we have here addresses the compromise by pairing the 25 W CPU with dedicated GeForce GTX 1650 Ti Max-Q graphics meaning users can now have their cake and eat it, too. This particular SKU is unique in the subnotebook world as the uncommon GTX 1650 Ti Max-Q allows it to play games far better than any other 13.3-inch laptop available at the moment. However, all that power in a small package comes with some drawbacks which we'll detail below.
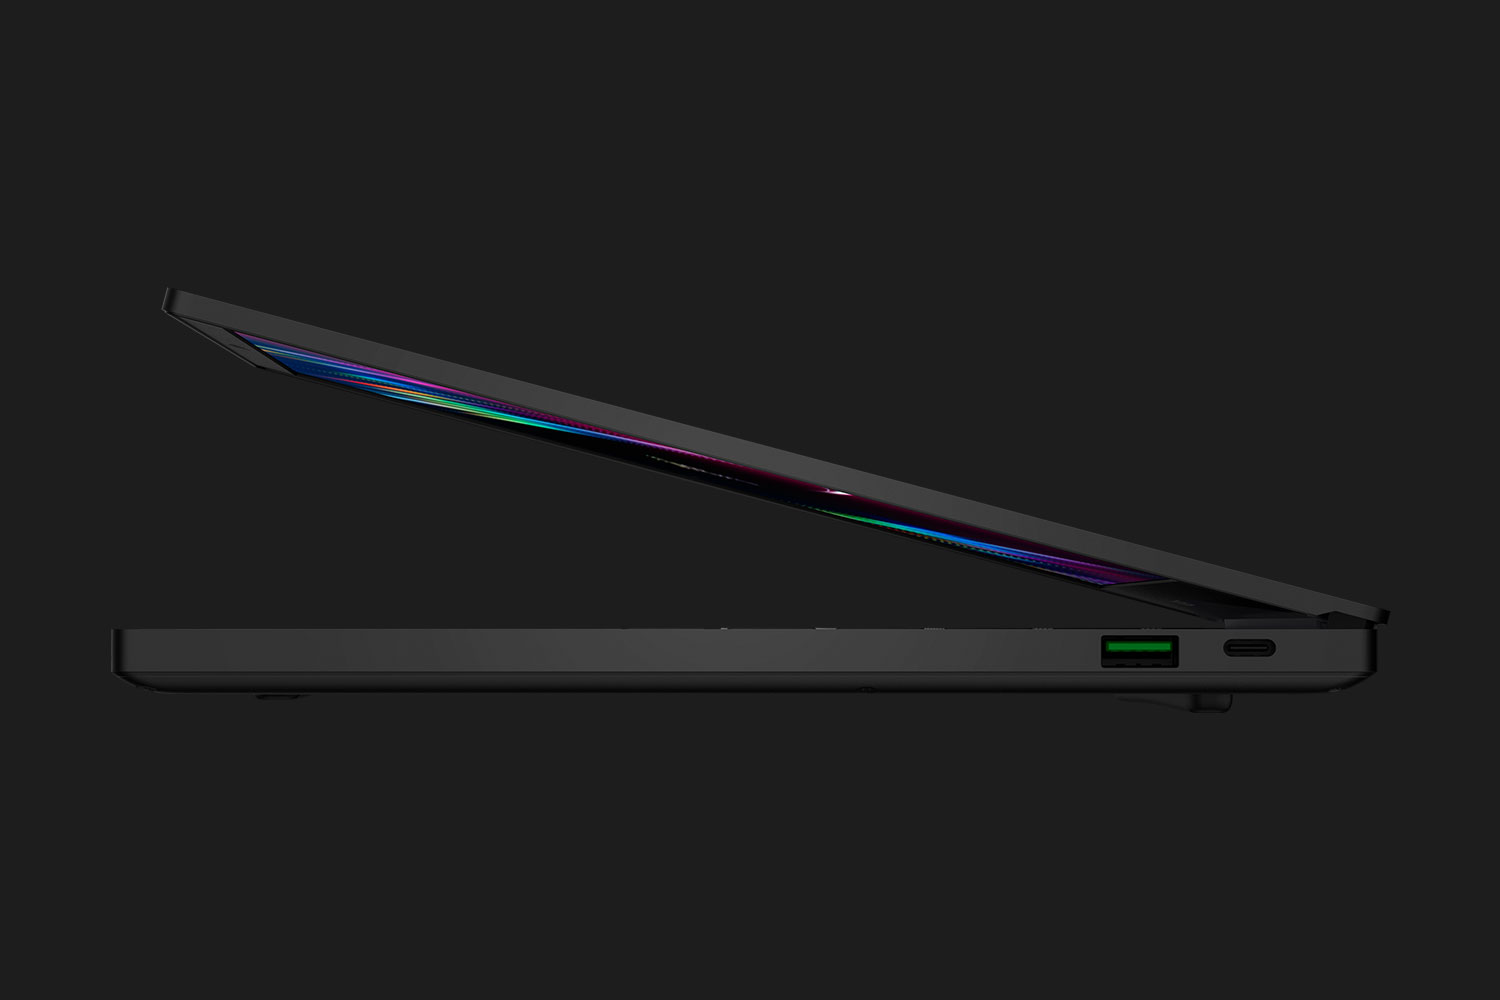
The 2020 Blade Stealth currently retails for $1800 USD and $2000 USD with a 1080p120 and 4K60 display, respectively. The chassis design remains almost completely unchanged year-over-year and so we recommend checking out our existing reviews on the 2019 Blade Stealth for more information on the case, clickpad, ports, keyboard, speakers, and other physical features.
Direct competitors are far and few between since 13.3-inch laptops with GeForce GTX graphics are so rare. Potential buyers will still compare the Blade Stealth to other high-end subnotebooks nonetheless including the Dell XPS 13, HP Spectre 13, Asus ZenBook S13, Lenovo IdeaPad S940, Microsoft Surface Book 2, or the 14-inch MSI Prestige 14.
More Razer reviews:
Rating | Date | Model | Weight | Height | Size | Resolution | Best Price |
|---|---|---|---|---|---|---|---|
| 84.8 % | 06/2020 | Razer Blade Stealth Core i7 GTX 1650 Ti Max-Q 4K i7-1065G7, GeForce GTX 1650 Ti Max-Q | 1.5 kg | 15.3 mm | 13.30" | 3840x2160 | |
| 88 % | 05/2020 | Dell XPS 13 9300 4K UHD i7-1065G7, Iris Plus Graphics G7 (Ice Lake 64 EU) | 1.2 kg | 14.8 mm | 13.40" | 3840x2400 | |
| 88.4 % | 12/2019 | HP Spectre x360 13-aw0013dx i7-1065G7, Iris Plus Graphics G7 (Ice Lake 64 EU) | 1.2 kg | 16.9 mm | 13.30" | 1920x1080 | |
| 86.6 % | 05/2019 | Asus ZenBook S13 UX392FN i7-8565U, GeForce MX150 | 1.1 kg | 12.9 mm | 13.90" | 1920x1080 | |
| 85 % | 06/2019 | Lenovo IdeaPad S940-14IWL i7-8565U, UHD Graphics 620 | 1.2 kg | 12 mm | 14.00" | 3840x2160 | |
| 84.2 % | 02/2020 | MSI Prestige 14 A10SC-009 i7-10710U, GeForce GTX 1650 Max-Q | 1.3 kg | 16 mm | 14.00" | 3840x2160 |
Case


Communication
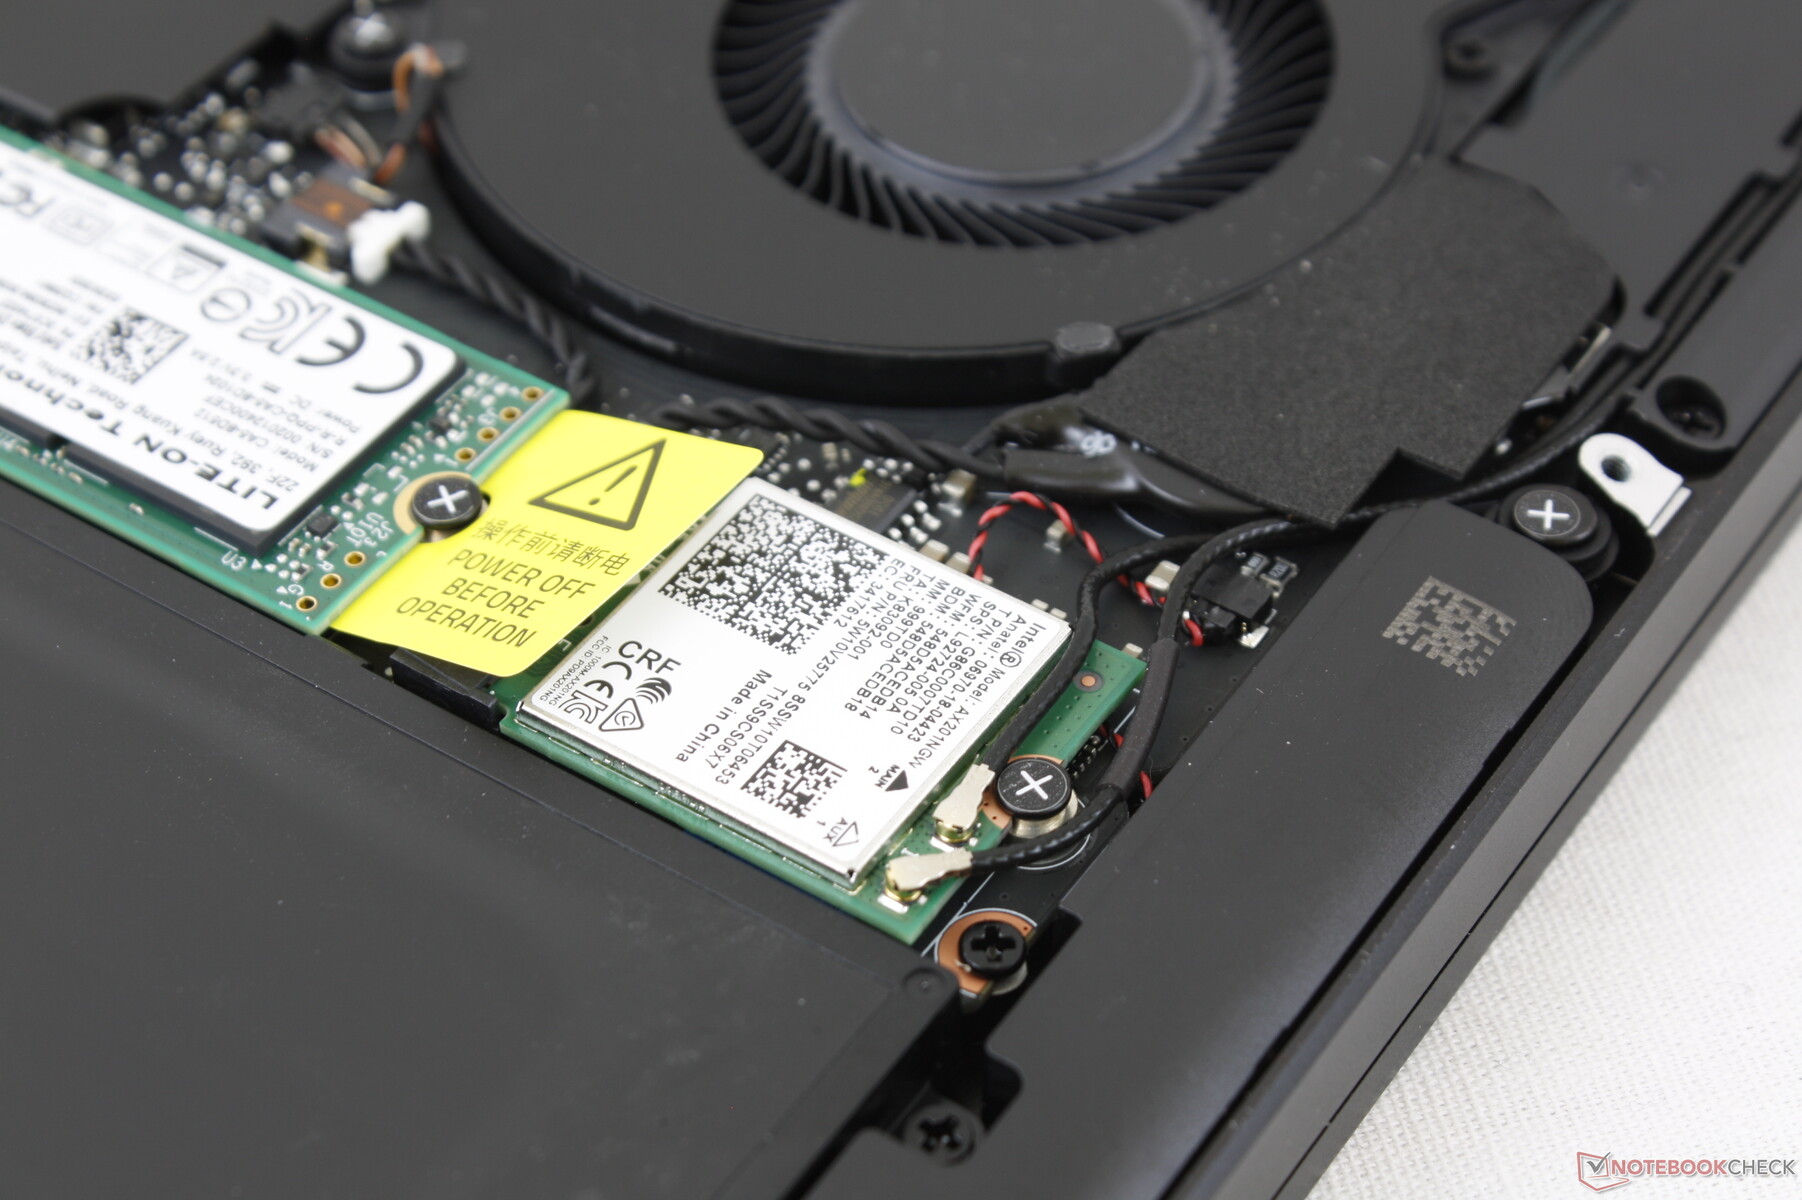
The Intel AX201 comes standard for Wi-Fi 6 and Bluetooth 5.1 connectivity. We experienced no issues when paired with our Netgear RAX200 router.
Webcam


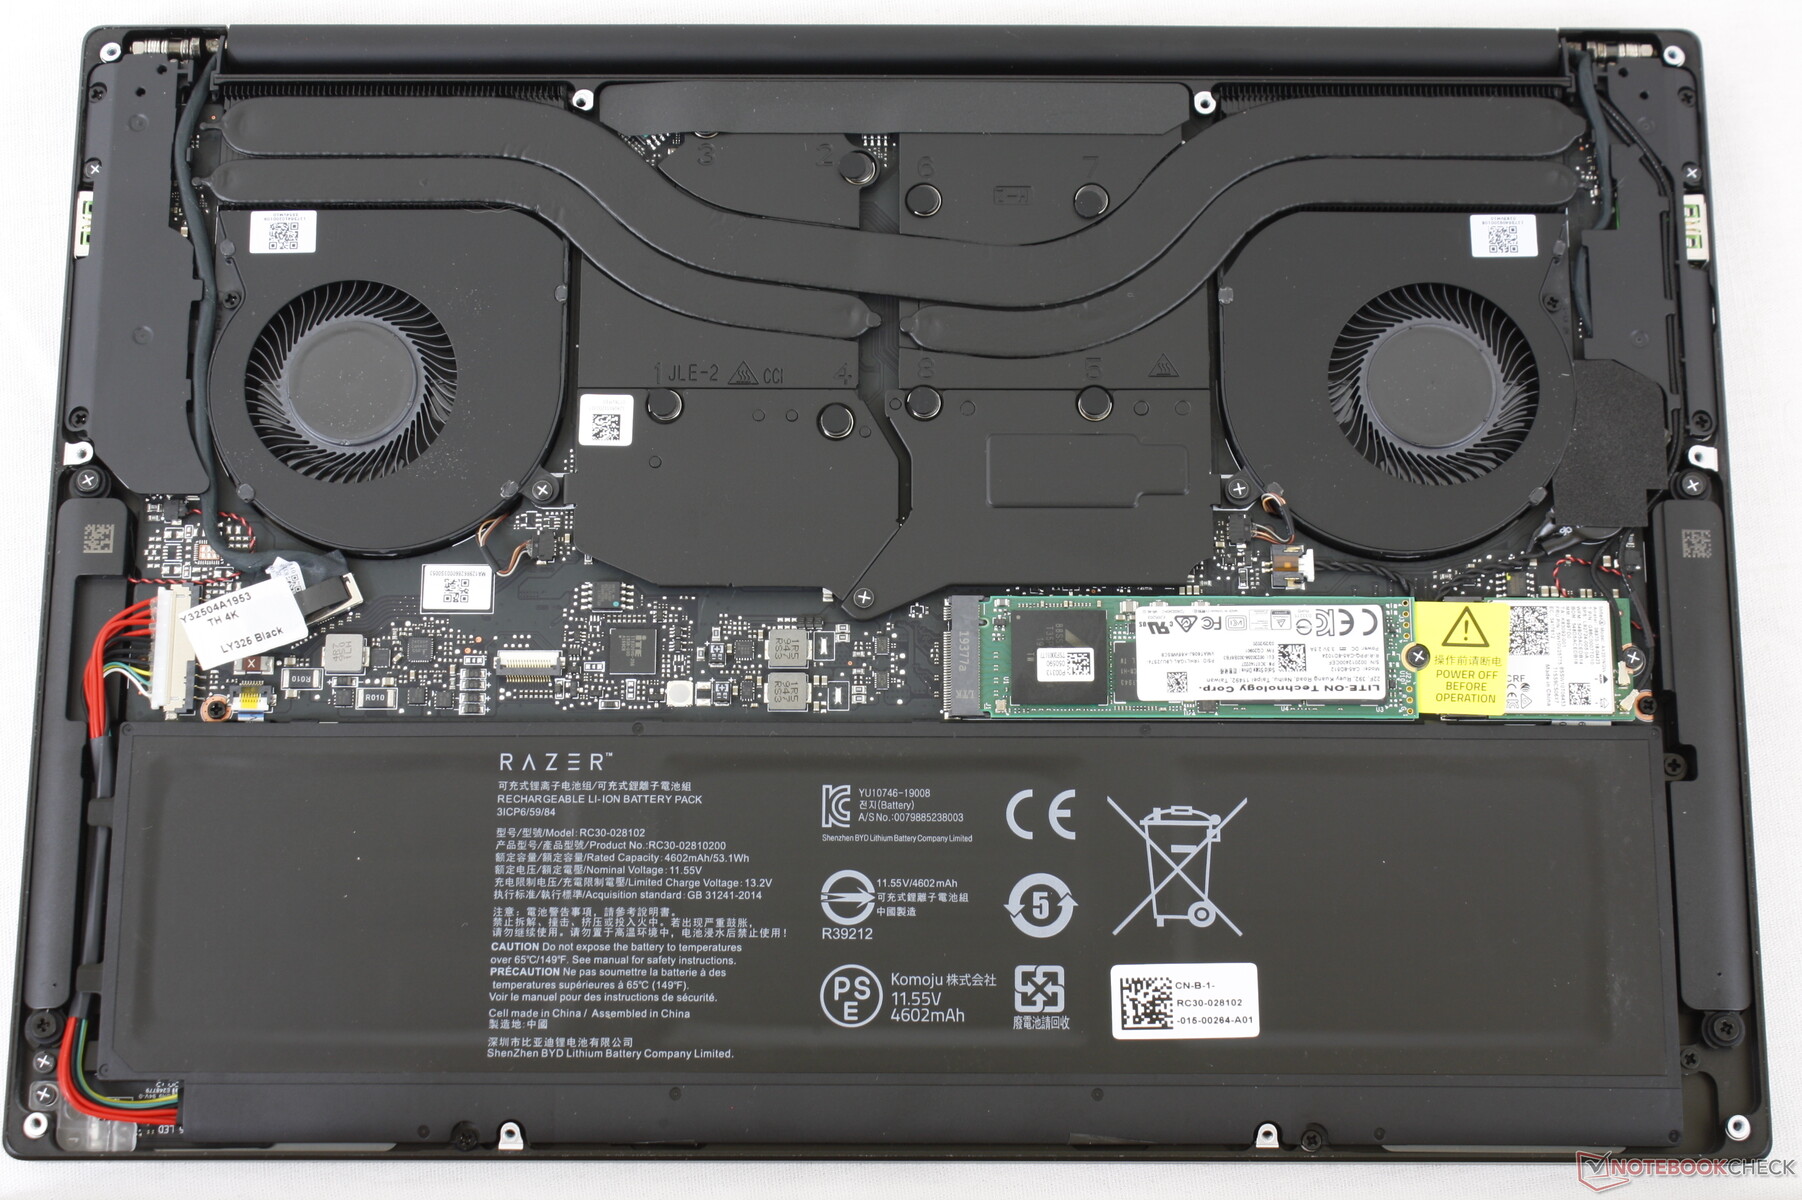
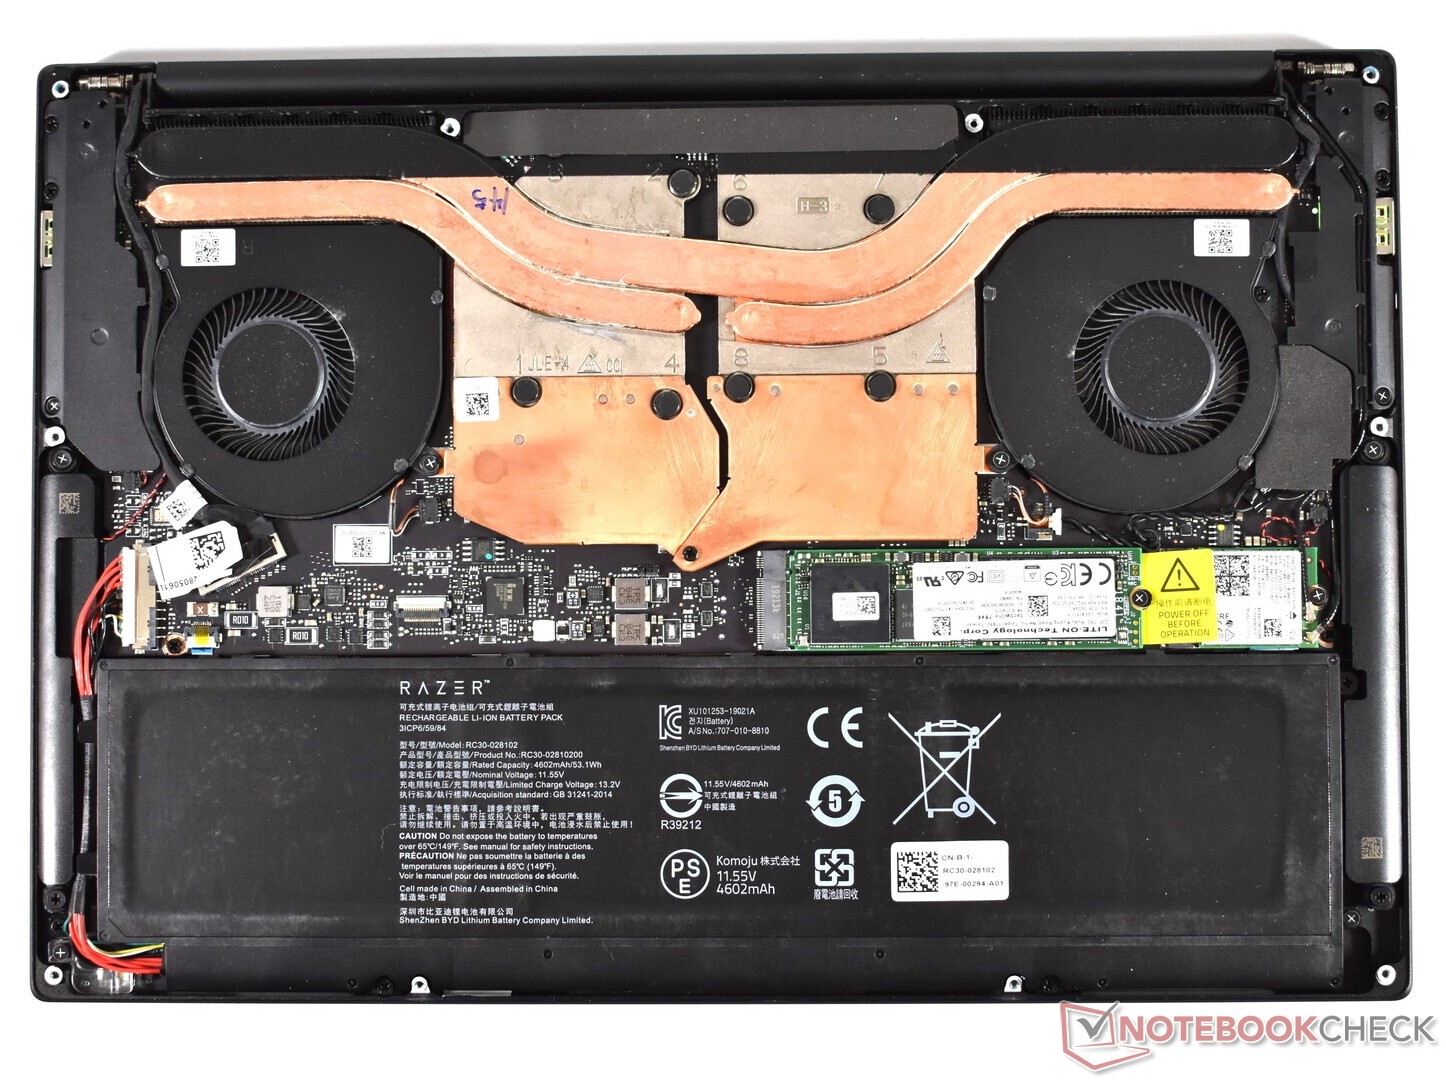
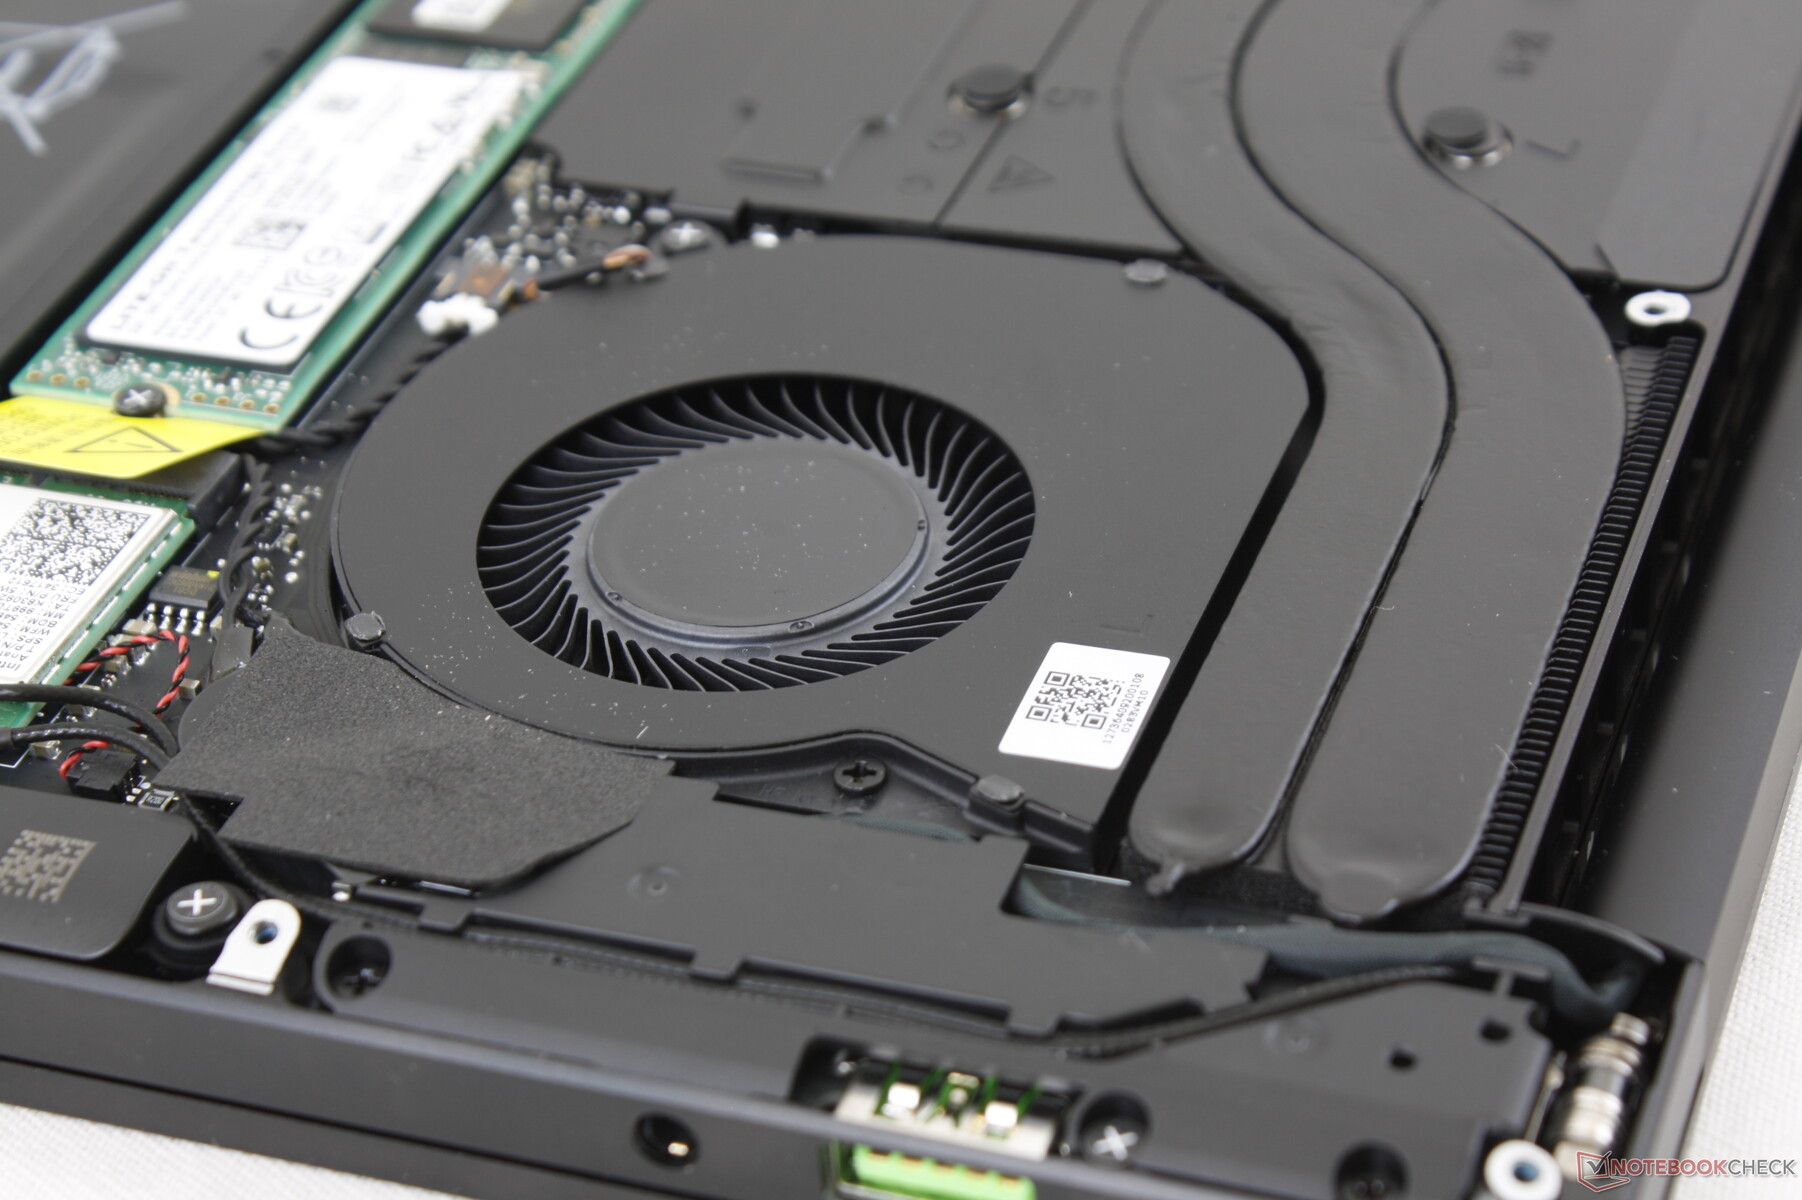
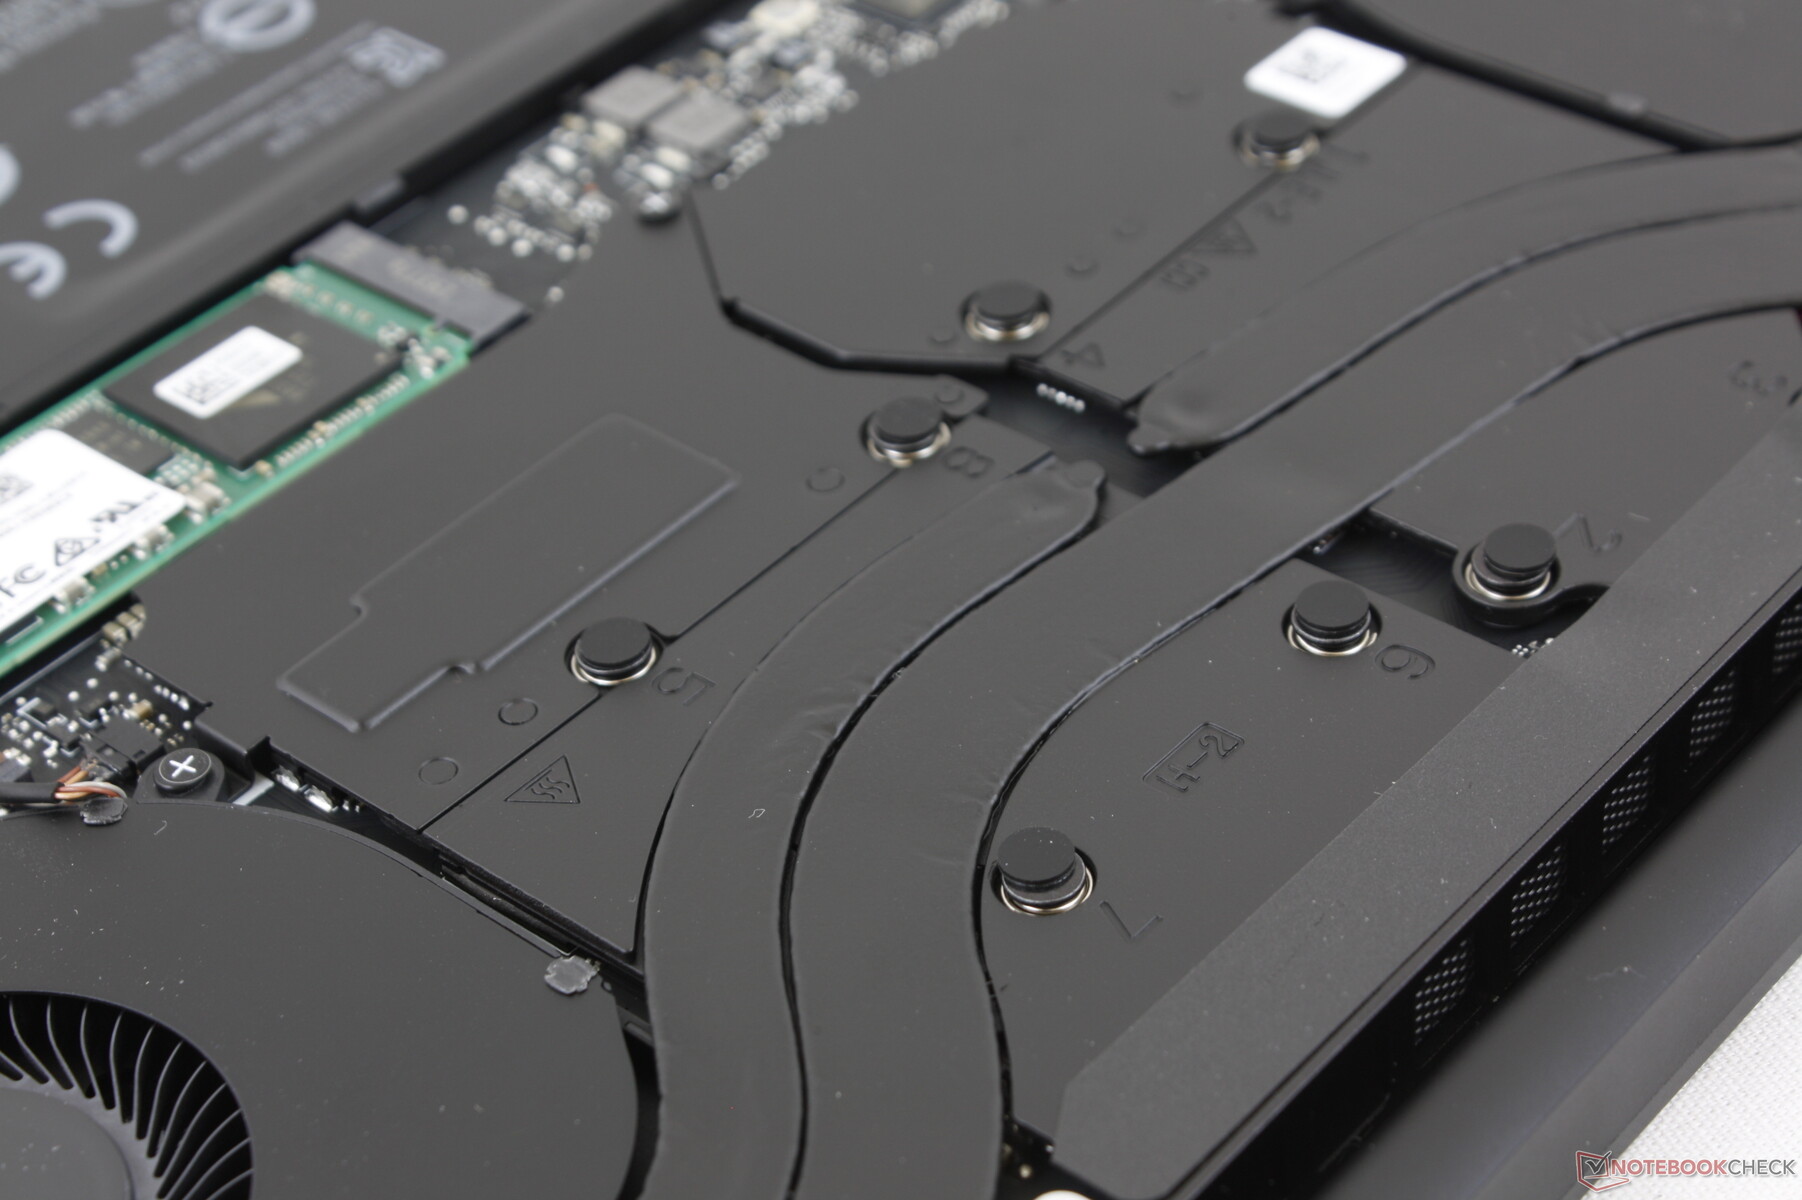
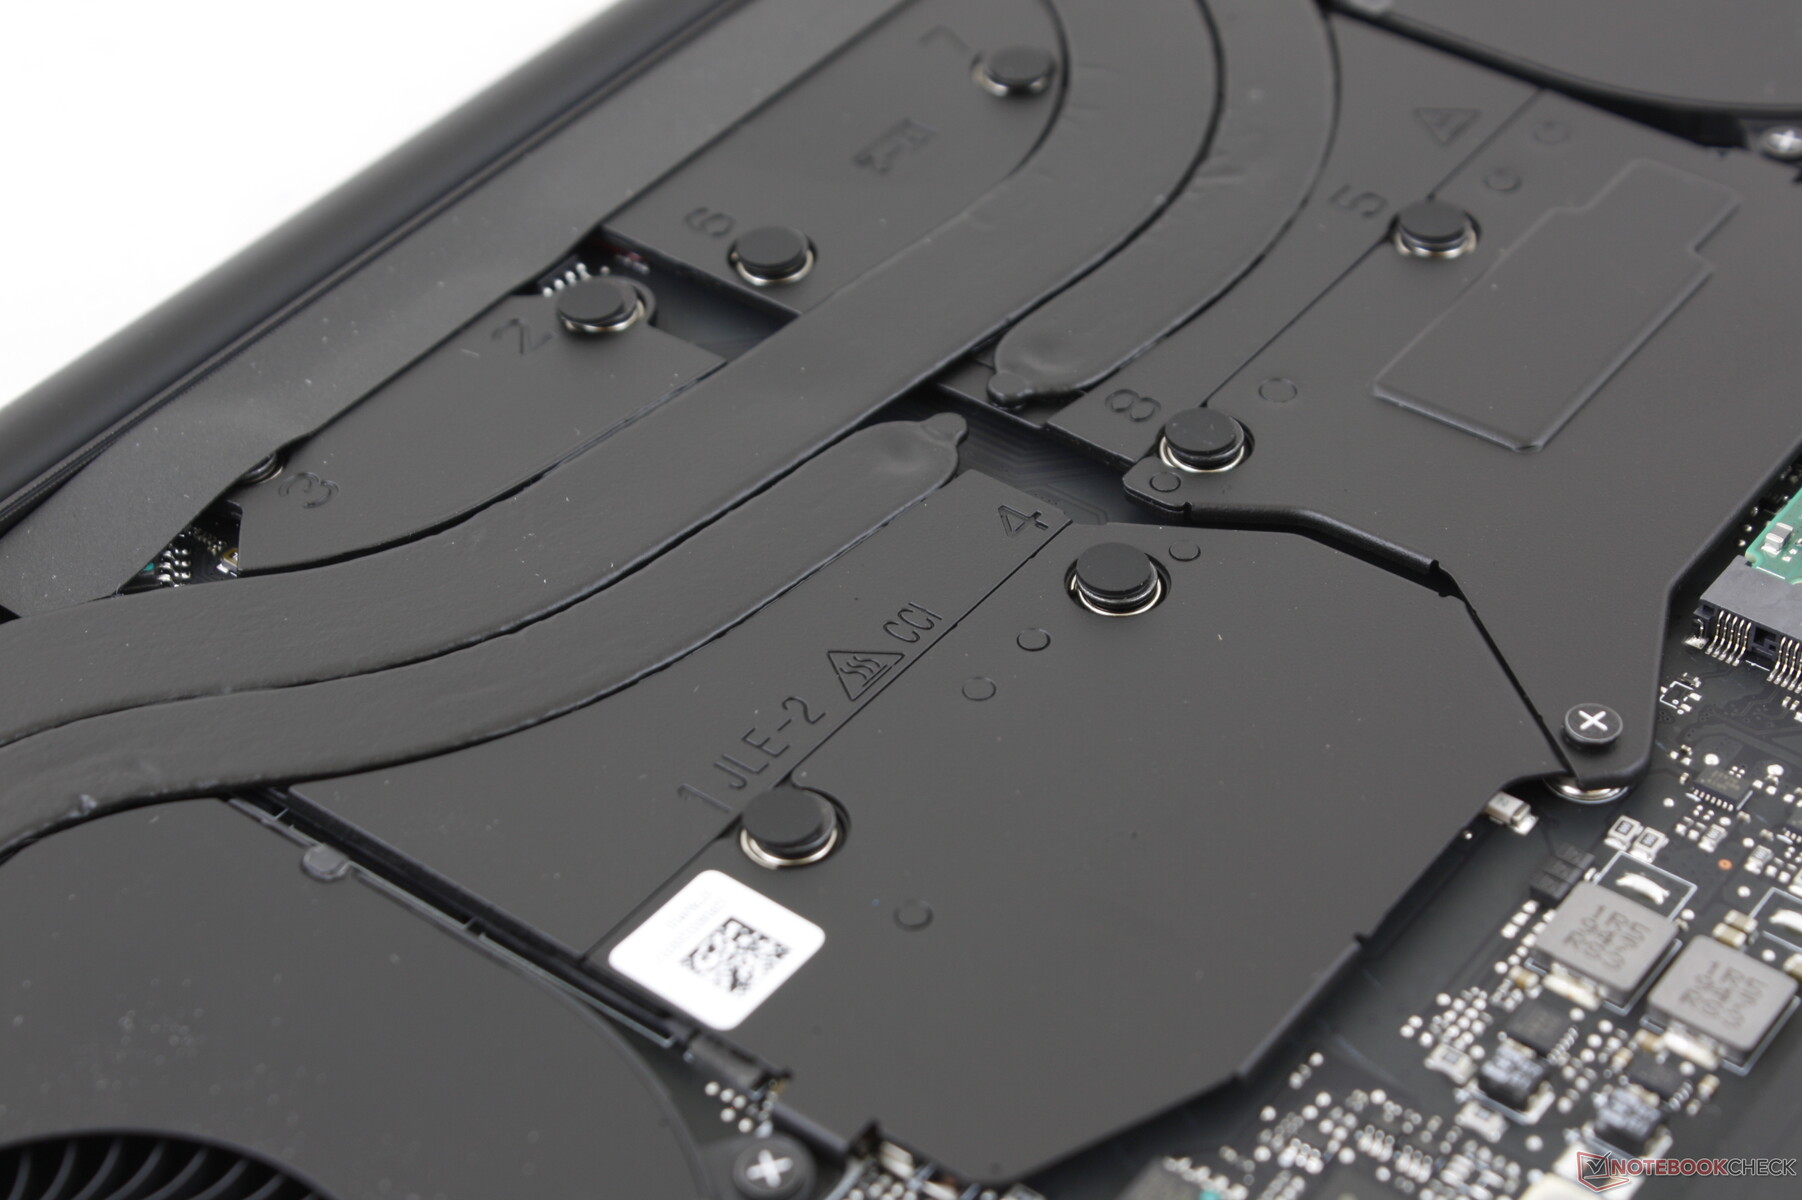
Maintenance
Input Devices
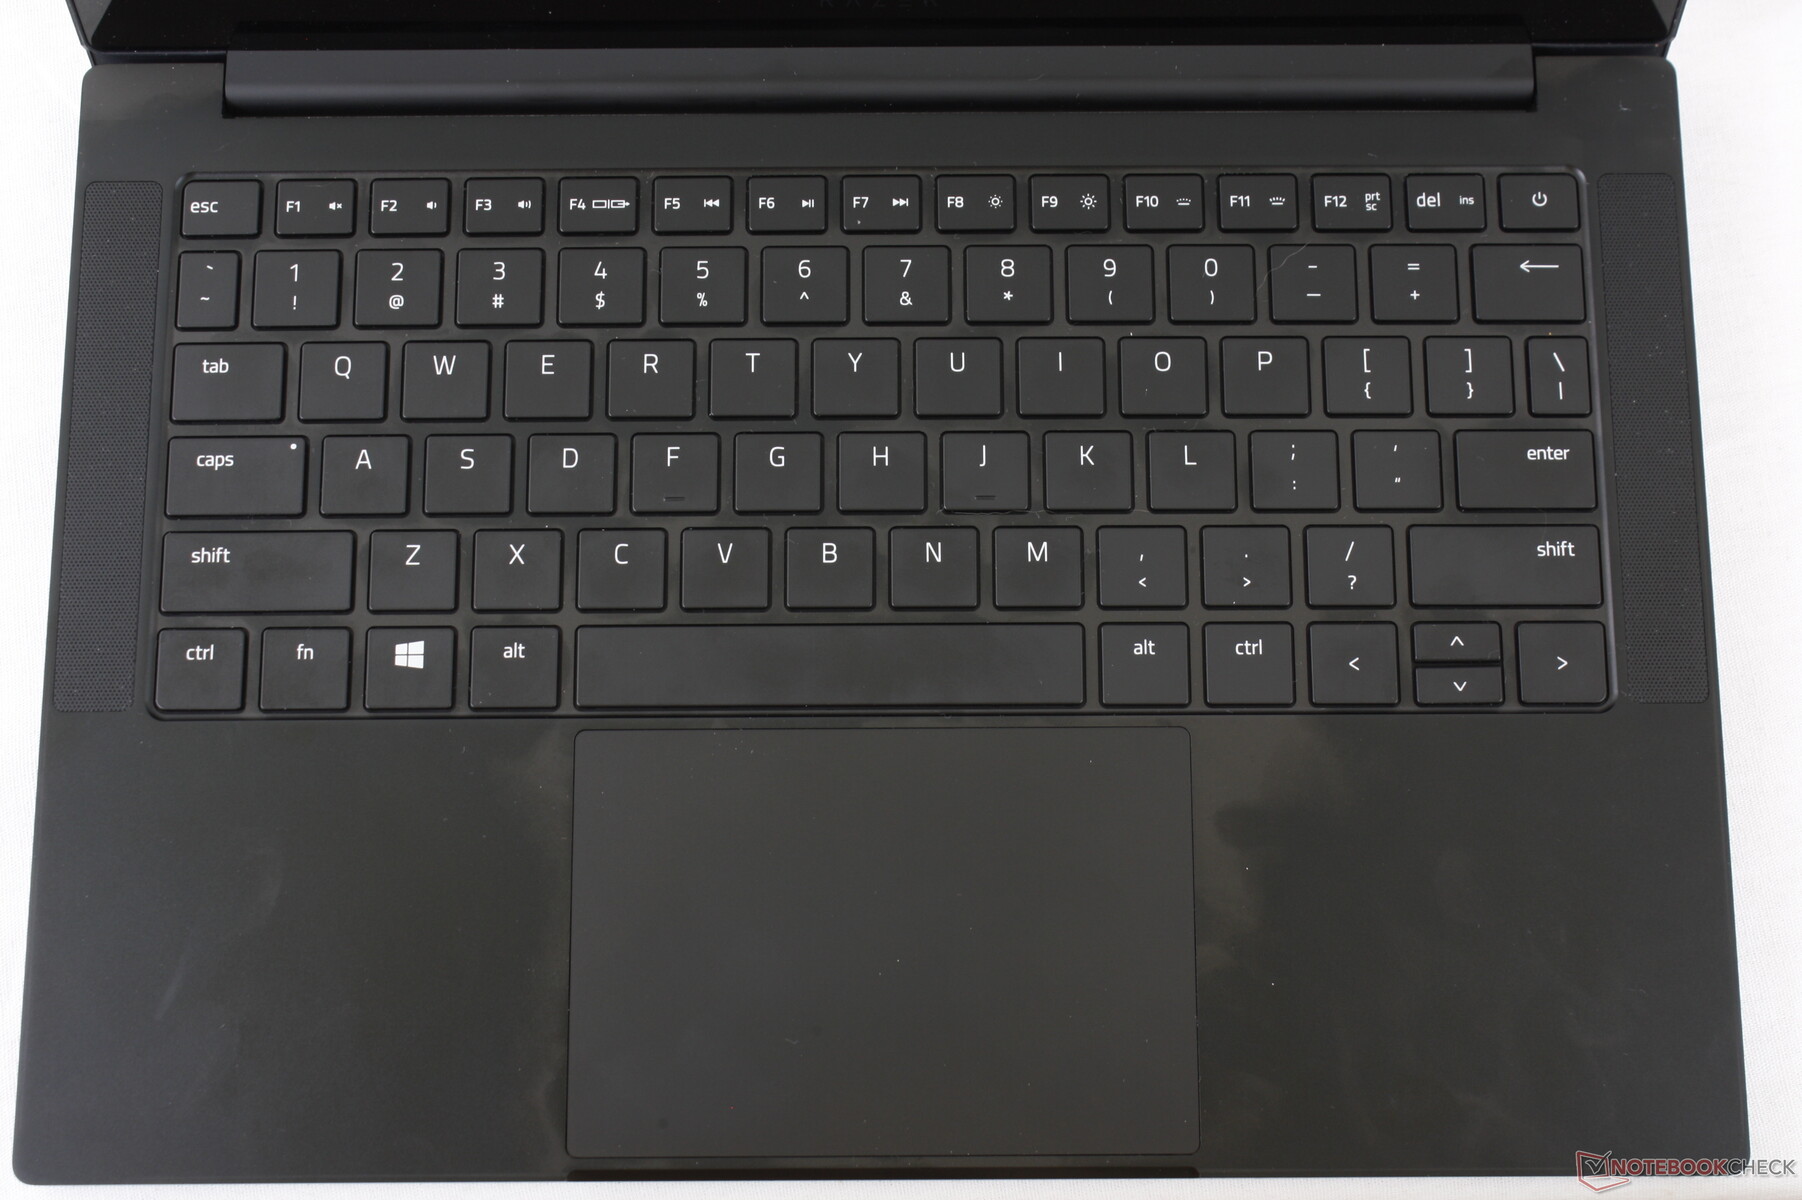
Keyboard
Much like the 2020 Blade 15, the Shift key has been elongated for easier typing. This is the easiest way to tell the 2020 Blade Stealth apart from earlier versions.

Display
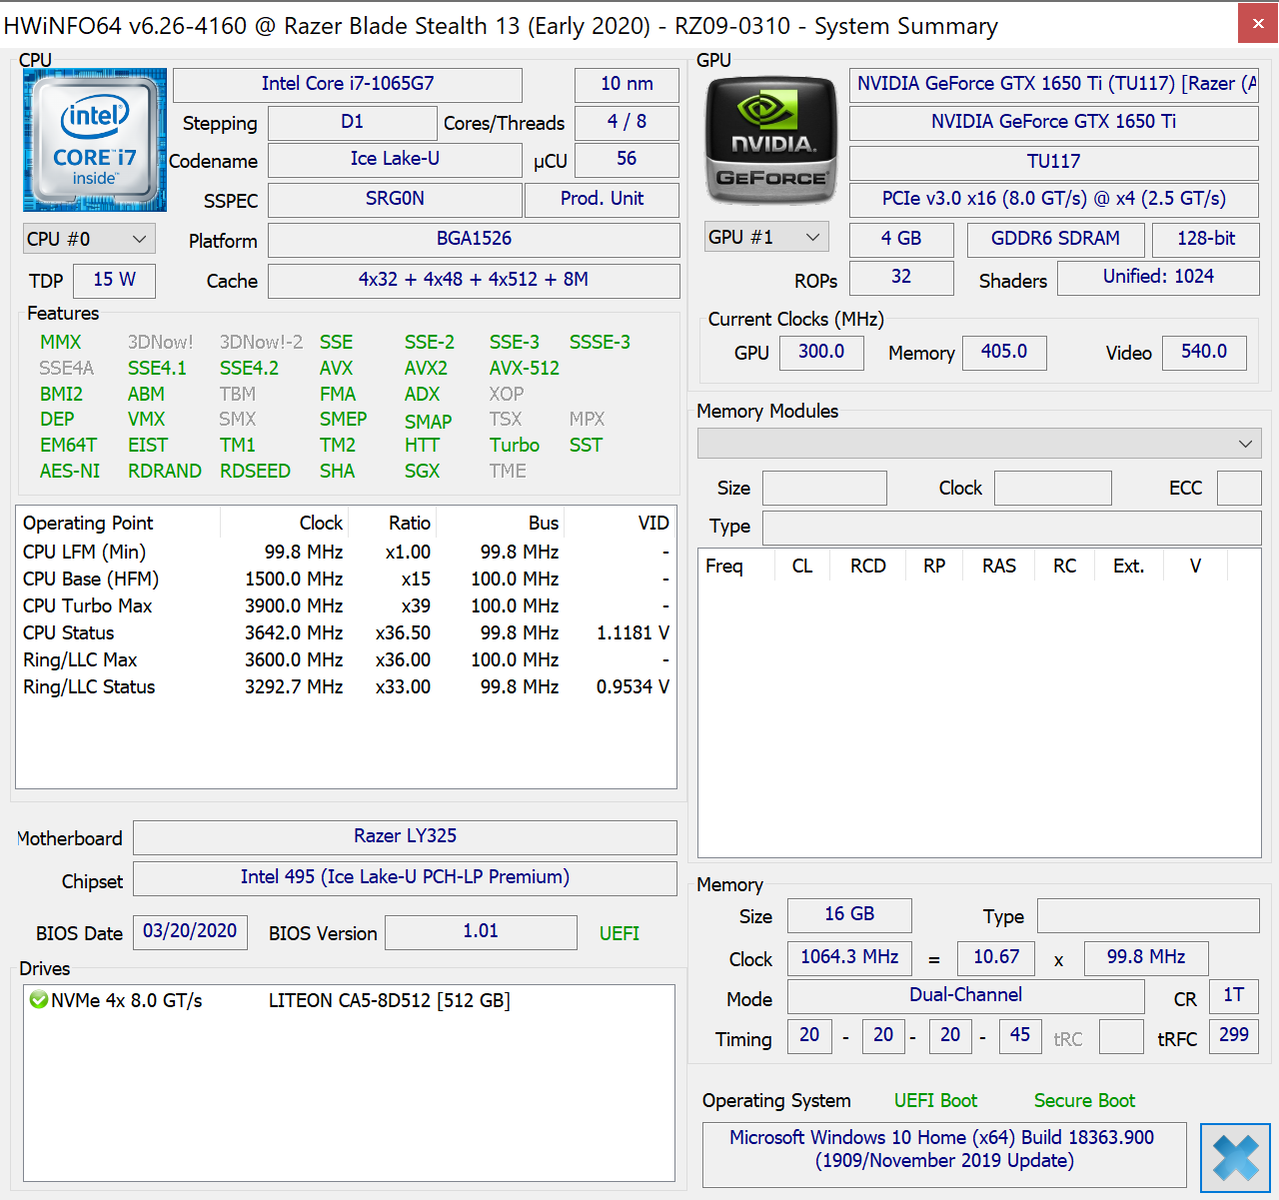
HWiNFO is unable to pull the exact panel name yet again, but at least we can confirm that it is of AU Optronics origin similar to the one on the 2019 Blade Stealth. Response times, gamut, and contrast ratio are not all that different between the 2019 and 2020 models as a result. Our 2020 unit is using a different display controller than the one on the 2019 version (AUO272B vs. AUO202B).
The worst aspect of the 4K panel is its slow black-white and gray-gray response times. Normally, we wouldn't complain too much about this since Ultrabooks with 4K panels aren't targeted towards gamers. The Blade Stealth and its gaming-capable GPU, however, will indubitably attract a lot of gamers who may not be aware of the slow response times of the 4K display. Ghosting is very noticeable here and even distracting in fast-paced games like Overwatch or Rocket league.
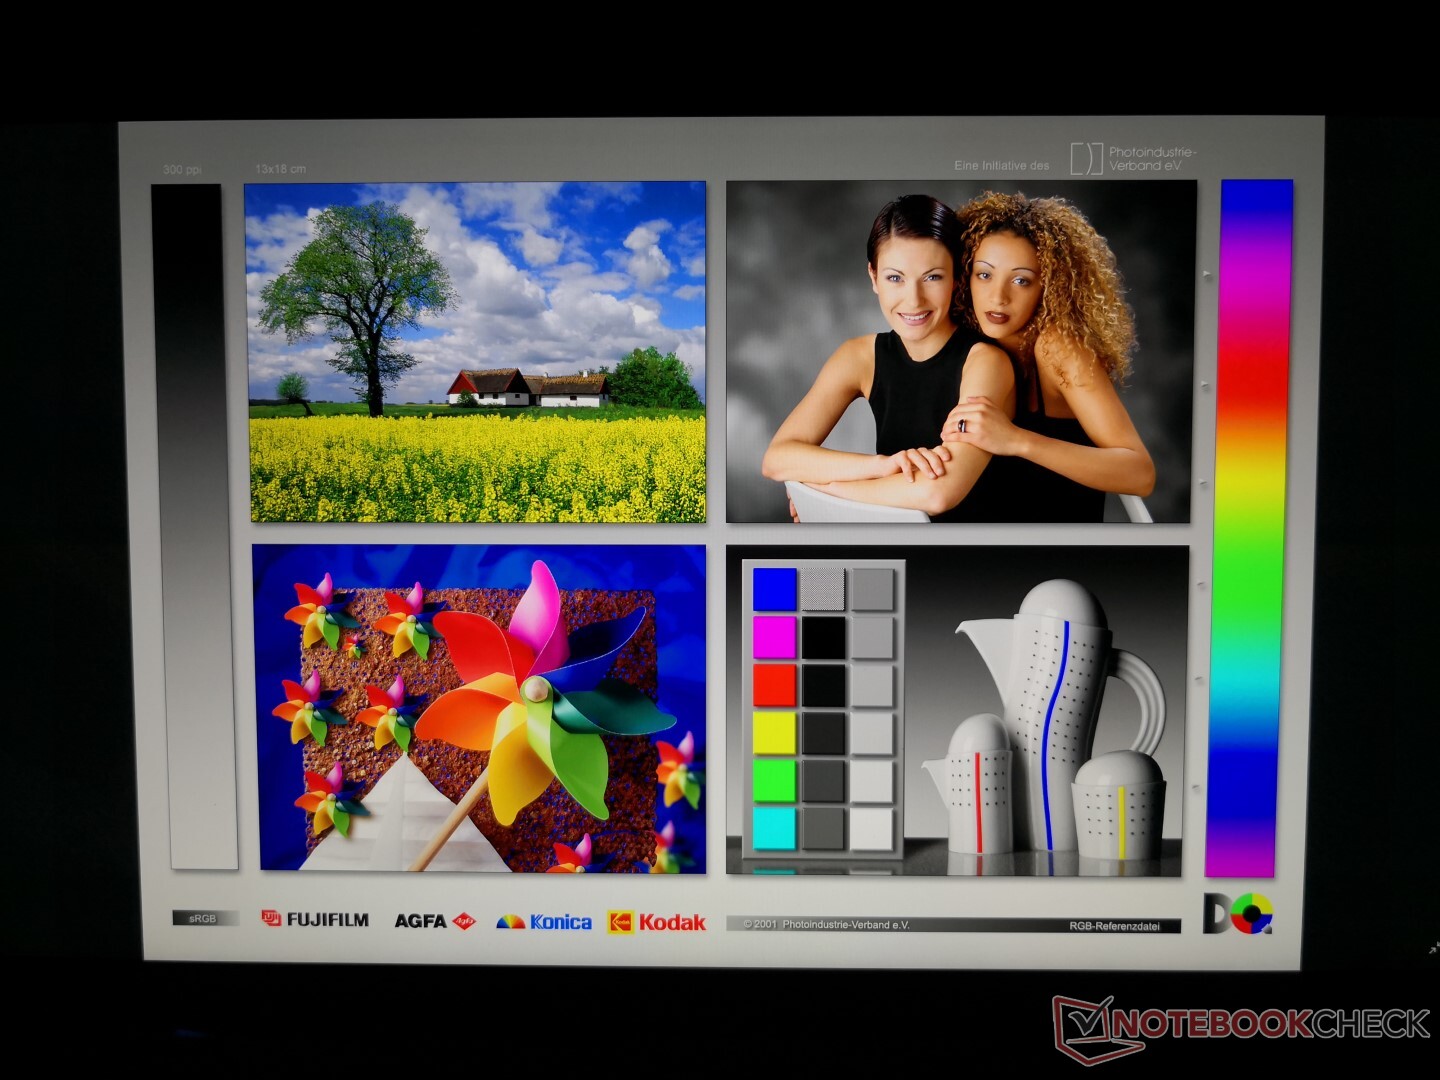
Other than the slow response times, the glossy 4K touchscreen is otherwise crisp and even brighter than the 4K 2019 Blade Stealth. Note that the less expensive matte 1080p 120 Hz SKU will likely return very different results than what we've recorded below.


| |||||||||||||||||||||||||
Brightness Distribution: 92 %
Center on Battery: 467 cd/m²
Contrast: 1197:1 (Black: 0.39 cd/m²)
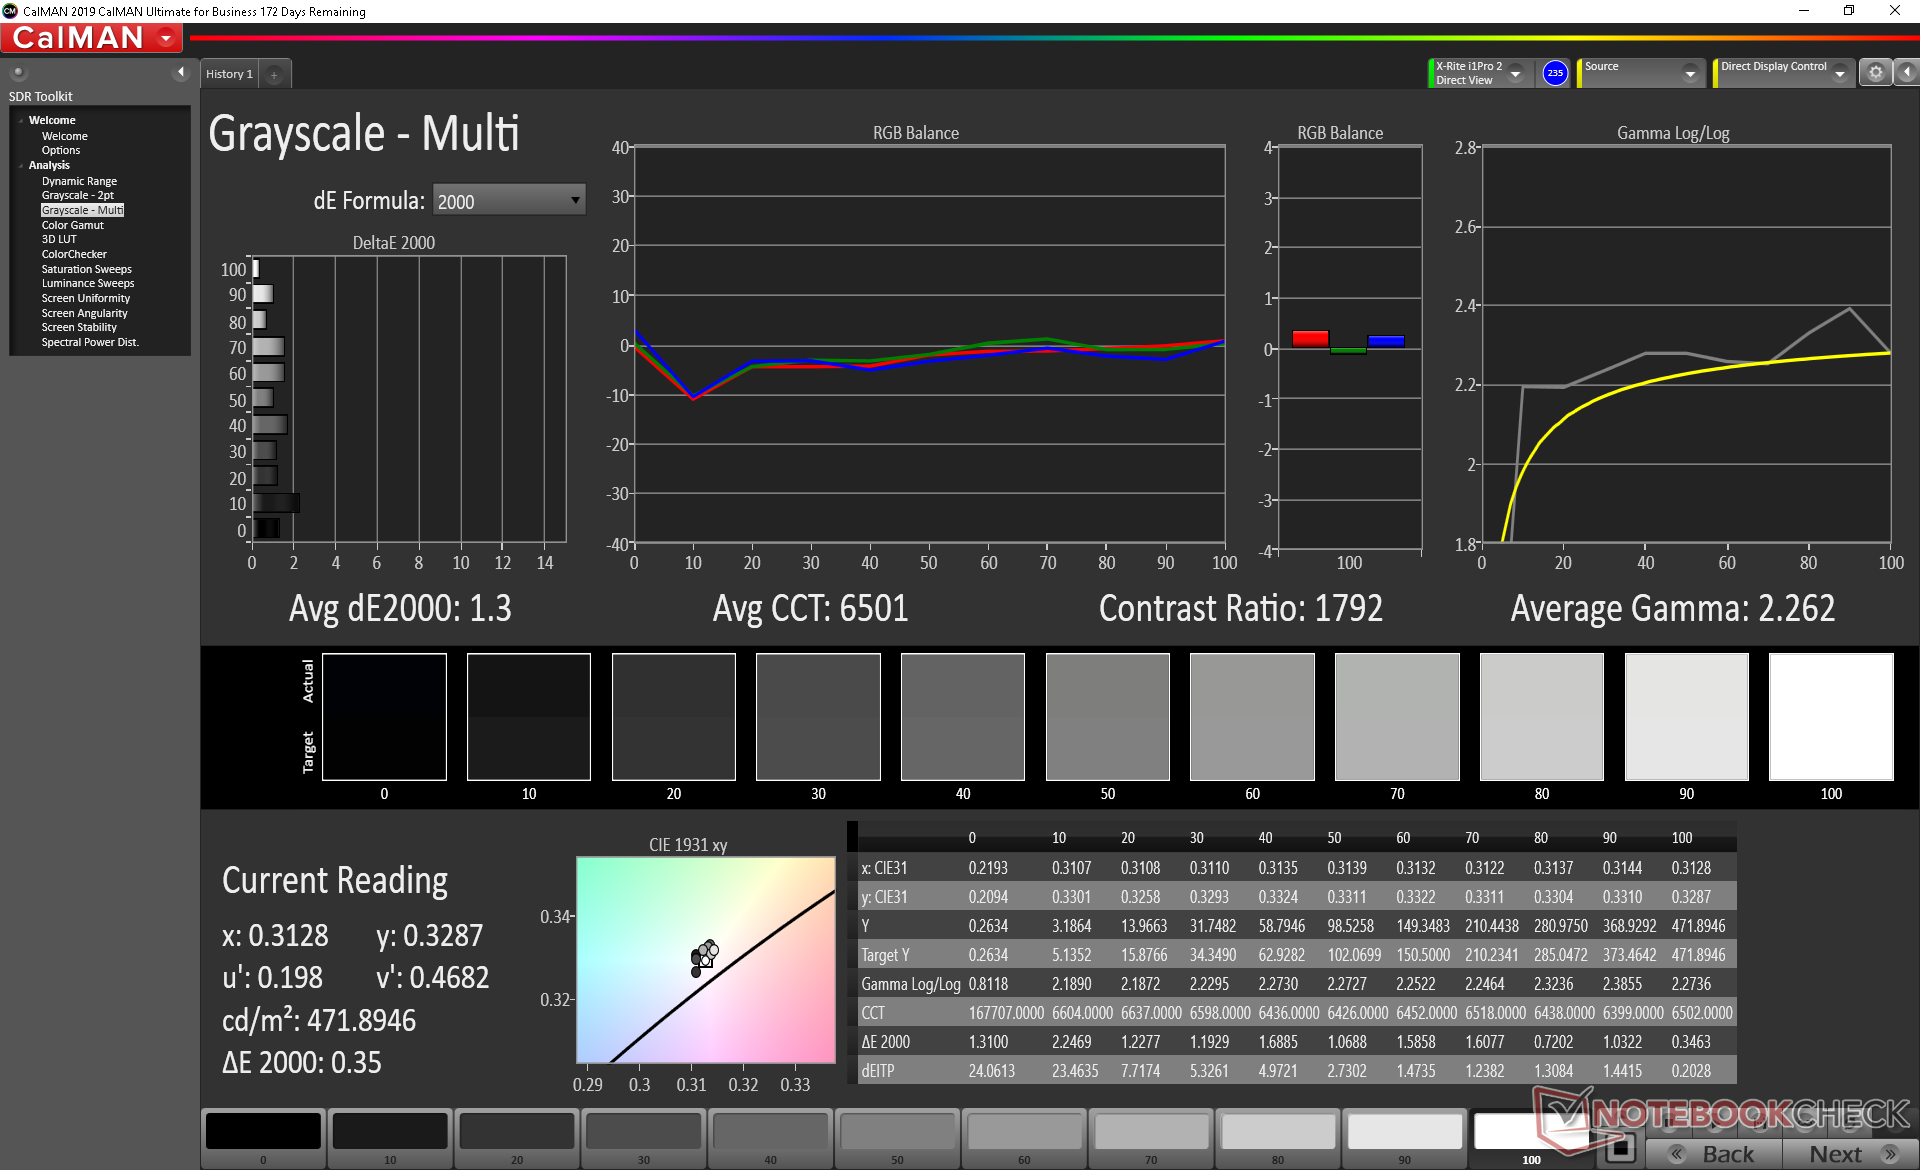
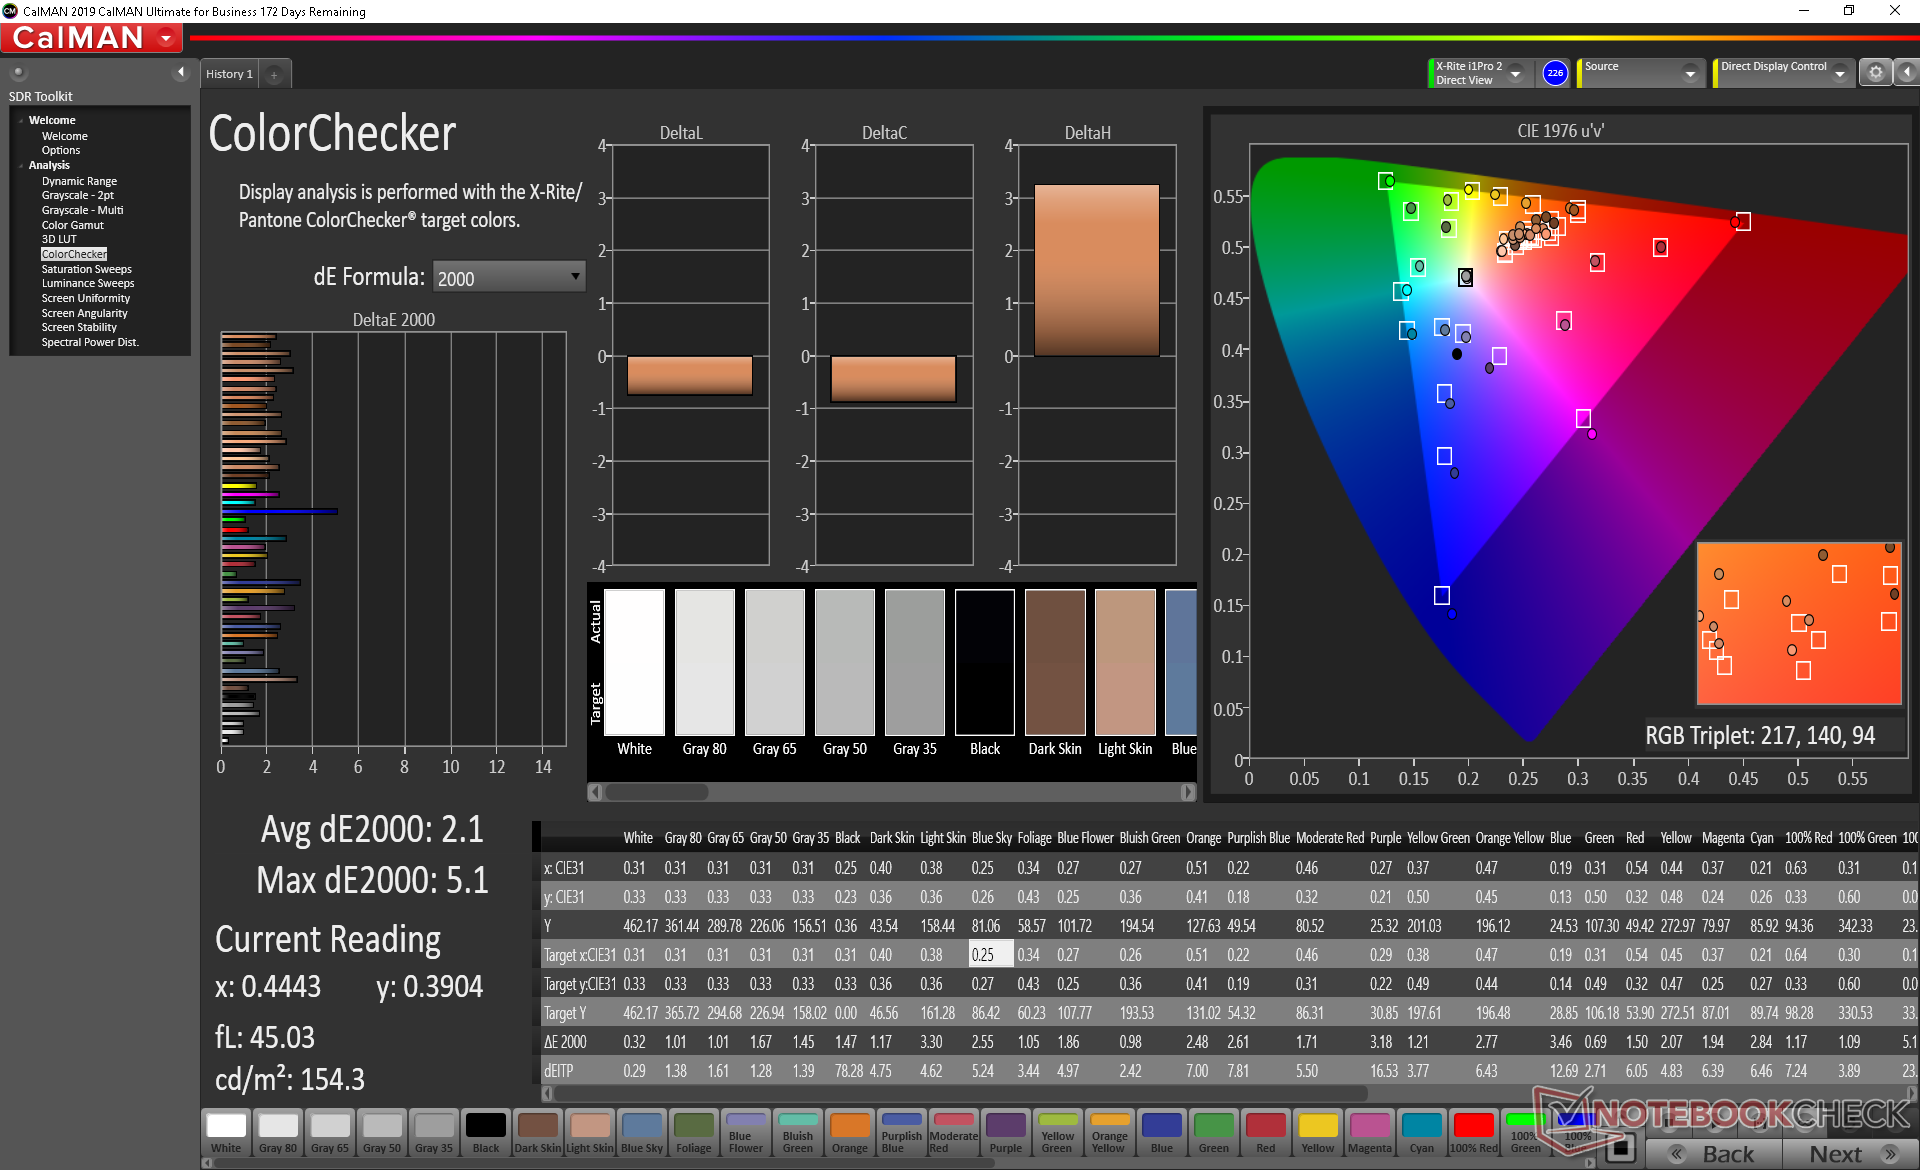
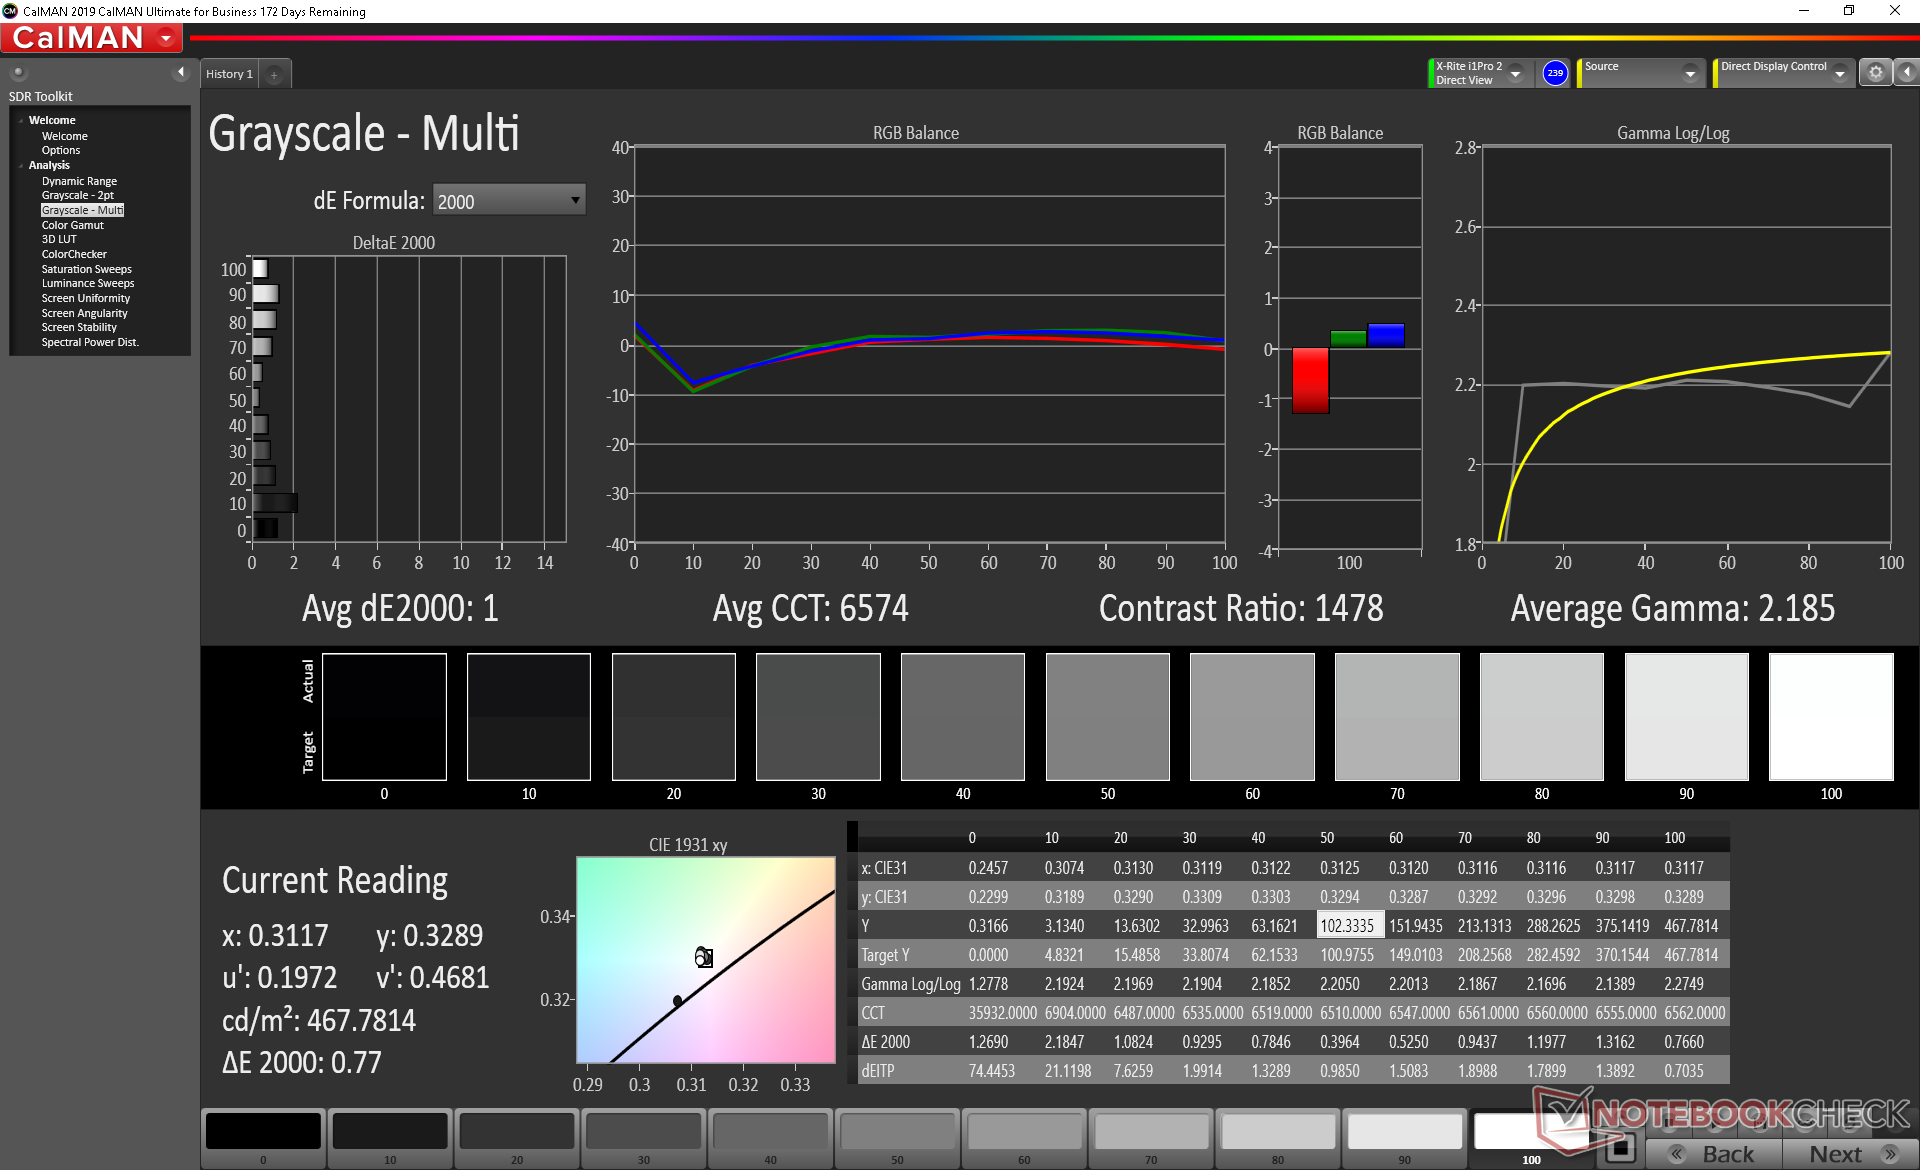
ΔE Color 2.1 | 0.5-29.43 Ø5, calibrated: 2.04
ΔE Greyscale 1.3 | 0.57-98 Ø5.3
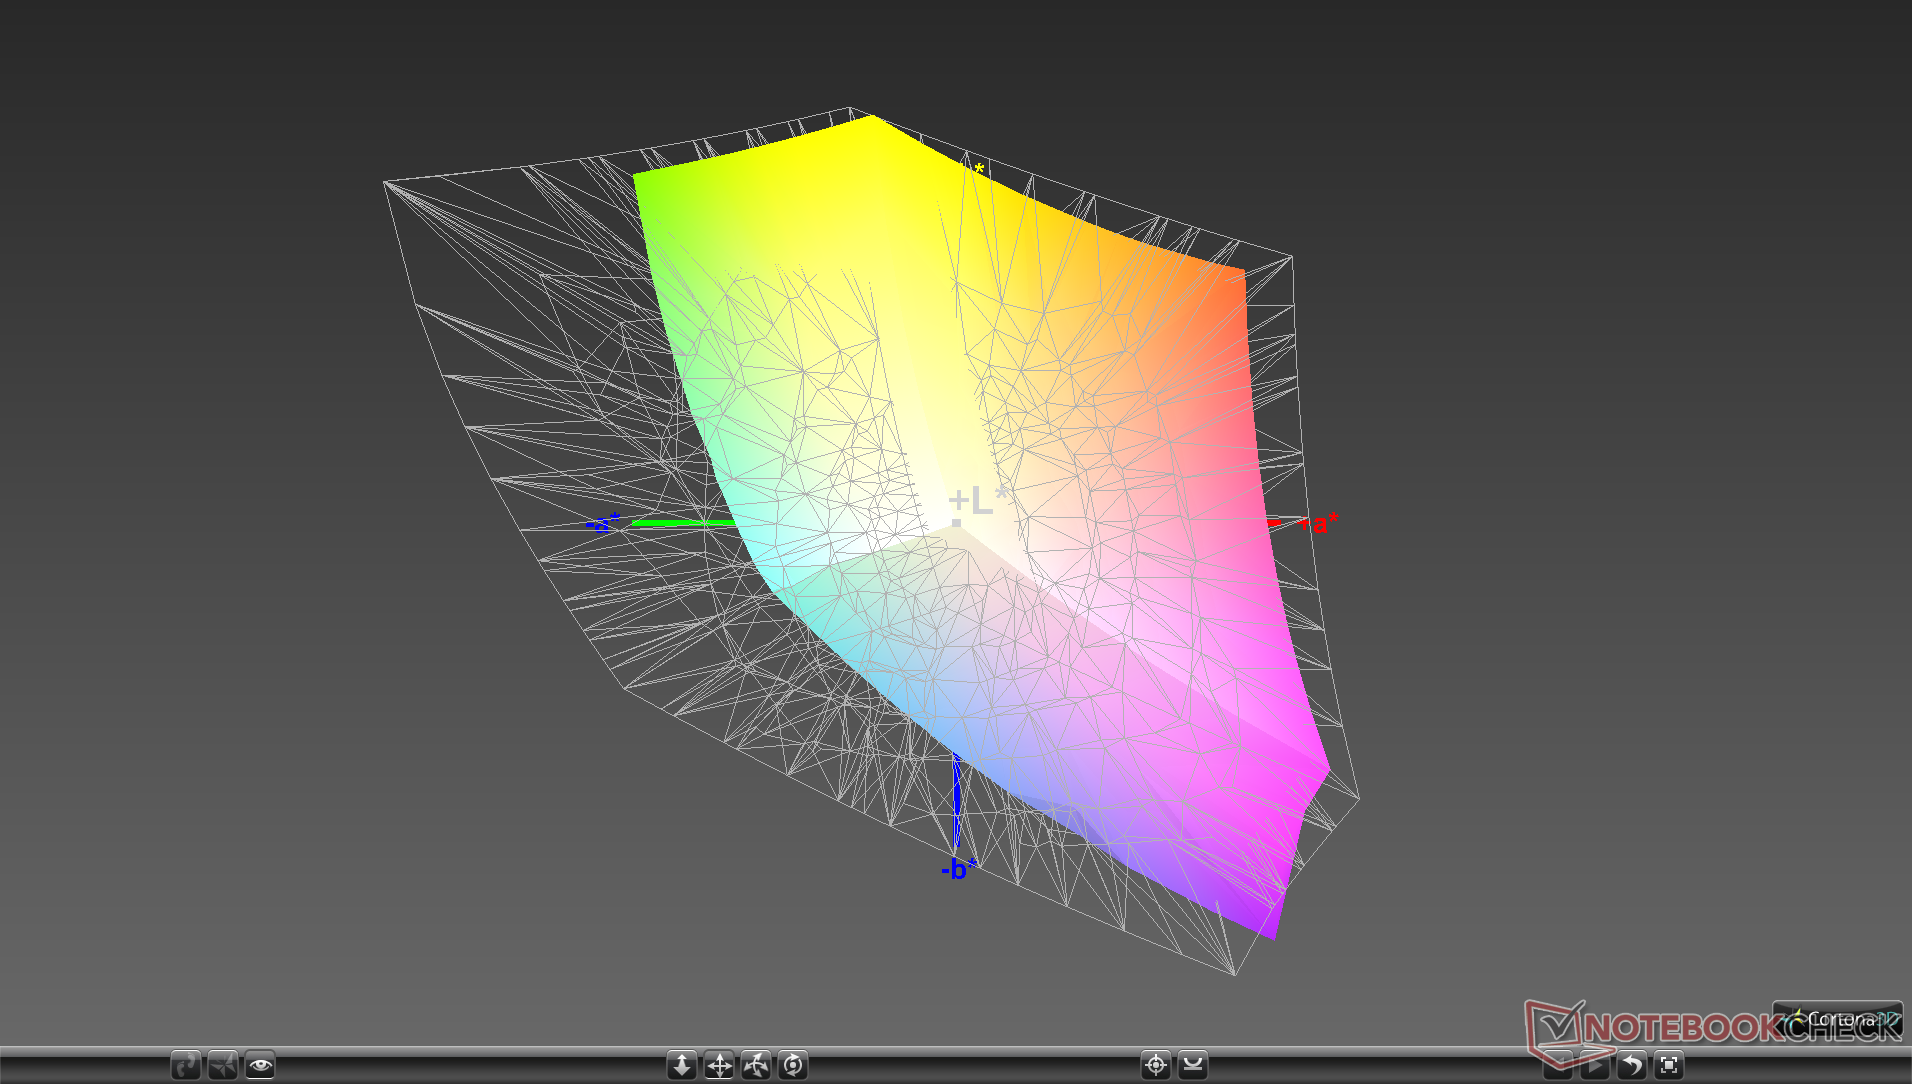
93.4% sRGB (Argyll 1.6.3 3D)
59.5% AdobeRGB 1998 (Argyll 1.6.3 3D)
64.5% AdobeRGB 1998 (Argyll 2.2.0 3D)
93.7% sRGB (Argyll 2.2.0 3D)
63.7% Display P3 (Argyll 2.2.0 3D)
Gamma: 2.26
| Razer Blade Stealth Core i7 GTX 1650 Ti Max-Q 4K AUO272B, IPS, 13.30, 3840x2160 | Dell XPS 13 9300 4K UHD Sharp LQ134R1, IPS, 13.40, 3840x2400 | HP Spectre x360 13-aw0013dx AU Optronics AUO5E2D, IPS, 13.30, 1920x1080 | MSI Prestige 14 A10SC-009 IPS, 14.00, 3840x2160 | Razer Blade Stealth i7-8565U Sharp LQ133M1JW41, IPS, 13.30, 1920x1080 | Razer Blade Stealth 13, Core i7-1065G7 AUO202B, IPS LED, 13.30, 3840x2160 | |
|---|---|---|---|---|---|---|
| Display | 1% | 9% | 3% | 2% | ||
| Display P3 Coverage | 63.7 | 64.5 1% | 69.6 9% | 65.5 3% | 64.3 1% | |
| sRGB Coverage | 93.7 | 91.4 -2% | 98.9 6% | 96.3 3% | 95.8 2% | |
| AdobeRGB 1998 Coverage | 64.5 | 66.6 3% | 71.5 11% | 66.3 3% | 65.7 2% | |
| Response Times | 30% | -3% | 4% | 5% | -7% | |
| Response Time Grey 50% / Grey 80% * | 57.6 ? | 41.6 ? 28% | 60.8 ? -6% | 55 ? 5% | 57.6 ? -0% | 62 ? -8% |
| Response Time Black / White * | 37.2 ? | 25.6 ? 31% | 36.8 ? 1% | 36 ? 3% | 34 ? 9% | 39 ? -5% |
| PWM Frequency | 22730 ? | |||||
| Screen | -22% | -44% | 8% | 12% | -38% | |
| Brightness middle | 467 | 414 -11% | 447.4 -4% | 567 21% | 429.8 -8% | 353 -24% |
| Brightness | 448 | 401 -10% | 420 -6% | 516 15% | 403 -10% | 335 -25% |
| Brightness Distribution | 92 | 94 2% | 85 -8% | 86 -7% | 89 -3% | 90 -2% |
| Black Level * | 0.39 | 0.28 28% | 0.31 21% | 0.445 -14% | 0.32 18% | 0.25 36% |
| Contrast | 1197 | 1479 24% | 1443 21% | 1274 6% | 1343 12% | 1412 18% |
| Colorchecker dE 2000 * | 2.1 | 3.06 -46% | 4.23 -101% | 1.55 26% | 1.08 49% | 4.4 -110% |
| Colorchecker dE 2000 max. * | 5.1 | 6.5 -27% | 9.34 -83% | 5.14 -1% | 3.96 22% | 7.21 -41% |
| Colorchecker dE 2000 calibrated * | 2.04 | 3.5 -72% | 1.32 35% | 1.24 39% | 1.21 41% | 1.1 46% |
| Greyscale dE 2000 * | 1.3 | 3 -131% | 6.1 -369% | 1.48 -14% | 1.3 -0% | 5.49 -322% |
| Gamma | 2.26 97% | 2.42 91% | 2.11 104% | 2.19 100% | 2.23 99% | 2.26 97% |
| CCT | 6501 100% | 6840 95% | 6136 106% | 6741 96% | 6452 101% | 7689 85% |
| Color Space (Percent of AdobeRGB 1998) | 59.5 | 61.1 3% | 64.8 9% | 61.4 3% | 61 3% | |
| Color Space (Percent of sRGB) | 93.4 | 91.4 -2% | 98.9 6% | 96.3 3% | 96 3% | |
| Total Average (Program / Settings) | 3% /
-11% | -13% /
-29% | 6% /
7% | 7% /
9% | -14% /
-27% |
* ... smaller is better
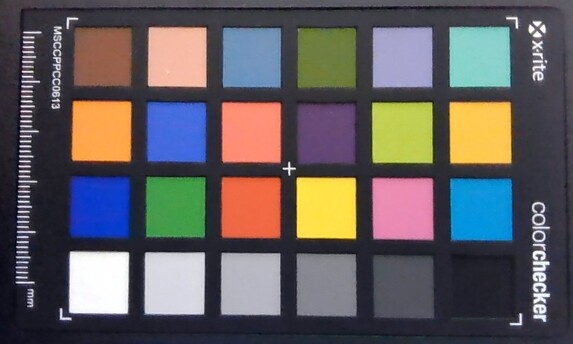
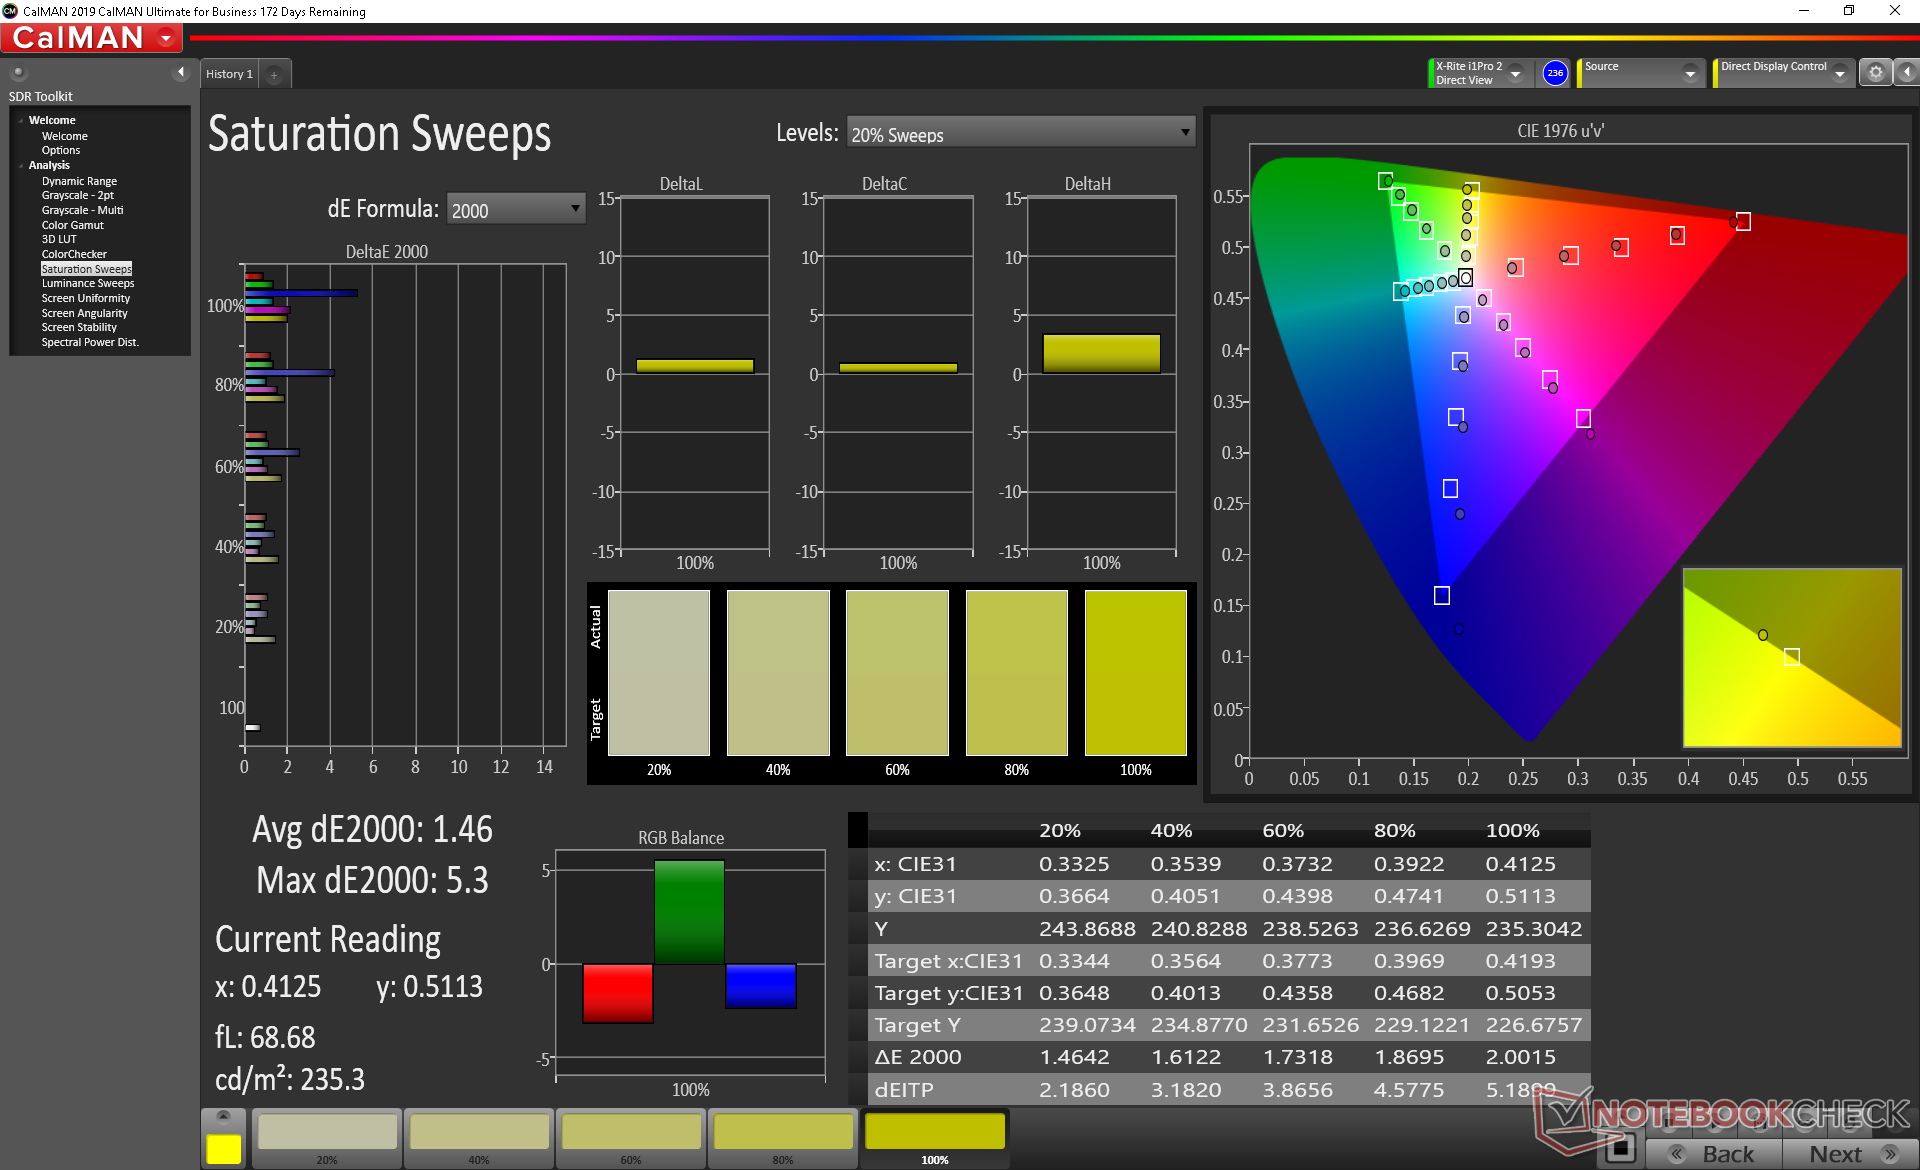
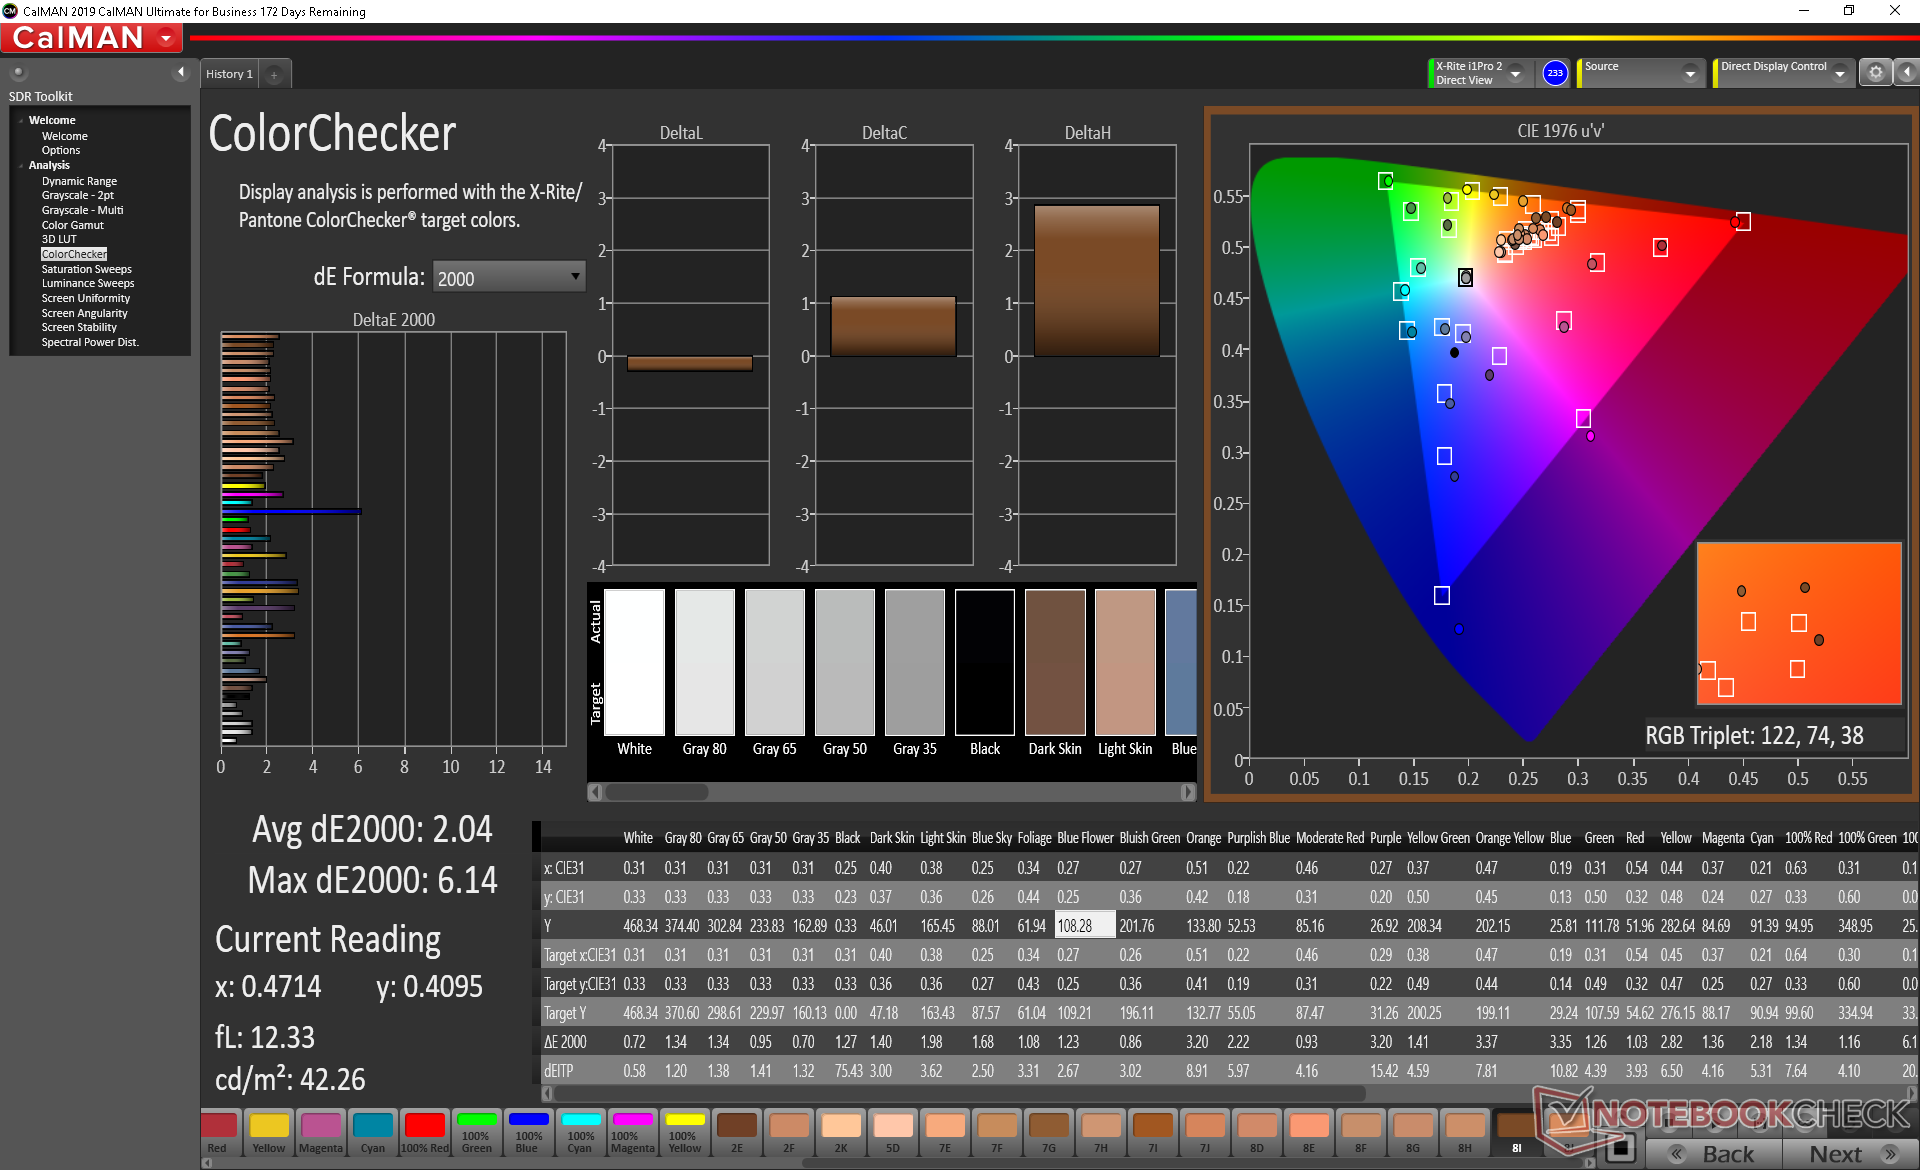
The 4K panel here covers just 60 percent of AdobeRGB compared to >90 percent on most other 4K laptops. This shouldn't bother most users except for serious digital artists. Users are at least guaranteed >95 percent sRGB coverage.
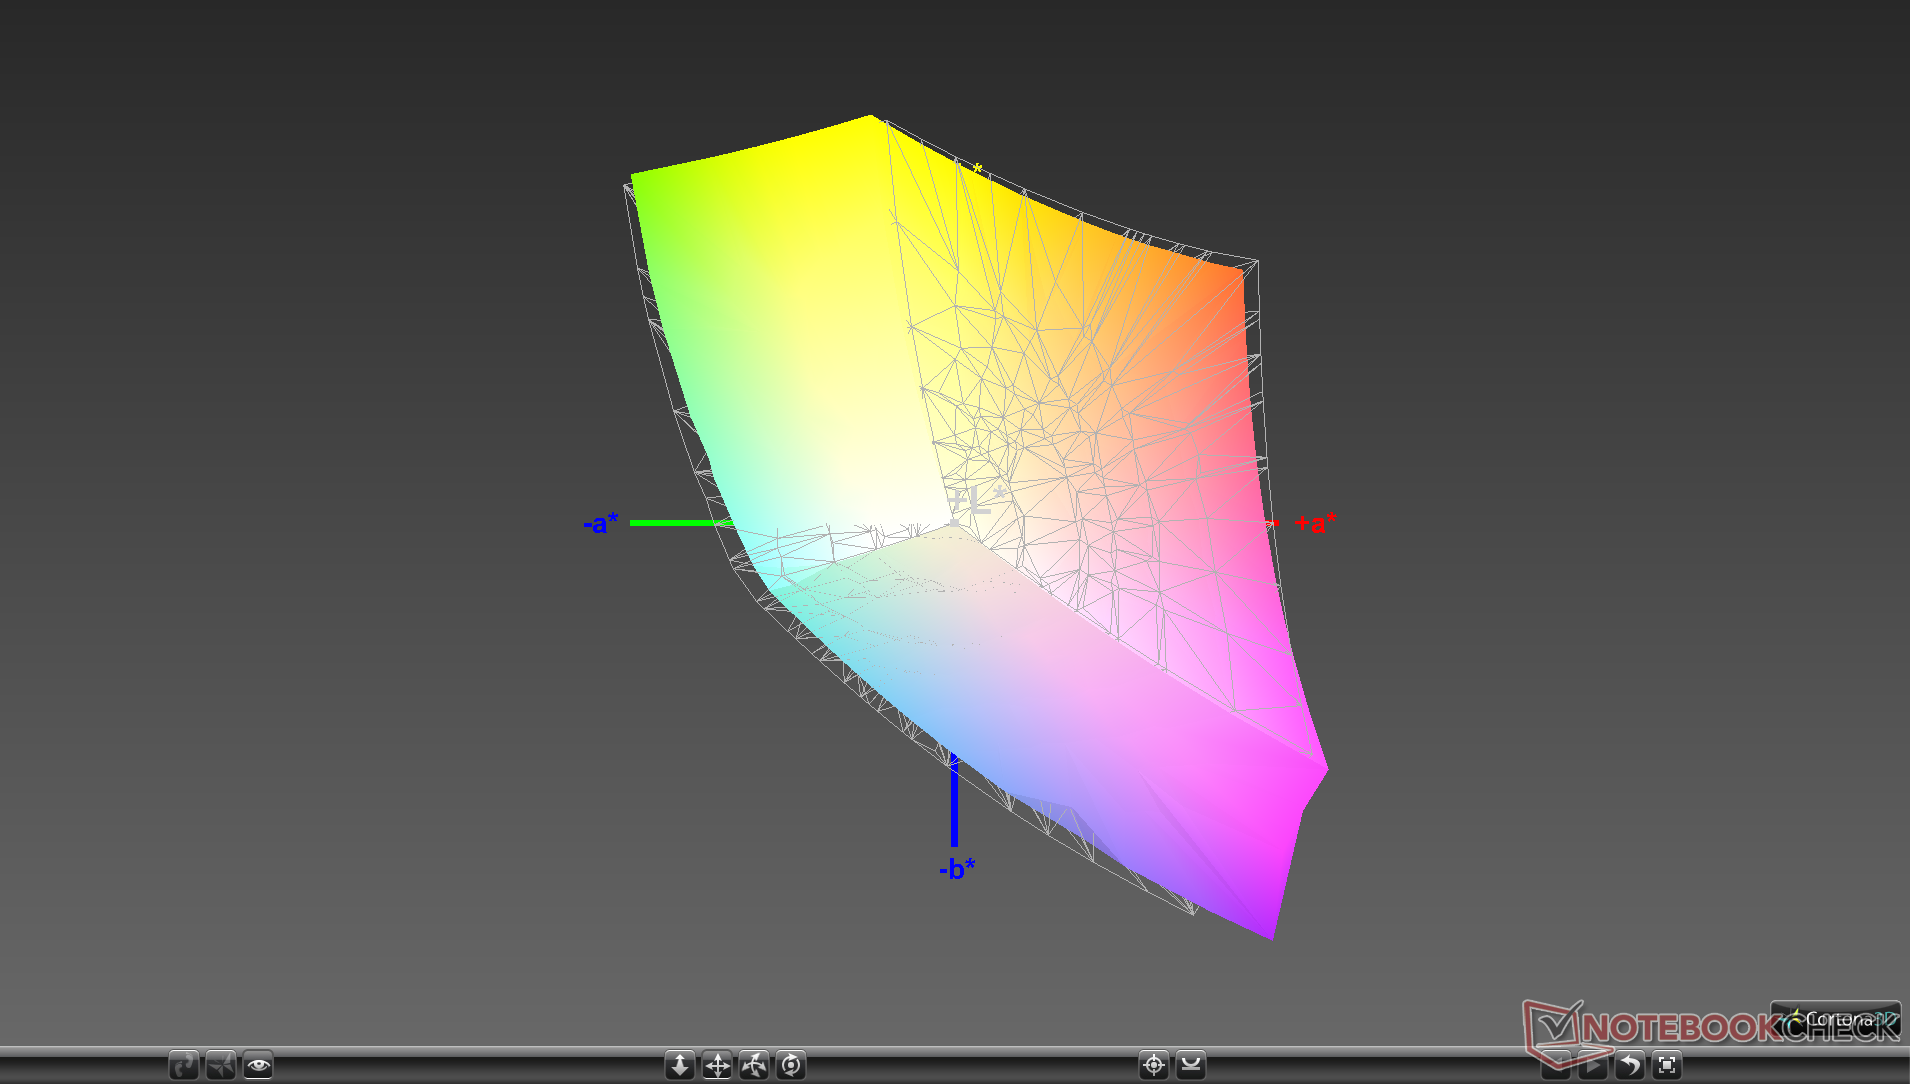
The panel comes well-calibrated out of the box with average grayscale and color deltaE values of just 1.3 and 2.1, respectively. End-user calibration will not be necessary.

Display Response Times
| ↔ Response Time Black to White | ||
|---|---|---|
| 37.2 ms ... rise ↗ and fall ↘ combined | ↗ 21.2 ms rise | 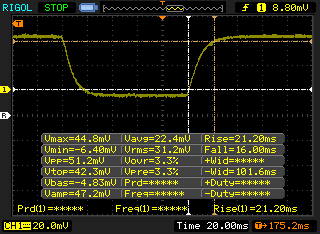 |
| ↘ 16 ms fall | ||
| The screen shows slow response rates in our tests and will be unsatisfactory for gamers. In comparison, all tested devices range from 0.1 (minimum) to 240 (maximum) ms. » 95 % of all devices are better. This means that the measured response time is worse than the average of all tested devices (21.5 ms). | ||
| ↔ Response Time 50% Grey to 80% Grey | ||
| 57.6 ms ... rise ↗ and fall ↘ combined | ↗ 28 ms rise | 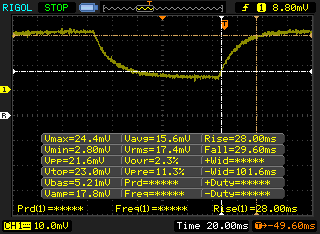 |
| ↘ 29.6 ms fall | ||
| The screen shows slow response rates in our tests and will be unsatisfactory for gamers. In comparison, all tested devices range from 0.2 (minimum) to 636 (maximum) ms. » 93 % of all devices are better. This means that the measured response time is worse than the average of all tested devices (33.7 ms). | ||
Screen Flickering / PWM (Pulse-Width Modulation)
| Screen flickering / PWM not detected |  | ||
In comparison: 53 % of all tested devices do not use PWM to dim the display. If PWM was detected, an average of 17900 (minimum: 5 - maximum: 3846000) Hz was measured. | |||
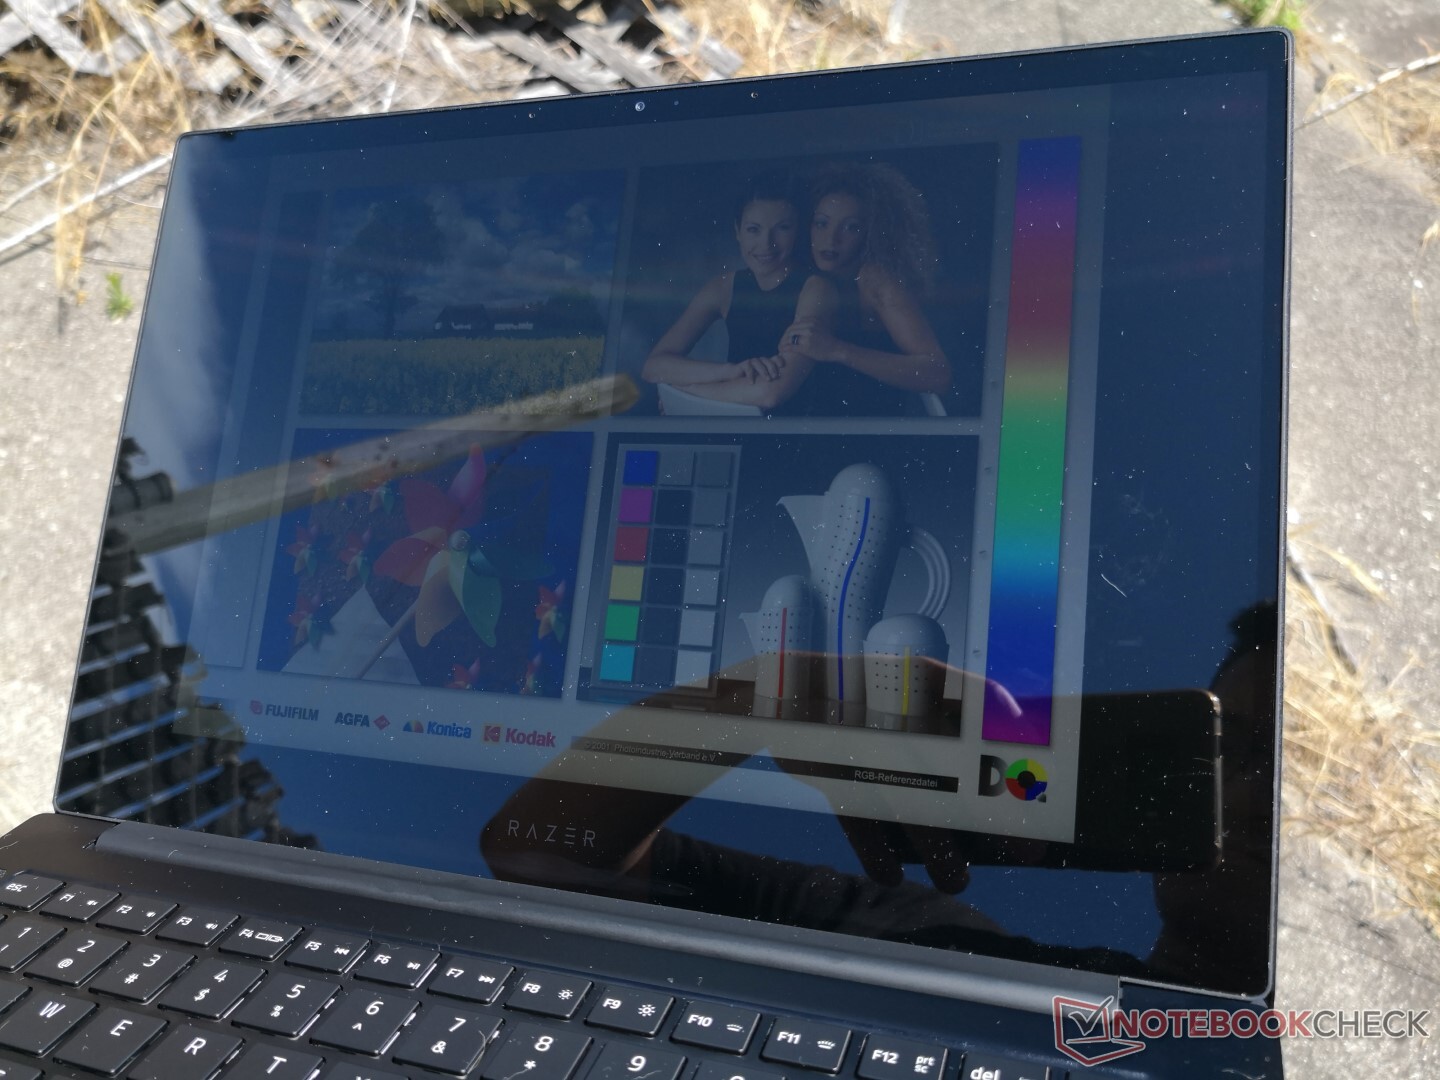
Outdoor visibility is better than last year's model due to the brighter backlight to be roughly on par with the MacBook Pro 13 or HP Spectre x360 13. Still, it's not ideal because of the glossy overlay and inevitable glare even if working under shade.


Performance
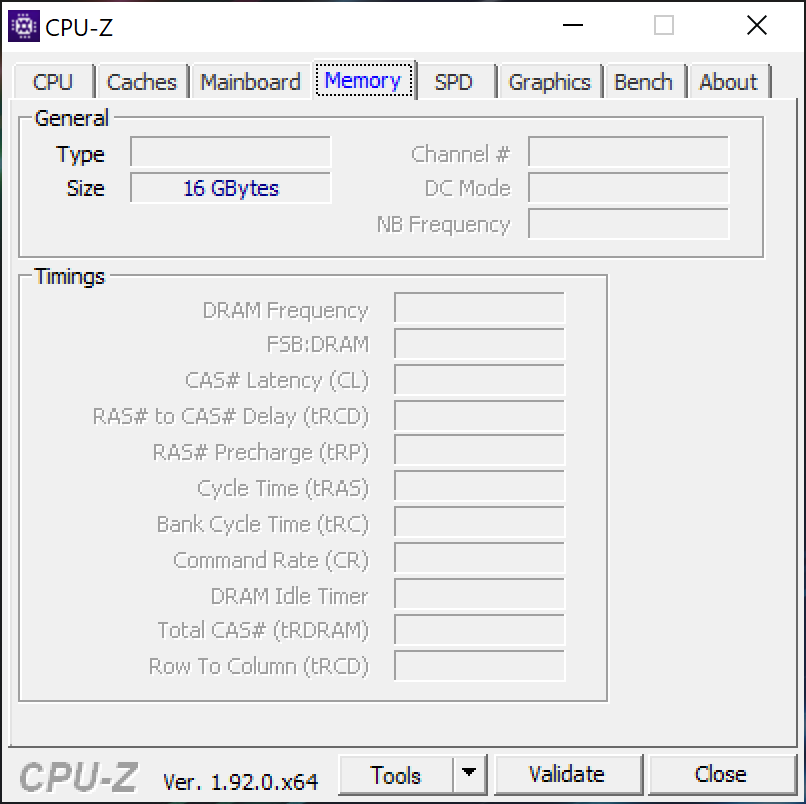
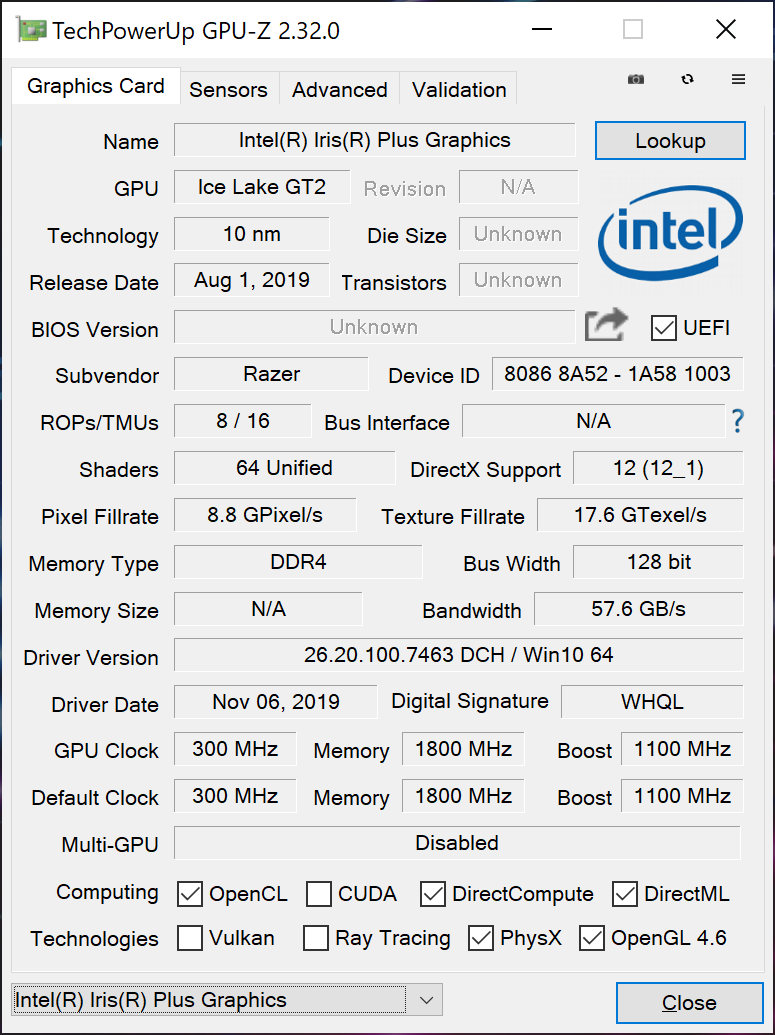
Razer has updated the CPU from the 10 W Core i7-1065G7 to the 25 W Core i7-1065G7 and the GPU from the GTX 1650 Max-Q to the GTX 1650 Ti Max-Q when compared to the 2019 model. 8 GB RAM options have been dropped in favor of 16 GB LPDDR4X-3733 across the board. Optimus comes standard again with no G-Sync options.
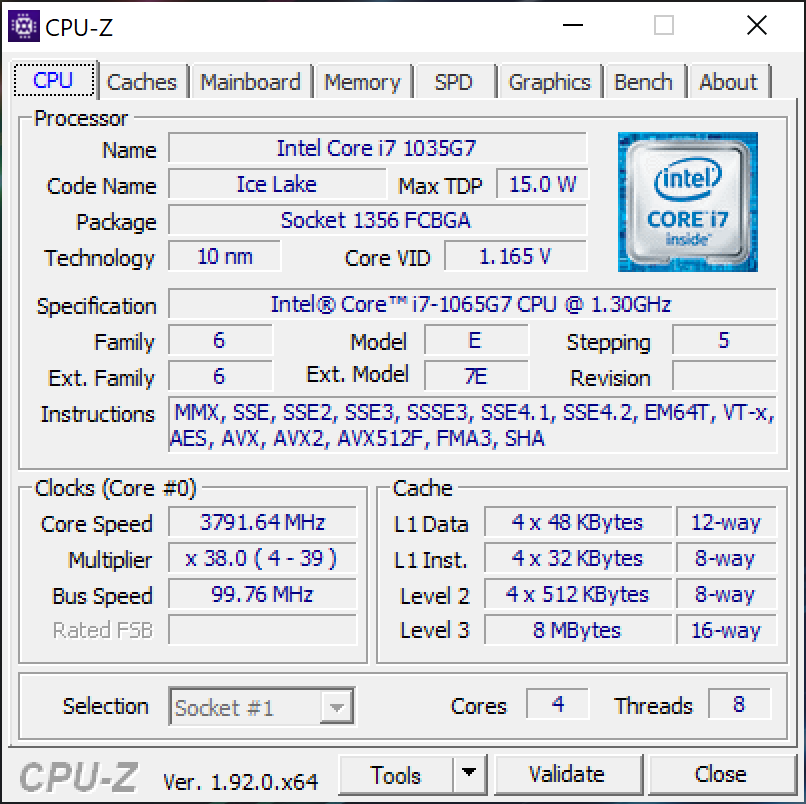
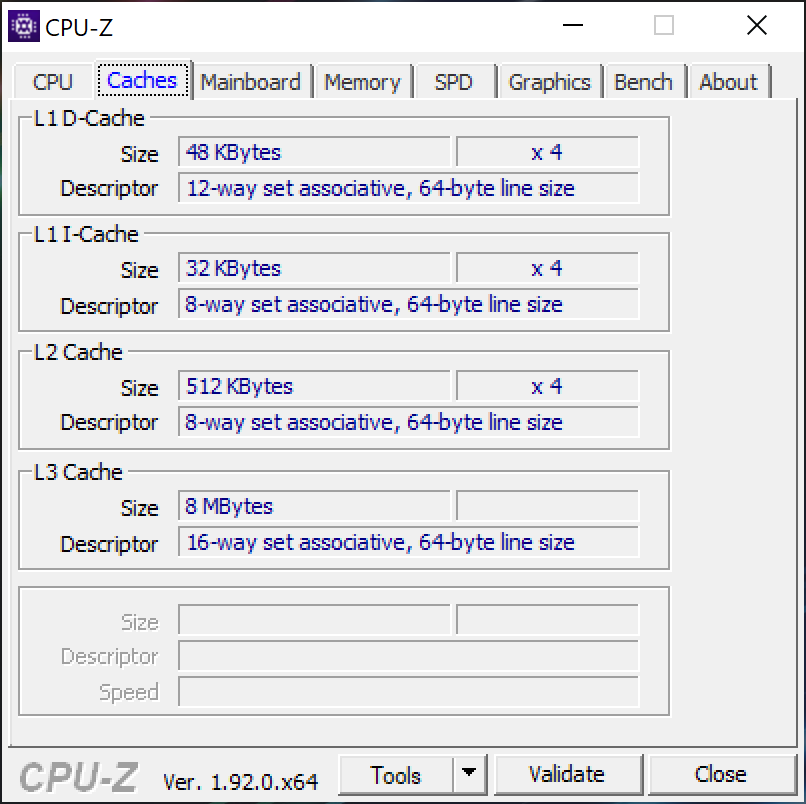
Processor
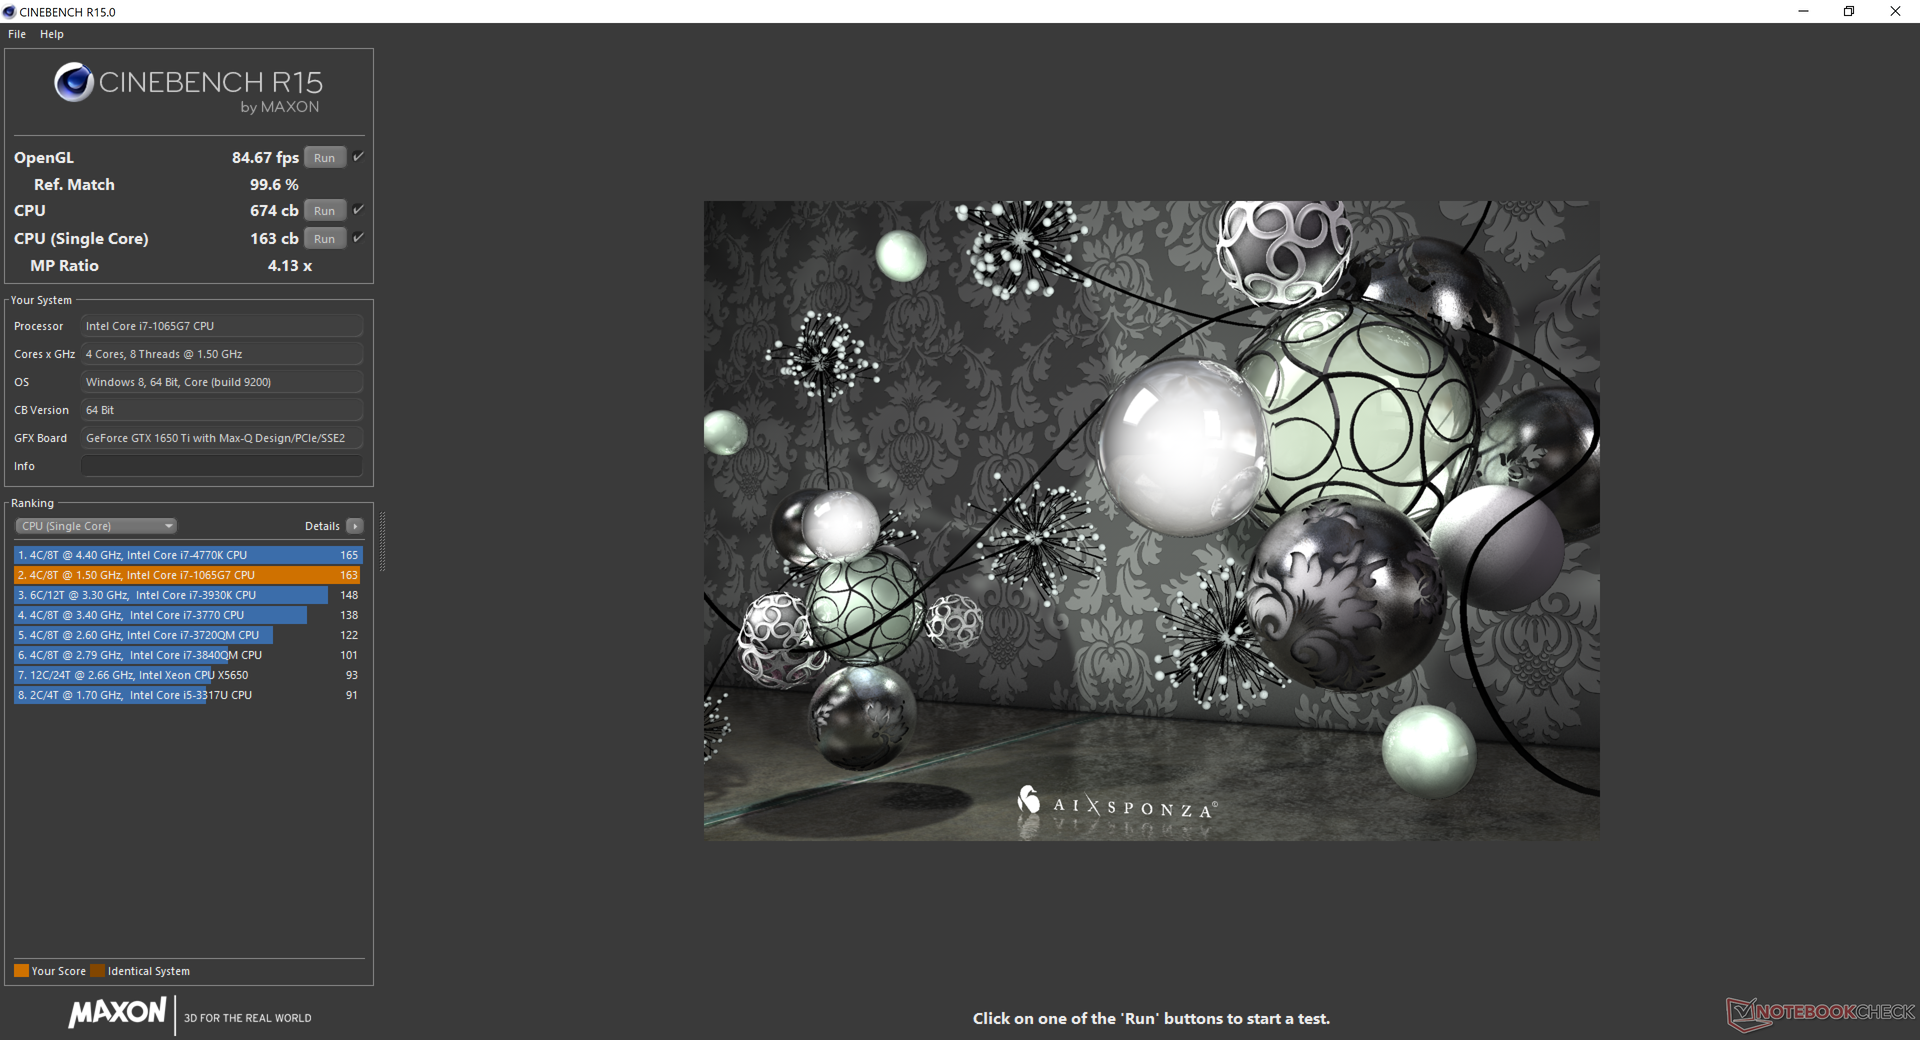
We were disappointed by the CPU performance of the 10 W Core i7-1065G7 in the 2019 Blade Stealth. It was so slow that even the older Core i7-8565U would handily outperform it. Thankfully, the 25 W Core i7-1065G7 version runs 40 percent faster than last year's 10 W version to be more in line with other Ultrabooks sporting the same Core i7-1065G7 CPU.
Running CineBench R15 Multi-Thread in a loop shows a performance dip of about 8 percent over time.
See our dedicated page on the Core i7-1065G7 for more technical information and benchmark comparisons. It's too bad that Razer offers no hexa-core Core i7-10710U options which would have boosted multi-thread performance by another 40 percent.
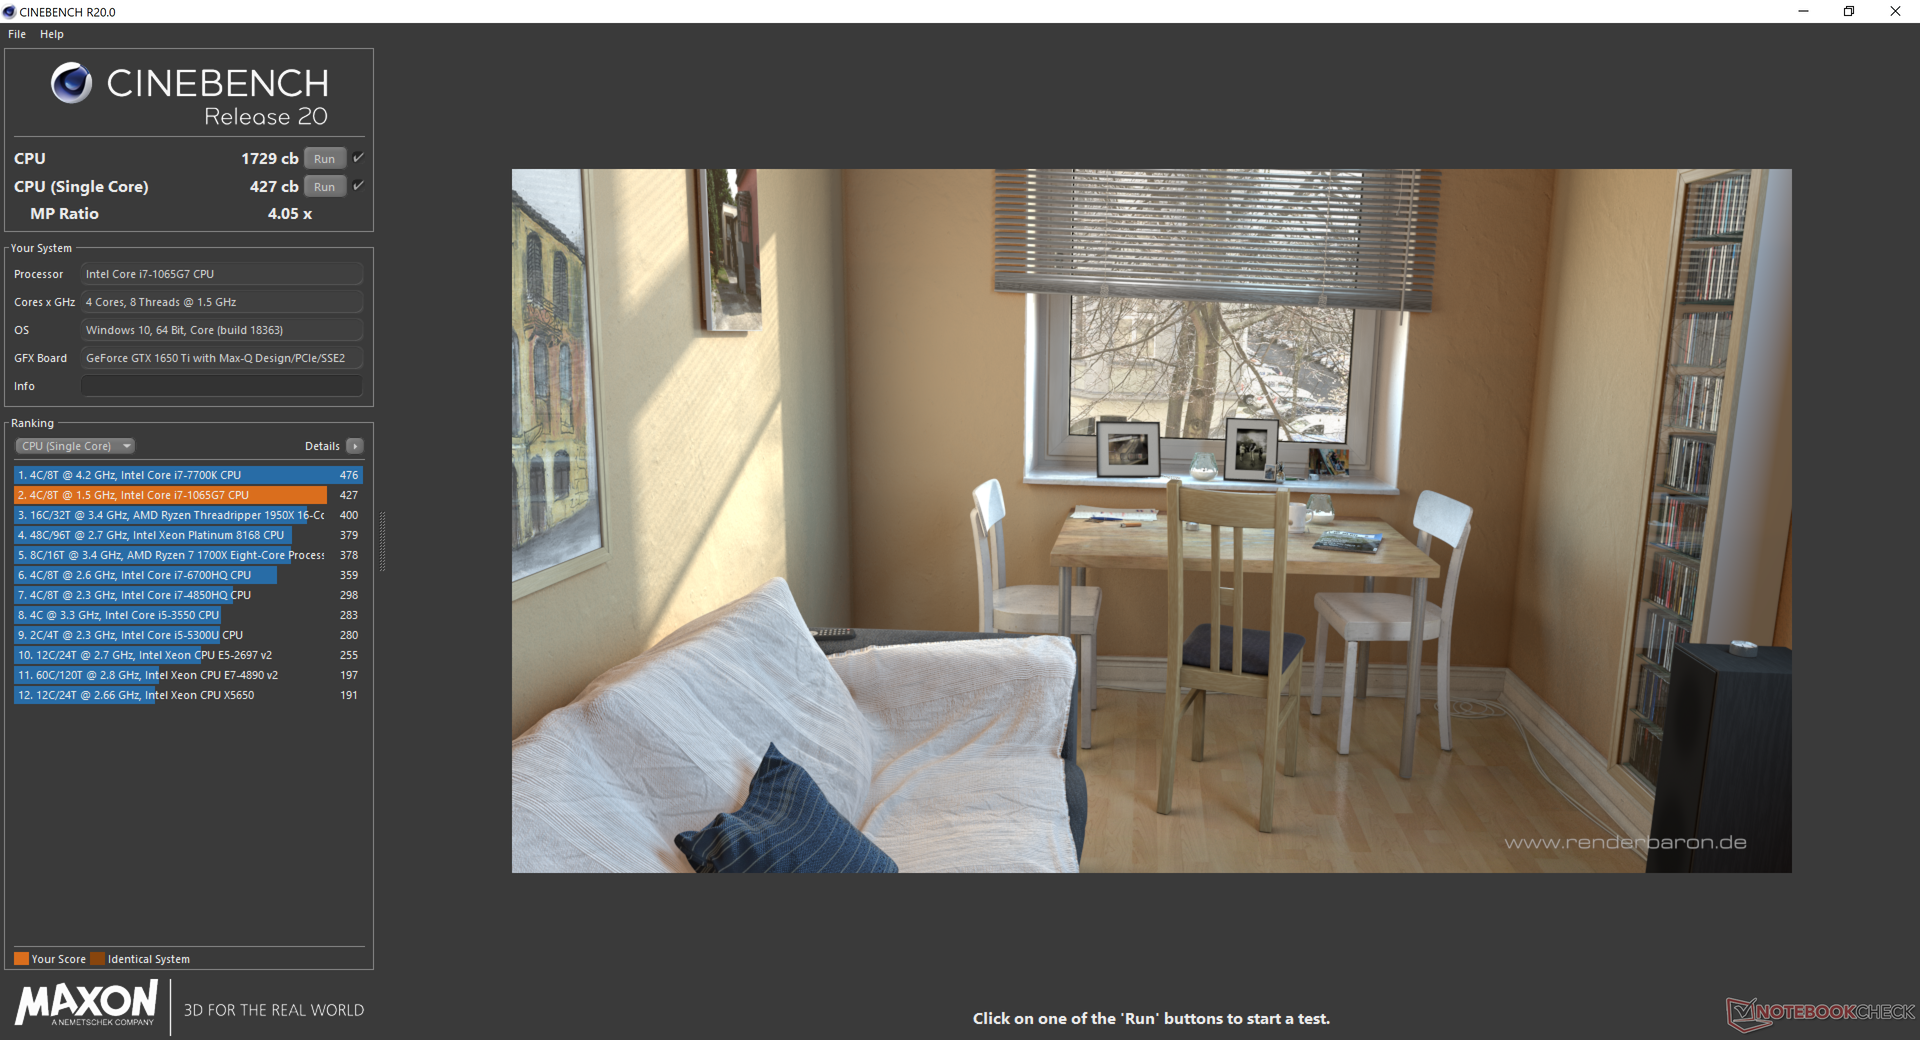
Cinebench R20: CPU (Multi Core) | CPU (Single Core)
Blender: v2.79 BMW27 CPU
7-Zip 18.03: 7z b 4 -mmt1 | 7z b 4
Geekbench 5.5: Single-Core | Multi-Core
HWBOT x265 Benchmark v2.2: 4k Preset
LibreOffice : 20 Documents To PDF
R Benchmark 2.5: Overall mean
| Blender / v2.79 BMW27 CPU | |
| Huawei MateBook X Pro 2020 i7 | |
| HP Spectre x360 13-ap0312ng | |
| Average Intel Core i7-1065G7 (675 - 1650, n=23) | |
| Dell XPS 13 7390 Core i7-10710U | |
| Dell XPS 15 9500 Core i5 | |
| 7-Zip 18.03 / 7z b 4 -mmt1 | |
| Dell XPS 15 9500 Core i5 | |
| Huawei MateBook X Pro 2020 i7 | |
| Dell XPS 13 7390 Core i7-10710U | |
| Average Intel Core i7-1065G7 (3289 - 4589, n=24) | |
| HP Spectre x360 13-ap0312ng | |
| Razer Blade Stealth Core i7 GTX 1650 Ti Max-Q 4K | |
| 7-Zip 18.03 / 7z b 4 | |
| Dell XPS 13 7390 Core i7-10710U | |
| Dell XPS 15 9500 Core i5 | |
| Razer Blade Stealth Core i7 GTX 1650 Ti Max-Q 4K | |
| Average Intel Core i7-1065G7 (10406 - 22898, n=24) | |
| Huawei MateBook X Pro 2020 i7 | |
| HP Spectre x360 13-ap0312ng | |
| Geekbench 5.5 / Single-Core | |
| Average Intel Core i7-1065G7 (948 - 1348, n=18) | |
| Razer Blade Stealth Core i7 GTX 1650 Ti Max-Q 4K | |
| Dell XPS 15 9500 Core i5 | |
| Huawei MateBook X Pro 2020 i7 | |
| Geekbench 5.5 / Multi-Core | |
| Razer Blade Stealth Core i7 GTX 1650 Ti Max-Q 4K | |
| Dell XPS 15 9500 Core i5 | |
| Average Intel Core i7-1065G7 (2464 - 4855, n=18) | |
| Huawei MateBook X Pro 2020 i7 | |
| HWBOT x265 Benchmark v2.2 / 4k Preset | |
| Dell XPS 15 9500 Core i5 | |
| Dell XPS 13 7390 Core i7-10710U | |
| Average Intel Core i7-1065G7 (2.2 - 6.38, n=22) | |
| Huawei MateBook X Pro 2020 i7 | |
| HP Spectre x360 13-ap0312ng | |
| LibreOffice / 20 Documents To PDF | |
| Dell XPS 15 9500 Core i5 | |
| Razer Blade Stealth Core i7 GTX 1650 Ti Max-Q 4K | |
| Average Intel Core i7-1065G7 (46.9 - 85.3, n=19) | |
| Huawei MateBook X Pro 2020 i7 | |
| R Benchmark 2.5 / Overall mean | |
| Average Intel Core i7-1065G7 (0.661 - 0.798, n=18) | |
| Dell XPS 15 9500 Core i5 | |
| Huawei MateBook X Pro 2020 i7 | |
* ... smaller is better
System Performance
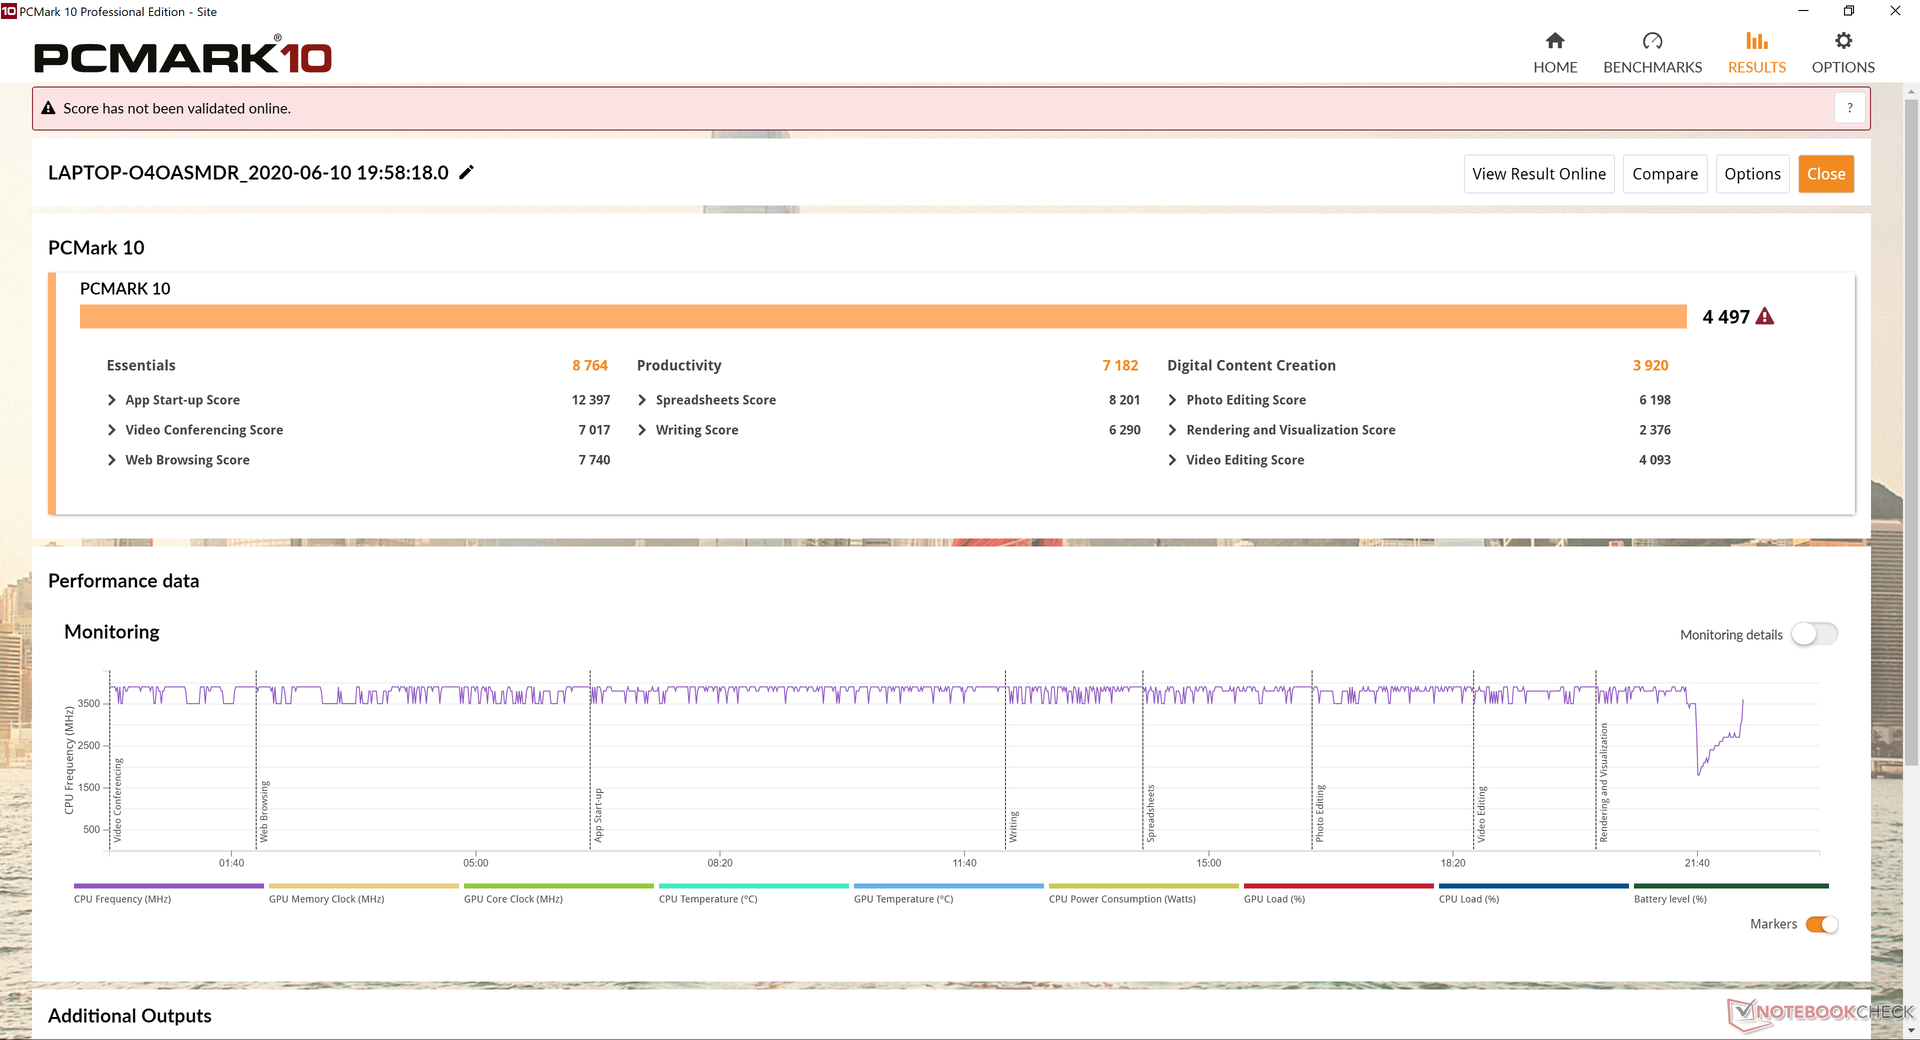
PCMark benchmarks are essentially identical to the 2019 Blade Stealth and most other Whiskey Lake-U or Ice Lake Ultrabooks. Common everyday loads like browsing will not feel any faster on the 2020 Blade Stealth despite the huge leap in graphics performance.
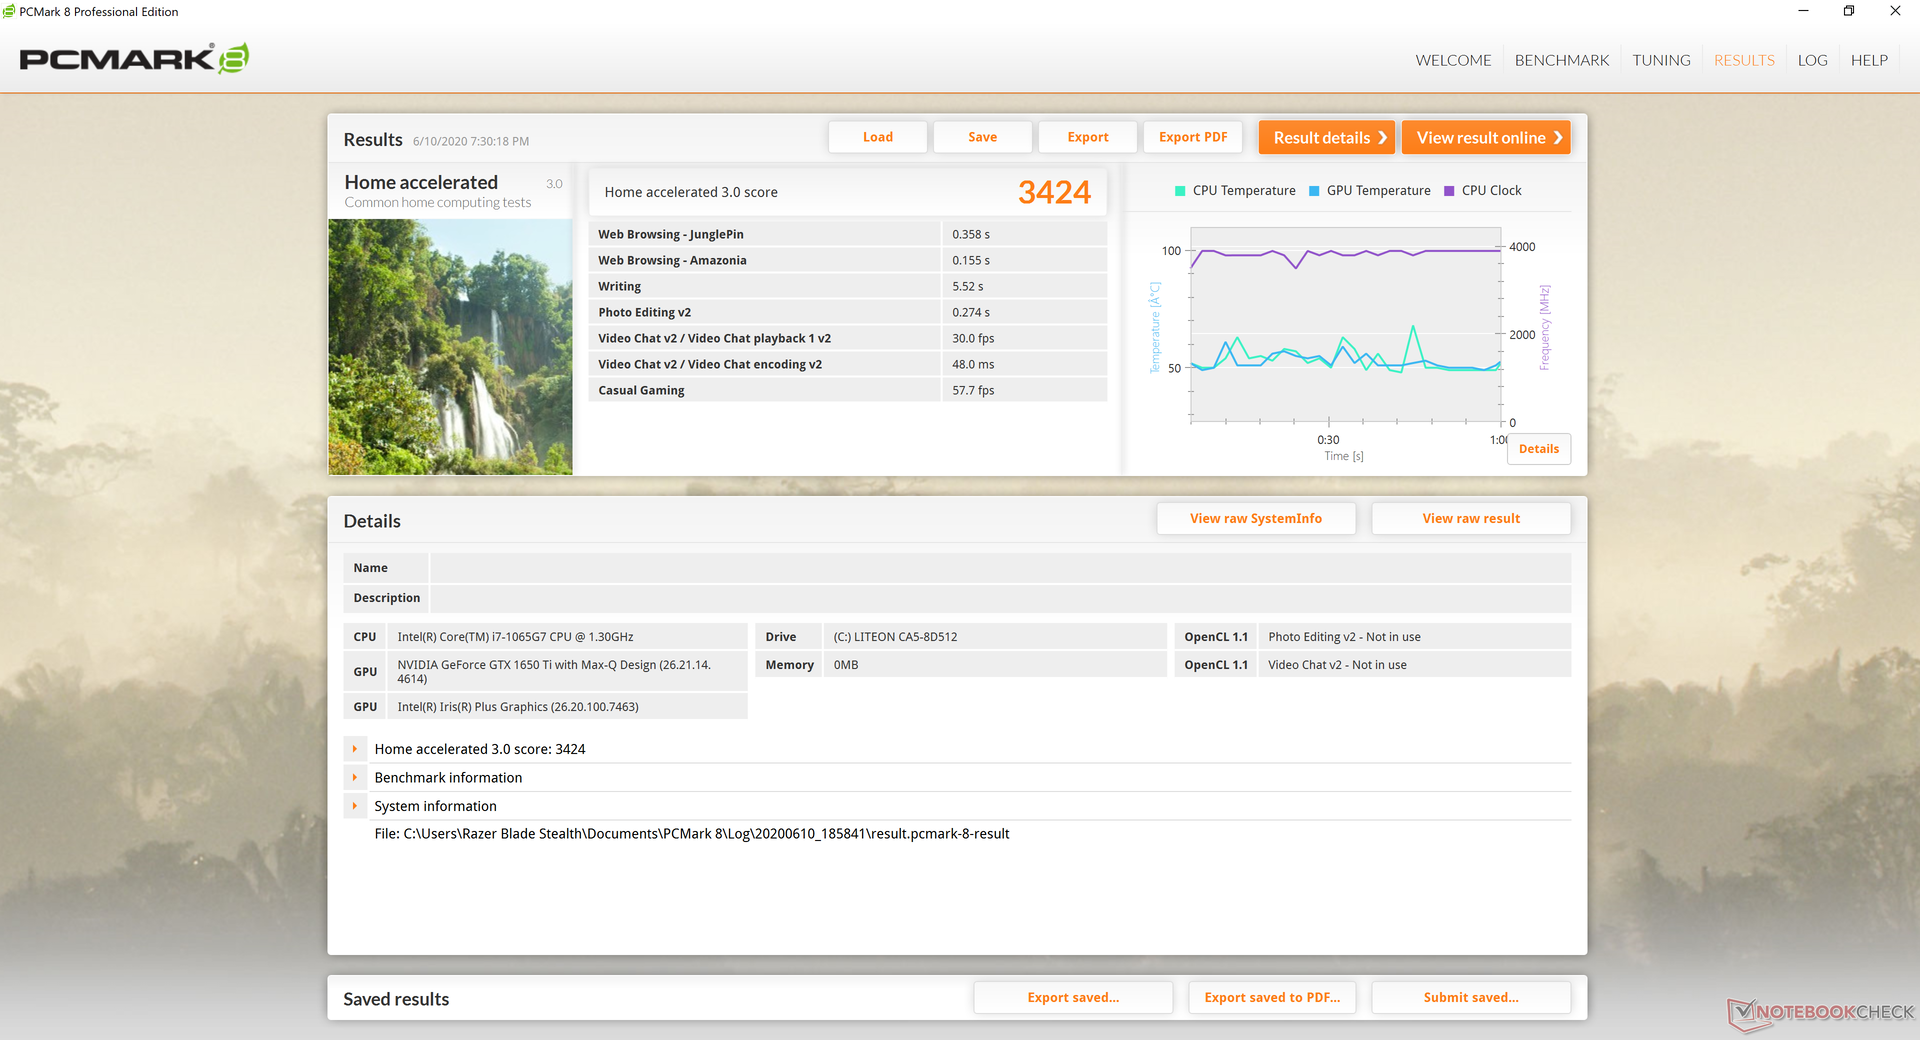
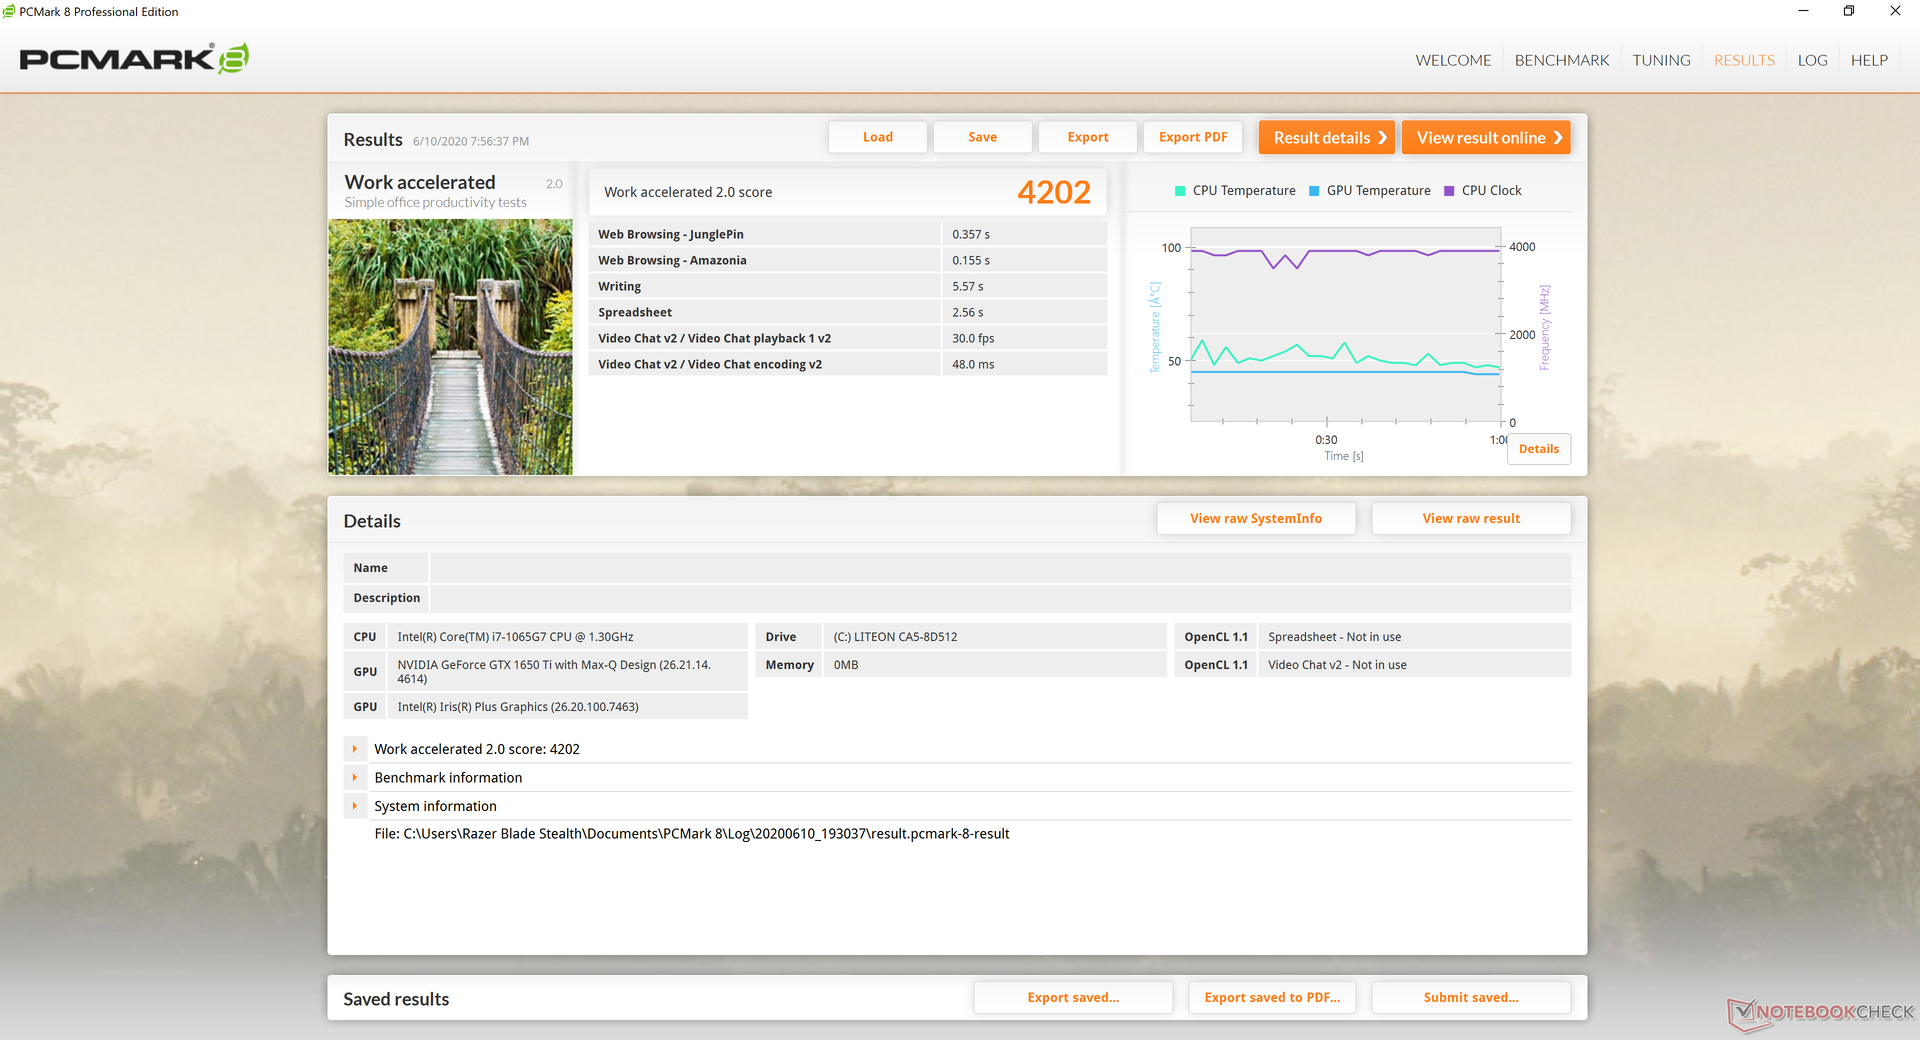
| PCMark 8 Home Score Accelerated v2 | 3424 points | |
| PCMark 8 Work Score Accelerated v2 | 4202 points | |
| PCMark 10 Score | 4497 points | |
Help | ||
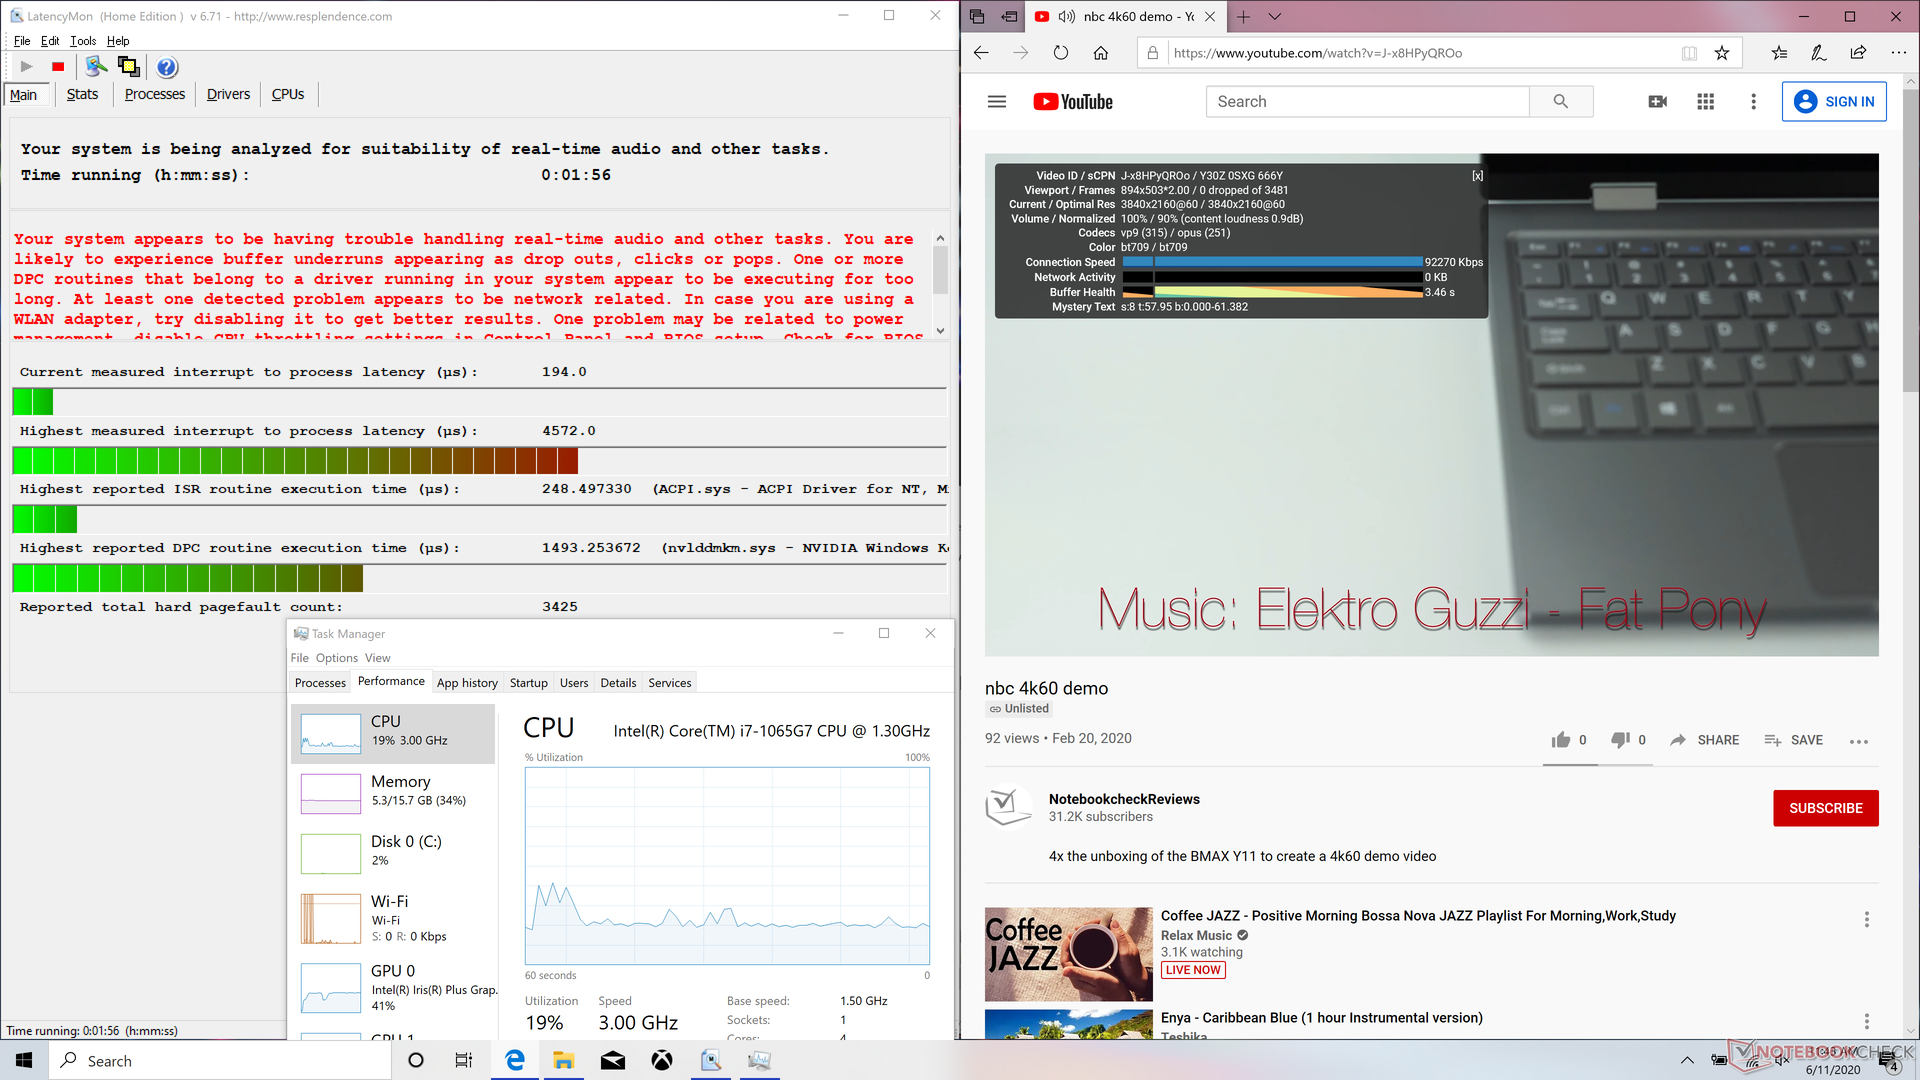
DPC Latency
LatencyMon shows DPC latency issues when opening multiple tabs on our homepage. 4K video playback is otherwise smooth on YouTube with no dropped frames.

| DPC Latencies / LatencyMon - interrupt to process latency (max), Web, Youtube, Prime95 | |
| Dell XPS 15 9500 Core i7 4K UHD | |
| Razer Blade Stealth Core i7 GTX 1650 Ti Max-Q 4K | |
| Dell XPS 13 9300 4K UHD | |
| Asus Zephyrus G14 GA401IV | |
| Dell XPS 15 9500 Core i5 | |
| MSI GS66 10SGS | |
| Eluktronics RP-15 | |
* ... smaller is better
Storage Devices
The 2020 Blade Stealth is using the newer 512 GB Lite-On CA5-8D512 NVMe SSD compared to last year's Lite-On CA3-8D512. This exact same drive can also be found on the 2020 Blade 15 Base Model. Running DiskSpd Read in a loop 50 times shows no performance throttling issues.
See our table of HDDs and SSDs for more benchmark comparisons.


| Razer Blade Stealth Core i7 GTX 1650 Ti Max-Q 4K Lite-On CA5-8D512 | Dell XPS 13 9300 4K UHD Intel SSDPEMKF512G8 NVMe SSD | Asus ZenBook S13 UX392FN WDC PC SN520 SDAPNUW-512G | MSI Prestige 14 A10SC-009 Samsung SSD PM981 MZVLB1T0HALR | Razer Blade Stealth 13, Core i7-1065G7 Lite-On CA3-8D512 | |
|---|---|---|---|---|---|
| AS SSD | -11% | 8% | 39% | -5% | |
| Seq Read | 2220 | 1821 -18% | 1224 -45% | 2300 4% | 2666 20% |
| Seq Write | 2006 | 931 -54% | 907 -55% | 2051 2% | 1497 -25% |
| 4K Read | 51.4 | 56.4 10% | 41.46 -19% | 46.23 -10% | 53.7 4% |
| 4K Write | 119.2 | 127.2 7% | 126.2 6% | 84.6 -29% | 133.7 12% |
| 4K-64 Read | 740 | 462.6 -37% | 1021 38% | 1552 110% | 652 -12% |
| 4K-64 Write | 968 | 541 -44% | 1251 29% | 1789 85% | 272 -72% |
| Access Time Read * | 0.051 | 0.04 22% | 0.053 -4% | 0.049 4% | 0.075 -47% |
| Access Time Write * | 0.1 | 0.123 -23% | 0.027 73% | 0.045 55% | 0.032 68% |
| Score Read | 1013 | 701 -31% | 1185 17% | 1828 80% | 972 -4% |
| Score Write | 1288 | 762 -41% | 1468 14% | 2079 61% | 555 -57% |
| Score Total | 2822 | 1797 -36% | 3250 15% | 4831 71% | 1982 -30% |
| Copy ISO MB/s | 1881 | 1068 -43% | 1404 -25% | 1495 -21% | |
| Copy Program MB/s | 441.8 | 446.4 1% | 402.4 -9% | 458.4 4% | |
| Copy Game MB/s | 505 | 1163 130% | 902 79% | 964 91% | |
| CrystalDiskMark 5.2 / 6 | -23% | -22% | -11% | -7% | |
| Write 4K | 158.7 | 126.2 -20% | 149.2 -6% | 163.8 3% | 153 -4% |
| Read 4K | 58.2 | 61.1 5% | 47.18 -19% | 48.6 -16% | 59.5 2% |
| Write Seq | 2219 | 1049 -53% | 750 -66% | 2269 2% | 1608 -28% |
| Read Seq | 2444 | 2231 -9% | 1137 -53% | 1963 -20% | 2293 -6% |
| Write 4K Q32T1 | 475.9 | 410.1 -14% | 749 57% | 289.8 -39% | 497 4% |
| Read 4K Q32T1 | 509 | 418.9 -18% | 478.7 -6% | 373.6 -27% | 544 7% |
| Write Seq Q32T1 | 2202 | 784 -64% | 1453 -34% | 2395 9% | 1640 -26% |
| Read Seq Q32T1 | 3372 | 2964 -12% | 1713 -49% | 3479 3% | 3158 -6% |
| Write 4K Q8T8 | 960 | ||||
| Read 4K Q8T8 | 844 | ||||
| Total Average (Program / Settings) | -17% /
-16% | -7% /
-3% | 14% /
18% | -6% /
-6% |
* ... smaller is better

Disk Throttling: DiskSpd Read Loop, Queue Depth 8
GPU Performance
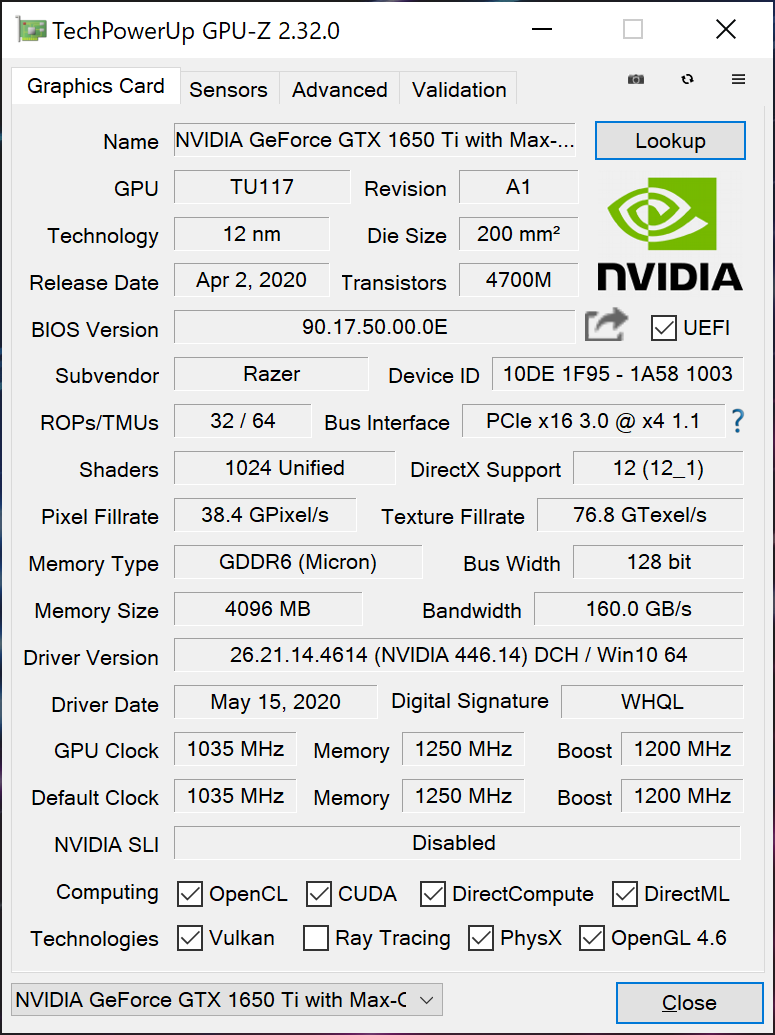
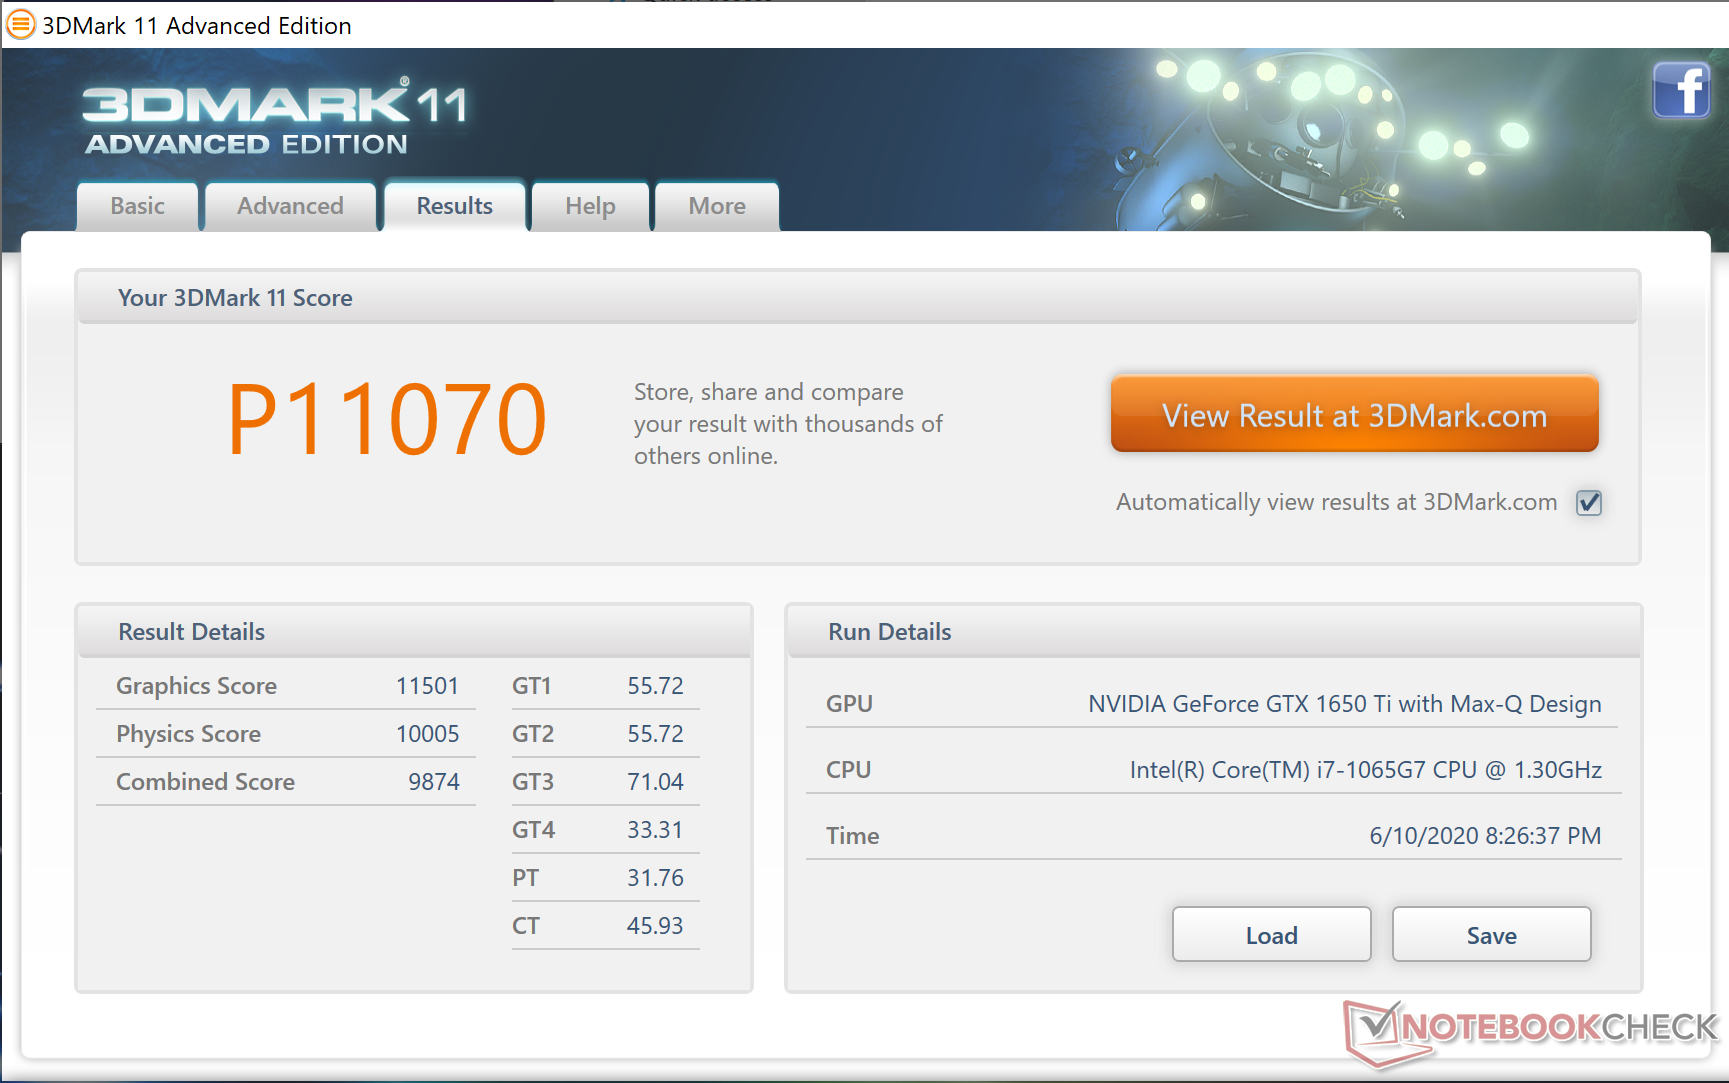
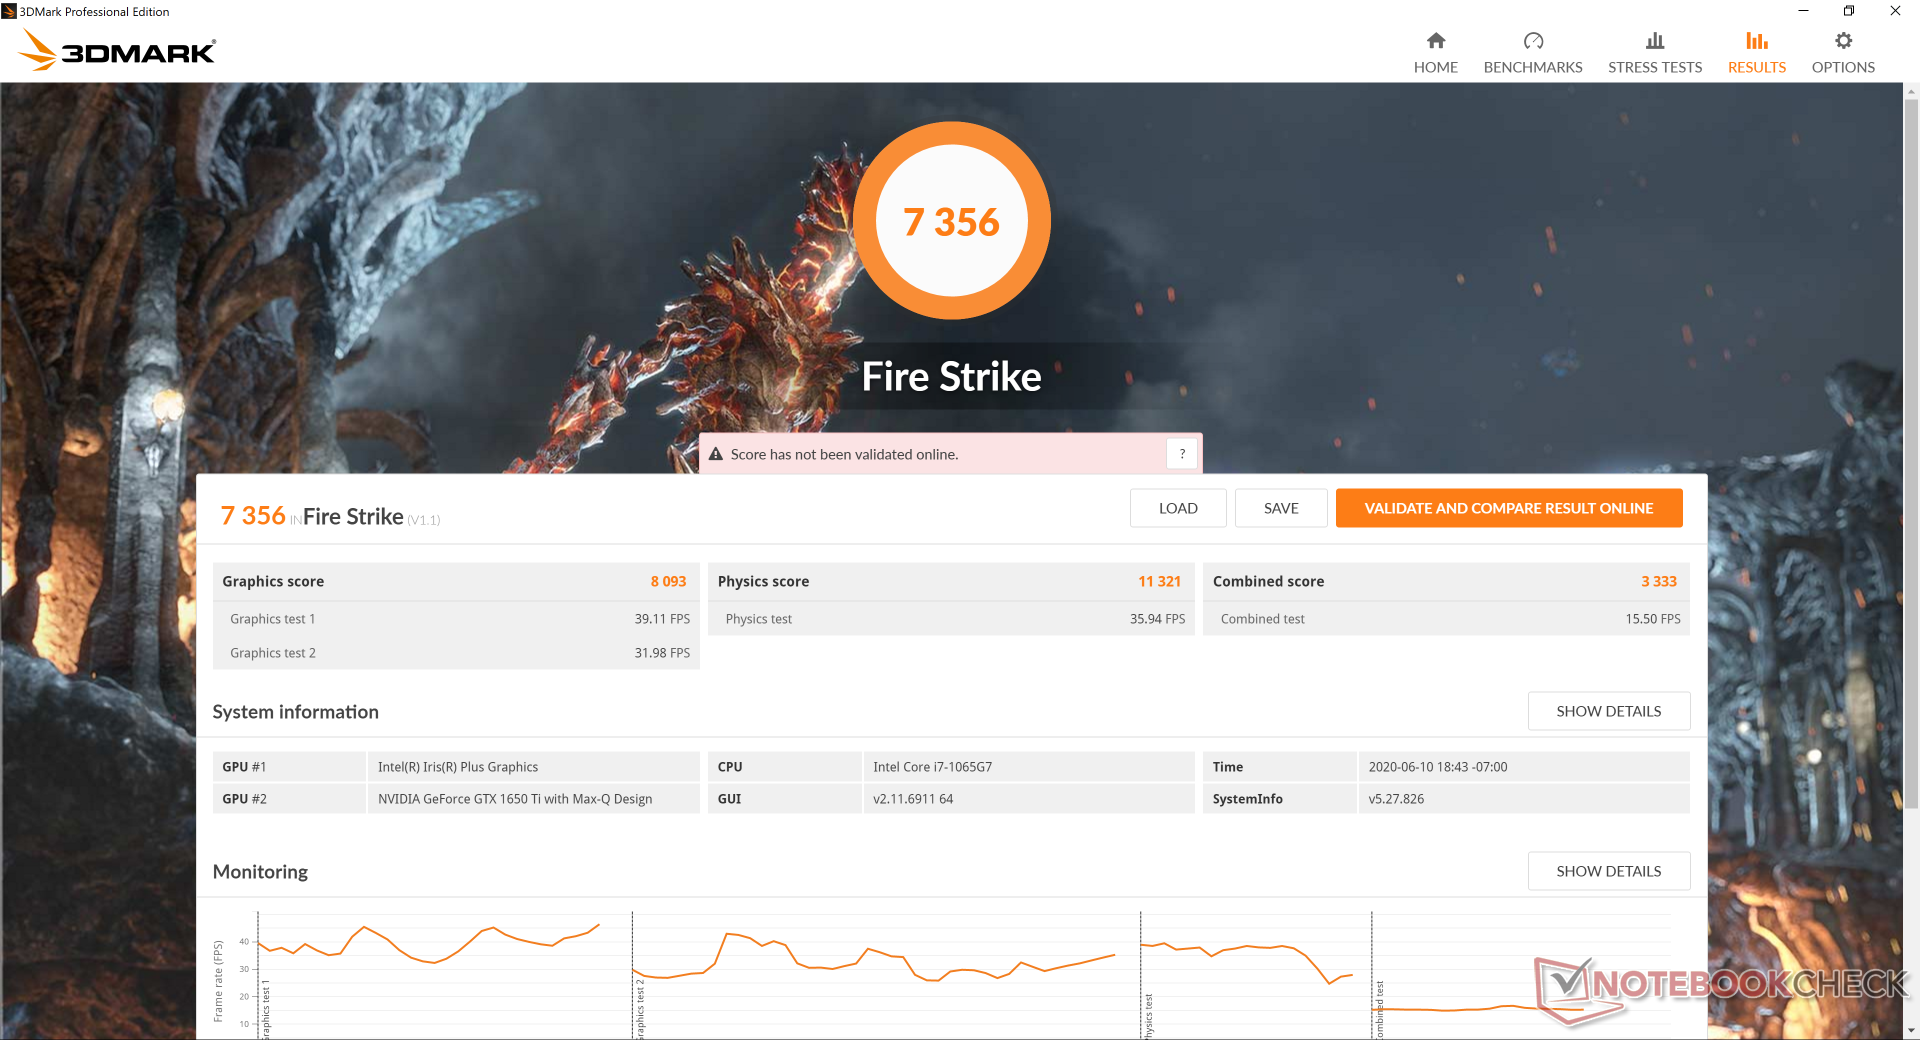
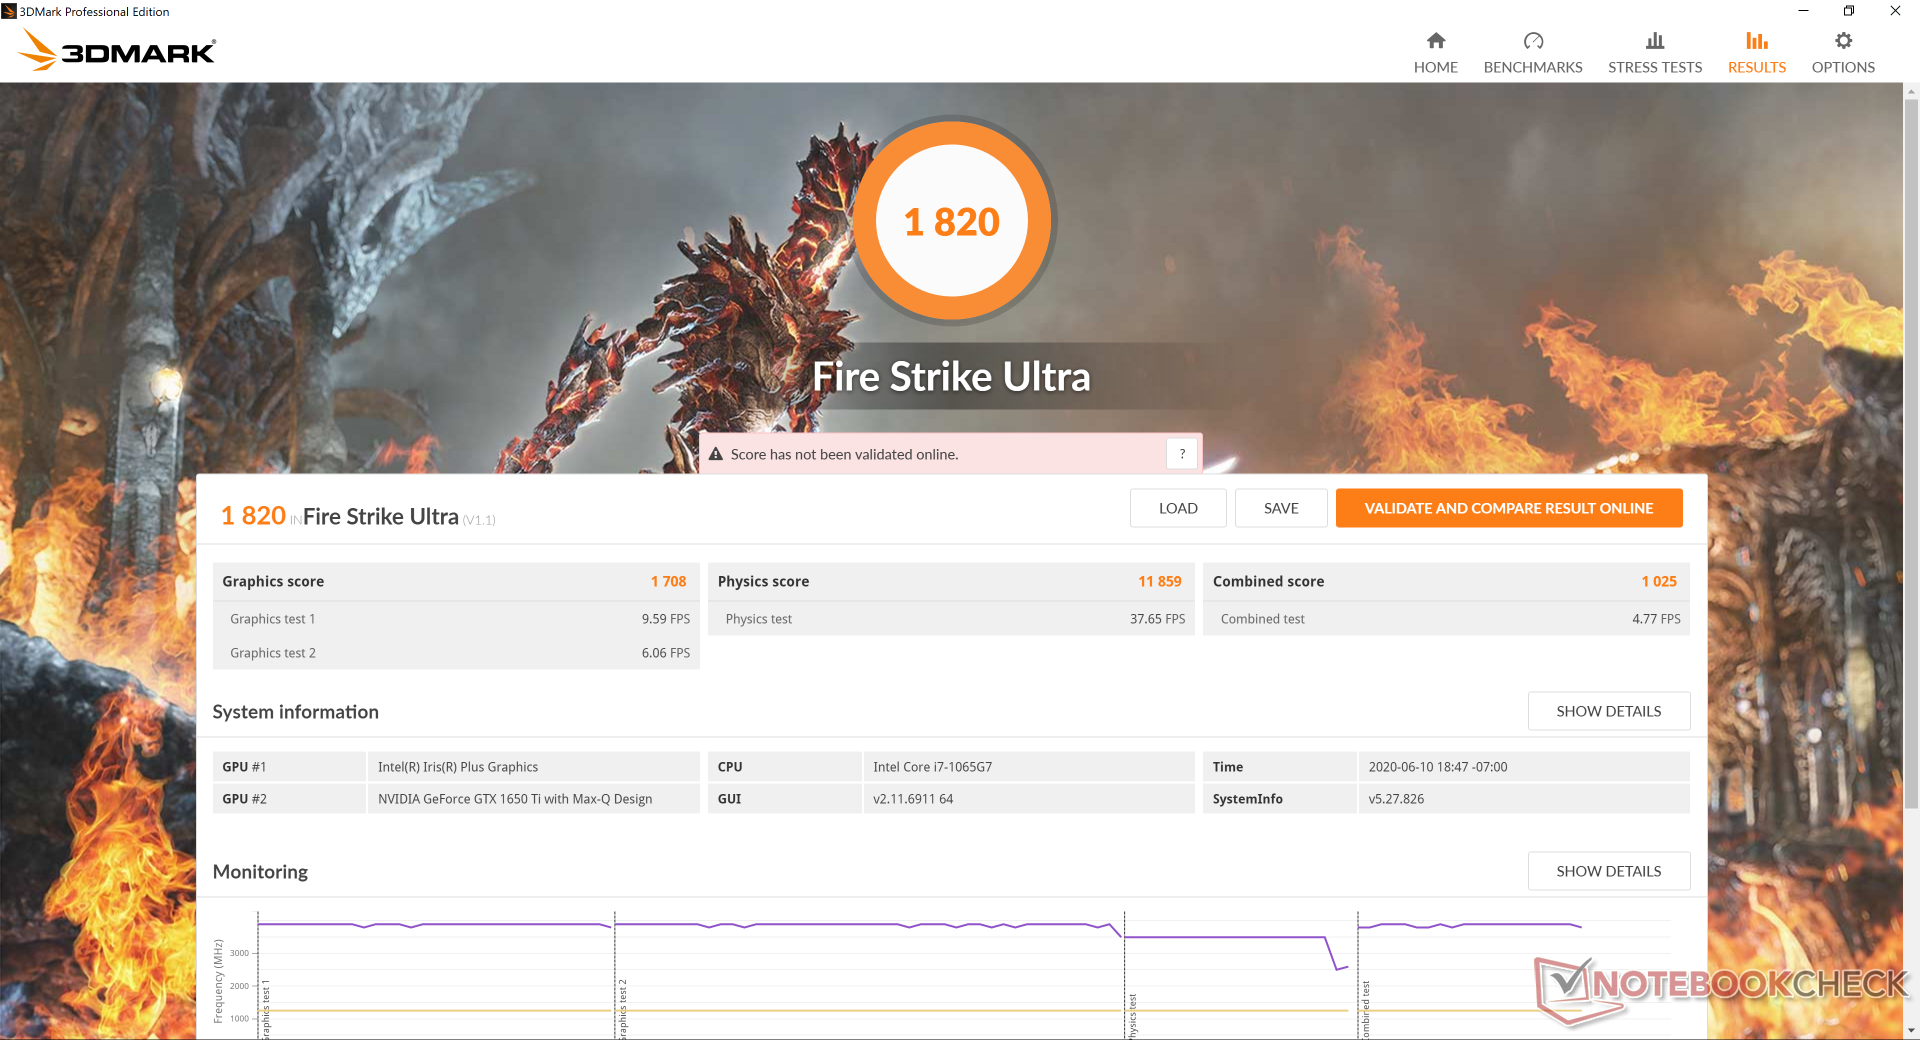
The GTX 1650 Ti Max-Q is approximately 10 percent slower than the mobile GTX 1060 and only 7 percent faster than the GTX 1650 Max-Q in last year's Blade Stealth according to 3DMark benchmarks. Thus, you're not missing much in terms of GPU power if you already own the 2019 Blade Stealth. Users with the GeForce MX150 or MX250, however, will see significant gains of over 150 percent and have the most to benefit from jumping to the GTX 1650 series.
See our dedicated page on the GeForce GTX 1650 Ti Max-Q for more technical information and benchmark comparisons. The Blade Stealth is the first laptop to ship with this specific GPU.


| 3DMark 06 Standard Score | 30266 points | |
| 3DMark Vantage P Result | 31116 points | |
| 3DMark 11 Performance | 11070 points | |
| 3DMark Cloud Gate Standard Score | 19073 points | |
| 3DMark Fire Strike Score | 7356 points | |
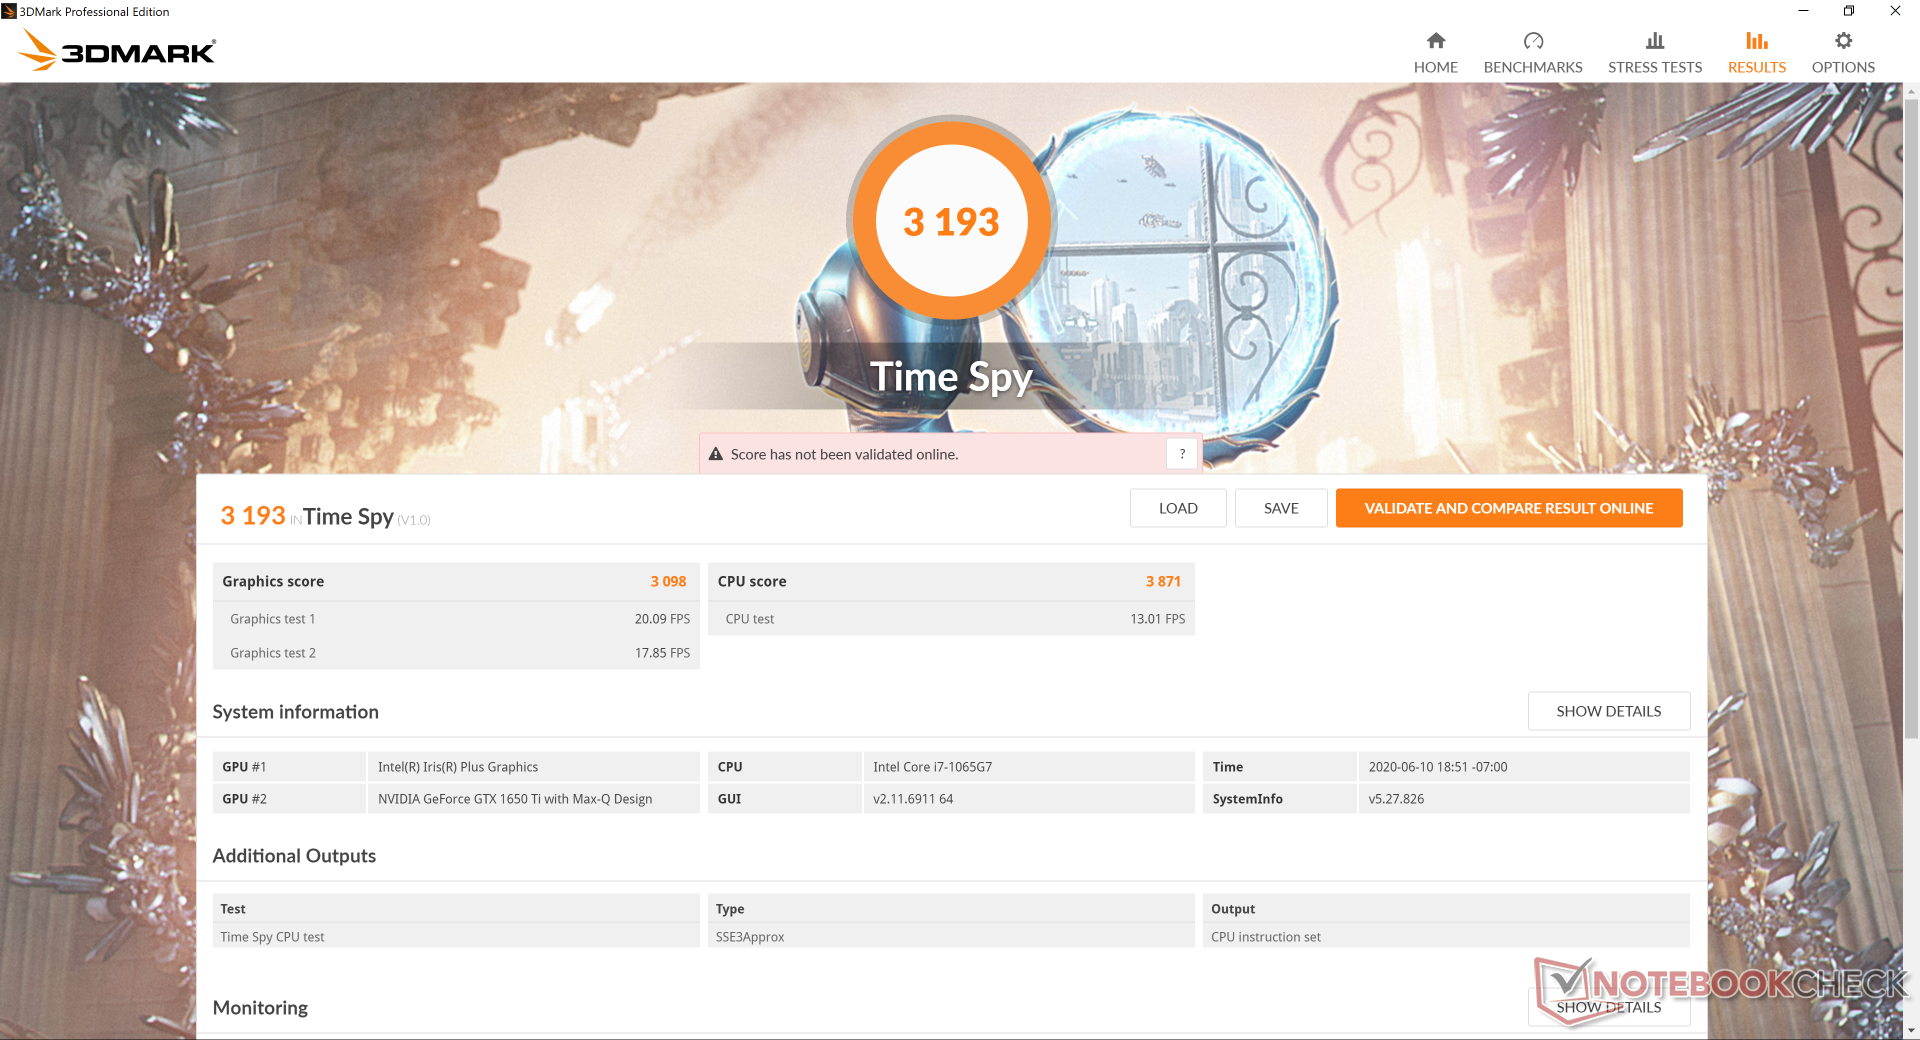
| 3DMark Time Spy Score | 3193 points | |
Help | ||
| The Witcher 3 | |
| 1024x768 Low Graphics & Postprocessing | |
| Razer Blade 15 GTX 1660 Ti | |
| Razer Blade Stealth Core i7 GTX 1650 Ti Max-Q 4K | |
| Razer Blade Stealth 13, Core i7-1065G7 | |
| Razer Blade Stealth i7-8565U | |
| 1366x768 Medium Graphics & Postprocessing | |
| Razer Blade 15 GTX 1660 Ti | |
| Razer Blade Stealth Core i7 GTX 1650 Ti Max-Q 4K | |
| Razer Blade Stealth 13, Core i7-1065G7 | |
| Razer Blade Stealth i7-8565U | |
| 1920x1080 High Graphics & Postprocessing (Nvidia HairWorks Off) | |
| Razer Blade 15 GTX 1660 Ti | |
| Razer Blade Stealth Core i7 GTX 1650 Ti Max-Q 4K | |
| Razer Blade Stealth 13, Core i7-1065G7 | |
| Razer Blade Stealth i7-8565U | |
| 1920x1080 Ultra Graphics & Postprocessing (HBAO+) | |
| Razer Blade 15 GTX 1660 Ti | |
| Razer Blade Stealth Core i7 GTX 1650 Ti Max-Q 4K | |
| Razer Blade Stealth 13, Core i7-1065G7 | |
| Razer Blade Stealth i7-8565U | |
Frame rates are stable when idling on Witcher 3 for over an hour unlike what we observed on the XPS 15 9500.
| low | med. | high | ultra | QHD | 4K | |
| The Witcher 3 (2015) | 159.5 | 92 | 52.6 | 29.8 | ||
| Dota 2 Reborn (2015) | 118 | 112 | 107 | 104 | 51.5 | |
| X-Plane 11.11 (2018) | 79 | 71.5 | 60.5 | 49.2 | ||
| Shadow of the Tomb Raider (2018) | 102 | 55 | 44 | 37 | ||
| Assassin´s Creed Odyssey (2018) | 63 | 49 | 41 | 19 | ||
| Apex Legends (2019) | 143.7 | 86.2 | 68.7 | 62.9 | ||
| Far Cry New Dawn (2019) | 89 | 56 | 53 | 49 | ||
| Metro Exodus (2019) | 83.1 | 40.1 | 29.8 | 23.2 | ||
| Dirt Rally 2.0 (2019) | 195.9 | 63.1 | 55.1 | 38.1 | ||
| The Division 2 (2019) | 93 | 51 | 41 | 30 | ||
| Anno 1800 (2019) | 89.4 | 65.8 | 41.1 | 21.5 | ||
| Total War: Three Kingdoms (2019) | 155.9 | 56 | 33.4 | 21.6 | ||
| F1 2019 (2019) | 171 | 89 | 71 | 62 | ||
| Control (2019) | 104.7 | 39.2 | 29.1 | |||
| Borderlands 3 (2019) | 102.8 | 52.6 | 34.7 | 26.1 | ||
| Ghost Recon Breakpoint (2019) | 74 | 45 | 34 | 22 | ||
| GRID 2019 (2019) | 114 | 76.9 | 64.3 | 27.5 | ||
| Need for Speed Heat (2019) | 61.8 | 49.3 | 45.8 | 33.9 | ||
| Star Wars Jedi Fallen Order (2019) | 63.3 | 53.2 | 46 | |||
| Escape from Tarkov (2020) | 120.7 | 71.2 | 52.8 | 47 | ||
| Hunt Showdown (2020) | 115.7 | 50.1 | 41.8 | |||
| Doom Eternal (2020) | 145.1 | 91.2 | 52.6 | |||
| Gears Tactics (2020) | 162.9 | 73.7 | 44.4 | 33.4 | 23.5 | 13.5 |
Emissions
System Noise
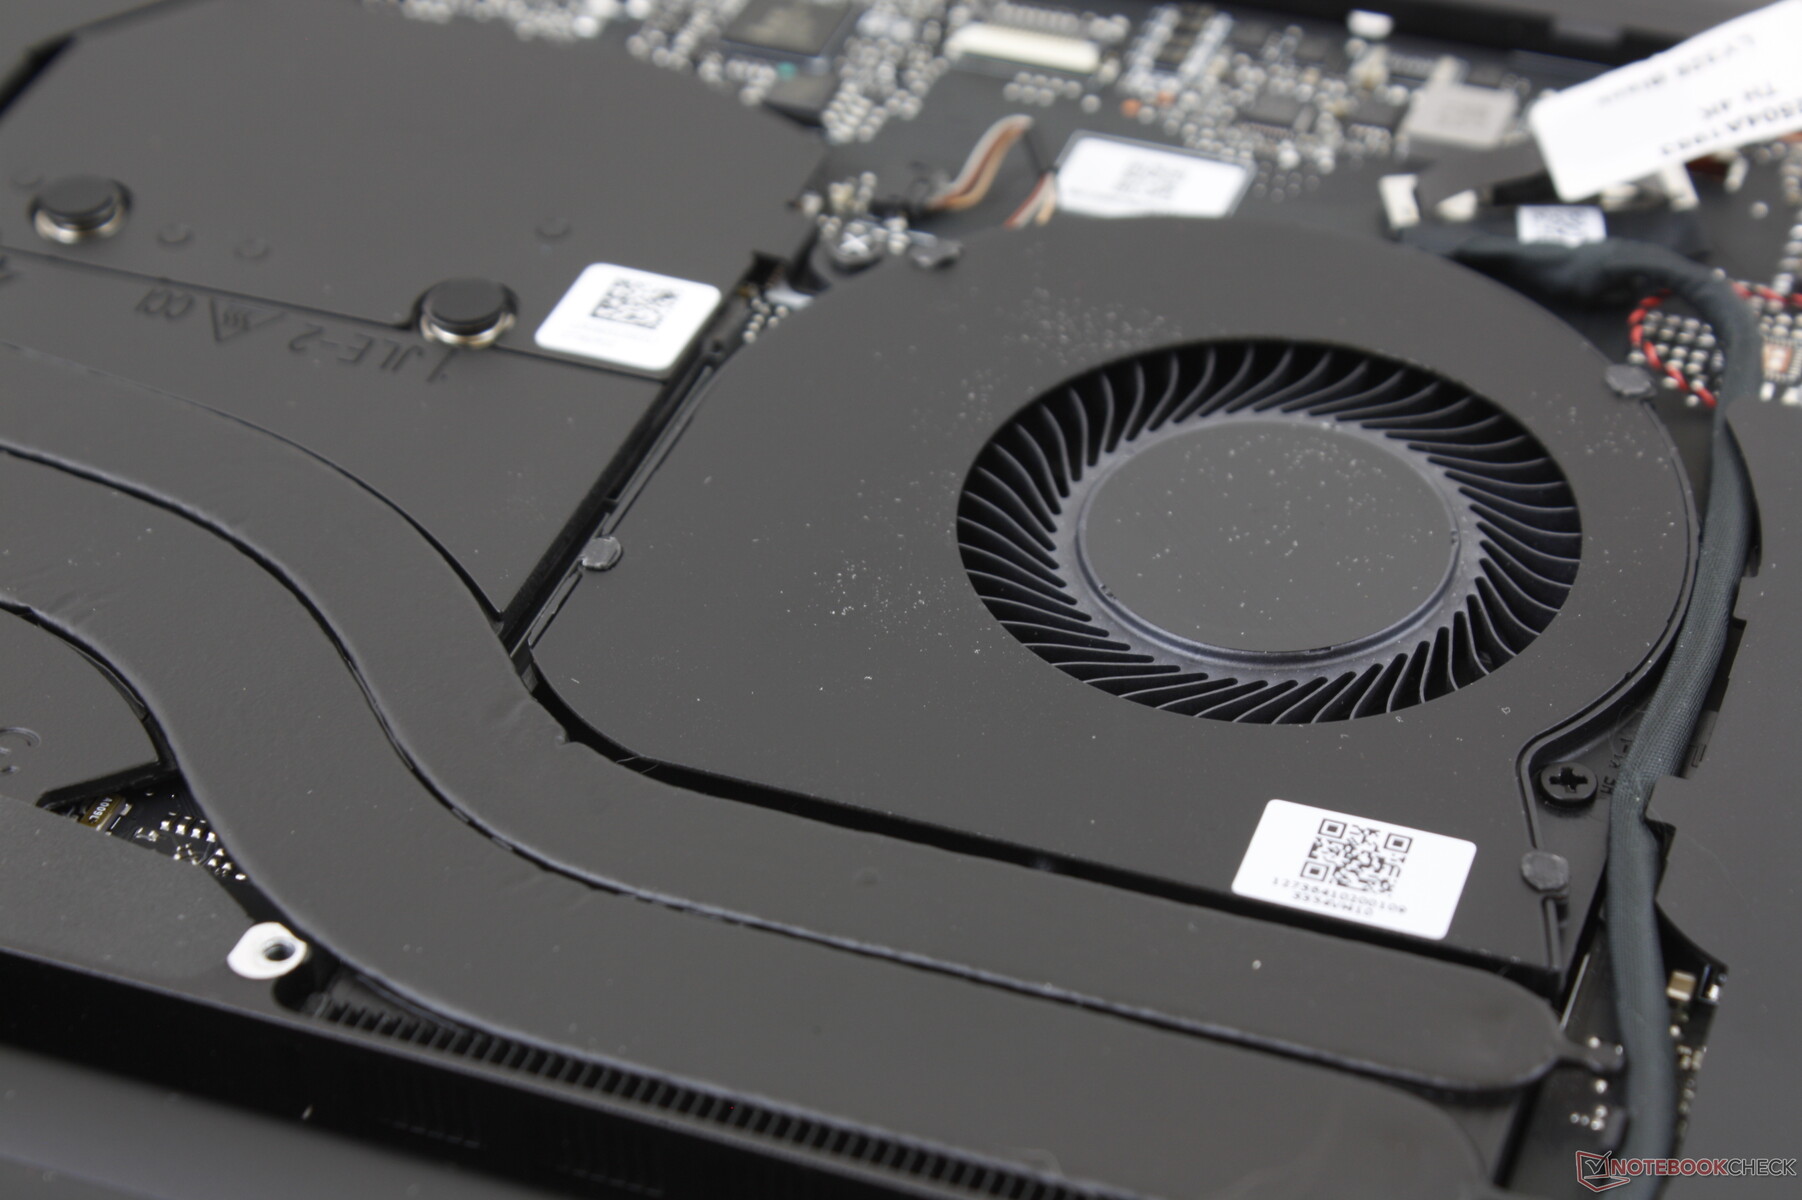
The cooling solution has not changed from the 2019 GeForce SKU. When gaming, fan noise will actually be louder at almost 43 dB(A) compared to 38 dB(A) on last year's model. There is, after all, a more demanding 25 W CPU to cool this time around.
Fortunately, fan noise is silent during low loads when on the Power Saver profile. At worst, fan noise may jump to 32.5 dB(A) which is audible but not distracting when browsing in this mode. We recommend avoiding Gaming Performance or Balanced modes when not gaming to avoid pulsing fans.
We can notice no electronic noise or coil whine on our test unit.
| Razer Blade Stealth Core i7 GTX 1650 Ti Max-Q 4K GeForce GTX 1650 Ti Max-Q, i7-1065G7, Lite-On CA5-8D512 | Dell XPS 13 9300 4K UHD Iris Plus Graphics G7 (Ice Lake 64 EU), i7-1065G7, Intel SSDPEMKF512G8 NVMe SSD | Asus ZenBook S13 UX392FN GeForce MX150, i7-8565U, WDC PC SN520 SDAPNUW-512G | MSI Prestige 14 A10SC-009 GeForce GTX 1650 Max-Q, i7-10710U, Samsung SSD PM981 MZVLB1T0HALR | Razer Blade Stealth 13, Core i7-1065G7 GeForce GTX 1650 Max-Q, i7-1065G7, Lite-On CA3-8D512 | Razer Blade Stealth i7-8565U GeForce MX150, i7-8565U, Lite-On CA3-8D256-Q11 | |
|---|---|---|---|---|---|---|
| Noise | 1% | 0% | -6% | 1% | -2% | |
| off / environment * | 28 | 29 -4% | 28.1 -0% | 30.3 -8% | 30 -7% | 28.4 -1% |
| Idle Minimum * | 28 | 29 -4% | 28.1 -0% | 30.3 -8% | 30 -7% | 28.5 -2% |
| Idle Average * | 28 | 29 -4% | 28.1 -0% | 30.3 -8% | 30 -7% | 29 -4% |
| Idle Maximum * | 28 | 29 -4% | 29 -4% | 30.3 -8% | 30 -7% | 29.1 -4% |
| Load Average * | 39 | 33.5 14% | 41.1 -5% | 40.2 -3% | 33.9 13% | 42.8 -10% |
| Witcher 3 ultra * | 42.7 | 40.5 5% | 41.1 4% | 38.1 11% | 41.4 3% | |
| Load Maximum * | 43.7 | 40.5 7% | 41.1 6% | 43.5 -0% | 38.1 13% | 41.6 5% |
* ... smaller is better
Noise Level
| Idle |
| 28 / 28 / 28 dB(A) |
| Load |
| 39 / 43.7 dB(A) |
 | ||
30 dB silent 40 dB(A) audible 50 dB(A) loud |
||
min: | ||
Temperature
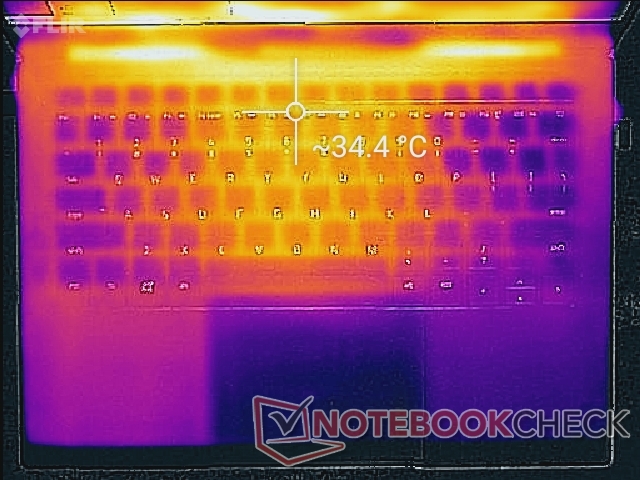
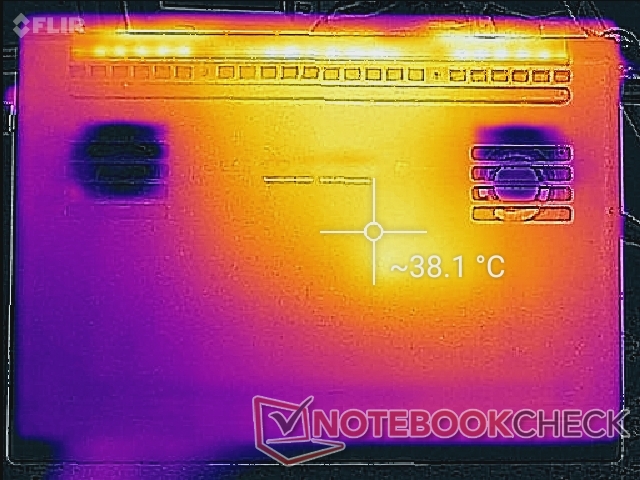
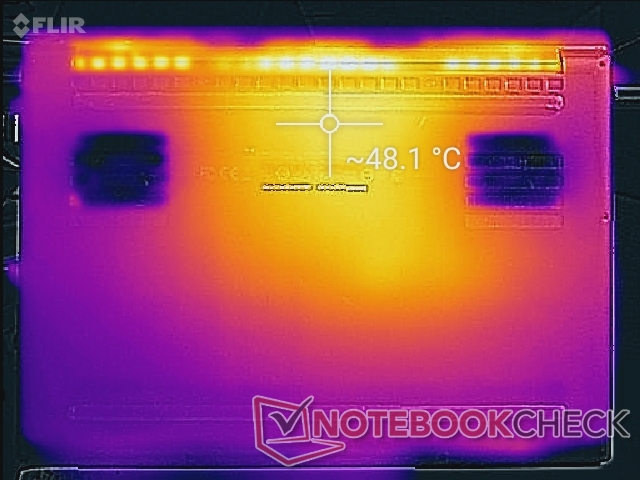
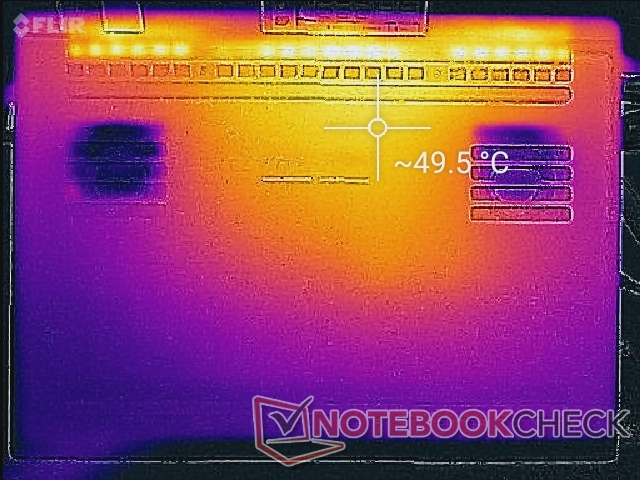
You don't need a PhD in physics to understand what happens when you cram powerful processors in a super-thin metal chassis. The Blade Stealth is one of the warmest subnotebooks we've tested, if not the warmest. Simply idling on desktop, for example, will induce a hot spot of up to 38 C on the bottom surface compared to just 32 C and 28 C on the Ice Lake-powered XPS 13 9300 and HP Spectre x360 13, respectively. Fan noise is automatically set to low when there's not much going on and so users can manually increase the fan noise via Synapse to reduce surface temperatures if desired.
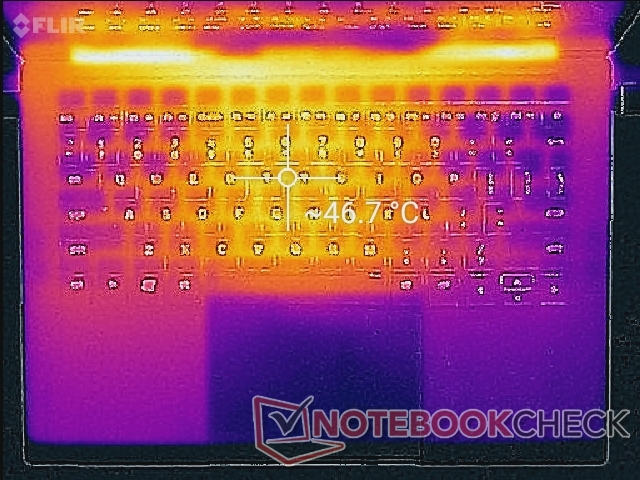
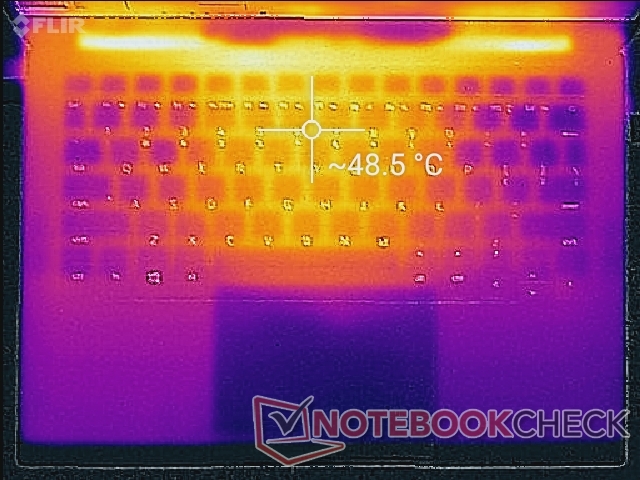
The palm rests will heat up to as high as 38 C when running Witcher 3 while the keyboard center can become as warm as 48 C even when the fans are at maximum. Suffice to say, you're going to want a table around when running demanding loads.
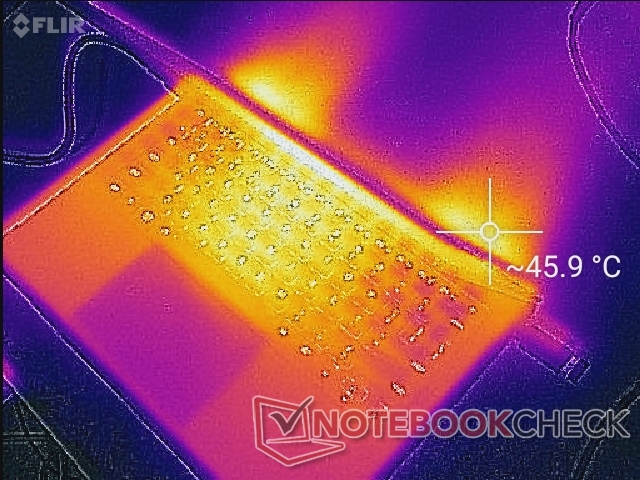
(-) The maximum temperature on the upper side is 48.2 °C / 119 F, compared to the average of 35.9 °C / 97 F, ranging from 21.4 to 59 °C for the class Subnotebook.
(-) The bottom heats up to a maximum of 50 °C / 122 F, compared to the average of 39.4 °C / 103 F
(±) In idle usage, the average temperature for the upper side is 32.3 °C / 90 F, compared to the device average of 30.7 °C / 87 F.
(-) Playing The Witcher 3, the average temperature for the upper side is 40 °C / 104 F, compared to the device average of 30.7 °C / 87 F.
(±) The palmrests and touchpad can get very hot to the touch with a maximum of 38.2 °C / 100.8 F.
(-) The average temperature of the palmrest area of similar devices was 28.3 °C / 82.9 F (-9.9 °C / -17.9 F).
Stress Test
We stress the system to identify for potential throttling or stability issues. When running Prime95, the CPU would boost up to 3.6 GHz until hitting a core temperature of 87 C approximately 20 seconds later. Thereafter, clock rates and temperature would drop and stabilize to 2.6 GHz and 70 C, respectively. The system is therefore unable to maintain maximum Turbo Boost for long periods. Running both Prime95 and FurMark simultaneously would result in stable CPU and GPU temperatures of 77 C and 65 C, respectively, compared to the 70 C CPU temperature we recorded on the 2019 Blade Stealth GTX 1650 Max-Q SKU. The system runs both warmer and louder than last year's model as a result.
When running Witcher 3, the CPU and GPU would stabilize at 70 C and 65 C, respectively, to be at least 10 C warmer than what we recorded on the MX150-powered Blade Stealth.
Performance falls if running on battery power. A 3DMark 11 test on batteries returns Physics and Graphics scores of 5888 and 10422 points, respectively, compared to 10005 and 11501 points when on mains.
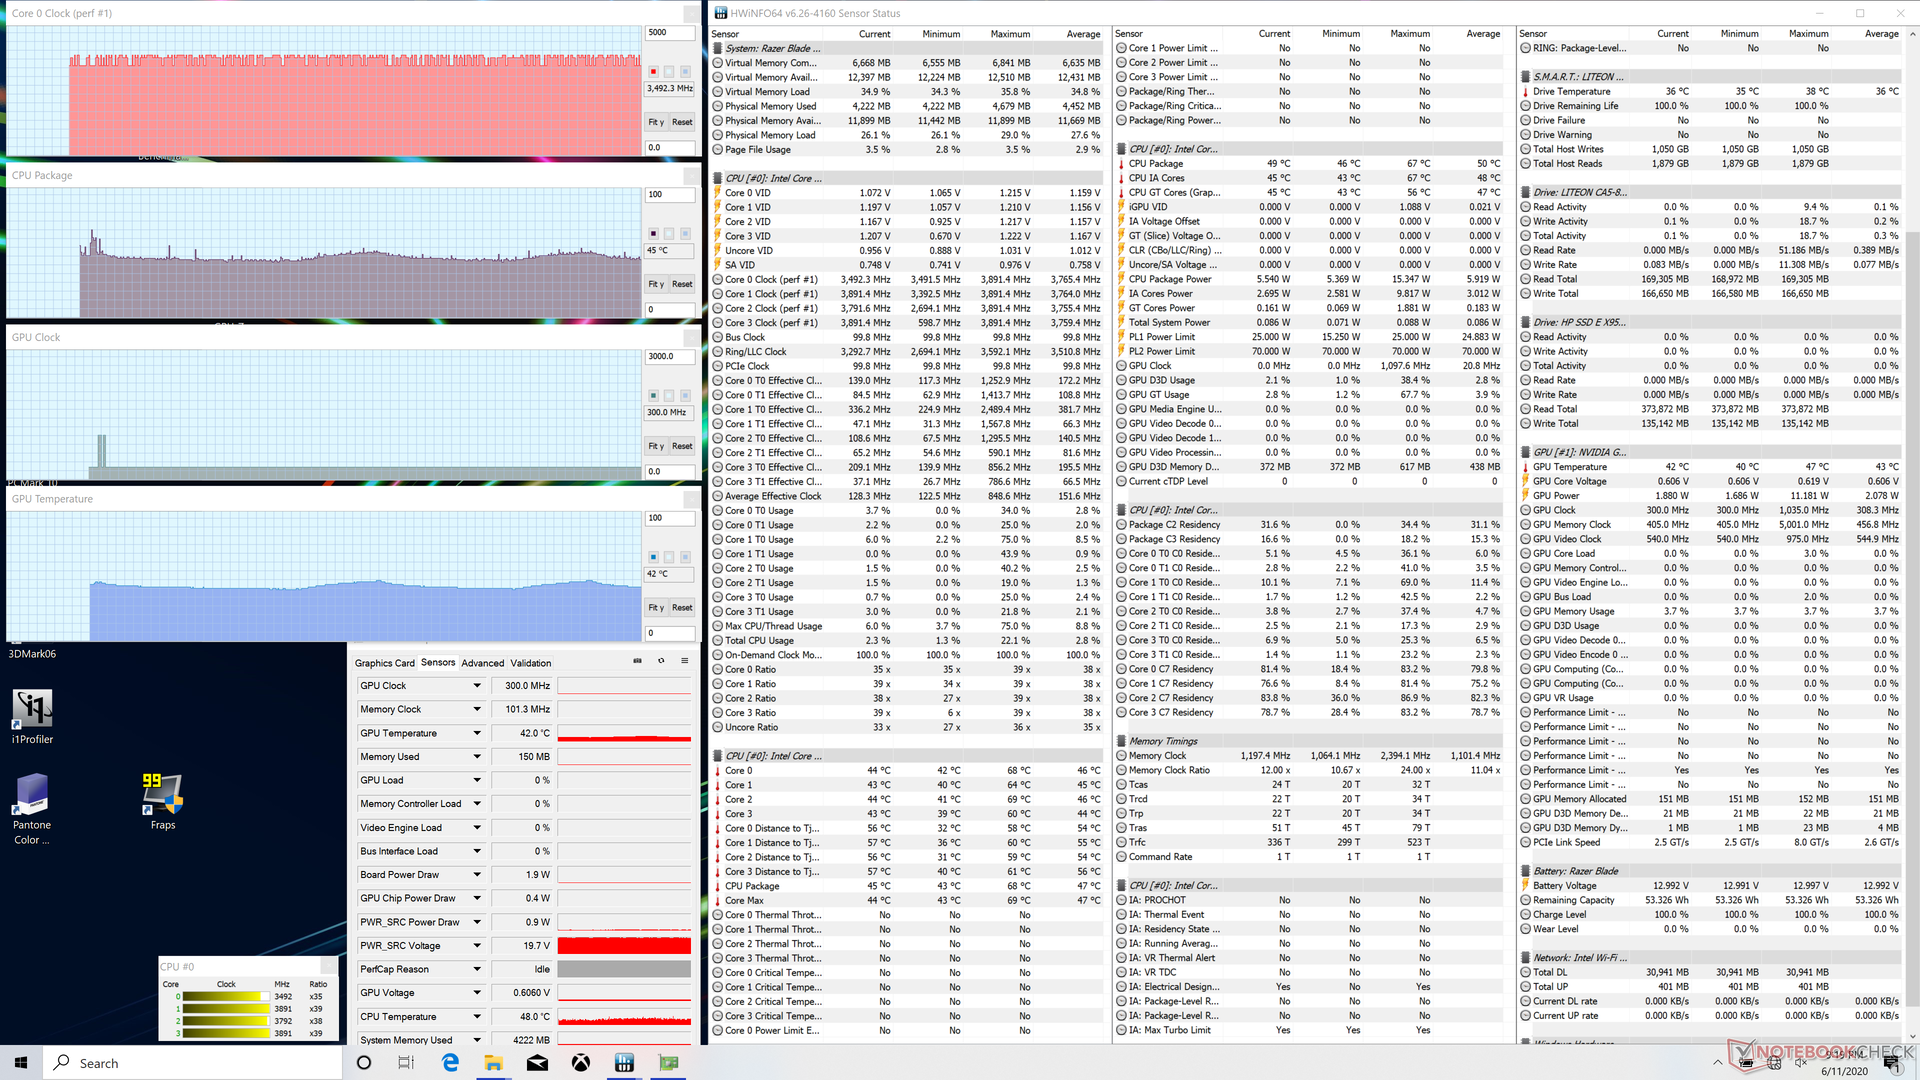
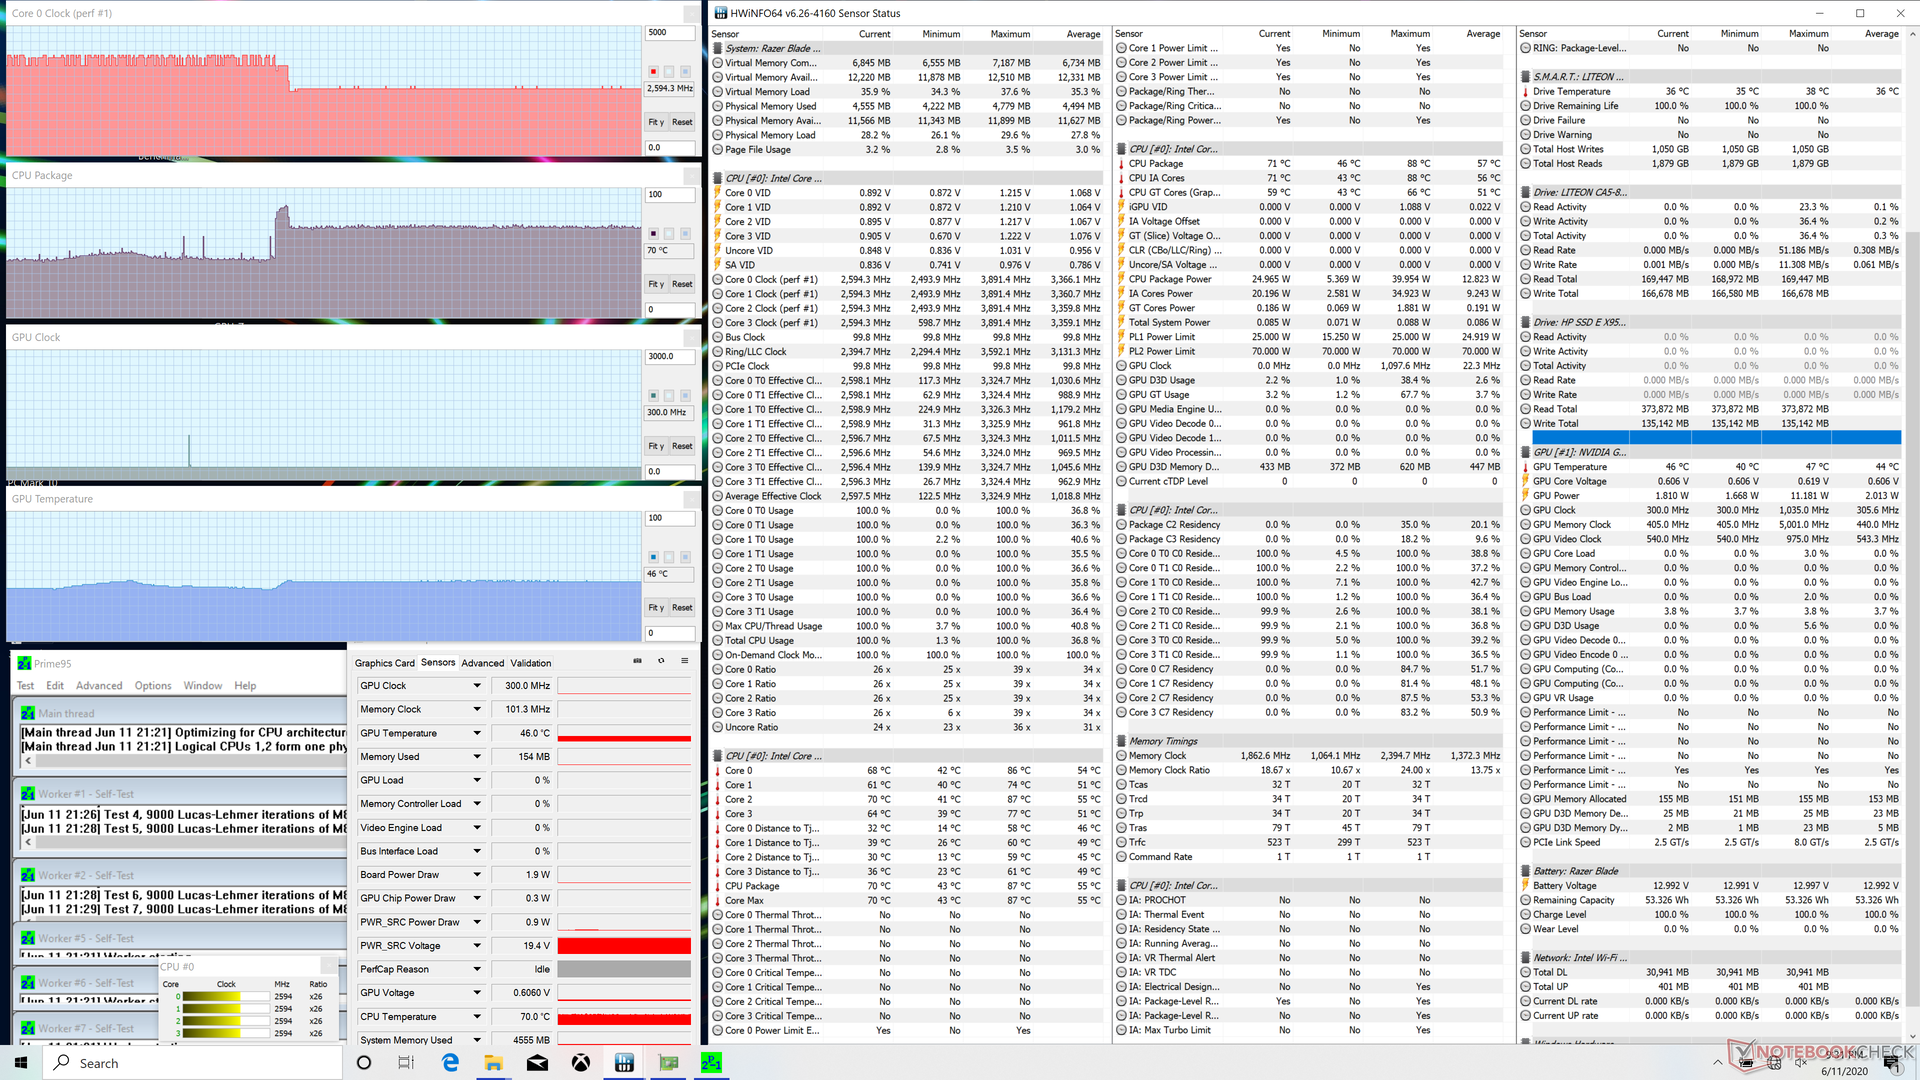
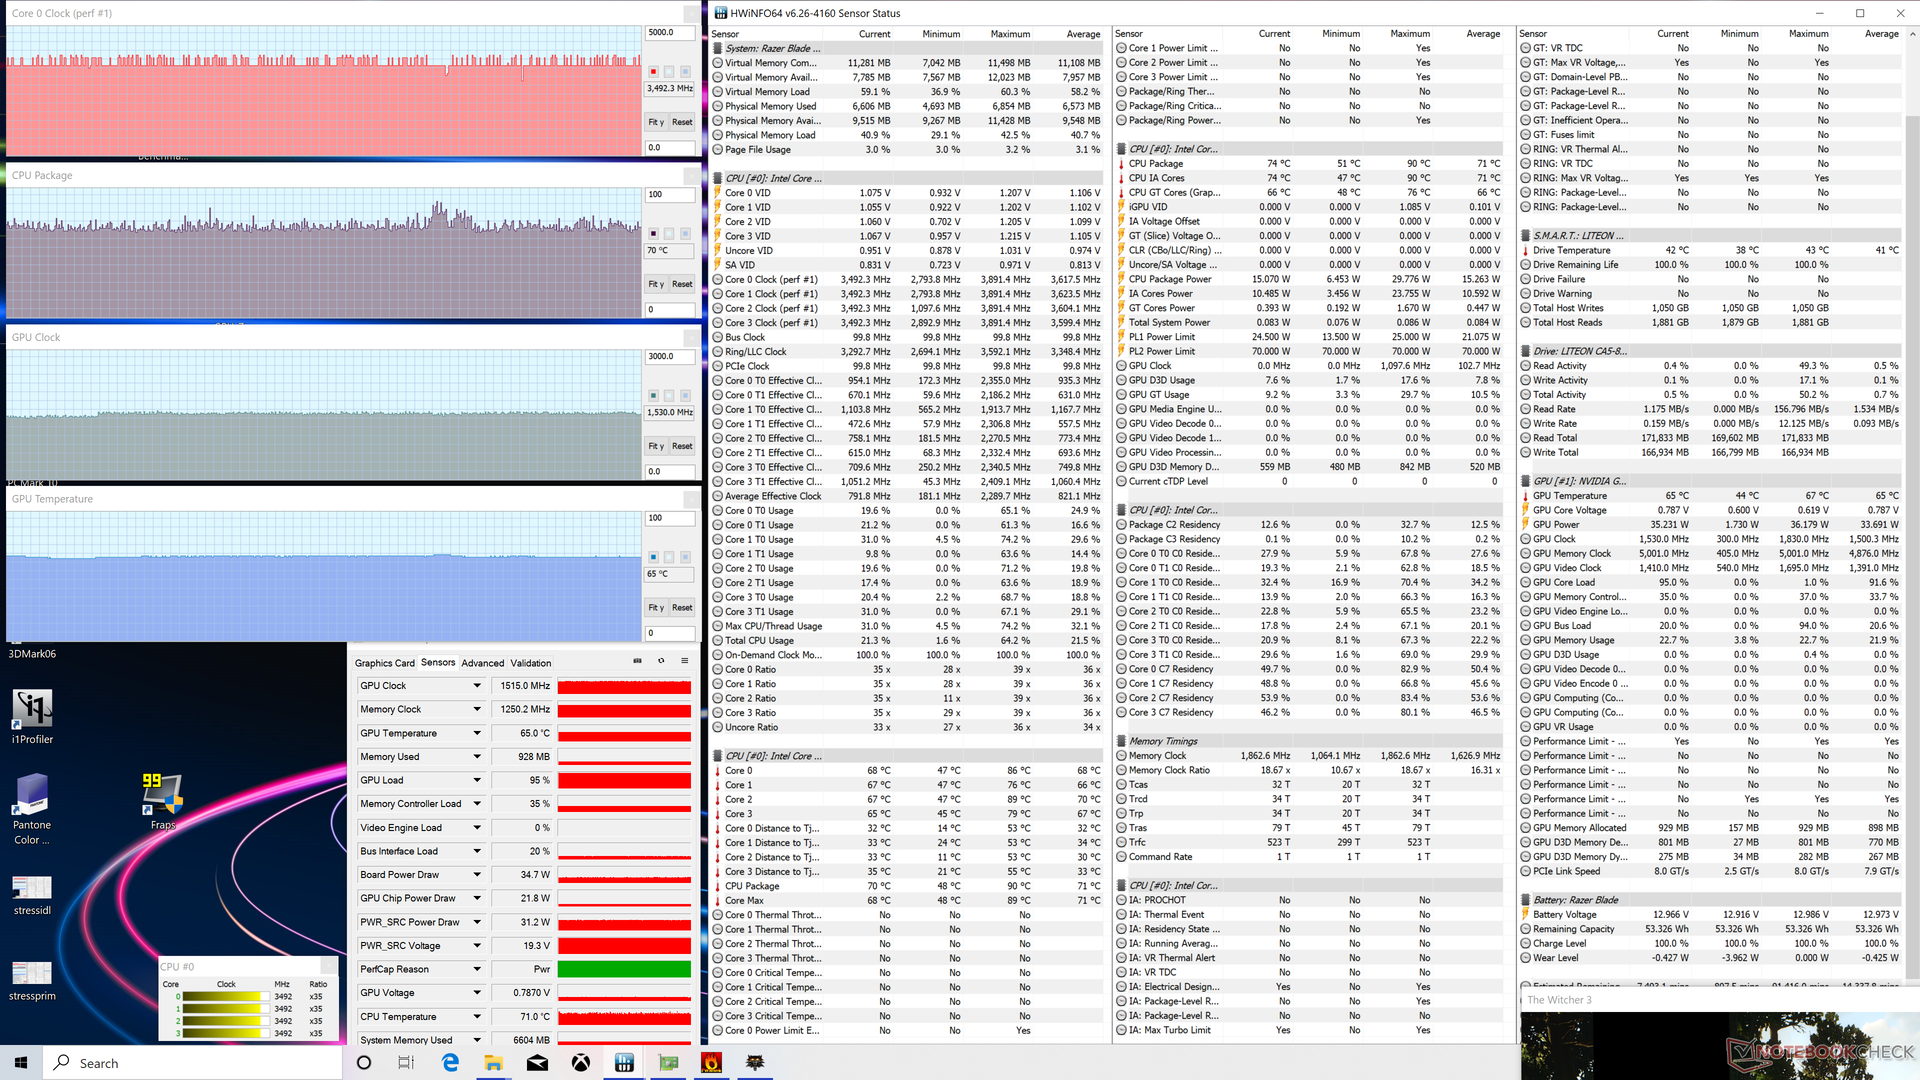
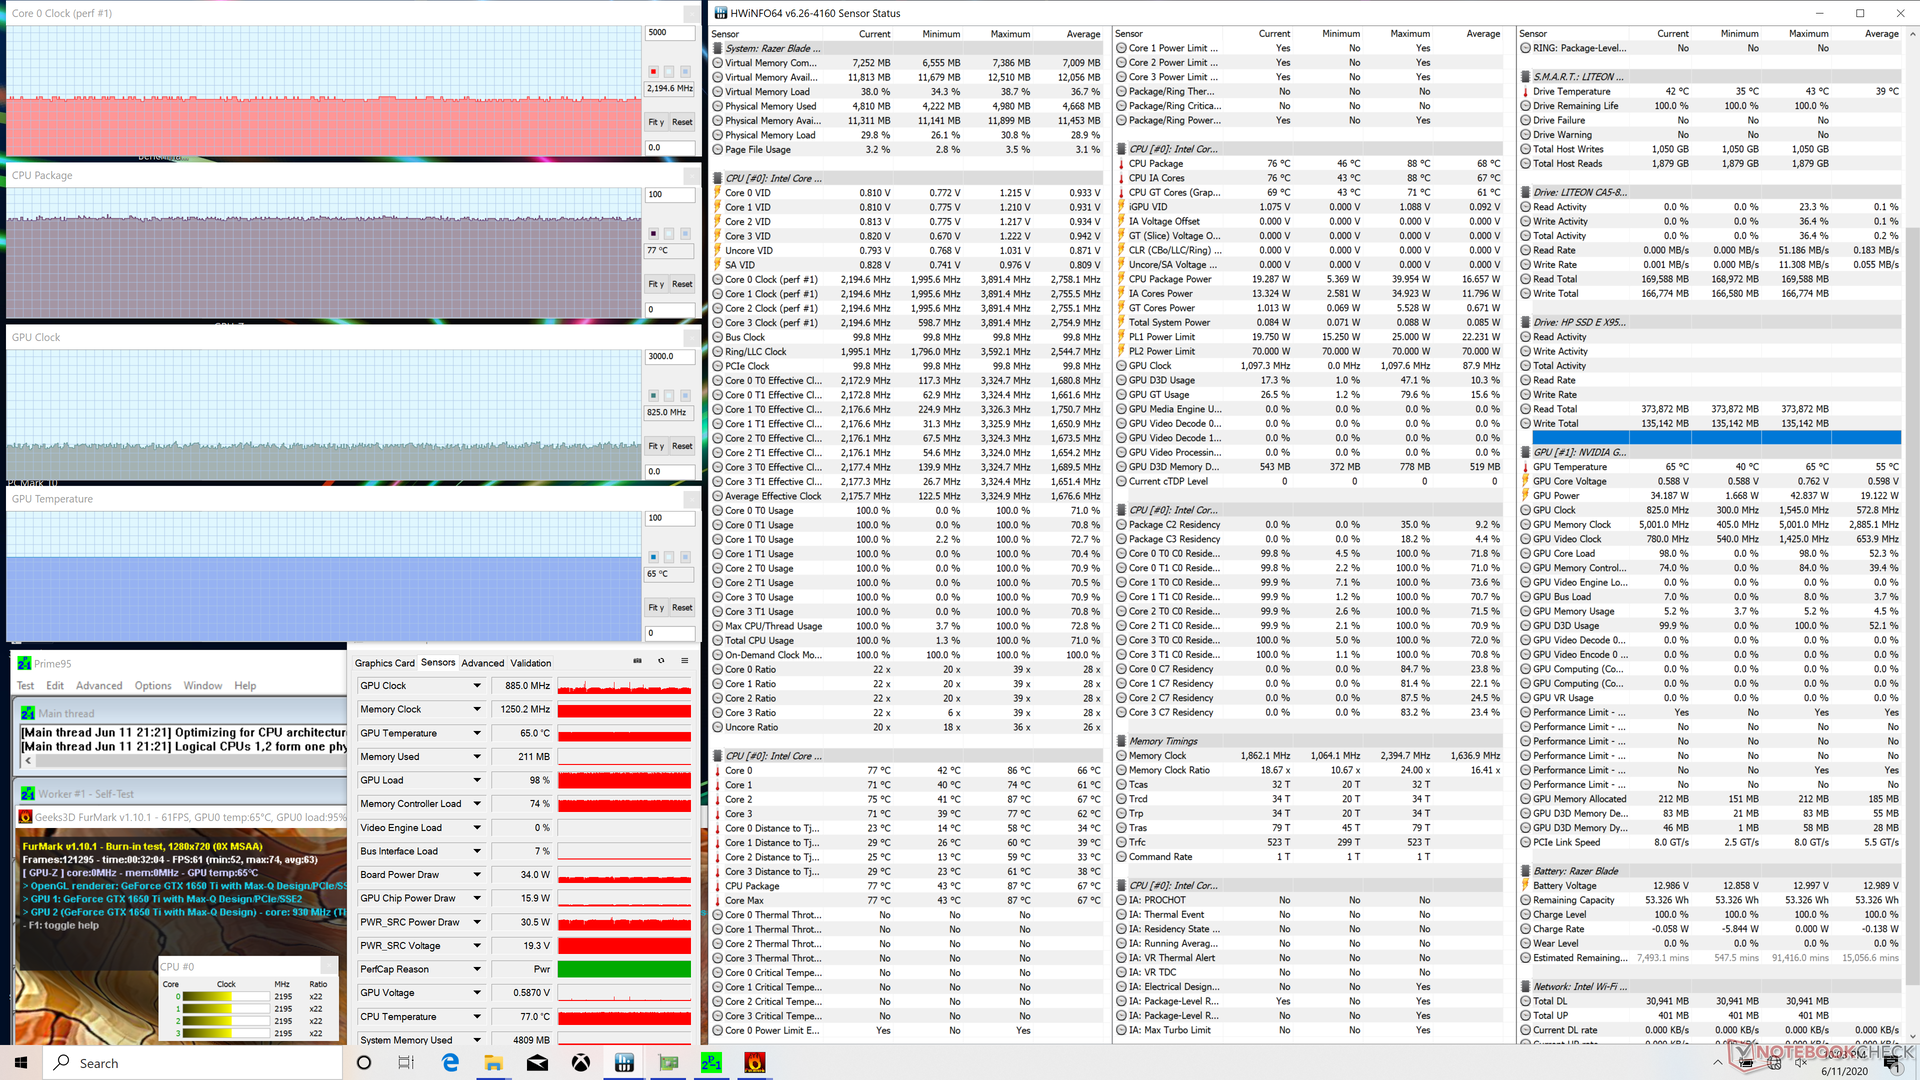
| CPU Clock (GHz) | GPU Clock (MHz) | Average CPU Temperature (°C) | Average GPU Temperature (°C) | |
| System Idle | -- | -- | ~45 | ~42 |
| Prime95 Stress | 2.6 | -- | 70 | 46 |
| Prime95 + FurMark Stress | 2.1 - 2.2 | ~885 | 77 | 65 |
| Witcher 3 Stress | 3.5+ | 1515 | ~70 | 65 |
Speakers

Energy Management
Power Consumption
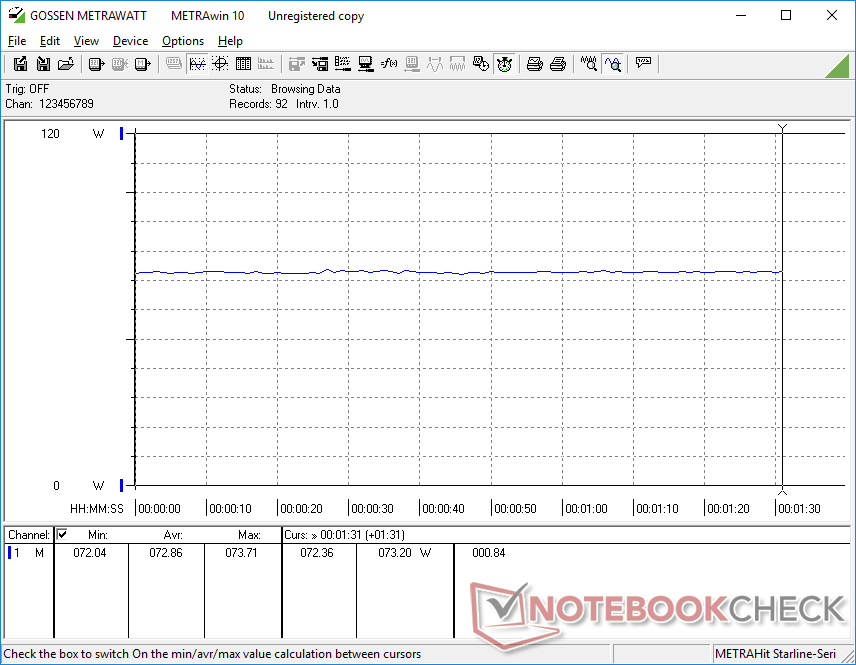
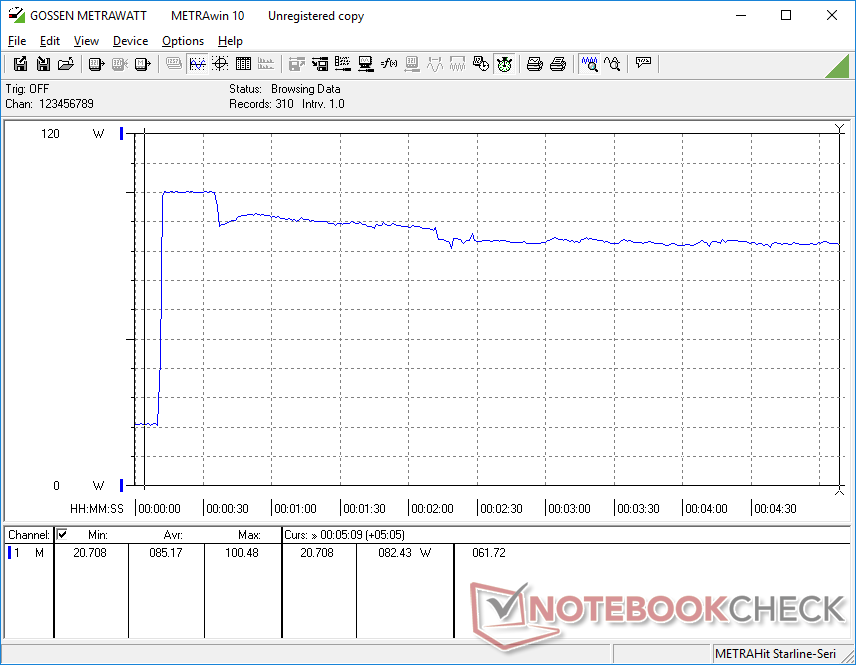
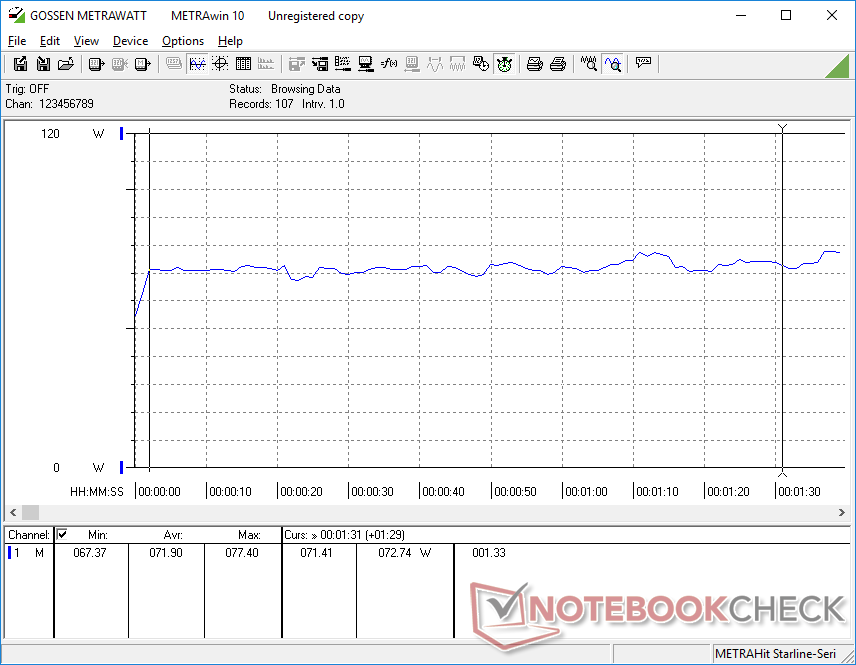
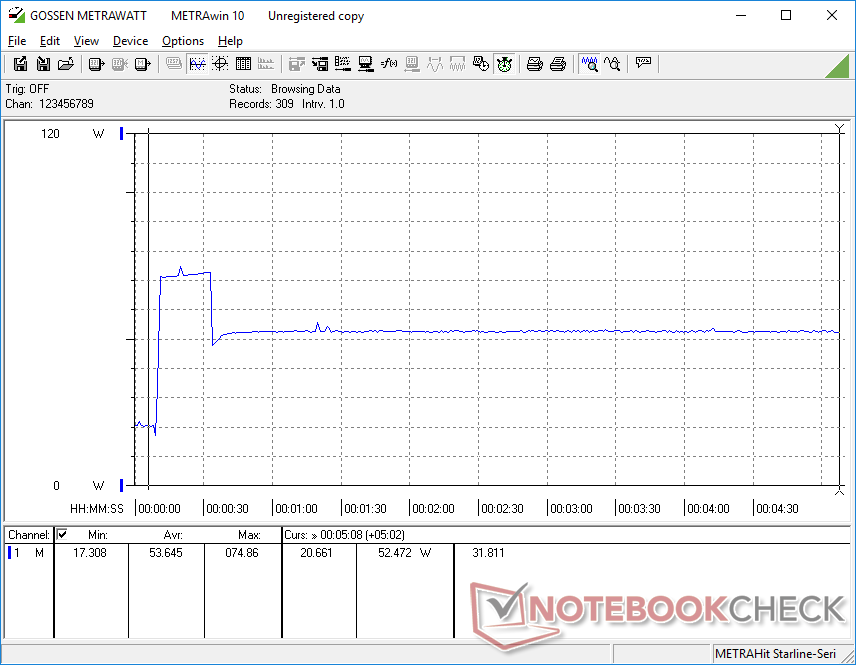
Gaming will consume between 71 W and 73 C compared to 60 W to 64 W on last year's 10 W Core i7 model. The higher consumption when under higher loads is expected due to the more demanding 25 W CPU.
Perhaps most noteworthy is that power consumption is only about 13 percent higher than the 2018 Blade Stealth with the MX150 GPU. When considering that our GTX 1650 Ti Max-Q offers about 2.5x faster gaming performance, the performance-per-watt advantage is significant.
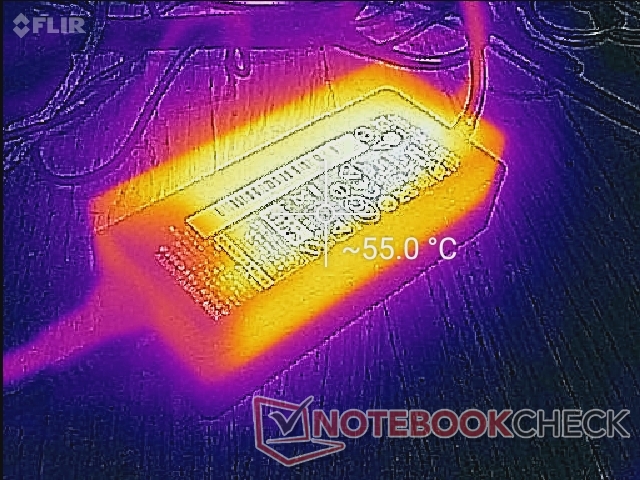
We're able to measure a maximum draw of 100.5 W from the relatively small (~13 x 5.8 x 2.8 cm) 100 W AC adapter. This rate is not indefinite as shown by our graphs below.
| Off / Standby | |
| Idle | |
| Load |
|
| Razer Blade Stealth Core i7 GTX 1650 Ti Max-Q 4K i7-1065G7, GeForce GTX 1650 Ti Max-Q, Lite-On CA5-8D512, IPS, 3840x2160, 13.30 | Dell XPS 13 9300 4K UHD i7-1065G7, Iris Plus Graphics G7 (Ice Lake 64 EU), Intel SSDPEMKF512G8 NVMe SSD, IPS, 3840x2400, 13.40 | HP Spectre x360 13-aw0013dx i7-1065G7, Iris Plus Graphics G7 (Ice Lake 64 EU), Intel Optane Memory H10 with Solid State Storage 32GB + 512GB HBRPEKNX0202A(L/H), IPS, 1920x1080, 13.30 | MSI Prestige 14 A10SC-009 i7-10710U, GeForce GTX 1650 Max-Q, Samsung SSD PM981 MZVLB1T0HALR, IPS, 3840x2160, 14.00 | Razer Blade Stealth i7-8565U i7-8565U, GeForce MX150, Lite-On CA3-8D256-Q11, IPS, 1920x1080, 13.30 | Razer Blade Stealth 13, Core i7-1065G7 i7-1065G7, GeForce GTX 1650 Max-Q, Lite-On CA3-8D512, IPS LED, 3840x2160, 13.30 | |
|---|---|---|---|---|---|---|
| Power Consumption | 34% | 49% | 10% | 18% | -8% | |
| Idle Minimum * | 6 | 5.3 12% | 3.9 35% | 5.2 13% | 6.7 -12% | 10.7 -78% |
| Idle Average * | 10.9 | 7.8 28% | 6.3 42% | 12.2 -12% | 8.6 21% | 13.6 -25% |
| Idle Maximum * | 15.5 | 9.8 37% | 6.8 56% | 14.3 8% | 9.4 39% | 15.7 -1% |
| Load Average * | 71.9 | 46 36% | 32.6 55% | 67 7% | 64.1 11% | 60 17% |
| Witcher 3 ultra * | 72.9 | 43 41% | 25.6 65% | 63.7 13% | 64 12% | |
| Load Maximum * | 100.5 | 48.3 52% | 59 41% | 67 33% | 64.1 36% | 71 29% |
* ... smaller is better
Battery Life
Runtimes are closer to the 2019 Blade Stealth GTX 1650 Max-Q than to the longer-lasting 2018 MX150 version. Still, 6 hours of real-world WLAN use should be sufficient for most users even if more traditional Ultrabooks like the XPS 13 or Spectre 13 are able to last for hours longer.
Recharging from empty to full capacity takes about 1.5 hours. Battery percentage will not drop while gaming unlike what we observed on the 2018 model.
| Razer Blade Stealth Core i7 GTX 1650 Ti Max-Q 4K i7-1065G7, GeForce GTX 1650 Ti Max-Q, 53.1 Wh | Dell XPS 13 9300 4K UHD i7-1065G7, Iris Plus Graphics G7 (Ice Lake 64 EU), 52 Wh | HP Spectre x360 13-aw0013dx i7-1065G7, Iris Plus Graphics G7 (Ice Lake 64 EU), 60 Wh | MSI Prestige 14 A10SC-009 i7-10710U, GeForce GTX 1650 Max-Q, 52 Wh | Razer Blade Stealth i7-8565U i7-8565U, GeForce MX150, 53.1 Wh | Razer Blade Stealth 13, Core i7-1065G7 i7-1065G7, GeForce GTX 1650 Max-Q, 53.1 Wh | |
|---|---|---|---|---|---|---|
| Battery Runtime | 75% | 163% | 14% | 80% | 2% | |
| Reader / Idle | 467 | 2223 376% | 596 28% | 1230 163% | 500 7% | |
| WiFi v1.3 | 390 | 682 75% | 594 52% | 351 -10% | 571 46% | 329 -16% |
| Load | 100 | 160 60% | 125 25% | 131 31% | 114 14% |
Pros
Cons
Verdict
We didn't particularly like either of the 2019 options in terms of performance, but the 2020 version addresses those concerns upfront to be the fastest Blade Stealth you can get. The differences become even more pronounced if comparing the 2020 version to the MX150-powered 2018 version. Certain Ultrabooks may offer faster processors like those with the hexa-core Core i7-10710U or Zen 2 CPU, but none come close to the gaming potential of the Blade Stealth. The GTX 1650 Ti Max-Q makes the system unique in its 13-inch size class.
If you want to game, then we recommend the cheaper 1080p 120 Hz SKU instead of this 4K 60 Hz SKU. Ghosting is too noticeable here and most titles are not going to run well at such a high native resolution. The GTX 1650 Ti Max-Q will pair better with the 1080p120 panel as a result. If you do a lot of spreadsheet or CAD work, however, then the 4K option may be of more value.
With that in mind, we can't help but feel that the 2020 Blade Stealth is a slap in the face to users who bought the 10 W Core i7 2019 version. Razer could have simply skipped the 10 W Core i7 entirely and offered this 25 W version in 2019 instead. Such an approach would have simplified the Blade Stealth lineup as well. Now, buying a model has gotten awfully confusing with all these different 10/25 W Core i7 CPU and Max-Q GPU options to keep track of.
There is no direct alternative to the Blade Stealth at the moment. It's the fastest 13.3-inch Ultrabook you can get for gaming so long as you are aware of the fan noise and very warm surface temperatures that entail.
Razer Blade Stealth Core i7 GTX 1650 Ti Max-Q 4K
-
06/15/2020 v7
Allen Ngo
More articles related to this device
Razer Blade Stealth Core i7 GTX 1650 Ti Max-Q 4K (Blade Stealth Series)Related Articles


Pricecompare
