Notebookcheck Logo

AMD Ryzen 3 1300X vs AMD Ryzen 3 2200G

AMD Ryzen 3 1300X

► remove from comparison AMD R3 1300X

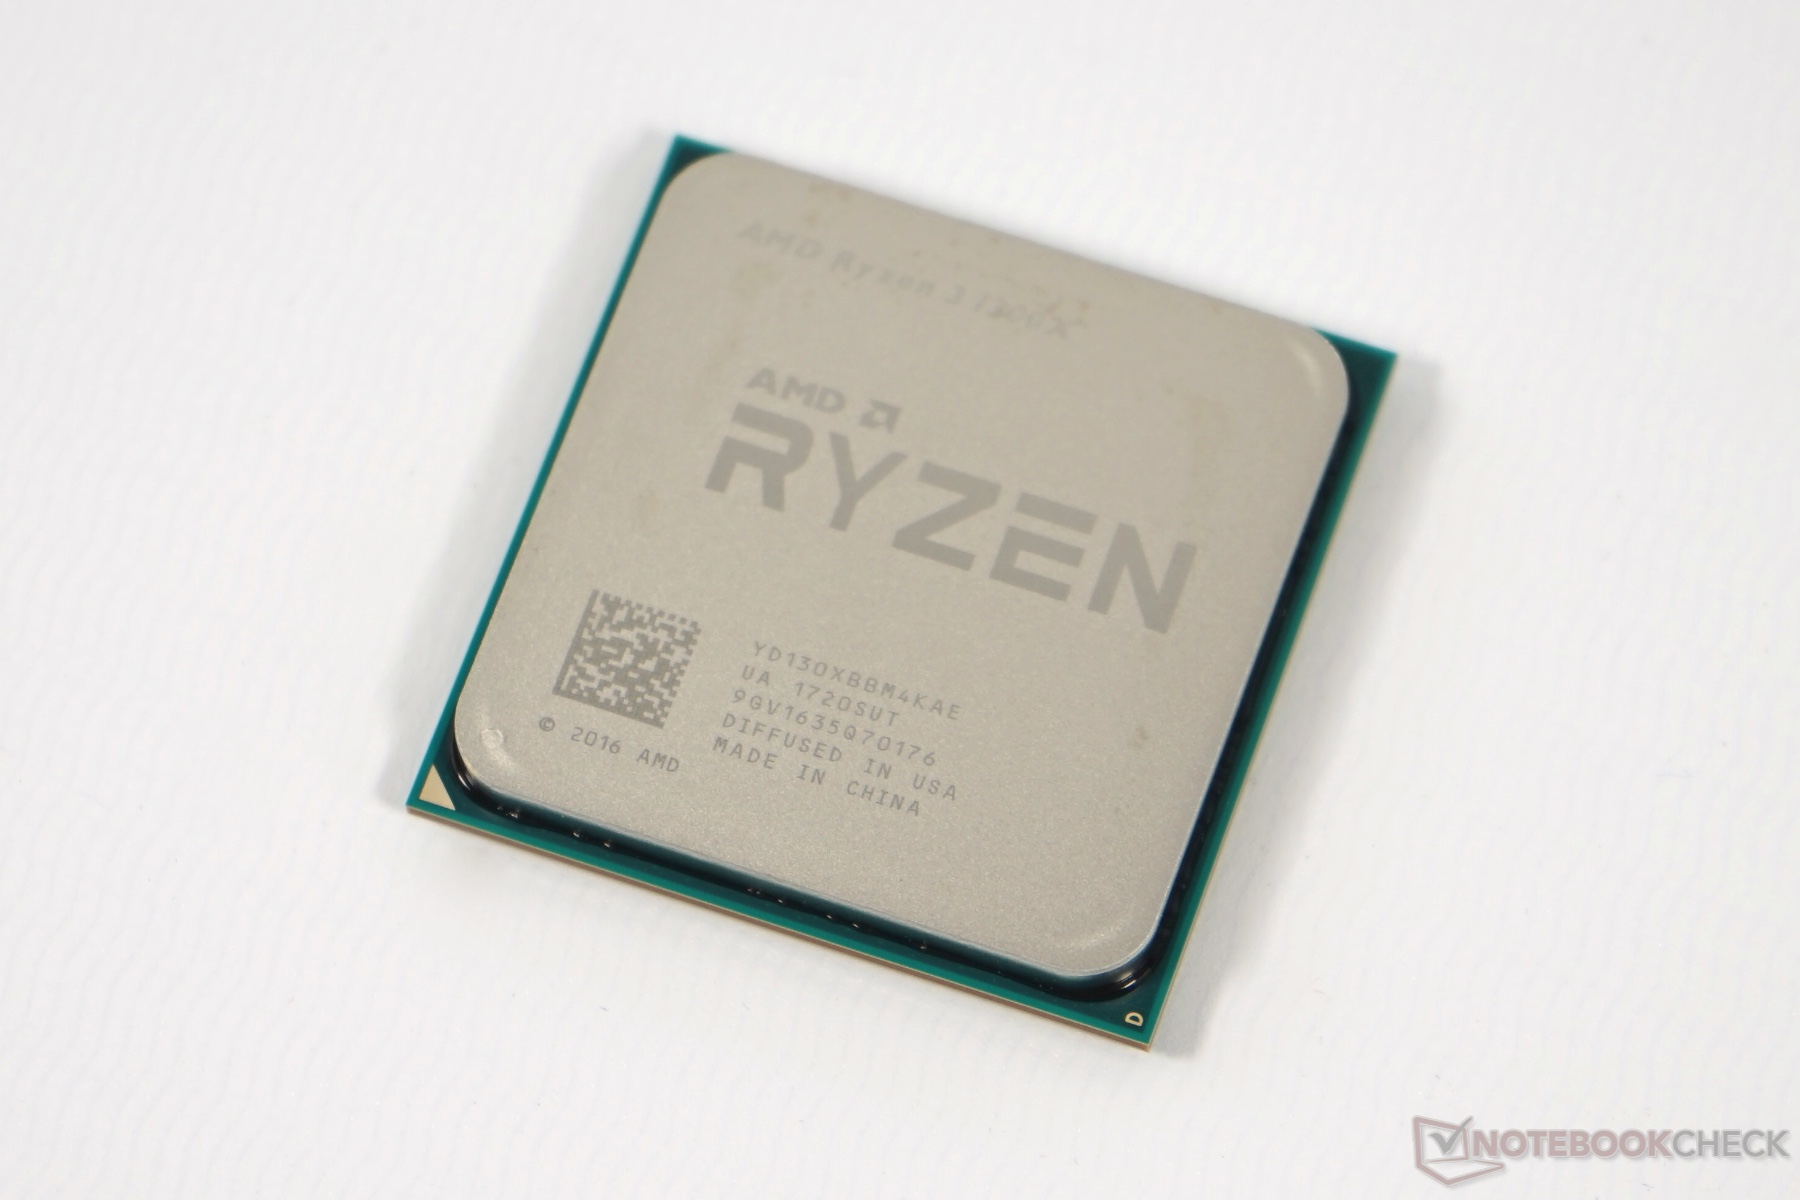
The AMD Ryzen 3 1300X is a desktop quad-core processor with 4 cores and no Hyperthreading / SMT (4 threads only). Mid 2017 it is the fastest Ryzen 3 quad-core CPU. The TDP is specified at 65 Watt and the CPU cores clock with up to 3.9 GHz (XFR 2 cores, 3.7 GHz without XFR). A detailed review can be found here.

AMD Ryzen 3 2200G

► remove from comparison

The AMD Ryzen 3 2200G is a desktop APU that was announced in early 2018. It combines four Zen cores (4 threads as no SMT/HyperThreading support) clocked at 3.5 - 3.7 GHz with a Radeon RX Vega 8 graphics card with 8 CUs (512 of the 704 Shaders on the chip) clocked at up to 1100 MHz. The integrated dual-channel memory controller supports up to DDR-2933. The TDP is specified at 65 Watt and the CPU, GPU and memory are unlocked for overclocking. More information on Raven Ridge can be found in our launch article.

ModelAMD Ryzen 3 1300XAMD Ryzen 3 2200G
SeriesAMD Ryzen 3AMD Raven Ridge (Ryzen 2000 APU)
CodenameZenZen
Clock3500 - 3700 MHz3500 - 3700 MHz
L1 Cache384 KB384 KB
L2 Cache2 MB2 MB
L3 Cache8 MB4 MB
Cores / Threads4 / 44 / 4
TDP65 Watt65 Watt
Transistors4800 Million4500 Million
Technology14 nm14 nm
SocketAM4AM4
FeaturesXFR, FMA3, SSE 4.2, AVX2, SMTXFR, FMA3, SSE 4.2, AVX2, SMT
Architecturex86x86
Announced
Manufacturerwww.amd.comproducts.amd.com
Series: Raven Ridge (Ryzen 2000 APU) Zen
AMD Ryzen 5 2400G compare3.6 - 3.9 GHz4 / 8 cores4 MB L3
AMD Ryzen 7 2700U compare2.2 - 3.8 GHz4 / 8 cores4 MB L3
AMD Ryzen 7 PRO 2700U compare2.2 - 3.8 GHz4 / 8 cores4 MB L3
AMD Ryzen 3 2200G « 3.5 - 3.7 GHz4 / 4 cores4 MB L3
AMD Ryzen 5 2600H compare3.2 - 3.6 GHz4 / 8 cores4 MB L3
AMD Ryzen 5 2500U compare2 - 3.6 GHz4 / 8 cores4 MB L3
AMD Ryzen 5 PRO 2500U compare2 - 3.6 GHz4 / 8 cores4 MB L3
AMD Ryzen Embedded V1605B compare2 - 3.6 GHz4 / 8 cores4 MB L3
AMD Ryzen 3 2300U compare2 - 3.4 GHz4 / 4 cores4 MB L3
AMD Ryzen 3 PRO 2300U compare2 - 3.4 GHz4 / 4 cores4 MB L3
AMD Ryzen Embedded R1606G compare2.6 - 3.5 GHz2 / 4 cores4 MB L3
AMD Ryzen 3 2200U compare2.5 - 3.4 GHz2 / 4 cores4 MB L3
AMD Ryzen 3 PRO 2200U compare2.5 - 3.4 GHz2 / 4 cores4 MB L3
AMD Ryzen Embedded R1505G compare2.4 - 3.3 GHz2 / 4 cores4 MB L3
AMD Athlon 300U compare2.4 - 3.3 GHz2 / 4 cores4 MB L3
iGPUAMD Radeon RX Vega 8 (Ryzen 2000/3000) ( - 1100 MHz)

Benchmarks

Performance Rating - CB R15 + R20 + 7-Zip + X265 + Blender + 3DM11 CPU - R3 1300X
26.4 pt (37%)
Performance Rating - CB R15 + R20 + 7-Zip + X265 + Blender + 3DM11 CPU - R3 2200G
26.8 pt (37%)
Cinebench R23 - Cinebench R23 Multi Core
3486 Points (3%)
Cinebench R23 - Cinebench R23 Single Core
947 Points (40%)
Cinebench R20 - Cinebench R20 CPU (Single Core)
345 Points (38%)
363 Points (40%)
Cinebench R20 - Cinebench R20 CPU (Multi Core)
1336 Points (3%)
1446 Points (4%)
Cinebench R15 - Cinebench R15 CPU Multi 64 Bit
558 Points (4%)
min: 561     avg: 574     median: 577 (4%)     max: 581 Points
Cinebench R15 - Cinebench R15 CPU Single 64 Bit
152 Points (46%)
min: 142     avg: 145.8     median: 145.6 (44%)     max: 150 Points
Cinebench R11.5 - Cinebench R11.5 CPU Multi 64 Bit
6.4 Points (8%)
6.7 Points (9%)
Cinebench R11.5 - Cinebench R11.5 CPU Single 64 Bit
1.7 Points (43%)
1.7 Points (42%)
Cinebench R10 - Cinebench R10 Rend. Single (32bit)
4676 Points (28%)
4625 Points (28%)
Cinebench R10 - Cinebench R10 Rend. Multi (32bit)
16094 Points (12%)
16684 Points (12%)
wPrime 2.10 - wPrime 2.0 1024m *
334.8 s (4%)
333 s (4%)
wPrime 2.10 - wPrime 2.0 32m *
10.8 s (2%)
10.8 s (2%)
WinRAR - WinRAR 4.0
2677 Points (4%)
3229 Points (5%)
7-Zip 18.03 - 7-Zip 18.03 Multli Thread 4 runs
13712 MIPS (8%)
14790 MIPS (8%)
7-Zip 18.03 - 7-Zip 18.03 Single Thread 4 runs
3772 MIPS (45%)
3948 MIPS (47%)
X264 HD Benchmark 4.0 - x264 Pass 2
38.4 fps (13%)
39.7 fps (14%)
X264 HD Benchmark 4.0 - x264 Pass 1
181.6 fps (42%)
184 fps (42%)
HWBOT x265 Benchmark v2.2 - HWBOT x265 4k Preset
4.1 fps (7%)
4.3 fps (8%)
TrueCrypt - TrueCrypt Serpent
0.3 GB/s (0%)
0.3 GB/s (0%)
TrueCrypt - TrueCrypt Twofish
0.5 GB/s (8%)
0.5 GB/s (8%)
TrueCrypt - TrueCrypt AES
3 GB/s (8%)
3.1 GB/s (8%)
Blender - Blender 2.79 BMW27 CPU *
870 Seconds (6%)
min: 825     avg: 826     median: 826 (6%)     max: 827 Seconds
R Benchmark 2.5 - R Benchmark 2.5 *
0.7 sec (15%)
0.7 sec (15%)
3DMark 06 - CPU - 3DMark 06 - CPU
6310 Points (13%)
6636 Points (14%)
Super Pi mod 1.5 XS 1M - Super Pi mod 1.5 XS 1M *
11 s (2%)
11.7 s (3%)
Super Pi mod 1.5 XS 2M - Super Pi mod 1.5 XS 2M *
25.1 s (1%)
26.2 s (1%)
Super Pi Mod 1.5 XS 32M - Super Pi mod 1.5 XS 32M *
619 s (3%)
651 s (3%)
3DMark 11 - 3DM11 Performance Physics
6579 Points (18%)
min: 6549     avg: 6805     median: 6805 (18%)     max: 7061 Points
3DMark - 3DMark Ice Storm Unlimited Physics
71141 Points (60%)
3DMark - 3DMark Cloud Gate Physics
5655 Points (14%)
3DMark - 3DMark Fire Strike Standard Physics
7706 Points (14%)
Geekbench 5.5 - Geekbench 5.1 - 5.4 64 Bit Single-Core
920 Points (39%)
min: 950     avg: 1087     median: 1086.5 (46%)     max: 1223 Points
Geekbench 5.5 - Geekbench 5.1 - 5.4 64 Bit Multi-Core
5210 Points (9%)
min: 3391     avg: 4882     median: 4881.5 (9%)     max: 6372 Points
Geekbench 5.0 - Geekbench 5.0 64 Bit Single-Core
959 Points (4%)
Geekbench 5.0 - Geekbench 5.0 64 Bit Multi-Core
3431 Points (11%)
Geekbench 4.4 - Geekbench 4.1 - 4.4 64 Bit Single-Core
4327 Points (43%)
min: 4148     avg: 4249     median: 4249 (42%)     max: 4350 Points
Geekbench 4.4 - Geekbench 4.1 - 4.4 64 Bit Multi-Core
12230 Points (14%)
min: 11266     avg: 11897     median: 11896.5 (13%)     max: 12527 Points
Geekbench 4.0 - Geekbench 4.0 64 Bit Single-Core
4250 Points (58%)
4082 Points (56%)
Geekbench 4.0 - Geekbench 4.0 64 Bit Multi-Core
11803 Points (29%)
11105 Points (27%)
Geekbench 3 - Geekbench 3 64 Bit Multi-Core
13096 Points (21%)
Geekbench 3 - Geekbench 3 64 Bit Single-Core
4173 Points (62%)
Mozilla Kraken 1.1 - Kraken 1.1 Total Score *
min: 989     avg: 1002     median: 1001.5 (1%)     max: 1014 ms
min: 954     avg: 997     median: 997 (1%)     max: 1040 ms
Sunspider - Sunspider 1.0 Total Score *
81 ms (1%)
92.7 ms (1%)
Octane V2 - Octane V2 Total Score
35289 Points (32%)
34670 Points (31%)
WebXPRT 3 - WebXPRT 3 Score
171 Points (36%)
Power Consumption - Prime95 Power Consumption - external Monitor *
95.4 Watt (16%)
Power Consumption - Cinebench R15 Multi Power Consumption - external Monitor *
69 Watt (13%)
Power Consumption - Cinebench R15 Multi Power Efficiency - external Monitor
8.4 Points per Watt (6%)

Average Benchmarks AMD Ryzen 3 1300X → 100% n=35

Average Benchmarks AMD Ryzen 3 2200G → 102% n=35

- Range of benchmark values for this graphics card
- Average benchmark values for this graphics card
* Smaller numbers mean a higher performance
1 This benchmark is not used for the average calculation

Add one or more devices and compare

In the following list you can select (and also search for) devices that should be added to the comparison. You can select more than one device.

restrict list:

show all (including archived), 2024, 2023
v1.26
log 23. 20:43:42

#0 checking url part for id 9304 +0s ... 0s

#1 checking url part for id 9896 +0s ... 0s

#2 not redirecting to Ajax server +0s ... 0s

#3 did not recreate cache, as it is less than 5 days old! Created at Tue, 23 Apr 2024 05:40:15 +0200 +0.001s ... 0.001s

#4 composed specs +0.019s ... 0.02s

#5 did output specs +0s ... 0.02s

#6 getting avg benchmarks for device 9304 +0.017s ... 0.036s

#7 got single benchmarks 9304 +0.009s ... 0.045s

#8 getting avg benchmarks for device 9896 +0.013s ... 0.058s

#9 got single benchmarks 9896 +0.01s ... 0.068s

#10 got avg benchmarks for devices +0s ... 0.068s

#11 min, max, avg, median took s +0.212s ... 0.28s

#12 return log +0.025s ... 0.304s

Please share our article, every link counts!
> Expert Reviews and News on Laptops, Smartphones and Tech Innovations > Benchmarks / Tech > Processor Comparison - Head 2 Head
Redaktion, 2017-09- 8 (Update: 2023-07- 1)