 Deutsch
 English
 Español
 Français
 Italiano
 Nederlands
 Polski
 Português
 Русский
 Türkçe
 Svenska
 Chinese
 Magyar
Zotac Gaming GeForce RTX 4070 AMP Airo Review: RTX 3080-ish performance for US$200 markup over RTX 3070
Update 04/17: Review now complete with heat, noise, and power measurements
Even though it's only been a few months since the RTX 4070 Ti launched, Nvidia is back again with a further sliced-down AD104 GPU in the form of the RTX 4070.
Unlike the RTX 4070 Ti, Nvidia is offering a Founders Edition card for the US$599 RTX 4070, whose embargo lifted yesterday alongside other similarly priced add-in board (AiB) partner models.
Today, though, is when the amped-up RTX 4070 cards make their presence felt. We have with us the Zotac Gaming GeForce RTX 4070 AMP Airo for review.
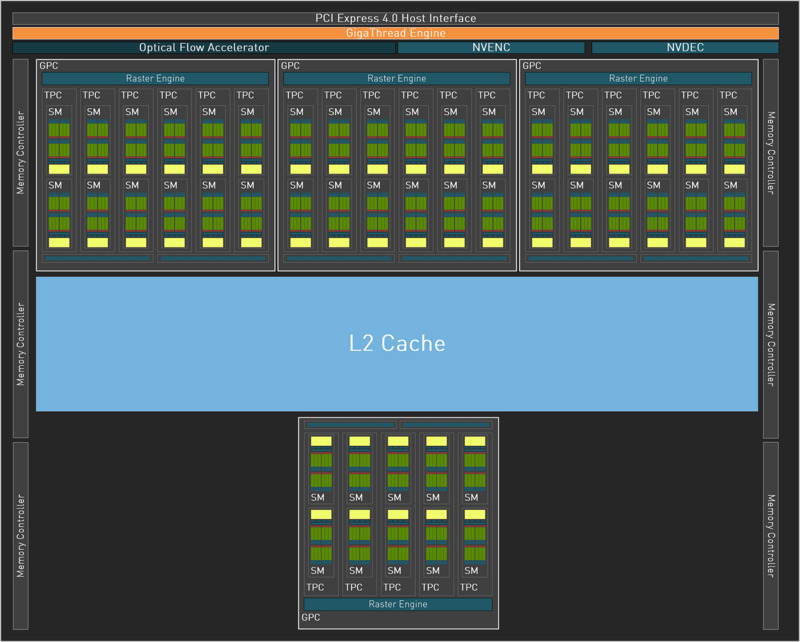
While the RTX 4070 Ti featured the full fat AD104 die with 7,680 CUDA cores, the RTX 4070 is a drastically cut-down part with just 5,888 CUDA cores. This is a 23% decrease that manifests accordingly in various benchmarks as we will see shortly.
Together, these 5,888 CUDA cores can output 29 TFLOPs of FP32 performance for rasterization. The RTX 4070 also offers 184 fourth generation Tensor cores and 46 third generation RT cores.
The RTX 4070 shares the same memory subsystem as that of the RTX 4070 Ti — 12 GB of 192-bit GDDR6X with a 504 GB/s bandwidth.
The Zotac RTX 4070 AMP Airo retails for ₹70,199 or US$699. In India, the card comes with a five-year warranty: a standard warranty of three years that is extensible by another two years.
In this review, we test Zotac's premium RTX 4070 offering, see how it compares with the RTX 4070 Ti, and evaluate whether it has the guts to convincingly displace the GeForce RTX 3080 and the Radeon RX 6900 XT.
Comparison of the Zotac Gaming RTX 4070 AMP Airo with other Nvidia GPUs
| Specification | RTX 4090 FE | RTX 4080 FE | Asus TUF RTX 4070 Ti | Zotac RTX 4070 AMP Airo | RTX 3090 Ti FE | RTX 3090 FE | RTX 3080 Ti FE | RTX 3080 FE | RTX 3070 FE | Titan RTX |
|---|---|---|---|---|---|---|---|---|---|---|
| Chip | AD102 | AD103 | AD104 | AD104 | GA102 | GA102 | GA102 | GA102 | GA104 | TU102 |
| FinFET Process | Custom 4N | Custom 4N | Custom 4N | Custom 4N | 8 nm | 8 nm | 8 nm | 8 nm | 8 nm | 12 nm |
| CUDA Cores | 16,384 | 9,728 | 7,680 | 5,888 | 10,752 | 10,496 | 10,240 | 8,704 | 5,888 | 4,608 |
| Texture Units | 512 | 304 | 240 | 184 | 336 | 328 | 320 | 272 | 184 | 288 |
| Tensor Cores | 512 4th Gen. | 304 4th Gen. | 240 4th Gen. | 184 4th Gen. | 336 3rd Gen. | 328 3rd Gen. | 320 3rd Gen. | 272 3rd Gen. | 184 3rd Gen. | 576 2nd Gen. |
| RT Cores | 128 3rd Gen. | 76 3rd Gen. | 60 3rd Gen. | 46 3rd Gen. | 84 2nd Gen. | 82 2nd Gen. | 80 2nd Gen. | 68 2nd Gen. | 46 2nd Gen. | 72 |
| GPU Base Clock | 2,235 MHz | 2,205 MHz | 2,310 MHz | 1,920MHz | 1,560 MHz | 1,395 MHz | 1,365 MHz | 1,440 MHz | 1,500 MHz | 1,350 MHz |
| GPU Boost Clock | 2,520 MHz | 2,505 MHz | 2,760 MHz | 2,535 MHz | 1,860 MHz | 1,695 MHz | 1,665 MHz | 1,710 MHz | 1,750 MHz | 1,770 MHz |
| Memory Bus | 384-bit | 256-bit | 192-bit | 192-bit | 384-bit | 384-bit | 384-bit | 320-bit | 256-bit | 384-bit |
| Memory Bandwidth | 1,008 GB/s | 716.8 GB/s | 504 GB/s | 504 GB/s | 1,008 GB/s | 936 GB/s | 912 GB/s | 760 GB/s | 448 GB/s | 672 GB/s |
| Video Memory | 24 GB GDDR6X | 16 GB GDDR6X | 12 GB GDDR6X | 12 GB GDDR6X | 24 GB GDDR6X | 24 GB GDDR6X | 12 GB GDDR6X | 10 GB GDDR6X | 8 GB GDDR6 | 24 GB GDDR6 |
| Power Consumption | 450 W | 320 W | 285 W | 215 W | 450 W | 350 W | 350 W | 320 W | 220 W | 280 W |
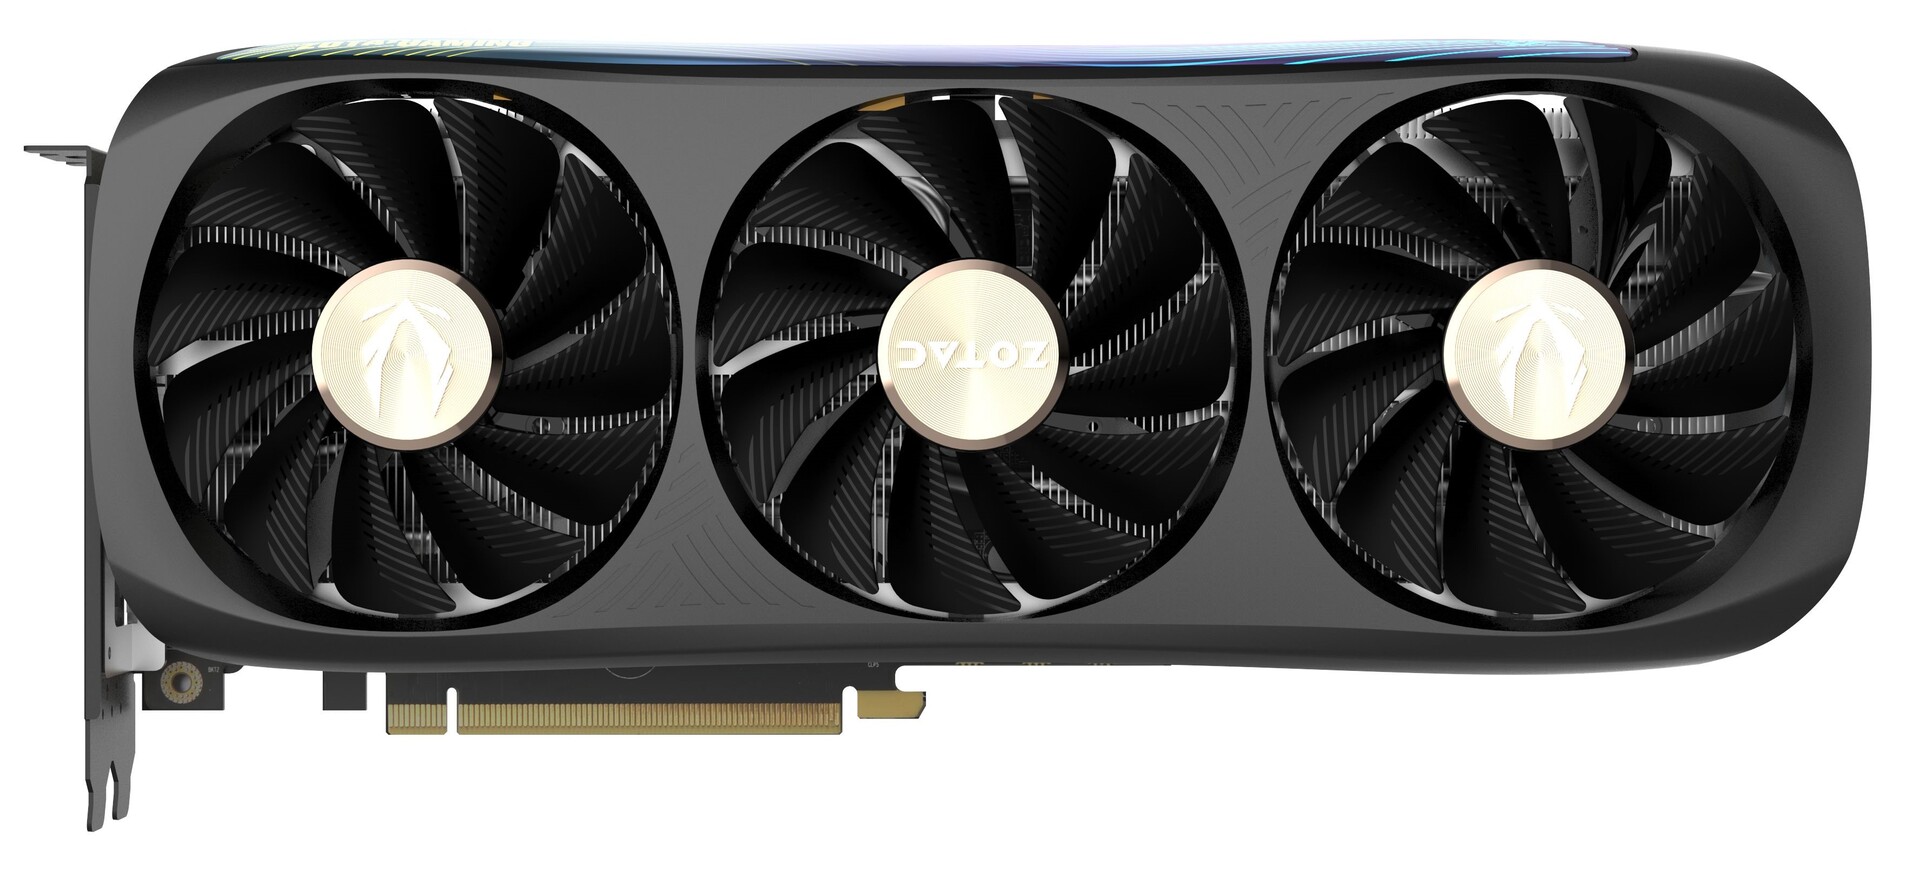
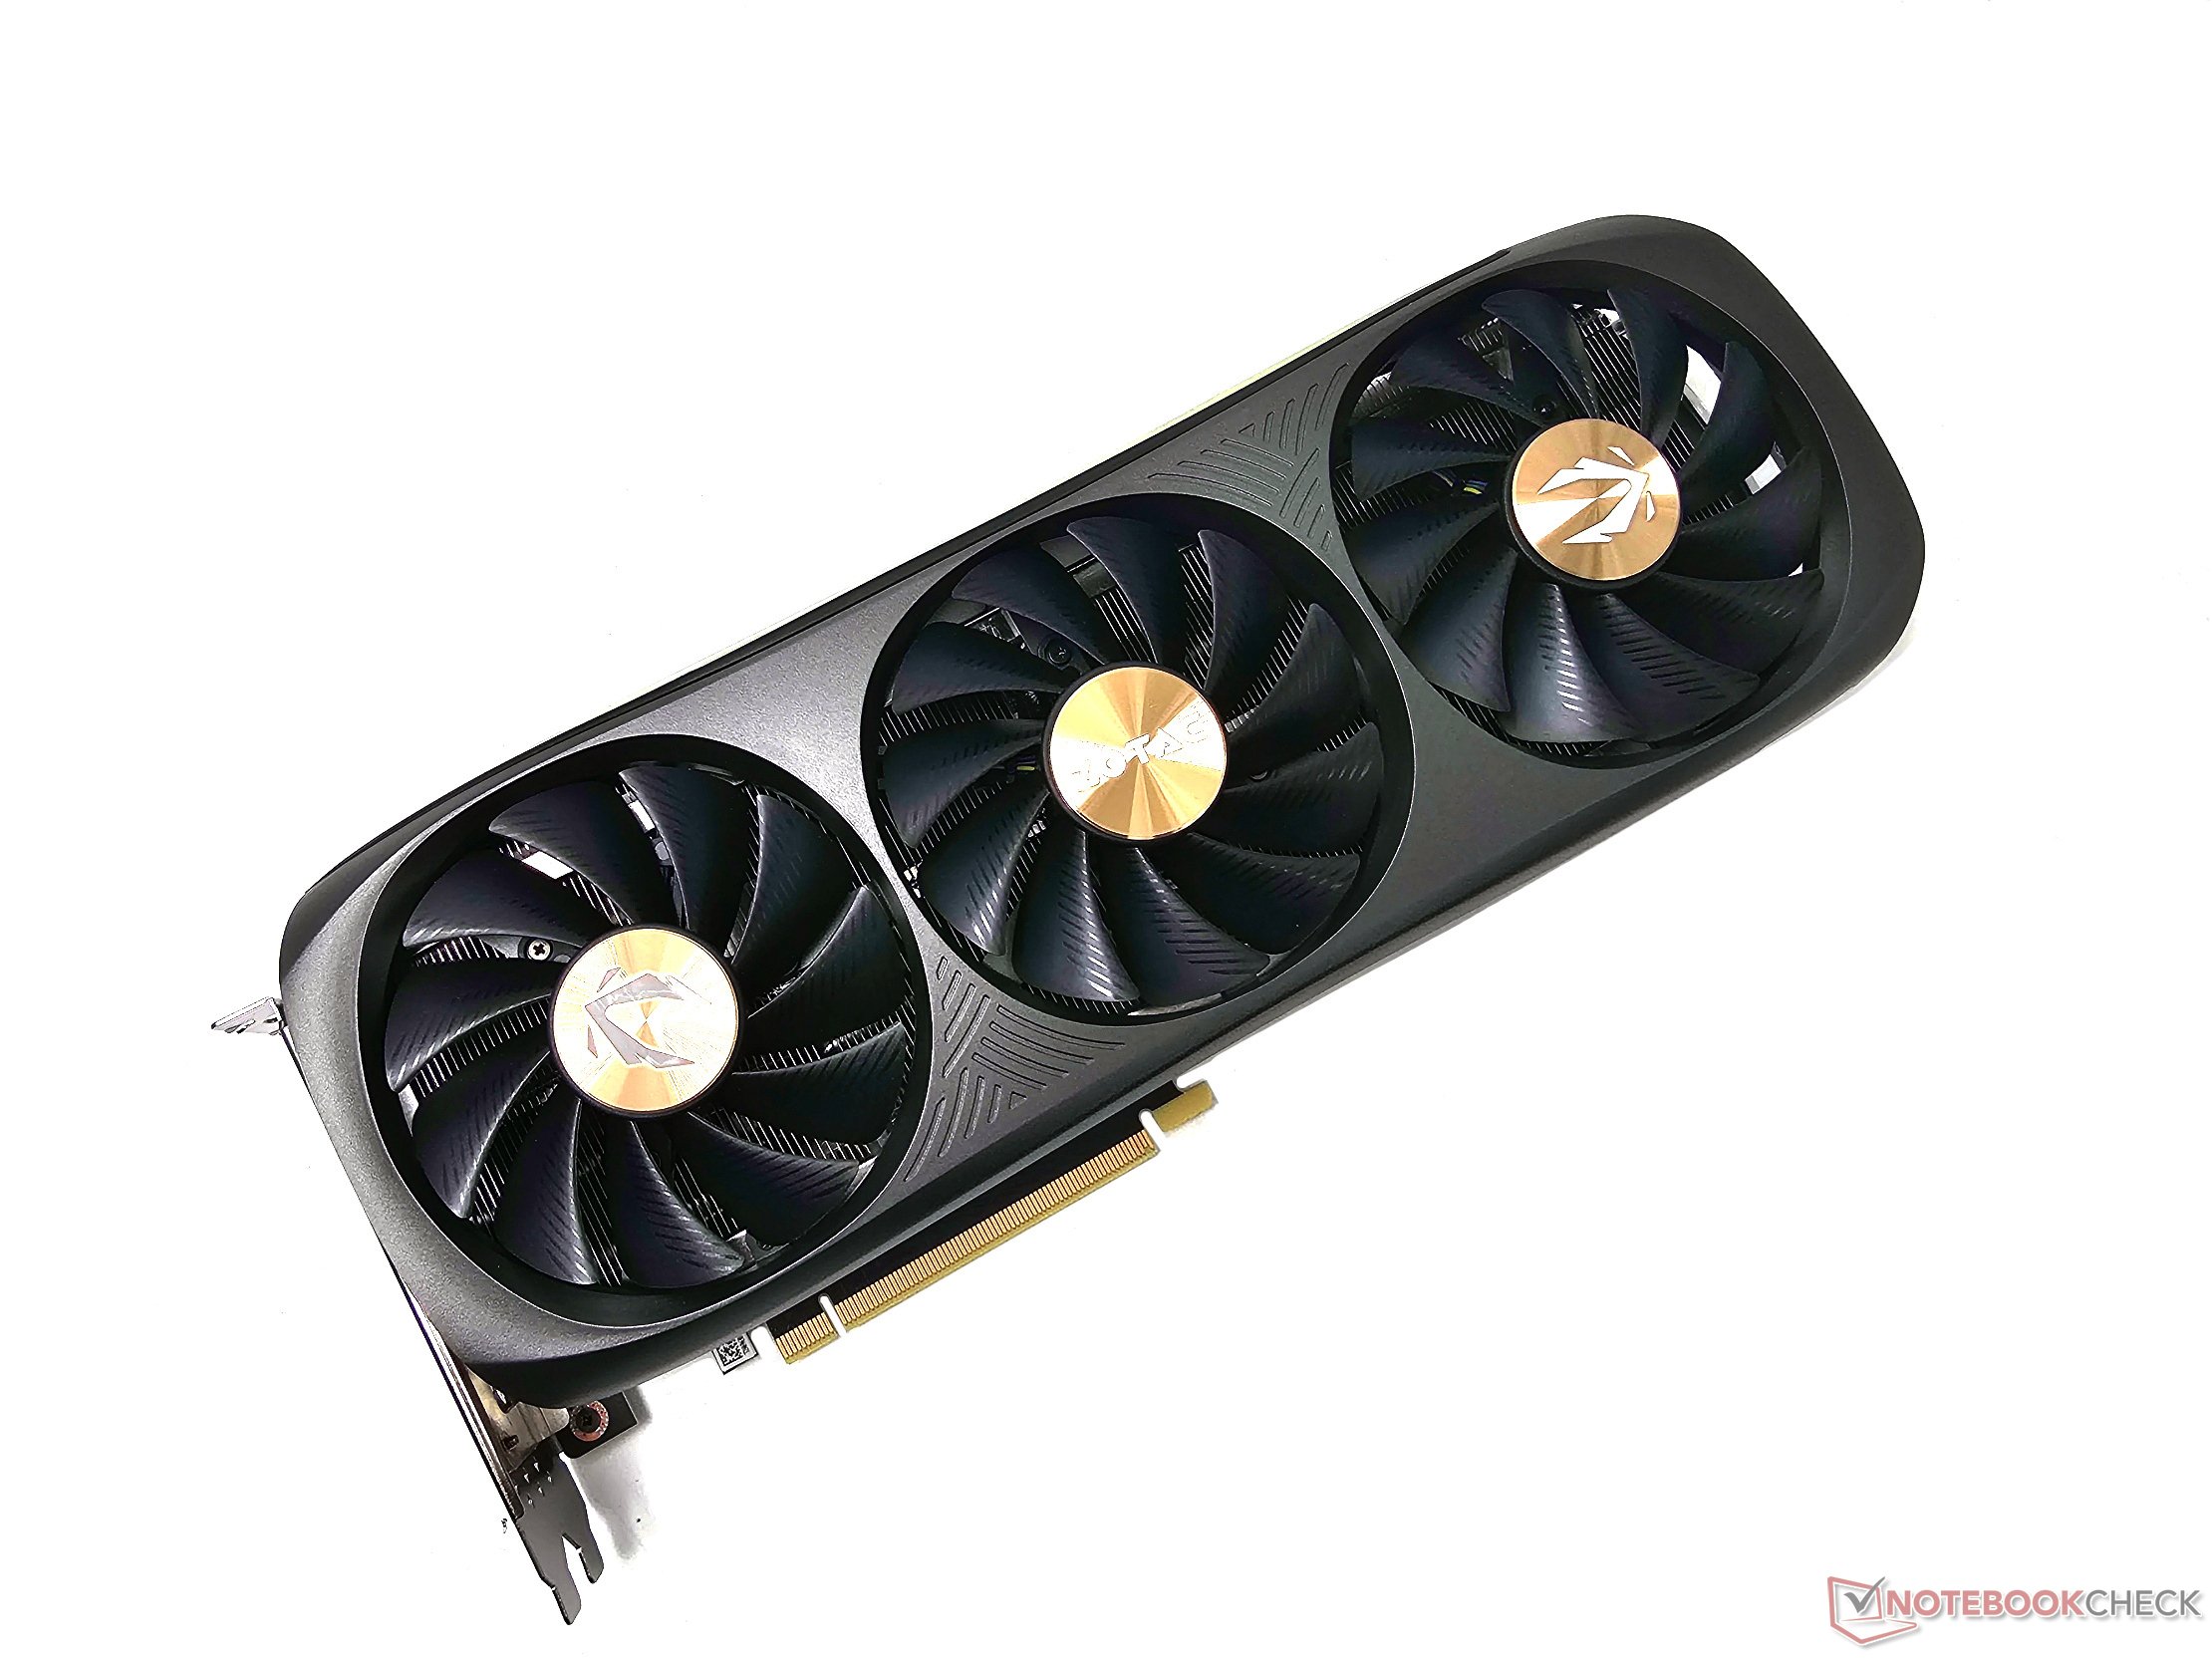
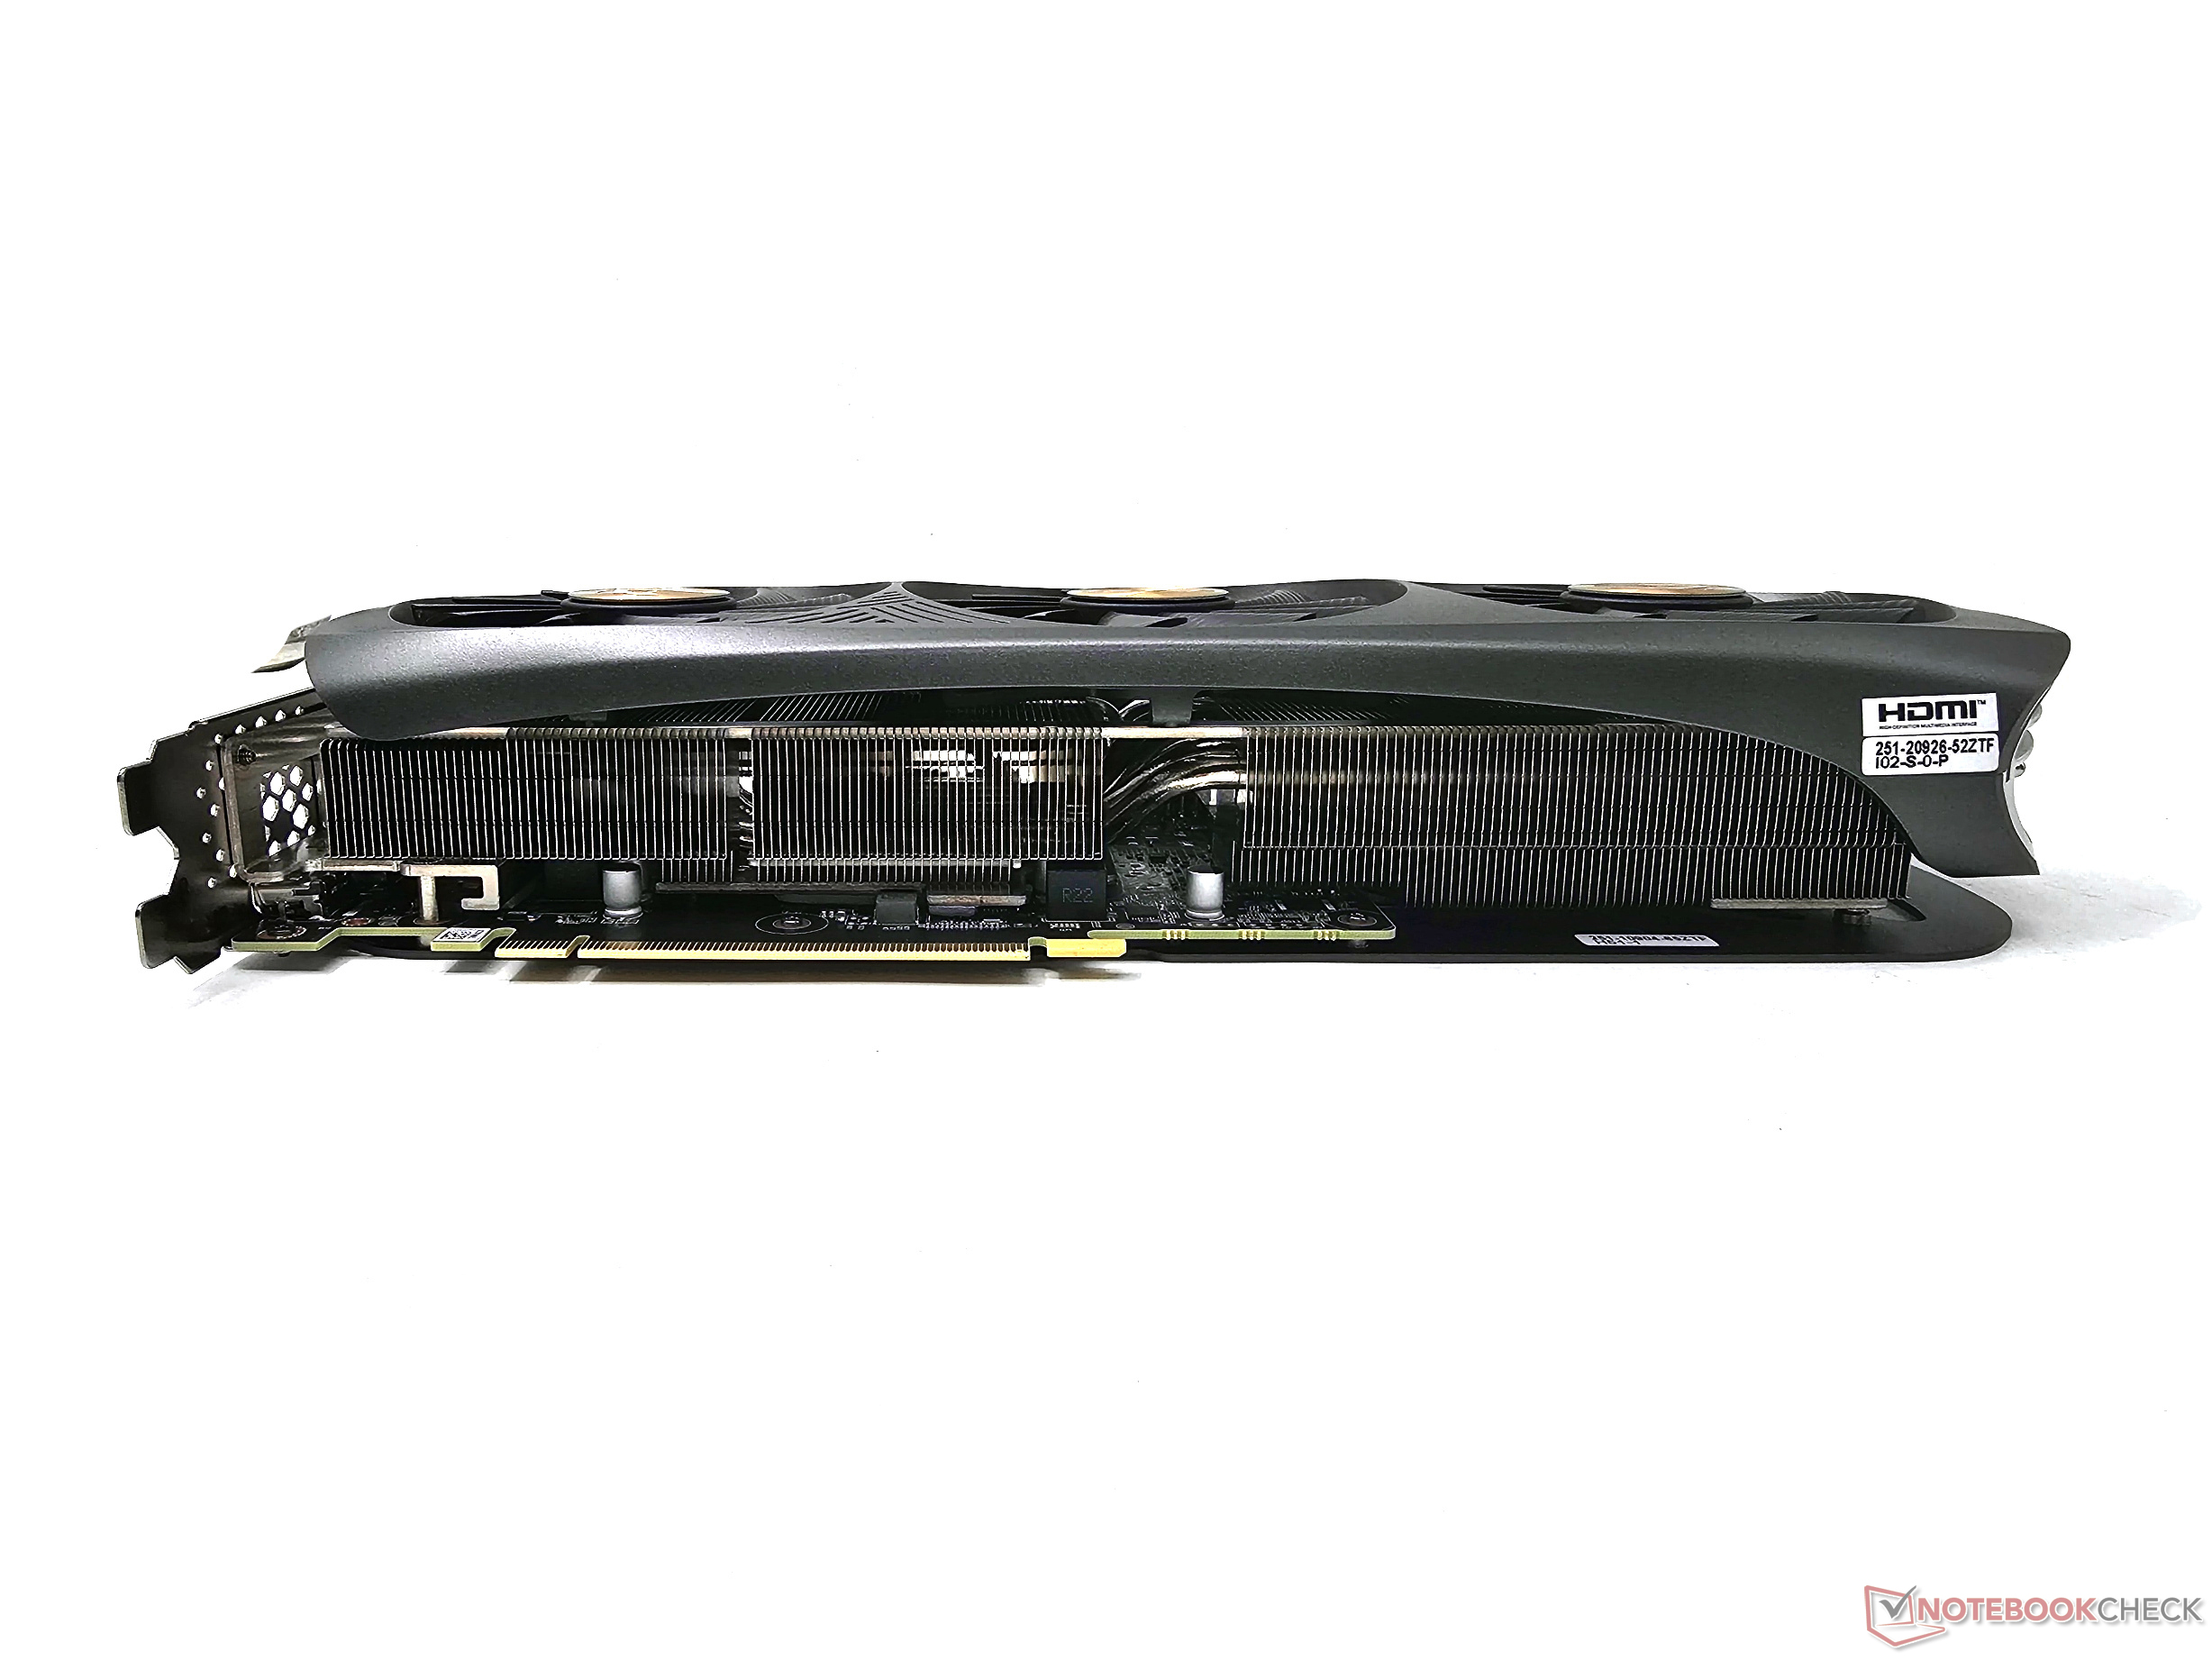
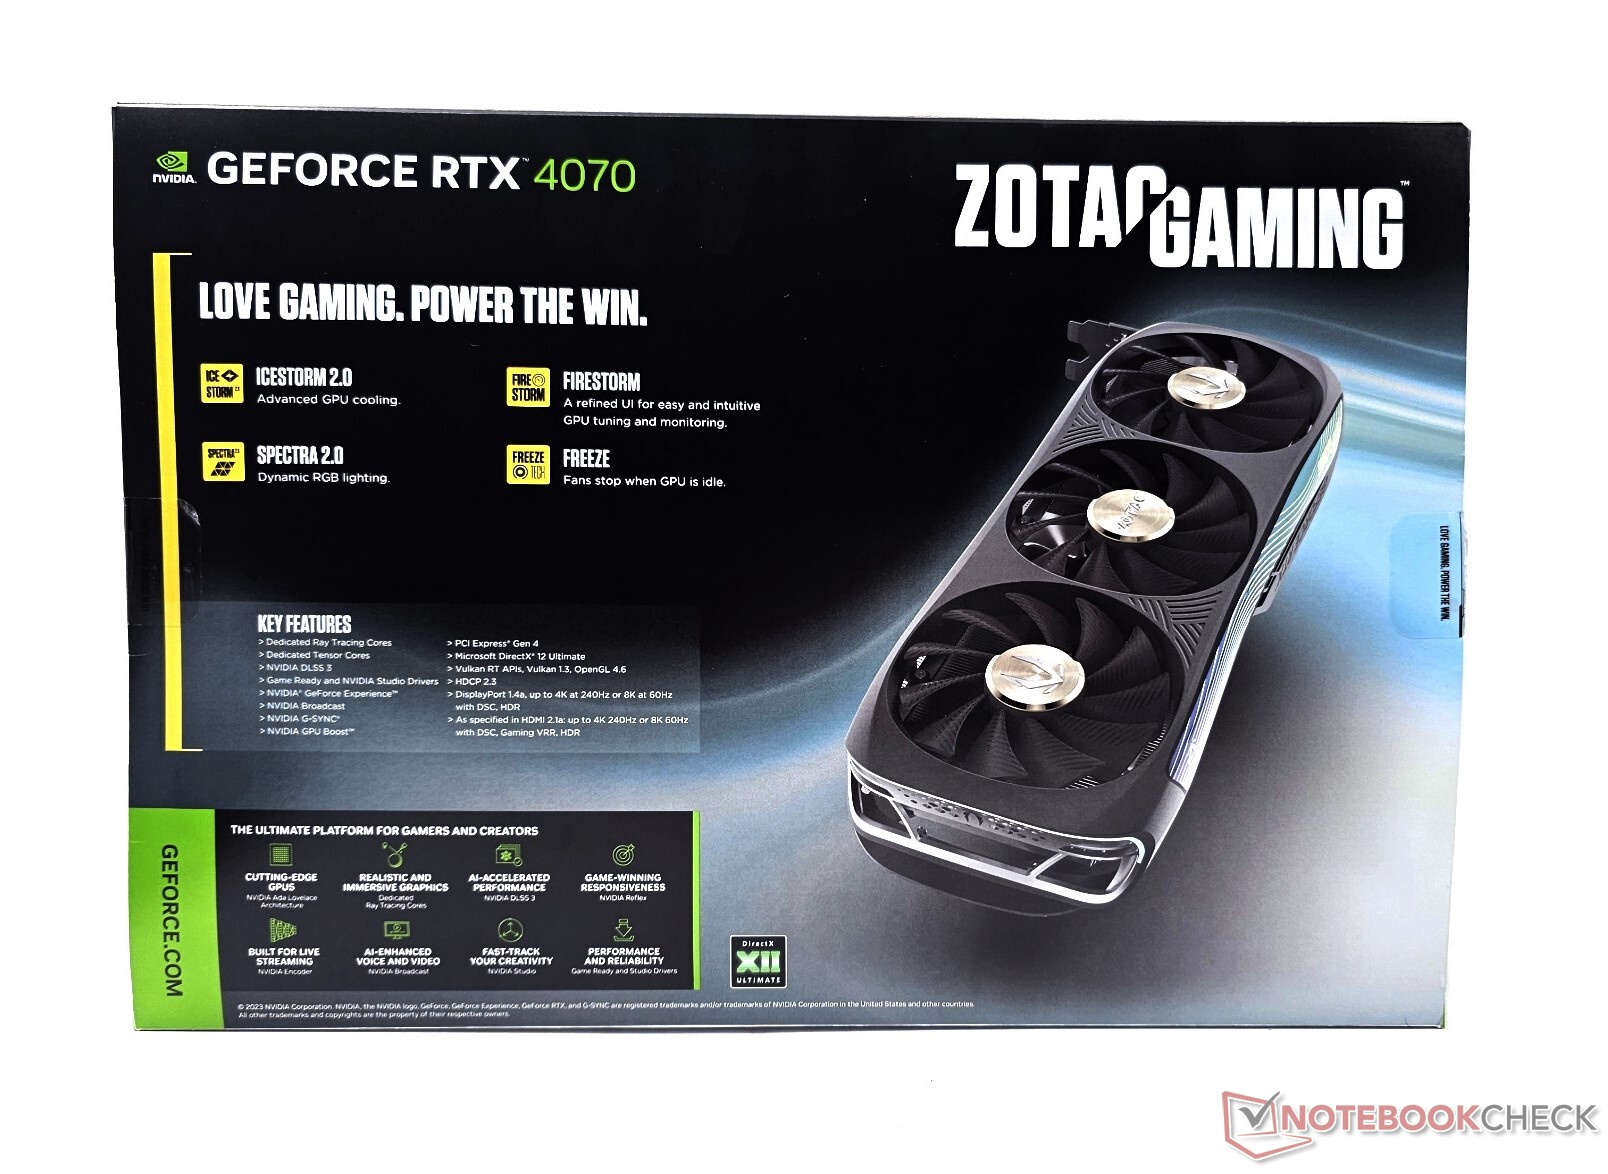
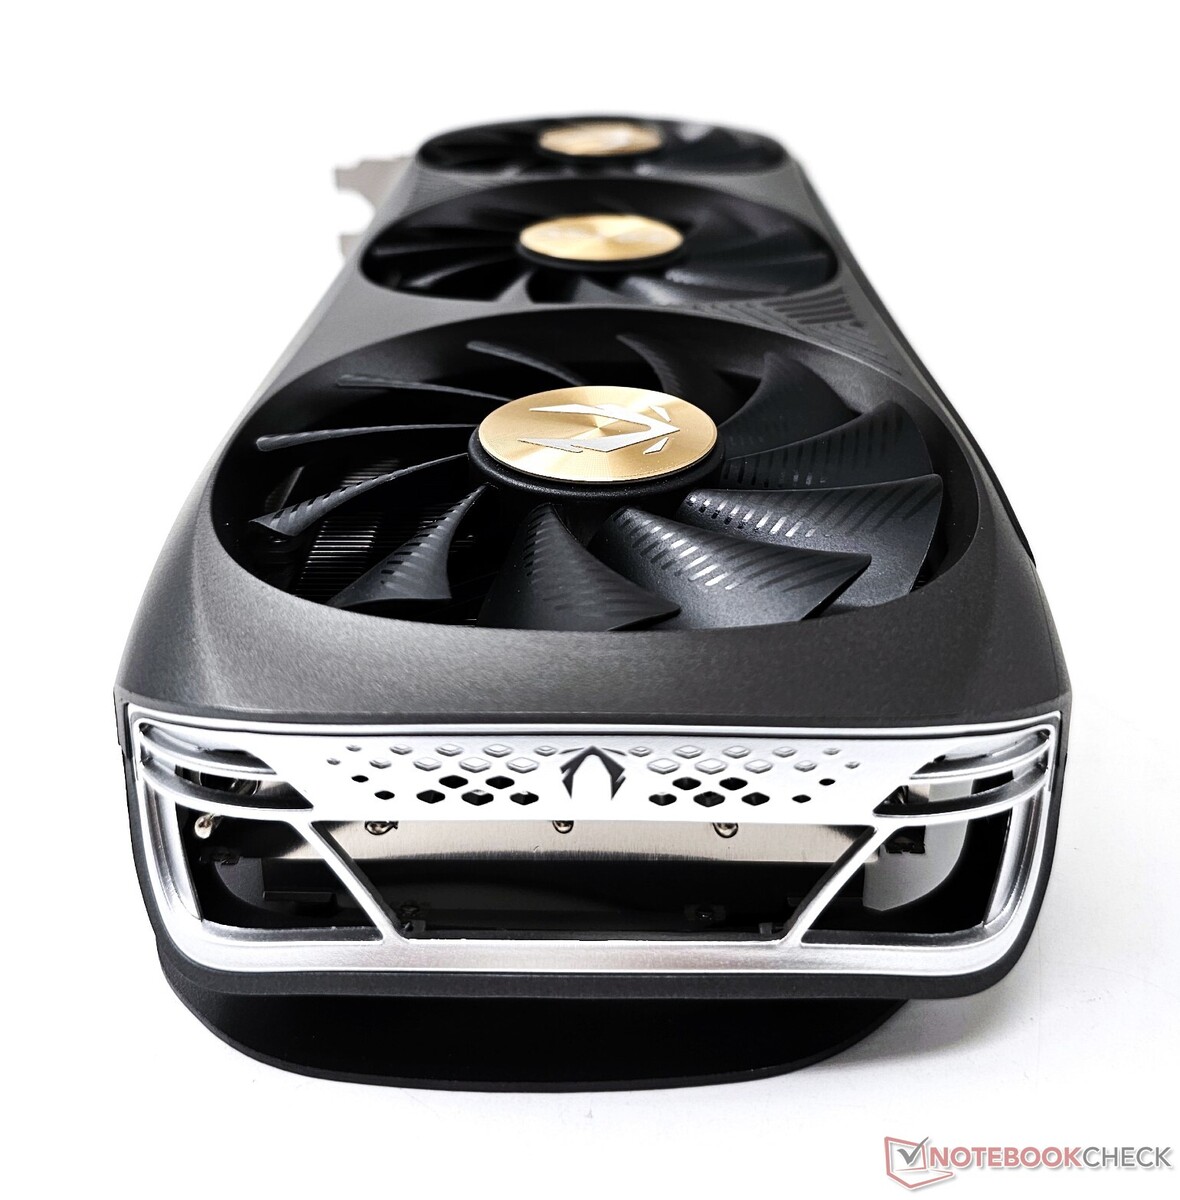
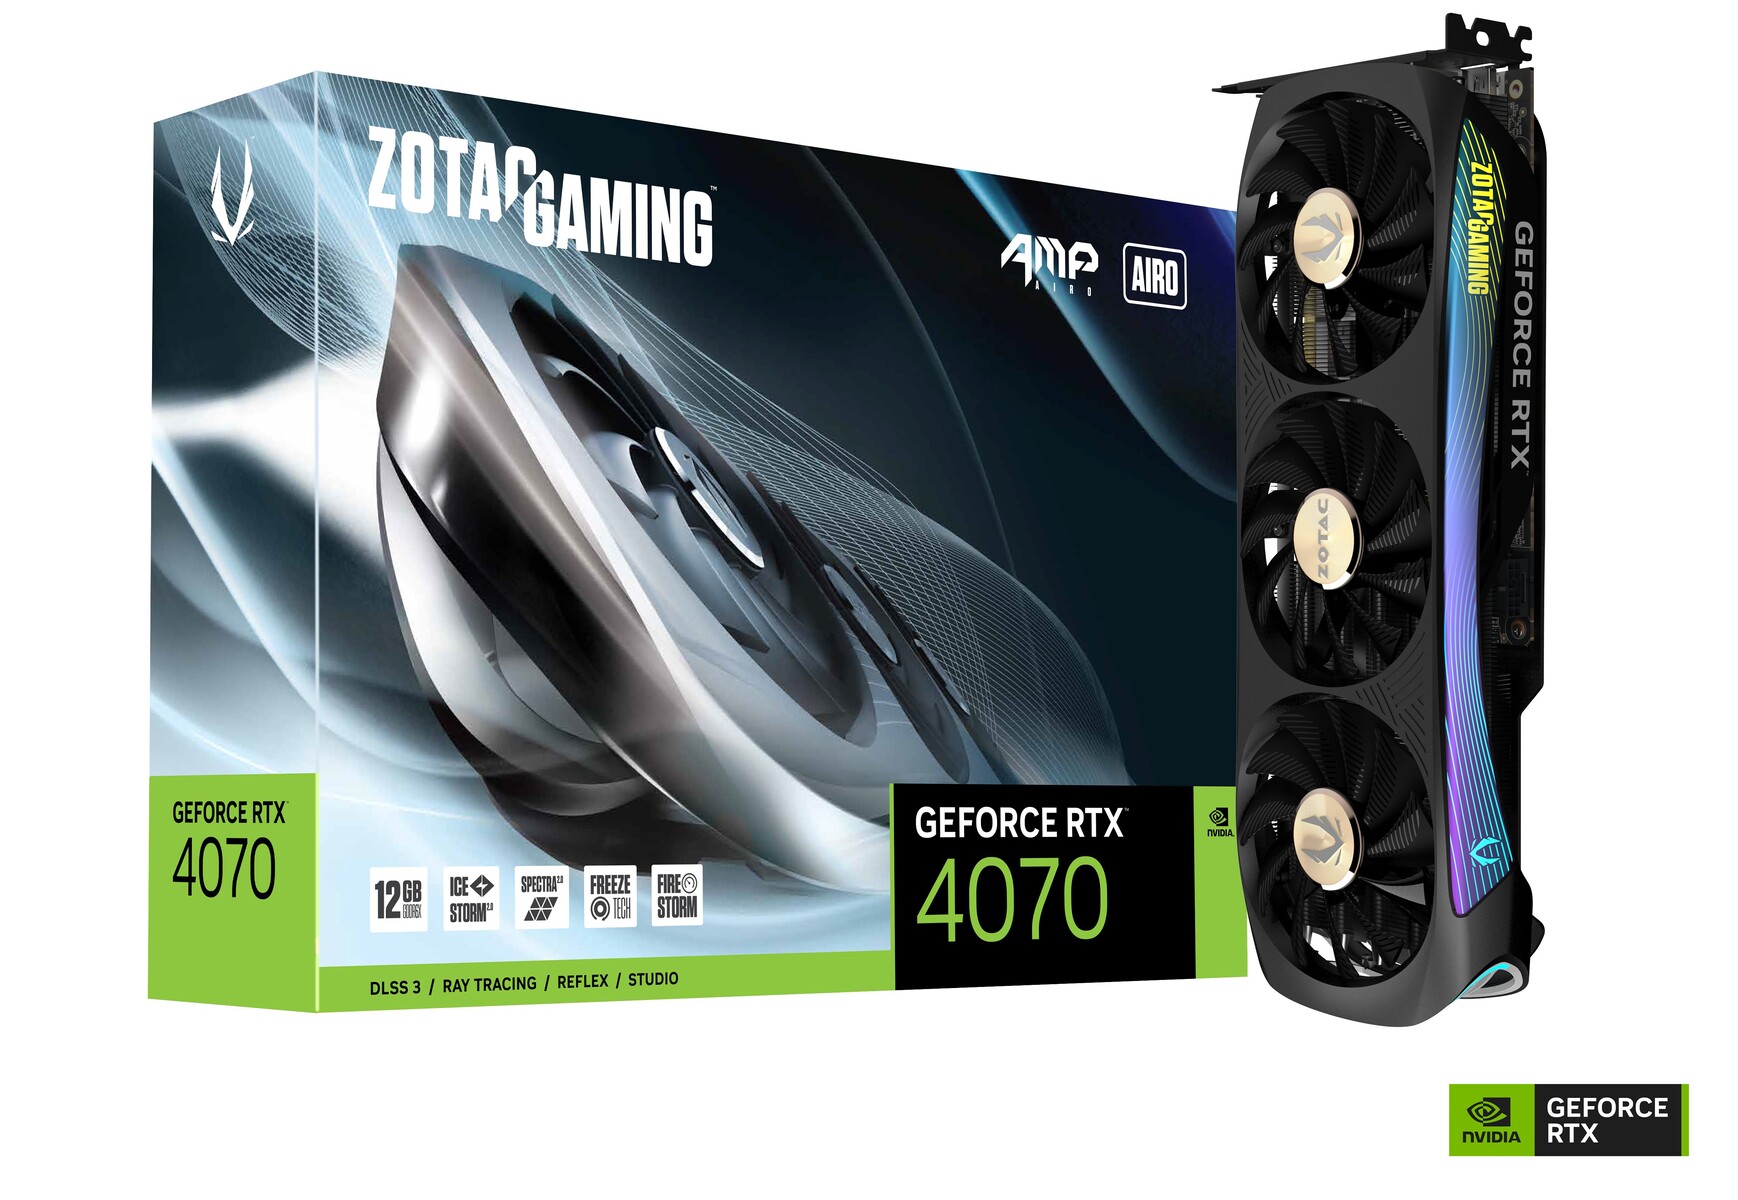
A closer look at the Zotac Gaming GeForce RTX 4070 AMP Airo
Zotac has taken a new design approach with the RTX 40 series cards, and the RTX 4070 AMP Airo inherits this as well.
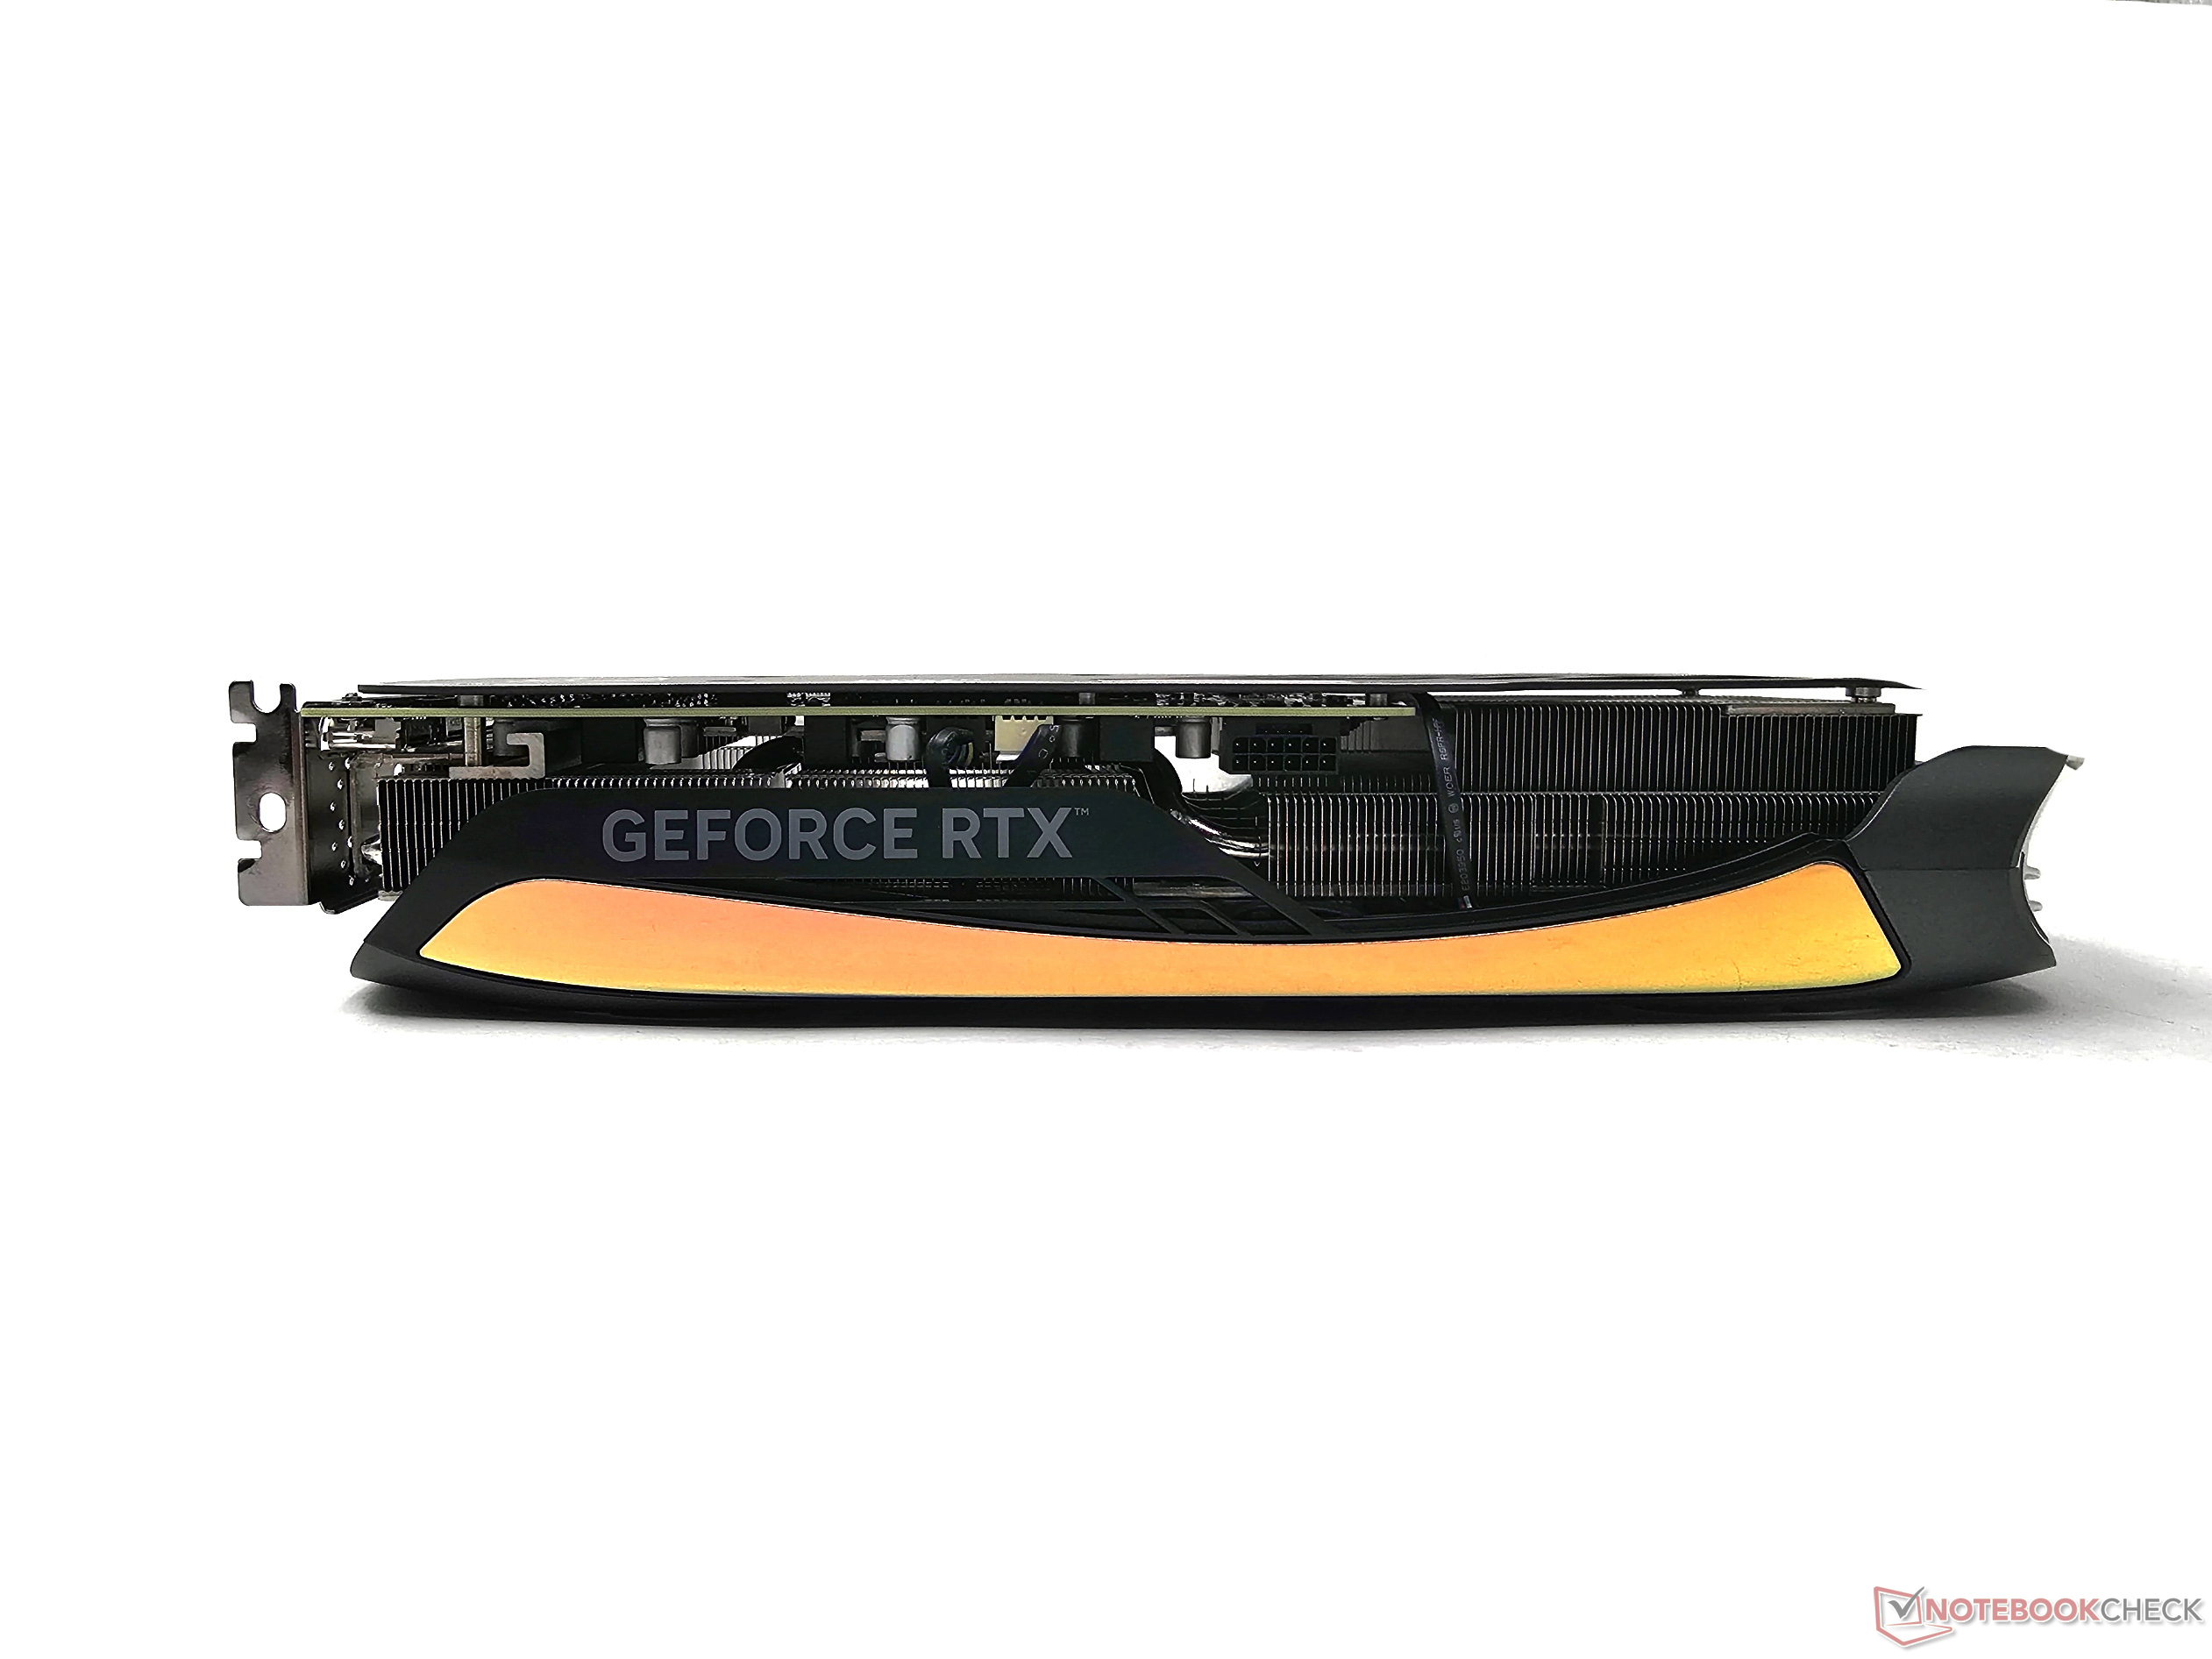
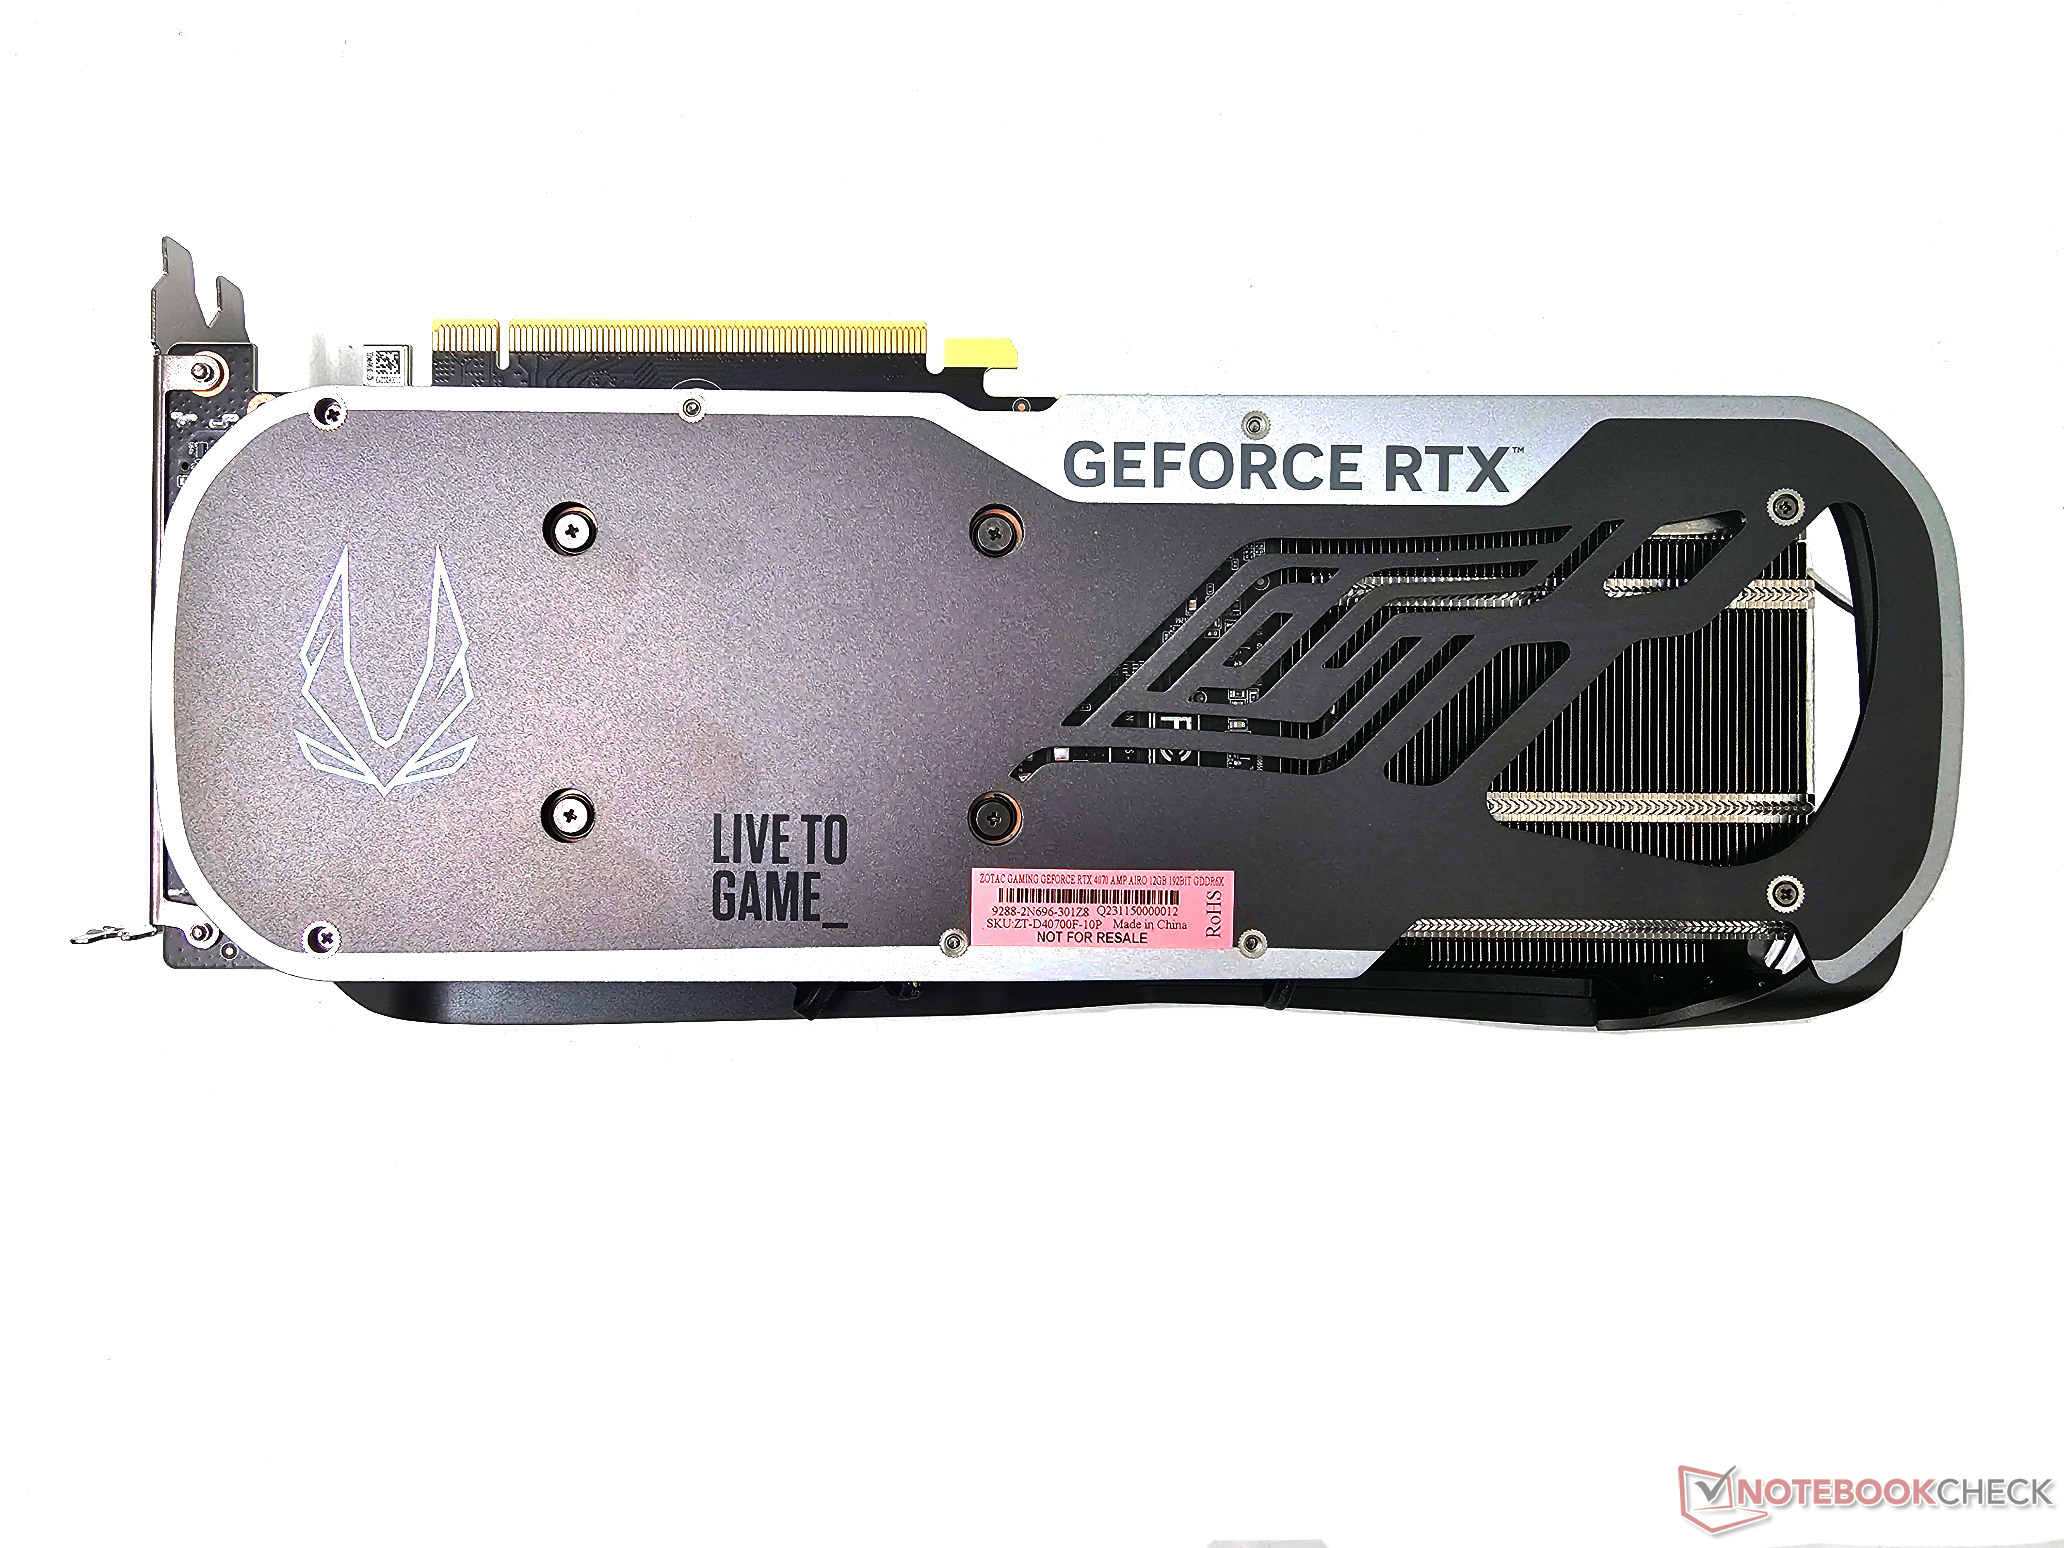
The RTX 4070 AMP Airo's two-slot design comes a relief from the bulky Ada cards we've been seeing so far. The front shroud is primarily plastic with a good amount of flex. The rear, however, sports a metal backplate with a prominent ventilation cutout.
The top of the front shroud sports a neat design that gets some RGB love. The GeForce RTX logo is not lit, however. RGB effects can be adjusted via Zotac's FireStorm utility. However, the version supporting this card was not available at the time of testing.
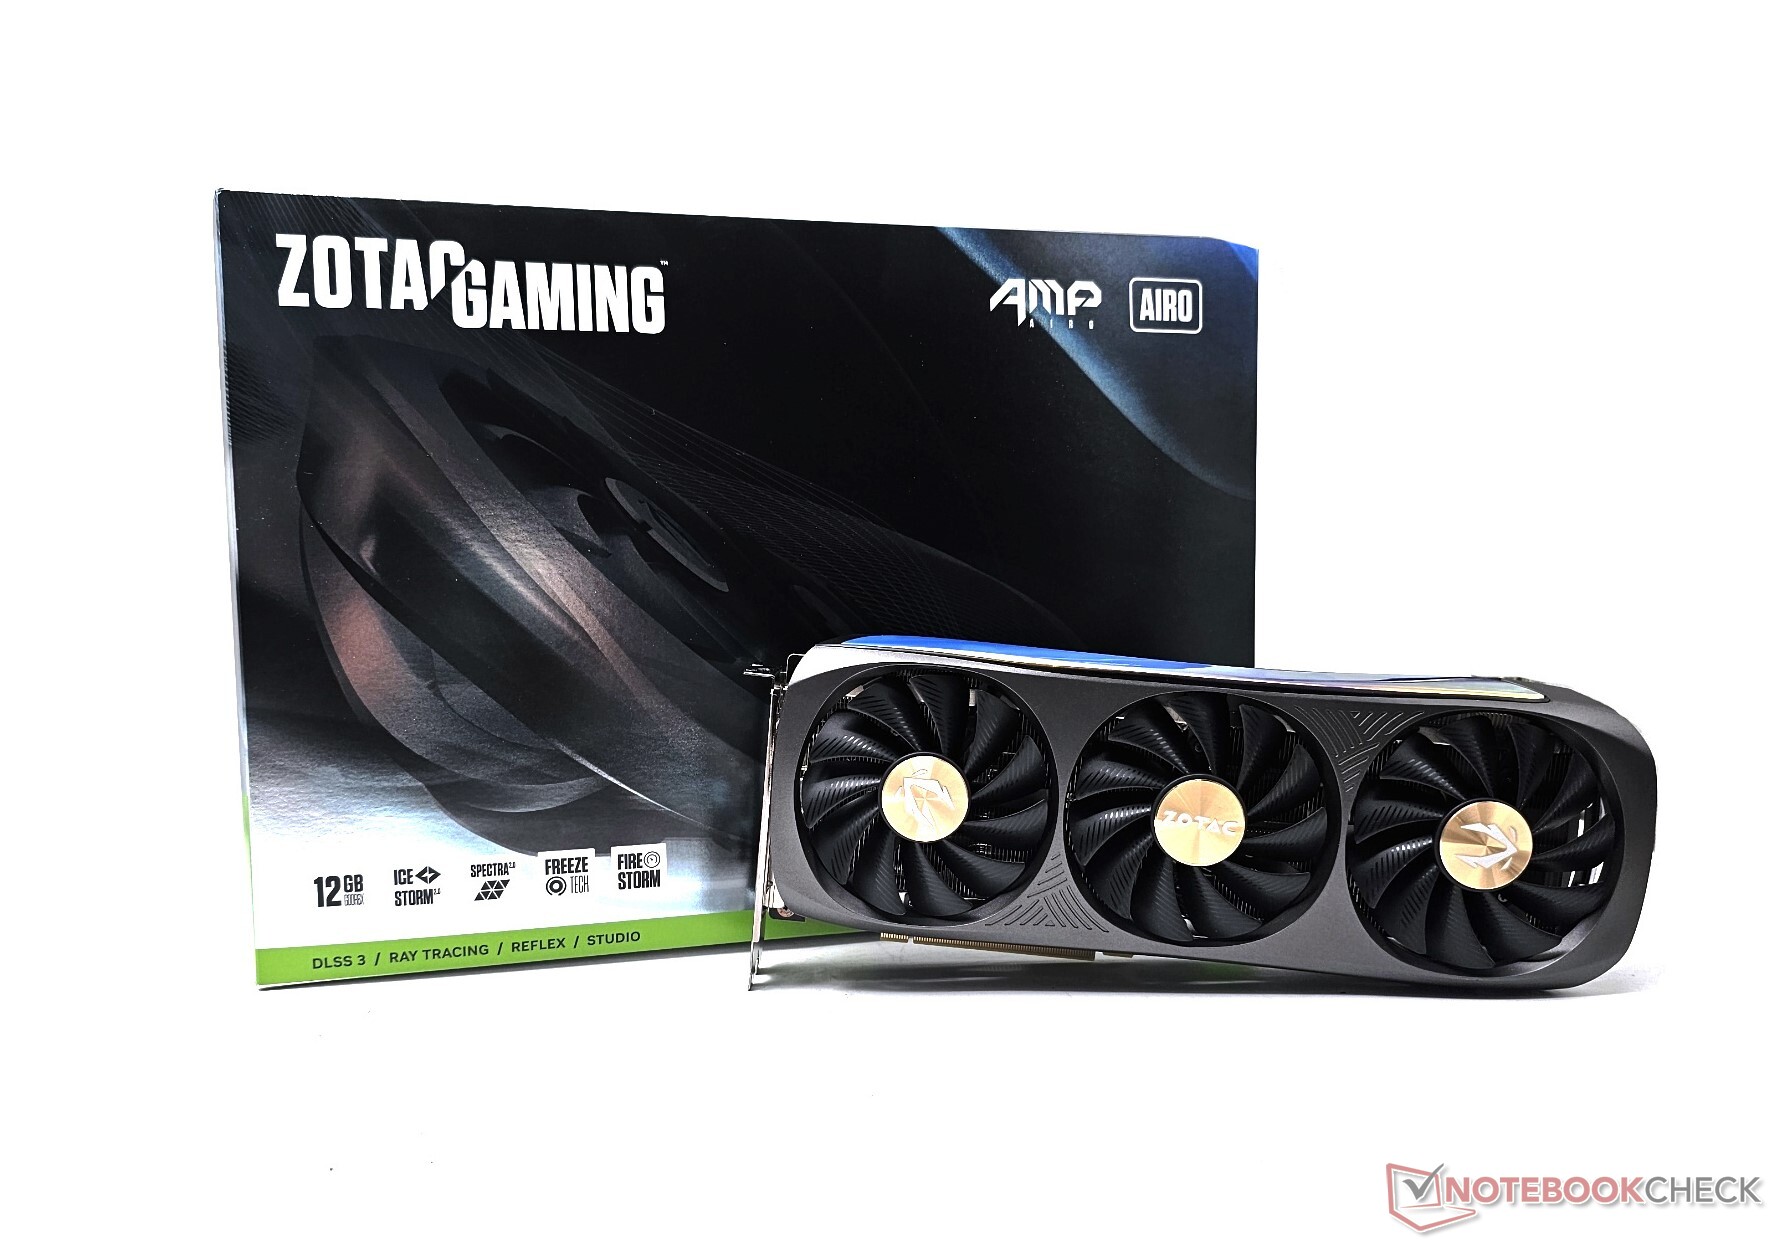
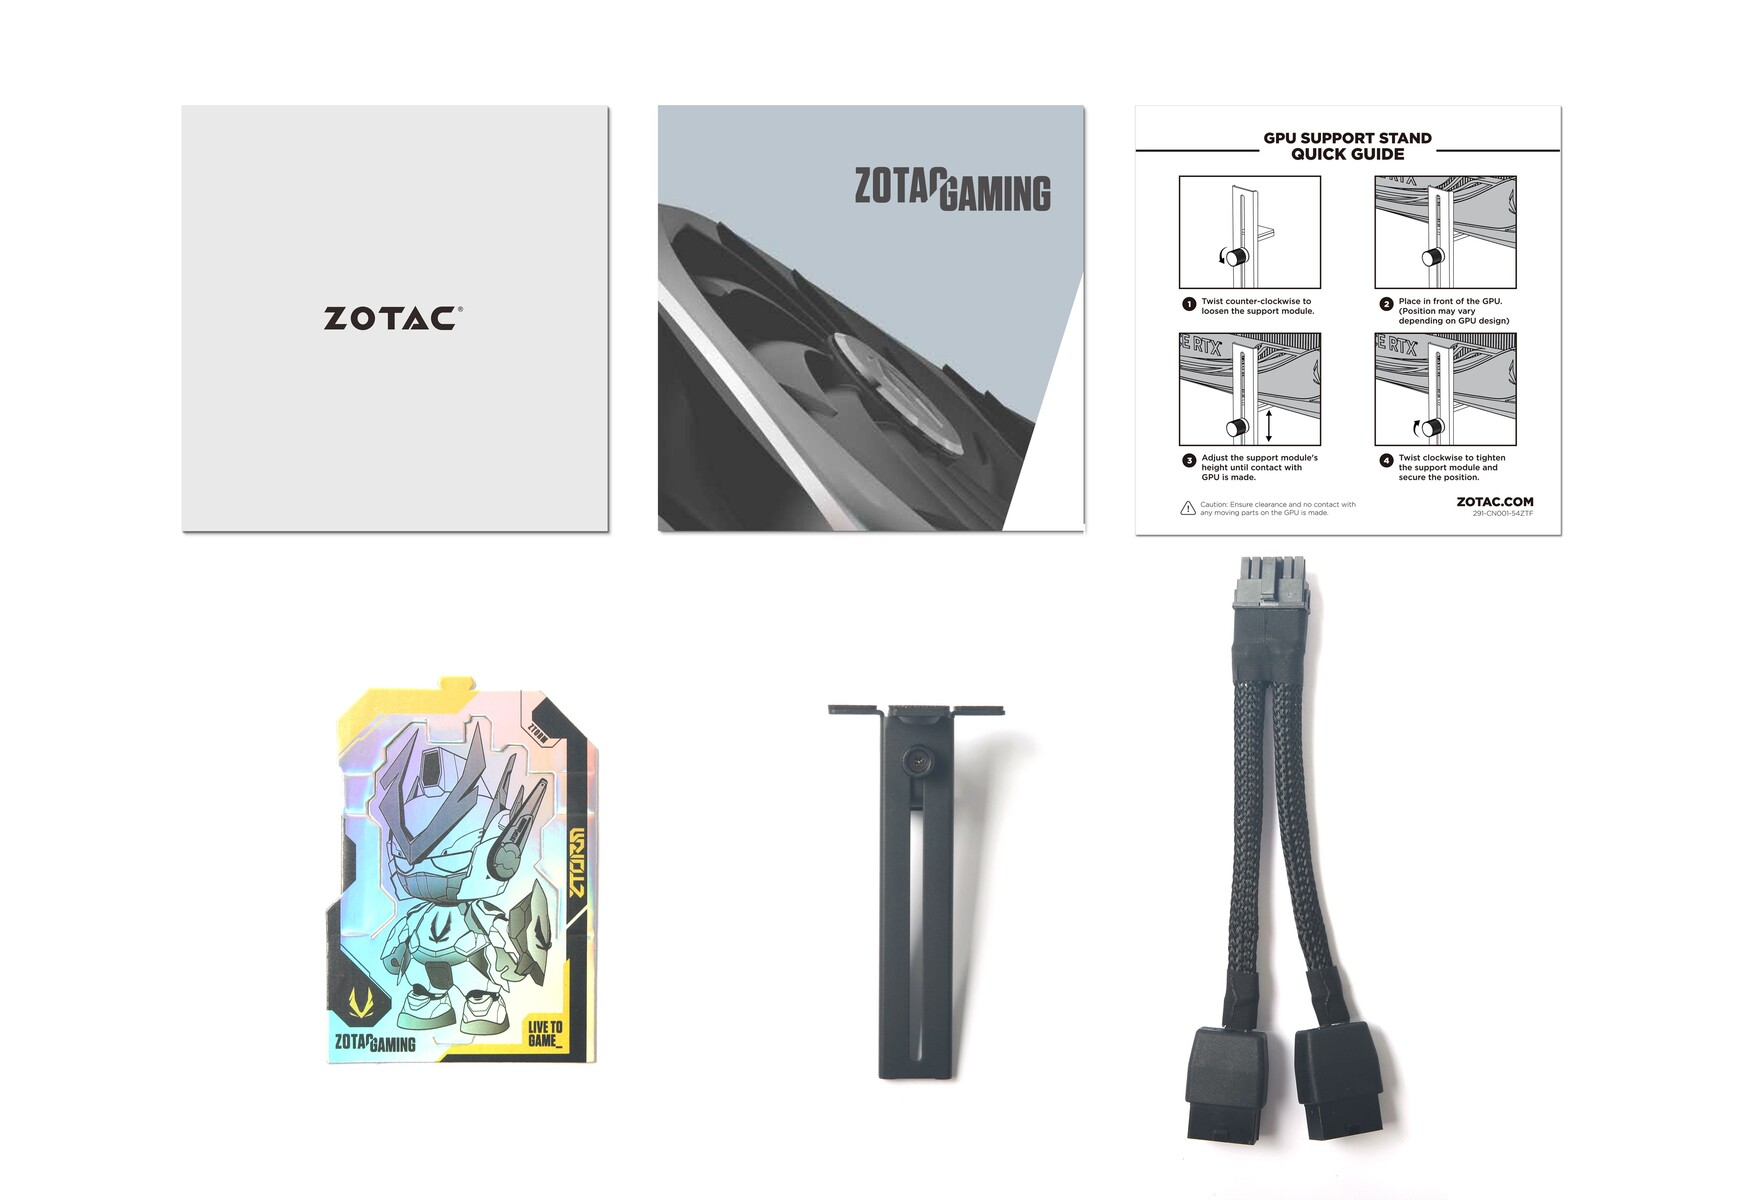
Inside the box, we get some paperwork, stickers, a 2x 8-pin to 12VHPWR adapter, and an anti-sag support.
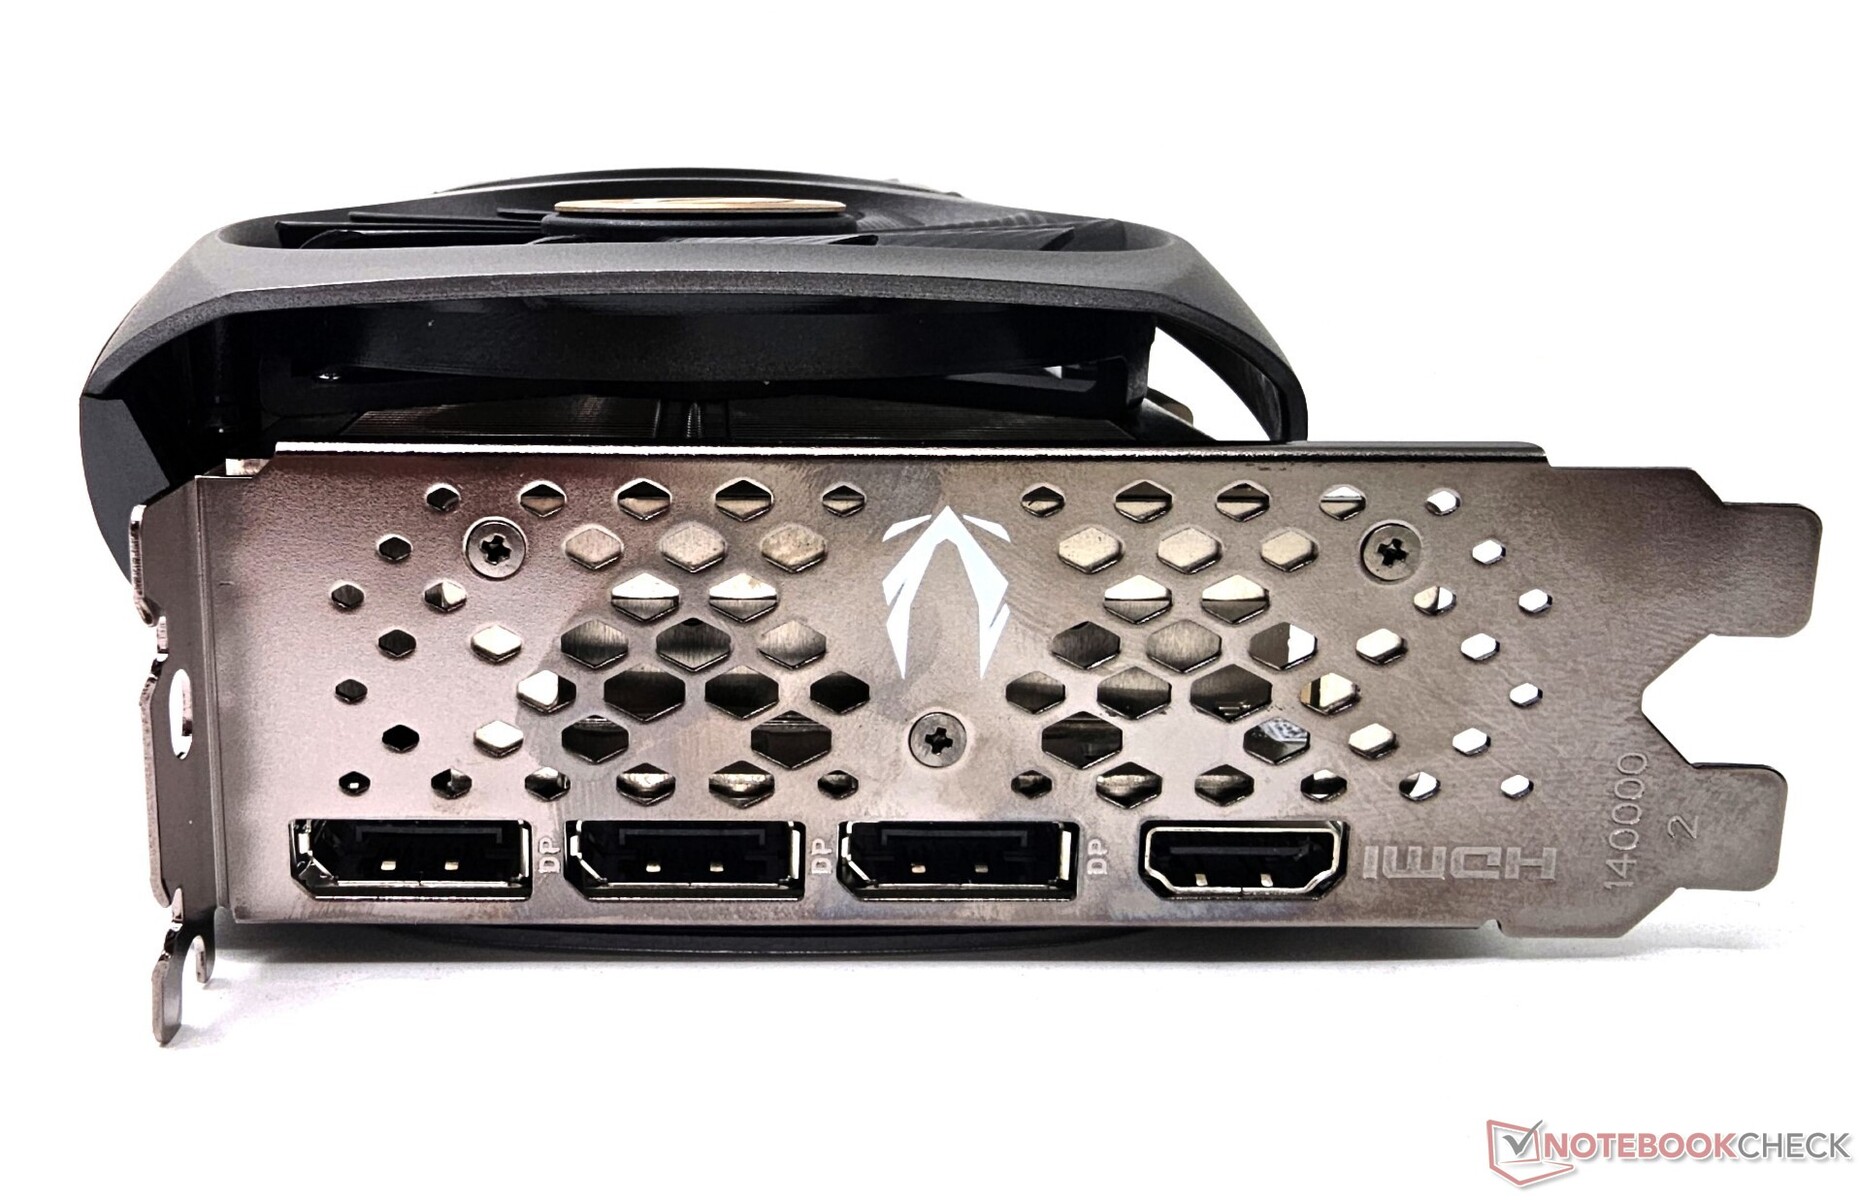
The RTX 4070 AMP Airo gets a predictable set of ports including three DisplayPort 1.4a-outs and a HDMI 2.1a port. There's no additional HDMI-out as we've seen with the Asus TUF Gaming GeForce RTX 4070 Ti OC.
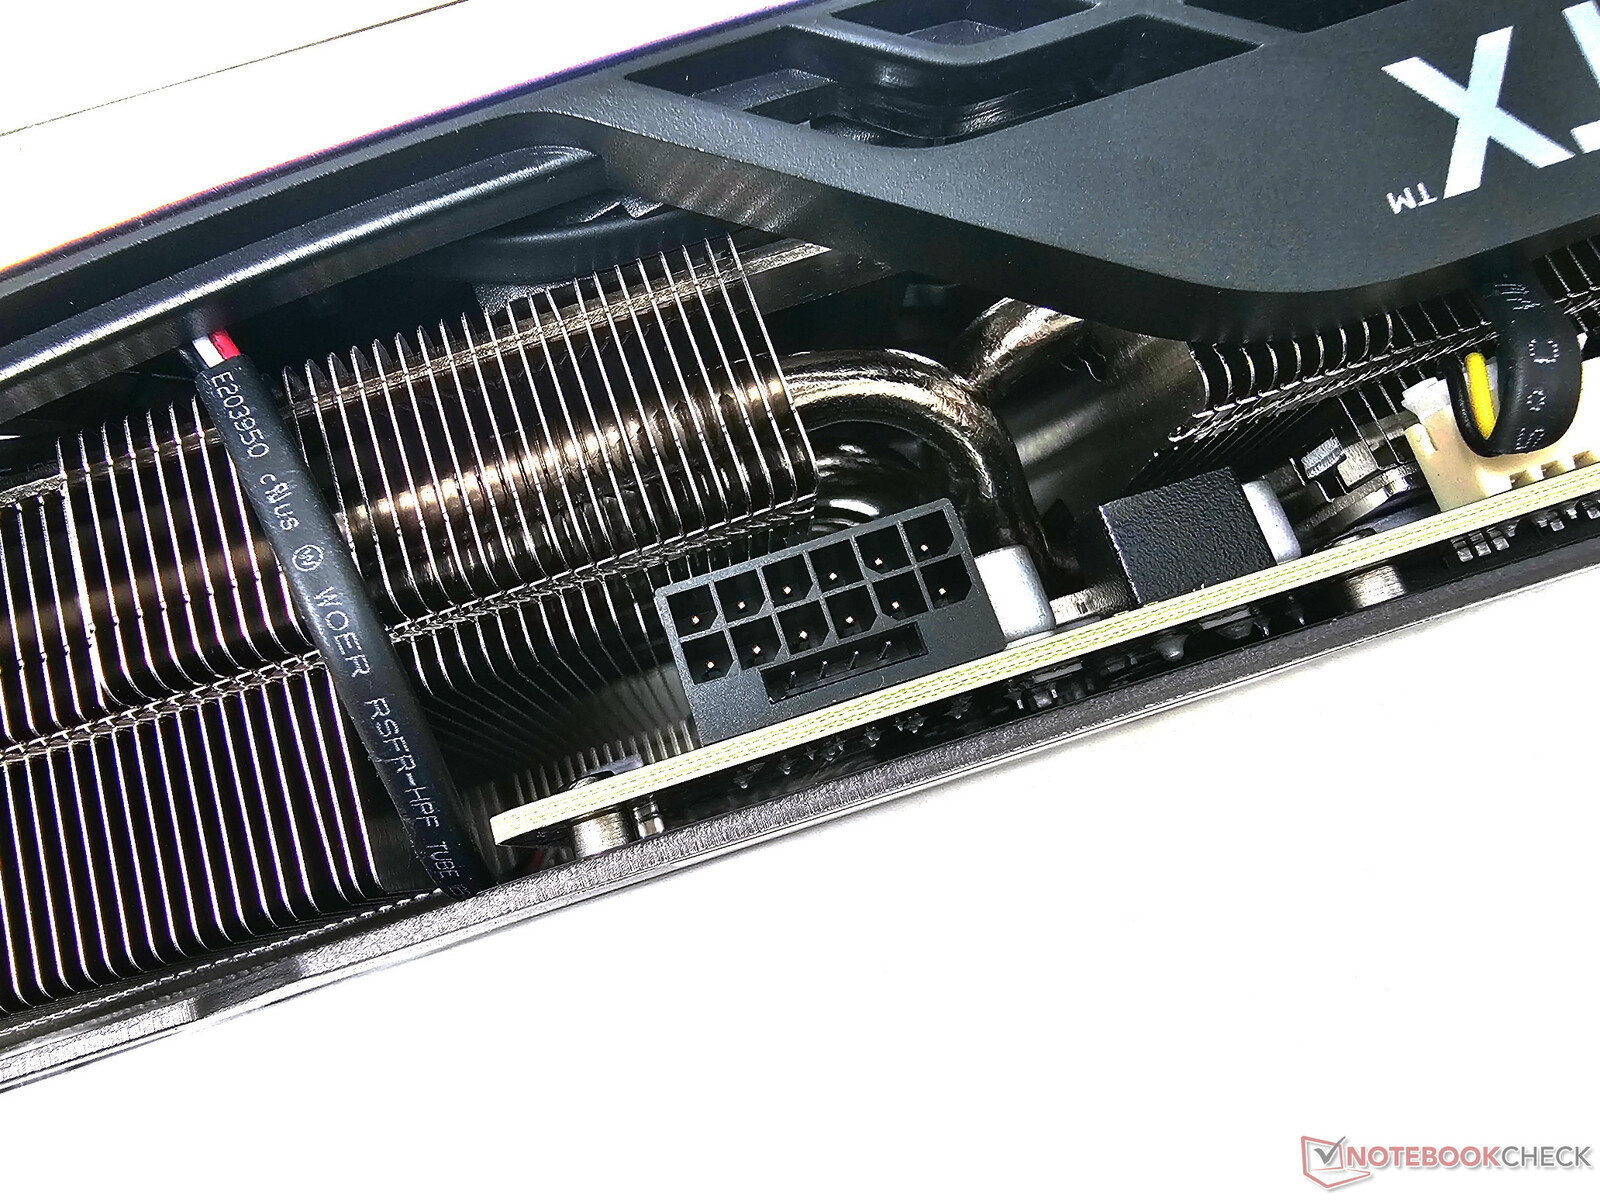
The 12VHPWR connector has become the staple of all Ada cards and the RTX 4070 AMP Airo is no different. Unlike some of the other AiB offerings, Zotac doesn't provide any diagnostic LEDs to indicate proper connector seating. There is no physical VBIOS switch either.
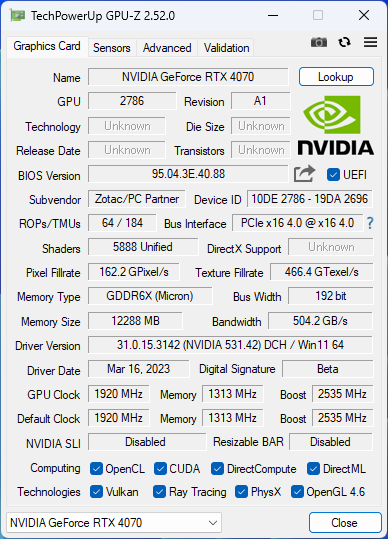
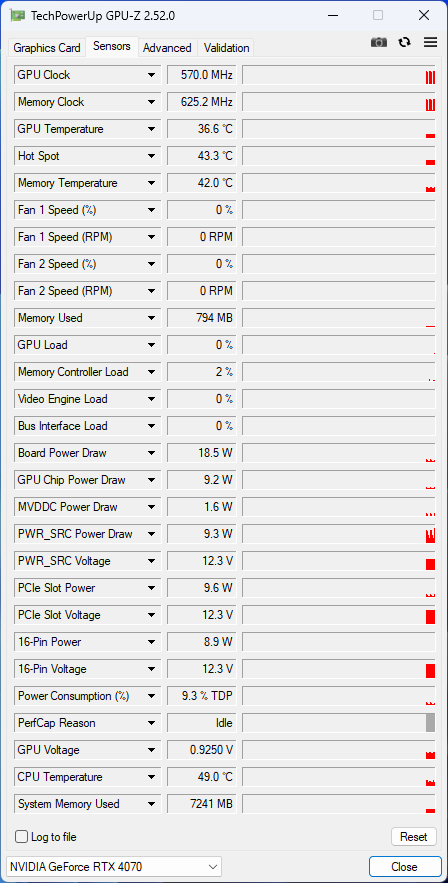
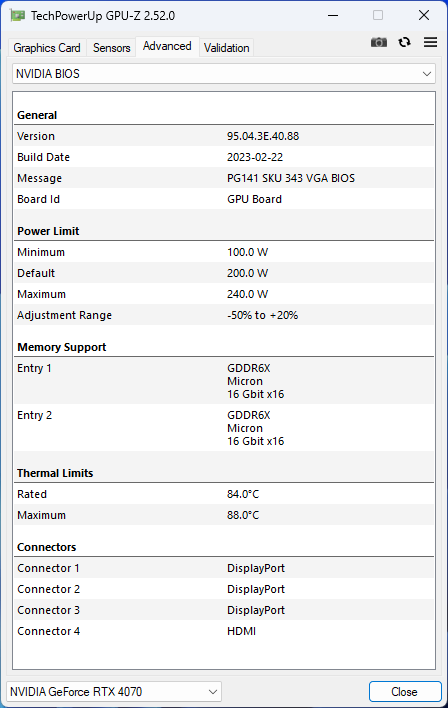
GPU-Z unfortunately isn't yet updated to properly recognize the RTX 4070. Nevertheless, the RTX 4070 AMP Airo comes factory overclocked to 2,535 MHz against the reference design's 2,475 MHz.
Thus, the RTX 4070 AMP Airo operates at a 215 W TGP as opposed to the Founders Edition's 200 W rating. It is possible to increase the power target by another 20% for an increased TGP of 258 W.
The test bench: RTX 4070 AMP Airo gets paired with the Intel Core i9-13900K
Our test bench continues to be the same as the one we've used for previous RTX 40 reviews including the RTX 4090 FE, RTX 4080 FE, and the RTX 4070 Ti. Specifications include:
- Cooler MasterFrame 700 test bench
- Intel Core i9-13900K
- Gigabyte Z790 Aorus Master motherboard
- Gigabyte Aorus Gen 4 2 TB NVMe SSD for benchmarks and games
- 2x 16 GB Kingston Fury Renegade DDR5-6400 RAM with timings 32-39-39-80 at 1.40 V
- Gigabyte M28U 4K 144 Hz monitor
- Cooler Master MasterLiquid ML360L V2 ARGB AIO cooler
- Thermaltake ToughPower Grand RGB 850
- A fresh installation of Windows 11 22H2 with latest patches together with provided test Game Ready driver version 531.42
Synthetic benchmarks: RTX 3080-level performance that is well behind the RTX 4070 Ti
The Zotac RTX 4070 AMP Airo sits just above the AMD Radeon RX 6800 XT in overall synthetic benchmark performance and leads the RTX 3080 average by about 6%. The RTX 4070 AMP Airo lags behind the RTX 4070 Ti average by a significant 19%.
Although the RTX 4070 Ti is right on the heels of the Radeon RX 7900 XT in cumulative synthetic tests, AMD's second rung flagship manages a comfortable 34% lead compared to the RTX 4070 AMP Airo.
Zotac's best RTX 4070 offering manages to have a decent lead over the RTX 3080 average in 3DMark Fire Strike Graphics, but there's no significant advantage with the Ultra and Extreme variants of the test.
In Time Spy Graphics, the RTX 4070 AMP Airo only manages to inch past the RX 6800 XT by a whisker. Performance vis-à-vis the RTX 4070 Ti seems deficient by 22%.
Unigine Superposition tests see the RTX 4070 AMP Airo trying to close the gap with the RTX 4070 Ti average at 720p, but the card takes a beating at higher resolutions.
| 3DMark 11 Performance | 47838 points | |
| 3DMark Ice Storm Standard Score | 272162 points | |
| 3DMark Cloud Gate Standard Score | 80436 points | |
| 3DMark Fire Strike Score | 36970 points | |
| 3DMark Fire Strike Extreme Score | 20698 points | |
| 3DMark Time Spy Score | 18120 points | |
Help | ||
Compute performance: Good gains over Ampere flagships in select tests
Compute benchmarks show a similar trend as before with the RTX 4070 AMP Airo lagging behind the RTX 4070 Ti average by up to 20% in V-Ray 5. However, V-Ray 4.1 GPU sees Zotac's latest offering coming very close to the Aorus RTX 4070 Ti Master resulting in a massive 51% gain over the RTX 3080 average.
The RTX 4070 AMP Airo trails the RTX 3080 Ti average by 1.5 seconds in Blender 3.3 Classroom CUDA. However, the card manages to regain leads by half a second in Classroom Optix.
LuxMark sees the RTX 4070 AMP Airo convincingly leaving behind even the Radeon RX 7900 XTX in Room GPU while being about 29% slower than the RTX 4080 Founders Edition. AMD RDNA 2 cards, however, continue to dominate the charts in Sala GPU.
| V-Ray Benchmark Next 4.10 - GPU | |
| NVIDIA GeForce RTX 4090 Founders Edition (v4.10.07 ) | |
| NVIDIA GeForce RTX 4080 Founders Edition (v4.10.07 ) | |
| Average NVIDIA GeForce RTX 4070 Ti (1056 - 1076, n=3) | |
| Gigabyte Aorus GeForce RTX 4070 Ti Master (v4.10.07 ) | |
| Zotac Gaming GeForce RTX 4070 AMP Airo (v4.10.07 ) | |
| Zotac Gaming GeForce RTX 3090 Ti AMP Extreme Holo (v4.10.07 ) | |
| Intel Core i9-13900K (v4.10.07 ) | |
| Average NVIDIA GeForce RTX 3090 (781 - 877, n=16) | |
| Average NVIDIA GeForce RTX 3080 Ti (854 - 855, n=3) | |
| Average of class Desktop (4 - 1880, n=28, last 2 years) | |
| Average NVIDIA GeForce RTX 3080 (636 - 643, n=2) | |
| Average NVIDIA GeForce RTX 3070 (464 - 508, n=4) | |
| Average NVIDIA Titan RTX (386 - 439, n=16) | |
| AMD Radeon RX 6800 XT (v4.10.07 ) | |
| Sapphire AMD Radeon RX 6950 XT Nitro+ Pure (v4.10.07 ) | |
* ... smaller is better
Gaming performance: Slower memory impedes 4K gaming relative to the RTX 3080
The RTX 4070 AMP Airo is about 8% faster in cumulative game benchmarks compared to the RTX 3080 average while trailing by 20% against the RTX 4070 Ti average. Again, this largely tallies with the corresponding decrease in CUDA core counts compared to the full AD102 GPU in the RTX 4070 Ti.
Taken individually, the RTX 3080 average does have perceivable leads over the RTX 4070 in games such as The Witcher 3, Control, Borderlands 3, and Mafia Definitive Edition in 4K Ultra settings.
This can be attributed to the fact that the RTX 3080 features a 320-bit 760 GB/s GDDR6X VRAM, which helps with heavy textures against the 192-bit 504 GB/s memory of the RTX 4070.
That being said, the RTX 4070 has a clear advantage over the RTX 3080 and the RX 6900 XT at lower resolutions particularly at QHD and 1080p Ultra.
Ray tracing performance
Just like the RTX 4070 Ti, the RTX 4070 is not capable of native 4K Ultra ray tracing without some upscaling help.
4K Ultra ray tracing in Cyberpunk 2077 1.5 sees the RTX 4070 AMP Airo outputting barely playable frame rates while native 1080p Ultra ray tracing yields more favorable 60 fps.
The card performs well in Far Cry 6 ray tracing at 1080p Ultra and is, interestingly, mostly on par with the RTX 4070 Ti, which itself isn't too far from an RTX 4090 Founders Edition. The RDNA 3 cards seem to have an advantage in this game.
The RX 7900 XT can amass up to a 16% lead in ray tracing compared to the RTX 4070.
Gamers who wish to play at higher resolutions with all the ray tracing bells and whistles enabled should invariably enable DLSS 2 or DLSS 3 for smooth frame rates.
| The Callisto Protocol - 1920x1080 Ultra Preset (without FSR Upscaling) + Full Ray-Tracing | |
| AMD Radeon RX 7900 XTX | |
| AMD Radeon RX 7900 XT | |
| Average NVIDIA GeForce RTX 4070 Ti (82.1 - 97.5, n=4) | |
| Gigabyte Aorus GeForce RTX 4070 Ti Master | |
| Average of class Desktop (50.2 - 97.6, n=7, last 2 years) | |
| Zotac Gaming GeForce RTX 4070 AMP Airo | |
| Average NVIDIA GeForce RTX 3080 Ti () | |
| Average NVIDIA GeForce RTX 3080 () | |
| Average NVIDIA GeForce RTX 3070 () | |
| Average NVIDIA Titan RTX () | |
| low | med. | high | ultra | QHD | 4K | |
| GTA V (2015) | 188.3 | 188.1 | 187.3 | 161.7 | 138.4 | 145.7 |
| The Witcher 3 (2015) | 350 | 168.6 | 116.9 | |||
| Dota 2 Reborn (2015) | 281.8 | 255.9 | 244.3 | 229.9 | 210.7 | |
| Final Fantasy XV Benchmark (2018) | 237 | 230 | 175.8 | 133.7 | 74 | |
| X-Plane 11.11 (2018) | 244 | 214 | 162.9 | 136.5 | ||
| Strange Brigade (2018) | 611 | 478 | 375 | 321 | 222 | 121 |
| Shadow of the Tomb Raider (2018) | 256 | 239 | 162.6 | 83.7 | ||
| Metro Exodus (2019) | 159.4 | 129.4 | 103.8 | 65 | ||
| Control (2019) | 159.5 | 101.8 | 50.2 | |||
| Borderlands 3 (2019) | 183.2 | 154.5 | 110.8 | 58.8 | ||
| Mafia Definitive Edition (2020) | 207 | 141.1 | 72.3 | |||
| Watch Dogs Legion (2020) | 163.7 | 124.4 | 93.3 | 49.5 | ||
| F1 2021 (2021) | 617 | 530 | 421 | 218 | 160.3 | 89.7 |
| Far Cry 6 (2021) | 188 | 172 | 133 | 74 | ||
| Dying Light 2 (2022) | 135.2 | 92.7 | 45.8 | |||
| Cyberpunk 2077 1.6 (2022) | 139.3 | 124.9 | 80.9 | 36.7 | ||
| Ghostwire Tokyo (2022) | 264 | 261 | 165.4 | 73.6 | ||
| F1 22 (2022) | 378 | 372 | 296 | 111.8 | 71.9 | 36.7 |
| Uncharted Legacy of Thieves Collection (2022) | 124.7 | 121.4 | 92.8 | 54.8 | ||
| Call of Duty Modern Warfare 2 2022 (2022) | 149 | 143 | 103 | 62 | ||
| The Callisto Protocol (2022) | 185 | 121.6 | 89.6 | 52 | ||
| The Witcher 3 v4.00 (2023) | 141.3 | 120.4 | 75.2 | 38.4 |
Emissions: No perceivable throttling and low fan noise under load
Zotac has equipped the RTX 4070 AMP Airo with a triple-fan cooler. Unfortunately, there's no VBIOS switch provided so you will have to tinker with the power targets and clocks manually.
The company claims much-improved heat dissipation due to the IceStorm 2.0 cooling system that is made of six composite heatpipes and offers ample scope for ventilation.
Overclocking potential is somewhat limited as the card only allows increasing the power target by 20% for a maximum of 258 W TGP.
Stress tests
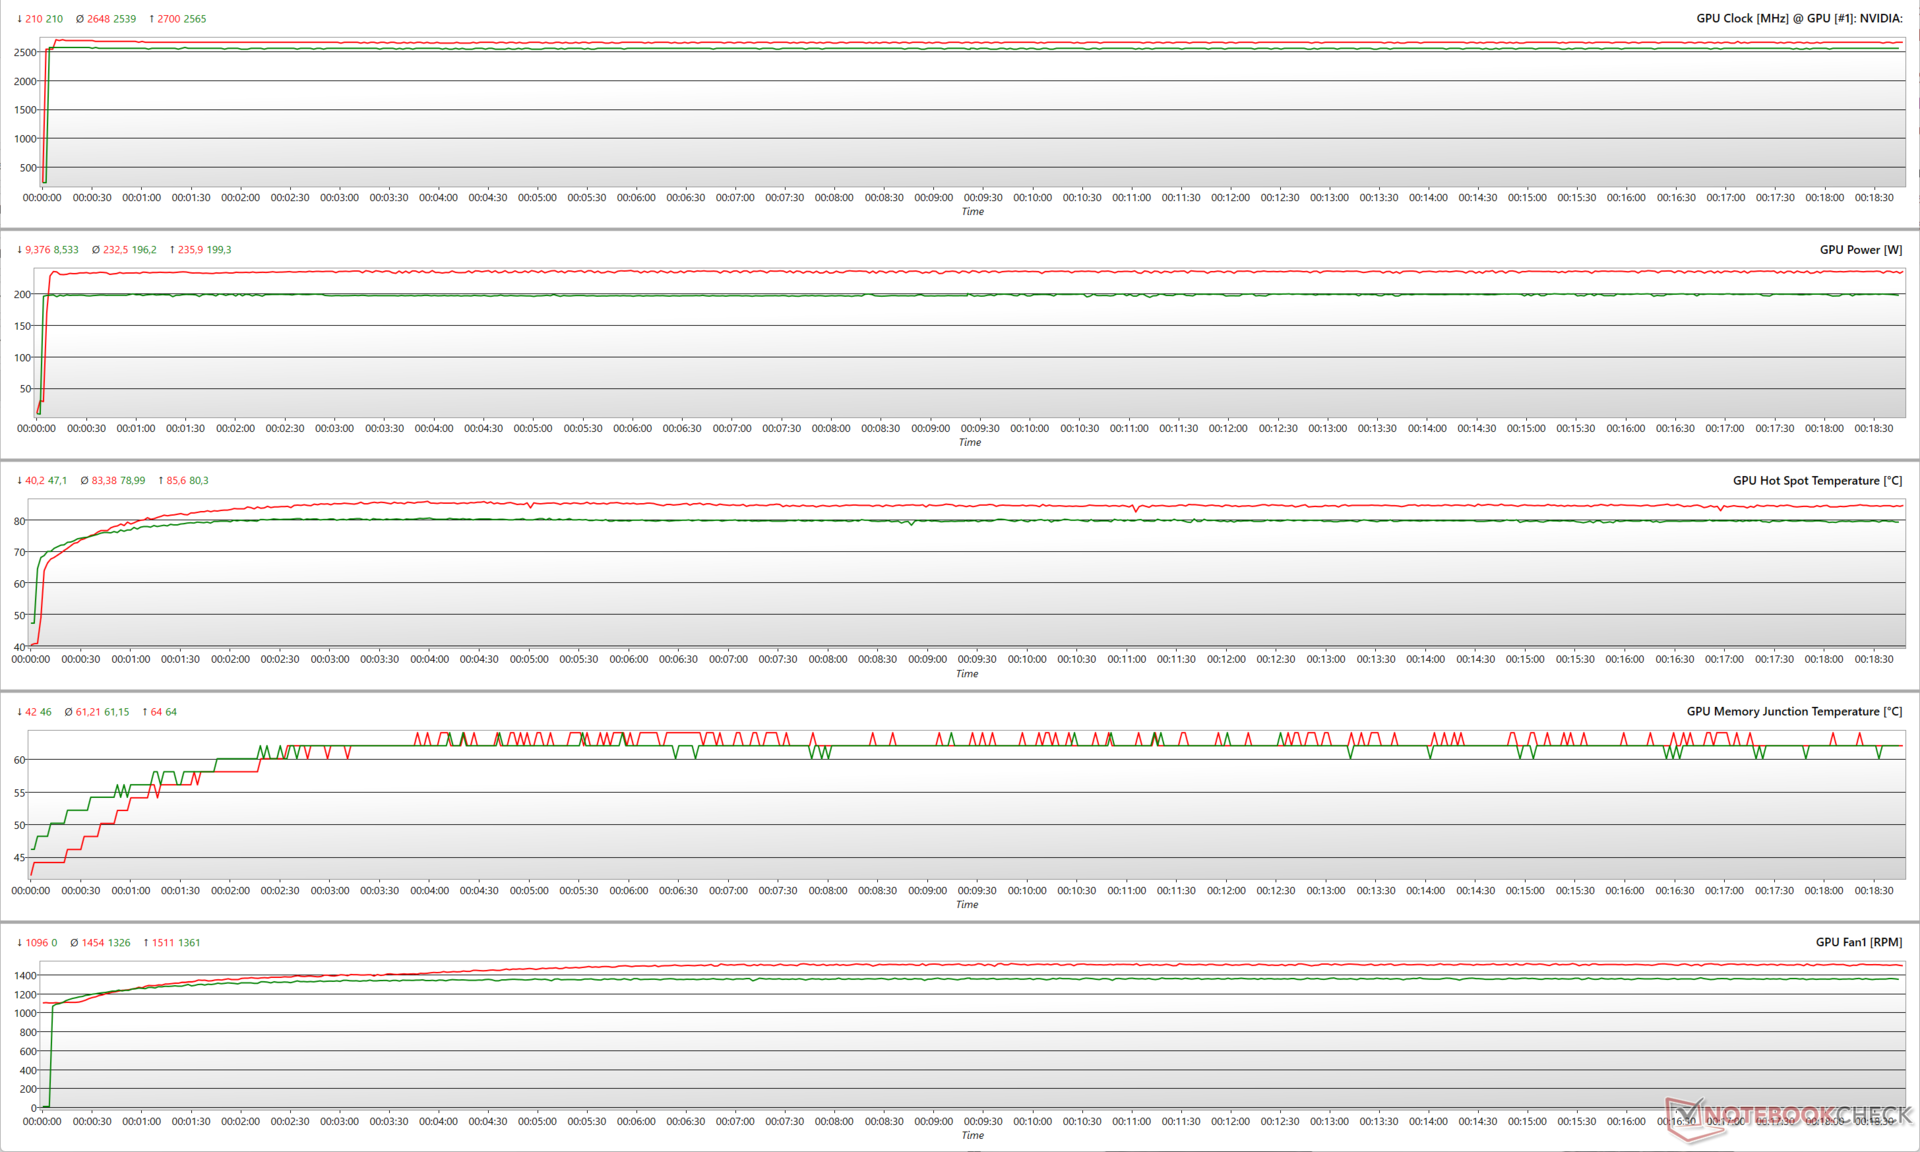
Stress testing the Zotac RTX 4070 AMP Airo with FurMark at 1,280 x 720 with no AA sees the card attaining its maximum TGP at both 100% and 120% power targets (PT).
The 120% PT affords a slight increase in maximum clocks to 2,700 MHz from the default 2,565 MHz together with an increase in hot spot temperature to 85.6 °C.
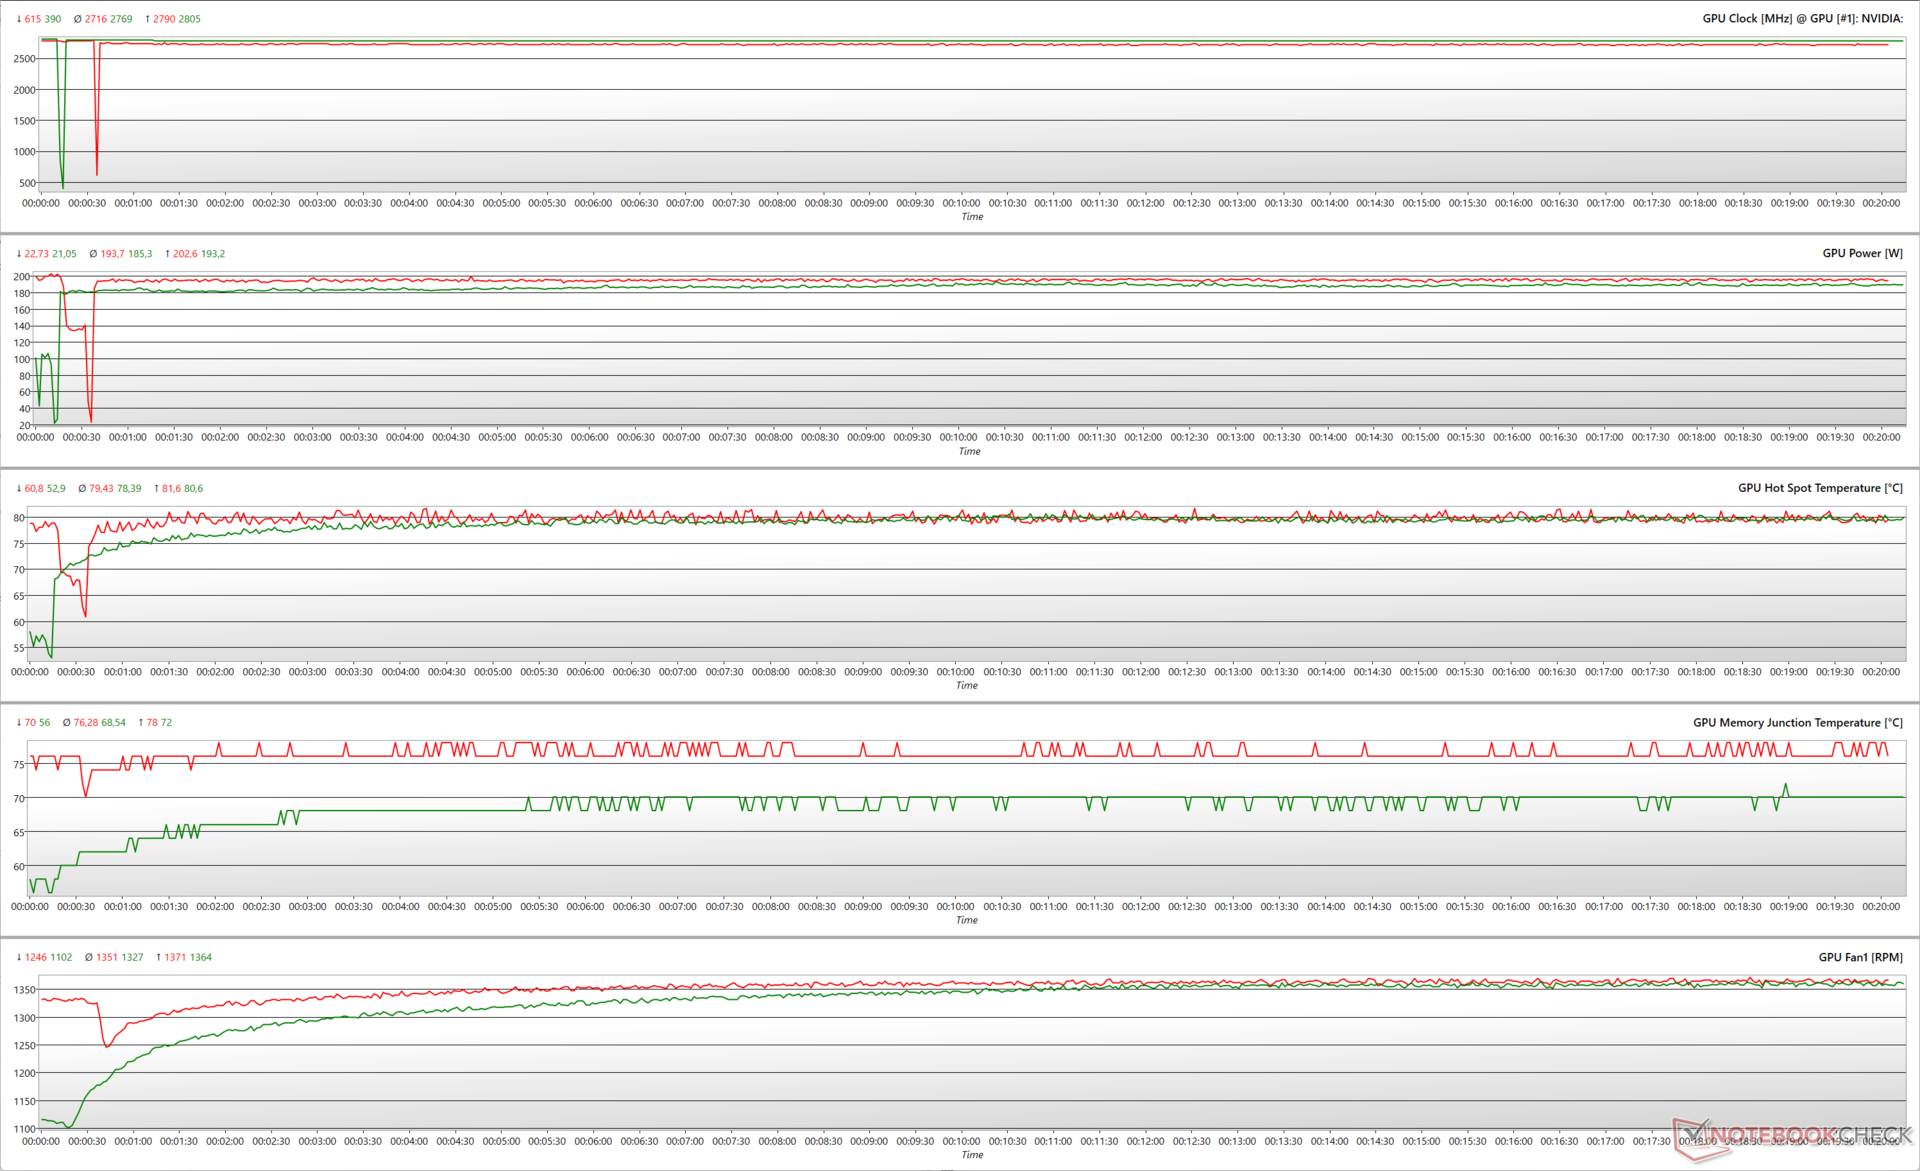
The Witcher 3 at 1080p Ultra sees the RTX 4070 AMP Airo maximizing its clocks to 2,805 MHz at a 100% PT and 193 W TGP itself. Ada does not rely on power limits alone to boost clocks and we see the benefits of this approach here.
At 4K Ultra, the card hits a maximum TGP of 202 W. This results in a slight increase in hot spot temperature and fan speed without any tangible benefit to the boost clock.
The Witcher 3 FPS Chart
Zotac's excellent implementation of the IceStorm 2.0 cooling system results in relatively stable frames in The Witcher 3 stress at both 1080p and 4K Ultra settings.
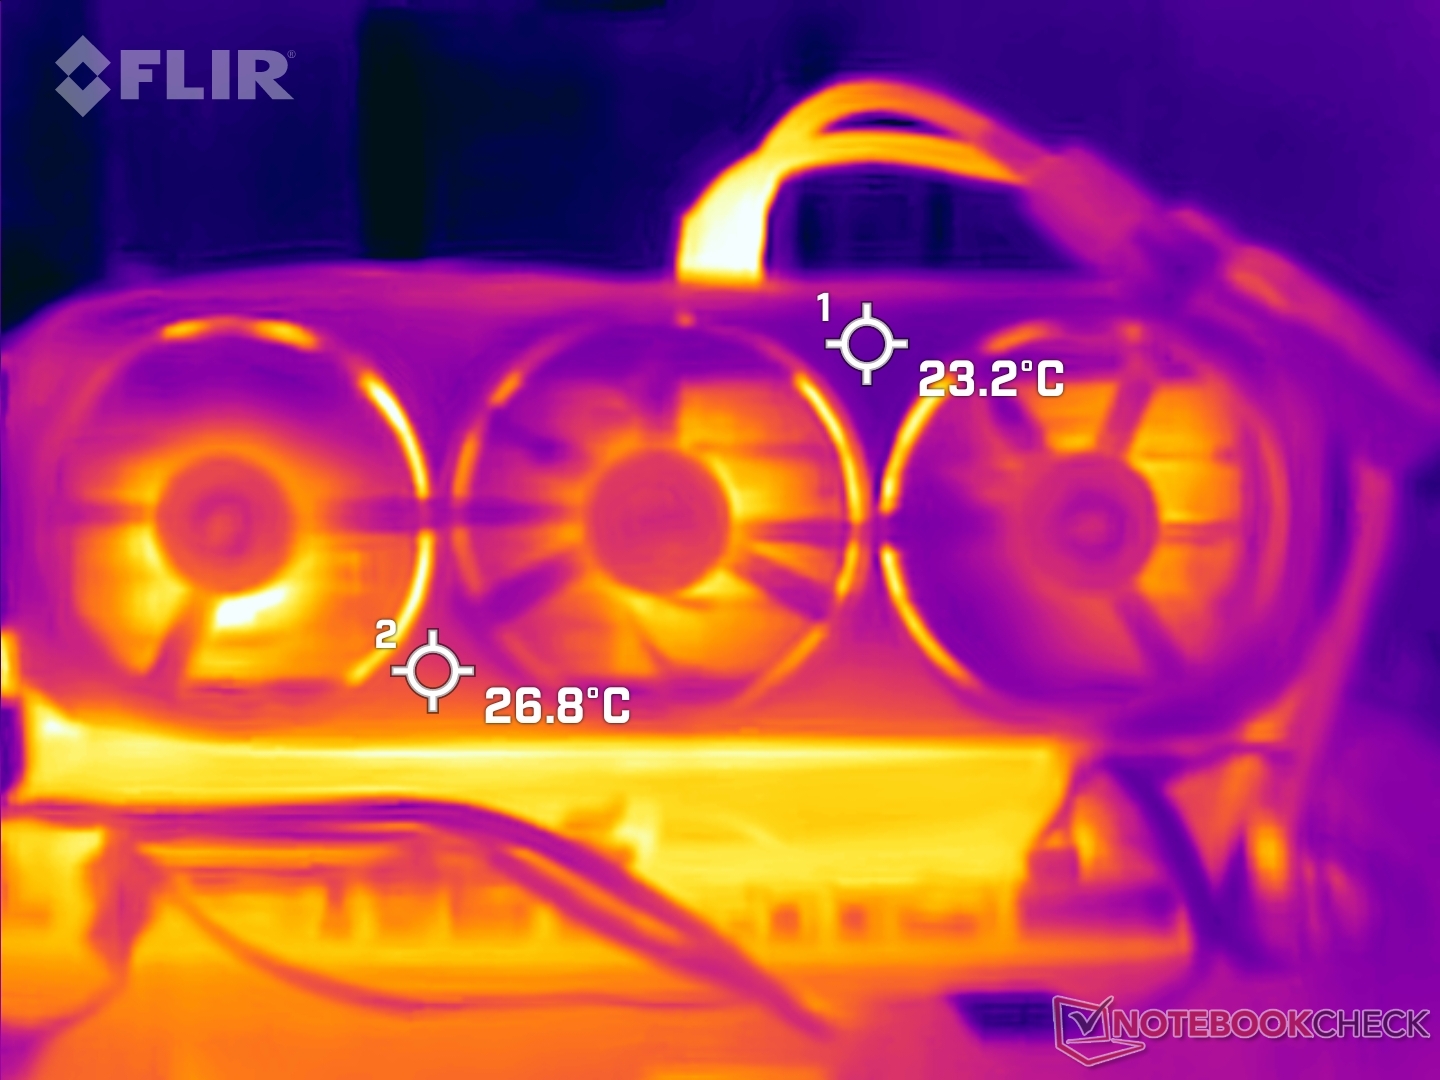
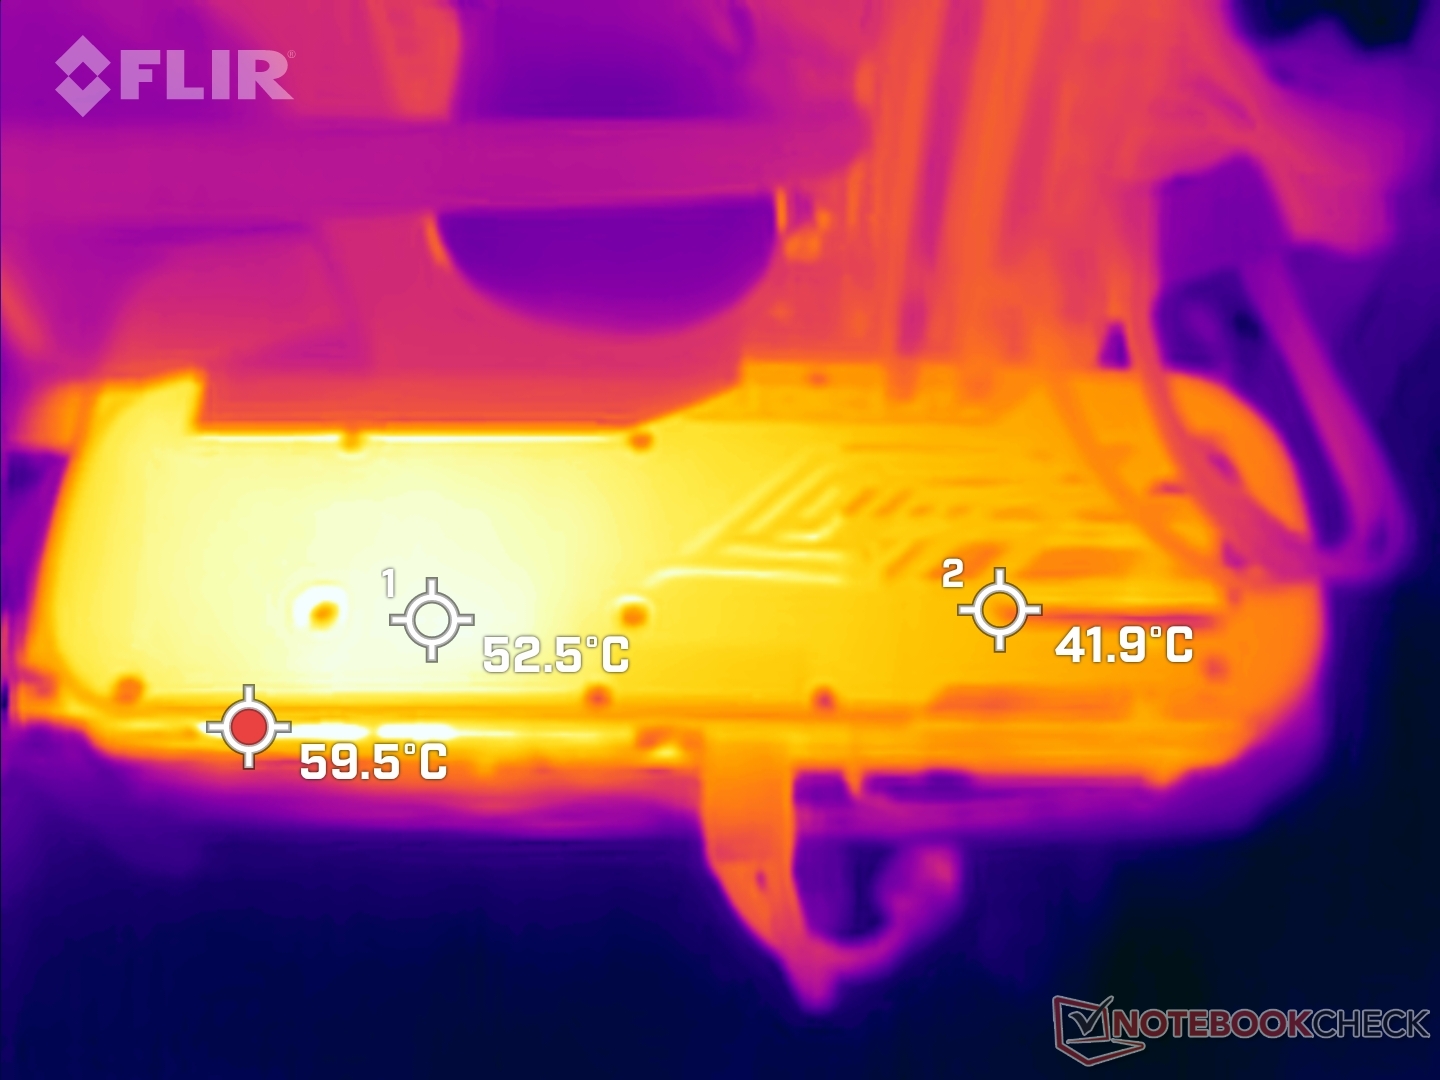
Surface temperatures
Surface temperatures are quite tolerable in daily use. The plastic front shroud hardly heats up even under stress and remains close to the ambient temperature of 23 °C.
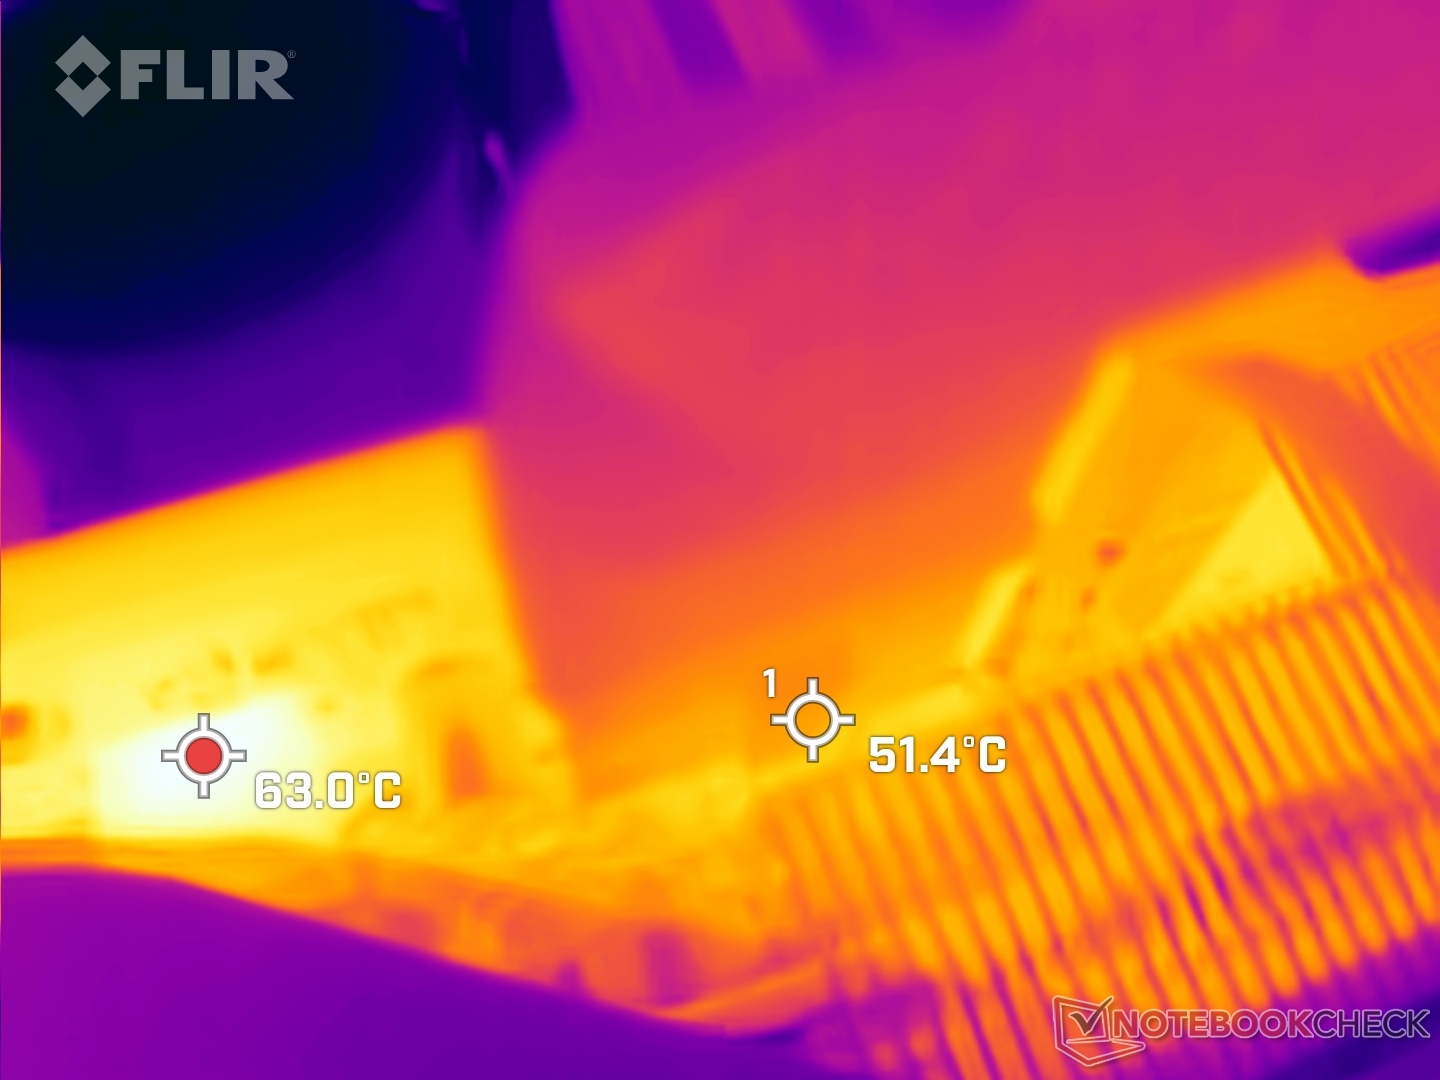
The metal backplate, however, can get quite toasty with surface temperatures of close to 53 °C under stress. The 12VHPWR connector area is on the hotter side at about 51 °C, but we don't find this to be a cause for concern.
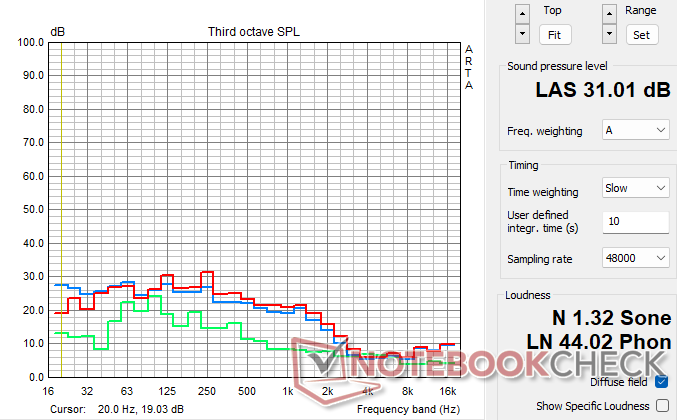
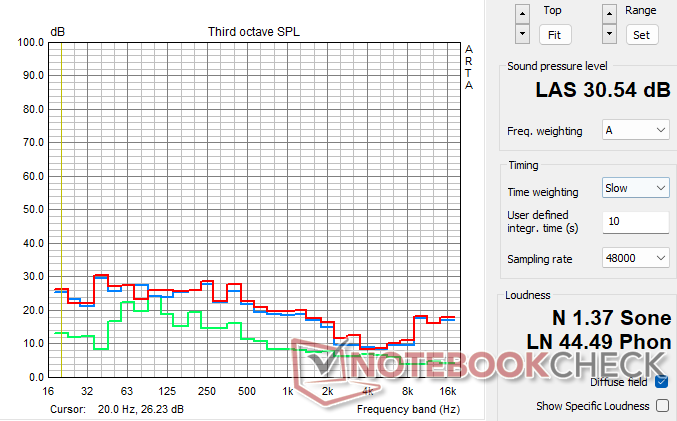
Noise levels
Fan performance has improved considerably compared to previous generation Zotac cards. The triple IceStorm 2.0 fans have admirably low emissions under stress. The left and center fans are considered a single unit and are controlled together.
Zotac's FireStorm utility wasn't yet compatible with the RTX 4070 AMP Airo at the time of testing, so we could not compare different preset fan profiles.
The fan noise appears to be capped around the 30 dB(A) mark no matter the load, which is commendable for a triple-fan setup. Increasing the power target does not affect the fan noise much.
The RTX 4070 AMP Airo also implements a complete fan stop in idle.
| Stress Test | Power Target | Max. Fan Speed (RPM) | Fan Noise dB(A) |
|---|---|---|---|
| FurMark 1280 x 720, no AA | 100% | 1,361 | 29.02 |
| FurMark 1280 x 720, no AA | 120% | 1,511 | 31.01 |
| The Witcher 3 1080p Ultra | 100% | 1,364 | 29.33 |
Energy Management: Up to 38% more economical than the RTX 3080
Total system power consumption is about 38% and 30% more economical than the RTX 3080 average in FurMark and The Witcher 3 1080p Ultra, respectively.
Compared to the RTX 4070 Ti, the power consumption can be up to 26% lesser with the RTX 4070 AMP Airo at 100% PT depending on the load.
Power Consumption: External monitor
| 1280x720 FurMark 1.19 GPU Stress Test (external Monitor) | |
| 1920x1080 The Witcher 3 ultra (external Monitor) | |
* ... smaller is better
Pros
Cons
Verdict: RTX 3080 performance with DLSS 3 for US$699

With the RTX 4070, Nvidia once again tries to up the ante against last year's corresponding Ampere cards, and it succeeds for the most part. With the RTX 4070, gamers now have RTX 3080-class gaming performance with the added benefits of DLSS 3.
The US$699 Zotac Gaming GeForce RTX 4070 AMP Airo (US$599 for the RTX 4070 Founders Edition) is among the many AiB offerings we are seeing for this GPU alongside the Founders Edition. The RTX 4070 AMP Airo is built well and is clocked higher than most RTX 4070s on the market.
On the performance front, synthetic benchmarks show only a 6% cumulative advantage over the RTX 3080 average although the RTX 4070 is firmly within Radeon RX 6900 XT territory here. The setback relative to the RTX 3090 average is just about 10%, but we see a good 31% gain over the RTX 3070 average.
The real strength of the RTX 4070 AMP Airo lies in QHD Ultra wherein we see triple-digit fps across most of our gaming tests.
The RTX 4070 AMP Airo is not marketed as a 4K gaming card given its comparatively weaker memory subsystem vis-à-vis the RTX 3080. However, a good number of modern games are able to perform well at native 4K Ultra settings and those that are texture-heavy can use some uplift with upscaling technologies such as FSR 2, XeSS, and DLSS 3, which the RTX 4070 fully supports.
The Zotac Gaming GeForce RTX 4070 AMP Airo is a highly capable and efficient card for QHD Ultra gaming that manages to best the RTX 3080 by a small margin. However, the US$699 pricing might compel those not much into ray tracing and AI-based upscaling towards RDNA 2 cards such as the Radeon RX 6900 XT that have higher VRAM."
The performance improvements relative to the RTX 3070 average are high, but the leads over the RTX 3080 are quite minimal and that too only at FHD and QHD resolutions. The RTX 3080's higher bandwidth VRAM is useful for processing heavy textures from the frame buffer.
On its part, Zotac has improved considerably in terms of thermals and fan noise with this generation. The RTX 4070 AMP Airo has a subdued noise profile around the 30 dB(A) mark no matter the load.
Power efficiency with Ada has traditionally been good, especially since the RTX 4080 and below. The RTX 4070 AMP Airo, even with its slightly higher 215 W TGP compared to the reference design, is very power-efficient compared to the RTX 3080 average or any of the RX 6800 XT or RX 6900 XT cards.
The RTX 4070, as with all GPU launches the past few months, puts prospective buyers in a conundrum once again. If you are in the market for a US$699 RTX 4070 AMP Airo, you might as well spend another US$100 and get the RTX 4070 Ti that offers near-RTX 3090 levels of performance.
The Radeon RX 6900 XT also makes for a viable choice at this price if you feel the need to be futureproof in terms of VRAM and don't mind losing out on some of the ray tracing, AI-upscaling, and efficiency goodness.
Price and Availability
The Zotac Gaming GeForce RTX 4070 AMP Airo is available on Amazon for US$670. In India, the RTX 4070 AMP Airo retails for ₹70,199, but it should be possible to find the card at decent discounts across popular PC stores.


Transparency
The present review sample was made available to the author as a loan by the manufacturer or a shop for the purposes of review. The lender had no influence on this review, nor did the manufacturer receive a copy of this review before publication. There was no obligation to publish this review.
Pricecompare
