 Deutsch
 English
 Español
 Français
 Italiano
 Nederlands
 Polski
 Português
 Русский
 Türkçe
 Svenska
 Chinese
 Magyar
Xiaomi Mi NoteBook 14 Horizon Edition Laptop Review: Cost-cutting not done right
Xiaomi has been offering quite a few laptops targeting midrange and educational use cases since quite some time now. Back in 2018, we had reviewed the Mi Notebook Pro and Mi Notebook SKUs. After somewhat of a lull, the company once again started focusing on laptops with introductions such as the Mi NoteBook 14 series and the AMD Ryzen 5 4500U-powered RedmiBook 16
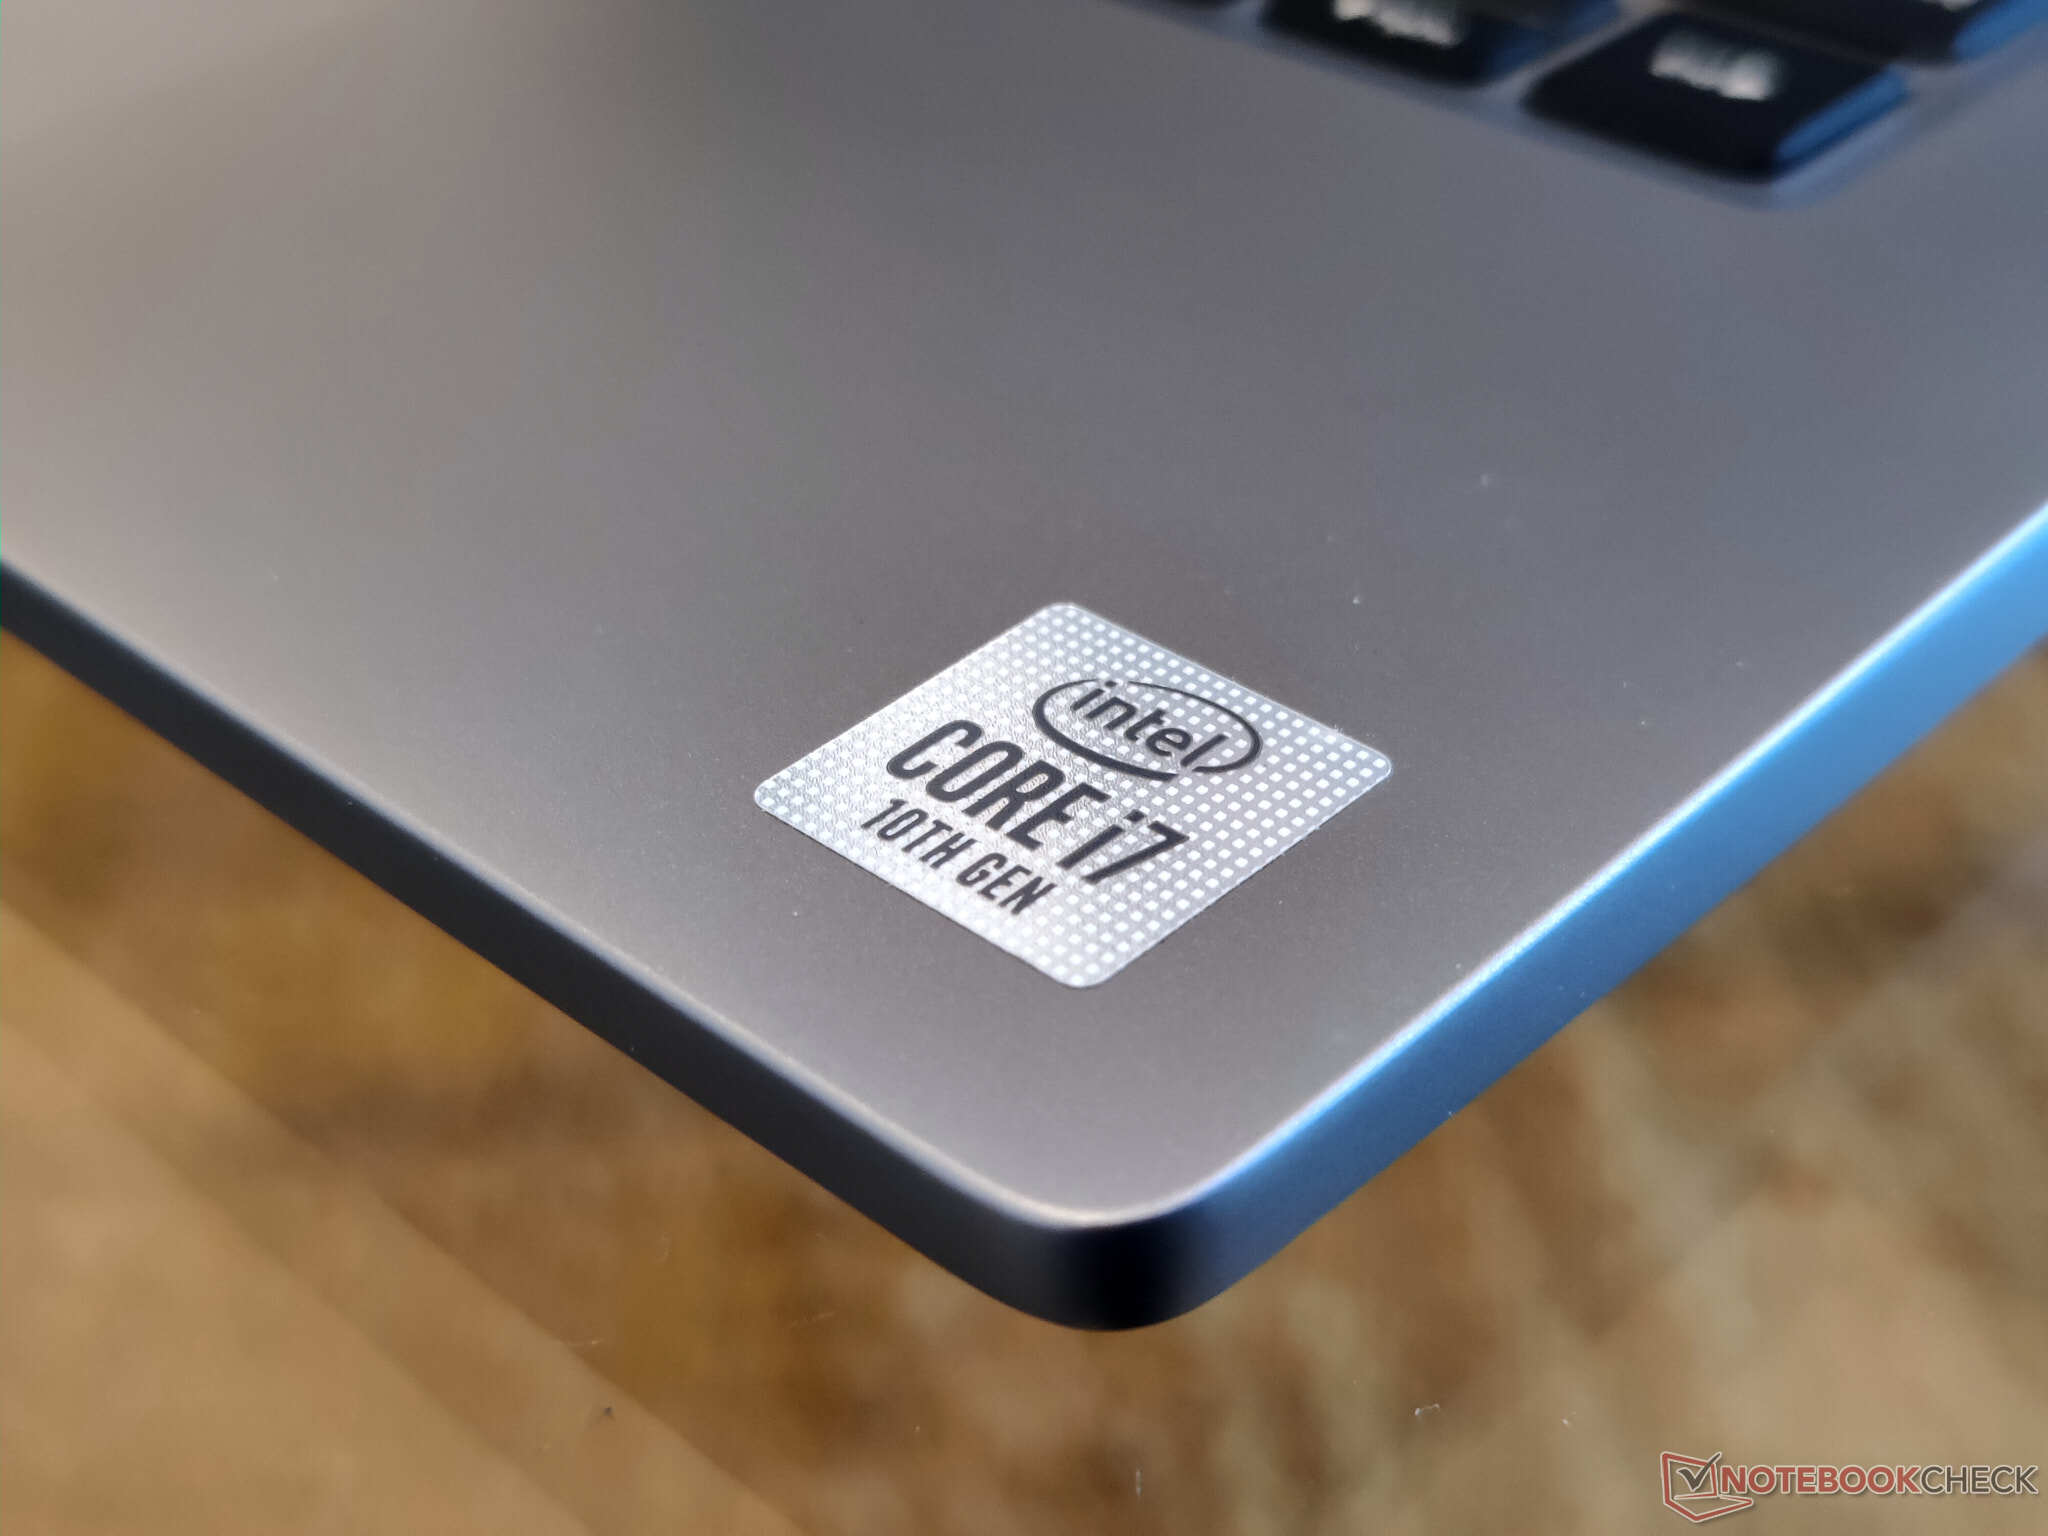
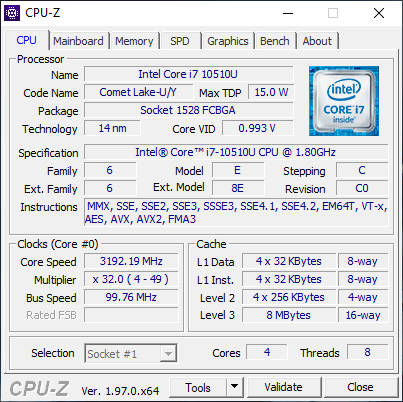
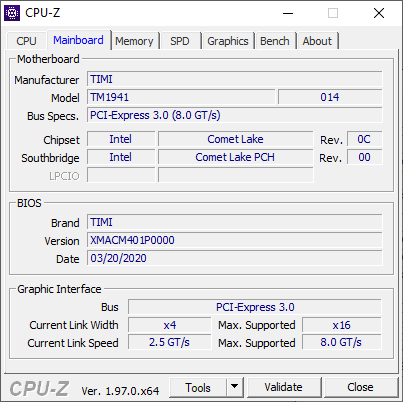
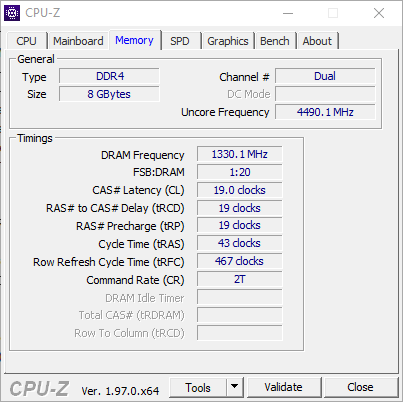
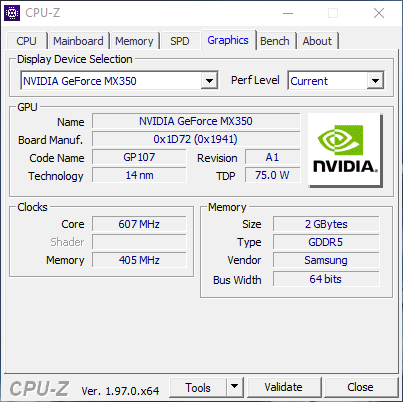
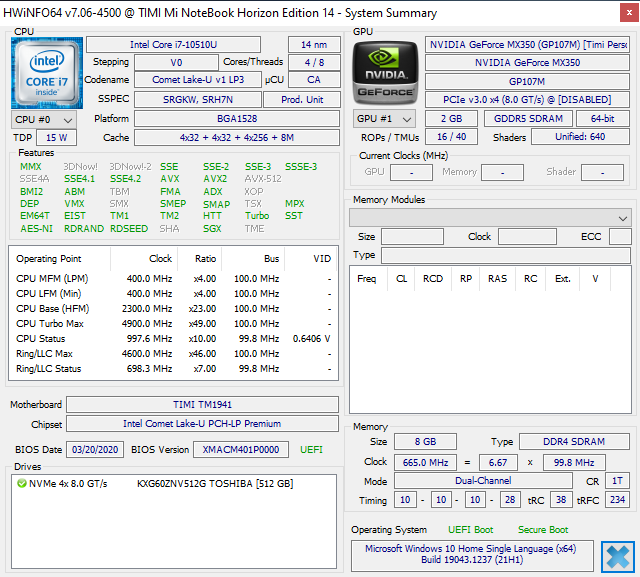
We have with us the Mi NoteBook 14 Horizon Edition, which was the top-end model that Xiaomi introduced in 2020. Our test sample is powered by the Intel Comet Lake-U Core i7-10510U processor and a dedicated Nvidia GeForce MX350 GPU. Xiaomi offers 8 GB of RAM across all 2020 Mi Notebook variants including the Horizon Edition. The device also features a 512 GB PCIe Gen 3 NVMe SSD. We take the Mi NoteBook 14 Horizon Edition for a test drive and see how well it competes against the competition.
Potential competitors in comparison
Rating | Date | Model | Weight | Height | Size | Resolution | Best Price |
|---|---|---|---|---|---|---|---|
| 78 % | 09/2021 | Xiaomi Mi NoteBook 14 Horizon Edition i7-10510U, GeForce MX350 | 1.4 kg | 17.15 mm | 14.00" | 1920x1080 | |
| 86.3 % | 12/2020 | Huawei MateBook 14 2020 Intel i7-10510U, GeForce MX350 | 1.5 kg | 15.9 mm | 14.00" | 2160x1440 | |
| 87 % | 08/2020 | Acer TravelMate P6 P614-51T-G2-72ZU i7-10510U, UHD Graphics 620 | 1.2 kg | 16.6 mm | 14.00" | 1920x1080 | |
| 80.7 % | 07/2020 | Asus VivoBook S14 S433FL i7-10510U, GeForce MX250 | 1.4 kg | 16 mm | 14.00" | 1920x1080 | |
| 87.1 % | 12/2020 | HP Envy 13-ba0001ng i7-10510U, GeForce MX350 | 1.3 kg | 16 mm | 13.30" | 1920x1080 | |
| 86.5 % | 06/2020 | Acer Swift 3 SF314-42-R4XJ R7 4700U, Vega 7 | 1.2 kg | 16.55 mm | 14.00" | 1920x1080 |
The Mi NoteBook 14 Horizon Edition can be currently had in India for ₹56,999 (€660/US$768), which makes it a decent bargain. This aggressive pricing makes it somewhat difficult for a direct comparison against the competition, which is usually placed close to or above the €1,000 mark for largely similar specifications. Xiaomi did have to cut some corners to achieve this though, which we shall see during the course of this review.
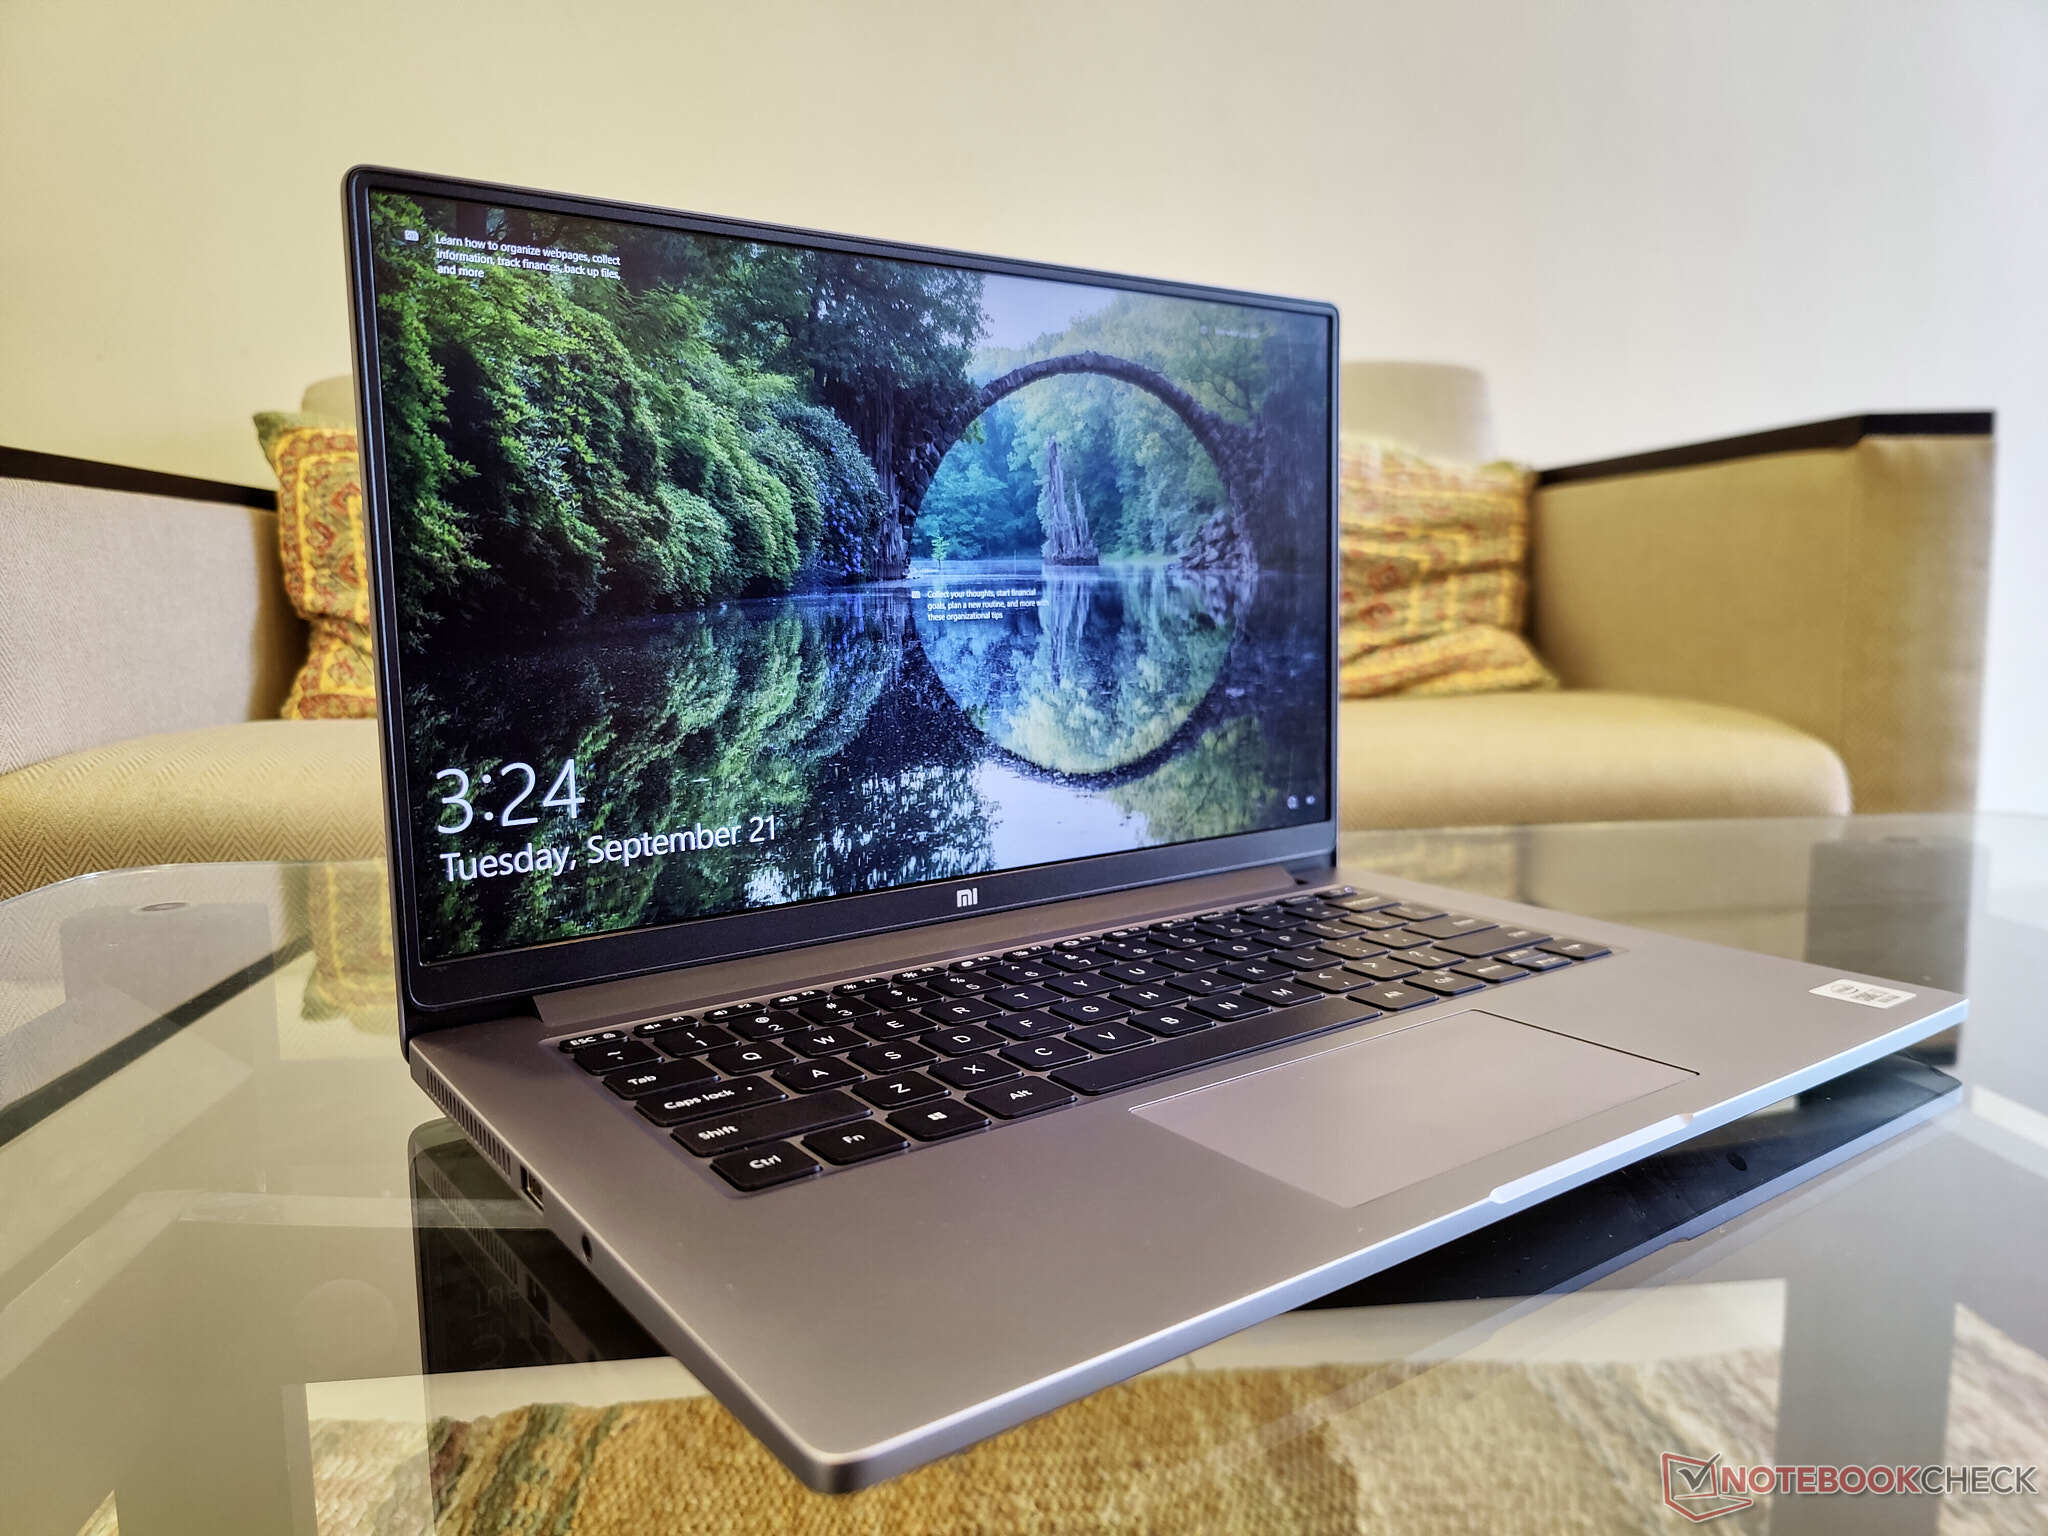
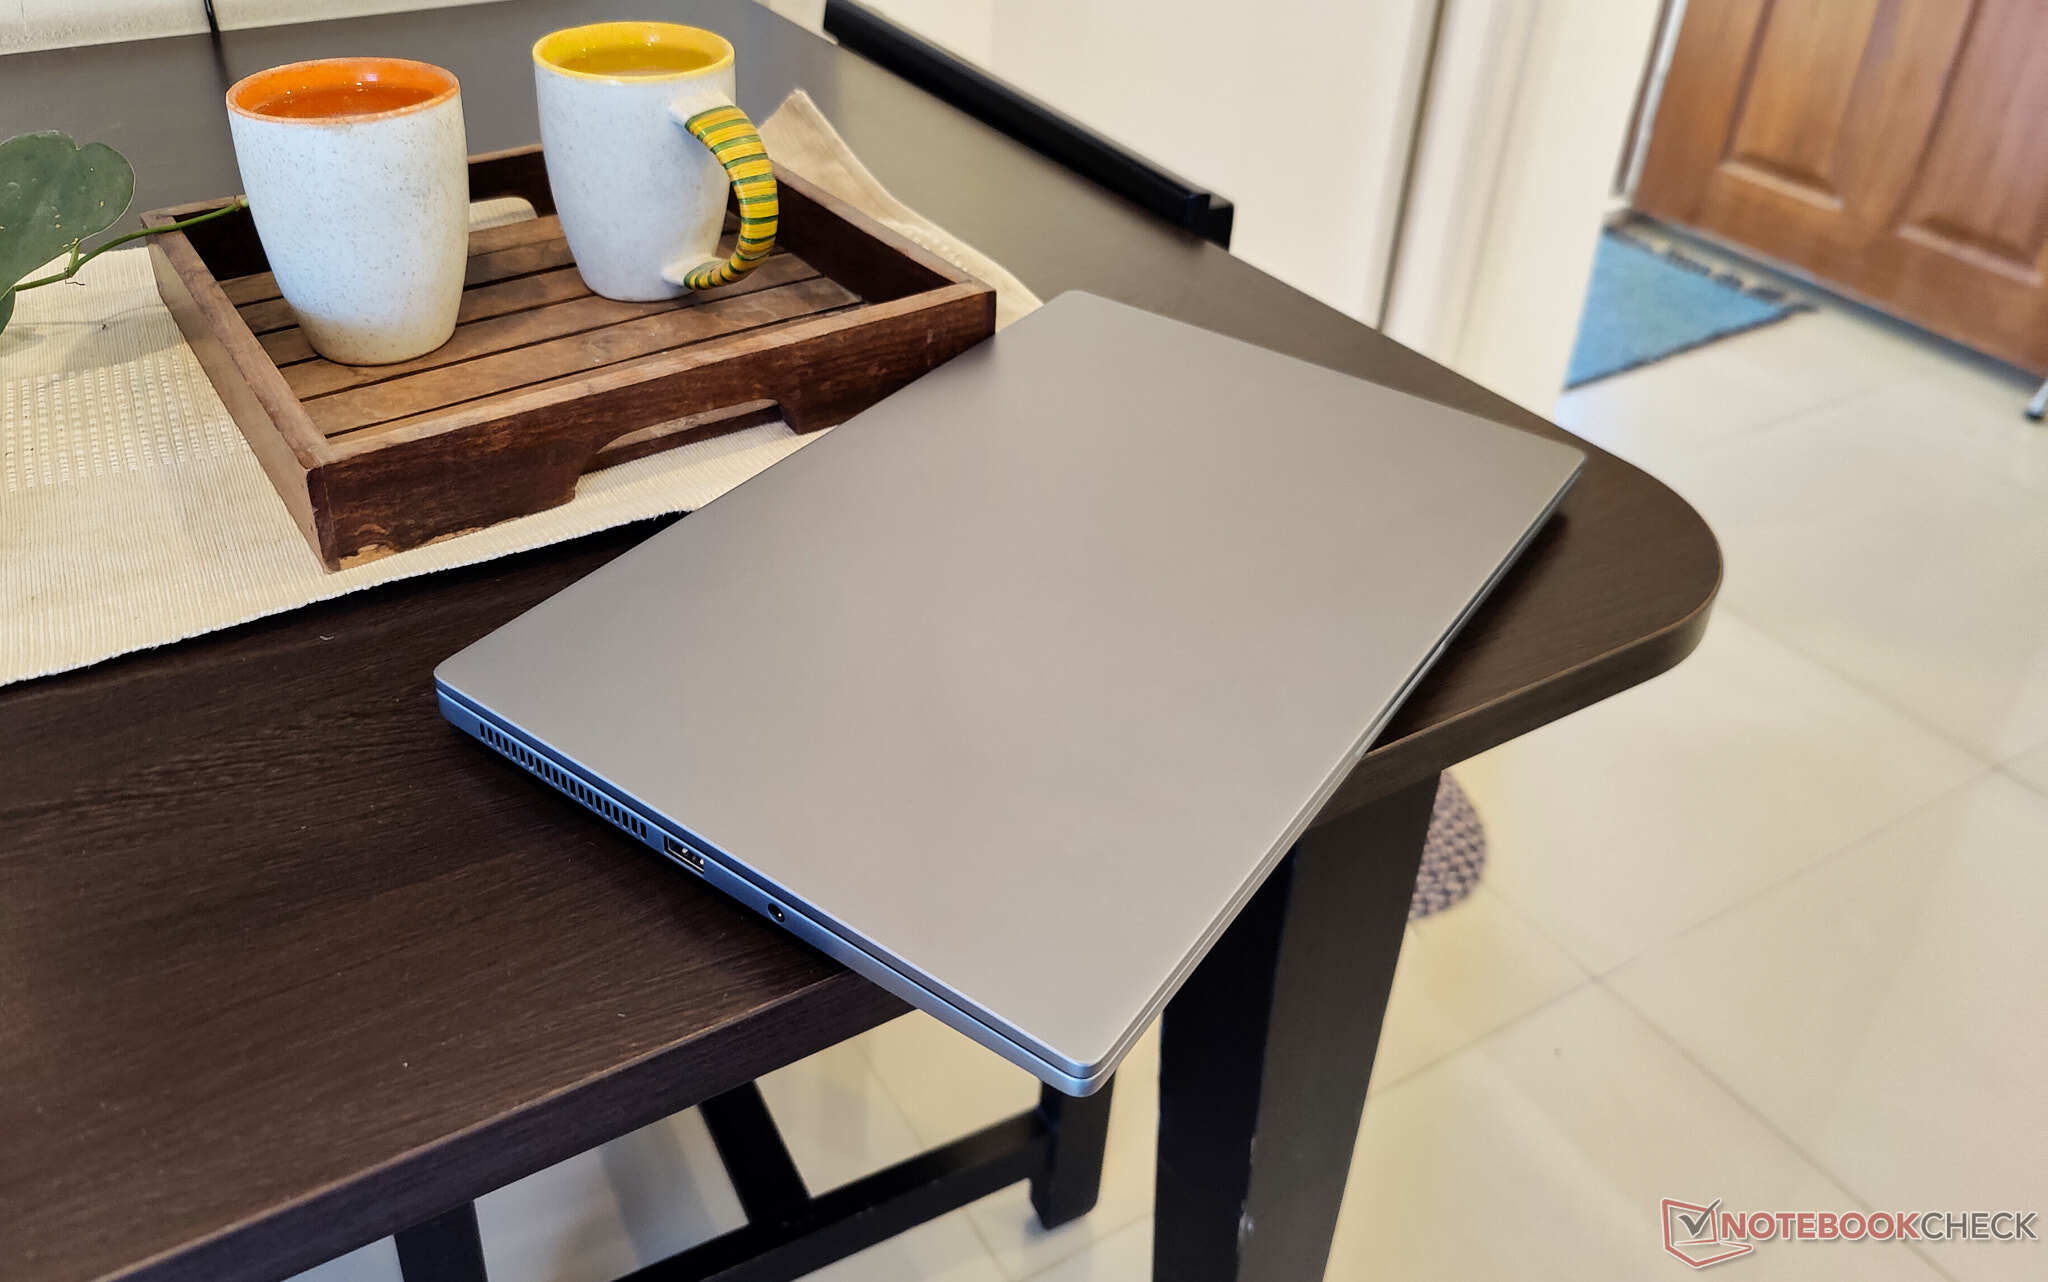
Case: Sturdy construction that feels premium
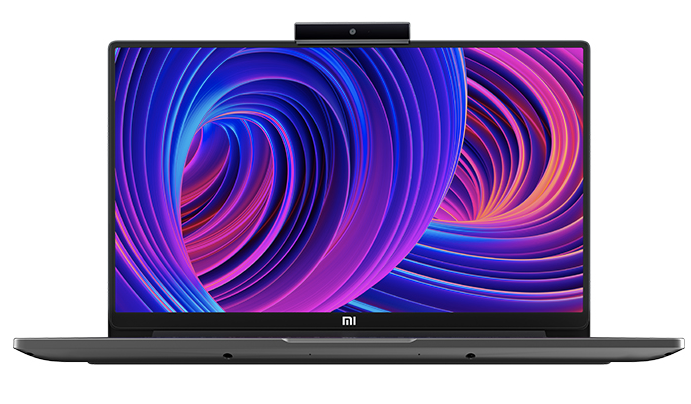
The Mi NoteBook 14 Horizon Edition weighs just 1.35 kg. The device sports an anodized sandblasted finish for the aluminum-magnesium alloy chassis that feels quite premium. It isn't quite the MacBook Air class that Xiaomi aims to imitate, but it gets the job done. The design is minimalist — the only place where you can find the Mi branding is in the bottom bezel and the bottom lid — and the grey finish can complement just about any setting.
The lid can be opened with just one finger without the device sliding or tipping backwards. The hinges seem smooth yet firm. We did not notice any wobble with the display and neither there was any noticeable flex when we tried to put pressure on the lid. The touchpad is the only area where we observed some rattle.
Overall, the Mi Notebook 14 Horizon Edition gets chassis construction largely right despite the seemingly budget price.
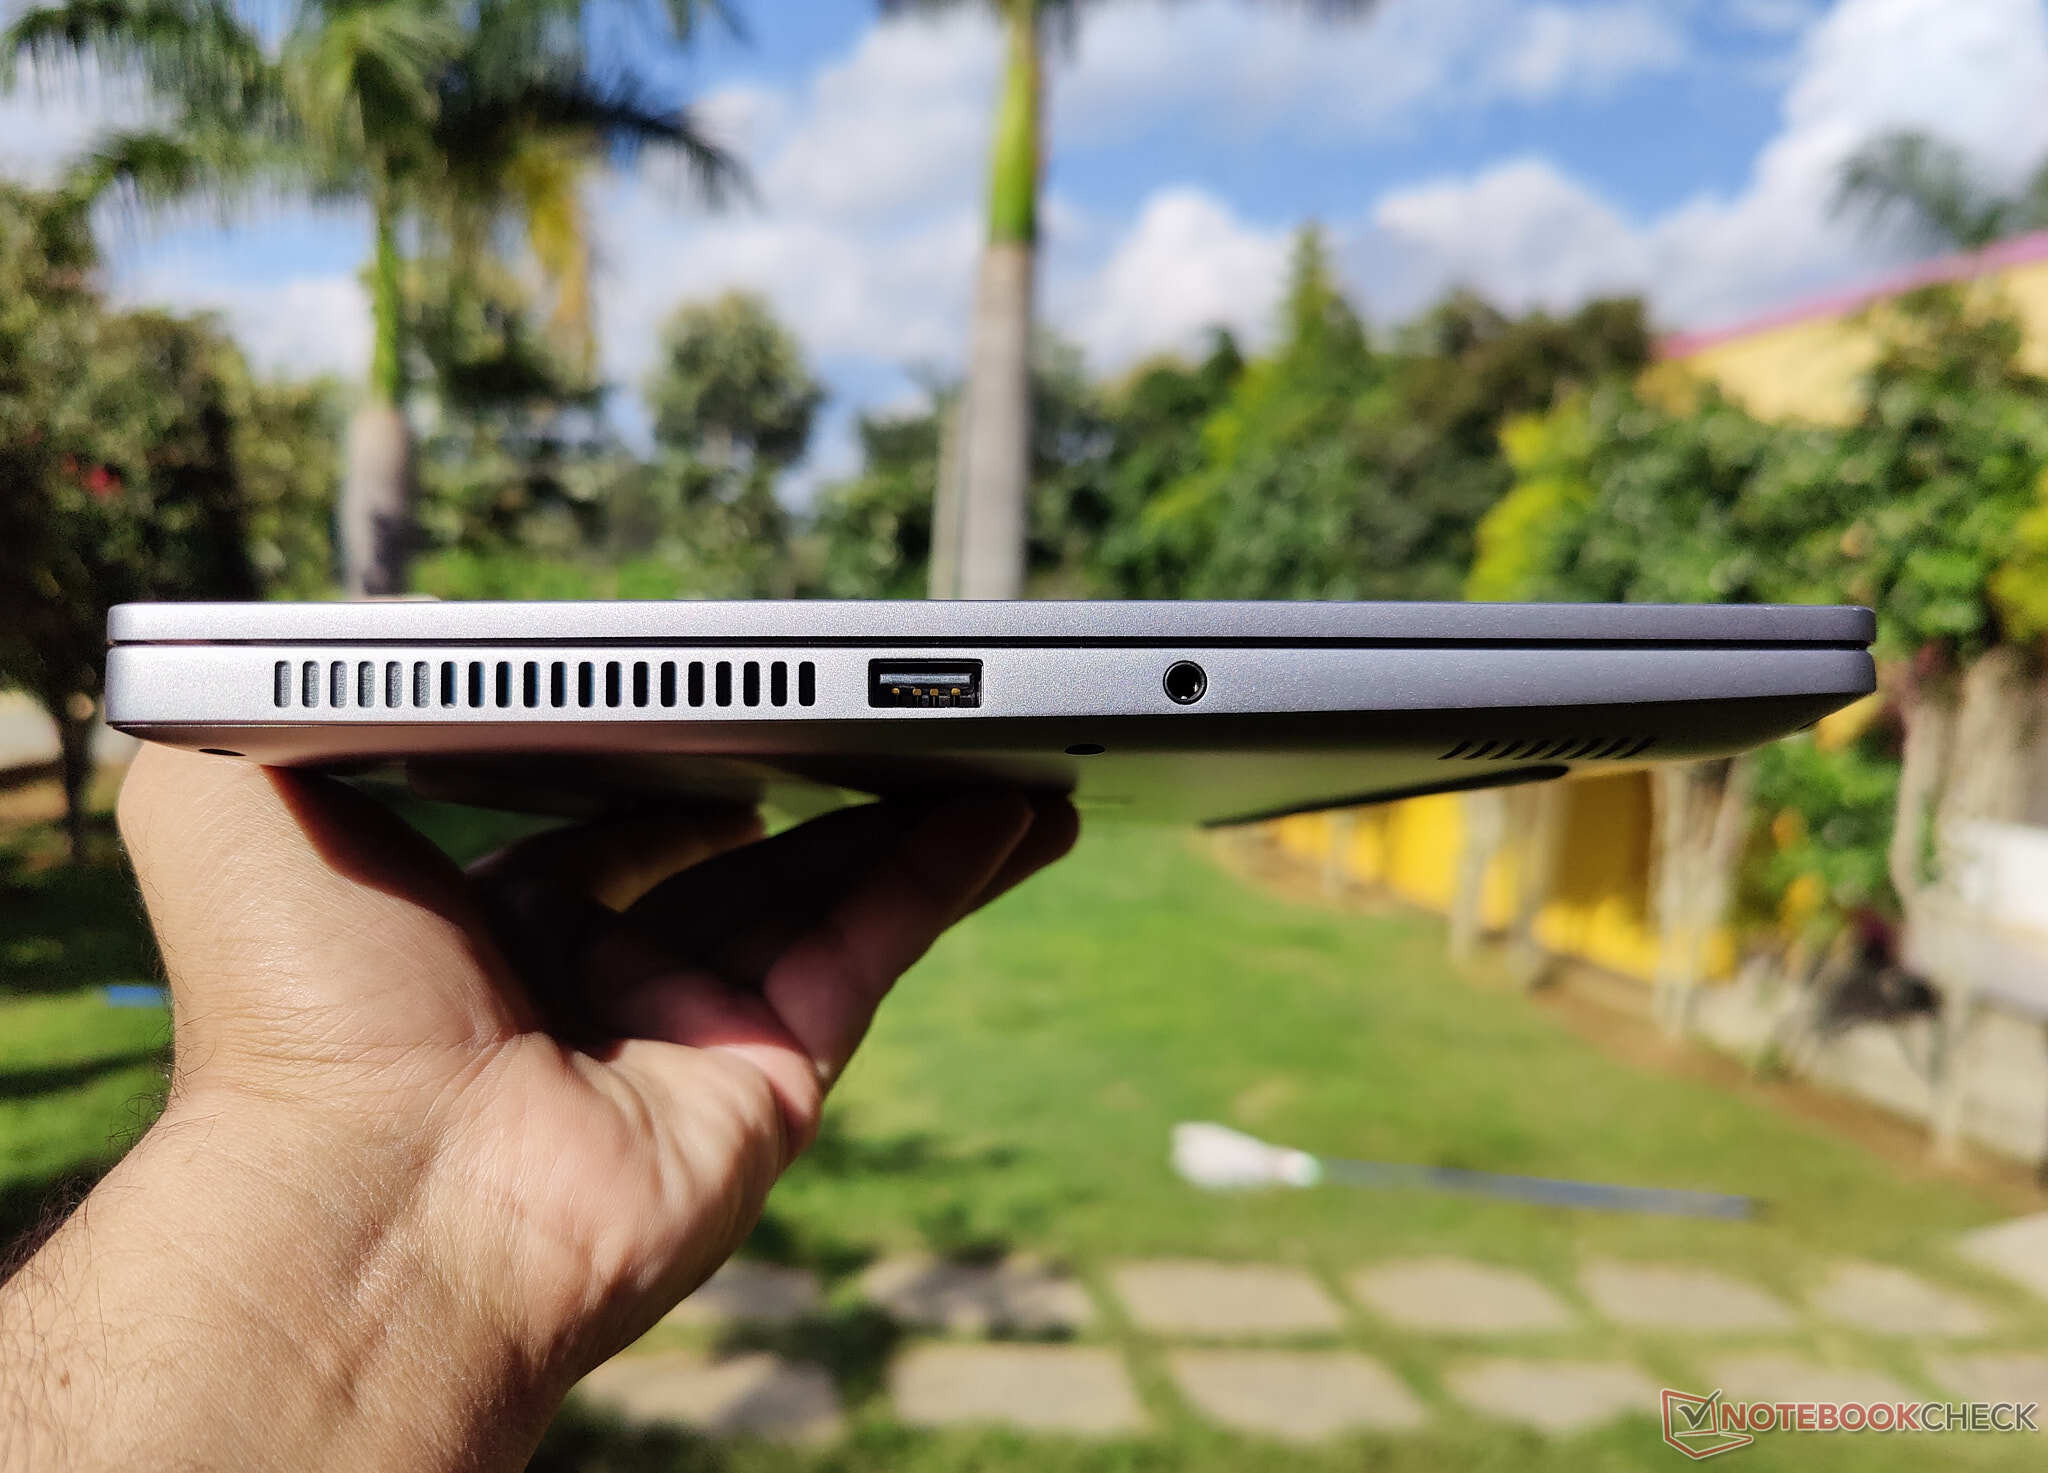
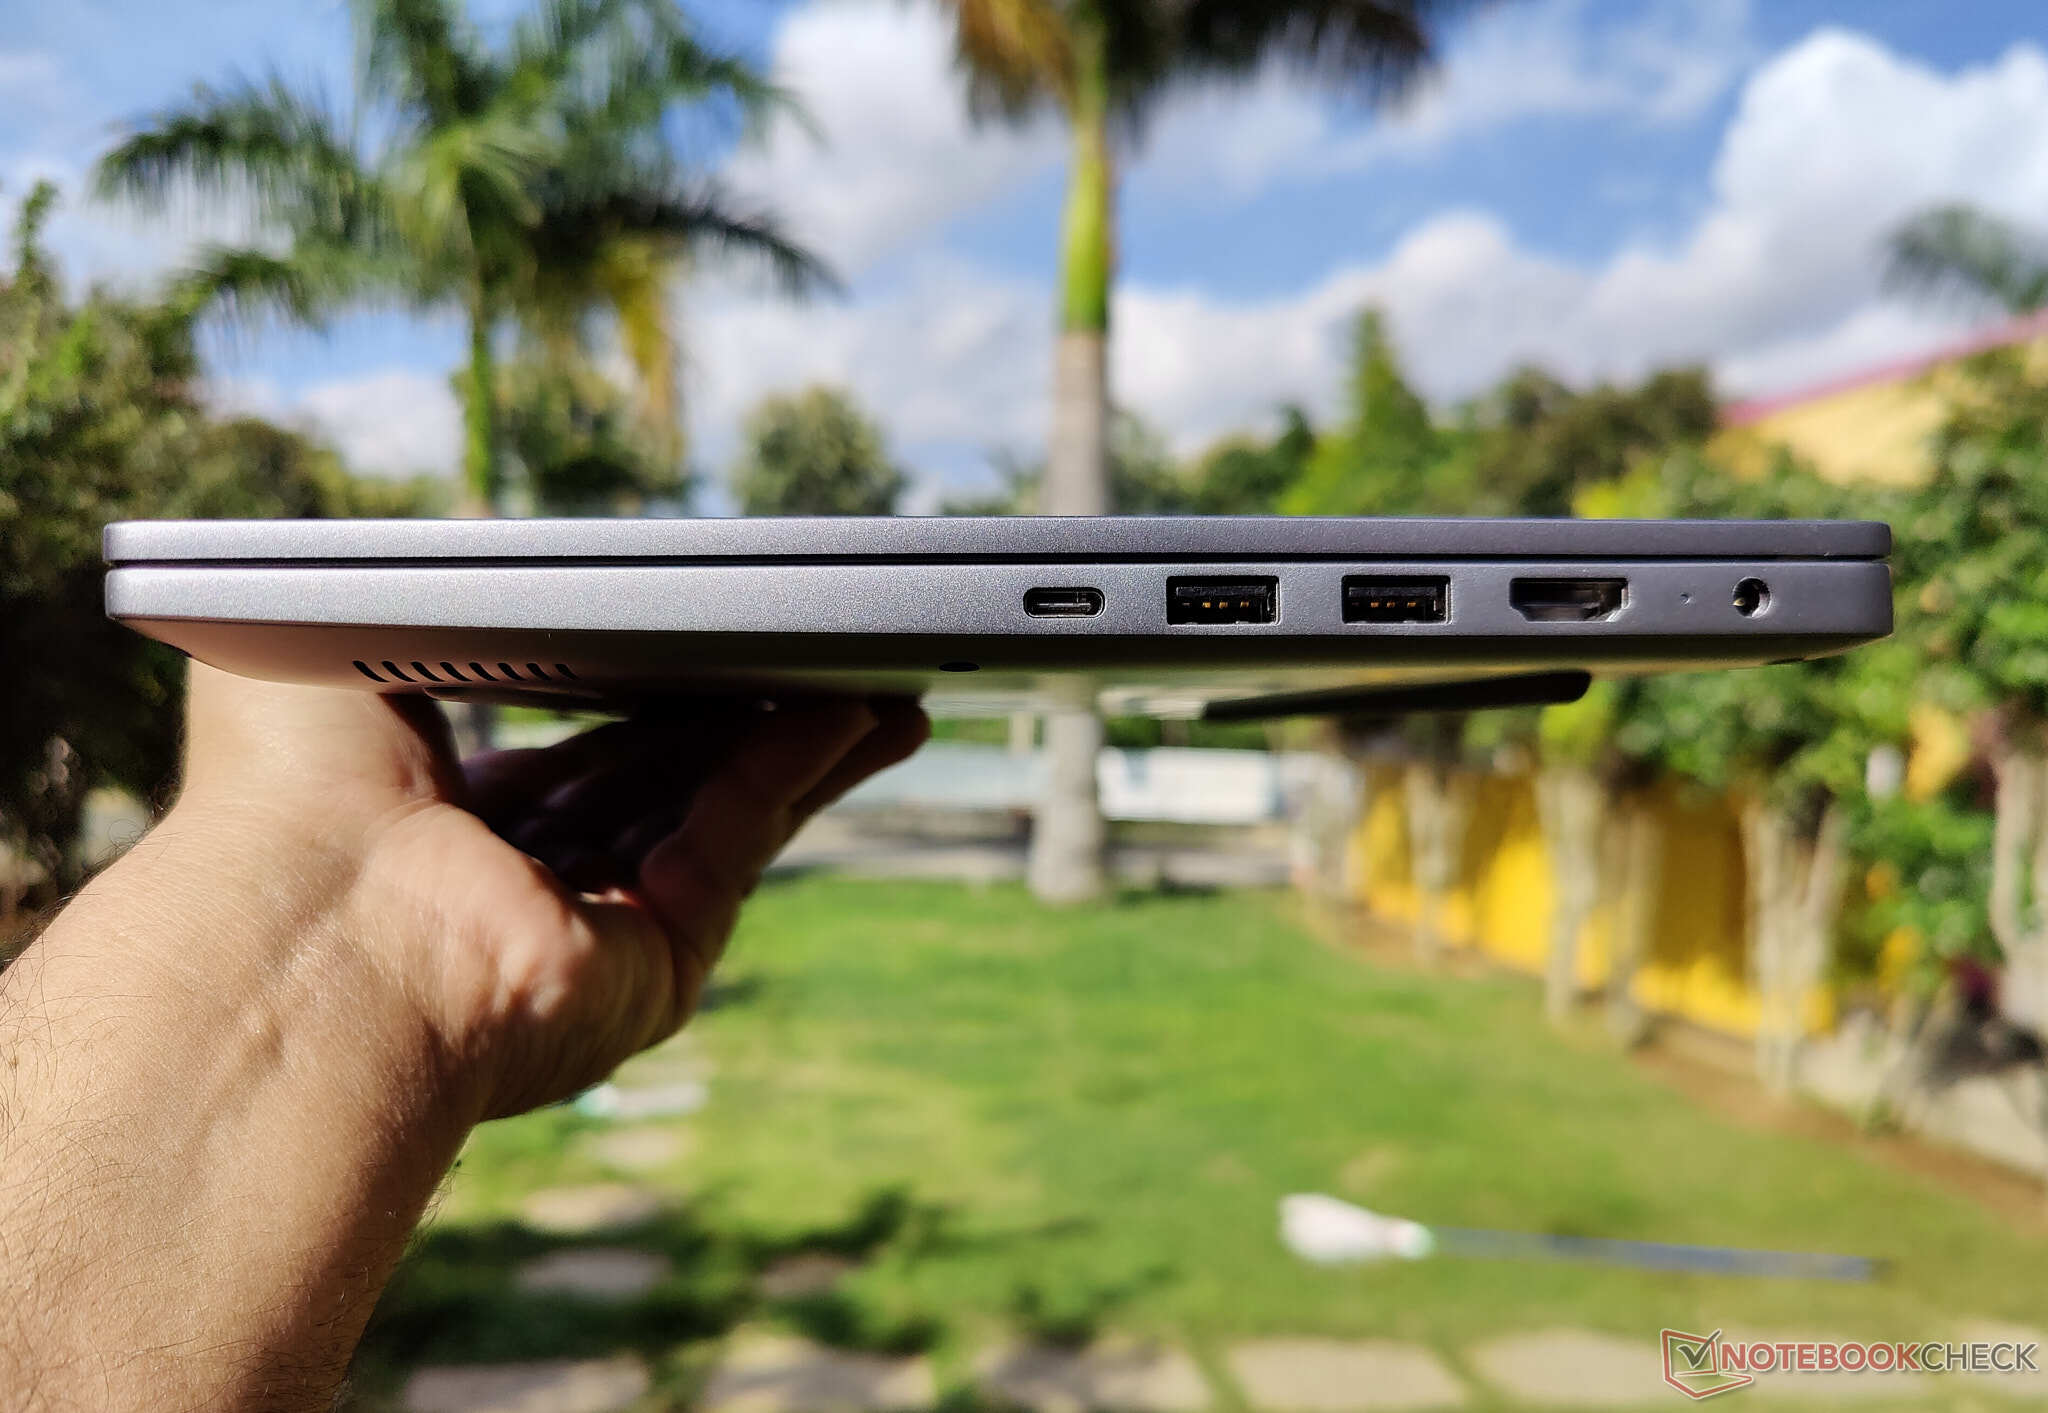
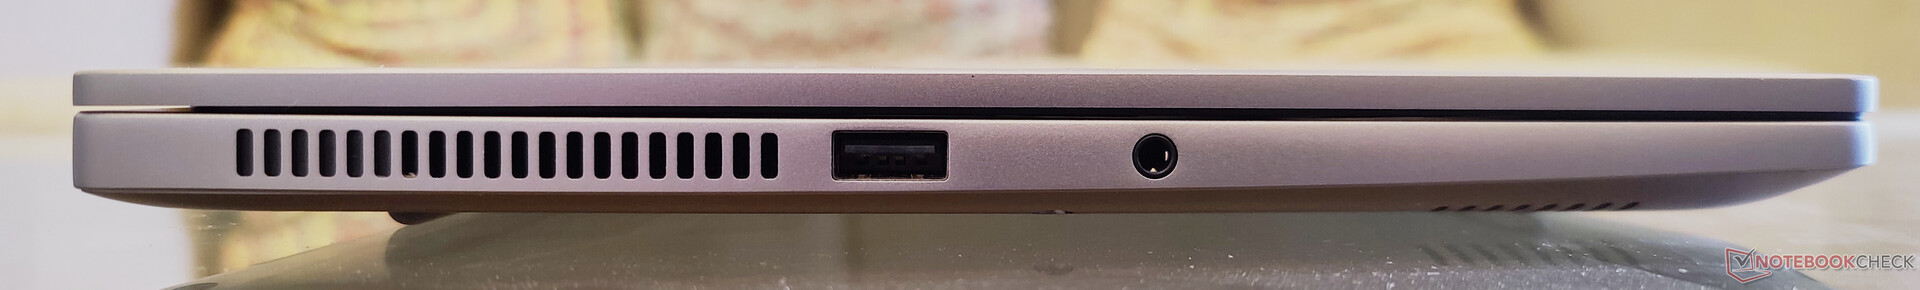
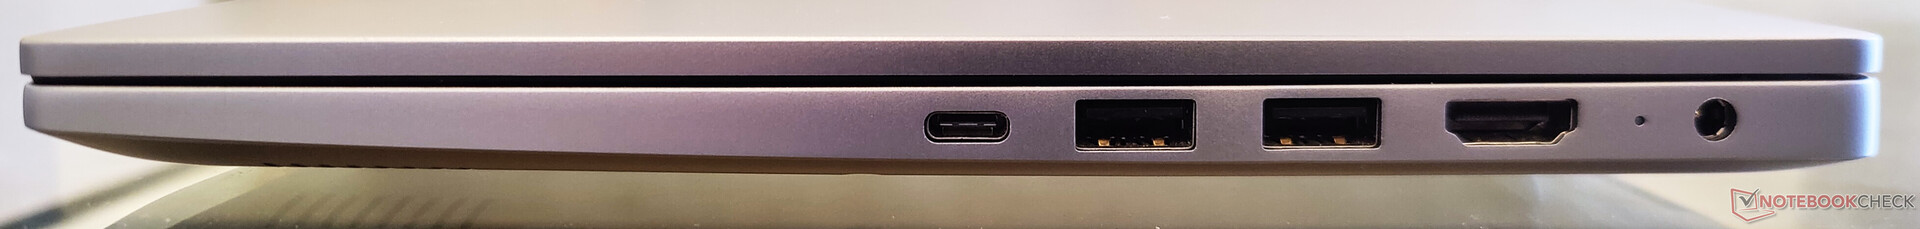
Connectivity: Cutting more corners than needed
Xiaomi has endowed the Mi NoteBook 14 Horizon with a decent port selection. On the left we have a single USB 2.0 Type-A port and a 3.5 mm combo audio jack. Towards the right, we get to see a USB 3.1 Gen1 Type-C port for data transfer (no power delivery), a pair of USB 3.1 Gen1 Type-A ports, HDMI 1.4b-out, and a charging port.
It is also here that we notice the first cost-cutting measure — there is no microSD card reader or even a Kensington lock slot available.
Communication
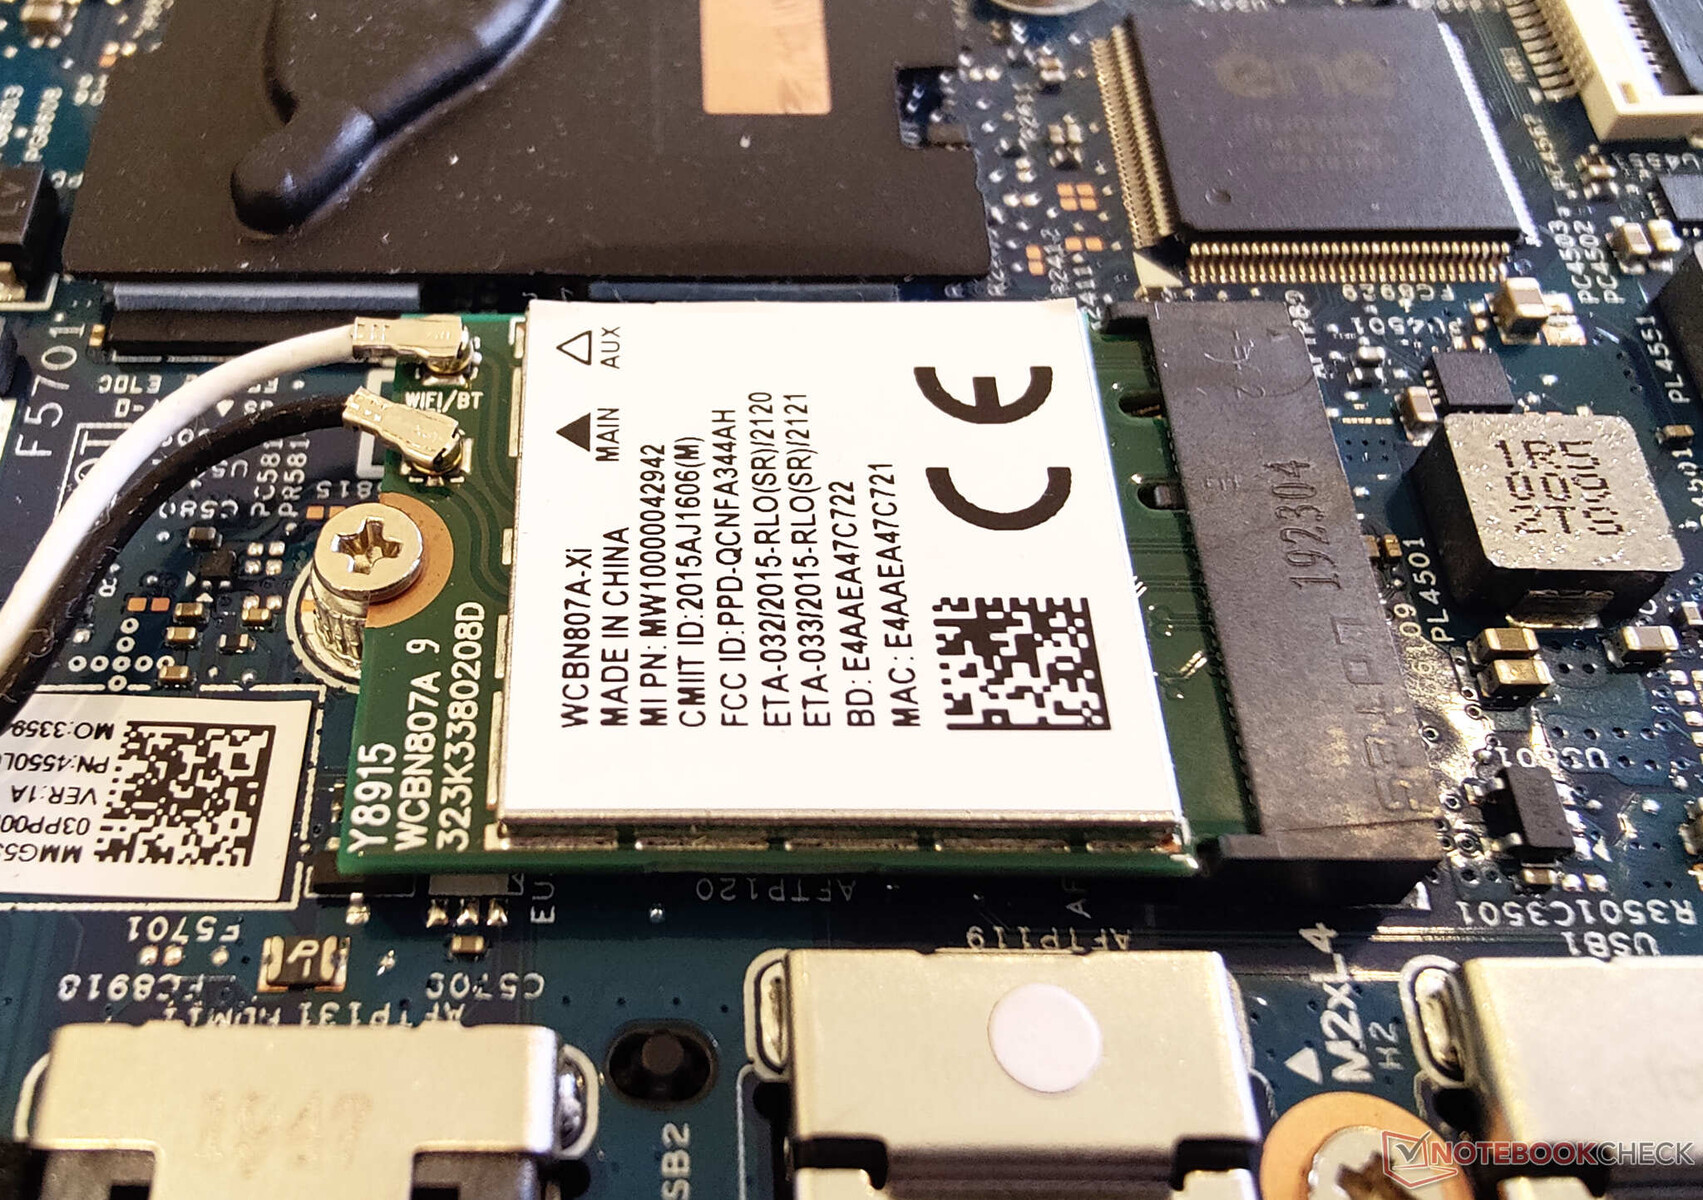
The Mi Notebook 14 Horizon implements a Qualcomm QCA61x4A WLAN card, which supports Wi-Fi 5 and Bluetooth 5.0. Wi-Fi performance significantly trails behind the competition.
Wi-Fi speeds should suffice for the vast majority of internet needs, but local networking may be slower than expected. Thankfully, the WLAN card be swapped out for a more performant alternative.
Webcam
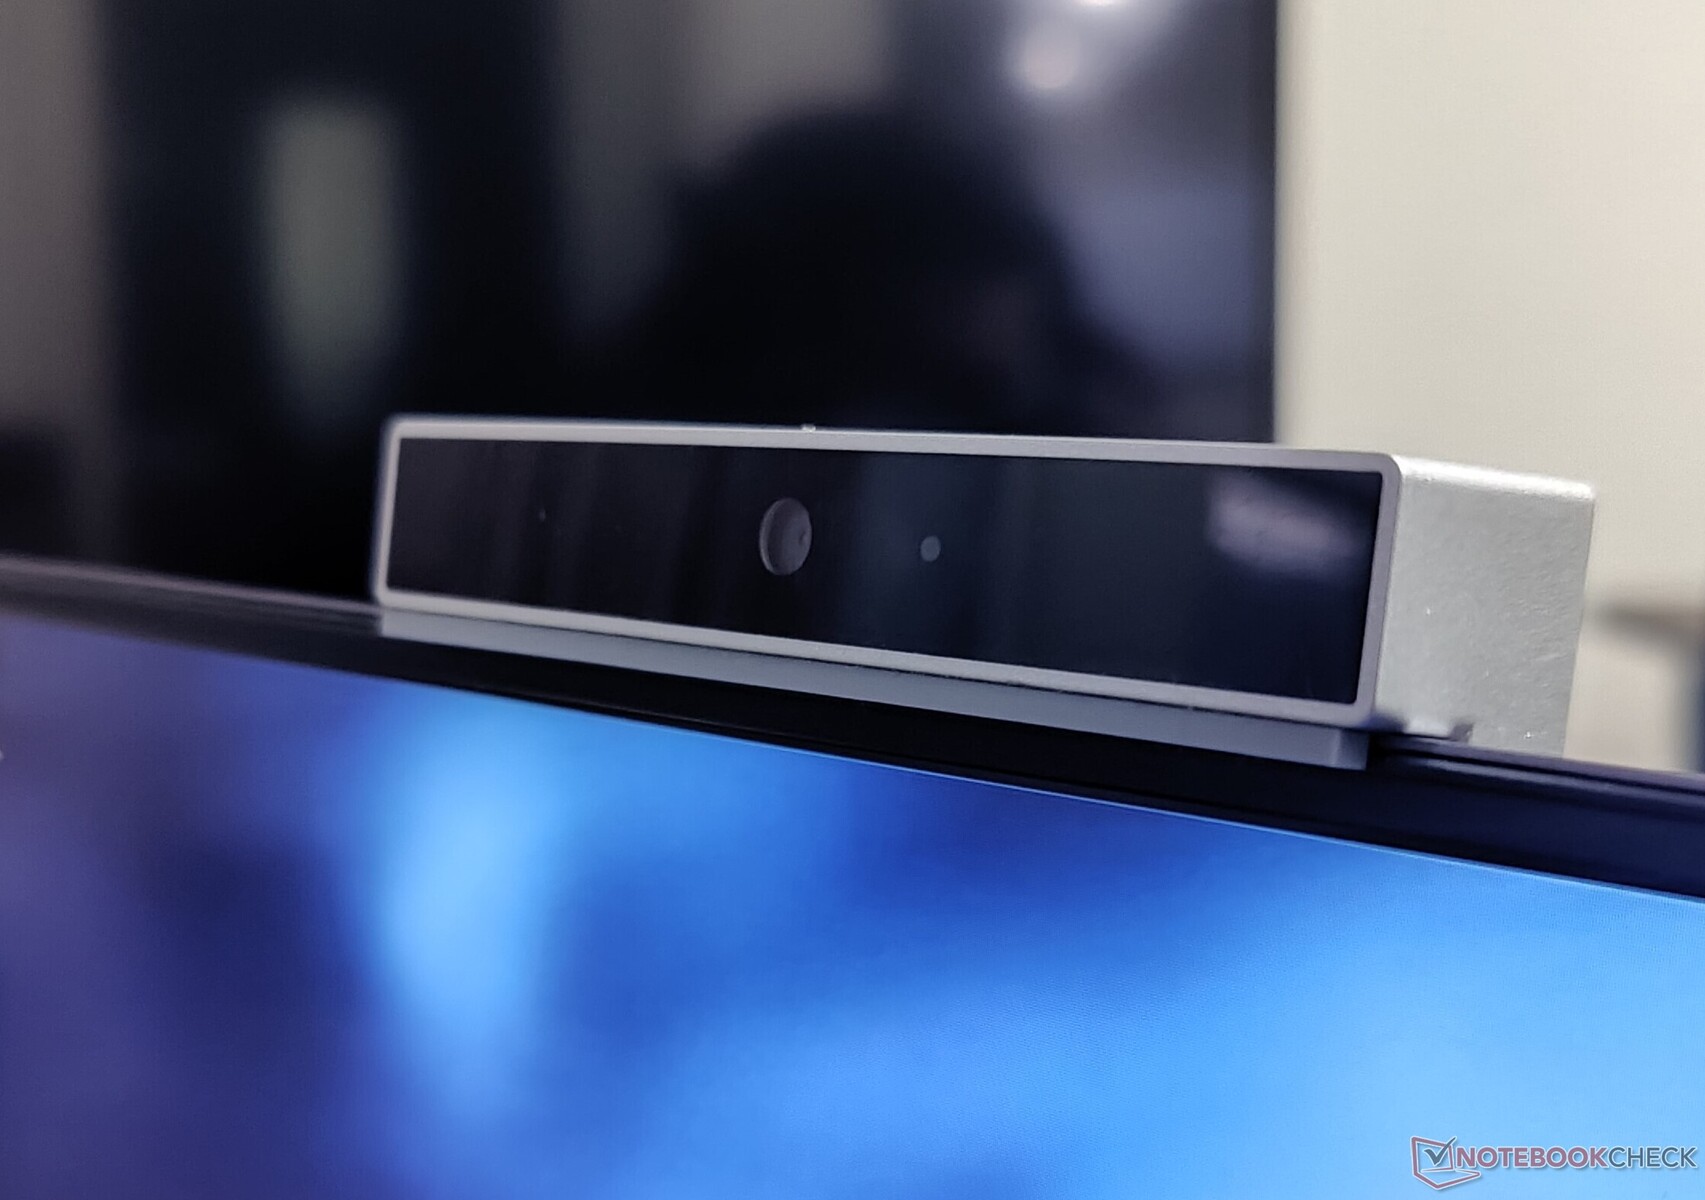
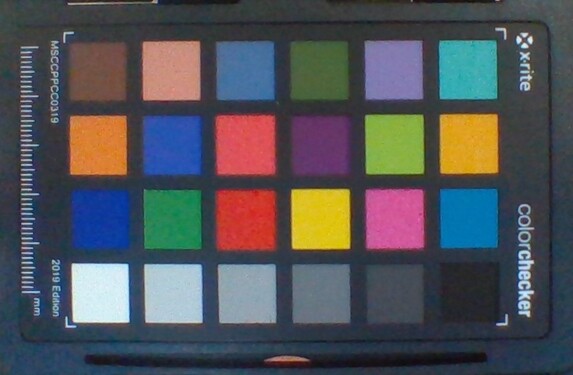
The Mi NoteBook 14 Horizon does not actually feature a built-in webcam. But given the work/learn from home situation in the pandemic, Xiaomi bundles a separate USB camera module with every purchase. Despite coming in a distinct module, the external webcam performs rather poorly with low details and poor sharpness.
Xiaomi could have included an IR camera for Windows Hello to compensate for the lack of a fingerprint sensor at a slight price markup, or at least used a much better sensor in the external module, so this seems like a wasted opportunity.


Security
There are no built-in security measures by default. The laptop lacks any form of biometric logins. However, users of the Mi Band can configure the Blaze Unlock feature to unlock the laptop with the Band. A discrete TPM 2.0 module is nevertheless available, so upgrading to Windows 11 shouldn't be an issue down the line.
Accessories
There are no additional accessories in the box apart from the external webcam, regular paperwork and a 65 W power adapter.
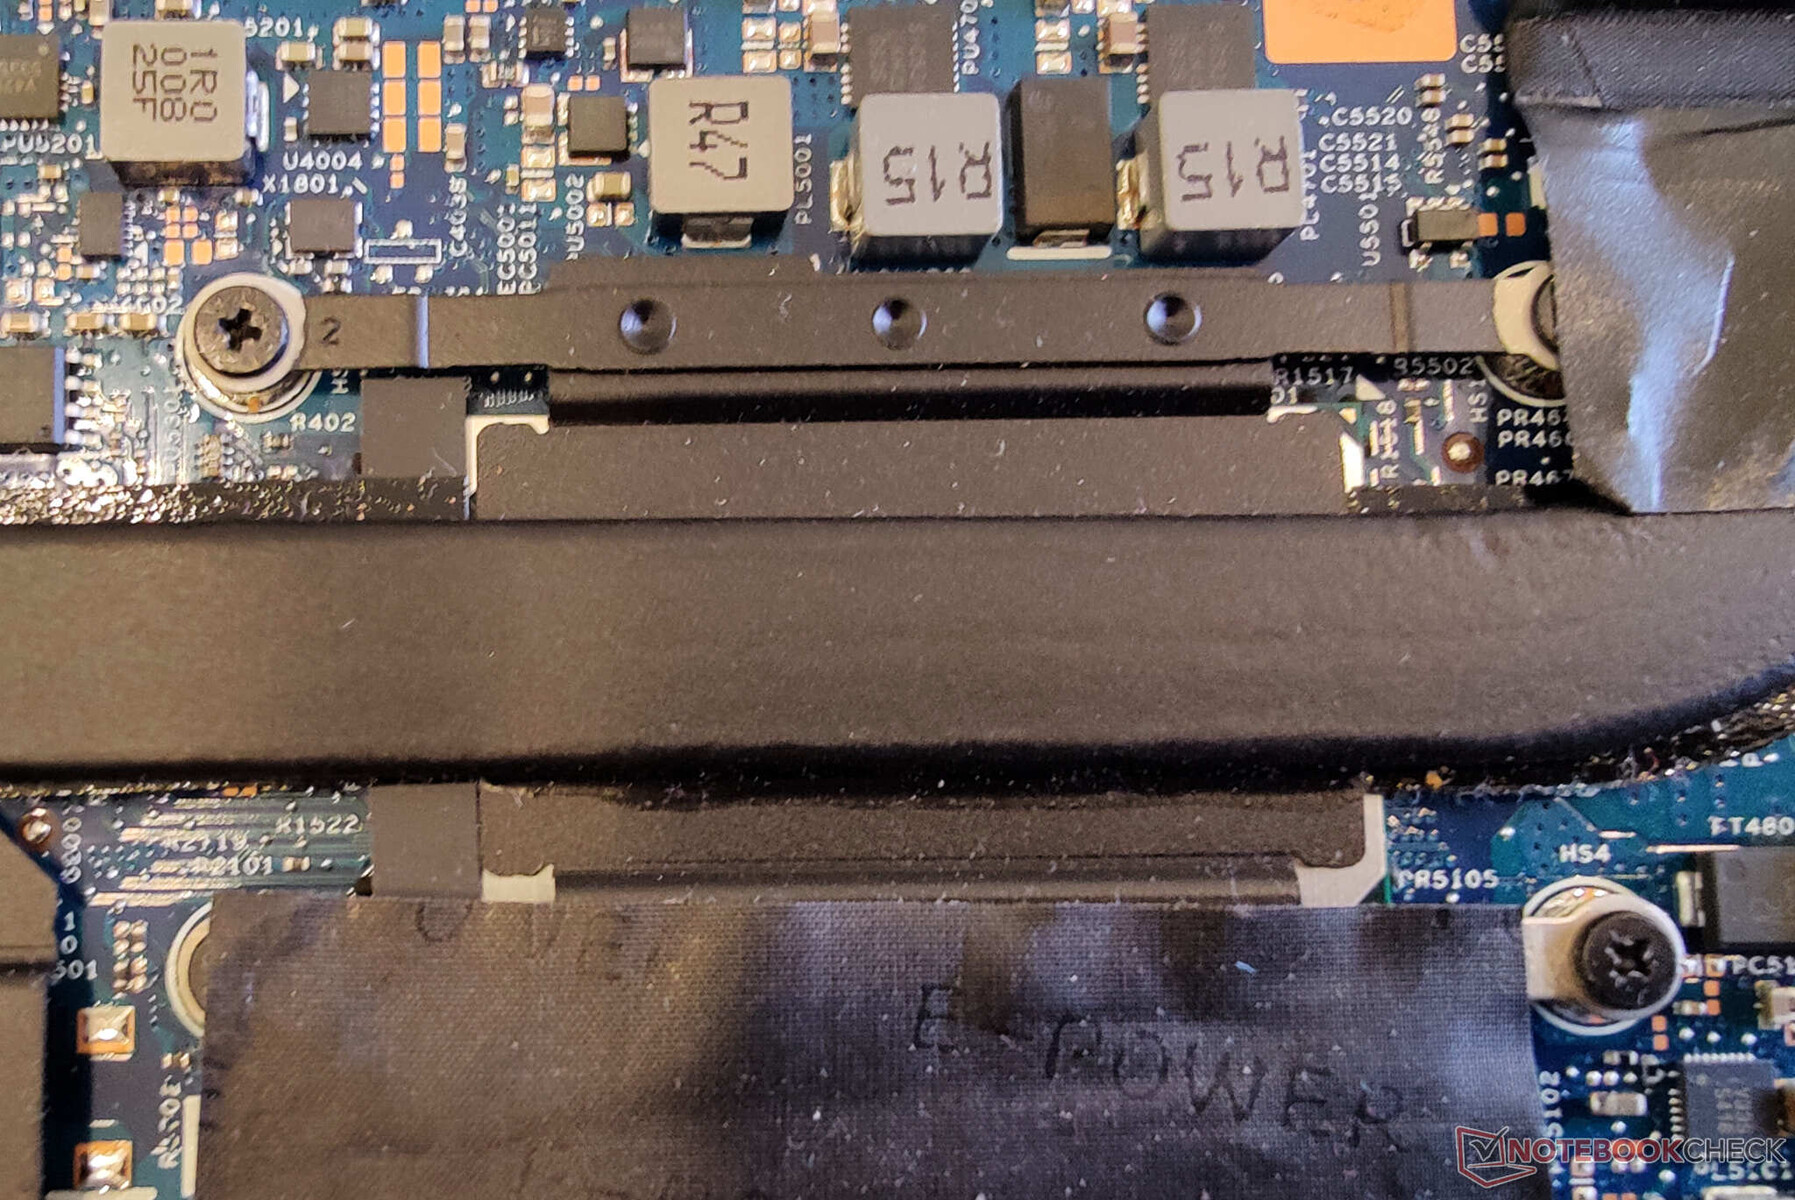
Maintenance
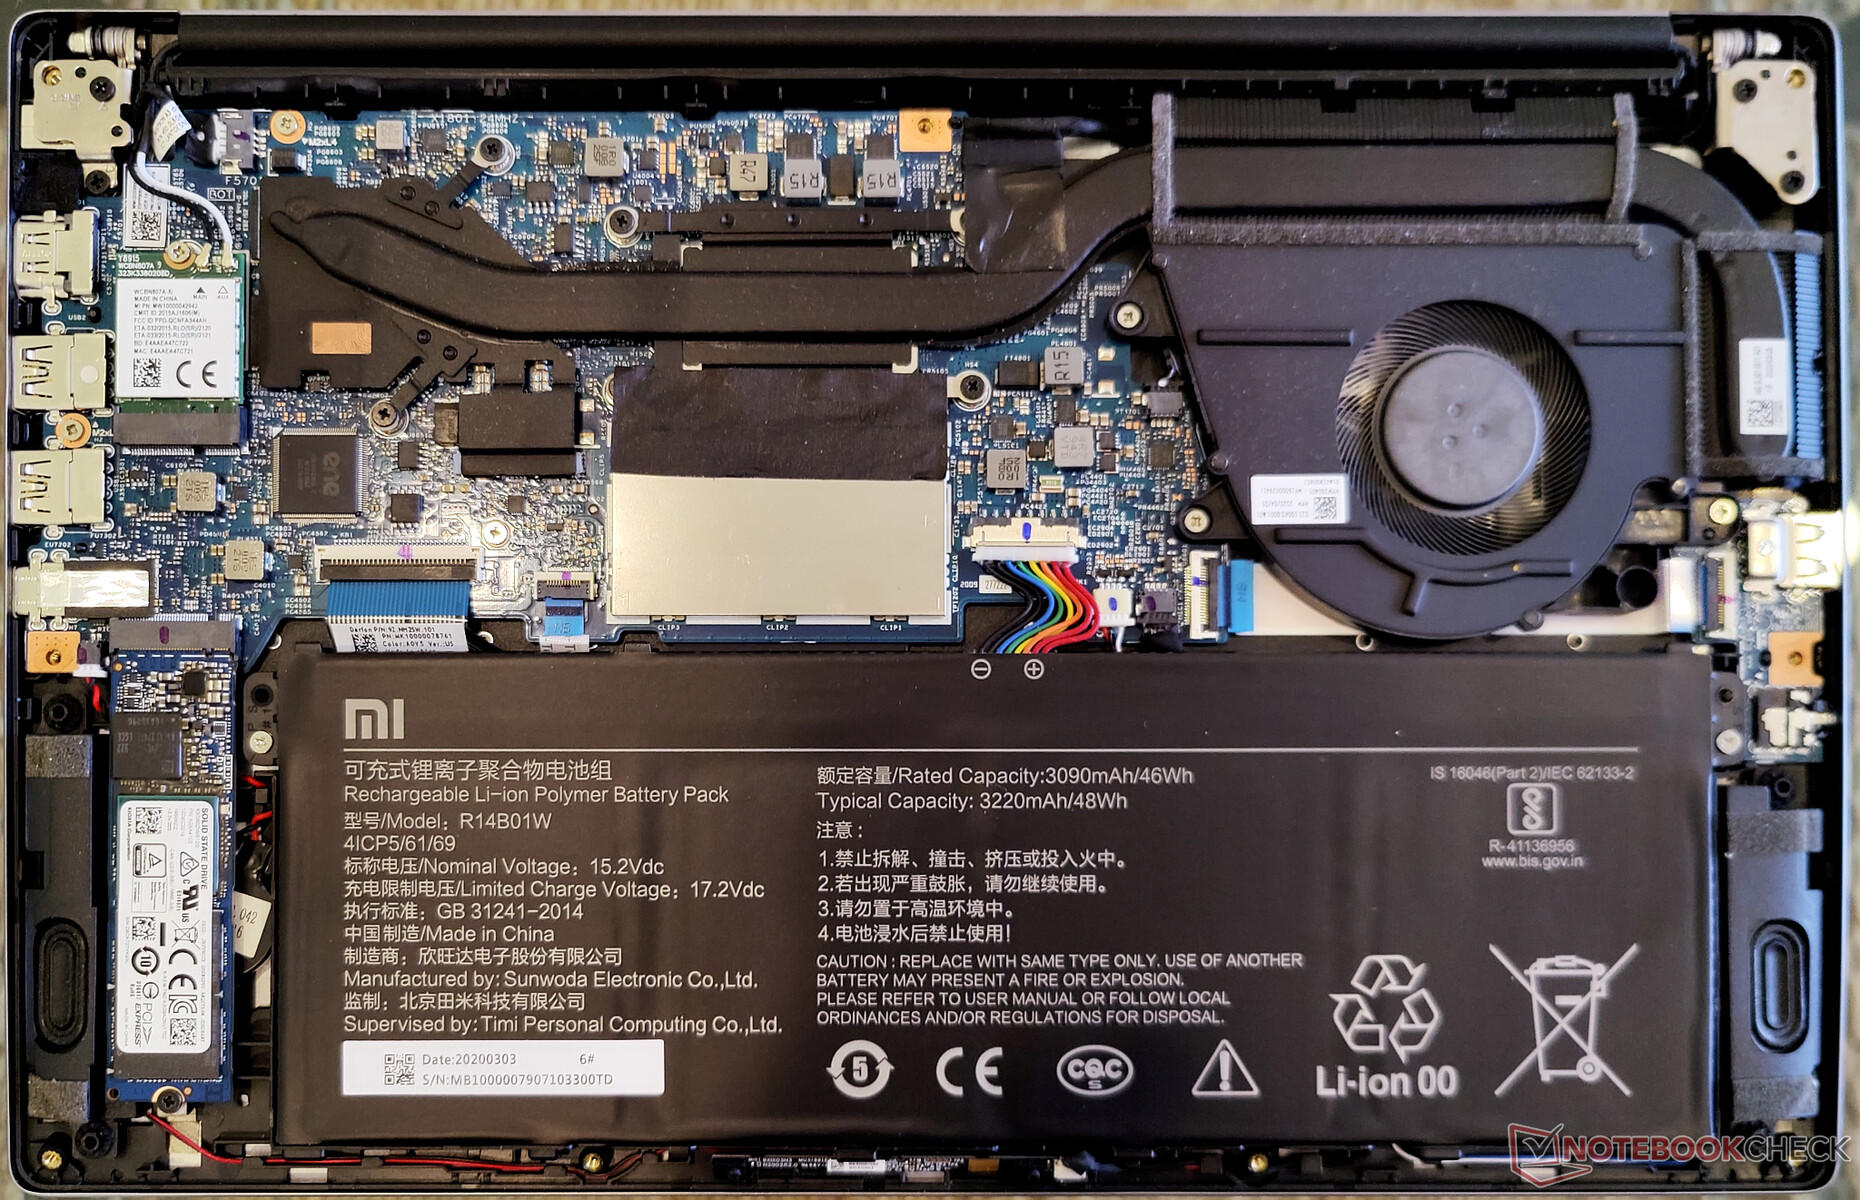
There are no service flaps available. Removing nine screws enables dislodging the bottom panel but with some effort.
There is some scope for user-servicing. While the RAM comes soldered, the Wi-Fi card and NVMe SSD can be swapped out for better options. There are no additional drive bays or M.2 slots for storage expansion.
Warranty
Xiaomi offers a standard one year warranty for the Mi Notebook 14 Horizon Edition. Buyers can choose from several add-on Mi Protection plans including Mi Laptop Insurance and Mi Extended Warranty up to two years at checkout.
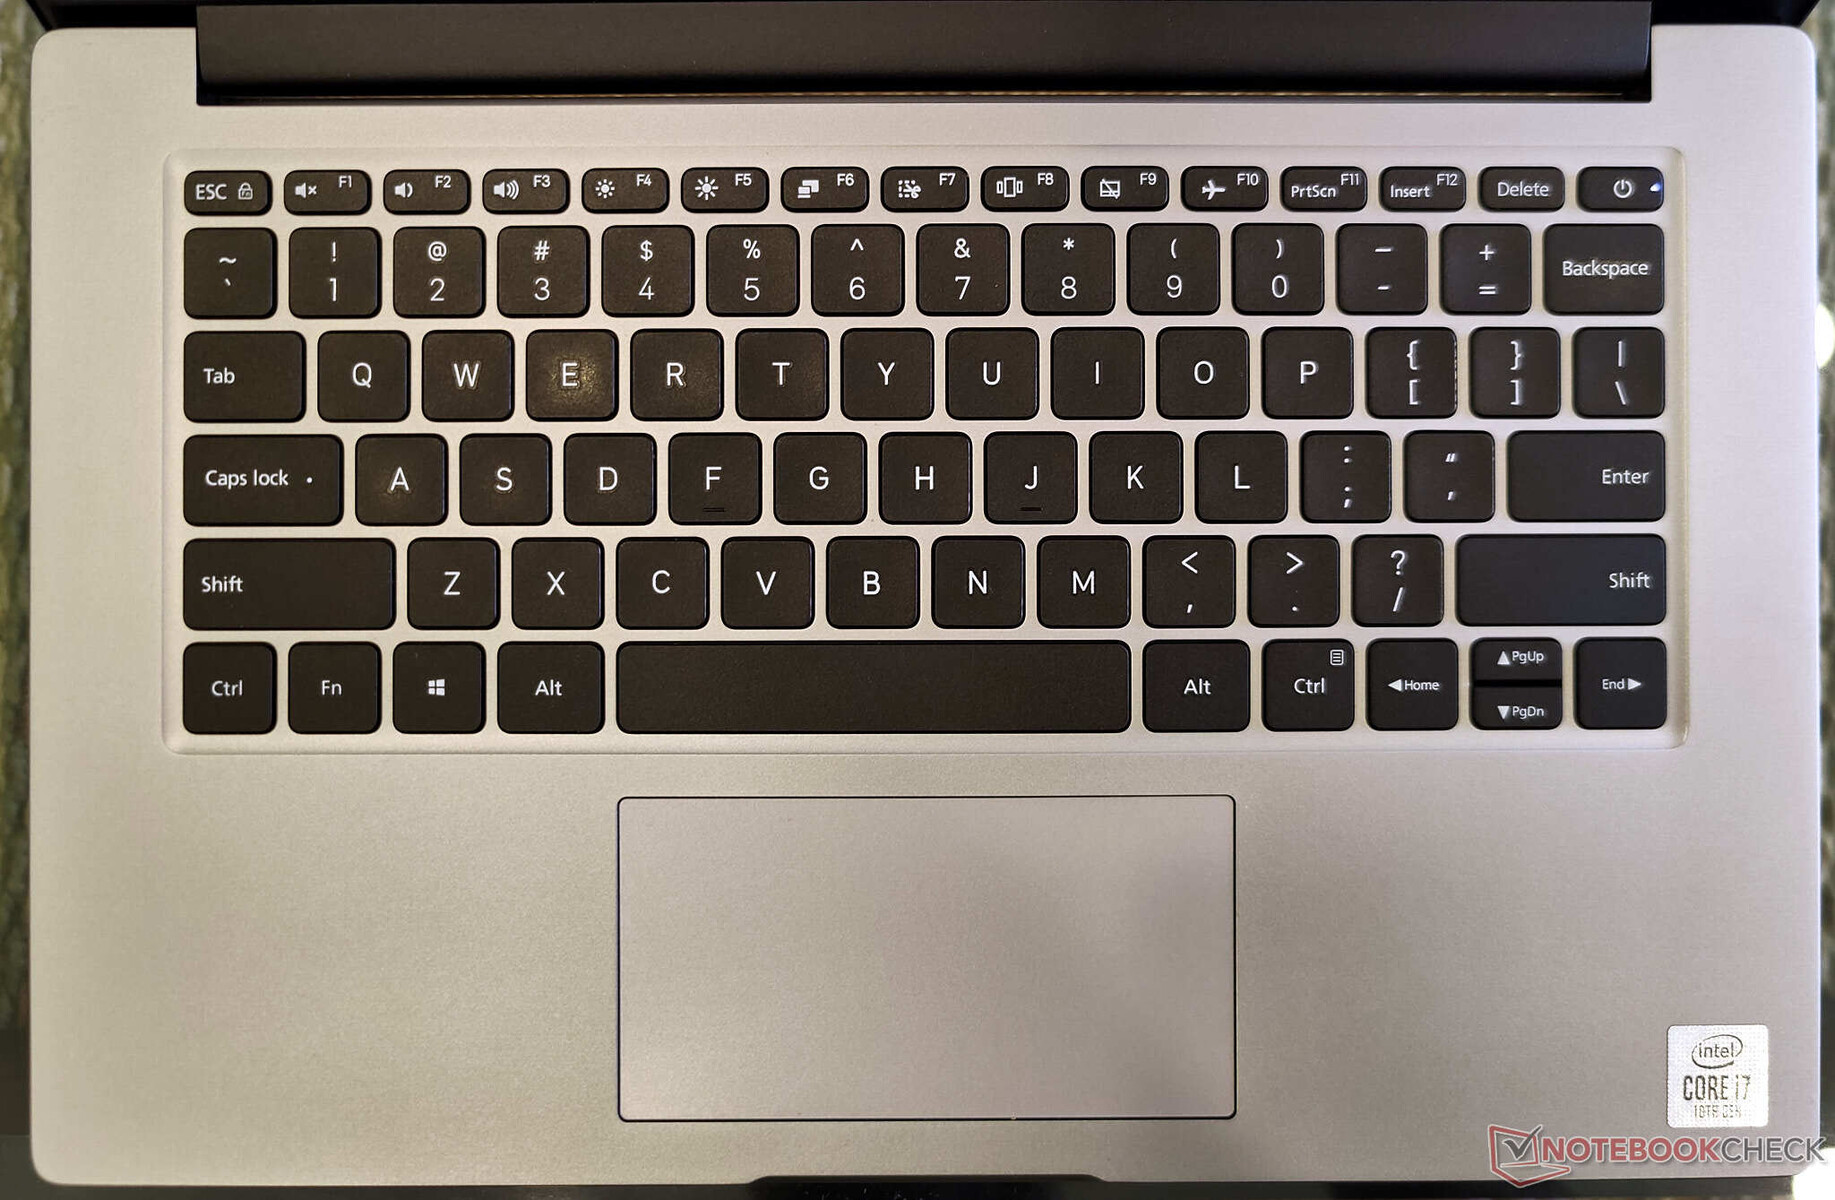
Input Devices: Scissor mechanism with no backlight
Keyboard
Chassis design apart, Xiaomi also seems to have taken inspired by the scissor mechanism keyboards in MacBooks. The keys do sound like they are scissor switches. The keyboard is specified to offer a 1.3 mm key travel. However, in practical use, the key travel feels a lot shallower. Tactile feedback, although decent, is somewhat on the lower side so long typing durations can seem a bit tedious at times.
The keyboard lacks any form of backlighting, which is a major negative for a device in this price range.
Touchpad
The touchpad offers a smooth gliding experience and supports Windows Precision gestures. However, at just 11 cm x 5.5 cm, the touchpad area feels somewhat cramped. The bottom left and right corners of the touchpad can act as corresponding mouse buttons while the entire surface, even at the corners, works as a general left-click.
The buttons are firm and click a tad louder for our preference. The touchpad also supports palm rejection, which seemed to work well in our testing.
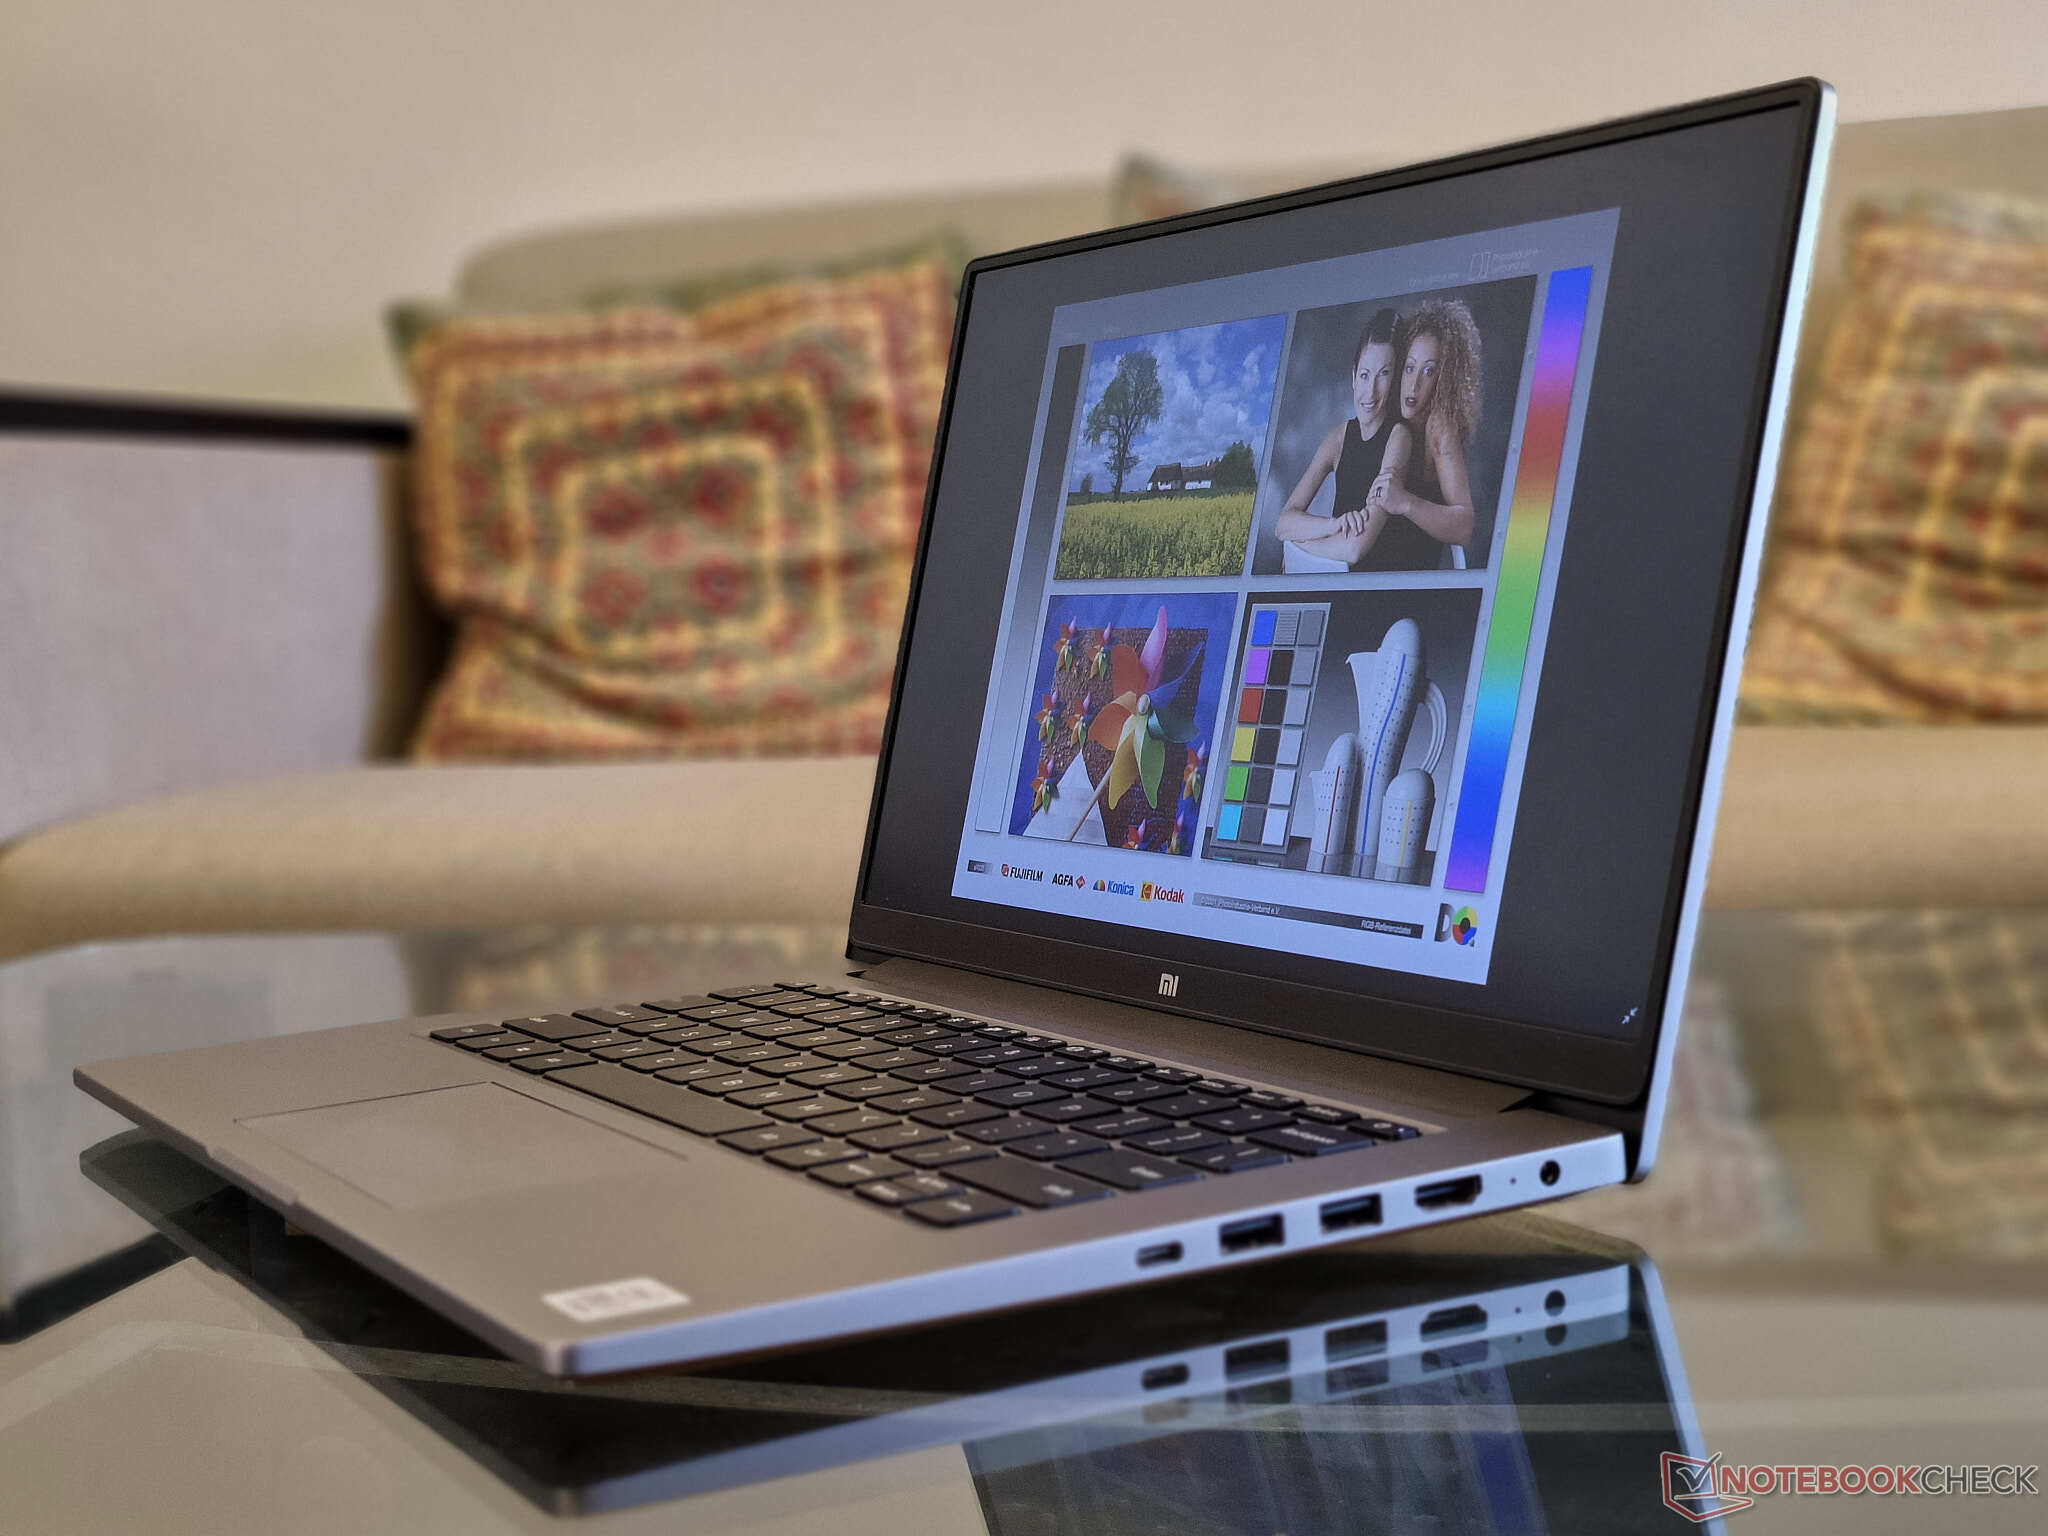
Display: Fine for casual use but with very low PWM
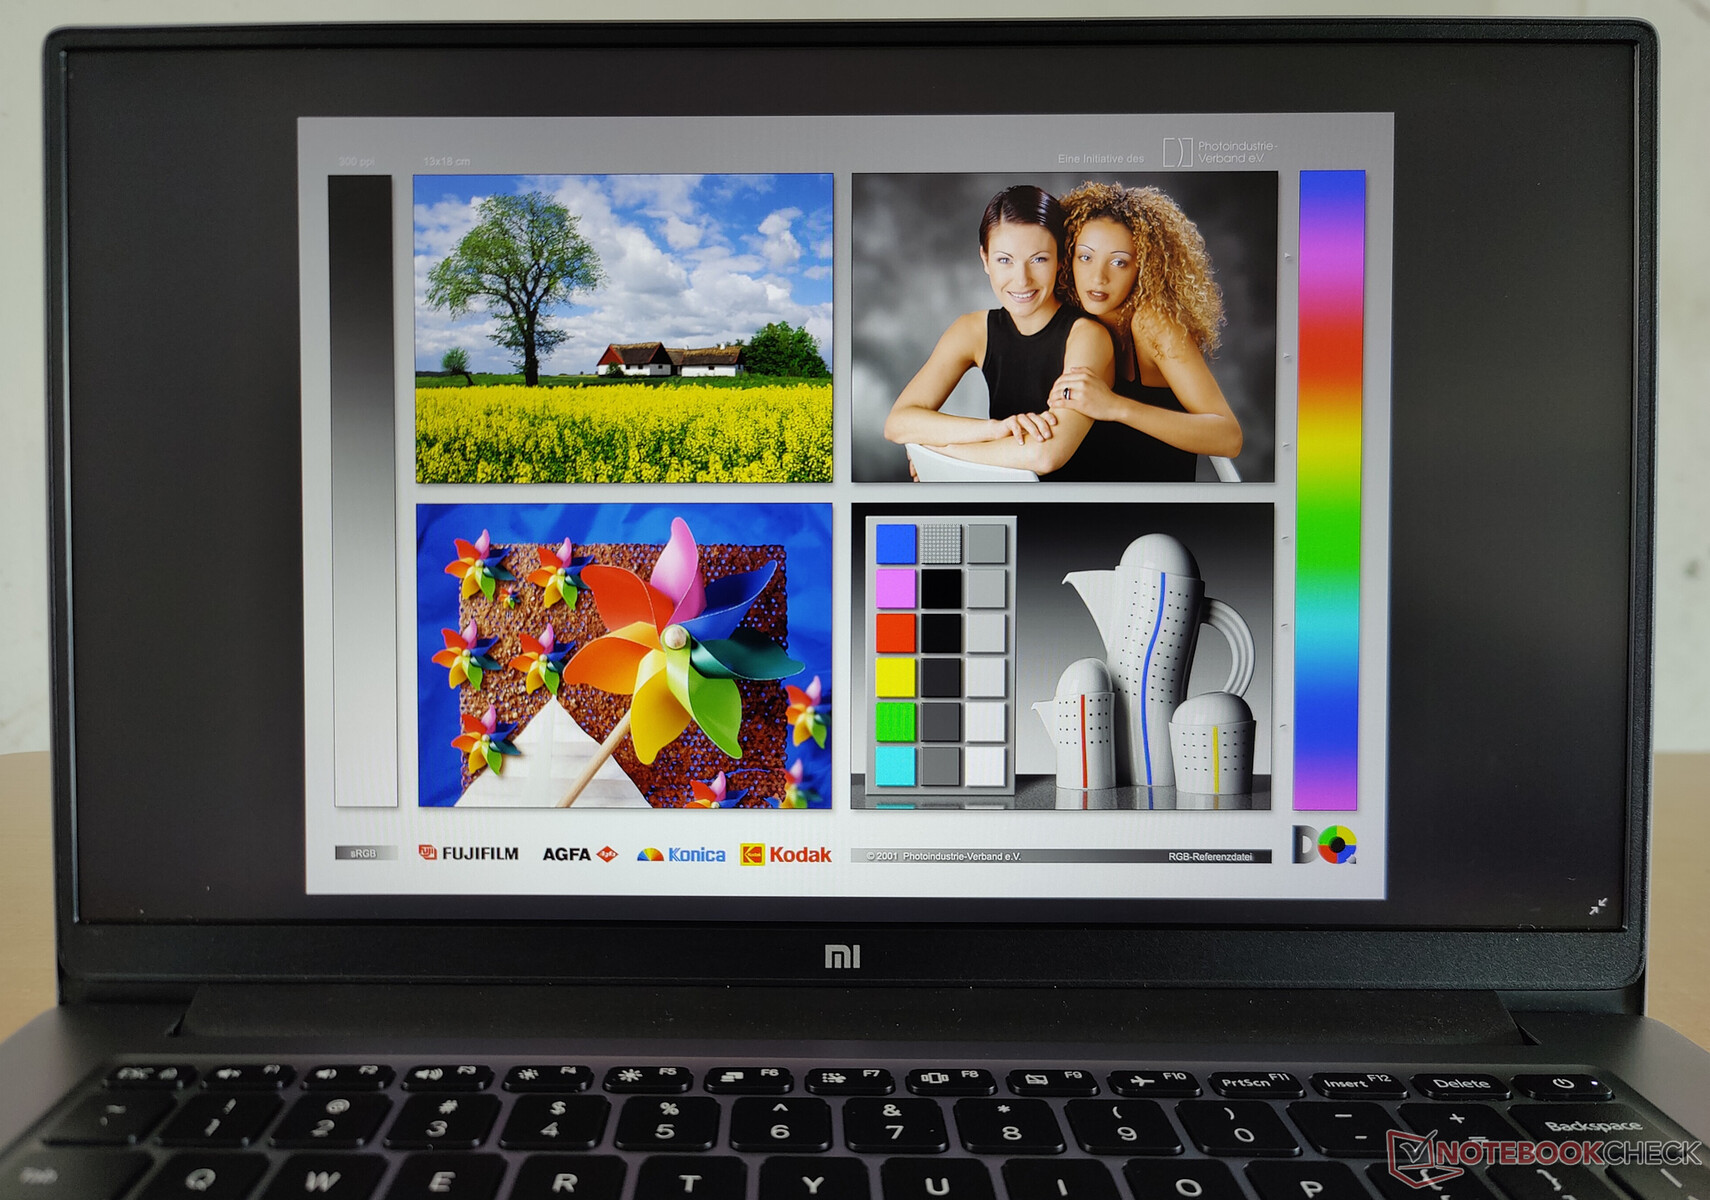
Our test unit came equipped with a 14-inch FHD 16:9 panel with a 60 Hz refresh rate. The display does not feature any enticing characteristics, which is to be expected given the budget positioning. However, it does not show any significant backlight bleeding, which manifests in a decent brightness distribution of 91%.


| |||||||||||||||||||||||||
Brightness Distribution: 91 %
Center on Battery: 268.65 cd/m²
Contrast: 1644:1 (Black: 0.17 cd/m²)
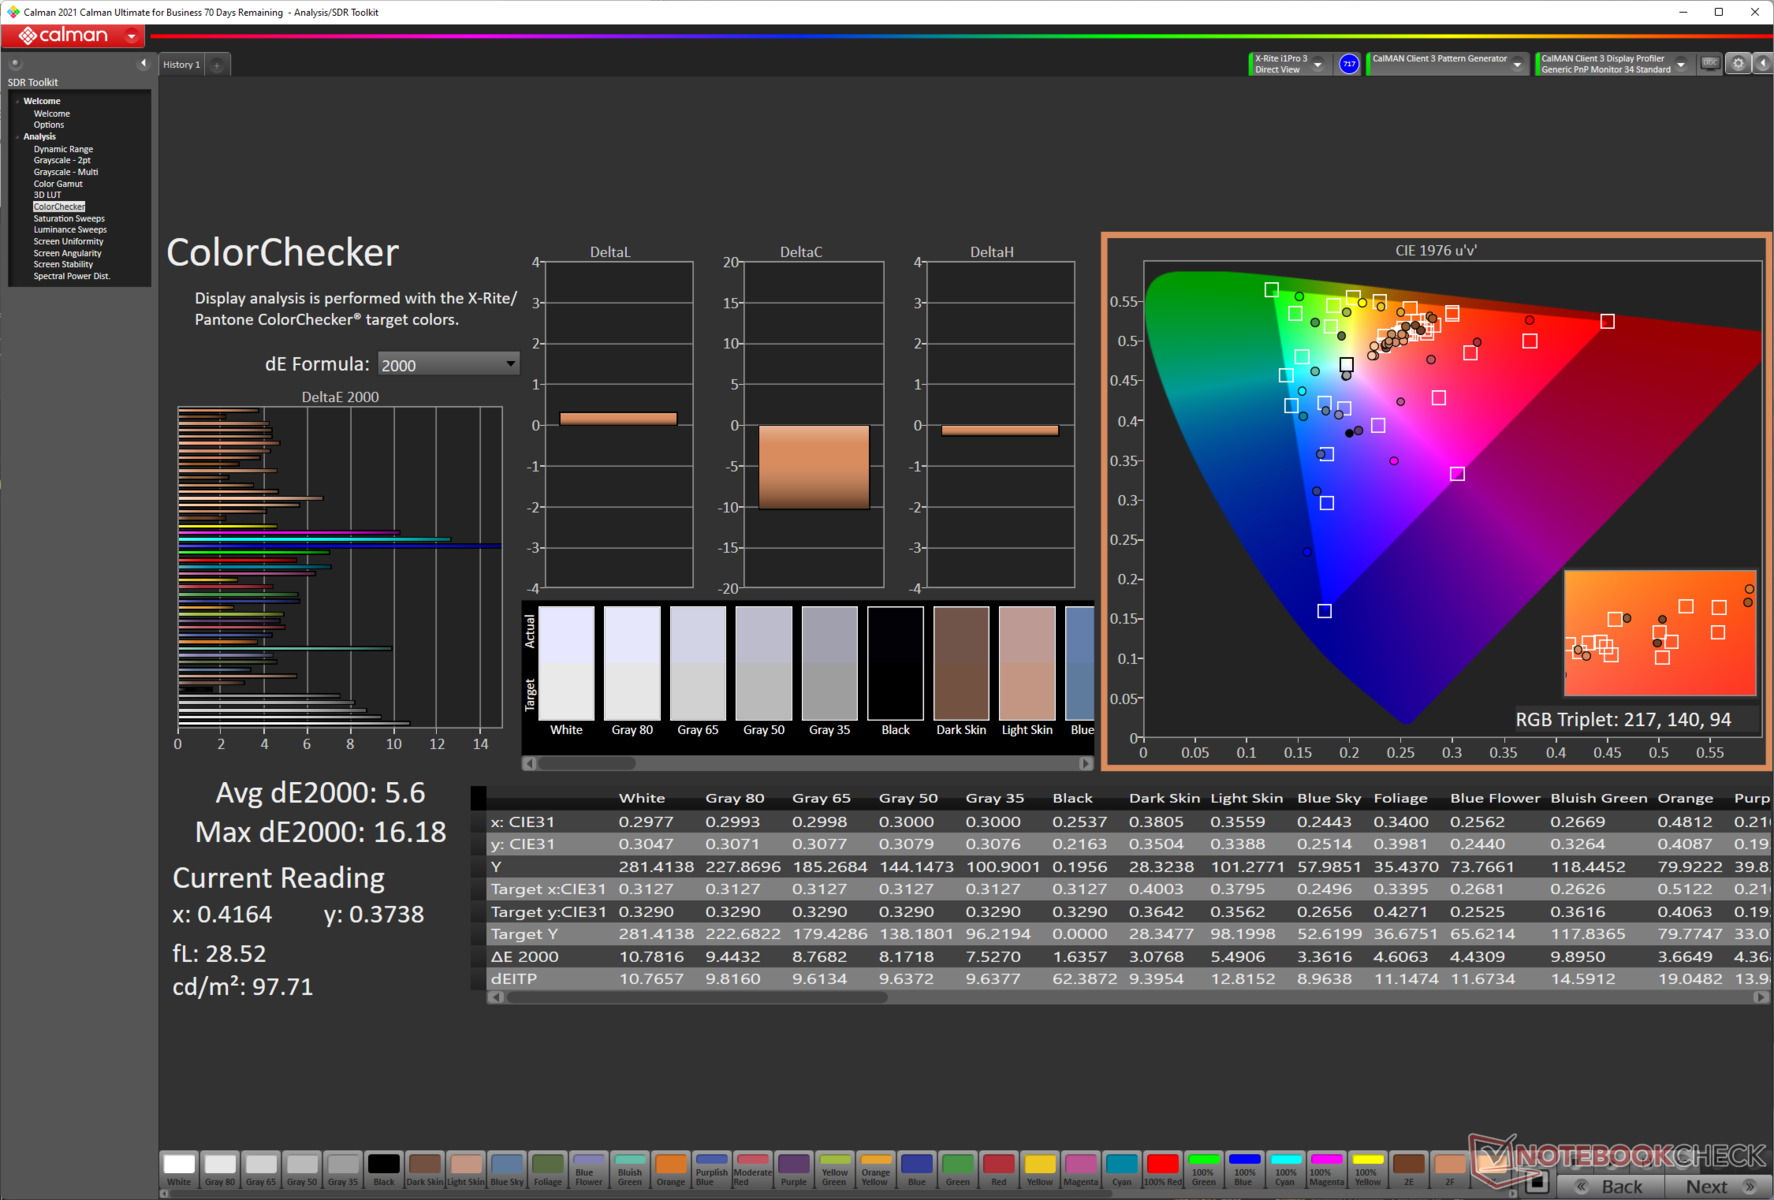
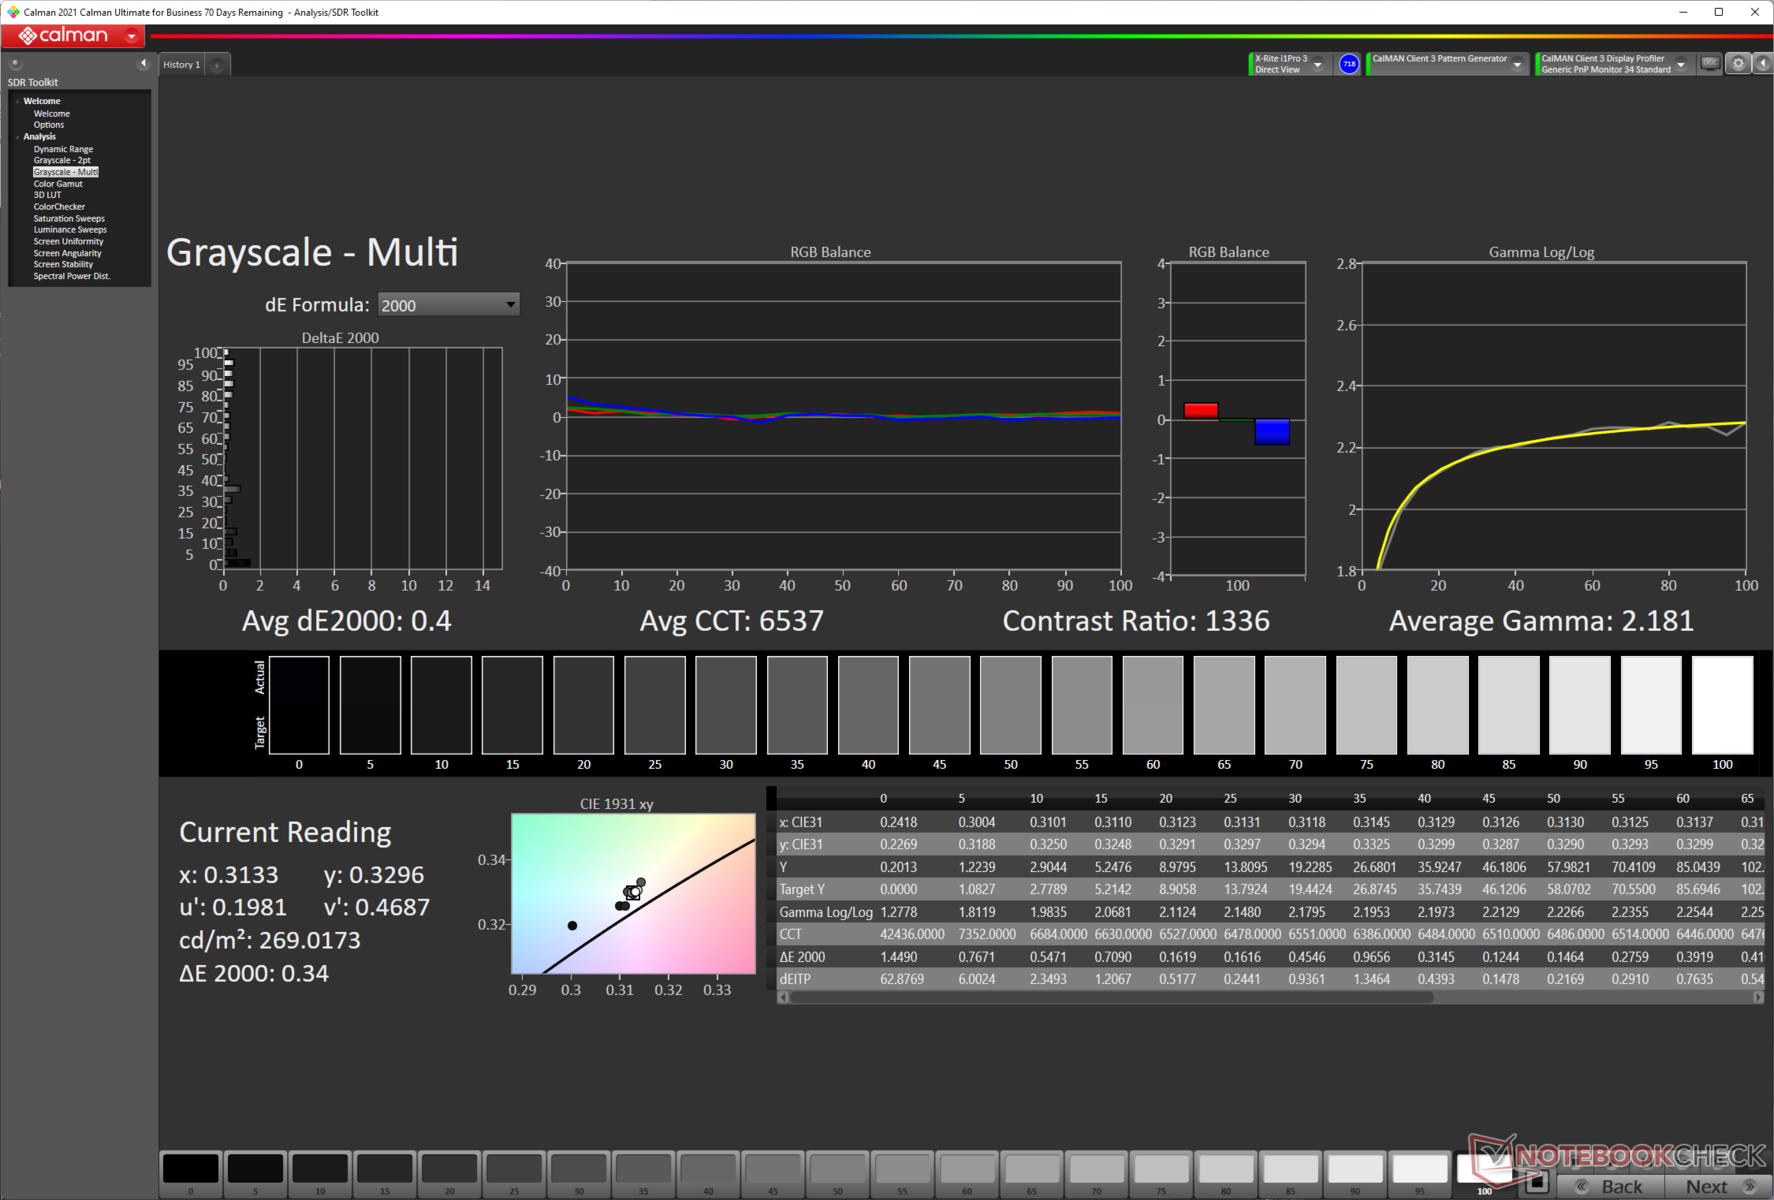
ΔE Color 5.6 | 0.5-29.43 Ø5, calibrated: 3.76
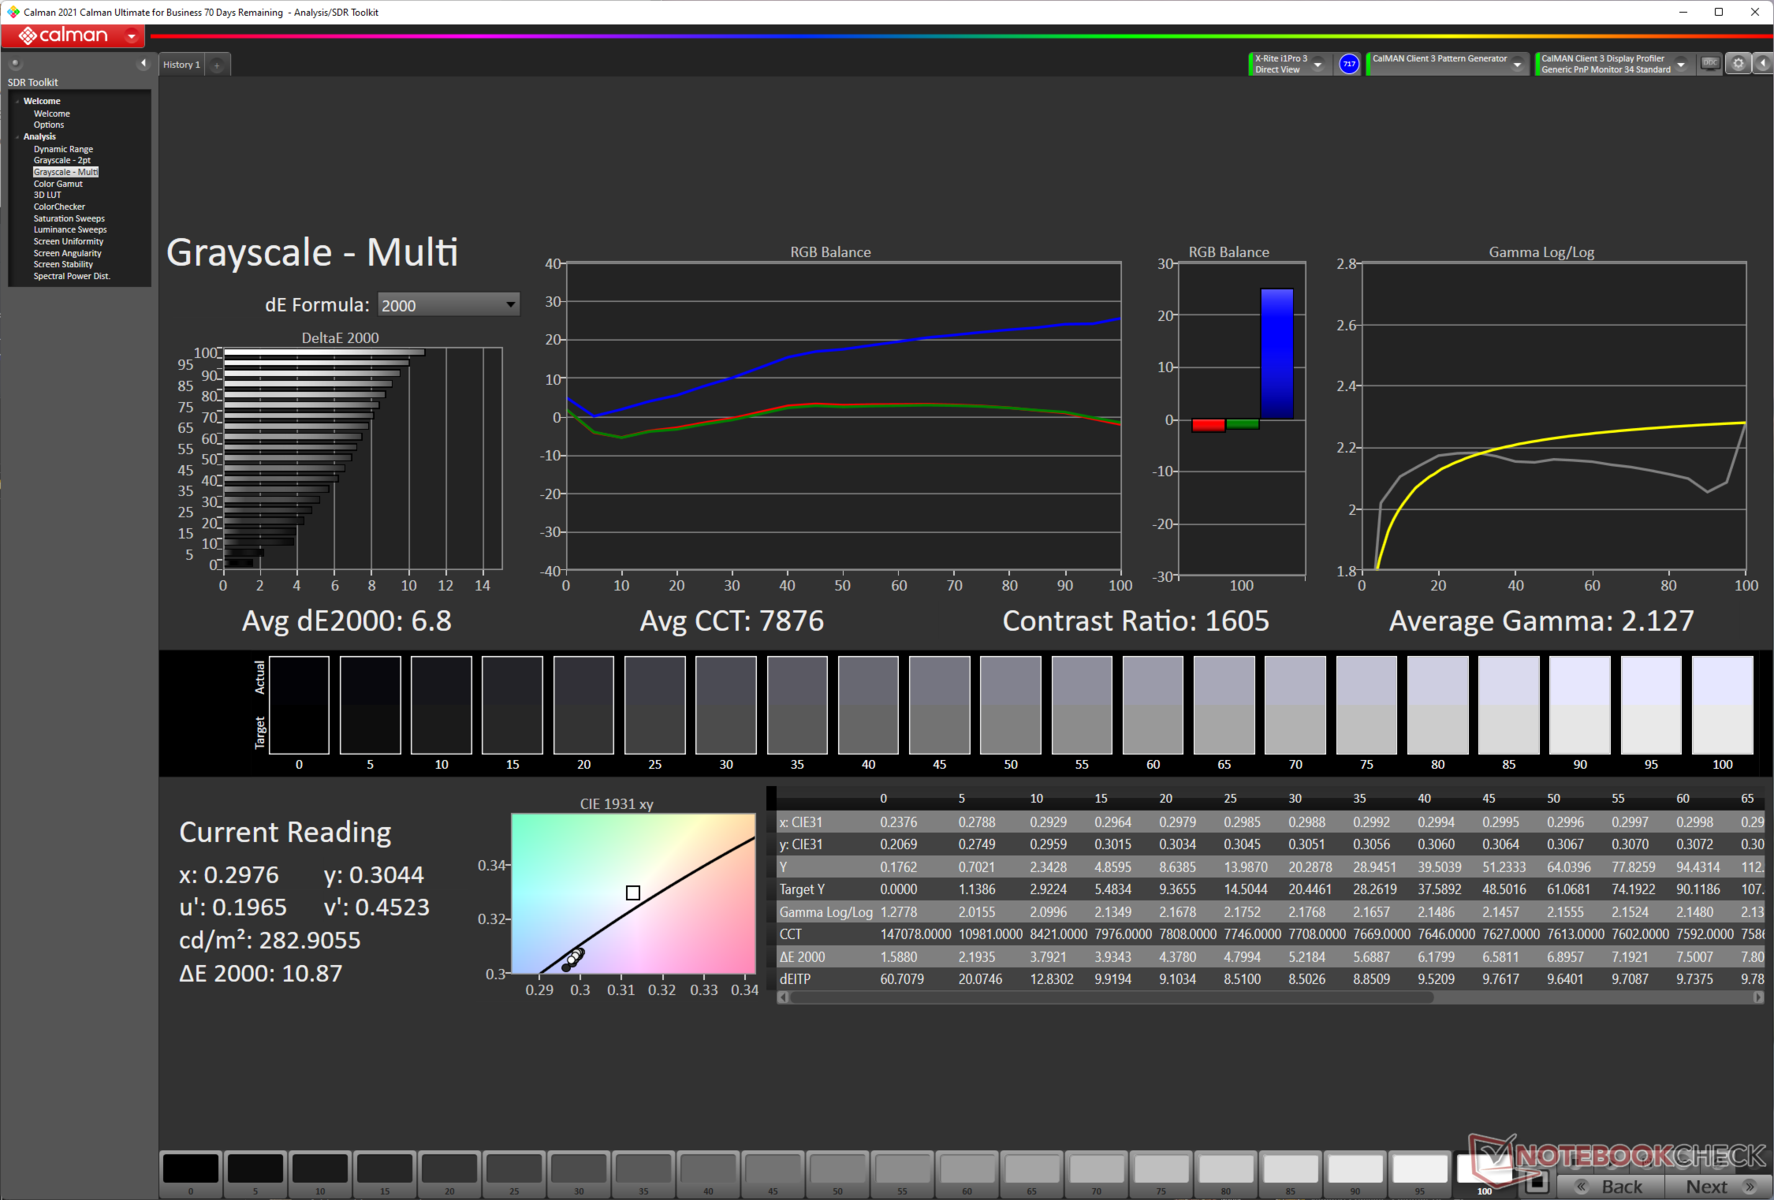
ΔE Greyscale 6.8 | 0.57-98 Ø5.3
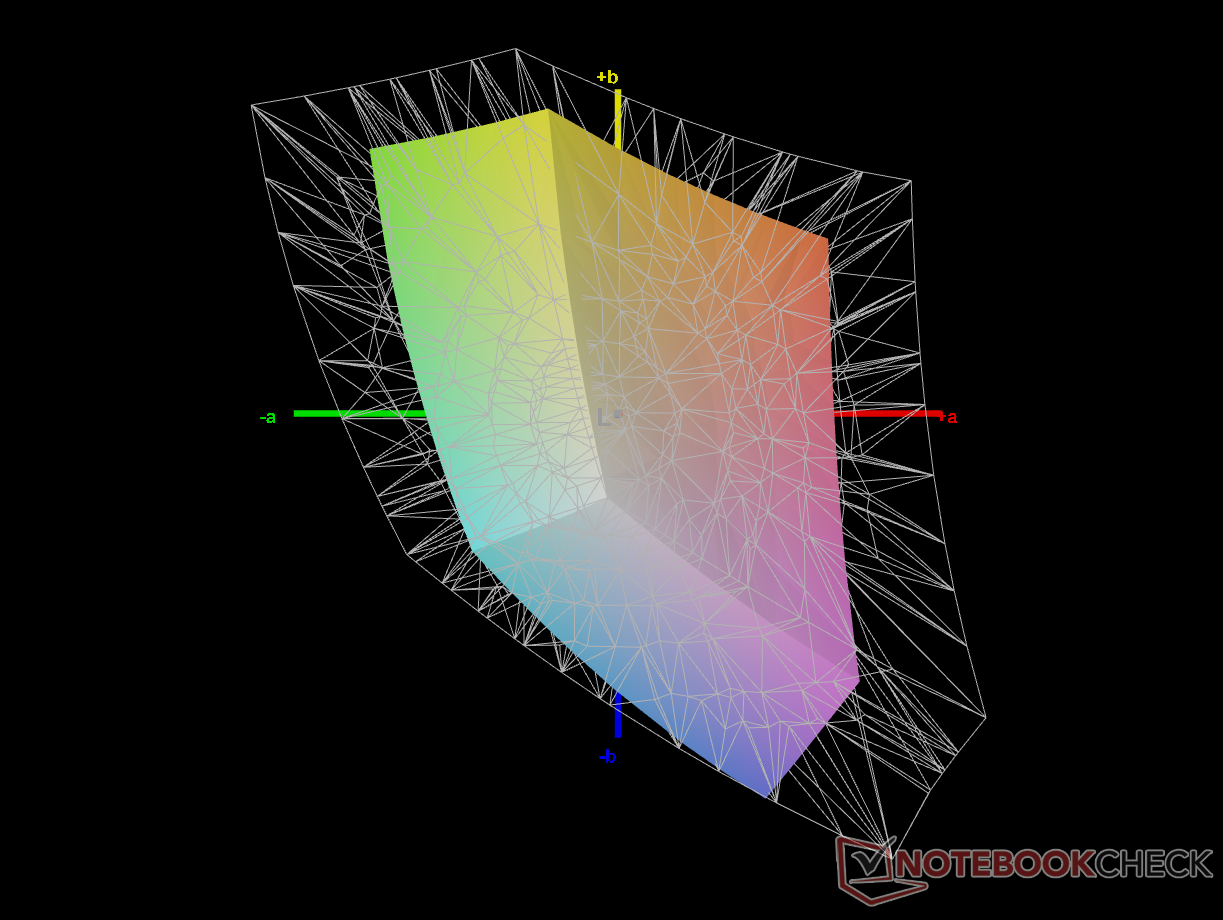
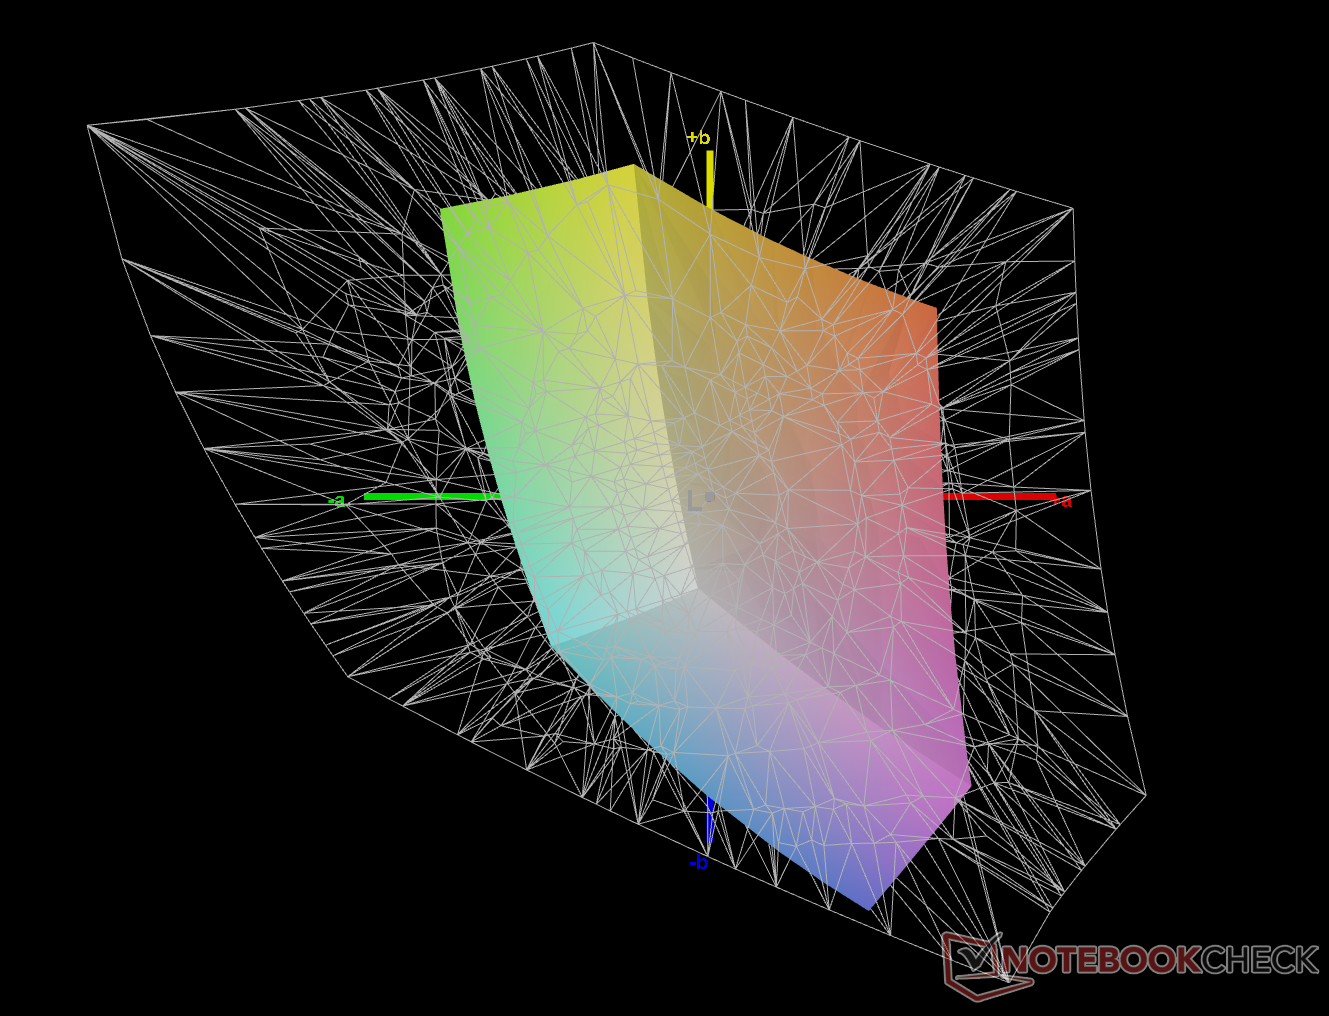
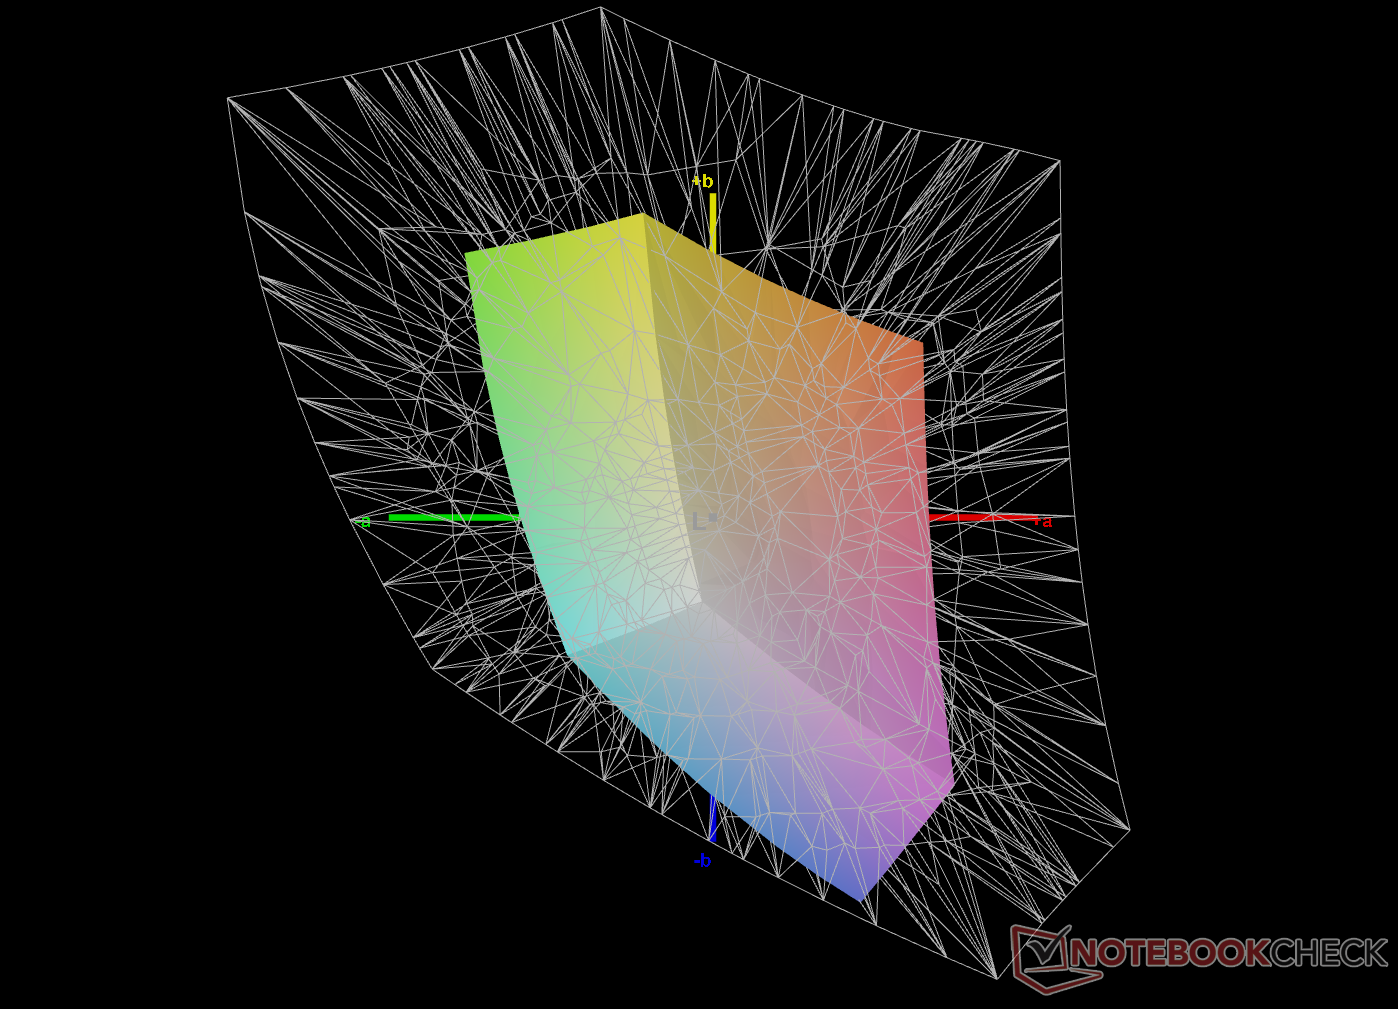
40.2% AdobeRGB 1998 (Argyll 2.2.0 3D)
58.5% sRGB (Argyll 2.2.0 3D)
38.9% Display P3 (Argyll 2.2.0 3D)
Gamma: 2.12
| Xiaomi Mi NoteBook 14 Horizon Edition Panda LM140LF4L01, TFT-LCD, 14.00, 1920x1080 | Huawei MateBook 14 2020 Intel TV140WTM-NH0, IPS LED, 14.00, 2160x1440 | Acer TravelMate P6 P614-51T-G2-72ZU AU Optronics B140HAK02.5, IPS, 14.00, 1920x1080 | Asus VivoBook S14 S433FL Chi Mei CMN14D4, IPS, 14.00, 1920x1080 | HP Envy 13-ba0001ng AU Optronics AUO3A8C, IPS, 13.30, 1920x1080 | Acer Swift 3 SF314-42-R4XJ AU Optronics B140HAN04.0, IPS, 14.00, 1920x1080 | |
|---|---|---|---|---|---|---|
| Display | 71% | 70% | 7% | 71% | -4% | |
| Display P3 Coverage | 38.9 | 67.1 72% | 69.2 78% | 41.55 7% | 67.1 72% | 37.2 -4% |
| sRGB Coverage | 58.5 | 99.1 69% | 93.7 60% | 62 6% | 99.1 69% | 55.9 -4% |
| AdobeRGB 1998 Coverage | 40.2 | 69 72% | 68.6 71% | 42.99 7% | 69.2 72% | 38.43 -4% |
| Response Times | 33016% | -34% | 90% | -80% | -39% | |
| Response Time Grey 50% / Grey 80% * | 26.41 ? | 37.6 ? -42% | 37 ? -40% | 34 ? -29% | 56 ? -112% | 41 ? -55% |
| Response Time Black / White * | 20.37 ? | 22.4 ? -10% | 26 ? -28% | 24 ? -18% | 30 ? -47% | 25 ? -23% |
| PWM Frequency | 60 ? | 59520 ? 99100% | 250 ? 317% | |||
| Screen | 30% | 7% | -8% | 49% | -7% | |
| Brightness middle | 279.47 | 458 64% | 323 16% | 220 -21% | 466 67% | 269 -4% |
| Brightness | 269 | 448 67% | 308 14% | 204 -24% | 418 55% | 244 -9% |
| Brightness Distribution | 91 | 89 -2% | 90 -1% | 68 -25% | 85 -7% | 83 -9% |
| Black Level * | 0.17 | 0.25 -47% | 0.35 -106% | 0.155 9% | 0.215 -26% | 0.23 -35% |
| Contrast | 1644 | 1832 11% | 923 -44% | 1419 -14% | 2167 32% | 1170 -29% |
| Colorchecker dE 2000 * | 5.6 | 3.4 39% | 3.07 45% | 5.23 7% | 1.06 81% | 4.94 12% |
| Colorchecker dE 2000 max. * | 16.18 | 6.7 59% | 5.8 64% | 21.51 -33% | 1.59 90% | 20.37 -26% |
| Colorchecker dE 2000 calibrated * | 3.76 | 1.7 55% | 3.07 18% | 4.4 -17% | 1.09 71% | 5.03 -34% |
| Greyscale dE 2000 * | 6.8 | 4.9 28% | 2.99 56% | 3.77 45% | 1.3 81% | 1.71 75% |
| Gamma | 2.12 104% | 2.16 102% | 2.32 95% | 2.35 94% | 2.39 92% | 2.52 87% |
| CCT | 7876 83% | 7704 84% | 6097 107% | 6666 98% | 6699 97% | 6535 99% |
| Color Space (Percent of AdobeRGB 1998) | 63.5 | 61 | 40 | 63 | 35 | |
| Color Space (Percent of sRGB) | 99.1 | 93 | 62 | 99 | 56 | |
| Total Average (Program / Settings) | 11039% /
6636% | 14% /
15% | 30% /
14% | 13% /
36% | -17% /
-11% |
* ... smaller is better
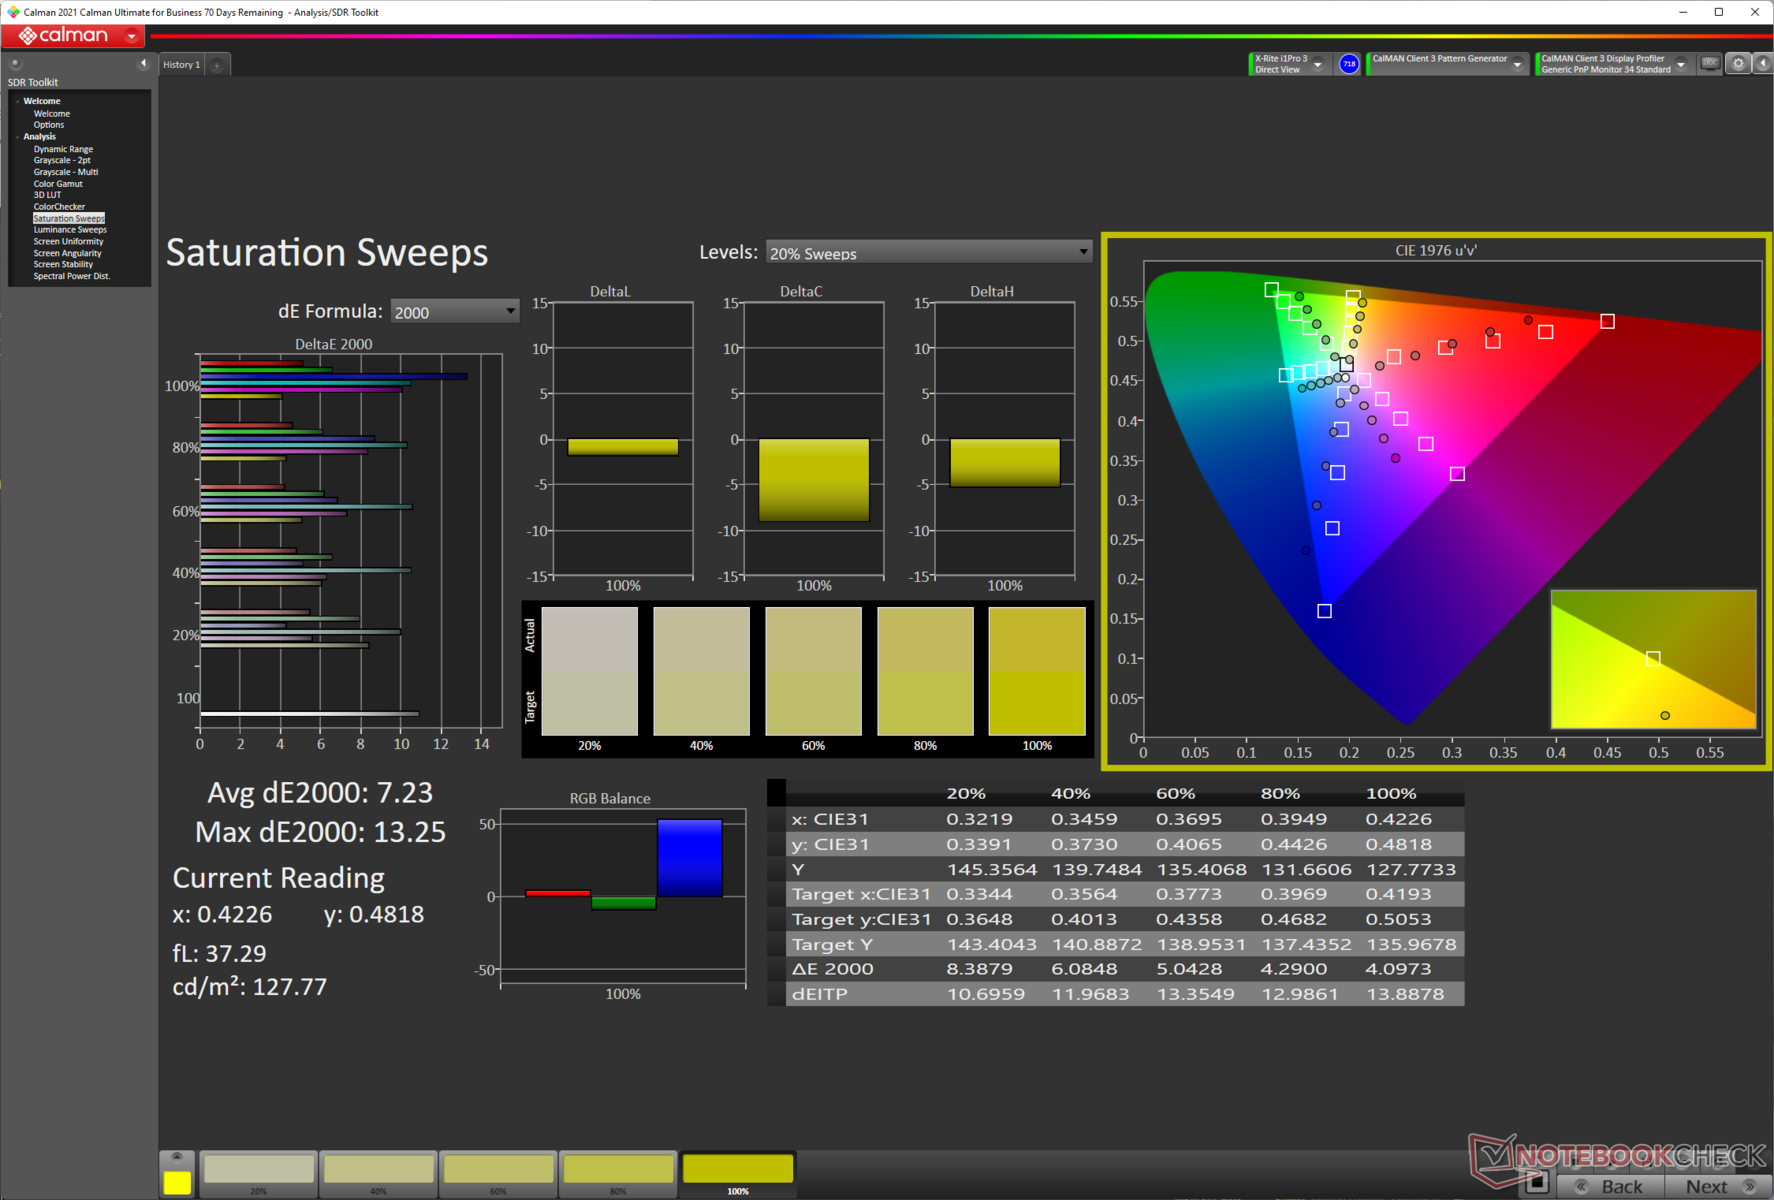
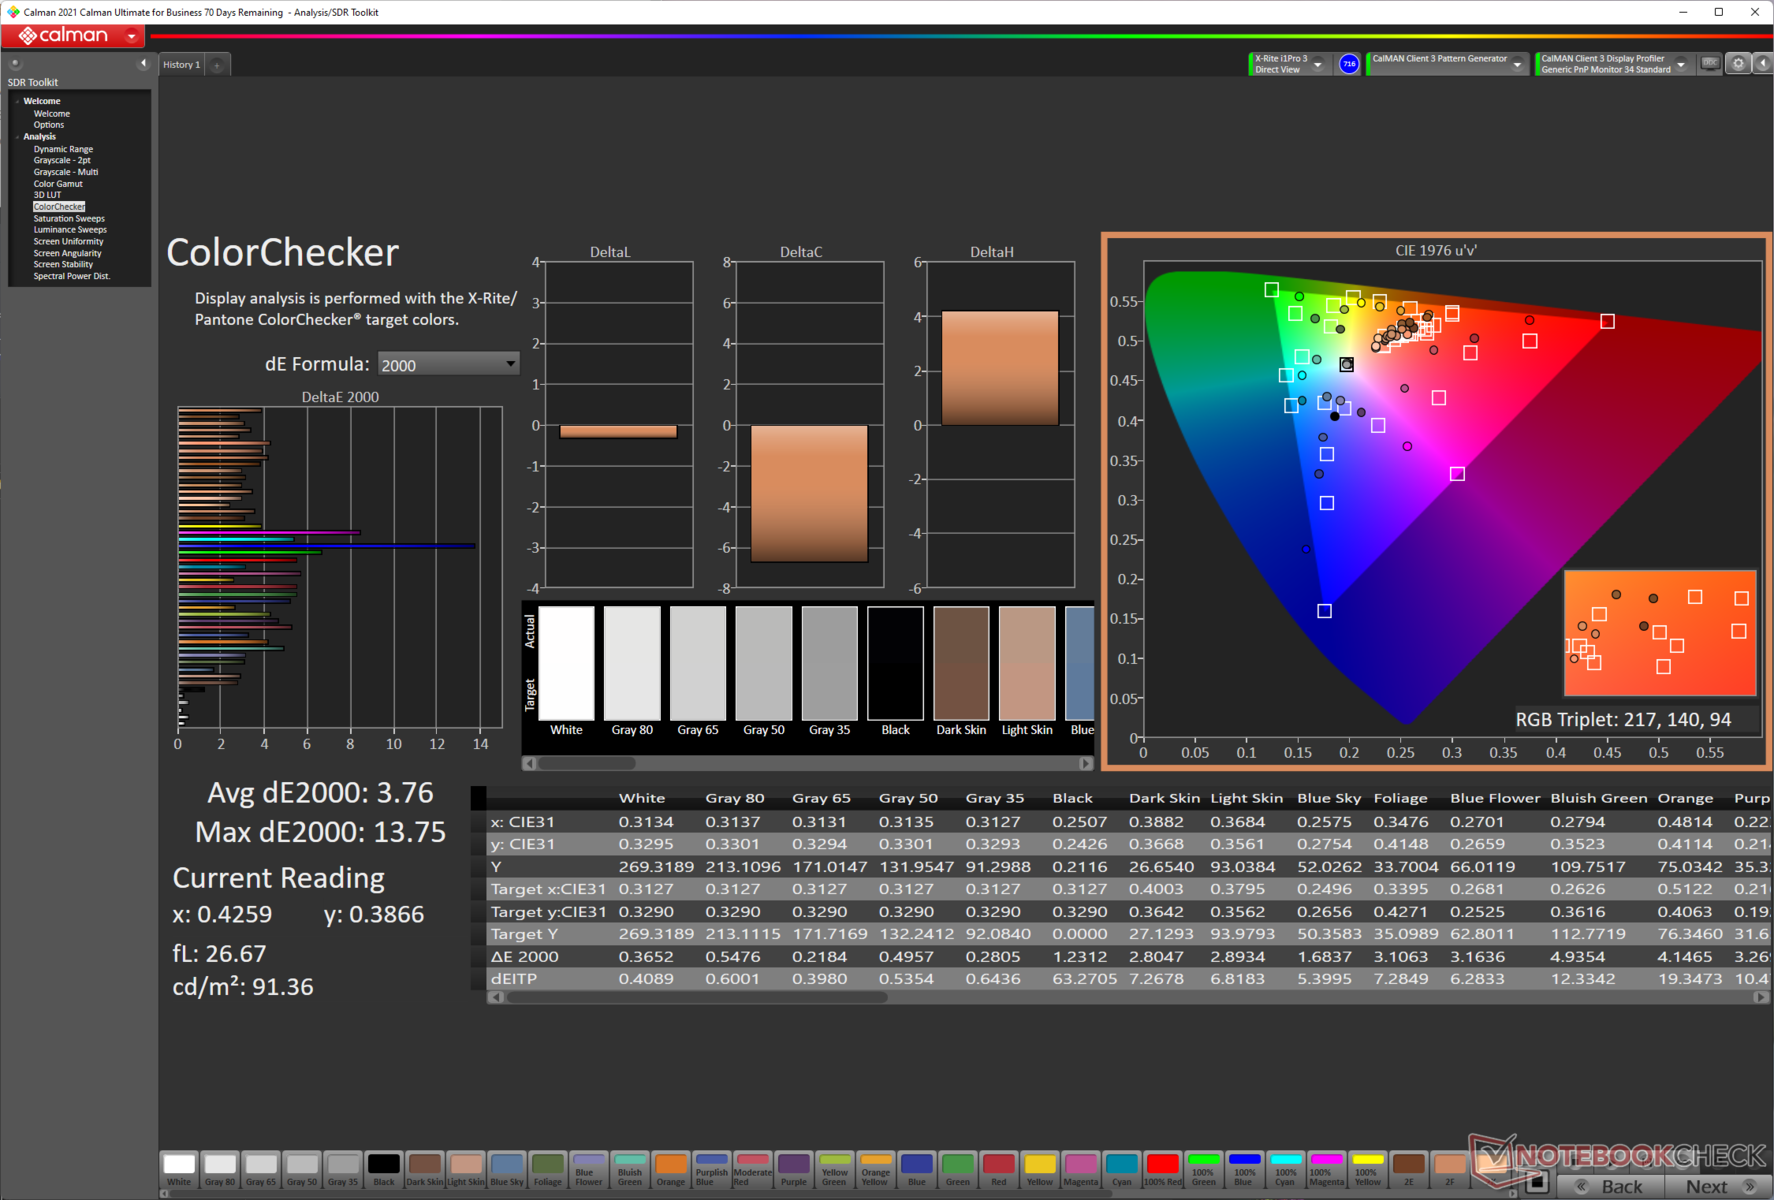
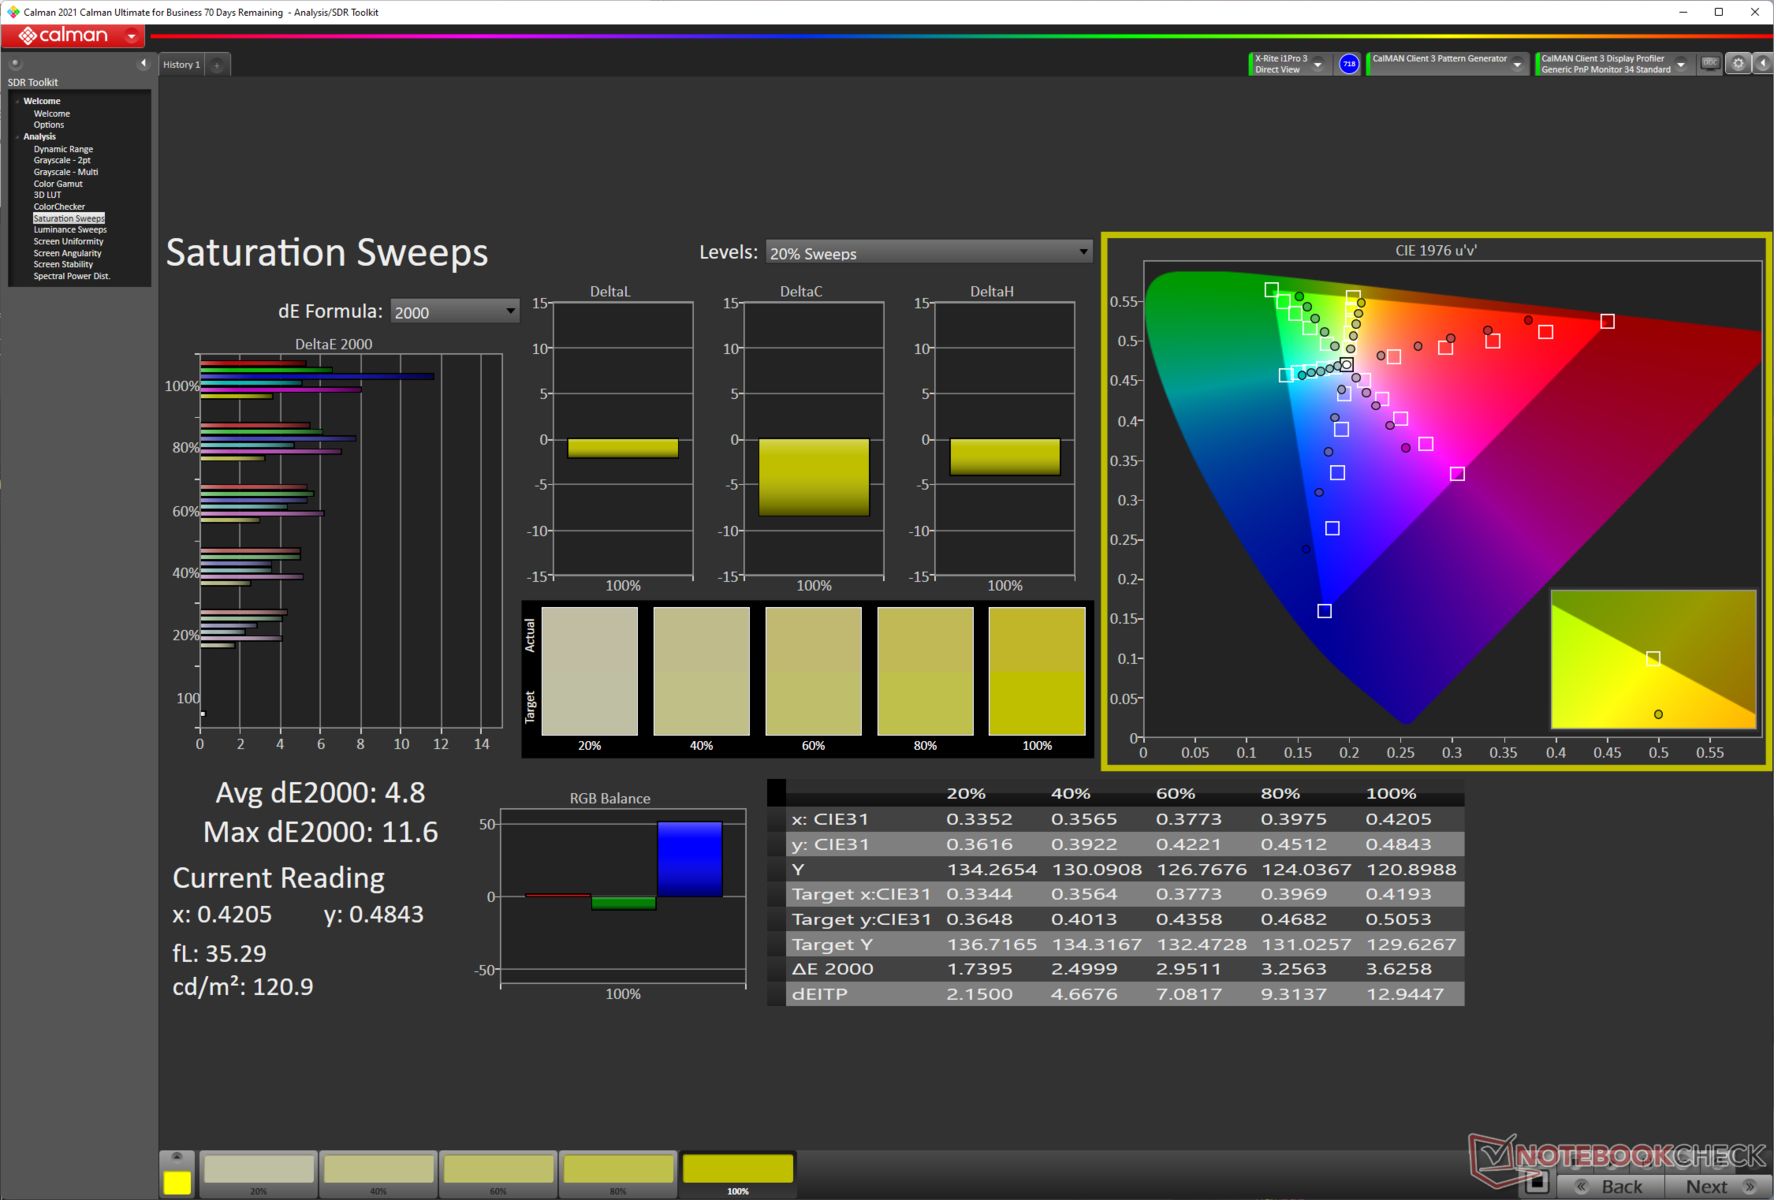
The Mi NoteBook 14 Horizon's display offers mediocre coverage across all three color gamuts. Color accuracy is not ideal out-of-the-box with an average Delta E of 5.6. However, we could bring it down to a more reasonable 3.76 with our color calibration. While good enough for basic productivity and media consumption, we do not recommend this display for any serious image or video editing tasks.
We measured a combined response time of 20.37 ms from black to white and 26.41 ms from 50% grey to 80% grey. The Mi NoteBook 14 Horizon Edition is not positioned as a gaming laptop, so these response times are on expected lines for this panel.
However, the display uses PWM for backlight adjustment. We recorded a PWM of 60 Hz from 0 to 60% brightness levels. At 61% brightness, the PWM increased to 2.7 kHz after which no PWM was observed. Therefore, those using this device at low brightness settings should be wary of low PWM frequencies that can potentially cause headaches and eye strain.
For more information on PWM, check out our article on "Why Pulse Width Modulation (PWM) is such a headache". Also, have a look at our PWM ranking table for an overview of measured PWM and response times data for all reviewed devices.
Display Response Times
| ↔ Response Time Black to White | ||
|---|---|---|
| 20.37 ms ... rise ↗ and fall ↘ combined | ↗ 10.82 ms rise | 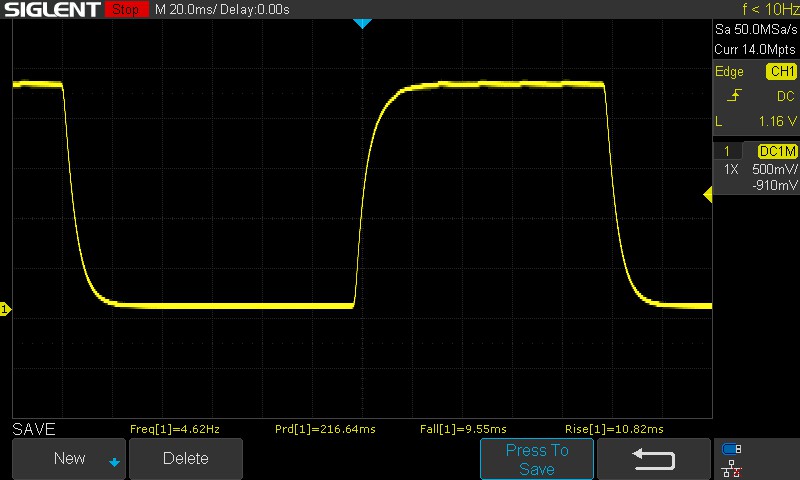 |
| ↘ 9.55 ms fall | ||
| The screen shows good response rates in our tests, but may be too slow for competitive gamers. In comparison, all tested devices range from 0.1 (minimum) to 240 (maximum) ms. » 39 % of all devices are better. This means that the measured response time is similar to the average of all tested devices (21.5 ms). | ||
| ↔ Response Time 50% Grey to 80% Grey | ||
| 26.41 ms ... rise ↗ and fall ↘ combined | ↗ 11.06 ms rise | 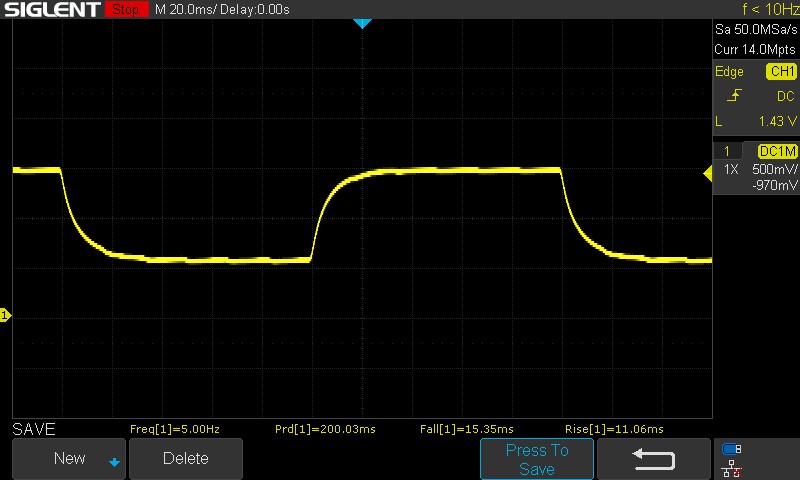 |
| ↘ 15.35 ms fall | ||
| The screen shows relatively slow response rates in our tests and may be too slow for gamers. In comparison, all tested devices range from 0.2 (minimum) to 636 (maximum) ms. » 31 % of all devices are better. This means that the measured response time is better than the average of all tested devices (33.7 ms). | ||
Screen Flickering / PWM (Pulse-Width Modulation)
| Screen flickering / PWM detected | 60 Hz | ≤ 60 % brightness setting | 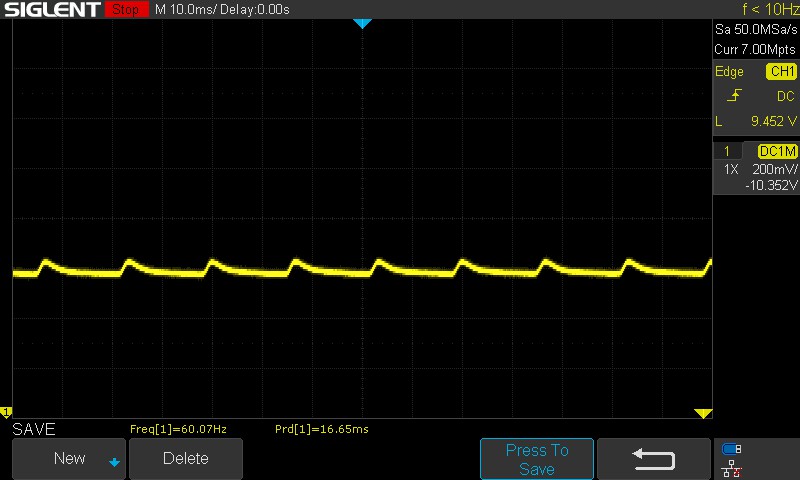 |
The display backlight flickers at 60 Hz (worst case, e.g., utilizing PWM) Flickering detected at a brightness setting of 60 % and below. There should be no flickering or PWM above this brightness setting. The frequency of 60 Hz is very low, so the flickering may cause eyestrain and headaches after extended use. In comparison: 53 % of all tested devices do not use PWM to dim the display. If PWM was detected, an average of 17924 (minimum: 5 - maximum: 3846000) Hz was measured. | |||
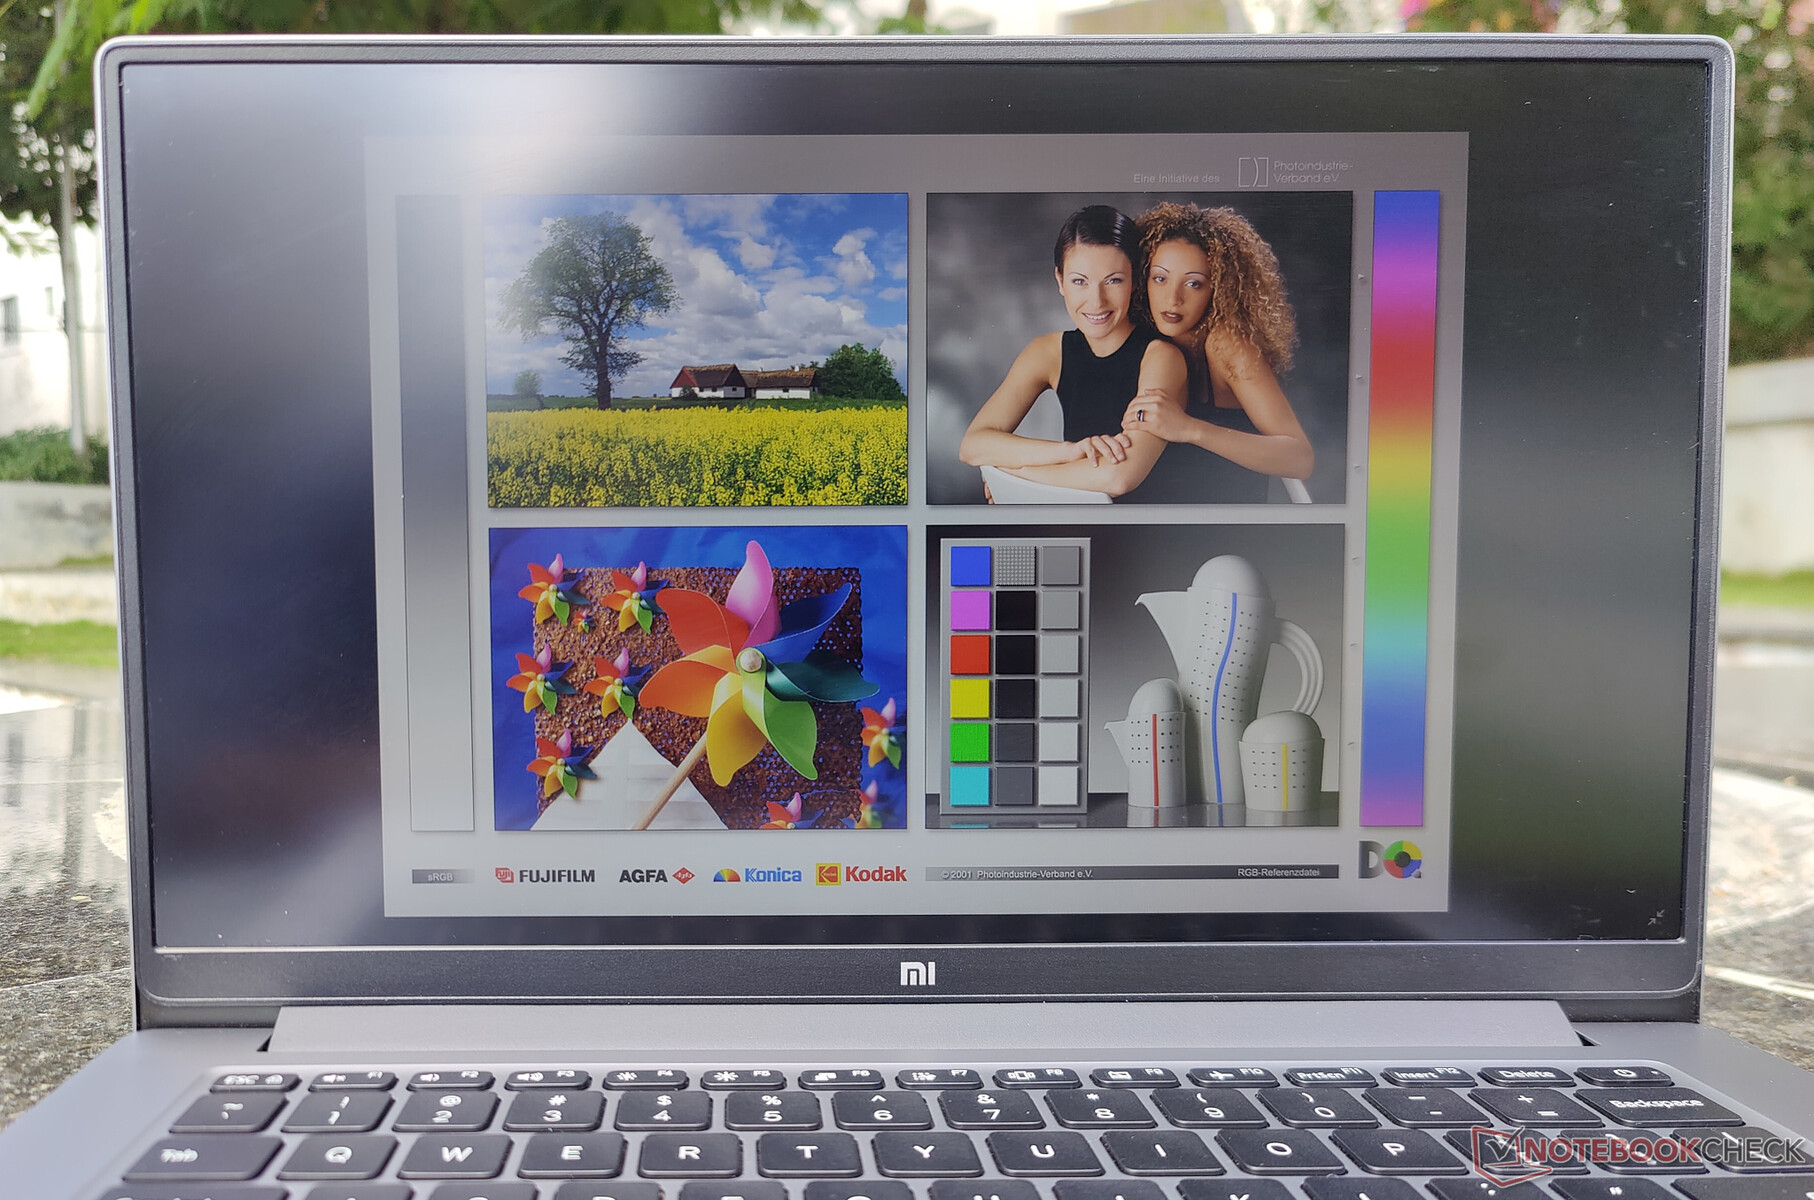
Though not specifically labeled as an IPS display, the viewing angles of this TFT screen are quite good. Outdoors visibility isn't too shabby at maximum brightness, though you may want to avoid direct sunlight.
Xiaomi claims a 178° viewing angle for device, which is true for the most part. However, there is a good amount of brightness reduction and color loss when viewed from various angles.

Performance: On par or better than the competition
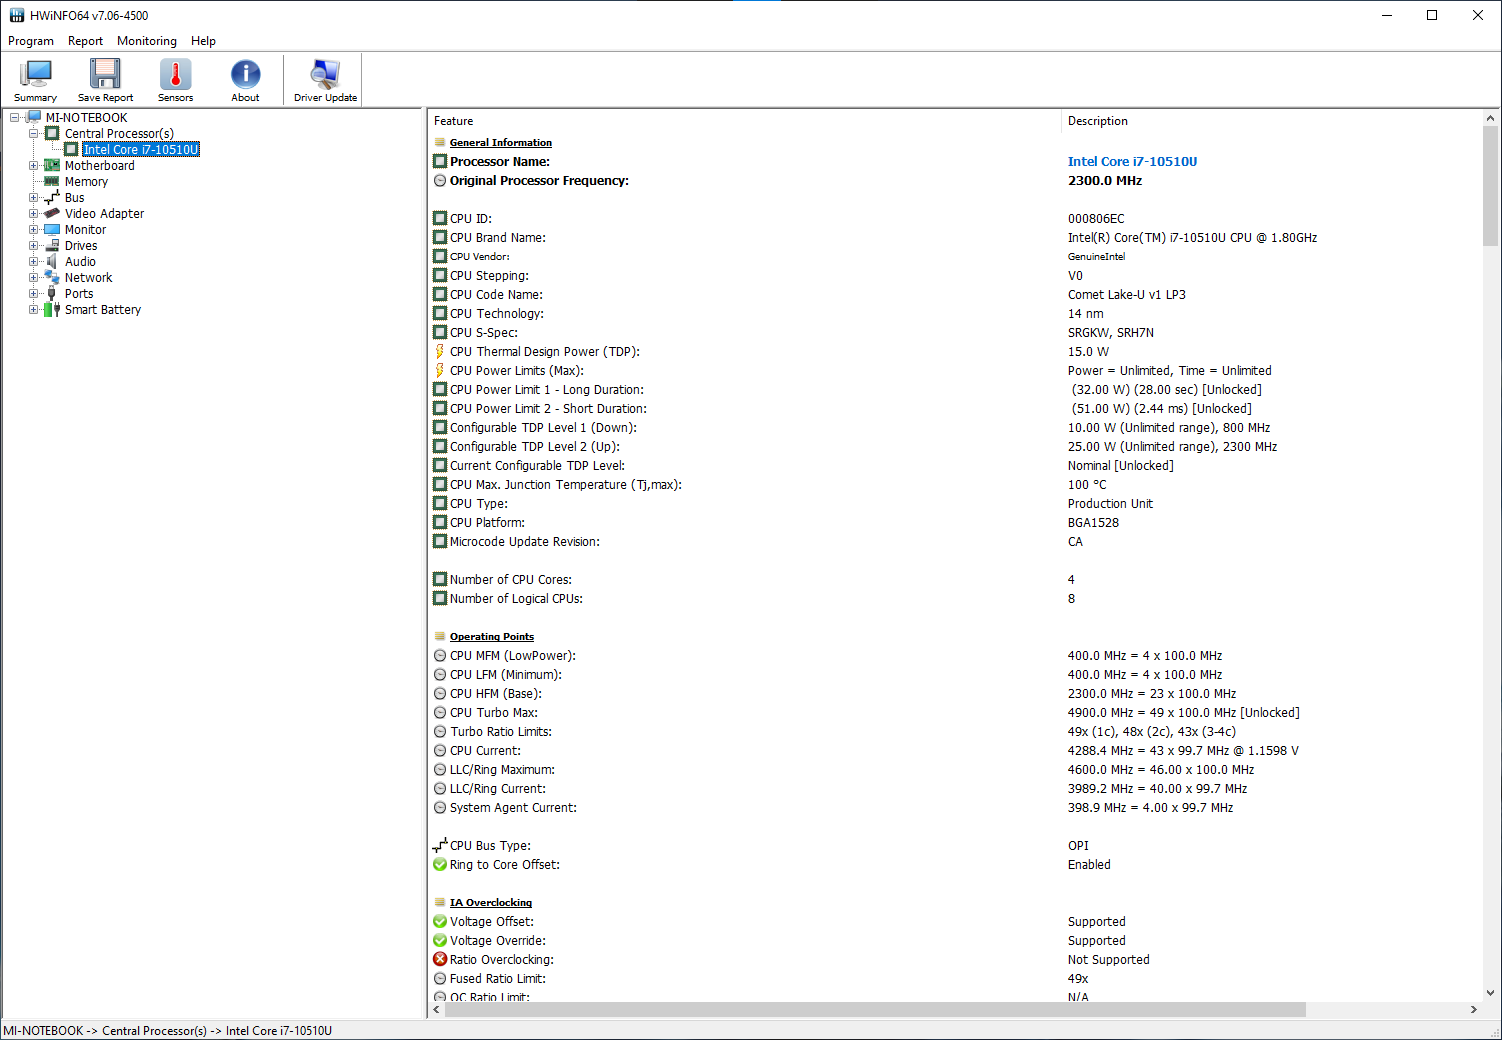
Our test sample is powered by the Core i7-10510U, which is a 4C/8T processor with a base clock of 1.8 GHz and a boost of 4.9 GHz. The device also features a dedicated Nvidia GeForce MX350 GPU for added graphics horsepower. Xiaomi also offers the Mi NoteBook 14 Horizon in a Core i5-10210U configuration with the rest of the specifications being the same.
Processor
We see very good performance with the Mi NoteBook 14 Horizon's Core i7-10510U particularly with the single-core score being on par or better than the competition. While the AMD Ryzen 7 4700U-powered Acer Swift 3 offers significantly higher multi-core scores, the Core i7-10510U in our test device is still able to perform better than competing laptops powered by this processor.
Though the Cinebench R15 multi-core results are perceivably higher than other Core i7-10510U-powered laptops, we do see quite an inconsistent performance in the loop test. That being said, the device does try to get back to near-maximum scores even if it seems to be undergoing intermittent throttling.
There are no special power modes or apps to change performance modes available in the default configuration. Adjusting the Windows battery slider to Best Performance on AC power gives a PL1 of 32 W and a PL2 of 51 W. On battery power, this drops to 25 W PL1 and 40 W PL2.
Cinebench R15 Multi Loop
Cinebench R23: Multi Core | Single Core
Cinebench R15: CPU Multi 64Bit | CPU Single 64Bit
Blender: v2.79 BMW27 CPU
7-Zip 18.03: 7z b 4 -mmt1 | 7z b 4
Geekbench 5.5: Single-Core | Multi-Core
HWBOT x265 Benchmark v2.2: 4k Preset
LibreOffice : 20 Documents To PDF
R Benchmark 2.5: Overall mean
| Cinebench R20 / CPU (Multi Core) | |
| Average of class Multimedia (1783 - 11768, n=95, last 2 years) | |
| Acer Swift 3 SF314-42-R4XJ | |
| Asus VivoBook S14 S433FL | |
| Xiaomi Mi NoteBook 14 Horizon Edition | |
| Average Intel Core i7-10510U (1015 - 1897, n=38) | |
| Acer TravelMate P6 P614-51T-G2-72ZU | |
| Huawei MateBook 14 2020 Intel | |
| HP Envy 13-ba0001ng | |
| Cinebench R20 / CPU (Single Core) | |
| Average of class Multimedia (341 - 812, n=95, last 2 years) | |
| Acer Swift 3 SF314-42-R4XJ | |
| Xiaomi Mi NoteBook 14 Horizon Edition | |
| Asus VivoBook S14 S433FL | |
| Huawei MateBook 14 2020 Intel | |
| Average Intel Core i7-10510U (362 - 497, n=37) | |
| Acer TravelMate P6 P614-51T-G2-72ZU | |
| HP Envy 13-ba0001ng | |
| Cinebench R23 / Multi Core | |
| Average of class Multimedia (4624 - 30789, n=99, last 2 years) | |
| Average Intel Core i7-10510U (3626 - 4239, n=3) | |
| Xiaomi Mi NoteBook 14 Horizon Edition | |
| Cinebench R23 / Single Core | |
| Average of class Multimedia (878 - 2110, n=97, last 2 years) | |
| Average Intel Core i7-10510U (1066 - 1207, n=3) | |
| Xiaomi Mi NoteBook 14 Horizon Edition | |
| Cinebench R15 / CPU Multi 64Bit | |
| Average of class Multimedia (785 - 4703, n=104, last 2 years) | |
| Acer Swift 3 SF314-42-R4XJ | |
| Acer TravelMate P6 P614-51T-G2-72ZU | |
| Xiaomi Mi NoteBook 14 Horizon Edition | |
| Average Intel Core i7-10510U (482 - 856, n=45) | |
| Asus VivoBook S14 S433FL | |
| Huawei MateBook 14 2020 Intel | |
| HP Envy 13-ba0001ng | |
| Cinebench R15 / CPU Single 64Bit | |
| Average of class Multimedia (142.6 - 308, n=97, last 2 years) | |
| Xiaomi Mi NoteBook 14 Horizon Edition | |
| Acer TravelMate P6 P614-51T-G2-72ZU | |
| Huawei MateBook 14 2020 Intel | |
| Acer Swift 3 SF314-42-R4XJ | |
| Average Intel Core i7-10510U (113 - 202, n=42) | |
| Asus VivoBook S14 S433FL | |
| HP Envy 13-ba0001ng | |
| Blender / v2.79 BMW27 CPU | |
| HP Envy 13-ba0001ng | |
| Acer TravelMate P6 P614-51T-G2-72ZU | |
| Huawei MateBook 14 2020 Intel | |
| Average Intel Core i7-10510U (628 - 1051, n=31) | |
| Asus VivoBook S14 S433FL | |
| Xiaomi Mi NoteBook 14 Horizon Edition | |
| Acer Swift 3 SF314-42-R4XJ | |
| Average of class Multimedia (107 - 662, n=93, last 2 years) | |
| 7-Zip 18.03 / 7z b 4 -mmt1 | |
| Average of class Multimedia (3398 - 7163, n=88, last 2 years) | |
| Xiaomi Mi NoteBook 14 Horizon Edition | |
| Acer TravelMate P6 P614-51T-G2-72ZU | |
| HP Envy 13-ba0001ng | |
| Asus VivoBook S14 S433FL | |
| Huawei MateBook 14 2020 Intel | |
| Average Intel Core i7-10510U (3747 - 4981, n=31) | |
| Acer Swift 3 SF314-42-R4XJ | |
| 7-Zip 18.03 / 7z b 4 | |
| Average of class Multimedia (20166 - 119900, n=88, last 2 years) | |
| Acer Swift 3 SF314-42-R4XJ | |
| Xiaomi Mi NoteBook 14 Horizon Edition | |
| Acer TravelMate P6 P614-51T-G2-72ZU | |
| Average Intel Core i7-10510U (12196 - 21298, n=31) | |
| Huawei MateBook 14 2020 Intel | |
| Asus VivoBook S14 S433FL | |
| HP Envy 13-ba0001ng | |
| Geekbench 5.5 / Single-Core | |
| Average of class Multimedia (926 - 2342, n=98, last 2 years) | |
| Acer TravelMate P6 P614-51T-G2-72ZU | |
| HP Envy 13-ba0001ng | |
| Huawei MateBook 14 2020 Intel | |
| Xiaomi Mi NoteBook 14 Horizon Edition | |
| Asus VivoBook S14 S433FL | |
| Average Intel Core i7-10510U (977 - 1287, n=31) | |
| Acer Swift 3 SF314-42-R4XJ | |
| Geekbench 5.5 / Multi-Core | |
| Average of class Multimedia (3828 - 23059, n=98, last 2 years) | |
| Acer Swift 3 SF314-42-R4XJ | |
| Huawei MateBook 14 2020 Intel | |
| Acer TravelMate P6 P614-51T-G2-72ZU | |
| Xiaomi Mi NoteBook 14 Horizon Edition | |
| HP Envy 13-ba0001ng | |
| Asus VivoBook S14 S433FL | |
| Average Intel Core i7-10510U (2474 - 4484, n=31) | |
| HWBOT x265 Benchmark v2.2 / 4k Preset | |
| Average of class Multimedia (4.99 - 30.5, n=86, last 2 years) | |
| Acer Swift 3 SF314-42-R4XJ | |
| Xiaomi Mi NoteBook 14 Horizon Edition | |
| Huawei MateBook 14 2020 Intel | |
| Average Intel Core i7-10510U (3.41 - 6.04, n=31) | |
| Asus VivoBook S14 S433FL | |
| Acer TravelMate P6 P614-51T-G2-72ZU | |
| HP Envy 13-ba0001ng | |
| LibreOffice / 20 Documents To PDF | |
| Xiaomi Mi NoteBook 14 Horizon Edition | |
| Average Intel Core i7-10510U (50.7 - 77.8, n=27) | |
| Acer Swift 3 SF314-42-R4XJ | |
| Asus VivoBook S14 S433FL | |
| HP Envy 13-ba0001ng | |
| Acer TravelMate P6 P614-51T-G2-72ZU | |
| Huawei MateBook 14 2020 Intel | |
| Average of class Multimedia (6.7 - 84.9, n=90, last 2 years) | |
| R Benchmark 2.5 / Overall mean | |
| Average Intel Core i7-10510U (0.637 - 0.81, n=28) | |
| Huawei MateBook 14 2020 Intel | |
| HP Envy 13-ba0001ng | |
| Xiaomi Mi NoteBook 14 Horizon Edition | |
| Acer TravelMate P6 P614-51T-G2-72ZU | |
| Asus VivoBook S14 S433FL | |
| Acer Swift 3 SF314-42-R4XJ | |
| Average of class Multimedia (0.3826 - 0.723, n=88, last 2 years) | |
* ... smaller is better
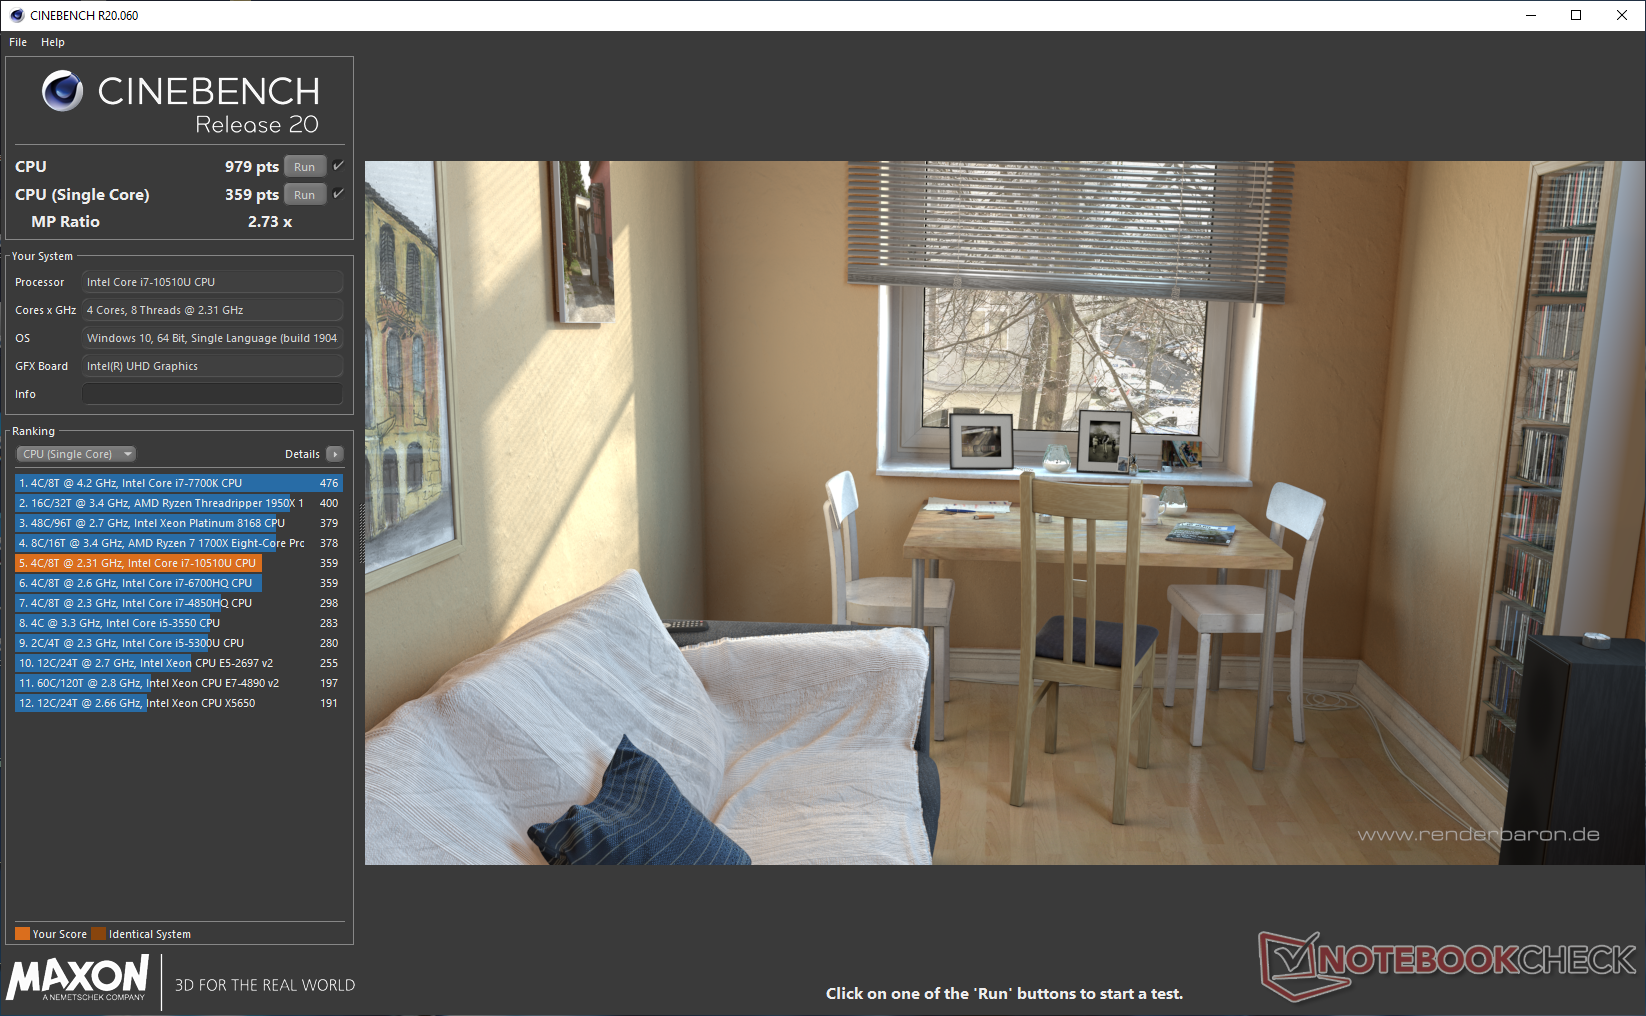
Due to reduced power limits while running on battery, we see a nearly 32% reduction in the Cinebench R20 multi-core score and nearly 23% lower single-core score compared to what we had recorded when on AC power.
Thus, users can expect significant performance regression while doing heavy computing on the move.
Check out our dedicated Core i7-10510U page for more information and benchmarks.
System Performance
The Mi NoteBook 14 Horizon has no issues with general productivity that includes a mix of video conferencing, word processing, spreadsheets, and light image editing. In PCMark 10, the Mi NoteBook 14 Horizon is just 6% behind the Ryzen 7 4700U-powered Acer Swift 3 and is about 17% faster than the Asus VivoBook S14 featuring the same processor.
| PCMark 10 / Score | |
| Average of class Multimedia (4635 - 8670, n=83, last 2 years) | |
| Acer Swift 3 SF314-42-R4XJ | |
| Xiaomi Mi NoteBook 14 Horizon Edition | |
| Acer TravelMate P6 P614-51T-G2-72ZU | |
| Huawei MateBook 14 2020 Intel | |
| Average Intel Core i7-10510U, NVIDIA GeForce MX350 (4134 - 4611, n=4) | |
| HP Envy 13-ba0001ng | |
| Asus VivoBook S14 S433FL | |
| PCMark 10 / Essentials | |
| Average of class Multimedia (8480 - 12420, n=83, last 2 years) | |
| Acer Swift 3 SF314-42-R4XJ | |
| Acer TravelMate P6 P614-51T-G2-72ZU | |
| Xiaomi Mi NoteBook 14 Horizon Edition | |
| Huawei MateBook 14 2020 Intel | |
| Average Intel Core i7-10510U, NVIDIA GeForce MX350 (7534 - 8942, n=4) | |
| Asus VivoBook S14 S433FL | |
| HP Envy 13-ba0001ng | |
| PCMark 10 / Productivity | |
| Average of class Multimedia (5845 - 11186, n=83, last 2 years) | |
| HP Envy 13-ba0001ng | |
| Acer TravelMate P6 P614-51T-G2-72ZU | |
| Xiaomi Mi NoteBook 14 Horizon Edition | |
| Huawei MateBook 14 2020 Intel | |
| Acer Swift 3 SF314-42-R4XJ | |
| Average Intel Core i7-10510U, NVIDIA GeForce MX350 (5883 - 7451, n=4) | |
| Asus VivoBook S14 S433FL | |
| PCMark 10 / Digital Content Creation | |
| Average of class Multimedia (4688 - 13548, n=83, last 2 years) | |
| Acer Swift 3 SF314-42-R4XJ | |
| Xiaomi Mi NoteBook 14 Horizon Edition | |
| Average Intel Core i7-10510U, NVIDIA GeForce MX350 (3130 - 4496, n=4) | |
| Huawei MateBook 14 2020 Intel | |
| Acer TravelMate P6 P614-51T-G2-72ZU | |
| HP Envy 13-ba0001ng | |
| Asus VivoBook S14 S433FL | |
| PCMark 8 Home Score Accelerated v2 | 4355 points | |
| PCMark 8 Creative Score Accelerated v2 | 6280 points | |
| PCMark 10 Score | 4611 points | |
Help | ||
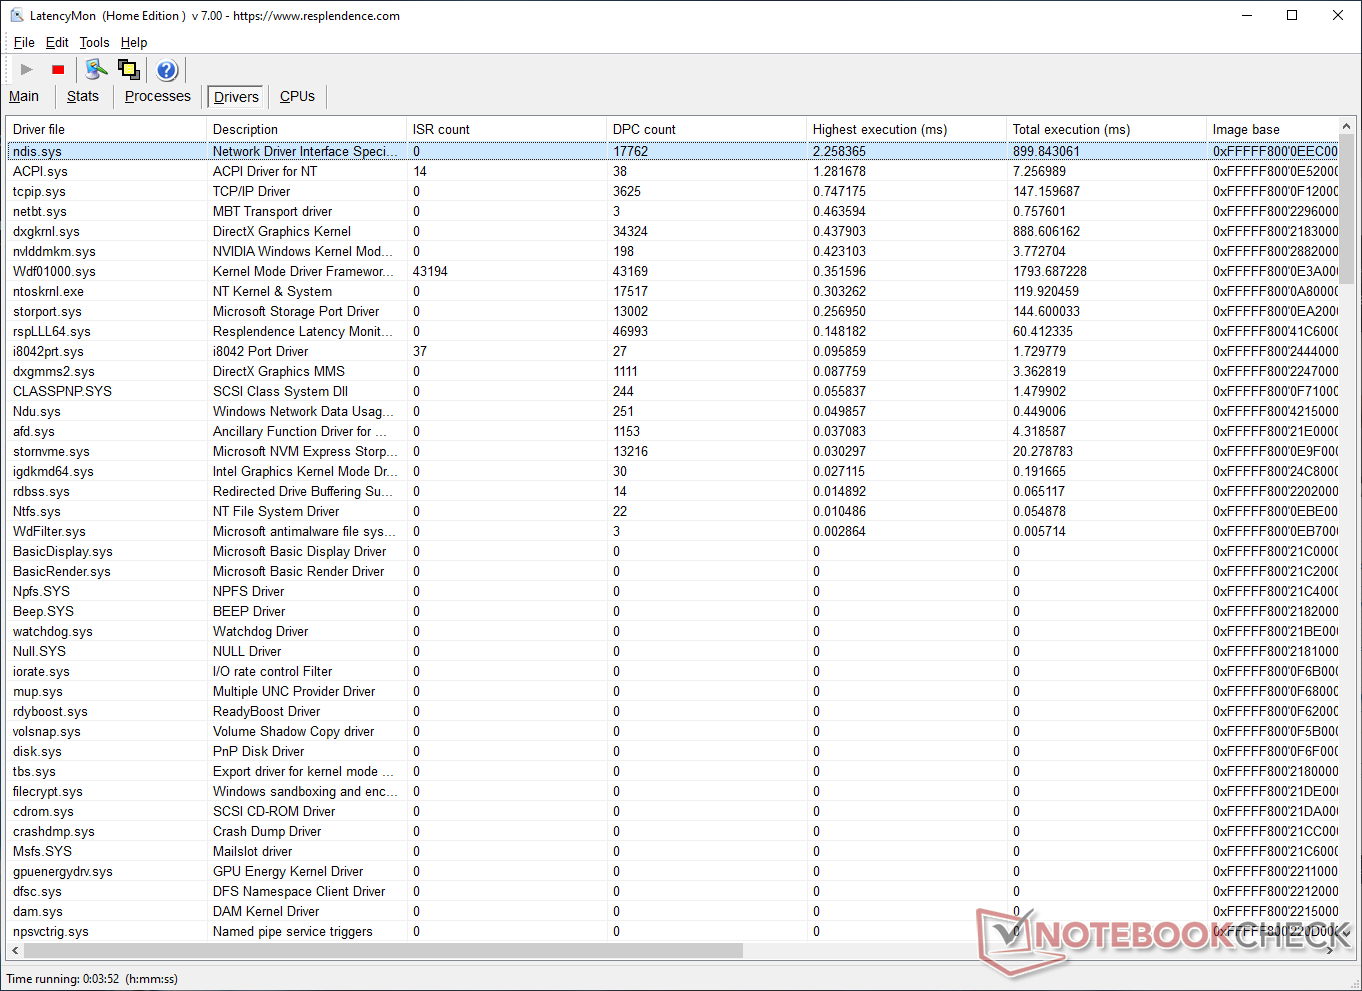
DPC Latency
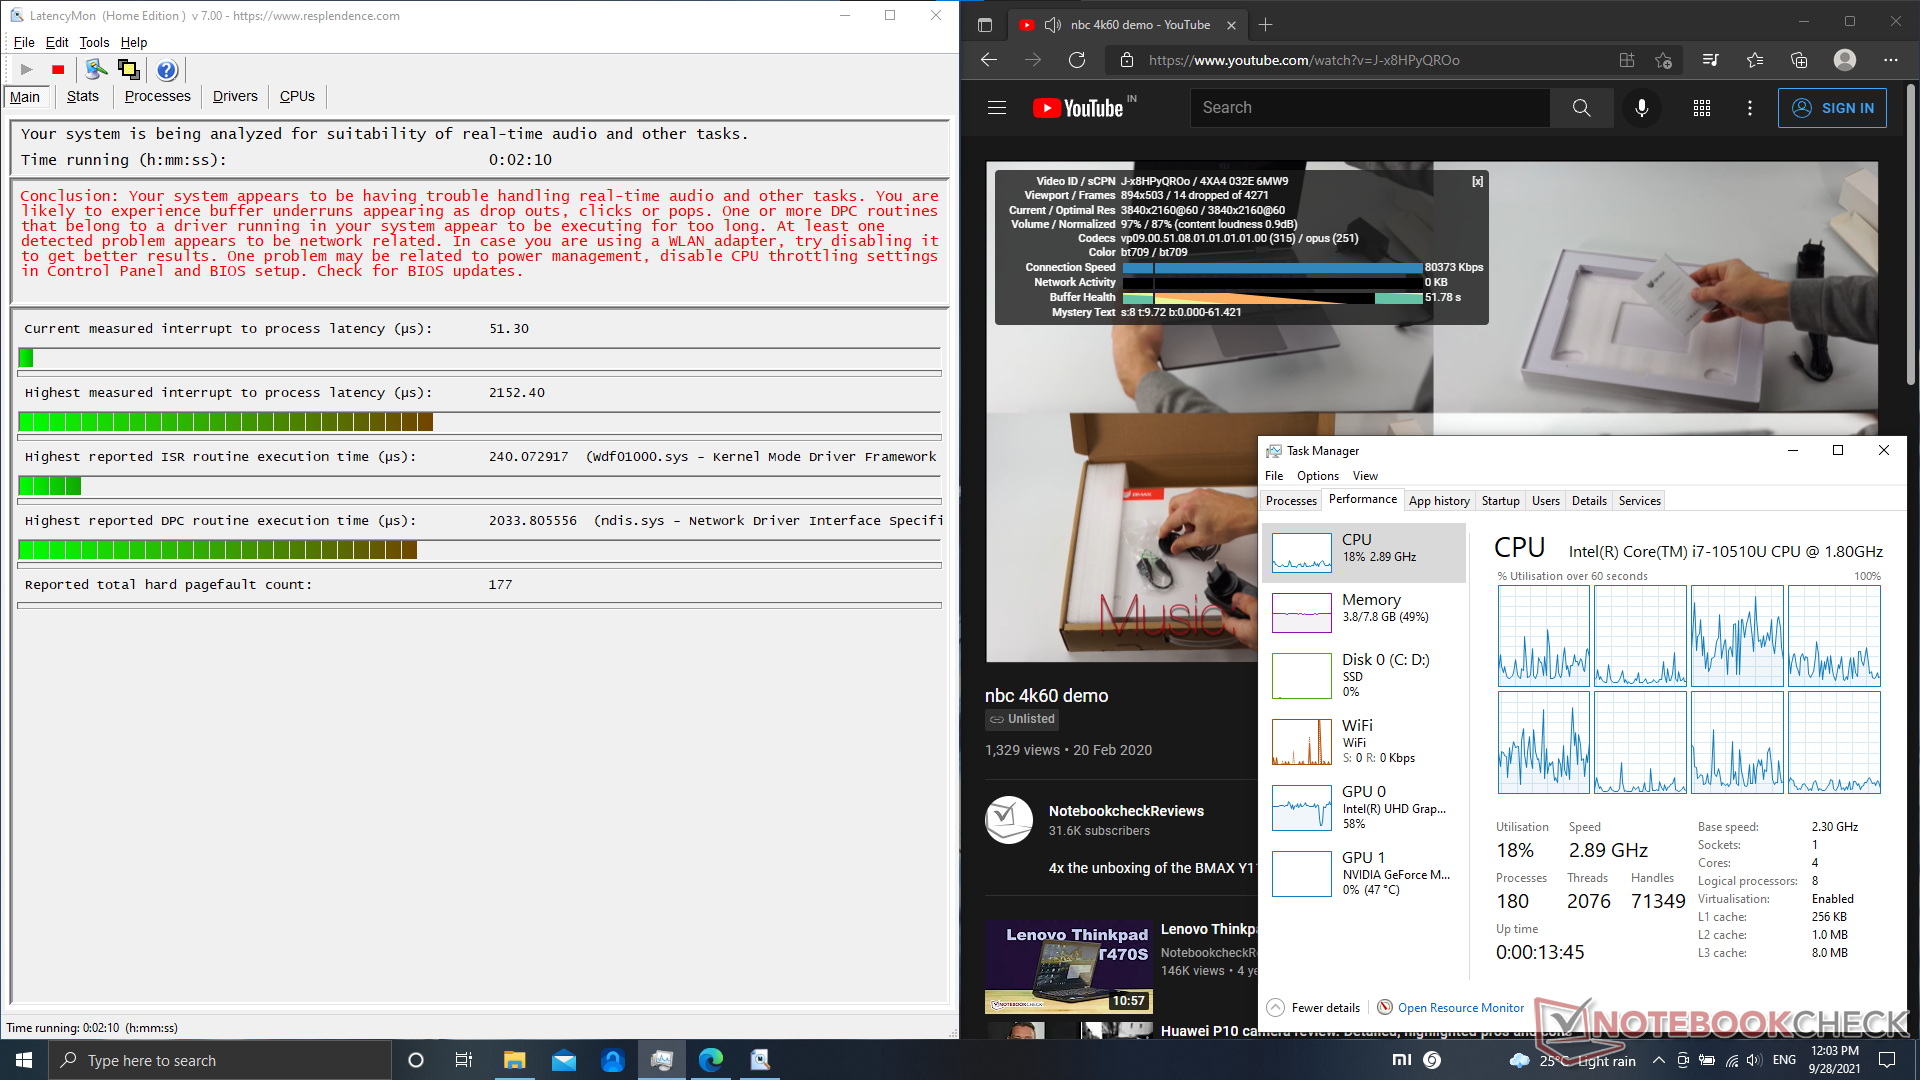
System latency was measured using LatencyMon. The process included opening multiple tabs of our site, playing back our sample 4K video, and running a short Prime95 in-place large FFTs stress test for 10 seconds.
We recorded a high latency of 2152.40 µs, which means that the device is not suitable for real-time audio workflows.
Check out our DPC Latency Ranking page for more latency comparisons
| DPC Latencies / LatencyMon - interrupt to process latency (max), Web, Youtube, Prime95 | |
| Acer TravelMate P6 P614-51T-G2-72ZU | |
| HP Envy 13-ba0001ng | |
| Xiaomi Mi NoteBook 14 Horizon Edition | |
| Acer Swift 3 SF314-42-R4XJ | |
| Asus VivoBook S14 S433FL | |
| Huawei MateBook 14 2020 Intel | |
* ... smaller is better
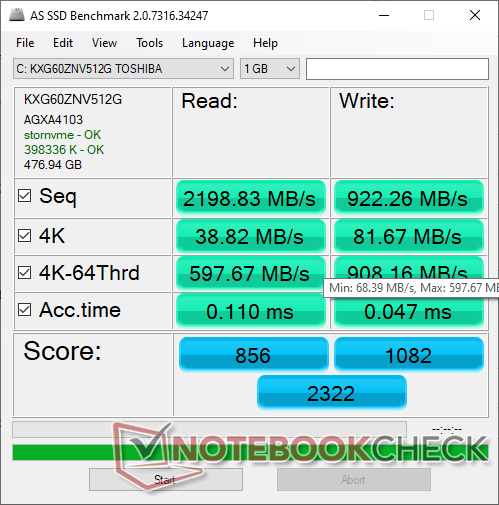
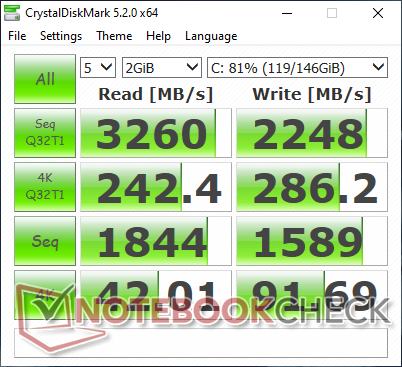
Storage Devices
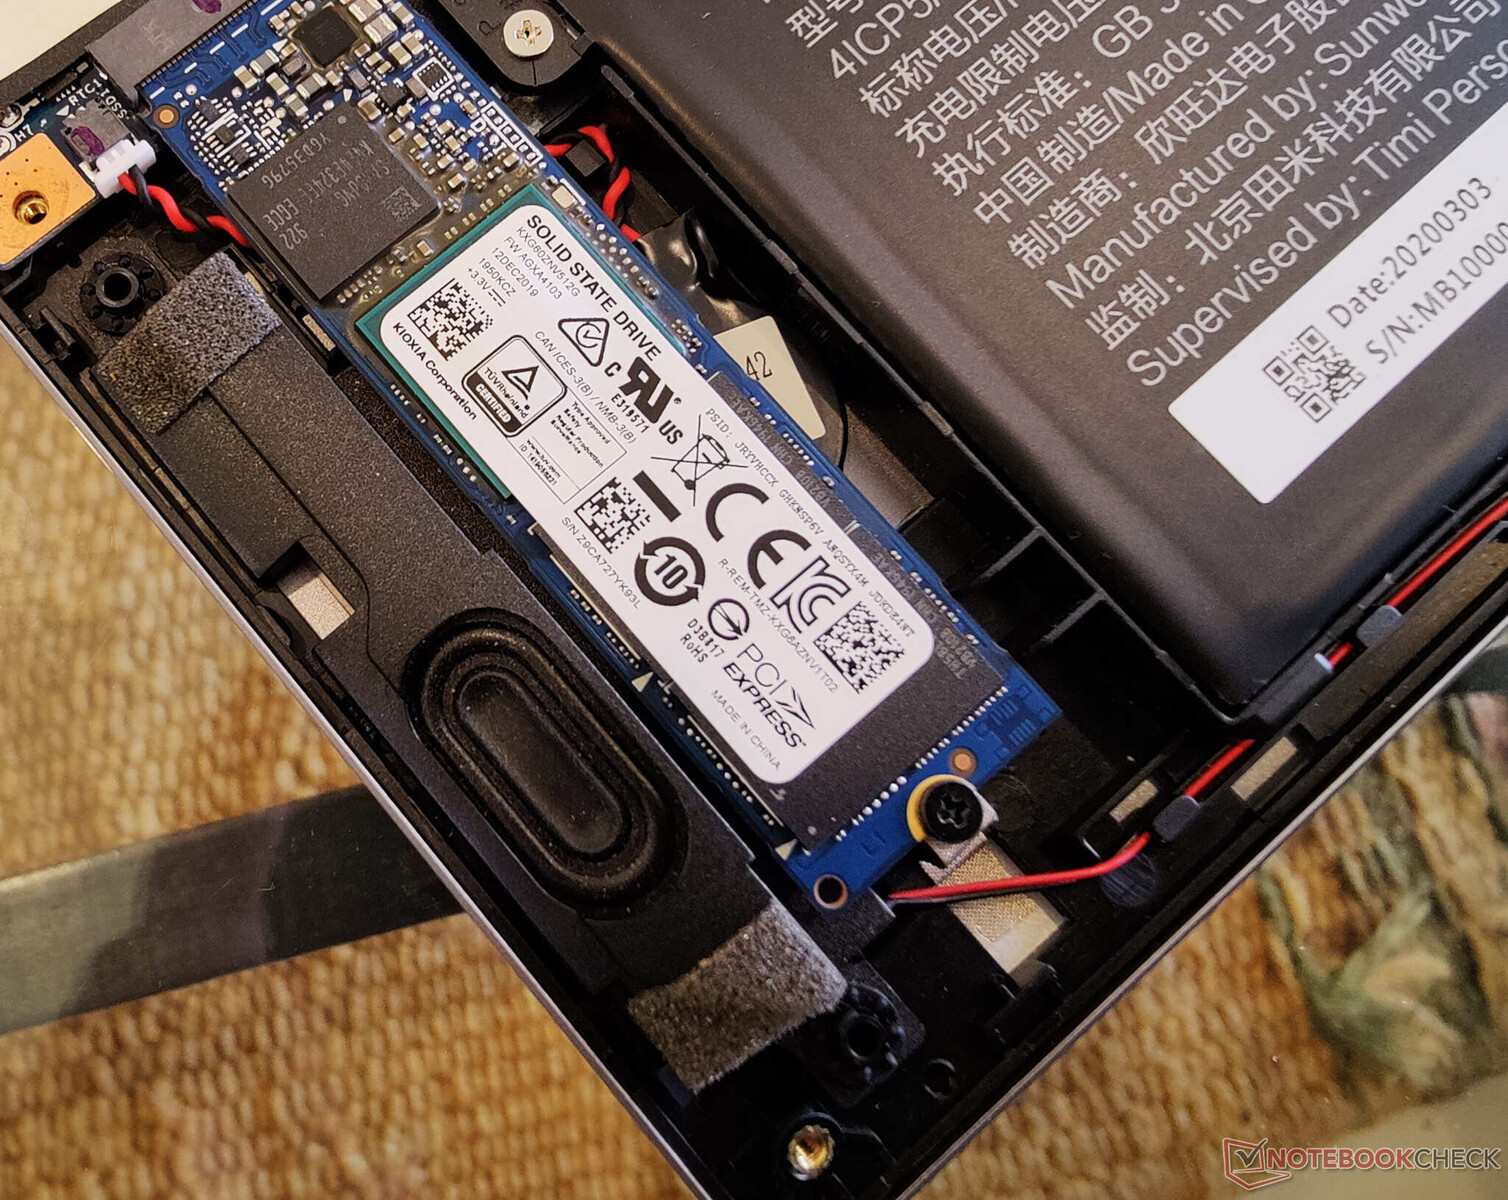
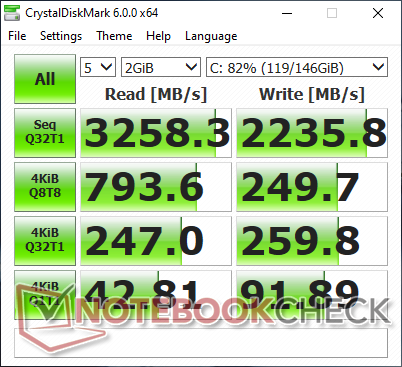
The Mi NoteBook 14 Horizon Edition comes with a Toshiba (now Kioxia) 512 GB PCIe NVMe SSD that occupies the lone M.2 2280 slot on the motherboard. Users who need added storage will have to swap out the existing SSD for a higher capacity drive as there are no additional M.2 expansion slots or drive bays.
The drive performs decently in our suite of SSD benchmarks, but we have seen higher scores with the same drive in other laptops. Though we did not notice any throttling in our DiskSpd loop test with a queue depth of 8, the drive could reach peak performance only after 31 rounds.
Check out our dedicated SSD and HDD benchmarks page for more storage performance comparisons.
| Xiaomi Mi NoteBook 14 Horizon Edition Toshiba XG6 KXG60ZNV512G | Huawei MateBook 14 2020 Intel Lite-On CA5-8D512 | Acer TravelMate P6 P614-51T-G2-72ZU Samsung PM991 MZVLQ512HALU | Asus VivoBook S14 S433FL Intel Optane Memory H10 with Solid State Storage 32GB + 512GB HBRPEKNX0202A(L/H) | HP Envy 13-ba0001ng Intel SSD 660p SSDPEKNW512G8 | Acer Swift 3 SF314-42-R4XJ Samsung PM991 MZVLQ1T0HALB | Average Toshiba XG6 KXG60ZNV512G | |
|---|---|---|---|---|---|---|---|
| AS SSD | 37% | 19% | -15% | 1% | -14% | 31% | |
| Seq Read | 2199 | 2933 33% | 2057 -6% | 957 -56% | 1587 -28% | 1960 -11% | 2456 ? 12% |
| Seq Write | 922 | 810 -12% | 1244 35% | 353.1 -62% | 709 -23% | 1547 68% | 1493 ? 62% |
| 4K Read | 38.82 | 56.6 46% | 48.07 24% | 62.4 61% | 52 34% | 31.56 -19% | 44.1 ? 14% |
| 4K Write | 81.7 | 147.6 81% | 125.8 54% | 122.8 50% | 144 76% | 116.6 43% | 119.3 ? 46% |
| 4K-64 Read | 598 | 856 43% | 875 46% | 386.2 -35% | 322.8 -46% | 454.7 -24% | 980 ? 64% |
| 4K-64 Write | 908 | 1099 21% | 785 -14% | 605 -33% | 835 -8% | 262.1 -71% | 1180 ? 30% |
| Access Time Read * | 0.11 | 0.046 58% | 0.107 3% | 0.103 6% | 0.08057 ? 27% | ||
| Access Time Write * | 0.047 | 0.028 40% | 0.031 34% | 0.046 2% | 0.045 4% | 0.034 28% | 0.055 ? -17% |
| Score Read | 856 | 1206 41% | 1129 32% | 544 -36% | 533 -38% | 682 -20% | 1269 ? 48% |
| Score Write | 1082 | 1328 23% | 1035 -4% | 763 -29% | 1050 -3% | 533 -51% | 1449 ? 34% |
| Score Total | 2322 | 3059 32% | 2712 17% | 1581 -32% | 1832 -21% | 1552 -33% | 3326 ? 43% |
| Copy ISO MB/s | 1348 | 1600 19% | 1483 10% | 974 -28% | 1894 ? 41% | ||
| Copy Program MB/s | 470.3 | 517 10% | 730 55% | 356.5 -24% | 552 ? 17% | ||
| Copy Game MB/s | 1052 | 1009 -4% | 943 -10% | 621 -41% | 1187 ? 13% | ||
| CrystalDiskMark 5.2 / 6 | 54% | 19% | 27% | 2% | 6% | 47% | |
| Write 4K | 91.7 | 161.8 76% | 151.8 66% | 124.9 36% | 146.3 60% | 98.8 8% | 112.8 ? 23% |
| Read 4K | 42.01 | 60.6 44% | 55 31% | 147.9 252% | 55.7 33% | 32.44 -23% | 42.7 ? 2% |
| Write Seq | 1589 | 2209 39% | 1292 -19% | 753 -53% | 949 -40% | 1582 0% | 1489 ? -6% |
| Read Seq | 1844 | 2473 34% | 1668 -10% | 1223 -34% | 1494 -19% | 1471 -20% | 1771 ? -4% |
| Write 4K Q32T1 | 259.8 | 514 98% | 440.7 70% | 369.2 42% | 408.5 57% | 375.4 44% | 345 ? 33% |
| Read 4K Q32T1 | 247 | 586 137% | 477.4 93% | 358.1 45% | 304 23% | 491.9 99% | 359 ? 45% |
| Write Seq Q32T1 | 2236 | 2205 -1% | 1169 -48% | 1057 -53% | 984 -56% | 1574 -30% | 2257 ? 1% |
| Read Seq Q32T1 | 3258 | 3352 3% | 2245 -31% | 2738 -16% | 1779 -45% | 2329 -29% | 2926 ? -10% |
| Write 4K Q8T8 | 249.7 | 1080 ? 333% | |||||
| Read 4K Q8T8 | 794 | 1232 ? 55% | |||||
| Total Average (Program / Settings) | 46% /
44% | 19% /
19% | 6% /
3% | 2% /
1% | -4% /
-6% | 39% /
38% |
* ... smaller is better

Disk Throttling: DiskSpd Read Loop, Queue Depth 8
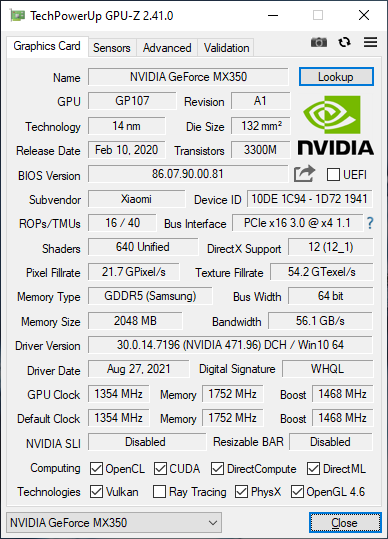
GPU Performance
The Mi NoteBook 14 Horizon Edition uses a discrete Nvidia GeForce MX350 GPU alongside the UHD Graphics 620 iGPU. The MX350 in our sample performs perceivably better than competing laptops featuring the same GPU.
However, GPU performance drops by about 12.3% when running on battery power as seen from the 3DMark Time Spy results.
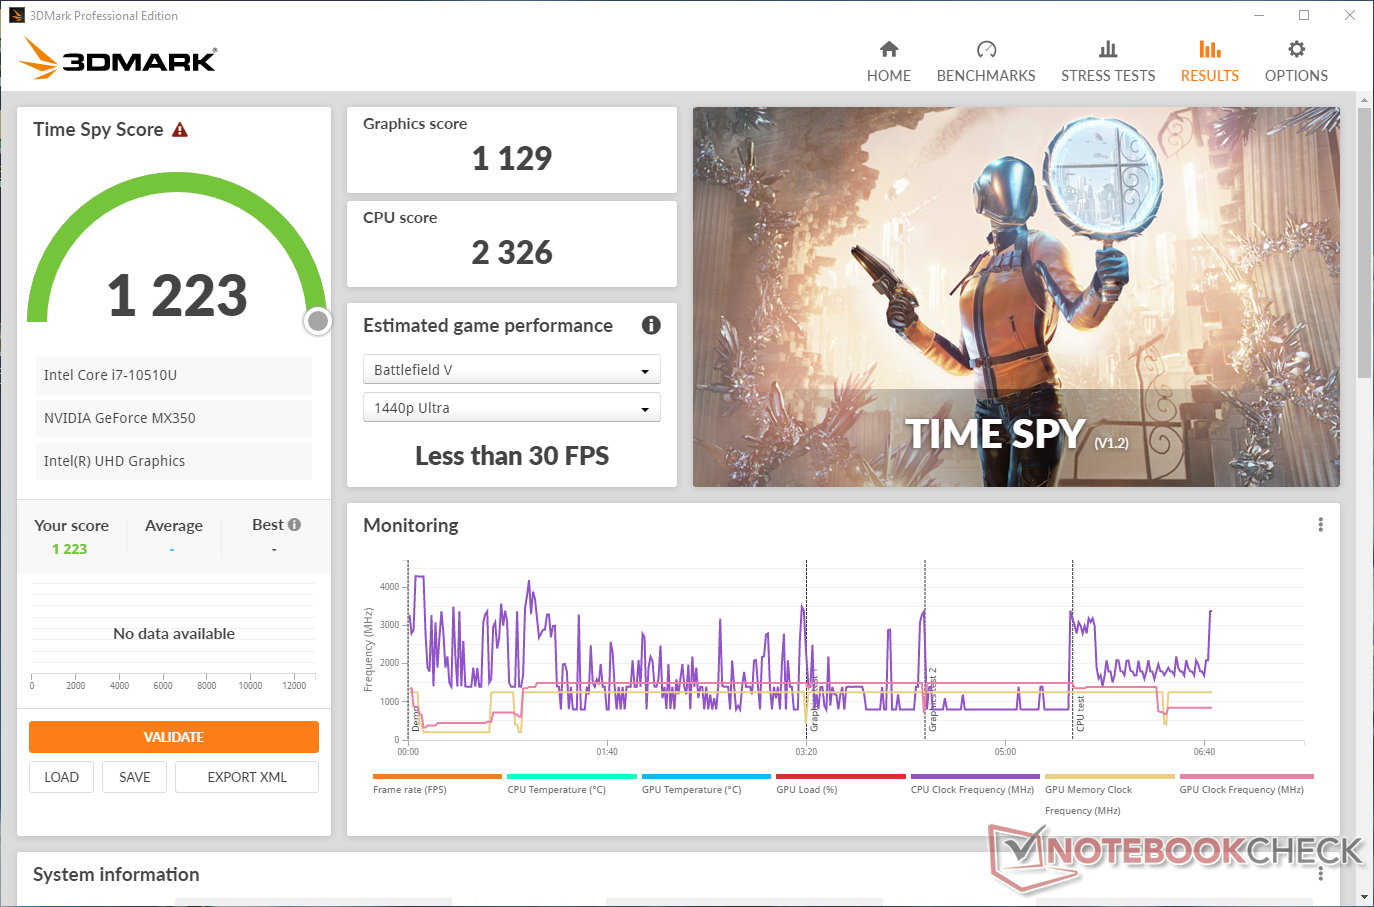
| 3DMark 11 Performance | 6295 points | |
| 3DMark Ice Storm Standard Score | 79728 points | |
| 3DMark Cloud Gate Standard Score | 11700 points | |
| 3DMark Fire Strike Score | 3938 points | |
| 3DMark Time Spy Score | 1369 points | |
Help | ||
Gaming Performance
The MX350 is only capable of running somewhat older titles at low to medium settings, though those playing less-intensive MOBA titles such as Dota 2 Reborn will be able to get by just fine even at 1080p Ultra.
| Final Fantasy XV Benchmark | |
| 1280x720 Lite Quality | |
| Average of class Multimedia (19 - 211, n=71, last 2 years) | |
| Average NVIDIA GeForce MX350 (36.5 - 49.2, n=5) | |
| Xiaomi Mi NoteBook 14 Horizon Edition | |
| 1920x1080 Standard Quality | |
| Average of class Multimedia (9.75 - 162.4, n=82, last 2 years) | |
| Xiaomi Mi NoteBook 14 Horizon Edition | |
| Average NVIDIA GeForce MX350 (20.4 - 23.9, n=5) | |
| 1920x1080 High Quality | |
| Average of class Multimedia (6.53 - 141.8, n=87, last 2 years) | |
| Xiaomi Mi NoteBook 14 Horizon Edition | |
| Average NVIDIA GeForce MX350 (10.7 - 15.1, n=5) | |
| Strange Brigade | |
| 1280x720 lowest AF:1 | |
| Average of class Multimedia (39.7 - 460, n=75, last 2 years) | |
| Average NVIDIA GeForce MX350 (90.9 - 94.4, n=3) | |
| Xiaomi Mi NoteBook 14 Horizon Edition | |
| 1920x1080 medium AA:medium AF:4 | |
| Average of class Multimedia (15.2 - 270, n=79, last 2 years) | |
| Average NVIDIA GeForce MX350 (31.7 - 35, n=3) | |
| Xiaomi Mi NoteBook 14 Horizon Edition | |
| 1920x1080 high AA:high AF:8 | |
| Average of class Multimedia (12.8 - 243, n=83, last 2 years) | |
| Average NVIDIA GeForce MX350 (24.6 - 27.2, n=3) | |
| Xiaomi Mi NoteBook 14 Horizon Edition | |
| 1920x1080 ultra AA:ultra AF:16 | |
| Average of class Multimedia (11 - 233, n=84, last 2 years) | |
| Average NVIDIA GeForce MX350 (18.8 - 20.1, n=3) | |
| Xiaomi Mi NoteBook 14 Horizon Edition | |
The Witcher 3 FPS Chart
Our test sample is able to do a fairly decent job in maintaining consistent frame rates without much throttling in The Witcher 3 stress test at 1080p Ultra. We do notice a few frame drops but they occur only intermittently.
Check out our dedicated Nvidia GeForce MX350 page for more performance benchmarks and comparisons.
| low | med. | high | ultra | |
| BioShock Infinite (2013) | 218.2 | 135 | 111.4 | 43.36 |
| The Witcher 3 (2015) | 81.5 | 49.7 | 28.5 | 15 |
| Dota 2 Reborn (2015) | 112.8 | 97.3 | 78.7 | 66.6 |
| Final Fantasy XV Benchmark (2018) | 43.3 | 23.2 | 14.9 | |
| X-Plane 11.11 (2018) | 49.1 | 43.5 | 36.7 | |
| Strange Brigade (2018) | 90.9 | 31.7 | 24.6 | 18.9 |
Emissions: Single heatpipe-fan combo leads to higher emissions
System Noise
The Mi NoteBook 14 Horizon is a silent operator as long as there is no additional stress. However, we do notice higher noise levels under all kinds of loads when compared with the competition.
Maximum noise levels were recorded while stressing with The Witcher 3 at 1080p Ultra. We did not observe any annoying noises such as coil whine, clicks, or bleeps during testing.
| Xiaomi Mi NoteBook 14 Horizon Edition GeForce MX350, i7-10510U, Toshiba XG6 KXG60ZNV512G | Huawei MateBook 14 2020 Intel GeForce MX350, i7-10510U, Lite-On CA5-8D512 | Acer TravelMate P6 P614-51T-G2-72ZU UHD Graphics 620, i7-10510U, Samsung PM991 MZVLQ512HALU | Asus VivoBook S14 S433FL GeForce MX250, i7-10510U, Intel Optane Memory H10 with Solid State Storage 32GB + 512GB HBRPEKNX0202A(L/H) | HP Envy 13-ba0001ng GeForce MX350, i7-10510U, Intel SSD 660p SSDPEKNW512G8 | Acer Swift 3 SF314-42-R4XJ Vega 7, R7 4700U, Samsung PM991 MZVLQ1T0HALB | |
|---|---|---|---|---|---|---|
| Noise | 2% | 8% | -7% | 7% | 0% | |
| off / environment * | 27.24 | 29.3 -8% | 27 1% | 30.7 -13% | 25.4 7% | 31.2 -15% |
| Idle Minimum * | 27.24 | 29.3 -8% | 27 1% | 31 -14% | 25.4 7% | 31.2 -15% |
| Idle Average * | 27.24 | 29.3 -8% | 27 1% | 31 -14% | 25.4 7% | 31.2 -15% |
| Idle Maximum * | 27.24 | 30.8 -13% | 27 1% | 31.3 -15% | 25.4 7% | 31.2 -15% |
| Load Average * | 42.76 | 35.7 17% | 35 18% | 43.4 -1% | 40.6 5% | 33.8 21% |
| Witcher 3 ultra * | 43.9 | 35.7 19% | 42.8 3% | 36.3 17% | ||
| Load Maximum * | 43.65 | 37.9 13% | 32.8 25% | 41.5 5% | 39.1 10% | 33.5 23% |
* ... smaller is better
Noise Level
| Idle |
| 27.24 / 27.24 / 27.24 dB(A) |
| Load |
| 42.76 / 43.65 dB(A) |
 | ||
30 dB silent 40 dB(A) audible 50 dB(A) loud |
||
min: | ||
Temperature
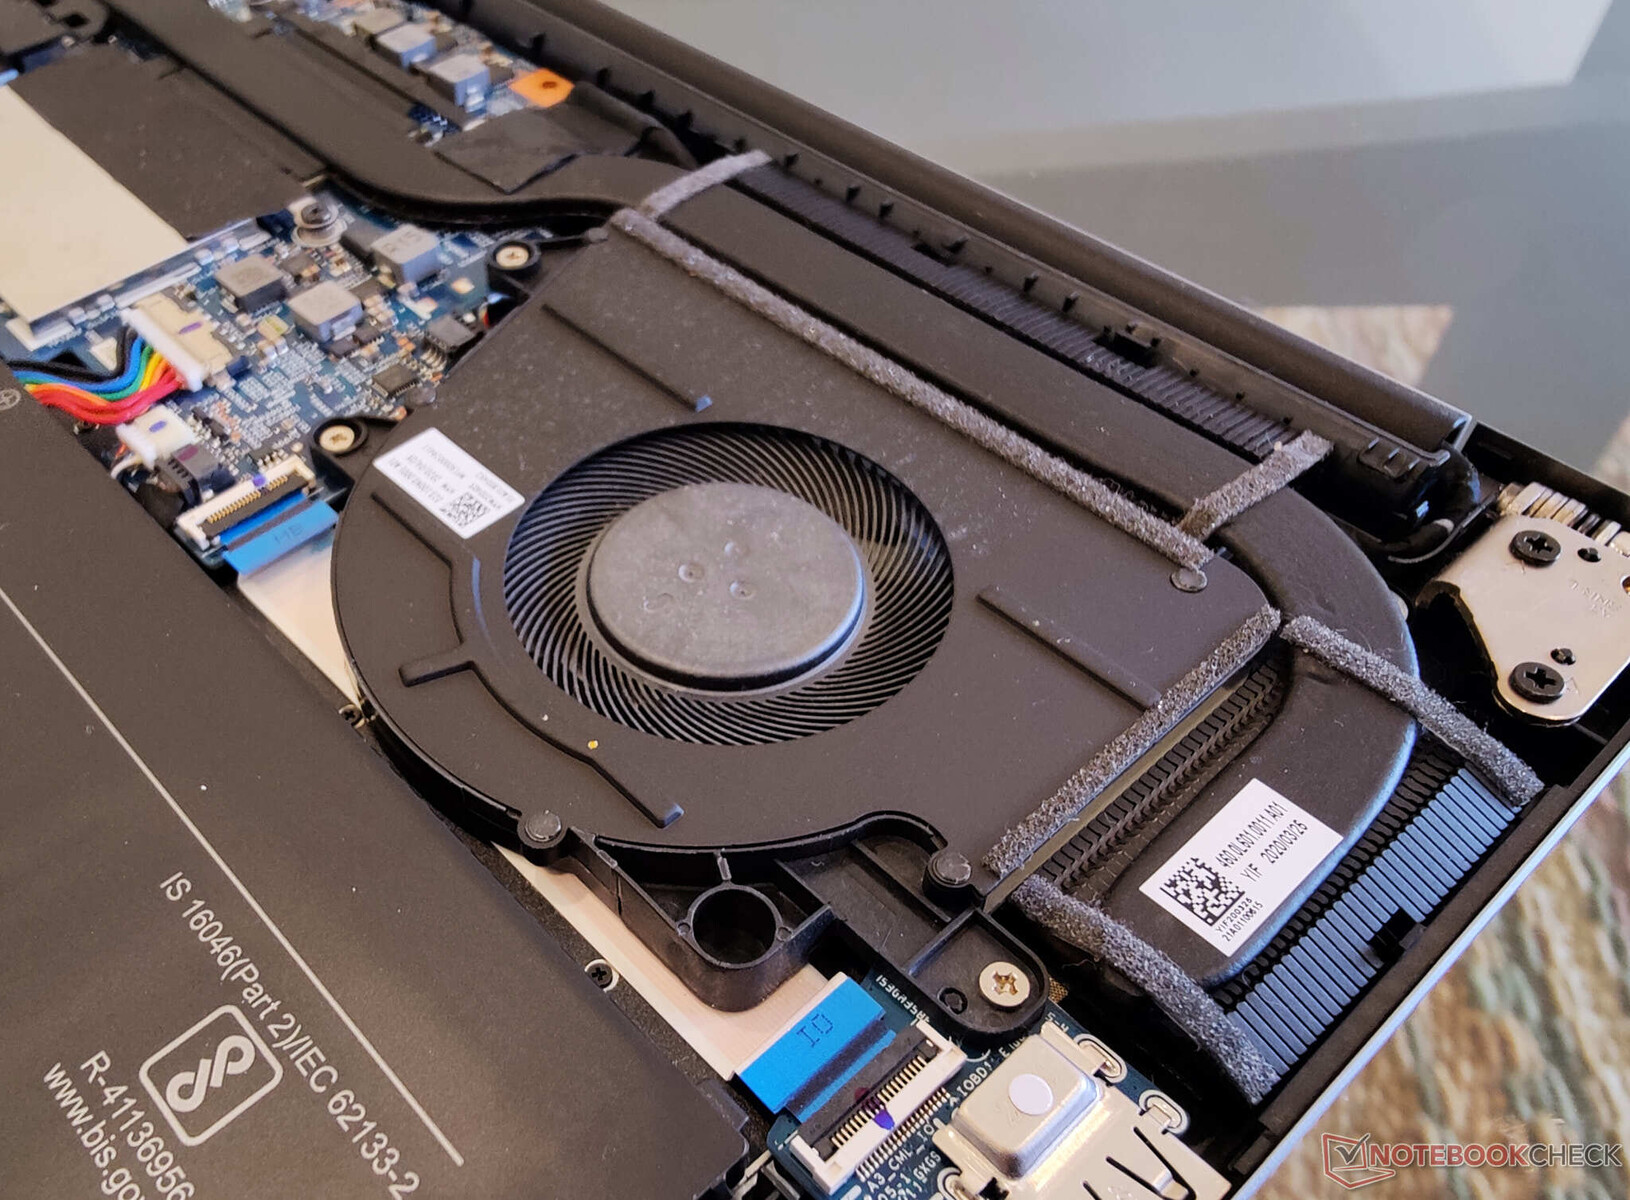
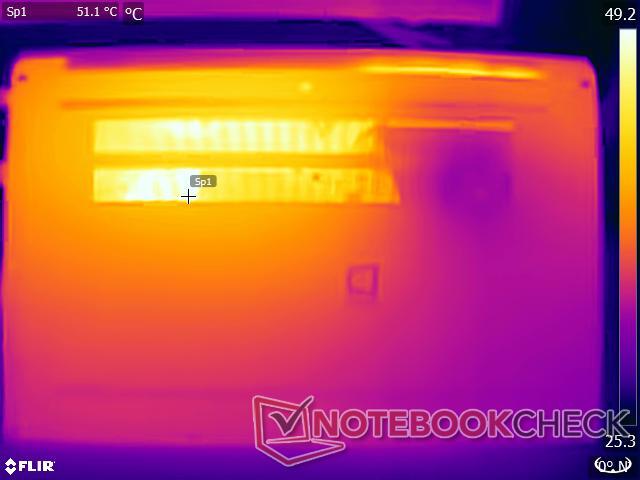
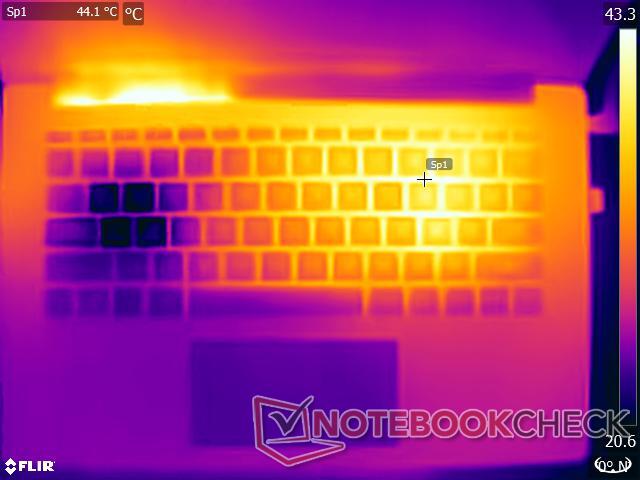
In regular use, the surface temperatures are quite manageable. However, the single fan and single heatpipe system seems a bit inadequate under stressful conditions.
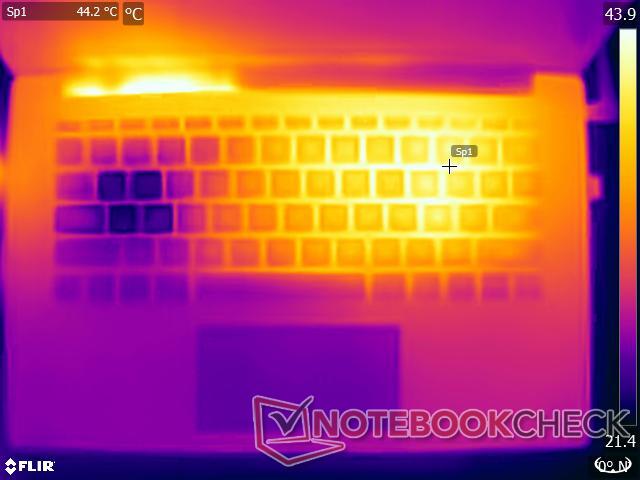
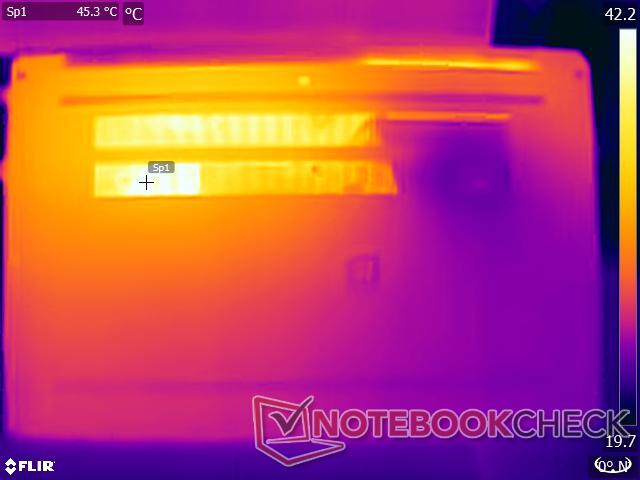
Under a maximum load that includes Prime95 and FurMark, we see that the top right and bottom left areas get quite hot. A similar heat profile is seen during The Witcher 3 stress as well. This means that the device cannot be used on the lap when stressed. However, the palm rest and touchpad areas continue to remain relatively cool.
Note that these are extreme conditions and real-life applications are not likely to stress the device as much.
(-) The maximum temperature on the upper side is 50.8 °C / 123 F, compared to the average of 36.9 °C / 98 F, ranging from 21.1 to 71 °C for the class Multimedia.
(-) The bottom heats up to a maximum of 53.2 °C / 128 F, compared to the average of 39.1 °C / 102 F
(+) In idle usage, the average temperature for the upper side is 29.4 °C / 85 F, compared to the device average of 31.2 °C / 88 F.
(-) Playing The Witcher 3, the average temperature for the upper side is 40.48 °C / 105 F, compared to the device average of 31.2 °C / 88 F.
(±) The palmrests and touchpad can get very hot to the touch with a maximum of 36.4 °C / 97.5 F.
(-) The average temperature of the palmrest area of similar devices was 28.8 °C / 83.8 F (-7.6 °C / -13.7 F).


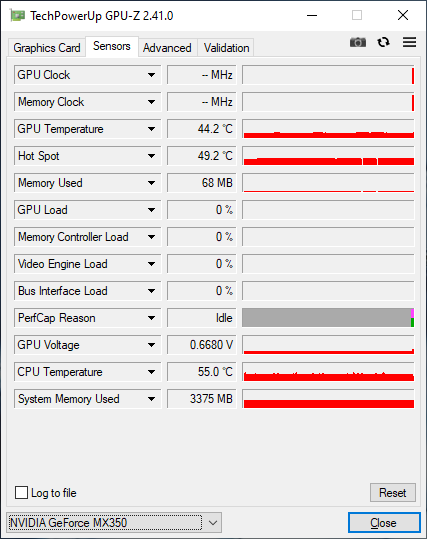
Stress Test
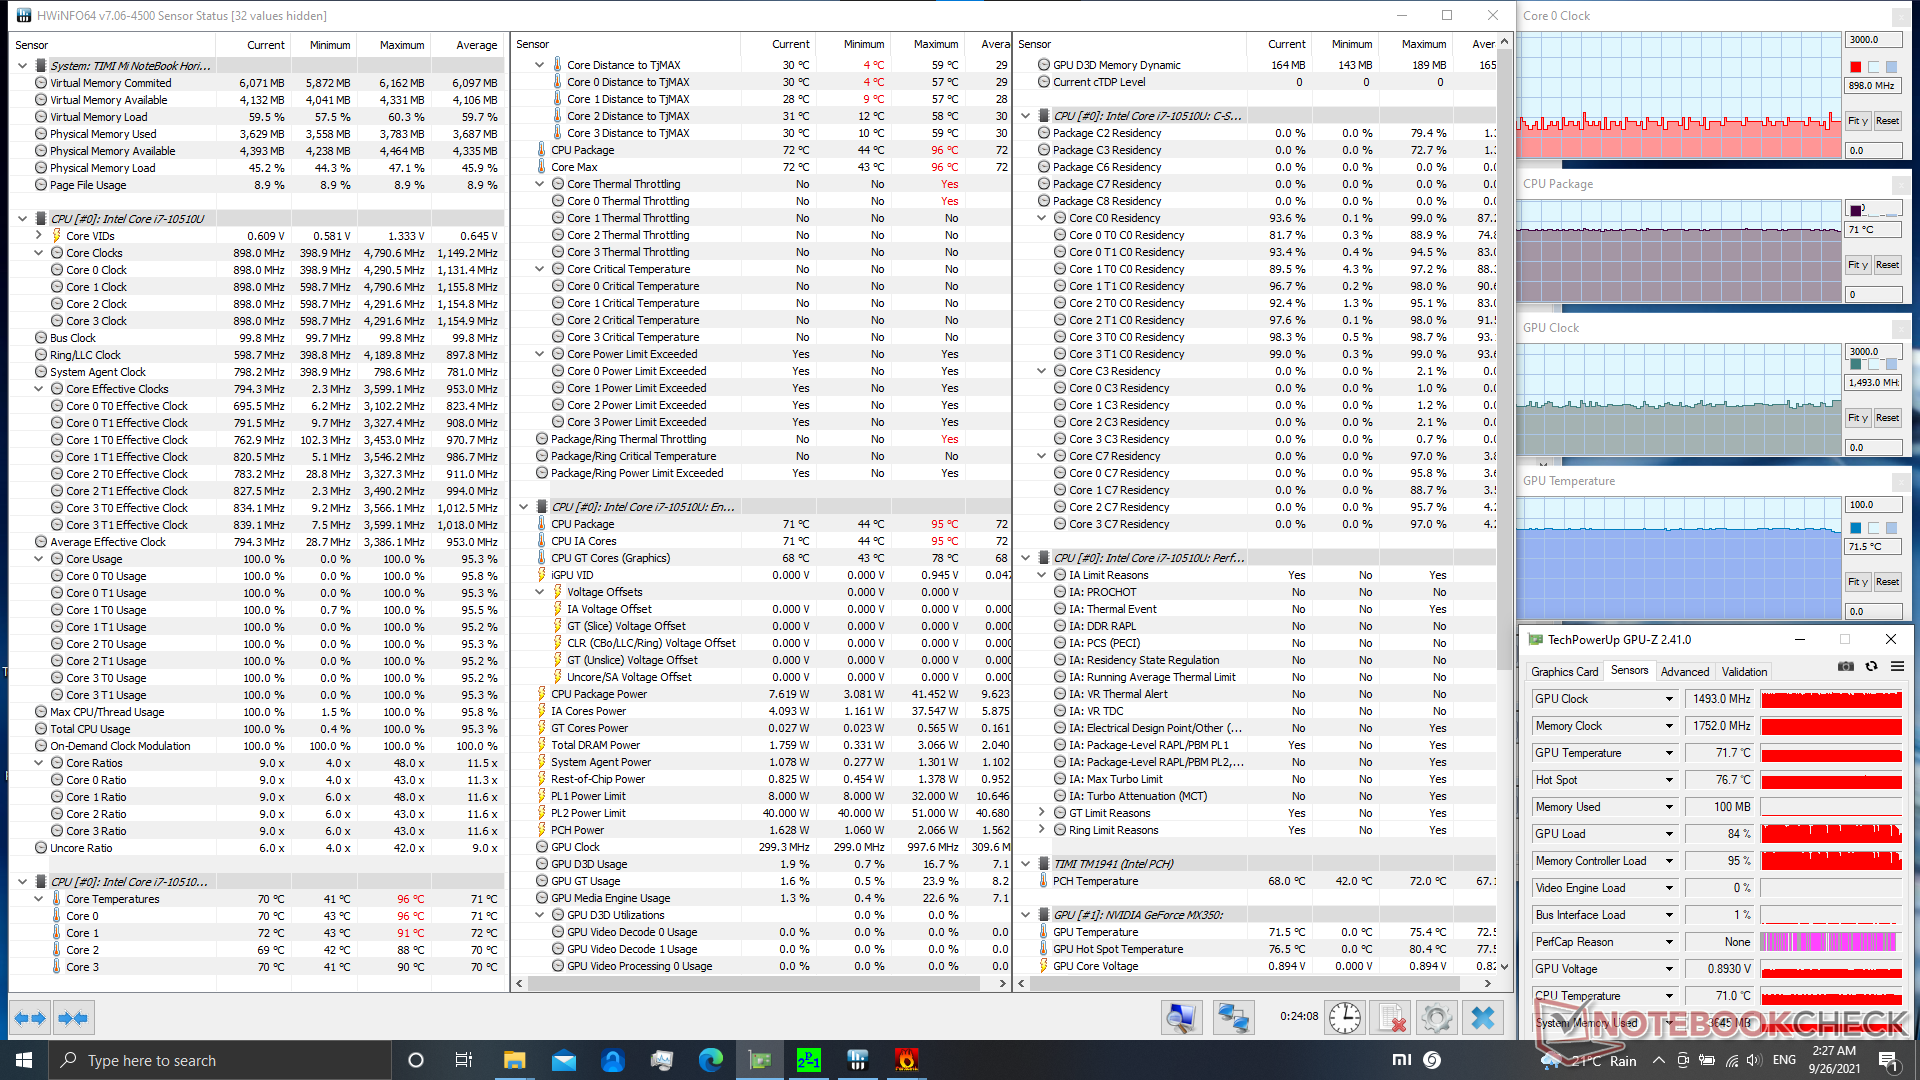
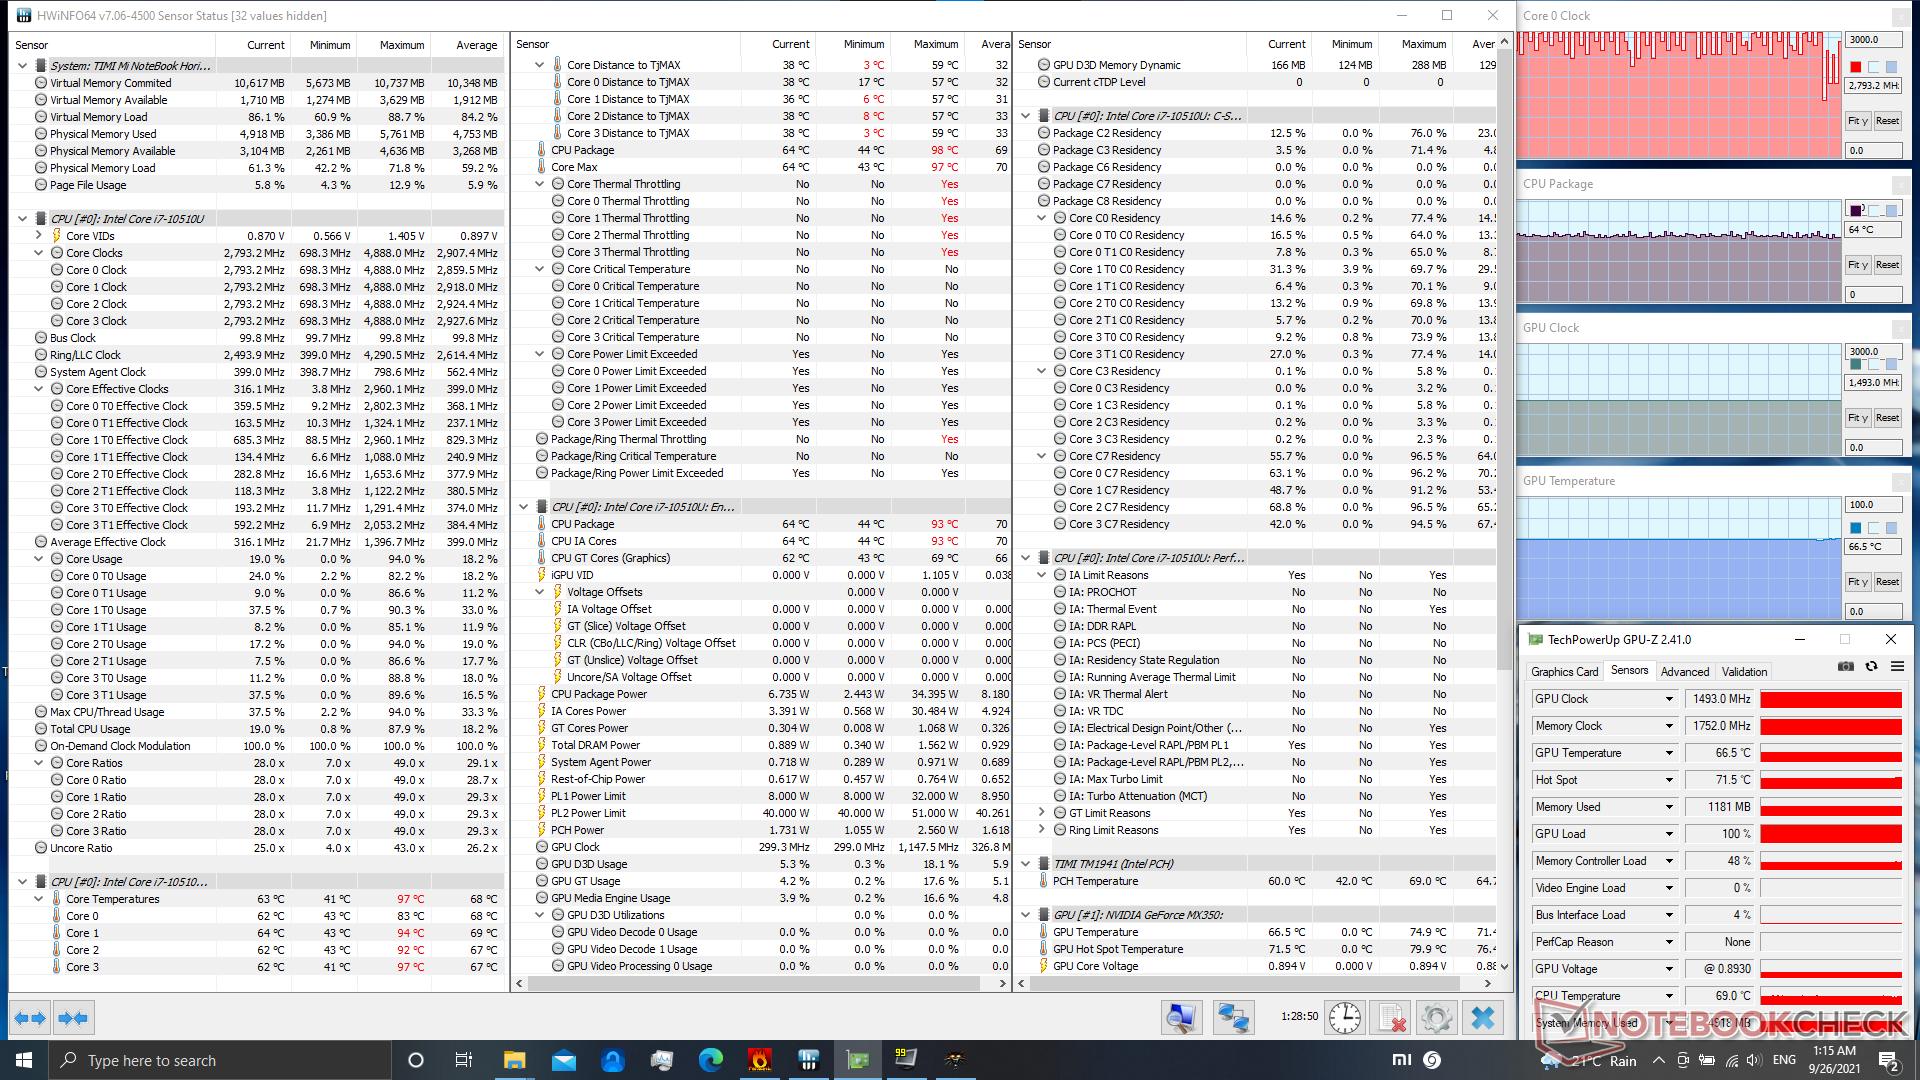
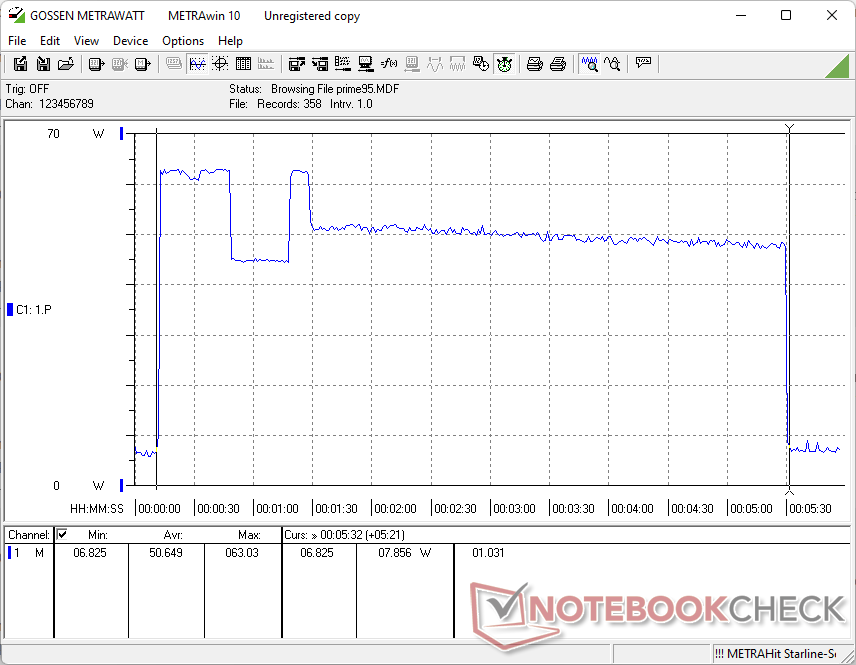
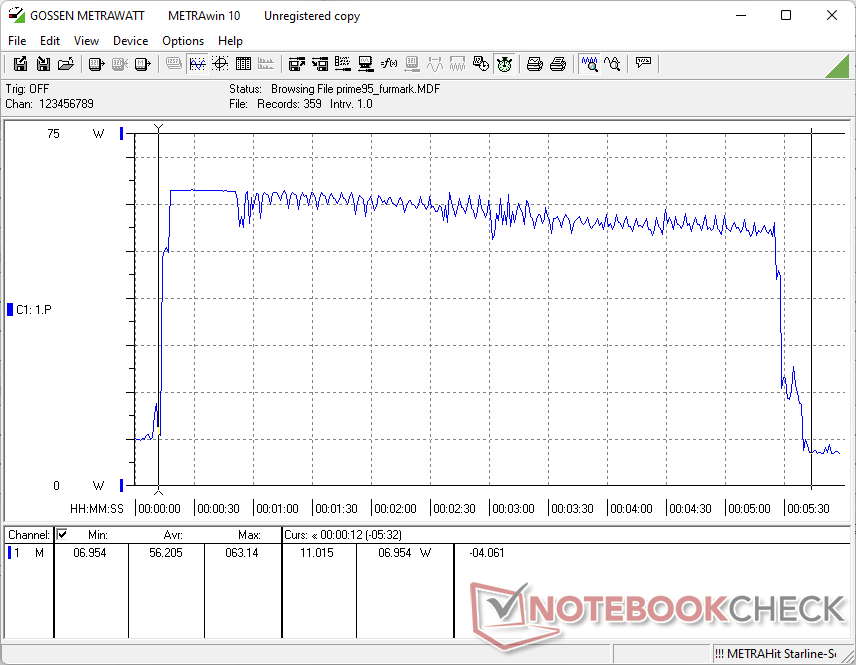
Though the Core i7-10510U actually offers a PL1/PL2 of 32 W/51 W, we found that the processor allowed for only 12 W/40 W during stress testing. While stressing the CPU alone with Prime95, we see that the CPU clock reaches to a maximum of 1.6 GHz. Adding FurMark to the mix results in the CPU clocks going down to 0.9 GHz while the MX350 GPU reaches 1,493 MHz, which is slightly higher than the rated boost of 1,468 MHz.
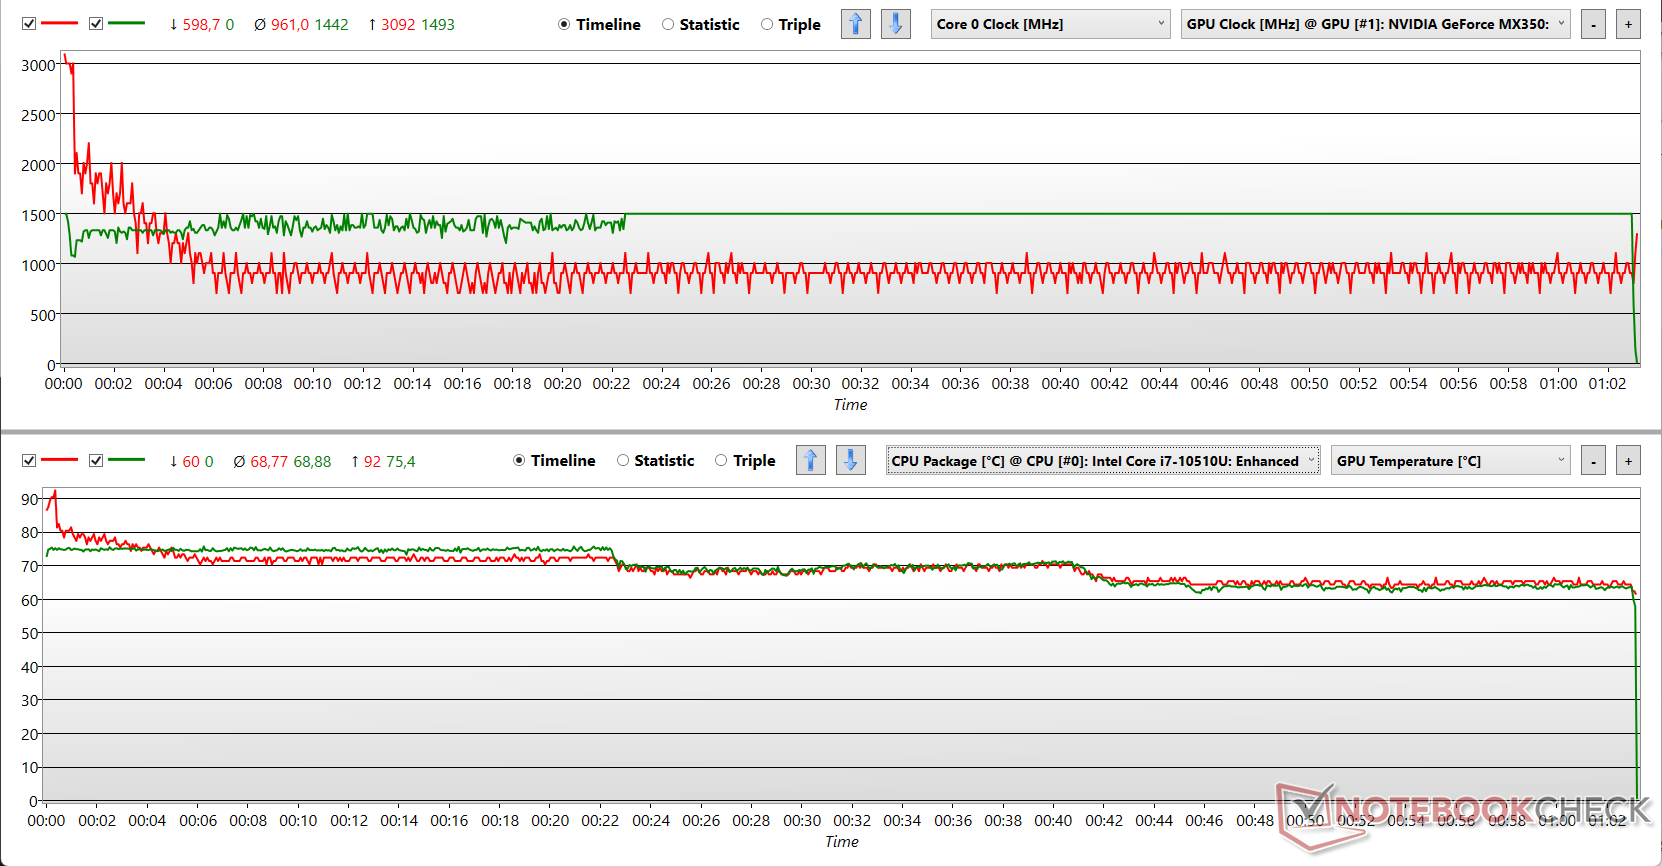
In The Witcher 3 stress, we see the GPU clocks maintaining a steady 1,493 MHz without any throttling. While the CPU clocks reach 3.5 GHz, they fluctuate a lot often dropping to the 2.8 GHz mark. This probably explains why we see intermittent fps fluctuations in this stress test although the GPU operates fairly steadily.
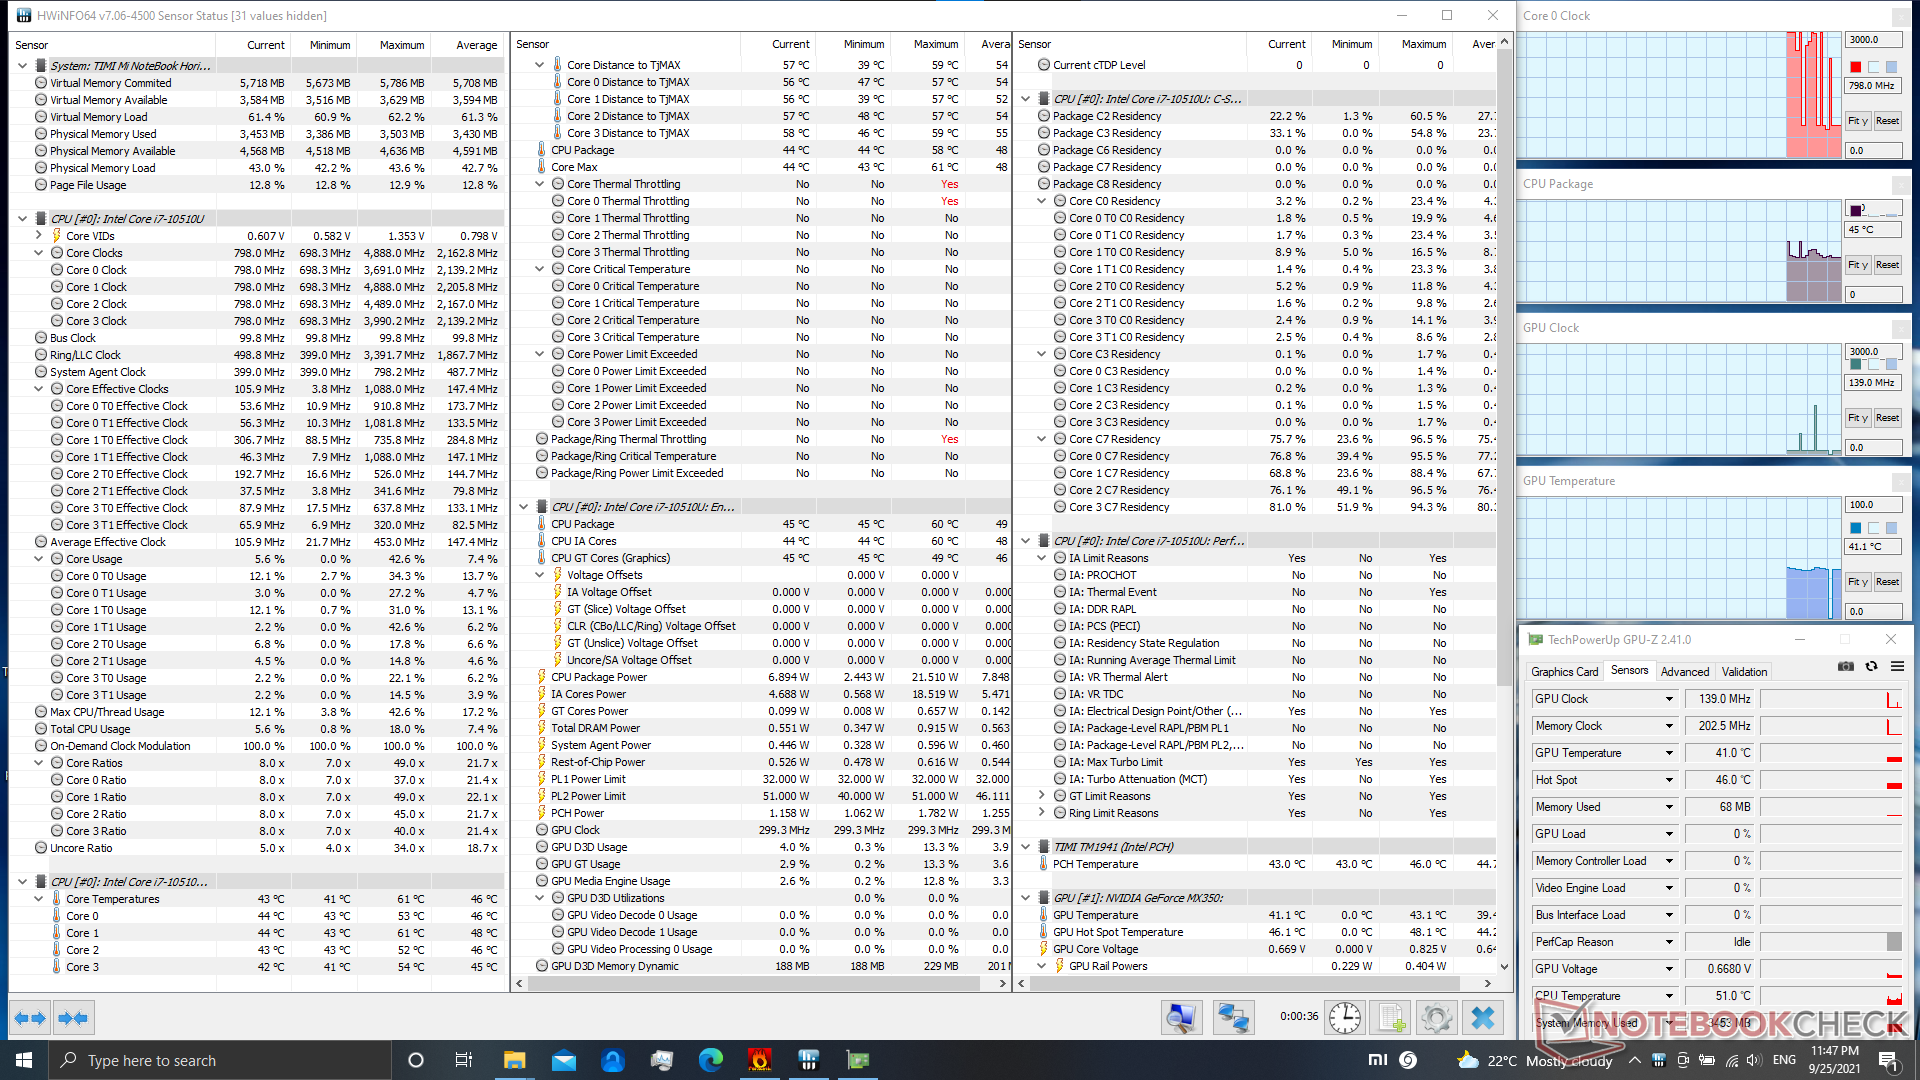
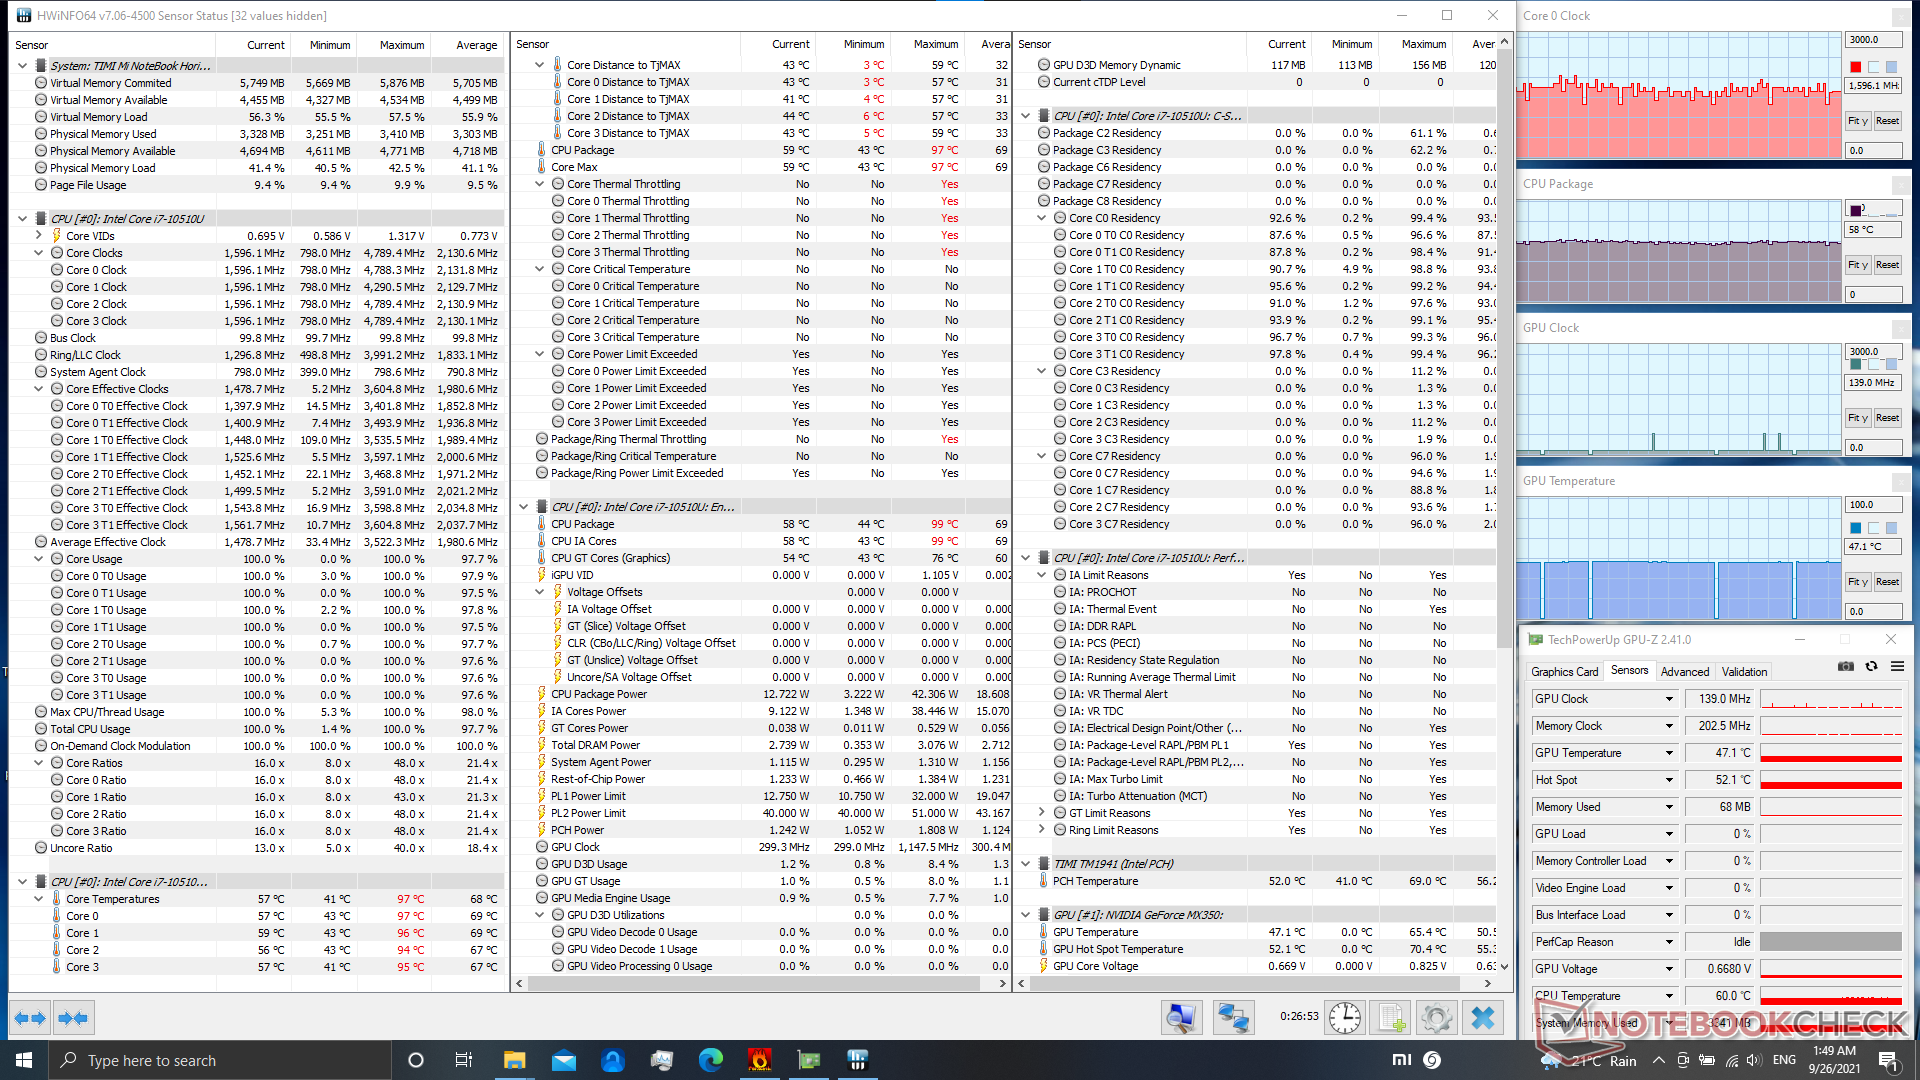
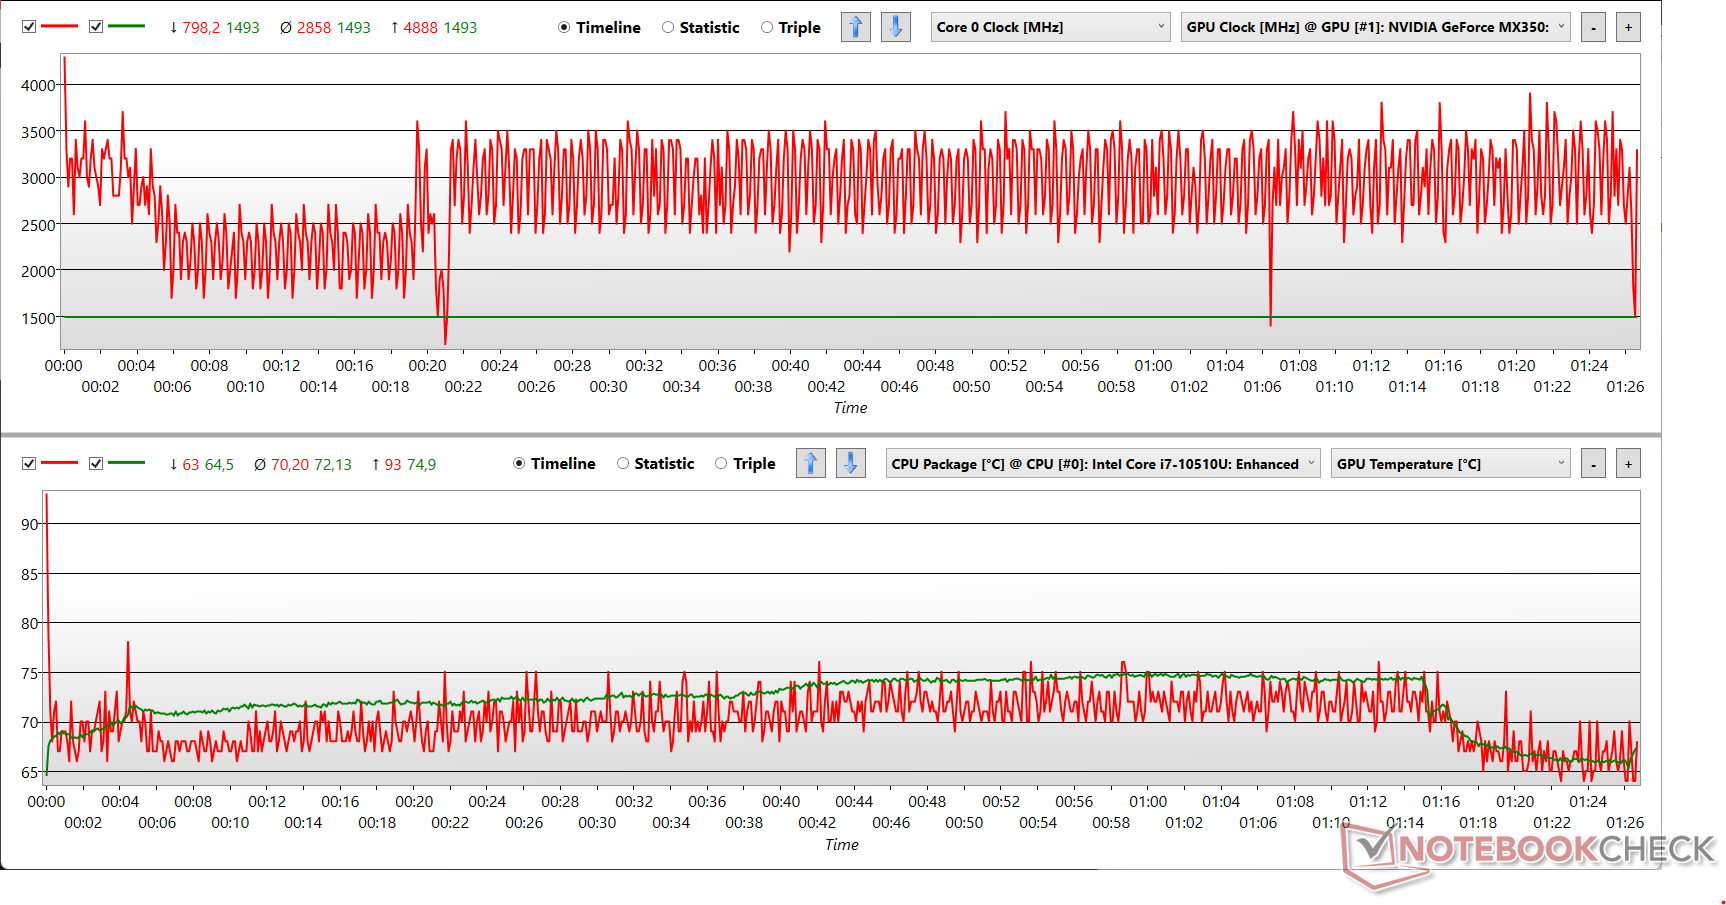
| Stress Test | CPU Clock (GHz) | GPU Clock (MHz) | Average CPU Temperature (°C) | Average GPU Temperature (°C) |
| System Idle | 0.8 | 139 | 49 | 39.4 |
| Prime95 | 1.59 | 139 | 69 | 50.5 |
| Prime95 + FurMark | 0.9 | 1493 | 72 | 72.5 |
| The Witcher 3 | 2.79 | 1493 | 70 | 71.4 |
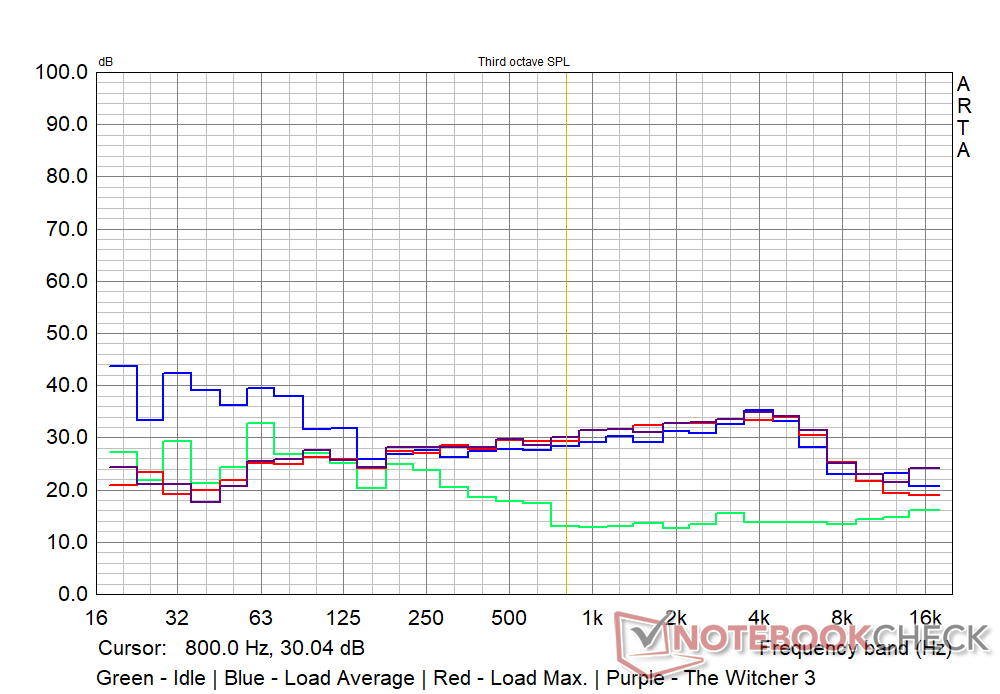
Speakers

The Mi NoteBook 14 Horizon is endowed with a pair of bottom-firing speakers, and their quality corresponds to the budget pricing. The audio is serviceable for the occasional video call and casual listening. However, the bass is non-existent and the mids seem a tad too sharp though higher frequencies are somewhat better. Xiaomi includes the DTS Audio Processing app that allows for adjusting a few presets.
Xiaomi Mi NoteBook 14 Horizon Edition audio analysis
(-) | not very loud speakers (69.7 dB)
Bass 100 - 315 Hz
(-) | nearly no bass - on average 15.9% lower than median
(-) | bass is not linear (19.2% delta to prev. frequency)
Mids 400 - 2000 Hz
(±) | higher mids - on average 5.7% higher than median
(±) | linearity of mids is average (12.5% delta to prev. frequency)
Highs 2 - 16 kHz
(+) | balanced highs - only 2.9% away from median
(±) | linearity of highs is average (8.1% delta to prev. frequency)
Overall 100 - 16.000 Hz
(±) | linearity of overall sound is average (23.2% difference to median)
Compared to same class
» 80% of all tested devices in this class were better, 5% similar, 15% worse
» The best had a delta of 5%, average was 18%, worst was 45%
Compared to all devices tested
» 65% of all tested devices were better, 6% similar, 29% worse
» The best had a delta of 4%, average was 25%, worst was 134%
Apple MacBook 12 (Early 2016) 1.1 GHz audio analysis
(+) | speakers can play relatively loud (83.6 dB)
Bass 100 - 315 Hz
(±) | reduced bass - on average 11.3% lower than median
(±) | linearity of bass is average (14.2% delta to prev. frequency)
Mids 400 - 2000 Hz
(+) | balanced mids - only 2.4% away from median
(+) | mids are linear (5.5% delta to prev. frequency)
Highs 2 - 16 kHz
(+) | balanced highs - only 2% away from median
(+) | highs are linear (4.5% delta to prev. frequency)
Overall 100 - 16.000 Hz
(+) | overall sound is linear (10.2% difference to median)
Compared to same class
» 5% of all tested devices in this class were better, 2% similar, 93% worse
» The best had a delta of 5%, average was 19%, worst was 53%
Compared to all devices tested
» 3% of all tested devices were better, 1% similar, 96% worse
» The best had a delta of 4%, average was 25%, worst was 134%
Energy Management: Economical on AC power
Power Consumption
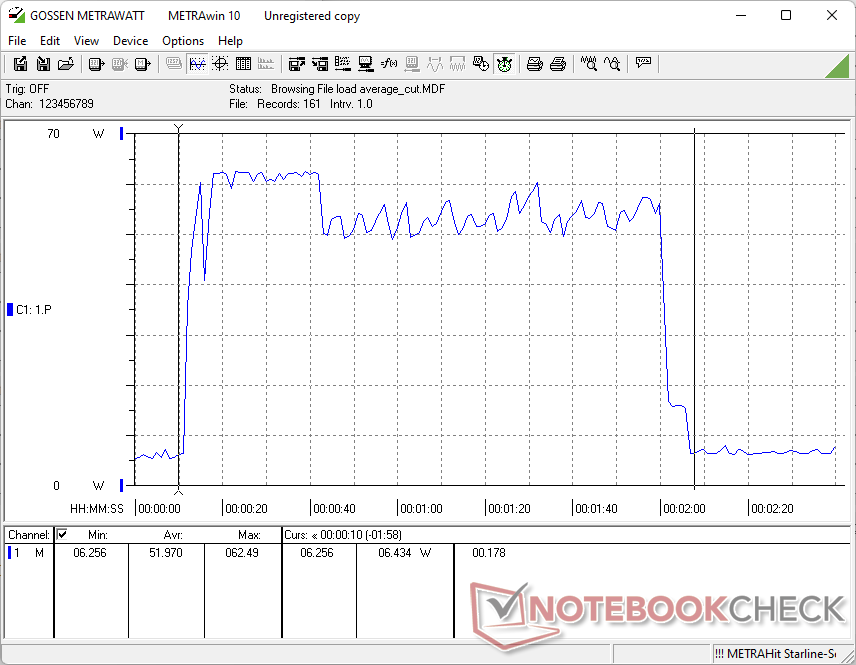
Compared to the competition, the Mi NoteBook 14 Horizon Edition is a somewhat economical device when it comes to overall power consumption. The provided 65 W AC adapter seems sufficient to cater to the needs of the device even under maximum load.
| Off / Standby | |
| Idle | |
| Load |
|
| Xiaomi Mi NoteBook 14 Horizon Edition i7-10510U, GeForce MX350, Toshiba XG6 KXG60ZNV512G, TFT-LCD, 1920x1080, 14.00 | Huawei MateBook 14 2020 Intel i7-10510U, GeForce MX350, Lite-On CA5-8D512, IPS LED, 2160x1440, 14.00 | Acer TravelMate P6 P614-51T-G2-72ZU i7-10510U, UHD Graphics 620, Samsung PM991 MZVLQ512HALU, IPS, 1920x1080, 14.00 | Asus VivoBook S14 S433FL i7-10510U, GeForce MX250, Intel Optane Memory H10 with Solid State Storage 32GB + 512GB HBRPEKNX0202A(L/H), IPS, 1920x1080, 14.00 | HP Envy 13-ba0001ng i7-10510U, GeForce MX350, Intel SSD 660p SSDPEKNW512G8, IPS, 1920x1080, 13.30 | Acer Swift 3 SF314-42-R4XJ R7 4700U, Vega 7, Samsung PM991 MZVLQ1T0HALB, IPS, 1920x1080, 14.00 | |
|---|---|---|---|---|---|---|
| Power Consumption | -44% | -17% | -10% | 6% | 5% | |
| Idle Minimum * | 2.22 | 3 -35% | 3.6 -62% | 2.4 -8% | 2 10% | 2.8 -26% |
| Idle Average * | 4.64 | 9 -94% | 5.8 -25% | 4.2 9% | 4 14% | 4.8 -3% |
| Idle Maximum * | 5.86 | 11 -88% | 9.5 -62% | 7.8 -33% | 6.5 -11% | 6.7 -14% |
| Load Average * | 51.97 | 60.8 -17% | 42 19% | 57 -10% | 44 15% | 28 46% |
| Witcher 3 ultra * | 49.2 | 56 -14% | 52 -6% | 57 -16% | ||
| Load Maximum * | 56.2 | 65.6 -17% | 31 45% | 64 -14% | 55.6 1% | 31 45% |
* ... smaller is better
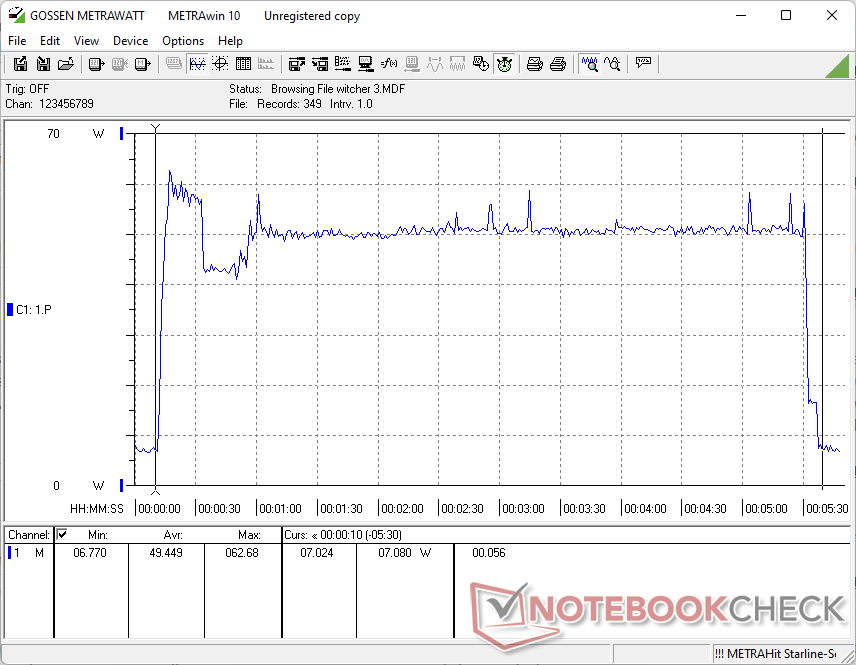
Power Consumption Witcher 3 / Stresstest
Battery Life
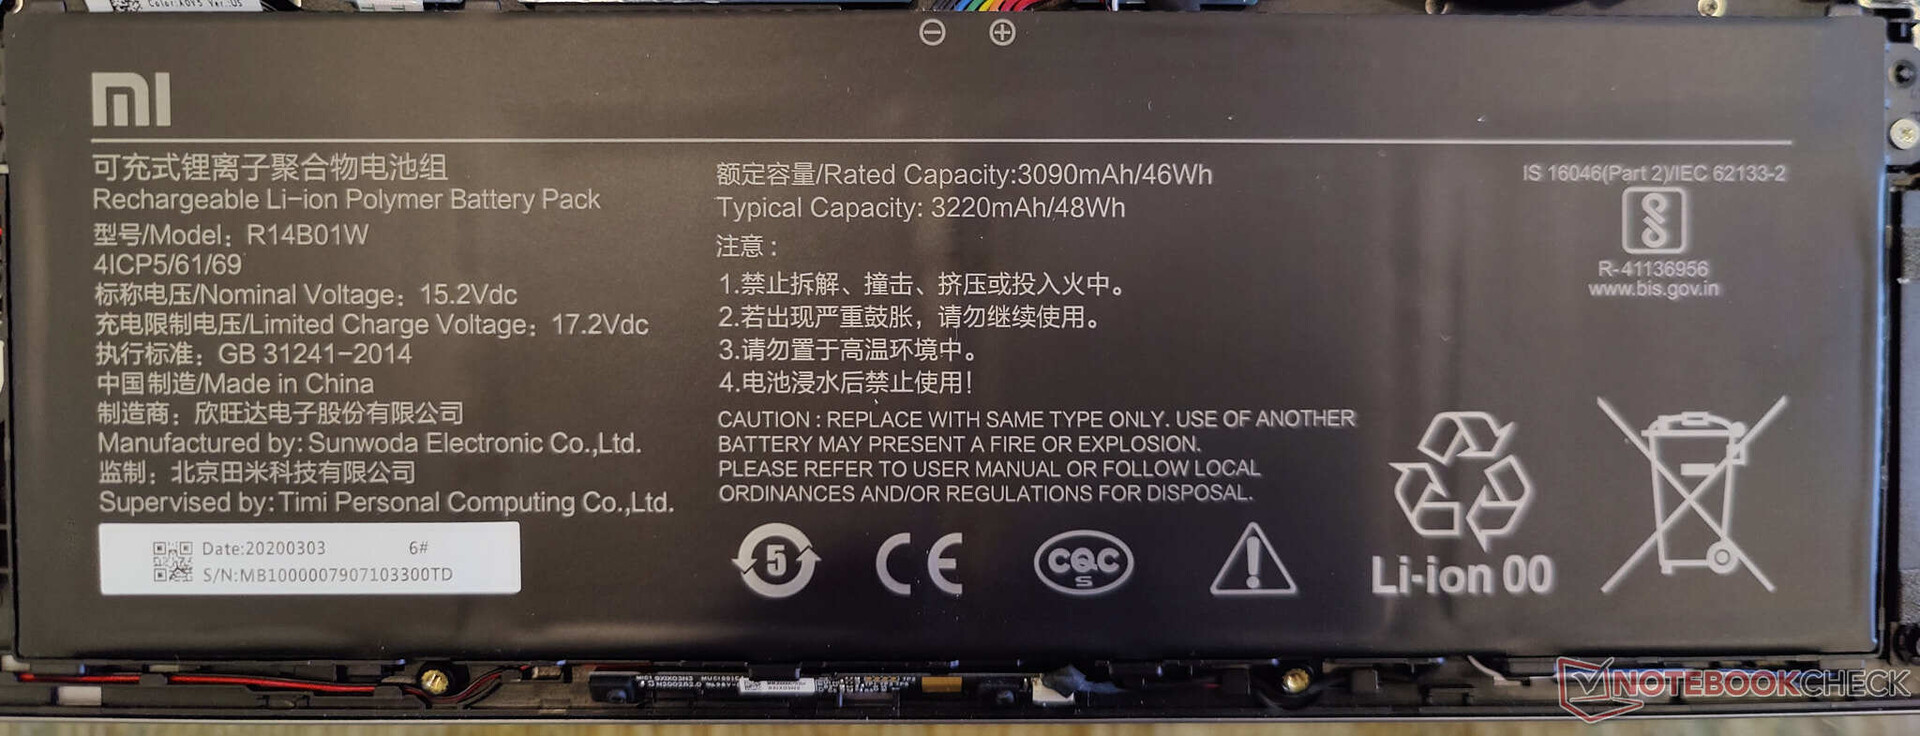
The provided 46 Wh cell trails behind the competition that all offer bigger batteries. That being said, it is possible to get slightly above 11.5 hours of runtime while web browsing and about 16 hours of video playback when the screen is set to a brightness of 150 nits. Battery runtimes can get drastically affected while gaming or under stress.
| Xiaomi Mi NoteBook 14 Horizon Edition i7-10510U, GeForce MX350, 46 Wh | Huawei MateBook 14 2020 Intel i7-10510U, GeForce MX350, 56 Wh | Acer TravelMate P6 P614-51T-G2-72ZU i7-10510U, UHD Graphics 620, 60 Wh | Asus VivoBook S14 S433FL i7-10510U, GeForce MX250, 50 Wh | HP Envy 13-ba0001ng i7-10510U, GeForce MX350, 51 Wh | Acer Swift 3 SF314-42-R4XJ R7 4700U, Vega 7, 48.85 Wh | |
|---|---|---|---|---|---|---|
| Battery Runtime | 60% | 37% | -26% | 30% | 27% | |
| Reader / Idle | 1920 | 1549 -19% | 941 -51% | 1392 -27% | ||
| WiFi v1.3 | 697 | 768 10% | 676 -3% | 514 -26% | 630 -10% | 715 3% |
| Witcher 3 ultra | 66 | |||||
| Load | 56 | 117 109% | 131 134% | 141 152% | 114 104% |
Pros
Cons
Verdict: Questionable relevance in 2021
The Mi NoteBook 14 Horizon Edition is one of the more recent attempts by Xiaomi to lower the entry point for mid-range multimedia laptops. The device sports a good metal alloy construction with firm hinges and minimal distractions. While the port selection is decent, the lack of a dedicated card reader or even a Kensington lock slot can be off-putting to many.
Though Xiaomi offers an external webcam in the package, the quality isn't any better than most integrated webcams. The slow Wi-Fi speeds can be a cause for concern as well. A cramped touchpad, a non-backlit keyboard, and lack of biometrics are other things that buyers have to contend with.
The Xiaomi Mi NoteBook 14 Horizon Edition tries its best to get the basics right but seems to have cut more corners than needed. With 11th gen laptops already widely available, its relevance as a new purchase option in 2021 is not without question.
The Mi NoteBook 14 Horizon makes up for lost ground on the performance front with good overall CPU and GPU scores. The Nvidia MX350 GPU will not break any records in 2021 but should offer much better hardware acceleration than the iGPU. However, both CPU and GPU scores tank when on battery which, by the way, is another area that Xiaomi has compromised on.
The Mi NoteBook 14 Horizon Edition is not a bad multimedia laptop per se, but the competition clearly offers better devices. Though laptops such as the Huawei MateBook 14 2020 and the HP Envy 13 lag behind the Mi NoteBook 14 Horizon Edition in raw performance, they do offer an overall better package. Xiaomi clearly has a price advantage, however, which is something you should factor in.
With most OEMs including Xiaomi already on the Tiger Lake bandwagon, opting for a Comet Lake device with several glaring deficiencies might not be the best option as a new daily driver laptop in 2021.
Price and availability
The Xiaomi Mi NoteBook 14 Horizon Edition can be currently purchased from Mi.com or Amazon India for ₹56,999 (US$768)
Xiaomi Mi NoteBook 14 Horizon Edition
-
09/29/2021 v7
Vaidyanathan Subramaniam
More articles related to this device
Xiaomi Mi NoteBook 14 Horizon Edition (Mi Notebook Series)Related Articles


Pricecompare
