 Deutsch
 English
 Español
 Français
 Italiano
 Nederlands
 Polski
 Português
 Русский
 Türkçe
 Svenska
 Chinese
 Magyar
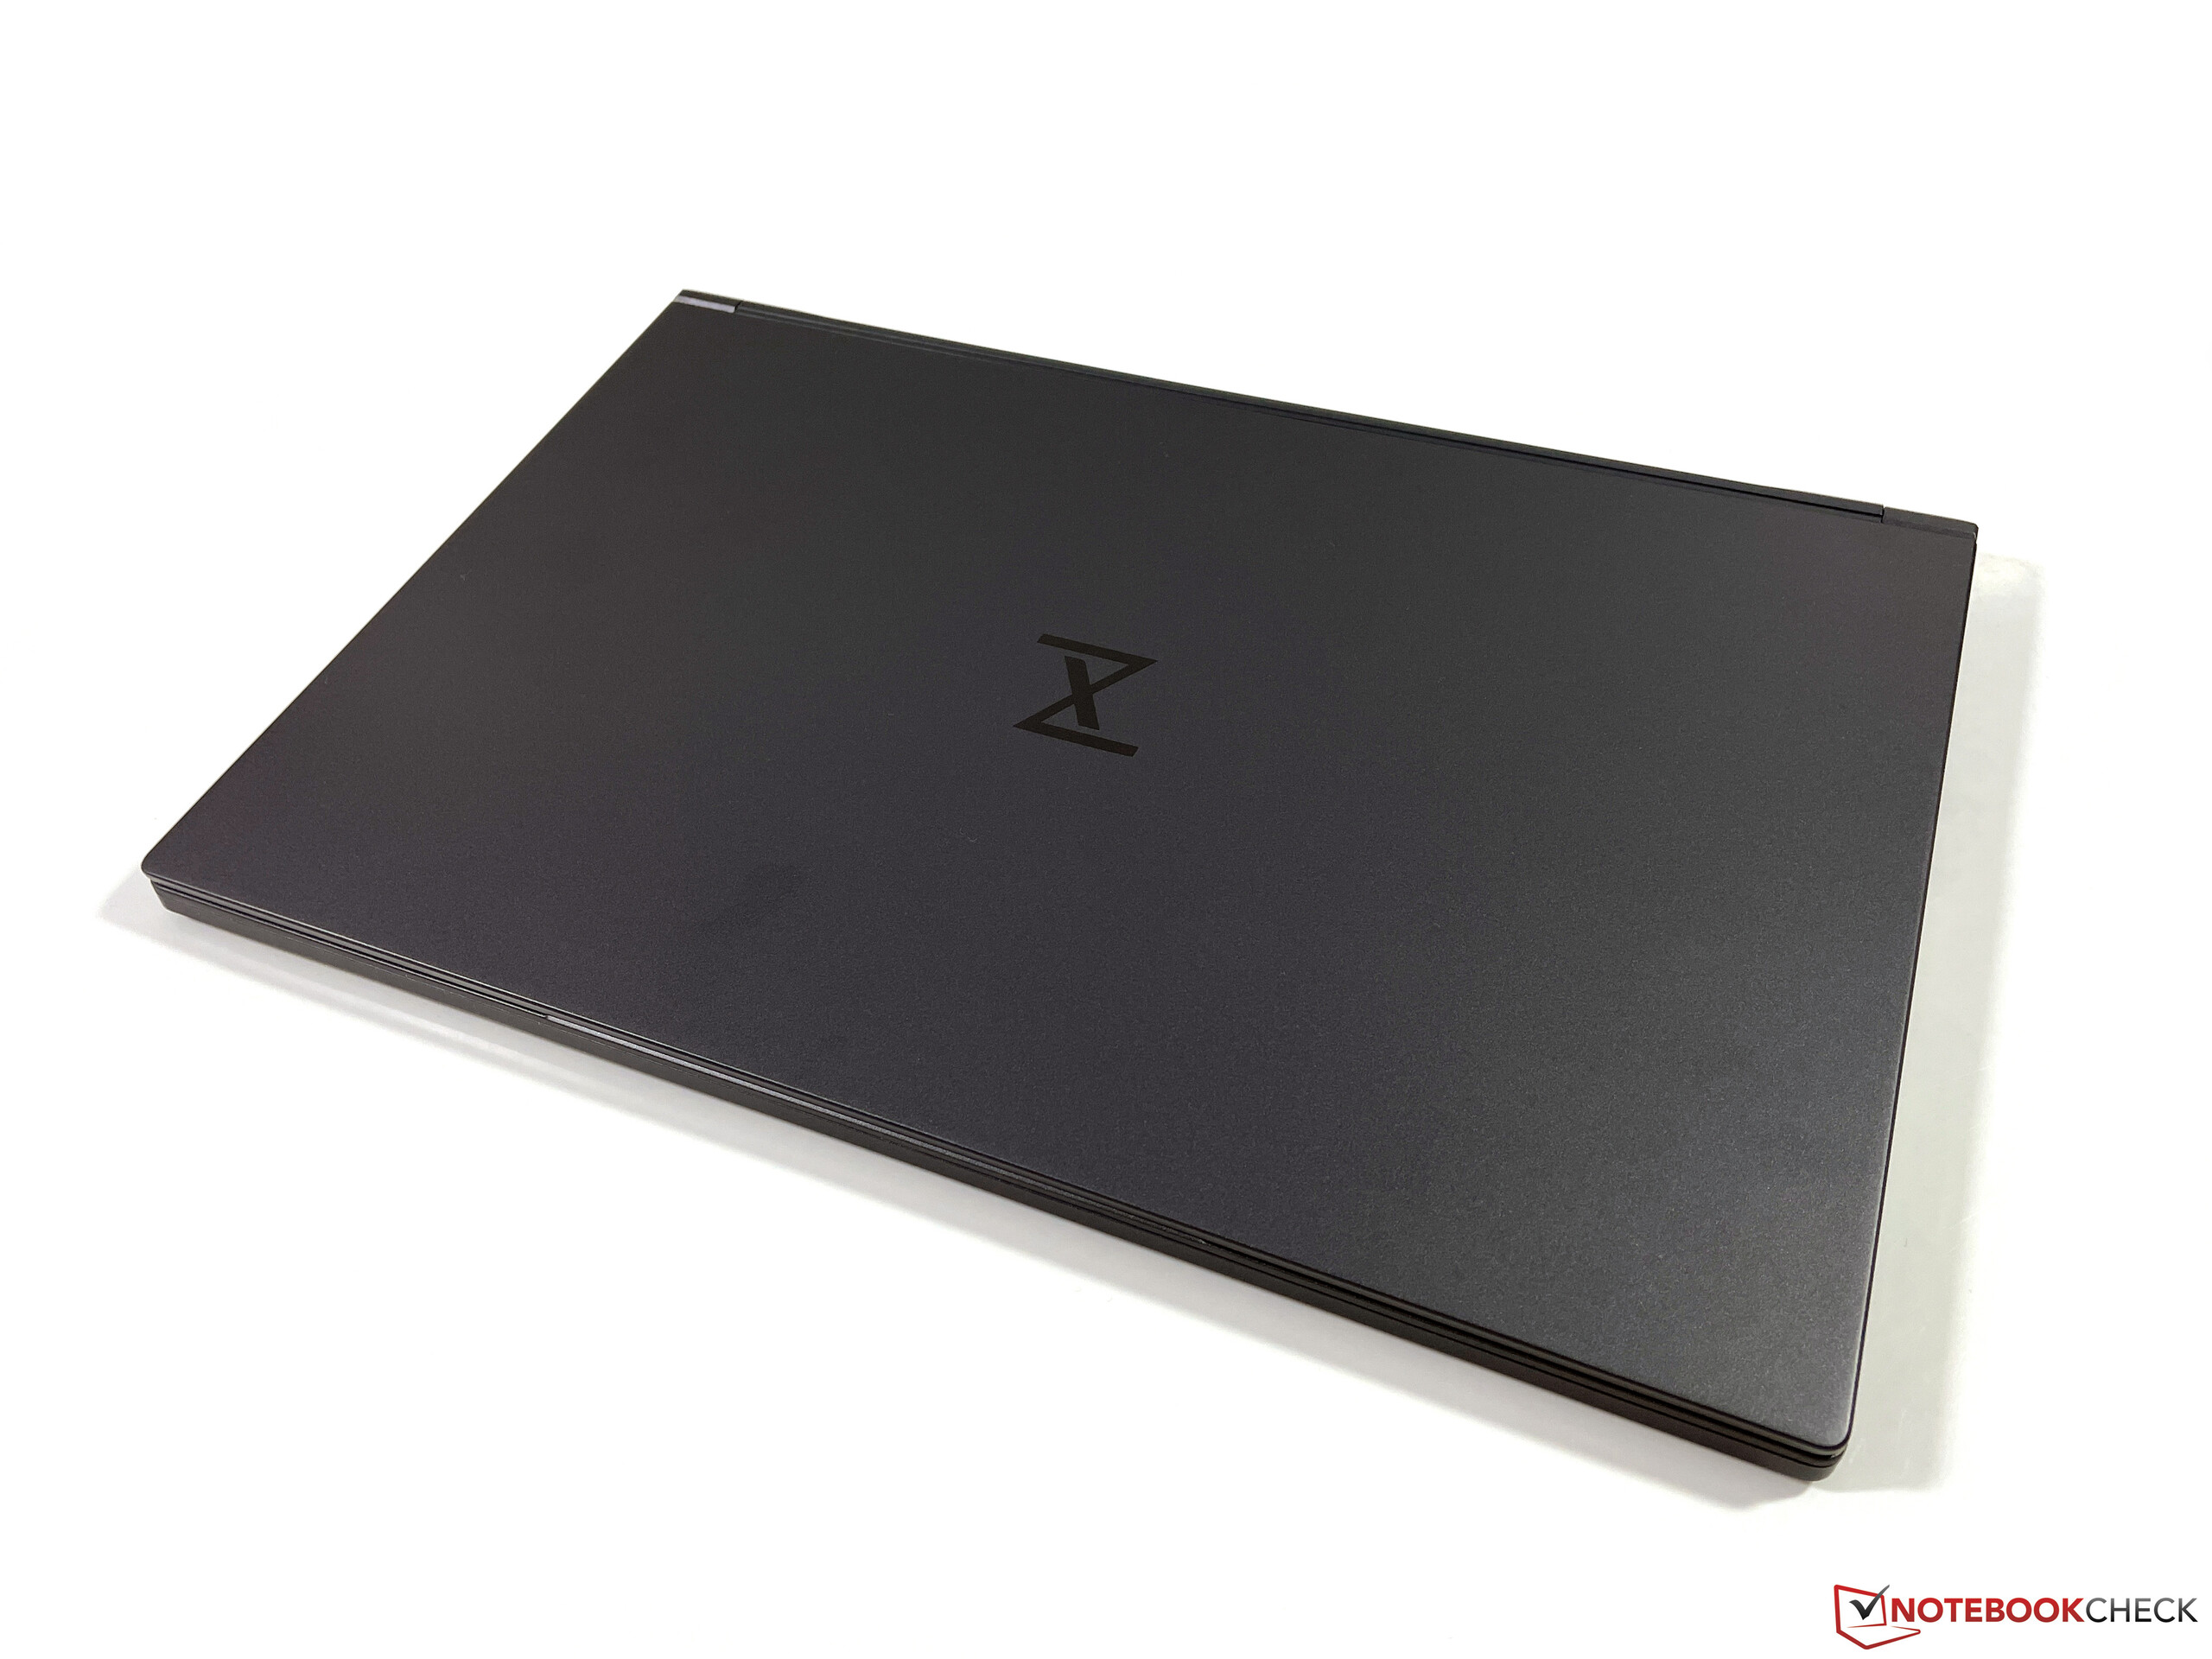
Tuxedo Pulse 15 Laptop Review - AMD-powered 15-inch Linux Ultrabook
The Pulse 15 is a 15-inch Ultrabook with a fast 45 W AMD Ryzen 4000-series processor. It features a very compact magnesium case that weighs just 1.5 kg. The matte IPS panel found on our review unit is featured in every SKU and the device is freely configurable otherwise. For example, you can opt for the faster Ryzen 7 4800HS instead of the Ryzen 5 4600H, and RAM and SSD options are aplenty. Prices start at around 1,000 Euros. Our particular review unit, equipped with a 1 TB SSD, 32 GB of RAM, and an additional dual-boot Windows installation cost around 1,300 Euros at the time of writing.
If you are interested in the Pulse 15 but would prefer Windows to Linux, you may want to take a closer look at the otherwise identical Schenker Via Pro 15.
Please not that we ran all benchmarks and tests under Windows for better comparability. Drivers for Windows are included with the device and can also be downloaded from the manufacturer’s website.
Competitors in Comparison
Rating | Date | Model | Weight | Height | Size | Resolution | Best Price |
|---|---|---|---|---|---|---|---|
| 84.9 % | 03/2021 | Tuxedo Pulse 15 R5 4600H, Vega 6 | 1.5 kg | 17 mm | 15.60" | 1920x1080 | |
| 84.5 % | 11/2020 | Honor MagicBook Pro (AMD) R5 4600H, Vega 6 | 1.7 kg | 16.9 mm | 16.10" | 1920x1080 | |
| 87.7 % | 12/2020 | SCHENKER Vision 15 i7-1165G7, Iris Xe G7 96EUs | 1.7 kg | 15 mm | 15.60" | 1920x1080 | |
| 86.8 % | 05/2020 | Dell XPS 15 9500 Core i5 i5-10300H, UHD Graphics 630 | 1.8 kg | 18 mm | 15.60" | 1920x1200 | |
| 84.8 % | 07/2020 | LG Gram 15Z90N i5-1035G7, Iris Plus Graphics G7 (Ice Lake 64 EU) | 1.1 kg | 16.8 mm | 15.60" | 1920x1080 |
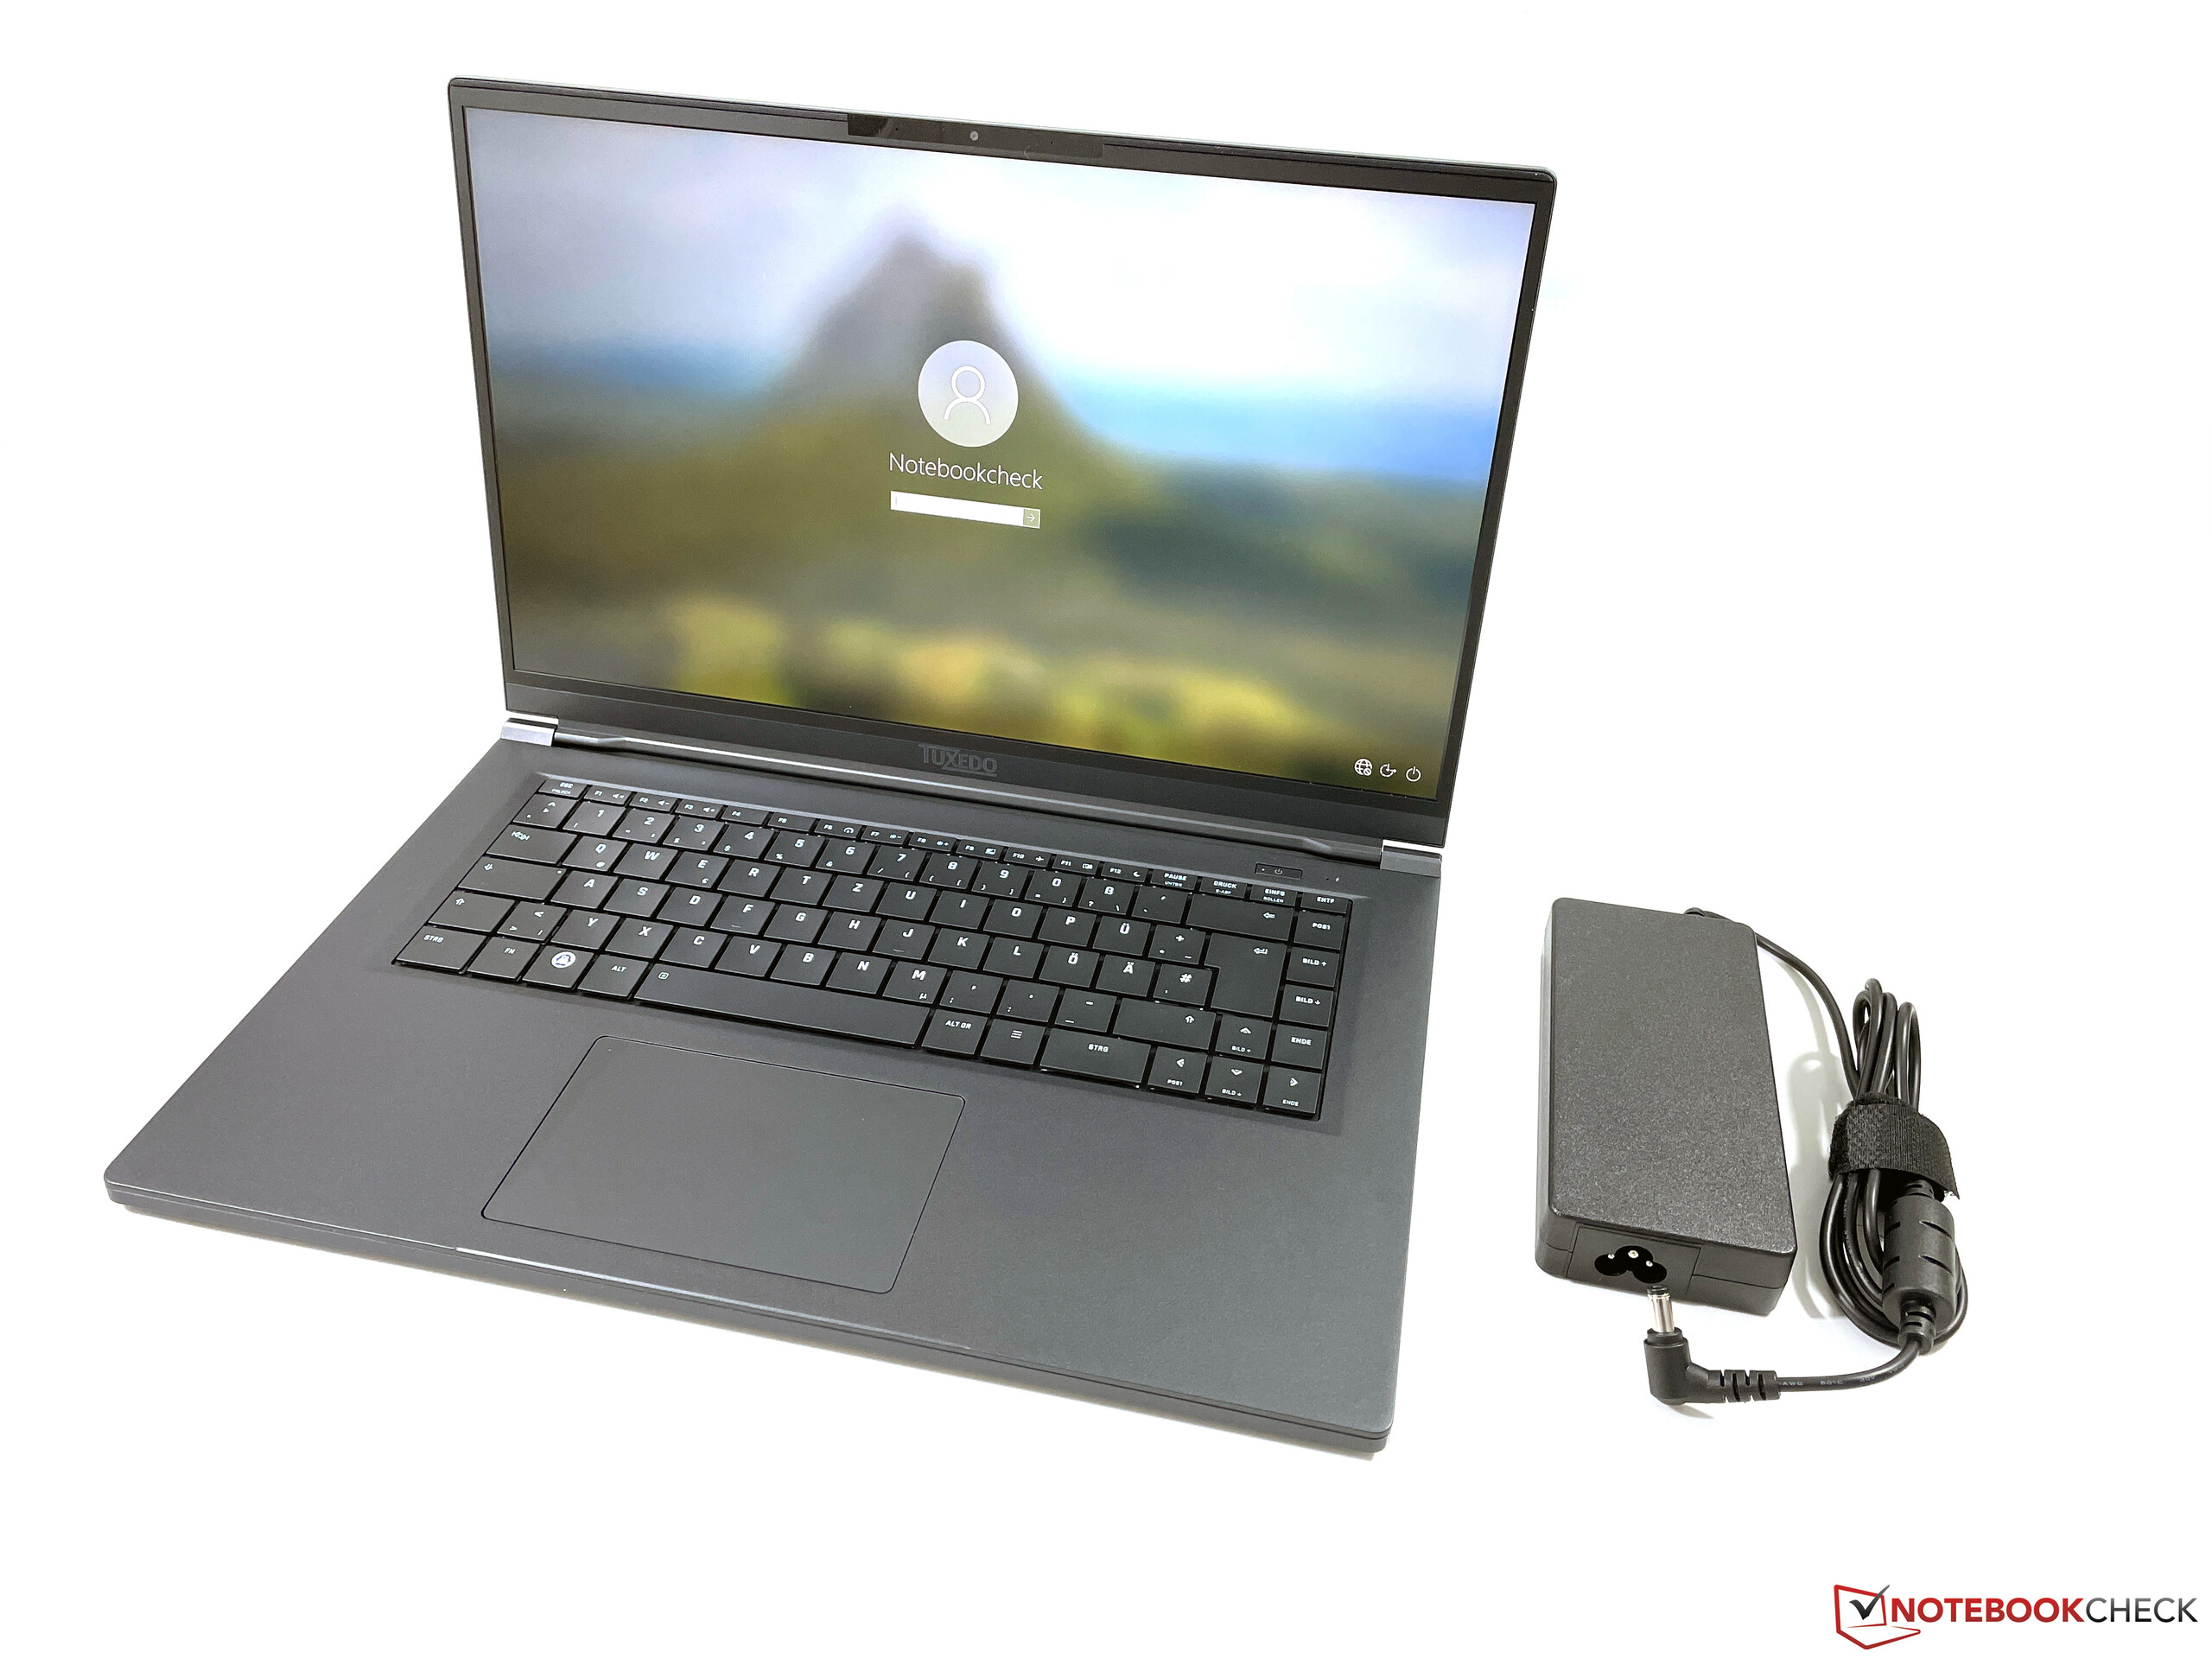
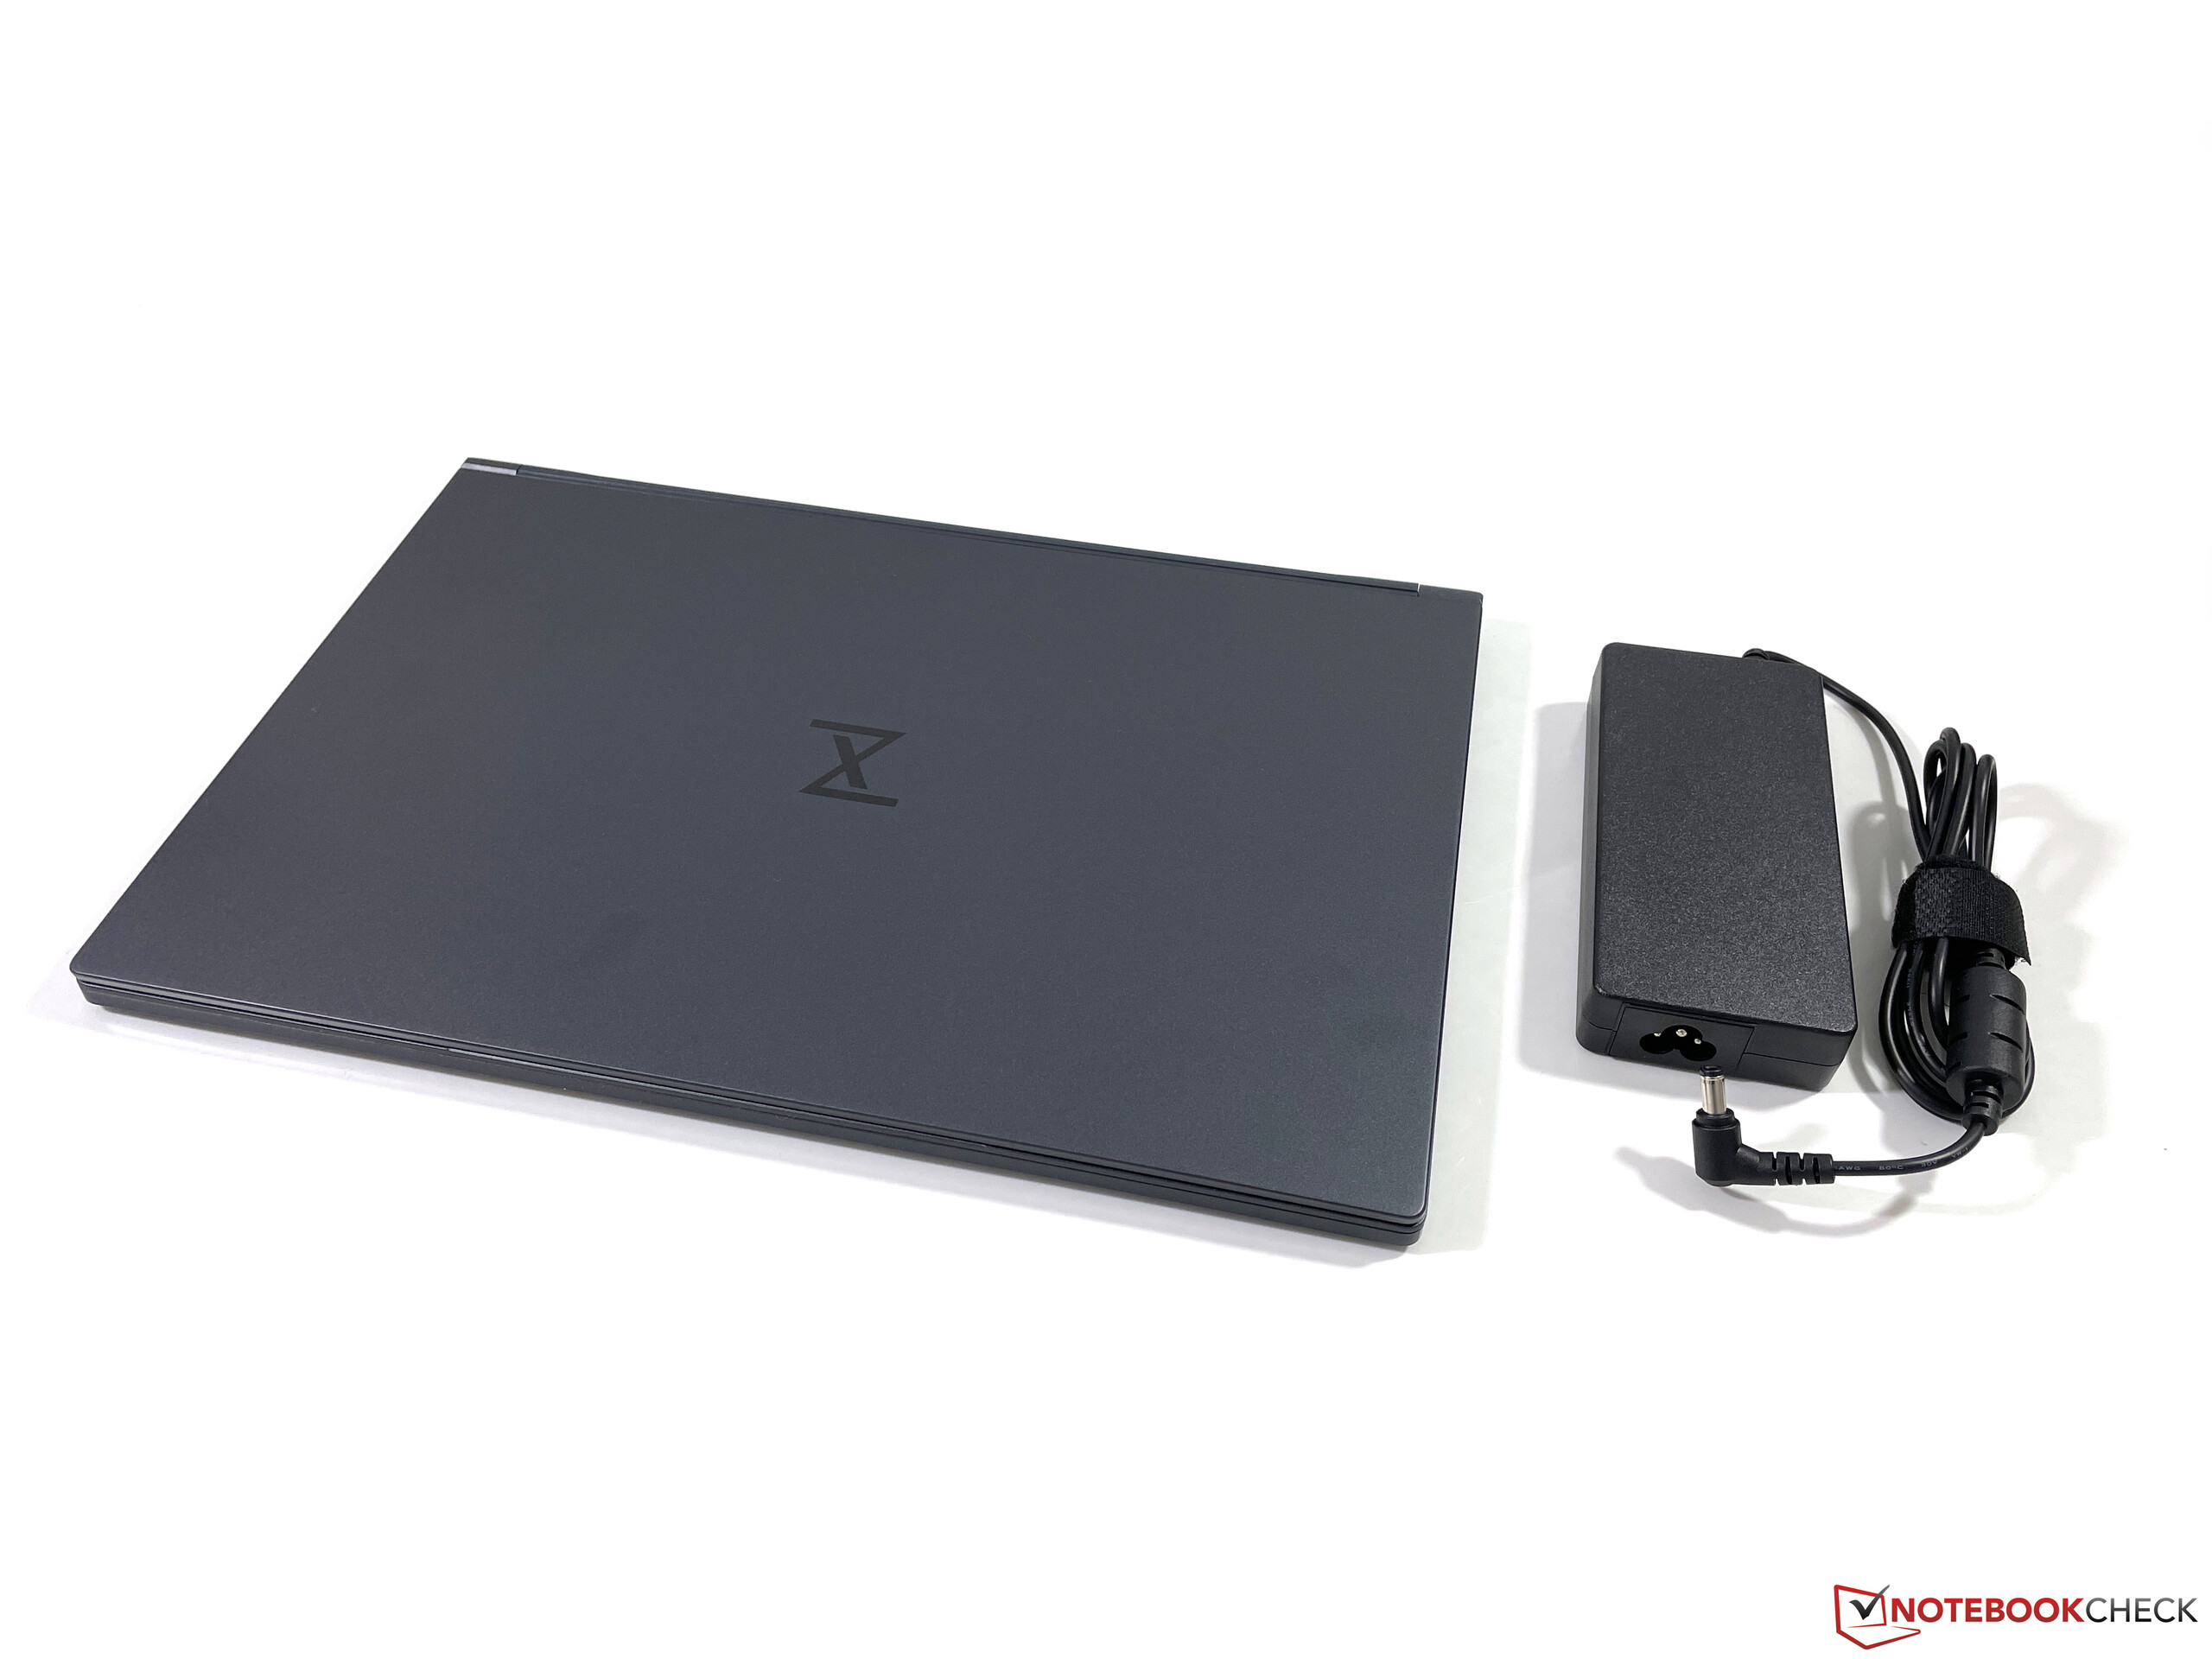
Case & Connectivity
The case is made of either metal (base unit bottom cover) or a magnesium alloy (display lid and base unit top case), and its dark color leaves a very subtle and sleek impression. The case is very well made, and it felt very robust and stable. The center of the keyboard area depresses a little when typing but does not creak at all. The thin lid is more flexible than the base but even here we found no evidence of creaking or visual distortions of any kind. The hinges could have been firmer as the lid falls shut when cracked open and left ajar. Maximum opening angle is 145 degrees.
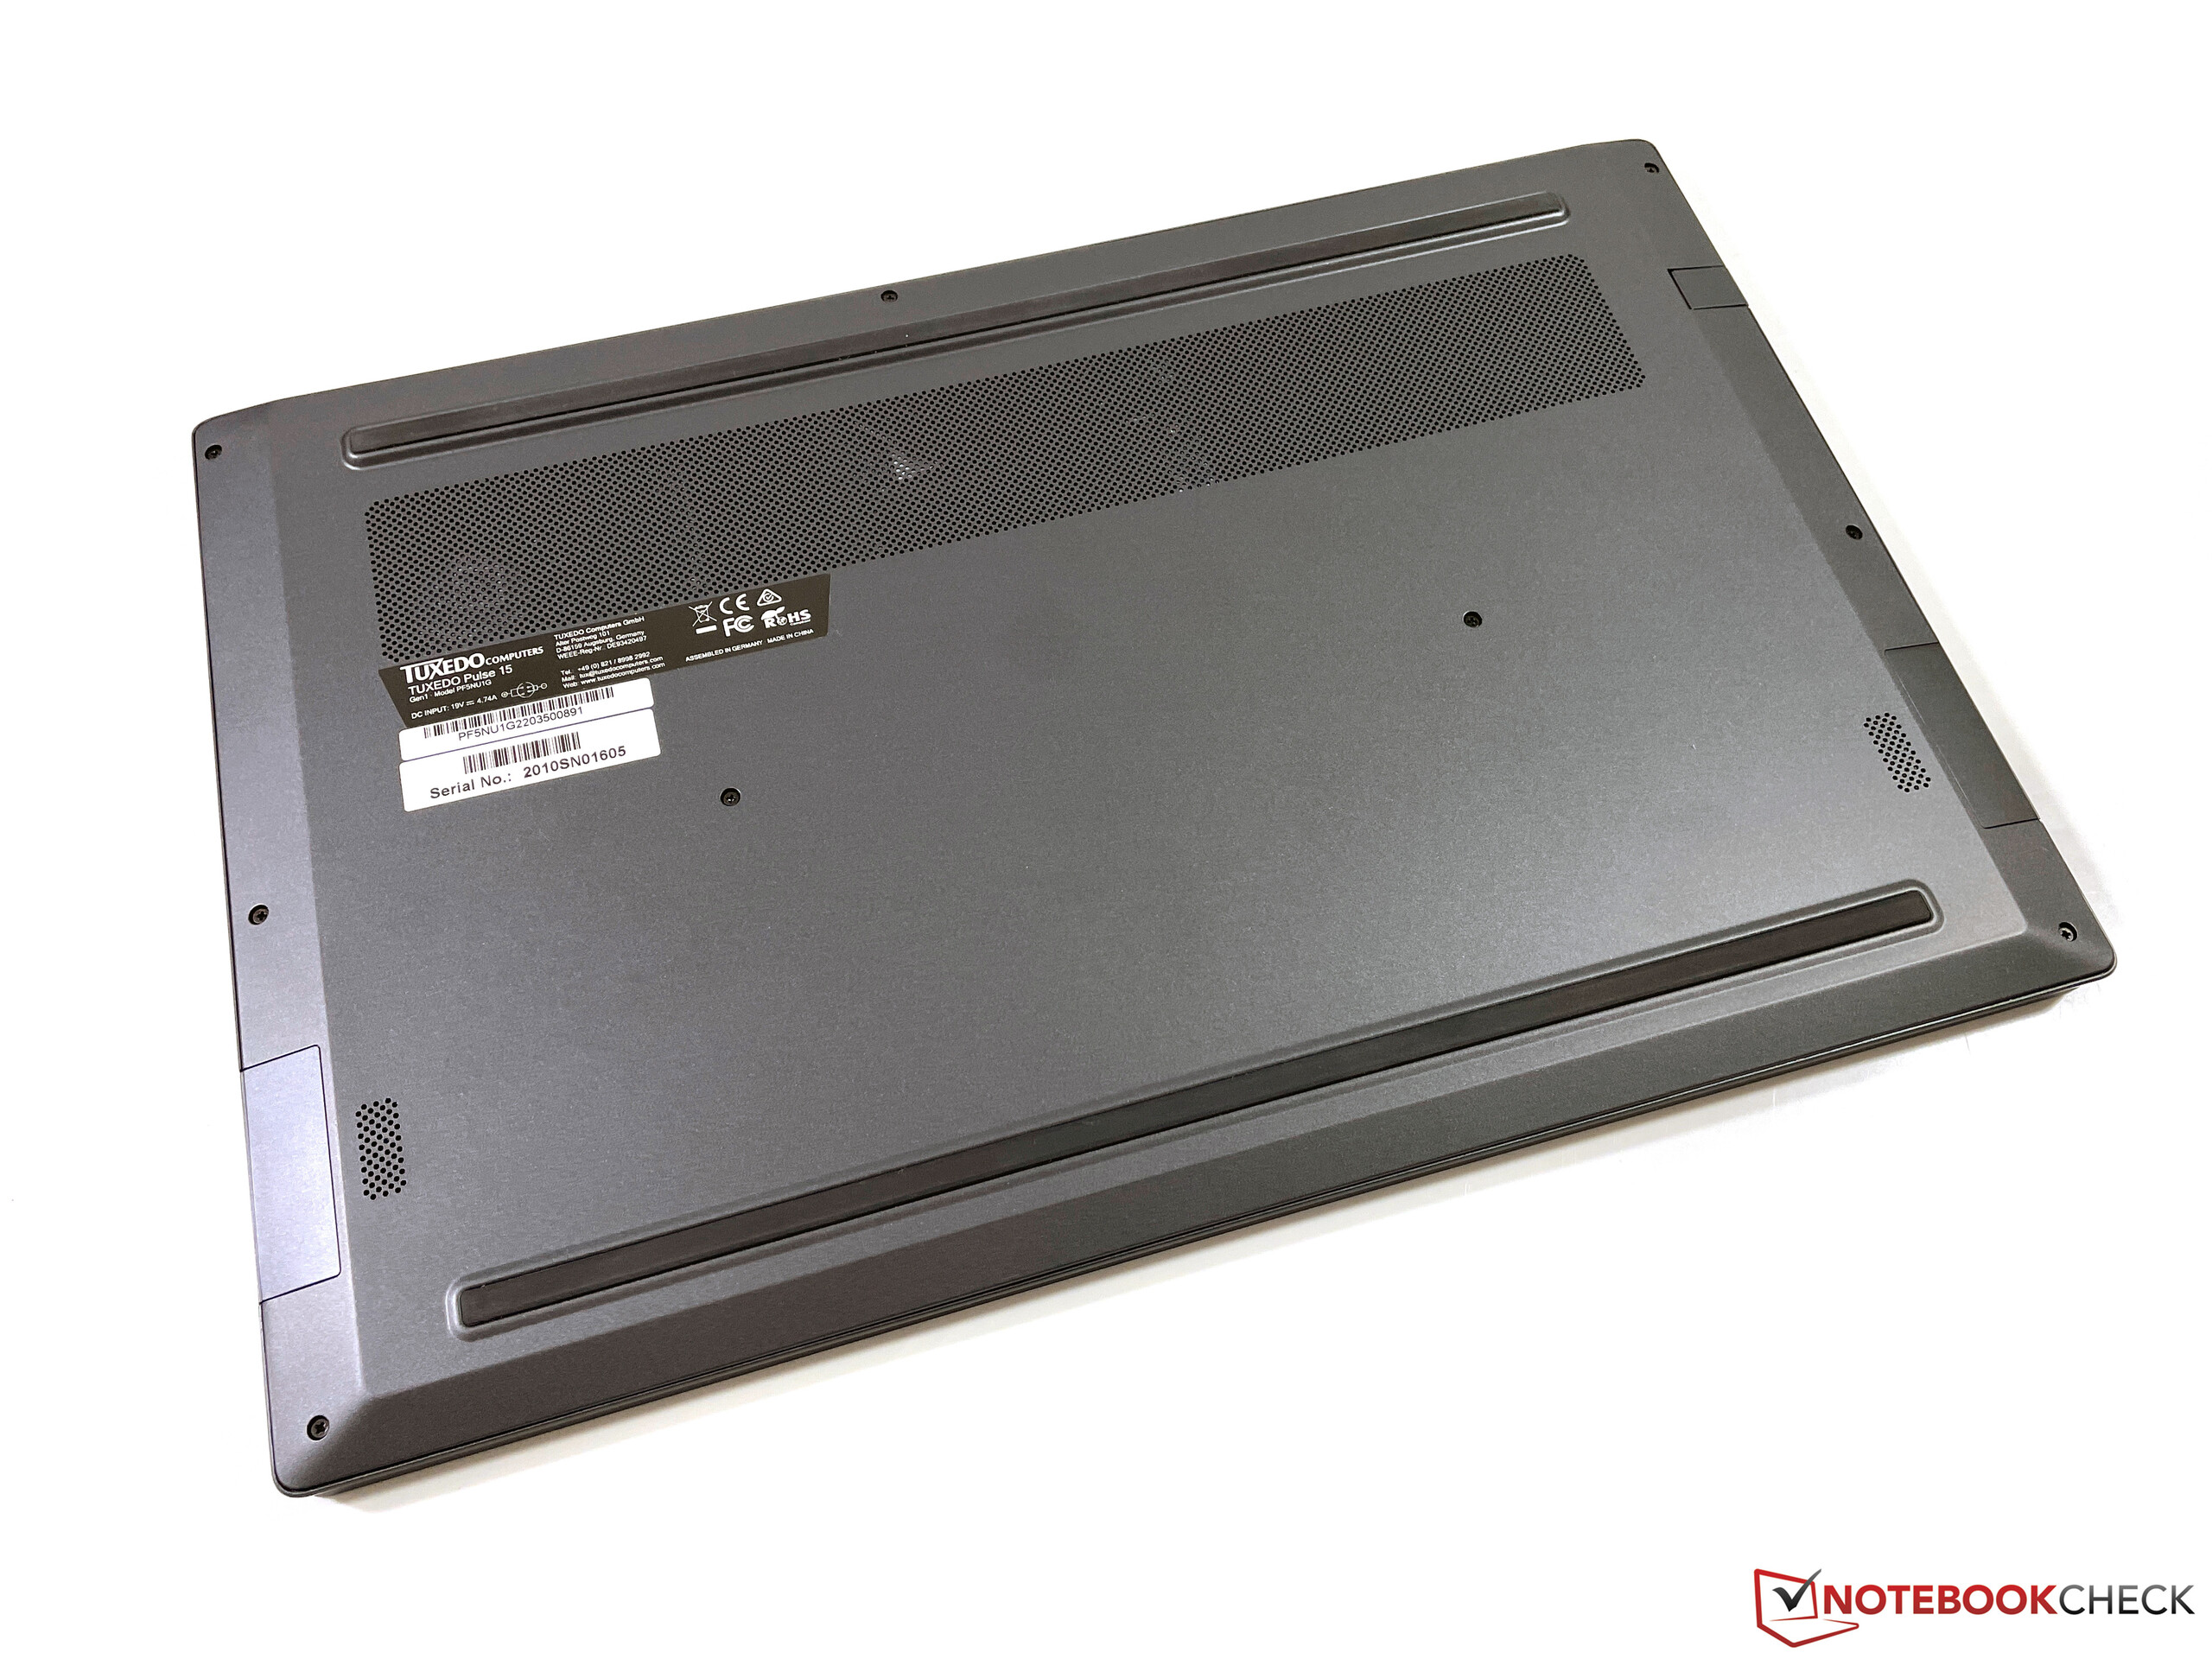
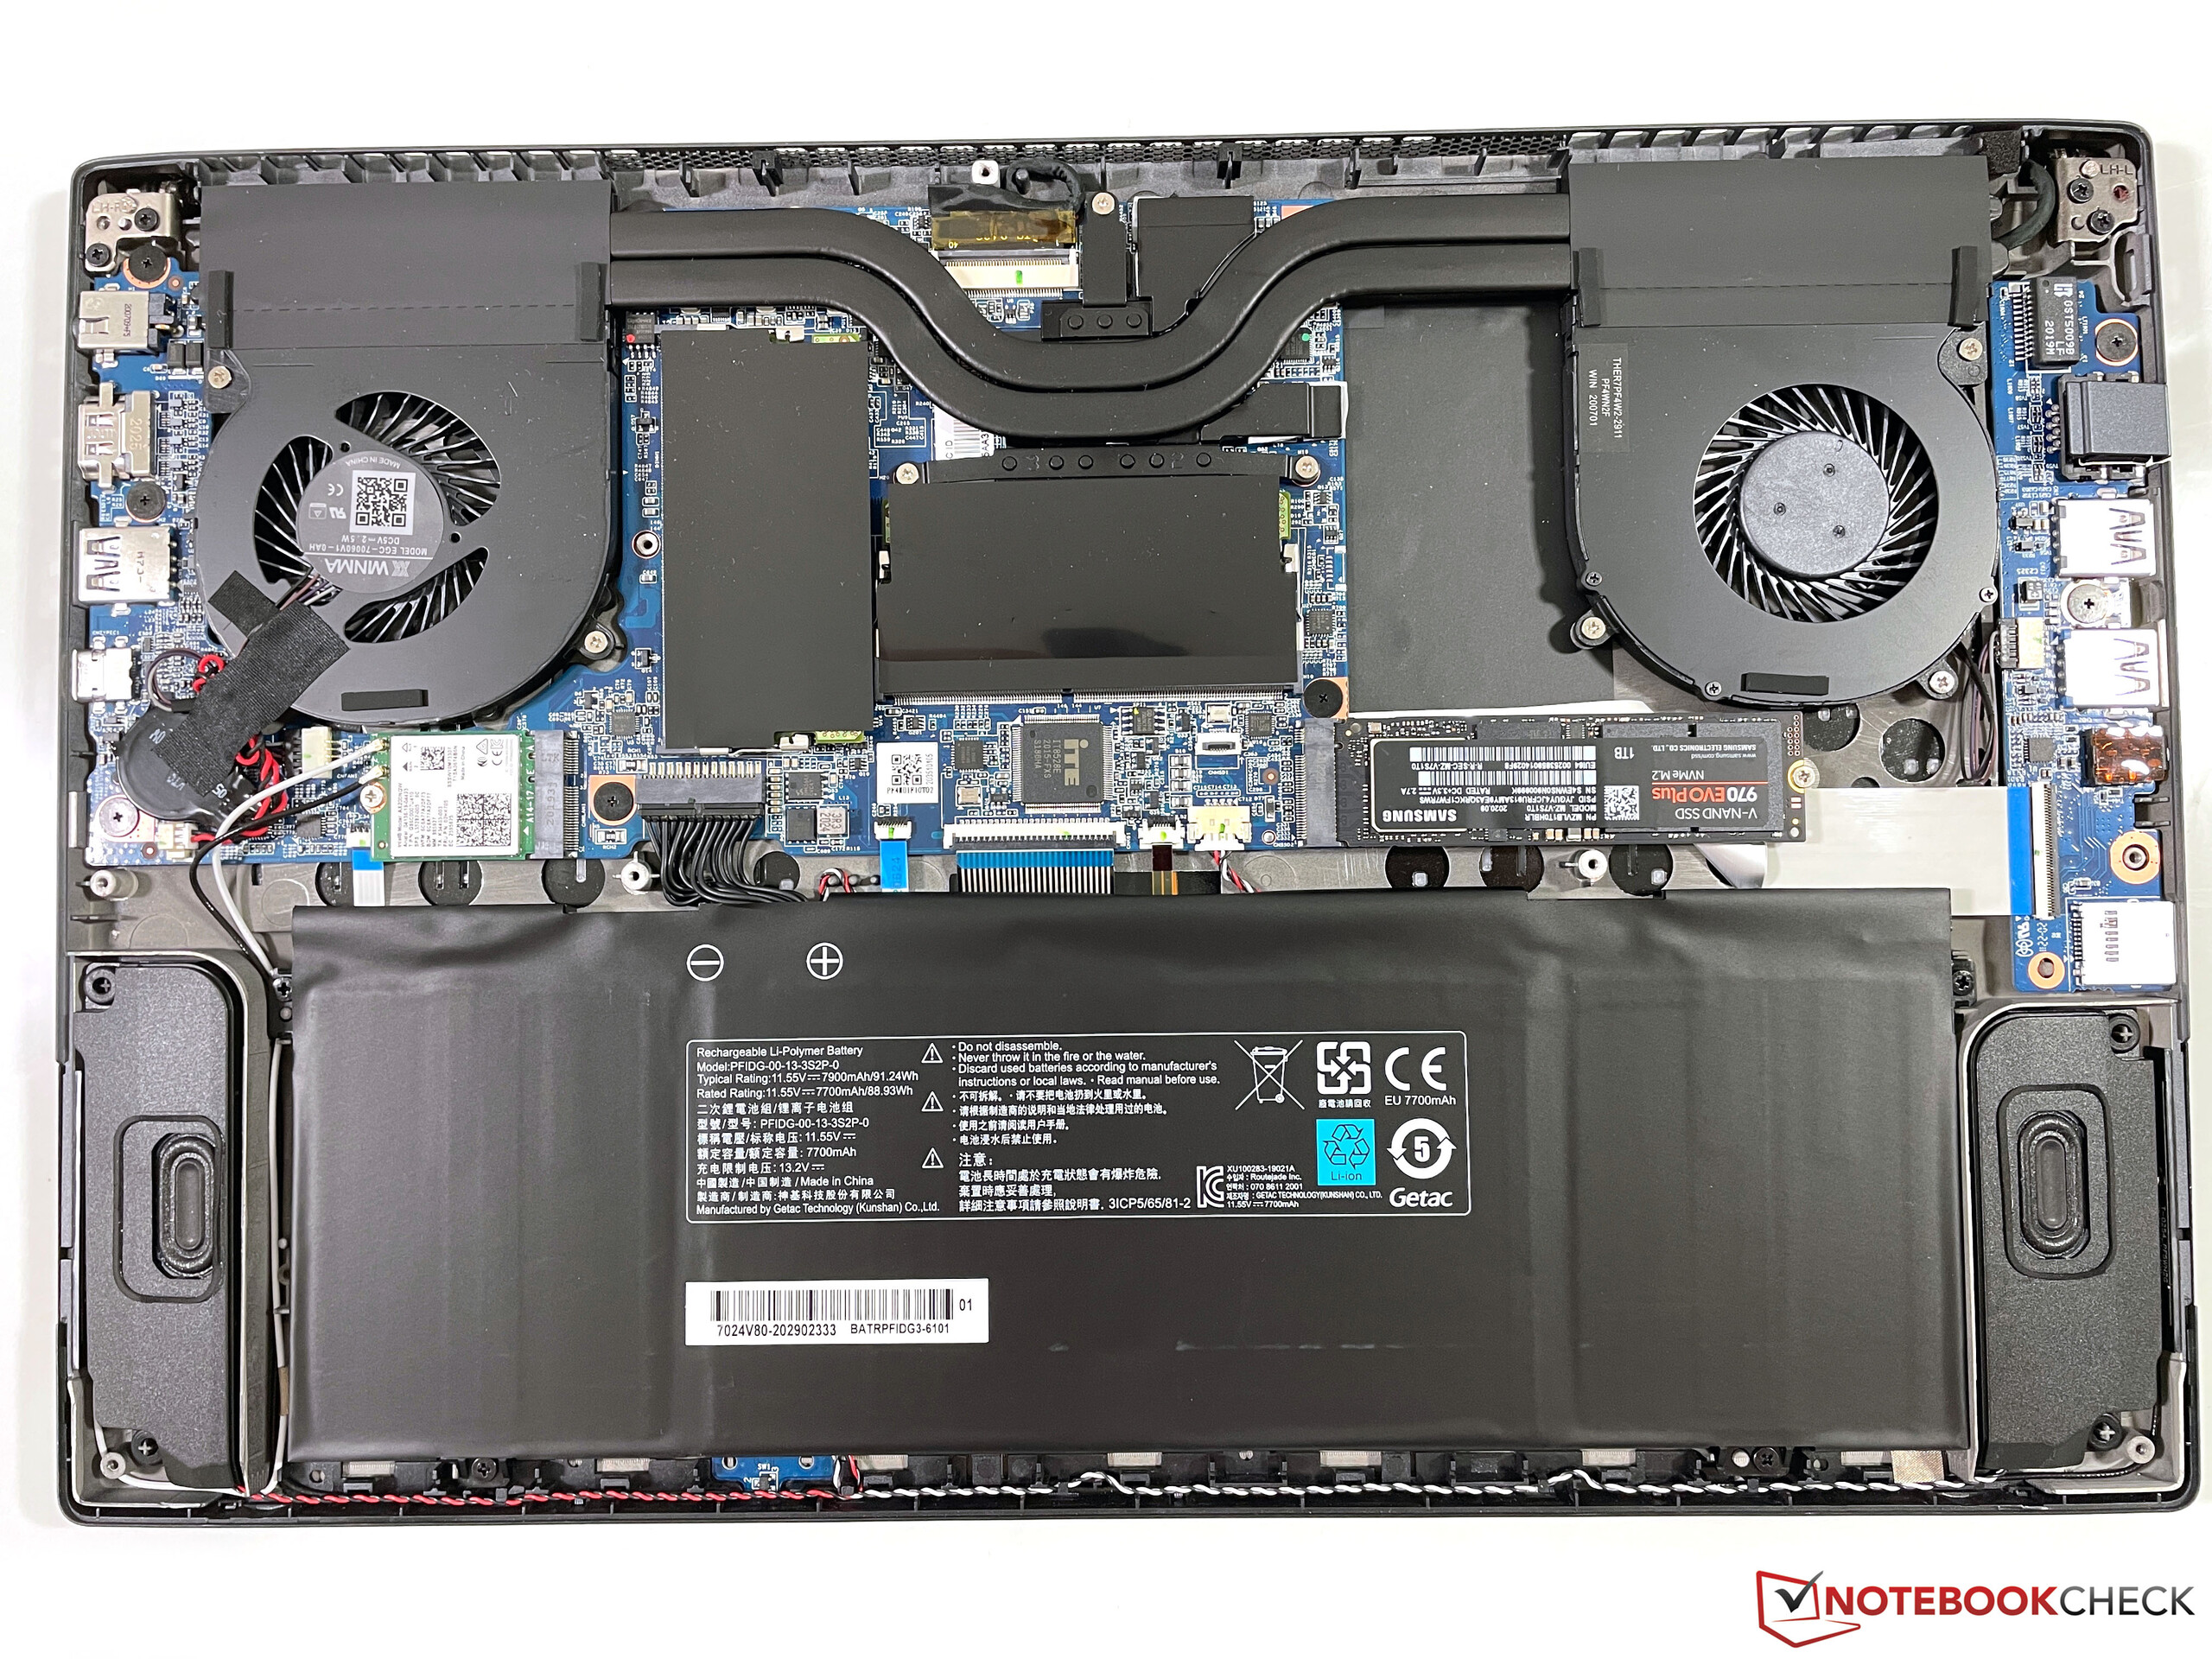
The bottom cover is held in place with Phillips screws and can be easily removed. Once inside you get access to the replaceable Wi-fi module and M.2 SSD as well as the fan assembly for servicing and cleaning.
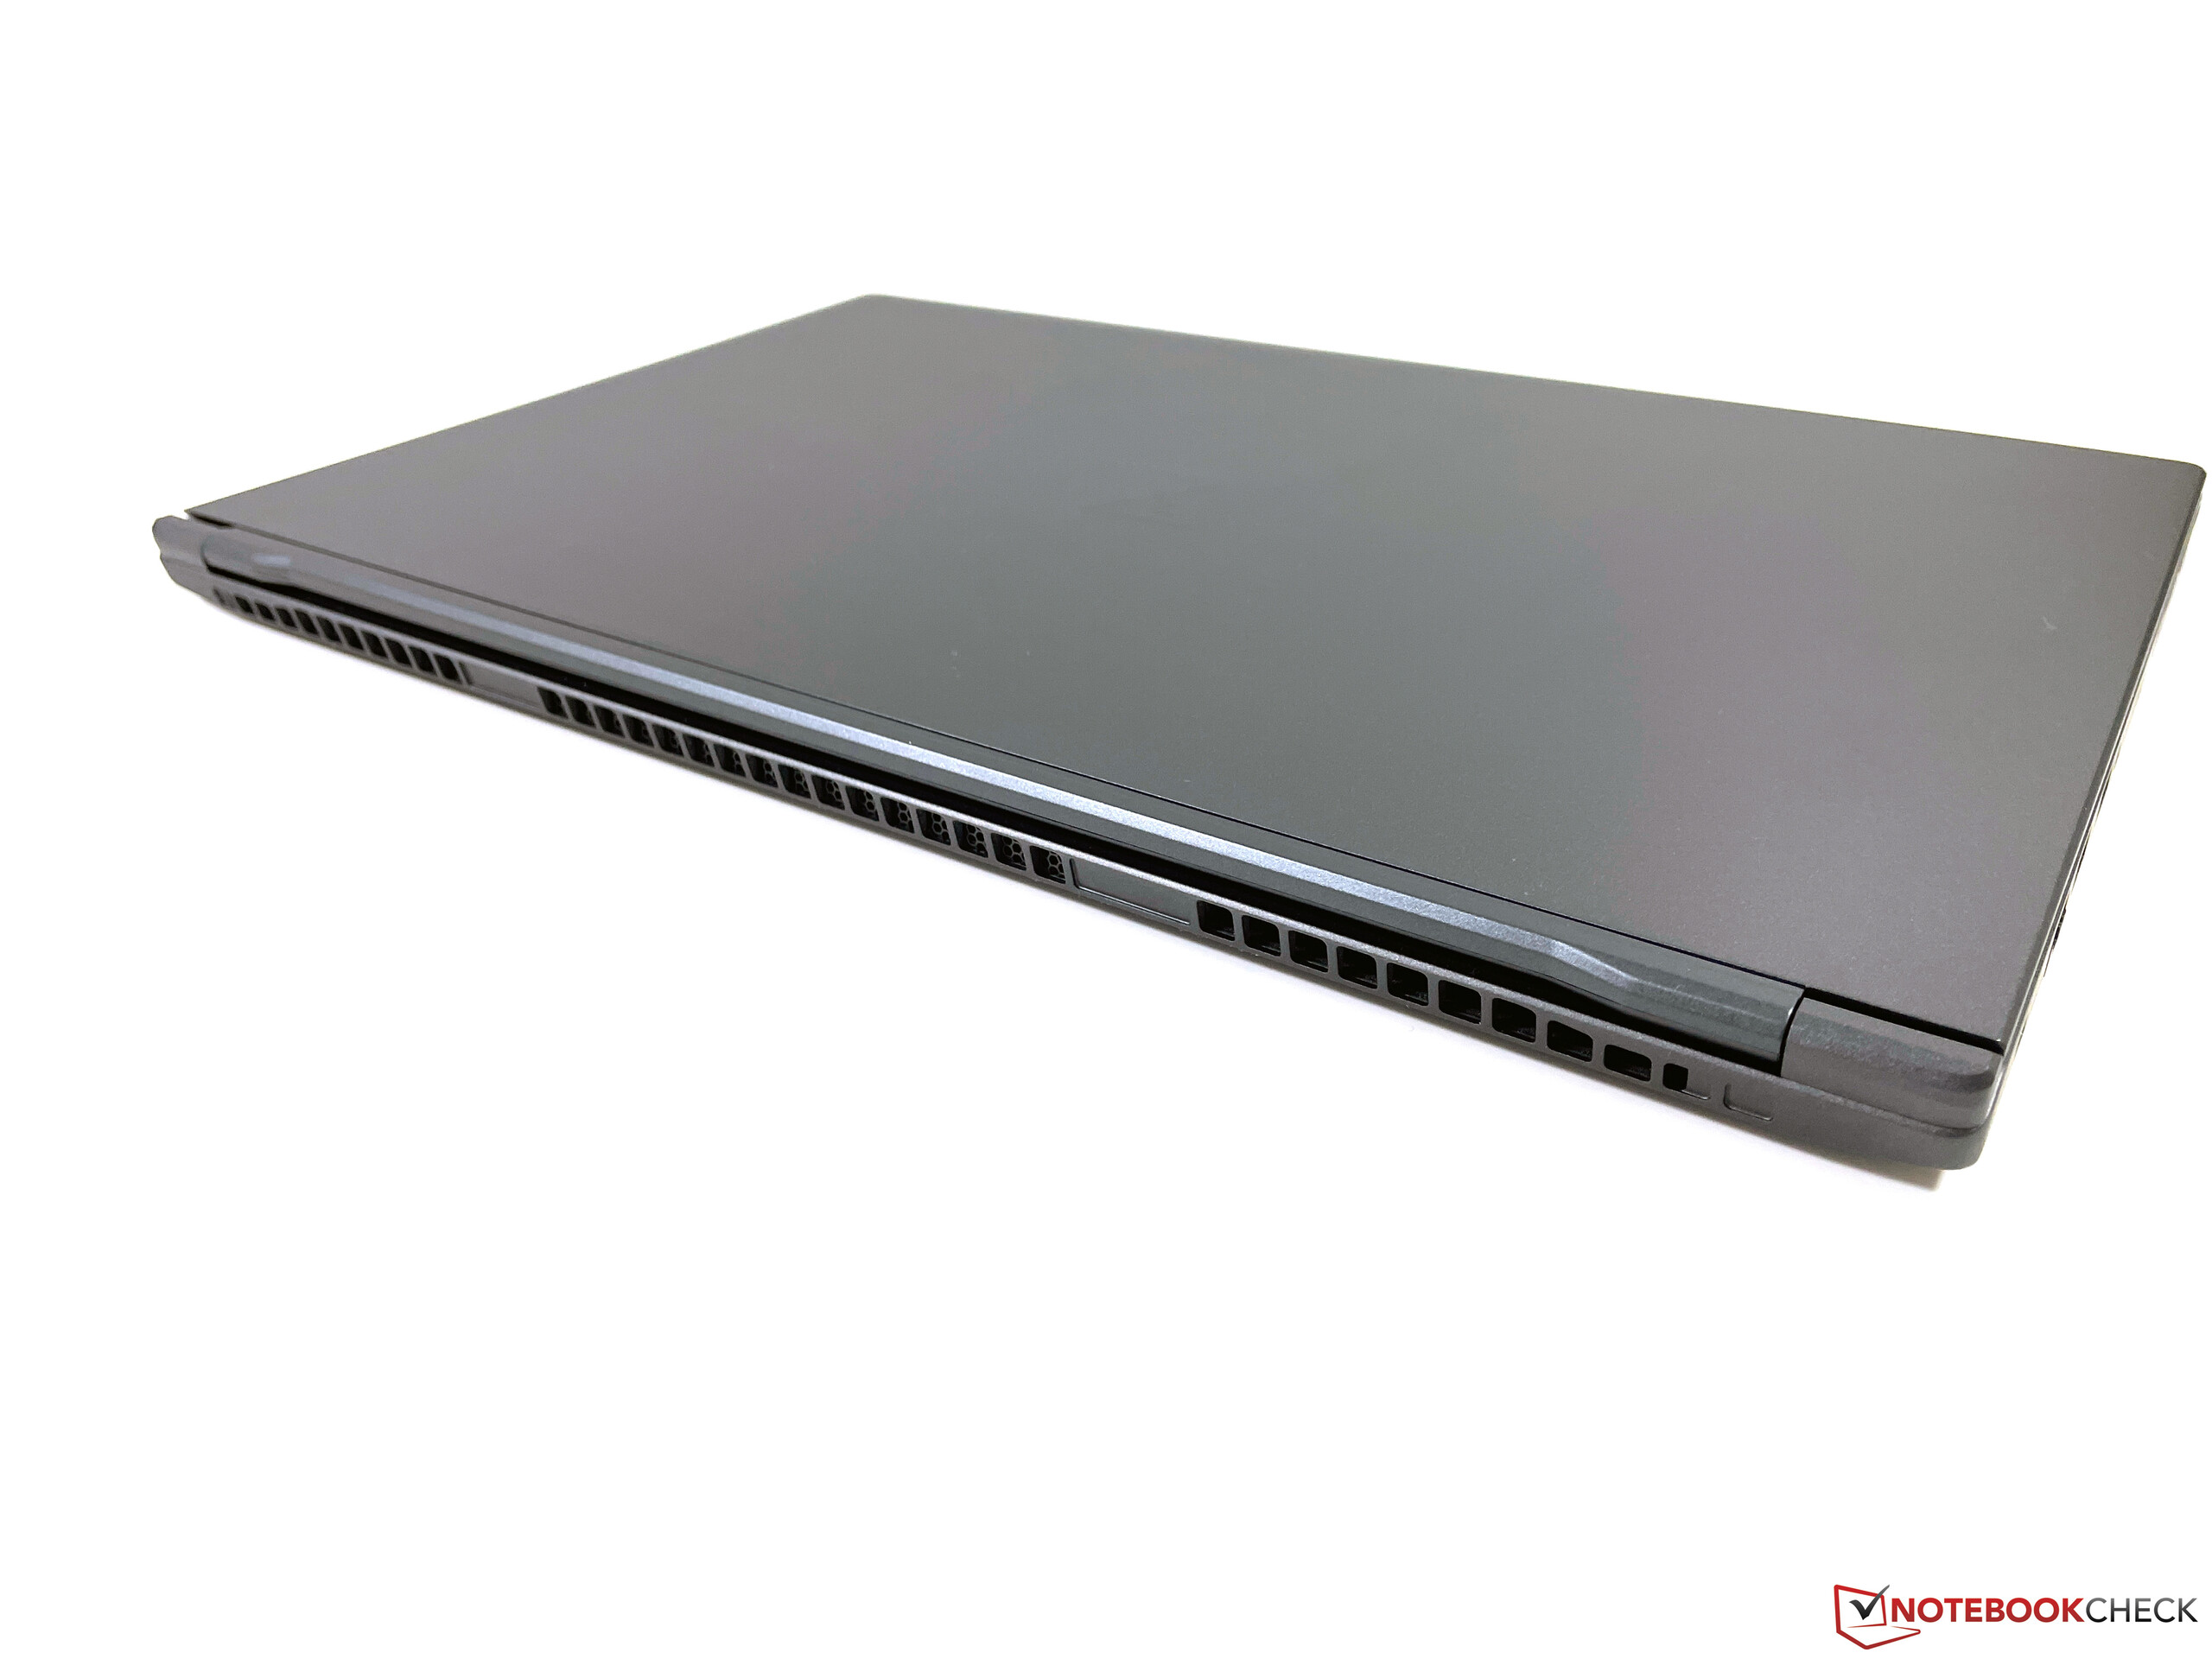
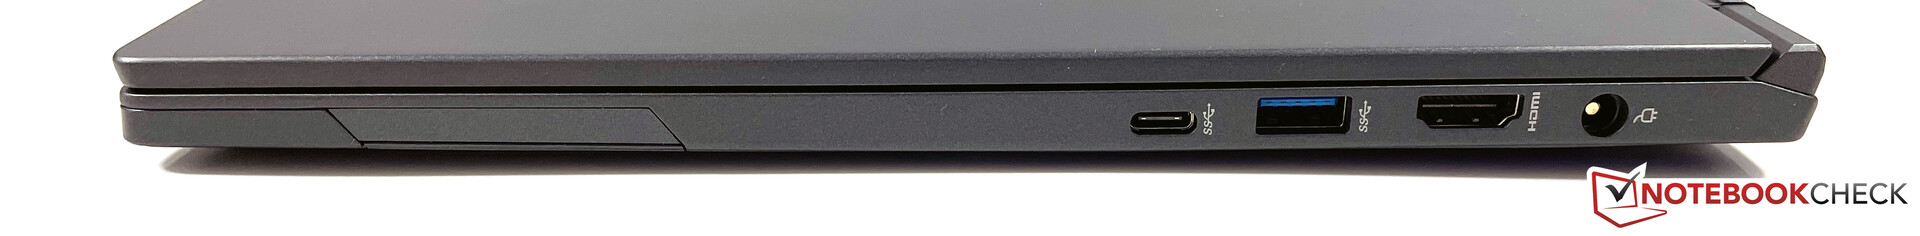
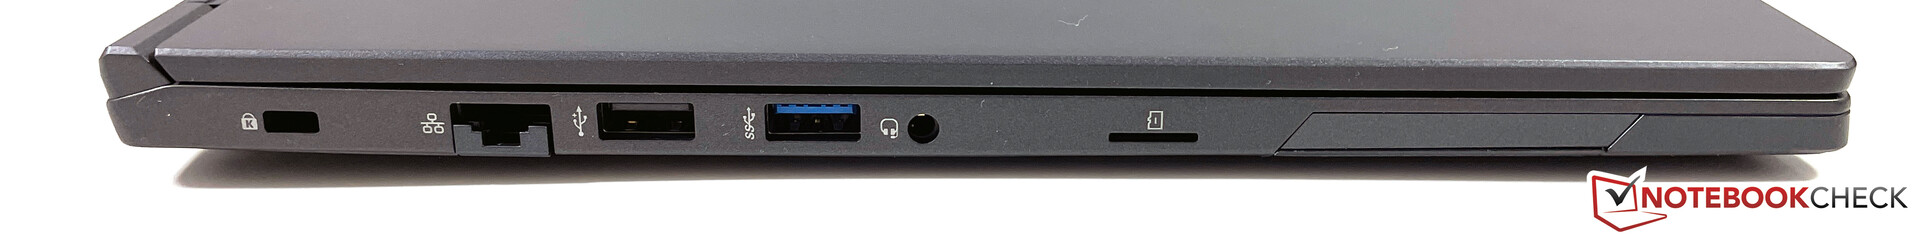
Ports
The Pulse 15 features the most important ports but lacks USB 4 and Thunderbolt. Its USB-C port can be used for charging but does not carry a DisplayPort signal. The lethargic USB 2.0 port feels out of place, a relict that seems to have fallen out of time.
Unfortunately, the microSD card reader is connected via said USB 2.0 bus and thus very slow. In return, the modern and fast Intel Wi-Fi modem (AX200 incl. Wi-Fi 6 and Bluetooth 5.1) performed very well and without any issues.
| SD Card Reader | |
| average JPG Copy Test (av. of 3 runs) | |
| Dell XPS 15 9500 Core i5 (Toshiba Exceria Pro SDXC 64 GB UHS-II) | |
| Average of class Multimedia (17.6 - 205, n=66, last 2 years) | |
| LG Gram 15Z90N (Toshiba Exceria Pro M501 microSDXC 64GB) | |
| Tuxedo Pulse 15 (AV Pro V60) | |
| maximum AS SSD Seq Read Test (1GB) | |
| Dell XPS 15 9500 Core i5 (Toshiba Exceria Pro SDXC 64 GB UHS-II) | |
| Average of class Multimedia (16.8 - 266, n=62, last 2 years) | |
| LG Gram 15Z90N (Toshiba Exceria Pro M501 microSDXC 64GB) | |
| Tuxedo Pulse 15 (AV Pro V60) | |


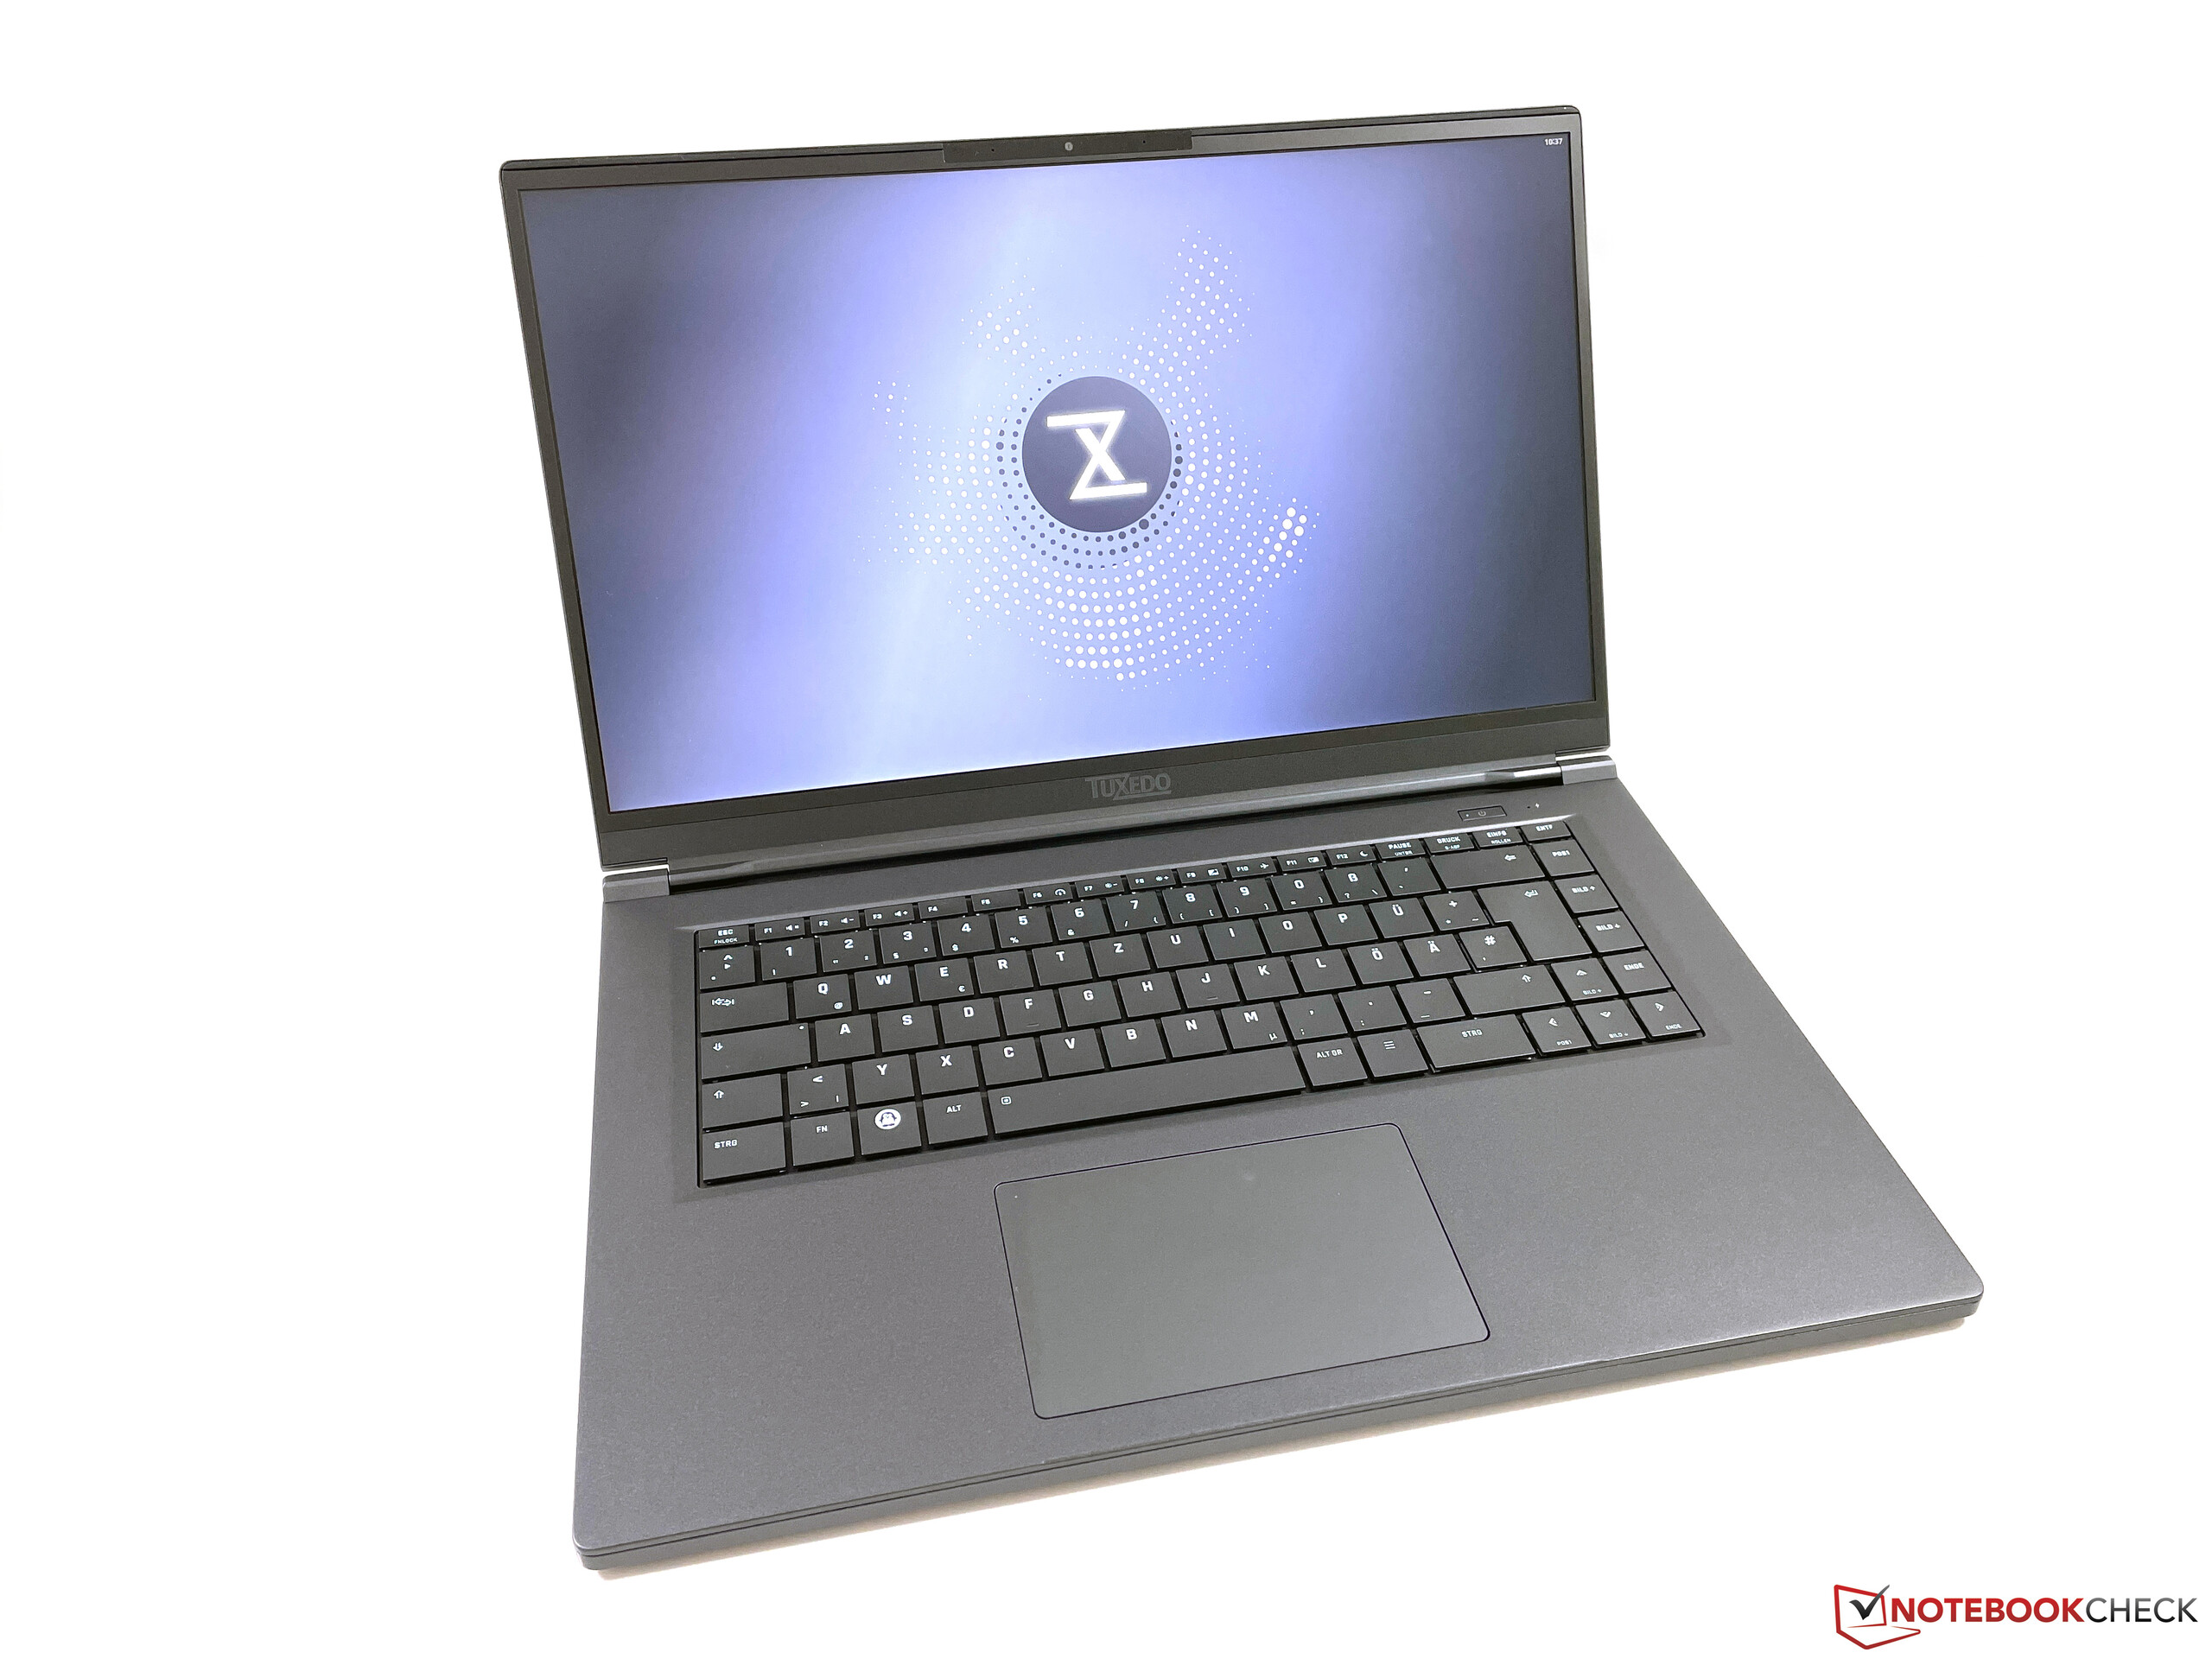
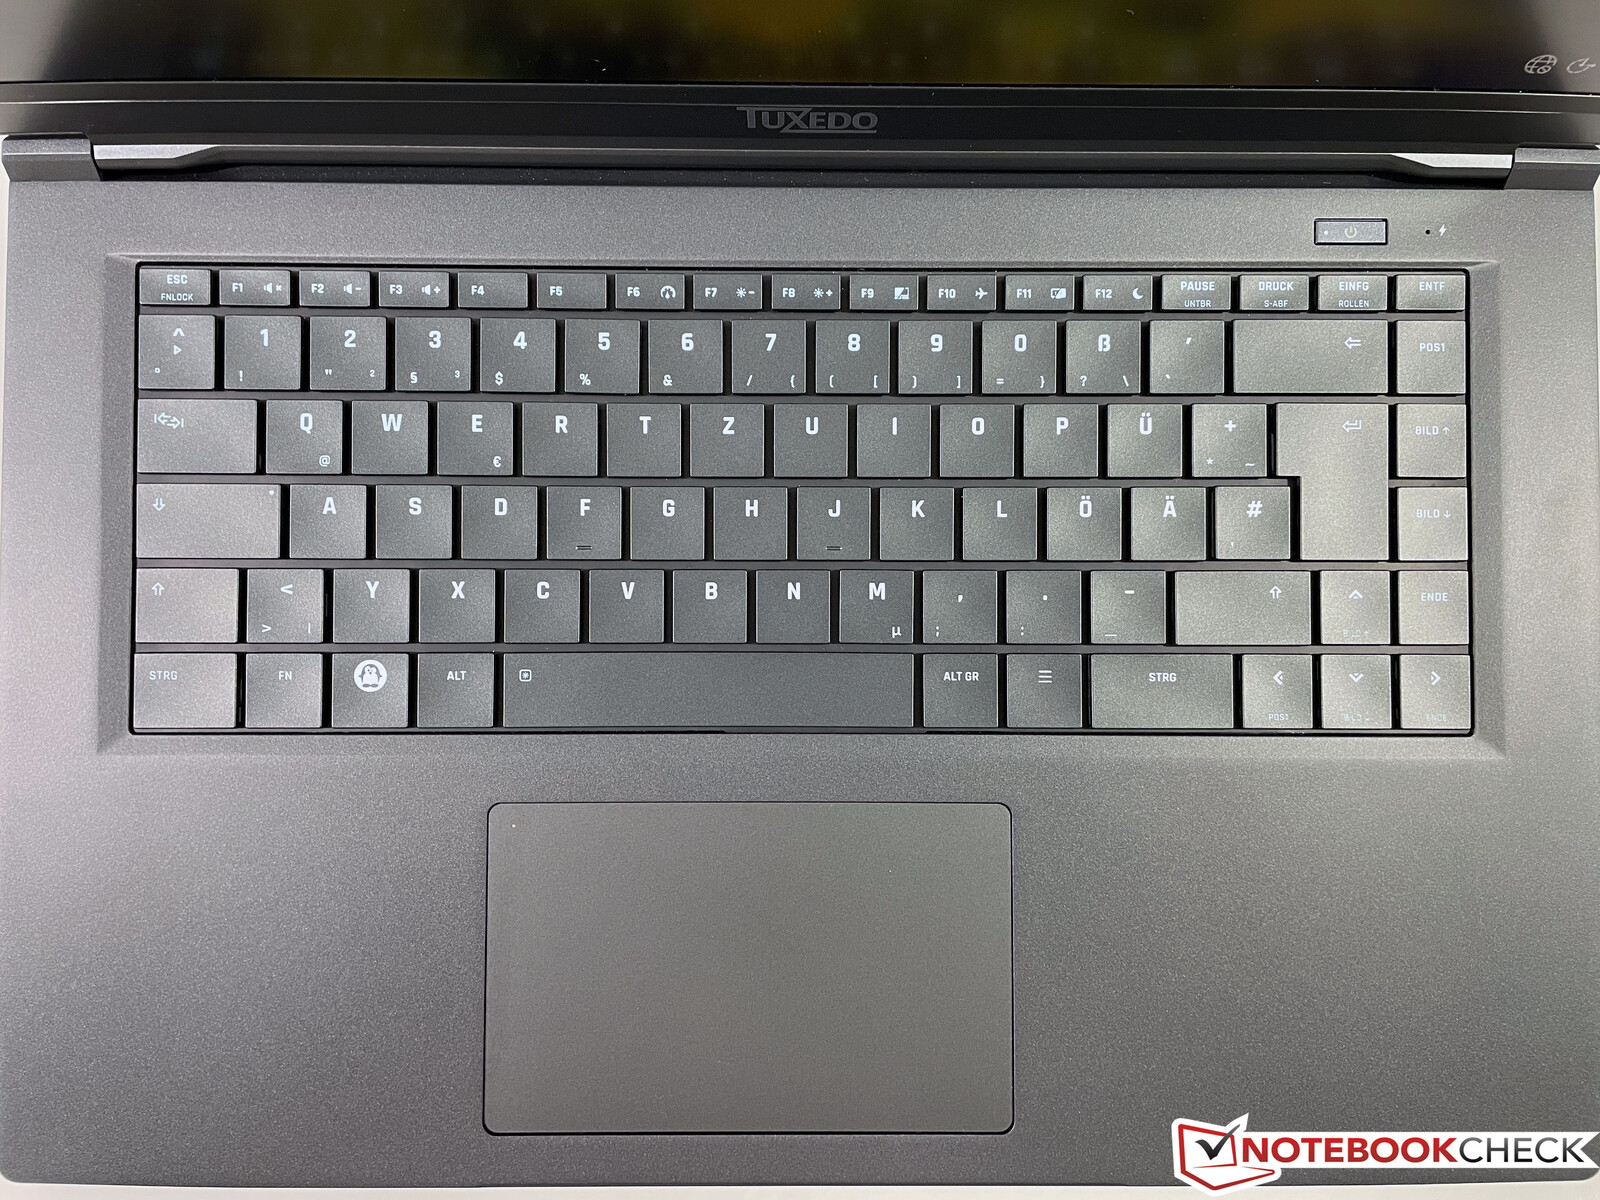
Input Devices
At first glance, the keyboard with its white backlight and large keycaps looks more akin to an old-style traditional keyboard and not a modern chiclet-style keyboard. Typing feels very comfortable thanks to its very accurate keystroke, and we encountered no issues typing longer texts either. The keys themselves are comfortably quiet save for the larger keys, such as Space or Return, that tend to clatter a bit.
The large clickpad (11.7 x 7.3 cm / 4.6 x 2.9 inches) sits firmly in place and has no play. Its smooth plastic surface made controlling the cursor a breeze. The bottom area can be depressed and clicked, which is immediately acknowledged with a fairly loud sound. Gestures worked flawlessly. The clickpad can be enabled or disabled via double clicking the top left corner, the status of which is indicated via a small LED.
Display – Pulse 15 with Matte IPS Panel

The only display available for the Pulse 15 is a 15.6-inch FHD IPS panel with a matte surface. Subjectively, it did alright save for bright areas that tended to look slightly grainy.
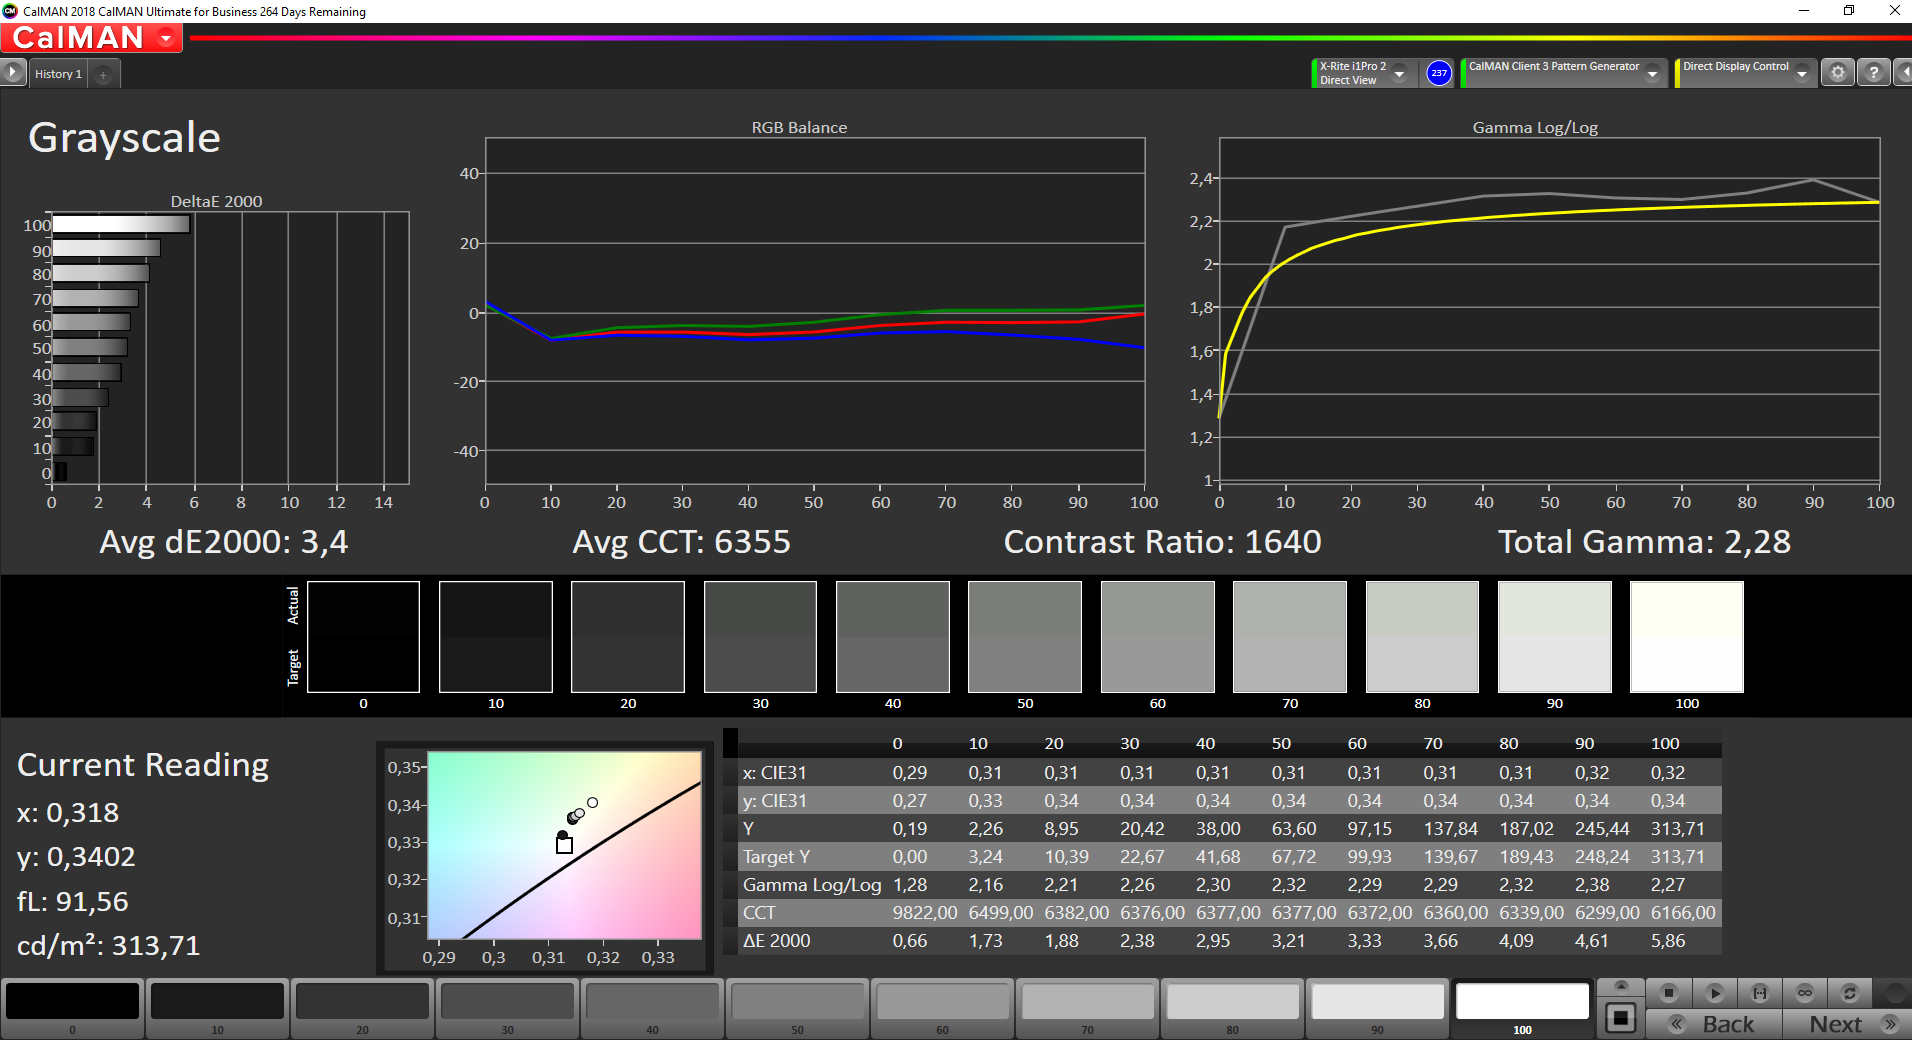
According to the data sheet the display should reach up to 321 nits, which we are unable to affirm. In our tests, we were able to determine a maximum of 314 nits in the center with an average of just 299 nits. Its low black level of just 0.19 nits makes for a very good contrast ratio of up to 1,600:1.
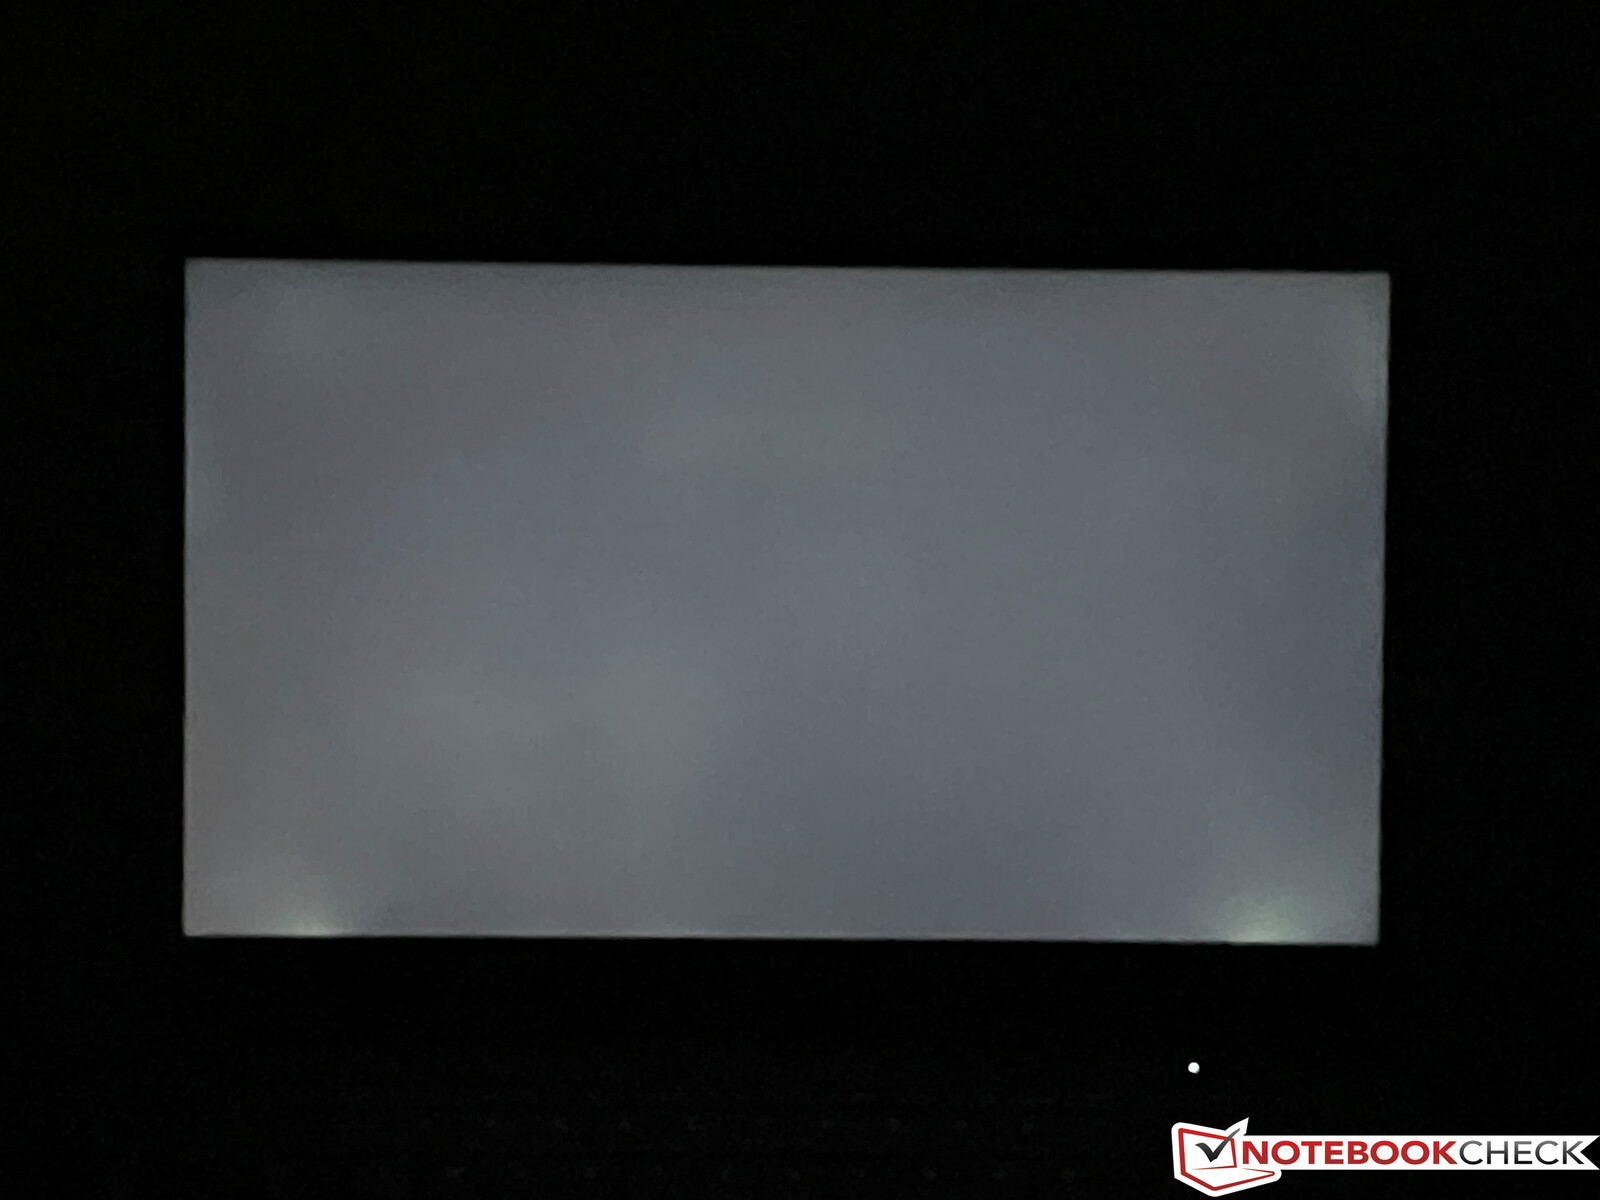
We found PWM flickering at brightness levels of 30 % and below at a very high frequency of 25 kHz, which we don’t expect to cause any issues. Response times were fairly slow overall causing visible ghosting. In addition, a completely dark background with the backlight turned up will produce two spots of visible backlight bleeding at the bottom of the display. Fortunately, those were not visible during everyday use.
| |||||||||||||||||||||||||
Brightness Distribution: 85 %
Center on Battery: 310 cd/m²
Contrast: 1653:1 (Black: 0.19 cd/m²)
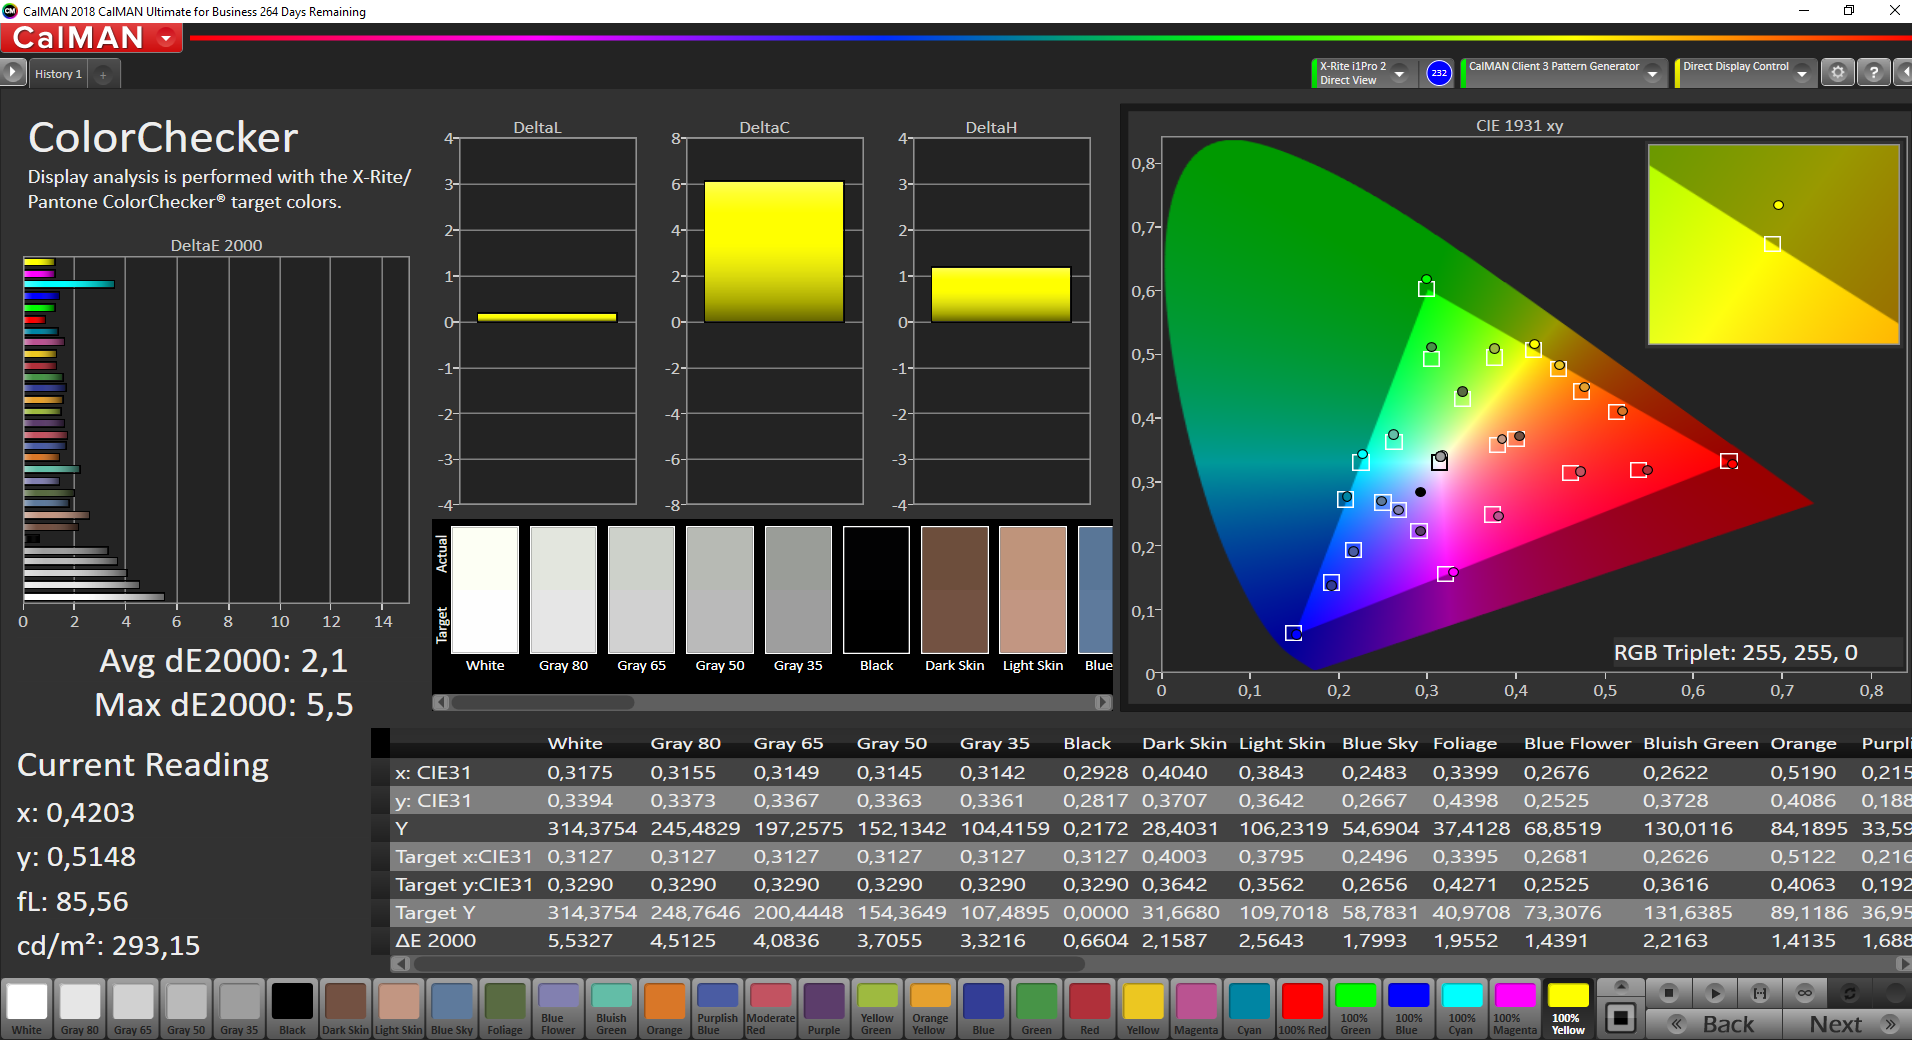
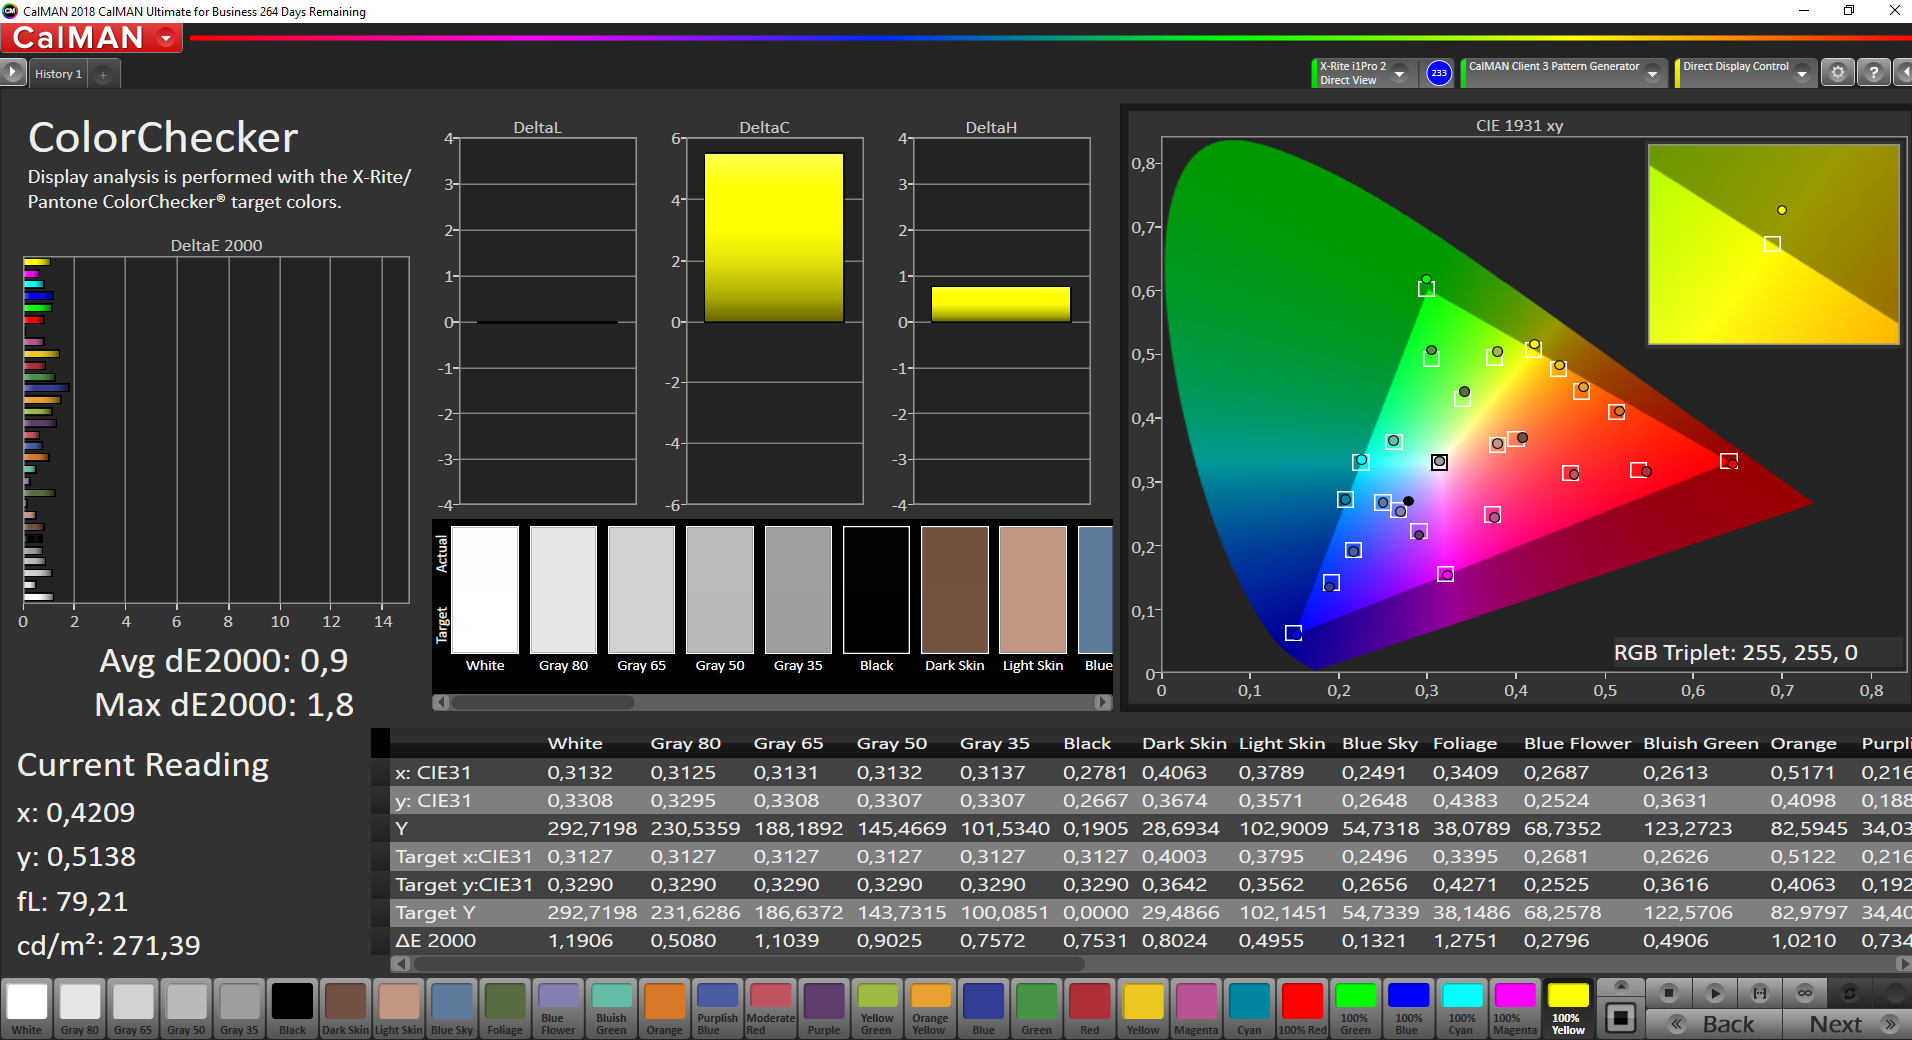
ΔE Color 2.1 | 0.5-29.43 Ø5, calibrated: 0.9
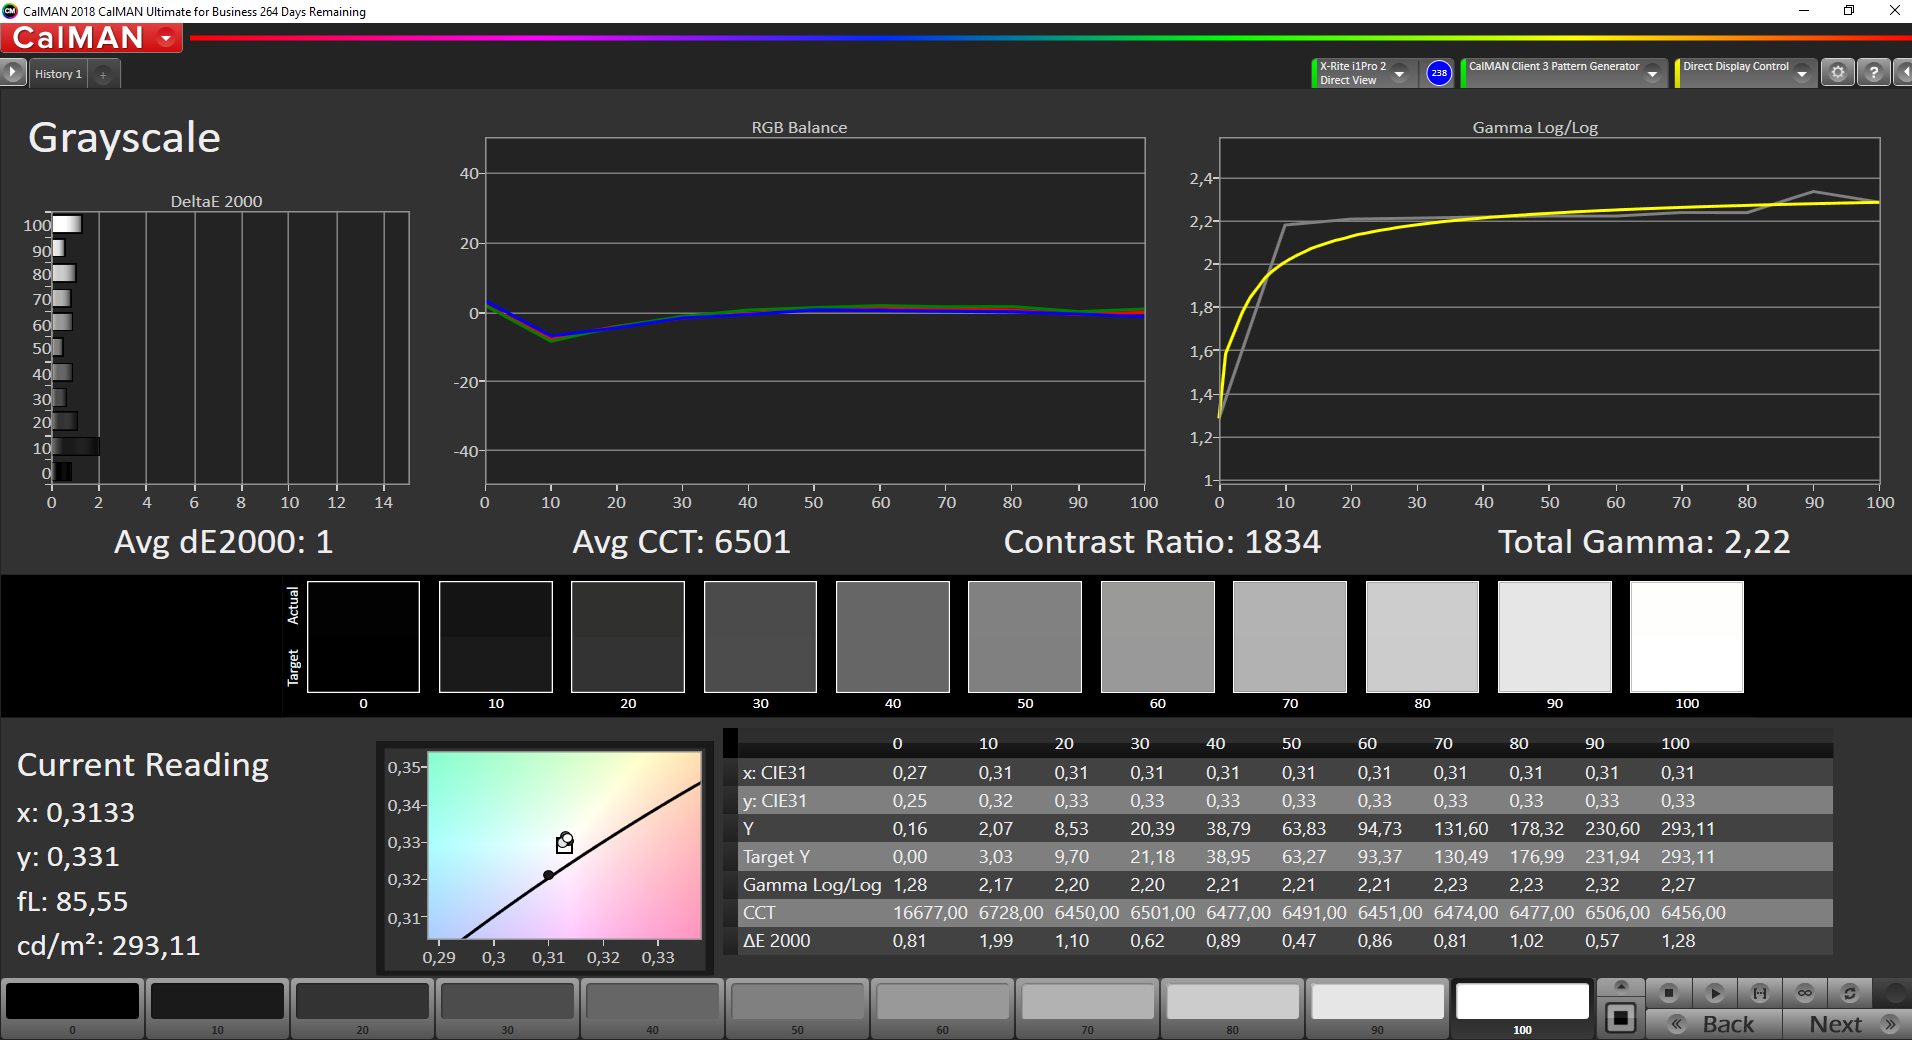
ΔE Greyscale 3.4 | 0.57-98 Ø5.3
99.3% sRGB (Argyll 1.6.3 3D)
64.5% AdobeRGB 1998 (Argyll 1.6.3 3D)
70.5% AdobeRGB 1998 (Argyll 2.2.0 3D)
99.4% sRGB (Argyll 2.2.0 3D)
69.2% Display P3 (Argyll 2.2.0 3D)
Gamma: 2.28
| Tuxedo Pulse 15 LQ156M1JW01, IPS, 1920x1080, 15.60 | Honor MagicBook Pro (AMD) N161HCA-EA3, IPS, 1920x1080, 16.10 | SCHENKER Vision 15 BOE08F5, IPS, 1920x1080, 15.60 | Dell XPS 15 9500 Core i5 Sharp LQ156N1, IPS, 1920x1200, 15.60 | LG Gram 15Z90N LP156WF9-SPN1, .2 IPS LED, 1920x1080, 15.60 | |
|---|---|---|---|---|---|
| Display | -11% | -2% | 11% | -4% | |
| Display P3 Coverage | 69.2 | 67.5 -2% | 69.3 0% | 81.5 18% | 66 -5% |
| sRGB Coverage | 99.4 | 69.7 -30% | 94 -5% | 100 1% | 96.4 -3% |
| AdobeRGB 1998 Coverage | 70.5 | 69.7 -1% | 70.8 0% | 79.6 13% | 66.8 -5% |
| Response Times | 24% | 0% | 28% | 42% | |
| Response Time Grey 50% / Grey 80% * | 59.2 ? | 37.6 ? 36% | 60 ? -1% | 42 ? 29% | 36 ? 39% |
| Response Time Black / White * | 39.2 ? | 25.6 ? 35% | 39 ? 1% | 28.8 ? 27% | 22 ? 44% |
| PWM Frequency | 25000 ? | 25250 ? 1% | |||
| Screen | 23% | -16% | -15% | -5% | |
| Brightness middle | 314 | 337 7% | 478 52% | 592 89% | 366 17% |
| Brightness | 292 | 312 7% | 462 58% | 565 93% | 342 17% |
| Brightness Distribution | 85 | 89 5% | 94 11% | 85 0% | 88 4% |
| Black Level * | 0.19 | 0.2 -5% | 0.27 -42% | 0.46 -142% | 0.28 -47% |
| Contrast | 1653 | 1685 2% | 1770 7% | 1287 -22% | 1307 -21% |
| Colorchecker dE 2000 * | 2.1 | 0.8 62% | 3.2 -52% | 3.19 -52% | 2.68 -28% |
| Colorchecker dE 2000 max. * | 5.5 | 1.1 80% | 8.4 -53% | 5.45 1% | 5.25 5% |
| Colorchecker dE 2000 calibrated * | 0.9 | 0.7 22% | 2 -122% | 2.03 -126% | 1.08 -20% |
| Greyscale dE 2000 * | 3.4 | 1 71% | 4.5 -32% | 3.9 -15% | 2.4 29% |
| Gamma | 2.28 96% | 2.2 100% | 2.16 102% | 2.25 98% | 2.25 98% |
| CCT | 6355 102% | 6538 99% | 6788 96% | 6522 100% | 6474 100% |
| Color Space (Percent of AdobeRGB 1998) | 64.5 | 63.8 -1% | 63.1 -2% | 71.6 11% | 61 -5% |
| Color Space (Percent of sRGB) | 99.3 | 99.5 0% | 93.6 -6% | 100 1% | 96 -3% |
| Total Average (Program / Settings) | 12% /
17% | -6% /
-12% | 8% /
-5% | 11% /
1% |
* ... smaller is better
Display Response Times
| ↔ Response Time Black to White | ||
|---|---|---|
| 39.2 ms ... rise ↗ and fall ↘ combined | ↗ 19.6 ms rise |  |
| ↘ 19.6 ms fall | ||
| The screen shows slow response rates in our tests and will be unsatisfactory for gamers. In comparison, all tested devices range from 0.1 (minimum) to 240 (maximum) ms. » 96 % of all devices are better. This means that the measured response time is worse than the average of all tested devices (21.5 ms). | ||
| ↔ Response Time 50% Grey to 80% Grey | ||
| 59.2 ms ... rise ↗ and fall ↘ combined | ↗ 30 ms rise | 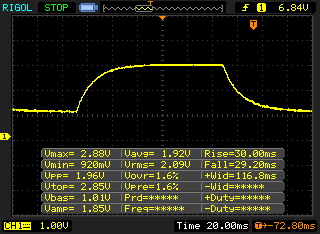 |
| ↘ 29.2 ms fall | ||
| The screen shows slow response rates in our tests and will be unsatisfactory for gamers. In comparison, all tested devices range from 0.2 (minimum) to 636 (maximum) ms. » 95 % of all devices are better. This means that the measured response time is worse than the average of all tested devices (33.7 ms). | ||
Screen Flickering / PWM (Pulse-Width Modulation)
| Screen flickering / PWM detected | 25000 Hz | ≤ 30 % brightness setting | 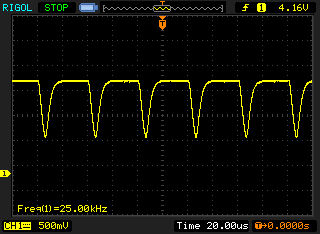 |
The display backlight flickers at 25000 Hz (worst case, e.g., utilizing PWM) Flickering detected at a brightness setting of 30 % and below. There should be no flickering or PWM above this brightness setting. The frequency of 25000 Hz is quite high, so most users sensitive to PWM should not notice any flickering. In comparison: 53 % of all tested devices do not use PWM to dim the display. If PWM was detected, an average of 17900 (minimum: 5 - maximum: 3846000) Hz was measured. | |||
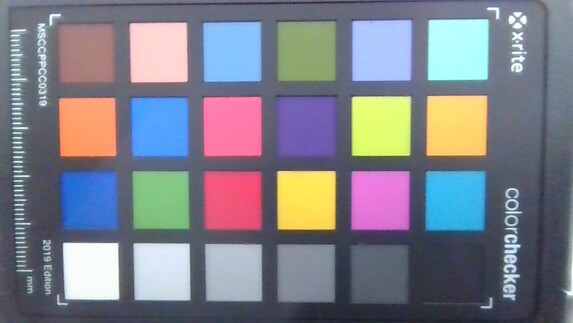
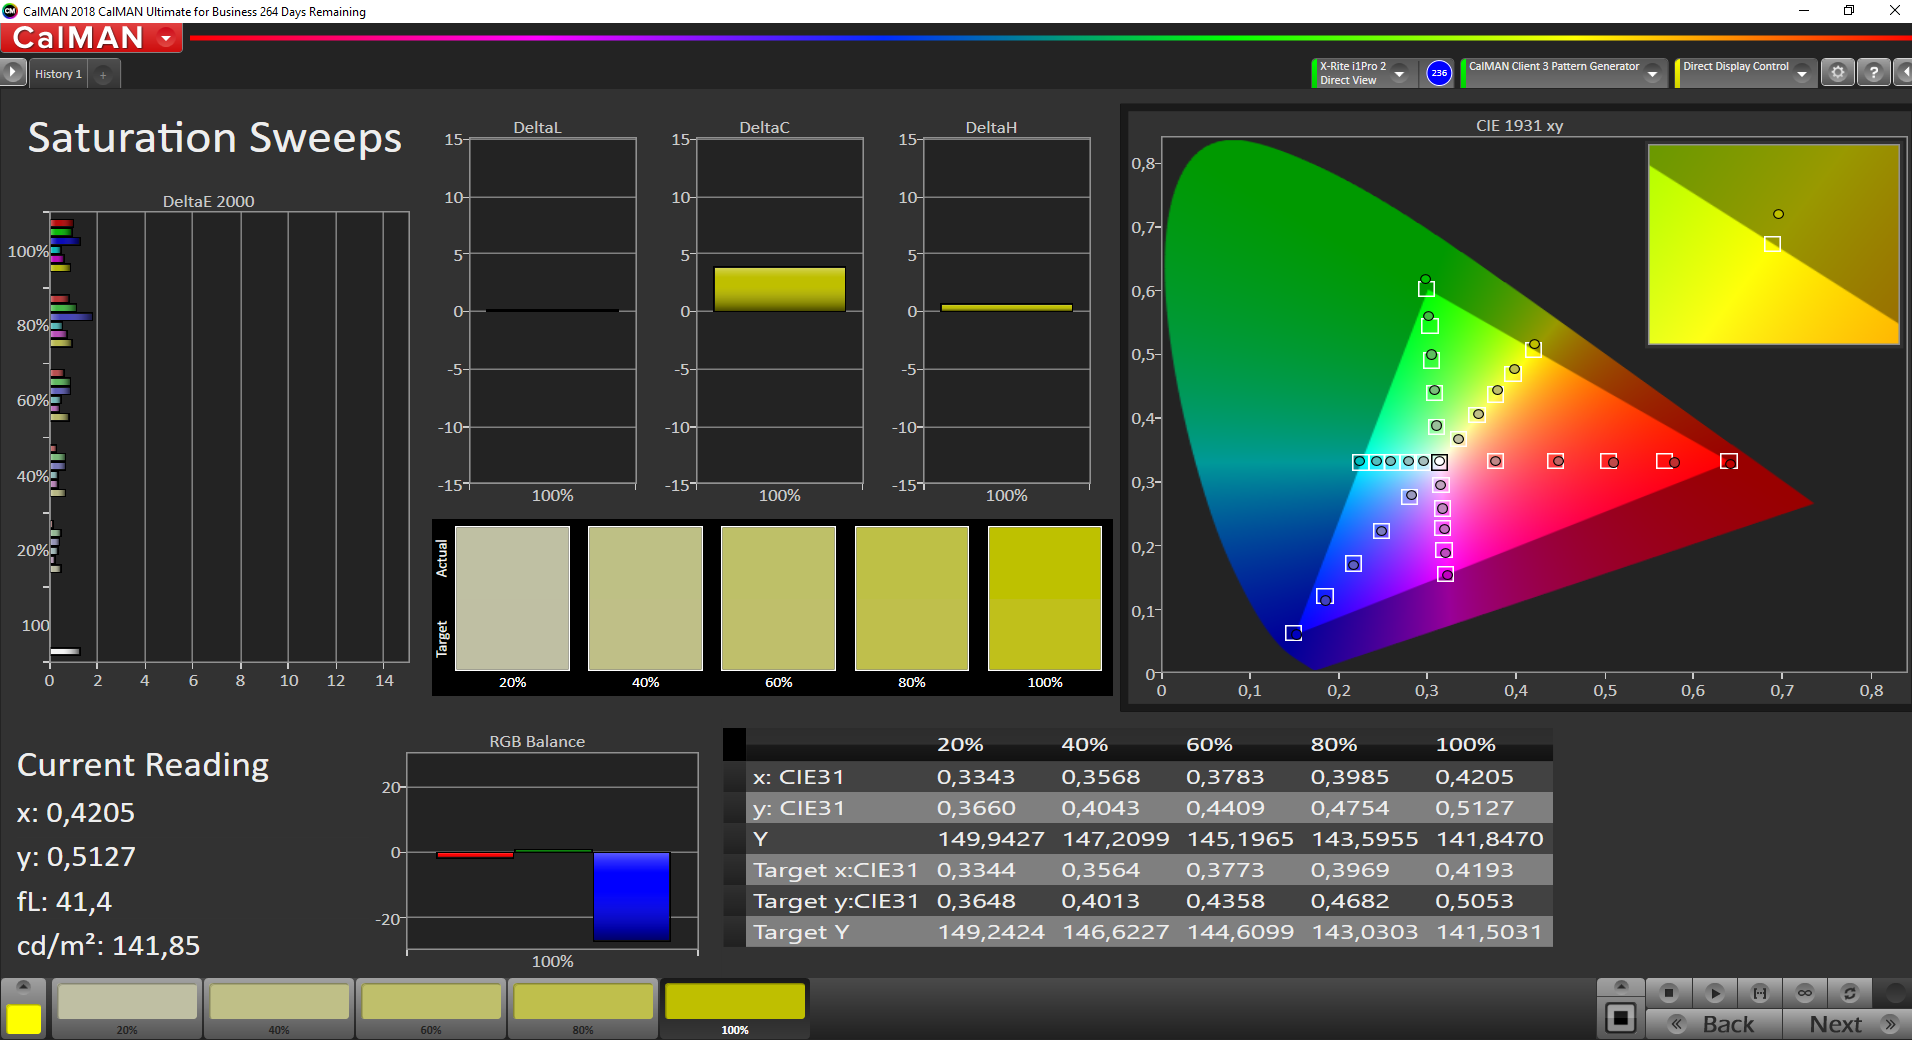
The display is very well calibrated by default and does not suffer from a visible color tint. We were able to improve upon color accuracy even further through calibration, and the display turned out to be very well usable for photo and video editing purposes thanks to its complete coverage of the sRGB color space.
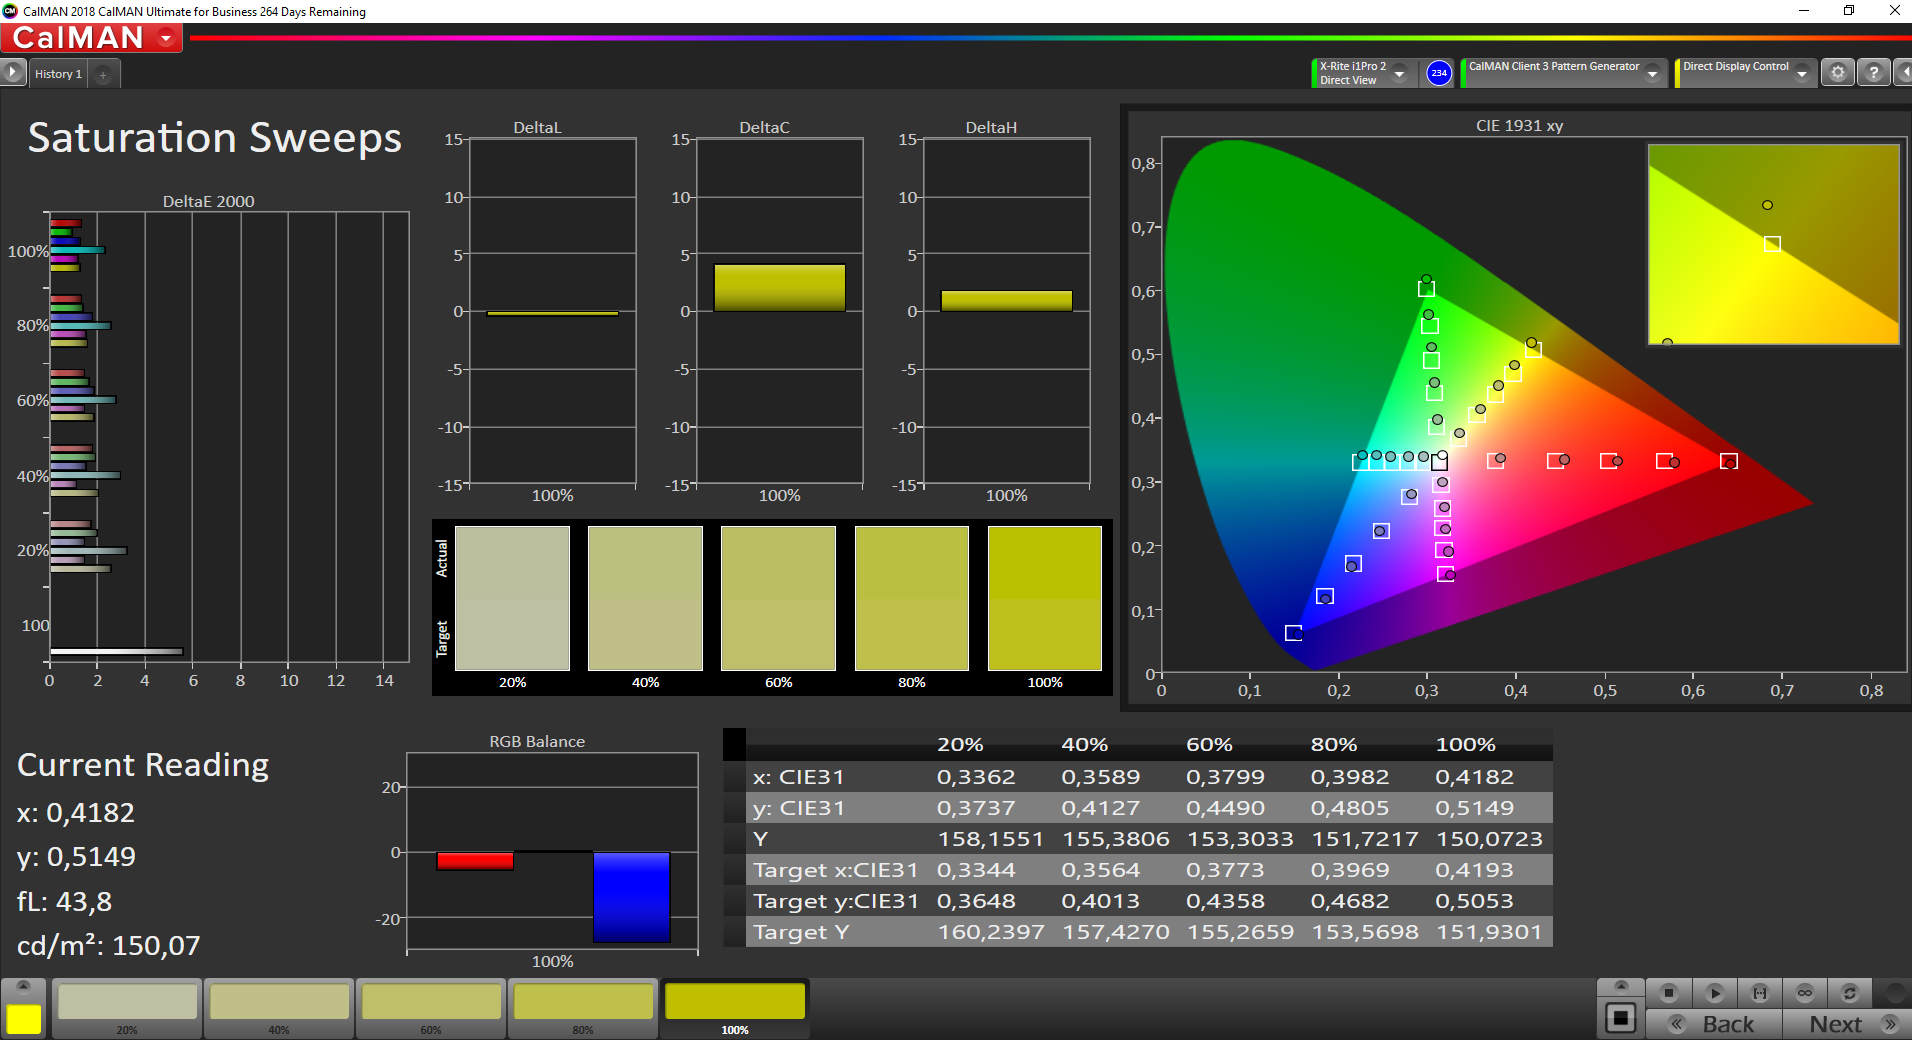
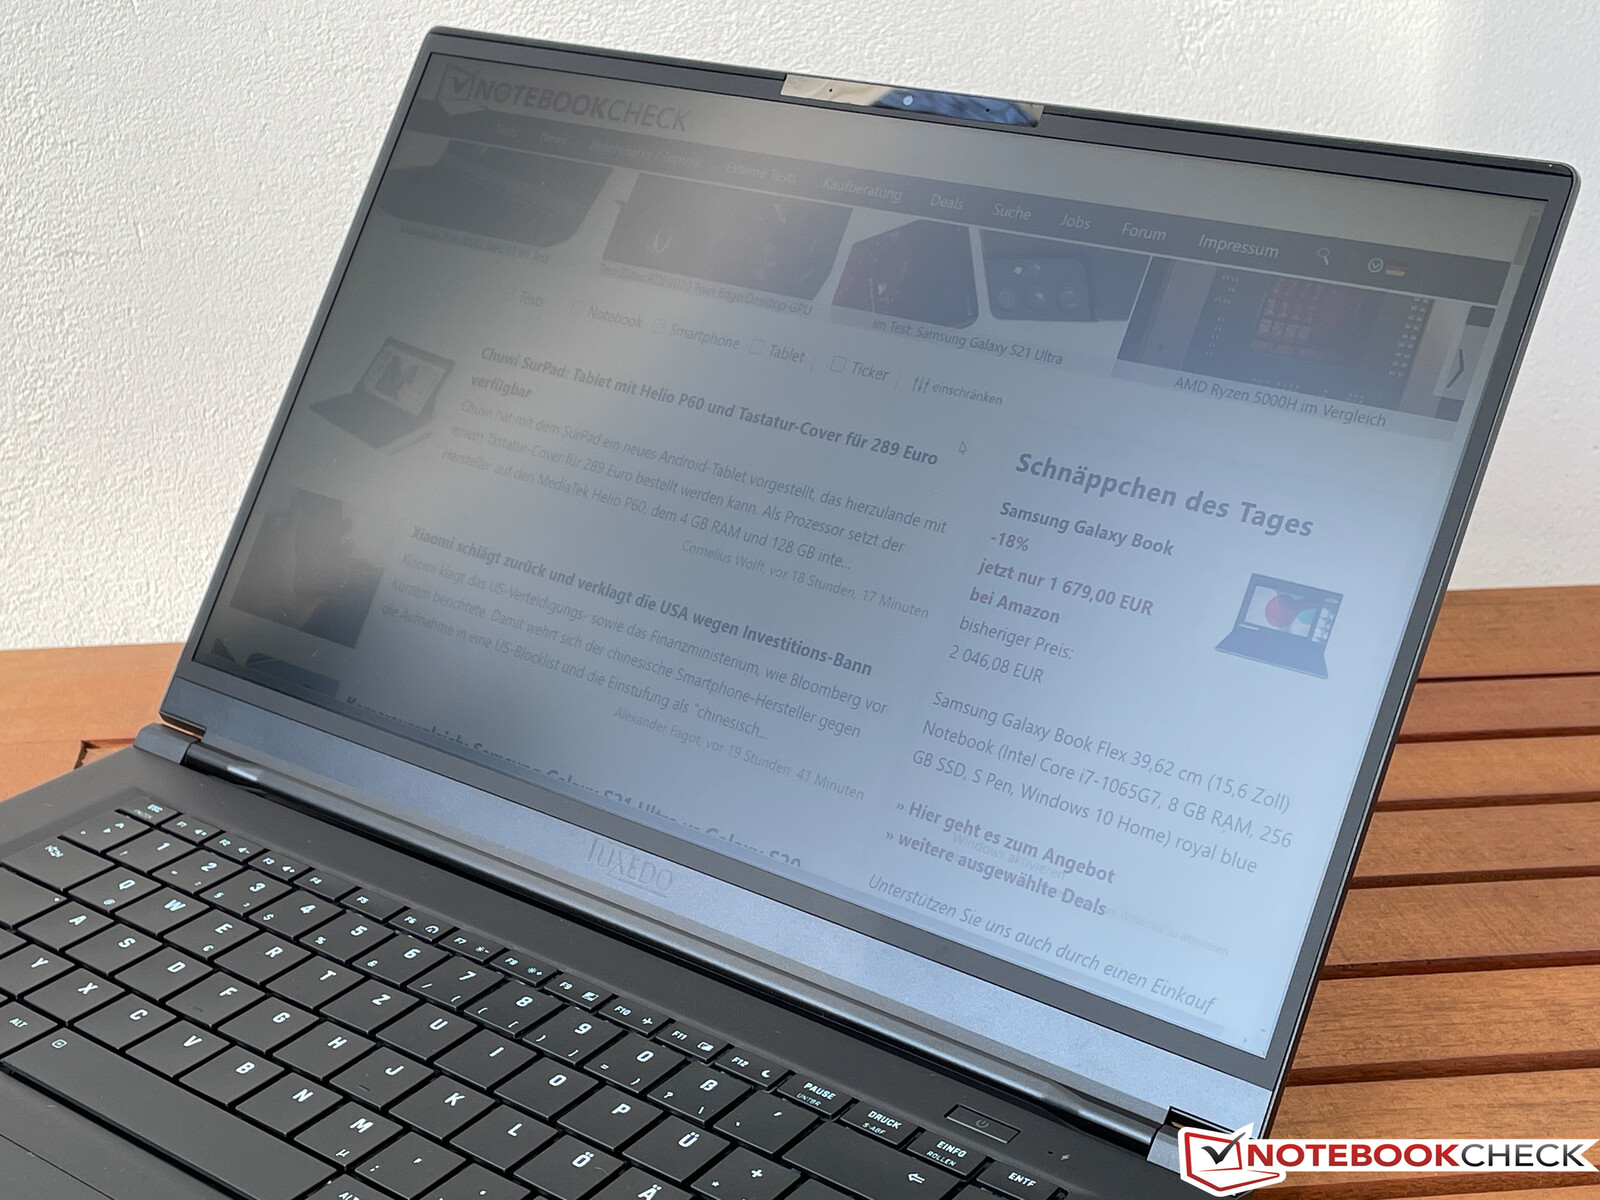
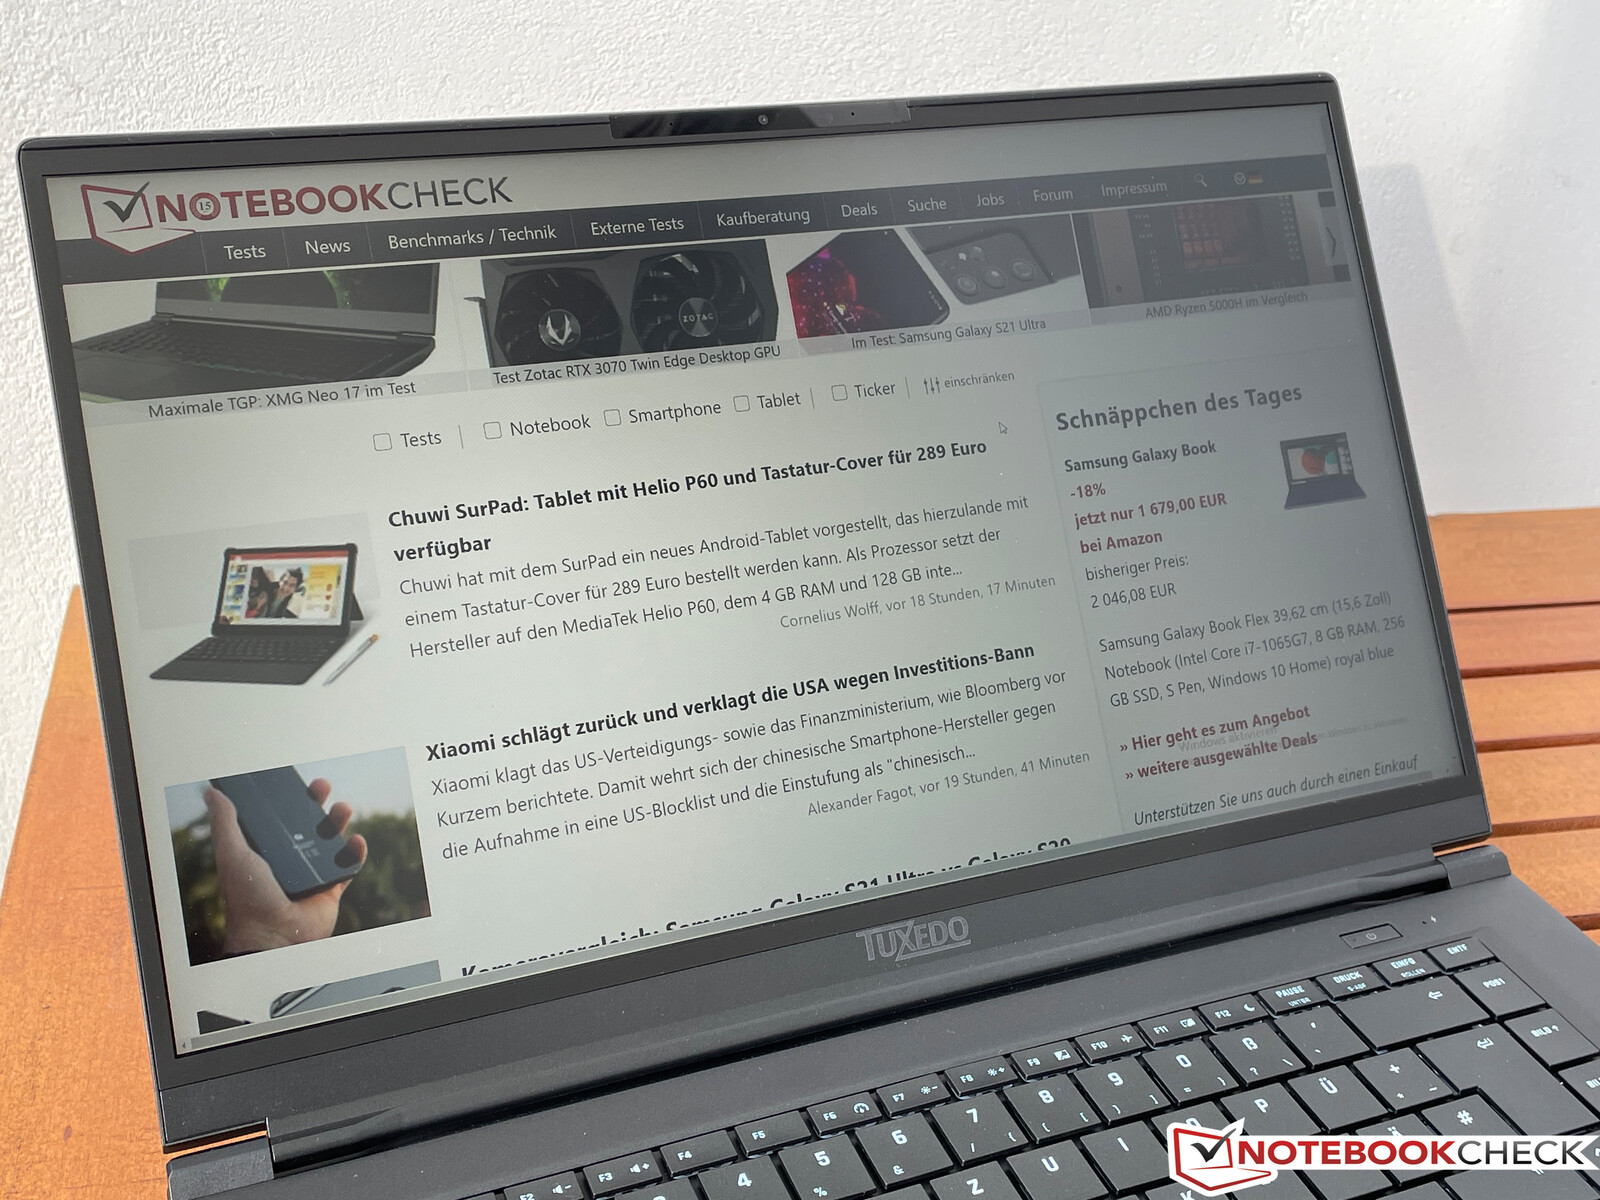
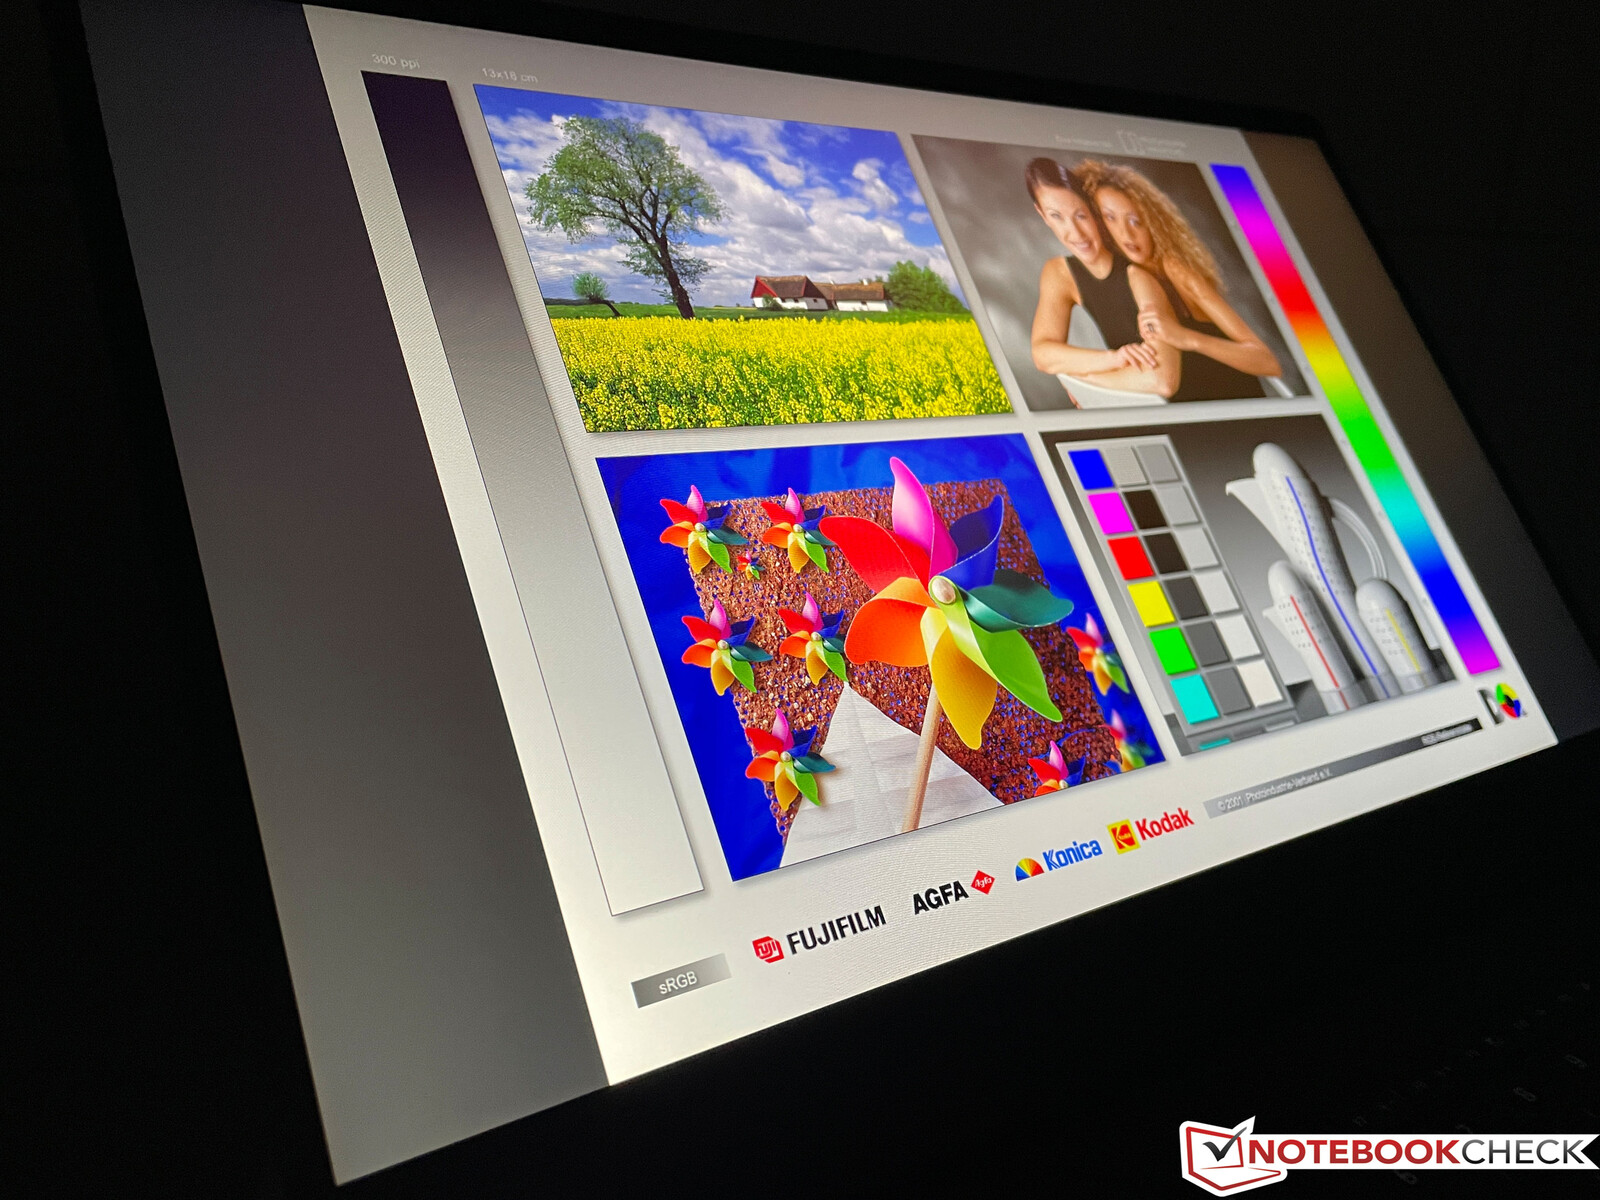
While the matte surface is beneficial outdoors, we would have wished for a brighter display backlight. As it is, the display is only comfortably usable in the shade. As expected of an IPS panel viewing angles are quite good.
Performance – Fast SSD and a lot of RAM
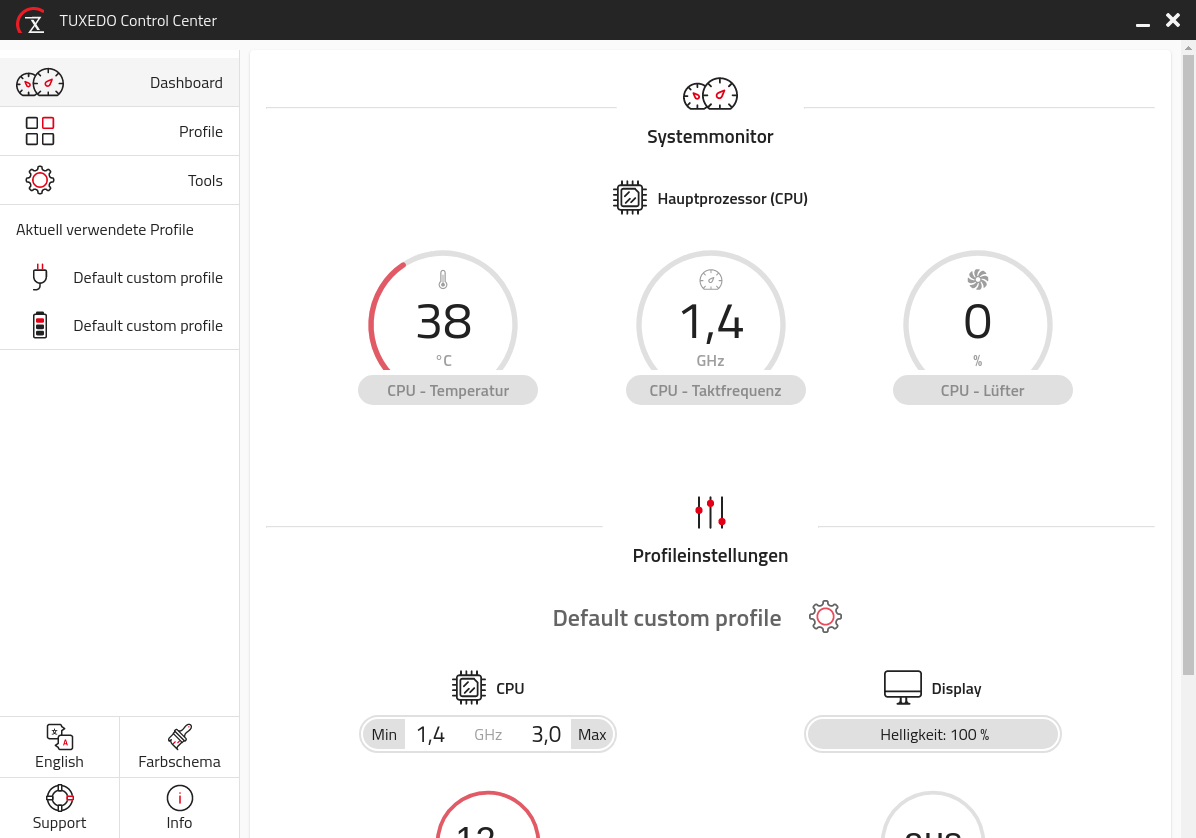
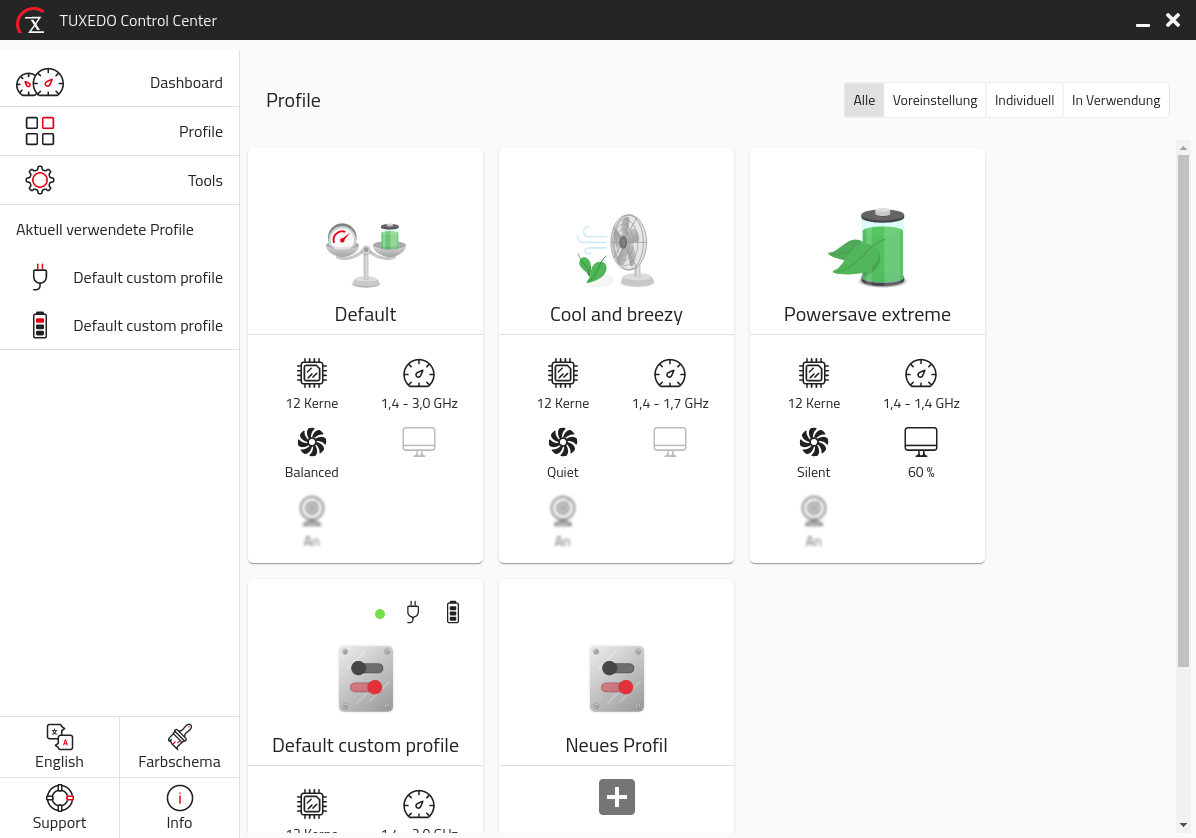
The preinstalled ControlCenter software runs under both Linux and Windows, and it enables the user to select between the various performance modes and fan profiles. We ran our tests in the default Balanced setting.
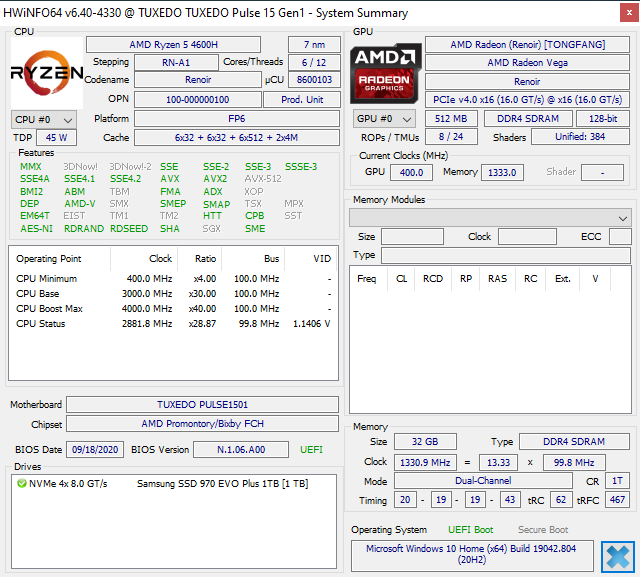
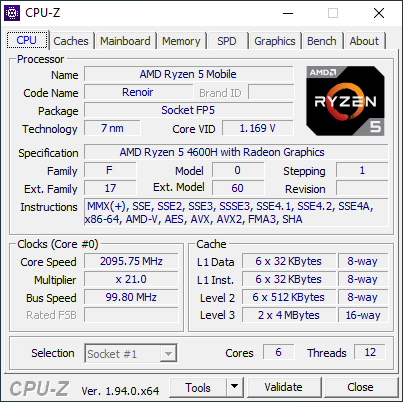
Processor – AMD Ryzen 5
The AMD Ryzen 5 4600H features 6 cores that can process 12 threads simultaneously. This particular 45 W CPU will boost up to 4.0 GHz, and overall performance of our Pulse 15 review unit turned out to be very good. After an initial TDP boost of up to 54 W the CPU quickly settled at 35 W. With Performance Mode enabled in ControlCenter were were able to increase continuous TDP to 45 W.
Overall, our benchmark results are almost identical to those of the Honor MagicBook Pro with the exact same processor. All other comparison devices featured Intel CPUs and were incapable of keeping up. CPU performance drops by around 15 % on battery.
Cinebench R15: CPU Single 64Bit | CPU Multi 64Bit
Blender: v2.79 BMW27 CPU
7-Zip 18.03: 7z b 4 -mmt1 | 7z b 4
Geekbench 5.5: Single-Core | Multi-Core
HWBOT x265 Benchmark v2.2: 4k Preset
LibreOffice : 20 Documents To PDF
R Benchmark 2.5: Overall mean
| Cinebench R20 / CPU (Single Core) | |
| Average of class Multimedia (341 - 812, n=97, last 2 years) | |
| SCHENKER Vision 15 | |
| Tuxedo Pulse 15 | |
| Honor MagicBook Pro (AMD) | |
| Dell XPS 15 9500 Core i5 | |
| Average AMD Ryzen 5 4600H (428 - 454, n=8) | |
| LG Gram 15Z90N | |
| Cinebench R20 / CPU (Multi Core) | |
| Average of class Multimedia (1783 - 11768, n=97, last 2 years) | |
| Honor MagicBook Pro (AMD) | |
| Average AMD Ryzen 5 4600H (3055 - 3393, n=8) | |
| Tuxedo Pulse 15 | |
| Dell XPS 15 9500 Core i5 | |
| SCHENKER Vision 15 | |
| LG Gram 15Z90N | |
| Cinebench R15 / CPU Single 64Bit | |
| Average of class Multimedia (142.6 - 308, n=99, last 2 years) | |
| SCHENKER Vision 15 | |
| Dell XPS 15 9500 Core i5 | |
| Average AMD Ryzen 5 4600H (172.1 - 179, n=9) | |
| Honor MagicBook Pro (AMD) | |
| Tuxedo Pulse 15 | |
| LG Gram 15Z90N | |
| Cinebench R15 / CPU Multi 64Bit | |
| Average of class Multimedia (785 - 4703, n=106, last 2 years) | |
| Average AMD Ryzen 5 4600H (1398 - 1467, n=10) | |
| Honor MagicBook Pro (AMD) | |
| Tuxedo Pulse 15 | |
| SCHENKER Vision 15 | |
| Dell XPS 15 9500 Core i5 | |
| LG Gram 15Z90N | |
| Blender / v2.79 BMW27 CPU | |
| LG Gram 15Z90N | |
| SCHENKER Vision 15 | |
| Dell XPS 15 9500 Core i5 | |
| Tuxedo Pulse 15 | |
| Honor MagicBook Pro (AMD) | |
| Average AMD Ryzen 5 4600H (337 - 369, n=6) | |
| Average of class Multimedia (107 - 662, n=95, last 2 years) | |
| 7-Zip 18.03 / 7z b 4 -mmt1 | |
| Average of class Multimedia (3398 - 7163, n=90, last 2 years) | |
| SCHENKER Vision 15 | |
| Dell XPS 15 9500 Core i5 | |
| Average AMD Ryzen 5 4600H (4334 - 4471, n=6) | |
| Tuxedo Pulse 15 | |
| Honor MagicBook Pro (AMD) | |
| LG Gram 15Z90N | |
| 7-Zip 18.03 / 7z b 4 | |
| Average of class Multimedia (20166 - 119900, n=90, last 2 years) | |
| Tuxedo Pulse 15 | |
| Honor MagicBook Pro (AMD) | |
| Average AMD Ryzen 5 4600H (36693 - 38873, n=6) | |
| SCHENKER Vision 15 | |
| Dell XPS 15 9500 Core i5 | |
| LG Gram 15Z90N | |
| Geekbench 5.5 / Single-Core | |
| Average of class Multimedia (926 - 2342, n=100, last 2 years) | |
| SCHENKER Vision 15 | |
| Dell XPS 15 9500 Core i5 | |
| LG Gram 15Z90N | |
| Tuxedo Pulse 15 | |
| Honor MagicBook Pro (AMD) | |
| Average AMD Ryzen 5 4600H (1099 - 1124, n=7) | |
| Geekbench 5.5 / Multi-Core | |
| Average of class Multimedia (3828 - 23059, n=100, last 2 years) | |
| Tuxedo Pulse 15 | |
| Honor MagicBook Pro (AMD) | |
| Average AMD Ryzen 5 4600H (5260 - 6574, n=7) | |
| SCHENKER Vision 15 | |
| Dell XPS 15 9500 Core i5 | |
| LG Gram 15Z90N | |
| HWBOT x265 Benchmark v2.2 / 4k Preset | |
| Average of class Multimedia (4.99 - 30.5, n=88, last 2 years) | |
| Tuxedo Pulse 15 | |
| Average AMD Ryzen 5 4600H (9.27 - 10.4, n=5) | |
| Honor MagicBook Pro (AMD) | |
| SCHENKER Vision 15 | |
| Dell XPS 15 9500 Core i5 | |
| LibreOffice / 20 Documents To PDF | |
| Average AMD Ryzen 5 4600H (58.4 - 73.3, n=6) | |
| Dell XPS 15 9500 Core i5 | |
| Honor MagicBook Pro (AMD) | |
| Tuxedo Pulse 15 | |
| Average of class Multimedia (6.7 - 84.9, n=92, last 2 years) | |
| SCHENKER Vision 15 | |
| LG Gram 15Z90N | |
| R Benchmark 2.5 / Overall mean | |
| LG Gram 15Z90N | |
| Dell XPS 15 9500 Core i5 | |
| Honor MagicBook Pro (AMD) | |
| Tuxedo Pulse 15 | |
| Average AMD Ryzen 5 4600H (0.607 - 0.627, n=6) | |
| SCHENKER Vision 15 | |
| Average of class Multimedia (0.3826 - 0.723, n=90, last 2 years) | |
* ... smaller is better
System Performance
Thanks to its powerful processor and its fast SSD the Pulse 15 turned out to be a very responsive computer that reacted practically instantaneously to input. We did not encounter any issues during our review period.
| PCMark 10 Score | 4977 points | |
Help | ||
DPC Latencies
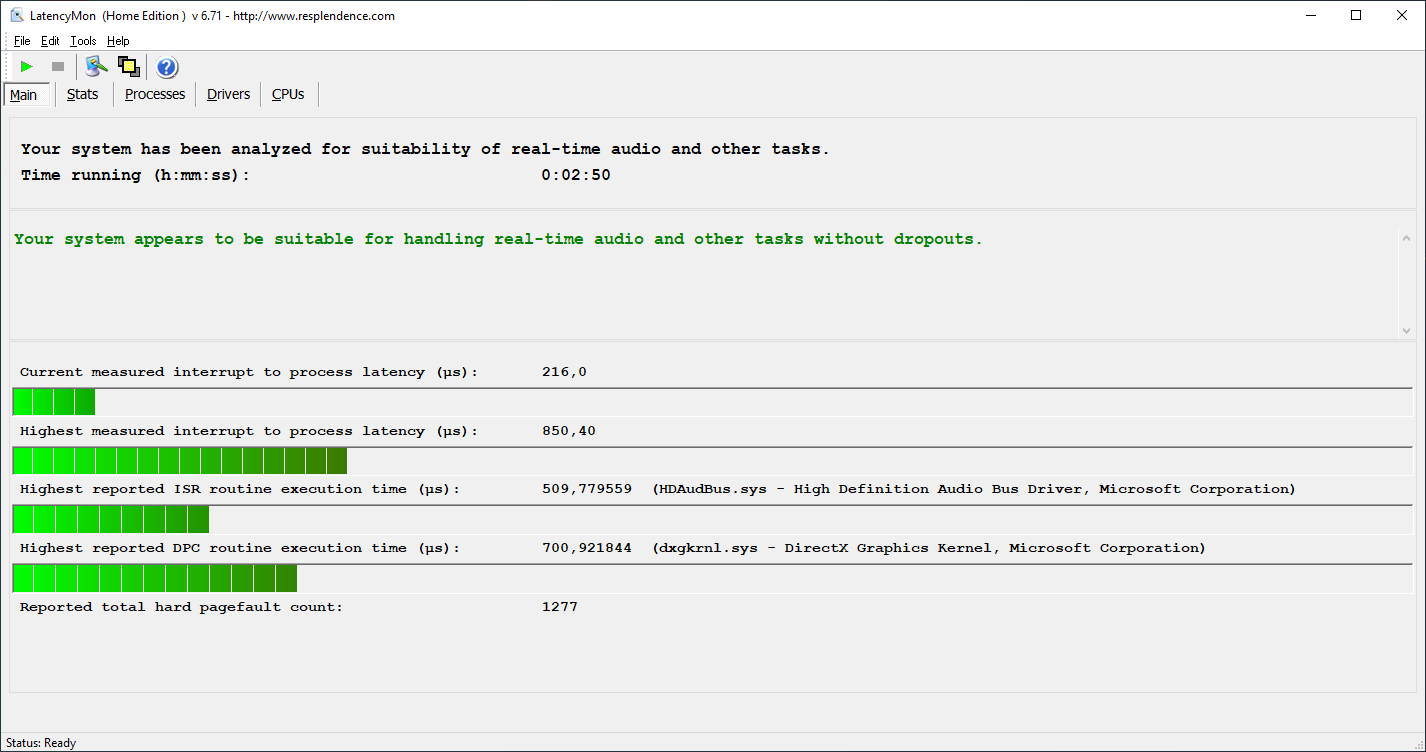
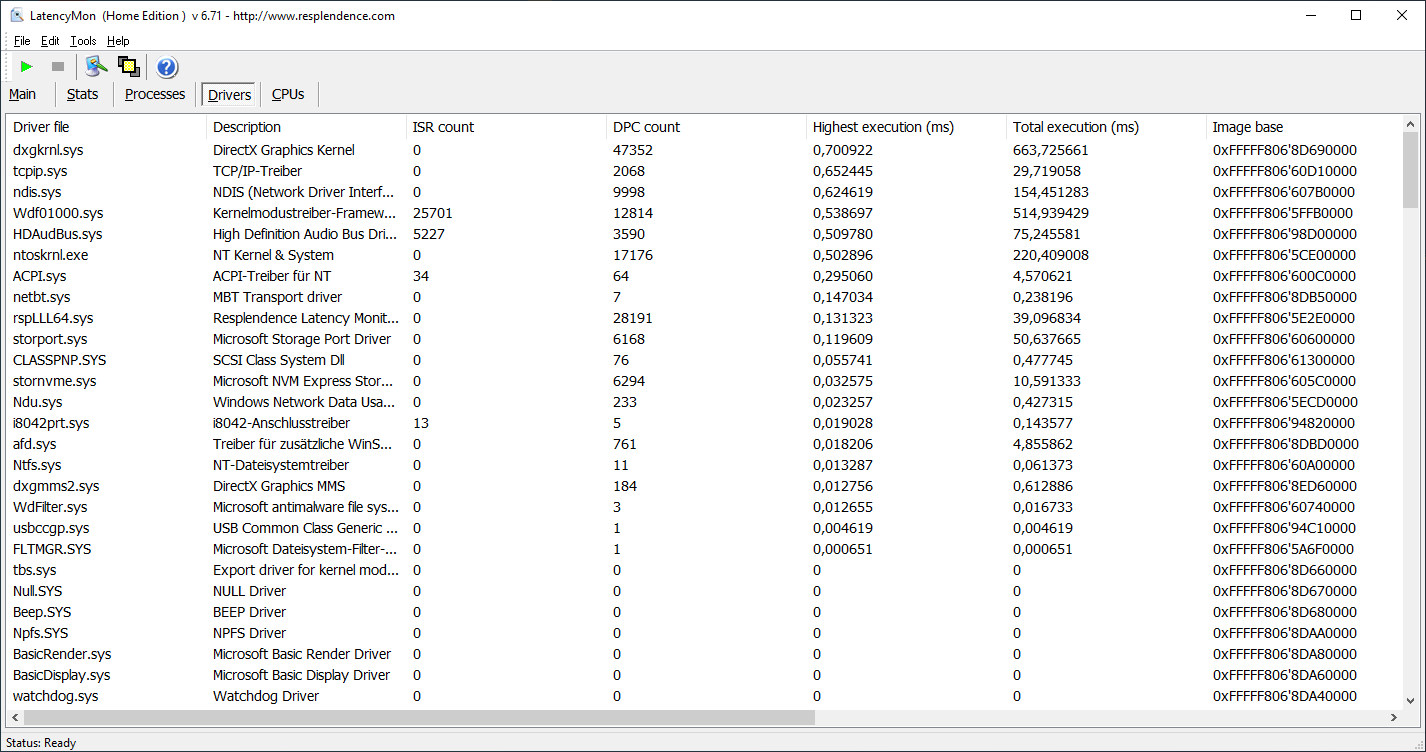
| DPC Latencies / LatencyMon - interrupt to process latency (max), Web, Youtube, Prime95 | |
| SCHENKER Vision 15 | |
| LG Gram 15Z90N | |
| Dell XPS 15 9500 Core i5 | |
| Honor MagicBook Pro (AMD) | |
| Tuxedo Pulse 15 | |
* ... smaller is better
Storage Devices
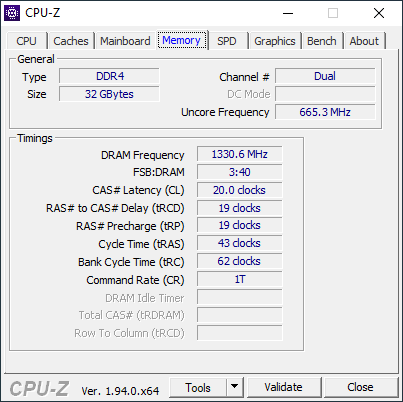
The Pulse 15’s single M.2-2280 slot is connected via PCIe 3.0 x4. The exact SSD model of your liking can be selected during configuration. Our review unit came equipped with a fast 1 TB Samsung 970 Evo Plus.
| Tuxedo Pulse 15 Samsung SSD 970 EVO Plus 1TB | Honor MagicBook Pro (AMD) WDC PC SN730 SDBPNTY-512G | SCHENKER Vision 15 Samsung SSD 980 Pro 1TB MZ-V8P1T0BW | Dell XPS 15 9500 Core i5 Toshiba KBG40ZNS256G NVMe | LG Gram 15Z90N SK Hynix PC401 512GB M.2 (HFS512GD9TNG) | Average Samsung SSD 970 EVO Plus 1TB | Average of class Multimedia | |
|---|---|---|---|---|---|---|---|
| CrystalDiskMark 5.2 / 6 | -9% | 74% | -32% | -1% | 9% | 28% | |
| Write 4K | 110.5 | 156.9 42% | 238.1 115% | 93.3 -16% | 177.1 60% | 155.5 ? 41% | 170.2 ? 54% |
| Read 4K | 43.38 | 48.81 13% | 79.2 83% | 45.9 6% | 47.88 10% | 51.6 ? 19% | 66.2 ? 53% |
| Write Seq | 3041 | 1050 -65% | 4139 36% | 1211 -60% | 2182 -28% | 2660 ? -13% | 2761 ? -9% |
| Read Seq | 2414 | 2517 4% | 4133 71% | 1633 -32% | 1900 -21% | 2390 ? -1% | 2981 ? 23% |
| Write 4K Q32T1 | 392 | 408.7 4% | 697 78% | 273.1 -30% | 448.4 14% | 447 ? 14% | 479 ? 22% |
| Read 4K Q32T1 | 490.9 | 504 3% | 758 54% | 356 -27% | 470.3 -4% | 544 ? 11% | 550 ? 12% |
| Write Seq Q32T1 | 3329 | 1087 -67% | 5187 56% | 1198 -64% | 2228 -33% | 3296 ? -1% | 4002 ? 20% |
| Read Seq Q32T1 | 3568 | 3407 -5% | 7117 99% | 2269 -36% | 3454 -3% | 3551 ? 0% | 5393 ? 51% |
| Write 4K Q8T8 | 1283 | 1656 ? | 1079 ? | ||||
| Read 4K Q8T8 | 1052 | 2076 ? | 1411 ? | ||||
| AS SSD | -22% | 33% | -218% | -29% | 0% | -8% | |
| Seq Read | 2425 | 2749 13% | 5427 124% | 1423 -41% | 2842 17% | 2800 ? 15% | 4005 ? 65% |
| Seq Write | 2539 | 2348 -8% | 3886 53% | 766 -70% | 974 -62% | 2633 ? 4% | 2553 ? 1% |
| 4K Read | 55.6 | 44.22 -20% | 72.9 31% | 42.21 -24% | 50.5 -9% | 51.2 ? -8% | 62.7 ? 13% |
| 4K Write | 157.2 | 140.5 -11% | 219.3 40% | 74.8 -52% | 147.5 -6% | 131.2 ? -17% | 188.5 ? 20% |
| 4K-64 Read | 1878 | 1450 -23% | 2209 18% | 973 -48% | 1191 -37% | 1839 ? -2% | 1231 ? -34% |
| 4K-64 Write | 2512 | 2346 -7% | 2265 -10% | 218.8 -91% | 1275 -49% | 2144 ? -15% | 2123 ? -15% |
| Access Time Read * | 0.034 | 0.079 -132% | 0.033 3% | 0.125 -268% | 0.043 -26% | 0.04528 ? -33% | 0.0578 ? -70% |
| Access Time Write * | 0.024 | 0.027 -13% | 0.02 17% | 0.552 -2200% | 0.027 -13% | 0.03128 ? -30% | 0.05992 ? -150% |
| Score Read | 2176 | 1769 -19% | 2825 30% | 1157 -47% | 1526 -30% | 2171 ? 0% | 1695 ? -22% |
| Score Write | 2923 | 2721 -7% | 2873 -2% | 370 -87% | 1520 -48% | 2539 ? -13% | 2567 ? -12% |
| Score Total | 6221 | 5376 -14% | 7069 14% | 2094 -66% | 3741 -40% | 5812 ? -7% | 5067 ? -19% |
| Copy ISO MB/s | 2101 | 2775 32% | 1151 -45% | 1135 -46% | 2133 ? 2% | 2409 ? 15% | |
| Copy Program MB/s | 437 | 662 51% | 499.4 14% | 346 -21% | 698 ? 60% | 664 ? 52% | |
| Copy Game MB/s | 1027 | 1655 61% | 733 -29% | 665 -35% | 1521 ? 48% | 1475 ? 44% | |
| Total Average (Program / Settings) | -16% /
-16% | 54% /
48% | -125% /
-151% | -15% /
-19% | 5% /
3% | 10% /
5% |
* ... smaller is better

Sustained Read: DiskSpd Read Loop, Queue Depth 8
GPU Performance
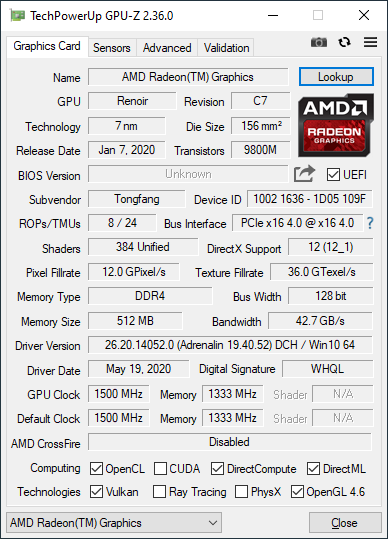
The AMD Radeon RX Vega 6 performs as expected and at the same level as in the Honor MagicBook Pro. Schenker's Vision 15 with Intel Xe Graphics was much faster in comparison, Dell’s XPS 15 with UHD Graphics much slower. The Pulse 15 is thus more than fast enough for regular multimedia applications, including high-definition video playback.
GPU performance remained consistent under sustained load and on battery.
| 3DMark 11 Performance | 4905 points | |
| 3DMark Fire Strike Score | 2836 points | |
| 3DMark Time Spy Score | 1028 points | |
Help | ||
Gaming Performance
While the integrated GPU performed admirably the Pulse 15 is most certainly not a gaming notebook by any means. It will, however, run older and less demanding games smoothly even in high details.
| low | med. | high | ultra | |
| The Witcher 3 (2015) | 58.6 | 18.4 | ||
| Dota 2 Reborn (2015) | 109 | 89 | 50 | 46.5 |
| X-Plane 11.11 (2018) | 45.6 | 33.8 | 29.9 |
Emissions & Energy
Noise Emissions
Both fans are off most of the time during everyday use. Only when the CPU is subjected to sustained load will the fans ramp up noticeably and peak at 42.3 dB(A) under maximum load or around 40 dB(A) while gaming. The frequency was not particularly unpleasant, and we found no evidence of coil while or other electrical noise whatsoever. The additional fan profiles that can be enabled using the ControlCenter software allow for further fan noise customization.
Noise Level
| Idle |
| 24.4 / 24.4 / 28.6 dB(A) |
| Load |
| 32.3 / 42.3 dB(A) |
 | ||
30 dB silent 40 dB(A) audible 50 dB(A) loud |
||
min: | ||
| Tuxedo Pulse 15 Vega 6, R5 4600H, Samsung SSD 970 EVO Plus 1TB | Honor MagicBook Pro (AMD) Vega 6, R5 4600H, WDC PC SN730 SDBPNTY-512G | SCHENKER Vision 15 Iris Xe G7 96EUs, i7-1165G7, Samsung SSD 980 Pro 1TB MZ-V8P1T0BW | Dell XPS 15 9500 Core i5 UHD Graphics 630, i5-10300H, Toshiba KBG40ZNS256G NVMe | LG Gram 15Z90N Iris Plus Graphics G7 (Ice Lake 64 EU), i5-1035G7, SK Hynix PC401 512GB M.2 (HFS512GD9TNG) | |
|---|---|---|---|---|---|
| Noise | -5% | -14% | -5% | -13% | |
| off / environment * | 24.4 | 29.7 -22% | 29.8 -22% | 28 -15% | 30.7 -26% |
| Idle Minimum * | 24.4 | 29.7 -22% | 29.8 -22% | 28 -15% | 30.7 -26% |
| Idle Average * | 24.4 | 29.7 -22% | 29.8 -22% | 28 -15% | 30.7 -26% |
| Idle Maximum * | 28.6 | 30.5 -7% | 31.1 -9% | 28 2% | 31.9 -12% |
| Load Average * | 32.3 | 31 4% | 40.5 -25% | 28 13% | 34 -5% |
| Witcher 3 ultra * | 40.1 | 31.3 22% | 40.5 -1% | ||
| Load Maximum * | 42.3 | 36.7 13% | 40.5 4% | 41.9 1% | 34.2 19% |
* ... smaller is better
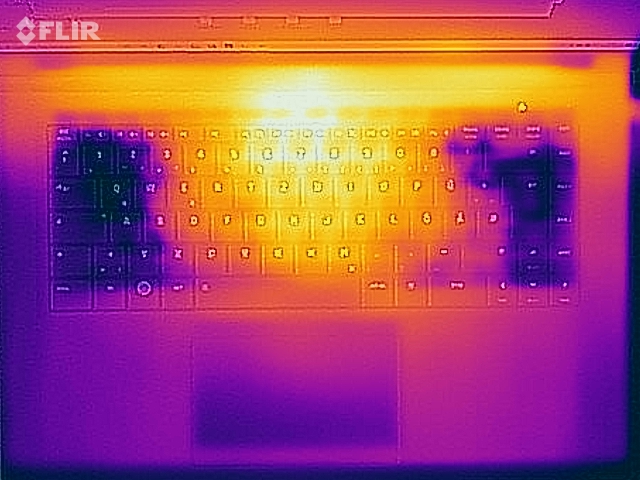
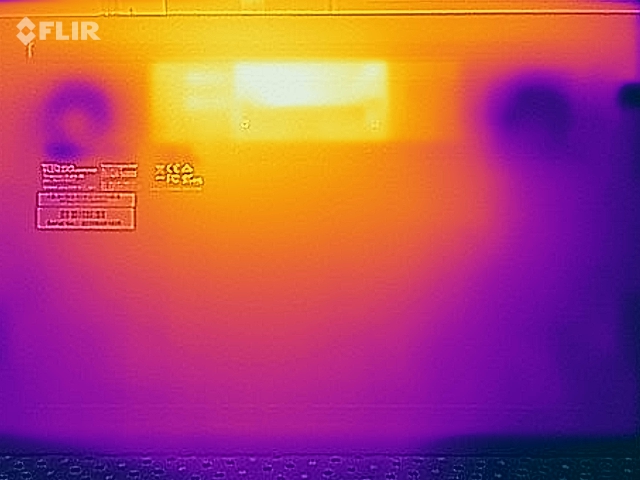
Temperature
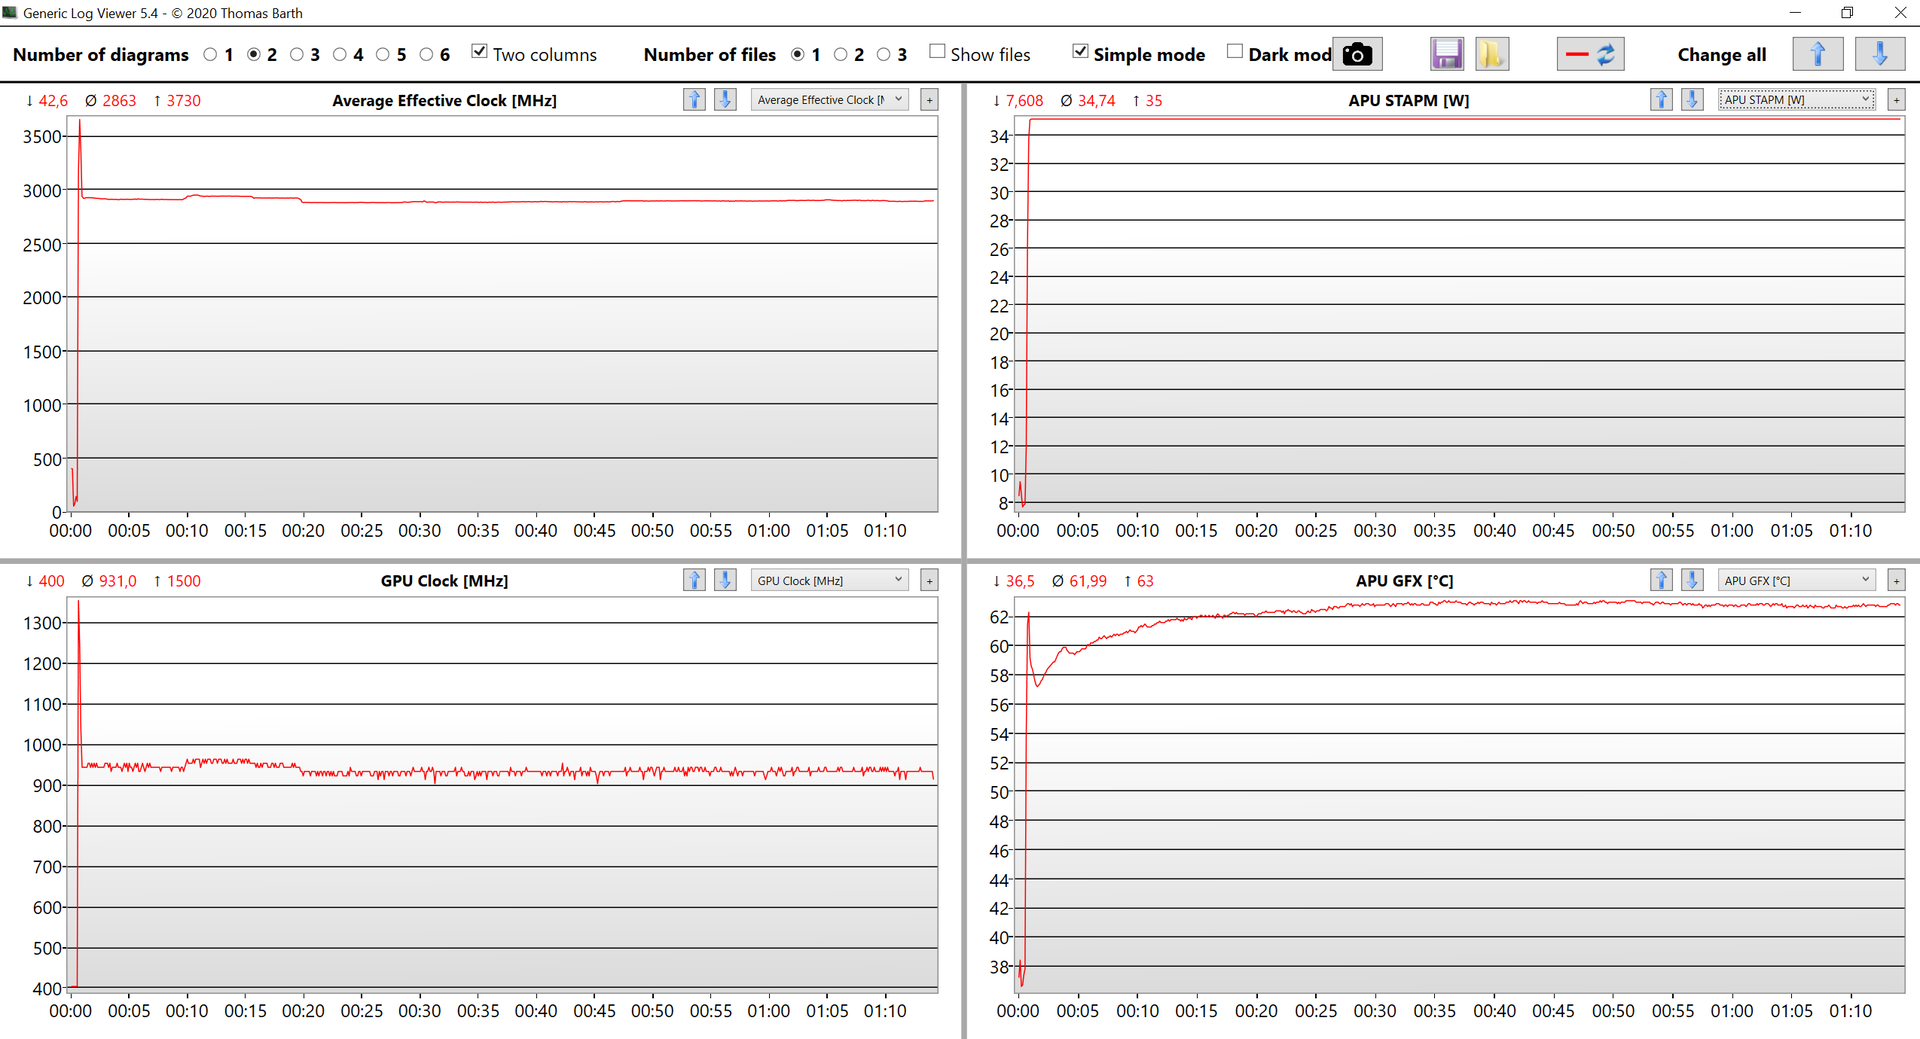
Surface temperatures remained inconspicuous even under load. We found a single hot spot in the center above the keyboard with a temperature of slightly over 40 °C. With both CPU and GPU under load the APU’s power consumption settled at around 35 W with the CPU cores running at around 3 GHz and the GPU at around 930 MHz.
(±) The maximum temperature on the upper side is 41.4 °C / 107 F, compared to the average of 36.9 °C / 98 F, ranging from 21.1 to 71 °C for the class Multimedia.
(±) The bottom heats up to a maximum of 43.8 °C / 111 F, compared to the average of 39.1 °C / 102 F
(+) In idle usage, the average temperature for the upper side is 26.7 °C / 80 F, compared to the device average of 31.2 °C / 88 F.
(+) The palmrests and touchpad are cooler than skin temperature with a maximum of 26.3 °C / 79.3 F and are therefore cool to the touch.
(+) The average temperature of the palmrest area of similar devices was 28.8 °C / 83.8 F (+2.5 °C / 4.5 F).
Speakers
The two 2 W speakers are located at the bottom of the device. Accordingly, they can sound quite muffled depending on what surface the device is placed on. Audio performance was not particularly good overall. While maximum volume was decent the speakers tended to boom noticeably at higher volume levels and sounded very tinny overall. They are certainly good enough for occasionally watching short videos or listening to background music, but we would still recommend a set of external speakers of headphones for a much-improved audio experience.
Tuxedo Pulse 15 audio analysis
(±) | speaker loudness is average but good (76.2 dB)
Bass 100 - 315 Hz
(±) | reduced bass - on average 11.2% lower than median
(±) | linearity of bass is average (10.5% delta to prev. frequency)
Mids 400 - 2000 Hz
(±) | higher mids - on average 14.1% higher than median
(±) | linearity of mids is average (9.3% delta to prev. frequency)
Highs 2 - 16 kHz
(±) | higher highs - on average 5.7% higher than median
(±) | linearity of highs is average (8.3% delta to prev. frequency)
Overall 100 - 16.000 Hz
(-) | overall sound is not linear (30% difference to median)
Compared to same class
» 94% of all tested devices in this class were better, 3% similar, 3% worse
» The best had a delta of 5%, average was 18%, worst was 45%
Compared to all devices tested
» 86% of all tested devices were better, 3% similar, 11% worse
» The best had a delta of 4%, average was 25%, worst was 134%
Dell XPS 15 9500 Core i5 audio analysis
(+) | speakers can play relatively loud (84.2 dB)
Bass 100 - 315 Hz
(+) | good bass - only 4.6% away from median
(±) | linearity of bass is average (10% delta to prev. frequency)
Mids 400 - 2000 Hz
(+) | balanced mids - only 3.3% away from median
(+) | mids are linear (4.5% delta to prev. frequency)
Highs 2 - 16 kHz
(+) | balanced highs - only 2.4% away from median
(+) | highs are linear (4.3% delta to prev. frequency)
Overall 100 - 16.000 Hz
(+) | overall sound is linear (7.7% difference to median)
Compared to same class
» 4% of all tested devices in this class were better, 1% similar, 94% worse
» The best had a delta of 5%, average was 18%, worst was 45%
Compared to all devices tested
» 1% of all tested devices were better, 0% similar, 99% worse
» The best had a delta of 4%, average was 25%, worst was 134%
Power Consumption
Power consumption turned out to be inconspicuous and without any surprises. It was okay when idle, and the included 90 W power supply was more than adequate under load. However, we would have wished for lower power consumption during standby and when powered off.
| Off / Standby | |
| Idle | |
| Load |
|
Battery Life
Battery life is very long thanks to the device’s large 91 Wh battery. When running our real-world Wi-Fi test with brightness normalized at 150 nits the device lasted for almost 14 hours. With brightness turned all the way up it still managed over 8 hours and lasted for around 2 hours under maximum load.
Pros
Cons
Verdict – Good-Looking and Powerful Ultrabook

The Tuxedo Pulse 15’s highlights are its excellent metal case and its fast processor while at the same time retaining low temperatures and noise emissions. We also liked its input devices and its connectivity, albeit we were taken aback by its slow USB 2.0 port that we would not have expected on a modern laptop with a price tag of more than 1,000 Euros.
The Pulse 15 is a compact 15-inch Ultrabook with fast AMD processor and long battery life.
Its FHD display is well-suited for productivity applications. Not only is it matte but it can be calibrated to ensure very high color accuracy. Our only gripe is its low maximum brightness, which could have been higher for outdoor use in particular. Other downsides include its poor speakers and slow microSD reader. If you are looking for a thin 15-inch laptop with a powerful CPU the Pulse 15 (as well as its Schenker Via 15 Pro running Windows) is worth a closer look.
Price and Availability
The Pulse 15 can be configured and purchased on Tuxedo’s website and starts at around 1,000 Euros.
Tuxedo Pulse 15
-
03/17/2021 v7
Andreas Osthoff
More articles related to this device
Tuxedo Pulse 15 (Pulse 15 Series)Related Articles


Pricecompare

