Notebookcheck Logo

The Witcher 3 v4.00: Notebook and desktop benchmarks

Now with Ray Tracing. Although the flagship role-playing game has been around for several years now, the developers did not miss the opportunity to add various new (graphical) features in the course of the patches. We tested several desktop and notebook GPUs with the current version - including RT benchmarks.
The Witcher 3

Technology

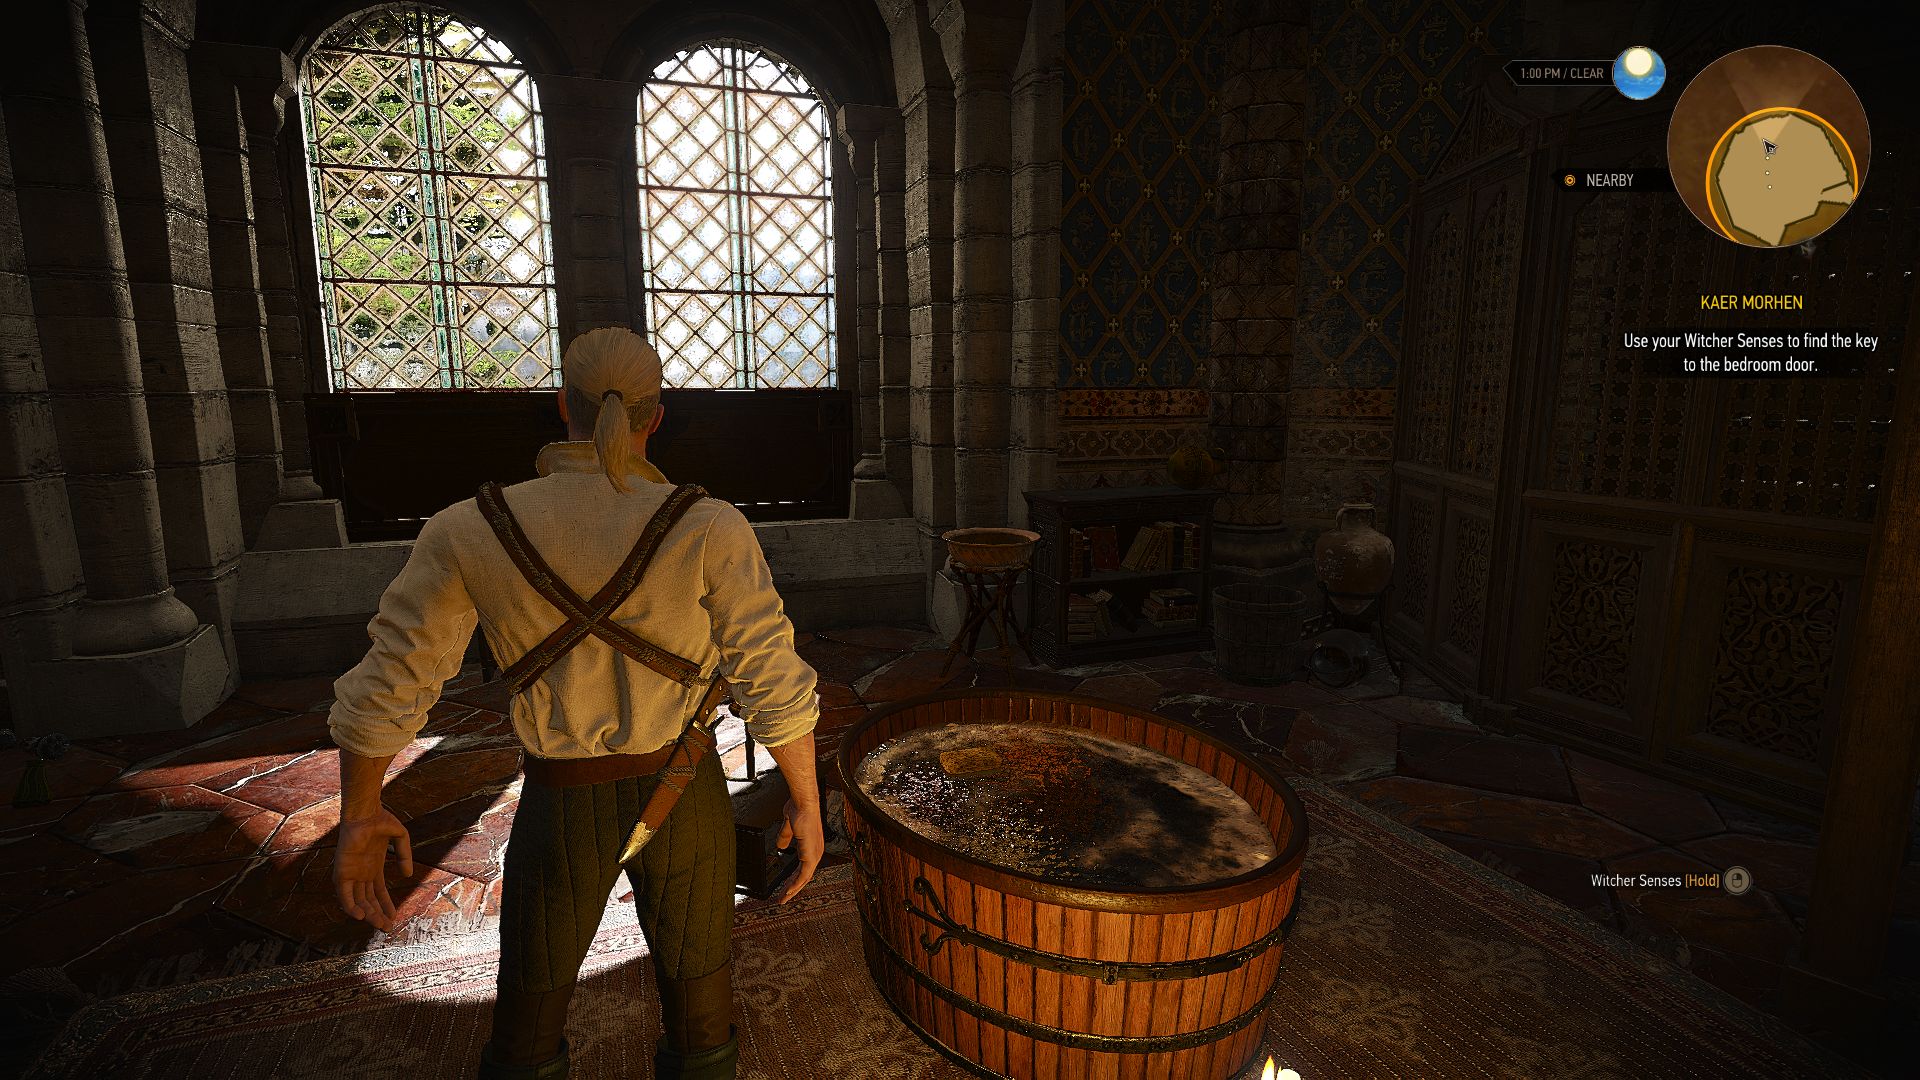
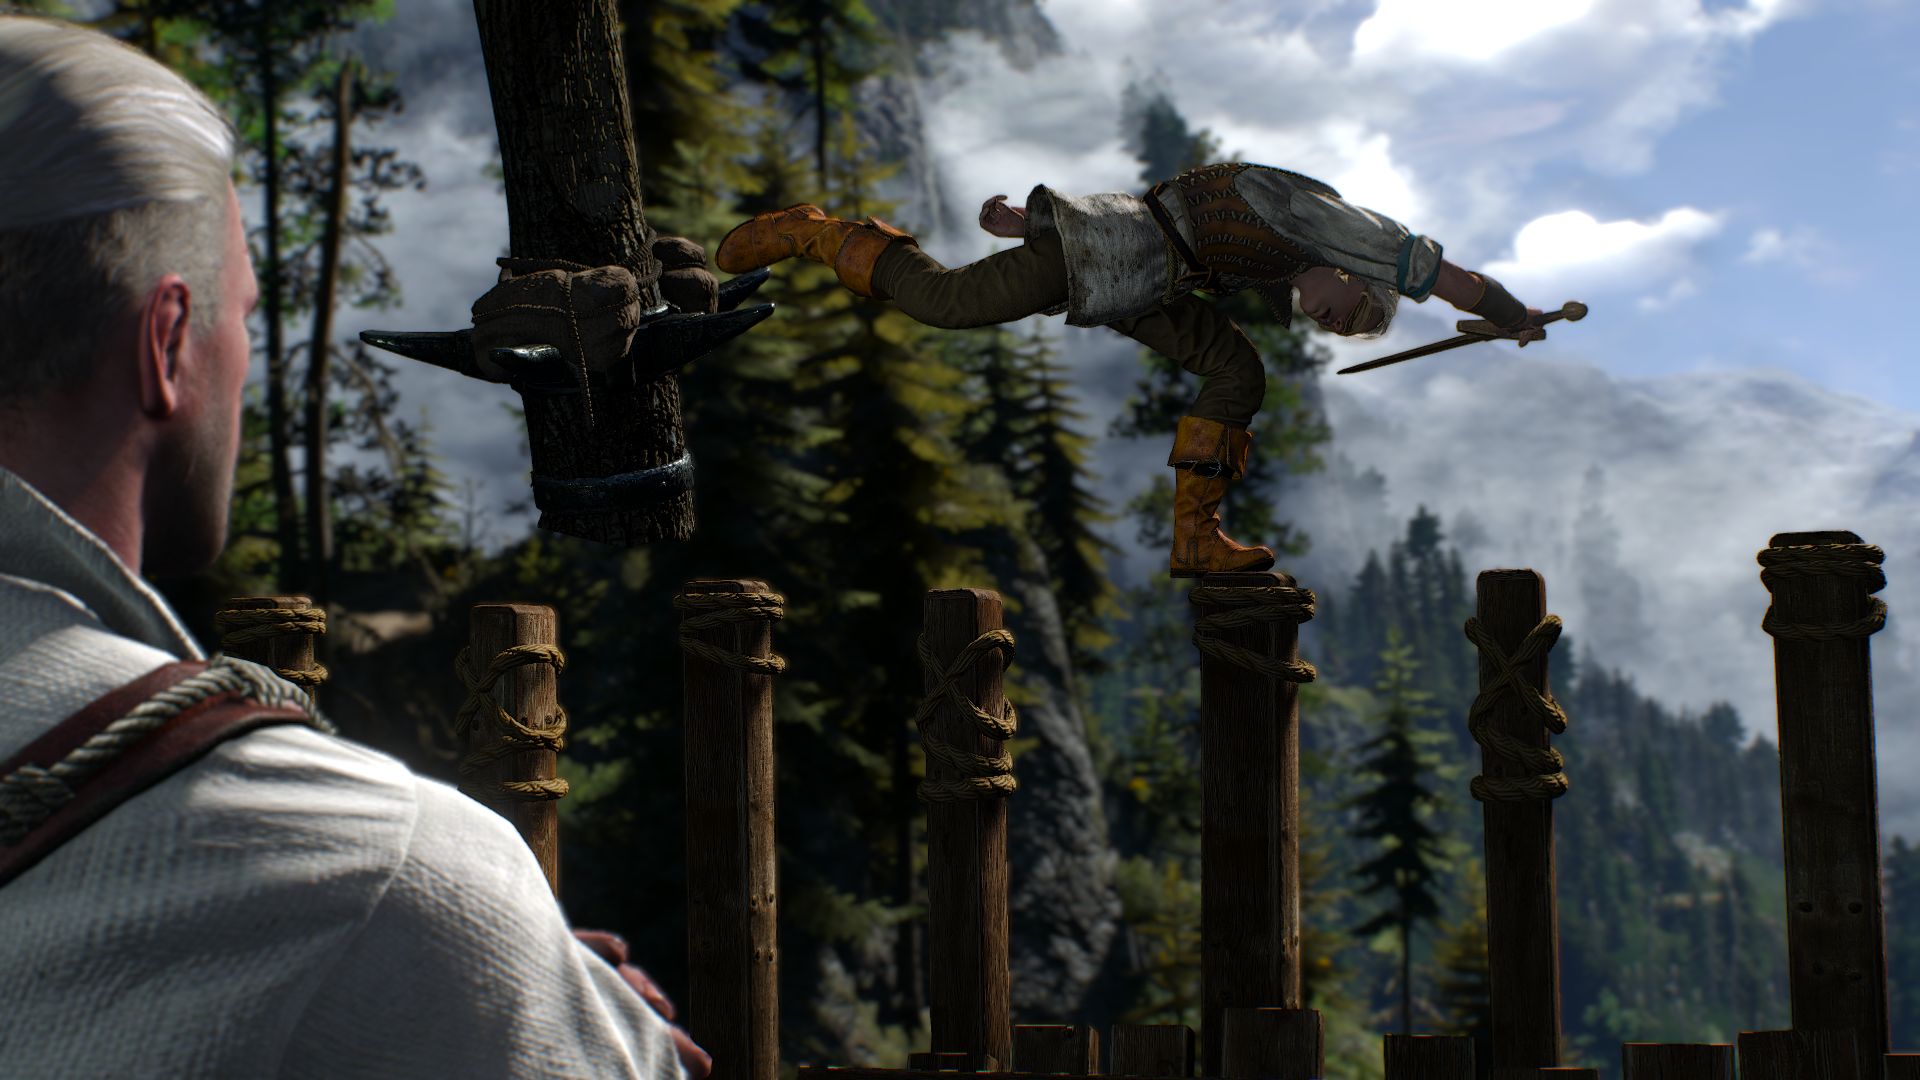
The Witcher 3 has not only been one of the standard benchmarks in our notebook tests for a few years but is also used to check long-term 3D performance. However, since the developer CD Project - as mentioned at the beginning - has incorporated many technical innovations over time, we thought it would be appropriate to switch to a current version.

The Witcher 3
The Witcher 3
The Witcher 3
The Witcher 3
The Witcher 3
The Witcher 3

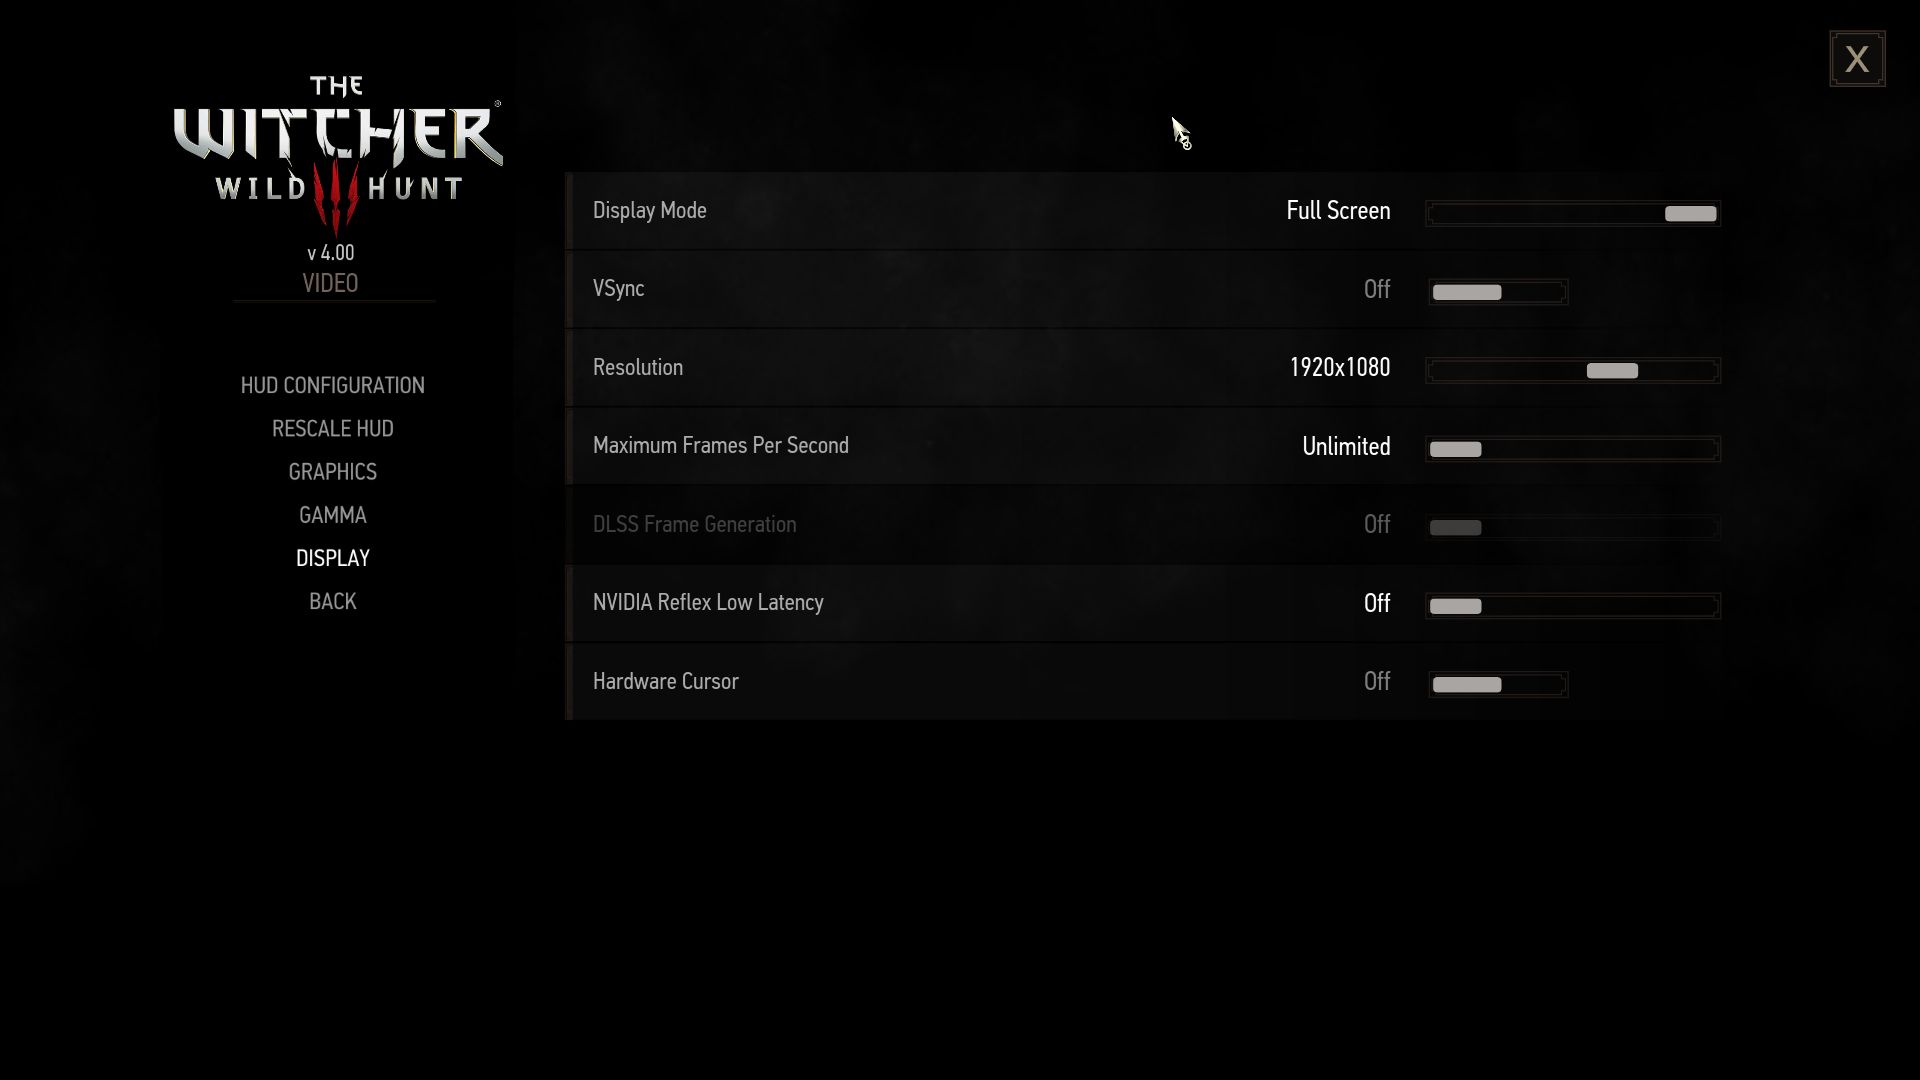
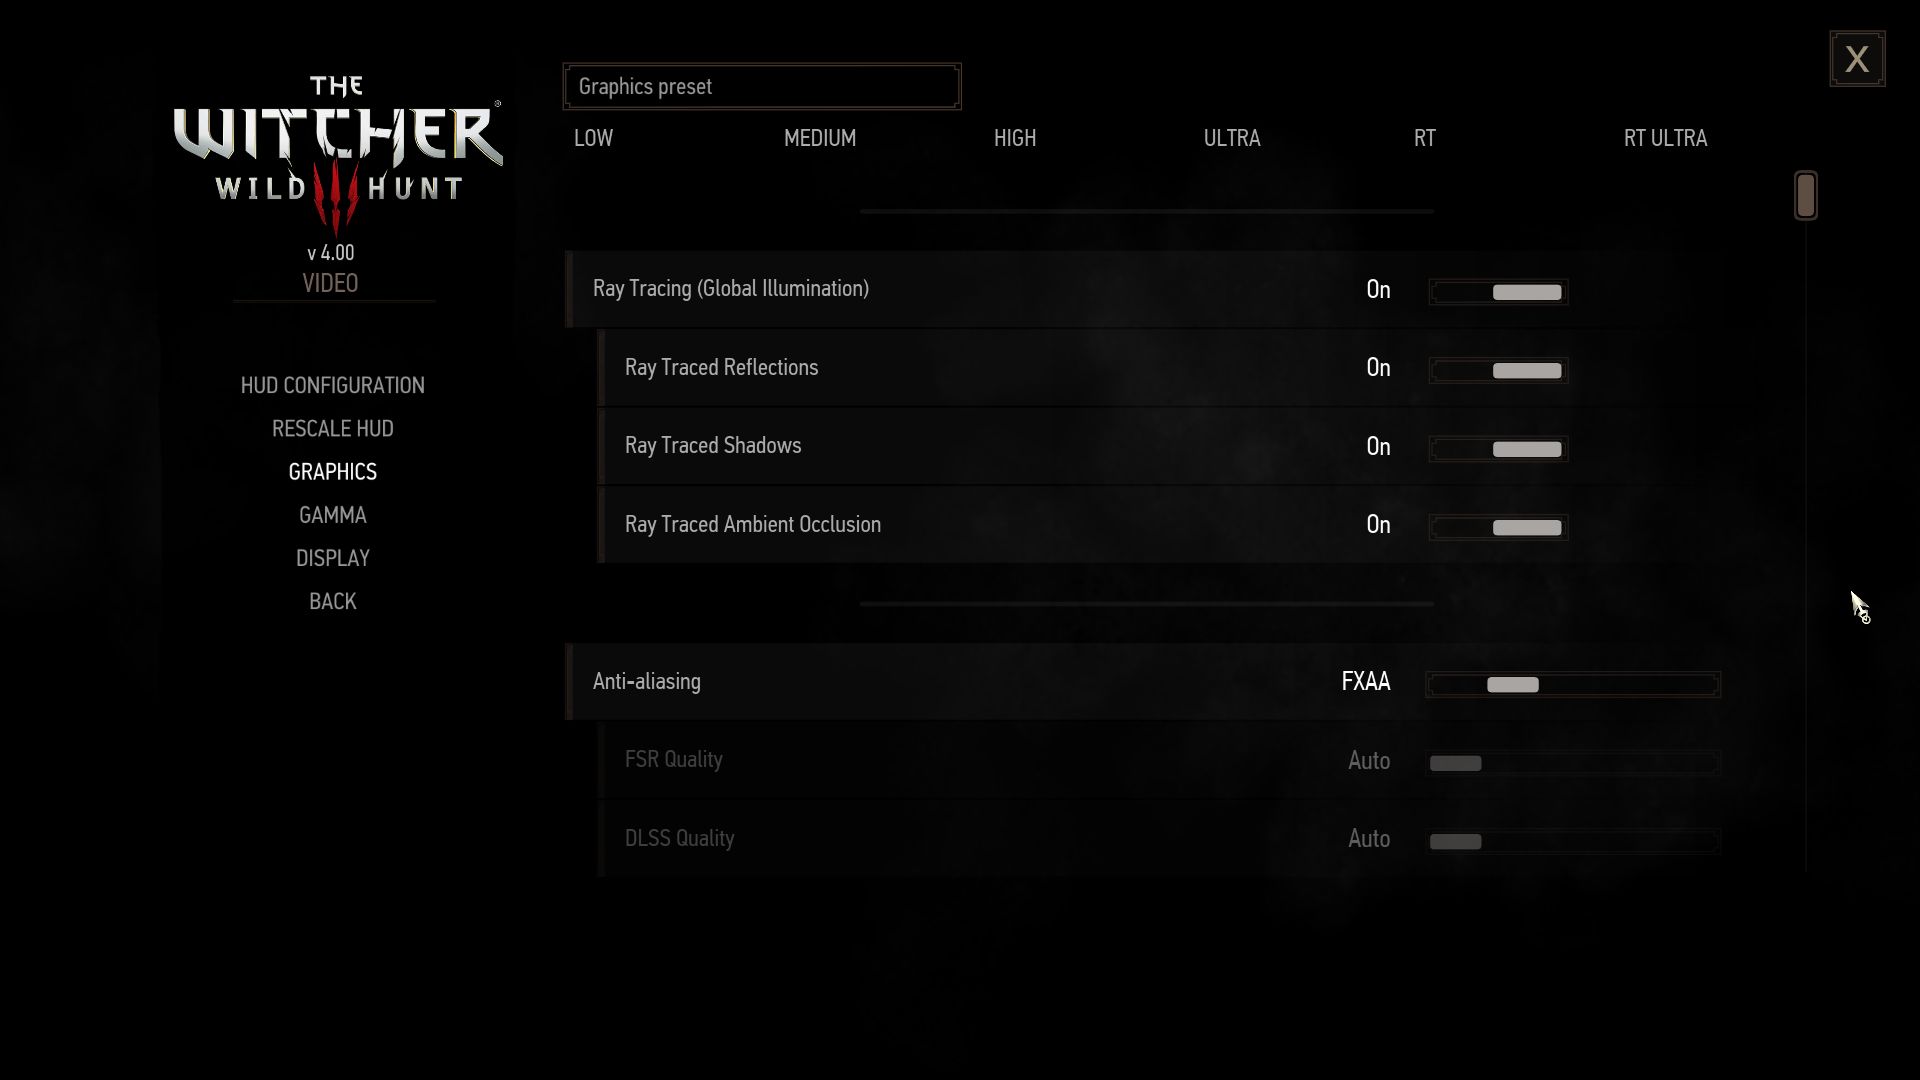
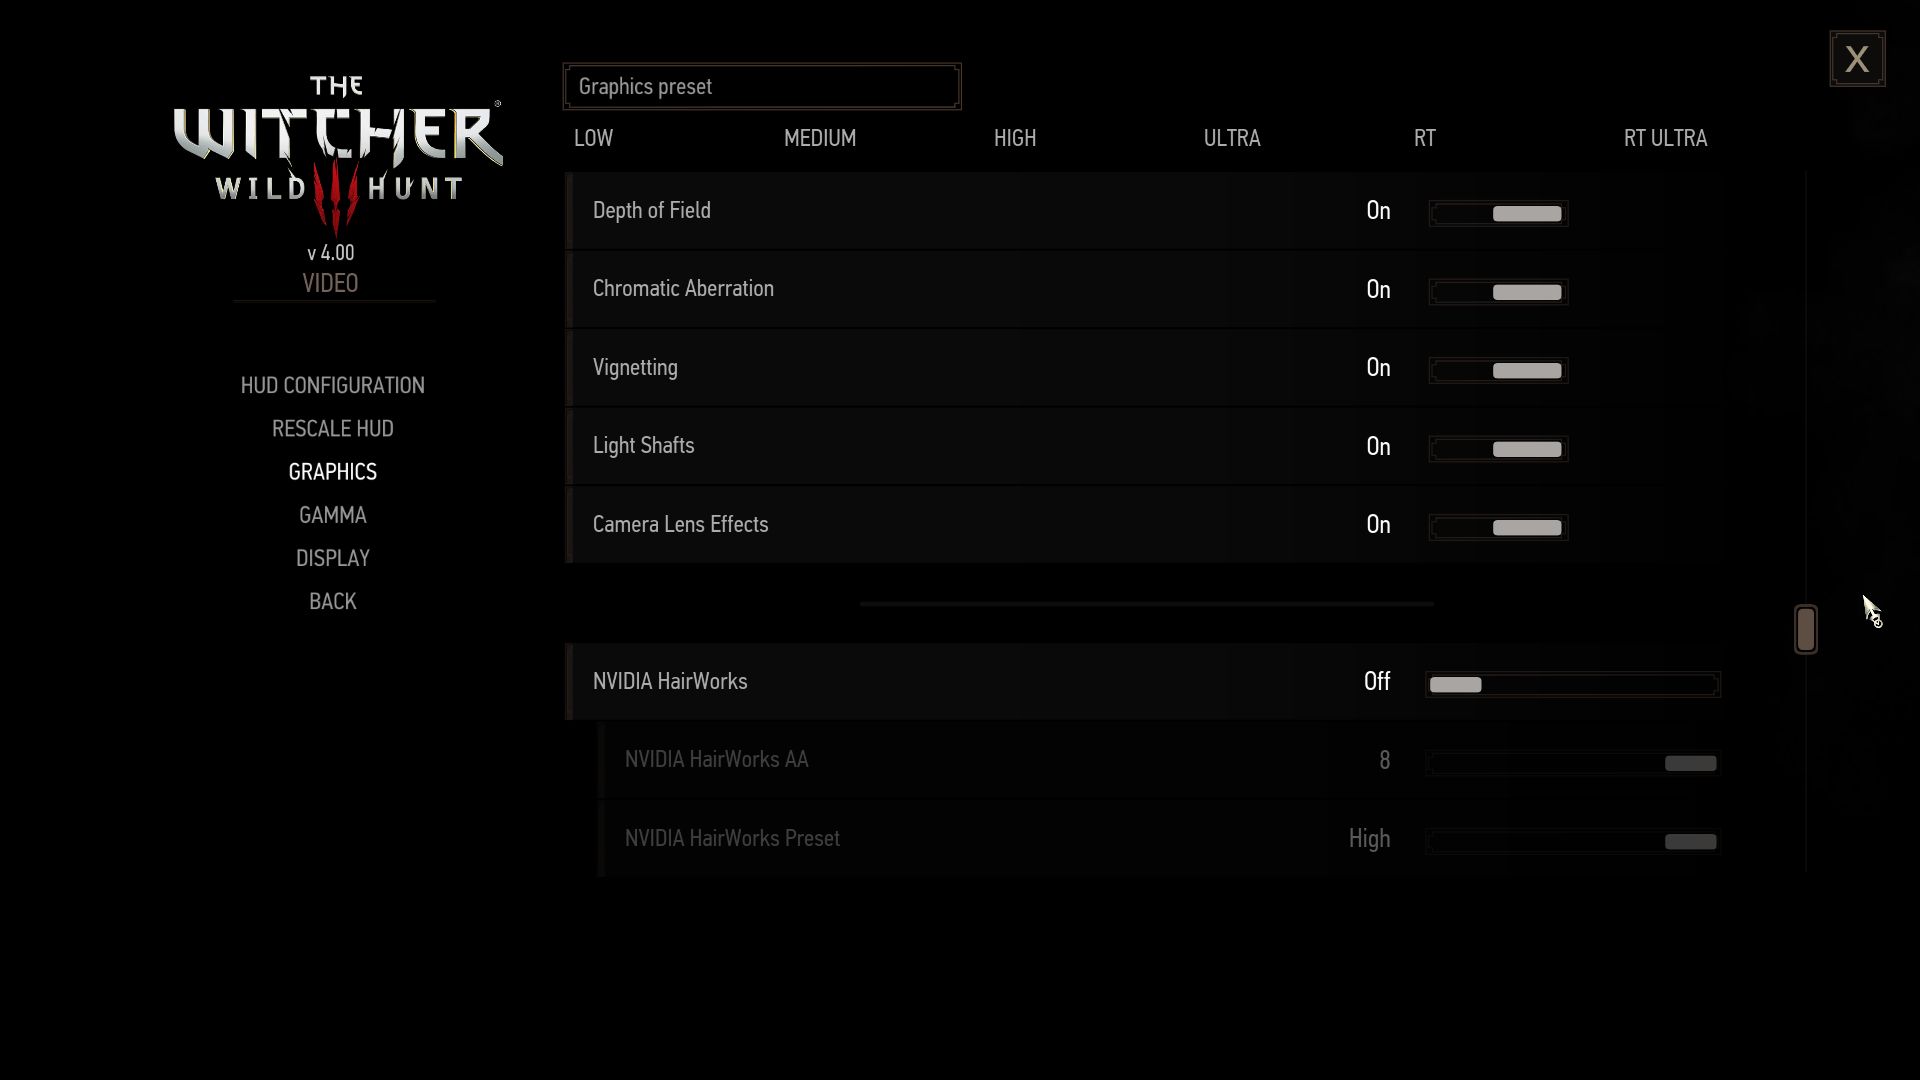
Compared to the original version the graphics menus have been significantly revised. There is no longer a post-processing tab (the options are now in the "normal" graphics menu). Instead, the screen options (resolution, etc.) have been moved to a separate menu.

The Witcher 3
The Witcher 3
The Witcher 3
The Witcher 3
The Witcher 3
The Witcher 3

In addition, there are now numerous fresh settings, especially for ray tracing, to which the developer has dedicated two presets. While the normal RT preset only activates the ray tracing illumination, the RT Ultra preset (used for the ray tracing benchmarks) also includes corresponding reflections, shadows, and ambient occlusion. In addition, there is support for DLSS and FSR 2.

The Witcher 3
The Witcher 3
The Witcher 3
The Witcher 3
The Witcher 3
The Witcher 3

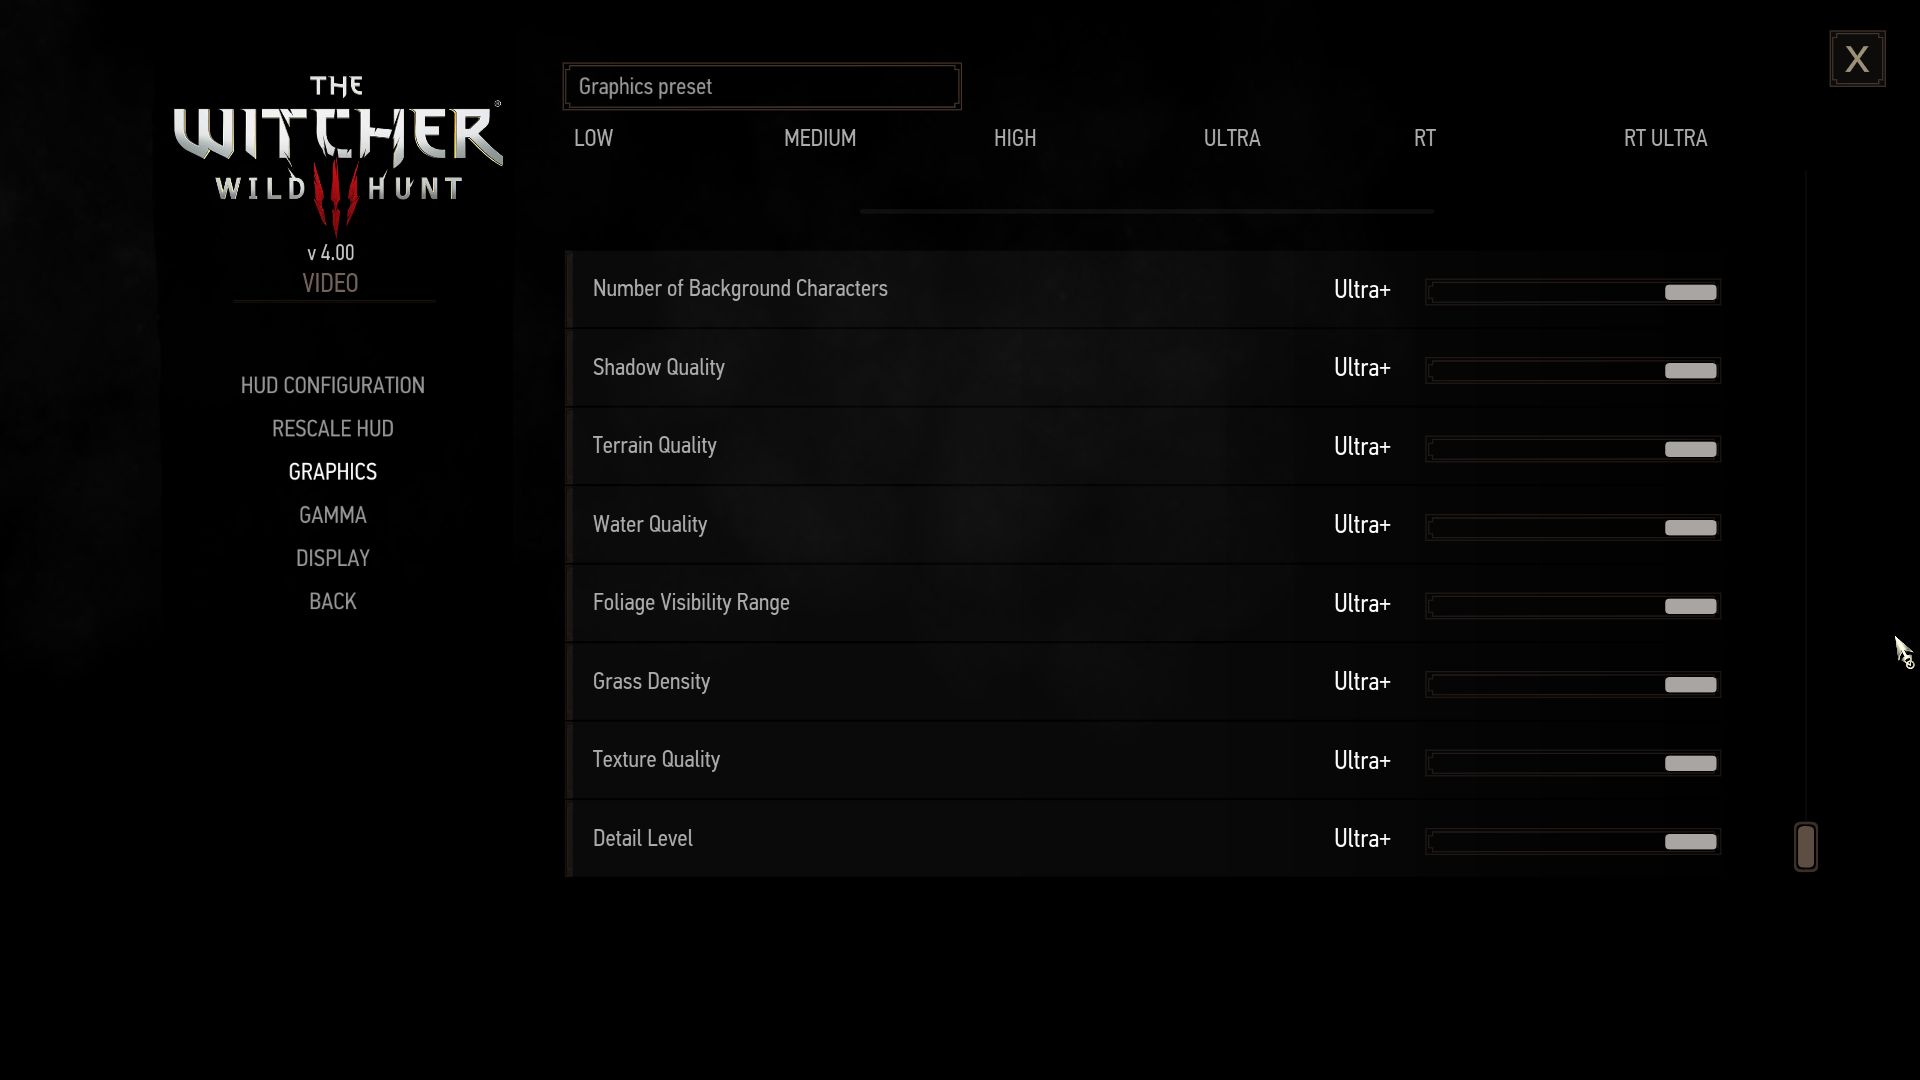
On the other hand, it is a bit of a shame that you once again have to do without explanations for the individual settings, some options are not influenced by the presets and there is a lot of scrolling due to the sheer mass of features. On the other hand, changes are applied without a restart. The game size has increased from just under 30 GB to around 40 GB since our reference version, which is still within limits.

The Witcher 3
The Witcher 3
The Witcher 3
The Witcher 3
The Witcher 3
 

Benchmark

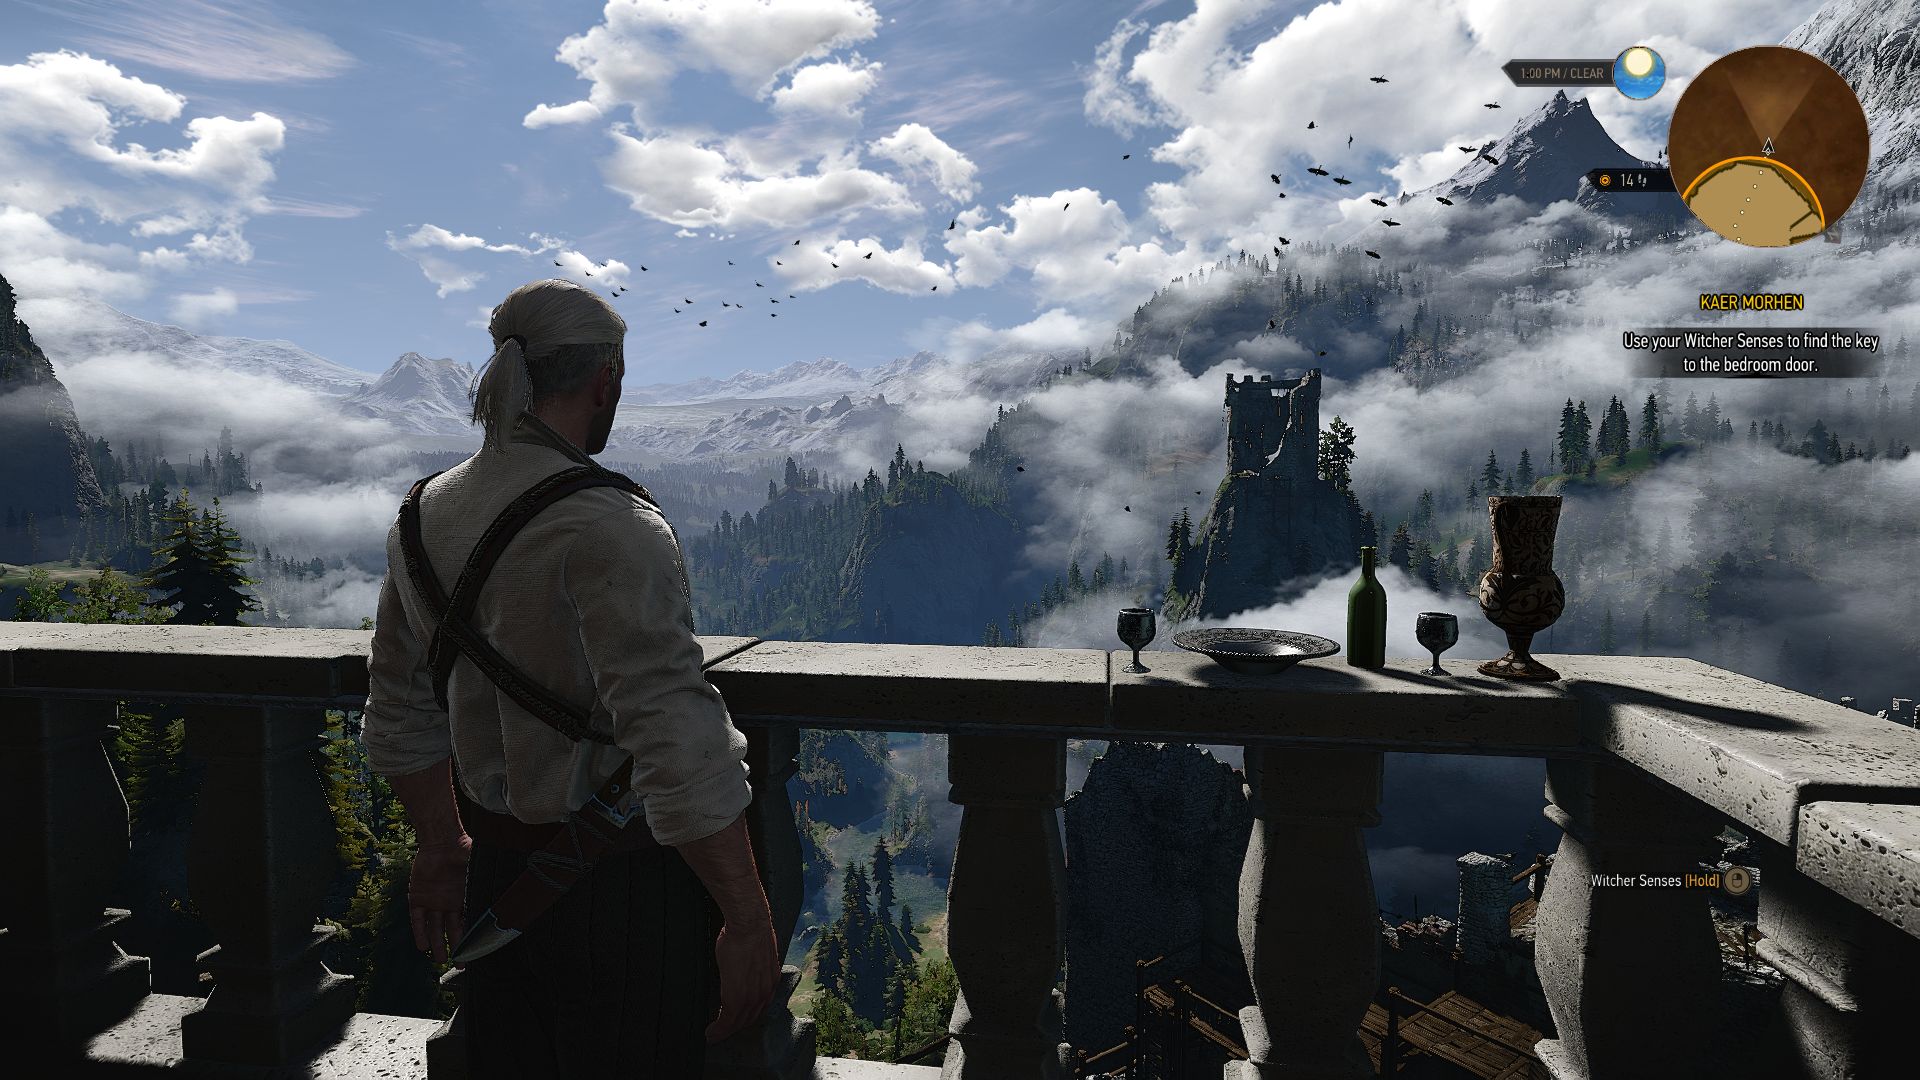
For better comparability, the same sequence as back then is used as a benchmark. Shortly after the tutorial, the main character Geralt is released into the open game world and is allowed to explore the countryside with his horse. As you can see in the following video, we ride after the witcher colleague on a set route for about a minute until a video sequence starts near a bridge. The frame rate is recorded with the CapeFrameX tool. For decent gameplay, we recommend at least 40 FPS as an average value in the benchmark.

Results

For the benchmarks, we mainly use rental devices from XMG (Schenker Technologies).

FHD (1,920 x 1,080)

At moderate resolutions and settings, The Witcher 3 is not particularly demanding. While iGPUs from Intel (e.g. the Iris Xe Graphics G7 with 96 EUs) can handle a maximum of 1,280 x 720 pixels and the preset Low, some iGPUs from AMD (e.g. the Radeon 680M) can also handle minimum details in Full HD. Midrange chips on the level of the GeForce RTX 3050 Ti on the other hand, do not have any problems at 1920x1080 pixels even with medium to maximum settings.

The Witcher 3 v4.00
    1920x1080 Low Preset / Off     1920x1080 Medium Preset / On AA:FX     1920x1080 High Preset / On AA:FX     1920x1080 Ultra Preset / On AA:FX
NVIDIA GeForce RTX 3080, i9-12900K
Desktop-PC
257 (56.6min, 145.9P0.1, 183.2P1) fps ∼41%
222 (61.5min, 141.2P0.1, 166.3P1) fps ∼45%
191.6 (97.6min, 121.2P0.1, 132.8P1) fps ∼42%
NVIDIA GeForce RTX 3070, i9-12900K
Desktop-PC
226 (10.6min, 43.2P0.1, 154.5P1) fps ∼36%
188.2 (17.3min, 118.8P0.1, 136.2P1) fps ∼38%
151.5 (56.1min, 93.8P0.1, 105.3P1) fps ∼34%
NVIDIA GeForce RTX 3080 Ti Laptop GPU, i9-12900HX
MSI Titan GT77 12UHS
226 (33.7min, 106.9P0.1, 164.8P1) fps ∼30%
195.6 (29.9min, 65.9P0.1, 141P1) fps ∼31%
168.1 (30.5min, 55.1P0.1, 121.1P1) fps ∼34%
140 (25.5min, 73.5P0.1, 97.6P1) fps ∼31%
NVIDIA GeForce RTX 3080 Laptop GPU, i7-11800H
XMG Neo 15 @165 W TGP
189.3 (9.59min, 28.5P0.1, 129.3P1) fps ∼25%
164.4 (50.2min, 95.1P0.1, 120.2P1) fps ∼26%
142.2 (49.6min, 92.1P0.1, 105.1P1) fps ∼29%
120.9 (48.9min, 72.1P0.1, 82.2P1) fps ∼27%
NVIDIA GeForce RTX 3070 Laptop GPU, i7-11800H
XMG Neo 17 @140 W TGP
188.6 (7.29min, 30P0.1, 132.3P1) fps ∼25%
160.7 (51.5min, 86.1P0.1, 120.1P1) fps ∼26%
136.7 (16.8min, 85.2P0.1, 101.4P1) fps ∼28%
117.3 (33.6min, 62.6P0.1, 80.3P1) fps ∼26%
AMD Radeon RX 6800M, R9 5900HX
Asus ROG Strix G15
119.6 (5.39min, 14.3P0.1, 82.4P1) fps ∼19%
110.3 (36.9min, 75.1P0.1, 85.9P1) fps ∼22%
97.5 (59.2min, 64P0.1, 74.5P1) fps ∼22%
NVIDIA GeForce RTX 3060 Laptop GPU, i7-11800H
XMG Core 15 @130 W TGP
158.3 (37.7min, 89.4P0.1, 113P1) fps ∼21%
138.7 (9.84min, 29.1P0.1, 93.3P1) fps ∼22%
108.6 (32.2min, 50.8P0.1, 76.8P1) fps ∼22%
87.6 (27.7min, 50.5P0.1, 60.5P1) fps ∼19%
AMD Radeon RX 6600M, R7 5800H
Lenovo Legion 5
110.3 (4.86min, 9.46P0.1, 80.6P1) fps ∼18%
95.3 (28.7min, 65.8P0.1, 75.3P1) fps ∼19%
76.7 (39.5min, 47P0.1, 53.8P1) fps ∼17%
NVIDIA GeForce RTX 3050 Ti Laptop GPU, i7-11800H
XMG Focus 17 @75 W TGP
127.2 (66.7min, 79.9P0.1, 90.5P1) fps ∼17%
92.5 (50.1min, 57.1P0.1, 63.3P1) fps ∼15%
74 (41.4min, 46.6P0.1, 53P1) fps ∼15%
58 (26.3min, 37.4P0.1, 41.8P1) fps ∼13%
AMD Radeon 680M, R9 6900HS
Asus ROG Zephyrus G14
44.7 (22.2min, 22.7P0.1, 24.8P1) fps ∼6%
35.7 (16.7min, 22.1P0.1, 26.8P1) fps ∼6%
30.2 (19.1min, 19.5P0.1, 23.6P1) fps ∼6%
24.5 (12min, 12.2P0.1, 13.5P1) fps ∼5%
Intel Iris Xe Graphics G7 96EUs, i7-1165G7
Zotac ZBOX CI665 Nano
28.1 (15.5min, 21.3P0.1, 23.2P1) fps ∼4%
21.5 (16.6min, 17.1P0.1, 18.2P1) fps ∼3%
18.3 (14.7min, 14.7P0.1, 15.6P1) fps ∼4%
15.1 (11.7min, 11.8P0.1, 12.7P1) fps ∼3%

QHD (2,560 x 1,440)

For QHD displays with 2,560 x 1,440 pixels, it should be a graphics card from the upper mid-range. The Ultra-Preset is used here starting with a Radeon RX 6600M smoothly on the screen.

The Witcher 3 v4.00
    2560x1440 Ultra Preset / On AA:FX
NVIDIA GeForce RTX 3080, i9-12900K
Desktop-PC
154 (88.1min, 98.8P0.1, 106.1P1) fps ∼38%
NVIDIA GeForce RTX 3080 Ti Laptop GPU, i9-12900HX
MSI Titan GT77 12UHS
110 (43min) fps ∼27%
NVIDIA GeForce RTX 3070, i9-12900K
Desktop-PC
109.9 (63min, 68.6P0.1, 78.3P1) fps ∼27%
NVIDIA GeForce RTX 3080 Laptop GPU, i7-11800H
XMG Neo 15 @165 W TGP
85.8 (36.5min, 54.8P0.1, 60.9P1) fps ∼21%
NVIDIA GeForce RTX 3070 Laptop GPU, i7-11800H
XMG Neo 17 @140 W TGP
83 (34.7min, 52.2P0.1, 59.4P1) fps ∼20%
AMD Radeon RX 6800M, R9 5900HX
Asus ROG Strix G15
78.2 (46.2min, 51.2P0.1, 60.3P1) fps ∼19%
AMD Radeon RX 6600M, R7 5800H
Lenovo Legion 5
51.7 (24.3min, 38.1P0.1, 42P1) fps ∼13%

UHD (3,840 x 2,160)

4K monitors, on the other hand, cry out for a true high-end GPU if maximum details are desired. A mixture of 3,840 x 2,160 pixels and the Ultra preset needs at least Radeon RX 6800M or better. If you miss the 4K results of our Nvidia notebooks: unfortunately, we have had to struggle with partly significantly worse performance on external screens for a few weeks (probably a bug in newer driver versions). Fortunately, the AMD devices are not affected.

The Witcher 3 v4.00
    3840x2160 Ultra Preset / On AA:FX
NVIDIA GeForce RTX 3080, i9-12900K
Desktop-PC
87.8 (54.2min, 63.3P0.1, 66.9P1) fps ∼26%
NVIDIA GeForce RTX 3070, i9-12900K
Desktop-PC
61.9 (39.4min, 42.5P0.1, 47.9P1) fps ∼18%
AMD Radeon RX 6800M, R9 5900HX
Asus ROG Strix G15
43 (29min, 31.5P0.1, 34.1P1) fps ∼13%
AMD Radeon RX 6600M, R7 5800H
Lenovo Legion 5
27.6 (9.74min, 23.1P0.1, 24.2P1) fps ∼8%

Ray Tracing

The Witcher 3 becomes really demanding when ray tracing is enabled. Most laptop graphics cards already reach their limits in Full HD. Only Nvidia's top model, the GeForce RTX 3080 Ti scratches the 40 FPS mark in the RT Ultra preset.

The Witcher 3 v4.00
    1920x1080 RT Ultra Preset / On AA:FX
NVIDIA GeForce RTX 3080, i9-12900K
Desktop-PC
53.6 (6.43min, 8.23P0.1, 19.8P1) fps ∼30%
NVIDIA GeForce RTX 3080 Ti Laptop GPU, i9-12900HX
MSI Titan GT77 12UHS
39.5 (5.02min, 5.86P0.1, 15.7P1) fps ∼22%
NVIDIA GeForce RTX 3070, i9-12900K
Desktop-PC
37 (6.25min, 7.08P0.1, 13.5P1) fps ∼21%
NVIDIA GeForce RTX 3080 Laptop GPU, i7-11800H
XMG Neo 15 @165 W TGP
32.3 (4.43min, 5.42P0.1, 12.4P1) fps ∼18%
NVIDIA GeForce RTX 3070 Laptop GPU, i7-11800H
XMG Neo 17 @140 W TGP
30.1 (4.72min, 5.65P0.1, 11.7P1) fps ∼17%
NVIDIA GeForce RTX 3060 Laptop GPU, i7-11800H
XMG Core 15 @130 W TGP
23.5 (3.92min, 4.65P0.1, 8.51P1) fps ∼13%
AMD Radeon RX 6800M, R9 5900HX
Asus ROG Strix G15
22.4 (2.58min, 3P0.1, 16.2P1) fps ∼13%
AMD Radeon RX 6600M, R7 5800H
Lenovo Legion 5
15.6 (2.76min, 3.08P0.1, 6.06P1) fps ∼9%
NVIDIA GeForce RTX 3050 Ti Laptop GPU, i7-11800H
XMG Focus 17 @75 W TGP
14.5 (3.24min, 4.64P0.1, 5.26P1) fps ∼8%

Note

Since gaming tests are very time-consuming and often restricted by installation or activation limits, we can only provide you with a part of the benchmarks for the publication of the articles. More graphics cards will be installed in the coming days and weeks.

Overview

Show Restrictions
PosModel< PrevNext >The Witcher 3 v4.00
 The Witcher 3 v4.00 (2023)
low
1920x1080
Low Preset / Off
med.
1920x1080
Medium Preset / On
FXAA
high
1920x1080
High Preset / On
FXAA
ultra
1920x1080
Ultra Preset / On
FXAA
QHD
2560x1440
Ultra Preset / On
FXAA
4K
3840x2160
Ultra Preset / On
FXAA
NVIDIA GeForce RTX 4090
351n9
297n9
269n9
226n9
223n9
169n9
AMD Radeon RX 7900 XTX
365
318
298
275
268
146.1
NVIDIA GeForce RTX 4080 Super
363n2
314n2
279.5n2
265n2
230.5n2
117.8n2
NVIDIA GeForce RTX 4070 Ti
276.5n2
242.5n2
222.5n2
203.25n2
170.9n2
92.9n2
AMD Radeon RX 7900 GRE
279.1n2
238.25n2
213.75n2
189.4n2
150.05n2
73.9n2
AMD Radeon RX 6950 XT
450
356
176.2
148
122.2
81.3
NVIDIA GeForce RTX 4090 Laptop GPU
230n2
174n3
158n3
139.7n6
101.2n7
49.5n6
NVIDIA GeForce RTX 3090
296
260
229
208
169.6
97.8
AMD Radeon RX 7800 XT
323
280.4
247.4
217.6
157.8
76.9
NVIDIA GeForce RTX 4080 Laptop GPU
161.4
144
125.3
81.1
42.8
NVIDIA GeForce RTX 3080
257
222
191.6
154
87.8
NVIDIA GeForce RTX 4070
263n2
257
183.65n2
156.8n2
108.45n2
56.35n2
AMD Radeon RX 6800
279
227
192.8
159.1
119.2
65.4
AMD Radeon RX 7700 XT
307
264
233
198
122.6
59.3
NVIDIA Titan RTX
298
245
208
175.3
125.2
72.6
NVIDIA GeForce RTX 4060 Ti 16G
273
229
190.9
149.9
99.7
52
NVIDIA GeForce RTX 4060 Ti 8G
276n3
227.2n3
188.1n3
151.8n3
99.8n3
52.6n3
NVIDIA GeForce RTX 3080 Ti Laptop GPU
226
195.6
168.1
148n2
110
NVIDIA GeForce RTX 4070 Laptop GPU
101
85
54
28
PosModel< PrevNext >The Witcher 3 v4.00
low med. high ultra QHD 4K
NVIDIA GeForce RTX 3070
226
188.2
151.5
109.9
61.9
AMD Radeon RX 6750 XT
247
199
169.1
137.9
99.8
51.2
AMD Radeon RX 6700 XT
237
191.5
163.2
130.8
95.5
48.9
NVIDIA GeForce RTX 3080 Laptop GPU
193.7n2
164.65n2
139.65n2
115.45n2
83.95n2
46.4
NVIDIA GeForce RTX 3060 Ti
175.35n4
149.6n4
128.35n4
105.1n4
81.85n4
51.25n4
Intel Arc A770
154.9
129.7
115.6
104.5
94.8
52.1
NVIDIA GeForce RTX 4060
225
177.6
149.1
117.4
79.7
44.2
AMD Radeon RX 7600
210.4
175.1
149.9
121.3
77.3
40.1
NVIDIA GeForce RTX 3070 Ti Laptop GPU
174.4
149.6
81.3
71.4
47.4
NVIDIA GeForce RTX 4060 Laptop GPU
179.3n2
144.75n2
72.3n2
66.3n3
42.65n2
21.4
AMD Radeon RX 6800M
119.6
110.3
97.5
78.2
43
AMD Radeon RX 6650 XT
181.5
149.6
126.5
101
67.8
35.8
NVIDIA GeForce RTX 3070 Laptop GPU
174.85n2
155.95n2
132.55n2
114.95n2
82.45n2
46.5
AMD Radeon RX 7600M XT
197.9
169.8
141.5
113.7
72.6
37.7
NVIDIA Titan X Pascal
212
172.3
144.6
112.2
79.5
44.4
NVIDIA GeForce RTX 2070 Super (Desktop)
223
177.1
149.6
119.6
85
47.9
AMD Radeon RX 5700 XT (Desktop)
190.1
149.7
125.8
105.1
74.2
40.9
NVIDIA GeForce RTX 3060 Laptop GPU
164.2n2
135.45n2
108.5n2
87.55n2
71.4
AMD Radeon RX 7600S
156.7
129.5
103.1
69.3
36.3
Intel Arc A580
189.9
154.8
132.6
110.1
78.3
42.1
PosModel< PrevNext >The Witcher 3 v4.00
low med. high ultra QHD 4K
NVIDIA GeForce RTX 2060 Super (Desktop)
191.8
153.3
125.8
100.2
71.3
40.3
Intel Arc A770M
143.7
125.1
111.3
99.2
44.1
AMD Radeon RX 6600
153.7
123.2
104.7
89.1
57.1
29.6
AMD Radeon RX 5700 (Desktop)
167.6
133.6
112.7
94.3
66.6
36.2
AMD Radeon RX 6600M
149.3
115.4n2
100.75n2
83.45n2
54.7n2
28.55n2
NVIDIA GeForce RTX 3050
145.8
128.2
88.7
70.7
50.4
28.2
AMD Radeon RX 5600 XT (Desktop)
158.9
123
105.2
88.6
62
33.6
NVIDIA GeForce GTX 1660 Super (Desktop)
141
105.8
87.6
71.4
49.8
27.5
AMD Radeon RX 6500 XT
99.9
75.1
65.7
54.1
30.4
9.91
AMD Radeon RX 5500 XT (Desktop)
106.7
82.6
71
58
41.1
22.5
NVIDIA GeForce RTX 4050 Laptop GPU
109.7n2
79.25n2
55.5n2
48.55n2
30.4n2
17
Intel Arc A730M
126.2
102.8
51.2
44.4
NVIDIA GeForce GTX 1660 Ti Mobile
134
101.4
43.2
37
NVIDIA GeForce RTX 3050 Ti Laptop GPU
107.8n2
84.05n2
55.4n2
45.2n2
19.6
NVIDIA GeForce GTX 1660 (Desktop)
123.5
92.9
78
63.9
44.2
23.8
NVIDIA GeForce GTX 1650 Super (Desktop)
112.6
83.9
70.4
56.1
37.2
13.5
NVIDIA GeForce RTX 3050 4GB Laptop GPU
98.1
79.9
64.7
49.4
AMD Radeon RX 6500M
81.4
61
29.4
25.7
NVIDIA GeForce GTX 1060 Mobile
85.2
28.9
26.8
23.7
NVIDIA GeForce GTX 1650 Ti Mobile
91.4
68.1
55.6
41.1
PosModel< PrevNext >The Witcher 3 v4.00
low med. high ultra QHD 4K
AMD Radeon RX 5500M
86.5
66.7
29.1
25.9
NVIDIA GeForce RTX 2050 Mobile
66.7
46.2
18.8
15.8
NVIDIA GeForce GTX 1650 Mobile
79.4
58.7
21.25n2
Intel Arc A380
76
57.8
49.2
40.3
Intel Arc A350M
56.3
42.6
36.1
29.7
20.4
AMD Radeon 780M
52.6n2
39.65n2
33.85n2
28.3n2
21.3
10.5
AMD Radeon 680M
43.3n3
35.7n3
30.2n3
24.5n3
16.4
8.28
NVIDIA GeForce MX450
45.8
32.4
24.9
14.1
NVIDIA GeForce GTX 1050 Mobile
53.6
40.6
32.2
12.8
AMD Radeon 660M
31.8
25.3
10.1
AMD Radeon RX 560X (Laptop)
44.3
33.7
28.5
22.3
Intel Iris Xe Graphics G7 96EUs
29.75n2
23.2n2
19.65n2
16.15n2
NVIDIA GeForce MX350
33.8
24.6
7.42
AMD Radeon RX 550 (Laptop)
20.6
15.8
12.3
NVIDIA GeForce MX250
28.2
20.7
7.83
Intel Iris Xe Graphics G7 80EUs
20.7
15.9
7.41
AMD Radeon 540X
17.3
AMD Radeon RX Vega 10
20.2
15.3
Intel UHD Graphics Xe G4 48EUs
21
16.4
Intel UHD Graphics 32EUs (Alder Lake)
14.1
11.2
PosModel< PrevNext >The Witcher 3 v4.00
low med. high ultra QHD 4K
Intel UHD Graphics Xe 32EUs (Tiger Lake-H)
23
18.2
Intel UHD Graphics 770
21.3
16.7
AMD Radeon RX Vega 8 (Ryzen 4000/5000)
24.4
17.6
7.14
AMD Radeon RX Vega 7
24.9
18
15.3
11.1
NVIDIA GeForce MX130
13.6
AMD Radeon RX Vega 8 (Ryzen 2000/3000)
14
NVIDIA GeForce 930MX
6.73
AMD Radeon RX Vega 6 (Ryzen 4000/5000)
21.9
17.1
6.69
AMD Radeon RX Vega 6 (Ryzen 2000/3000)
11.1
AMD Radeon RX Vega 5
16.3
12.1
Intel UHD Graphics Xe 16EUs (Tiger Lake-H)
9.76
AMD Radeon R5 M255
8.74
AMD Radeon RX Vega 3
11.4
(-) * Smaller values are better. / n123 Number of benchmarks for this median value / * Approximate position


Legend
5Stutters – This game is very likely to stutter and have poor frame rates. Based on all known benchmarks using the specified graphical settings, average frame rates are expected to fall below 25fps
May Stutter – This graphics card has not been explicitly tested on this game. Based on interpolated information from surrounding graphics cards of similar performance levels, stutters and poor frame rates are expected.
30Fluent – Based on all known benchmarks using the specified graphical settings, this game should run at or above 25fps
40Fluent – Based on all known benchmarks using the specified graphical settings, this game should run at or above 35fps
60Fluent – Based on all known benchmarks using the specified graphical settings, this game should run at or above 58fps
May Run Fluently – This graphics card has not been explicitly tested on this game. Based on interpolated information from surrounding graphics cards of similar performance levels, fluent frame rates are expected.
?Uncertain – This graphics card experienced unexpected performance issues during testing for this game. A slower card may be able to achieve better and more consistent frame rates than this particular GPU running the same benchmark scene.
Uncertain – This graphics card has not been explicitly tested on this game and no reliable interpolation can be made based on the performances of surrounding cards of the same class or family.
The value in the fields displays the average frame rate of all values in the database. Move your cursor over the value to see individual results.

Test systems

XMG Neo 15 (RTX 3080) - Click on photo to open the configurator (bestware.com)
XMG Neo 17 (RTX 3070) - Click on photo to open the configurator (bestware.com)
XMG Core 15 (RTX 3060) - Click on photo to open the configurator (bestware.com)
XMG Focus 17 (RTX 3050 Ti) - Click on photo to open the configurator (bestware.com)
Device Graphics card Processor Memory Operating system
Notebooks
MSI Titan GT77 12UHS Nvidia GeForce RTX 3080 Ti @175 W TGP (16 GB GDDR6) Intel Core i9-12900 2 x 16 GB DDR5 Windows 11
XMG Neo 15 Nvidia GeForce RTX 3080 @165 W TGP (16 GB GDDR6) Intel Core i7-11800H 2 x 16 GB DDR4 Windows 11
XMG Neo 17 Nvidia GeForce RTX 3070 @140 W TGP (8 GB GDDR6) Intel Core i7-11800H 2 x 16 GB DDR4 Windows 11
XMG Core 15 Nvidia GeForce RTX 3060 @130 W TGP (6 GB GDDR6) Intel Core i7-11800H 2 x 16 GB DDR4 Windows 11
XMG Focus 17 Nvidia GeForce RTX 3050 Ti @75 W TGP (4 GB GDDR6) Intel Core i7-11800H 2 x 16 GB DDR4 Windows 11
Asus ROG Strix G15 AMD Radeon RX 6800M (12 GB GDDR6) AMD Ryzen 9 5900HX 2 x 8 GB DDR4 Windows 11
Lenovo Legion 5 AMD Radeon RX 6600M (8 GB GDDR6) AMD Ryzen 7 5800H 2 x 8 GB DDR4 Windows 11
Asus ROG Zephyrus G14 AMD Radeon 680M AMD Ryzen 9 6900HS 2 x 16 GB DDR5 Windows 11
Tower PCs
Custom I MSI GeForce RTX 3080 (10 GB GDDR6X)
MSI GeForce RTX 3070 (8 GB GDDR6)
Intel Core i9-12900K 2 x 16 GB DDR4 Windows 11
Custom II Palit GeForce RTX 4090 GameRock OC (24 GB GDDR6X)
Nvidia GeForce RTX 3090 FE (24 GB GDDR6X)
Nvidia GeForce RTX 3060 Ti (8 GB GDDR6X)
Nvidia Titan RTX (24 GB GDDR6)
lNvidia GeForce RTX 2070 Super (8 GB GDDR6)
Nvidia GeForce RTX 2060 Super (8 GB GDDR6)
KFA2 GeForce GTX 1660 Super (6 GB GDDR6)
PNY GeForce GTX 1660 (6 GB GDDR5)
KFA2 GeForce GTX 1650 Super (4 GB GDDR6) AMDGDDR6)
AMD Radeon RX 6800 (16 GB DDR6)
AMD Radeon RX 6700 XT (12 GB DDR6)
AMD Radeon RX 6650 XT (8 GB GDDR6)
AMD Radeon RX 6600 (8 GB GDDR6)
AMD Radeon RX 5700XT (8 GB GDDR6)
AMD Radeon RX 5700 (8 GB GDDR6)
AMD Radeon RX 5600 XT (6 GB GDDR6)
AMD Radeon RX 5500 XT (8 GB GDDR6)
AMD Ryzen 9 7950X 2 x 16 GB DDR5 Windows 11
Custom III Nvidia GeForce RTX 2080 Super FE Intel Core i9-11900K 2 x 8 GB DDR4 Windows 11
Mini PCs
Zotac ZBOX CI665 Nano Intel Iris Xe Graphics G7 (96 CUs) Intel Core i7-1165G7 2 x 8 GB DDR4 Windows 11
Morefine S500+ AMD Radeon RX Vega 8 AMD Ryzen 9 5900HX 2 x 16 GB DDR4 Windows 11
Minisforum NUCXi7 Nvidia GeForce RTX 3070 @125 W TGP (8 GB GDDR6) Intel Core i7-11800H 2 x 8 GB DDR4 Windows 11
Minisforum HX90G AMD Radeon RX 6600M @100 W TGP (8 GB GDDR6) AMD Ryzen 9 5900HX 2 x 16 GB DDR4 Windows 11
4K monitors Nvidia drivers AMD drivers
Asus PB287Q, Philips Brilliance 329P9H, Gigabyte M32U ForceWare 528.02 Adrenalin 22.11.2
Read all 2 comments / answer
static version load dynamic
Loading Comments
Comment on this article
Please share our article, every link counts!
> Expert Reviews and News on Laptops, Smartphones and Tech Innovations > Reviews > The Witcher 3 v4.00: Notebook and desktop benchmarks
Florian Glaser, 2023-01-20 (Update: 2023-01-20)