 Deutsch
 English
 Español
 Français
 Italiano
 Nederlands
 Polski
 Português
 Русский
 Türkçe
 Svenska
 Chinese
 Magyar
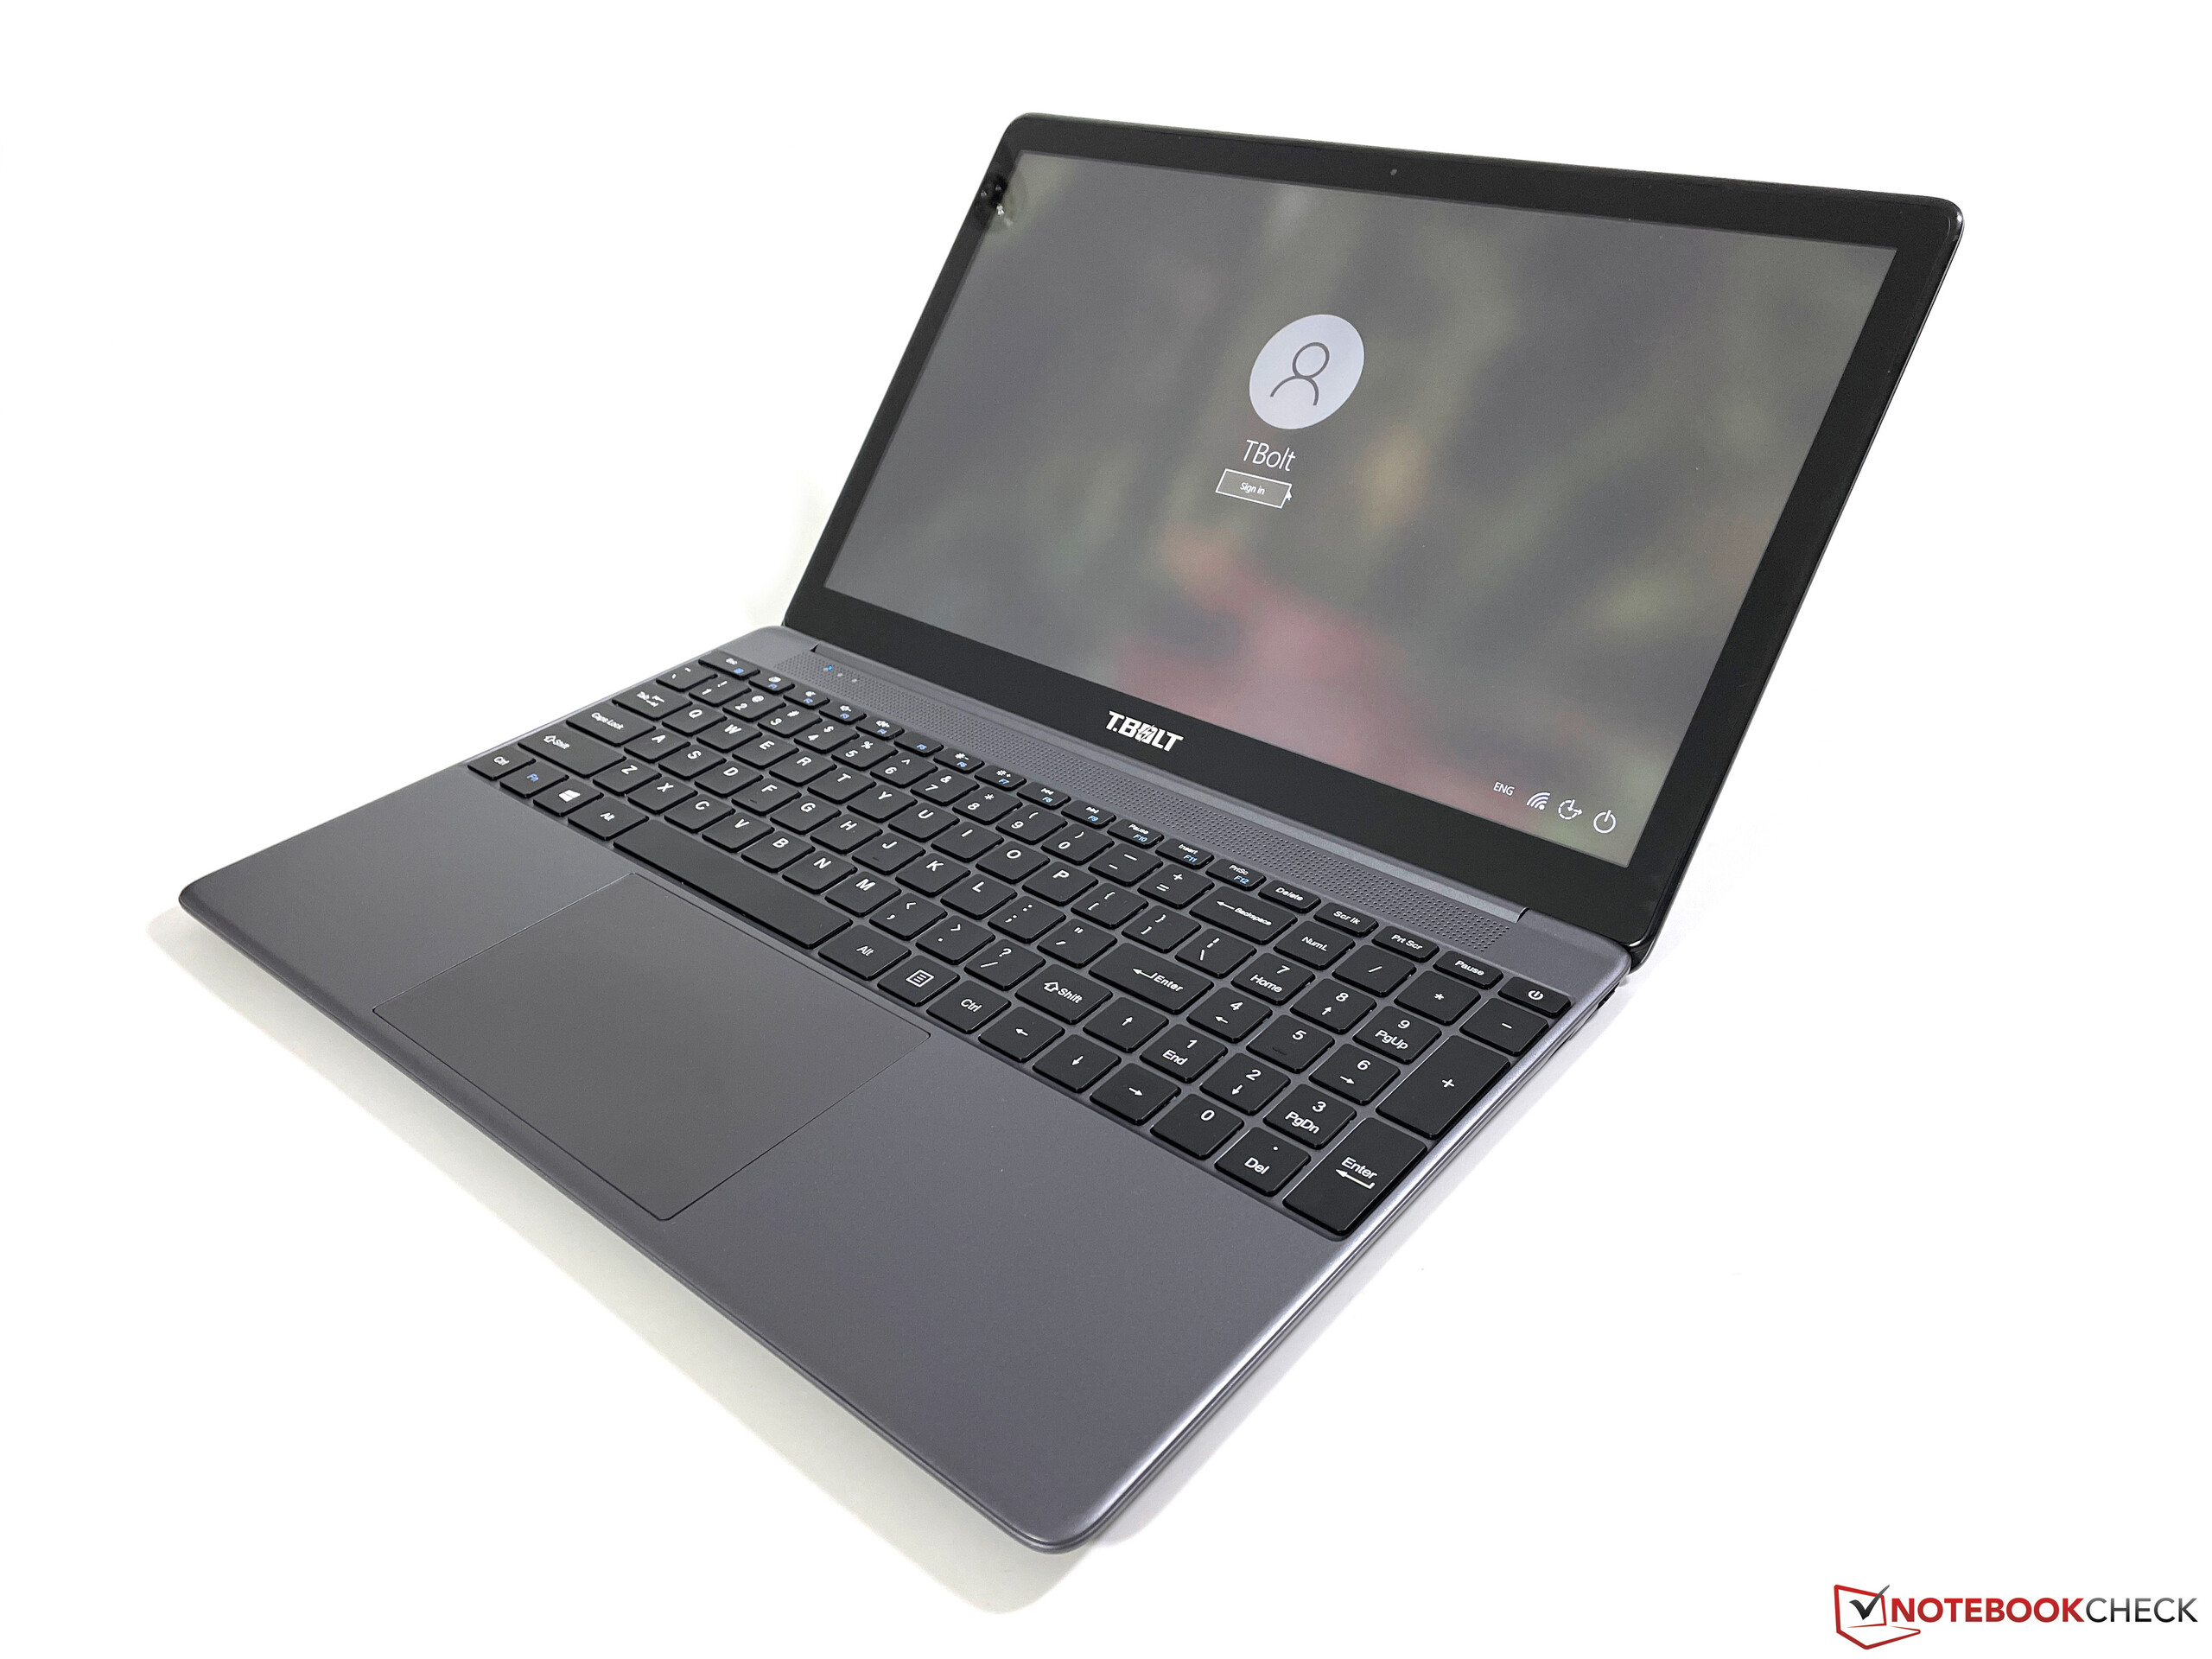
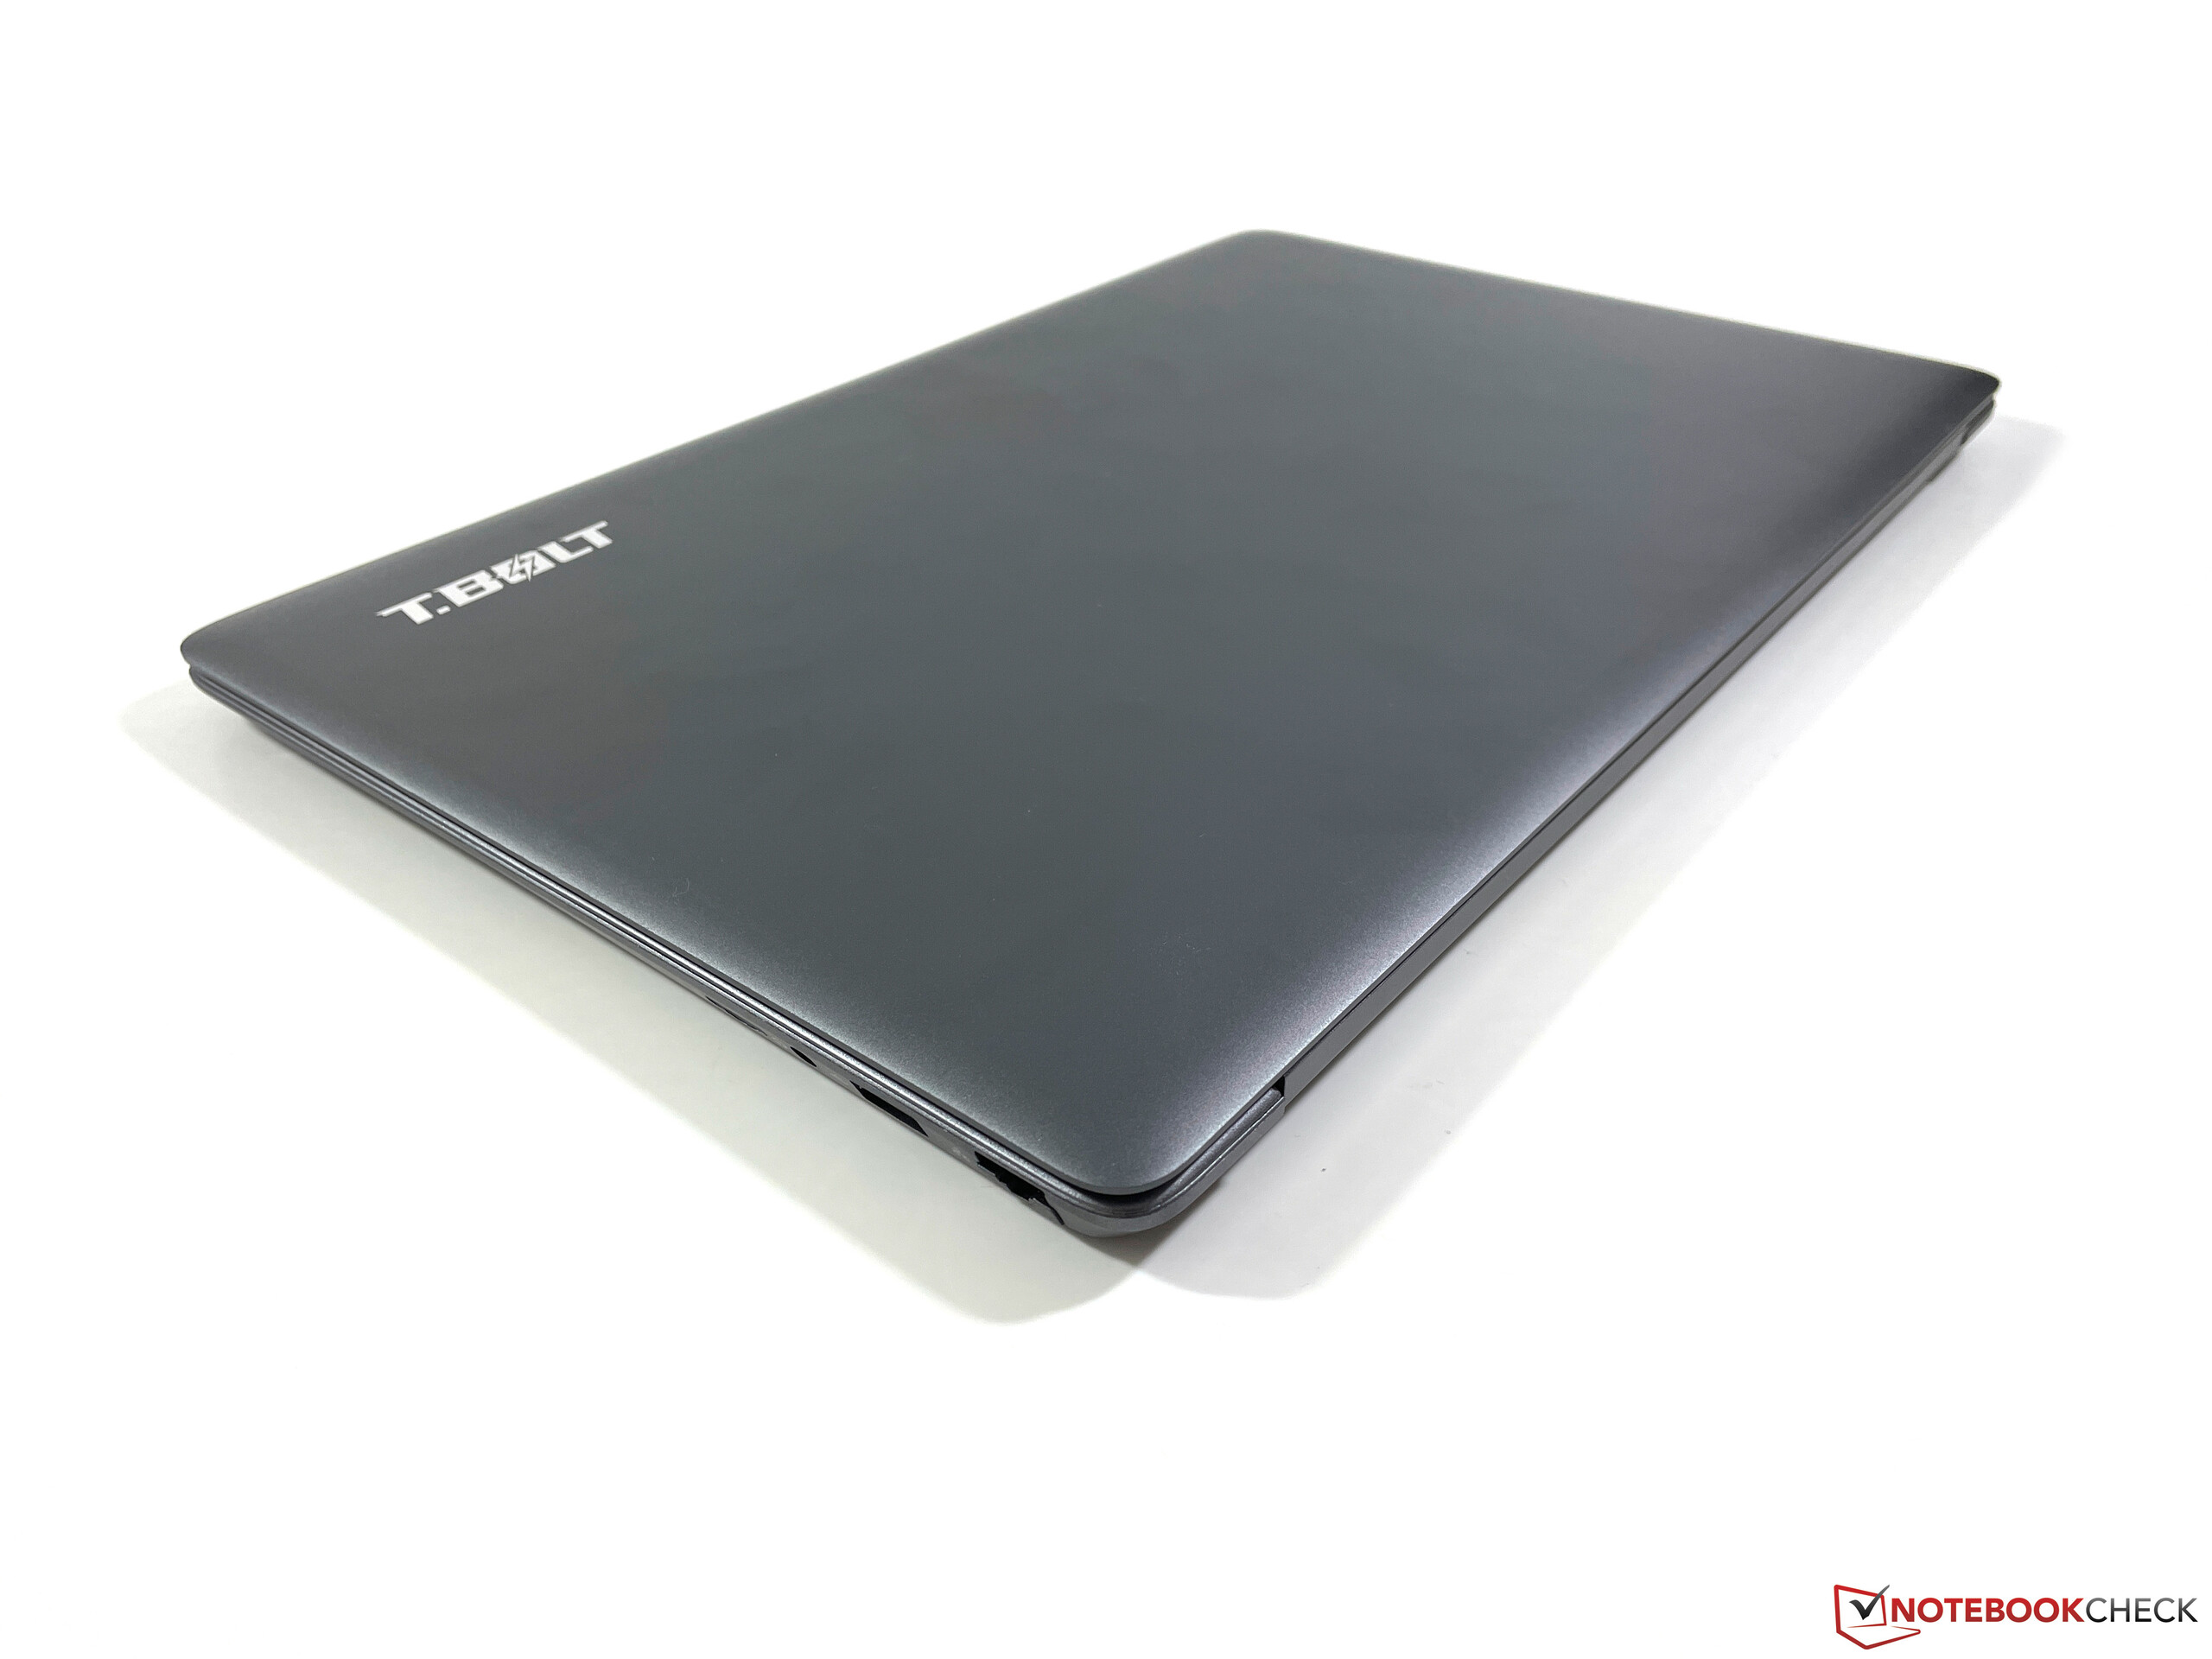
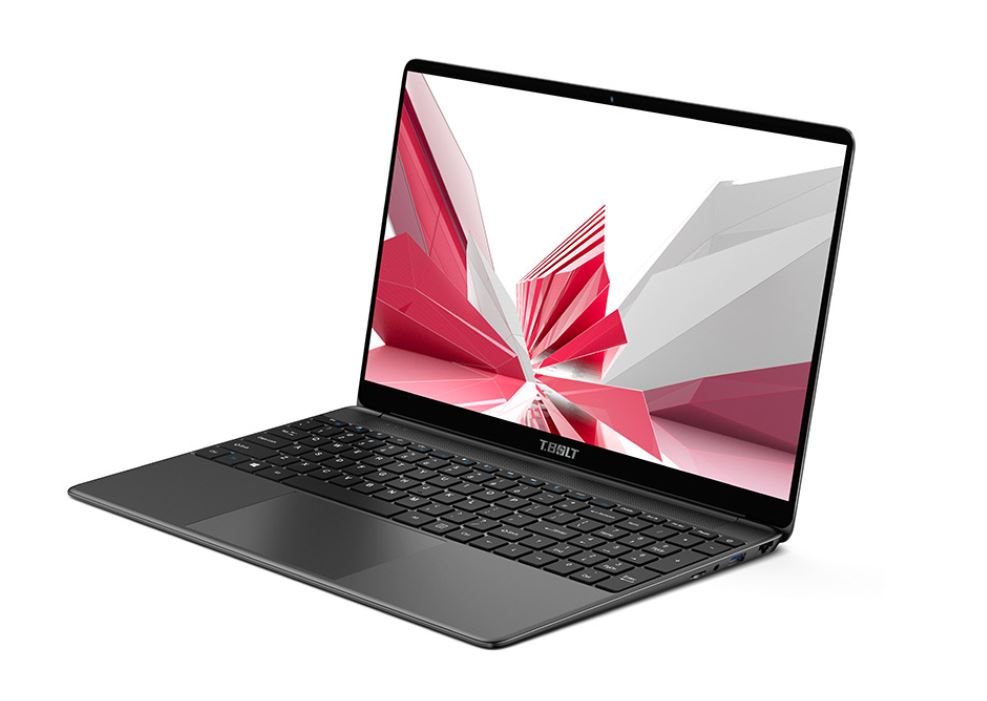
Teclast TBOLT F15 Pro in review: Low-priced 15-inch laptop for basic tasks
Possible competitors in comparison
Rating | Date | Model | Weight | Height | Size | Resolution | Best Price |
|---|---|---|---|---|---|---|---|
| 77 % | 09/2021 | Teclast TBOLT F15 Pro i3-1005G1, UHD Graphics G1 (Ice Lake 32 EU) | 1.9 kg | 20.5 mm | 15.60" | 1920x1080 | |
| 85.2 % | 03/2020 | Huawei MateBook D 15-53010TUY R5 3500U, Vega 8 | 1.5 kg | 16.9 mm | 15.60" | 1920x1080 | |
| 76.5 % | 03/2021 | Lenovo V15-ADA 82C7009SGE Athlon 3150U, Vega 3 | 1.9 kg | 20 mm | 15.60" | 1920x1080 | |
| 78.2 % | 12/2020 | Dell Inspiron 15 5000 5502 i3-1115G4, UHD Graphics Xe G4 48EUs | 1.6 kg | 17.9 mm | 15.60" | 1920x1080 |
Case, equipment and input devices
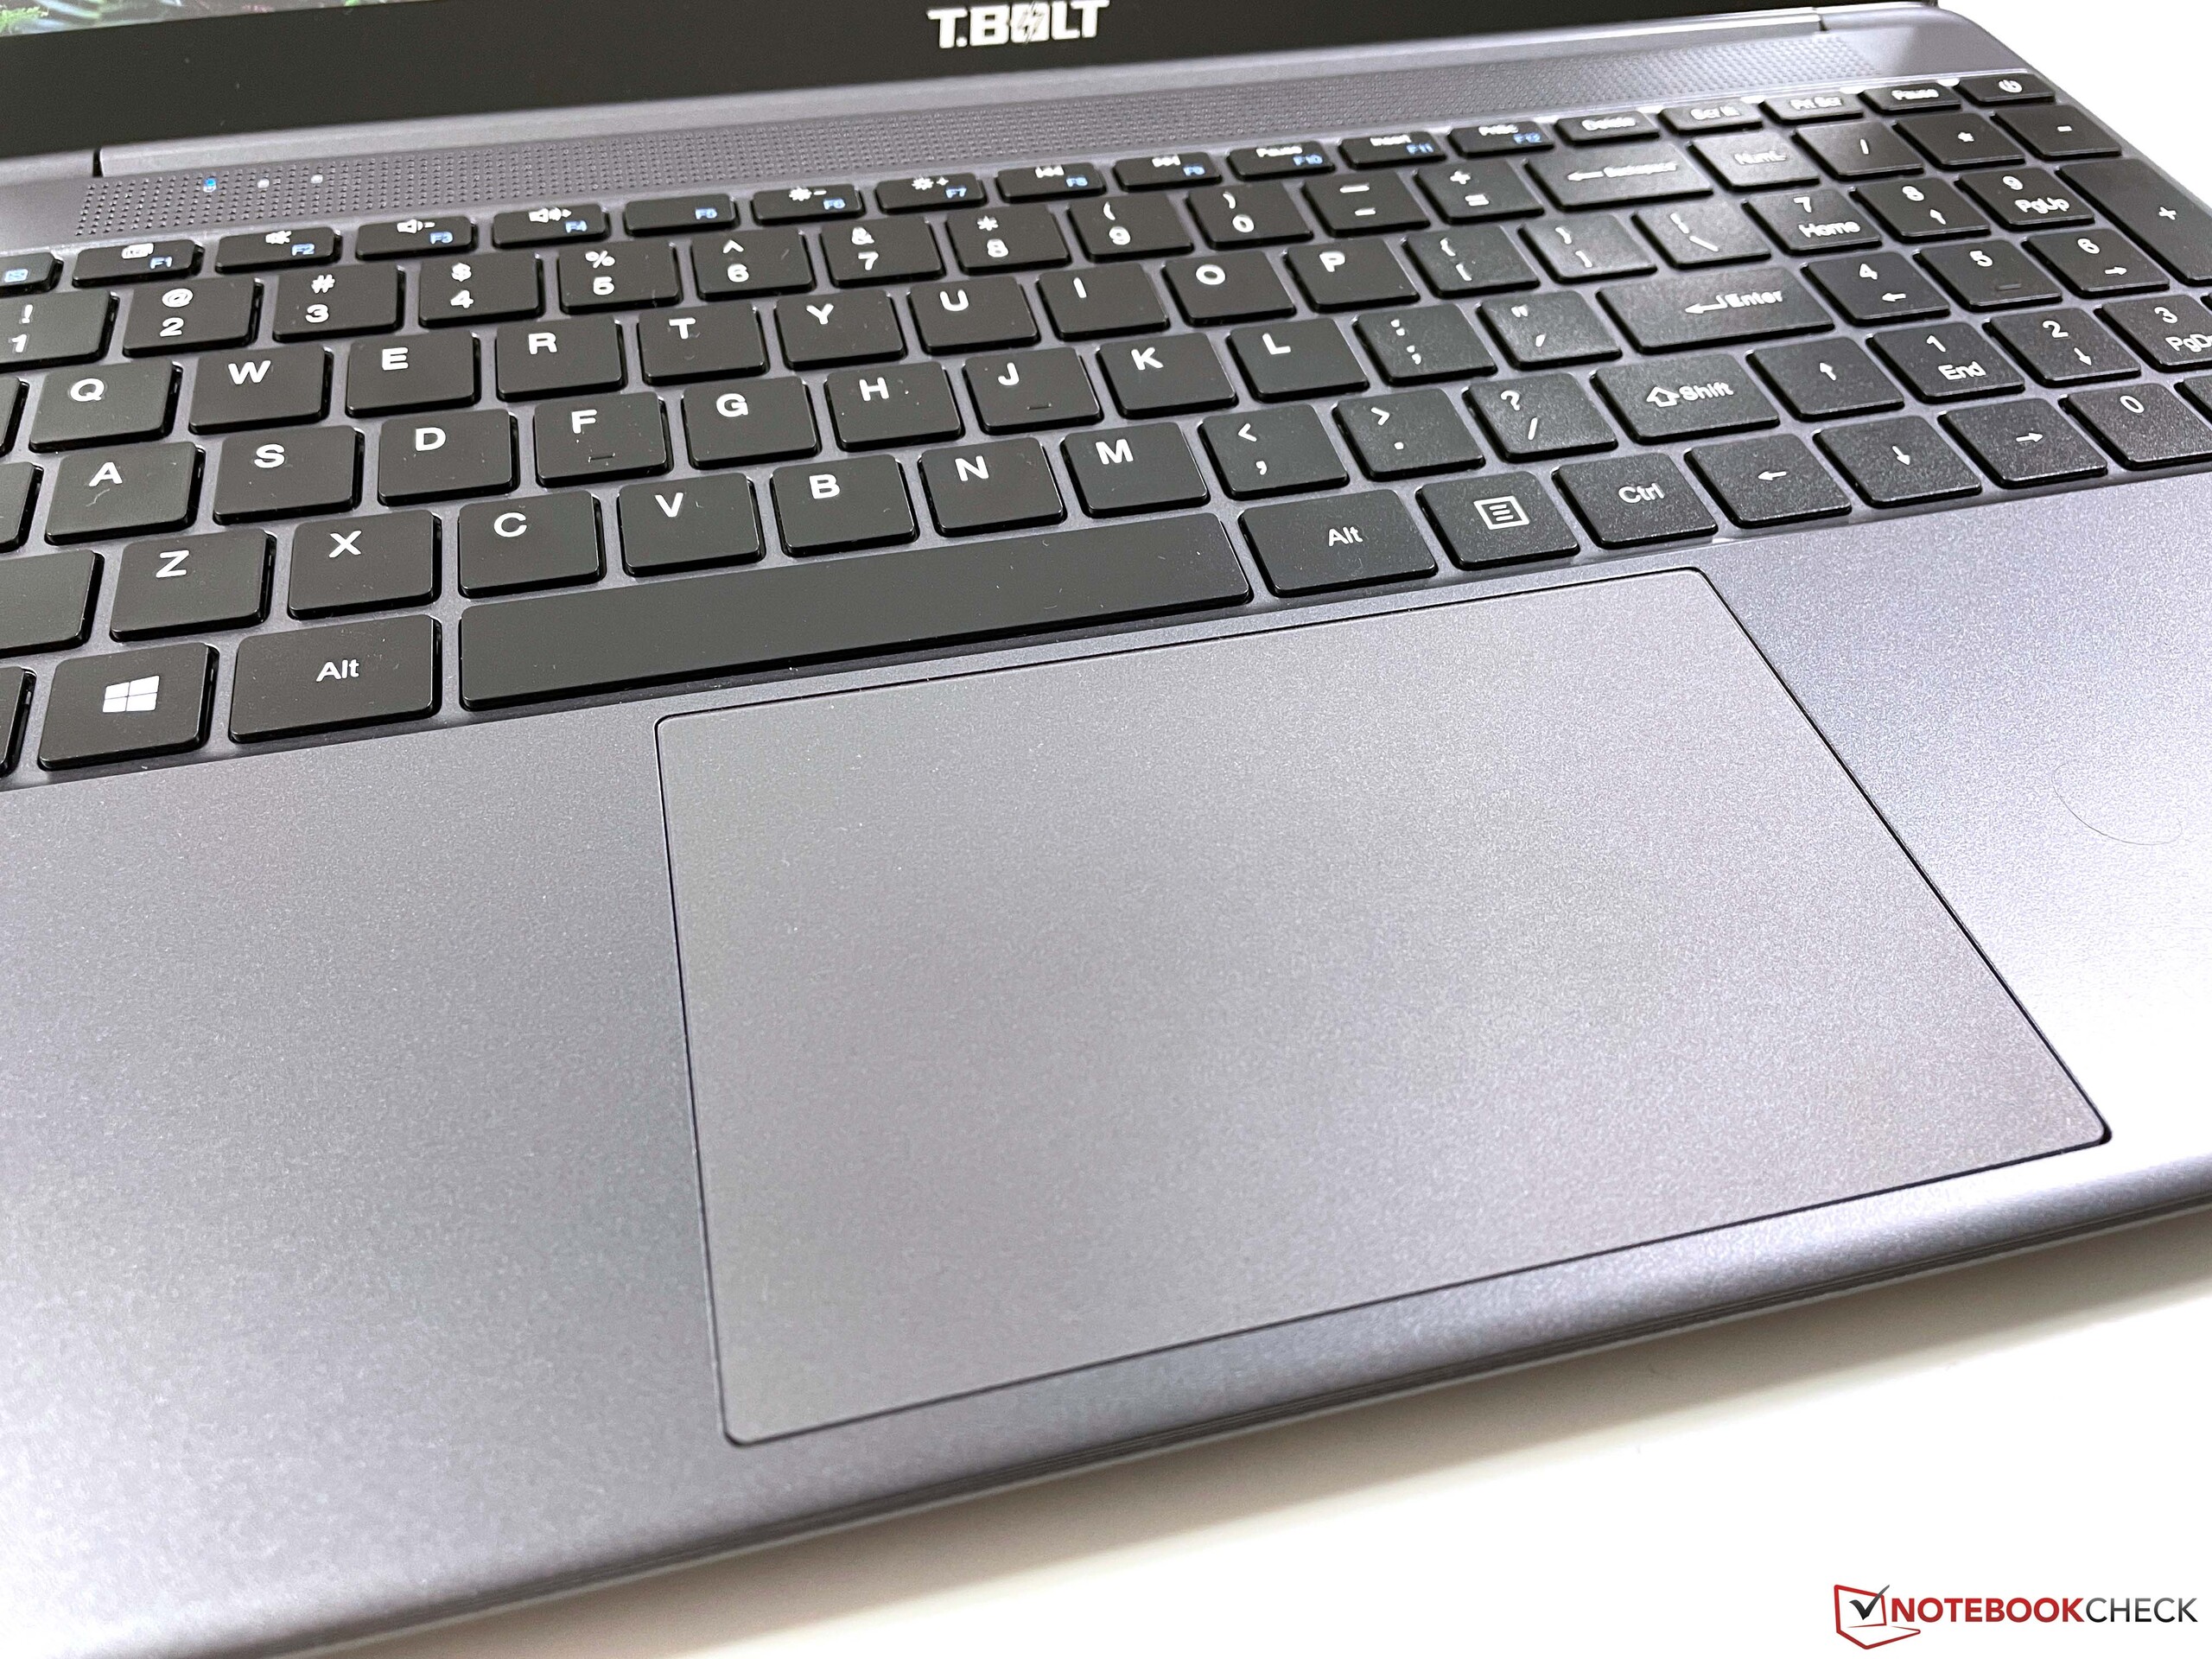
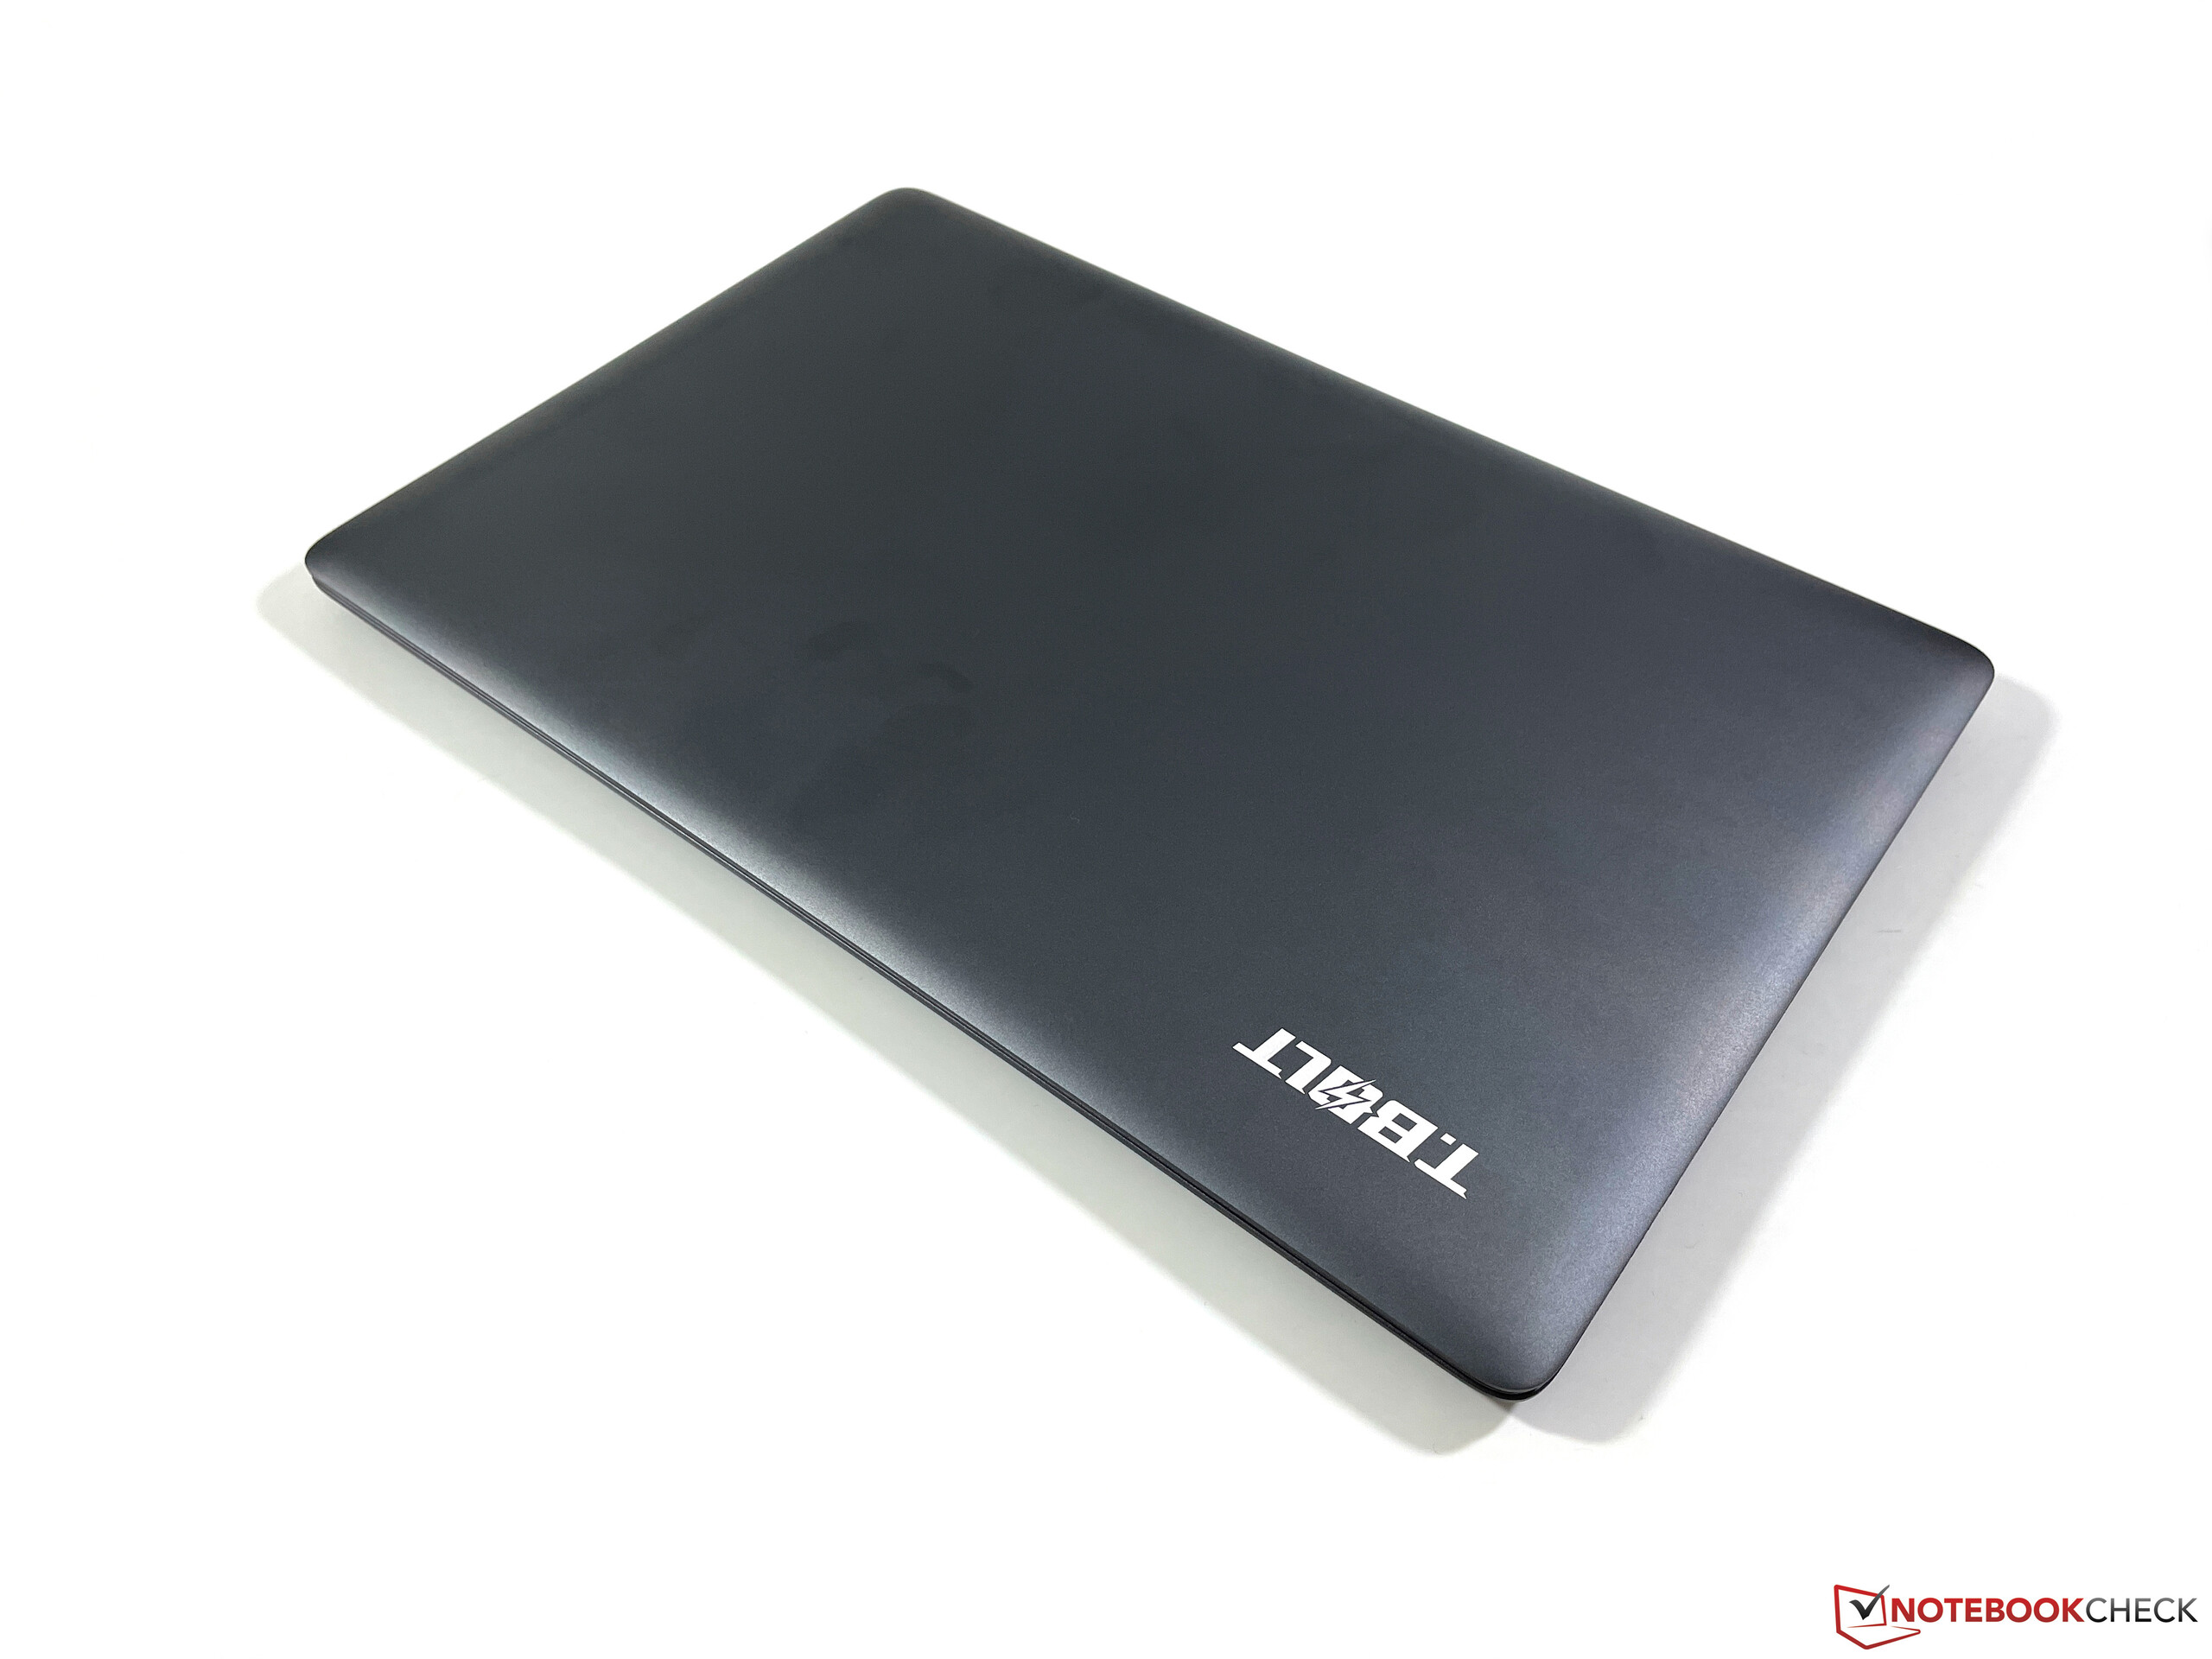
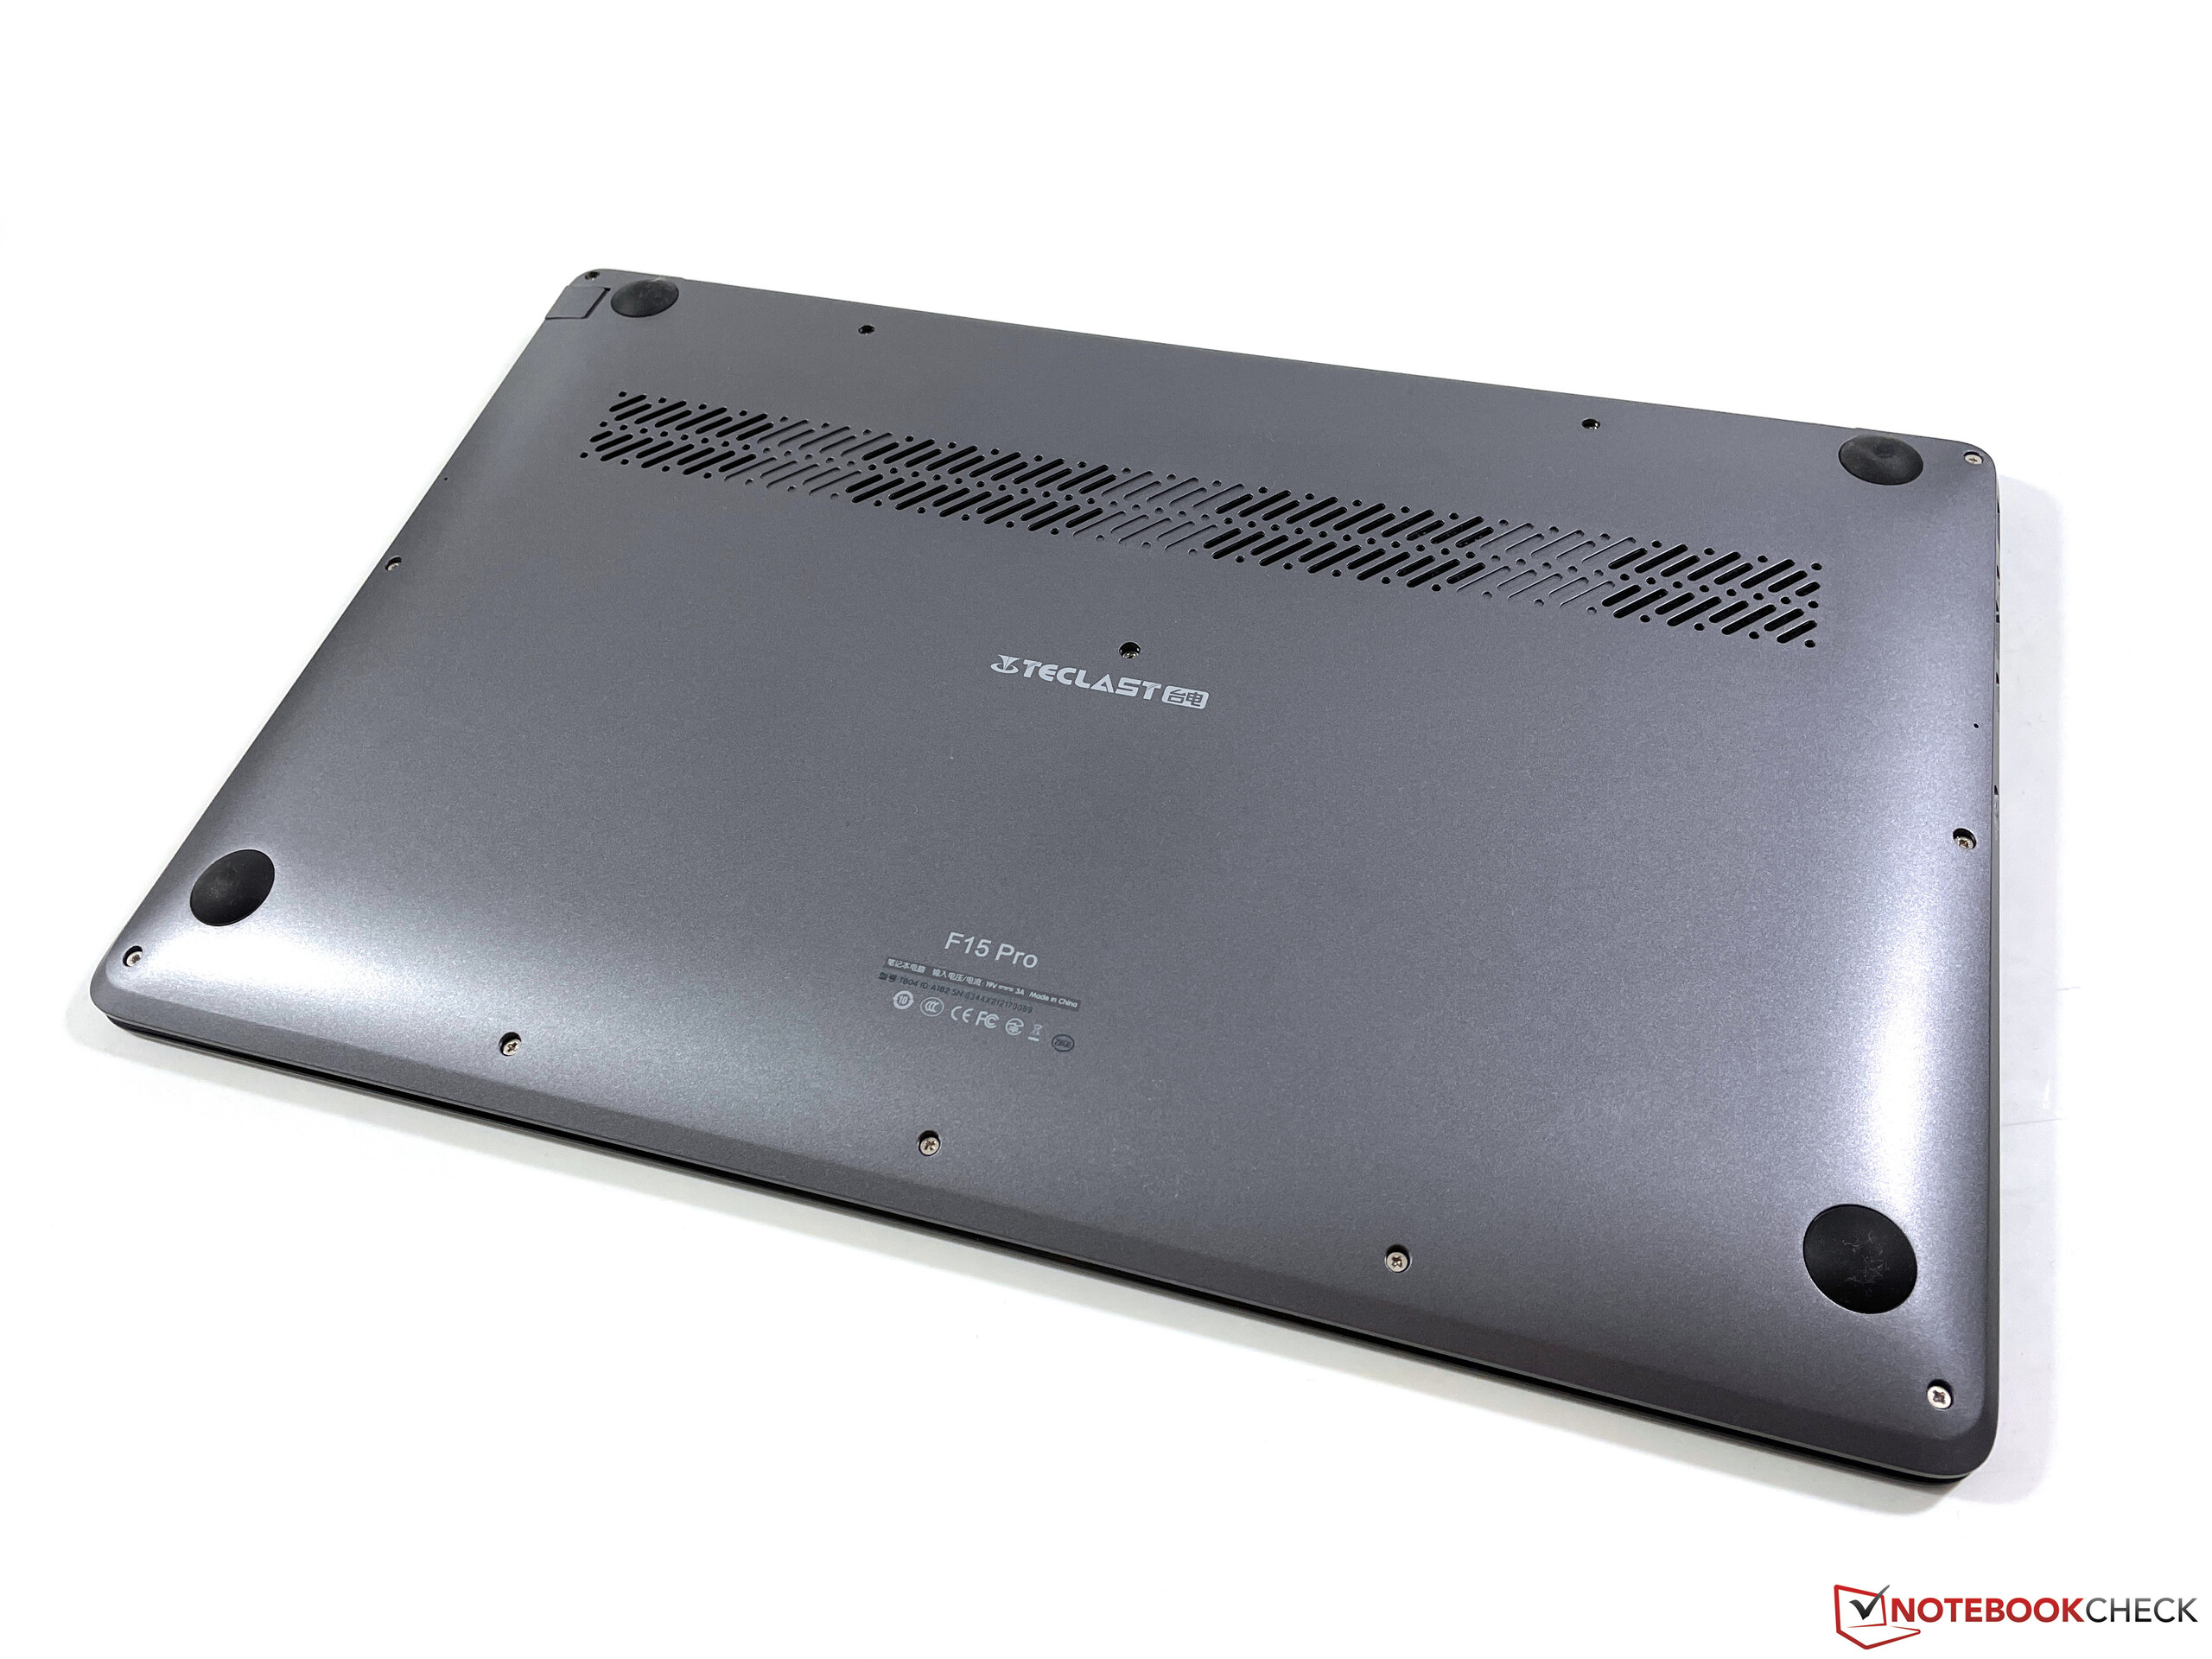
Teclast uses a mixture of aluminum (lid) and plastic for the dark gray case. The stability is okay and the overall build quality is as expected for this price range, but other manufacturers also offer higher-quality cases in this price range (e.g. Chuwi, Huawei). However, the hinge is not well-adjusted, as it clearly teeters. The black keyboard is not illuminated and the keystroke is quite loud. We liked the large ClickPad and the operation was no problem.
You get a USB-C connector, but it cannot be used for charging (also no DisplayPort). Otherwise, there are two USB ports (3.2 Gen.1) and a full-fledged HDMI output. The microSD reader is very slow, as is the RealTek WLAN module (802.11ac 1x1 & BT 5.0).
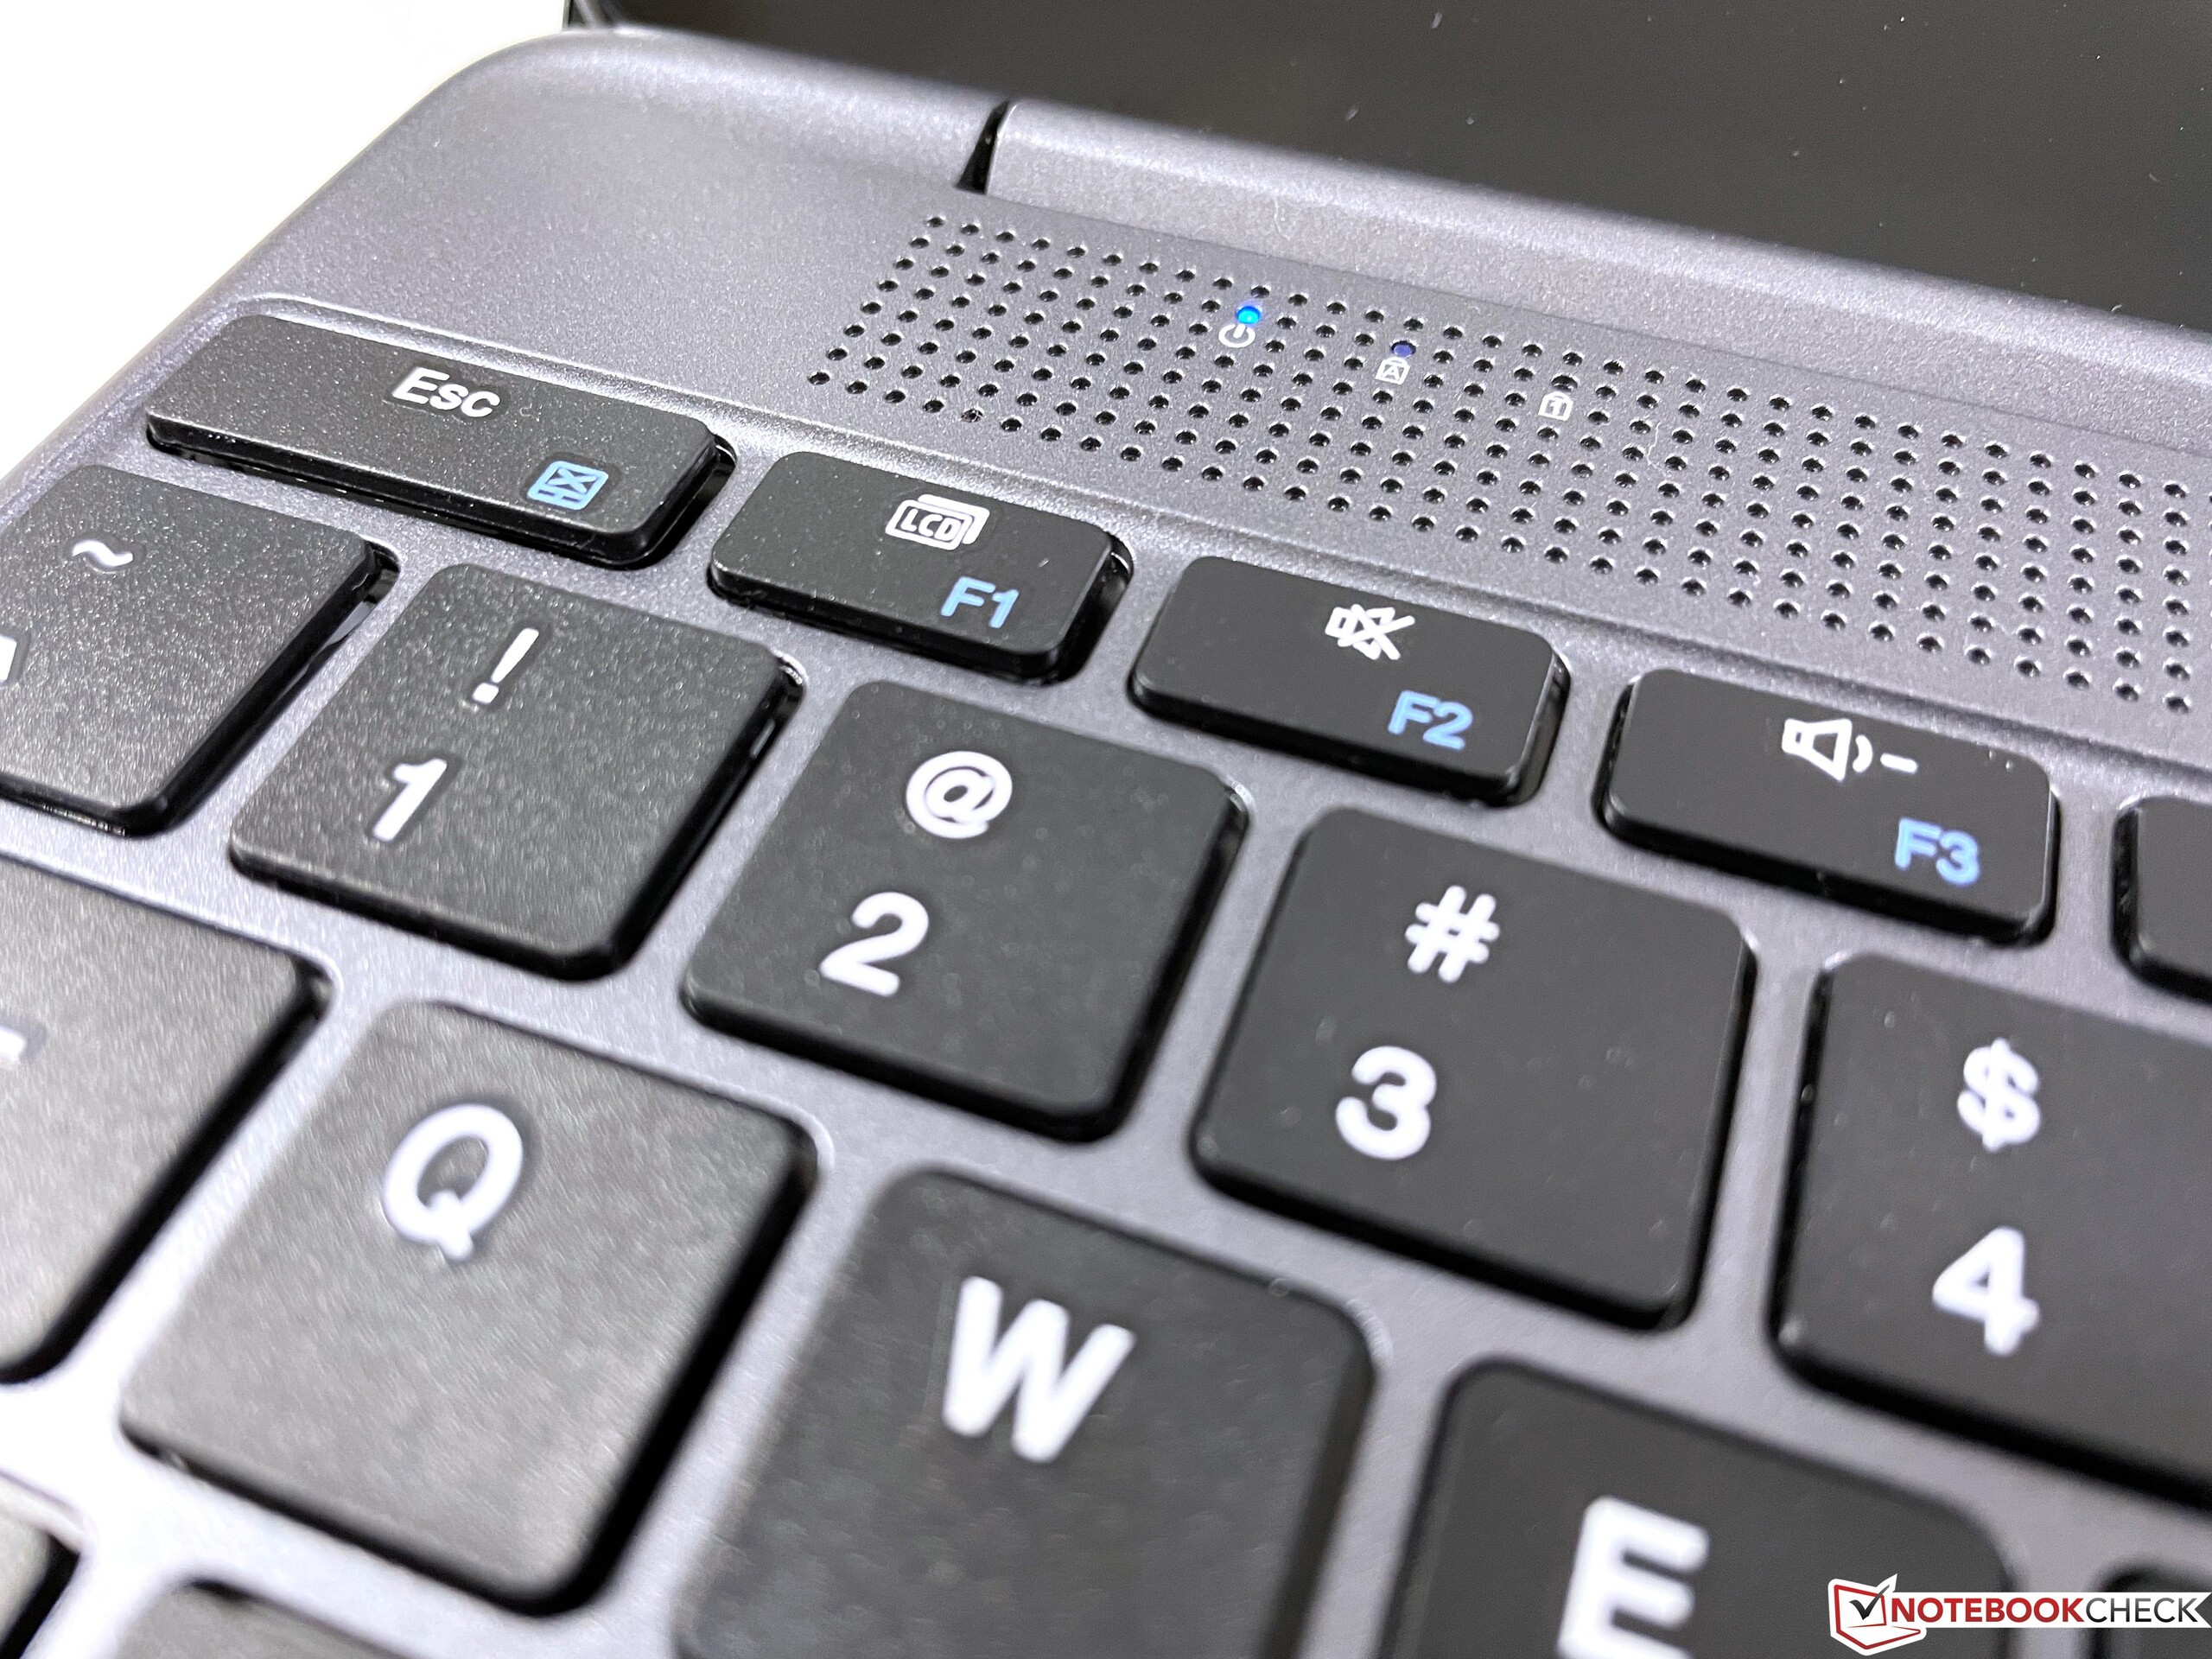
The black keyboard offers enough travel, but does not look particularly high-quality due to the loud and clattery stroke. There is no backlight, but the dedicated number pad is practical. The large ClickPad works well, but the loud clicking noises are annoying here as well.
| SD Card Reader | |
| average JPG Copy Test (av. of 3 runs) | |
| Average of class Office (8 - 82.7, n=49, last 2 years) | |
| Lenovo V15-ADA 82C7009SGE (Toshiba Exceria Pro SDXC 64 GB UHS-II) | |
| Teclast TBOLT F15 Pro (AV Pro v60) | |
| Dell Inspiron 15 5000 5502 (Toshiba Exceria Pro M501 microSDXC 32GB) | |
| maximum AS SSD Seq Read Test (1GB) | |
| Average of class Office (25 - 90.5, n=43, last 2 years) | |
| Lenovo V15-ADA 82C7009SGE (Toshiba Exceria Pro SDXC 64 GB UHS-II) | |
| Teclast TBOLT F15 Pro (AV Pro v60) | |
| Dell Inspiron 15 5000 5502 (Toshiba Exceria Pro M501 microSDXC 32GB) | |
, i3-1005G1, Teclast BD256GB")
, i3-1005G1, Teclast BD256GB")
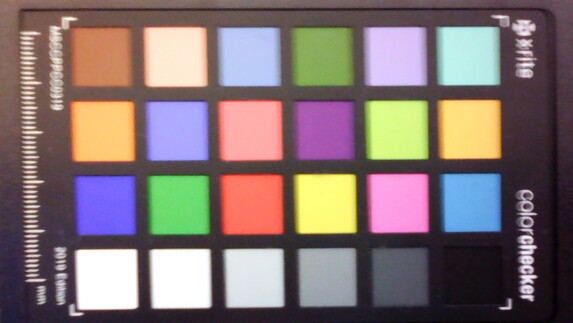
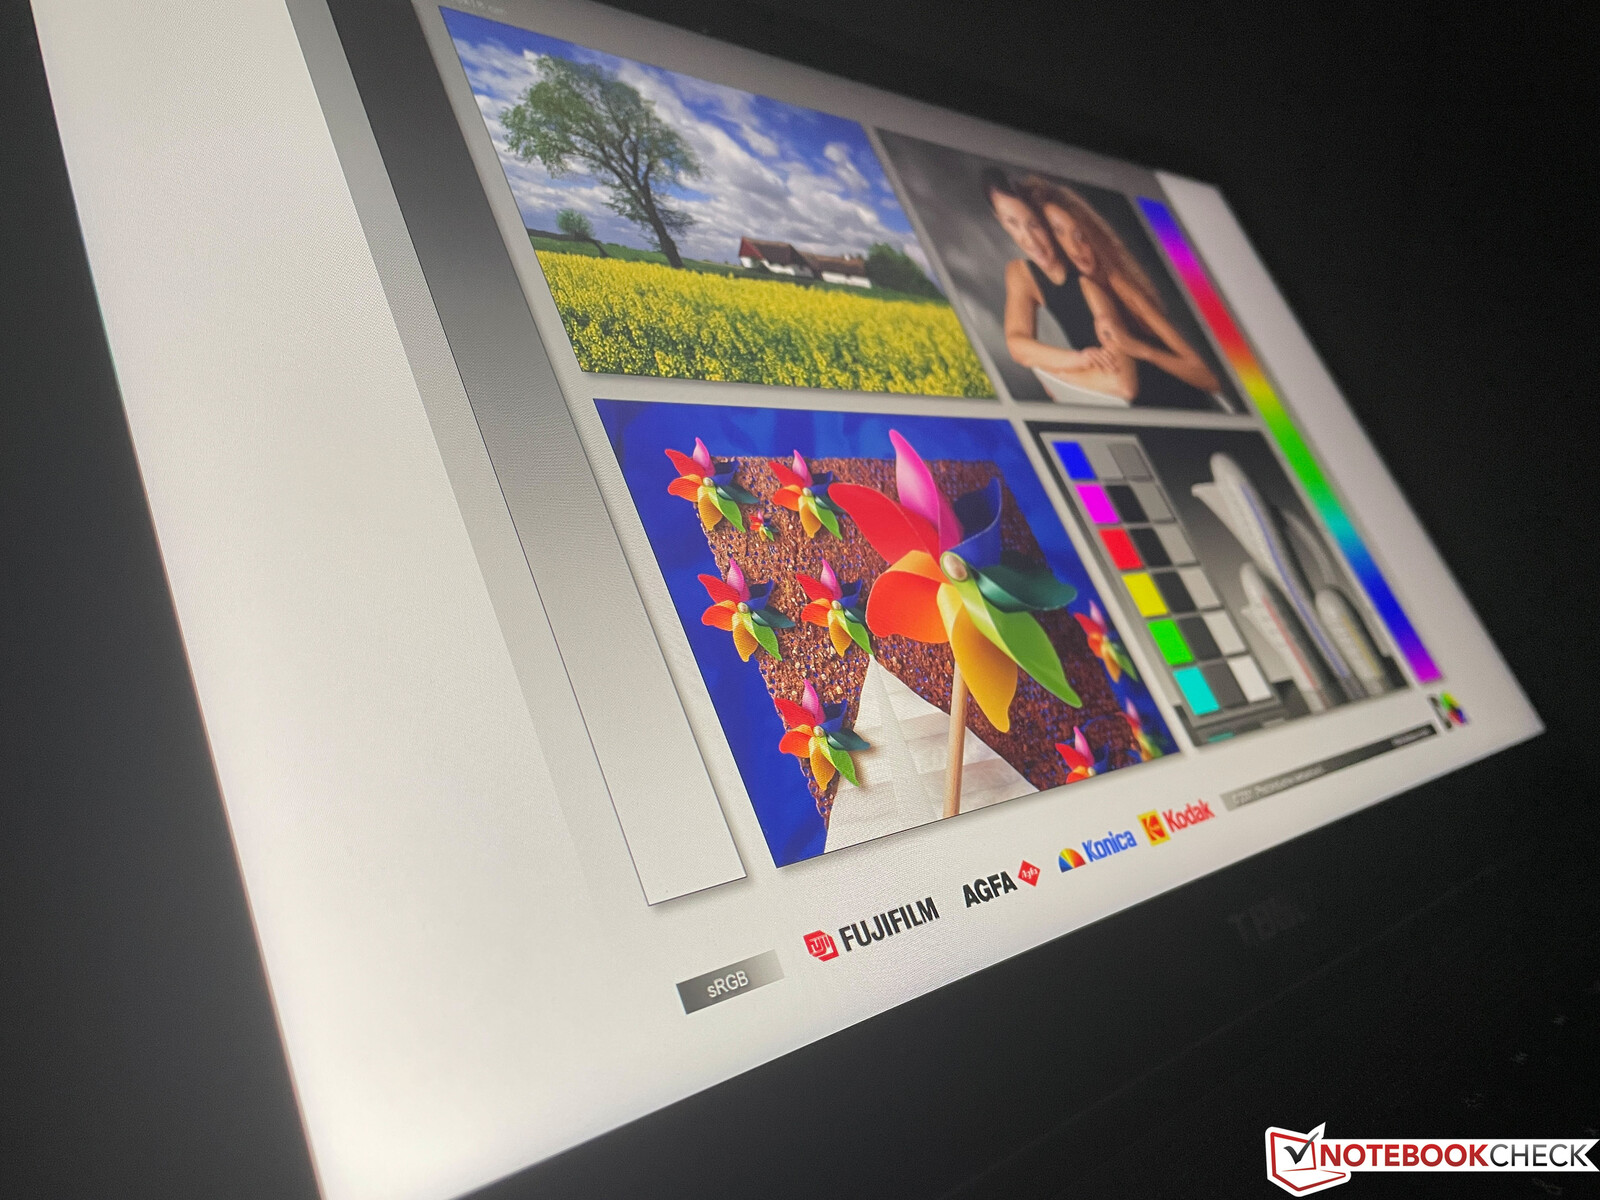
Display - 1080p IPS panel
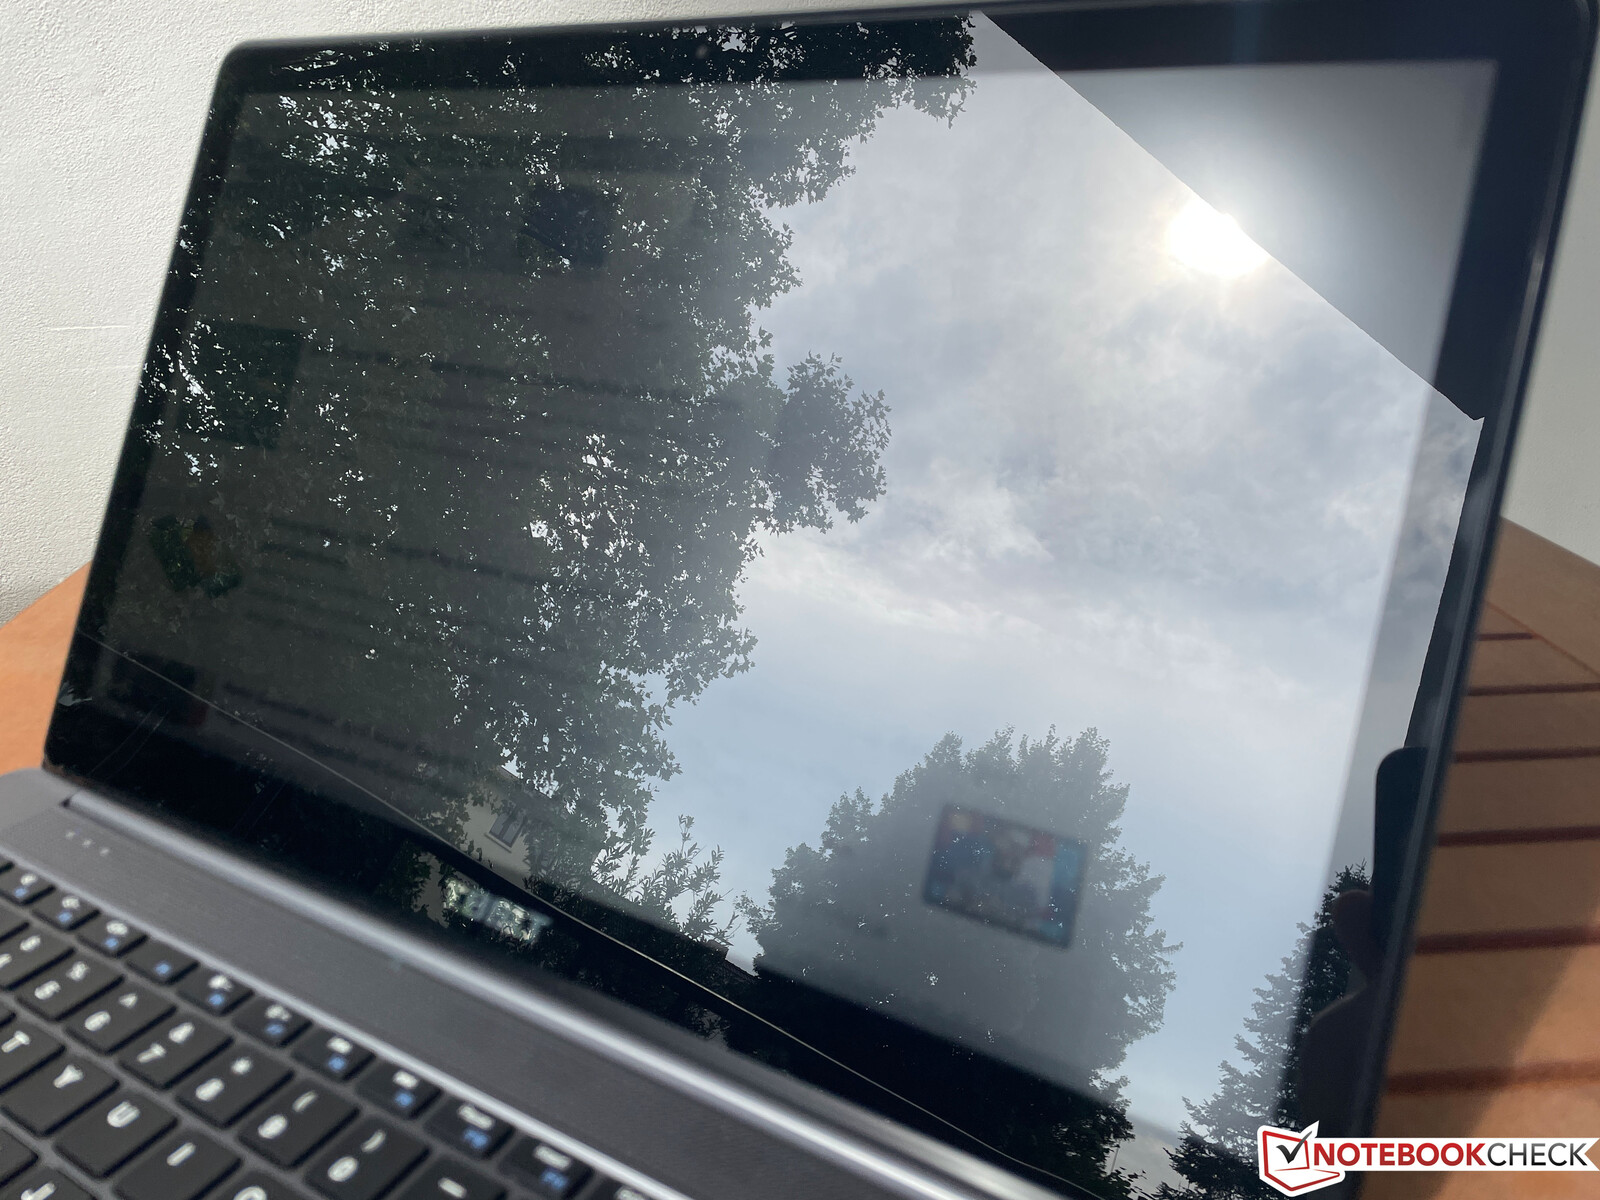
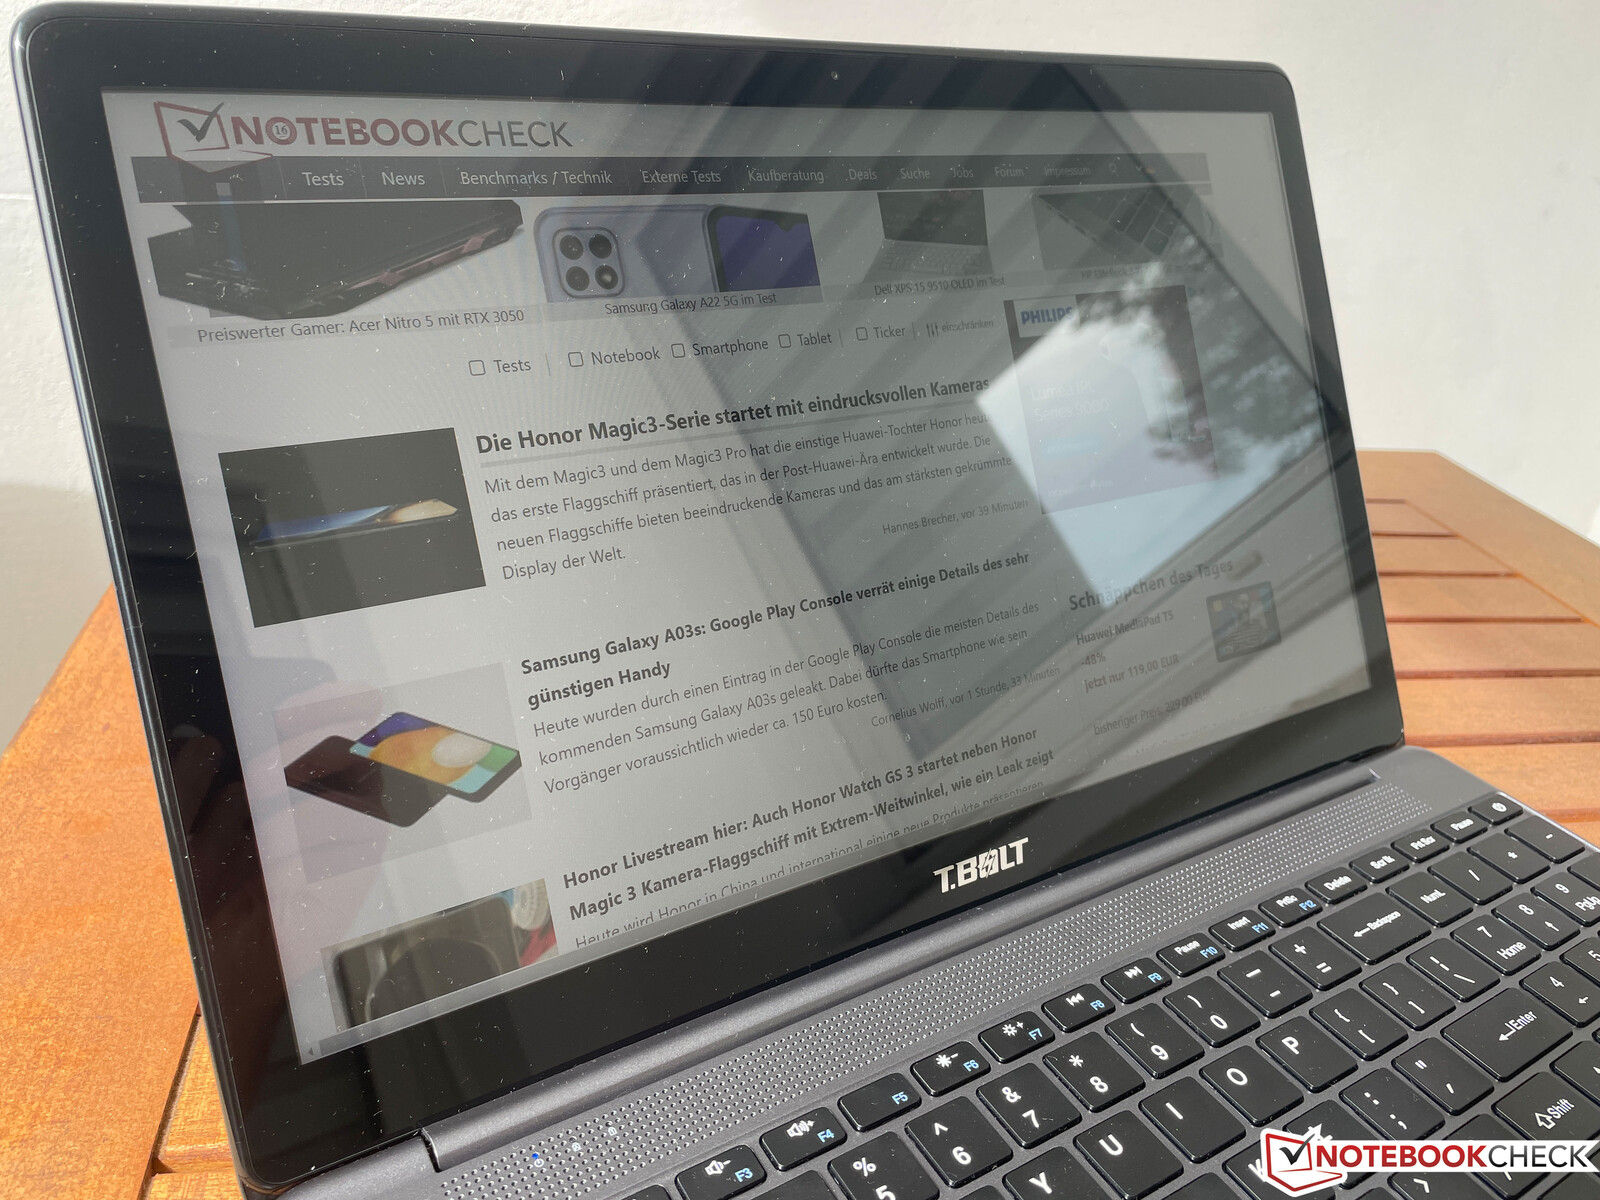
The 15.6-inch IPS display offers Full HD resolution and has a glossy surface. This is problematic outdoors, but at least the subjective picture impression of the panel is good and the colors also look vivid.
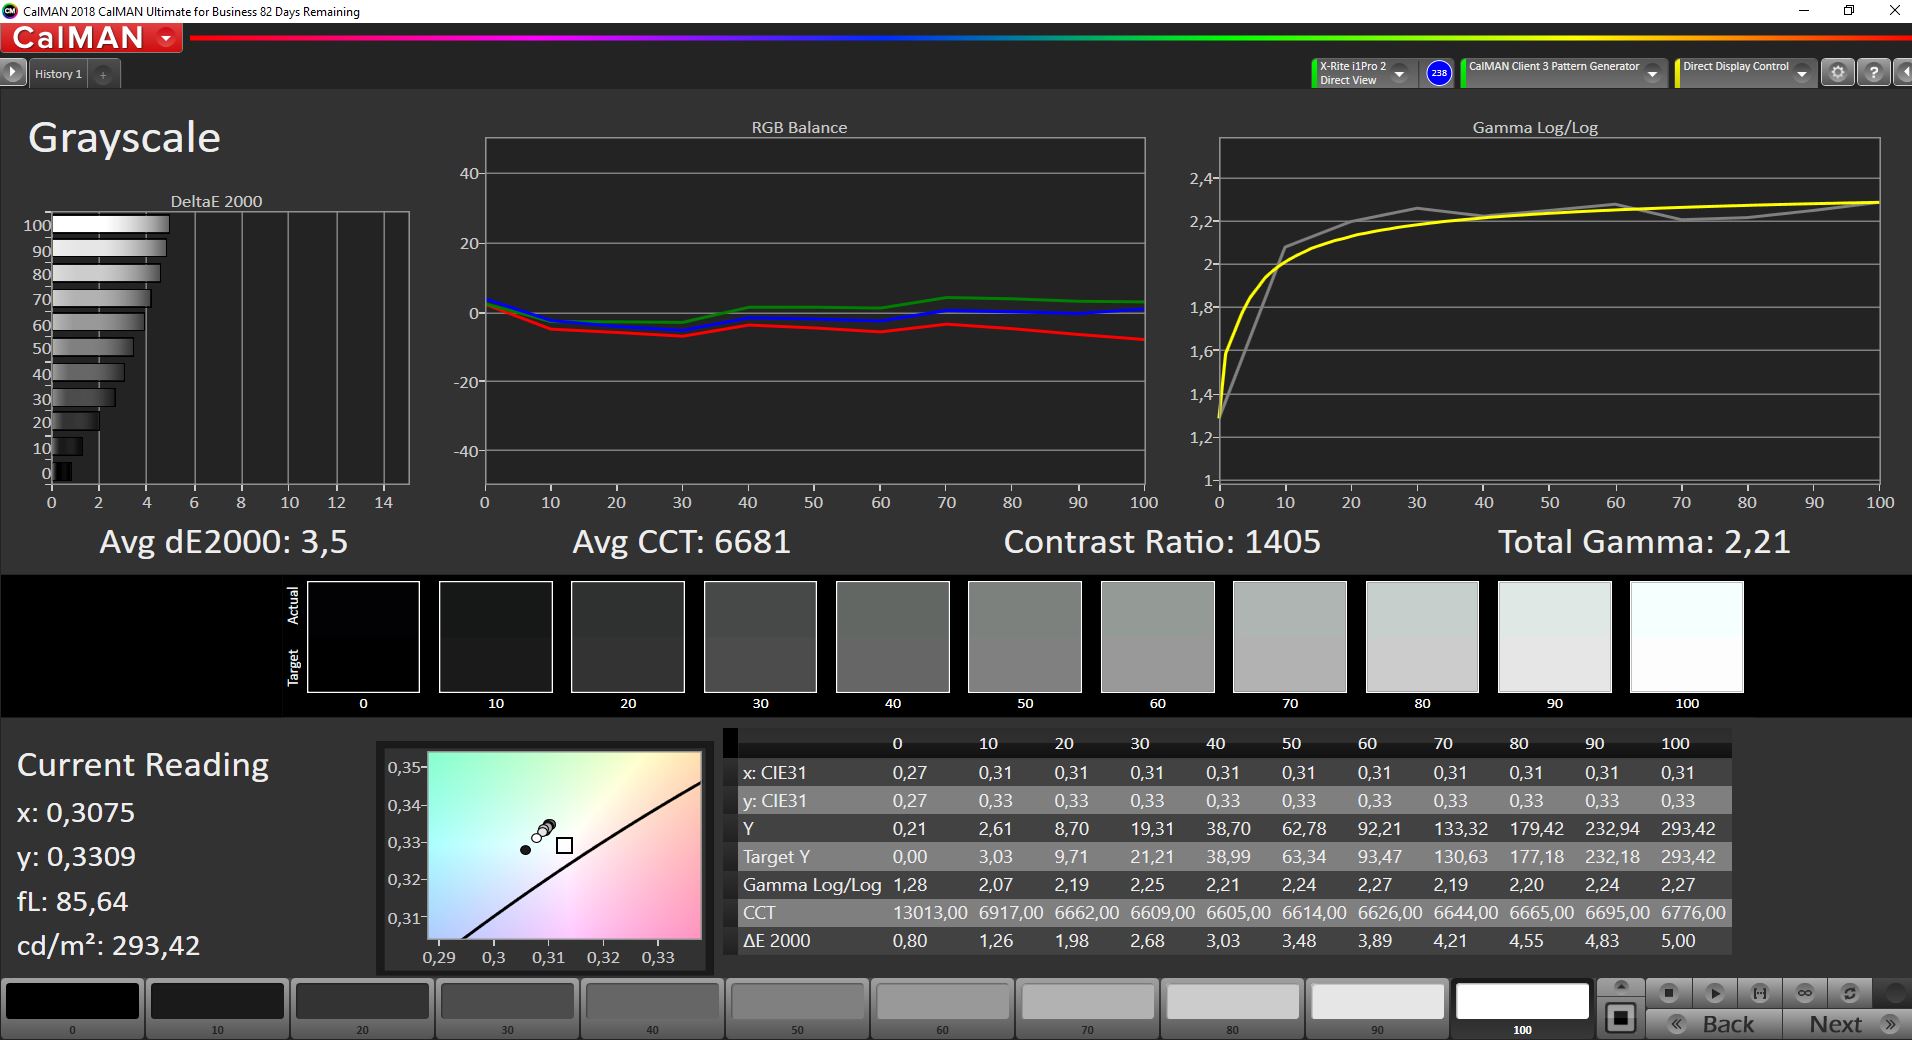
The average brightness is around 260 cd/m² and the contrast ratio is even a very good 1400:1. However, the minimum brightness is a bit problematic at 77 cd/m², which is too high in very dark environments. We could not detect PWM flickering and halos are not a problem.
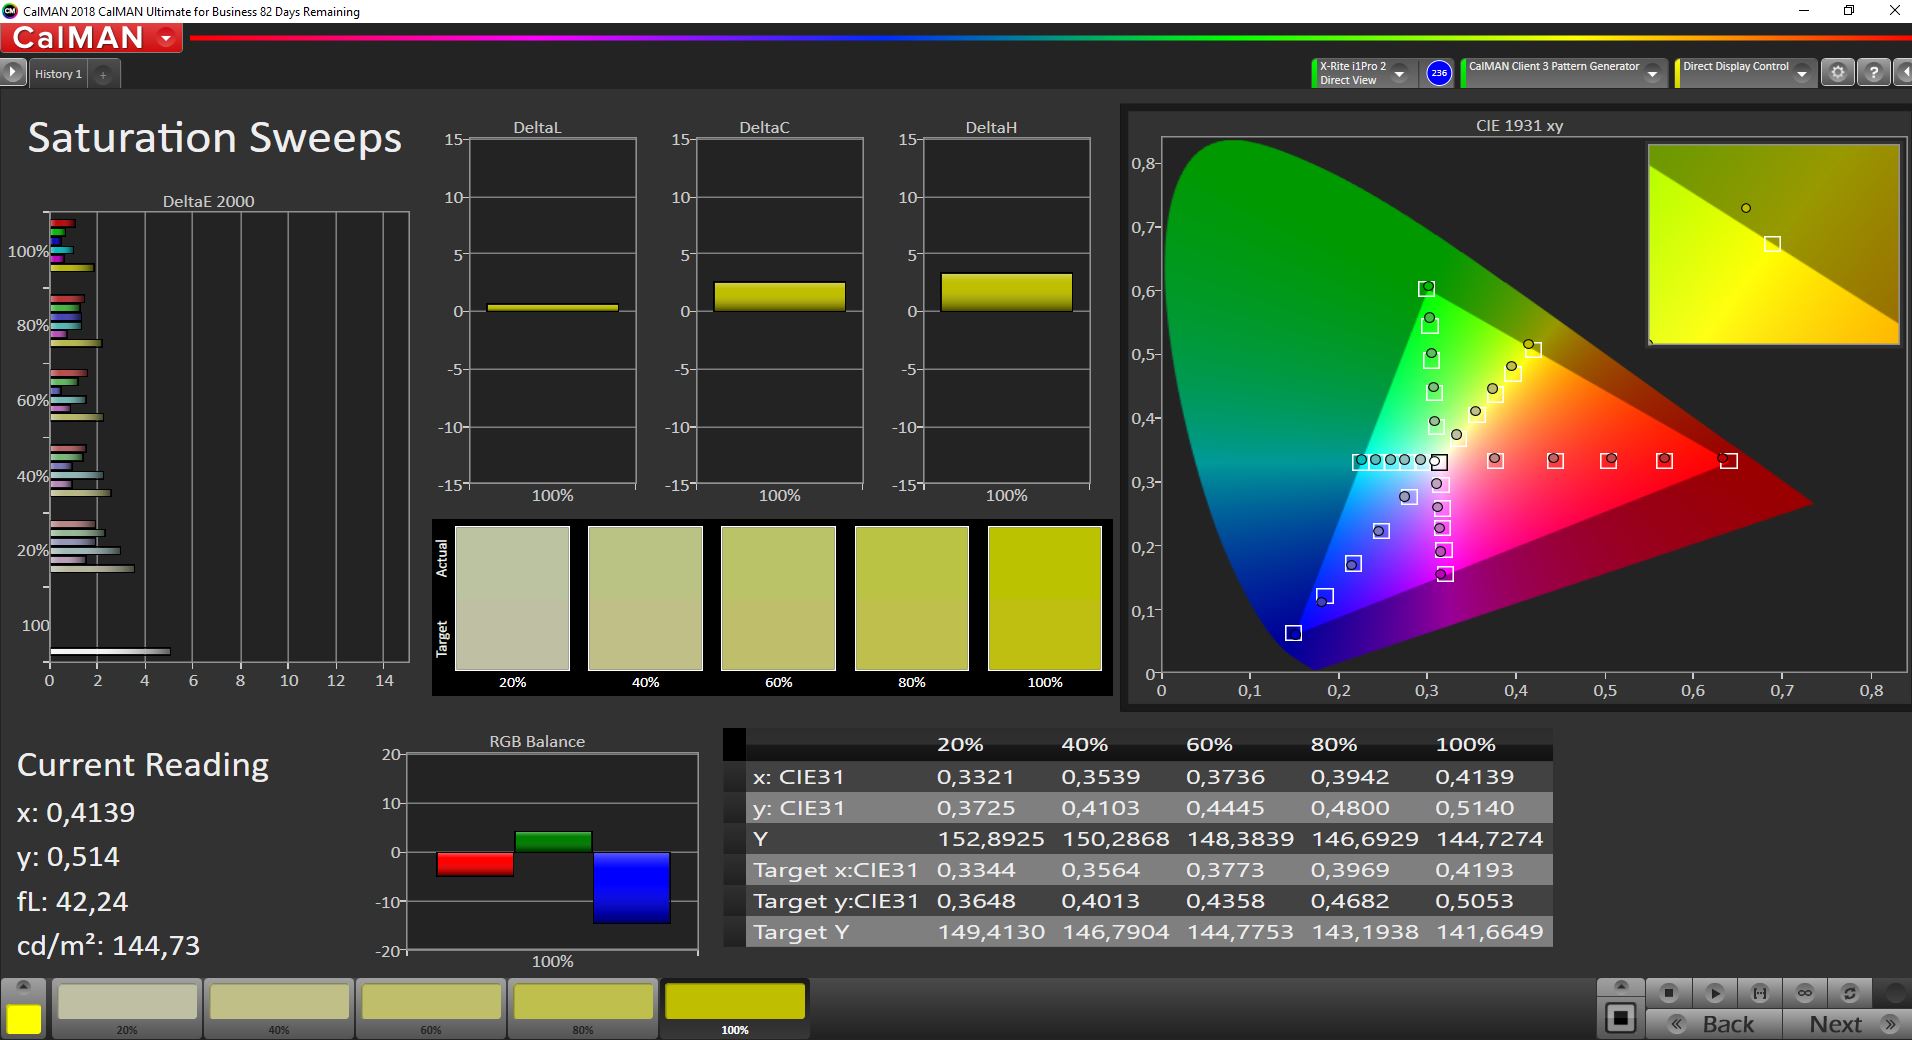
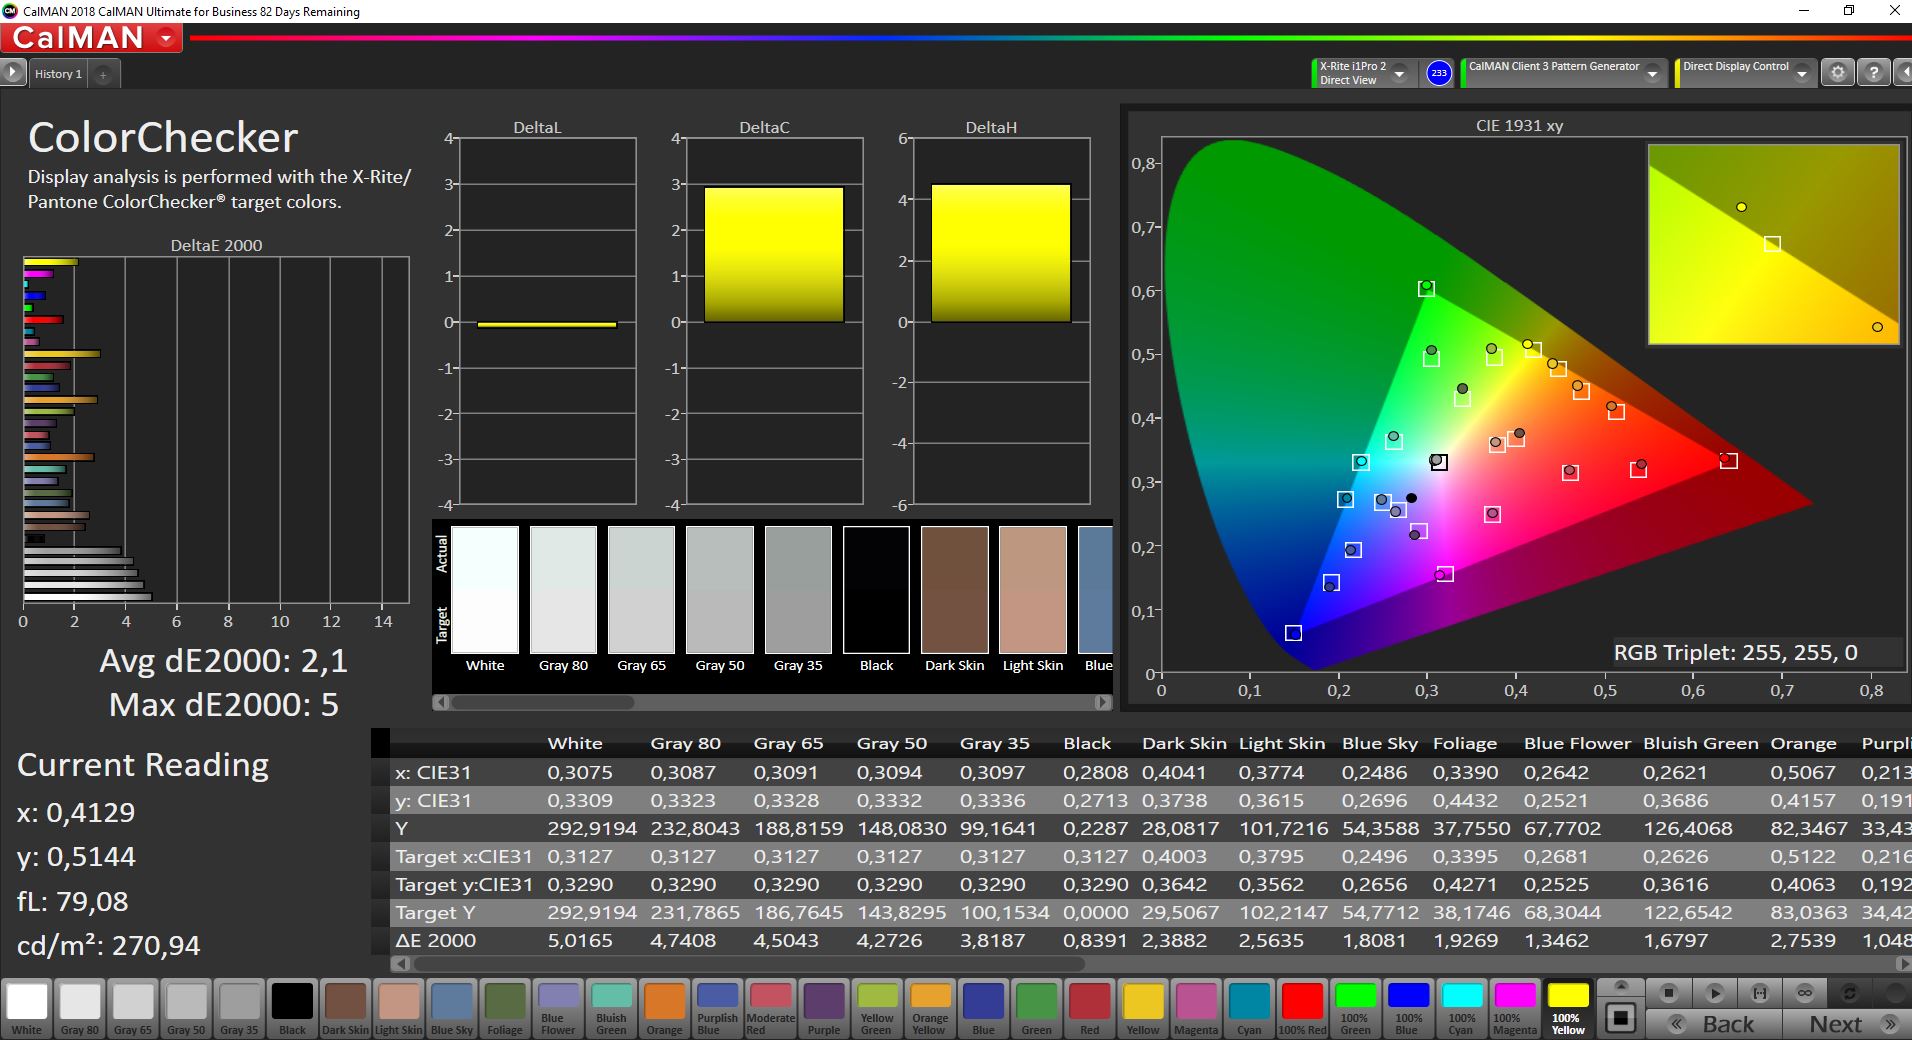
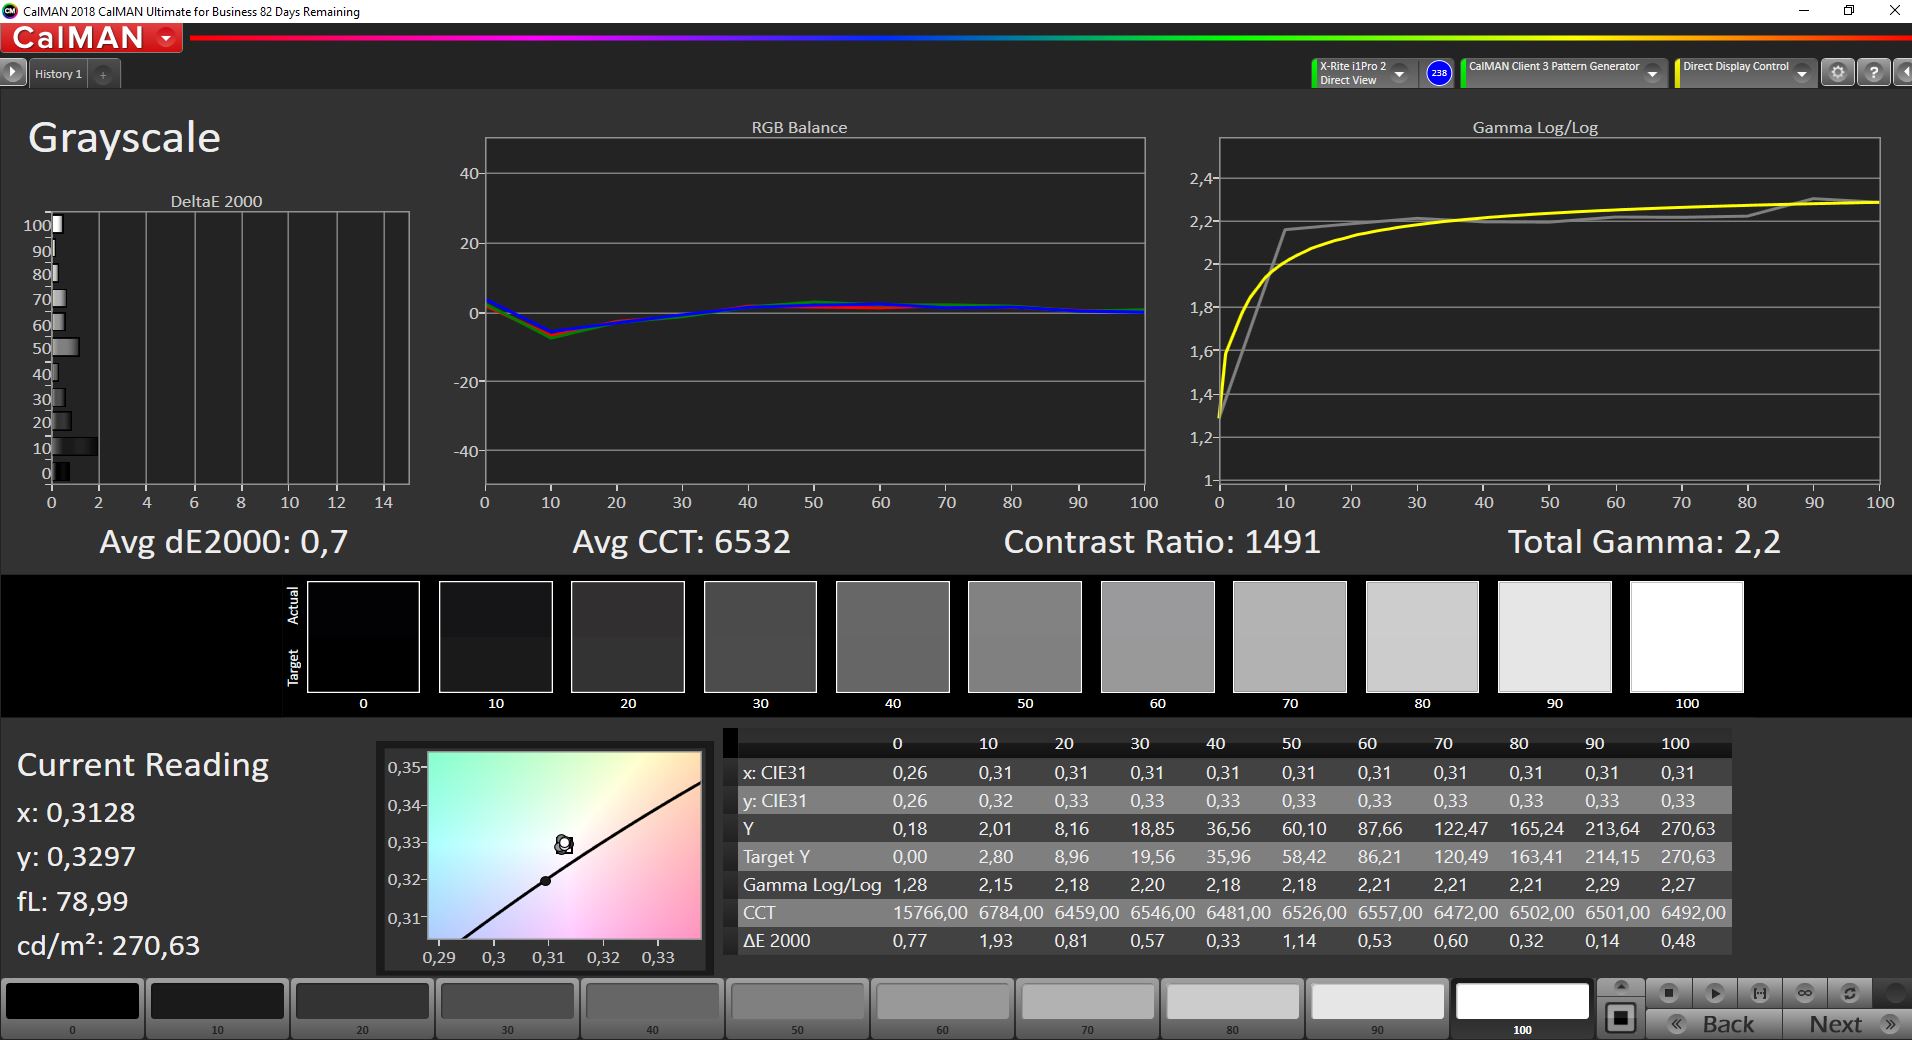
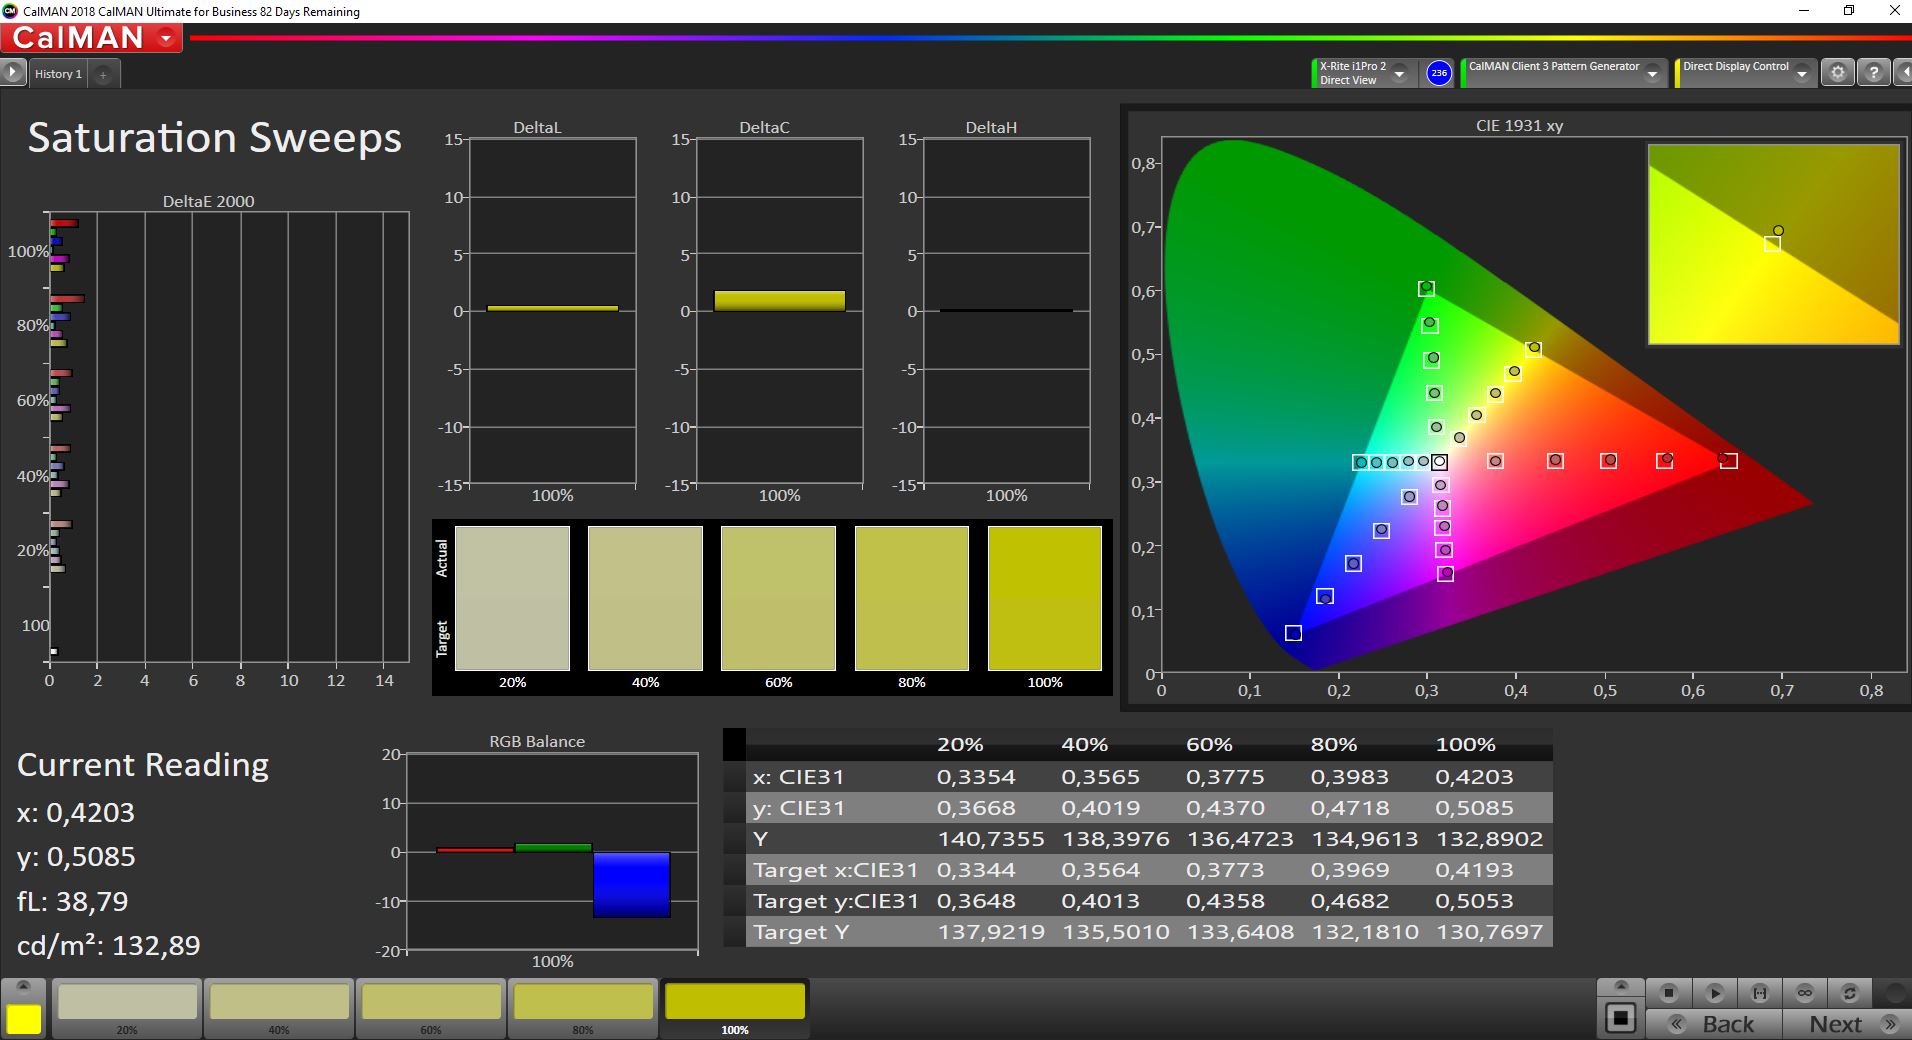
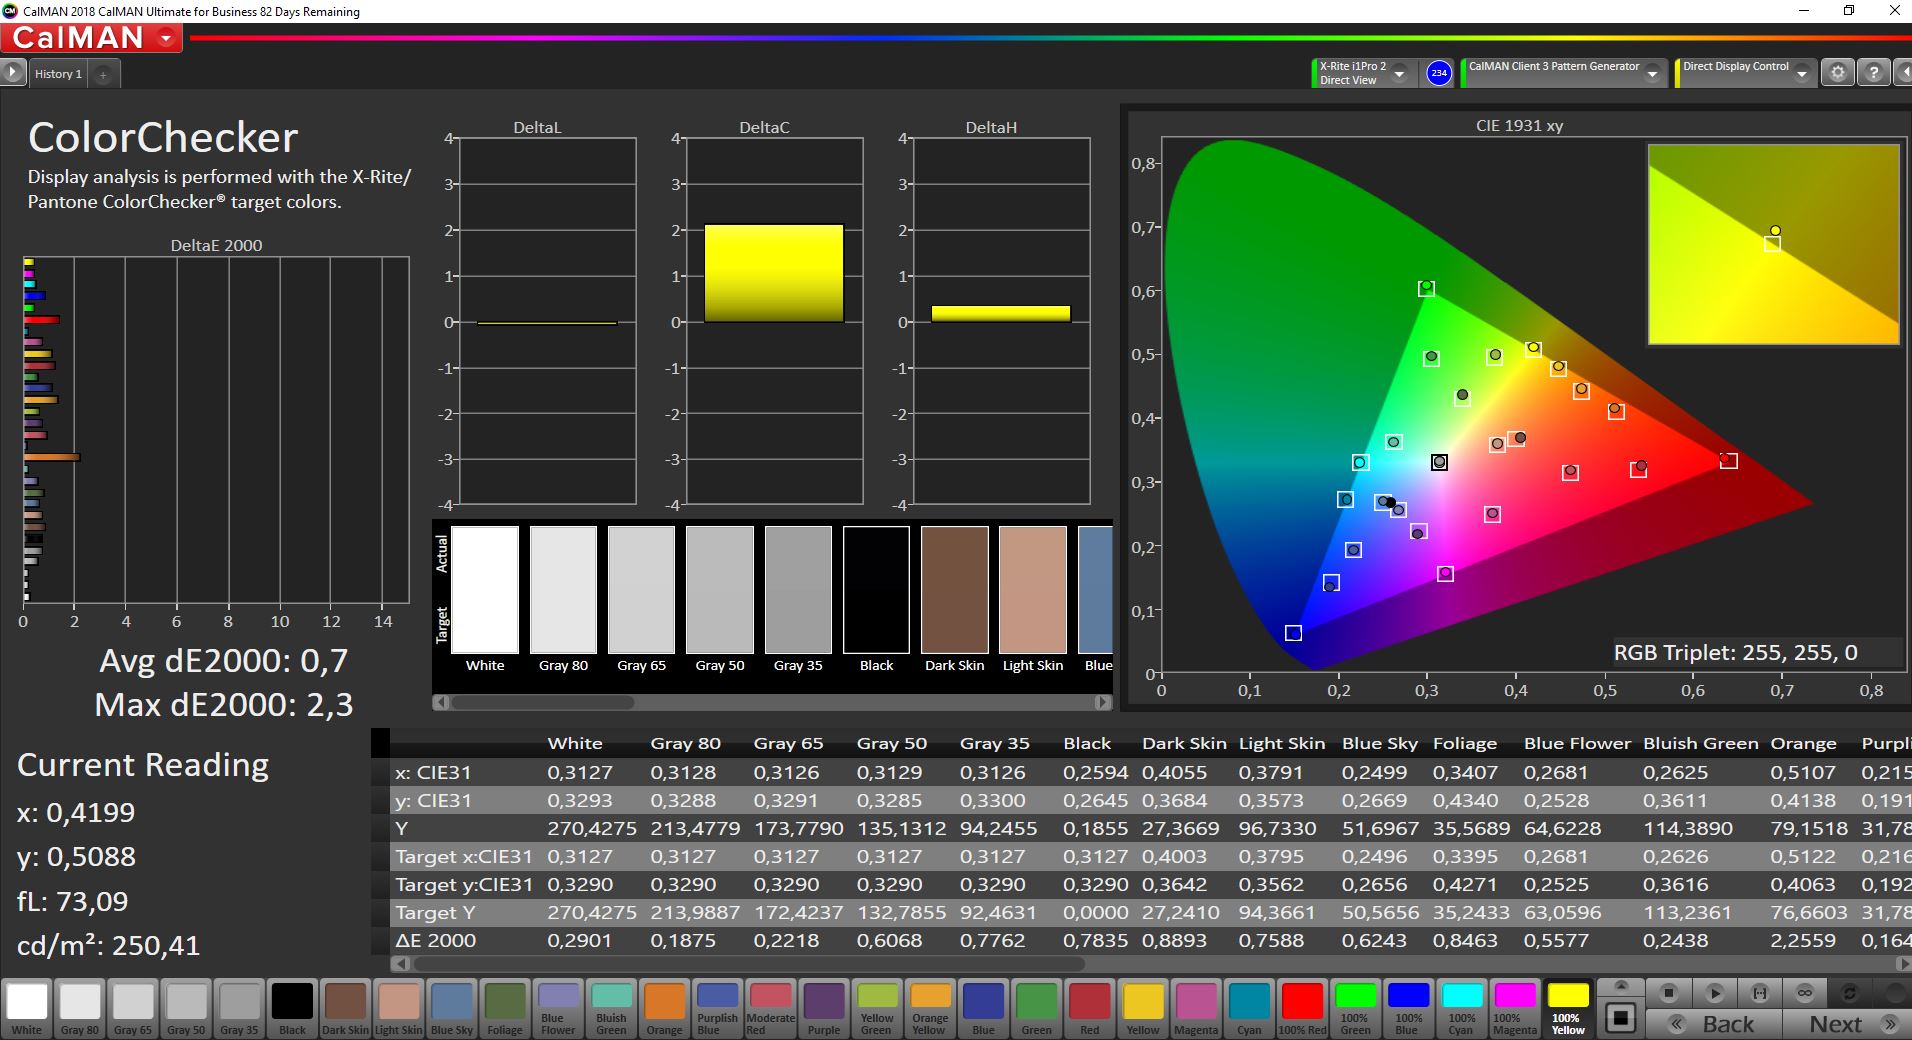
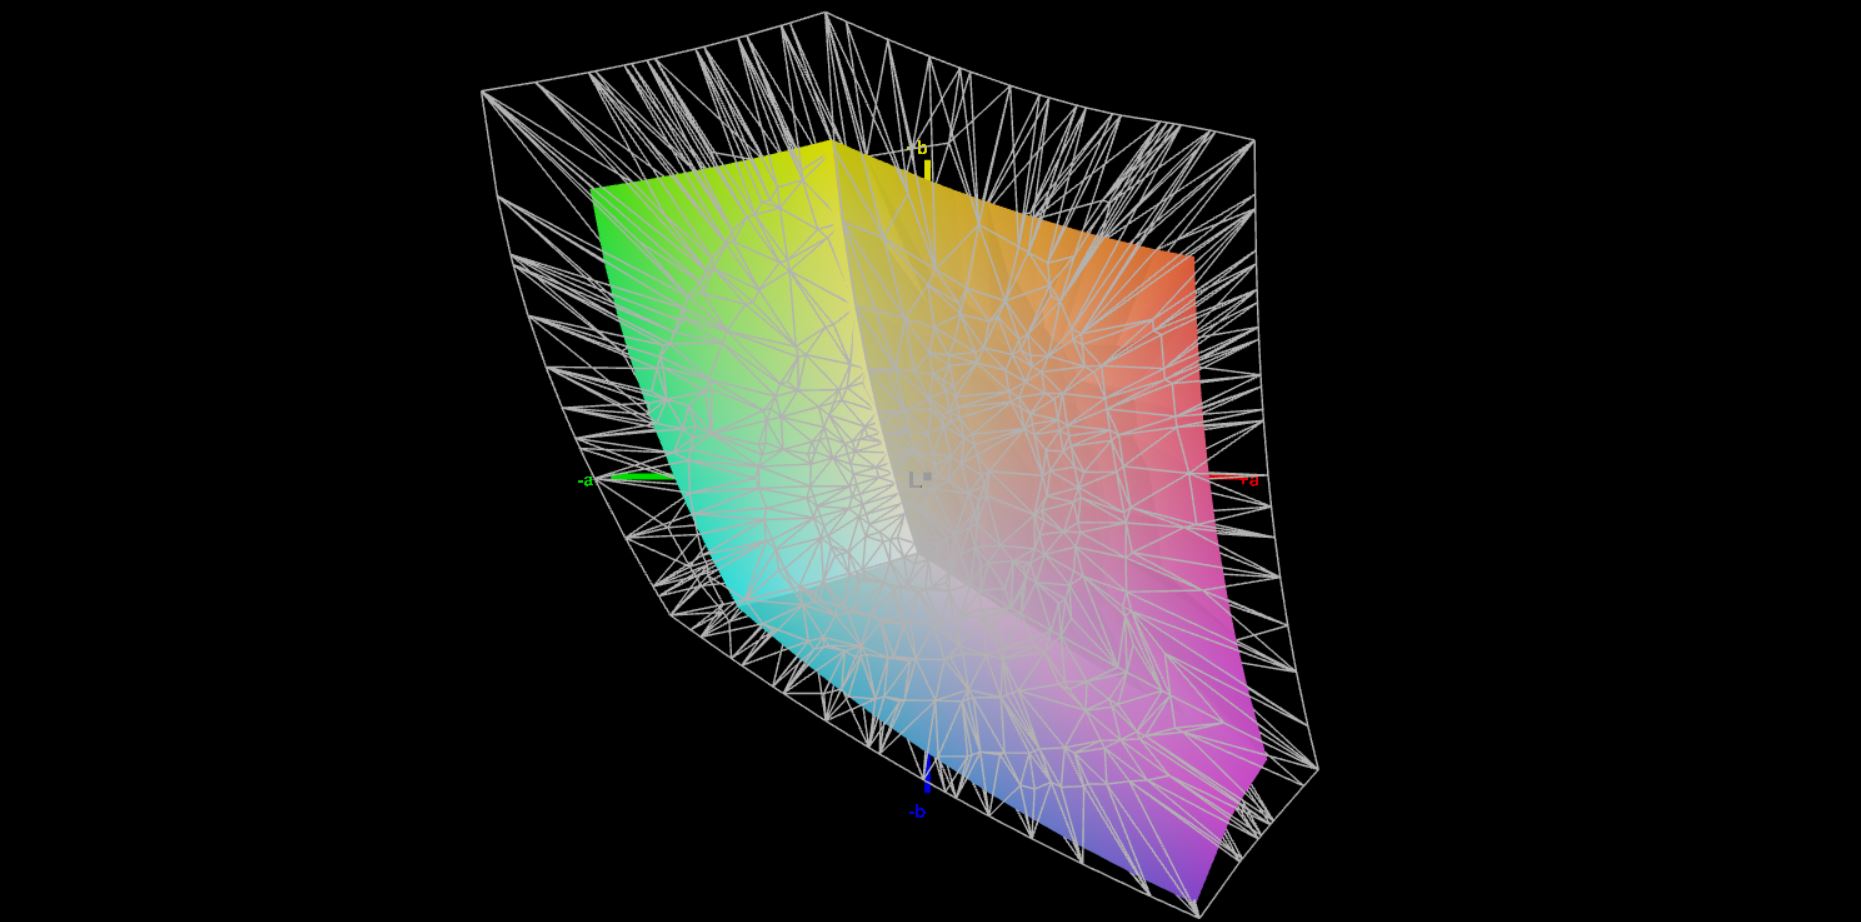
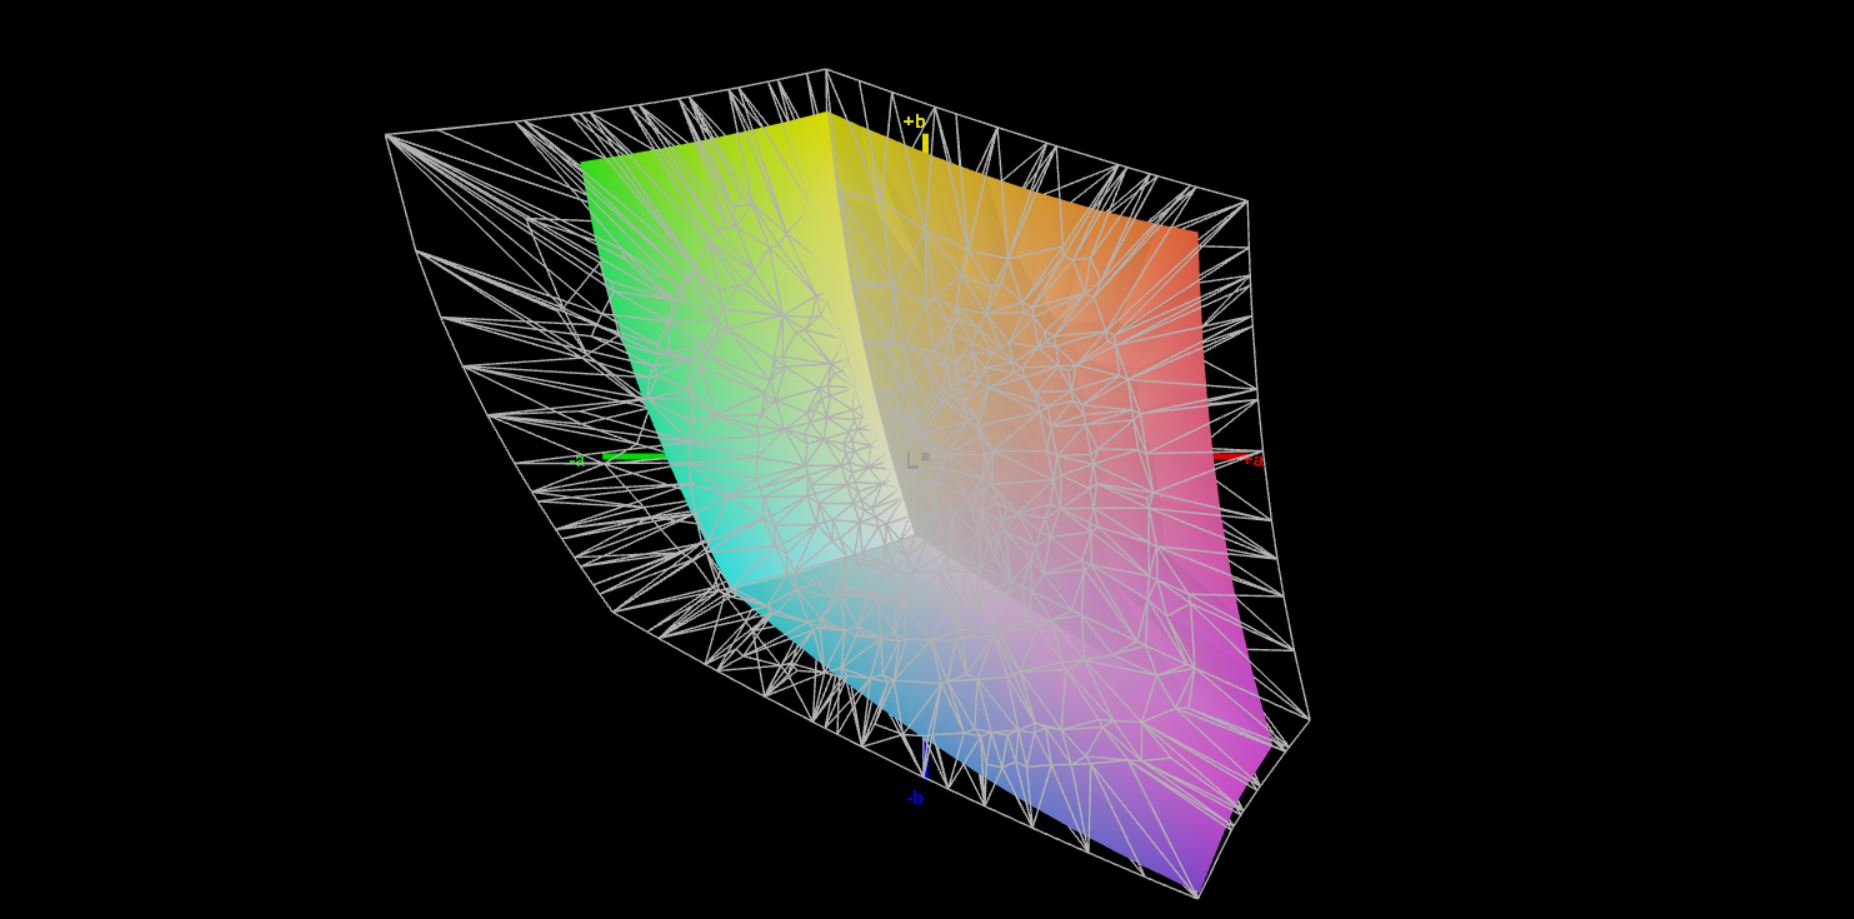
The panel is already very well calibrated ex-works and even editing pictures/videos is reasonably possible thanks to the almost complete sRGB. The viewing angle stability of the IPS display is good.
| |||||||||||||||||||||||||
Brightness Distribution: 84 %
Center on Battery: 294 cd/m²
Contrast: 1395:1 (Black: 0.21 cd/m²)
ΔE Color 2.1 | 0.5-29.43 Ø5, calibrated: 0.7
ΔE Greyscale 3.5 | 0.57-98 Ø5.3
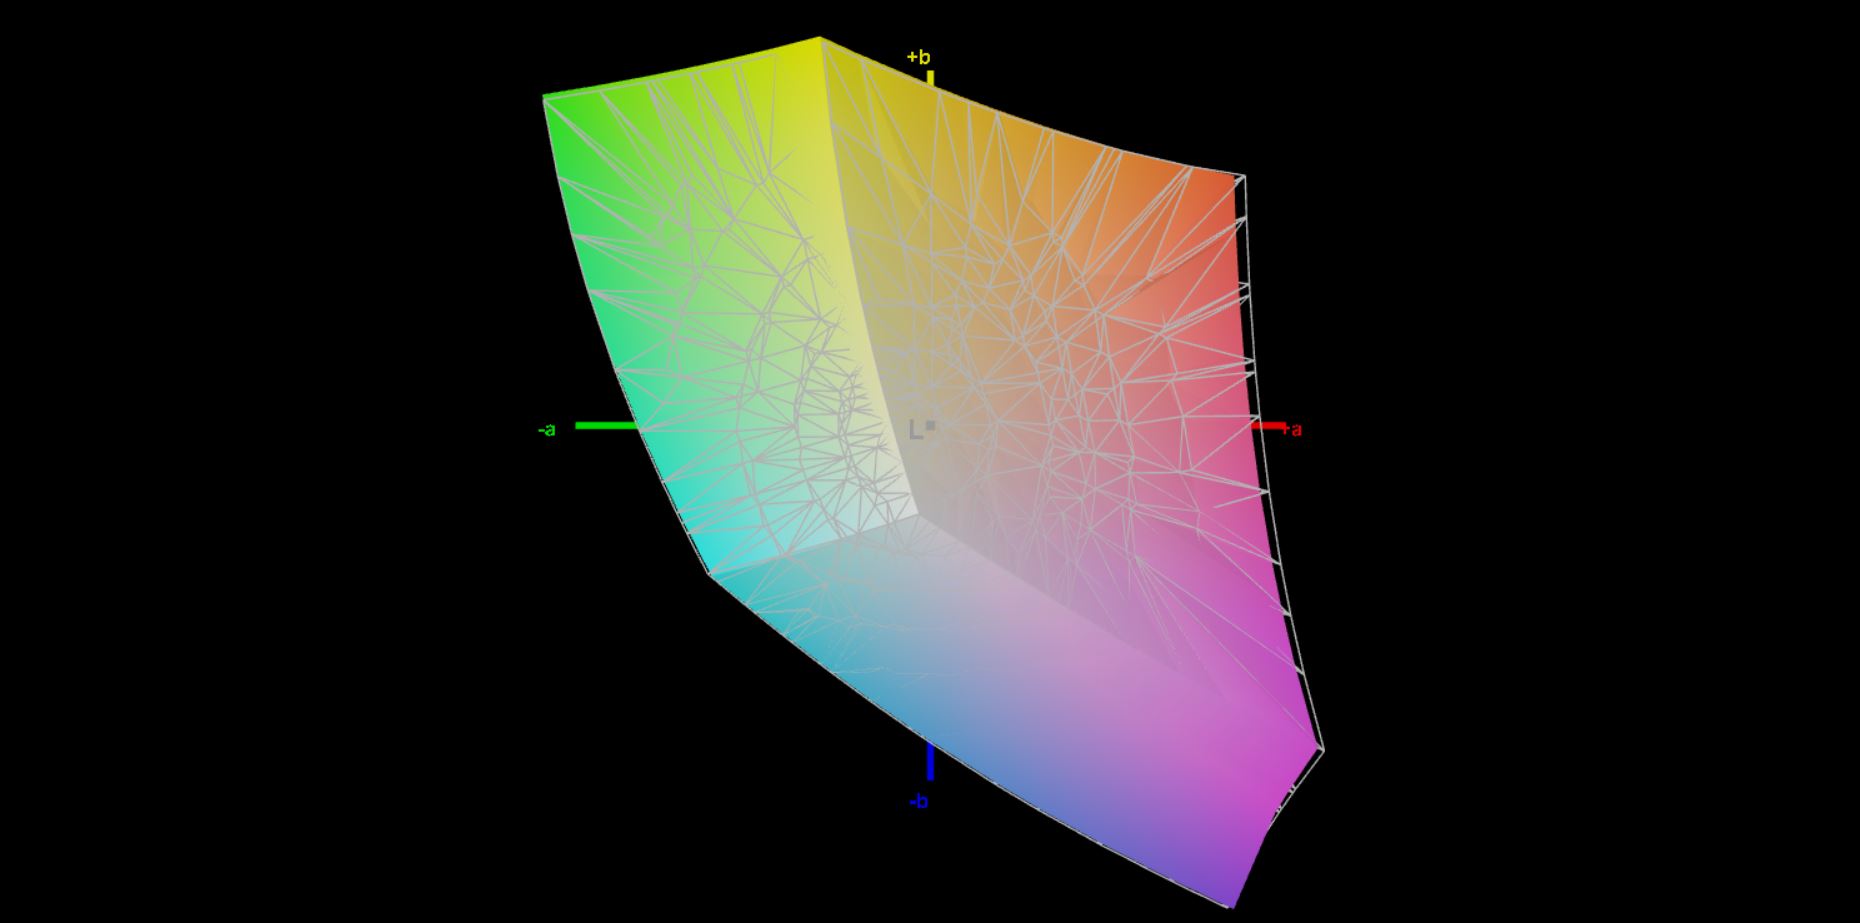
67.8% AdobeRGB 1998 (Argyll 2.2.0 3D)
98.1% sRGB (Argyll 2.2.0 3D)
65.6% Display P3 (Argyll 2.2.0 3D)
Gamma: 2.21
| Teclast TBOLT F15 Pro N156HCA-EN1, IPS, 1920x1080, 15.60 | Huawei MateBook D 15-53010TUY AU Optronics AUO28ED, IPS, 1920x1080, 15.60 | Lenovo V15-ADA 82C7009SGE Chi Mei CMN15F5, TN, 1920x1080, 15.60 | Dell Inspiron 15 5000 5502 BOE NV15N3D, IPS, 1920x1080, 15.60 | |
|---|---|---|---|---|
| Display | -38% | -43% | -40% | |
| Display P3 Coverage | 65.6 | 40.49 -38% | 37.13 -43% | 39.42 -40% |
| sRGB Coverage | 98.1 | 60.9 -38% | 55.8 -43% | 58.7 -40% |
| AdobeRGB 1998 Coverage | 67.8 | 41.84 -38% | 38.36 -43% | 40.73 -40% |
| Response Times | -13% | 41% | -26% | |
| Response Time Grey 50% / Grey 80% * | 39.6 ? | 43.6 ? -10% | 26 ? 34% | 45.6 ? -15% |
| Response Time Black / White * | 26.8 ? | 31.2 ? -16% | 14 ? 48% | 36.4 ? -36% |
| PWM Frequency | 1020 ? | |||
| Screen | -98% | -105% | -128% | |
| Brightness middle | 293 | 271 -8% | 232 -21% | 233.1 -20% |
| Brightness | 266 | 256 -4% | 211 -21% | 226 -15% |
| Brightness Distribution | 84 | 90 7% | 82 -2% | 90 7% |
| Black Level * | 0.21 | 0.15 29% | 0.41 -95% | 0.21 -0% |
| Contrast | 1395 | 1807 30% | 566 -59% | 1110 -20% |
| Colorchecker dE 2000 * | 2.1 | 4.7 -124% | 6.83 -225% | 5.69 -171% |
| Colorchecker dE 2000 max. * | 5 | 20.4 -308% | 18.77 -275% | 20.62 -312% |
| Colorchecker dE 2000 calibrated * | 0.7 | 4.6 -557% | 5.12 -631% | |
| Greyscale dE 2000 * | 3.5 | 1.6 54% | 8.52 -143% | 3.3 6% |
| Gamma | 2.21 100% | 2.17 101% | 2.45 90% | 2.35 94% |
| CCT | 6681 97% | 6649 98% | 9753 67% | 6749 96% |
| Color Space (Percent of AdobeRGB 1998) | 38.5 | 35 | 37.1 | |
| Color Space (Percent of sRGB) | 60.6 | 56 | 58 | |
| Total Average (Program / Settings) | -50% /
-73% | -36% /
-68% | -65% /
-95% |
* ... smaller is better
Display Response Times
| ↔ Response Time Black to White | ||
|---|---|---|
| 26.8 ms ... rise ↗ and fall ↘ combined | ↗ 16 ms rise | 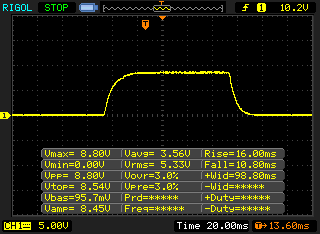 |
| ↘ 10.8 ms fall | ||
| The screen shows relatively slow response rates in our tests and may be too slow for gamers. In comparison, all tested devices range from 0.1 (minimum) to 240 (maximum) ms. » 62 % of all devices are better. This means that the measured response time is worse than the average of all tested devices (21.5 ms). | ||
| ↔ Response Time 50% Grey to 80% Grey | ||
| 39.6 ms ... rise ↗ and fall ↘ combined | ↗ 20.4 ms rise | 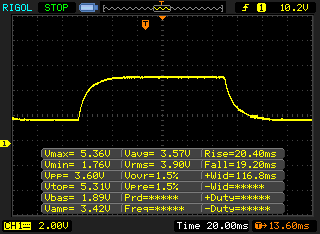 |
| ↘ 19.2 ms fall | ||
| The screen shows slow response rates in our tests and will be unsatisfactory for gamers. In comparison, all tested devices range from 0.2 (minimum) to 636 (maximum) ms. » 55 % of all devices are better. This means that the measured response time is worse than the average of all tested devices (33.7 ms). | ||
Screen Flickering / PWM (Pulse-Width Modulation)
| Screen flickering / PWM not detected |  | ||
In comparison: 53 % of all tested devices do not use PWM to dim the display. If PWM was detected, an average of 17924 (minimum: 5 - maximum: 3846000) Hz was measured. | |||
Screenshots CalMAN measurement
Performance, emissions and battery life
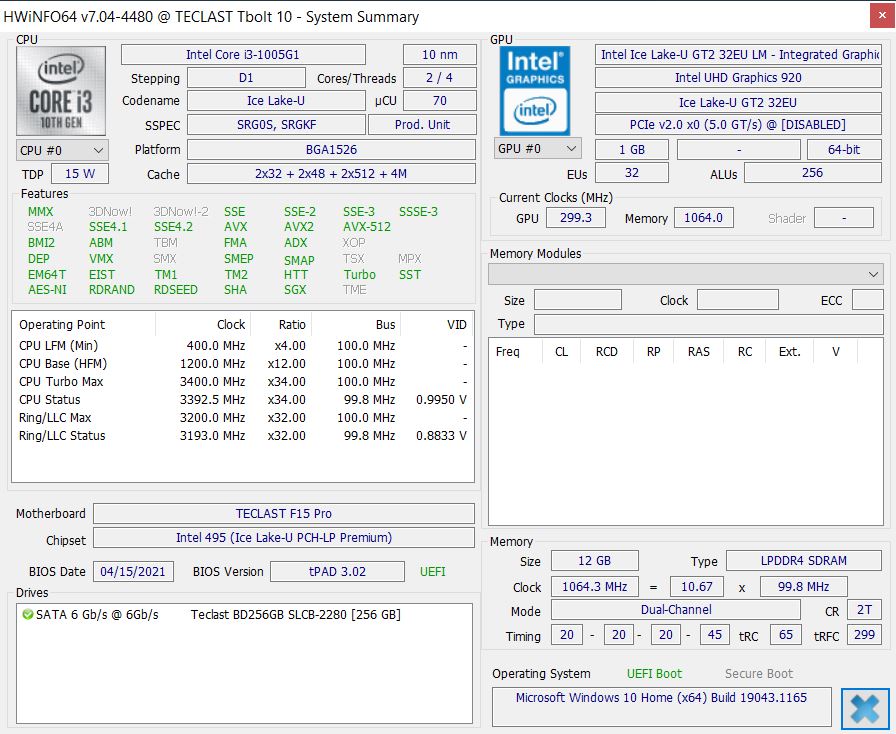
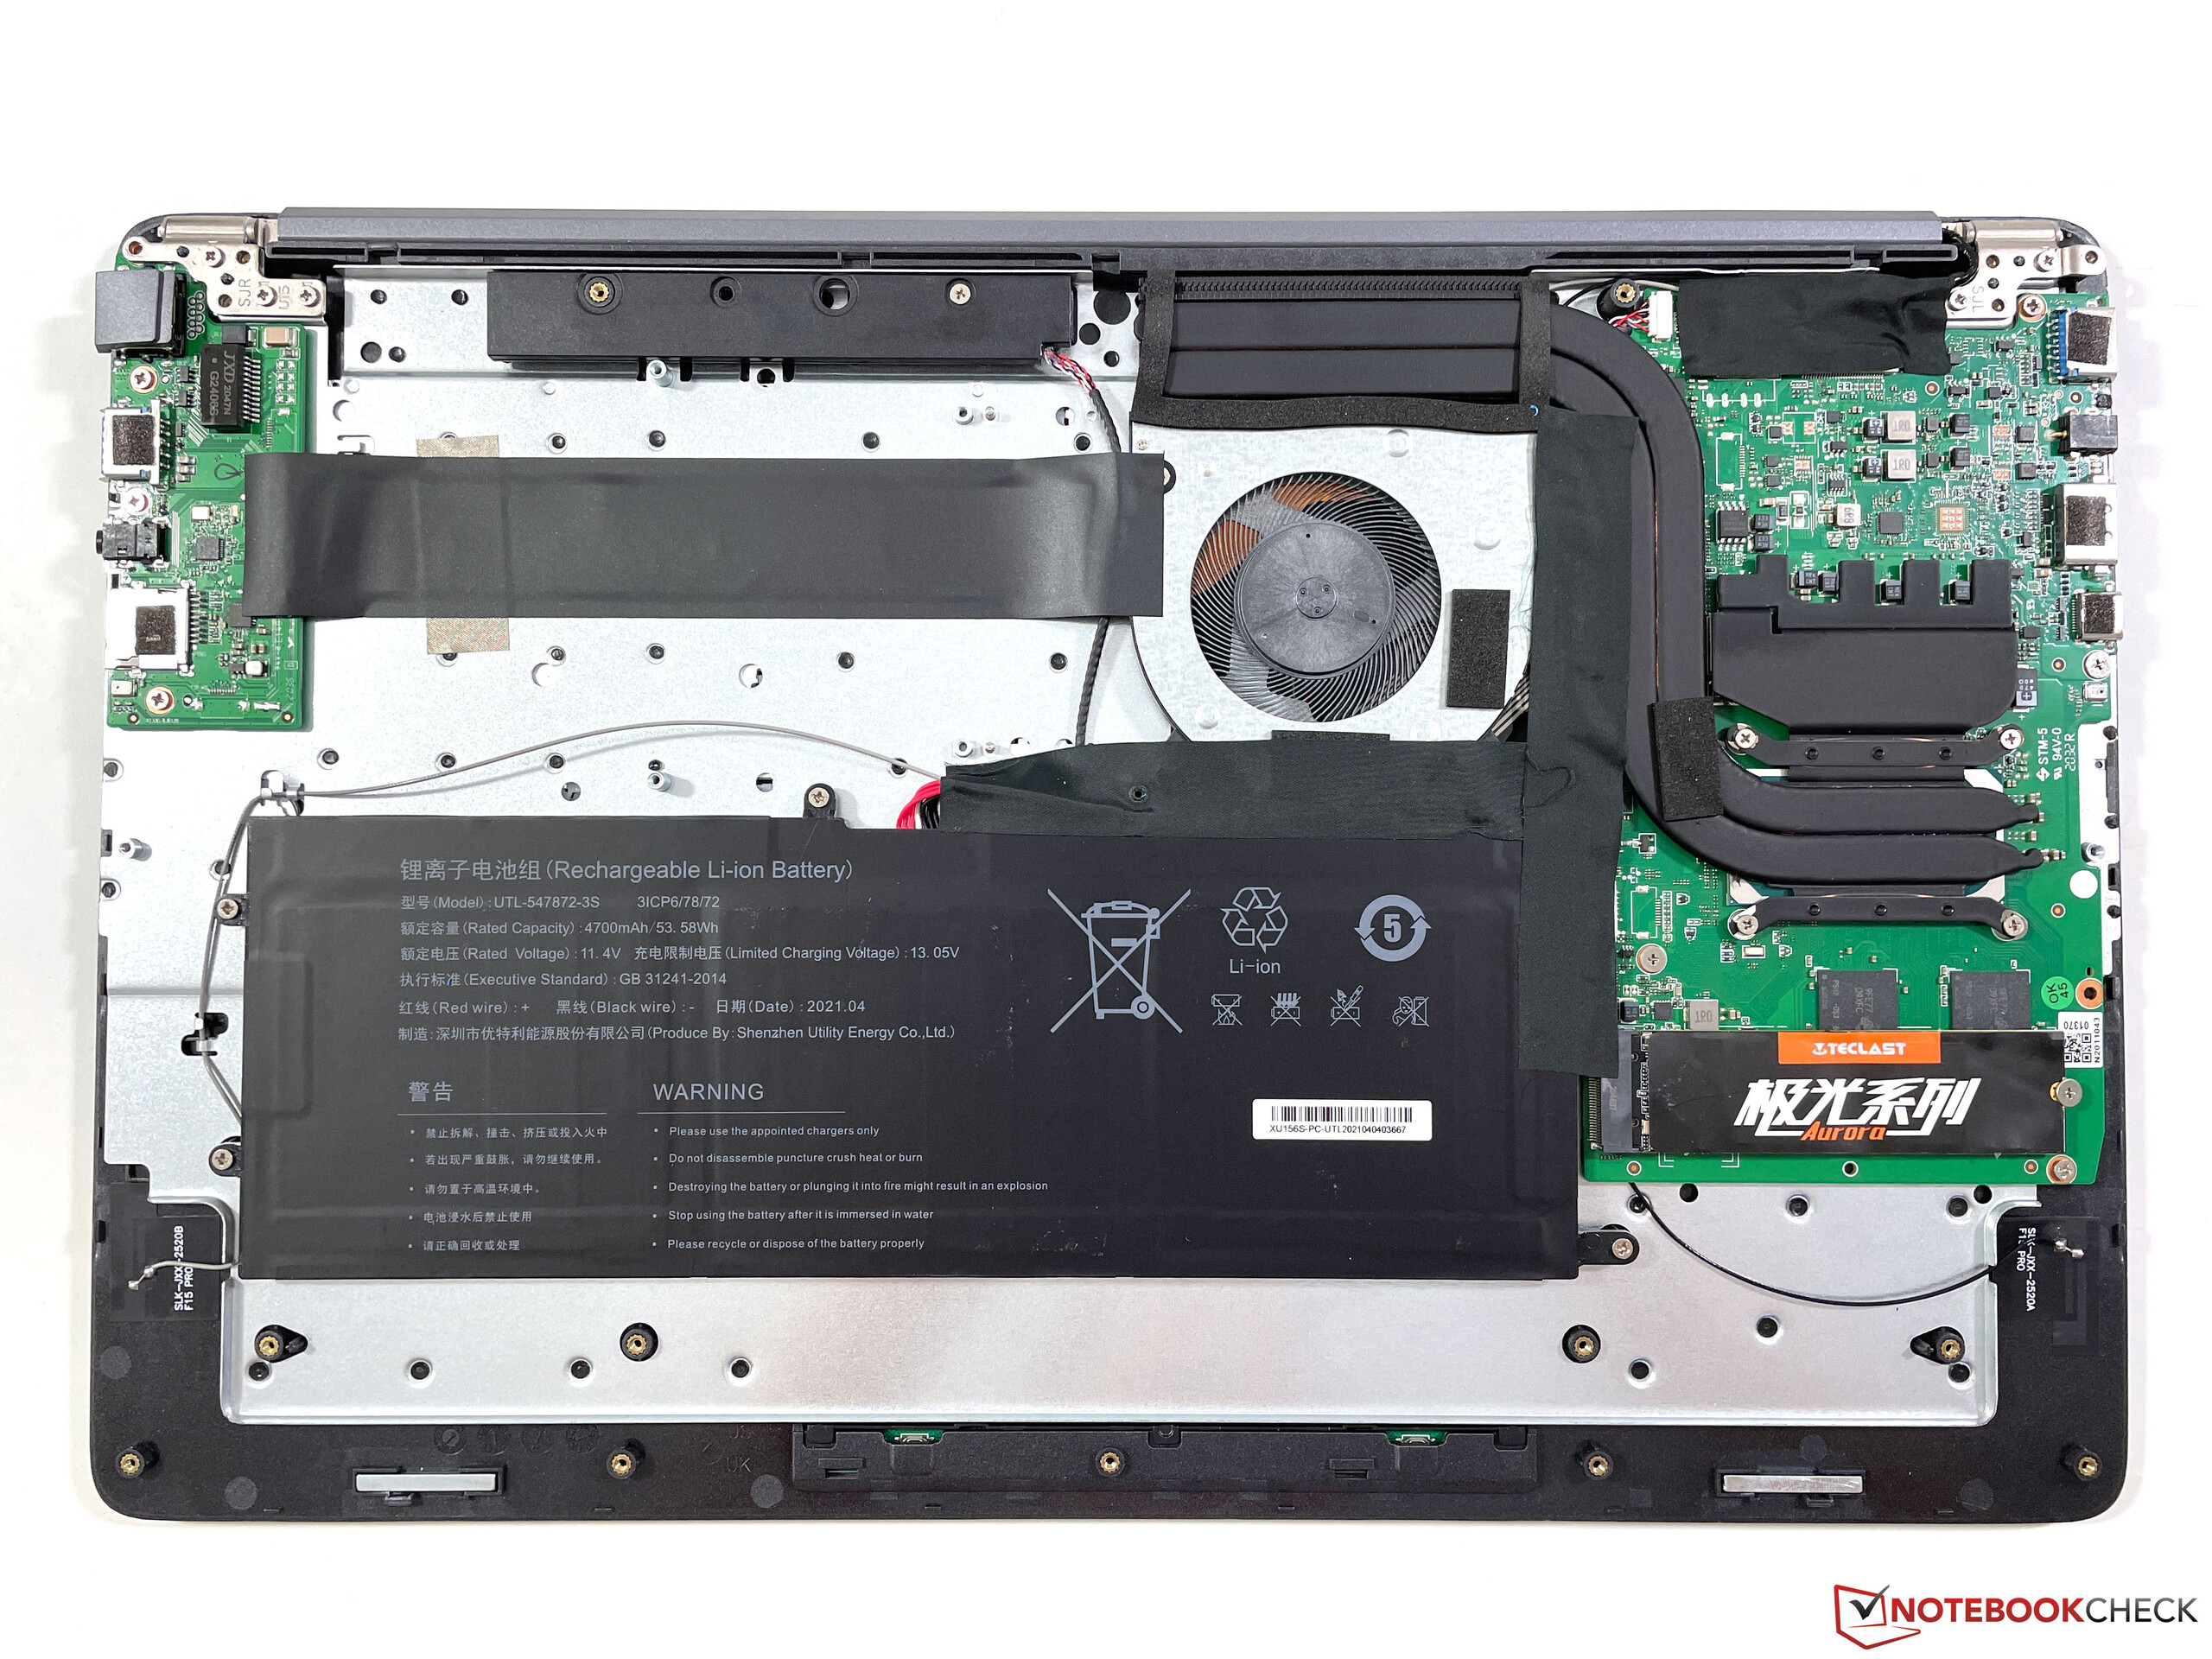
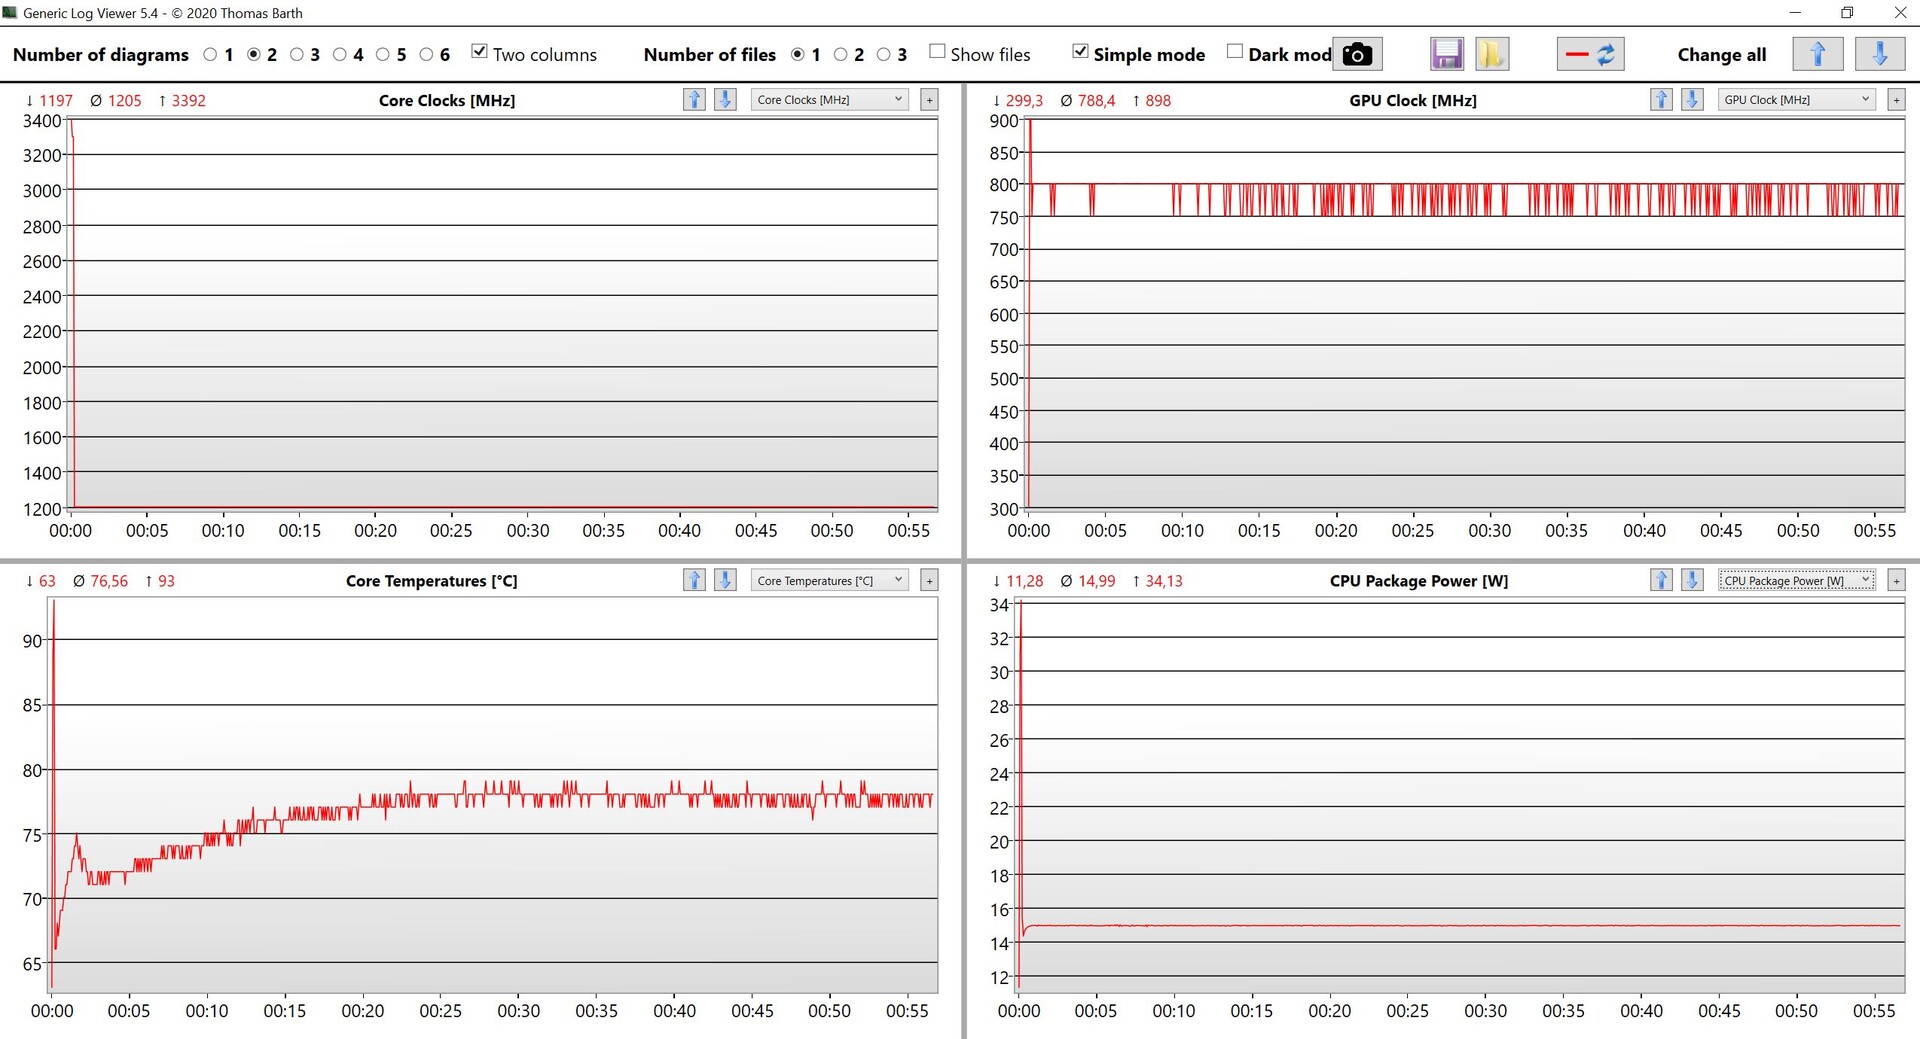
The Intel Core i3-1005G1 is still from the Ice Lake generation and offers 2 cores (4 threads) with a maximum clock of 3.4 GHz. The TDP is very briefly 34 watts and then immediately drops to 15 watts. The performance is accordingly very weak for the year 2021. The subjective operation is also smooth thanks to the M.2 SSD (SATA-III). The F15 Pro is hardly suitable for gaming, but the integrated GPU from Intel easily copes with everyday things like video playback (even 4K). However, the speakers are below average and we recommend external speakers or headphones.
There is a fan, but you can hardly hear it even under load. In return, the surface temperatures are quite high under load, but there are no problems in everyday use.
Idle consumption is a bit high and you should not expect too much in terms of battery life either; our WLAN test with a brightness of 150 cd/m² only runs for just under 6 hours.
Cinebench R15 Multi Endurance test
Cinebench R20: CPU (Multi Core) | CPU (Single Core)
Cinebench R15: CPU Multi 64Bit | CPU Single 64Bit
Blender: v2.79 BMW27 CPU
7-Zip 18.03: 7z b 4 | 7z b 4 -mmt1
Geekbench 5.5: Multi-Core | Single-Core
HWBOT x265 Benchmark v2.2: 4k Preset
LibreOffice : 20 Documents To PDF
R Benchmark 2.5: Overall mean
| Cinebench R23 / Multi Core | |
| Average of class Office (1056 - 15743, n=122, last 2 years) | |
| Average Intel Core i3-1005G1 (2135 - 2636, n=4) | |
| Teclast TBOLT F15 Pro | |
| Cinebench R23 / Single Core | |
| Average of class Office (529 - 1995, n=121, last 2 years) | |
| Average Intel Core i3-1005G1 (1046 - 1061, n=4) | |
| Teclast TBOLT F15 Pro | |
| Cinebench R20 / CPU (Multi Core) | |
| Average of class Office (356 - 5904, n=120, last 2 years) | |
| Huawei MateBook D 15-53010TUY | |
| Dell Inspiron 15 5000 5502 | |
| Average Intel Core i3-1005G1 (820 - 1015, n=7) | |
| Teclast TBOLT F15 Pro | |
| Lenovo V15-ADA 82C7009SGE | |
| Cinebench R20 / CPU (Single Core) | |
| Average of class Office (181.3 - 764, n=120, last 2 years) | |
| Dell Inspiron 15 5000 5502 | |
| Teclast TBOLT F15 Pro | |
| Average Intel Core i3-1005G1 (338 - 407, n=7) | |
| Huawei MateBook D 15-53010TUY | |
| Lenovo V15-ADA 82C7009SGE | |
| Cinebench R15 / CPU Multi 64Bit | |
| Average of class Office (160.8 - 2642, n=120, last 2 years) | |
| Huawei MateBook D 15-53010TUY | |
| Average Intel Core i3-1005G1 (346 - 407, n=6) | |
| Dell Inspiron 15 5000 5502 | |
| Lenovo V15-ADA 82C7009SGE | |
| Teclast TBOLT F15 Pro | |
| Cinebench R15 / CPU Single 64Bit | |
| Average of class Office (82.6 - 284, n=118, last 2 years) | |
| Dell Inspiron 15 5000 5502 | |
| Average Intel Core i3-1005G1 (148 - 160, n=6) | |
| Teclast TBOLT F15 Pro | |
| Huawei MateBook D 15-53010TUY | |
| Lenovo V15-ADA 82C7009SGE | |
| Blender / v2.79 BMW27 CPU | |
| Teclast TBOLT F15 Pro | |
| Lenovo V15-ADA 82C7009SGE | |
| Average Intel Core i3-1005G1 (1123 - 1388, n=7) | |
| Dell Inspiron 15 5000 5502 | |
| Huawei MateBook D 15-53010TUY | |
| Average of class Office (214 - 2844, n=121, last 2 years) | |
| 7-Zip 18.03 / 7z b 4 | |
| Average of class Office (4226 - 62349, n=121, last 2 years) | |
| Huawei MateBook D 15-53010TUY | |
| Dell Inspiron 15 5000 5502 | |
| Average Intel Core i3-1005G1 (9731 - 11135, n=7) | |
| Teclast TBOLT F15 Pro | |
| Lenovo V15-ADA 82C7009SGE | |
| 7-Zip 18.03 / 7z b 4 -mmt1 | |
| Average of class Office (2233 - 6687, n=121, last 2 years) | |
| Dell Inspiron 15 5000 5502 | |
| Average Intel Core i3-1005G1 (3851 - 4057, n=7) | |
| Teclast TBOLT F15 Pro | |
| Huawei MateBook D 15-53010TUY | |
| Lenovo V15-ADA 82C7009SGE | |
| Geekbench 5.5 / Multi-Core | |
| Average of class Office (1018 - 11980, n=122, last 2 years) | |
| Huawei MateBook D 15-53010TUY | |
| Teclast TBOLT F15 Pro | |
| Dell Inspiron 15 5000 5502 | |
| Average Intel Core i3-1005G1 (2153 - 2595, n=6) | |
| Lenovo V15-ADA 82C7009SGE | |
| Geekbench 5.5 / Single-Core | |
| Average of class Office (510 - 1974, n=122, last 2 years) | |
| Dell Inspiron 15 5000 5502 | |
| Teclast TBOLT F15 Pro | |
| Average Intel Core i3-1005G1 (1118 - 1194, n=6) | |
| Huawei MateBook D 15-53010TUY | |
| Lenovo V15-ADA 82C7009SGE | |
| HWBOT x265 Benchmark v2.2 / 4k Preset | |
| Average of class Office (1.55 - 17.4, n=120, last 2 years) | |
| Huawei MateBook D 15-53010TUY | |
| Dell Inspiron 15 5000 5502 | |
| Average Intel Core i3-1005G1 (2.42 - 3.59, n=7) | |
| Teclast TBOLT F15 Pro | |
| Lenovo V15-ADA 82C7009SGE | |
| LibreOffice / 20 Documents To PDF | |
| Lenovo V15-ADA 82C7009SGE | |
| Teclast TBOLT F15 Pro | |
| Average Intel Core i3-1005G1 (55.8 - 81.7, n=6) | |
| Dell Inspiron 15 5000 5502 | |
| Average of class Office (31.3 - 117.5, n=120, last 2 years) | |
| R Benchmark 2.5 / Overall mean | |
| Lenovo V15-ADA 82C7009SGE | |
| Teclast TBOLT F15 Pro | |
| Average Intel Core i3-1005G1 (0.746 - 0.763, n=6) | |
| Huawei MateBook D 15-53010TUY | |
| Dell Inspiron 15 5000 5502 | |
| Average of class Office (0.4244 - 1.397, n=119, last 2 years) | |
* ... smaller is better
| PCMark 10 / Score | |
| Average of class Office (2325 - 7157, n=105, last 2 years) | |
| Dell Inspiron 15 5000 5502 | |
| Huawei MateBook D 15-53010TUY | |
| Teclast TBOLT F15 Pro | |
| Average Intel Core i3-1005G1, Intel UHD Graphics G1 (Ice Lake 32 EU) (3386 - 3562, n=6) | |
| Lenovo V15-ADA 82C7009SGE | |
| DPC Latencies / LatencyMon - interrupt to process latency (max), Web, Youtube, Prime95 | |
| Lenovo V15-ADA 82C7009SGE | |
| Dell Inspiron 15 5000 5502 | |
| Teclast TBOLT F15 Pro | |
* ... smaller is better
| Teclast TBOLT F15 Pro Teclast BD256GB | Huawei MateBook D 15-53010TUY Samsung SSD PM981 MZVLB256HAHQ | Lenovo V15-ADA 82C7009SGE WDC PC SN530 SDBPMPZ-265G | Dell Inspiron 15 5000 5502 Toshiba BG4 KBG40ZNS128G | Average Teclast BD256GB | Average of class Office | |
|---|---|---|---|---|---|---|
| CrystalDiskMark 5.2 / 6 | 182% | 98% | 38% | 0% | 294% | |
| Write 4K | 109.4 | 134.8 23% | 124.8 14% | 138.5 27% | 109.4 ? 0% | 158.7 ? 45% |
| Read 4K | 38.89 | 41.68 7% | 43.56 12% | 41.98 8% | 38.9 ? 0% | 61.7 ? 59% |
| Write Seq | 405.2 | 1651 307% | 977 141% | 213.5 -47% | 405 ? 0% | 2427 ? 499% |
| Read Seq | 529 | 2300 335% | 1685 219% | 1289 144% | 529 ? 0% | 2611 ? 394% |
| Write 4K Q32T1 | 284.2 | 260 -9% | 185.9 -35% | 157.8 -44% | 284 ? 0% | 400 ? 41% |
| Read 4K Q32T1 | 337.8 | 335.1 -1% | 272.7 -19% | 448.9 33% | 338 ? 0% | 519 ? 54% |
| Write Seq Q32T1 | 436.5 | 1641 276% | 971 122% | 210.5 -52% | 437 ? 0% | 3062 ? 601% |
| Read Seq Q32T1 | 560 | 3452 516% | 2424 333% | 1853 231% | 560 ? 0% | 4260 ? 661% |
| low | med. | high | ultra | |
| The Witcher 3 (2015) | 30.2 | 19.6 | 10.3 | |
| Dota 2 Reborn (2015) | 76.7 | 31.9 | 20.9 | 19.4 |
| Final Fantasy XV Benchmark (2018) | 15.4 | 7.68 | 7.68 | |
| X-Plane 11.11 (2018) | 28.1 | 13.7 | 12.9 |
Noise emissions
Noise Level
| Idle |
| 24.2 / 24.2 / 24.2 dB(A) |
| Load |
| 24.2 / 25.3 dB(A) |
 | ||
30 dB silent 40 dB(A) audible 50 dB(A) loud |
||
min: | ||
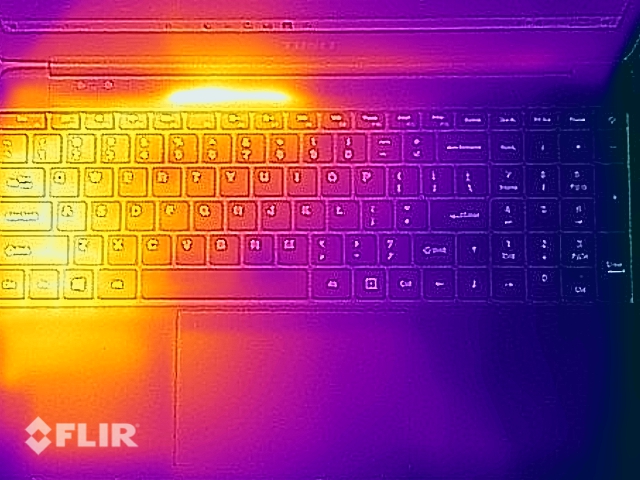
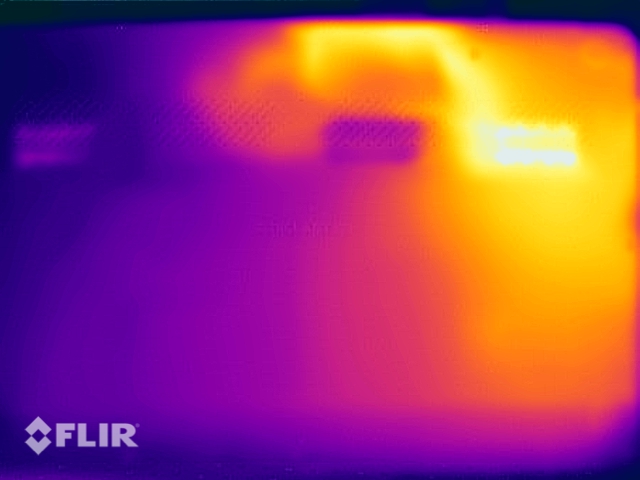
Temperature
(±) The maximum temperature on the upper side is 43.1 °C / 110 F, compared to the average of 34.2 °C / 94 F, ranging from 21.2 to 62.5 °C for the class Office.
(-) The bottom heats up to a maximum of 51.8 °C / 125 F, compared to the average of 36.7 °C / 98 F
(+) In idle usage, the average temperature for the upper side is 26.5 °C / 80 F, compared to the device average of 29.5 °C / 85 F.
(±) The palmrests and touchpad can get very hot to the touch with a maximum of 37.1 °C / 98.8 F.
(-) The average temperature of the palmrest area of similar devices was 27.7 °C / 81.9 F (-9.4 °C / -16.9 F).
Speaker
Teclast TBOLT F15 Pro audio analysis
(±) | speaker loudness is average but good (81.8 dB)
Bass 100 - 315 Hz
(-) | nearly no bass - on average 22.3% lower than median
(+) | bass is linear (5.8% delta to prev. frequency)
Mids 400 - 2000 Hz
(±) | higher mids - on average 7.4% higher than median
(±) | linearity of mids is average (8.9% delta to prev. frequency)
Highs 2 - 16 kHz
(±) | higher highs - on average 6.5% higher than median
(±) | linearity of highs is average (7.2% delta to prev. frequency)
Overall 100 - 16.000 Hz
(±) | linearity of overall sound is average (24.5% difference to median)
Compared to same class
» 68% of all tested devices in this class were better, 9% similar, 23% worse
» The best had a delta of 7%, average was 22%, worst was 53%
Compared to all devices tested
» 70% of all tested devices were better, 6% similar, 24% worse
» The best had a delta of 4%, average was 25%, worst was 134%
Huawei MateBook D 15-53010TUY audio analysis
(-) | not very loud speakers (70.2 dB)
Bass 100 - 315 Hz
(±) | reduced bass - on average 13.5% lower than median
(±) | linearity of bass is average (13.5% delta to prev. frequency)
Mids 400 - 2000 Hz
(+) | balanced mids - only 4% away from median
(+) | mids are linear (4.5% delta to prev. frequency)
Highs 2 - 16 kHz
(+) | balanced highs - only 3.7% away from median
(±) | linearity of highs is average (7.2% delta to prev. frequency)
Overall 100 - 16.000 Hz
(±) | linearity of overall sound is average (22.1% difference to median)
Compared to same class
» 71% of all tested devices in this class were better, 6% similar, 23% worse
» The best had a delta of 5%, average was 19%, worst was 53%
Compared to all devices tested
» 59% of all tested devices were better, 7% similar, 34% worse
» The best had a delta of 4%, average was 25%, worst was 134%
Energy consumption
| Off / Standby | |
| Idle | |
| Load |
|
Energy consumption Witcher 3 / Stress test
Battery life
Pros
Cons
Verdict - Only the IPS display convinces
Of course, you have to ask yourself what you can expect from a new laptop for just under 500 Euros (~$588). The Teclast F15 Pro does not show any massive weaknesses in the test and can score especially with the color-strong IPS display, which even offers full sRGB coverage. That is by no means a matter of course in this price range.
However, we are rather at the lower edge of the performance spectrum in the other disciplines. Besides the slow dual-core processor, there are also no highlights in the ports and the communication modules.
The Teclast F15 Pro covers the basic requirements and offers a decent IPS display, but all in all, there are better overall packages among the competition even in this price range.
It gets problematic when you look at the rivals. For example, there is the Huawei MateBook D 15, which offers a much better overall package for a lower price (currently around 450 Euros/~$529) depending on the configuration.
Price and availability
The Teclast F15 Pro is available at Aliexpress for around €490 (~$576).
Teclast TBOLT F15 Pro
-
09/14/2021 v7
Andreas Osthoff
Pricecompare

