 Deutsch
 English
 Español
 Français
 Italiano
 Nederlands
 Polski
 Português
 Русский
 Türkçe
 Svenska
 Chinese
 Magyar
Schenker XMG Pro 17 (Clevo PB71RD-G) Laptop Review: Temperature vs. Noise

After restructuring its online presence, Schenker Technologies devices are now available on bestware.com instead of mysn.de.
The base configuration of the XMG Pro 17 costs 1,699 Euros (~$1,849). For the price, buyers receive a Full HD panel with 144 Hz and G-Sync support, a Core i7-9750H CPU and a GeForce RTX 2060 GPU. A Core i9-9980HK and a GeForce RTX 2070 are also available at a premium. There is a particularly wide variety in terms of mass storage options, since the case comes with two M.2 slots (type 2280) and a traditional 2.5-inch bay. Two DDR4 RAM slots that can be fitted with up to 64 GB complete the package.
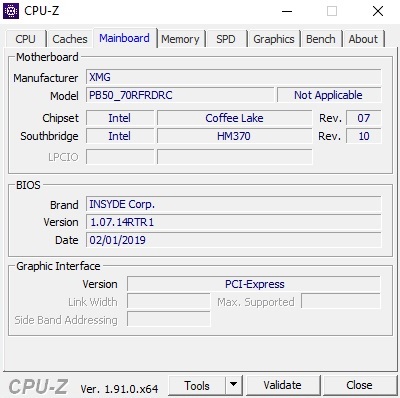
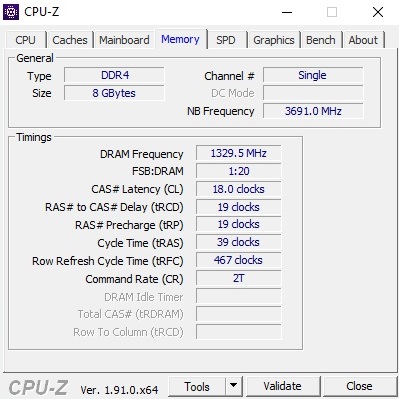
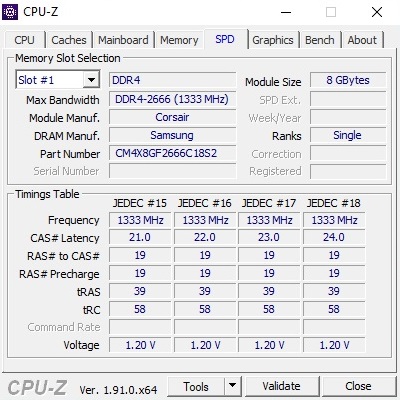
Our configuration, the exact specifications of which can be found in the datasheet below, is available for just below 1,900 Euros (~$2,068) and includes a Core i7-9750H CPU, GeForce RTX 2060 GPU, 500-GB SSD and 16 GB of DDR4 RAM. However, only 8 GB of RAM was recognized due to a bug or a defect. The frame rates of some games are adversely affected by the single-channel mode.
Competitors of the XMG Pro 17 include other 17-inch laptops with an identical CPU and GPU combination such as the Razer Blade Pro 17, Asus Strix G731GV, Lenovo Legion Y740-17IRH and the MSI GL75 9SEK. We will also list the aforementioned laptops in our comparison tables.
Rating | Date | Model | Weight | Height | Size | Resolution | Best Price |
|---|---|---|---|---|---|---|---|
| 83.2 % | 02/2020 | SCHENKER XMG Pro 17 PB71RD-G i7-9750H, GeForce RTX 2060 Mobile | 2.8 kg | 30 mm | 17.30" | 1920x1080 | |
| 89.4 % | 08/2019 | Razer Blade Pro 17 RTX 2060 i7-9750H, GeForce RTX 2060 Mobile | 2.8 kg | 19.9 mm | 17.30" | 1920x1080 | |
| 86 % | 08/2019 | Asus Strix Hero III G731GV i7-9750H, GeForce RTX 2060 Mobile | 2.9 kg | 26.2 mm | 17.30" | 1920x1080 | |
| 83.2 % | 10/2019 | Lenovo Legion Y740-17IRH i7-9750H, GeForce RTX 2060 Mobile | 3 kg | 23 mm | 17.30" | 1920x1080 | |
| 82.9 % | 10/2019 | MSI GL75 9SEK-056US i7-9750H, GeForce RTX 2060 Mobile | 2.5 kg | 28 mm | 17.30" | 1920x1080 |
Case
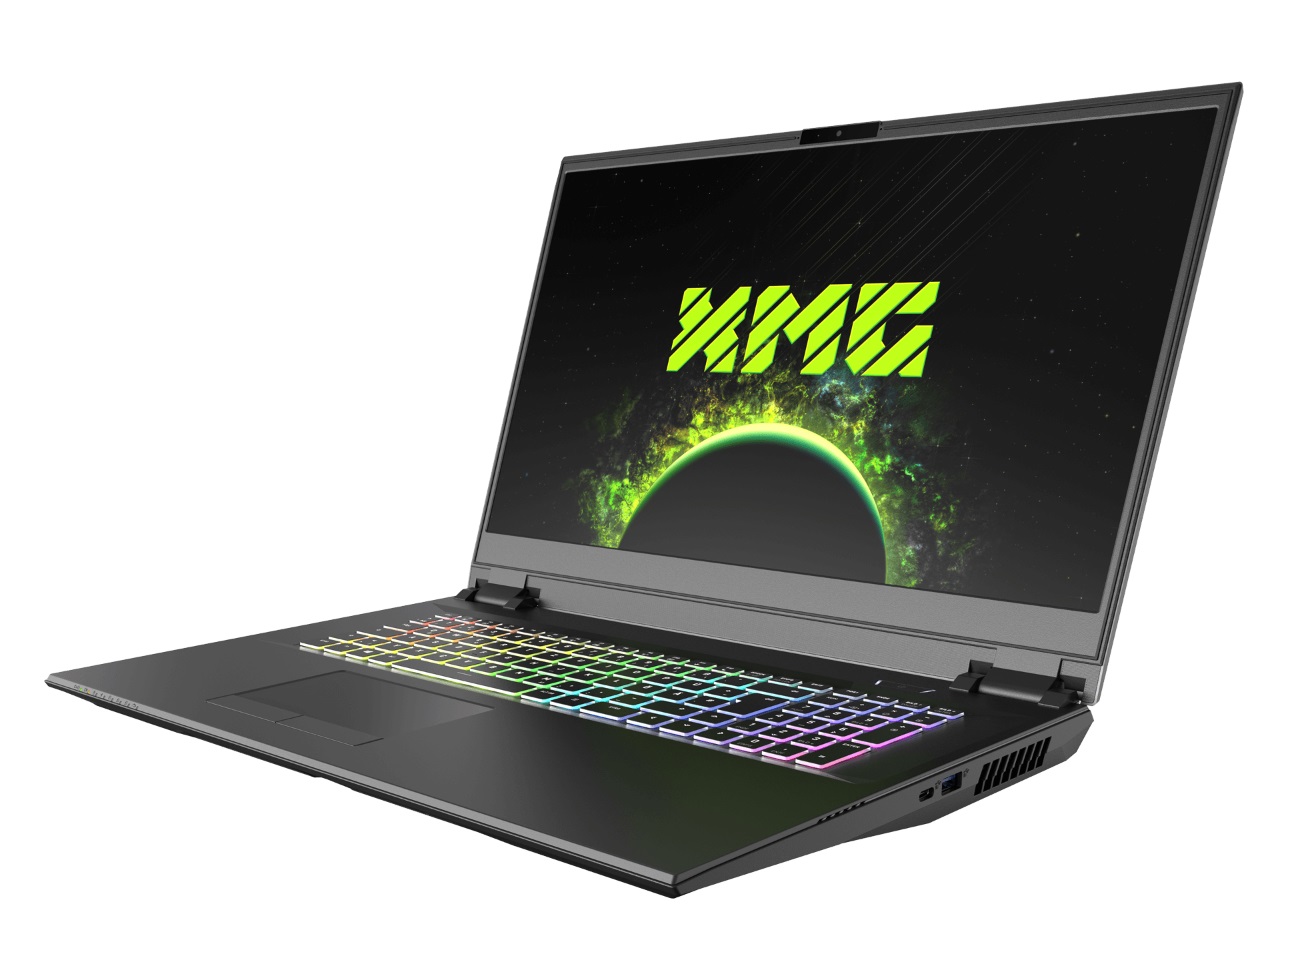
The case of the XMG Pro 17 has undergone a significant upgrade since our review from two years ago. Instead of the Clevo barebone PA71HS-G, the system is now based on the PB71RD-G chassis, which is different not only in terms of the design but also in terms of the size. Furthermore, the dimensions have shrunk from 41.9 x 28.7 cm to 39.9 x 27.5 cm to be more compact overall due to the smaller bezels. There were also improvements made when it comes to the weight. The new chassis only weighs in at 2.8 kg instead of 3.1 kg, which is still average compared to competitors.

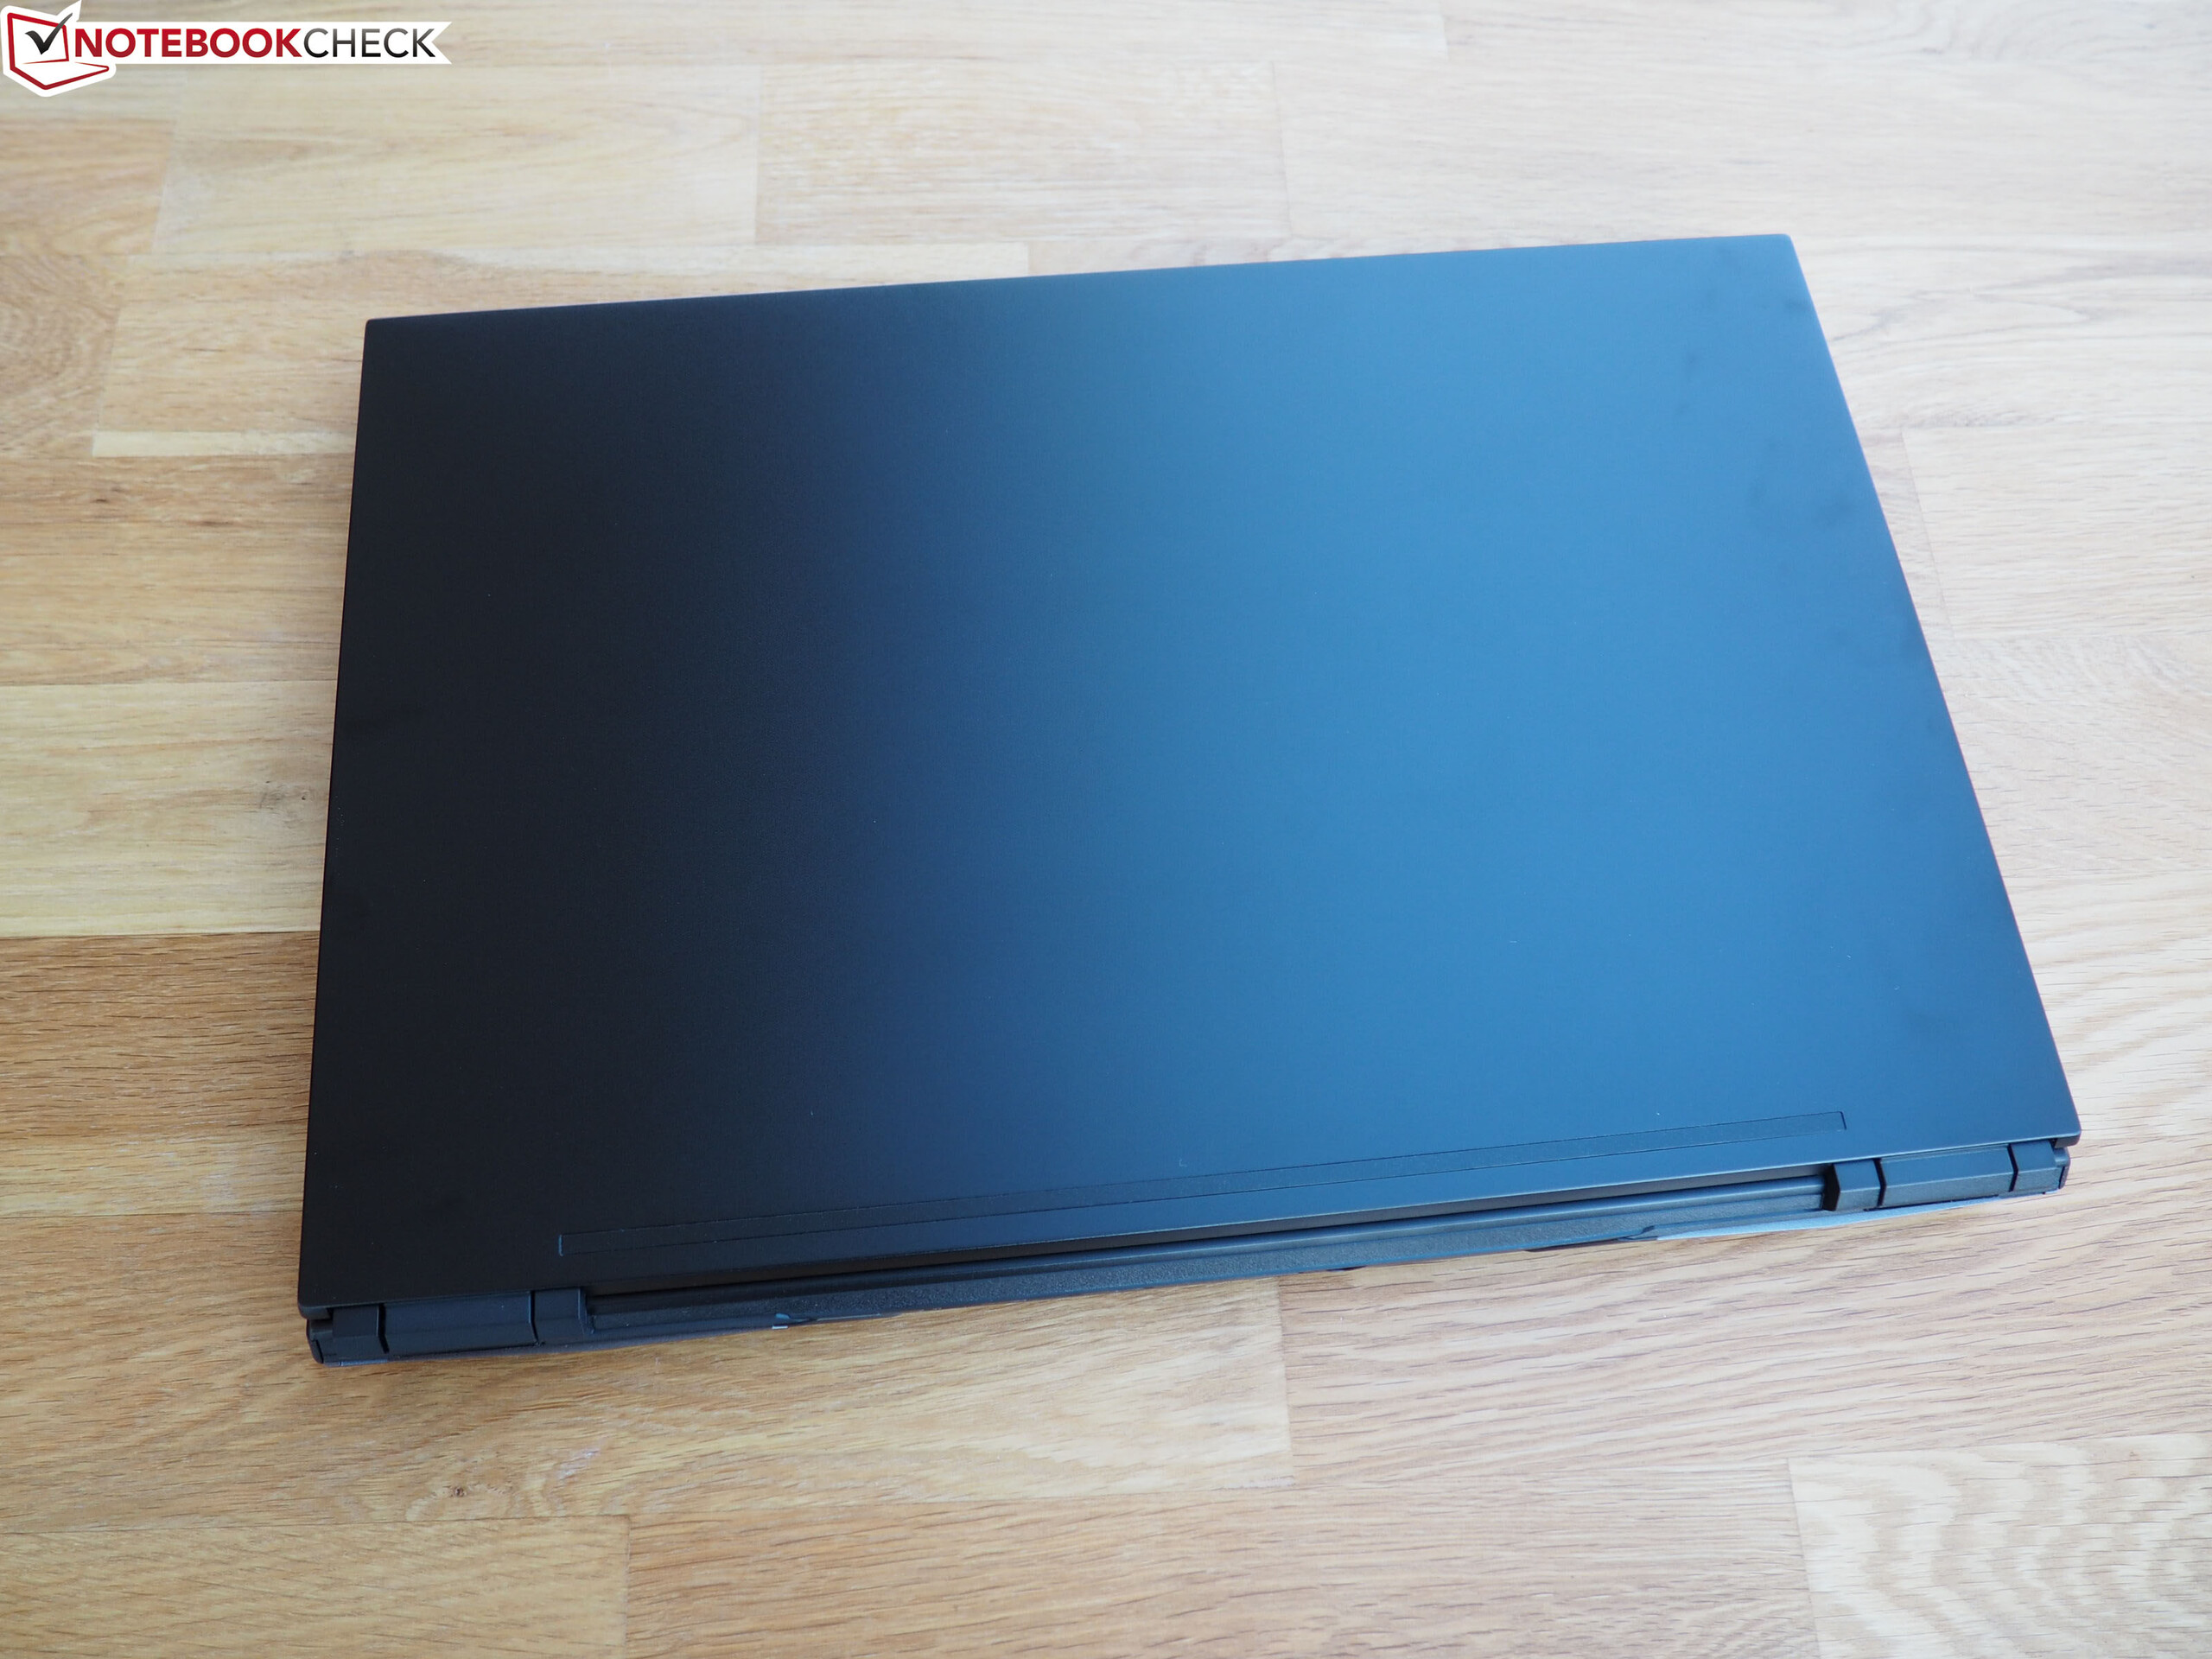
For the most part the quality of the chassis is good. Aside from the cover, the top of the base unit also consists of metal. The build quality leaves very little room for complaints. The same holds true for the rigidity, which is very solid in most areas. Only the lid (creaks when being twisted) and the center of the keyboard could have been even more rigid still. Very positive: Unlike on most other gaming laptops, the battery is accessible from the outside.
Features
Port Selection
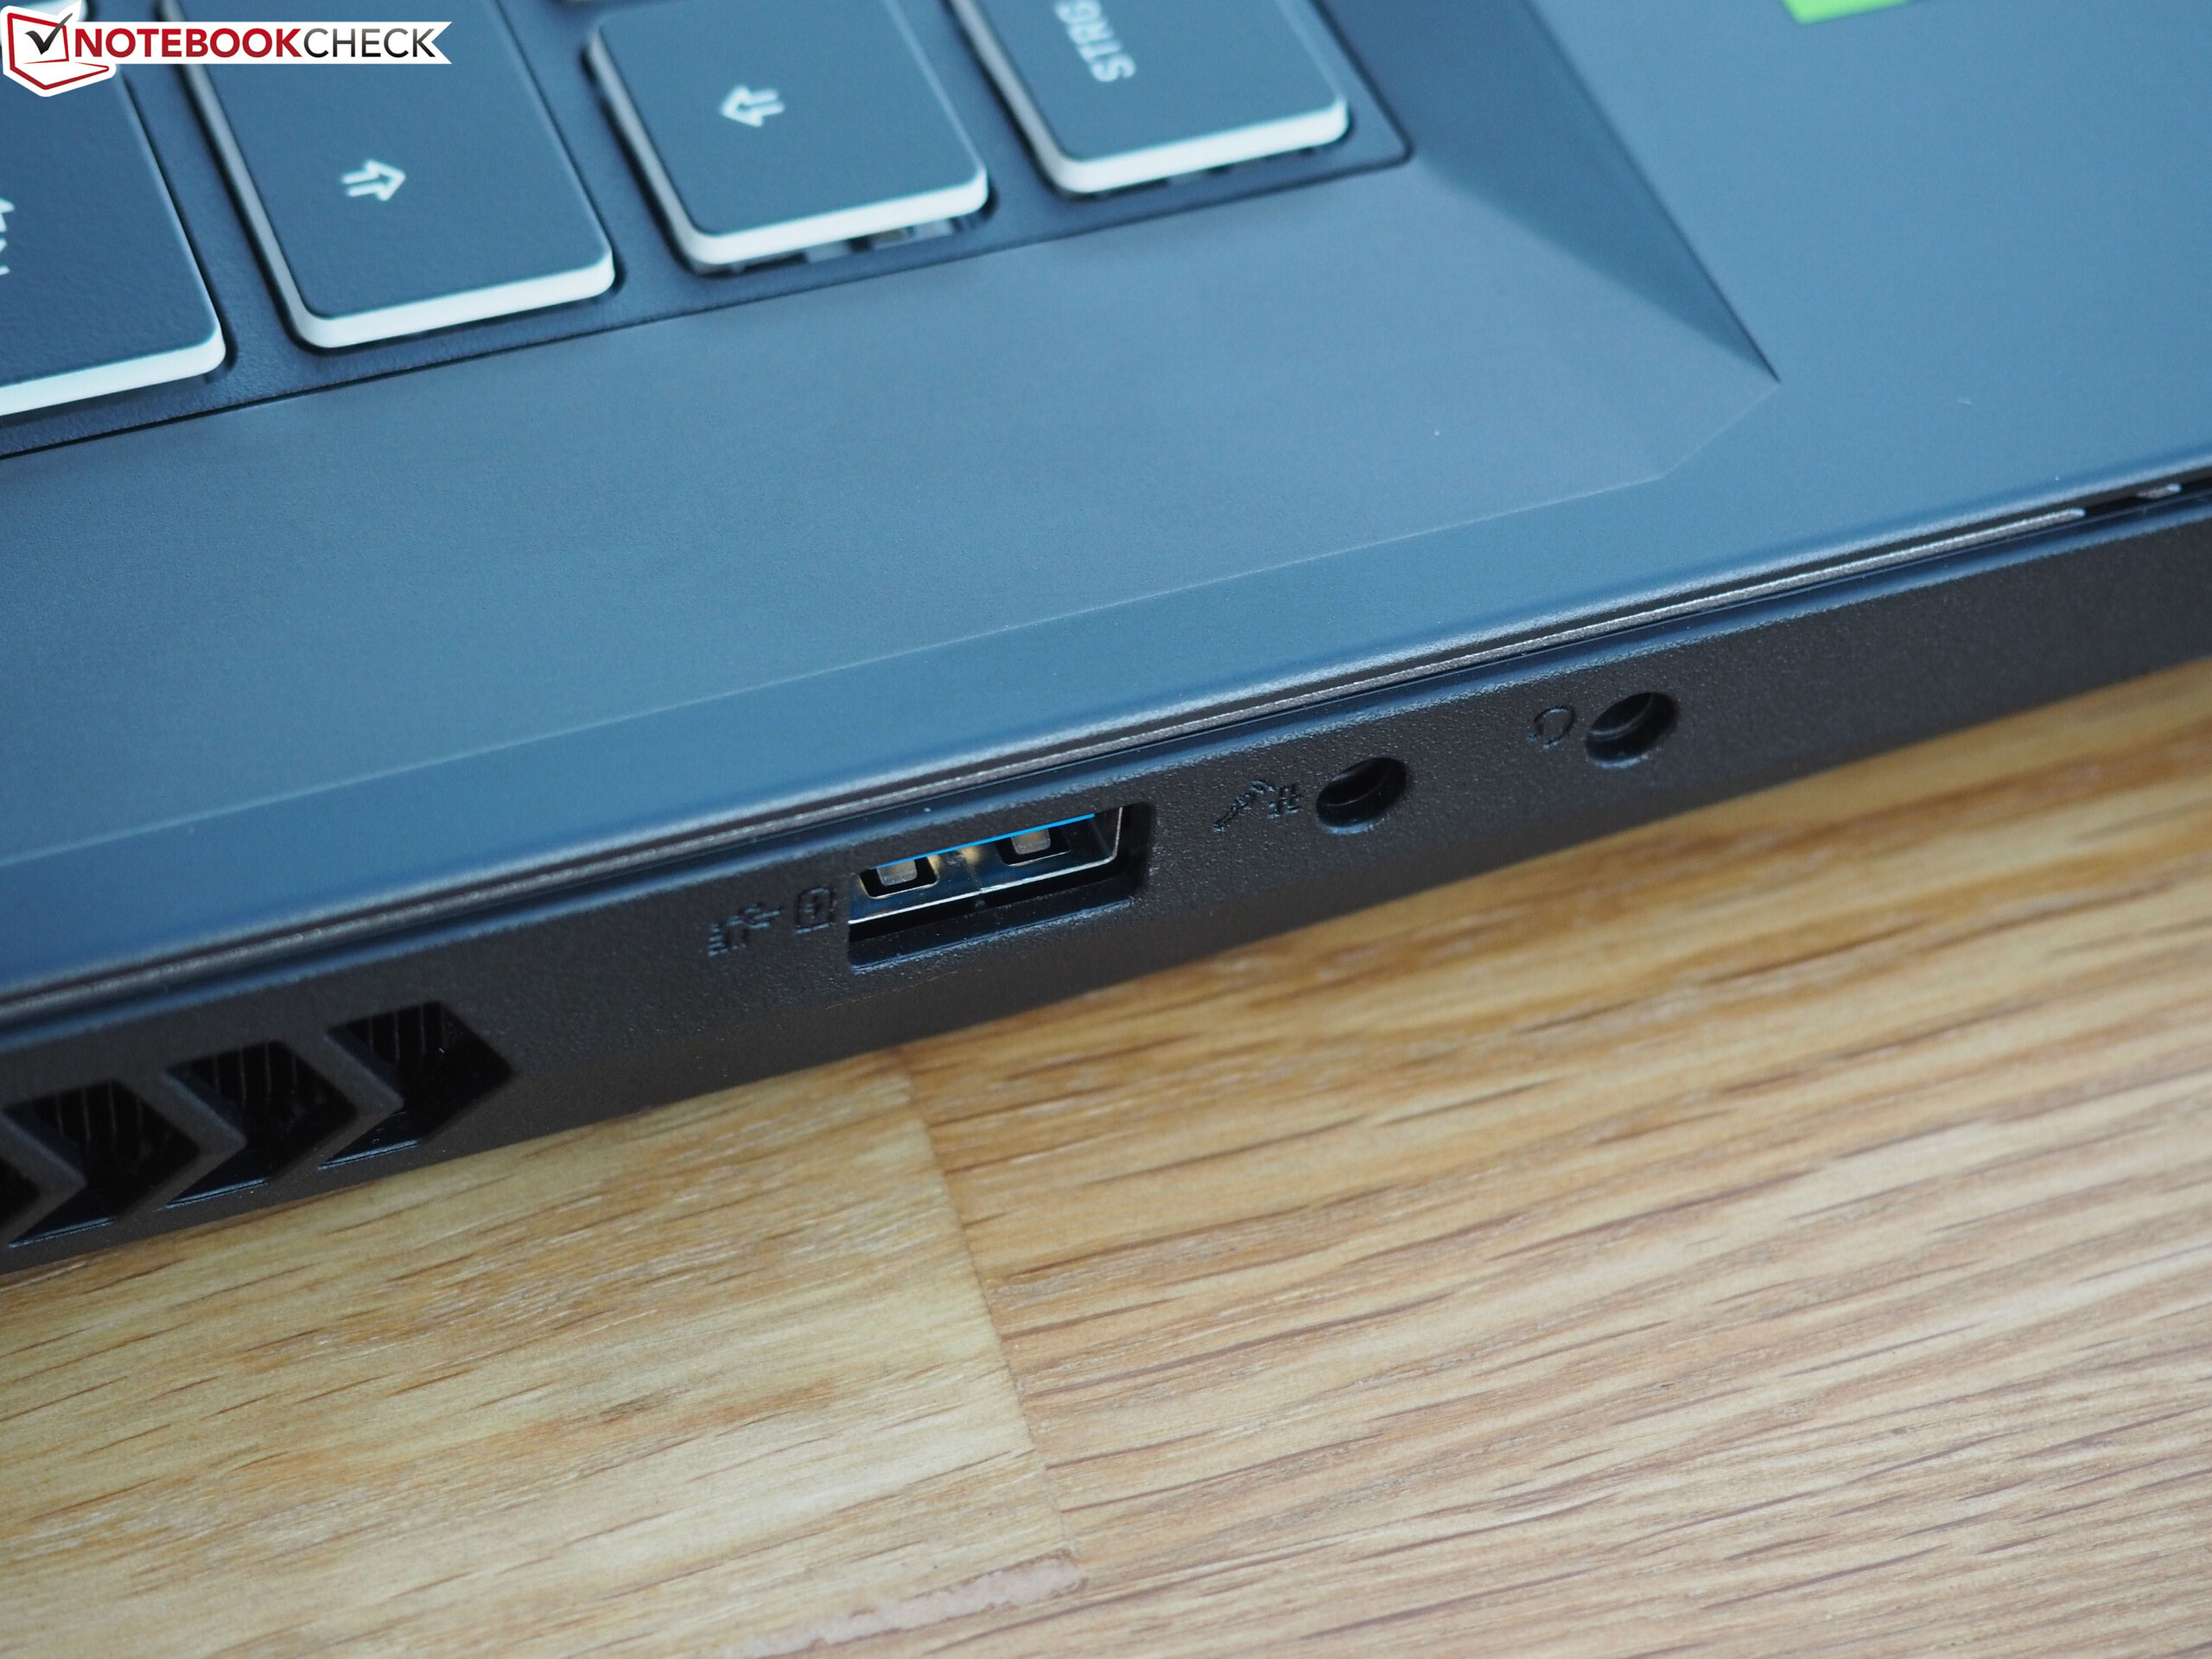
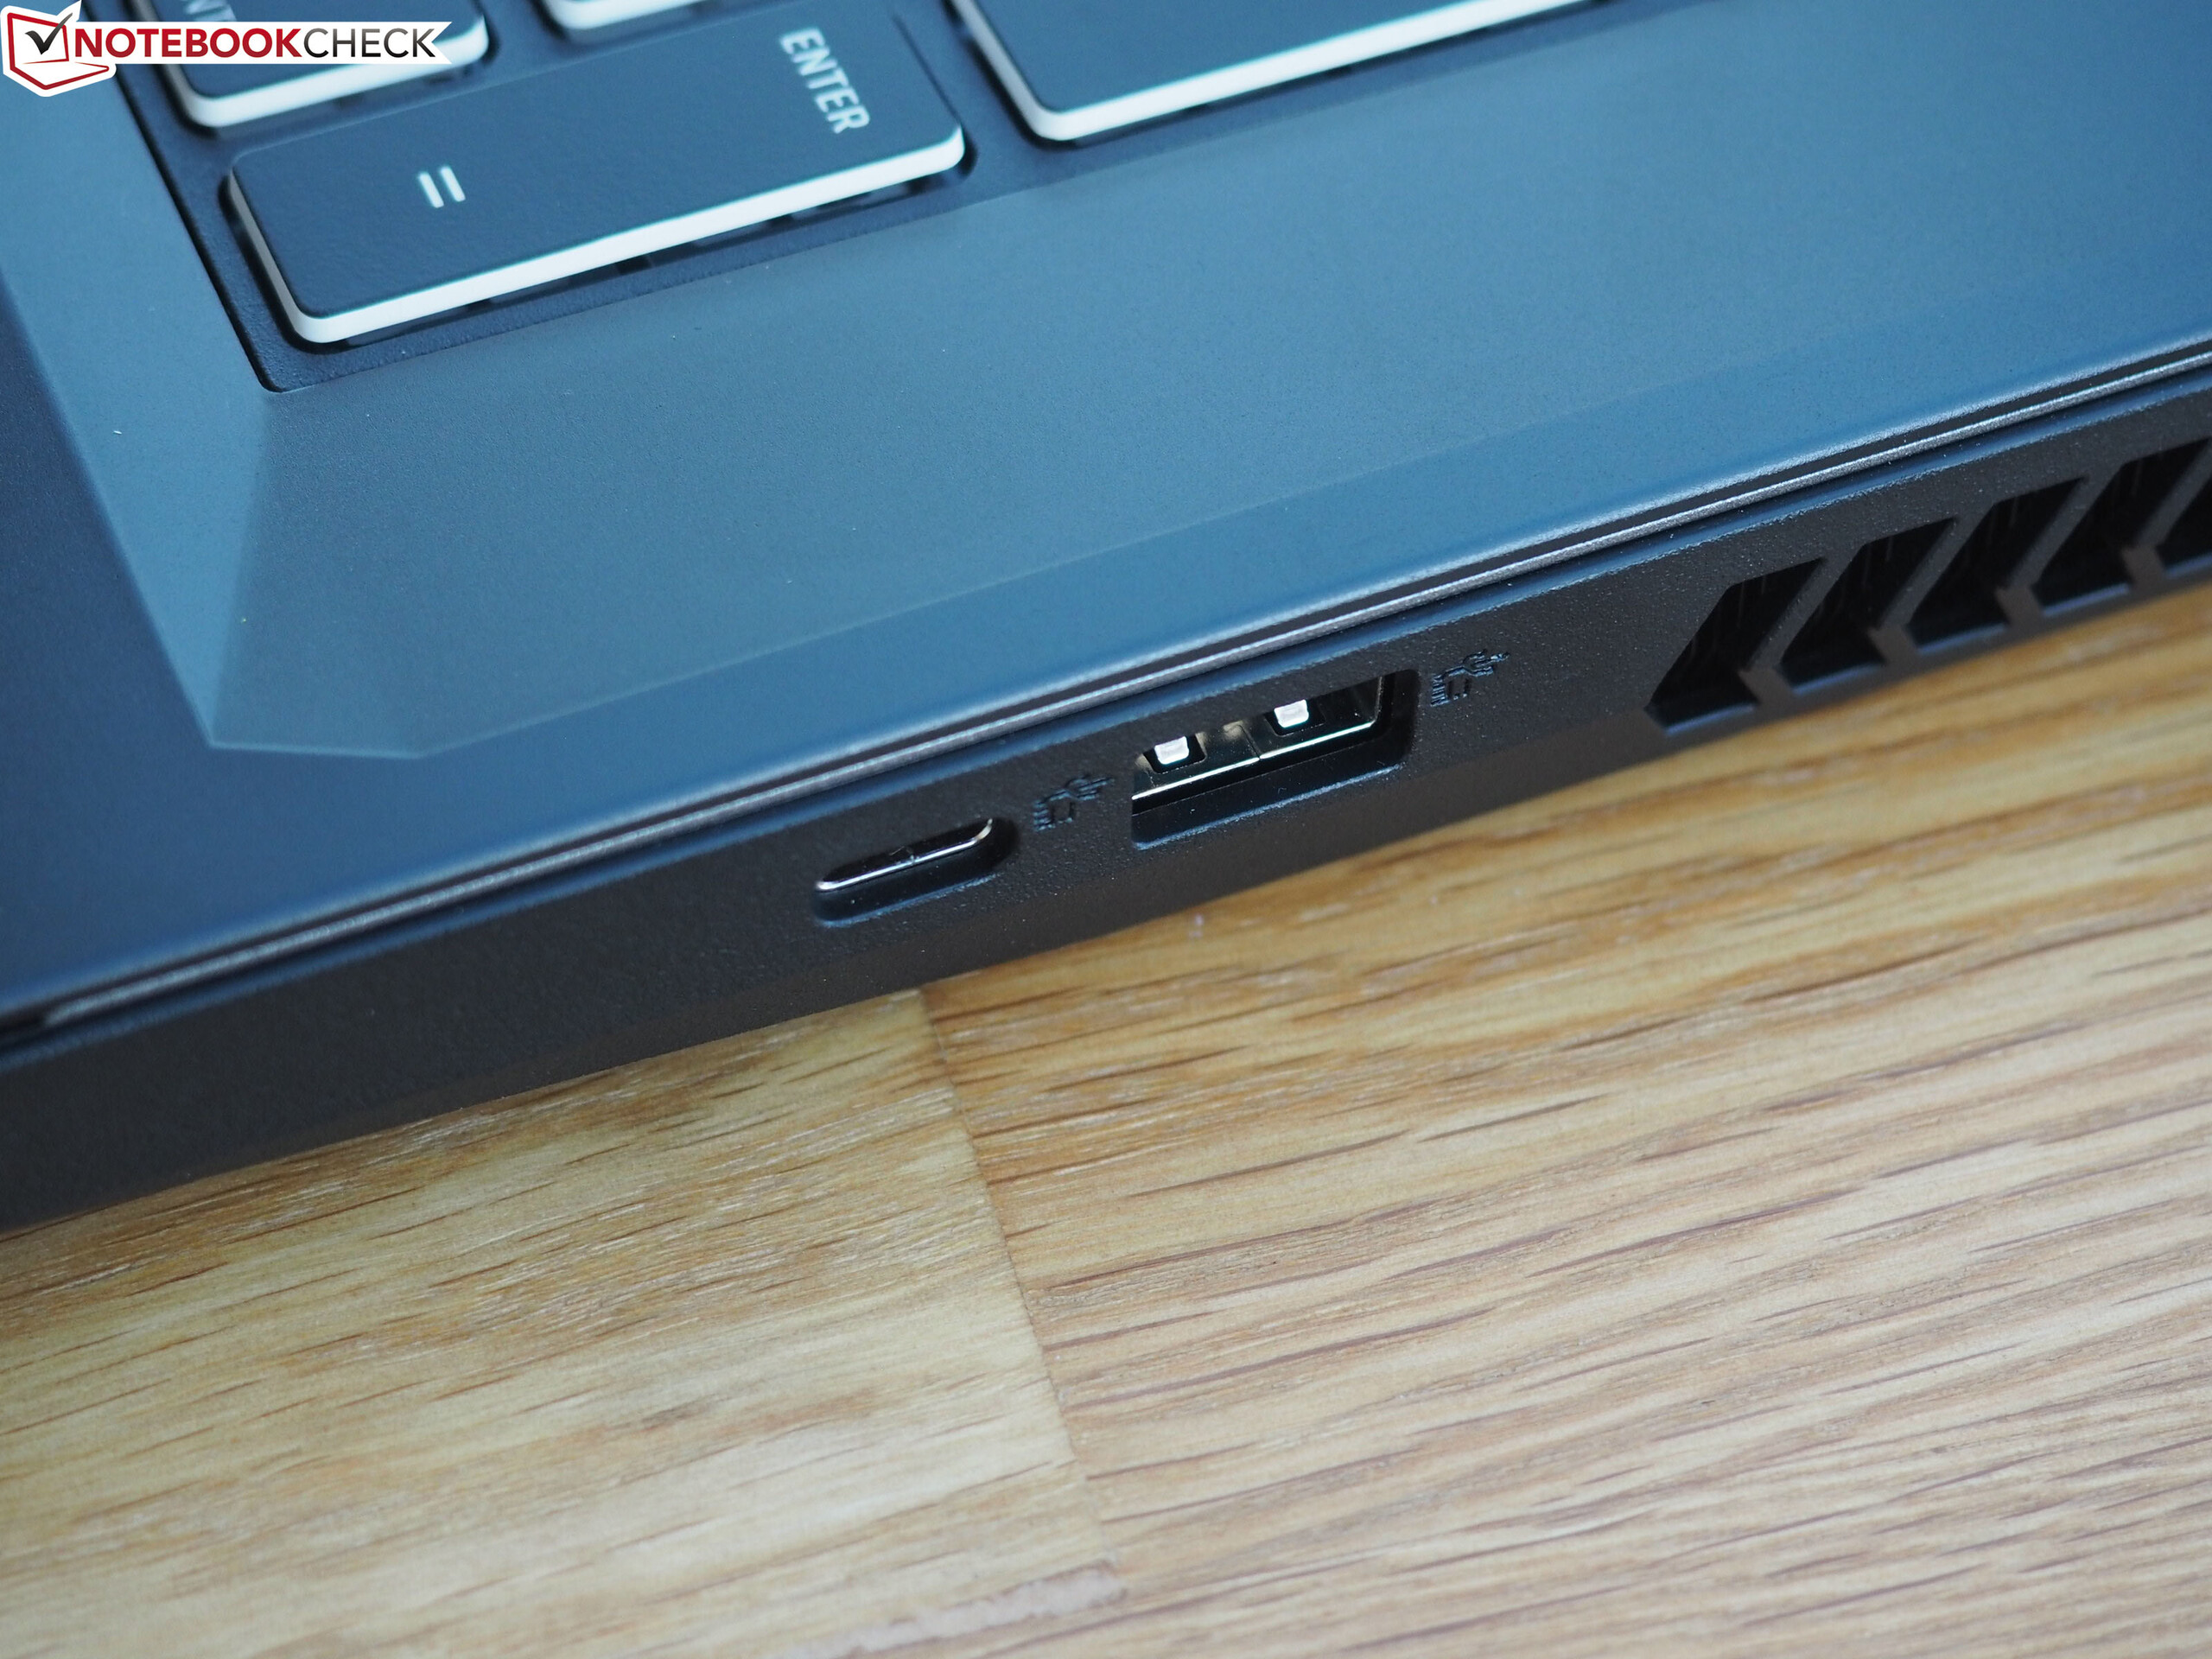
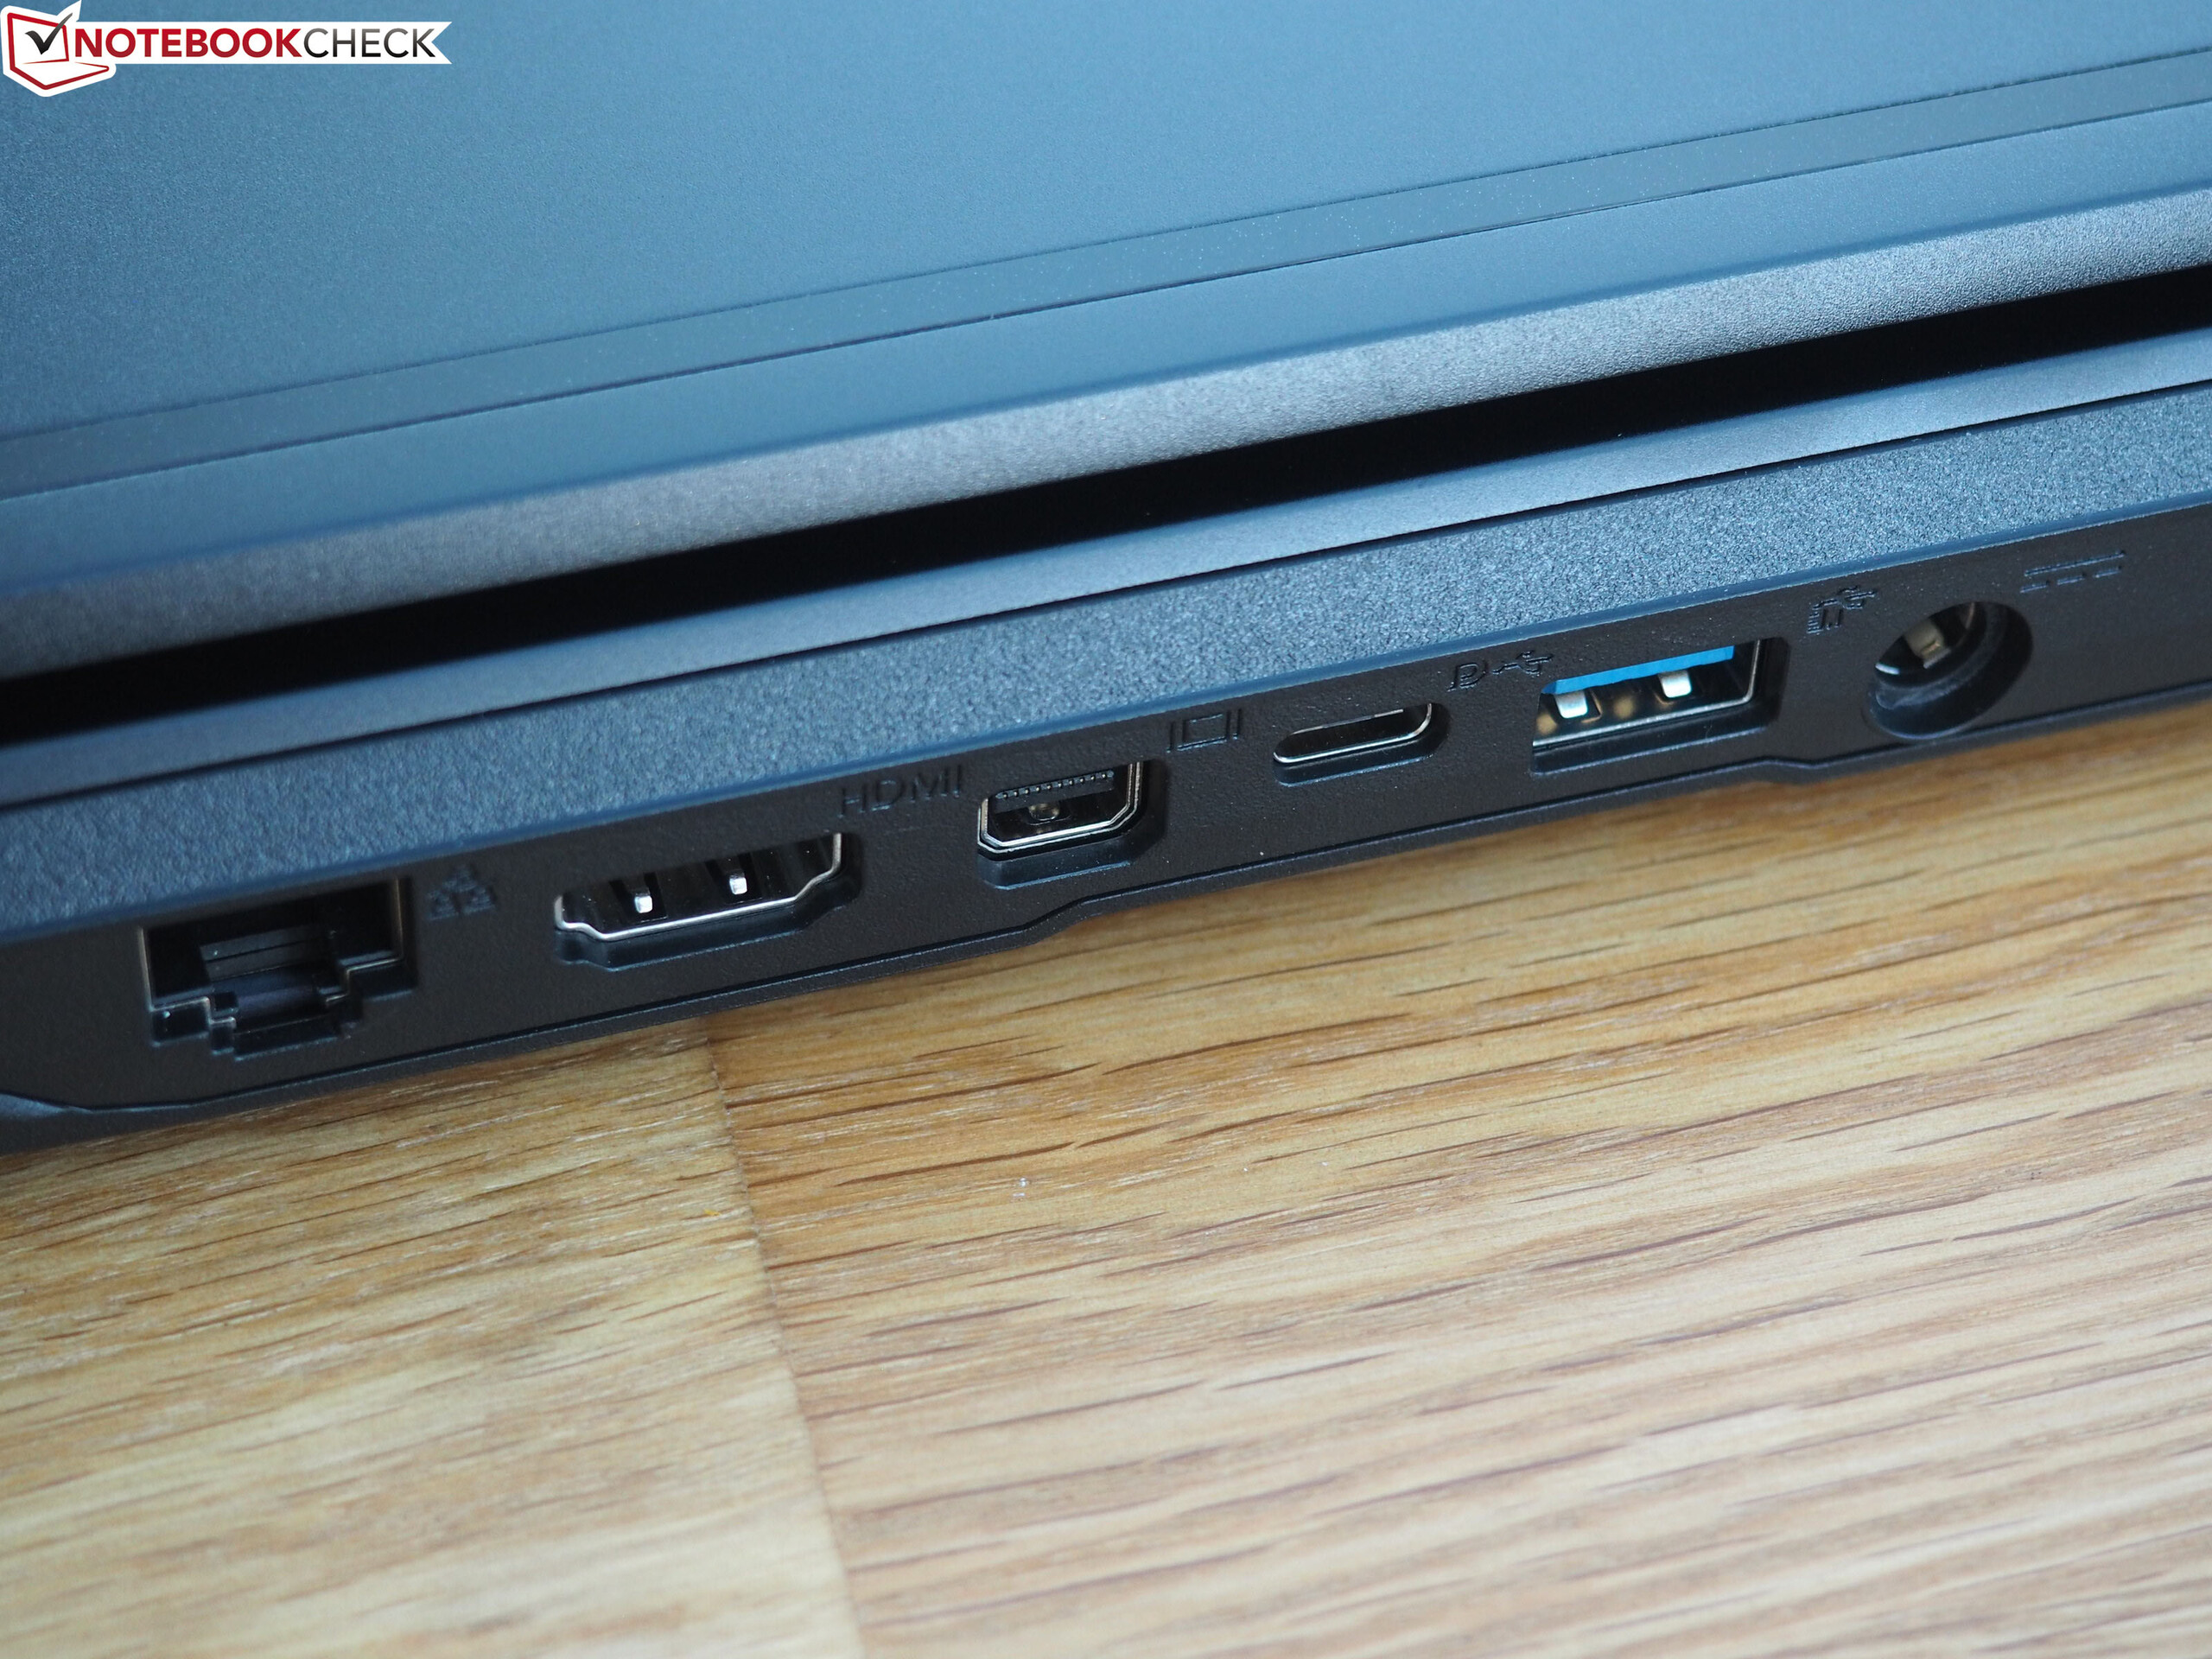
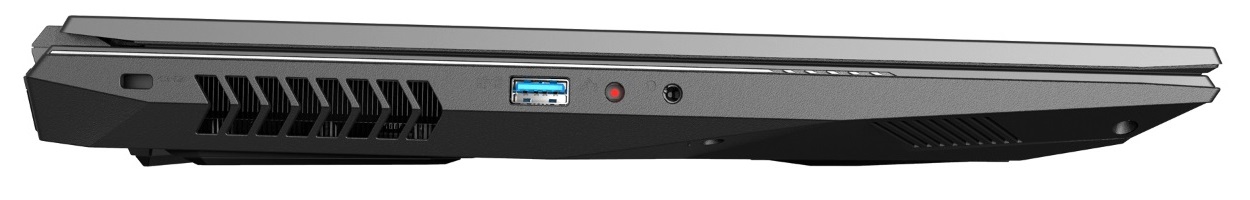
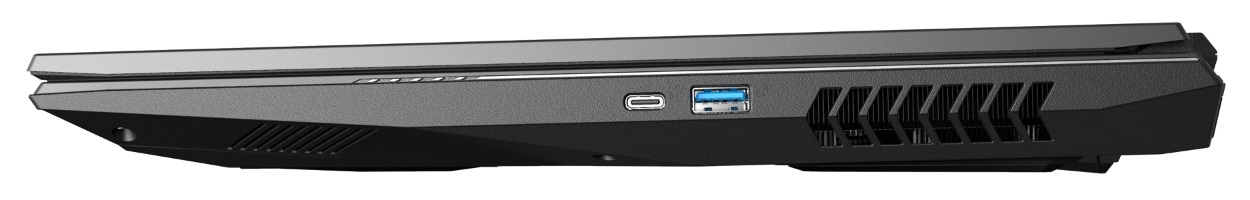
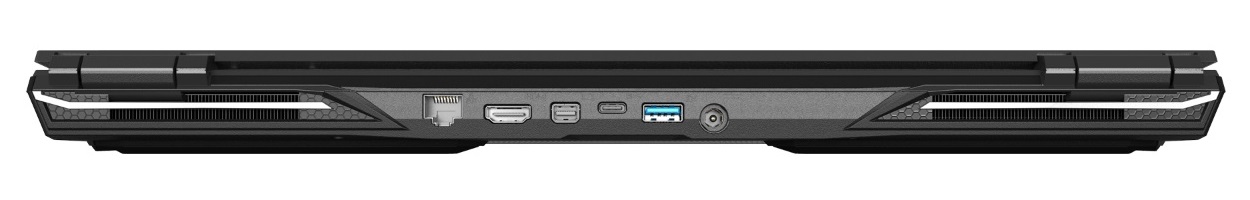
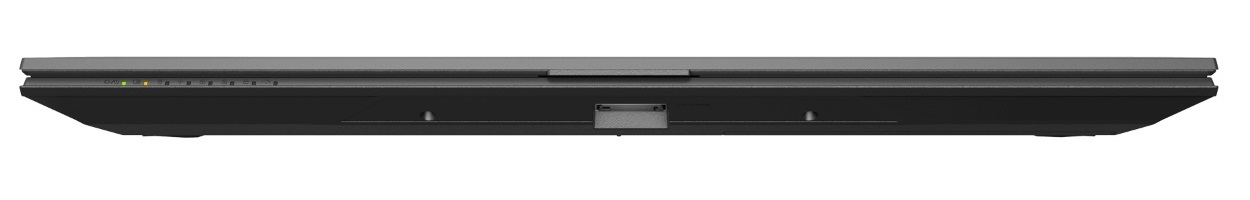
The vast port selection is one of the biggest advantages of the XMG Pro 17. Thanks to the HDMI port, Mini DisplayPort and two USB Type-C 3.1 Gen2 ports (1x Thunderbolt 3, 1x DisplayPort), users can theoretically connect up to four monitors. Additionally, there are three USB Type-A 3.0 ports, two audio jacks, an RJ45 port and a Kensington lock slot. Furthermore, there is a (somewhat hard to reach) card reader hidden on the front edge of the chassis. Since there are barely any ports to the left and right sides, there should be enough space for users to use an external mouse without being obstructed.
SD Card Reader
As our measurements of the MSI GL75 9SEK show, fast card readers are not a given, even on more expensive gaming laptops. With transfer speeds of 203 MB/s to 219 MB/s, the XMG Pro 17 shows what is possible and even beats the card reader of the Razer Blade Pro 17, which is already fast.
| SD Card Reader | |
| average JPG Copy Test (av. of 3 runs) | |
| SCHENKER XMG Pro 17 PB71RD-G (Toshiba Exceria Pro SDXC 64 GB UHS-II) | |
| Razer Blade Pro 17 RTX 2060 (Toshiba Exceria Pro SDXC 64 GB UHS-II) | |
| Average of class Gaming (19 - 202, n=100, last 2 years) | |
| MSI GL75 9SEK-056US | |
| maximum AS SSD Seq Read Test (1GB) | |
| SCHENKER XMG Pro 17 PB71RD-G (Toshiba Exceria Pro SDXC 64 GB UHS-II) | |
| Razer Blade Pro 17 RTX 2060 (Toshiba Exceria Pro SDXC 64 GB UHS-II) | |
| Average of class Gaming (25.8 - 269, n=94, last 2 years) | |
| MSI GL75 9SEK-056US | |
Communication
With our brand new ax router, which Netgear has recently provided us with, the XMG Pro 17 handily beats all other devices in our comparison, which were only tested with an ac router, in our Wi-Fi test (tested at a distance of 1 m). 1,410 Mb/s or 1,620 Mb/s when sending and receiving data, respectively, are excellent results. However, it comes at a premium of a few USD, since either an Intel or a Rivet Networks Wi-Fi 6 chip has to be selected during the configuration.
Webcam
Accessories
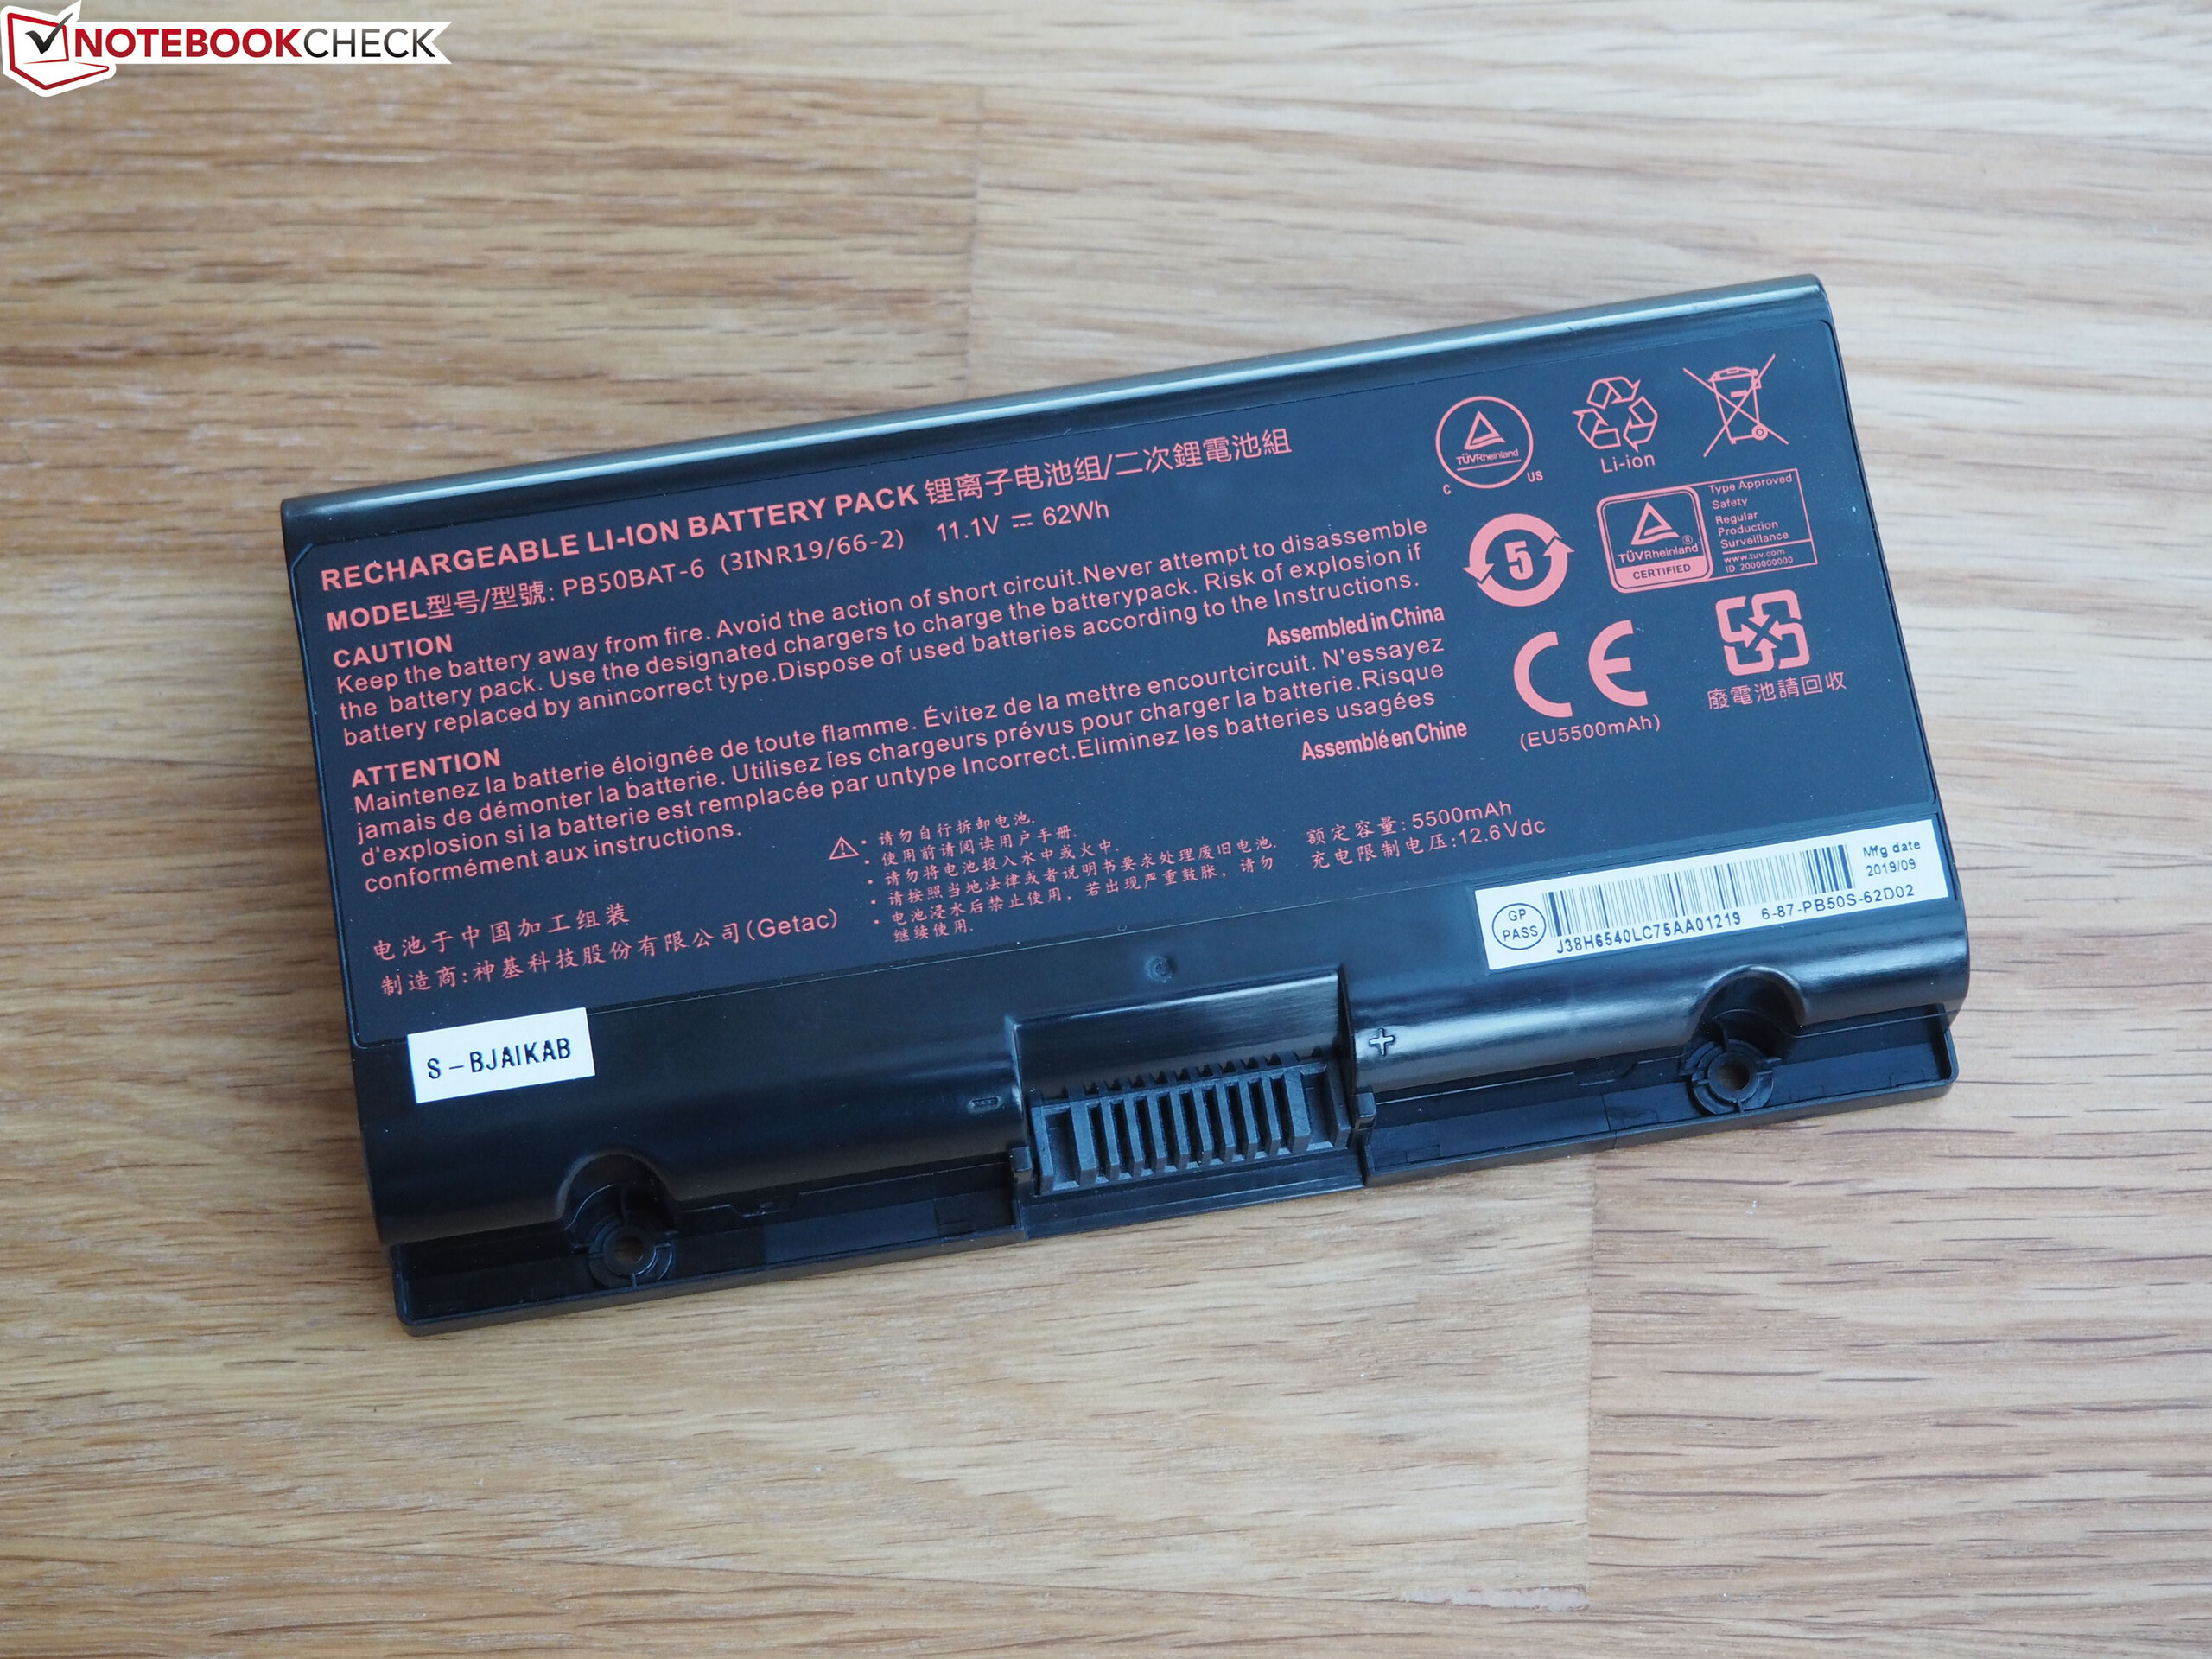
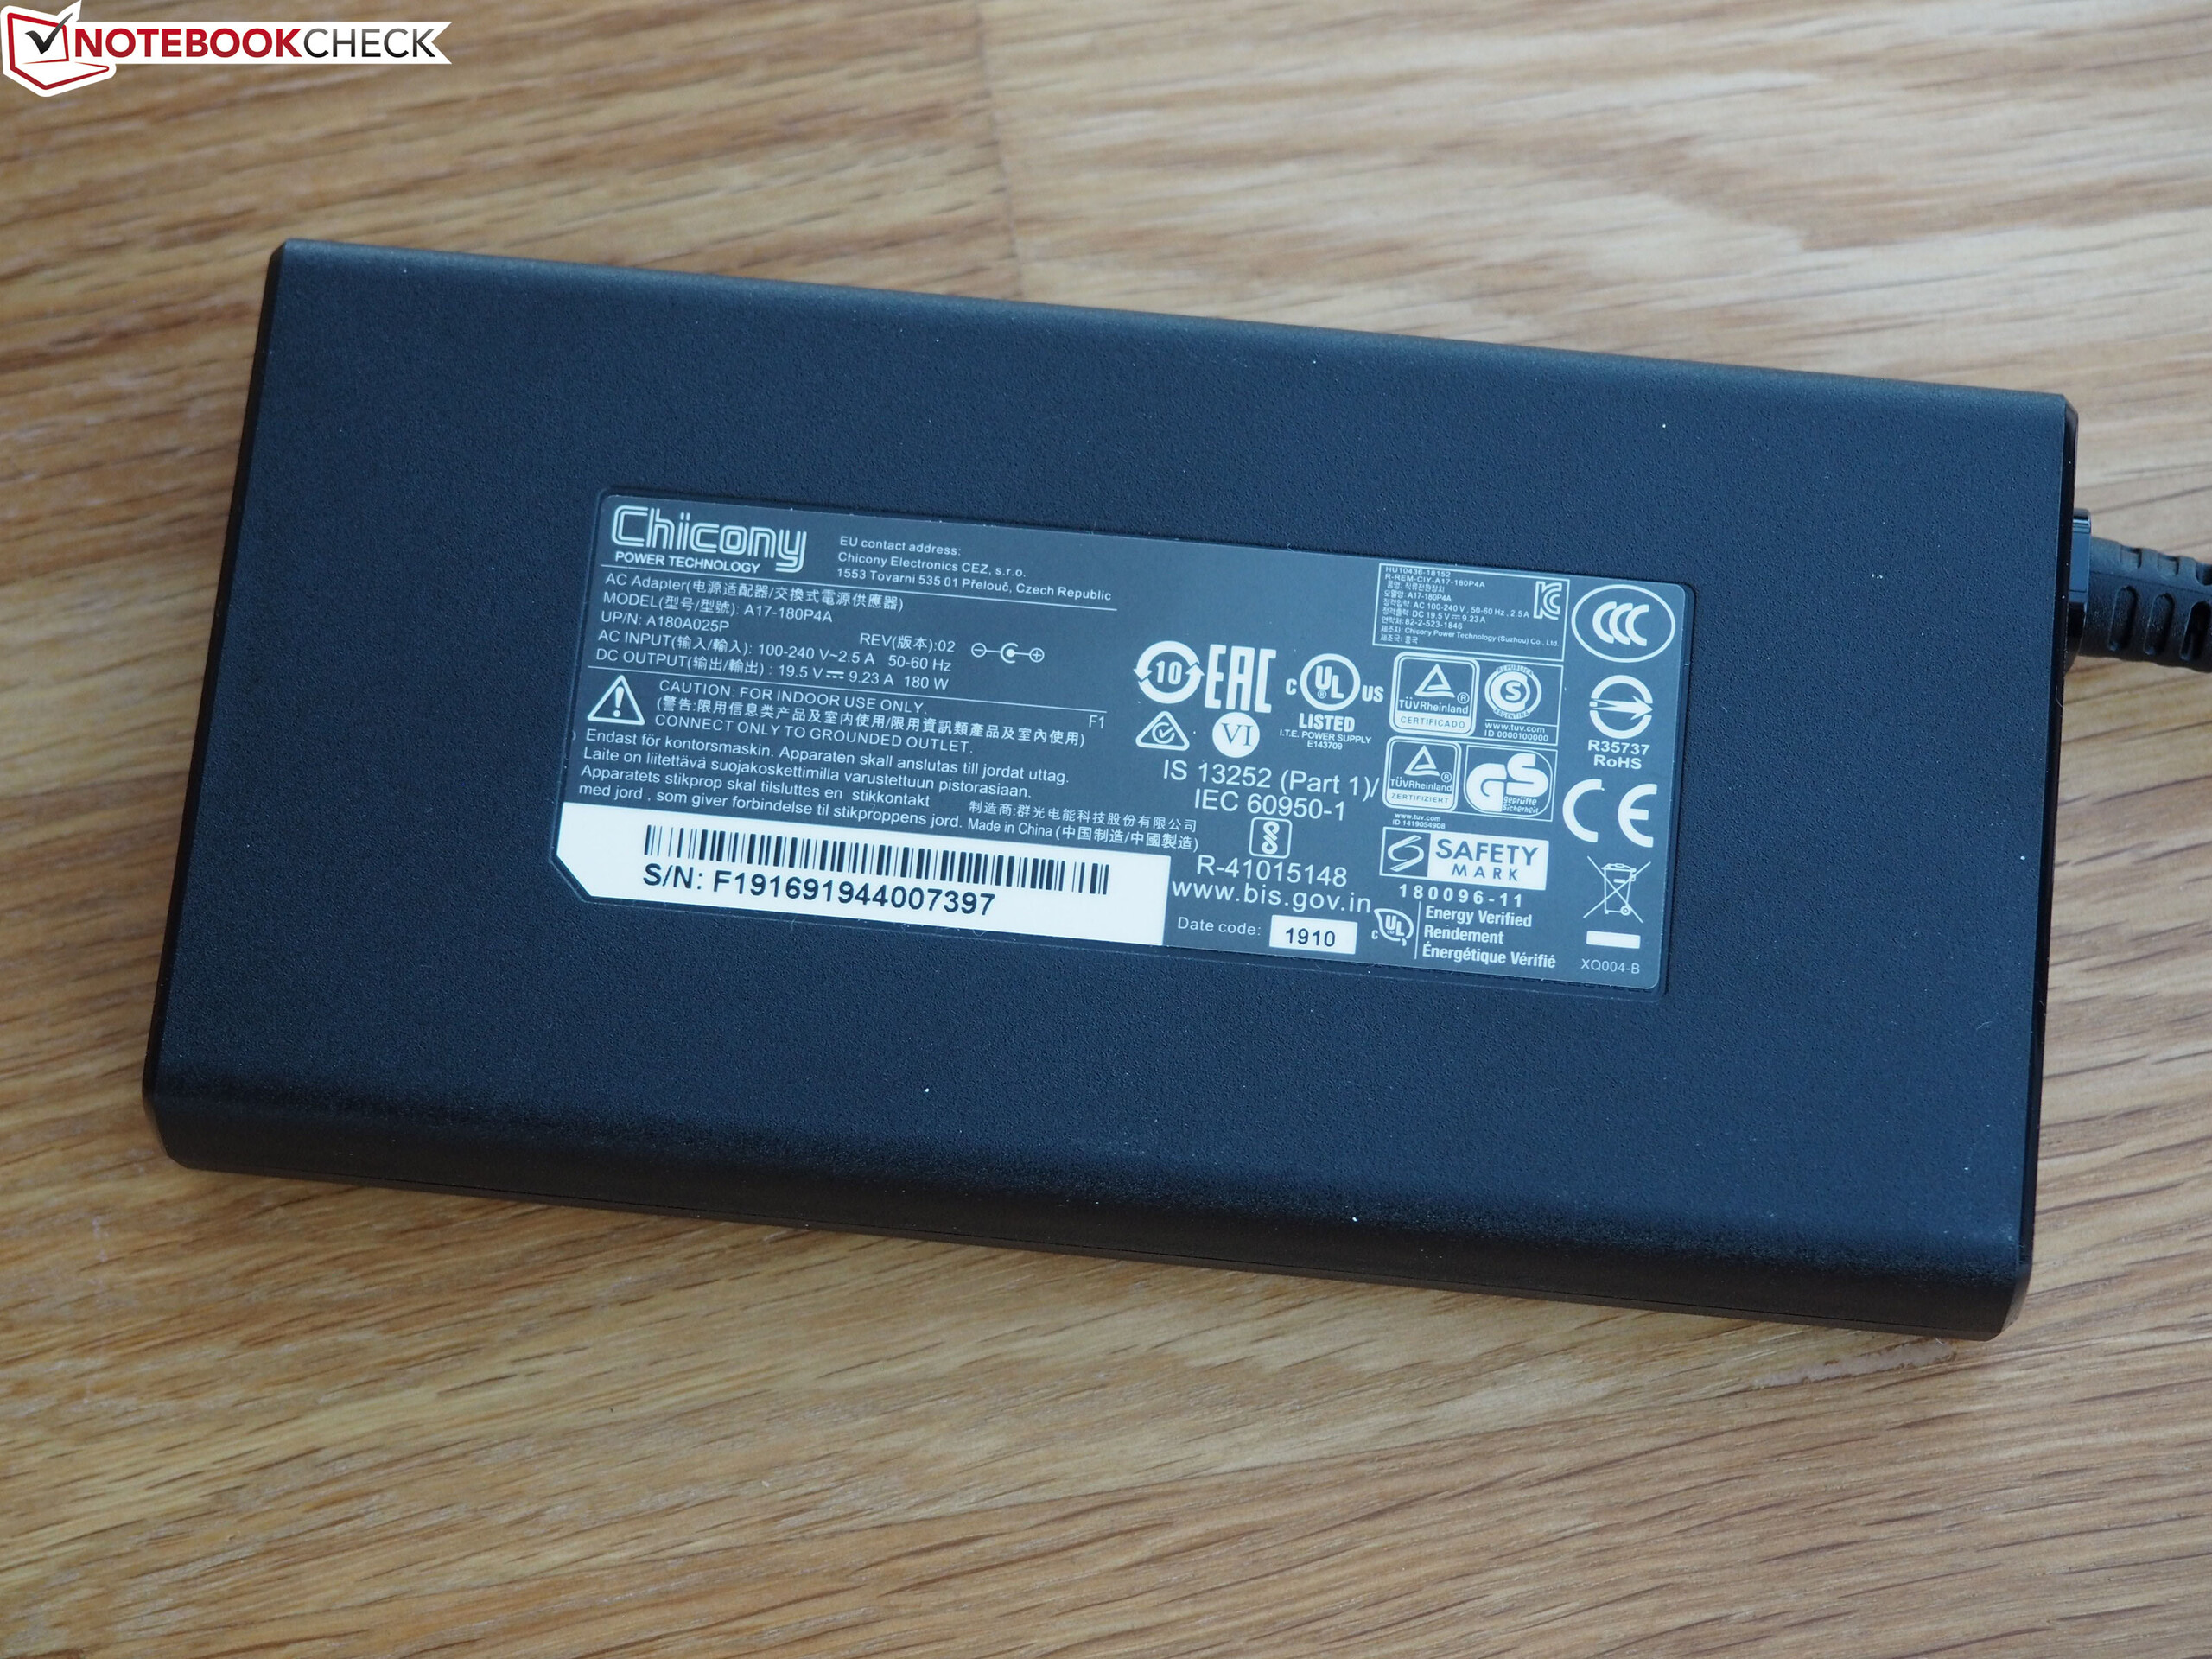
Our test model includes a USB thumb drive, a driver DVD, a manual, and screws for the 2.5-inch bay. The power rating of the included AC adapter varies depending on the selected GPU option. Schenker includes a 230-Watt model with the RTX 2070 configuration, while the RTX 2060 model comes with a surprisingly lightweight and slim 180-Watt model.
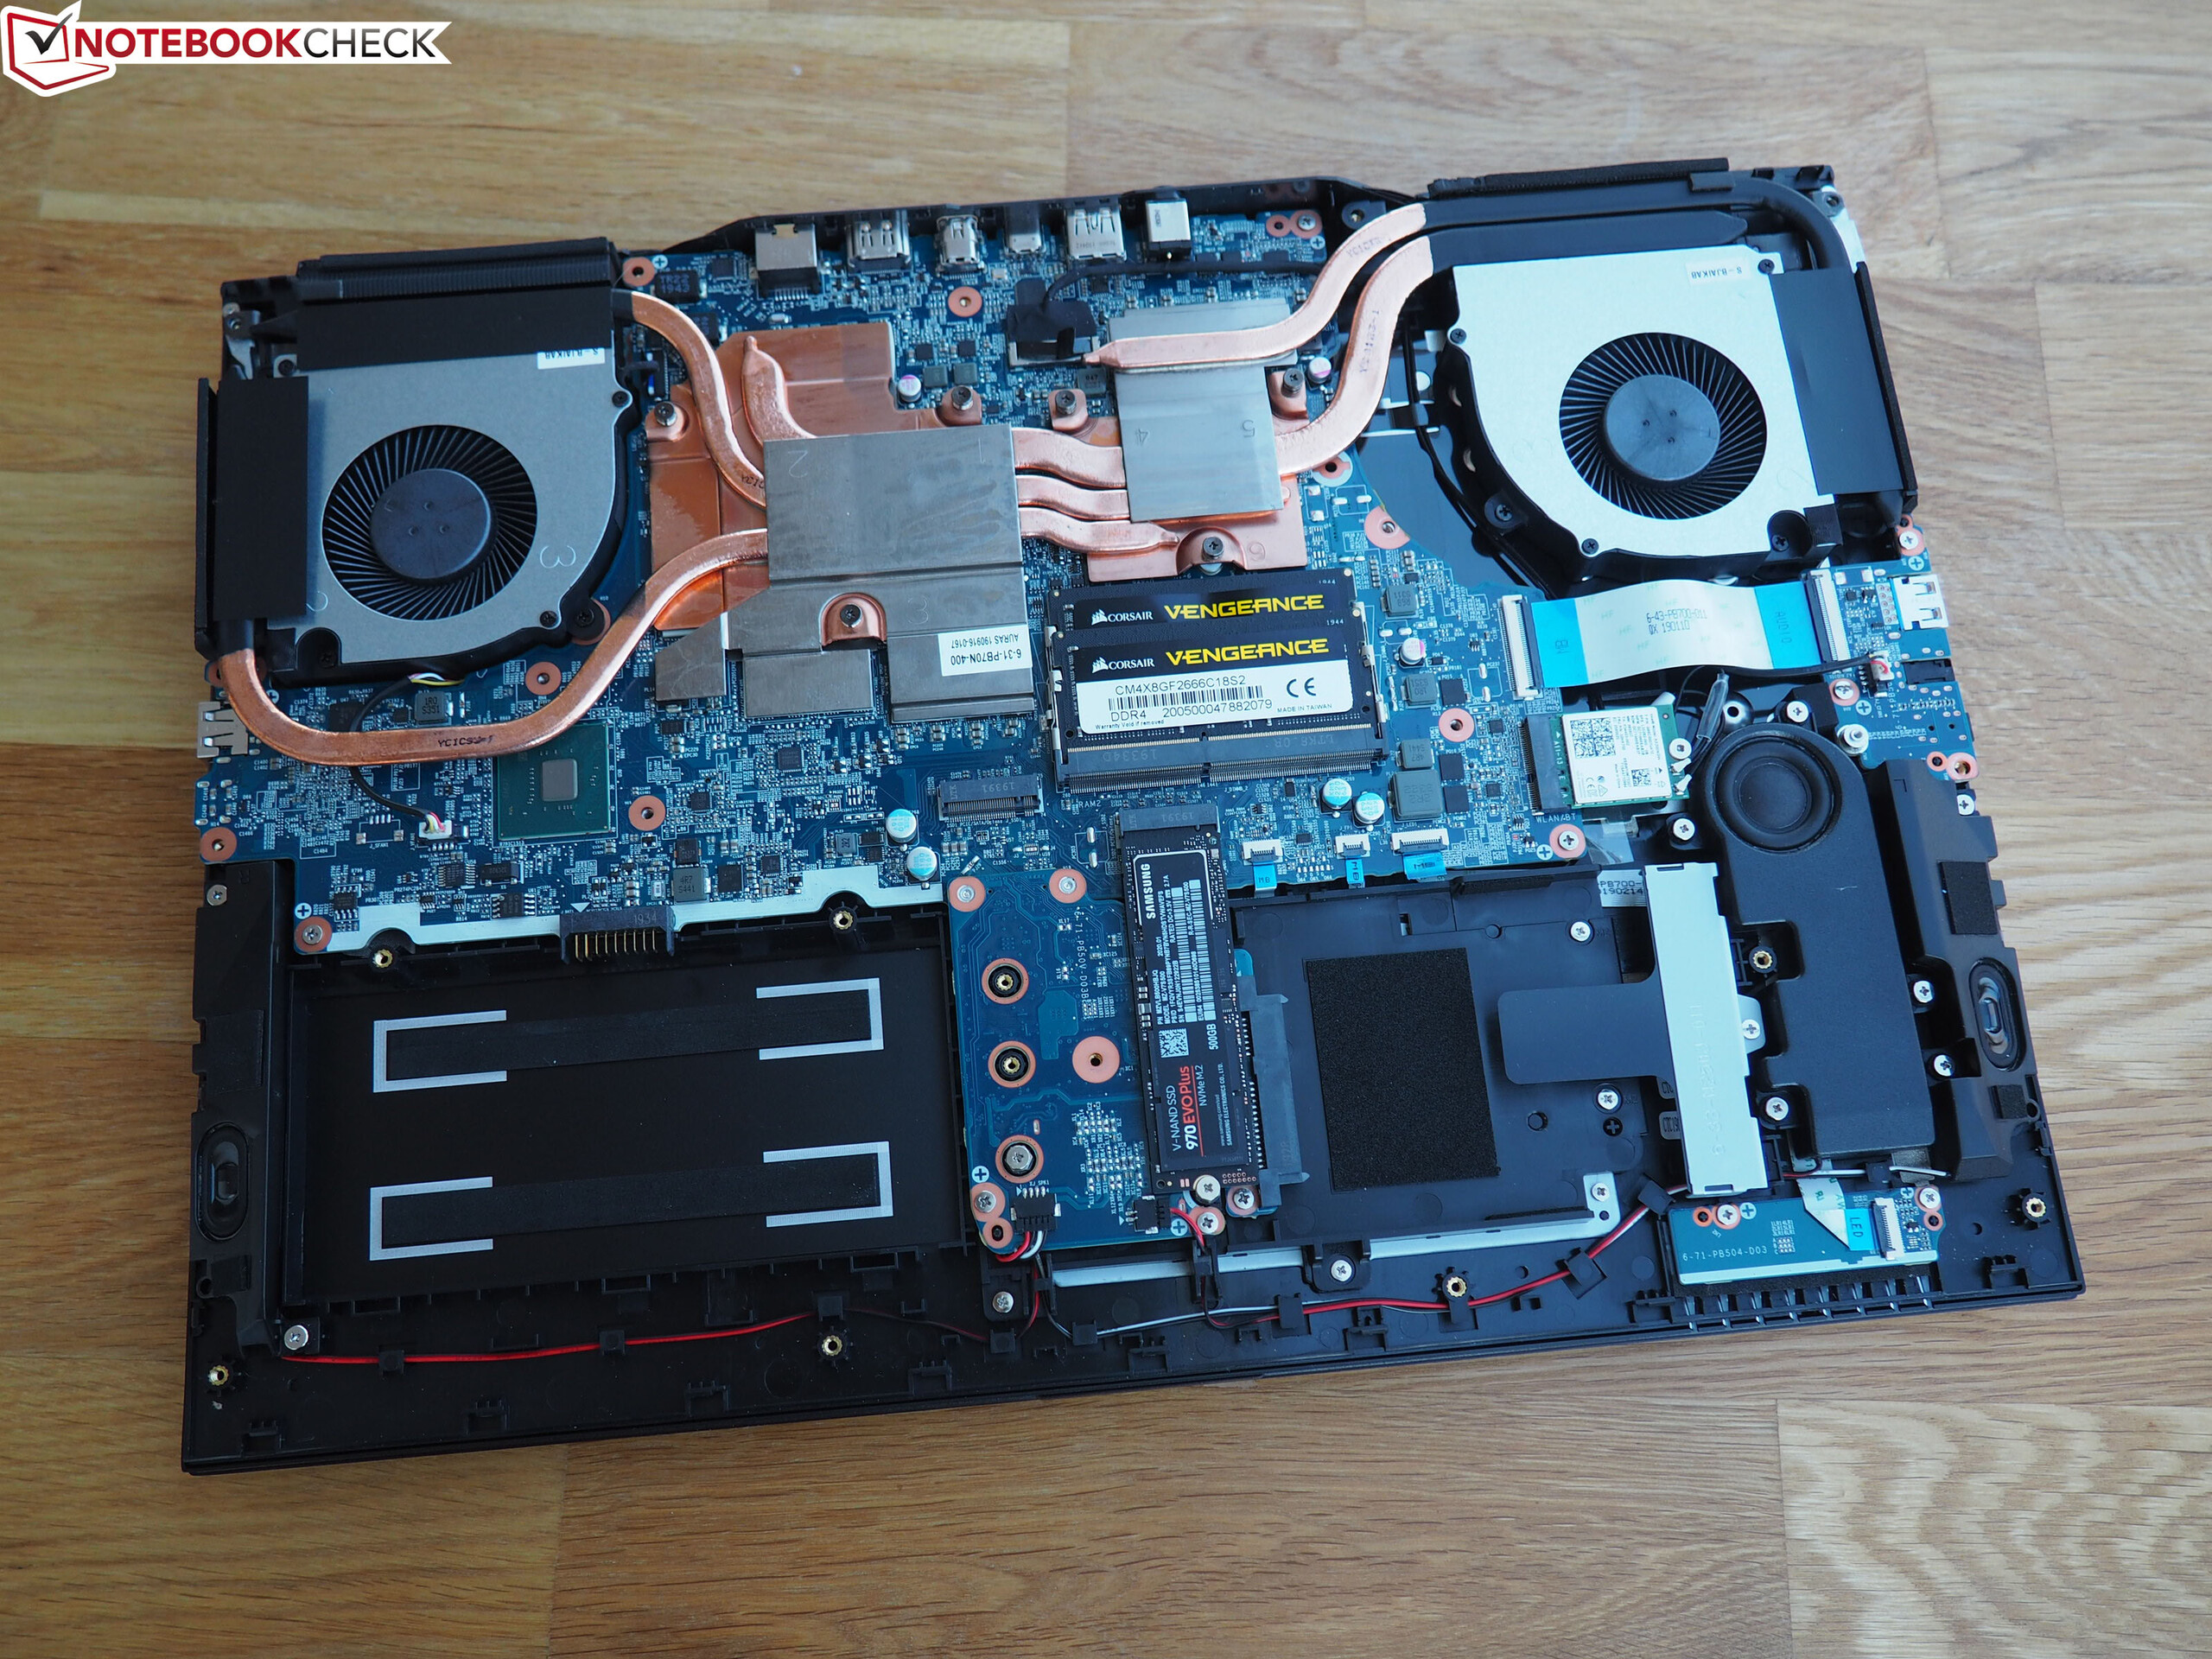
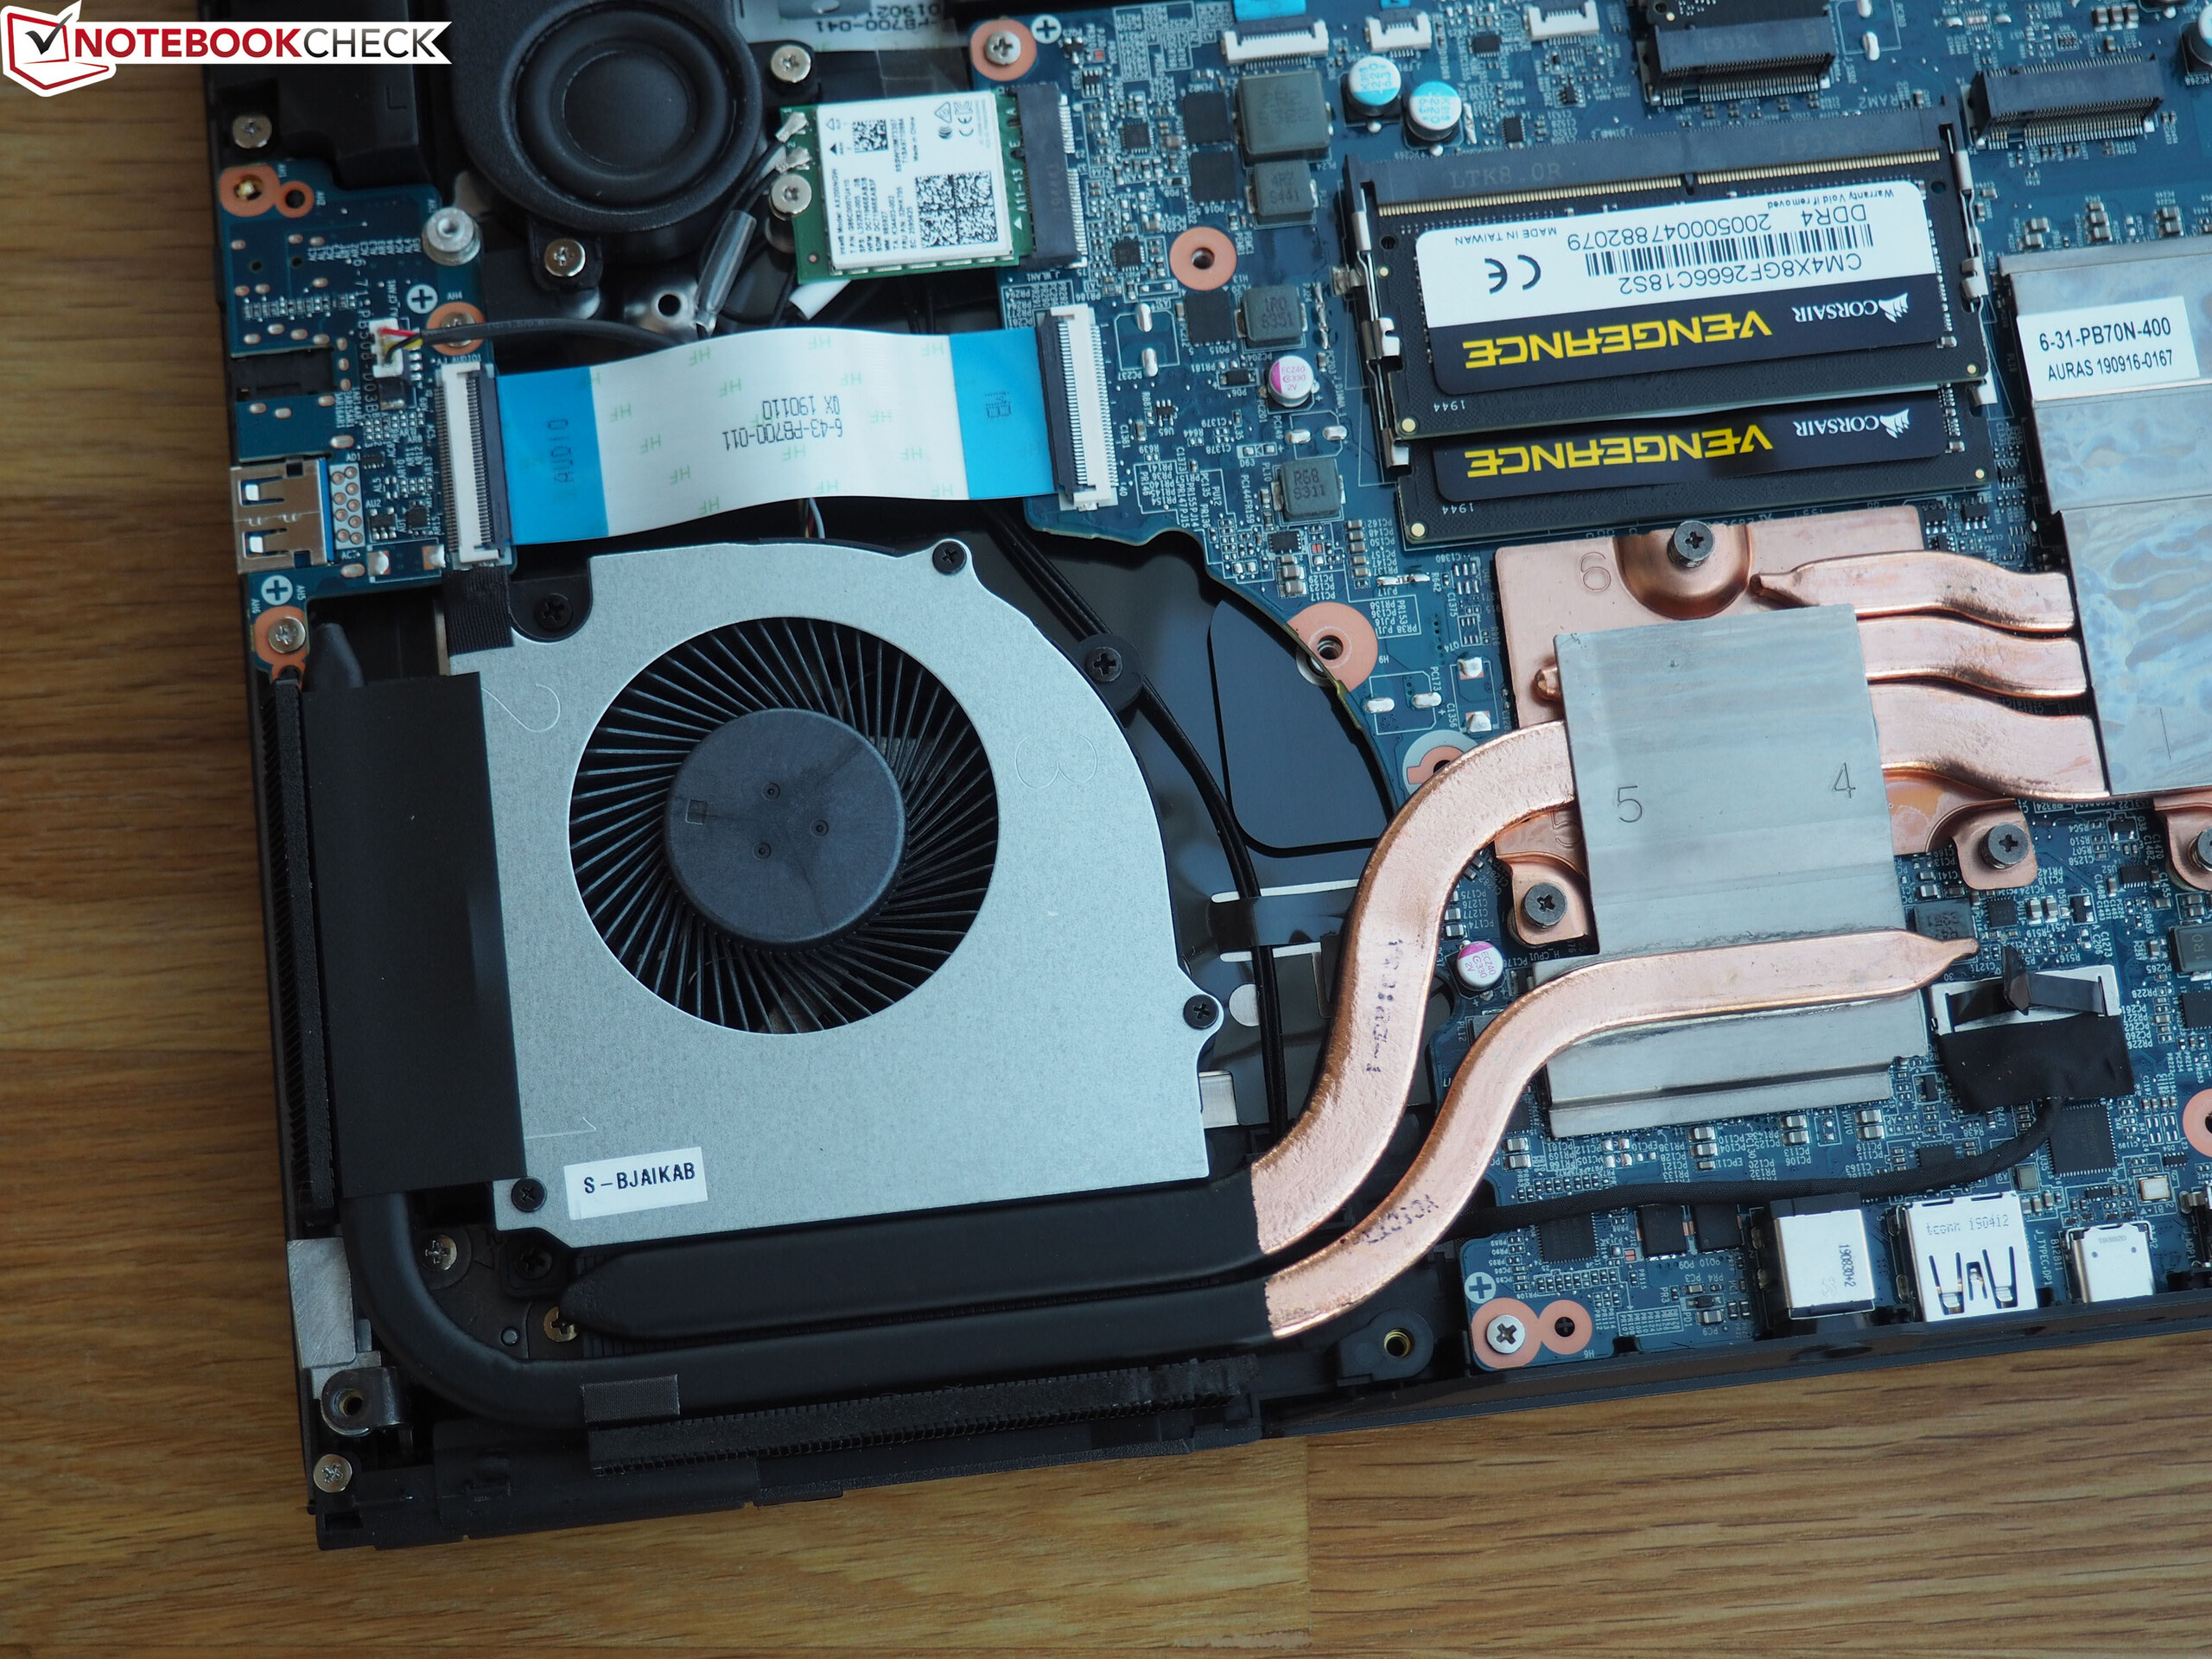
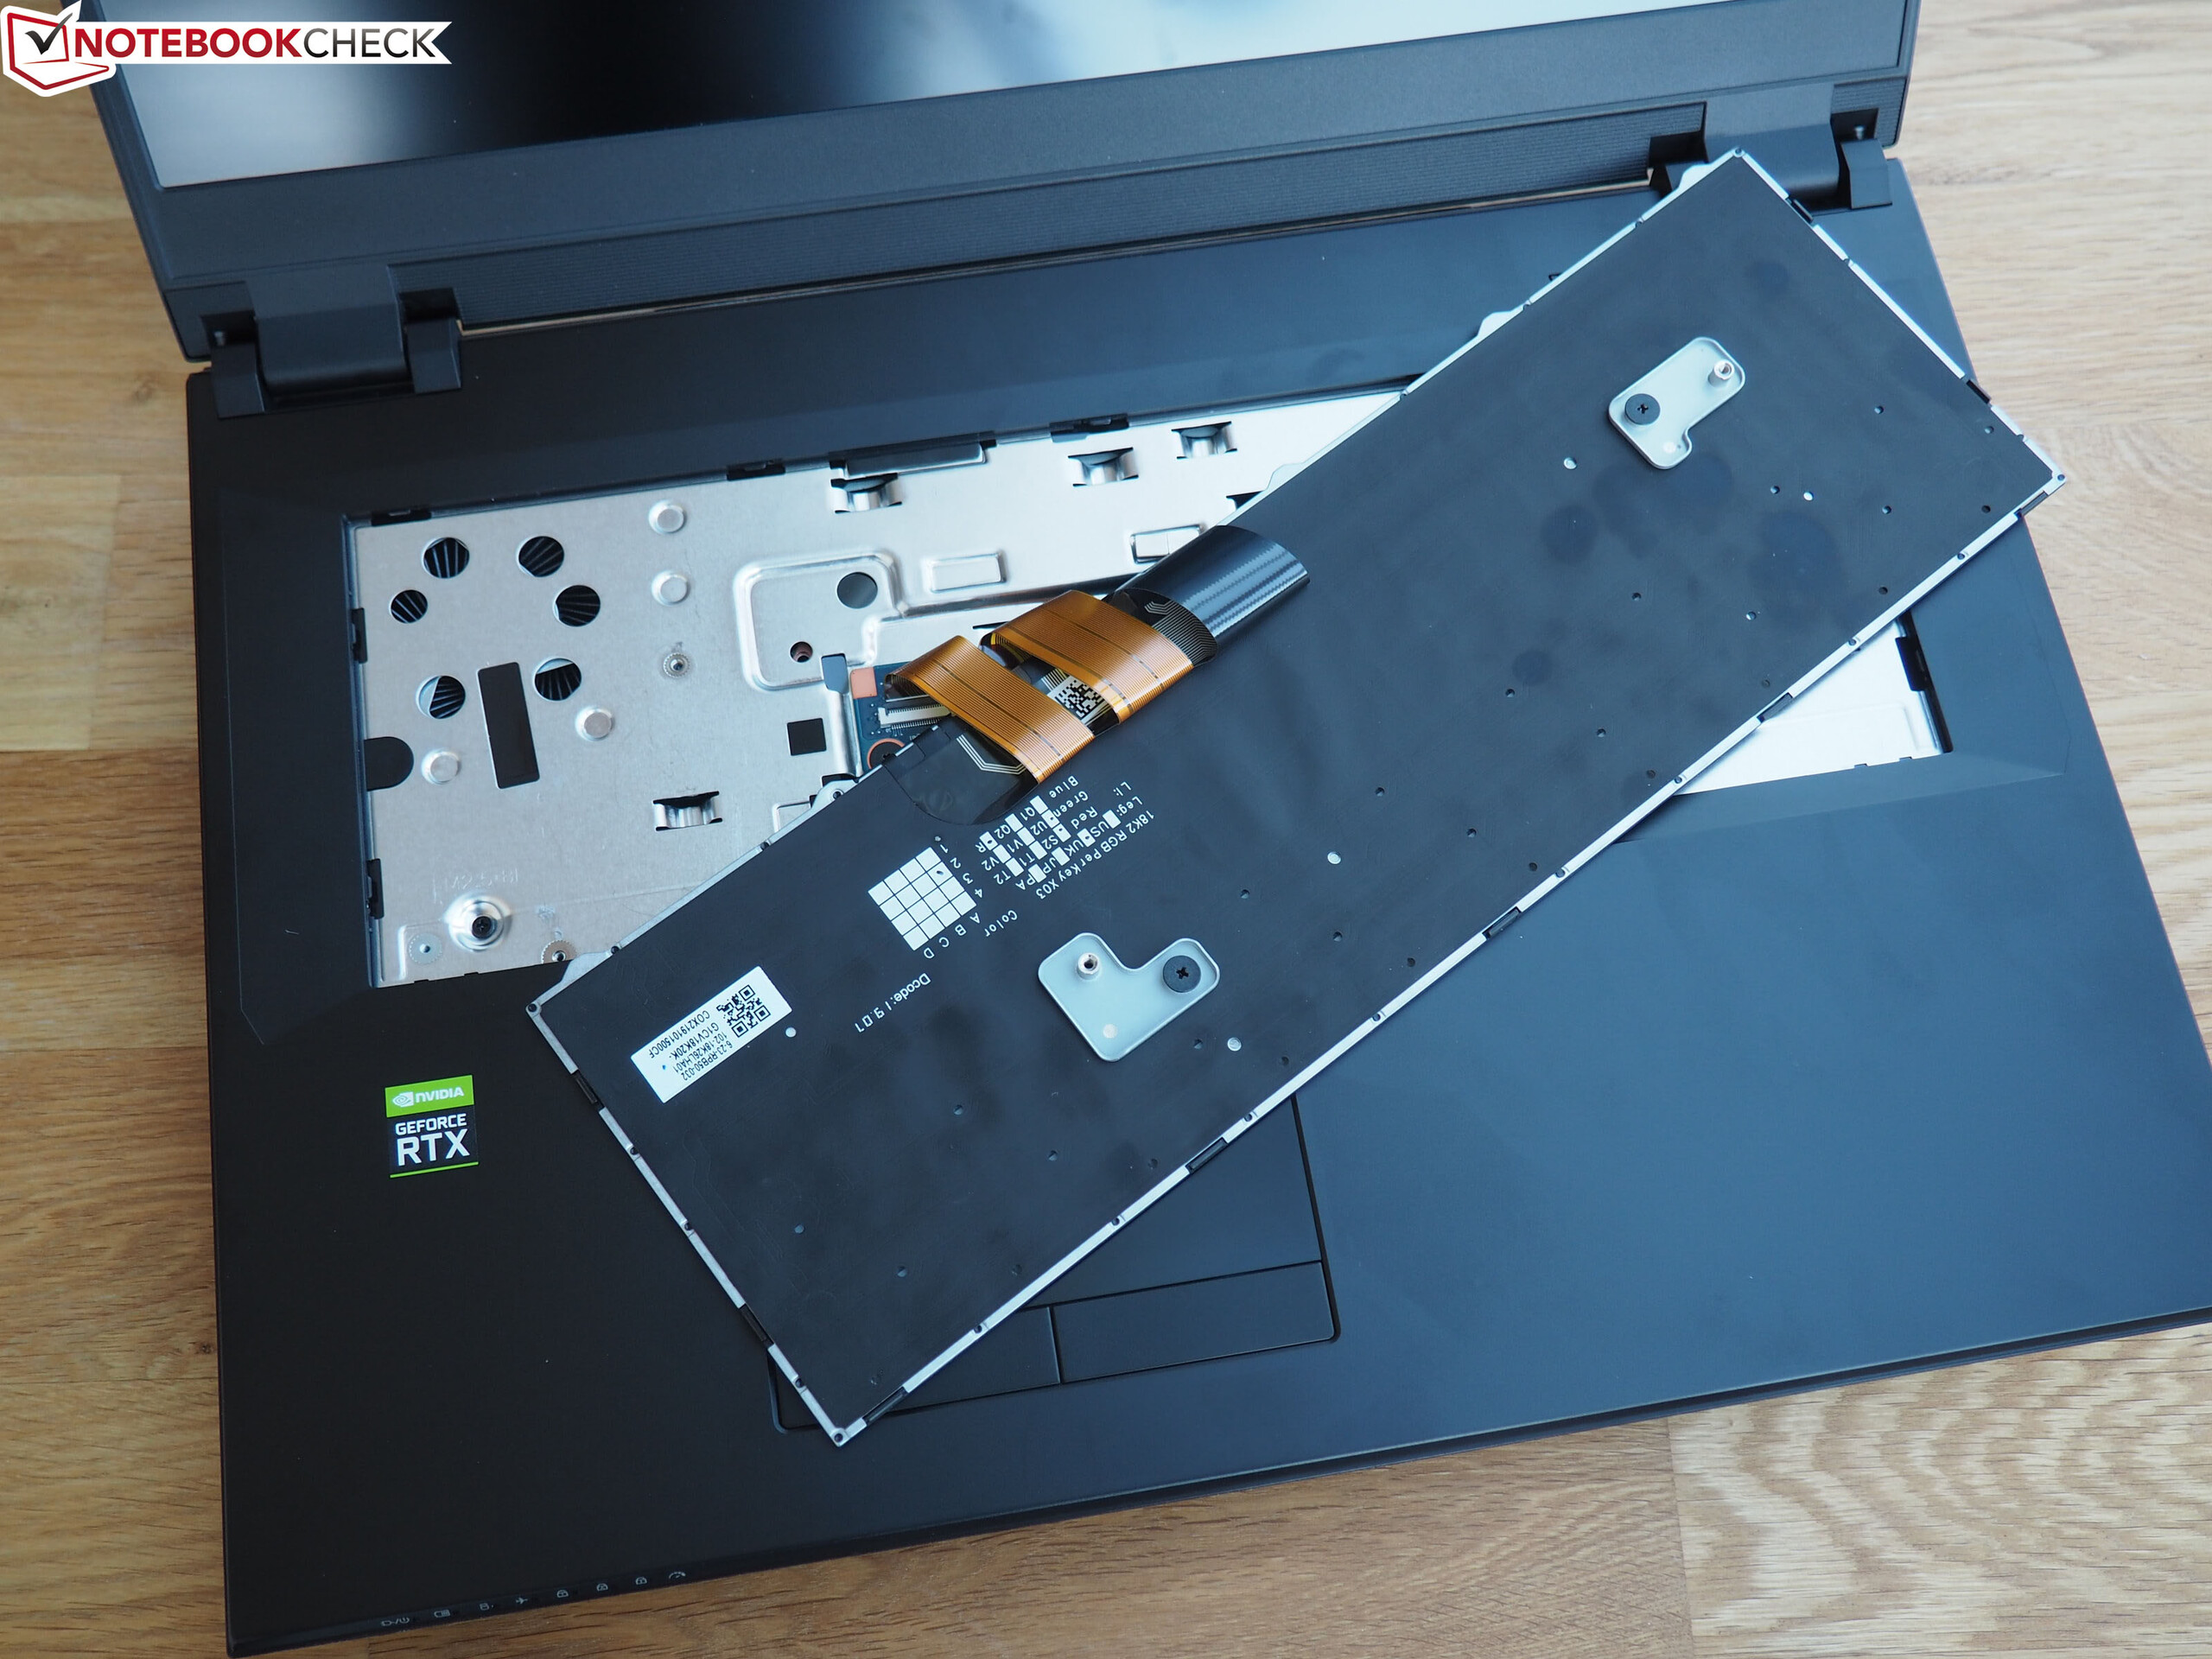
Maintenance
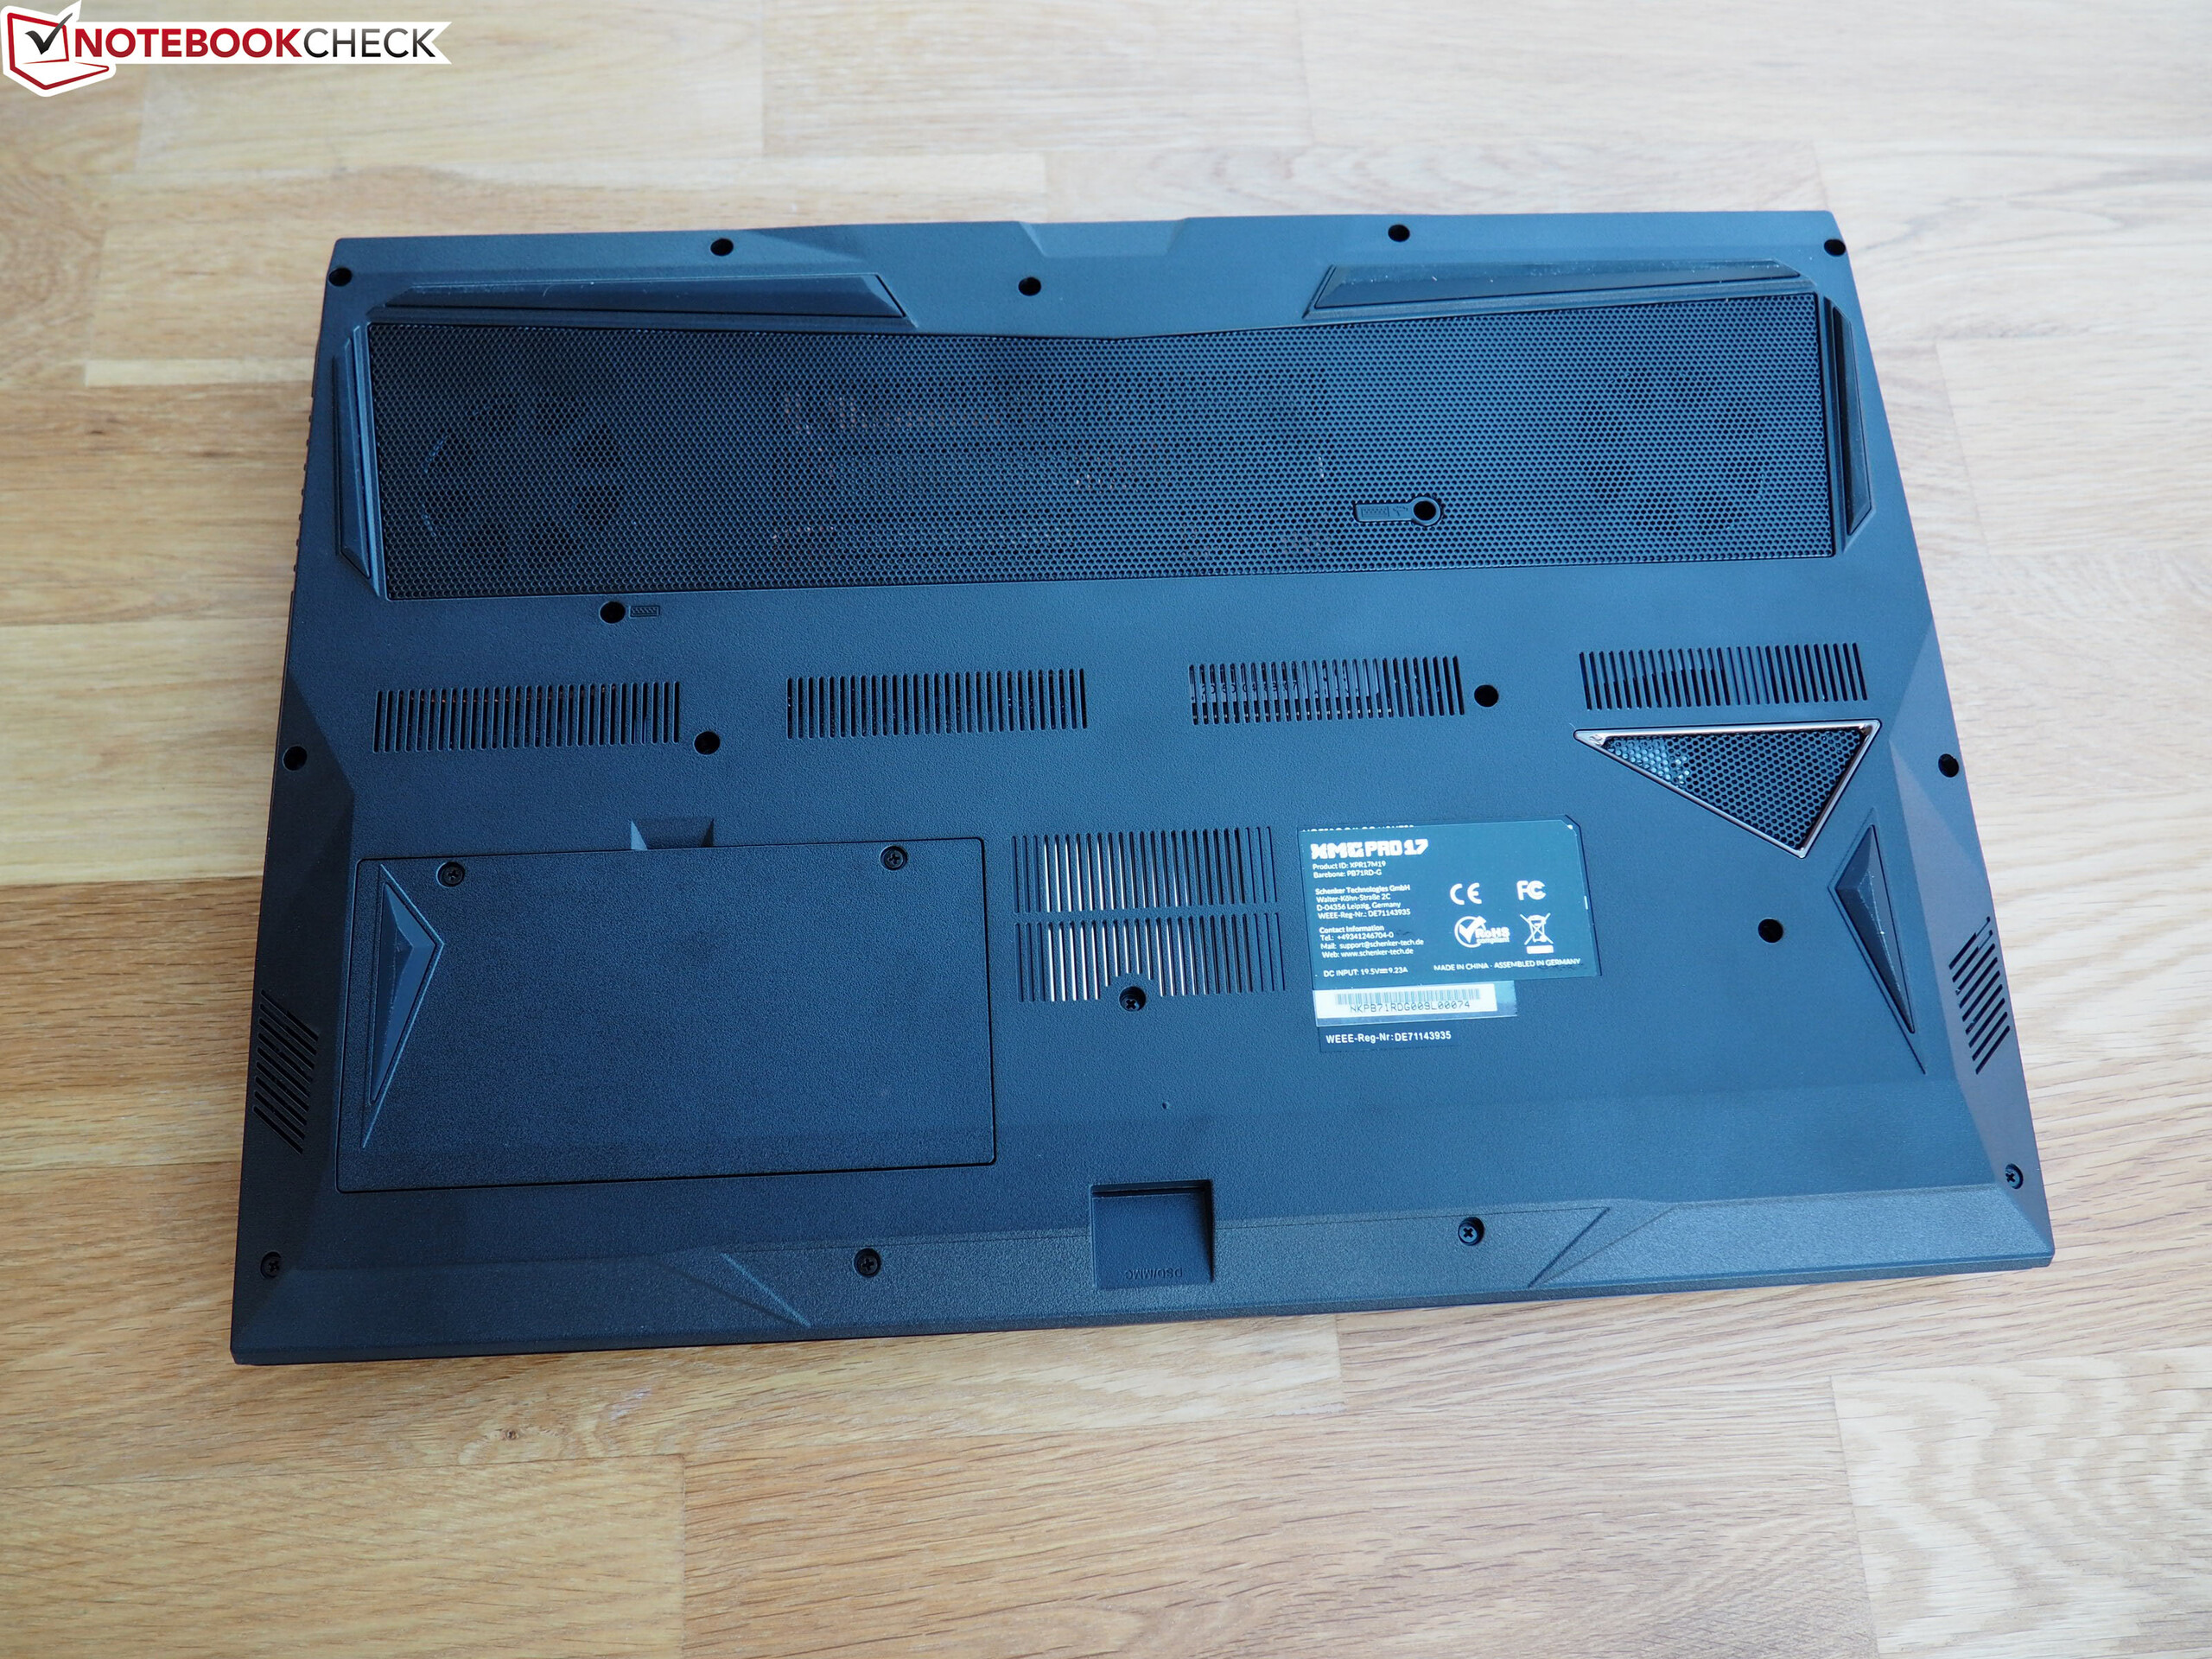
As it turns out, servicing the PB71RD-G barebone is fairly difficult. In order to reach the components, almost 20 screws need to be loosened on the bottom. After this time-consuming task, the keyboard also needs to be unmounted, since there is an additional screw below it (the last step is not necessary on the 15-inch version). Only then can the bottom plate be removed from the unit with the help of a sharp tool. This is unfortunate, since Clevo barebones used to be very maintenance-friendly in the past. As with most current laptops, the CPU and GPU are soldered and thus cannot be replaced.
Warranty
Schenker offers users of the XMG Pro 17 a base warranty period of 24 months. It can be extended to up to three years according to the buyer's preferences. The fast repair service period can be extended as well.
Input Devices
Keyboard
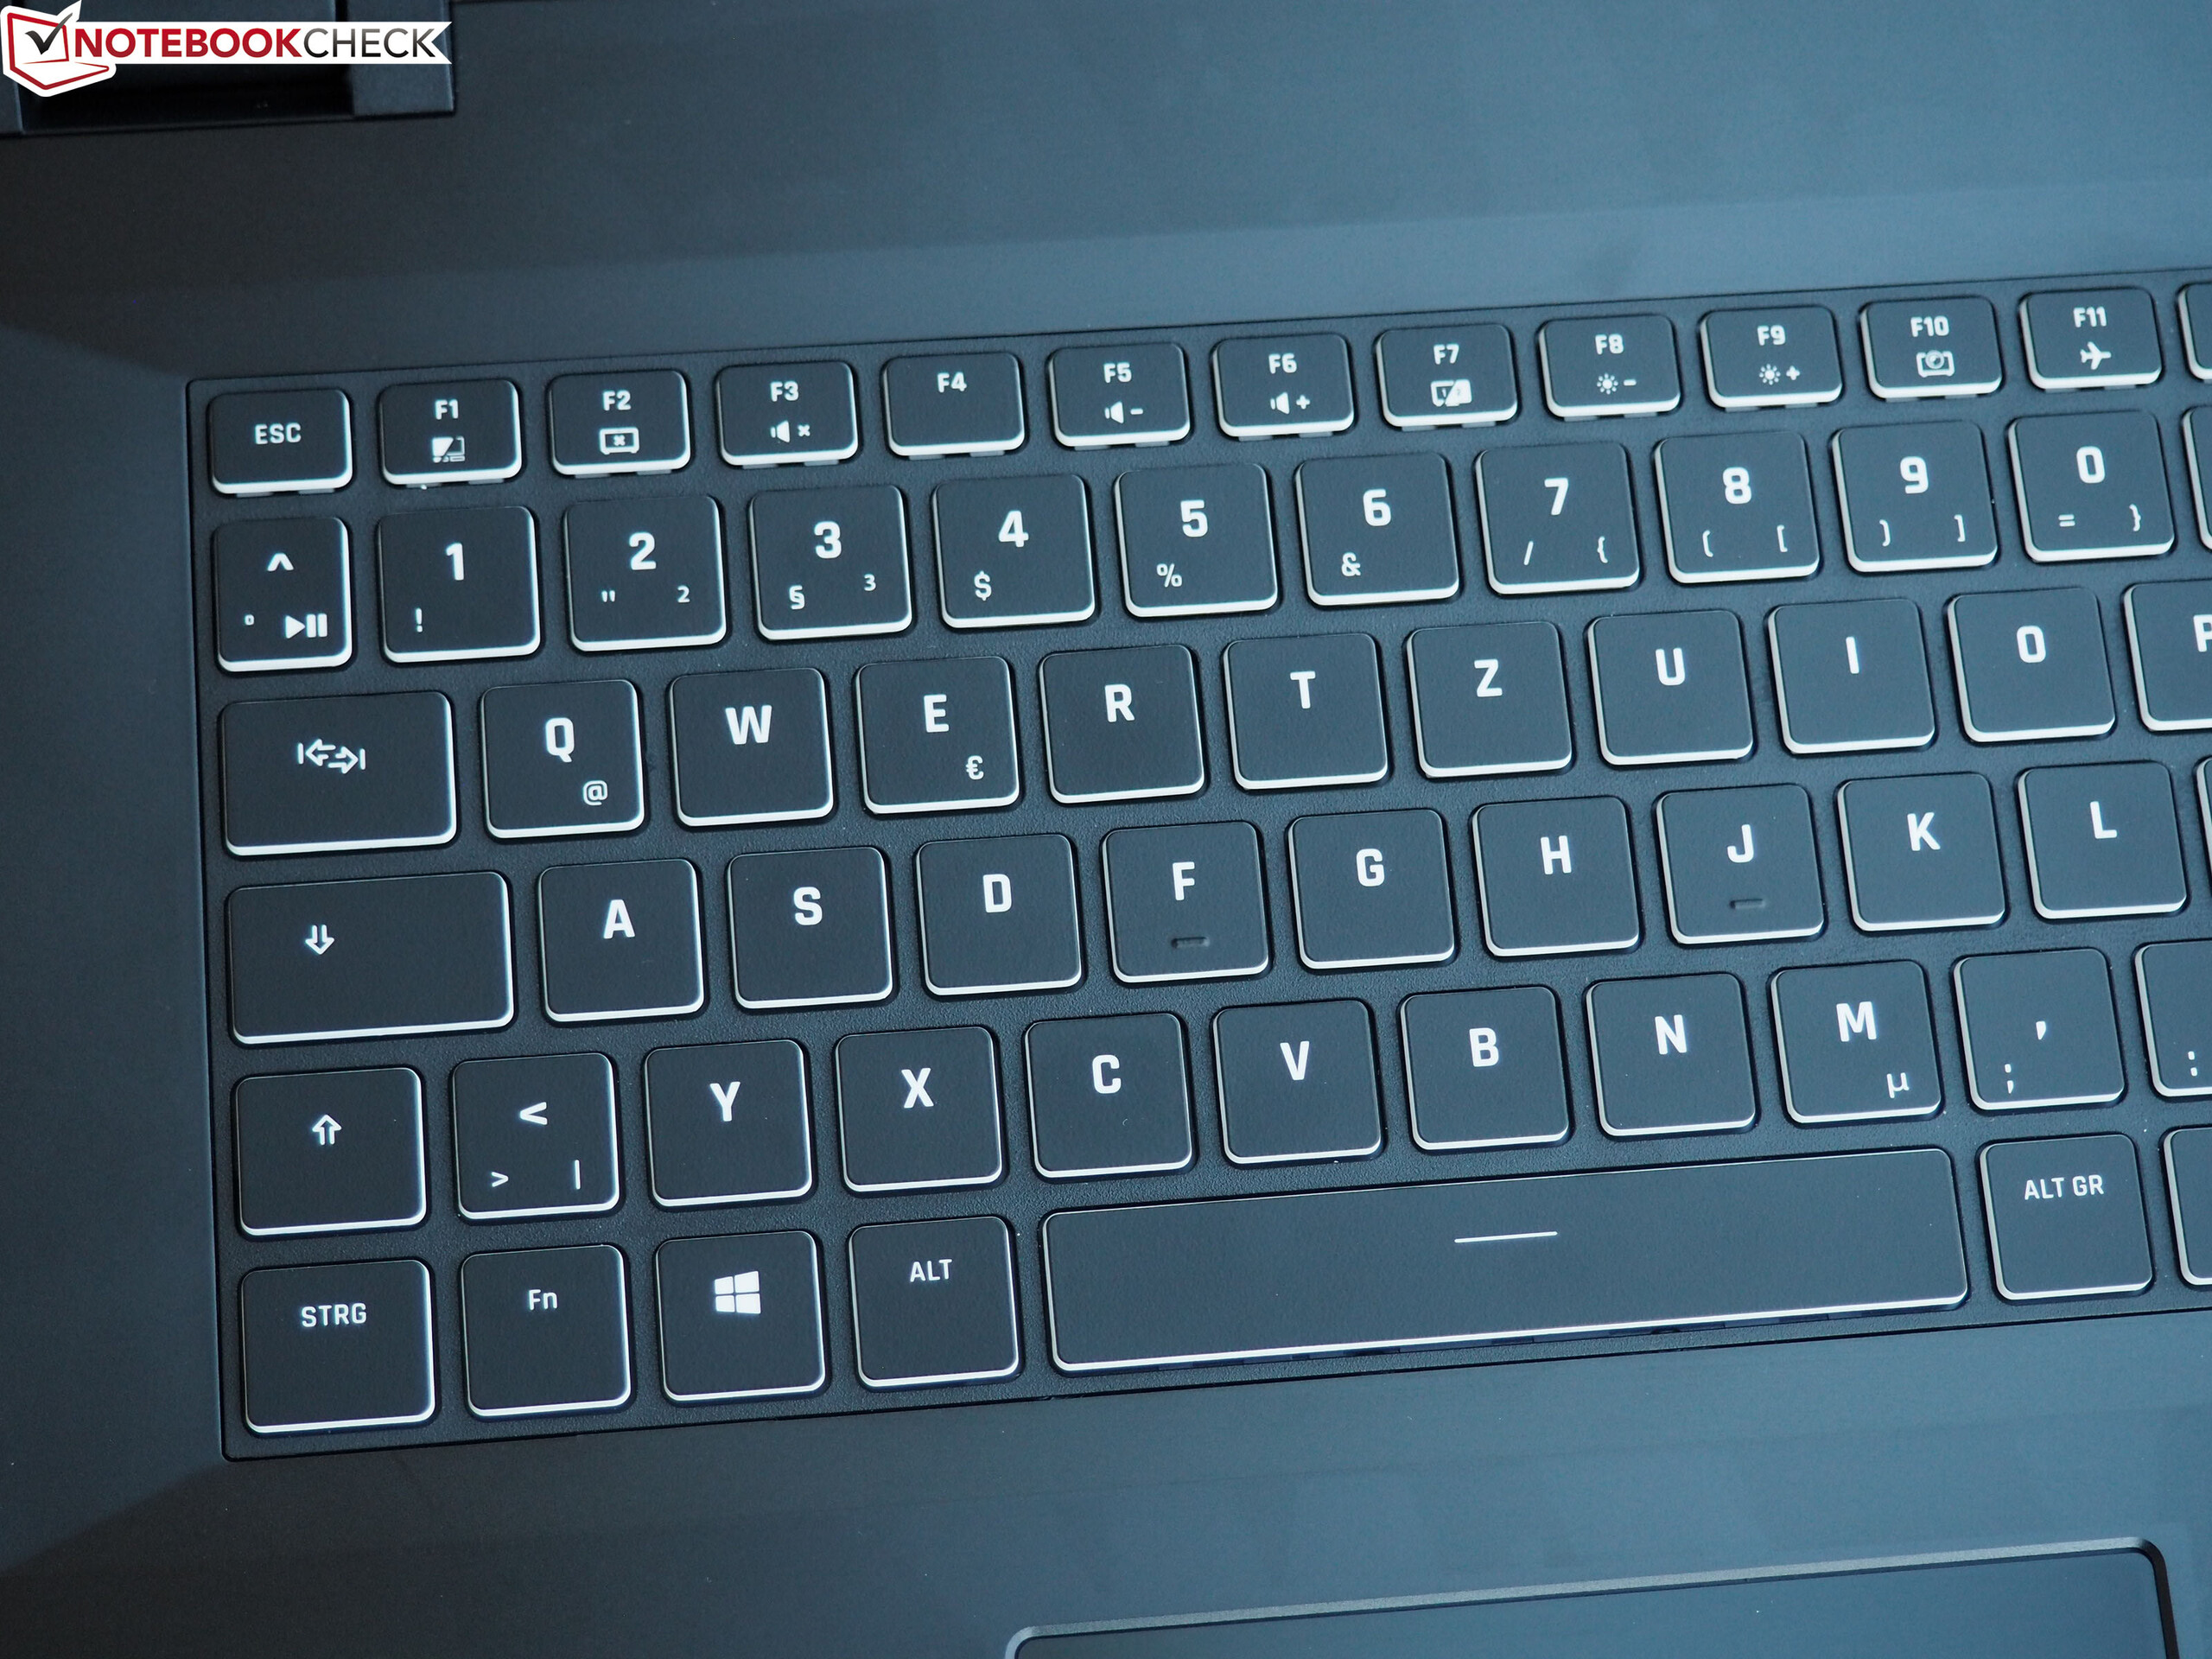
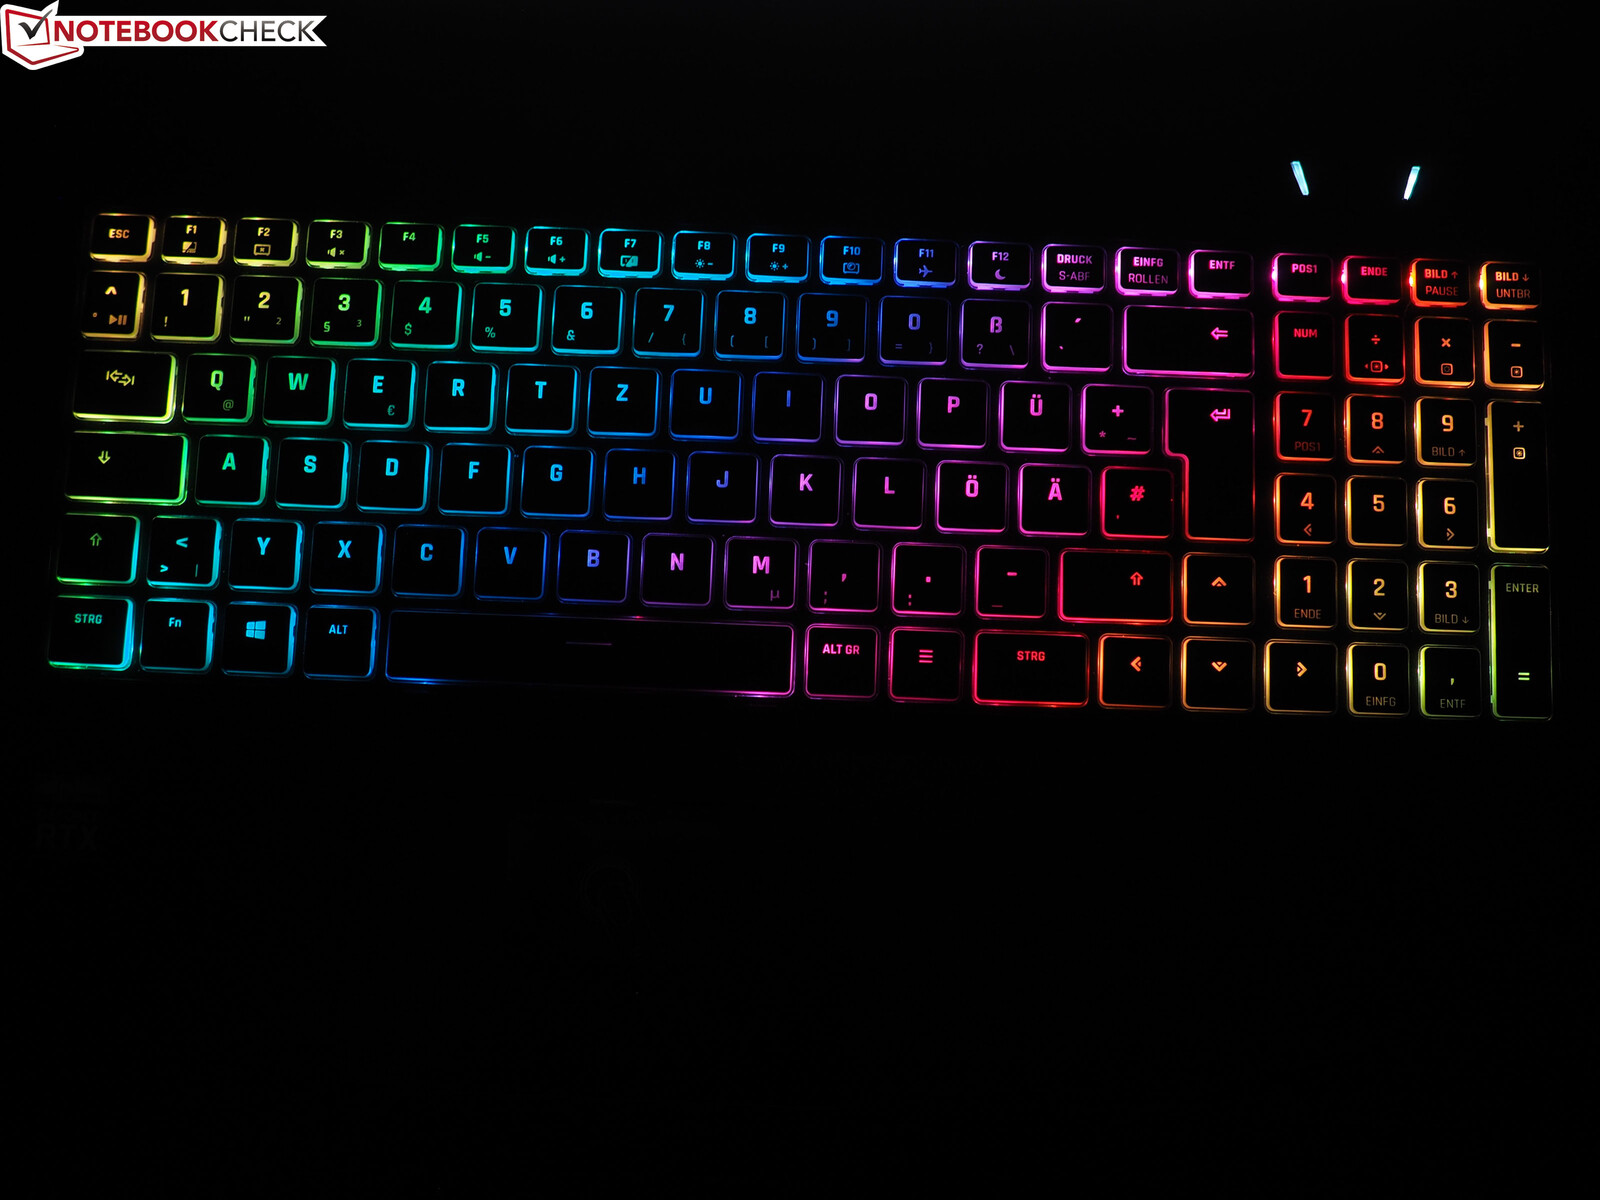
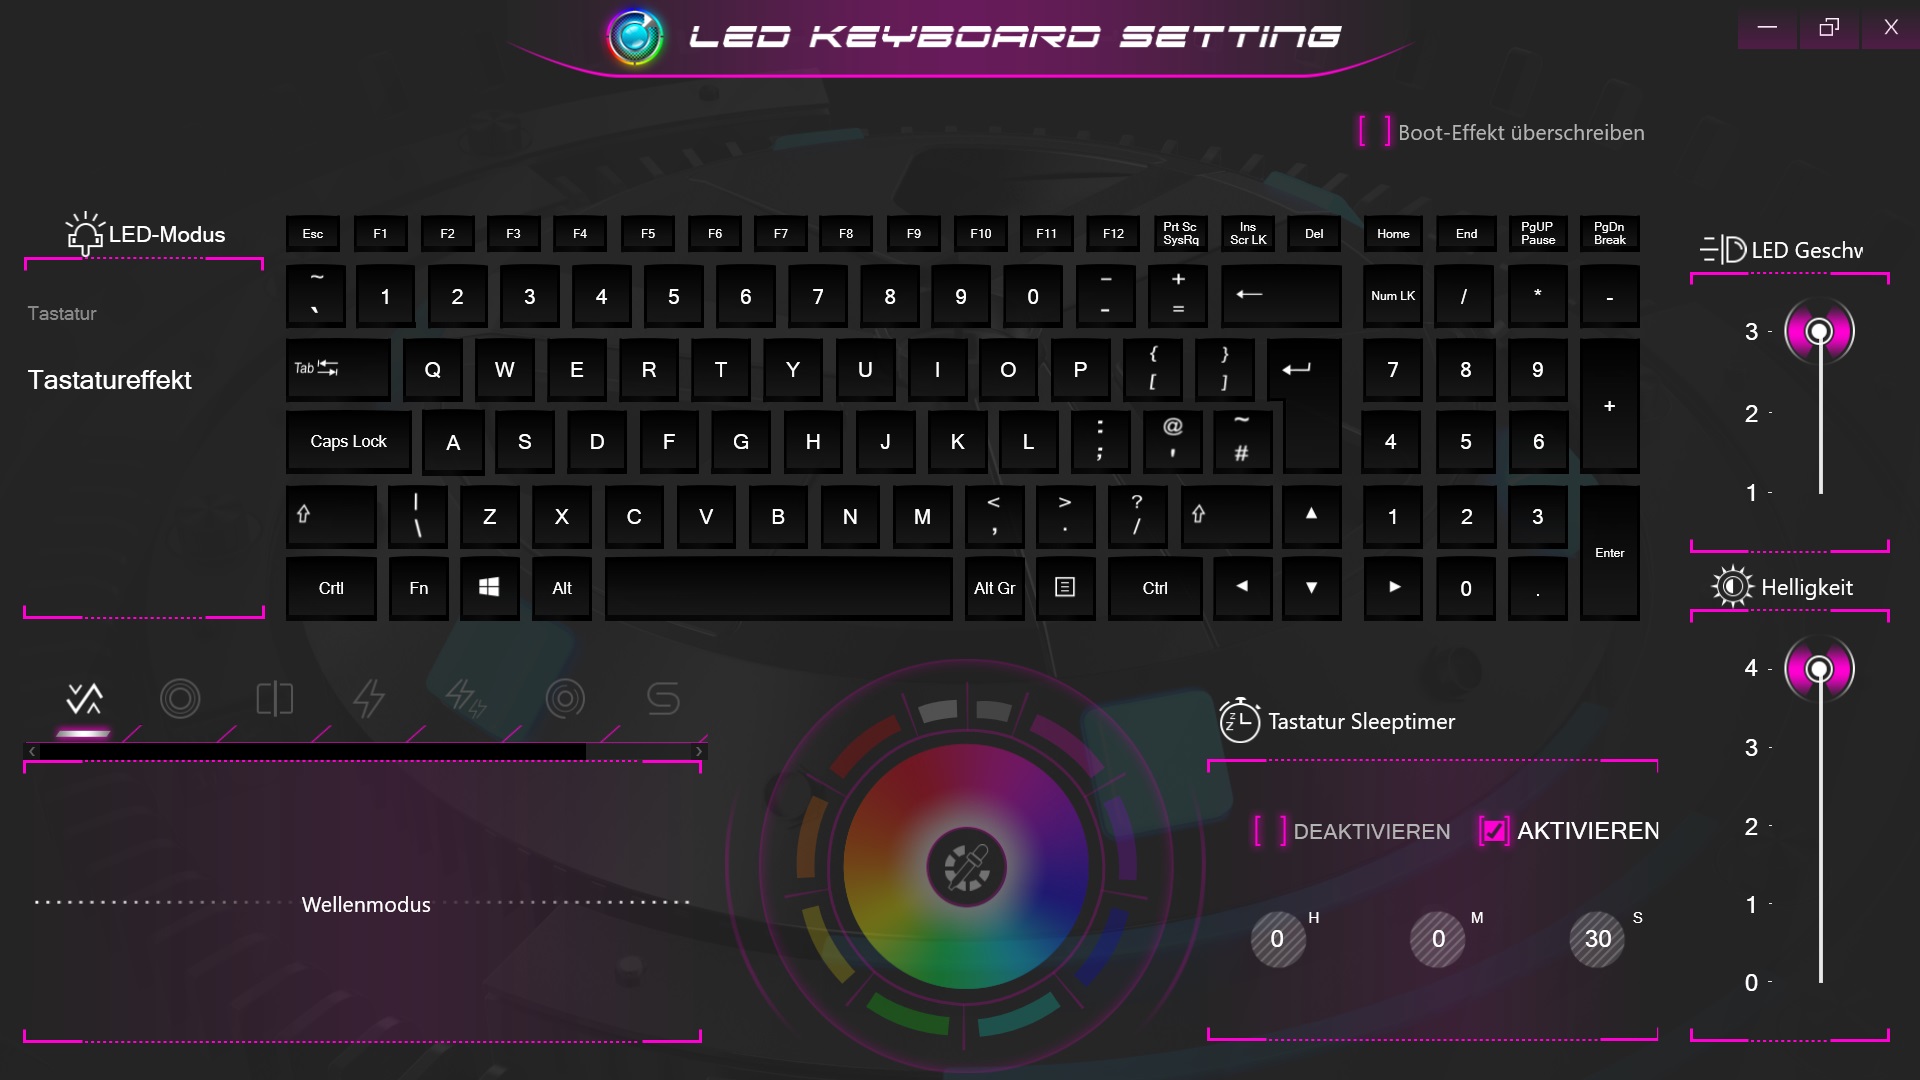
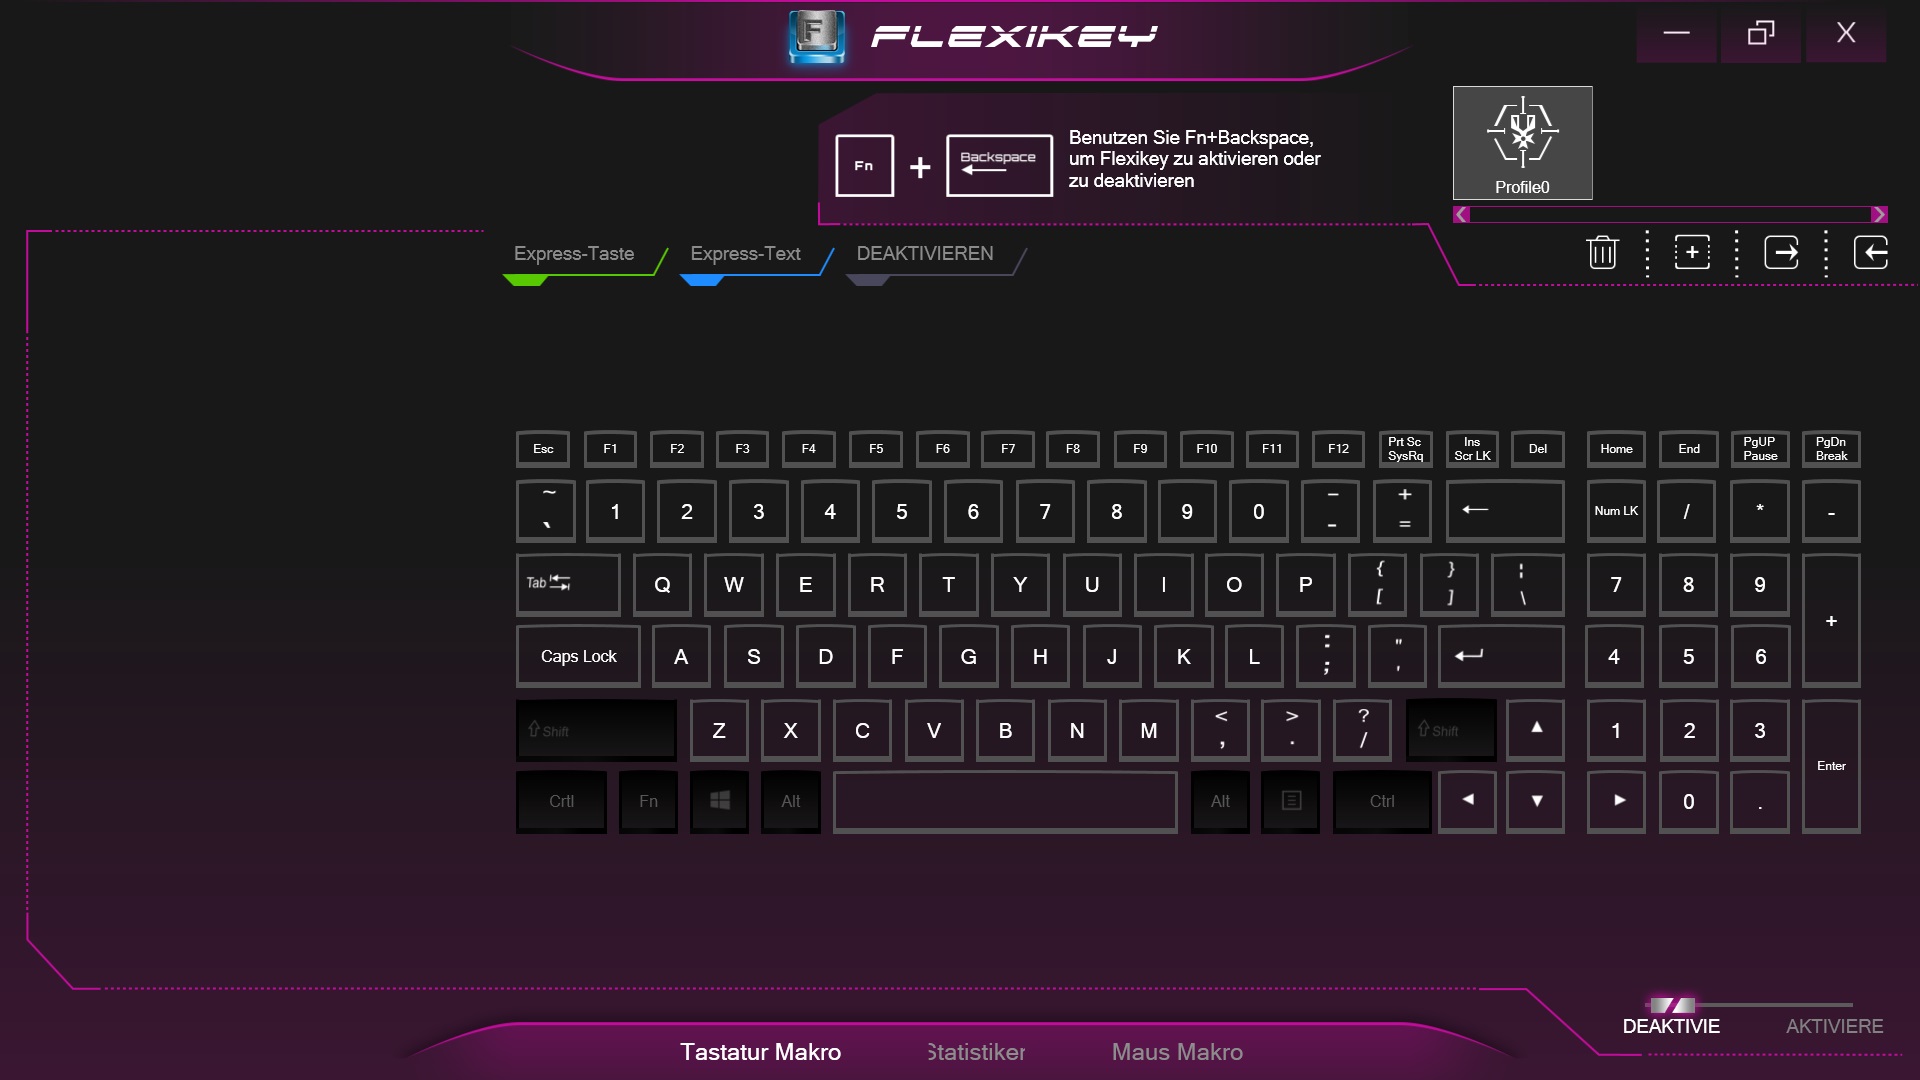
The keyboard is identical to the one on the XMG Pro 15 and thus comes with the same strengths and weaknesses. Advantages primarily include the high-intensity RGB lighting (with multiple brightness settings), which can be adjusted to your personal preferences via its software - be it color, mode or effect speed.
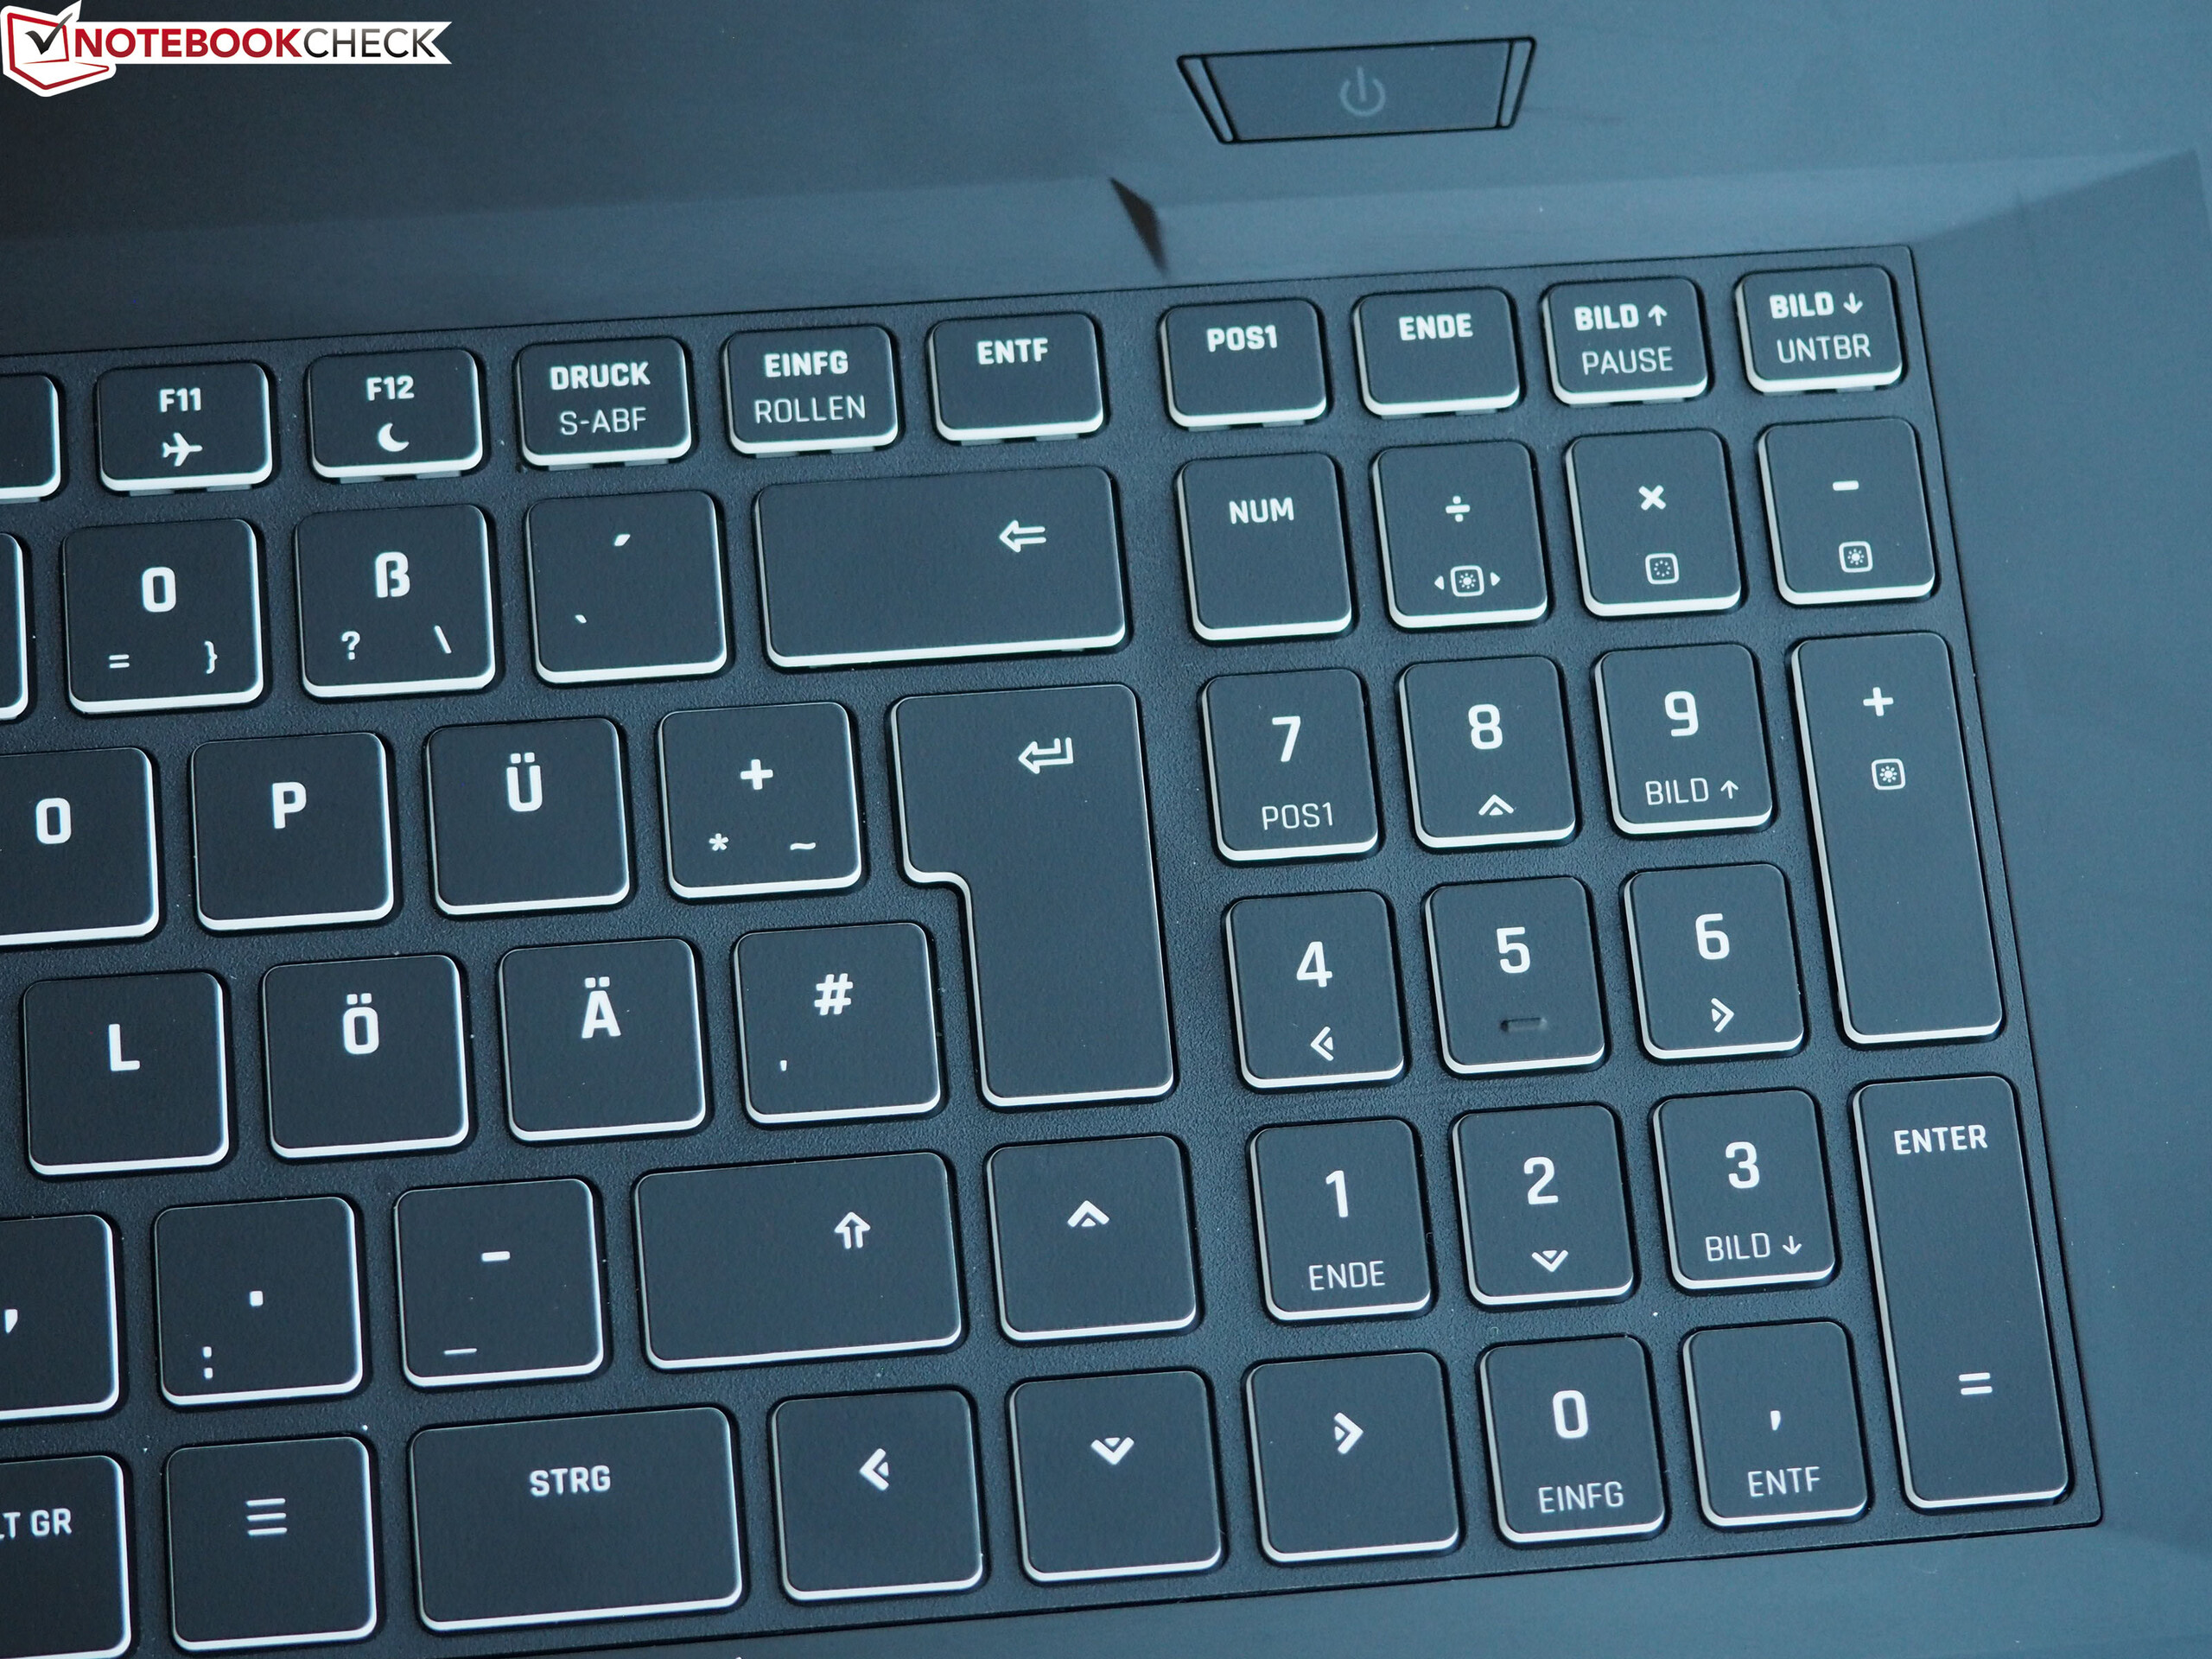
Apart from the slightly weak center, the typing experience is fairly good and neither too firm nor too soft. Similarly, the layout and the key sizes barely warrant criticism. Only the numpad could have been slightly wider, since there is enough available space anyway.
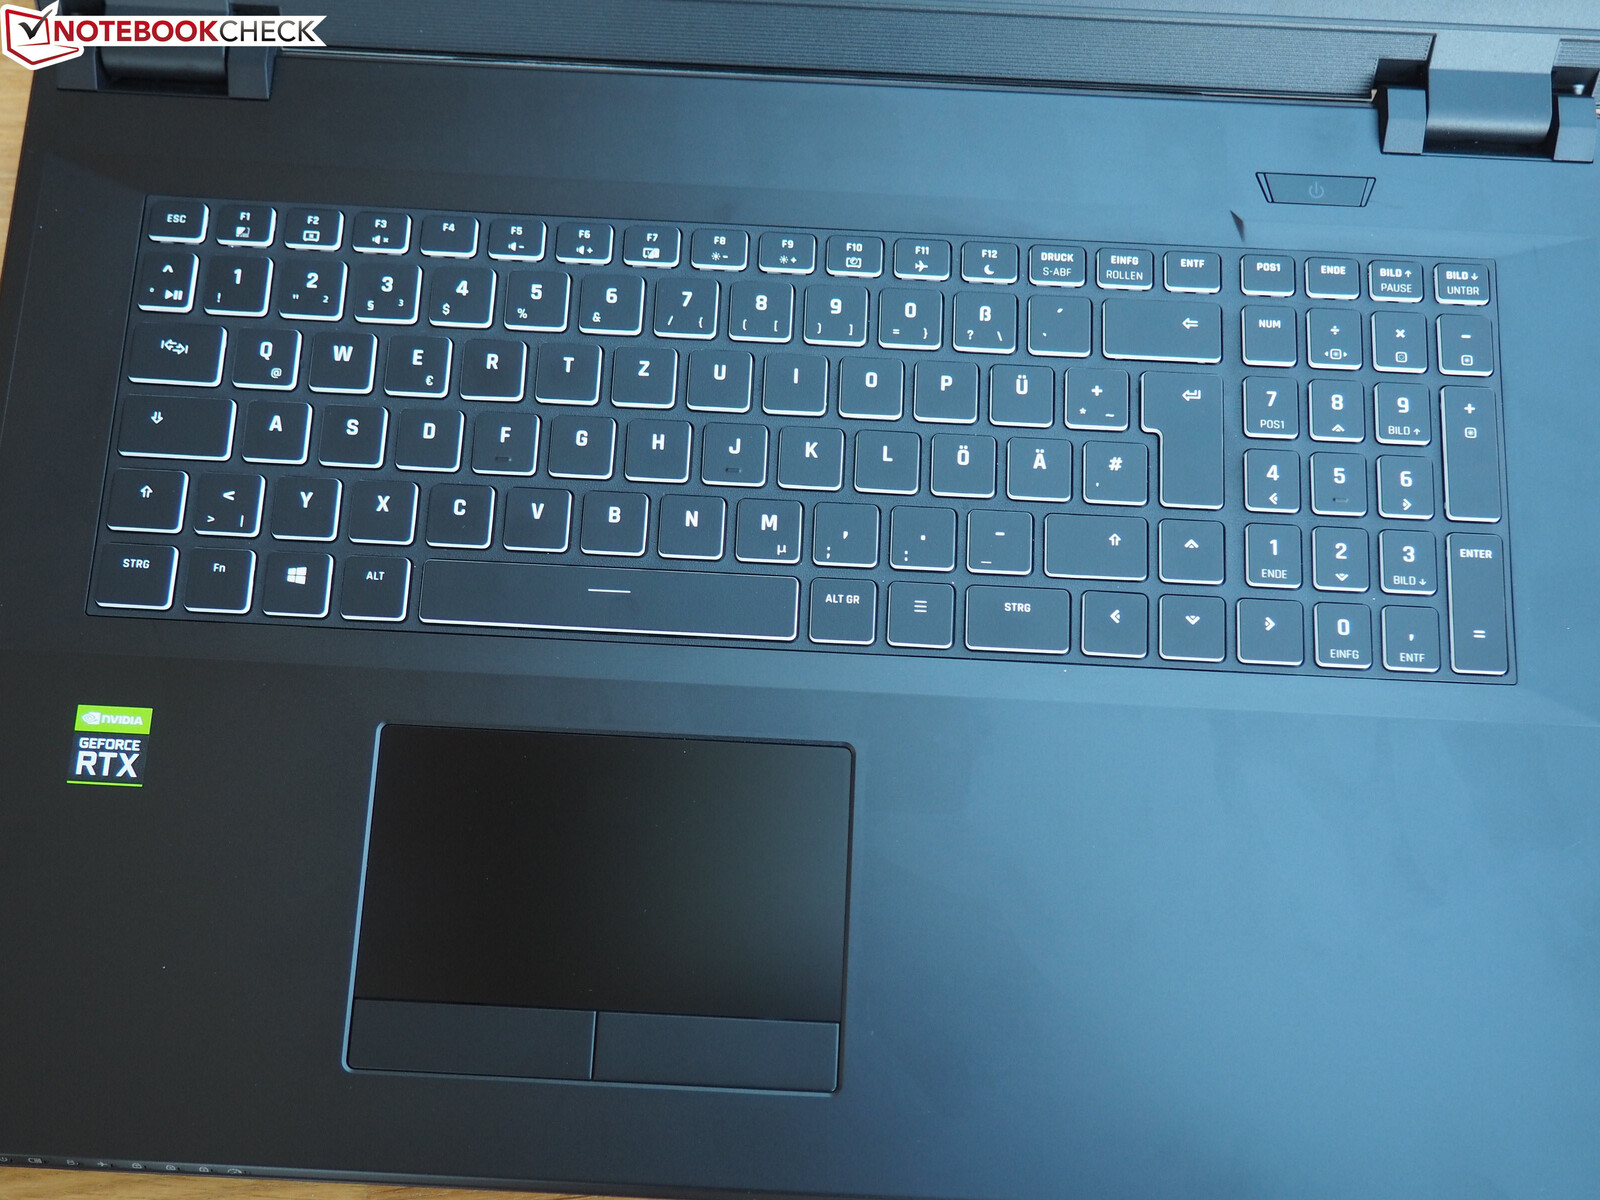
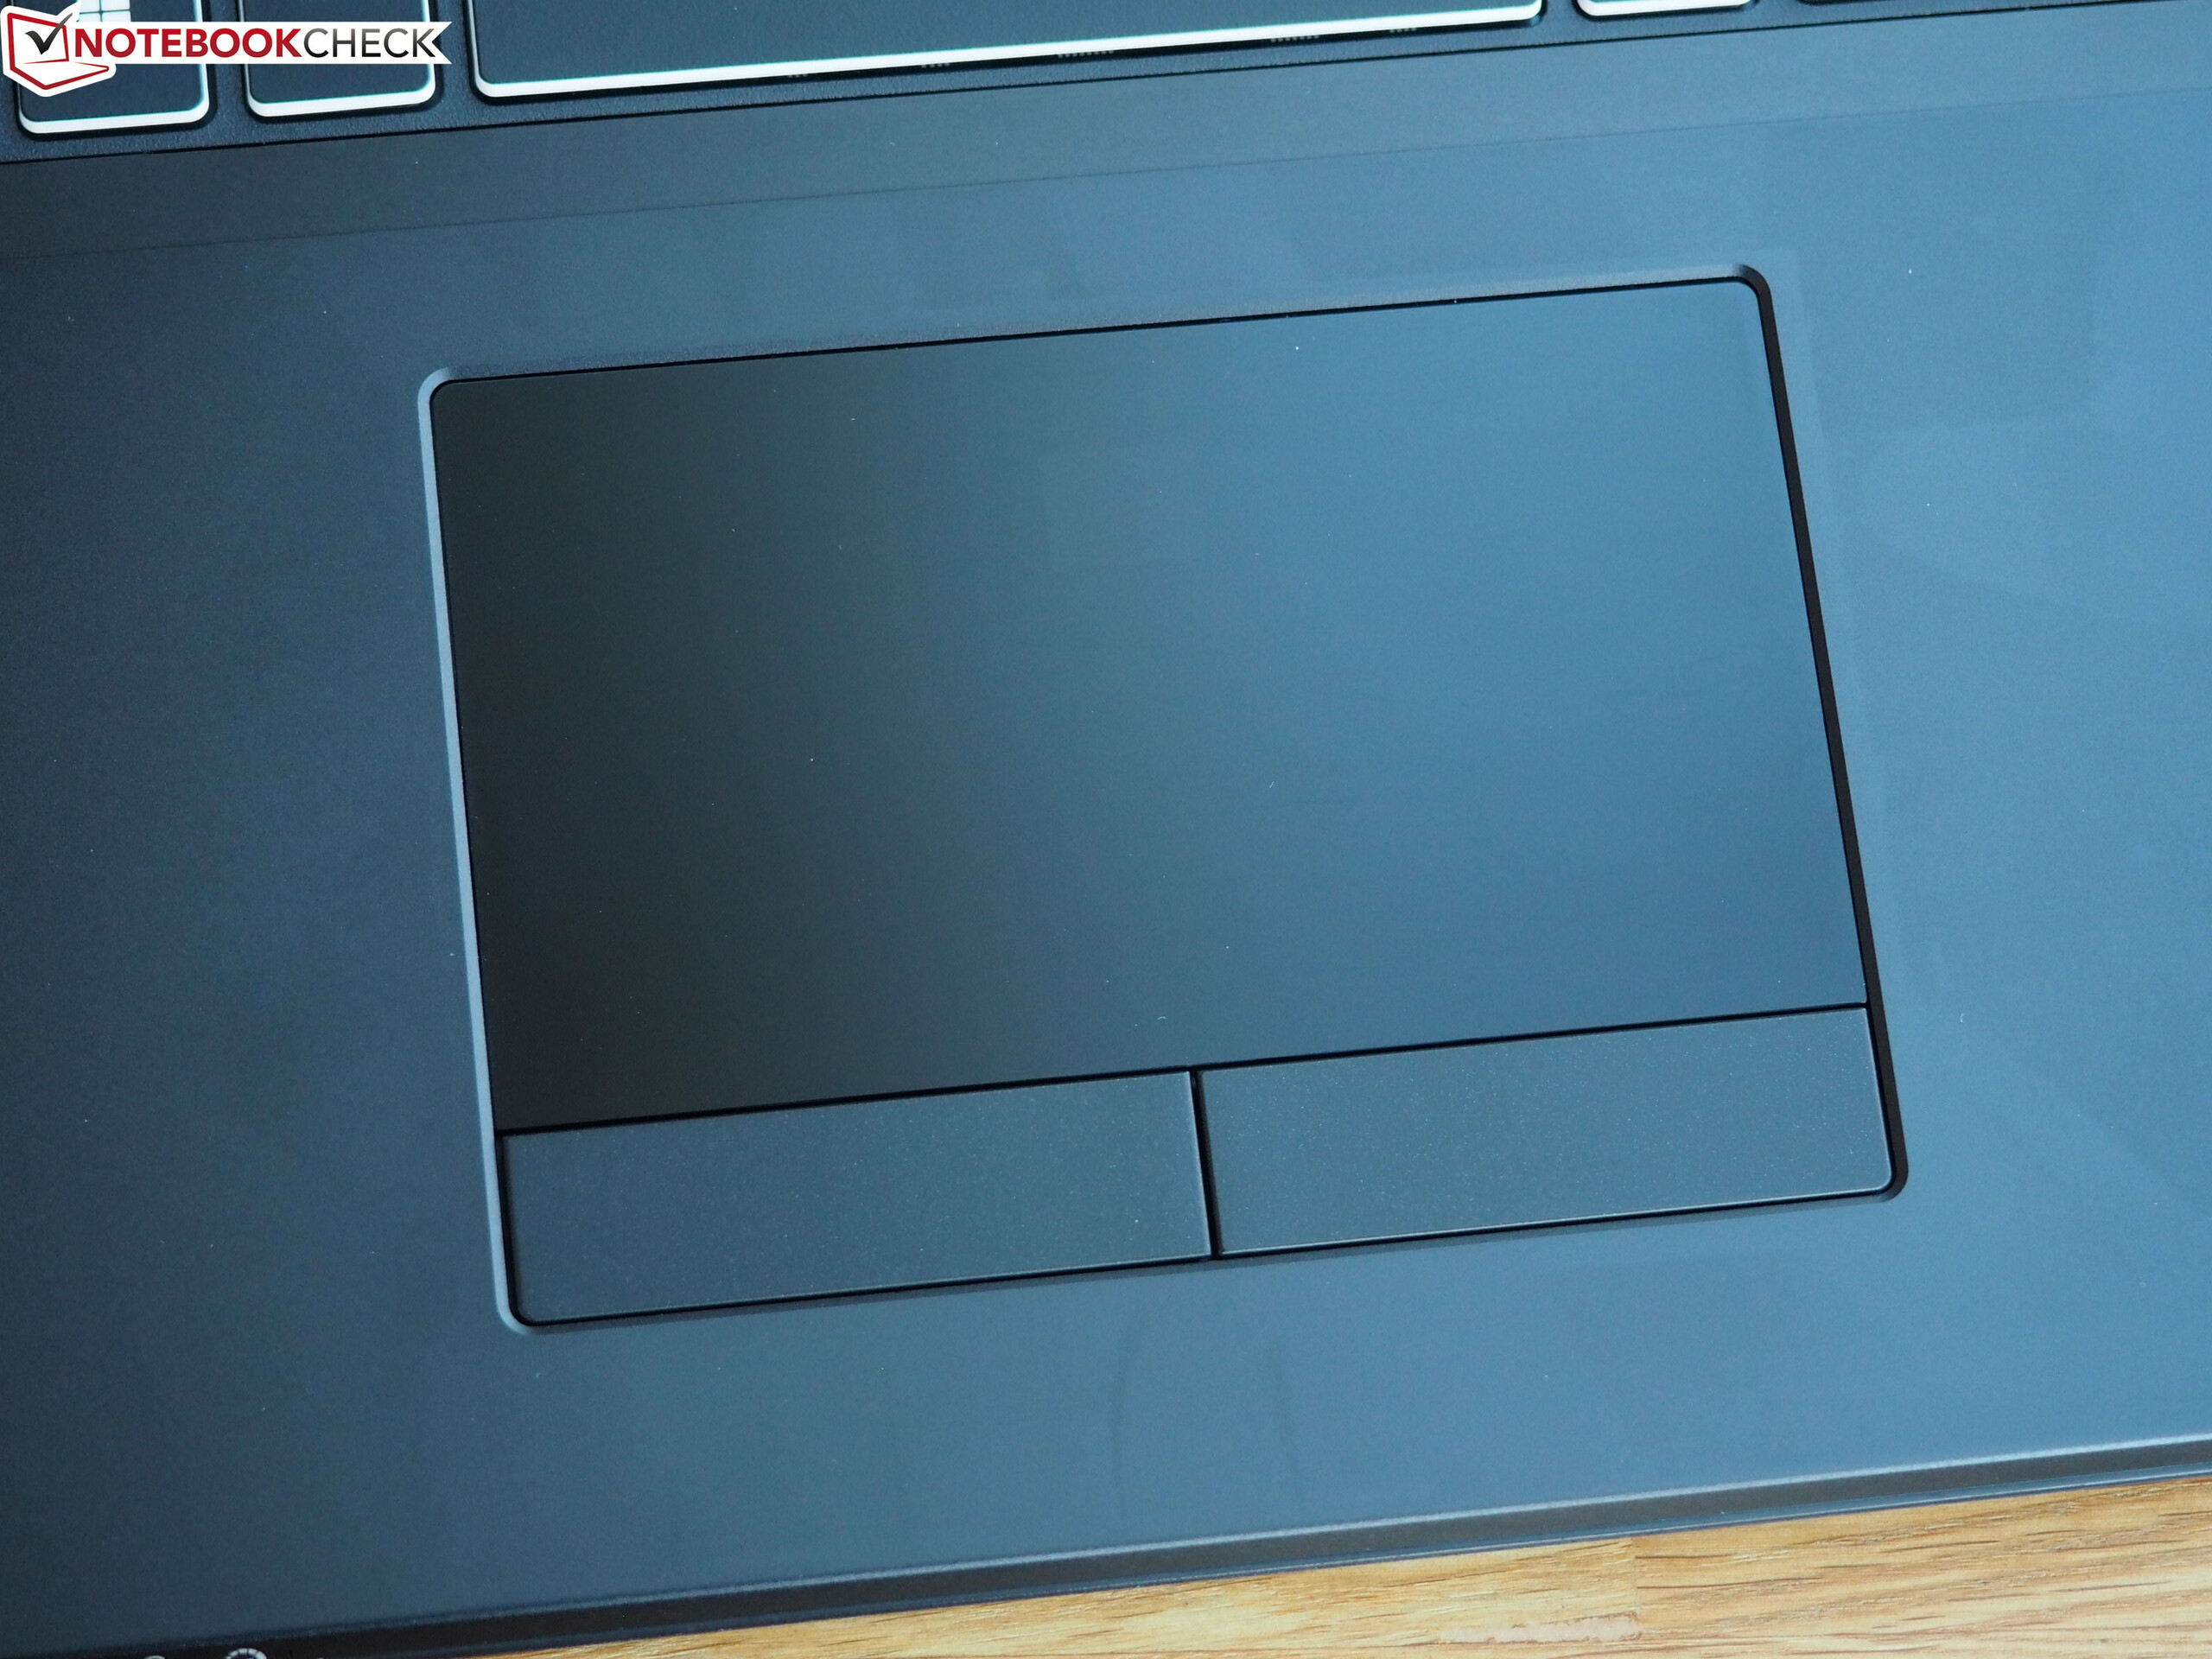
Touchpad
At 10.8 x 6.2 cm, the touchpad dimensions are decent for a 17-inch device, but they are not exceptional. Due to the very smooth finish, fingers glide very quickly (some may say too quickly) across the surface, which comes with an integrated, invisible fingerprint sensor. Here, many actions (such as, for example, drag and drop) can be accomplished much easier than with most ClickPads thanks to the dedicated mouse buttons. In the same vein, gestures and particularly zooming as well as scrolling with two fingers worked well in our tests. That said, the precision of the touchpad is only average.
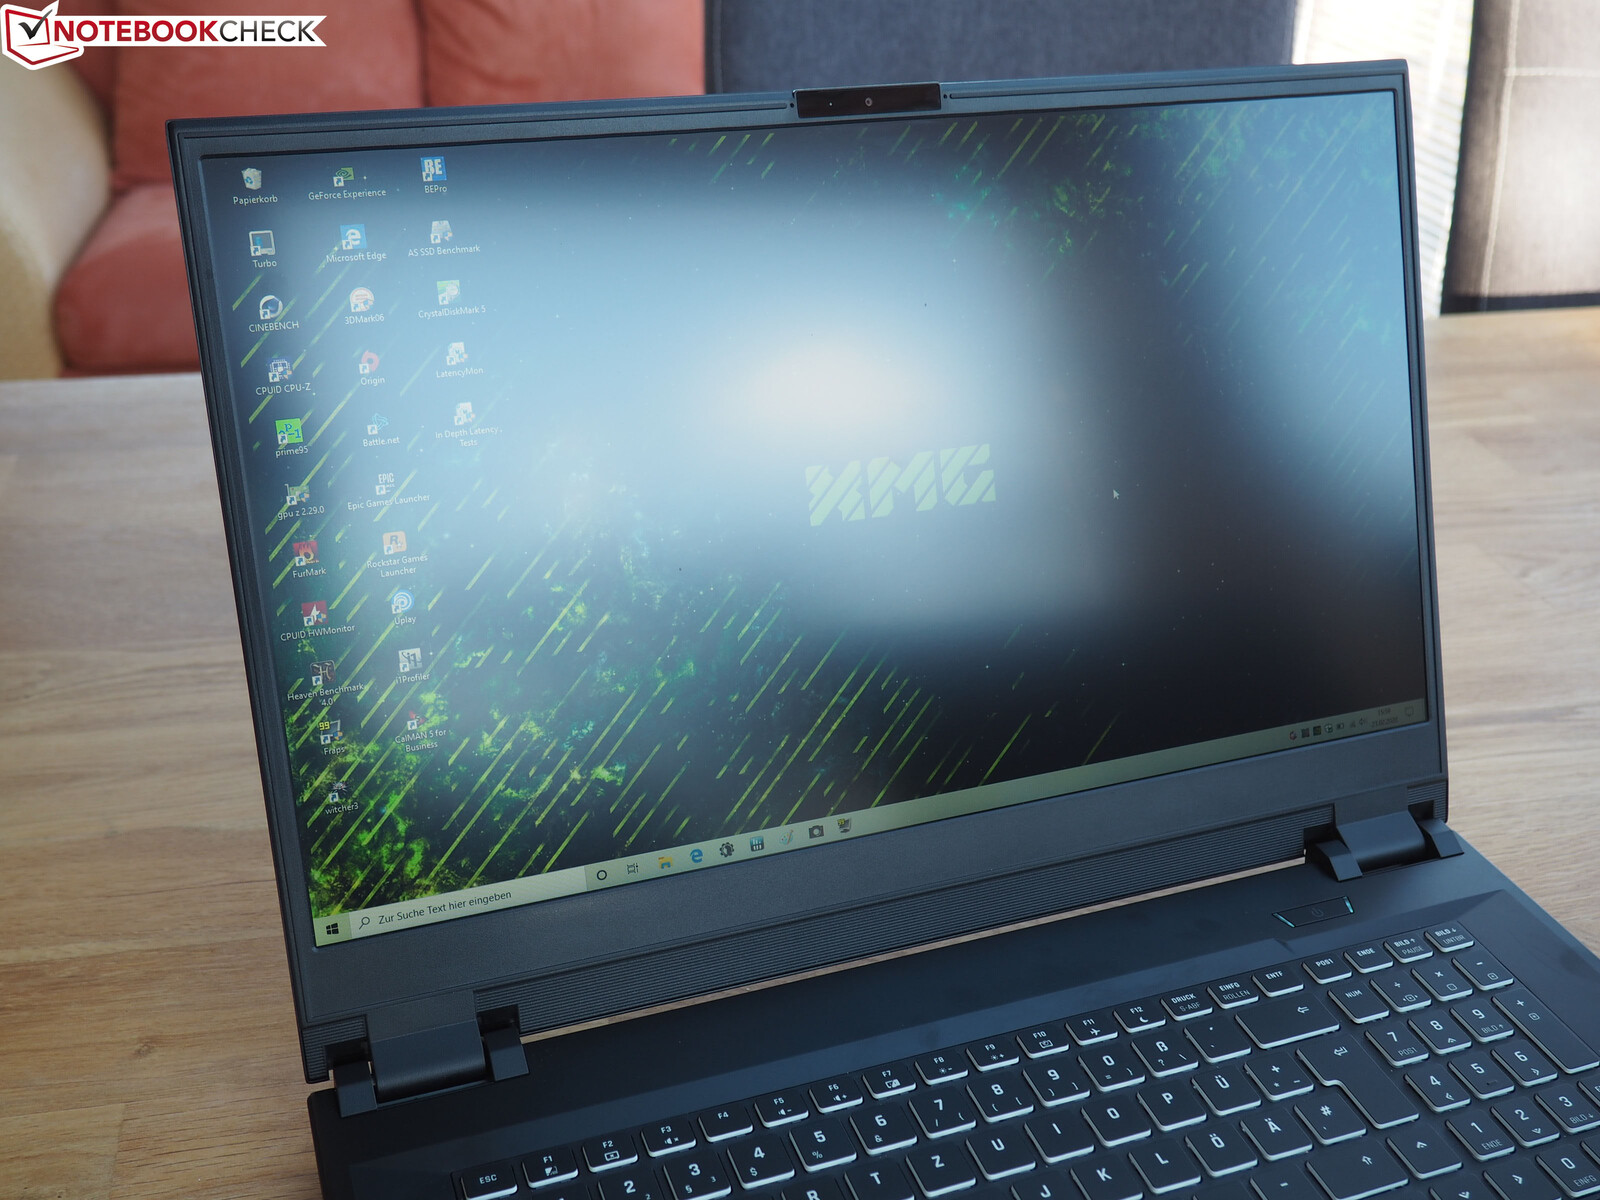
Display
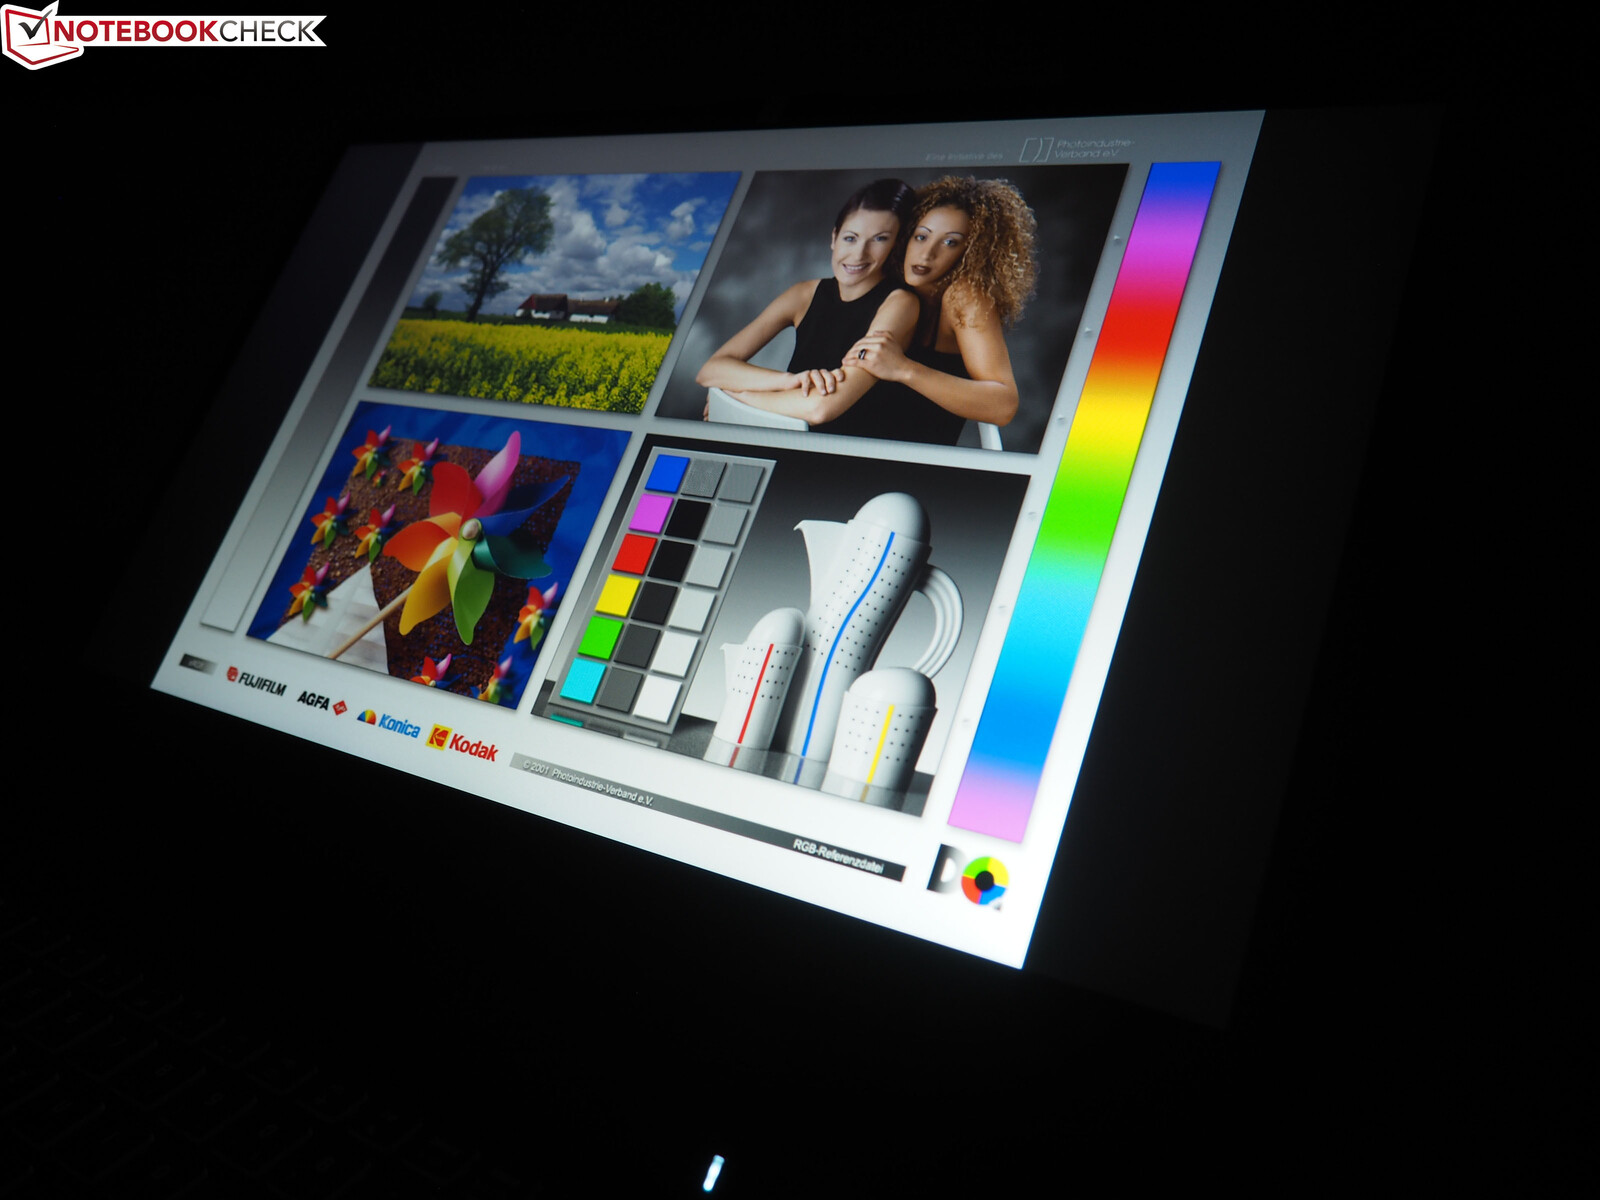
We are already familiar with the Full HD panel installed in our XMG Pro 17 (AU Optronics B173HAN04.0) from other gaming laptops such as the Razer Blade 17 and the Asus Strix G731GV.
| |||||||||||||||||||||||||
Brightness Distribution: 95 %
Center on Battery: 274 cd/m²
Contrast: 1054:1 (Black: 0.26 cd/m²)
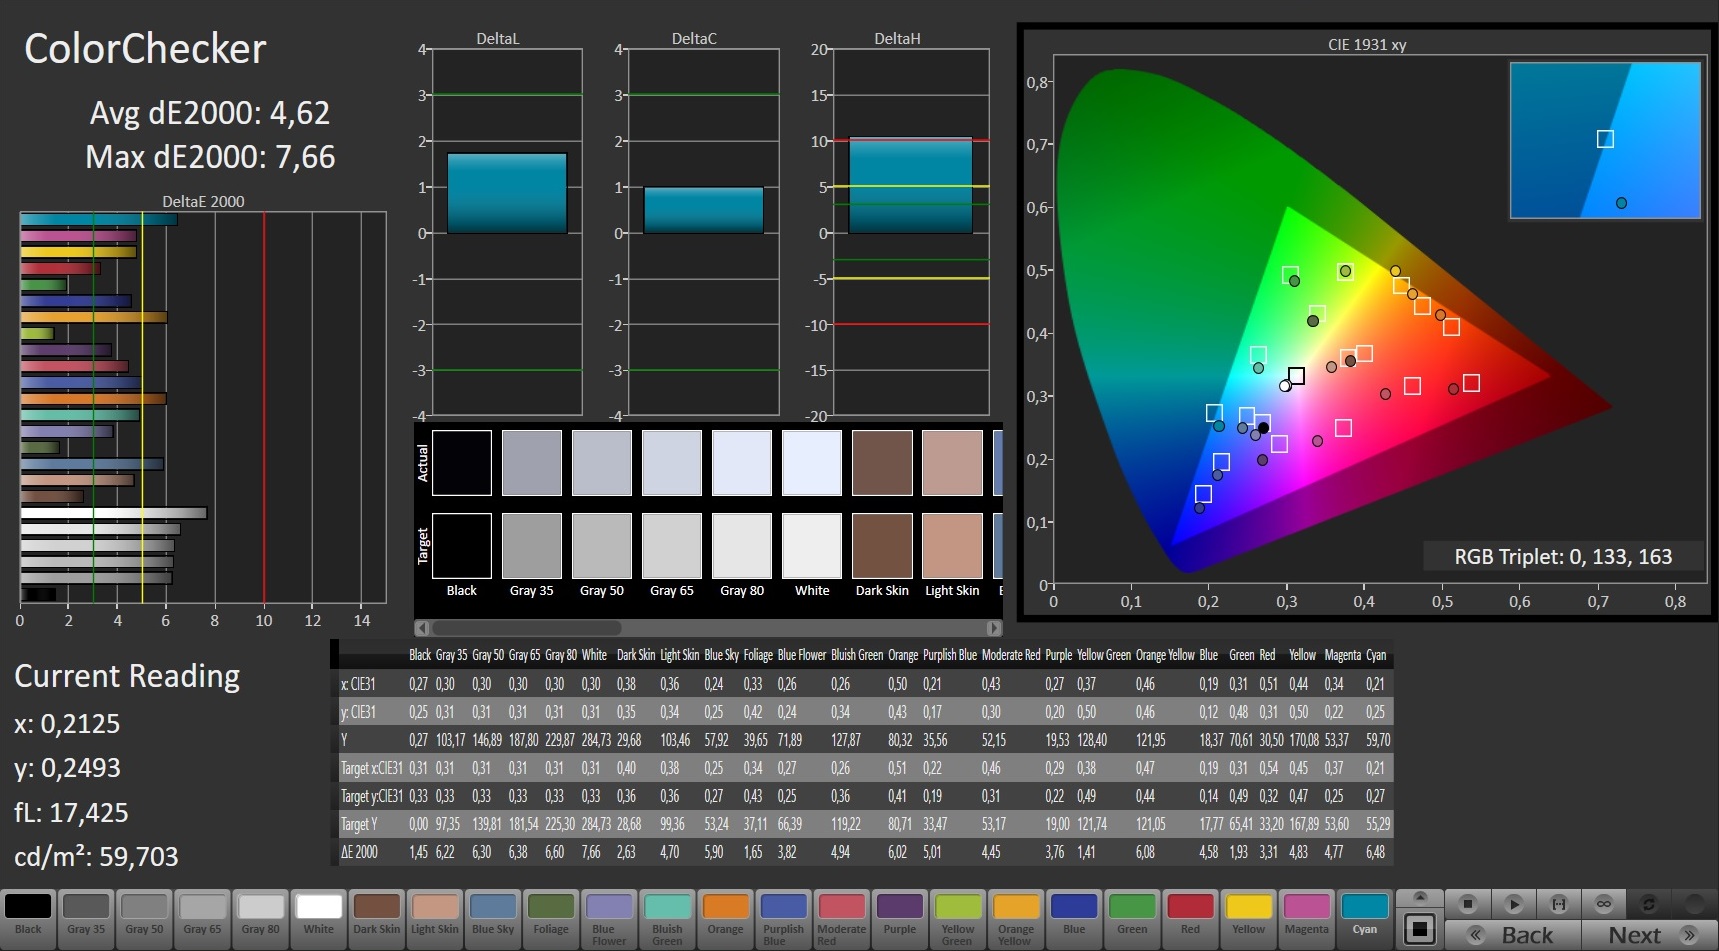
ΔE Color 4.62 | 0.5-29.43 Ø5, calibrated: 1.93
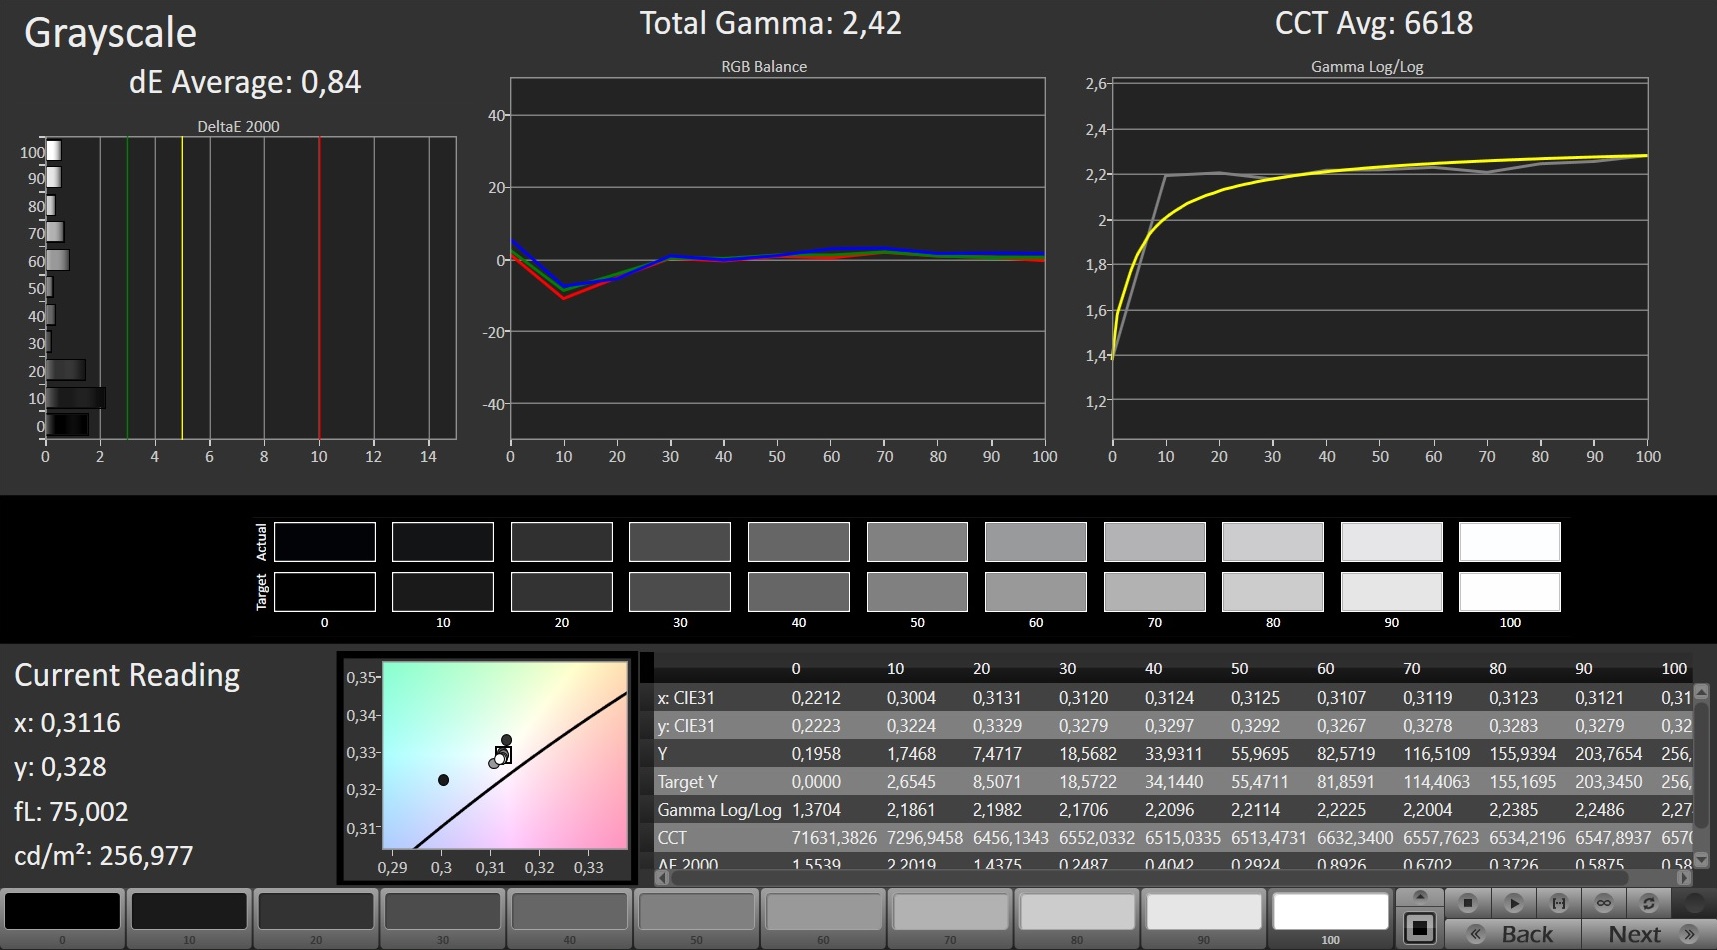
ΔE Greyscale 5.3 | 0.57-98 Ø5.3
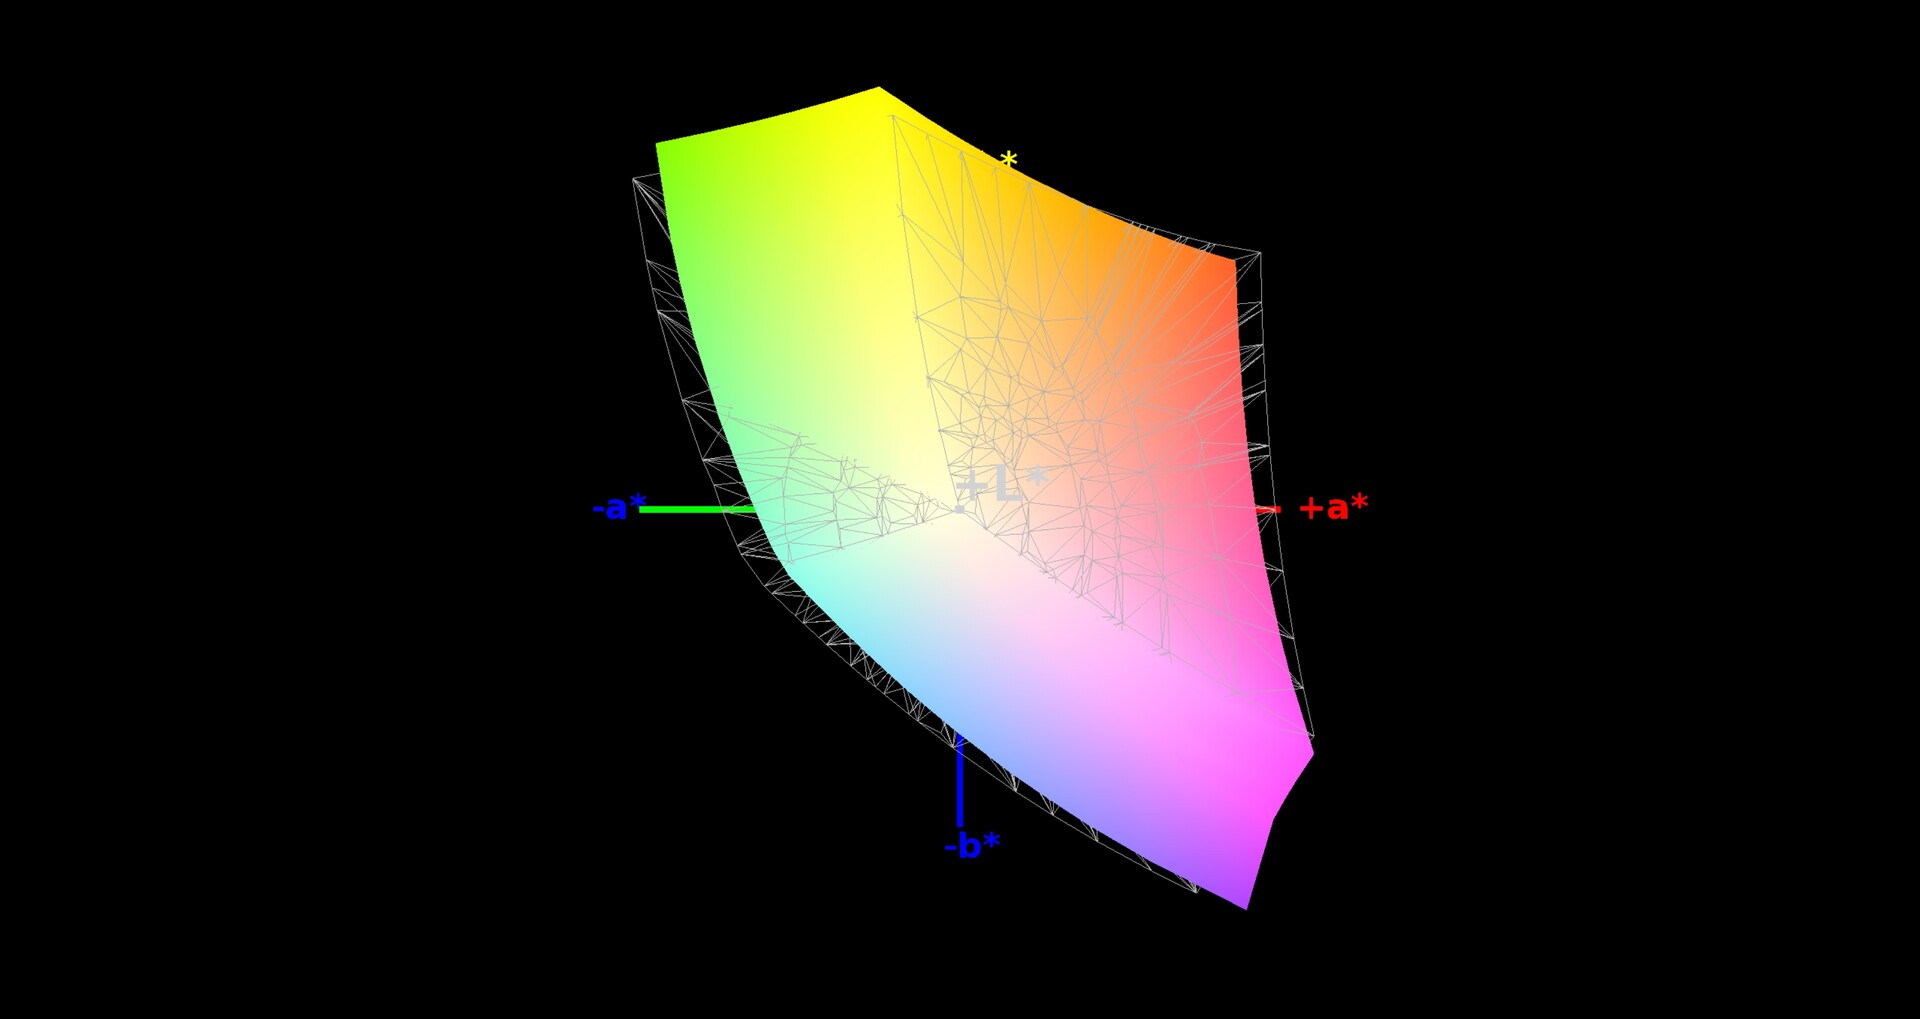
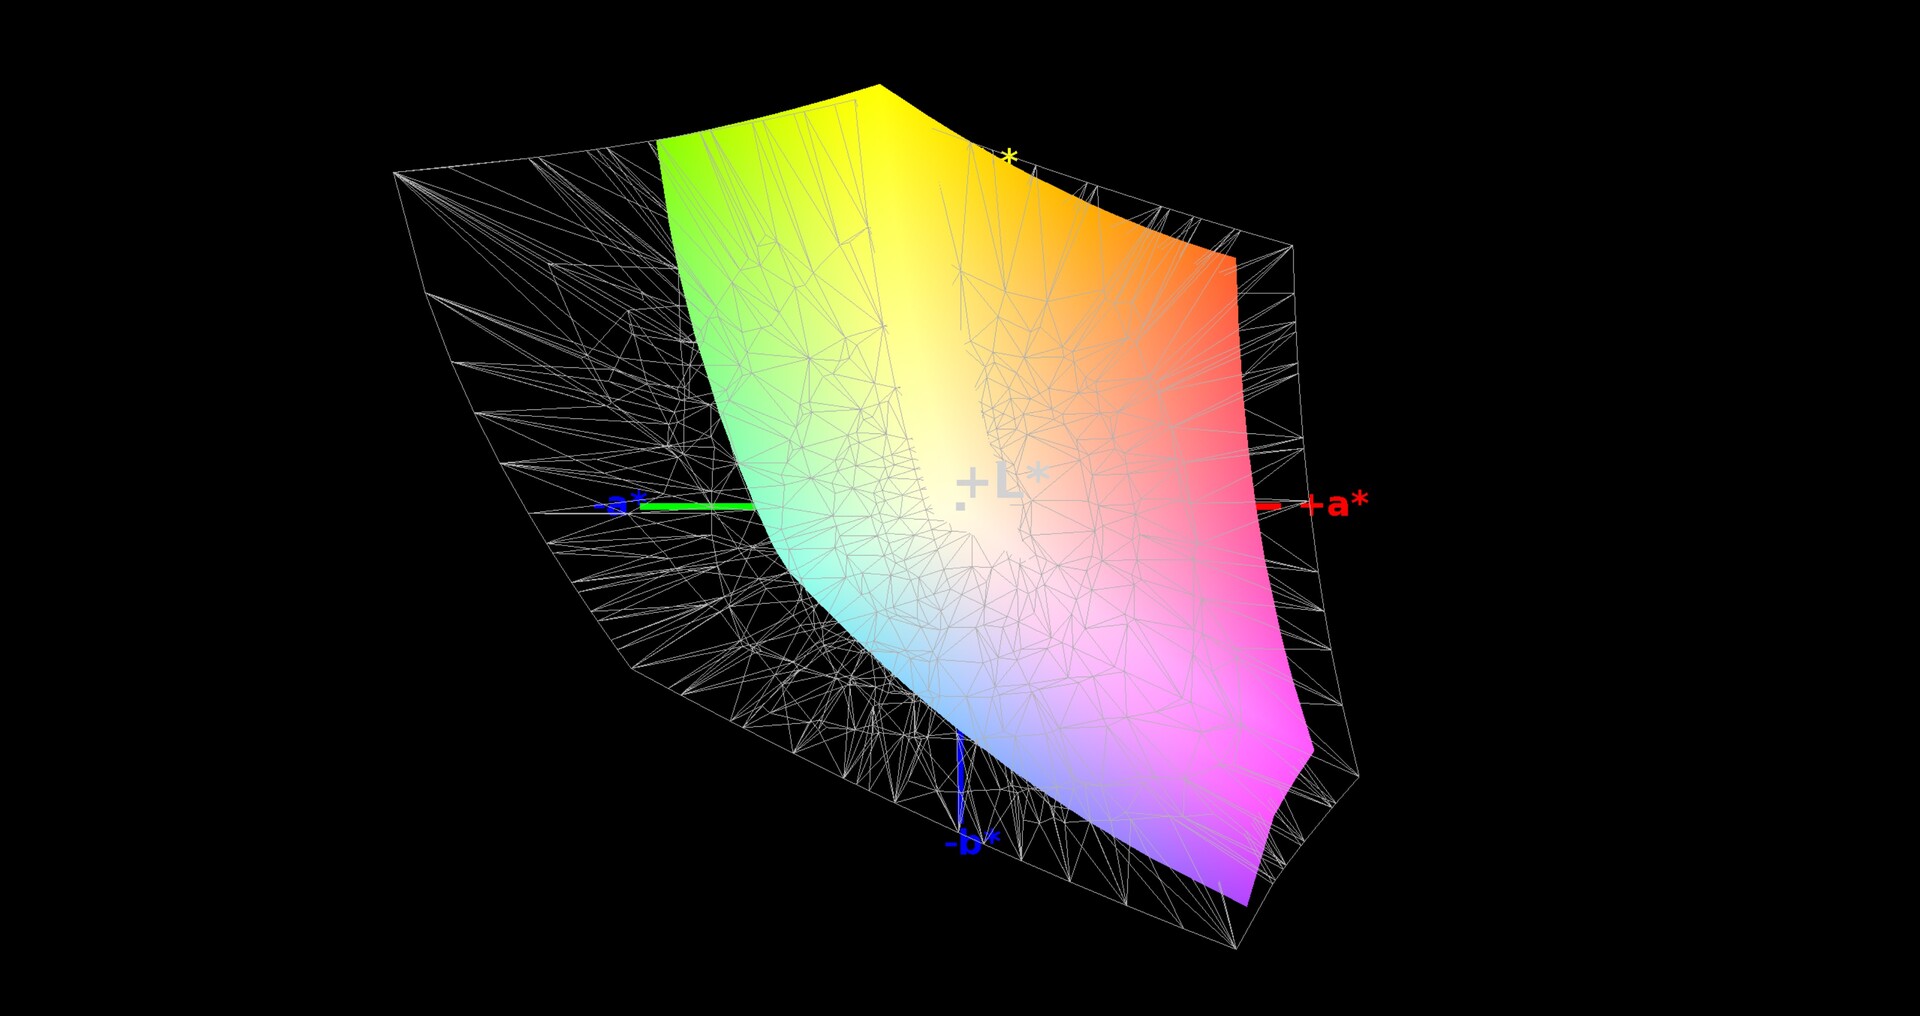
90% sRGB (Argyll 1.6.3 3D)
58% AdobeRGB 1998 (Argyll 1.6.3 3D)
64.2% AdobeRGB 1998 (Argyll 2.2.0 3D)
89.8% sRGB (Argyll 2.2.0 3D)
62.8% Display P3 (Argyll 2.2.0 3D)
Gamma: 2.34
| SCHENKER XMG Pro 17 PB71RD-G AU Optronics B173HAN04.0 (AUO409D), IPS, 1920x1080 | Razer Blade Pro 17 RTX 2060 AU Optronics B173HAN04.0, IPS, 1920x1080 | Asus Strix Hero III G731GV AU Optronics AUO B173HAN04.0, IPS, 1920x1080 | Lenovo Legion Y740-17IRH LG Philips LP173WFG-SPD2 (LGD05E0), IPS, 1920x1080 | MSI GL75 9SEK-056US AU Optronics AUO479D (B173HAN04.7), IPS, 1920x1080 | |
|---|---|---|---|---|---|
| Display | -2% | -1% | 4% | -34% | |
| Display P3 Coverage | 62.8 | 61.1 -3% | 62.9 0% | 64.8 3% | 41.12 -35% |
| sRGB Coverage | 89.8 | 89.4 0% | 87.2 -3% | 96 7% | 61.1 -32% |
| AdobeRGB 1998 Coverage | 64.2 | 62.5 -3% | 63.8 -1% | 65.8 2% | 42.49 -34% |
| Response Times | 44% | 30% | 10% | -79% | |
| Response Time Grey 50% / Grey 80% * | 16.8 ? | 6.8 ? 60% | 6.8 ? 60% | 14.8 ? 12% | 26 ? -55% |
| Response Time Black / White * | 12 ? | 8.8 ? 27% | 12 ? -0% | 11.2 ? 7% | 24.4 ? -103% |
| PWM Frequency | |||||
| Screen | 9% | 4% | 8% | -27% | |
| Brightness middle | 274 | 300.4 10% | 312.3 14% | 282 3% | 259.1 -5% |
| Brightness | 273 | 289 6% | 297 9% | 261 -4% | 261 -4% |
| Brightness Distribution | 95 | 93 -2% | 91 -4% | 87 -8% | 93 -2% |
| Black Level * | 0.26 | 0.32 -23% | 0.21 19% | 0.27 -4% | 0.25 4% |
| Contrast | 1054 | 939 -11% | 1487 41% | 1044 -1% | 1036 -2% |
| Colorchecker dE 2000 * | 4.62 | 2.32 50% | 3.6 22% | 3.18 31% | 4.23 8% |
| Colorchecker dE 2000 max. * | 7.66 | 3.81 50% | 6.74 12% | 8.39 -10% | 23.39 -205% |
| Colorchecker dE 2000 calibrated * | 1.93 | 2.95 -53% | 3.95 -105% | 0.95 51% | 3.9 -102% |
| Greyscale dE 2000 * | 5.3 | 1.5 72% | 3.1 42% | 4.1 23% | 1.3 75% |
| Gamma | 2.34 94% | 2.3 96% | 2.26 97% | 2.55 86% | 2.076 106% |
| CCT | 7619 85% | 6764 96% | 7002 93% | 7260 90% | 6542 99% |
| Color Space (Percent of AdobeRGB 1998) | 58 | 57.4 -1% | 56.6 -2% | 61 5% | 39 -33% |
| Color Space (Percent of sRGB) | 90 | 89 -1% | 86.6 -4% | 96 7% | 61 -32% |
| Total Average (Program / Settings) | 17% /
11% | 11% /
6% | 7% /
8% | -47% /
-35% |
* ... smaller is better
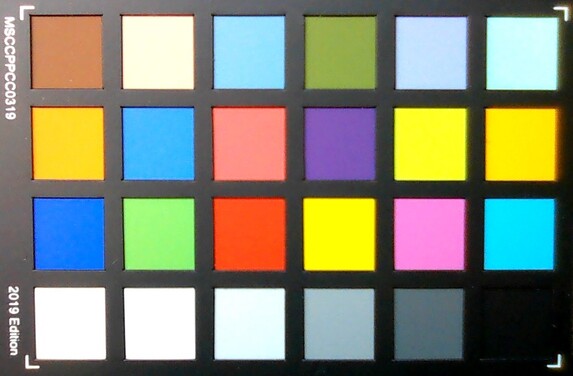
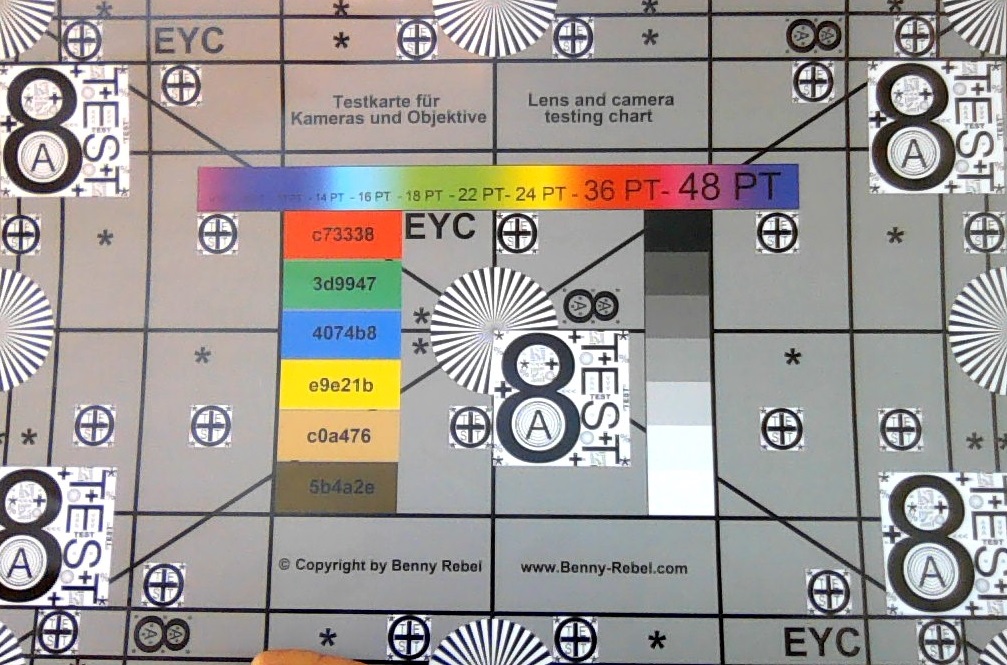
The 144-Hz screen supports G-Sync and offers surprisingly low response times. 12 ms to 17 ms promise a ghosting-free experience even in fast-paced games (e.g. first-person shooters). The contrast ratio should also be satisfactory for most users. While close to 1050:1 does not represent a peak value, it still results in a well-differentiated image. The same holds true for the color space: 90% of the sRGB color space is more than enough for multimedia use (movies, games, etc.).
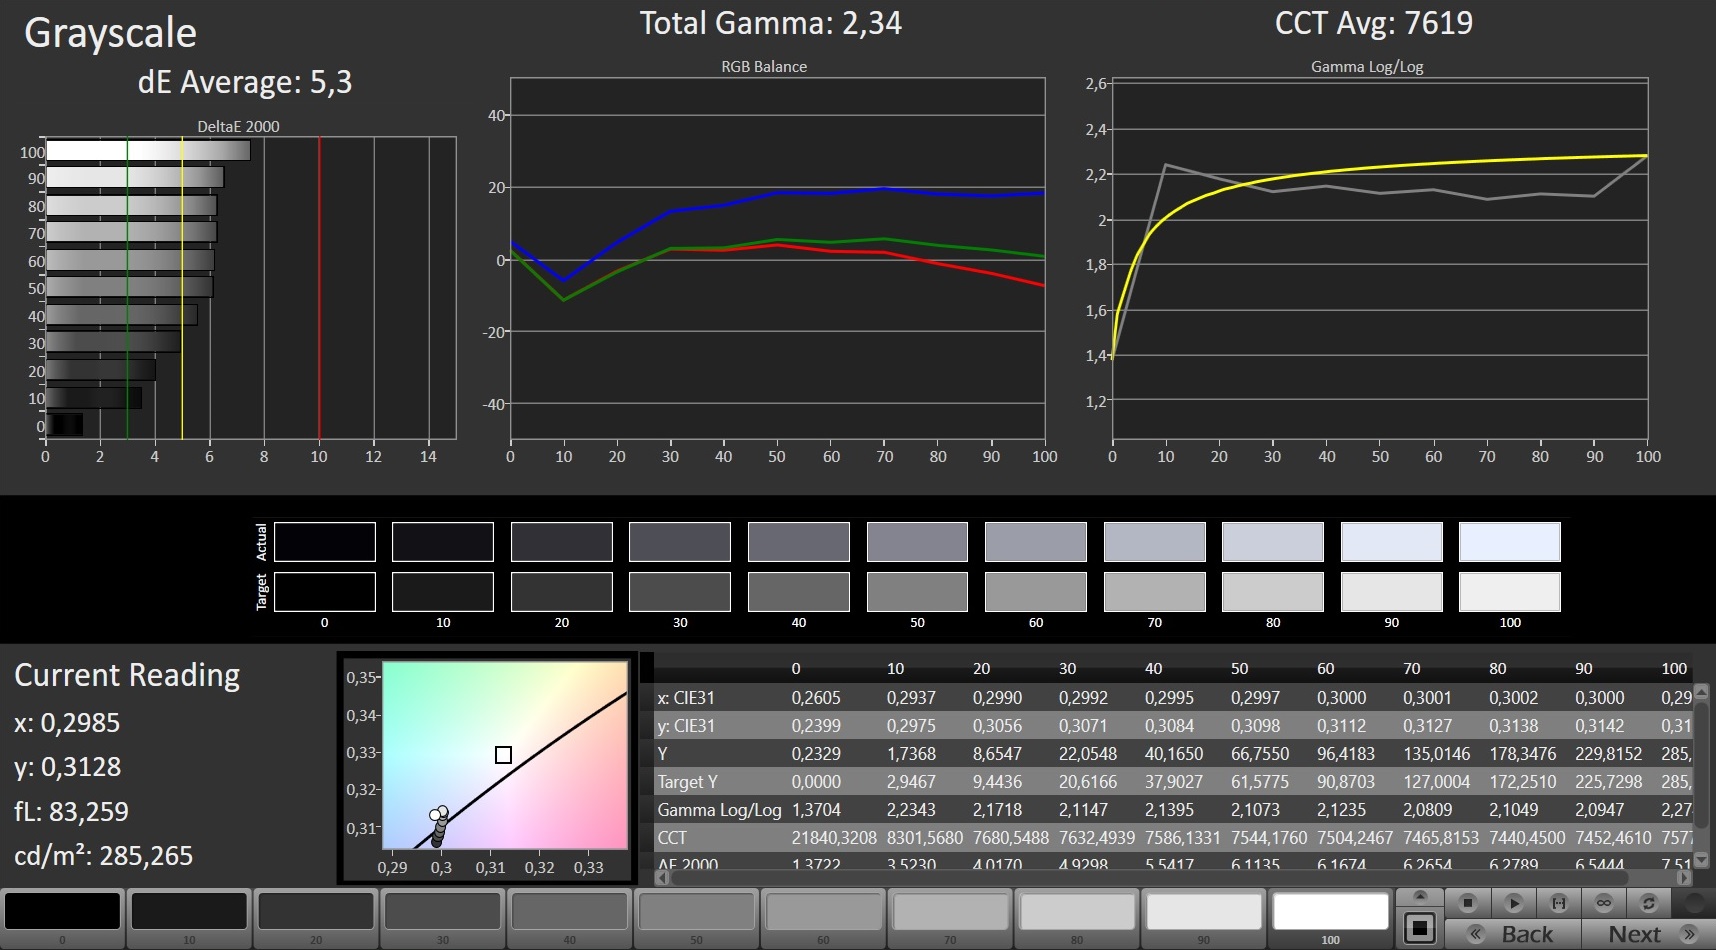
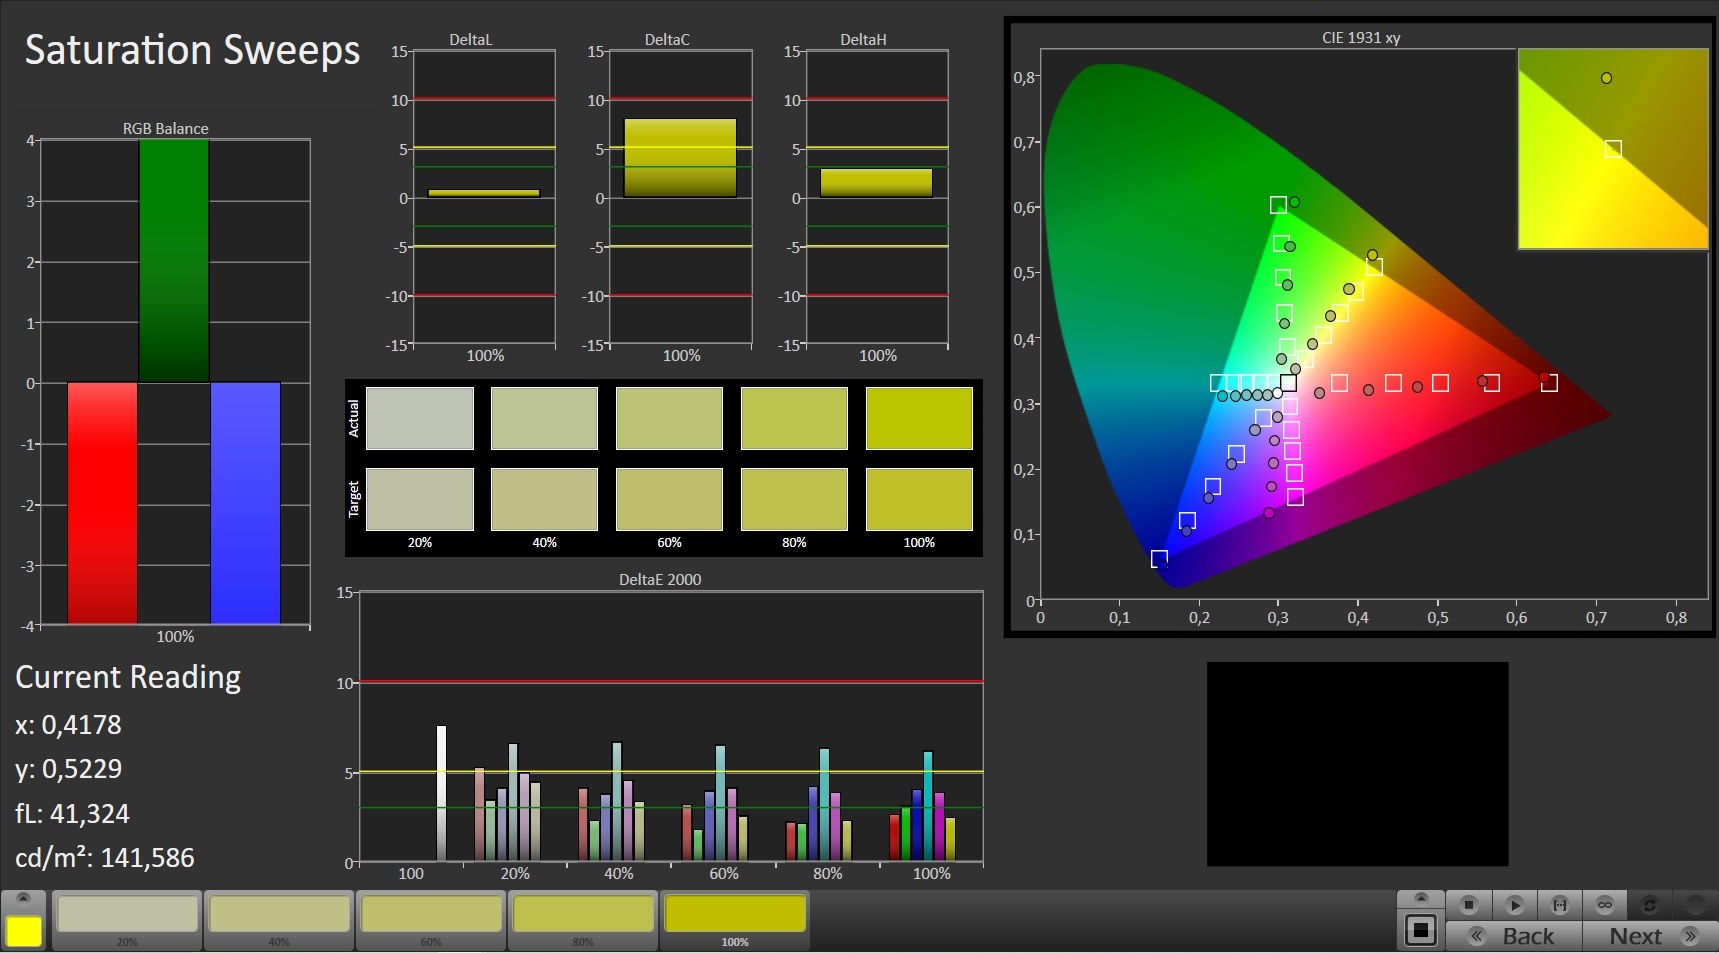
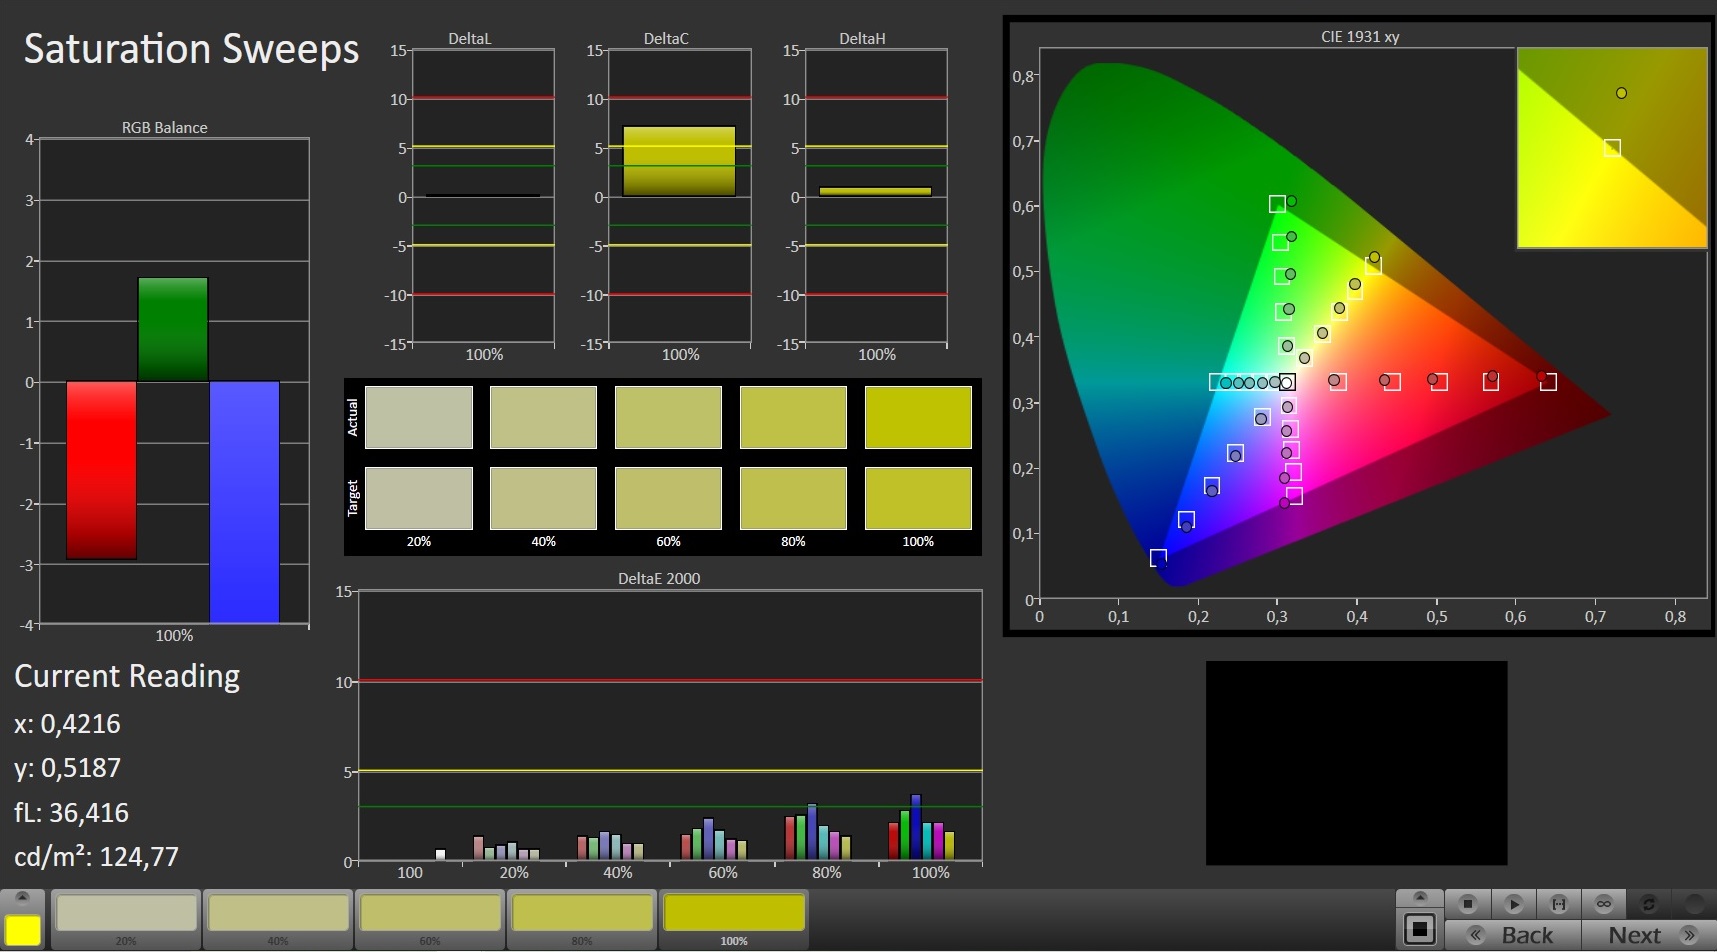
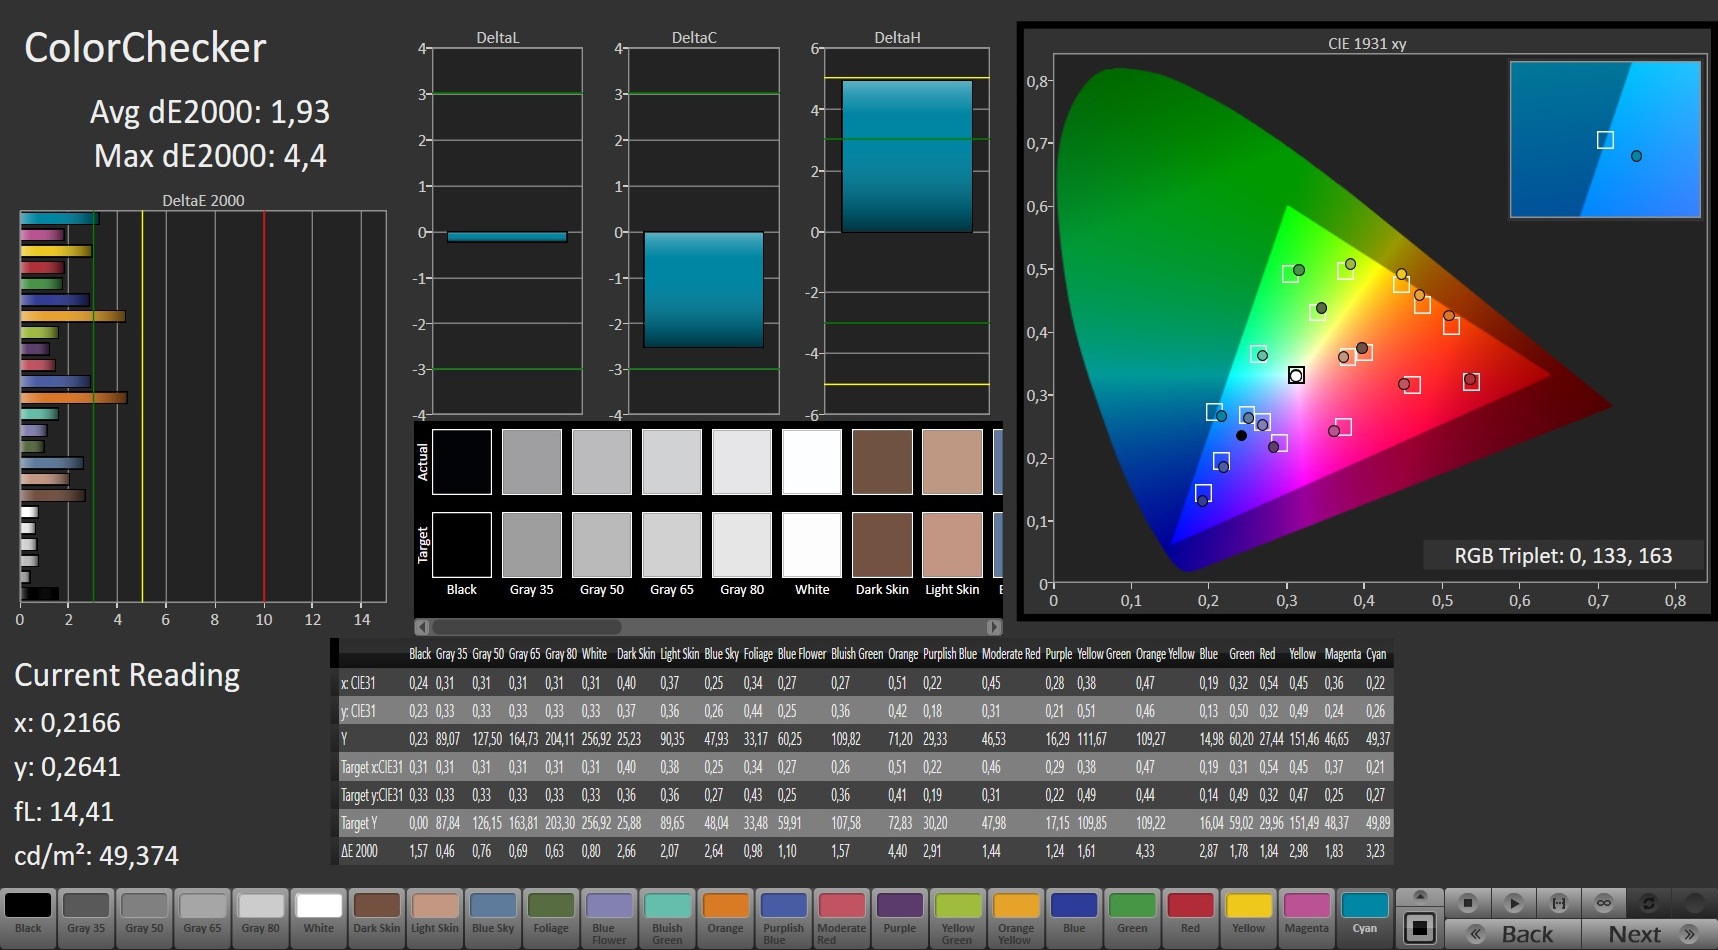
There is room for improvement for the manufacturer in terms of the color accuracy. Ex-factory, the panel suffers from a faint blue tint, which can be fixed by applying the ICC file linked above. The luminosity XMG Pro 17 is not exactly excessive, either. At 273 cd/m² on average, it tends to only be sufficient for indoor use. Outdoors, the display's content usually becomes too hard to read, rendering it almost unusable.
On the plus side, our test device does not suffer from backlight bleeding. As per usual, the viewing angles of the IPS panel are good. Note: In order to be able to use G-Sync, the BIOS setting (under Setup Utility, Advanced, Chipset Control) MSHybrid has to be set to Discrete.
Display Response Times
| ↔ Response Time Black to White | ||
|---|---|---|
| 12 ms ... rise ↗ and fall ↘ combined | ↗ 6.8 ms rise | 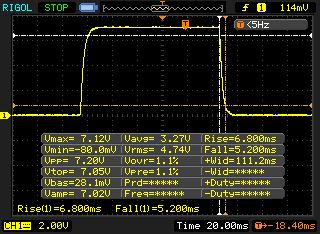 |
| ↘ 5.2 ms fall | ||
| The screen shows good response rates in our tests, but may be too slow for competitive gamers. In comparison, all tested devices range from 0.1 (minimum) to 240 (maximum) ms. » 26 % of all devices are better. This means that the measured response time is better than the average of all tested devices (21.5 ms). | ||
| ↔ Response Time 50% Grey to 80% Grey | ||
| 16.8 ms ... rise ↗ and fall ↘ combined | ↗ 8.4 ms rise | 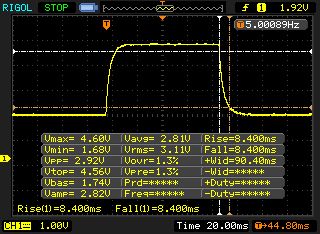 |
| ↘ 8.4 ms fall | ||
| The screen shows good response rates in our tests, but may be too slow for competitive gamers. In comparison, all tested devices range from 0.2 (minimum) to 636 (maximum) ms. » 26 % of all devices are better. This means that the measured response time is better than the average of all tested devices (33.7 ms). | ||
Screen Flickering / PWM (Pulse-Width Modulation)
| Screen flickering / PWM not detected | 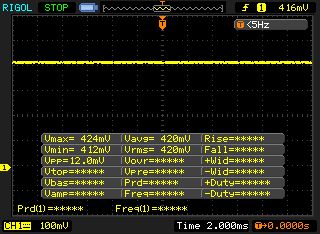 | ||
In comparison: 53 % of all tested devices do not use PWM to dim the display. If PWM was detected, an average of 17900 (minimum: 5 - maximum: 3846000) Hz was measured. | |||
Test Conditions
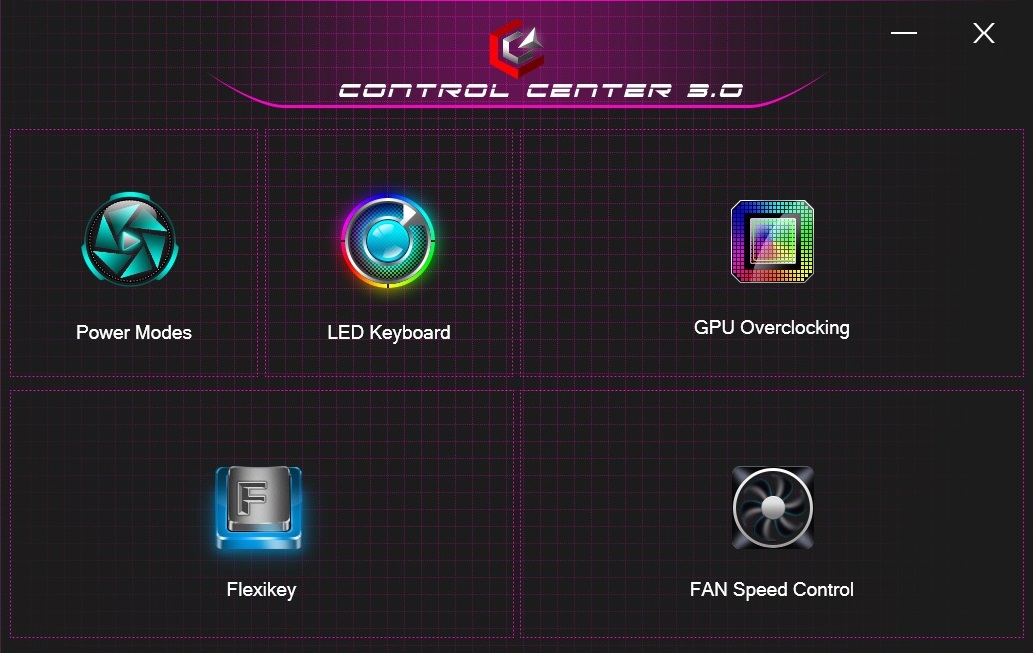
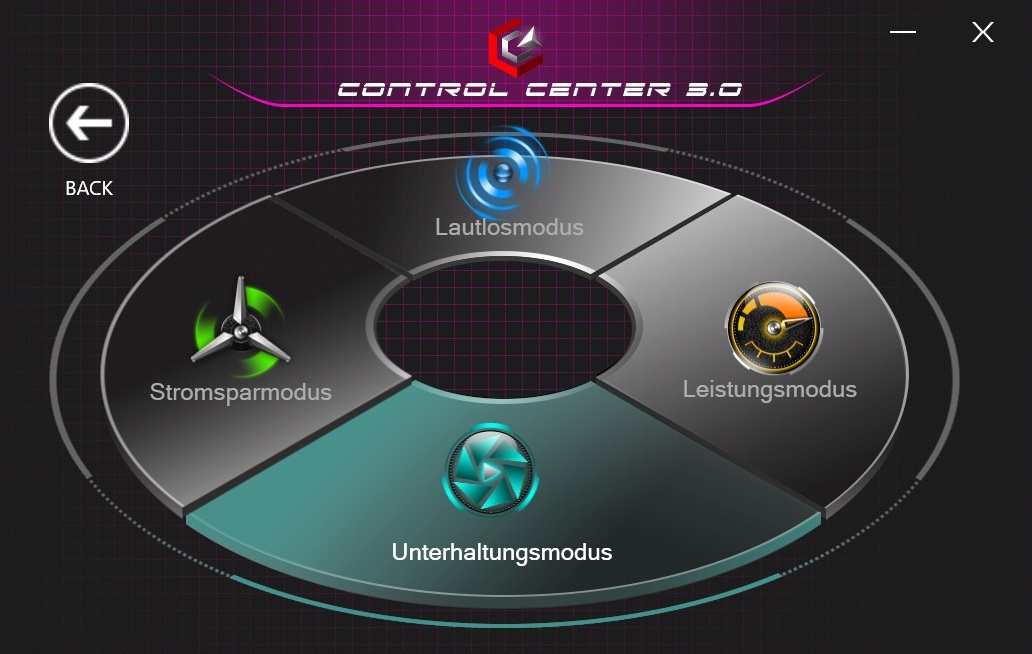
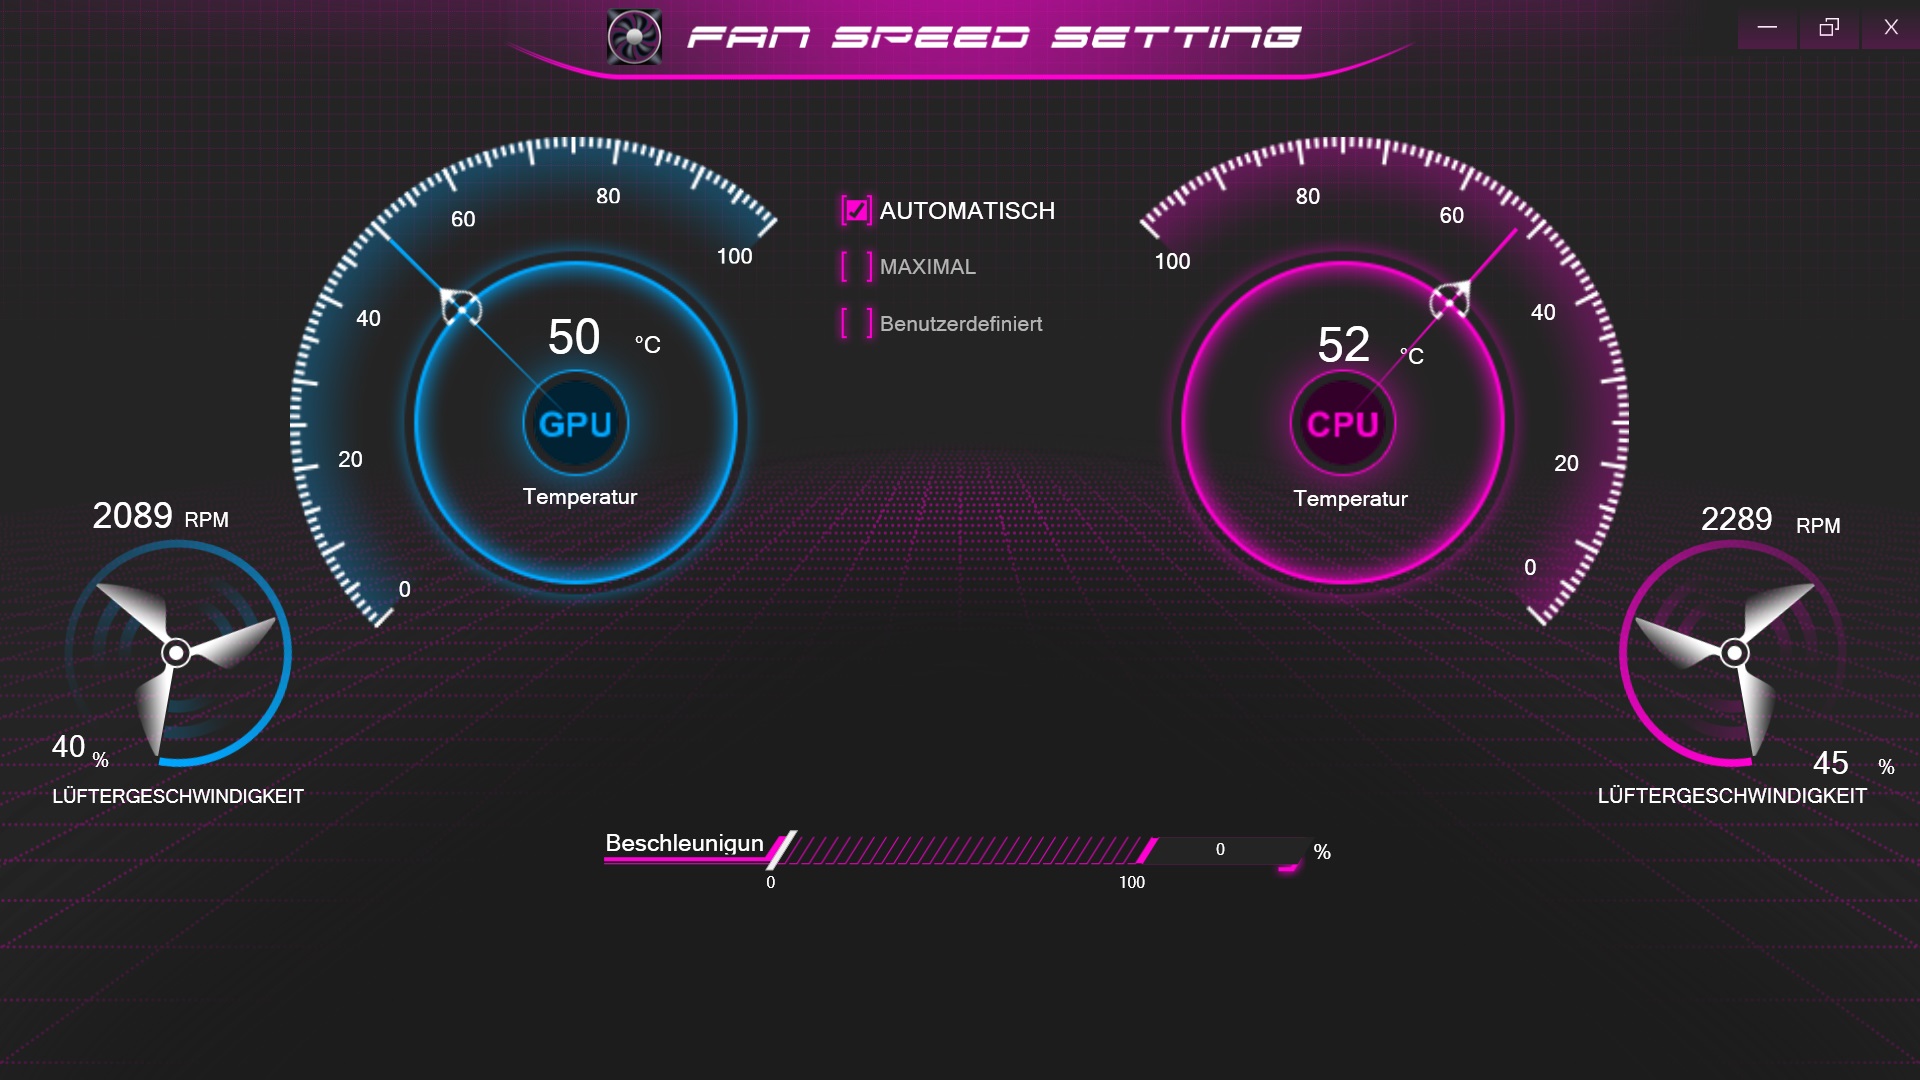
Various system settings can be adjusted via the preinstalled Control Center. All of our tests were performed with graphics switching enabled (Nvidia Optimus), while using the power profile entertainment. We left the fan speed setting on Auto.
Performance
Regardless of the choice between Core i7-9750H and GeForce RTX 2060 or Core i9-9980HK and GeForce RTX 2070: The XMG Pro 17 cannot deny its high-end nature. In order to be somewhat future-proof, we recommend buyers to increase both the storage and the RAM capacity during configuration.
Processor
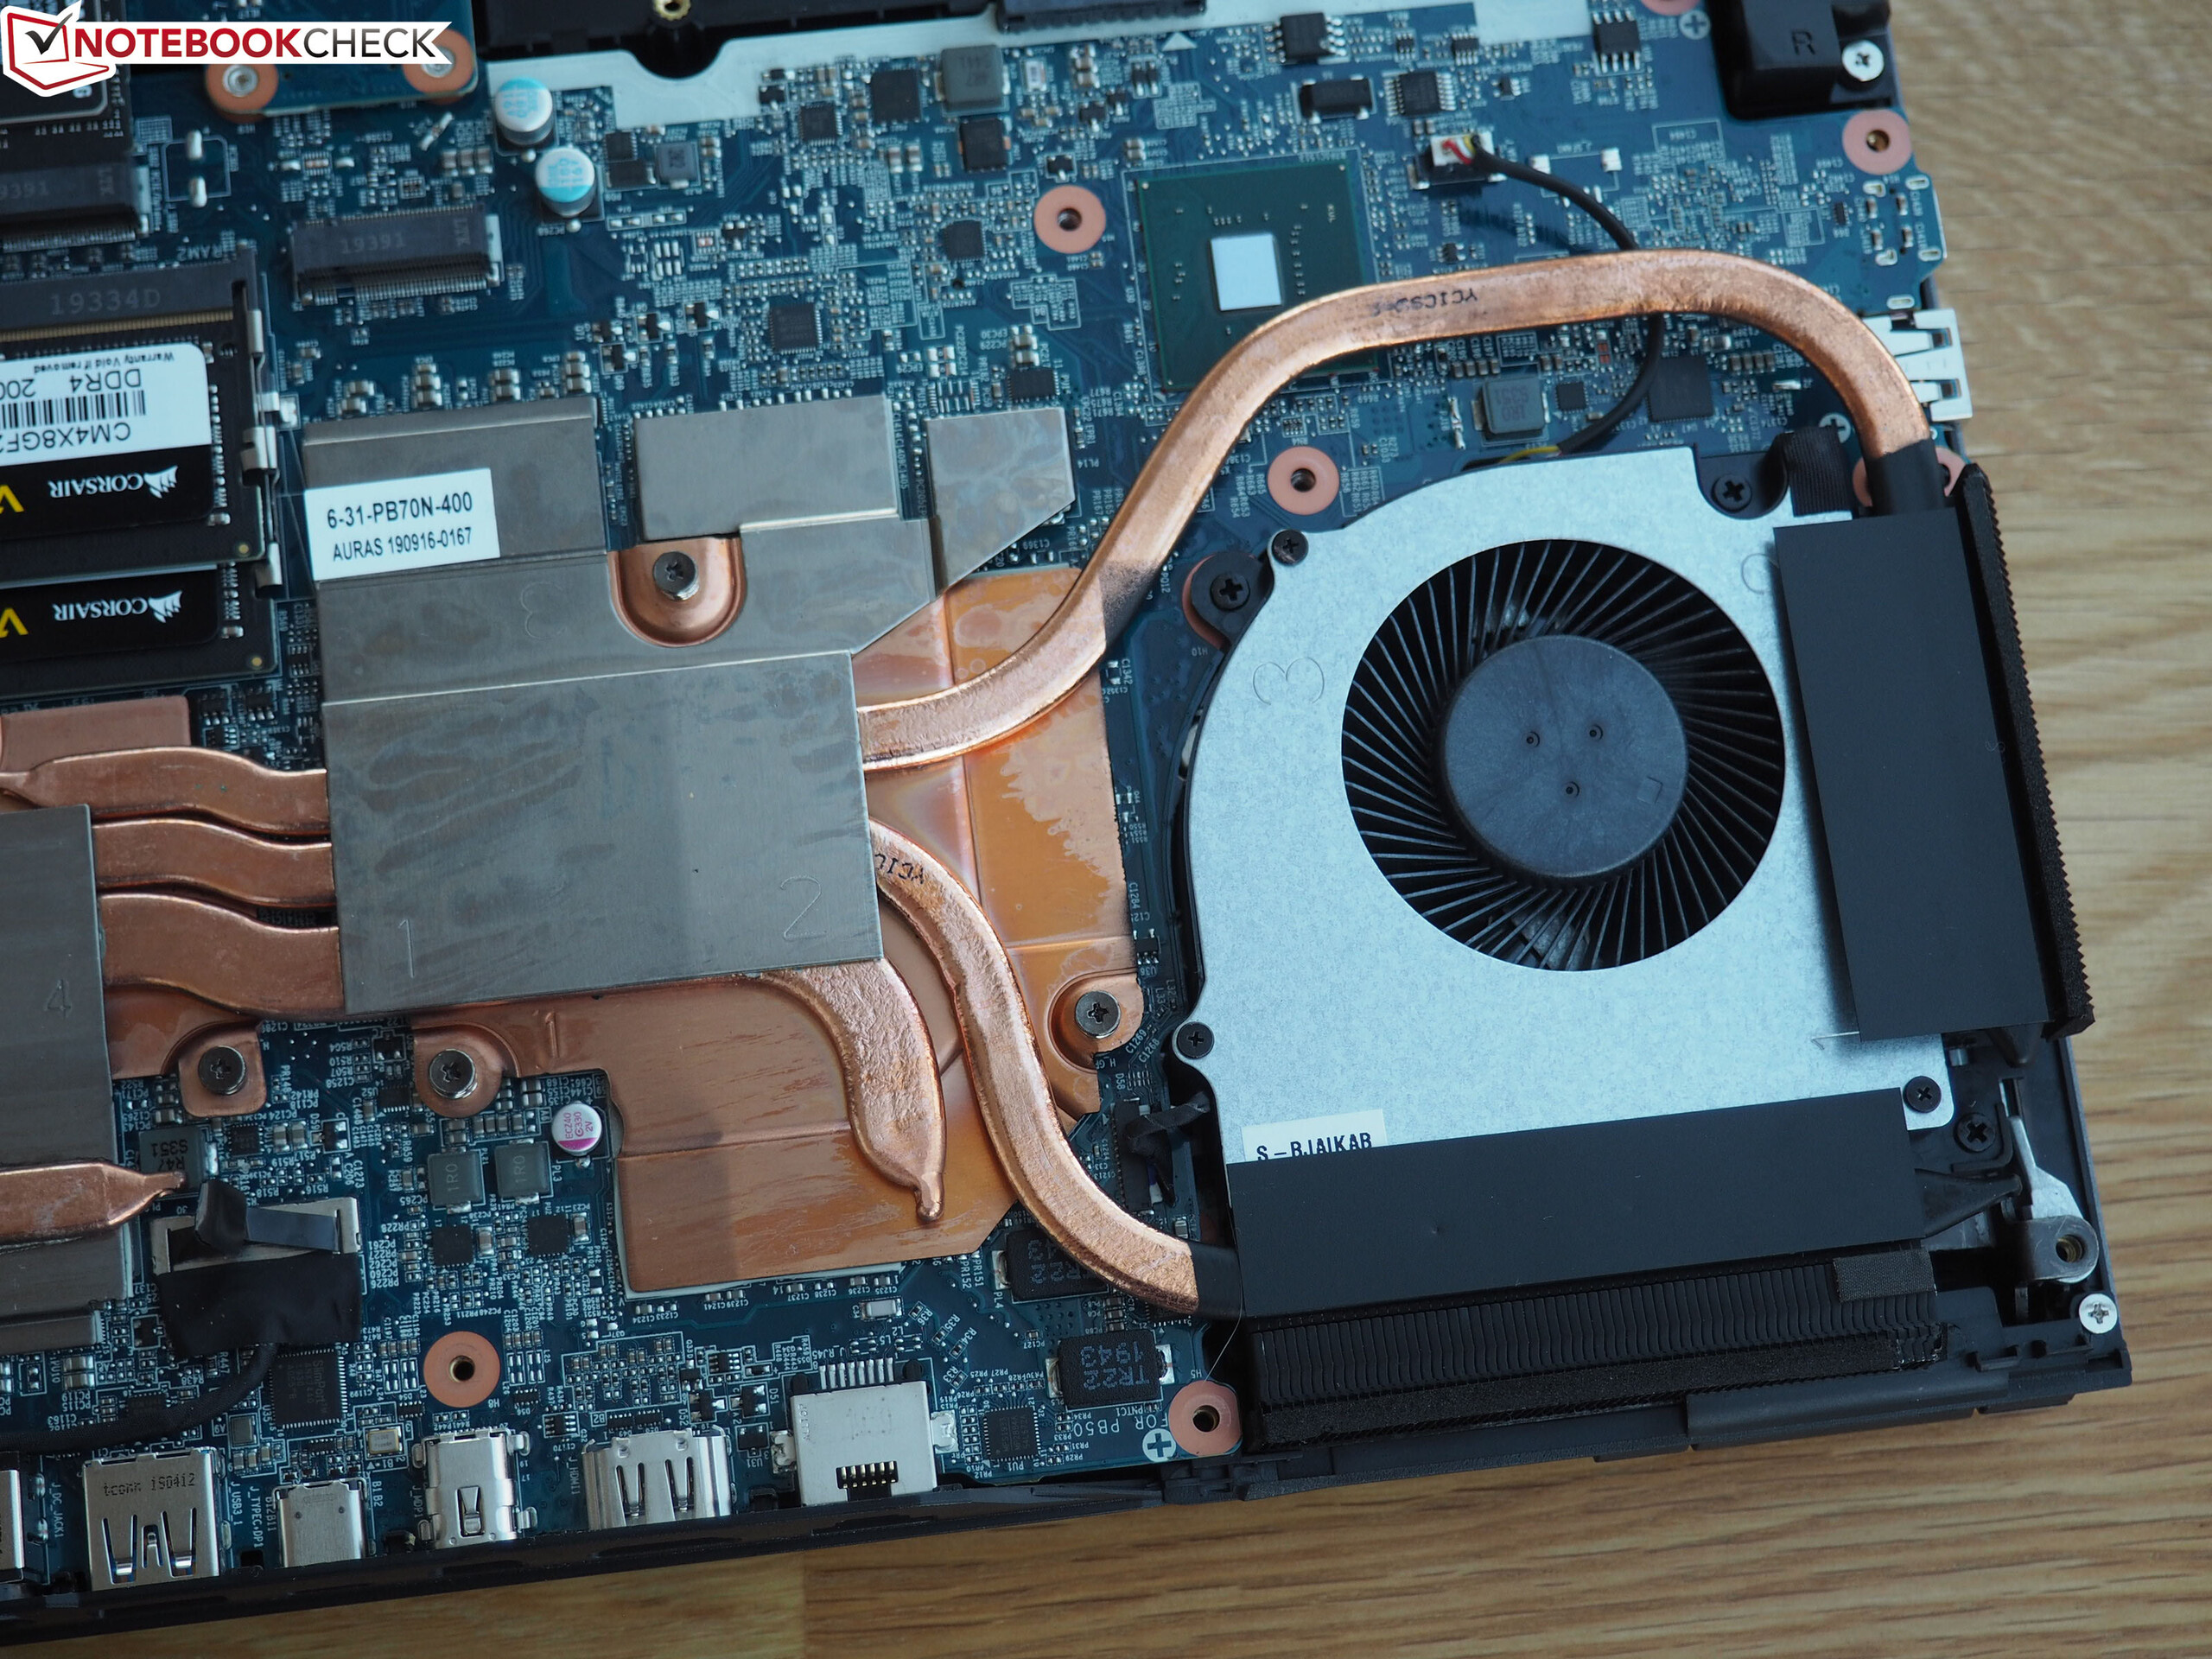
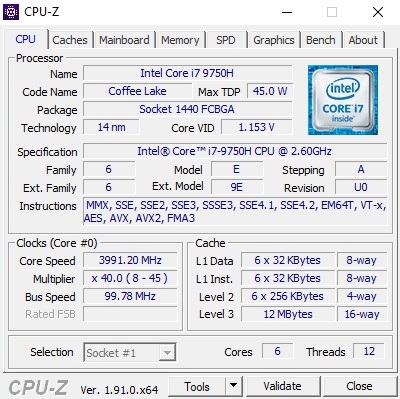
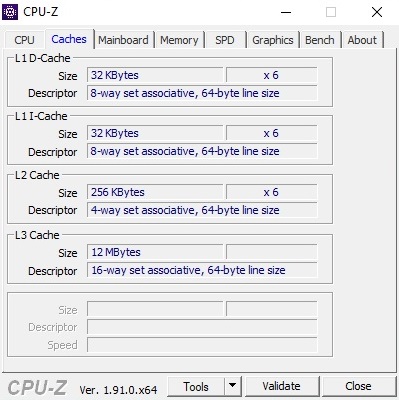
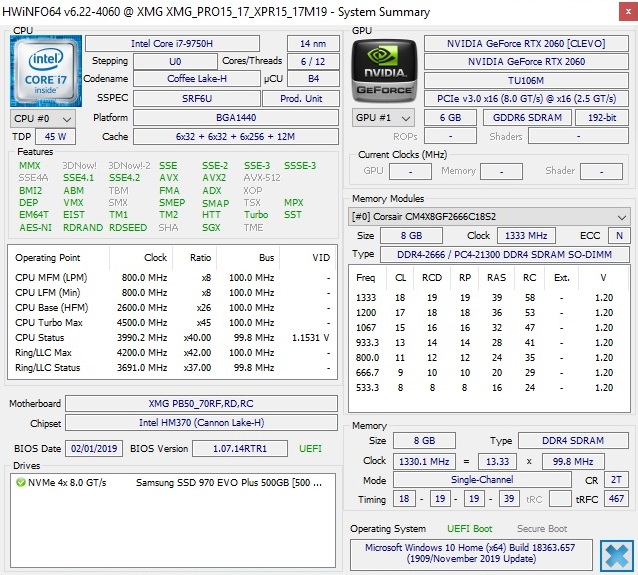
The Core i7-9750H from Intel's Coffee Lake generation is the current go-to CPU for powerful gaming laptops. The hexacore model is based on the 14-nm process, rated for a TDP of 45 watts and it is able to process up to 12 threads simultaneously thanks to Hyper-Threading. The integrated graphics chip UHD Graphics 630 handles low-intensity workloads such as office, video and web applications while Optimus is active.
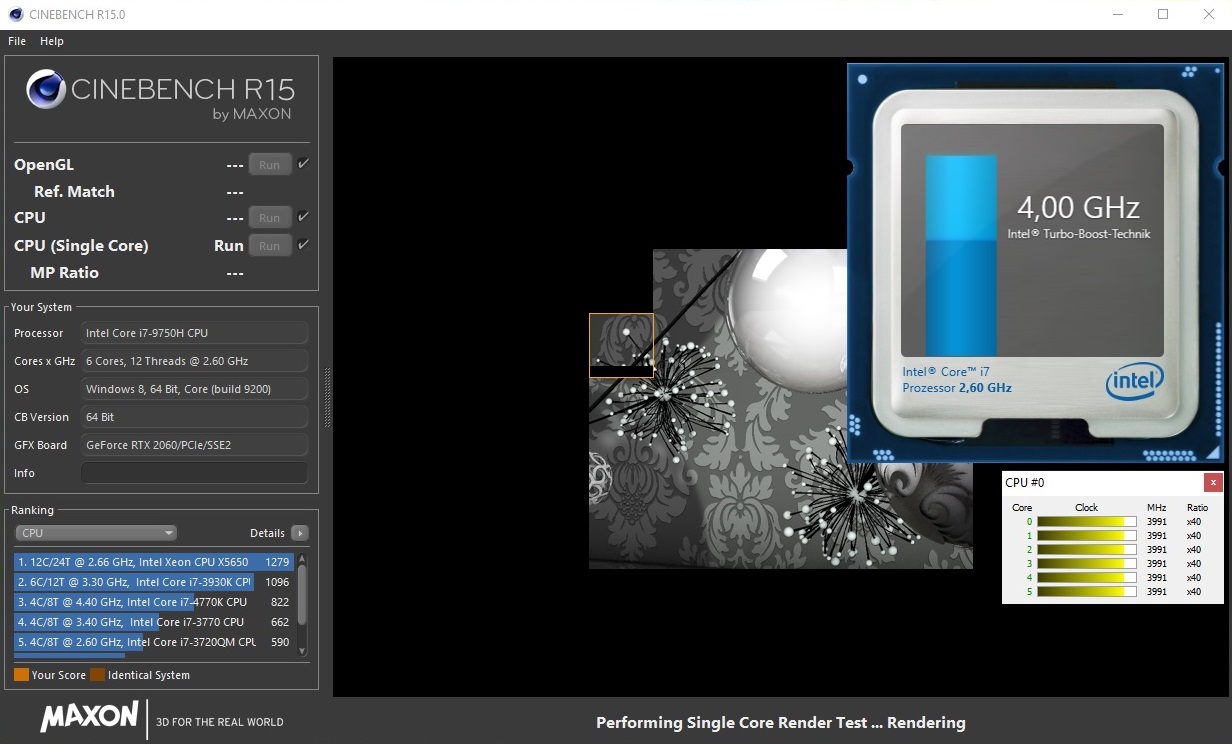
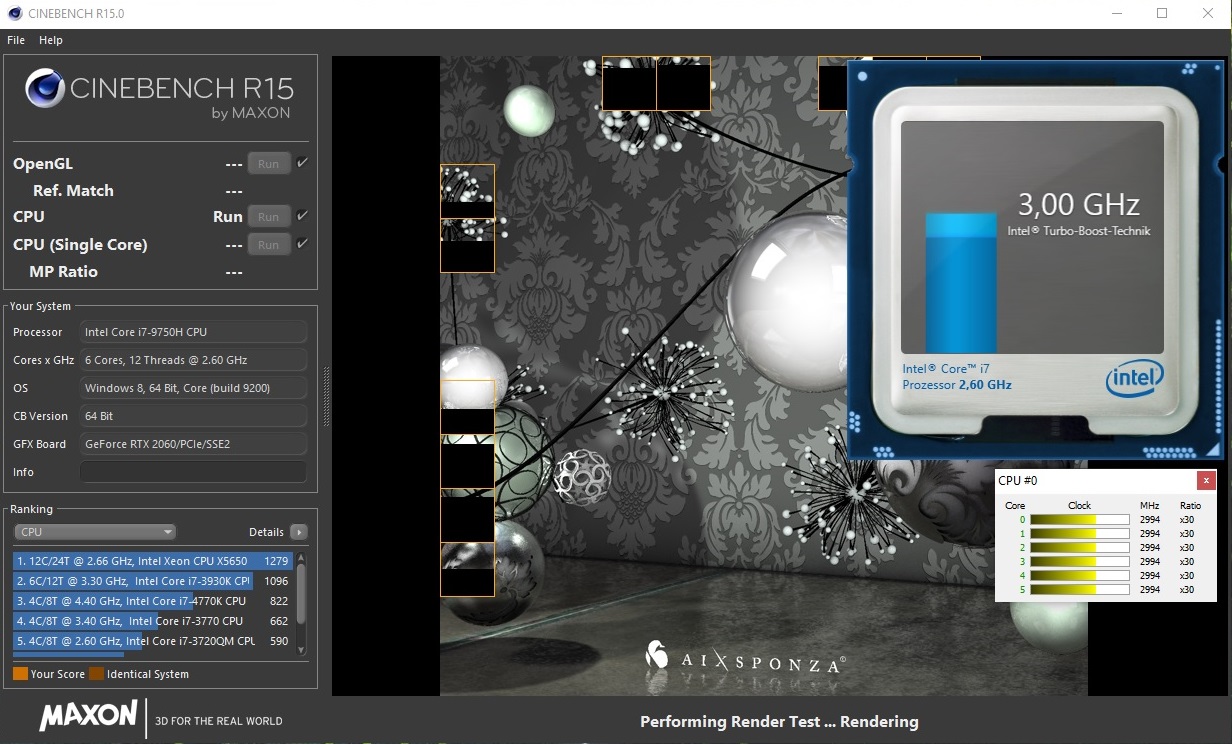
We observed the behavior in regard to the clock speeds of the 9750H using Cinebench R15. While the CPU consistently runs at 4.0 GHz during single-core scenarios, the clock speed quickly drops from the 3.4 to 3.9 GHz range to the meager 2.9 to 3.0 GHz range when being stressed on all cores.
As the diagram above and the benchmark table below illustrate nicely, the Pro 17 falls behind its competitors with these results. Those who need more CPU performance should select the performance mode from within the Control Center.
System Performance
The weakish Turbo Boost also adversely affects the system performance. With 4,739 points, the Schenker laptop holds the lowest PCMark 10 score among the devices in our comparison. Subjectively, no difference is noticeable in most situations. All devices feel similarly fast in terms of installing, starting and loading programs. Only the boot process of our XMG Pro 17 takes longer than average.
Storage Solution
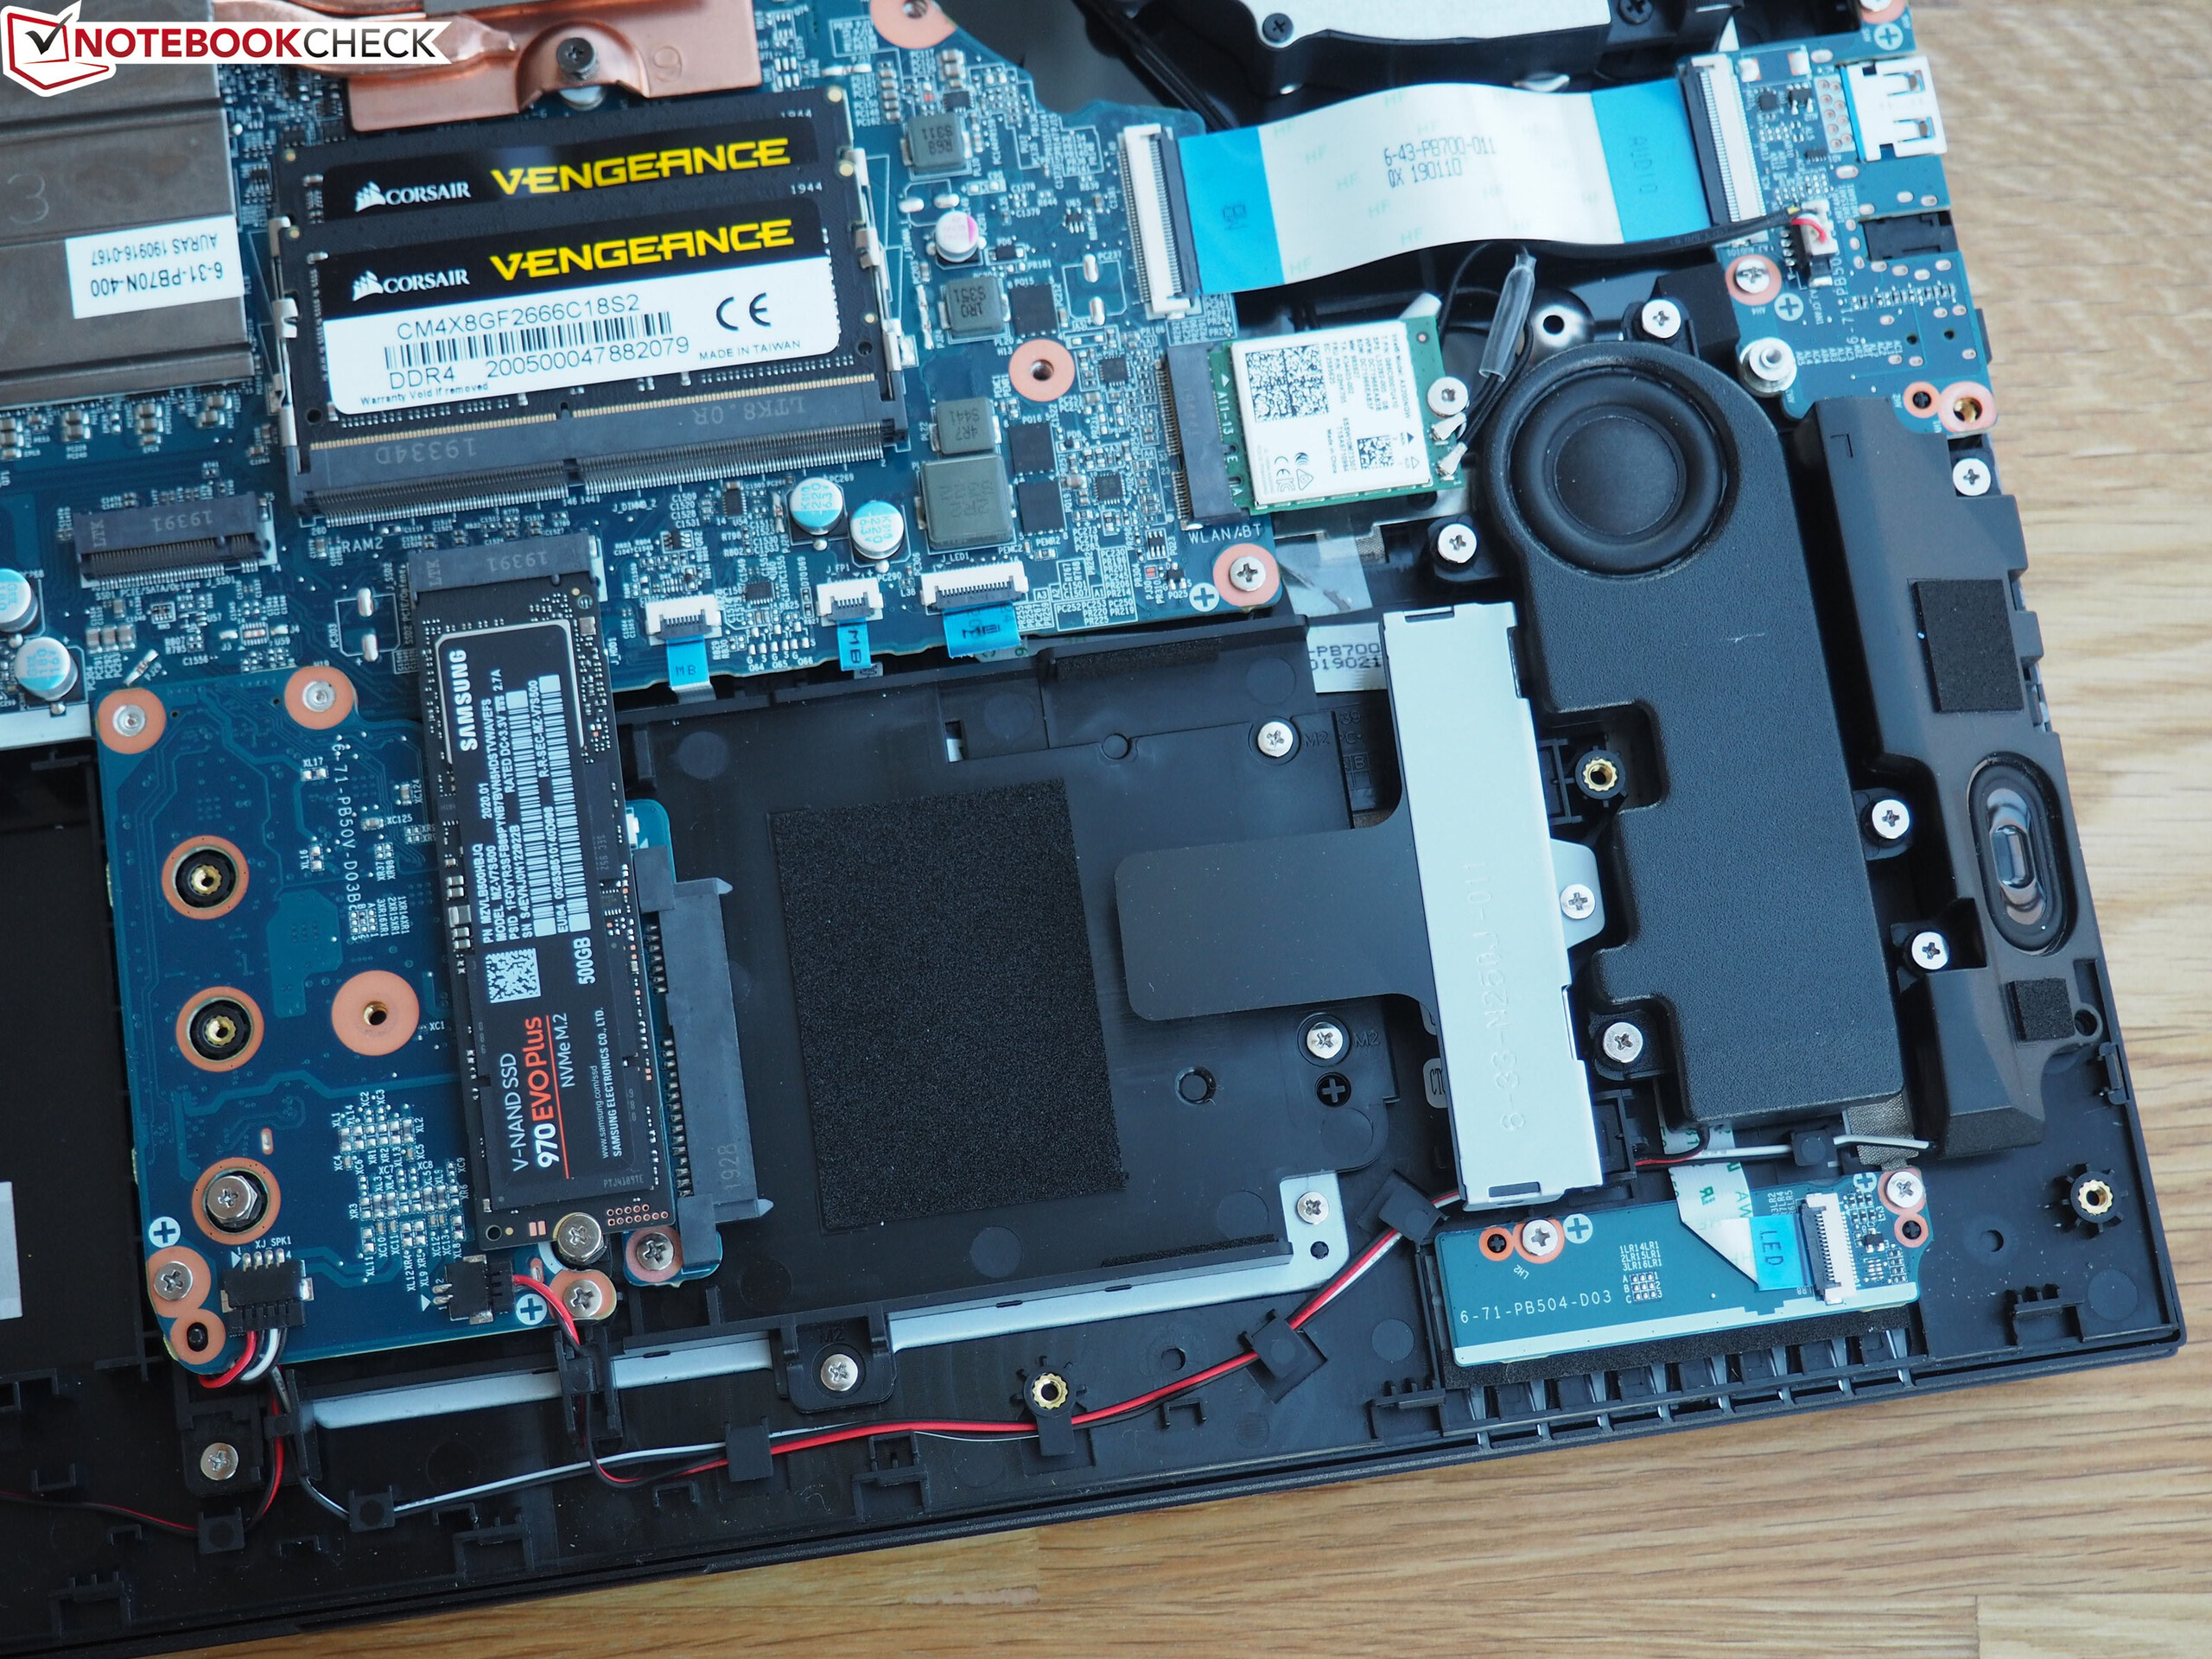
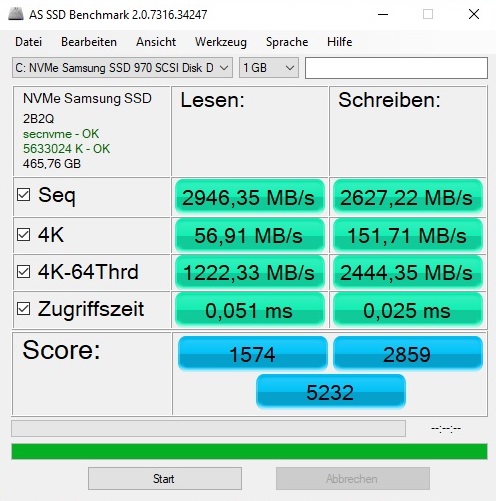
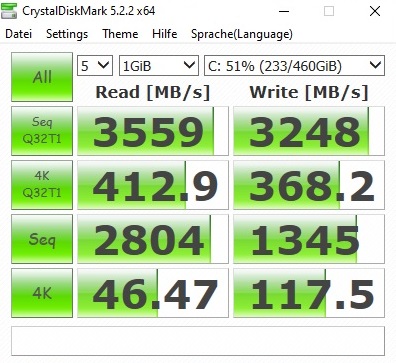
Our test device uses a 500-GB Samsung 970 Evo Plus as the system drive (Windows 10 Home 64-bit). The M.2 drive achieves excellent values in our benchmark parcours in terms of both read and write speeds. As mentioned initially, a second M.2 slot as well as a 2.5-inch drive bay is available for expansion.
| SCHENKER XMG Pro 17 PB71RD-G Samsung SSD 970 EVO Plus 500GB | Razer Blade Pro 17 RTX 2060 Samsung SSD PM981 MZVLB512HAJQ | Asus Strix Hero III G731GV Intel SSD 660p SSDPEKNW512G8 | Lenovo Legion Y740-17IRH WDC PC SN520 SDAPMUW-128G | MSI GL75 9SEK-056US WDC PC SN520 SDAPNUW-512G | |
|---|---|---|---|---|---|
| CrystalDiskMark 5.2 / 6 | -3% | -20% | -44% | -1% | |
| Write 4K | 117.5 | 124.1 6% | 129.3 10% | 102.7 -13% | 149.1 27% |
| Read 4K | 46.47 | 44.75 -4% | 54.4 17% | 29.12 -37% | 48.58 5% |
| Write Seq | 1345 | 1292 -4% | 978 -27% | 362.2 -73% | |
| Read Seq | 2804 | 1272 -55% | 1447 -48% | 1010 -64% | |
| Write 4K Q32T1 | 368.2 | 514 40% | 476.8 29% | 298.1 -19% | 462 25% |
| Read 4K Q32T1 | 412.9 | 596 44% | 338.1 -18% | 349.6 -15% | 606 47% |
| Write Seq Q32T1 | 3248 | 1892 -42% | 982 -70% | 788 -76% | 1454 -55% |
| Read Seq Q32T1 | 3559 | 3209 -10% | 1622 -54% | 1490 -58% | 1724 -52% |

GPU Performance
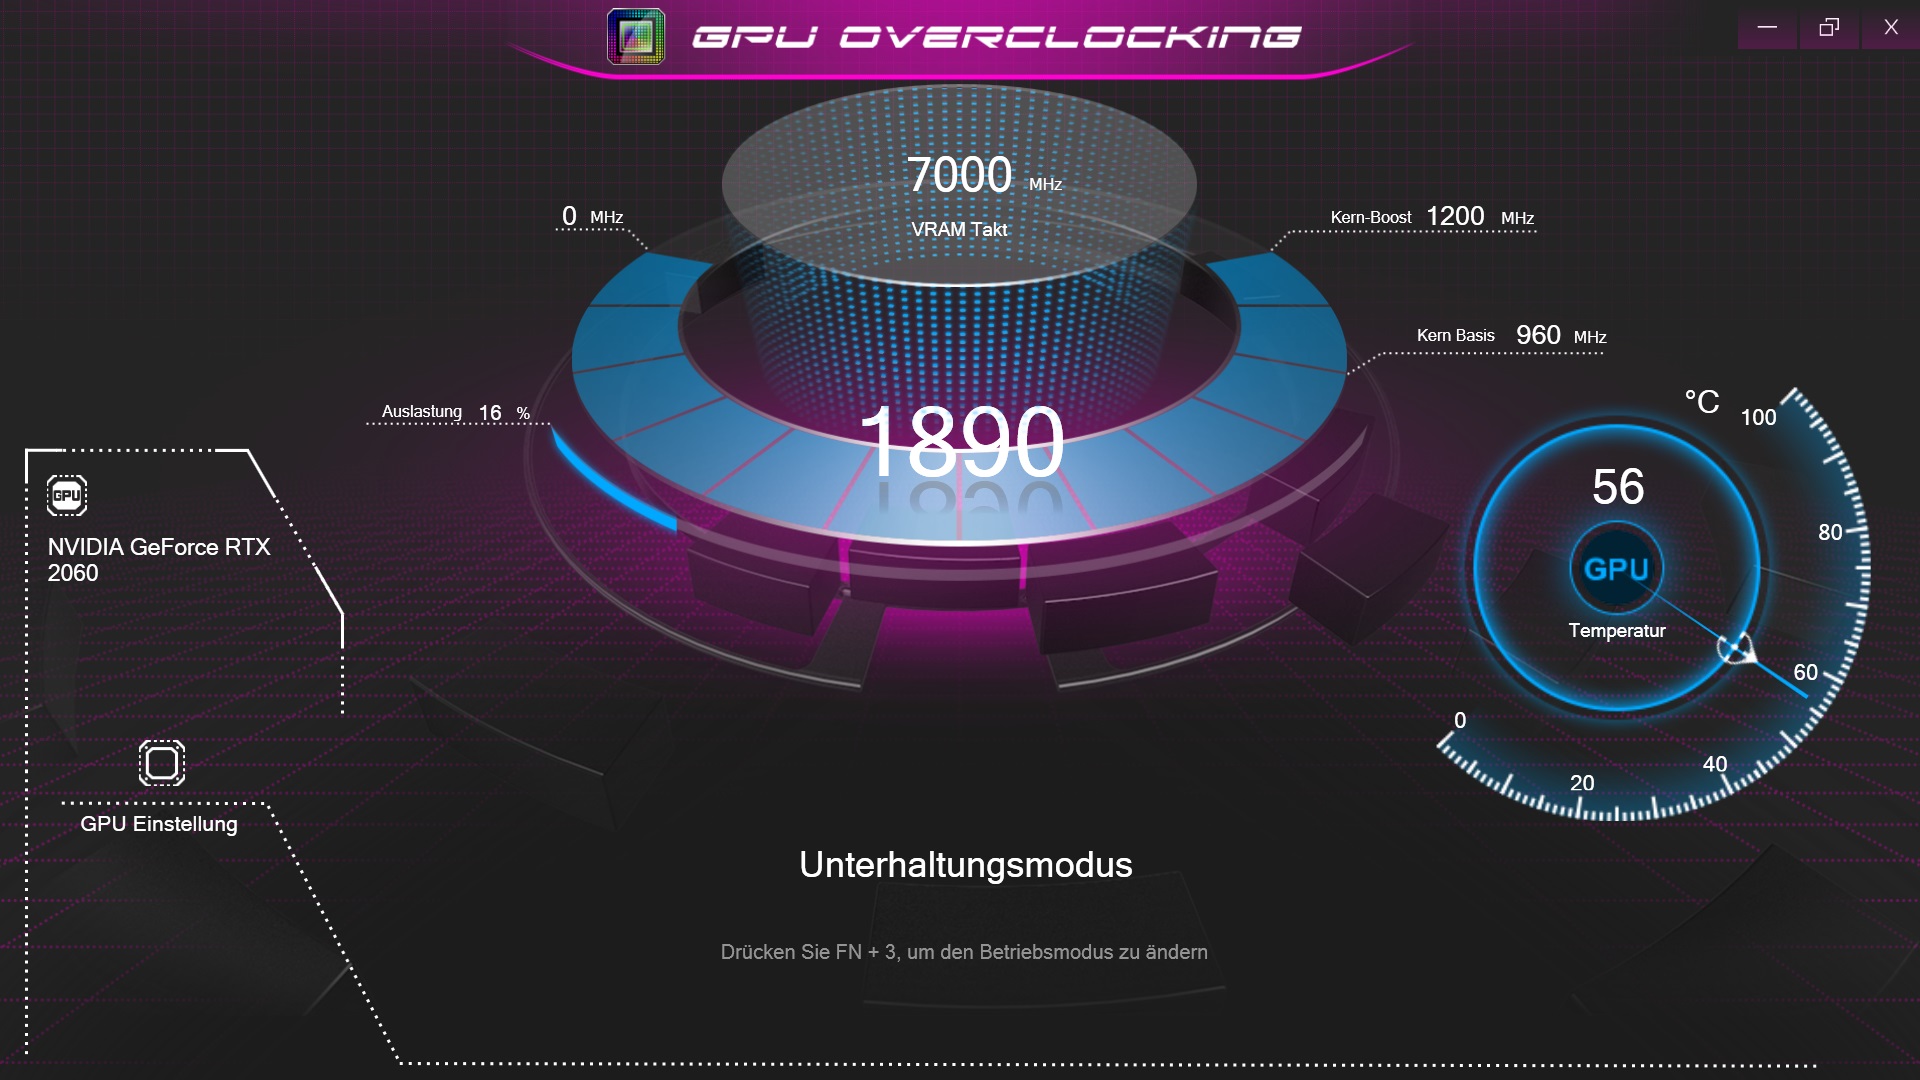
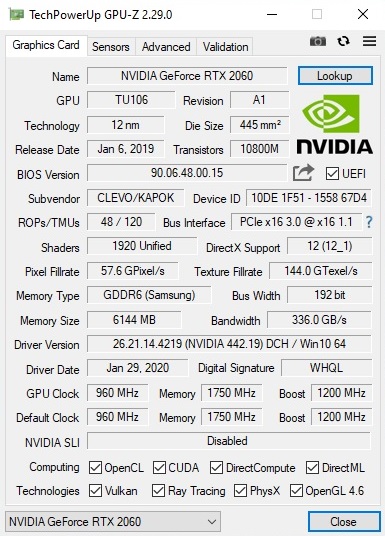
The GeForce RTX 2060, which is based on Nvidia's Turing architecture, represents the entry point into the world of ray tracing. The 12-nm chip contains 1,920 shader units and 6 GB of GDDR6 video memory with a 192-bit memory bus.
| 3DMark 11 Performance | 16140 points | |
| 3DMark Cloud Gate Standard Score | 31746 points | |
| 3DMark Fire Strike Score | 14712 points | |
| 3DMark Time Spy Score | 5830 points | |
Help | ||
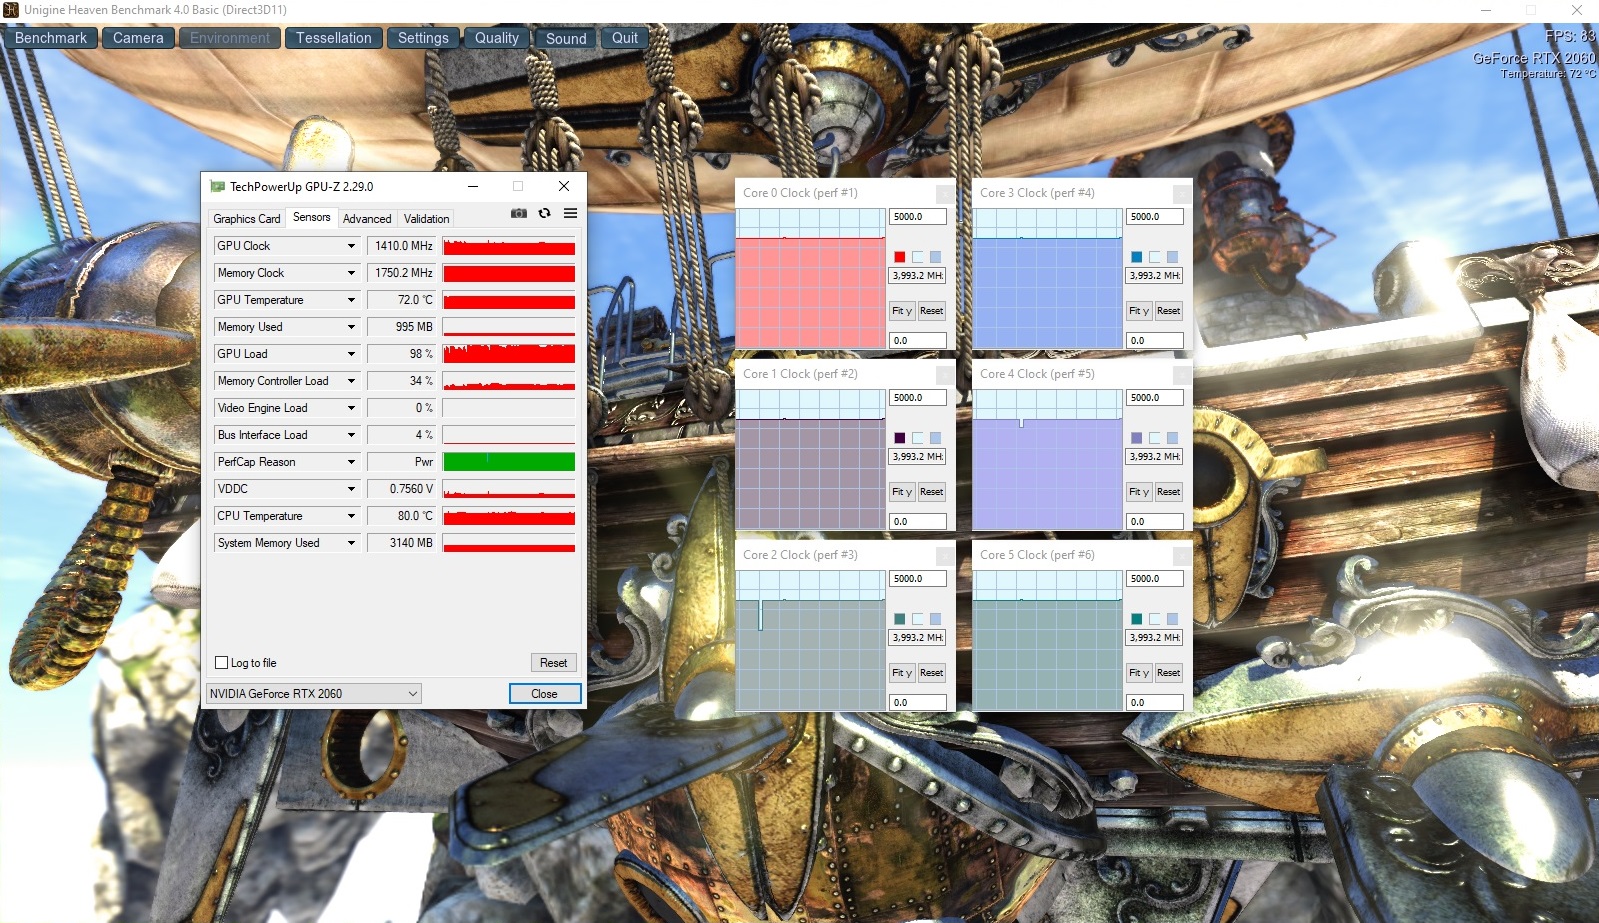
While the base clock is 960 MHz, significantly higher clock speeds are possible via GPU Boost (which works similarly to Intel's Turbo Boost). For example, the clock speed increased to up to 1,905 MHz during the render test of GPU-Z. In practice (such as gaming use), users can expect a clock frequency of around 1,400 MHz - an acceptable result. The graphics performance of the XMG Pro 17 is nothing out of the ordinary, which is a good thing. The Schenker laptop also tends to achieve average results in 3DMark 13 and 3DMark 11 compared to its competition.
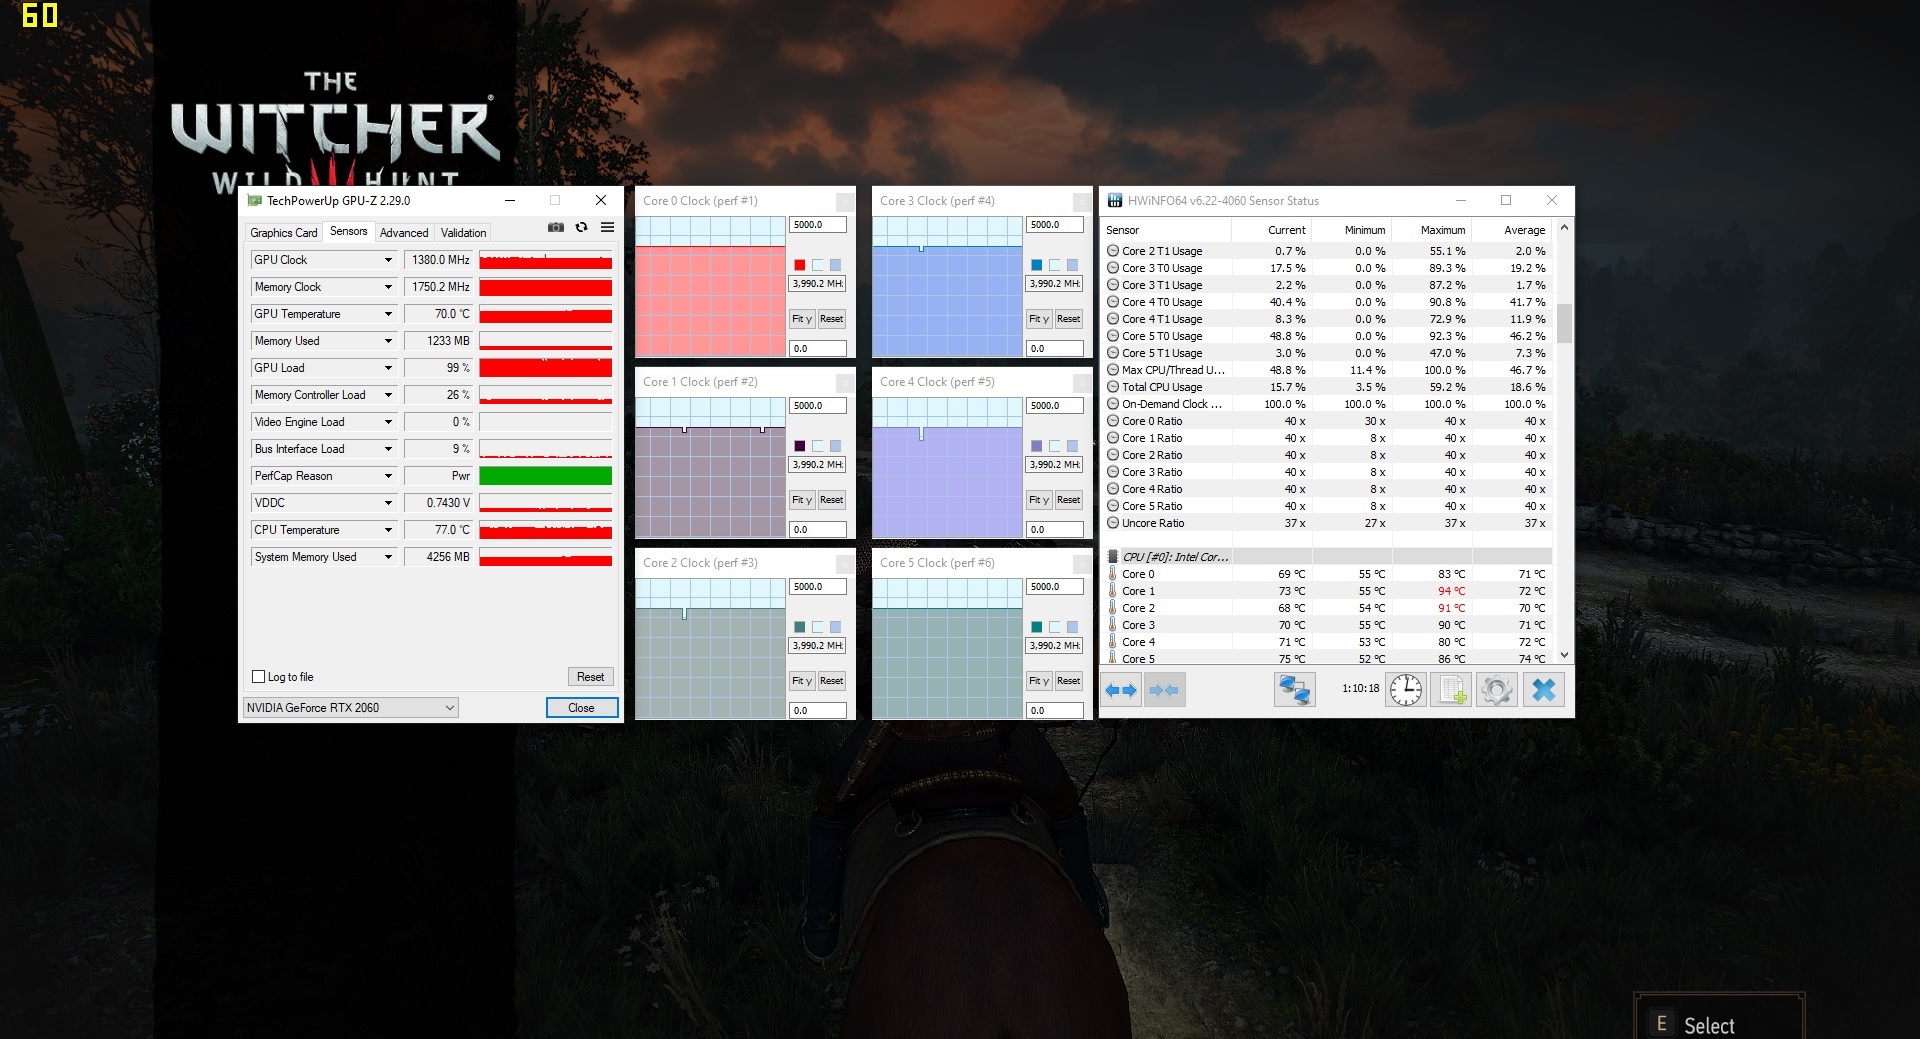
In order to determine whether the GPU is able to maintain its clock speeds over a prolonged period of time, we ran The Witcher 3 (1920x1080, ultra) for around 60 minutes. Here, the frame rate remained consistent over the entire duration and there were no unusual fluctuations or dips.
Gaming Performance
The GeForce RTX 2060 is fast enough to be able to run almost all modern titles at maximum settings, unless an external WQHD or 4K display is used. Only in extremely demanding games such as Red Dead Redemption 2, users should settle for high details. Meanwhile, less demanding games (e.g. FIFA 20) exceed 100 FPS even on ultra settings, which benefits the visual experience on the 144-Hz display.
| The Witcher 3 - 1920x1080 Ultra Graphics & Postprocessing (HBAO+) | |
| Average of class Gaming (8.61 - 216, n=225, last 2 years) | |
| Razer Blade Pro 17 RTX 2060 | |
| SCHENKER XMG Pro 17 PB71RD-G | |
| Lenovo Legion Y740-17IRH | |
| MSI GL75 9SEK-056US | |
| Asus Strix Hero III G731GV | |
| low | med. | high | ultra | |
| The Witcher 3 (2015) | 103 | 58.5 | ||
| Dota 2 Reborn (2015) | 127 | 109 | 97.5 | 91.3 |
| X-Plane 11.11 (2018) | 91.5 | 76.3 | 66.2 | |
| Anthem (2019) | 55.8 | 47.7 | ||
| FIFA 20 (2019) | 111 | 109 | ||
| GRID 2019 (2019) | 64.8 | 58.2 | ||
| Call of Duty Modern Warfare 2019 (2019) | 87.4 | 74.1 | ||
| Need for Speed Heat (2019) | 62.8 | 57.8 | ||
| Star Wars Jedi Fallen Order (2019) | 65.8 | 65.4 | ||
| Red Dead Redemption 2 (2019) | 50.7 | 32.8 |
Emissions
System Noise
In terms of emissions, the entertainment mode has been fairly poorly configured. A quick glance at the measurements shows that the barebone manufacturer Clevo highly prioritizes moderate temperatures as opposed to moderate noise. Around 70 °C for both CPU and GPU after running The Witcher 3 for one hour and a noise level of 54 dB(A) is a very unbalanced result. Thus, the XMG Pro 17 is louder than its competitors, which "only" reach 46 dB to 53 dB. In our opinion, letting the components run slightly hotter in return for a quieter operation would be a worthwhile tradeoff.
Things are much less critical during idle. Although the fans can occasionally and unnecessarily spin up, the 17-inch laptop tends to be quiet or even silent during prolonged use.
Noise Level
| Idle |
| 30 / 32 / 39 dB(A) |
| Load |
| 51 / 54 dB(A) |
 | ||
30 dB silent 40 dB(A) audible 50 dB(A) loud |
||
min: | ||
| SCHENKER XMG Pro 17 PB71RD-G i7-9750H, GeForce RTX 2060 Mobile | Razer Blade Pro 17 RTX 2060 i7-9750H, GeForce RTX 2060 Mobile | Asus Strix Hero III G731GV i7-9750H, GeForce RTX 2060 Mobile | Lenovo Legion Y740-17IRH i7-9750H, GeForce RTX 2060 Mobile | MSI GL75 9SEK-056US i7-9750H, GeForce RTX 2060 Mobile | Average of class Gaming | |
|---|---|---|---|---|---|---|
| Noise | 11% | 7% | 3% | 8% | 14% | |
| off / environment * | 30 | 28.2 6% | 28.2 6% | 30 -0% | 28.1 6% | 24.1 ? 20% |
| Idle Minimum * | 30 | 28.2 6% | 29.5 2% | 33 -10% | 30.9 -3% | 25.6 ? 15% |
| Idle Average * | 32 | 28.2 12% | 30.3 5% | 34 -6% | 30.9 3% | 27.4 ? 14% |
| Idle Maximum * | 39 | 28.2 28% | 31.9 18% | 35 10% | 31 21% | 30.7 ? 21% |
| Load Average * | 51 | 43 16% | 50.4 1% | 48 6% | 39 24% | 43.1 ? 15% |
| Witcher 3 ultra * | 54 | 48.4 10% | 50.1 7% | 46 15% | 53.5 1% | |
| Load Maximum * | 54 | 53.4 1% | 50.1 7% | 49 9% | 53.5 1% | 53.4 ? 1% |
* ... smaller is better
Temperature
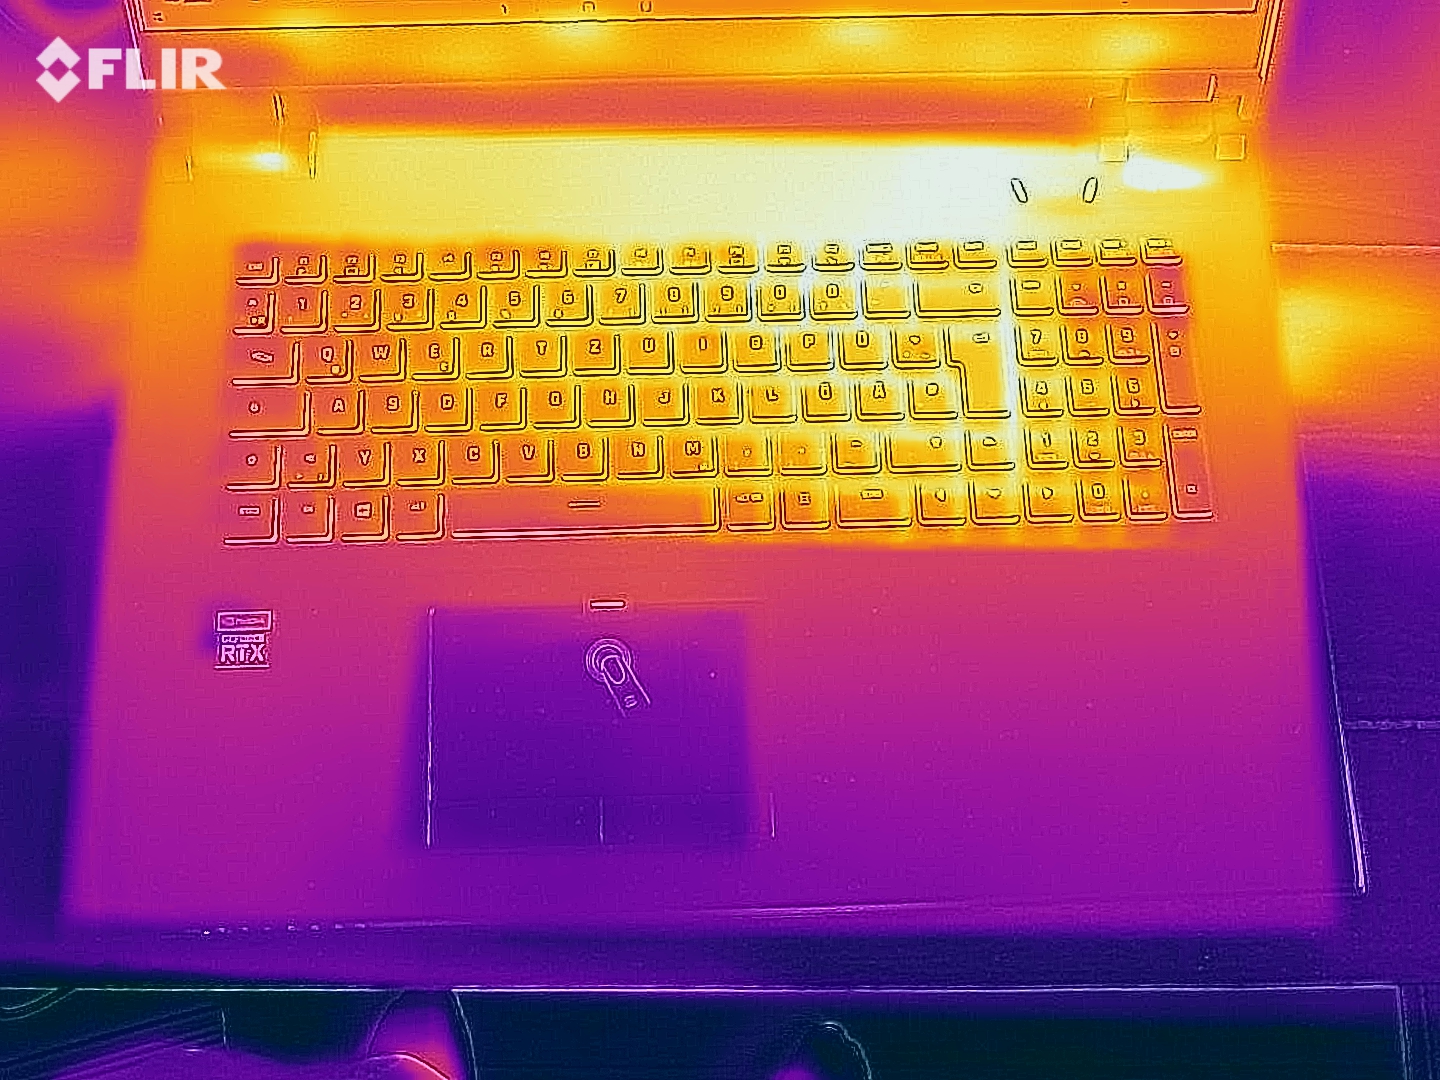
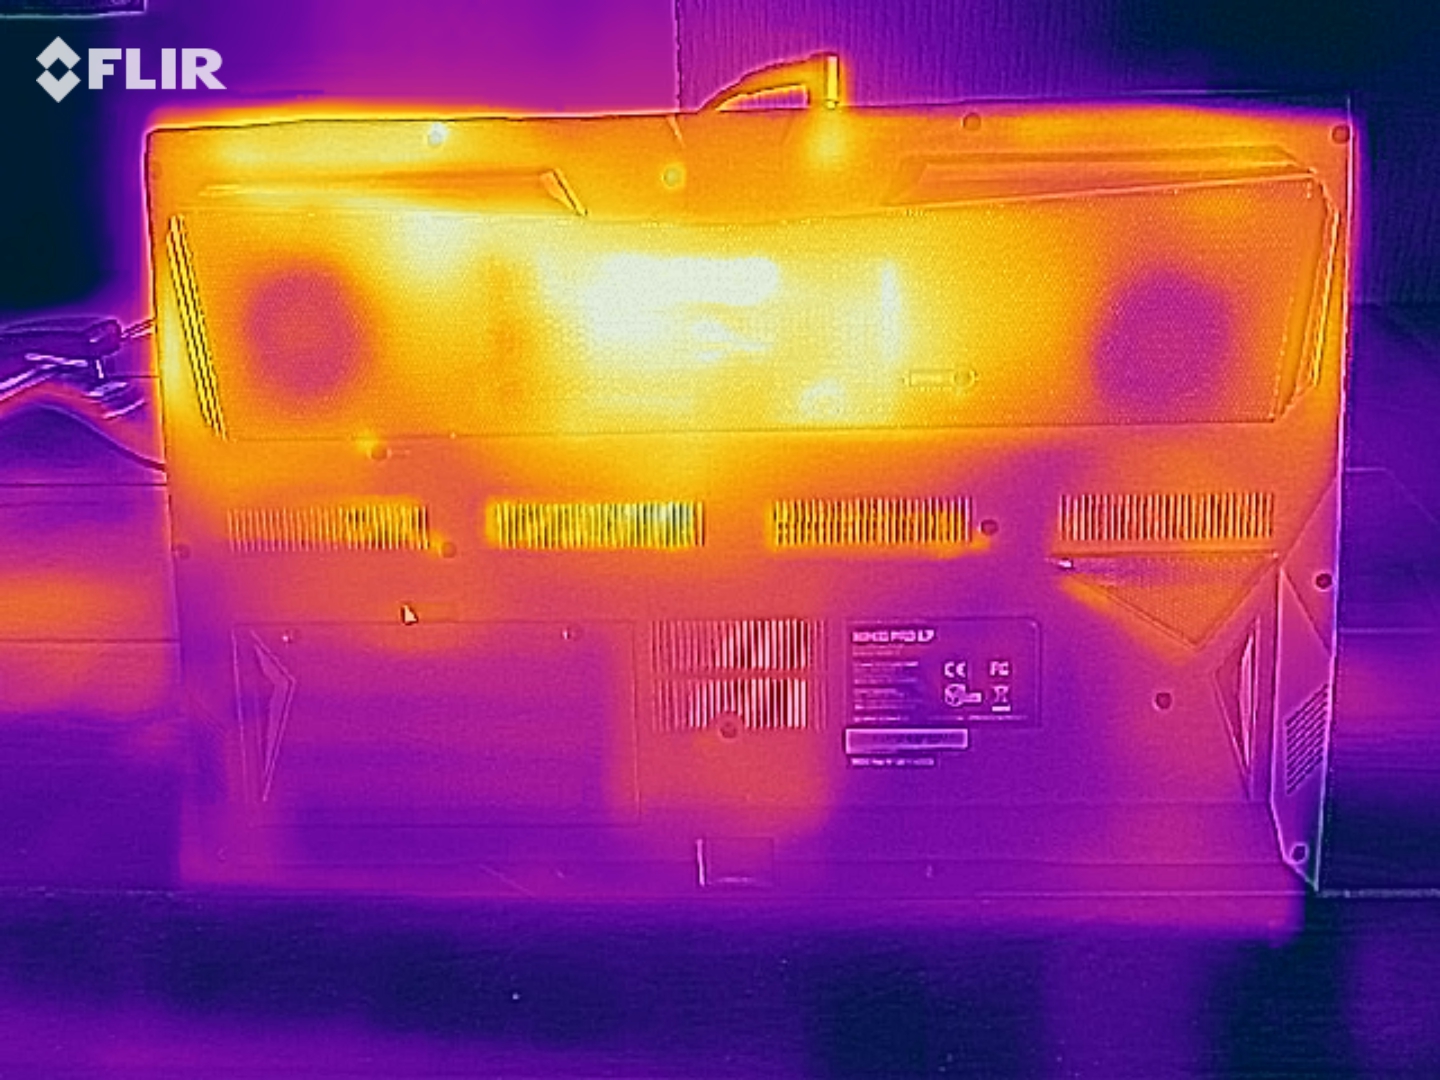
Buyers of the XMG Pro 17 will not have to worry about the temperatures of the surfaces or the components. Peak values of 47 °C on top and 48 °C on the bottom of the chassis are reasonable, particularly since the palm rests remain comfortably cool.
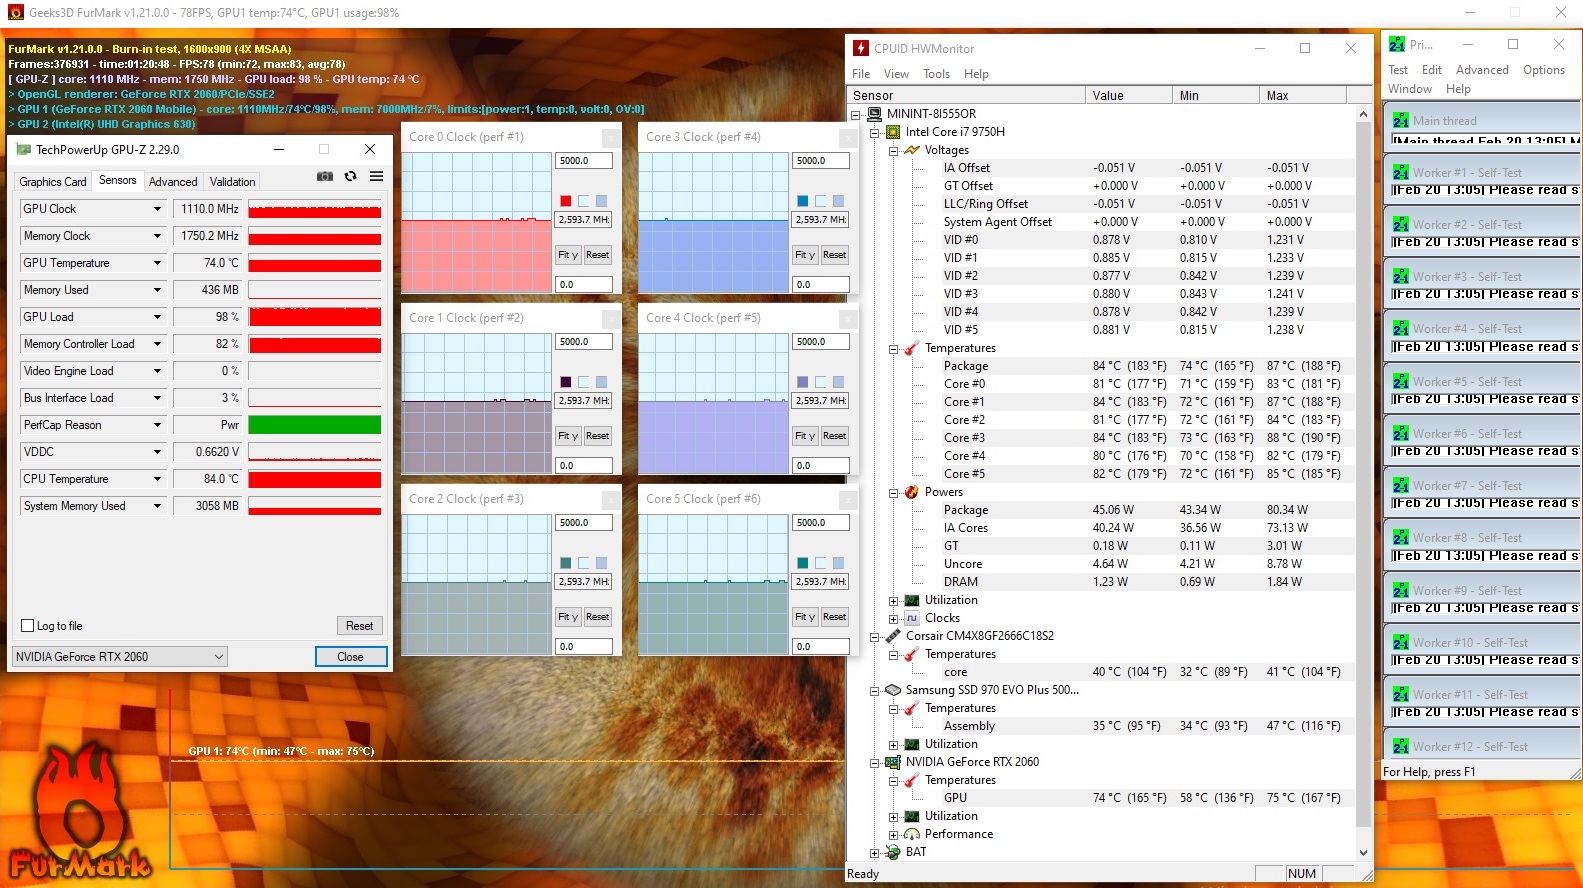
We used the tools FurMark and Prime95 for close to 60 minutes, in order to determine the maximum temperature values for the CPU and GPU. While the Core i7-9750H remained below 90 °C, the GeForce RTX 2060 never exceeded 75 °C.
(-) The maximum temperature on the upper side is 47 °C / 117 F, compared to the average of 40.4 °C / 105 F, ranging from 21.2 to 68.8 °C for the class Gaming.
(-) The bottom heats up to a maximum of 48 °C / 118 F, compared to the average of 43.2 °C / 110 F
(+) In idle usage, the average temperature for the upper side is 27.4 °C / 81 F, compared to the device average of 33.8 °C / 93 F.
(±) Playing The Witcher 3, the average temperature for the upper side is 35.7 °C / 96 F, compared to the device average of 33.8 °C / 93 F.
(+) The palmrests and touchpad are cooler than skin temperature with a maximum of 27 °C / 80.6 F and are therefore cool to the touch.
(±) The average temperature of the palmrest area of similar devices was 28.9 °C / 84 F (+1.9 °C / 3.4 F).
| SCHENKER XMG Pro 17 PB71RD-G i7-9750H, GeForce RTX 2060 Mobile | Razer Blade Pro 17 RTX 2060 i7-9750H, GeForce RTX 2060 Mobile | Asus Strix Hero III G731GV i7-9750H, GeForce RTX 2060 Mobile | Lenovo Legion Y740-17IRH i7-9750H, GeForce RTX 2060 Mobile | MSI GL75 9SEK-056US i7-9750H, GeForce RTX 2060 Mobile | Average of class Gaming | |
|---|---|---|---|---|---|---|
| Heat | 7% | -3% | 3% | -16% | -0% | |
| Maximum Upper Side * | 47 | 40.6 14% | 47.2 -0% | 43 9% | 49.4 -5% | 46 ? 2% |
| Maximum Bottom * | 48 | 45.4 5% | 51 -6% | 46 4% | 50.6 -5% | 49.5 ? -3% |
| Idle Upper Side * | 30 | 30 -0% | 30.2 -1% | 31 -3% | 39 -30% | 31.3 ? -4% |
| Idle Bottom * | 34 | 31 9% | 35.4 -4% | 34 -0% | 42 -24% | 32.5 ? 4% |
* ... smaller is better
Speakers
According to our sound analysis, the audio system of the XMG Pro 17 performs significantly better than the stereo speakers of the XMG Pro 15. This is expected, since the 17-inch model includes a subwoofer, which improves the bass. Even though the sound is fairly good for a gaming laptop overall, your expectations should remain reasonable. The high maximum volume level of 90 dB(A) is only usable in a limited capacity, since the sound tends to become muddy and distorted at higher volumes.
SCHENKER XMG Pro 17 PB71RD-G audio analysis
(+) | speakers can play relatively loud (90 dB)
Bass 100 - 315 Hz
(±) | reduced bass - on average 10.3% lower than median
(±) | linearity of bass is average (12.2% delta to prev. frequency)
Mids 400 - 2000 Hz
(±) | higher mids - on average 7.6% higher than median
(+) | mids are linear (6% delta to prev. frequency)
Highs 2 - 16 kHz
(+) | balanced highs - only 1.1% away from median
(+) | highs are linear (2.5% delta to prev. frequency)
Overall 100 - 16.000 Hz
(+) | overall sound is linear (12% difference to median)
Compared to same class
» 10% of all tested devices in this class were better, 4% similar, 86% worse
» The best had a delta of 6%, average was 18%, worst was 132%
Compared to all devices tested
» 7% of all tested devices were better, 2% similar, 91% worse
» The best had a delta of 4%, average was 25%, worst was 134%
Razer Blade Pro 17 RTX 2060 audio analysis
(+) | speakers can play relatively loud (84.9 dB)
Bass 100 - 315 Hz
(±) | reduced bass - on average 9.6% lower than median
(±) | linearity of bass is average (14.4% delta to prev. frequency)
Mids 400 - 2000 Hz
(±) | higher mids - on average 6.7% higher than median
(+) | mids are linear (5.1% delta to prev. frequency)
Highs 2 - 16 kHz
(+) | balanced highs - only 2.4% away from median
(+) | highs are linear (4.4% delta to prev. frequency)
Overall 100 - 16.000 Hz
(±) | linearity of overall sound is average (18.1% difference to median)
Compared to same class
» 54% of all tested devices in this class were better, 8% similar, 38% worse
» The best had a delta of 6%, average was 18%, worst was 132%
Compared to all devices tested
» 33% of all tested devices were better, 8% similar, 59% worse
» The best had a delta of 4%, average was 25%, worst was 134%
Energy Management
Energy Consumption
Thanks to the graphics-switching feature, the energy consumption remains relatively low during idle. At 11 to 28 watts, the results are similar to those of the competition. Under load, we measured between 99 and 210 watts, which is a common range for a Core i7-9750H and GeForce RTX 2060 configuration.
| Off / Standby | |
| Idle | |
| Load |
|
| SCHENKER XMG Pro 17 PB71RD-G i7-9750H, GeForce RTX 2060 Mobile | Razer Blade Pro 17 RTX 2060 i7-9750H, GeForce RTX 2060 Mobile | Asus Strix Hero III G731GV i7-9750H, GeForce RTX 2060 Mobile | Lenovo Legion Y740-17IRH i7-9750H, GeForce RTX 2060 Mobile | MSI GL75 9SEK-056US i7-9750H, GeForce RTX 2060 Mobile | Average of class Gaming | |
|---|---|---|---|---|---|---|
| Power Consumption | -14% | -20% | -11% | 11% | -12% | |
| Idle Minimum * | 11 | 16 -45% | 16.2 -47% | 20 -82% | 10.7 3% | 13.8 ? -25% |
| Idle Average * | 18 | 21.7 -21% | 24.8 -38% | 21 -17% | 15.2 16% | 19.2 ? -7% |
| Idle Maximum * | 28 | 26.1 7% | 28.6 -2% | 26 7% | 17.8 36% | 26.9 ? 4% |
| Load Average * | 99 | 105.6 -7% | 127.6 -29% | 97 2% | 88.2 11% | 111.1 ? -12% |
| Witcher 3 ultra * | 146 | 161.8 -11% | 147.1 -1% | 139 5% | 147.8 -1% | |
| Load Maximum * | 210 | 225.3 -7% | 212.7 -1% | 168 20% | 206.5 2% | 251 ? -20% |
* ... smaller is better
Battery Life
The XMG Pro 17 was not designed for long trips away from an outlet. Despite its Optimus technology and even at minimum brightness, the 62-Wh battery of the 17-inch device struggles to last for more than 5 hours. Around 4 hours of Wi-Fi use at medium brightness is not exactly a great result, either. In this category, the competition at least manages to last slightly longer. Under high load and at maximum brightness, the laptop runs out of steam after running for just above 1 hour. The 3D performance drops by 66% in battery mode.
| SCHENKER XMG Pro 17 PB71RD-G i7-9750H, GeForce RTX 2060 Mobile, 62 Wh | Razer Blade Pro 17 RTX 2060 i7-9750H, GeForce RTX 2060 Mobile, 70 Wh | Asus Strix Hero III G731GV i7-9750H, GeForce RTX 2060 Mobile, 66 Wh | Lenovo Legion Y740-17IRH i7-9750H, GeForce RTX 2060 Mobile, 76 Wh | MSI GL75 9SEK-056US i7-9750H, GeForce RTX 2060 Mobile, 51 Wh | Average of class Gaming | |
|---|---|---|---|---|---|---|
| Battery Runtime | 11% | 11% | 7% | 10% | 44% | |
| Reader / Idle | 313 | 414 32% | 474 51% | 544 ? 74% | ||
| WiFi v1.3 | 244 | 272 11% | 270 11% | 256 5% | 254 4% | 368 ? 51% |
| Load | 79 | 67 -15% | 60 -24% | 84.4 ? 7% | ||
| H.264 | 260 | 399 ? |
Pros
Cons
Verdict
If you are not bothered by the loud fan noise or you regularly use a headset, the XMG Pro 17 is a powerful gaming laptop with a sleek design fit for any environment.
The 17-inch model shines with good peripherals, numerous ports (including Thunderbolt 3) and moderate temperatures. The image and sound quality also match the price. Many individual customization options are another strength of the XMG Pro 17.
The final score not being higher is a result of the mediocre battery life, noise during 3D usage, and the difficult serviceability.
SCHENKER XMG Pro 17 PB71RD-G
-
02/23/2020 v7
Florian Glaser
More articles related to this device
SCHENKER XMG Pro 17 PB71RD-G (XMG Pro 17 Series)Related Articles

Pricecompare

