 Deutsch
 English
 Español
 Français
 Italiano
 Nederlands
 Polski
 Português
 Русский
 Türkçe
 Svenska
 Chinese
 Magyar
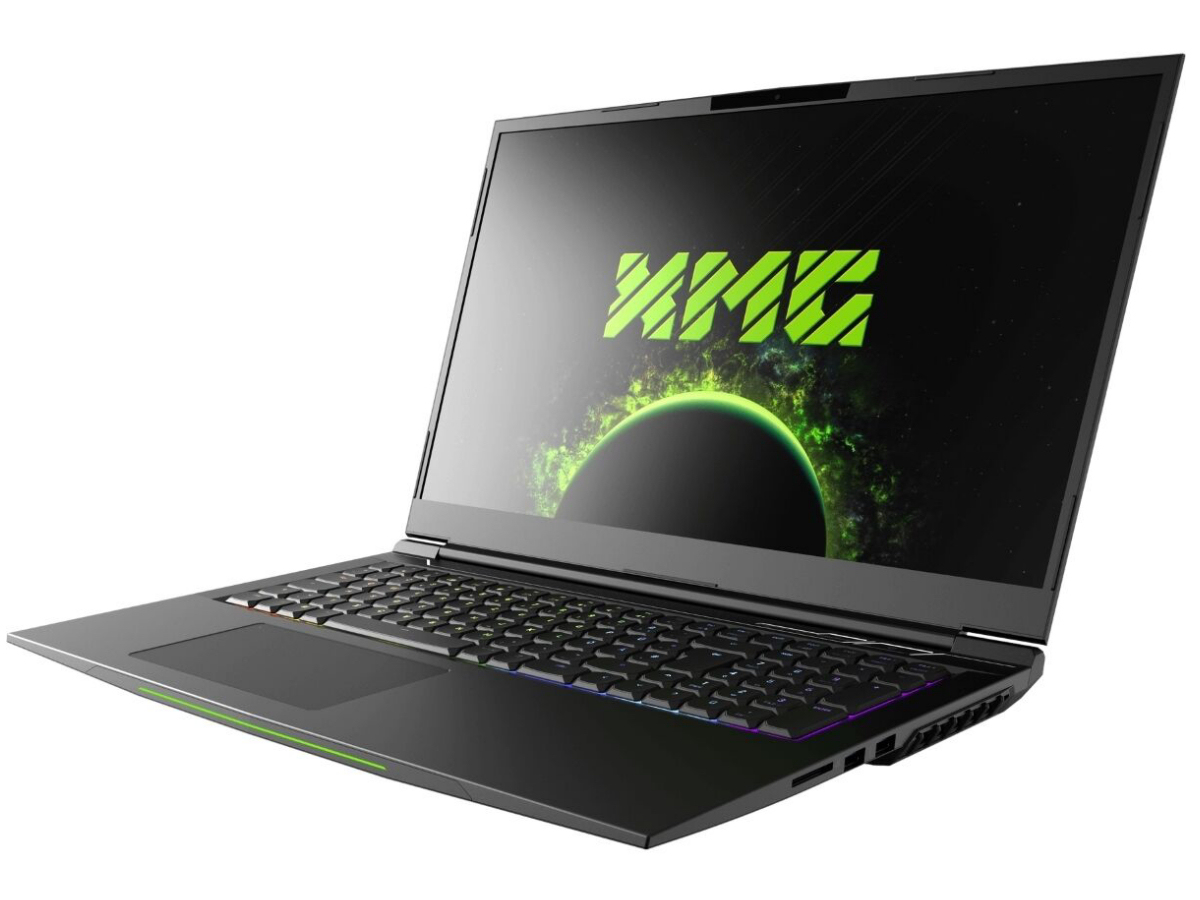
Schenker XMG Neo 17 (2020, Tongfang GM7MPHS) Review: Overboost unleashes the Core-i7 processor

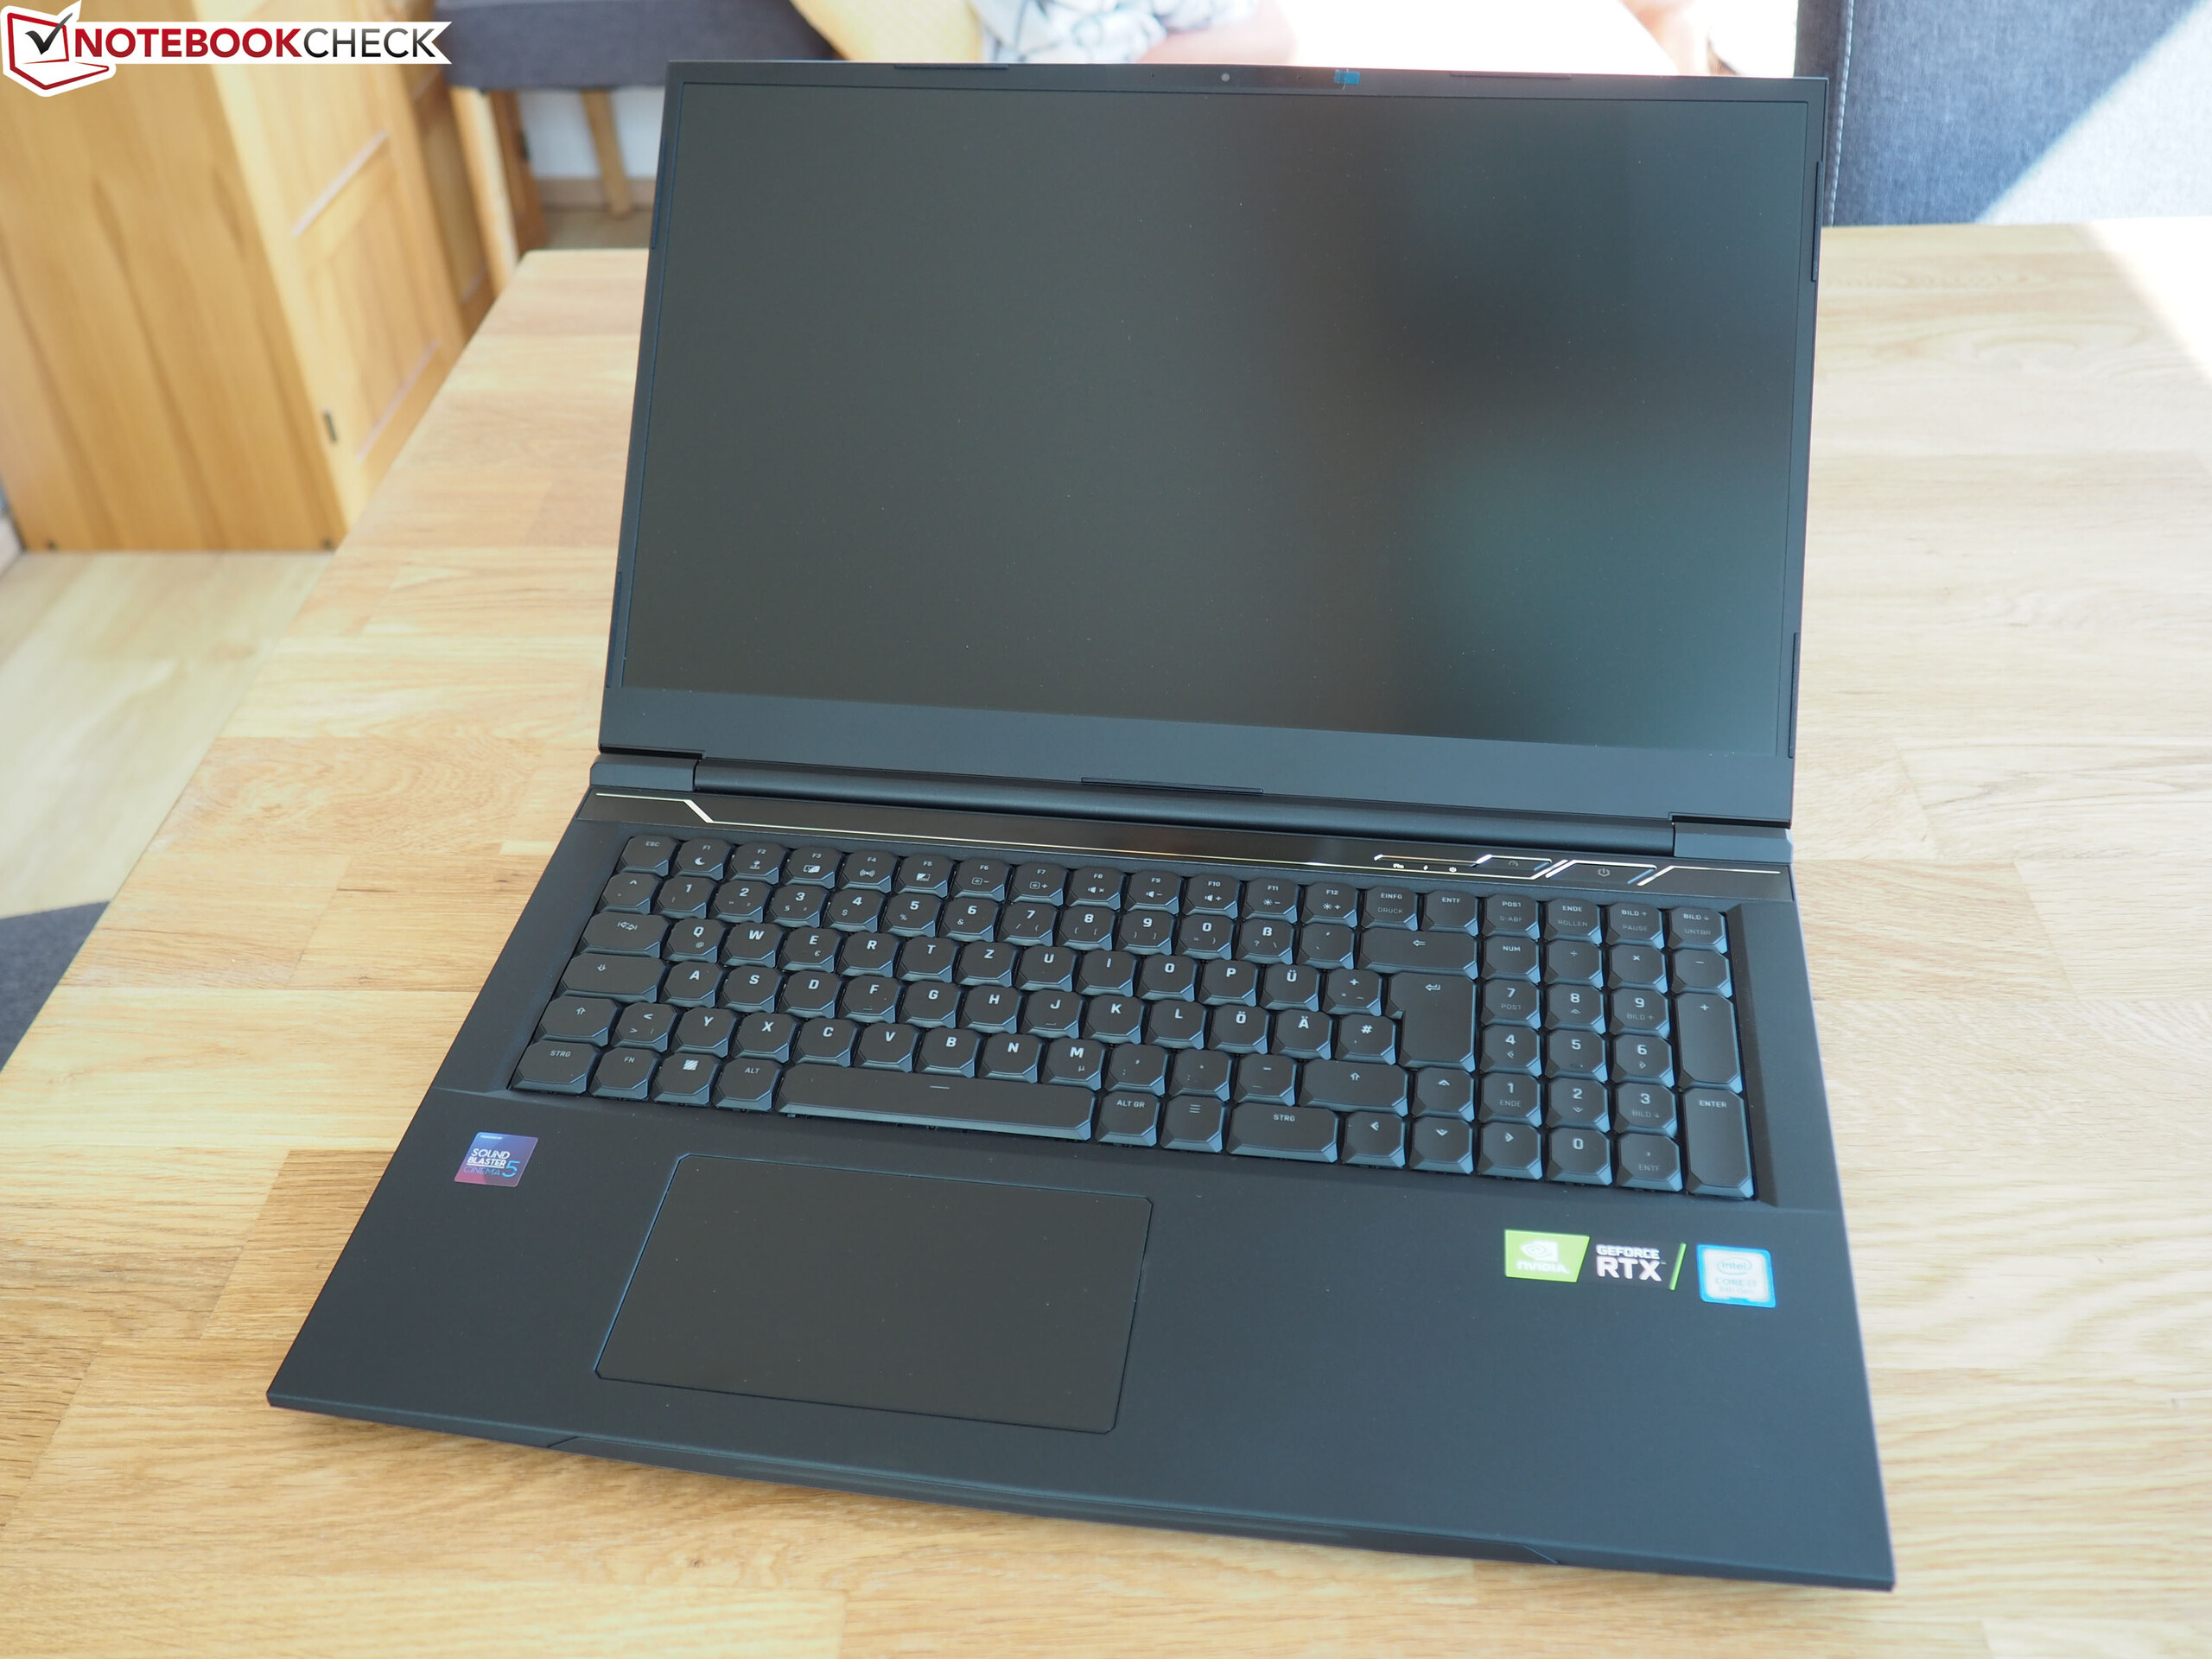
With the XMG Neo 17, Schenker offers a 17.3-inch gaming notebook that is equipped with powerful hardware. The test unit that was made available to us is run by a Core i7-10875H octa-core processor and a GeForce RTX-2070 Super GPU. The competitors include the Acer Predator Helios 300 PH317-54, the MSI GL75 10SFR, the Asus Strix G17 G712LWS, and the Aorus 17G XB.
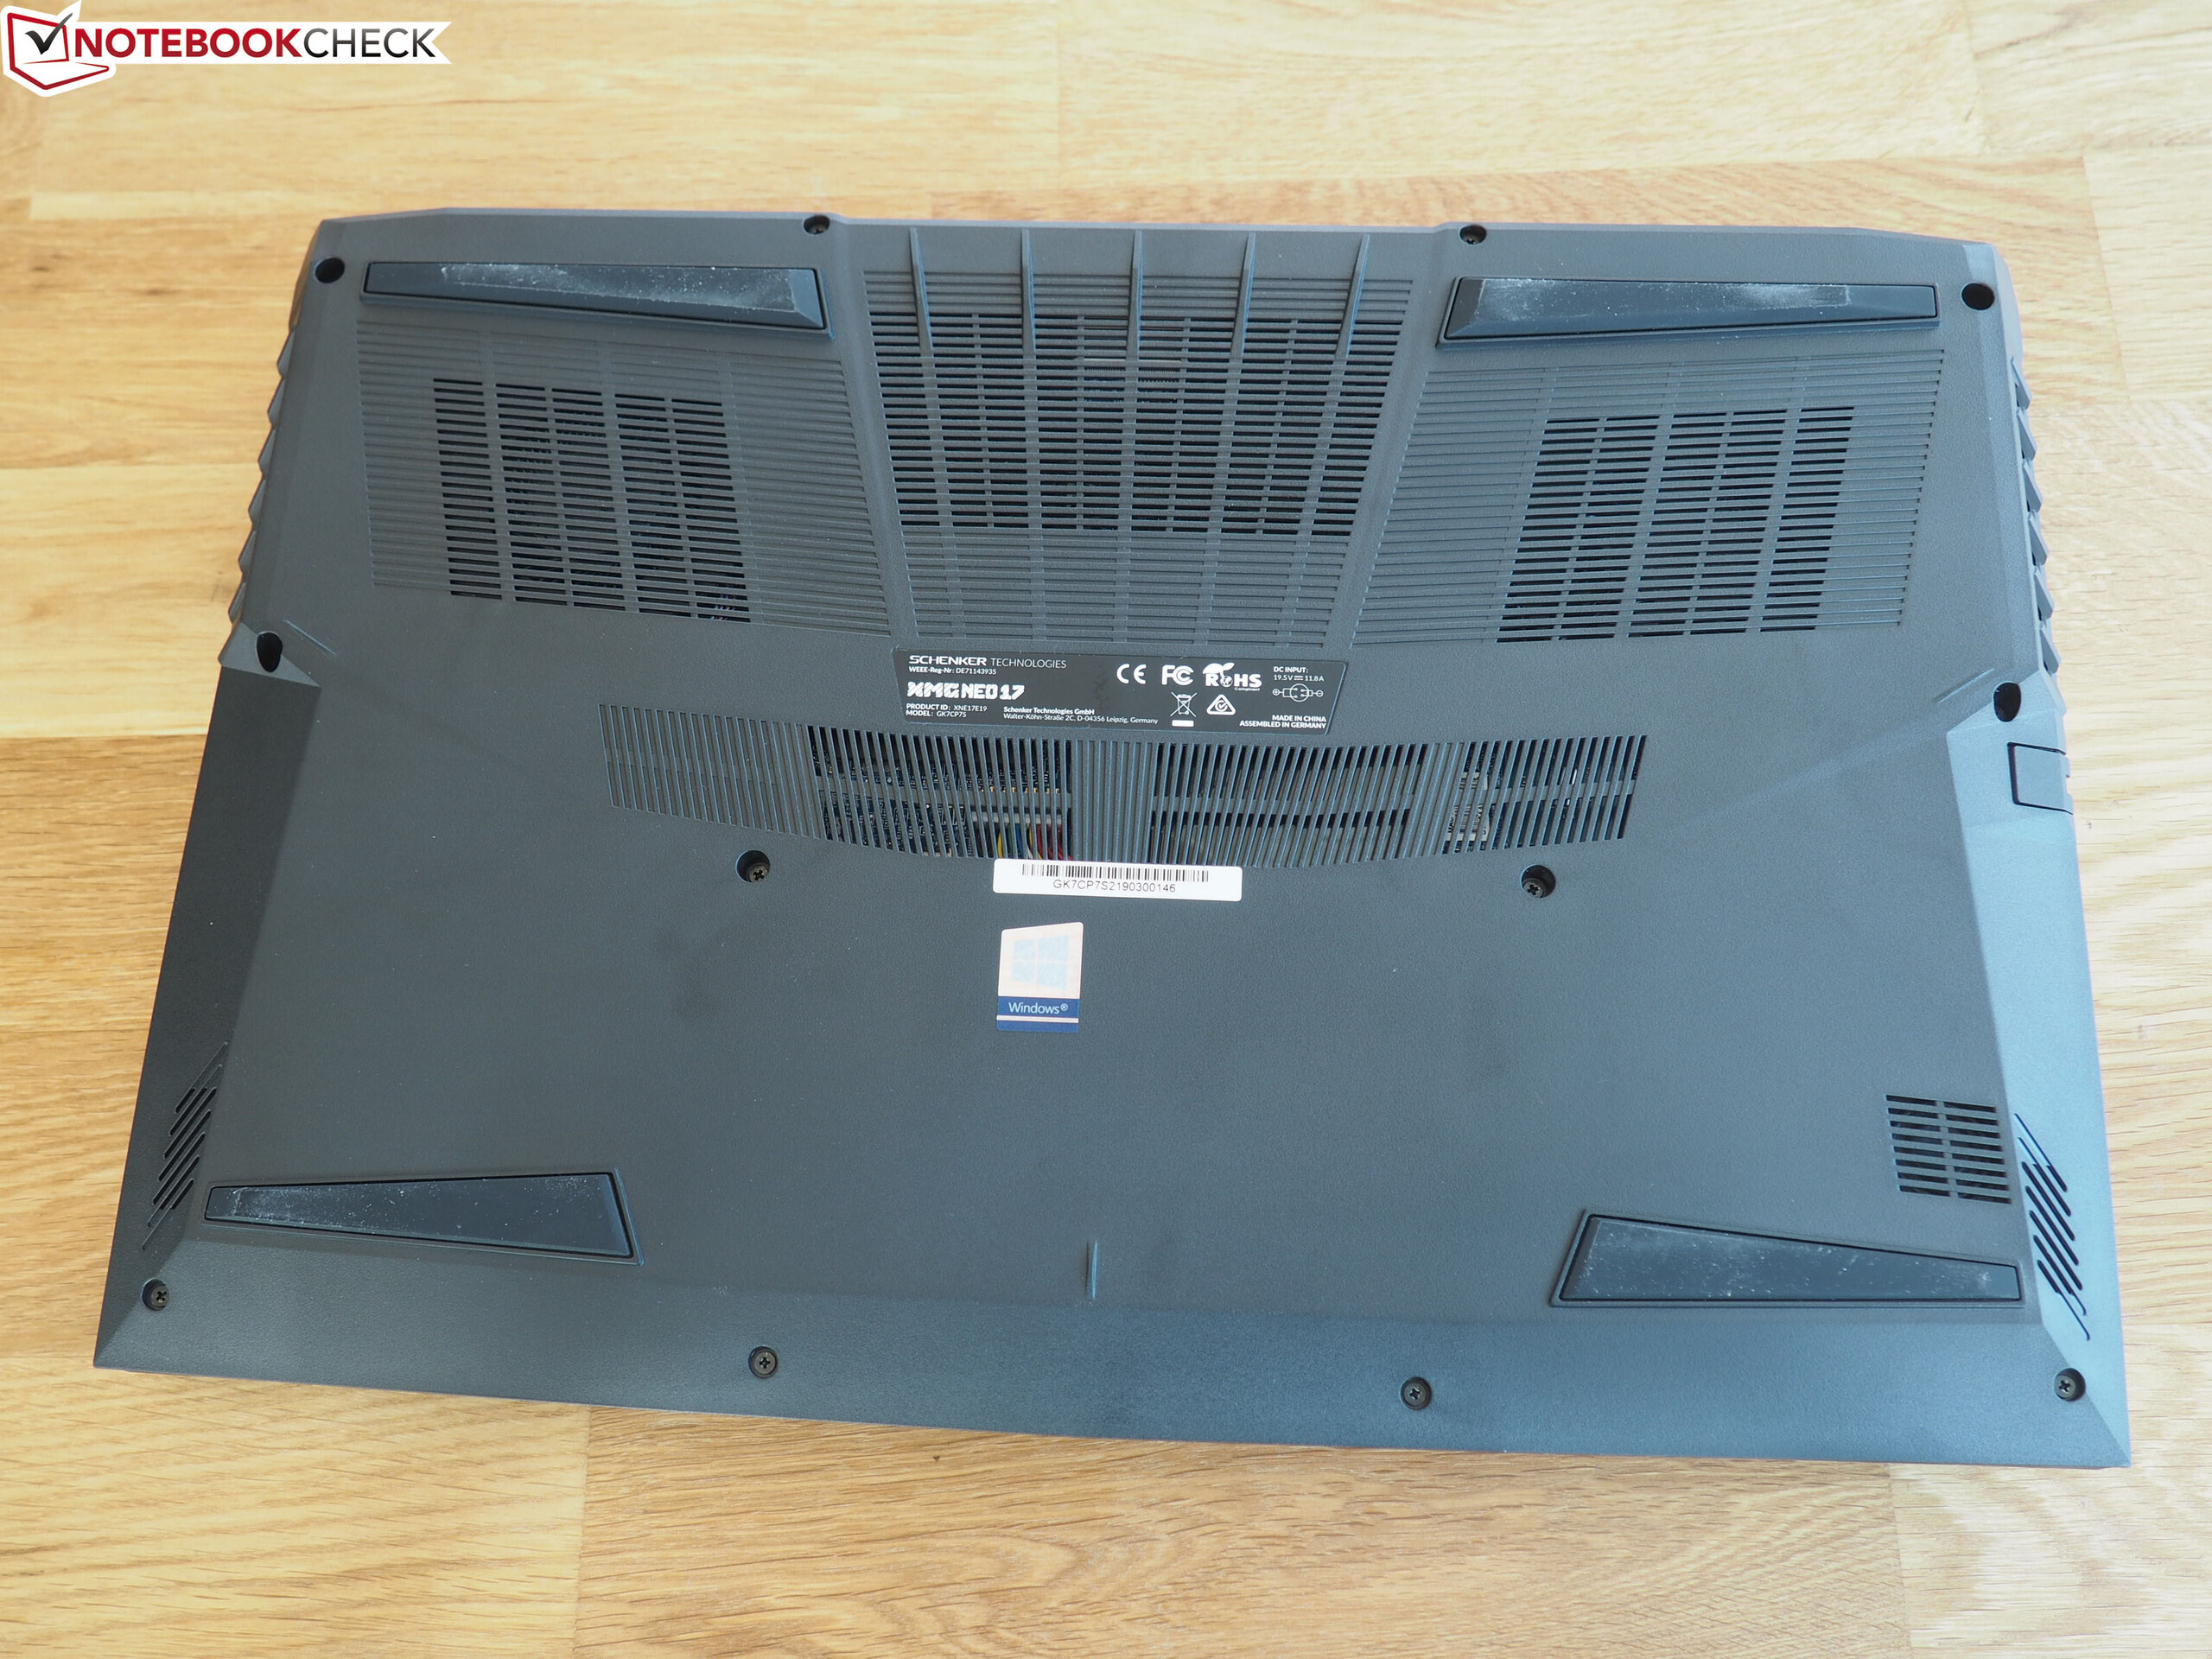
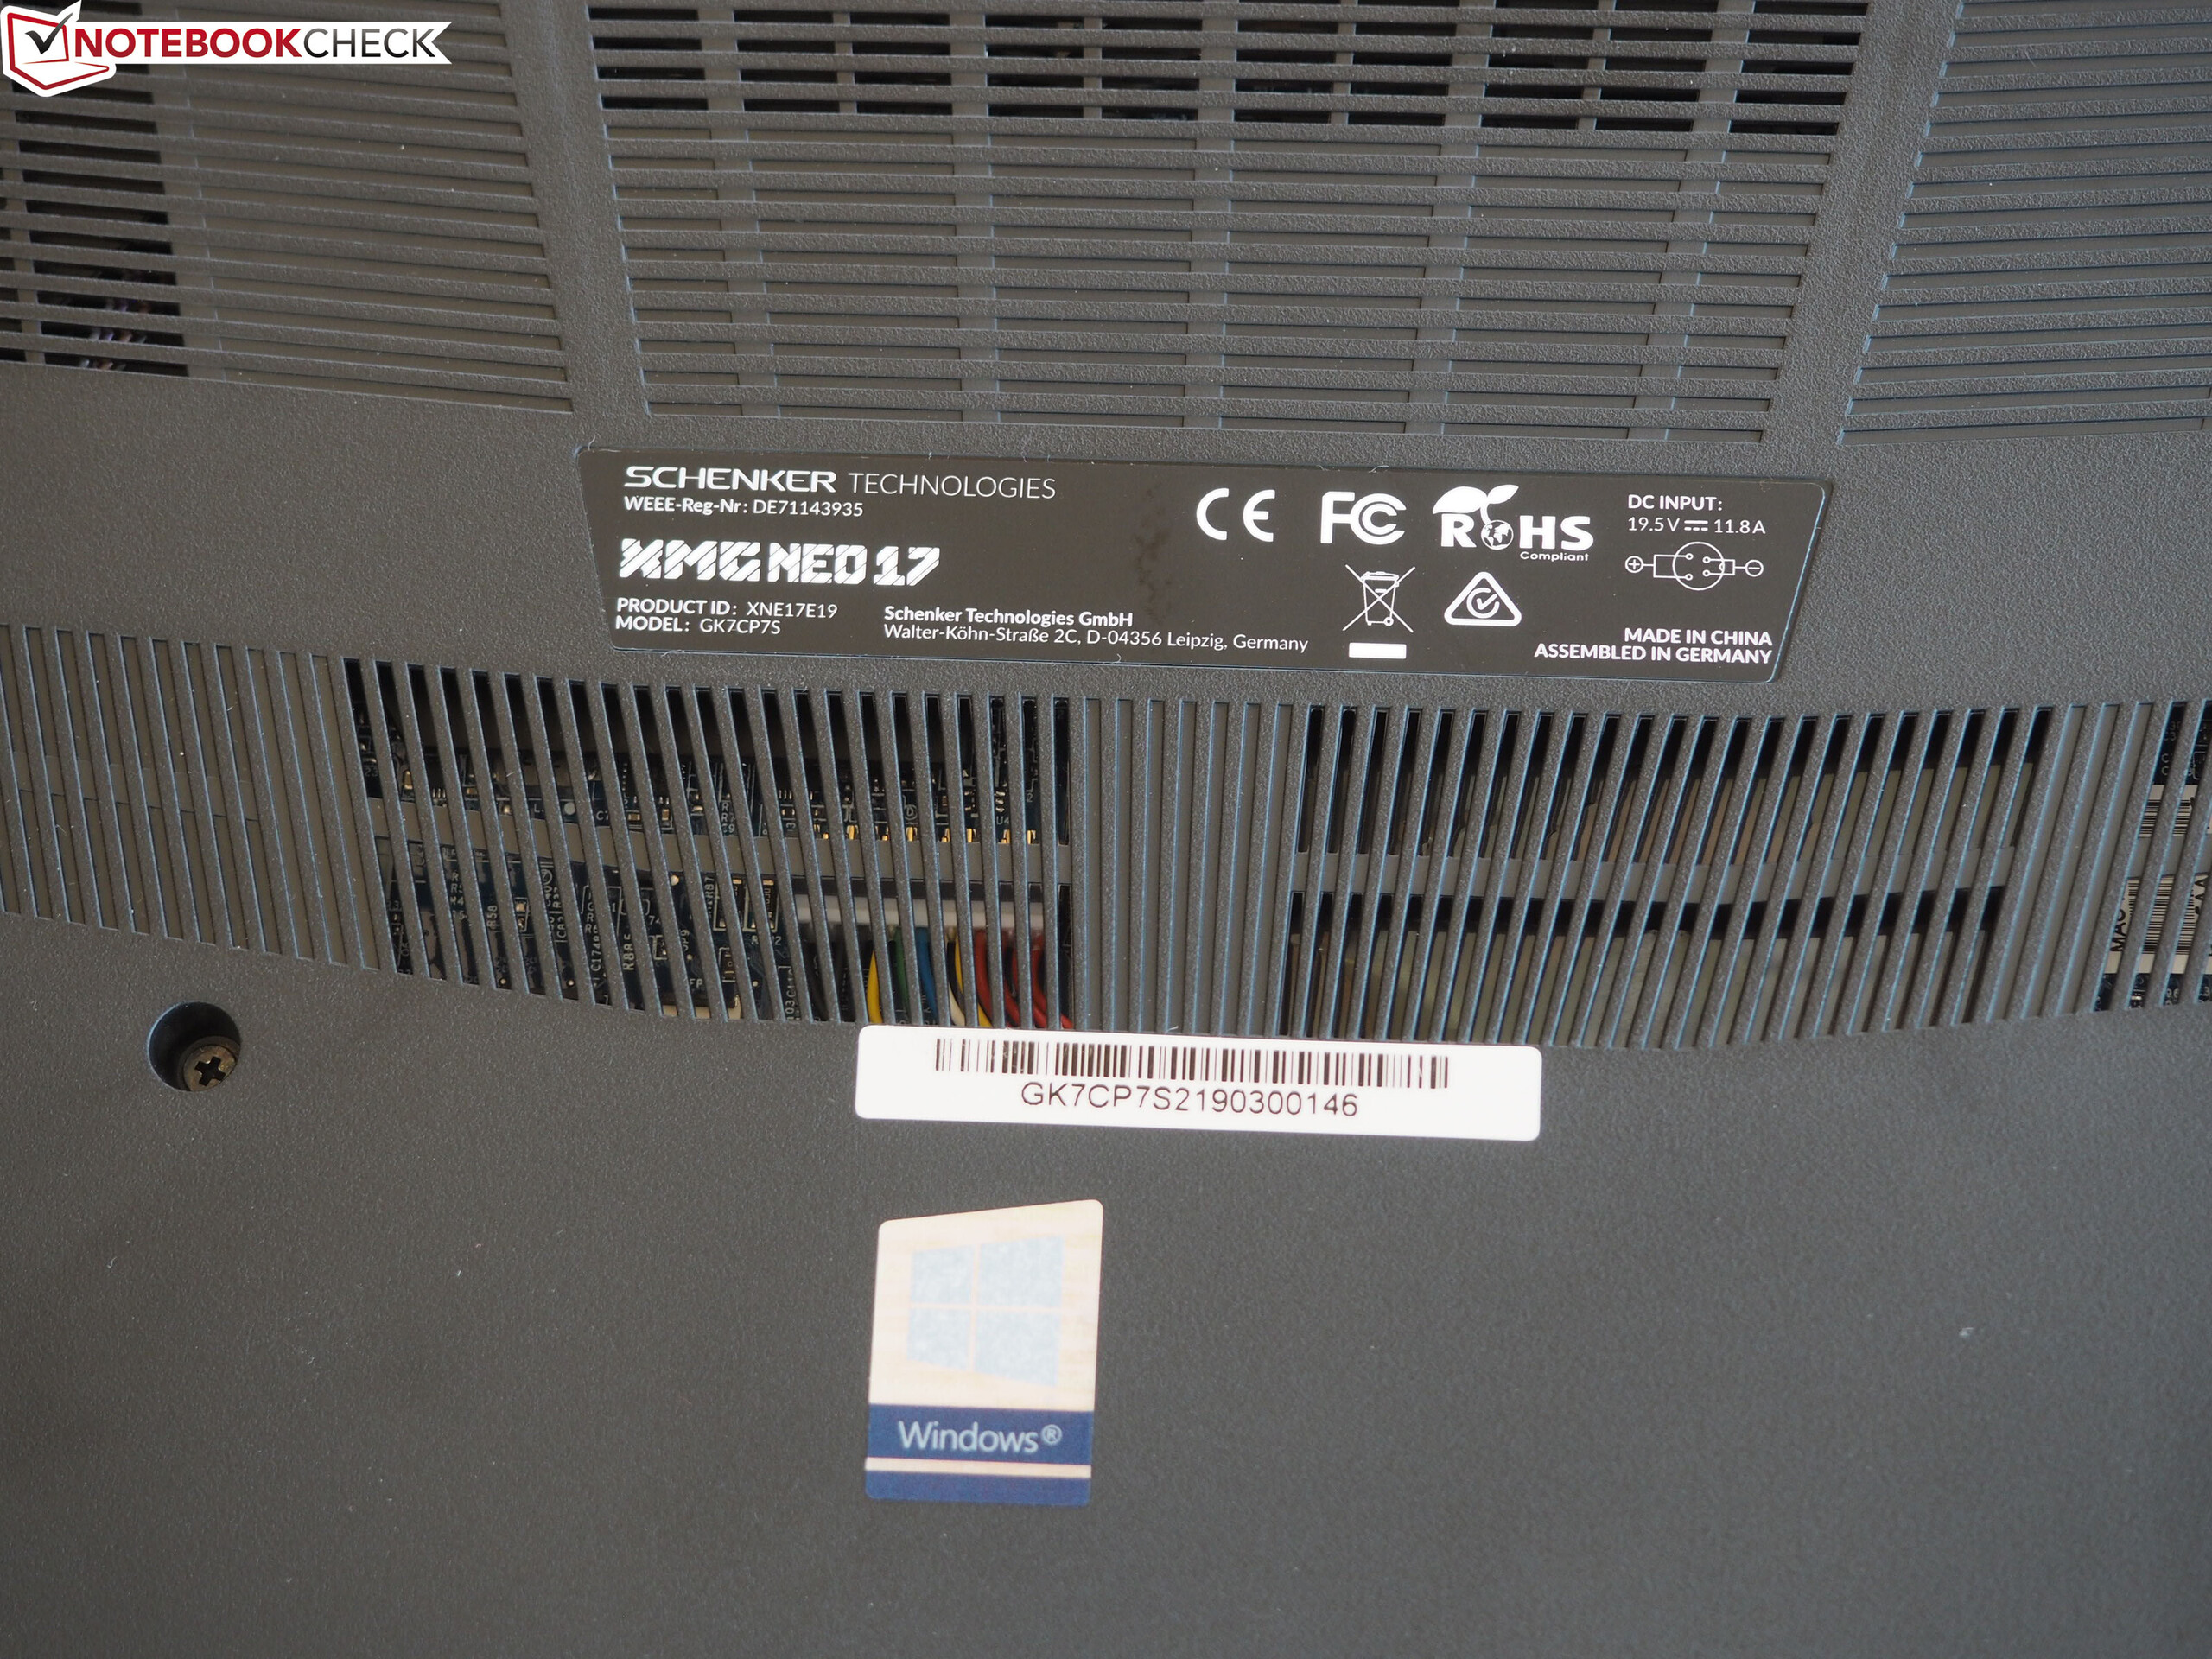
Since the device shares an identical build with its predecessor, we will not discuss the case, connection equipment, input devices, or speakers again, except where there are some differences. You can find the corresponding information in our review of the Schenker XMG Neo 17 (Tongfang GK7CP7S).
Rating | Date | Model | Weight | Height | Size | Resolution | Best Price |
|---|---|---|---|---|---|---|---|
| 85.8 % | 11/2020 | SCHENKER XMG Neo 17 Comet Lake i7-10875H, GeForce RTX 2070 Super Mobile | 2.6 kg | 27.45 mm | 17.30" | 1920x1080 | |
| 83.6 % | 10/2020 | Acer Predator Helios 300 PH317-54-75G8 i7-10750H, GeForce RTX 2060 Mobile | 2.8 kg | 25 mm | 17.30" | 1920x1080 | |
| 83.5 % | 08/2020 | MSI GL75 10SFR i7-10750H, GeForce RTX 2070 Mobile | 2.6 kg | 28 mm | 17.30" | 1920x1080 | |
| 83.1 % | 10/2020 | Asus Strix G17 G712LWS i7-10750H, GeForce RTX 2070 Super Mobile | 2.8 kg | 26.5 mm | 17.30" | 1920x1080 | |
| 86.5 % | 05/2020 | Aorus 17G XB i7-10875H, GeForce RTX 2070 Super Max-Q | 2.7 kg | 26 mm | 17.30" | 1920x1080 |
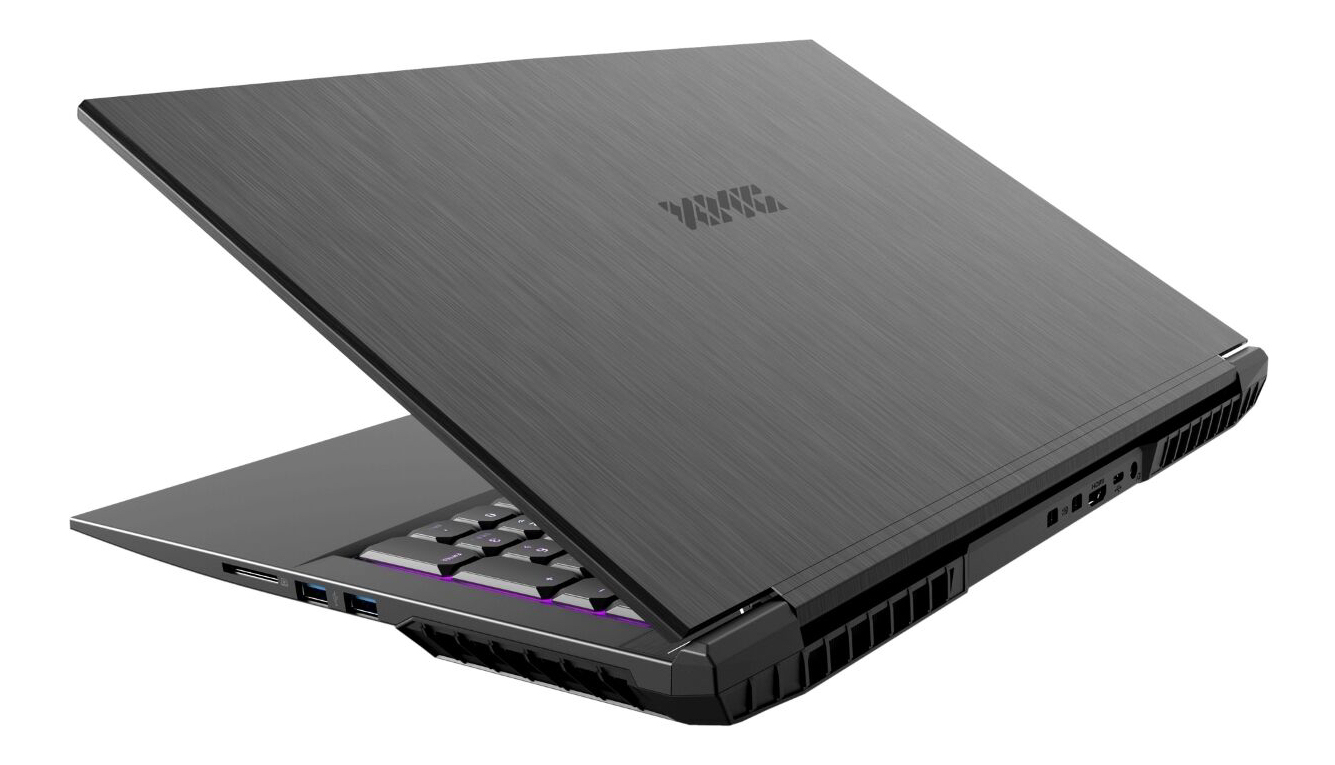
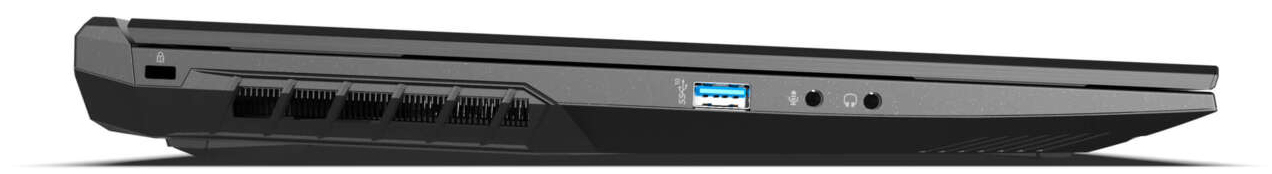
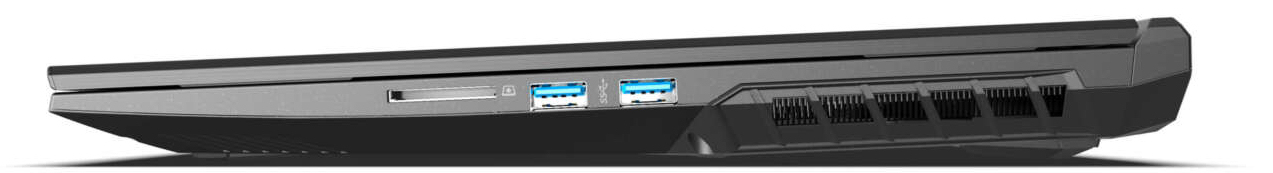
Equipment - Neo 17 now with Thunderbolt 3
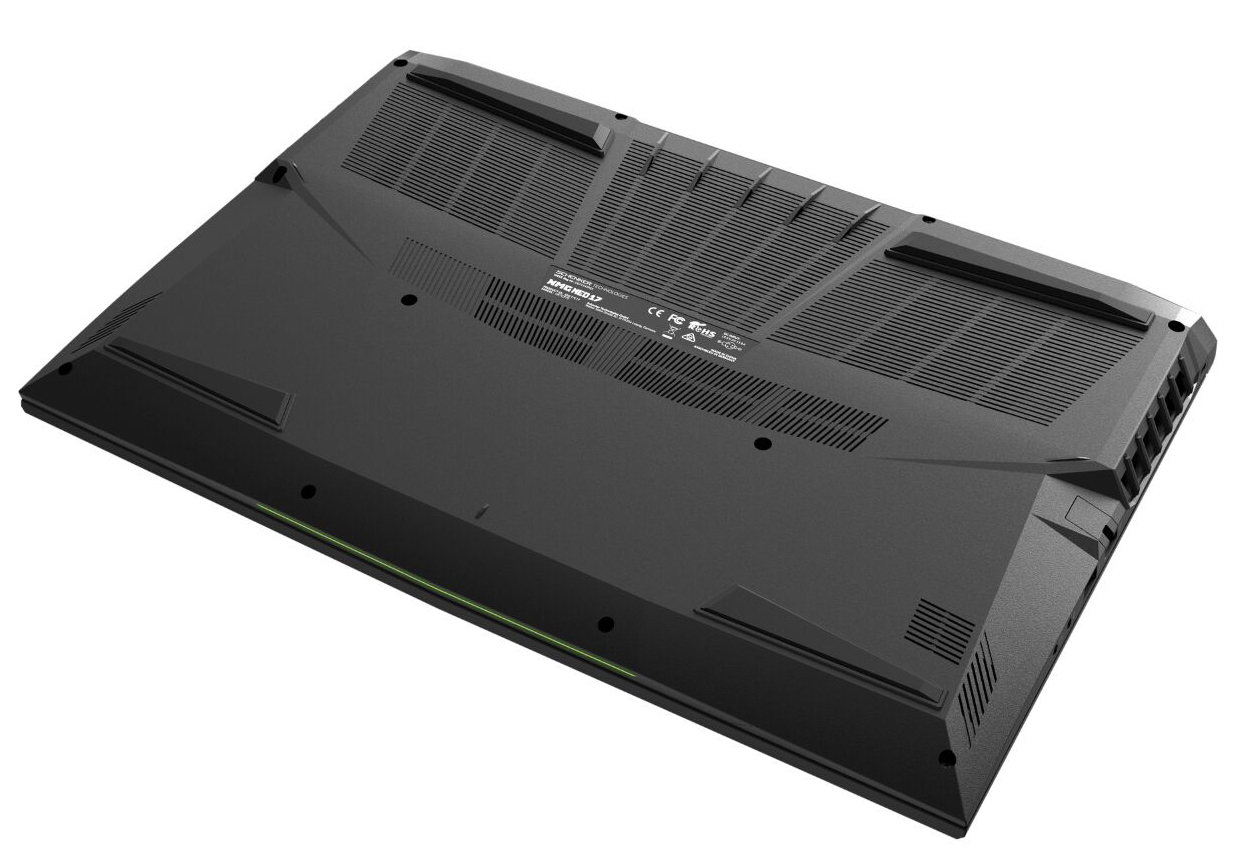
In terms of the connections, some things have changed compared to the predecessor model: the two Mini DisplayPorts have been replaced with a Thunderbolt 3 connection (DisplayPort-via-USB-C is supported). According to Schenker, you can connect two monitors (in series/MST) to the TB3 connection. A USB-Type-C-to-DisplayPort adapter is included. In addition, the USB 2.0 connection was upgraded to a USB 3.2 Gen 2 (Type-A) connection.
Connection Equipment

| SD Card Reader | |
| average JPG Copy Test (av. of 3 runs) | |
| Aorus 17G XB (Toshiba Exceria Pro SDXC 64 GB UHS-II) | |
| Average of class Gaming (19 - 202, n=100, last 2 years) | |
| SCHENKER XMG Neo 17 Comet Lake (Toshiba Exceria Pro SDXC 64 GB UHS-II) | |
| SCHENKER XMG Neo 17 (Toshiba Exceria Pro SDXC 64 GB UHS-II) | |
| SCHENKER XMG Neo 17 XNE17M19 (Toshiba Exceria Pro SDXC 64 GB UHS-II) | |
| MSI GL75 10SFR (Toshiba Exceria Pro SDXC 64 GB UHS-II) | |
| maximum AS SSD Seq Read Test (1GB) | |
| Aorus 17G XB (Toshiba Exceria Pro SDXC 64 GB UHS-II) | |
| Average of class Gaming (25.8 - 269, n=94, last 2 years) | |
| SCHENKER XMG Neo 17 (Toshiba Exceria Pro SDXC 64 GB UHS-II) | |
| SCHENKER XMG Neo 17 XNE17M19 (Toshiba Exceria Pro SDXC 64 GB UHS-II) | |
| SCHENKER XMG Neo 17 Comet Lake (Toshiba Exceria Pro SDXC 64 GB UHS-II) | |
| MSI GL75 10SFR (Toshiba Exceria Pro SDXC 64 GB UHS-II) | |
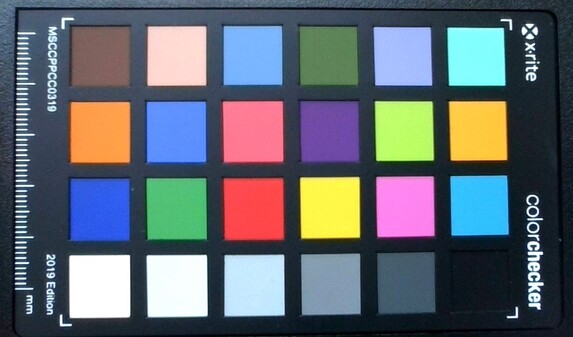


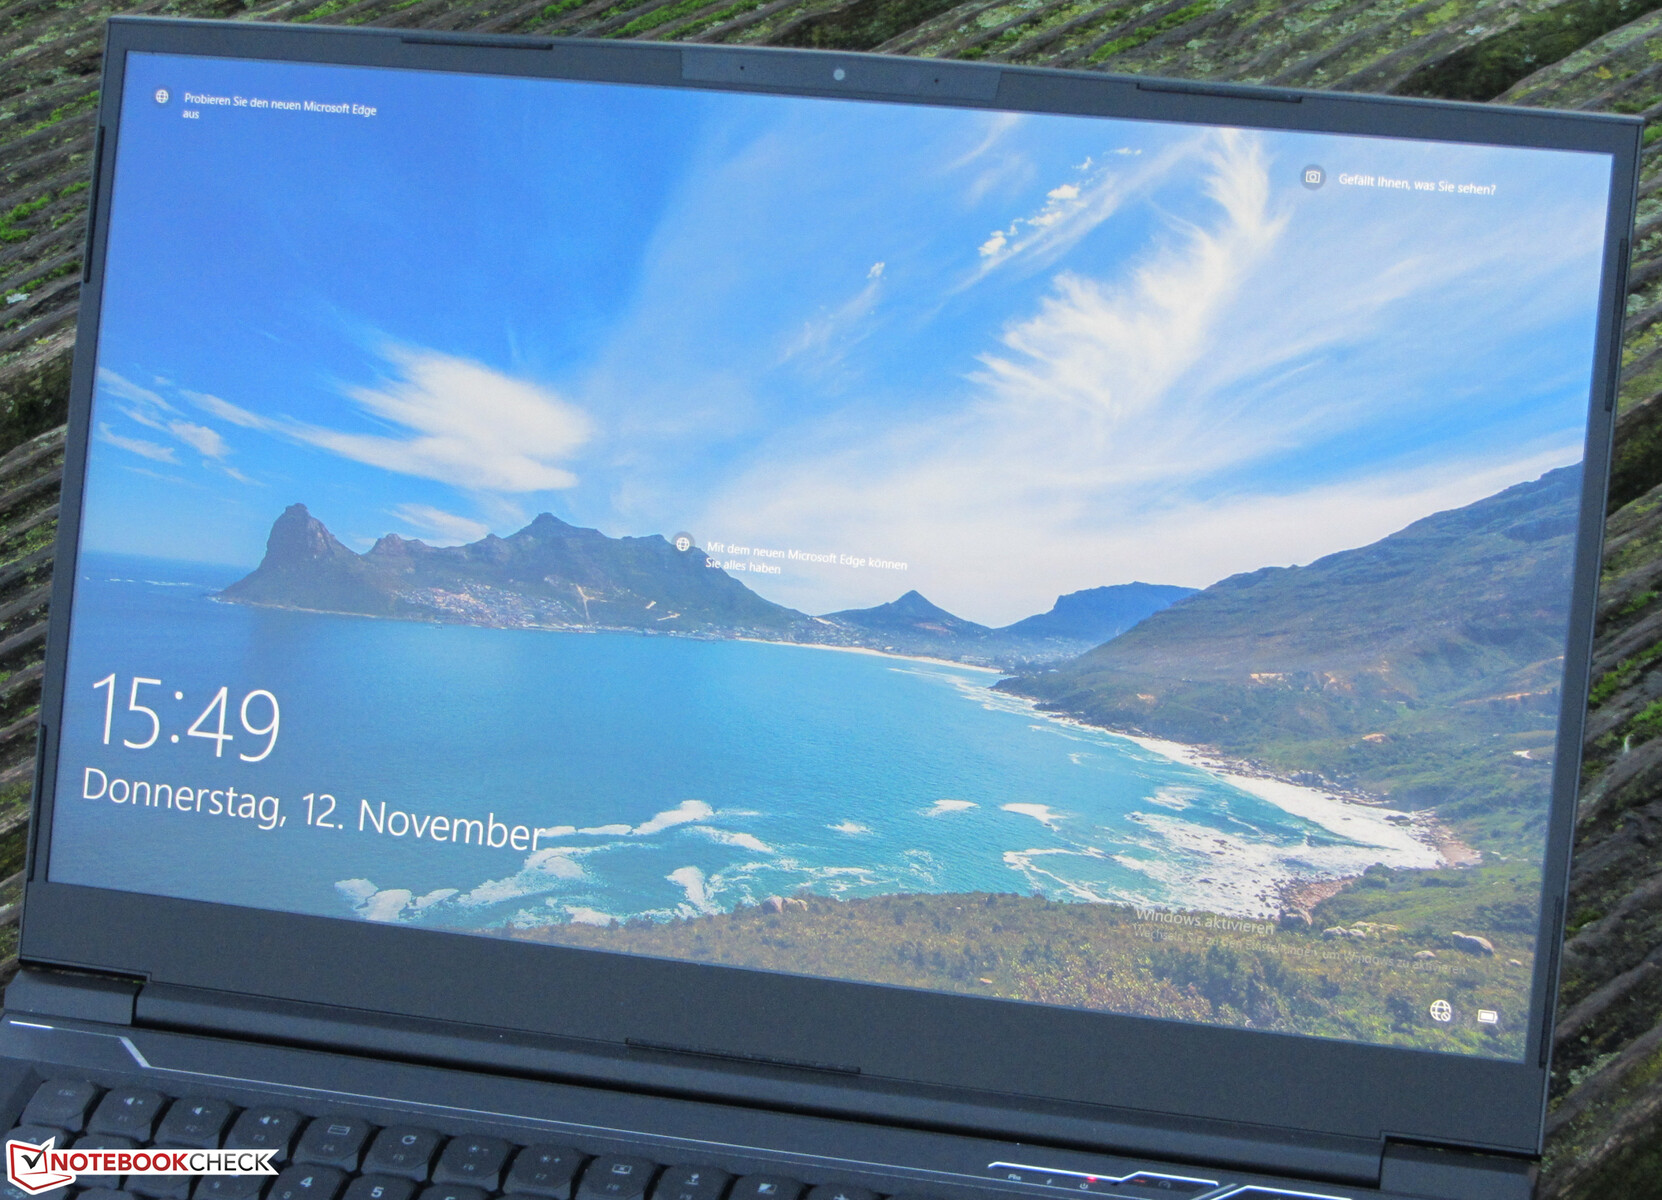
Display - 240 Hz IPS panel
The matte 17.3-inch display of the Neo 17 offers a native resolution of 1920 x 1080 pixels. The brightness (305.4 cd/m²) and contrast (1022:1) turn out good. The 240-Hz panel delivers short response times. Another positive point is the lack of any PWM flickering.
| |||||||||||||||||||||||||
Brightness Distribution: 87 %
Center on Battery: 327 cd/m²
Contrast: 1022:1 (Black: 0.32 cd/m²)
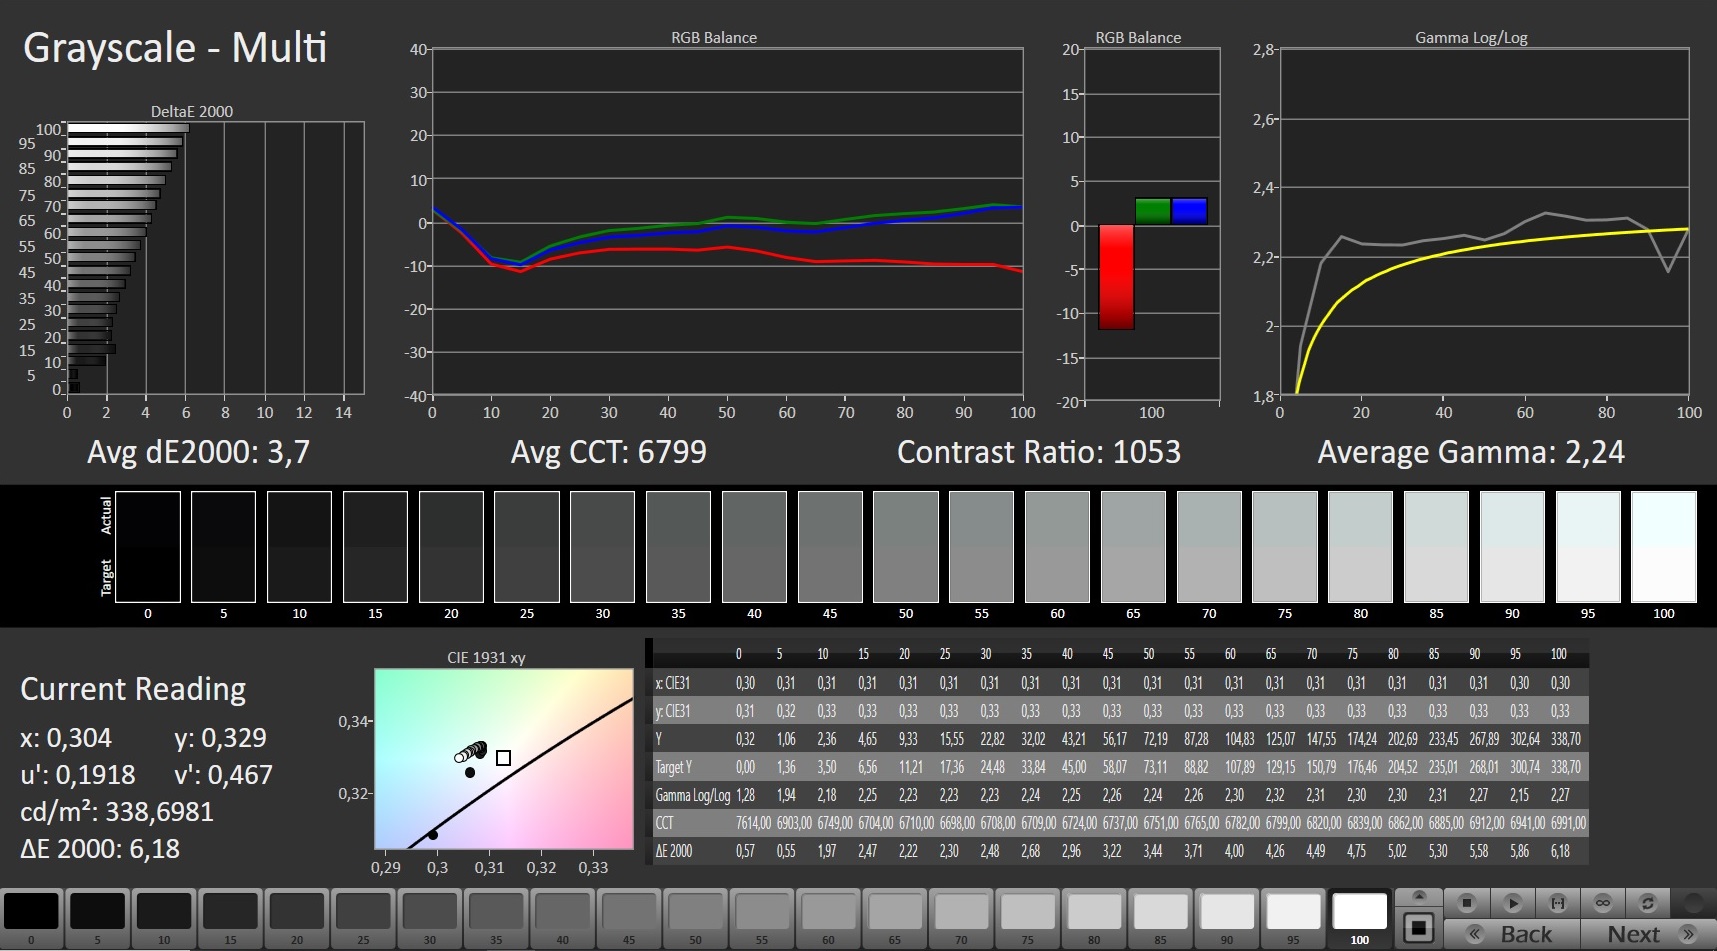
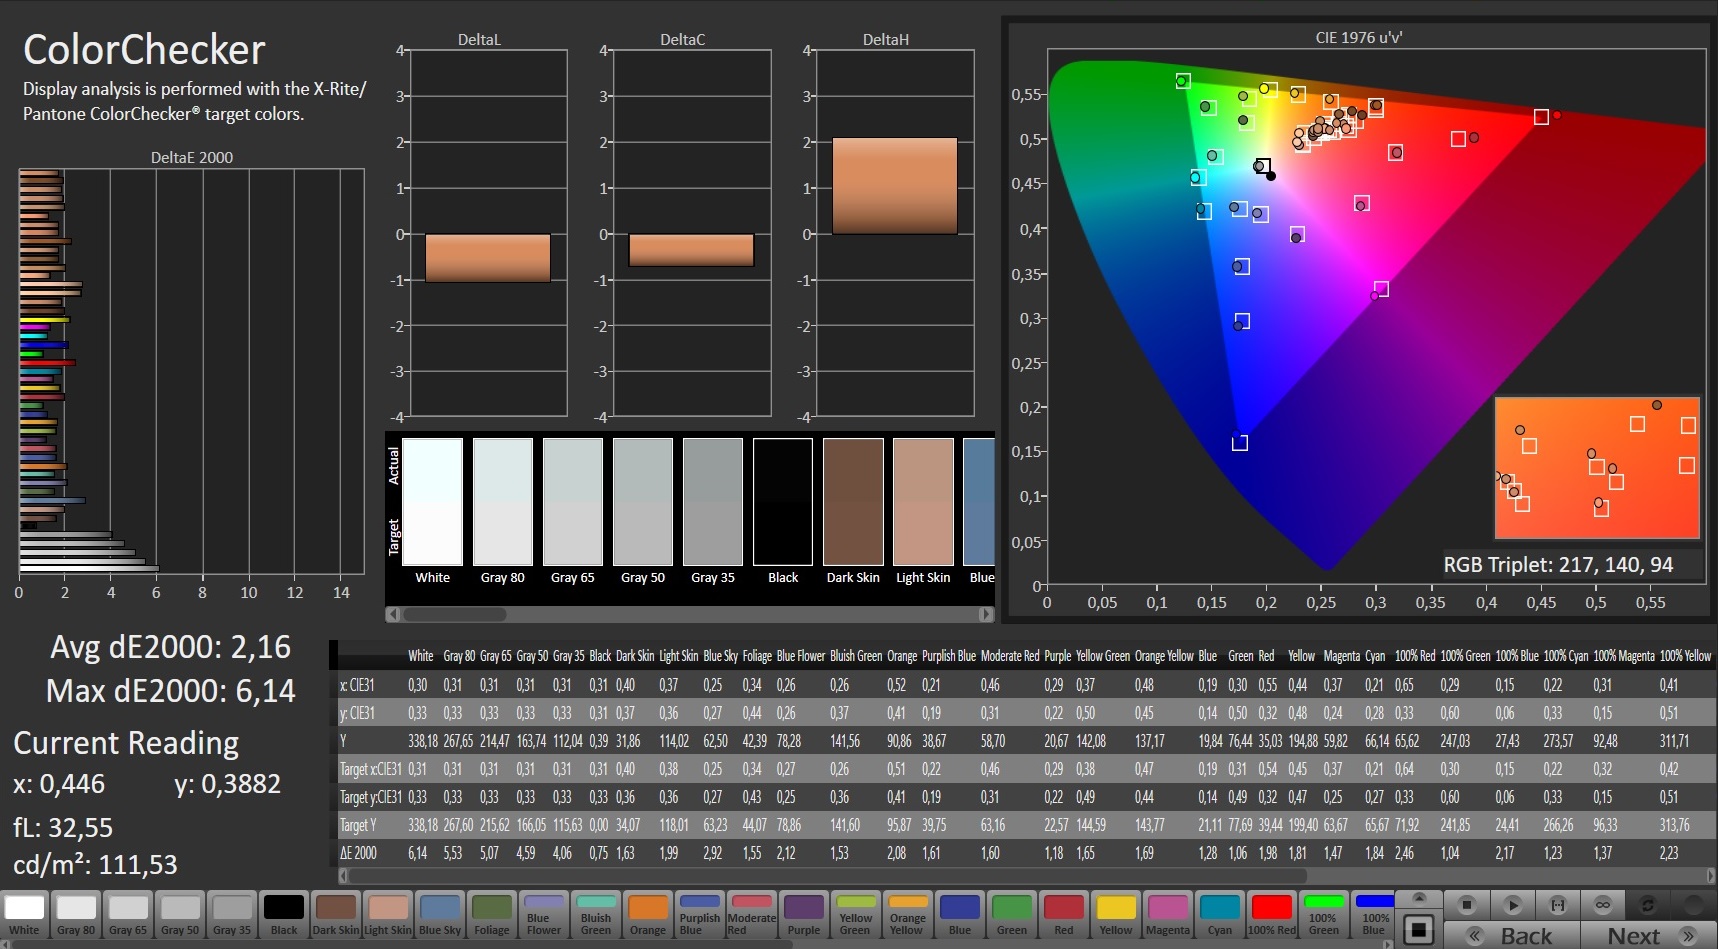
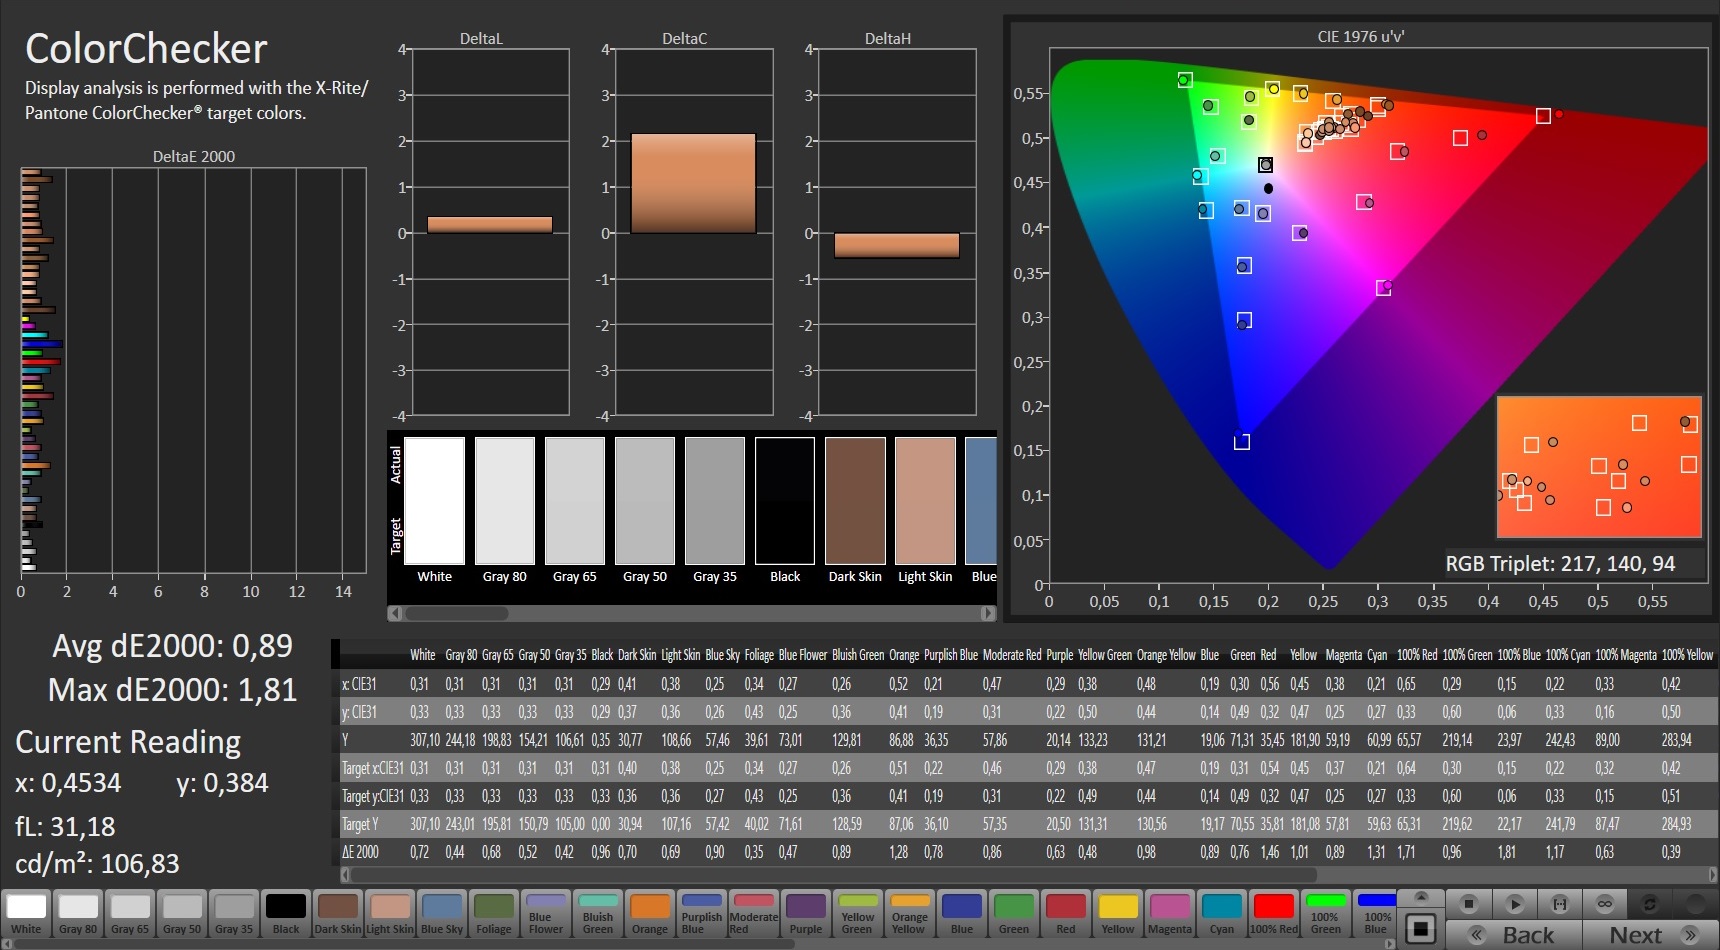
ΔE Color 2.16 | 0.5-29.43 Ø5, calibrated: 0.89
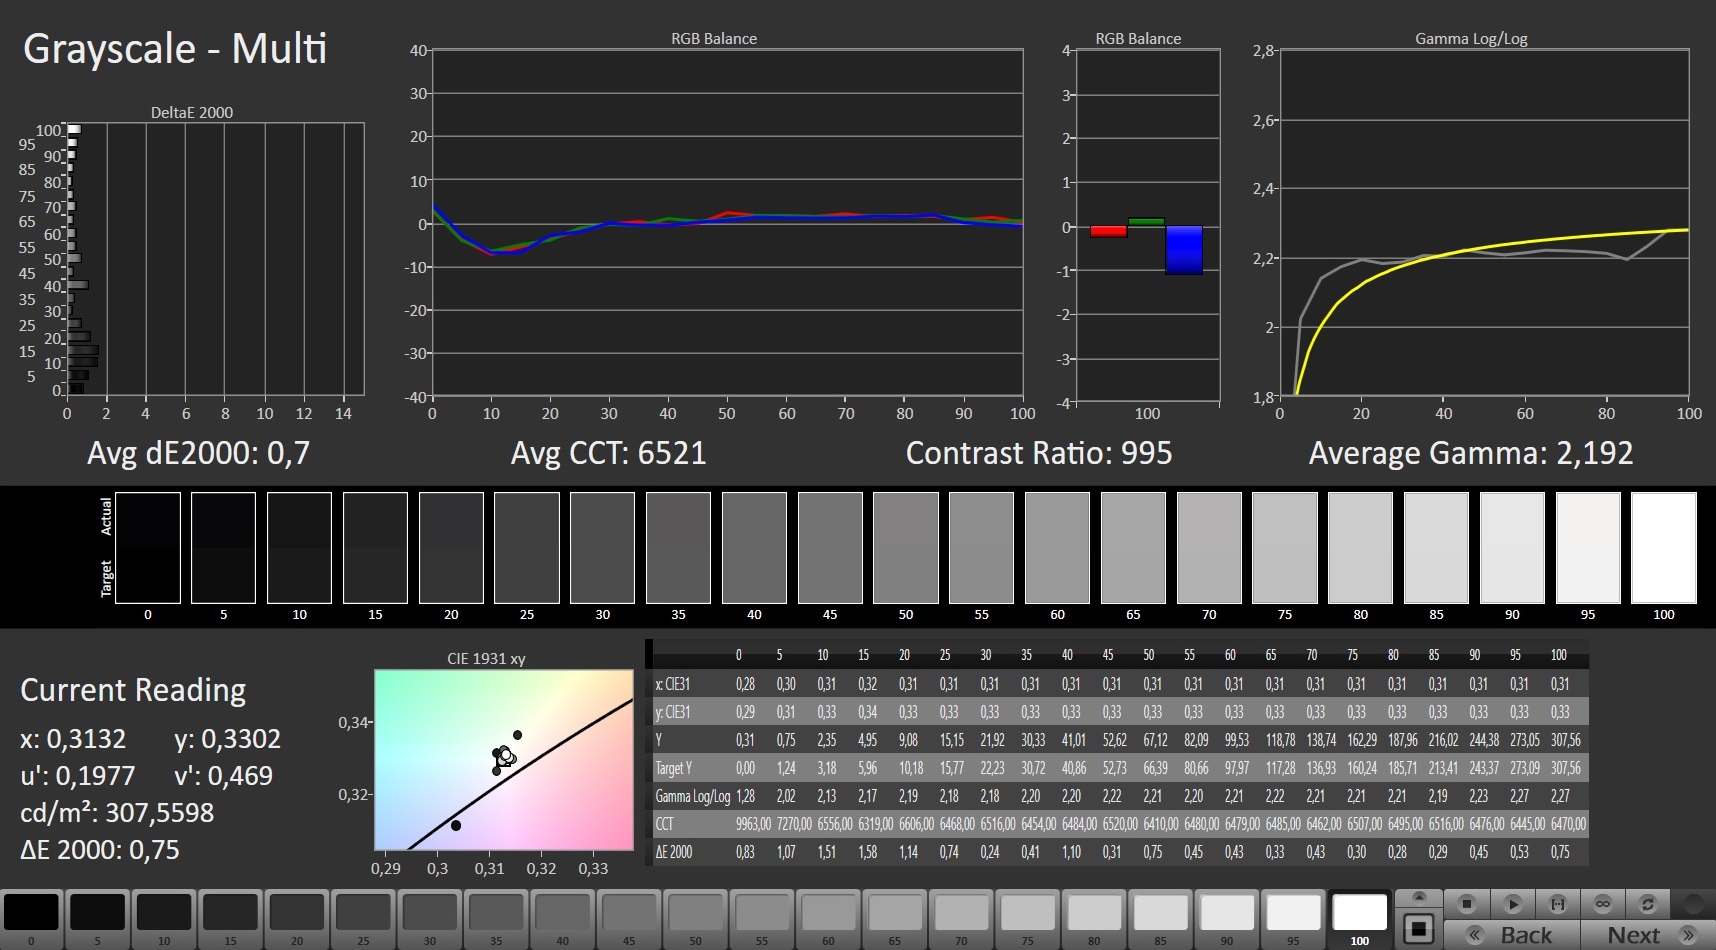
ΔE Greyscale 3.7 | 0.57-98 Ø5.3
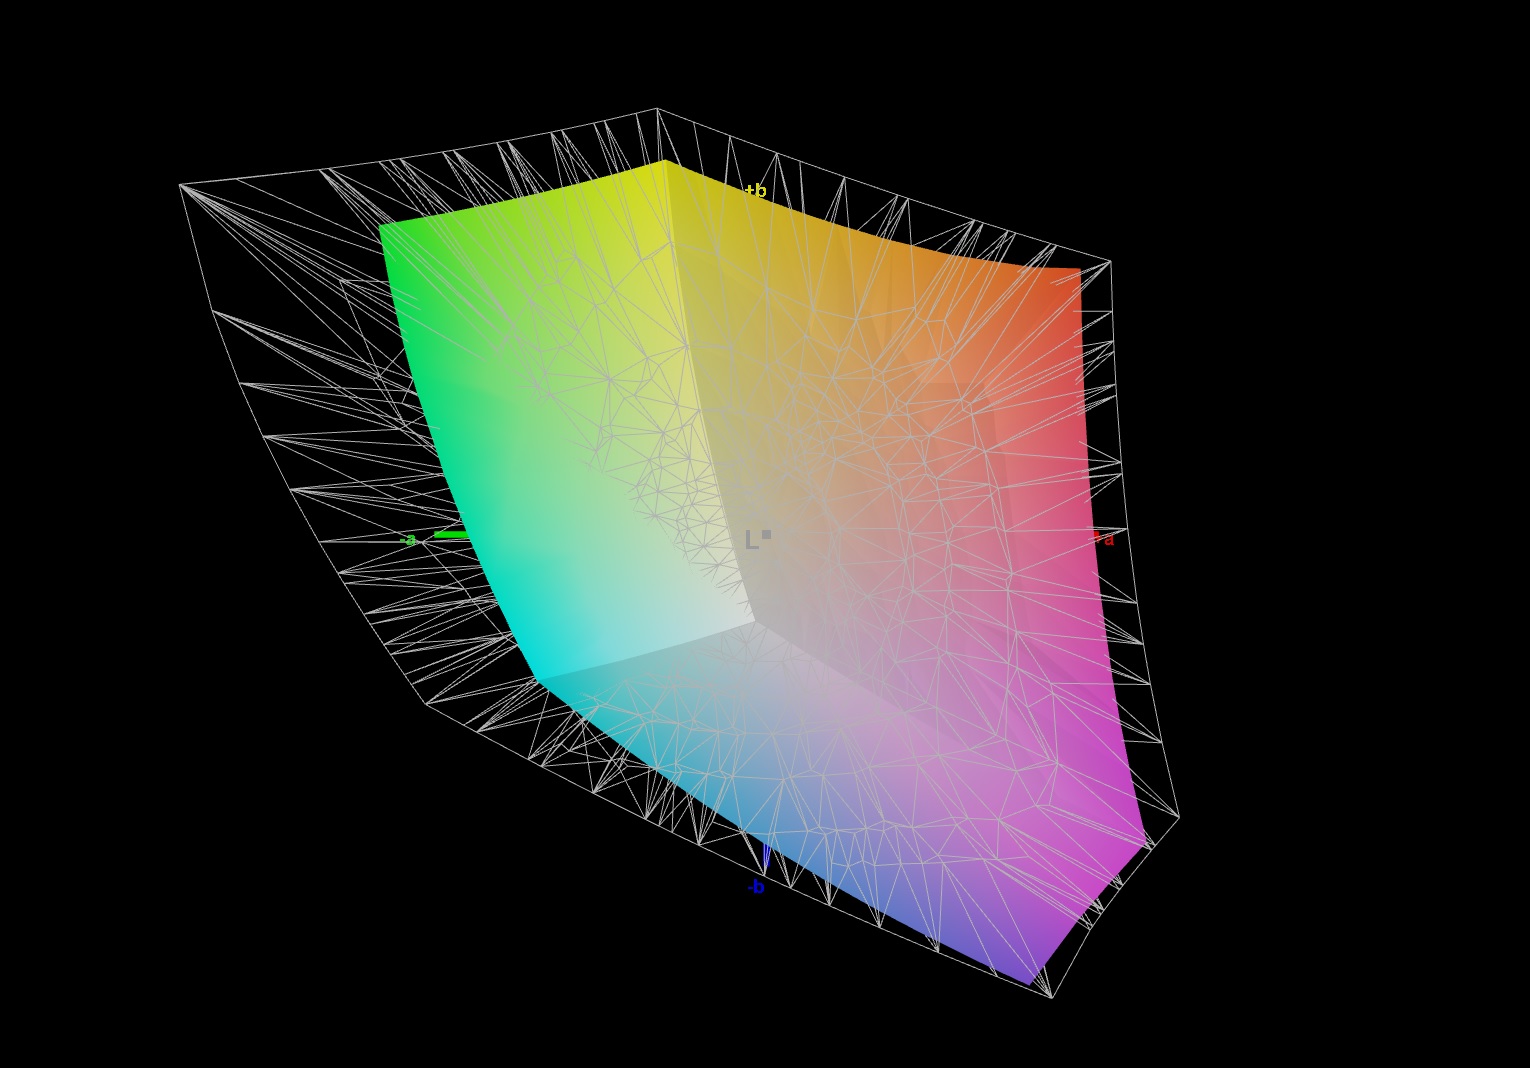
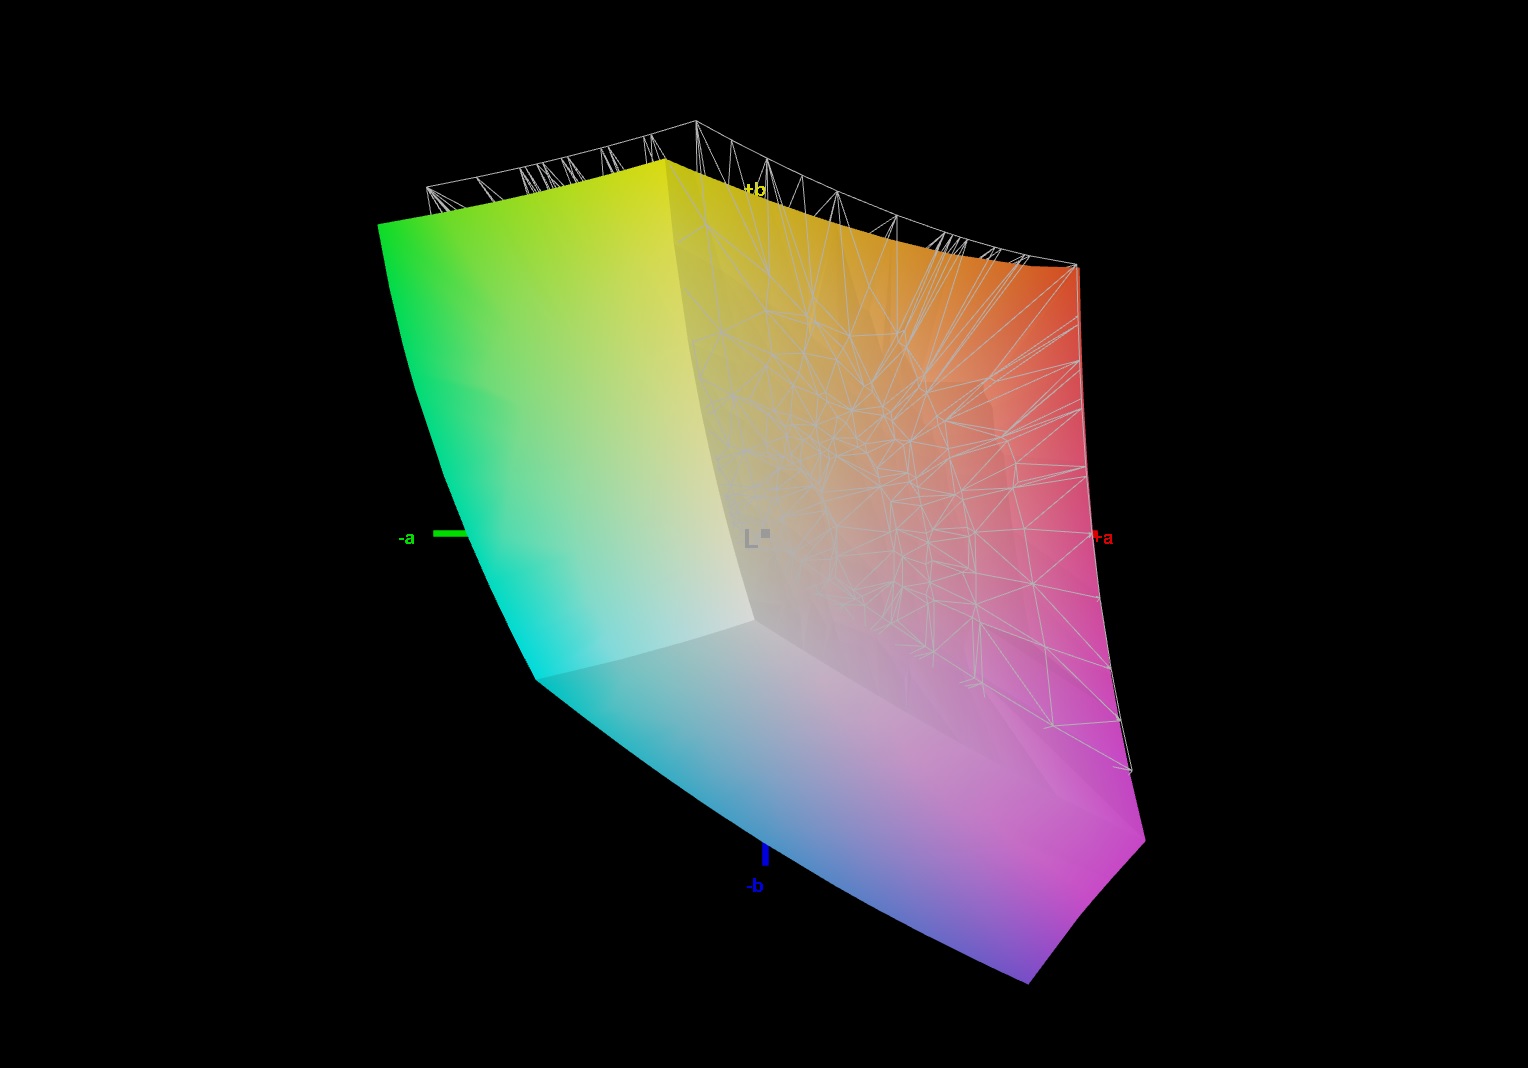
93% sRGB (Argyll 1.6.3 3D)
71% AdobeRGB 1998 (Argyll 1.6.3 3D)
70.9% AdobeRGB 1998 (Argyll 2.2.0 3D)
99.2% sRGB (Argyll 2.2.0 3D)
69.4% Display P3 (Argyll 2.2.0 3D)
Gamma: 2.24
| SCHENKER XMG Neo 17 Comet Lake BOE HF NE173FHM-NZ1, IPS, 1920x1080, 17.30 | SCHENKER XMG Neo 17 BOEhydis NV173FHM-N44 (BOE07B6), IPS, 1920x1080, 17.30 | SCHENKER XMG Neo 17 XNE17M19 LG LP173WFG-SPB1 (LGD0615), IPS, 1920x1080, 17.30 | Acer Predator Helios 300 PH317-54-75G8 Chi Mei N173HCE-G33, IPS, 1920x1080, 17.30 | MSI GL75 10SFR Chi Mei N173HCE-G33, IPS, 1920x1080, 17.30 | Asus Strix G17 G712LWS LG Philips LP173WFG-SPB3, IPS, 1920x1080, 17.30 | Aorus 17G XB AU Optronics B173HAN05.0 (AUO509D), IPS, 1920x1080, 17.30 | |
|---|---|---|---|---|---|---|---|
| Display | -6% | -6% | -8% | -6% | -5% | 1% | |
| Display P3 Coverage | 69.4 | 65.2 -6% | 64.6 -7% | 62.6 -10% | 63.9 -8% | 65.2 -6% | 70.6 2% |
| sRGB Coverage | 99.2 | 92.2 -7% | 95.6 -4% | 94.3 -5% | 96.2 -3% | 96.8 -2% | 97.2 -2% |
| AdobeRGB 1998 Coverage | 70.9 | 66.5 -6% | 65.6 -7% | 64.7 -9% | 66 -7% | 66.4 -6% | 72.8 3% |
| Response Times | -81% | -63% | -61% | -26% | -48% | -68% | |
| Response Time Grey 50% / Grey 80% * | 10.8 ? | 18.8 ? -74% | 15.6 ? -44% | 16.4 ? -52% | 12 ? -11% | 14.4 ? -33% | 16 ? -48% |
| Response Time Black / White * | 6.4 ? | 12 ? -88% | 11.6 ? -81% | 10.8 ? -69% | 9 ? -41% | 10.4 ? -63% | 12 ? -88% |
| PWM Frequency | 971 ? | 24510 ? | 208 ? | ||||
| Screen | -5% | -15% | 23% | 1% | -8% | 17% | |
| Brightness middle | 327 | 304 -7% | 318 -3% | 322 -2% | 333 2% | 323 -1% | 293 -10% |
| Brightness | 305 | 289 -5% | 286 -6% | 308 1% | 309 1% | 300 -2% | 285 -7% |
| Brightness Distribution | 87 | 90 3% | 86 -1% | 92 6% | 86 -1% | 89 2% | 95 9% |
| Black Level * | 0.32 | 0.26 19% | 0.23 28% | 0.18 44% | 0.215 33% | 0.31 3% | 0.24 25% |
| Contrast | 1022 | 1169 14% | 1383 35% | 1789 75% | 1549 52% | 1042 2% | 1221 19% |
| Colorchecker dE 2000 * | 2.16 | 2.65 -23% | 3.89 -80% | 1.53 29% | 1.98 8% | 3.01 -39% | 1.27 41% |
| Colorchecker dE 2000 max. * | 6.14 | 6.11 -0% | 10.56 -72% | 3.14 49% | 4.34 29% | 7.65 -25% | 2.24 64% |
| Colorchecker dE 2000 calibrated * | 0.89 | 1.5 -69% | 1.03 -16% | 0.74 17% | 2.01 -126% | 1 -12% | 1.06 -19% |
| Greyscale dE 2000 * | 3.7 | 2.75 26% | 5.3 -43% | 1.9 49% | 2.97 20% | 3.8 -3% | 1.34 64% |
| Gamma | 2.24 98% | 2.46 89% | 2.46 89% | 2.144 103% | 2.41 91% | 2.154 102% | 2.38 92% |
| CCT | 6799 96% | 6763 96% | 7462 87% | 6809 95% | 6750 96% | 7507 87% | 6542 99% |
| Color Space (Percent of AdobeRGB 1998) | 71 | 60 -15% | 60 -15% | 65 -8% | 61 -14% | 66 -7% | 73 3% |
| Color Space (Percent of sRGB) | 93 | 92 -1% | 96 3% | 87 -6% | 96 3% | 90 -3% | 94 1% |
| Total Average (Program / Settings) | -31% /
-15% | -28% /
-20% | -15% /
7% | -10% /
-4% | -20% /
-12% | -17% /
4% |
* ... smaller is better
Display Response Times
| ↔ Response Time Black to White | ||
|---|---|---|
| 6.4 ms ... rise ↗ and fall ↘ combined | ↗ 3 ms rise | 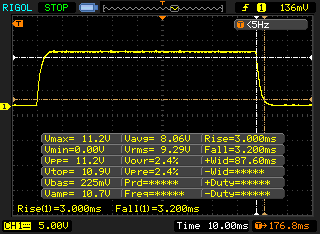 |
| ↘ 3.2 ms fall | ||
| The screen shows very fast response rates in our tests and should be very well suited for fast-paced gaming. In comparison, all tested devices range from 0.1 (minimum) to 240 (maximum) ms. » 15 % of all devices are better. This means that the measured response time is better than the average of all tested devices (21.5 ms). | ||
| ↔ Response Time 50% Grey to 80% Grey | ||
| 10.8 ms ... rise ↗ and fall ↘ combined | ↗ 5.6 ms rise | 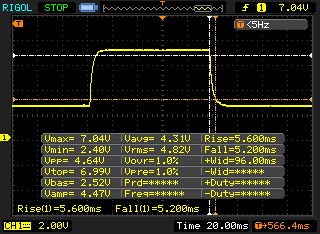 |
| ↘ 5.2 ms fall | ||
| The screen shows good response rates in our tests, but may be too slow for competitive gamers. In comparison, all tested devices range from 0.2 (minimum) to 636 (maximum) ms. » 19 % of all devices are better. This means that the measured response time is better than the average of all tested devices (33.7 ms). | ||
Screen Flickering / PWM (Pulse-Width Modulation)
| Screen flickering / PWM not detected | 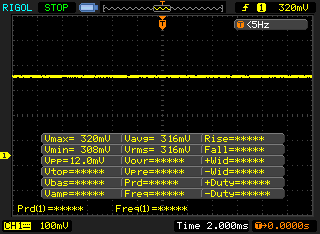 | ||
In comparison: 53 % of all tested devices do not use PWM to dim the display. If PWM was detected, an average of 17900 (minimum: 5 - maximum: 3846000) Hz was measured. | |||
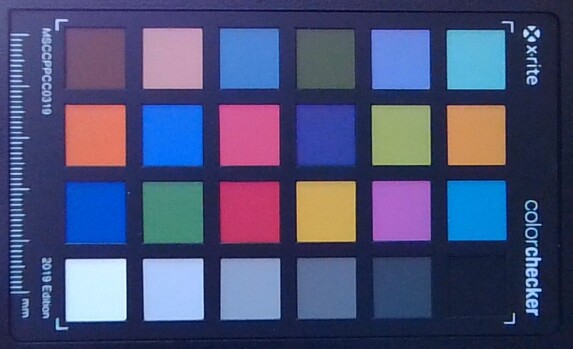
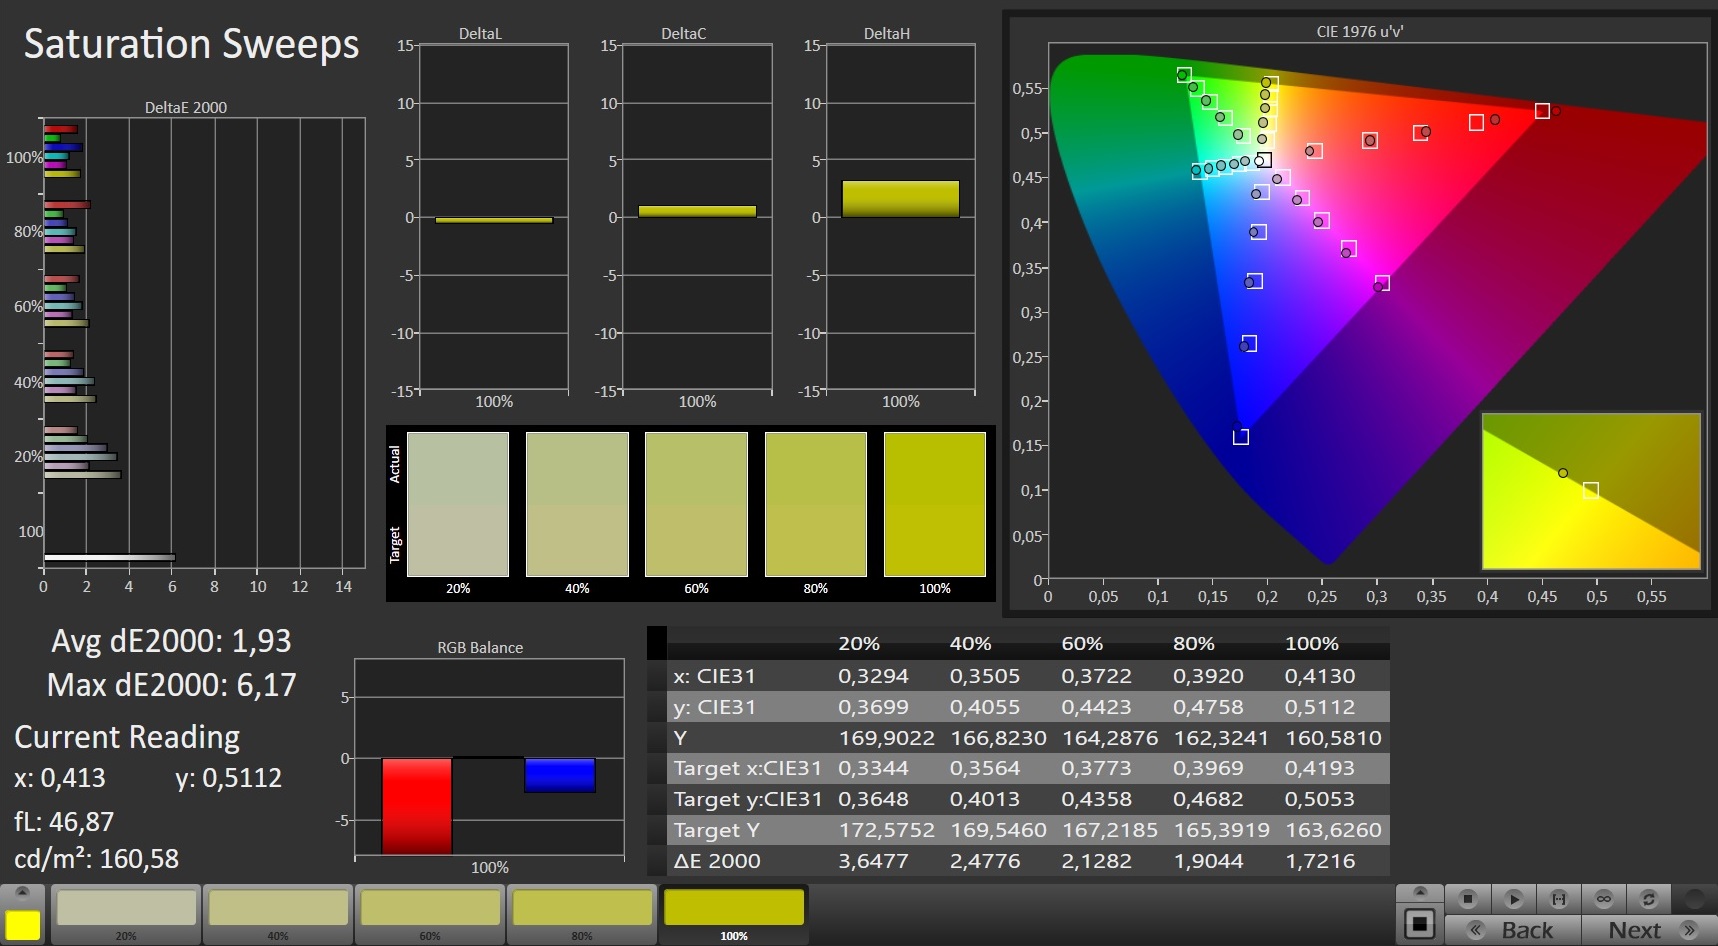
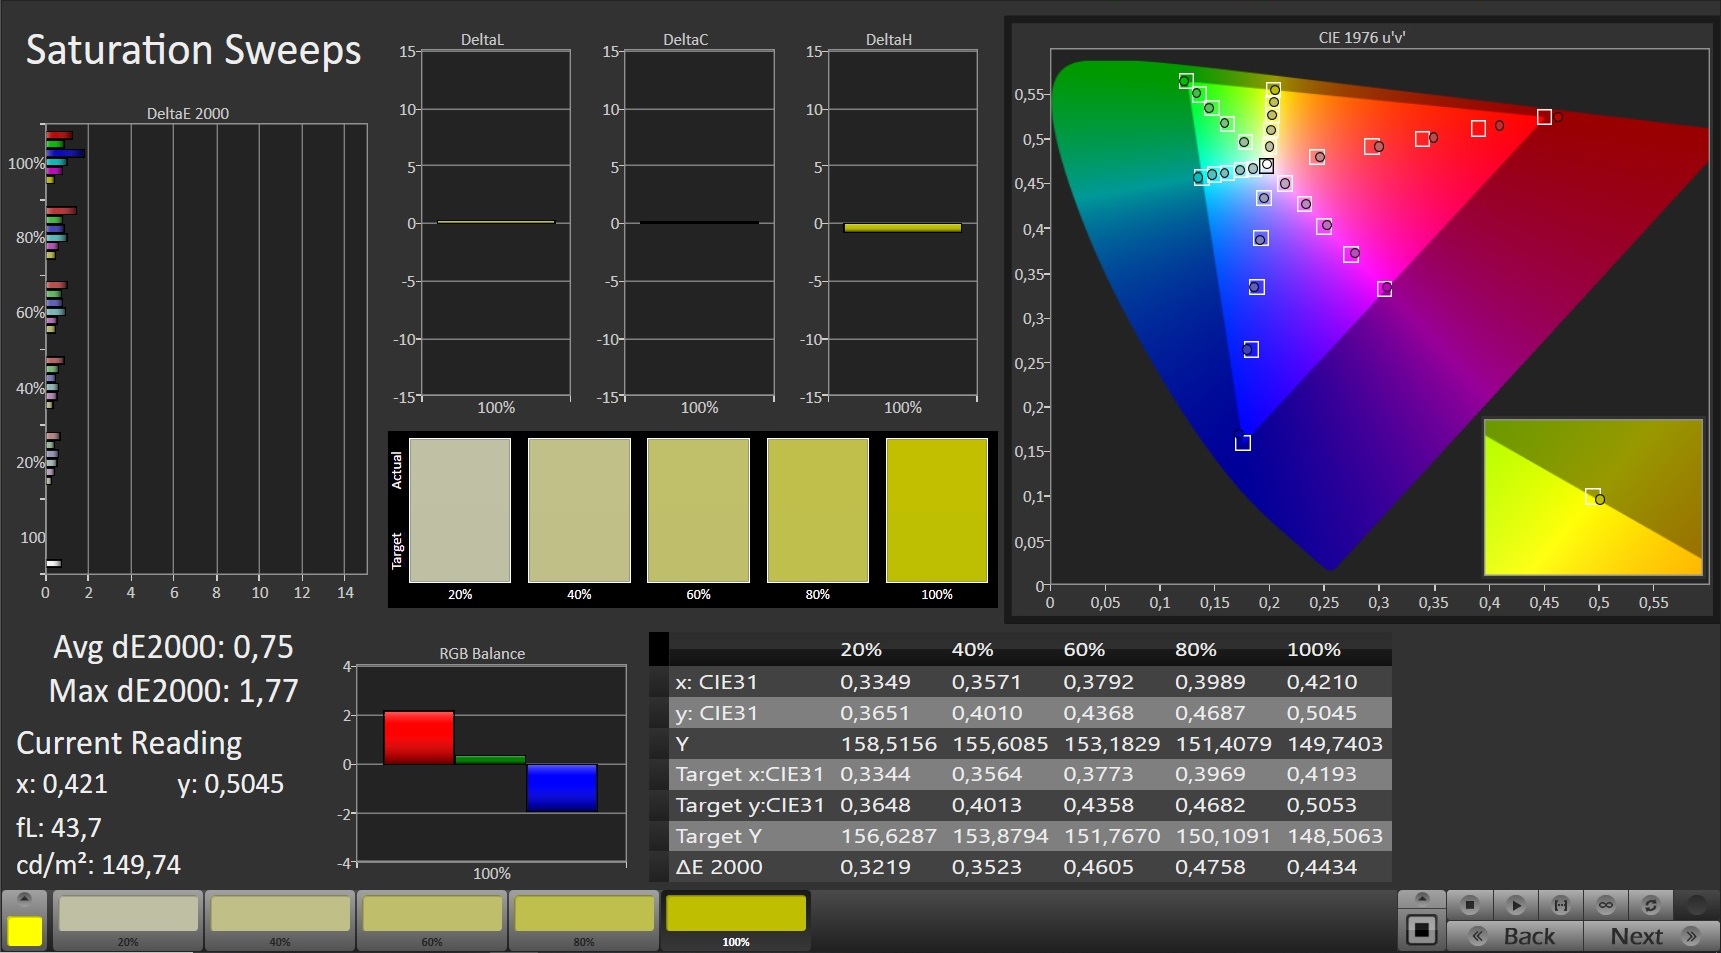
The display shows a good color reproduction. With a color deviation of 2.16, the target of Delta-E smaller than 3 is reached. The display does not suffer from a blue tint. A calibration still brings additional improvements with the color deviation dropping to 0.89 and the grayscale display becoming more balanced. The AdobeRGB (71%) and sRGB (93%) color spaces are not covered completely.
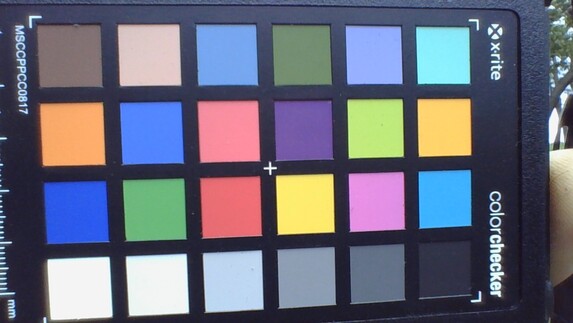
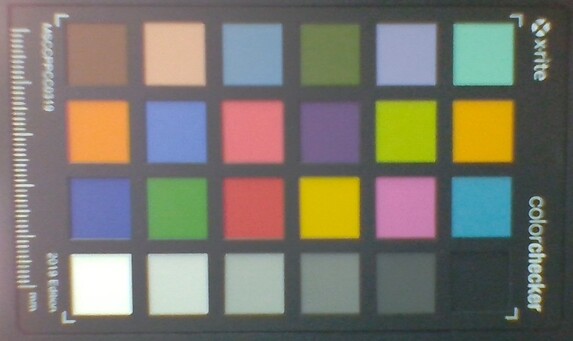
Schenker has equipped the laptop with an IPS panel with stable viewing angles, allowing you to read the screen contents from any angle. Outdoors you can read the display contents when the sunlight is not too bright.
Performance - Sufficient for the next few years
With the Neo 17, Schenker offers a 17.3-inch gaming laptop that brings all the current games to the screen smoothly and also strikes a good figure in other application areas. You would have to pay about 2349 Euros (~$2781) for our test unit. The device can be individually configured in the Schenker online shop.
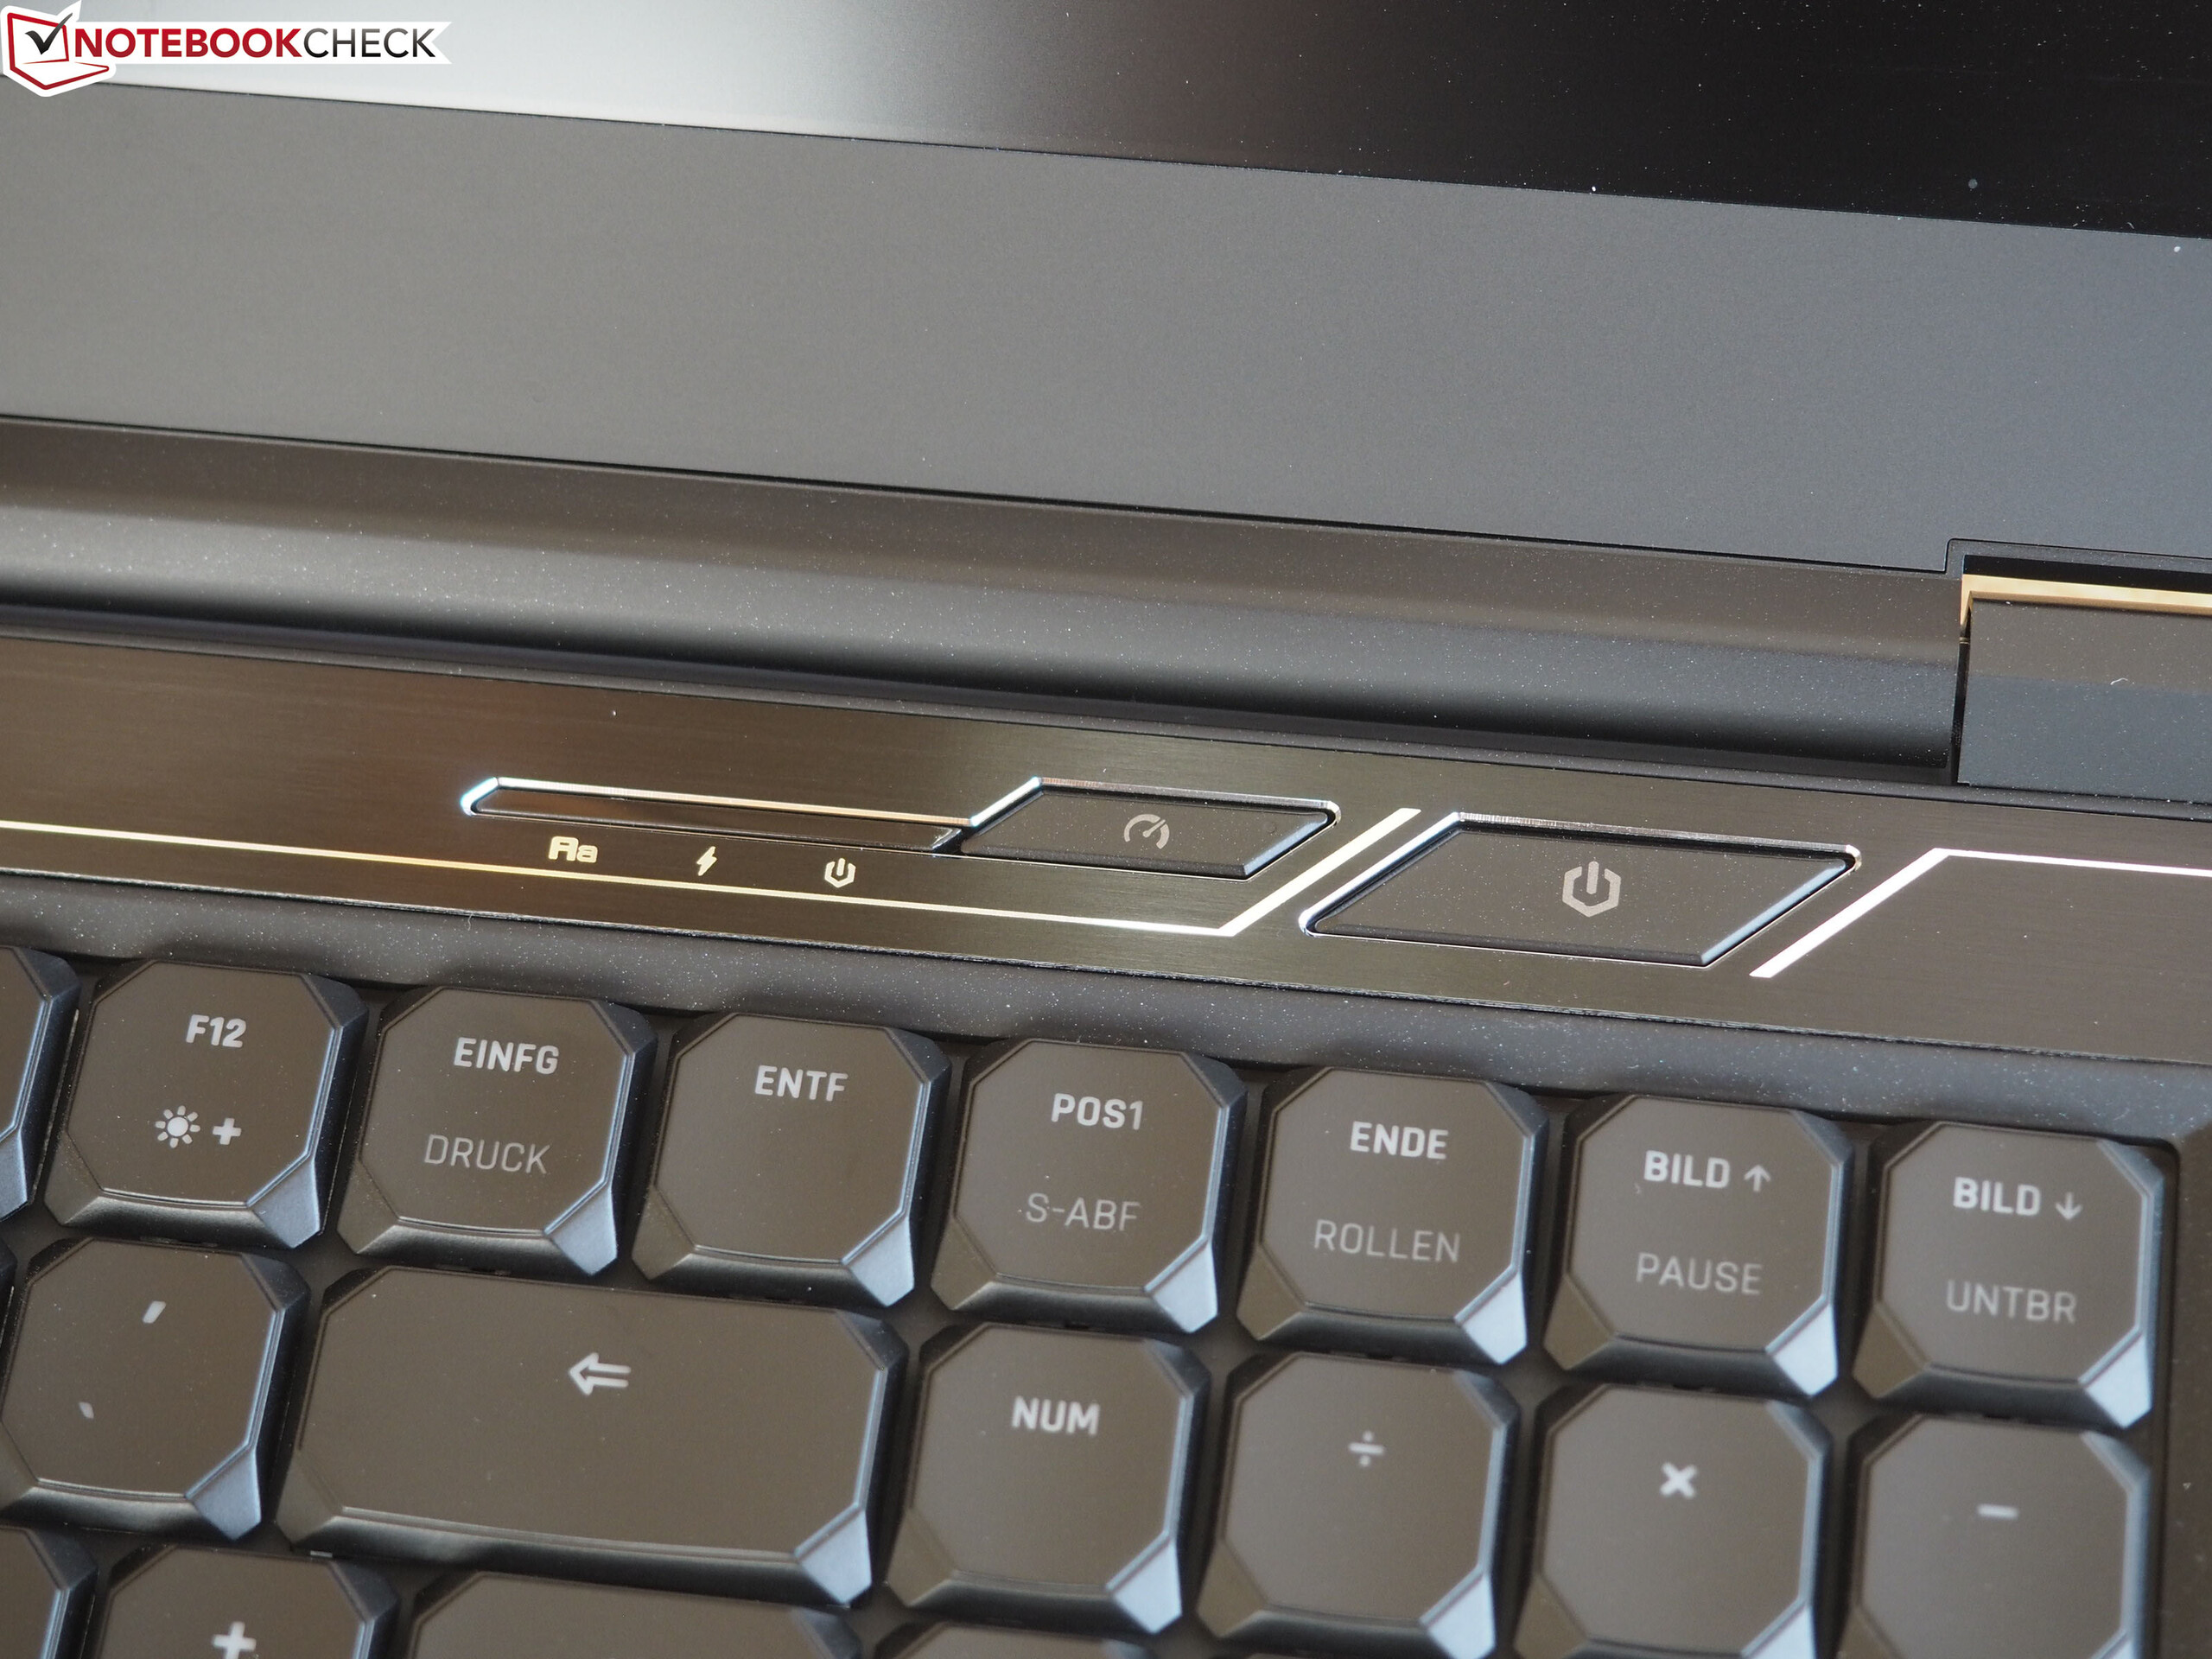
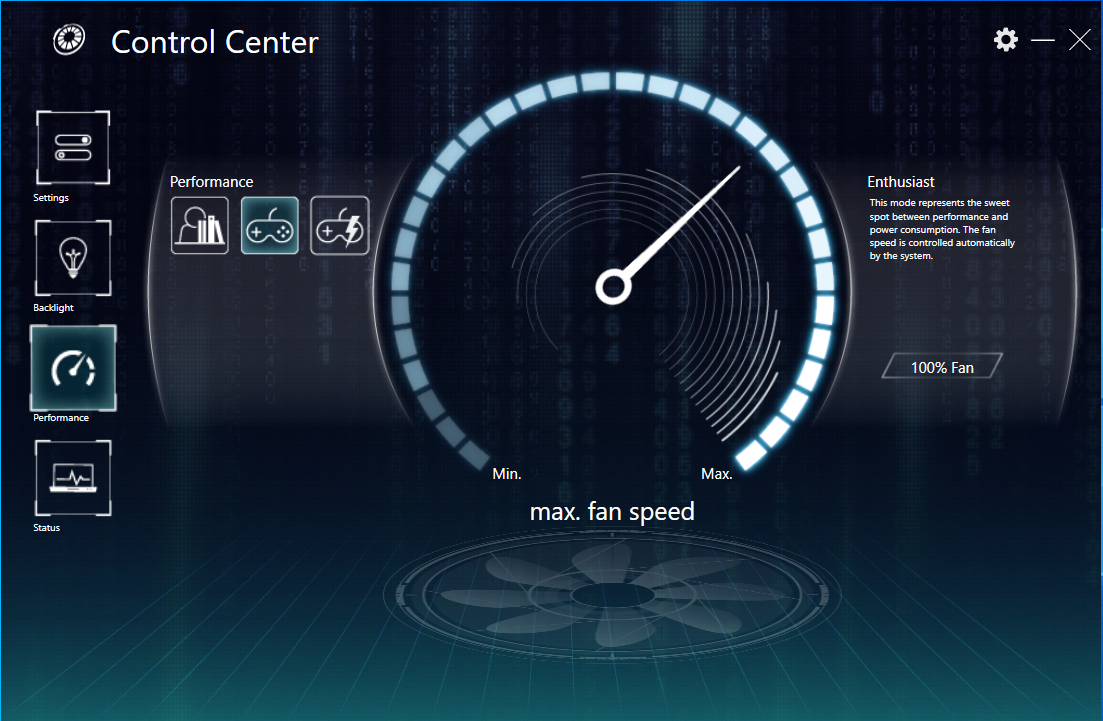
Test Conditions
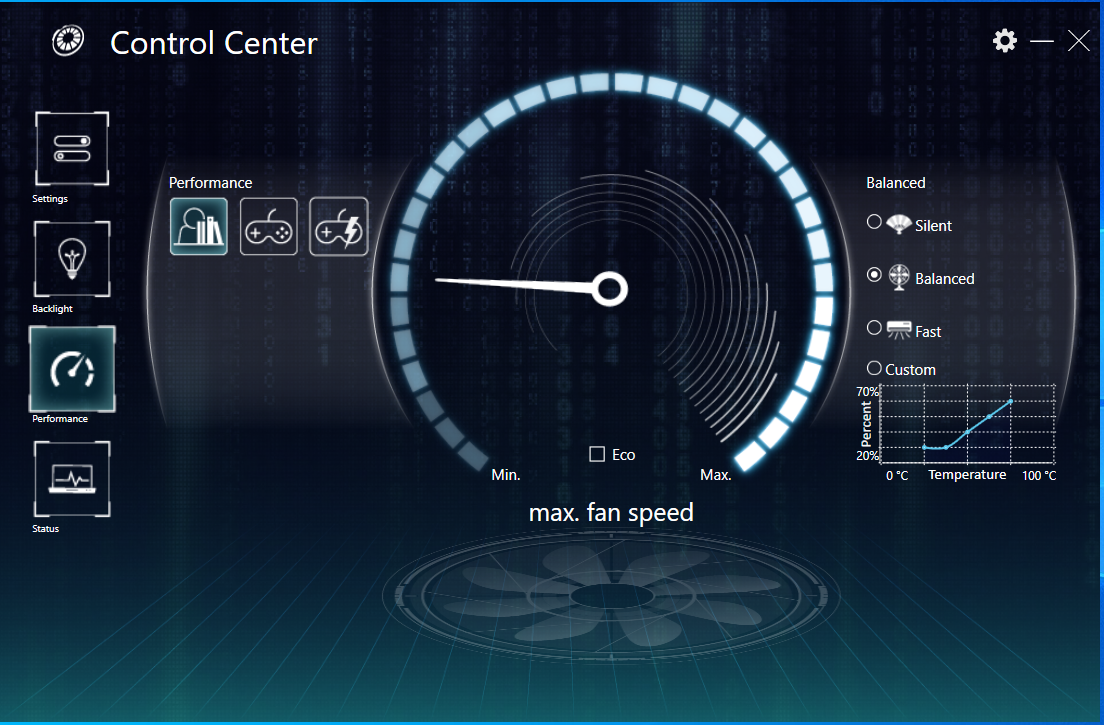
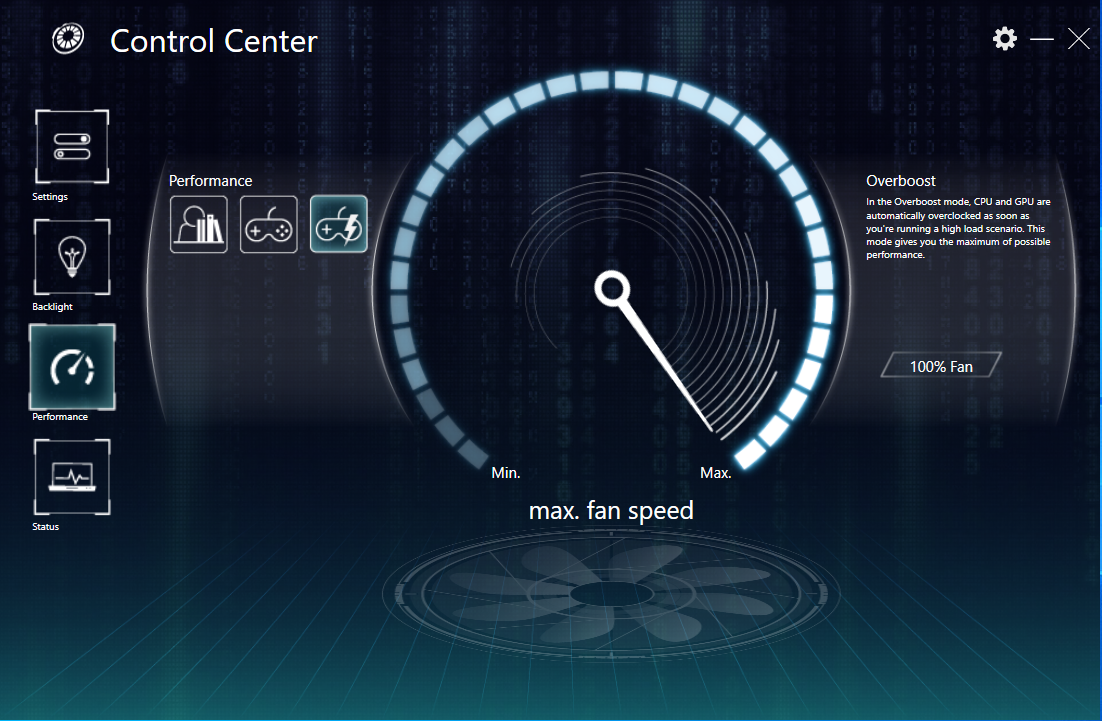
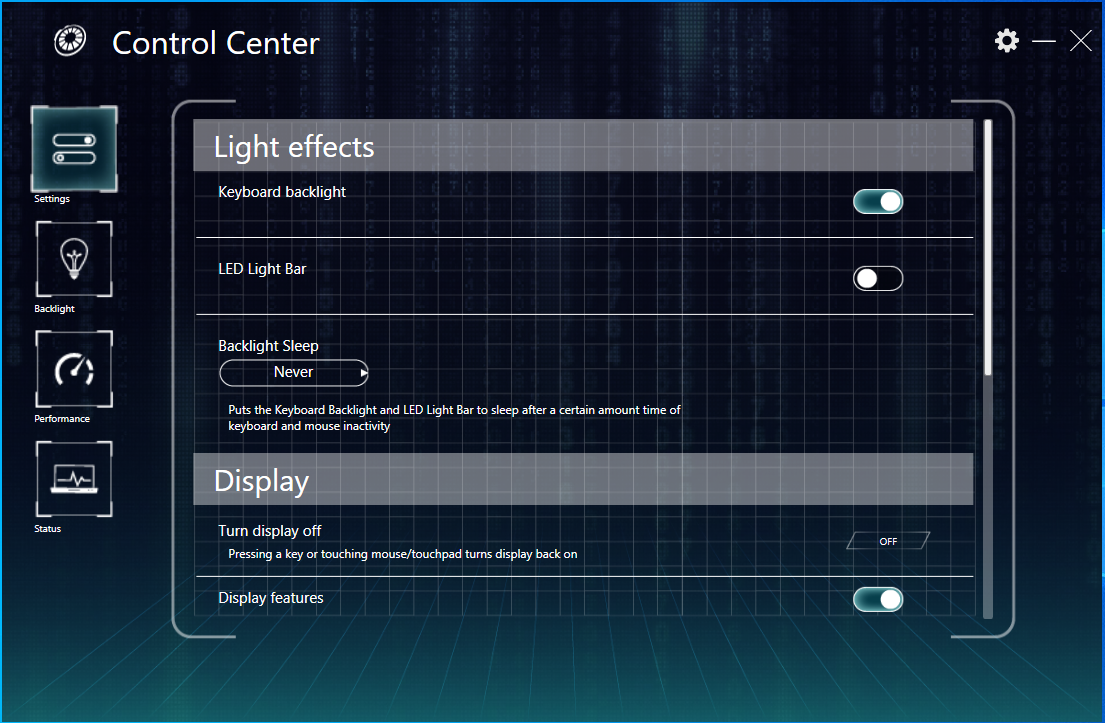
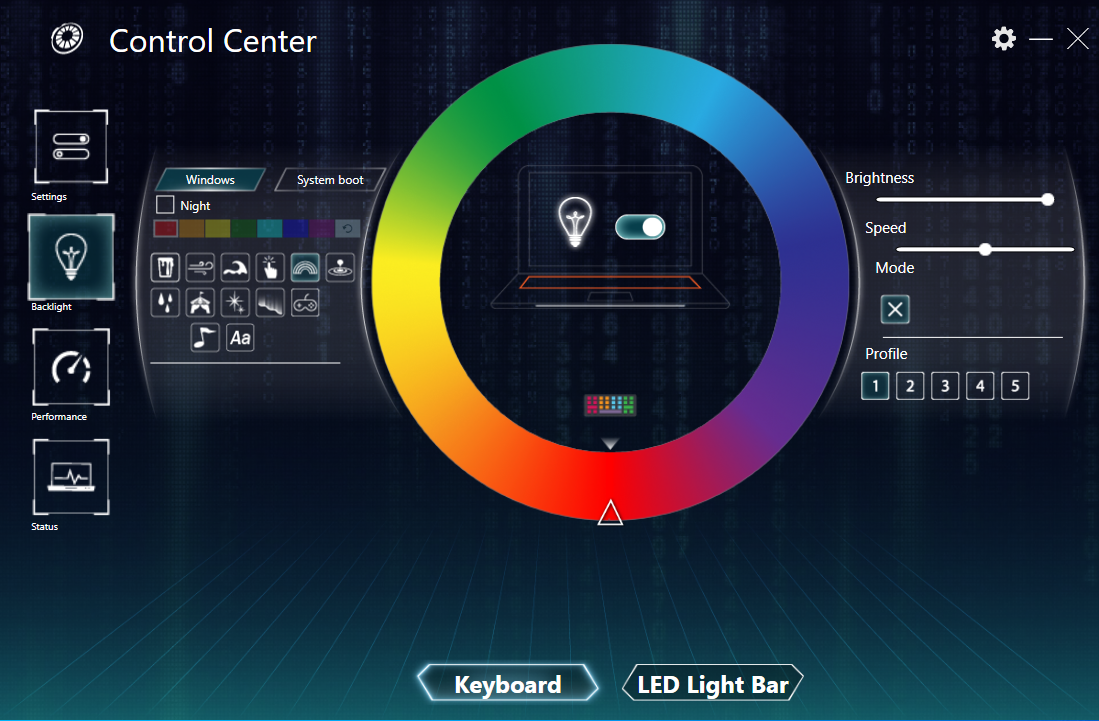
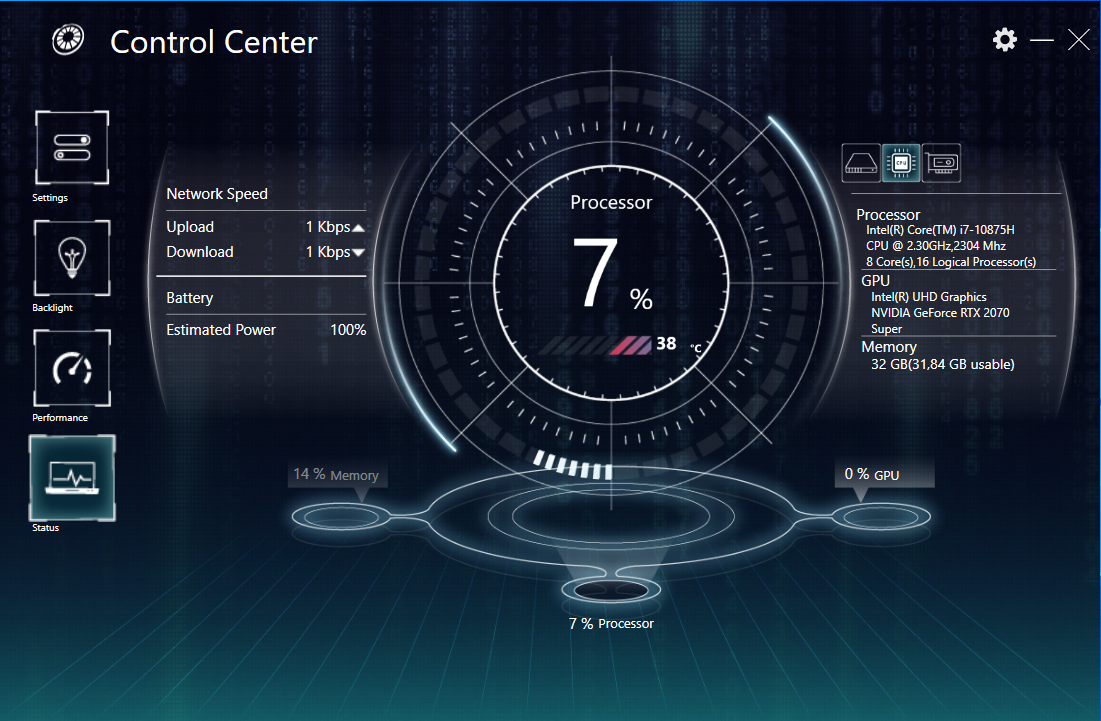
The preinstalled Control Center provides an overview of the system status and allows adjusting the keyboard illumination as well as choosing a performance profile ("Balanced," "Enthusiast," or "Overboost"). We ran our test with the "Enthusiast" profile and automatic fan control activated. We also ran several benchmarks with the "Overboost" profile activated. You can find the results in the comparison charts.
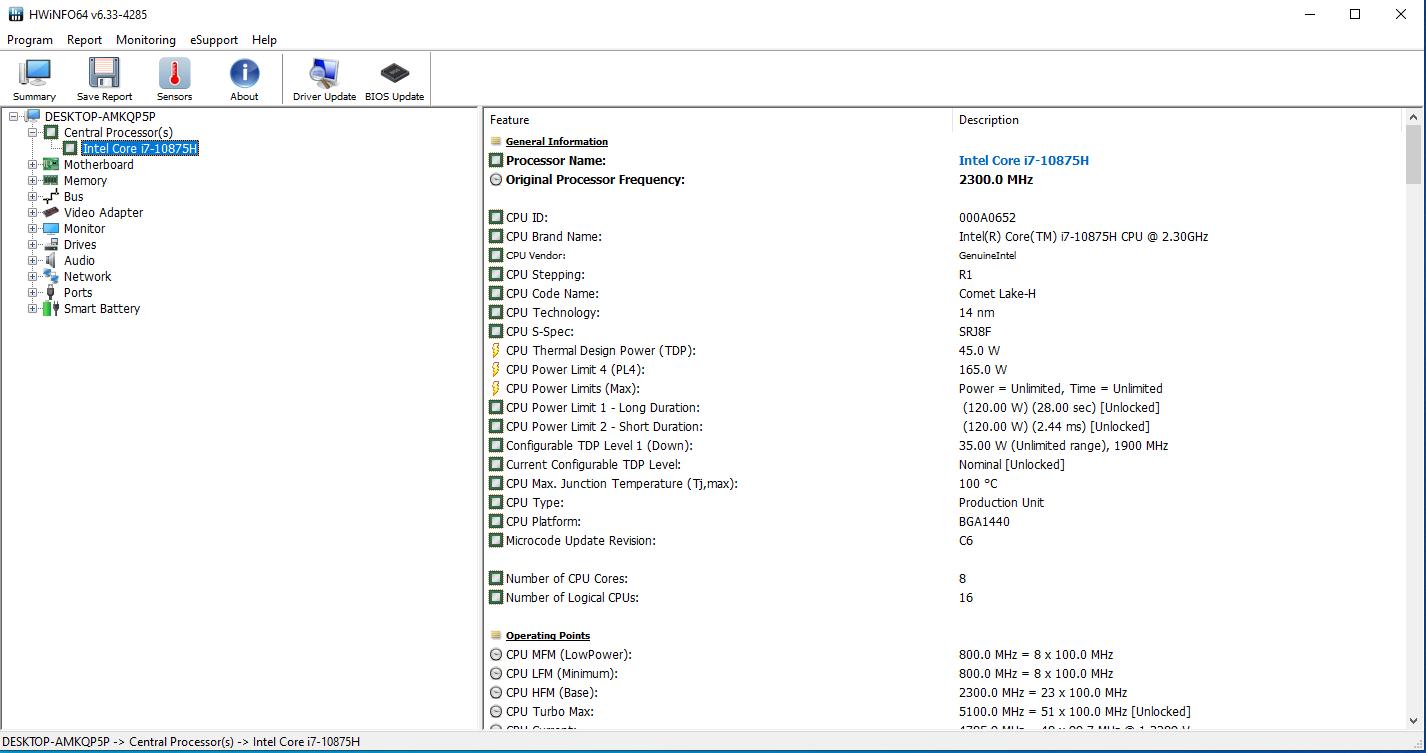
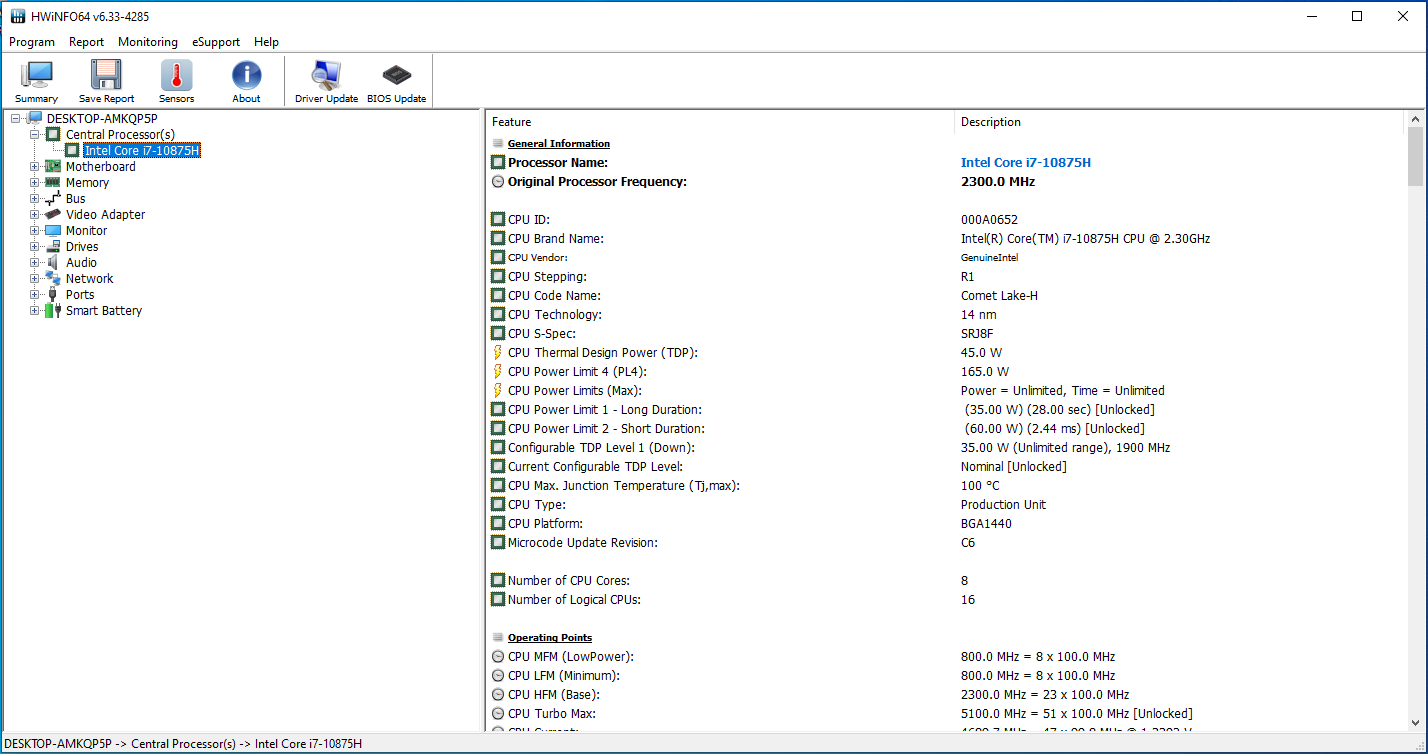
Processor
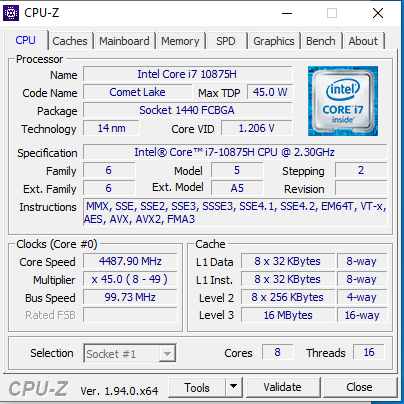
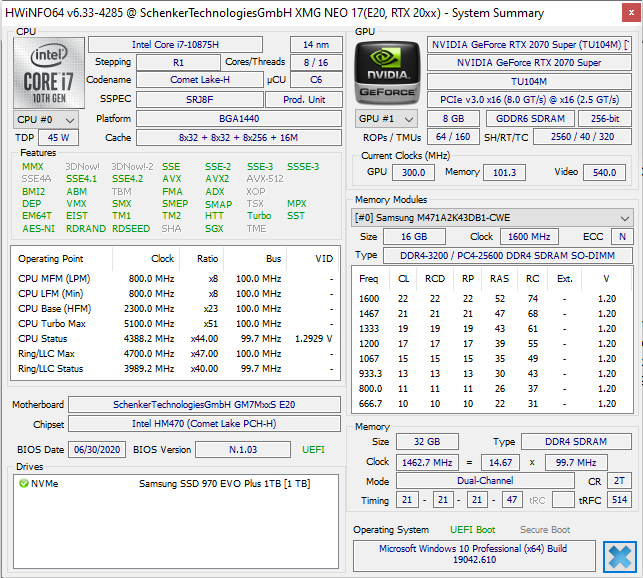
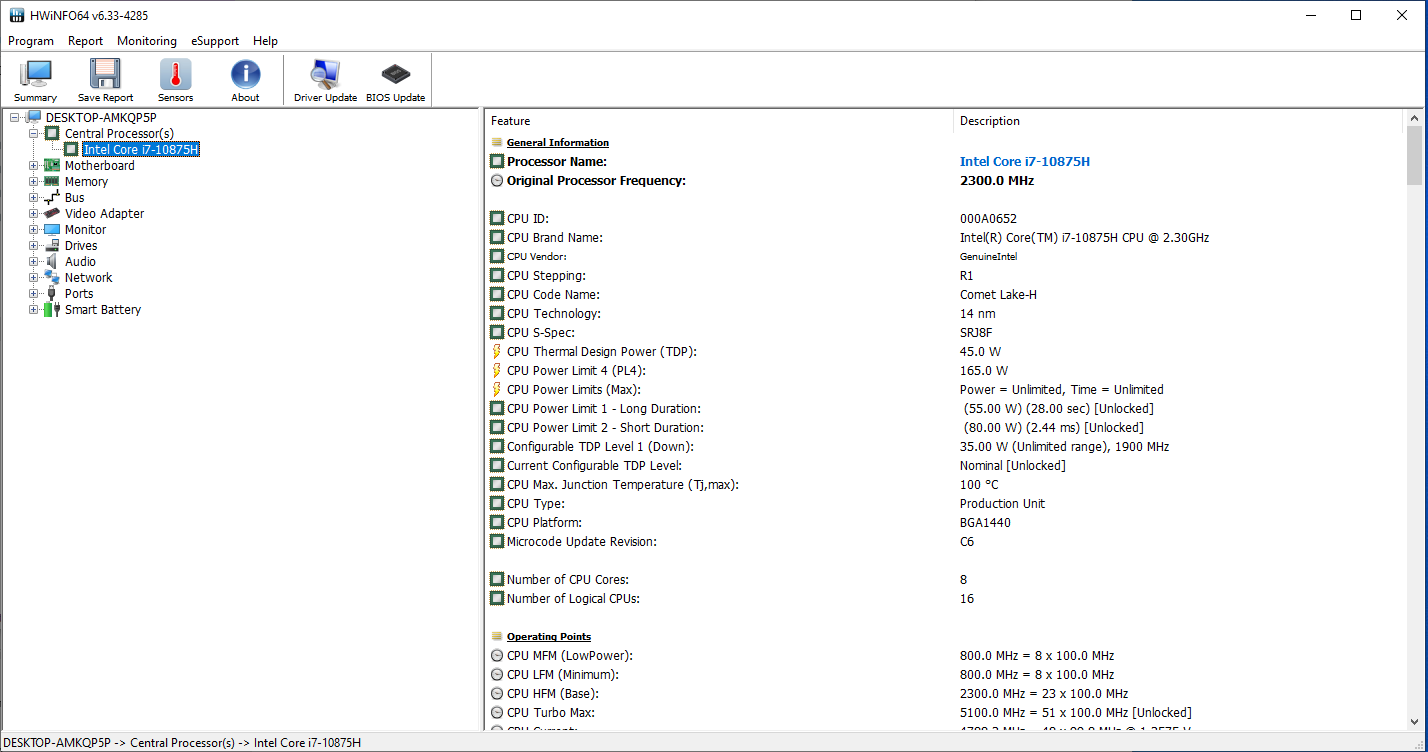
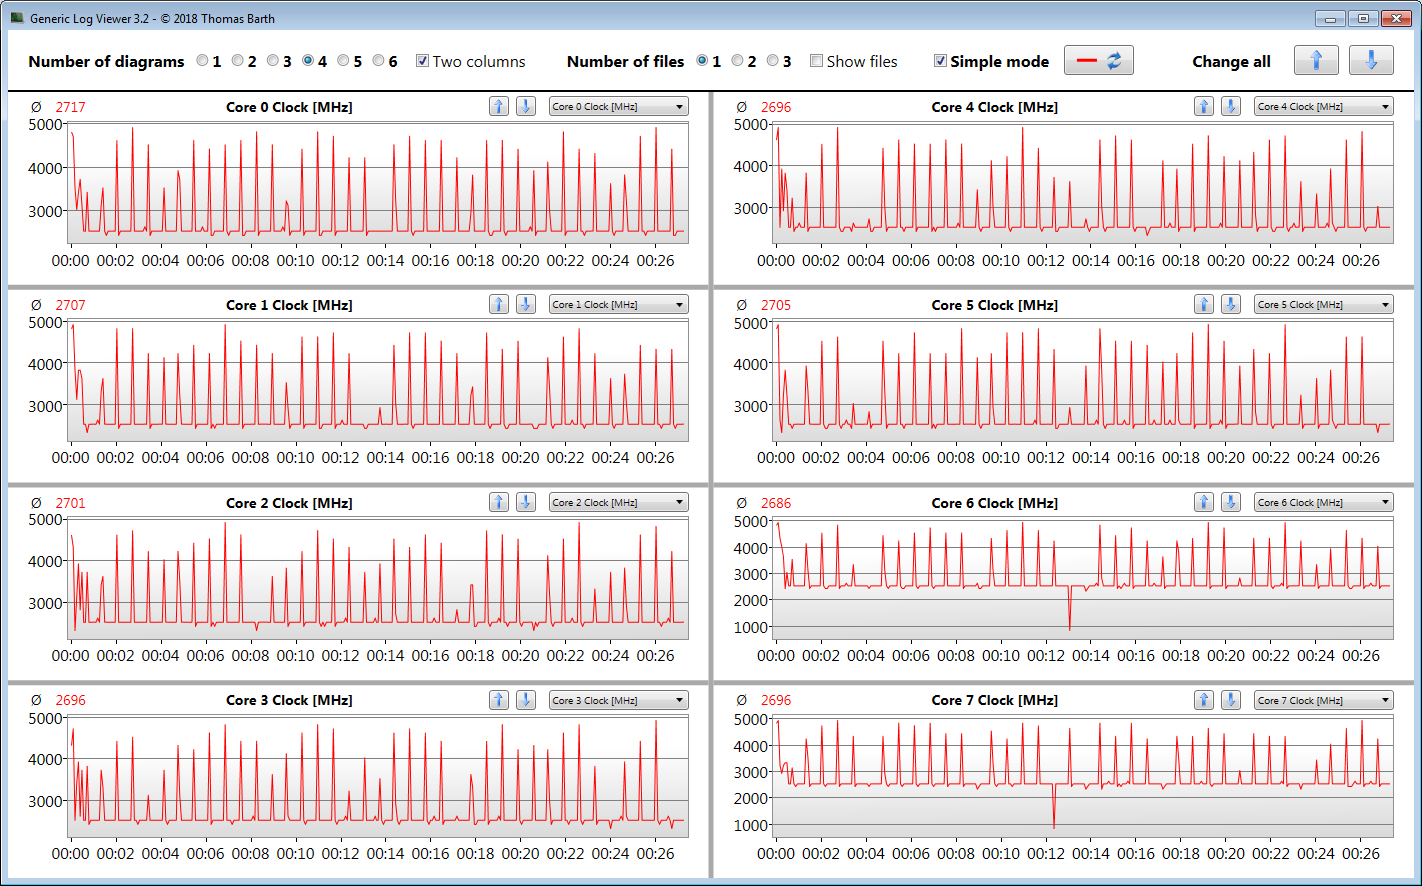
The Core i7-10875H octa-core processor (Comet Lake) runs at a basic clock speed of 2.3 GHz, which can be increased via Turbo to 4.3 GHz (eight cores) or up to 5.1 GHz (single core). Hyperthreading (two threads running per core) is supported.
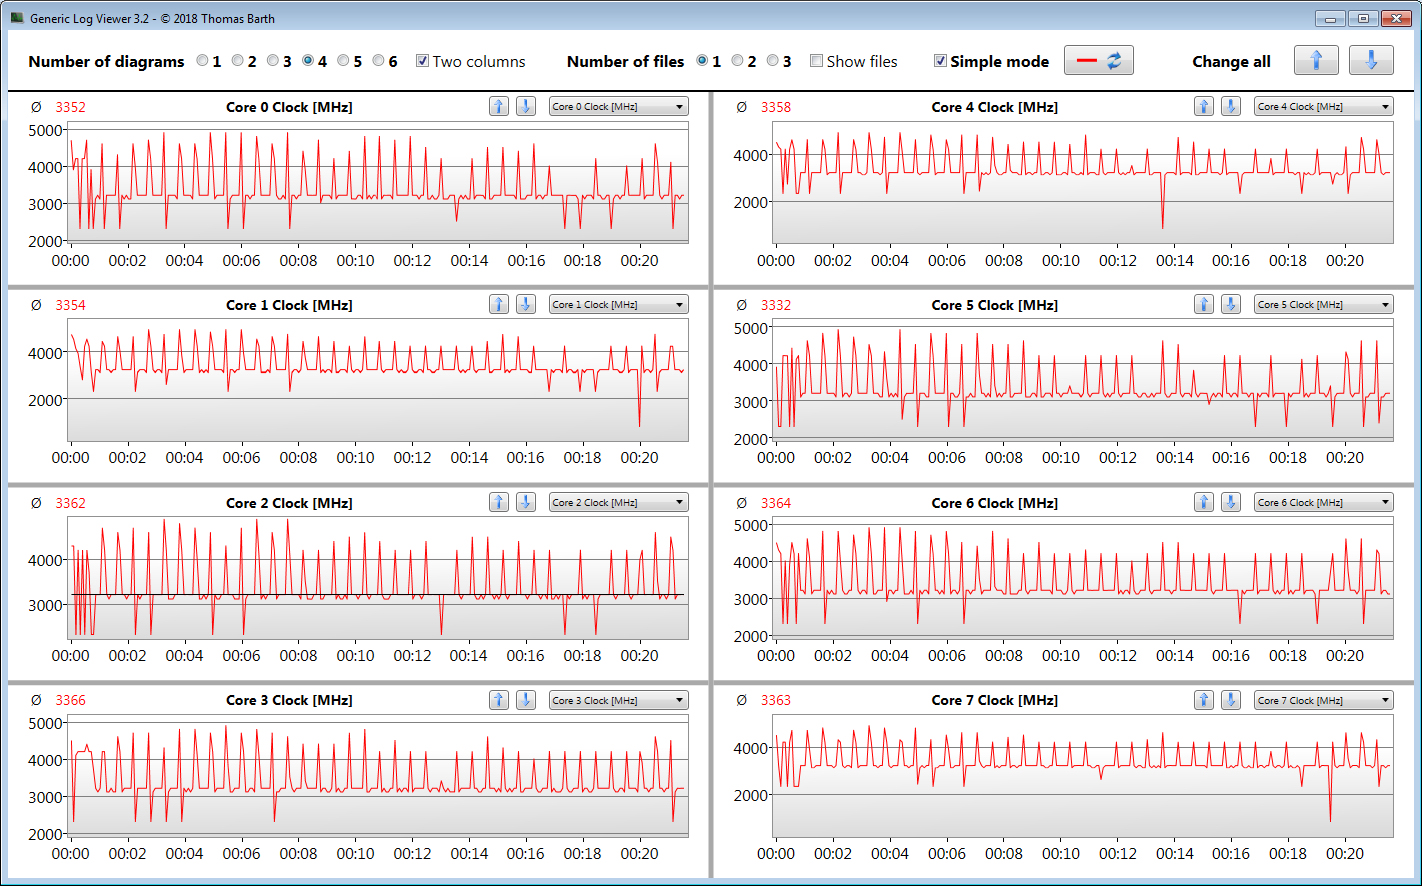
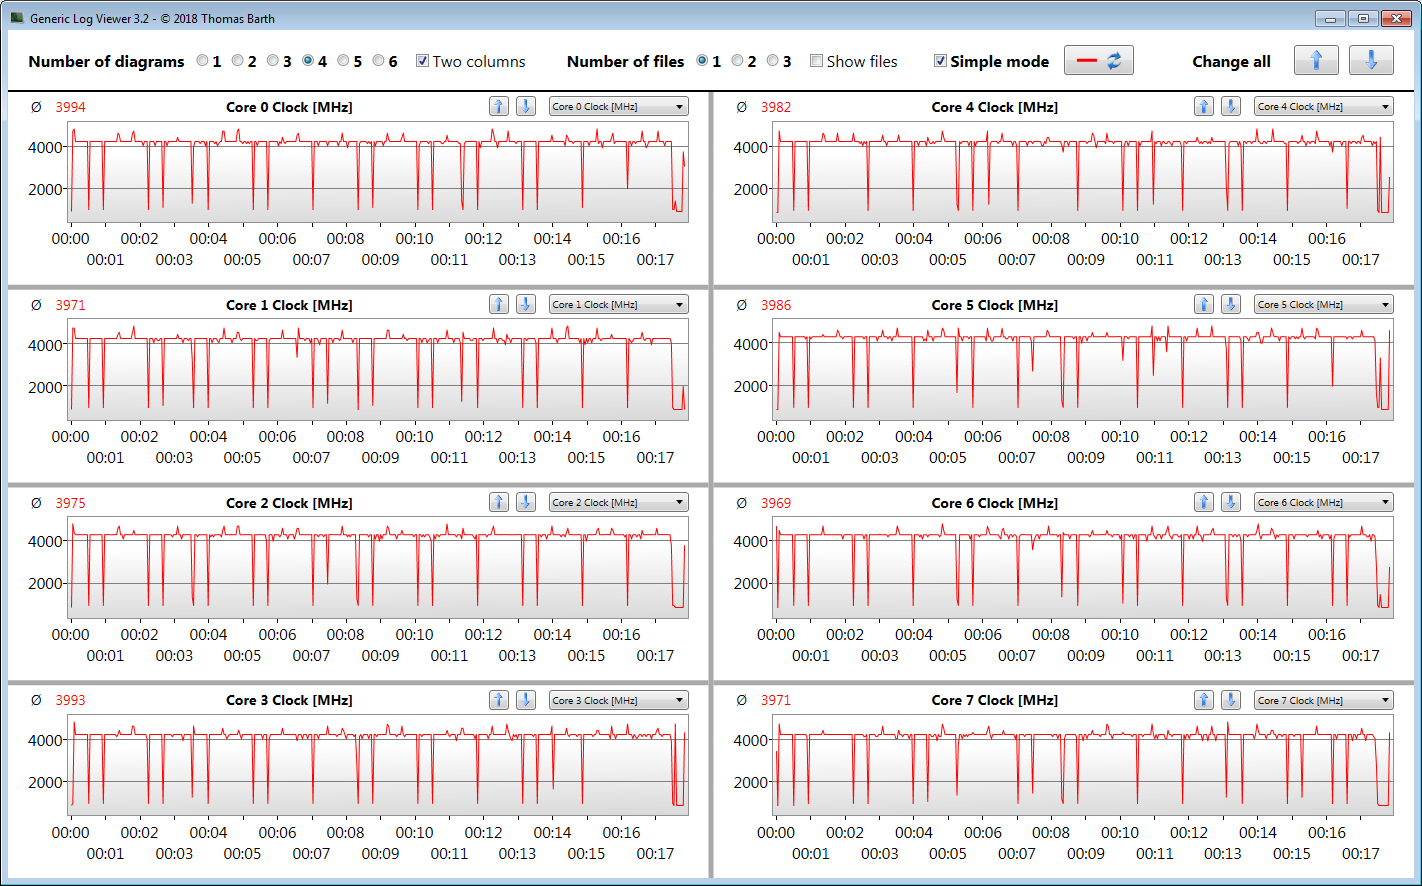
The CPU runs through the multi-thread test of the Cinebench R15 benchmark at clock speeds between 2.2 and 4.2 GHz and the single-thread test with between 4 and 5.1 GHz. In battery operation, the speed is between 2.7 and 2.8 GHz (multi-thread) and between 2.4 and 4.2 GHz (single-thread).
We evaluate whether the CPU Turbo is also used constantly in mains operation by running the multi-thread test of the Cinebench R15 benchmark for at least 30 minutes in a constant loop. Towards the third run, the results drop slightly but then remain at a constant level. The Turbo is used, and the "Overboost" mode allows increasing the Turbo clock speeds significantly.
| Cinebench R15 | |
| CPU Single 64Bit | |
| Average of class Gaming (79.2 - 318, n=234, last 2 years) | |
| SCHENKER XMG Neo 17 Comet Lake | |
| SCHENKER XMG Neo 17 Comet Lake (Overboost) | |
| Average Intel Core i7-10875H (190 - 220, n=37) | |
| Aorus 17G XB | |
| Asus Strix G17 G712LWS | |
| Acer Predator Helios 300 PH317-54-75G8 | |
| SCHENKER XMG Neo 17 XNE17M19 | |
| MSI GL75 10SFR | |
| SCHENKER XMG Neo 17 | |
| CPU Multi 64Bit | |
| Average of class Gaming (400 - 5663, n=235, last 2 years) | |
| Aorus 17G XB | |
| SCHENKER XMG Neo 17 Comet Lake (Overboost) | |
| Average Intel Core i7-10875H (1003 - 1833, n=38) | |
| SCHENKER XMG Neo 17 Comet Lake | |
| Asus Strix G17 G712LWS | |
| Acer Predator Helios 300 PH317-54-75G8 | |
| MSI GL75 10SFR | |
| SCHENKER XMG Neo 17 XNE17M19 | |
| SCHENKER XMG Neo 17 | |
| Blender - v2.79 BMW27 CPU | |
| MSI GL75 10SFR | |
| Acer Predator Helios 300 PH317-54-75G8 | |
| Asus Strix G17 G712LWS | |
| Average Intel Core i7-10875H (259 - 535, n=30) | |
| SCHENKER XMG Neo 17 Comet Lake | |
| Aorus 17G XB | |
| SCHENKER XMG Neo 17 Comet Lake (Overboost) | |
| Average of class Gaming (87 - 1259, n=228, last 2 years) | |
| 7-Zip 18.03 | |
| 7z b 4 -mmt1 | |
| Average of class Gaming (2685 - 7581, n=229, last 2 years) | |
| SCHENKER XMG Neo 17 Comet Lake | |
| SCHENKER XMG Neo 17 Comet Lake (Overboost) | |
| Average Intel Core i7-10875H (5071 - 5780, n=31) | |
| Aorus 17G XB | |
| Acer Predator Helios 300 PH317-54-75G8 | |
| MSI GL75 10SFR | |
| Asus Strix G17 G712LWS | |
| 7z b 4 | |
| Average of class Gaming (11386 - 140932, n=229, last 2 years) | |
| SCHENKER XMG Neo 17 Comet Lake (Overboost) | |
| Aorus 17G XB | |
| SCHENKER XMG Neo 17 Comet Lake | |
| Average Intel Core i7-10875H (29844 - 49562, n=31) | |
| Asus Strix G17 G712LWS | |
| MSI GL75 10SFR | |
| Acer Predator Helios 300 PH317-54-75G8 | |
| Cinebench R20 | |
| CPU (Single Core) | |
| Average of class Gaming (169 - 855, n=230, last 2 years) | |
| SCHENKER XMG Neo 17 Comet Lake | |
| SCHENKER XMG Neo 17 Comet Lake (Overboost) | |
| Asus Strix G17 G712LWS | |
| Aorus 17G XB | |
| Average Intel Core i7-10875H (430 - 524, n=32) | |
| MSI GL75 10SFR | |
| Acer Predator Helios 300 PH317-54-75G8 | |
| SCHENKER XMG Neo 17 XNE17M19 | |
| CPU (Multi Core) | |
| Average of class Gaming (930 - 13769, n=230, last 2 years) | |
| SCHENKER XMG Neo 17 Comet Lake (Overboost) | |
| Aorus 17G XB | |
| Average Intel Core i7-10875H (1986 - 4176, n=32) | |
| SCHENKER XMG Neo 17 Comet Lake | |
| Asus Strix G17 G712LWS | |
| Acer Predator Helios 300 PH317-54-75G8 | |
| MSI GL75 10SFR | |
| SCHENKER XMG Neo 17 XNE17M19 | |
| Geekbench 5.5 | |
| Single-Core | |
| Average of class Gaming (158 - 2210, n=234, last 2 years) | |
| SCHENKER XMG Neo 17 Comet Lake | |
| SCHENKER XMG Neo 17 Comet Lake (Overboost) | |
| Average Intel Core i7-10875H (1233 - 1371, n=29) | |
| Aorus 17G XB | |
| MSI GL75 10SFR | |
| Asus Strix G17 G712LWS | |
| Acer Predator Helios 300 PH317-54-75G8 | |
| Multi-Core | |
| Average of class Gaming (1946 - 22200, n=234, last 2 years) | |
| SCHENKER XMG Neo 17 Comet Lake (Overboost) | |
| Aorus 17G XB | |
| Average Intel Core i7-10875H (5715 - 8620, n=29) | |
| SCHENKER XMG Neo 17 Comet Lake | |
| Asus Strix G17 G712LWS | |
| Acer Predator Helios 300 PH317-54-75G8 | |
| MSI GL75 10SFR | |
| HWBOT x265 Benchmark v2.2 - 4k Preset | |
| Average of class Gaming (3 - 37.6, n=232, last 2 years) | |
| SCHENKER XMG Neo 17 Comet Lake (Overboost) | |
| Aorus 17G XB | |
| SCHENKER XMG Neo 17 Comet Lake | |
| Average Intel Core i7-10875H (7.27 - 14.1, n=27) | |
| Asus Strix G17 G712LWS | |
| Acer Predator Helios 300 PH317-54-75G8 | |
| MSI GL75 10SFR | |
| LibreOffice - 20 Documents To PDF | |
| Asus Strix G17 G712LWS | |
| Acer Predator Helios 300 PH317-54-75G8 | |
| Aorus 17G XB | |
| SCHENKER XMG Neo 17 Comet Lake | |
| MSI GL75 10SFR | |
| Average Intel Core i7-10875H (30.2 - 84.3, n=30) | |
| Average of class Gaming (32.8 - 332, n=226, last 2 years) | |
| SCHENKER XMG Neo 17 Comet Lake (Overboost) | |
| R Benchmark 2.5 - Overall mean | |
| Acer Predator Helios 300 PH317-54-75G8 | |
| Asus Strix G17 G712LWS | |
| MSI GL75 10SFR | |
| Aorus 17G XB | |
| Average Intel Core i7-10875H (0.546 - 0.662, n=29) | |
| SCHENKER XMG Neo 17 Comet Lake (Overboost) | |
| SCHENKER XMG Neo 17 Comet Lake | |
| Average of class Gaming (0.3609 - 4.47, n=229, last 2 years) | |
* ... smaller is better
System Performance
The system runs quickly and smoothly, and we did not run into any problems. The PC-Mark results confirm that the laptop offers sufficient computing performance for all the usual application areas.
| PCMark 8 Home Score Accelerated v2 | 4405 points | |
| PCMark 8 Creative Score Accelerated v2 | 6494 points | |
| PCMark 8 Work Score Accelerated v2 | 5803 points | |
| PCMark 10 Score | 5747 points | |
Help | ||
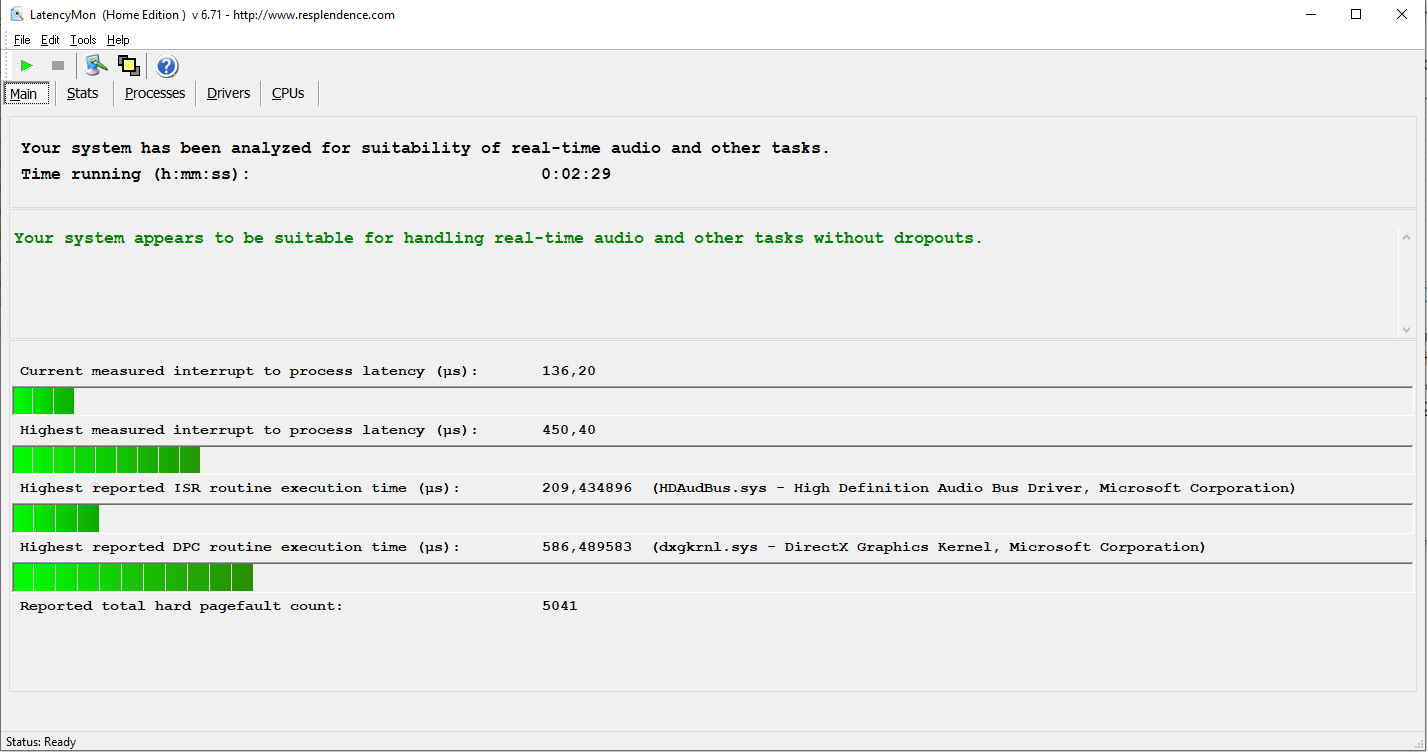
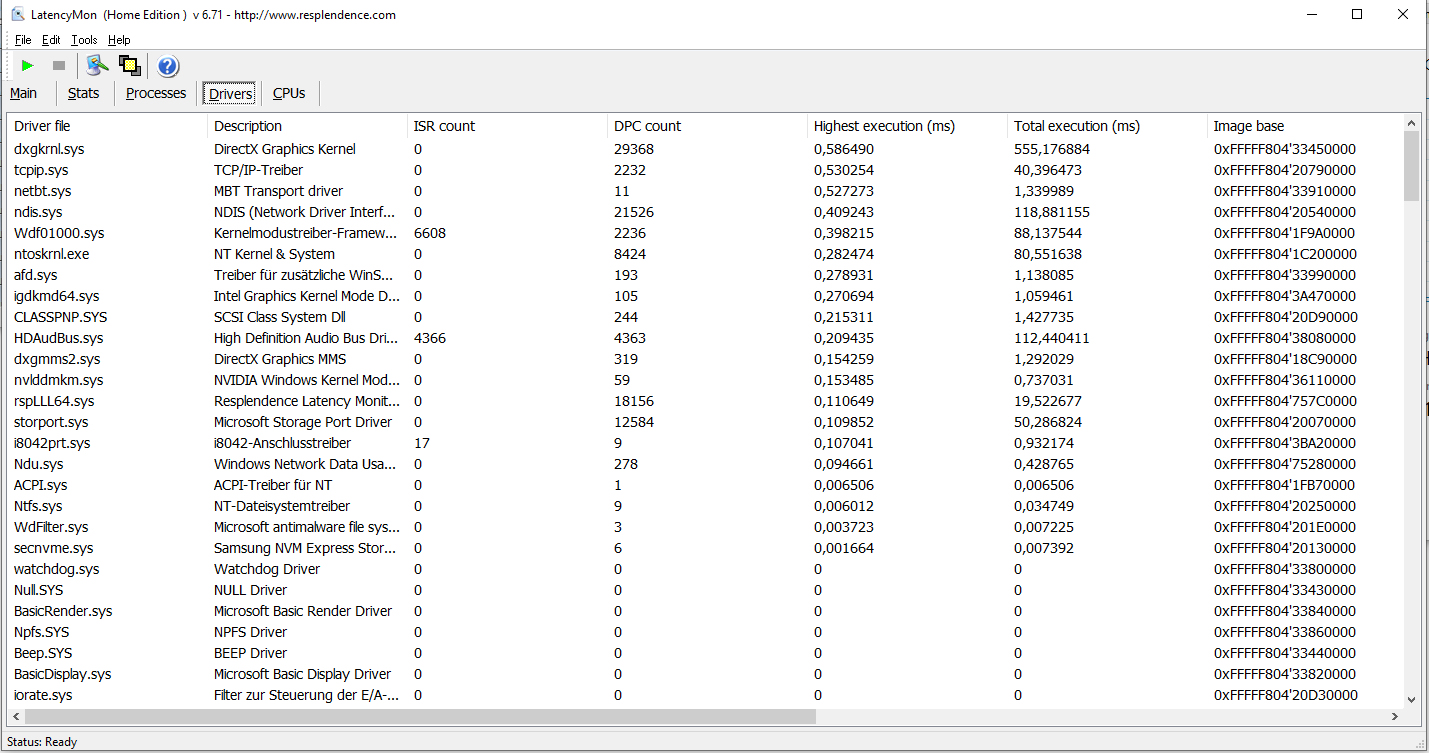
DPC Latencies
| DPC Latencies / LatencyMon - interrupt to process latency (max), Web, Youtube, Prime95 | |
| Aorus 17G XB | |
| Asus Strix G17 G712LWS | |
| MSI GL75 10SFR | |
| Acer Predator Helios 300 PH317-54-75G8 | |
| SCHENKER XMG Neo 17 Comet Lake | |
* ... smaller is better
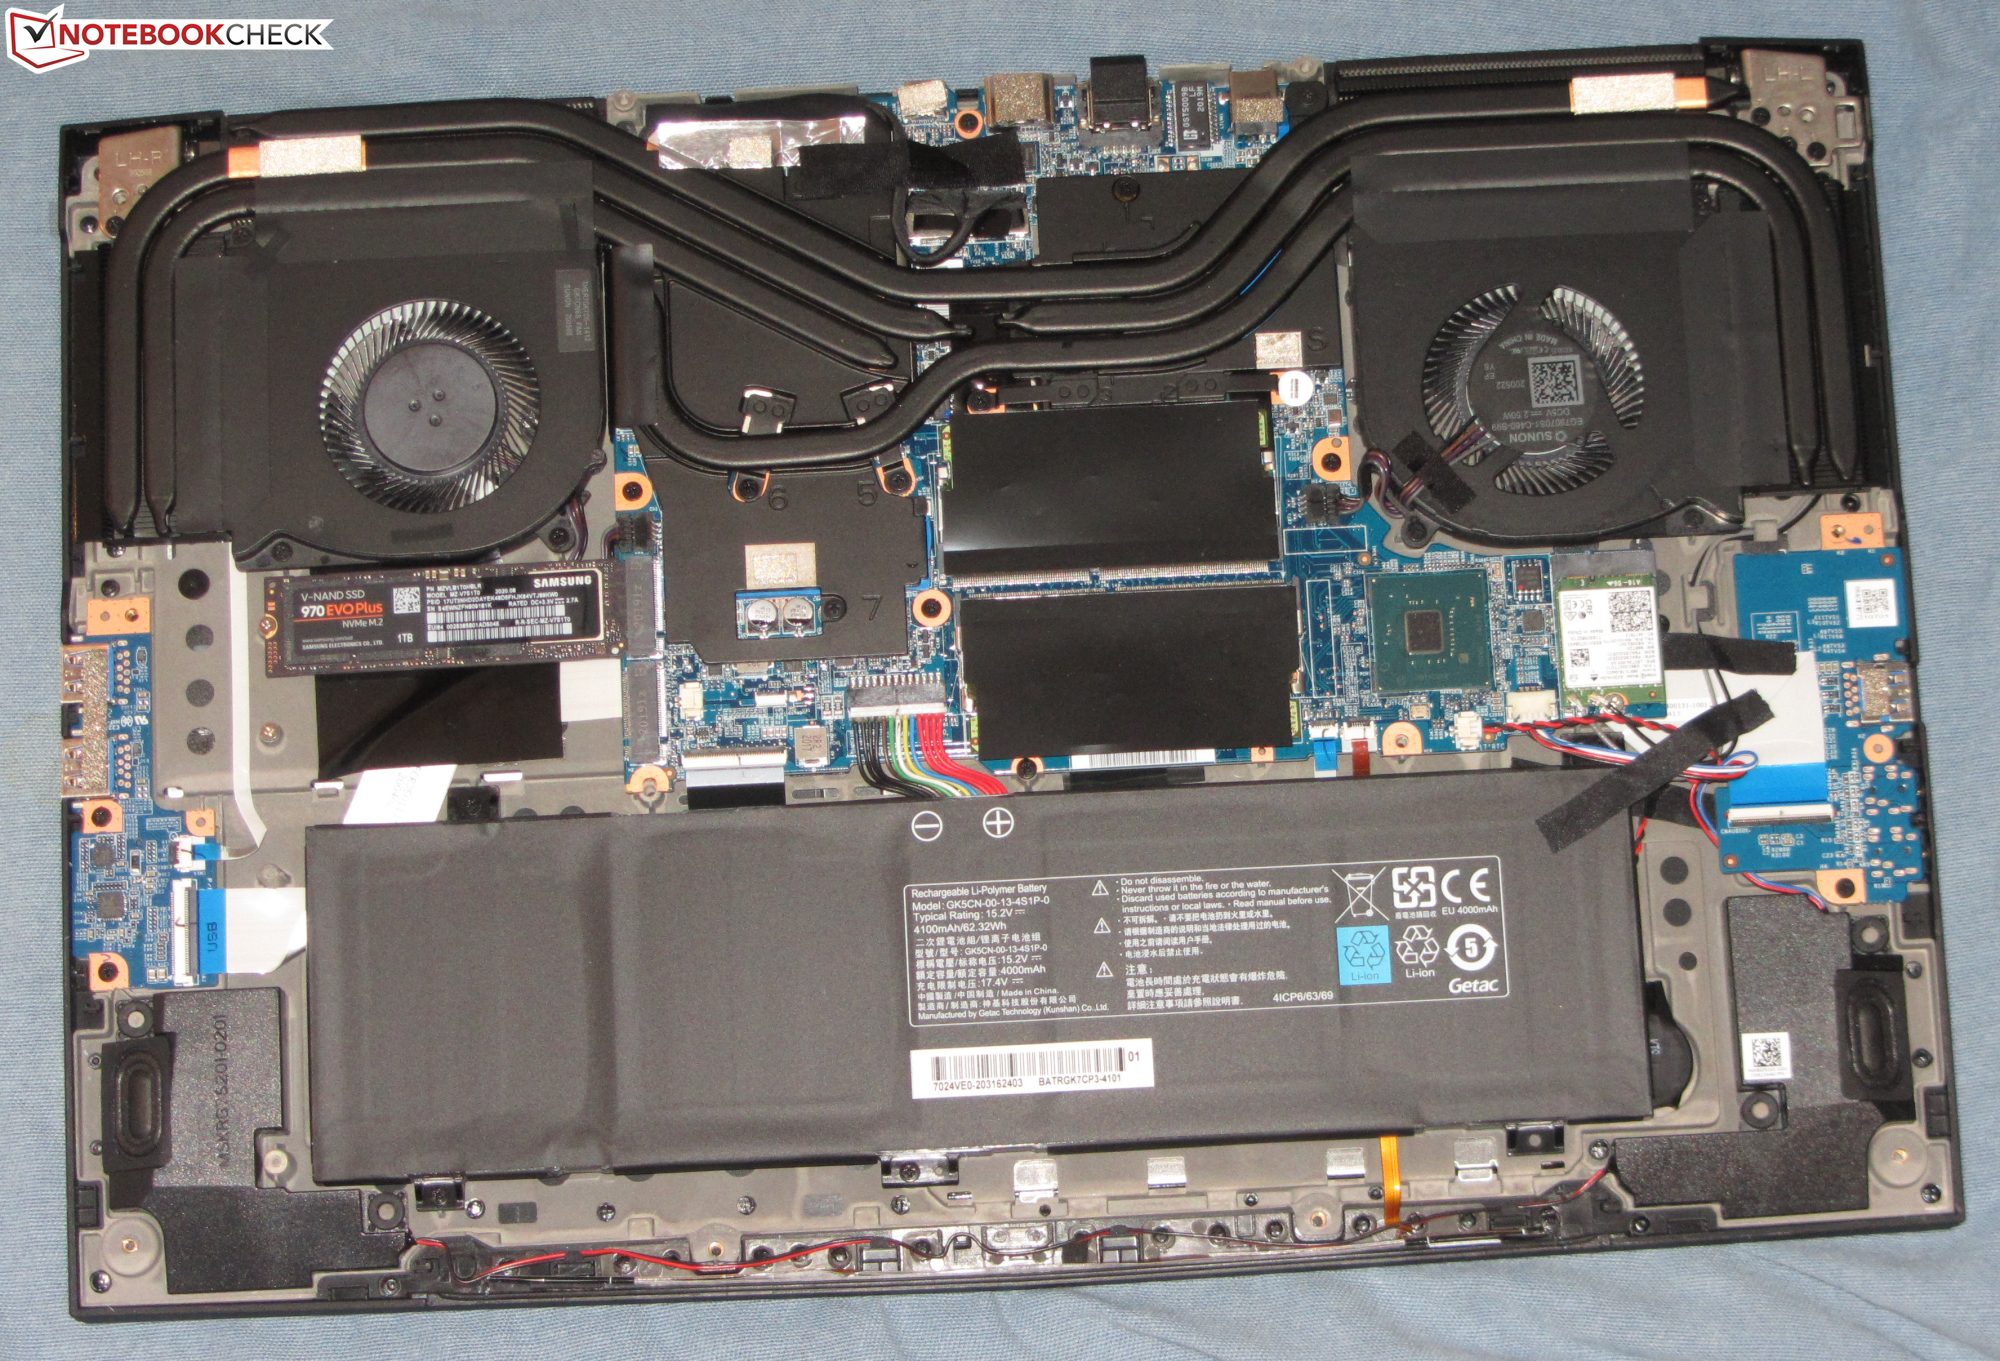
Storage Solution
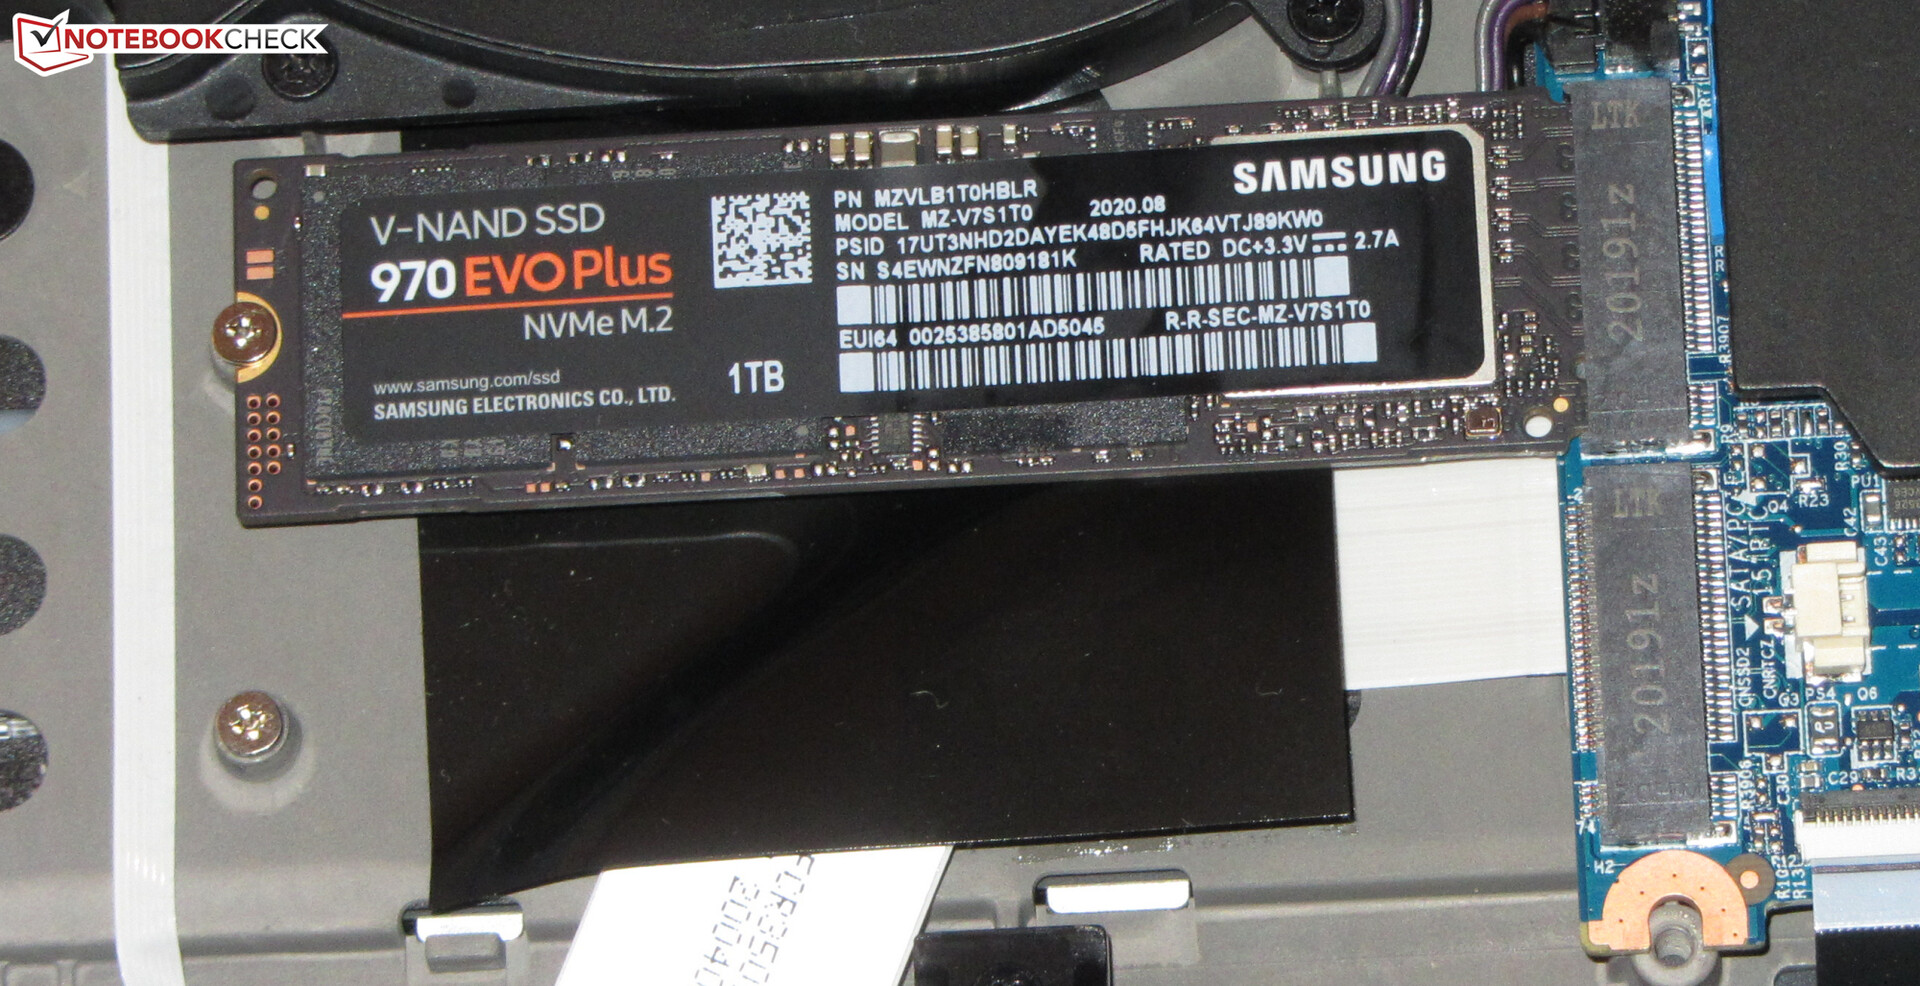
One of the two M.2-2280 slots (1x NVMe, 1x NVMe/SATA; RAID 0/1) is equipped with a 1-TB NVMe SSD from Samsung, which delivers excellent transfer rates.
While generally, the laptop still offers space for a 2.5-inch storage medium, because our test unit is equipped with the larger of the two available batteries (46 Wh, 62 Wh), the battery is taking up the additional space.

| SCHENKER XMG Neo 17 Comet Lake Samsung SSD 970 EVO Plus 1TB | SCHENKER XMG Neo 17 Samsung SSD 970 EVO Plus 1TB | Acer Predator Helios 300 PH317-54-75G8 WDC PC SN730 SDBQNTY-1T00 | MSI GL75 10SFR Lite-On CL1-8D512 | Asus Strix G17 G712LWS Intel SSD 660p 1TB SSDPEKNW010T8 | Aorus 17G XB Samsung SSD PM981a MZVLB512HBJQ | Average Samsung SSD 970 EVO Plus 1TB | Average of class Gaming | |
|---|---|---|---|---|---|---|---|---|
| CrystalDiskMark 5.2 / 6 | -31% | -10% | -28% | -25% | -9% | -3% | 43% | |
| Write 4K | 158.6 | 92.7 -42% | 141.9 -11% | 132.2 -17% | 141.1 -11% | 123.4 -22% | 155.5 ? -2% | 217 ? 37% |
| Read 4K | 53.6 | 41.4 -23% | 48.75 -9% | 45.62 -15% | 60.9 14% | 45.02 -16% | 51.6 ? -4% | 70.5 ? 32% |
| Write Seq | 2671 | 1363 -49% | 2734 2% | 1511 -43% | 1681 -37% | 2526 -5% | 2660 ? 0% | 3760 ? 41% |
| Read Seq | 2130 | 1259 -41% | 1921 -10% | 1890 -11% | 1602 -25% | 2062 -3% | 2390 ? 12% | 3728 ? 75% |
| Write 4K Q32T1 | 525 | 289.7 -45% | 422.6 -20% | 375.9 -28% | 406.6 -23% | 497.9 -5% | 447 ? -15% | 554 ? 6% |
| Read 4K Q32T1 | 609 | 337.5 -45% | 509 -16% | 525 -14% | 470.2 -23% | 579 -5% | 544 ? -11% | 737 ? 21% |
| Write Seq Q32T1 | 3308 | 3332 1% | 3055 -8% | 1505 -55% | 1759 -47% | 2982 -10% | 3296 ? 0% | 4830 ? 46% |
| Read Seq Q32T1 | 3557 | 3477 -2% | 3257 -8% | 2008 -44% | 1932 -46% | 3440 -3% | 3551 ? 0% | 6486 ? 82% |
| AS SSD | -7% | -12% | -63% | -42% | -16% | 5% | 25% | |
| Seq Read | 2882 | 2359 -18% | 2828 -2% | 1923 -33% | 1778 -38% | 1791 -38% | 2800 ? -3% | 4963 ? 72% |
| Seq Write | 2764 | 2469 -11% | 2677 -3% | 1065 -61% | 1478 -47% | 2193 -21% | 2633 ? -5% | 3673 ? 33% |
| 4K Read | 55.9 | 53.5 -4% | 39.94 -29% | 25.43 -55% | 49.76 -11% | 50.7 -9% | 51.2 ? -8% | 66.9 ? 20% |
| 4K Write | 129.4 | 117.6 -9% | 100.9 -22% | 101.9 -21% | 117.9 -9% | 116.8 -10% | 131.2 ? 1% | 211 ? 63% |
| 4K-64 Read | 1793 | 1579 -12% | 1562 -13% | 477.9 -73% | 591 -67% | 1525 -15% | 1839 ? 3% | 1939 ? 8% |
| 4K-64 Write | 2140 | 2048 -4% | 1867 -13% | 563 -74% | 875 -59% | 1958 -9% | 2144 ? 0% | 2544 ? 19% |
| Access Time Read * | 0.054 | 0.048 11% | 0.053 2% | 0.082 -52% | 0.07 -30% | 0.04528 ? 16% | 0.05343 ? 1% | |
| Access Time Write * | 0.03 | 0.03 -0% | 0.037 -23% | 0.126 -320% | 0.041 -37% | 0.032 -7% | 0.03128 ? -4% | 0.04639 ? -55% |
| Score Read | 2137 | 1869 -13% | 1885 -12% | 696 -67% | 818 -62% | 1755 -18% | 2171 ? 2% | 2508 ? 17% |
| Score Write | 2546 | 2413 -5% | 2236 -12% | 771 -70% | 1140 -55% | 2294 -10% | 2539 ? 0% | 3120 ? 23% |
| Score Total | 5774 | 5248 -9% | 5076 -12% | 1785 -69% | 2377 -59% | 4972 -14% | 5812 ? 1% | 6843 ? 19% |
| Copy ISO MB/s | 2189 | 1870 -15% | 1710 -22% | 1495 -32% | 2133 ? -3% | 2651 ? 21% | ||
| Copy Program MB/s | 625 | 545 -13% | 465.3 -26% | 446 -29% | 698 ? 12% | 775 ? 24% | ||
| Copy Game MB/s | 936 | 1083 16% | 1042 11% | 697 -26% | 1521 ? 63% | 1766 ? 89% | ||
| Total Average (Program / Settings) | -19% /
-17% | -11% /
-11% | -46% /
-50% | -34% /
-36% | -13% /
-13% | 1% /
3% | 34% /
32% |
* ... smaller is better
Constant Speed Reading: DiskSpd Read Loop, Queue Depth 8
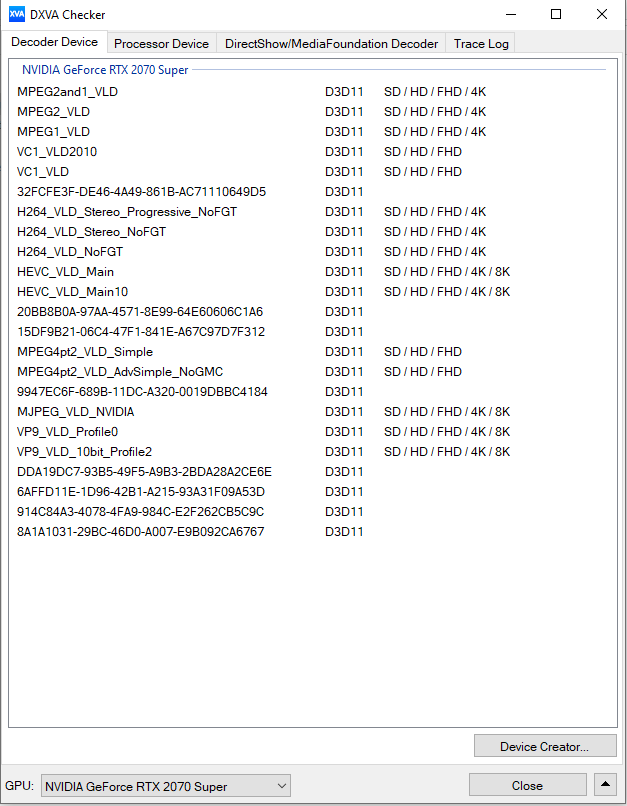
Graphics Card
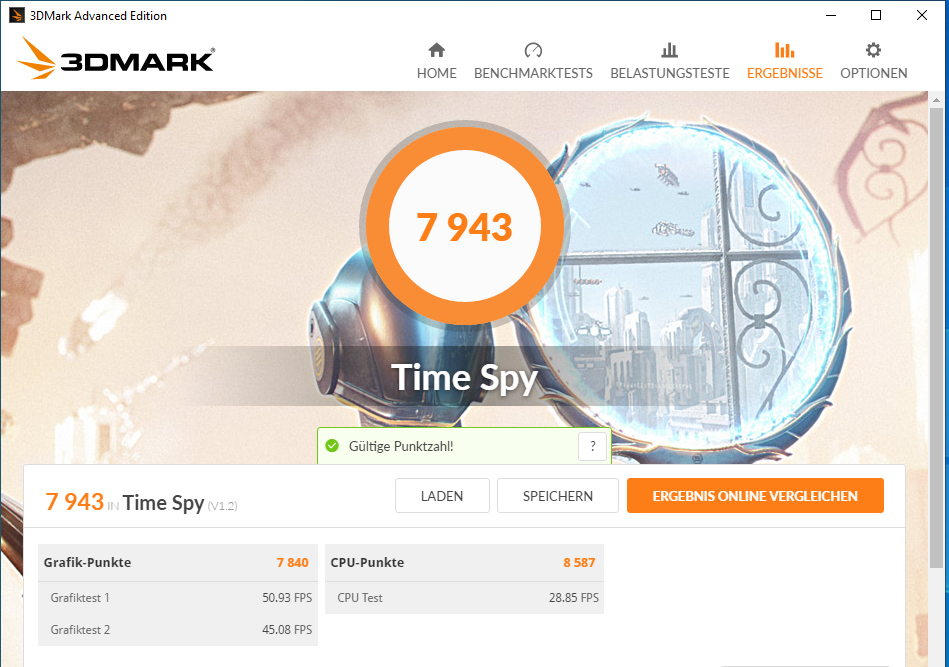
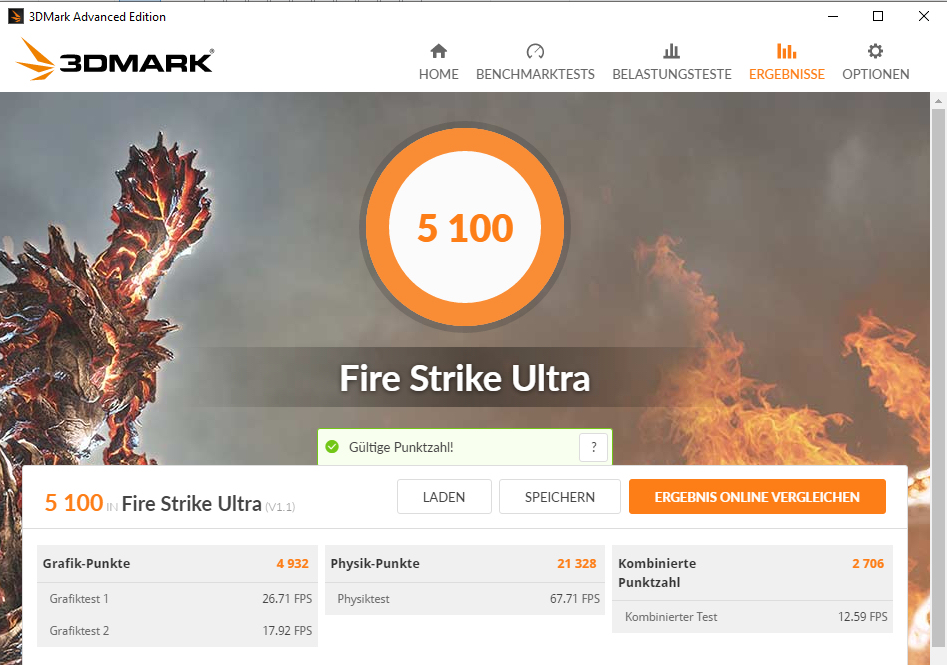
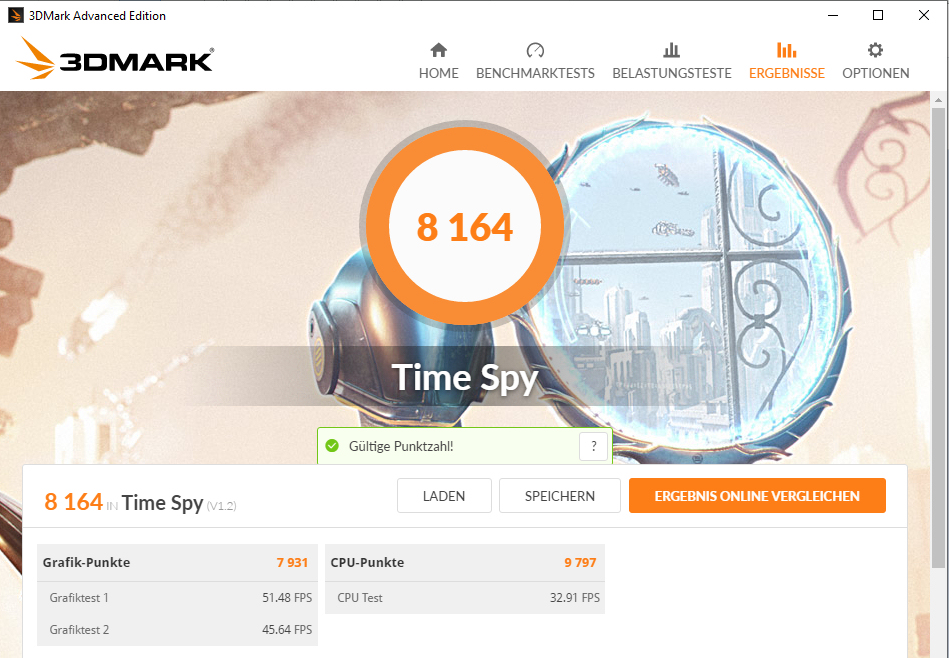
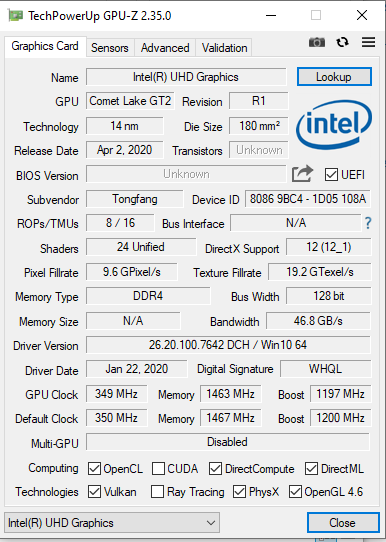
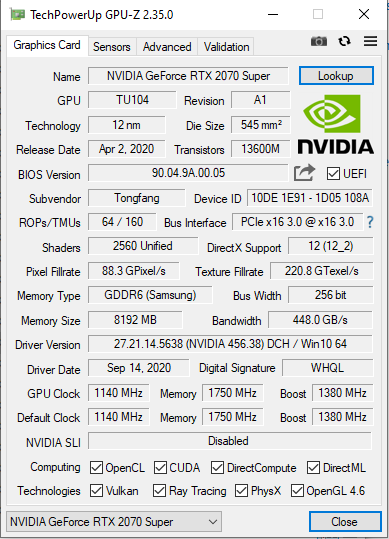
The GeForce RTX-2070 Super graphics core (Turing) belongs to the powerful GPU high end, and it is accompanied by fast GDDR6 storage (8192 GB). The 3D-Mark results range at a normal level for the GPU used. The "Overboost" mode leads to an increase in the graphics performance. The UHD Graphics-630 GPU integrated into the processor is active, and the laptop uses Nvidia' s Optimus graphics switching solution.
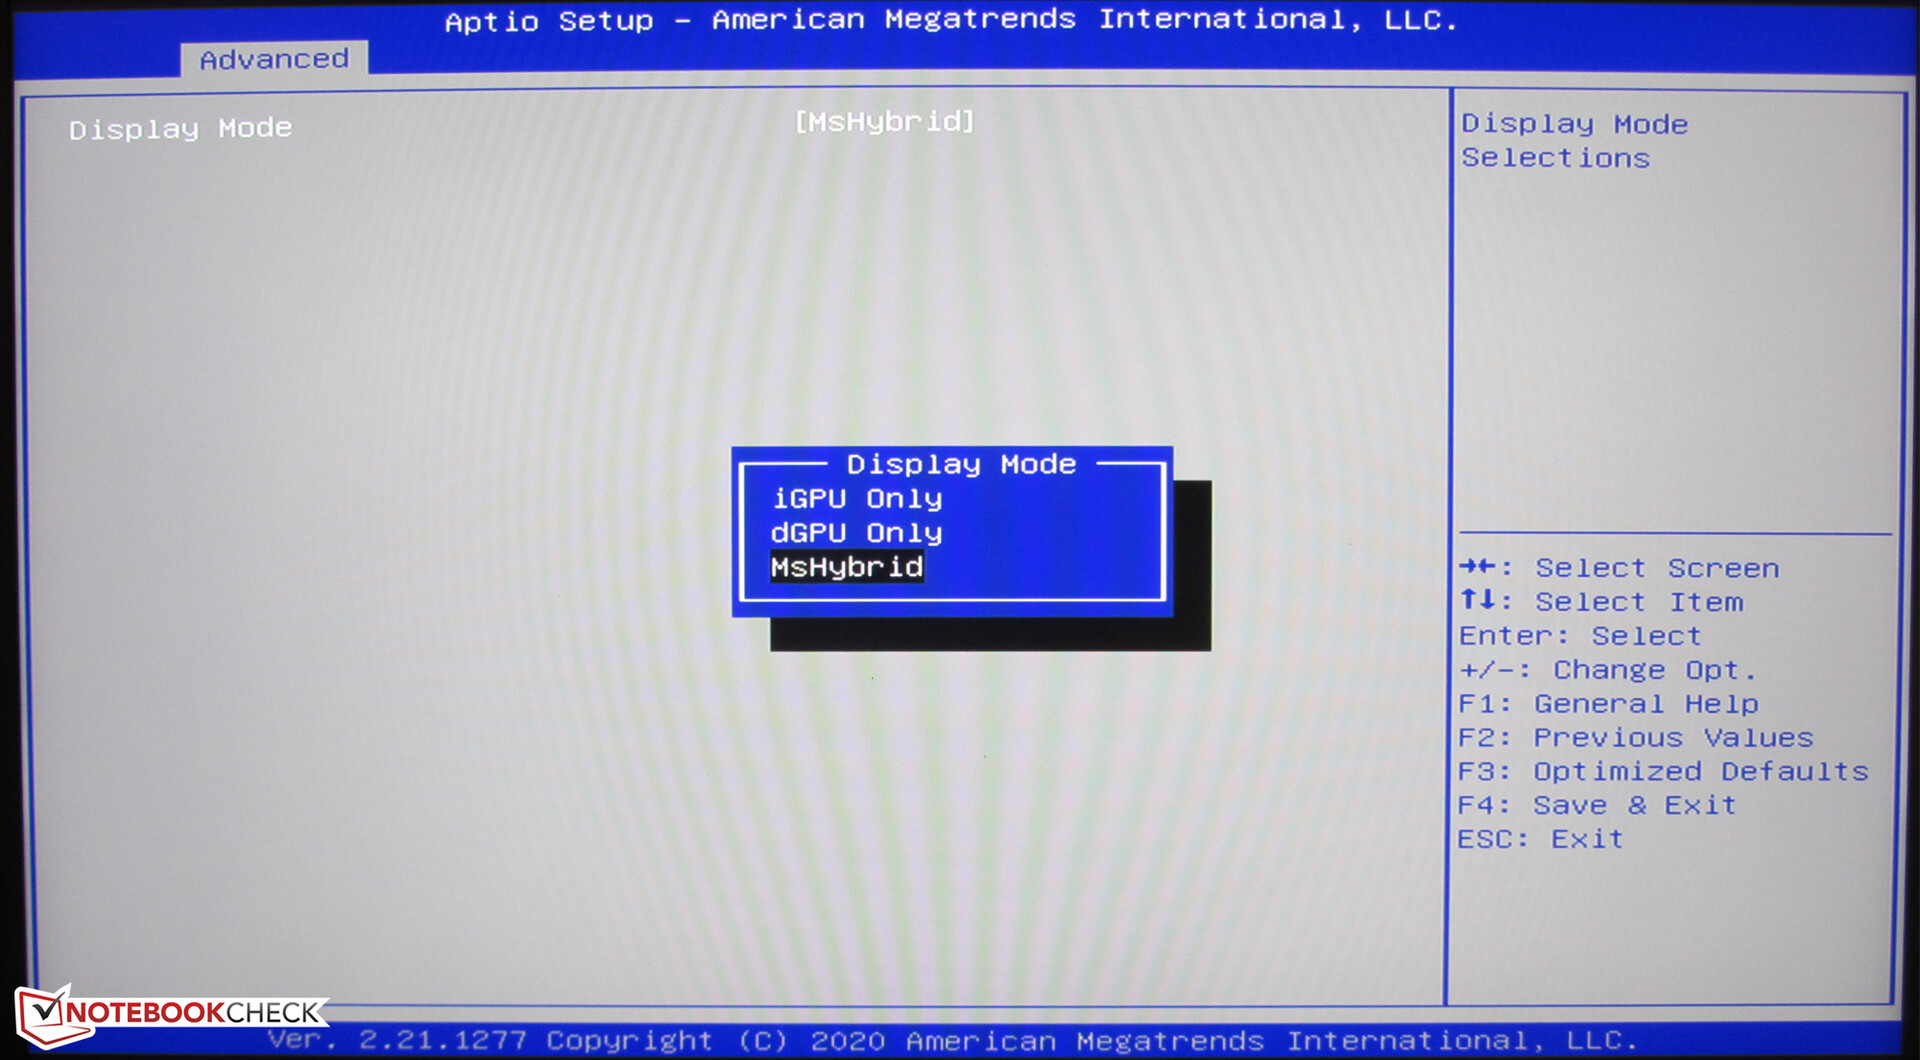
It is not absolutely necessary to use Optimus. The BIOS of the laptop offers the three options "MSHybrid" (= Optimus), "iGPU Only" (= UHD Graphics 630), and "dGPU Only" (= 2070 Super). So there is an option to connect the display directly to the GeForce GPU.


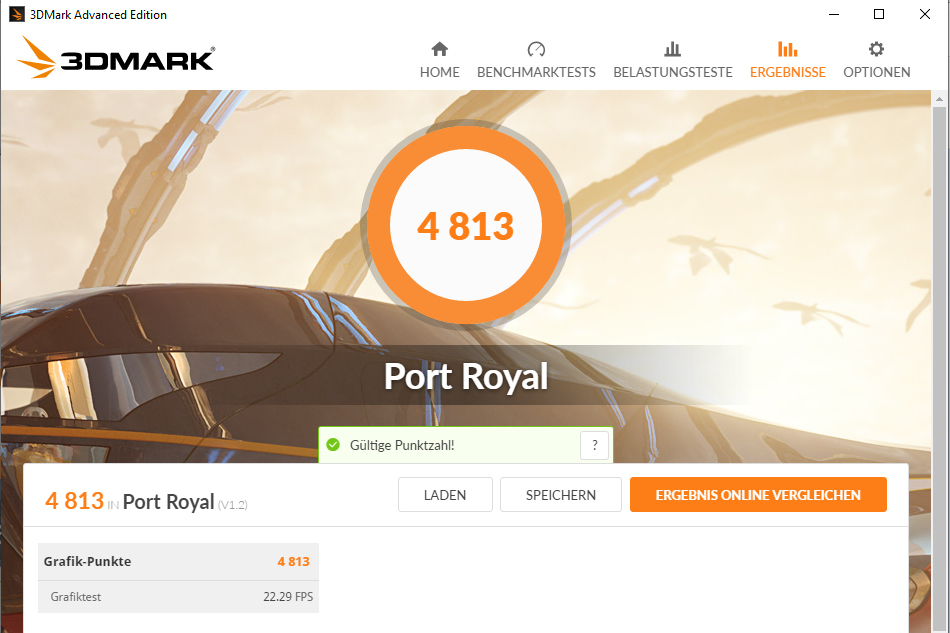
| 3DMark 11 Performance | 24031 points | |
| 3DMark Cloud Gate Standard Score | 46745 points | |
| 3DMark Fire Strike Score | 18229 points | |
| 3DMark Time Spy Score | 7943 points | |
Help | ||
Gaming Performance
The Neo 17 brings all the current games smoothly to the screen in in Full-HD resolution and at maximum quality settings, and the hardware is also able to handle higher resolutions (if you connect the corresponding monitor). The "Overboost" mode does not lead to any increase in the frame rates (see comparison chart).
| The Witcher 3 - 1920x1080 Ultra Graphics & Postprocessing (HBAO+) | |
| Average of class Gaming (8.61 - 216, n=227, last 2 years) | |
| SCHENKER XMG Neo 17 Comet Lake | |
| Asus Strix G17 G712LWS | |
| Average NVIDIA GeForce RTX 2070 Super Mobile (76.3 - 94.6, n=8) | |
| MSI GL75 10SFR | |
| Aorus 17G XB | |
| SCHENKER XMG Neo 17 | |
| Acer Predator Helios 300 PH317-54-75G8 | |
| SCHENKER XMG Neo 17 XNE17M19 | |
| Serious Sam 4 - 1920x1080 Ultra (DX12) AA:2xMS | |
| Average NVIDIA GeForce RTX 2070 Super Mobile (71.1 - 82.1, n=4) | |
| SCHENKER XMG Neo 17 Comet Lake | |
| Asus Strix G17 G712LWS | |
| Average of class Gaming (42.5 - 82.9, n=2, last 2 years) | |
| Acer Predator Helios 300 PH317-54-75G8 | |
| Mafia Definitive Edition - 1920x1080 High Preset | |
| Average of class Gaming (52.7 - 187.9, n=5, last 2 years) | |
| SCHENKER XMG Neo 17 Comet Lake | |
| Average NVIDIA GeForce RTX 2070 Super Mobile (92 - 96.6, n=2) | |
| Asus Strix G17 G712LWS | |
| Acer Predator Helios 300 PH317-54-75G8 | |
| Watch Dogs Legion - 1920x1080 Ultra Preset (DX12) | |
| Average of class Gaming (18 - 127, n=14, last 2 years) | |
| Average NVIDIA GeForce RTX 2070 Super Mobile (59.3 - 64, n=4) | |
| SCHENKER XMG Neo 17 Comet Lake (Overboost) | |
| SCHENKER XMG Neo 17 Comet Lake | |
| Dirt 5 - 1920x1080 Ultra High Preset | |
| Average of class Gaming (54 - 110.5, n=6, last 2 years) | |
| Average NVIDIA GeForce RTX 2070 Super Mobile (45.5 - 68.6, n=3) | |
| SCHENKER XMG Neo 17 Comet Lake | |
| Flight Simulator 2020 - 1920x1080 Ultra AA:TAA AF:16x | |
| Average of class Gaming (24.7 - 74, n=8, last 2 years) | |
| SCHENKER XMG Neo 17 Comet Lake (Overboost) | |
| SCHENKER XMG Neo 17 Comet Lake | |
| Average NVIDIA GeForce RTX 2070 Super Mobile (37.8 - 43.8, n=3) | |
| Asus Strix G17 G712LWS | |
| Acer Predator Helios 300 PH317-54-75G8 | |
In order to evaluate whether the frame rates remain mostly constant over long time periods, we run the game "The Witcher 3" for about 60 minutes in Full-HD resolution and at maximum quality settings, without moving the gaming character. We do not notice any drop in the frame rates.
| low | med. | high | ultra | |
| The Witcher 3 (2015) | 274 | 247.1 | 162.9 | 90.8 |
| Doom Eternal (2020) | 234.1 | 171.5 | 151.9 | 151 |
| Horizon Zero Dawn (2020) | 152 | 129 | 116 | 98 |
| Flight Simulator 2020 (2020) | 71.2 | 61.7 | 53.3 | 42.1 |
| Serious Sam 4 (2020) | 122 | 93.7 | 87.8 | 72.5 |
| Mafia Definitive Edition (2020) | 149.5 | 106 | 96.6 | |
| Watch Dogs Legion (2020) | 112.2 | 102.7 | 90.1 | 59.3 |
| Dirt 5 (2020) | 157 | 91 | 73.6 | 45.5 |
| Assassin´s Creed Valhalla (2020) | 122 | 83 | 71 | 60 |
Emissions and Power Management - The XMG Neo offers only a mediocre battery life
Noise Emissions
During idle operation, the two fans run mainly at low speeds. Occasionally they will turn off and there is silence. Under load, the fans rev up and we register maximum noise levels of 52 dB(A) (stress test) and 50 dB(A) (The Witcher 3 test). The usage of a headset recommends itself.
Noise Level
| Idle |
| 26 / 30 / 33 dB(A) |
| Load |
| 50 / 52 dB(A) |
 | ||
30 dB silent 40 dB(A) audible 50 dB(A) loud |
||
min: | ||
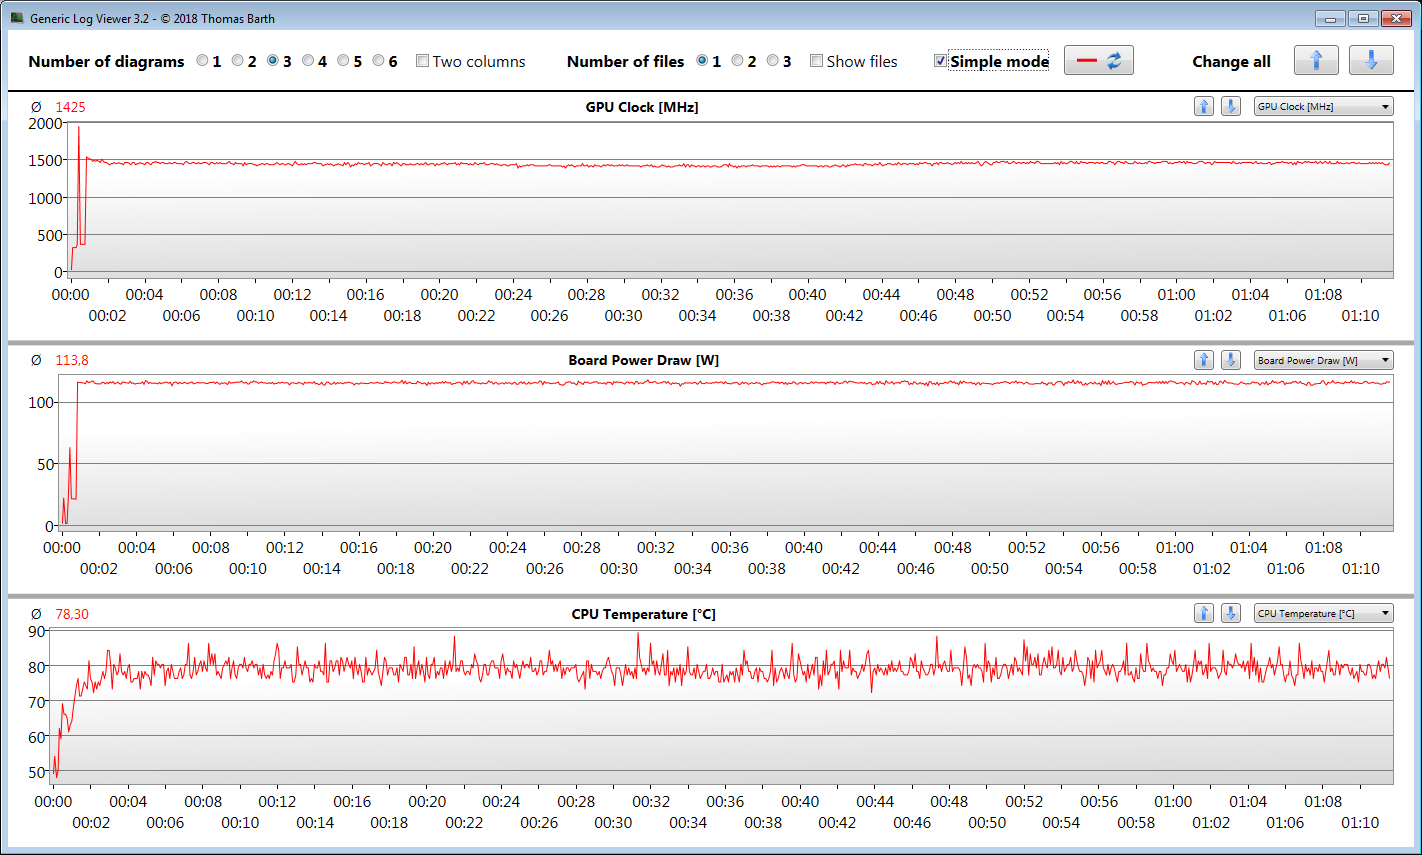
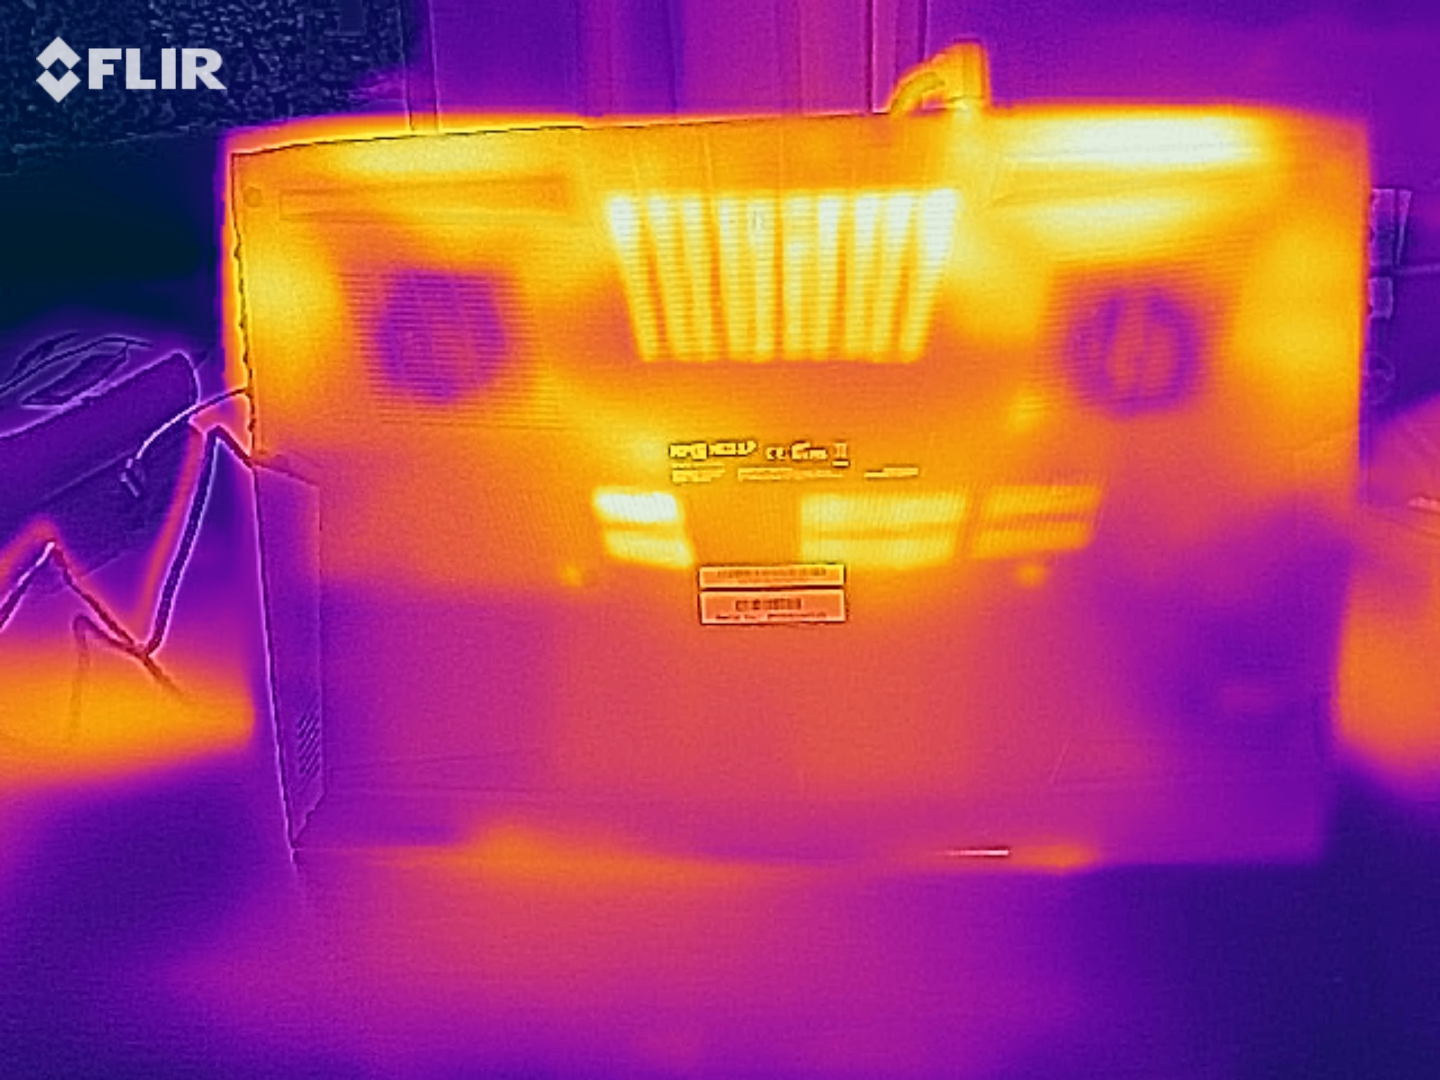
Temperature
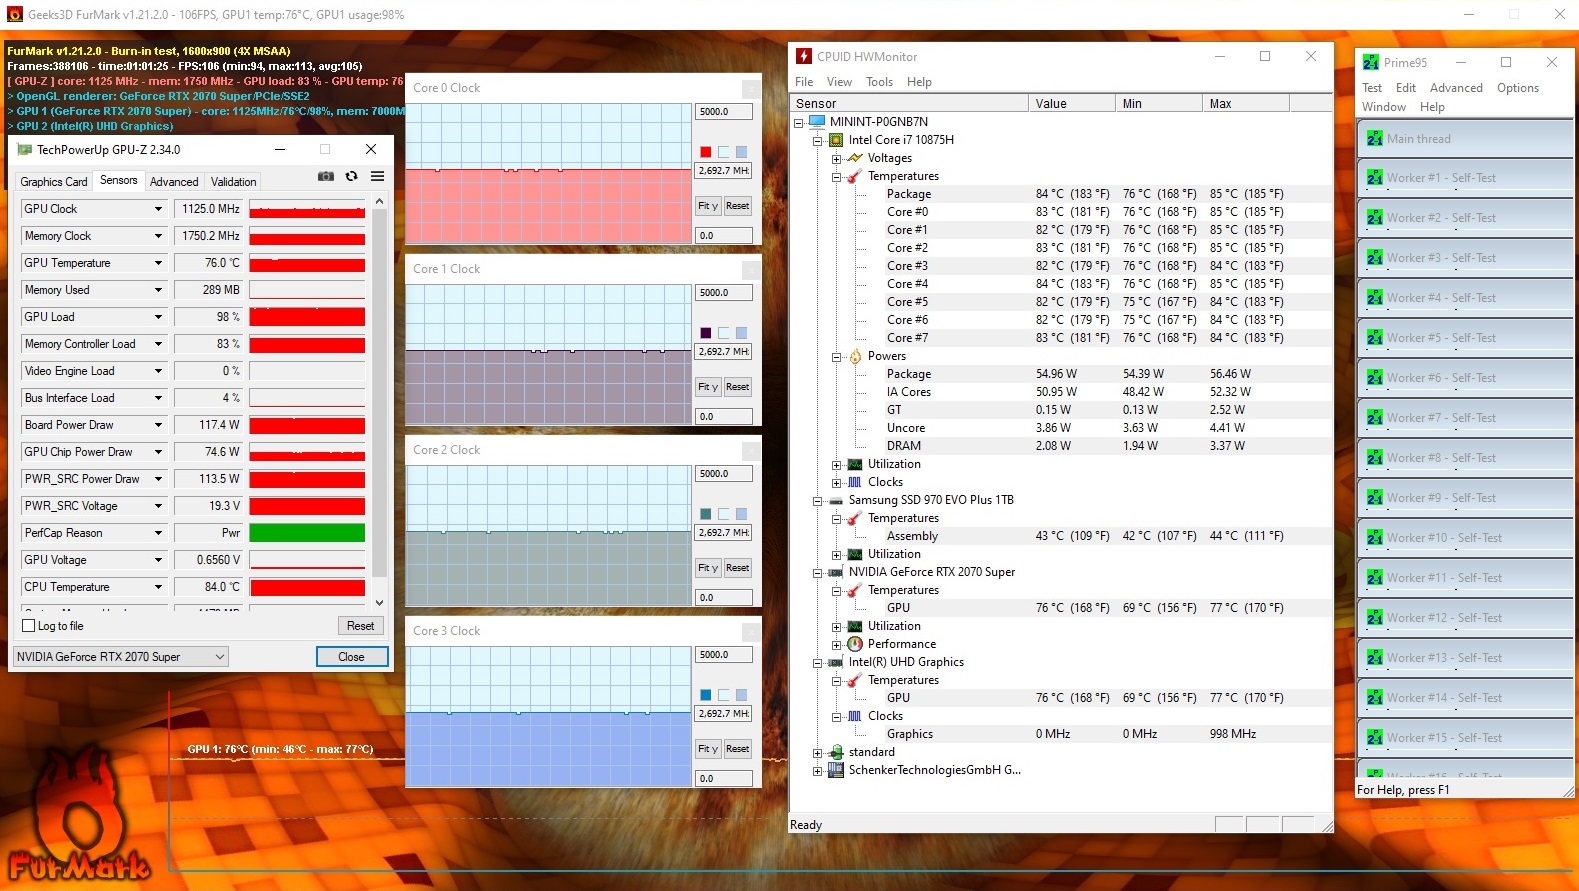
The CPU and GPU run through our stress test (with Prime95 and FurMark running for at least one hour) at 2.7 GHz and 1125 MHz, respectively. The stress test represents an extreme scenario. We are using this test to evaluate whether the system also remains stable under full load.
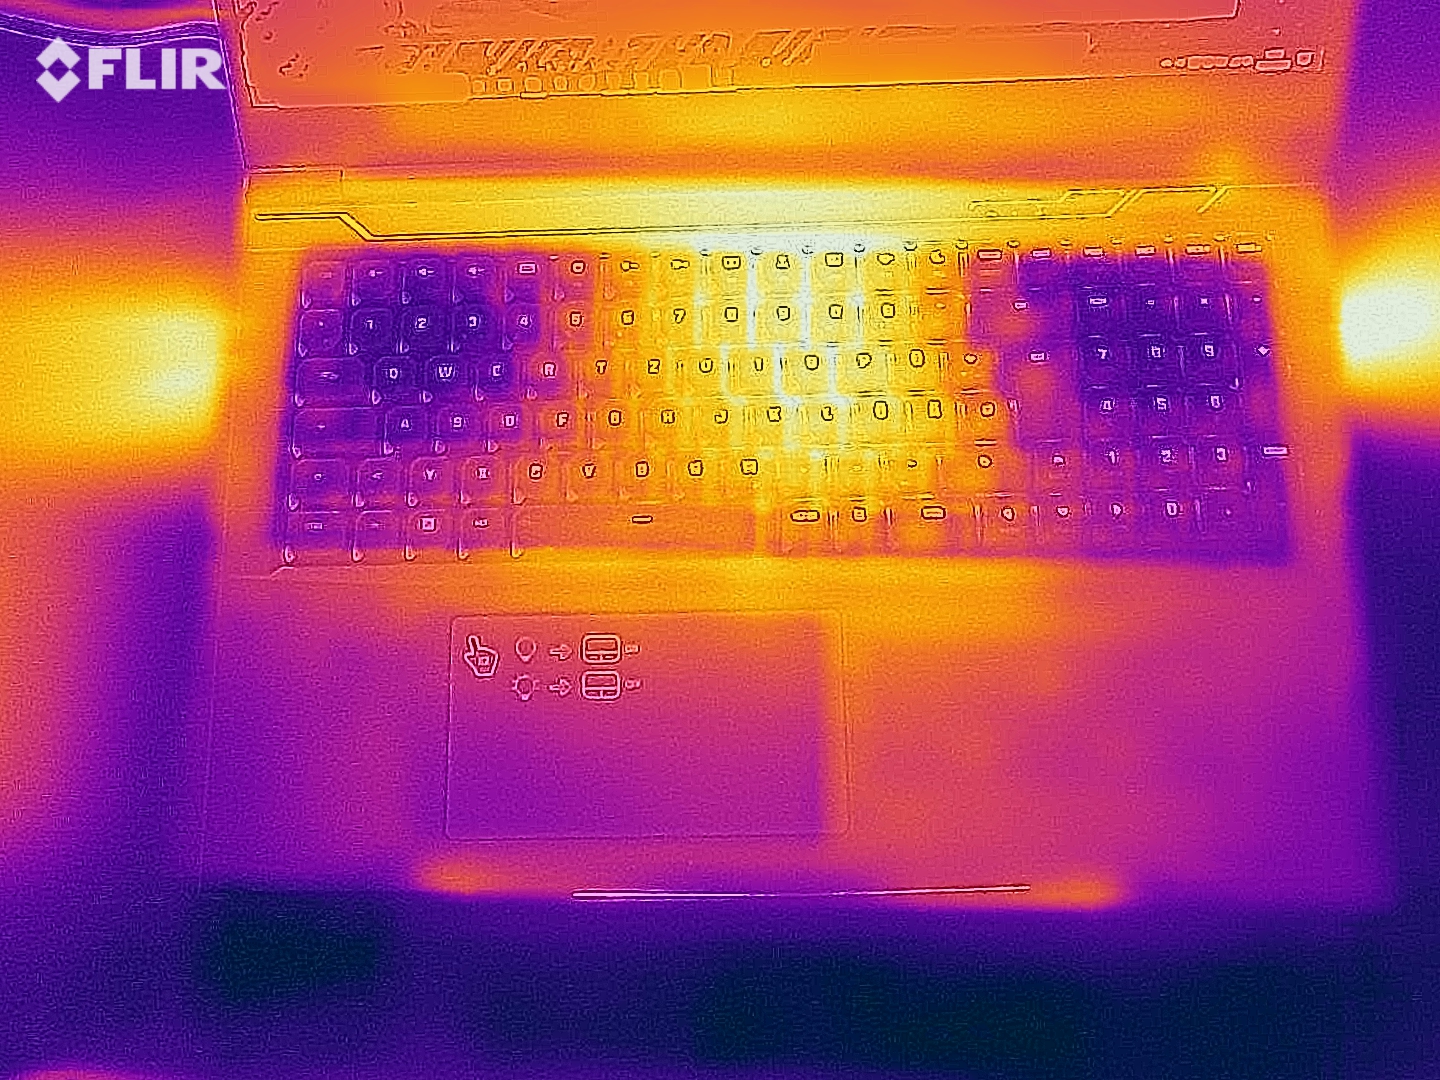
The laptop warms up noticeably. During the stress test, we measure temperatures in the 50-degree Celsius (122 °F) range in some measurement spots. The heat development turns out slightly lower while running our The Witcher 3 test. However, you should not place the device on your lap. In everyday operation, the temperatures remain within the green range.
(-) The maximum temperature on the upper side is 48 °C / 118 F, compared to the average of 40.4 °C / 105 F, ranging from 21.2 to 68.8 °C for the class Gaming.
(-) The bottom heats up to a maximum of 54 °C / 129 F, compared to the average of 43.2 °C / 110 F
(+) In idle usage, the average temperature for the upper side is 29.1 °C / 84 F, compared to the device average of 33.8 °C / 93 F.
(-) Playing The Witcher 3, the average temperature for the upper side is 41.6 °C / 107 F, compared to the device average of 33.8 °C / 93 F.
(±) The palmrests and touchpad can get very hot to the touch with a maximum of 39 °C / 102.2 F.
(-) The average temperature of the palmrest area of similar devices was 28.9 °C / 84 F (-10.1 °C / -18.2 F).
Speakers
SCHENKER XMG Neo 17 Comet Lake audio analysis
(+) | speakers can play relatively loud (82 dB)
Bass 100 - 315 Hz
(-) | nearly no bass - on average 25.2% lower than median
(±) | linearity of bass is average (12.7% delta to prev. frequency)
Mids 400 - 2000 Hz
(+) | balanced mids - only 3.3% away from median
(+) | mids are linear (4.4% delta to prev. frequency)
Highs 2 - 16 kHz
(+) | balanced highs - only 2.8% away from median
(±) | linearity of highs is average (7.8% delta to prev. frequency)
Overall 100 - 16.000 Hz
(±) | linearity of overall sound is average (17.1% difference to median)
Compared to same class
» 43% of all tested devices in this class were better, 12% similar, 45% worse
» The best had a delta of 6%, average was 18%, worst was 132%
Compared to all devices tested
» 26% of all tested devices were better, 8% similar, 66% worse
» The best had a delta of 4%, average was 25%, worst was 134%
Power Consumption
In idle operation, we register a maximum power consumption of 29 watts. The stress test and our The Witcher 3 test lead to an increase in the consumption of up to 258 watts and an average of 199 watts, respectively.
| Off / Standby | |
| Idle | |
| Load |
|
Battery Life
The battery life does not win any praises. The 17.3-inch laptop lasts for 3:47 hours in our WLAN test (loading websites using a script and with a display brightness of about 150 cd/m²). The additional battery capacity (62 Wh instead of 46 Wh) compared to the 2019 models we tested does not give any advantage to the current Neo 17.
Pros
Cons
Verdict
Thanks to the Core i7-10875H octa-core processor, GeForce RTX 2070-Super graphics core, and 32 GB of working memory, the XMG Neo 17 is equipped for any possible challenge. The hardware is able to bring all the current computer games to the screen smoothly, without the need for any compromises.
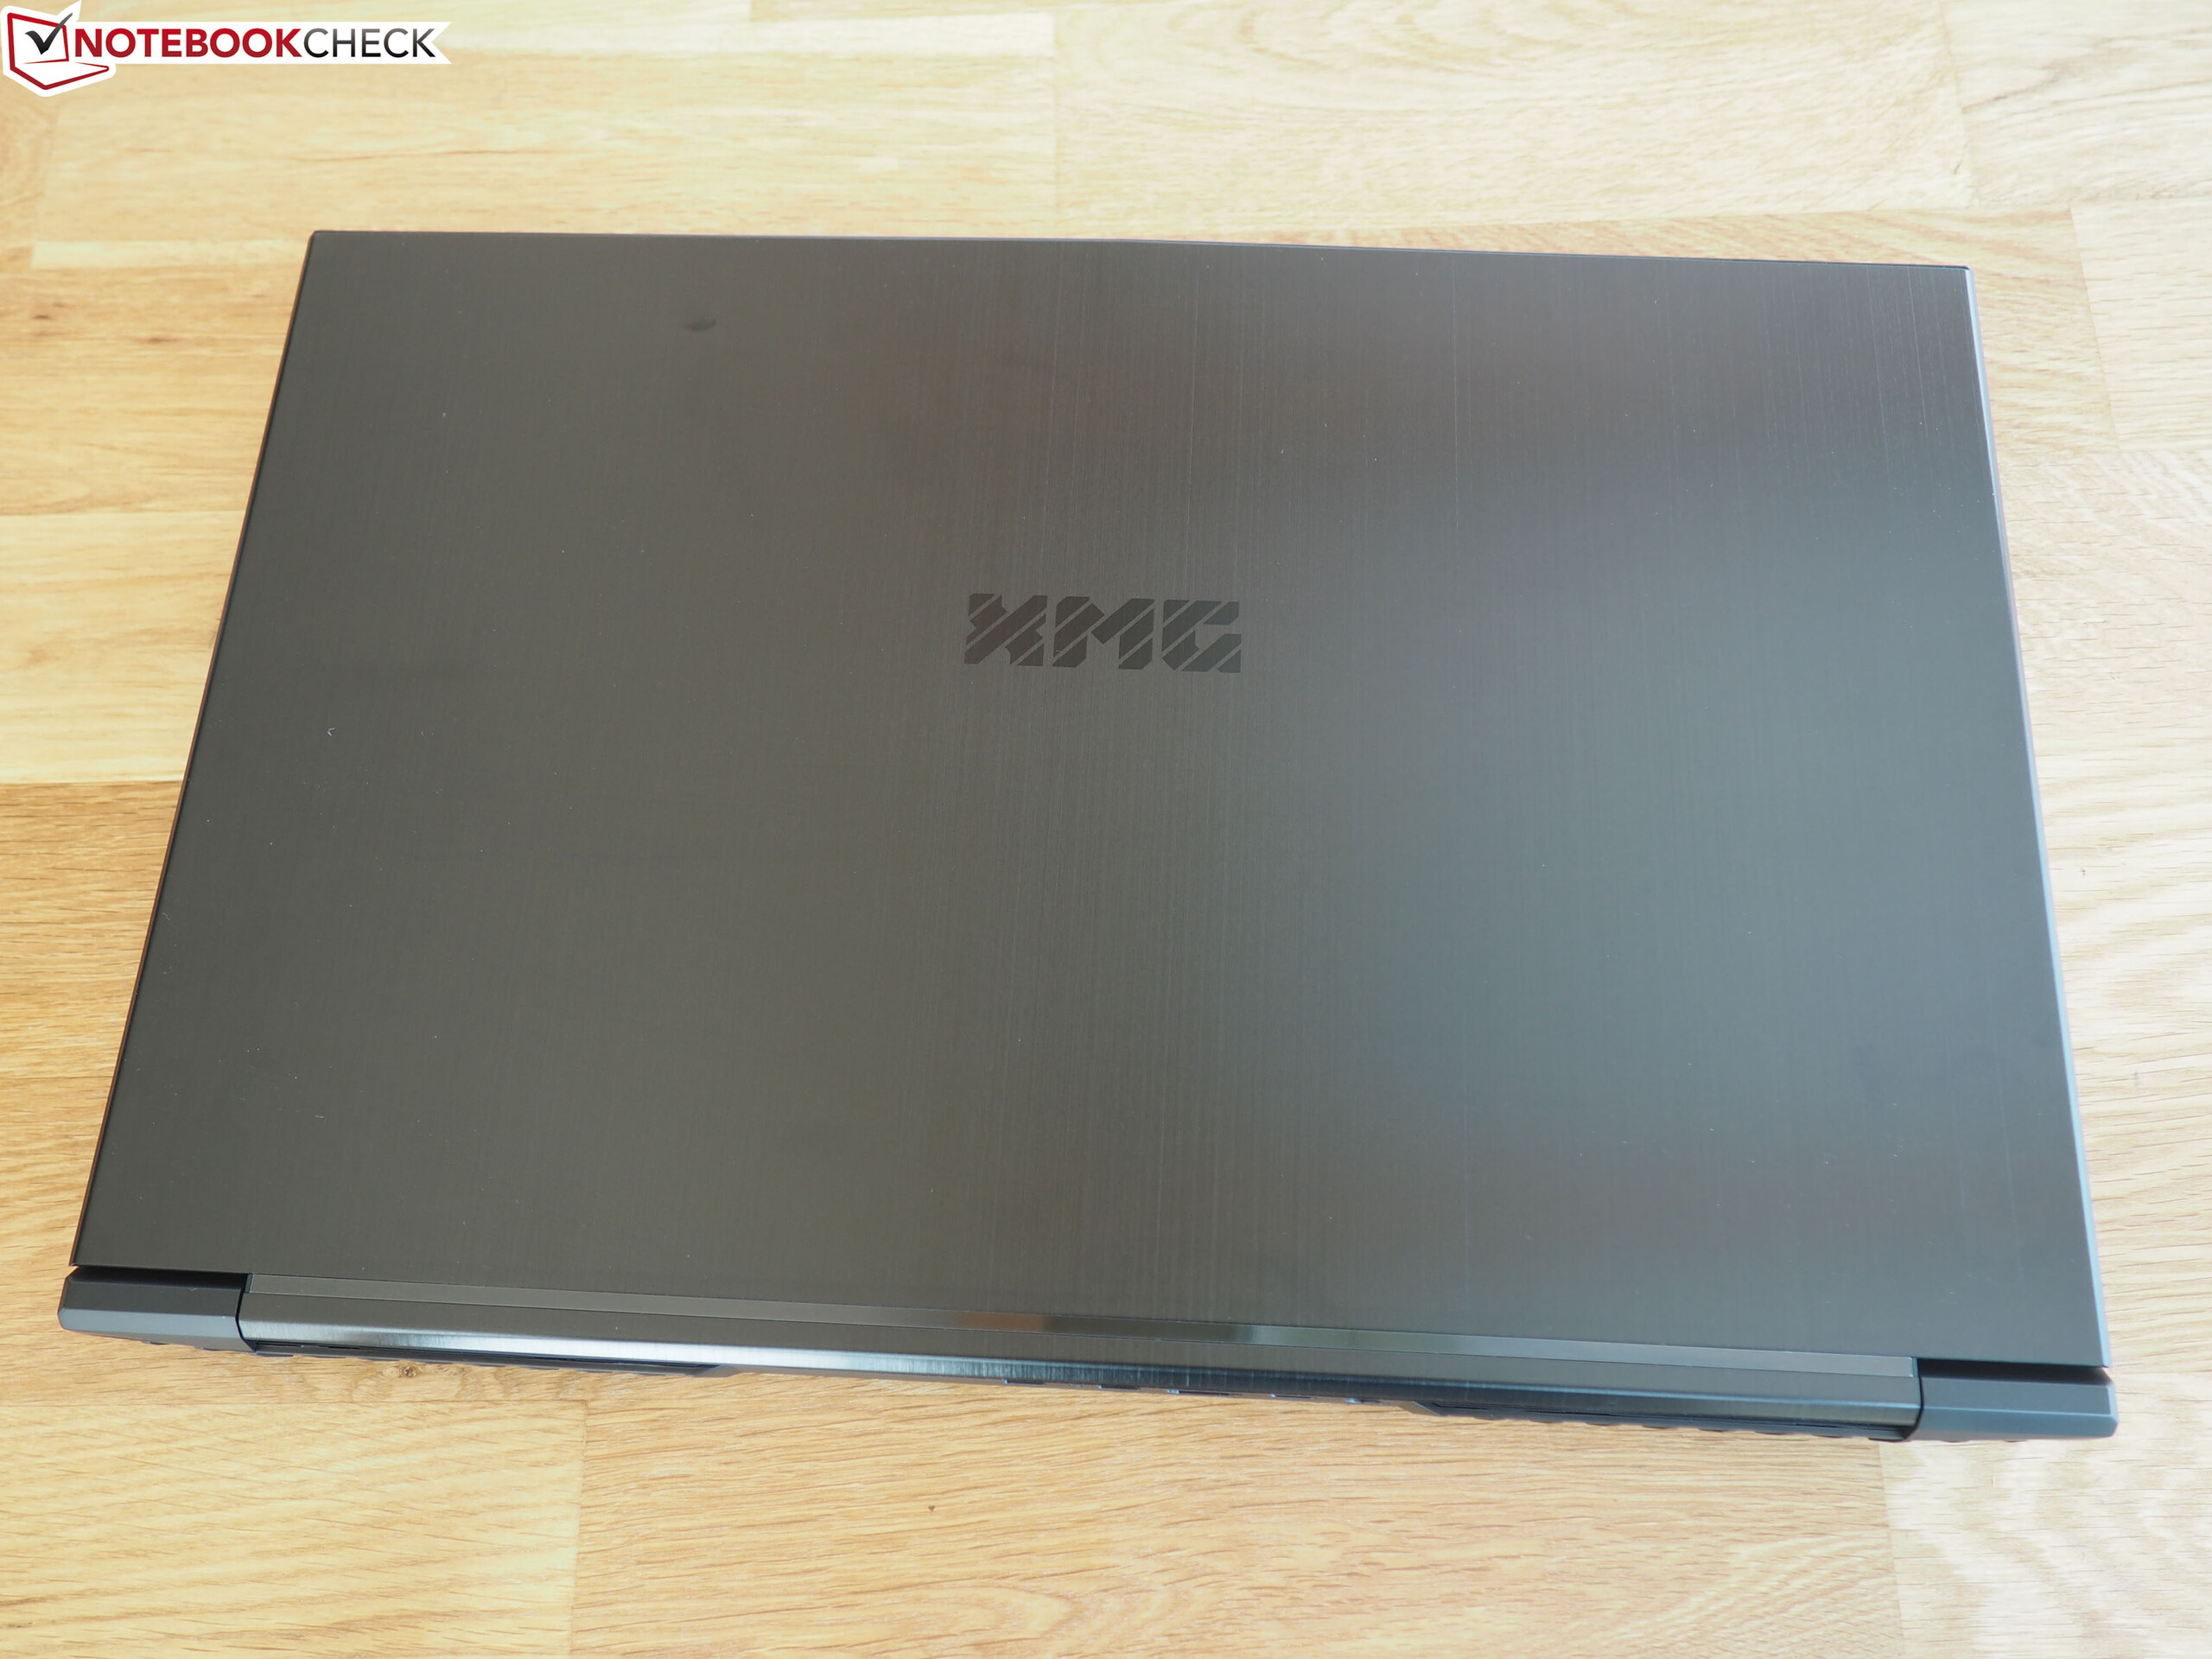
With the XMG Neo 17 (2020), Schenker delivers an extremely powerful gaming laptop whose moderate looks allow using it in the office.
If you run out of storage space with the built-in 1-TB NVMe SSD, an upgrade is possible, since the laptop offers space for two M.2-2280 SSDs (1x NVMe, 1x NVMe/SATA; RAID 0/1). The very responsive display (FHD, IPS, 240 Hz) scores with a good color reproduction and an acceptable color space coverage. The brightness and contrast fulfill the requirements, but the battery life turns out mediocre.
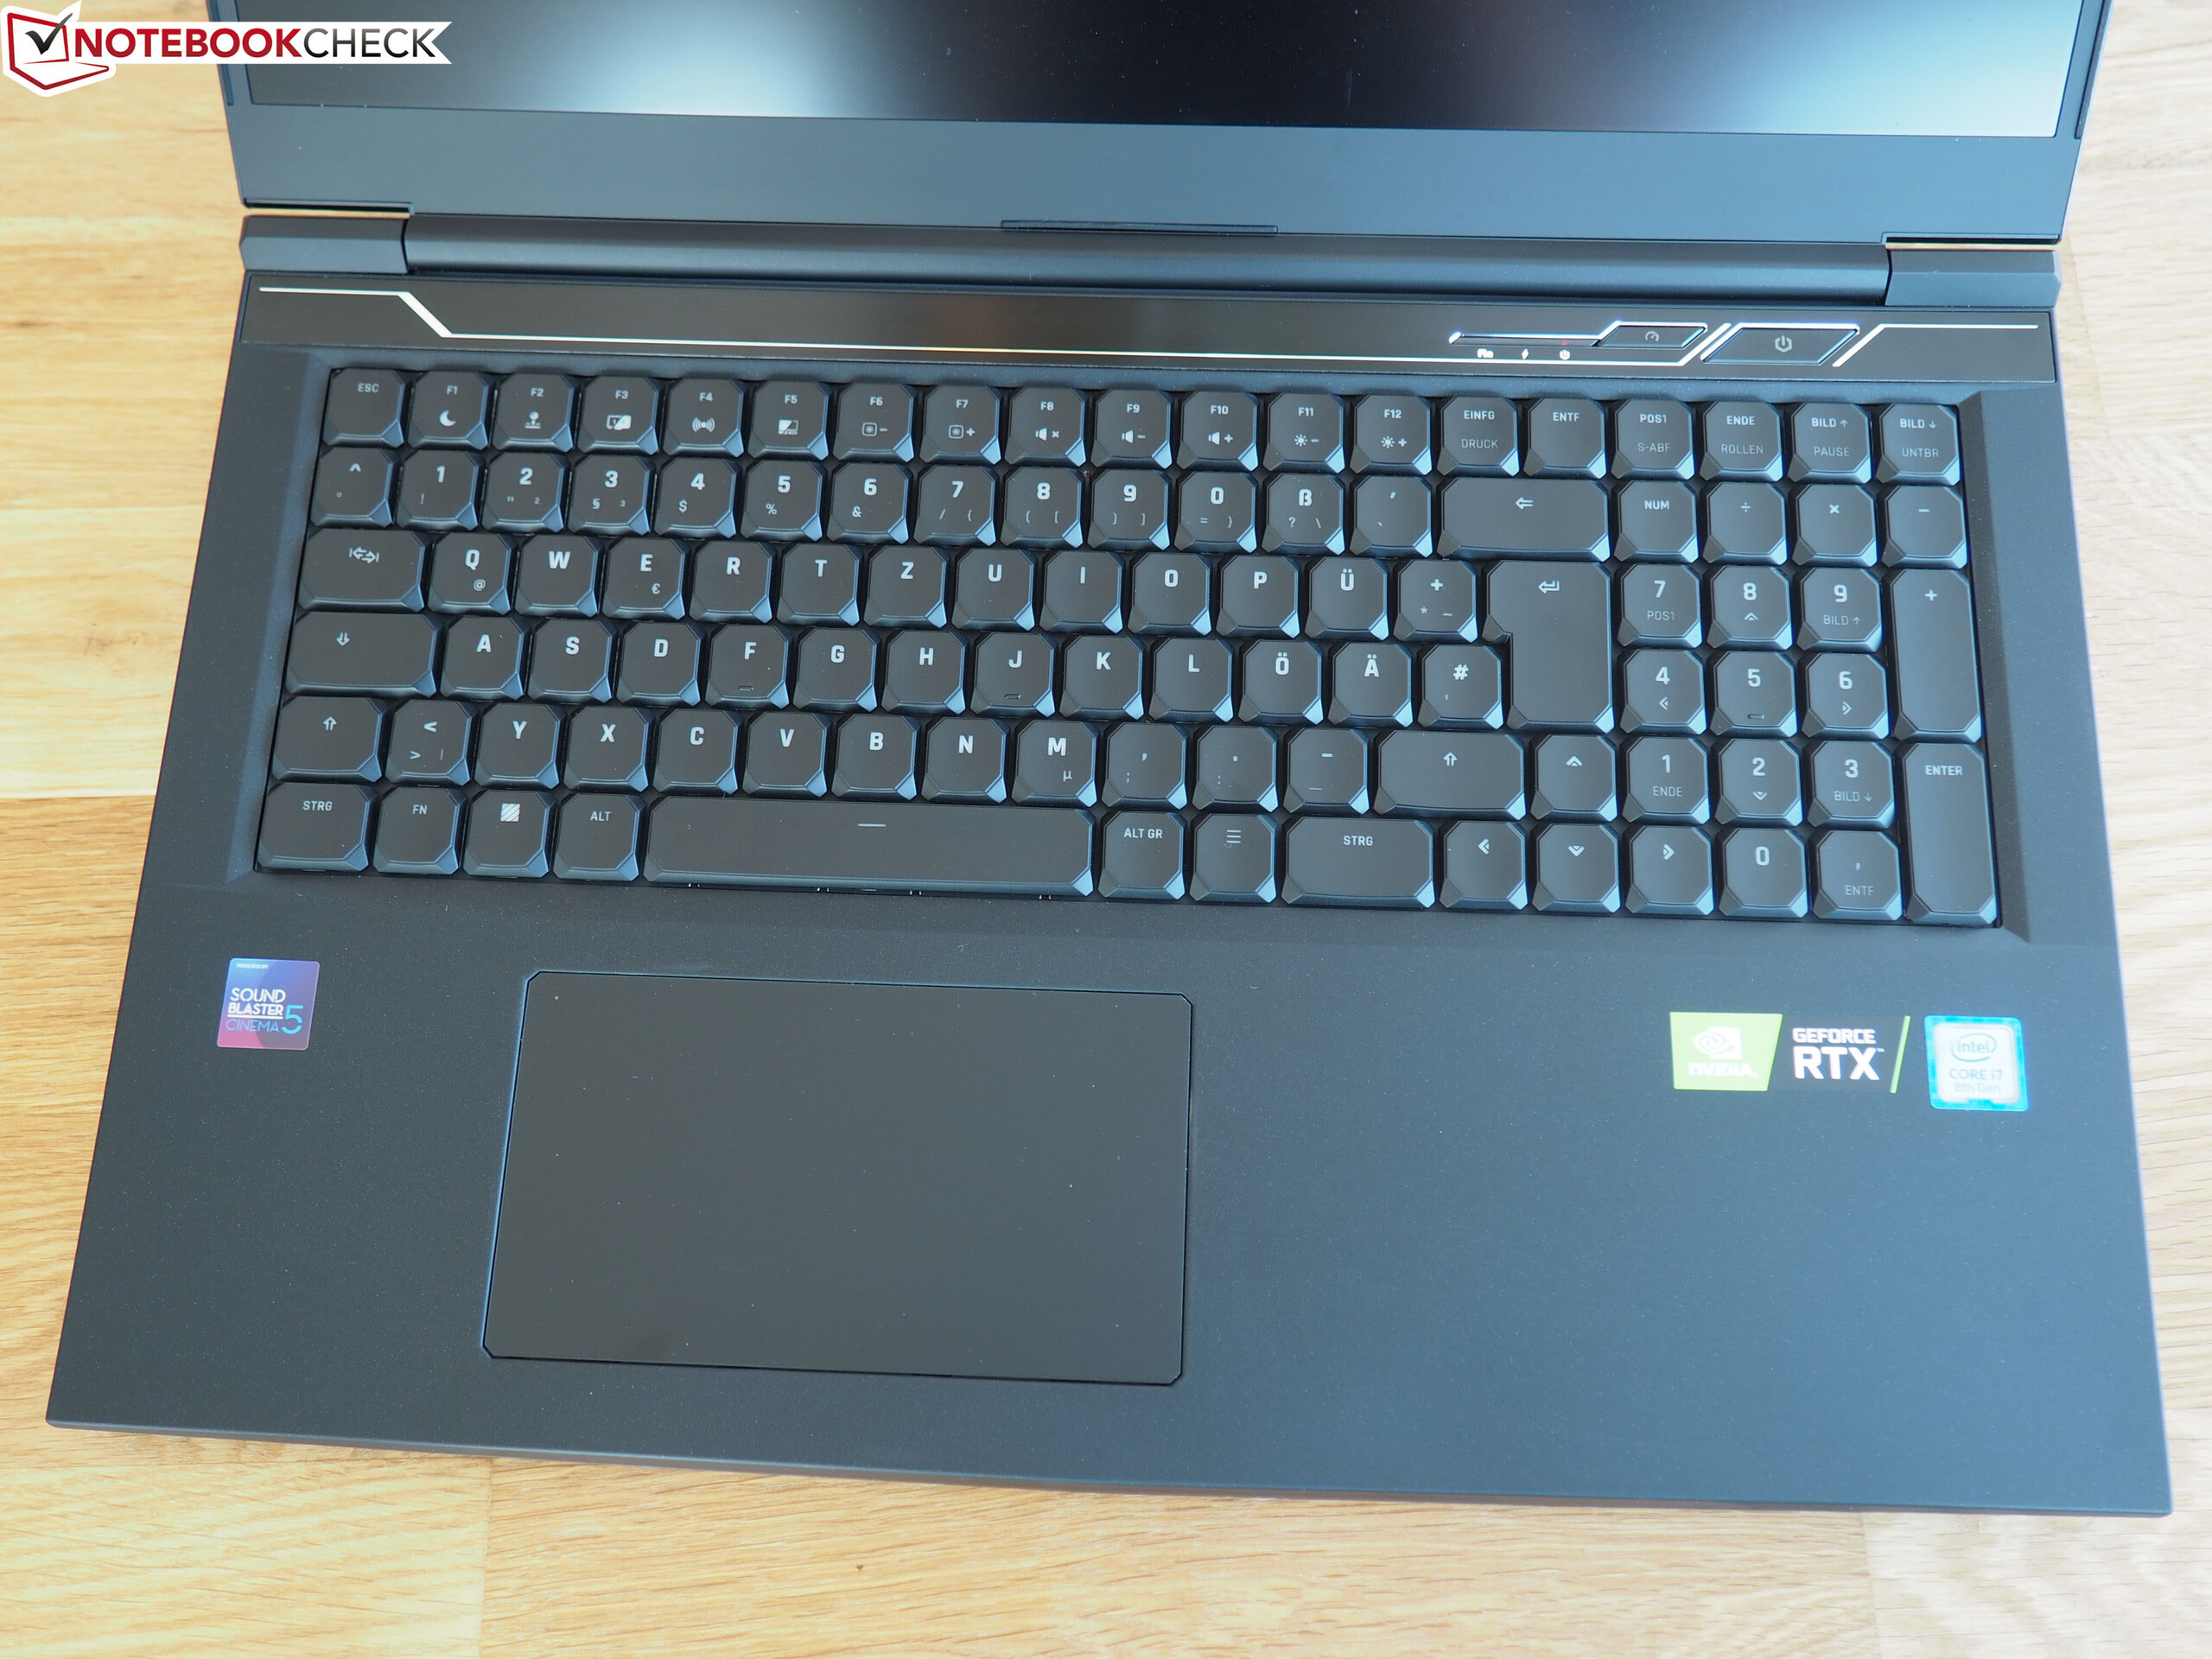
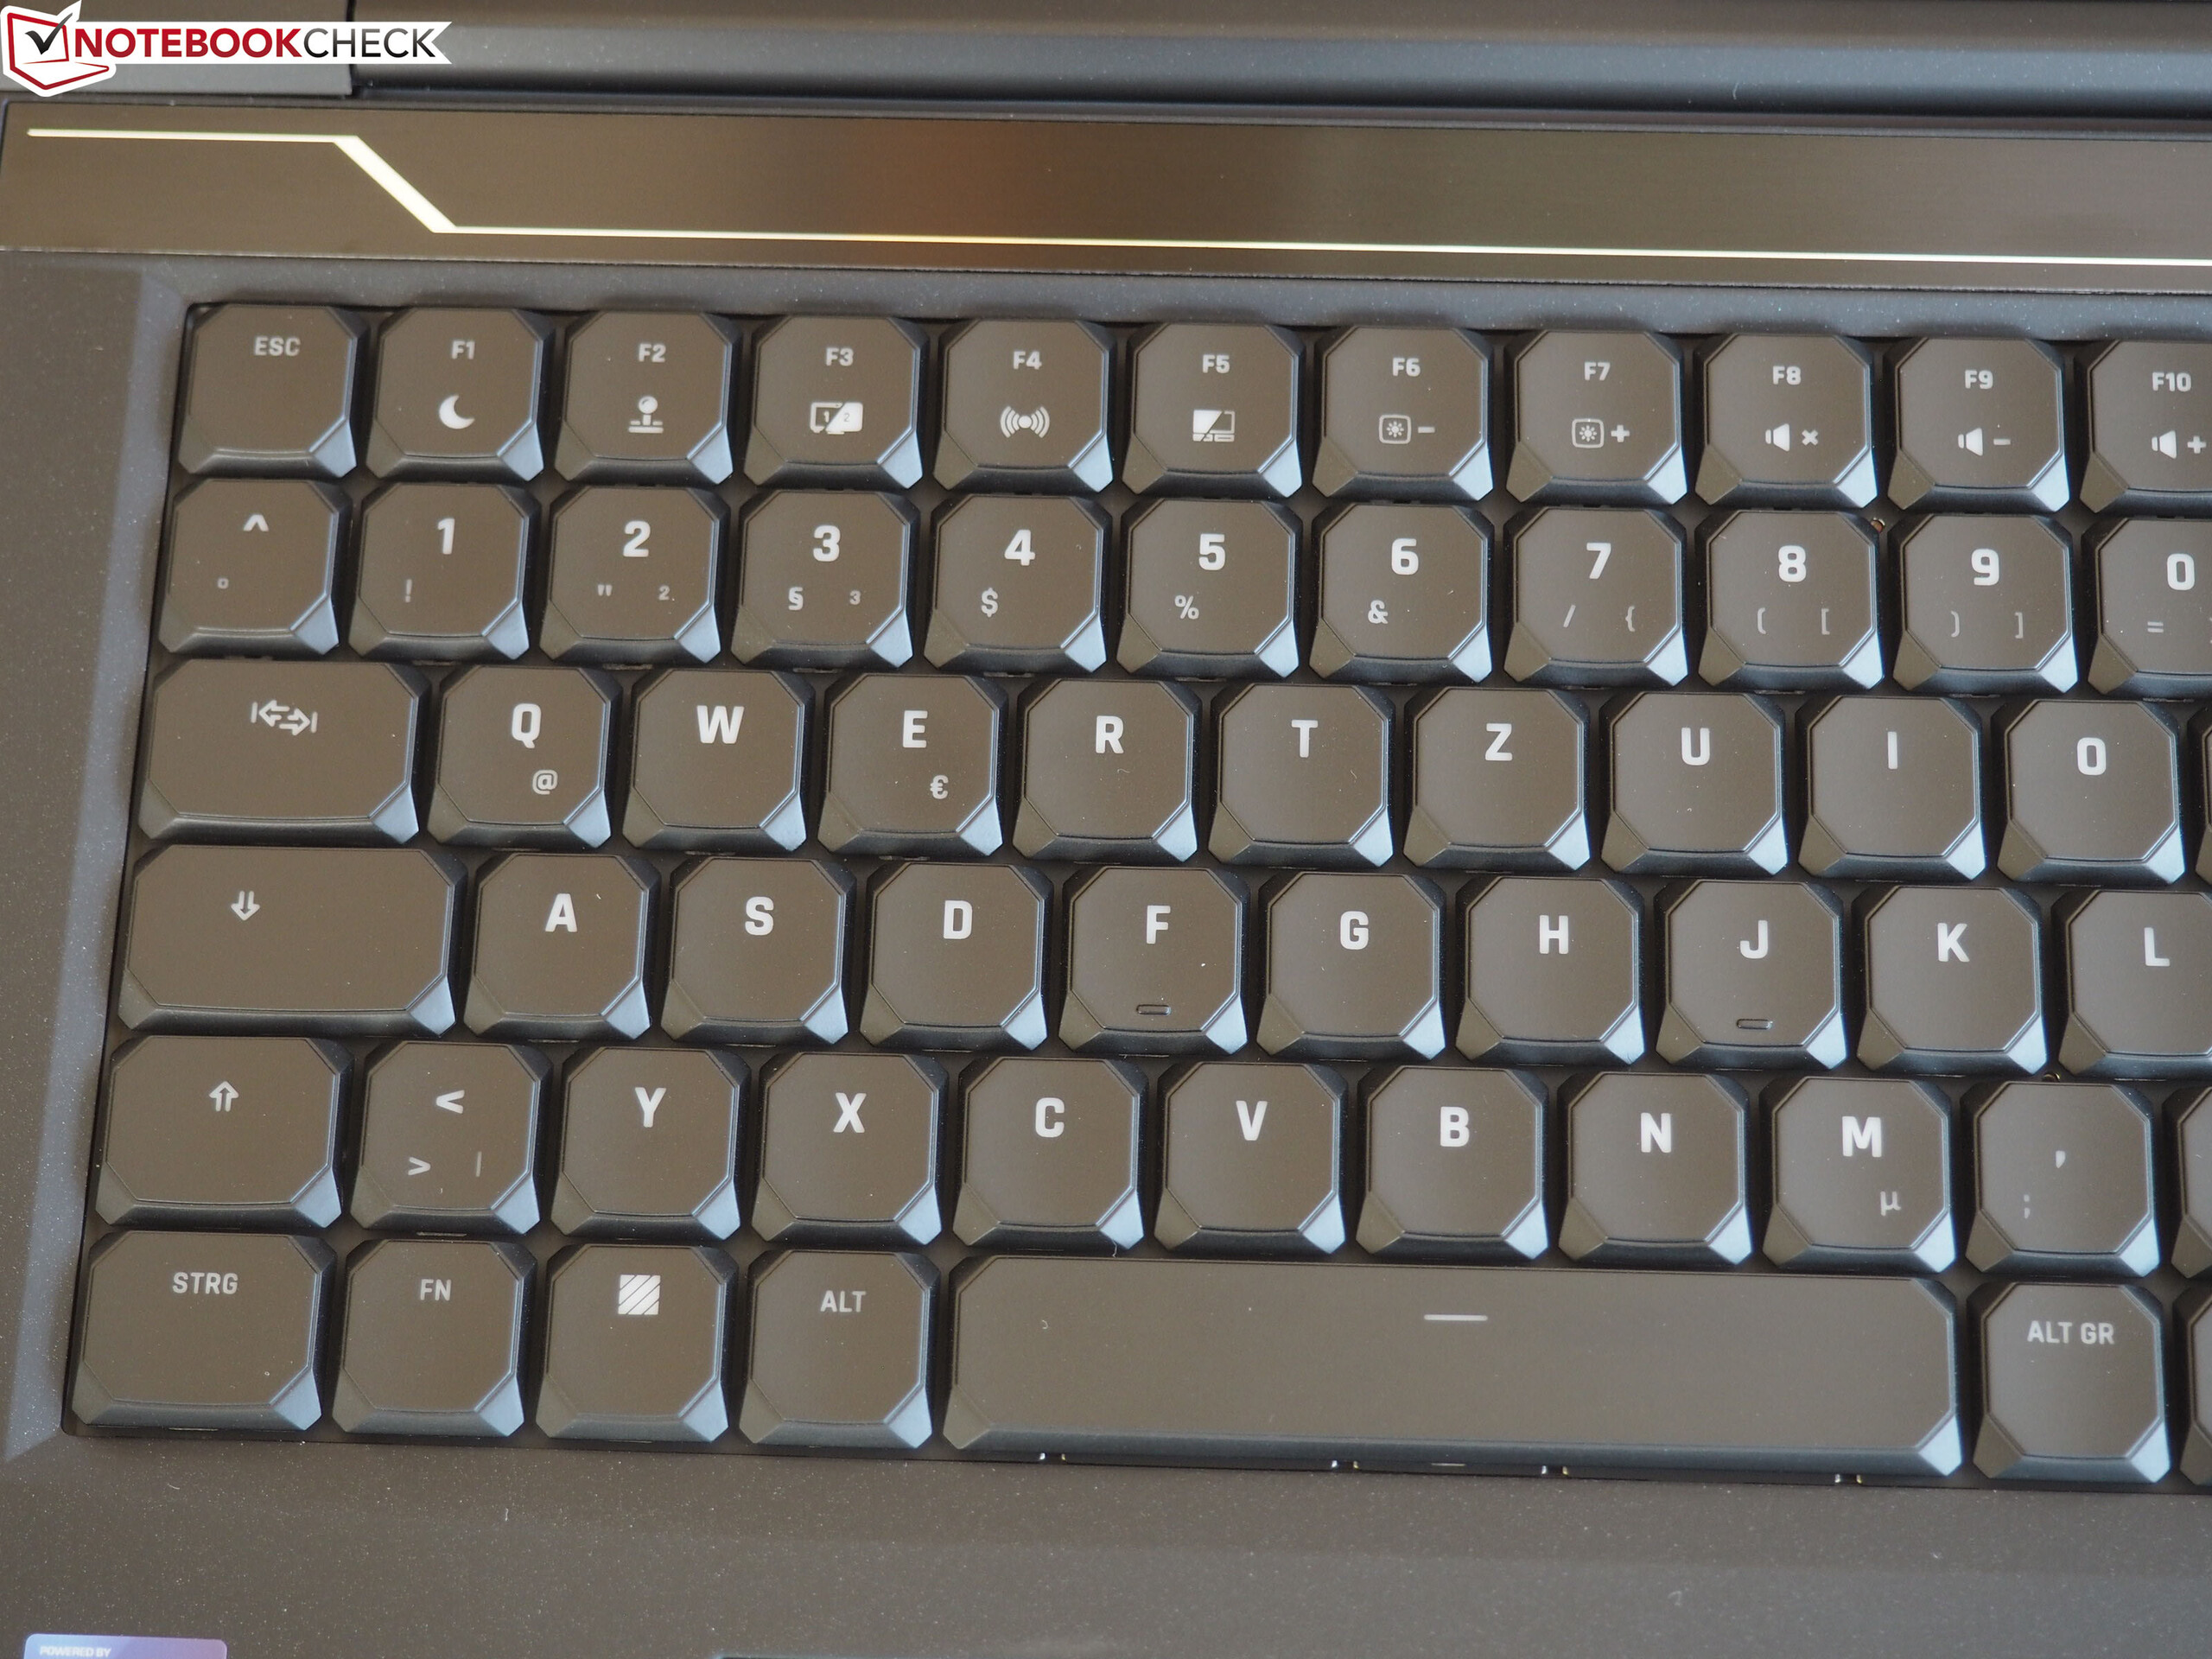
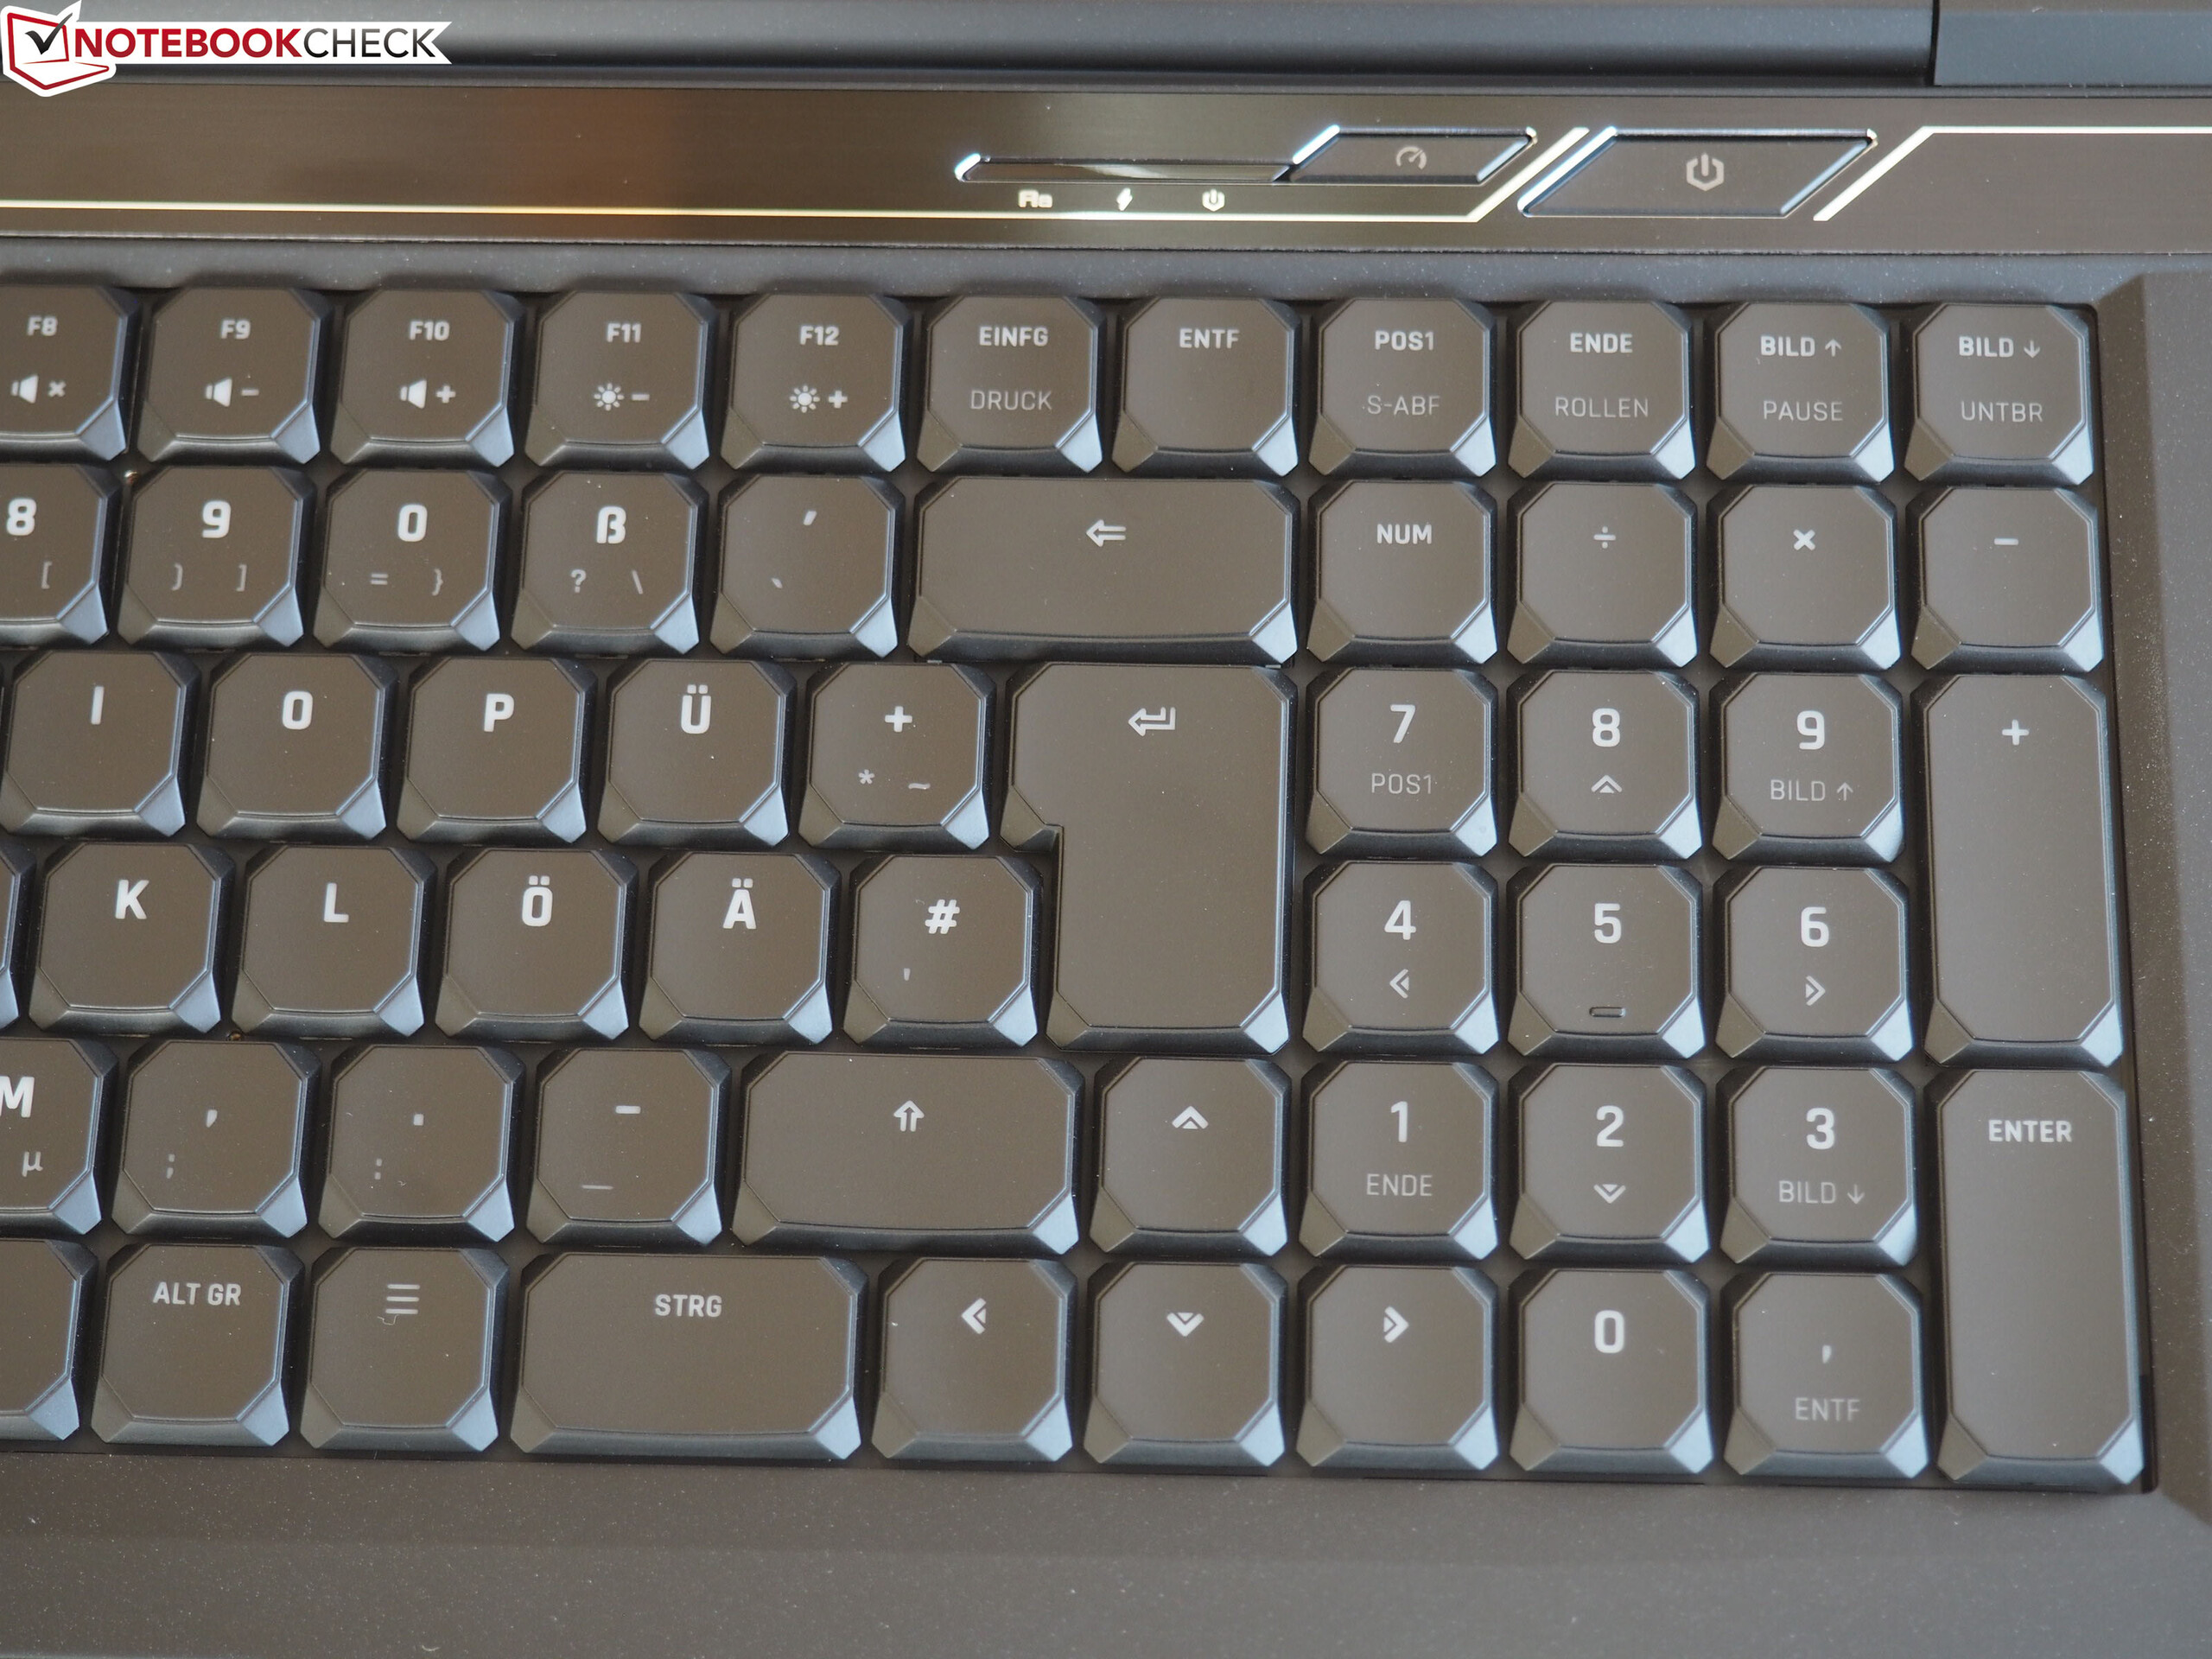
The mechanical keyboard (with RGB illumination) left a good impression and will represent an important purchase point for many potential buyers. The Thunderbolt 3 connection that was added compared to the predecessor allows connecting an extensive docking solution or an external GPU.
SCHENKER XMG Neo 17 Comet Lake
-
11/27/2020 v7
Sascha Mölck
More articles related to this device
SCHENKER XMG Neo 17 Comet Lake (Uniwill Technology Series)Related Articles


Pricecompare

