 Deutsch
 English
 Español
 Français
 Italiano
 Nederlands
 Polski
 Português
 Русский
 Türkçe
 Svenska
 Chinese
 Magyar
Schenker XMG NEO 17 with RTX 3080 in laptop review: Users can unleash the RTX 3080 themselves

At the beginning of the year, we reviewed the Schenker XMG Neo 17 with AMD CPU and RTX 3070, and now one of the top models follows with RTX 3080 and Intel Tiger Lake CPU, and the mechanical keyboard is also on board again. As with the sister model, the TGP of the graphics card can be completely set via software, and the full 165 W can be assigned to the GPU this way. However, the sister model was already very loud under load with an RTX 3070, so did the developers still tweak the cooling system in the meantime?
The main competitors are the Aorus 17G YD, with the same CPU and GPU, the Medion Erazer Beast X25, the more expensive Asus ROG Zephyrus S17 and the Asus Strix Scar 17. In addition, we compare with the predecessor.
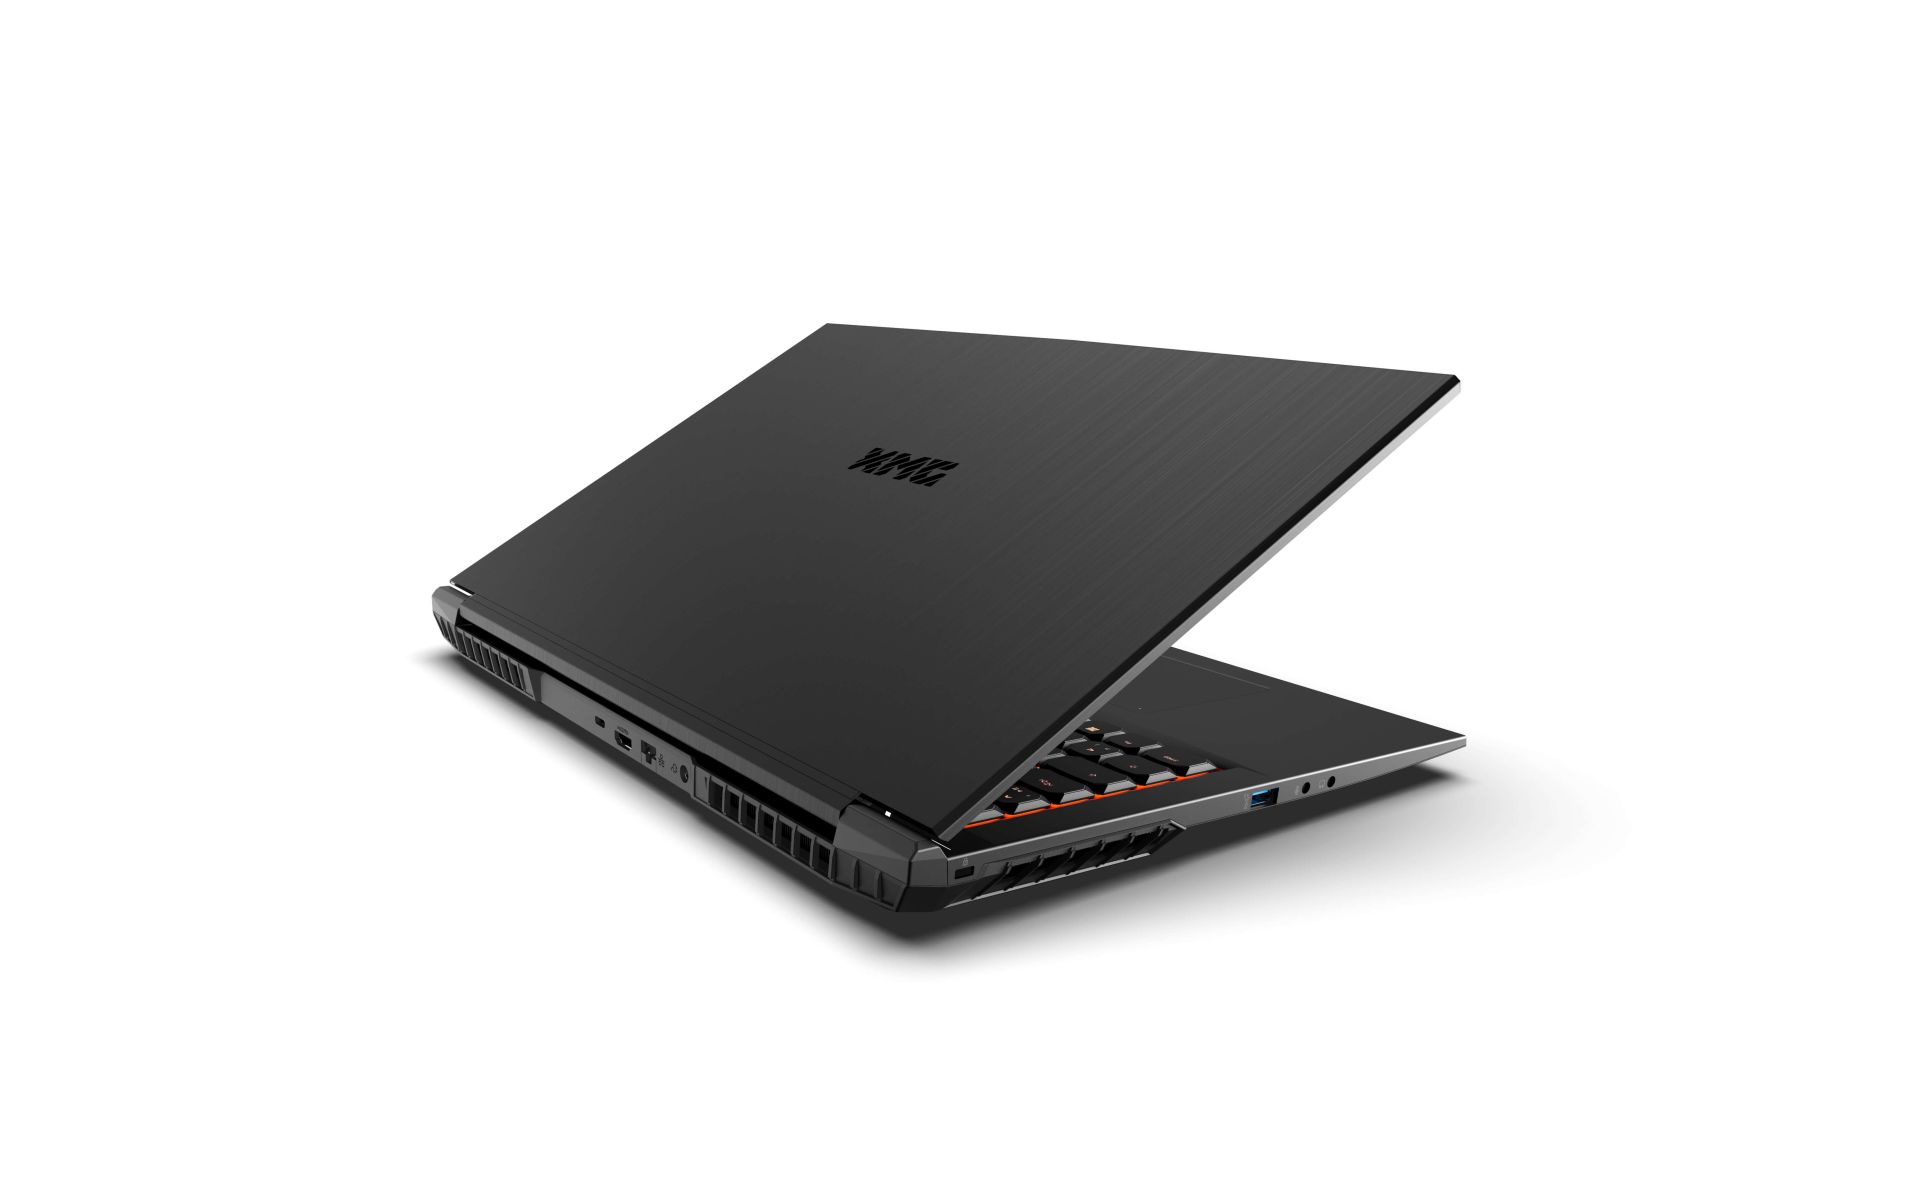
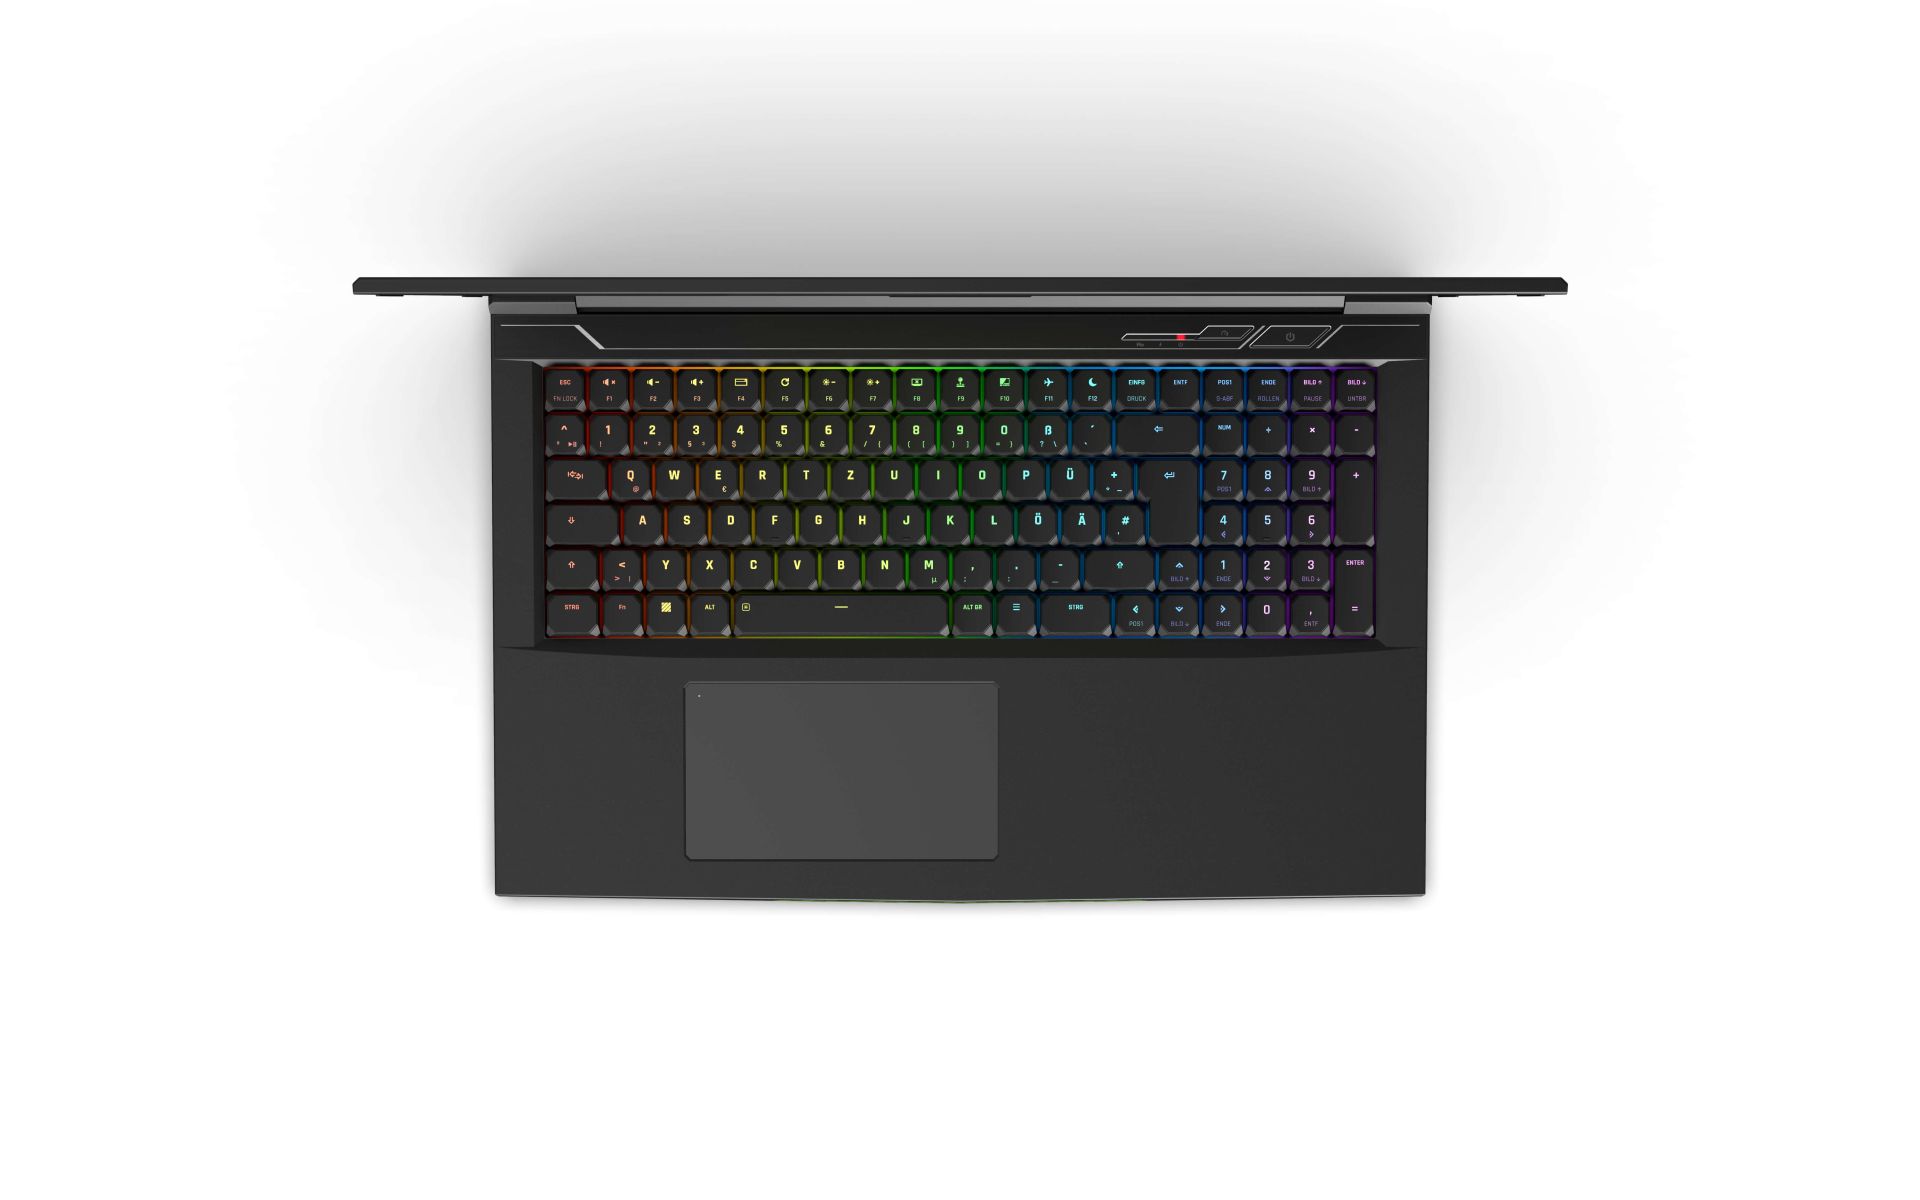
Since virtually nothing has changed in the case since 2019, we refer to the review of the Schenker XMG Neo 17 (Tongfang GK7CP7S) for the chassis, equipment and input devices sections.
Possible competitors in comparison
Rating | Date | Model | Weight | Height | Size | Resolution | Best Price |
|---|---|---|---|---|---|---|---|
| 87.4 % | 09/2021 | SCHENKER XMG NEO 17 GM7TG8S i7-11800H, GeForce RTX 3080 Laptop GPU | 2.6 kg | 27.45 mm | 17.30" | 2560x1440 | |
| 85.1 % | 01/2021 | SCHENKER XMG Neo 17 (Early 2021, RTX 3070, 5800H) R7 5800H, GeForce RTX 3070 Laptop GPU | 2.5 kg | 27 mm | 17.30" | 2560x1440 | |
| 86 % | 06/2021 | Aorus 17G YD i7-11800H, GeForce RTX 3080 Laptop GPU | 2.8 kg | 26 mm | 17.30" | 1920x1080 | |
| 85 % | 07/2021 | Medion Erazer Beast X25 R9 5900HX, GeForce RTX 3080 Laptop GPU | 2.3 kg | 23 mm | 17.30" | 1920x1080 | |
| 90.1 % | 07/2021 | Asus ROG Zephyrus S17 GX703HSD i9-11900H, GeForce RTX 3080 Laptop GPU | 2.8 kg | 19.9 mm | 17.30" | 2560x1440 | |
| 86.6 % | 05/2021 | Asus Strix Scar 17 G733QSA-XS99 R9 5900HX, GeForce RTX 3080 Laptop GPU | 2.8 kg | 28.3 mm | 17.30" | 1920x1080 |
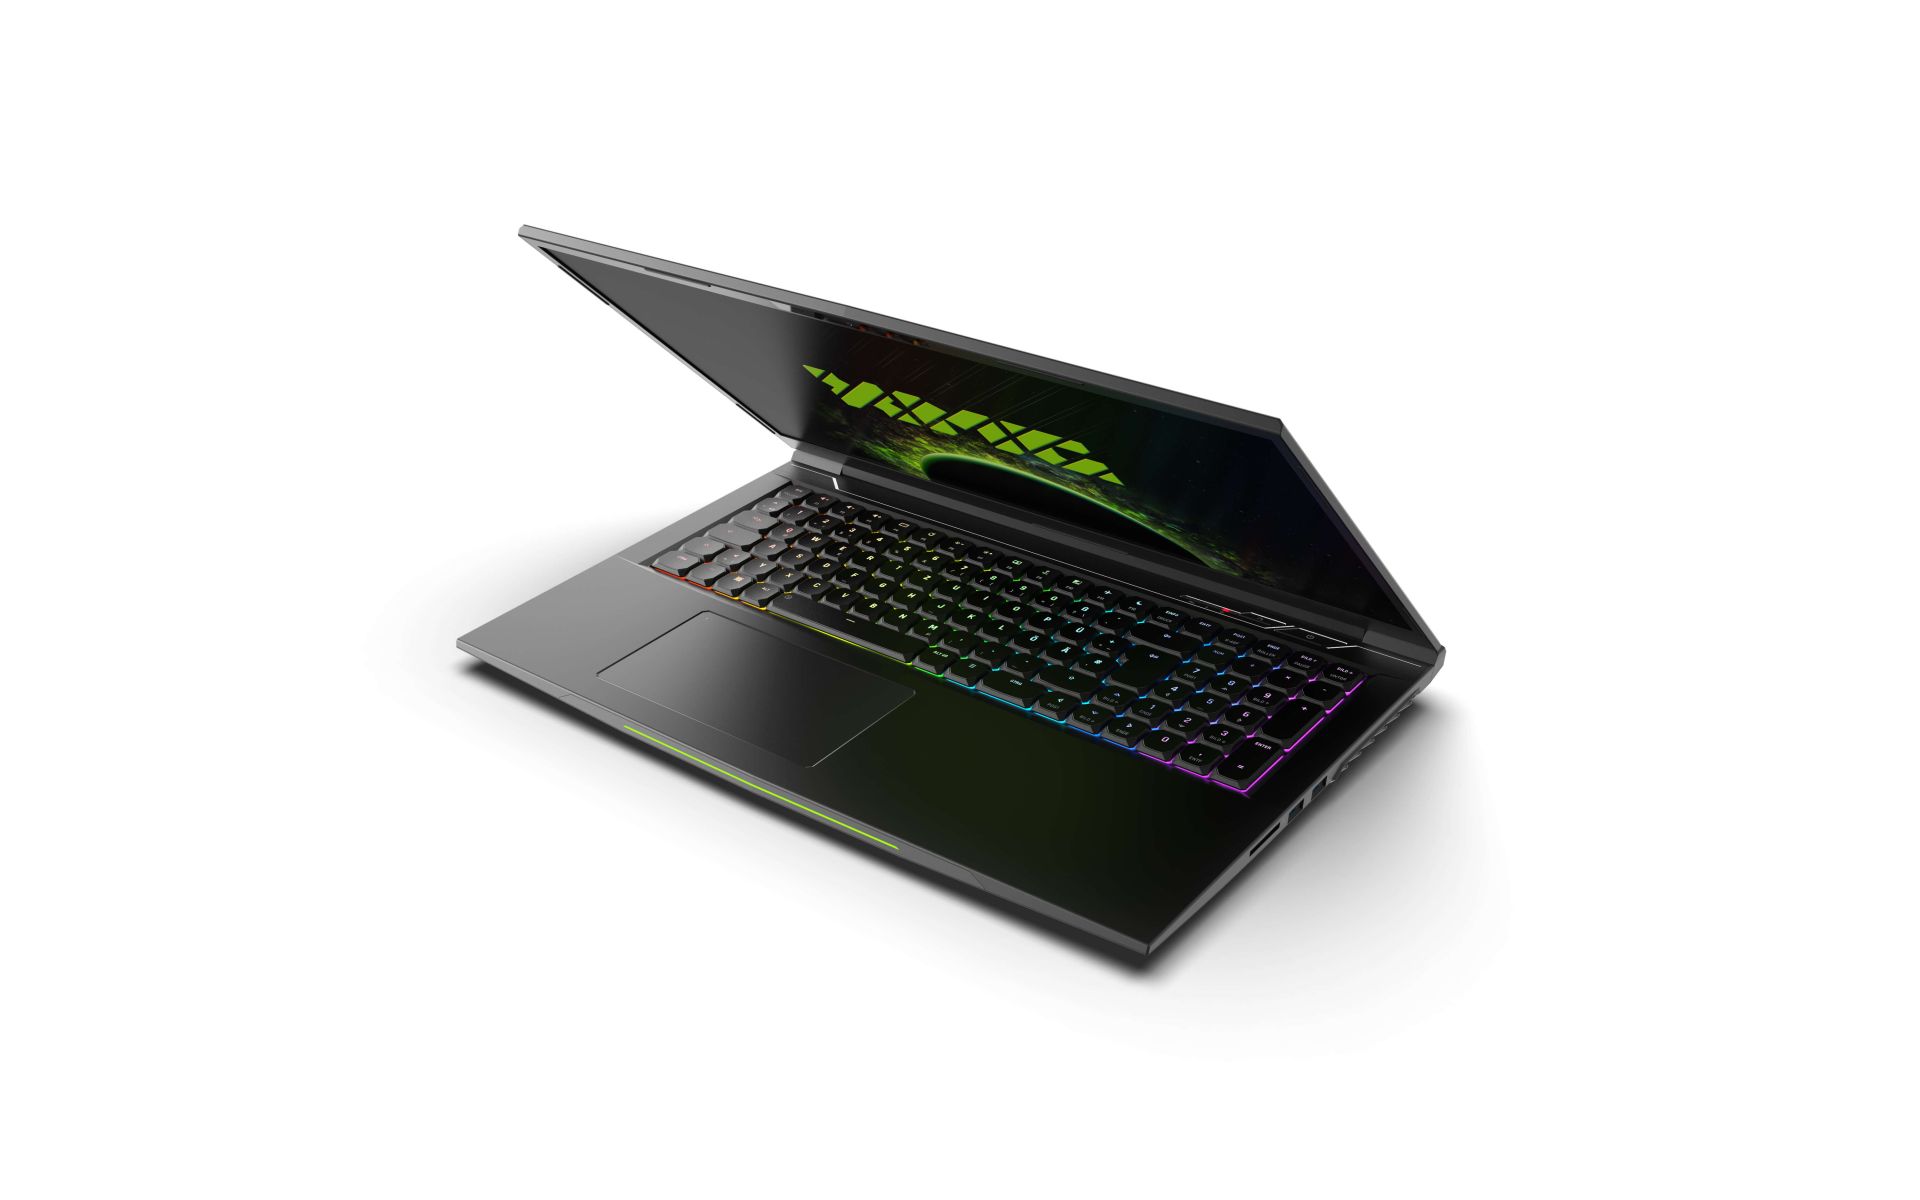
Case - Stable and relatively slim
(Image source: Schenker)
Equipment - Prank cure with speed update
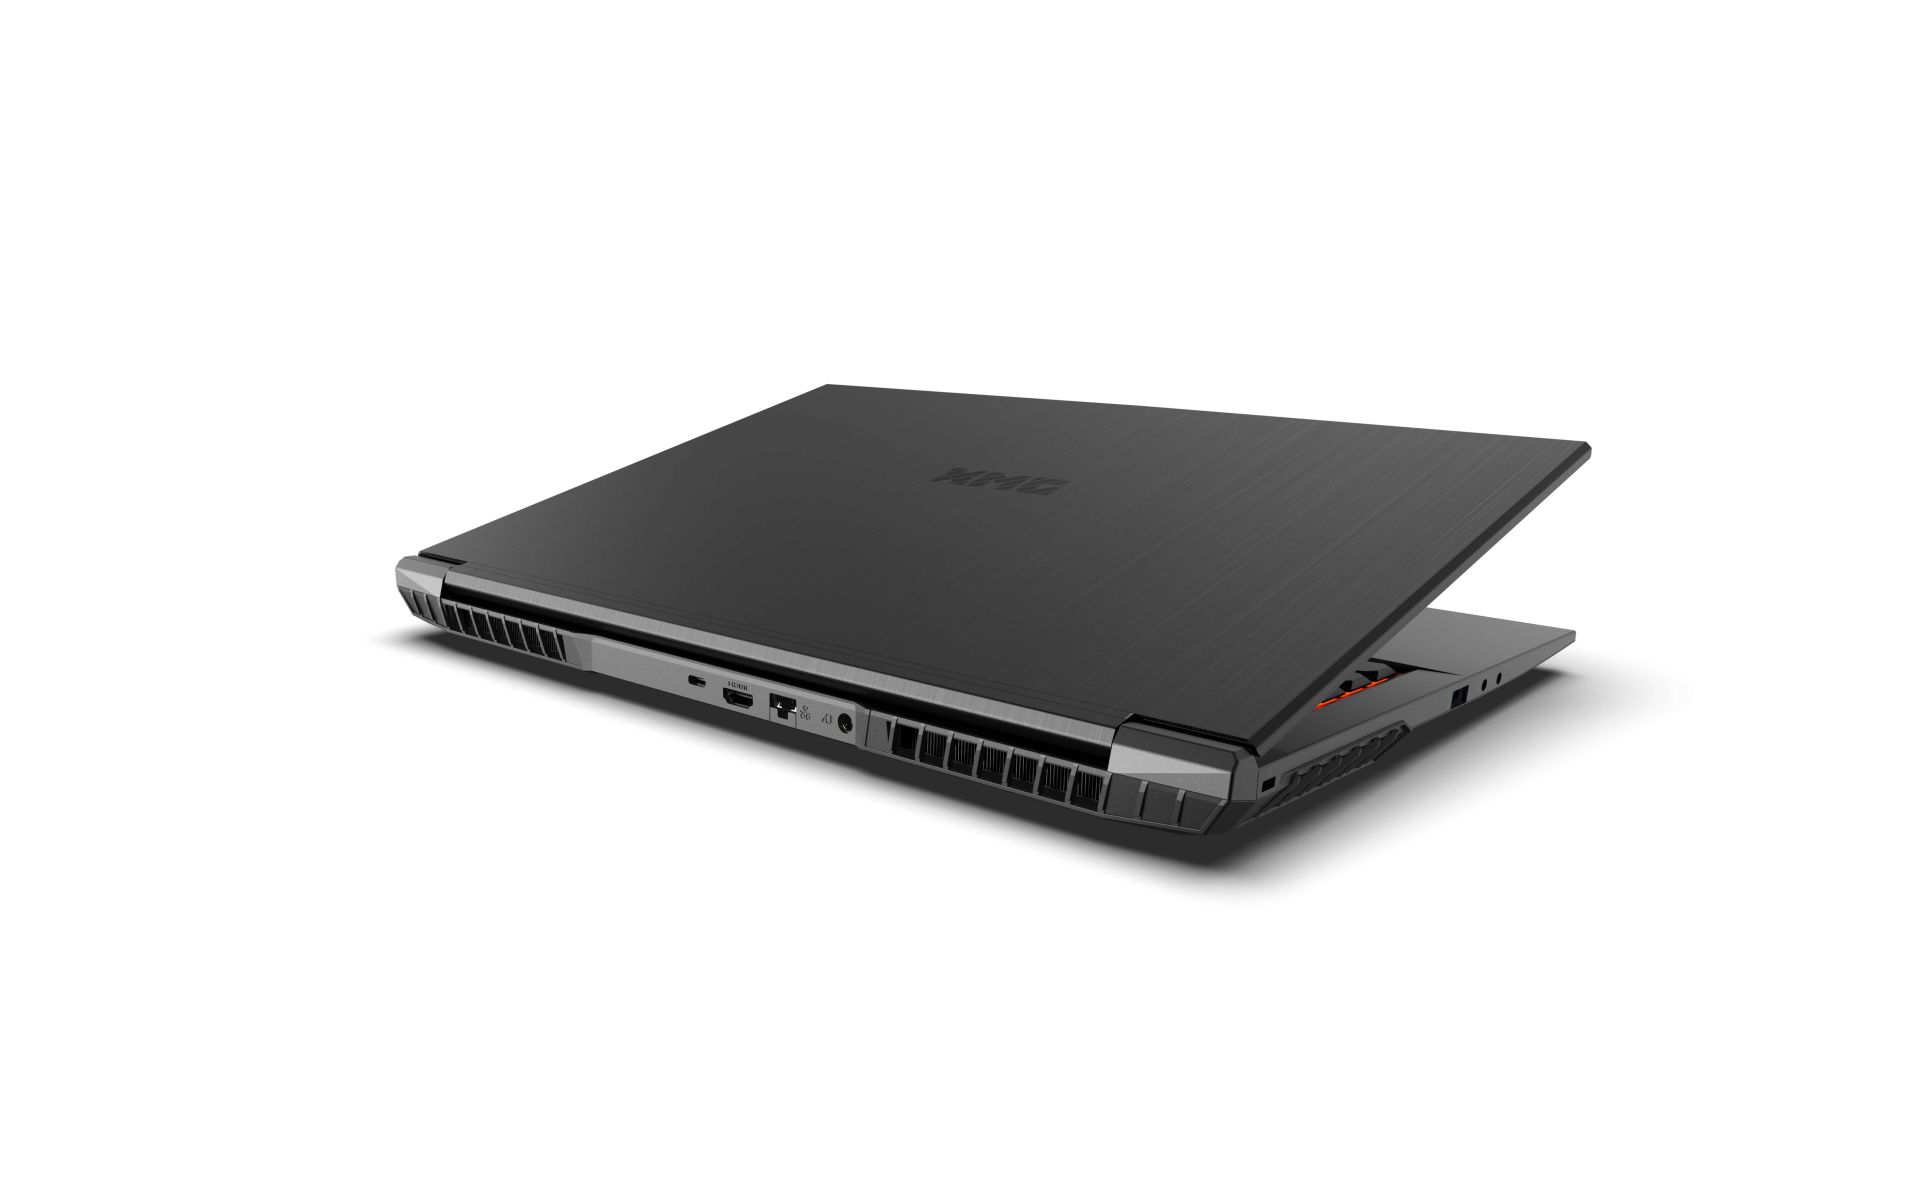
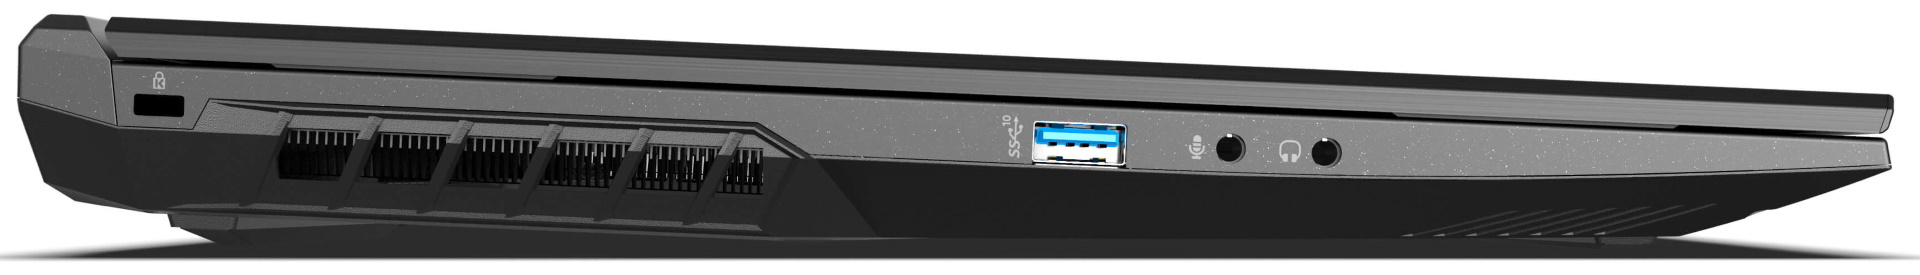
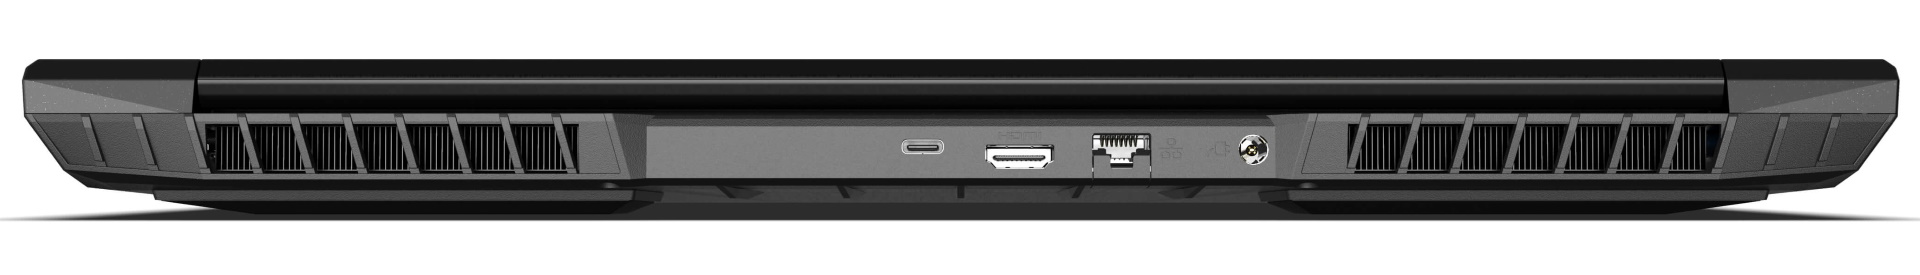
Of course, some things have already changed here since 2019, but not necessarily only for the better. For example, both miniDP ports are dropped, which is not compensated by anything. Otherwise, some ports change position: For example, the LAN port now moves to the back. The two USB-A ports on the right only support 3.0, whereas the USB-A port on the left supports 3.2 Gen2. The USB-C 4.0 port on the back supports Thunderbolt 4, including DisplayPort 1.4 and G-SYNC compatibility, but without Power Delivery; the gamer cannot charge via USB-C.
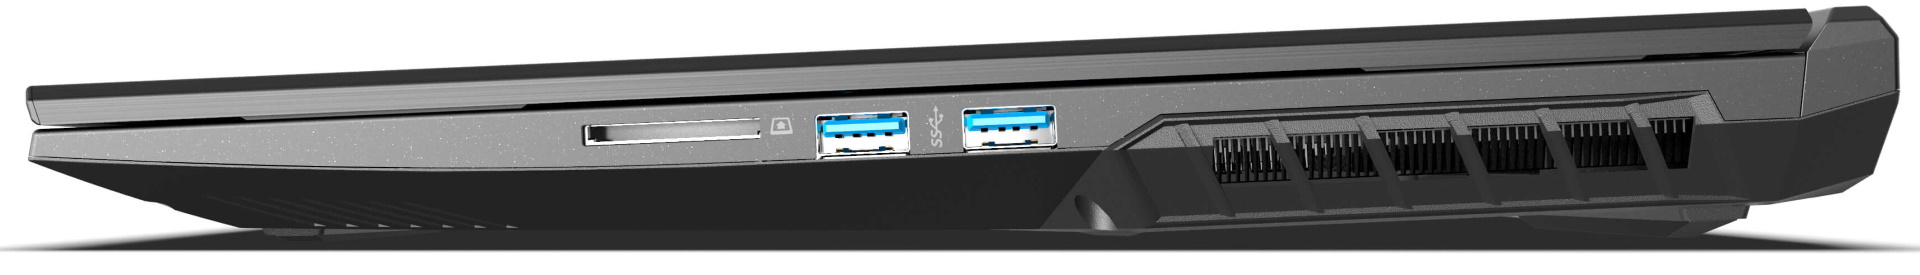
SD card reader
The SD reader accepts standard-sized SD cards, which do not snap into place and stick out halfway. The speed test with our reference memory card AV PRO microSD 128 GB V60 results in average rates. The readers in the Zephyrus and Aorus are significantly faster, whereas the Medion has similar rates. Overall, the rates are clearly below average for the gaming sector, especially considering the price.
| SD Card Reader | |
| average JPG Copy Test (av. of 3 runs) | |
| Aorus 17G YD (AV PRO microSD 128 GB V60) | |
| Asus ROG Zephyrus S17 GX703HSD | |
| Average of class Gaming (19 - 202, n=100, last 2 years) | |
| SCHENKER XMG Neo 17 (Early 2021, RTX 3070, 5800H) (Toshiba Exceria Pro SDXC 64 GB UHS-II) | |
| Medion Erazer Beast X25 (AV PRO microSD 128 GB V60) | |
| SCHENKER XMG NEO 17 GM7TG8S | |
| maximum AS SSD Seq Read Test (1GB) | |
| Asus ROG Zephyrus S17 GX703HSD | |
| Aorus 17G YD (AV PRO microSD 128 GB V60) | |
| Average of class Gaming (25.8 - 269, n=94, last 2 years) | |
| SCHENKER XMG NEO 17 GM7TG8S | |
| SCHENKER XMG Neo 17 (Early 2021, RTX 3070, 5800H) (Toshiba Exceria Pro SDXC 64 GB UHS-II) | |
| Medion Erazer Beast X25 (AV PRO microSD 128 GB V60) | |
Communication
The LAN port supports 2.5 Gbit/s. In terms of WLAN transfer rates, the NEO is assured a place in the lower midfield, but most competitors are slightly faster. The transmission performance in particular fluctuates strongly and has outliers towards the bottom.
Webcam
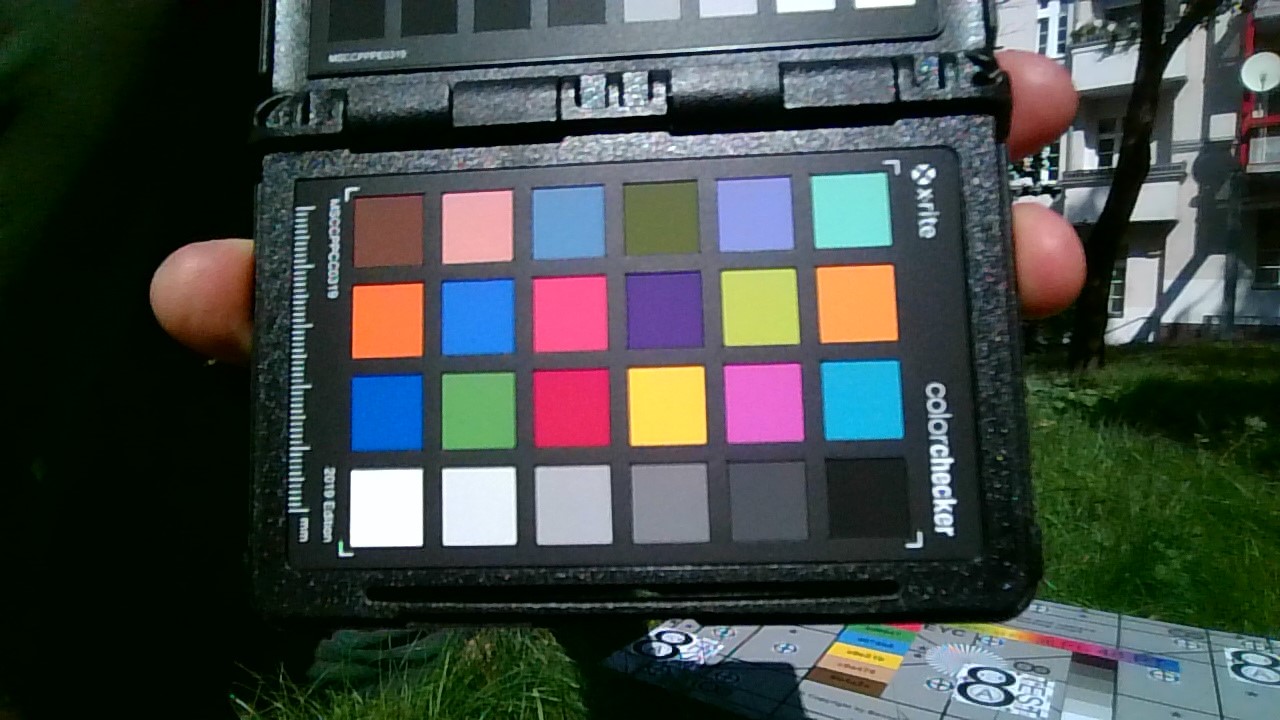
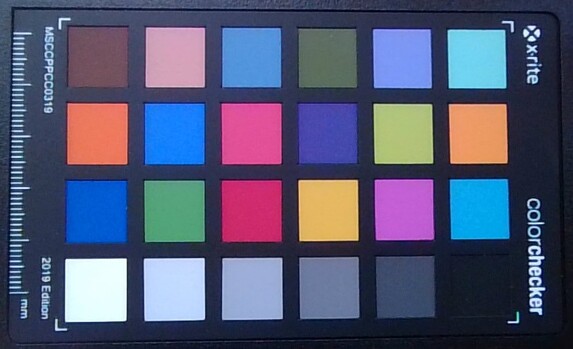
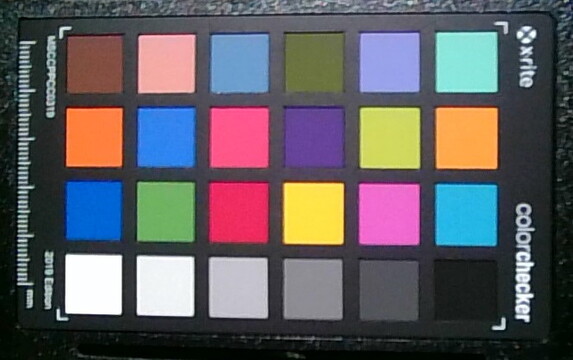
The webcam is abysmal even for 720p standard cameras. While the color deviations are surprisingly low, the pictures are far too dark, blurry and washed out even in sunshine, which is why the webcam is only usable in an emergency. If you do not want to come across like a goth on your video conferences, you should rely on an external solution and ignore the internal camera.


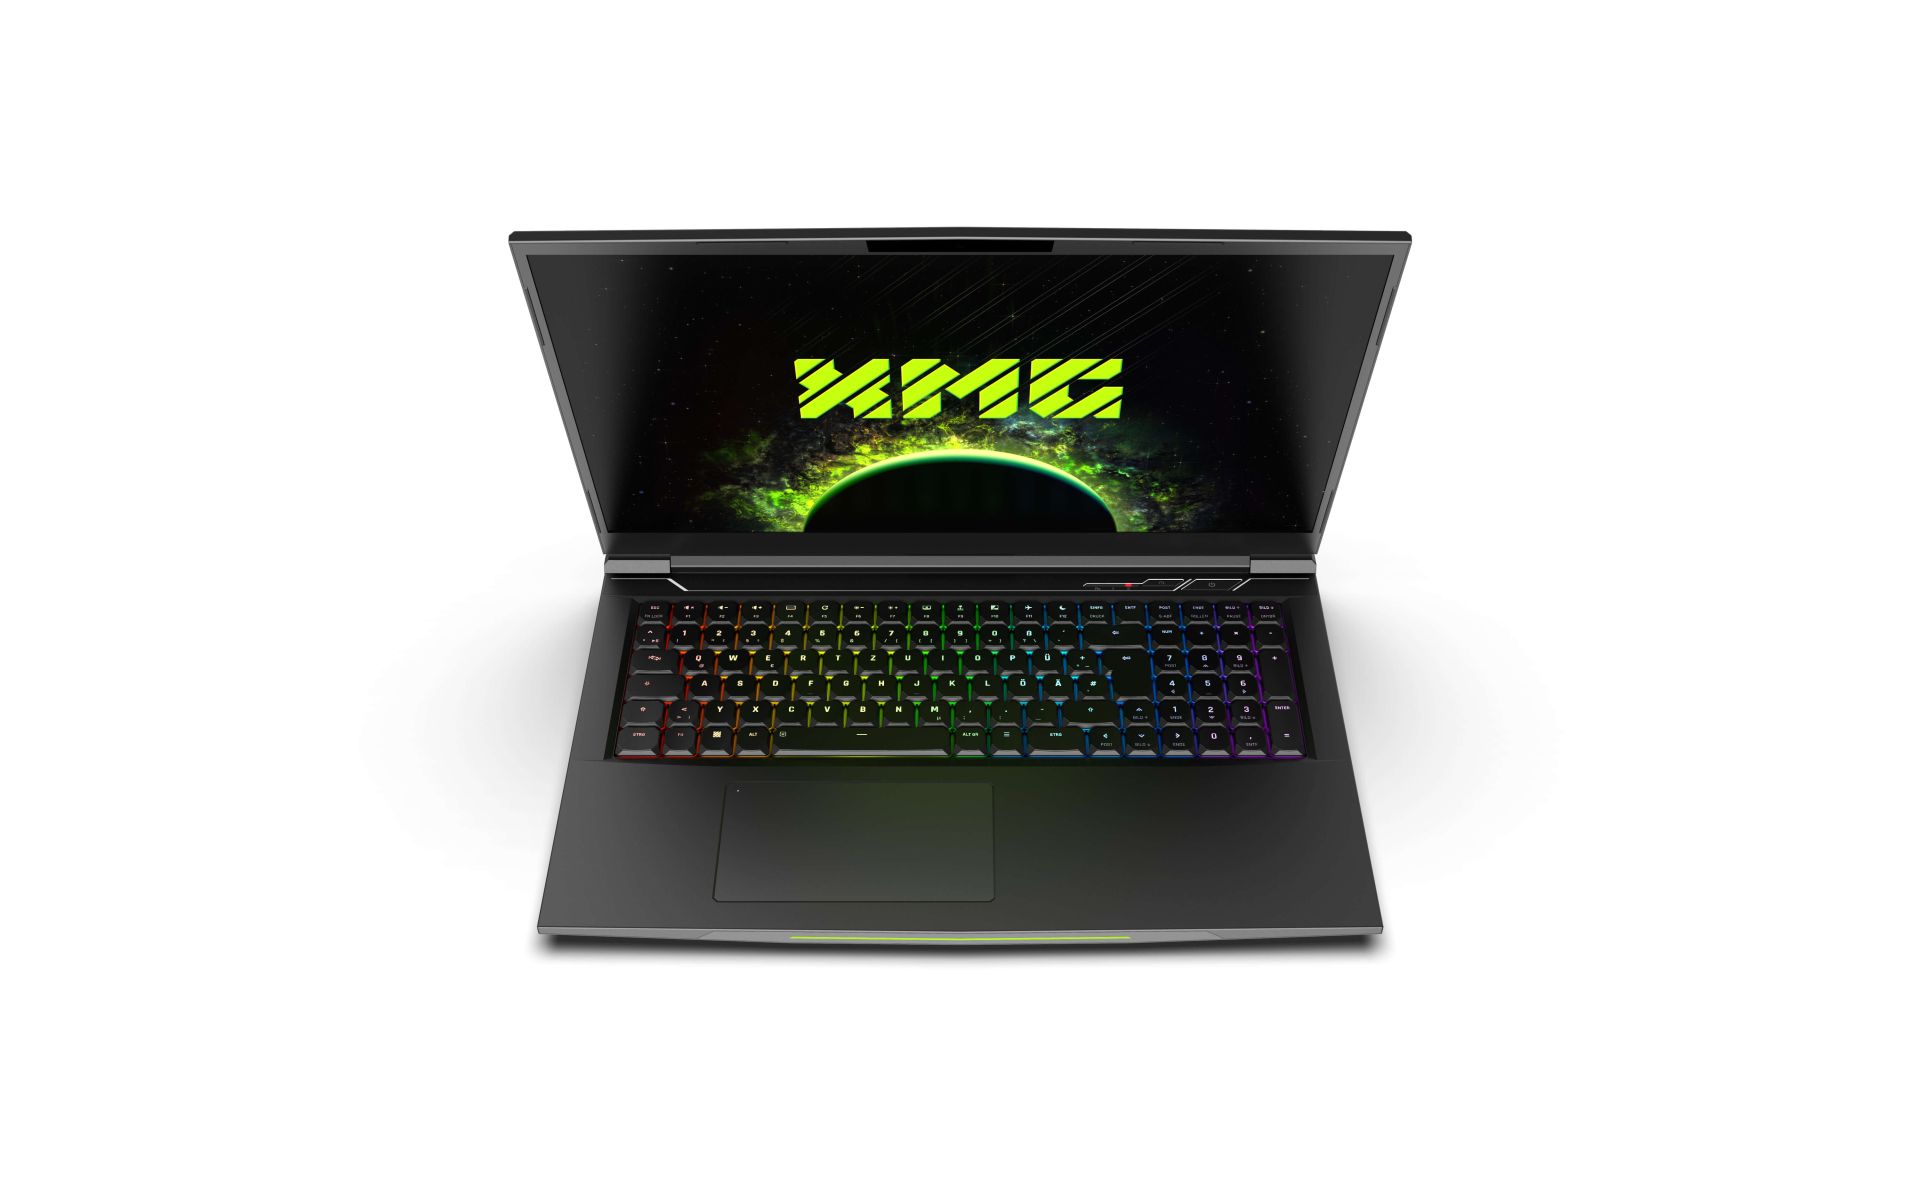
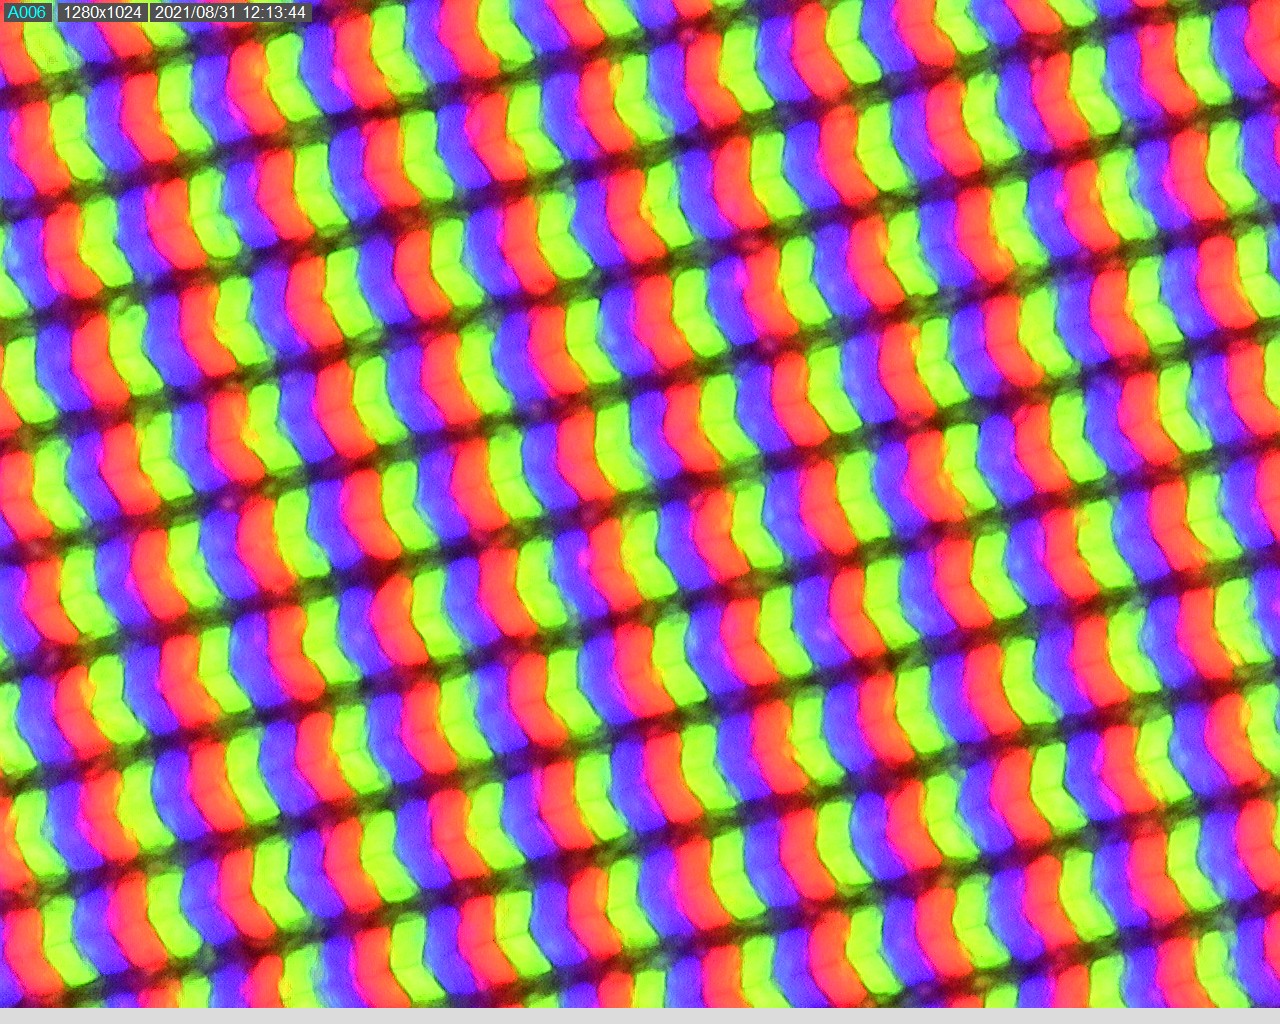
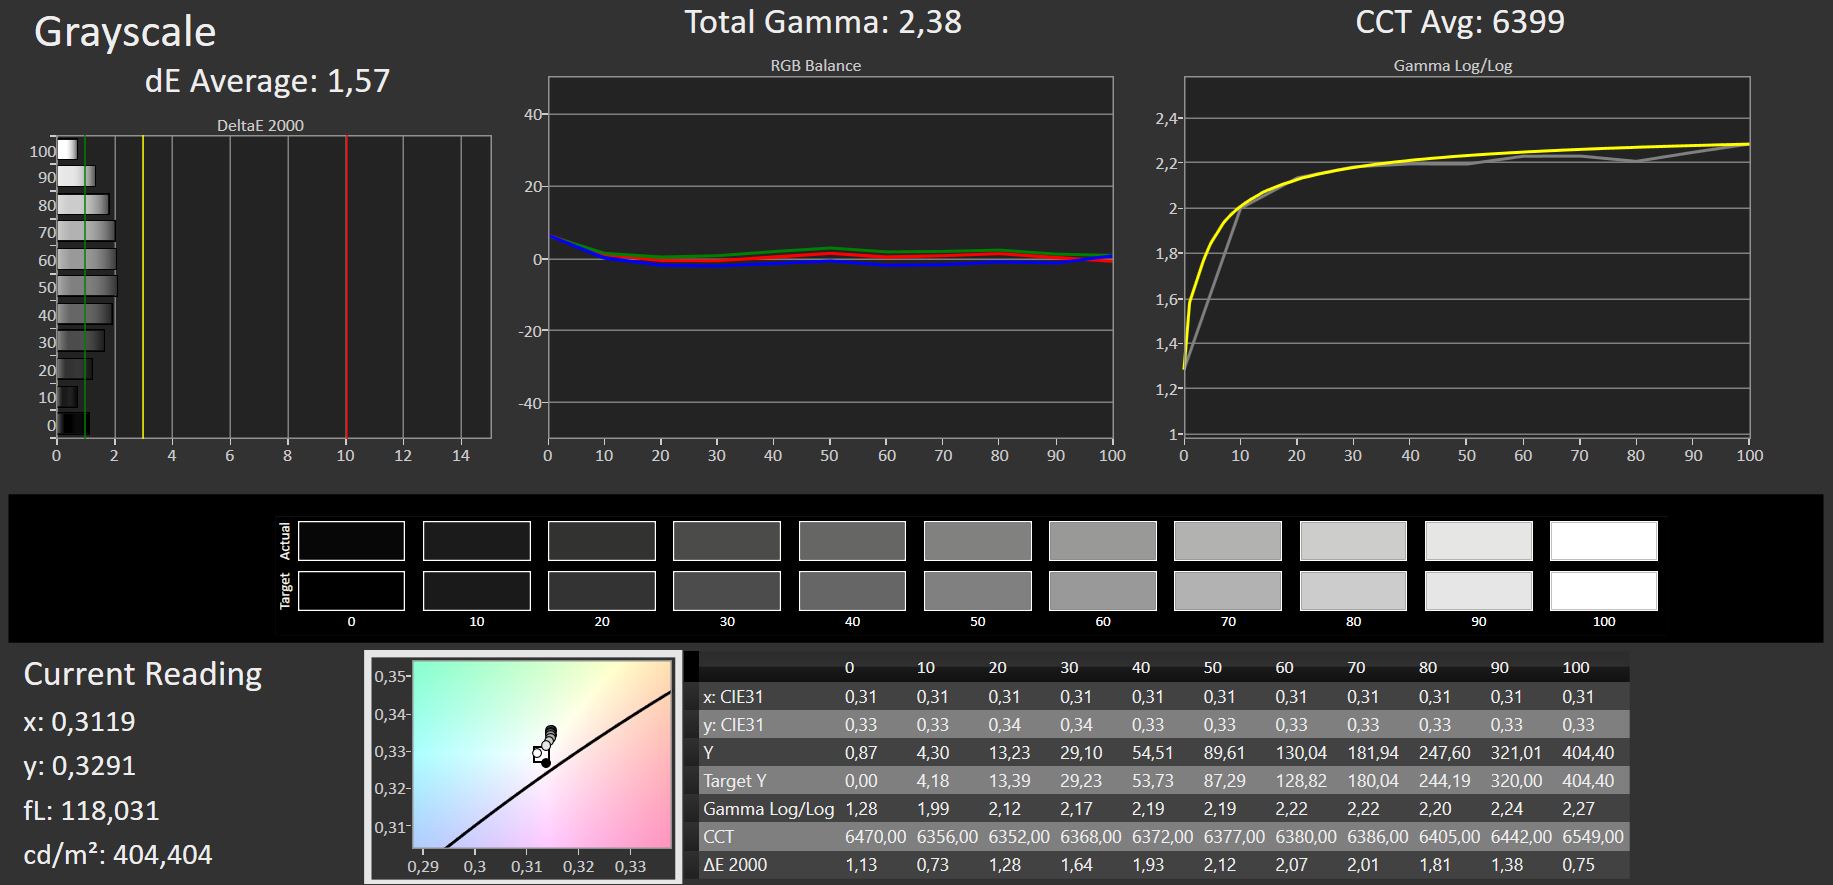
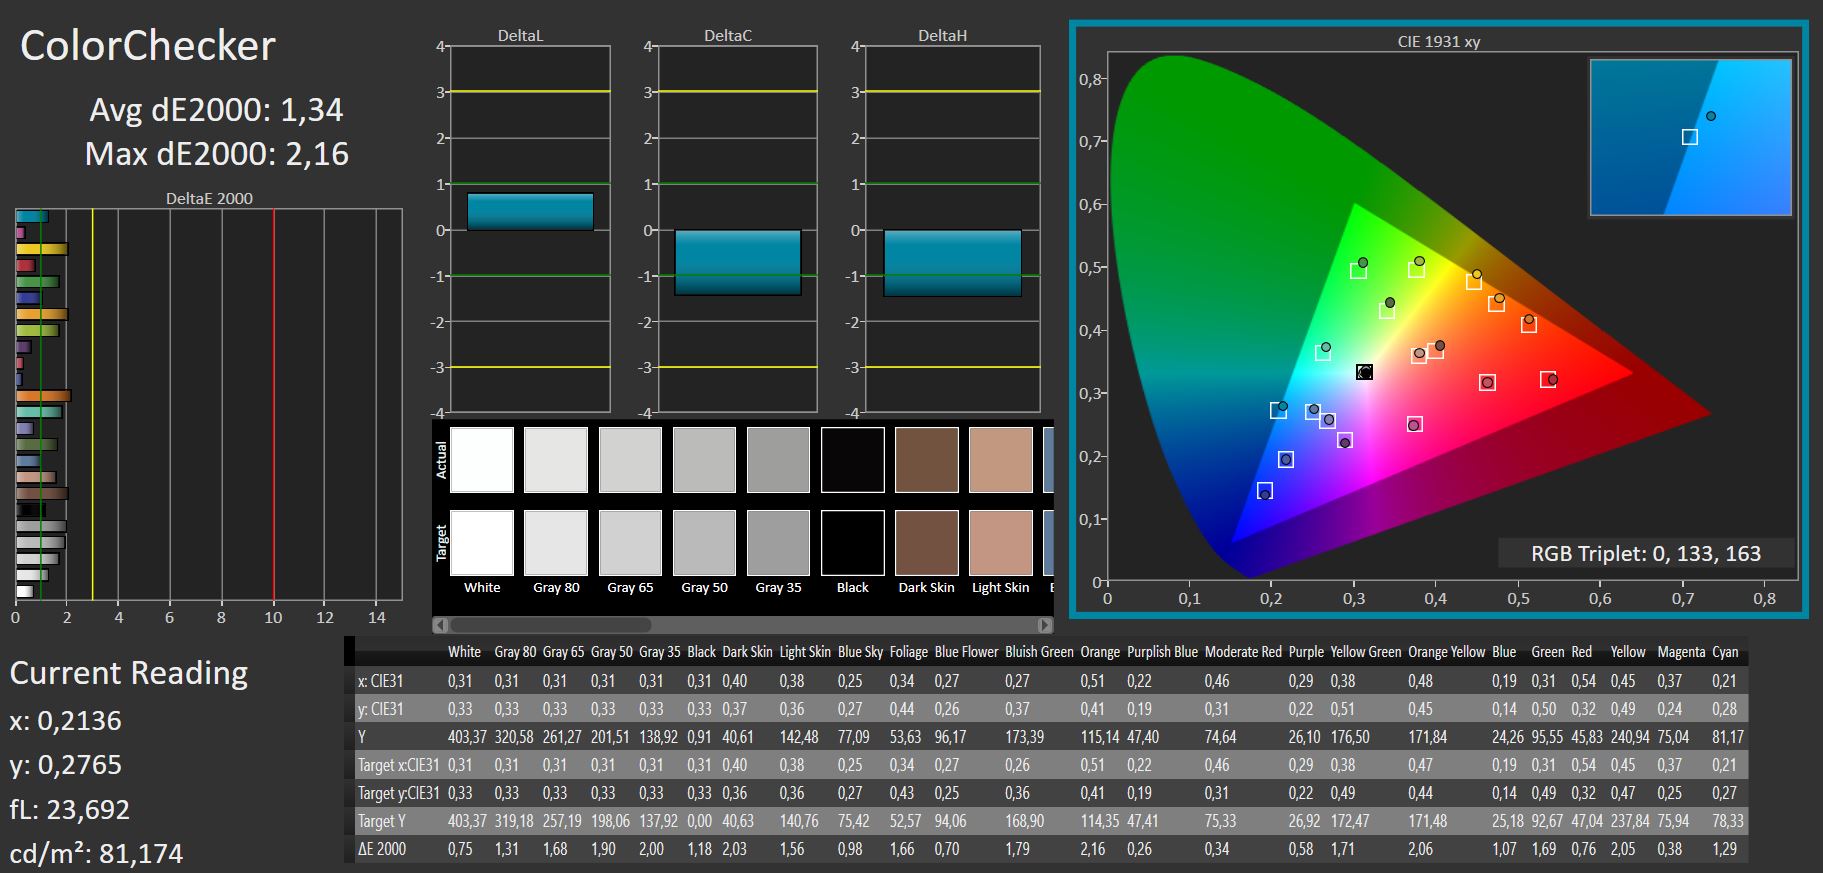
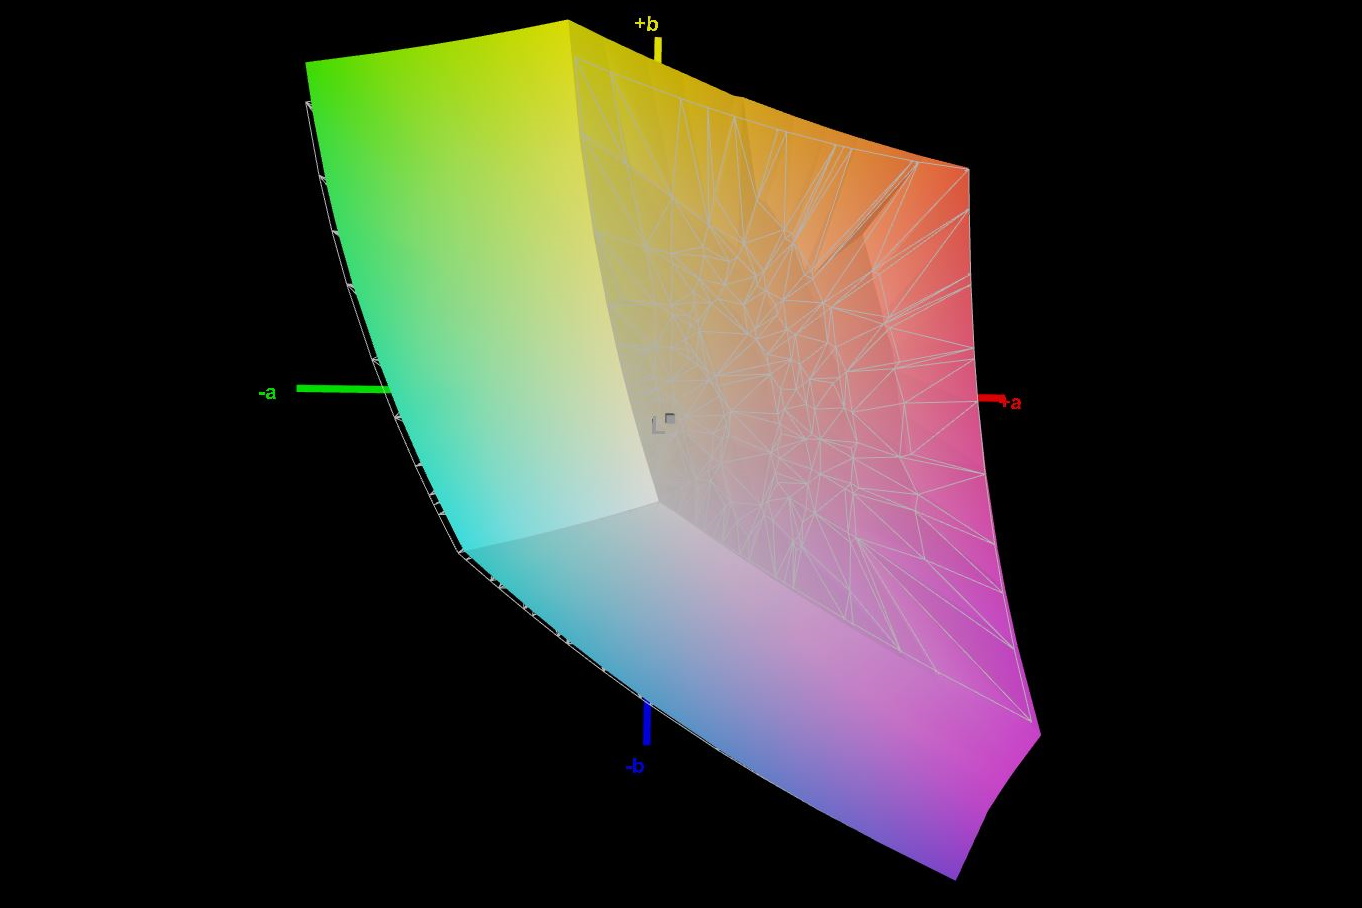
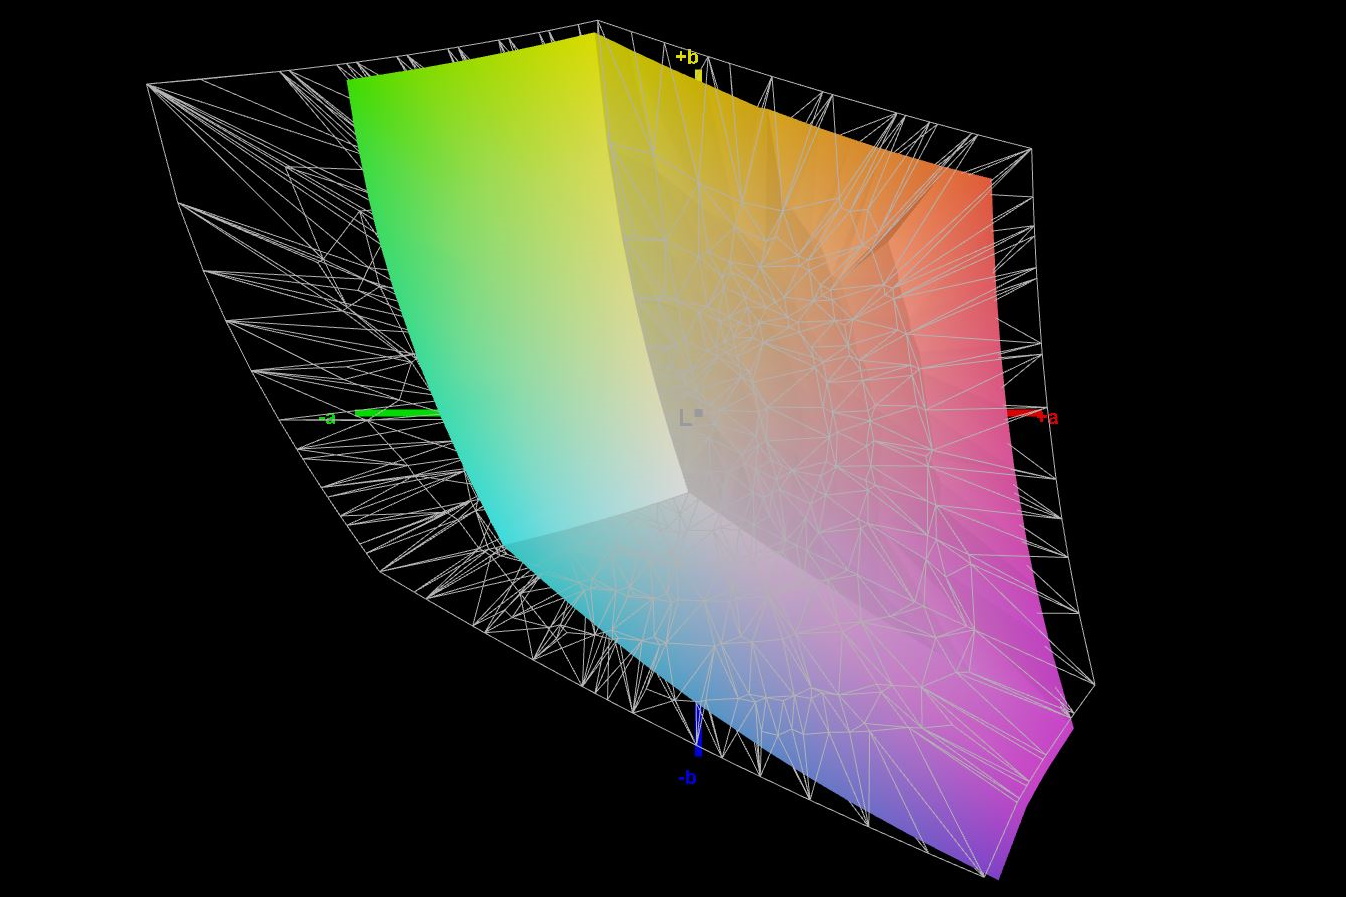
Display - Well calibrated WQHD panel
Schenker relies on a matte 17.3-inch IPS display from BOE with a 16:9 resolution of 2,560 x 1,440 pixels and a refresh rate of 165 Hz. Thus, the display is the same as in the NEO 17 with AMD CPU and RTX 3060.
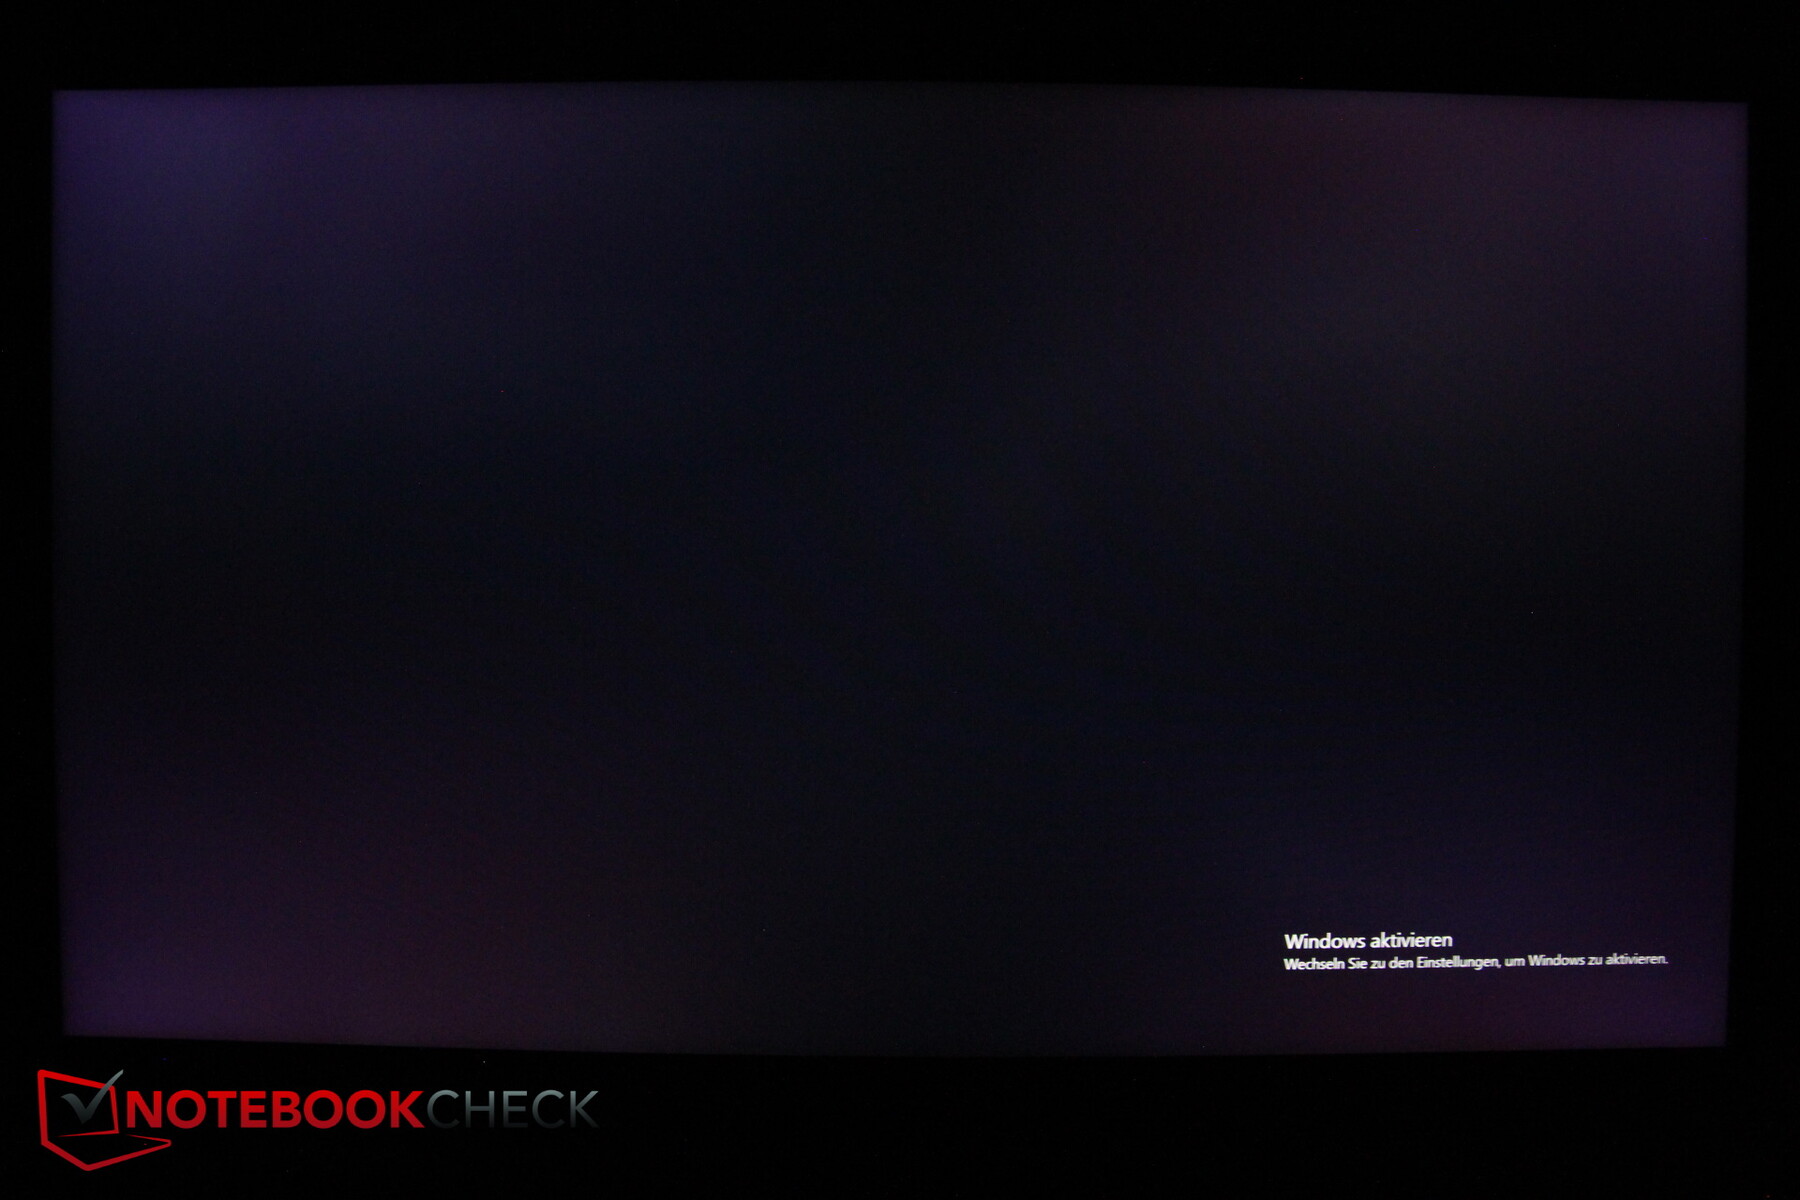
The average brightness of 366 nits is okay, and the illumination of 82 percent is acceptable.
| |||||||||||||||||||||||||
Brightness Distribution: 82 %
Center on Battery: 397 cd/m²
Contrast: 880:1 (Black: 0.45 cd/m²)
ΔE Color 1.43 | 0.5-29.43 Ø5, calibrated: 1.34
ΔE Greyscale 1.8 | 0.57-98 Ø5.3
68.6% AdobeRGB 1998 (Argyll 2.2.0 3D)
96.3% sRGB (Argyll 2.2.0 3D)
67.1% Display P3 (Argyll 2.2.0 3D)
Gamma: 2.4
| SCHENKER XMG NEO 17 GM7TG8S BOE0977 (NE173QHM-NY2), IPS, 2560x1440, 17.30 | SCHENKER XMG Neo 17 (Early 2021, RTX 3070, 5800H) BOE NE173QHM-NY2 (BOE0977), IPS, 2560x1440, 17.30 | Aorus 17G YD Sharp LQ173M1JW04, IPS, 1920x1080, 17.30 | Medion Erazer Beast X25 BOE NE173FHM-NZ1 (BOE0884), IPS, 1920x1080, 17.30 | Asus ROG Zephyrus S17 GX703HSD BOE099D (BOE CQ NE173QHM-NY3), IPS, 2560x1440, 17.30 | Asus Strix Scar 17 G733QSA-XS99 AU Optronics B173HAN05.4, IPS, 1920x1080, 17.30 | |
|---|---|---|---|---|---|---|
| Display | 4% | 6% | 4% | 22% | 5% | |
| Display P3 Coverage | 67.1 | 70.5 5% | 72.3 8% | 70.4 5% | 94.2 40% | 71 6% |
| sRGB Coverage | 96.3 | 99.5 3% | 100 4% | 99.8 4% | 98.7 2% | 99.4 3% |
| AdobeRGB 1998 Coverage | 68.6 | 71.8 5% | 73.7 7% | 71.6 4% | 84.4 23% | 72.2 5% |
| Response Times | -13% | 3% | 38% | 39% | 17% | |
| Response Time Grey 50% / Grey 80% * | 15.2 | 16.8 ? -11% | 13.6 ? 11% | 9.2 ? 39% | 4.8 68% | 6.6 ? 57% |
| Response Time Black / White * | 8.8 | 10 ? -14% | 9.2 ? -5% | 5.6 ? 36% | 8 9% | 10.8 ? -23% |
| PWM Frequency | ||||||
| Screen | -22% | -35% | -26% | -40% | -9% | |
| Brightness middle | 396 | 410 4% | 286 -28% | 329 -17% | 322 -19% | 303.8 -23% |
| Brightness | 366 | 381 4% | 282 -23% | 315 -14% | 288 -21% | 292 -20% |
| Brightness Distribution | 82 | 88 7% | 73 -11% | 88 7% | 72 -12% | 85 4% |
| Black Level * | 0.45 | 0.37 18% | 0.24 47% | 0.33 27% | 0.3 33% | 0.23 49% |
| Contrast | 880 | 1108 26% | 1192 35% | 997 13% | 1073 22% | 1321 50% |
| Colorchecker dE 2000 * | 1.43 | 2.55 -78% | 2.79 -95% | 2.03 -42% | 3.05 -113% | 1.87 -31% |
| Colorchecker dE 2000 max. * | 2.2 | 4.33 -97% | 6.23 -183% | 5.5 -150% | 5.23 -138% | 3.26 -48% |
| Colorchecker dE 2000 calibrated * | 1.34 | 1.28 4% | 0.82 39% | 0.82 39% | 1.92 -43% | 1.45 -8% |
| Greyscale dE 2000 * | 1.8 | 3.4 -89% | 3.5 -94% | 3.5 -94% | 3.11 -73% | 2.7 -50% |
| Gamma | 2.4 92% | 2.275 97% | 2.358 93% | 2.223 99% | 2.13 103% | 2.26 97% |
| CCT | 6489 100% | 6637 98% | 6147 106% | 6526 100% | 6553 99% | 6436 101% |
| Color Space (Percent of AdobeRGB 1998) | 72 | 74 | 84 | 65.6 | ||
| Color Space (Percent of sRGB) | 95 | 96 | 99 | 99.4 | ||
| Total Average (Program / Settings) | -10% /
-15% | -9% /
-21% | 5% /
-10% | 7% /
-16% | 4% /
-2% |
* ... smaller is better
Black level and contrast are slightly worse than in the AMD NEO, but the display seems to be better calibrated in return. The color deviations are minimal, a manual calibration only brings minor improvements.
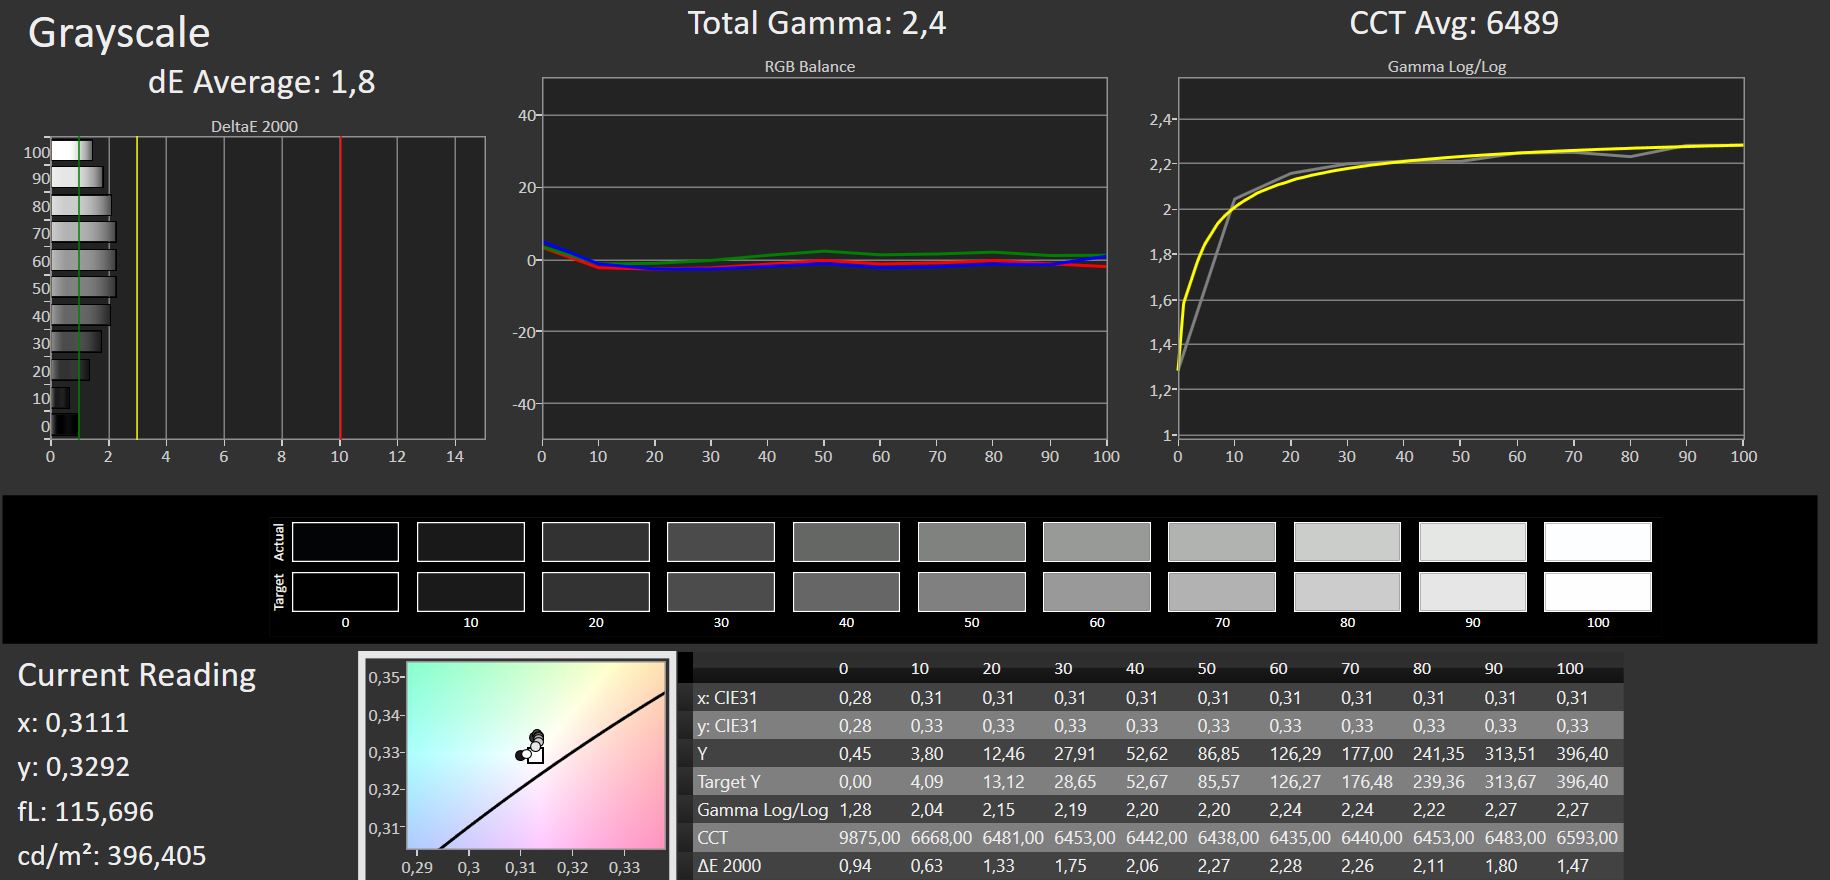
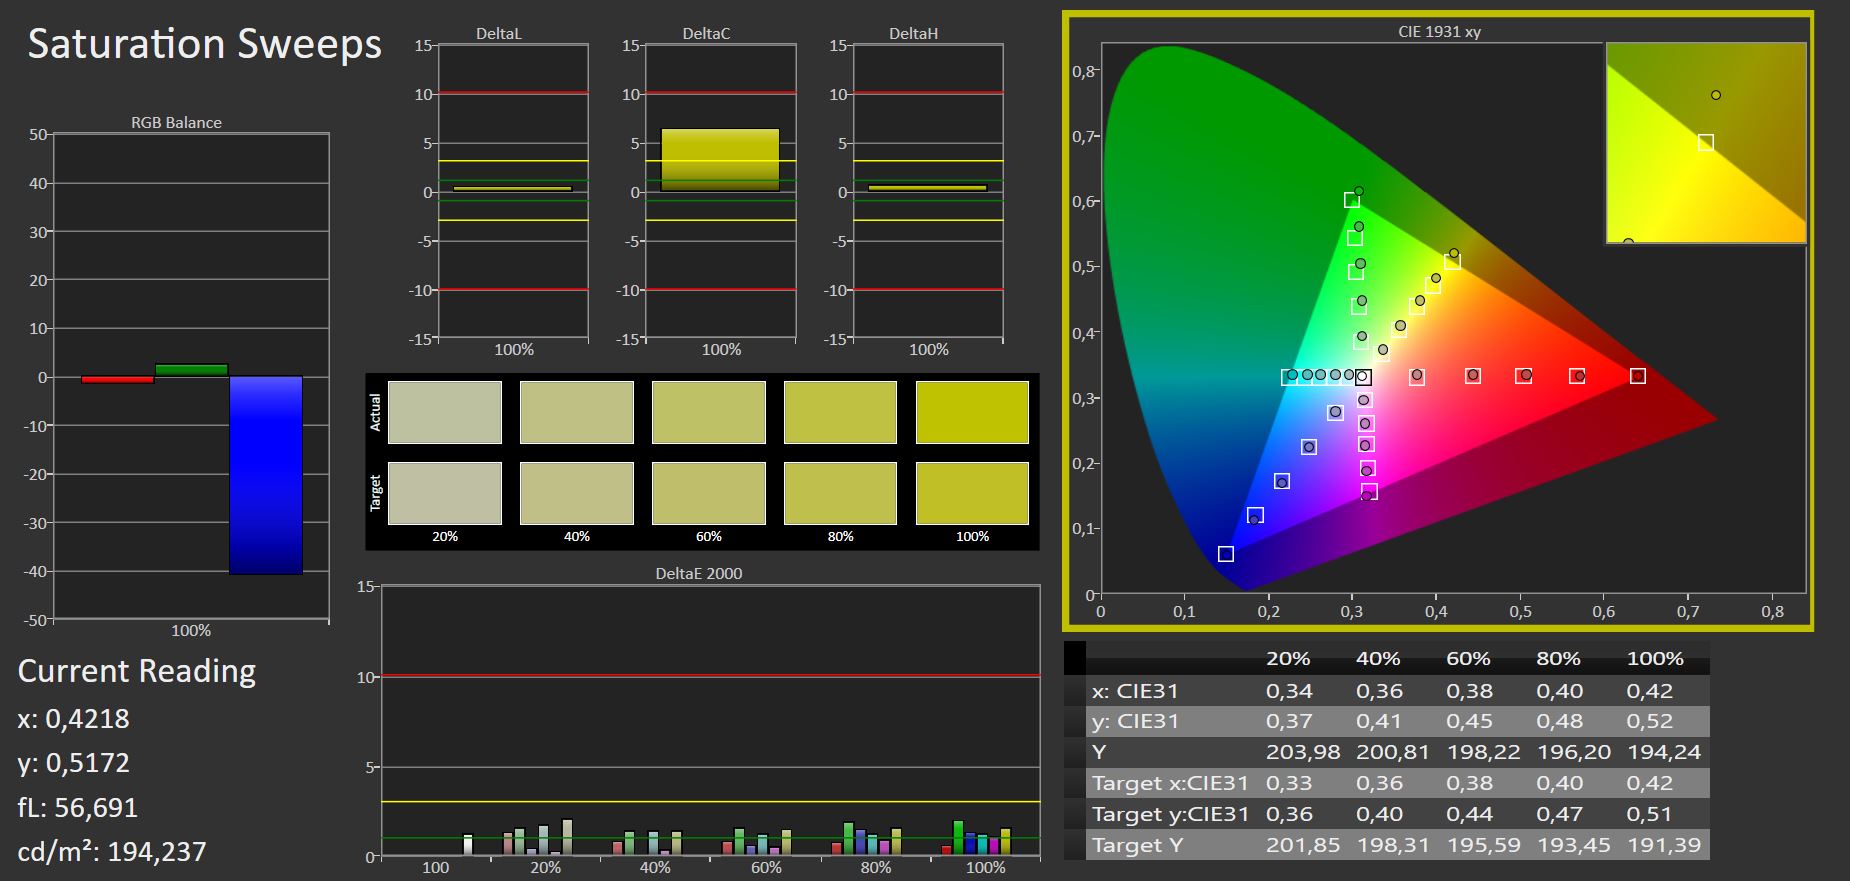
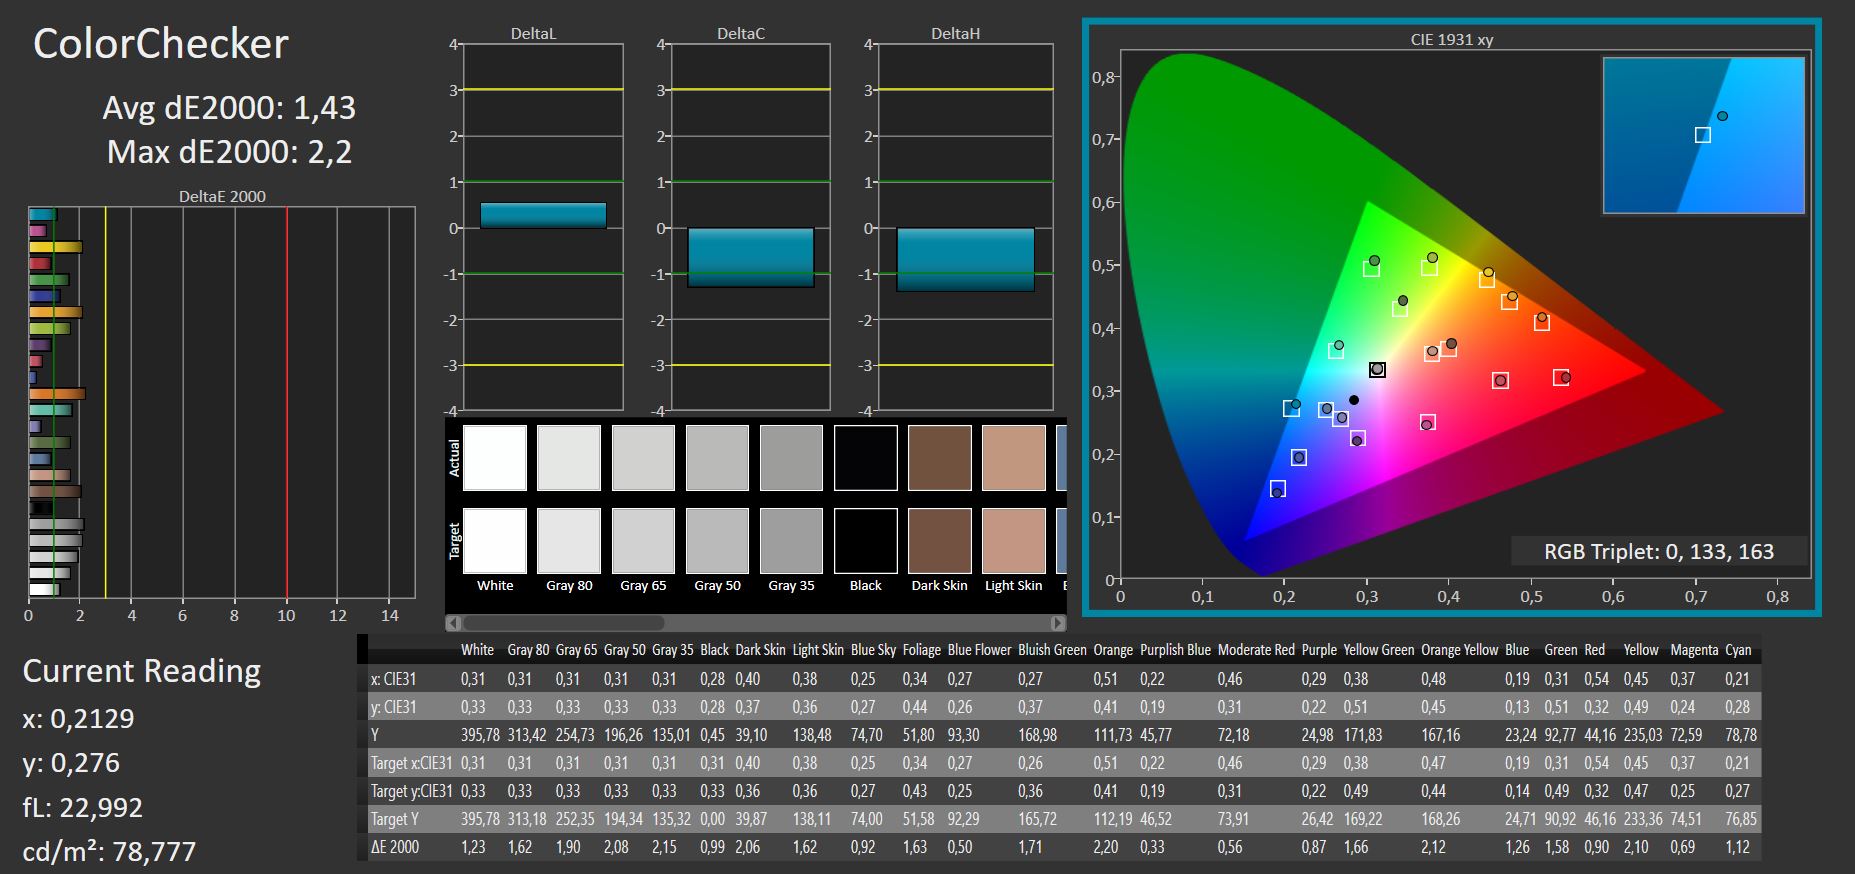
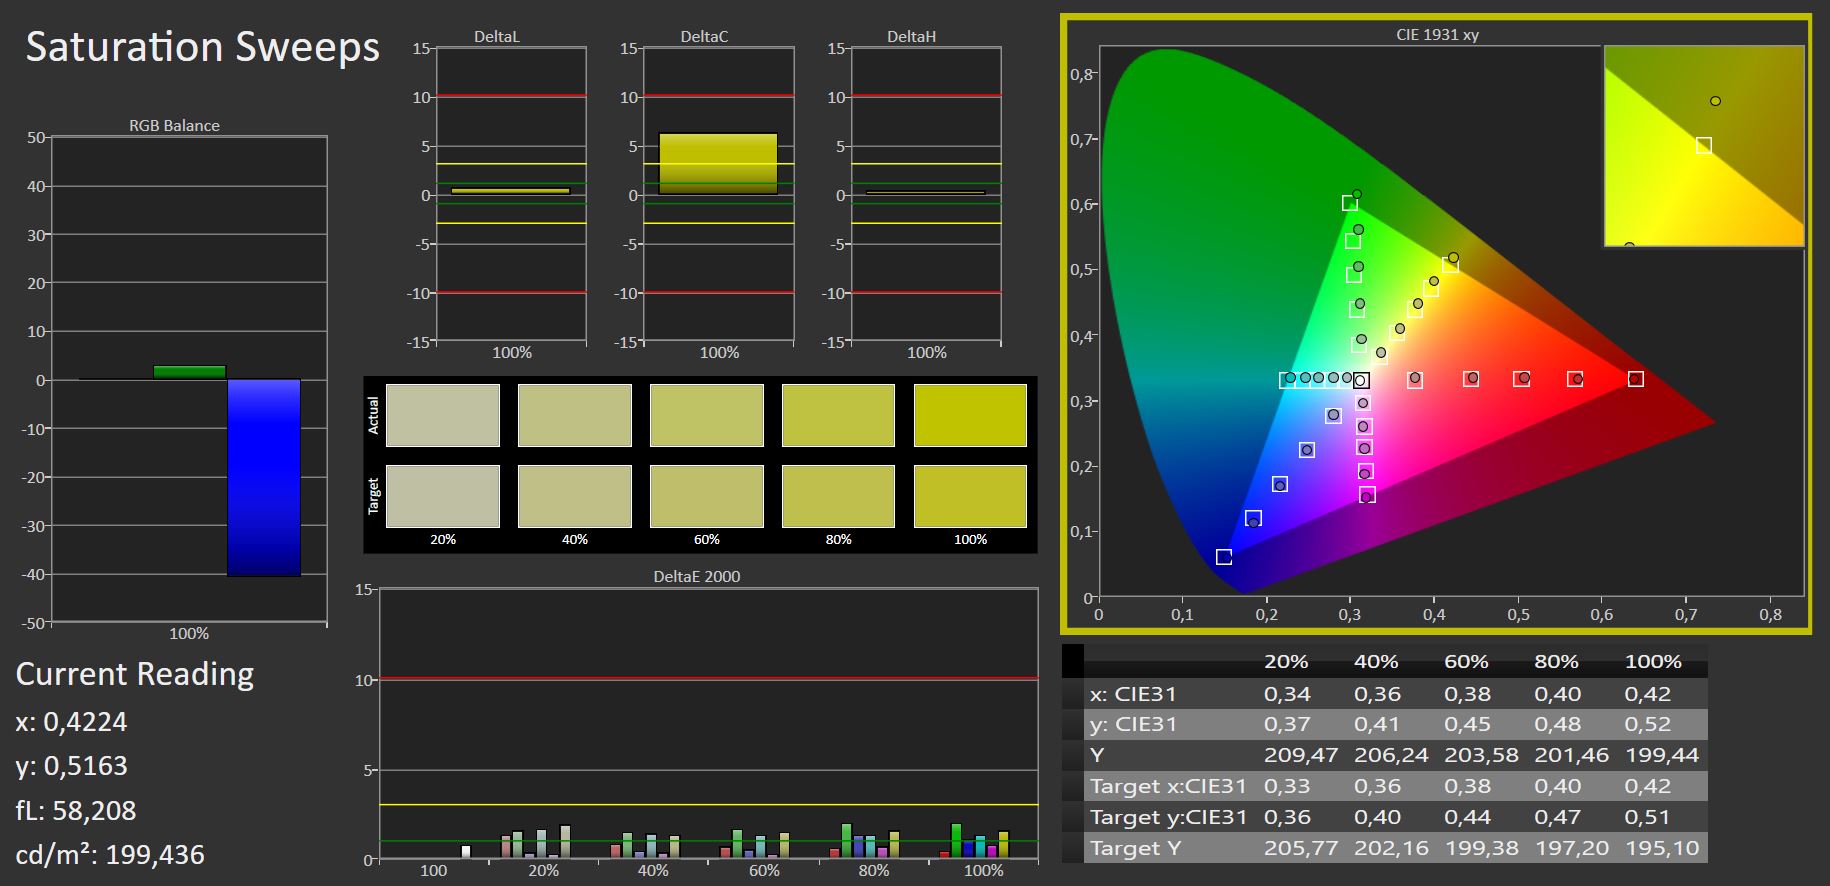
AdobeRGB is still covered by about 69 percent, sRGB almost completely.
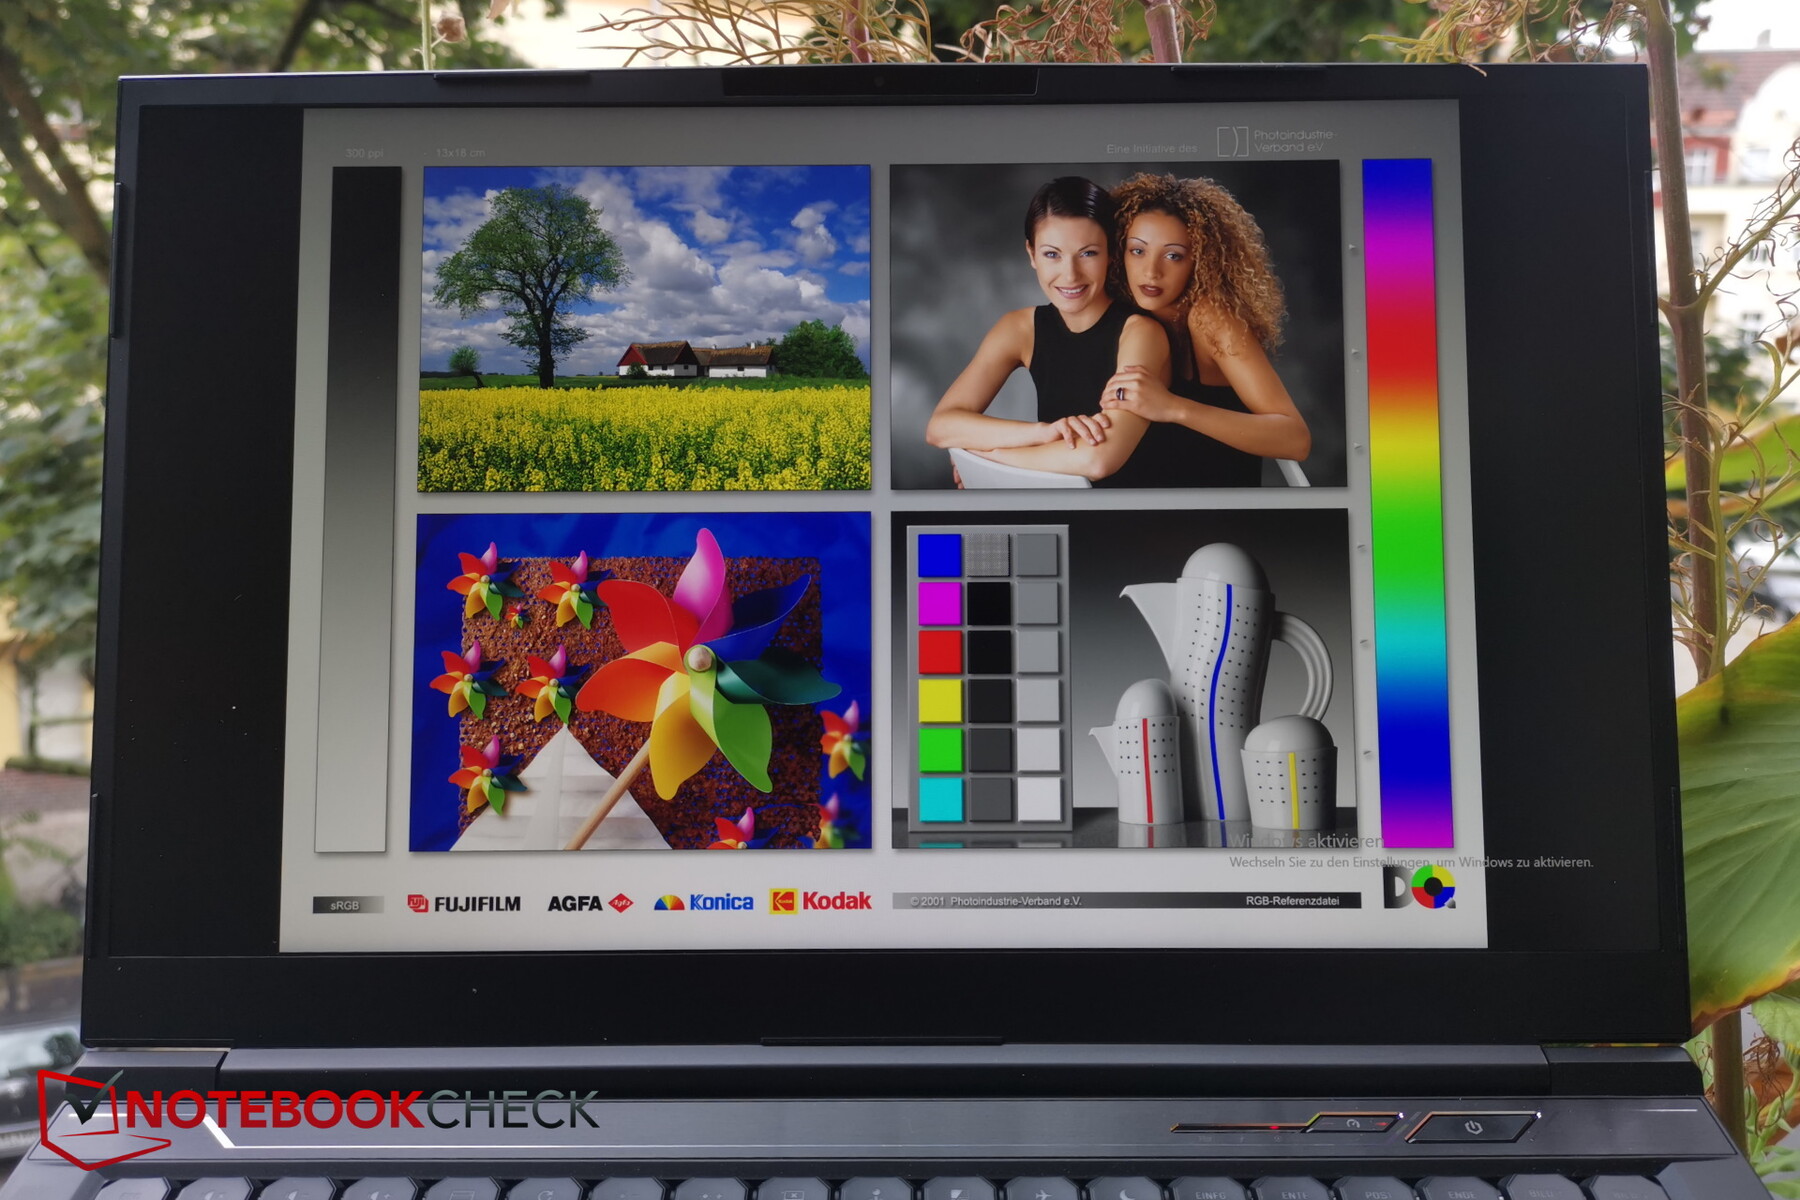
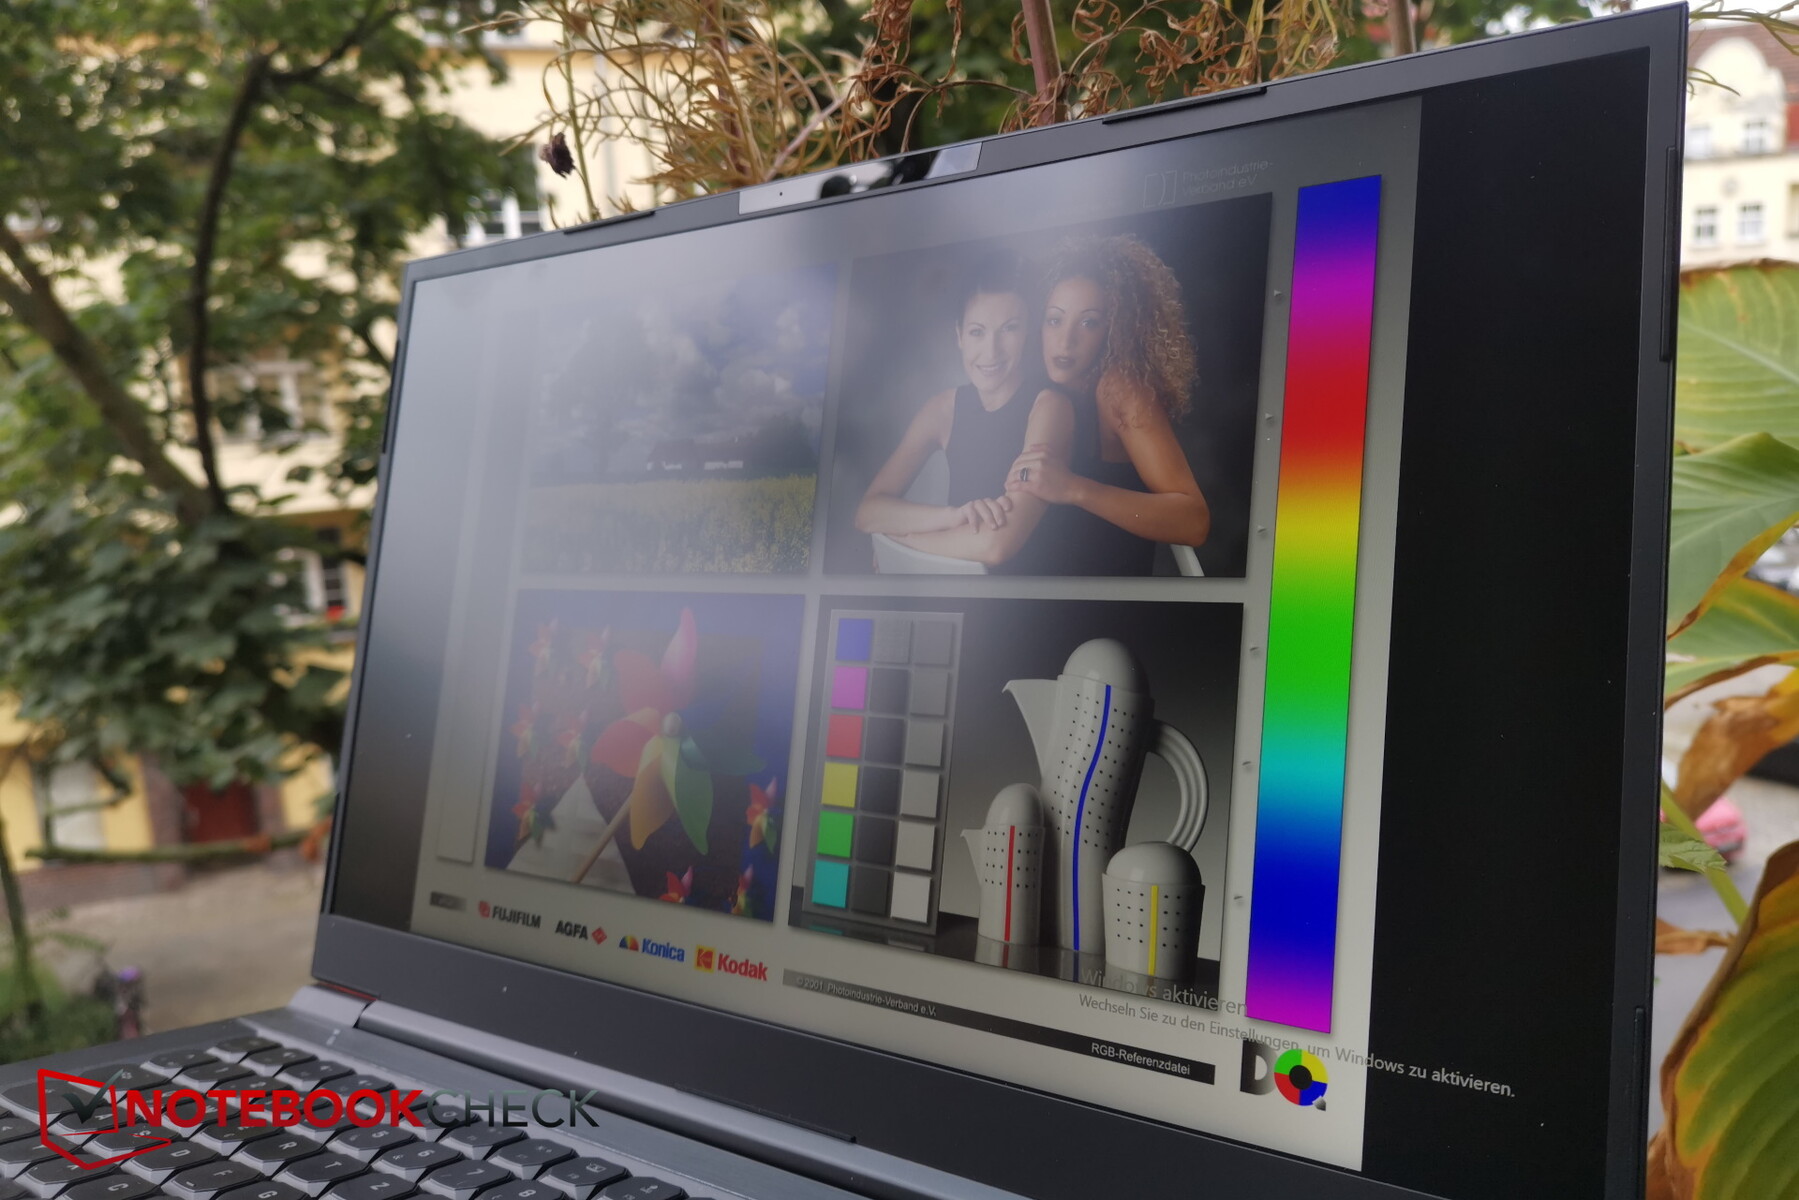
Due to the matte surface and the quite good brightness, the NEO 17 can also be used quite well outdoors, at least in the shade.
The response times are not outstanding for a gamer, but sufficient. We did not notice any PWM.
Display Response Times
| ↔ Response Time Black to White | ||
|---|---|---|
| 8.8 ms ... rise ↗ and fall ↘ combined | ↗ ms rise | |
| ↘ ms fall | ||
| The screen shows fast response rates in our tests and should be suited for gaming. In comparison, all tested devices range from 0.1 (minimum) to 240 (maximum) ms. » 19 % of all devices are better. This means that the measured response time is better than the average of all tested devices (21.5 ms). | ||
| ↔ Response Time 50% Grey to 80% Grey | ||
| 15.2 ms ... rise ↗ and fall ↘ combined | ↗ ms rise | |
| ↘ ms fall | ||
| The screen shows good response rates in our tests, but may be too slow for competitive gamers. In comparison, all tested devices range from 0.2 (minimum) to 636 (maximum) ms. » 24 % of all devices are better. This means that the measured response time is better than the average of all tested devices (33.7 ms). | ||
Screen Flickering / PWM (Pulse-Width Modulation)
| Screen flickering / PWM not detected | ||
In comparison: 53 % of all tested devices do not use PWM to dim the display. If PWM was detected, an average of 17900 (minimum: 5 - maximum: 3846000) Hz was measured. | ||
A bit of brightness is lost when viewing from extreme angles, but the loss is very limited as is typical for IPS.

Performance - Unbridled RTX 3080
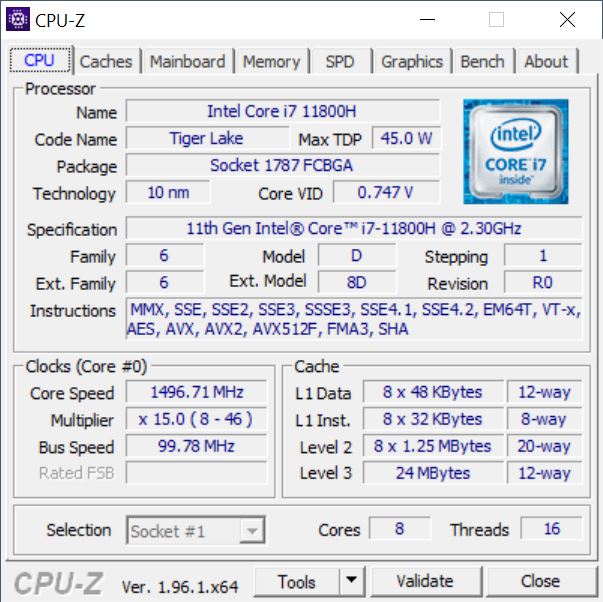
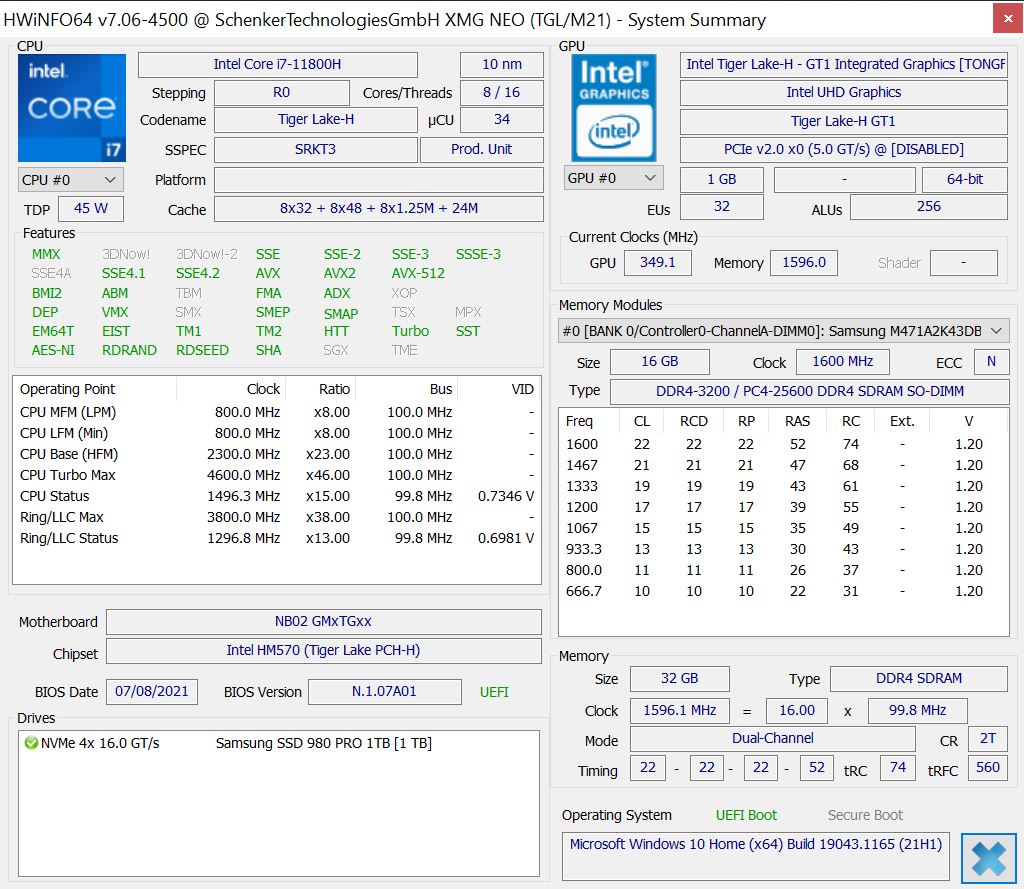
The NEO 17 is clearly a gamer, not only because of the Nvidia GeForce RTX 3080 laptop GPU or the 8-core Intel Core i7-11800H CPU. The RGB illumination of the keyboard also gives some hints. With this hardware combination, even the latest and most demanding games should be playable smoothly in the native resolution, and there are enough reserves for 4K gaming on external monitors.
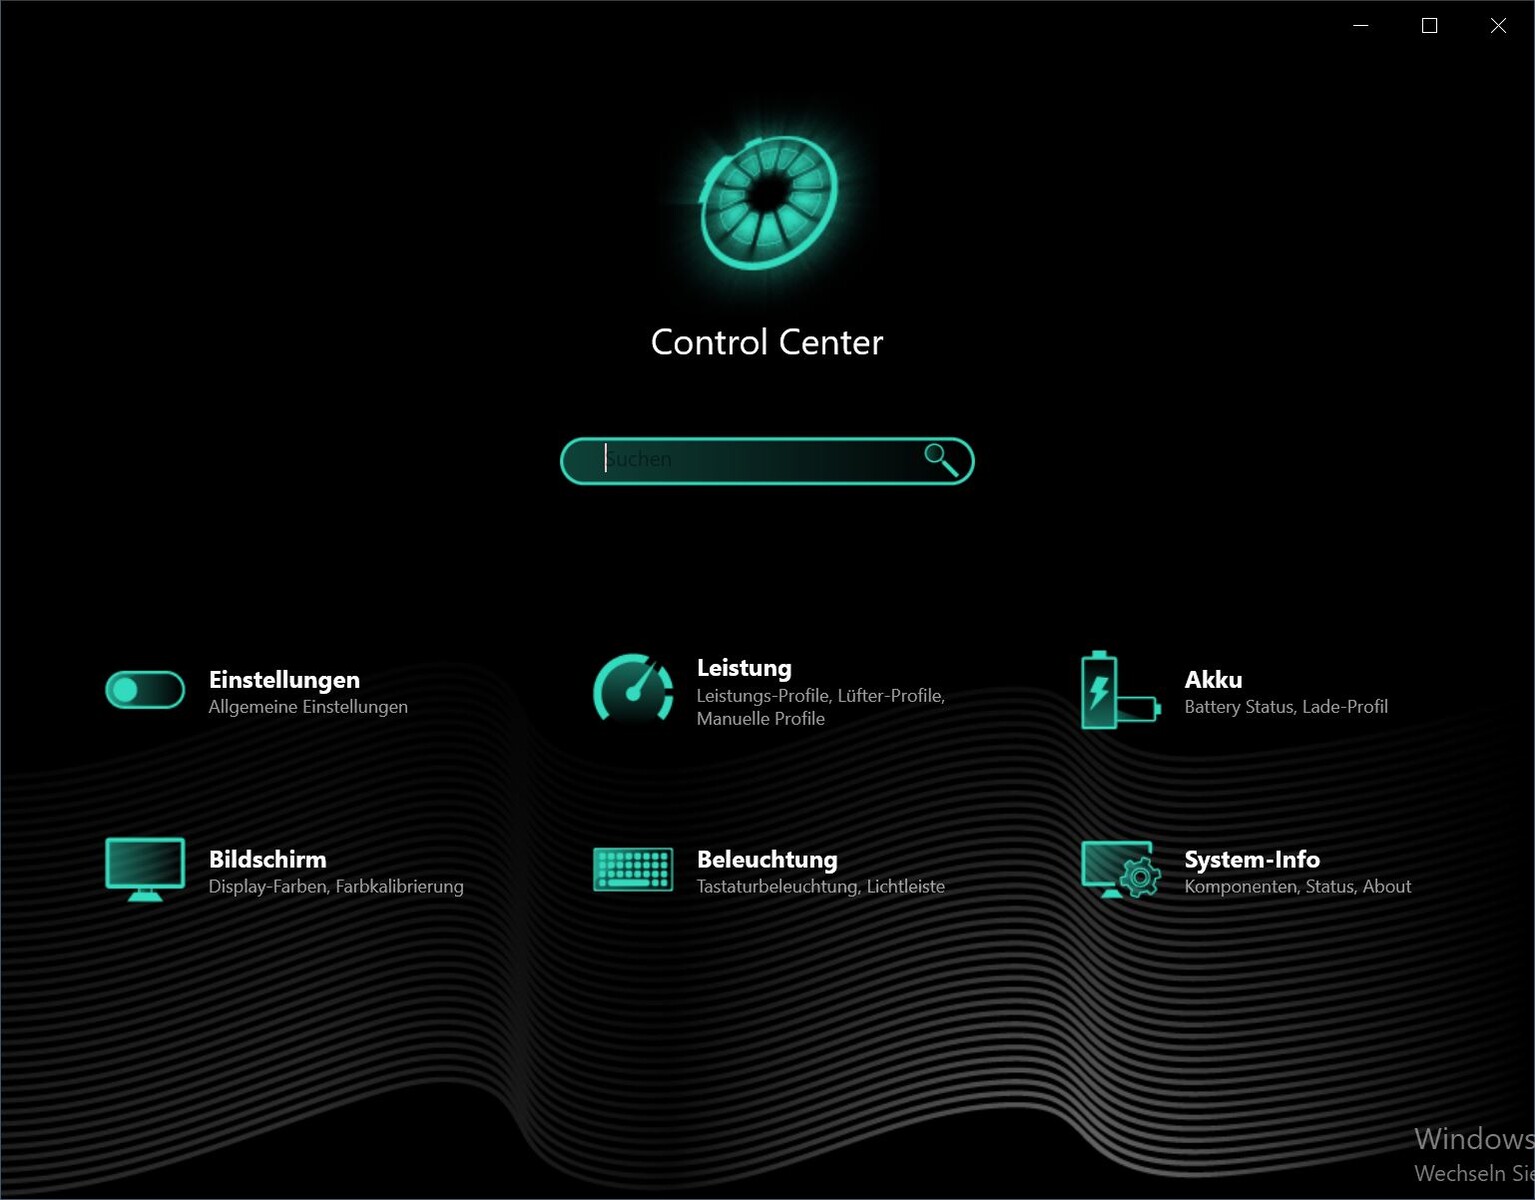
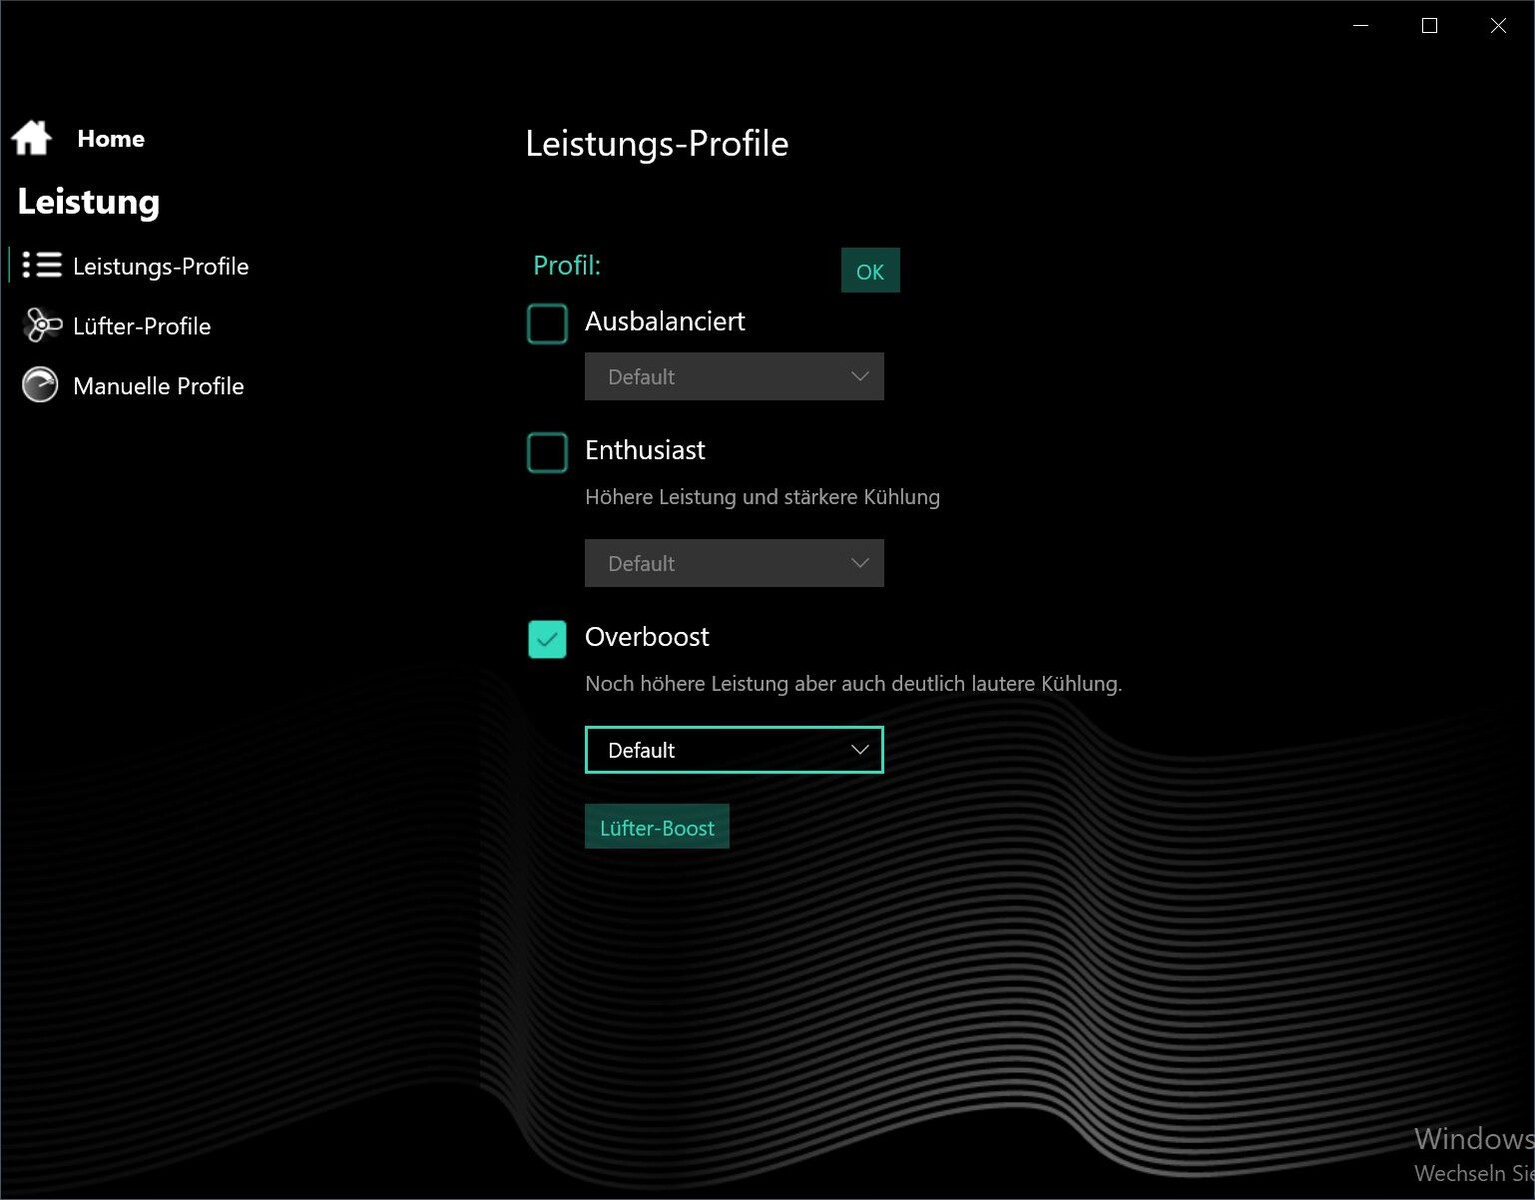
For the best results in the benchmarks, we deactivate the internal GPU in the Control Center and activate the Overboost mode.
Processor
The 8 cores of the Intel Core i7-11800H clock between 2.3 and 4.6 GHz
The NEO 17 performs somewhat below average in the Cinebench R15 continuous loop despite the overboost mode, but the difference is only small. For example, the Aorus with the same CPU is a tad faster. The TDP is always 75 W in the individual runs. However, you could manually increase the TDP in the Control Center, but we leave it at the default settings of the overboost mode.
The NEO 17 loses about 20% in battery mode and only scores 1,420 instead of 1,767 points in Cinebench R15 Multi.
Cinebench R15 Multi Endurance test
Cinebench R20: CPU (Single Core) | CPU (Multi Core)
Cinebench R15: CPU Single 64Bit | CPU Multi 64Bit
Blender: v2.79 BMW27 CPU
7-Zip 18.03: 7z b 4 -mmt1 | 7z b 4
Geekbench 5.5: Single-Core | Multi-Core
HWBOT x265 Benchmark v2.2: 4k Preset
LibreOffice : 20 Documents To PDF
R Benchmark 2.5: Overall mean
| Cinebench R23 / Single Core | |
| Average of class Gaming (527 - 2235, n=228, last 2 years) | |
| Asus ROG Zephyrus S17 GX703HSD | |
| Aorus 17G YD | |
| Asus Strix Scar 17 G733QSA-XS99 | |
| Average Intel Core i7-11800H (1386 - 1522, n=45) | |
| SCHENKER XMG NEO 17 GM7TG8S | |
| Medion Erazer Beast X25 | |
| SCHENKER XMG Neo 17 (Early 2021, RTX 3070, 5800H) | |
| Cinebench R23 / Multi Core | |
| Average of class Gaming (2435 - 34613, n=230, last 2 years) | |
| Asus Strix Scar 17 G733QSA-XS99 | |
| Aorus 17G YD | |
| Asus ROG Zephyrus S17 GX703HSD | |
| Medion Erazer Beast X25 | |
| SCHENKER XMG Neo 17 (Early 2021, RTX 3070, 5800H) | |
| Average Intel Core i7-11800H (6508 - 14088, n=48) | |
| SCHENKER XMG NEO 17 GM7TG8S | |
| Cinebench R20 / CPU (Single Core) | |
| Average of class Gaming (169 - 855, n=228, last 2 years) | |
| Asus ROG Zephyrus S17 GX703HSD | |
| SCHENKER XMG NEO 17 GM7TG8S | |
| Medion Erazer Beast X25 | |
| Average Intel Core i7-11800H (520 - 586, n=47) | |
| Asus Strix Scar 17 G733QSA-XS99 | |
| Aorus 17G YD | |
| SCHENKER XMG Neo 17 (Early 2021, RTX 3070, 5800H) | |
| Cinebench R20 / CPU (Multi Core) | |
| Average of class Gaming (930 - 13769, n=228, last 2 years) | |
| Asus Strix Scar 17 G733QSA-XS99 | |
| Asus ROG Zephyrus S17 GX703HSD | |
| Aorus 17G YD | |
| Medion Erazer Beast X25 | |
| SCHENKER XMG Neo 17 (Early 2021, RTX 3070, 5800H) | |
| Average Intel Core i7-11800H (2498 - 5408, n=50) | |
| SCHENKER XMG NEO 17 GM7TG8S | |
| Cinebench R15 / CPU Single 64Bit | |
| Average of class Gaming (79.2 - 318, n=231, last 2 years) | |
| Asus ROG Zephyrus S17 GX703HSD | |
| Asus Strix Scar 17 G733QSA-XS99 | |
| Medion Erazer Beast X25 | |
| SCHENKER XMG Neo 17 (Early 2021, RTX 3070, 5800H) | |
| SCHENKER XMG NEO 17 GM7TG8S | |
| Aorus 17G YD | |
| Average Intel Core i7-11800H (201 - 231, n=46) | |
| Cinebench R15 / CPU Multi 64Bit | |
| Average of class Gaming (400 - 5663, n=232, last 2 years) | |
| Asus Strix Scar 17 G733QSA-XS99 | |
| Asus ROG Zephyrus S17 GX703HSD | |
| SCHENKER XMG Neo 17 (Early 2021, RTX 3070, 5800H) | |
| Aorus 17G YD | |
| Medion Erazer Beast X25 | |
| Average Intel Core i7-11800H (1342 - 2173, n=50) | |
| SCHENKER XMG NEO 17 GM7TG8S | |
| Blender / v2.79 BMW27 CPU | |
| Aorus 17G YD | |
| Average Intel Core i7-11800H (217 - 454, n=46) | |
| SCHENKER XMG NEO 17 GM7TG8S | |
| Medion Erazer Beast X25 | |
| SCHENKER XMG Neo 17 (Early 2021, RTX 3070, 5800H) | |
| Asus ROG Zephyrus S17 GX703HSD | |
| Asus Strix Scar 17 G733QSA-XS99 | |
| Average of class Gaming (87 - 1259, n=226, last 2 years) | |
| 7-Zip 18.03 / 7z b 4 -mmt1 | |
| Average of class Gaming (2685 - 7581, n=227, last 2 years) | |
| Asus ROG Zephyrus S17 GX703HSD | |
| Asus Strix Scar 17 G733QSA-XS99 | |
| Medion Erazer Beast X25 | |
| SCHENKER XMG Neo 17 (Early 2021, RTX 3070, 5800H) | |
| Aorus 17G YD | |
| SCHENKER XMG NEO 17 GM7TG8S | |
| Average Intel Core i7-11800H (5138 - 5732, n=46) | |
| 7-Zip 18.03 / 7z b 4 | |
| Average of class Gaming (11386 - 140932, n=227, last 2 years) | |
| Asus Strix Scar 17 G733QSA-XS99 | |
| Medion Erazer Beast X25 | |
| SCHENKER XMG Neo 17 (Early 2021, RTX 3070, 5800H) | |
| Asus ROG Zephyrus S17 GX703HSD | |
| Average Intel Core i7-11800H (33718 - 56758, n=46) | |
| Aorus 17G YD | |
| SCHENKER XMG NEO 17 GM7TG8S | |
| Geekbench 5.5 / Single-Core | |
| Average of class Gaming (158 - 2210, n=232, last 2 years) | |
| Asus ROG Zephyrus S17 GX703HSD | |
| SCHENKER XMG NEO 17 GM7TG8S | |
| Aorus 17G YD | |
| Average Intel Core i7-11800H (1429 - 1625, n=40) | |
| Asus Strix Scar 17 G733QSA-XS99 | |
| Medion Erazer Beast X25 | |
| SCHENKER XMG Neo 17 (Early 2021, RTX 3070, 5800H) | |
| Geekbench 5.5 / Multi-Core | |
| Average of class Gaming (1946 - 22200, n=232, last 2 years) | |
| Asus ROG Zephyrus S17 GX703HSD | |
| Aorus 17G YD | |
| Medion Erazer Beast X25 | |
| SCHENKER XMG NEO 17 GM7TG8S | |
| Asus Strix Scar 17 G733QSA-XS99 | |
| Average Intel Core i7-11800H (4655 - 9851, n=40) | |
| SCHENKER XMG Neo 17 (Early 2021, RTX 3070, 5800H) | |
| HWBOT x265 Benchmark v2.2 / 4k Preset | |
| Average of class Gaming (3 - 37.6, n=230, last 2 years) | |
| Asus Strix Scar 17 G733QSA-XS99 | |
| Asus ROG Zephyrus S17 GX703HSD | |
| Aorus 17G YD | |
| Medion Erazer Beast X25 | |
| SCHENKER XMG Neo 17 (Early 2021, RTX 3070, 5800H) | |
| Average Intel Core i7-11800H (7.38 - 17.4, n=46) | |
| SCHENKER XMG NEO 17 GM7TG8S | |
| LibreOffice / 20 Documents To PDF | |
| SCHENKER XMG Neo 17 (Early 2021, RTX 3070, 5800H) | |
| Medion Erazer Beast X25 | |
| Average of class Gaming (32.8 - 332, n=224, last 2 years) | |
| Average Intel Core i7-11800H (38.6 - 59.9, n=45) | |
| Asus Strix Scar 17 G733QSA-XS99 | |
| Asus ROG Zephyrus S17 GX703HSD | |
| SCHENKER XMG NEO 17 GM7TG8S | |
| Aorus 17G YD | |
| R Benchmark 2.5 / Overall mean | |
| SCHENKER XMG NEO 17 GM7TG8S | |
| Average Intel Core i7-11800H (0.548 - 0.615, n=46) | |
| Aorus 17G YD | |
| Asus ROG Zephyrus S17 GX703HSD | |
| SCHENKER XMG Neo 17 (Early 2021, RTX 3070, 5800H) | |
| Asus Strix Scar 17 G733QSA-XS99 | |
| Medion Erazer Beast X25 | |
| Average of class Gaming (0.3609 - 4.47, n=227, last 2 years) | |
* ... smaller is better
System performance
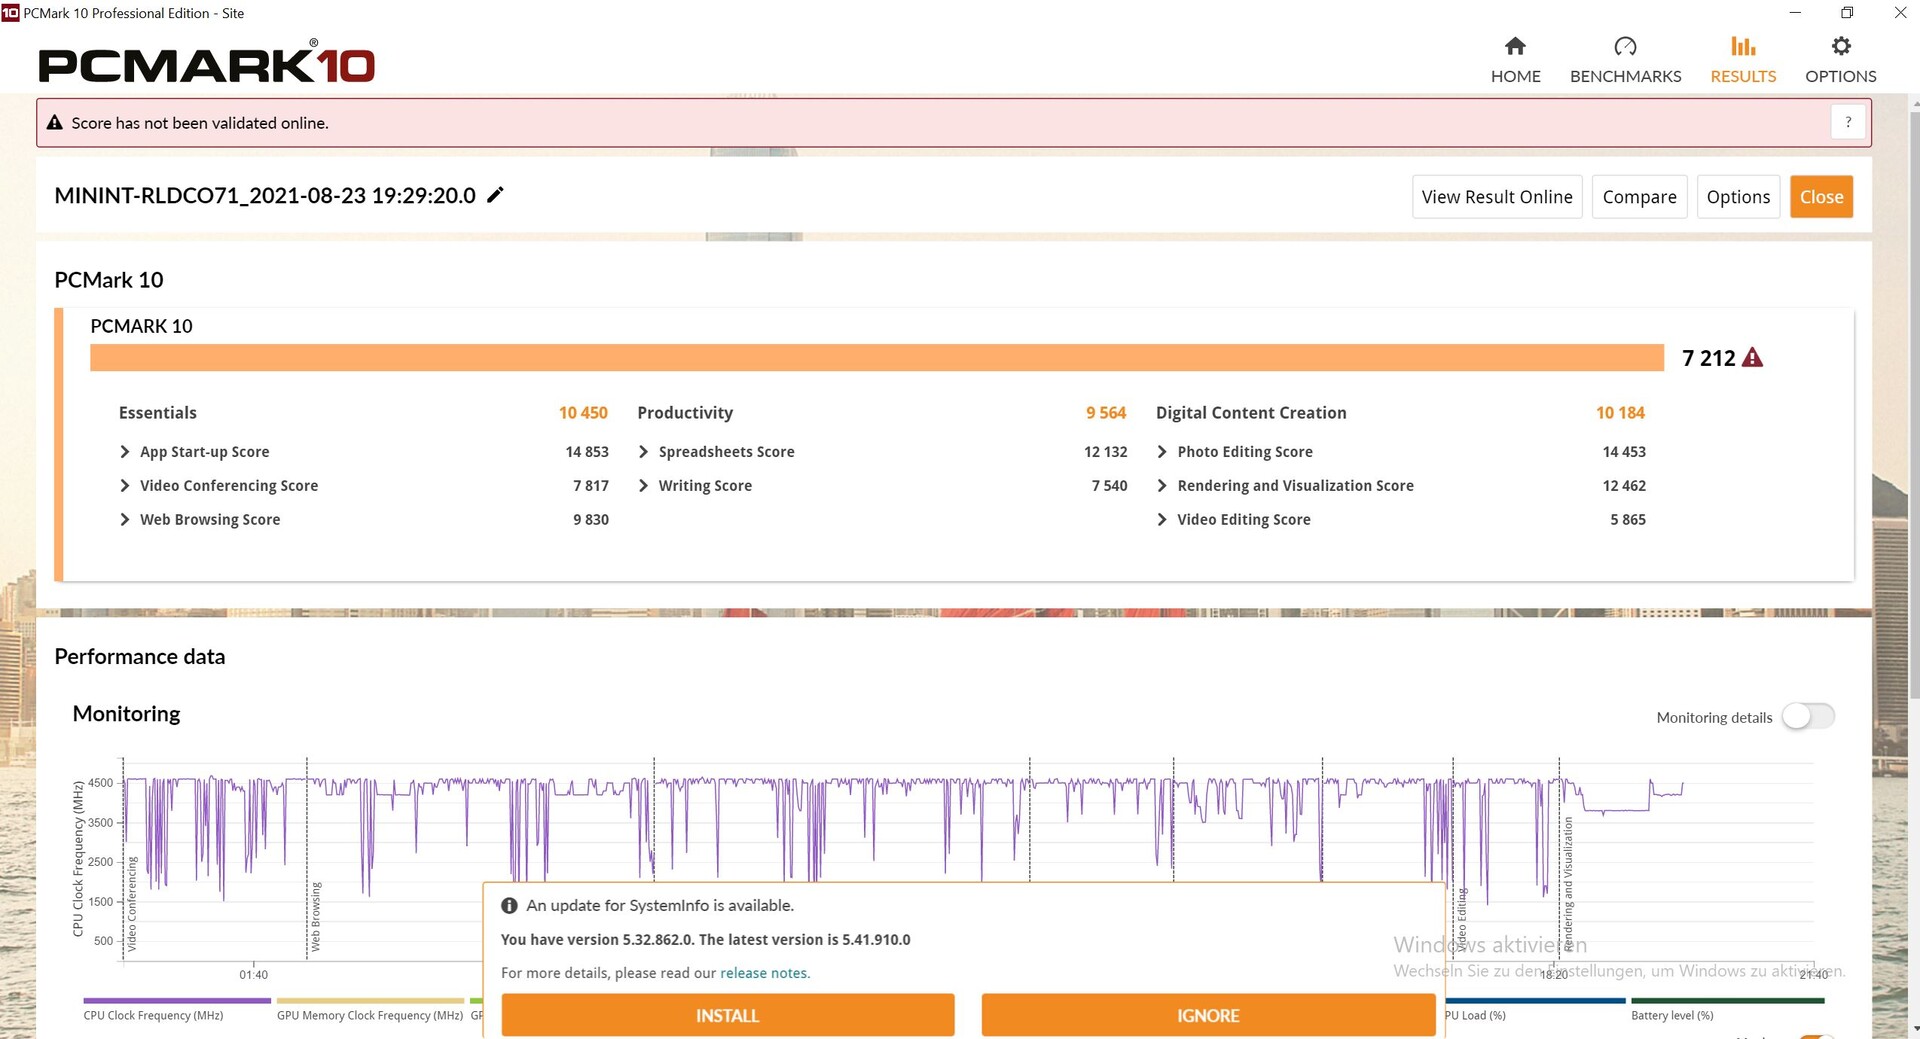
The system performance is nevertheless on the expected level, and the NEO 17 even takes one of the front places here.
| PCMark 10 / Score | |
| Average of class Gaming (5235 - 9852, n=197, last 2 years) | |
| Asus ROG Zephyrus S17 GX703HSD | |
| SCHENKER XMG NEO 17 GM7TG8S | |
| Asus Strix Scar 17 G733QSA-XS99 | |
| Average Intel Core i7-11800H, NVIDIA GeForce RTX 3080 Laptop GPU (6673 - 7470, n=11) | |
| Aorus 17G YD | |
| SCHENKER XMG Neo 17 (Early 2021, RTX 3070, 5800H) | |
| Medion Erazer Beast X25 | |
| PCMark 10 / Essentials | |
| Average of class Gaming (8300 - 12334, n=196, last 2 years) | |
| Asus ROG Zephyrus S17 GX703HSD | |
| Asus Strix Scar 17 G733QSA-XS99 | |
| SCHENKER XMG NEO 17 GM7TG8S | |
| Average Intel Core i7-11800H, NVIDIA GeForce RTX 3080 Laptop GPU (9862 - 11064, n=11) | |
| Aorus 17G YD | |
| SCHENKER XMG Neo 17 (Early 2021, RTX 3070, 5800H) | |
| Medion Erazer Beast X25 | |
| PCMark 10 / Productivity | |
| Average of class Gaming (6662 - 11833, n=196, last 2 years) | |
| Asus Strix Scar 17 G733QSA-XS99 | |
| SCHENKER XMG NEO 17 GM7TG8S | |
| Aorus 17G YD | |
| Medion Erazer Beast X25 | |
| Asus ROG Zephyrus S17 GX703HSD | |
| Average Intel Core i7-11800H, NVIDIA GeForce RTX 3080 Laptop GPU (8278 - 9803, n=11) | |
| SCHENKER XMG Neo 17 (Early 2021, RTX 3070, 5800H) | |
| PCMark 10 / Digital Content Creation | |
| Average of class Gaming (6462 - 18475, n=196, last 2 years) | |
| Asus ROG Zephyrus S17 GX703HSD | |
| Average Intel Core i7-11800H, NVIDIA GeForce RTX 3080 Laptop GPU (9881 - 11323, n=11) | |
| SCHENKER XMG Neo 17 (Early 2021, RTX 3070, 5800H) | |
| SCHENKER XMG NEO 17 GM7TG8S | |
| Aorus 17G YD | |
| Asus Strix Scar 17 G733QSA-XS99 | |
| Medion Erazer Beast X25 | |
| PCMark 10 Score | 7212 points | |
Help | ||
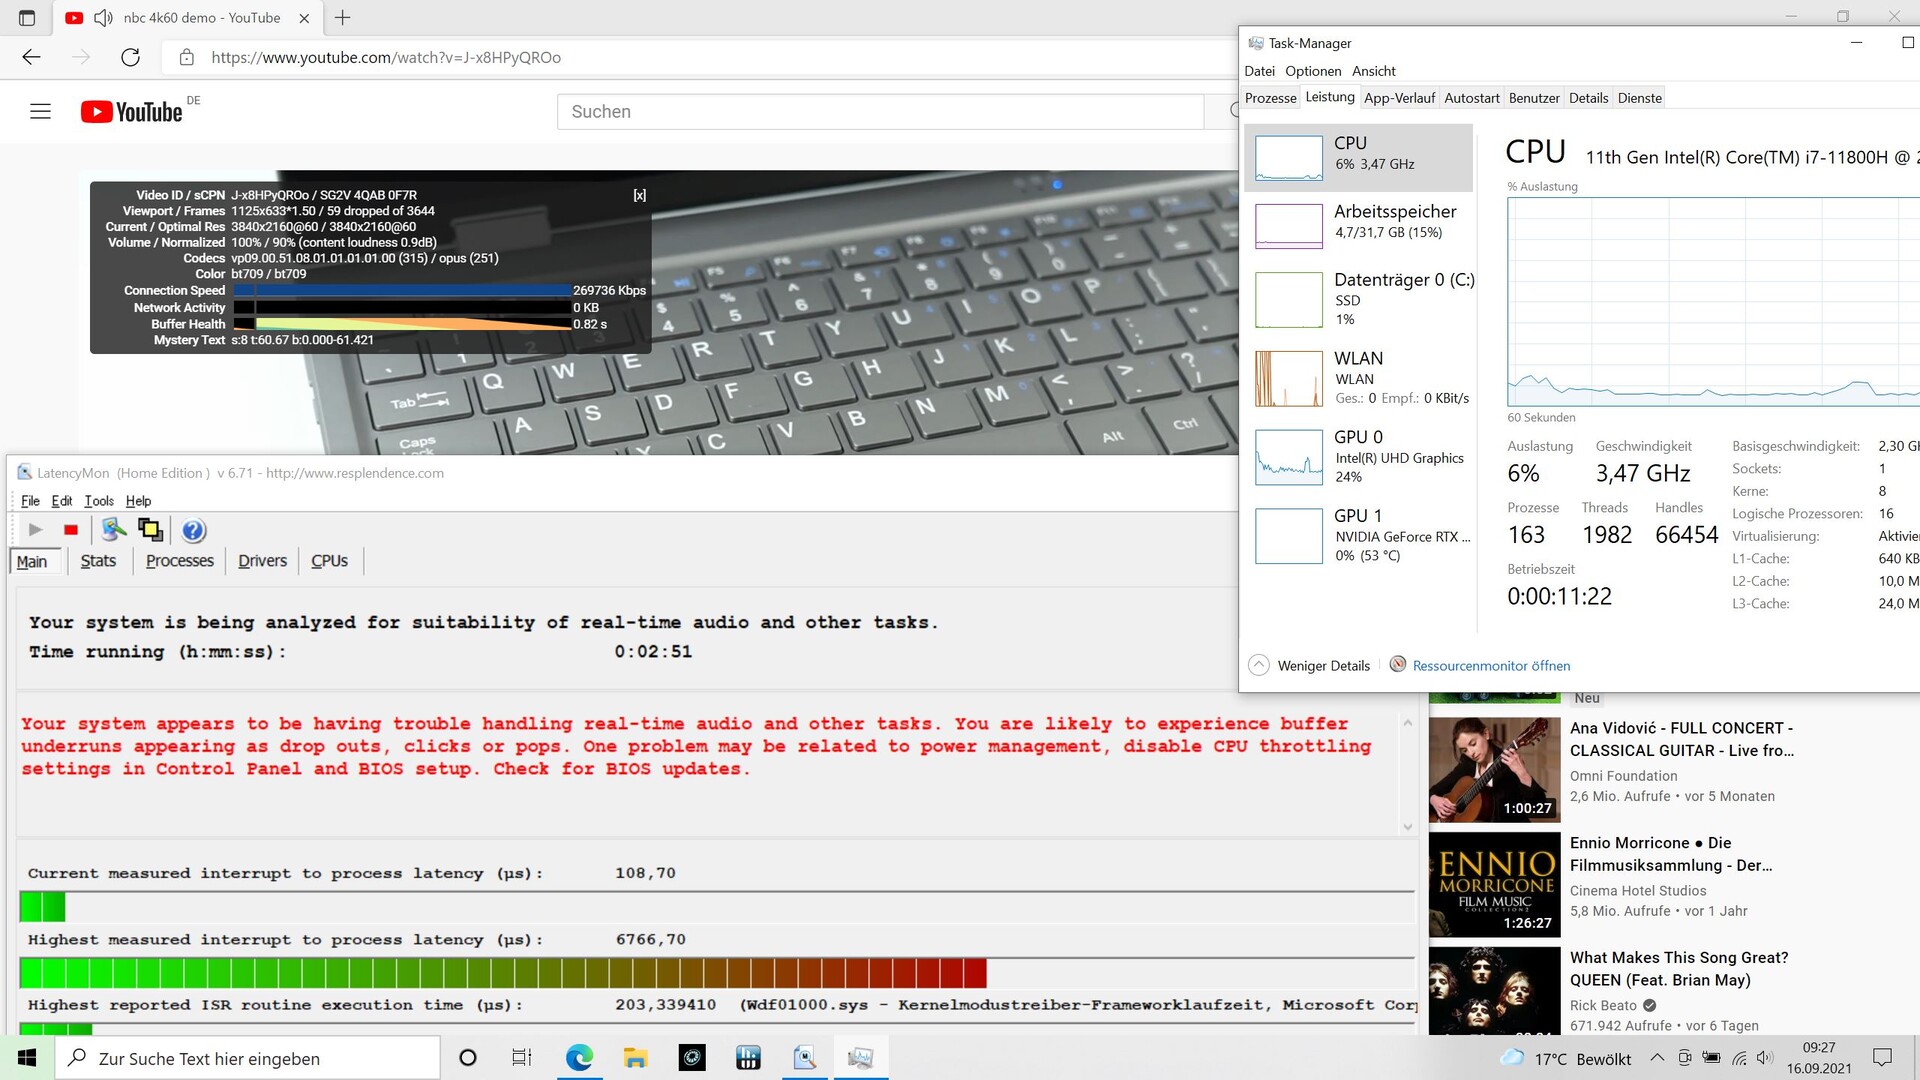
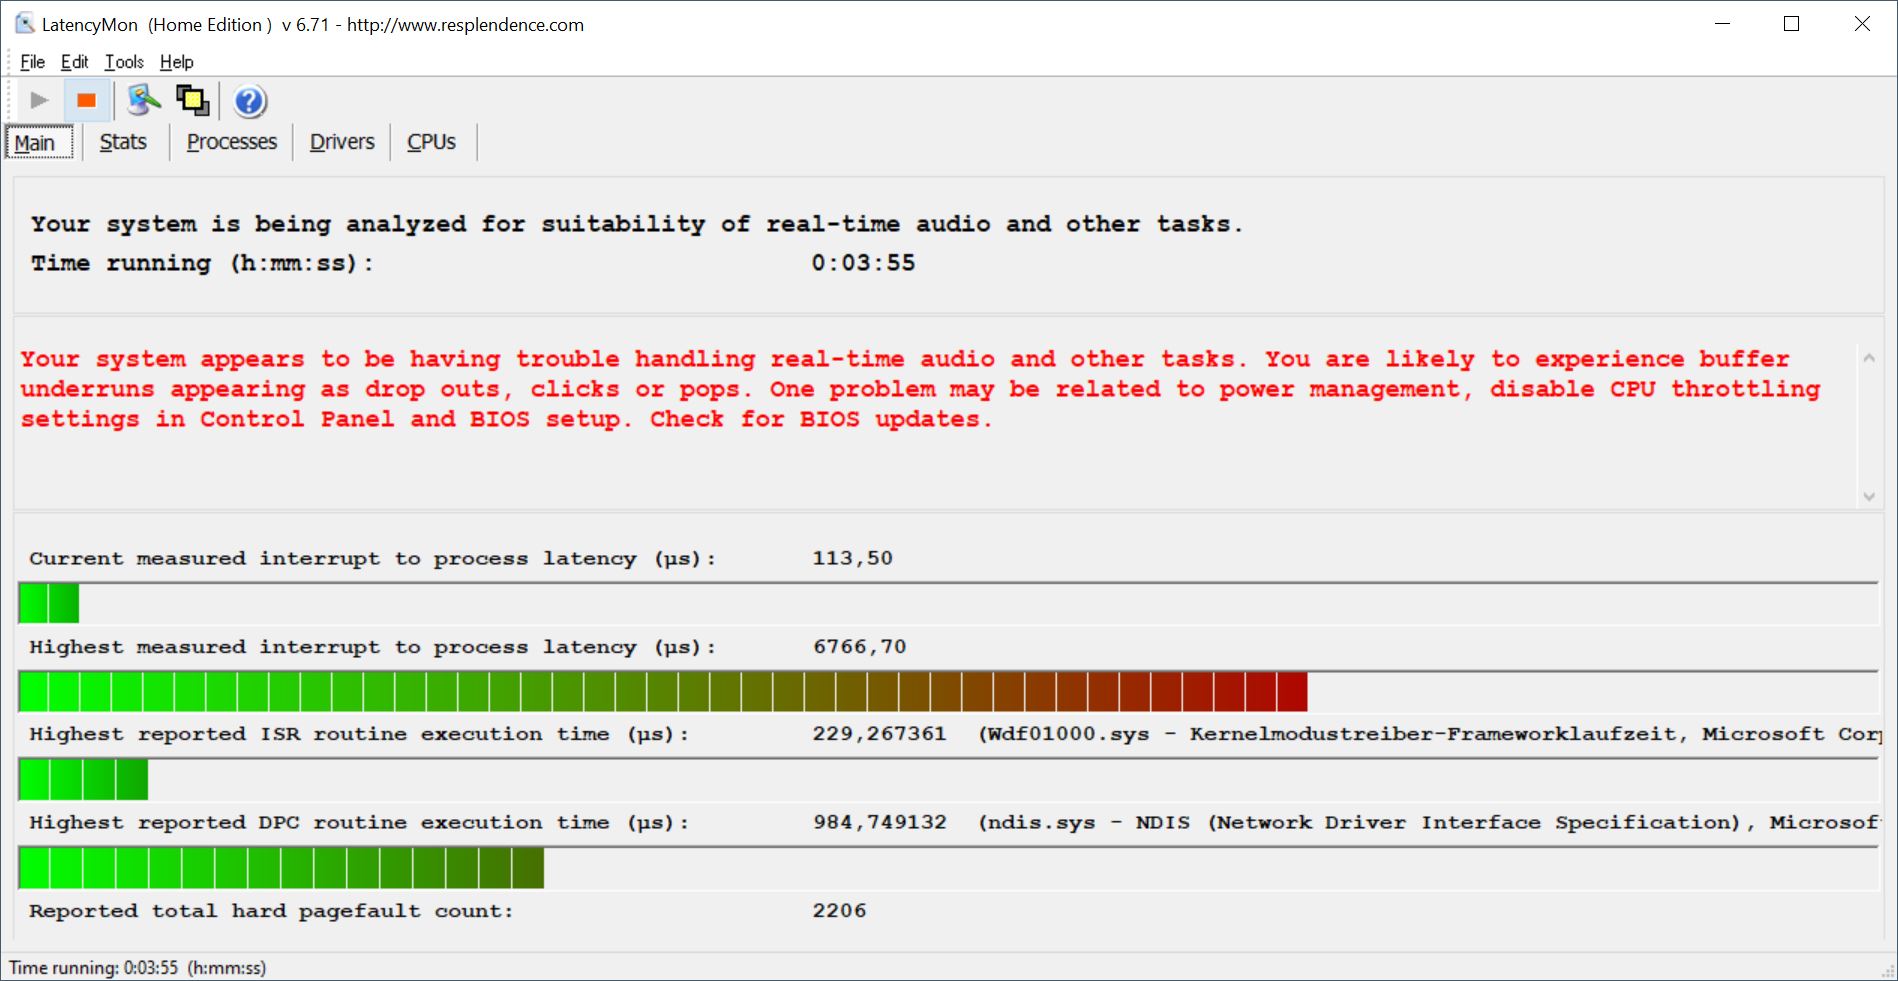
DPC latencies
If we open various articles from Notebookcheck.com in their own tabs, the NEO 17 copes well. The situation is different when we play our 4K/60 fps test video on YouTube. The result is a sad 59 dropped frames as well as a quite high delay in real-time rendering, which gives the Schenker the worst rates in comparison. Several drivers are to blame; Schenker should improve this with a BIOS update.
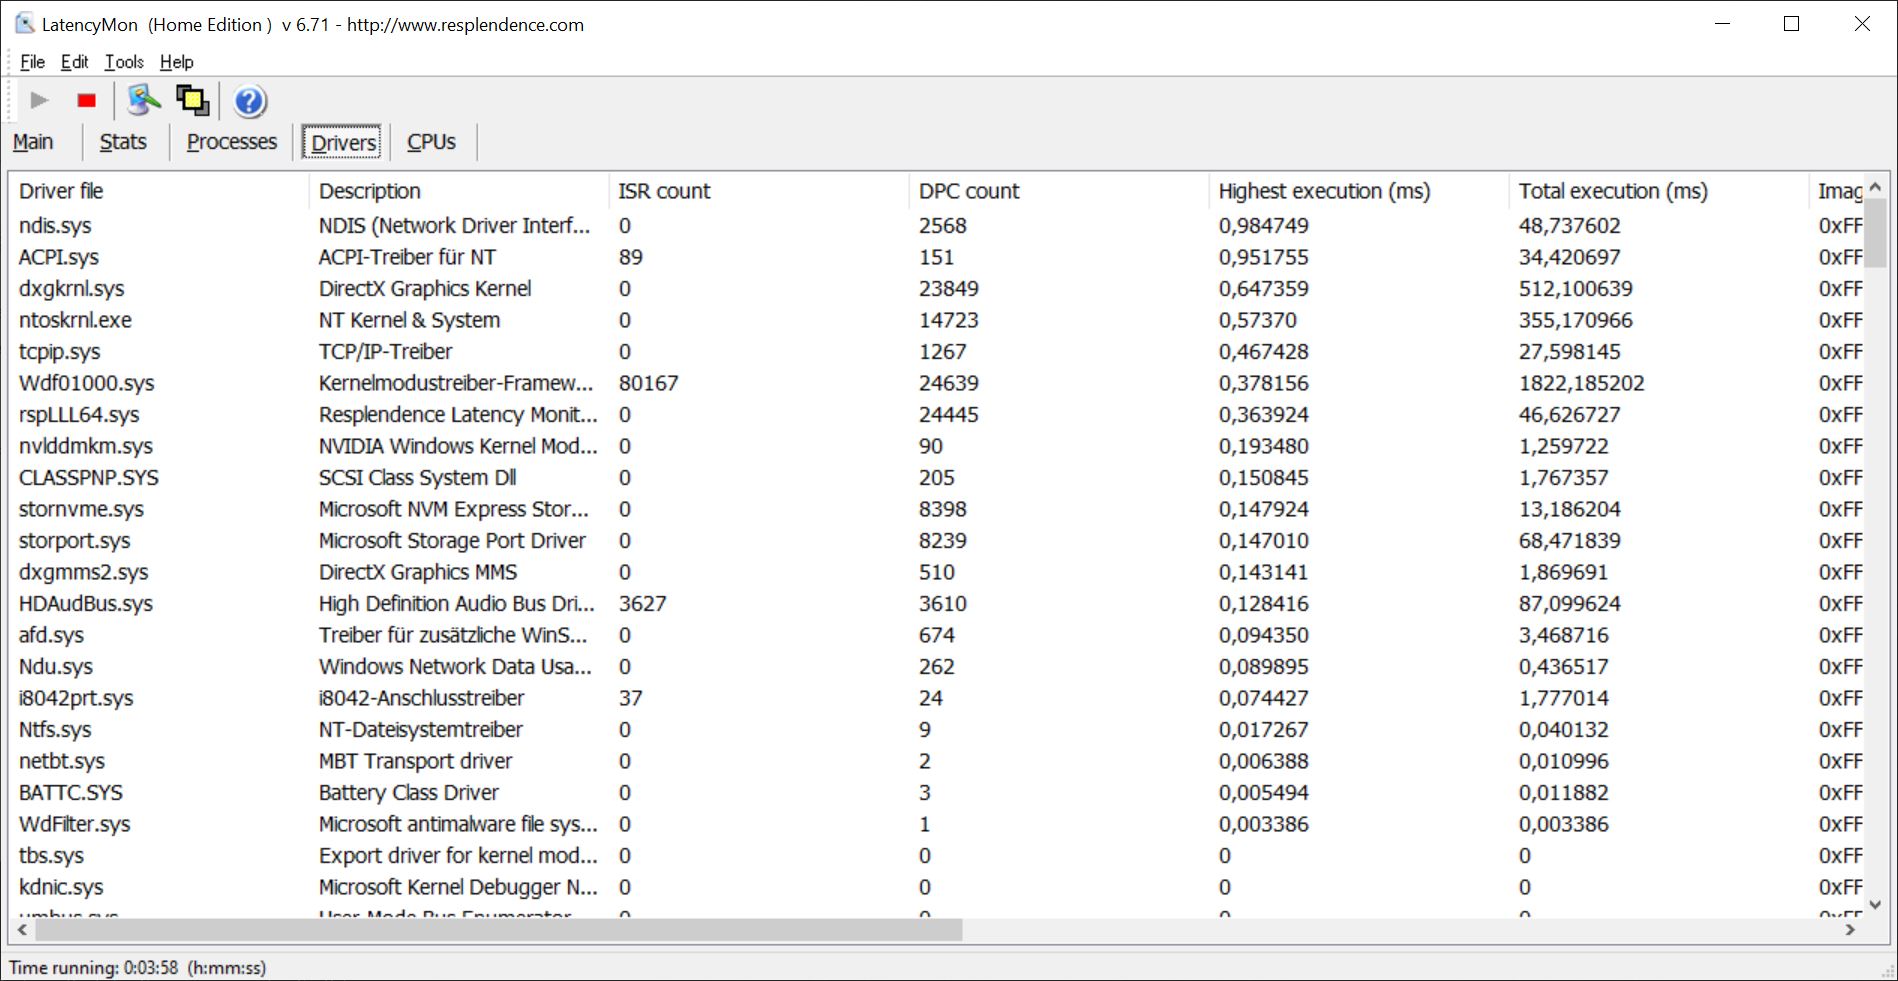
| DPC Latencies / LatencyMon - interrupt to process latency (max), Web, Youtube, Prime95 | |
| SCHENKER XMG NEO 17 GM7TG8S | |
| SCHENKER XMG Neo 17 (Early 2021, RTX 3070, 5800H) | |
| Asus ROG Zephyrus S17 GX703HSD | |
| Aorus 17G YD | |
| Medion Erazer Beast X25 | |
| Asus Strix Scar 17 G733QSA-XS99 | |
* ... smaller is better
Mass storage
Schenker installs a Samsung SSD 980 Pro with 1 TB of storage space, which is at the top of our HDD/SSD table. Accordingly, it also outclasses most of the competitors in terms of speed. Only the Samsung PM9A1 in the Asus ROG Zephyrus is even a bit faster.
| SCHENKER XMG NEO 17 GM7TG8S Samsung SSD 980 Pro 1TB MZ-V8P1T0BW | SCHENKER XMG Neo 17 (Early 2021, RTX 3070, 5800H) Samsung SSD 970 EVO Plus 500GB | Aorus 17G YD Samsung PM9A1 MZVL2512HCJQ | Medion Erazer Beast X25 Samsung PM9A1 MZVL22T0HBLB | Asus ROG Zephyrus S17 GX703HSD Samsung PM9A1 MZVL22T0HBLB | Asus Strix Scar 17 G733QSA-XS99 2x Samsung PM981a MZVLB1T0HBLR (RAID 0) | Average Samsung SSD 980 Pro 1TB MZ-V8P1T0BW | |
|---|---|---|---|---|---|---|---|
| CrystalDiskMark 5.2 / 6 | -29% | -13% | -37% | 0% | -6% | 0% | |
| Write 4K | 225.9 | 206.1 -9% | 227.4 1% | 129.7 -43% | 244.2 8% | 235.9 4% | 220 ? -3% |
| Read 4K | 90.3 | 53 -41% | 91.3 1% | 62.4 -31% | 89.8 -1% | 48.02 -47% | 85.1 ? -6% |
| Write Seq | 4289 | 3018 -30% | 2241 -48% | 2436 -43% | 4822 12% | 3911 ? -9% | |
| Read Seq | 4228 | 2575 -39% | 4496 6% | 2354 -44% | 5043 19% | 3999 ? -5% | |
| Write 4K Q32T1 | 626 | 535 -15% | 661 6% | 512 -18% | 607 -3% | 625 0% | 551 ? -12% |
| Read 4K Q32T1 | 685 | 608 -11% | 712 4% | 436.2 -36% | 658 -4% | 392.3 -43% | 977 ? 43% |
| Write Seq Q32T1 | 5184 | 3242 -37% | 1540 -70% | 3541 -32% | 5270 2% | 5350 3% | 4932 ? -5% |
| Read Seq Q32T1 | 7088 | 3617 -49% | 6806 -4% | 3568 -50% | 7091 0% | 7130 1% | 6842 ? -3% |
| Write 4K Q8T8 | 2270 | 1390 ? | |||||
| Read 4K Q8T8 | 2490 | 2134 ? | |||||
| AS SSD | -34% | -23% | -39% | 10% | -26% | -19% | |
| Seq Read | 5223 | 3020 -42% | 5150 -1% | 2591 -50% | 5085 -3% | 4981 -5% | 4838 ? -7% |
| Seq Write | 3922 | 2631 -33% | 3920 0% | 1900 -52% | 4434 13% | 3050 -22% | 3490 ? -11% |
| 4K Read | 82.2 | 60.3 -27% | 46.6 -43% | 53.9 -34% | 80.3 -2% | 57 -31% | 72 ? -12% |
| 4K Write | 207.6 | 171.6 -17% | 145.8 -30% | 112.6 -46% | 214.7 3% | 261.3 26% | 188.8 ? -9% |
| 4K-64 Read | 2439 | 1410 -42% | 2071 -15% | 1335 -45% | 2573 5% | 1205 -51% | 2234 ? -8% |
| 4K-64 Write | 2652 | 2324 -12% | 3267 23% | 2966 12% | 2972 12% | 1290 -51% | 2622 ? -1% |
| Access Time Read * | 0.022 | 0.045 -105% | 0.078 -255% | 0.038 -73% | 0.018 18% | 0.032 -45% | 0.04075 ? -85% |
| Access Time Write * | 0.021 | 0.024 -14% | 0.029 -38% | 0.036 -71% | 0.02 5% | 0.044 -110% | 0.03363 ? -60% |
| Score Read | 3044 | 1773 -42% | 2633 -14% | 1648 -46% | 3161 4% | 1760 -42% | 2811 ? -8% |
| Score Write | 3252 | 2759 -15% | 2805 -14% | 3269 1% | 3631 12% | 1857 -43% | 3159 ? -3% |
| Score Total | 7794 | 5429 -30% | 7716 -1% | 5733 -26% | 8380 8% | 4428 -43% | 7334 ? -6% |
| Copy ISO MB/s | 3221 | 3190 -1% | 3239 1% | 3357 4% | 2688 ? -17% | ||
| Copy Program MB/s | 1151 | 987 -14% | 899 -22% | 966 -16% | 568 ? -51% | ||
| Copy Game MB/s | 1194 | 2096 76% | 2171 82% | 2051 72% | 1346 ? 13% | ||
| Total Average (Program / Settings) | -32% /
-32% | -18% /
-20% | -38% /
-38% | 5% /
7% | -16% /
-19% | -10% /
-12% |
* ... smaller is better

Continuous load read: DiskSpd Read Loop, Queue Depth 8
Graphics card
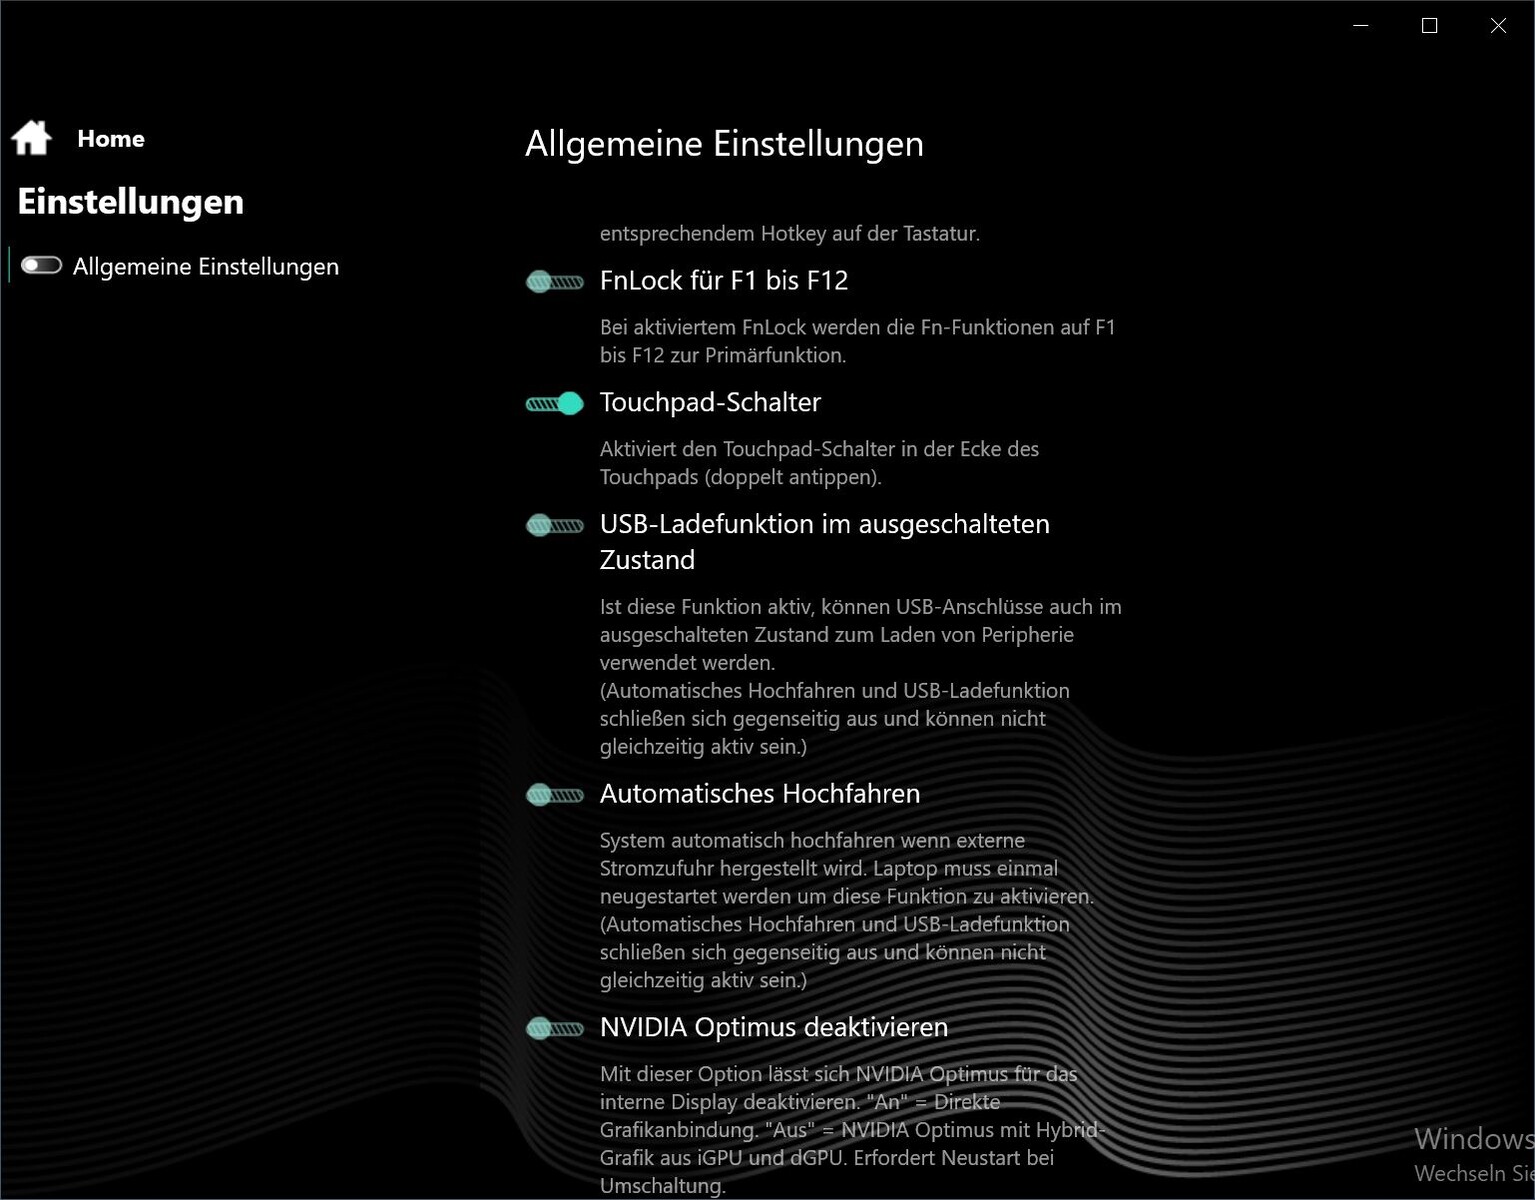
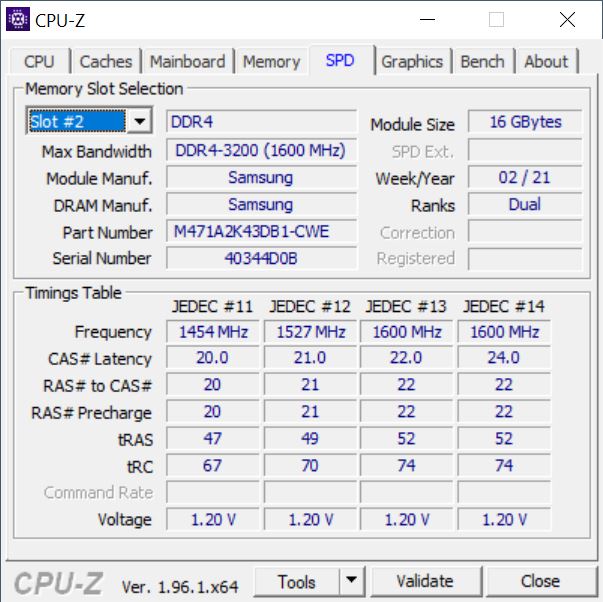
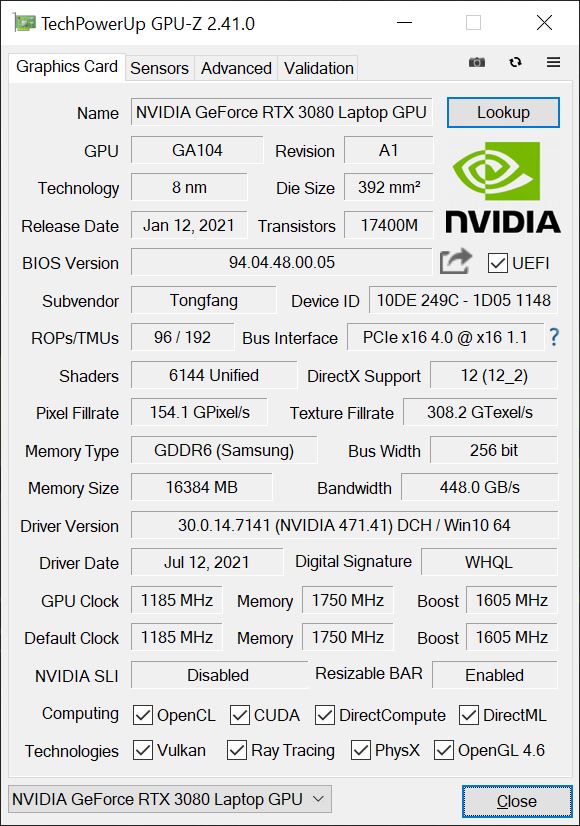
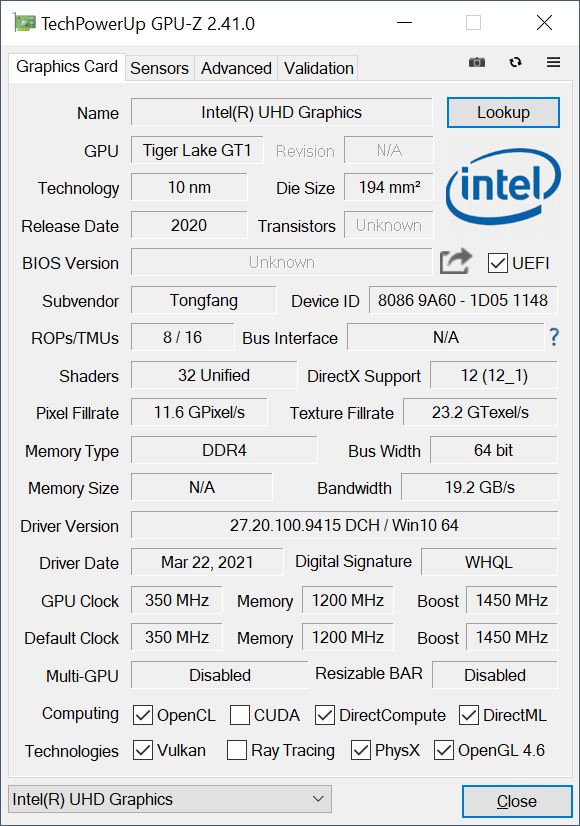
In the Neo, the integrated Intel Xe graphics works first, while the strong Nvidia GeForce RTX 3080 laptop GPU waits for demanding tasks. You can deactivate Nvidia Optimus and thus the integrated GPU in the Control Center, which might result in a few more fps due to the direct connection without signal redirection to the iGPU. Commendable: Schenker passes on the GPU's TGP choice released by Nvidia to the customer. This means that users can assign the maximum TGP of 165 W (including 15 W Turbo Boost) to their NEO in the Control Center.
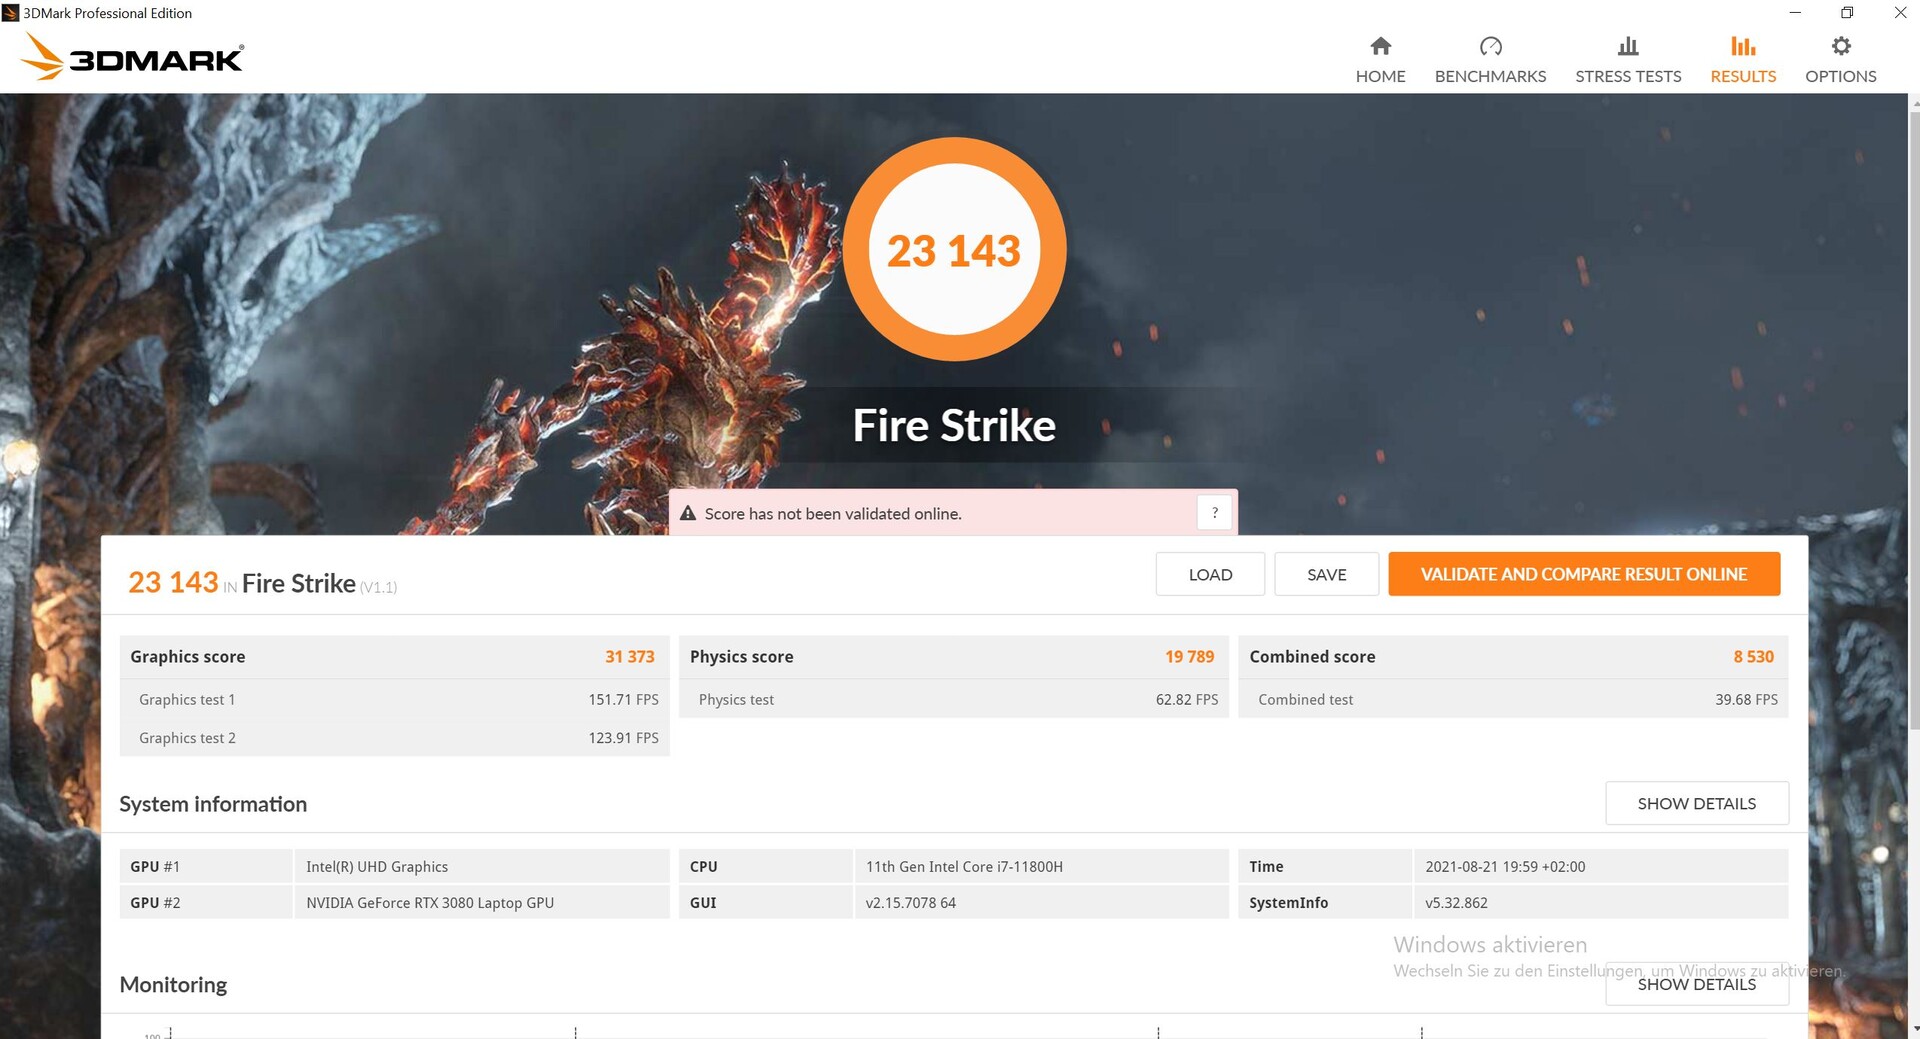
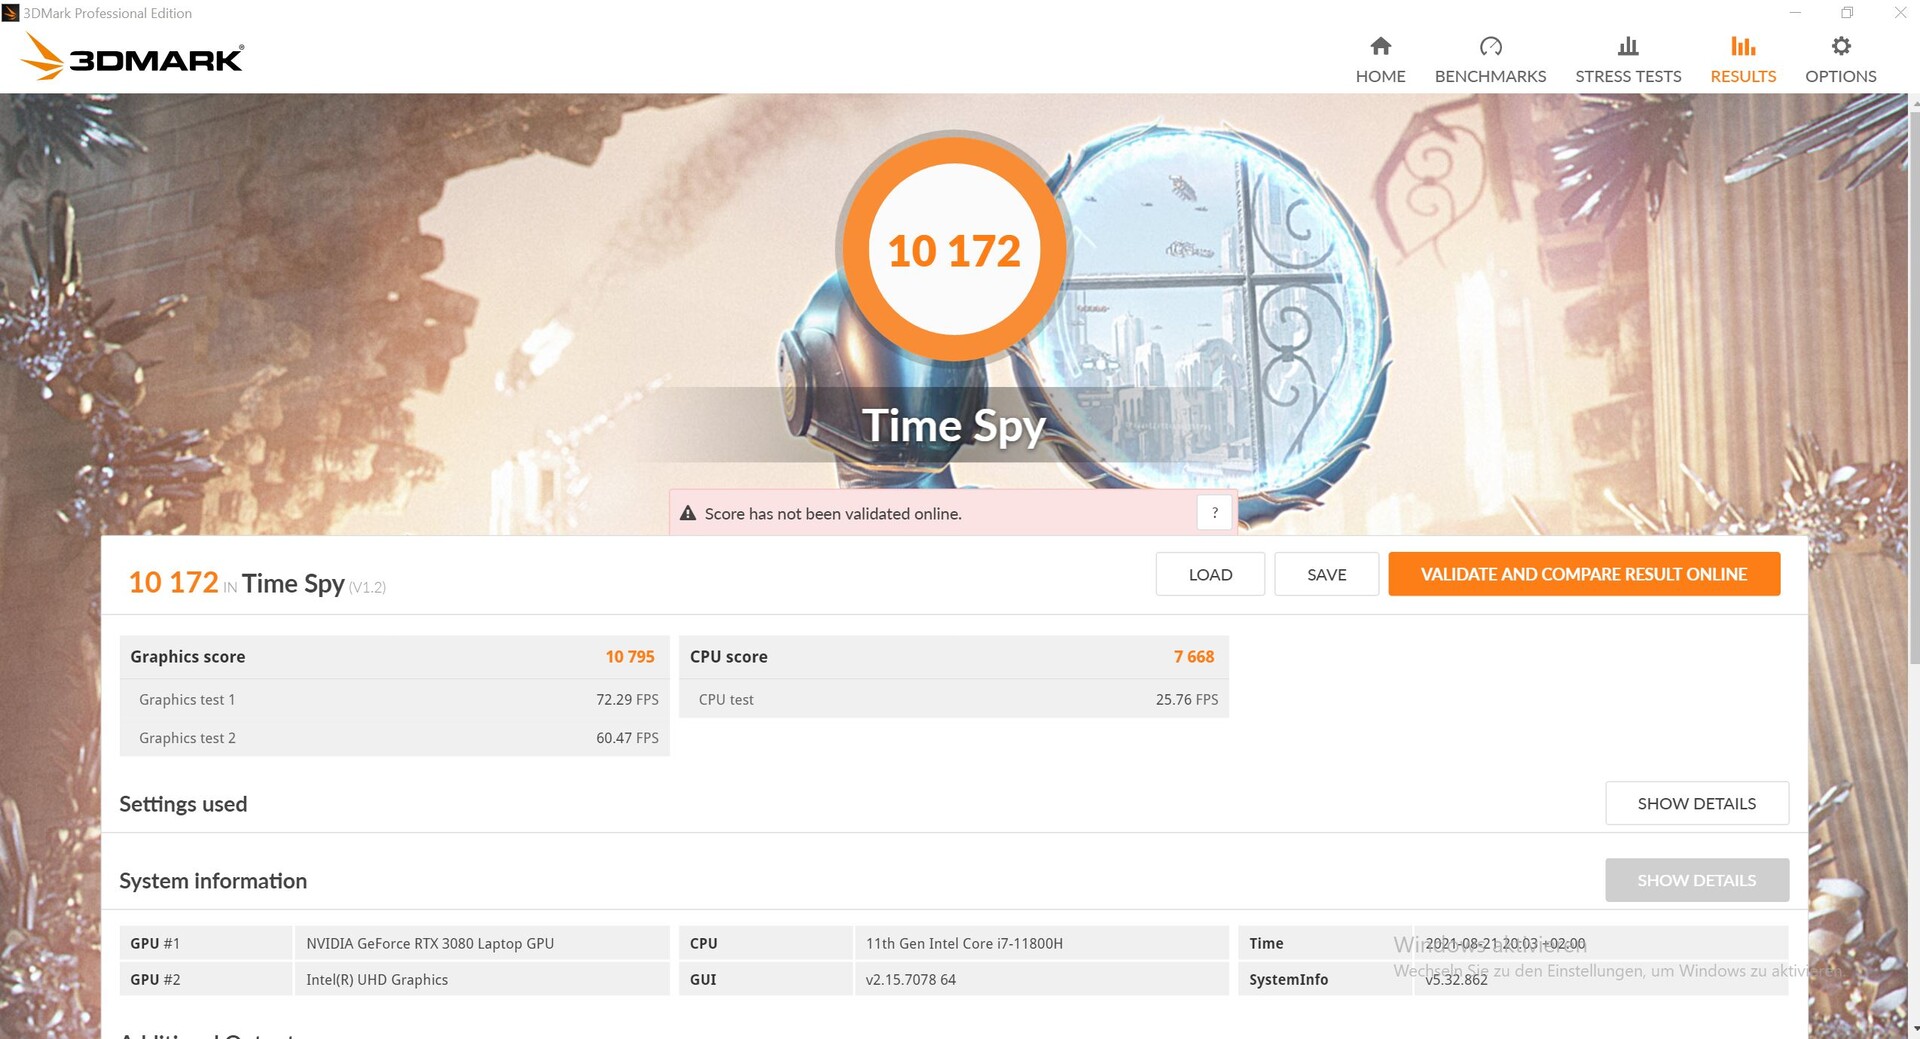
Our NEO also takes the lead in 3DMark 11, for example, as well as in 3DMark's Fire Strike test. However, the laptop performs somewhat below average in Time Spy and Cloud Gate. Overall, we can see that the performance of the RTX 3080 is very high.
Another 3DMark 11 run in battery mode reveals a performance loss of around 64%!
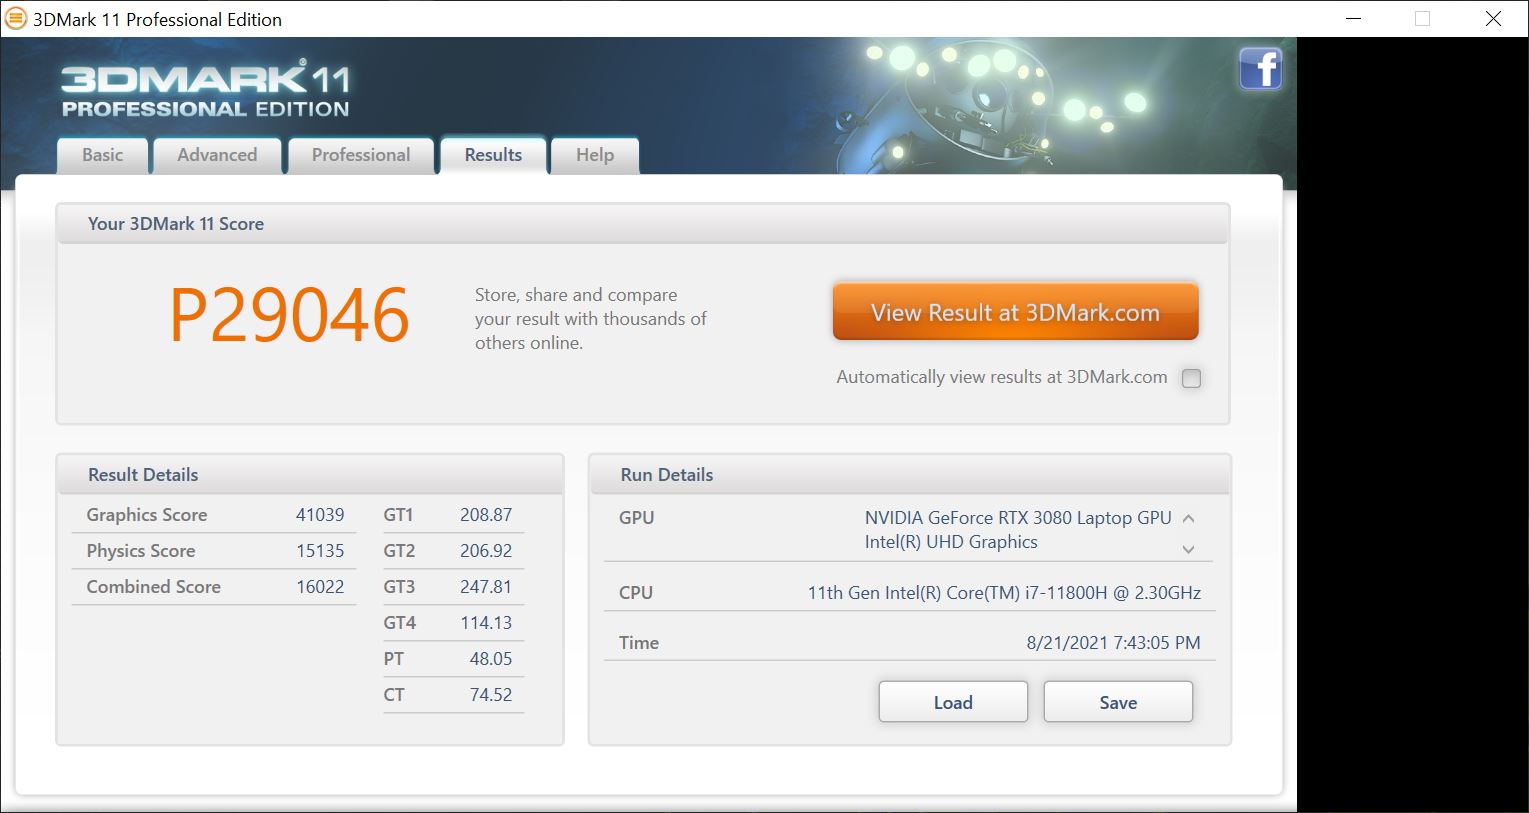

| 3DMark 11 Performance | 29046 points | |
| 3DMark Cloud Gate Standard Score | 40008 points | |
| 3DMark Fire Strike Score | 23143 points | |
| 3DMark Time Spy Score | 10172 points | |
Help | ||
Gaming performance
In the various gaming benchmarks, the NEO takes the top spot almost consistently thanks to its strong GPU, with the RTX 3080 performing about 10% above all models we tested. The Zephyrus is its strongest competitor and often comes very close to the NEO, although the RTX 3080 in the Zephyrus only has a TGP of 140W. So even though the NEO is often at the top, the performance could be a bit better.
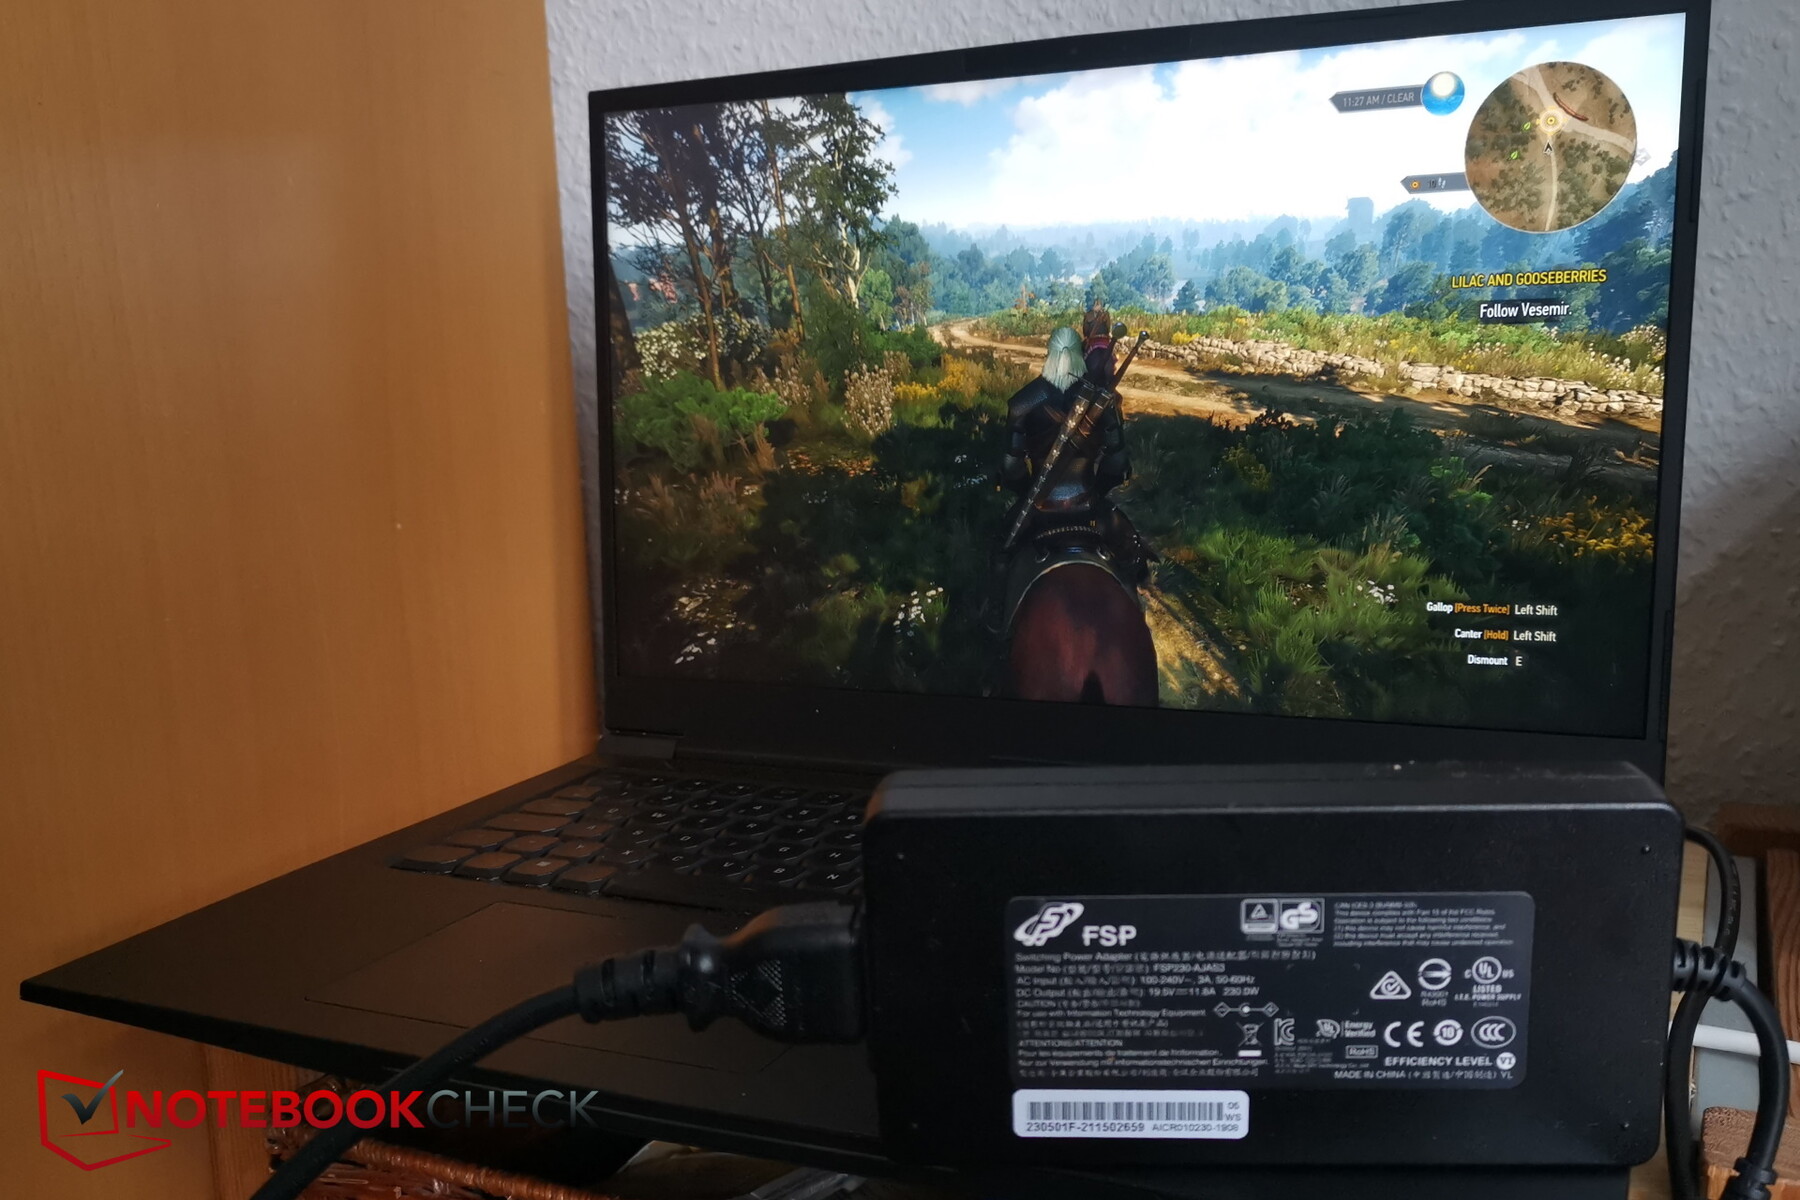
When analyzing the Witcher 3 frame rate over a period of one hour, it is noticeable that the fps drops slightly but continuously over time. Thus, throttling is definitely seen during prolonged load.
Witcher 3 FPS-Diagram
| low | med. | high | ultra | QHD | |
| GTA V (2015) | 185 | 182 | 176 | 112 | |
| The Witcher 3 (2015) | 418 | 329 | 210 | 113 | |
| Dota 2 Reborn (2015) | 179 | 157 | 141.5 | 134.7 | |
| X-Plane 11.11 (2018) | 132 | 118 | 88.9 | ||
| Far Cry 5 (2018) | 168 | 143 | 137 | 127 | 112 |
| Strange Brigade (2018) | 535 | 305 | 247 | 218 | |
| Shadow of the Tomb Raider (2018) | 170 | 150 | 131 | 132 | 113 |
Emissions - Annoying noise
Noise emissions
Even in overboost mode, the fans often remain silent while idling. However, if a load was applied beforehand, the fans still roar quietly for quite a long time in subsequent idle. Under load, the noise development is comparable to that of the competition, but 55 dB(A) is clearly annoying for all of them, only the Zephyrus stays a bit quieter under full load.
However, there are temporary disturbing noises. A somewhat louder electronic squeal and whirring occur temporarily when certain loads are applied, such as 3DMark or gaming, but then disappear again. These noises were more blatant in the Zephyrus, but they are annoying here as well because they seem unnecessary.
Noise Level
| Idle |
| 23 / 23 / 23 dB(A) |
| Load |
| 39.5 / 55.09 dB(A) |
 | ||
30 dB silent 40 dB(A) audible 50 dB(A) loud |
||
min: | ||
| SCHENKER XMG NEO 17 GM7TG8S GeForce RTX 3080 Laptop GPU, i7-11800H, Samsung SSD 980 Pro 1TB MZ-V8P1T0BW | SCHENKER XMG Neo 17 (Early 2021, RTX 3070, 5800H) GeForce RTX 3070 Laptop GPU, R7 5800H, Samsung SSD 970 EVO Plus 500GB | Aorus 17G YD GeForce RTX 3080 Laptop GPU, i7-11800H, Samsung PM9A1 MZVL2512HCJQ | Medion Erazer Beast X25 GeForce RTX 3080 Laptop GPU, R9 5900HX, Samsung PM9A1 MZVL22T0HBLB | Asus ROG Zephyrus S17 GX703HSD GeForce RTX 3080 Laptop GPU, i9-11900H, Samsung PM9A1 MZVL22T0HBLB | Asus Strix Scar 17 G733QSA-XS99 GeForce RTX 3080 Laptop GPU, R9 5900HX, 2x Samsung PM981a MZVLB1T0HBLR (RAID 0) | |
|---|---|---|---|---|---|---|
| Noise | -22% | -25% | -24% | 3% | -1% | |
| off / environment * | 23 | 24 -4% | 25 -9% | 25 -9% | 23 -0% | 25 -9% |
| Idle Minimum * | 23 | 29 -26% | 32 -39% | 26 -13% | 23 -0% | 25.2 -10% |
| Idle Average * | 23 | 32 -39% | 33 -43% | 30 -30% | 23 -0% | 25.2 -10% |
| Idle Maximum * | 23 | 38 -65% | 39 -70% | 43 -87% | 23 -0% | 25.2 -10% |
| Load Average * | 39.5 | 49 -24% | 43 -9% | 54 -37% | 41 -4% | 30.7 22% |
| Witcher 3 ultra * | 54.5 | 53 3% | 52 5% | 52 5% | 45 17% | 51.3 6% |
| Load Maximum * | 55.09 | 55 -0% | 61 -11% | 55 -0% | 52 6% | 51.3 7% |
* ... smaller is better
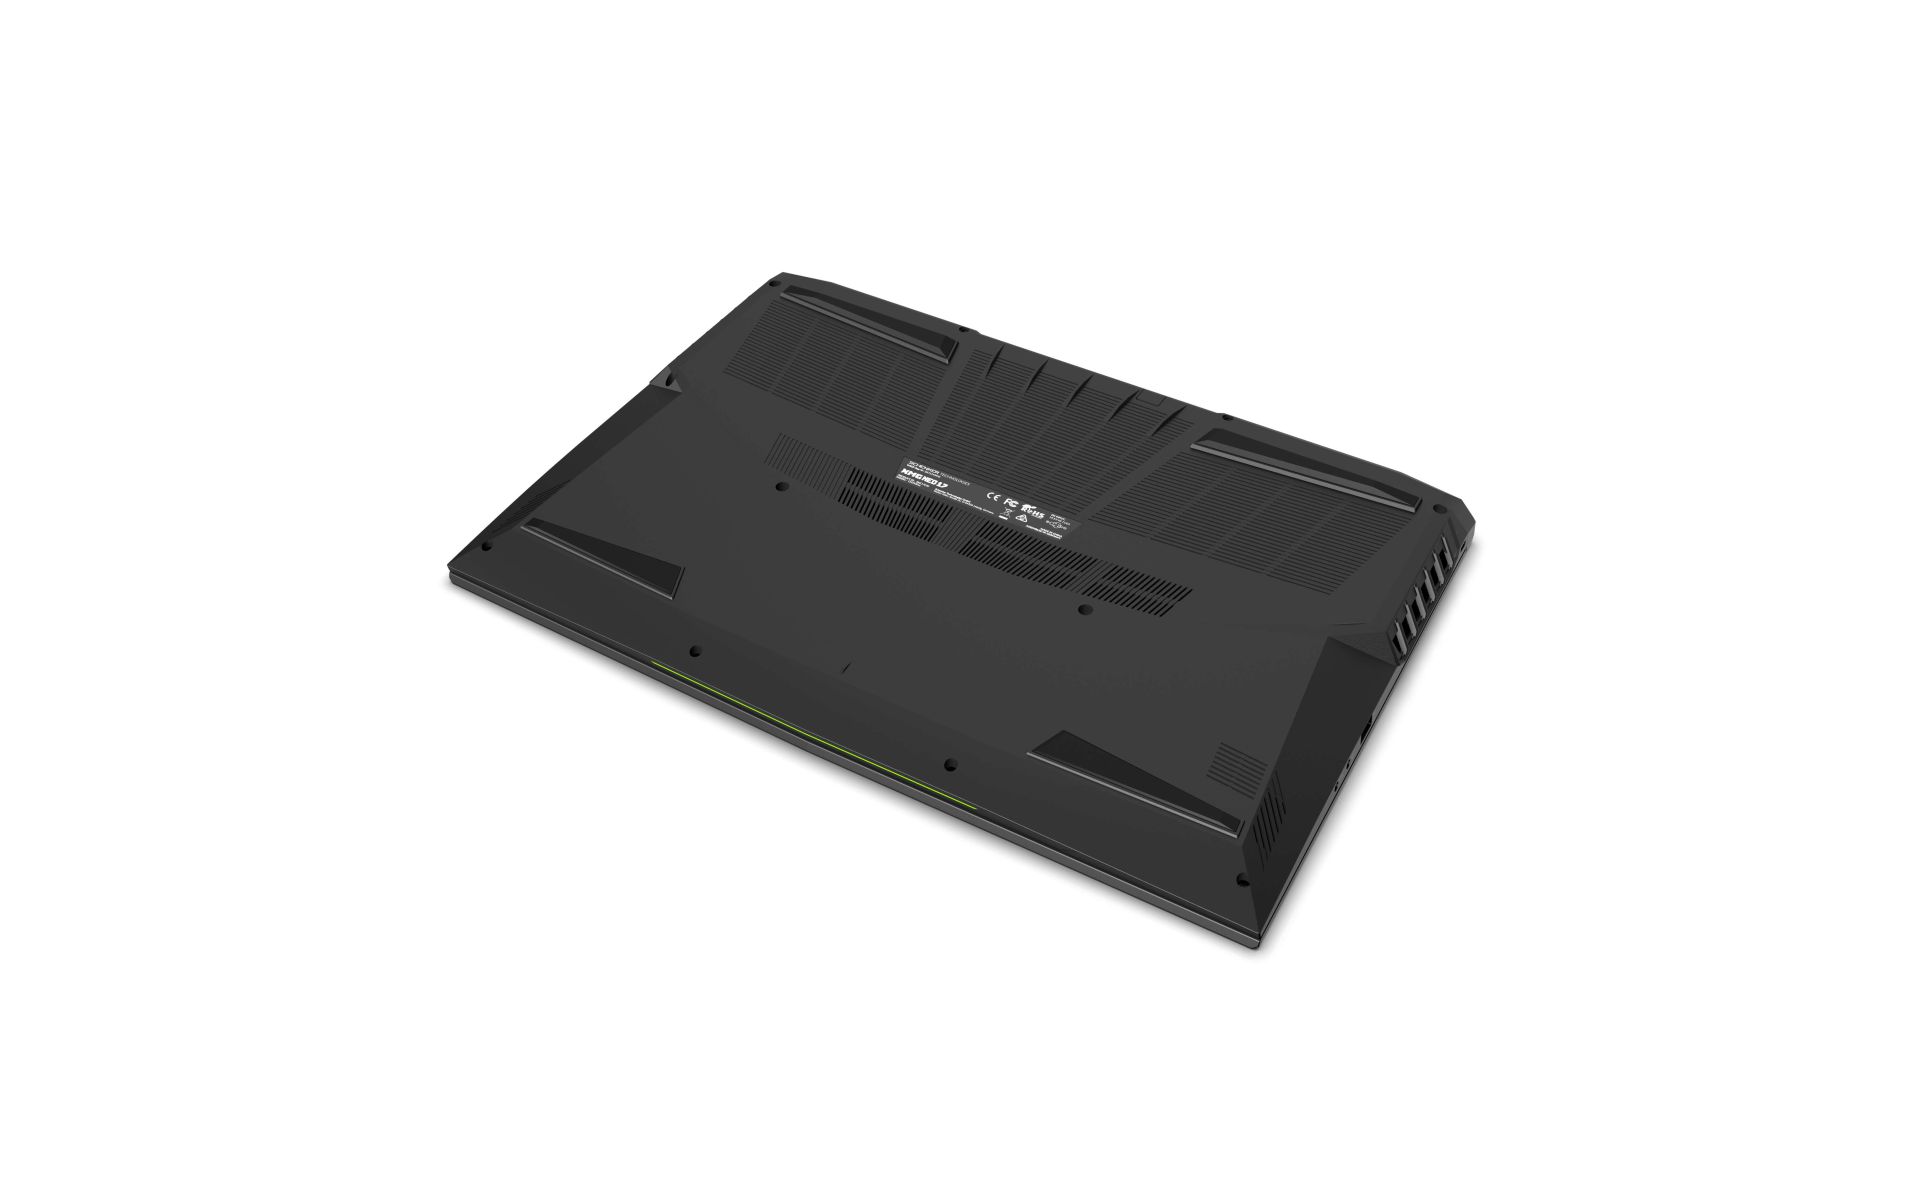
Temperature
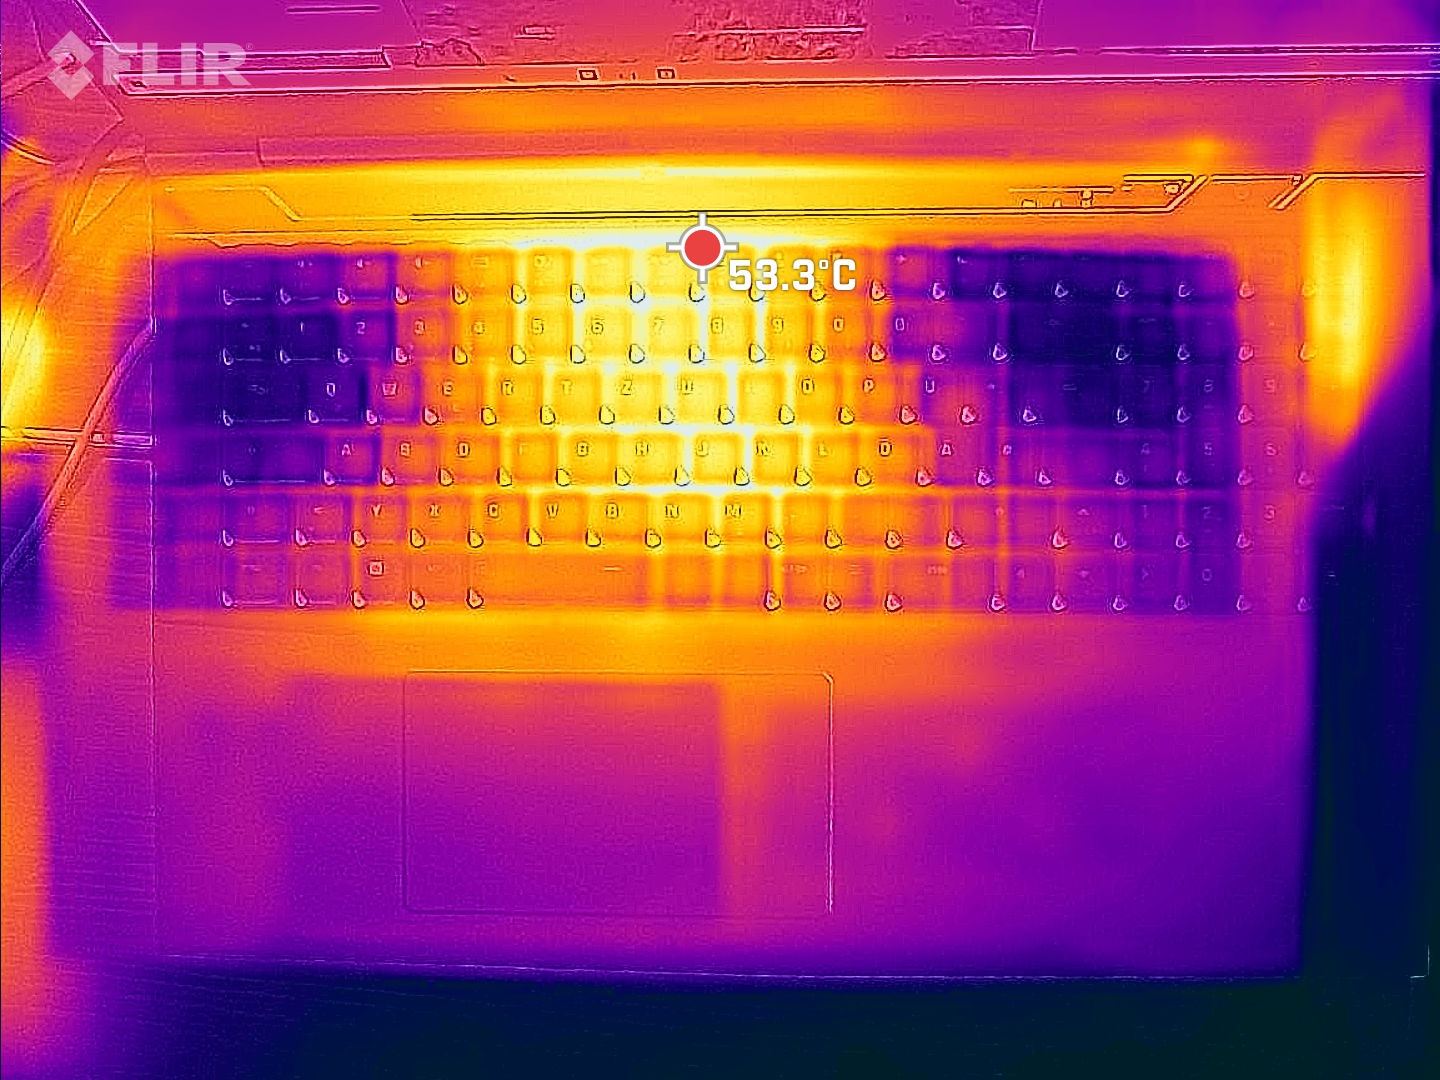
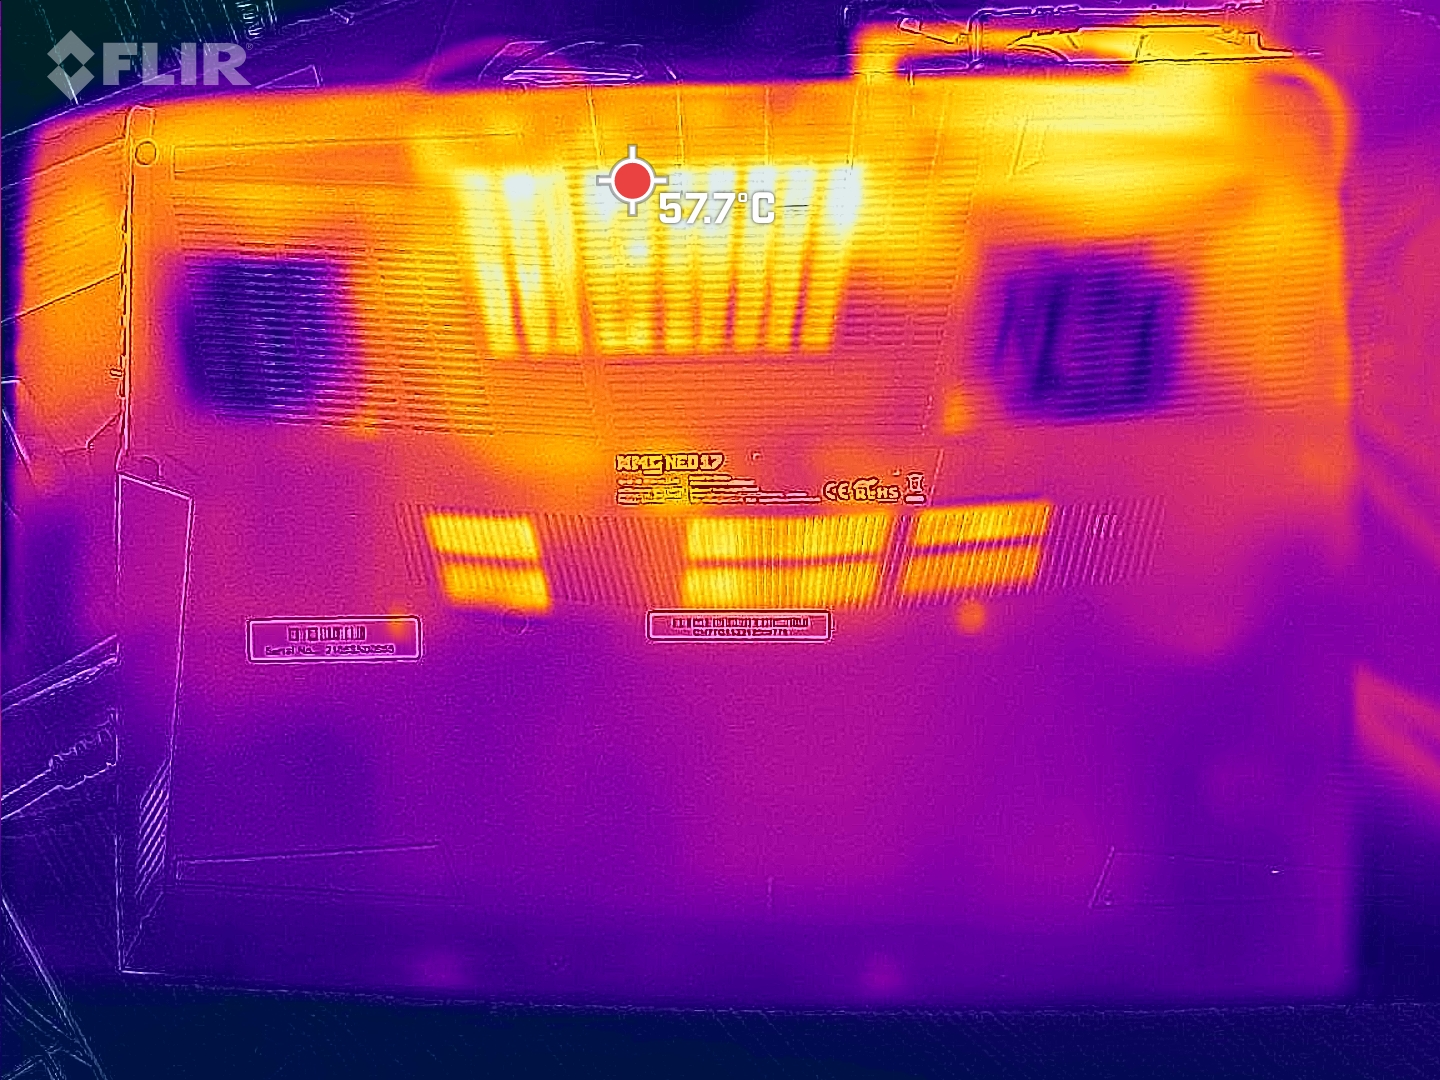
Hot spots of over 60 °C (140 °F) can develop on the underside under full load, which makes the NEO a bit warmer than most rivals. It gets especially hot in the center and towards the display, but fortunately the palm rests always stay cool. The WASD key area heats up to about 41 °C (105.8 °F) when playing Witcher 3. Especially the Aorus or the Asus Strix Scar stay cooler under load.
(-) The maximum temperature on the upper side is 51 °C / 124 F, compared to the average of 40.4 °C / 105 F, ranging from 21.2 to 68.8 °C for the class Gaming.
(-) The bottom heats up to a maximum of 62 °C / 144 F, compared to the average of 43.2 °C / 110 F
(+) In idle usage, the average temperature for the upper side is 30.9 °C / 88 F, compared to the device average of 33.8 °C / 93 F.
(-) Playing The Witcher 3, the average temperature for the upper side is 39.6 °C / 103 F, compared to the device average of 33.8 °C / 93 F.
(±) The palmrests and touchpad can get very hot to the touch with a maximum of 37 °C / 98.6 F.
(-) The average temperature of the palmrest area of similar devices was 28.9 °C / 84 F (-8.1 °C / -14.6 F).
| SCHENKER XMG NEO 17 GM7TG8S GeForce RTX 3080 Laptop GPU, i7-11800H, Samsung SSD 980 Pro 1TB MZ-V8P1T0BW | SCHENKER XMG Neo 17 (Early 2021, RTX 3070, 5800H) GeForce RTX 3070 Laptop GPU, R7 5800H, Samsung SSD 970 EVO Plus 500GB | Aorus 17G YD GeForce RTX 3080 Laptop GPU, i7-11800H, Samsung PM9A1 MZVL2512HCJQ | Medion Erazer Beast X25 GeForce RTX 3080 Laptop GPU, R9 5900HX, Samsung PM9A1 MZVL22T0HBLB | Asus ROG Zephyrus S17 GX703HSD GeForce RTX 3080 Laptop GPU, i9-11900H, Samsung PM9A1 MZVL22T0HBLB | Asus Strix Scar 17 G733QSA-XS99 GeForce RTX 3080 Laptop GPU, R9 5900HX, 2x Samsung PM981a MZVLB1T0HBLR (RAID 0) | |
|---|---|---|---|---|---|---|
| Heat | 10% | 19% | 3% | 2% | 15% | |
| Maximum Upper Side * | 51 | 47 8% | 36 29% | 54 -6% | 59 -16% | 40 22% |
| Maximum Bottom * | 62 | 51 18% | 52 16% | 57 8% | 53 15% | 39.8 36% |
| Idle Upper Side * | 35 | 32 9% | 29 17% | 34 3% | 35 -0% | 34.6 1% |
| Idle Bottom * | 38 | 37 3% | 33 13% | 35 8% | 35 8% | 38.4 -1% |
* ... smaller is better
The CPU cores start our stress test with about 4.2 GHz. The clock fluctuates strongly and is only 2.3 GHz at the end, which is the base clock. Thermal throttling is thus quite pronounced over time in the NEO, which is probably also due to the fact that we grant the RTX 3080 the maximum TGP. Here, users should test out a good compromise between the CPU's TDP, the GPU's TGP and the heat development. This need to test is one of the drawbacks of the otherwise nice freedoms in the NEO 17.
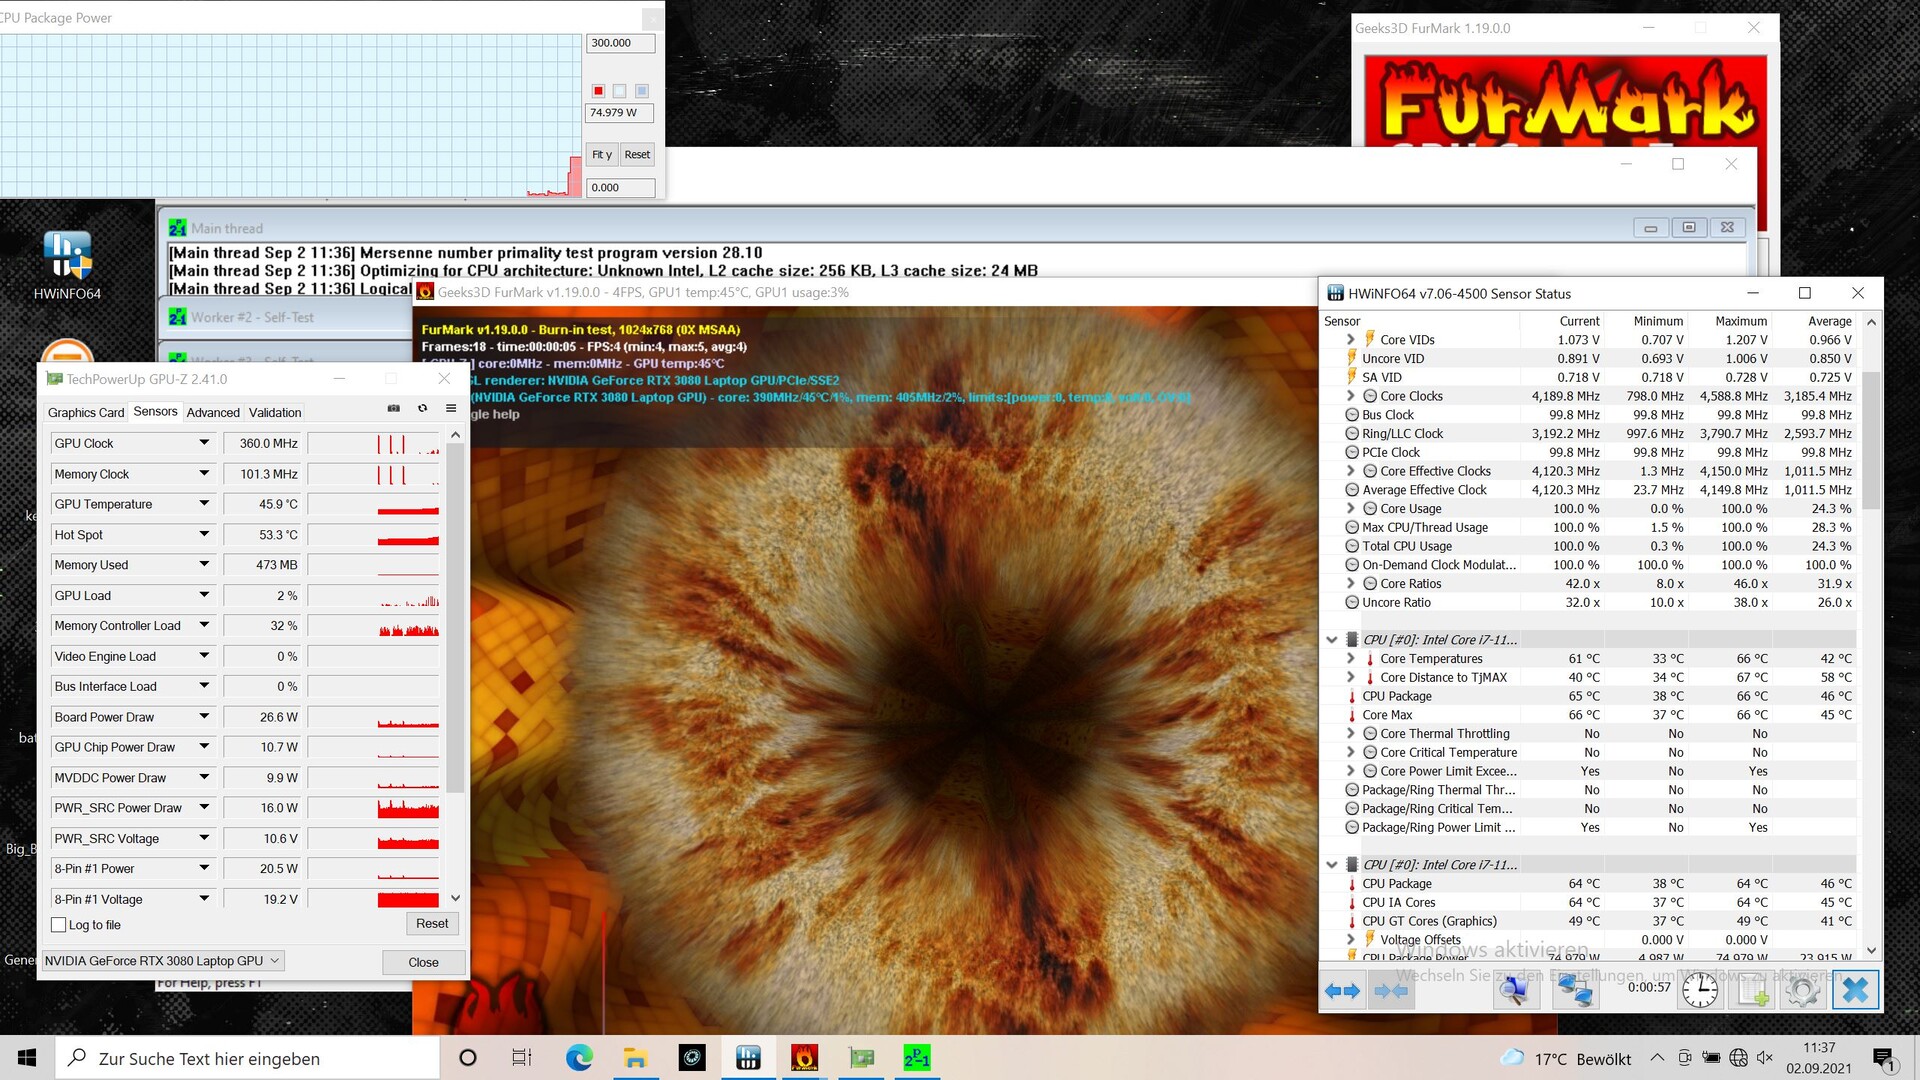
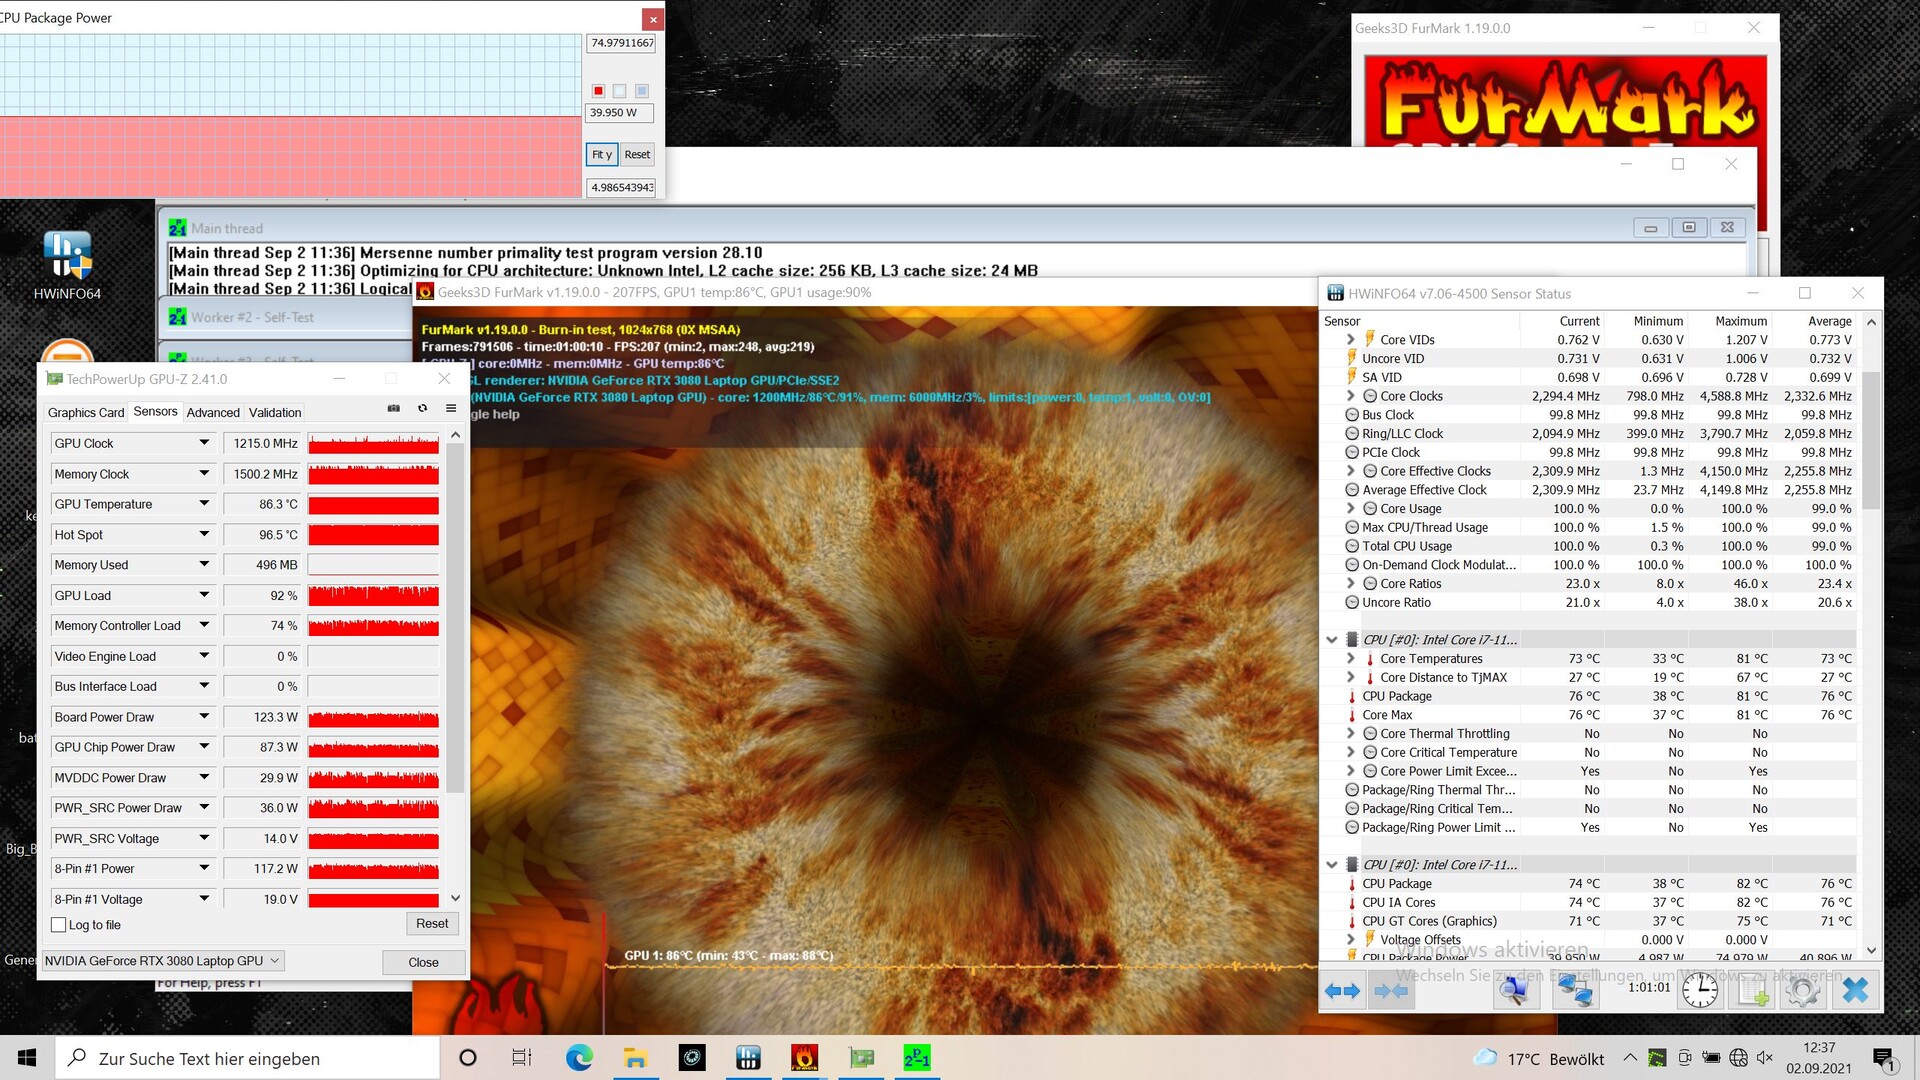
The NEO still has some room for improvement in terms of core temperatures, which are only 73 °C (163.4 °F) after one hour of testing, with a maximum of only 81 °C (177.8 °F).
The GPU clock drops from 1,485 MHz at the beginning to 1,215 MHz at the end. The core heats up to about 86 °C (186.8 °F), and the thermal limit is reached at 87°C (188.6 °F).
Speaker
The speakers are already among the better ones in the field of notebook speakers. They are quite loud and produce a balanced midrange and treble. Of course, the bass is a bit lowered, but compared to many other speakers, the bass does come across. Overall, the listening impression is positive in comparison. However, external equipment should be used for real audio enjoyment. A separate microphone input and a headphone output are available for analog connections.
SCHENKER XMG NEO 17 GM7TG8S audio analysis
(±) | speaker loudness is average but good (78.4 dB)
Bass 100 - 315 Hz
(±) | reduced bass - on average 13.7% lower than median
(±) | linearity of bass is average (12.5% delta to prev. frequency)
Mids 400 - 2000 Hz
(±) | higher mids - on average 5.3% higher than median
(+) | mids are linear (6.2% delta to prev. frequency)
Highs 2 - 16 kHz
(+) | balanced highs - only 2.8% away from median
(+) | highs are linear (5.7% delta to prev. frequency)
Overall 100 - 16.000 Hz
(+) | overall sound is linear (14.8% difference to median)
Compared to same class
» 26% of all tested devices in this class were better, 7% similar, 67% worse
» The best had a delta of 6%, average was 18%, worst was 132%
Compared to all devices tested
» 16% of all tested devices were better, 4% similar, 80% worse
» The best had a delta of 4%, average was 25%, worst was 134%
Apple MacBook 12 (Early 2016) 1.1 GHz audio analysis
(+) | speakers can play relatively loud (83.6 dB)
Bass 100 - 315 Hz
(±) | reduced bass - on average 11.3% lower than median
(±) | linearity of bass is average (14.2% delta to prev. frequency)
Mids 400 - 2000 Hz
(+) | balanced mids - only 2.4% away from median
(+) | mids are linear (5.5% delta to prev. frequency)
Highs 2 - 16 kHz
(+) | balanced highs - only 2% away from median
(+) | highs are linear (4.5% delta to prev. frequency)
Overall 100 - 16.000 Hz
(+) | overall sound is linear (10.2% difference to median)
Compared to same class
» 5% of all tested devices in this class were better, 2% similar, 93% worse
» The best had a delta of 5%, average was 19%, worst was 53%
Compared to all devices tested
» 3% of all tested devices were better, 1% similar, 96% worse
» The best had a delta of 4%, average was 25%, worst was 134%
Energy management - frugal at idle, wasteful during gaming
Power consumption
Across all scenarios, the NEO 17 is relatively frugal, with only the Asus Strix consuming less. However, the consumption is relatively high in gaming, which is probably due to the unleashed RTX and usually puts the NEO in first place in terms of fps.
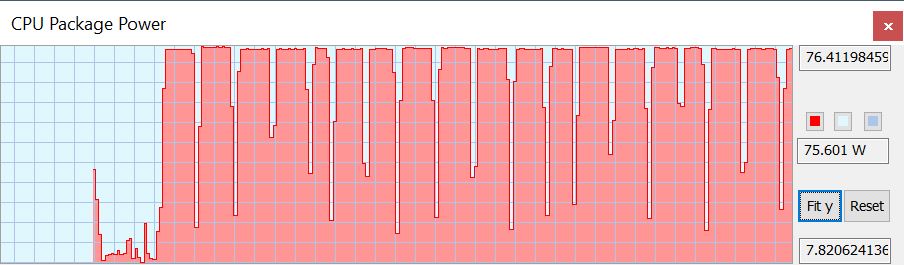
We measured very short peak consumptions of just over 230 W in the stress test. However, since the average consumption is 226 W even in this extreme load scenario, the 230 W power supply should actually be sufficiently sized.
| Idle | |
| Load |
|
| SCHENKER XMG NEO 17 GM7TG8S i7-11800H, GeForce RTX 3080 Laptop GPU, Samsung SSD 980 Pro 1TB MZ-V8P1T0BW, IPS, 2560x1440, 17.30 | SCHENKER XMG Neo 17 (Early 2021, RTX 3070, 5800H) R7 5800H, GeForce RTX 3070 Laptop GPU, Samsung SSD 970 EVO Plus 500GB, IPS, 2560x1440, 17.30 | Aorus 17G YD i7-11800H, GeForce RTX 3080 Laptop GPU, Samsung PM9A1 MZVL2512HCJQ, IPS, 1920x1080, 17.30 | Medion Erazer Beast X25 R9 5900HX, GeForce RTX 3080 Laptop GPU, Samsung PM9A1 MZVL22T0HBLB, IPS, 1920x1080, 17.30 | Asus ROG Zephyrus S17 GX703HSD i9-11900H, GeForce RTX 3080 Laptop GPU, Samsung PM9A1 MZVL22T0HBLB, IPS, 2560x1440, 17.30 | Asus Strix Scar 17 G733QSA-XS99 R9 5900HX, GeForce RTX 3080 Laptop GPU, 2x Samsung PM981a MZVLB1T0HBLR (RAID 0), IPS, 1920x1080, 17.30 | Average NVIDIA GeForce RTX 3080 Laptop GPU | Average of class Gaming | |
|---|---|---|---|---|---|---|---|---|
| Power Consumption | 10% | -6% | -7% | -4% | 17% | -5% | 7% | |
| Idle Minimum * | 19 | 13 32% | 24 -26% | 22 -16% | 21.7 -14% | 10.9 43% | 19.6 ? -3% | 13.8 ? 27% |
| Idle Average * | 25 | 16 36% | 26 -4% | 26 -4% | 27 -8% | 14.7 41% | 24.1 ? 4% | 19.2 ? 23% |
| Idle Maximum * | 28 | 26 7% | 38 -36% | 34 -21% | 33 -18% | 26.8 4% | 33.3 ? -19% | 26.9 ? 4% |
| Load Average * | 105 | 125 -19% | 101 4% | 120 -14% | 108 -3% | 106.7 -2% | 107.9 ? -3% | 111.1 ? -6% |
| Witcher 3 ultra * | 223 | 187 16% | 164 26% | 189 15% | 195 13% | 192.4 14% | ||
| Load Maximum * | 226 | 259 -15% | 230 -2% | 231 -2% | 210 7% | 228.4 -1% | 230 ? -2% | 251 ? -11% |
* ... smaller is better
Energy consumption Witcher 3 / Stress test
Battery life
Schenker saves on battery and only installs a capacity of 62 Wh. That is too little for such a performance-hungry gamer. The competition uses at least 90 Wh, and that is also noticeable in the runtimes. The rivals last almost twice as long in the Wi-Fi and video test! The NEO only lasts for 3 hours and 45 minutes. Unlike the performance benchmarks, we enabled Optimus again and switched back to the balanced mode in the Control Center instead of Overboost.
| SCHENKER XMG NEO 17 GM7TG8S i7-11800H, GeForce RTX 3080 Laptop GPU, 62 Wh | SCHENKER XMG Neo 17 (Early 2021, RTX 3070, 5800H) R7 5800H, GeForce RTX 3070 Laptop GPU, 62 Wh | Aorus 17G YD i7-11800H, GeForce RTX 3080 Laptop GPU, 99 Wh | Medion Erazer Beast X25 R9 5900HX, GeForce RTX 3080 Laptop GPU, 91 Wh | Asus ROG Zephyrus S17 GX703HSD i9-11900H, GeForce RTX 3080 Laptop GPU, 90 Wh | Asus Strix Scar 17 G733QSA-XS99 R9 5900HX, GeForce RTX 3080 Laptop GPU, 90 Wh | Average of class Gaming | |
|---|---|---|---|---|---|---|---|
| Battery Runtime | -31% | 43% | 34% | 88% | 70% | 44% | |
| H.264 | 222 | 370 67% | 430 94% | 399 ? 80% | |||
| WiFi v1.3 | 224 | 208 -7% | 360 61% | 410 83% | 449 100% | 559 150% | 368 ? 64% |
| Load | 96 | 44 -54% | 96 0% | 81 -16% | 162 69% | 86 -10% | 84.4 ? -12% |
| Reader / Idle | 281 | 541 | 591 | 797 | 544 ? | ||
| Witcher 3 ultra | 62 | 81.6 ? |
Pros
Cons
Verdict - Configure yourself
The advantage of the NEO is both a curse and a blessing: Almost all performance parameters can be set manually in the software. This allows unleashing the RTX 3080, for example, by assigning it the maximum TGP. Gaming enthusiasts will probably enjoy customizing the NEO 17 to their needs and squeezing every extra frame out of it. Non-gamers can at least use predefined profiles, but might be overwhelmed by the manual balancing of CPU and GPU performance in the slim case.
As so often, the AMD version has the better CPU performance, but Thunderbolt is omitted. Unfortunately, the battery runtimes are not very competitive for all NEO-17 configurations, especially at this price point.
However, there is nothing to complain about in the rest of the hardware. Besides the CPU and GPU, the SSD, for example, is also at the top.
The NEO 17 boasts many tuning options; almost all performance parameters can be set manually in the software. There is criticism for the poor battery runtime.
Price and availability
Schenker offers a link to bestware.com where our test model is currently available in the configurator for €2,721.98 (~$3,196).
SCHENKER XMG NEO 17 GM7TG8S
-
09/30/2021 v7
Christian Hintze
More articles related to this device
SCHENKER XMG NEO 17 GM7TG8S (Uniwill Technology Series)Related Articles

Pricecompare

