 Deutsch
 English
 Español
 Français
 Italiano
 Nederlands
 Polski
 Português
 Русский
 Türkçe
 Svenska
 Chinese
 Magyar
Schenker XMG Apex 15 (Clevo NH57AF1) Laptop Review: Extremely fast, extremely loud

Schenker's own online shop bestware.com offers numerous configuration options for the Apex 15. While the screen remains an IPS panel with 144 Hz (no G-Sync), buyers can choose between a GeForce RTX 2060 and a GeForce RTX 2070.
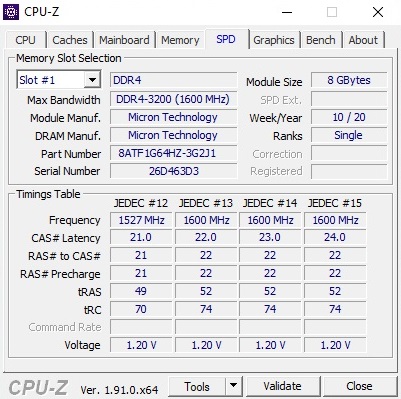
The core element of the Apex 15 - the processor - can also be chosen according to your wants and needs. The basic offer includes a Ryzen 5 3600 (6 cores). More money will get you a Ryzen 7 3700X (8 cores), a Ryzen 9 3900 (12 cores) or a Ryzen 9 3950X (16 cores). The surcharge is minimal for all upgrades save the last. The device can be equipped with up to 64 GB of DDR4 RAM and up to three storage devices (2x M.2, 1x 2.5-inch). Buyers can also have a say on the network module, the keyboard, the heat-conducting paste and the operating system.
The price of the Apex 15 starts at around 1300 Euros (~$1400). Our test configuration, equipped with a Ryzen 9 3900, a GeForce RTX 2070, 2x 8 GB of RAM and a 1-TB SSD, is currently available for around 2000 Euros (~$2160).
The competitors of the Apex 15 include other 15-inch laptops with a GeForce RTX 2070 and strong CPUs such as the Schenker XMG Ultra 15, the Eurocom Nightsky RX15, the MSI GE65 Raider 9SF and the Asus Strix G531GW. These laptops are cited as competitors in our comparison tables.
Rating | Date | Model | Weight | Height | Size | Resolution | Best Price |
|---|---|---|---|---|---|---|---|
| 81.2 % | 05/2020 | SCHENKER XMG Apex 15 NH57AF1 R9 3900, GeForce RTX 2070 Mobile | 2.7 kg | 32.5 mm | 15.60" | 1920x1080 | |
| 87 % | 03/2019 | SCHENKER XMG Ultra 15 Turing i7-9700K, GeForce RTX 2070 Mobile | 3.5 kg | 38 mm | 15.60" | 1920x1080 | |
| 85.9 % | 08/2019 | Eurocom Nightsky RX15 i9-9980HK, GeForce RTX 2070 Mobile | 2.5 kg | 29.9 mm | 15.60" | 3840x2160 | |
| 84.7 % | 12/2019 | MSI GE65 Raider 9SF-049US i9-9880H, GeForce RTX 2070 Mobile | 2.3 kg | 26.9 mm | 15.60" | 1920x1080 | |
| 86 % | 06/2019 | Asus Strix Scar III G531GW i9-9880H, GeForce RTX 2070 Mobile | 2.3 kg | 25 mm | 15.60" | 1920x1080 |
Case
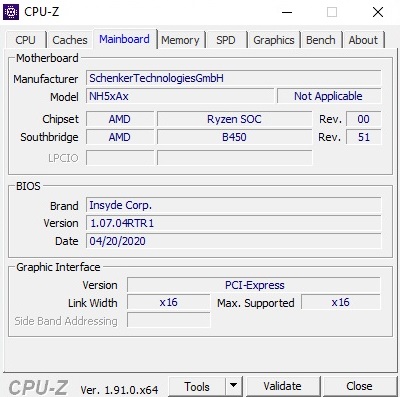
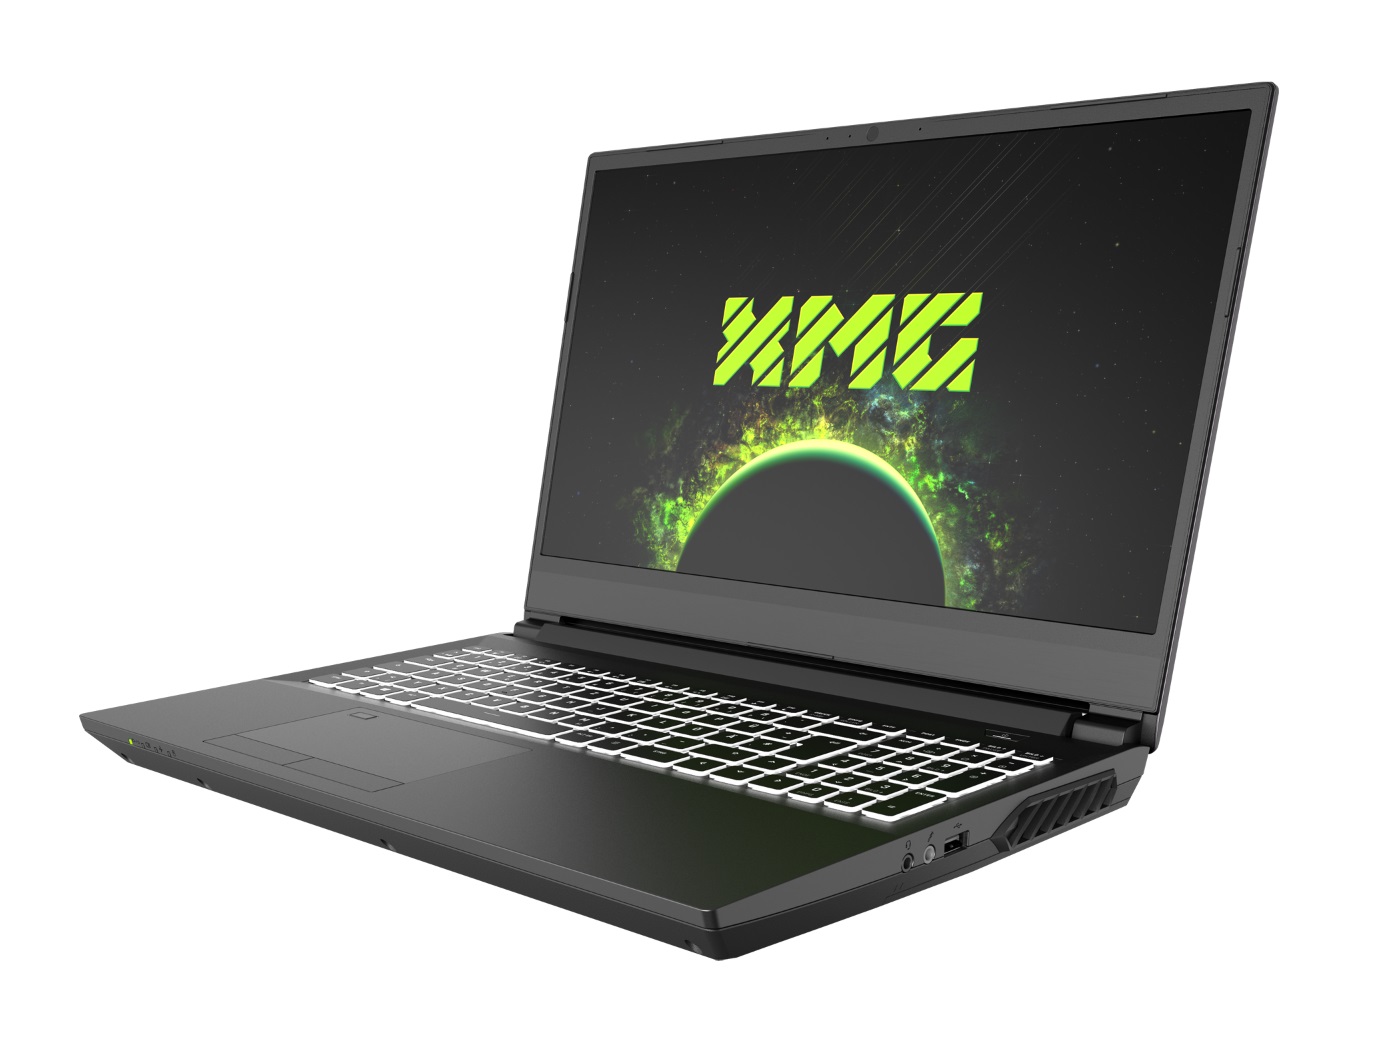
Unlike the XMG Ultra 15, which is rather large and heavy due to its height of 3.8 cm and a weight of 3.5 kg, the Apex 15 - which, by the way, features a slim bezel design - is fairly compact. It has a height of 3.25 cm and weighs 2.7 kg. Its dimensions are similar to those of the Eurocom Nightsky RX15, which also has a similar exterior in general. This is no surprise since both cases come from the barebone expert Clevo. The Apex 15 is based on the case NH57AF1.
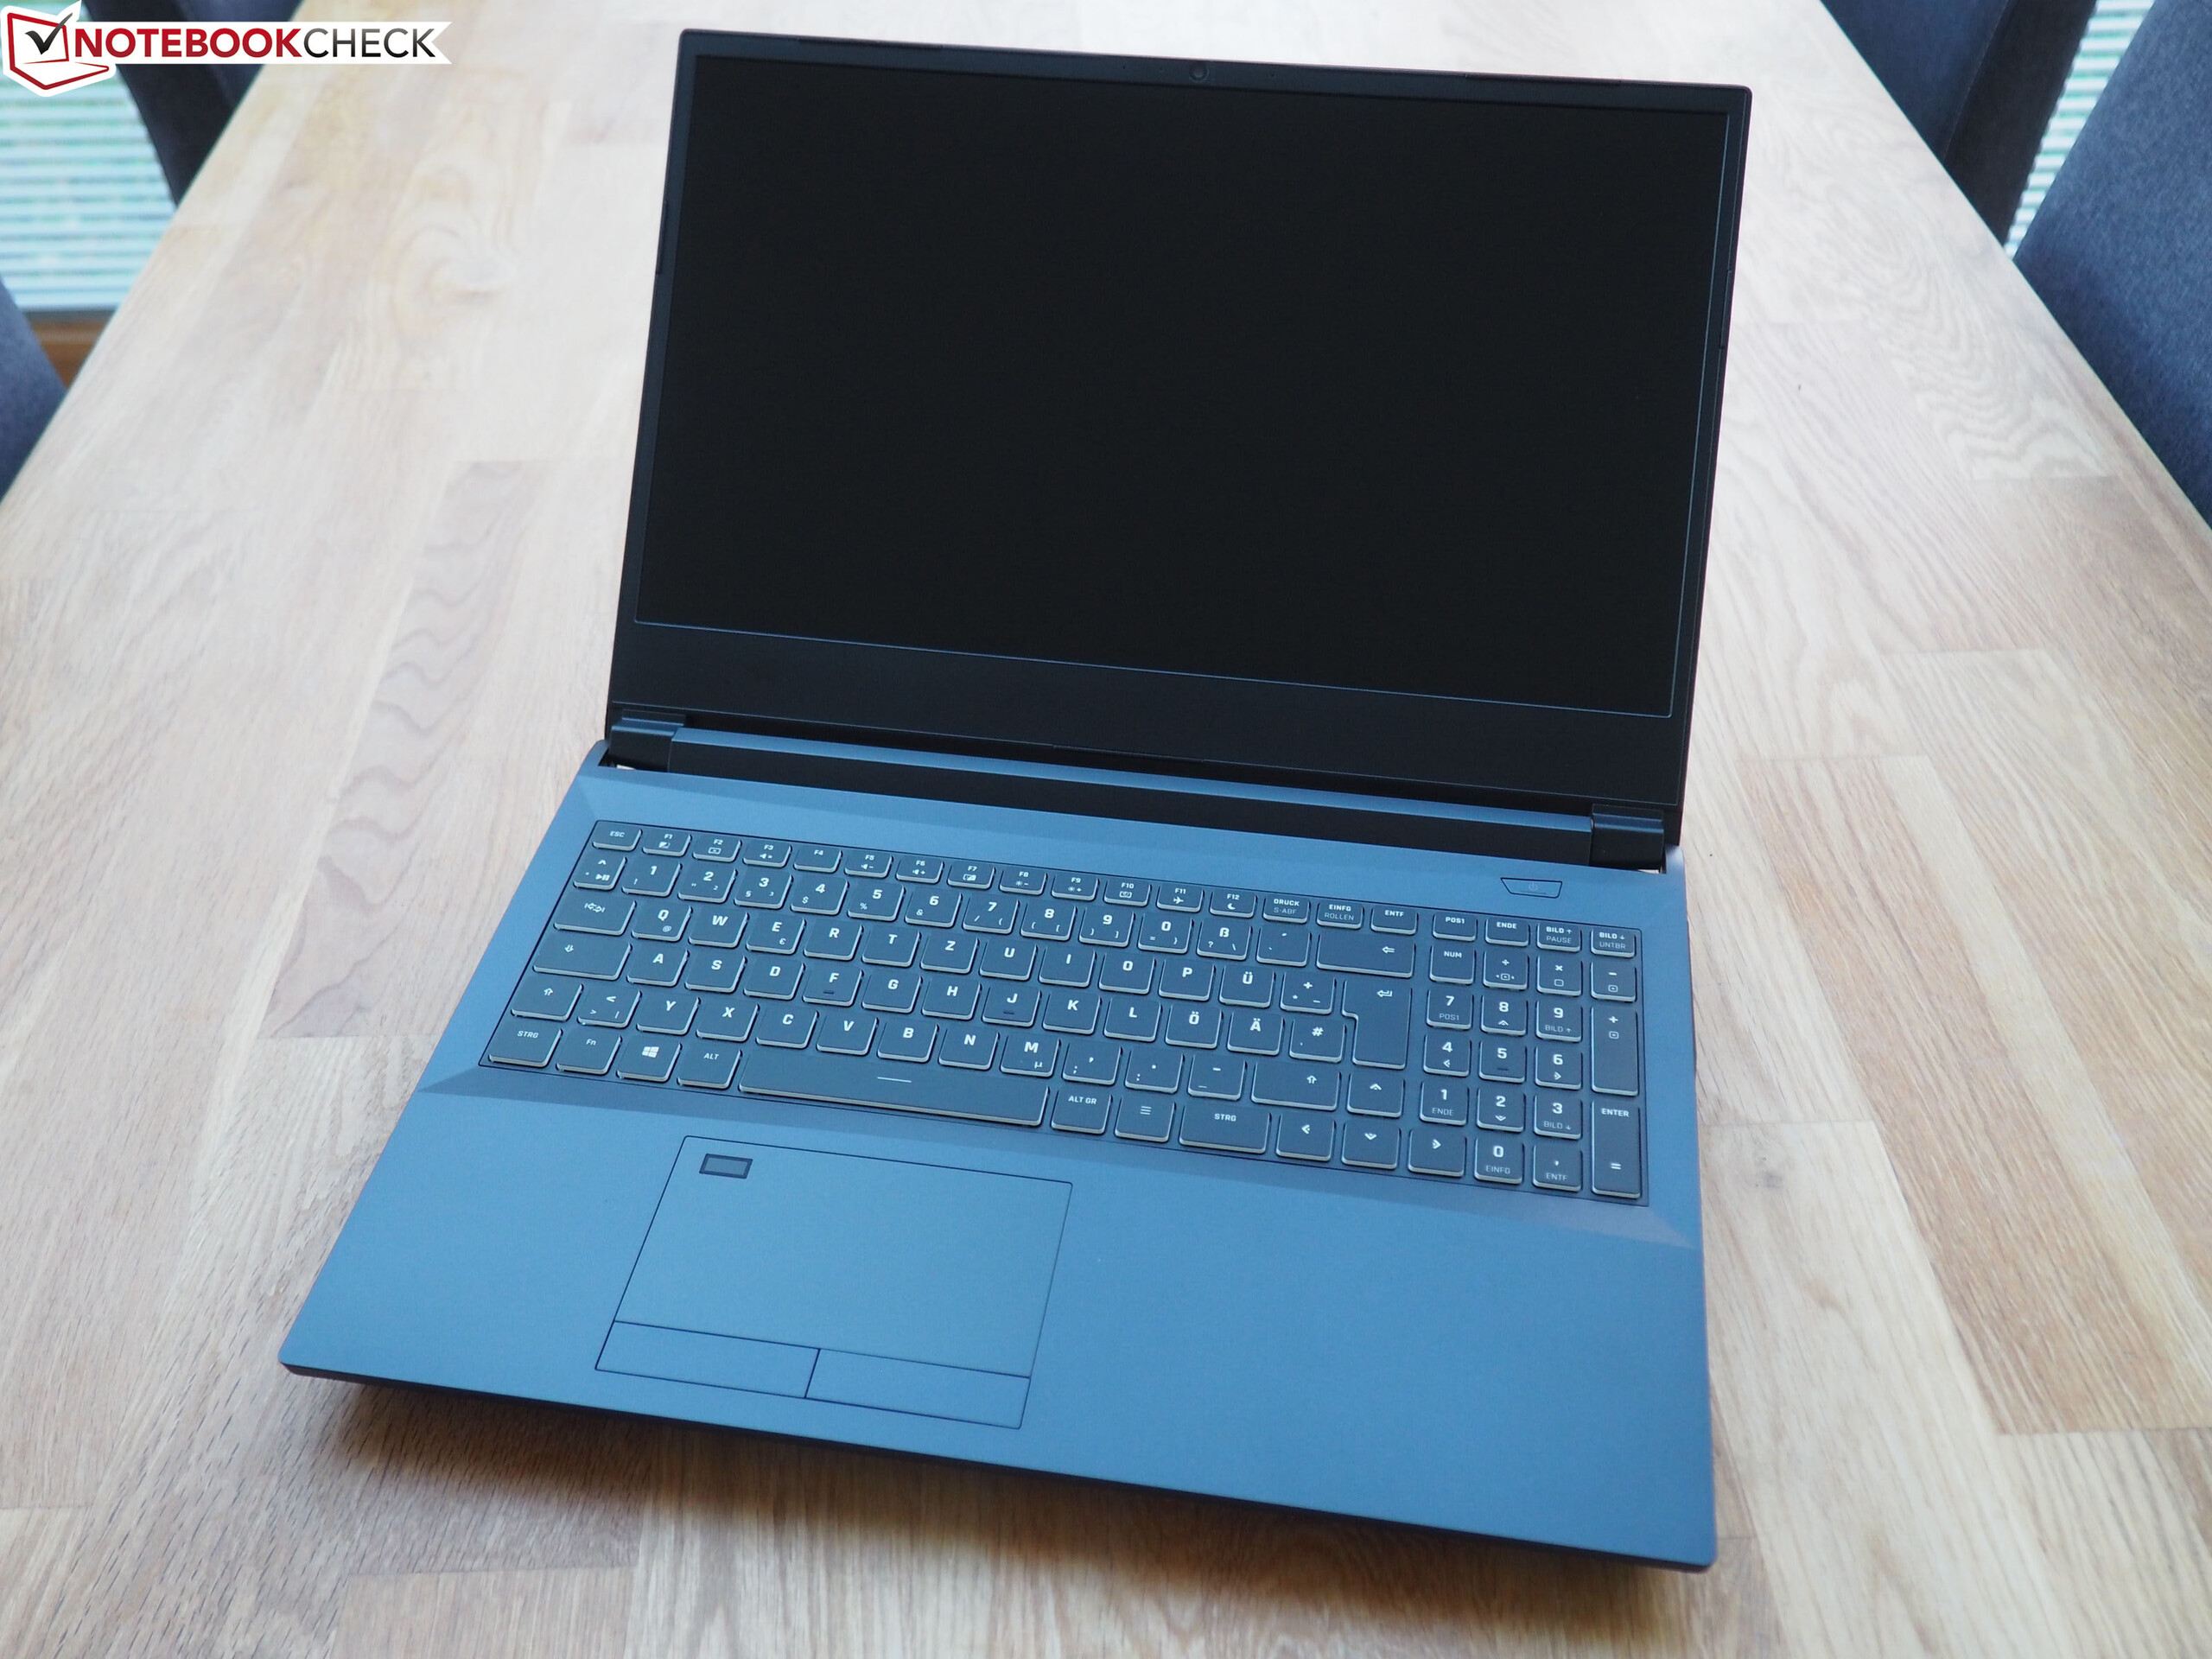
The 15-inch notebook gives a fairly good impression in terms of quality. While the lid is made of metal, the base unit consists of plastic. The workmanship is satisfactory and all elements come together nicely apart from one or two small details. The hinges are unobtrusive as well and the maximum opening angle of around 130° is typical for a standard notebook.
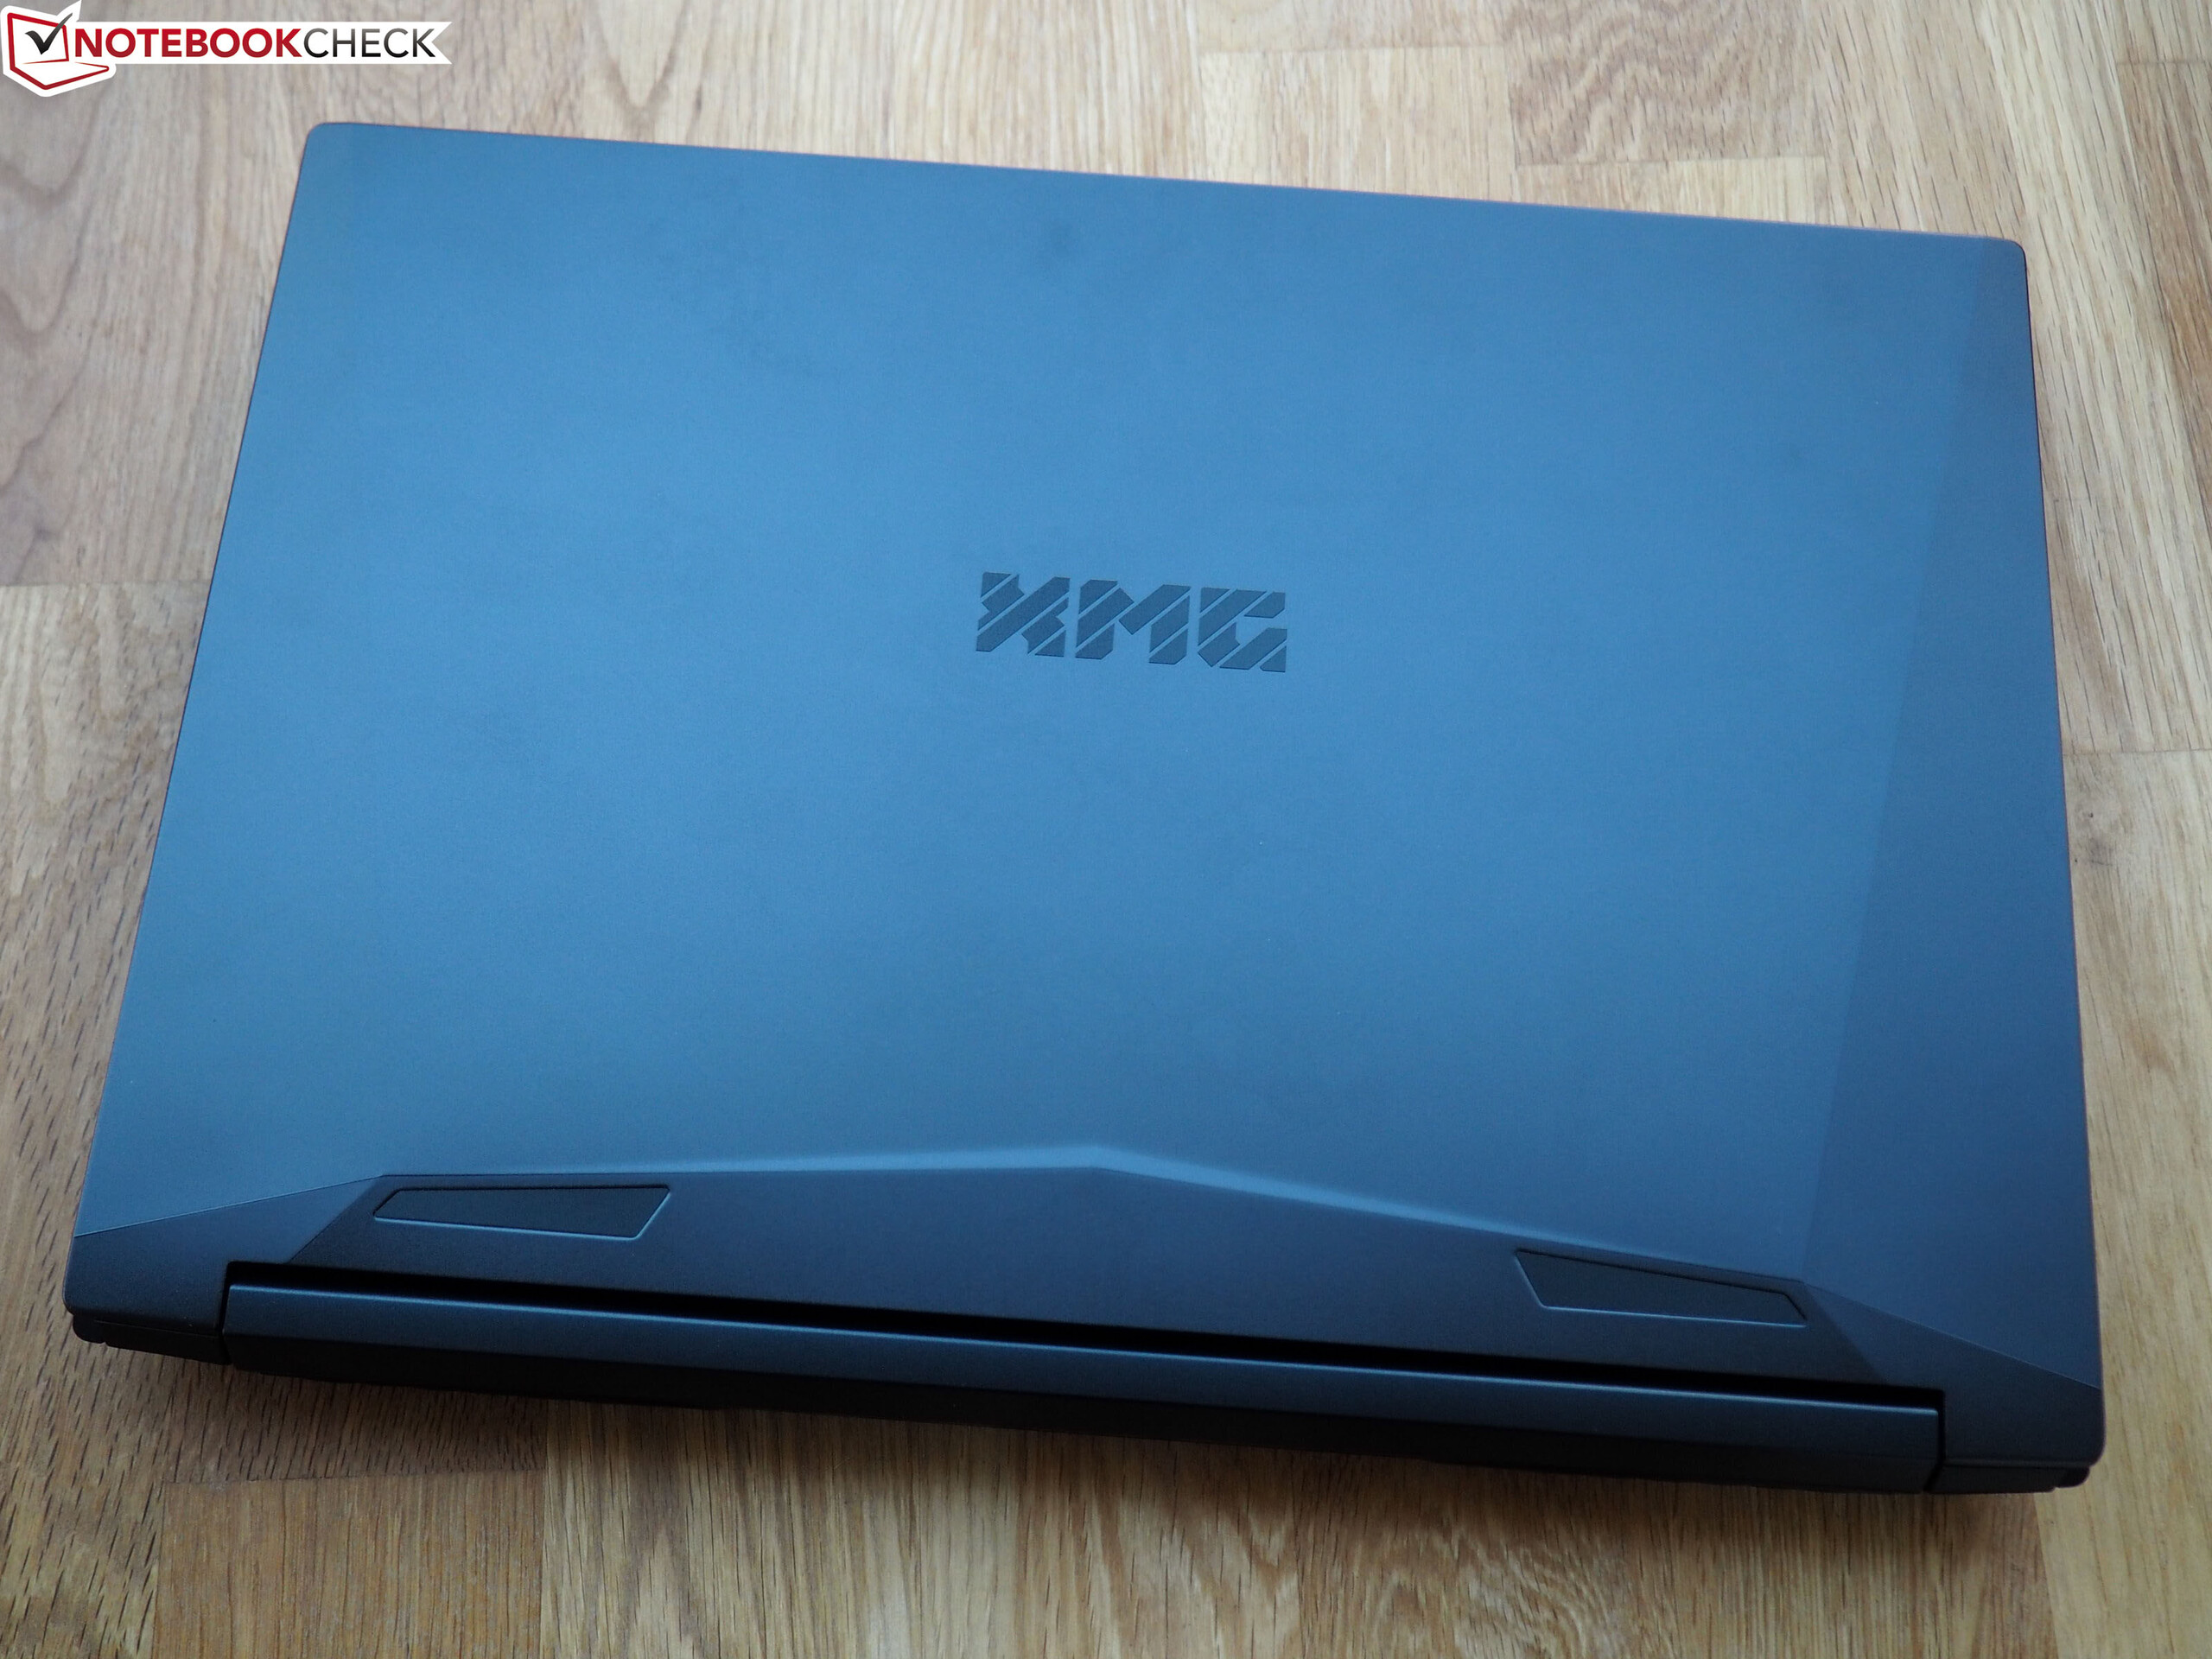
The Apex 15, like most Clevo barebones, does not try to make a bold design statement but has a rather subtle appearance. Only the line design of the lid might give away who this device is designed for. We only found one weak point in terms of stability: the lid. Like with many gaming laptops, the display can be warped quite strongly. The base unit on the other hand hardly gives way under strong pressure.
Connectivity
Ports
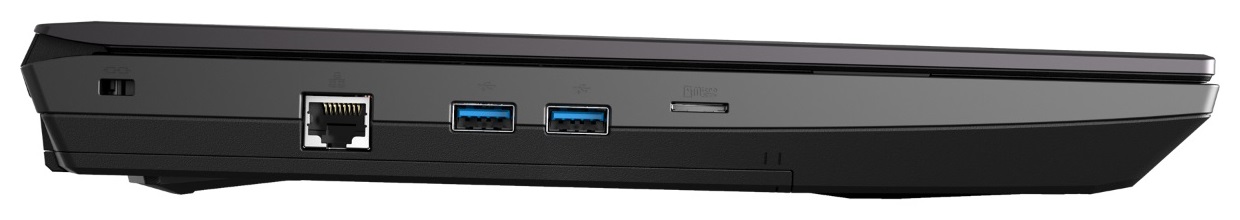
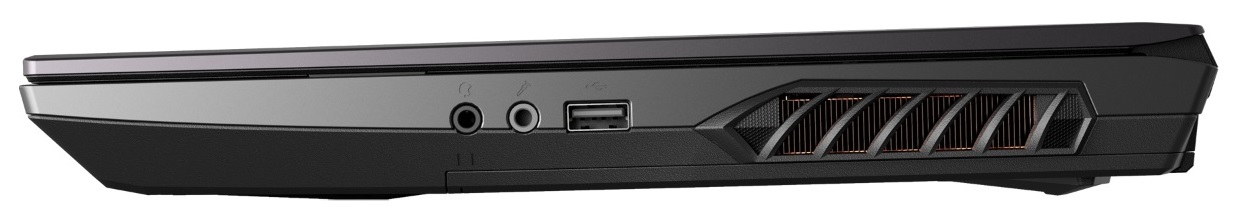
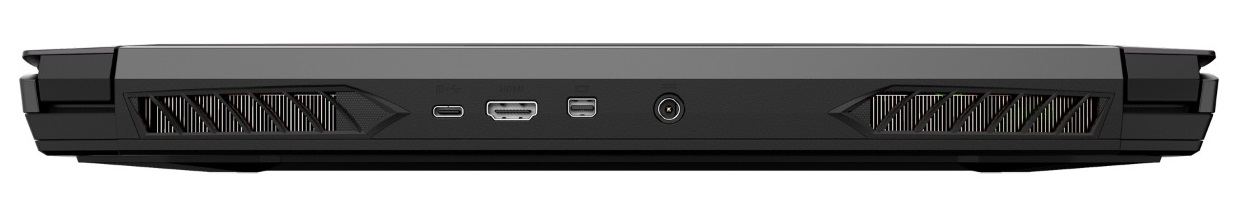
Apart from the missing Thunderbolt 3 port, which really is a must-have in this price range, the port selection is very satisfactory. There's a Kensington lock and an RJ45 port, one USB 2.0 and three USB 3.1 gen 2 ports, one of which is Type-C and supports DisplayPort.
Talking of image output: External monitors can also be connected via the HDMI 2.0 port or the dedicated Mini-DisplayPort. If you include the integrated display, you could theoretically have a quad-screen setup. The multimedia offering is completed by two audio jacks (one for headphones, one for a microphone) and an SD card reader, which was kept in the small micro format despite having ample space available.
As some of the ports are positioned along the back of the notebook and there are only a few connectors in the front half, users will have sufficient space for using an external mouse comfortably.
Communication
We would recommend upgrading the network module during configuration in order to receive maximum Wi-Fi range and speed. The Wi-Fi module in our test unit is the Intel Wi-Fi 6 AX200. It is not a lot more expensive and covers all modern features such as 802.11ax and Bluetooth 5.0. Please note: The results of the Wi-Fi test displayed below cannot be compared to those of the competition due to the recently updated router (Netgear Nighthawk AX12 instead of Linksys EA8500). The Apex 15 reaches more than 1300 Mb/s, which is a very good result.
Webcam


Accessories
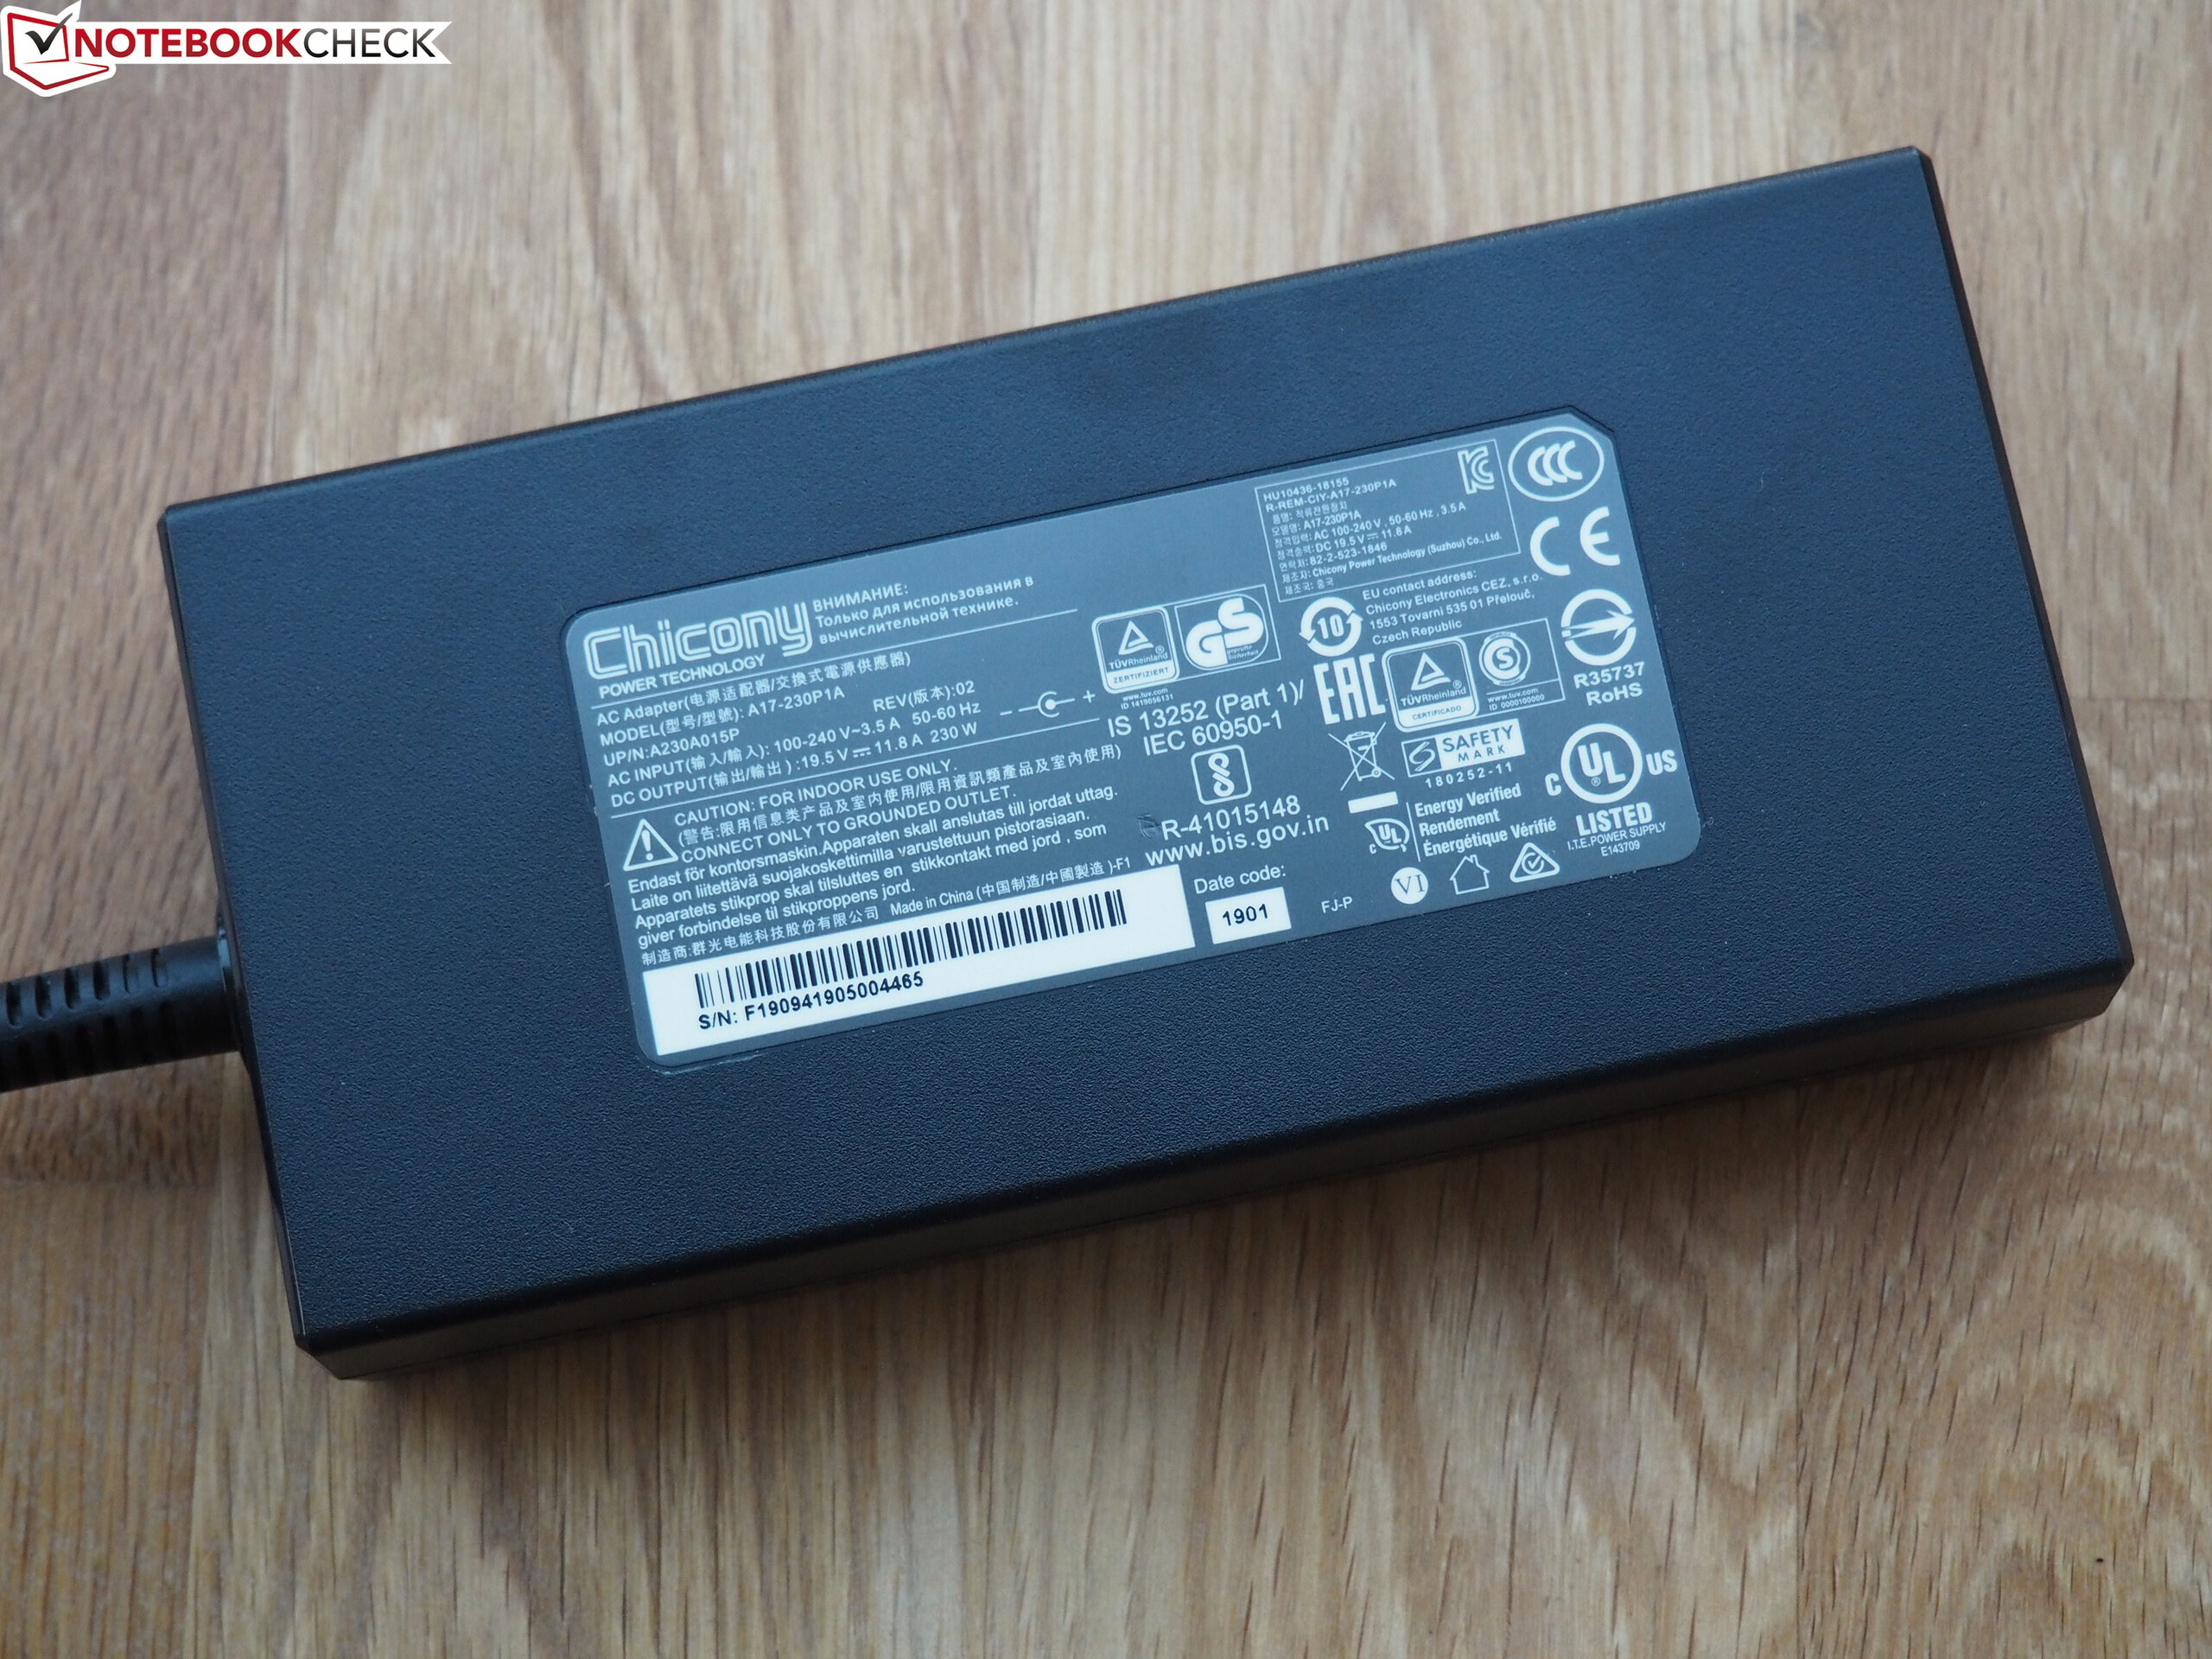
Schenker has equipped the notebook with a fair amount of accessories. Apart from a quick-start guide, a DVD with drivers on it, a USB stick with software and a tube of heat-conducting paste, we also found an enormous mouse pad. The device also comes with a 230-W power supply that weighs around 700 g and is 15 x 7 x 3 cm large.
Maintenance
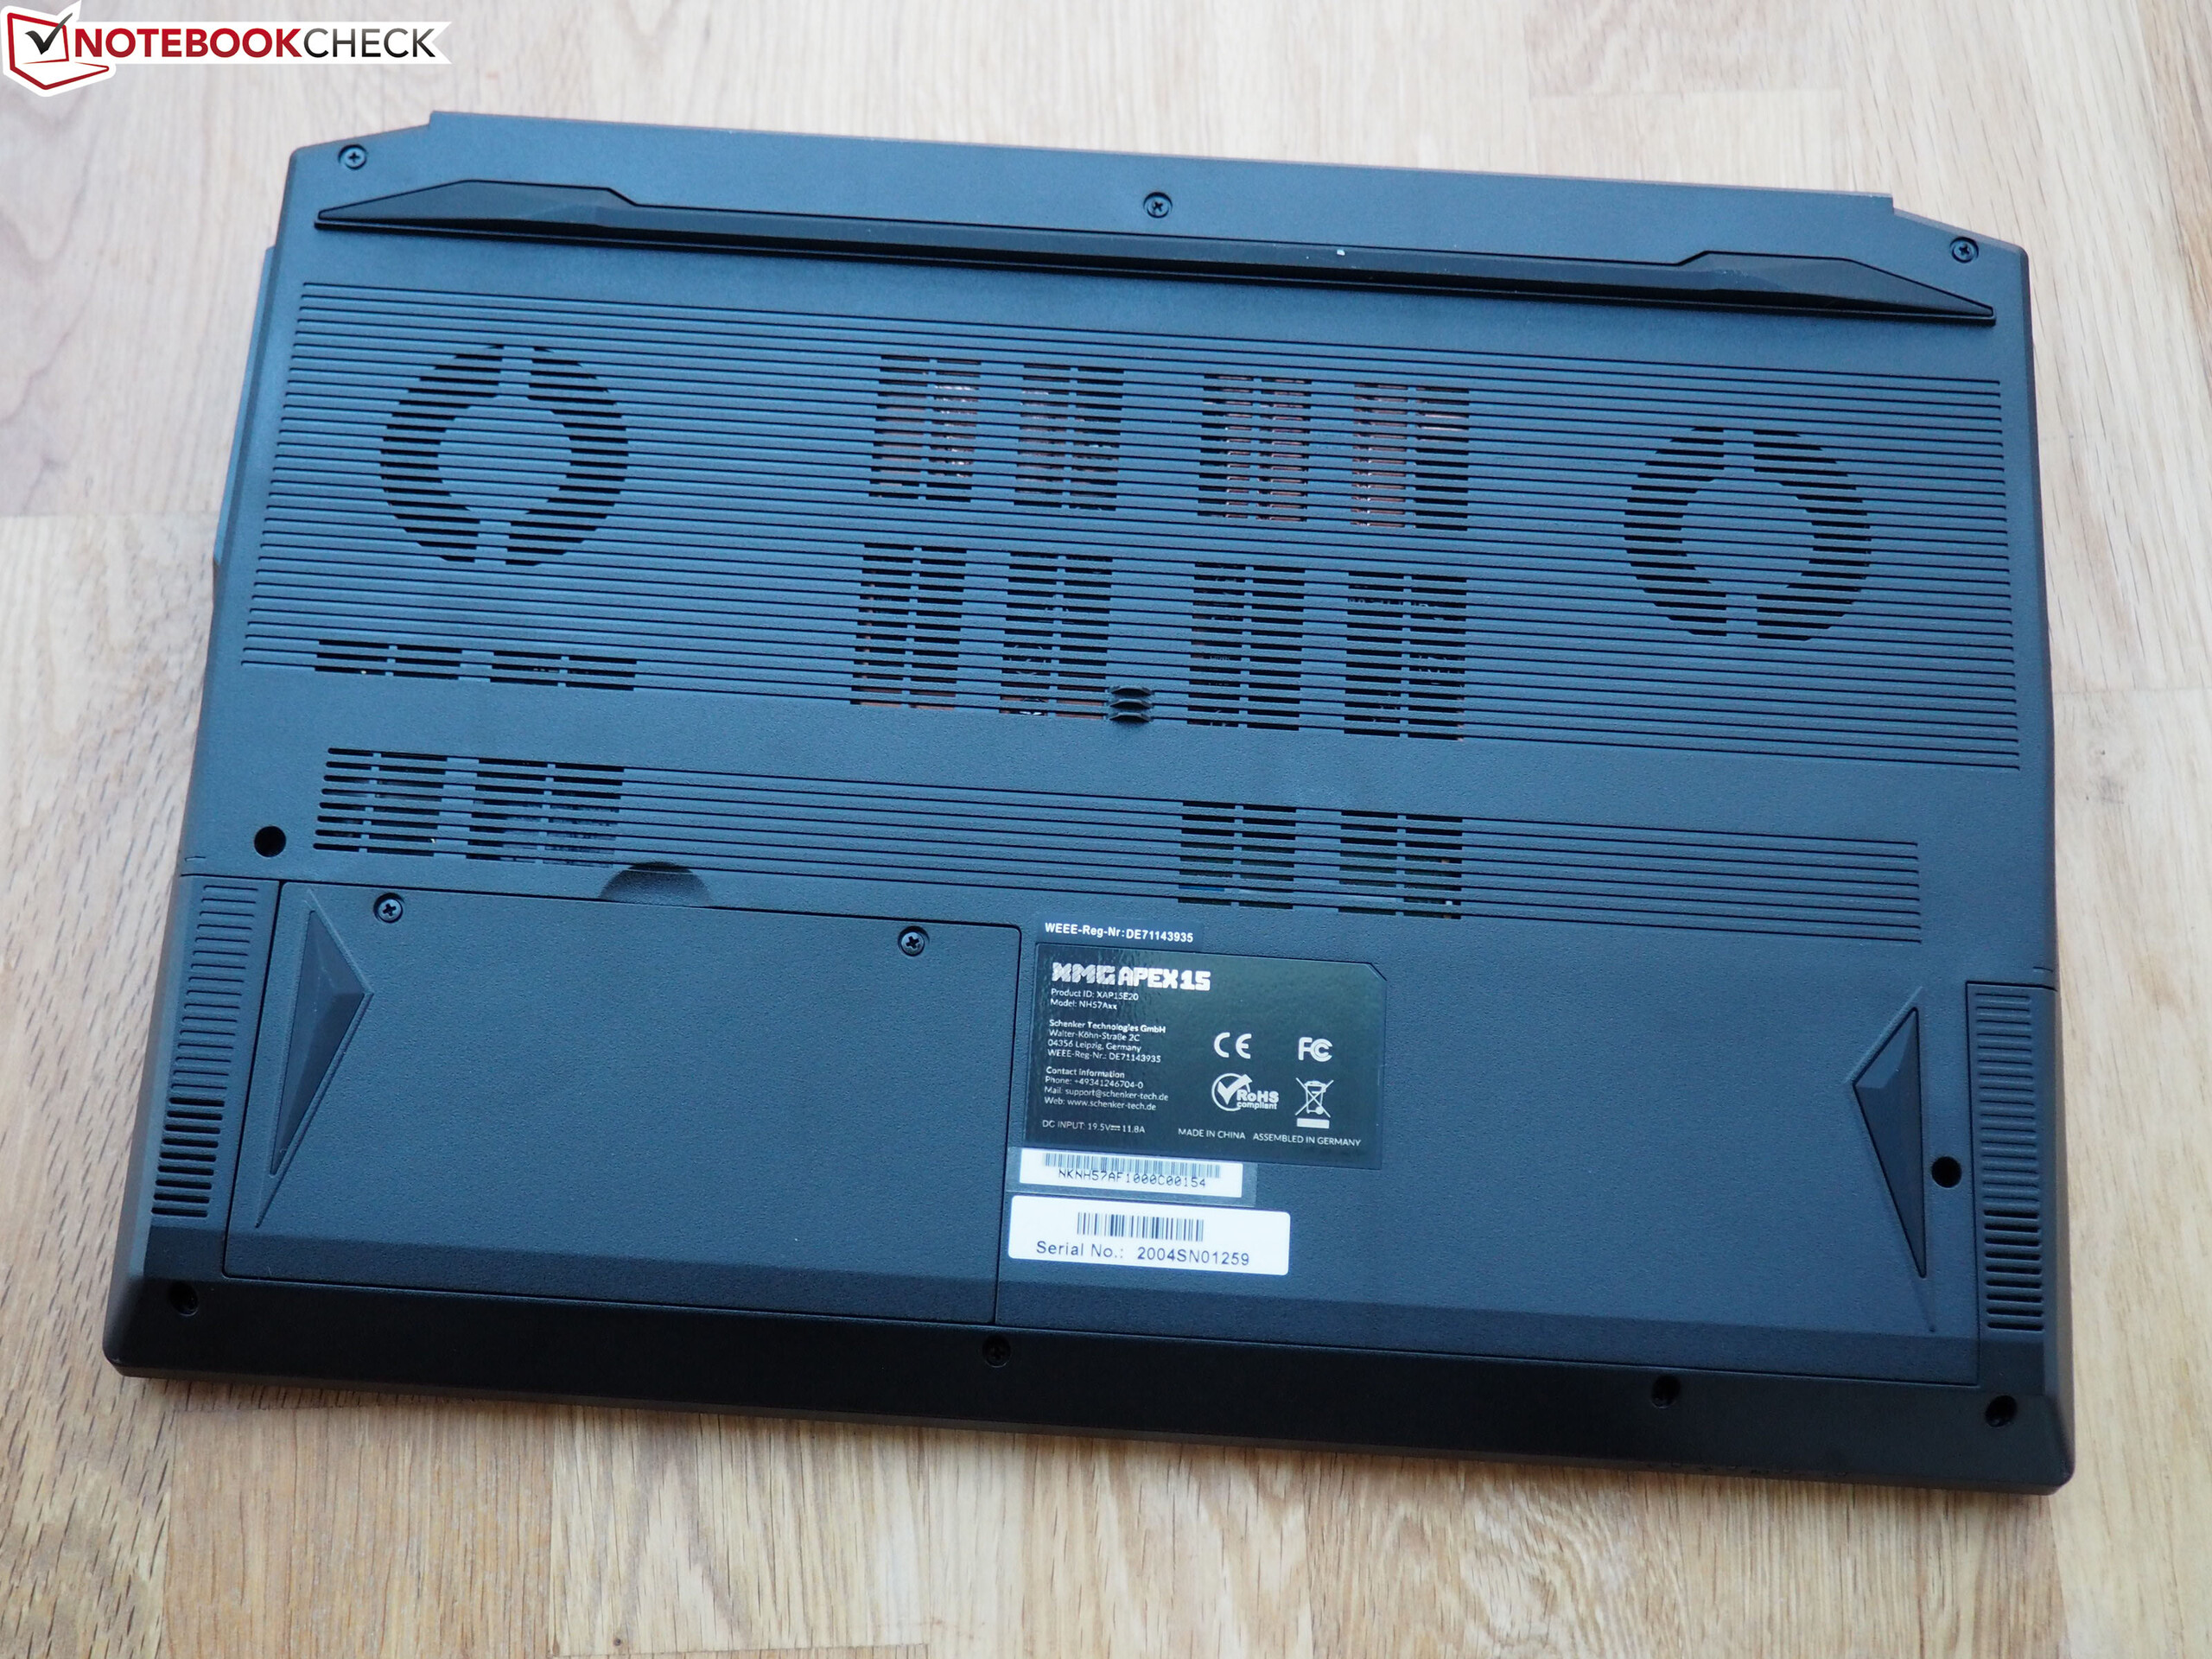
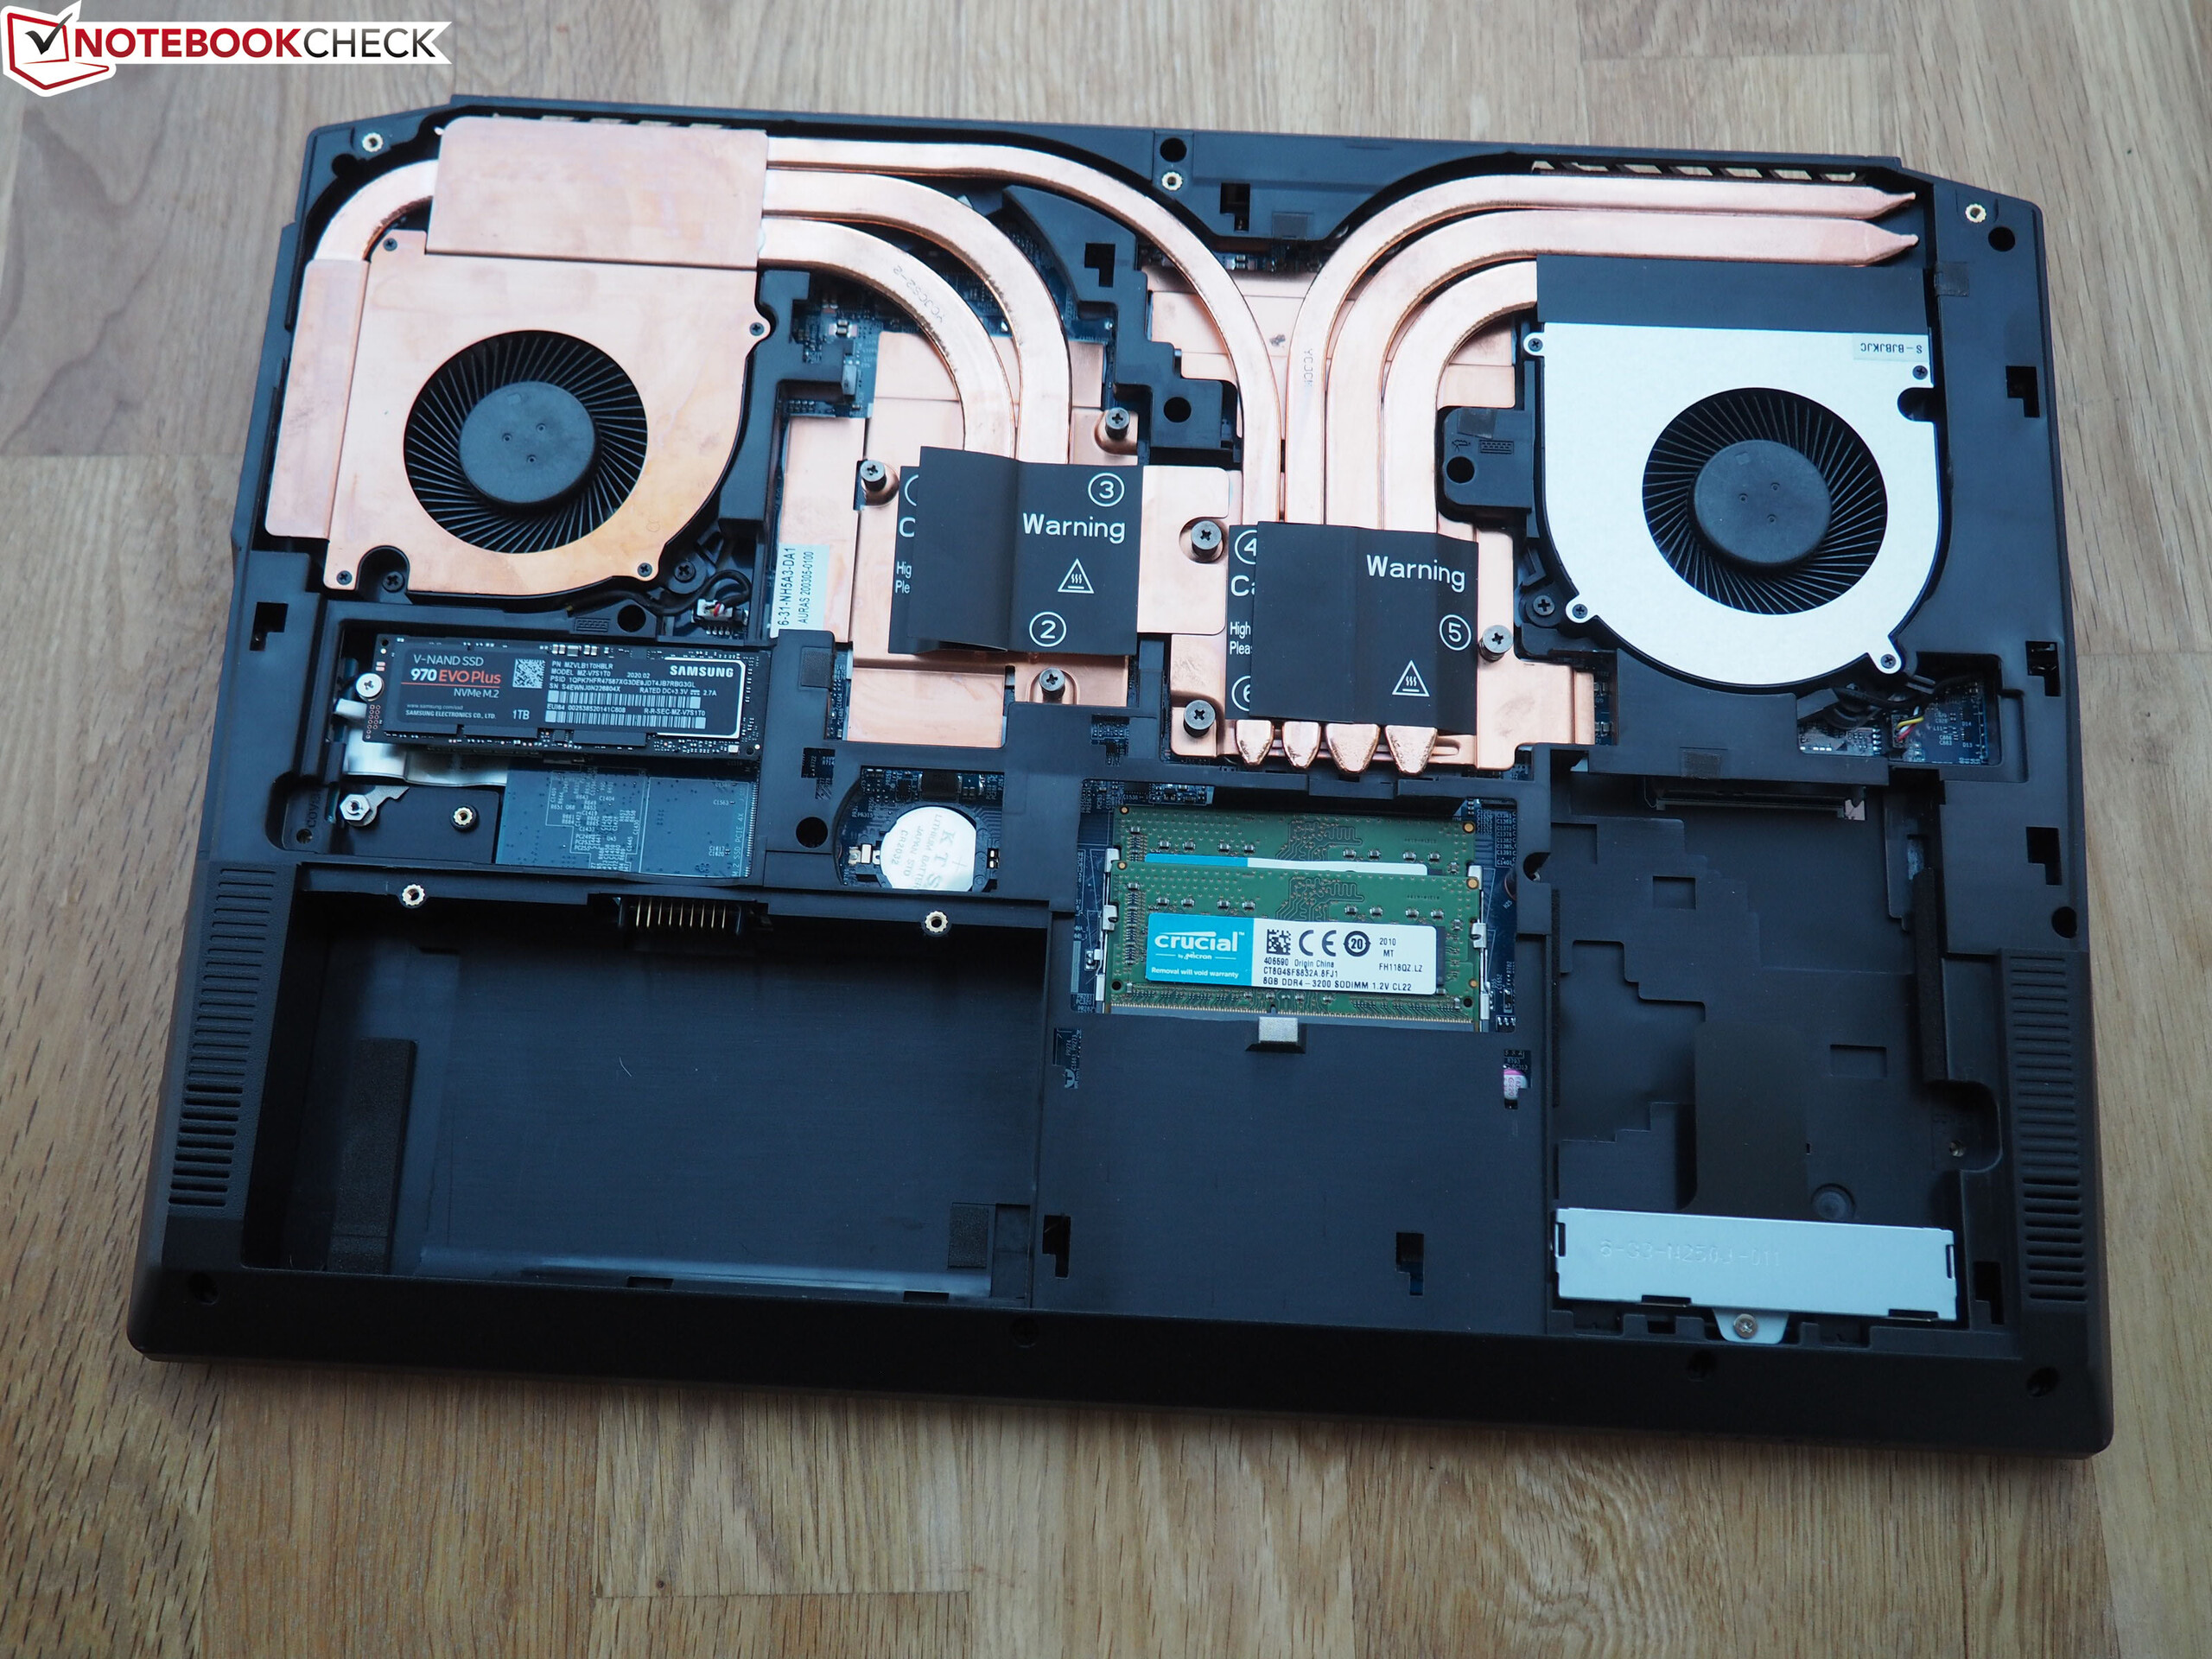
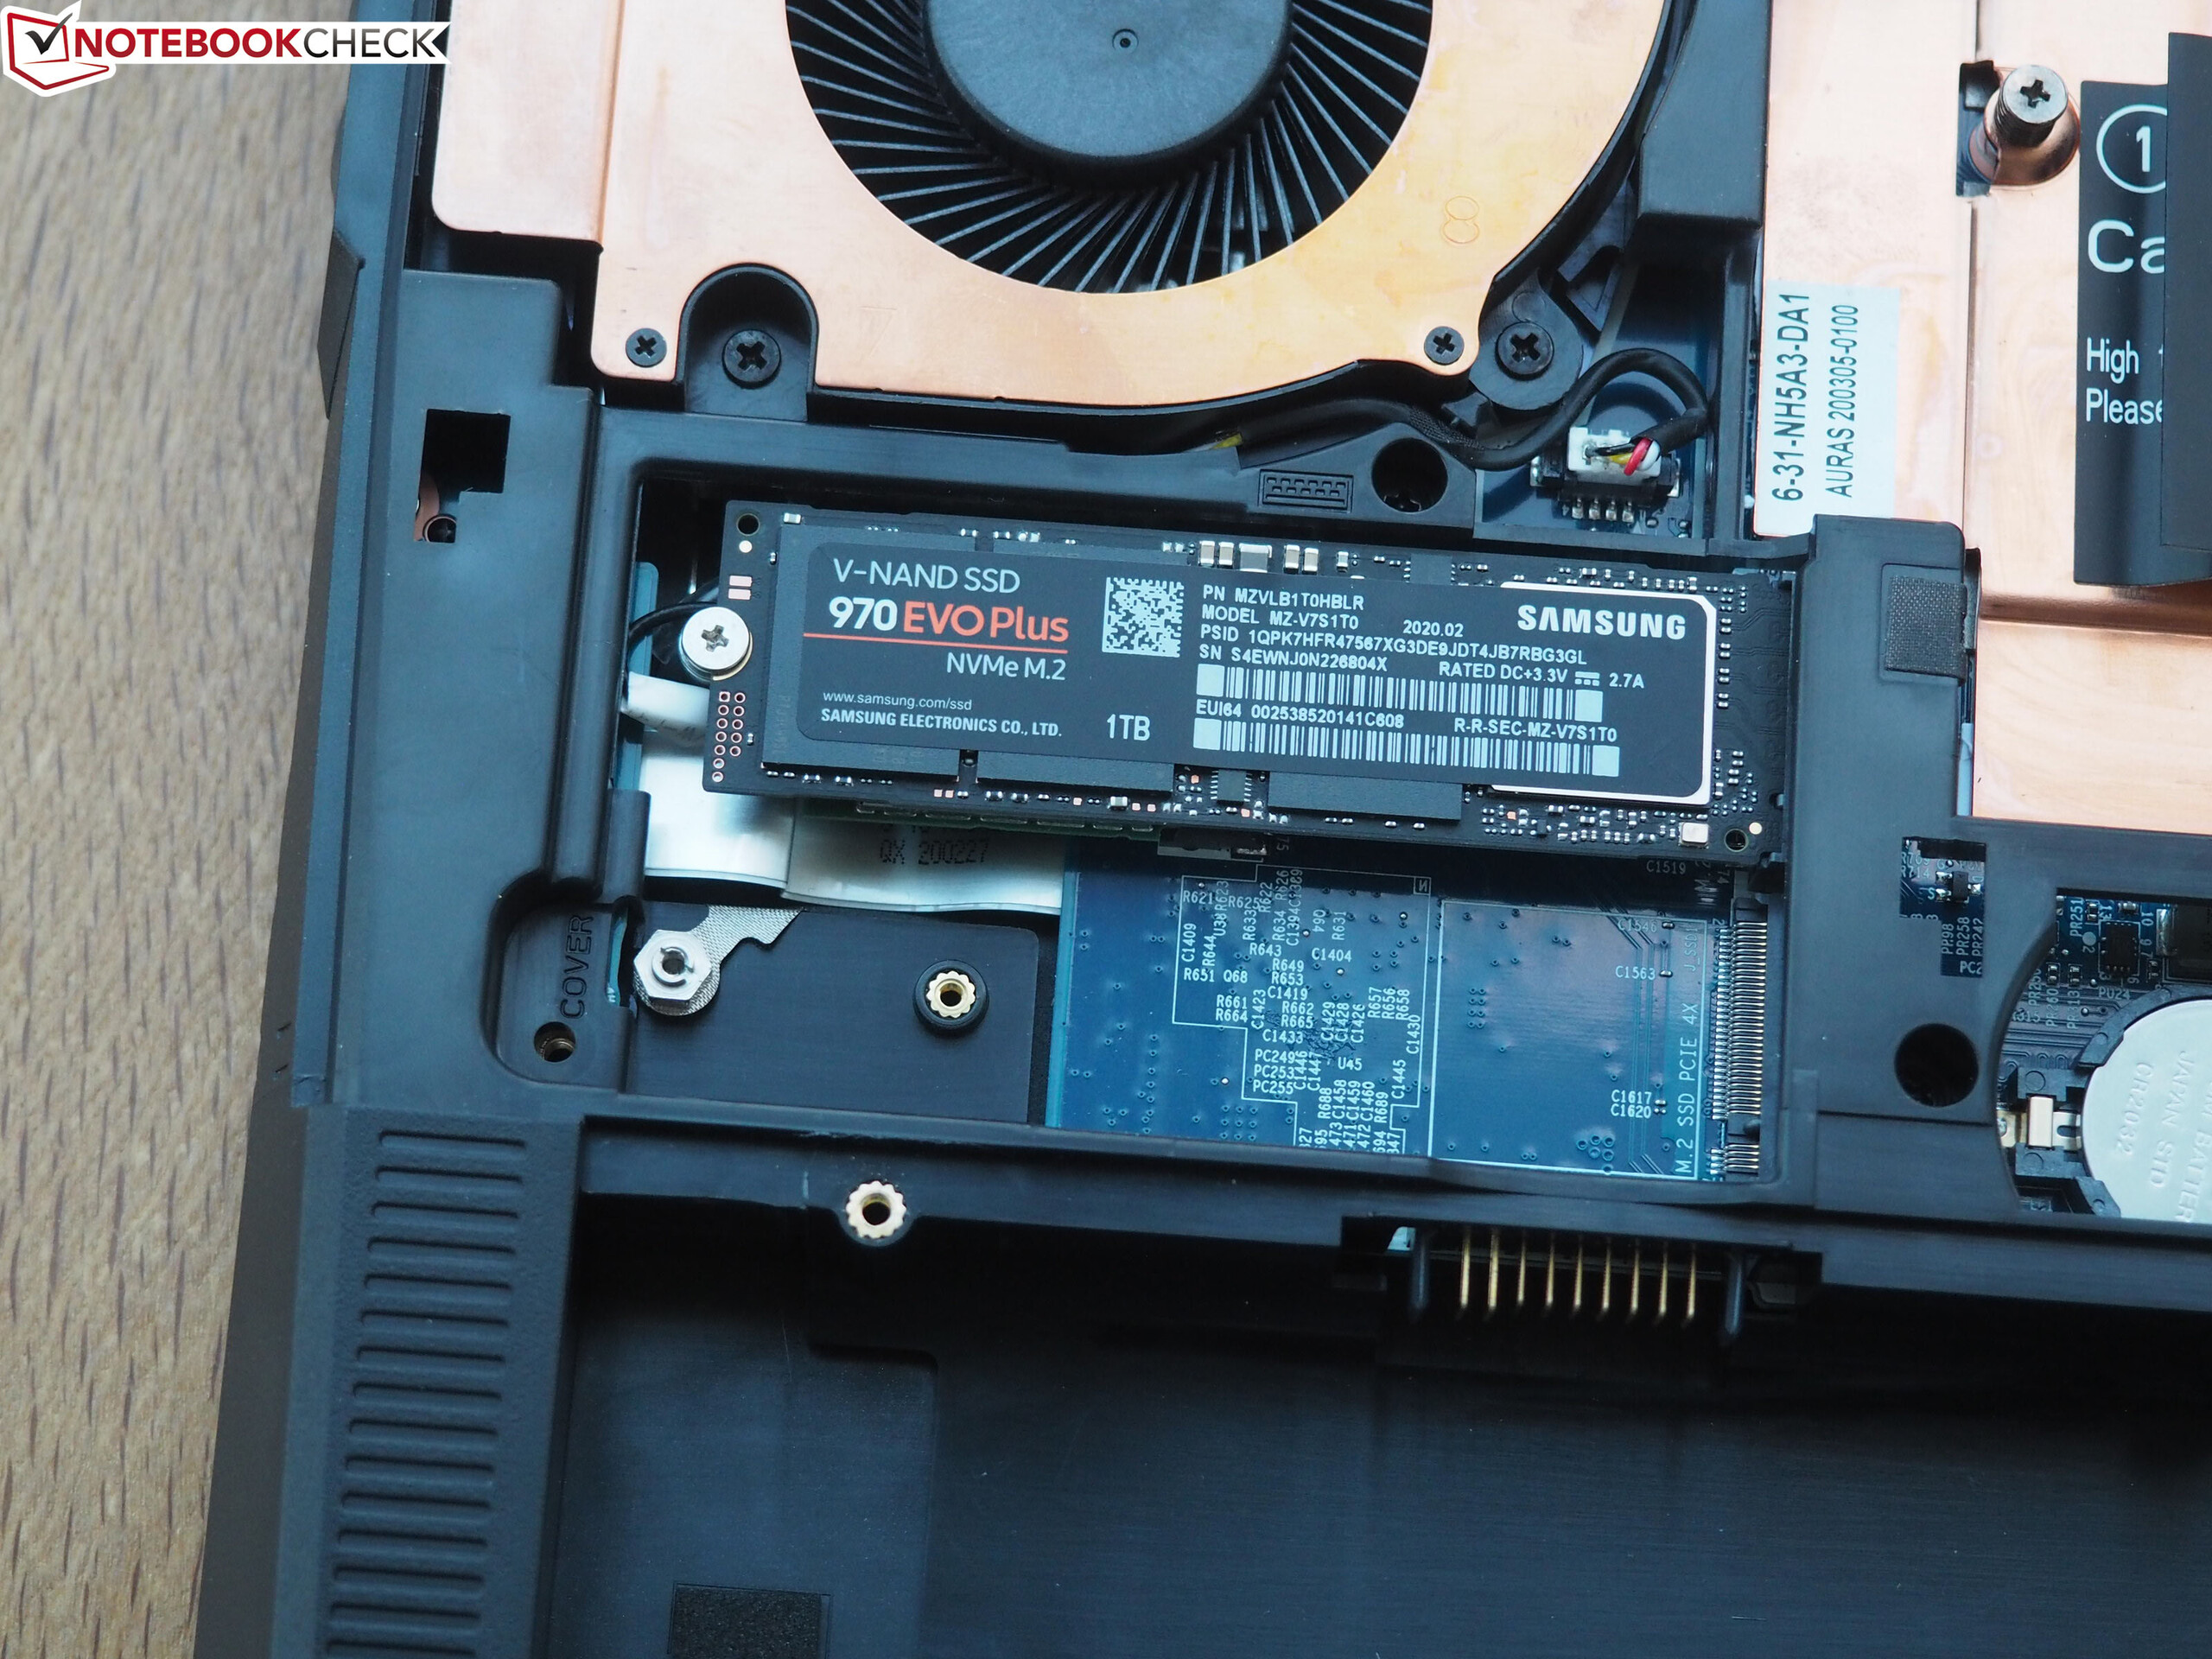
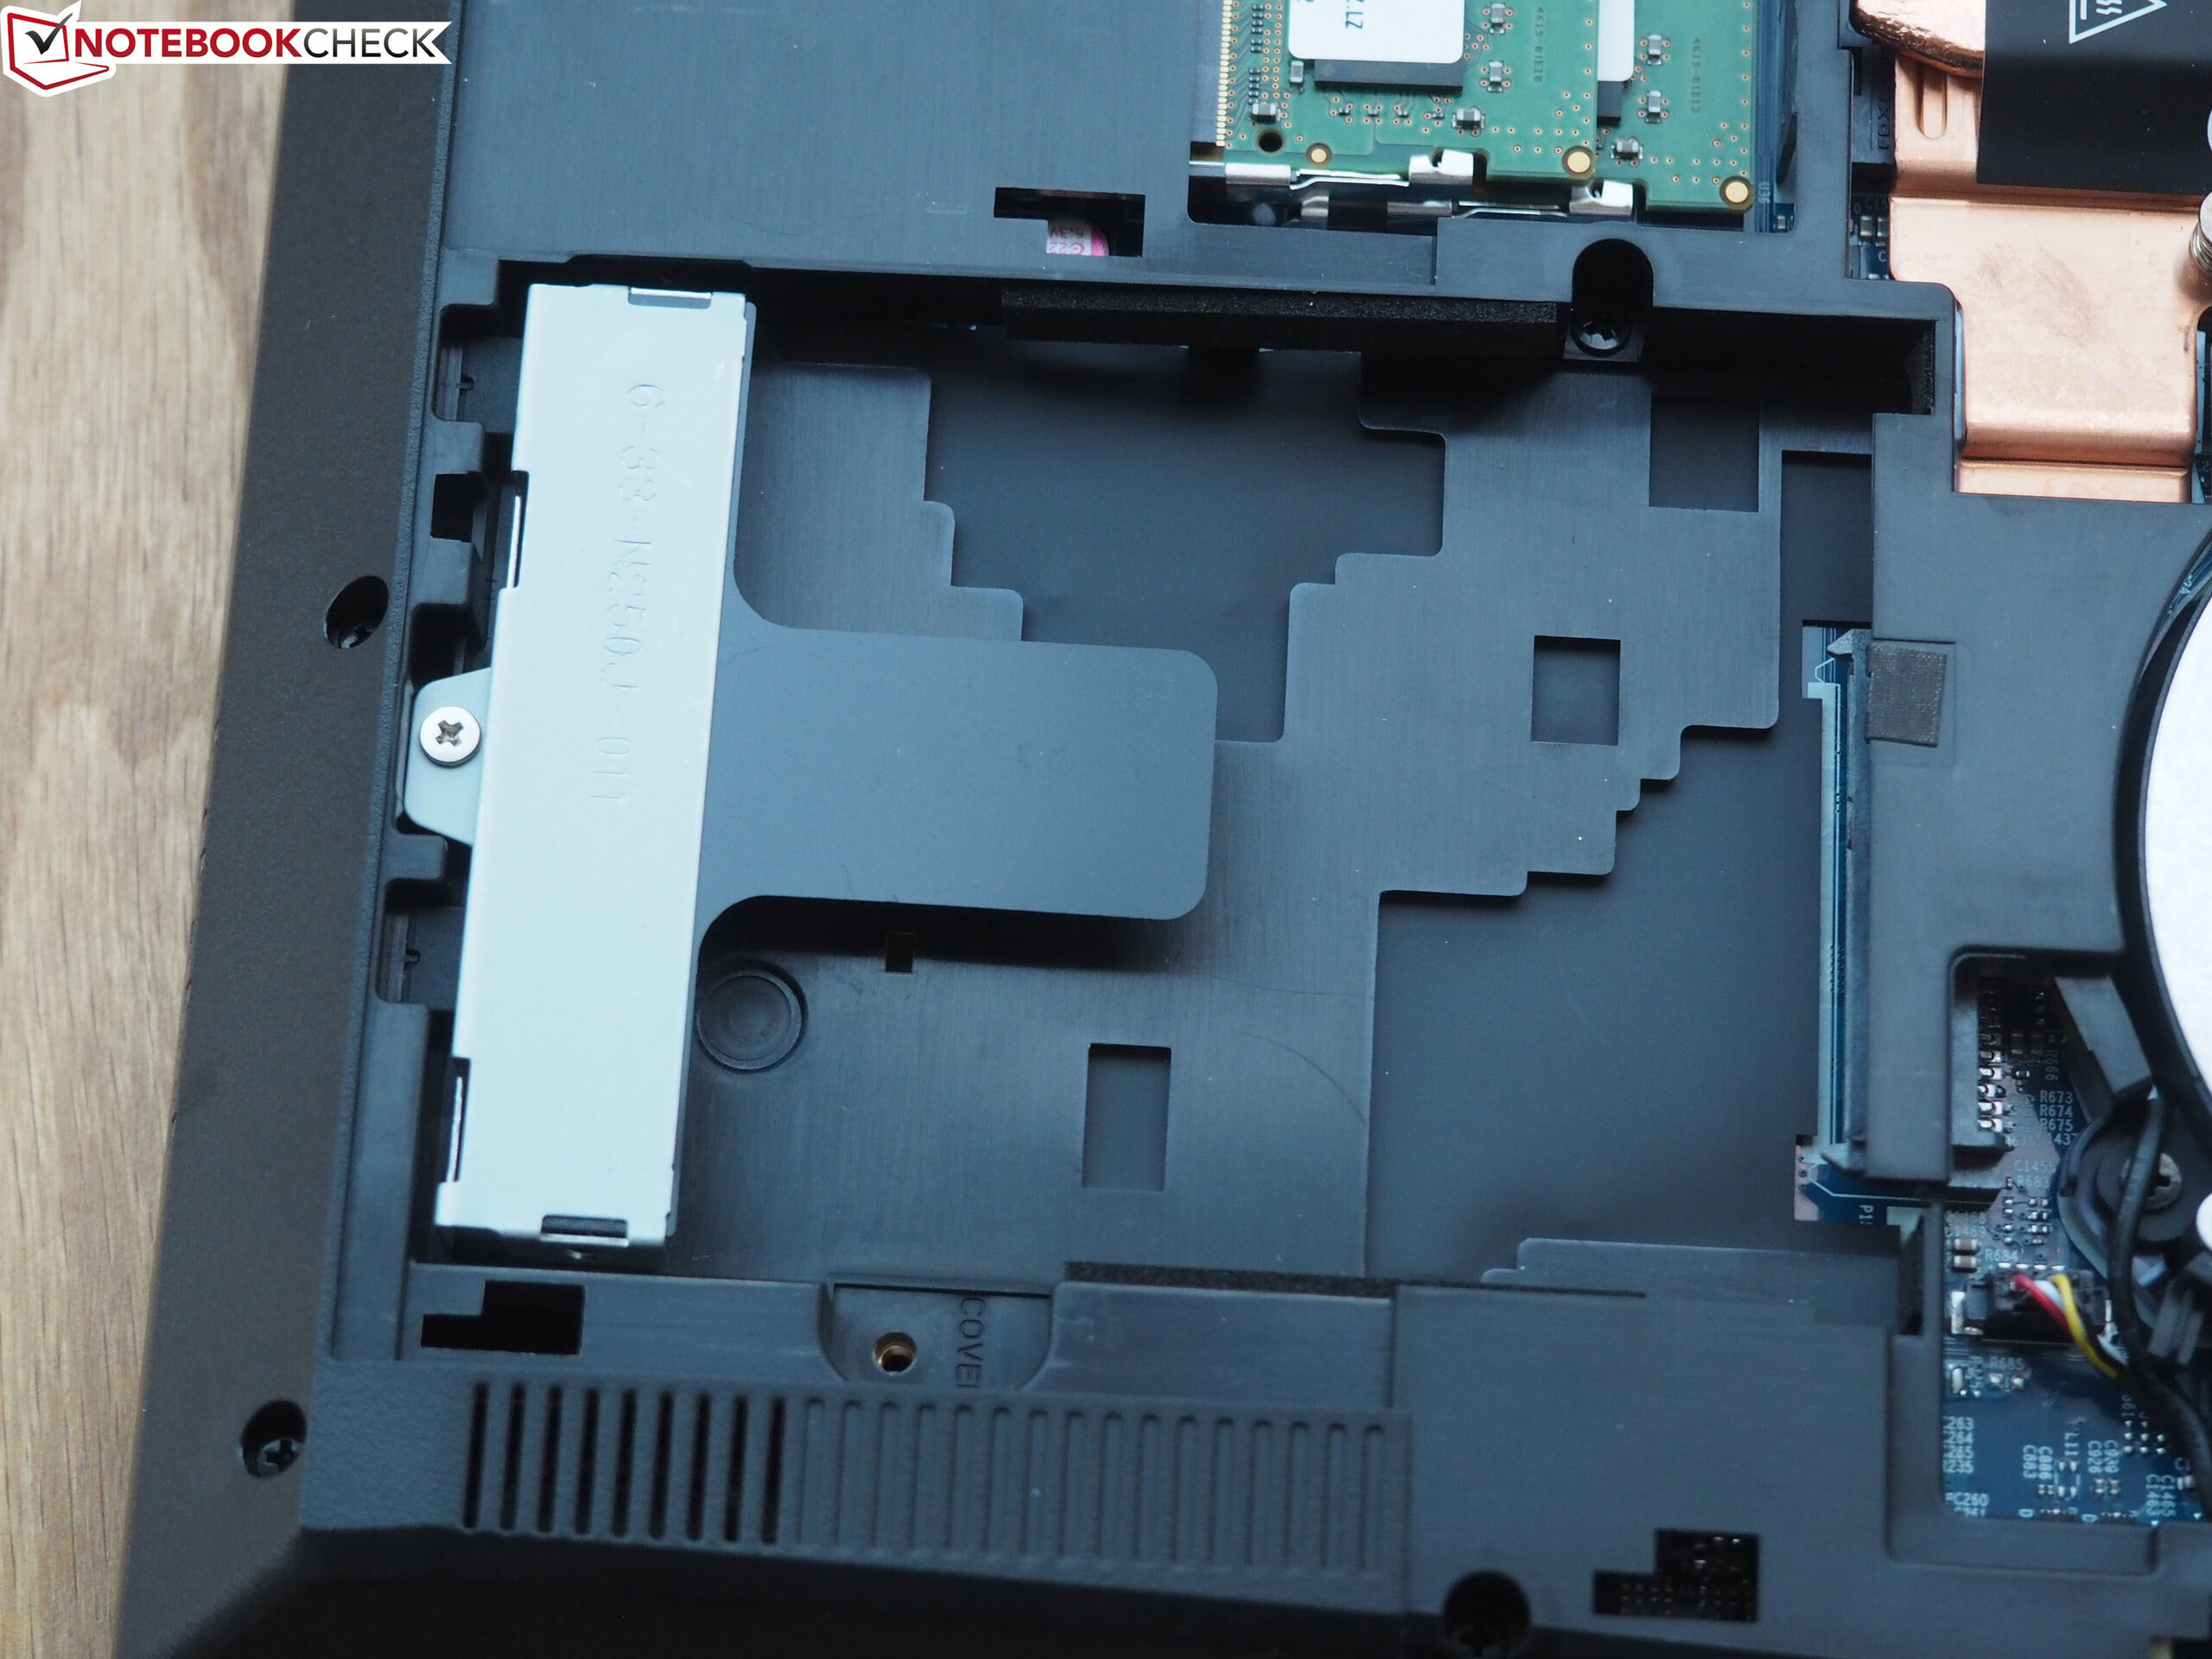
"Finally a notebook with good maintenance options" - that was the thought that went through our head after a look at the bottom of the laptop. Instead of having to remove the entire bottom cover with numerous screws and clips, the barebone manufacturer chose to include a large maintenance hatch that easily slides open after removing seven Phillips screws. The battery is directly accessible from the outside, which has also become a rare sight nowadays.
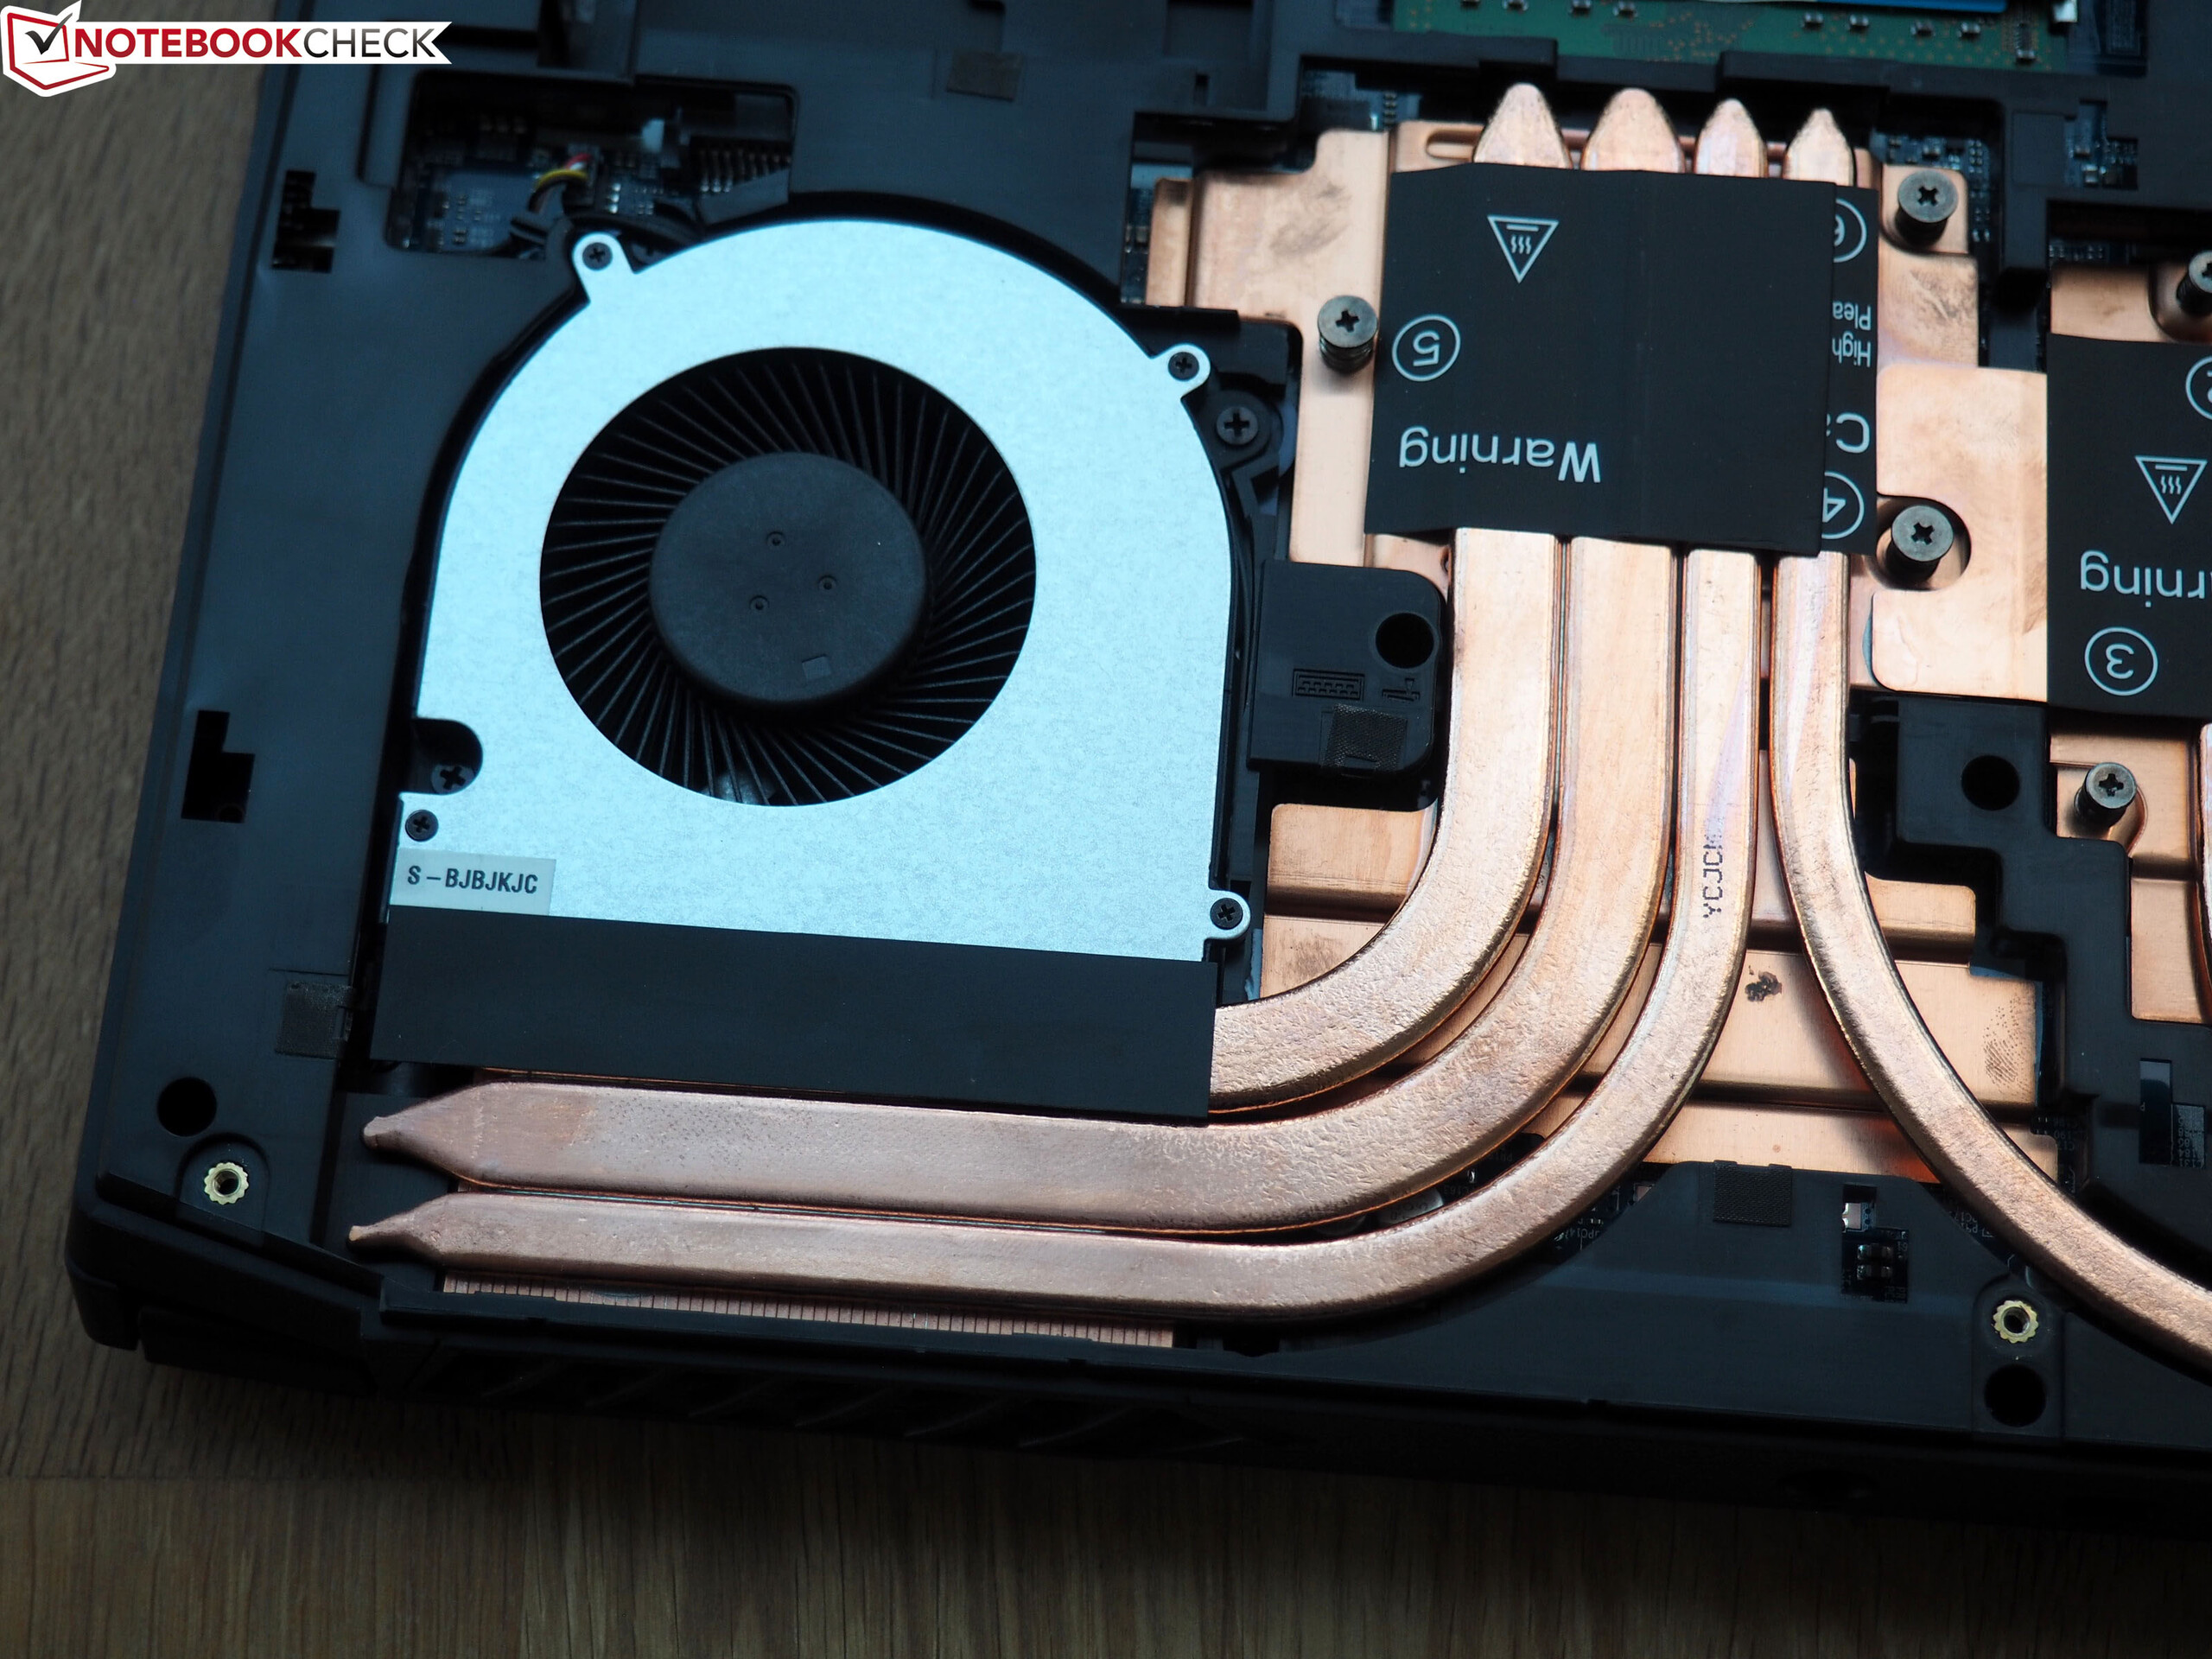
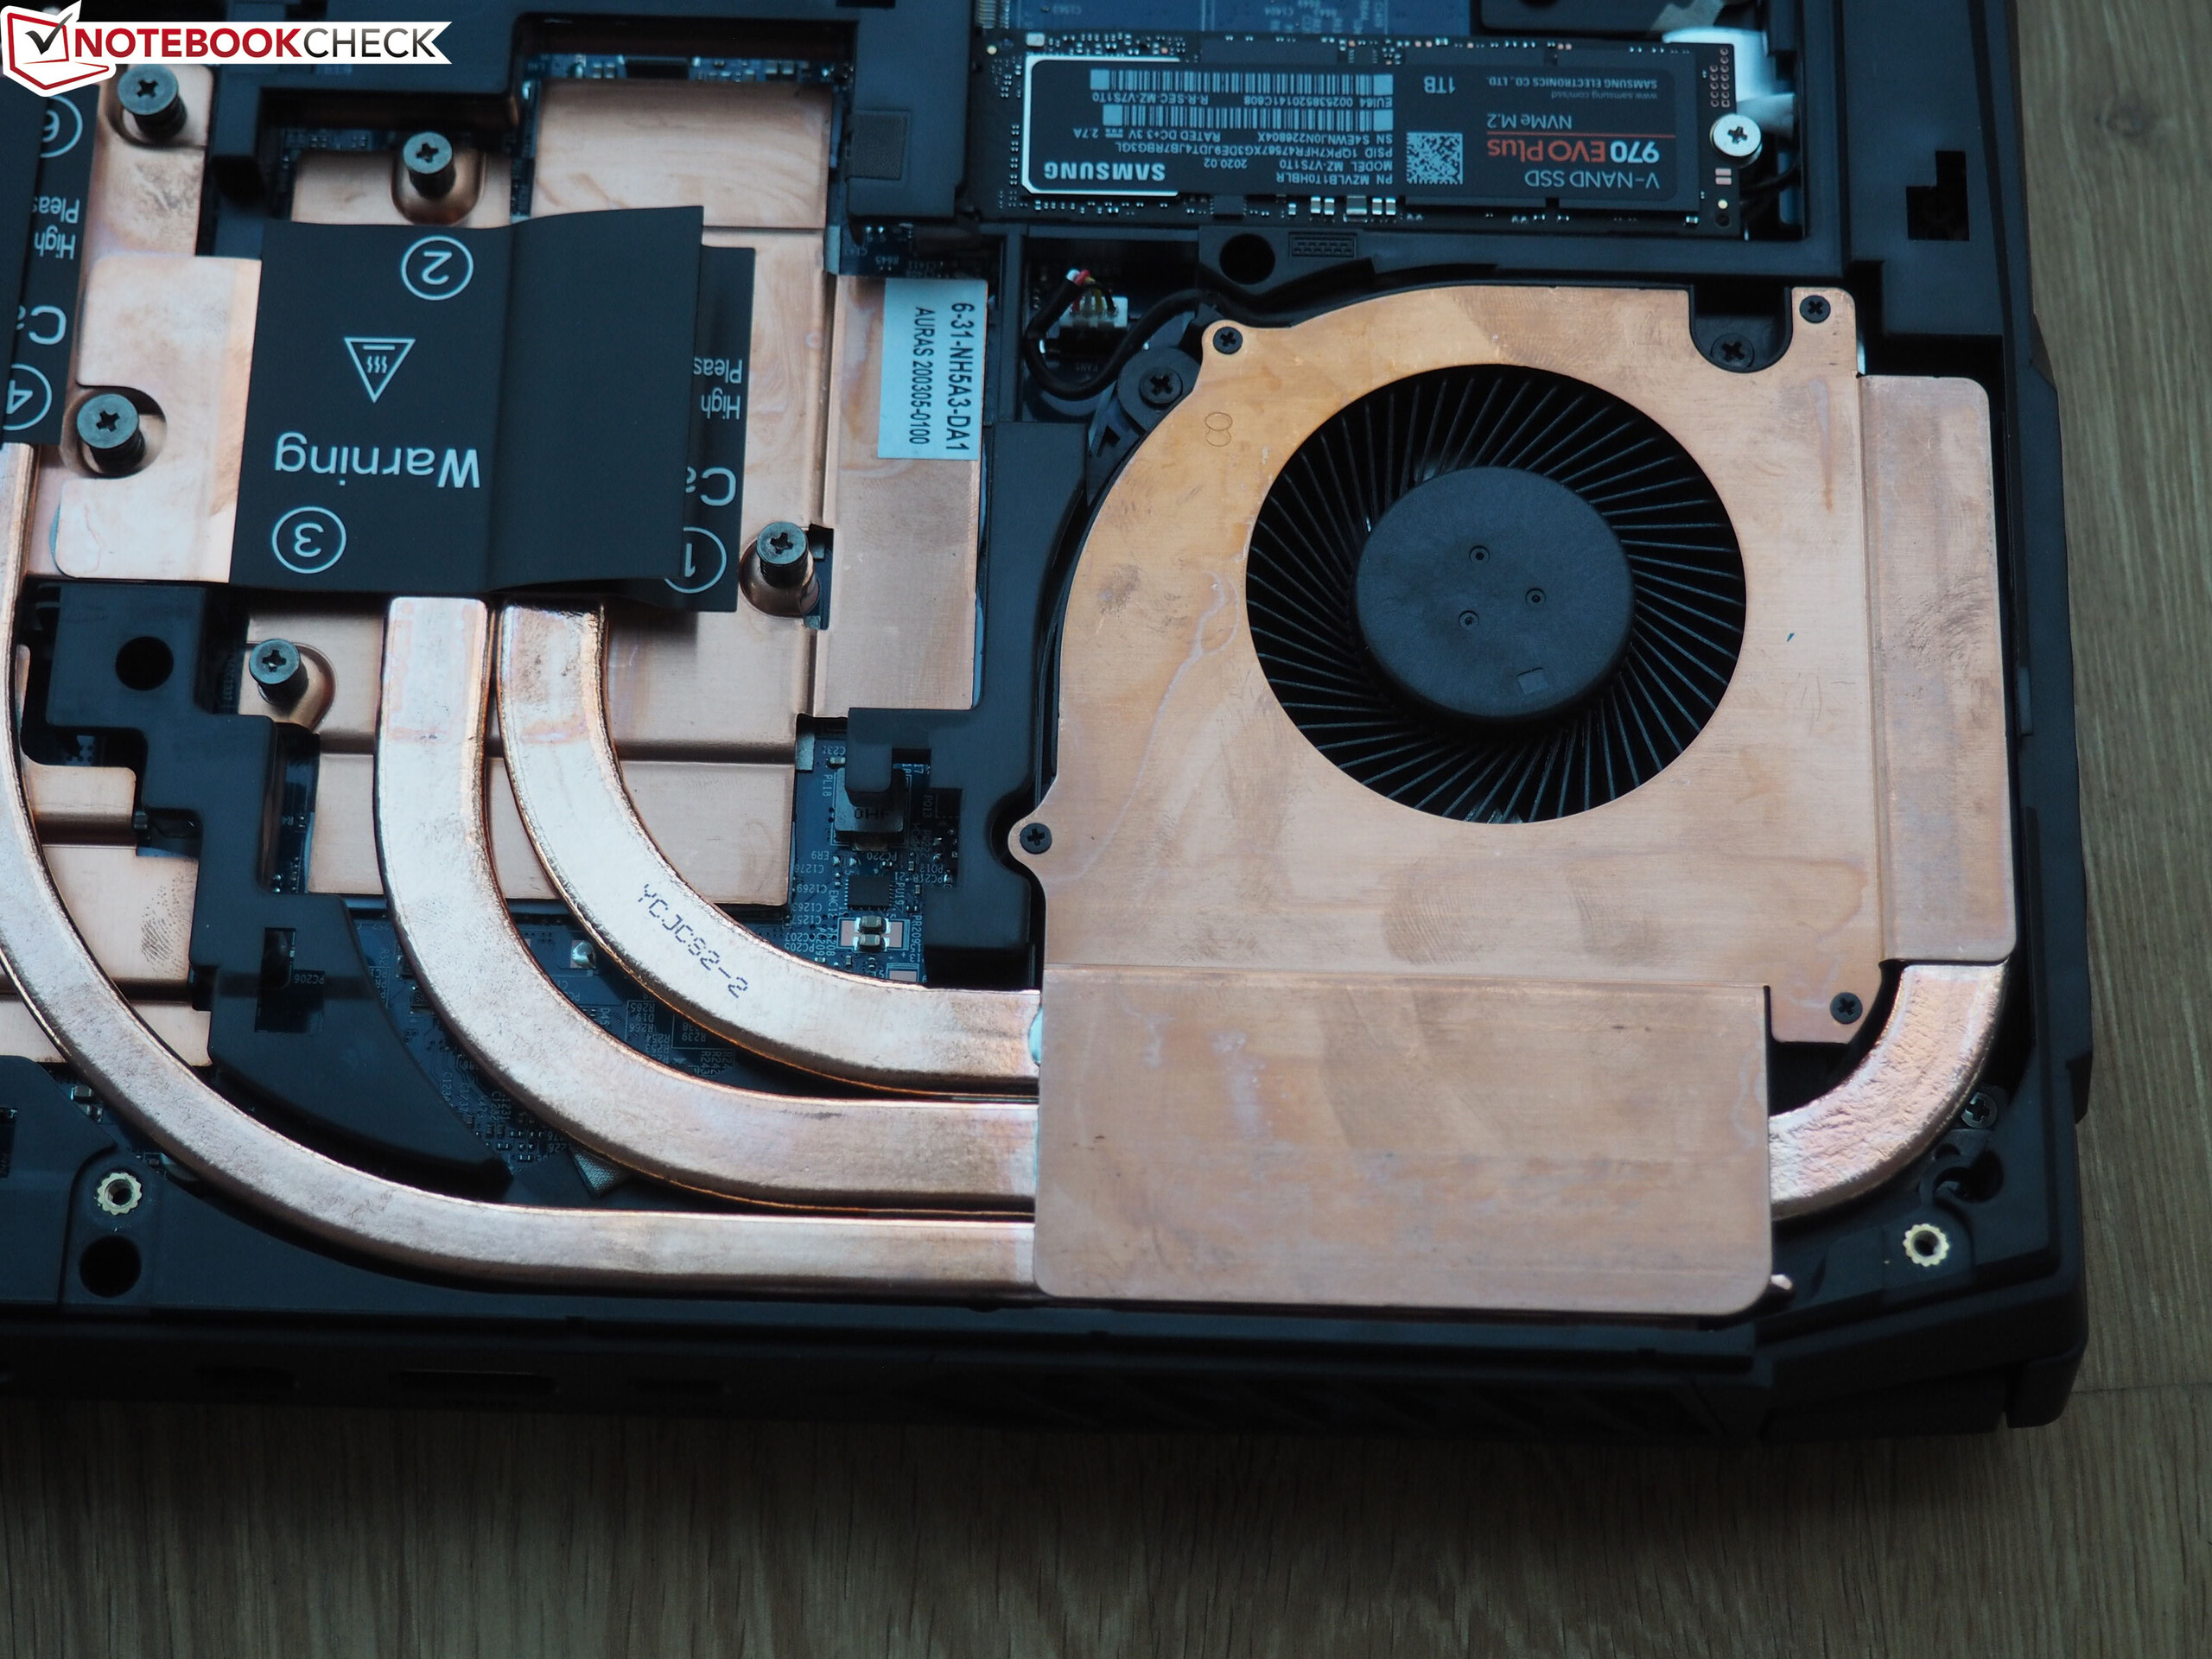
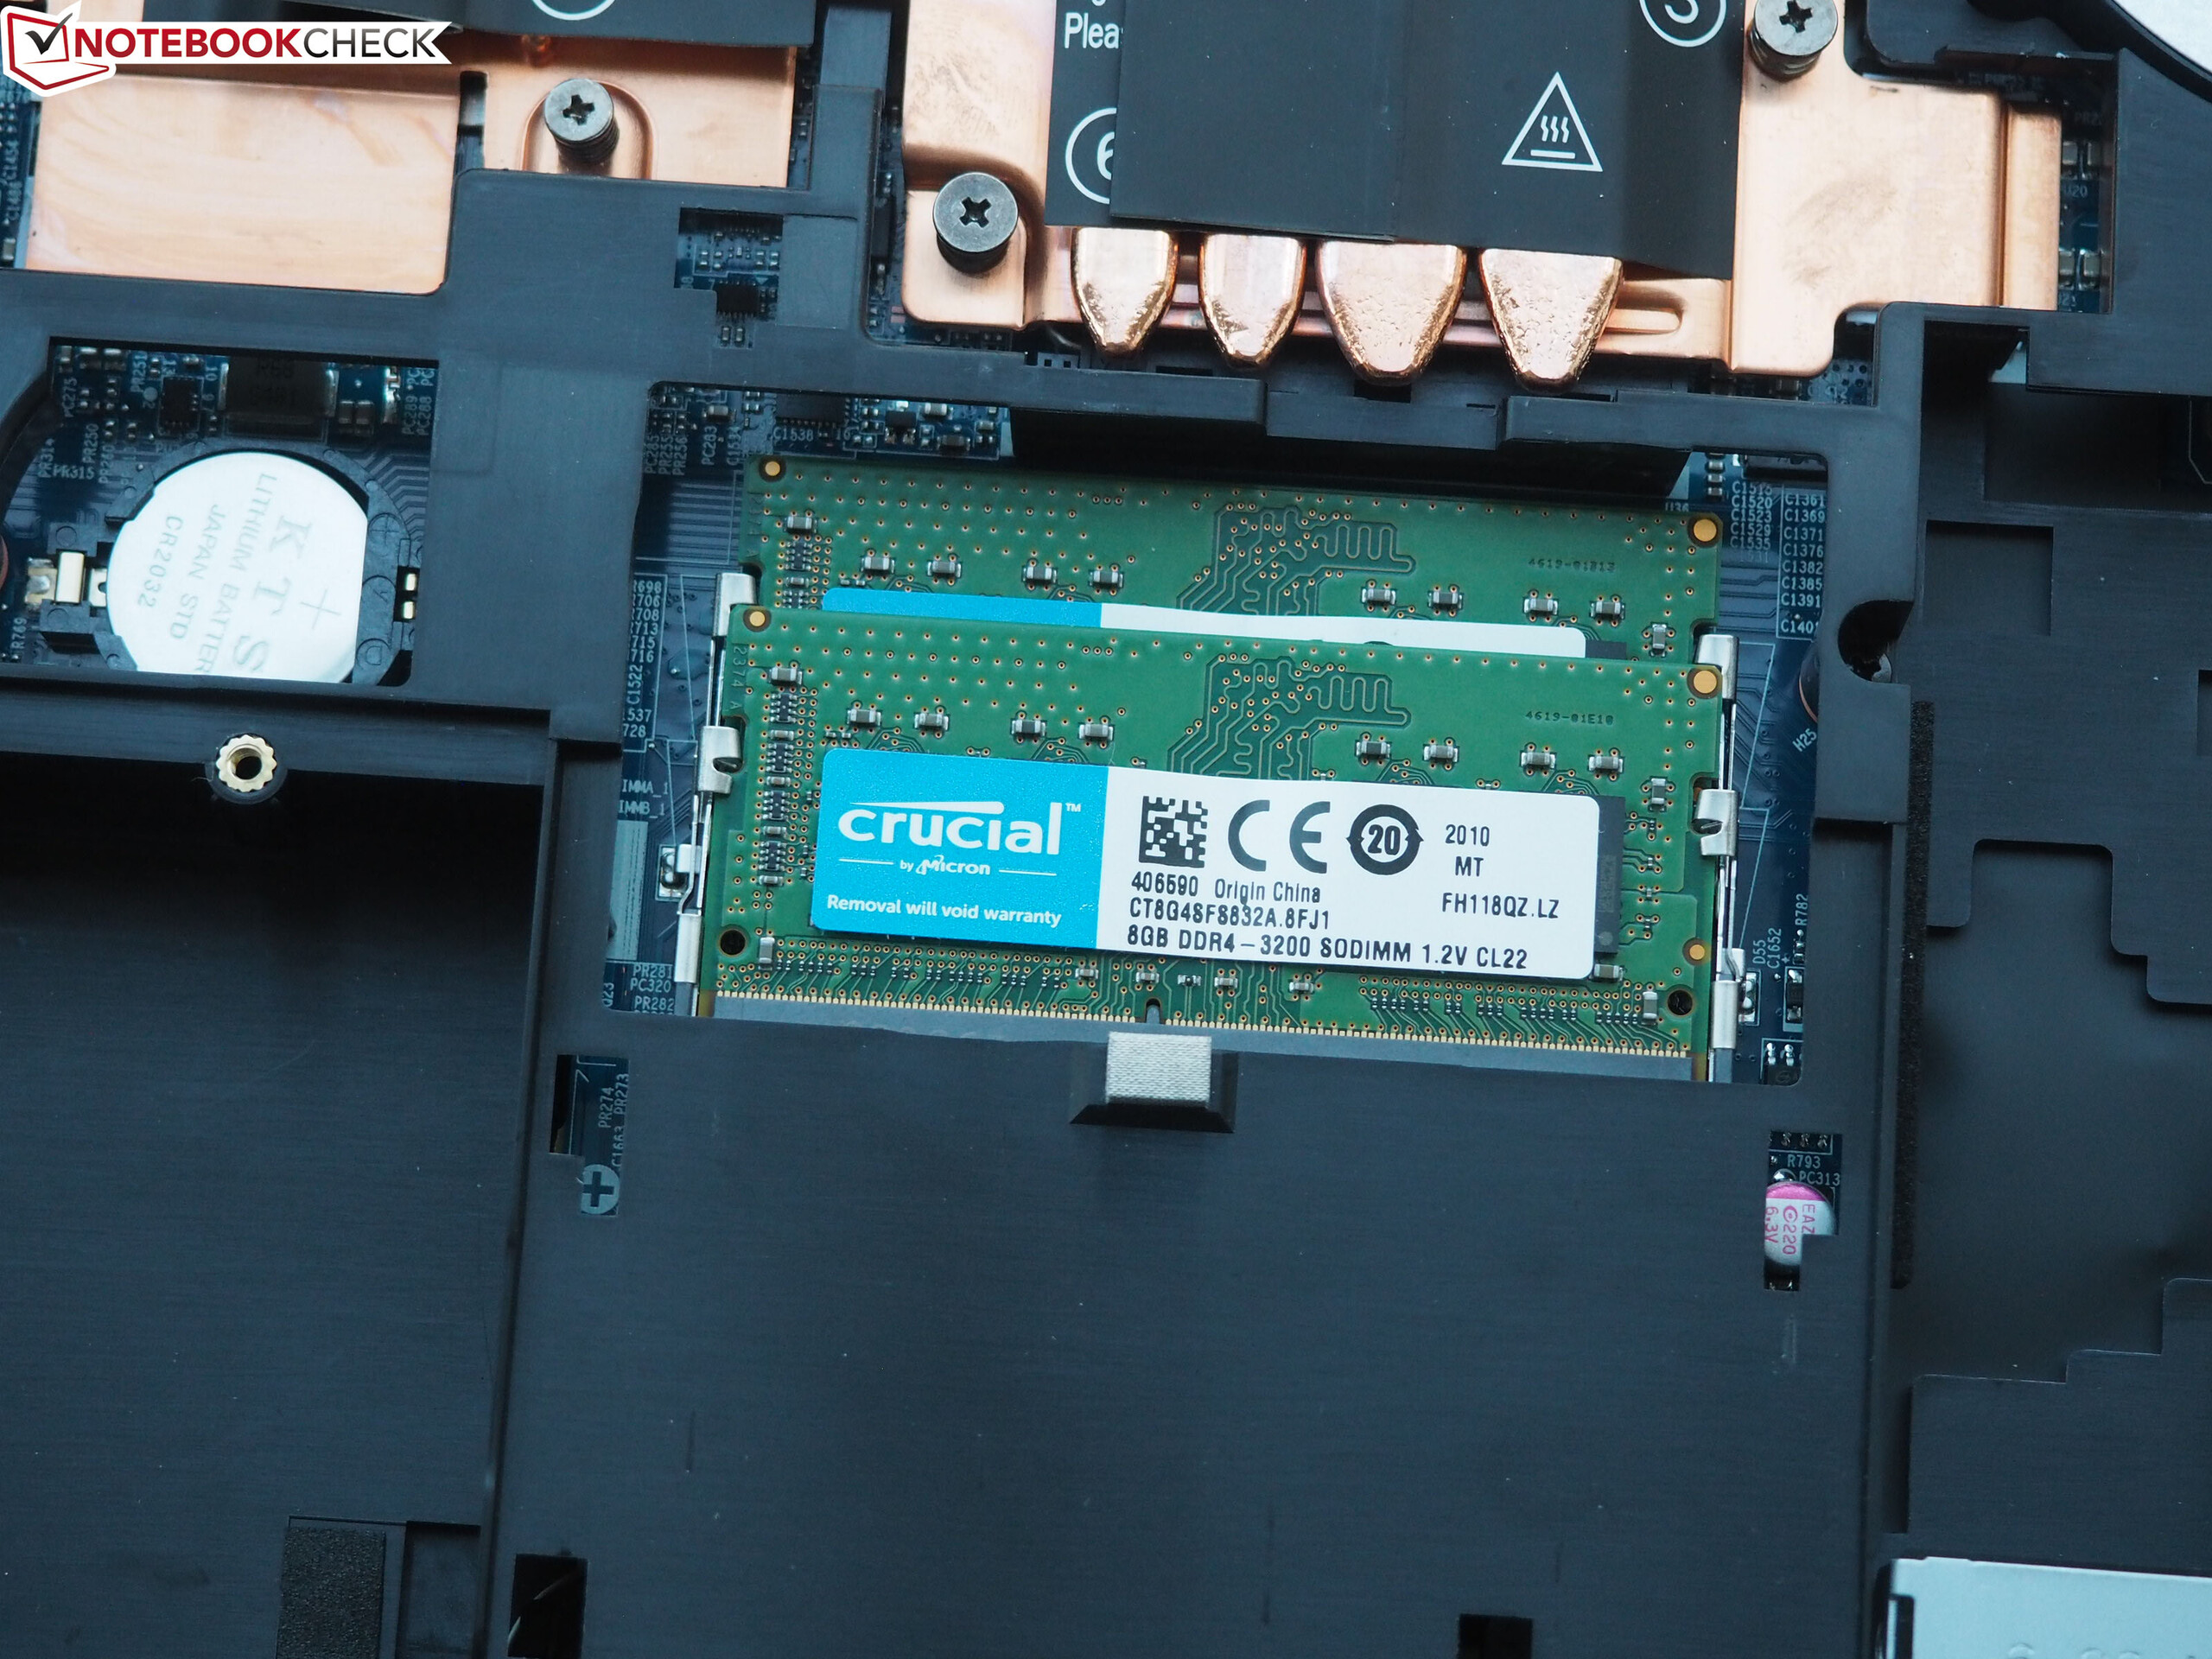
Buyers will continue to be pleased with maintenance options once they're inside the case. Thanks to its origins as a desktop chip, the processor can be exchanged if necessary (the GPU, however, is soldered on). The strong cooling system consists of several metal surfaces and two fans with three heat pipes leading away from each. Users can easily exchange the RAM modules and storage devices.
Warranty
The basic warranty covers 24 months (6 months fast repair). If you want to be on the safe side, you can extend the warranty to 36 months of fast repair.
Input Devices
Keyboard
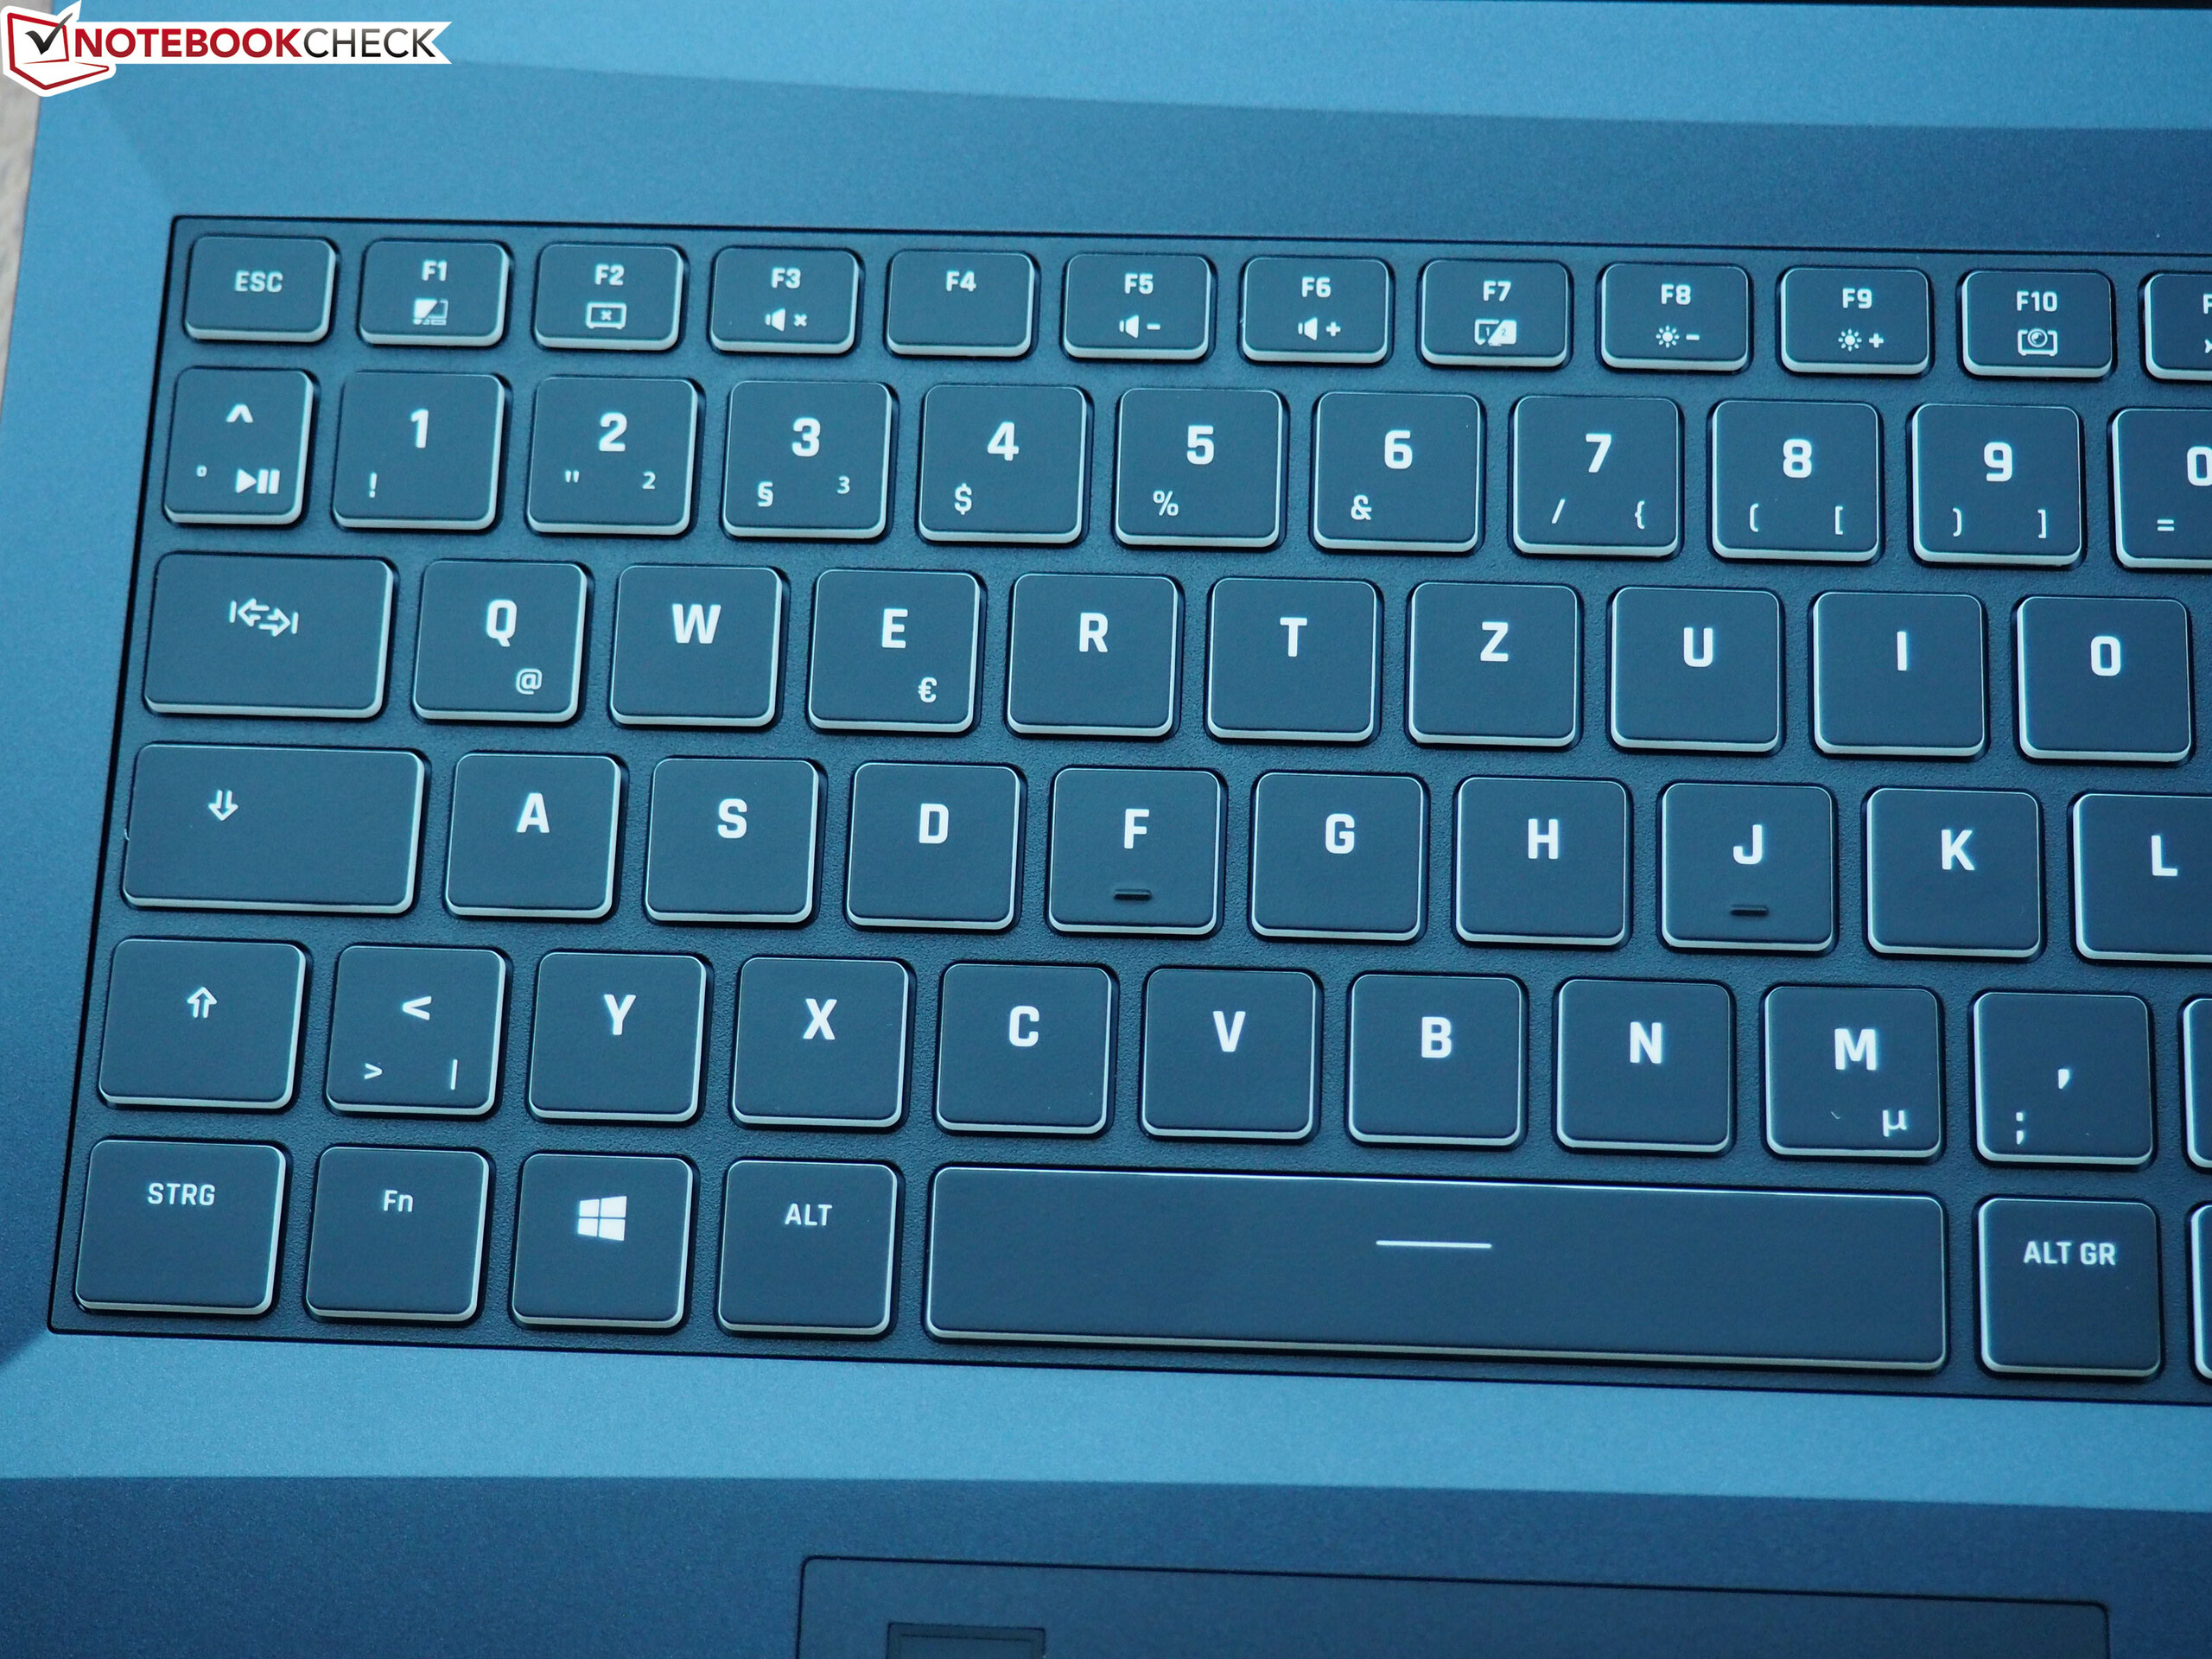
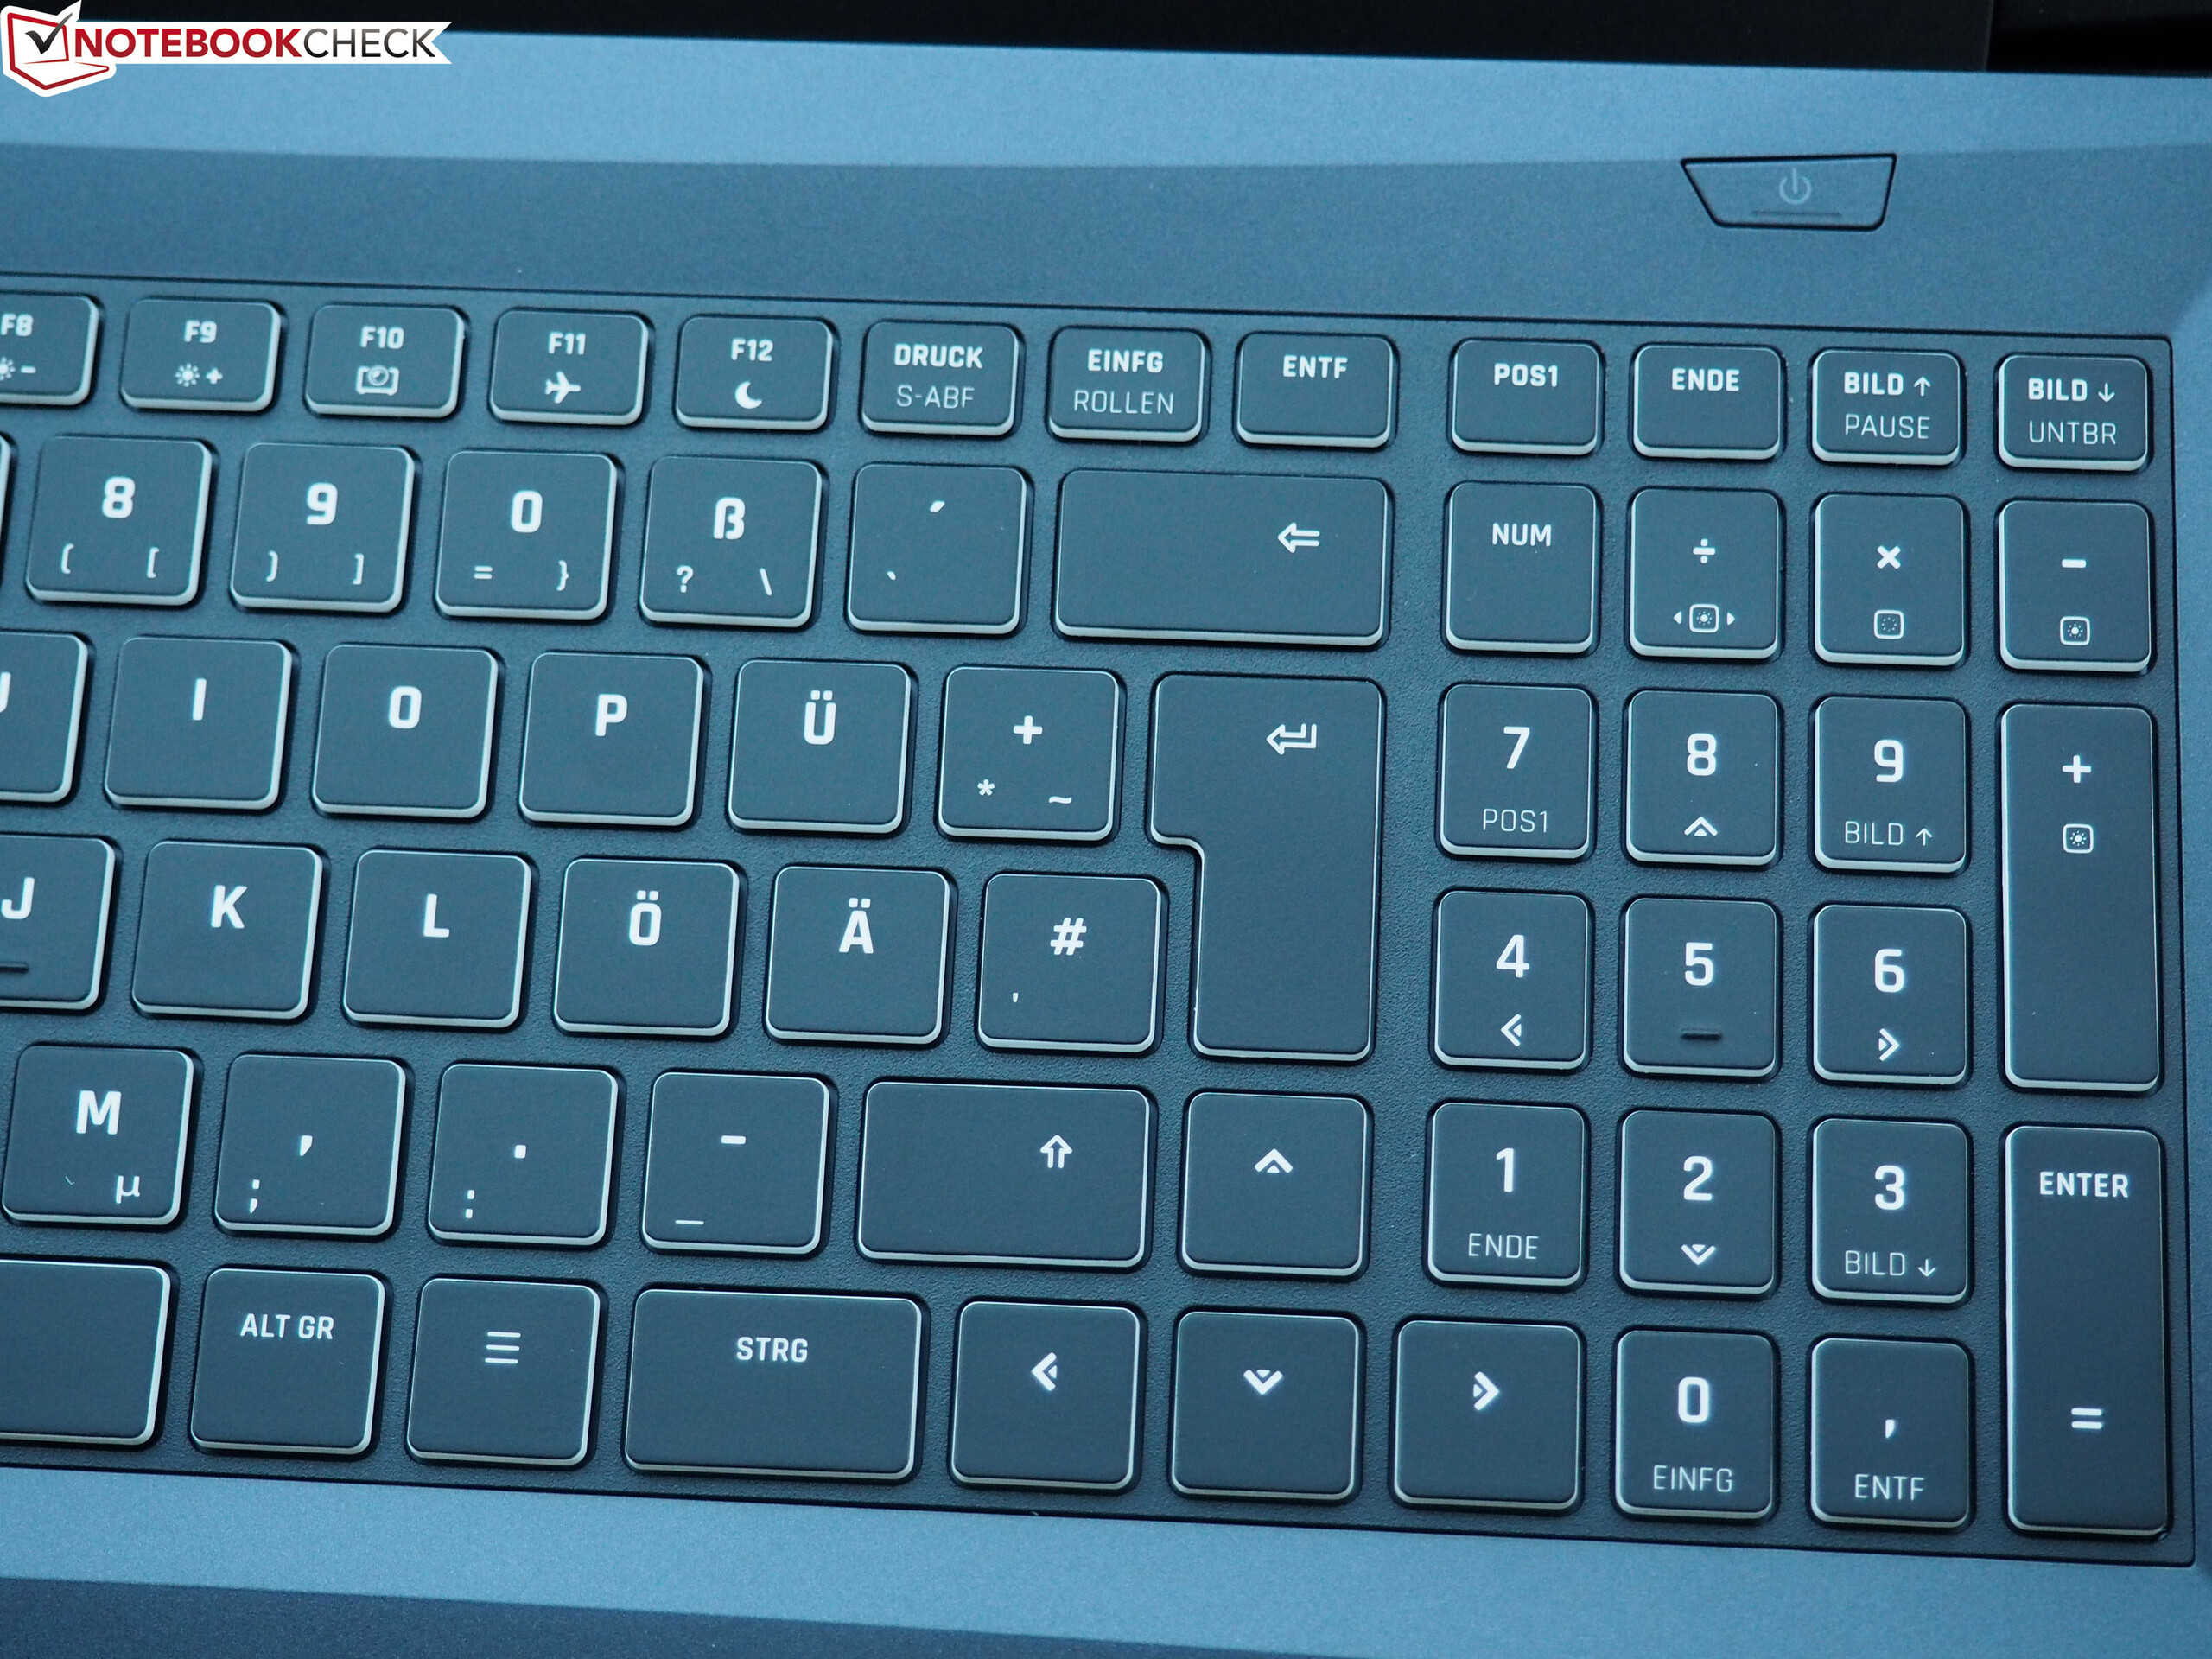
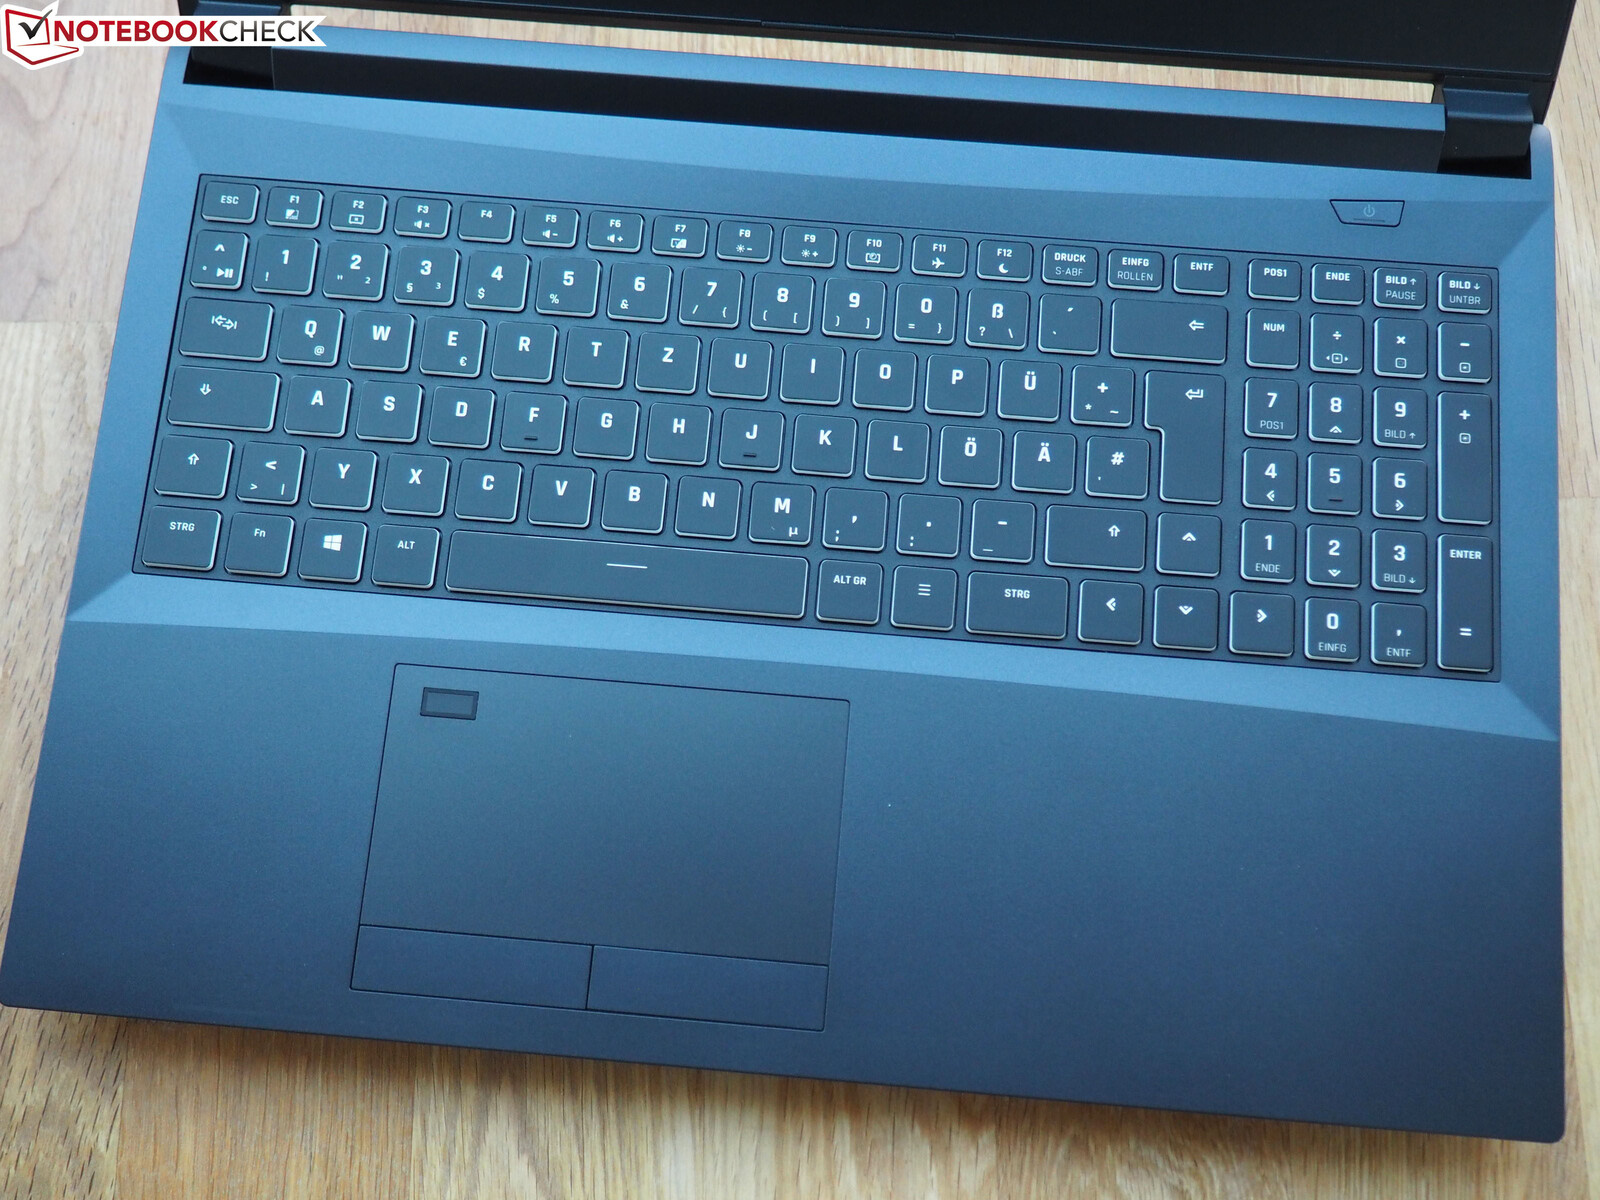
Clevo has again chosen its standard chiclet keyboard, which we find has a good layout. Apart from the narrow number block and row of F keys, all keys, including arrow keys, are decently sized.
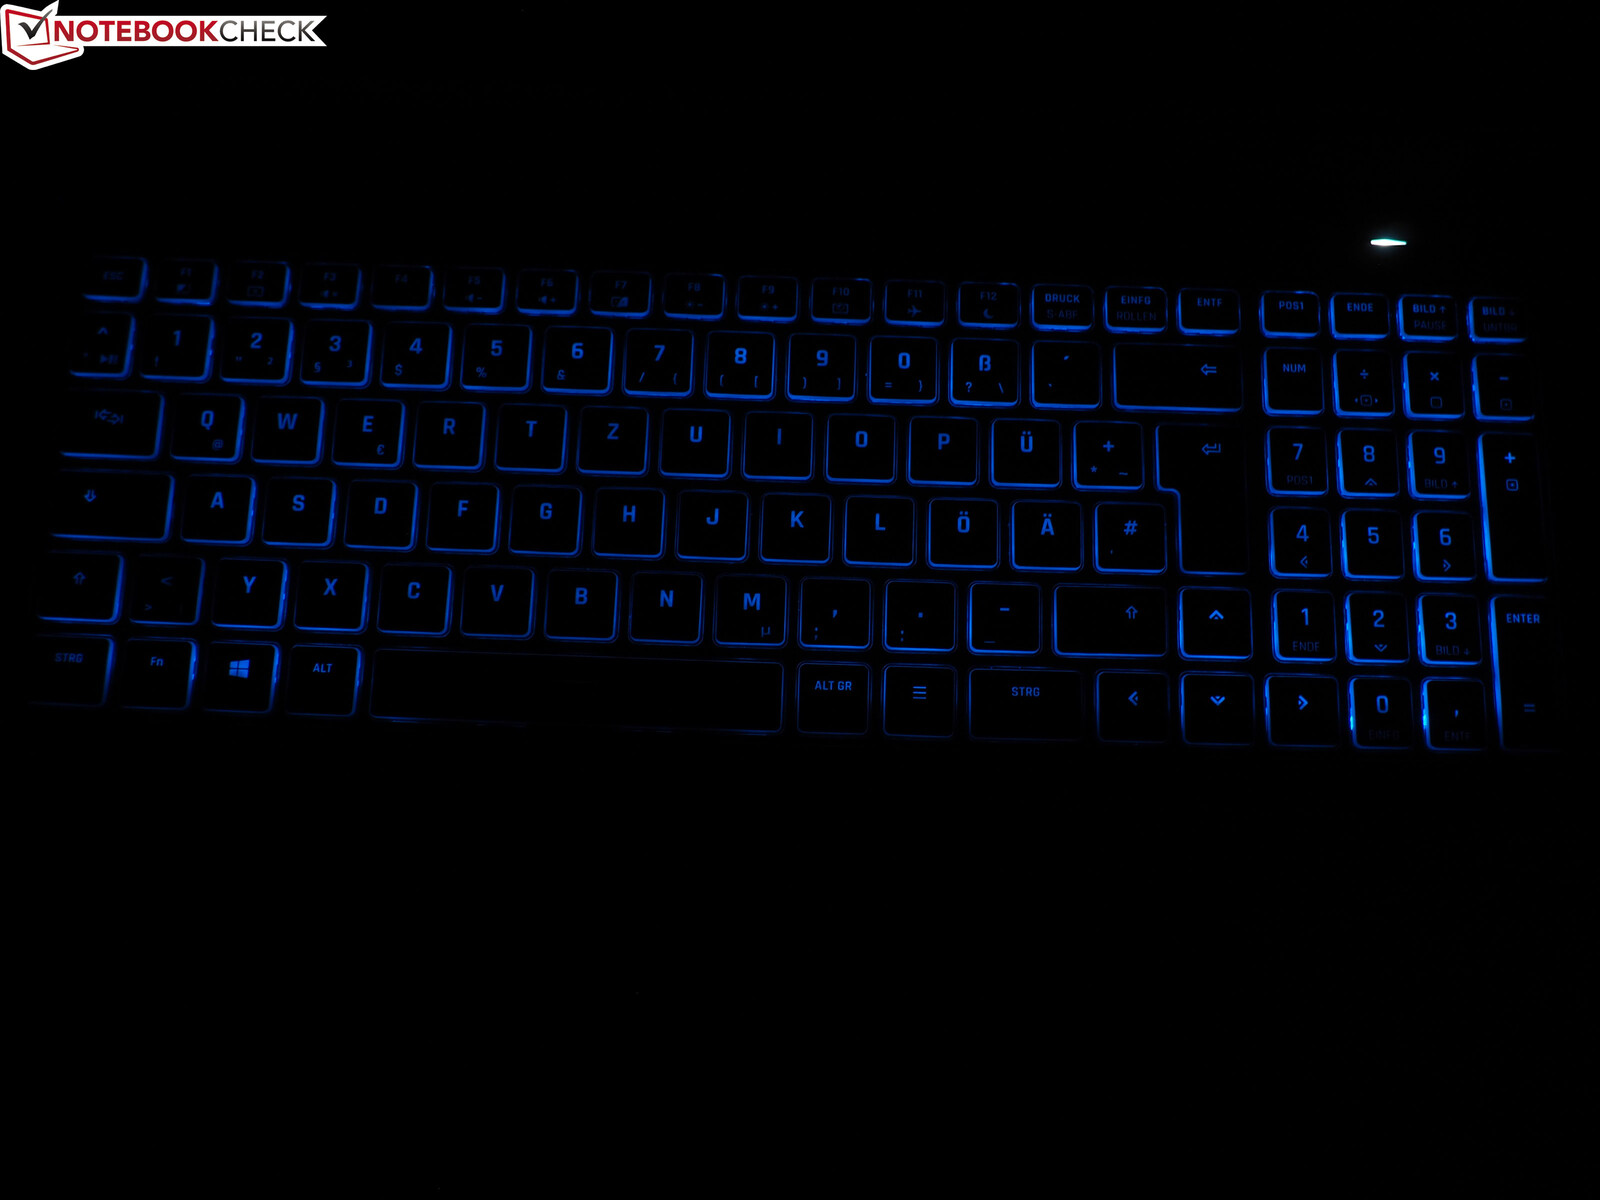
Typing is very comfortable on this device and the keys are the right balance between soft and hard. However, we would like to mention that there is significant keyboard clatter. Night owls will be pleased by the keyboard backlighting, which offers several colors and levels of brightness. The maximum brightness could be a bit more intense, however.
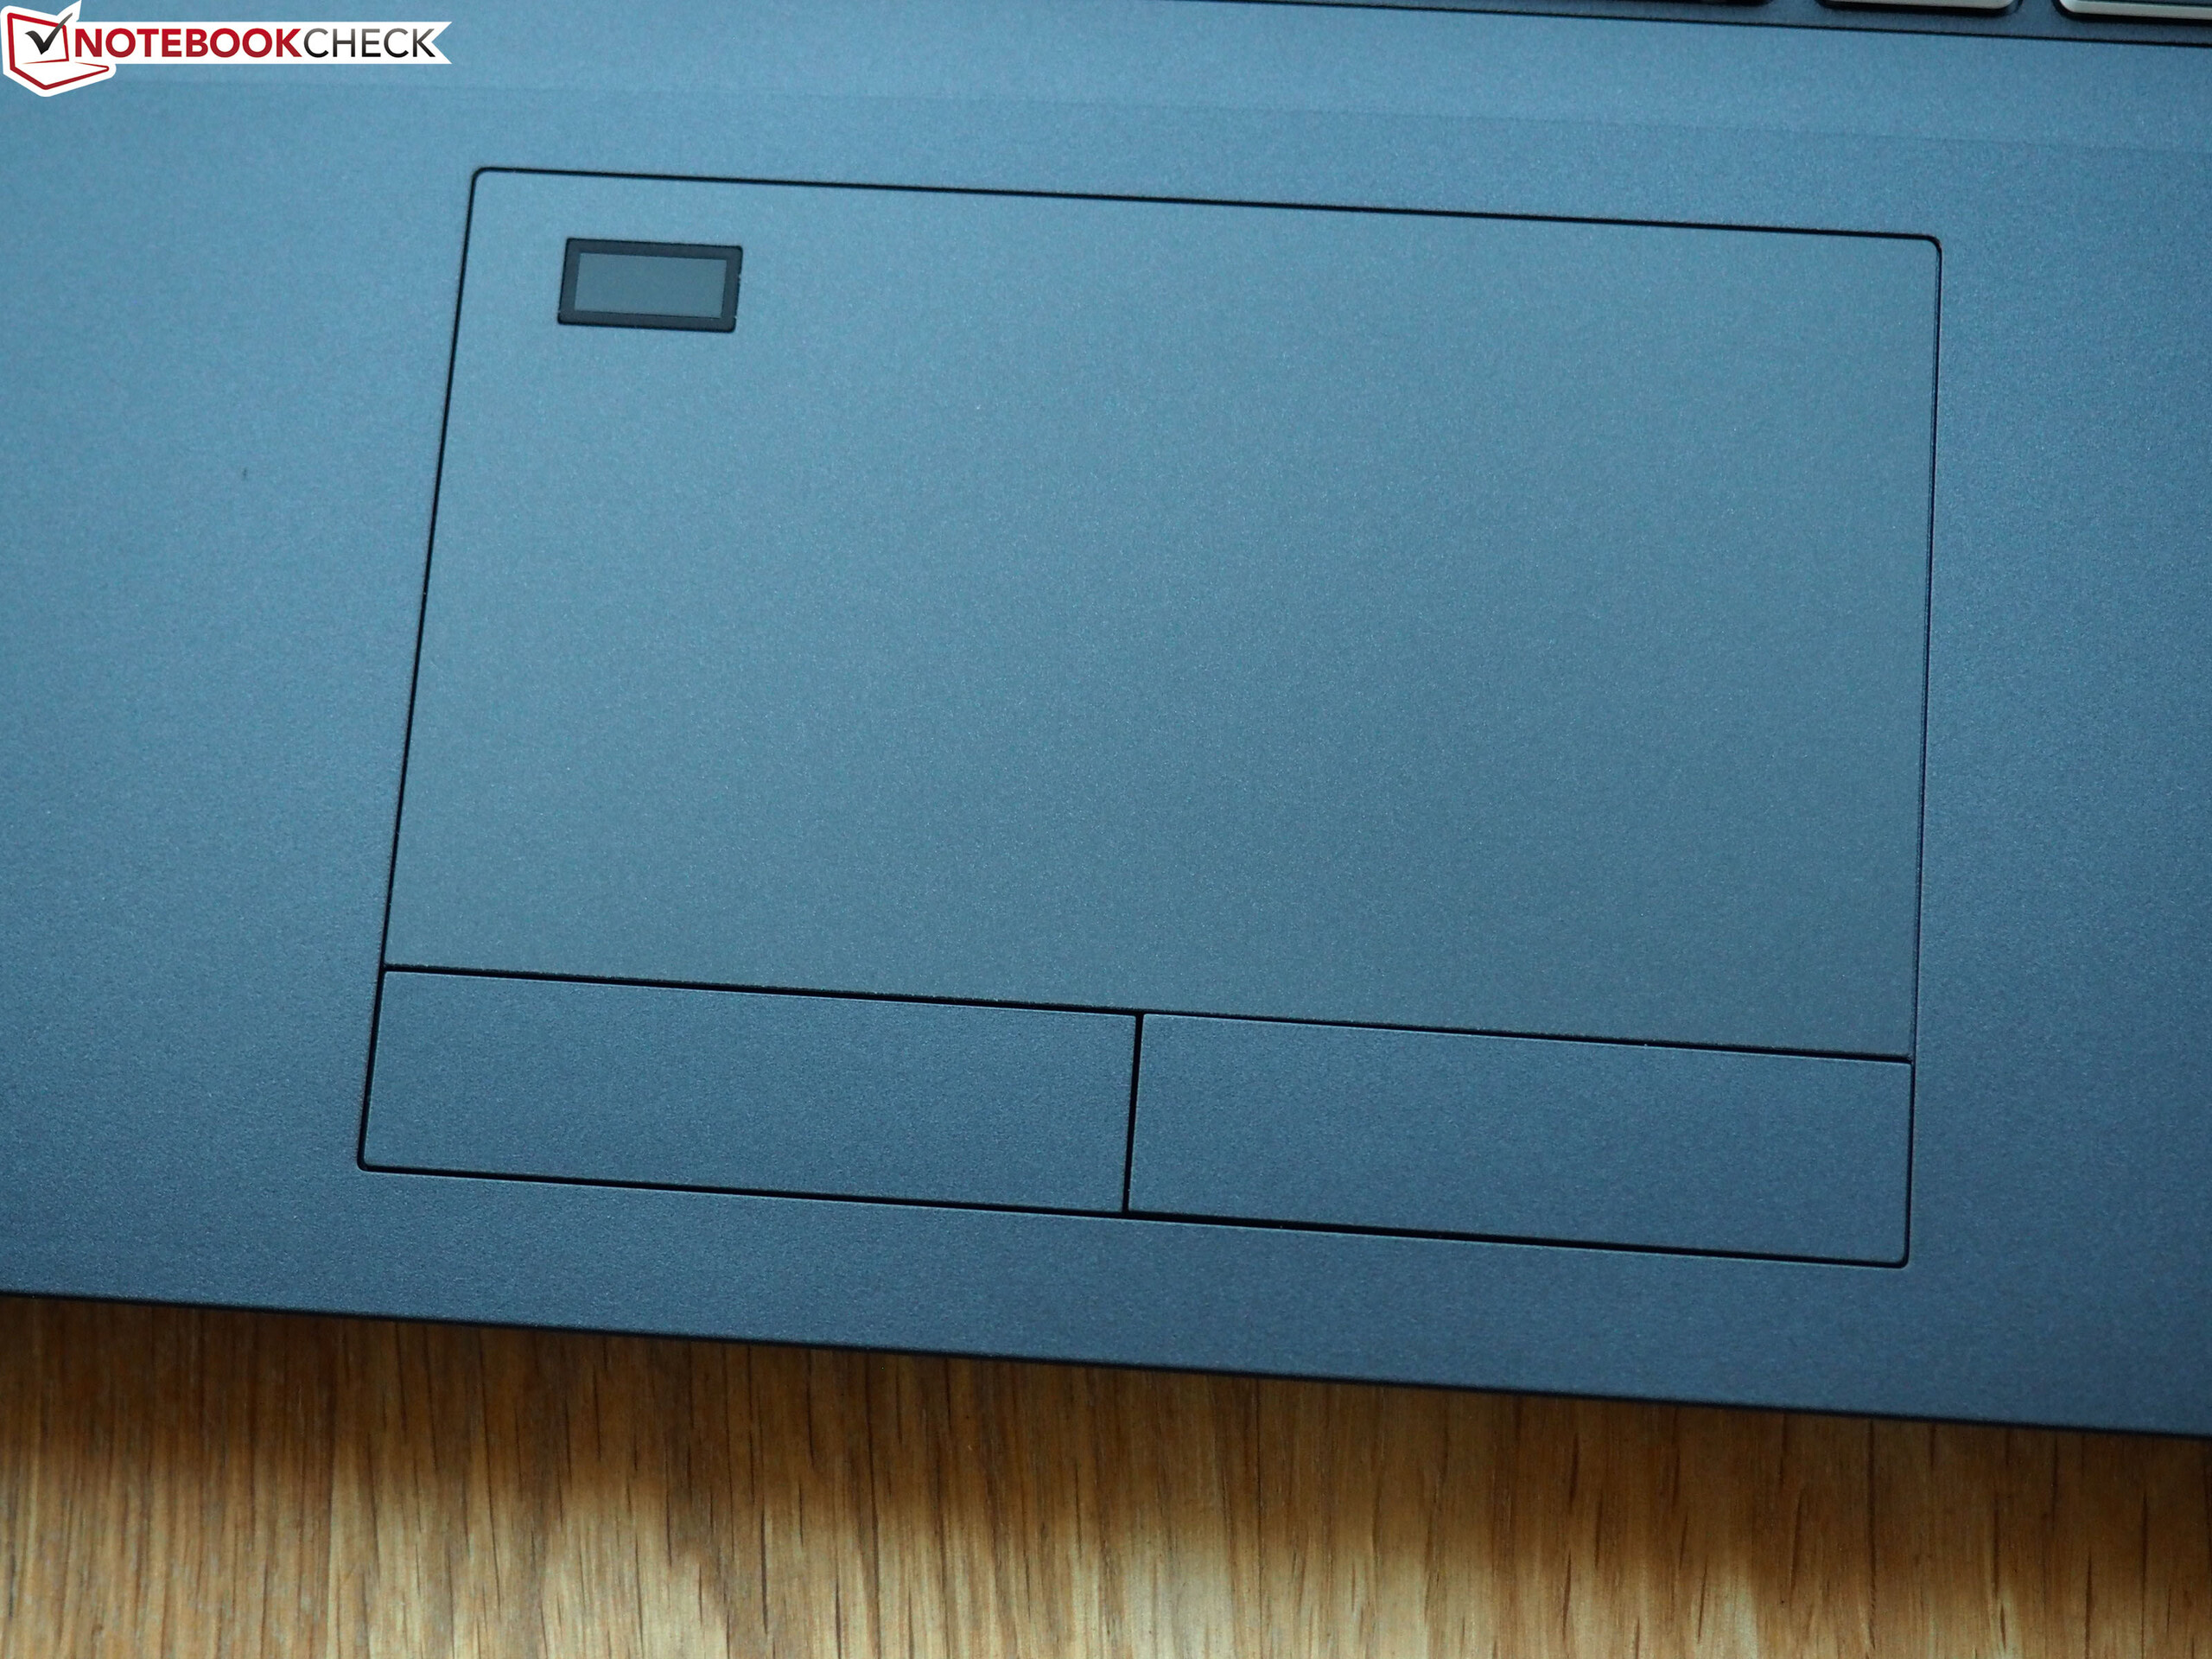
Touchpad
The device features a classic touchpad with dedicated mouse keys (which feel rather cheap and loud when clicked). The touchpad itself is around 11 x 6.2 cm large and has a smooth finish. Nonetheless, gliding isn't ideal, particularly when your fingers are wet or oily. Apart from that we were quite happy with the touchpad and its precision and gesture support (zooming, scrolling) worked well.
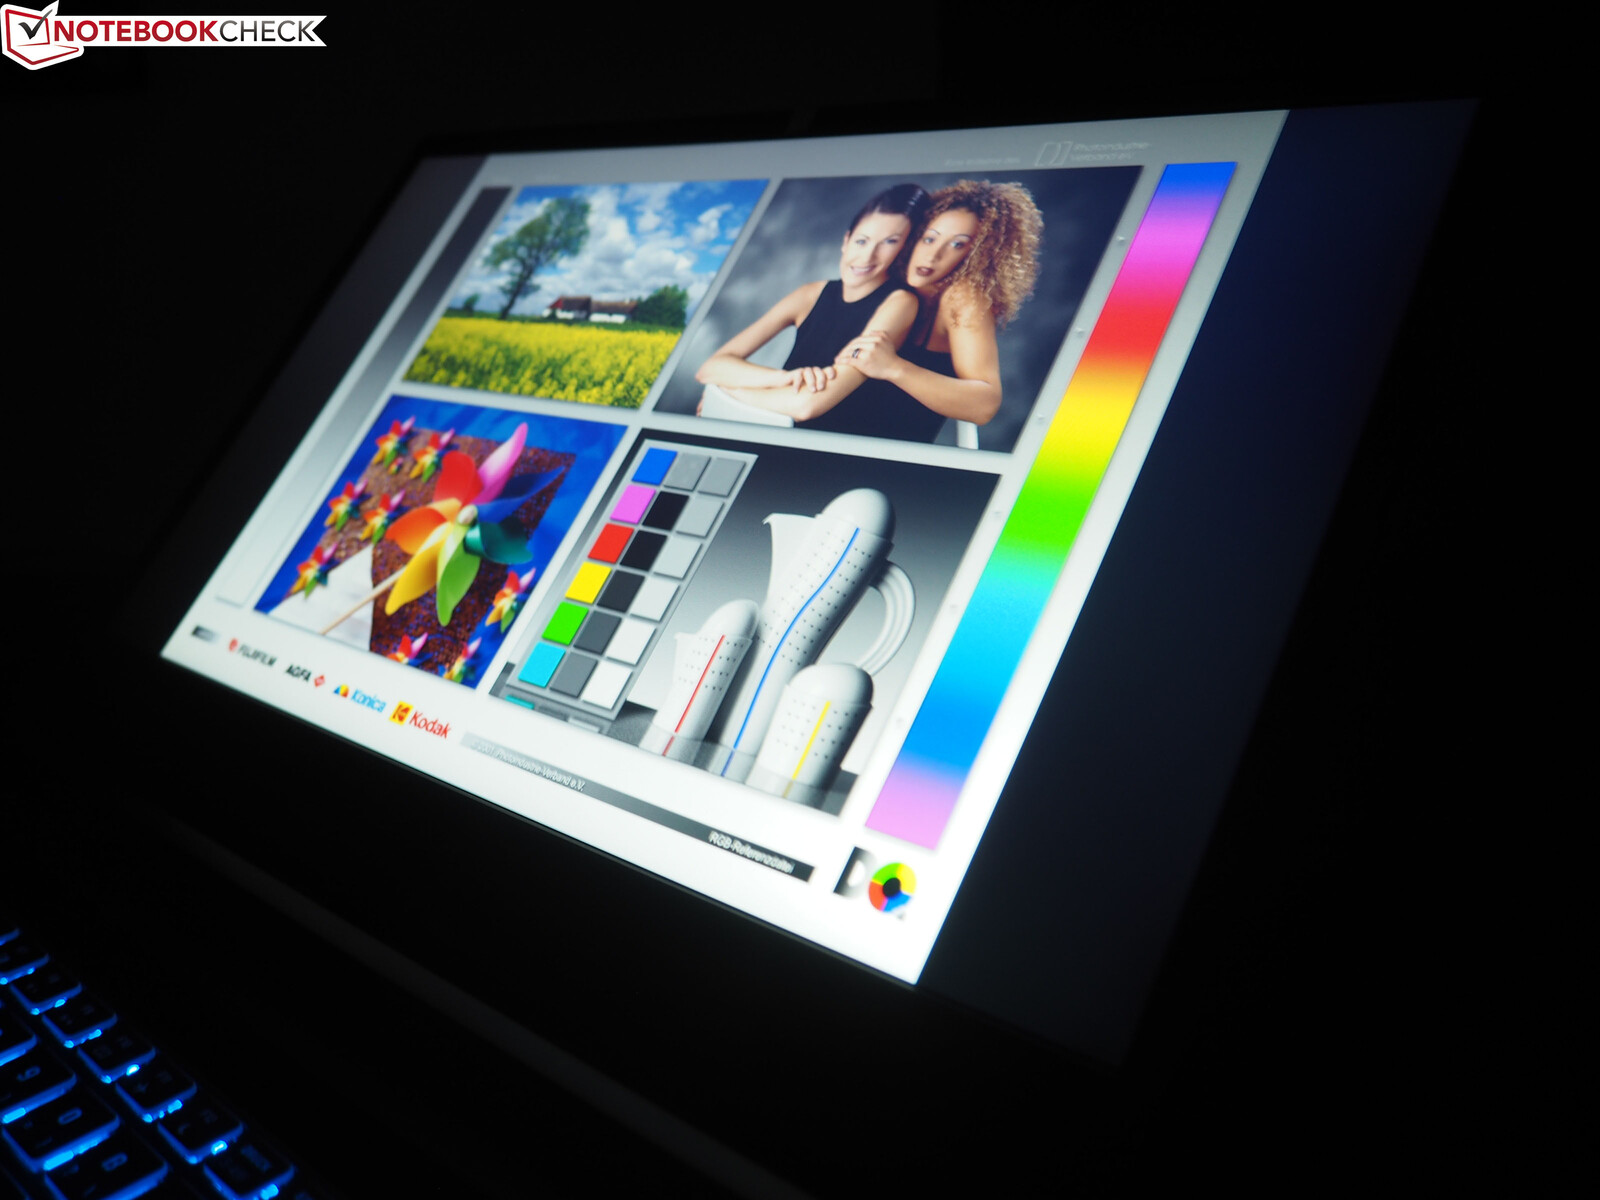
Display
Perhaps unsurprisingly, the Apex 15 is equipped with a matte Full-HD IPS display. Thanks to its 144 Hz, even normal Windows applications feel a lot smoother (cursor movements!). The 15-inch display is just as fast while gaming and has a response time of 11.2 ms (black-to-white) and 17.6 ms (gray-to-gray). This means that even fast games will be displayed smoothly for the most part. Most buyers should be satisfied with this display.
| |||||||||||||||||||||||||
Brightness Distribution: 84 %
Center on Battery: 317 cd/m²
Contrast: 1132:1 (Black: 0.28 cd/m²)
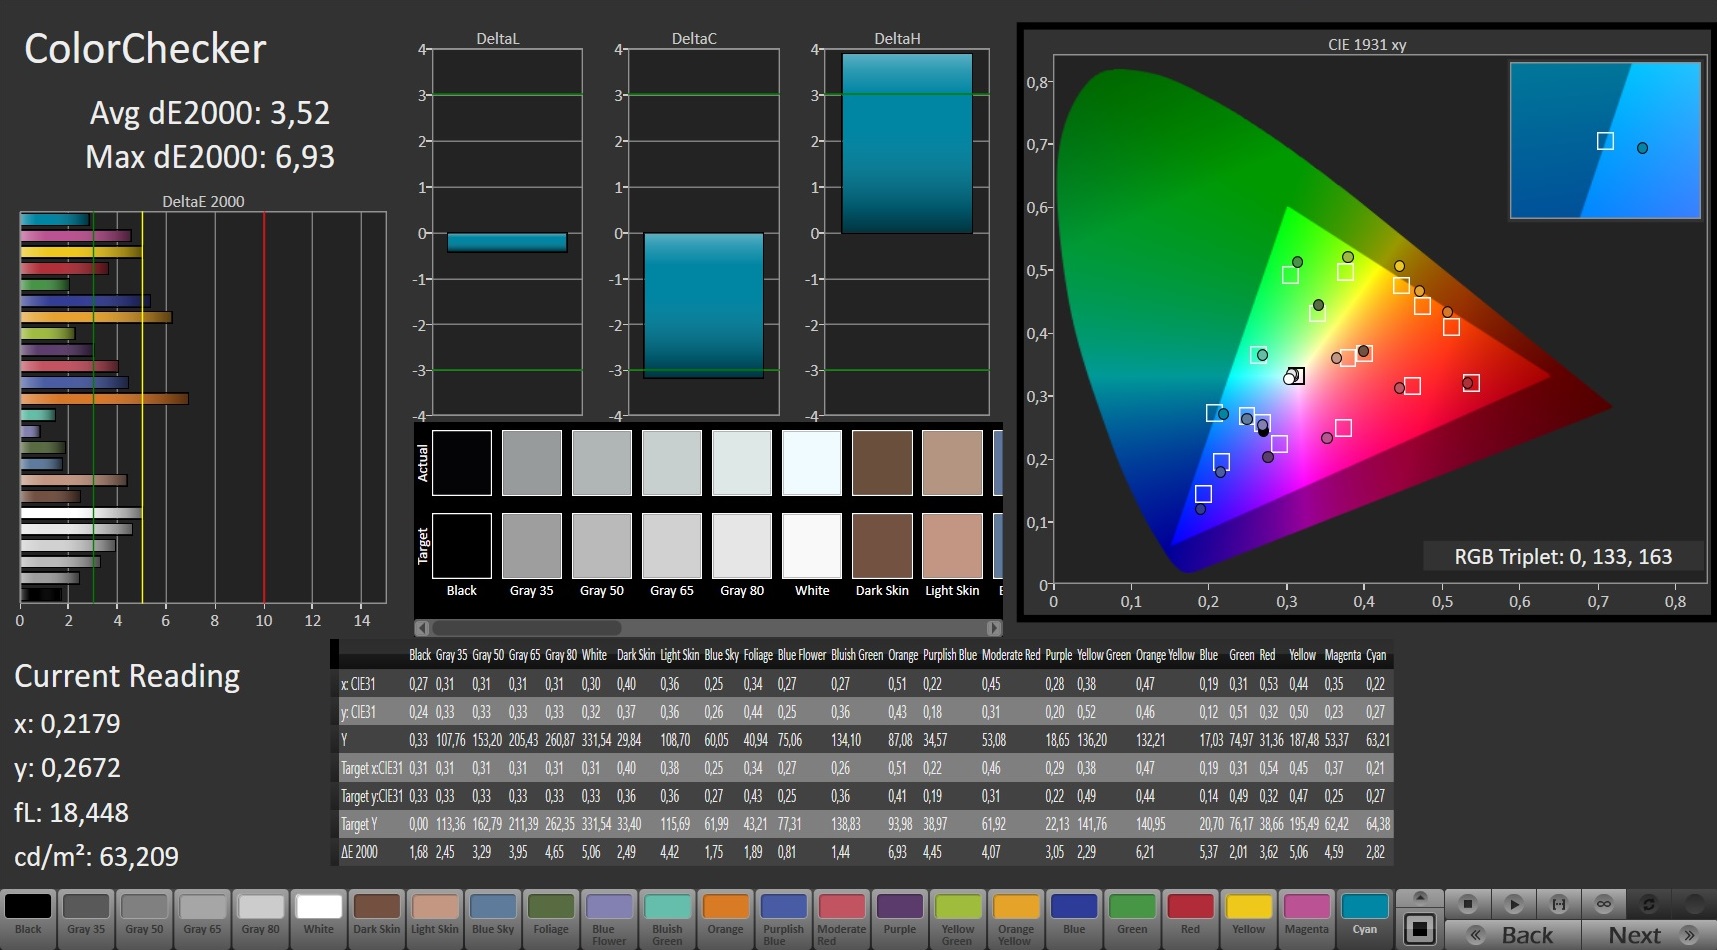
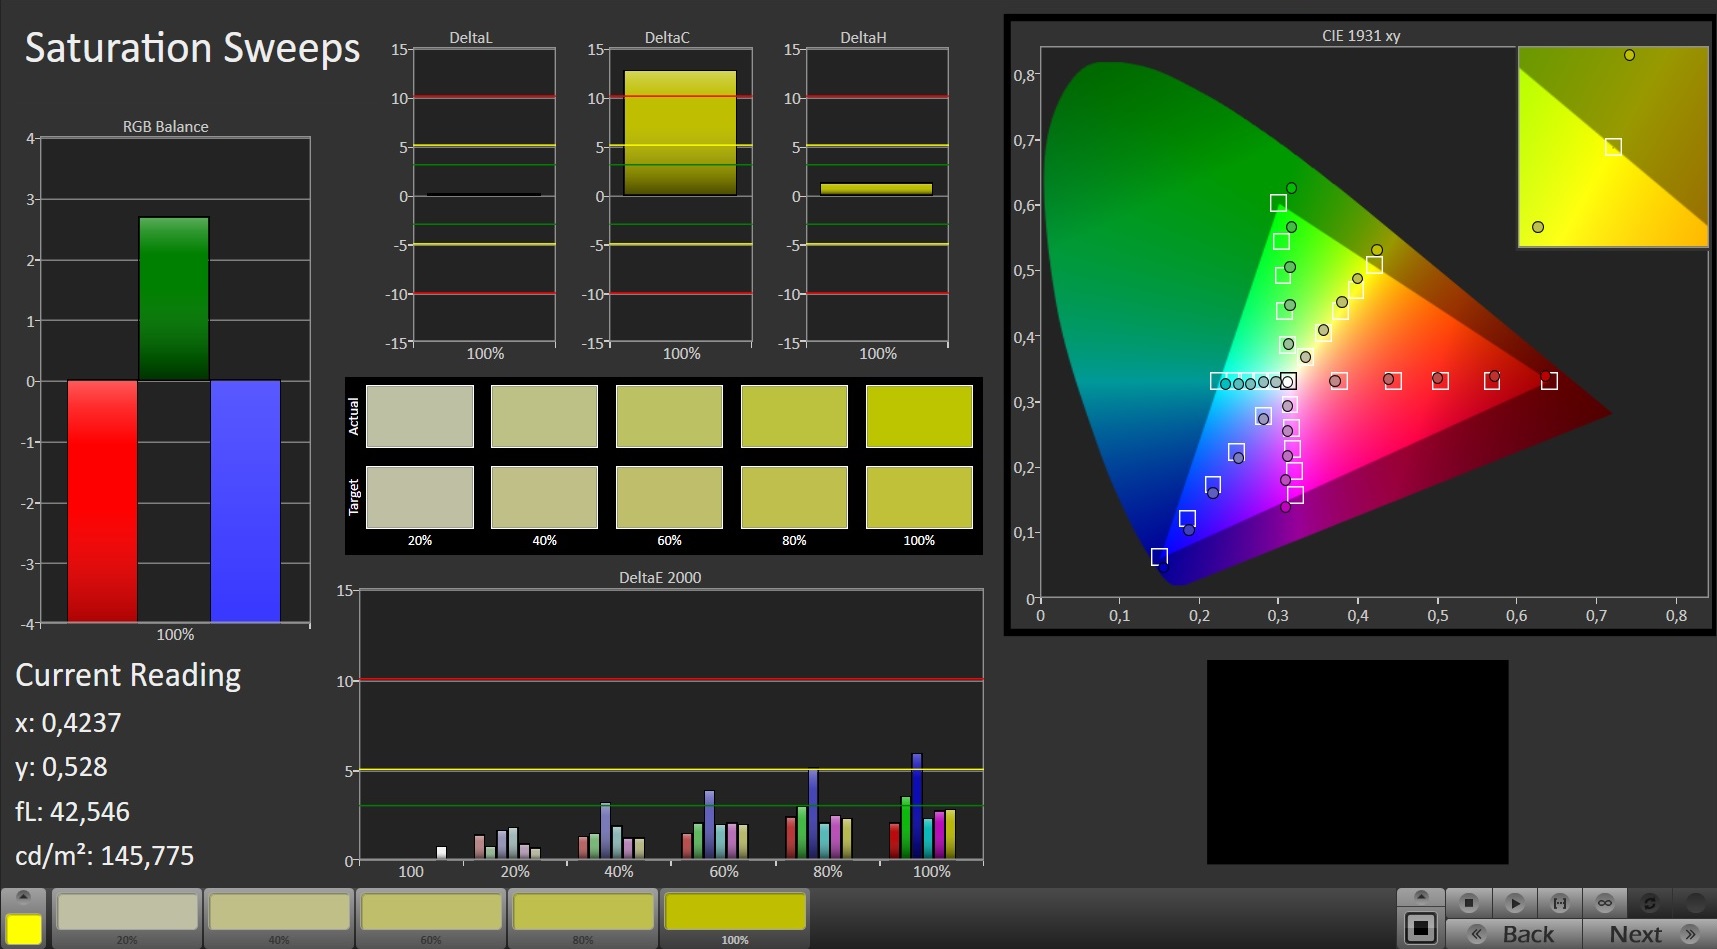
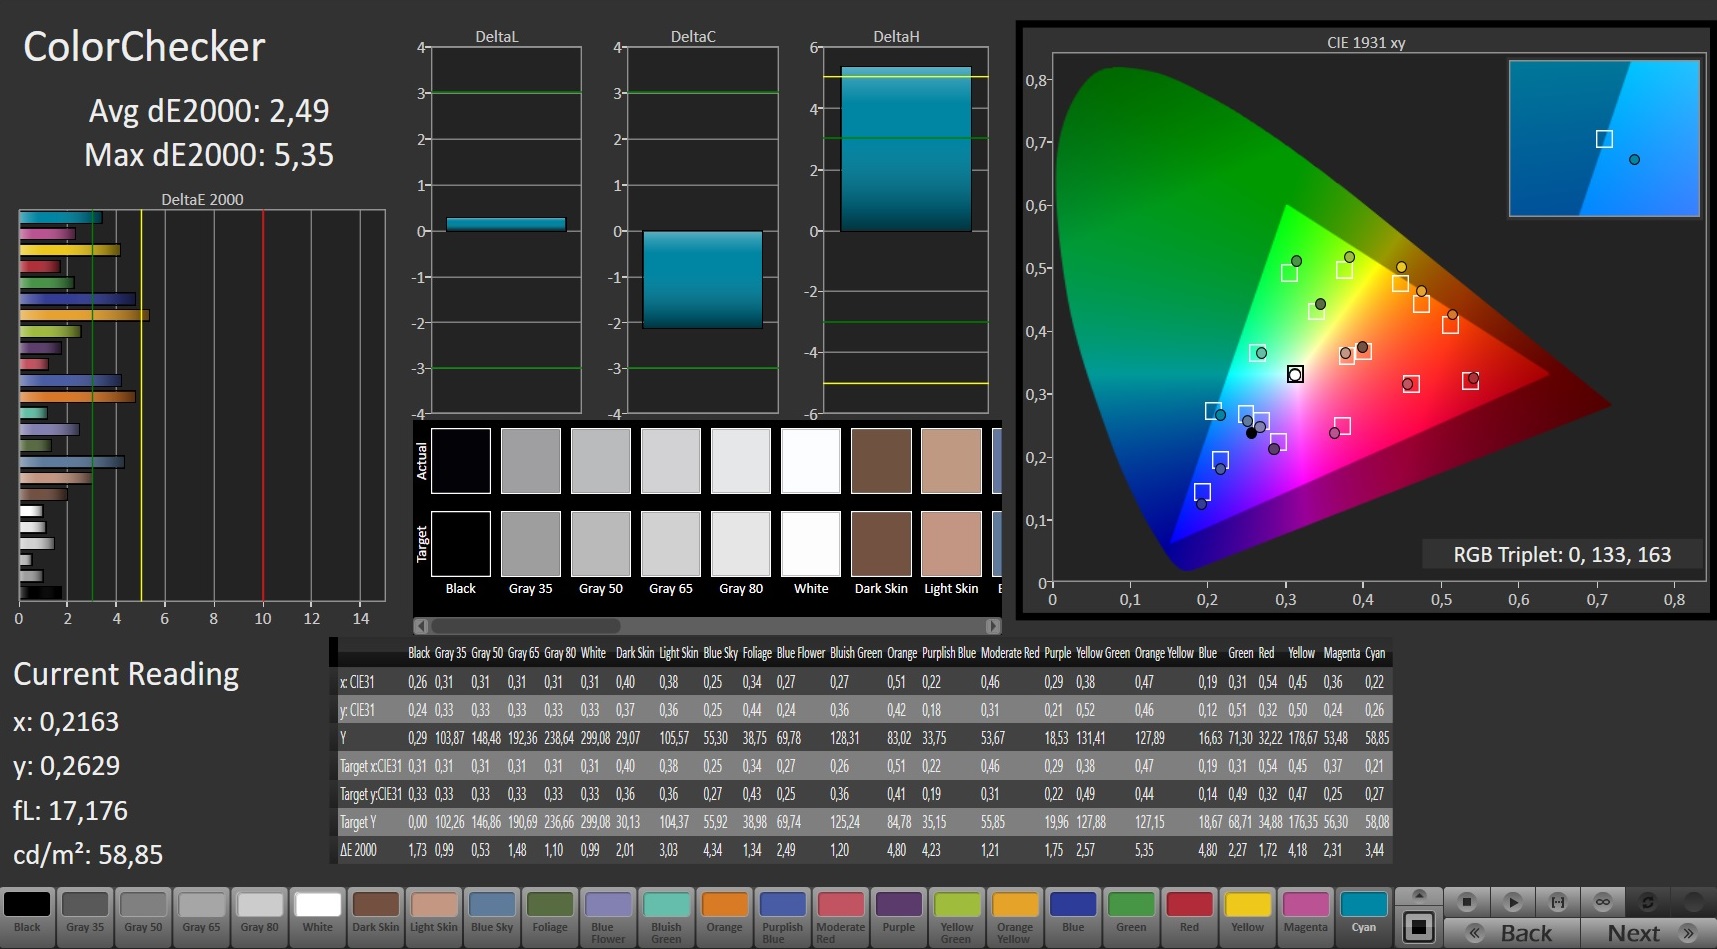
ΔE Color 3.52 | 0.5-29.43 Ø5, calibrated: 2.49
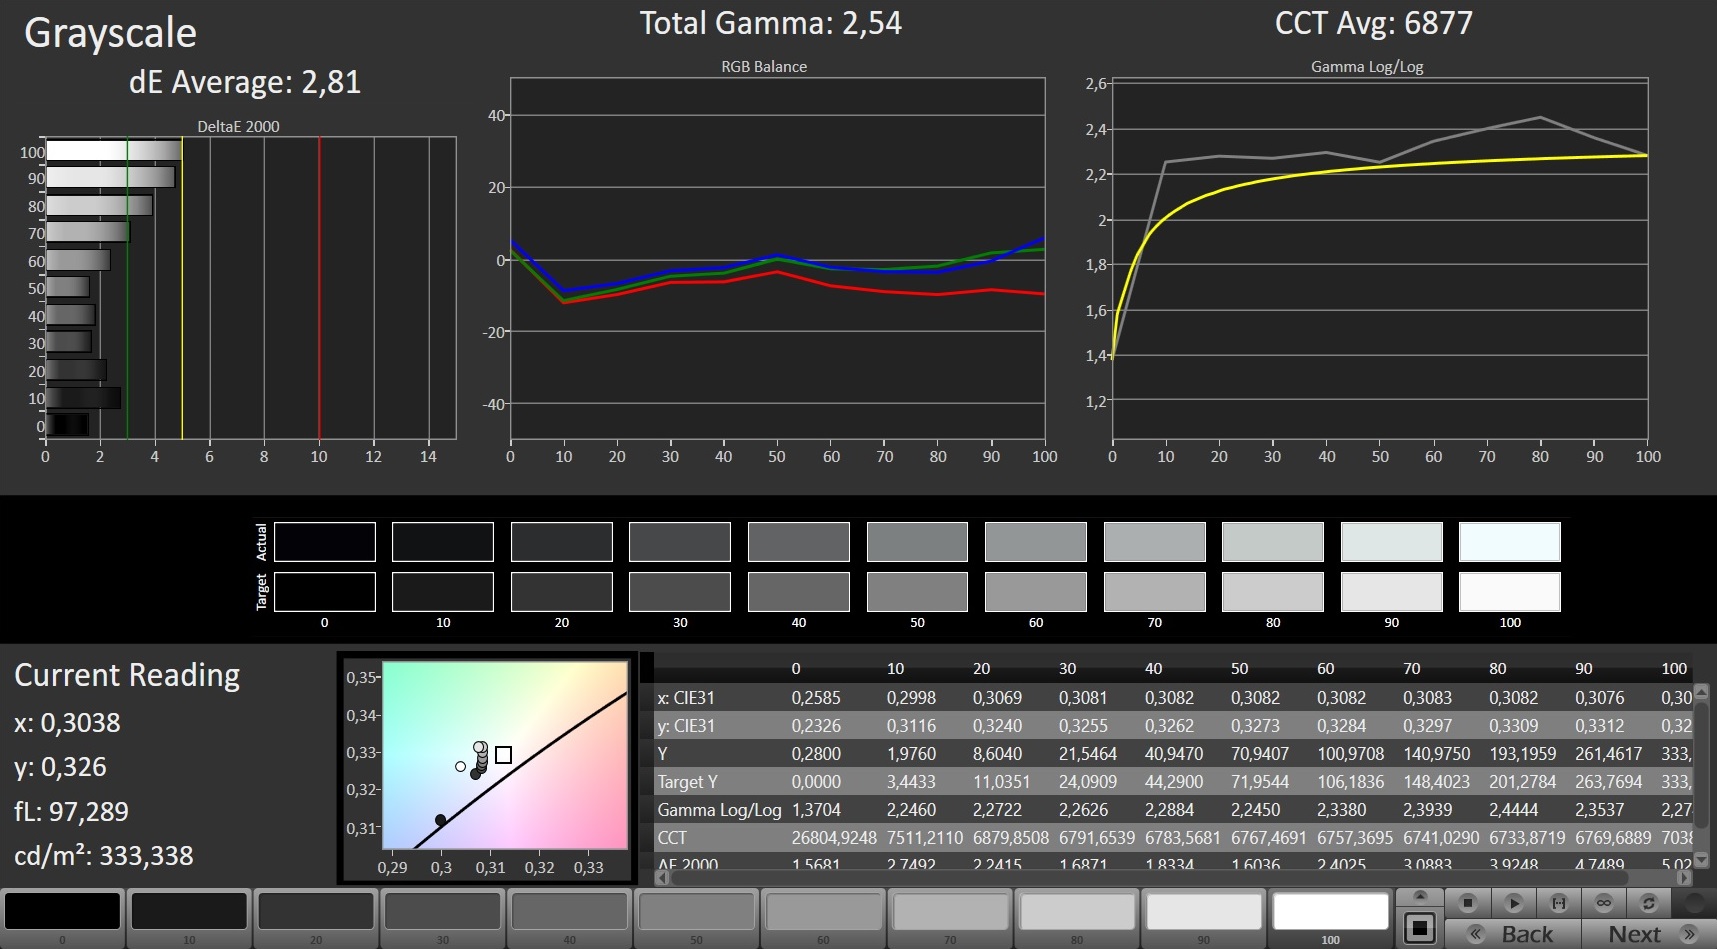
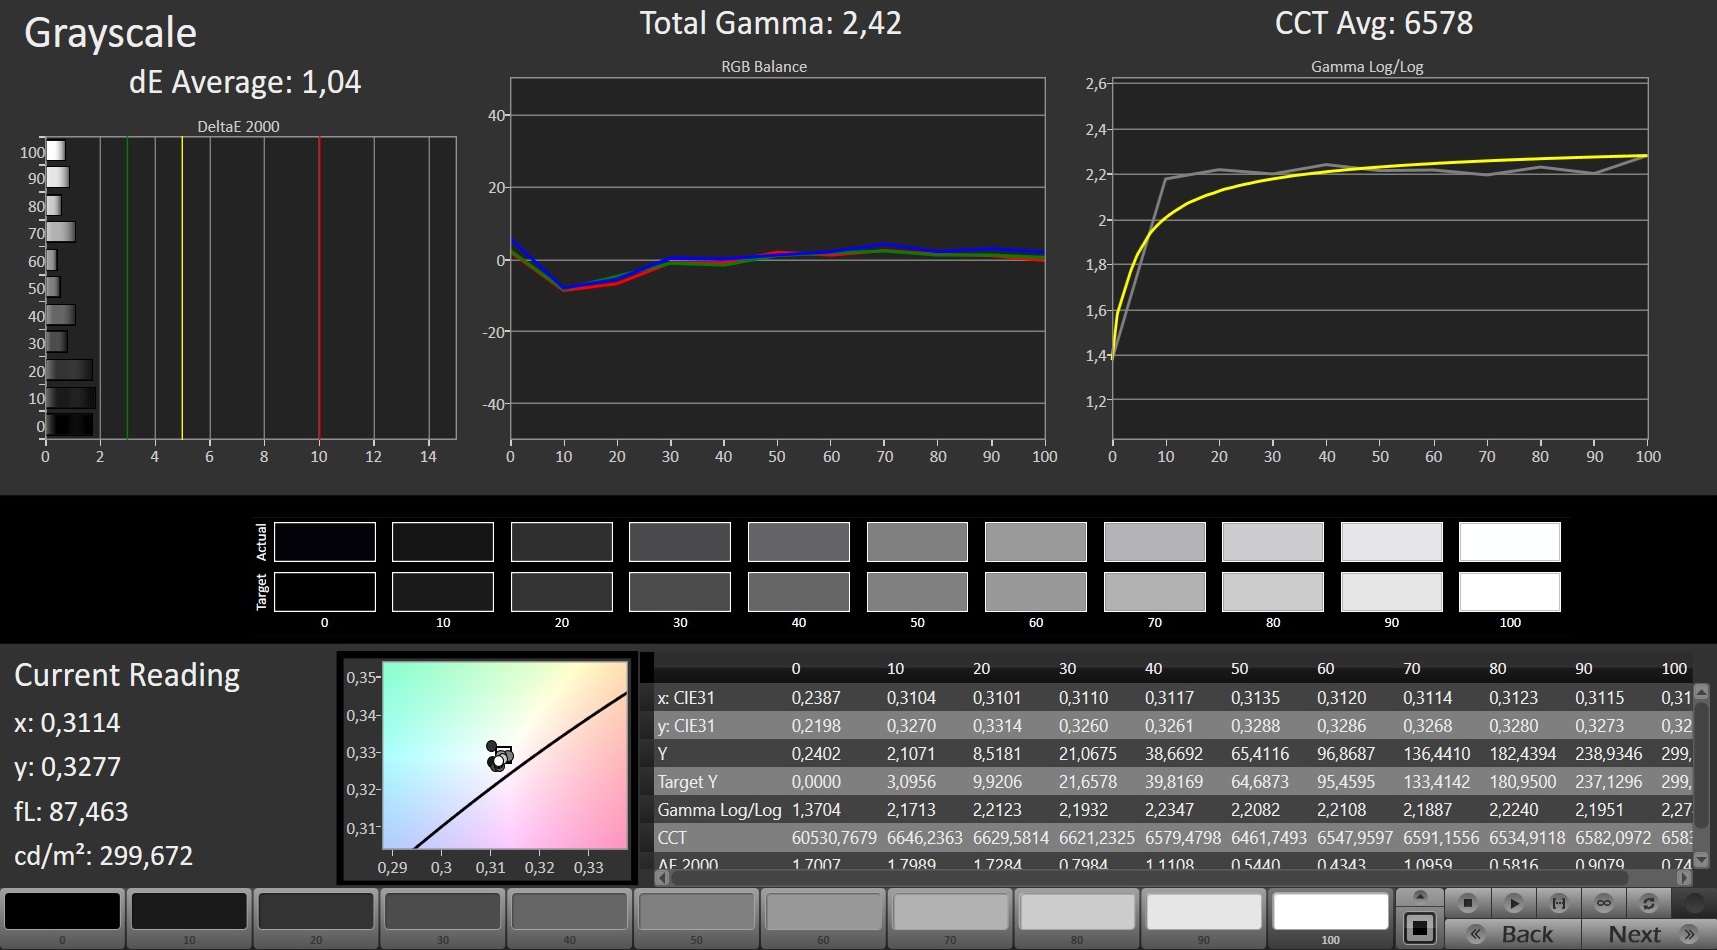
ΔE Greyscale 2.81 | 0.57-98 Ø5.3
91% sRGB (Argyll 1.6.3 3D)
67% AdobeRGB 1998 (Argyll 1.6.3 3D)
66.8% AdobeRGB 1998 (Argyll 2.2.0 3D)
91.3% sRGB (Argyll 2.2.0 3D)
67.3% Display P3 (Argyll 2.2.0 3D)
Gamma: 2.54
| SCHENKER XMG Apex 15 NH57AF1 AU Optronics B156HAN (AUO80ED), IPS, 1920x1080, 15.60 | SCHENKER XMG Ultra 15 Turing AU Optronics B156HAN07.0 (AUO70ED), IPS, 1920x1080, 15.60 | Eurocom Nightsky RX15 Samsung SDCA029, OLED, 3840x2160, 15.60 | MSI GE65 Raider 9SF-049US Sharp LQ156M1JW03, IPS, 1920x1080, 15.60 | Asus Strix Scar III G531GW Sharp LQ156M1JW09 (SHP14D3), IPS, 1920x1080, 15.60 | |
|---|---|---|---|---|---|
| Display | -0% | 35% | 6% | 2% | |
| Display P3 Coverage | 67.3 | 66.1 -2% | 99.9 48% | 69.3 3% | 66.2 -2% |
| sRGB Coverage | 91.3 | 92.6 1% | 100 10% | 98.9 8% | 96.5 6% |
| AdobeRGB 1998 Coverage | 66.8 | 67.1 0% | 99.1 48% | 70.7 6% | 67.5 1% |
| Response Times | -7% | 82% | 13% | 1% | |
| Response Time Grey 50% / Grey 80% * | 17.6 ? | 17.6 ? -0% | 2.4 ? 86% | 13.2 ? 25% | 17.2 ? 2% |
| Response Time Black / White * | 11.2 ? | 12.8 ? -14% | 2.6 ? 77% | 11.2 ? -0% | 11.2 ? -0% |
| PWM Frequency | 59.5 ? | 23150 ? | 24040 ? | ||
| Screen | -5% | -16% | 8% | 12% | |
| Brightness middle | 317 | 263 -17% | 414.9 31% | 277.4 -12% | 266 -16% |
| Brightness | 316 | 264 -16% | 404 28% | 264 -16% | 252 -20% |
| Brightness Distribution | 84 | 89 6% | 88 5% | 90 7% | 88 5% |
| Black Level * | 0.28 | 0.17 39% | 0.24 14% | 0.27 4% | |
| Contrast | 1132 | 1547 37% | 1156 2% | 985 -13% | |
| Colorchecker dE 2000 * | 3.52 | 4.45 -26% | 7.58 -115% | 1.51 57% | 1.81 49% |
| Colorchecker dE 2000 max. * | 6.93 | 8.33 -20% | 14.85 -114% | 4.93 29% | 3.23 53% |
| Colorchecker dE 2000 calibrated * | 2.49 | 1.93 22% | 1.77 29% | 1.03 59% | |
| Greyscale dE 2000 * | 2.81 | 4.77 -70% | 2.9 -3% | 3.7 -32% | 2.44 13% |
| Gamma | 2.54 87% | 2.52 87% | 2.05 107% | 2.23 99% | 2.42 91% |
| CCT | 6877 95% | 7767 84% | 6538 99% | 7061 92% | 7005 93% |
| Color Space (Percent of AdobeRGB 1998) | 67 | 60 -10% | 88.2 32% | 65.1 -3% | 62 -7% |
| Color Space (Percent of sRGB) | 91 | 93 2% | 100 10% | 99.1 9% | 97 7% |
| Total Average (Program / Settings) | -4% /
-4% | 34% /
11% | 9% /
8% | 5% /
9% |
* ... smaller is better
The panel was manufactured by AU Optronics (B156HAN) and offers not only short response times but also a good contrast ratio of 1130:1. The black value is good as well at 0.28 cd/m². We measured an average brightness of 316 cd/m², which is suitable for a high-end notebook, albeit not phenomenal. (Using devices outdoors only really becomes comfortable from around 400 cd/m².)
Unfortunately, our test unit did have fairly strong backlight bleeding along the edges. This is a common problem with Clevo barebones and most of the competition is also affected by this issue.
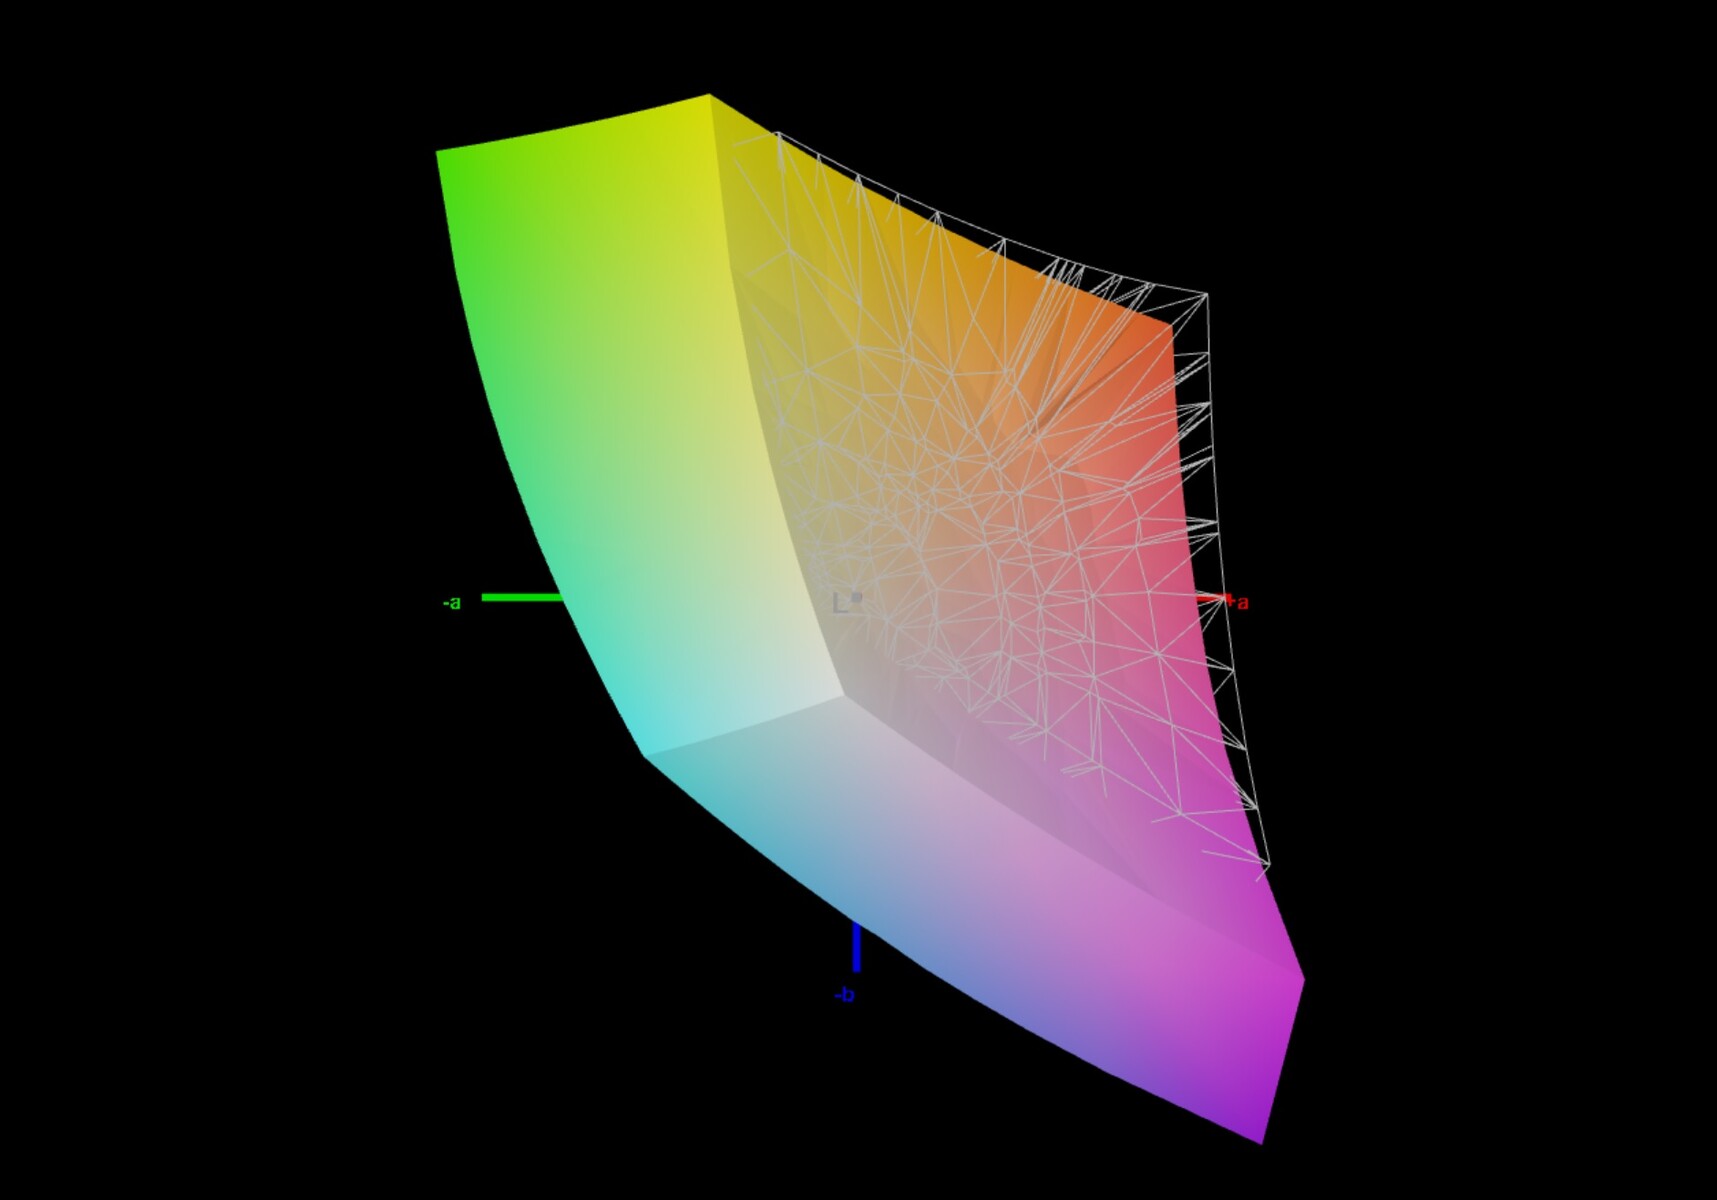
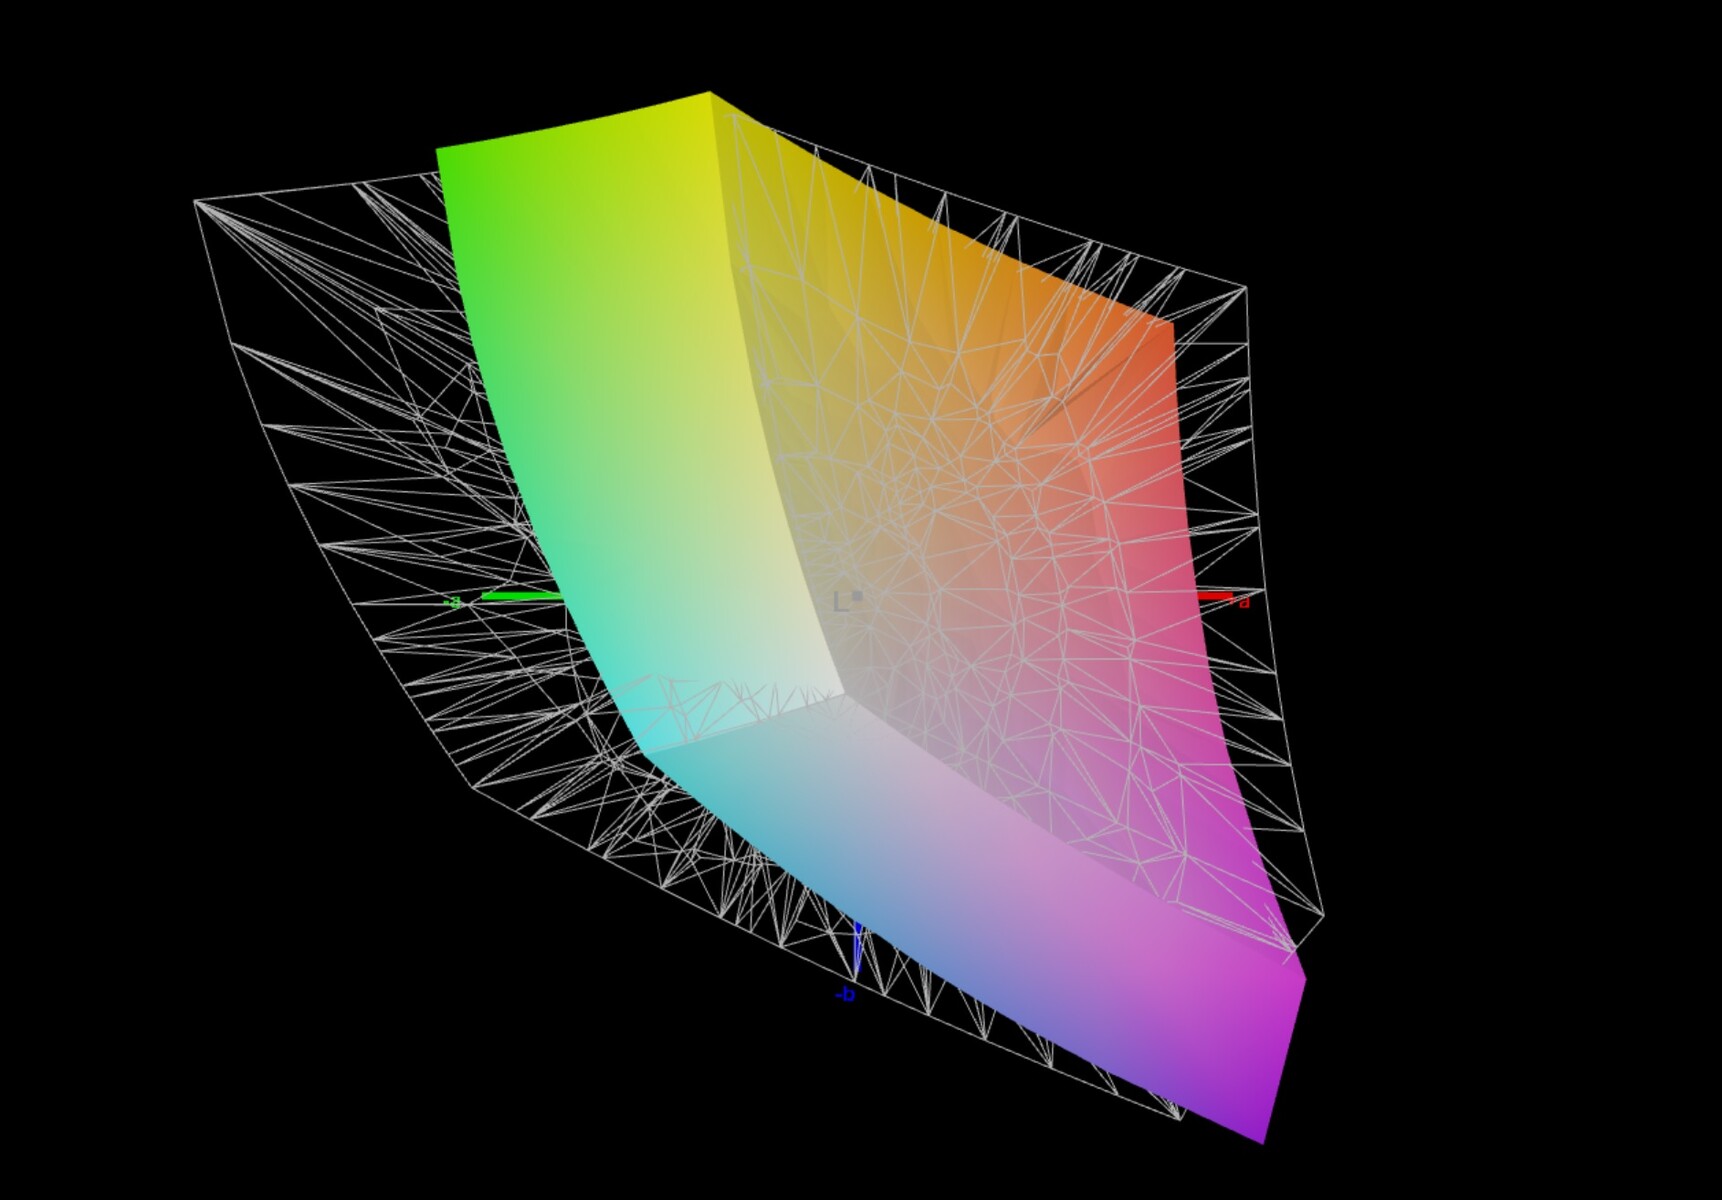
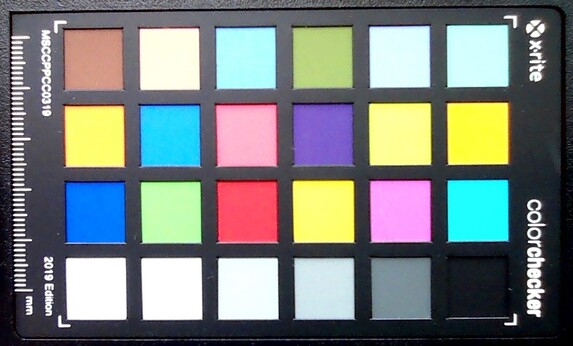
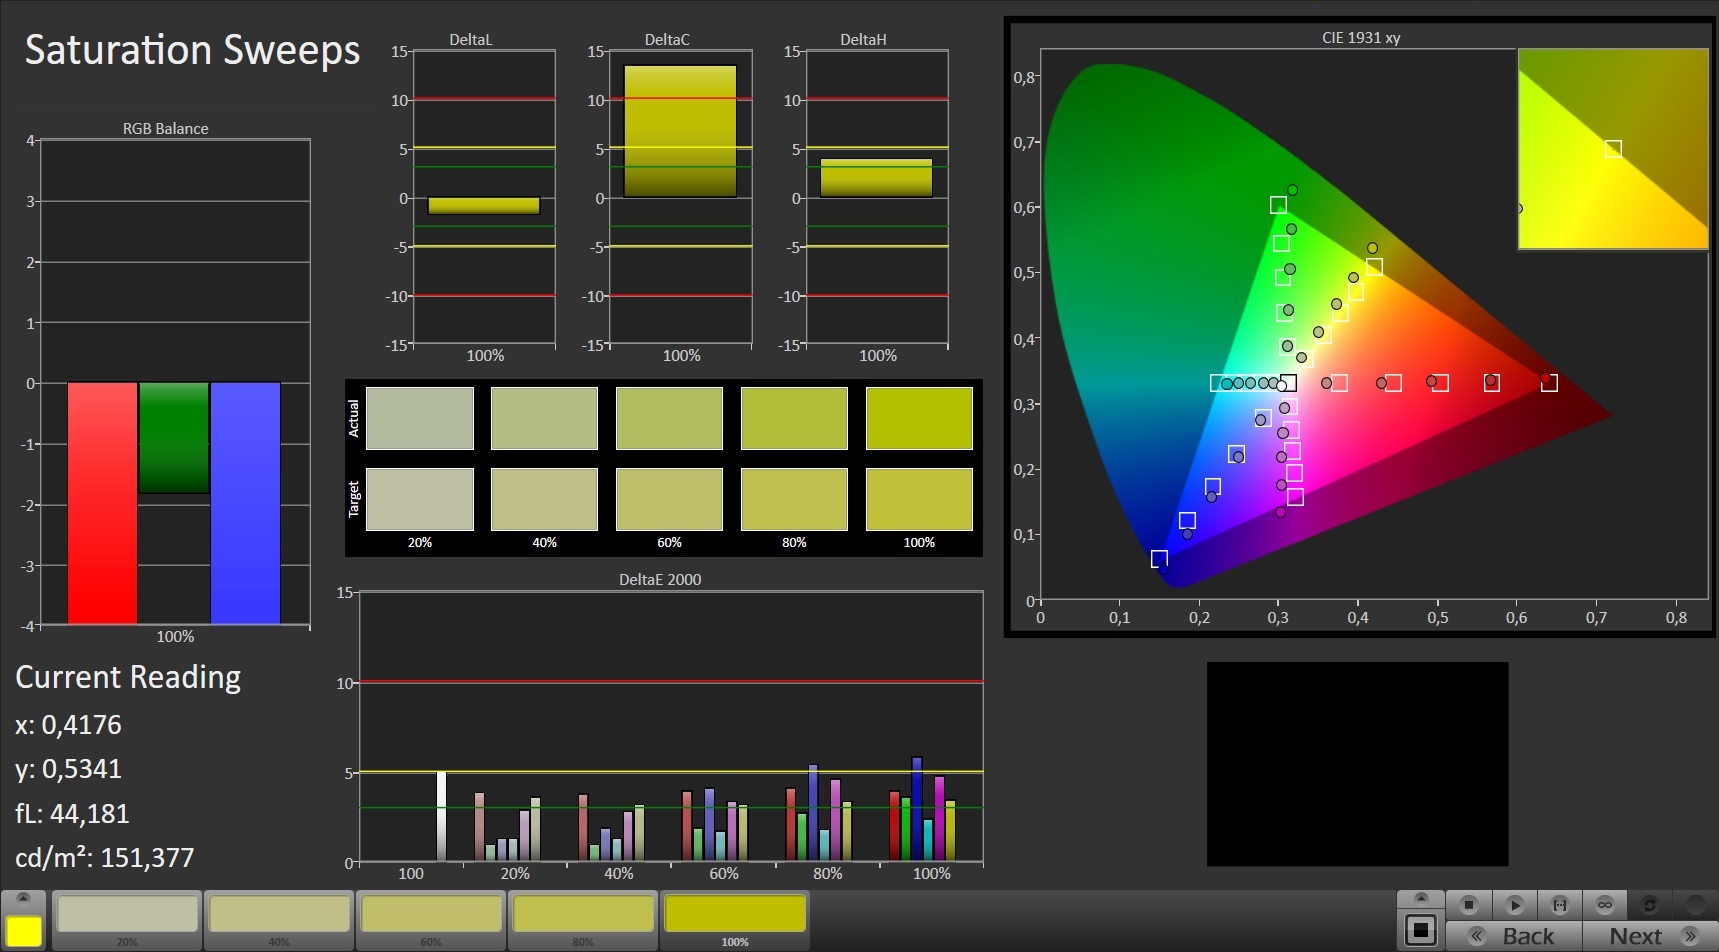
The color display is more satisfactory. On the one hand, the Apex 15 covers a decent color space (91% sRGB) and on the other hand the image looks very natural and accurate (see CalMAN screenshots).
Display Response Times
| ↔ Response Time Black to White | ||
|---|---|---|
| 11.2 ms ... rise ↗ and fall ↘ combined | ↗ 6 ms rise | 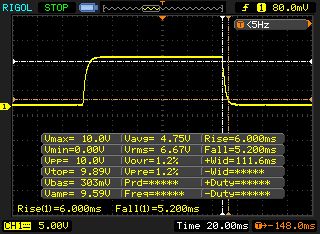 |
| ↘ 5.2 ms fall | ||
| The screen shows good response rates in our tests, but may be too slow for competitive gamers. In comparison, all tested devices range from 0.1 (minimum) to 240 (maximum) ms. » 25 % of all devices are better. This means that the measured response time is better than the average of all tested devices (21.5 ms). | ||
| ↔ Response Time 50% Grey to 80% Grey | ||
| 17.6 ms ... rise ↗ and fall ↘ combined | ↗ 9.2 ms rise | 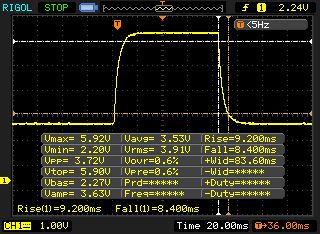 |
| ↘ 8.4 ms fall | ||
| The screen shows good response rates in our tests, but may be too slow for competitive gamers. In comparison, all tested devices range from 0.2 (minimum) to 636 (maximum) ms. » 26 % of all devices are better. This means that the measured response time is better than the average of all tested devices (33.8 ms). | ||
Screen Flickering / PWM (Pulse-Width Modulation)
| Screen flickering / PWM not detected | 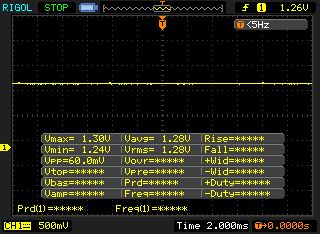 | ||
In comparison: 53 % of all tested devices do not use PWM to dim the display. If PWM was detected, an average of 17933 (minimum: 5 - maximum: 3846000) Hz was measured. | |||
Testing Conditions
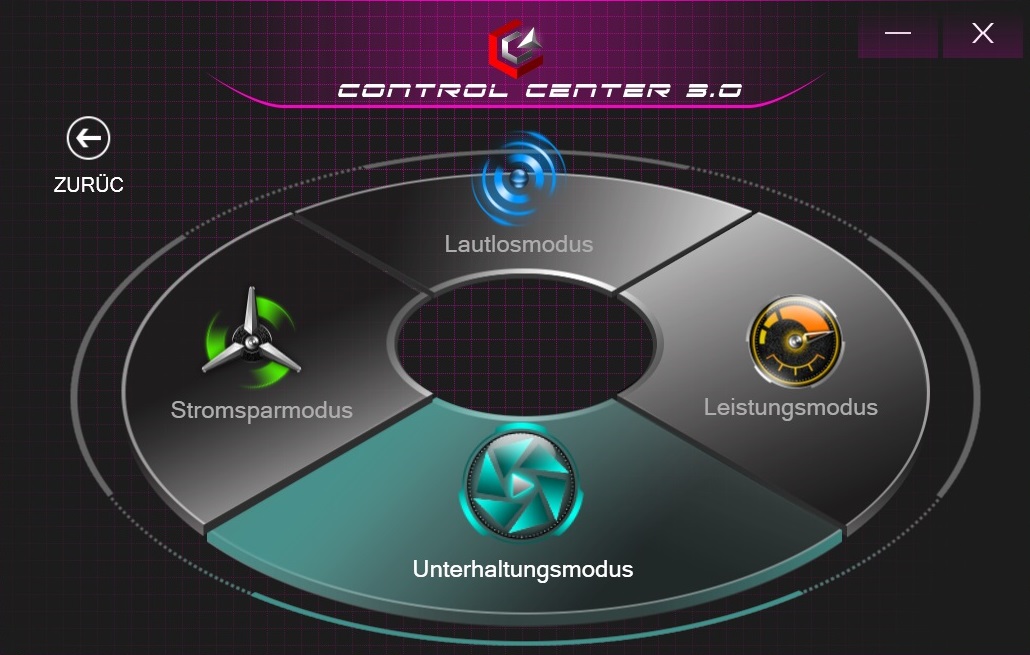
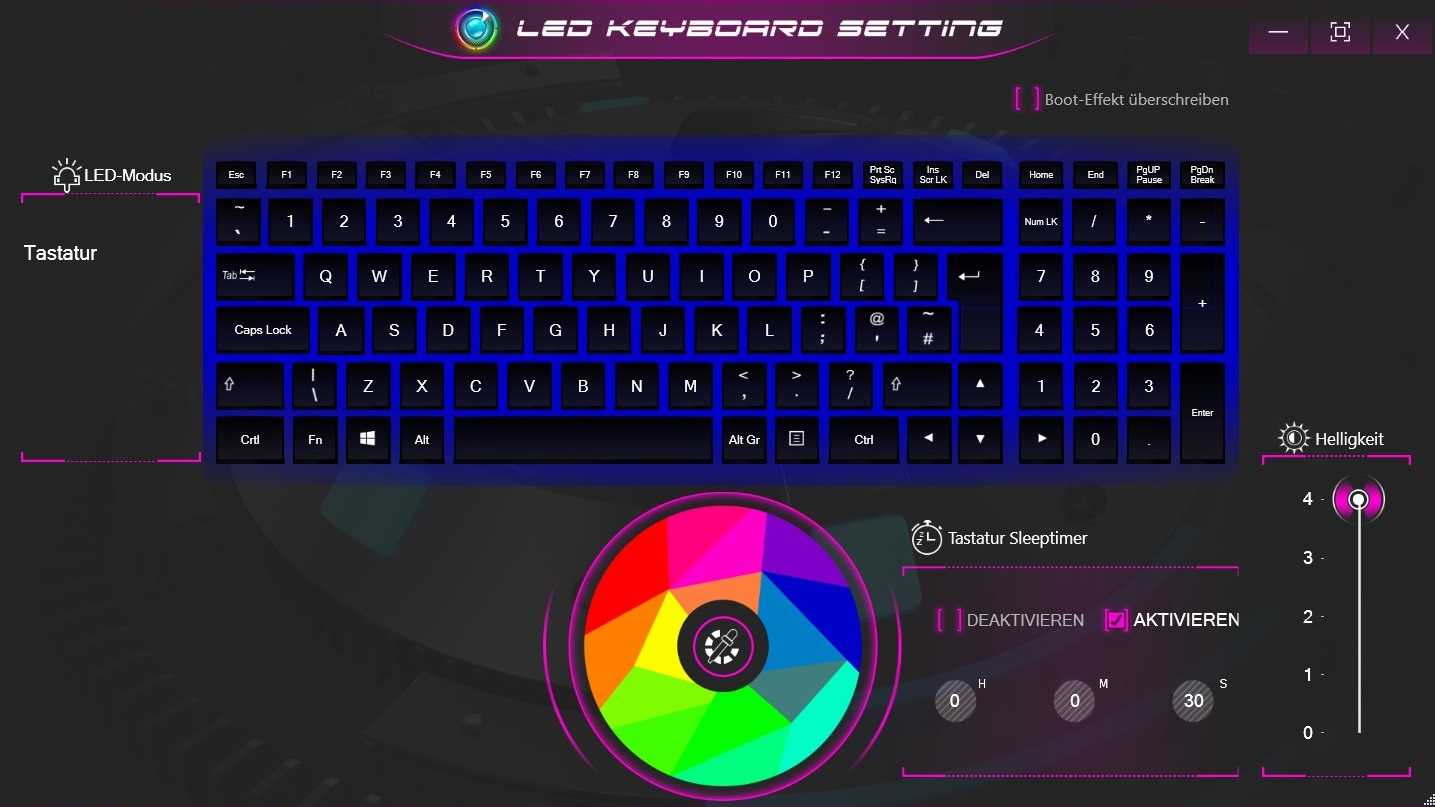
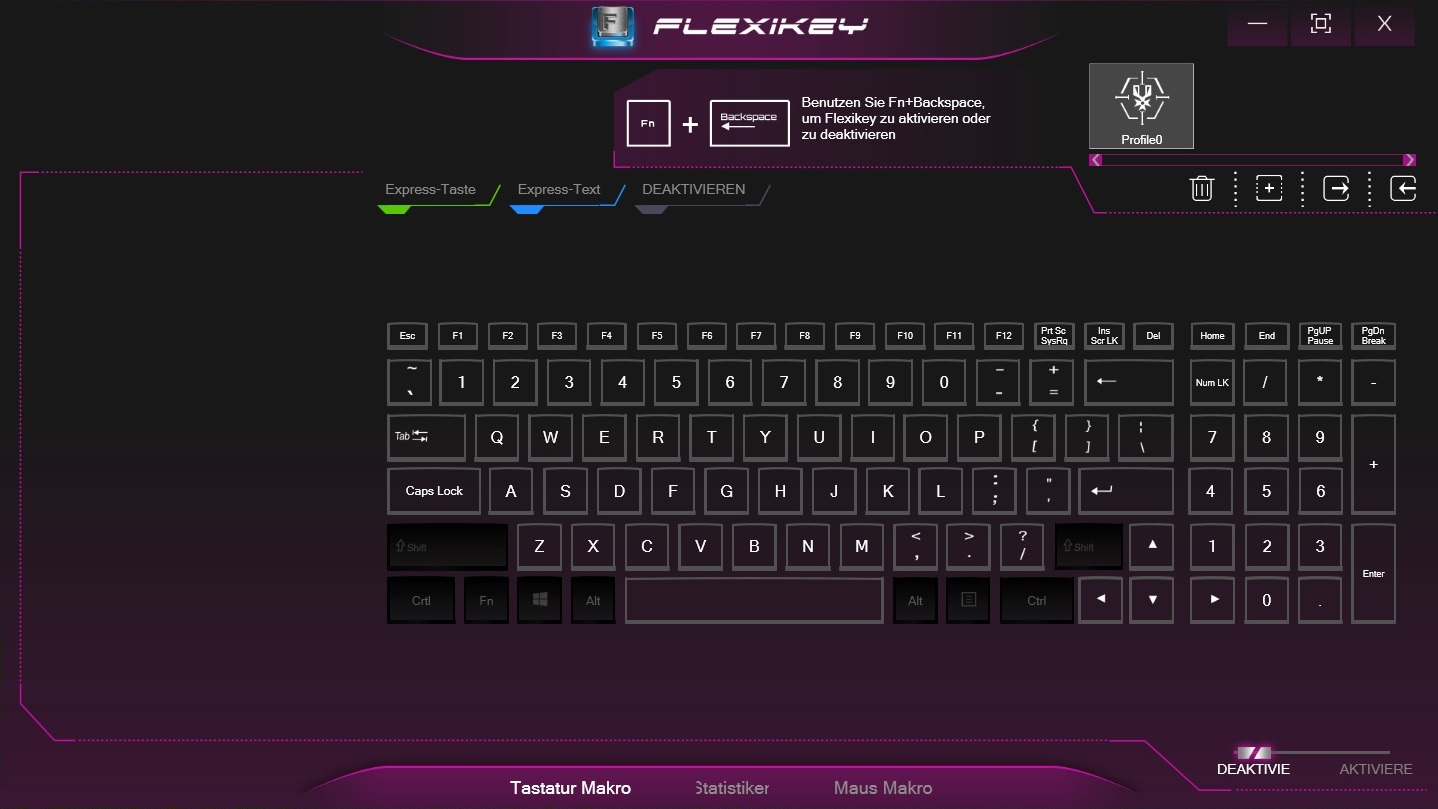
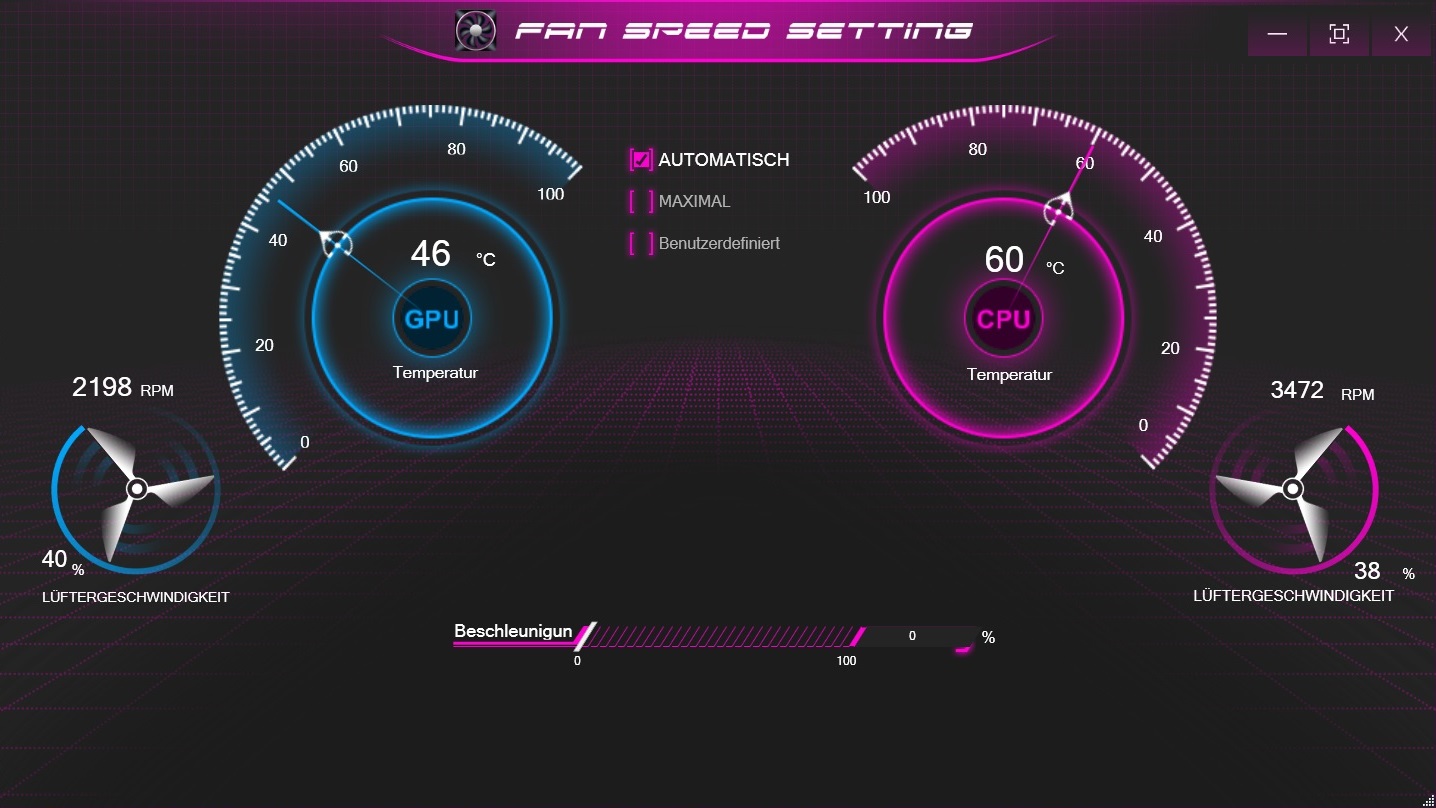
Clevo's so-called Control Center is the central controlling software in this device. It has a very clean design and offers various tuning options. There are two menus for the keyboard (backlighting, macros, etc.) as well as a menu for power profiles and one for fan behavior. As the cooling system was rather disappointing in this device (more on that later), we decided not to stick to the same mode for all our tests, but rather to switch between quiet (idle) and performance (load) mode depending on the scenario.
Performance
With its CPU socket, the Apex 15 definitely belongs in the category of desktop replacements. The ample number of cores combined with a high-end GPU, a PCIe SSD and at least 16 GB of RAM mean this device should be future-proof for quite some time.
Processor
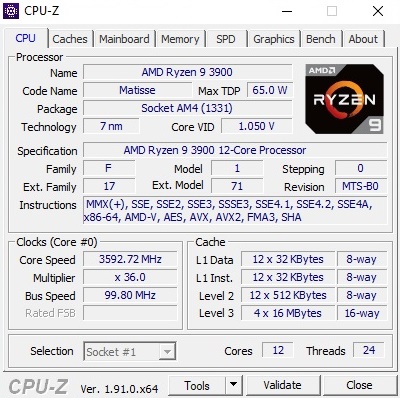
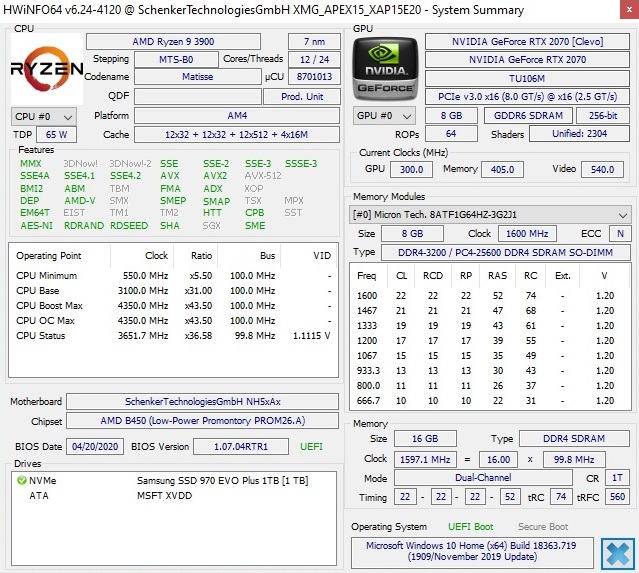
While the Intel processors used in notebooks usually max out at 8 cores, the AMD CPUs in the Apex 15 offer 6 to 16 cores. The Ryzen 9 3900 in our test unit is a 12-core model that can work up to 24 threads simultaneously via SMT and has a TDP of 65 W - that's quite low for a desktop processor. The clock rates according to AMD are between 3.1 and 4.3 GHz.

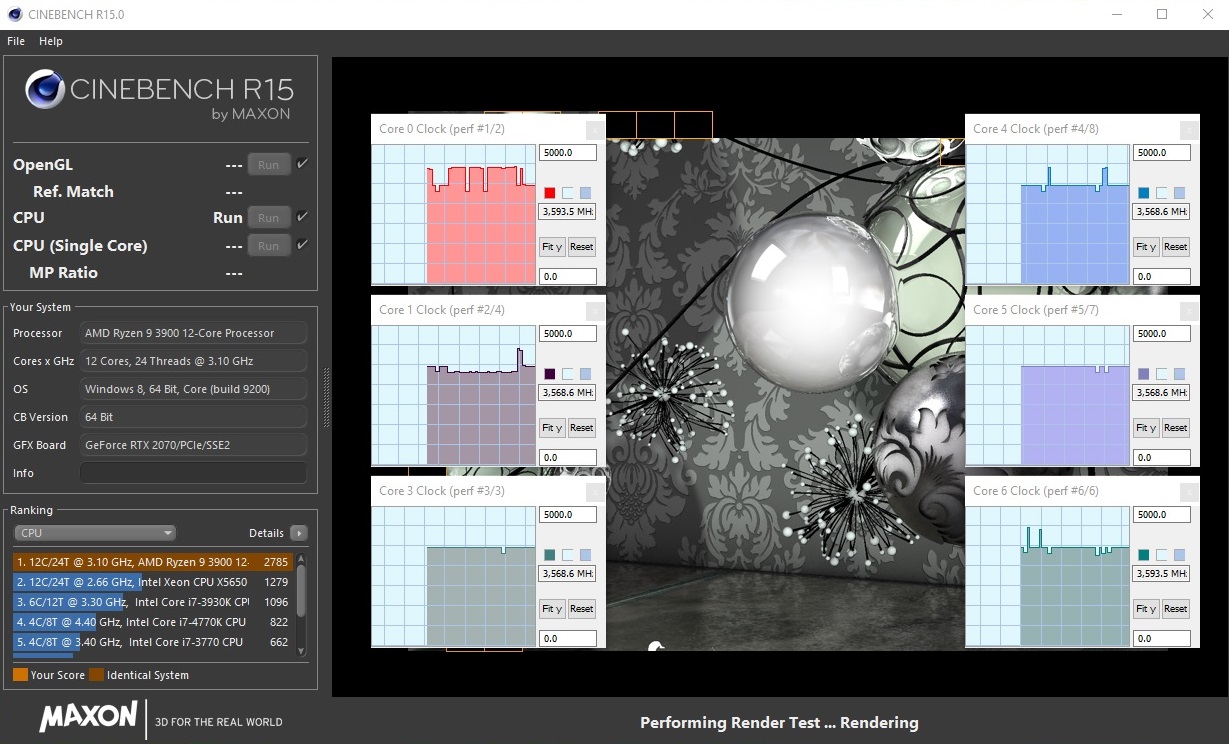
We tried to find out how the turbo fares with the help of our Cinebench loop (see graph). The fact that the clock rate dropped slightly after the initial round is quite normal. During Cinebench R15, the Ryzen 9 3900 clocked at 3.4-4.2 GHz under single-core load and at an average of 3.6 GHz when all cores were under load. That's a decent result. (The clock rate dropped to 2.8 GHz with the Control Center set to entertainment mode.)
The potential of this device becomes even more apparent during the remaining obstacle course of benchmarks. The multi-core Cinebench R15 places the Ryzen 9 3900 at around 50% above the Core i9-9980HK (Eurocom Nightsky RX15) and 90% above the Core i7-9700K (Schenker XMG Ultra 15). The advantage compared to the i9-9880H is 75% (MSI GE65 Raider 9SF) and 100% (Asus Strix G531GW). If you require a lot of processing power, you're in the right place.
| Blender - v2.79 BMW27 CPU | |
| Eurocom Nightsky RX15 | |
| Average of class Gaming (87 - 1259, n=225, last 2 years) | |
| SCHENKER XMG Apex 15 NH57AF1 | |
| Geekbench 5.5 | |
| Single-Core | |
| Average of class Gaming (158 - 2193, n=231, last 2 years) | |
| SCHENKER XMG Apex 15 NH57AF1 | |
| Multi-Core | |
| Average of class Gaming (1946 - 22200, n=231, last 2 years) | |
| SCHENKER XMG Apex 15 NH57AF1 | |
| HWBOT x265 Benchmark v2.2 - 4k Preset | |
| Average of class Gaming (3 - 37.6, n=229, last 2 years) | |
| SCHENKER XMG Apex 15 NH57AF1 | |
| Eurocom Nightsky RX15 | |
| LibreOffice - 20 Documents To PDF | |
| SCHENKER XMG Apex 15 NH57AF1 | |
| Average of class Gaming (32.8 - 332, n=223, last 2 years) | |
| R Benchmark 2.5 - Overall mean | |
| SCHENKER XMG Apex 15 NH57AF1 | |
| Average of class Gaming (0.3609 - 4.47, n=226, last 2 years) | |
* ... smaller is better
System Performance
As expected, the Apex 15 is number one in our list of comparison devices when it comes to system performance. It reached 6883 points in our PCMark benchmark, which is 18% more than its competitors. However, Schenker and Clevo could further improve the boot process as it's a little slow for a laptop equipped with an SSD.
DPC Latencies
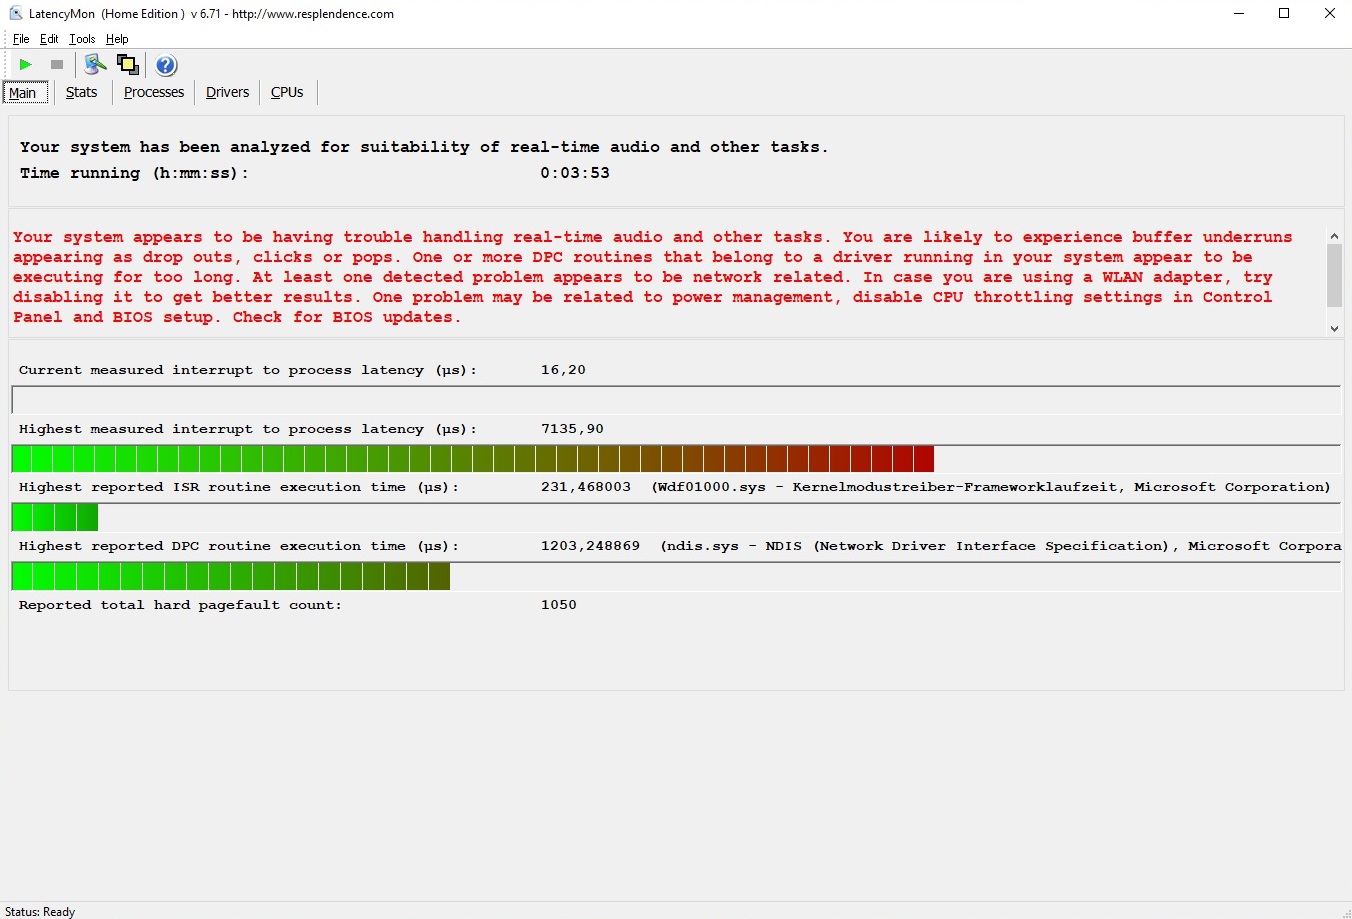
The DPC latencies are subpar as well. According to the tool LatencyMon, users might experience short dropouts during certain applications.
Update: With the new BIOS the latencies are in the green area. We exchanged the value.
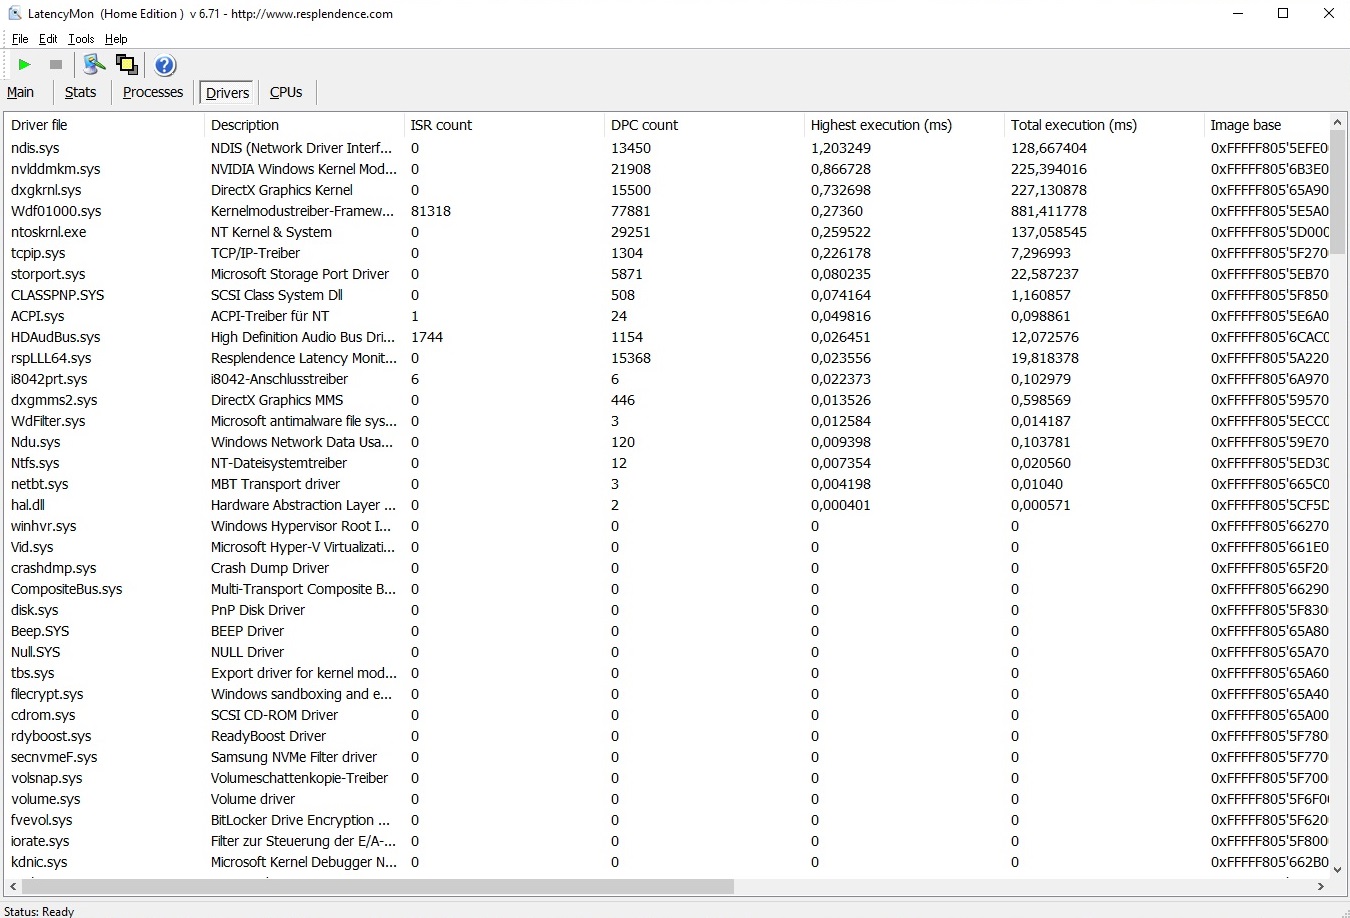
| DPC Latencies / LatencyMon - interrupt to process latency (max), Web, Youtube, Prime95 | |
| SCHENKER XMG Apex 15 NH57AF1 | |
* ... smaller is better
Storage Devices
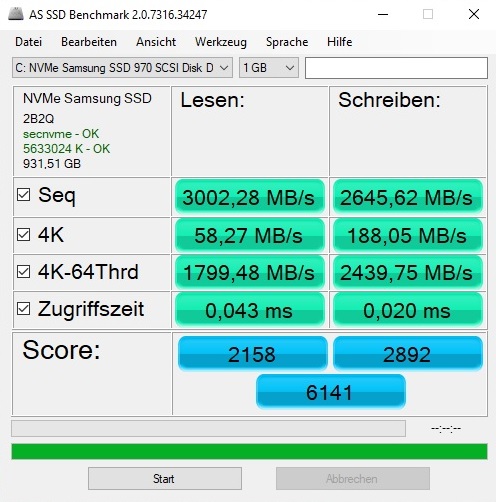
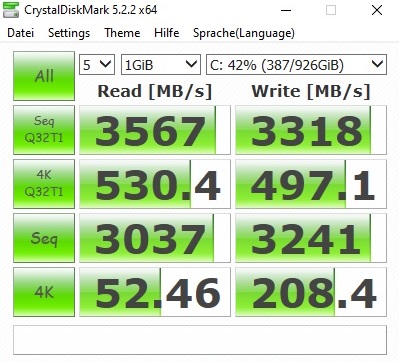
Our test unit has been equipped with a 1000-GB Samsung SSD 970 Evo Plus. The M.2 drive does a good job both when reading and writing and can eclipse several 1-TB competitors - at least on paper (e.g. the Intel SSD 660p).
| SCHENKER XMG Apex 15 NH57AF1 Samsung SSD 970 EVO Plus 1TB | SCHENKER XMG Ultra 15 Turing Samsung SSD 970 EVO Plus 1TB | Eurocom Nightsky RX15 Samsung SSD 970 Pro 512GB | MSI GE65 Raider 9SF-049US Samsung SSD PM981 MZVLB1T0HALR | Asus Strix Scar III G531GW Intel SSD 660p 1TB SSDPEKNW010T8 | |
|---|---|---|---|---|---|
| CrystalDiskMark 5.2 / 6 | -26% | -14% | -21% | -28% | |
| Write 4K | 208.4 | 129.9 -38% | 153 -27% | 125.7 -40% | 135 -35% |
| Read 4K | 52.5 | 47.15 -10% | 60.5 15% | 45.04 -14% | 54.9 5% |
| Write Seq | 3241 | 1840 -43% | 1938 -40% | 2361 -27% | 1649 -49% |
| Read Seq | 3037 | 1775 -42% | 1932 -36% | 1987 -35% | 1449 -52% |
| Write 4K Q32T1 | 497.1 | 294.5 -41% | 482.5 -3% | 407.1 -18% | 508 2% |
| Read 4K Q32T1 | 530 | 373.6 -30% | 594 12% | 537 1% | 559 5% |
| Write Seq Q32T1 | 3318 | 3295 -1% | 2324 -30% | 2398 -28% | 1759 -47% |
| Read Seq Q32T1 | 3567 | 3535 -1% | 3539 -1% | 3309 -7% | 1826 -49% |

Graphics
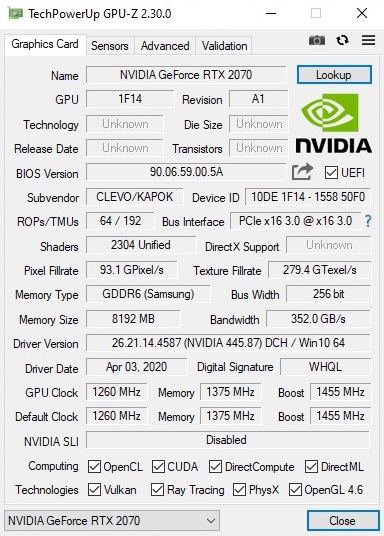
In line with our high-end CPU, this device also features a high-end GPU. The surcharge for switching from an RTX 2060 to an RTX 2070 is definitely worth the extra money. While the former is primarily made for Full-HD displays, the latter is often powerful enough for QHD and 4K displays. It also has 2304 shader units rather than the 1920 found on the RTX 2060 and 8 GB rather than 6 GB of GDDR6 VRAM (storage interface: 256 vs. 192-bit).
| 3DMark 06 Standard Score | 41167 points | |
| 3DMark 11 Performance | 23447 points | |
| 3DMark Cloud Gate Standard Score | 50713 points | |
| 3DMark Fire Strike Score | 18460 points | |
| 3DMark Time Spy Score | 8253 points | |
Help | ||
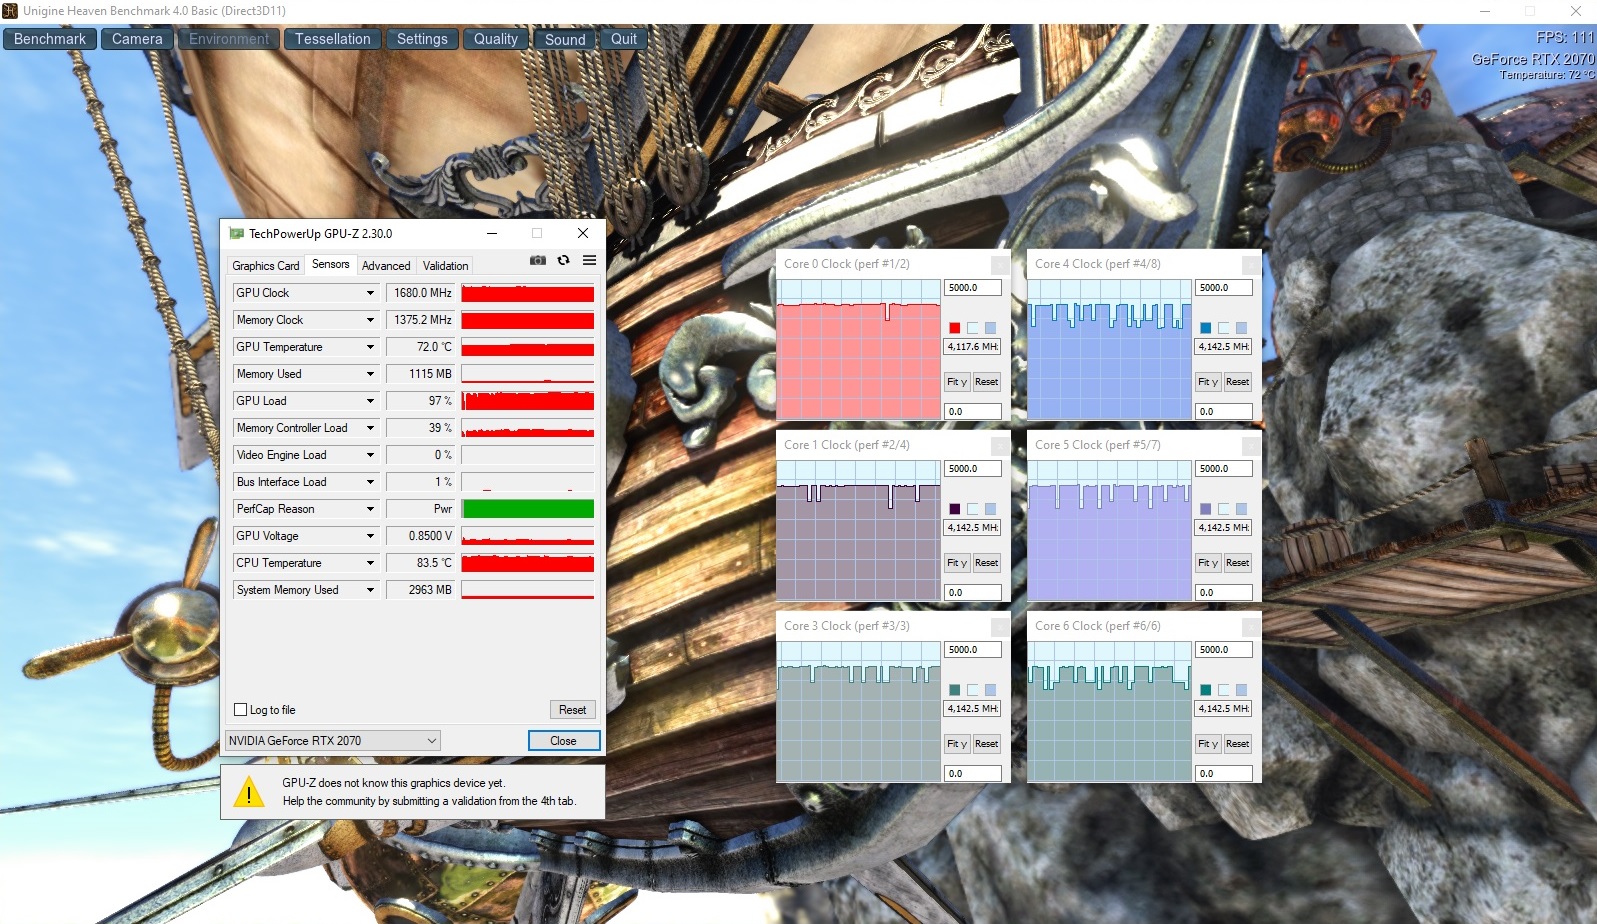
The base clock rate of the Turing chip is 1260 MHz. However, thanks to the automatic GPU boost, the chip reaches considerably higher clock rates in practice. The chip in our test unit settled down at around 1680 MHz during the Unigine Heaven benchmark and also offered a similar result during our benchmark with The Witcher 3, which we run at maximum details for around 60 minutes. The relatively constant frame rates in the lower graph show that the GPU performance remains the same over long periods of load.
We did not notice any anomalies during our benchmark check. The 3DMark 11 and the current 3DMark tests place the Apex 15 at the top of the comparison field in most scenarios. It's a shame that Schenker hasn't (yet) included the faster Super version of the RTX 2070 as an option.
Gaming Performance
The RTX 2070 can display every game smoothly at maximum settings in native resolution. Even demanding games such as Borderlands 3 are a piece of cake for this chip and frame rates reach over 60 FPS on average. Games that are less demanding or more optimized, such as Doom Eternal, can really make the most of the 144-Hz screen.
| The Witcher 3 - 1920x1080 Ultra Graphics & Postprocessing (HBAO+) | |
| Average of class Gaming (8.61 - 216, n=224, last 2 years) | |
| Eurocom Nightsky RX15 | |
| MSI GE65 Raider 9SF-049US | |
| SCHENKER XMG Apex 15 NH57AF1 | |
| SCHENKER XMG Ultra 15 Turing | |
| Asus Strix Scar III G531GW | |
| low | med. | high | ultra | |
| GTA V (2015) | 179 | 172 | 160 | 87 |
| The Witcher 3 (2015) | 142 | 74.5 | ||
| Dota 2 Reborn (2015) | 152 | 136 | 131 | 124 |
| X-Plane 11.11 (2018) | 112 | 102 | 82.9 | |
| Shadow of the Tomb Raider (2018) | 107 | 97 | ||
| Battlefield V (2018) | 136 | 124 | ||
| Borderlands 3 (2019) | 81.4 | 63.3 | ||
| Escape from Tarkov (2020) | 120 | 104 | ||
| Hunt Showdown (2020) | 101 | |||
| Doom Eternal (2020) | 161 | 157 | ||
| Gears Tactics (2020) | 119 | 85.8 |
Emissions
System Noise
The Apex 15 has set a new negative record in terms of system noise. We measured 62 dB(A) during The Witcher 3, which is the highest value we have ever measured in this scenario. The noise level is very loud, even when using a headset - buyers will have to have strong nerves. While the device is quieter in entertainment mode, we personally still find it too loud (around 50 dB(A) after the BIOS-update).
We would highly recommend using the quiet mode when working in idle. Otherwise, users will be confronted not only with a loud basic noise level but will also have to deal with occasional exaggerated rpm increases that cause higher noise levels than many gaming notebooks produce under maximum load. The quiet mode makes the Apex 15 more or less bearable while idling (35 to 39 dB(A)).
Clevo really should take another close look at power management and cooling fan behavior. The way it is now, the Apex 15 feels like a device in the alpha or beta stage of development - not like a finished product (upon inquiry, Schenker promised improvements).
Noise Level
| Idle |
| 35 / 36 / 39 dB(A) |
| Load |
| 59 / 63 dB(A) |
 | ||
30 dB silent 40 dB(A) audible 50 dB(A) loud |
||
min: | ||
| SCHENKER XMG Apex 15 NH57AF1 R9 3900, GeForce RTX 2070 Mobile | SCHENKER XMG Ultra 15 Turing i7-9700K, GeForce RTX 2070 Mobile | Eurocom Nightsky RX15 i9-9980HK, GeForce RTX 2070 Mobile | MSI GE65 Raider 9SF-049US i9-9880H, GeForce RTX 2070 Mobile | Asus Strix Scar III G531GW i9-9880H, GeForce RTX 2070 Mobile | Average of class Gaming | |
|---|---|---|---|---|---|---|
| Noise | 7% | 15% | 13% | 7% | 22% | |
| off / environment * | 30 | 30 -0% | 28.2 6% | 28.8 4% | 29 3% | 24.1 ? 20% |
| Idle Minimum * | 35 | 32 9% | 28.2 19% | 33 6% | 30 14% | 25.6 ? 27% |
| Idle Average * | 36 | 33 8% | 28.2 22% | 33 8% | 37 -3% | 27.4 ? 24% |
| Idle Maximum * | 39 | 36 8% | 31.7 19% | 33.1 15% | 39 -0% | 30.7 ? 21% |
| Load Average * | 59 | 55 7% | 53.7 9% | 38 36% | 54 8% | 43 ? 27% |
| Witcher 3 ultra * | 62 | 57 8% | 53.7 13% | 52.9 15% | 54 13% | |
| Load Maximum * | 63 | 59 6% | 53.7 15% | 57.8 8% | 54 14% | 53.4 ? 15% |
* ... smaller is better
Temperature
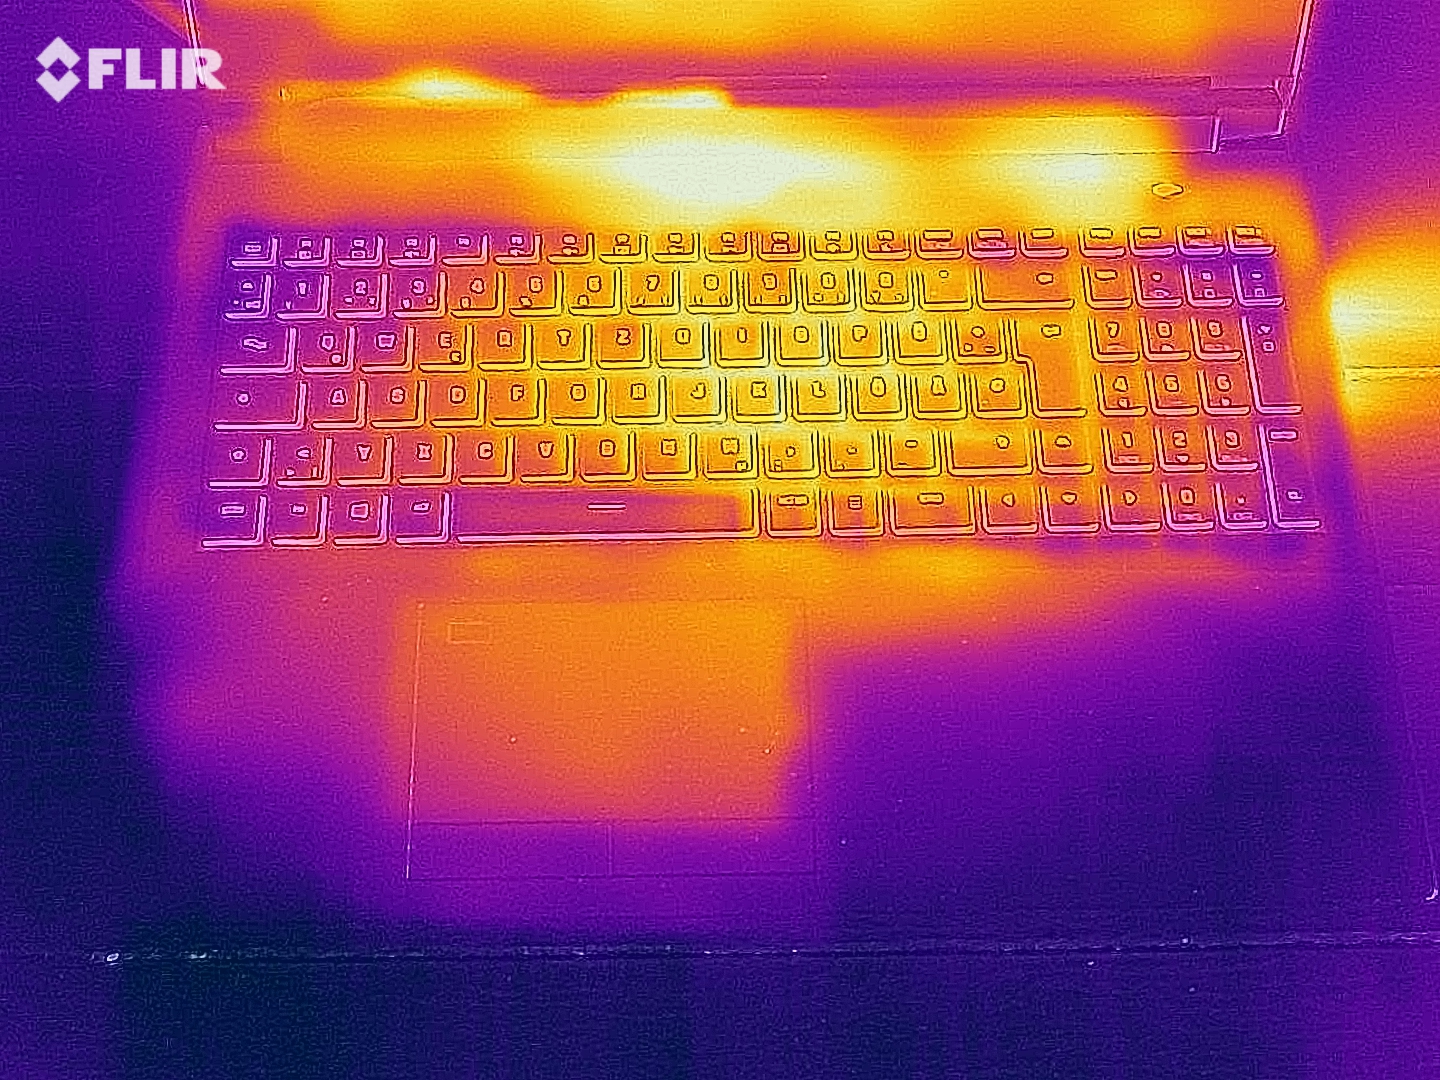
The advantage of the high fan rpm is that the temperatures remain moderate - at least on the outside of the device. We measured a maximum of 44 °C (top) and 48 °C (bottom) during our stress test using the tools FurMark and Prime95. This is fine considering the performance this device can offer, particularly because the wrist rest remains significantly cooler (below 35 °C).
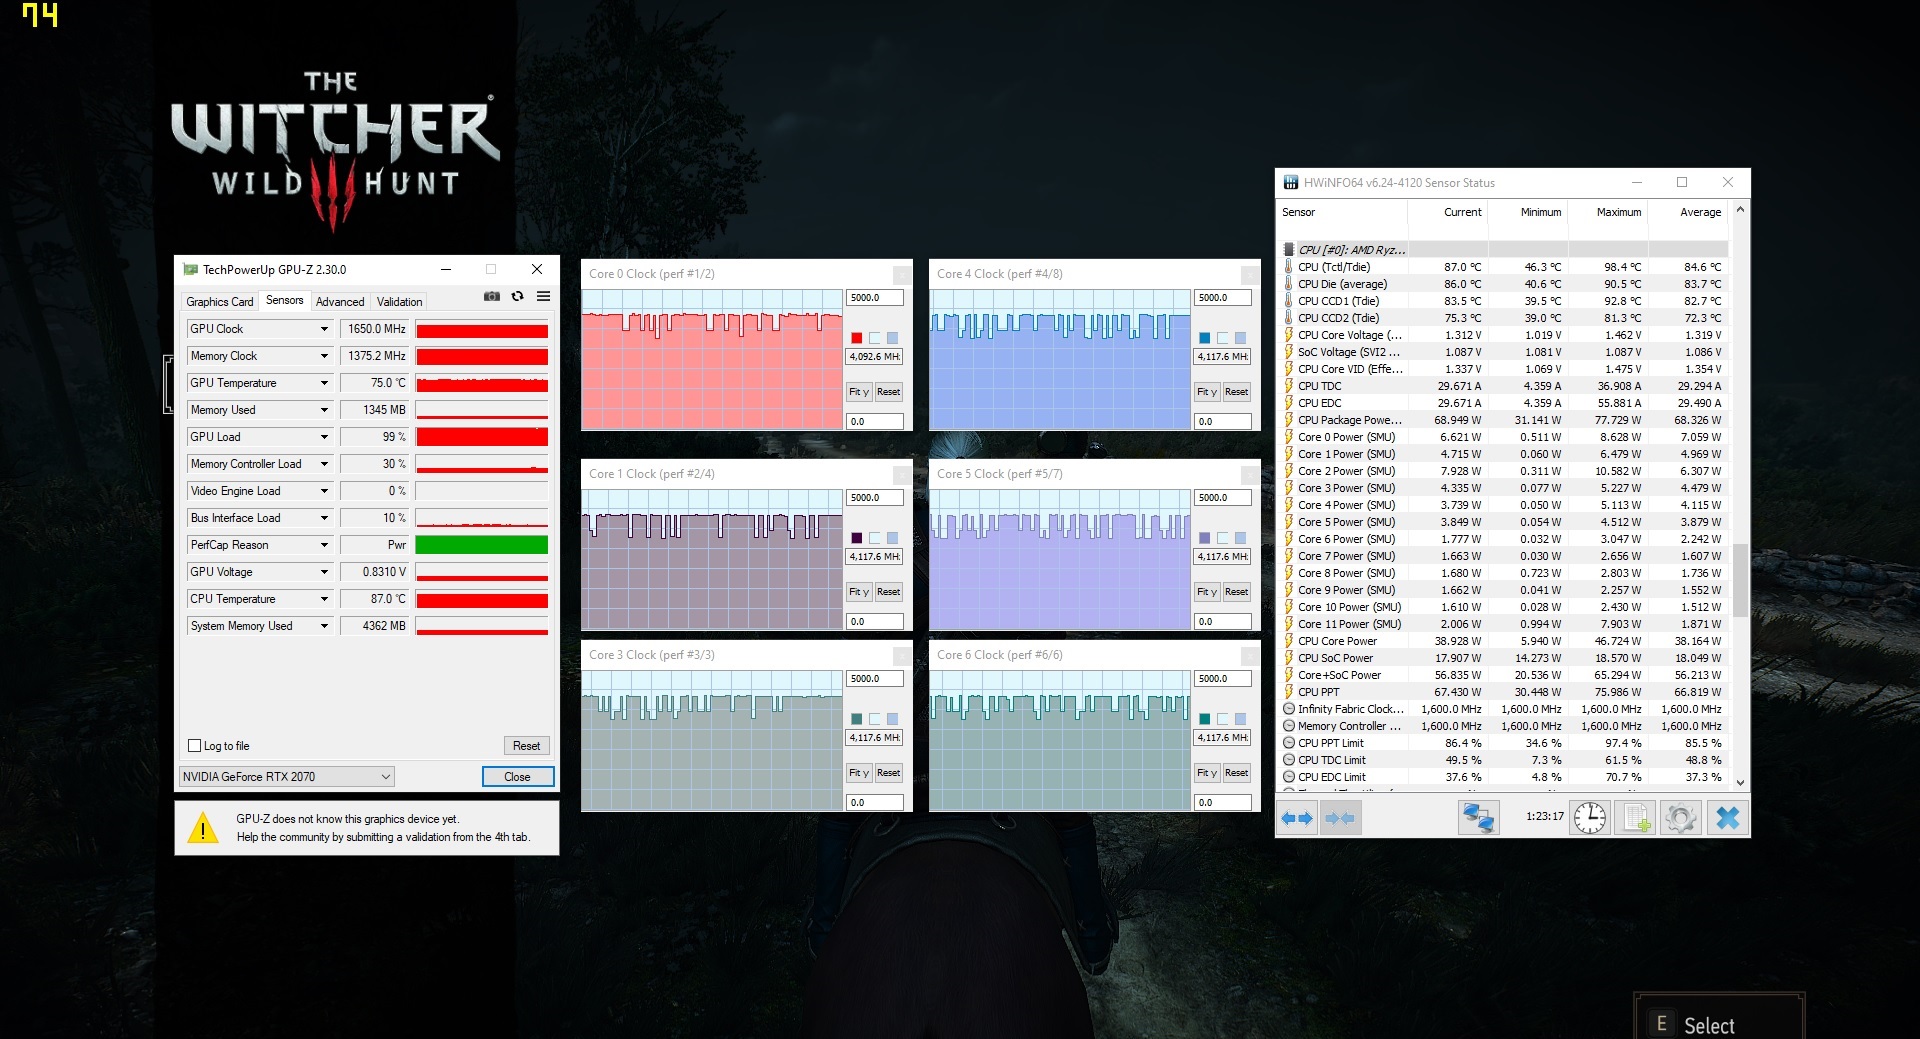
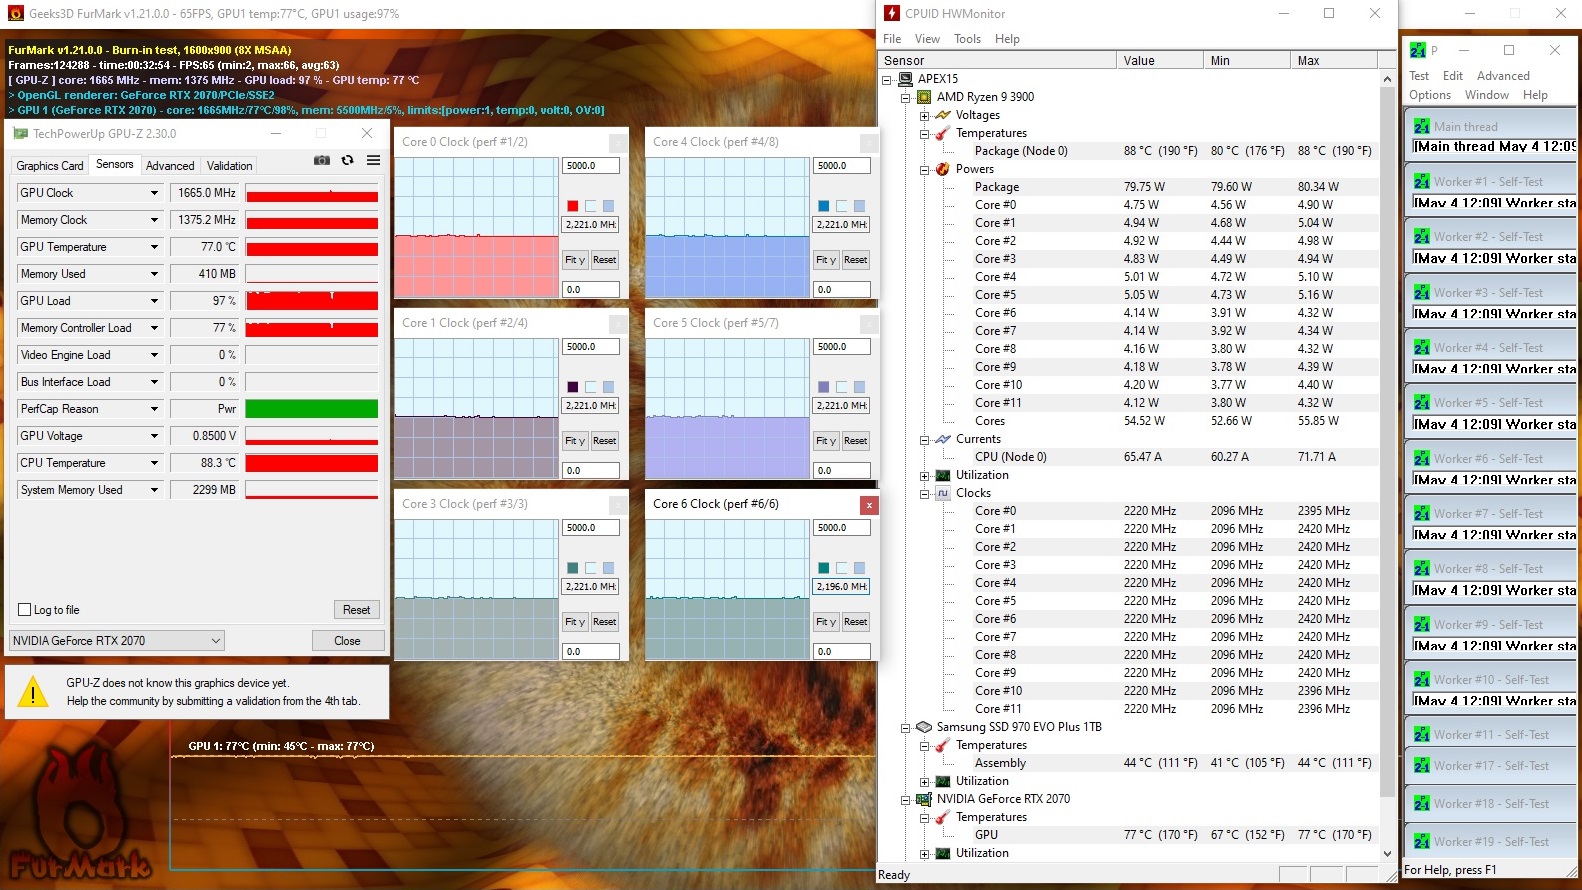
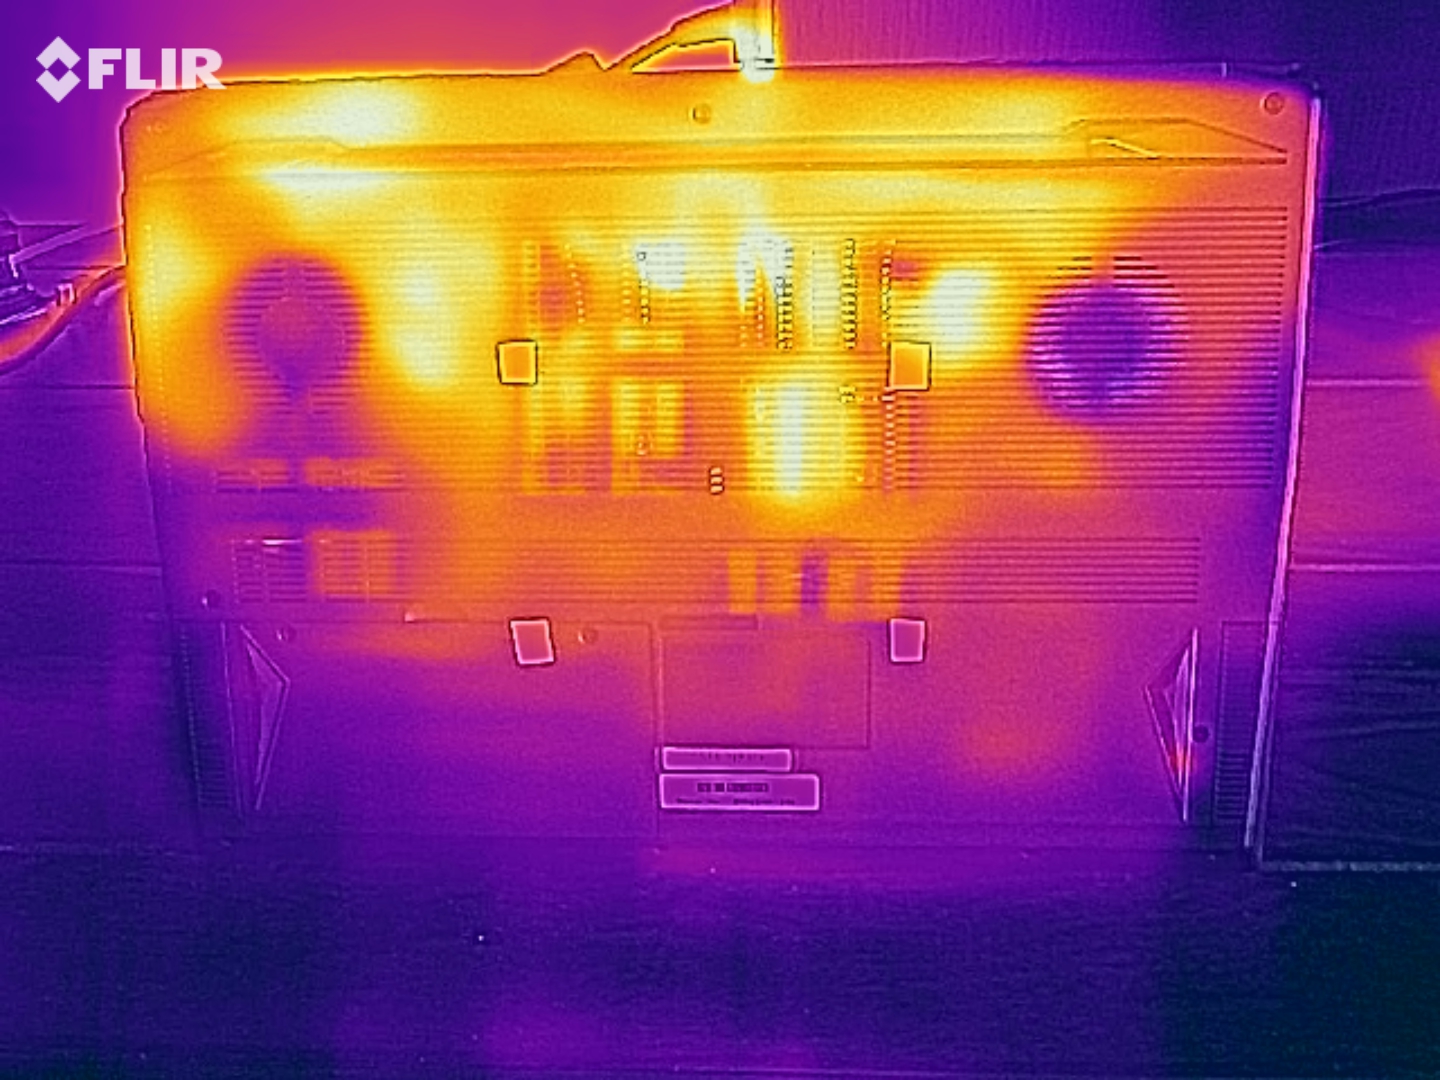
Looking at the components, it's the CPU in particular that really works up a sweat. While the GeForce RTX 2070 reaches no more than 77 °C under maximum load, the Ryzen 9 3900 gravitates towards 90 °C despite throttling to around 2.2 GHz. These results lead us to conclude that the Ryzen 9 3900 is too strong for this notebook and cooling system. It is the sole component responsible for the bad results in terms of emissions (we can't even imagine what these might look like with the Ryzen 9 3950X). We would therefore recommend buyers to stop at the octa-core Ryzen 7 2700X. The 12 and 16-core models are more suited for the case of the XMG Ultra 15.
(±) The maximum temperature on the upper side is 44 °C / 111 F, compared to the average of 40.4 °C / 105 F, ranging from 21.2 to 68.8 °C for the class Gaming.
(-) The bottom heats up to a maximum of 48 °C / 118 F, compared to the average of 43.2 °C / 110 F
(+) In idle usage, the average temperature for the upper side is 30.6 °C / 87 F, compared to the device average of 33.8 °C / 93 F.
(±) Playing The Witcher 3, the average temperature for the upper side is 37.6 °C / 100 F, compared to the device average of 33.8 °C / 93 F.
(+) The palmrests and touchpad are reaching skin temperature as a maximum (34 °C / 93.2 F) and are therefore not hot.
(-) The average temperature of the palmrest area of similar devices was 28.9 °C / 84 F (-5.1 °C / -9.2 F).
| SCHENKER XMG Apex 15 NH57AF1 R9 3900, GeForce RTX 2070 Mobile | SCHENKER XMG Ultra 15 Turing i7-9700K, GeForce RTX 2070 Mobile | Eurocom Nightsky RX15 i9-9980HK, GeForce RTX 2070 Mobile | MSI GE65 Raider 9SF-049US i9-9880H, GeForce RTX 2070 Mobile | Asus Strix Scar III G531GW i9-9880H, GeForce RTX 2070 Mobile | Average of class Gaming | |
|---|---|---|---|---|---|---|
| Heat | 9% | -1% | -1% | 2% | 5% | |
| Maximum Upper Side * | 44 | 45 -2% | 40.2 9% | 45 -2% | 51 -16% | 46 ? -5% |
| Maximum Bottom * | 48 | 48 -0% | 53 -10% | 53 -10% | 49 -2% | 49.4 ? -3% |
| Idle Upper Side * | 33 | 30 9% | 34.2 -4% | 31.2 5% | 30 9% | 31.4 ? 5% |
| Idle Bottom * | 41 | 30 27% | 39.6 3% | 39 5% | 35 15% | 32.5 ? 21% |
* ... smaller is better
Speakers
Don't have too many expectations for the sound system, either. Compared to the XMG Ultra 15, which offers fairly good audio for a notebook, the Apex 15 lacks bass and also mids and highs (linearity etc.).
SCHENKER XMG Apex 15 NH57AF1 audio analysis
(±) | speaker loudness is average but good (81 dB)
Bass 100 - 315 Hz
(-) | nearly no bass - on average 20.7% lower than median
(±) | linearity of bass is average (12.8% delta to prev. frequency)
Mids 400 - 2000 Hz
(±) | higher mids - on average 7.4% higher than median
(±) | linearity of mids is average (8% delta to prev. frequency)
Highs 2 - 16 kHz
(+) | balanced highs - only 4% away from median
(±) | linearity of highs is average (7.2% delta to prev. frequency)
Overall 100 - 16.000 Hz
(±) | linearity of overall sound is average (23.5% difference to median)
Compared to same class
» 83% of all tested devices in this class were better, 5% similar, 12% worse
» The best had a delta of 6%, average was 18%, worst was 132%
Compared to all devices tested
» 66% of all tested devices were better, 7% similar, 28% worse
» The best had a delta of 4%, average was 25%, worst was 134%
SCHENKER XMG Ultra 15 Turing audio analysis
(±) | speaker loudness is average but good (77 dB)
Bass 100 - 315 Hz
(±) | reduced bass - on average 11.1% lower than median
(±) | linearity of bass is average (12.7% delta to prev. frequency)
Mids 400 - 2000 Hz
(+) | balanced mids - only 1.9% away from median
(+) | mids are linear (4.3% delta to prev. frequency)
Highs 2 - 16 kHz
(+) | balanced highs - only 3.6% away from median
(+) | highs are linear (3.3% delta to prev. frequency)
Overall 100 - 16.000 Hz
(+) | overall sound is linear (14.5% difference to median)
Compared to same class
» 25% of all tested devices in this class were better, 7% similar, 69% worse
» The best had a delta of 6%, average was 18%, worst was 132%
Compared to all devices tested
» 15% of all tested devices were better, 3% similar, 82% worse
» The best had a delta of 4%, average was 25%, worst was 134%
Energy Management
Power Consumption
Whether you put the blame on Clevo or AMD - the power-saving mechanisms of the Ryzen 9 3900 are modest to say the least. This becomes particularly apparent when looking at consumption while idling (total system). 60 W is a lot even for a gaming notebook with a desktop CPU. Intel devices usually consume a lot less. The XMG Ultra 15, for example, consumes a meager 40 W (Core i7-9700K). At least the consumption levels are fairly normal under load. 141-259 W is not that different to the XMG Ultra 15, which loses out due to its number of CPU cores.
| Off / Standby | |
| Idle | |
| Load |
|
| SCHENKER XMG Apex 15 NH57AF1 R9 3900, GeForce RTX 2070 Mobile | SCHENKER XMG Ultra 15 Turing i7-9700K, GeForce RTX 2070 Mobile | Eurocom Nightsky RX15 i9-9980HK, GeForce RTX 2070 Mobile | MSI GE65 Raider 9SF-049US i9-9880H, GeForce RTX 2070 Mobile | Asus Strix Scar III G531GW i9-9880H, GeForce RTX 2070 Mobile | Average of class Gaming | |
|---|---|---|---|---|---|---|
| Power Consumption | 19% | 37% | 42% | 28% | 45% | |
| Idle Minimum * | 55 | 35 36% | 12.6 77% | 15 73% | 29 47% | 13.7 ? 75% |
| Idle Average * | 59 | 39 34% | 21.4 64% | 18.5 69% | 32 46% | 19.1 ? 68% |
| Idle Maximum * | 63 | 47 25% | 34.4 45% | 20.2 68% | 37 41% | 26.8 ? 57% |
| Load Average * | 141 | 117 17% | 123.2 13% | 110.9 21% | 157 -11% | 110.9 ? 21% |
| Witcher 3 ultra * | 238 | 196 18% | 192.4 19% | 187.3 21% | 173 27% | |
| Load Maximum * | 259 | 299 -15% | 246.6 5% | 260 -0% | 217 16% | 250 ? 3% |
* ... smaller is better
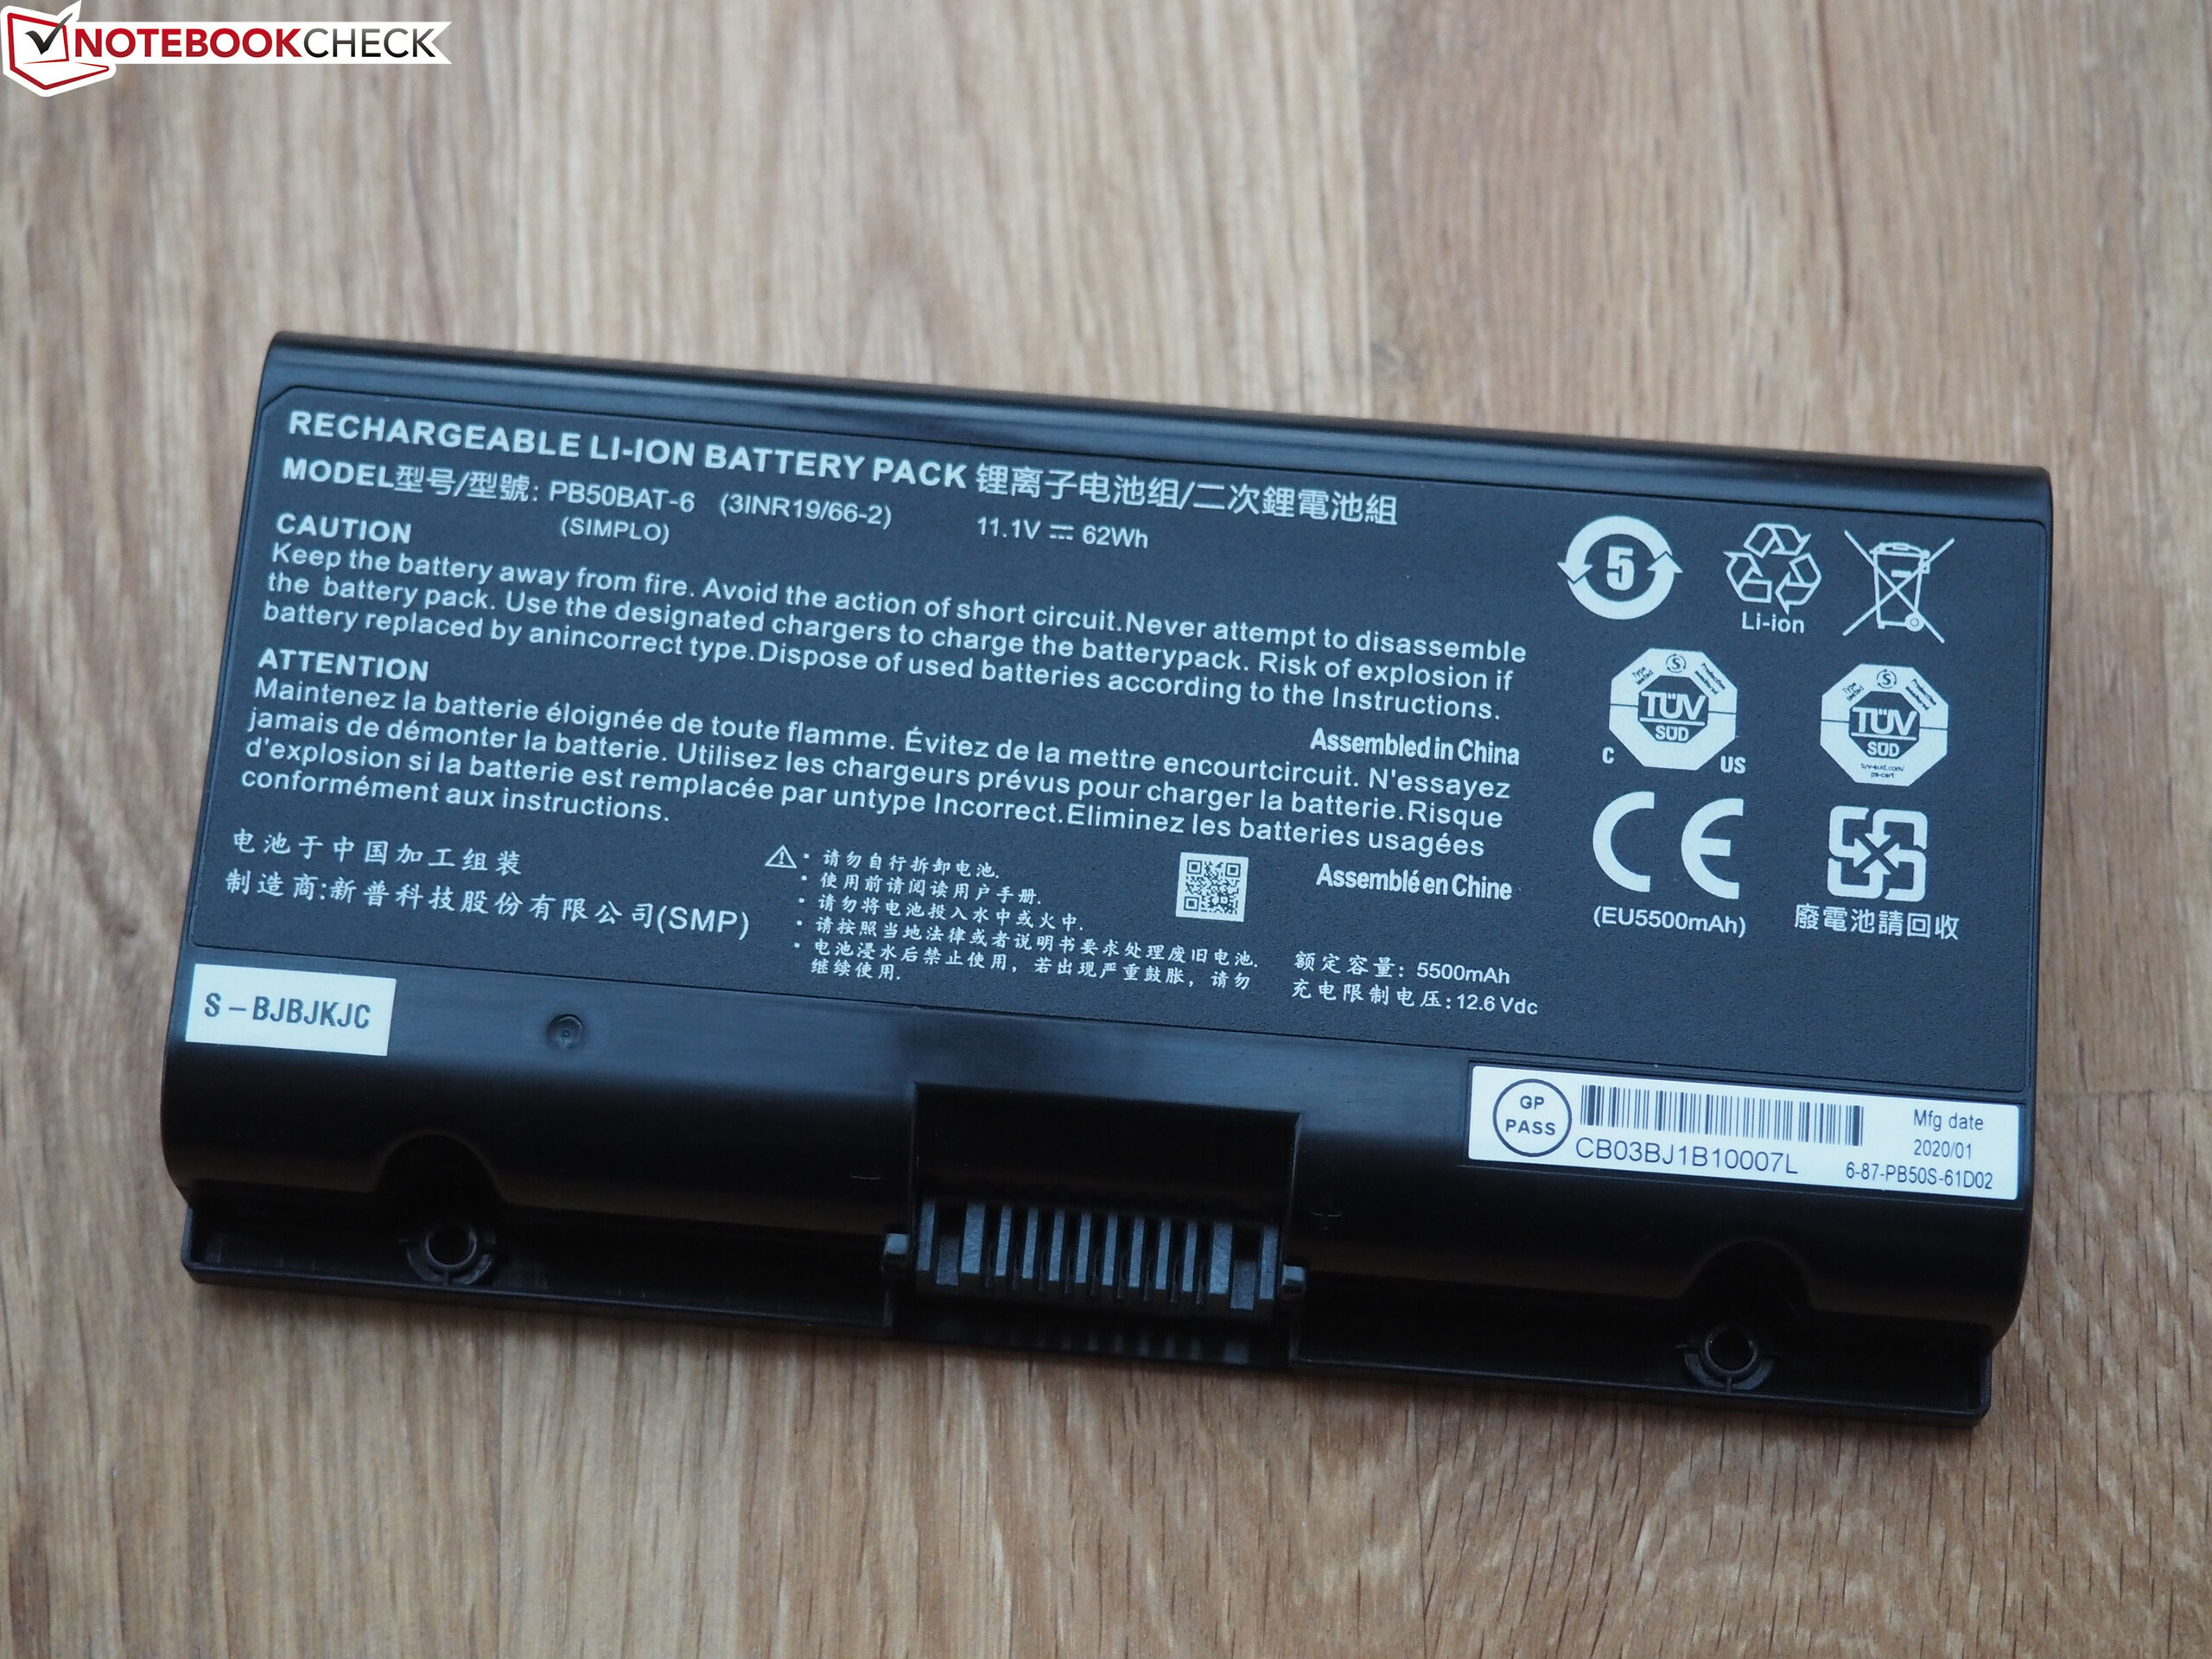
Battery Life
Let's not talk about the battery life. Even under perfect conditions (no load, minimum luminosity) the 62-Wh battery hardly lasts an hour. A larger battery would only make a small difference due to the high idle consumption.
| SCHENKER XMG Apex 15 NH57AF1 R9 3900, GeForce RTX 2070 Mobile, 62 Wh | SCHENKER XMG Ultra 15 Turing i7-9700K, GeForce RTX 2070 Mobile, 82 Wh | Eurocom Nightsky RX15 i9-9980HK, GeForce RTX 2070 Mobile, 62 Wh | MSI GE65 Raider 9SF-049US i9-9880H, GeForce RTX 2070 Mobile, 51 Wh | Asus Strix Scar III G531GW i9-9880H, GeForce RTX 2070 Mobile, 66 Wh | Average of class Gaming | |
|---|---|---|---|---|---|---|
| Battery Runtime | 165% | 232% | 224% | 235% | 440% | |
| Reader / Idle | 73 | 194 166% | 371 408% | 328 349% | 544 ? 645% | |
| WiFi v1.3 | 62 | 157 153% | 206 232% | 216 248% | 177 185% | 368 ? 494% |
| Load | 30 | 83 177% | 35 17% | 81 170% | 84.2 ? 181% | |
| H.264 | 154 | 399 ? |
Pros
Cons
Verdict
12 cores and 24 threads in a notebook: What sounds marvelous has some pitfalls in everyday use.
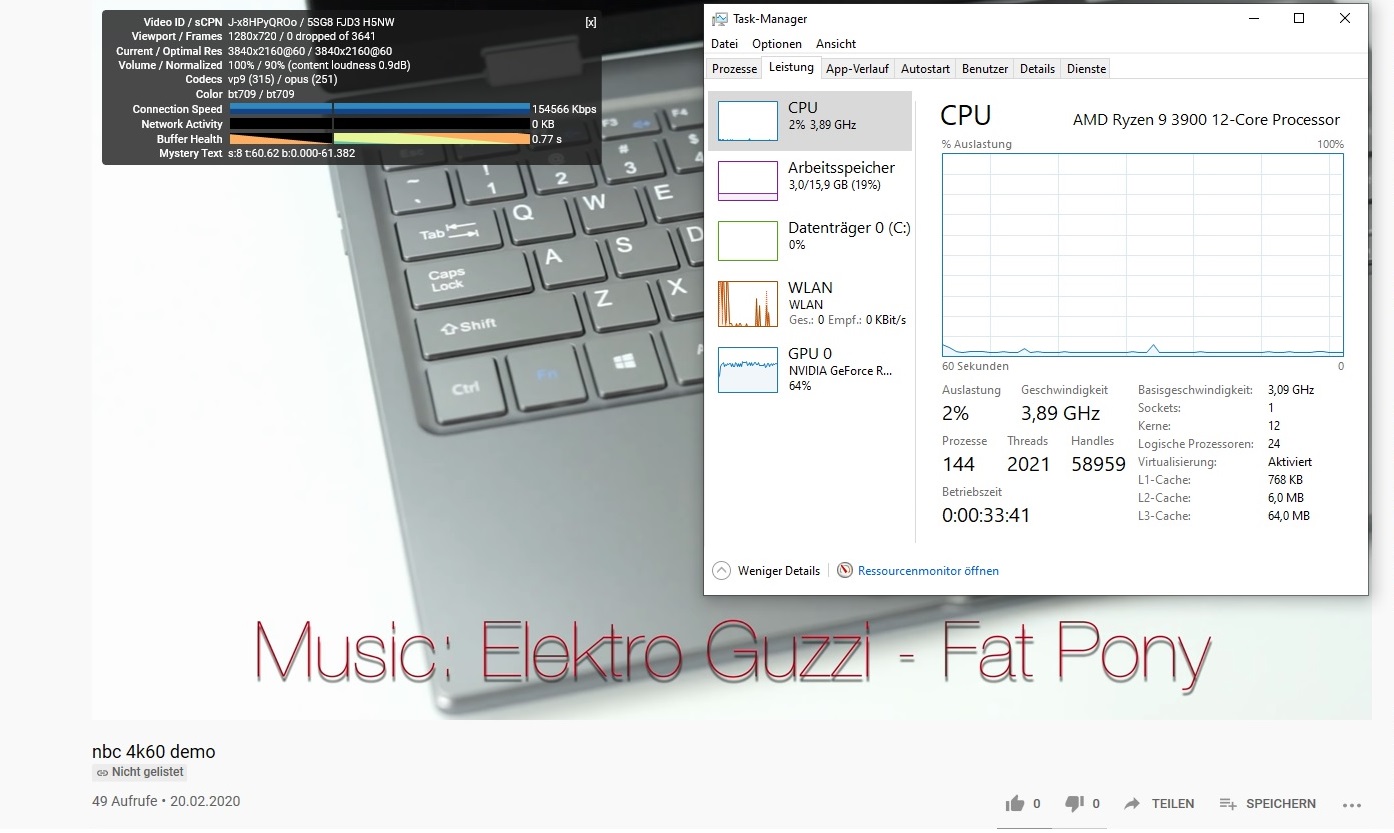
The meager energy-saving mechanisms of the AMD CPU mean that the Ryzen 9 3900 is very loud (3000 - 4000 rpm) and warm (60 - 70 °C) while idling and performing simple tasks such as watching videos or browsing the web. Fortunately, you can switch to quiet mode.
This is why we can hardly recommend the Apex 15 - although Schenker is planning a BIOS update. Better energy management and cooling fan control (entertainment and performance mode) would make this high-end newbie an interesting device for AMD fans. We know of no 15-inch notebook that offers as much CPU power as this one does. Most Intel models are a lot slower.
SCHENKER XMG Apex 15 NH57AF1
-
05/06/2020 v7
Florian Glaser
More articles related to this device
SCHENKER XMG Apex 15 NH57AF1 (XMG Apex Series)Related Articles


Pricecompare

