 Deutsch
 English
 Español
 Français
 Italiano
 Nederlands
 Polski
 Português
 Русский
 Türkçe
 Svenska
 Chinese
 Magyar
Razer Blade 18 laptop review: Smaller than many 17-inch gaming laptops
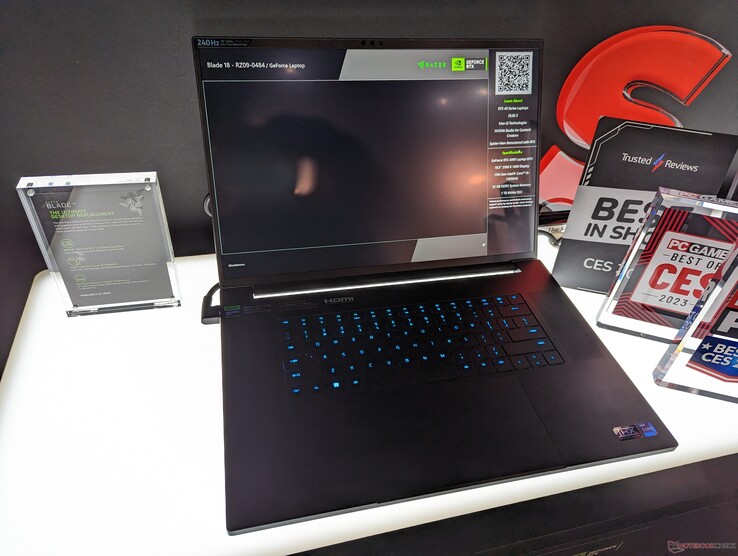
Unveiled at CES 2023, the Blade 18 offers the biggest screen size yet for a Blade laptop while sporting that familiar Razer chassis design. The launch of the model coincides with the launch of the mobile 13th gen Intel Core series and the mobile Nvidia GeForce 40 Ada Lovelace series much like with the recent Blade 16.
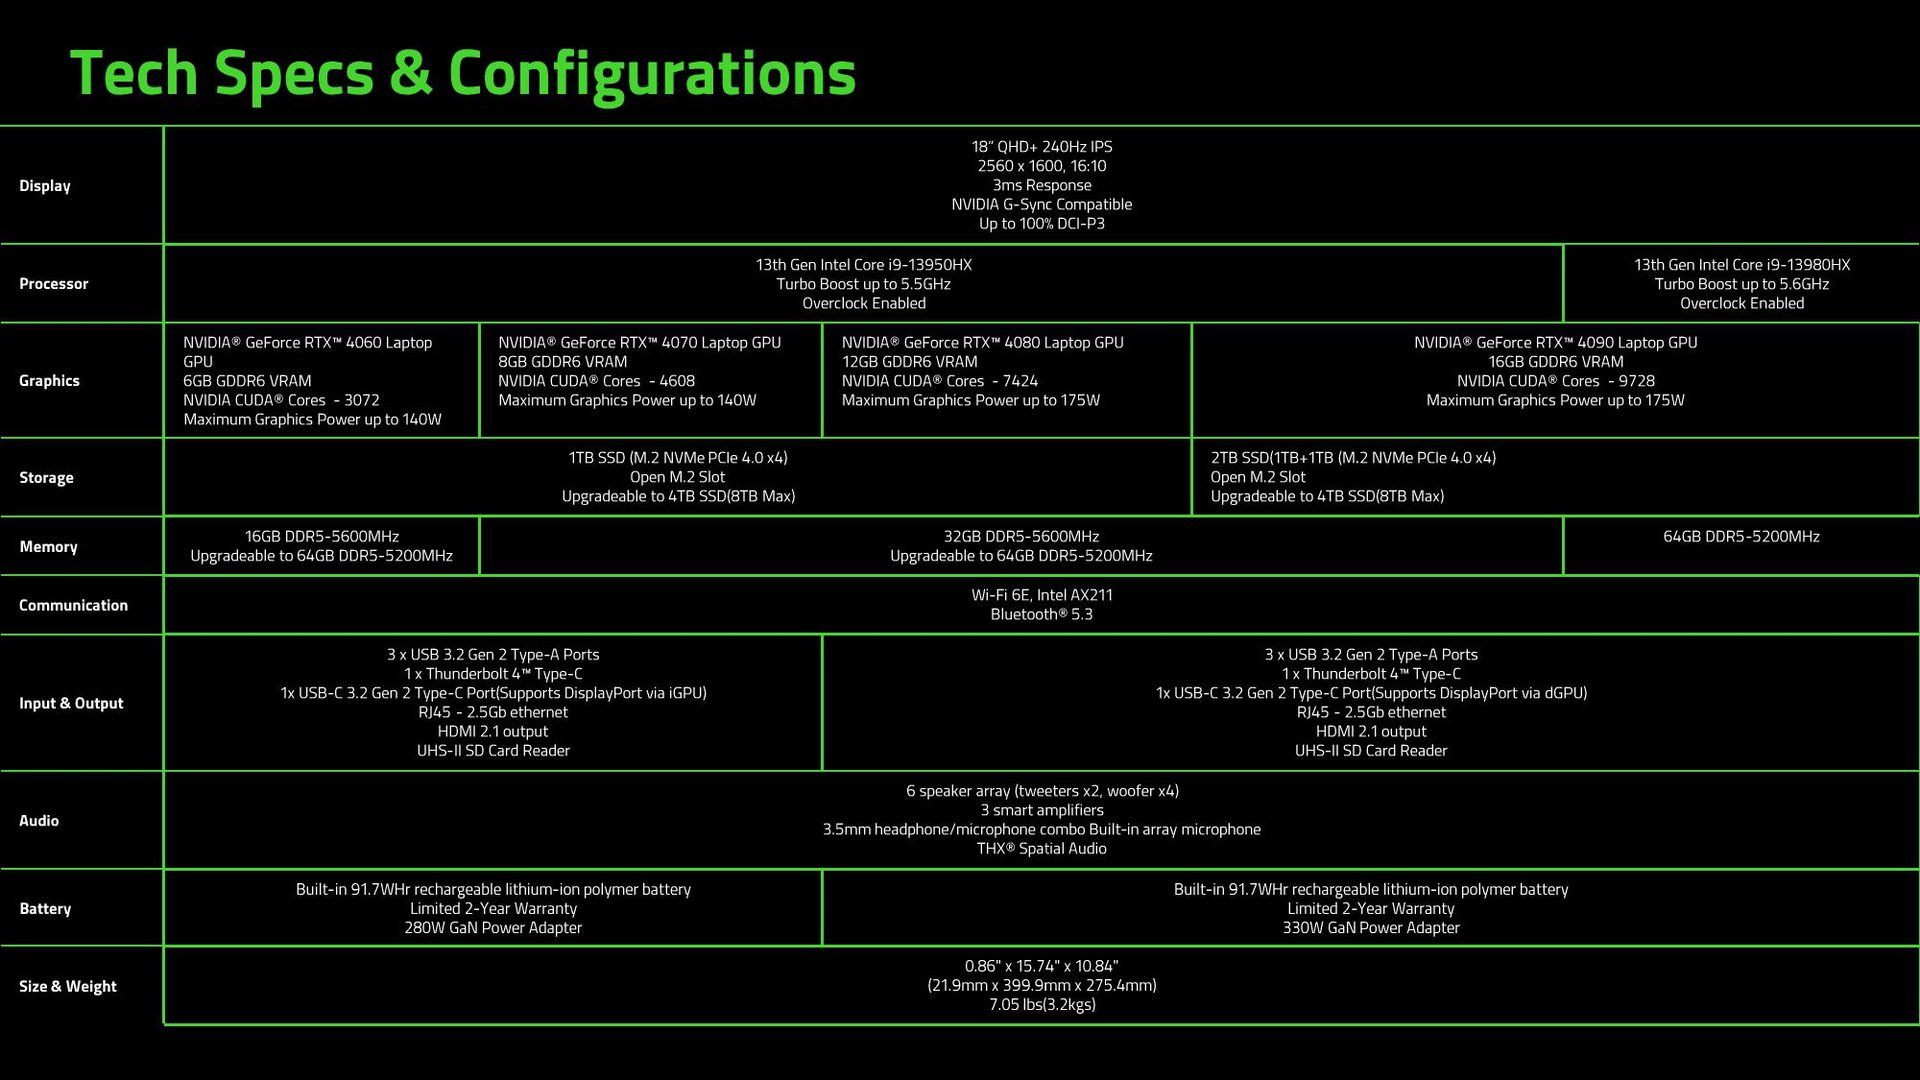
Configurations range from the Core i9-13950HX CPU and 140 W GeForce RTX 4060 GPU up to the Core i9-13980HX and 175 W RTX 4090. All configurations otherwise ship with the same 16:10 QHD+ 240 Hz IPS panel. Our specific review unit is a middle configuration sporting the 140 W RTX 4070 retailing for about $3200 USD.
18-inch laptops are uncommon with the 6-year old MSI GT83 Titan being a notable example. Asus and Dell are expected to launch the ROG Strix Scar 18 and Alienware m18, respectively, to compete directly against the Razer Blade 18.
More Razer reviews:
Potential Competitors in Comparison
Rating | Date | Model | Weight | Height | Size | Resolution | Best Price |
|---|---|---|---|---|---|---|---|
| 91.4 % | 02/2023 | Razer Blade 18 RTX 4070 i9-13950HX, NVIDIA GeForce RTX 4070 Laptop GPU | 3 kg | 21.9 mm | 18.00" | 2560x1600 | |
| 89.9 % | 07/2022 | Razer Blade 17 Early 2022 i9-12900H, GeForce RTX 3080 Ti Laptop GPU | 2.8 kg | 19.9 mm | 17.30" | 3840x2160 | |
| 89 % | 02/2023 | MSI Titan GT77 HX 13VI i9-13950HX, NVIDIA GeForce RTX 4090 Laptop GPU | 3.5 kg | 23 mm | 17.30" | 3840x2160 | |
| 83.3 % | 01/2023 | Gigabyte G7 KE i5-12500H, GeForce RTX 3060 Laptop GPU | 2.6 kg | 25 mm | 17.30" | 1920x1080 | |
| 86.1 % | 01/2023 | Alienware m17 R5 (R9 6900HX, RX 6850M XT) R9 6900HX, Radeon RX 6850M XT | 3.4 kg | 26.7 mm | 17.00" | 3840x2160 | |
| 86.9 % | 11/2022 | Asus ROG Strix Scar 17 SE G733CX-LL014W i9-12950HX, GeForce RTX 3080 Ti Laptop GPU | 2.9 kg | 28.3 mm | 17.30" | 2560x1440 |
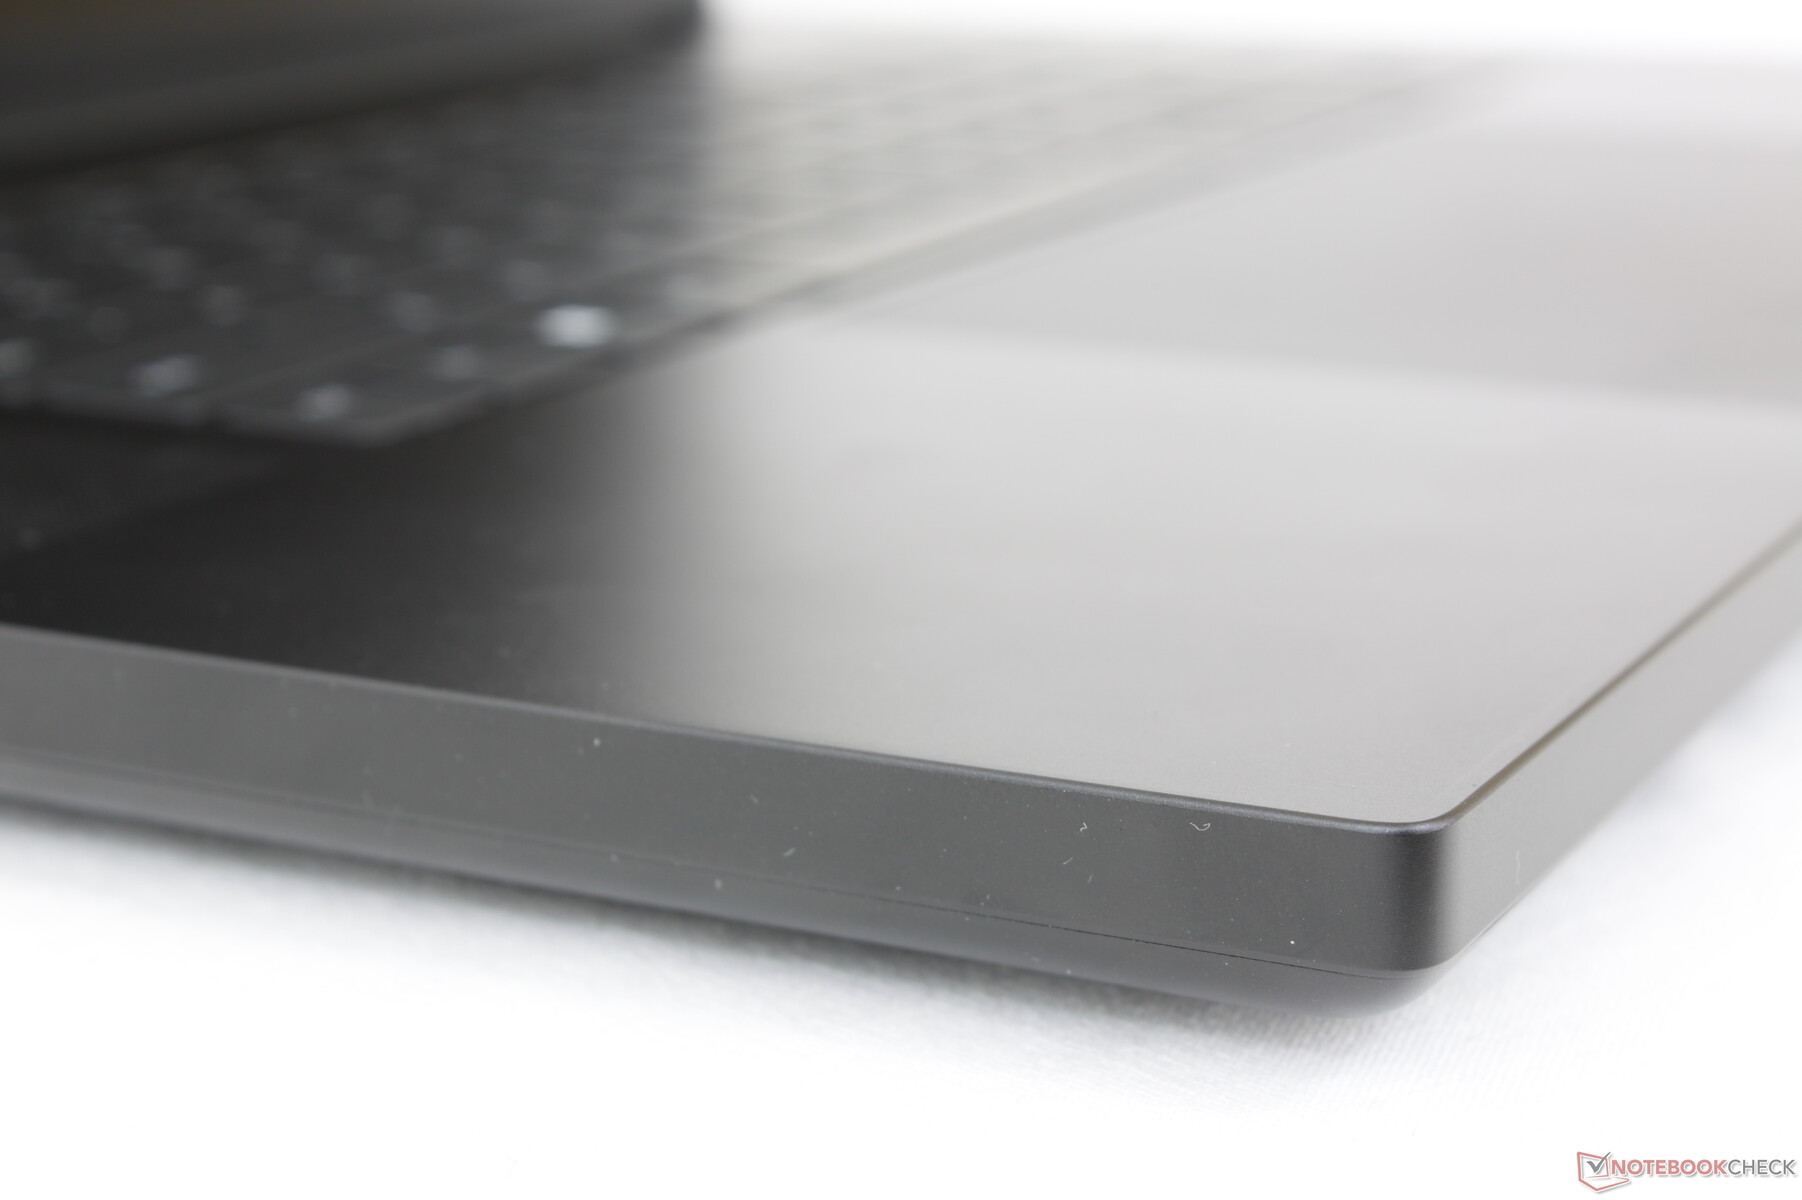
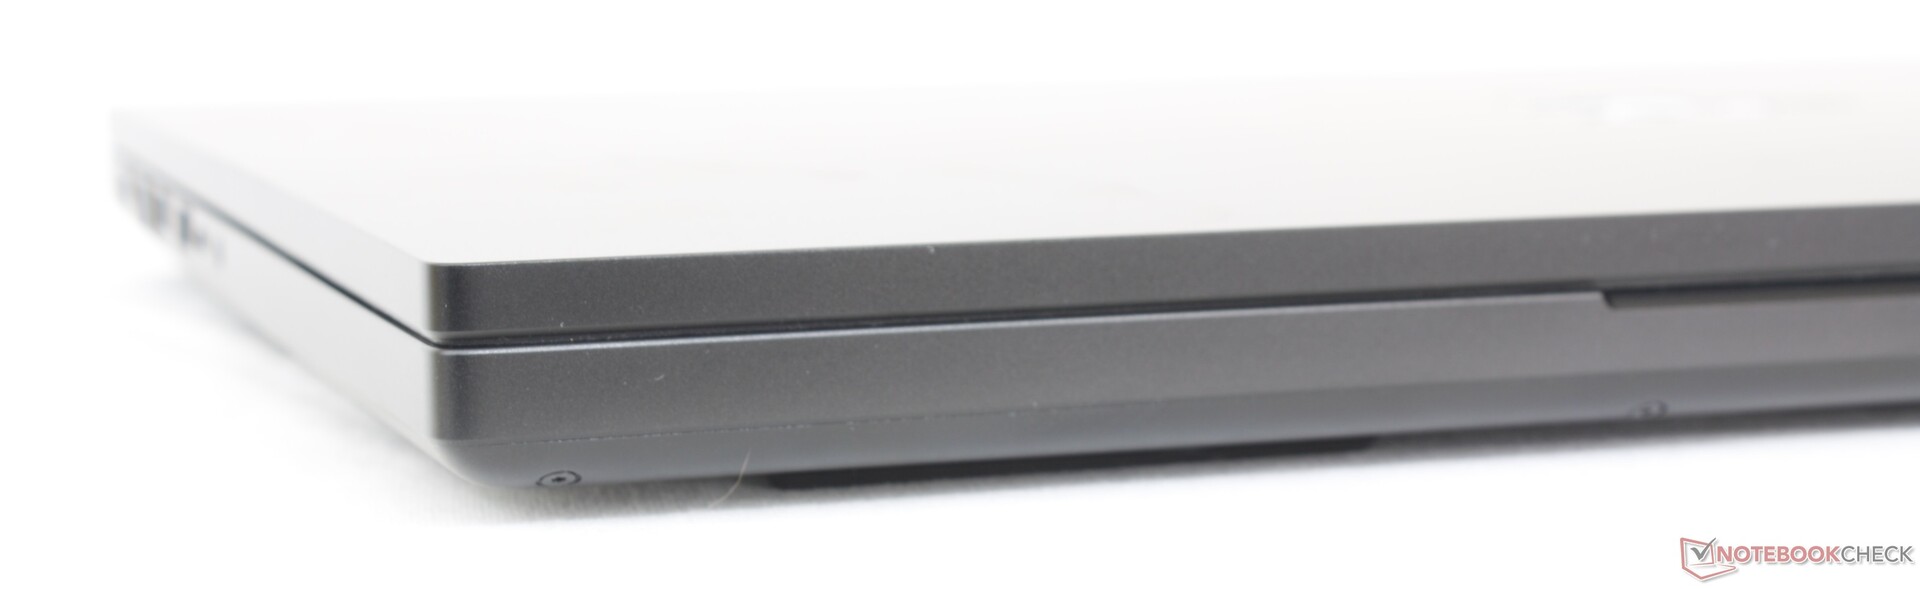
Case — Barely Larger Than The Blade 17
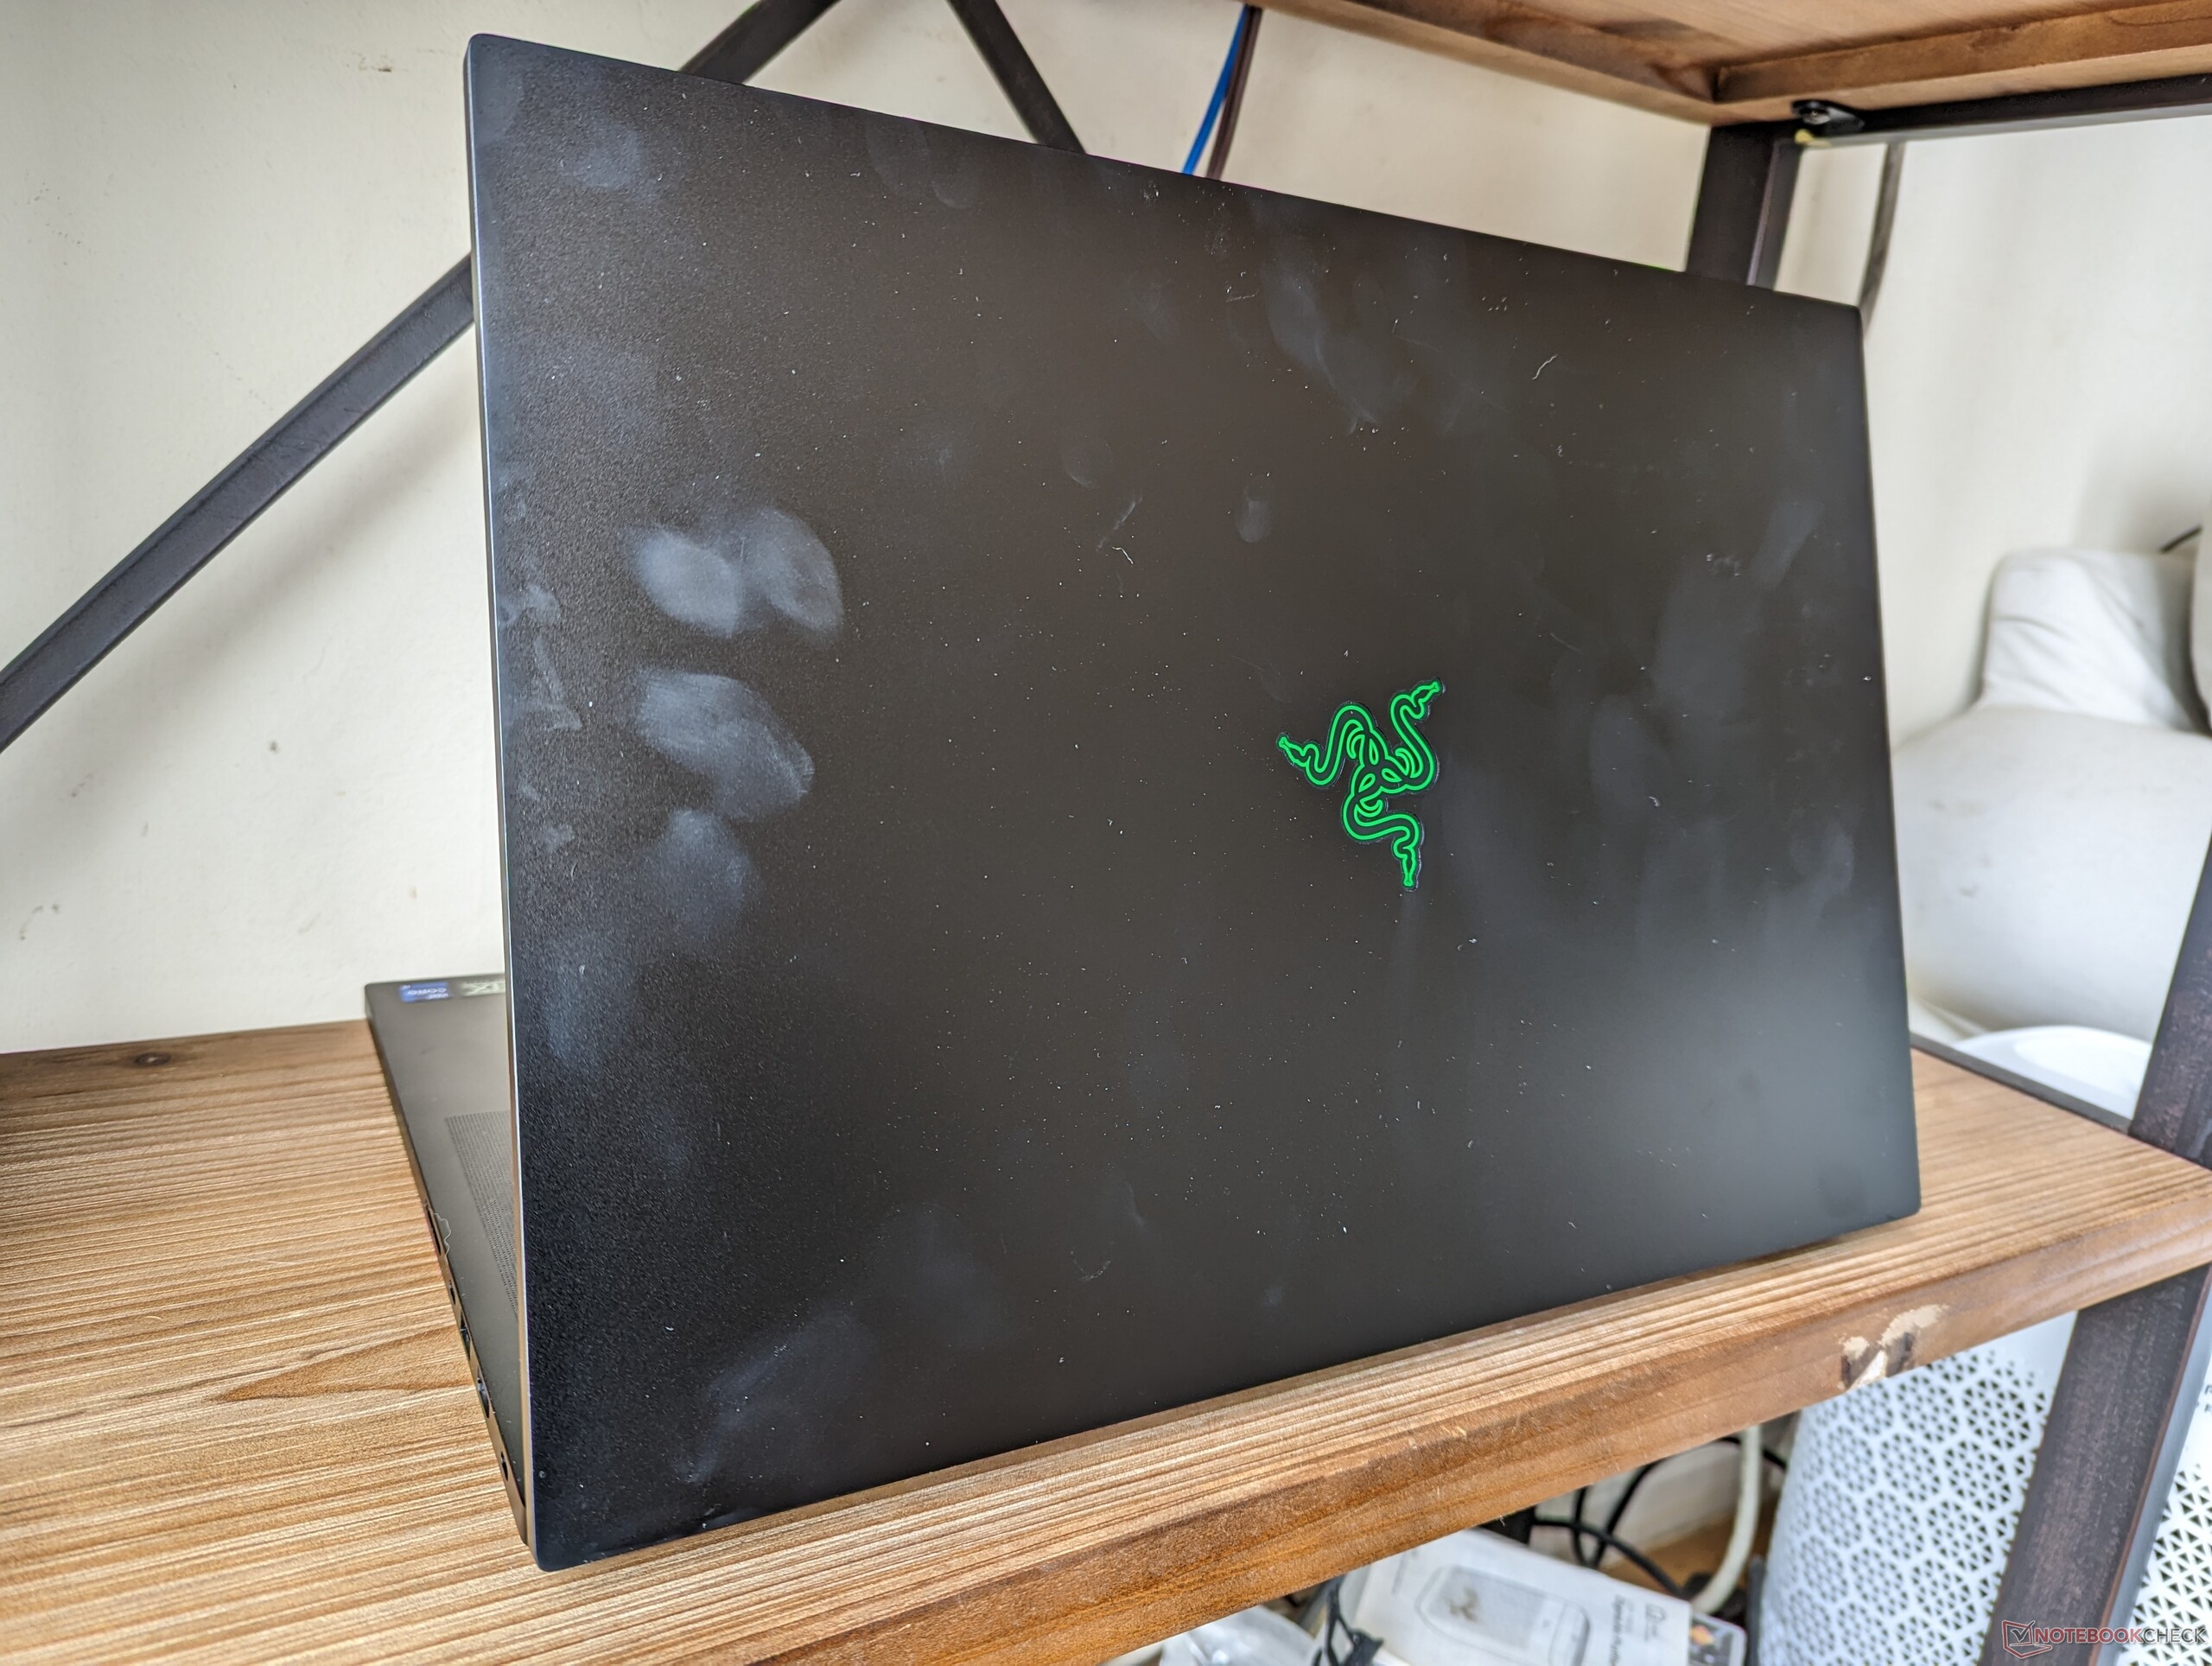
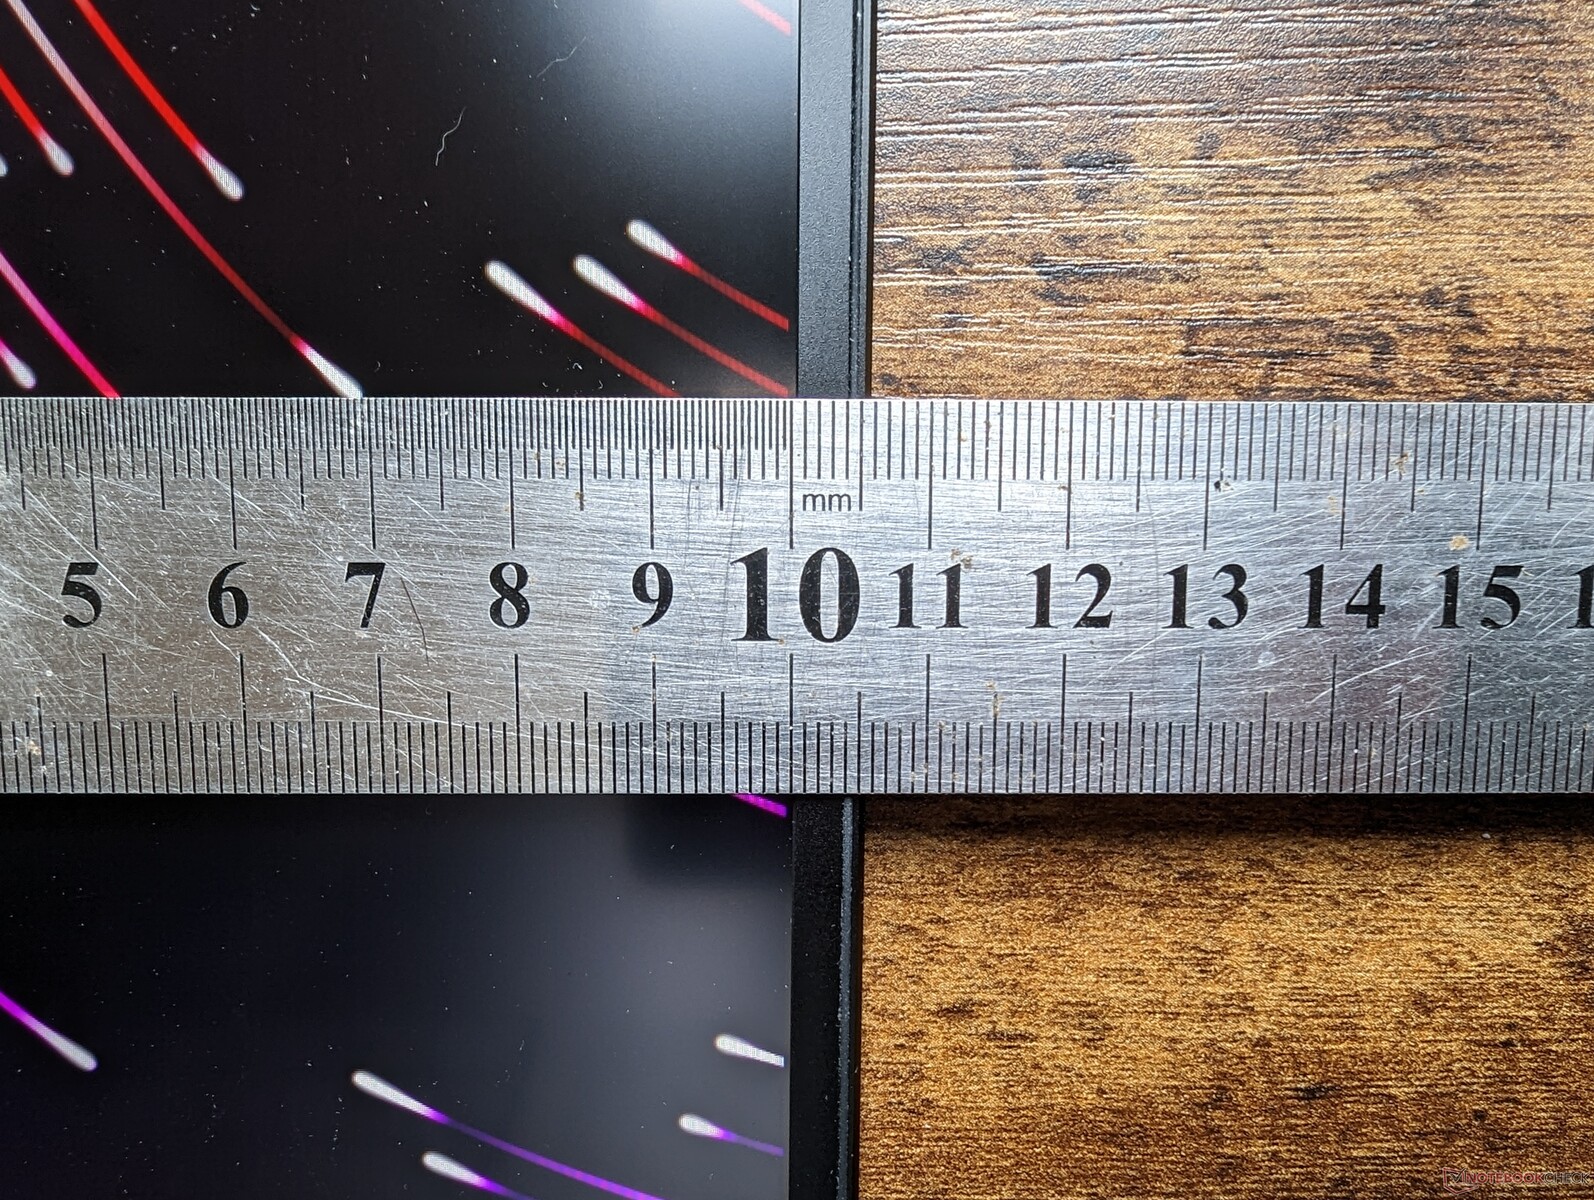
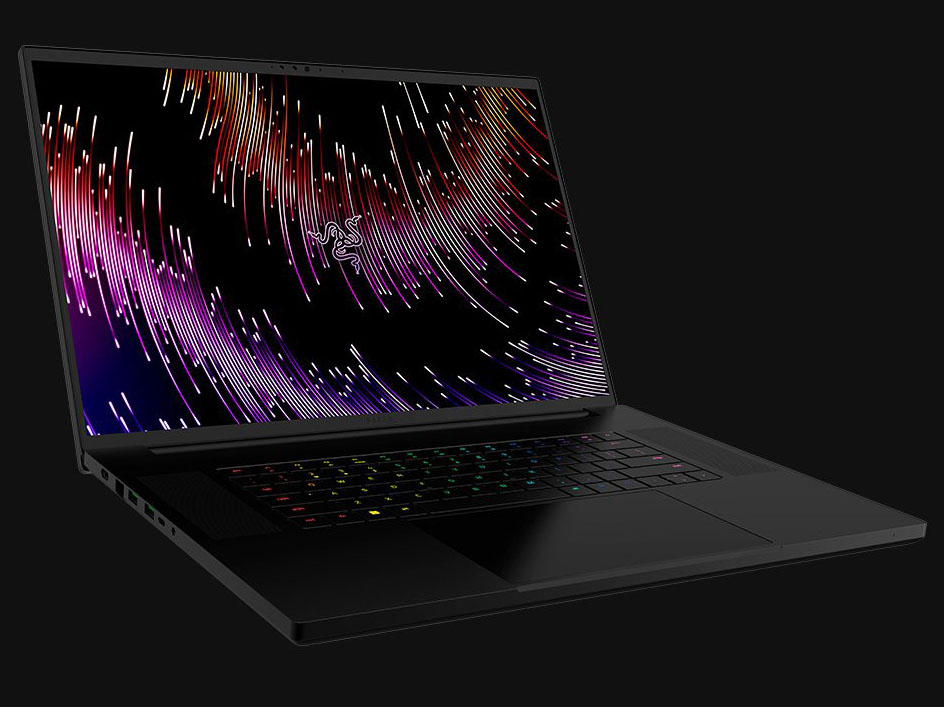
The Blade 18 may be a new screen size, but it holds no new surprises in terms of chassis design. The model looks and feels like a Blade 17 from top to bottom. The biggest visual difference relates to the much smaller chin bezel on the Blade 18 when compared to the Blade 17 for a higher screen-to-body ratio.
The larger 18-inch form factor thankfully doesn't impact the rigidity of the chassis. Both the base and lid are as solid as on the Blade 17 for strong MacBook Pro-like impressions. The hinges in particular hold up well despite the large screen, but their maximum angle is still well below the full 180 degrees. The weakest spot on the laptop is perhaps on the very center of the outer lid where the surface warps more easily from applied pressure.
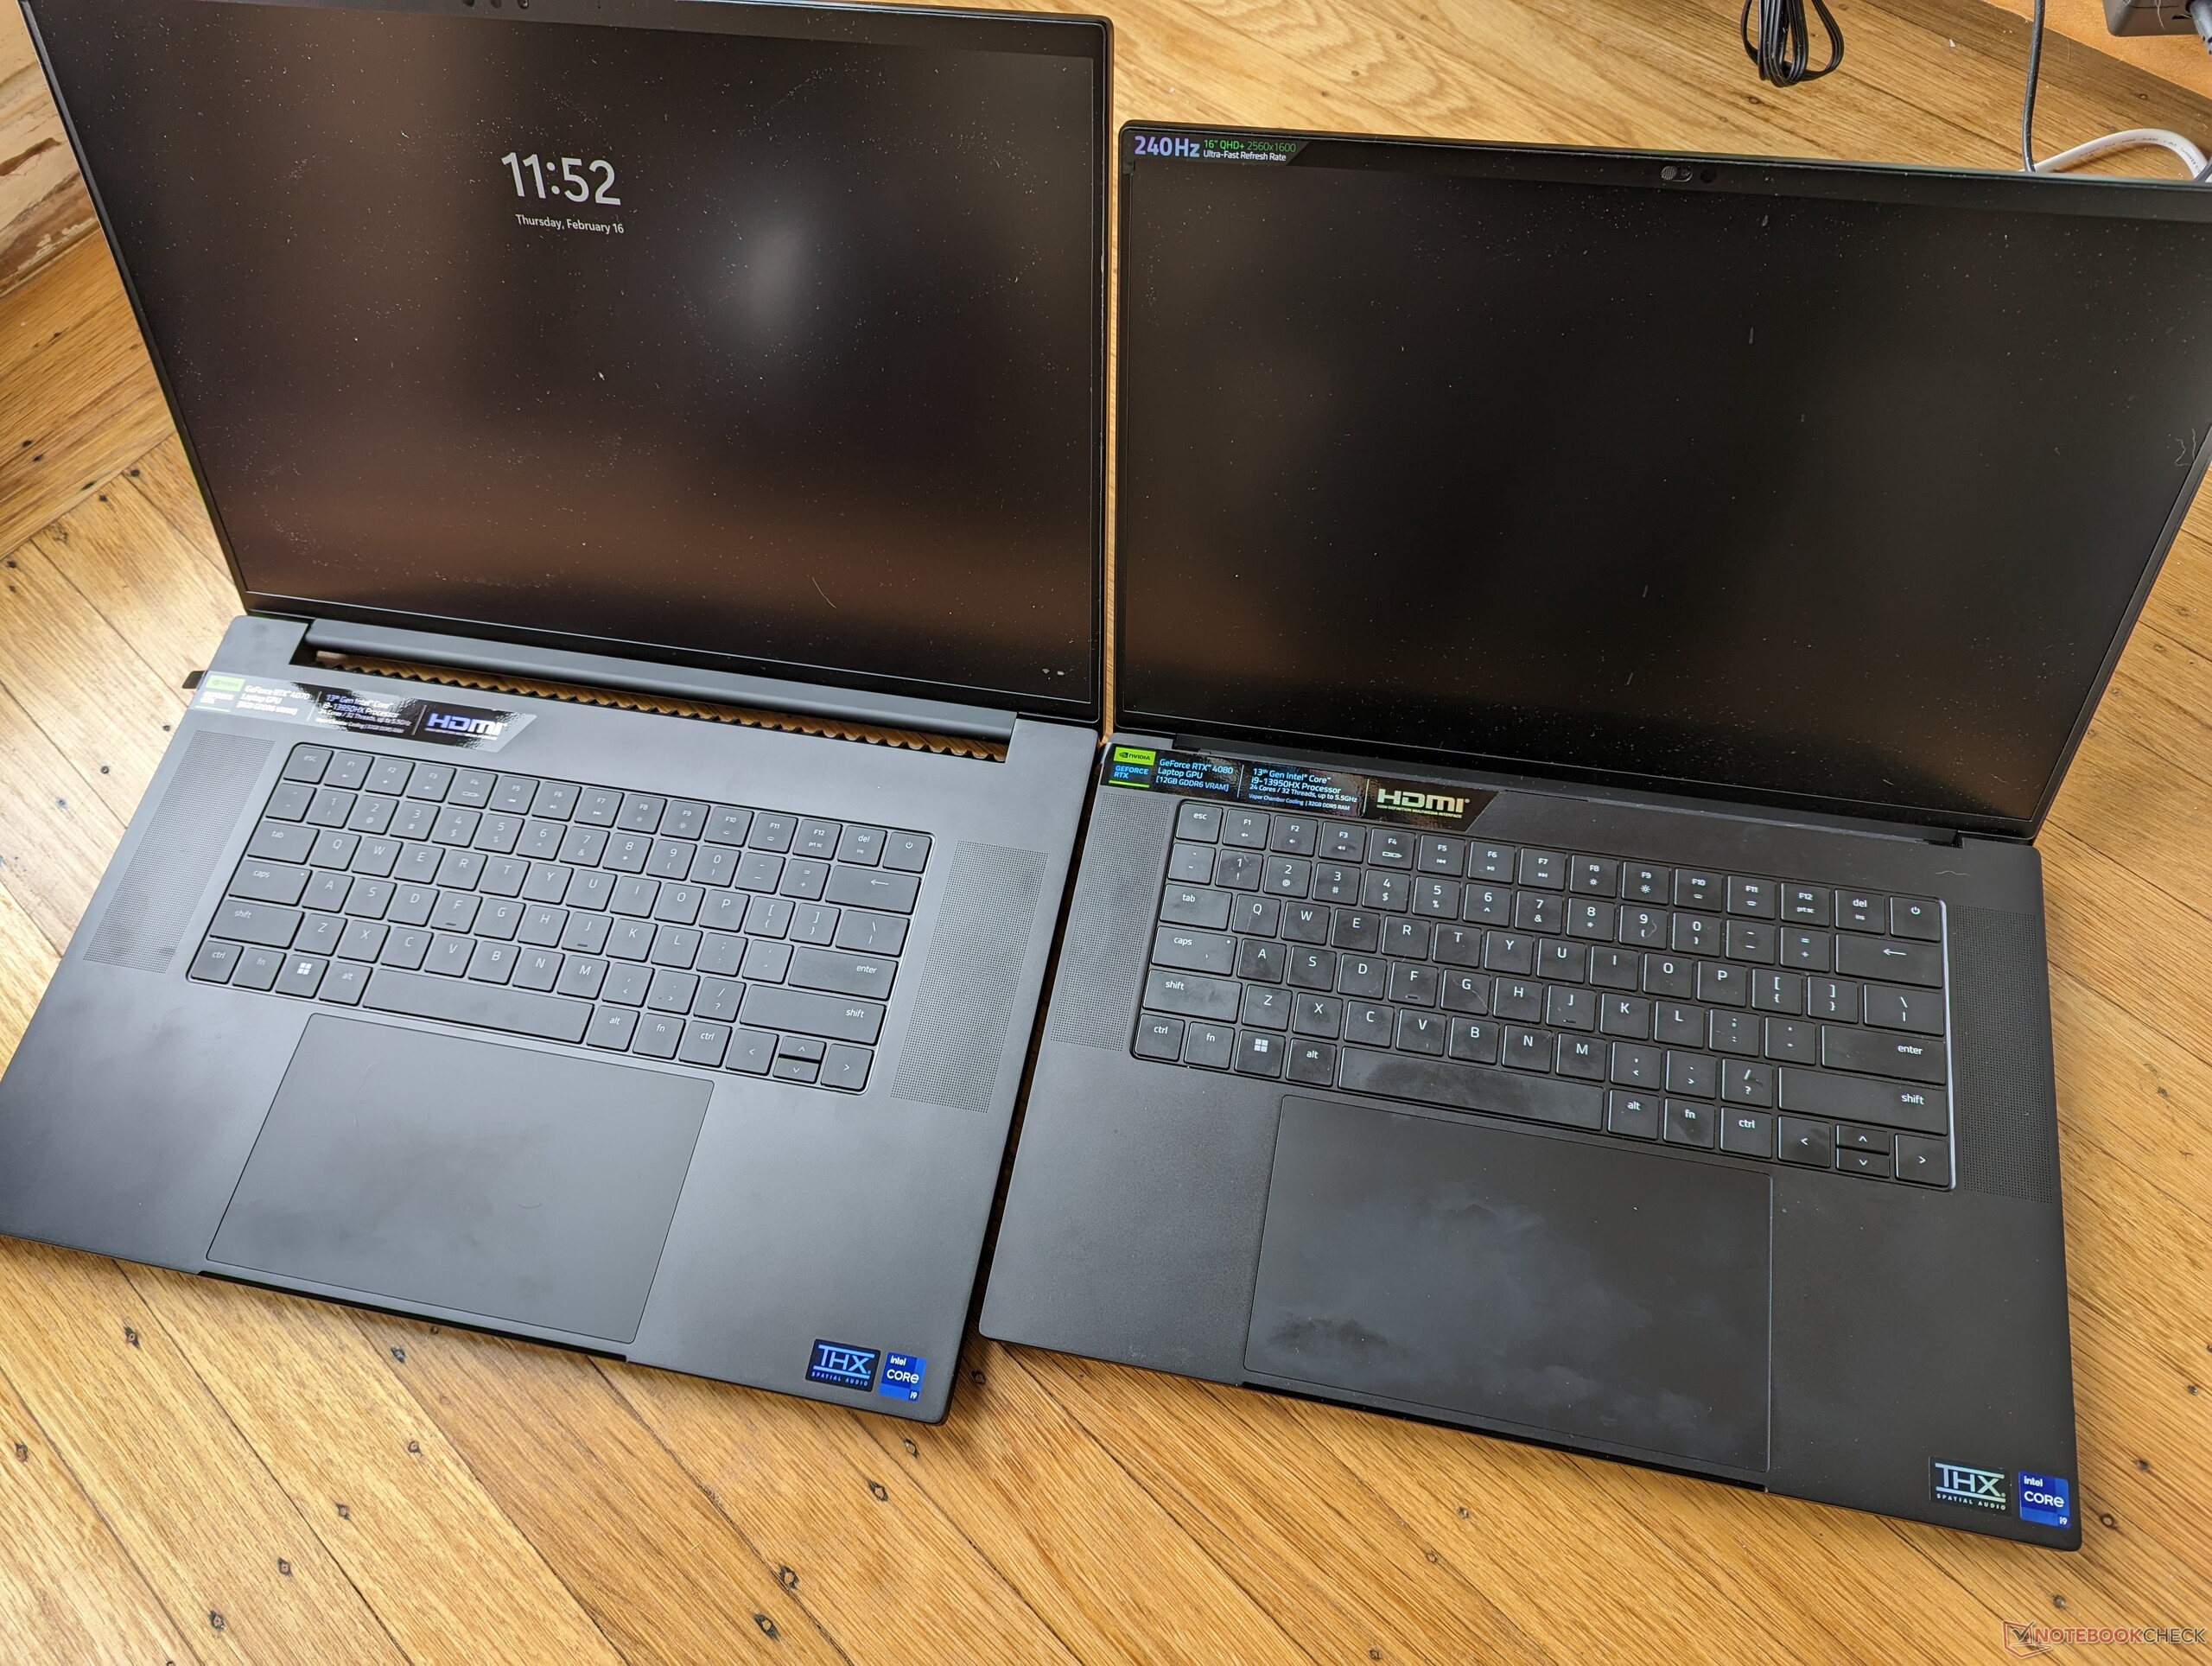
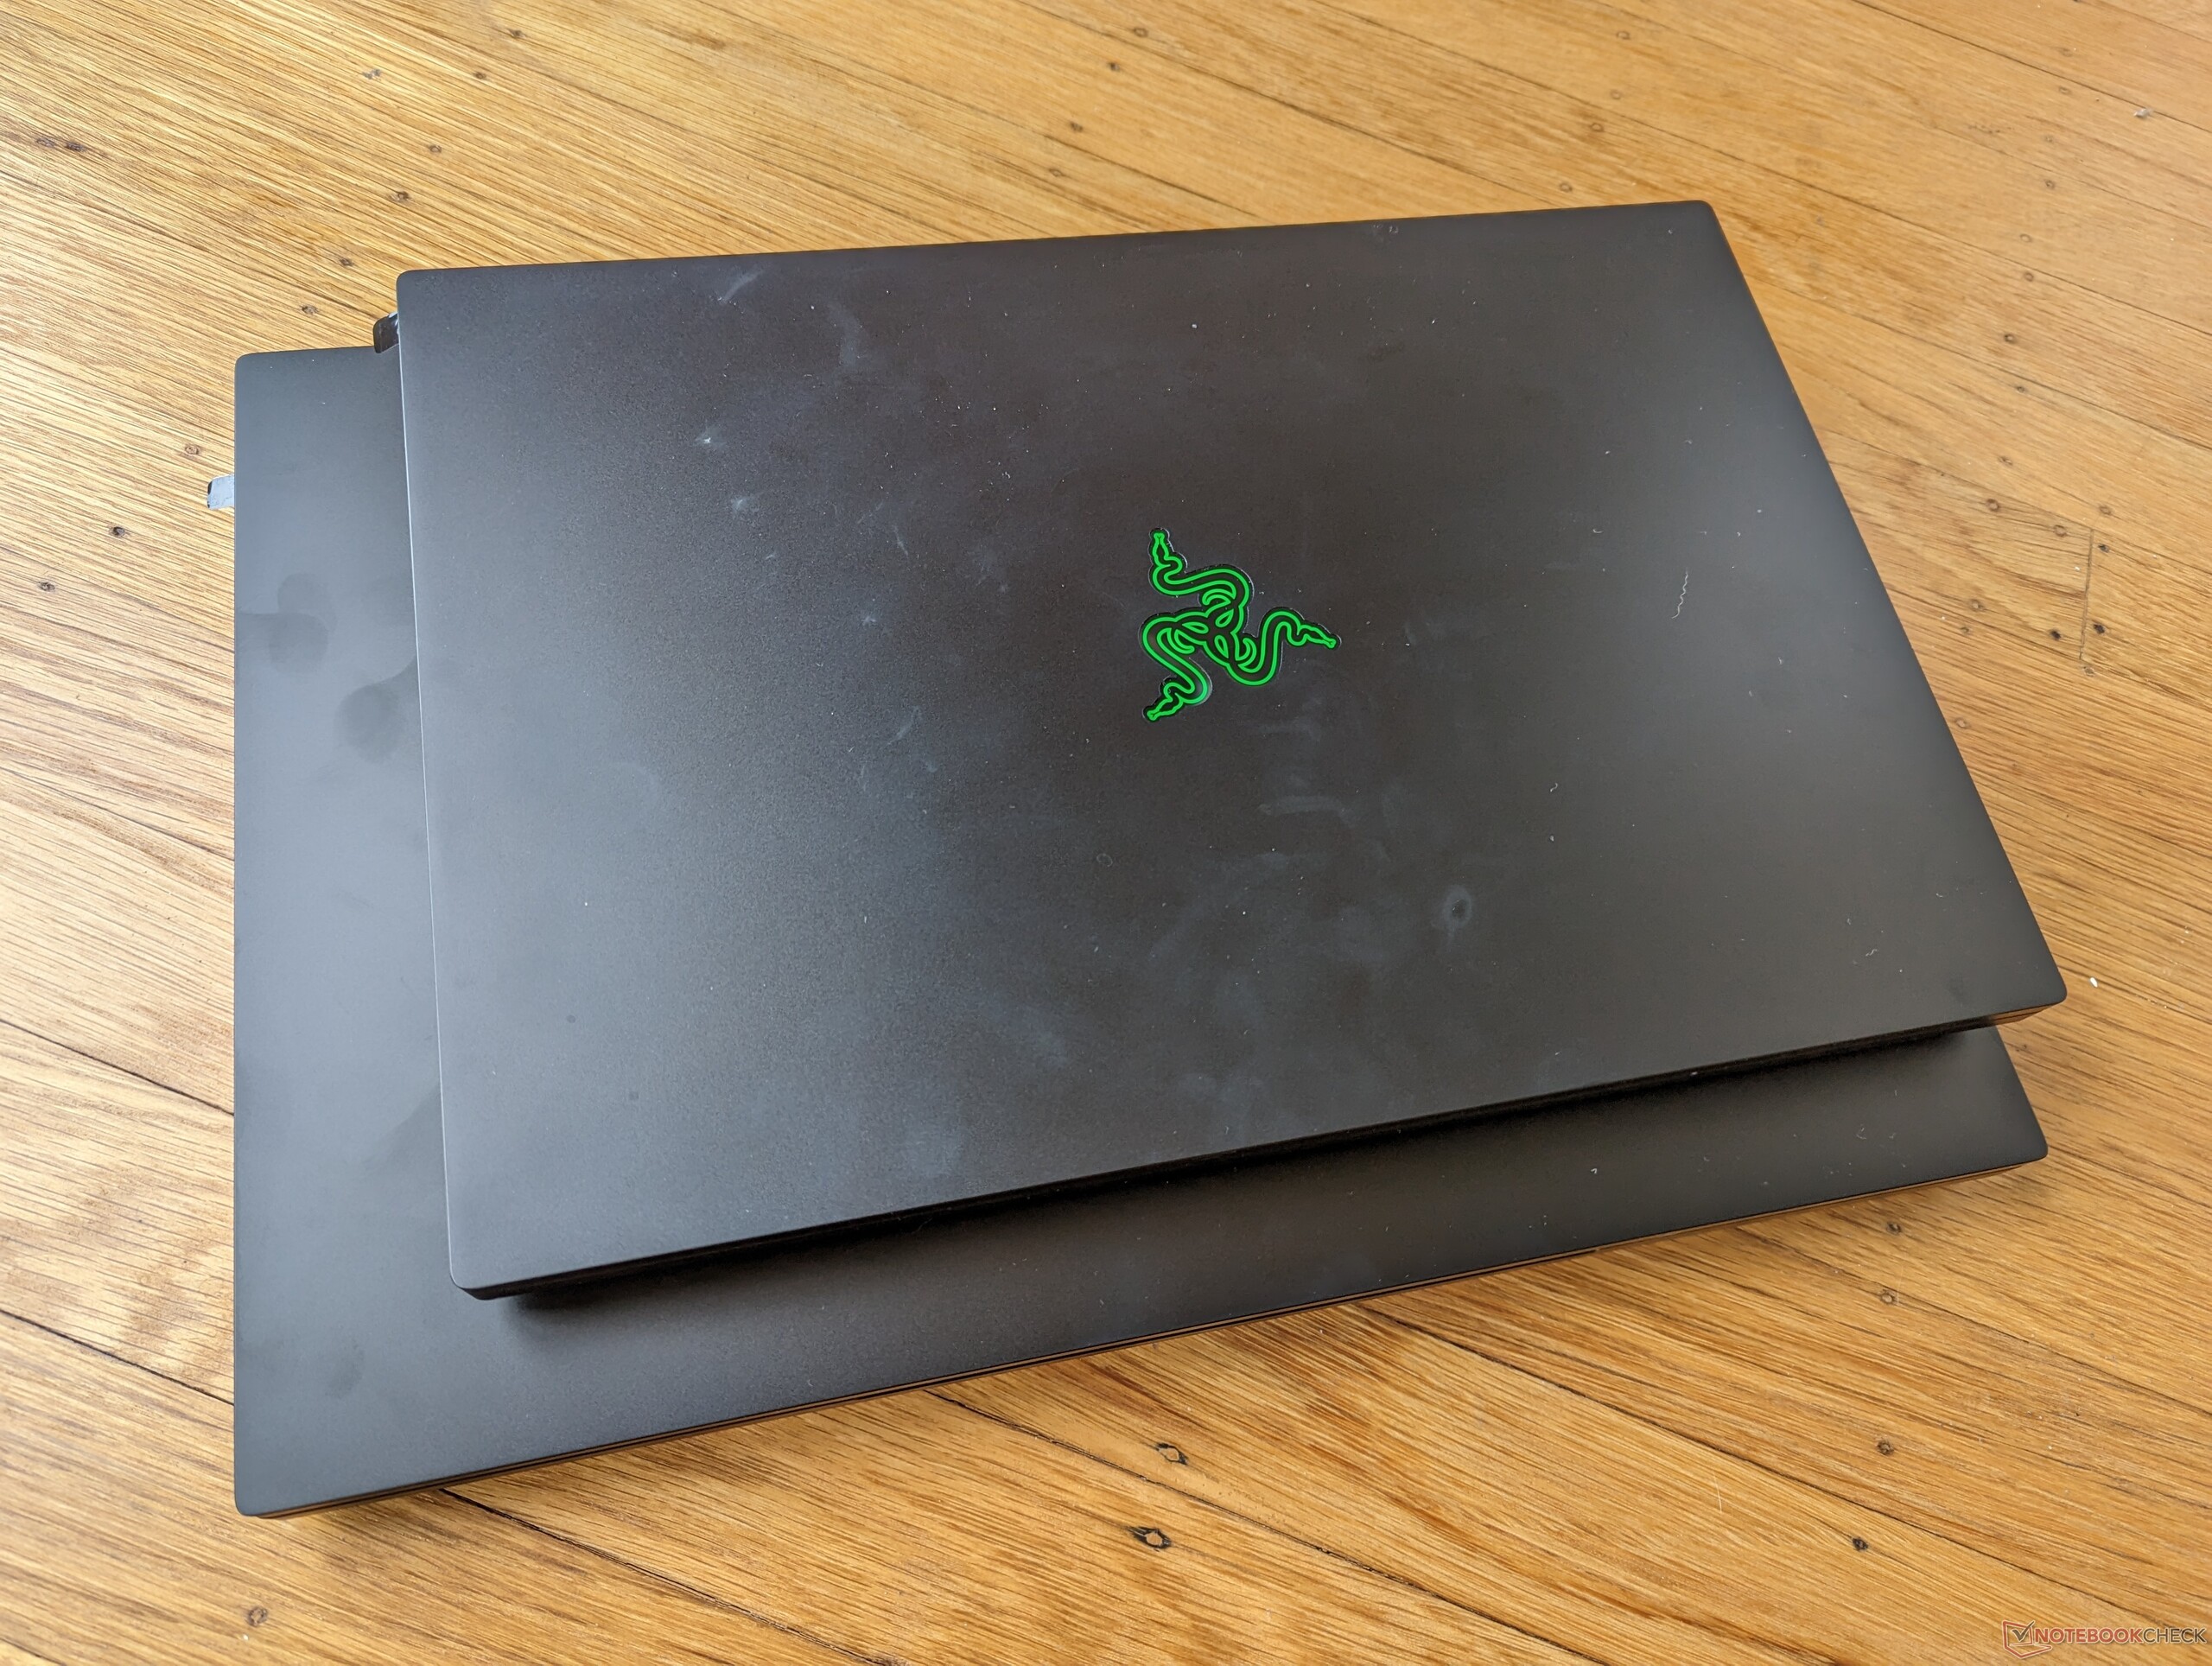
Razer is proud to point out that the Blade 18 is only 18 percent larger in volume and 7 percent heavier than the 2022 Blade 17 despite their screen sizes differences. Thus, the new 18-inch model doesn't feel as bulky as one might initially expect. In fact, some 17.3-inch gaming laptops are larger or even heavier than the Blade 18 including the Asus ROG Strix Scar 17 SE or Alienware m17 R5.
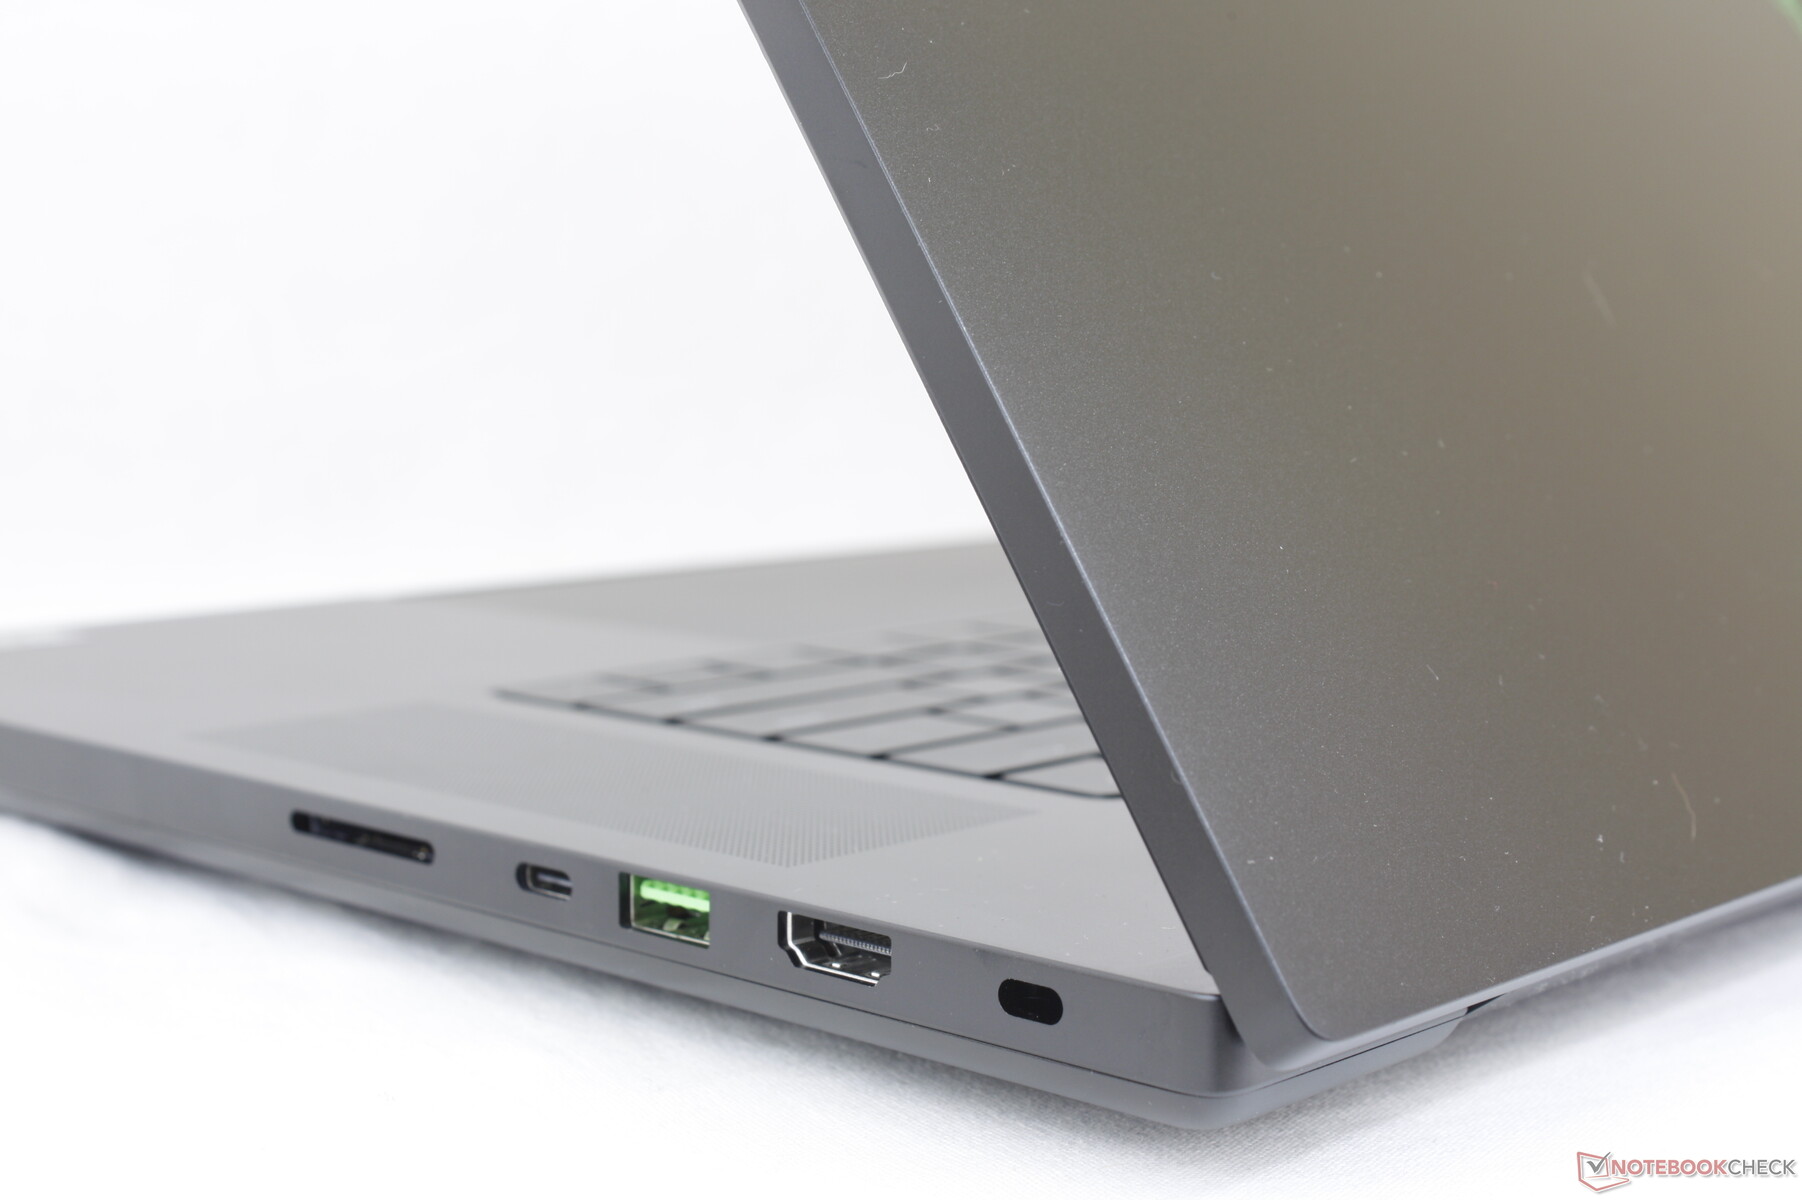
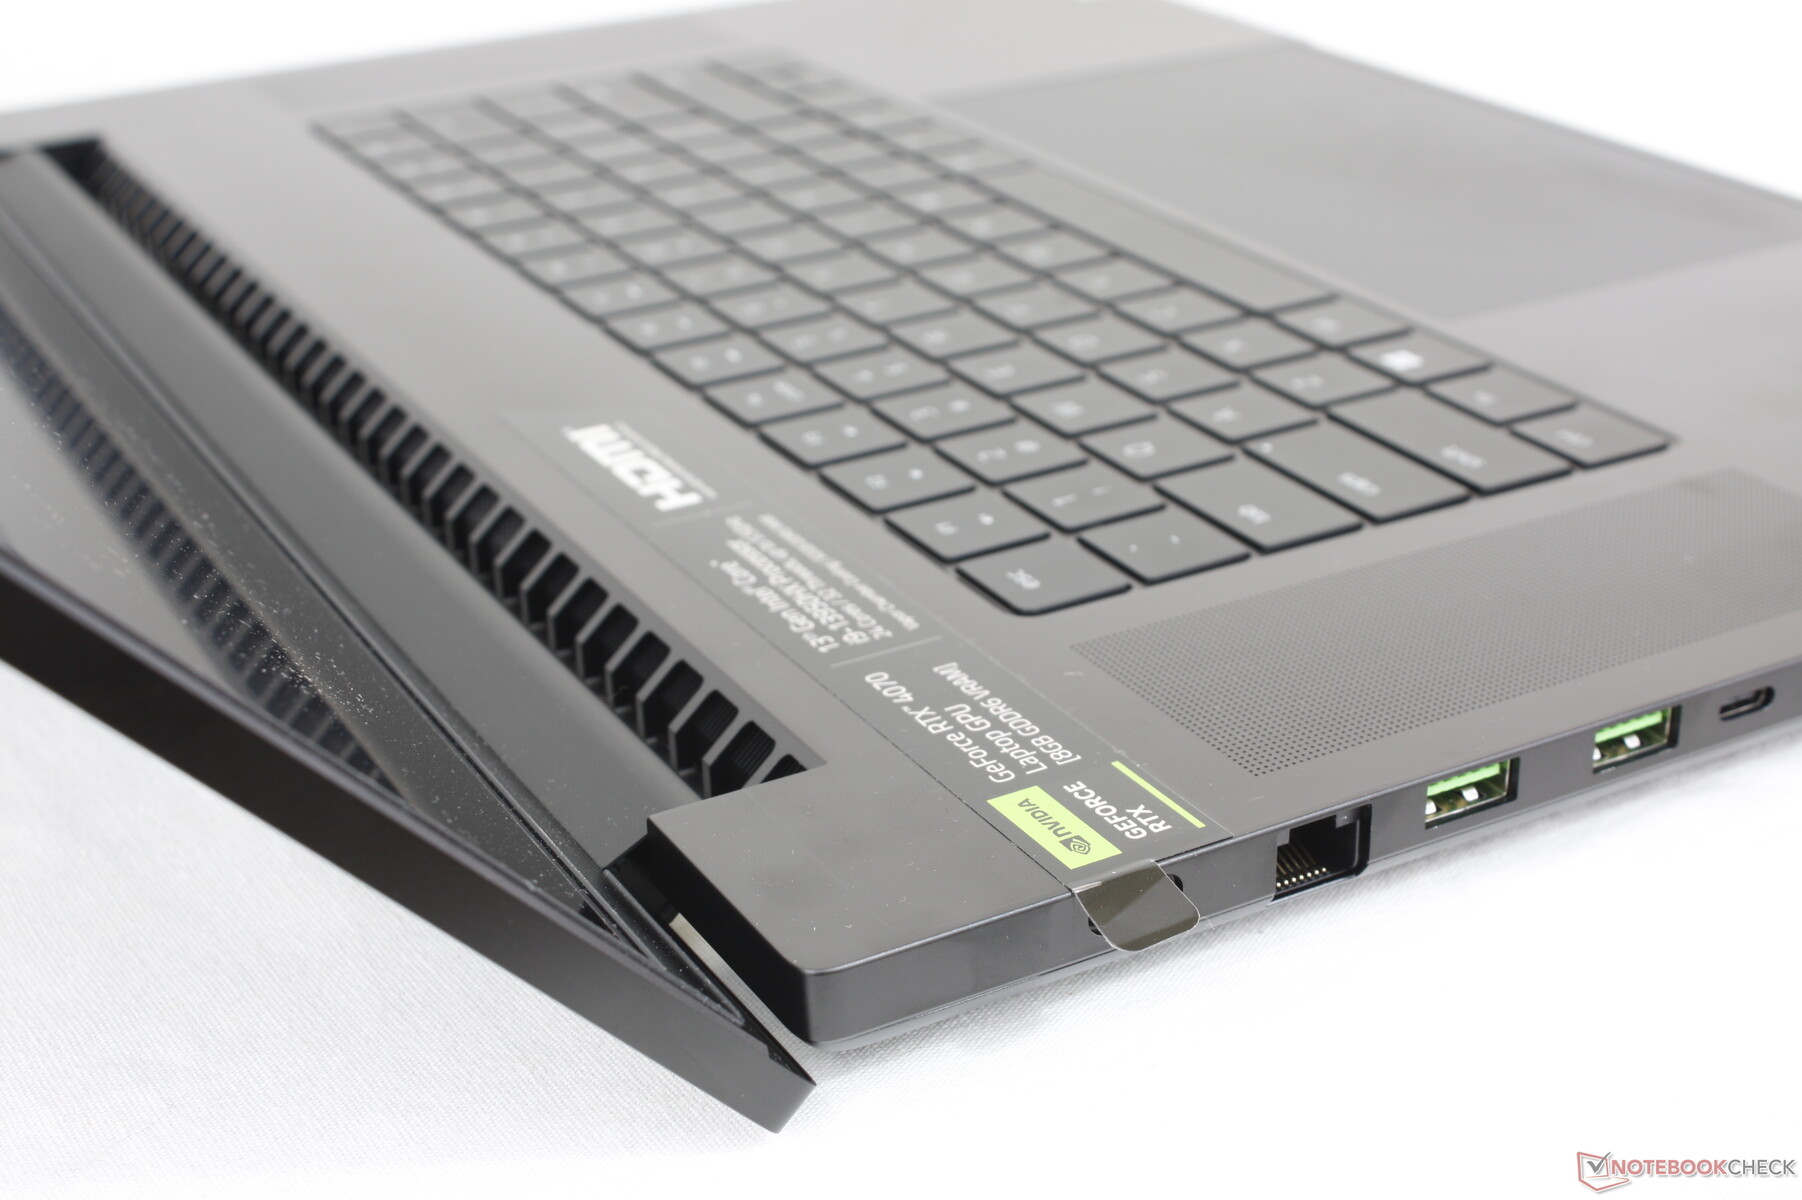
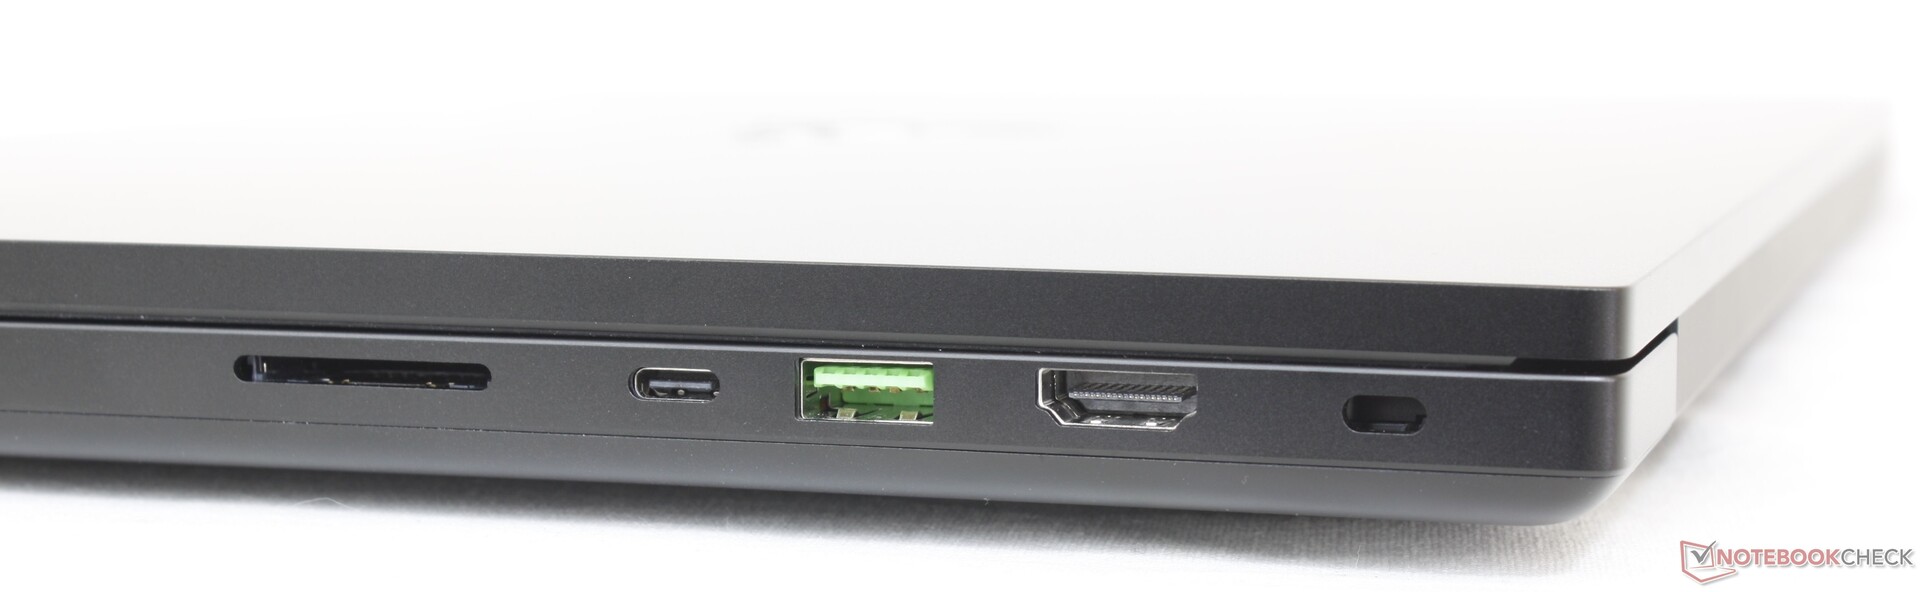
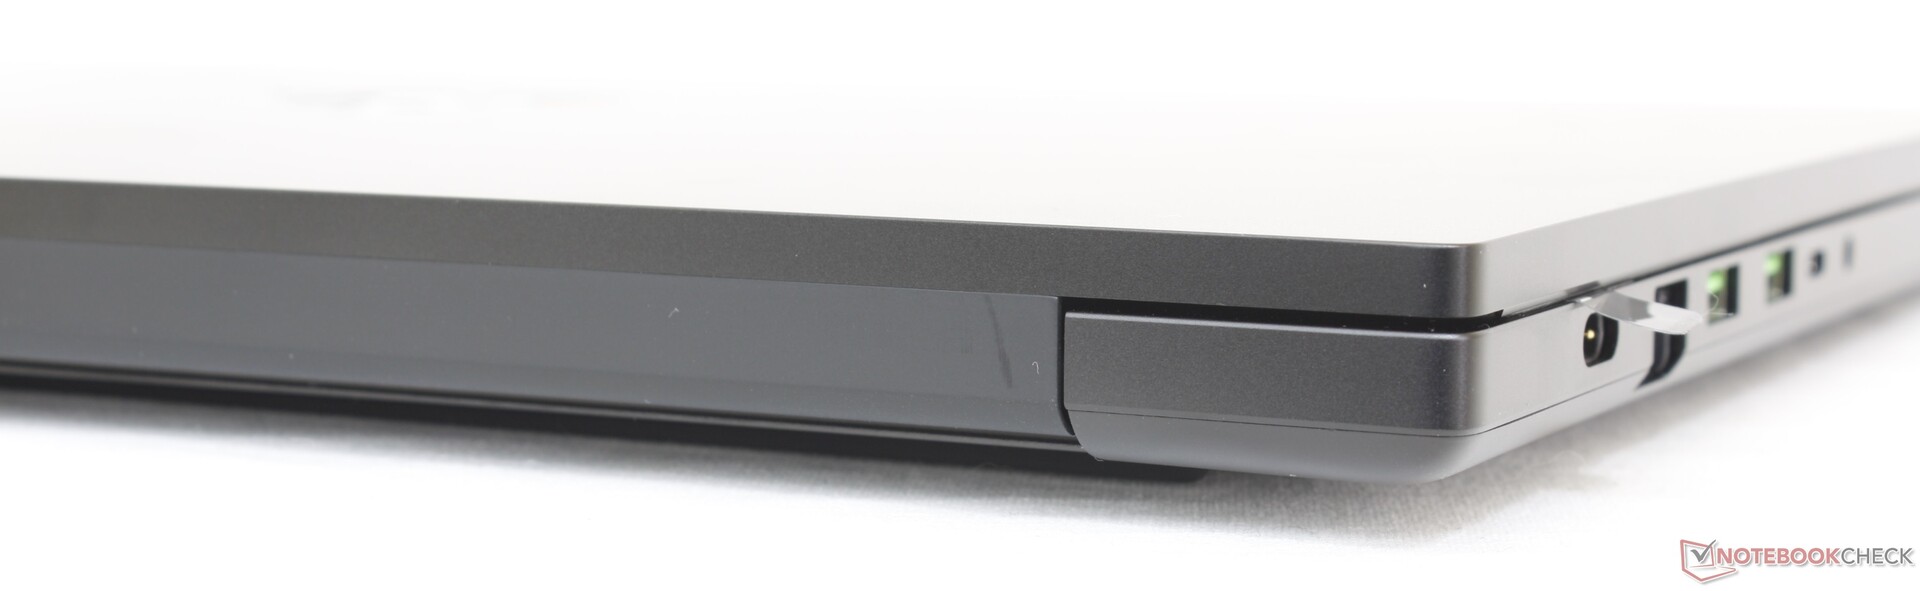
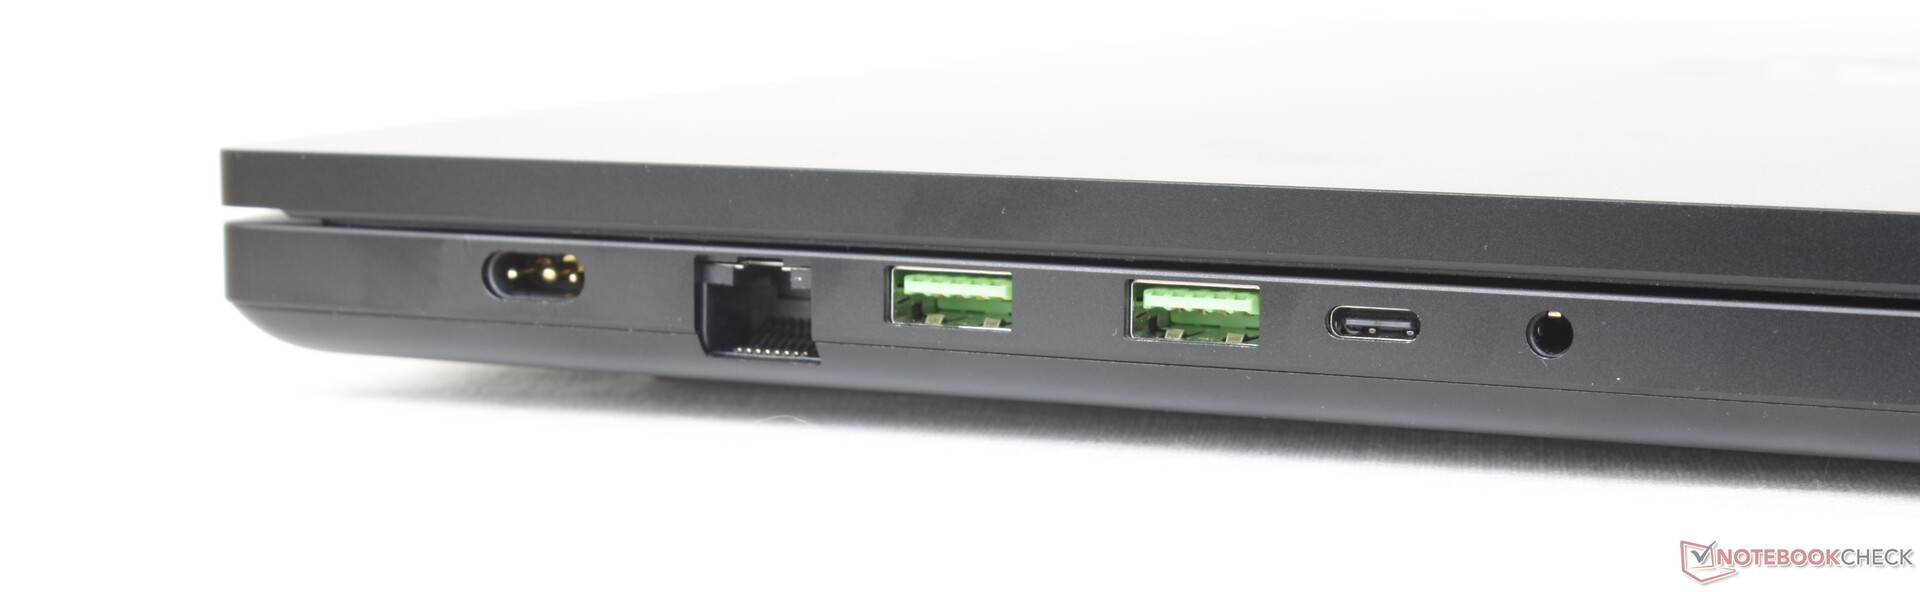
Connectivity — Just The Usual
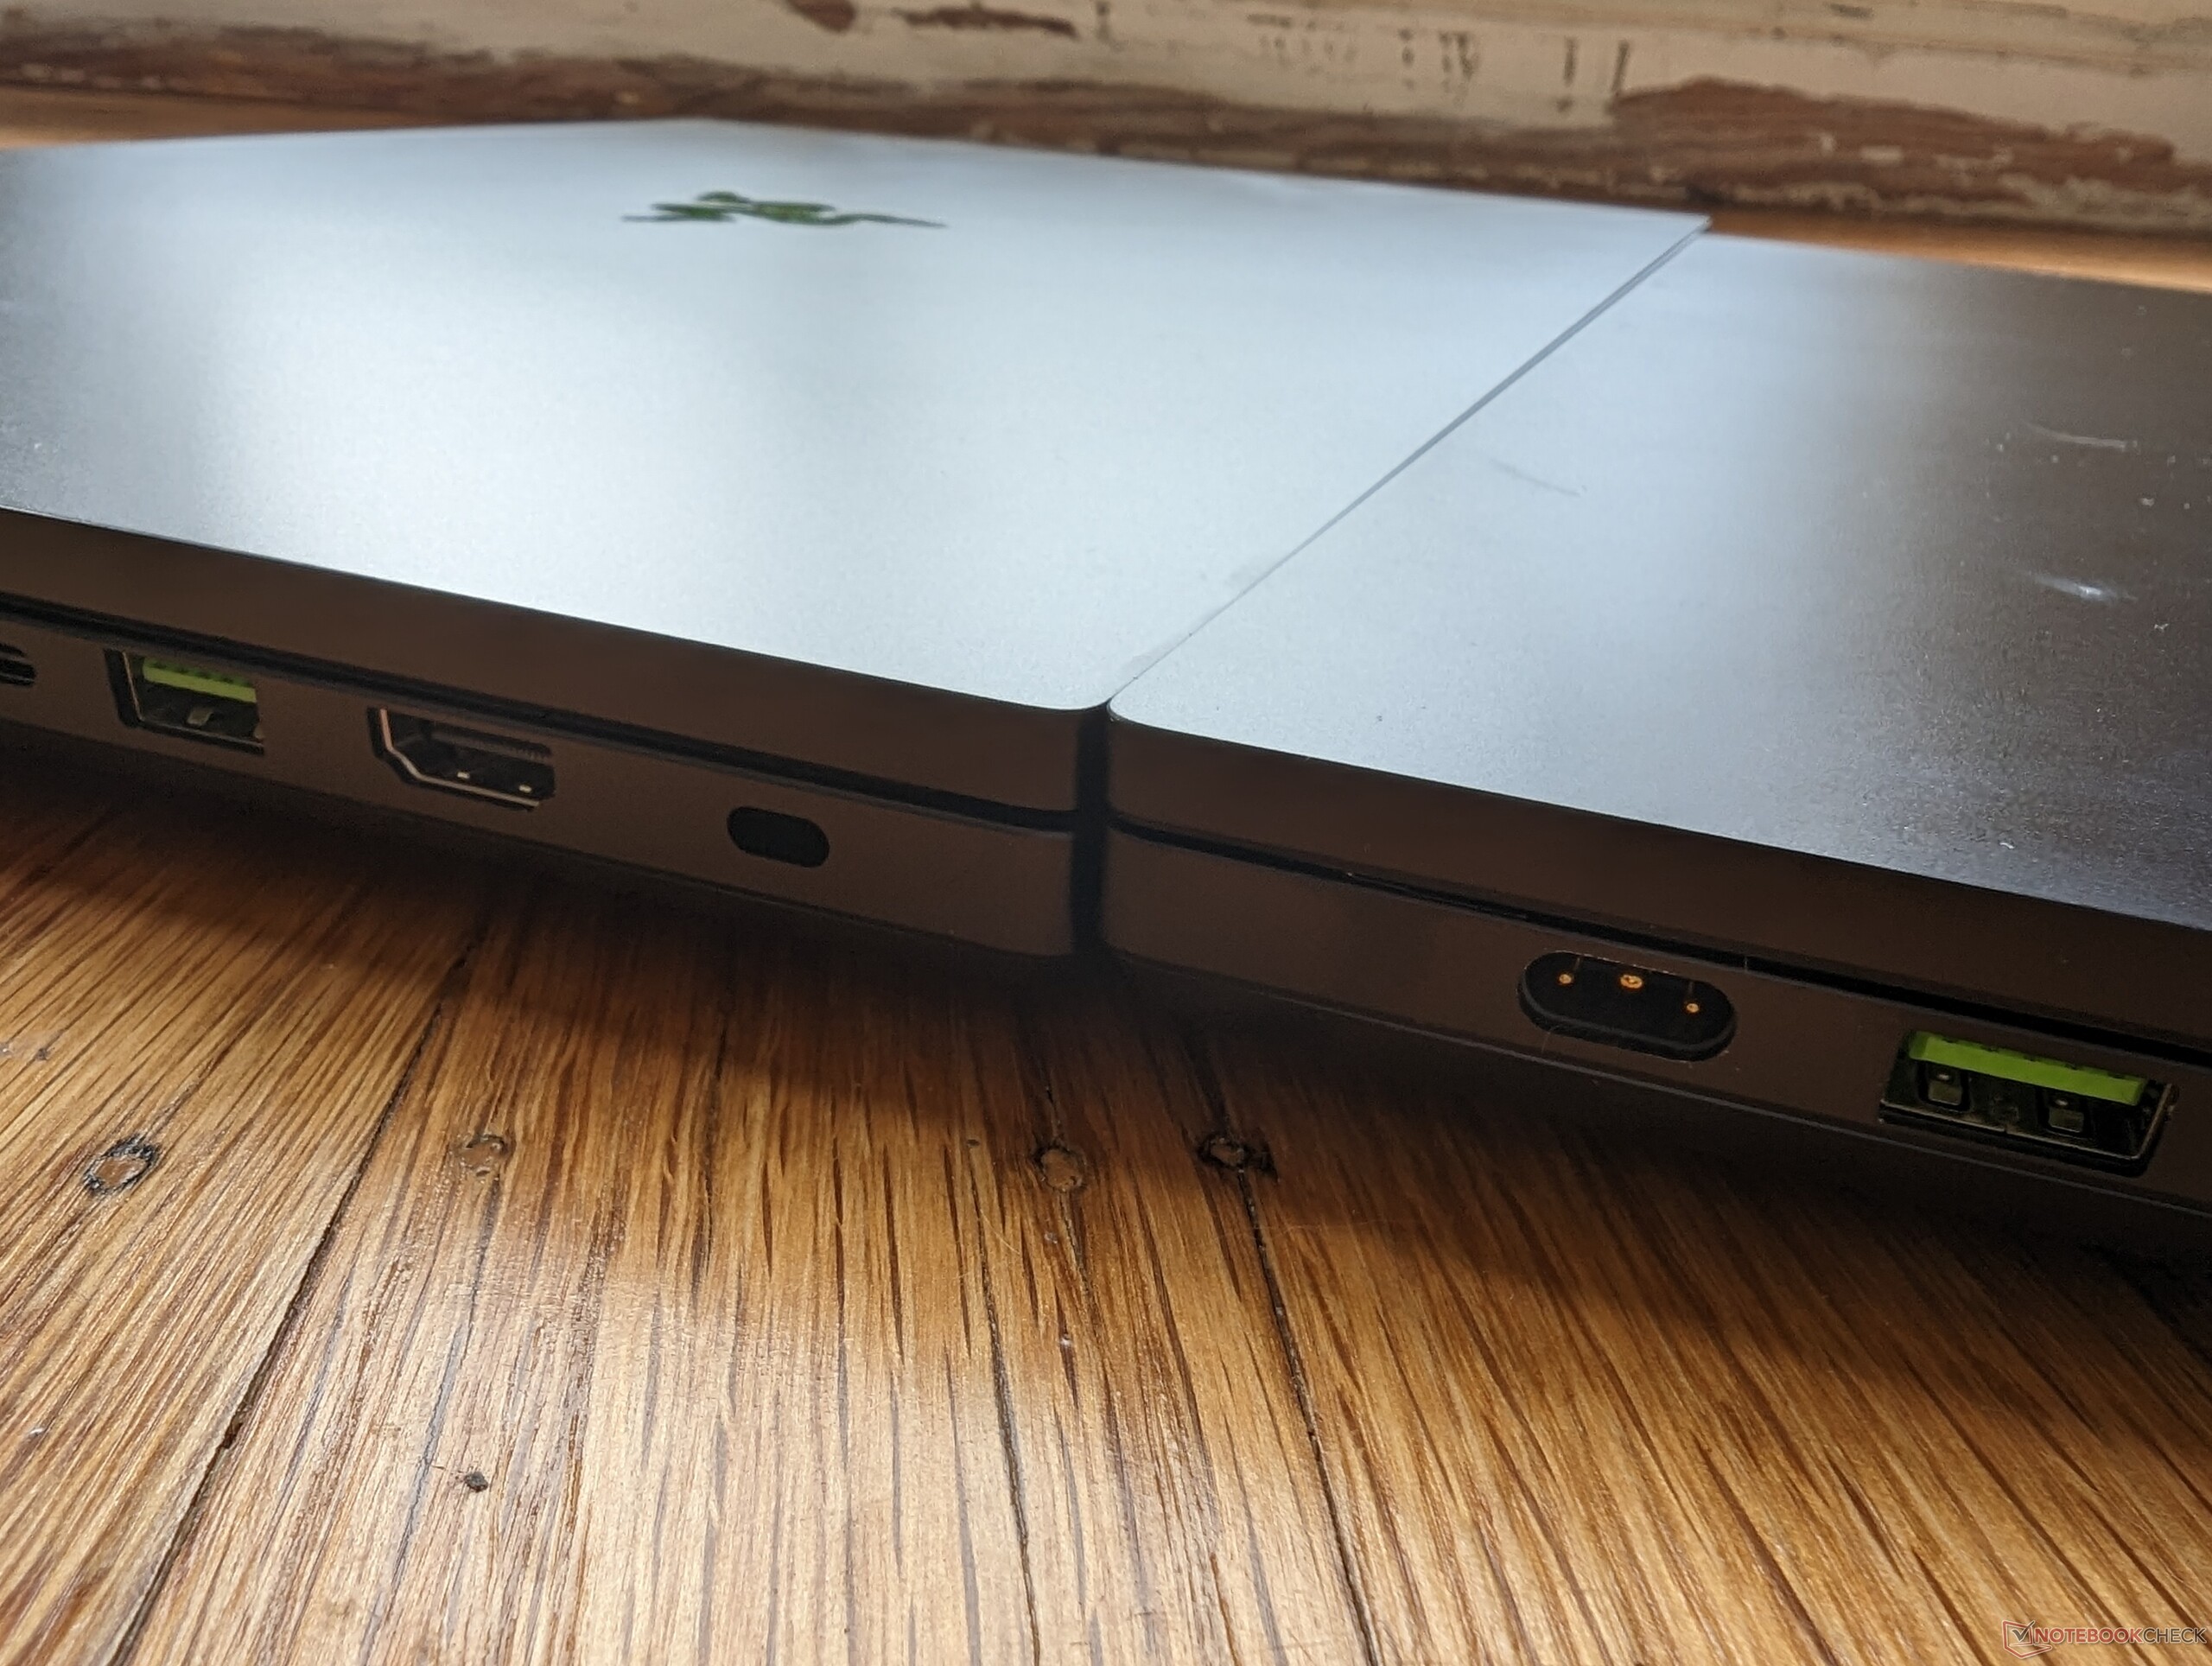
The new model inherits all the ports from the Blade 17 for a healthy selection of connectivity options. Even so, we would like to see a little more to better distinguish the Blade 18 from its smaller siblings. For example, an HDMI-in port would have added more versatility to the spacious 18-inch screen.
Keep in mind that only one of the two USB-C ports is compatible with Thunderbolt devices.
SD Card Reader
We're able to move 1 GB of pictures from our UHS-II test card to desktop in just 5 seconds compared to ~13 seconds on the MSI Titan GT77.
| SD Card Reader | |
| average JPG Copy Test (av. of 3 runs) | |
| Razer Blade 18 RTX 4070 (Angelibird AV Pro V60) | |
| Razer Blade 17 Early 2022 (AV PRO microSD 128 GB V60) | |
| Razer Blade 16 Early 2023 (AV PRO microSD 128 GB V60) | |
| MSI Titan GT77 HX 13VI (Angelibird AV Pro V60) | |
| maximum AS SSD Seq Read Test (1GB) | |
| Razer Blade 18 RTX 4070 (Angelibird AV Pro V60) | |
| Razer Blade 16 Early 2023 (AV PRO microSD 128 GB V60) | |
| Gigabyte G7 KE (AV PRO microSD 128 GB V60) | |
| MSI Titan GT77 HX 13VI (Angelibird AV Pro V60) | |
Communication
An Intel AX211 comes standard for Wi-Fi 6E and Bluetooth 5.3 connectivity whereas the Blade 17 ships with the Killer AX1690i in comparison. The Killer AX1690i is the gaming-specific derivative of the Intel AX211 and so users shouldn't see any significant performance differences between the two.
| Networking | |
| iperf3 transmit AXE11000 6GHz | |
| Asus ROG Strix Scar 17 SE G733CX-LL014W | |
| Razer Blade 18 RTX 4070 | |
| iperf3 receive AXE11000 6GHz | |
| Asus ROG Strix Scar 17 SE G733CX-LL014W | |
| Razer Blade 18 RTX 4070 | |
| iperf3 receive AXE11000 | |
| Razer Blade 17 Early 2022 | |
| Gigabyte G7 KE | |
| MSI Titan GT77 HX 13VI | |
| Razer Blade 18 RTX 4070 | |
| Alienware m17 R5 (R9 6900HX, RX 6850M XT) | |
| iperf3 transmit AXE11000 | |
| Gigabyte G7 KE | |
| MSI Titan GT77 HX 13VI | |
| Razer Blade 18 RTX 4070 | |
| Alienware m17 R5 (R9 6900HX, RX 6850M XT) | |
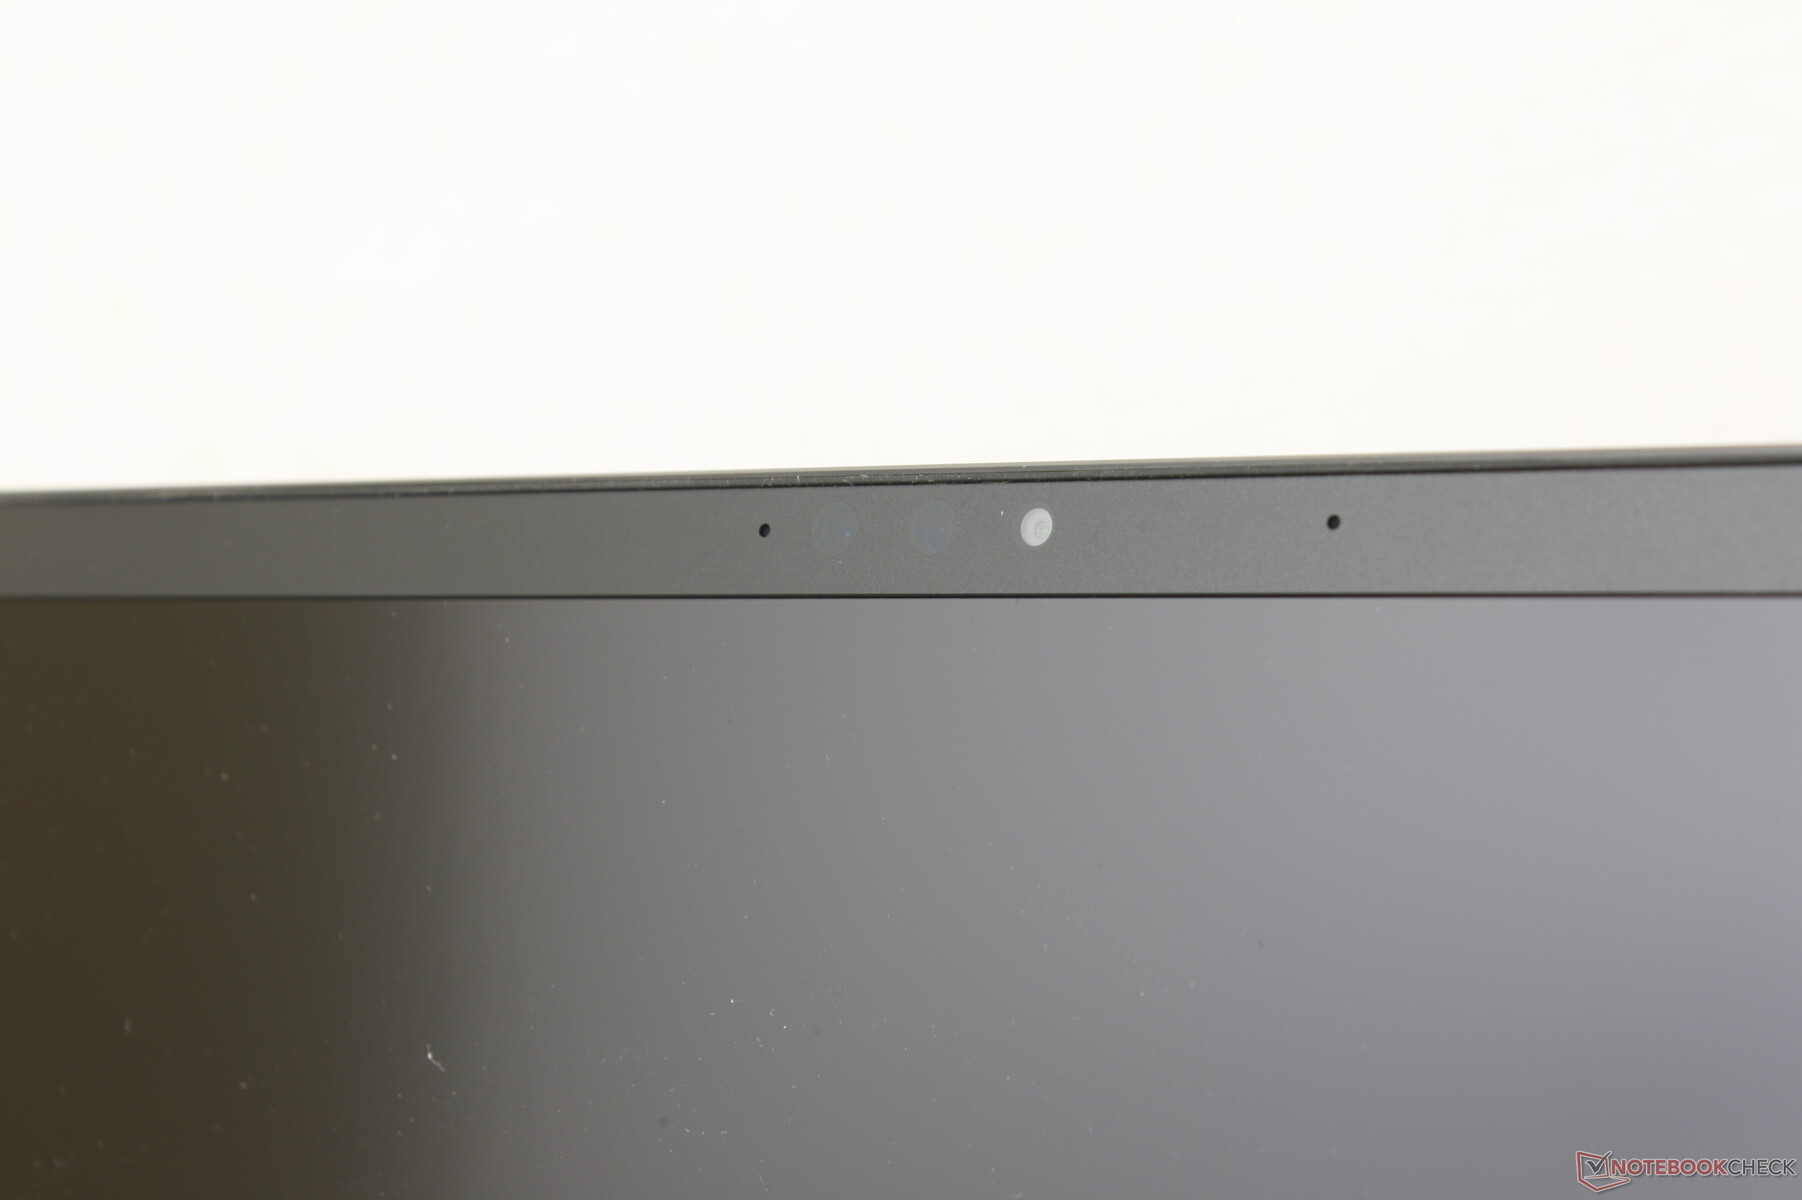
Webcam — Now with 5 MP
Razer has upgraded the webcam from 2 MP on the Blade 17 to 5 MP on the Blade 18. We fully expect the manufacturer to start updating its smaller Blade models with the same 5 MP sensor at some point in the near future. Images are sharper with the 5 MP sensor while colors haven't changed all that much. IR comes standard for Windows Hello support.
Strangely, there is no physical webcam privacy shutter even though the Blade 16 incorporates one. There is not even a digital kill switch or hotkey.


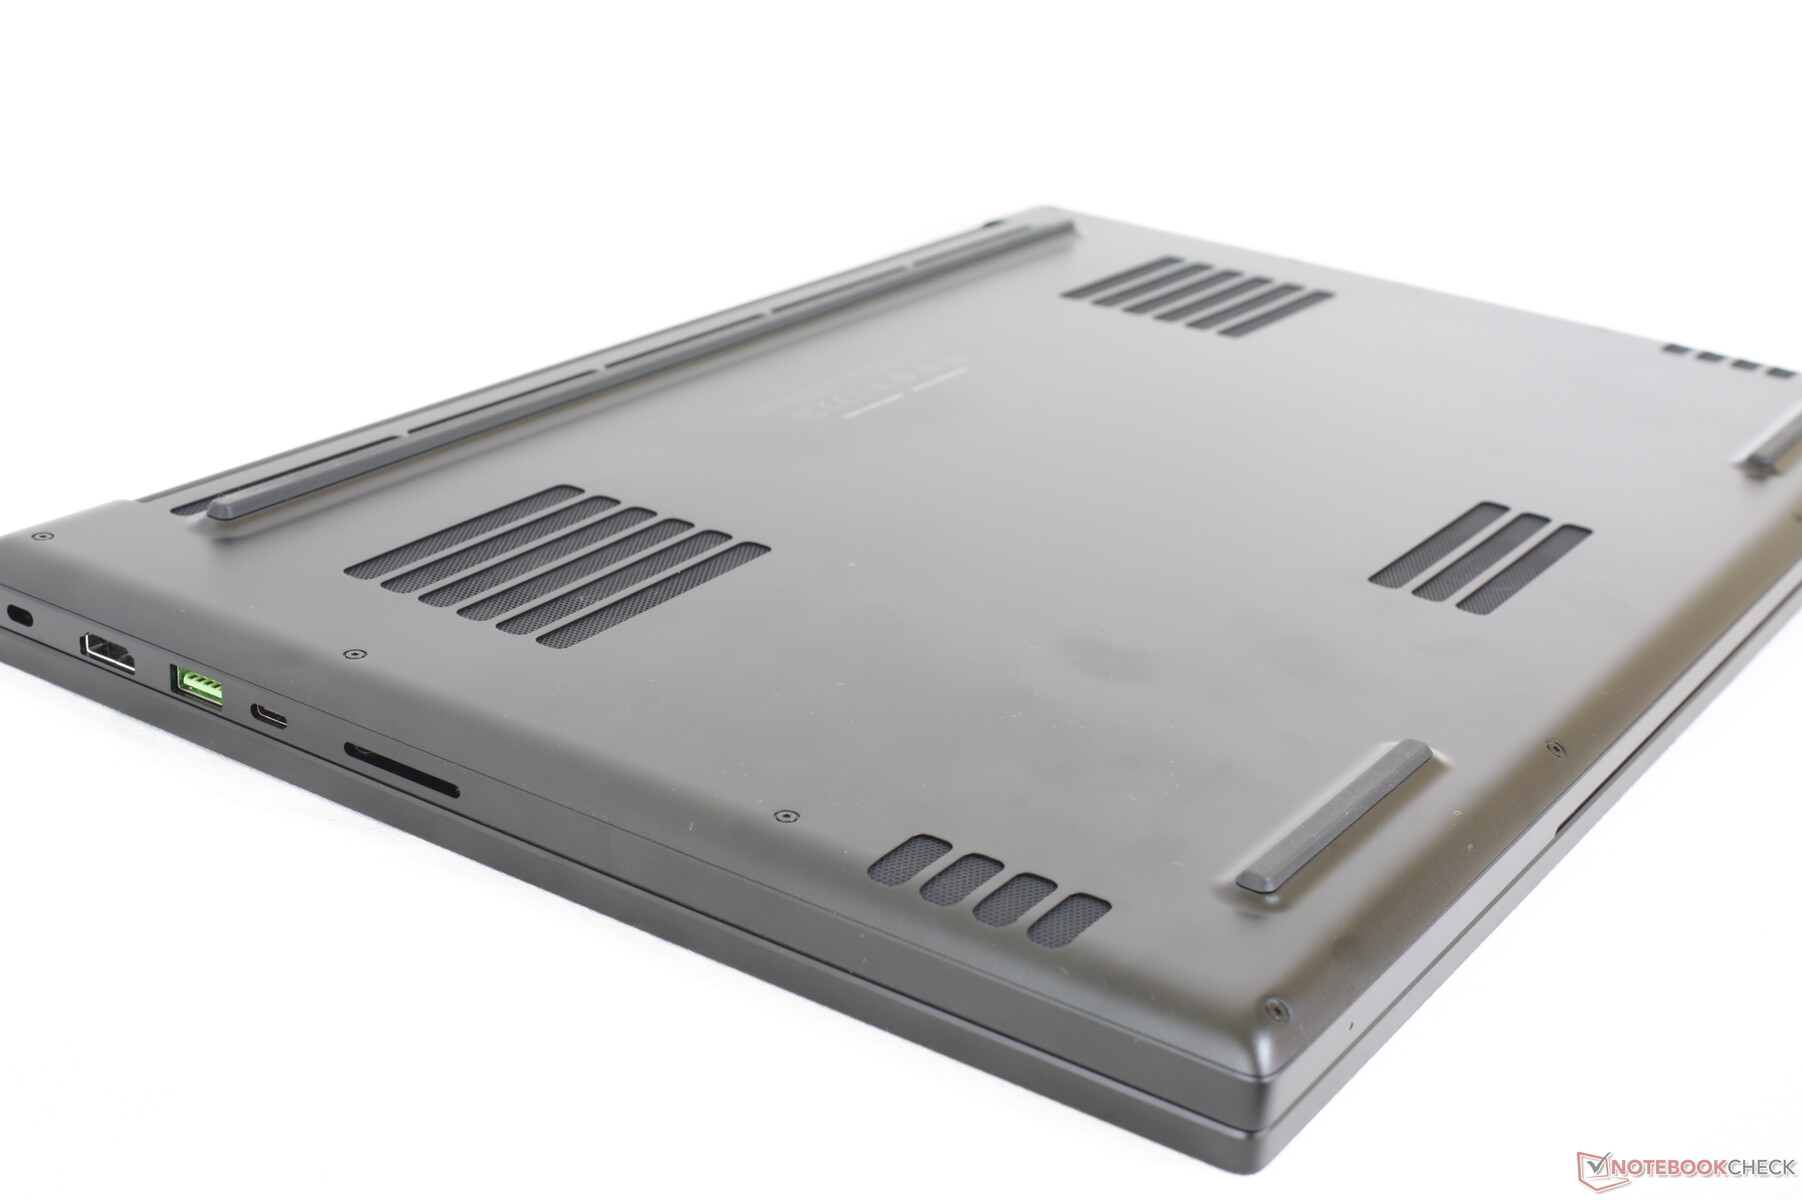
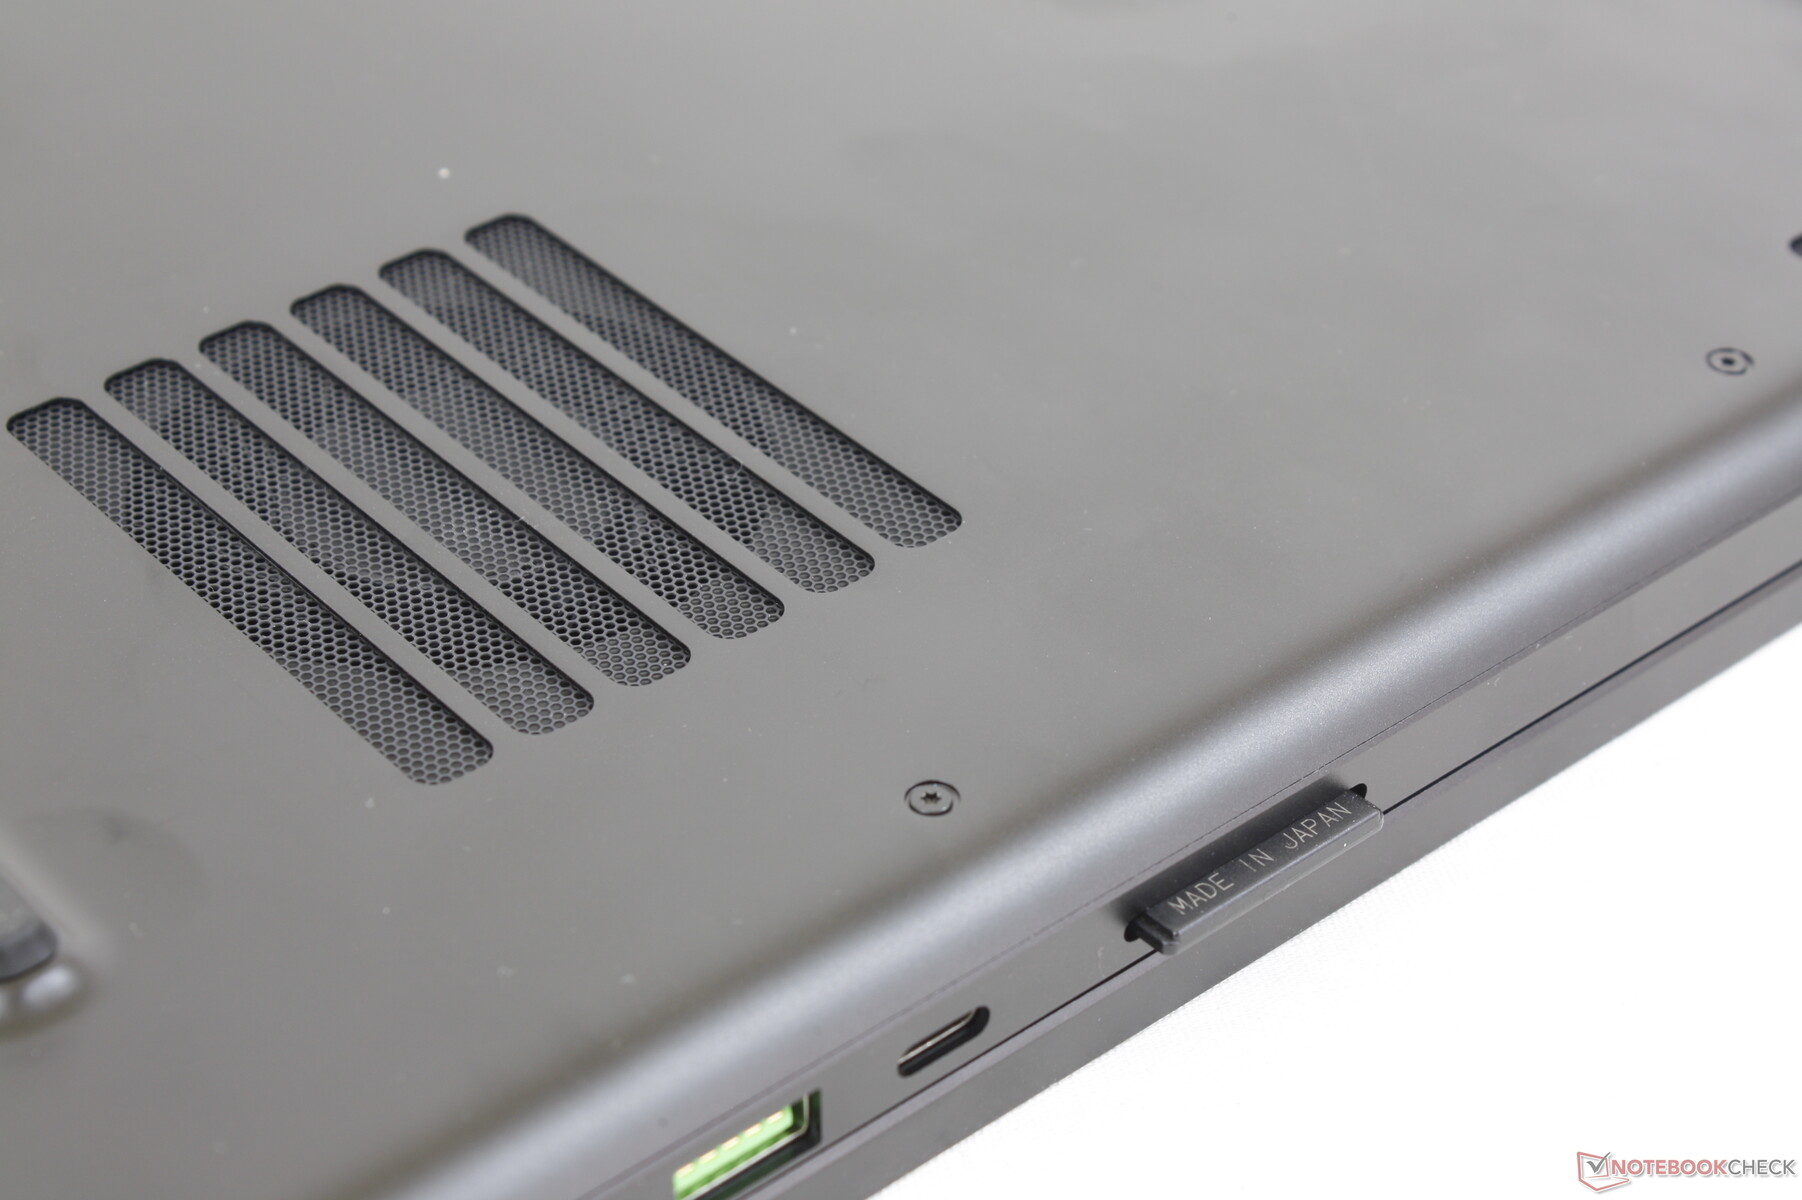
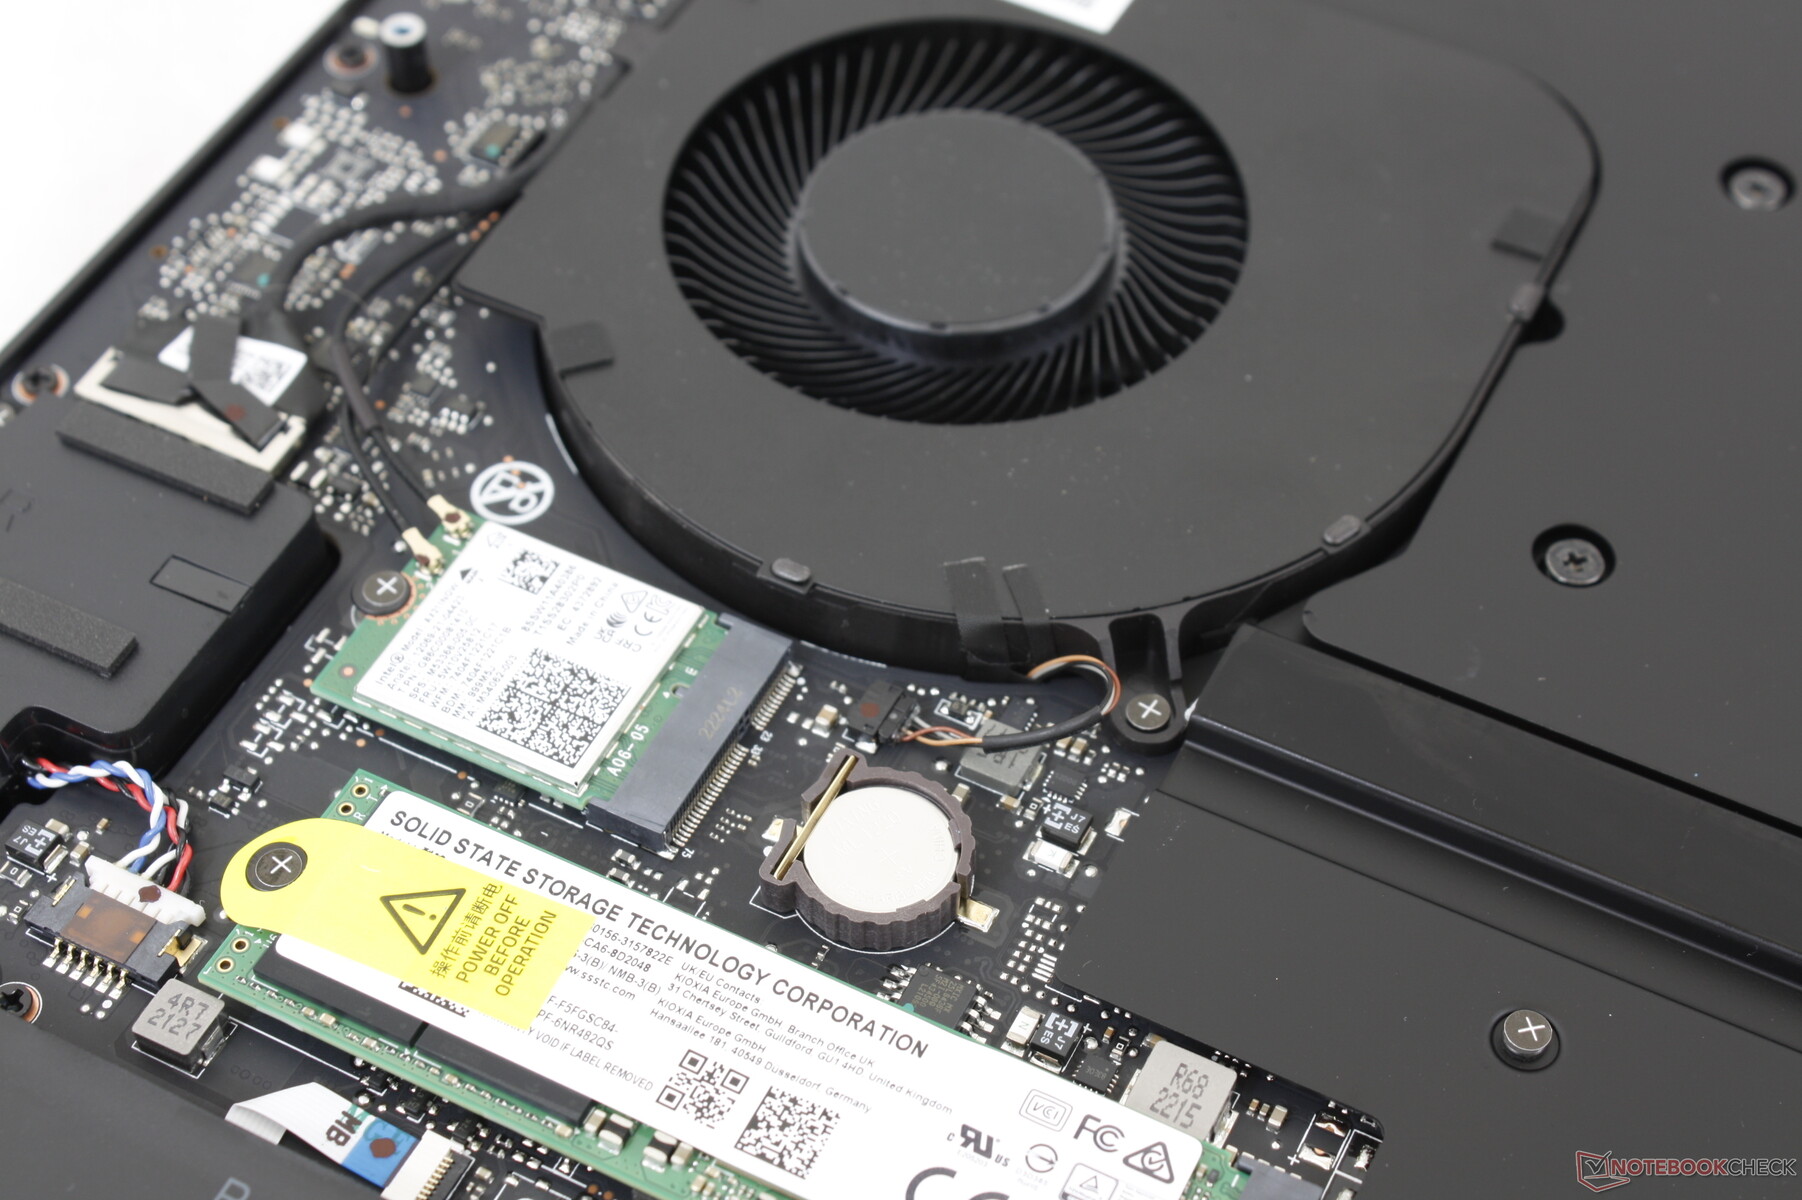
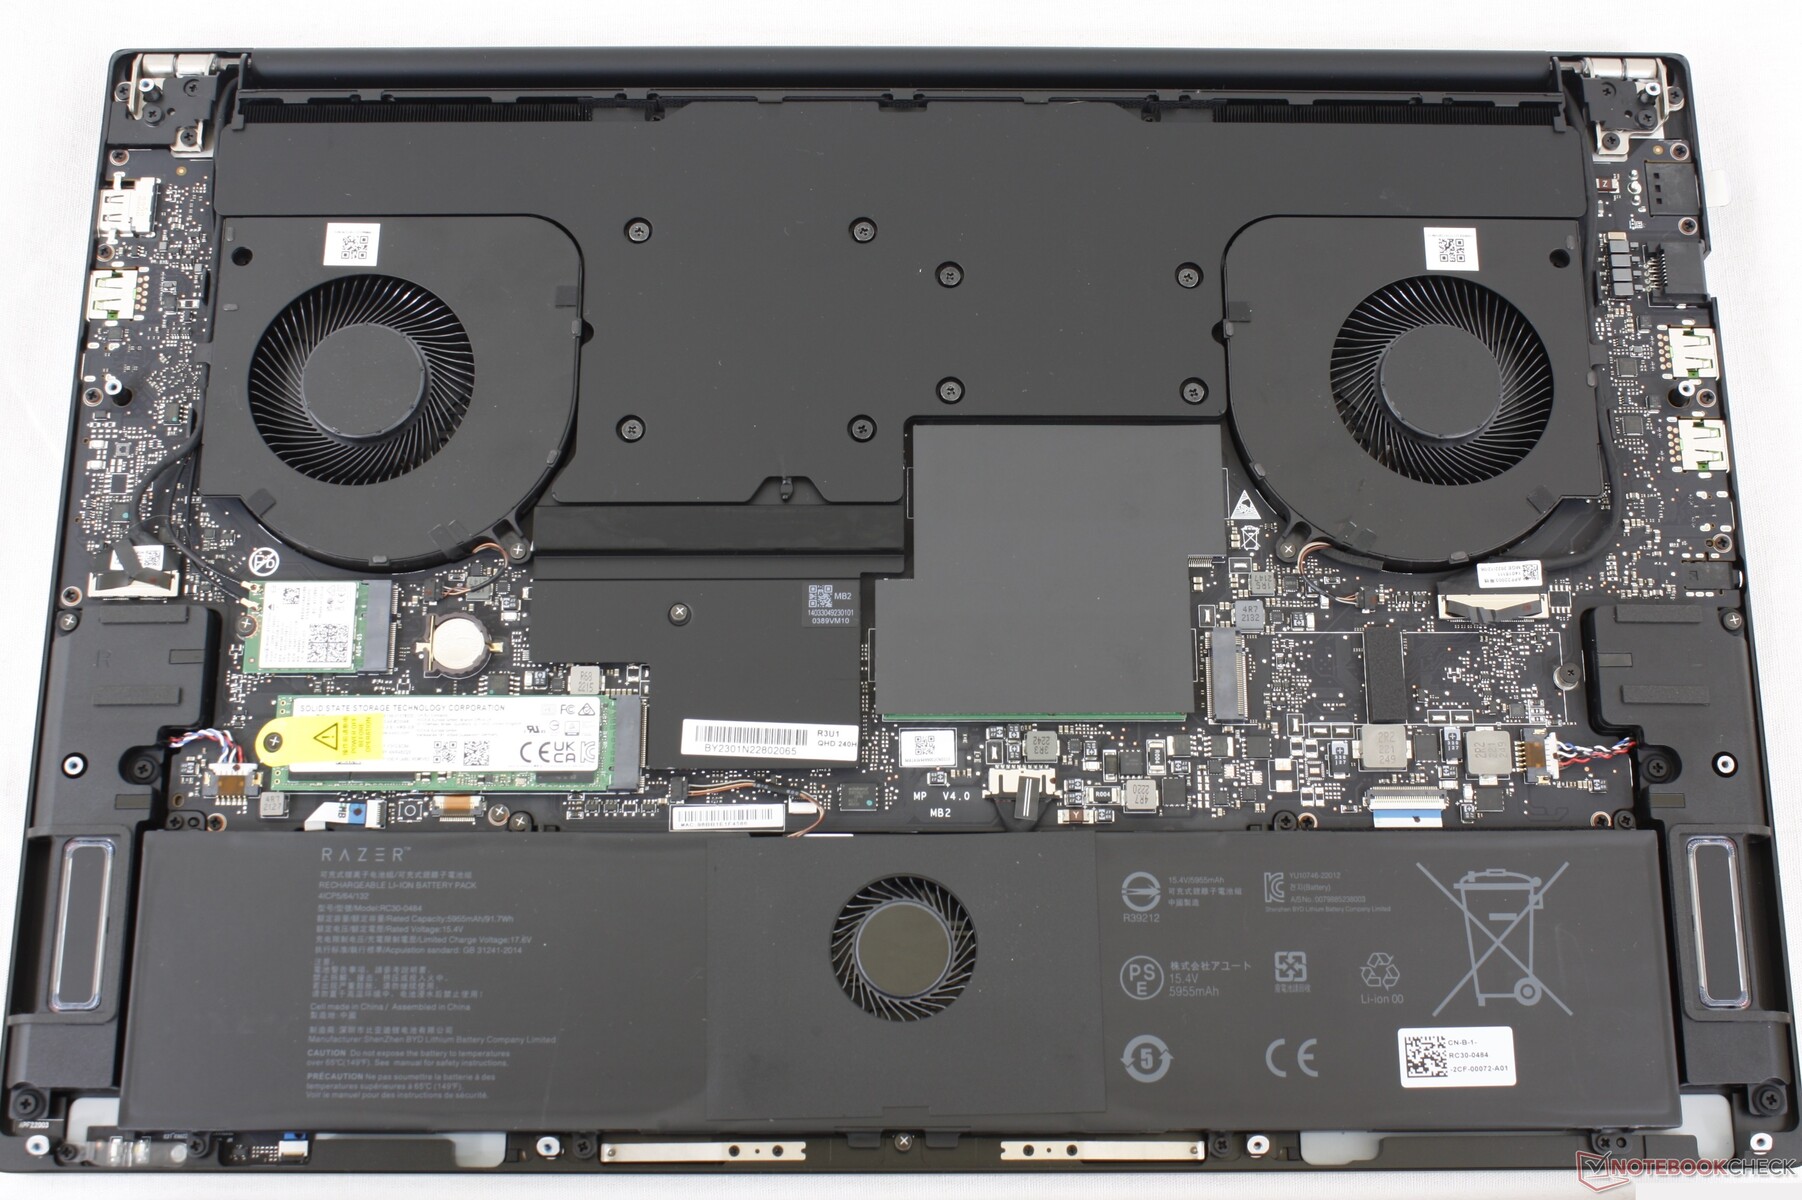
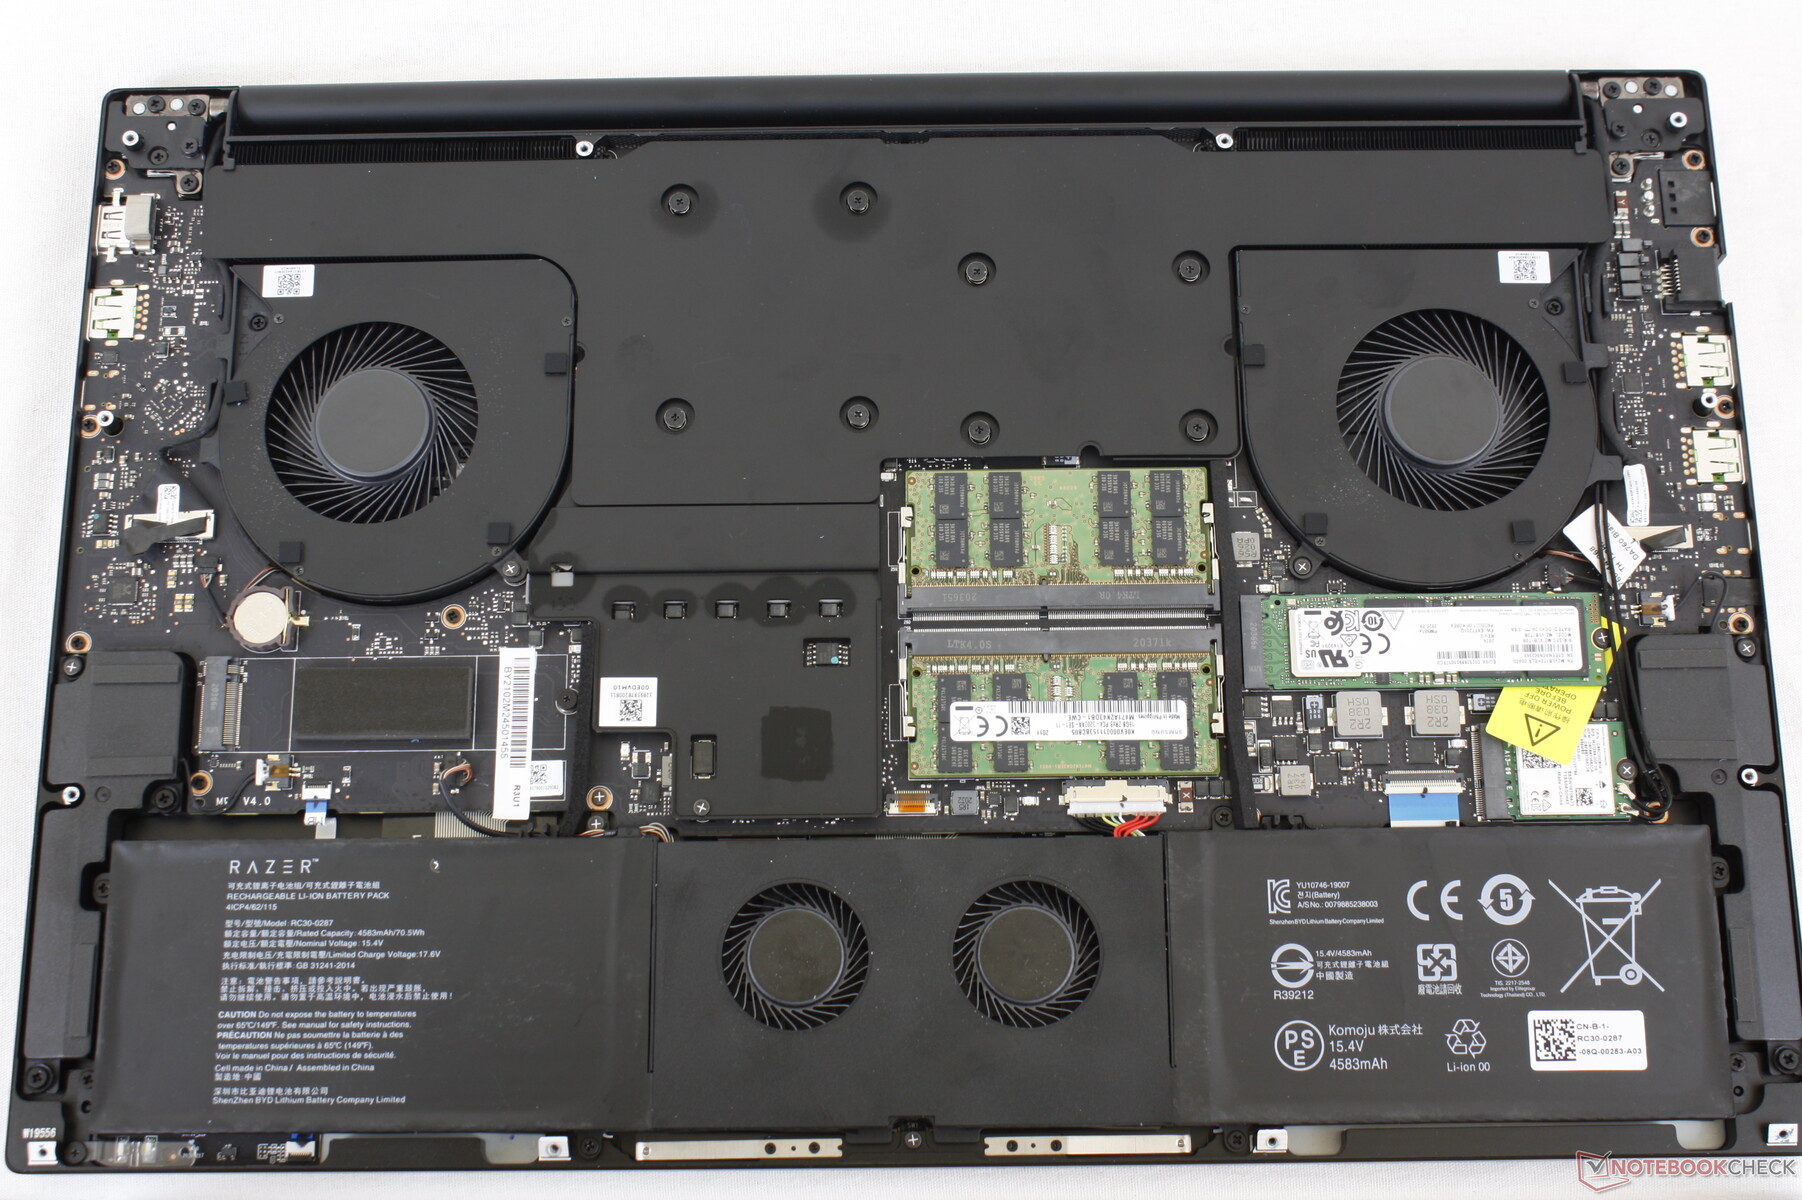
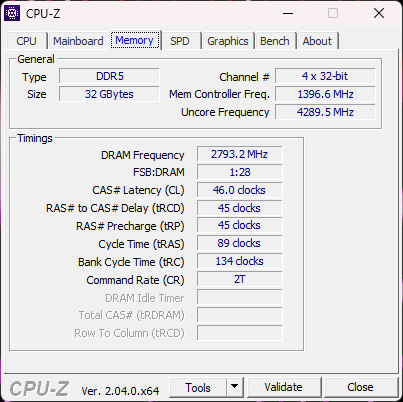
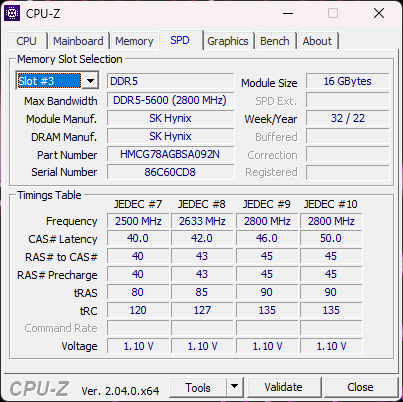
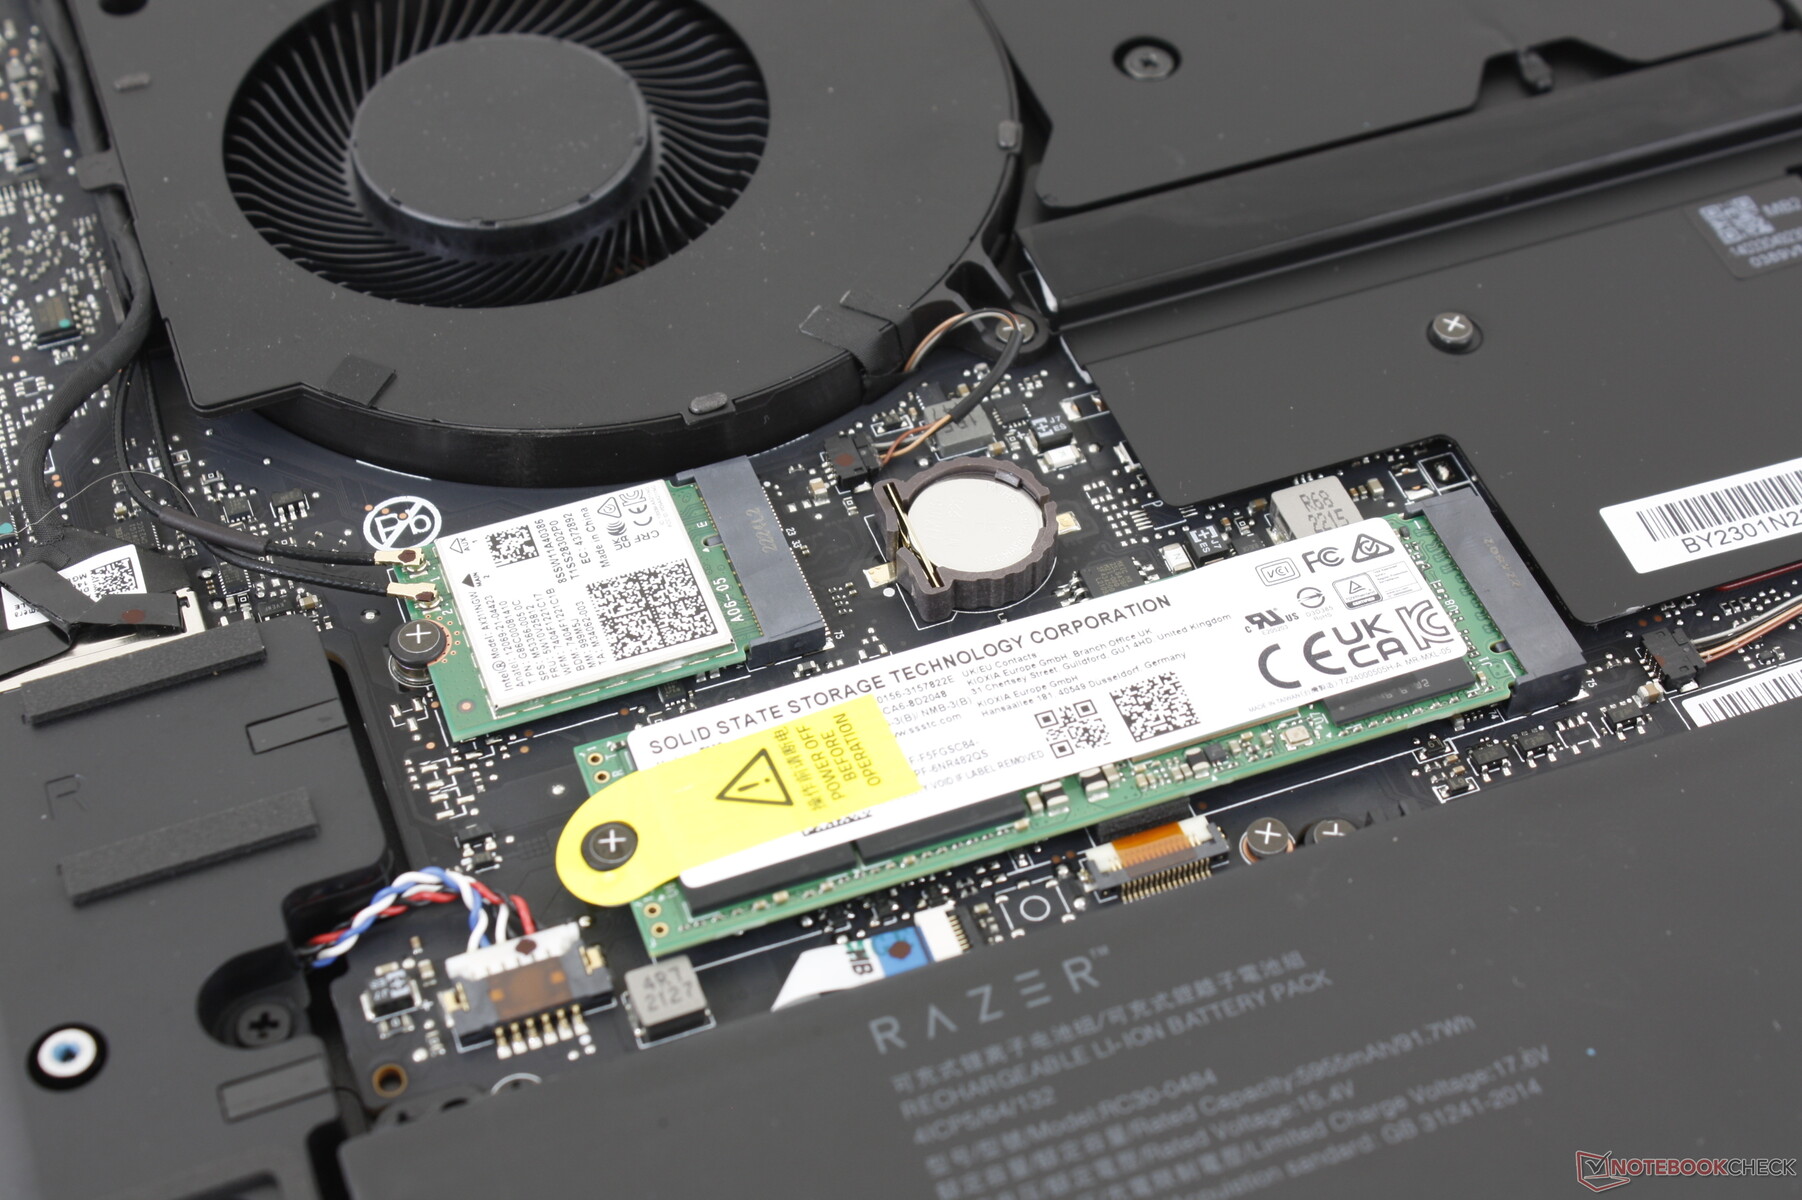
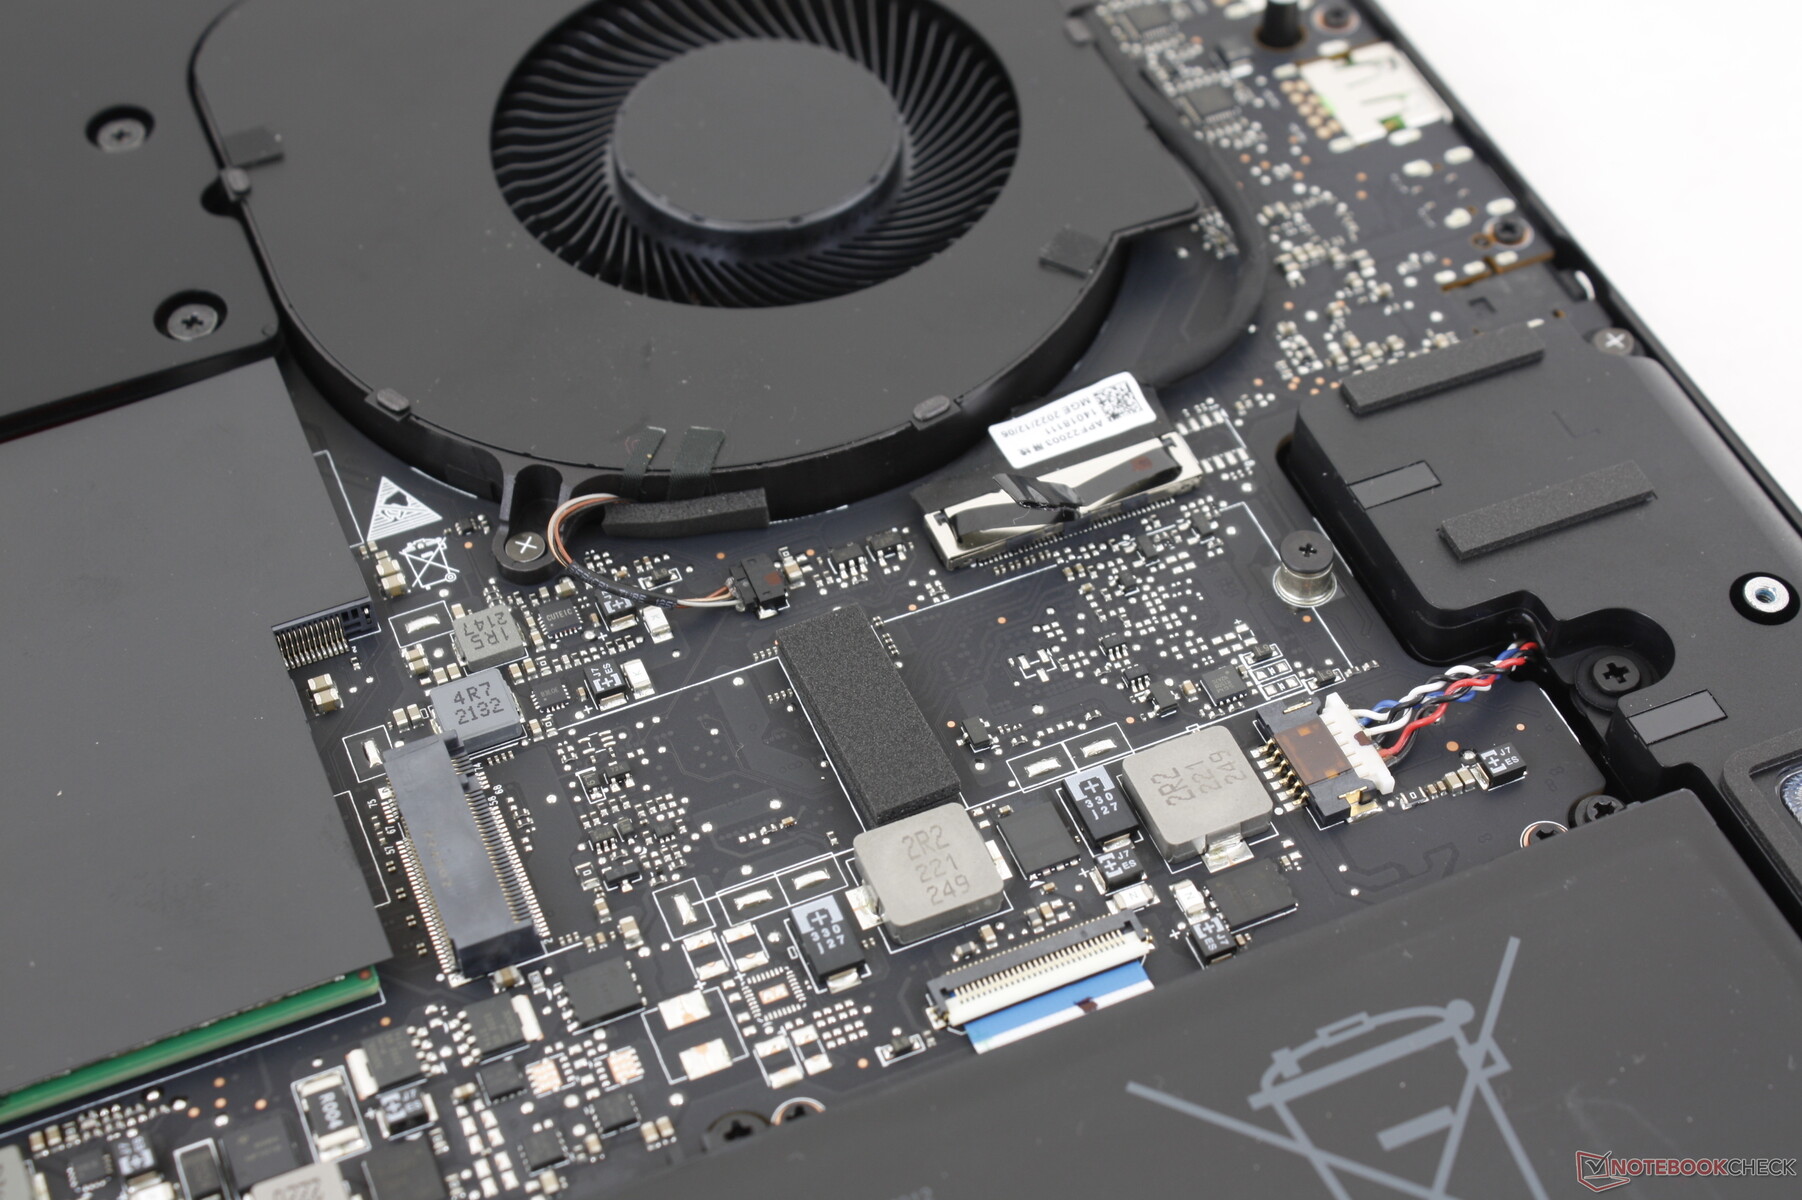
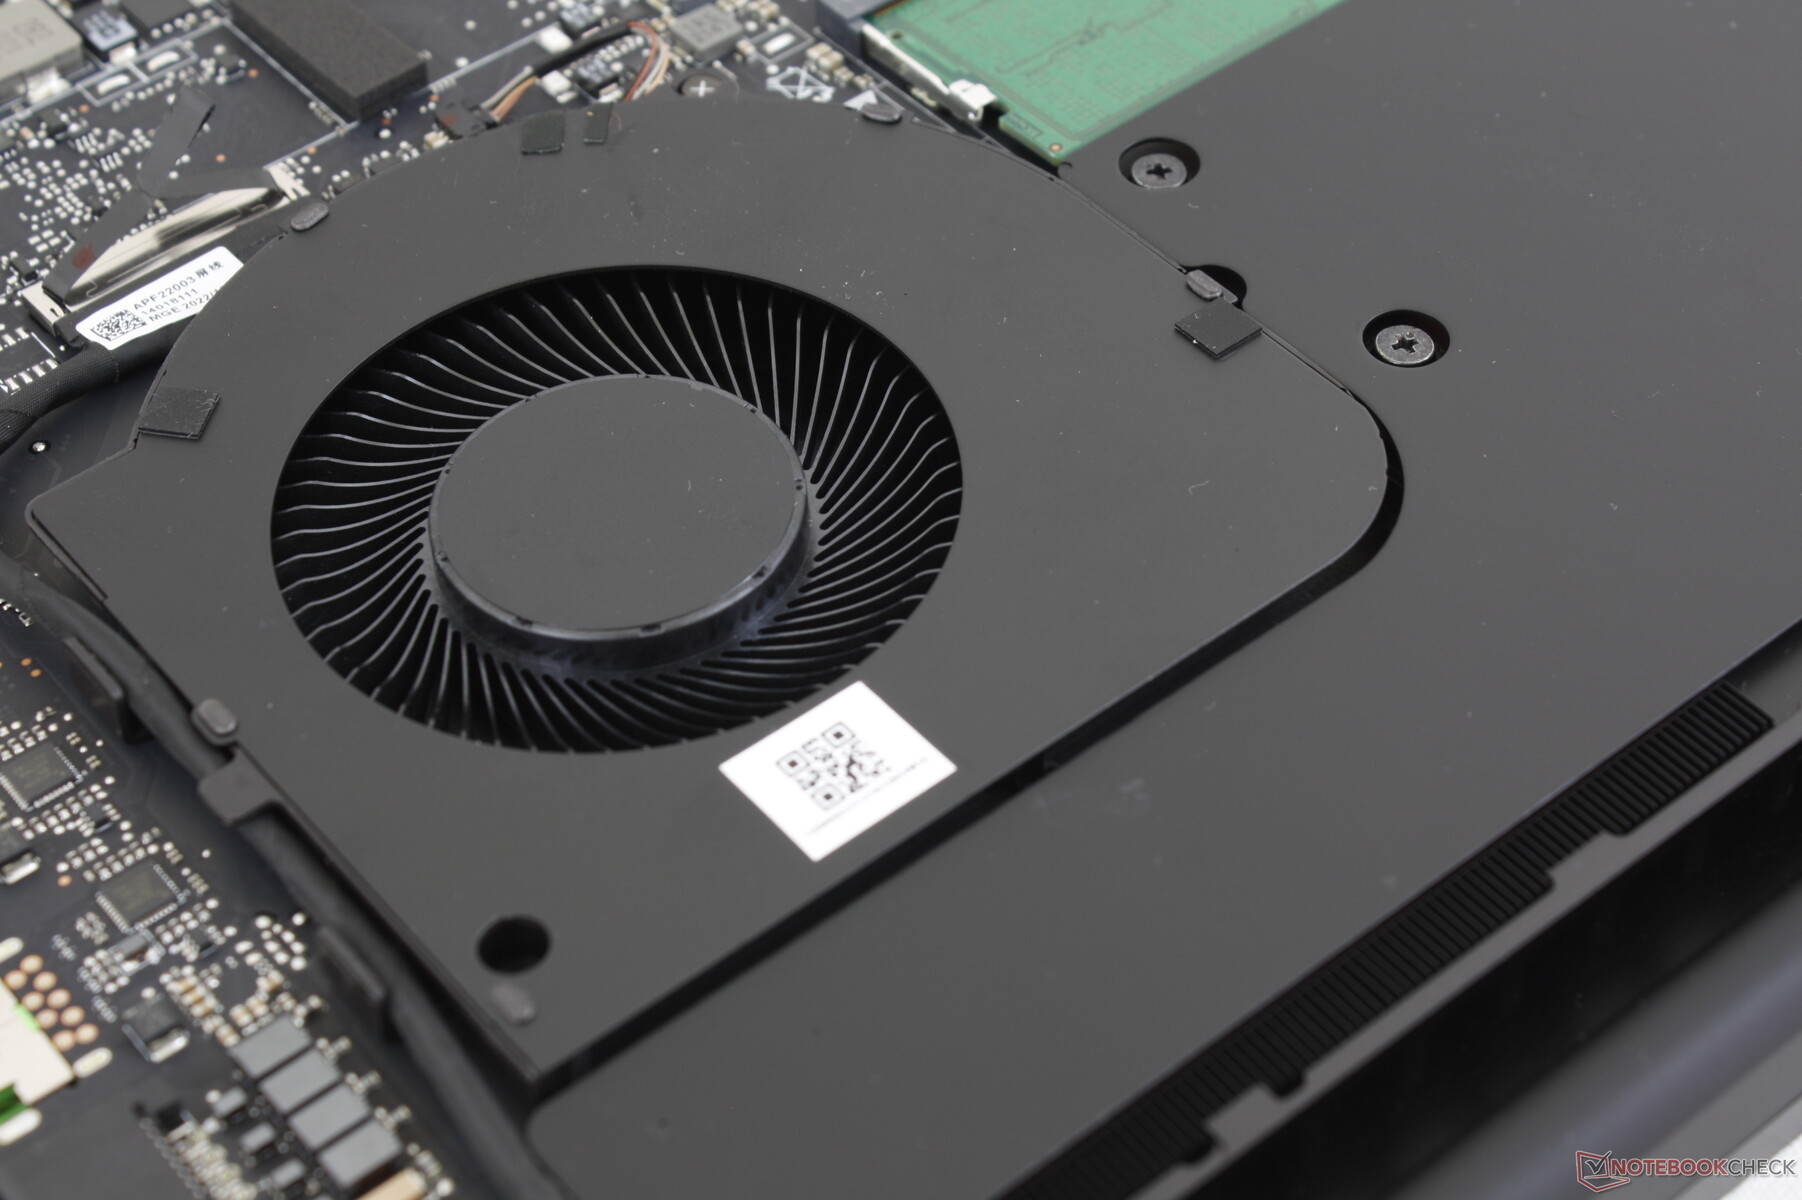
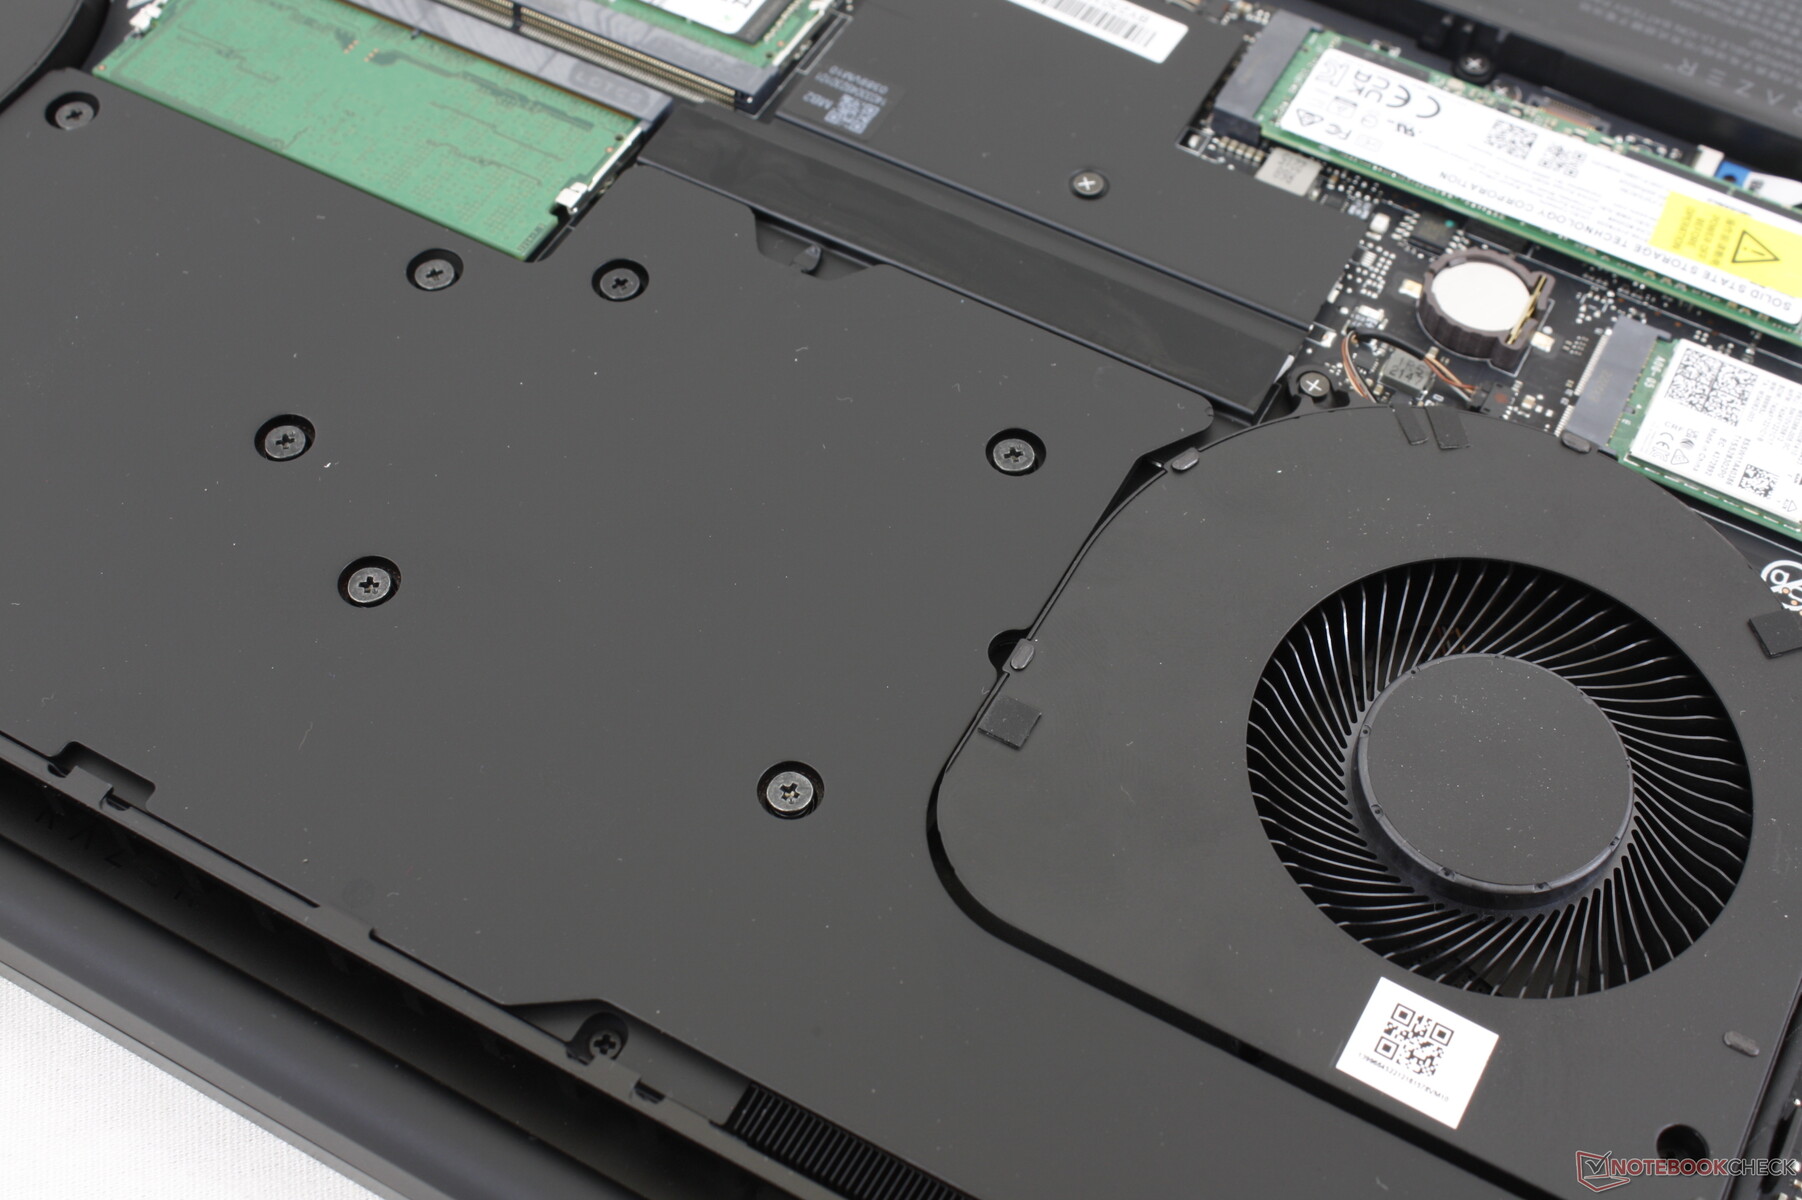
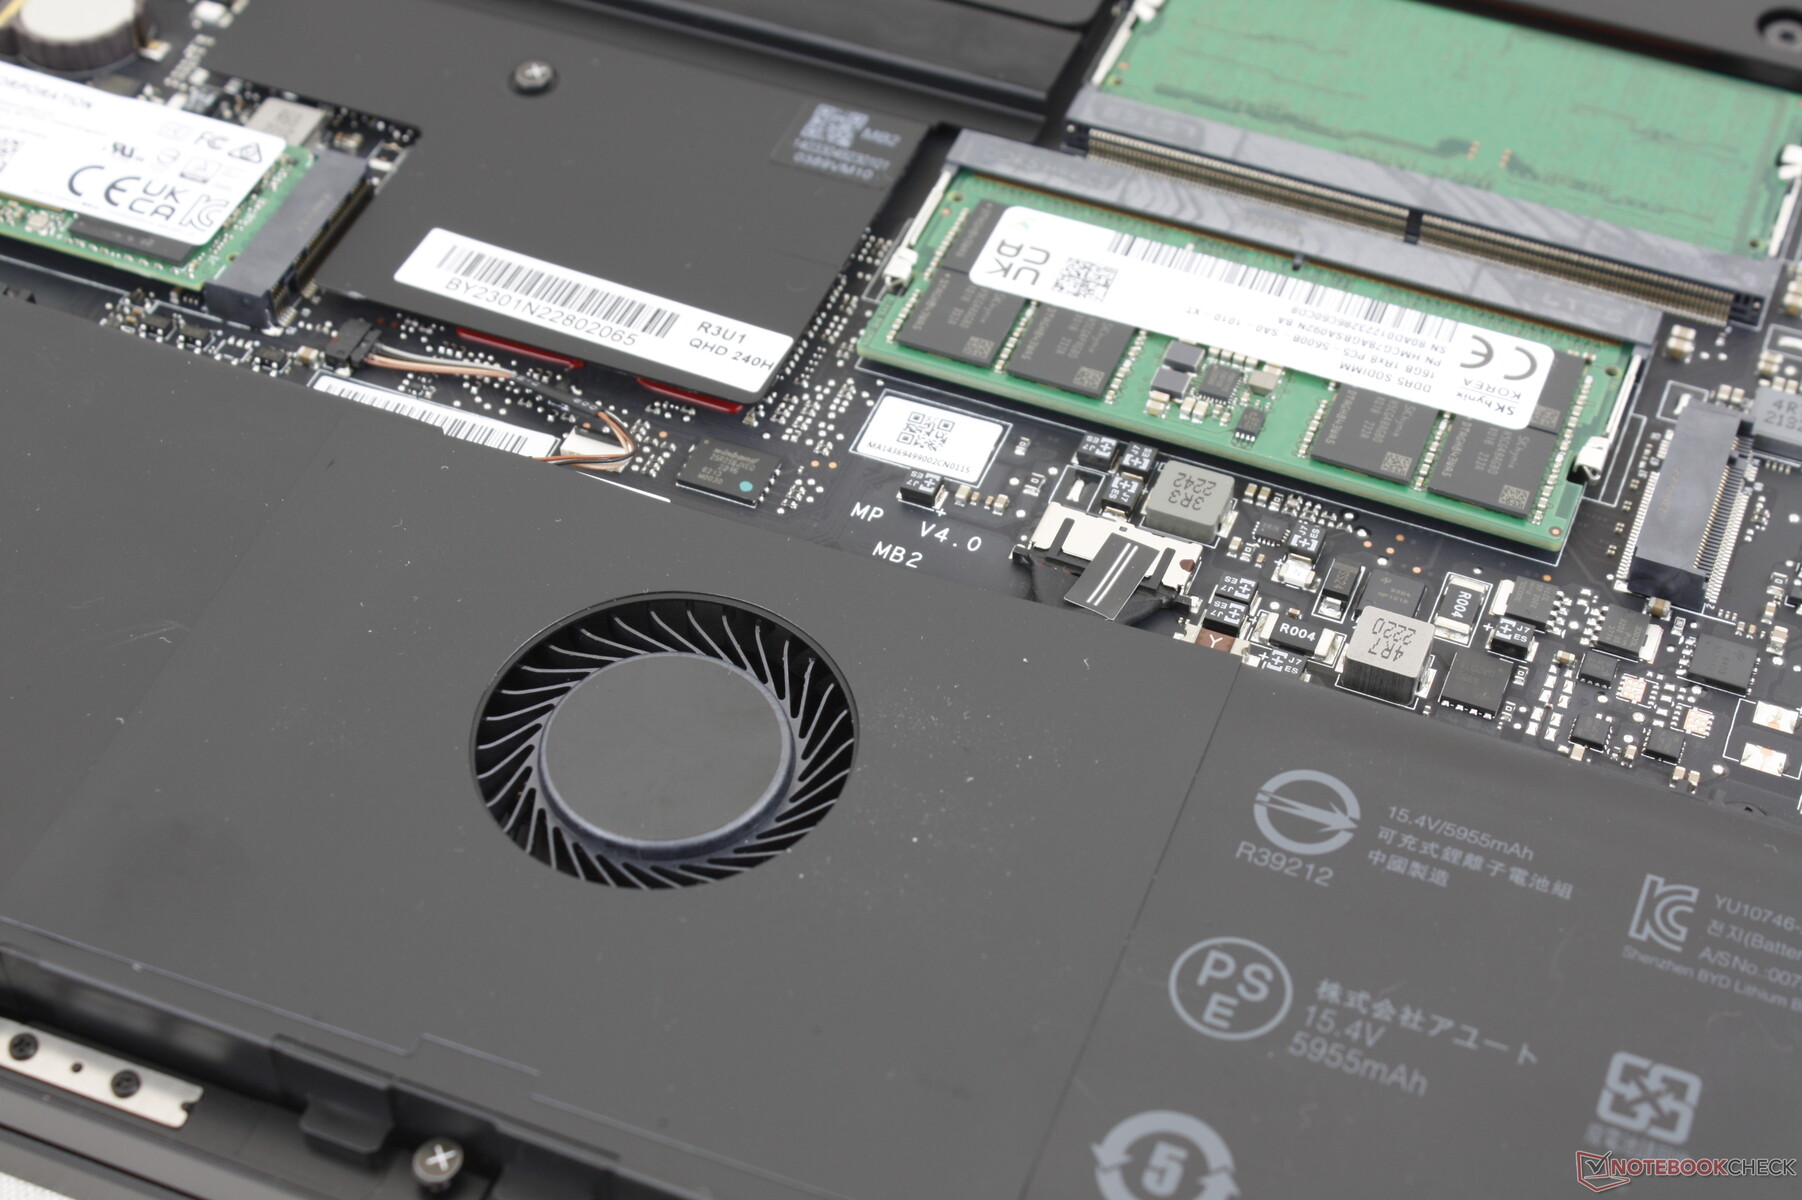
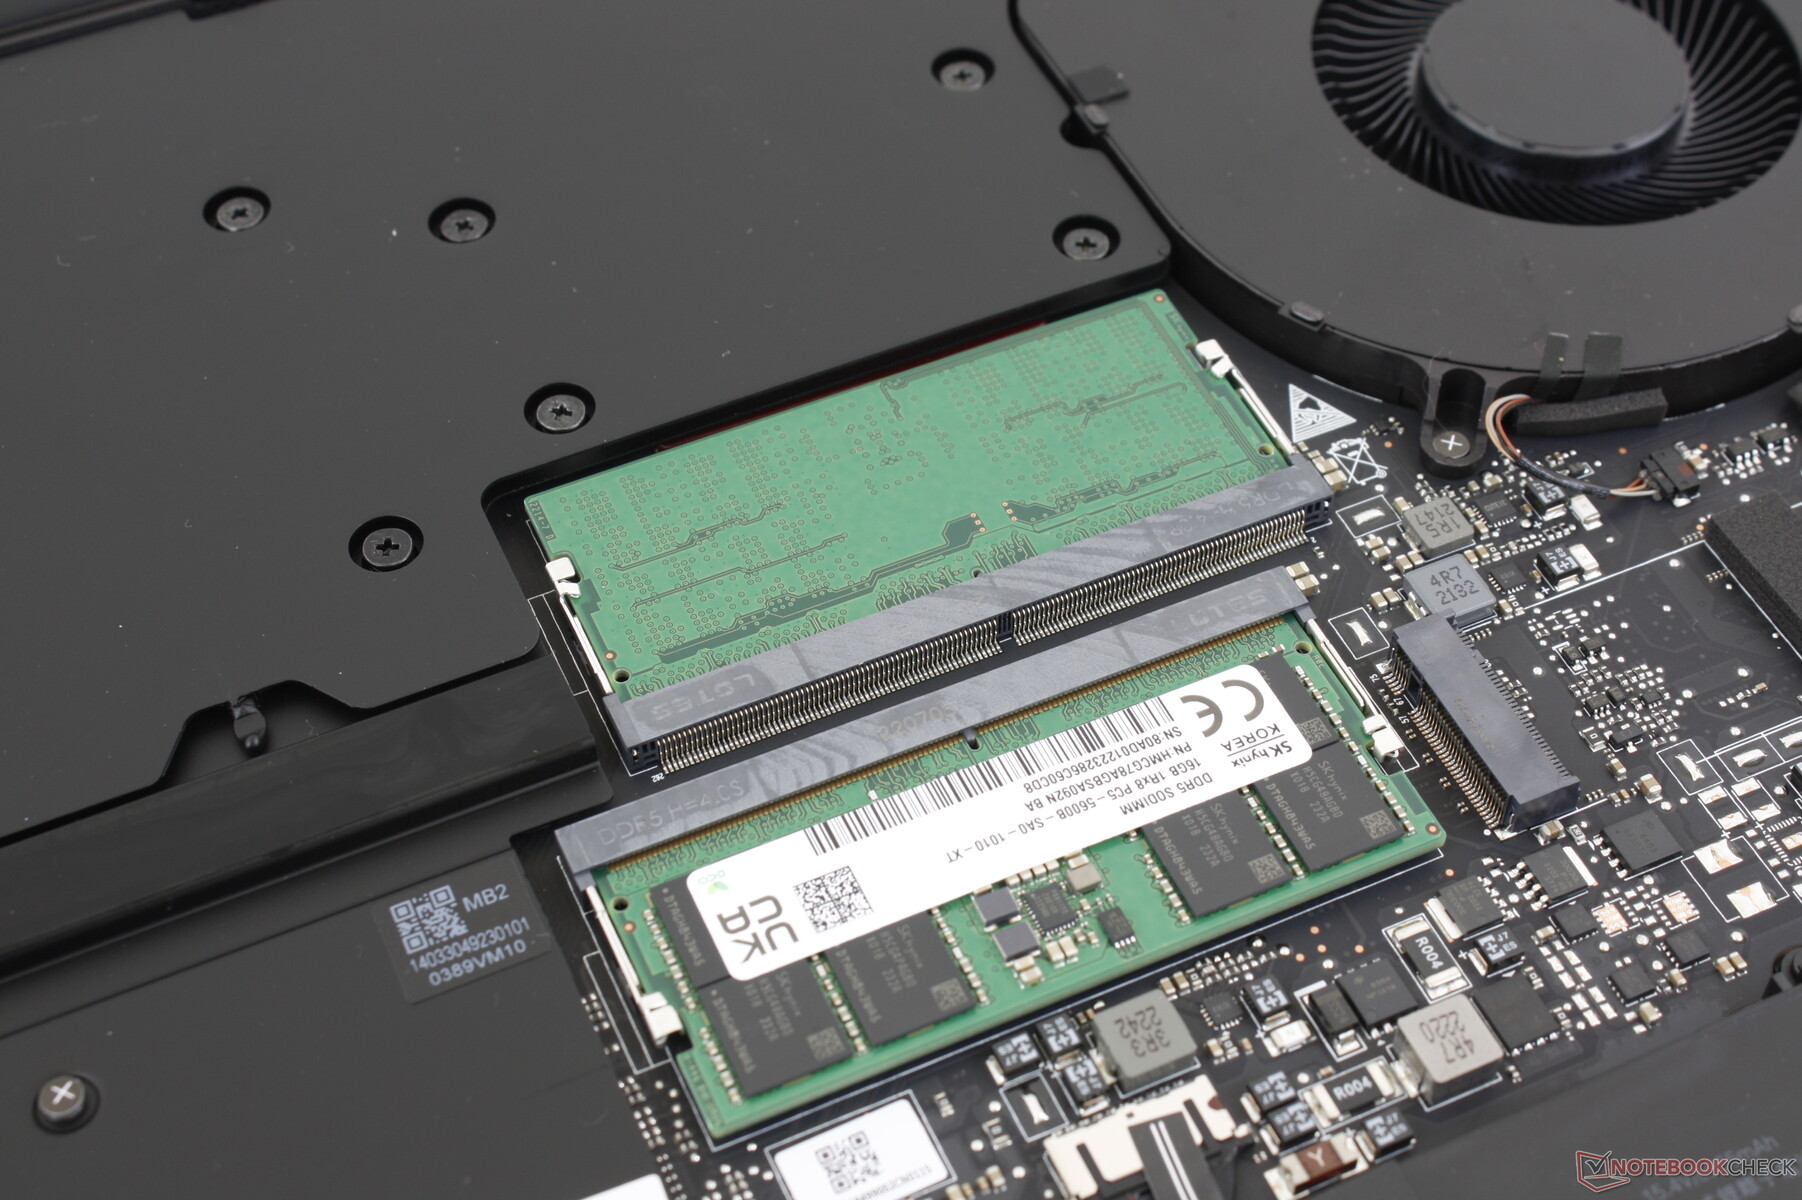
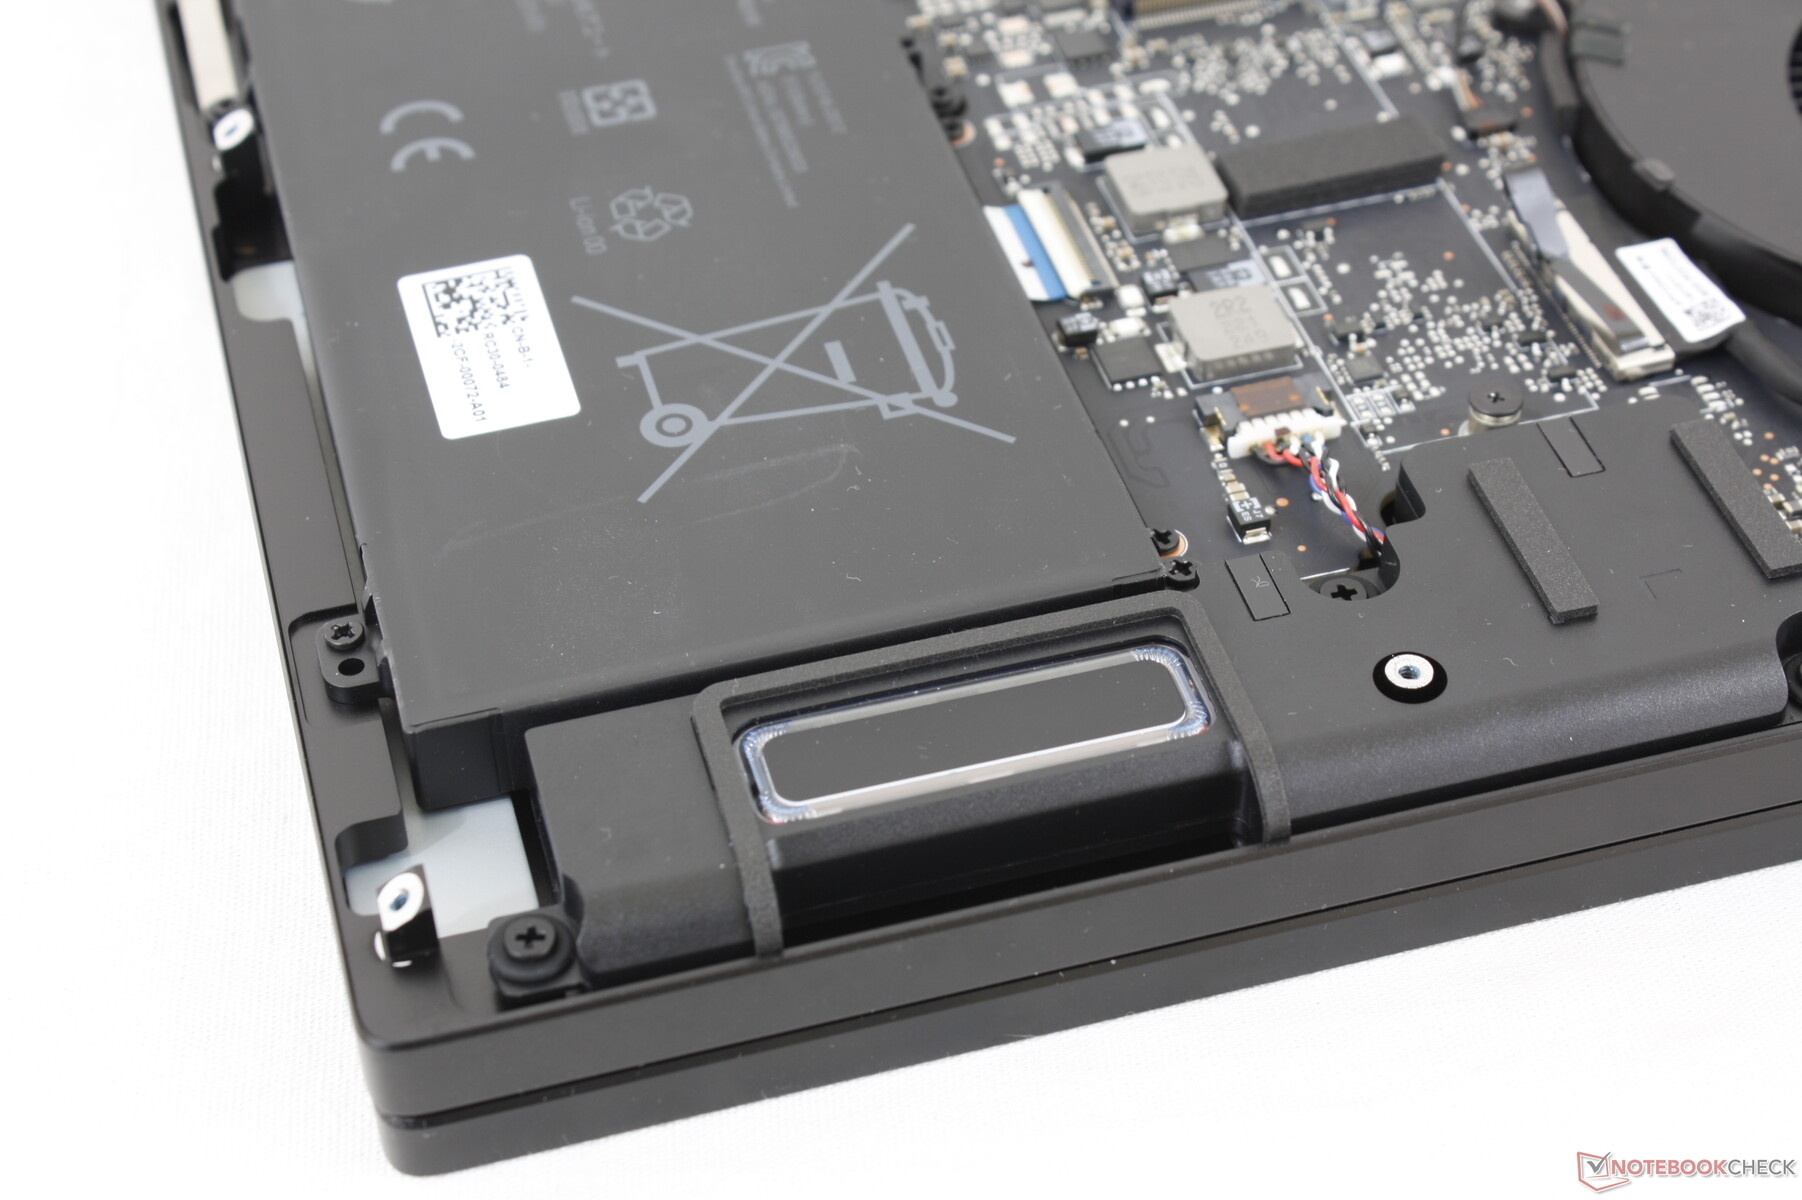
Maintenance
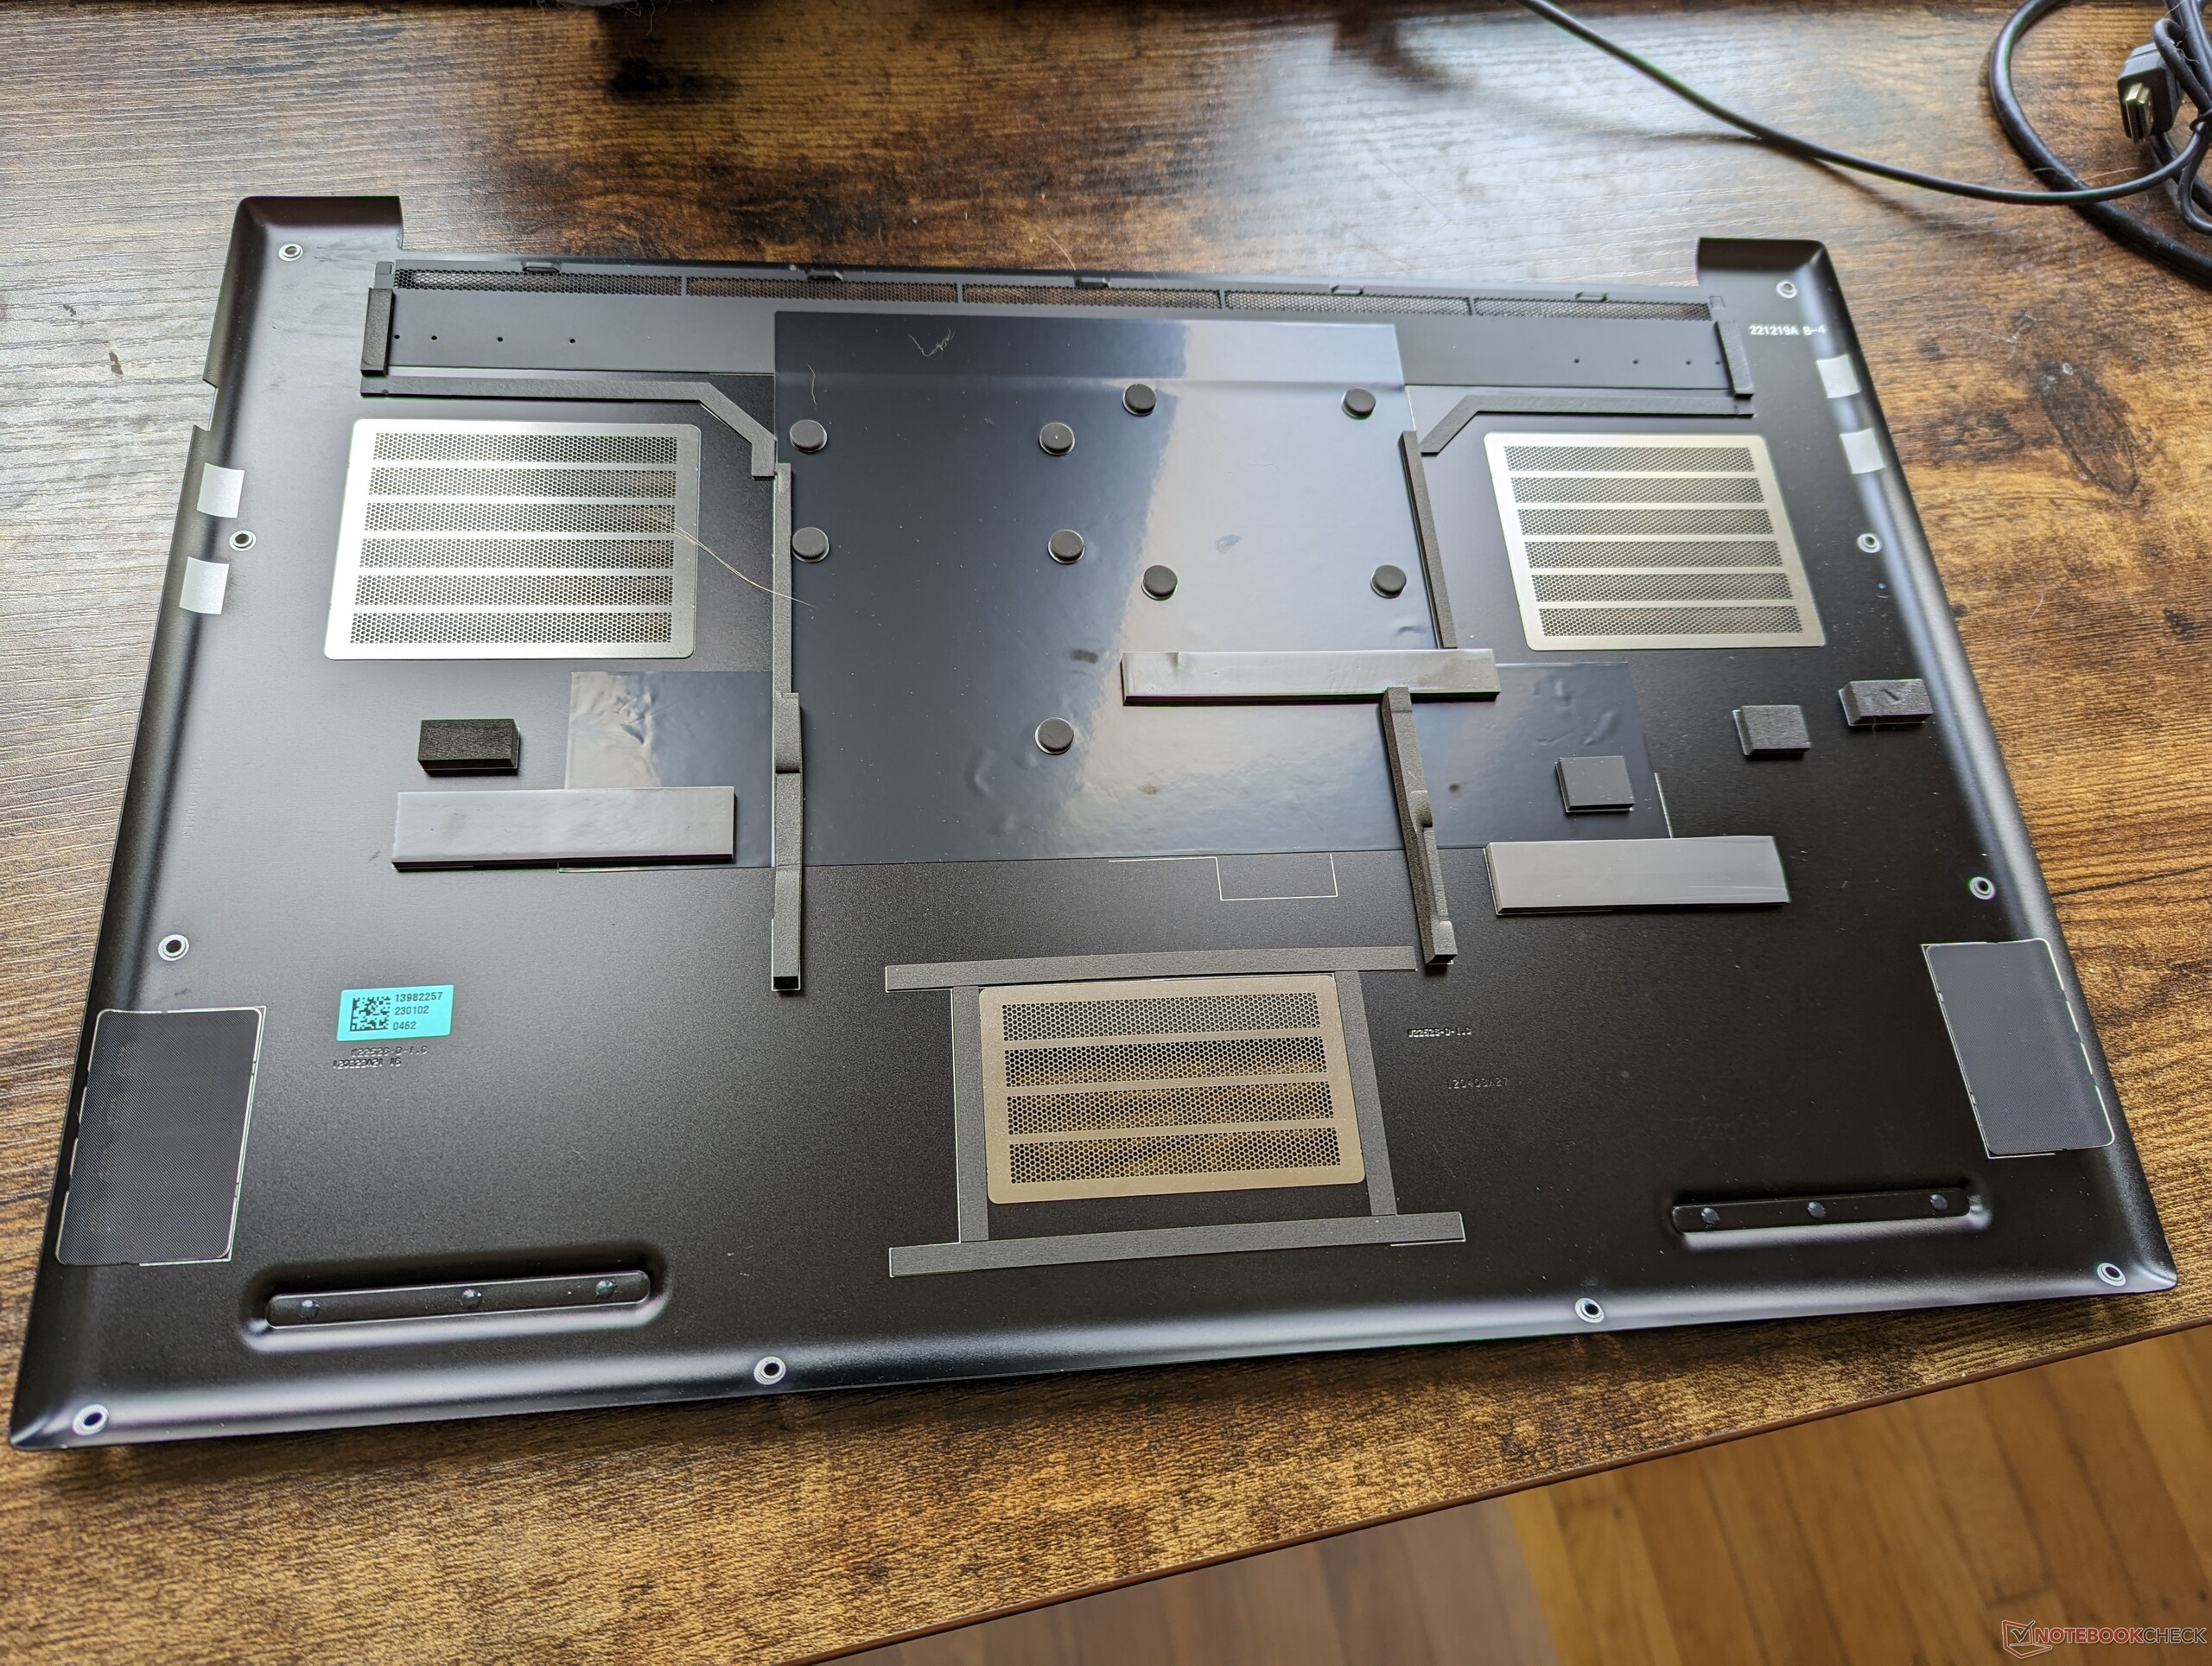
The bottom panel is secured by ten T5 Torx screws for easy servicing. Users have direct access to two M.2 2280 SSD slots, two SODIMM slots for up to 32 GB DDR5-5600 or 64 GB DDR5-5200, and the removable WLAN module. Most notably, the current Blade 18 design incorporates an additional fan directly underneath the clickpad similar to older Blade 17 designs.
Accessories and Warranty
There are no extras in the retail box. A one-year limited manufacturer warranty applies while the internal battery comes with a separate two-year warranty if purchased in the US.
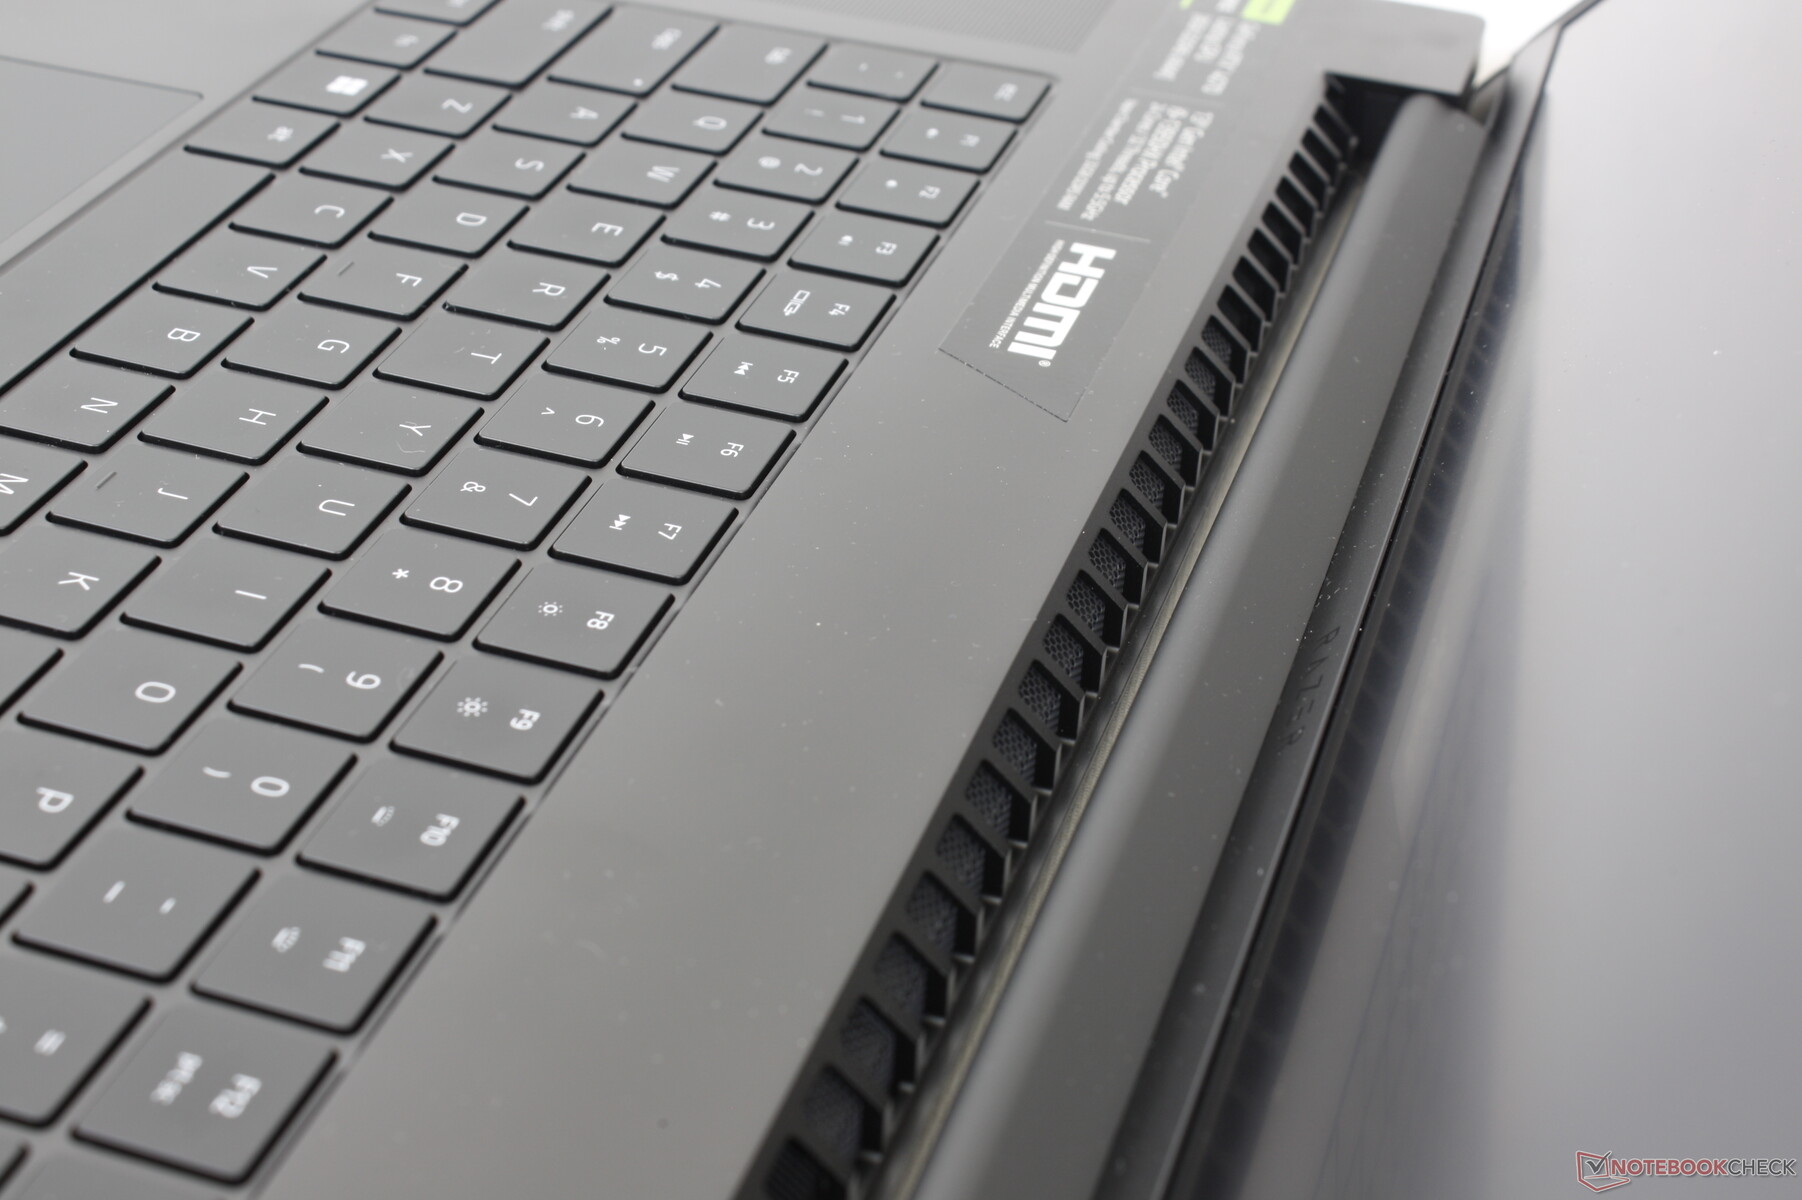
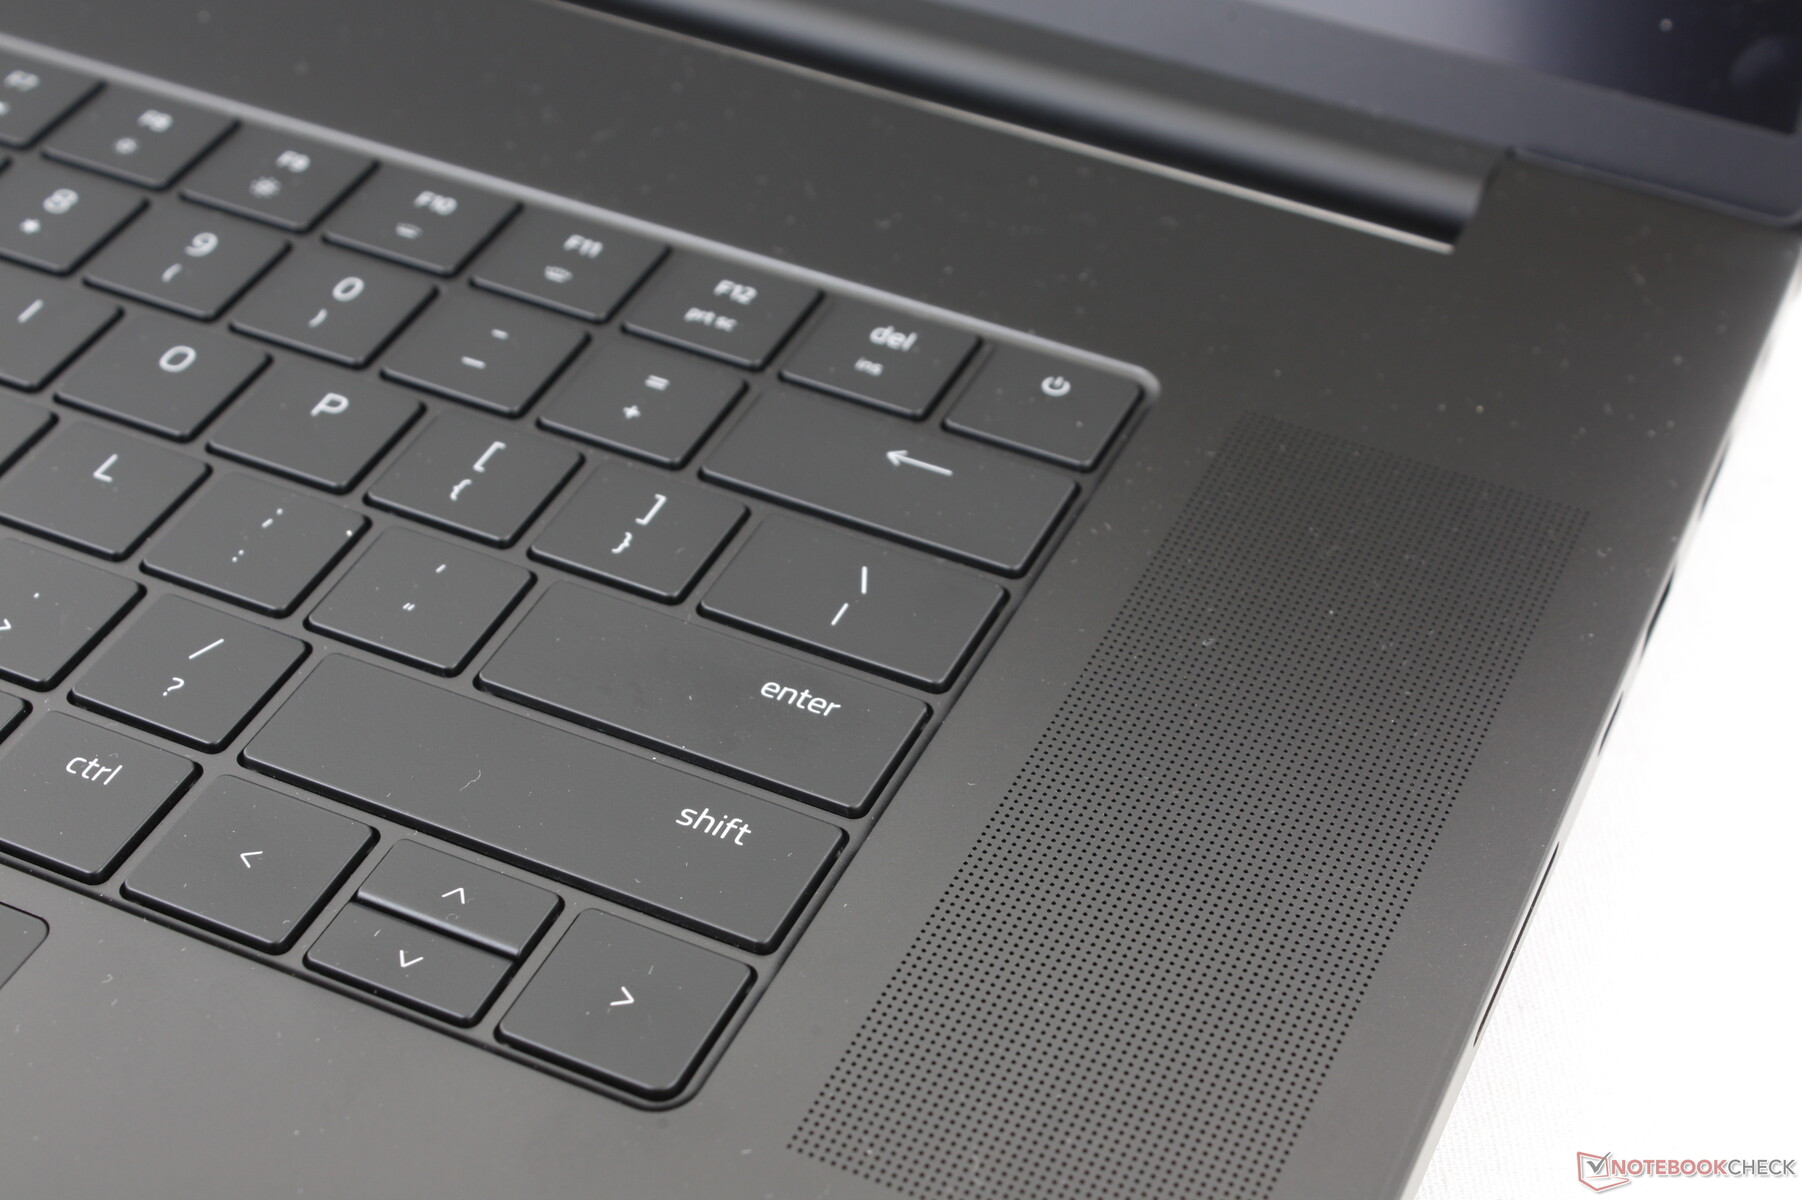
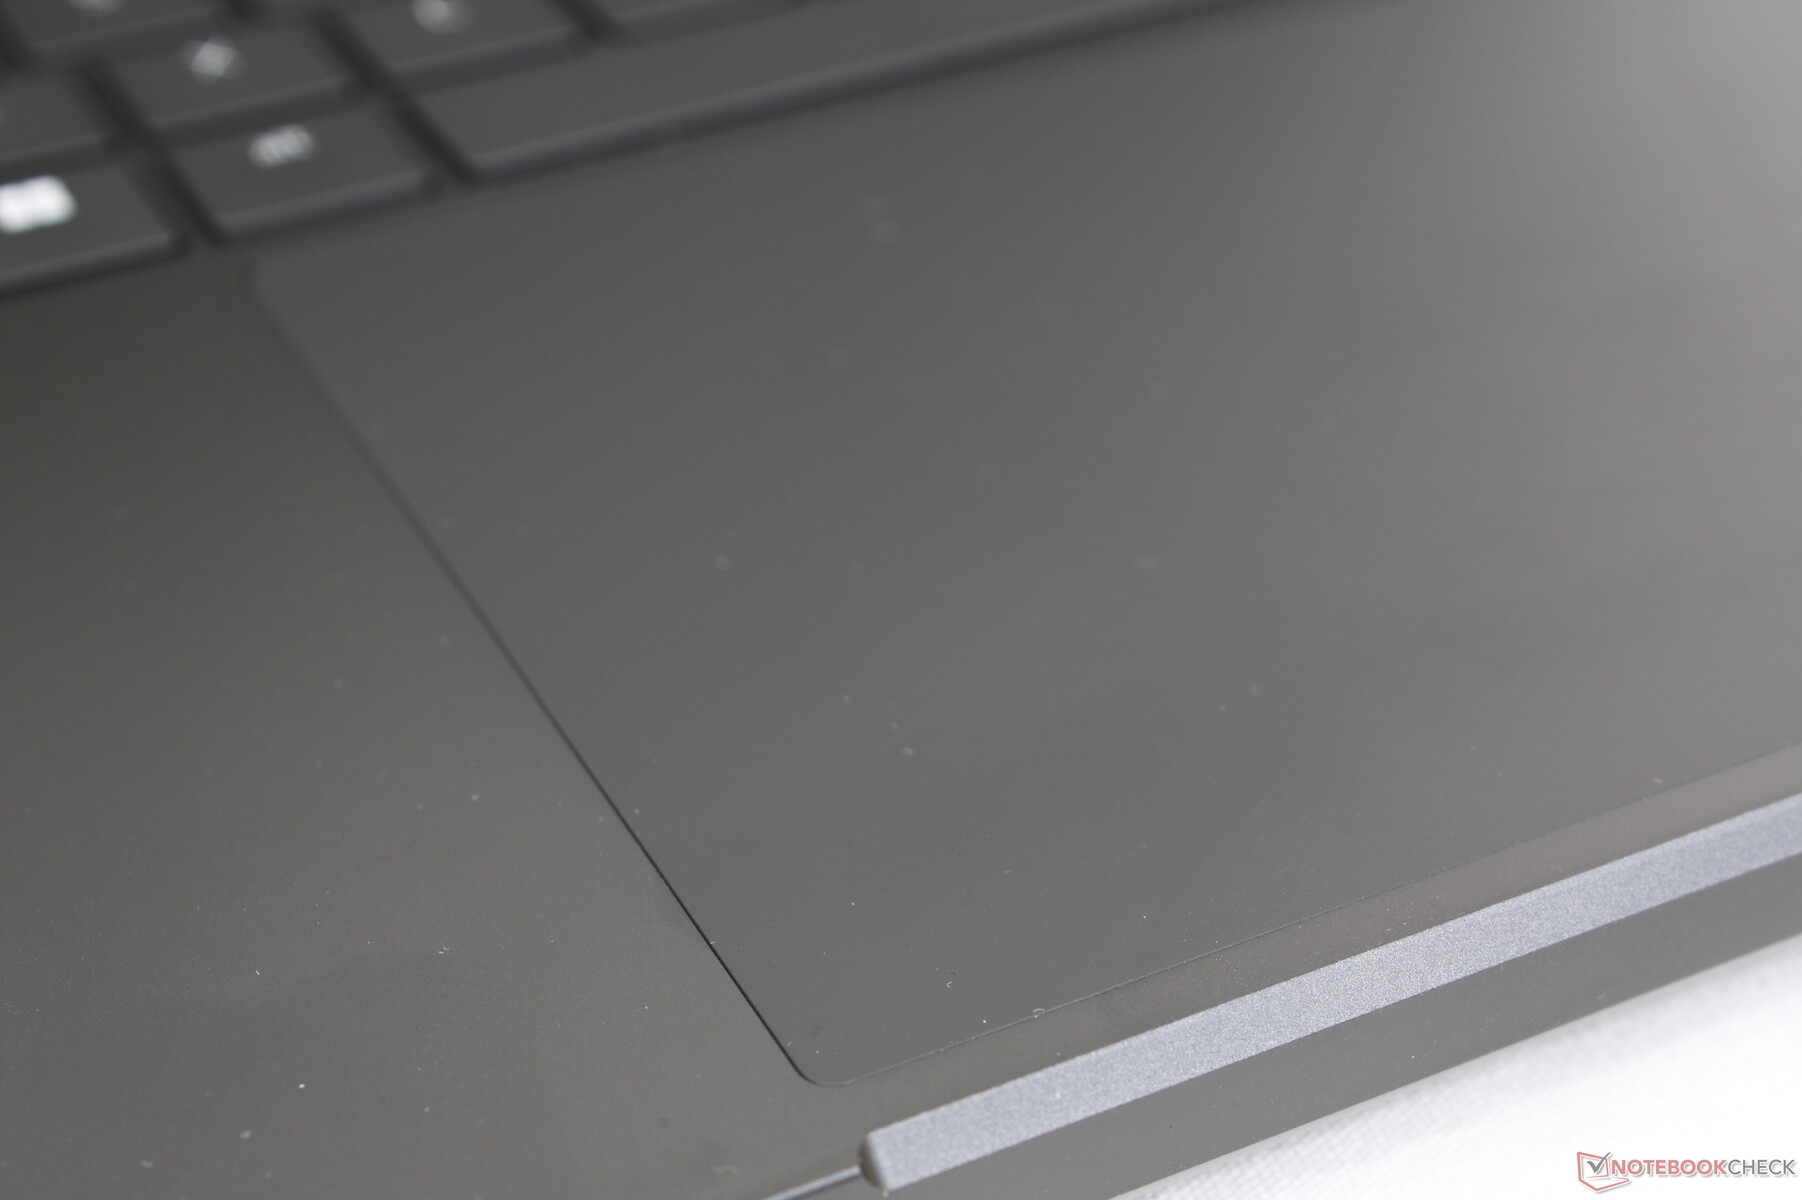
Input Devices — Identical To The Blade 16
Keyboard and Touchpad
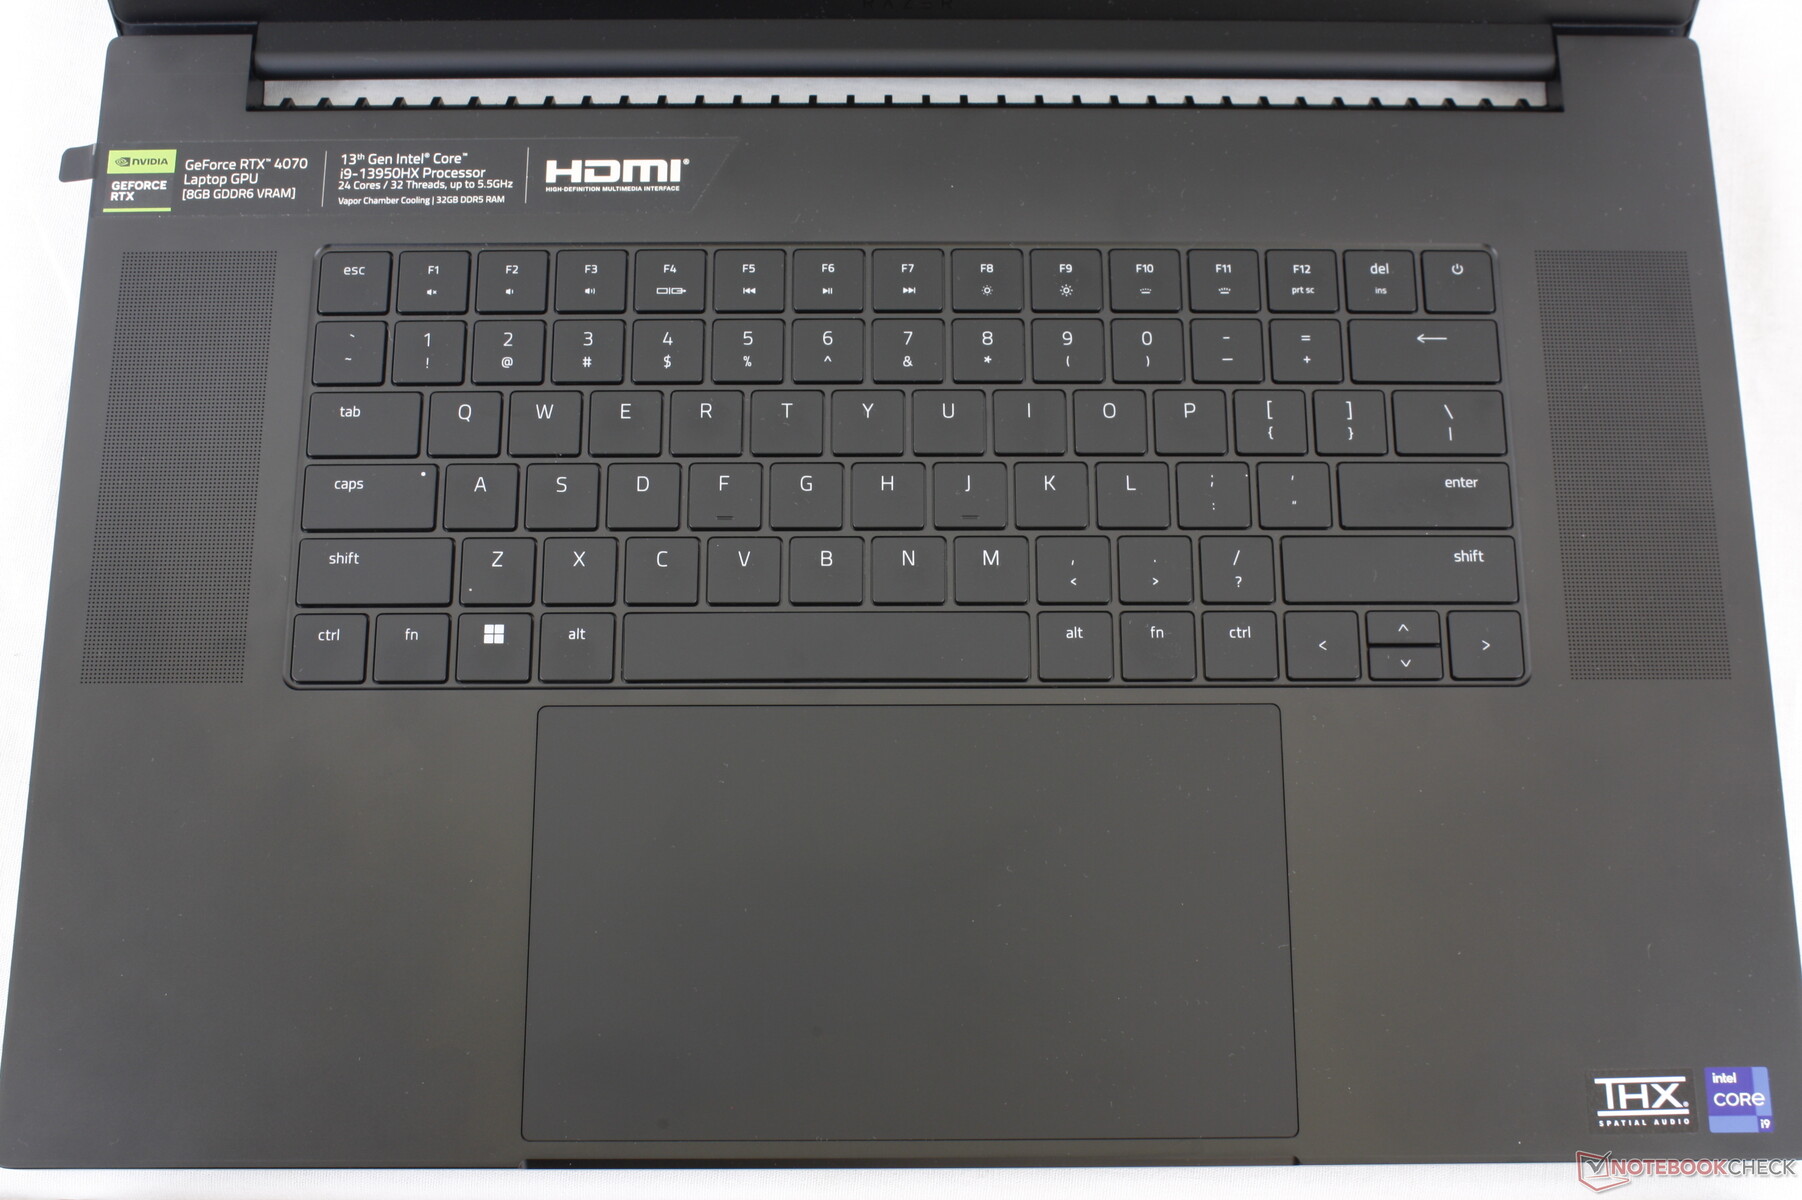
Both the keyboard and clickpad are the same as on the Blade 16 despite the screen size differences between the two models. Even the dimensions of the clickpad (17 x 9.7 cm) and keyboard have not changed and so our existing comments on the Blade 16 typing experience apply here on the Blade 18. It's too bad that Razer didn't utilize the extra surface area for larger arrow keys or a potential numpad.
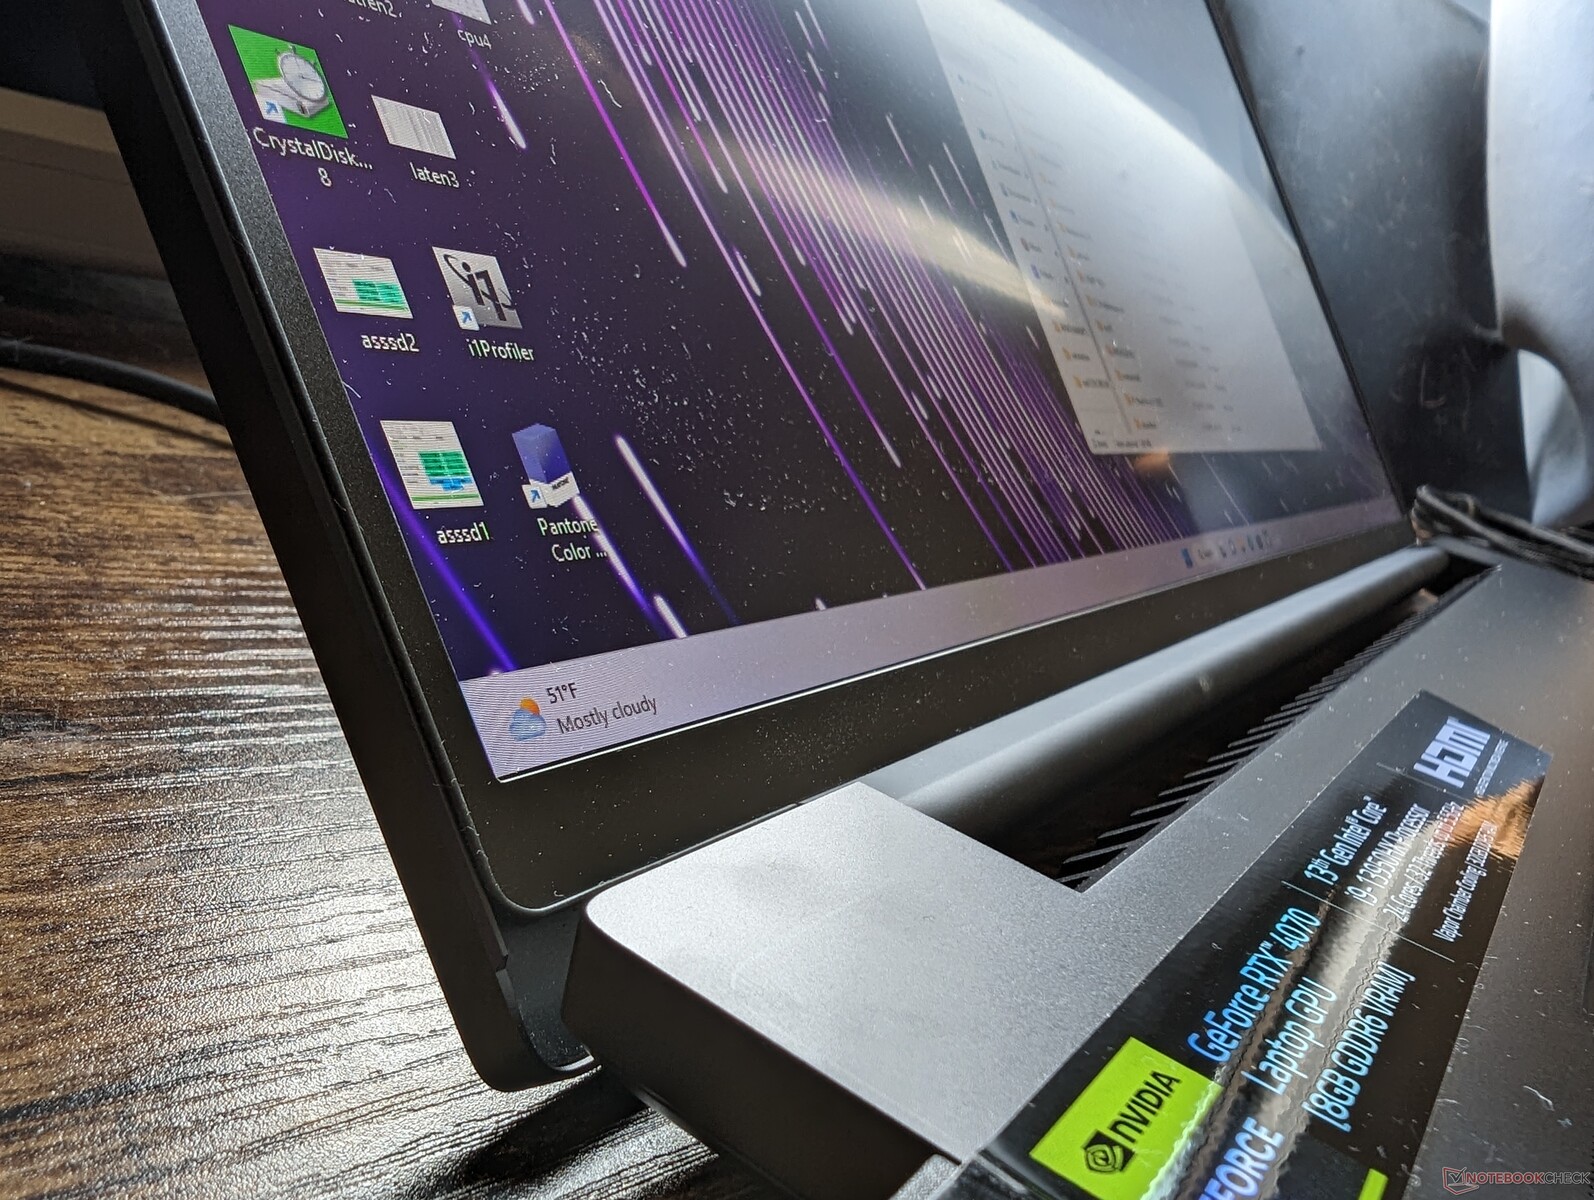
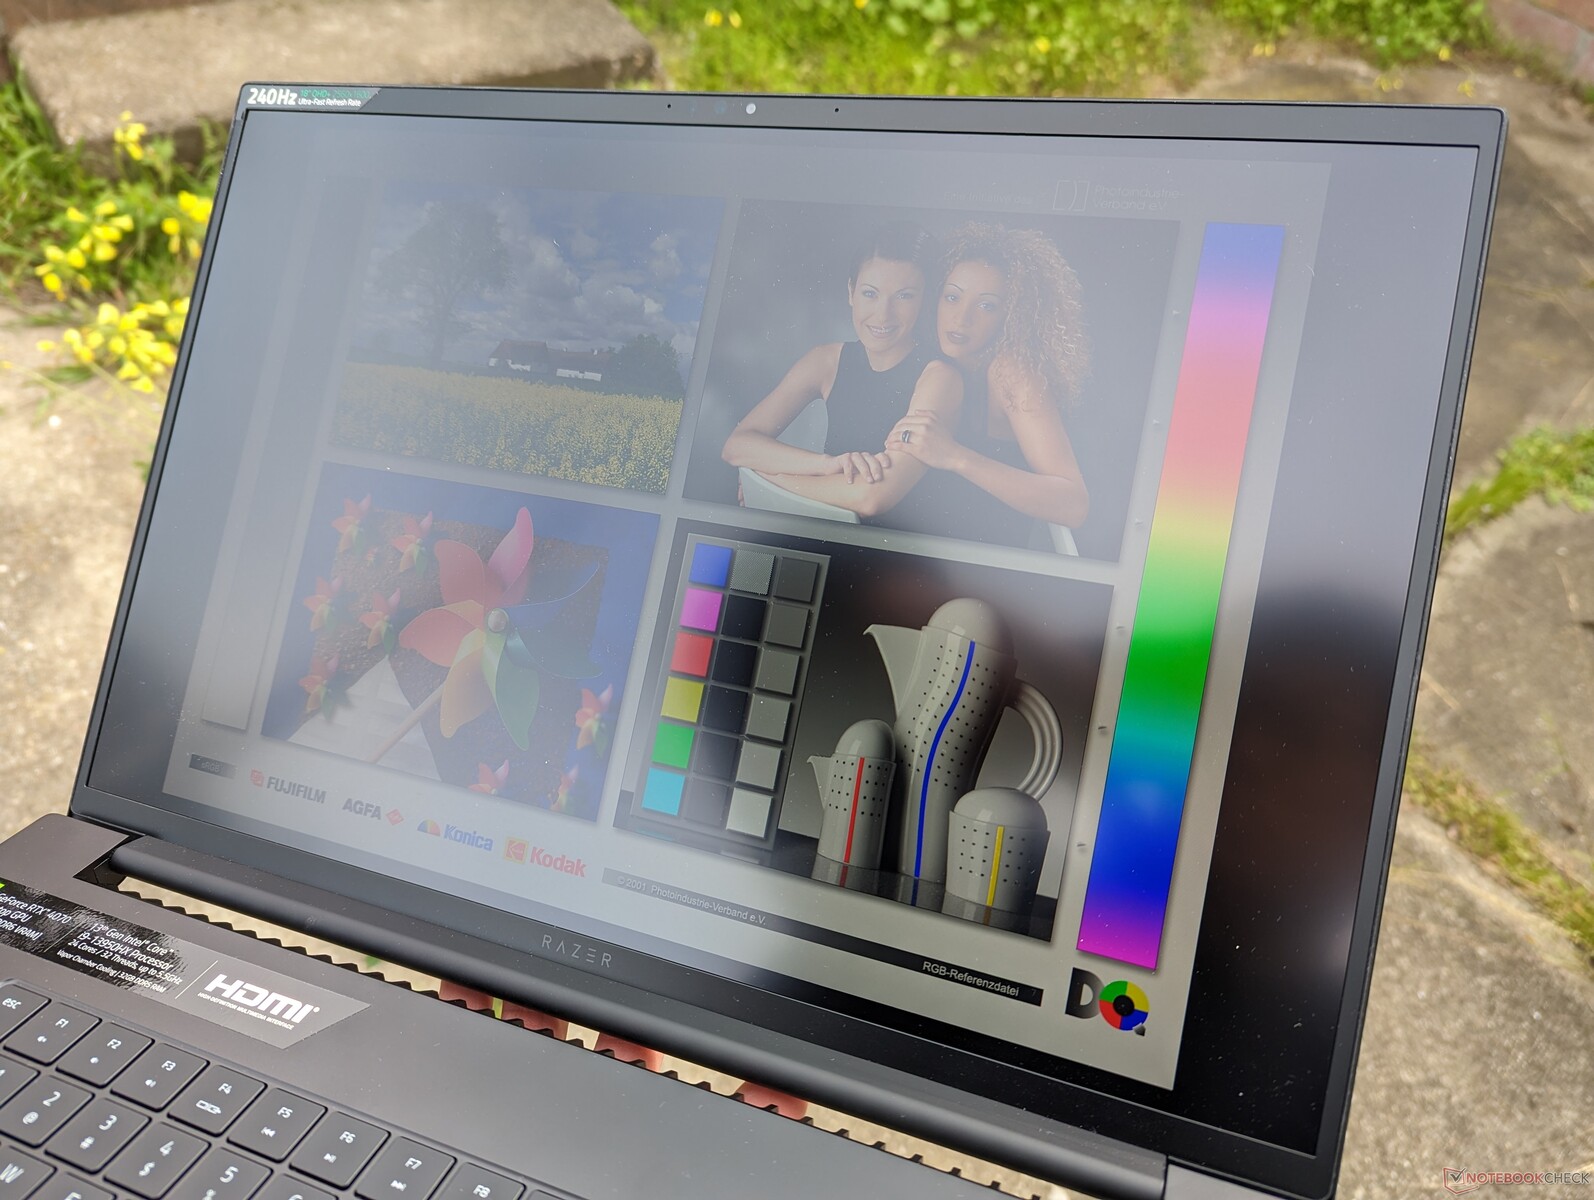
Display — Very Spacious
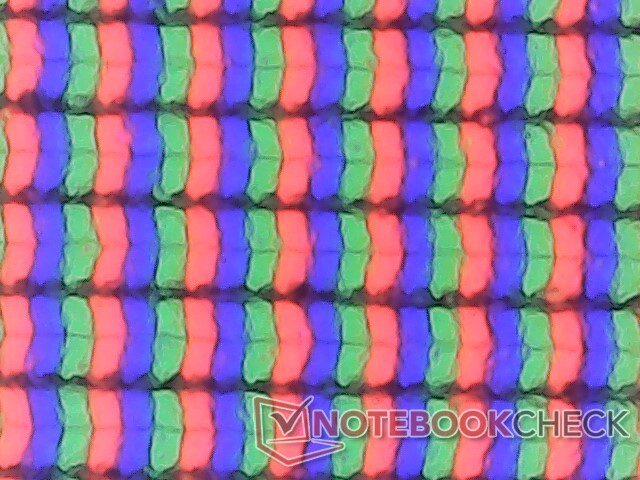
The Blade 18 comes with no second panel option at launch likely because of limited supply. In fact, the 18.0-inch Asus ROG Strix Scar 18 will probably utilize the same AU Optronics B180QAN01.0 IPS panel as on the Blade 18. With that said, this is still a high quality panel with the usual features common on high-end gaming laptops including the fast 240 Hz native refresh rate, fast 3 ms response times, full DCI-P3 color coverage, 500-nit brightness, and factory calibration. Our independent measurements with an X-Rite colorimeter and oscilloscope have confirmed these claims.
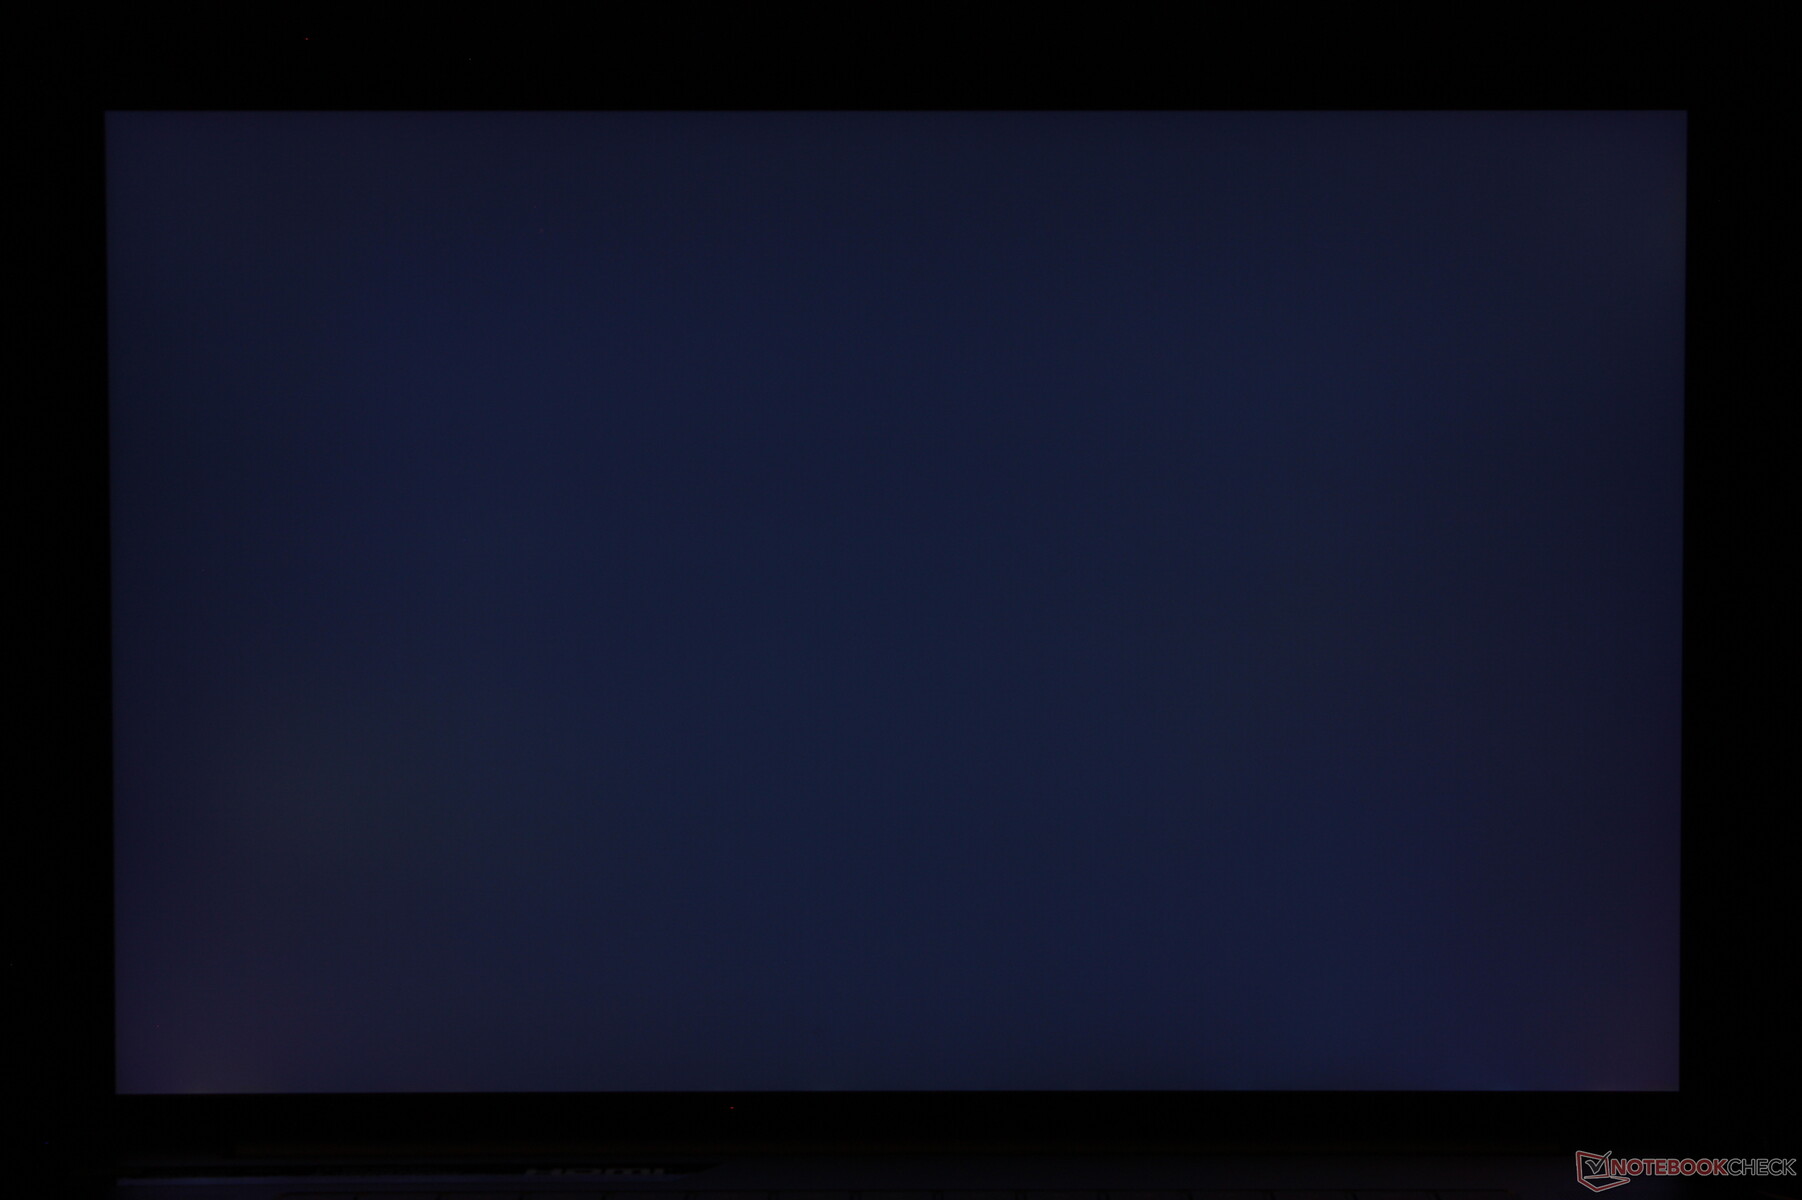
Unfortunately, the display on our test unit would occasionally flicker between different brightness levels for seemingly no reason. The flickering is unrelated to pulse-width modulation as the panel does not utilize PWM for brightness control. This is likely a fault with the screen, but we cannot confirm yet if it is a software or hardware issue. Purportedly, some consumers who already purchased the Blade 18 have been experiencing similar flickering issues as well. This section will be updated once we have an official word from Razer.
| |||||||||||||||||||||||||
Brightness Distribution: 89 %
Center on Battery: 549.6 cd/m²
Contrast: 1037:1 (Black: 0.53 cd/m²)
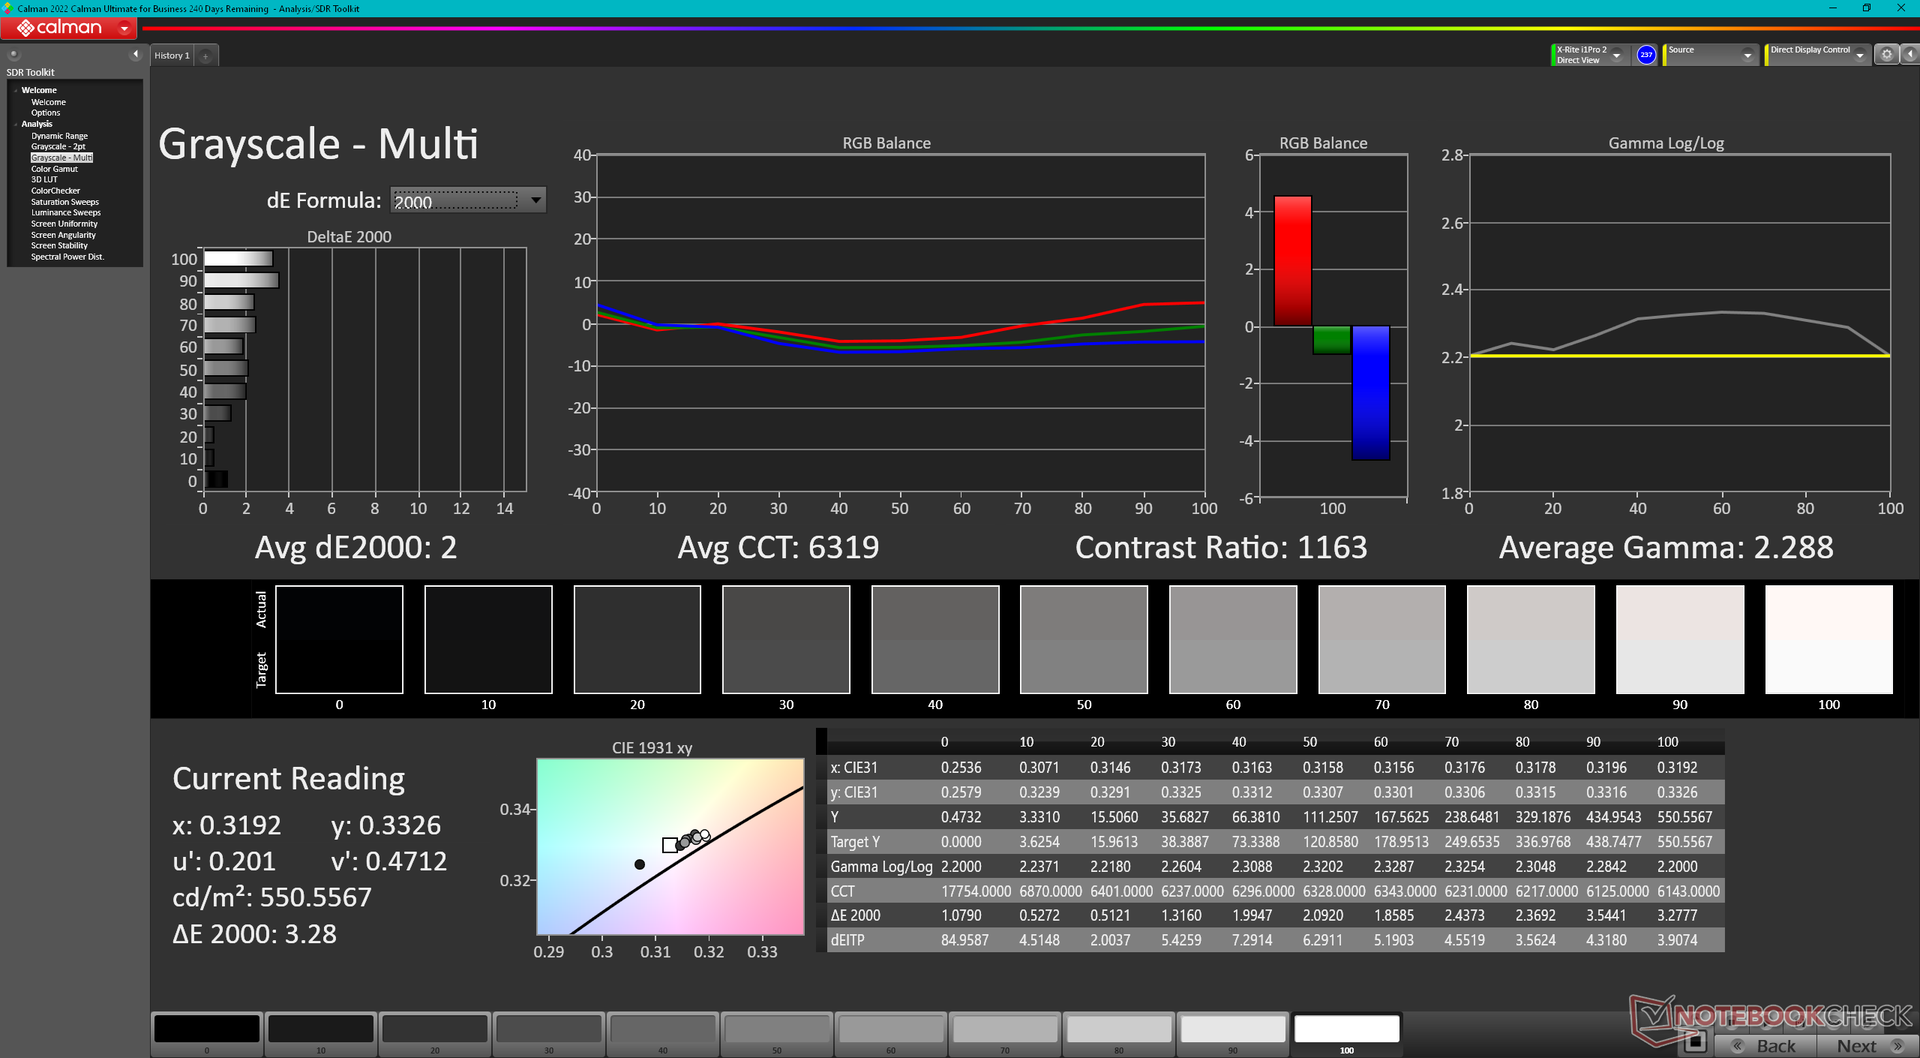
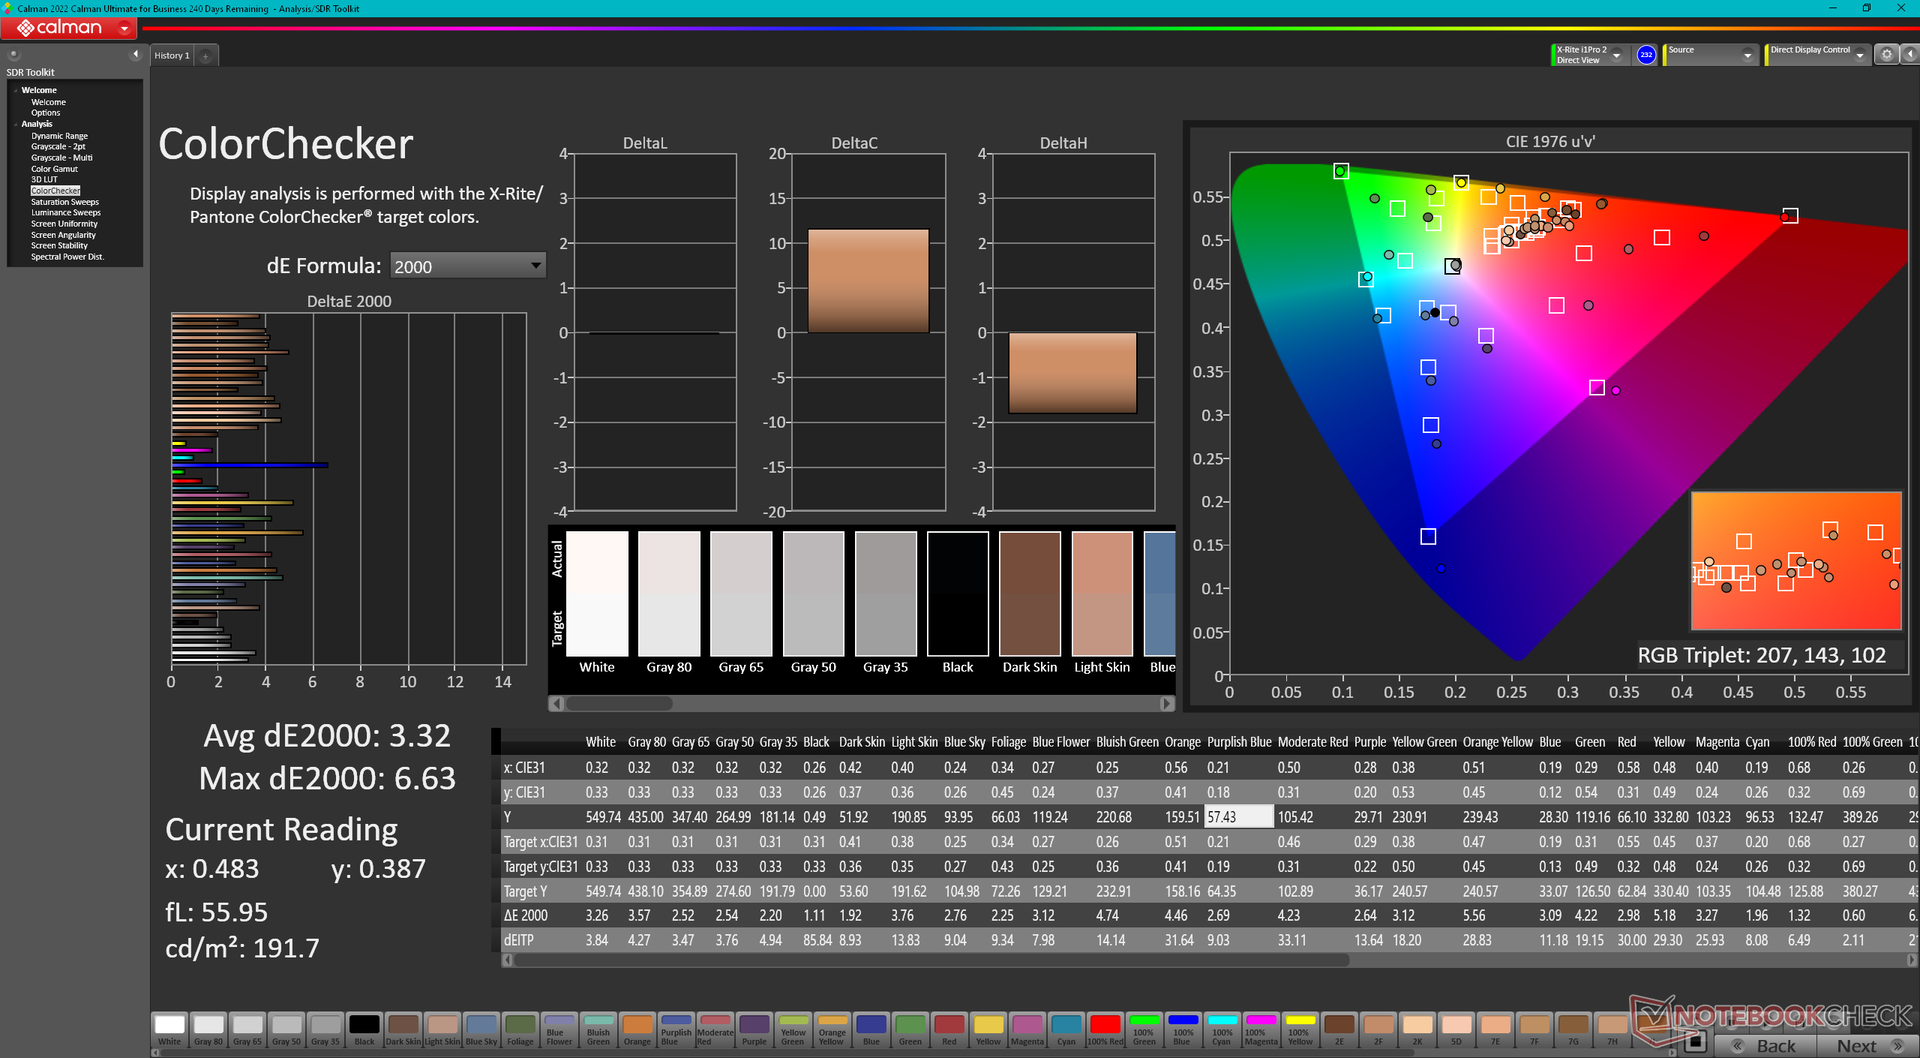
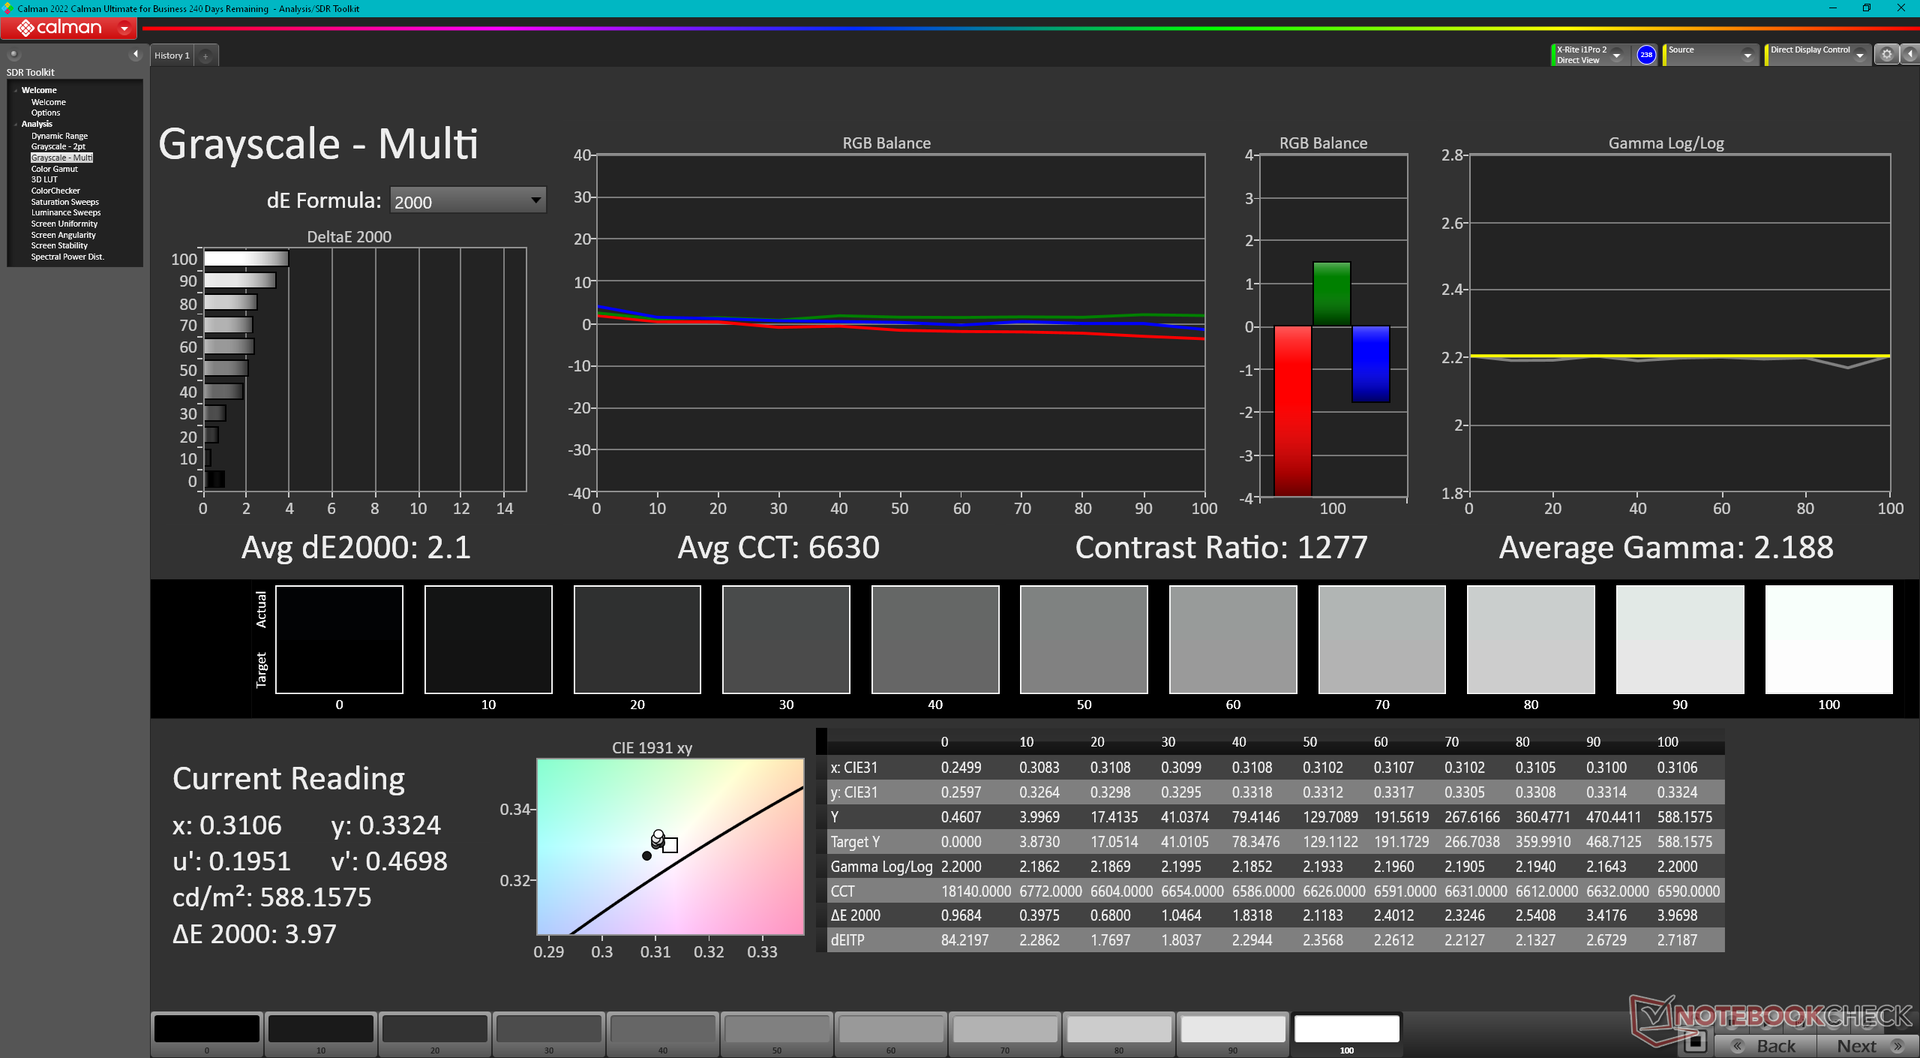
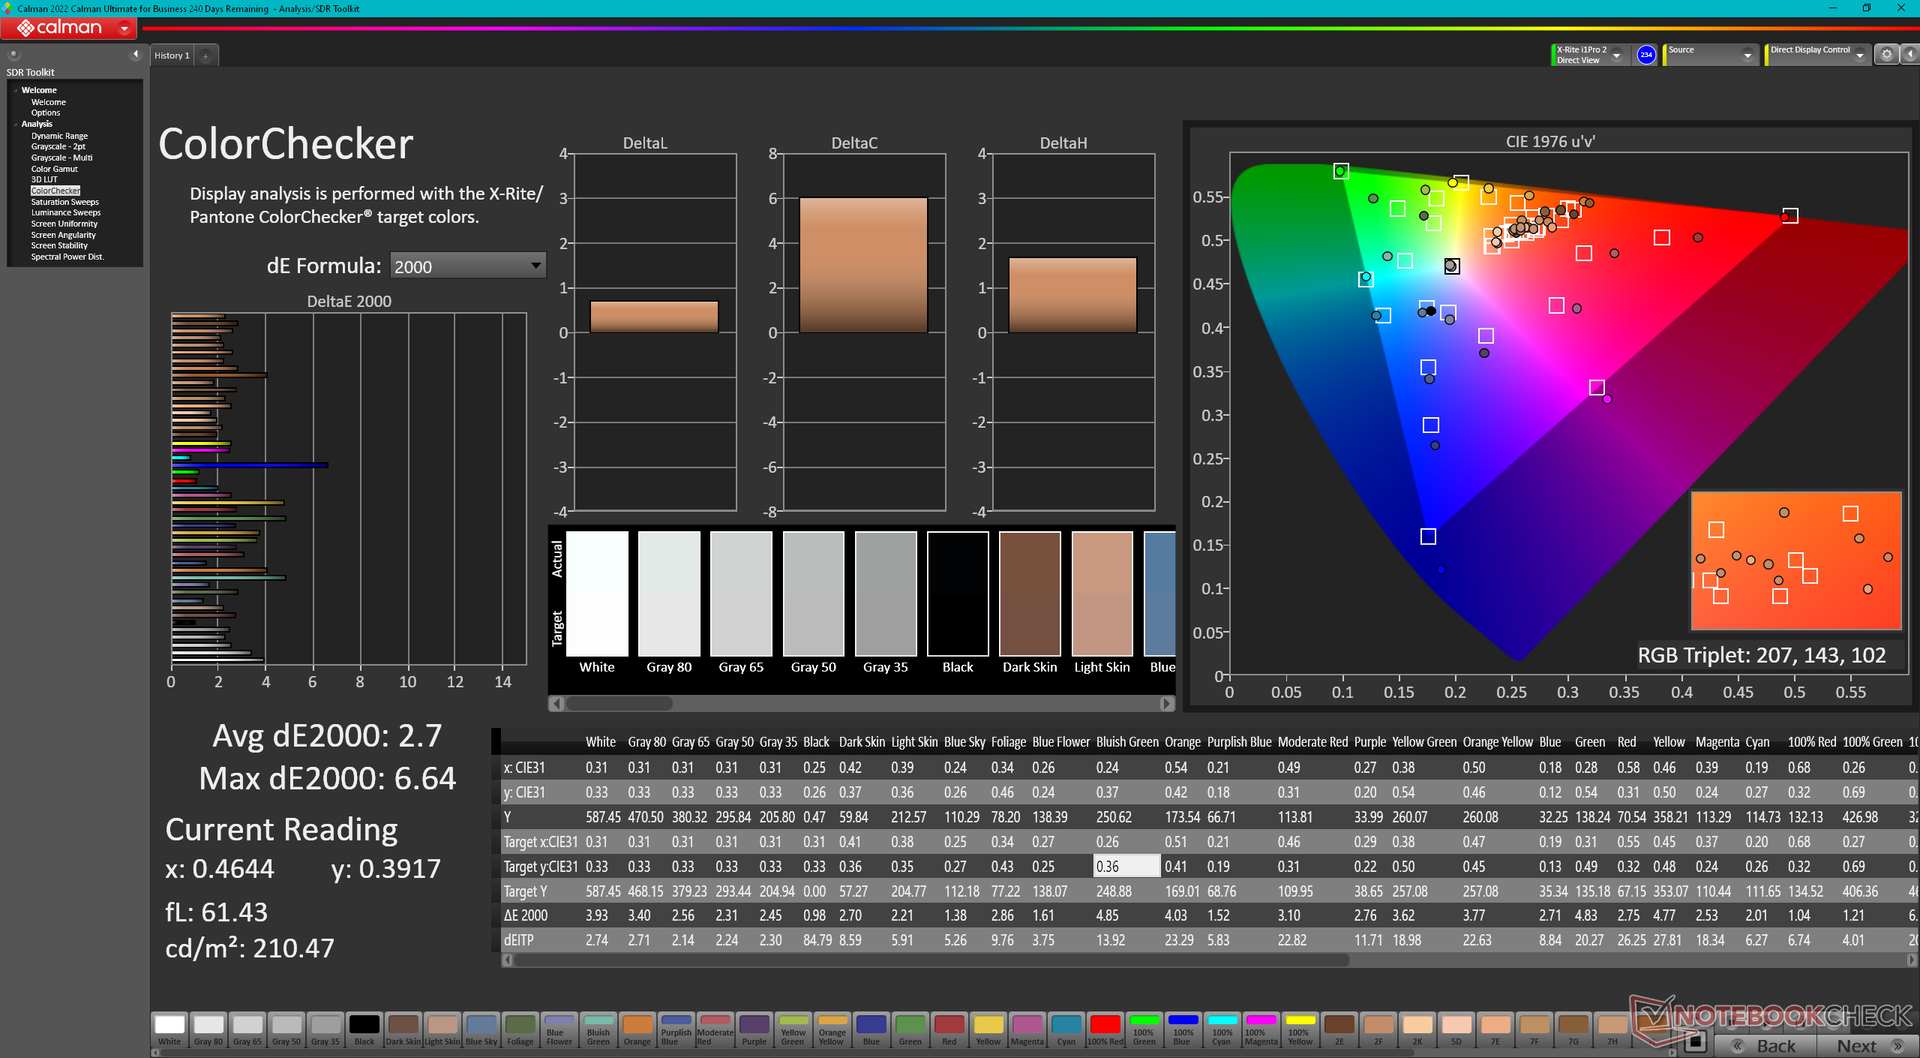
ΔE Color 3.32 | 0.5-29.43 Ø5, calibrated: 2.7
ΔE Greyscale 2 | 0.57-98 Ø5.3
85.3% AdobeRGB 1998 (Argyll 2.2.0 3D)
99.8% sRGB (Argyll 2.2.0 3D)
96.9% Display P3 (Argyll 2.2.0 3D)
Gamma: 2.29
| Razer Blade 18 RTX 4070 AU Optronics B180QAN01.0, IPS, 2560x1600, 18.00 | Razer Blade 17 Early 2022 AU Optronics B173ZAN06.9, IPS, 3840x2160, 17.30 | MSI Titan GT77 HX 13VI B173ZAN06.C, Mini-LED, 3840x2160, 17.30 | Gigabyte G7 KE AU Optronics B173HAN05.1, IPS, 1920x1080, 17.30 | Alienware m17 R5 (R9 6900HX, RX 6850M XT) AU Optronics AUODBA3, IPS, 3840x2160, 17.00 | Asus ROG Strix Scar 17 SE G733CX-LL014W NE173QHM-NZ2, IPS, 2560x1440, 17.30 | |
|---|---|---|---|---|---|---|
| Display | 2% | 2% | -14% | 1% | -0% | |
| Display P3 Coverage | 96.9 | 99.4 3% | 94.9 -2% | 70.4 -27% | 97.2 0% | 97.1 0% |
| sRGB Coverage | 99.8 | 100 0% | 99.9 0% | 99.8 0% | 99.6 0% | 99.9 0% |
| AdobeRGB 1998 Coverage | 85.3 | 87.3 2% | 92.4 8% | 71.7 -16% | 88.4 4% | 84.8 -1% |
| Response Times | -25% | -524% | -12% | -168% | -31% | |
| Response Time Grey 50% / Grey 80% * | 4.2 ? | 7.5 ? -79% | 38.4 ? -814% | 5 ? -19% | 16.4 ? -290% | 5.7 ? -36% |
| Response Time Black / White * | 8 ? | 5.6 ? 30% | 26.6 ? -233% | 8.3 ? -4% | 11.6 ? -45% | 10.1 ? -26% |
| PWM Frequency | 2380 ? | |||||
| Screen | 24% | 64905% | 19% | -40% | 16% | |
| Brightness middle | 549.6 | 503 -8% | 606 10% | 307 -44% | 484 -12% | 320 -42% |
| Brightness | 524 | 486 -7% | 602 15% | 301 -43% | 449 -14% | 303 -42% |
| Brightness Distribution | 89 | 84 -6% | 93 4% | 93 4% | 87 -2% | 87 -2% |
| Black Level * | 0.53 | 0.44 17% | 0.0001 100% | 0.2 62% | 0.55 -4% | 0.3 43% |
| Contrast | 1037 | 1143 10% | 6060000 584278% | 1535 48% | 880 -15% | 1067 3% |
| Colorchecker dE 2000 * | 3.32 | 1.08 67% | 4.8 -45% | 1.32 60% | 4.8 -45% | 1.1 67% |
| Colorchecker dE 2000 max. * | 6.63 | 4.54 32% | 8.2 -24% | 4.6 31% | 7.48 -13% | 2.7 59% |
| Colorchecker dE 2000 calibrated * | 2.7 | 0.6 78% | 1.8 33% | 1.03 62% | 4.74 -76% | |
| Greyscale dE 2000 * | 2 | 1.3 35% | 6.5 -225% | 2.1 -5% | 5.5 -175% | 1.1 45% |
| Gamma | 2.29 96% | 2.151 102% | 2.63 84% | 2.247 98% | 2.42 91% | 2.13 103% |
| CCT | 6319 103% | 6541 99% | 6596 99% | 6815 95% | 6148 106% | 6599 98% |
| Total Average (Program / Settings) | 0% /
12% | 21461% /
41650% | -2% /
8% | -69% /
-49% | -5% /
5% |
* ... smaller is better
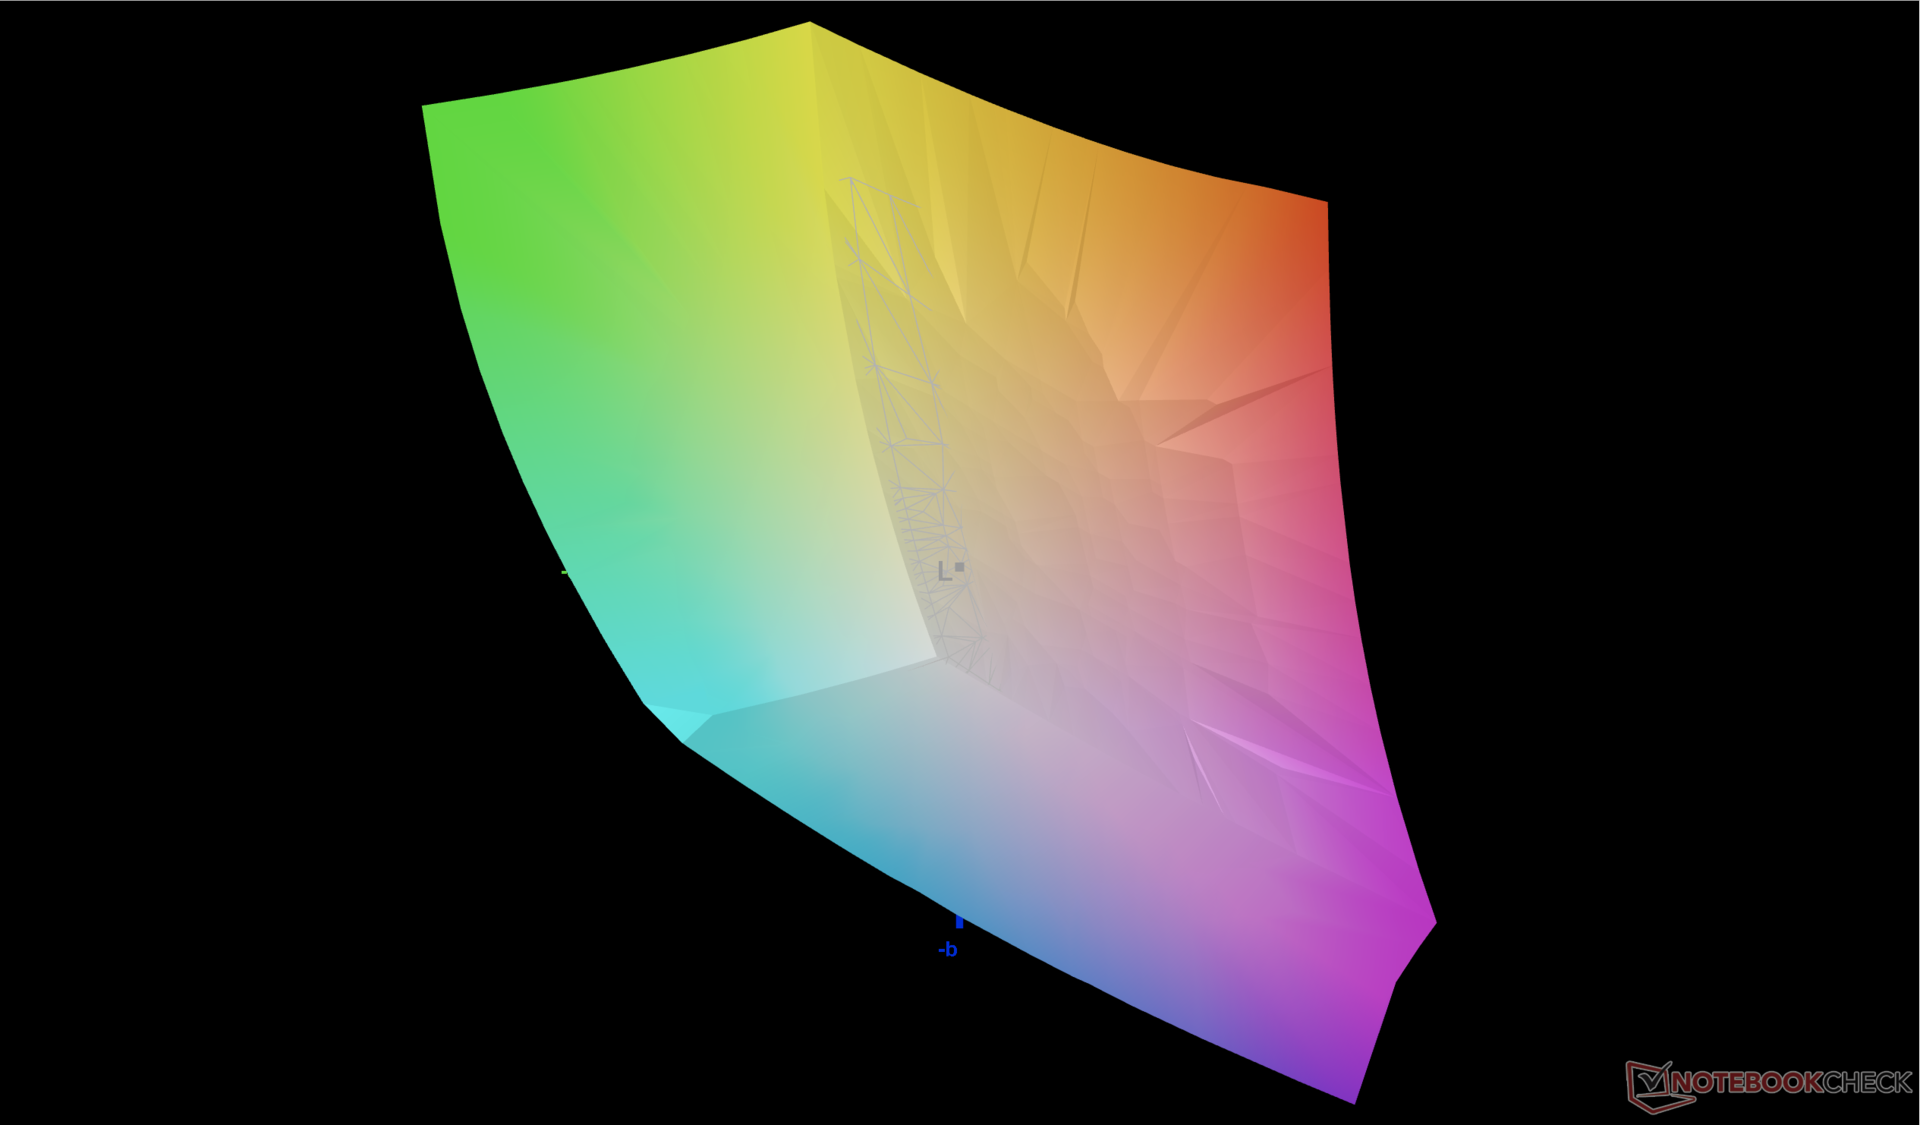
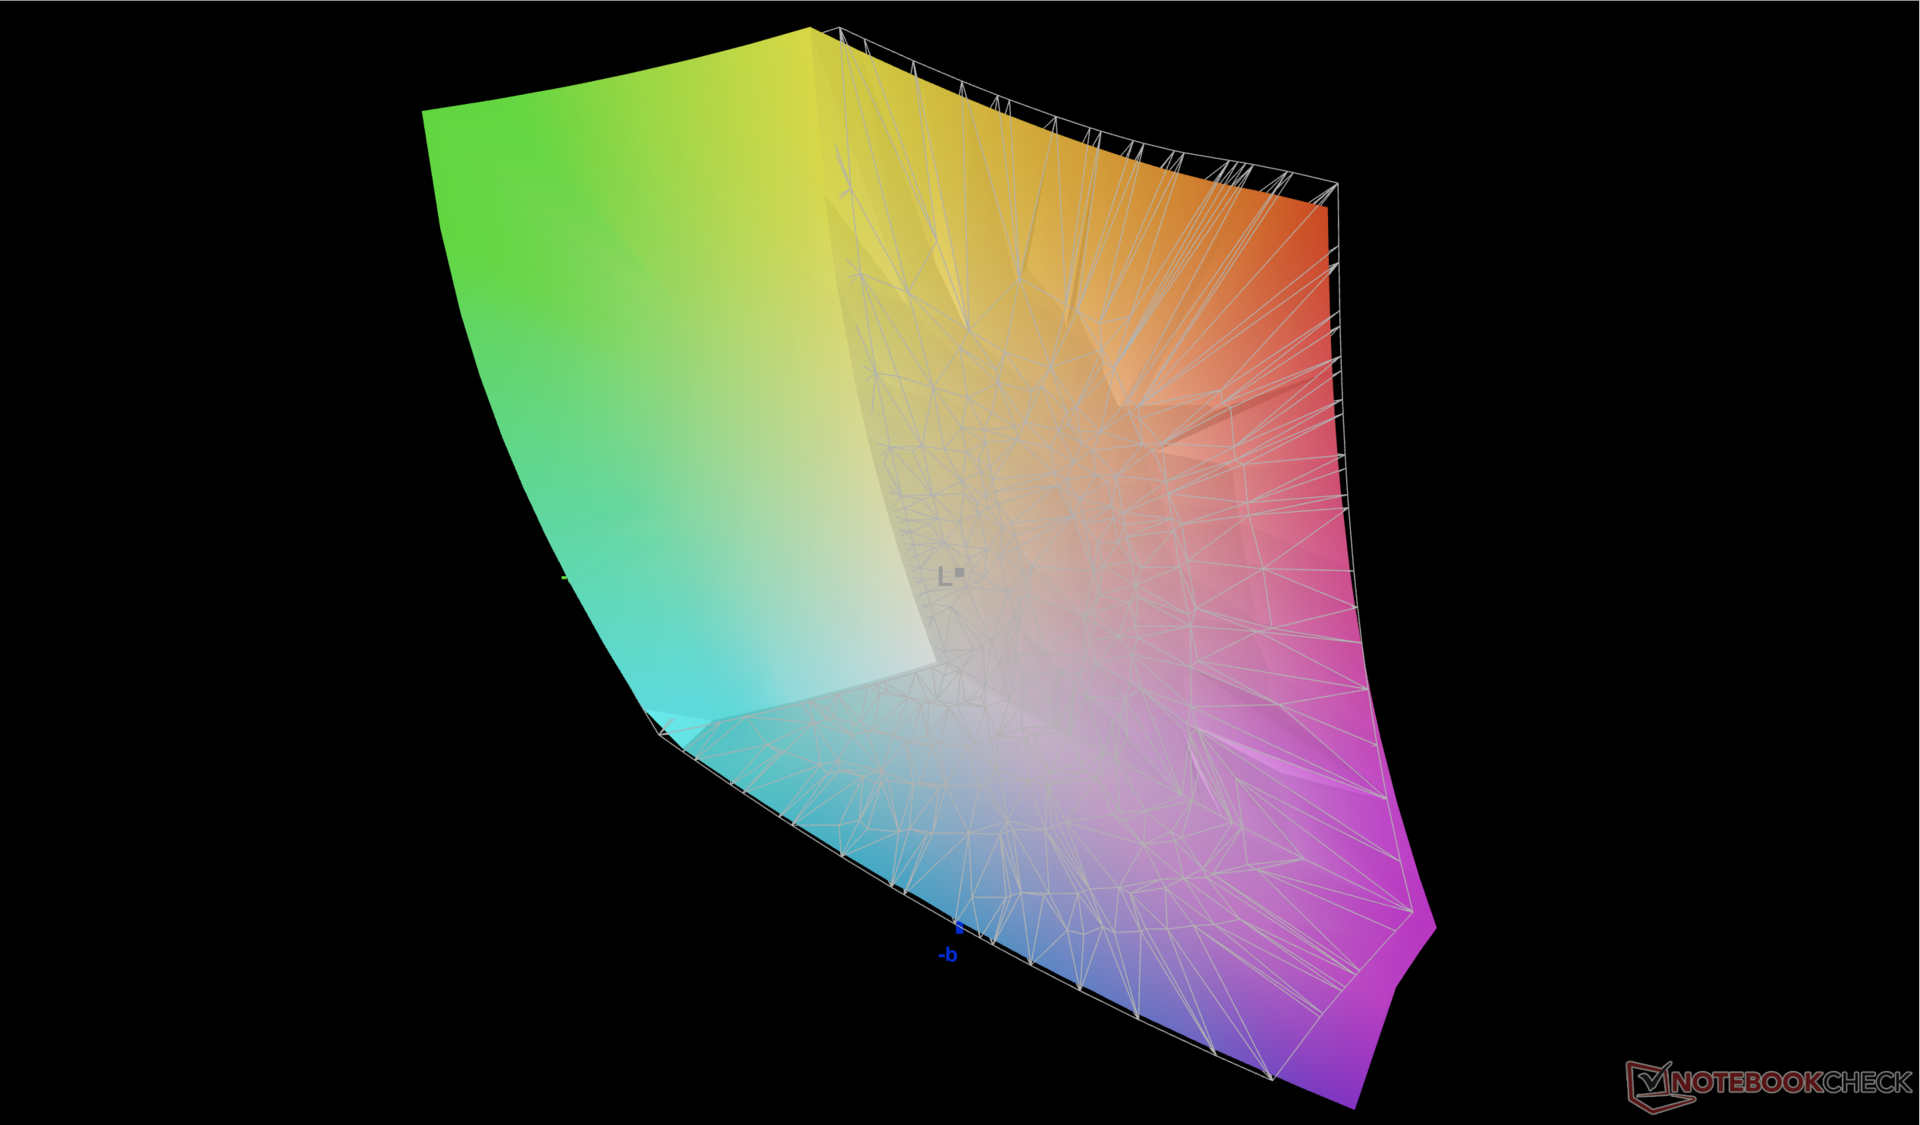
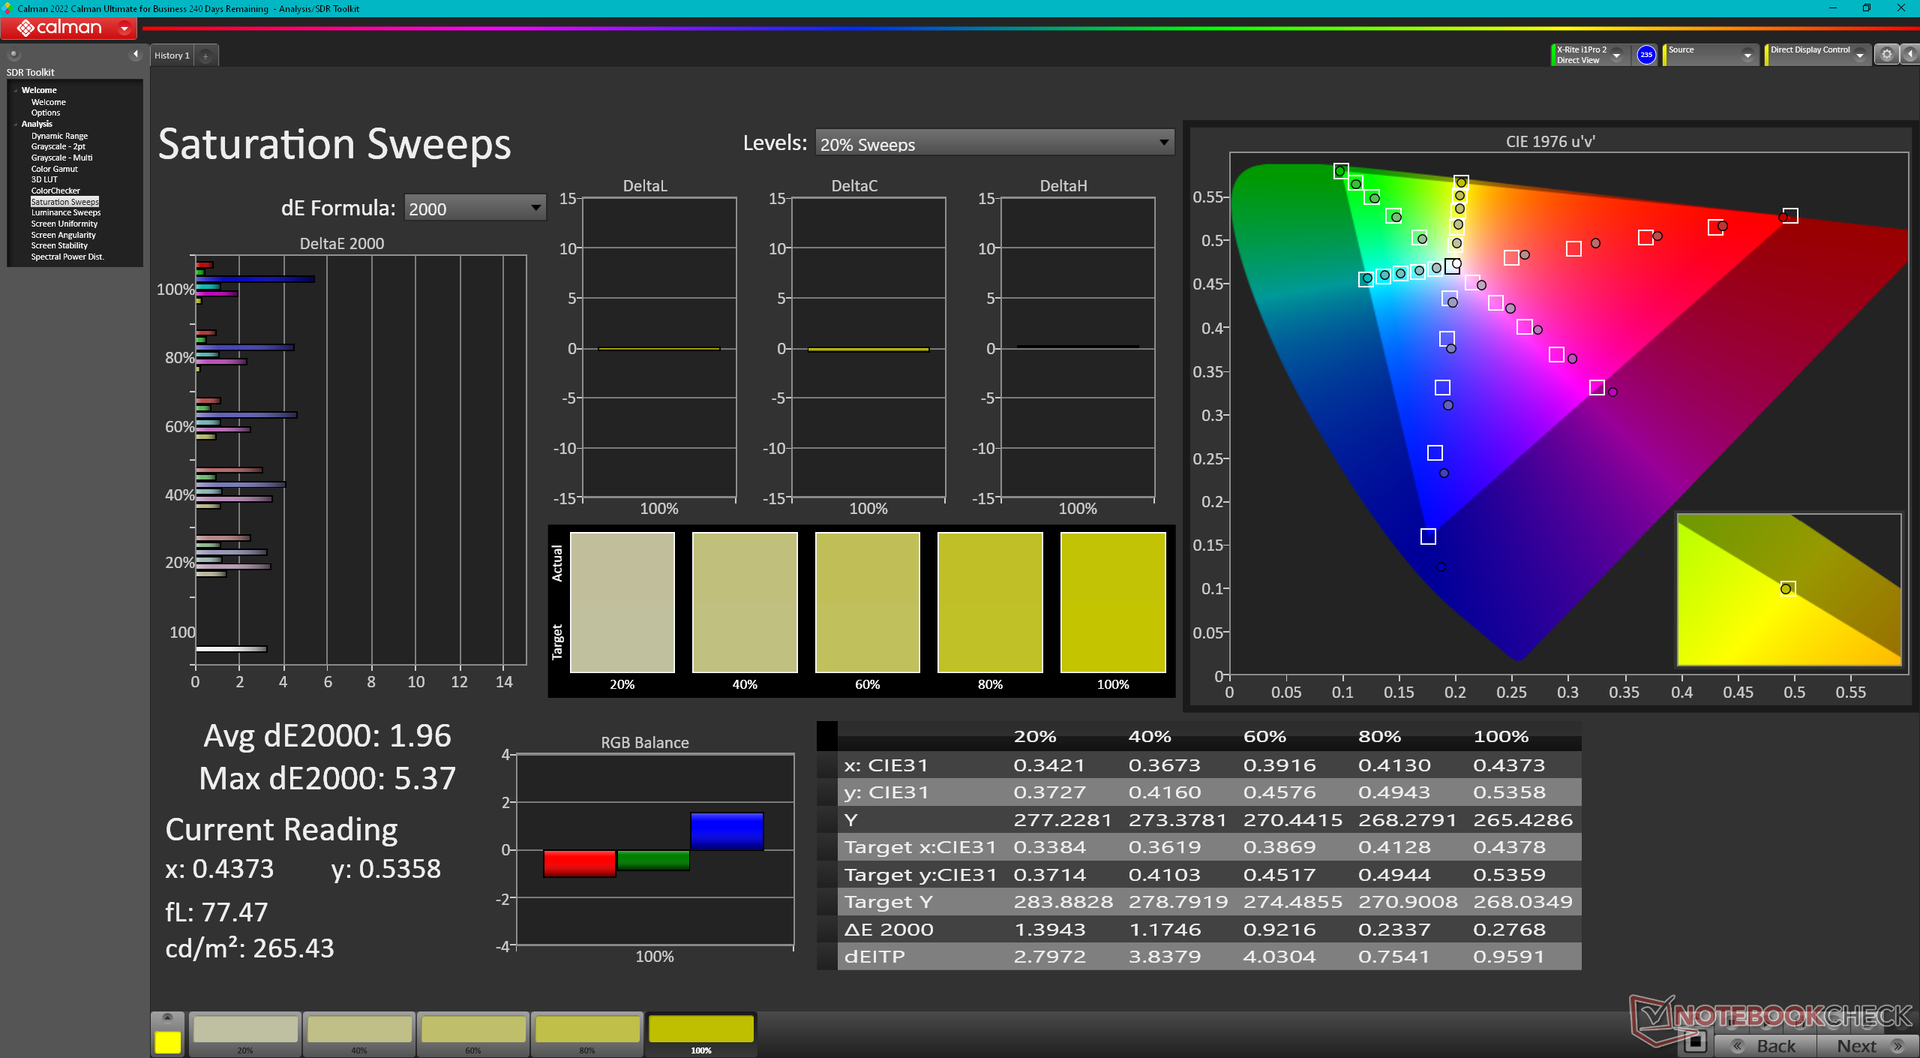
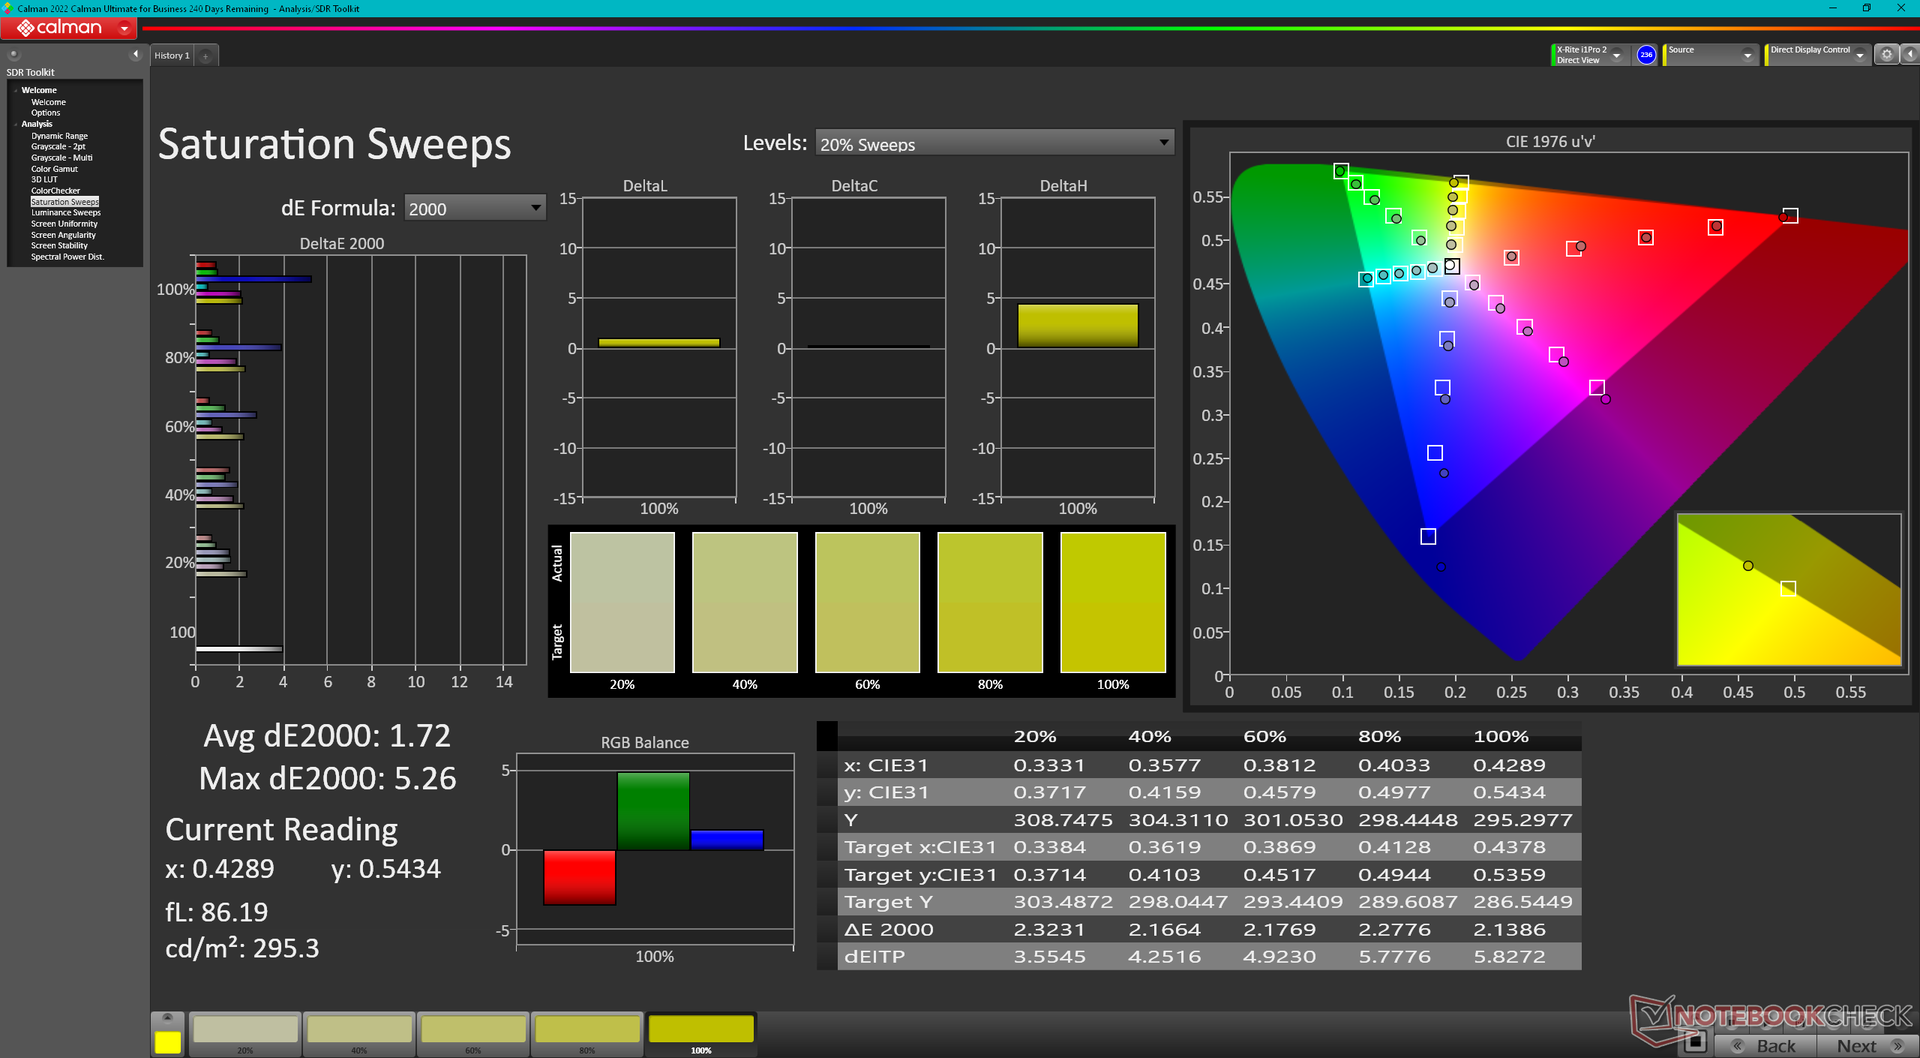
Average grayscale and color deltaE values are only 2.0 and 3.32 out of the box, respectively, as the panel comes pre-calibrated against the P3 standard. Attempting to calibrate the panel further ourselves would not improve the colors by a significant margin. Blue, however, appears to be represented more inaccurately than any other primary or secondary colors.
Display Response Times
| ↔ Response Time Black to White | ||
|---|---|---|
| 8 ms ... rise ↗ and fall ↘ combined | ↗ 3.8 ms rise | 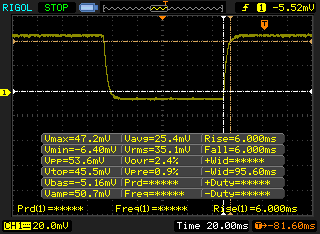 |
| ↘ 4.2 ms fall | ||
| The screen shows fast response rates in our tests and should be suited for gaming. In comparison, all tested devices range from 0.1 (minimum) to 240 (maximum) ms. » 17 % of all devices are better. This means that the measured response time is better than the average of all tested devices (21.5 ms). | ||
| ↔ Response Time 50% Grey to 80% Grey | ||
| 4.2 ms ... rise ↗ and fall ↘ combined | ↗ 2.1 ms rise | 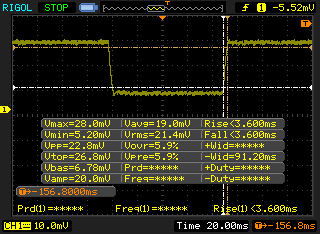 |
| ↘ 2.1 ms fall | ||
| The screen shows very fast response rates in our tests and should be very well suited for fast-paced gaming. In comparison, all tested devices range from 0.2 (minimum) to 636 (maximum) ms. » 11 % of all devices are better. This means that the measured response time is better than the average of all tested devices (33.7 ms). | ||
Screen Flickering / PWM (Pulse-Width Modulation)
| Screen flickering / PWM not detected | 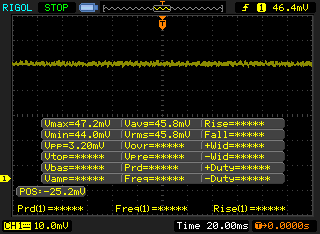 | ||
In comparison: 53 % of all tested devices do not use PWM to dim the display. If PWM was detected, an average of 17903 (minimum: 5 - maximum: 3846000) Hz was measured. | |||
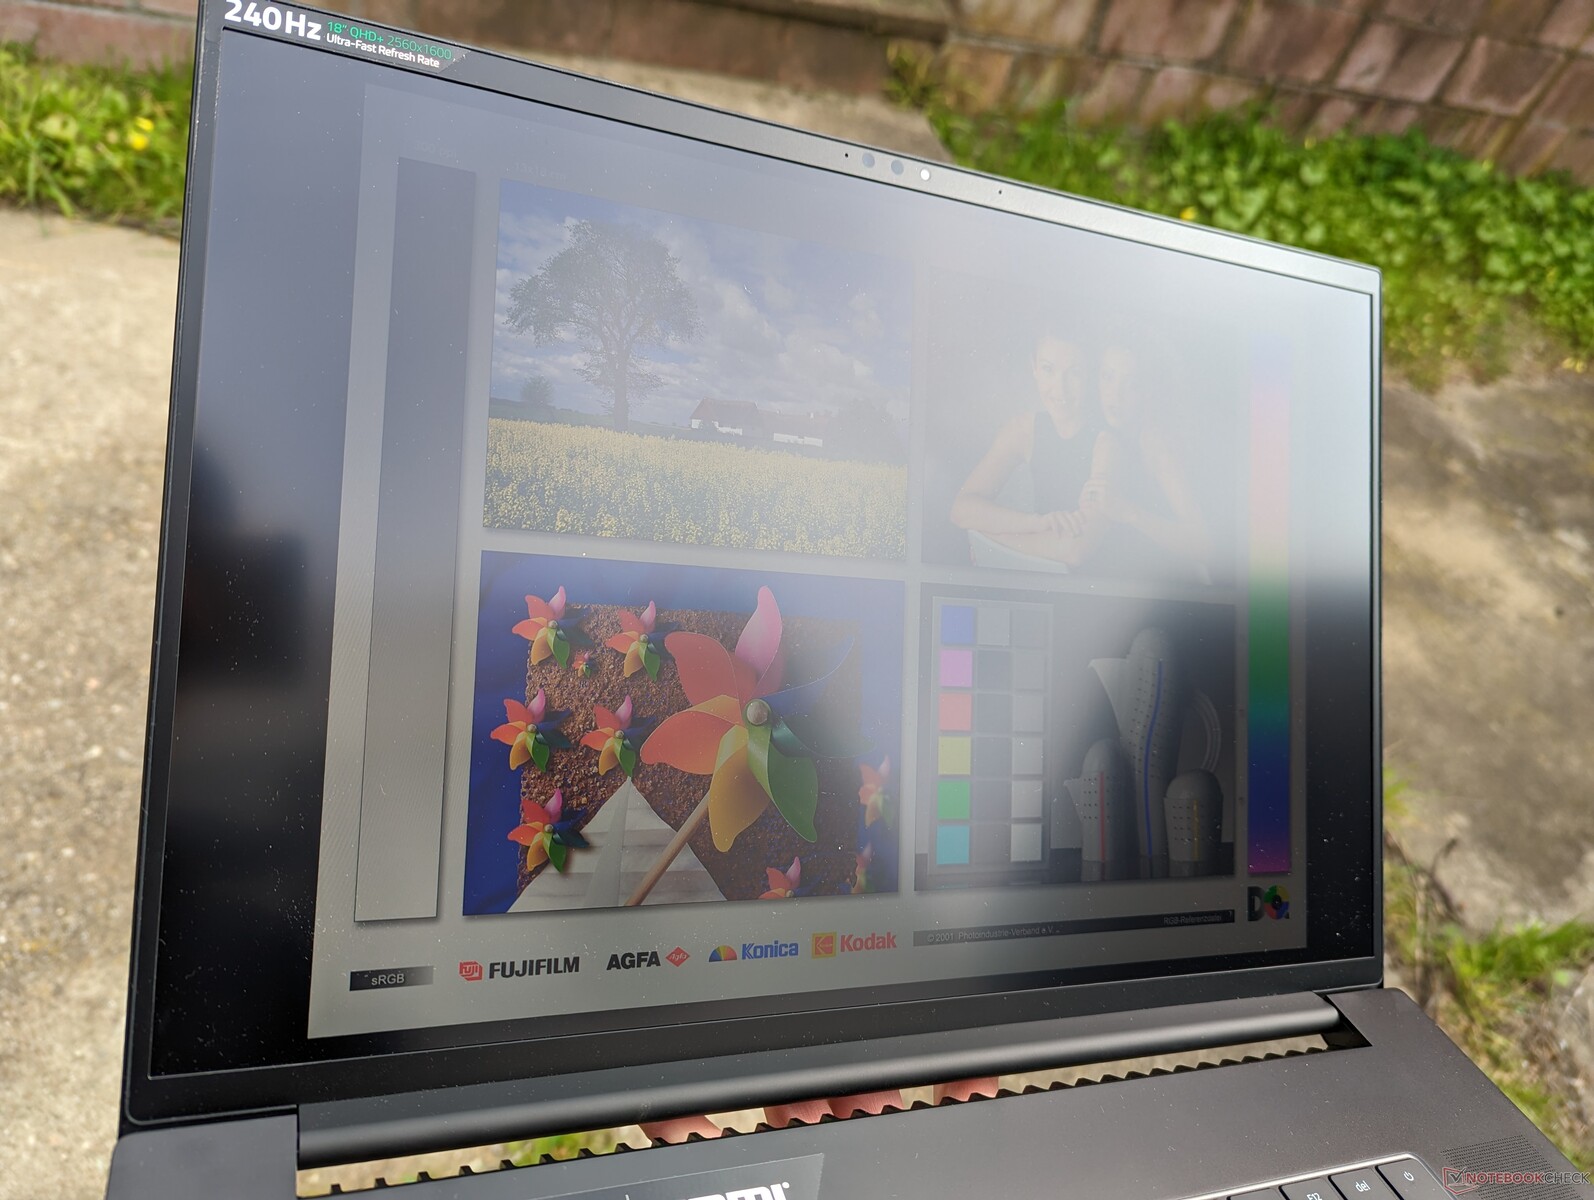
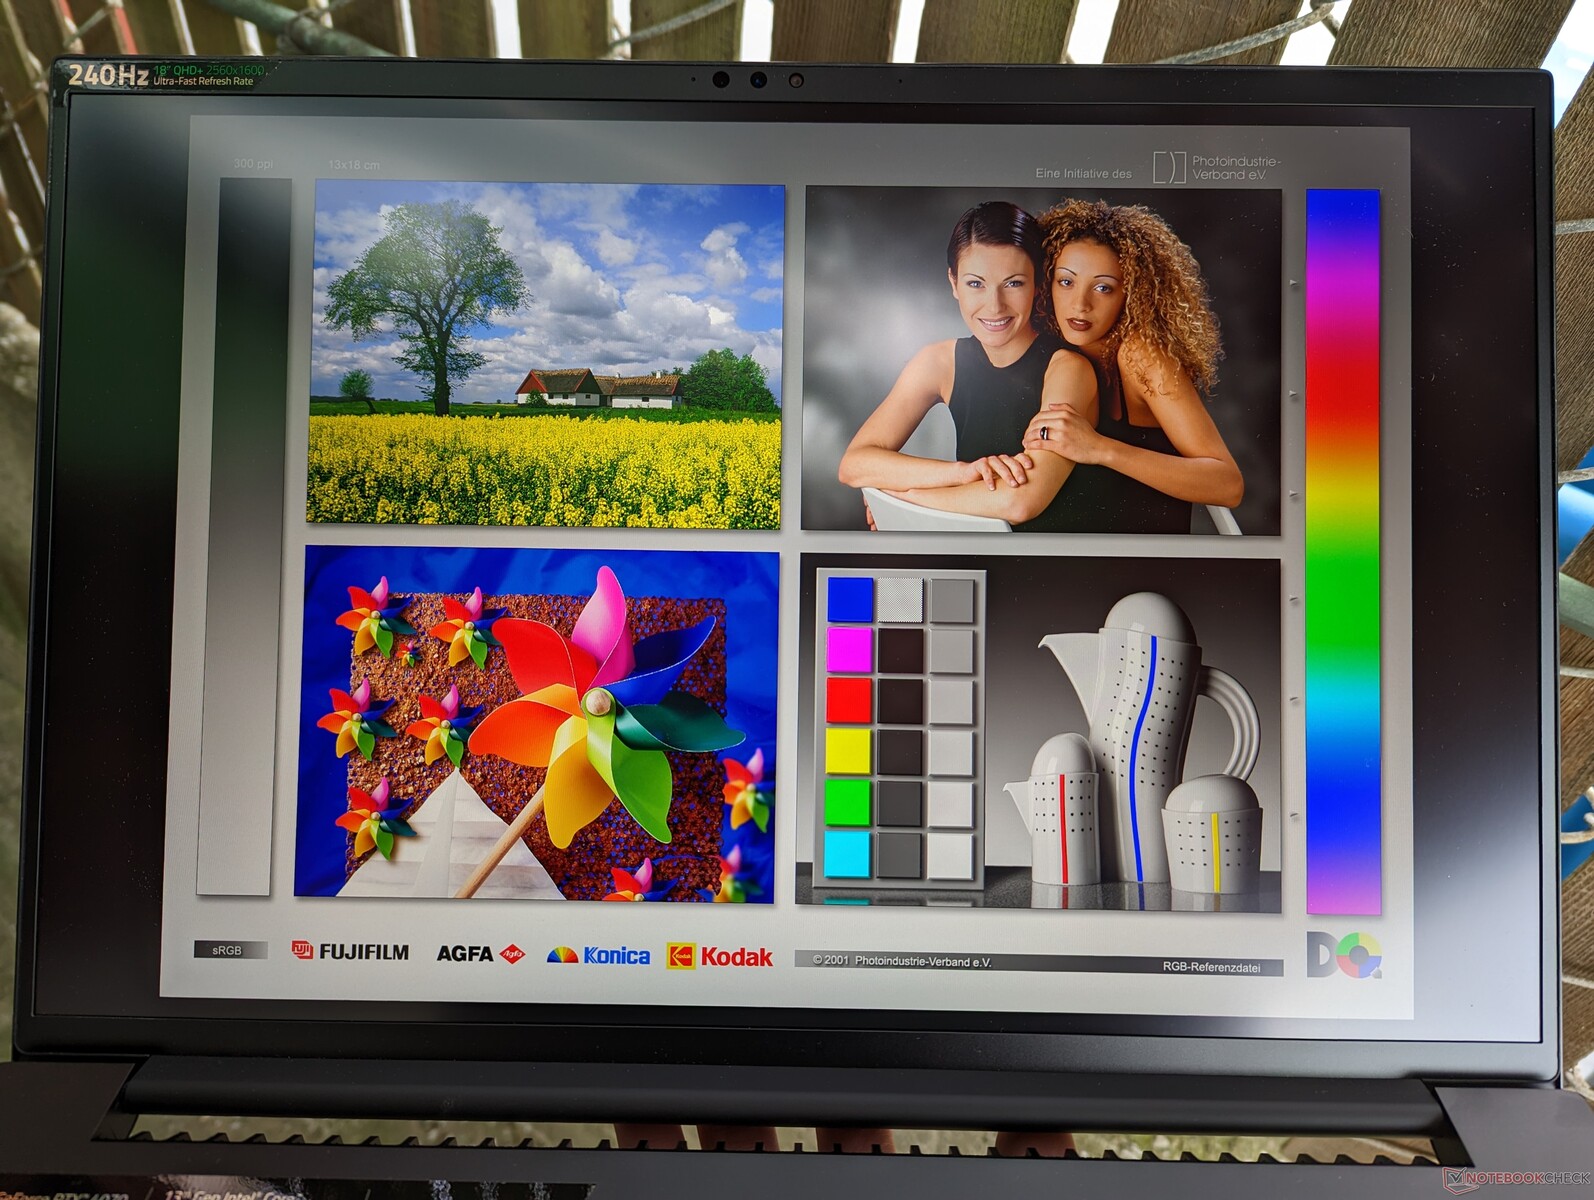
Outdoor visibility is similar to the Blade 17 since their displays each target a 500-nit maximum. Shade is always recommended for optimum colors and to reduce glare as much as possible.
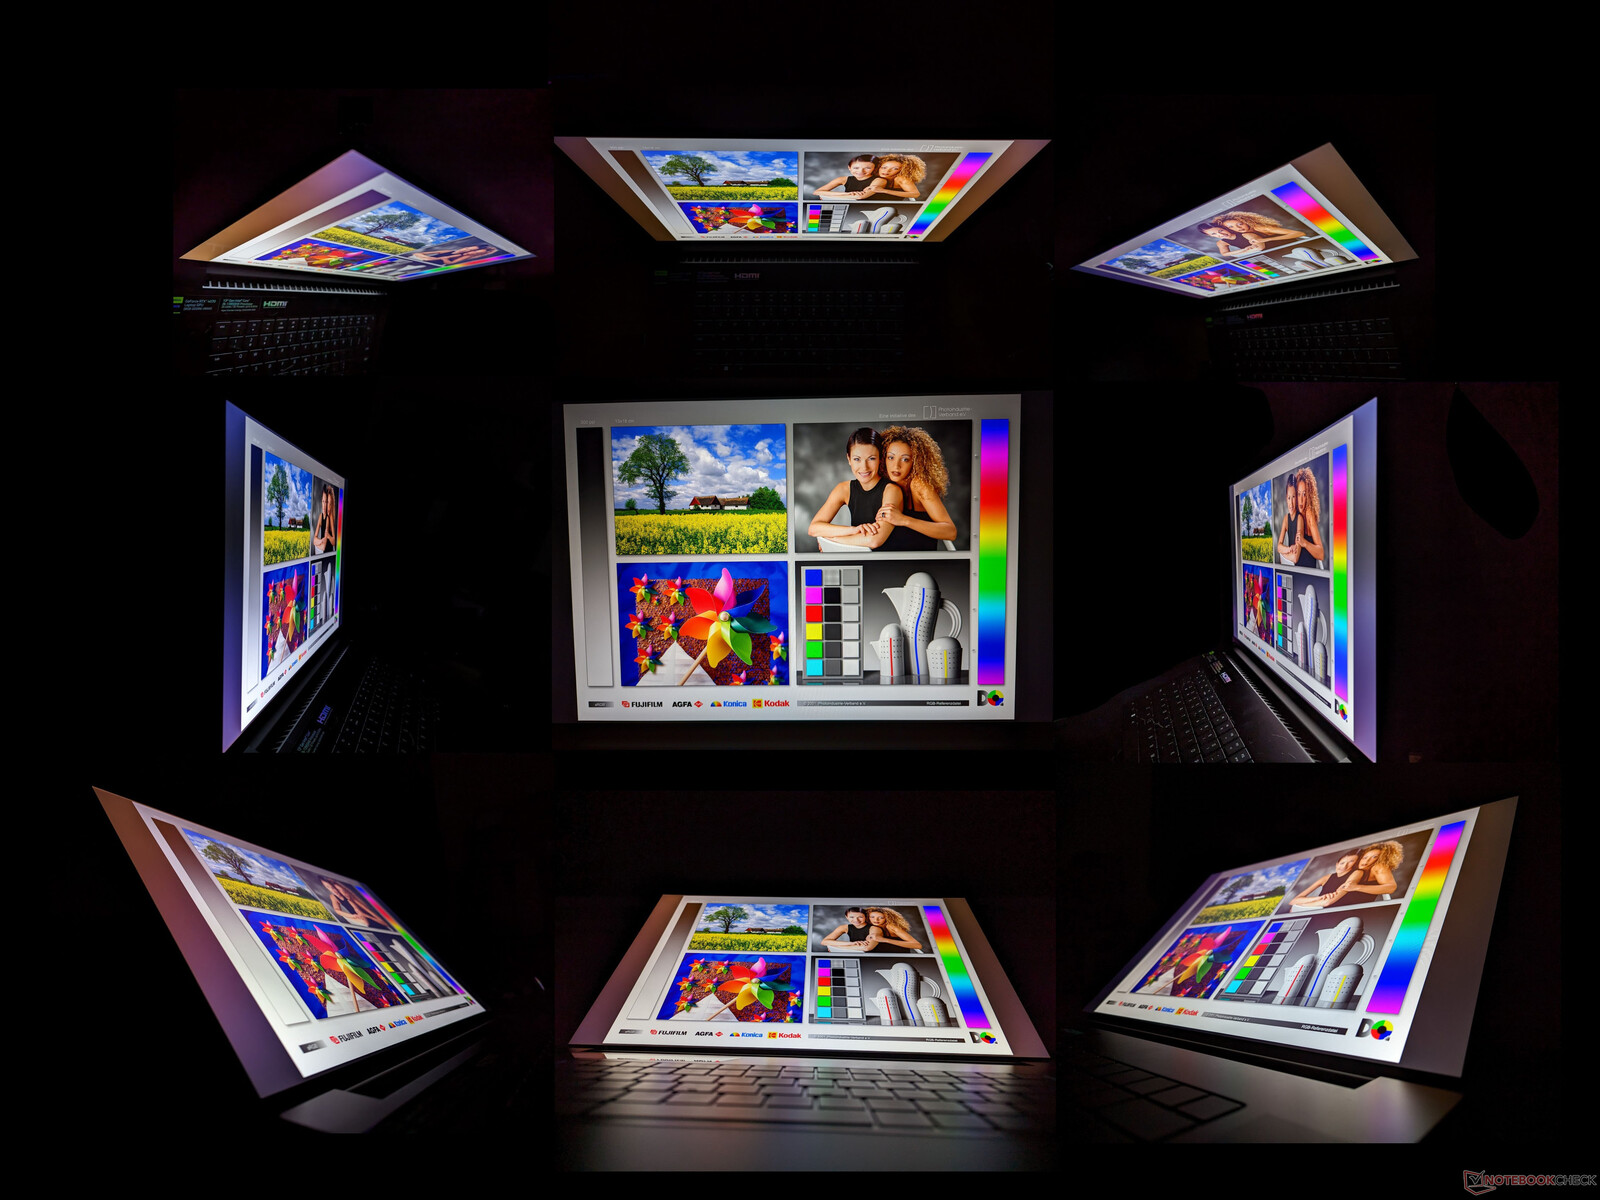
Viewing angles are wide as expected from an IPS panel. Colors and contrast shift only if viewing from extreme angles.
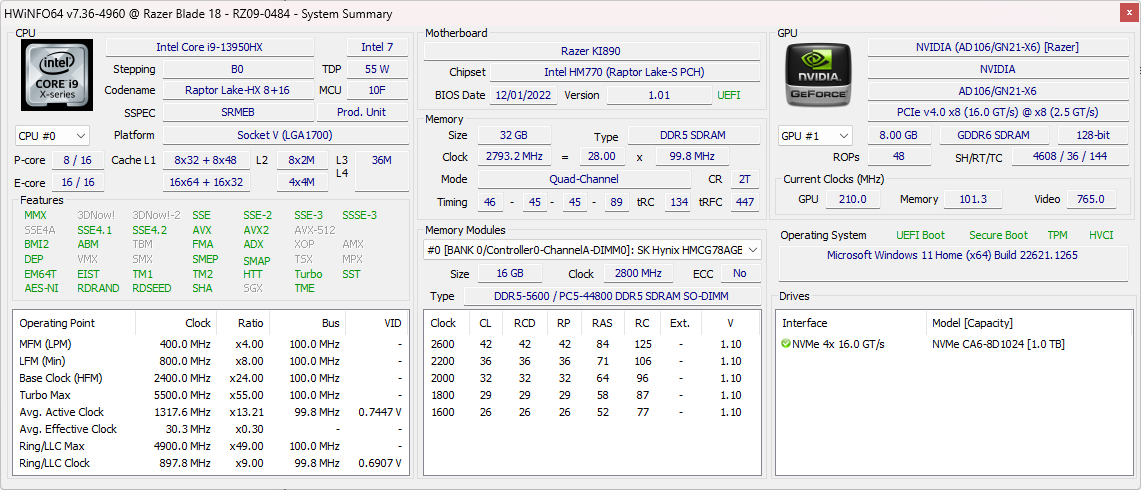
Performance — Intel Raptor Lake + Nvidia Ada Lovelace
Testing Conditions
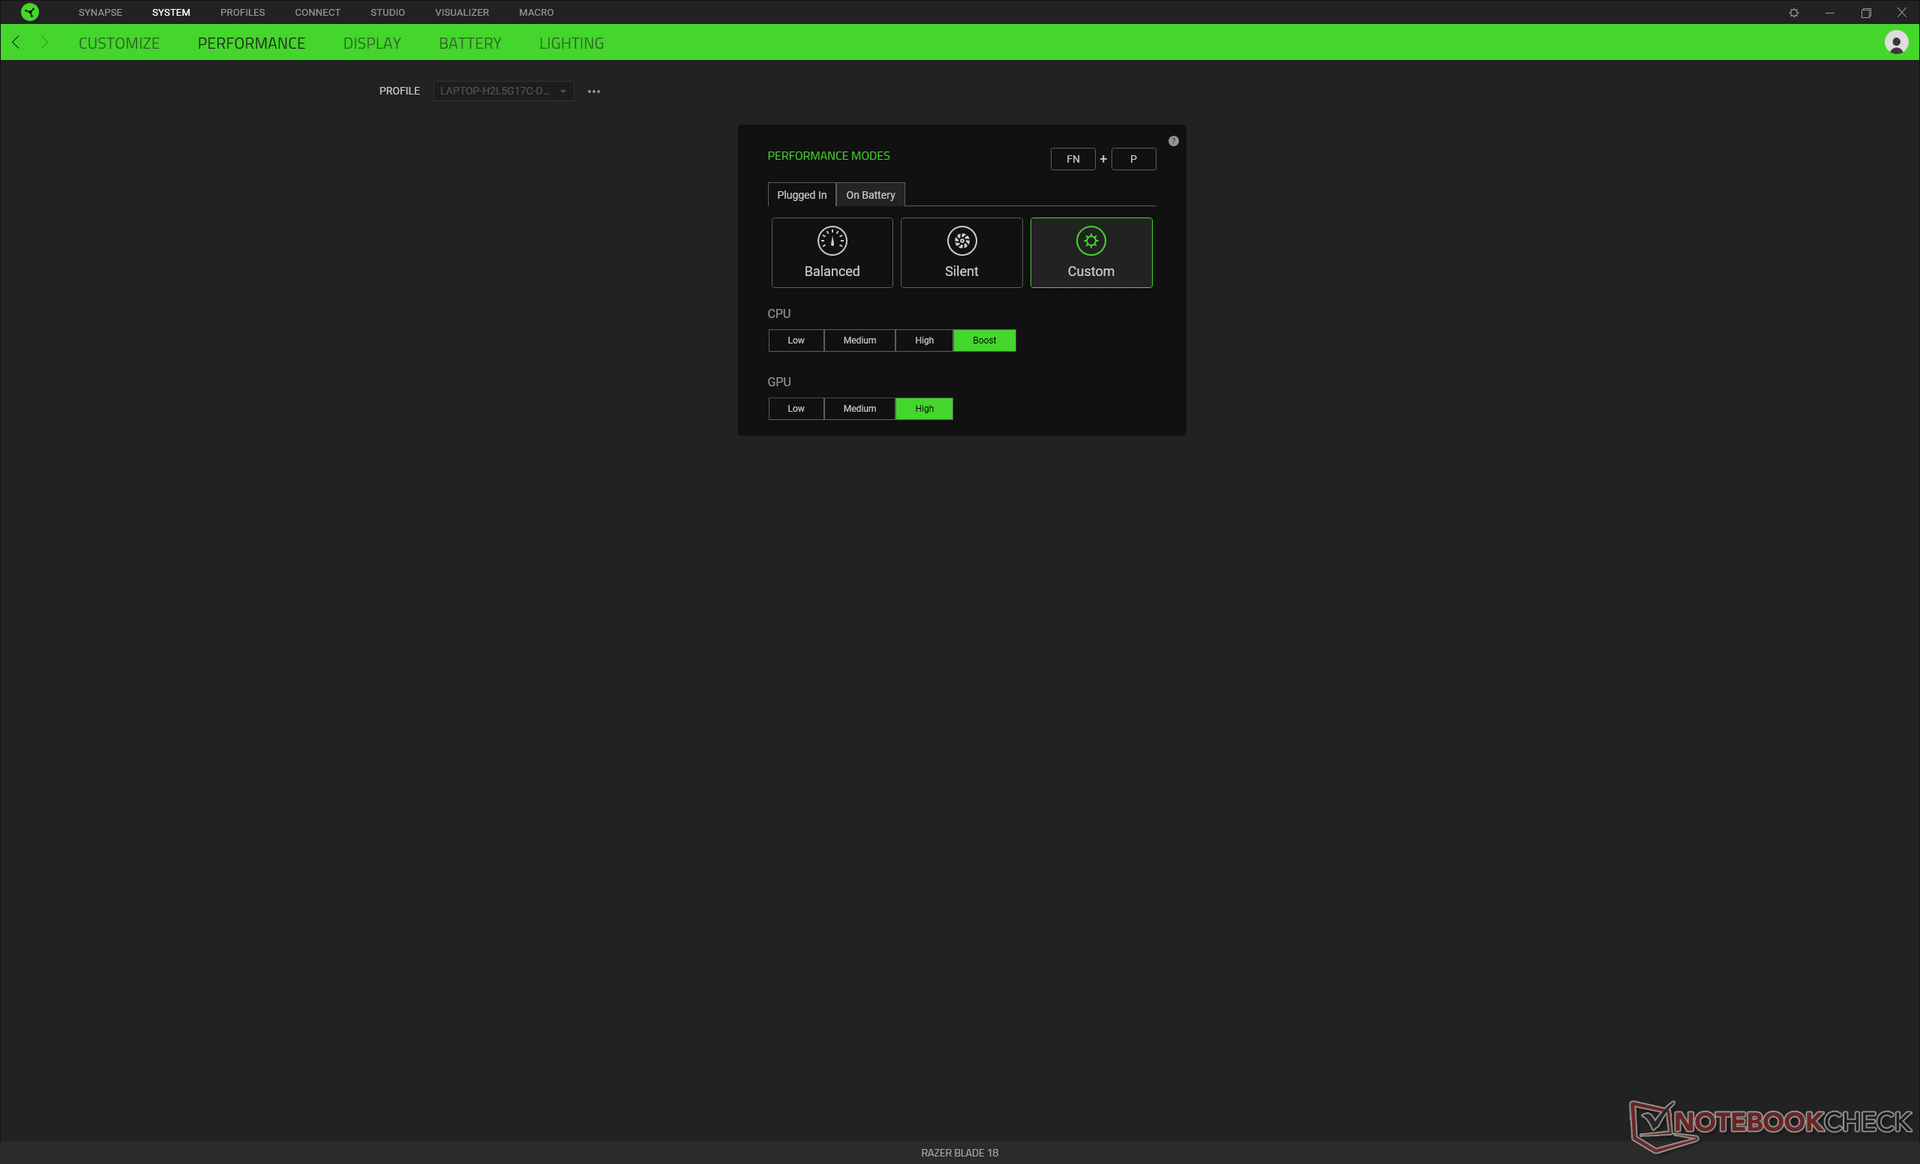
We set our unit to Performance mode via Windows and the CPU and GPU to Boost and High, respectively, via the Razer Synapse software as shown below. It's recommended that users become familiar with Synapse as it is the hub for adjusting any RGB lighting effects, performance profiles, macros, and other auxiliary features. The software isn't always reliable, unfortunately, as it would sometimes become unresponsive or not launch at all if there is no Internet connectivity.
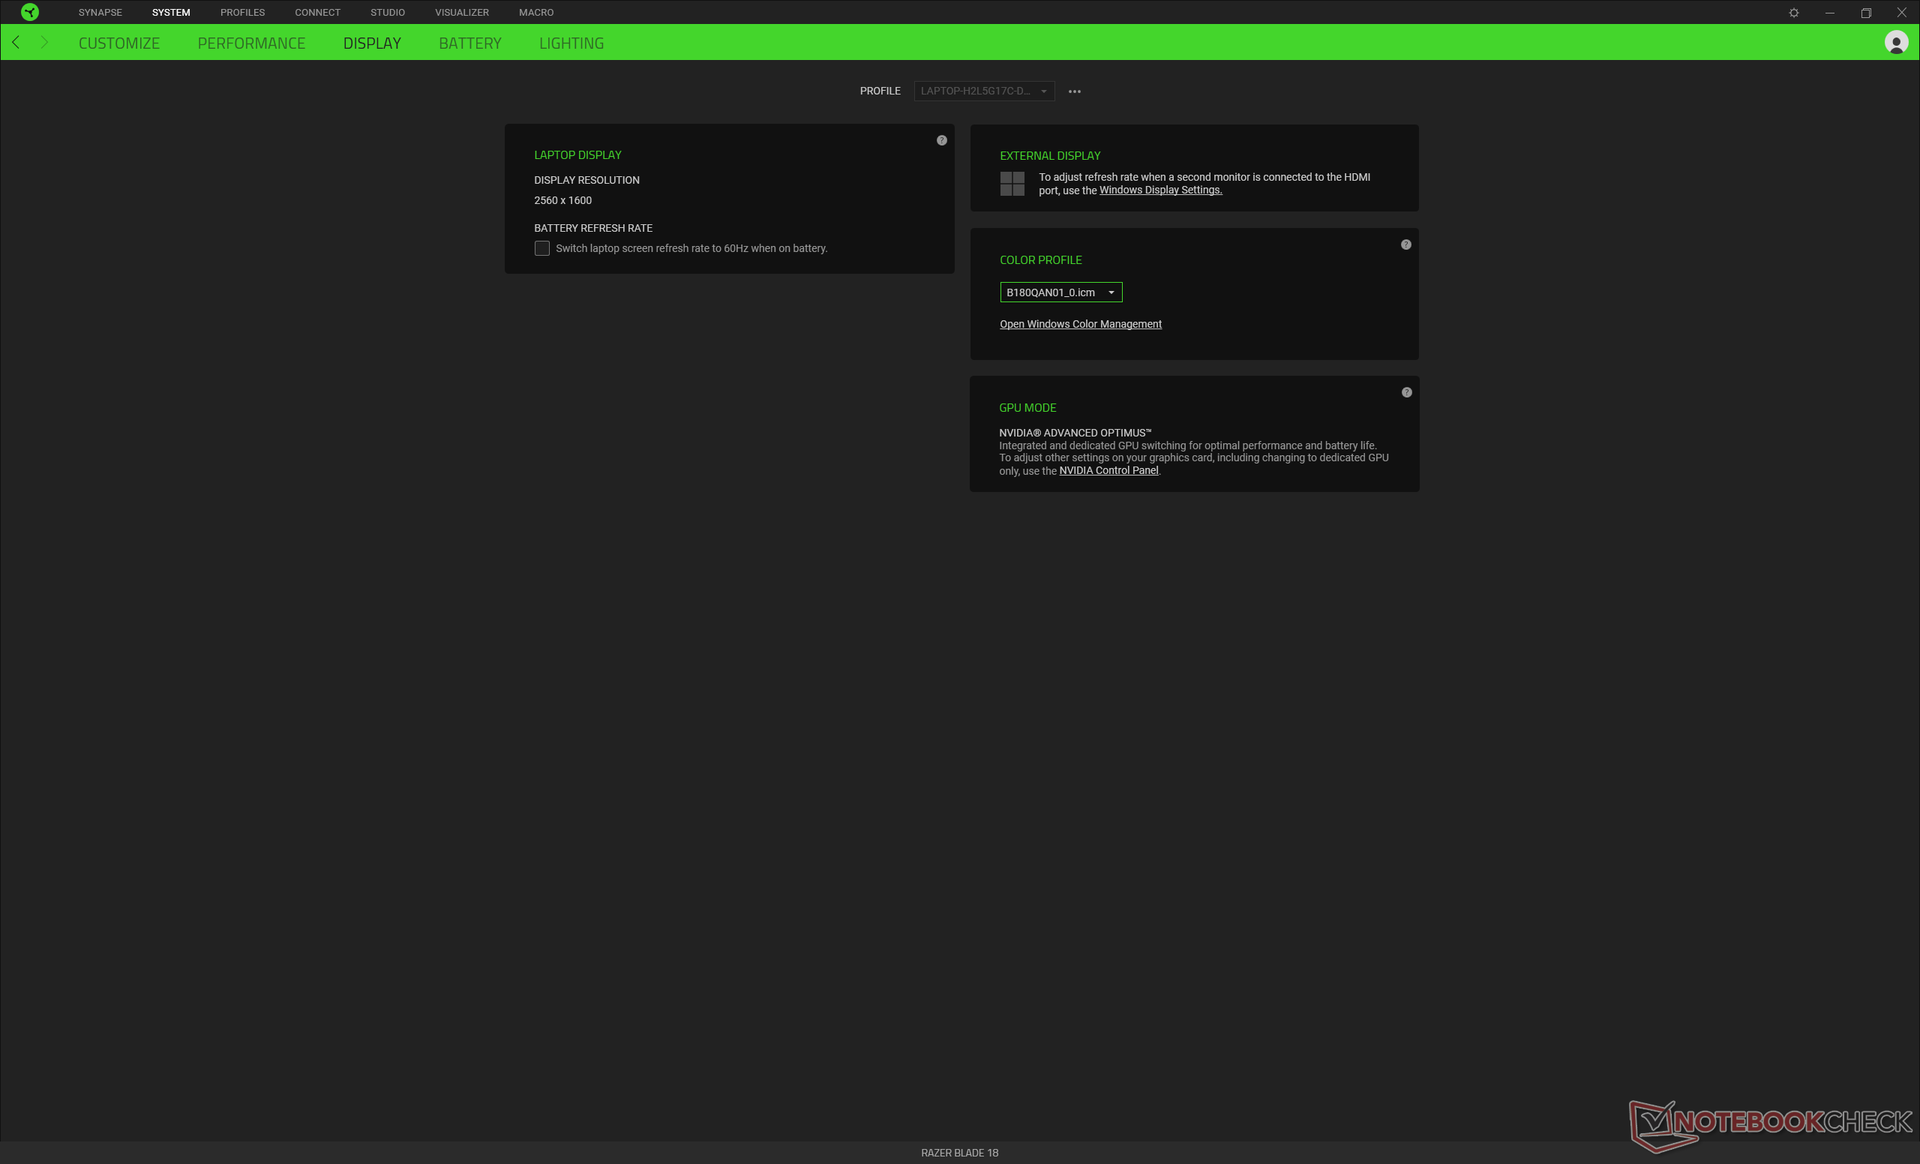
The Blade 18 does not support MUX or Advanced Optimus unlike on the Blade 16. Our unit would also not support G-Sync despite what Razer is advertising. We've reached out to Razer about the lack of G-Sync and will update this section when appropriate.
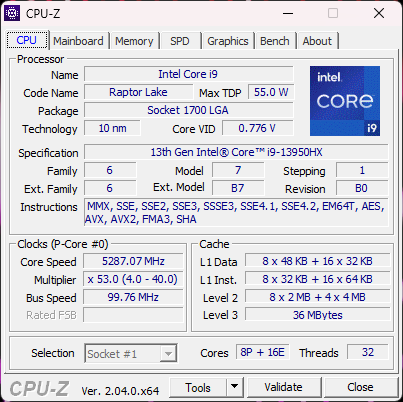
Processor
CPU performance is within just a few percentage points of the Blade 16 or GT77 each equipped with the same Core i9-13950HX processor. Thus, the CPU here does not appear to be suffering from any major throttling issues. Multi-thread performance is roughly 45 percent faster than the previous generation Core i9-12950HX to be on par with a stock desktop Core i9-12900K. The gen-to-gen performance leap is significant in this regard.
Our usual CineBench R15 xT loop test results are not included below as the scores are unusually low and unrepresentative of the performance of the processor. Running CineBench R15 activates both the CPU and dGPU and so the performance of the CPU can sometimes be power limited by the dGPU. This issue can be observed on a few other laptops as well. CineBench R23 is a pure CPU benchmark that doesn't activate the dGPU and so these results are provided below instead.
Cinebench R23 Multi Loop
Cinebench R23: Multi Core | Single Core
Cinebench R20: CPU (Multi Core) | CPU (Single Core)
Cinebench R15: CPU Multi 64Bit | CPU Single 64Bit
Blender: v2.79 BMW27 CPU
7-Zip 18.03: 7z b 4 | 7z b 4 -mmt1
Geekbench 5.5: Multi-Core | Single-Core
HWBOT x265 Benchmark v2.2: 4k Preset
LibreOffice : 20 Documents To PDF
R Benchmark 2.5: Overall mean
* ... smaller is better
AIDA64: FP32 Ray-Trace | FPU Julia | CPU SHA3 | CPU Queen | FPU SinJulia | FPU Mandel | CPU AES | CPU ZLib | FP64 Ray-Trace | CPU PhotoWorxx
| Performance Rating | |
| MSI Titan GT77 HX 13VI | |
| Razer Blade 18 RTX 4070 | |
| Average Intel Core i9-13950HX | |
| Asus ROG Strix Scar 17 SE G733CX-LL014W | |
| Alienware m17 R5 (R9 6900HX, RX 6850M XT) | |
| Gigabyte G7 KE | |
| Razer Blade 17 Early 2022 | |
| AIDA64 / FP32 Ray-Trace | |
| MSI Titan GT77 HX 13VI | |
| Razer Blade 18 RTX 4070 | |
| Average Intel Core i9-13950HX (18131 - 28957, n=7) | |
| Asus ROG Strix Scar 17 SE G733CX-LL014W | |
| Alienware m17 R5 (R9 6900HX, RX 6850M XT) | |
| Gigabyte G7 KE | |
| Razer Blade 17 Early 2022 | |
| AIDA64 / FPU Julia | |
| MSI Titan GT77 HX 13VI | |
| Razer Blade 18 RTX 4070 | |
| Average Intel Core i9-13950HX (102591 - 144303, n=7) | |
| Alienware m17 R5 (R9 6900HX, RX 6850M XT) | |
| Asus ROG Strix Scar 17 SE G733CX-LL014W | |
| Gigabyte G7 KE | |
| Razer Blade 17 Early 2022 | |
| AIDA64 / CPU SHA3 | |
| MSI Titan GT77 HX 13VI | |
| Razer Blade 18 RTX 4070 | |
| Average Intel Core i9-13950HX (4981 - 7093, n=7) | |
| Asus ROG Strix Scar 17 SE G733CX-LL014W | |
| Alienware m17 R5 (R9 6900HX, RX 6850M XT) | |
| Gigabyte G7 KE | |
| Razer Blade 17 Early 2022 | |
| AIDA64 / CPU Queen | |
| MSI Titan GT77 HX 13VI | |
| Razer Blade 18 RTX 4070 | |
| Average Intel Core i9-13950HX (131931 - 140103, n=7) | |
| Alienware m17 R5 (R9 6900HX, RX 6850M XT) | |
| Asus ROG Strix Scar 17 SE G733CX-LL014W | |
| Razer Blade 17 Early 2022 | |
| Gigabyte G7 KE | |
| AIDA64 / FPU SinJulia | |
| MSI Titan GT77 HX 13VI | |
| Razer Blade 18 RTX 4070 | |
| Average Intel Core i9-13950HX (12381 - 17057, n=7) | |
| Alienware m17 R5 (R9 6900HX, RX 6850M XT) | |
| Asus ROG Strix Scar 17 SE G733CX-LL014W | |
| Gigabyte G7 KE | |
| Razer Blade 17 Early 2022 | |
| AIDA64 / FPU Mandel | |
| MSI Titan GT77 HX 13VI | |
| Razer Blade 18 RTX 4070 | |
| Average Intel Core i9-13950HX (46539 - 71038, n=7) | |
| Alienware m17 R5 (R9 6900HX, RX 6850M XT) | |
| Asus ROG Strix Scar 17 SE G733CX-LL014W | |
| Gigabyte G7 KE | |
| Razer Blade 17 Early 2022 | |
| AIDA64 / CPU AES | |
| Asus ROG Strix Scar 17 SE G733CX-LL014W | |
| MSI Titan GT77 HX 13VI | |
| Average Intel Core i9-13950HX (99981 - 204491, n=7) | |
| Razer Blade 18 RTX 4070 | |
| Gigabyte G7 KE | |
| Alienware m17 R5 (R9 6900HX, RX 6850M XT) | |
| Razer Blade 17 Early 2022 | |
| AIDA64 / CPU ZLib | |
| MSI Titan GT77 HX 13VI | |
| Average Intel Core i9-13950HX (1472 - 2069, n=7) | |
| Razer Blade 18 RTX 4070 | |
| Asus ROG Strix Scar 17 SE G733CX-LL014W | |
| Gigabyte G7 KE | |
| Alienware m17 R5 (R9 6900HX, RX 6850M XT) | |
| Razer Blade 17 Early 2022 | |
| AIDA64 / FP64 Ray-Trace | |
| MSI Titan GT77 HX 13VI | |
| Razer Blade 18 RTX 4070 | |
| Average Intel Core i9-13950HX (9787 - 15573, n=7) | |
| Asus ROG Strix Scar 17 SE G733CX-LL014W | |
| Alienware m17 R5 (R9 6900HX, RX 6850M XT) | |
| Gigabyte G7 KE | |
| Razer Blade 17 Early 2022 | |
| AIDA64 / CPU PhotoWorxx | |
| Razer Blade 18 RTX 4070 | |
| Average Intel Core i9-13950HX (40233 - 50864, n=7) | |
| Asus ROG Strix Scar 17 SE G733CX-LL014W | |
| MSI Titan GT77 HX 13VI | |
| Razer Blade 17 Early 2022 | |
| Alienware m17 R5 (R9 6900HX, RX 6850M XT) | |
| Gigabyte G7 KE | |
System Performance
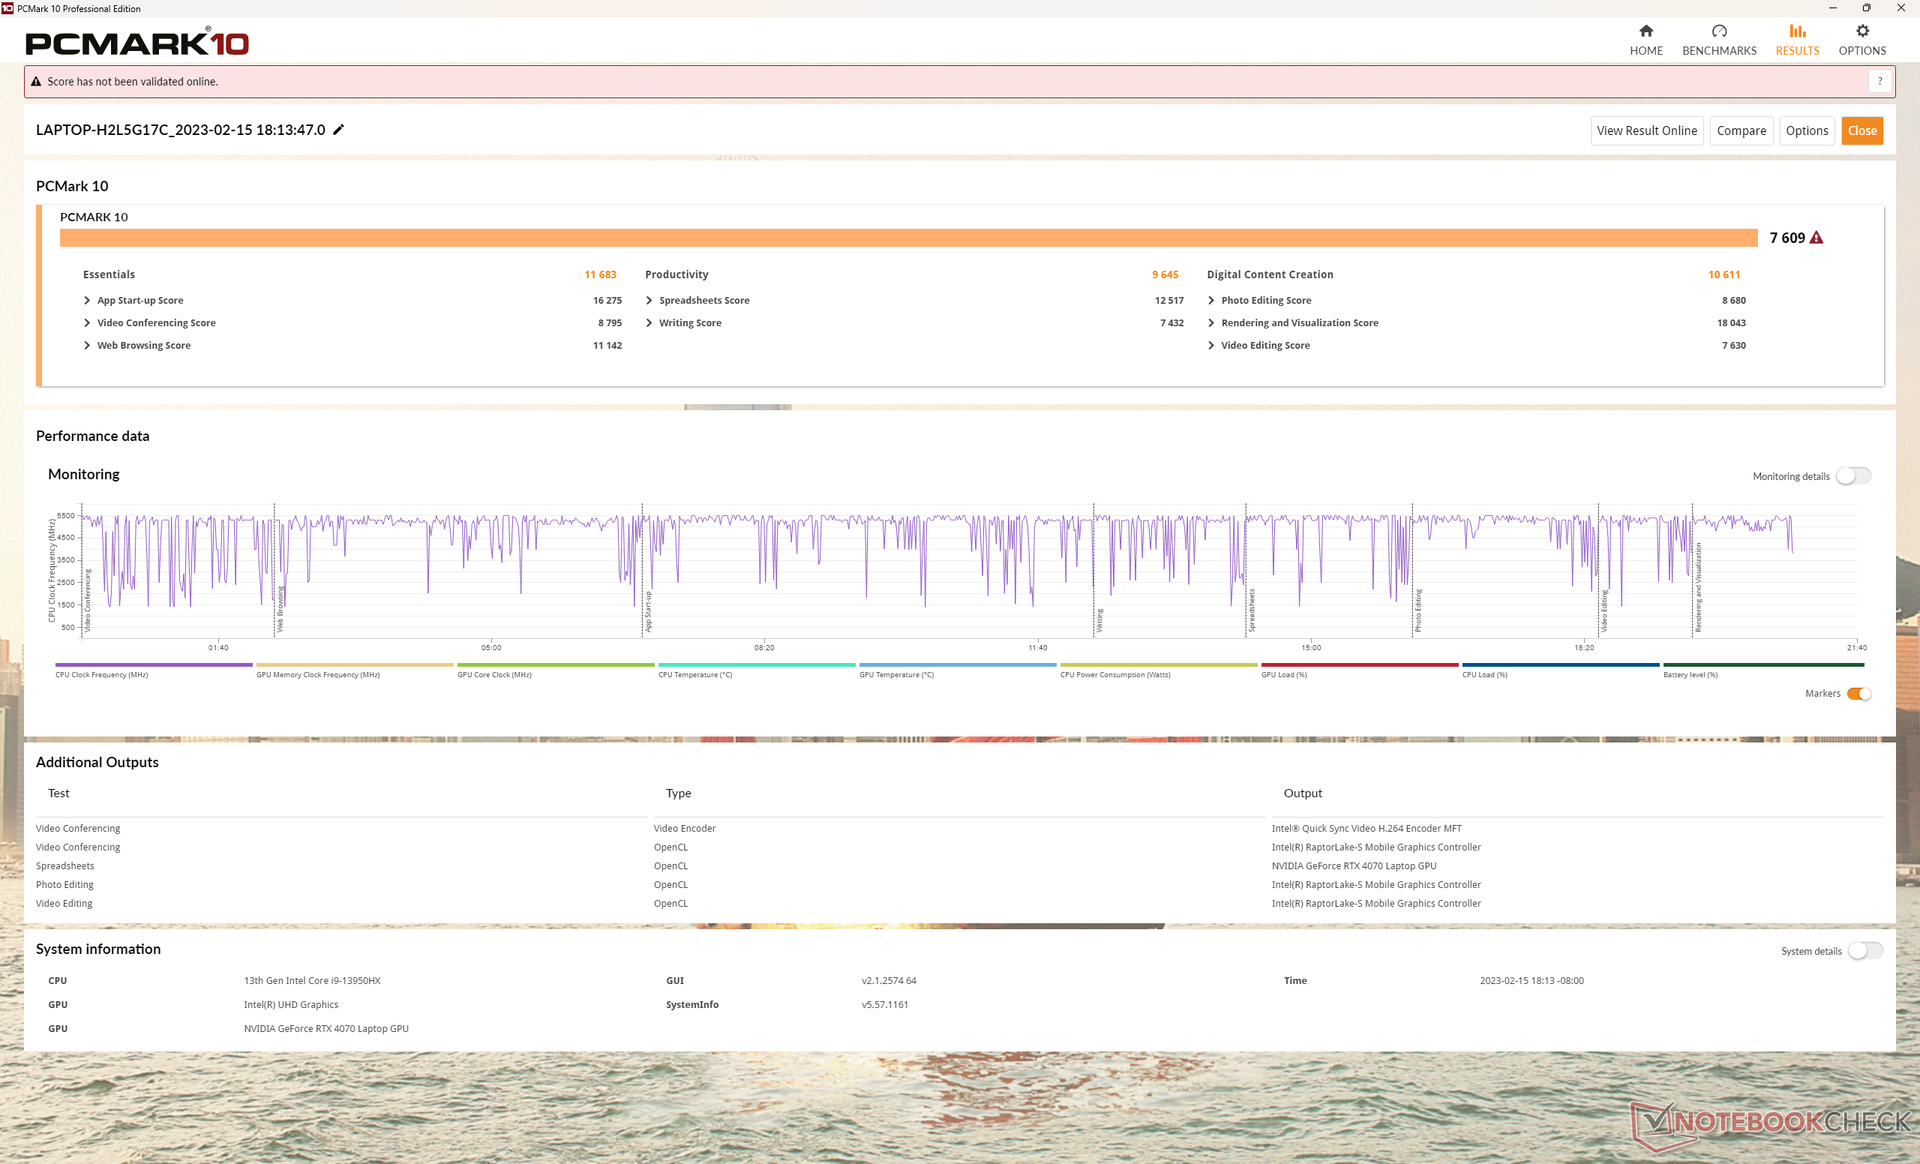
PCMark 10 scores are consistently higher than on the 2022 Blade 17 even if the margins are minor. The Blade 16 and MSI GT77 score better as they each sport faster RTX 4080 and 4090 GPUs, respectively.
CrossMark: Overall | Productivity | Creativity | Responsiveness
| PCMark 10 / Score | |
| MSI Titan GT77 HX 13VI | |
| Razer Blade 18 RTX 4070 | |
| Average Intel Core i9-13950HX, NVIDIA GeForce RTX 4070 Laptop GPU () | |
| Alienware m17 R5 (R9 6900HX, RX 6850M XT) | |
| Asus ROG Strix Scar 17 SE G733CX-LL014W | |
| Razer Blade 17 Early 2022 | |
| Gigabyte G7 KE | |
| PCMark 10 / Essentials | |
| MSI Titan GT77 HX 13VI | |
| Razer Blade 18 RTX 4070 | |
| Average Intel Core i9-13950HX, NVIDIA GeForce RTX 4070 Laptop GPU () | |
| Asus ROG Strix Scar 17 SE G733CX-LL014W | |
| Gigabyte G7 KE | |
| Razer Blade 17 Early 2022 | |
| Alienware m17 R5 (R9 6900HX, RX 6850M XT) | |
| PCMark 10 / Productivity | |
| Asus ROG Strix Scar 17 SE G733CX-LL014W | |
| MSI Titan GT77 HX 13VI | |
| Razer Blade 18 RTX 4070 | |
| Average Intel Core i9-13950HX, NVIDIA GeForce RTX 4070 Laptop GPU () | |
| Razer Blade 17 Early 2022 | |
| Alienware m17 R5 (R9 6900HX, RX 6850M XT) | |
| Gigabyte G7 KE | |
| PCMark 10 / Digital Content Creation | |
| MSI Titan GT77 HX 13VI | |
| Alienware m17 R5 (R9 6900HX, RX 6850M XT) | |
| Razer Blade 18 RTX 4070 | |
| Average Intel Core i9-13950HX, NVIDIA GeForce RTX 4070 Laptop GPU () | |
| Razer Blade 17 Early 2022 | |
| Asus ROG Strix Scar 17 SE G733CX-LL014W | |
| Gigabyte G7 KE | |
| CrossMark / Overall | |
| MSI Titan GT77 HX 13VI | |
| Razer Blade 18 RTX 4070 | |
| Average Intel Core i9-13950HX, NVIDIA GeForce RTX 4070 Laptop GPU () | |
| Asus ROG Strix Scar 17 SE G733CX-LL014W | |
| Gigabyte G7 KE | |
| Razer Blade 17 Early 2022 | |
| Alienware m17 R5 (R9 6900HX, RX 6850M XT) | |
| CrossMark / Productivity | |
| MSI Titan GT77 HX 13VI | |
| Razer Blade 18 RTX 4070 | |
| Average Intel Core i9-13950HX, NVIDIA GeForce RTX 4070 Laptop GPU () | |
| Asus ROG Strix Scar 17 SE G733CX-LL014W | |
| Gigabyte G7 KE | |
| Razer Blade 17 Early 2022 | |
| Alienware m17 R5 (R9 6900HX, RX 6850M XT) | |
| CrossMark / Creativity | |
| MSI Titan GT77 HX 13VI | |
| Razer Blade 18 RTX 4070 | |
| Average Intel Core i9-13950HX, NVIDIA GeForce RTX 4070 Laptop GPU () | |
| Asus ROG Strix Scar 17 SE G733CX-LL014W | |
| Razer Blade 17 Early 2022 | |
| Gigabyte G7 KE | |
| Alienware m17 R5 (R9 6900HX, RX 6850M XT) | |
| CrossMark / Responsiveness | |
| Gigabyte G7 KE | |
| Asus ROG Strix Scar 17 SE G733CX-LL014W | |
| Razer Blade 18 RTX 4070 | |
| Average Intel Core i9-13950HX, NVIDIA GeForce RTX 4070 Laptop GPU () | |
| MSI Titan GT77 HX 13VI | |
| Razer Blade 17 Early 2022 | |
| Alienware m17 R5 (R9 6900HX, RX 6850M XT) | |
| PCMark 10 Score | 7609 points | |
Help | ||
| AIDA64 / Memory Copy | |
| Razer Blade 18 RTX 4070 | |
| Average Intel Core i9-13950HX (61938 - 78494, n=7) | |
| MSI Titan GT77 HX 13VI | |
| Asus ROG Strix Scar 17 SE G733CX-LL014W | |
| Razer Blade 17 Early 2022 | |
| Alienware m17 R5 (R9 6900HX, RX 6850M XT) | |
| Gigabyte G7 KE | |
| AIDA64 / Memory Read | |
| Razer Blade 18 RTX 4070 | |
| Average Intel Core i9-13950HX (62368 - 86207, n=7) | |
| Asus ROG Strix Scar 17 SE G733CX-LL014W | |
| MSI Titan GT77 HX 13VI | |
| Razer Blade 17 Early 2022 | |
| Alienware m17 R5 (R9 6900HX, RX 6850M XT) | |
| Gigabyte G7 KE | |
| AIDA64 / Memory Write | |
| Razer Blade 18 RTX 4070 | |
| Average Intel Core i9-13950HX (59501 - 80441, n=7) | |
| Asus ROG Strix Scar 17 SE G733CX-LL014W | |
| MSI Titan GT77 HX 13VI | |
| Razer Blade 17 Early 2022 | |
| Alienware m17 R5 (R9 6900HX, RX 6850M XT) | |
| Gigabyte G7 KE | |
| AIDA64 / Memory Latency | |
| Alienware m17 R5 (R9 6900HX, RX 6850M XT) | |
| MSI Titan GT77 HX 13VI | |
| Average Intel Core i9-13950HX (84.4 - 99.5, n=7) | |
| Gigabyte G7 KE | |
| Asus ROG Strix Scar 17 SE G733CX-LL014W | |
| Razer Blade 18 RTX 4070 | |
* ... smaller is better
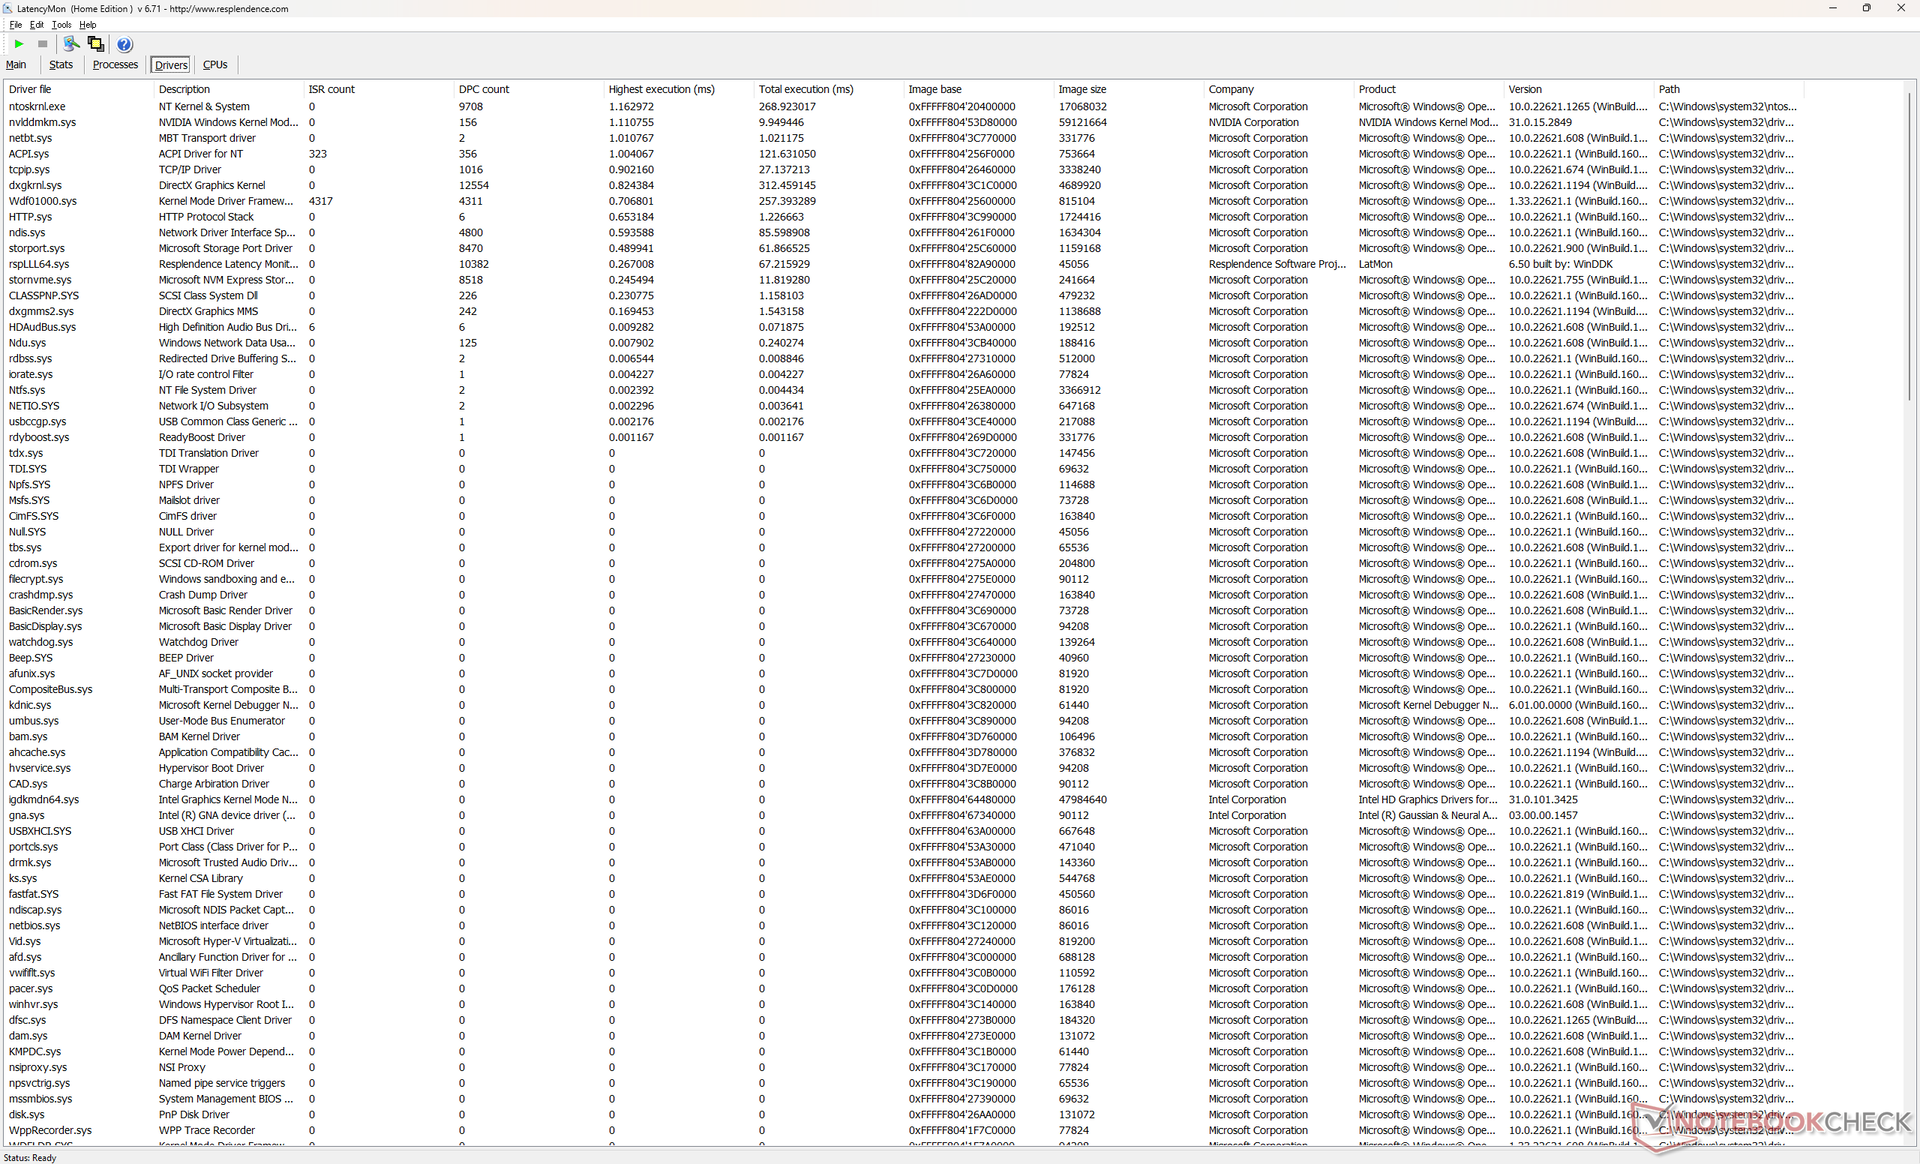
DPC Latency
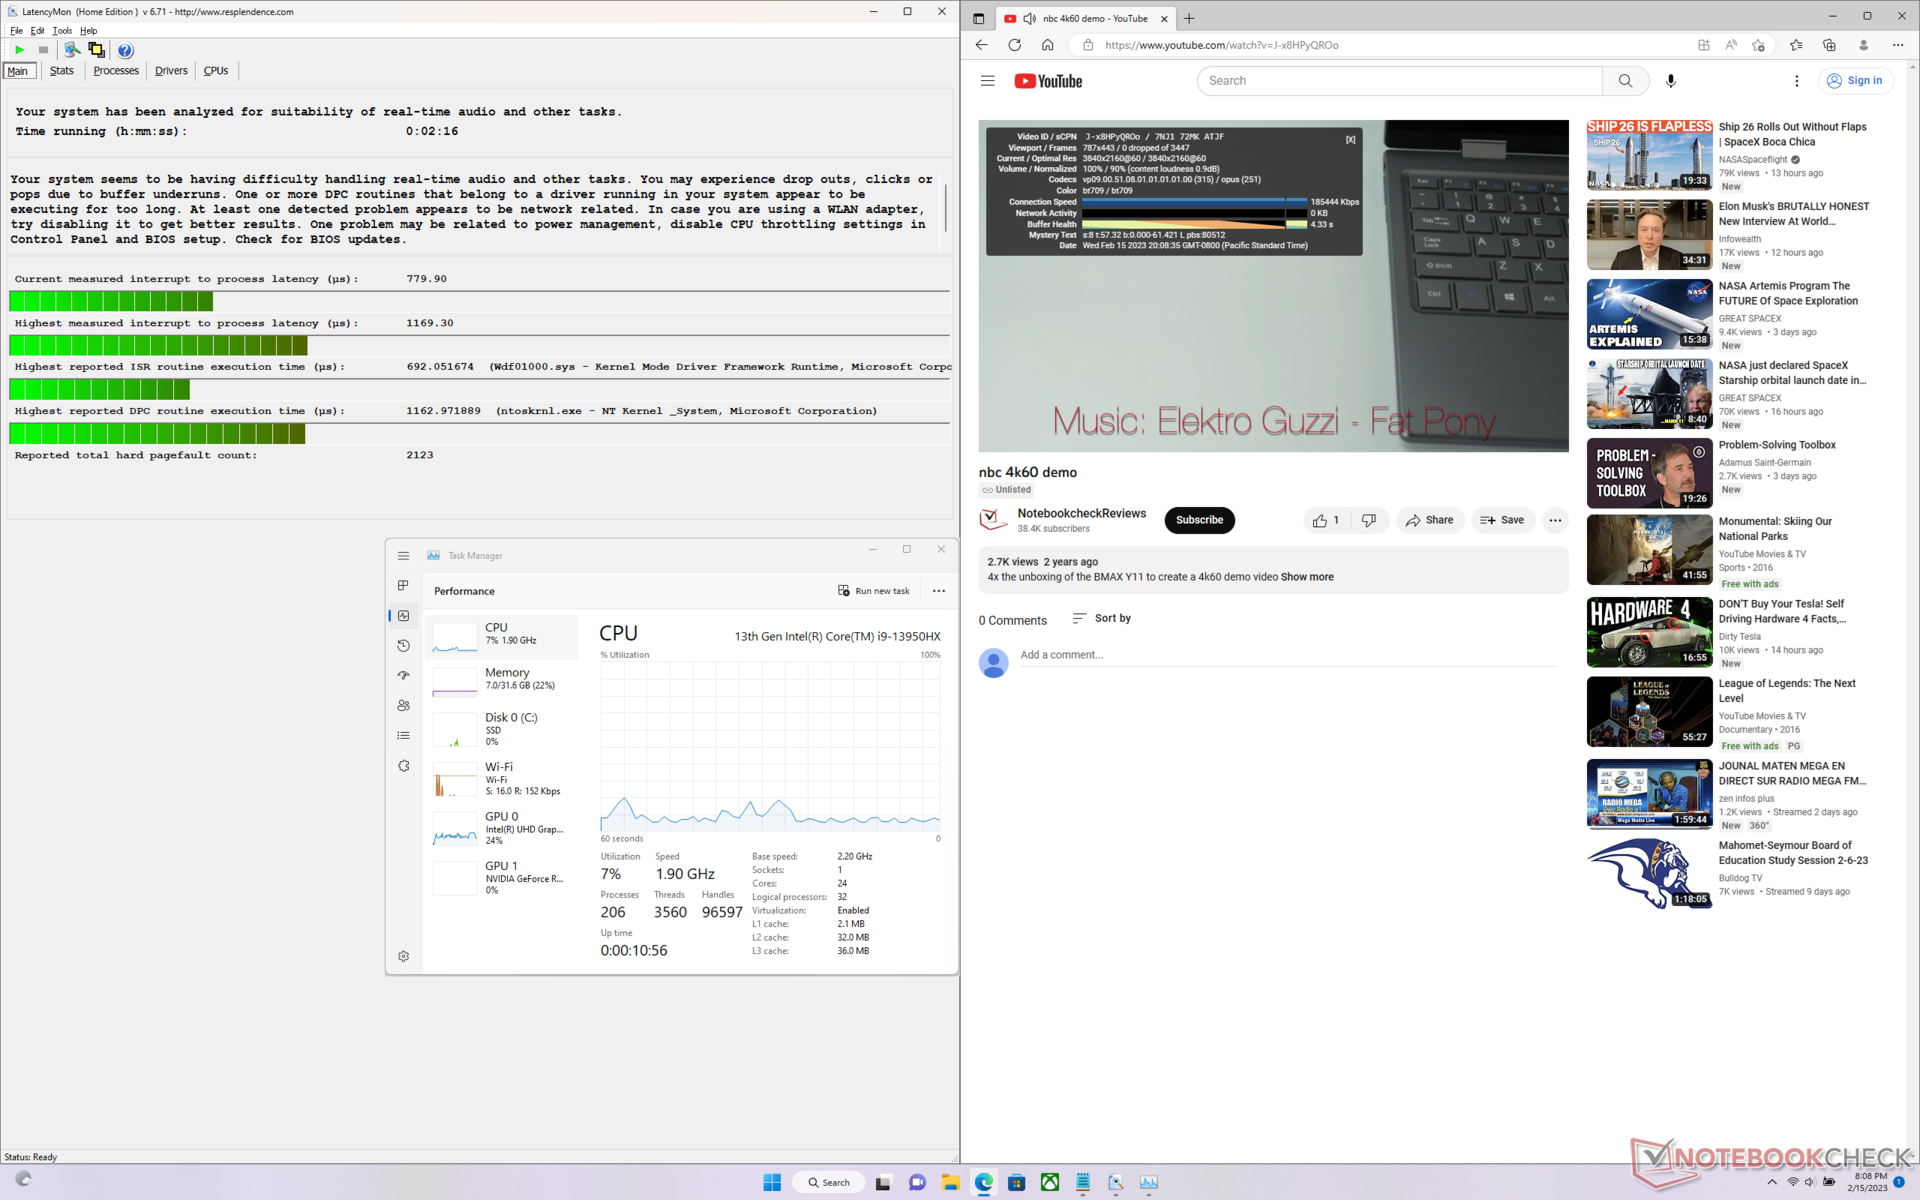
LatencyMon reveals slight DPC issues when opening multiple browser tabs of our homepage. 4K video playback at 60 FPS is otherwise flawless with both low CPU and GPU utilization.
| DPC Latencies / LatencyMon - interrupt to process latency (max), Web, Youtube, Prime95 | |
| MSI Titan GT77 HX 13VI | |
| Asus ROG Strix Scar 17 SE G733CX-LL014W | |
| Gigabyte G7 KE | |
| Alienware m17 R5 (R9 6900HX, RX 6850M XT) | |
| Razer Blade 18 RTX 4070 | |
| Razer Blade 17 Early 2022 | |
* ... smaller is better
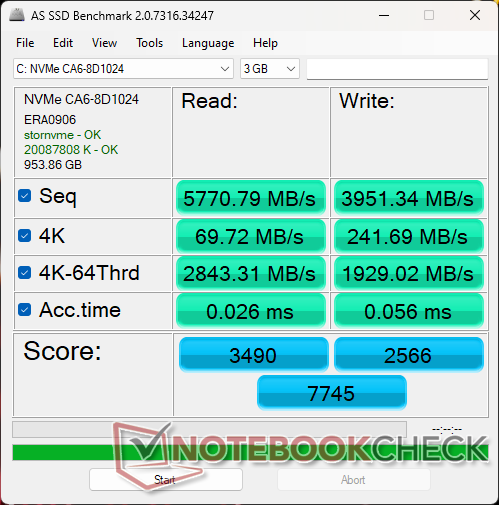
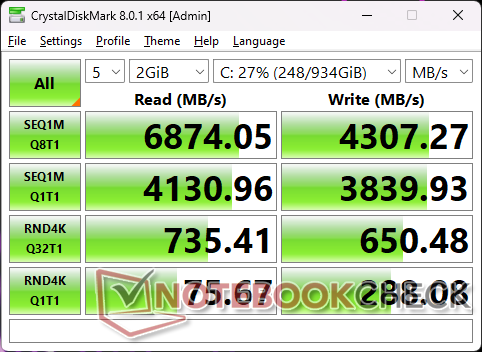
Storage Devices — Up To Two SSDs
Our test unit ships with the same 1 TB SSSTC CA6-8D1024 PCIe4 x4 NVMe SSD as found on the Alienware m17 R5. Transfer rates are comparable to the popular Samsung PM9A1 with stable sequential read and write rates approaching 6900 MB/s and 4300 MB/s, respectively. Razer includes a thermal pad for each of the two SSD slots to dissipate heat onto the metal bottom panel.

| Drive Performance Rating - Percent | |
| Asus ROG Strix Scar 17 SE G733CX-LL014W | |
| Gigabyte G7 KE | |
| Razer Blade 17 Early 2022 | |
| MSI Titan GT77 HX 13VI | |
| Razer Blade 18 RTX 4070 | |
| Alienware m17 R5 (R9 6900HX, RX 6850M XT) | |
* ... smaller is better
Disk Throttling: DiskSpd Read Loop, Queue Depth 8
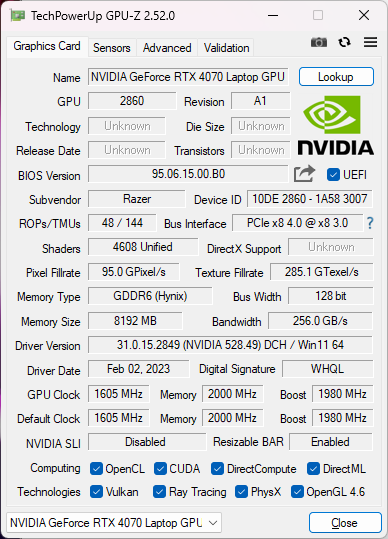
GPU Performance — Similar Performance To A Desktop GeForce RTX 3070
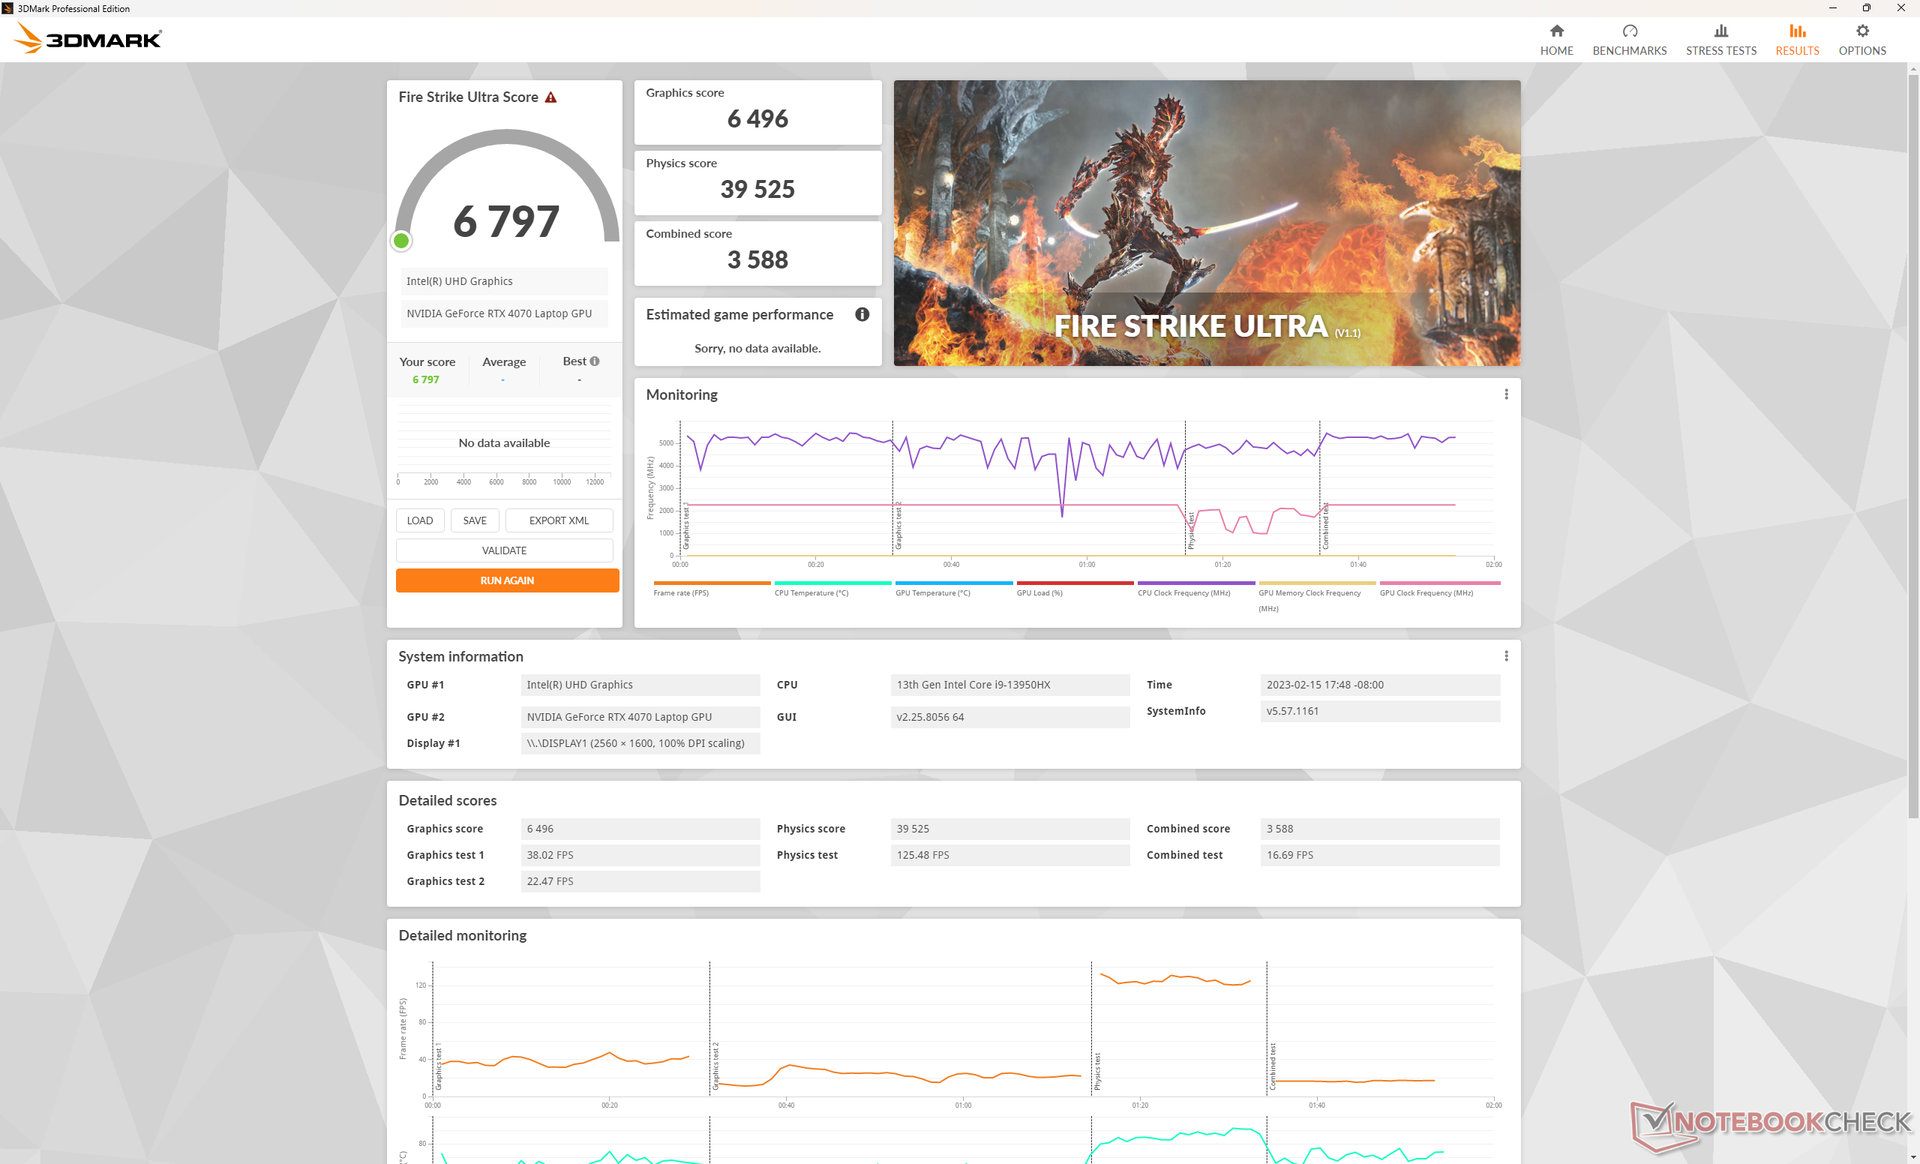
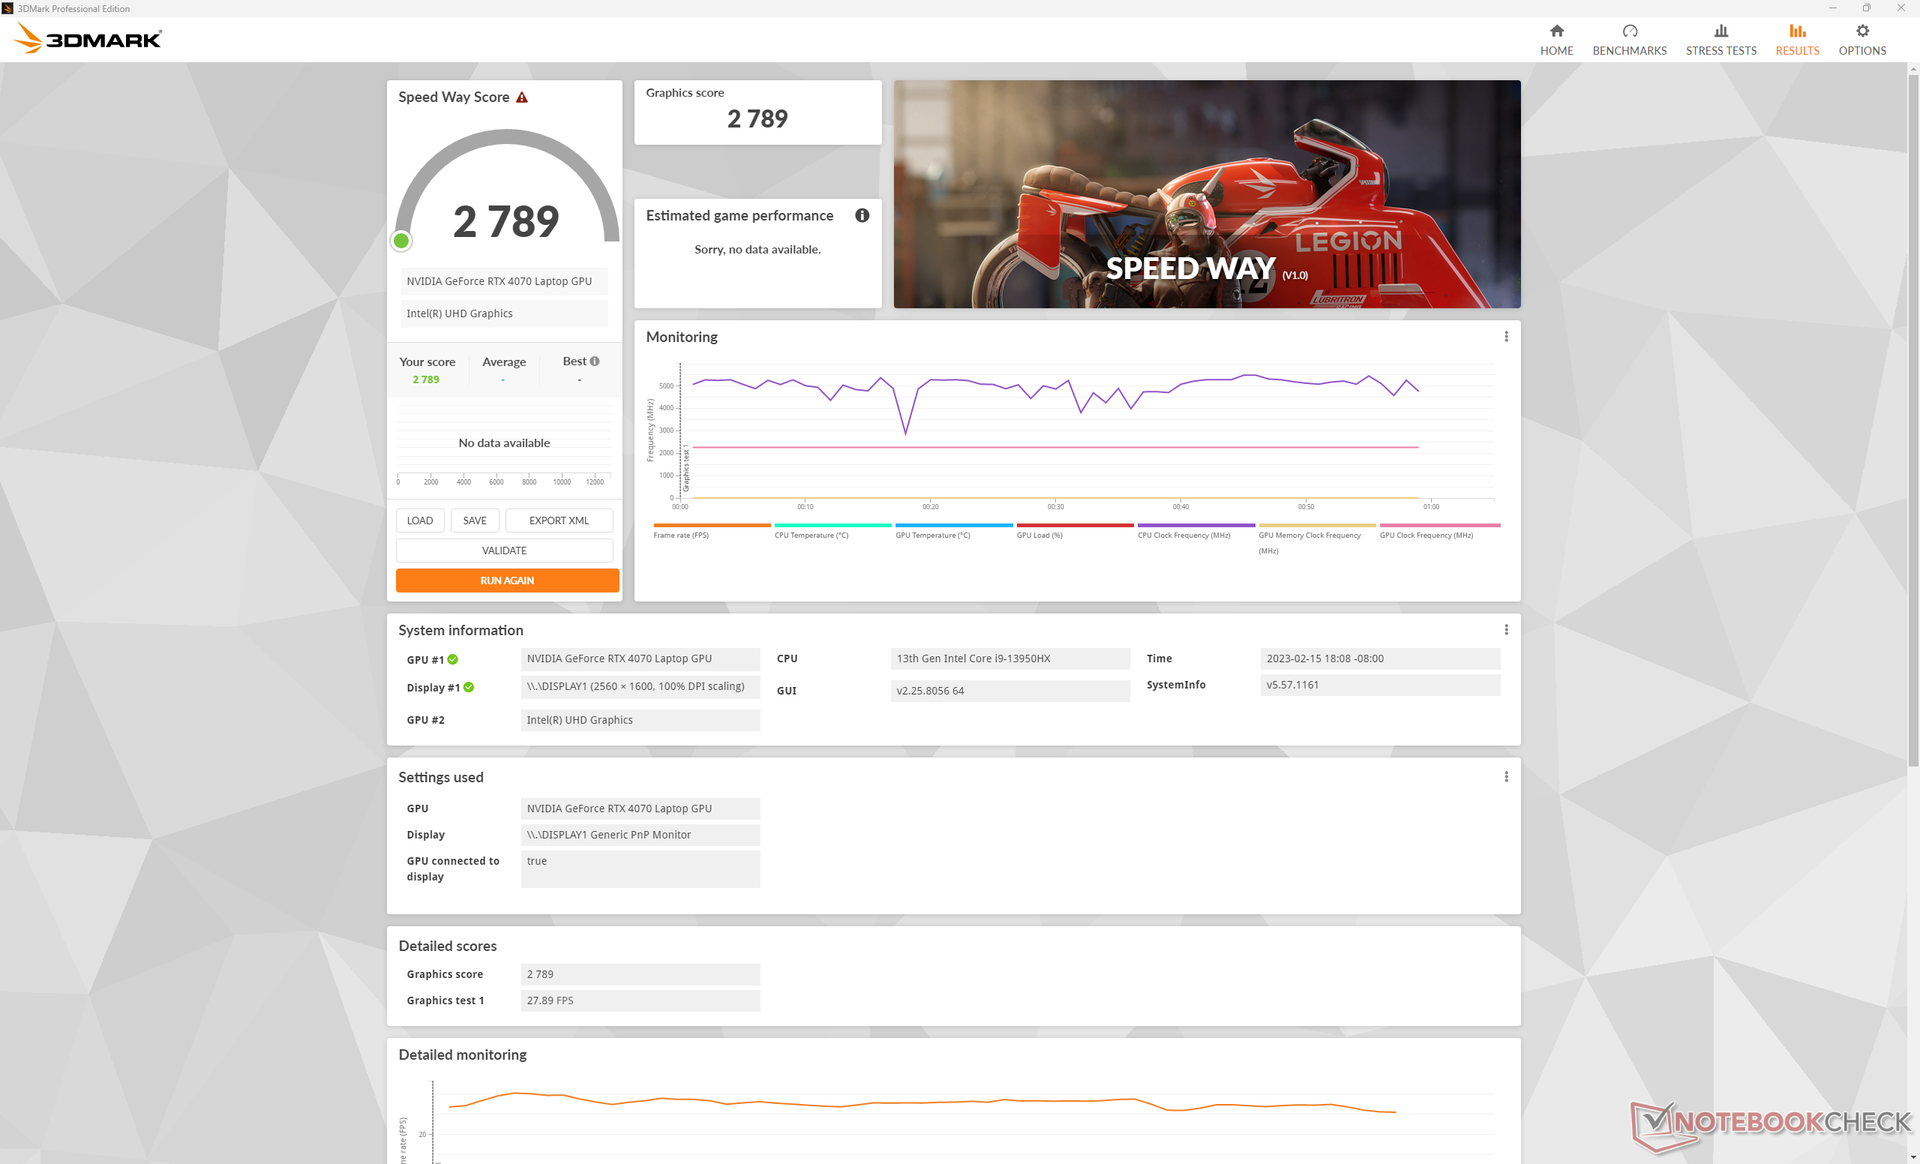
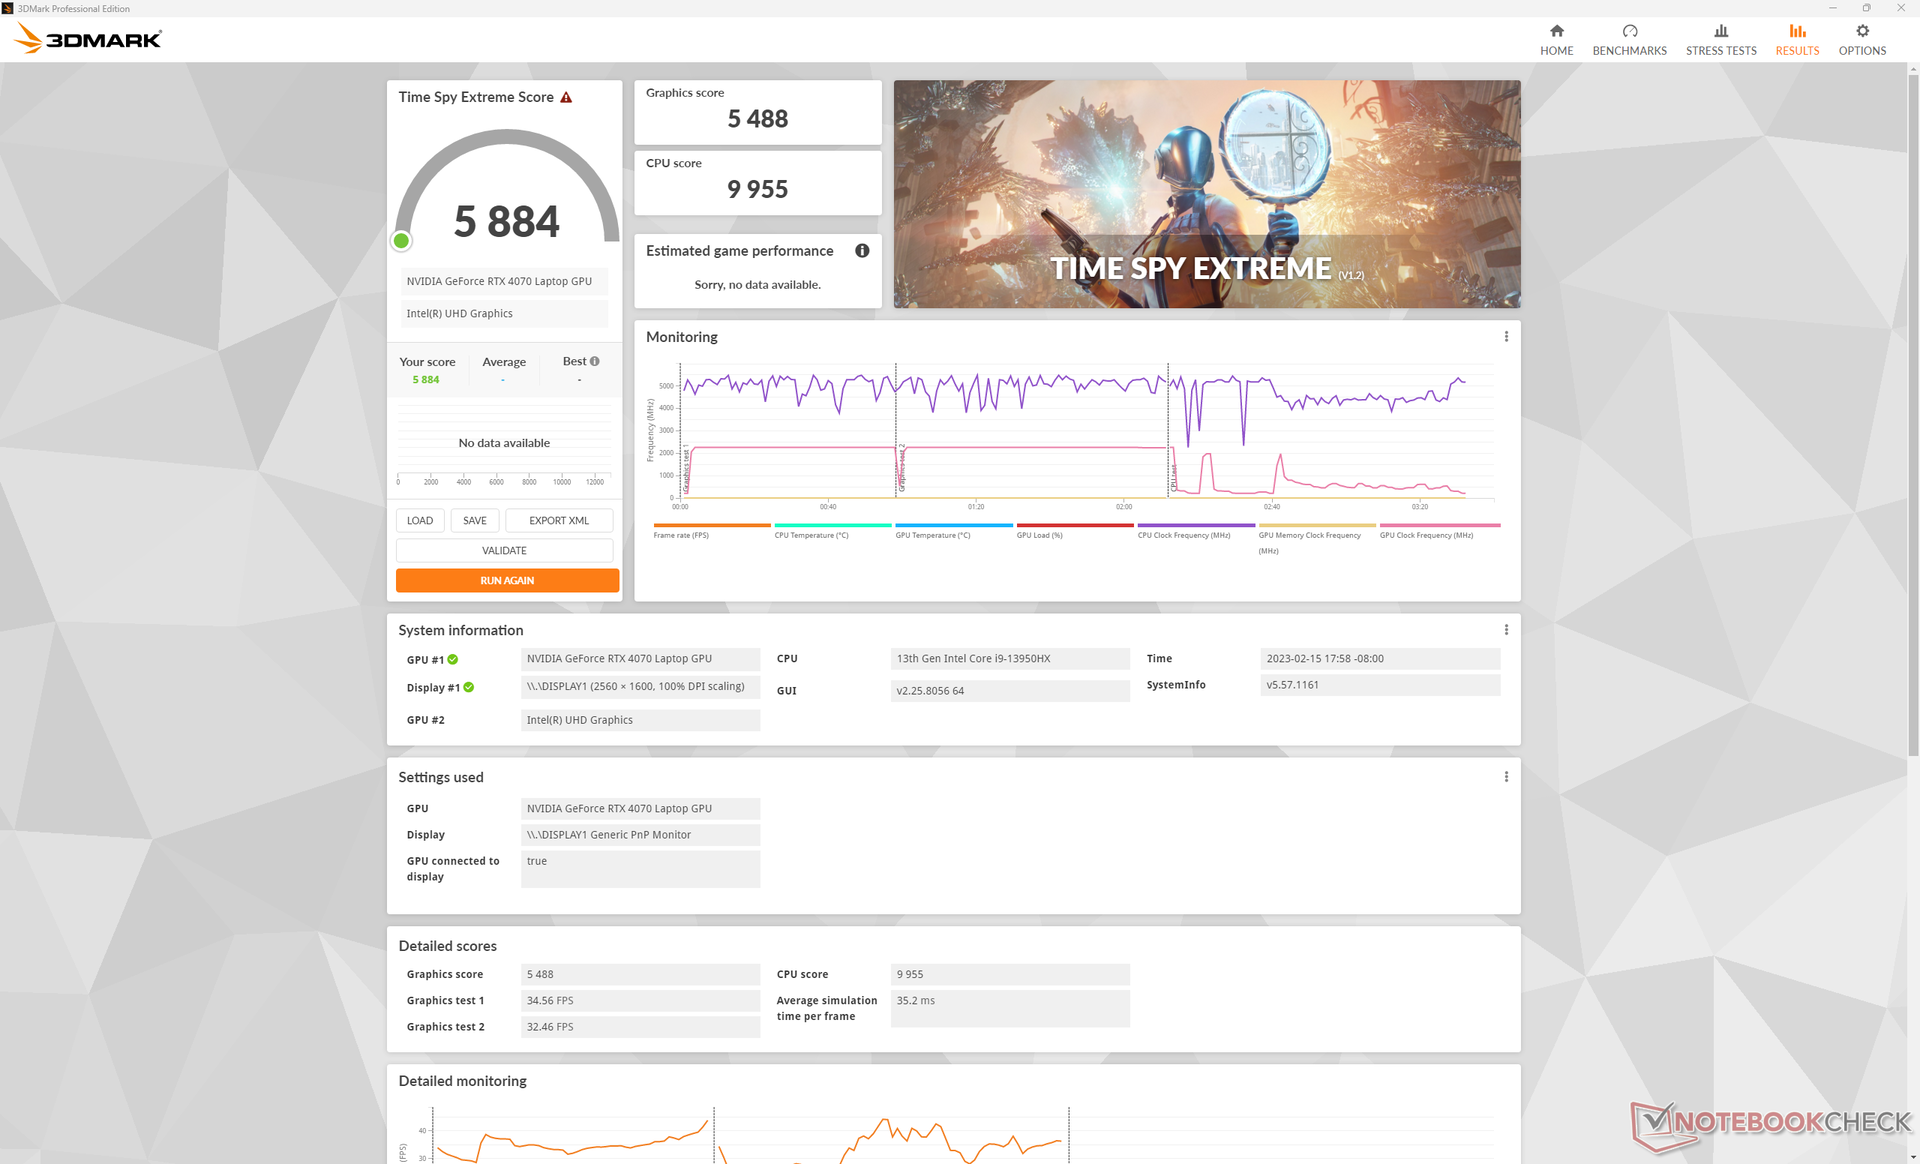
The 140 W mobile GeForce RTX 4070 sits comfortably in between the mobile RTX 3080 and mobile RTX 3080 Ti in terms of raw performance. It's only about 10 to 20 percent faster than the outgoing mobile RTX 3070, however, which is a bit disappointing when considering that the mobile RTX 4080 is about 40 to 50 percent faster than the mobile RTX 3080. This means that the performance gap between the mobile RTX 4070 and mobile RTX 4080 is more significant at 40 to 60 percent.
When compared to desktop GPUs, the mobile RTX 4070 is about 5 to 10 percent slower than the desktop RTX 3070 that launched three years ago.
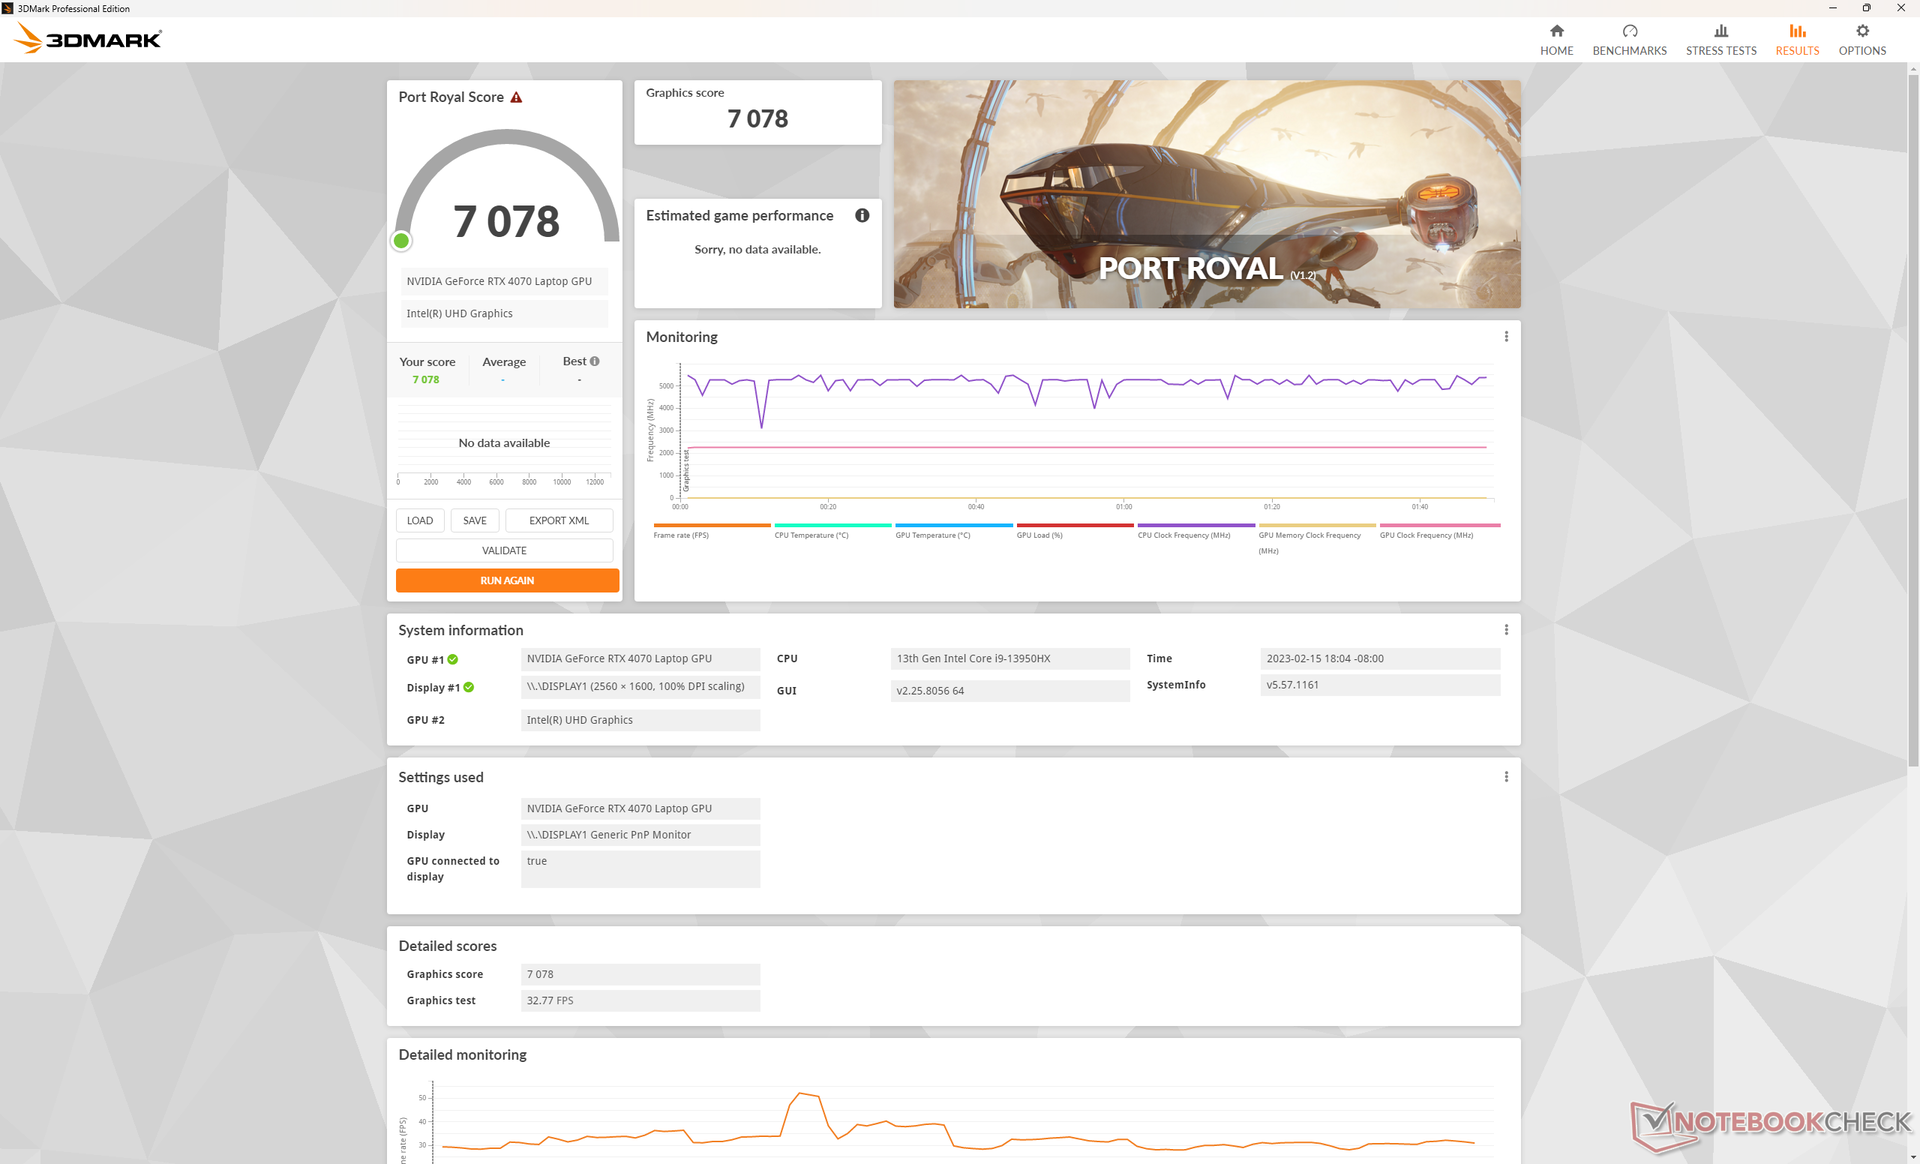
A big selling point for GeForce 40 GPUs is their support for frame generation or DLSS 3. Unfortunately, our Blade 18 RTX 4070 test unit would exhibit issues when running supported games with DLSS 3 enabled on an external HDMI or USB-C 4K monitor. Frame rates would tank to the <30 FPS range on all tested titles for seemingly no reason whereas the Blade 16 RTX 4080 would have no such problems. Oddly enough, DLSS 3 would run perfectly fine on the internal Blade 18 display. We've reached out to Razer for a potential solution and will update this section when appropriate. For now, however, you'll want to play games on the internal display if DLSS 3 is enabled.
Additional games will be benchmarked in the days to follow.
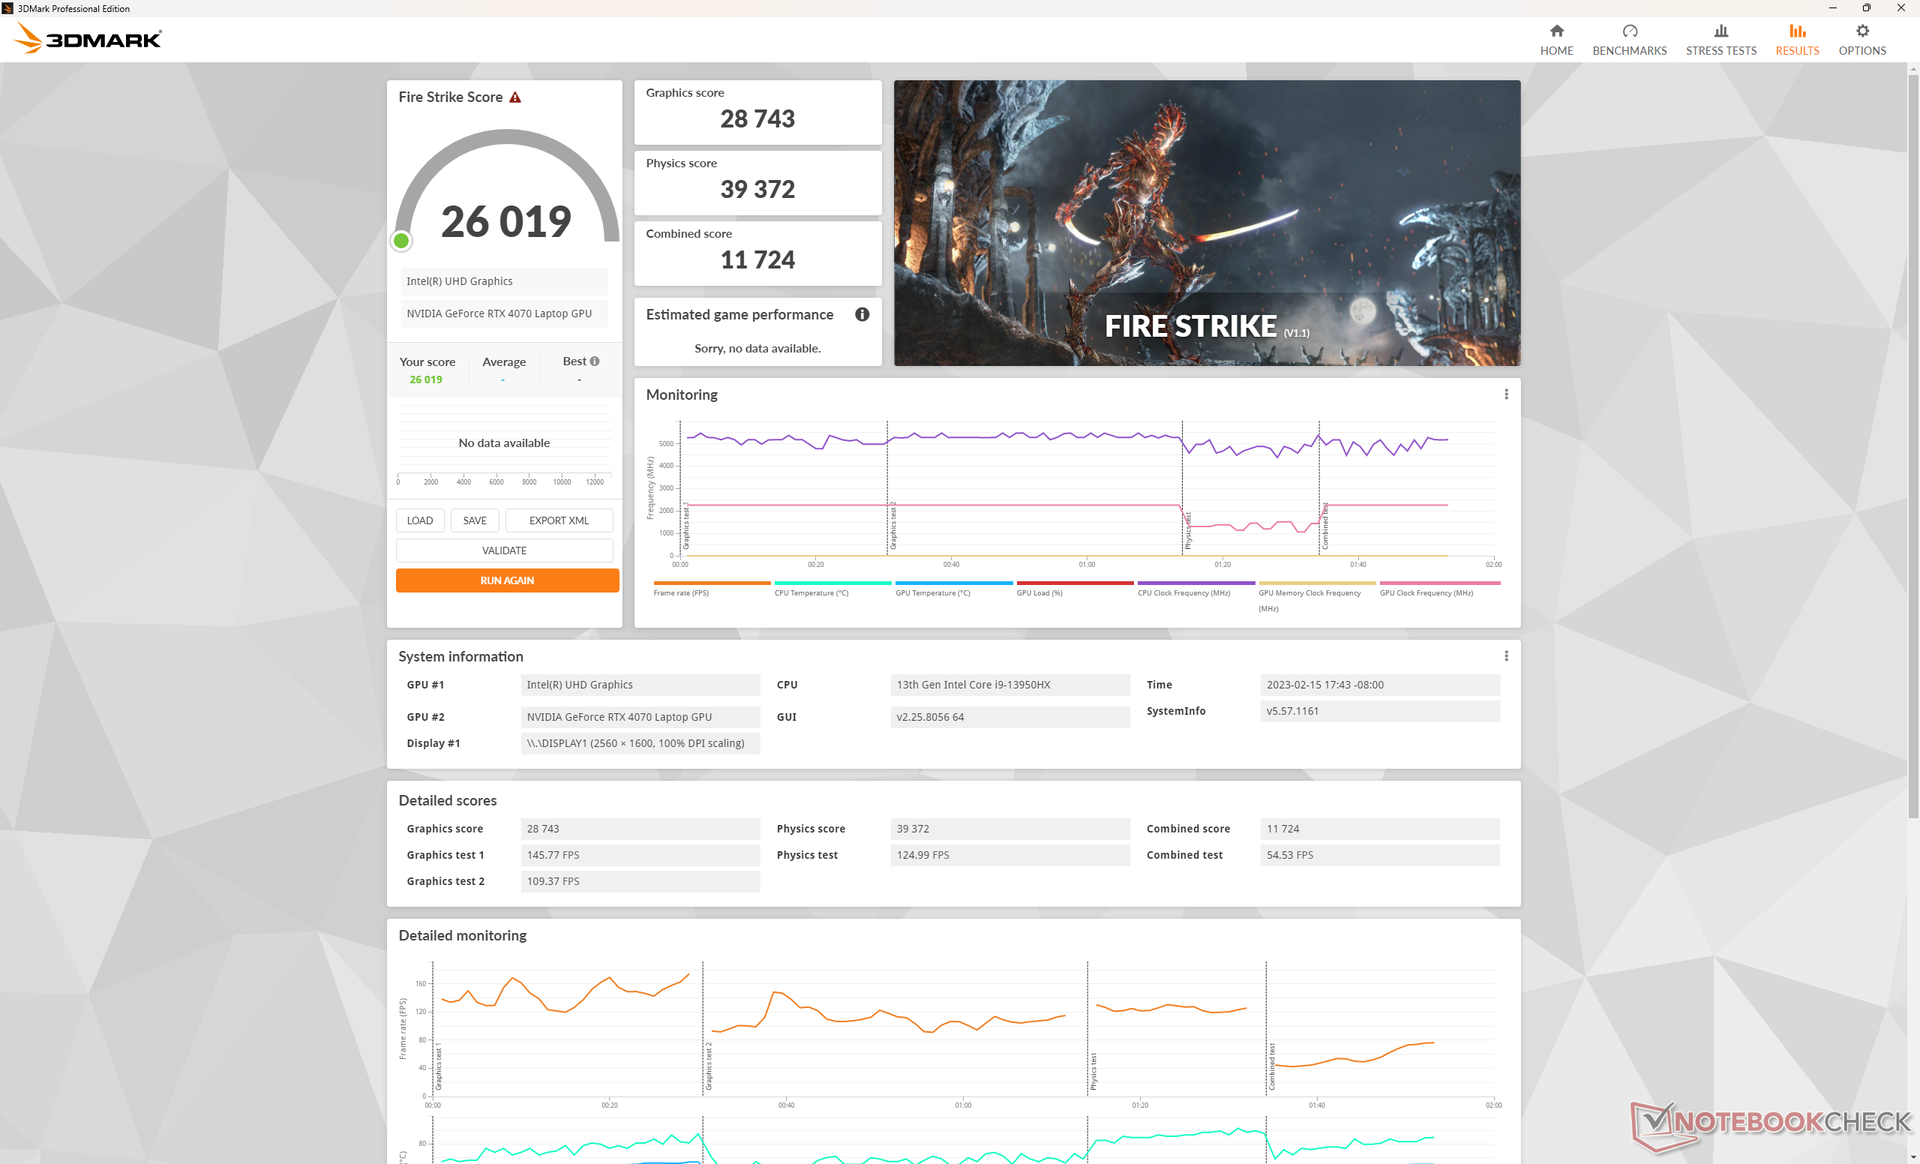
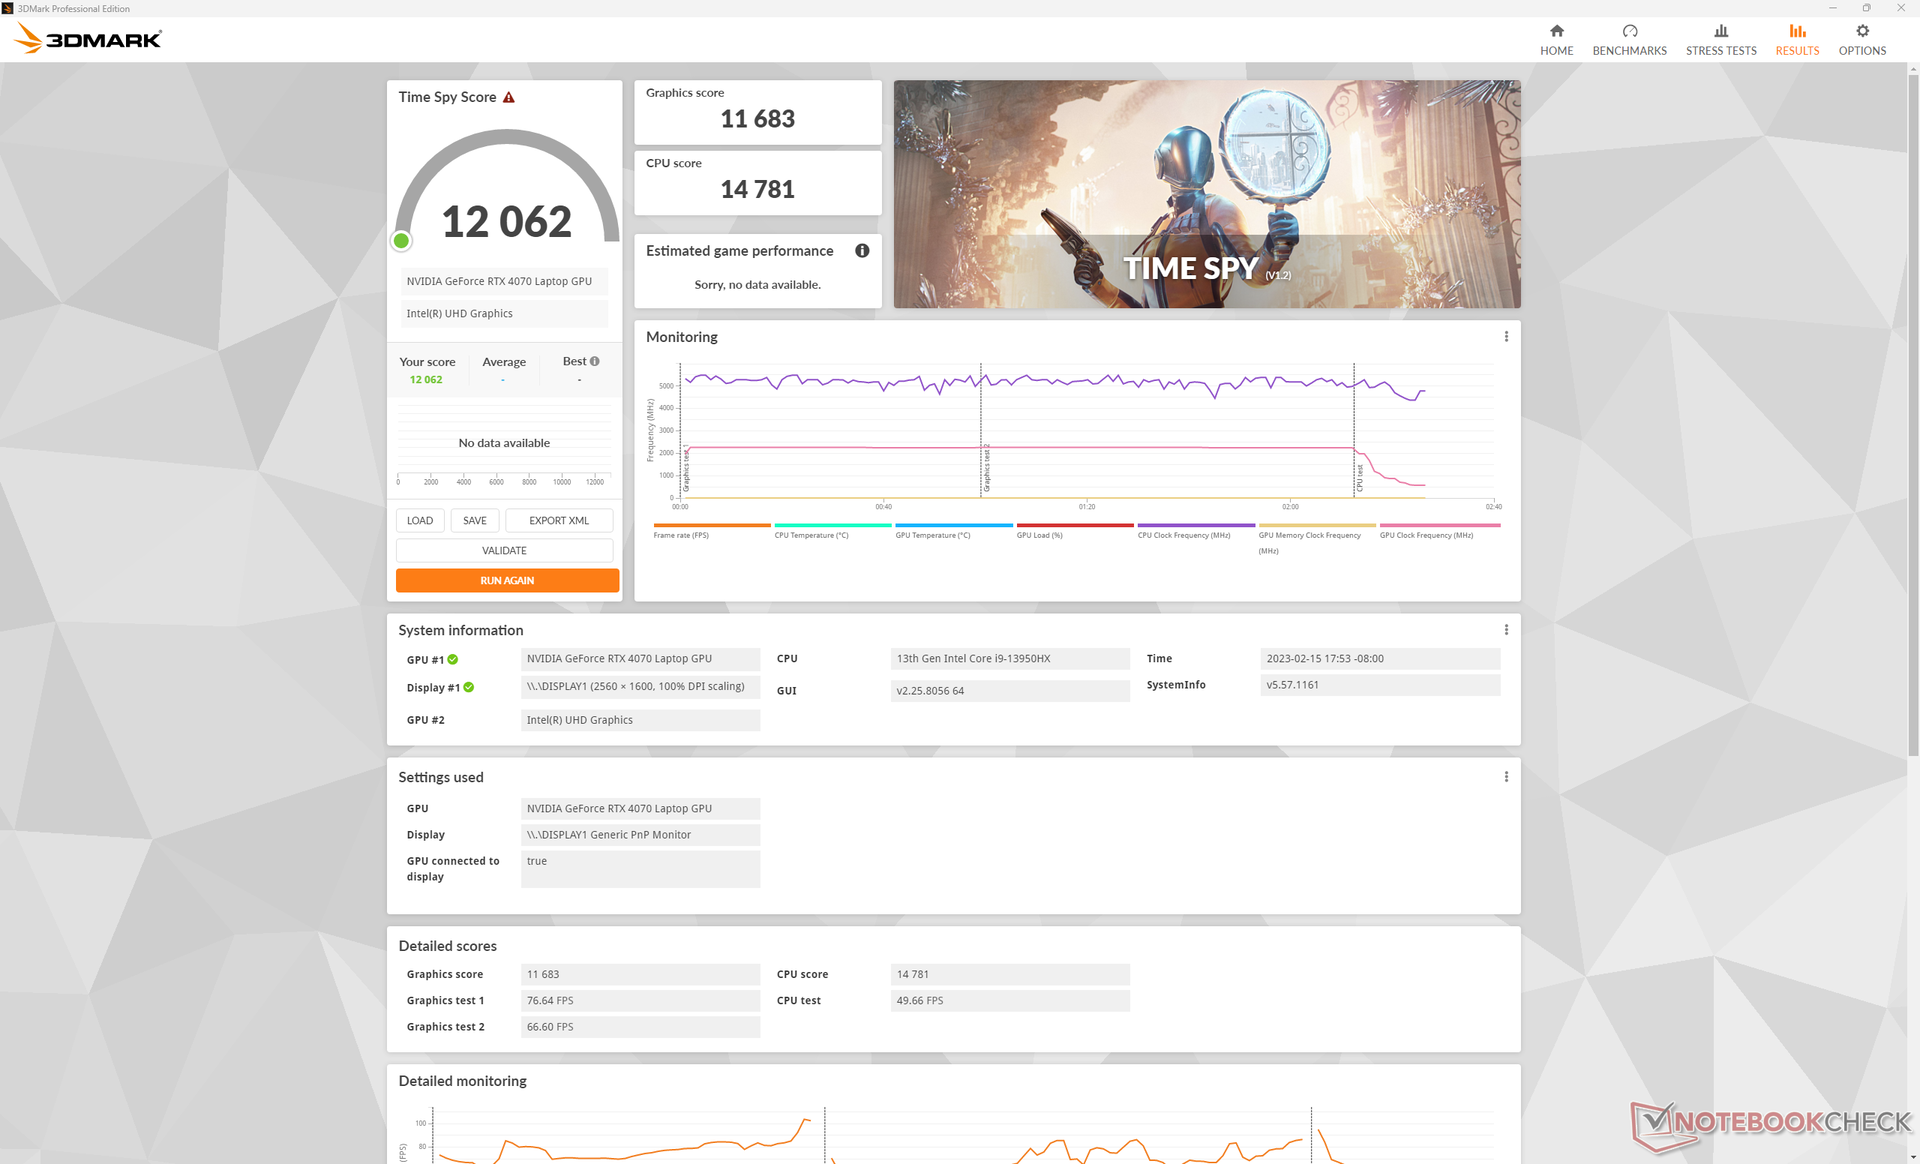
| 3DMark 11 Performance | 34754 points | |
| 3DMark Fire Strike Score | 26019 points | |
| 3DMark Time Spy Score | 12062 points | |
Help | ||
* ... smaller is better
Idling on Witcher 3 for one hour would return stable frame rates with no recurring dips in performance to suggest no interrupting background applications or major throttling.
Witcher 3 FPS Chart
| low | med. | high | ultra | QHD | 4K | |
| GTA V (2015) | 186.1 | 184.7 | 181.6 | 121.4 | 87.6 | 88.5 |
| The Witcher 3 (2015) | 617 | 405.9 | 240.9 | 113.9 | 72.5 | |
| Dota 2 Reborn (2015) | 225 | 200 | 191 | 178.6 | 145.5 | |
| Final Fantasy XV Benchmark (2018) | 231 | 166.9 | 115.2 | 82 | 46.6 | |
| X-Plane 11.11 (2018) | 203 | 178.9 | 137.9 | 117.7 | ||
| Strange Brigade (2018) | 464 | 315 | 243 | 208 | 136.7 | 71.9 |
| Metro Exodus (2019) | 208.9 | 139.8 | 109.7 | 86.8 | 69 | 44 |
| Borderlands 3 (2019) | 258.5 | 200.1 | 131.8 | 100.3 | 68.7 | 35.7 |
| Hitman 3 (2021) | 294.3 | 234 | 208.4 | 197.4 | 129.9 | 68.5 |
| Cyberpunk 2077 1.6 (2022) | 147.8 | 125.7 | 111.5 | 92.1 | 54 | 23.3 |
Emissions
System Noise — Quiet When Not Gaming
The internal fans are quiet when running undemanding loads like video streaming or web browsing. Fan noise would typically hover just under 27 dB(A) against a silent background of 23.5 dB(A) to be essentially inaudible in most conditions. This is quieter than expected given the sheer size and horsepower under the hood.
Running higher loads like games will increase fan RPM slowly but steadily before stabilizing at 48 dB(A). If stressed to 100 percent utilization, fan noise may even reach up to 54 dB(A). The low 50 dB(A) range is typical of most gaming laptops including the GT77 or Razer's own Blade 17. The Blade 18 is about as loud as its smaller siblings when gaming despite their size differences.
Noise Level
| Idle |
| 23.8 / 23.8 / 26.8 dB(A) |
| Load |
| 37.3 / 53.5 dB(A) |
 | ||
30 dB silent 40 dB(A) audible 50 dB(A) loud |
||
min: | ||
| Razer Blade 18 RTX 4070 NVIDIA GeForce RTX 4070 Laptop GPU, i9-13950HX, SSSTC CA6-8D1024 | Razer Blade 17 Early 2022 GeForce RTX 3080 Ti Laptop GPU, i9-12900H, Samsung PM9A1 MZVL21T0HCLR | MSI Titan GT77 HX 13VI NVIDIA GeForce RTX 4090 Laptop GPU, i9-13950HX, Samsung PM9A1 MZVL22T0HBLB | Gigabyte G7 KE GeForce RTX 3060 Laptop GPU, i5-12500H, Gigabyte AG470S1TB-SI B10 | Alienware m17 R5 (R9 6900HX, RX 6850M XT) Radeon RX 6850M XT, R9 6900HX, SSSTC CA6-8D1024 | Asus ROG Strix Scar 17 SE G733CX-LL014W GeForce RTX 3080 Ti Laptop GPU, i9-12950HX, Samsung PM9A1 MZVL22T0HBLB | |
|---|---|---|---|---|---|---|
| Noise | -12% | -17% | -26% | 0% | 5% | |
| off / environment * | 23.5 | 26 -11% | 24.6 -5% | 27 -15% | 23 2% | 23.9 -2% |
| Idle Minimum * | 23.8 | 26 -9% | 29.2 -23% | 27 -13% | 23 3% | 23.9 -0% |
| Idle Average * | 23.8 | 27 -13% | 29.2 -23% | 35 -47% | 28.11 -18% | 23.9 -0% |
| Idle Maximum * | 26.8 | 32 -19% | 29.2 -9% | 38 -42% | 28.11 -5% | 23.9 11% |
| Load Average * | 37.3 | 50 -34% | 50.7 -36% | 52 -39% | 30.62 18% | 34.3 8% |
| Witcher 3 ultra * | 48 | 51 -6% | 53.3 -11% | 56 -17% | 49.75 -4% | |
| Load Maximum * | 53.5 | 51 5% | 61 -14% | 59 -10% | 50.17 6% | 45.9 14% |
* ... smaller is better
Temperature
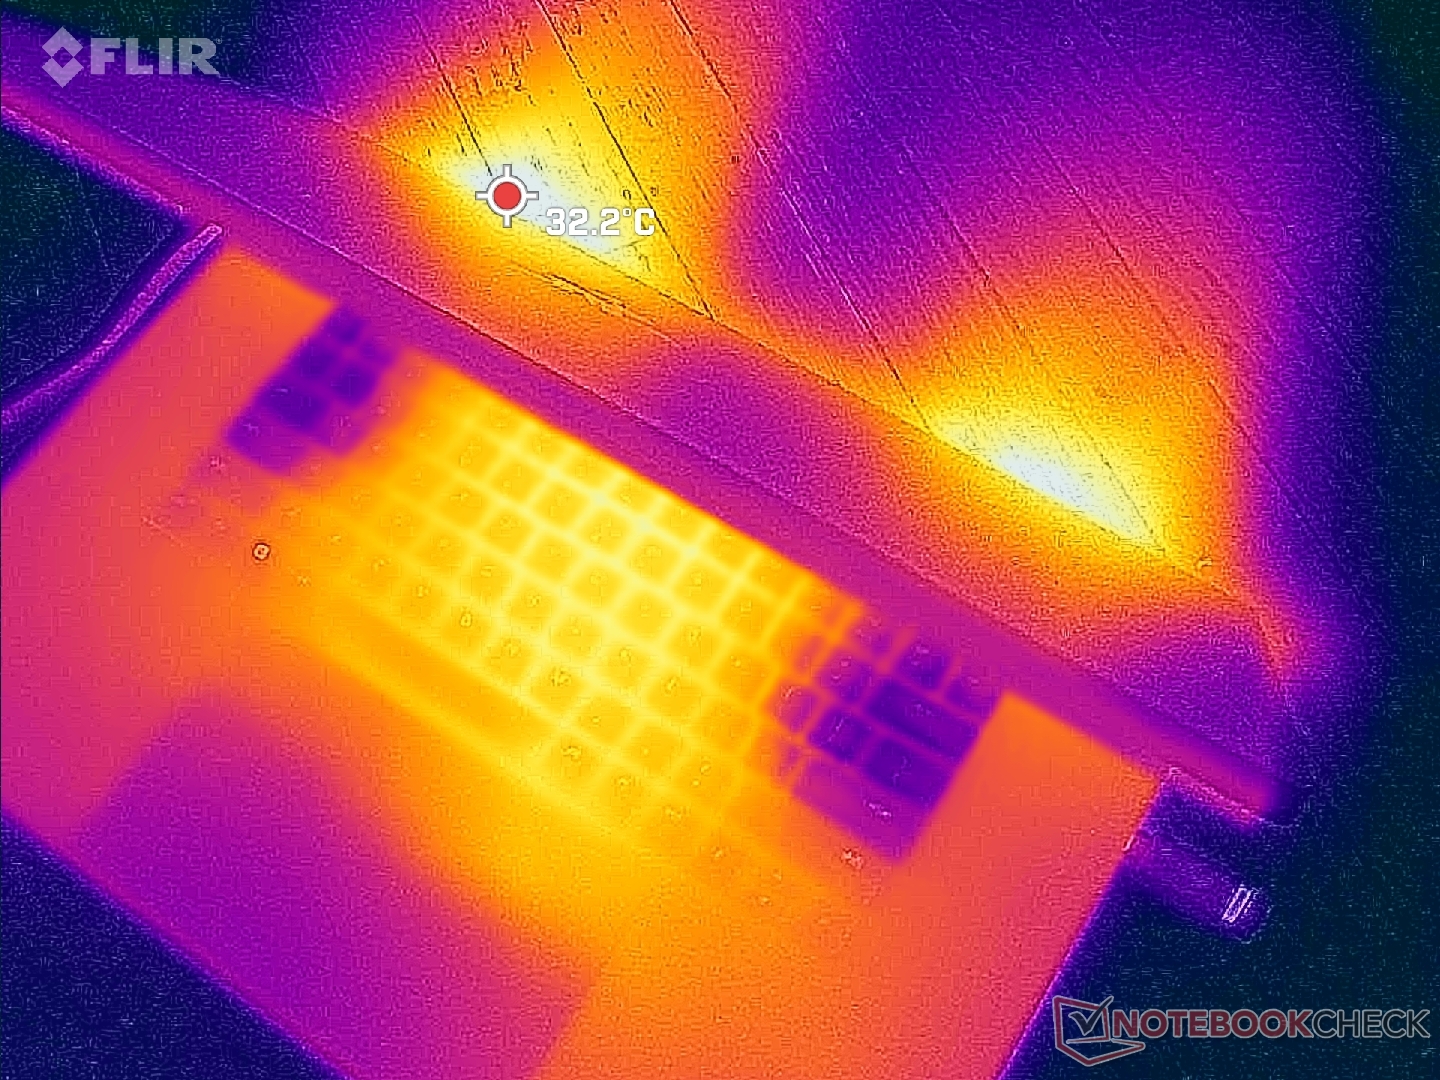
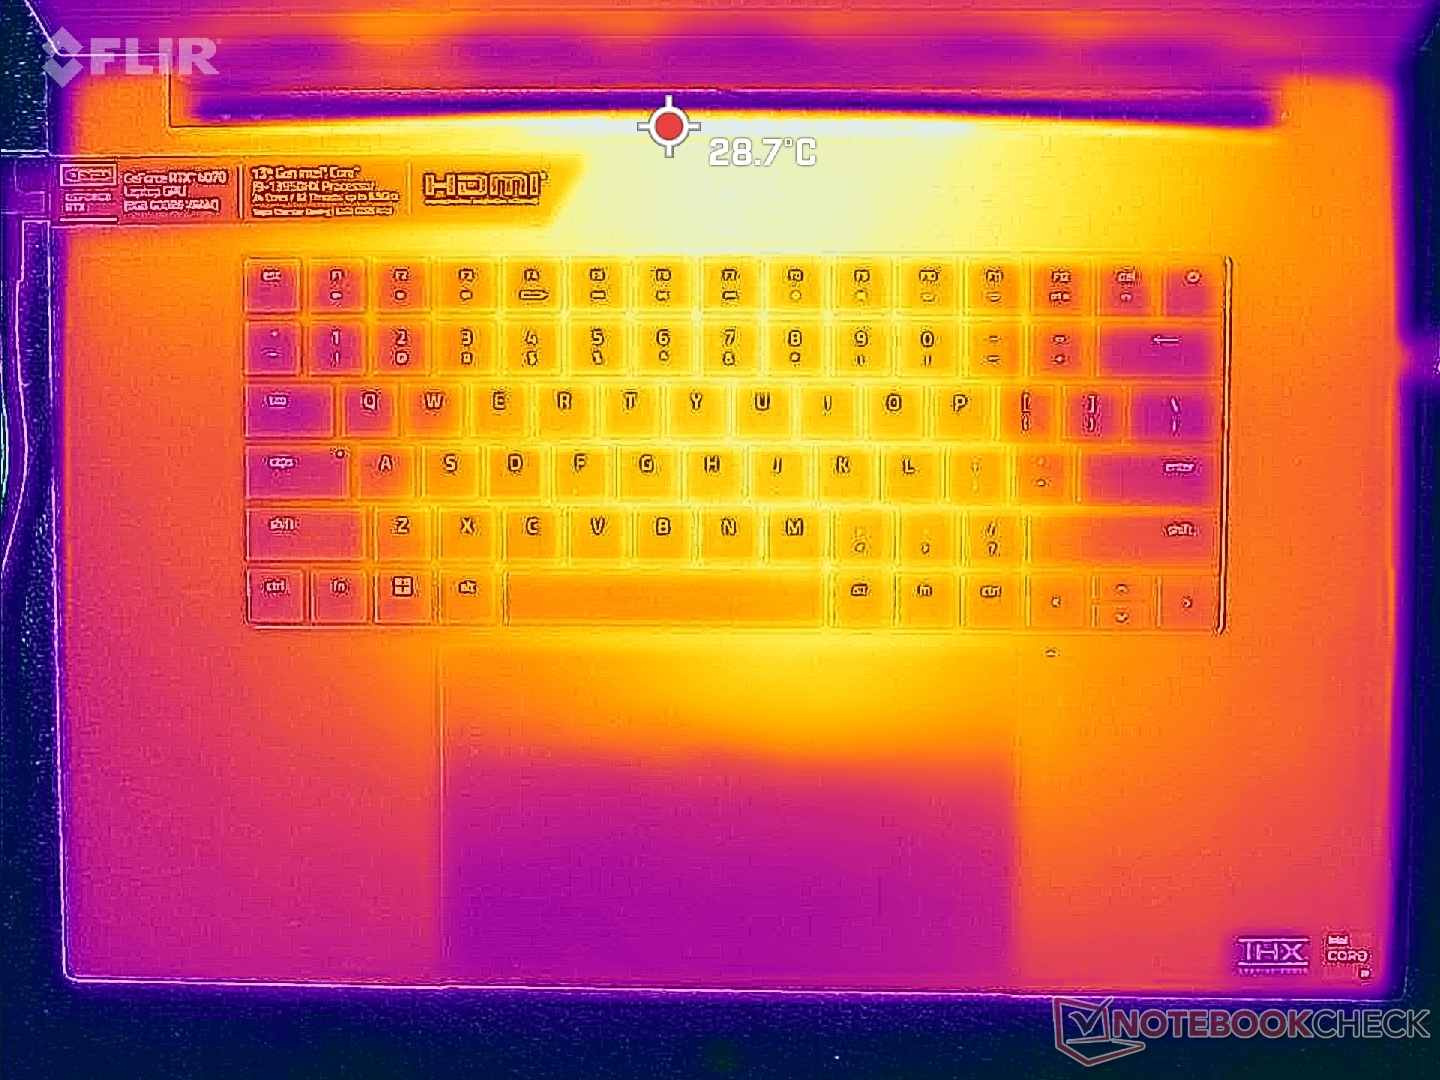
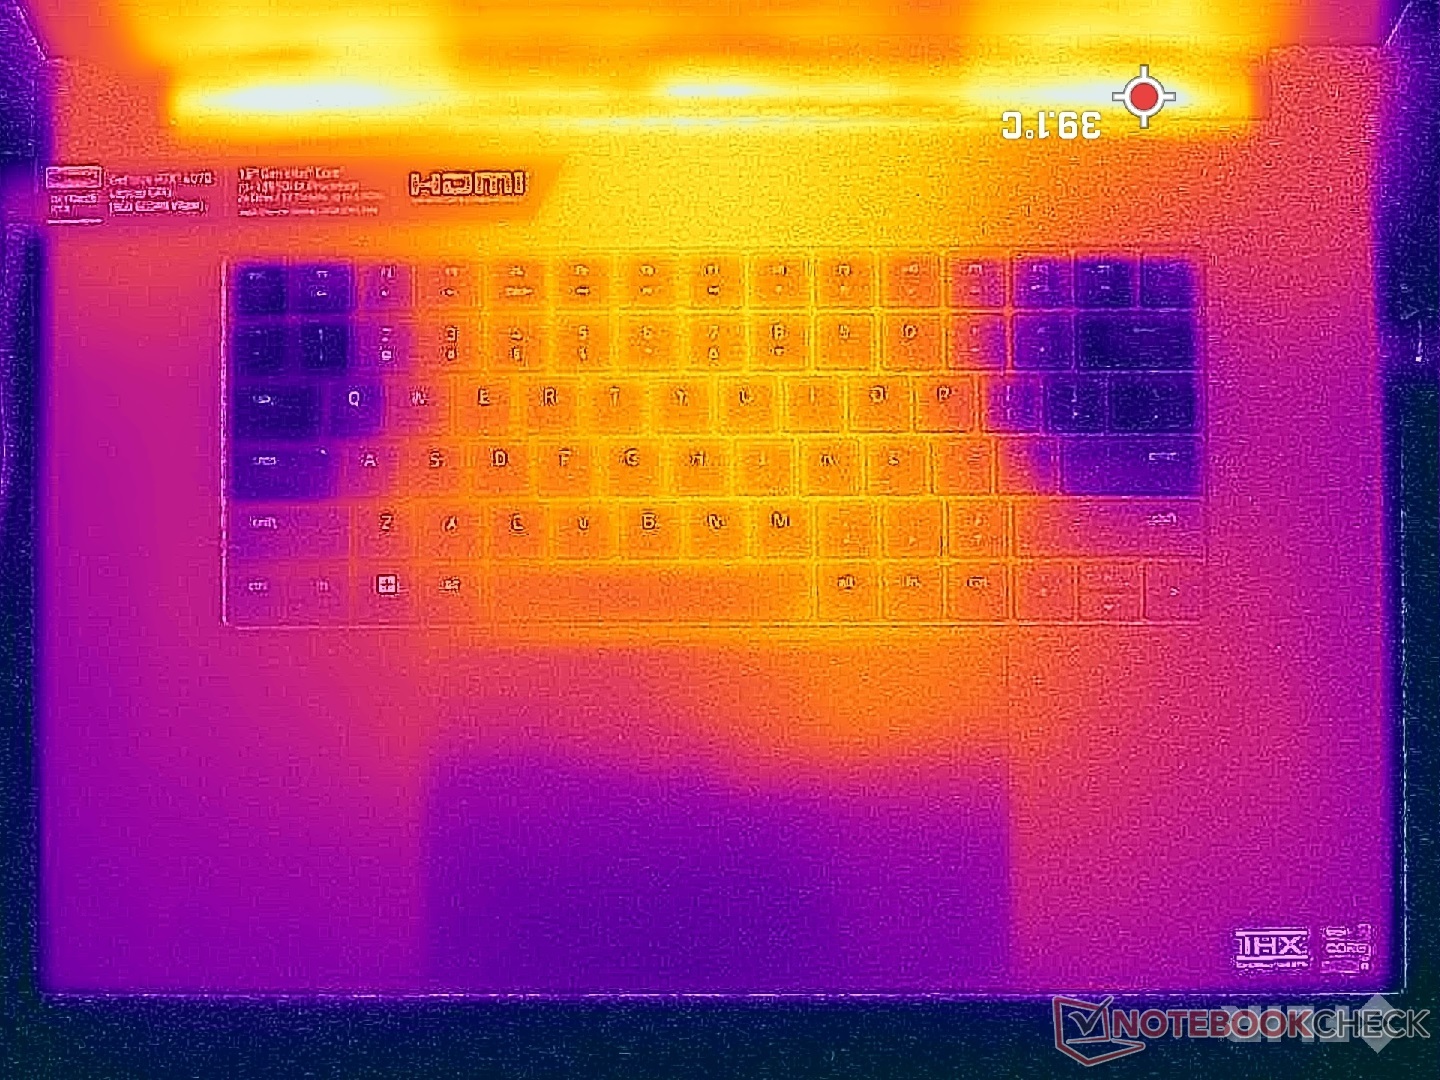
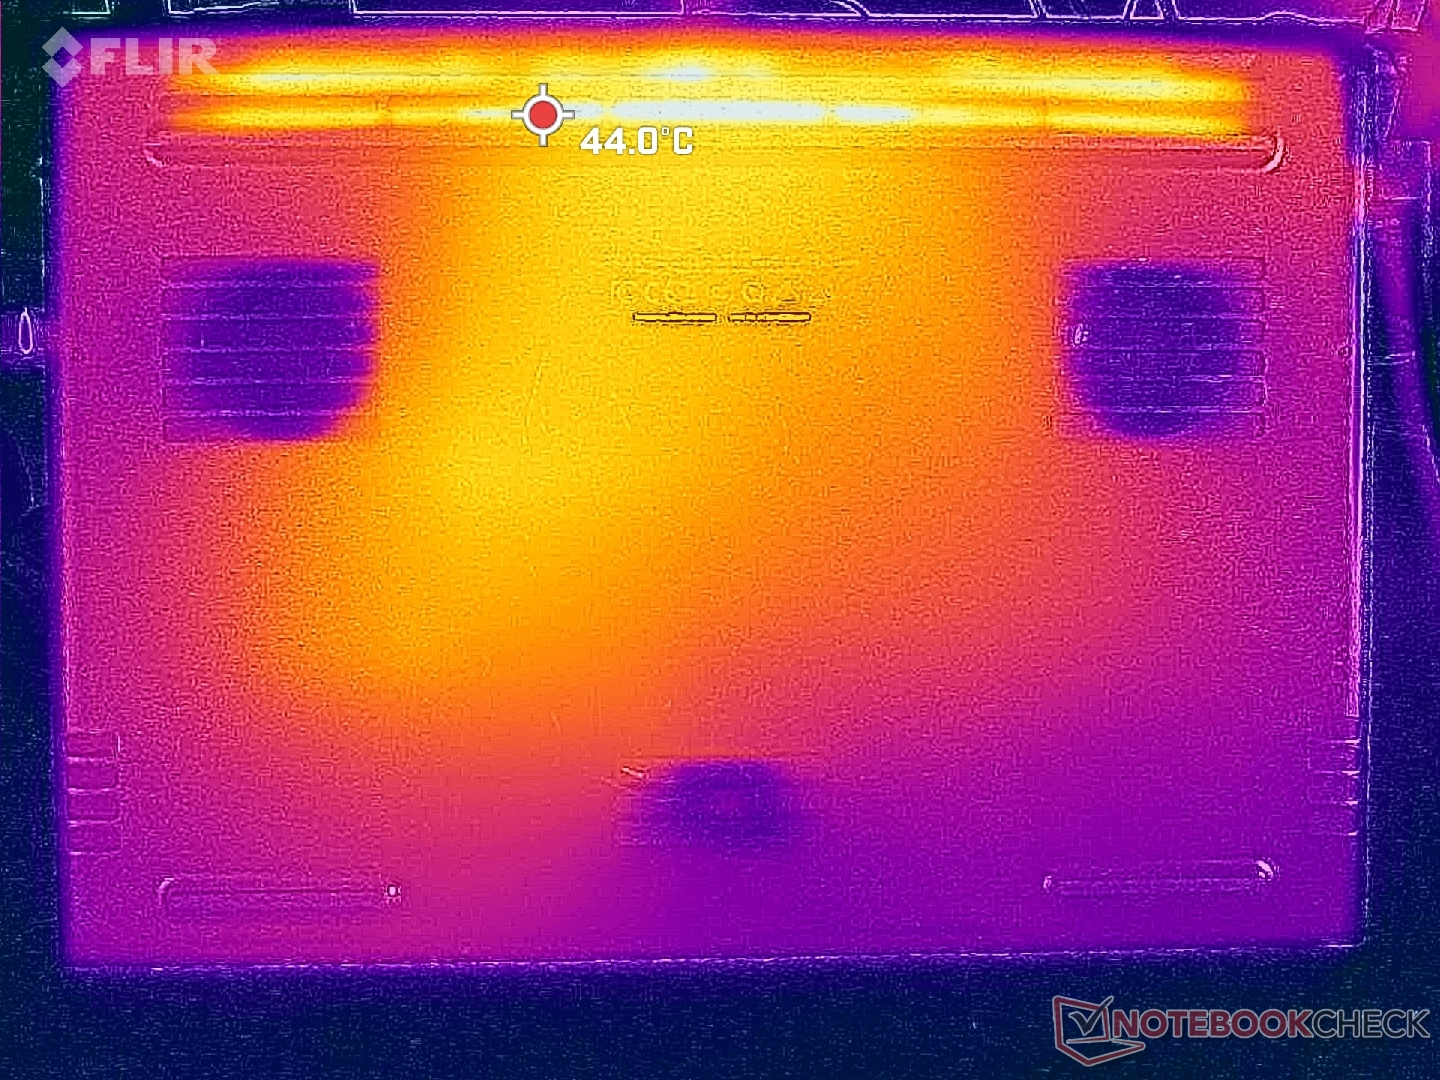
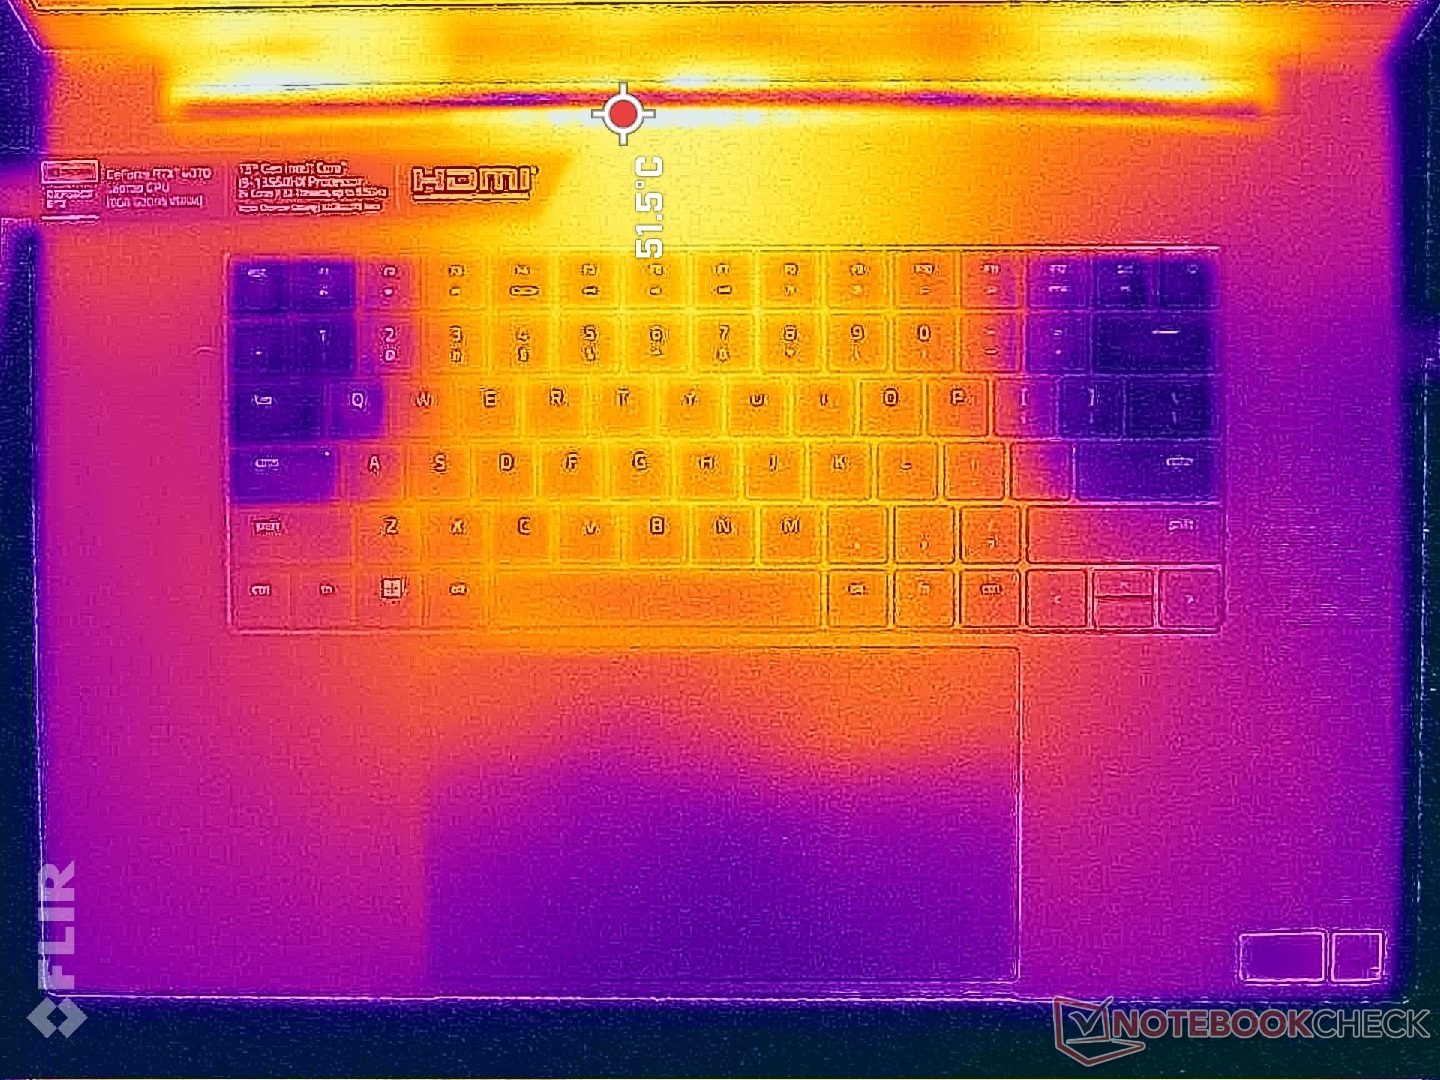
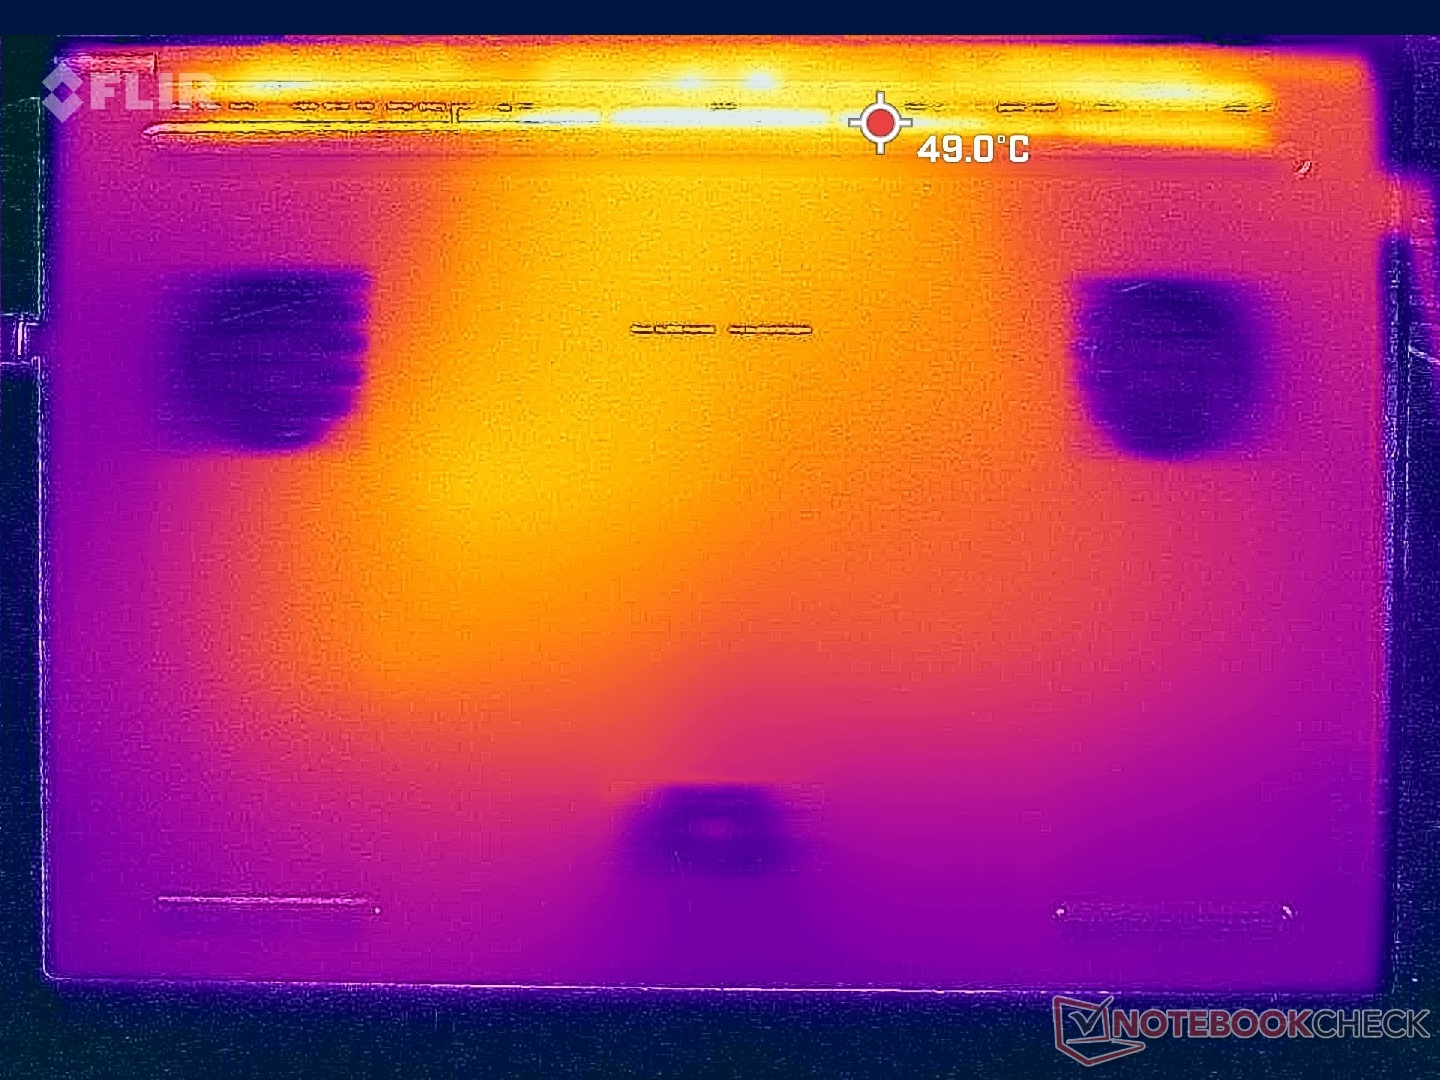
Surface temperatures are relatively cool for a gaming laptop likely due to the large 18-inch form factor, vapor chamber cooler with triple fans, and the 140 W TGP GPU. Faster RTX 4080 or 4090 configurations will likely run warmer than what we've recorded here since they each have a higher 175 W ceiling.
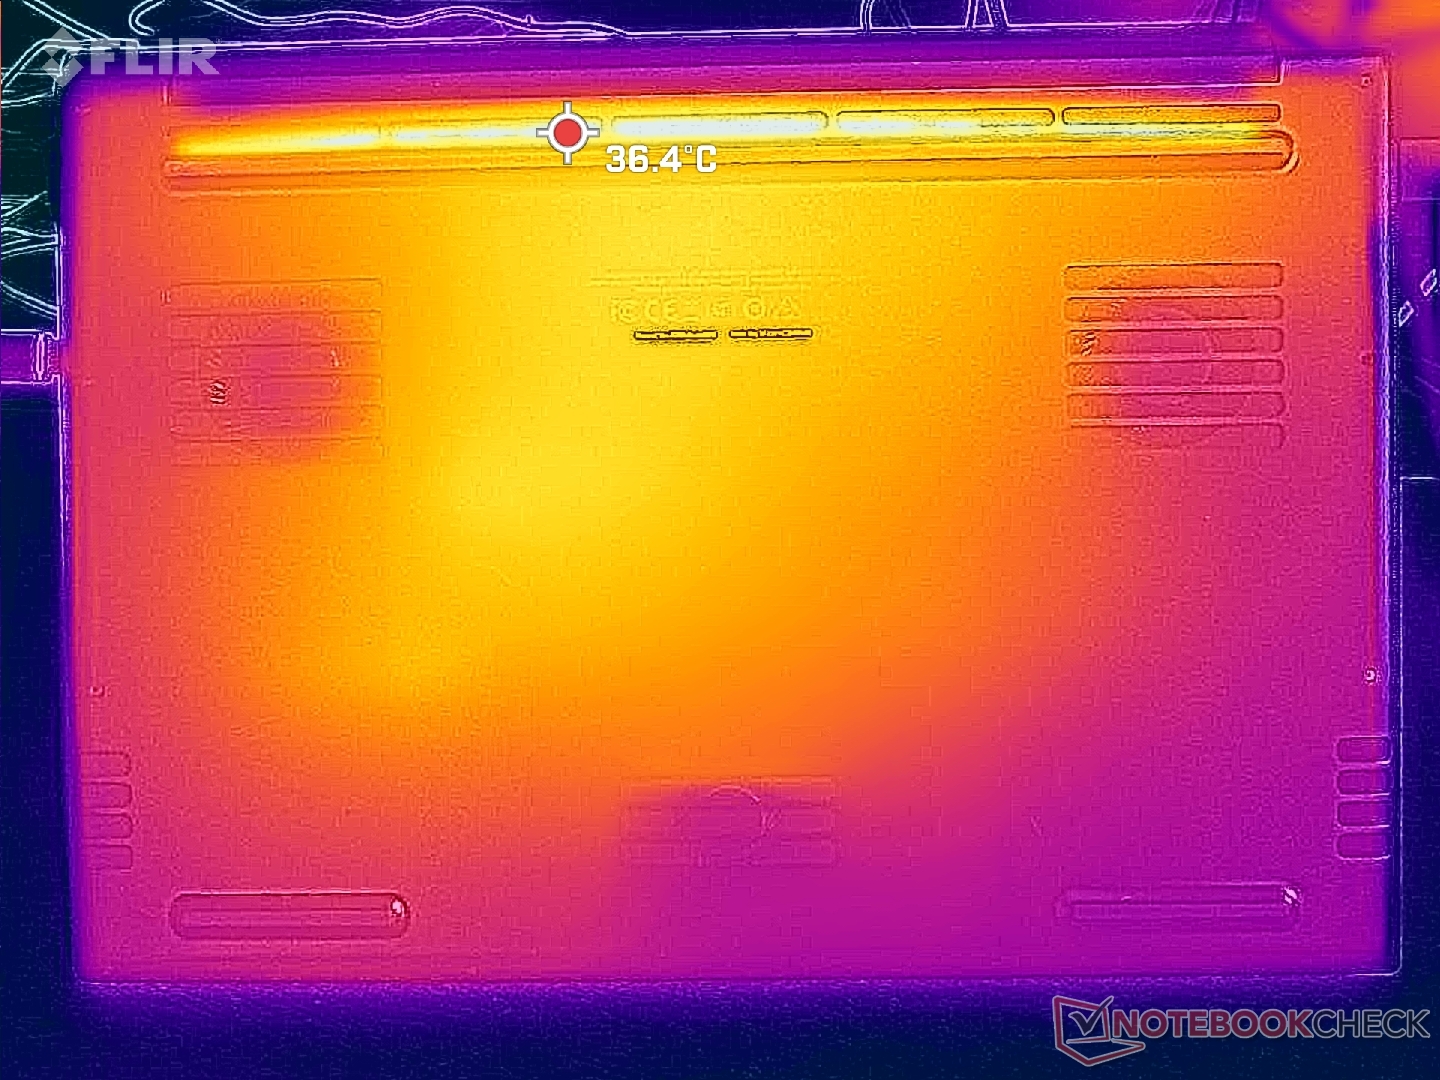
Hot spots when running Witcher 3 top out at just 36 C on the top and 33 C on the bottom compared to 50 C to 57 C on the Alienware m17 R5. The Blade 18 with RTX 4070 is one of the coolest-running gaming laptops we've tested thus far and it's clear that the chassis was built to handle more powerful options than our RTX 4070 configuration.
Surface temperatures when idling are slightly warmer than expected since the fans tend to idle during low loads. The Blade 18 never becomes uncomfortable to the skin so long as the rear edge is well ventilated.
(+) The maximum temperature on the upper side is 39.2 °C / 103 F, compared to the average of 40.4 °C / 105 F, ranging from 21.2 to 68.8 °C for the class Gaming.
(+) The bottom heats up to a maximum of 35.6 °C / 96 F, compared to the average of 43.2 °C / 110 F
(+) In idle usage, the average temperature for the upper side is 28.1 °C / 83 F, compared to the device average of 33.8 °C / 93 F.
(+) Playing The Witcher 3, the average temperature for the upper side is 28.9 °C / 84 F, compared to the device average of 33.8 °C / 93 F.
(+) The palmrests and touchpad are cooler than skin temperature with a maximum of 26 °C / 78.8 F and are therefore cool to the touch.
(+) The average temperature of the palmrest area of similar devices was 28.9 °C / 84 F (+2.9 °C / 5.2 F).
| Razer Blade 18 RTX 4070 Intel Core i9-13950HX, NVIDIA GeForce RTX 4070 Laptop GPU | Razer Blade 17 Early 2022 Intel Core i9-12900H, NVIDIA GeForce RTX 3080 Ti Laptop GPU | MSI Titan GT77 HX 13VI Intel Core i9-13950HX, NVIDIA GeForce RTX 4090 Laptop GPU | Gigabyte G7 KE Intel Core i5-12500H, NVIDIA GeForce RTX 3060 Laptop GPU | Alienware m17 R5 (R9 6900HX, RX 6850M XT) AMD Ryzen 9 6900HX, AMD Radeon RX 6850M XT | Asus ROG Strix Scar 17 SE G733CX-LL014W Intel Core i9-12950HX, NVIDIA GeForce RTX 3080 Ti Laptop GPU | |
|---|---|---|---|---|---|---|
| Heat | -28% | 2% | -17% | -18% | -18% | |
| Maximum Upper Side * | 39.2 | 50 -28% | 40.6 -4% | 52 -33% | 53 -35% | 48.8 -24% |
| Maximum Bottom * | 35.6 | 56 -57% | 41.1 -15% | 54 -52% | 56 -57% | 52.4 -47% |
| Idle Upper Side * | 31.8 | 36 -13% | 26.2 18% | 28 12% | 30 6% | 30.4 4% |
| Idle Bottom * | 33.2 | 38 -14% | 30.3 9% | 32 4% | 29 13% | 34.1 -3% |
* ... smaller is better
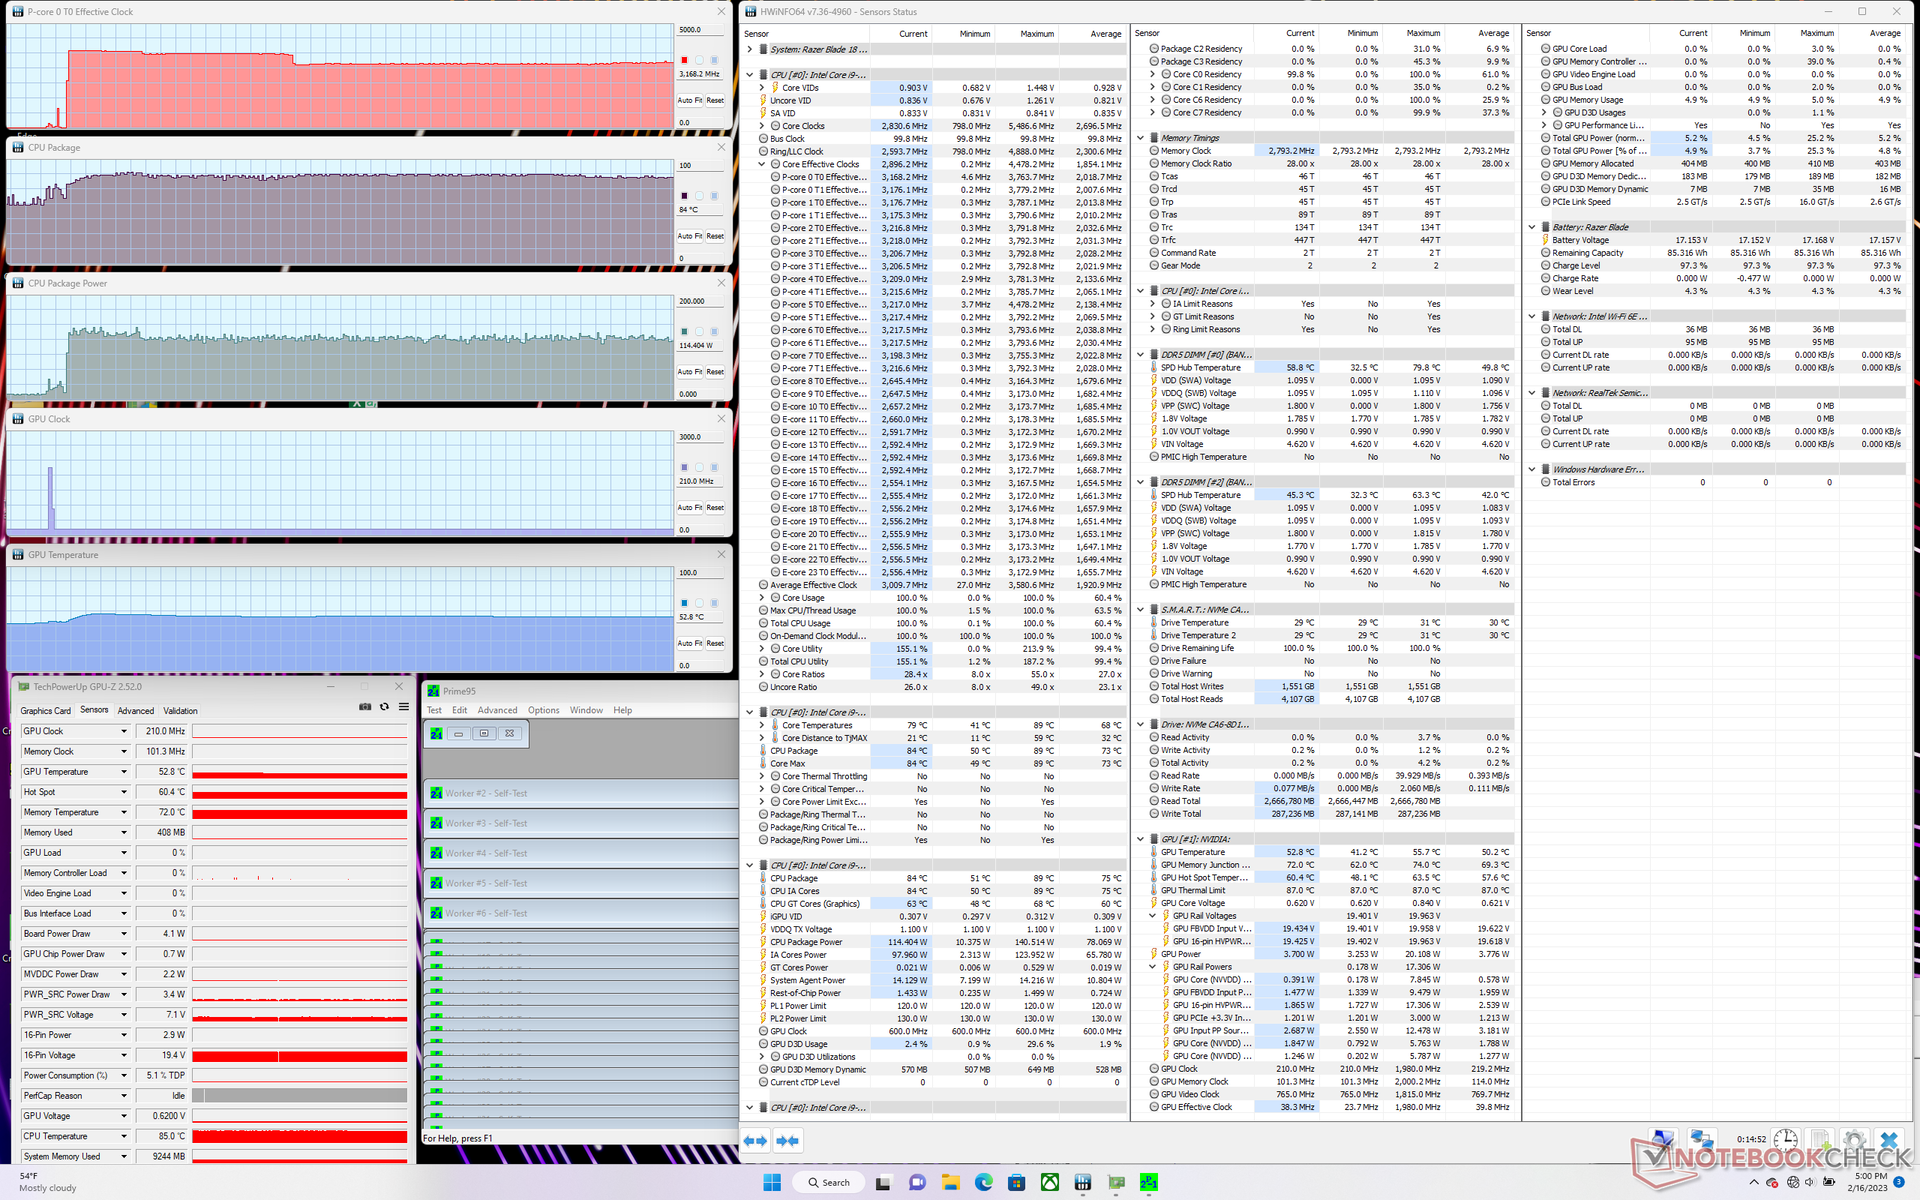
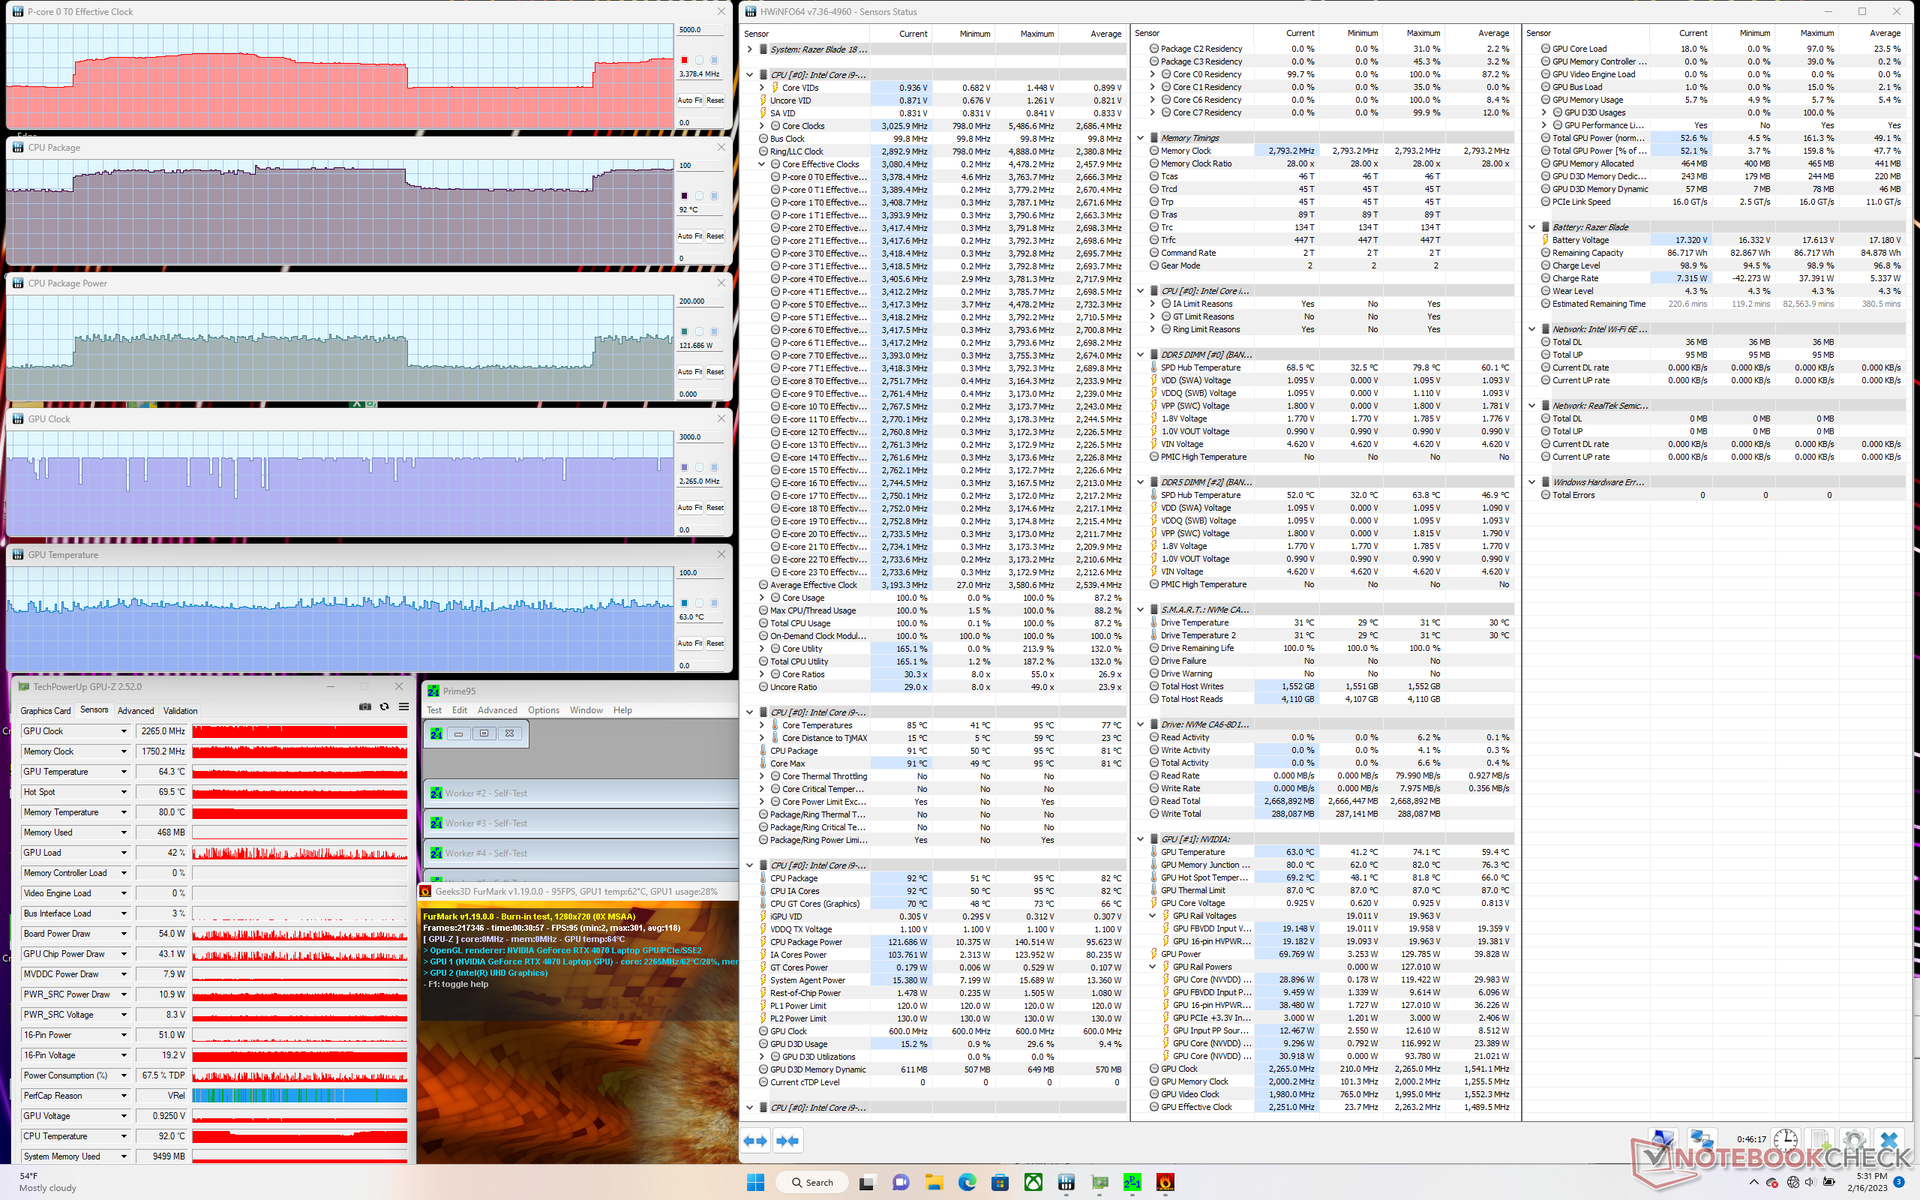
Stress Test
When running Prime95 to stress the CPU, clock rates and board power draw would spike to 3.8 GHz and 140 W, respectively, before dropping to 3.1 GHz and the 110 to 120 W range about 70 seconds later. Core temperature would stabilize at 87 C compared to 82 C on the Blade 16 equipped with the same CPU.
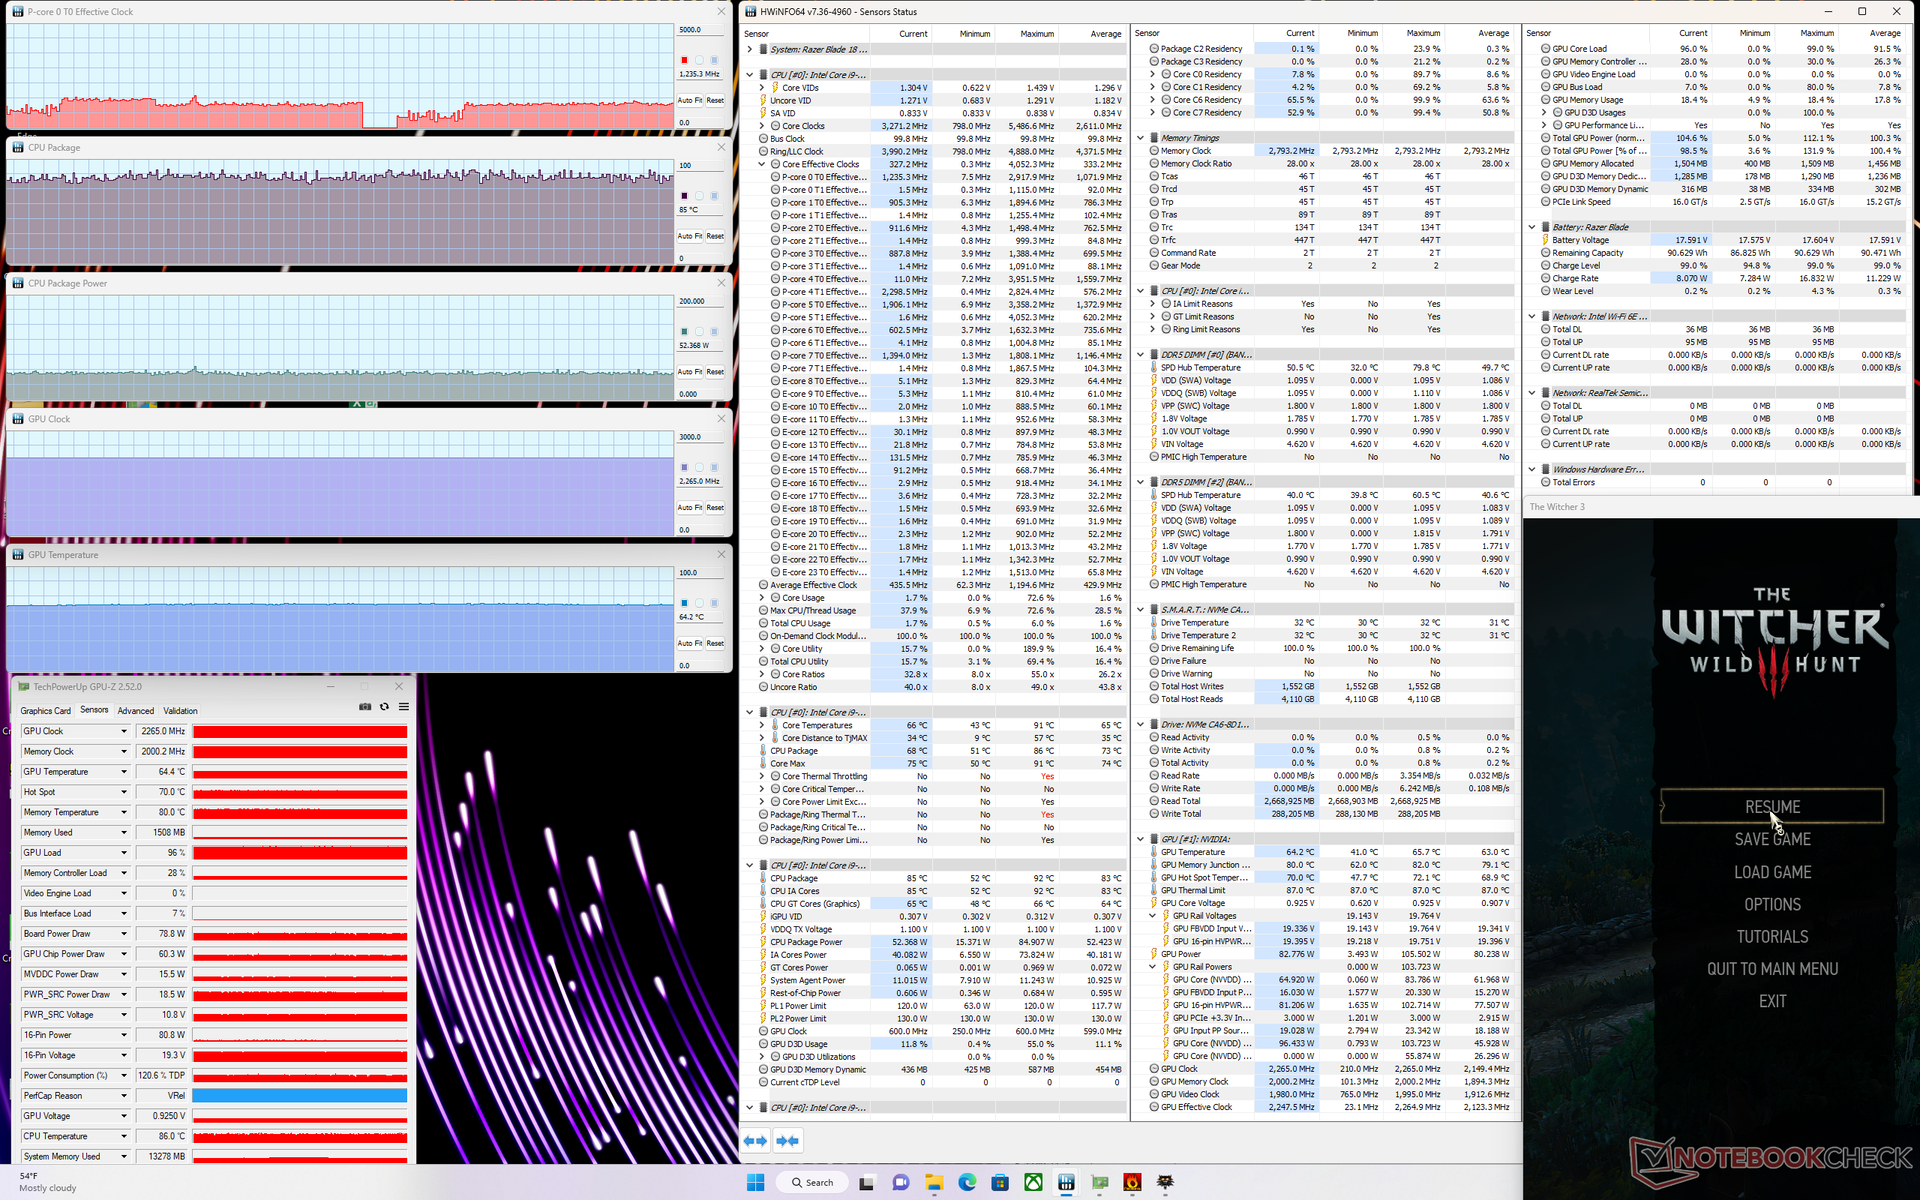
GPU clock rate, temperature, and board power draw would stabilize at 2265 MHz, 64 C, and 80 to 90 W, respectively, when running Witcher 3. The GPU itself is rated for a 140 W TGP and so the ~80 W range is much lower than expected even when set to Performance mode. We're only able to reach a peak of 100 W for the GPU when running a more demanding game like Cyberpunk 2077. In comparison, the RTX 4080 GPU in the Blade 16 would stabilize at ~160 W against its target 175 W TGP when running the same Witcher 3 test.
Running on battery power limits performance. A 3DMark 11 test on batteries would return Physics and Graphics scores of 10336 and 18043 points, respectively, compared to 25874 and 39733 points when on mains.
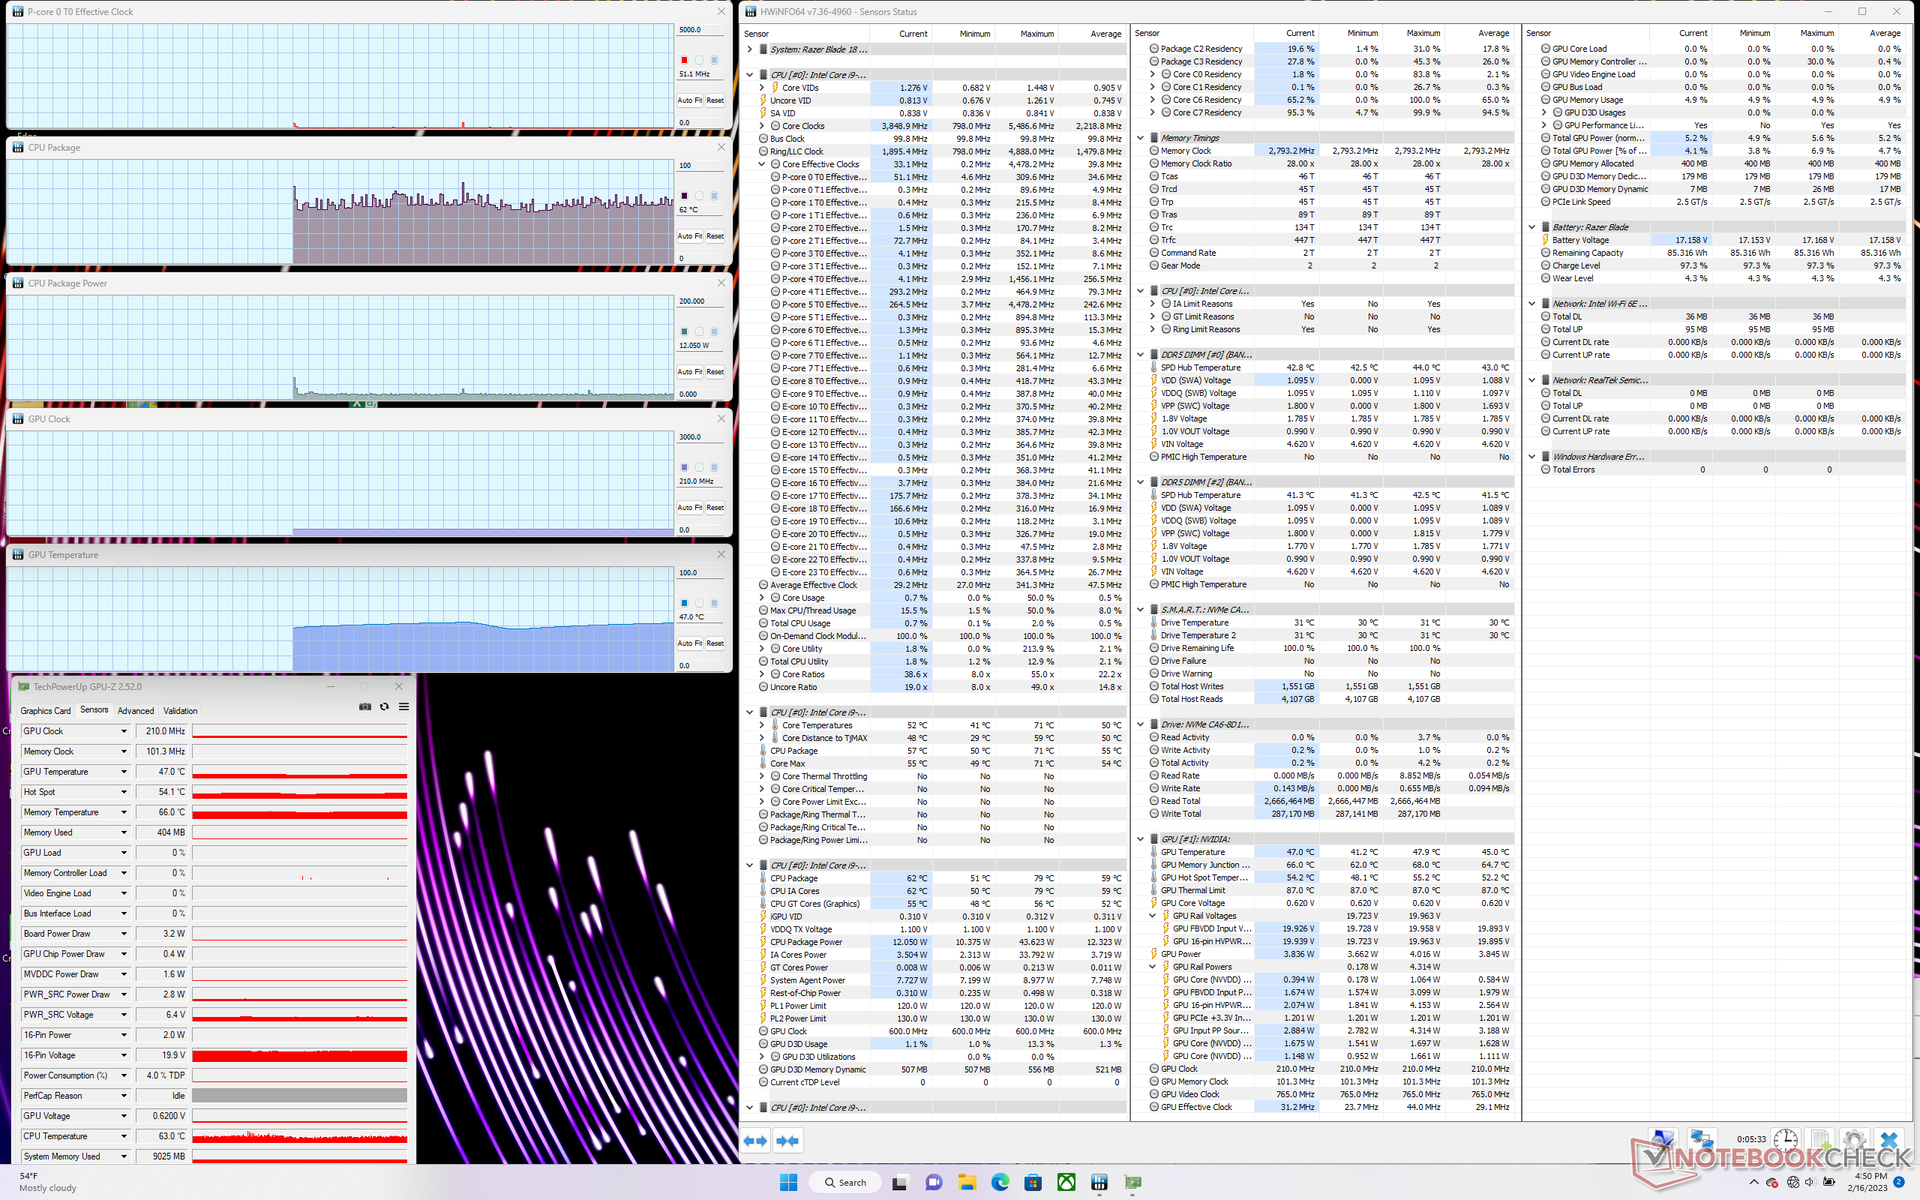
| CPU Clock (GHz) | GPU Clock (MHz) | Average CPU Temperature (°C) | Average GPU Temperature (°C) | |
| System Idle | -- | -- | 62 | 47 |
| Prime95 Stress | 3.2 | -- | 84 | 53 |
| Prime95 + FurMark Stress | 2.0 - 3.7 | 2265 | 70 - 91 | 63 |
| Witcher 3 Stress | ~1.2 | 2265 | 85 | 64 |
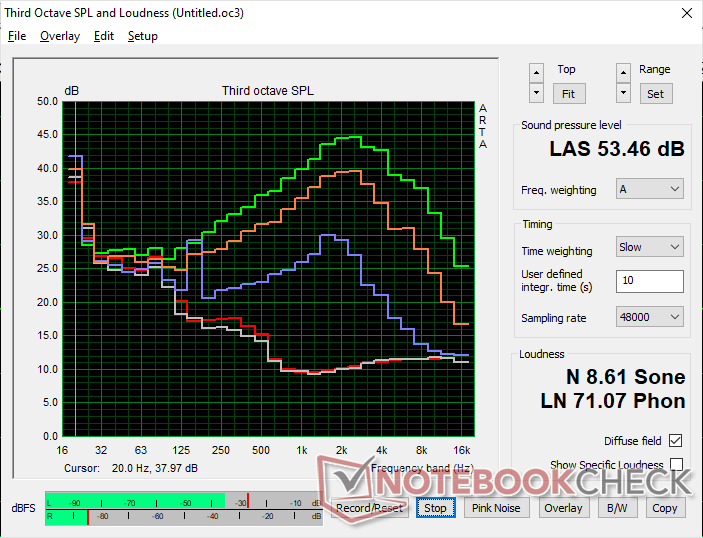
Speakers
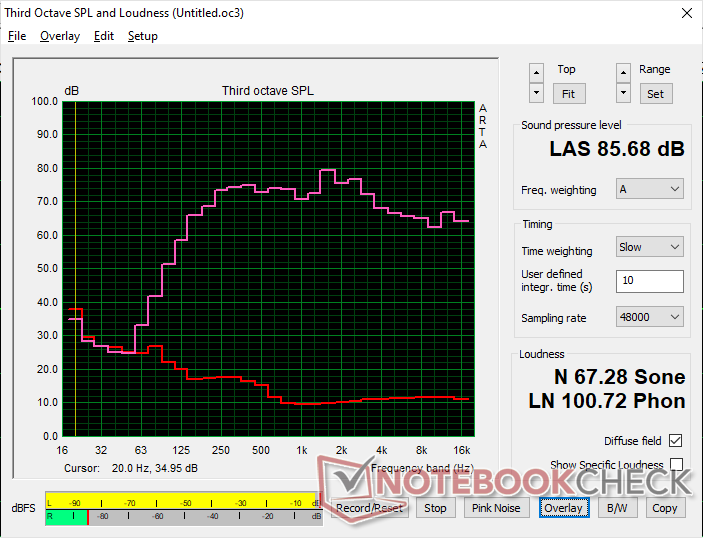
Razer Blade 18 RTX 4070 audio analysis
(+) | speakers can play relatively loud (85.7 dB)
Bass 100 - 315 Hz
(±) | reduced bass - on average 7.5% lower than median
(±) | linearity of bass is average (9.2% delta to prev. frequency)
Mids 400 - 2000 Hz
(+) | balanced mids - only 3.5% away from median
(+) | mids are linear (4.1% delta to prev. frequency)
Highs 2 - 16 kHz
(+) | balanced highs - only 4.8% away from median
(+) | highs are linear (3.8% delta to prev. frequency)
Overall 100 - 16.000 Hz
(+) | overall sound is linear (9.2% difference to median)
Compared to same class
» 2% of all tested devices in this class were better, 1% similar, 97% worse
» The best had a delta of 6%, average was 18%, worst was 132%
Compared to all devices tested
» 2% of all tested devices were better, 1% similar, 97% worse
» The best had a delta of 4%, average was 25%, worst was 134%
Apple MacBook Pro 16 2021 M1 Pro audio analysis
(+) | speakers can play relatively loud (84.7 dB)
Bass 100 - 315 Hz
(+) | good bass - only 3.8% away from median
(+) | bass is linear (5.2% delta to prev. frequency)
Mids 400 - 2000 Hz
(+) | balanced mids - only 1.3% away from median
(+) | mids are linear (2.1% delta to prev. frequency)
Highs 2 - 16 kHz
(+) | balanced highs - only 1.9% away from median
(+) | highs are linear (2.7% delta to prev. frequency)
Overall 100 - 16.000 Hz
(+) | overall sound is linear (4.6% difference to median)
Compared to same class
» 0% of all tested devices in this class were better, 0% similar, 100% worse
» The best had a delta of 5%, average was 18%, worst was 45%
Compared to all devices tested
» 0% of all tested devices were better, 0% similar, 100% worse
» The best had a delta of 4%, average was 25%, worst was 134%
Energy Management — Big Display, Big Power Demands
Power Consumption
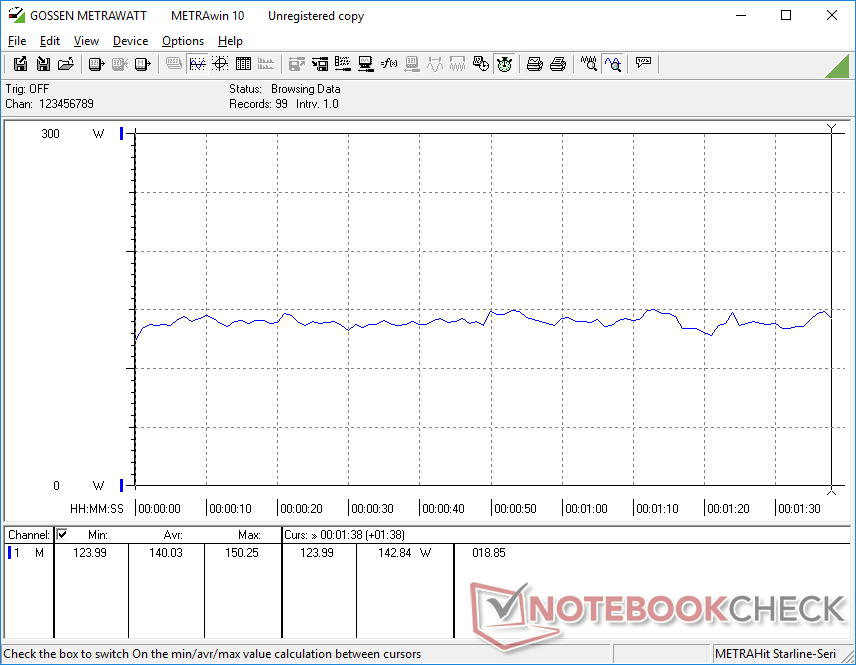
Power consumption when idling on desktop ranges between 24 W and 48 W depending on the brightness setting and power profile. In fact, the difference between the minimum and maximum brightness settings is as high as 10 W. This range is noticeably higher than on most other smaller laptops which can explain the unexceptional battery life results in the next section.
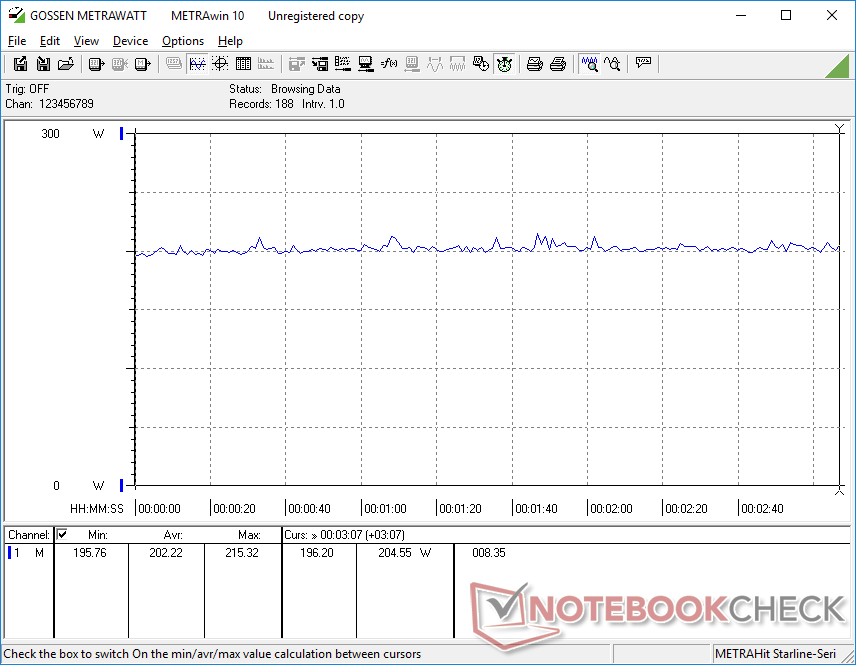
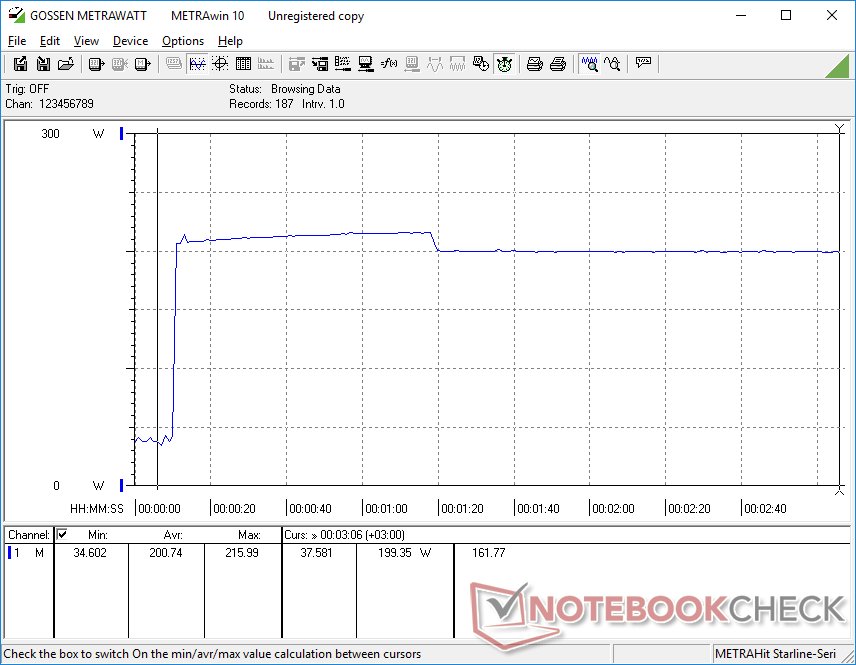
When running Witcher 3 to represent typical gaming loads, the system would demand an average of 202 W compared to 229 W or 225 W on the RTX 3080 Ti-powered Blade 17 or Asus ROG Strix Scar 17 SE, respectively. Thus, our 18-inch RTX 4070-powered system draws about 10 percent less power while offering nearly the same graphics performance as the last generation mobile RTX 3080 Ti. Upgrading to the RTX 4080 or RTX 4090 configuration will likely draw about 40 W to 50 W more power similar to what we observed on the Blade 16.
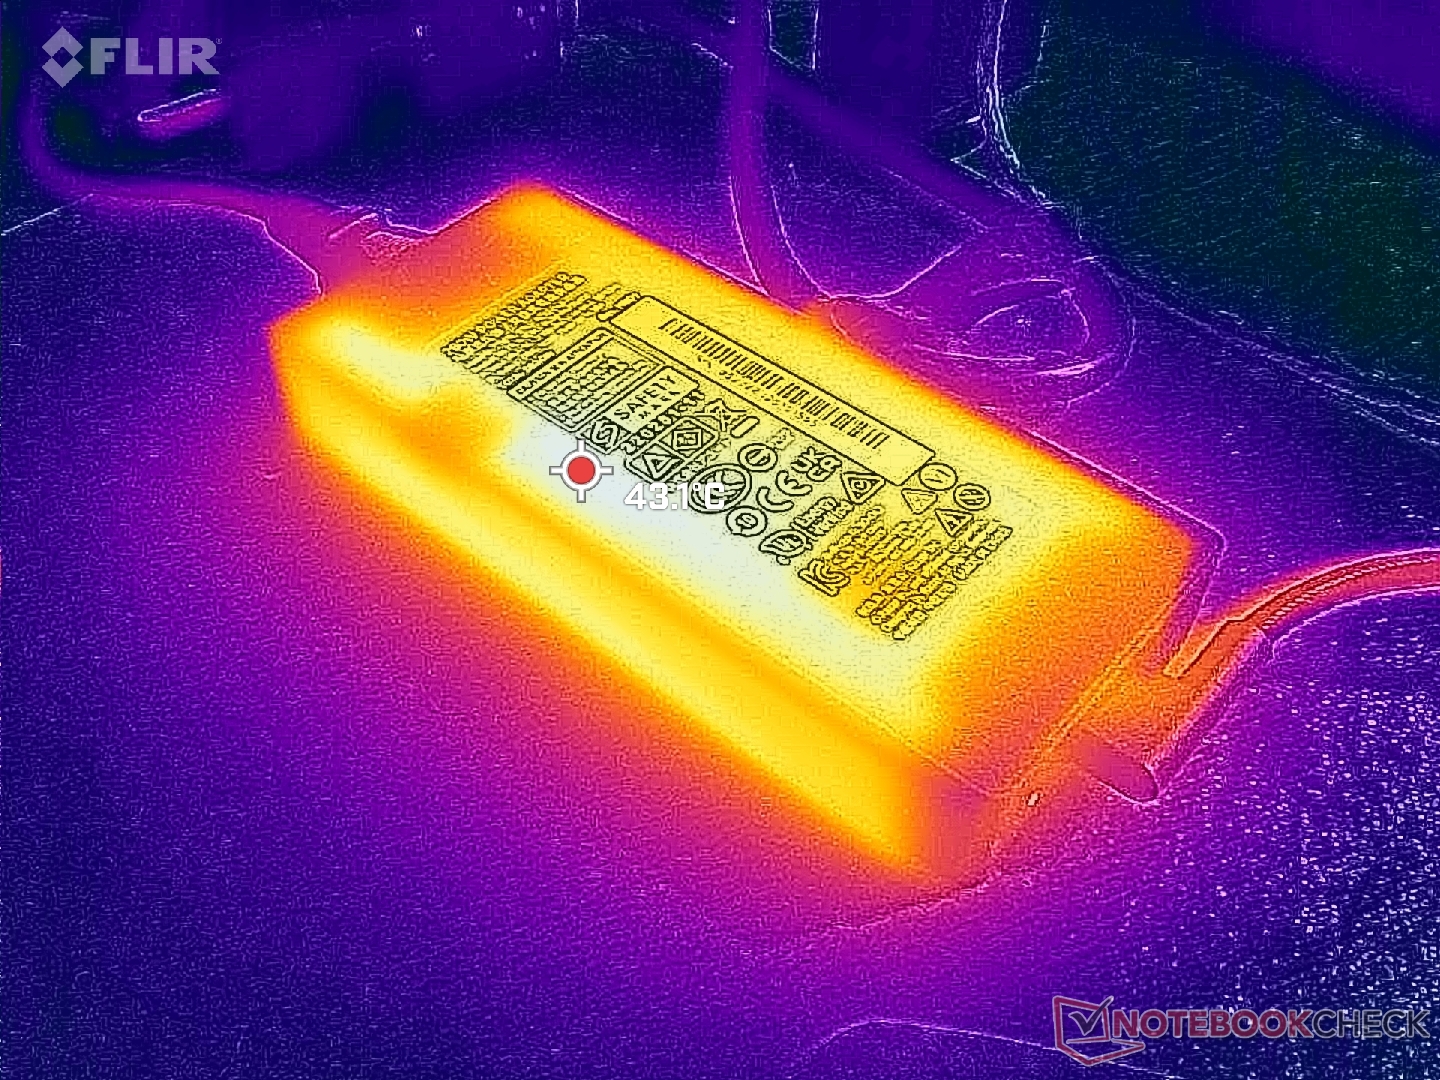
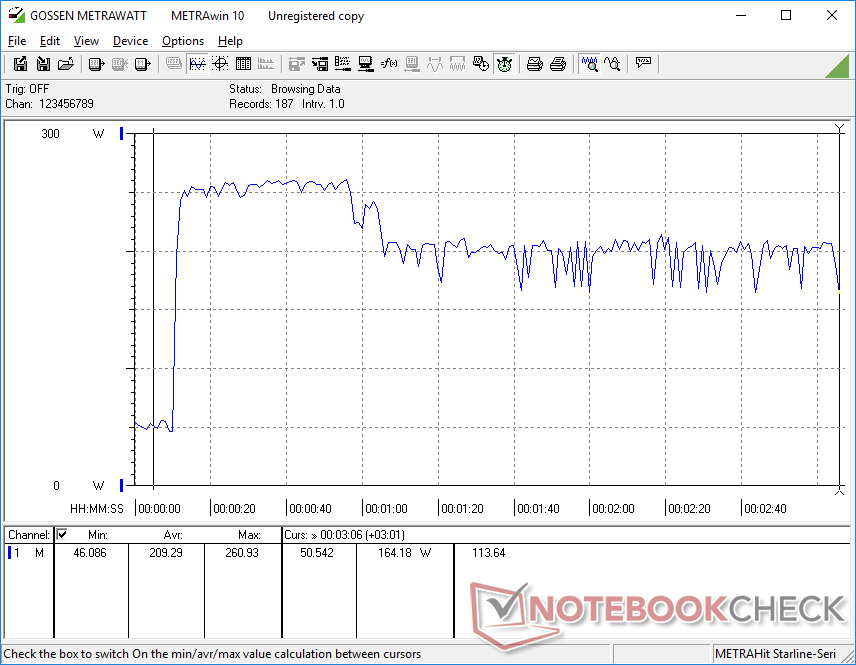
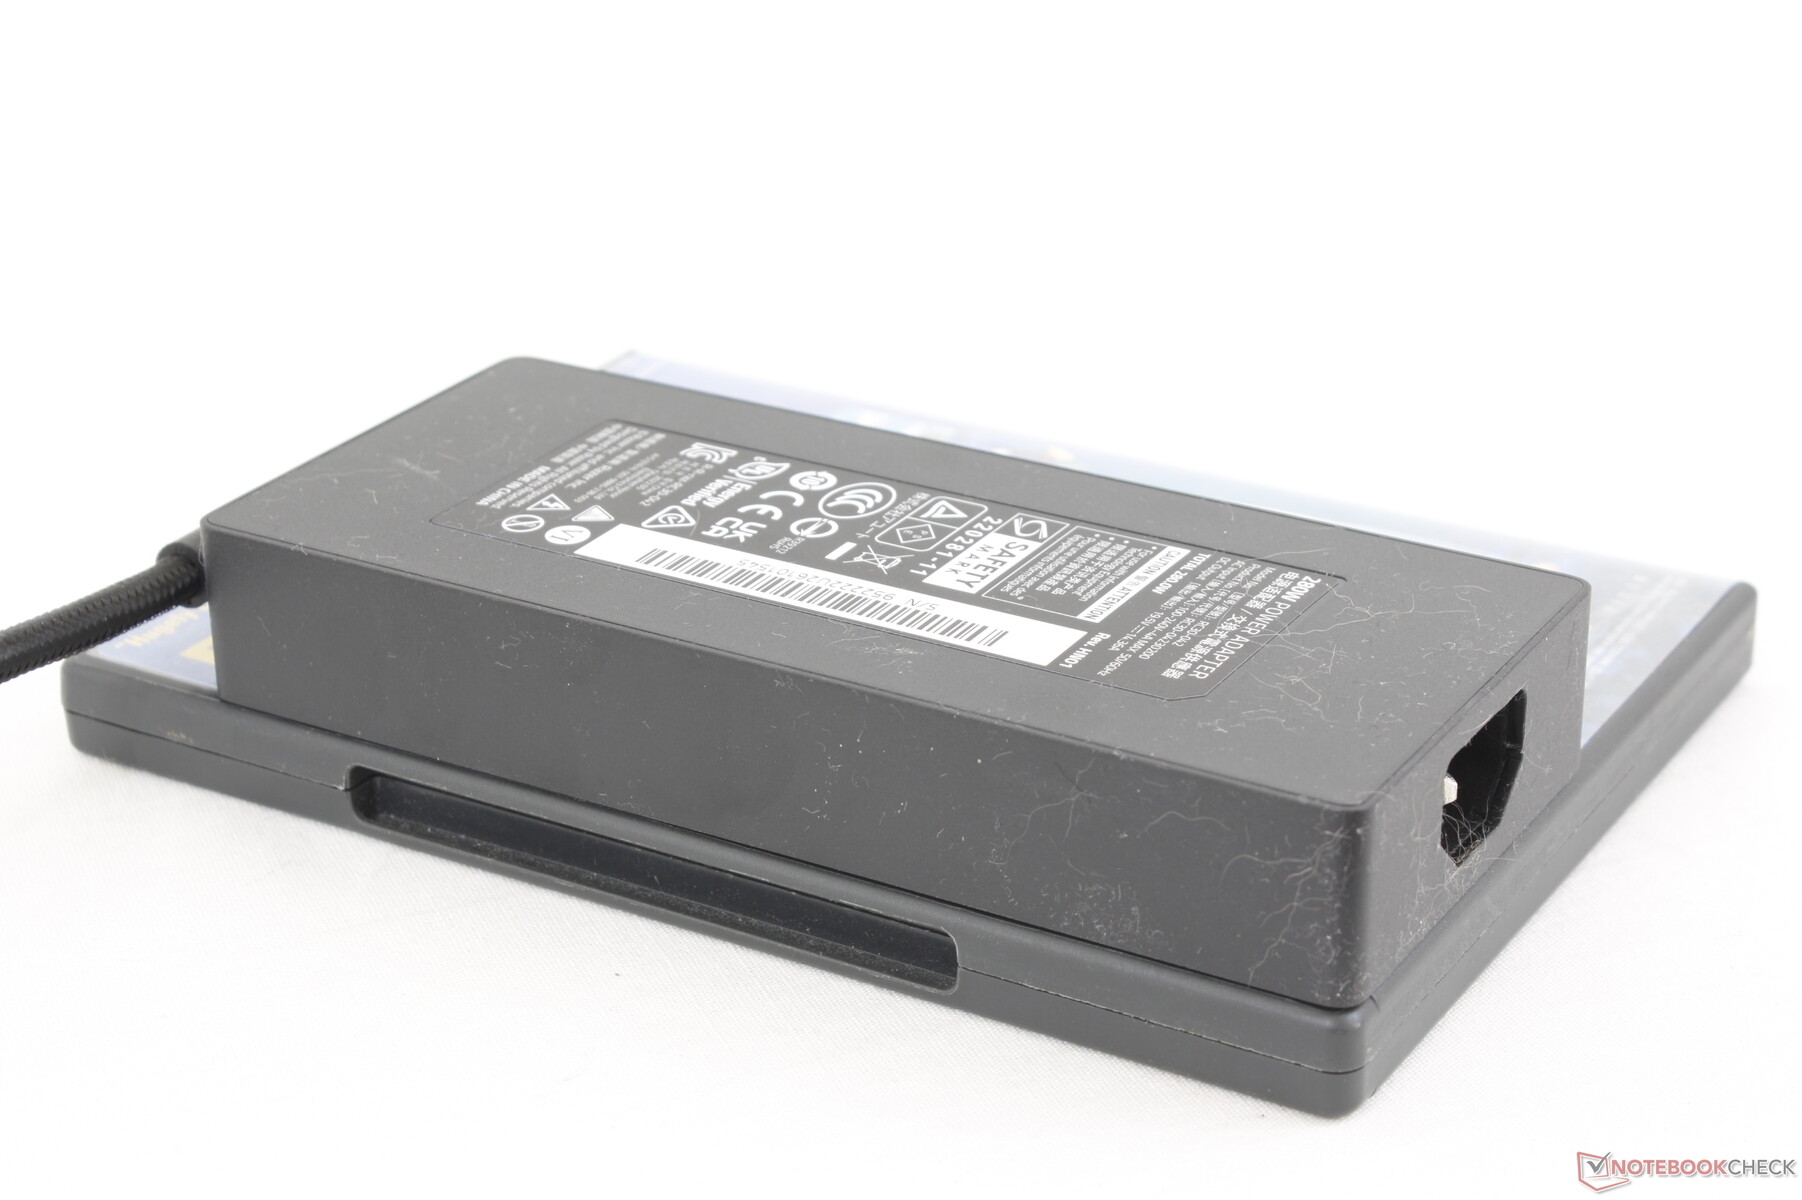
We're able to record a temporary maximum draw of 261 W from the small-medium (~16.3 x 7 x 2.5 cm) 280 W GaN AC adapter when running both Prime95 and FurMark simultaneously. Keep in mind that there are two different AC adapters depending on the configuration: a smaller 280 W adapter for the RTX 4060 and 4070 SKUs and a larger 330 W adapter for the RTX 4080 and 4090 SKUs.
| Off / Standby | |
| Idle | |
| Load |
|
| Razer Blade 18 RTX 4070 i9-13950HX, NVIDIA GeForce RTX 4070 Laptop GPU, SSSTC CA6-8D1024, IPS, 2560x1600, 18.00 | Razer Blade 17 Early 2022 i9-12900H, GeForce RTX 3080 Ti Laptop GPU, Samsung PM9A1 MZVL21T0HCLR, IPS, 3840x2160, 17.30 | MSI Titan GT77 HX 13VI i9-13950HX, NVIDIA GeForce RTX 4090 Laptop GPU, Samsung PM9A1 MZVL22T0HBLB, Mini-LED, 3840x2160, 17.30 | Gigabyte G7 KE i5-12500H, GeForce RTX 3060 Laptop GPU, Gigabyte AG470S1TB-SI B10, IPS, 1920x1080, 17.30 | Alienware m17 R5 (R9 6900HX, RX 6850M XT) R9 6900HX, Radeon RX 6850M XT, SSSTC CA6-8D1024, IPS, 3840x2160, 17.00 | Asus ROG Strix Scar 17 SE G733CX-LL014W i9-12950HX, GeForce RTX 3080 Ti Laptop GPU, Samsung PM9A1 MZVL22T0HBLB, IPS, 2560x1440, 17.30 | |
|---|---|---|---|---|---|---|
| Power Consumption | 17% | 8% | 32% | 31% | 9% | |
| Idle Minimum * | 24.5 | 17 31% | 14 43% | 15 39% | 13 47% | 19.3 21% |
| Idle Average * | 34.1 | 23 33% | 21.6 37% | 17 50% | 16.5 52% | 26.5 22% |
| Idle Maximum * | 47.7 | 34 29% | 24.8 48% | 24 50% | 17 64% | 27.1 43% |
| Load Average * | 140 | 120 14% | 122.5 12% | 111 21% | 93 34% | 141 -1% |
| Witcher 3 ultra * | 202 | 229 -13% | 265 -31% | 174.1 14% | 239 -18% | 225 -11% |
| Load Maximum * | 261 | 243 7% | 418 -60% | 208 20% | 251 4% | 307.9 -18% |
* ... smaller is better
Power Consumption Witcher 3 / Stresstest
Power Consumption external Monitor
Battery Life
It's no coincidence that the largest Blade model also carries the largest battery capacity in the family at 91.7 Wh. Battery life isn't necessarily longer, however, and it may even be shorter in many scenarios. We're able to browse the web on the Balanced power profile for 4 hours before needing to recharge which is almost a full hour shorter than on last year's Blade 15. Dropping the display refresh rate to 60 Hz instead of 240 Hz can extend battery life just marginally.
Charging from empty to full takes about 90 minutes. Users can also charge the system via USB-C albeit at a slower rate.
| Razer Blade 18 RTX 4070 i9-13950HX, NVIDIA GeForce RTX 4070 Laptop GPU, 91.7 Wh | Razer Blade 17 Early 2022 i9-12900H, GeForce RTX 3080 Ti Laptop GPU, 82 Wh | MSI Titan GT77 HX 13VI i9-13950HX, NVIDIA GeForce RTX 4090 Laptop GPU, 99.9 Wh | Gigabyte G7 KE i5-12500H, GeForce RTX 3060 Laptop GPU, 54 Wh | Alienware m17 R5 (R9 6900HX, RX 6850M XT) R9 6900HX, Radeon RX 6850M XT, 97 Wh | Asus ROG Strix Scar 17 SE G733CX-LL014W i9-12950HX, GeForce RTX 3080 Ti Laptop GPU, 90 Wh | |
|---|---|---|---|---|---|---|
| Battery Runtime | 9% | 21% | 9% | 28% | 4% | |
| Reader / Idle | 420 | 428 2% | 425 1% | |||
| WiFi v1.3 | 240 | 229 -5% | 319 33% | 317 32% | 290 21% | 250 4% |
| Load | 80 | 103 29% | 86 8% | 76 -5% | 107 34% | |
| H.264 | 290 | 358 | 132 | 294 |
Pros
Cons
Verdict — Love The Hardware, Hate The Bugs
We walked away impressed by the Blade 16, but the same cannot be said for the Blade 18. Our unit would exhibit major issues including buggy DLSS 3 performance on an external monitor, missing G-Sync support when G-Sync is supposedly included, and a potentially faulty flickering display. We considered withholding this review until these problems could be addressed, but the Blade 18 is already shipping to customers and so we felt it was right to inform our readers who may be in the market for one. This page will be updated with a final score in place once we have a proper solution from the manufacturer.
The Blade 18 shows potential to be another excellent addition to the Blade family when looking beyond the above issues. The 18-inch display is gorgeous and massive relative to the footprint and weight. The fact that the system isn't all that much bigger or heavier than the Blade 17 should make it very appealing to users who might already be considering a Blade 17 or some other 17-inch gaming laptop. Its relatively small GaN AC adapter further adds to the portable-DTR hybrid nature of the Blade 18.
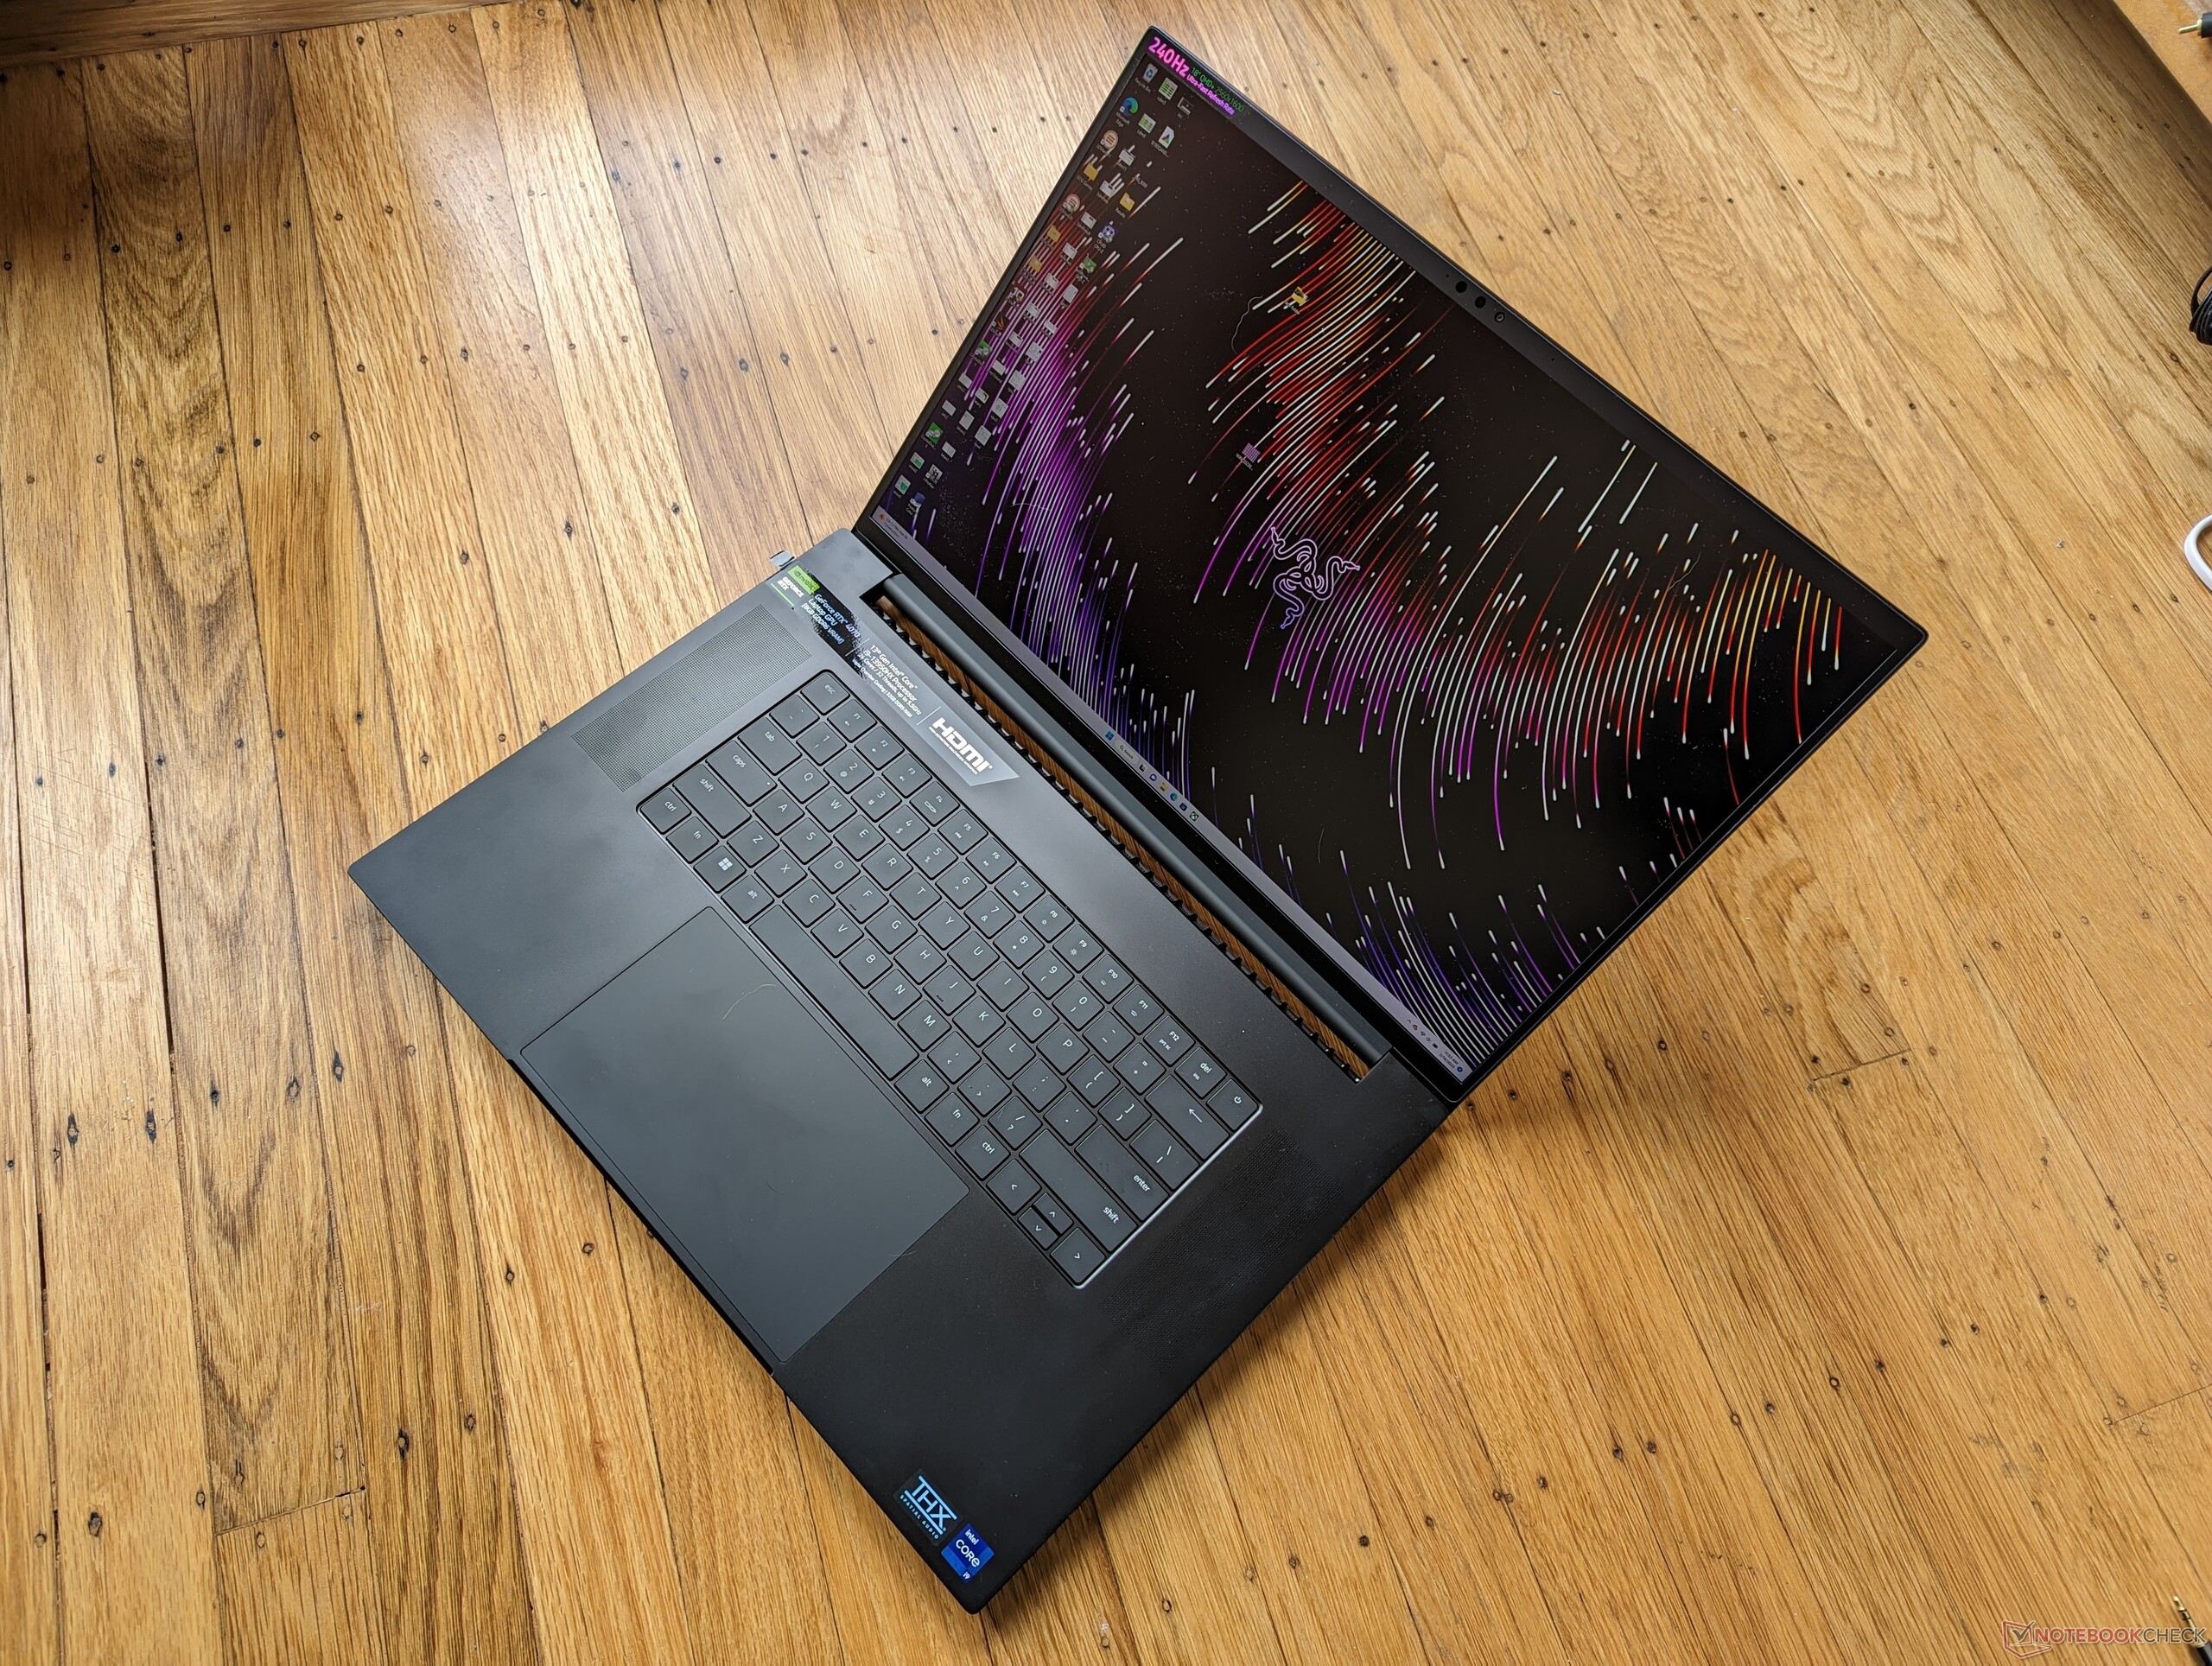
The Blade 18 may sound ginormous at first, but it's really not that much bigger than the existing Blade 17. Its large screen and high screen-to-body ratio are impressive.
As for the mobile RTX 4070, its performance can be underwhelming depending on the game. Titles that support DLSS 3 run like butter on the mobile RTX 4070. Otherwise, expect performance to be similar to last year's mobile RTX 3080 or a desktop RTX 3070. Fortunately, the list of titles supporting DLSS 3 has been steadily expanding.
It's an overall strong start for the 18-inch Blade series marred by some notable launch issues. The upcoming Asus ROG Strix Scar 18 and Dell Alienware m18 could spell trouble for the Blade 18 if some key problems aren't addressed.
(March 8, 2023 update: Razer has addressed two of the three issues we experienced. Firstly, a new BIOS 2.02 update is available which restores the MUX and G-Sync functionalities of the model. Secondly, a separate Nvidia driver update is available to resolve the flickering issue. We can confirm that both of these patches work as intended once installed.
Unfortunately, our unit would still exhibit performance issues when running games on an external monitor with DLSS 3 enabled. Razer is still investigating the matter and we will update this section once it is resolved.)
Price and Availability
Razer Blade 18 RTX 4070
-
04/25/2023 v7
Allen Ngo


Transparency
The present review sample was made available to the author as a loan by the manufacturer or a shop for the purposes of review. The lender had no influence on this review, nor did the manufacturer receive a copy of this review before publication. There was no obligation to publish this review.
Pricecompare
