 Deutsch
 English
 Español
 Français
 Italiano
 Nederlands
 Polski
 Português
 Русский
 Türkçe
 Svenska
 Chinese
 Magyar
Philips Brilliance 328P6VJEB 32" 4K Monitor Review
For the original German review, see here.
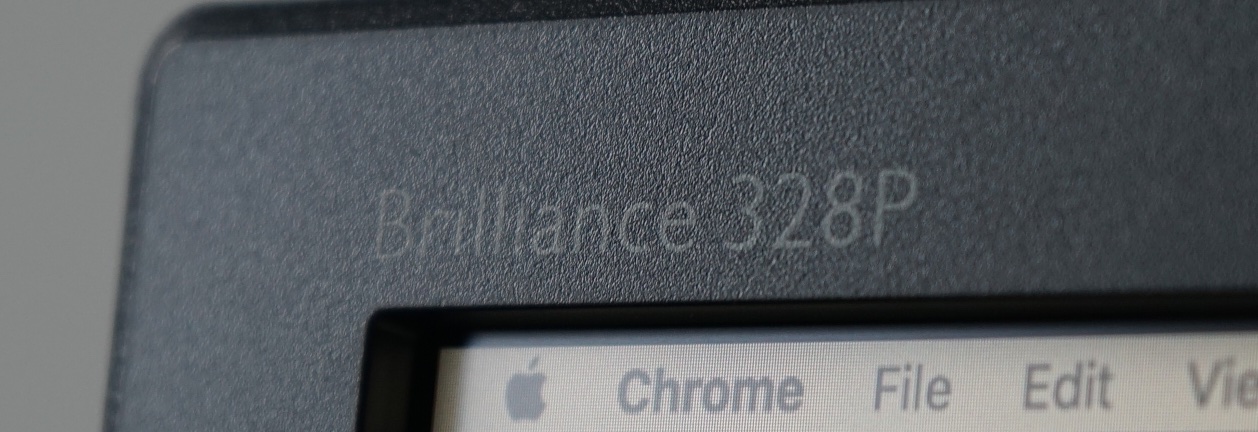
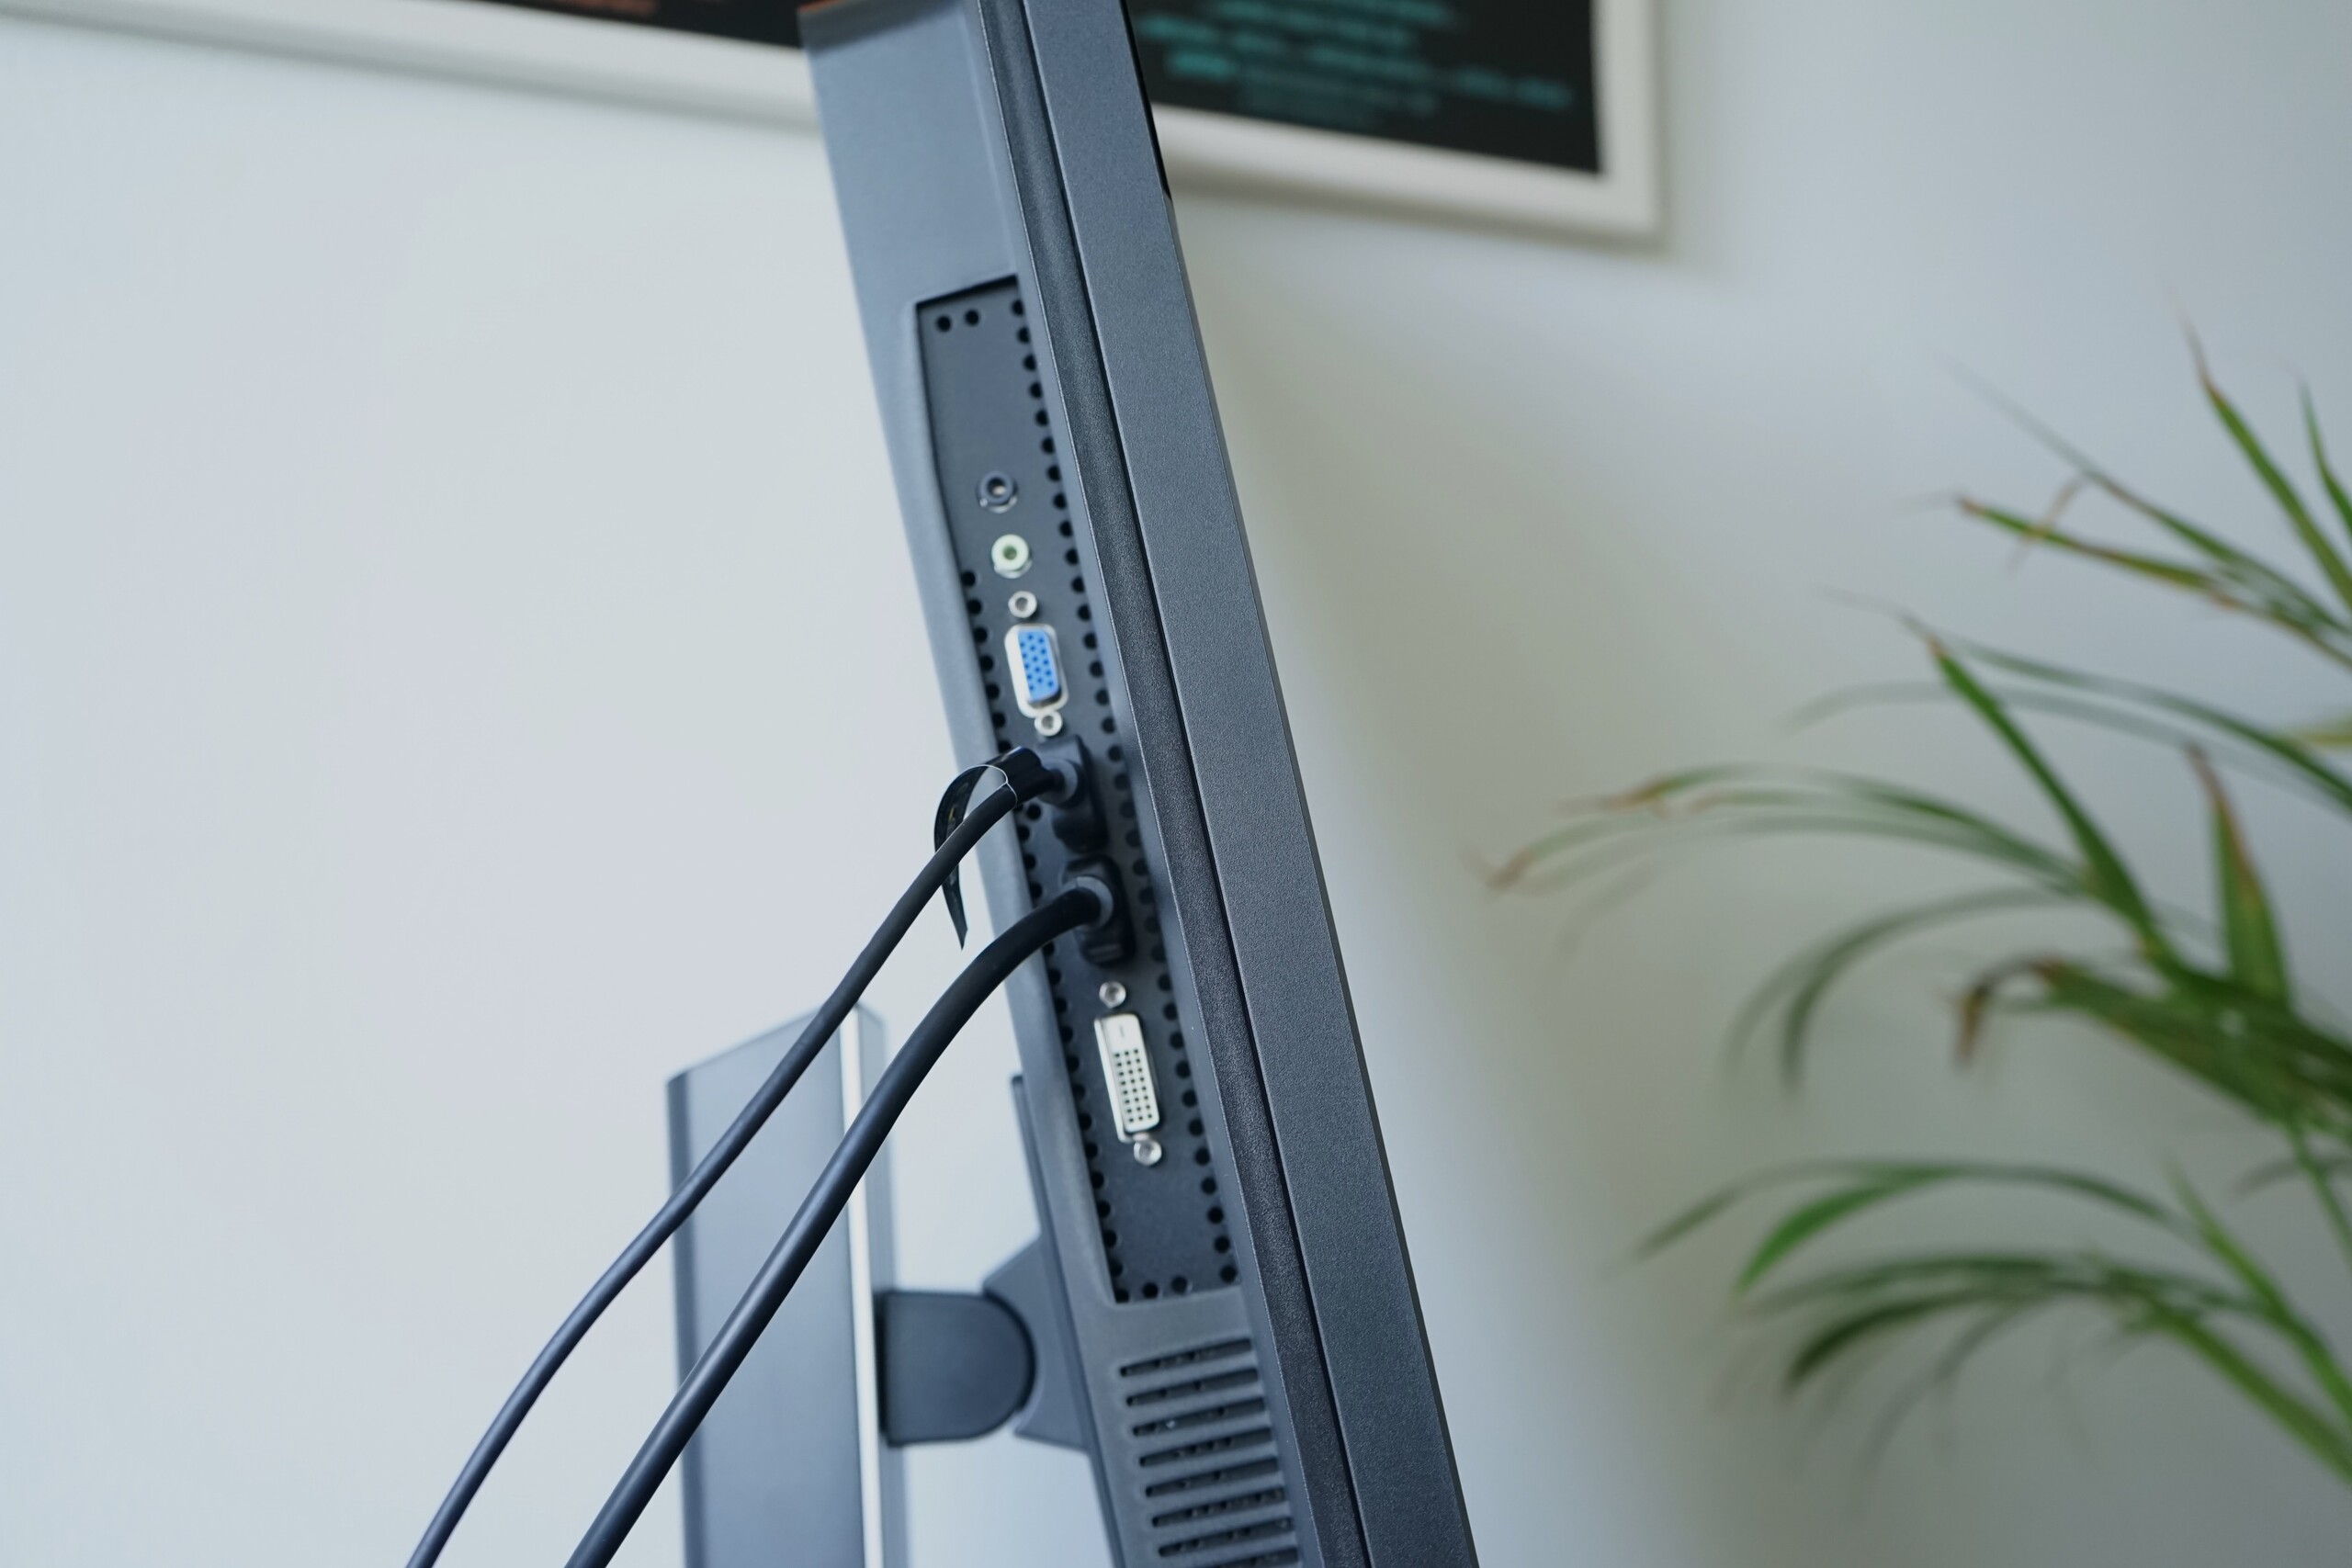
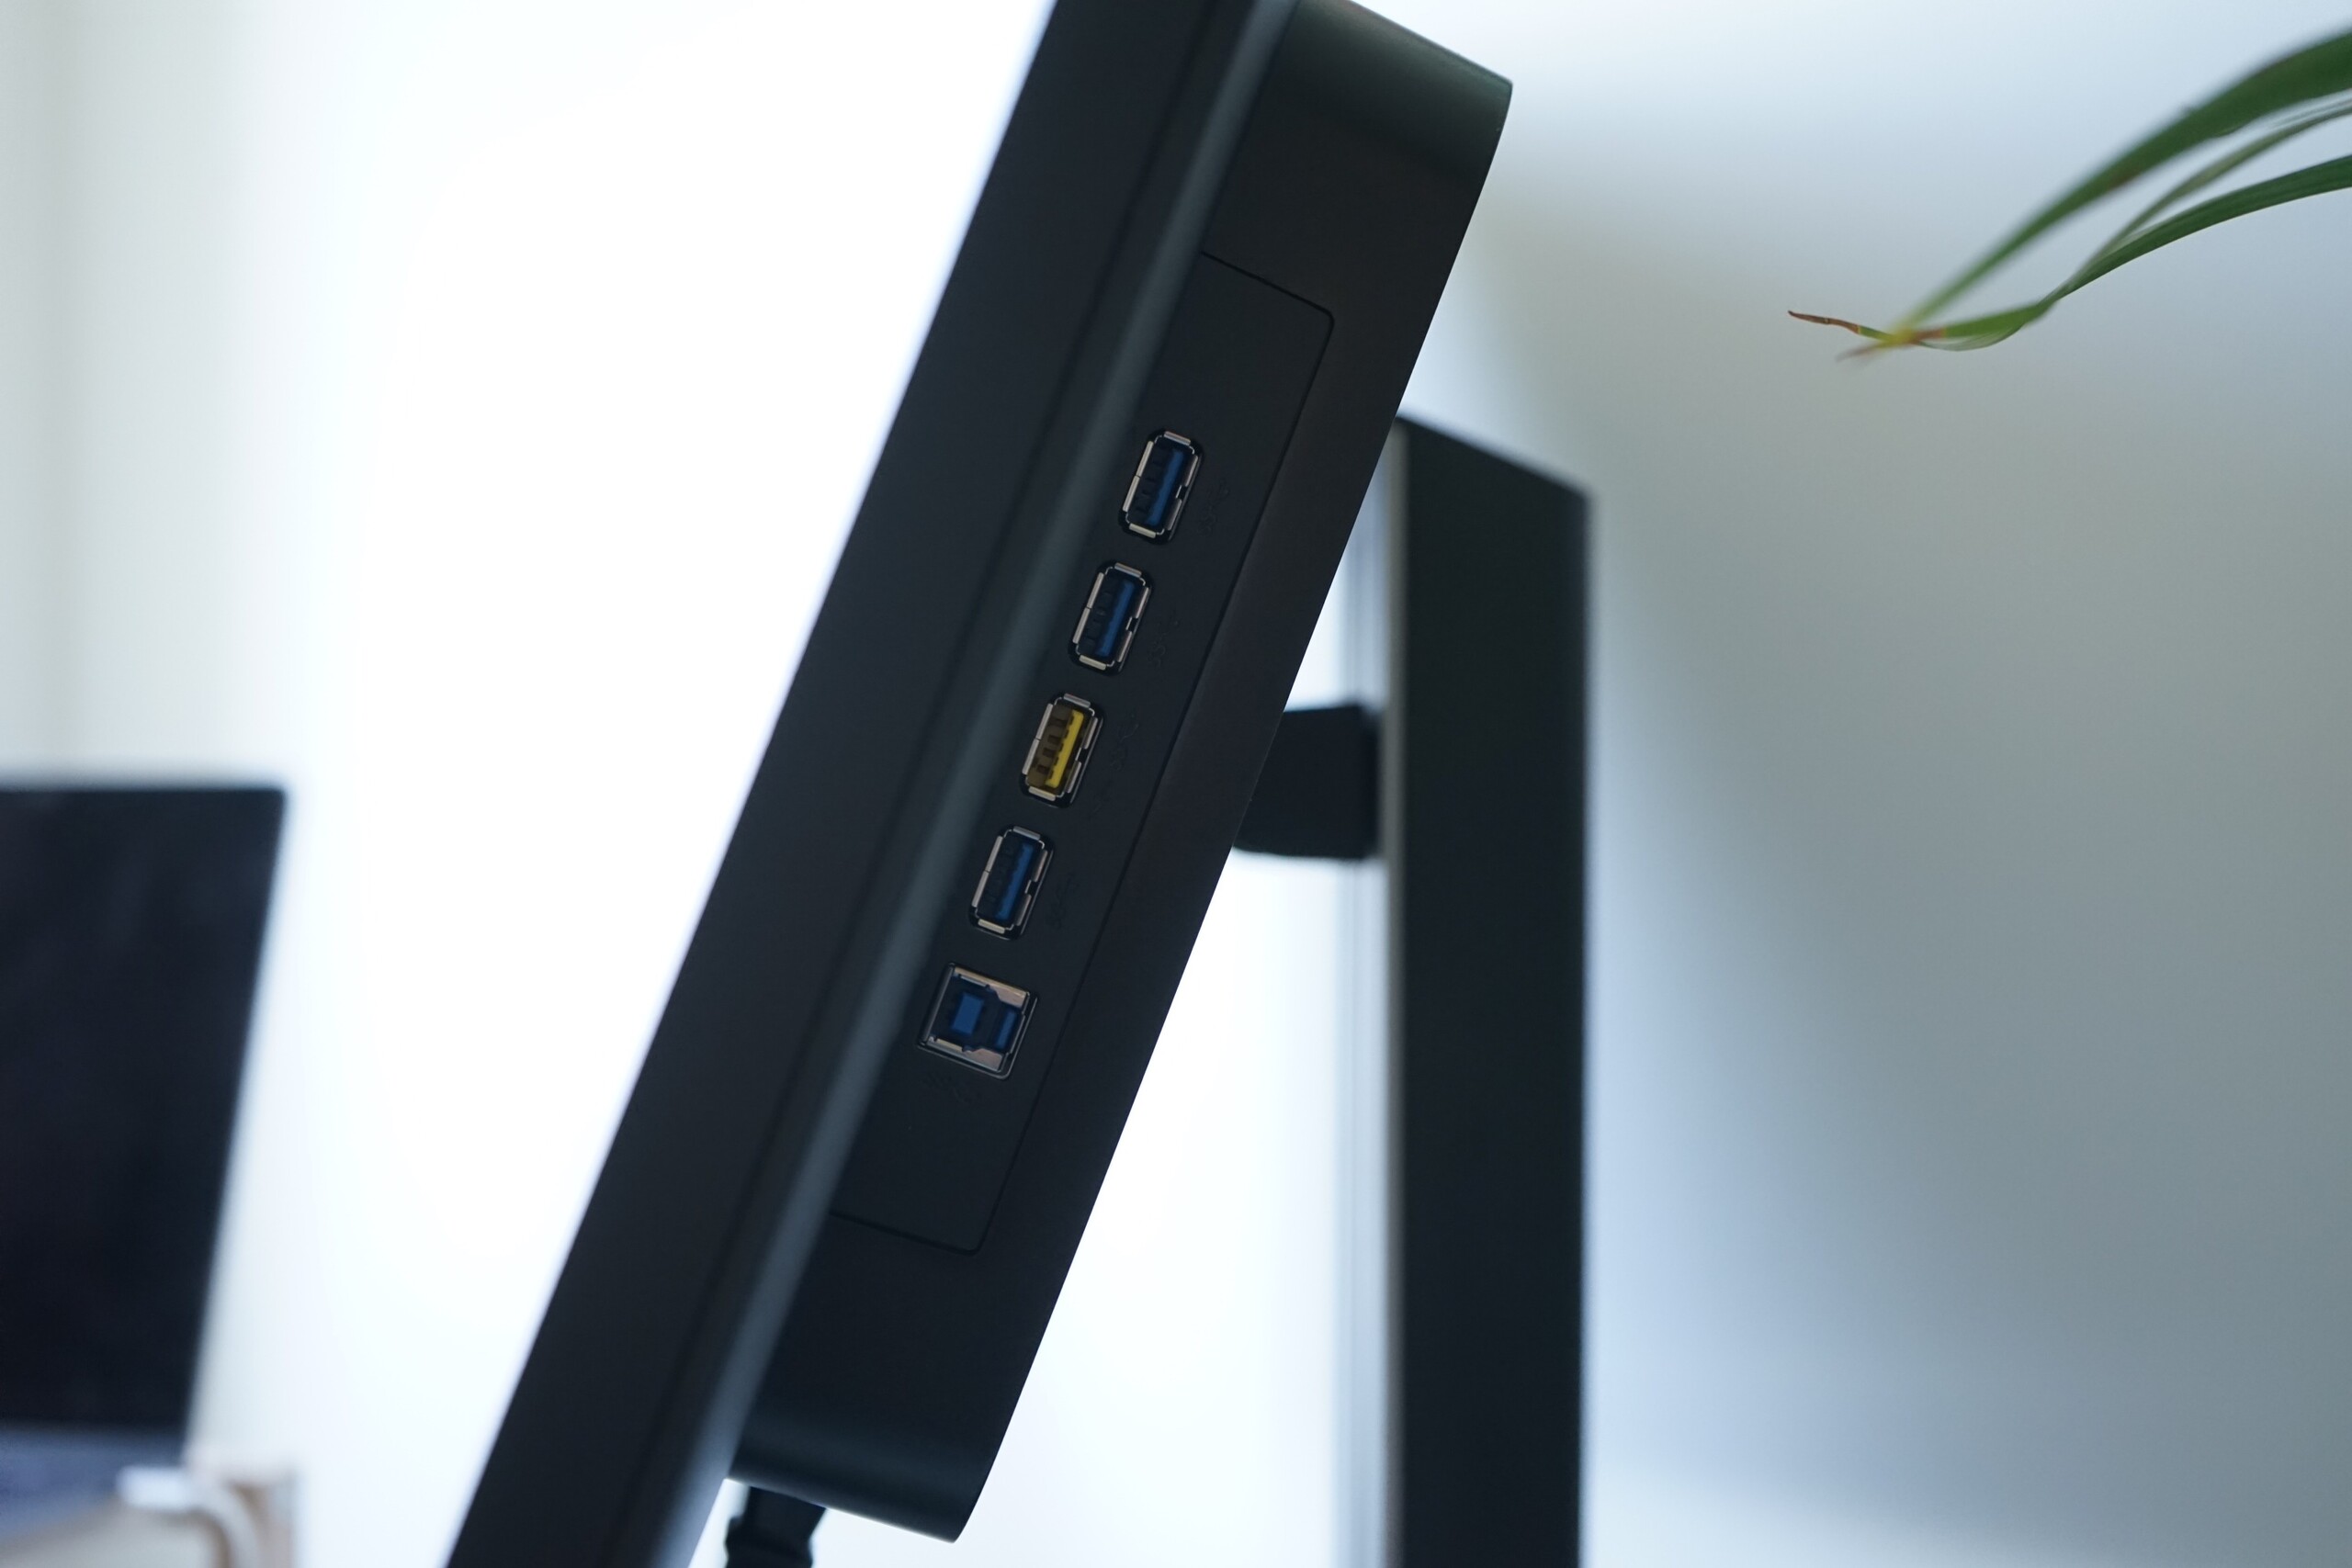
The Philips 328P6VJEB is a 31.5-inch desktop monitor with UHD/4K resolution (3840x2160 pixels) and a display diagonal of 80.1 cm (~31.5 in). The display and the detachable foot are well packaged. It is easy to put the parts together. In addition, there is a compatible cable for each port in the box (HDMI, DisplayPort, Audio, USB, and VGA).
Build Quality and Case
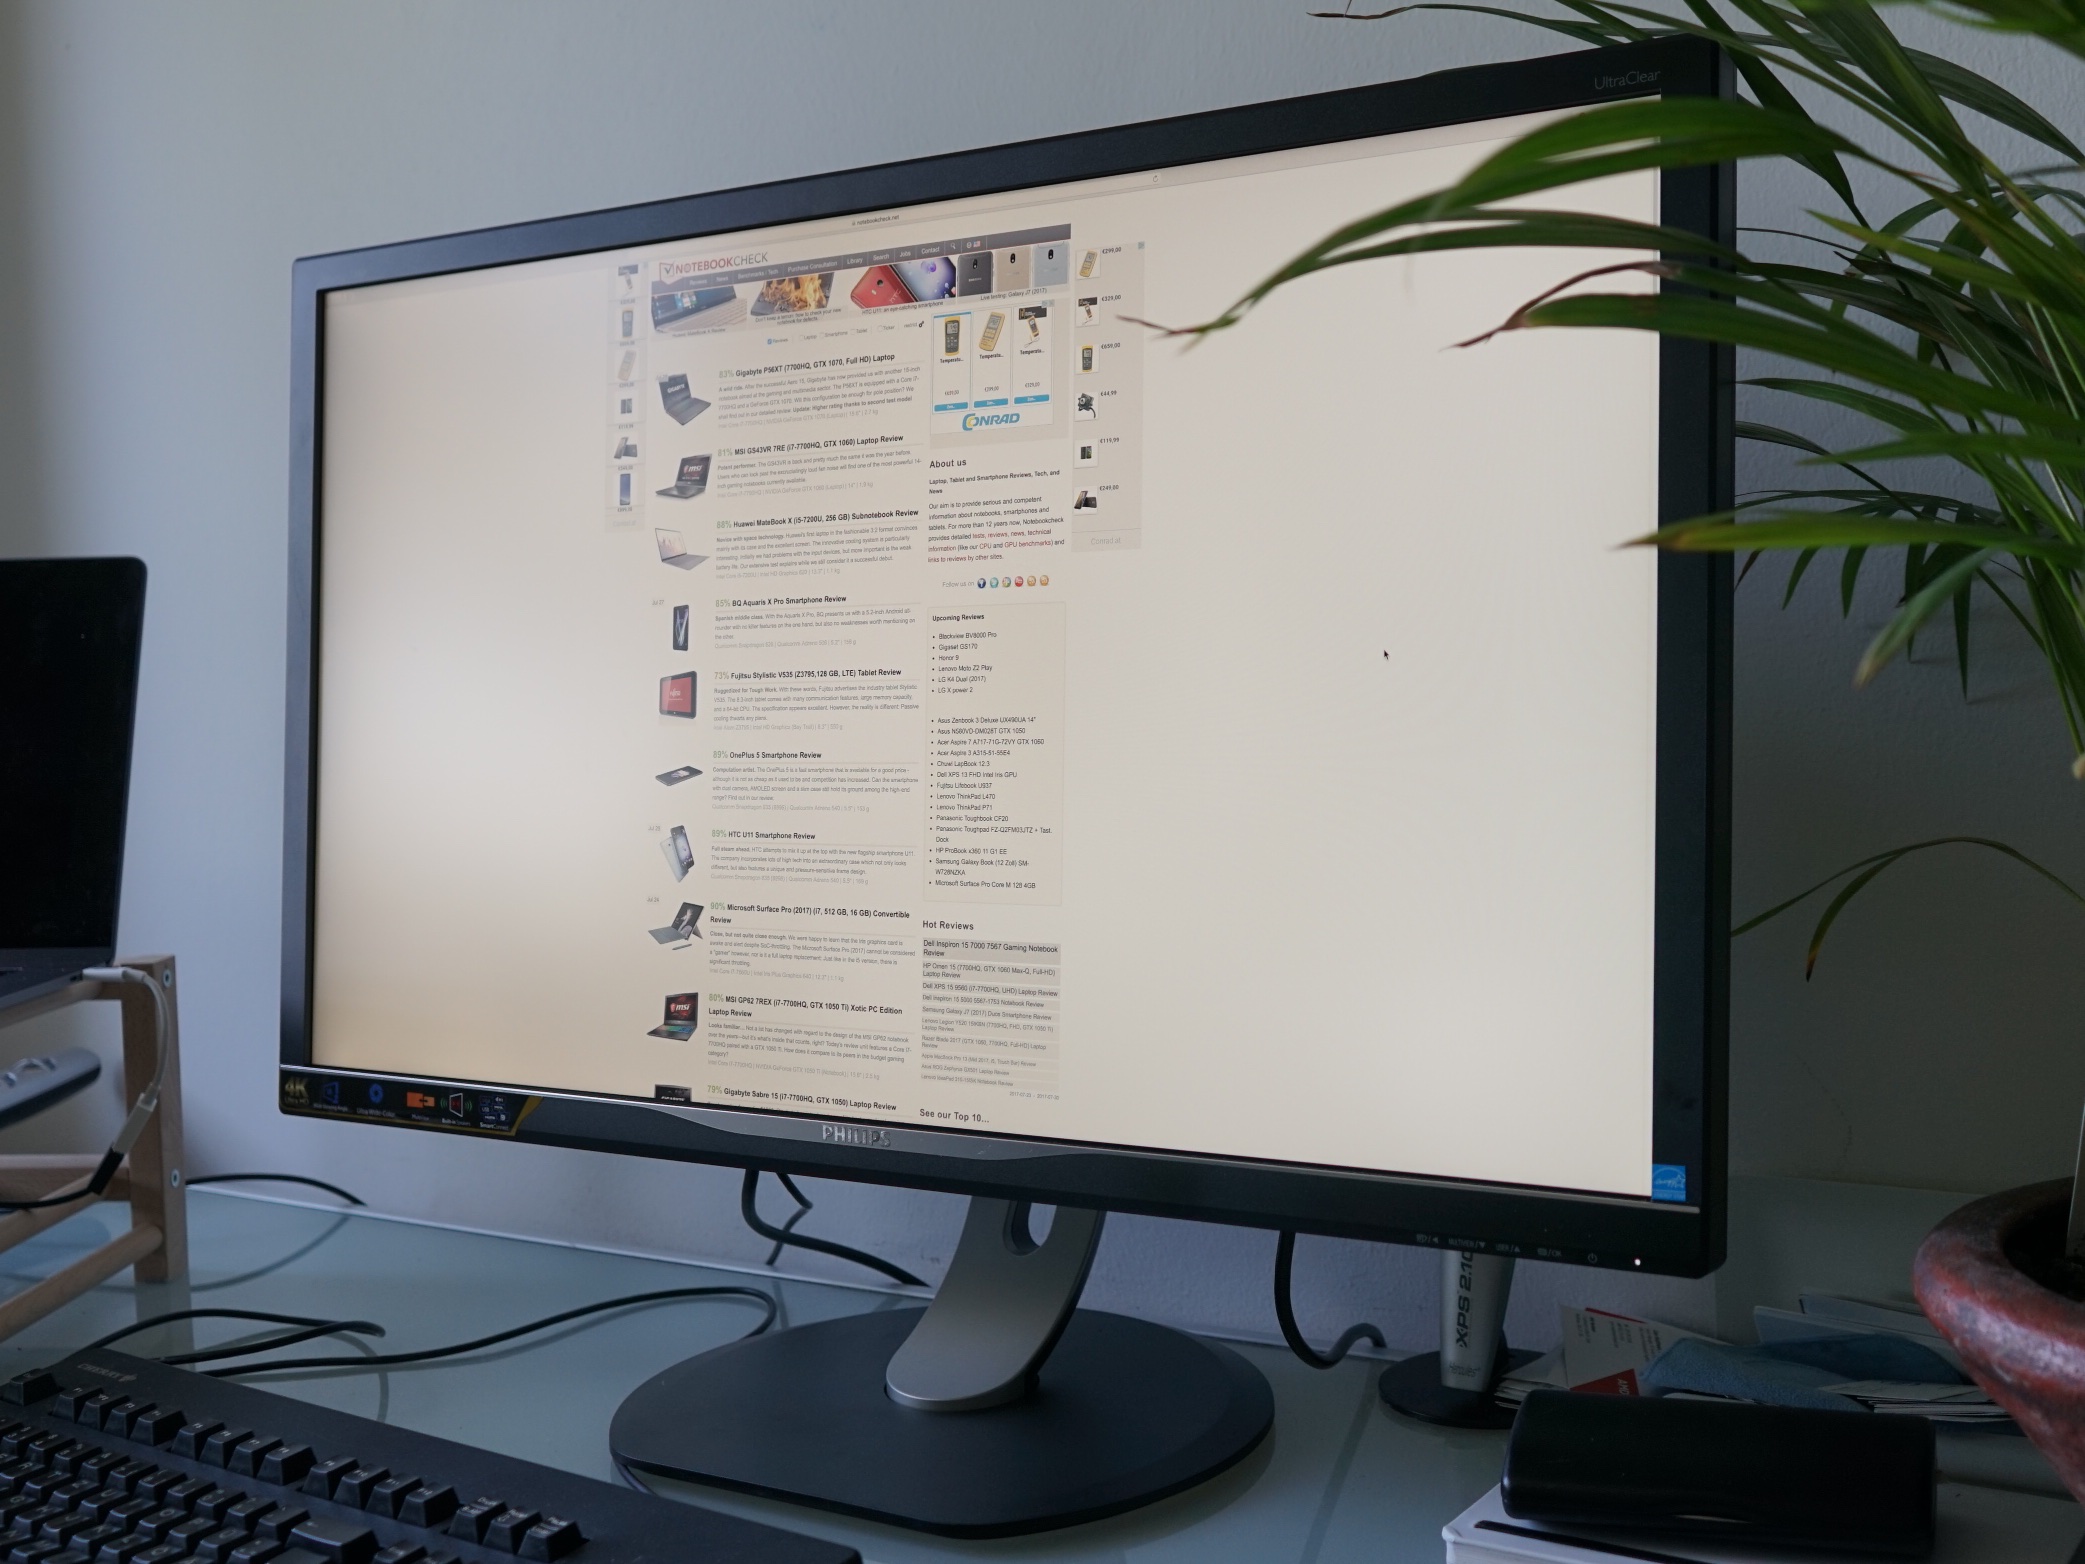
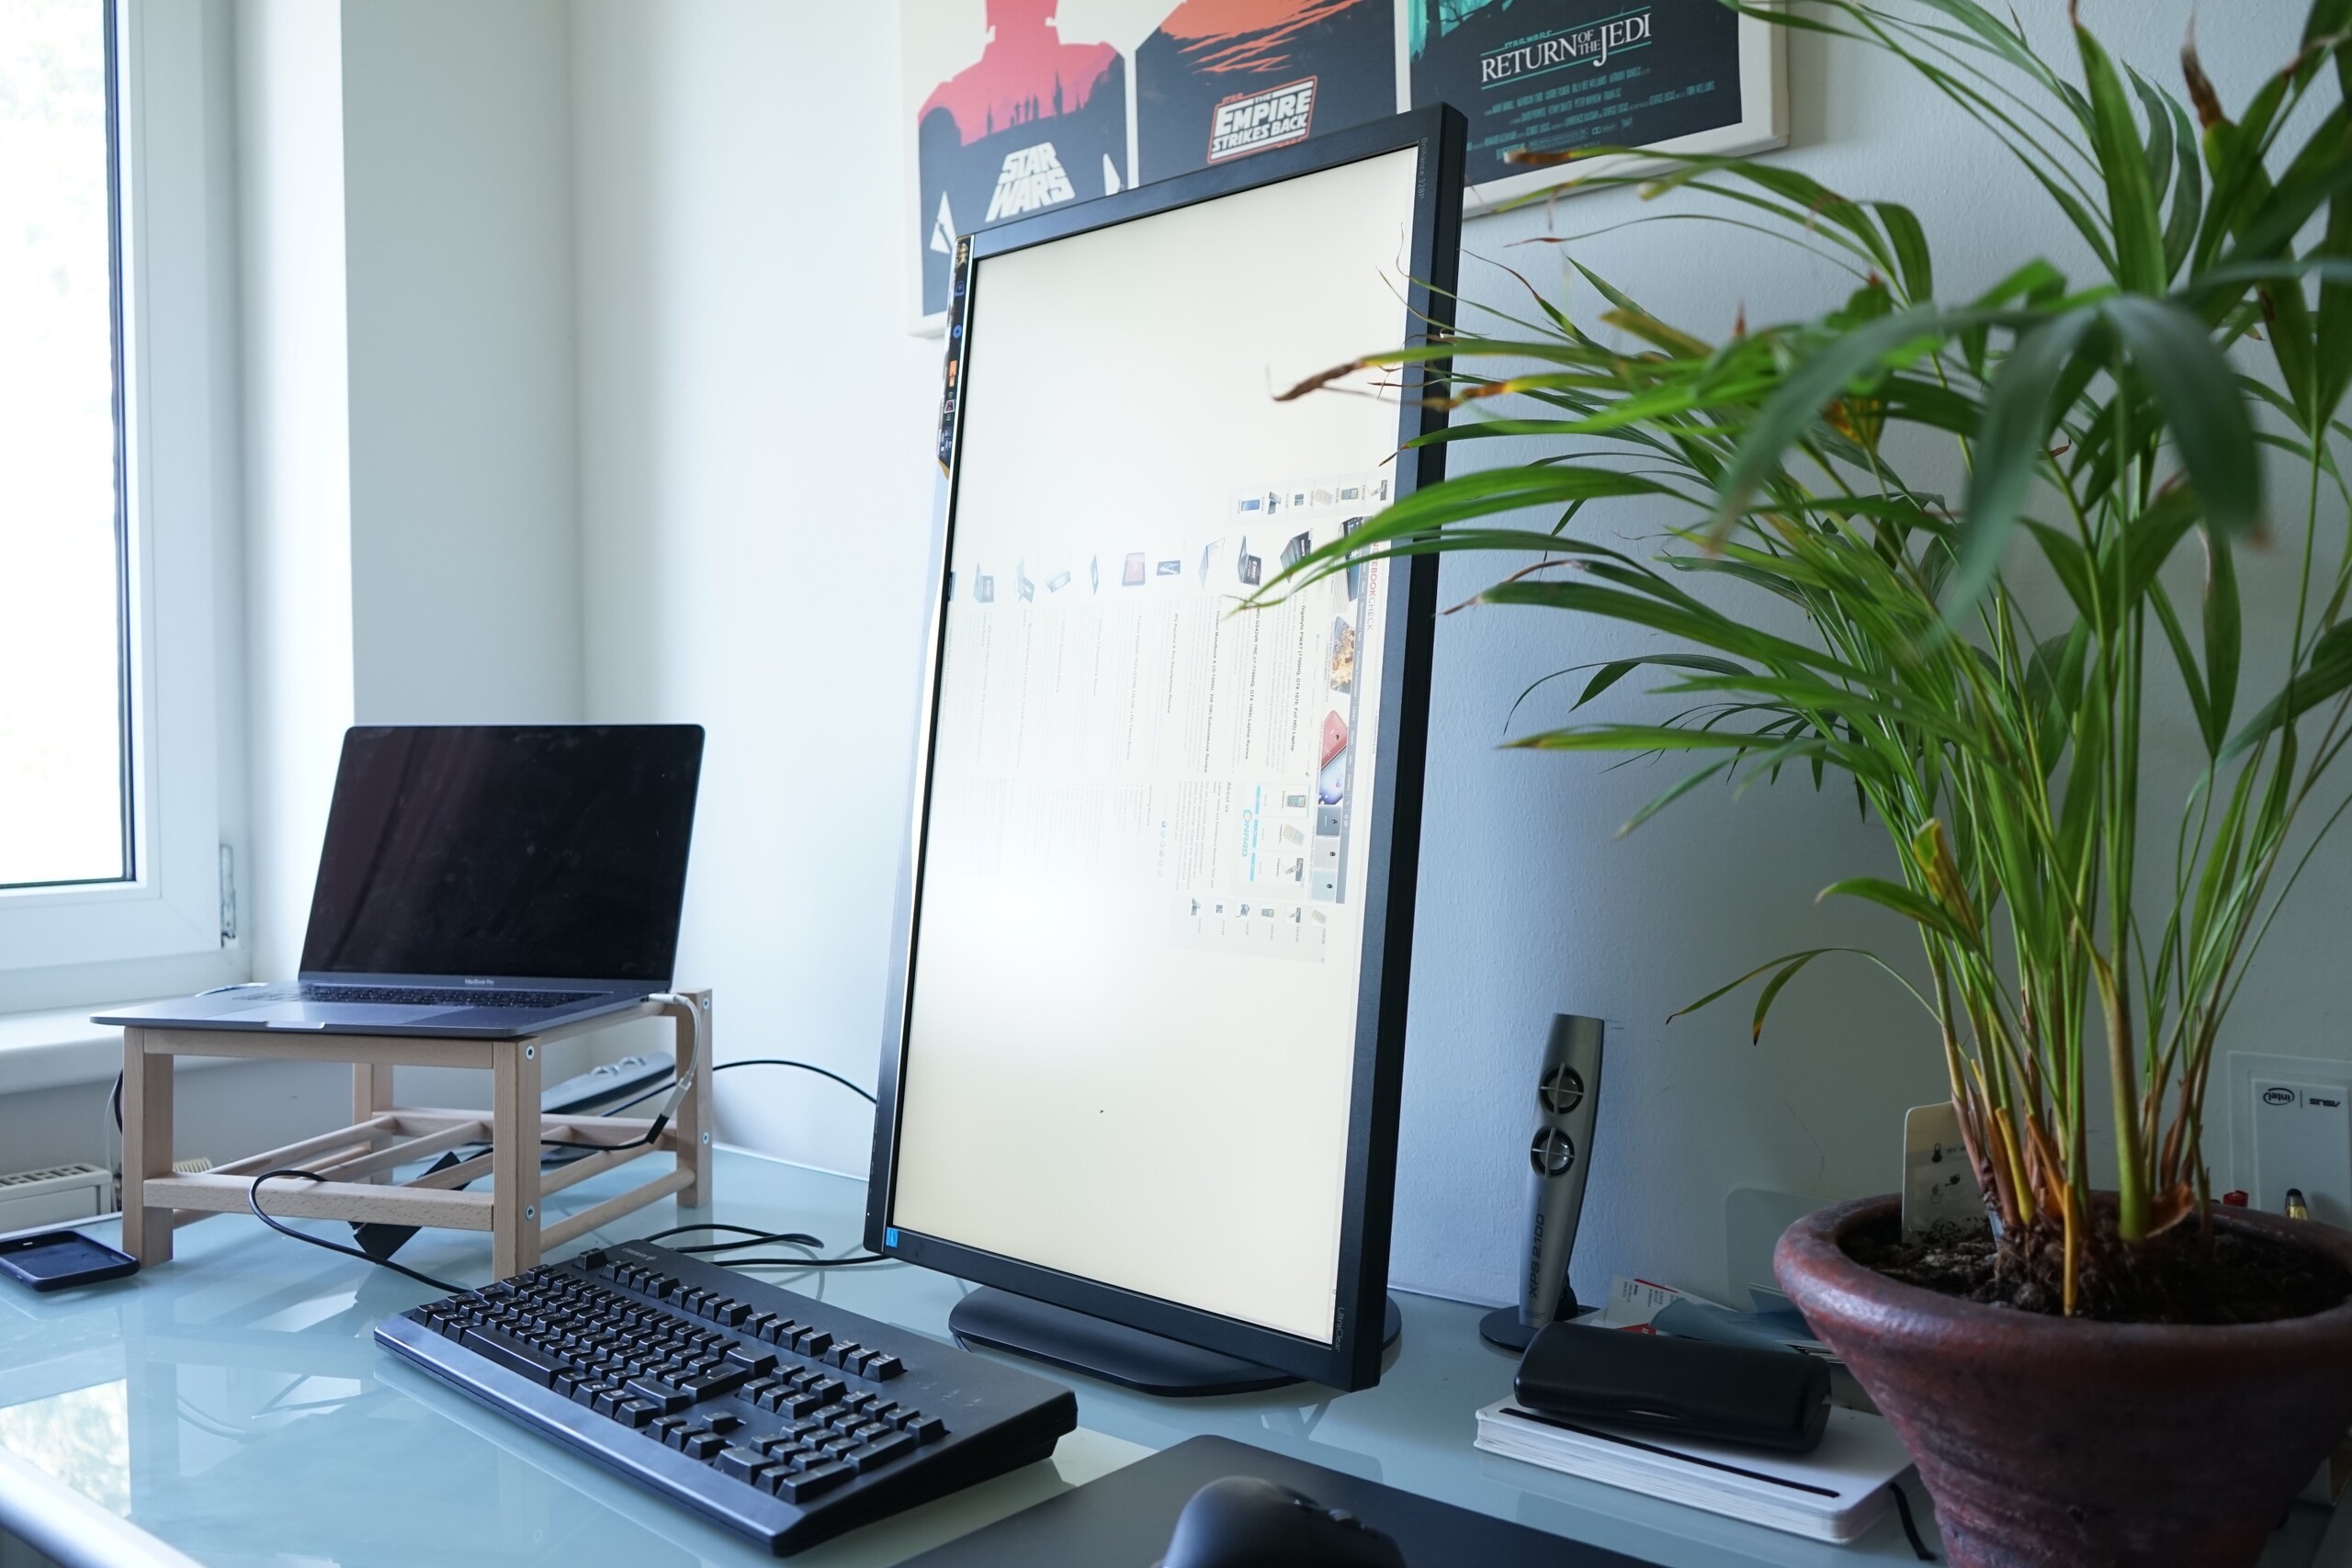
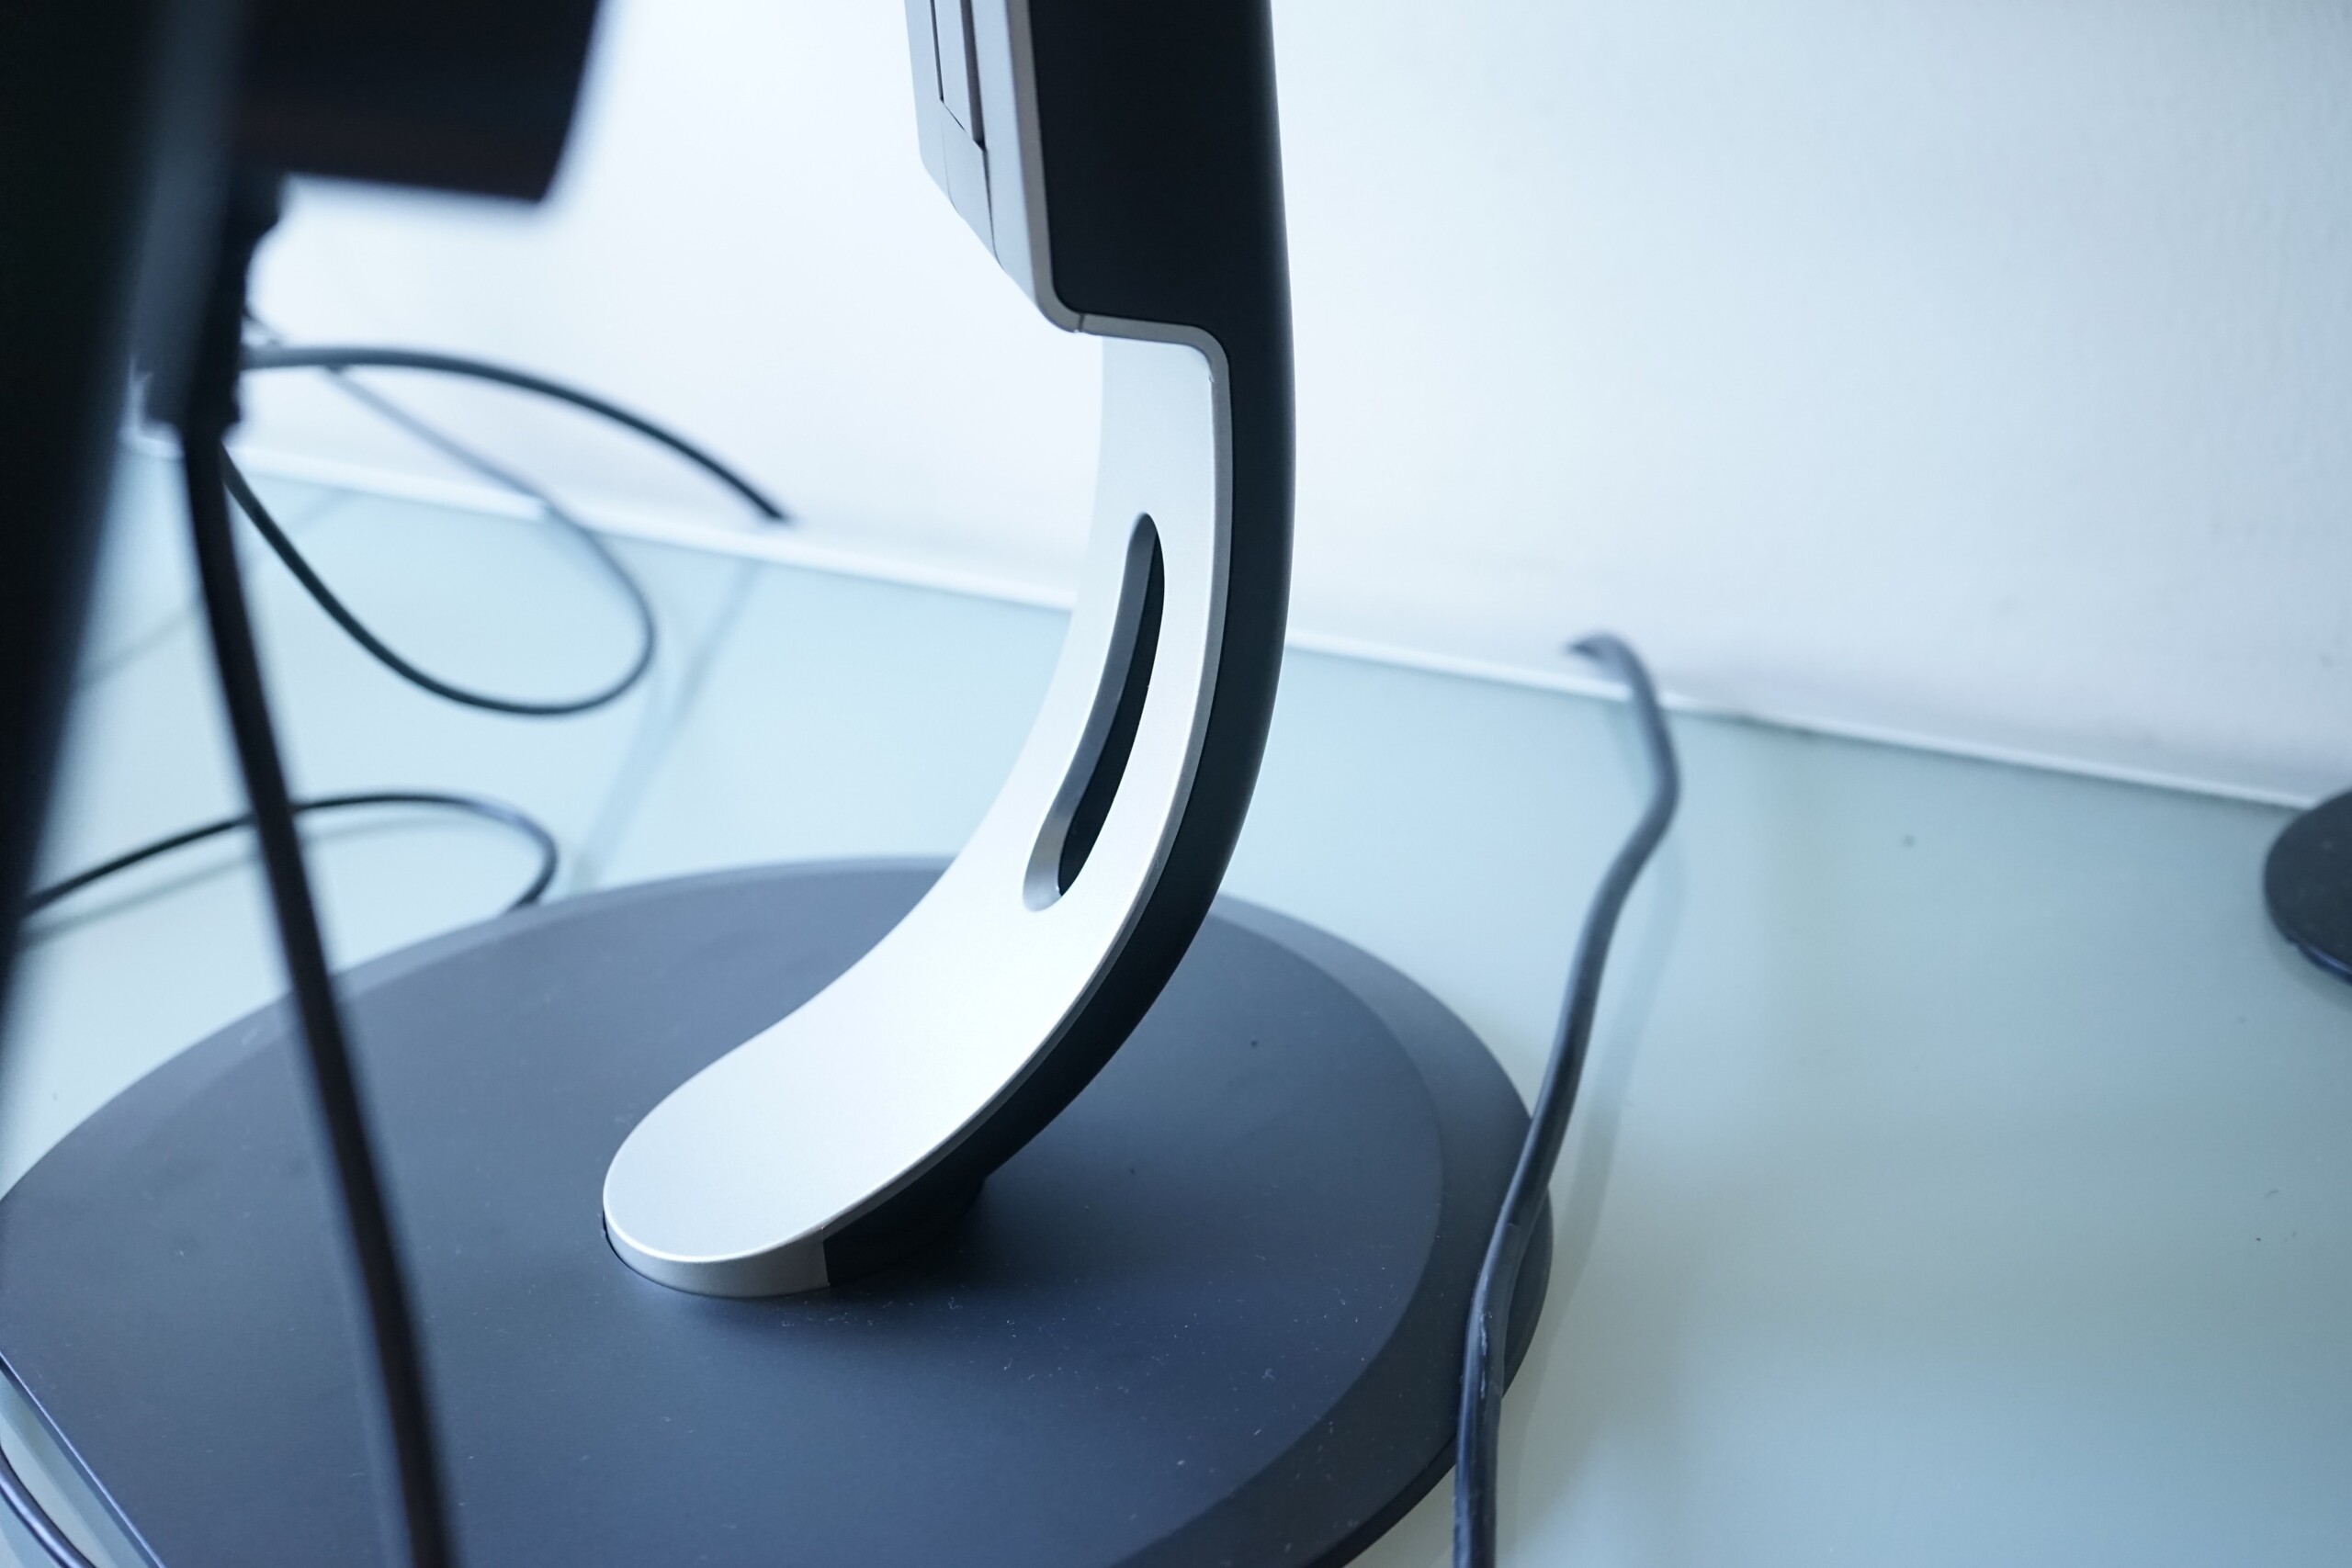
The Brilliance 328P features a plain design. The curved, silver-colored foot is most striking. However, the design is unobtrusive and nice from normal using distance. In detail, it feels rather average to the touch. The edges are relatively sharp using cheap hard plastics. However, the materials are quite adequate for the price. Its many adjustment possibilities, including pivot function are advantages. Because of the display's size, quite a lot of weight sits on the central hinge. As a result, it tends to wobble when typing on not entirely stable tables (e.g. on our glass table from Ikea). We liked that it runs silently regardless of the brightness level. We could not detect transistor whining or other noises.
On-Screen Menu / MultiView
The menu of the Brilliance 328P is well designed, but several functions are missing. We particularly missed a quick brightness adjustment via freely configurable shortcut or dedicated buttons. The absence of a brightness sensor makes the situation even worse. After assembly, it is recommended to immediately use the menu for changing the image mode from Adobe RGB to sRGB and set the used version of DisplayPort or HDMI. Otherwise, full 60 Hz in 4K and good color representation are not available.
MultiView is a separate menu. It allows using two signals simultaneously or per picture-in-picture. This worked flawlessly in our test with two 4K sources via HDMI (1.4) and DisplayPort. However, unfortunately, HDMI 2.0 did not work (neither in single image mode, nor in MultiView). We have, for example tested it with the Asus ROG Zephyrus GX501VIK and the Acer Aspire E5-553G.
Brightness and Contrast
With a maximum brightness of 230 cd/m² on average, the Philips 4K Monitor Desktop achieves normal values. The Asus PB287Q also did not perform better in our test with 220 cd/m2. Good notebook displays are significantly brighter with above 500 cd/m² since they can also be used outdoors.
Due to a low black value of 0.09 cd/m², the Philips display achieves an excellent contrast of 2822:1 in its center. In this respect, it can outperform the PB287Q and good notebook displays with 1000:1 - 1500:1 by far. The contrast is still as high as 1050:1 (30 to 0.029 cd/m²) at minimum brightness.
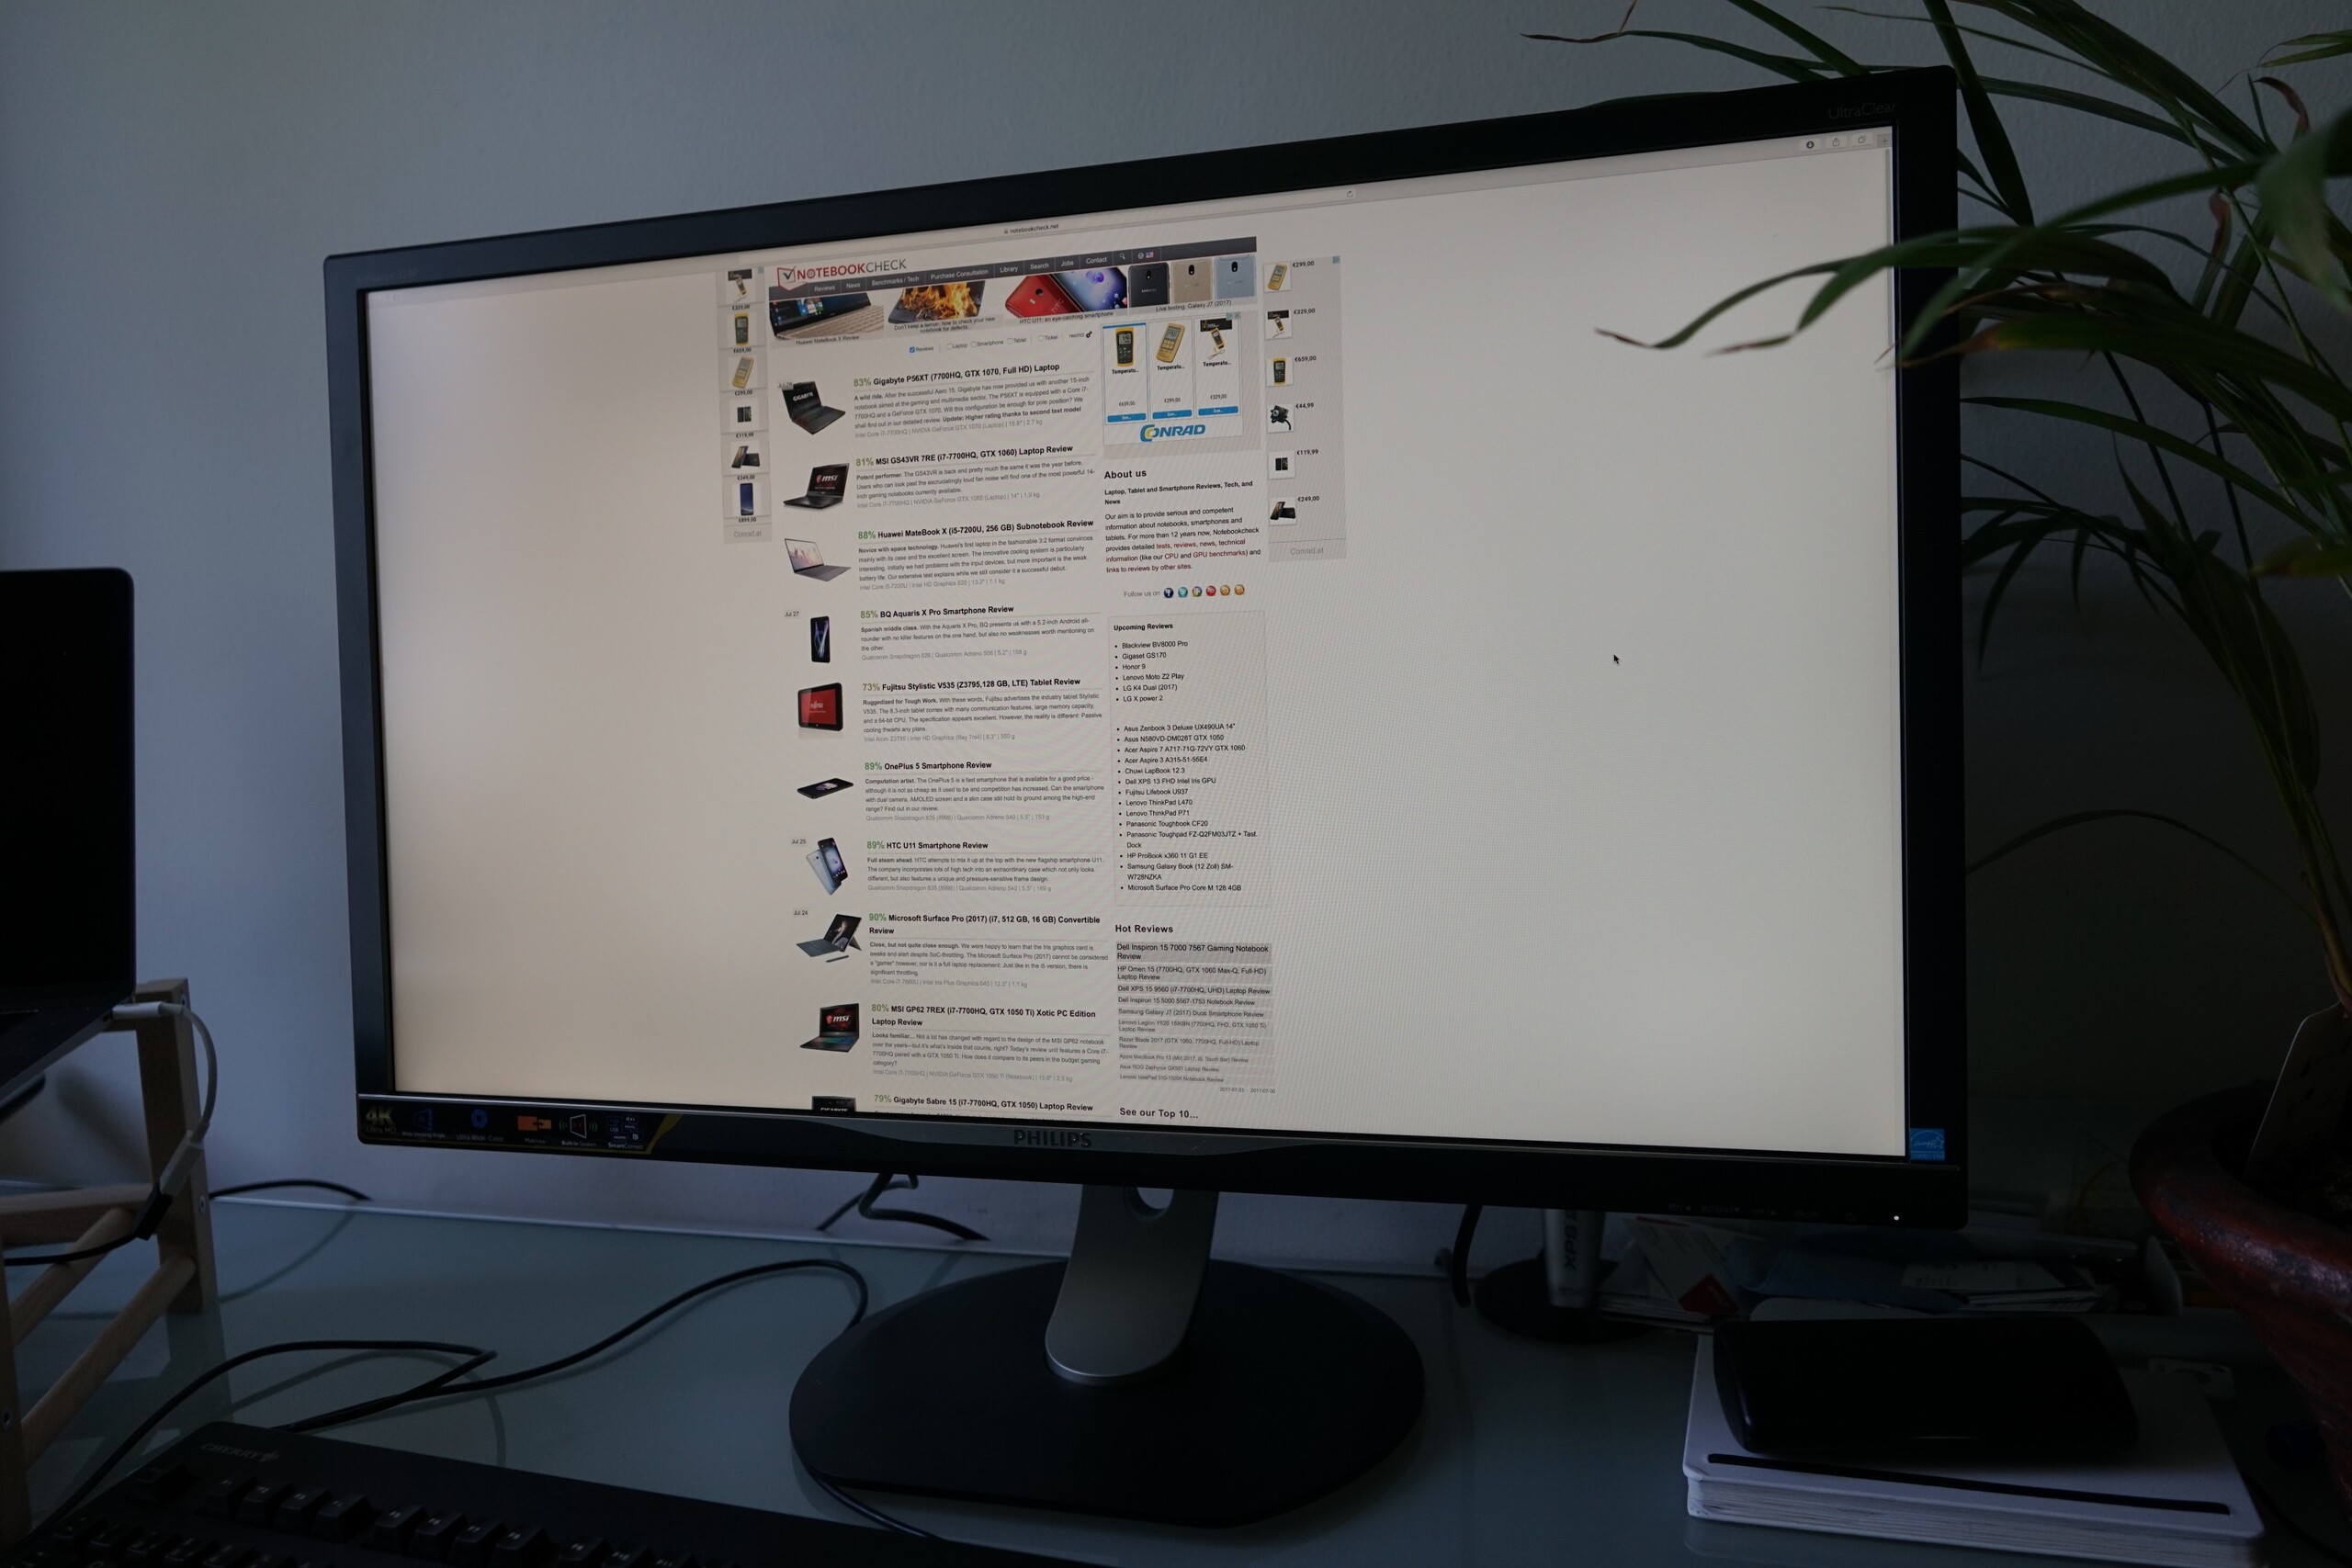
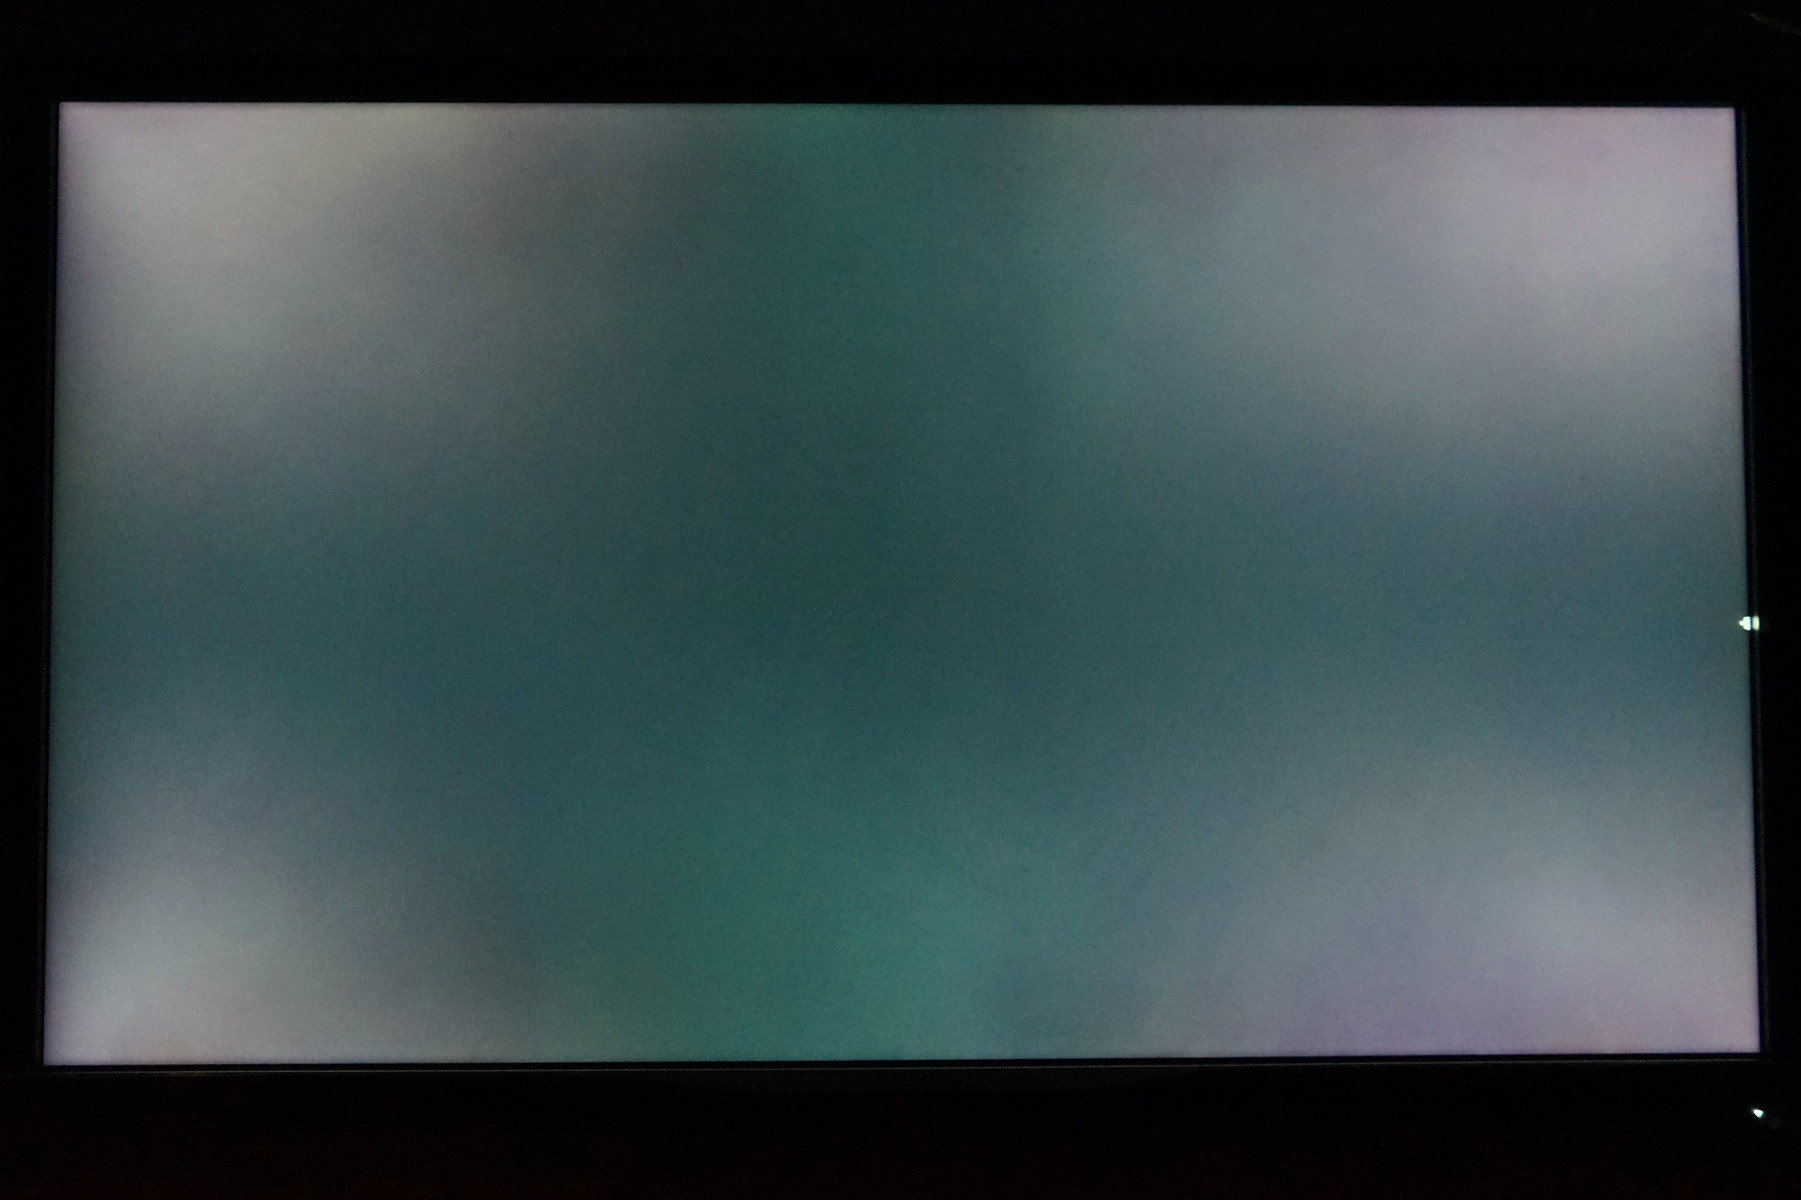
Despite the large display surface, the brightness distribution is relatively even. At longer exposure (see photo), you can see brighter corners however.
| |||||||||||||||||||||||||
Brightness Distribution: 84 %
Contrast: 2822:1 (Black: 0.09 cd/m²)
ΔE Color 2.6 | 0.5-29.43 Ø5
ΔE Greyscale 3.6 | 0.57-98 Ø5.3
99.9% sRGB (Argyll 1.6.3 3D)
62.7% AdobeRGB 1998 (Argyll 1.6.3 3D)
Gamma: 2.21
| Philips 328P6VJEB 3840x2160, 32.00 | Asus PB287Q 3840x2160, 28.00 | Apple iPad Pro 12.9 2017 2732x2048, 12.90 | Lenovo ThinkPad P51 20HH0016GE LEN40BD, B156ZAN02.1, 3840x2160, 15.60 | Apple MacBook Pro 15 2017 (2.8 GHz, 555) APPA031, 2880x1800, 15.40 | |
|---|---|---|---|---|---|
| Display | |||||
| Display P3 Coverage | 67.1 | 86.3 | 97.9 | ||
| sRGB Coverage | 92.7 | 99.5 | 99.9 | ||
| AdobeRGB 1998 Coverage | 67.8 | 99.3 | 85.9 | ||
| Response Times | 50% | -76% | -89% | -133% | |
| Response Time Grey 50% / Grey 80% * | 15.7 ? 6.7 ? | 17 ? -8% 5.2 ? 67% | 41.6 ? -165% | 40.8 ? -160% | 48 ? -206% |
| Response Time Black / White * | 21.3 ? | 7.7 ? 64% 4.9 ? 77% | 18.4 ? 14% | 25.2 ? -18% | 33.8 ? -59% |
| PWM Frequency | 119000 ? | ||||
| Screen | -39% | 14% | -22% | -10% | |
| Brightness middle | 254 | 243 -4% | 650 156% | 317 25% | 545 115% |
| Brightness | 229 | 218 -5% | 614 168% | 309 35% | 523 128% |
| Brightness Distribution | 84 | 83 -1% | 90 7% | 89 6% | 86 2% |
| Black Level * | 0.09 | 0.28 -211% | 0.42 -367% | 0.36 -300% | 0.44 -389% |
| Contrast | 2822 | 868 -69% | 1548 -45% | 881 -69% | 1239 -56% |
| Colorchecker dE 2000 * | 2.6 | 3.49 -34% | 1 62% | 2.7 -4% | 1.6 38% |
| Colorchecker dE 2000 max. * | 6.2 | 1.9 69% | 4.1 34% | 3.8 39% | |
| Greyscale dE 2000 * | 3.6 | 2.95 18% | 1.5 58% | 3 17% | 1.9 47% |
| Gamma | 2.21 100% | 2.2 100% | 2.25 98% | 2.27 97% | 2.26 97% |
| CCT | 6556 99% | 6811 95% | 6734 97% | 6077 107% | 6834 95% |
| Color Space (Percent of AdobeRGB 1998) | 62.7 | 60 -4% | 87.6 40% | ||
| Color Space (Percent of sRGB) | 99.9 | 99.5 0% | |||
| Total Average (Program / Settings) | 6% /
-9% | -31% /
-4% | -56% /
-33% | -72% /
-34% |
* ... smaller is better
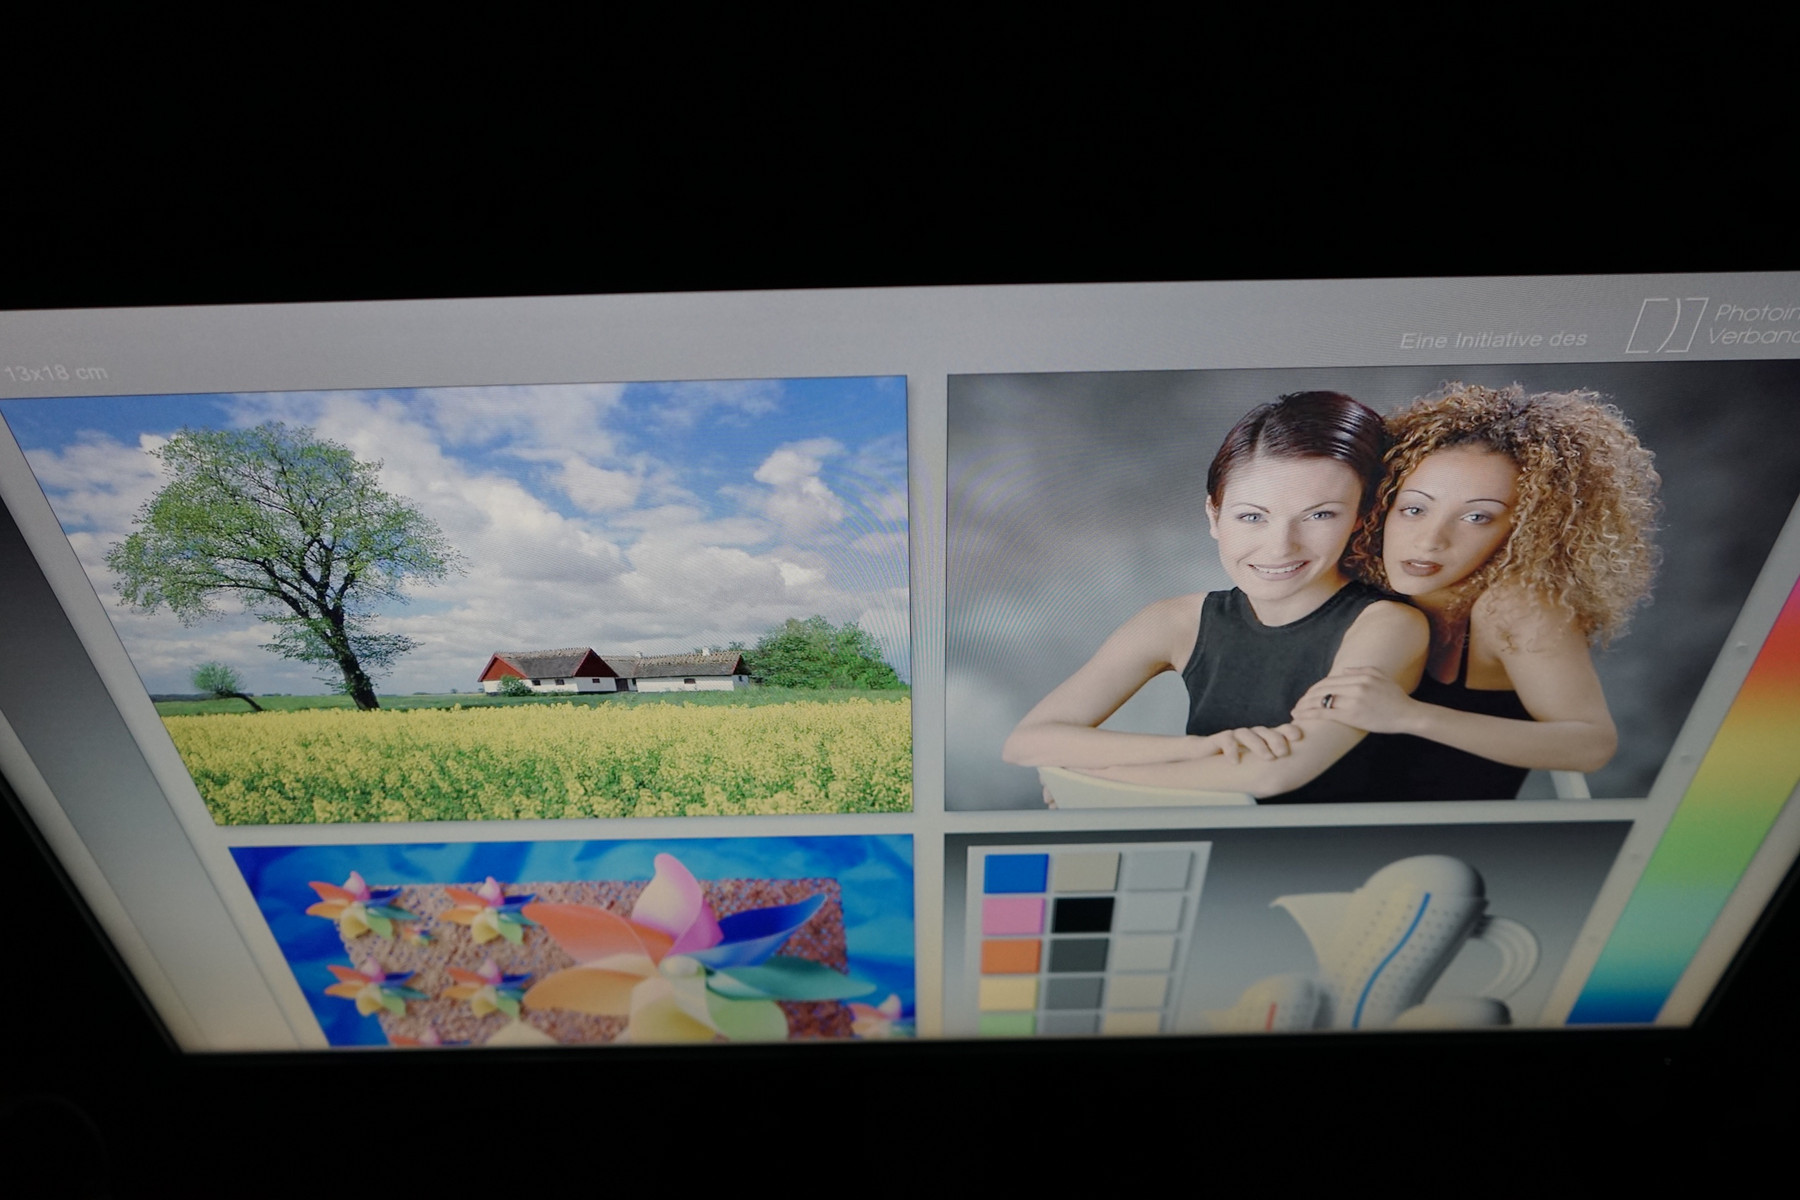
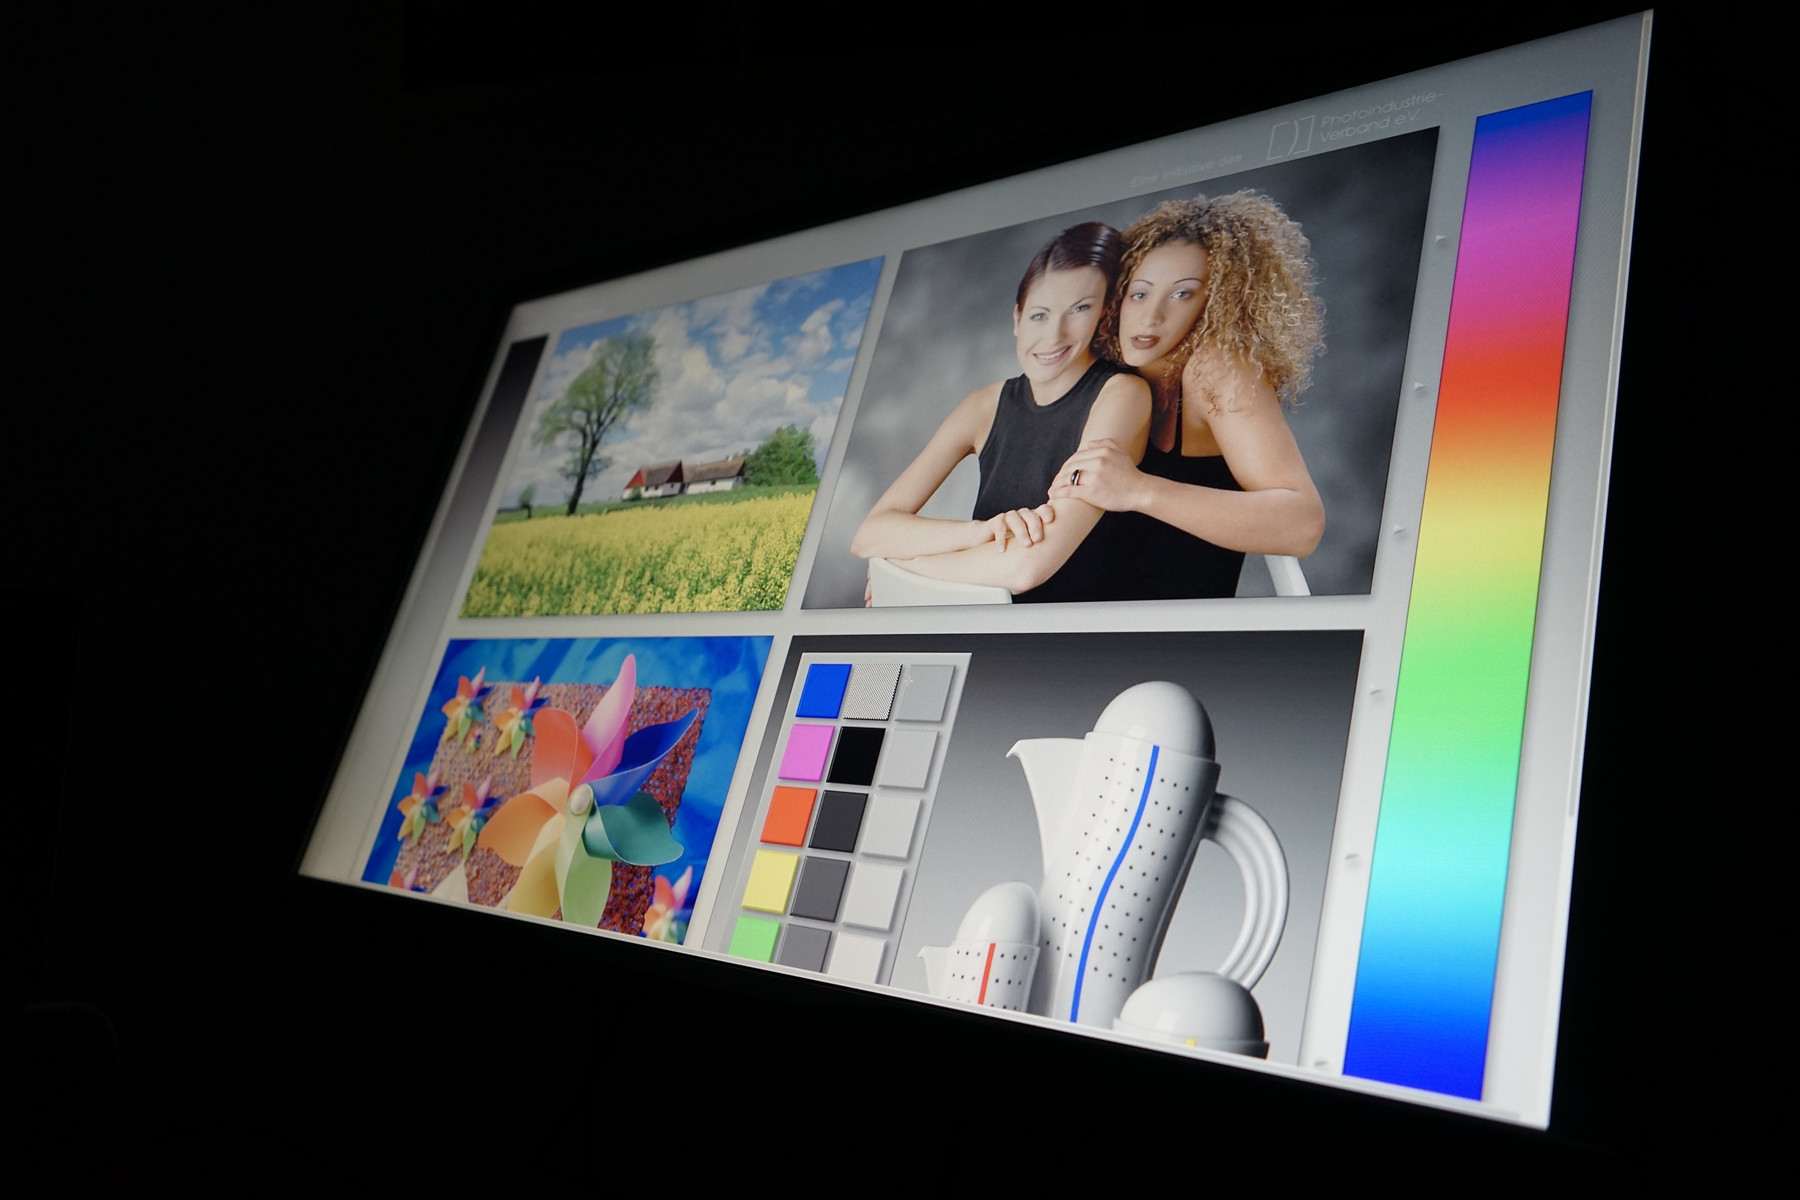
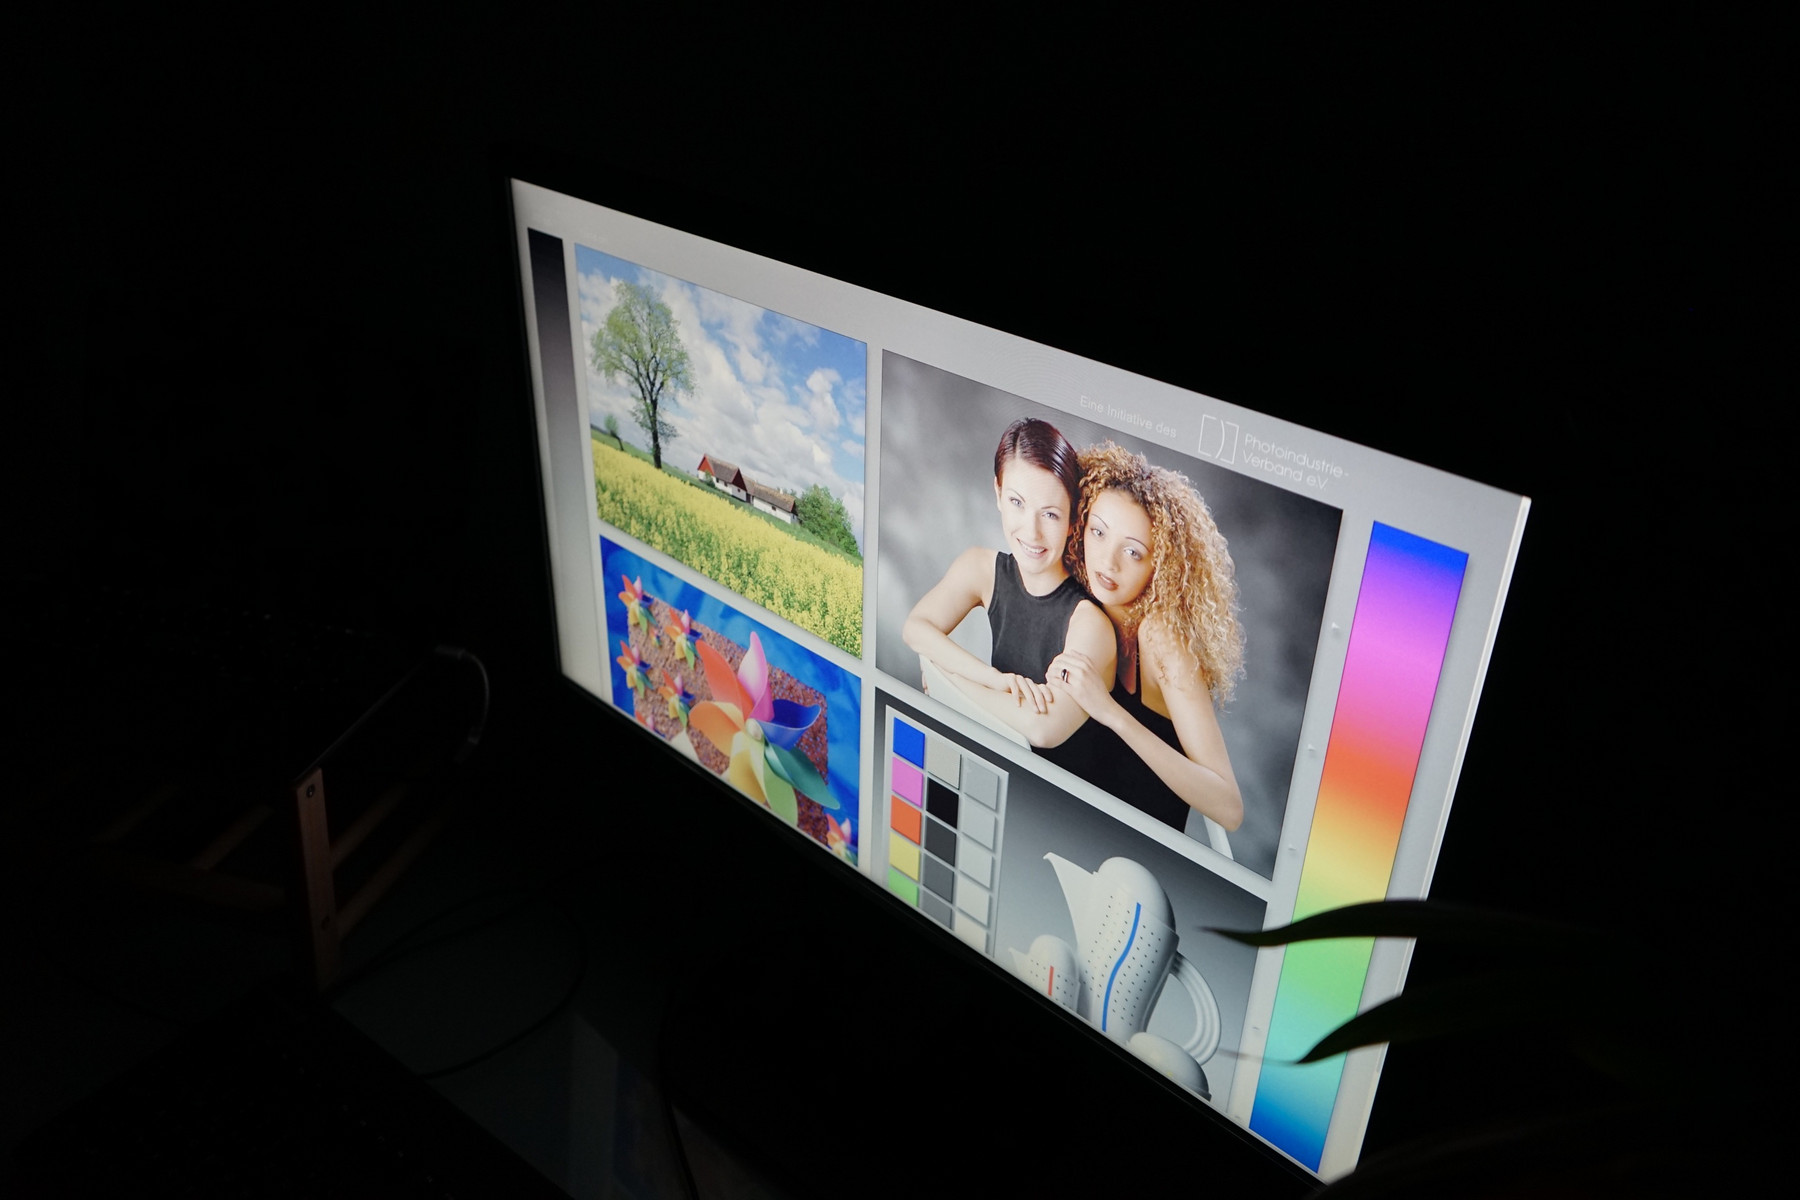
Viewing Angles
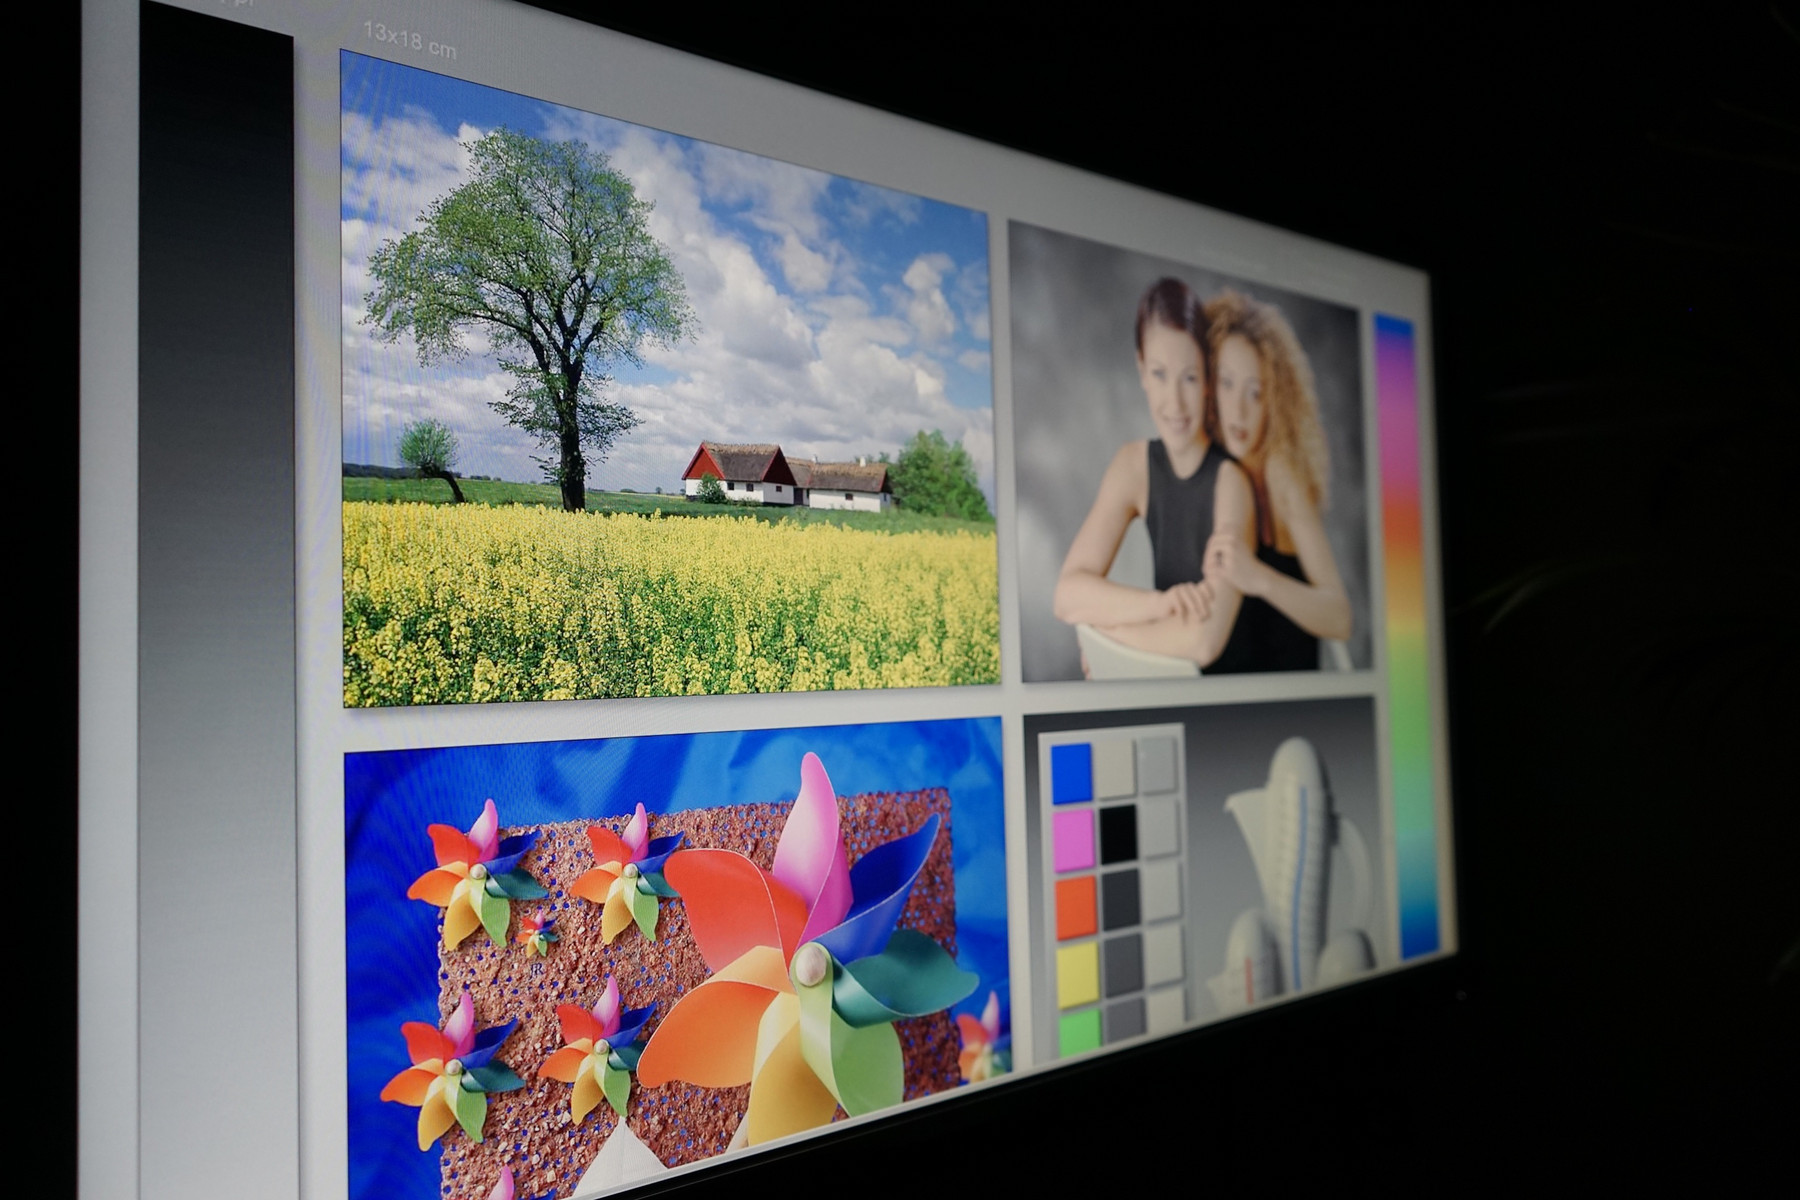
Philips praises the Brilliance 328P's wide viewing angles. This is actually true when viewed from the sides and colors stay stable for long. Color shifts are also not too big when viewed from top or bottom. However, a brightness loss can already be observed with large head movements. If you sit close to the display, the image already appears slightly less "vibrant" at the lower display edge. IPS panels definitely perform better than the VA panel in this respect. However, it shows its advantages when compared to TN panels such as the one in the Asus PB287Q.
PWM / Display Flickering
Regardless of the brightness level, we did not detect a flickering of the backlight. Apparently, Philips does not use PWM for brightness control. Hence, the display should not cause tired eyes or headaches even if it is used for a prolonged period. However, it is important to adjust the brightness to the environment. Unfortunately, brightness adjustment is cumbersome since it can only be done via the menu.
Screen Flickering / PWM (Pulse-Width Modulation)
| Screen flickering / PWM not detected | 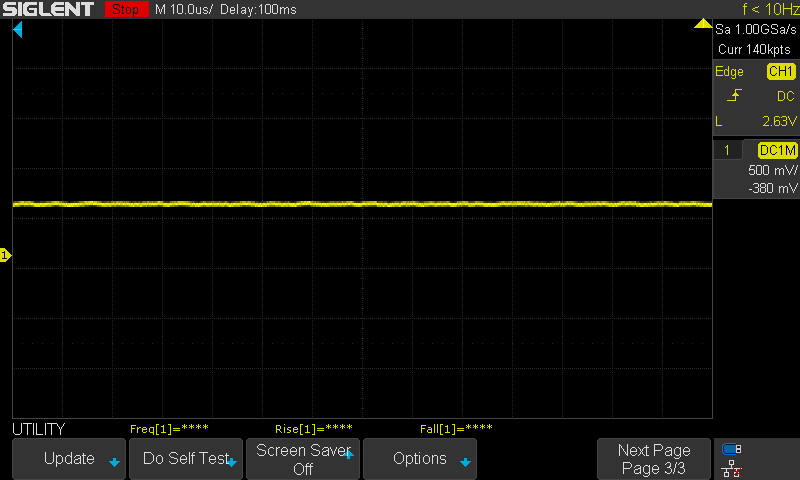 | ||
In comparison: 53 % of all tested devices do not use PWM to dim the display. If PWM was detected, an average of 17933 (minimum: 5 - maximum: 3846000) Hz was measured. | |||
Image Refresh Rates
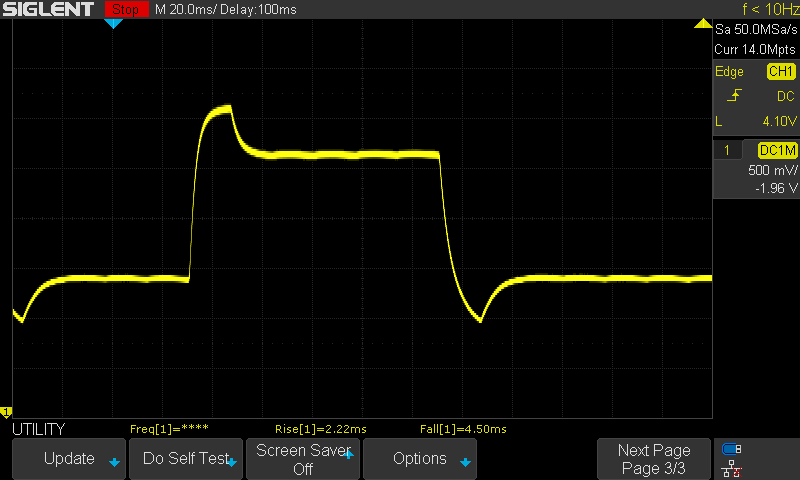
Overdrive (called SmartResponse here) is not enabled by default. Hence, gray-to-gray and black-to-white response times are rather average (for desktop displays). However, the MVA panel can already shine compared to notebook displays, which are usually slower. If you set SmartResponse to "fastest", the gray-to-gray response times fall significantly to 2.2 and 4.5 ms (6.7 ms versus 15.7 ms with default settings).
Display Response Times
| ↔ Response Time Black to White | ||
|---|---|---|
| 21.3 ms ... rise ↗ and fall ↘ combined | ↗ 14.5 ms rise | 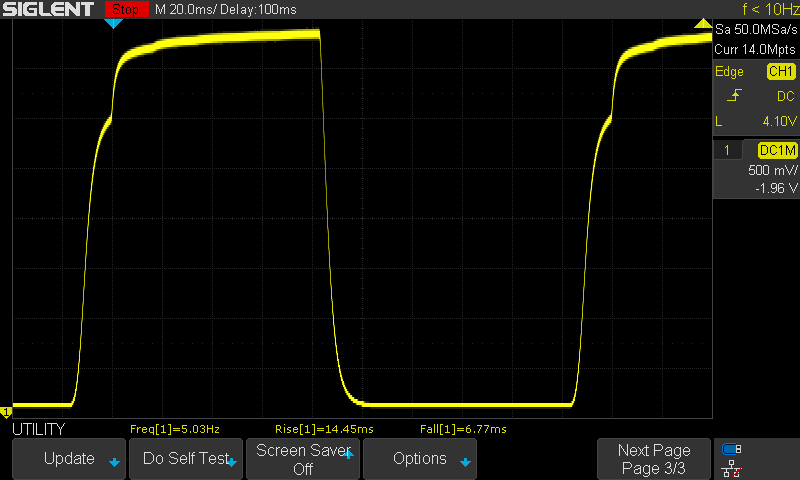 |
| ↘ 6.8 ms fall | ||
| The screen shows good response rates in our tests, but may be too slow for competitive gamers. In comparison, all tested devices range from 0.1 (minimum) to 240 (maximum) ms. » 41 % of all devices are better. This means that the measured response time is similar to the average of all tested devices (21.5 ms). | ||
| ↔ Response Time 50% Grey to 80% Grey | ||
| 15.7 ms ... rise ↗ and fall ↘ combined | ↗ 6.1 ms rise | 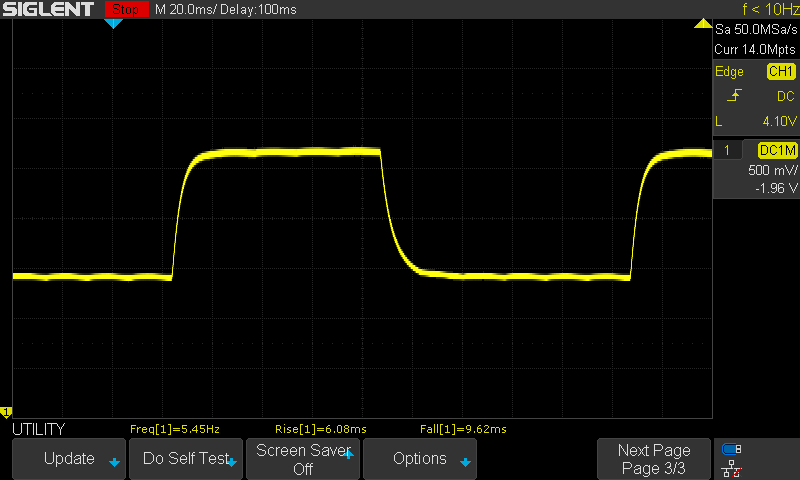 |
| ↘ 9.6 ms fall | ||
| The screen shows good response rates in our tests, but may be too slow for competitive gamers. In comparison, all tested devices range from 0.2 (minimum) to 636 (maximum) ms. » 25 % of all devices are better. This means that the measured response time is better than the average of all tested devices (33.8 ms). | ||
| ↔ Response Time 50% Grey to 80% Grey | ||
| 6.7 ms ... rise ↗ and fall ↘ combined | ↗ 2.2 ms rise | |
| ↘ 4.5 ms fall | ||
| The screen shows very fast response rates in our tests and should be very well suited for fast-paced gaming. In comparison, all tested devices range from 0.2 (minimum) to 636 (maximum) ms. » 14 % of all devices are better. This means that the measured response time is better than the average of all tested devices (33.8 ms). | ||
Color representation
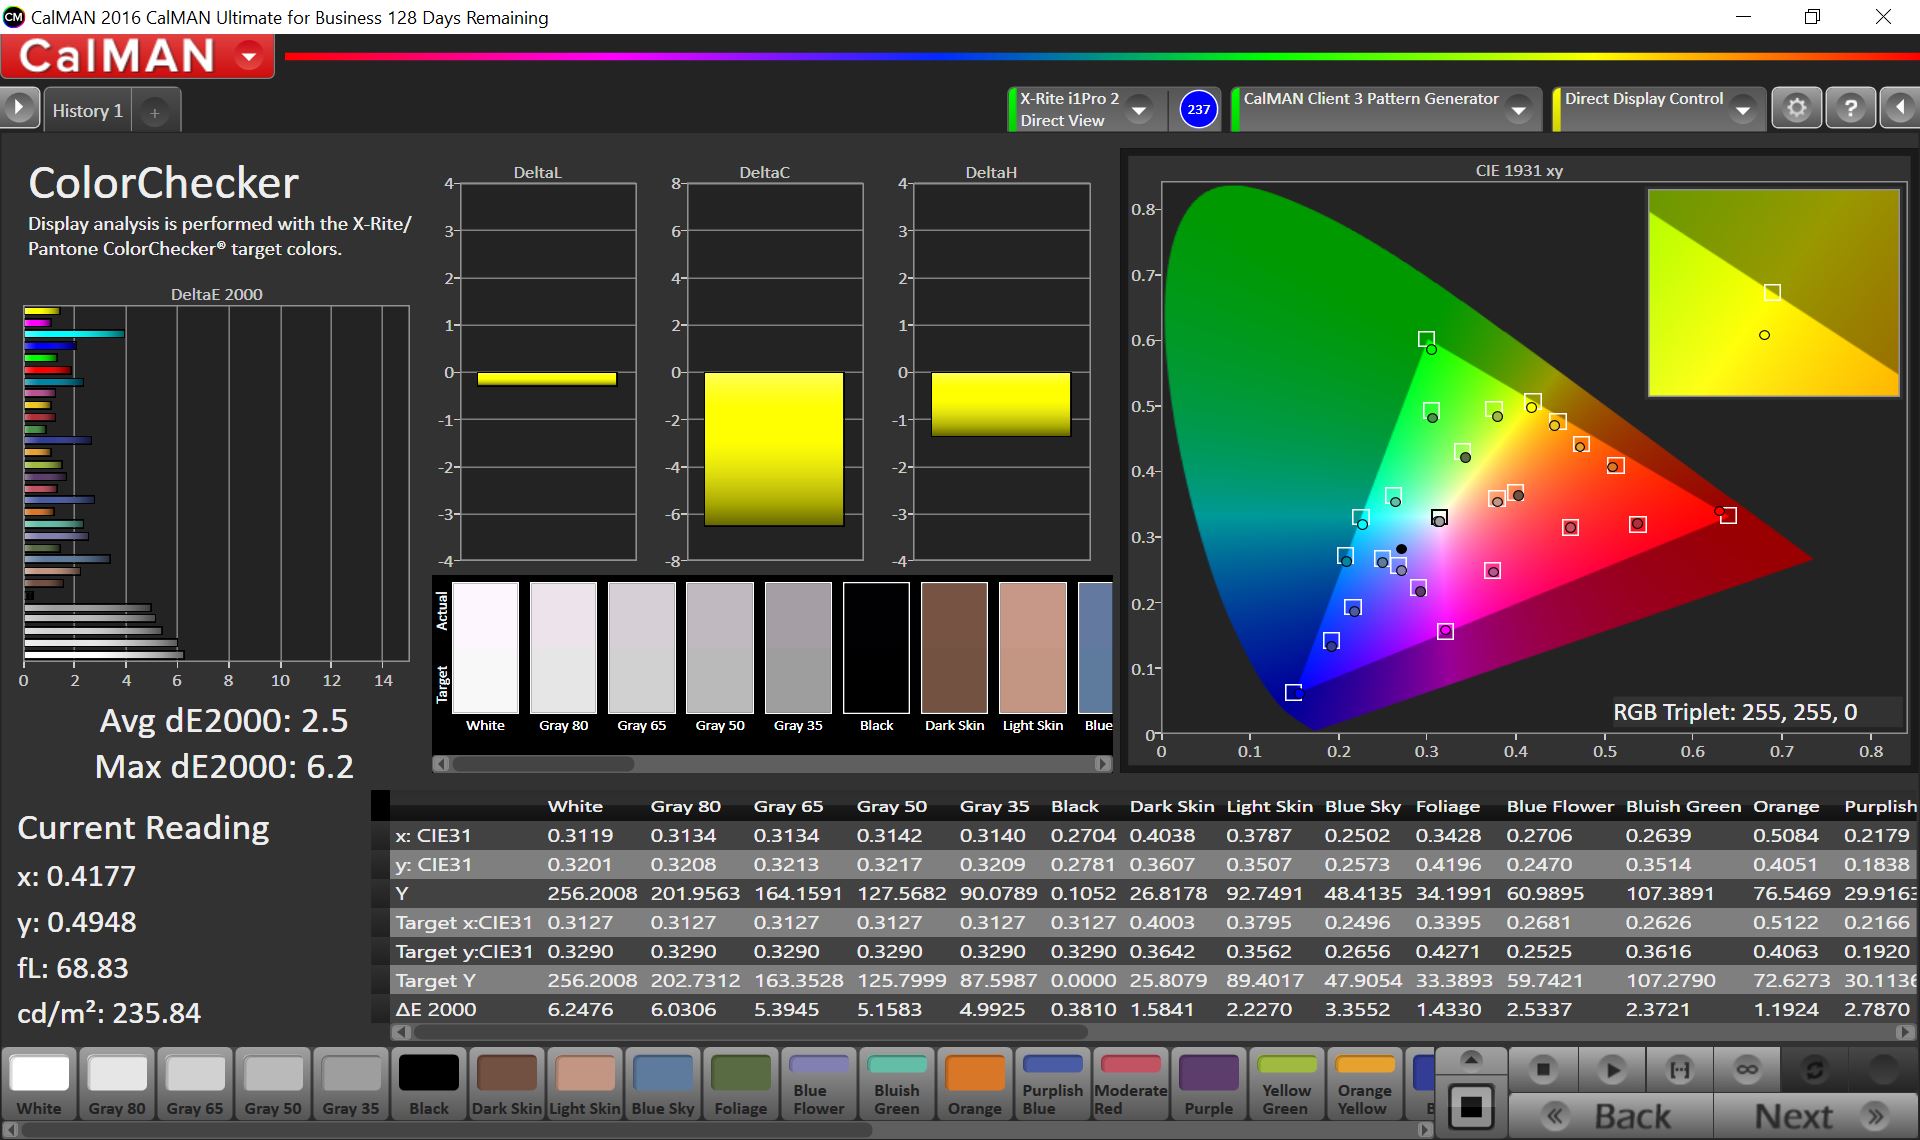
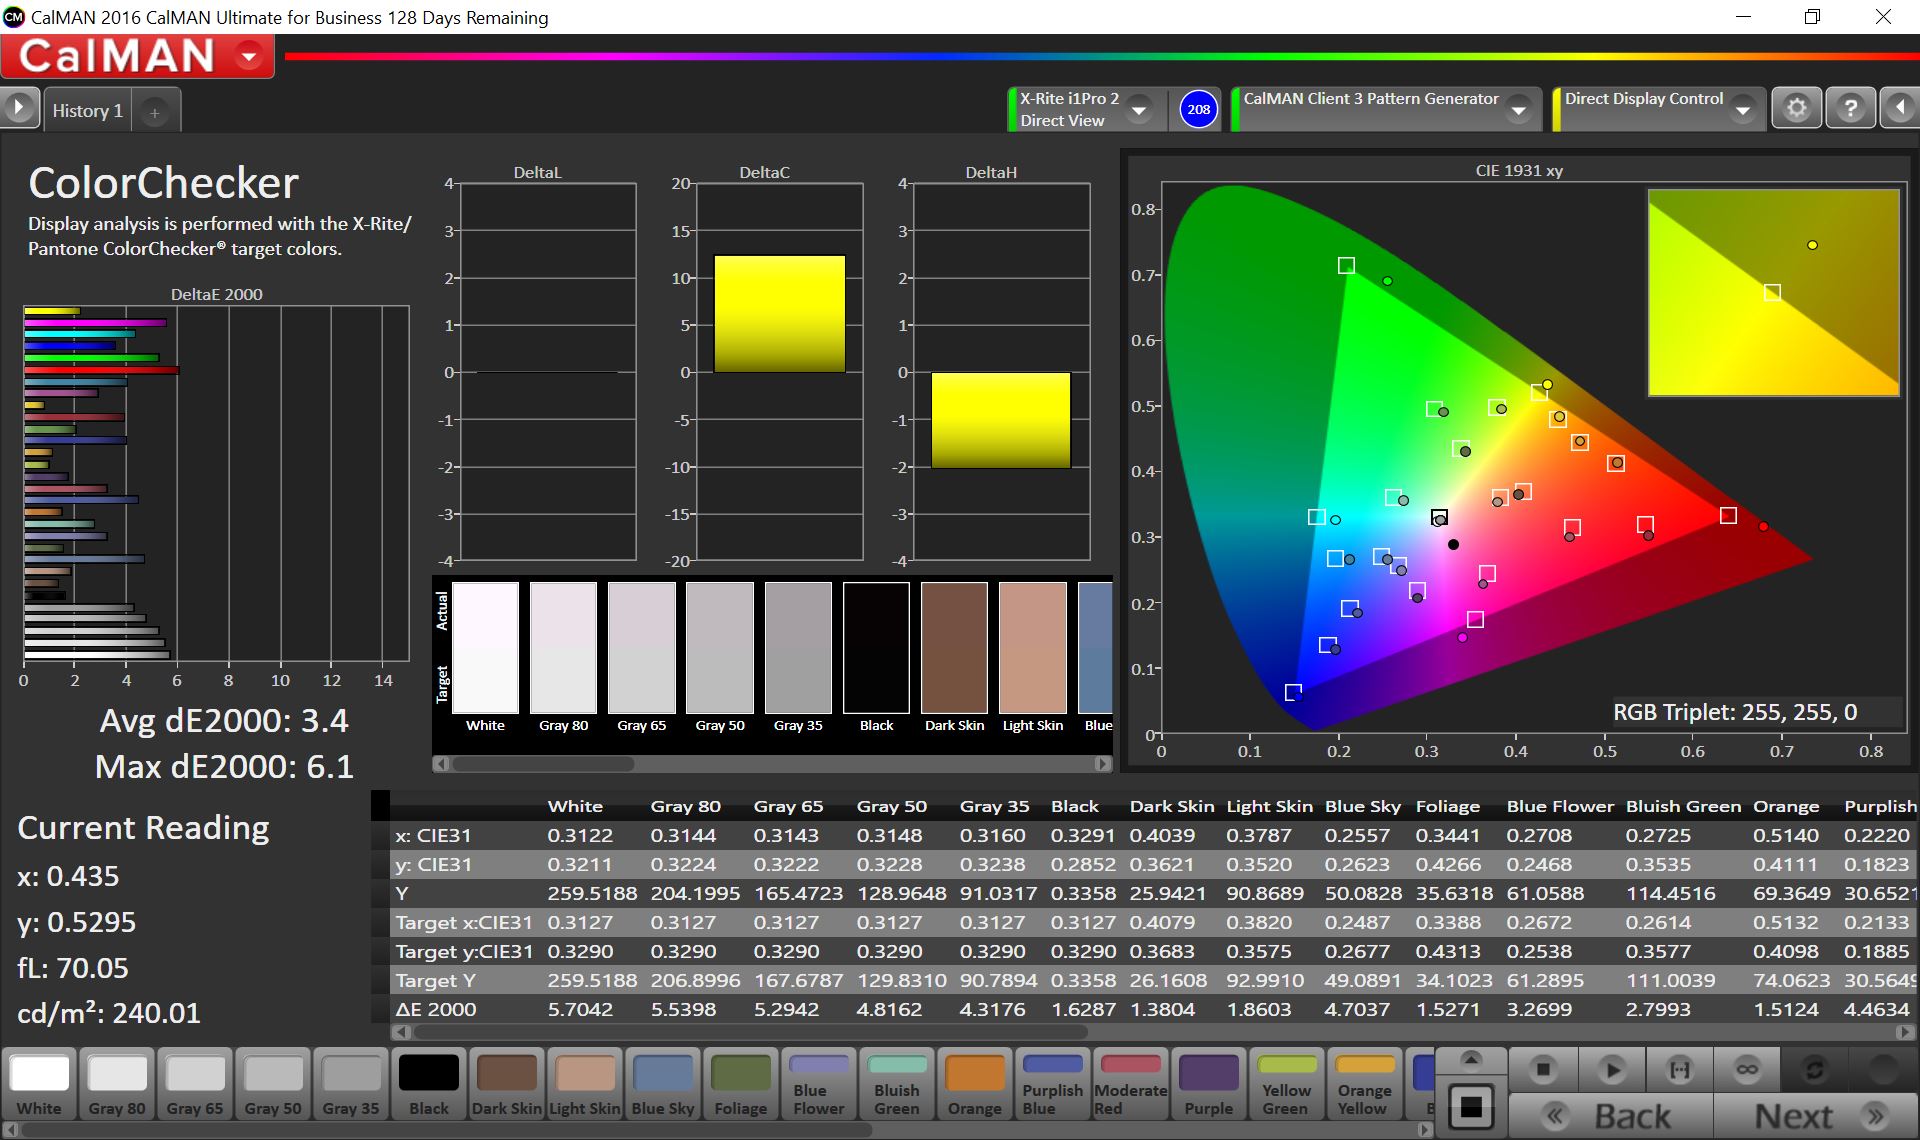
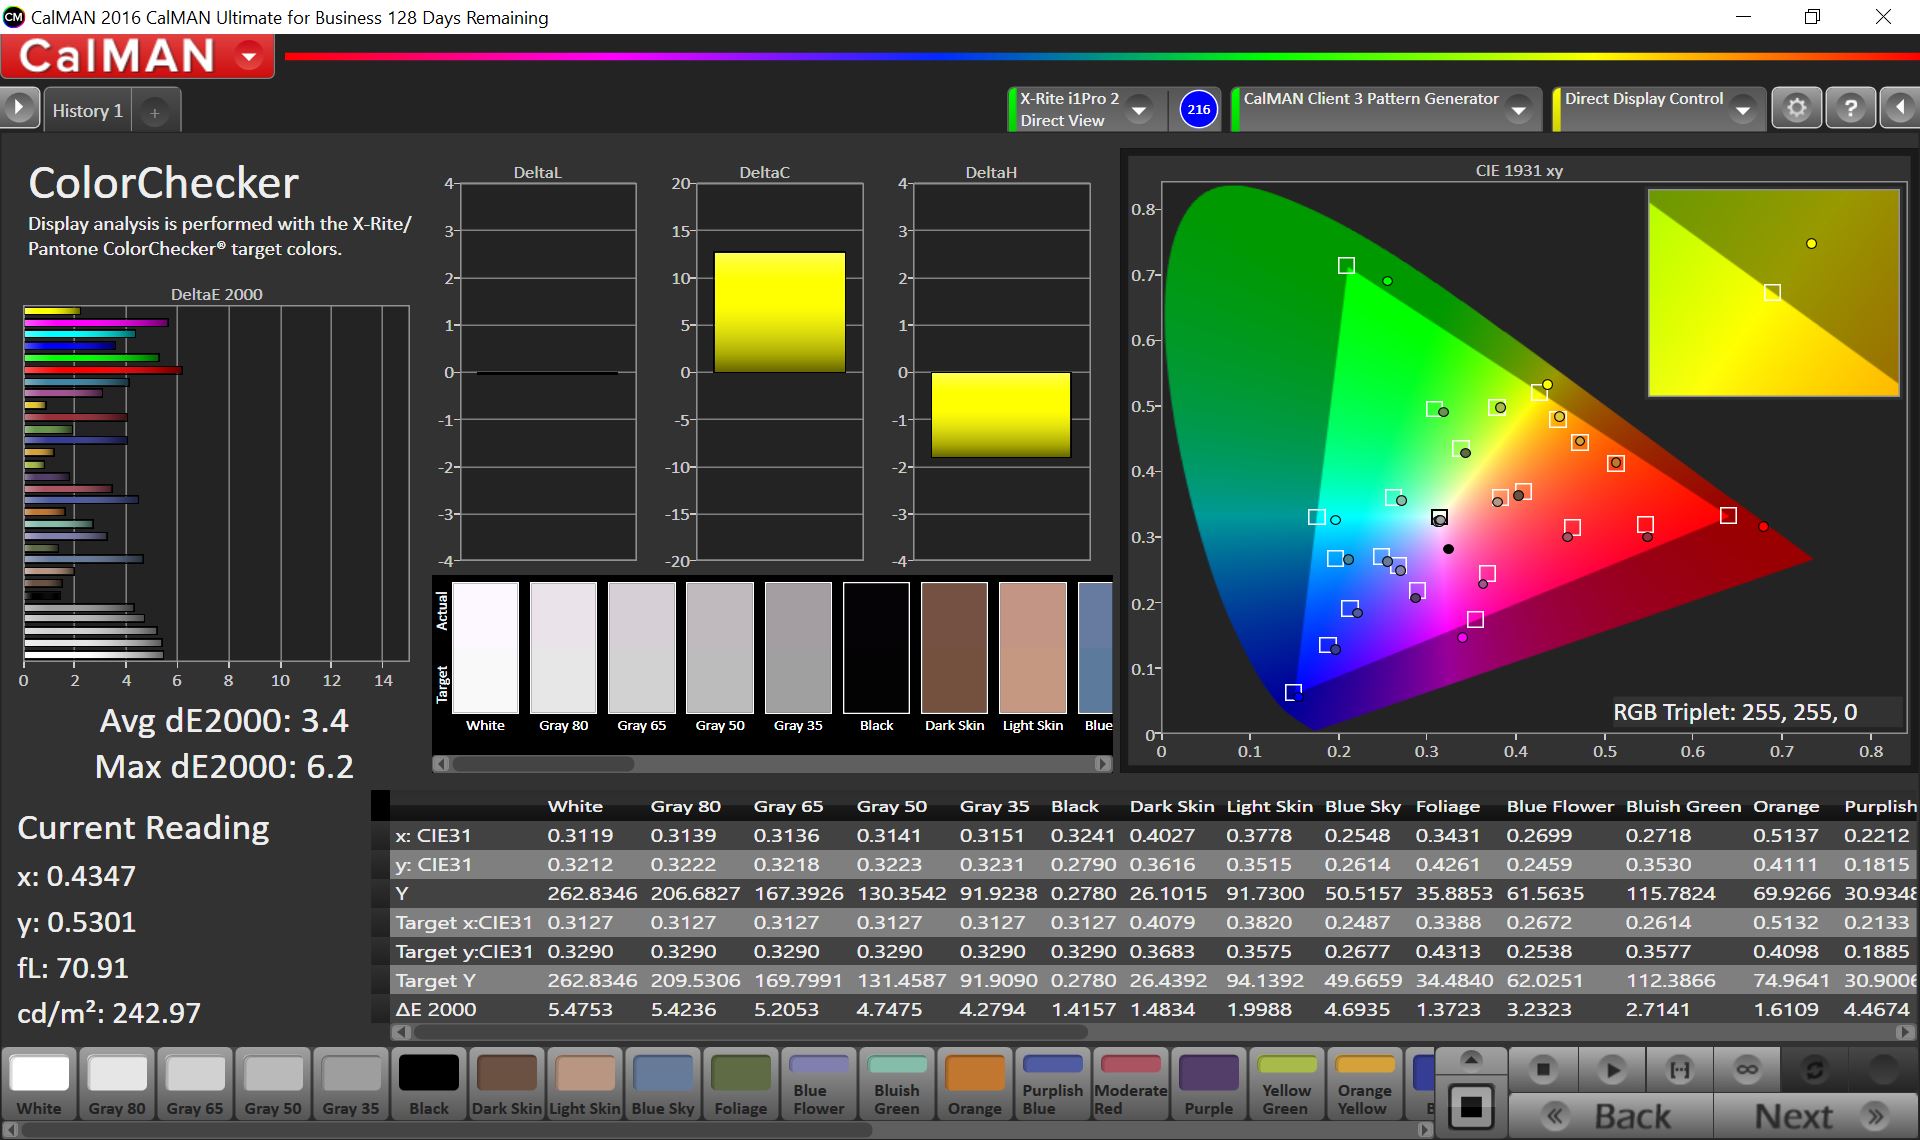
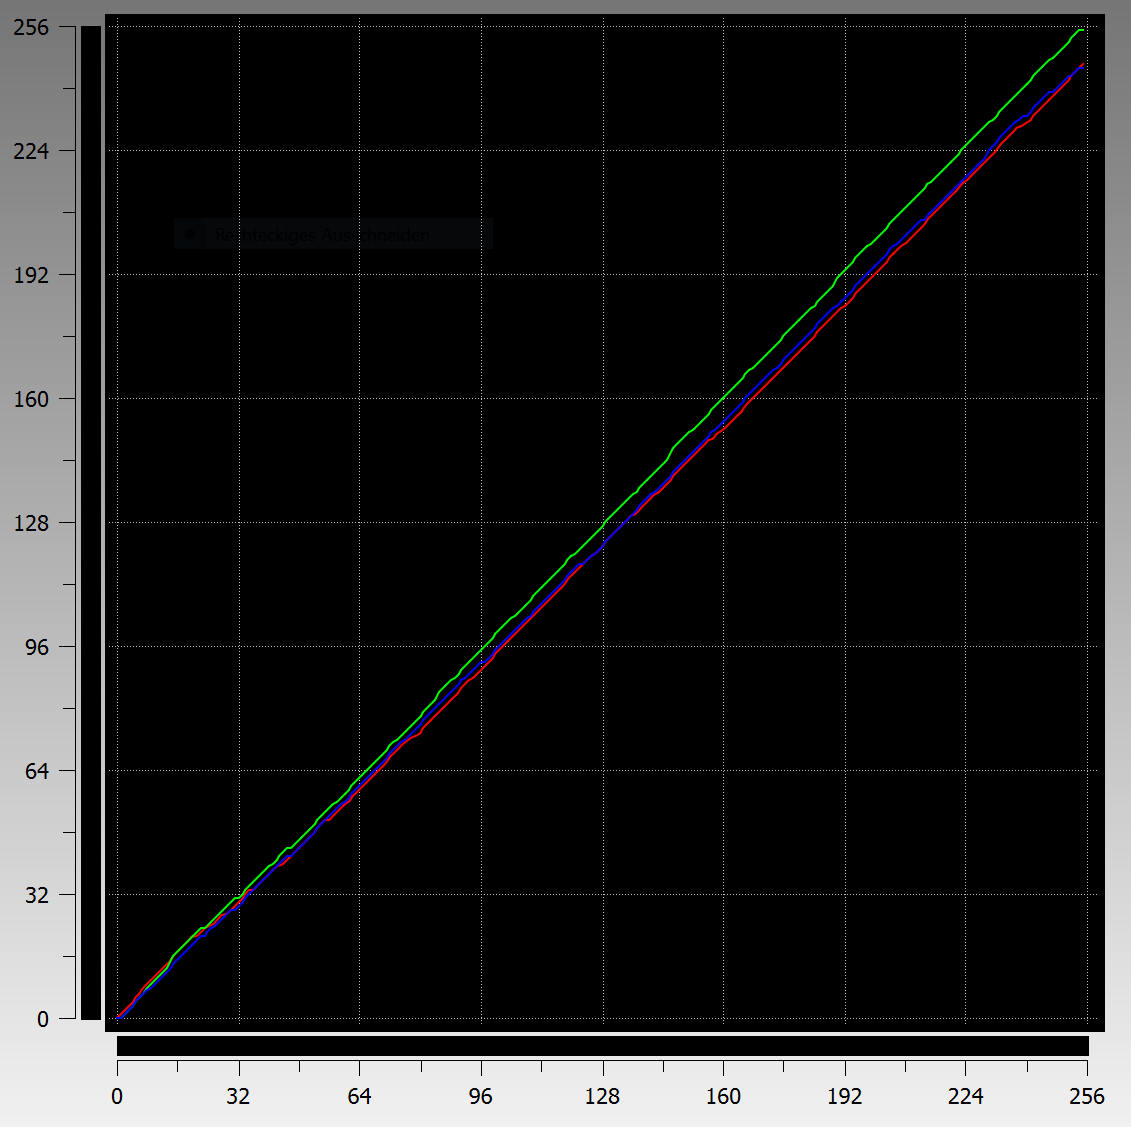
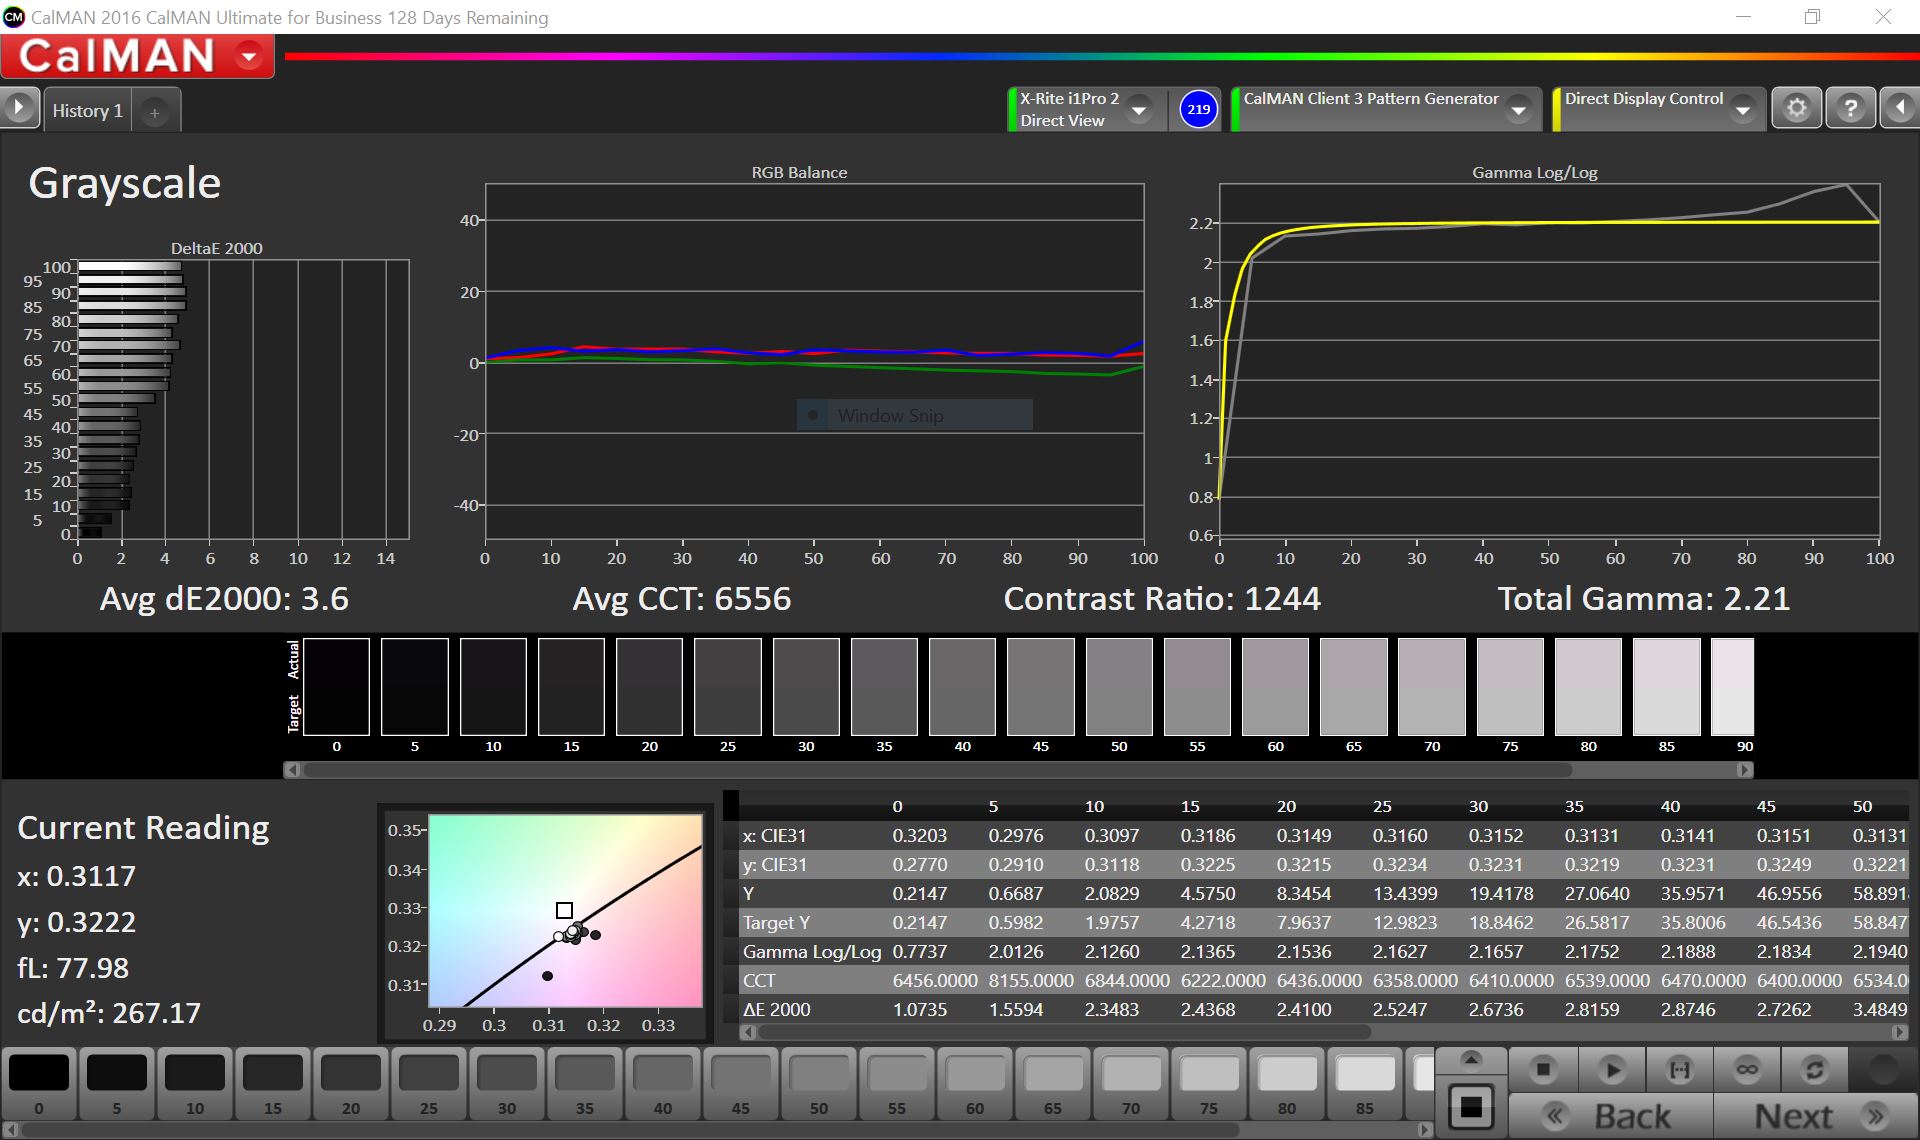
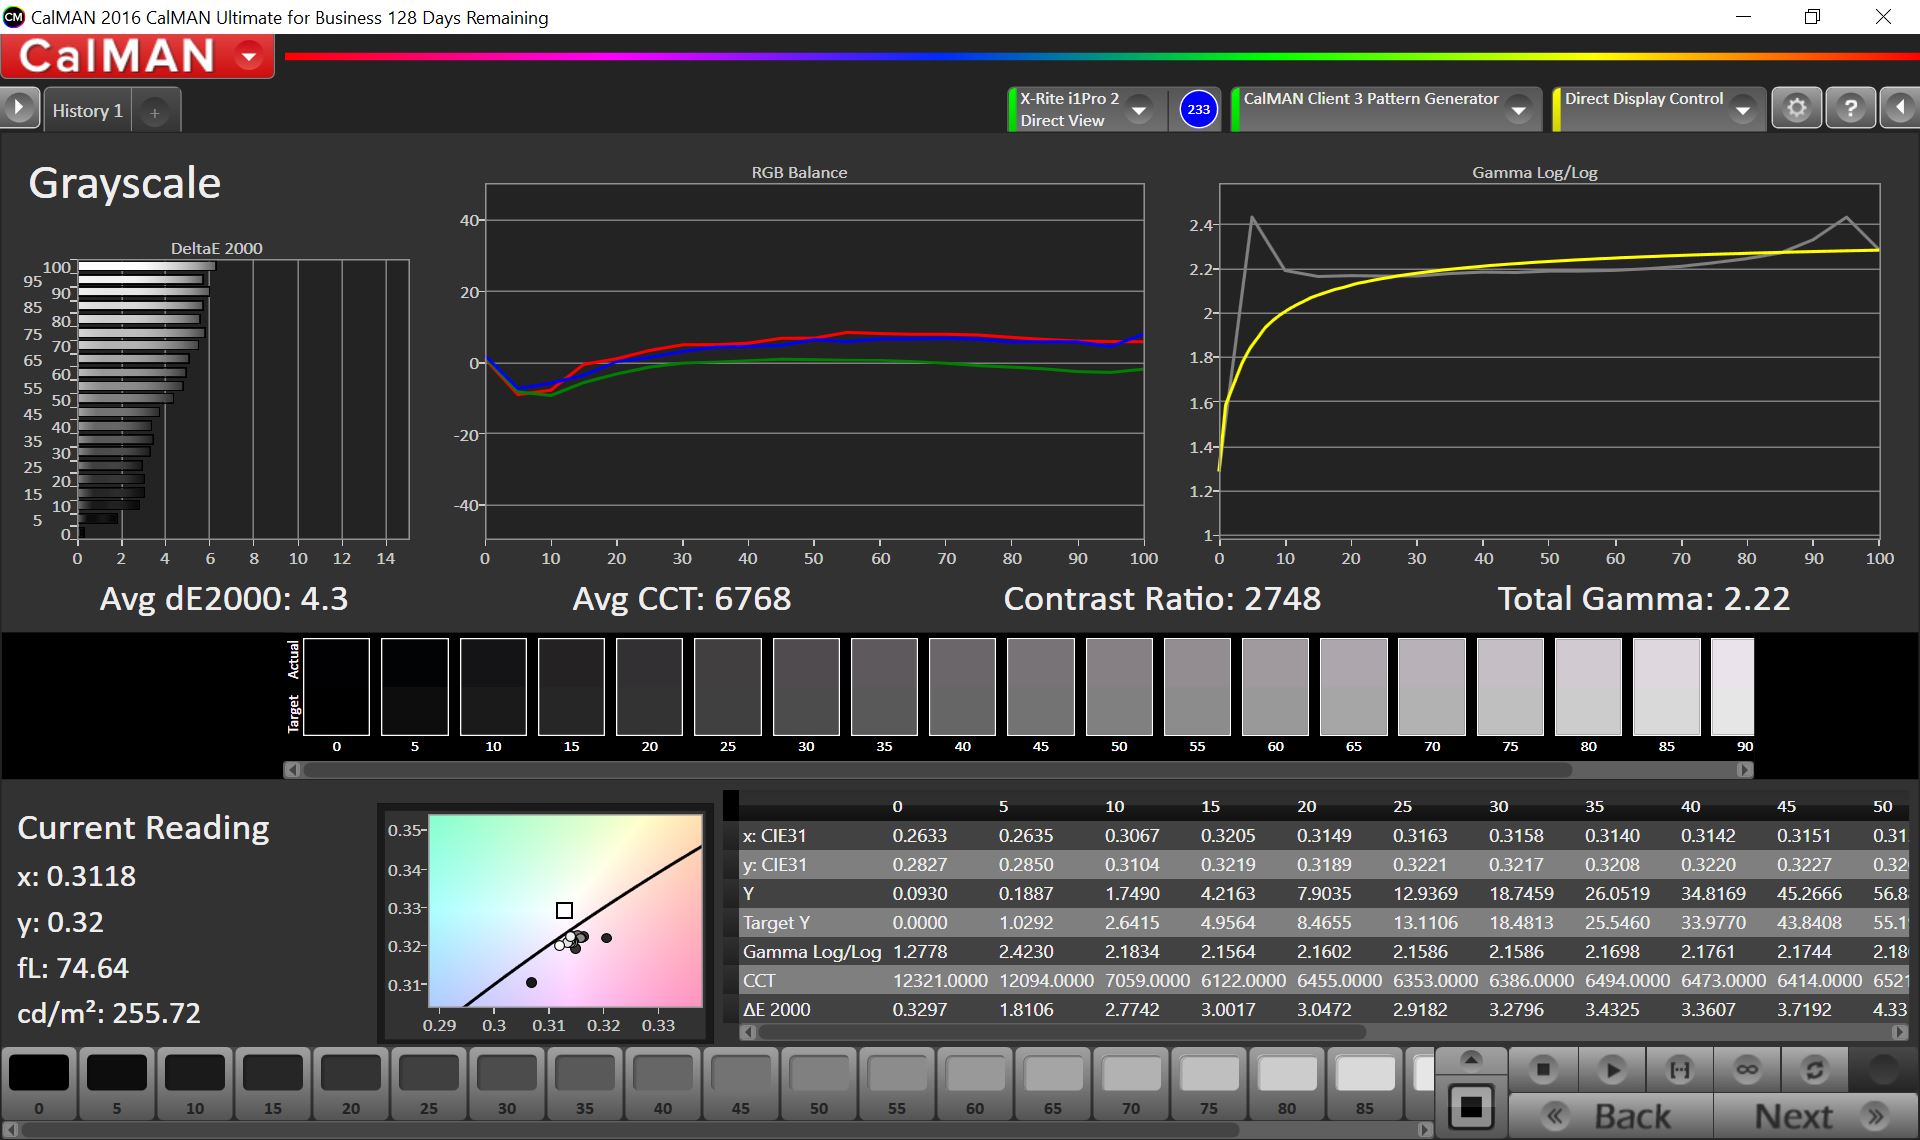
We measure the color fidelity with the CalMAN software and our X-Rite i1Pro 2 photo spectrometer. The ColorChecker test reported a good, yet not very good DeltaE 2000 value of 3.4 with default settings. If you select sRGB in the menu, the result improves significantly to 2.6. After calibration with the X-Rite-i1Match software, the result only improves slightly to 2.5. The best displays achieve a value of 1 (e.g. the Apple iPad Pro 12, 9/2017) in our test.
The gray scales perform slightly worse in our test model and achieve a DeltaE 2000 value of just 3.6. However, the grayscale values are slightly higher than the ColorChecker average in almost all test devices. The Asus PB287Q still performs slightly better with 2.95.
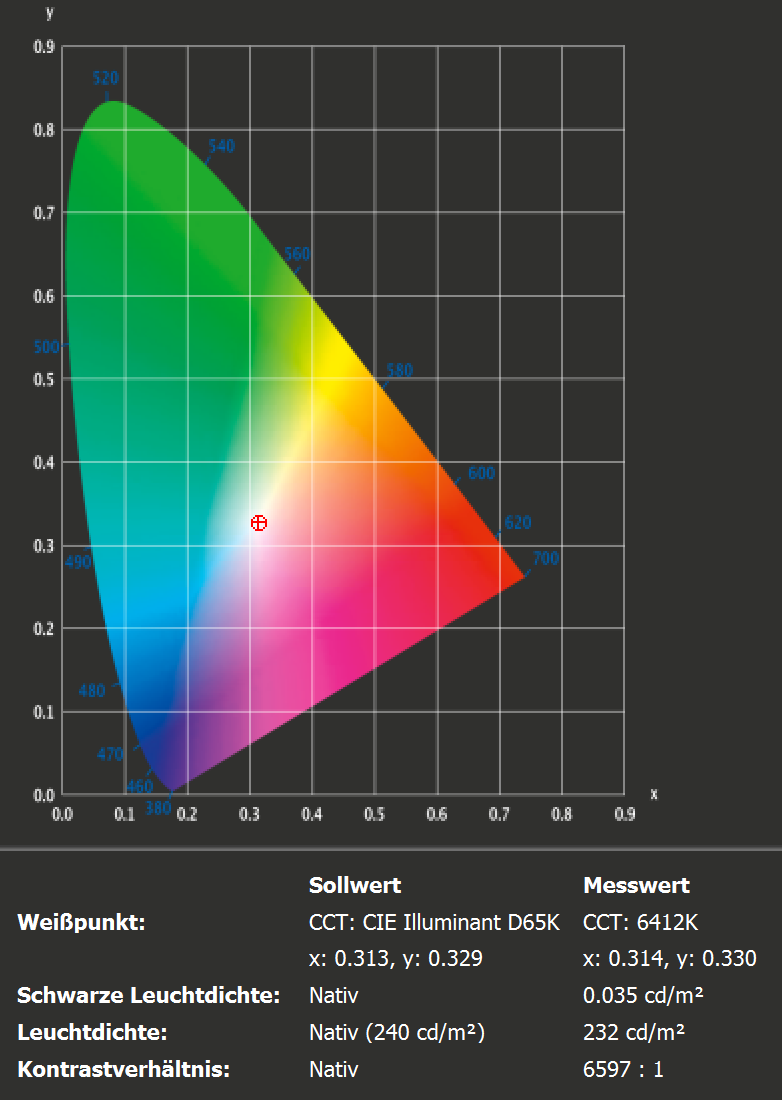
With 99.9% sRGB coverage, the display also shines in this respect.

Power Consumption
Thanks to LED backlight, the power consumption of the large 32-inch display remains within reason. We measured 47 to 48 watts in 4K model via DisplayPort and OS X at maximum brightness. The specified 55 watts are therefore not unreasonable, but our test model beats this value. At 50% brightness, the power consumption falls to 32.9 watts. At the minimum brightness (0% setting in the menu), the power consumption is only 22.1 watts. We measured just 0.1 watts in stand-by. Hence, it is not absolutely necessary to turn the display off with the physical power button. As expected, the power consumption is 0 when the display is switched off with the power button.
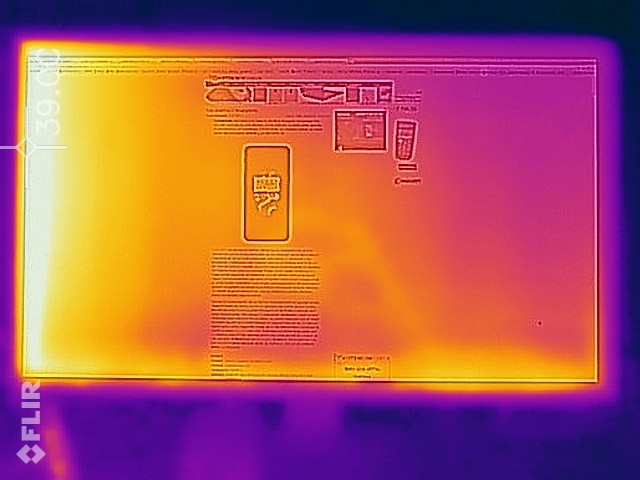
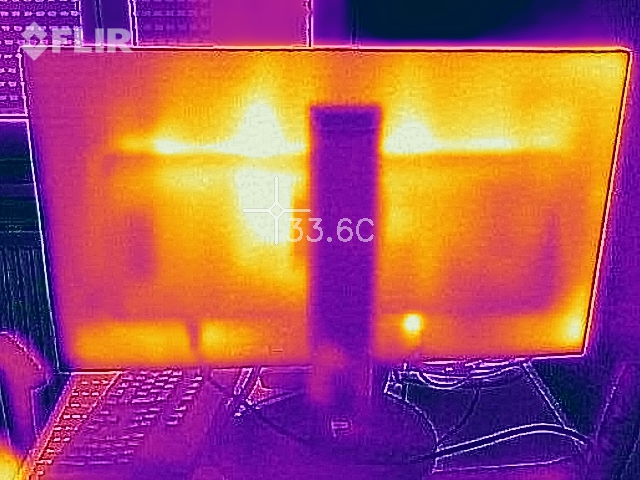
Temperature
The Philips 328P also remains within reason here. We measured a maximum of 32.9 °C (~91 °F) after prolonged use at an environment temperature of 20.7 °C (~69 °F) and maximum brightness (39 °C/~102 °F hotspot in the image from our thermal camera). The center reaches 29°C (~84 °F).
Speakers
The integrated speakers are sufficiently loud, yet not very linear. The speakers integrated in the current MacBook Pro produce a better sound however.
Philips 328P6VJEB audio analysis
(+) | speakers can play relatively loud (87 dB)
Bass 100 - 315 Hz
(±) | reduced bass - on average 9.6% lower than median
(±) | linearity of bass is average (13.2% delta to prev. frequency)
Mids 400 - 2000 Hz
(±) | higher mids - on average 10.3% higher than median
(±) | linearity of mids is average (7.6% delta to prev. frequency)
Highs 2 - 16 kHz
(+) | balanced highs - only 1.7% away from median
(+) | highs are linear (3% delta to prev. frequency)
Overall 100 - 16.000 Hz
(±) | linearity of overall sound is average (16% difference to median)
Compared to same class
» 21% of all tested devices in this class were better, 5% similar, 75% worse
» The best had a delta of 4%, average was 25%, worst was 134%
Compared to all devices tested
» 21% of all tested devices were better, 5% similar, 75% worse
» The best had a delta of 4%, average was 25%, worst was 134%
Apple MacBook Pro 15 2017 (2.8 GHz, 555) audio analysis
(+) | speakers can play relatively loud (87 dB)
Bass 100 - 315 Hz
(±) | reduced bass - on average 8.7% lower than median
(±) | linearity of bass is average (11.1% delta to prev. frequency)
Mids 400 - 2000 Hz
(+) | balanced mids - only 2.5% away from median
(±) | linearity of mids is average (7.5% delta to prev. frequency)
Highs 2 - 16 kHz
(+) | balanced highs - only 1.7% away from median
(+) | highs are linear (5% delta to prev. frequency)
Overall 100 - 16.000 Hz
(+) | overall sound is linear (7.9% difference to median)
Compared to same class
» 5% of all tested devices in this class were better, 1% similar, 94% worse
» The best had a delta of 5%, average was 18%, worst was 45%
Compared to all devices tested
» 1% of all tested devices were better, 0% similar, 99% worse
» The best had a delta of 4%, average was 25%, worst was 134%
Pros
Cons
Verdict
The Philips Brilliance 328P6VJEB is a large and relatively cheap 4K display (Amazon: about 676 Euros/~$794). We liked the color representation, contrast, ergonomics, color coverage, energy efficiency, and flicker-free backlight. The somewhat limited horizontal viewing angles and not perfectly calibrated colors make it slightly less suitable for professional photographers. The input lag reported by Prad.de might restrict gaming use slightly. However, the Brilliance 328P is perfectly suitable for office applications and multimedia playback.
