 Deutsch
 English
 Español
 Français
 Italiano
 Nederlands
 Polski
 Português
 Русский
 Türkçe
 Svenska
 Chinese
 Magyar
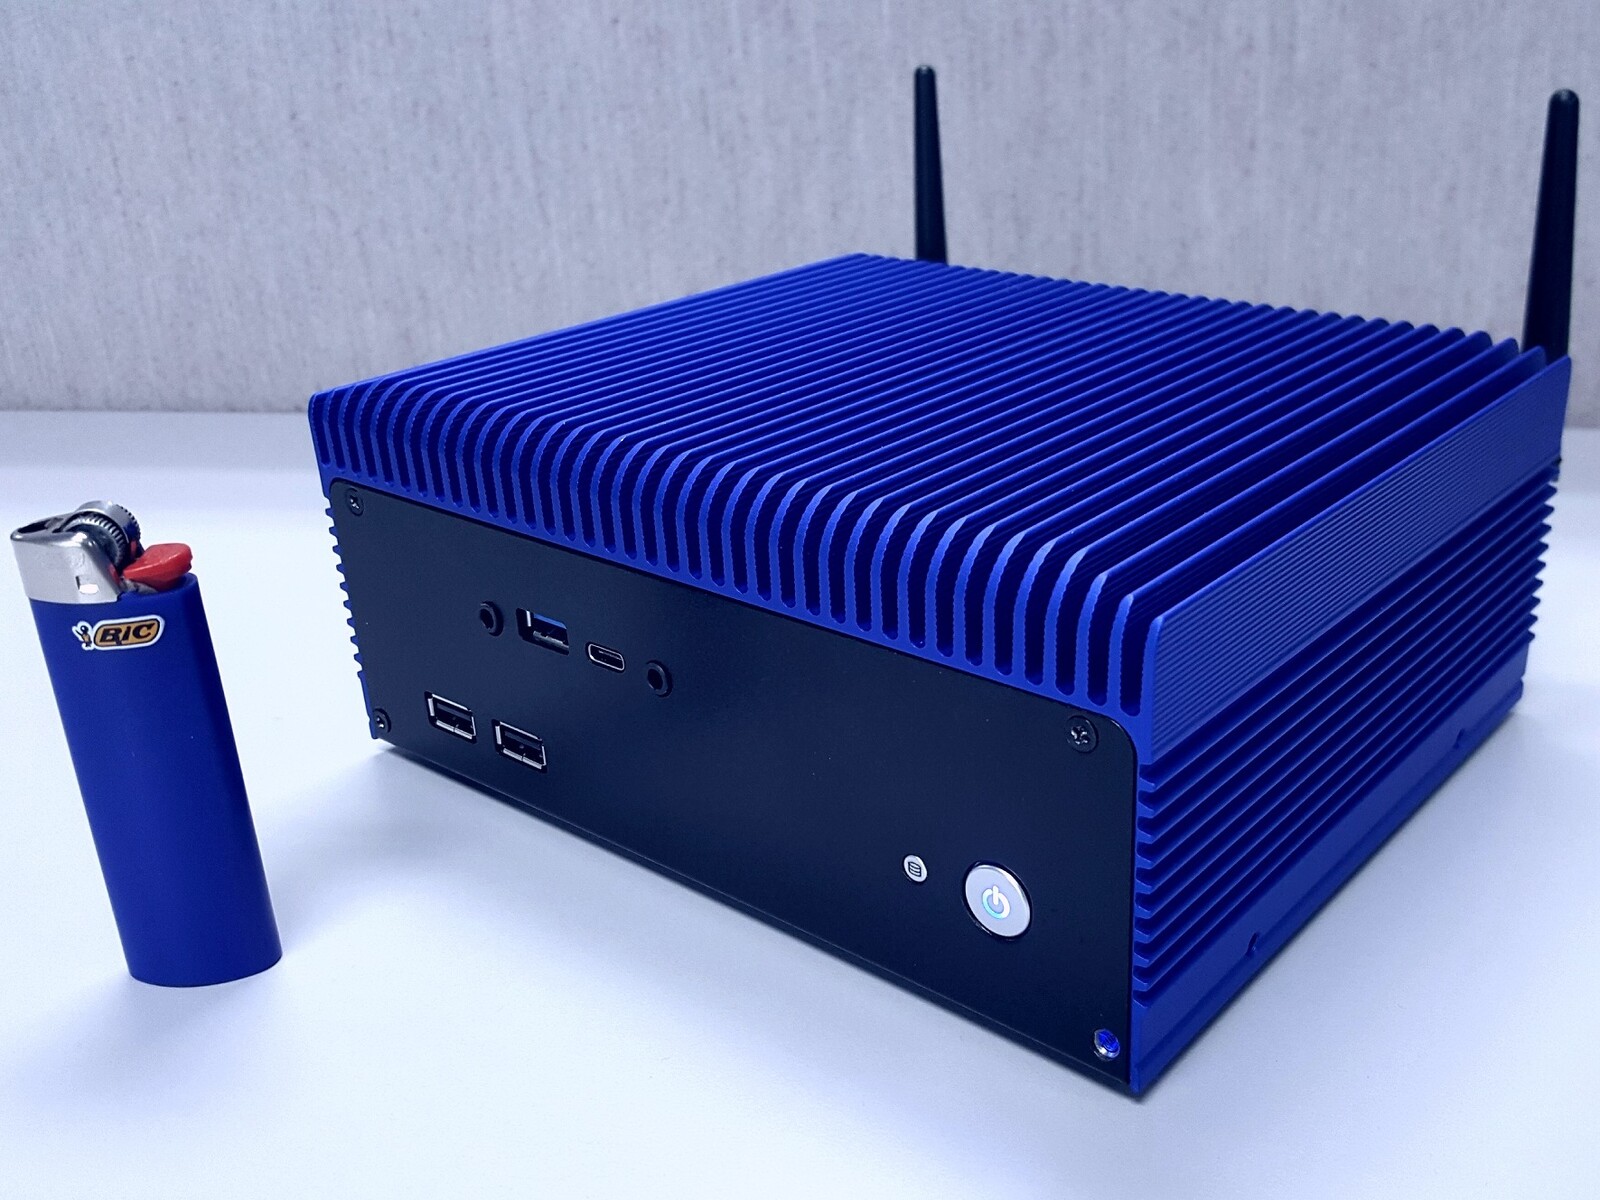
Passively Cooled Core i9: Impact Display Solutions IMP-3654-B1-R Mini PC Review
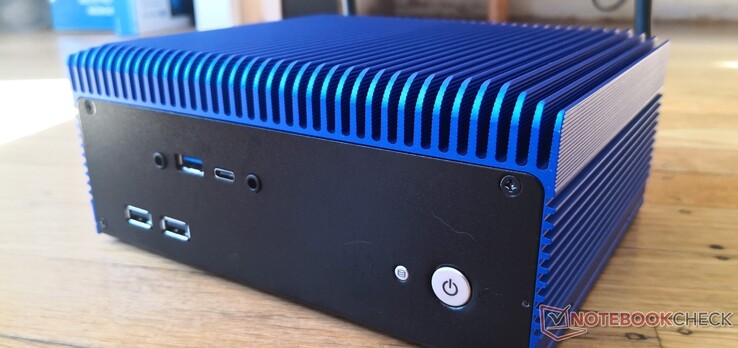
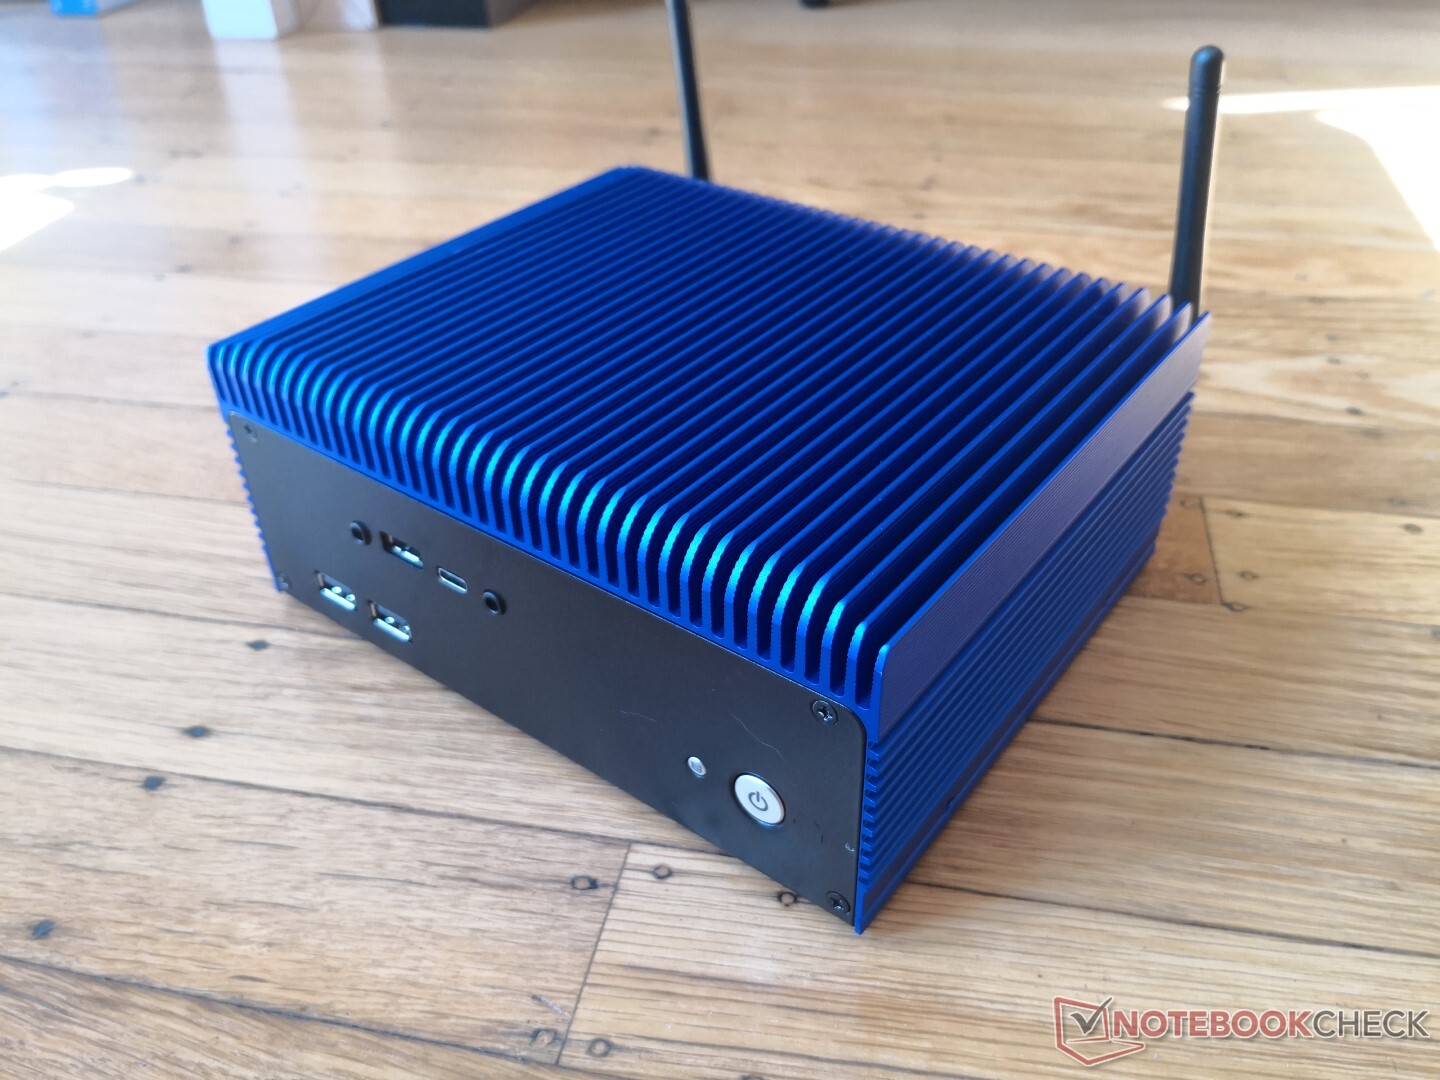
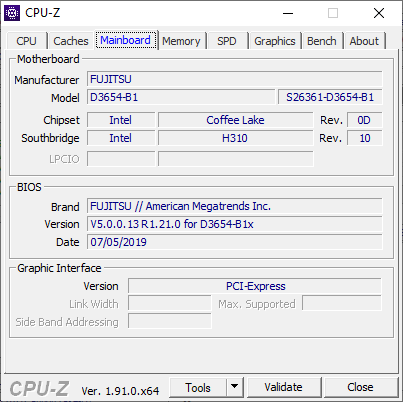
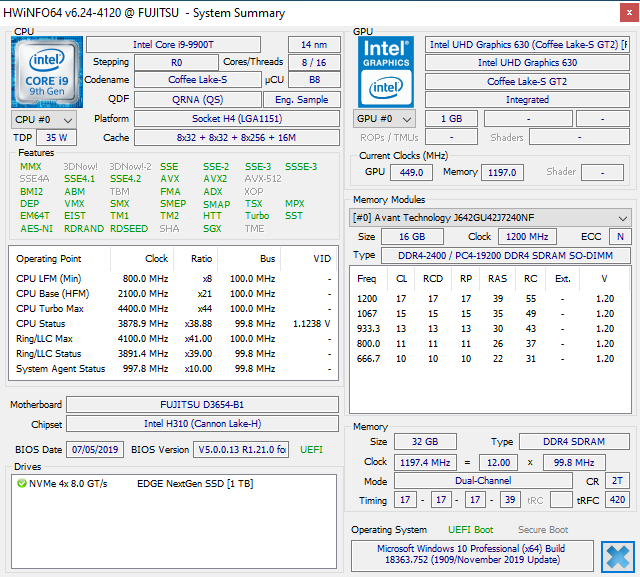
The IMP-3654-B1-B is a fanless mini PC from Impact Display Solutions based on the Kontron D3654-B mini-STX motherboard. It utilizes a large heat sink in lieu of any fans for a completely silent experience not unlike the Zotac ZBox CI660 Nano.
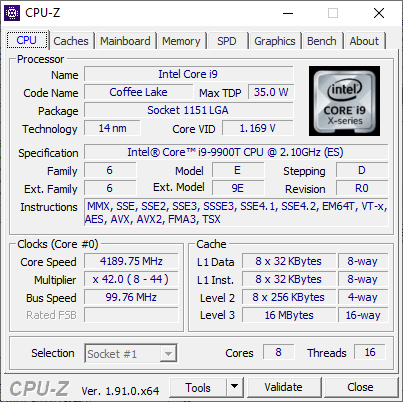
More information on the IMP-3654-B1-B can be found on its official specifications page and product page. A list of other mini PCs from Impact Display Solutions can be found here. For this review, we'll be focusing on the performance of the mini PC and how it handles a Core i9-9900T CPU with no fans whatsoever.
Communication
| Networking | |
| iperf3 transmit AX12 | |
| Impact Display Solutions IMP-3654-B1-R Core i9-9900T | |
| iperf3 receive AX12 | |
| Impact Display Solutions IMP-3654-B1-R Core i9-9900T | |
Performance
Processor
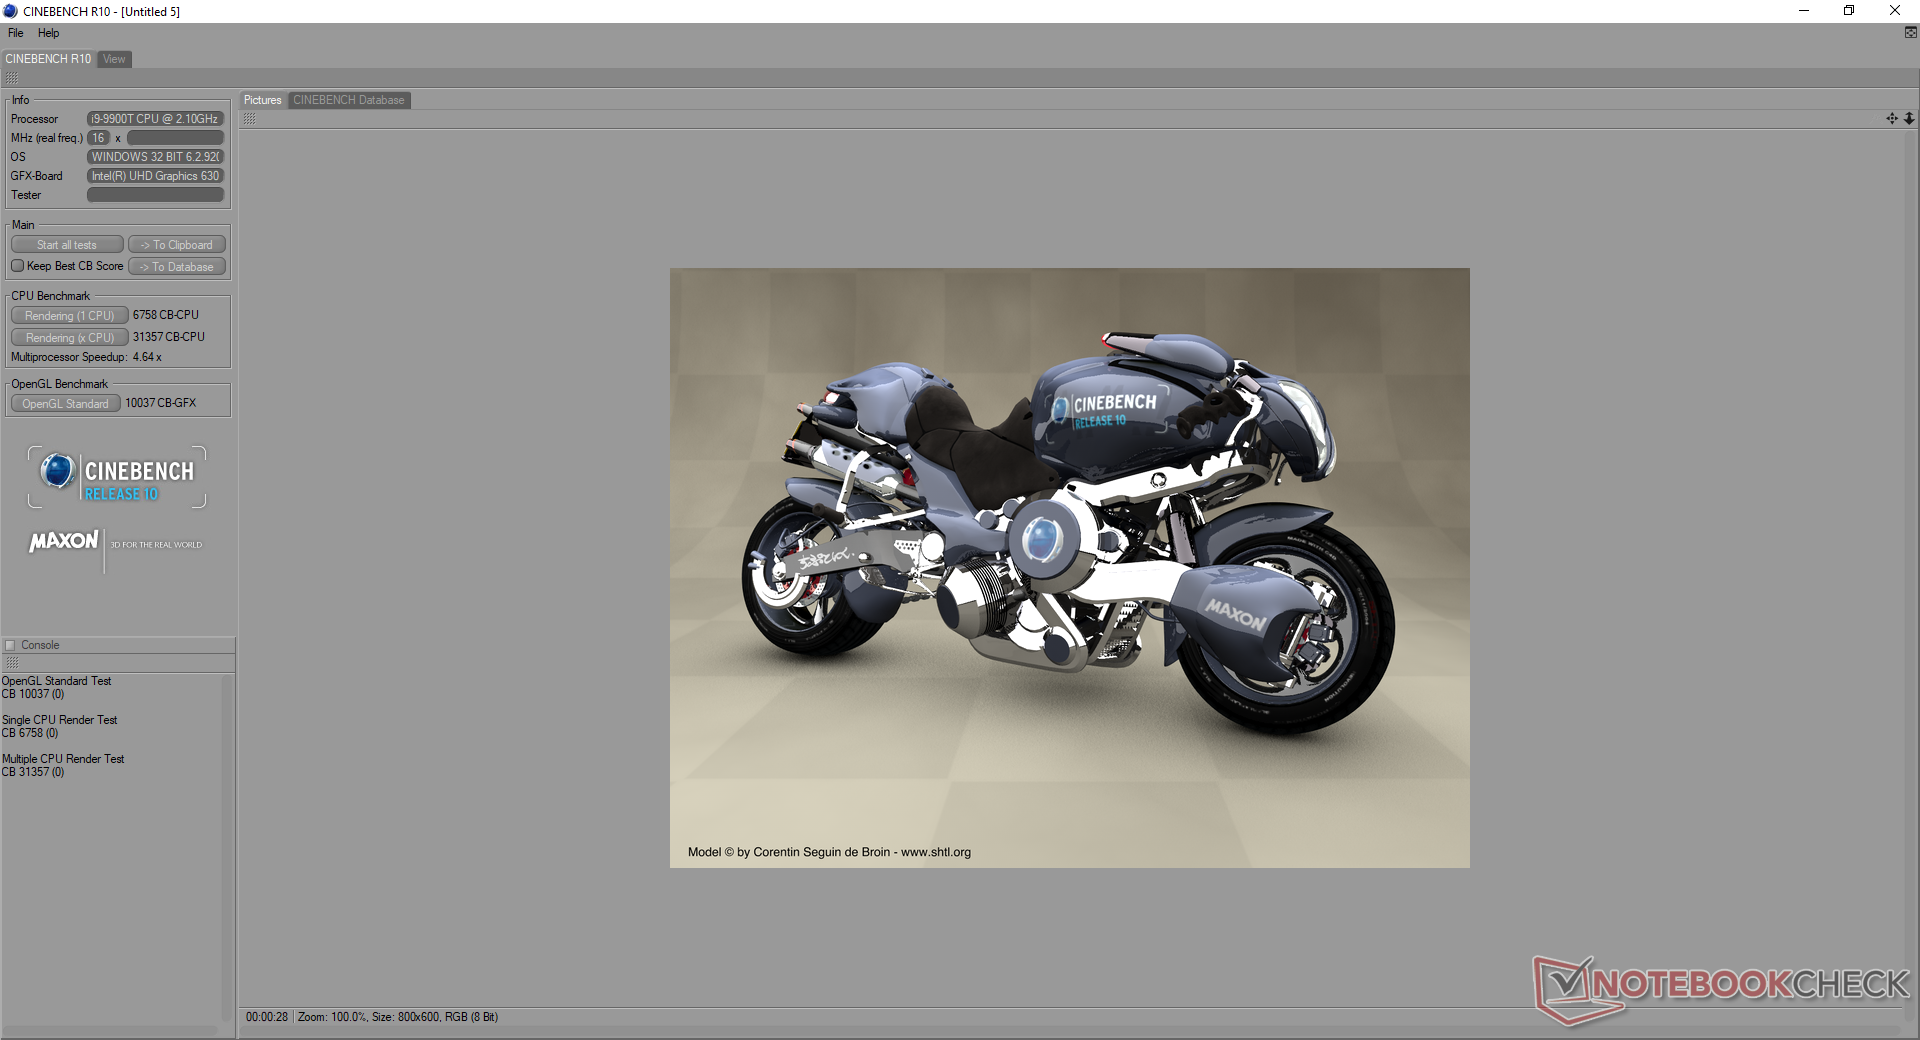
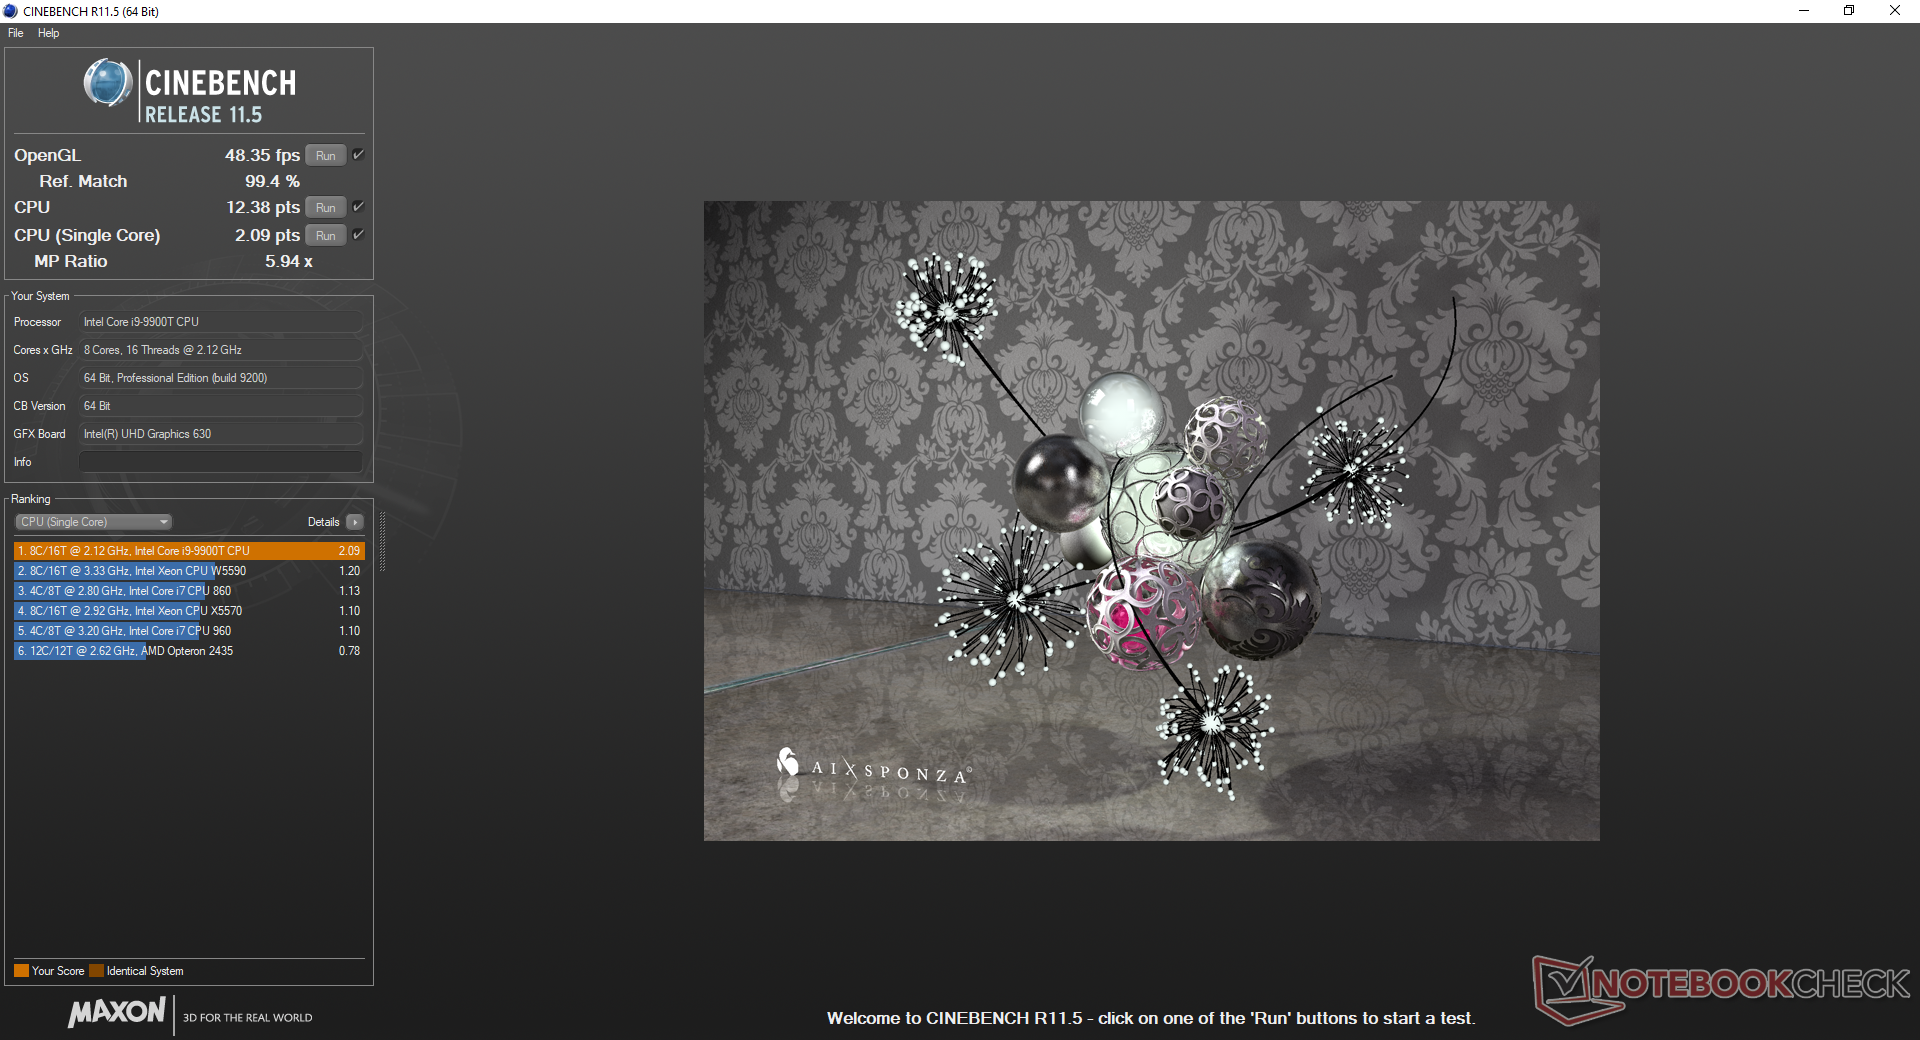
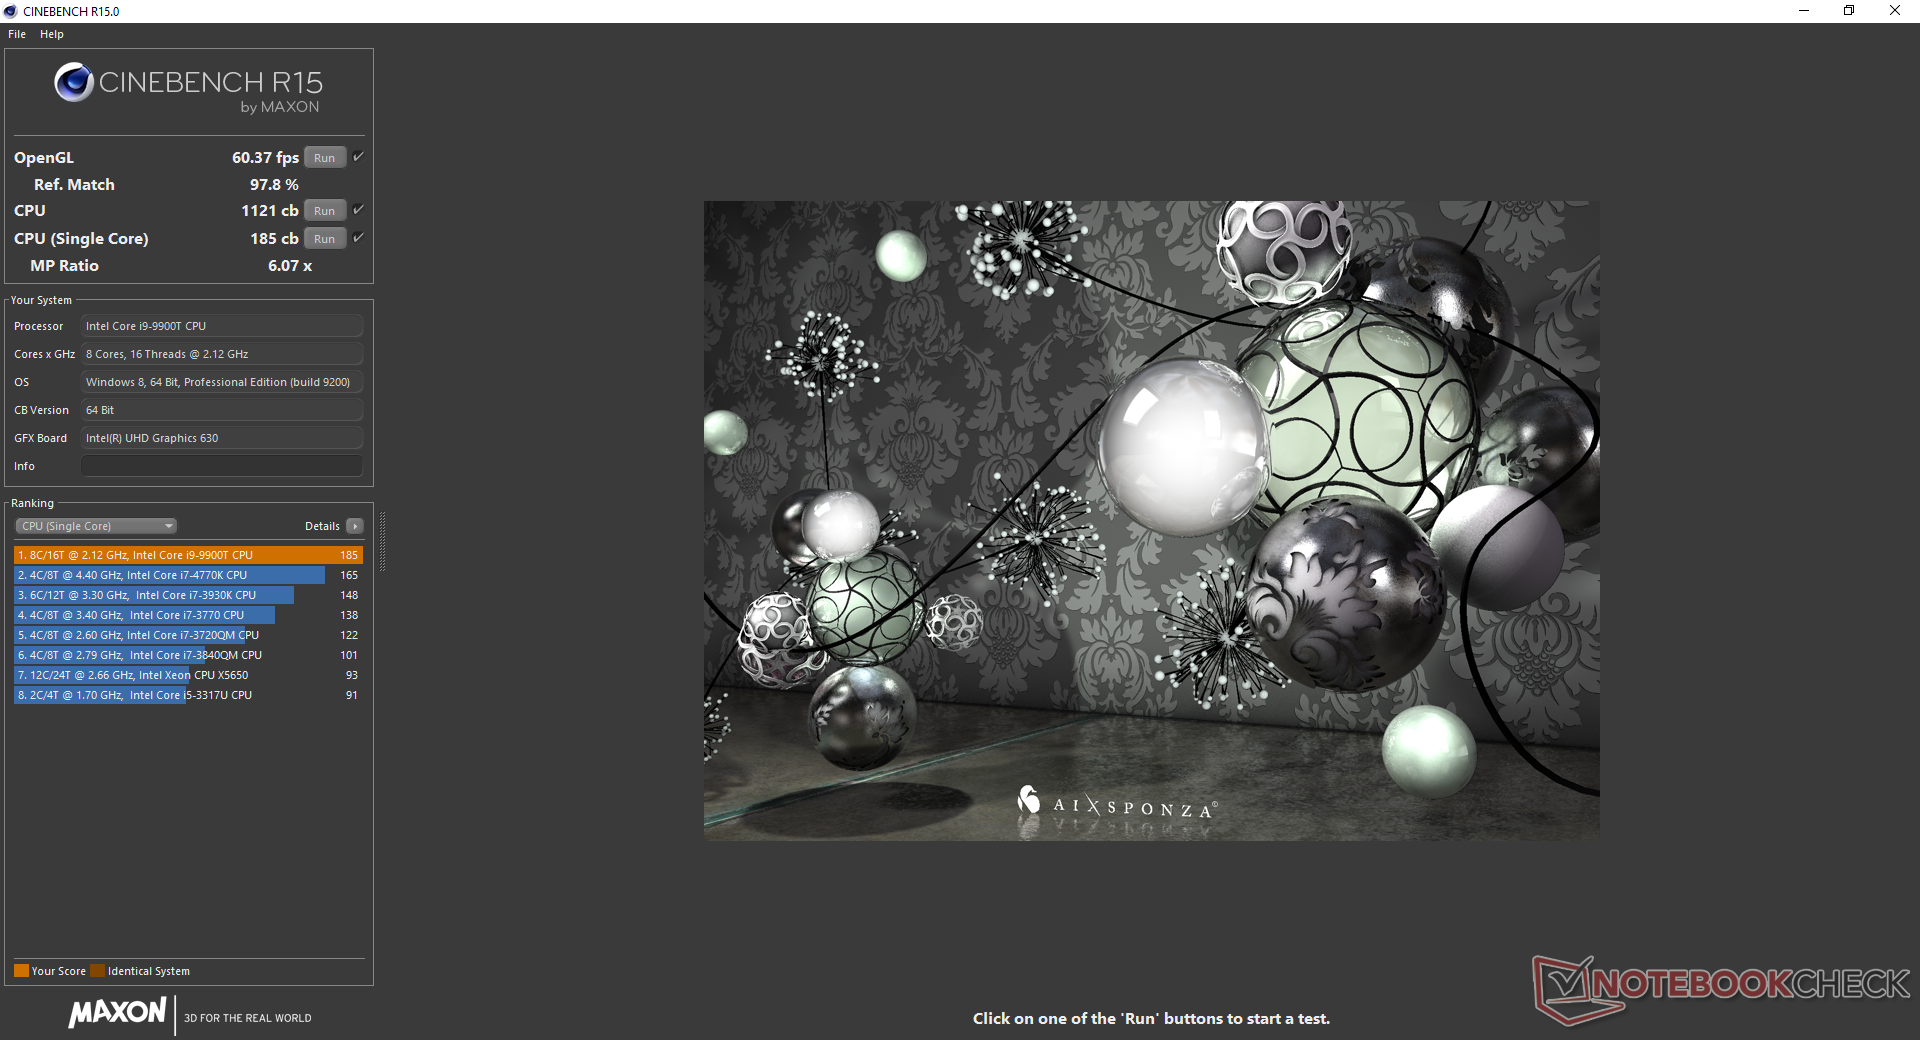
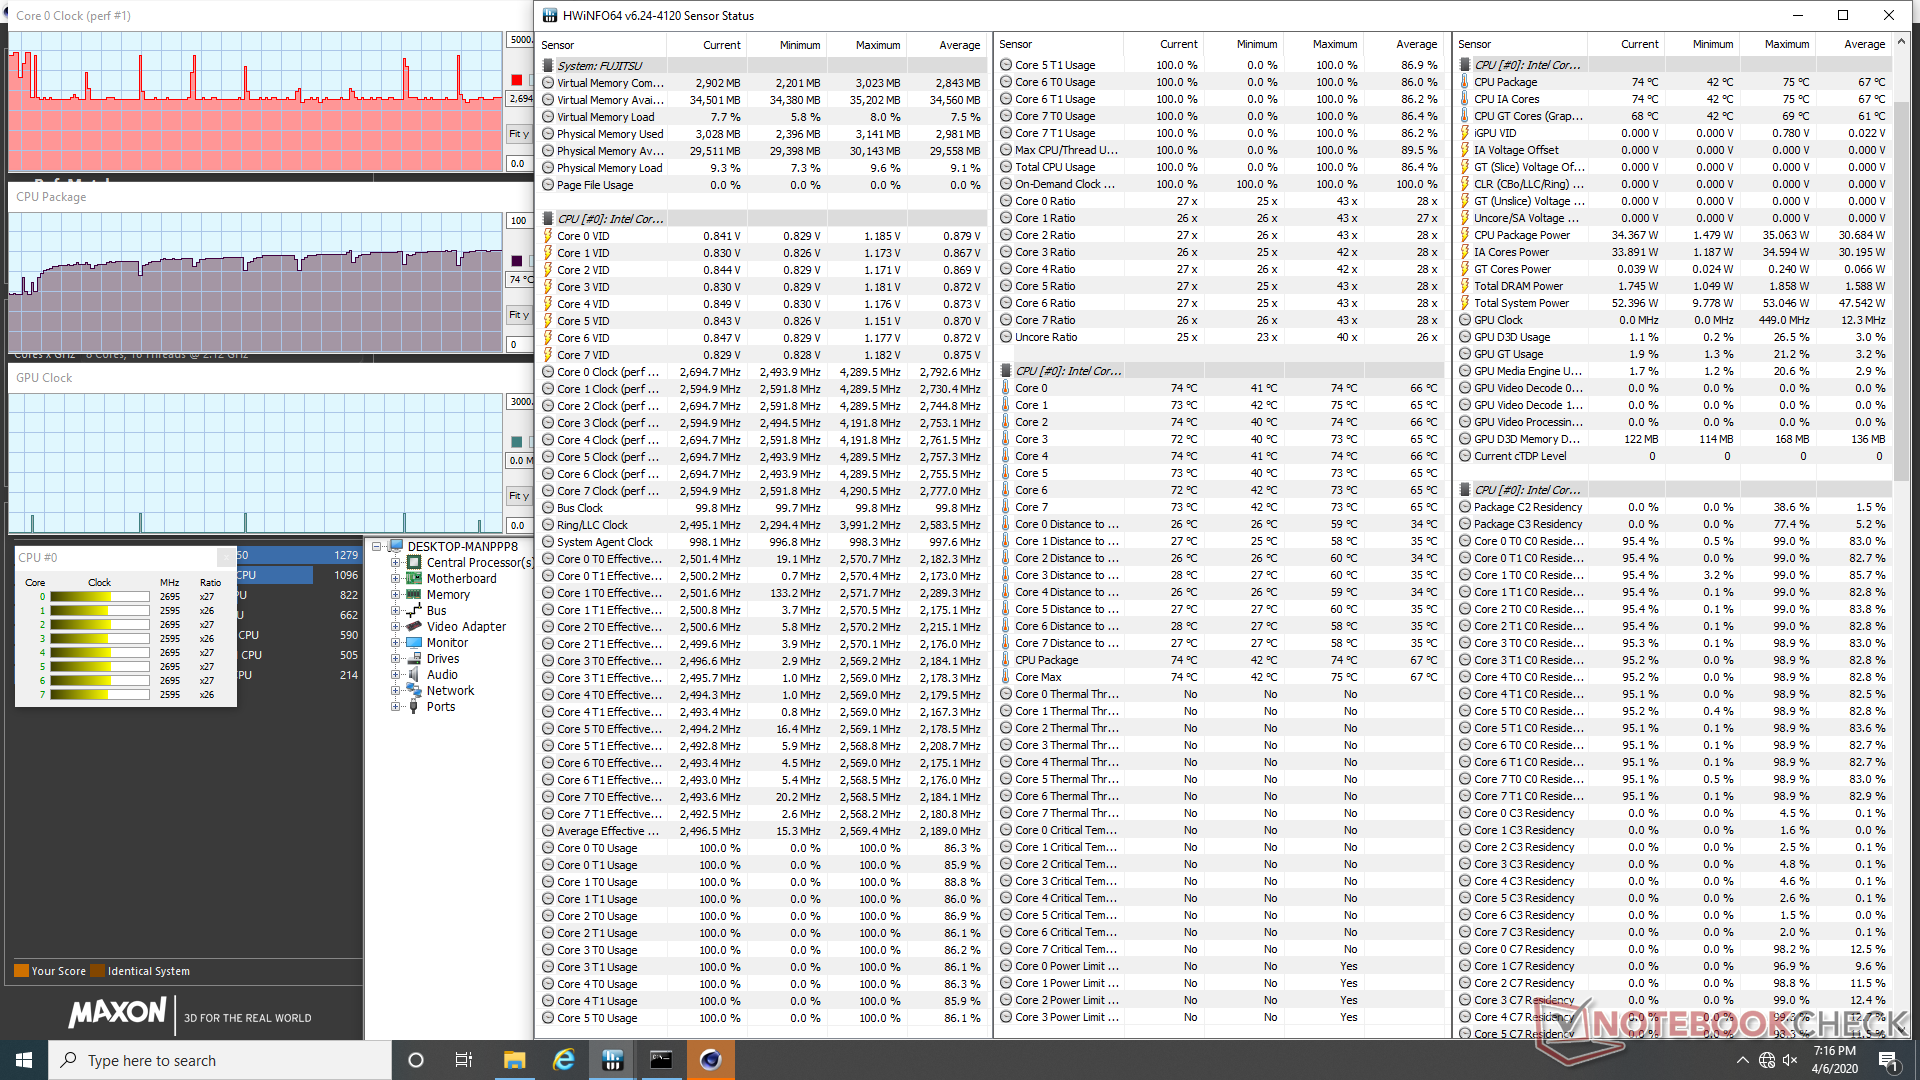
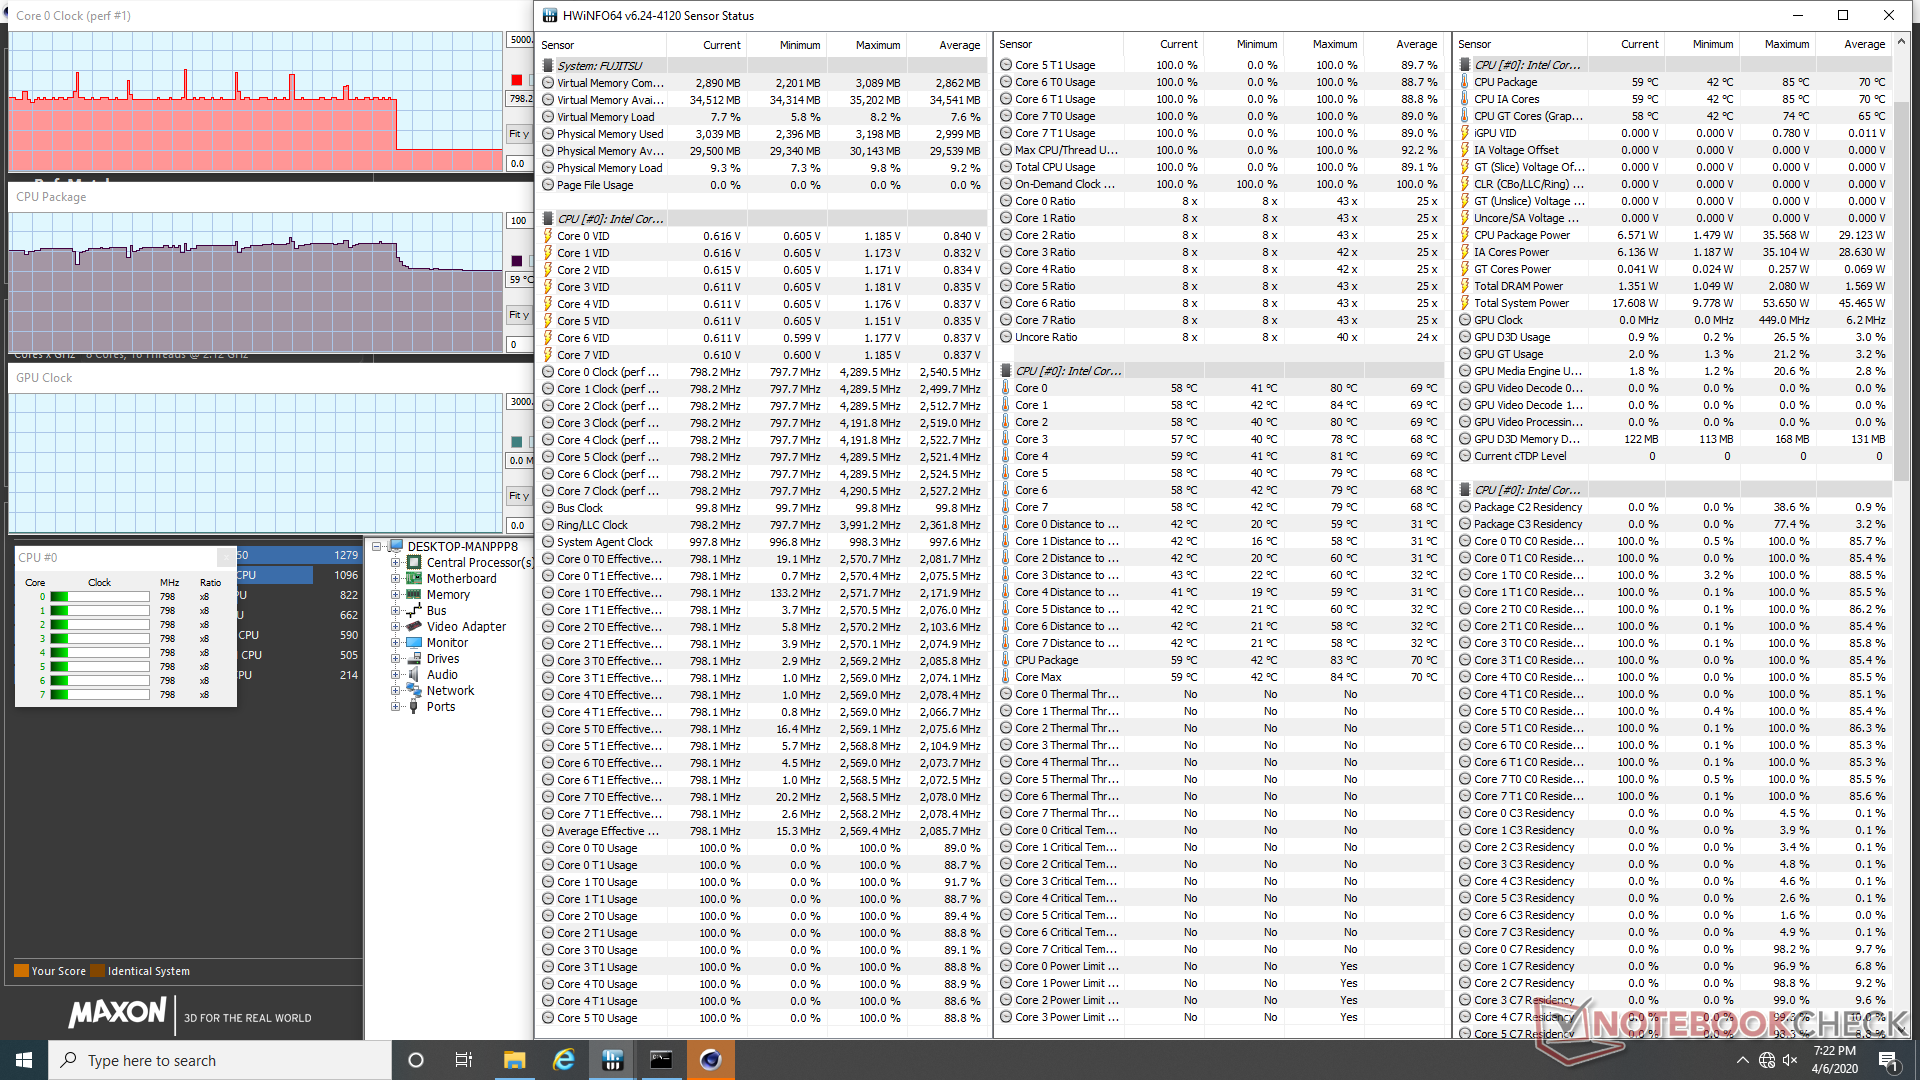
We're able to assess CPU performance over time by running CineBench R15 Multi-Thread in a loop. Performance remains stable at a score of about 1100 points until an abrupt drop to 390 points as shown by the chart below. Unusually, performance would spike back up again to normal towards the end of the test. We explore this phenomenon further in our Stress Test section.
| wPrime 2.10 - 1024m | |
| Intel Hades Canyon NUC8i7HVK | |
| Intel NUC10i7FNH | |
| Impact Display Solutions IMP-3654-B1-R Core i9-9900T | |
| Corsair One i160 | |
| Asus Zephyrus G14 GA401IV | |
* ... smaller is better
System Performance
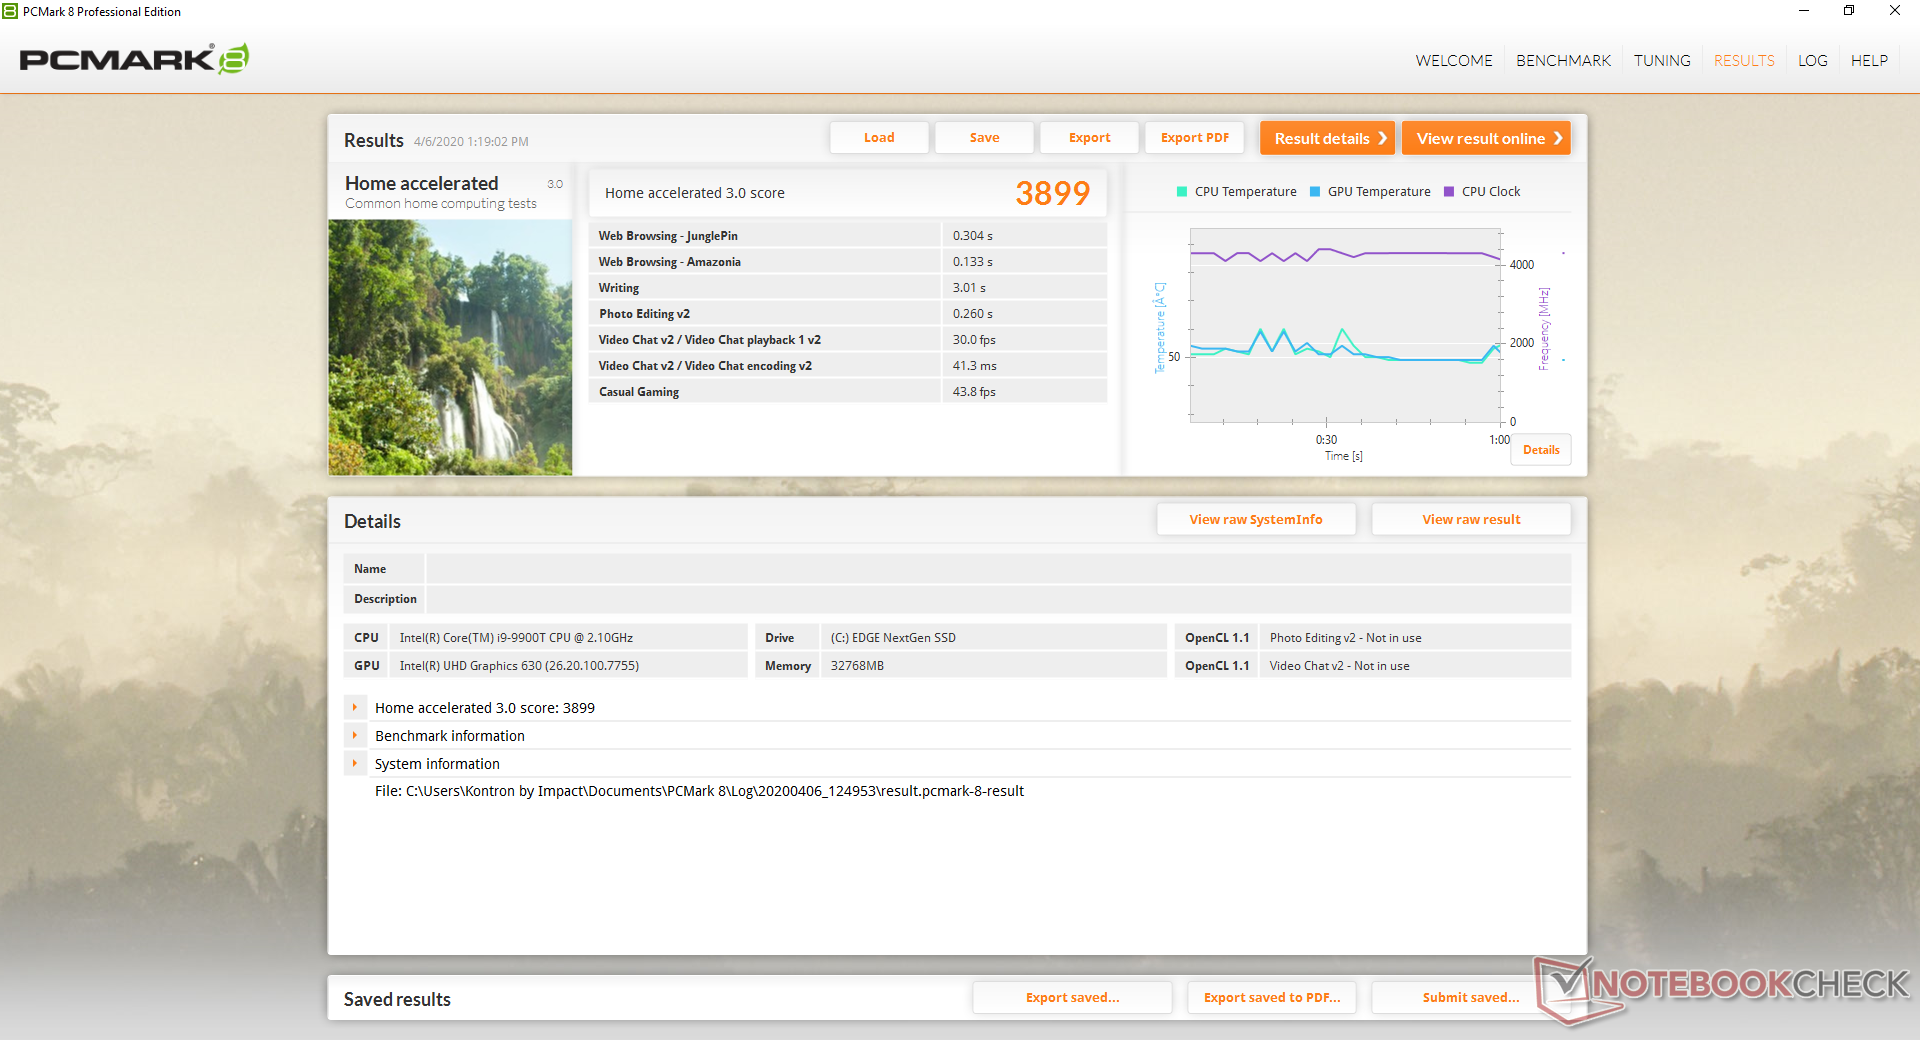
| PCMark 8 Home Score Accelerated v2 | 3899 points | |
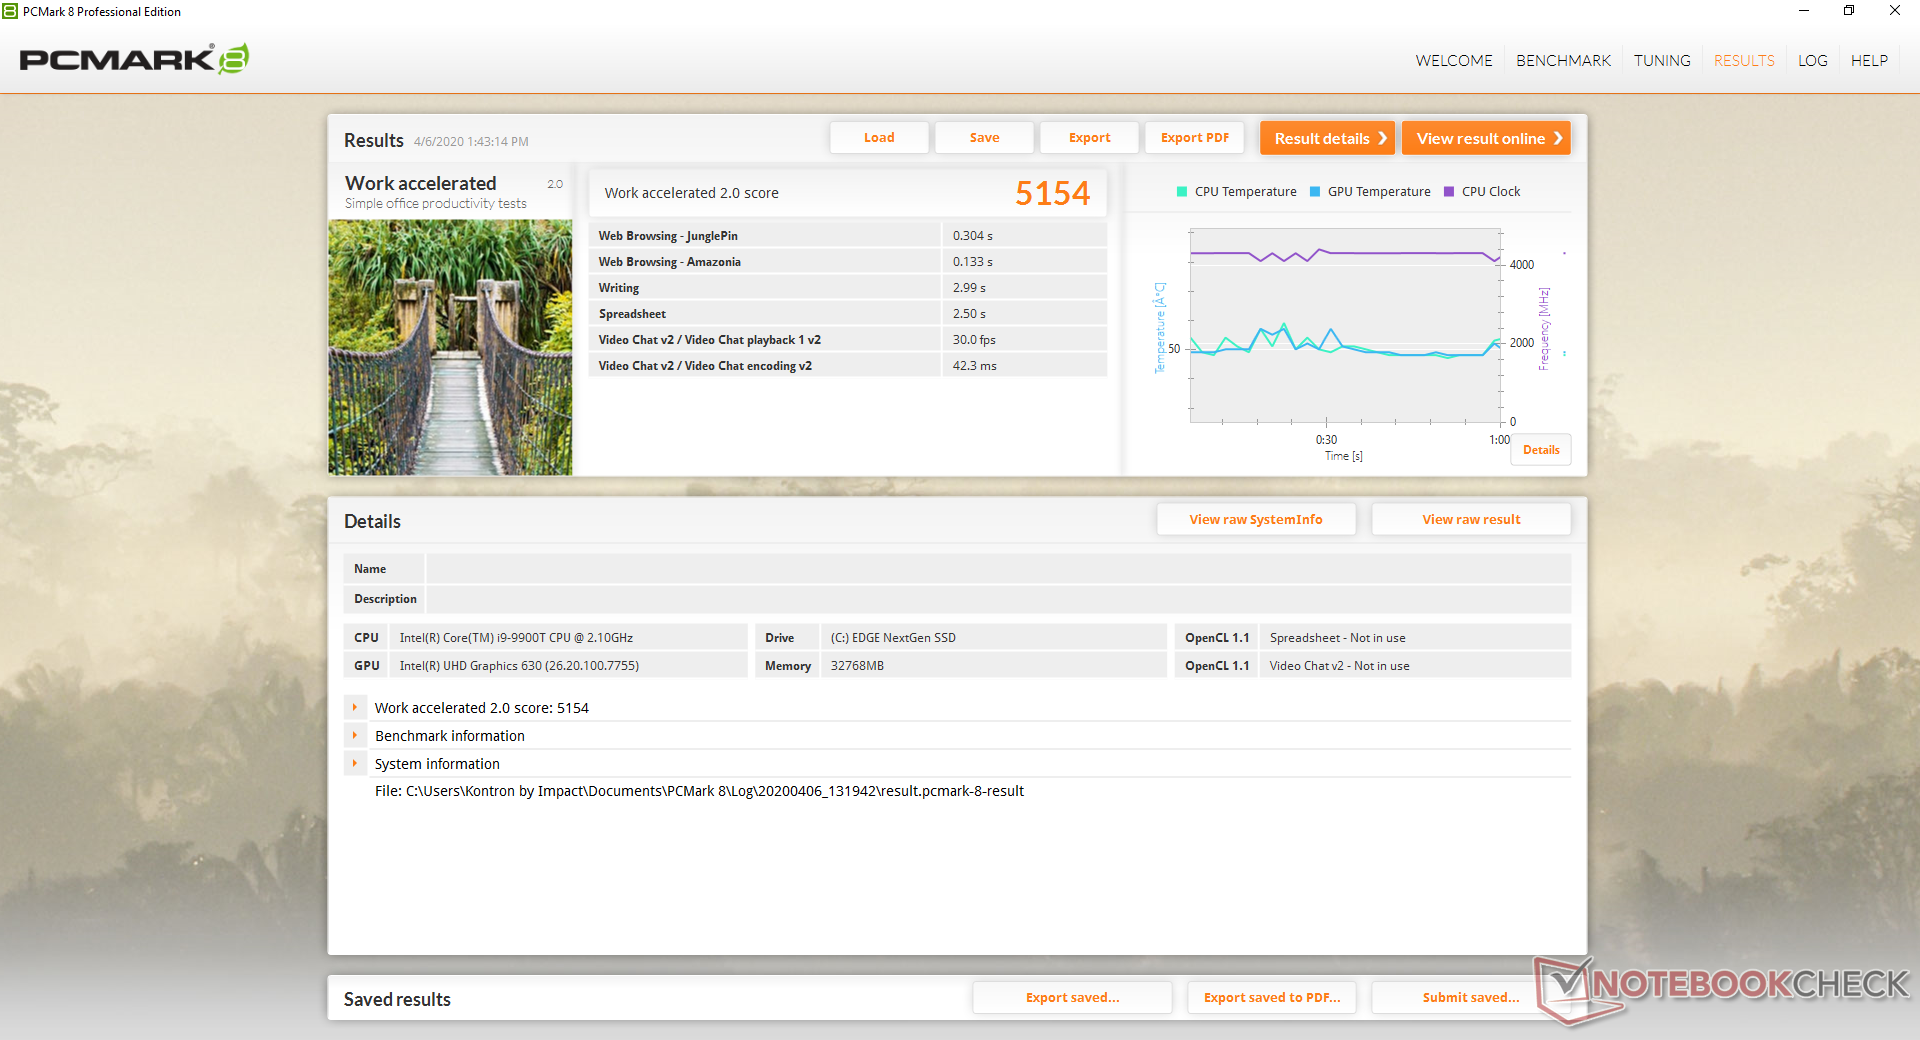
| PCMark 8 Work Score Accelerated v2 | 5154 points | |
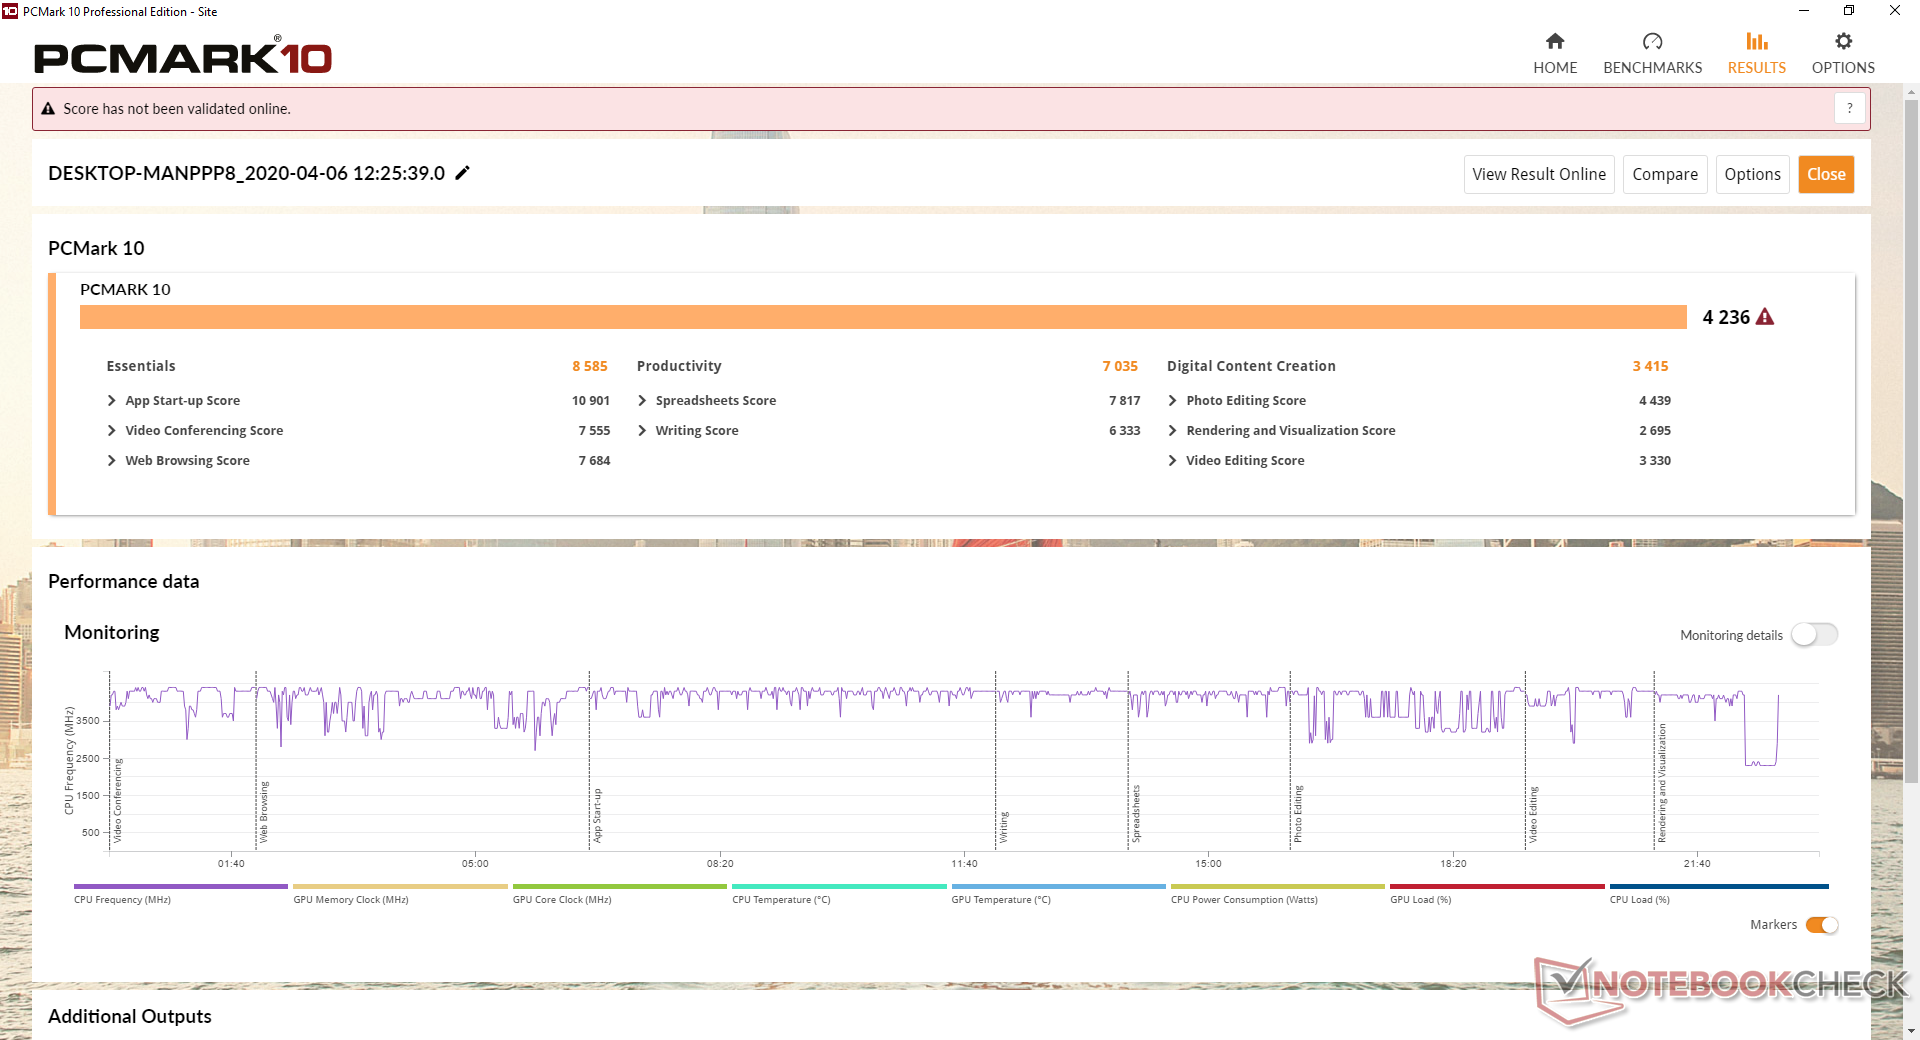
| PCMark 10 Score | 4236 points | |
Help | ||
Storage Devices
| Impact Display Solutions IMP-3654-B1-R Core i9-9900T EDGE NextGen SSD 1TB | Lenovo ThinkPad T490 20RY0002US Sabrent Rocket Q 1TB RKT30Q.1 | Walmart EVOO Gaming 17 Intel SSD 660p 1TB SSDPEKNW010T8 | Porsche Design Ultra One FORESEE P902F001TB | SCHENKER XMG Neo 15 Turing Samsung SSD 970 EVO Plus 1TB | |
|---|---|---|---|---|---|
| AS SSD | 94% | 34% | -32% | 118% | |
| Seq Read | 1218 | 2073 70% | 1038 -15% | 1285 6% | 2173 78% |
| Seq Write | 1306 | 1865 43% | 1604 23% | 754 -42% | 2587 98% |
| 4K Read | 25.97 | 50.9 96% | 42.9 65% | 40.63 56% | 44.84 73% |
| 4K Write | 43.25 | 157.6 264% | 107.4 148% | 100.2 132% | 100.4 132% |
| 4K-64 Read | 578 | 689 19% | 583 1% | 304.2 -47% | 1584 174% |
| 4K-64 Write | 520 | 1615 211% | 725 39% | 196.2 -62% | 2329 348% |
| Access Time Read * | 0.118 | 0.043 64% | 0.045 62% | 0.453 -284% | 0.048 59% |
| Access Time Write * | 0.286 | 0.07 76% | 0.127 56% | 0.263 8% | 0.036 87% |
| Score Read | 726 | 947 30% | 730 1% | 473 -35% | 1846 154% |
| Score Write | 694 | 1959 182% | 992 43% | 372 -46% | 2688 287% |
| Score Total | 1800 | 3394 89% | 2137 19% | 1076 -40% | 5500 206% |
| Copy ISO MB/s | 2082 | 3024 45% | 1612 -23% | 1710 -18% | |
| Copy Program MB/s | 422.8 | 715 69% | 564 33% | 390.5 -8% | |
| Copy Game MB/s | 1072 | 1650 54% | 1328 24% | 802 -25% | |
| CrystalDiskMark 5.2 / 6 | 38% | 13% | -27% | 14% | |
| Write 4K | 111.8 | 227.2 103% | 134 20% | 109.3 -2% | 92.5 -17% |
| Read 4K | 56.8 | 55.3 -3% | 55.5 -2% | 43.56 -23% | 40.45 -29% |
| Write Seq | 1148 | 1411 23% | 1292 13% | 518 -55% | 1197 4% |
| Read Seq | 1522 | 1046 -31% | 1476 -3% | 1118 -27% | 1018 -33% |
| Write 4K Q32T1 | 399.7 | 643 61% | 545 36% | 310.4 -22% | 288.6 -28% |
| Read 4K Q32T1 | 570 | 625 10% | 582 2% | 345.6 -39% | 332 -42% |
| Write Seq Q32T1 | 1375 | 1972 43% | 1746 27% | 926 -33% | 3317 141% |
| Read Seq Q32T1 | 1626 | 3247 100% | 1793 10% | 1431 -12% | 3515 116% |
| Total Average (Program / Settings) | 66% /
74% | 24% /
26% | -30% /
-30% | 66% /
80% |
* ... smaller is better

GPU Performance
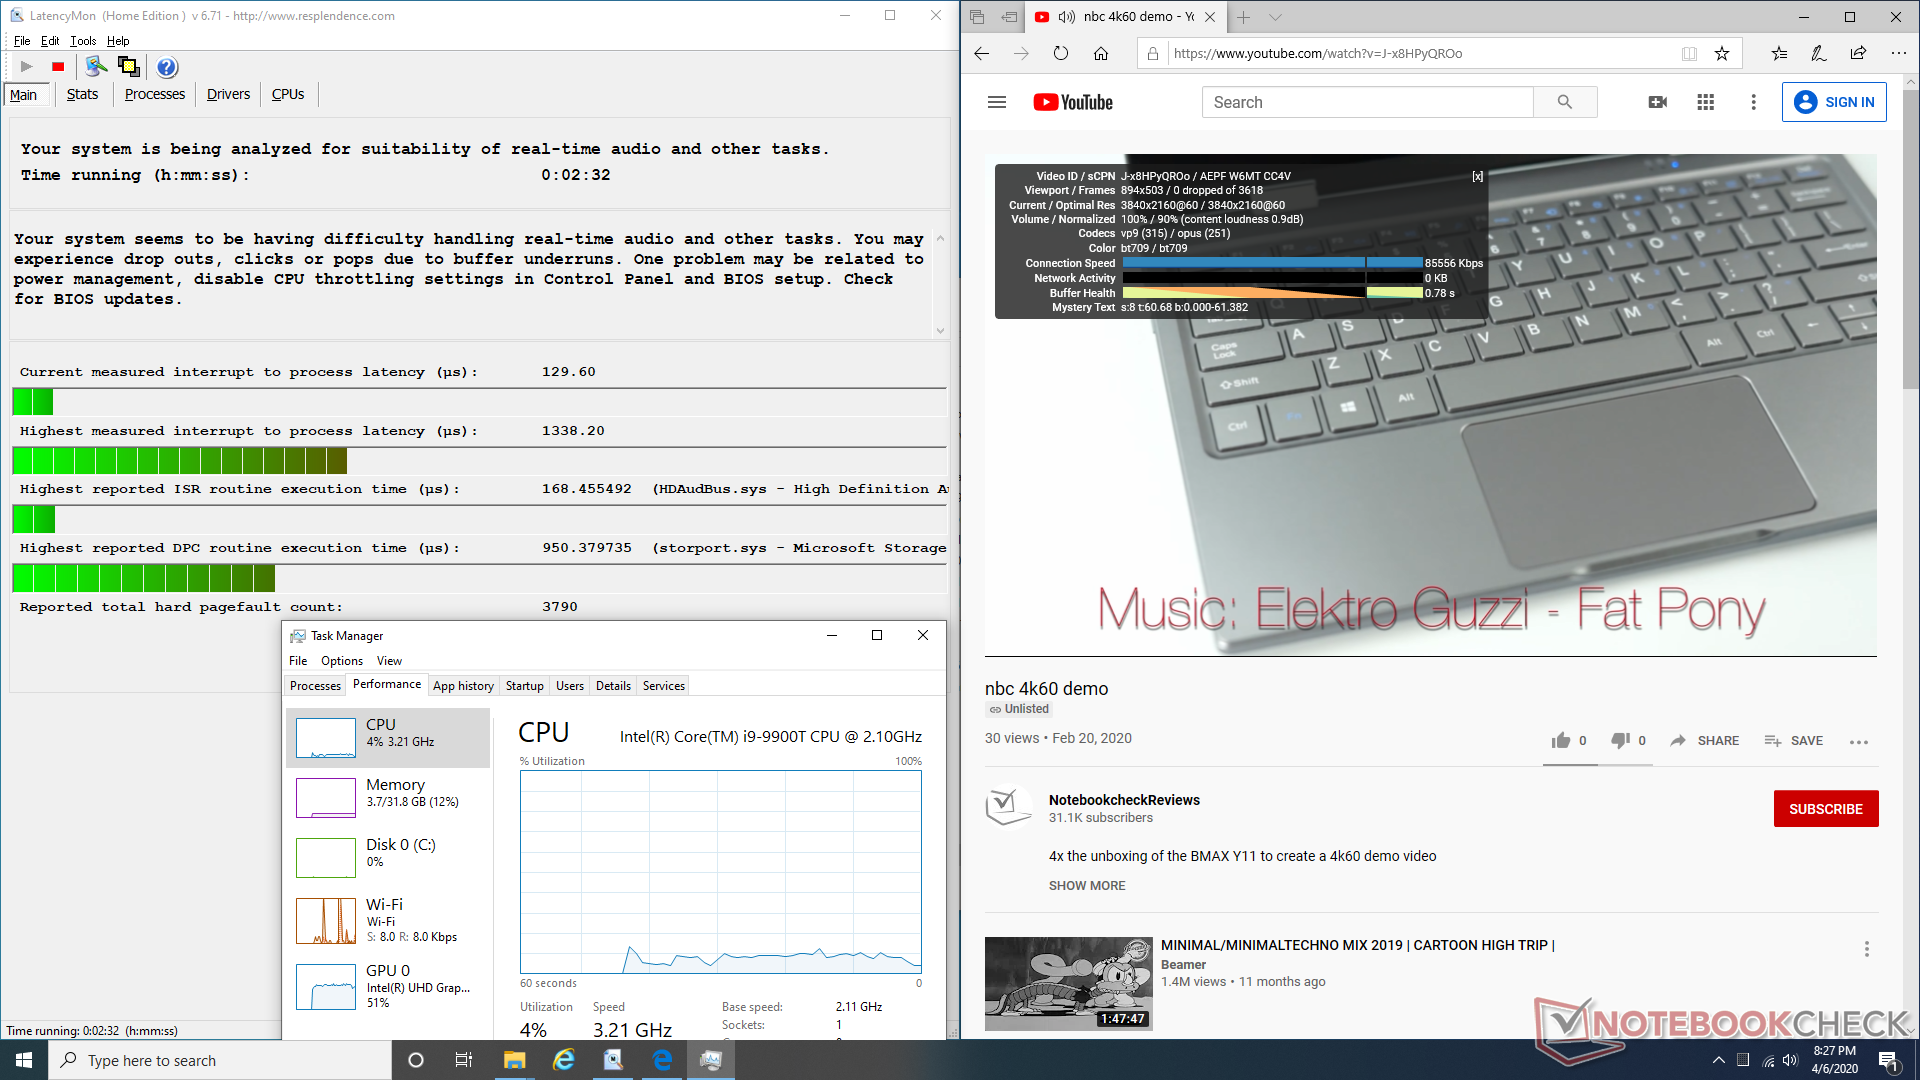
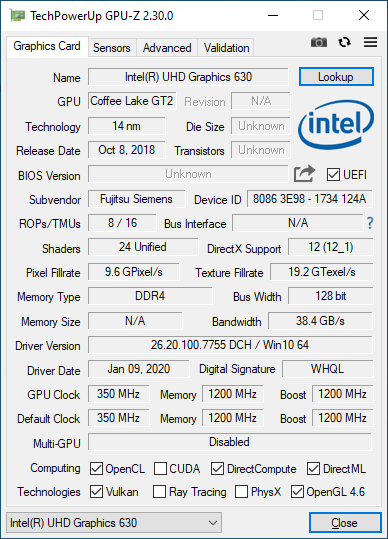
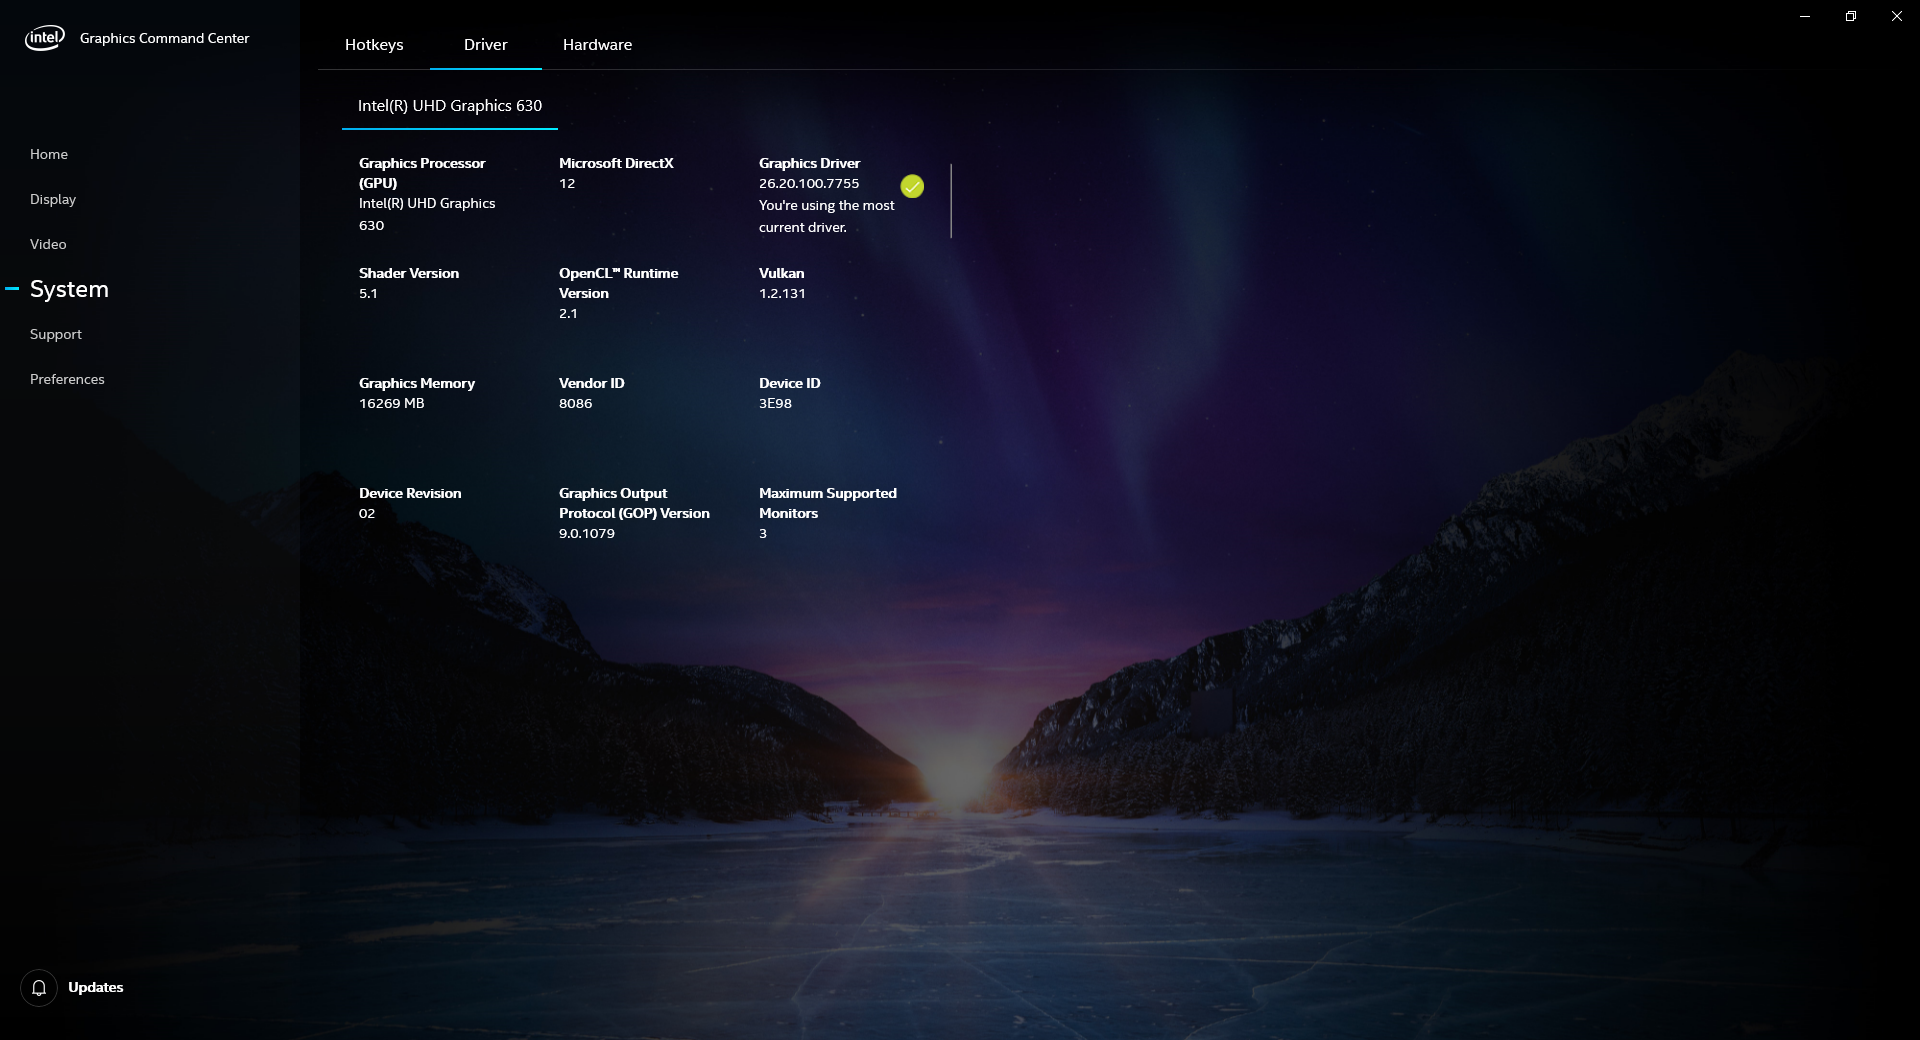
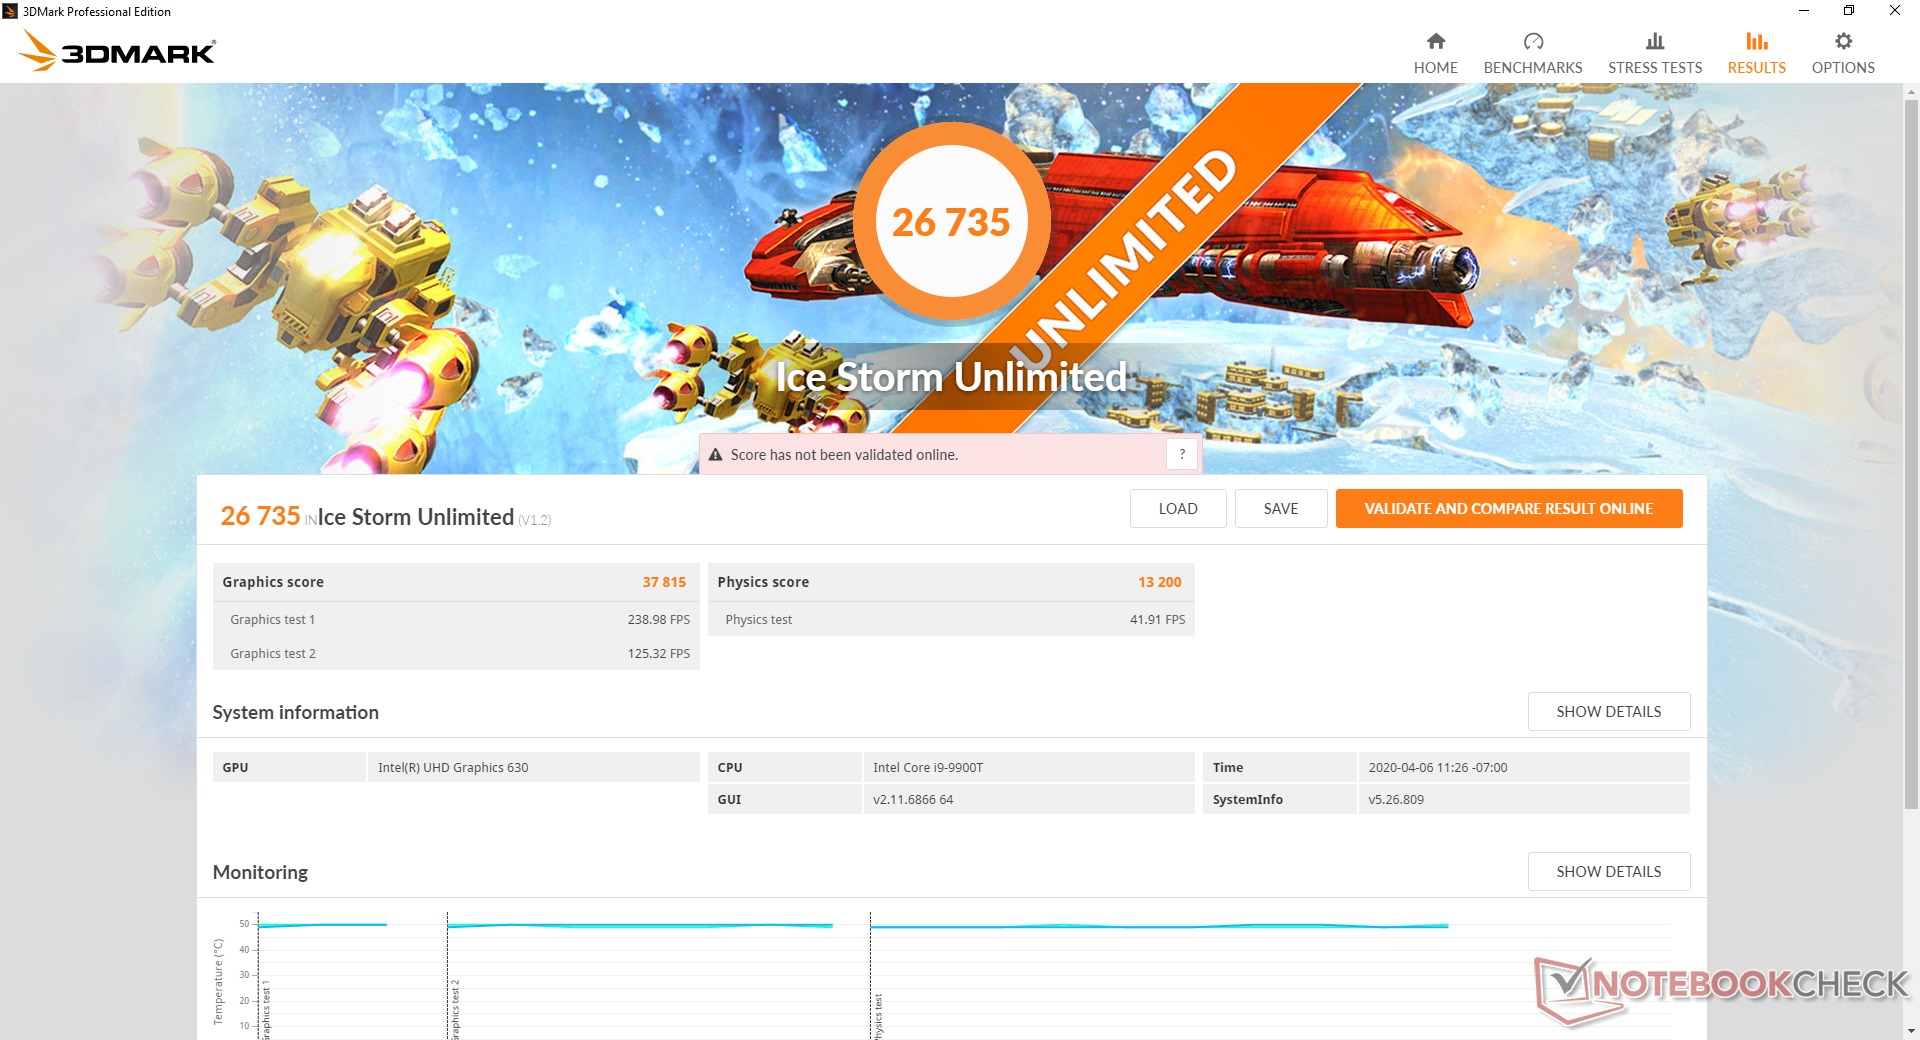
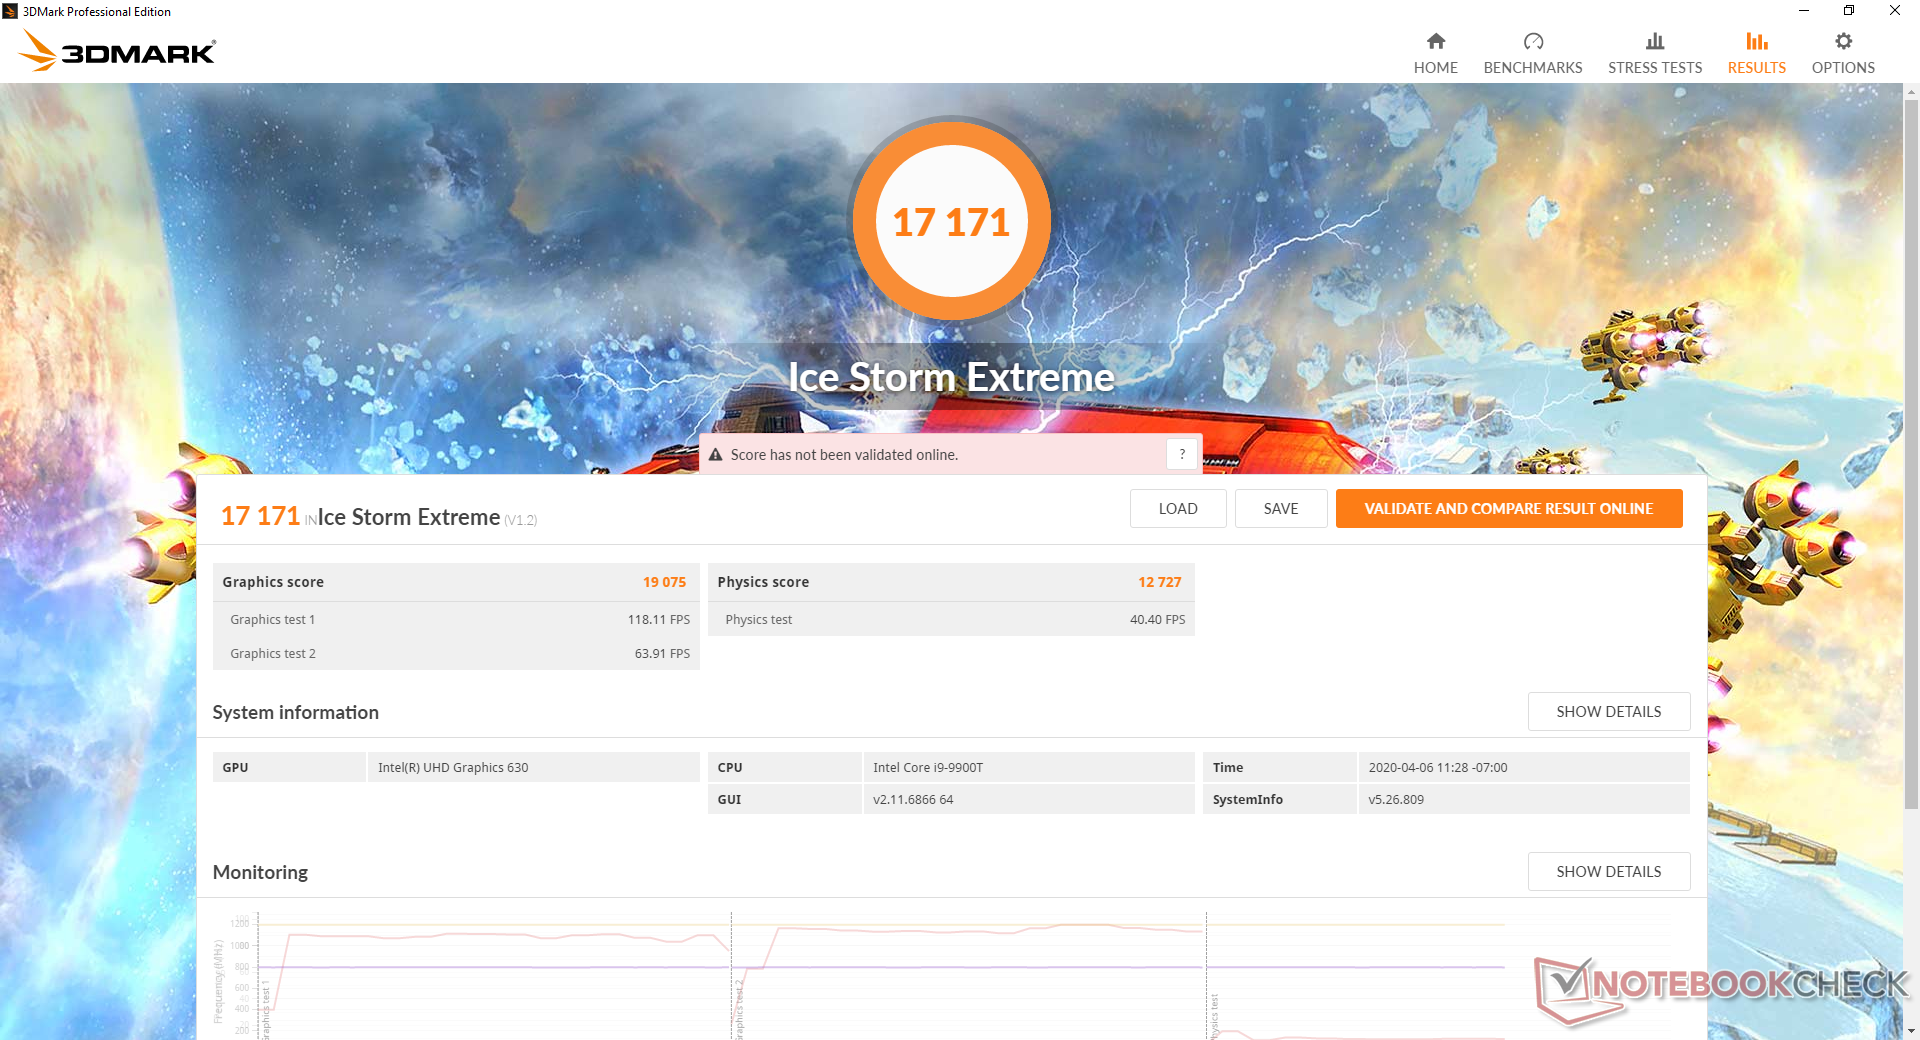
Intel's UHD Graphics series is years old and outdated as of 2020. Users looking for more integrated graphics power should consider the Iris Plus or competing RX Vega series instead which can offer nearly two times the performance at the same thermal envelope or lower. For standard web browsing and 4K playback, however, UHD Graphics will be sufficient. We're not able to record any dropped frames when playing our one-minute 4K UHD YouTube test video.
| 3DMark 06 Standard Score | 13646 points | |
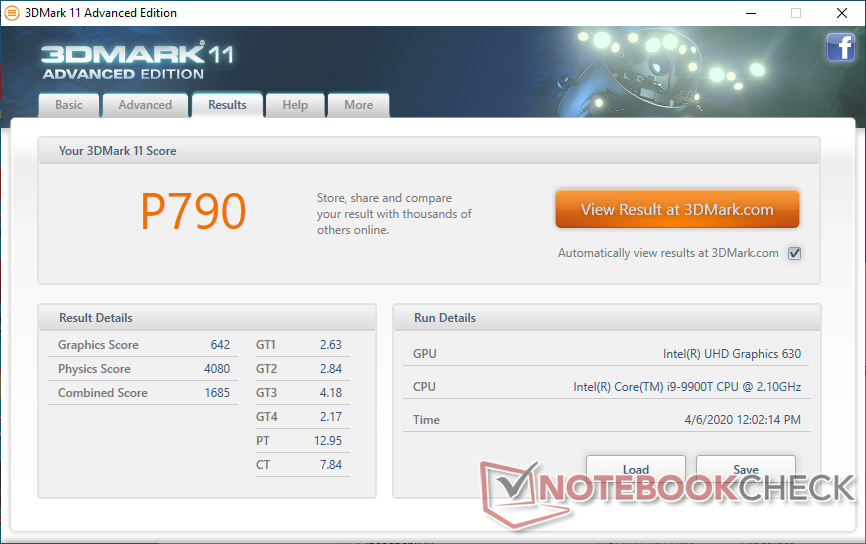
| 3DMark 11 Performance | 790 points | |
| 3DMark Ice Storm Standard Score | 28176 points | |
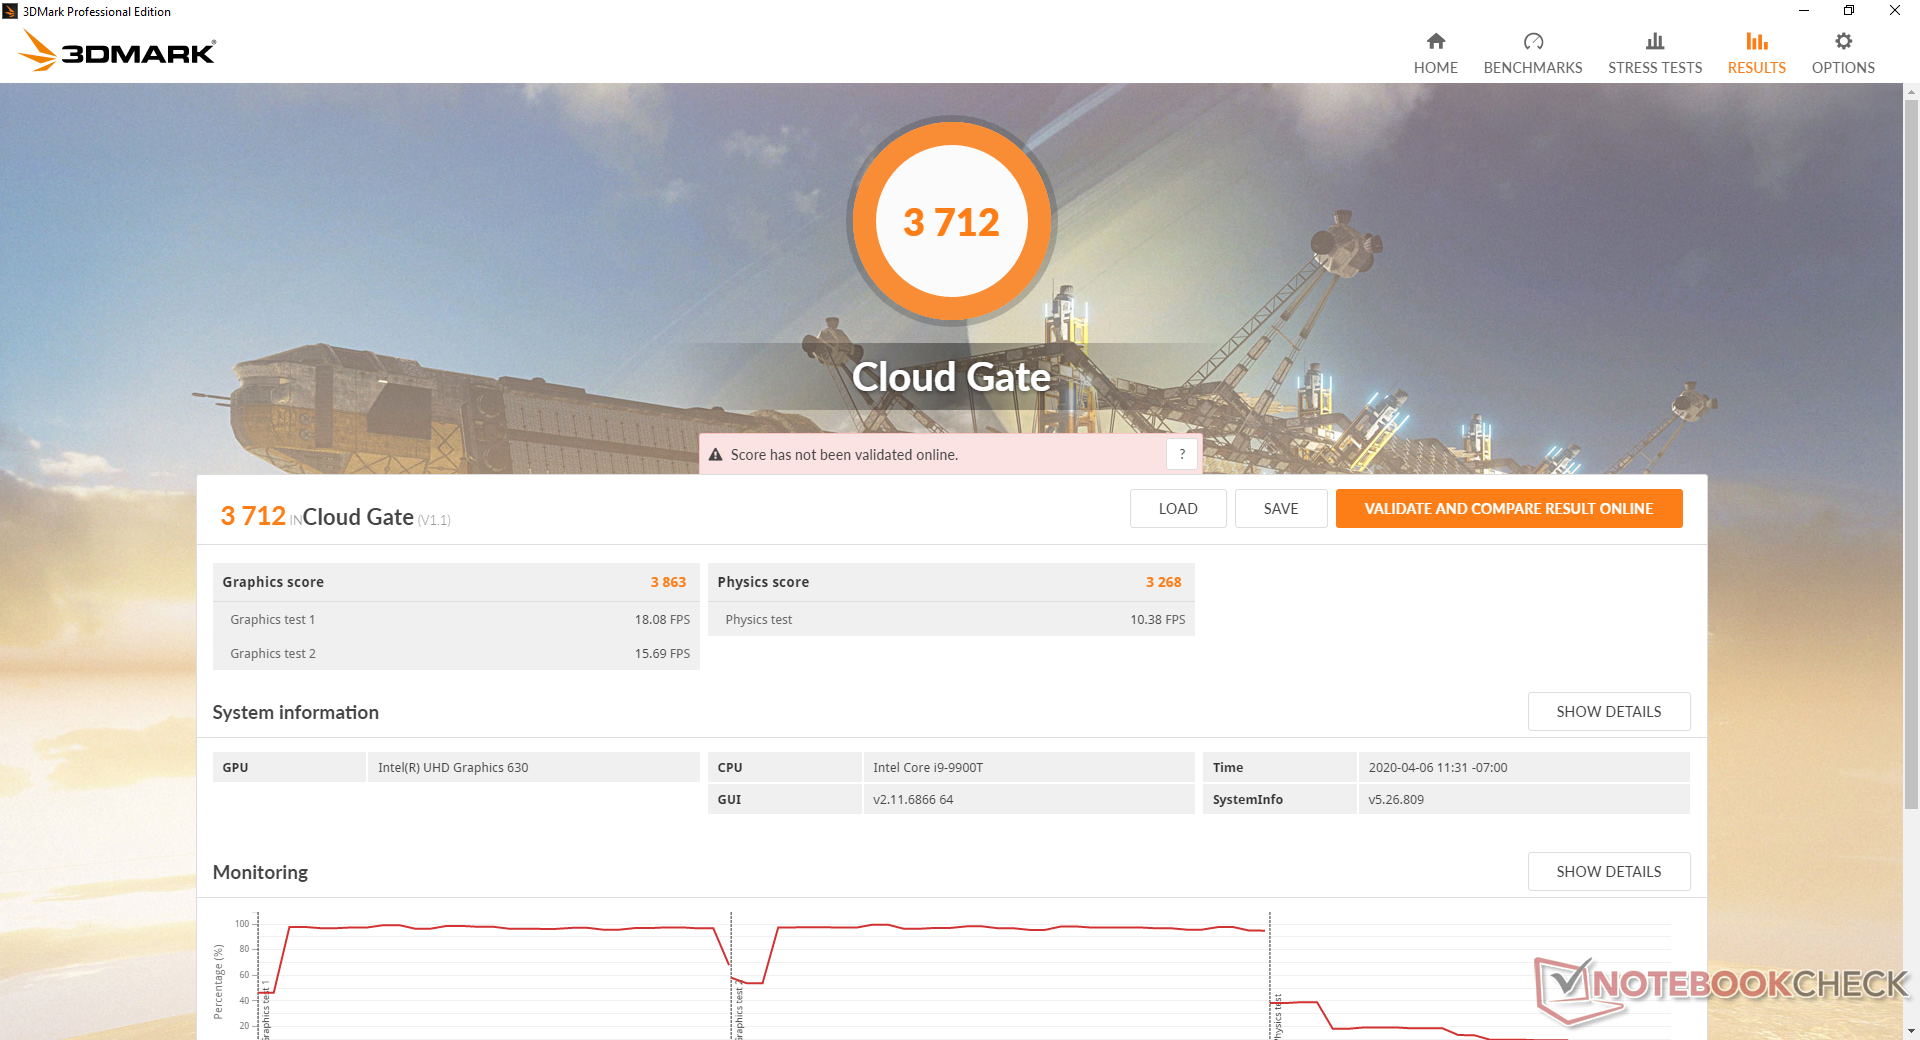
| 3DMark Cloud Gate Standard Score | 3712 points | |
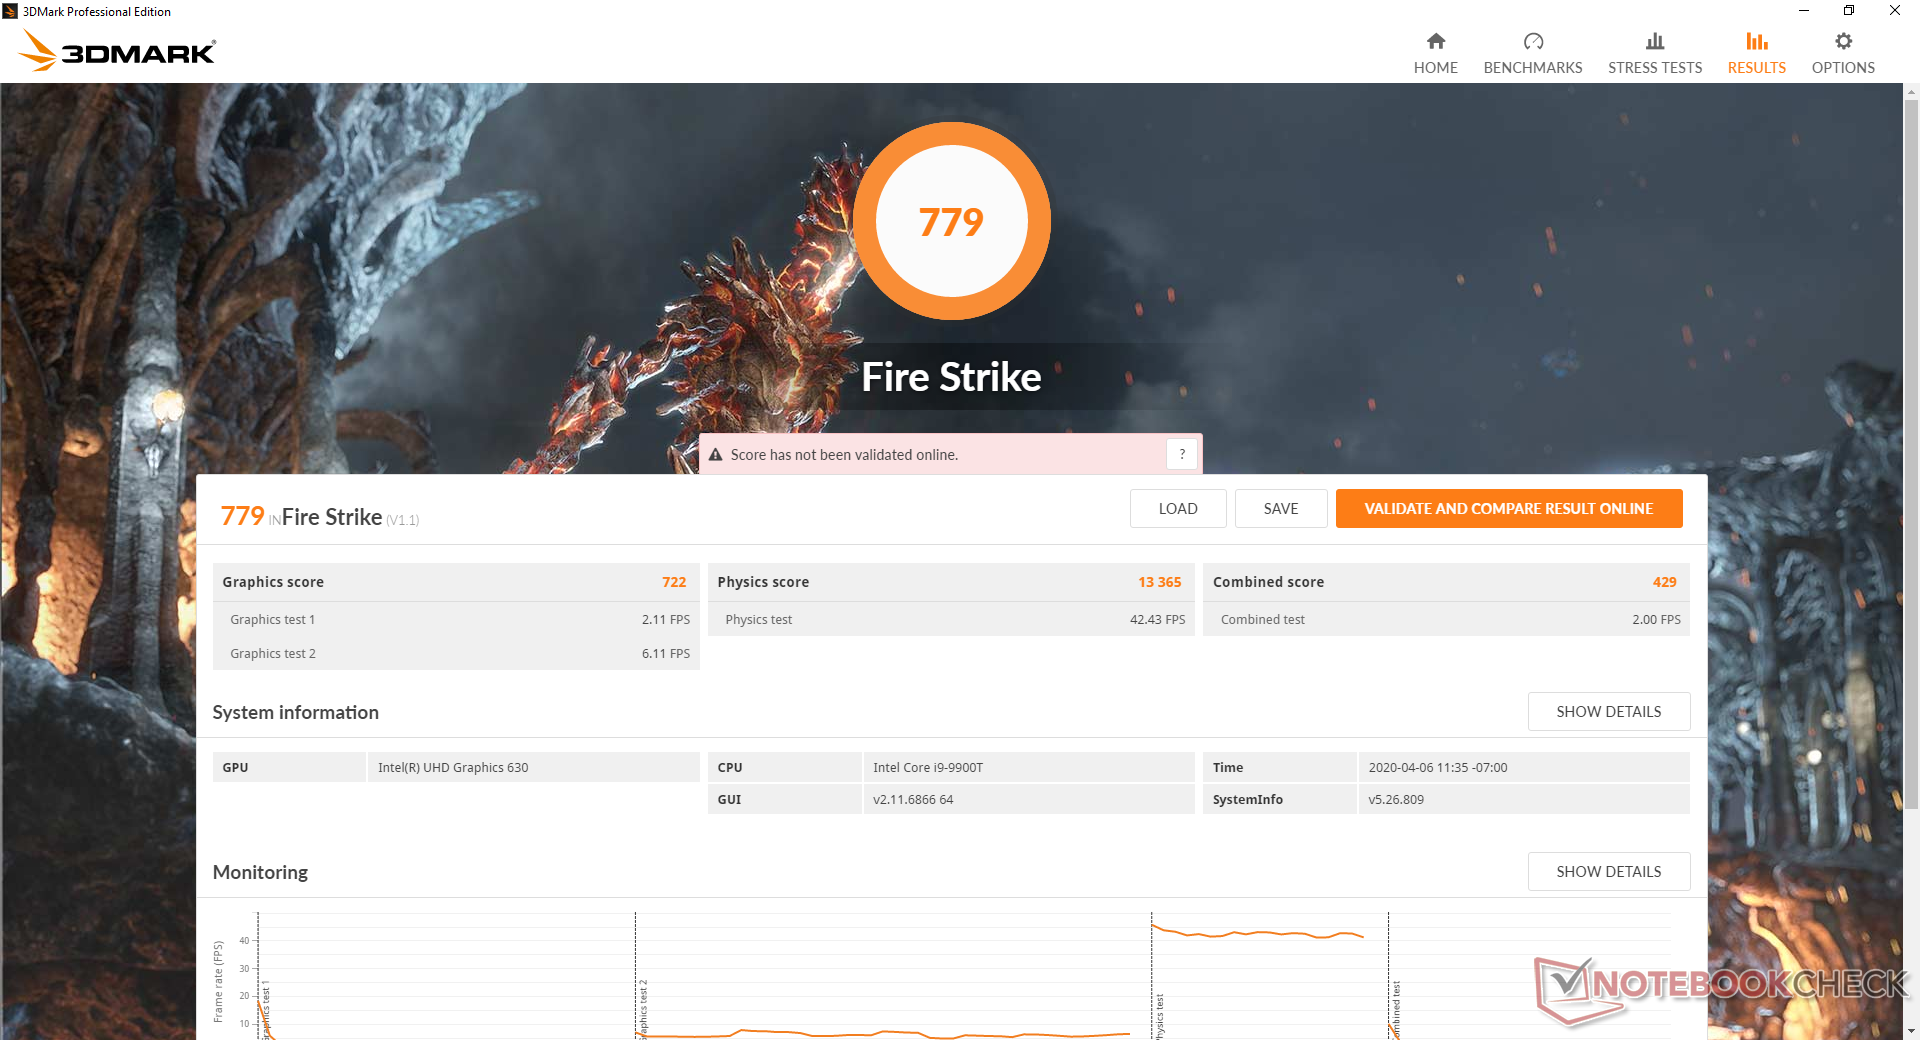
| 3DMark Fire Strike Score | 779 points | |
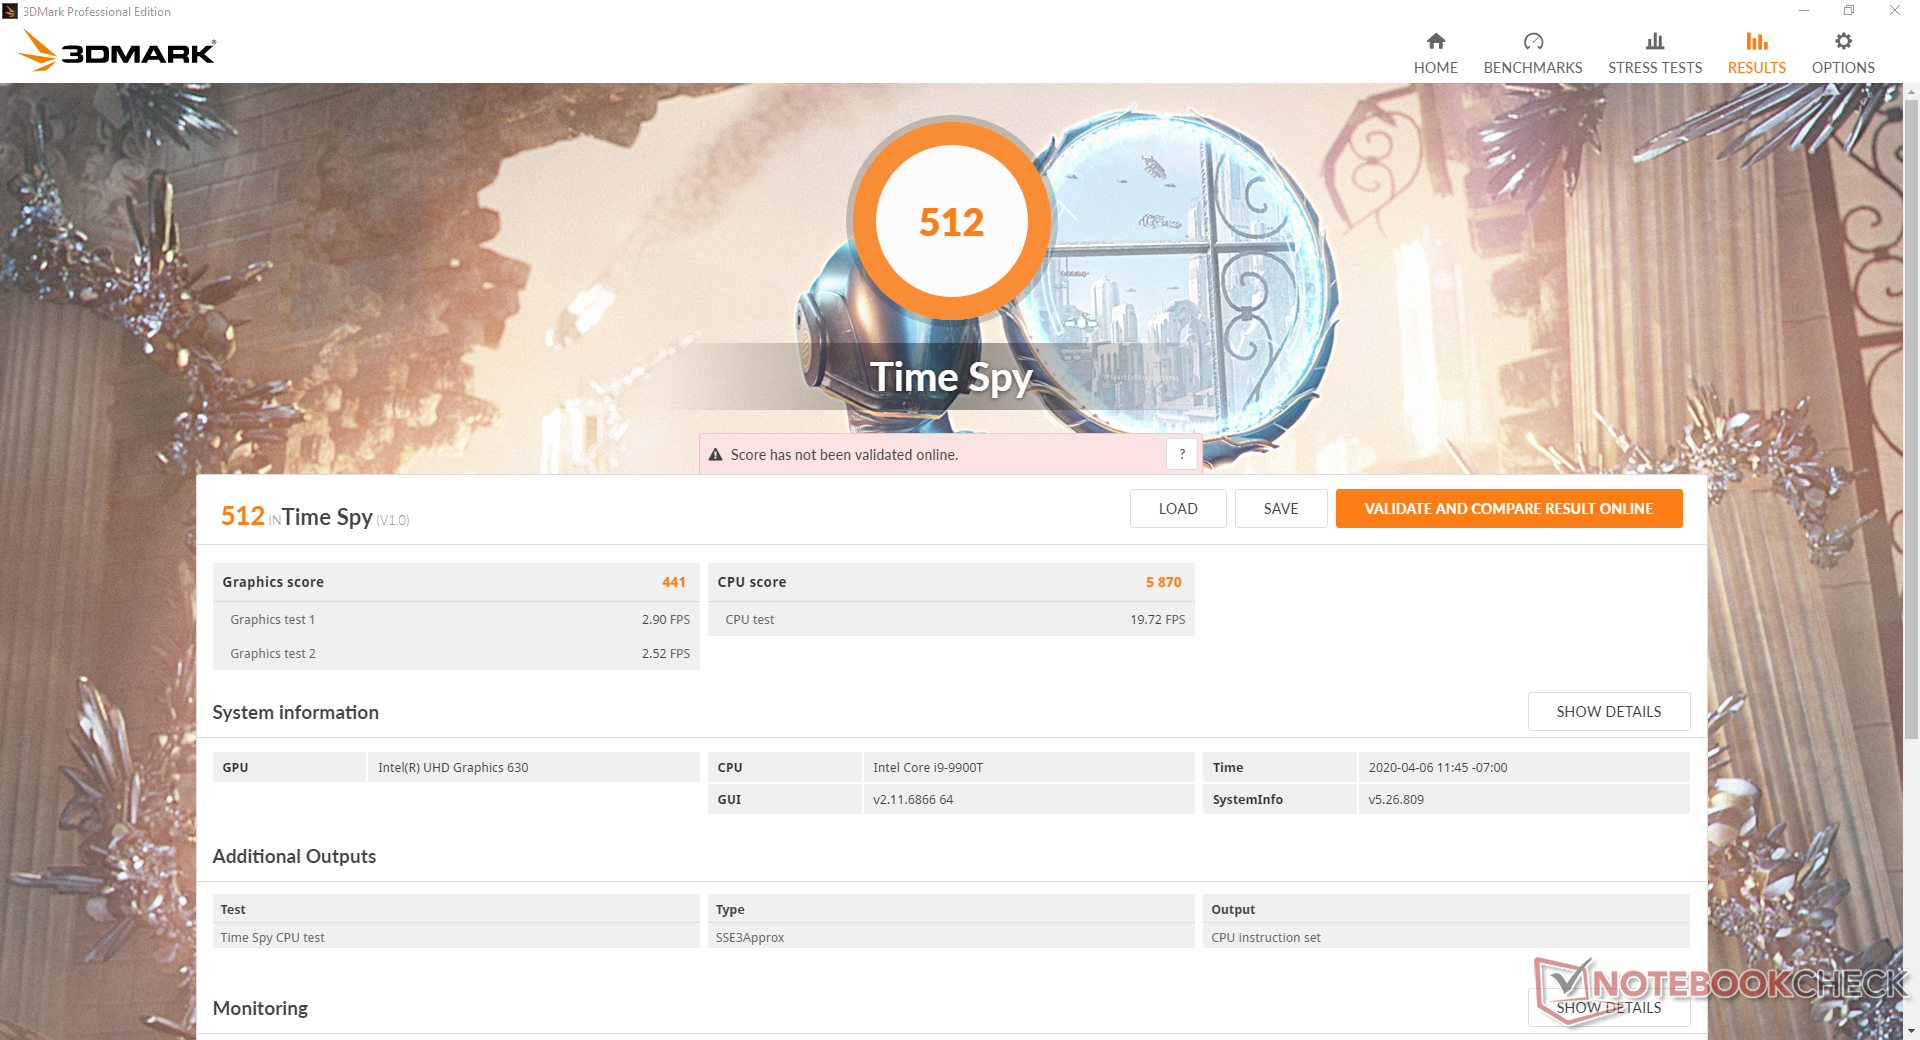
| 3DMark Time Spy Score | 512 points | |
Help | ||
| low | med. | high | ultra | |
| Dota 2 Reborn (2015) | 70.4 | 44.8 | 7.8 | 6.8 |
| X-Plane 11.11 (2018) | 12.7 | 11 | 11 |
Emissions
Temperature
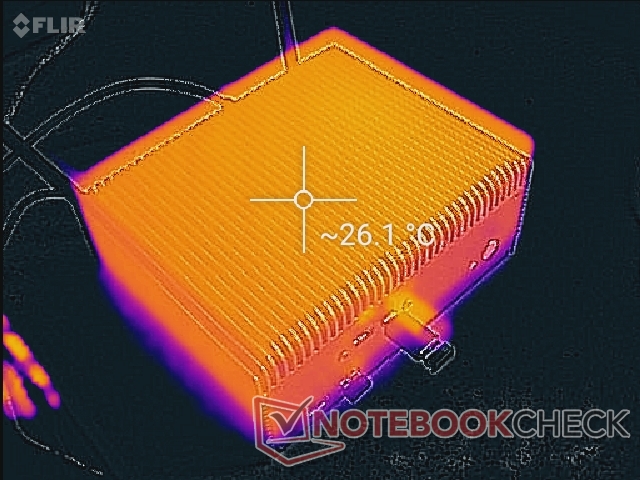
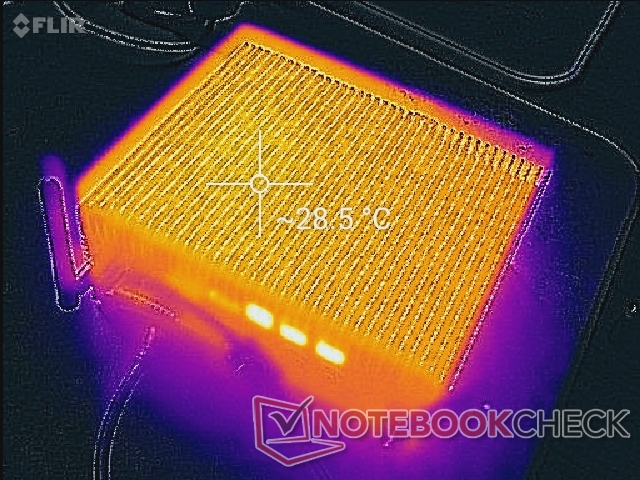
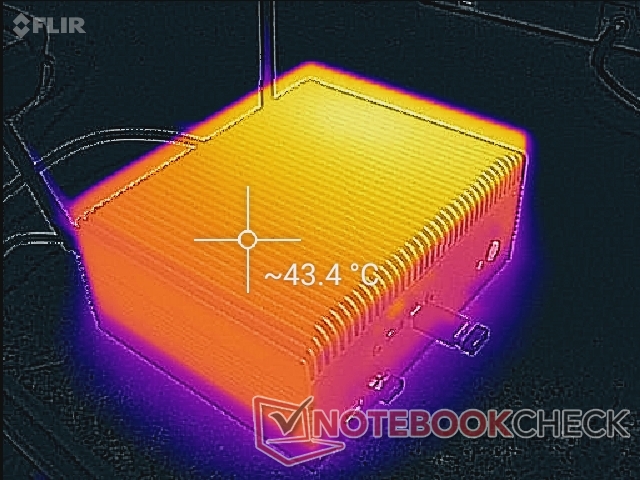
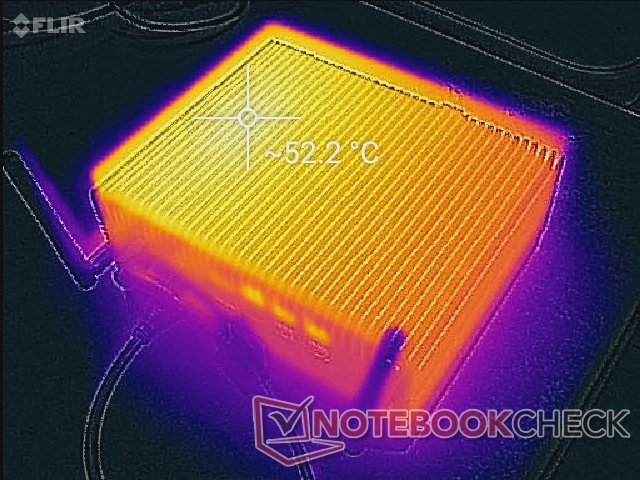
We're able to record surface temperatures just under 30 C when idling on desktop for just over an hour. When under maximum processor stress, the large heat sink can become as warm as 43 C to 53 C as shown by our temperature maps below. The right side of the mini PC will be noticeably warmer than the left due to how the CPU is positioned underneath. Of course, it's not recommended to place any books or novelties on top of the system which owners of other mini PCs may do.
Because of the throttling behavior of the system, however, surface temperatures will eventually fall and stabilize from the aforementioned 53 C to just 39 C.
Stress Test
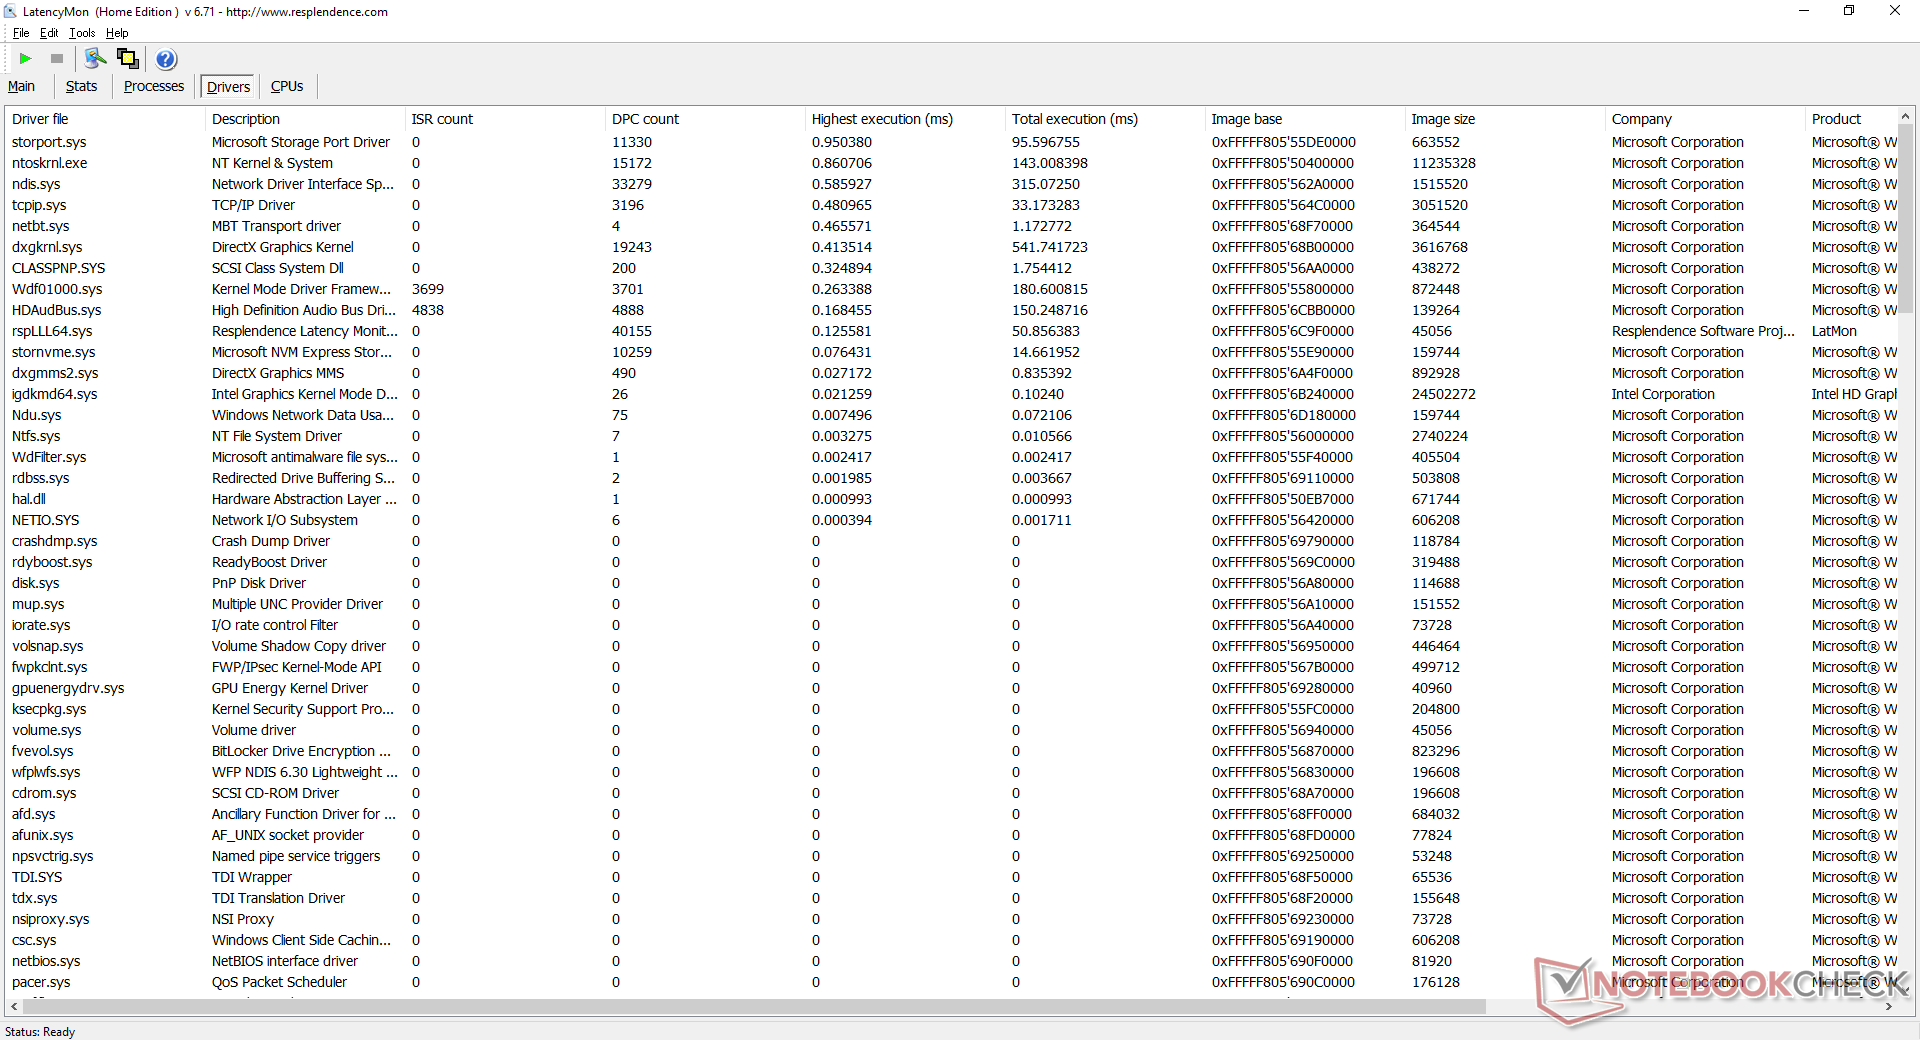
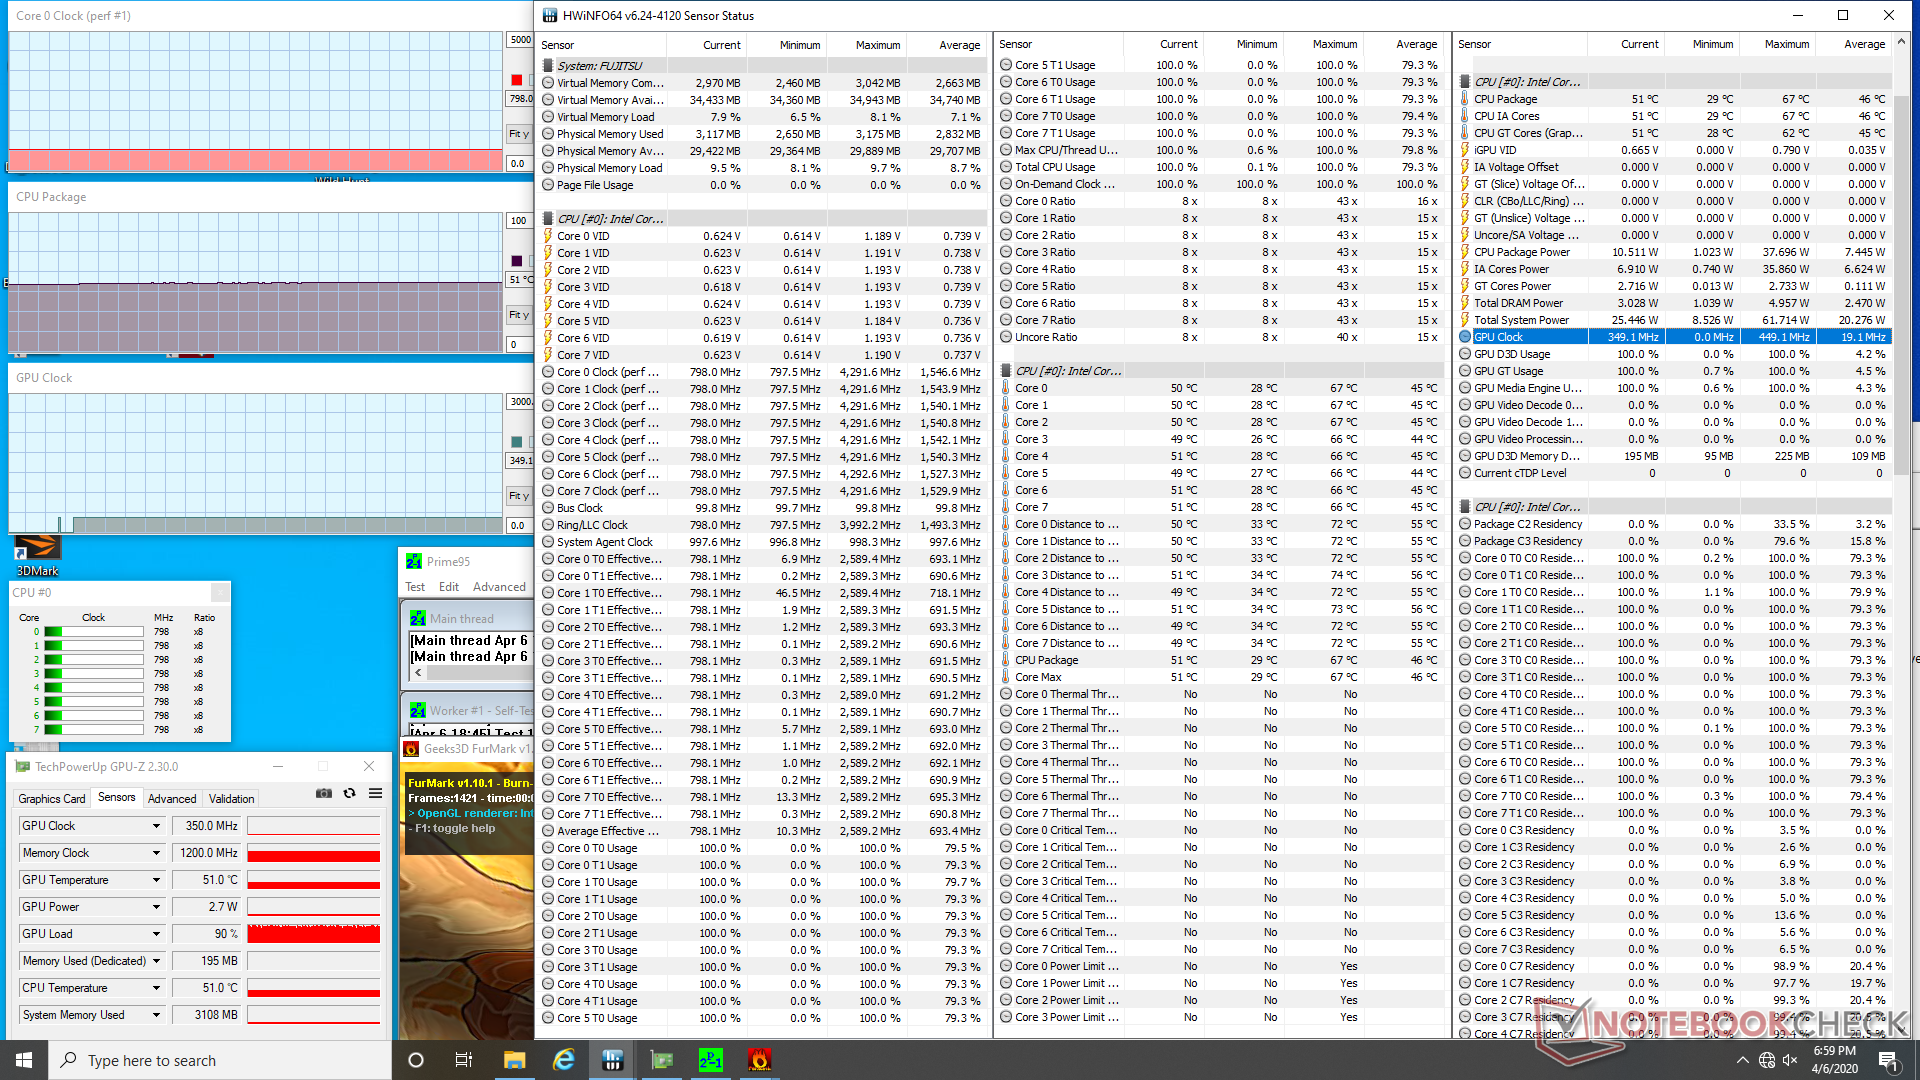
We stress the mini PC with synthetic loads and monitor system vitals with HWiNFO to identify for any potential throttling issues. When running Prime95, CPU clock rate will boost up to 2.6 GHz for about 20 seconds before falling slightly to the 2.3 to 2.4 GHz range. Core temperature would slowly rise until hitting 67 C where clock rates will then plateau down to just 800 MHz for a cooler core temperature of 48 C. Similar results can be observed when running CineBench R15 Multi-Thread in a loop; clock rates will run at about 2.5 to 2.7 GHz until hitting a temperature ceiling of 79 C. Thereafter, clock rates will fall to just 800 MHz in order to maintain a cooler core temperature.
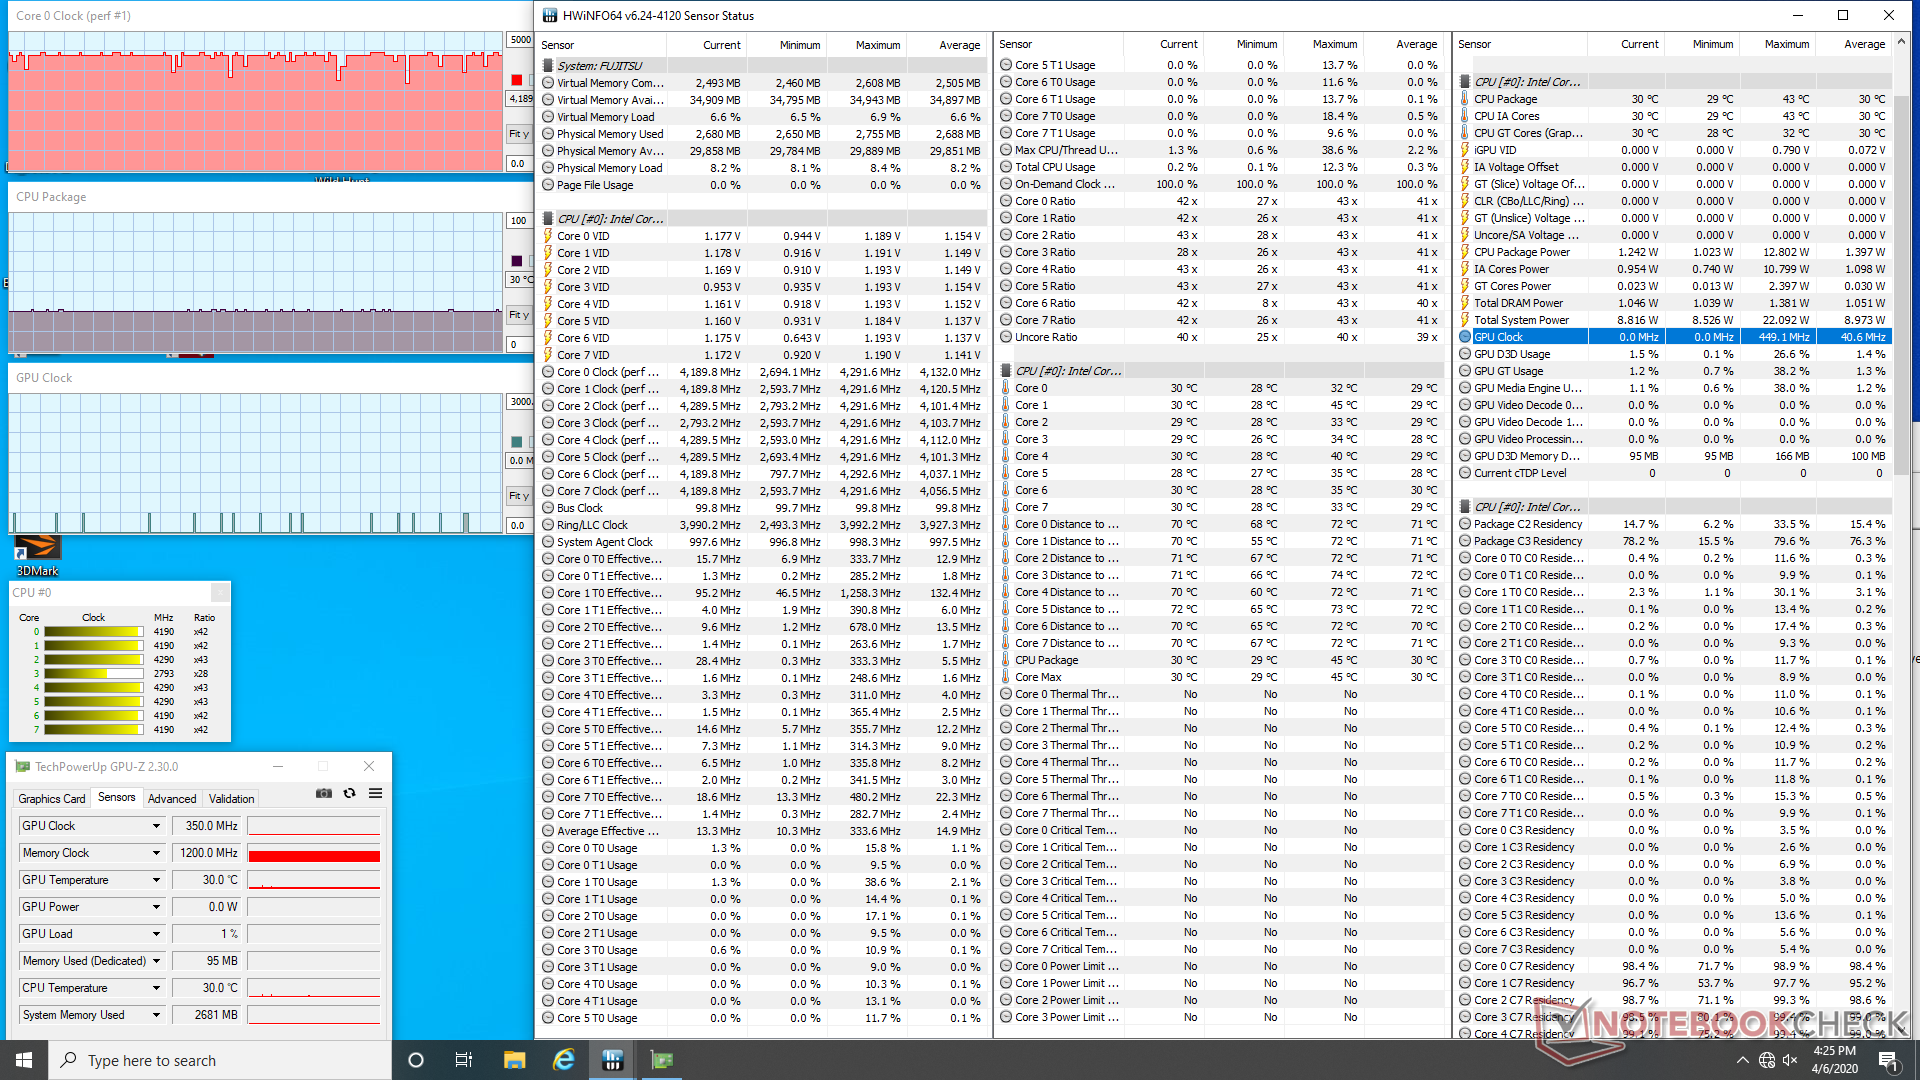
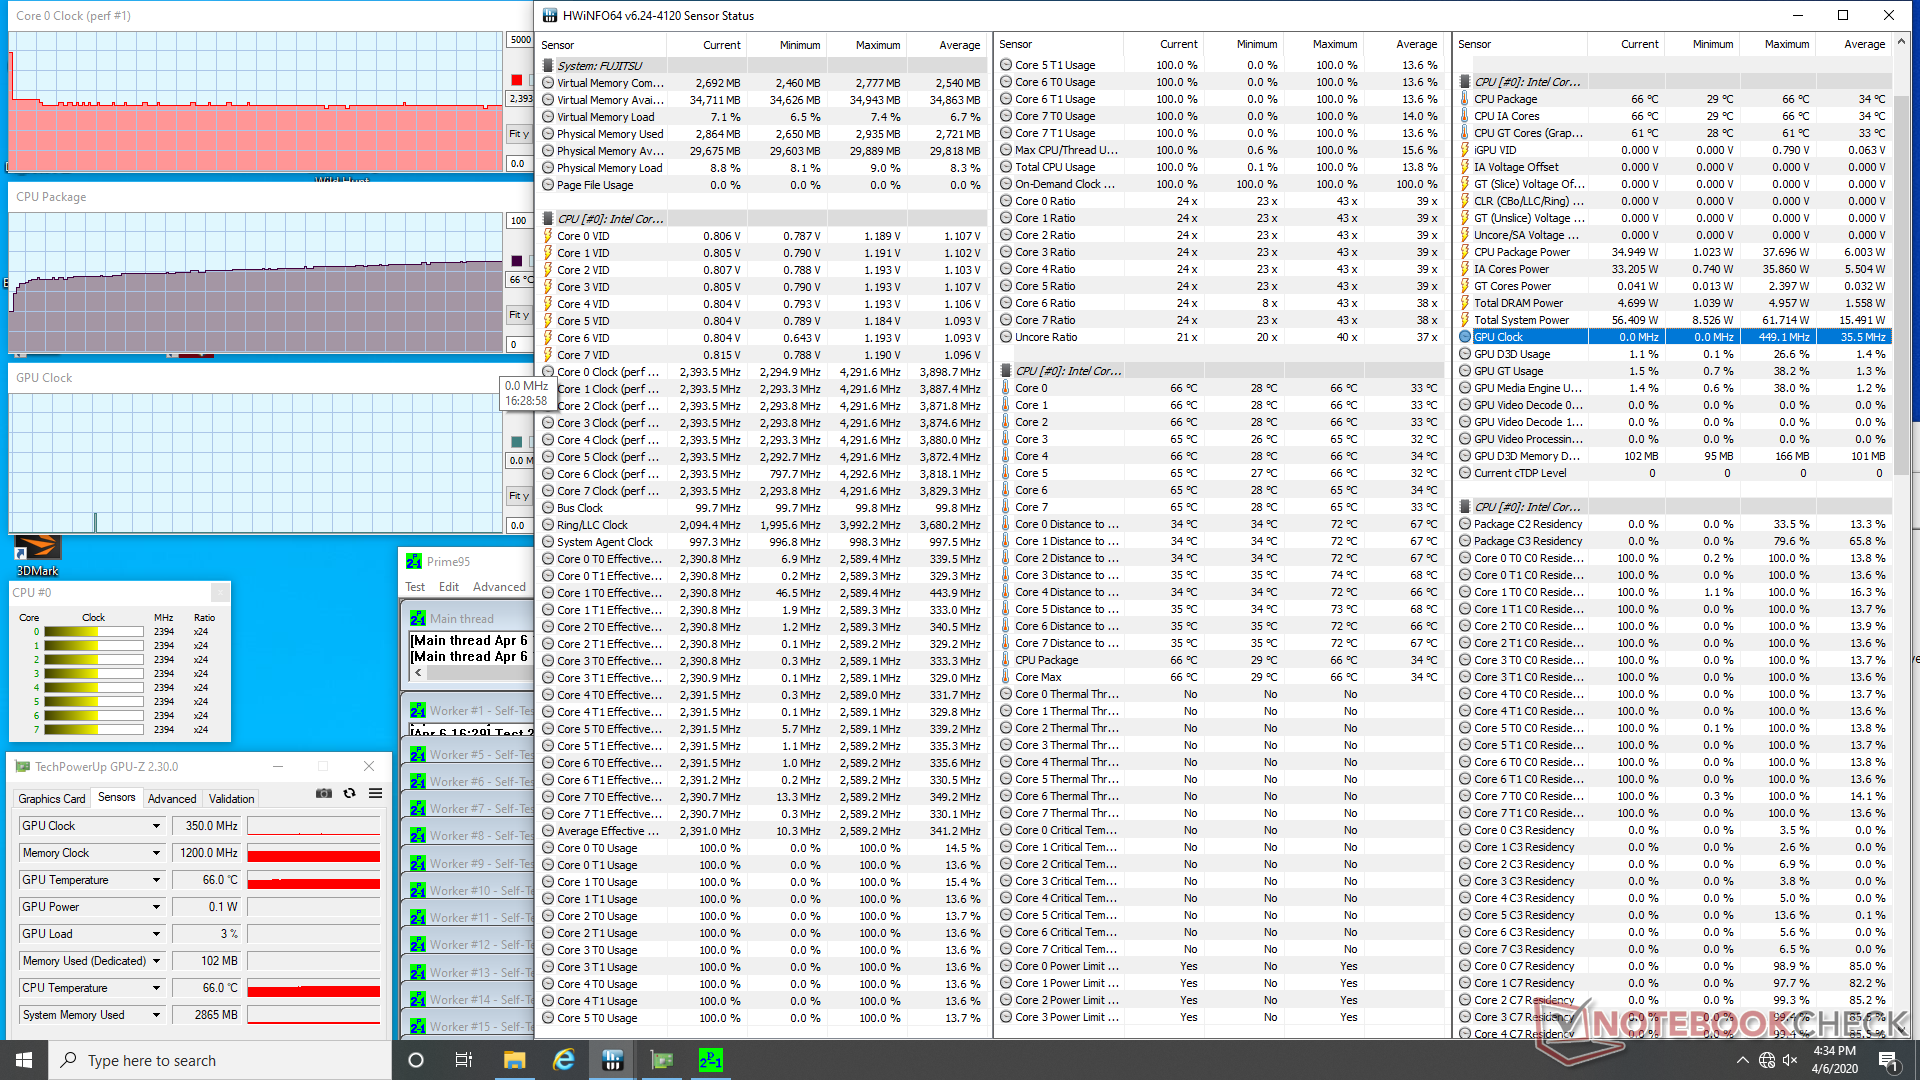
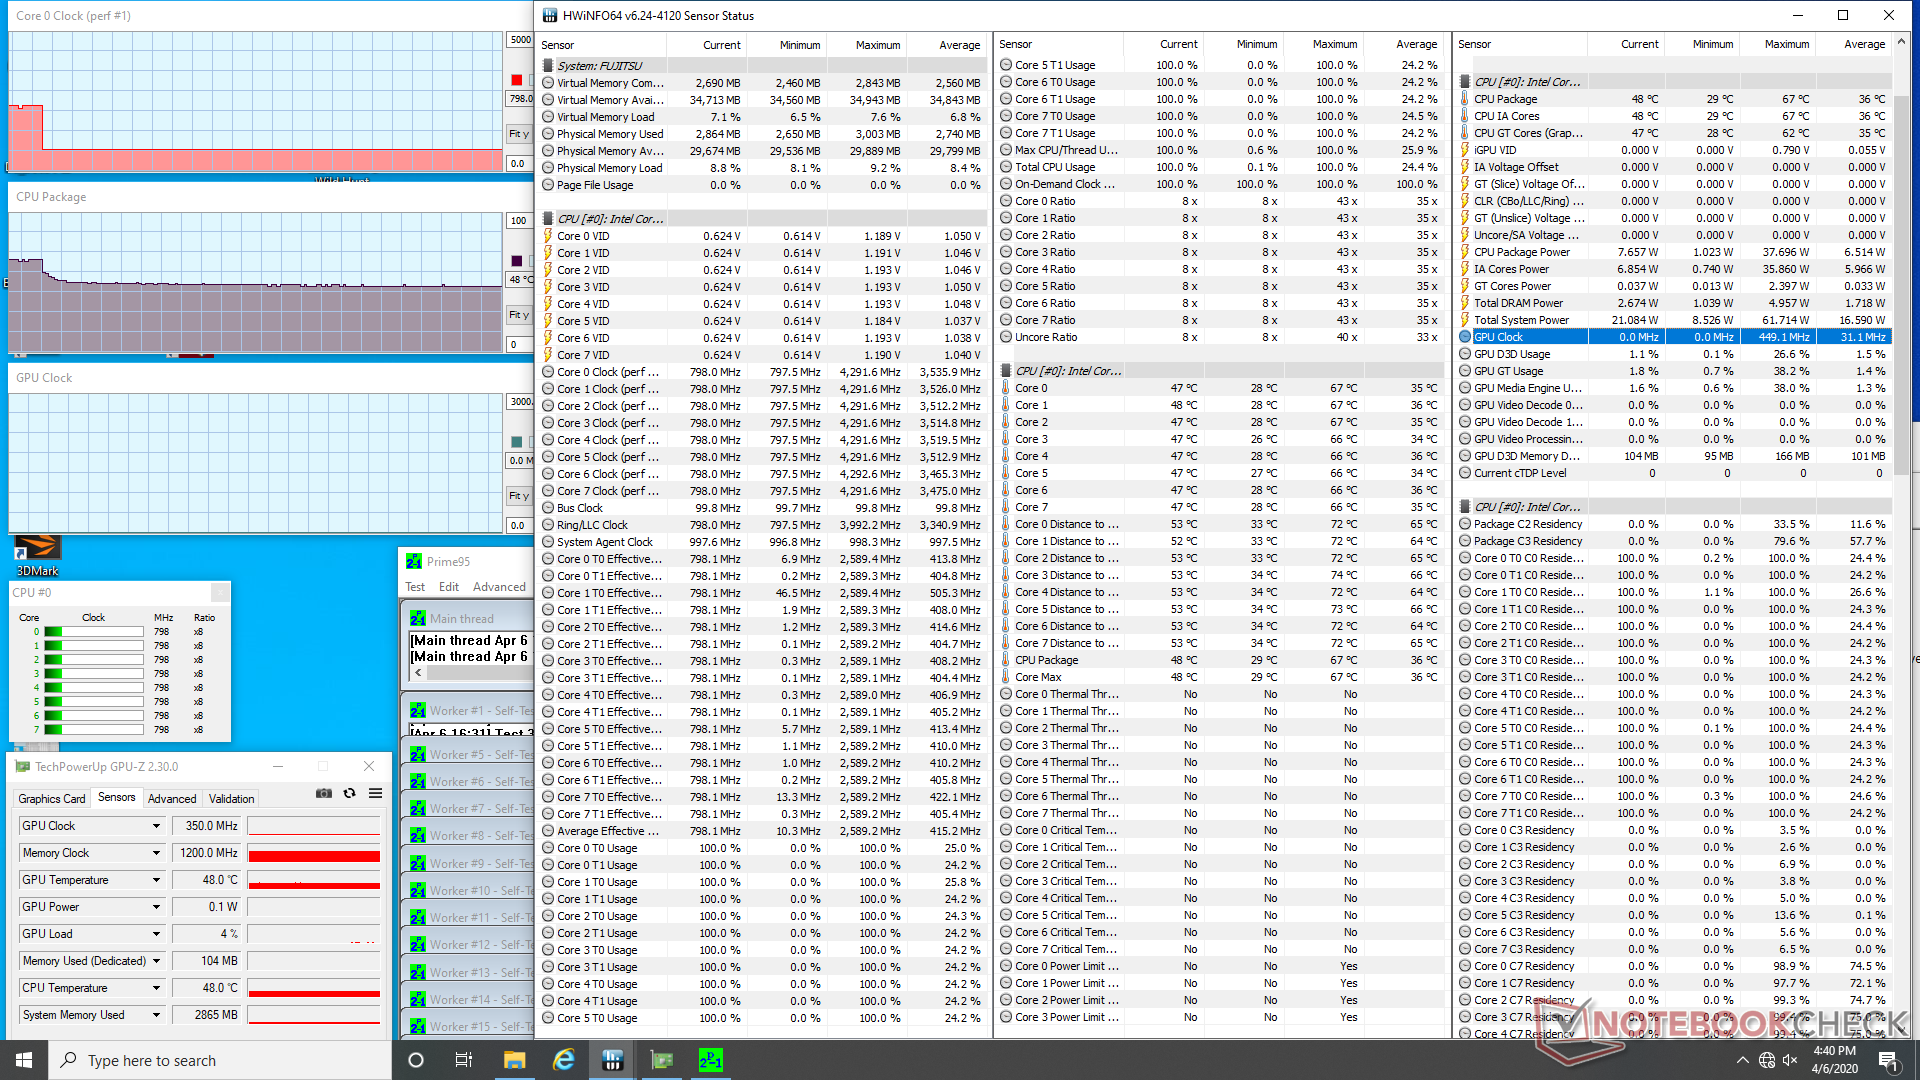
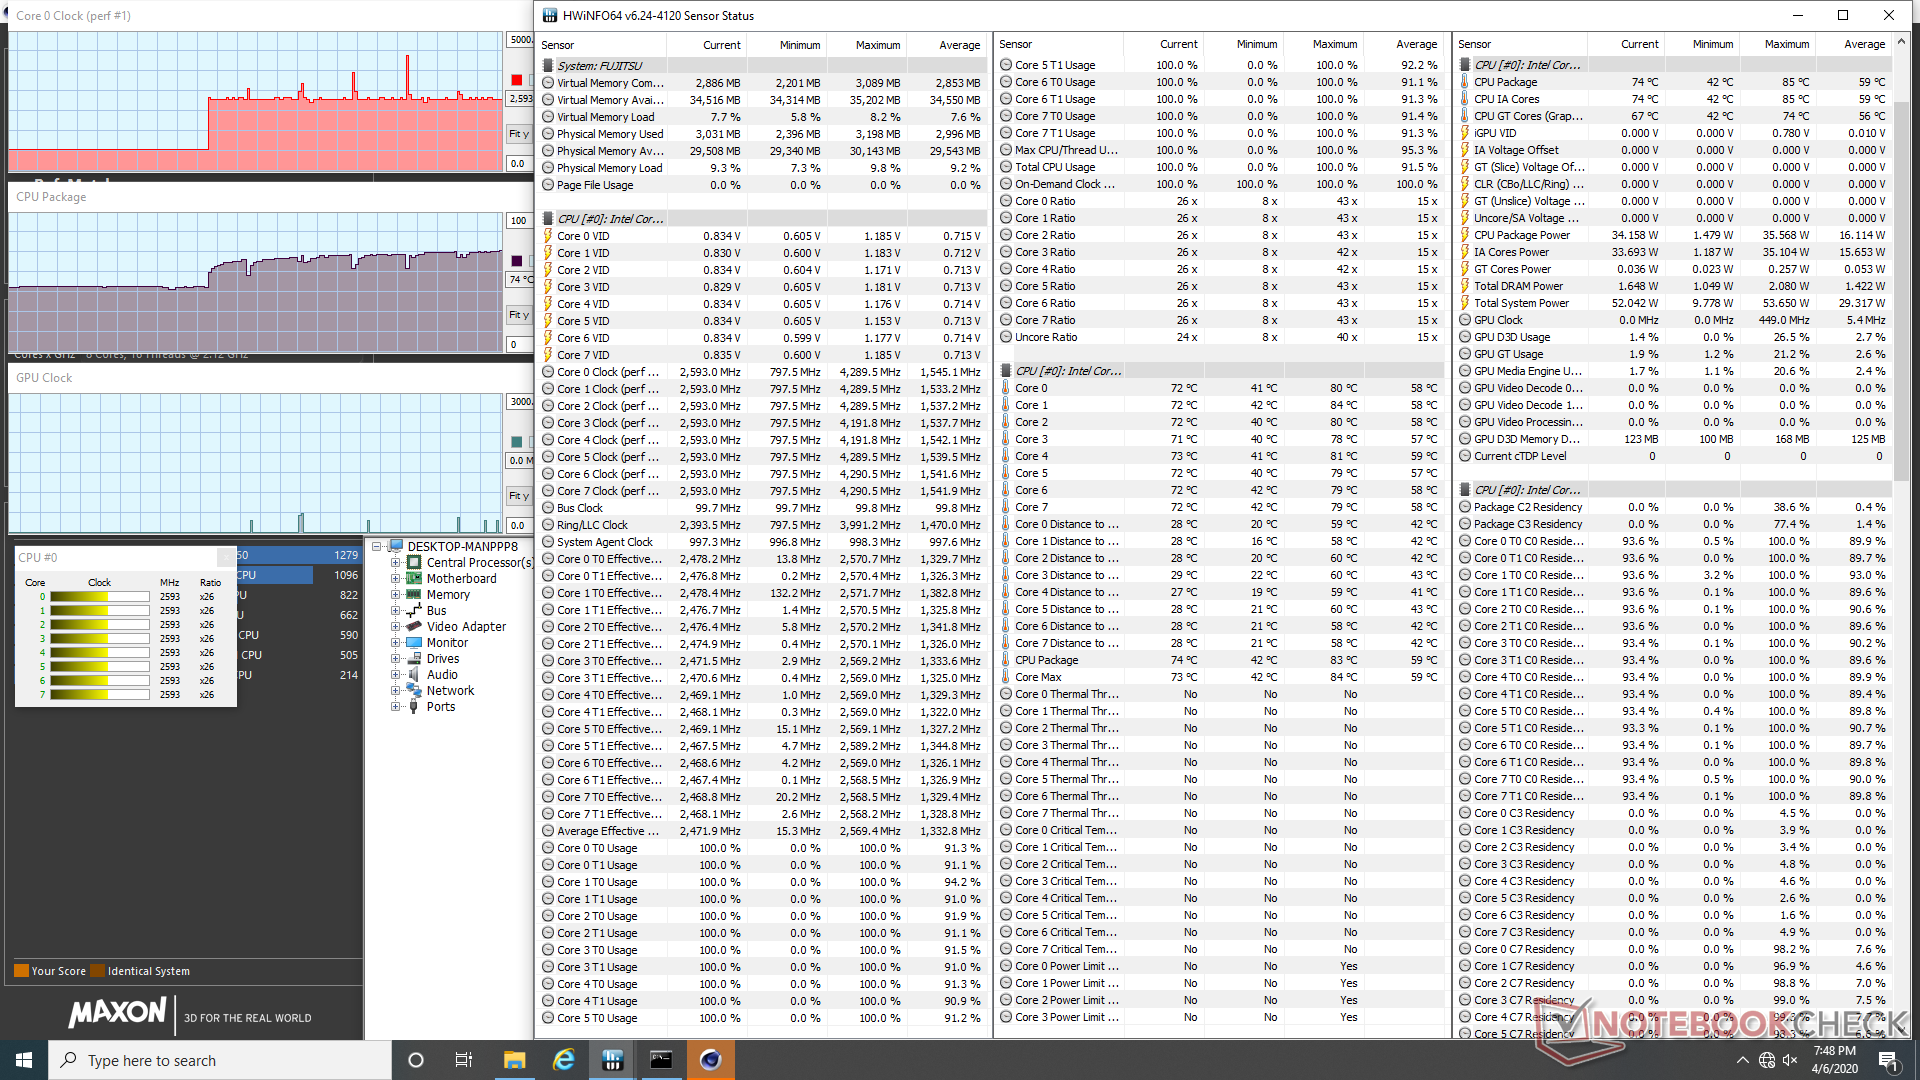
| CPU Clock (GHz) | GPU Clock (MHz) | Average CPU Temperature (°C) | |
| System Idle | -- | -- | 30 |
| Prime95 Stress | 0.8 - 2.4 | -- | 59 - 77 |
| Prime95 + FurMark Stress | 0.8 | 350 | 51 |
Energy Management
Power Consumption
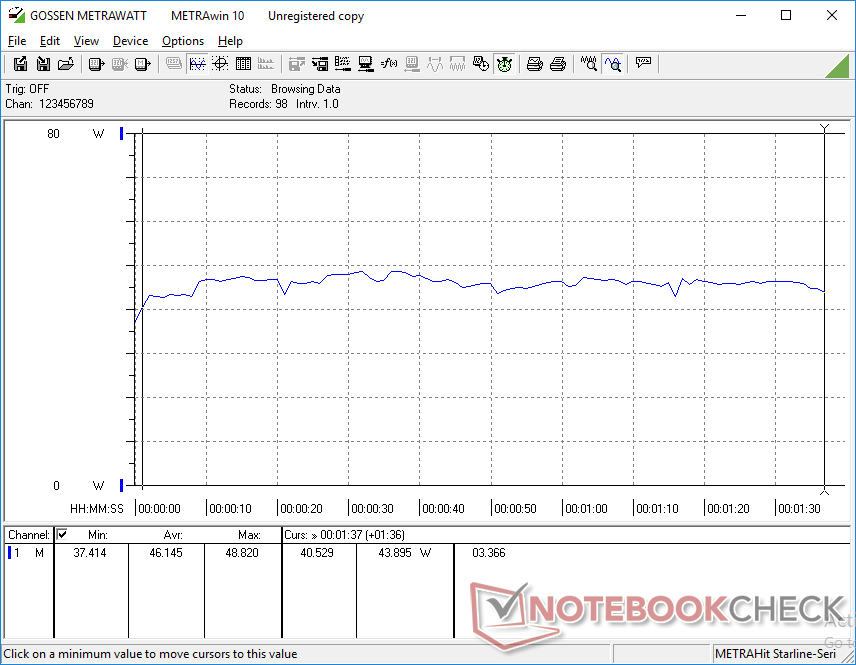
Idling demands between 6 W and 9 W to be very similar to what we recorded on the latest Intel Frost Canyon NUC. Running more stressful loads like 3DMark 06 will draw upwards of 46 W.
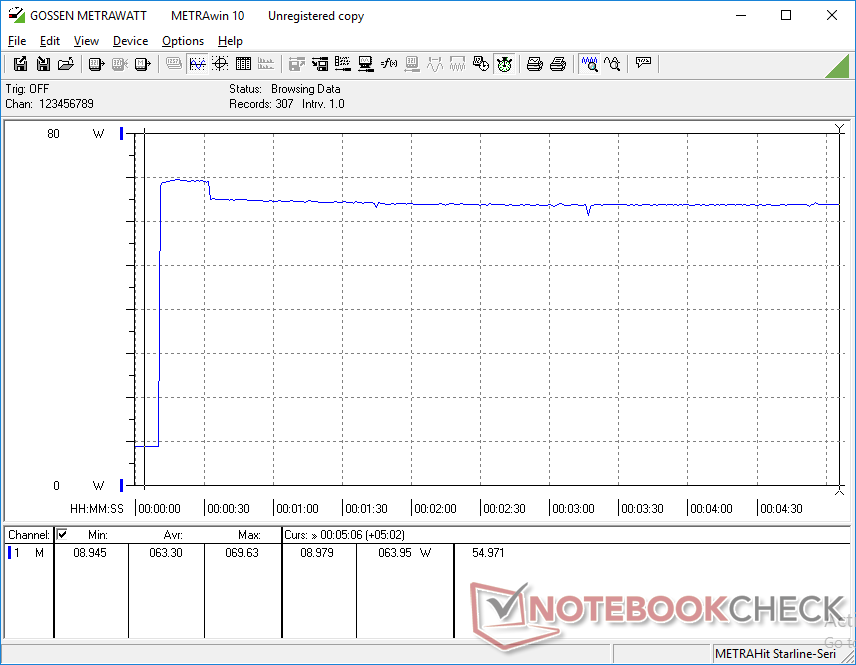
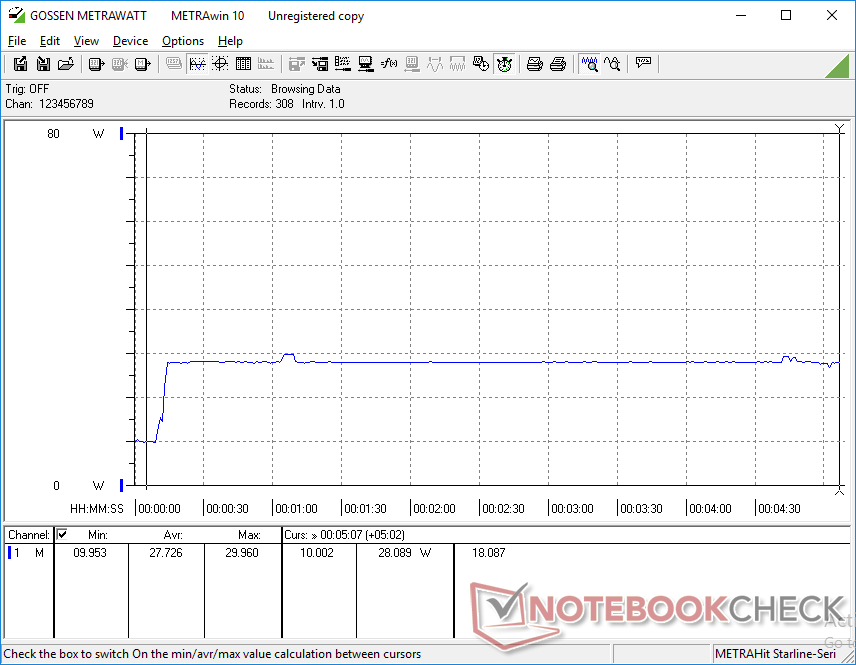
We're able to record a maximum draw of 69.7 W from the small (10.5 x 4.5 x 3 cm) 65 W AC adapter after initiating Prime95. However, this high of a consumption lasts for only 20 seconds before falling slightly to 64 C as shown by our graphs below. The initial boost corresponds with our Prime95 stress test observations above where the maximum clock rate of 2.6 GHz was also only attainable for about 20 seconds.
If CPU clock rates throttle to 800 MHz as mentioned earlier in the review, power consumption will fall even further to just 28 W.
| Off / Standby | |
| Idle | |
| Load |
|
| Impact Display Solutions IMP-3654-B1-R Core i9-9900T i9-9900T, UHD Graphics 630, EDGE NextGen SSD 1TB, , x, | Zotac ZBOX-QK7P3000 i7-7700T, Quadro P3000, Samsung SSD 960 Pro 512 GB m.2, , x, | Zotac ZBOX Magnus EK71080 i7-7700HQ, GeForce GTX 1080 (Desktop), Samsung PM961 MZVLW256HEHP, , x, 0.00 | Intel Hades Canyon NUC8i7HVK i7-8809G, Vega M GH, Intel Optane 120 GB SSDPEK1W120GA, , x, | Lenovo Yoga C940-15IRH i7-9750H, GeForce GTX 1650 Max-Q, Intel Optane Memory H10 with Solid State Storage 32GB + 512GB HBRPEKNX0202A(L/H), IPS, 1920x1080, 15.60 | Apple MacBook Pro 16 2019 i9 5500M i9-9880H, Radeon Pro 5500M, Apple SSD AP1024 7171, IPS, 3072x1920, 16.00 | |
|---|---|---|---|---|---|---|
| Power Consumption | -137% | -211% | -110% | -74% | -48% | |
| Idle Minimum * | 6.6 | 19.9 -202% | 27.1 -311% | 15.5 -135% | 5.2 21% | 3.7 44% |
| Idle Average * | 8.3 | 20.3 -145% | 27.4 -230% | 16.2 -95% | 10.7 -29% | 12.1 -46% |
| Idle Maximum * | 8.8 | 27.6 -214% | 28.8 -227% | 16.5 -88% | 24.3 -176% | 17 -93% |
| Load Average * | 46.2 | 86.2 -87% | 100.4 -117% | 83.4 -81% | 84.4 -83% | 91.5 -98% |
| Load Maximum * | 69.7 | 96.3 -38% | 186.7 -168% | 173.5 -149% | 142.8 -105% | 102.3 -47% |
| Witcher 3 ultra * | 114.4 | 243.1 | 121.7 | 83.9 | 103 |
* ... smaller is better
Verdict
Can the Impact IMP-3654-B1-R Mini PC run a Core i9 CPU with just a heat sink? The answer is yes, but it's only for a limited time. When the system is fully stressed for long periods, clock rates will eventually throttle and fall off a cliff as we've demonstrated above in multiple instances. At its best, clock rates will stabilize at around 2.5 GHz for an overall multi-core performance level similar to the 45 W hexa-core Core i7-9750H even though the Core i9-9900T is a 35 W octa-core part. This is one of the fastest silent mini PCs you can find in that regard.
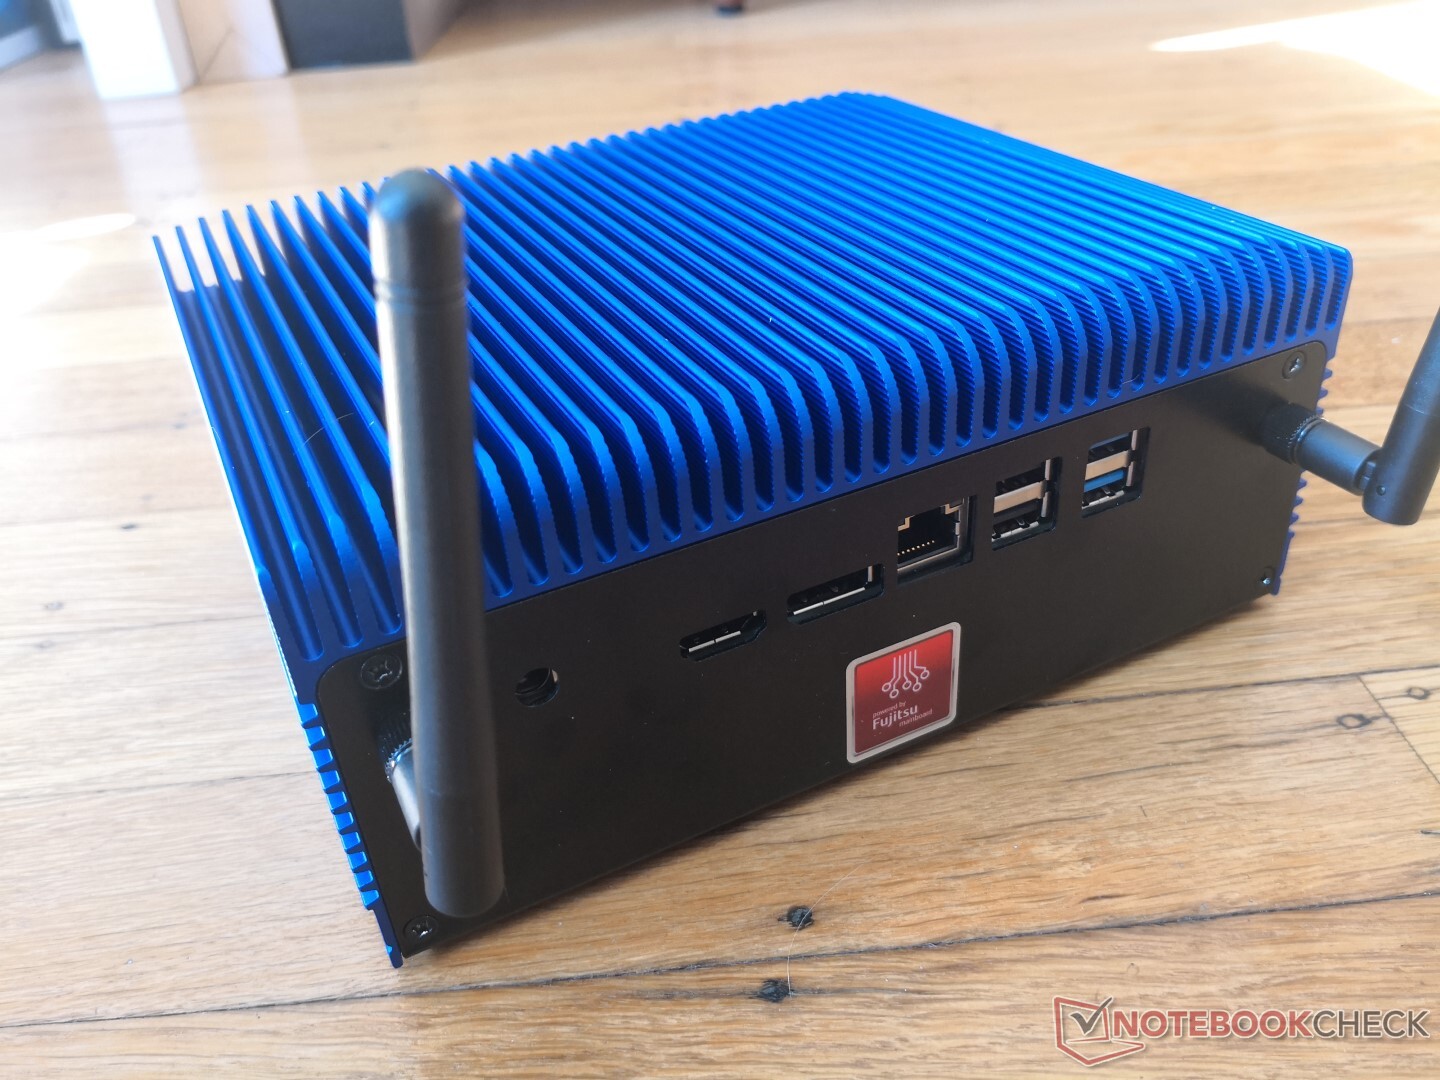
If you don't plan on running extreme processing loads for extended periods and only want the occasional boost in performance from a Core i9 CPU, then the silent IMP-3654-B1-R Mini PC should fit the bill. A Thunderbolt 3 port or SD reader would have expanded the versatility of the mini PC.
More articles related to this device
Impact Display Solutions IMP-3654-B1-R Core i9-9900T (IMP-3654-B1-R Series)Related Articles


