 Deutsch
 English
 Español
 Français
 Italiano
 Nederlands
 Polski
 Português
 Русский
 Türkçe
 Svenska
 Chinese
 Magyar
New CPU name, old CPU performance: Lenovo Slim 7 Pro Ryzen 7 7735HS laptop review

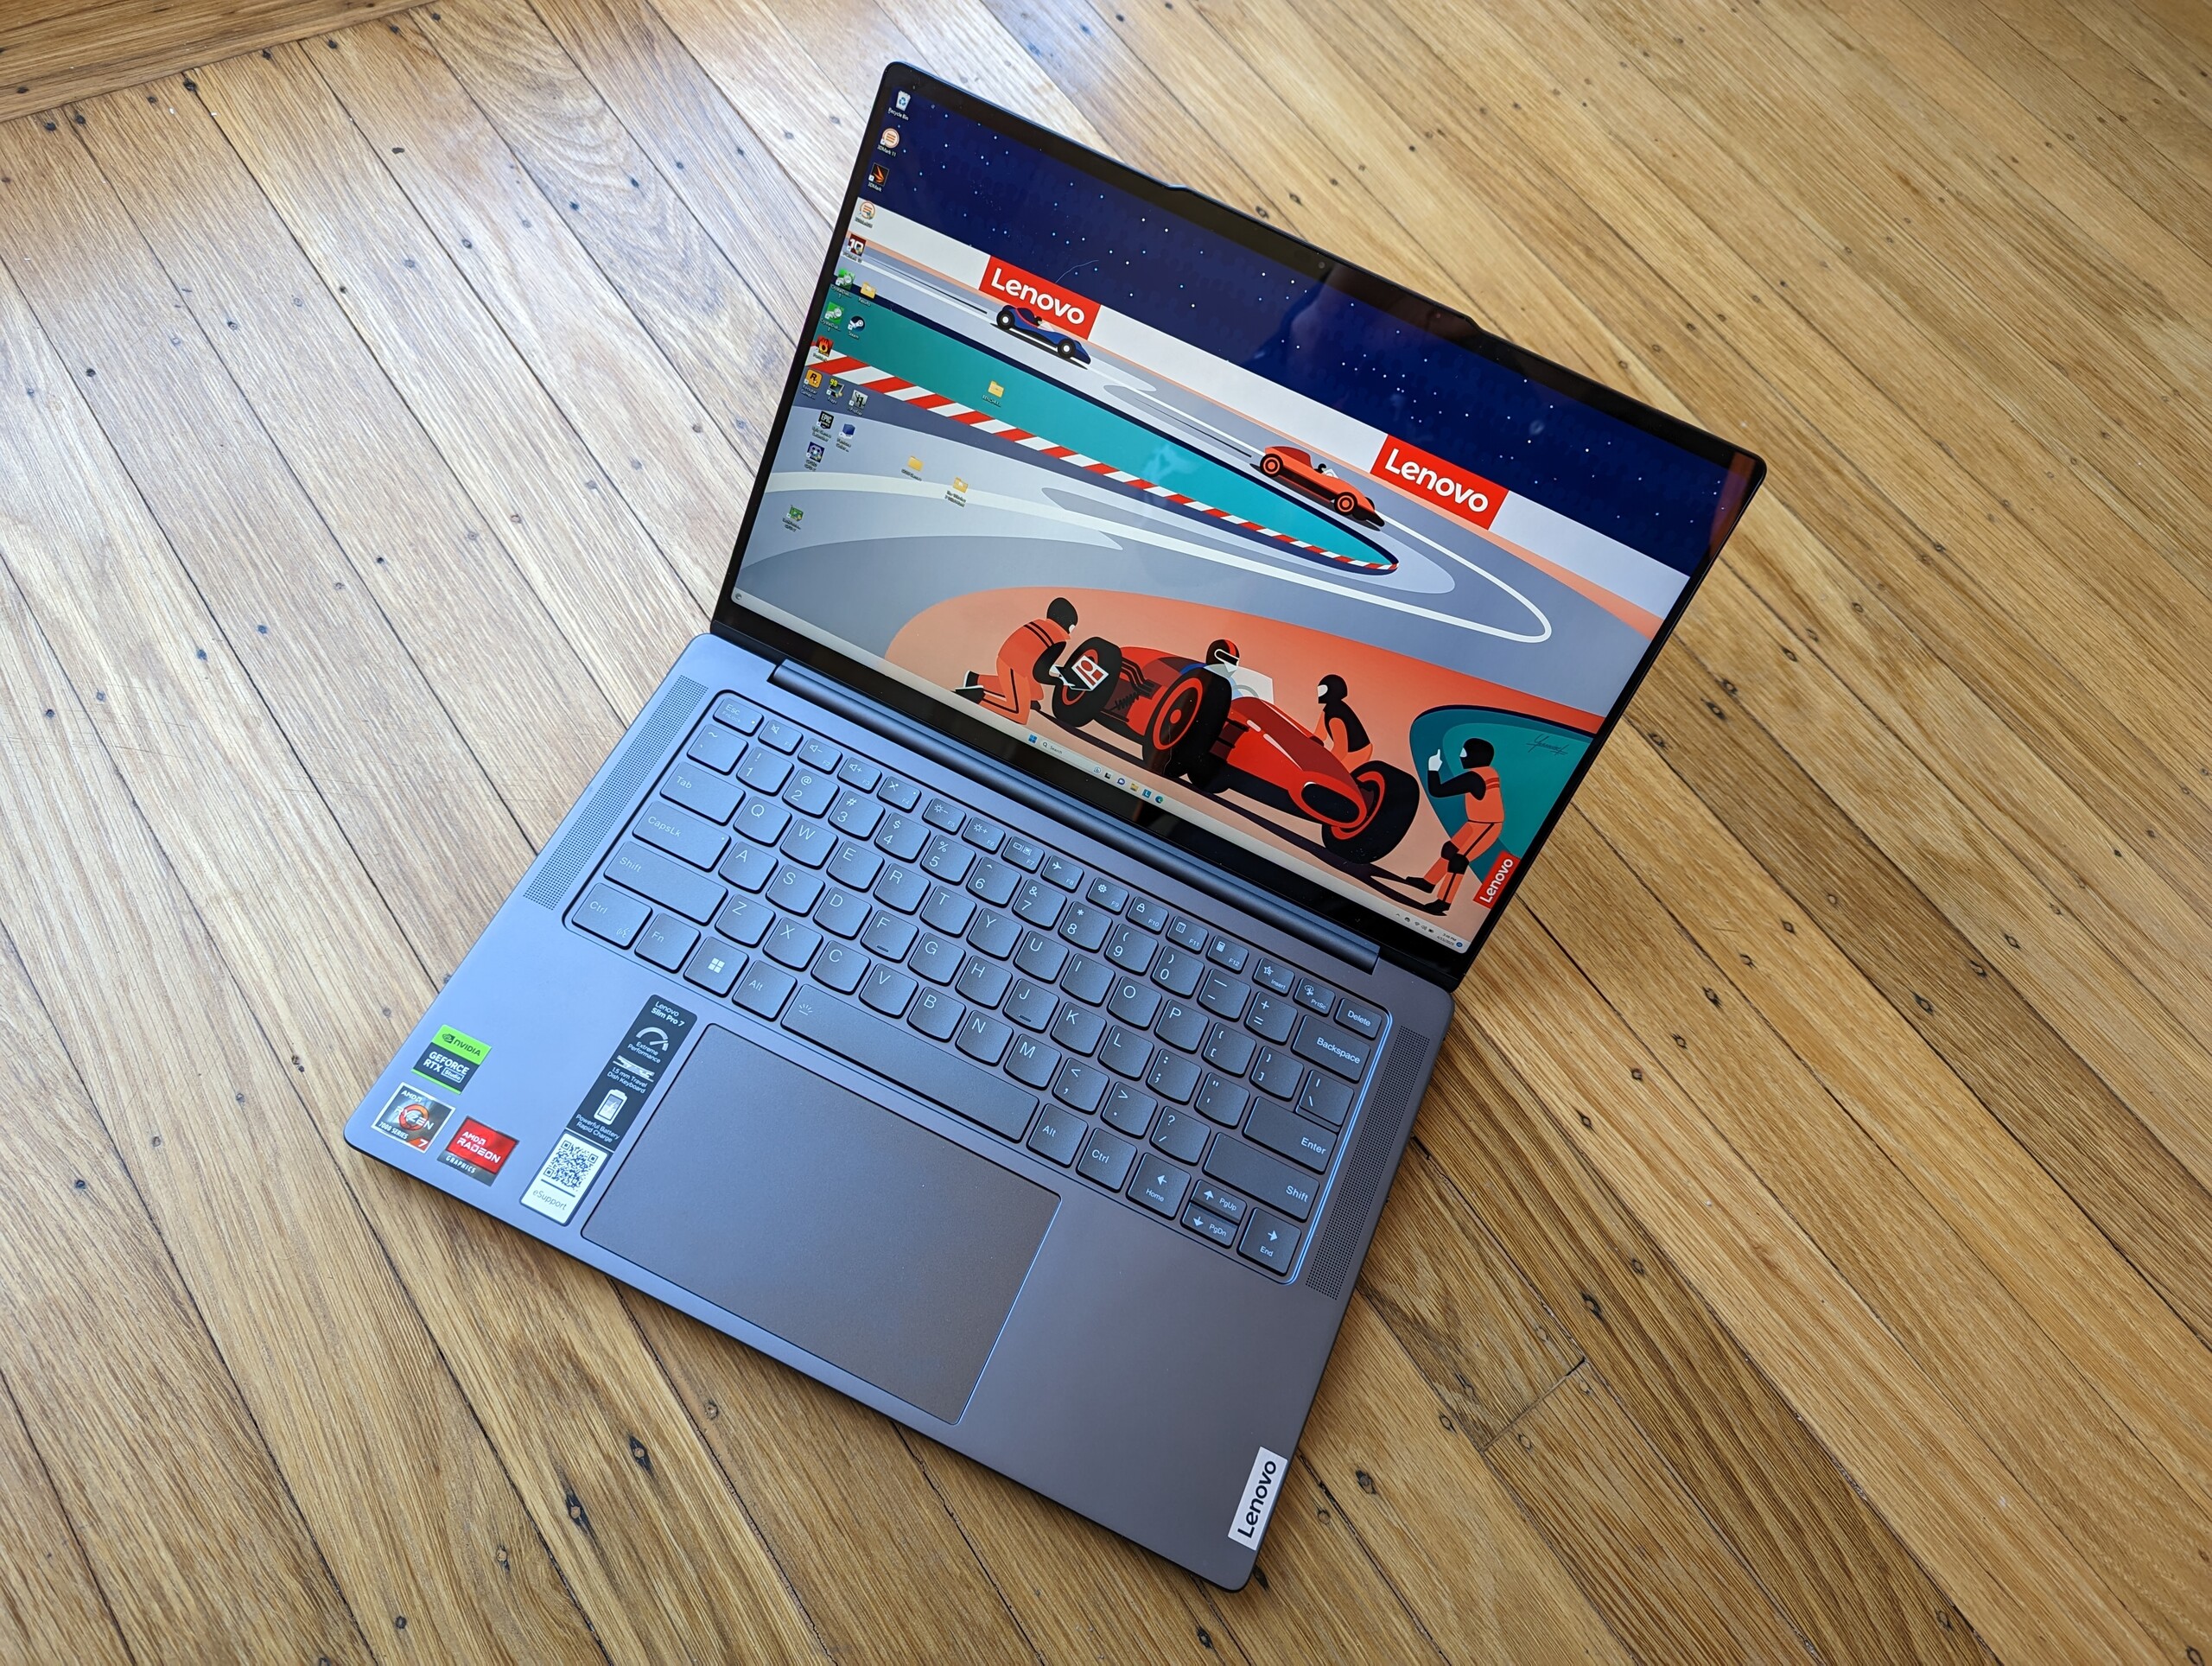
Lenovo has refreshed its ultralight Slim 7 Pro series this year with the new Zen 3+ Ryzen 7 7735HS CPU to replace last year's Core i7-12700H and Ryzen 9 6900HS options. Graphics has been slightly upgraded as well from the 4 GB GeForce RTX 3050 to the 6 GB version of the same GPU. Other than some internal changes, however, the exterior chassis remains almost exactly the same. We recommend checking out our existing two reviews on the Yoga Slim 7i Pro X and Slim 7 Pro X to learn more about the physical features of the series.
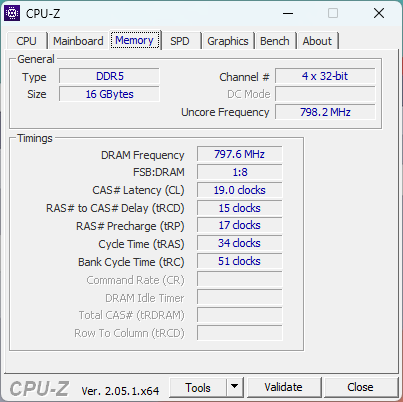
SKUs range from the Ryzen 7 7735HS to the Ryzen 7 7840HS CPU with a 14.5-inch 2.5K (2560 x 1600) or 3K (3072 x 1920) IPS touchscreen covering sRGB and DCI-P3, respectively. All options carry 16 GB of soldered LPDDR5 RAM and a 6 GB GeForce RTX 3050 GPU at the moment. Our particular configuration is the lower-end SKU retailing for $1200 USD at Best Buy.
Competitors to the Slim 7 Pro include other upper midrange 14-inch multimedia laptops like the Asus VivoBook 14, Honor MagicBook series, Dell Inspiron 14 Plus 7420, or the 13.5-inch HP Spectre x360 13.5.
More Lenovo reviews:
Potential Competitors in Comparison
Rating | Date | Model | Weight | Height | Size | Resolution | Best Price |
|---|---|---|---|---|---|---|---|
| 89.2 % | 04/2023 | Lenovo Slim Pro 7 14ARP8 R7 7735HS, GeForce RTX 3050 6GB Laptop GPU | 1.6 kg | 15.6 mm | 14.50" | 2560x1600 | |
| 86.9 % | 02/2023 | Lenovo Slim 7 Pro X 14ARH7 R9 6900HS, GeForce RTX 3050 4GB Laptop GPU | 1.6 kg | 15.9 mm | 14.50" | 3072x1920 | |
| 89.3 % | 03/2023 | Lenovo Yoga 9 14IRP G8 i7-1360P, Iris Xe G7 96EUs | 1.4 kg | 15.25 mm | 14.00" | 2880x1800 | |
| 89.4 % | 05/2023 | Gigabyte Aero 14 OLED BMF i7-13700H, NVIDIA GeForce RTX 4050 Laptop GPU | 1.4 kg | 17 mm | 14.00" | 2880x1800 | |
| 86.6 % | 10/2022 | LG Gram 14Z90Q i5-1240P, Iris Xe G7 80EUs | 980 g | 16.8 mm | 14.00" | 1920x1200 | |
| 87.2 % | 08/2022 | Dell Inspiron 14 Plus 7420 i7-12700H, GeForce RTX 3050 4GB Laptop GPU | 1.7 kg | 18.87 mm | 14.00" | 2240x1400 |
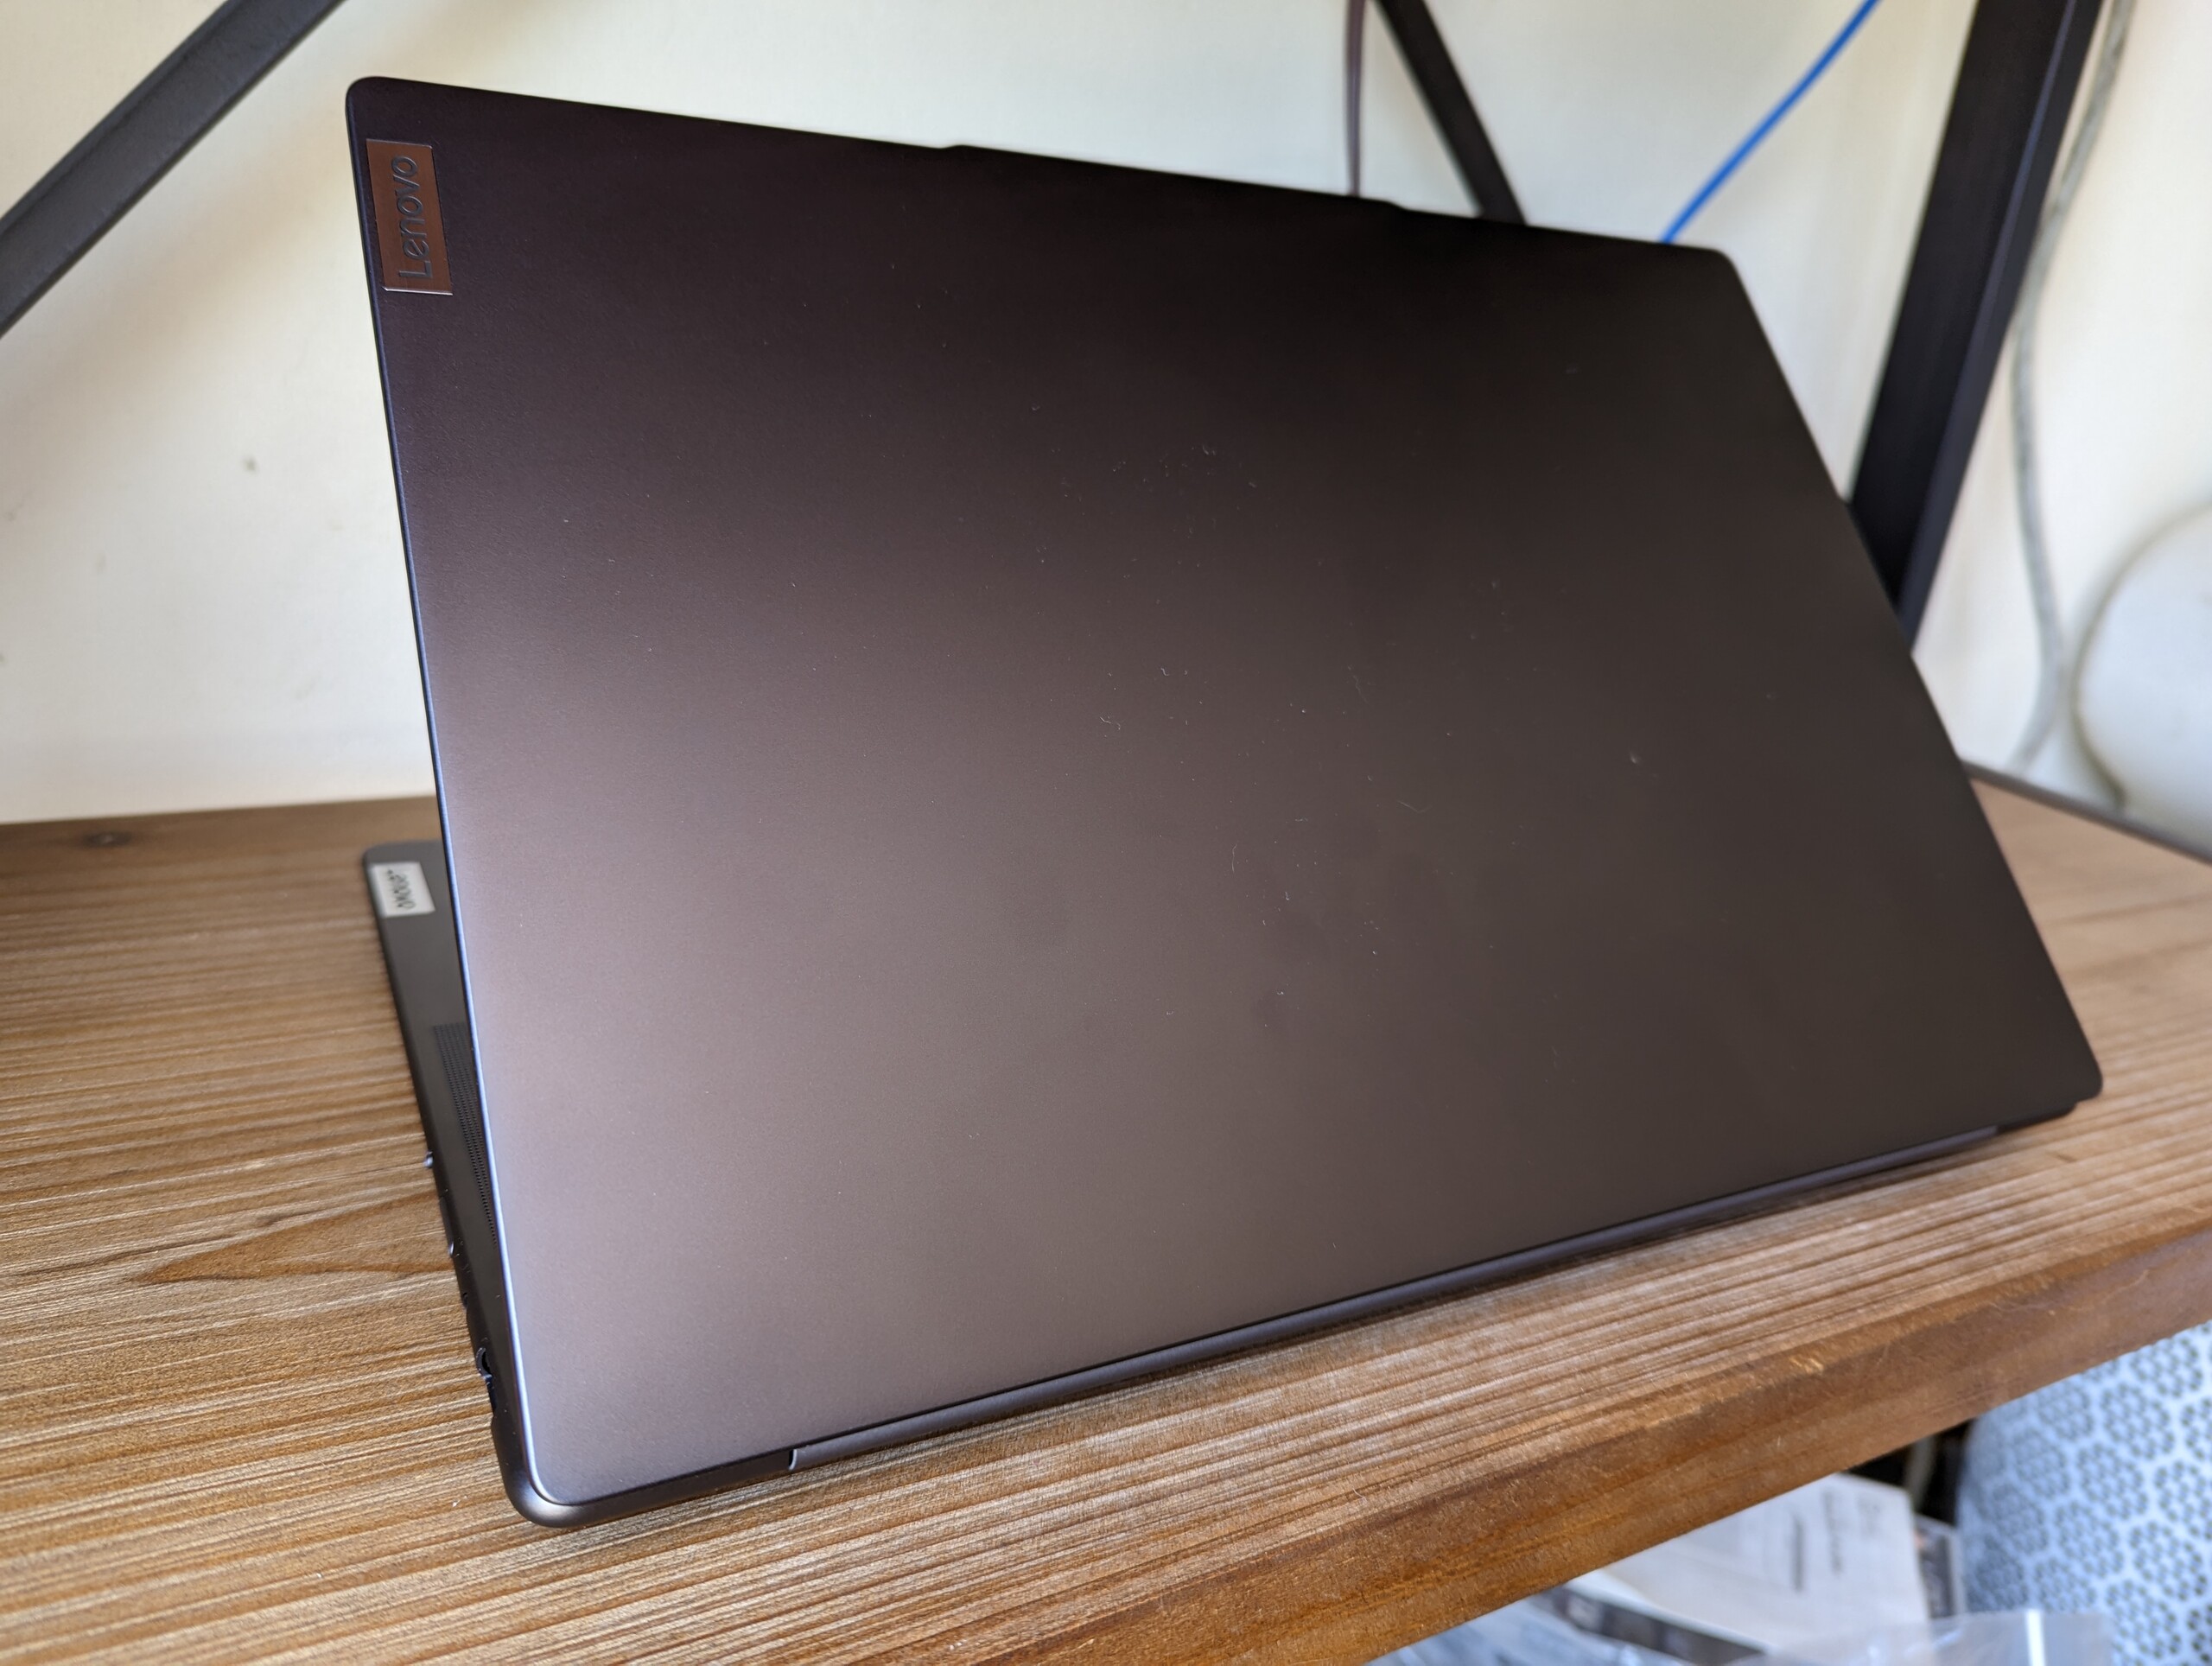
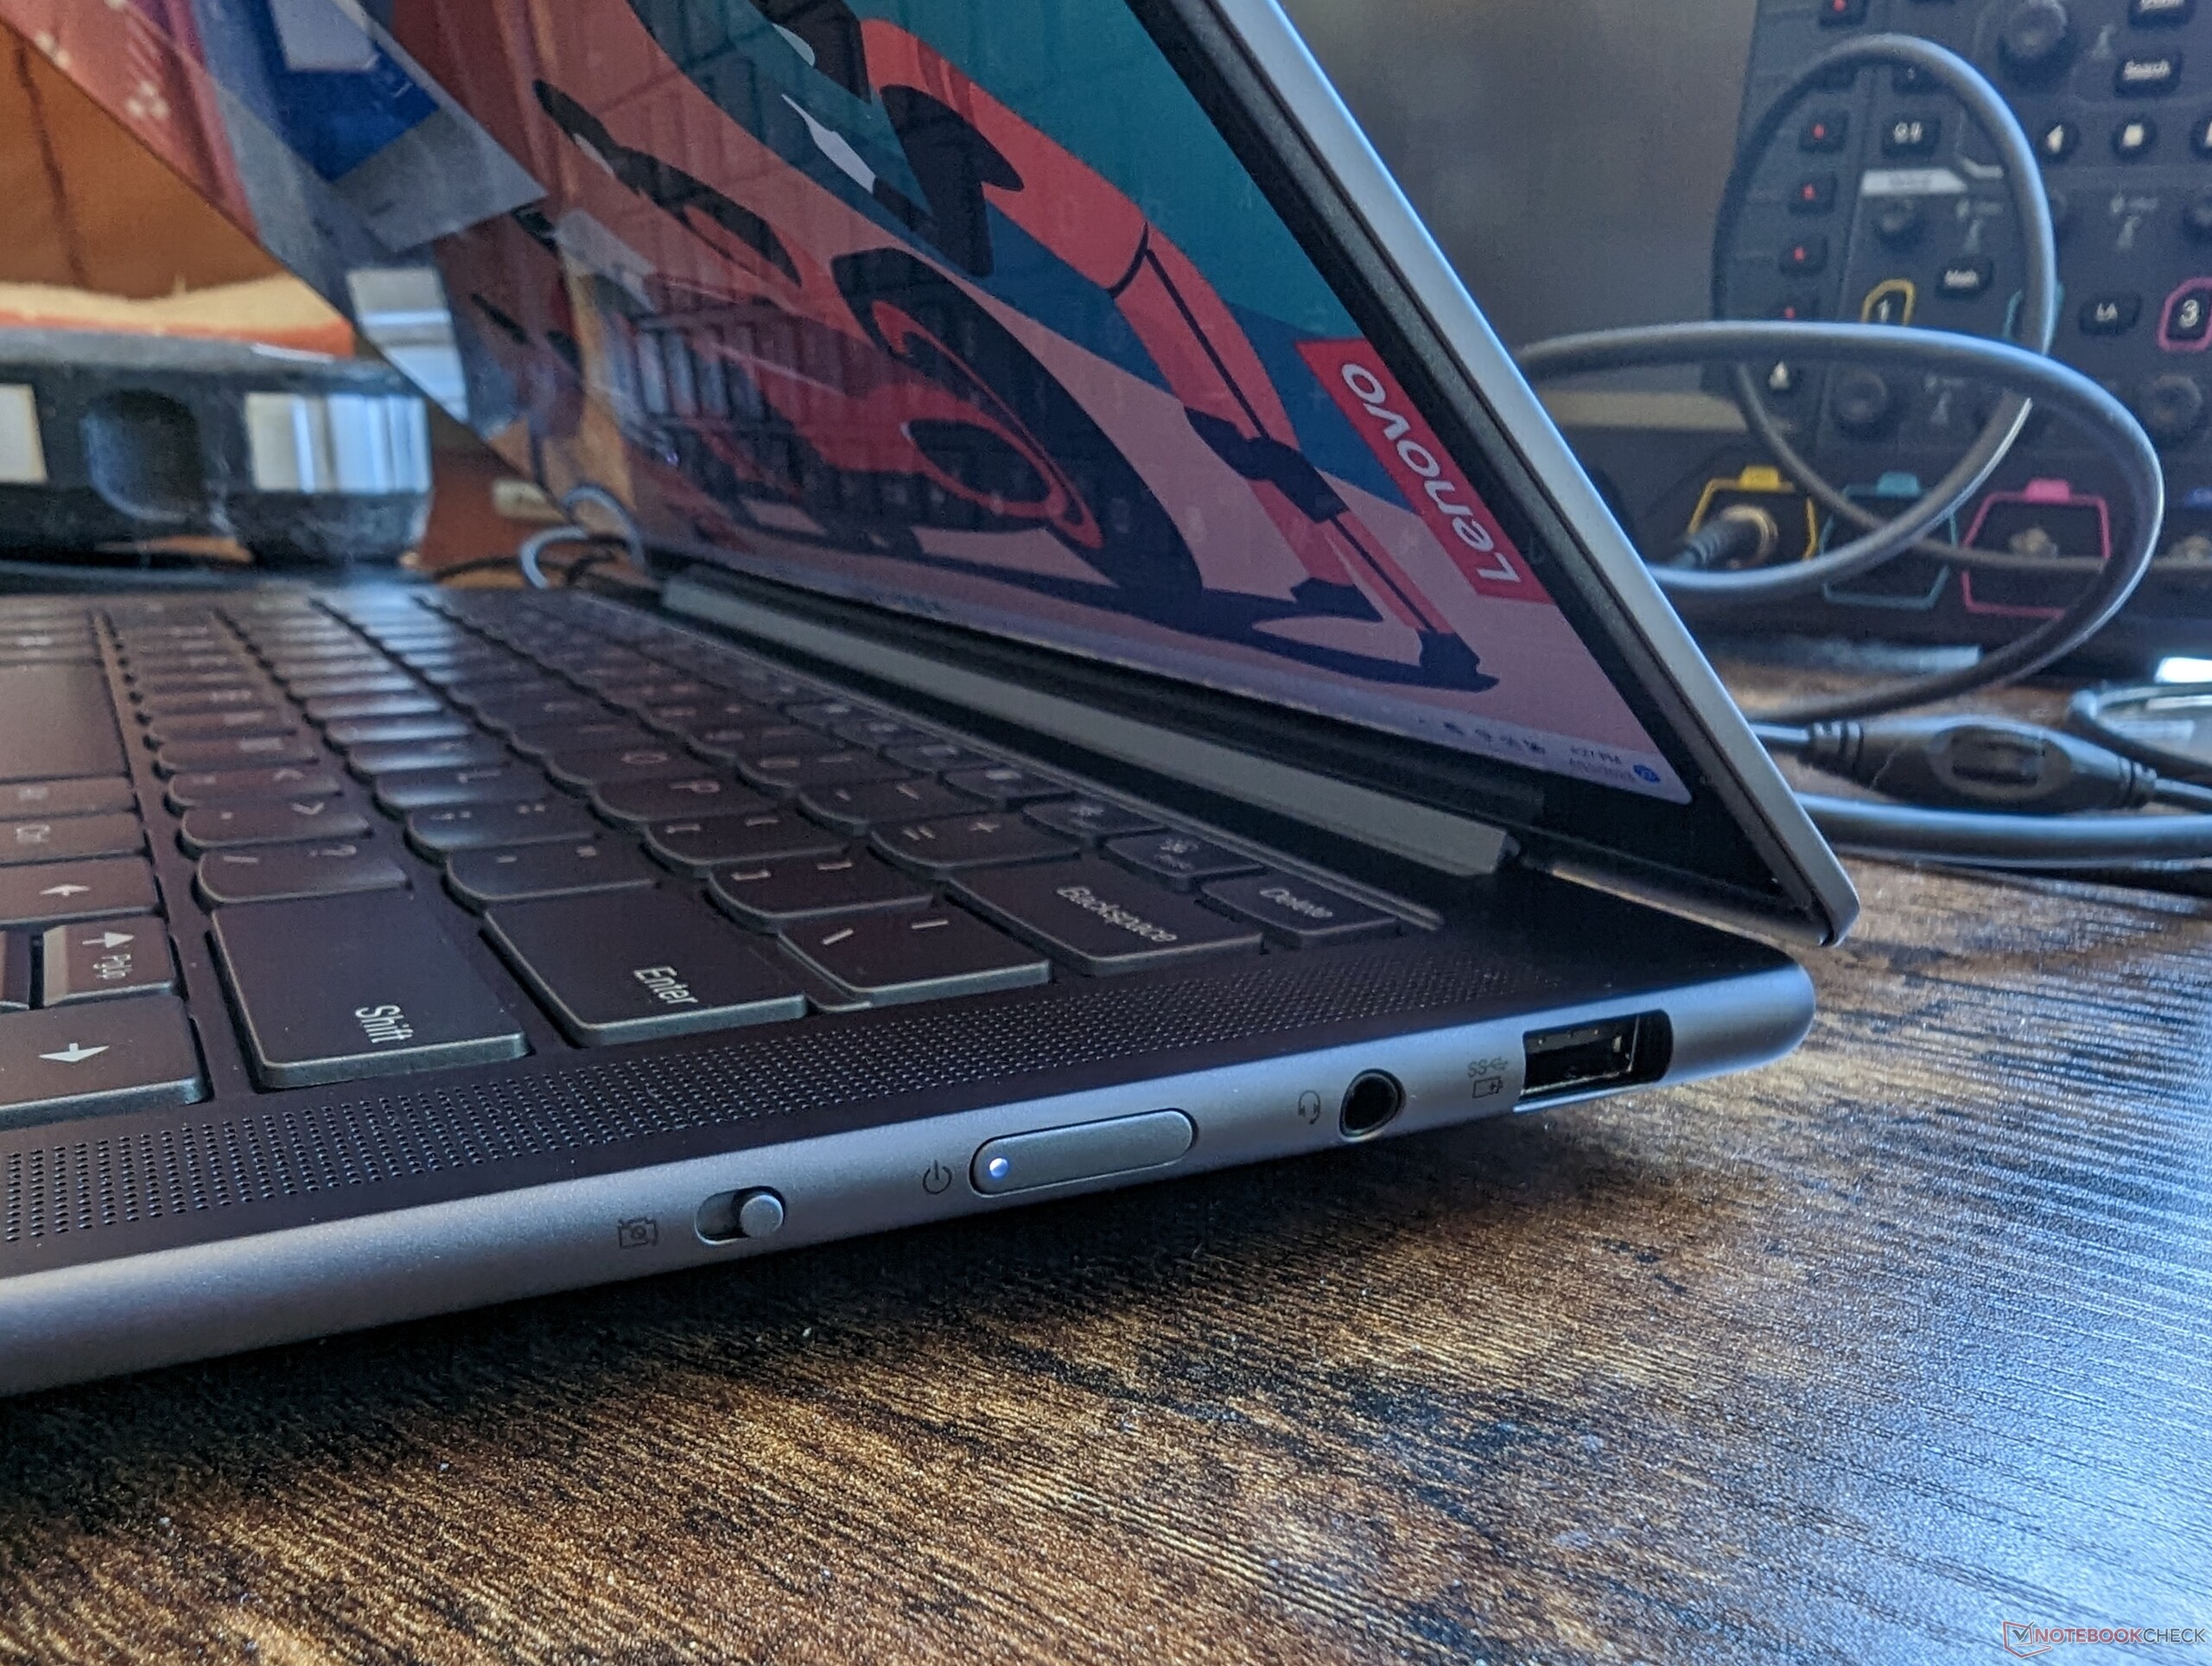
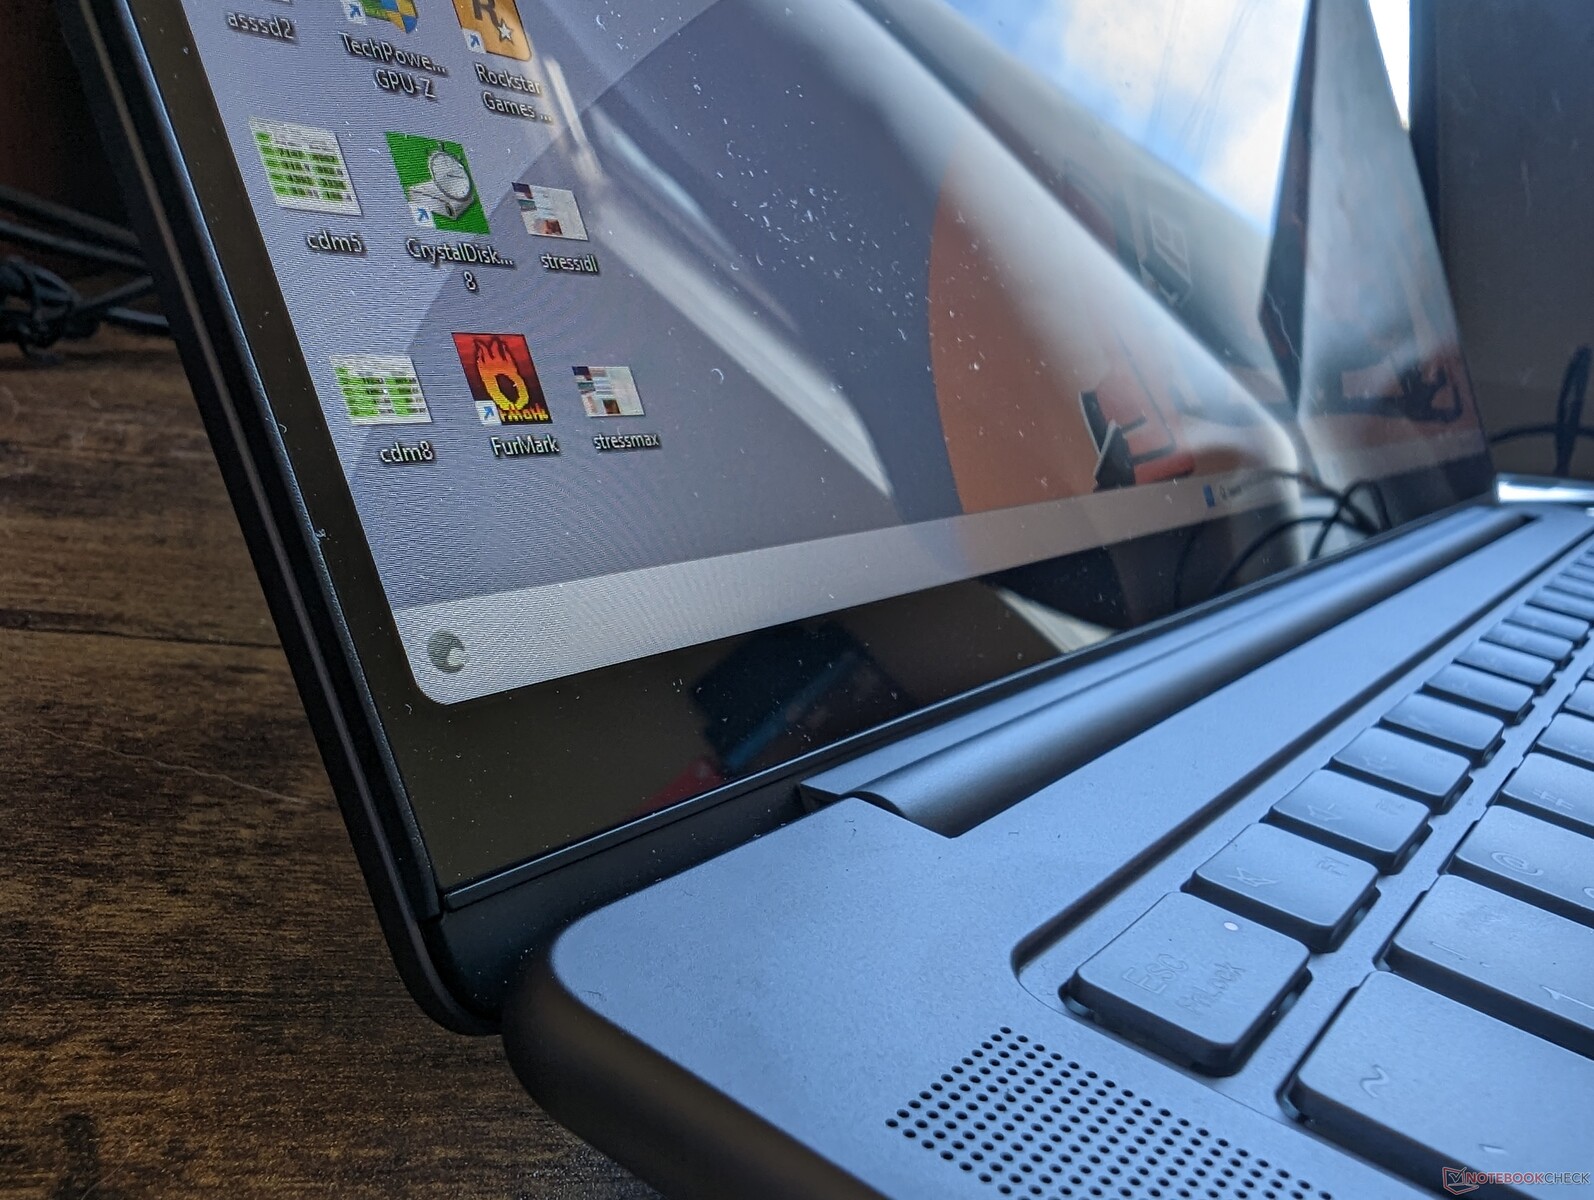
Case — Same Slim Spectacle
The positioning of the USB-A port and power button along the right edge of the laptop has been swapped. Additionally, one of the USB-C ports along the left edge now supports USB4 meaning native compatibility with most external GPU docking stations. Otherwise, port options remain the same.
Communication
The MediaTek Wi-Fi 6E MT7922 comes standard for 6 GHz Wi-Fi 6E and Bluetooth 5.1 connectivity instead of the usual Intel AX series. Unfortunately, our particular review unit would have issues recognizing our Asus AXE11000 Wi-Fi 6E network even after multiple retries and so we are only able to record its Wi-Fi 6 performance.
| Networking | |
| iperf3 transmit AXE11000 | |
| Lenovo Yoga 9 14IRP G8 | |
| Gigabyte Aero 14 OLED BMF | |
| Lenovo Slim Pro 7 14ARP8 | |
| Lenovo Slim 7 Pro X 14ARH7 | |
| iperf3 receive AXE11000 | |
| Gigabyte Aero 14 OLED BMF | |
| Lenovo Yoga 9 14IRP G8 | |
| Lenovo Slim Pro 7 14ARP8 | |
| Lenovo Slim 7 Pro X 14ARH7 | |
| iperf3 transmit AXE11000 6GHz | |
| Gigabyte Aero 14 OLED BMF | |
| Dell Inspiron 14 Plus 7420 | |
| iperf3 receive AXE11000 6GHz | |
| LG Gram 14Z90Q | |
| Gigabyte Aero 14 OLED BMF | |
| Dell Inspiron 14 Plus 7420 | |
Webcam
The 2 MP webcam, IR sensor, and electronic shutter come standard once again. However, image quality appears to be blurrier than before. Competing models from HP like the Spectre 13.5 ship with higher quality 5 MP webcams in comparison.


Maintenance
The bottom panel comes off relatively easily with just a Torx screwdriver. Users can upgrade the M.2 SSD and WLAN module while the LPDDR5 RAM modules are soldered.


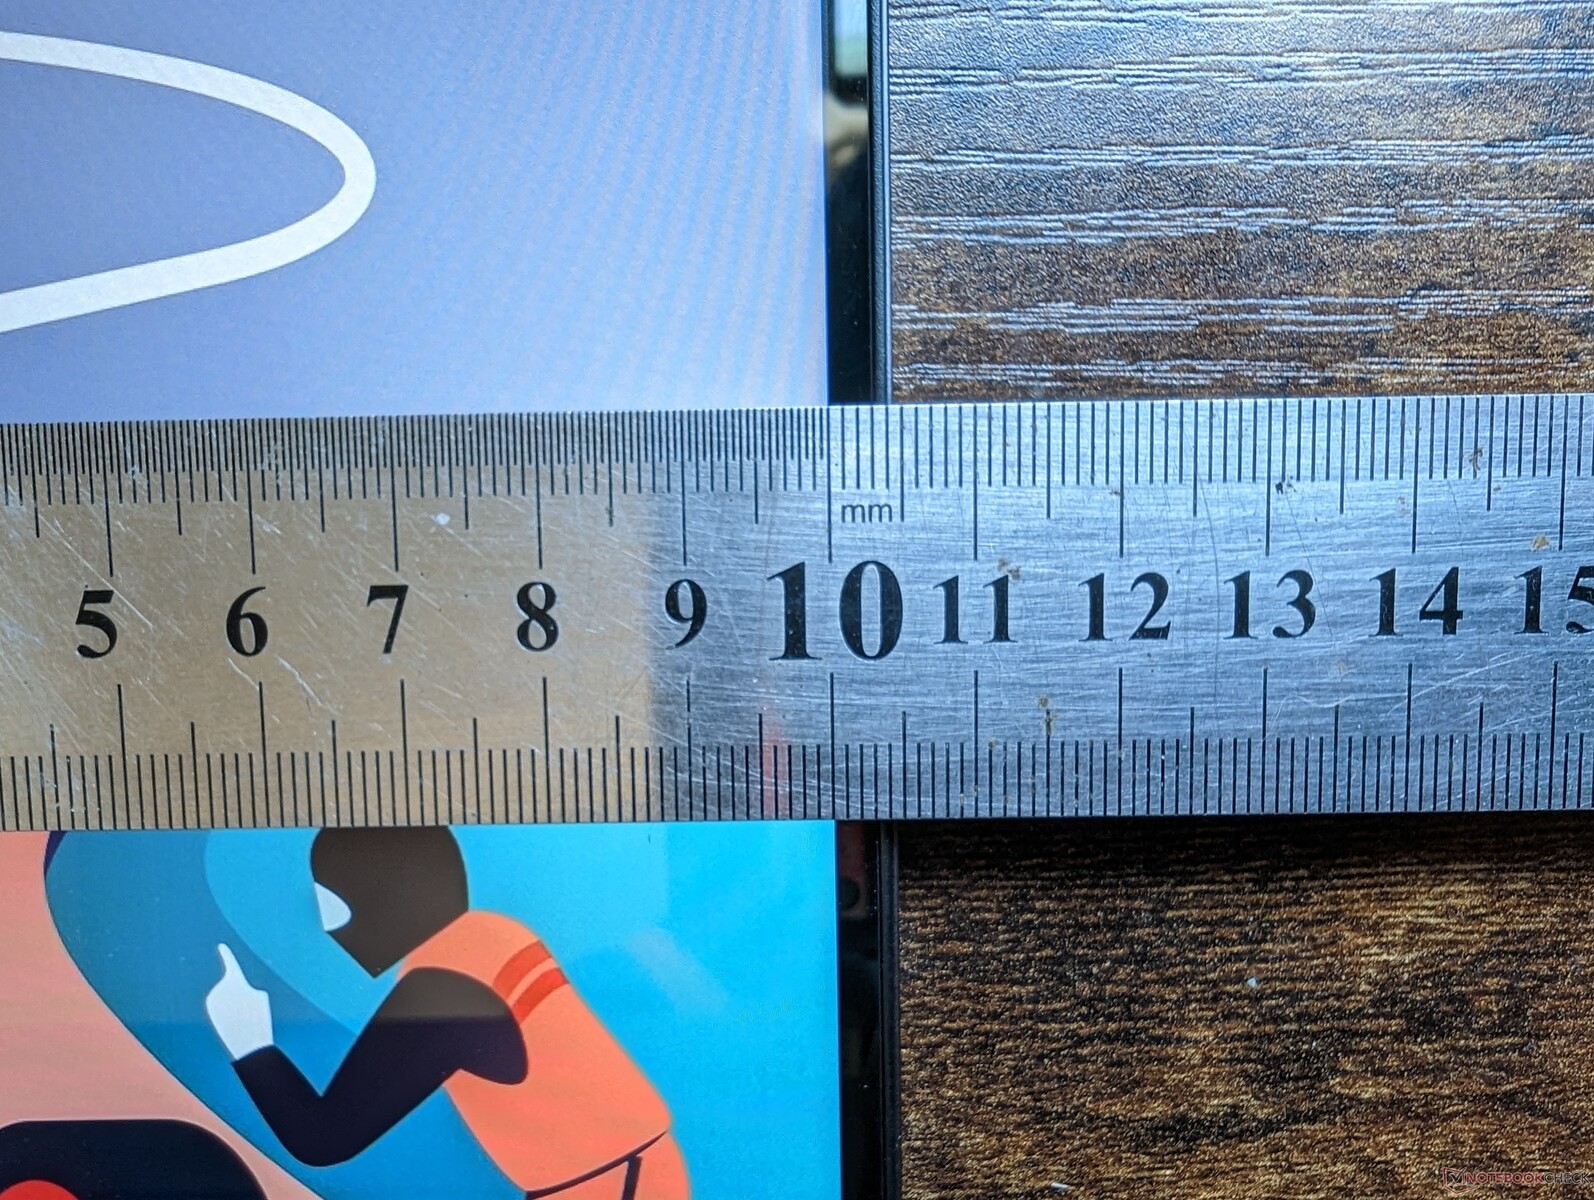
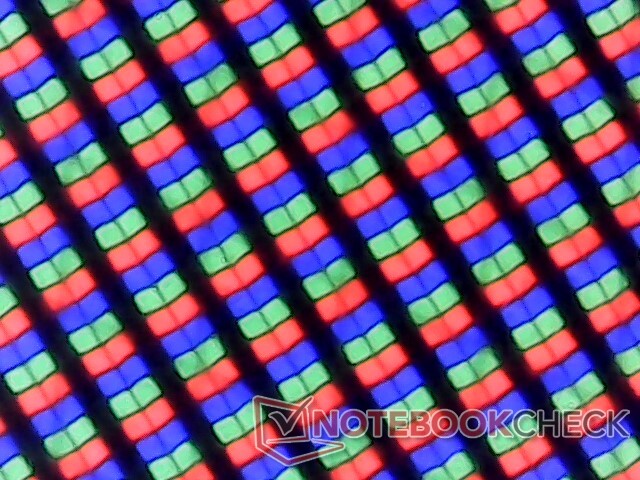
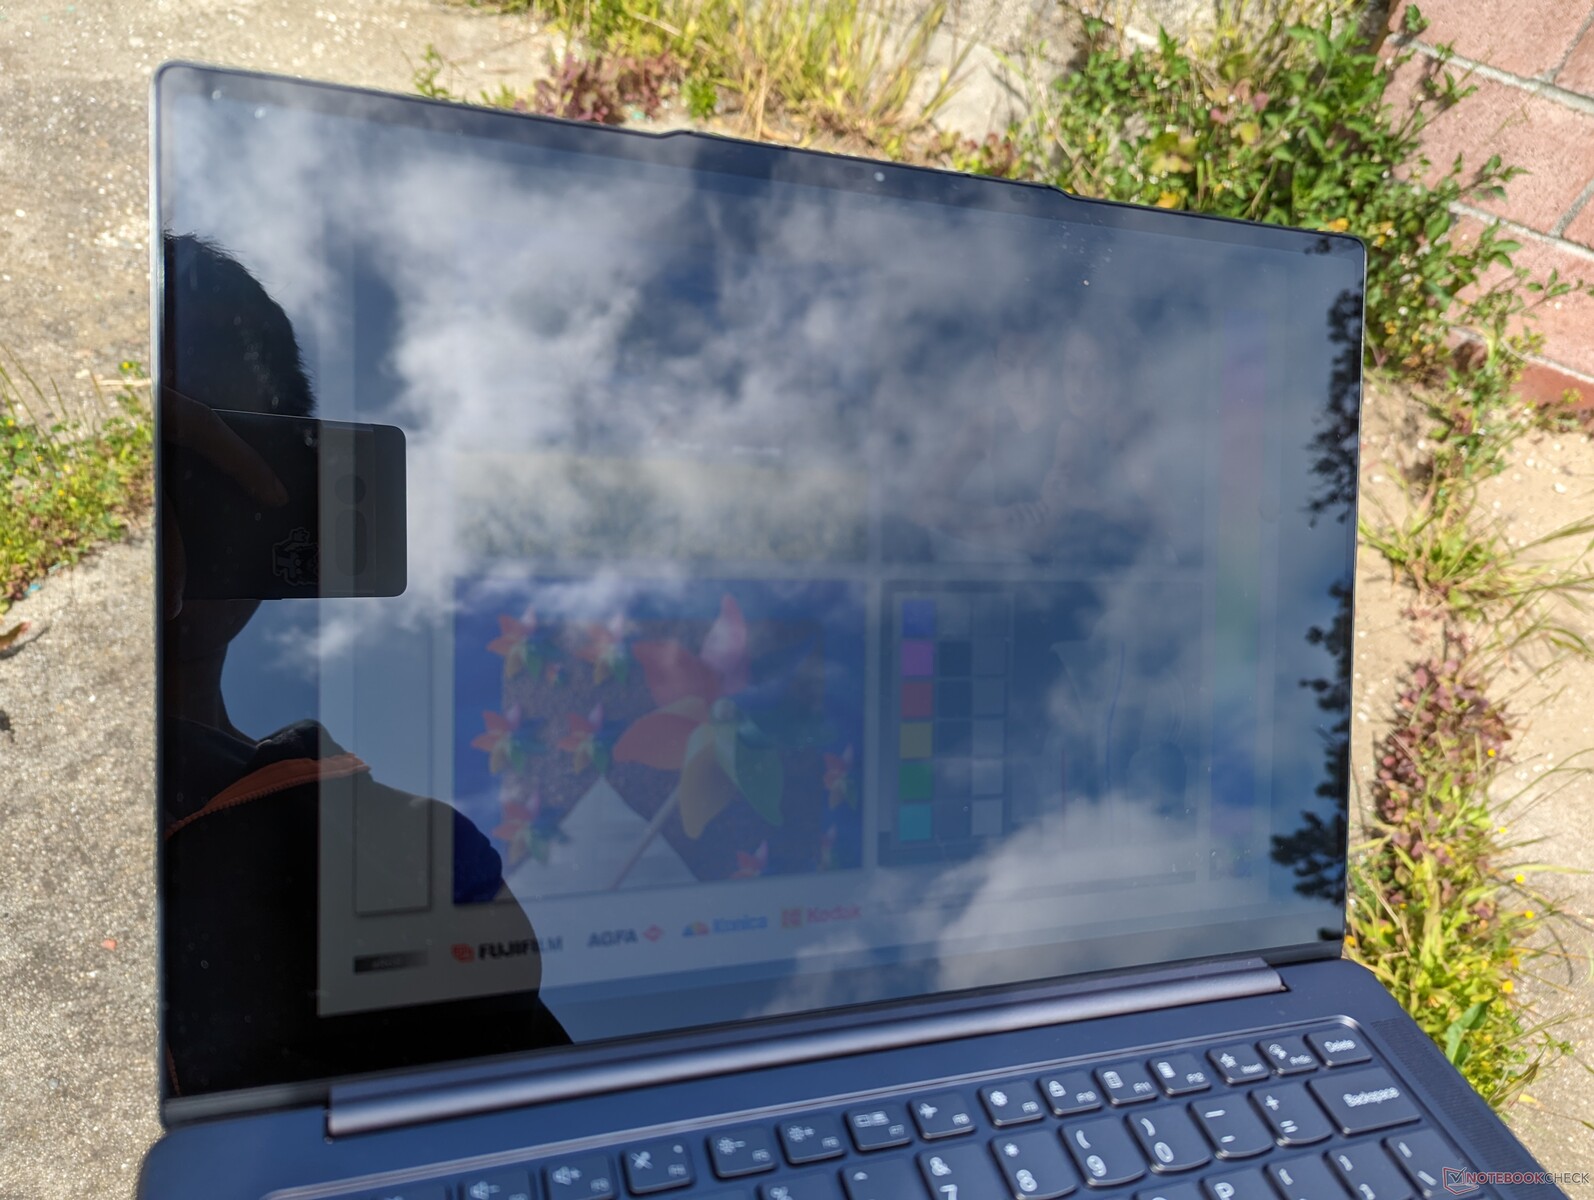
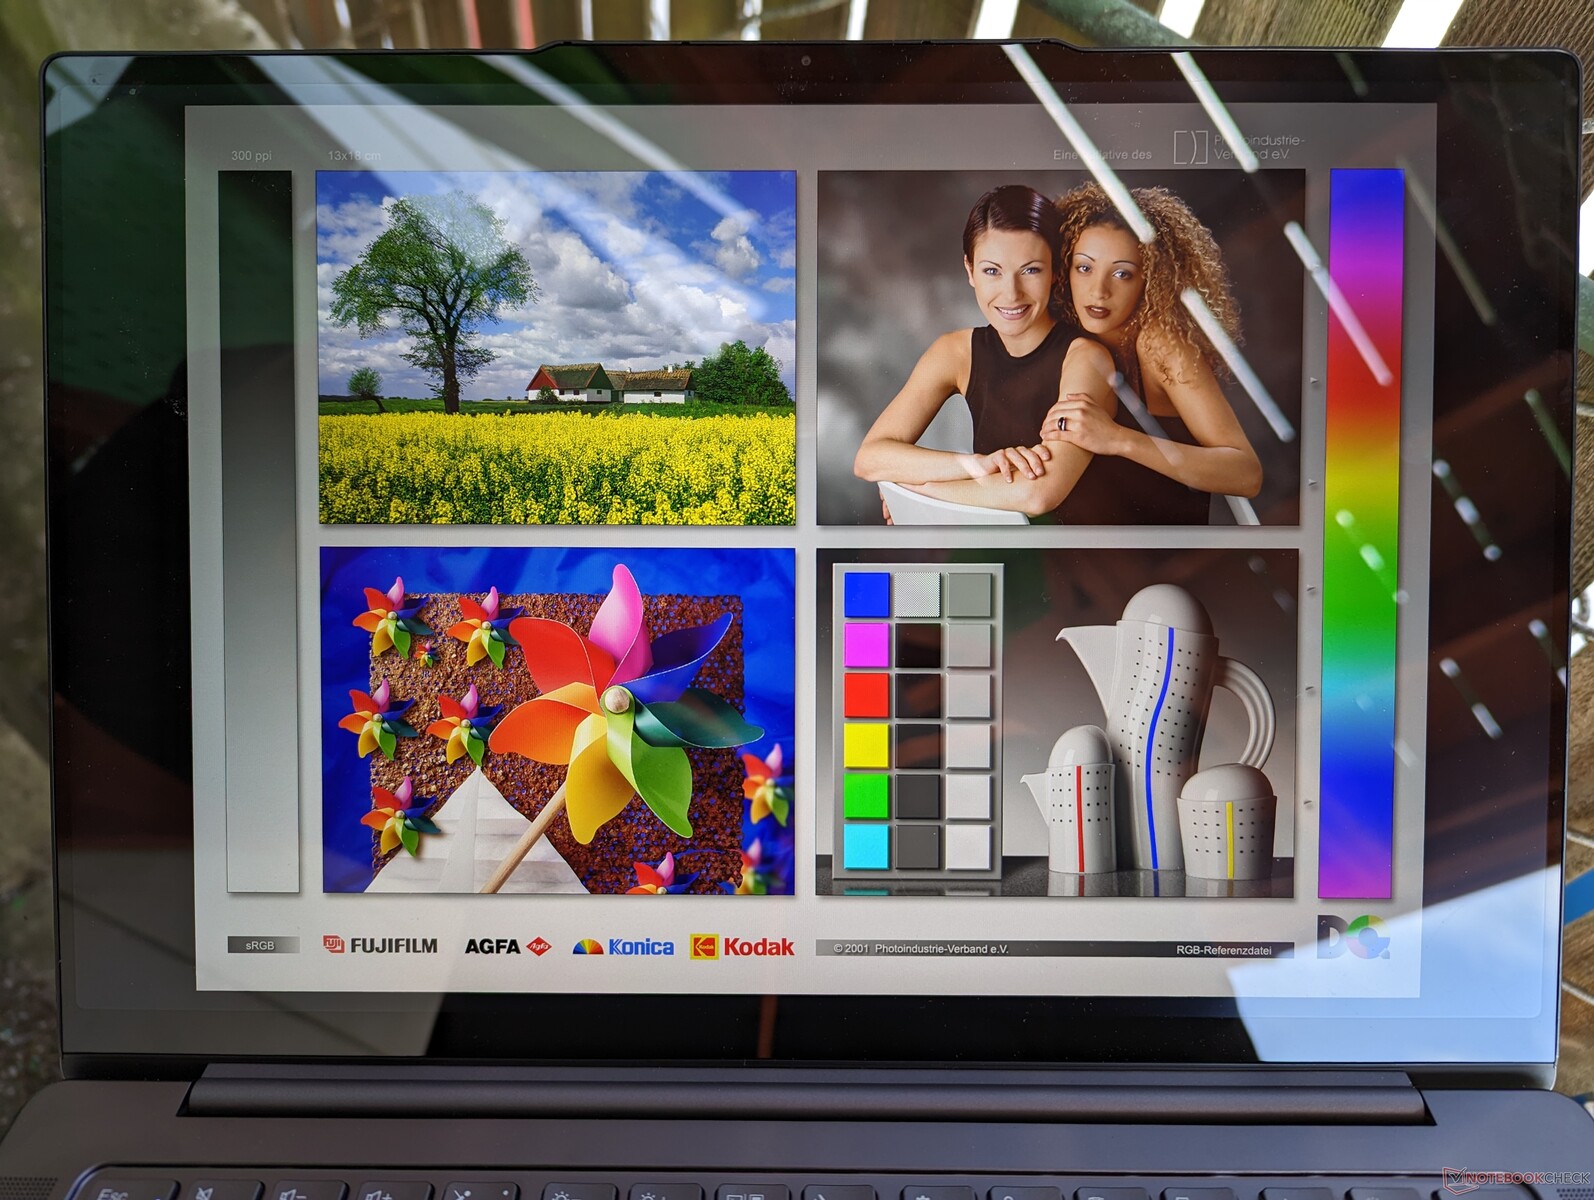
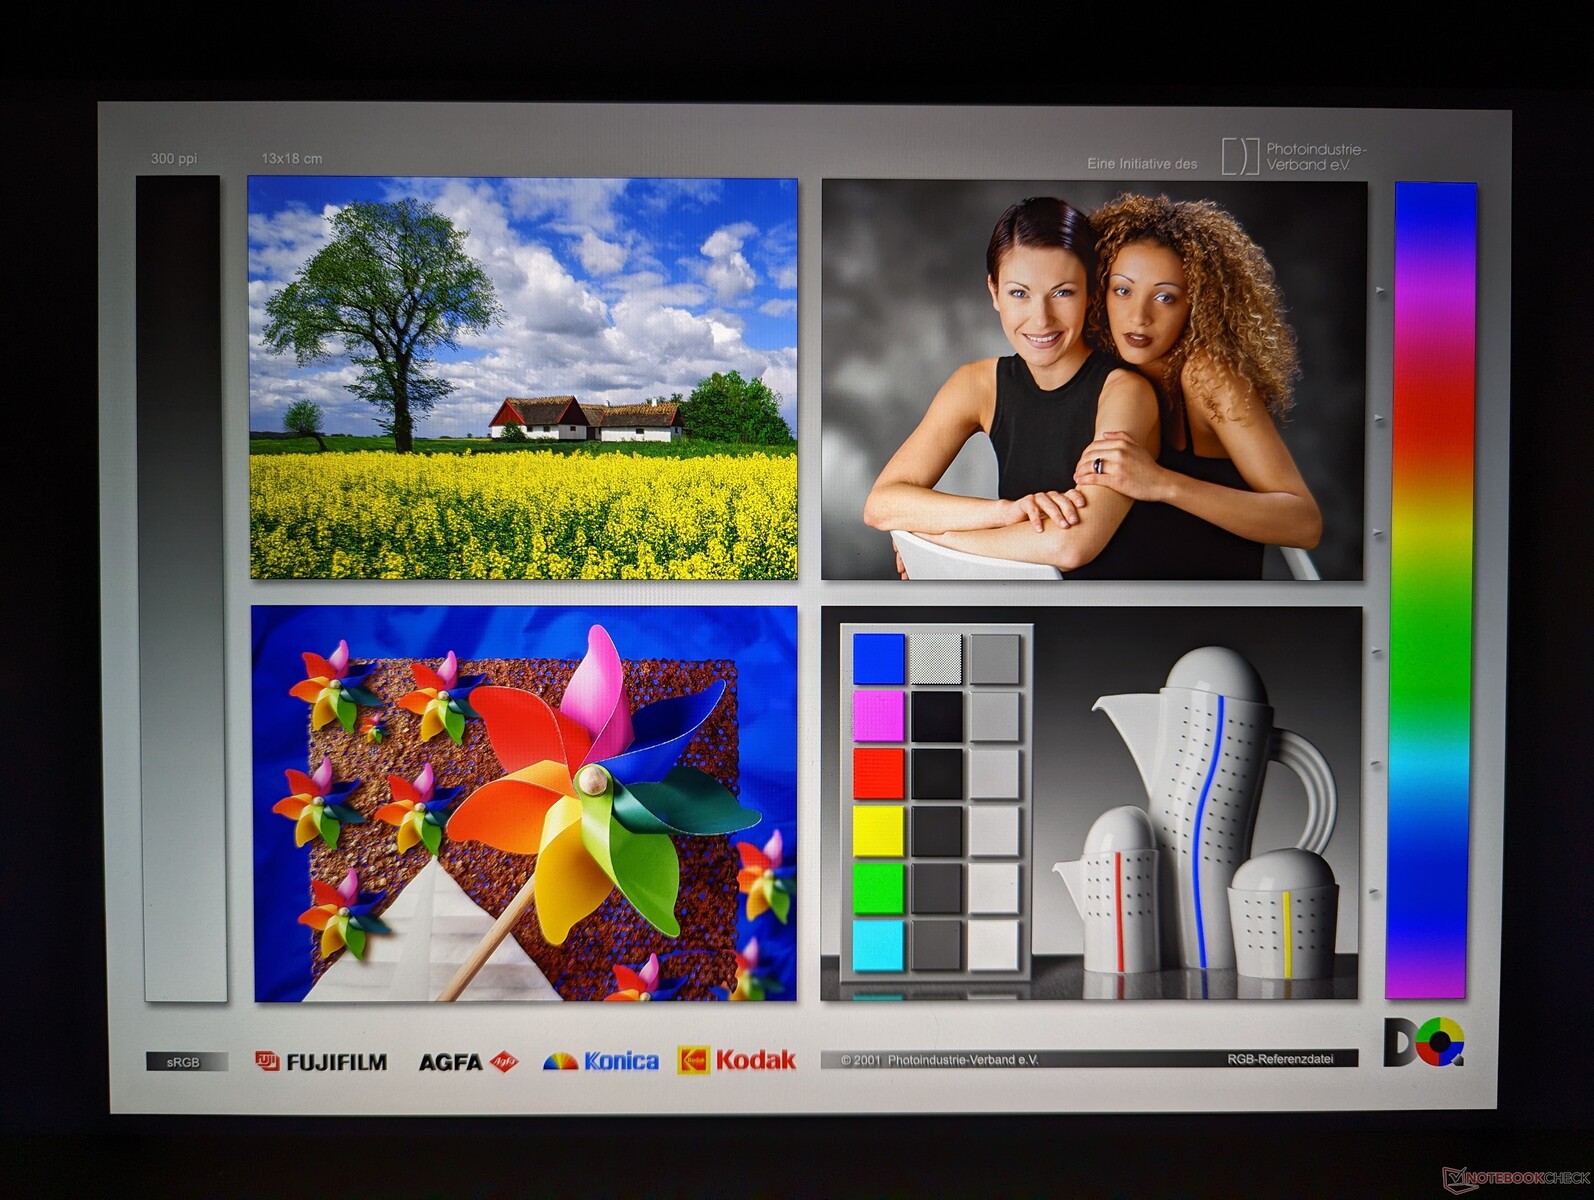
Display — 2.5K 90 Hz Standard
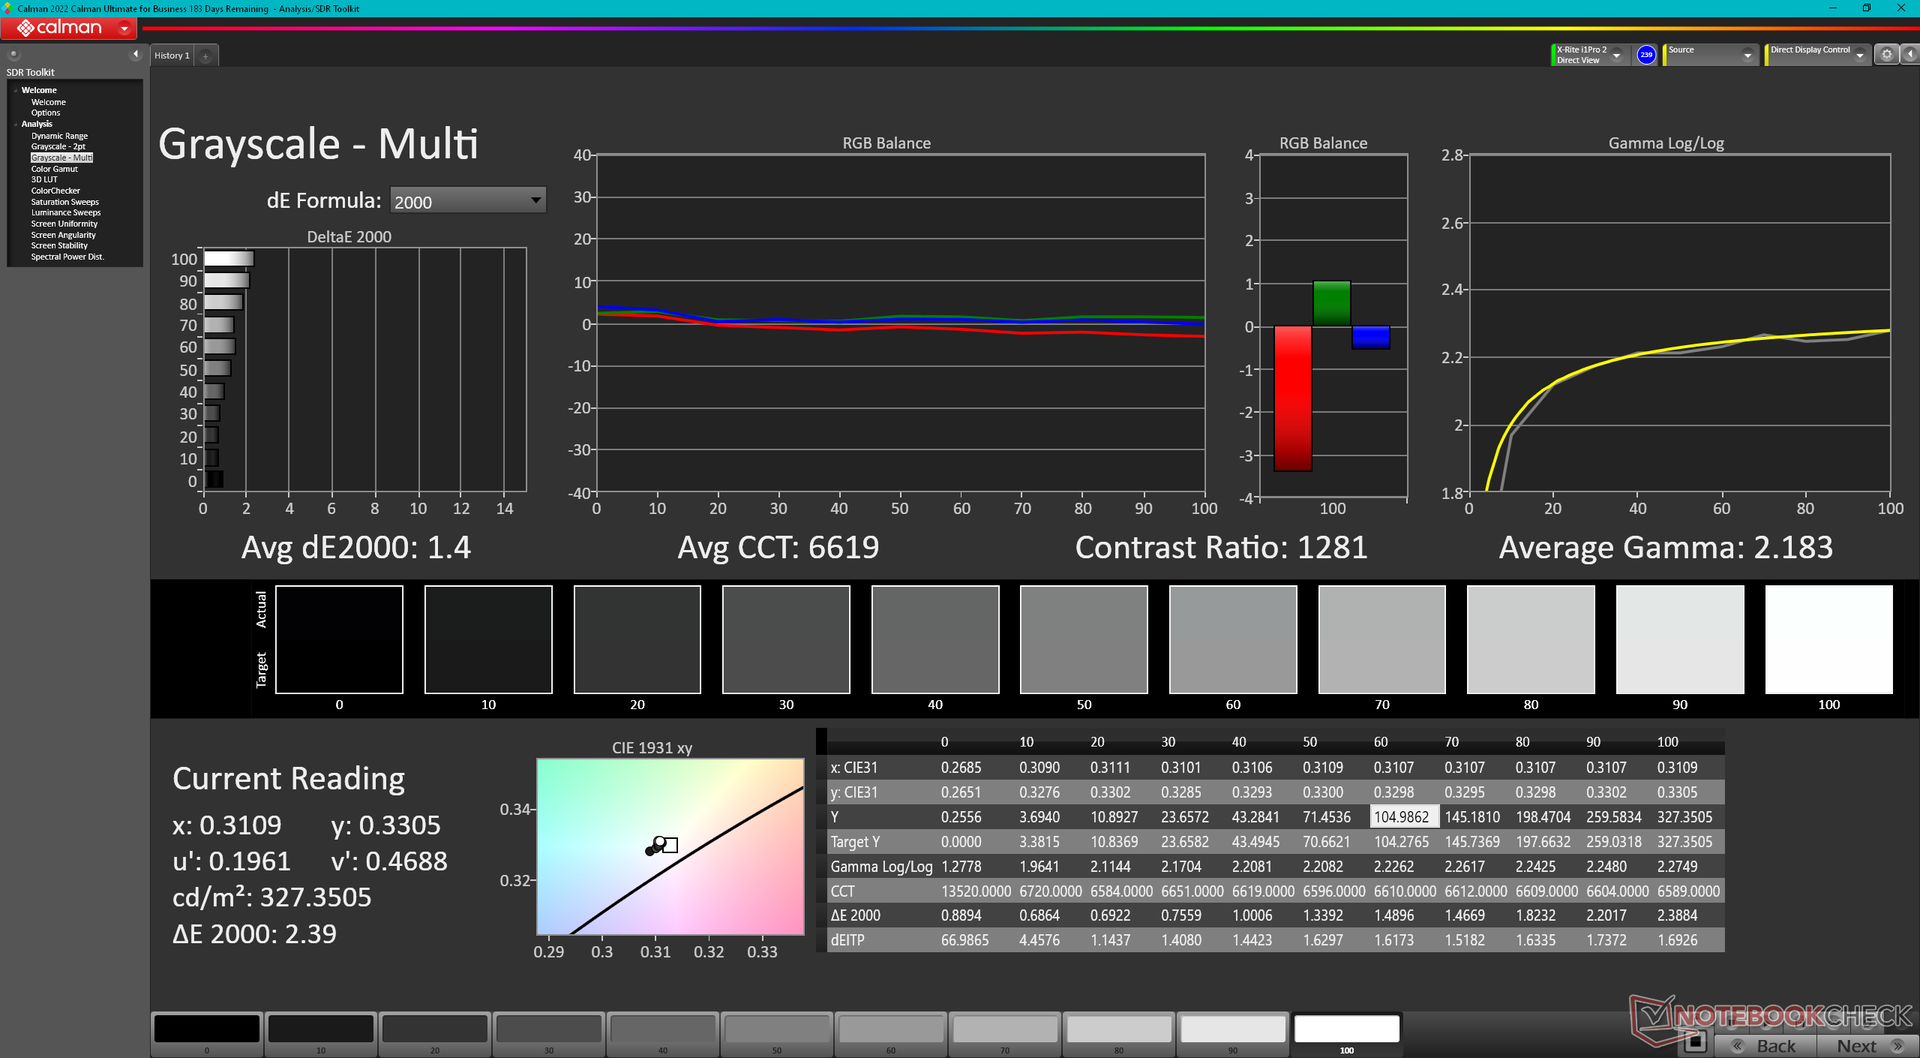
Our review unit sports the lower resolution 2.5K 2560 x 1600 panel instead of the 3K 3072 x 1920 panel as found on last year's Slim 7 Pro X or Slim 7i Pro X. Even so, contrast is just as good and the glossy screen is still very sharp and with no graininess issues. Response times are a little faster for less ghosting as well, but maximum brightness is slightly dimmer dimmer; Lenovo advertises a brightness of 350 nits for the 2.5K panel vs. 400 nits for the 3K option.
| |||||||||||||||||||||||||
Brightness Distribution: 92 %
Center on Battery: 344.7 cd/m²
Contrast: 1112:1 (Black: 0.31 cd/m²)
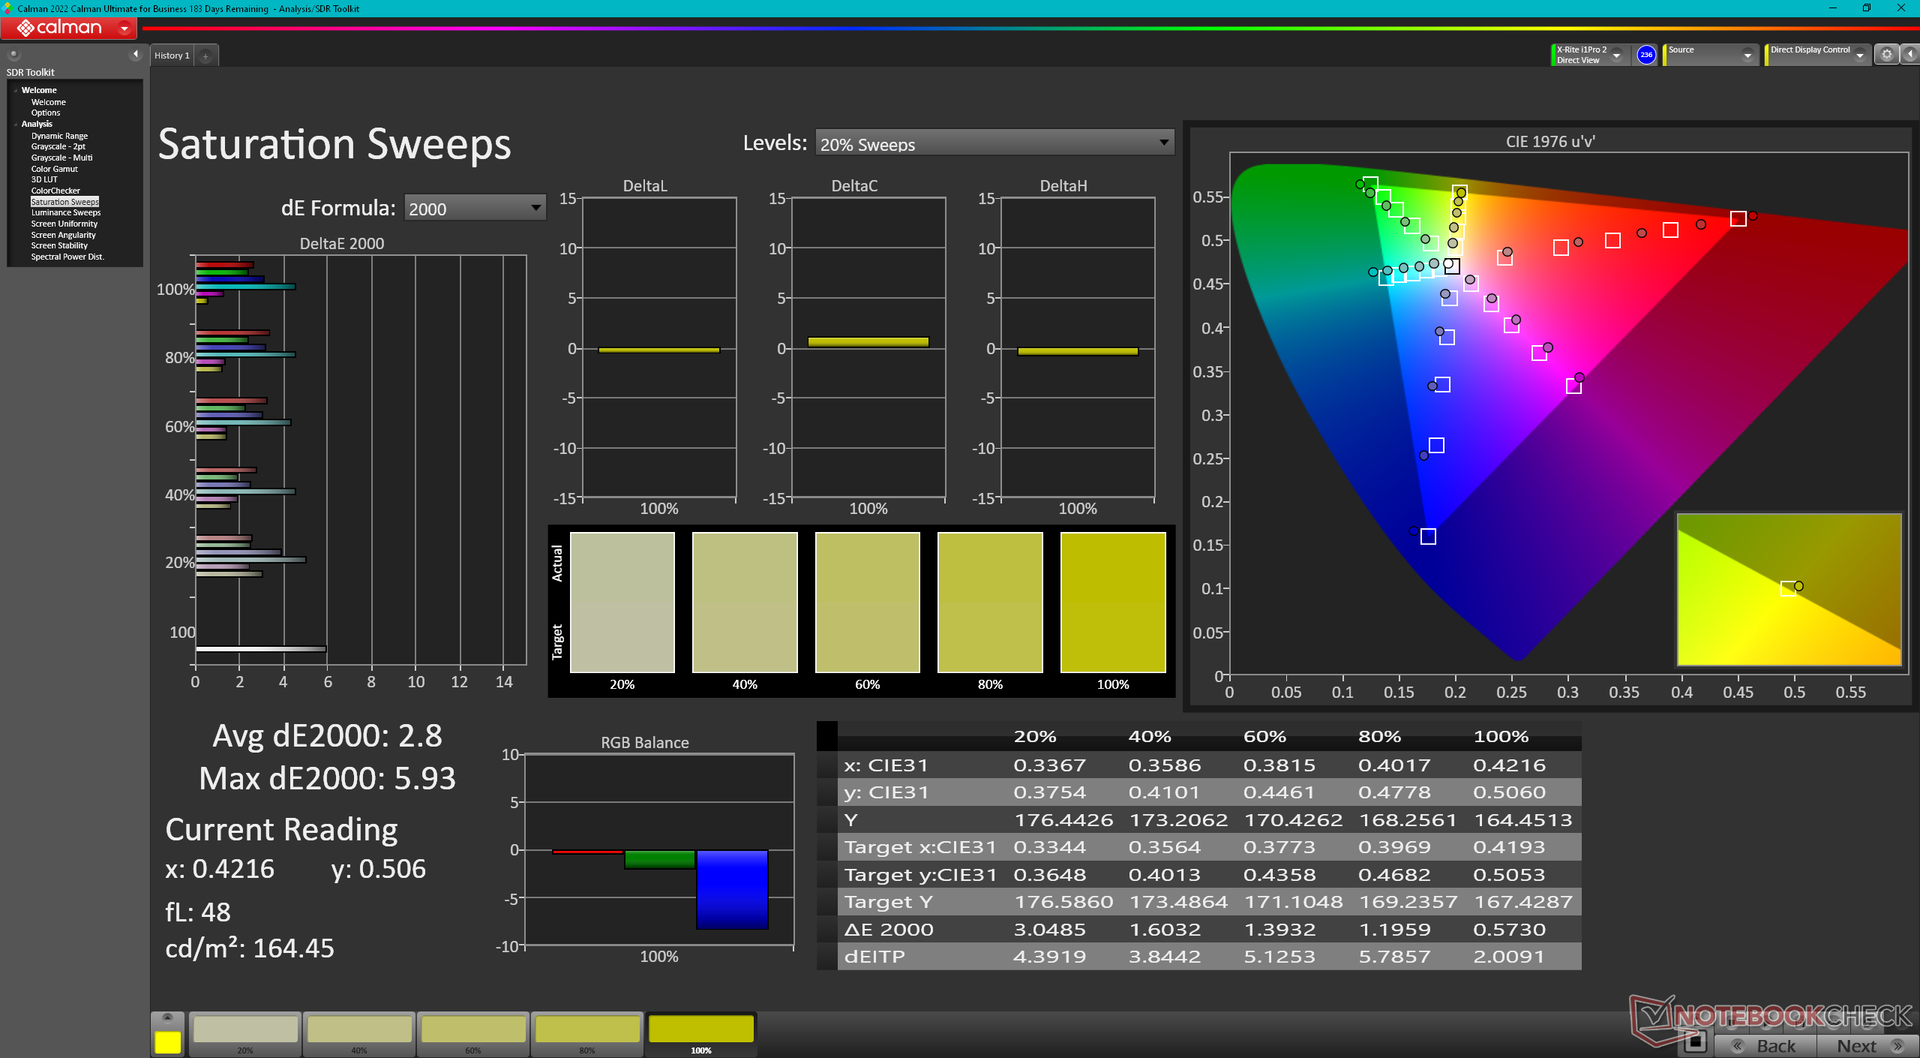
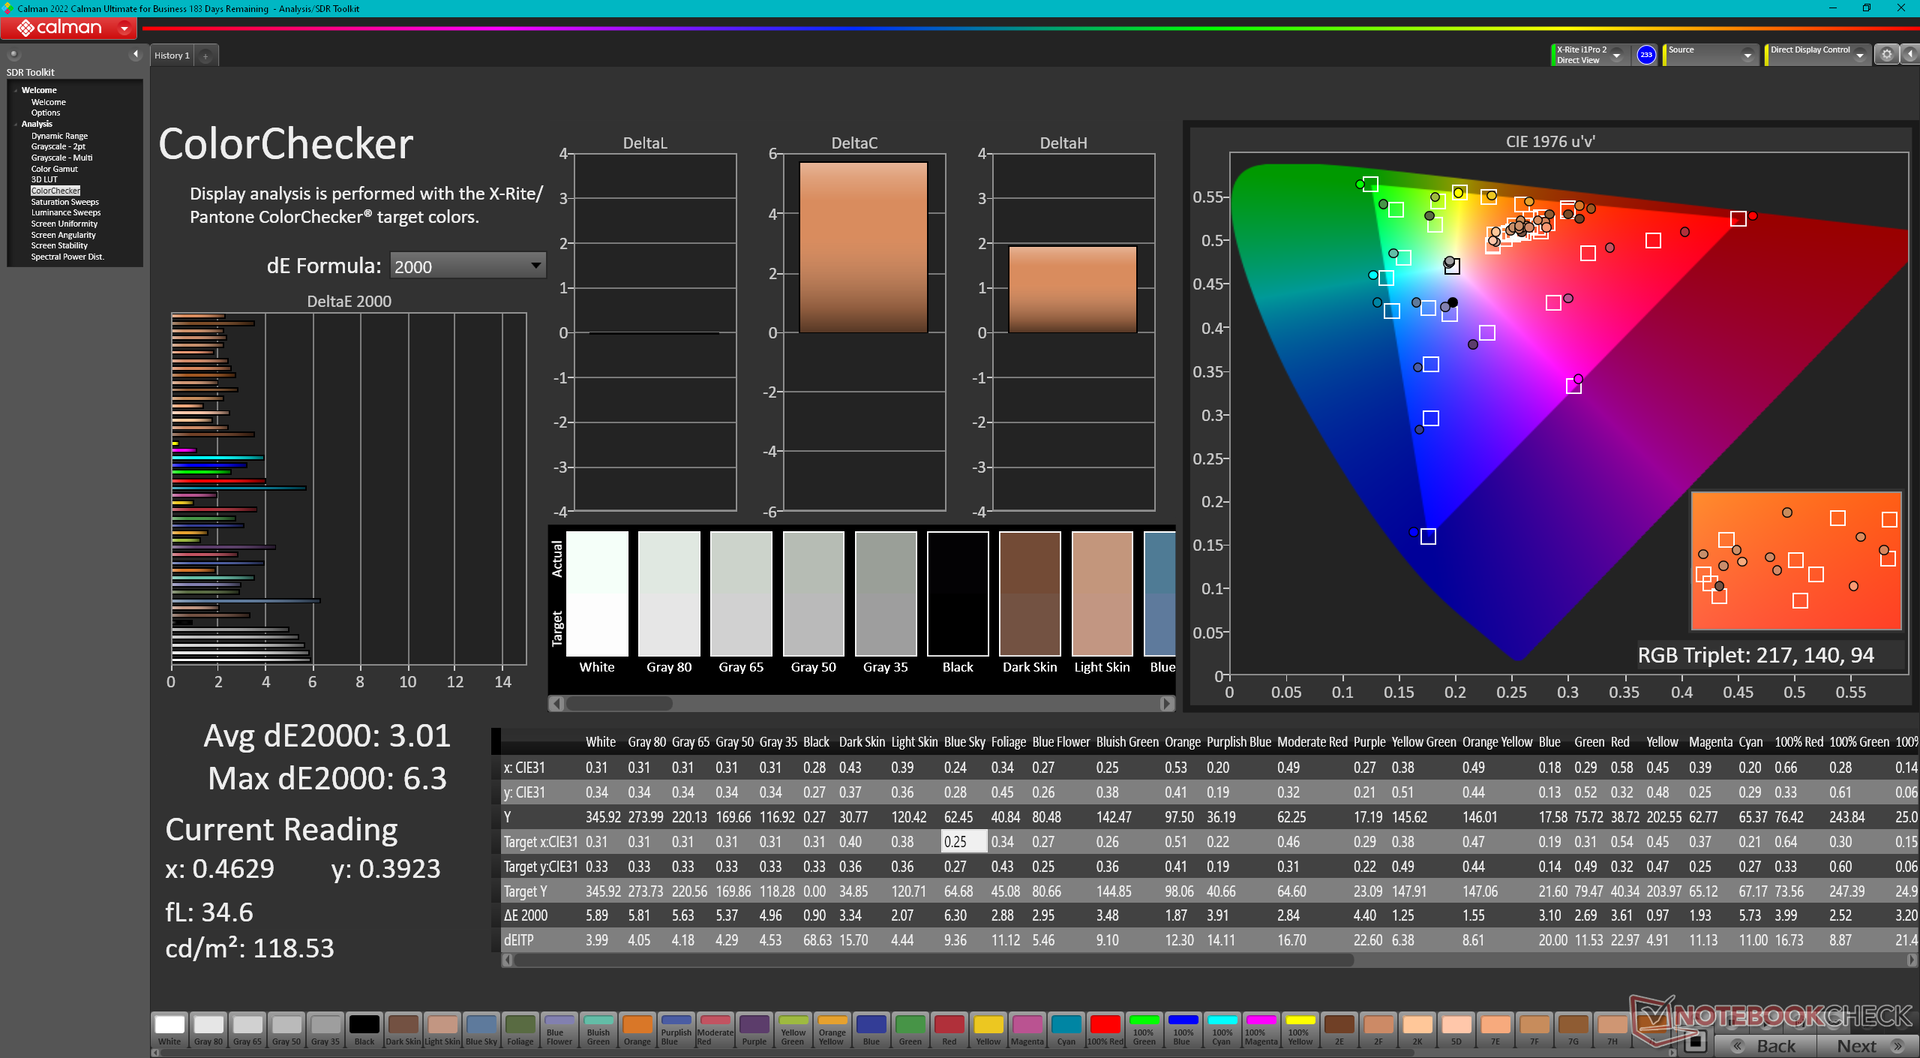
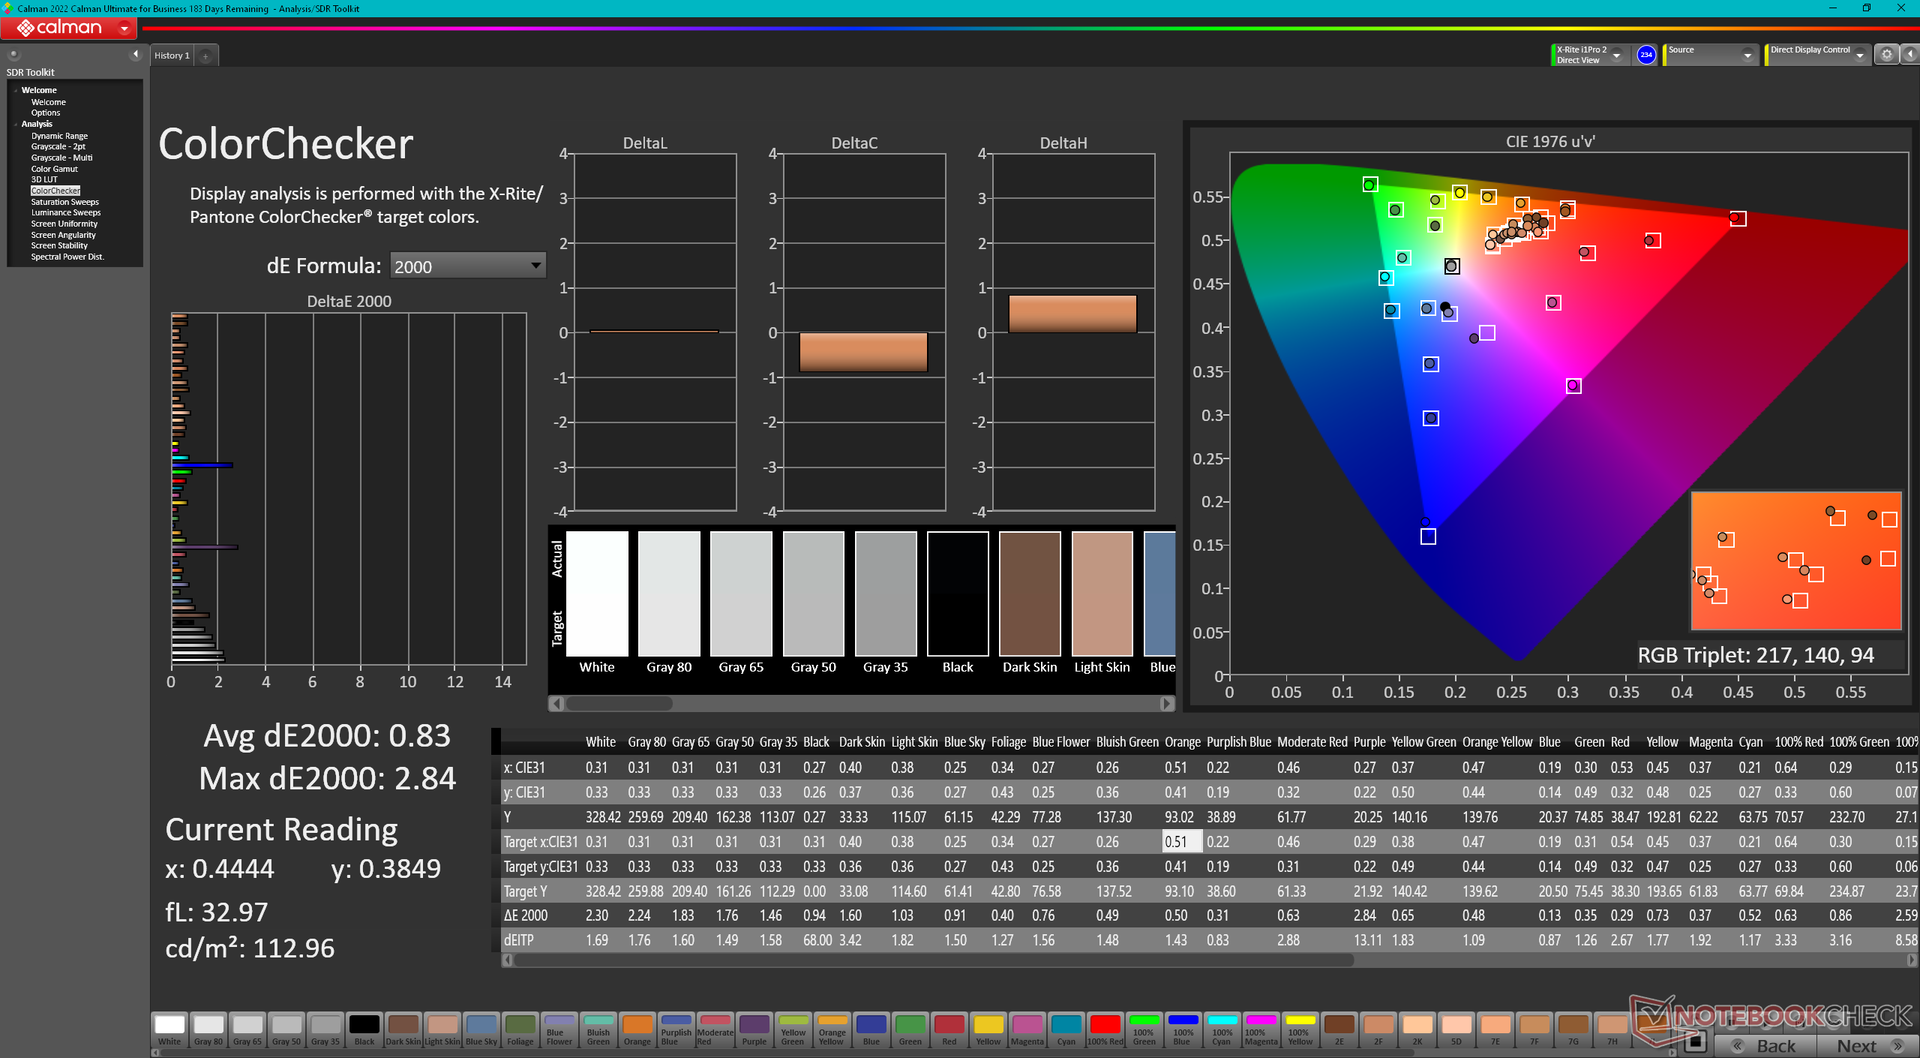
ΔE Color 3.01 | 0.5-29.43 Ø5, calibrated: 0.83
ΔE Greyscale 4.6 | 0.57-98 Ø5.3
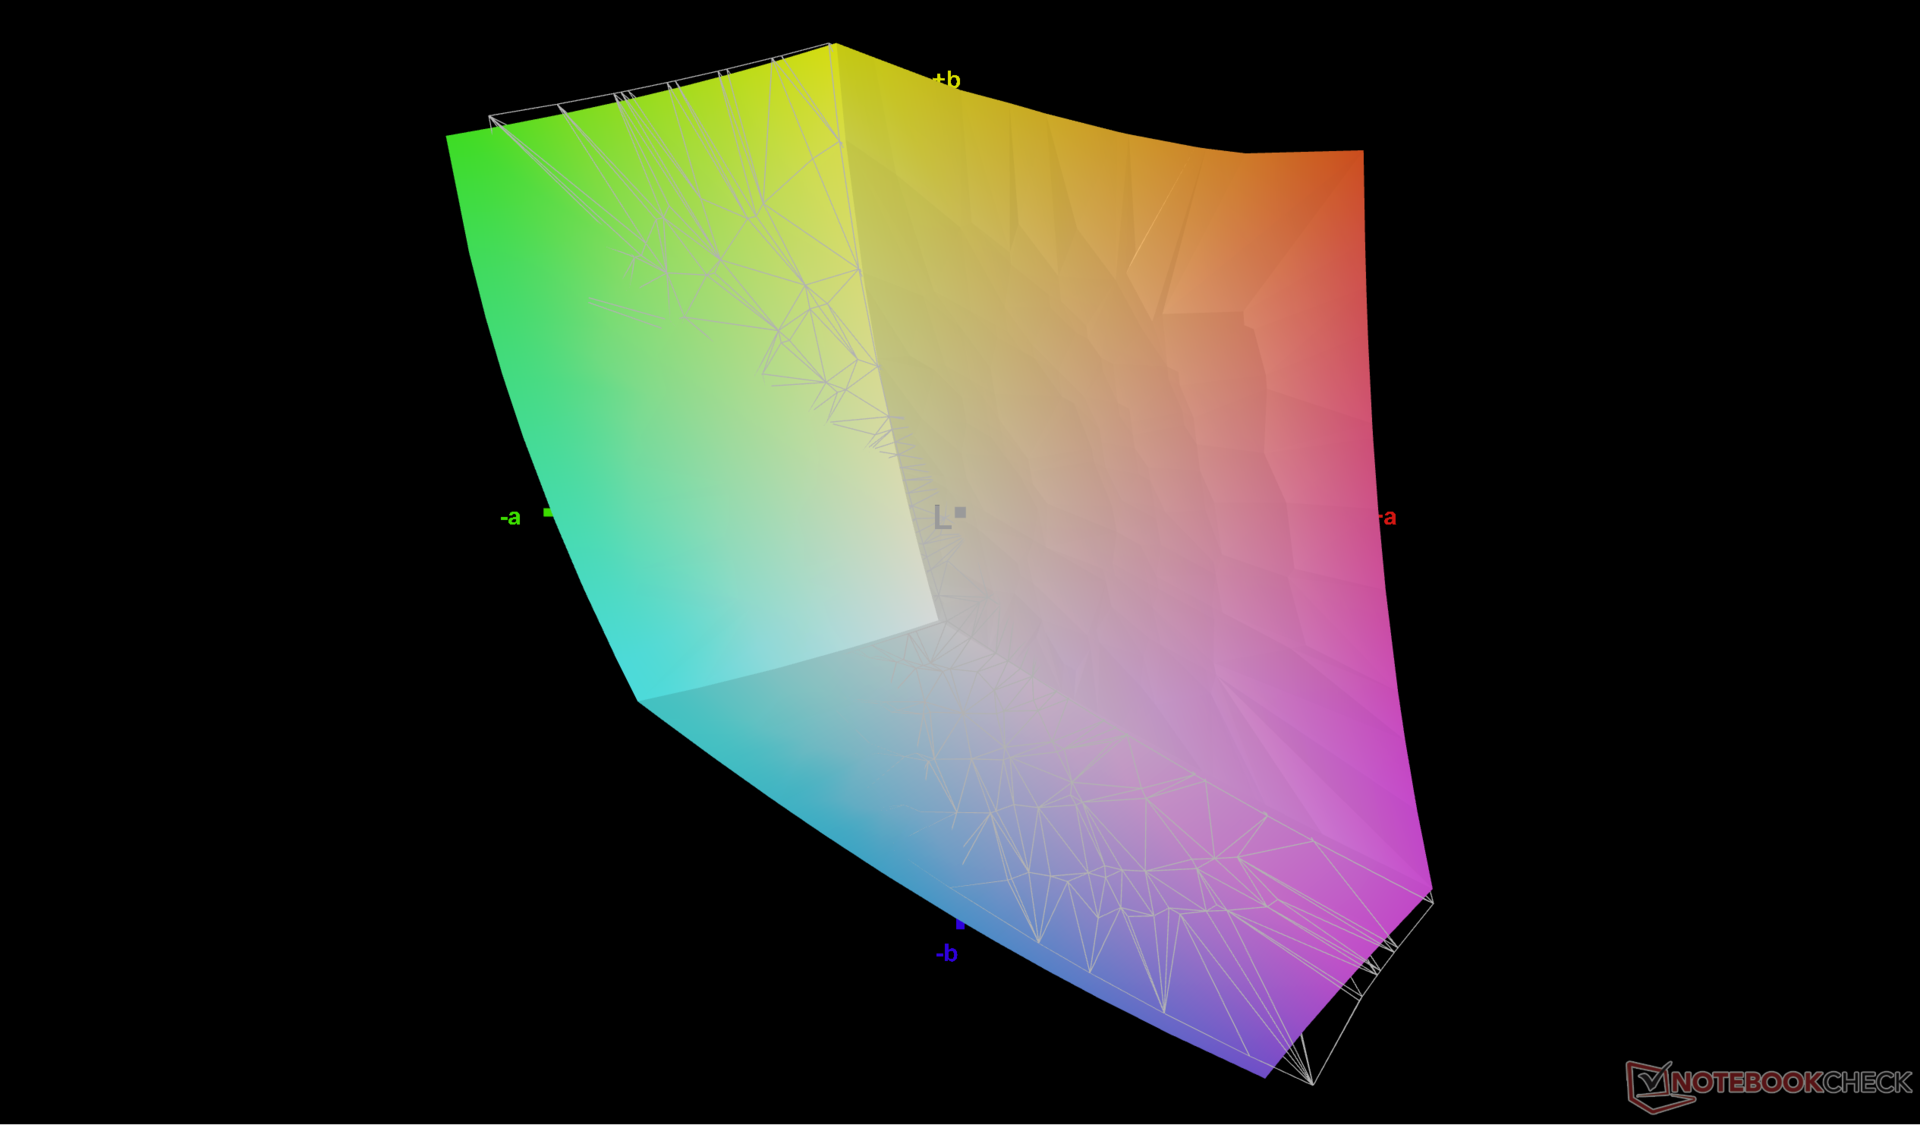
74.6% AdobeRGB 1998 (Argyll 2.2.0 3D)
98.2% sRGB (Argyll 2.2.0 3D)
72.9% Display P3 (Argyll 2.2.0 3D)
Gamma: 2.28
| Lenovo Slim Pro 7 14ARP8 LEN89C1, IPS, 2560x1600, 14.50 | Lenovo Slim 7 Pro X 14ARH7 CSOT T3 MNE507ZA1-1, IPS, 3072x1920, 14.50 | Lenovo Yoga 9 14IRP G8 LEN140WQ+, OLED, 2880x1800, 14.00 | Gigabyte Aero 14 OLED BMF Samsung SDC4192 (ATNA40YK14-0), OLED, 2880x1800, 14.00 | LG Gram 14Z90Q LG LP140WU1-SPF1, IPS, 1920x1200, 14.00 | Dell Inspiron 14 Plus 7420 InfoVision 140NWHE, IPS, 2240x1400, 14.00 | |
|---|---|---|---|---|---|---|
| Display | -6% | 24% | 19% | 17% | -4% | |
| Display P3 Coverage | 72.9 | 66 -9% | 99.9 37% | 99.8 37% | 98.4 35% | 68.8 -6% |
| sRGB Coverage | 98.2 | 98.5 0% | 100 2% | 100 2% | 99.9 2% | 99.3 1% |
| AdobeRGB 1998 Coverage | 74.6 | 67.7 -9% | 98.3 32% | 88.7 19% | 85.9 15% | 69.5 -7% |
| Response Times | -42% | 96% | 90% | -38% | -11% | |
| Response Time Grey 50% / Grey 80% * | 31.8 ? | 42.8 ? -35% | 1.04 ? 97% | 2.4 ? 92% | 47.5 ? -49% | 32.8 ? -3% |
| Response Time Black / White * | 19.3 ? | 28.7 ? -49% | 0.95 ? 95% | 2.4 ? 88% | 24.5 ? -27% | 22.8 ? -18% |
| PWM Frequency | 360 ? | 300 | ||||
| Screen | 20% | 125% | 68% | -3% | 9% | |
| Brightness middle | 344.7 | 426.5 24% | 378 10% | 423 23% | 341 -1% | 331.1 -4% |
| Brightness | 334 | 414 24% | 379 13% | 427 28% | 305 -9% | 326 -2% |
| Brightness Distribution | 92 | 88 -4% | 98 7% | 98 7% | 87 -5% | 85 -8% |
| Black Level * | 0.31 | 0.3 3% | 0.03 90% | 0.1 68% | 0.26 16% | 0.29 6% |
| Contrast | 1112 | 1422 28% | 12600 1033% | 4230 280% | 1312 18% | 1142 3% |
| Colorchecker dE 2000 * | 3.01 | 2.07 31% | 2.5 17% | 0.55 82% | 3.11 -3% | 2.23 26% |
| Colorchecker dE 2000 max. * | 6.3 | 4.76 24% | 4.7 25% | 1.15 82% | 8.29 -32% | 5.44 14% |
| Colorchecker dE 2000 calibrated * | 0.83 | 0.63 24% | 1.9 -129% | 1.15 -39% | 0.83 -0% | 0.63 24% |
| Greyscale dE 2000 * | 4.6 | 3.2 30% | 1.9 59% | 0.69 85% | 5.3 -15% | 3.6 22% |
| Gamma | 2.28 96% | 2.18 101% | 2.2 100% | 2.42 91% | 2.037 108% | 2.21 100% |
| CCT | 6420 101% | 6142 106% | 6222 104% | 6479 100% | 7571 86% | 6022 108% |
| Total Average (Program / Settings) | -9% /
6% | 82% /
99% | 59% /
61% | -8% /
-4% | -2% /
3% |
* ... smaller is better
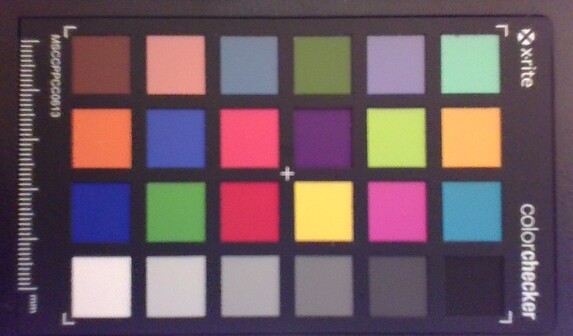
Though it's not poorly calibrated out of the box, the color accuracy has room for improvement especially since it covers sRGB in its entirety. Average grayscale and color DeltaE values by default are 4.6 and 3.01, respectively. We're able to minimize these deltaE values to just 1.4 and 0.83, respectively, after a proper calibration with our X-Rite colorimeter. Owners can apply our calibrated ICM profile above to improve color accuracy.


Display Response Times
| ↔ Response Time Black to White | ||
|---|---|---|
| 19.3 ms ... rise ↗ and fall ↘ combined | ↗ 11.4 ms rise | 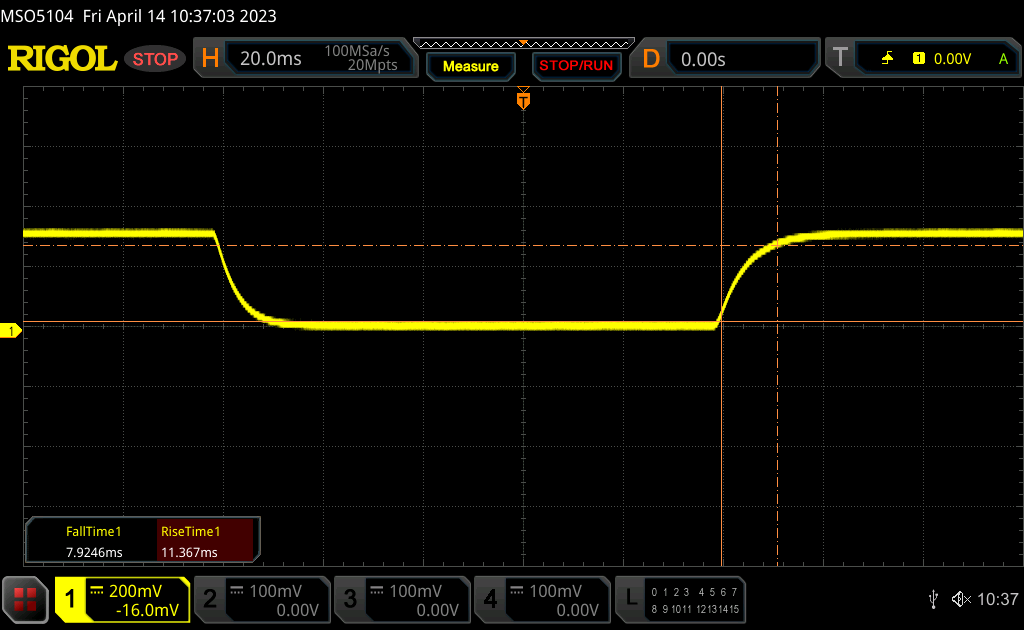 |
| ↘ 7.9 ms fall | ||
| The screen shows good response rates in our tests, but may be too slow for competitive gamers. In comparison, all tested devices range from 0.1 (minimum) to 240 (maximum) ms. » 37 % of all devices are better. This means that the measured response time is better than the average of all tested devices (21.5 ms). | ||
| ↔ Response Time 50% Grey to 80% Grey | ||
| 31.8 ms ... rise ↗ and fall ↘ combined | ↗ 15.3 ms rise | 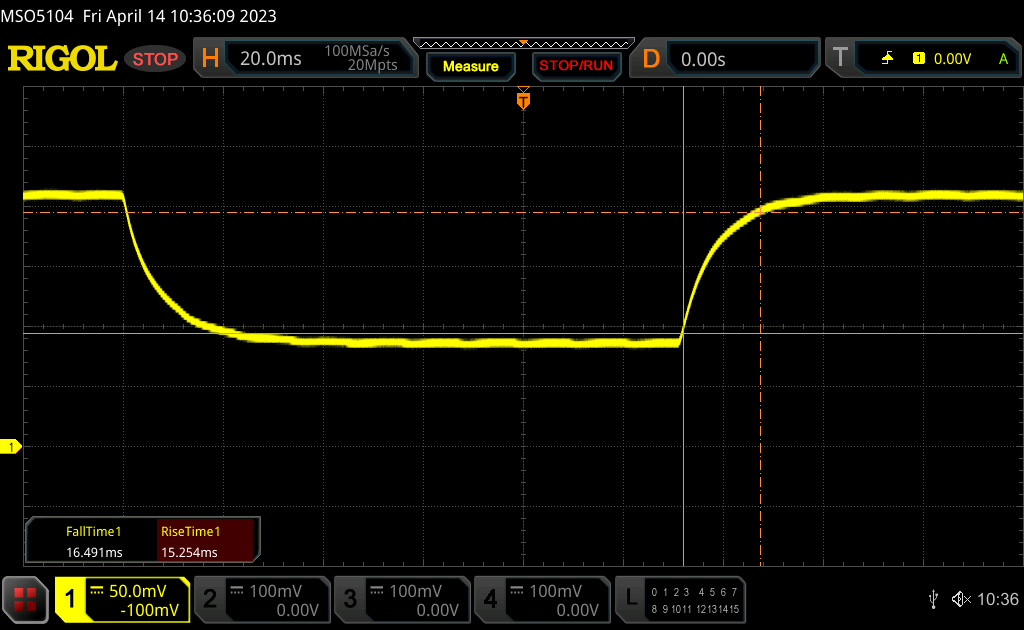 |
| ↘ 16.5 ms fall | ||
| The screen shows slow response rates in our tests and will be unsatisfactory for gamers. In comparison, all tested devices range from 0.2 (minimum) to 636 (maximum) ms. » 36 % of all devices are better. This means that the measured response time is similar to the average of all tested devices (33.8 ms). | ||
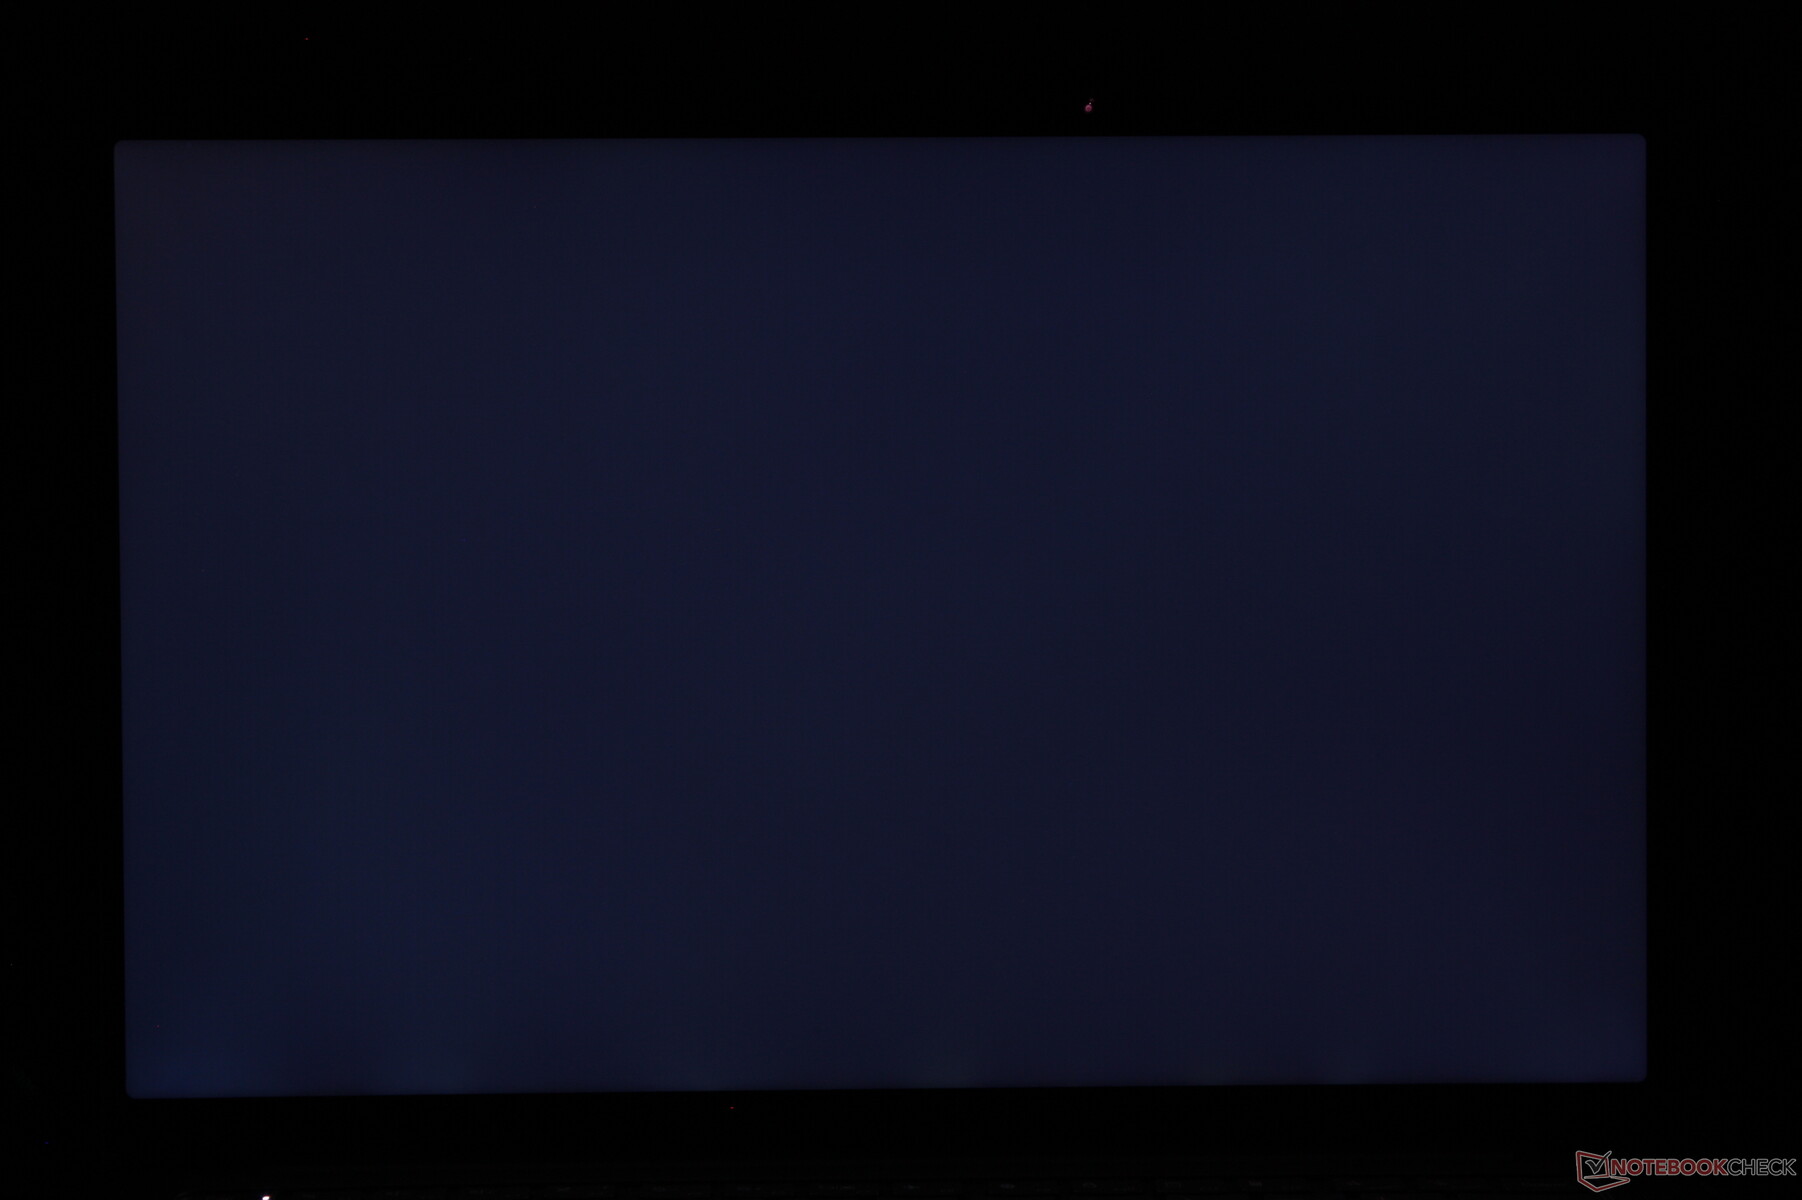
Screen Flickering / PWM (Pulse-Width Modulation)
| Screen flickering / PWM not detected |  | ||
In comparison: 53 % of all tested devices do not use PWM to dim the display. If PWM was detected, an average of 17933 (minimum: 5 - maximum: 3846000) Hz was measured. | |||
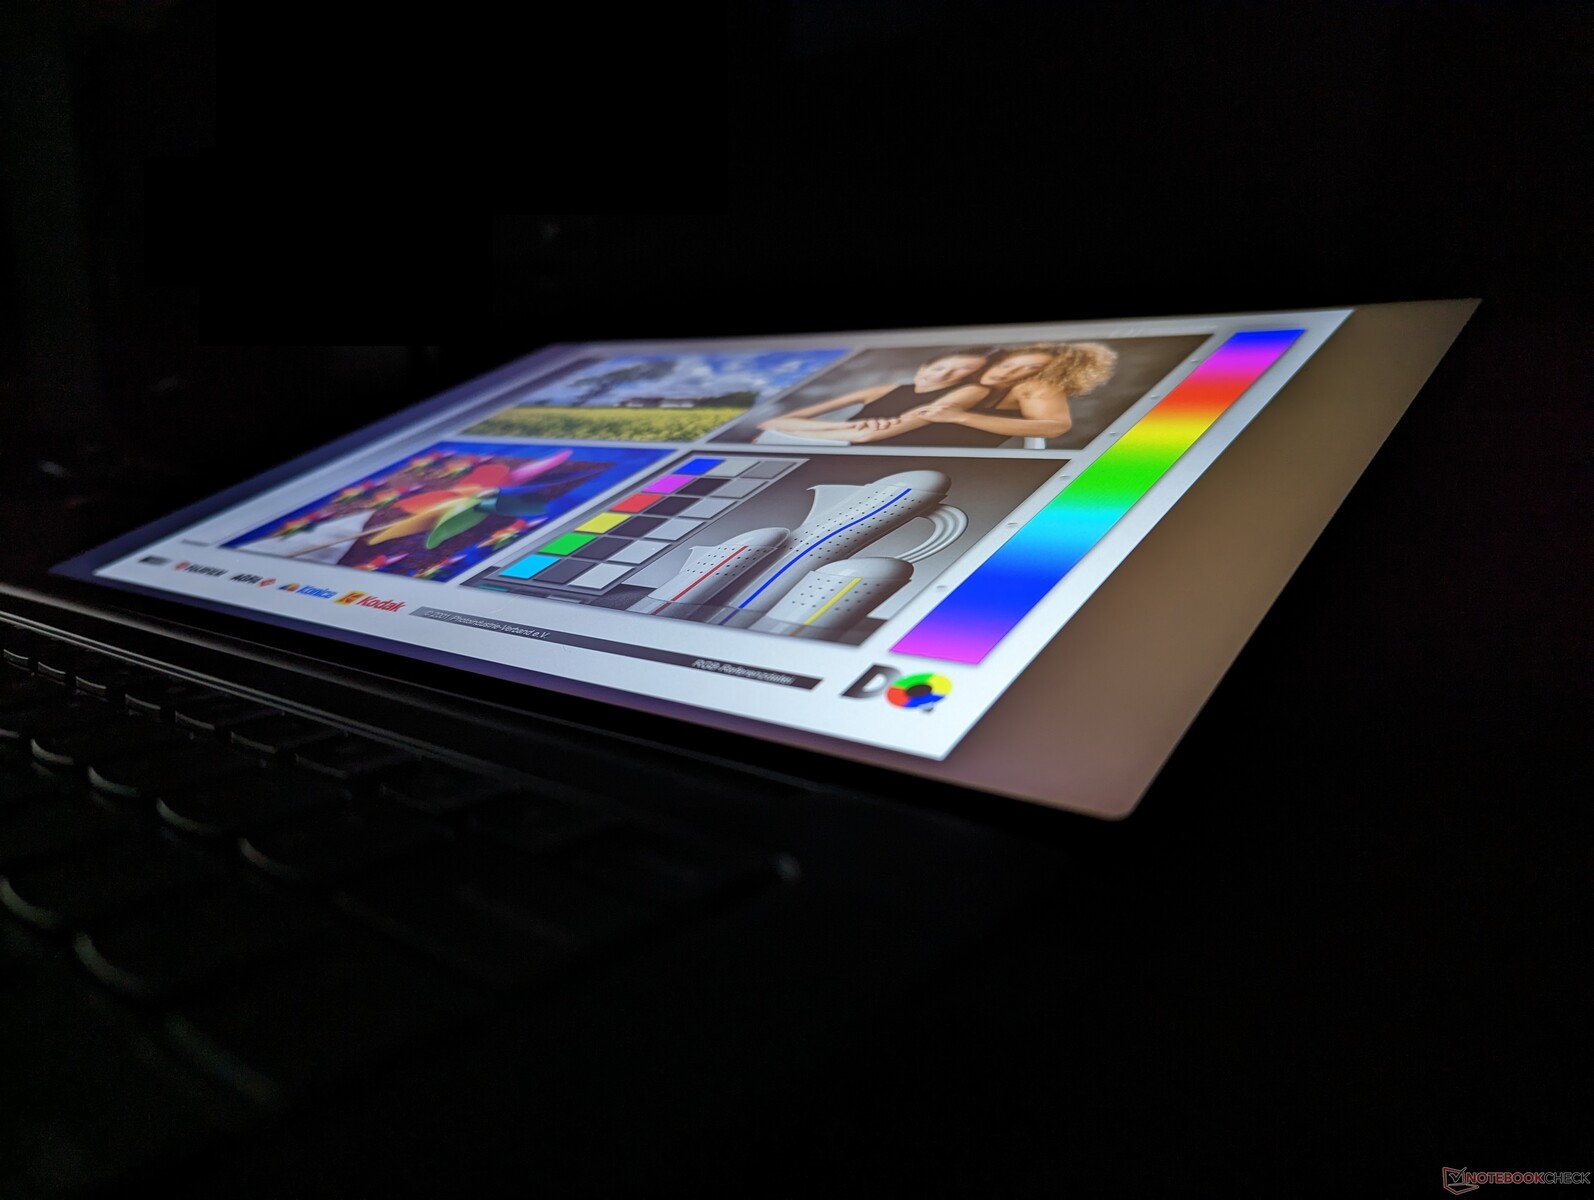
Outdoor visibility is acceptable when under shade where glare is more tolerable. If under brighter conditions, the glare becomes more difficult to ignore and onscreen content can appear too washed out. HP offers displays that can be over 2x brighter on some of its 14-inch EliteBook models if outdoor visibility is a concern.
Performance — New Ryzen 7 7735HS CPU


Testing Conditions
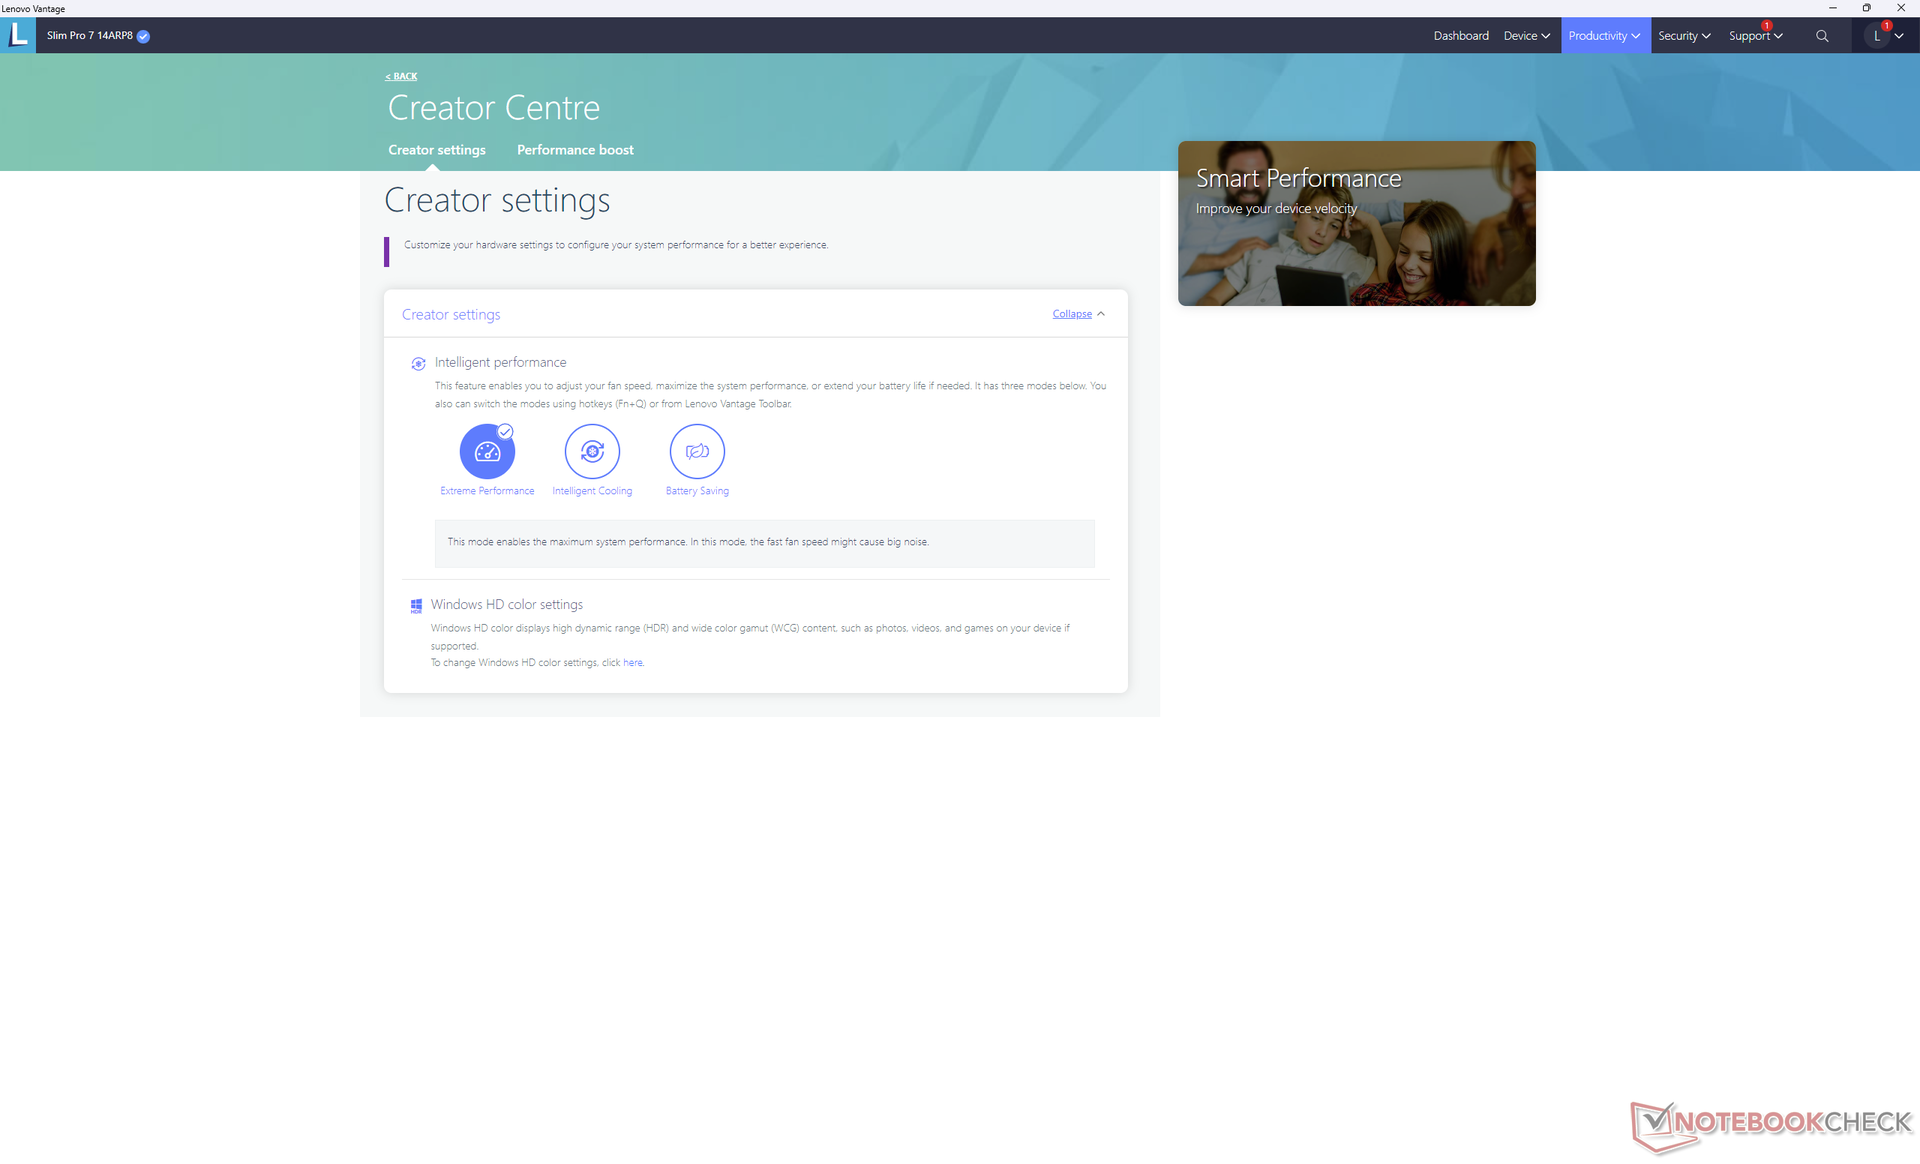
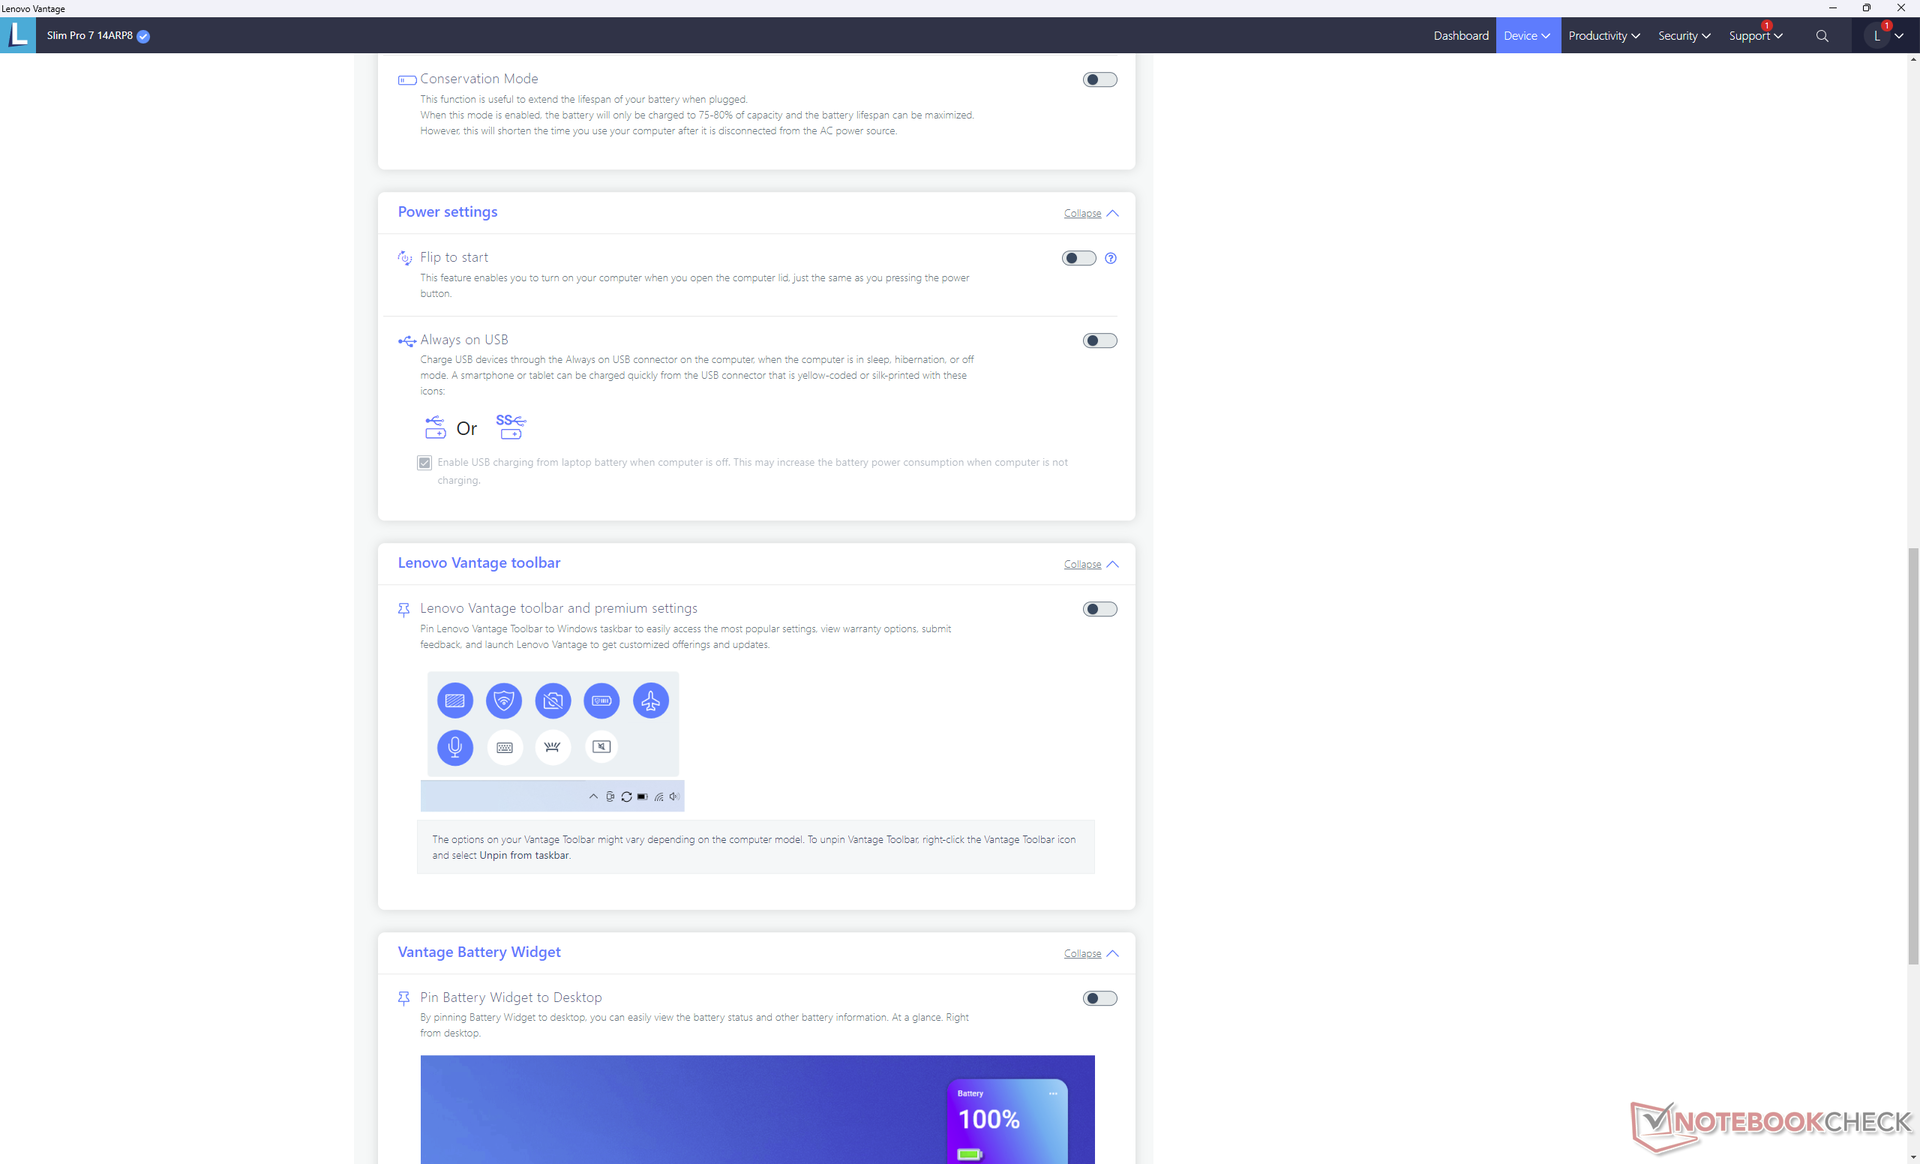
We set our unit to Performance mode via Windows and Extreme Performance mode via Lenovo Vantage prior to running the benchmarks below. Lenovo has redesigned its Vantage software this year and so all the settings and toggles have been annoyingly rearranged. The three performance profiles, for example, are under two different submenus.
Advanced Optimus and G-Sync are not supported.
We encountered a bug on our unit where the system would not properly wake from sleep at times. A hard reboot would then be required.


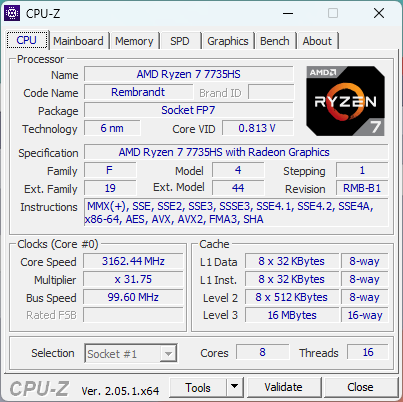
Processor
As impressive as the high-end Zen 4 Ryzen 7 7945HX may be, the lesser midrange Zen 3 Ryzen 7 7735HS feels like a simple rebrand of last year's Ryzen 7 6800H. Multi-thread performance lies in between the slower Ryzen 9 6900HS and faster Core i7-12700H. Single-thread performance is more disappointing with its 30 percent deficit behind the Core i7-12700H. Even the more power-efficient Intel Core i7-1260P can outperform the Ryzen 7 7735HS in single-threaded workloads.
Performance sustainability is nonetheless very good. When running CineBench R15 xT in a loop, final scores would remain steady throughout whereas the Core i7-12700H in the Dell Inspiron 14 Plus or Alienware x14 would experience steeper performance drops as shown by the comparison graph below.
Cinebench R15 Multi Loop
Cinebench R23: Multi Core | Single Core
Cinebench R20: CPU (Multi Core) | CPU (Single Core)
Cinebench R15: CPU Multi 64Bit | CPU Single 64Bit
Blender: v2.79 BMW27 CPU
7-Zip 18.03: 7z b 4 | 7z b 4 -mmt1
Geekbench 5.5: Multi-Core | Single-Core
HWBOT x265 Benchmark v2.2: 4k Preset
LibreOffice : 20 Documents To PDF
R Benchmark 2.5: Overall mean
* ... smaller is better
AIDA64: FP32 Ray-Trace | FPU Julia | CPU SHA3 | CPU Queen | FPU SinJulia | FPU Mandel | CPU AES | CPU ZLib | FP64 Ray-Trace | CPU PhotoWorxx
| Performance Rating | |
| Average AMD Ryzen 7 7735HS | |
| Lenovo Slim Pro 7 14ARP8 | |
| Gigabyte Aero 14 OLED BMF | |
| Lenovo Slim 7 Pro X 14ARH7 | |
| Dell Inspiron 14 Plus 7420 | |
| Lenovo Yoga 9 14IRP G8 | |
| LG Gram 14Z90Q | |
| AIDA64 / FP32 Ray-Trace | |
| Lenovo Slim Pro 7 14ARP8 | |
| Average AMD Ryzen 7 7735HS (12718 - 17161, n=12) | |
| Lenovo Slim 7 Pro X 14ARH7 | |
| Gigabyte Aero 14 OLED BMF | |
| Dell Inspiron 14 Plus 7420 | |
| Lenovo Yoga 9 14IRP G8 | |
| LG Gram 14Z90Q | |
| AIDA64 / FPU Julia | |
| Lenovo Slim Pro 7 14ARP8 | |
| Average AMD Ryzen 7 7735HS (81722 - 105483, n=12) | |
| Lenovo Slim 7 Pro X 14ARH7 | |
| Gigabyte Aero 14 OLED BMF | |
| Dell Inspiron 14 Plus 7420 | |
| Lenovo Yoga 9 14IRP G8 | |
| LG Gram 14Z90Q | |
| AIDA64 / CPU SHA3 | |
| Average AMD Ryzen 7 7735HS (2818 - 3494, n=12) | |
| Lenovo Slim Pro 7 14ARP8 | |
| Lenovo Slim 7 Pro X 14ARH7 | |
| Gigabyte Aero 14 OLED BMF | |
| Dell Inspiron 14 Plus 7420 | |
| Lenovo Yoga 9 14IRP G8 | |
| LG Gram 14Z90Q | |
| AIDA64 / CPU Queen | |
| Gigabyte Aero 14 OLED BMF | |
| Average AMD Ryzen 7 7735HS (90101 - 108729, n=12) | |
| Lenovo Slim 7 Pro X 14ARH7 | |
| Dell Inspiron 14 Plus 7420 | |
| Lenovo Slim Pro 7 14ARP8 | |
| Lenovo Yoga 9 14IRP G8 | |
| LG Gram 14Z90Q | |
| AIDA64 / FPU SinJulia | |
| Lenovo Slim 7 Pro X 14ARH7 | |
| Average AMD Ryzen 7 7735HS (11441 - 13097, n=12) | |
| Lenovo Slim Pro 7 14ARP8 | |
| Gigabyte Aero 14 OLED BMF | |
| Dell Inspiron 14 Plus 7420 | |
| Lenovo Yoga 9 14IRP G8 | |
| LG Gram 14Z90Q | |
| AIDA64 / FPU Mandel | |
| Average AMD Ryzen 7 7735HS (44756 - 58232, n=12) | |
| Lenovo Slim Pro 7 14ARP8 | |
| Lenovo Slim 7 Pro X 14ARH7 | |
| Gigabyte Aero 14 OLED BMF | |
| Dell Inspiron 14 Plus 7420 | |
| Lenovo Yoga 9 14IRP G8 | |
| LG Gram 14Z90Q | |
| AIDA64 / CPU AES | |
| Gigabyte Aero 14 OLED BMF | |
| Average AMD Ryzen 7 7735HS (49927 - 137629, n=12) | |
| Dell Inspiron 14 Plus 7420 | |
| Lenovo Slim 7 Pro X 14ARH7 | |
| Lenovo Slim Pro 7 14ARP8 | |
| Lenovo Yoga 9 14IRP G8 | |
| LG Gram 14Z90Q | |
| AIDA64 / CPU ZLib | |
| Dell Inspiron 14 Plus 7420 | |
| Gigabyte Aero 14 OLED BMF | |
| Lenovo Slim Pro 7 14ARP8 | |
| Lenovo Slim 7 Pro X 14ARH7 | |
| Average AMD Ryzen 7 7735HS (651 - 906, n=12) | |
| Lenovo Yoga 9 14IRP G8 | |
| LG Gram 14Z90Q | |
| AIDA64 / FP64 Ray-Trace | |
| Lenovo Slim Pro 7 14ARP8 | |
| Lenovo Slim 7 Pro X 14ARH7 | |
| Average AMD Ryzen 7 7735HS (1459 - 9094, n=12) | |
| Gigabyte Aero 14 OLED BMF | |
| Dell Inspiron 14 Plus 7420 | |
| Lenovo Yoga 9 14IRP G8 | |
| LG Gram 14Z90Q | |
| AIDA64 / CPU PhotoWorxx | |
| Gigabyte Aero 14 OLED BMF | |
| Lenovo Yoga 9 14IRP G8 | |
| Dell Inspiron 14 Plus 7420 | |
| Average AMD Ryzen 7 7735HS (19153 - 30542, n=12) | |
| Lenovo Slim Pro 7 14ARP8 | |
| Lenovo Slim 7 Pro X 14ARH7 | |
| LG Gram 14Z90Q | |
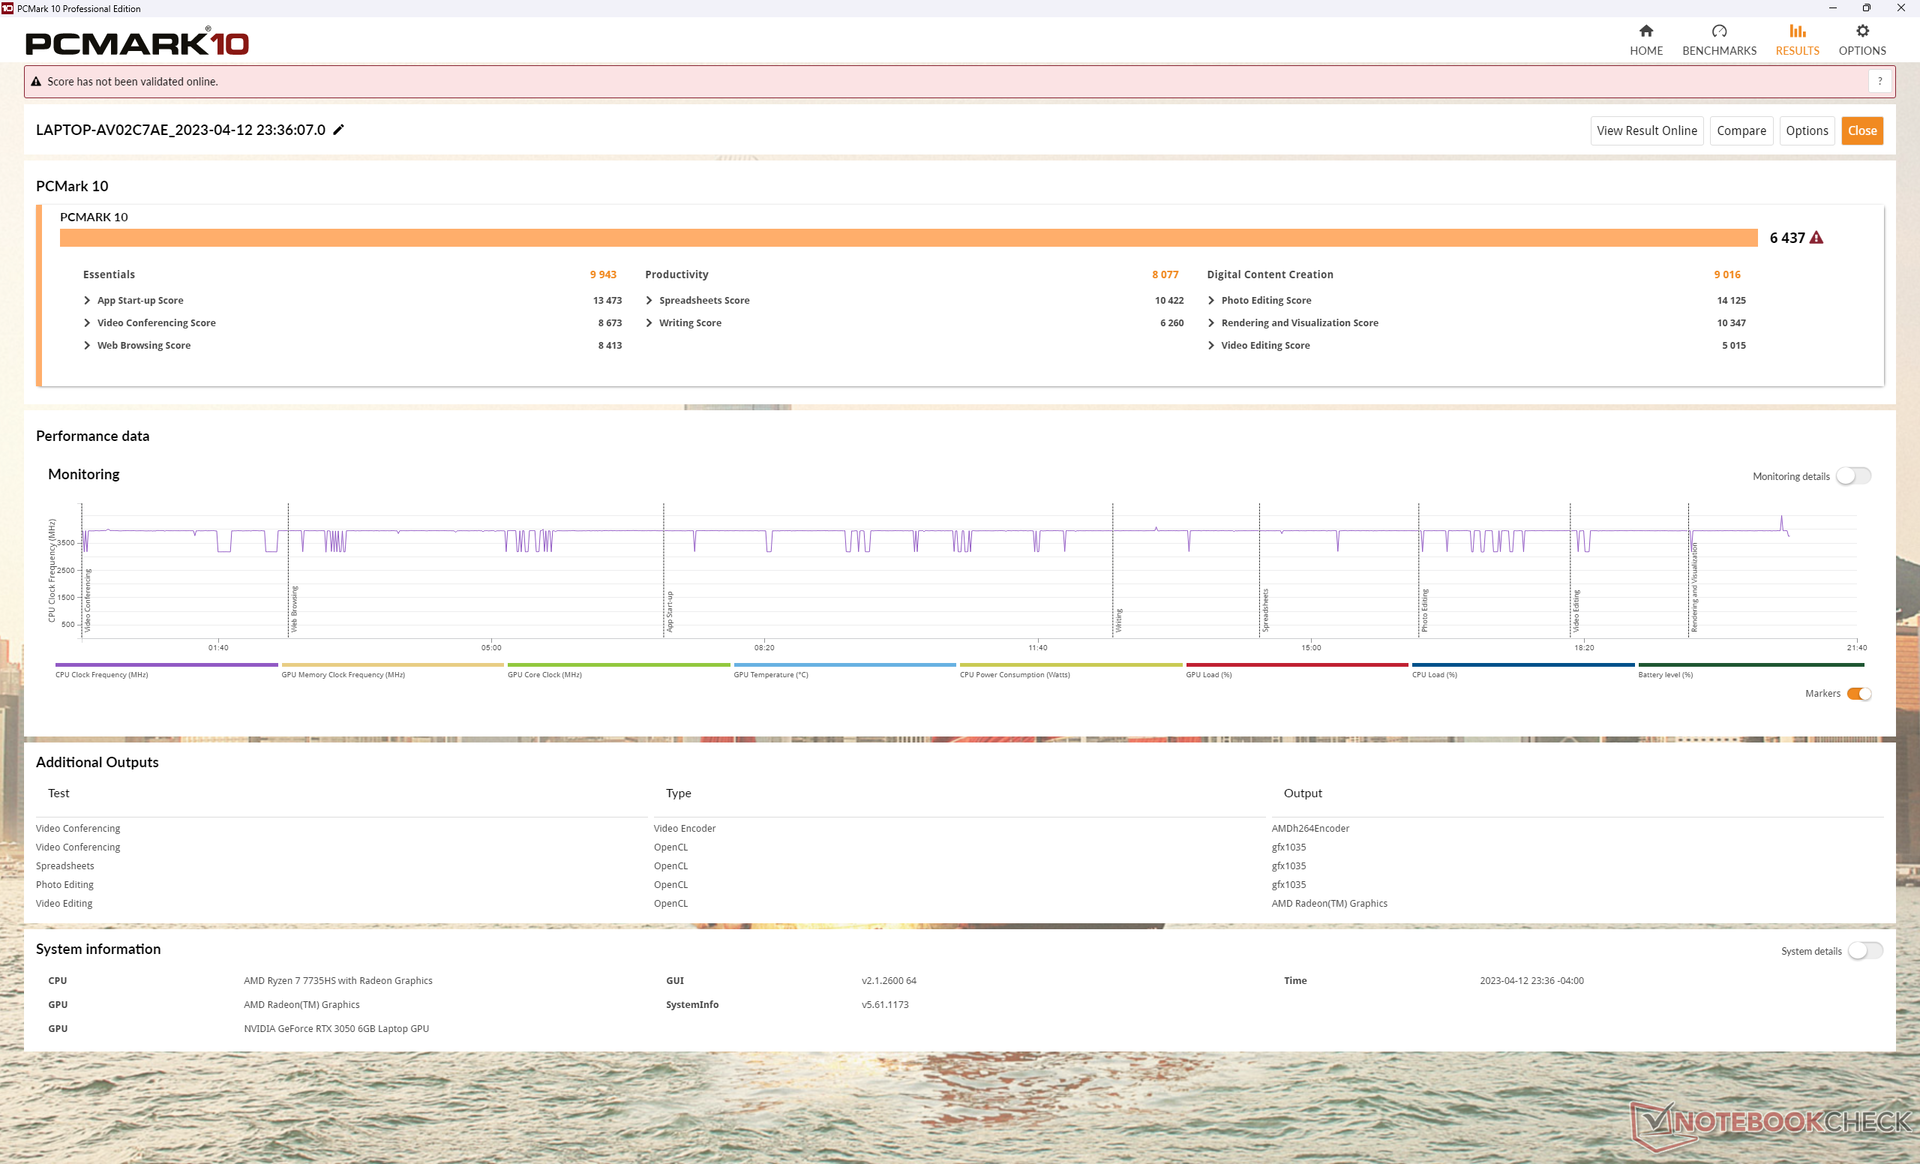
System Performance
PCMark results are slightly below last year's model with the Core i7-12700H since the 12th gen Intel CPU is still the faster overall processor than our Ryzen 7 7735HS.
CrossMark: Overall | Productivity | Creativity | Responsiveness
| PCMark 10 / Score | |
| Gigabyte Aero 14 OLED BMF | |
| Lenovo Yoga Slim 7 Pro X 14IAH7 82TK006CGE | |
| Dell Inspiron 14 Plus 7420 | |
| Lenovo Slim Pro 7 14ARP8 | |
| Average AMD Ryzen 7 7735HS, NVIDIA GeForce RTX 3050 6GB Laptop GPU () | |
| Lenovo Slim 7 Pro X 14ARH7 | |
| Lenovo Yoga 9 14IRP G8 | |
| LG Gram 14Z90Q | |
| PCMark 10 / Essentials | |
| Lenovo Yoga 9 14IRP G8 | |
| Gigabyte Aero 14 OLED BMF | |
| Lenovo Yoga Slim 7 Pro X 14IAH7 82TK006CGE | |
| Dell Inspiron 14 Plus 7420 | |
| Lenovo Slim 7 Pro X 14ARH7 | |
| Lenovo Slim Pro 7 14ARP8 | |
| Average AMD Ryzen 7 7735HS, NVIDIA GeForce RTX 3050 6GB Laptop GPU () | |
| LG Gram 14Z90Q | |
| PCMark 10 / Productivity | |
| Lenovo Yoga Slim 7 Pro X 14IAH7 82TK006CGE | |
| Gigabyte Aero 14 OLED BMF | |
| Dell Inspiron 14 Plus 7420 | |
| Lenovo Slim 7 Pro X 14ARH7 | |
| Lenovo Slim Pro 7 14ARP8 | |
| Average AMD Ryzen 7 7735HS, NVIDIA GeForce RTX 3050 6GB Laptop GPU () | |
| Lenovo Yoga 9 14IRP G8 | |
| LG Gram 14Z90Q | |
| PCMark 10 / Digital Content Creation | |
| Gigabyte Aero 14 OLED BMF | |
| Lenovo Slim Pro 7 14ARP8 | |
| Average AMD Ryzen 7 7735HS, NVIDIA GeForce RTX 3050 6GB Laptop GPU () | |
| Lenovo Yoga Slim 7 Pro X 14IAH7 82TK006CGE | |
| Dell Inspiron 14 Plus 7420 | |
| Lenovo Slim 7 Pro X 14ARH7 | |
| Lenovo Yoga 9 14IRP G8 | |
| LG Gram 14Z90Q | |
| CrossMark / Overall | |
| Gigabyte Aero 14 OLED BMF | |
| Lenovo Yoga Slim 7 Pro X 14IAH7 82TK006CGE | |
| Lenovo Yoga 9 14IRP G8 | |
| Dell Inspiron 14 Plus 7420 | |
| Lenovo Slim 7 Pro X 14ARH7 | |
| Lenovo Slim Pro 7 14ARP8 | |
| Average AMD Ryzen 7 7735HS, NVIDIA GeForce RTX 3050 6GB Laptop GPU () | |
| CrossMark / Productivity | |
| Gigabyte Aero 14 OLED BMF | |
| Lenovo Yoga 9 14IRP G8 | |
| Lenovo Yoga Slim 7 Pro X 14IAH7 82TK006CGE | |
| Dell Inspiron 14 Plus 7420 | |
| Lenovo Slim 7 Pro X 14ARH7 | |
| Lenovo Slim Pro 7 14ARP8 | |
| Average AMD Ryzen 7 7735HS, NVIDIA GeForce RTX 3050 6GB Laptop GPU () | |
| CrossMark / Creativity | |
| Lenovo Yoga Slim 7 Pro X 14IAH7 82TK006CGE | |
| Lenovo Yoga 9 14IRP G8 | |
| Gigabyte Aero 14 OLED BMF | |
| Dell Inspiron 14 Plus 7420 | |
| Lenovo Slim 7 Pro X 14ARH7 | |
| Lenovo Slim Pro 7 14ARP8 | |
| Average AMD Ryzen 7 7735HS, NVIDIA GeForce RTX 3050 6GB Laptop GPU () | |
| CrossMark / Responsiveness | |
| Gigabyte Aero 14 OLED BMF | |
| Lenovo Yoga 9 14IRP G8 | |
| Lenovo Yoga Slim 7 Pro X 14IAH7 82TK006CGE | |
| Dell Inspiron 14 Plus 7420 | |
| Lenovo Slim 7 Pro X 14ARH7 | |
| Lenovo Slim Pro 7 14ARP8 | |
| Average AMD Ryzen 7 7735HS, NVIDIA GeForce RTX 3050 6GB Laptop GPU () | |
| PCMark 10 Score | 6437 points | |
Help | ||
| AIDA64 / Memory Copy | |
| Gigabyte Aero 14 OLED BMF | |
| Lenovo Yoga 9 14IRP G8 | |
| Dell Inspiron 14 Plus 7420 | |
| LG Gram 14Z90Q | |
| Lenovo Slim Pro 7 14ARP8 | |
| Lenovo Slim 7 Pro X 14ARH7 | |
| Average AMD Ryzen 7 7735HS (30324 - 52012, n=12) | |
| AIDA64 / Memory Read | |
| Gigabyte Aero 14 OLED BMF | |
| LG Gram 14Z90Q | |
| Dell Inspiron 14 Plus 7420 | |
| Lenovo Yoga 9 14IRP G8 | |
| Average AMD Ryzen 7 7735HS (33938 - 51856, n=12) | |
| Lenovo Slim Pro 7 14ARP8 | |
| Lenovo Slim 7 Pro X 14ARH7 | |
| AIDA64 / Memory Write | |
| Gigabyte Aero 14 OLED BMF | |
| Lenovo Yoga 9 14IRP G8 | |
| LG Gram 14Z90Q | |
| Dell Inspiron 14 Plus 7420 | |
| Average AMD Ryzen 7 7735HS (33175 - 55284, n=12) | |
| Lenovo Slim 7 Pro X 14ARH7 | |
| Lenovo Slim Pro 7 14ARP8 | |
| AIDA64 / Memory Latency | |
| Dell Inspiron 14 Plus 7420 | |
| LG Gram 14Z90Q | |
| Lenovo Slim 7 Pro X 14ARH7 | |
| Lenovo Slim Pro 7 14ARP8 | |
| Lenovo Yoga 9 14IRP G8 | |
| Gigabyte Aero 14 OLED BMF | |
| Average AMD Ryzen 7 7735HS (78.2 - 109.7, n=12) | |
* ... smaller is better
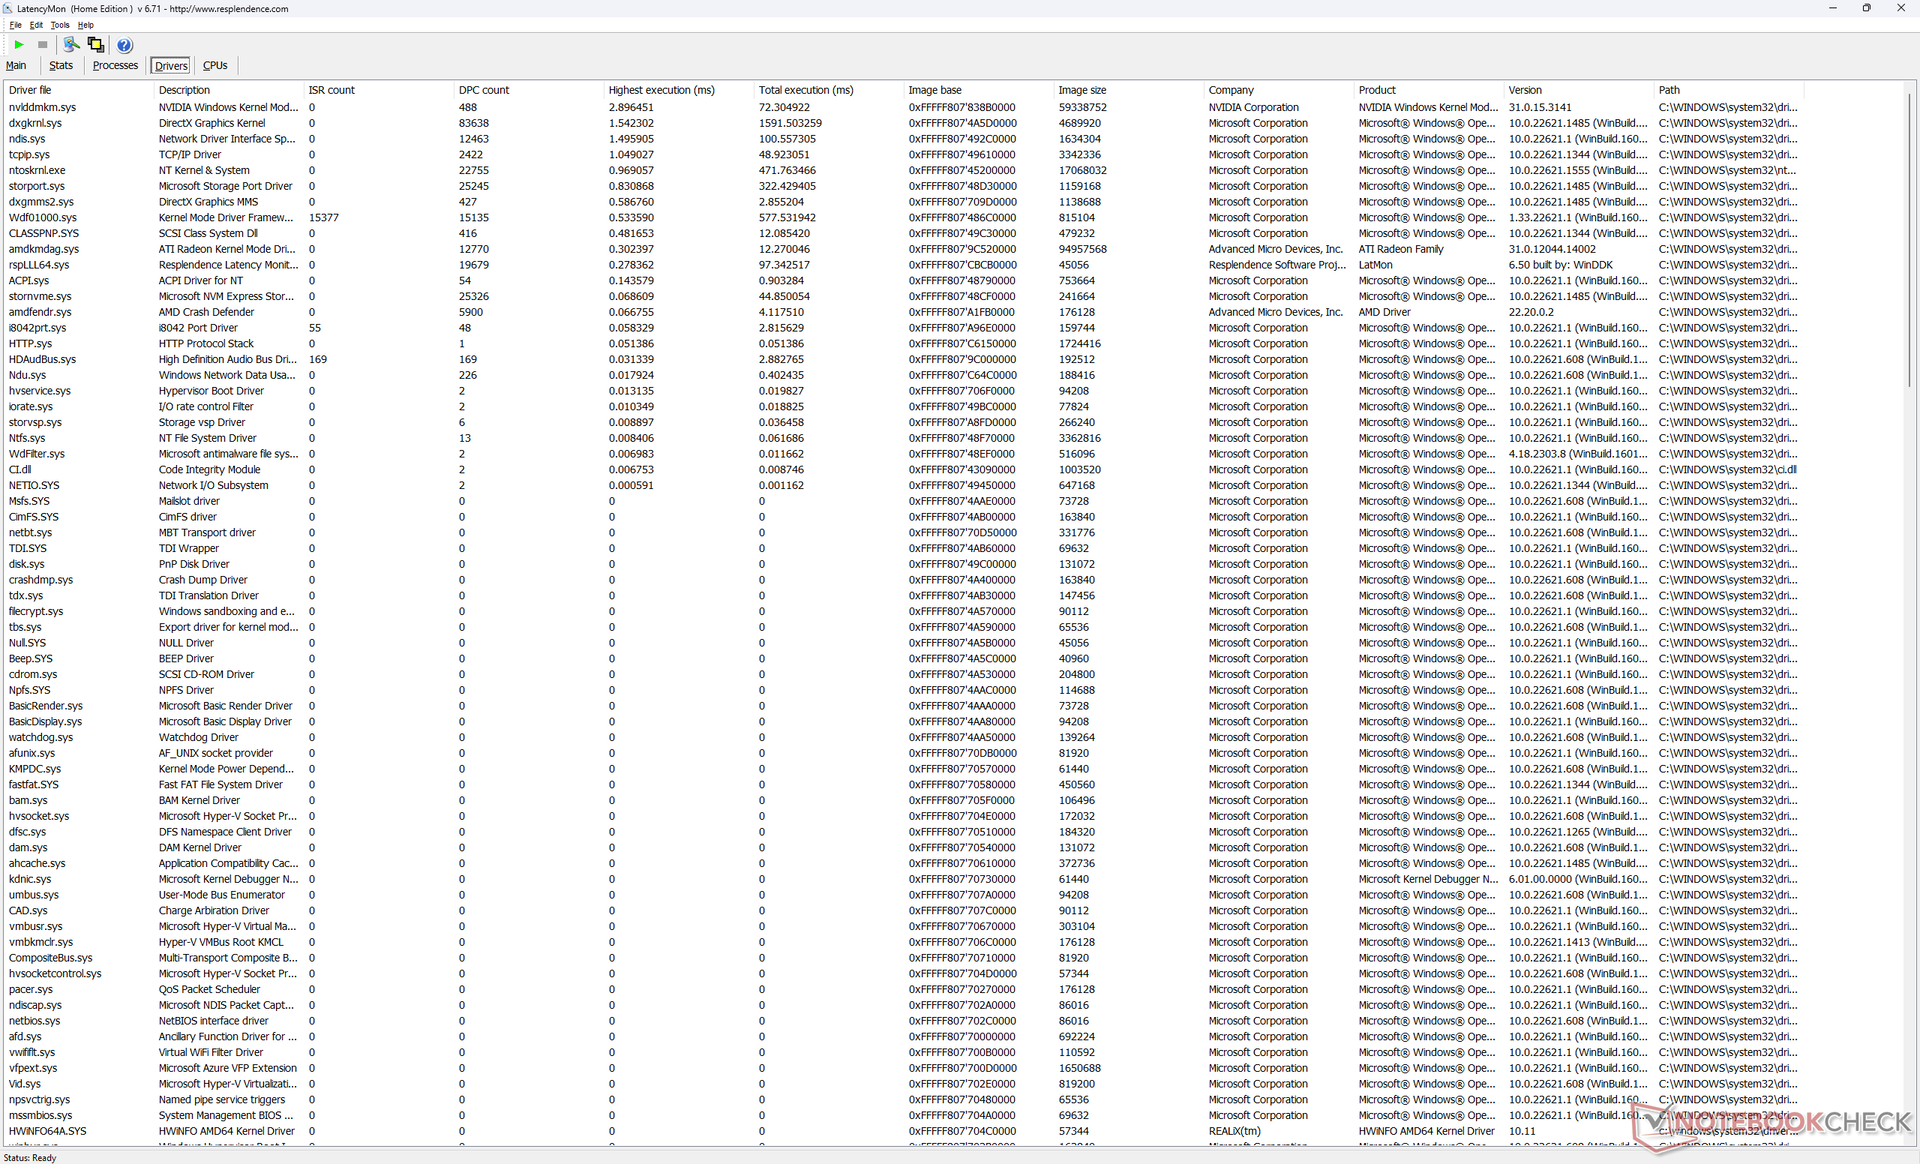
DPC Latency
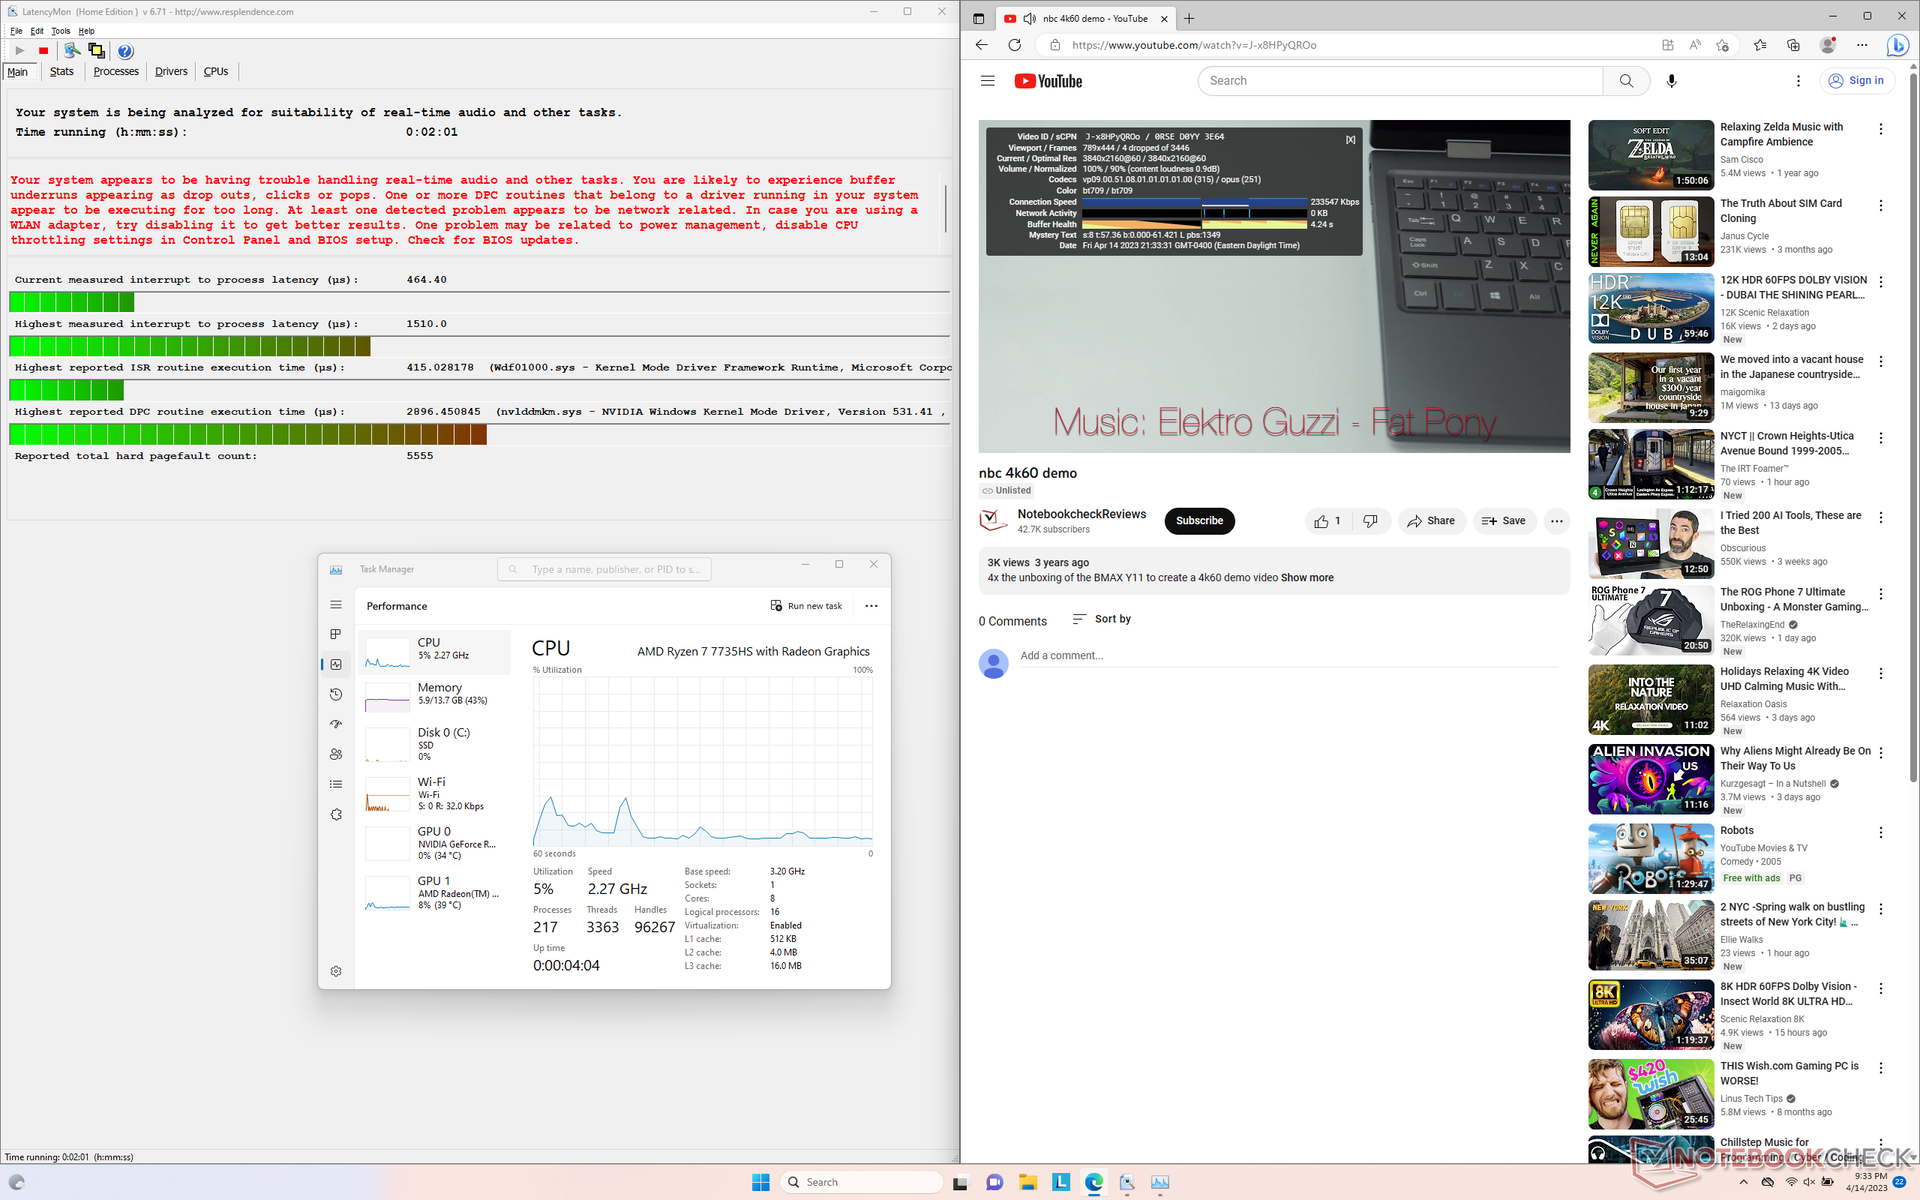
LatencyMon reveals DPC issues when opening multiple browser tabs of our homepage. 4K video playback at 60 FPS is also imperfect with 4 dropped frames during our minute-long test video.
| DPC Latencies / LatencyMon - interrupt to process latency (max), Web, Youtube, Prime95 | |
| Lenovo Slim 7 Pro X 14ARH7 | |
| Gigabyte Aero 14 OLED BMF | |
| Lenovo Yoga 9 14IRP G8 | |
| Lenovo Slim Pro 7 14ARP8 | |
| LG Gram 14Z90Q | |
| Dell Inspiron 14 Plus 7420 | |
* ... smaller is better
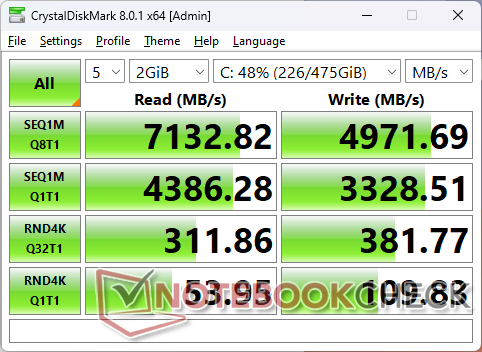
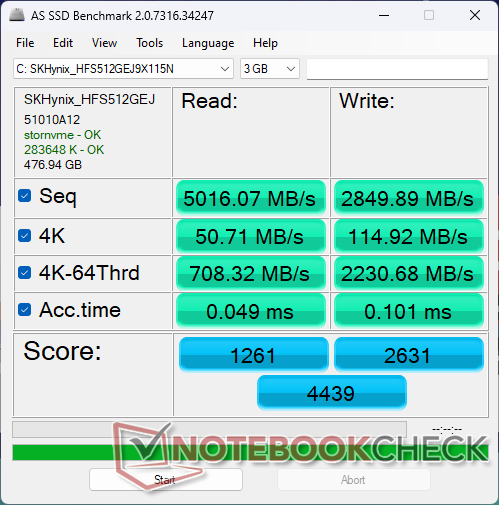
Storage Devices — One Drive Only
Our test unit carries a 1 TB SK Hynix PC801 PCIe4 x4 NVMe SSD for sequential read and write rates of up to 7200 MB/s and 5000 MB/s, respectively, to be competitive against the Samsung PM9A1 series. Performance sustainability is excellent with no throttling over time when under stress. An SSD heat pad comes installed to help dissipate heat onto the bottom panel.


| Drive Performance Rating - Percent | |
| Gigabyte Aero 14 OLED BMF | |
| LG Gram 14Z90Q | |
| Lenovo Yoga 9 14IRP G8 | |
| Lenovo Slim 7 Pro X 14ARH7 | |
| Lenovo Slim Pro 7 14ARP8 | |
| Dell Inspiron 14 Plus 7420 | |
* ... smaller is better
Disk Throttling: DiskSpd Read Loop, Queue Depth 8
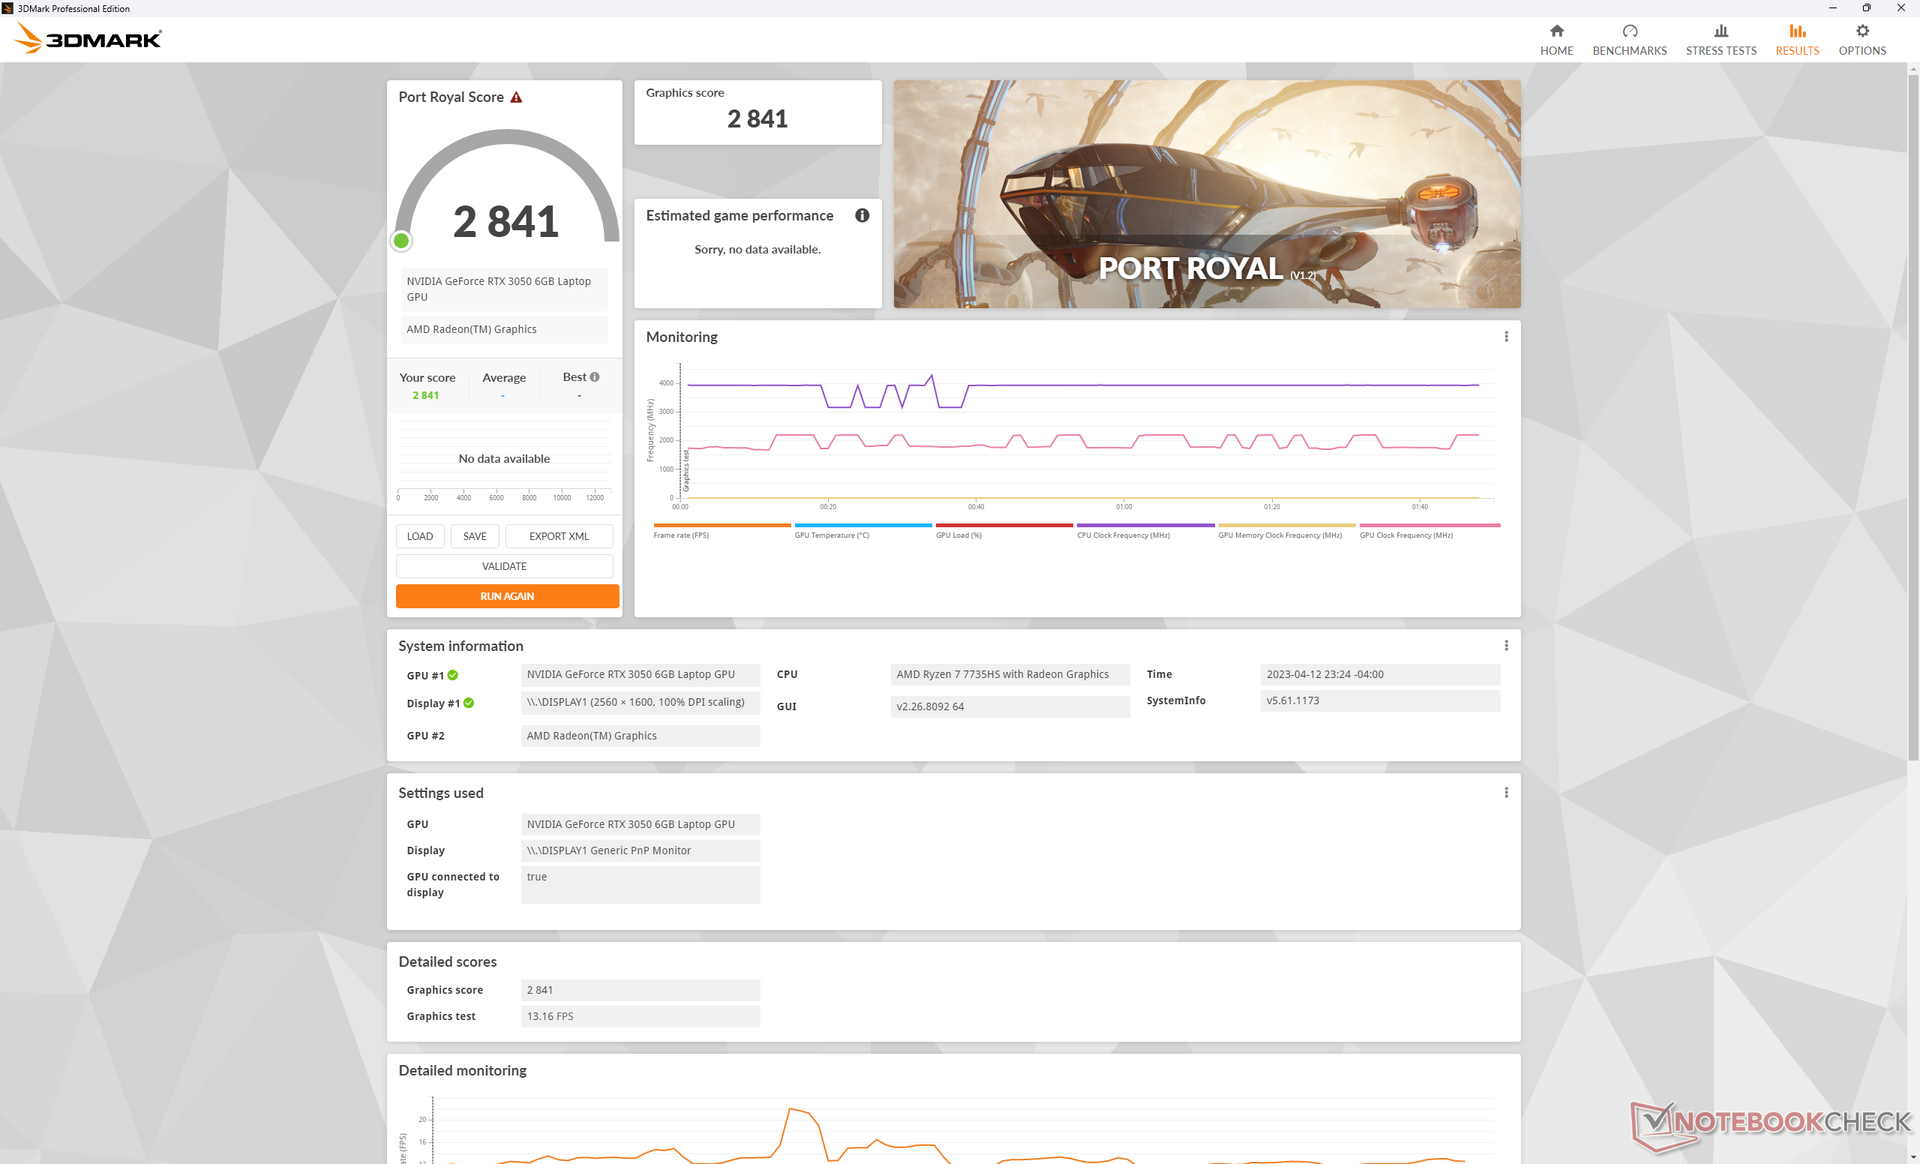
GPU Performance — 6 GB GeForce RTX 3050
The mobile GeForce RTX 3050 is one of Nvidia's more disappointing GPUs as it performs slower than even the GTX 1660 Ti by up to 15 percent for gaming purposes. It's certainly better than any integrated solution currently in the market, but your old GeForce RTX 2060 gaming laptop will still handily outperform the mobile RTX 3050. When compared to the 4 GB version, our 6 GB version is only about 5 percent faster.
The RTX 3050 is a better Studio GPU for content creation rather than gaming as it carries dedicated RT hardware and more CUDA cores than the GTX 1660 Ti to balance out the narrower bus width and slower clocks.
It's worth noting that Lenovo advertises a TGP of 58 W while Nvidia Control Center claims 63 W.
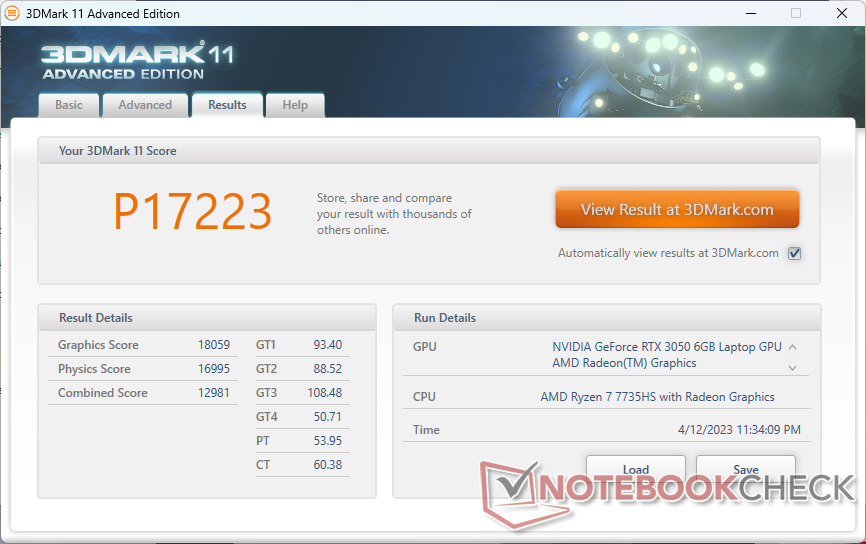
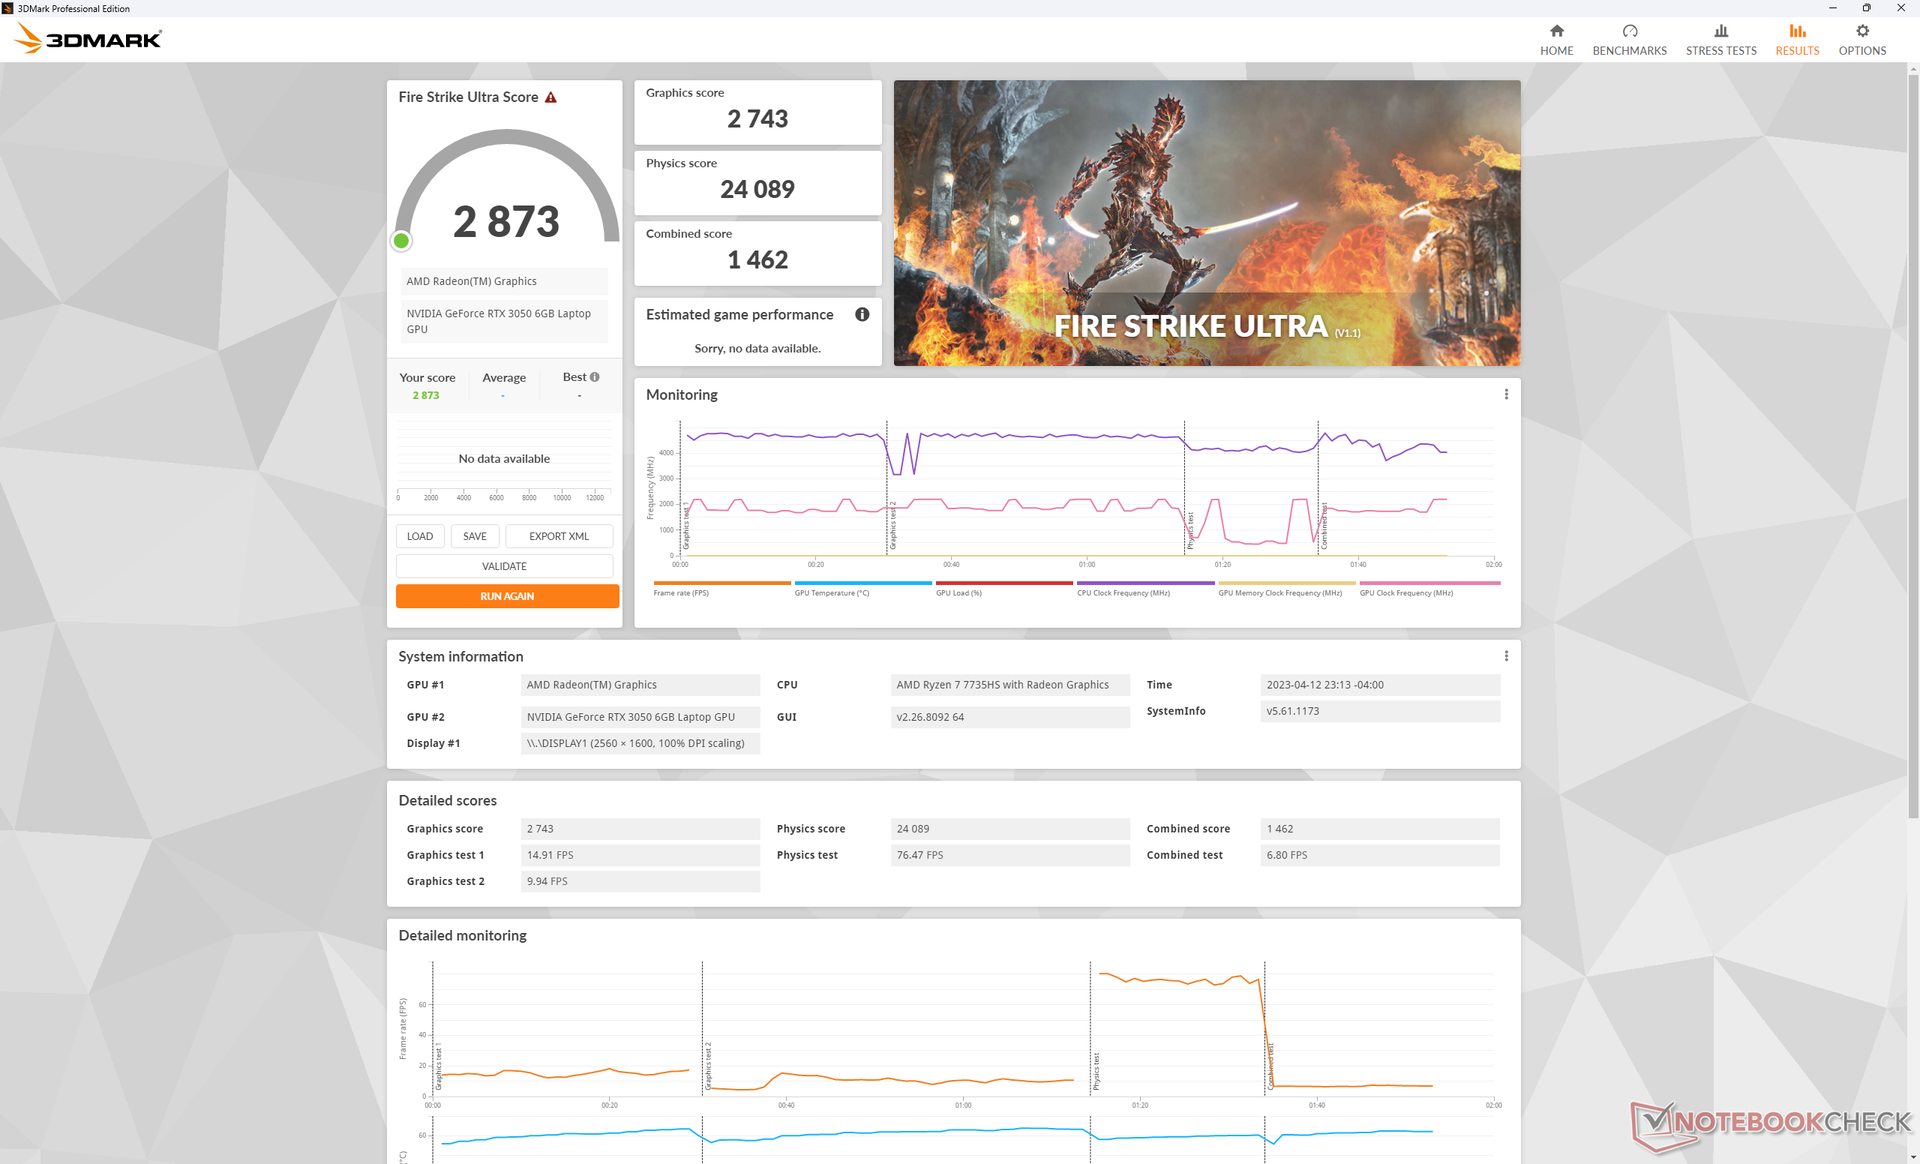
| 3DMark 11 Performance | 17223 points | |
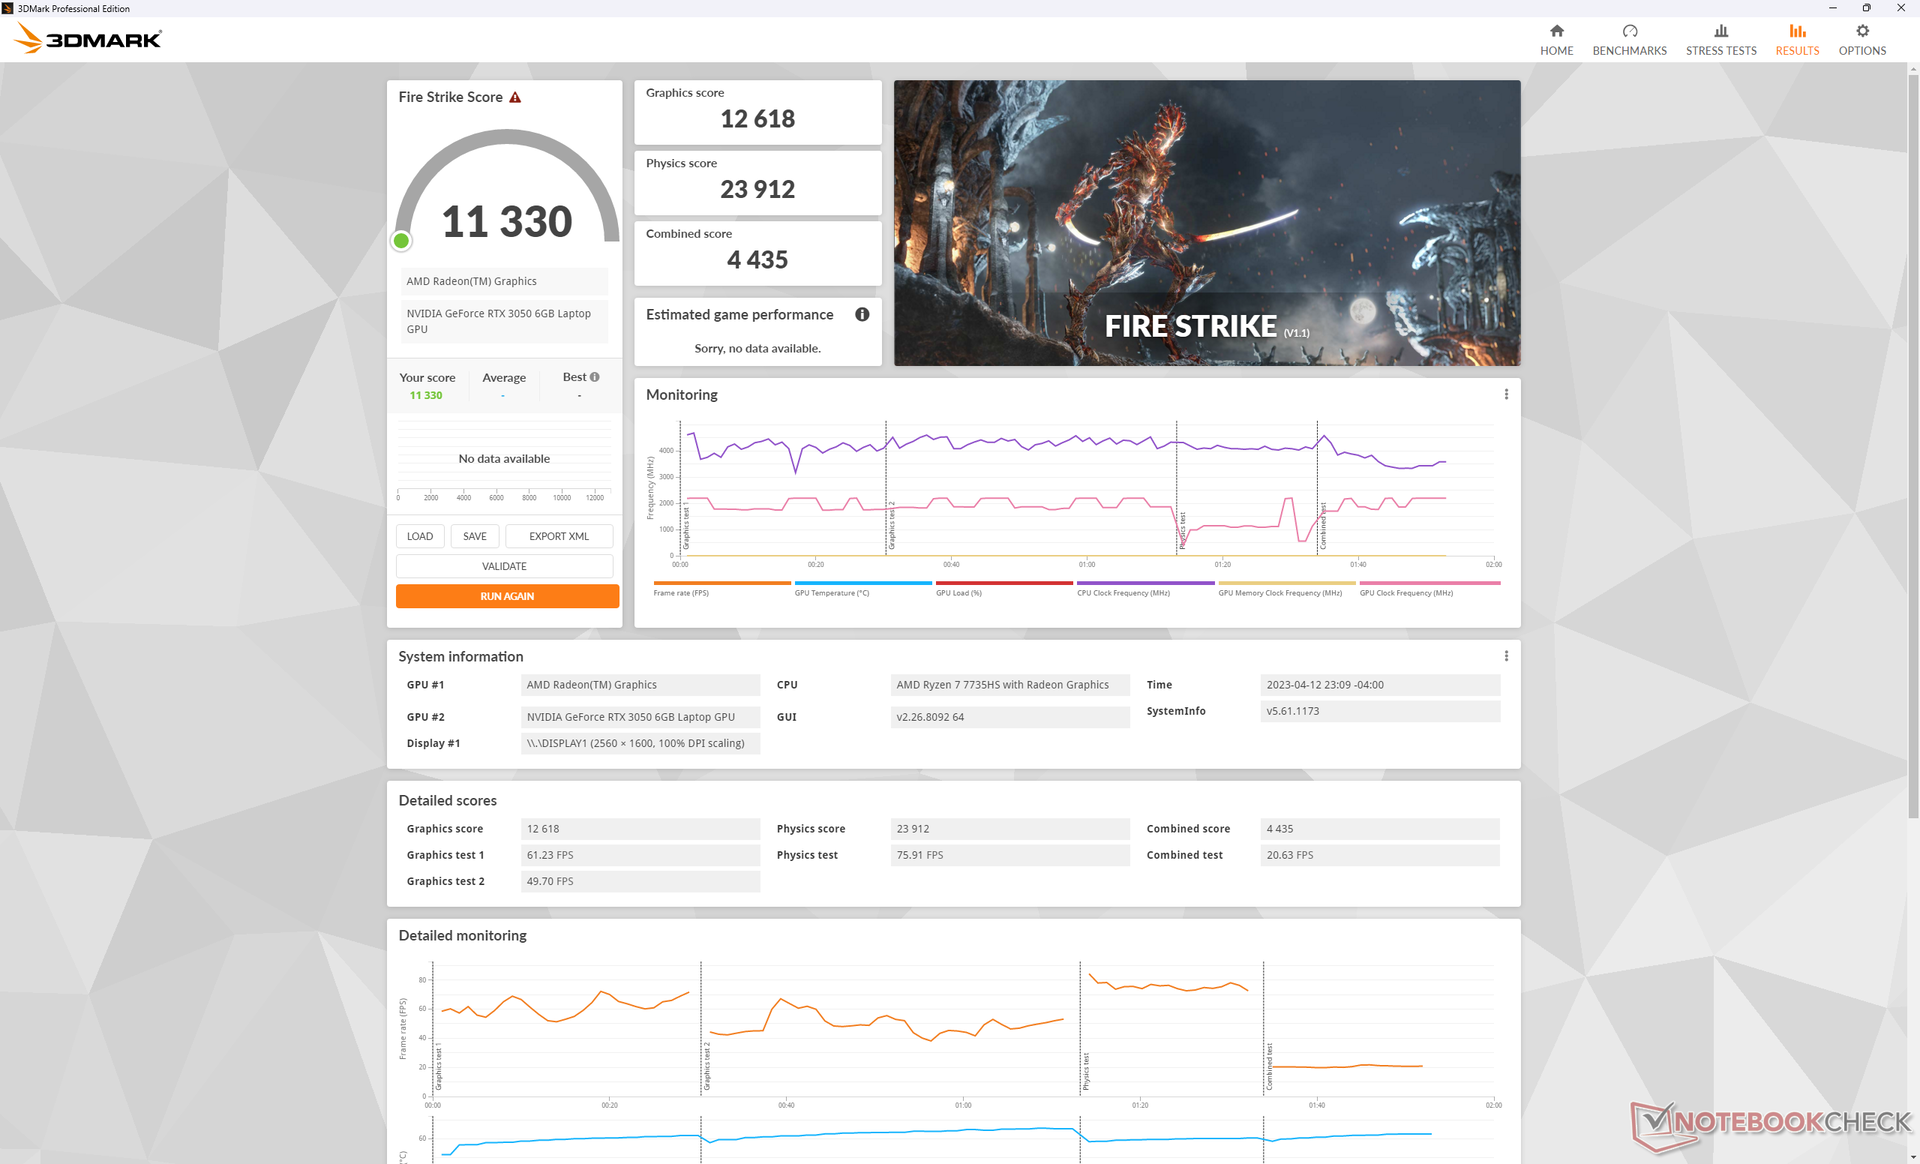
| 3DMark Fire Strike Score | 11330 points | |
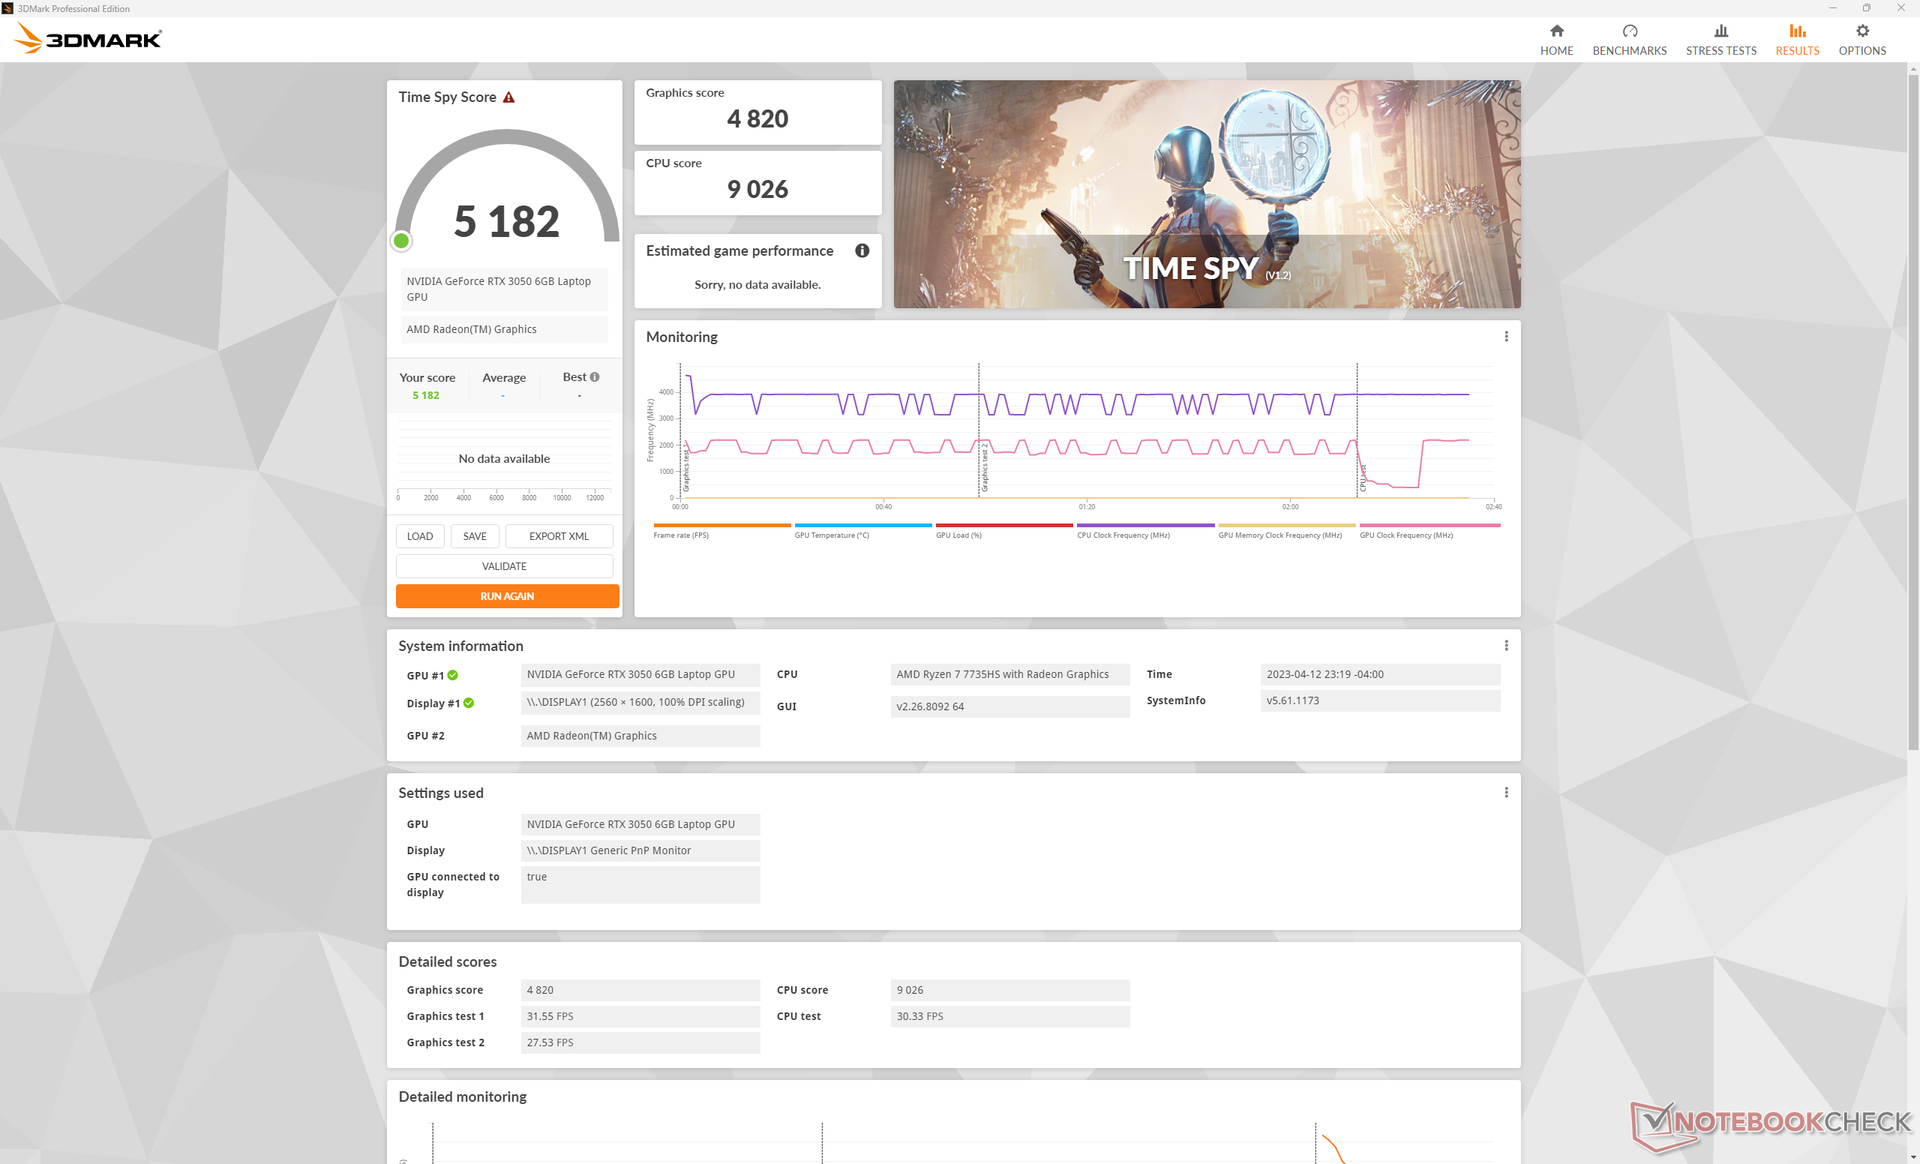
| 3DMark Time Spy Score | 5182 points | |
Help | ||
* ... smaller is better
Gaming Performance
The Slim Pro 7 is capable of running modern games even though it isn't a gaming laptop. Nonetheless, the relatively high 2.5K native resolution and weak GPU make the system best for playing undemanding multiplayer titles like DOTA 2 or Overwatch instead of more graphically intensive titles. Newer single-player titles like Returnal struggle to run unless if settings are lowered to 900p or 1080p.
| Tiny Tina's Wonderlands | |
| 1920x1080 Low Preset (DX12) | |
| Lenovo Slim Pro 7 14ARP8 | |
| Average NVIDIA GeForce RTX 3050 6GB Laptop GPU () | |
| 1920x1080 Medium Preset (DX12) | |
| Asus ROG Zephyrus G14 GA402RJ | |
| Lenovo Slim Pro 7 14ARP8 | |
| Average NVIDIA GeForce RTX 3050 6GB Laptop GPU () | |
| 1920x1080 High Preset (DX12) | |
| Asus ROG Zephyrus G14 GA402RJ | |
| Lenovo Slim Pro 7 14ARP8 | |
| Average NVIDIA GeForce RTX 3050 6GB Laptop GPU () | |
| 1920x1080 Badass Preset (DX12) | |
| Asus ROG Zephyrus G14 GA402RJ | |
| Lenovo Slim Pro 7 14ARP8 | |
| Average NVIDIA GeForce RTX 3050 6GB Laptop GPU () | |
| Returnal | |
| 1920x1080 Low Preset | |
| Aorus 15X ASF | |
| Lenovo Slim Pro 7 14ARP8 | |
| Average NVIDIA GeForce RTX 3050 6GB Laptop GPU () | |
| 1920x1080 Medium Preset | |
| Aorus 15X ASF | |
| Lenovo Slim Pro 7 14ARP8 | |
| Average NVIDIA GeForce RTX 3050 6GB Laptop GPU () | |
| 1920x1080 High Preset | |
| Aorus 15X ASF | |
| Lenovo Slim Pro 7 14ARP8 | |
| Average NVIDIA GeForce RTX 3050 6GB Laptop GPU () | |
| 1920x1080 Epic Preset | |
| Aorus 15X ASF | |
| Lenovo Slim Pro 7 14ARP8 | |
| Average NVIDIA GeForce RTX 3050 6GB Laptop GPU () | |
Witcher 3 FPS Chart
| low | med. | high | ultra | |
| GTA V (2015) | 163.4 | 119.5 | 63.8 | |
| The Witcher 3 (2015) | 236 | 96.5 | 52.9 | |
| Dota 2 Reborn (2015) | 117.3 | 112.6 | 104.4 | 98 |
| Final Fantasy XV Benchmark (2018) | 128.5 | 70.3 | 51.2 | |
| X-Plane 11.11 (2018) | 86.7 | 76 | 61.6 | |
| Cyberpunk 2077 1.6 (2022) | 80.8 | 64.2 | 46.4 | 38.5 |
| Tiny Tina's Wonderlands (2022) | 113.3 | 89.7 | 59.2 | 46.4 |
| F1 22 (2022) | 163.5 | 151.5 | 109.7 | 33.6 |
| Returnal (2023) | 40 | 38 | 34 | 29 |
Emissions
System Noise — Ramps Up Quickly
Fan noise is silent at 22.8 dB(A) when idling on desktop, but it more frequently hovers around 26 dB(A) when browsing the web or video streaming. It gets loud rather quickly when higher loads are introduced likely because of the thin design, H-series CPU, and RTX-class GPU. When running 3DMark 06, for example, the fans reach 44 dB(A) just 60 seconds into the test.
Noise Level
| Idle |
| 22.8 / 22.8 / 22.8 dB(A) |
| Load |
| 43.8 / 47.1 dB(A) |
 | ||
30 dB silent 40 dB(A) audible 50 dB(A) loud |
||
min: | ||
| Lenovo Slim Pro 7 14ARP8 GeForce RTX 3050 6GB Laptop GPU, R7 7735HS, SK hynix PC801 HFS512GEJ9X115N | Lenovo Slim 7 Pro X 14ARH7 GeForce RTX 3050 4GB Laptop GPU, R9 6900HS, Samsung PM9A1 MZVL21T0HCLR | Lenovo Yoga 9 14IRP G8 Iris Xe G7 96EUs, i7-1360P, SK hynix PC801 HFS512GEJ9X101N BF | Gigabyte Aero 14 OLED BMF NVIDIA GeForce RTX 4050 Laptop GPU, i7-13700H, Gigabyte AG470S1TB-SI B10 | LG Gram 14Z90Q Iris Xe G7 80EUs, i5-1240P, Samsung PM9A1 MZVL2512HCJQ | Dell Inspiron 14 Plus 7420 GeForce RTX 3050 4GB Laptop GPU, i7-12700H, SK Hynix BC711 512GB HFM512GD3GX013N | |
|---|---|---|---|---|---|---|
| Noise | 2% | -3% | -13% | -0% | -6% | |
| off / environment * | 22.7 | 23.2 -2% | 23.6 -4% | 24 -6% | 25 -10% | 23.2 -2% |
| Idle Minimum * | 22.8 | 23.3 -2% | 23.6 -4% | 24 -5% | 26 -14% | 23.2 -2% |
| Idle Average * | 22.8 | 23.3 -2% | 23.6 -4% | 24 -5% | 27 -18% | 23.2 -2% |
| Idle Maximum * | 22.8 | 23.3 -2% | 24.6 -8% | 35.71 -57% | 28 -23% | 23.2 -2% |
| Load Average * | 43.8 | 37.4 15% | 45 -3% | 35 20% | 47.5 -8% | |
| Witcher 3 ultra * | 43.8 | 41.7 5% | 45 -3% | 40.22 8% | 36 18% | 51.7 -18% |
| Load Maximum * | 47.1 | 47.7 -1% | 45 4% | 51.93 -10% | 36 24% | 51.7 -10% |
* ... smaller is better
Temperature
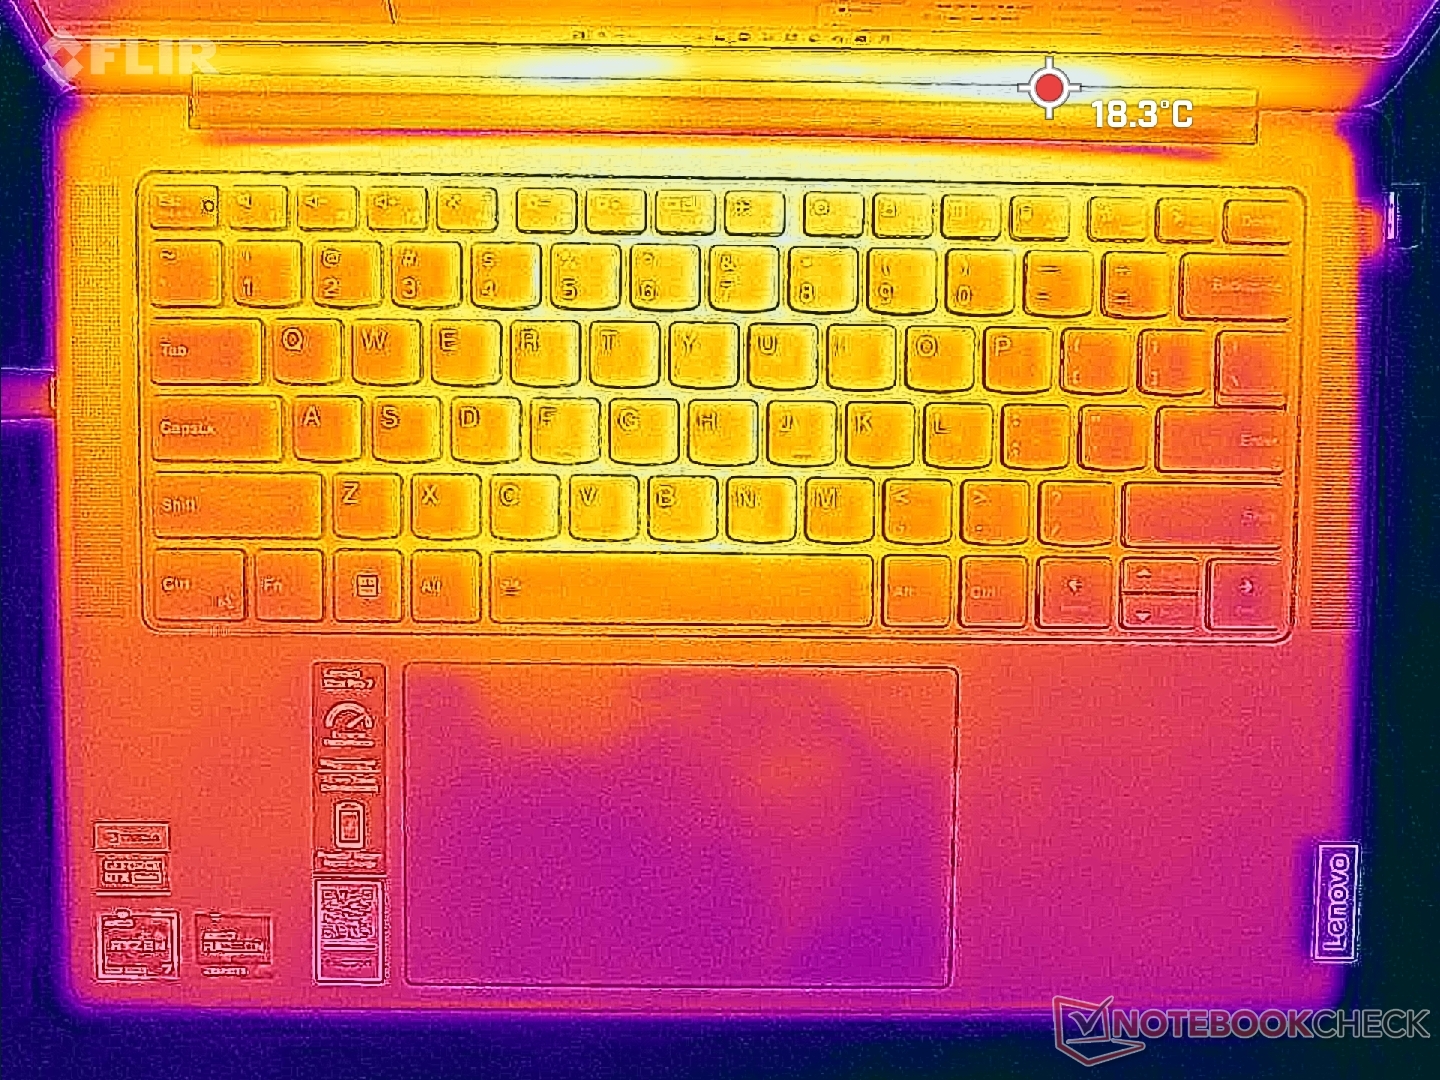
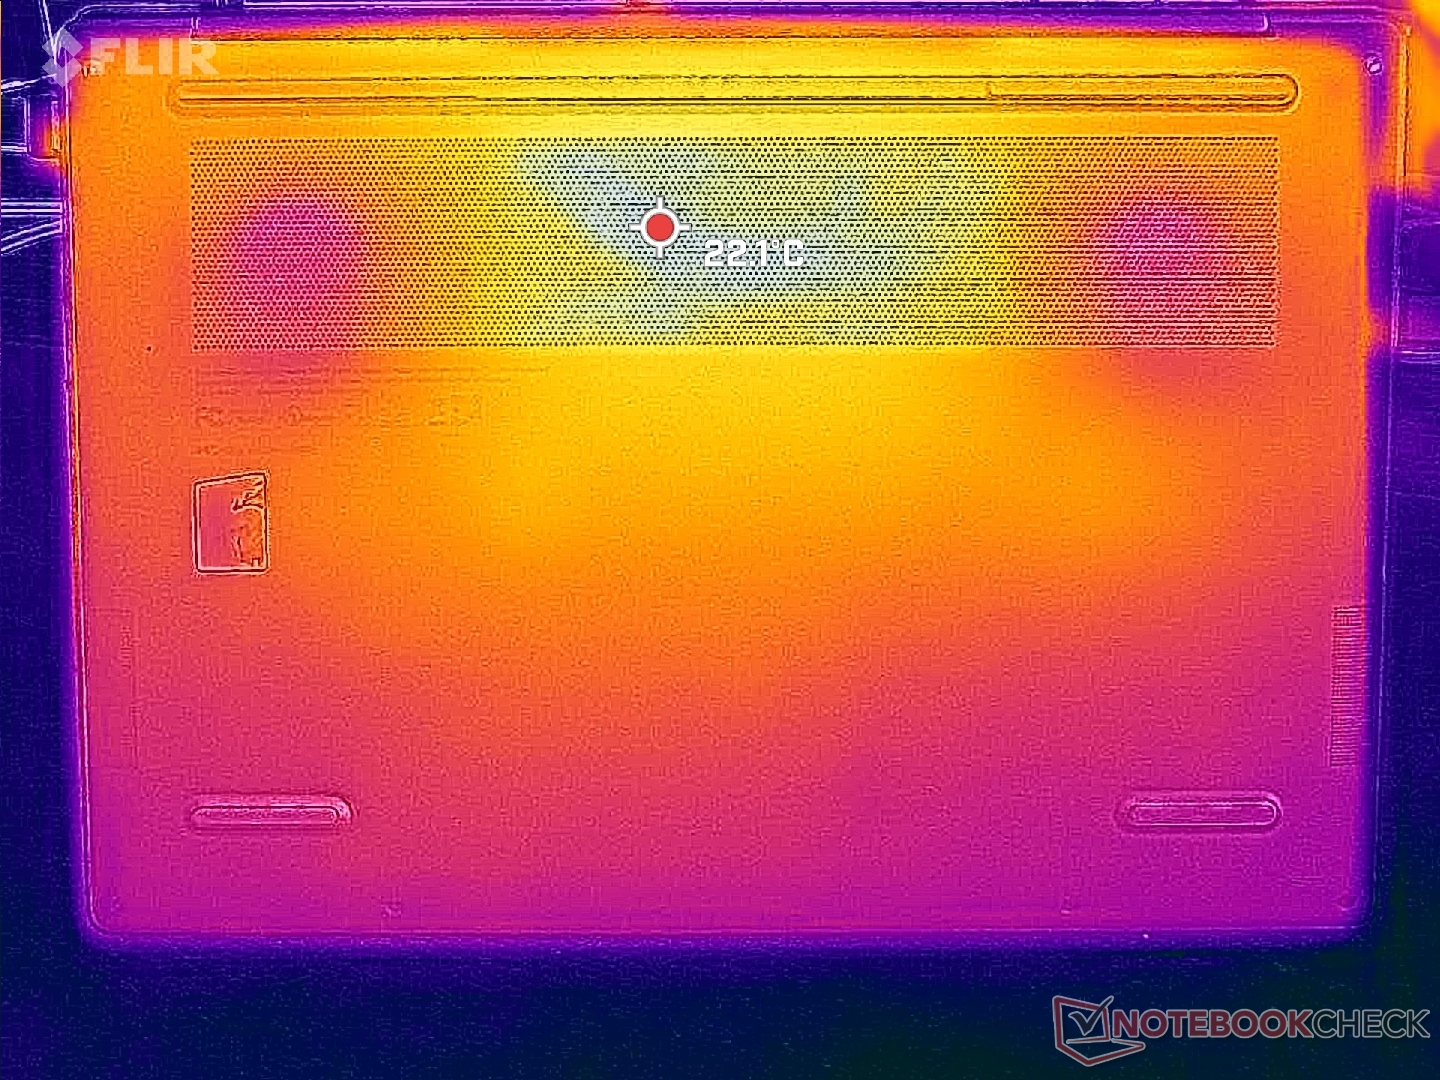
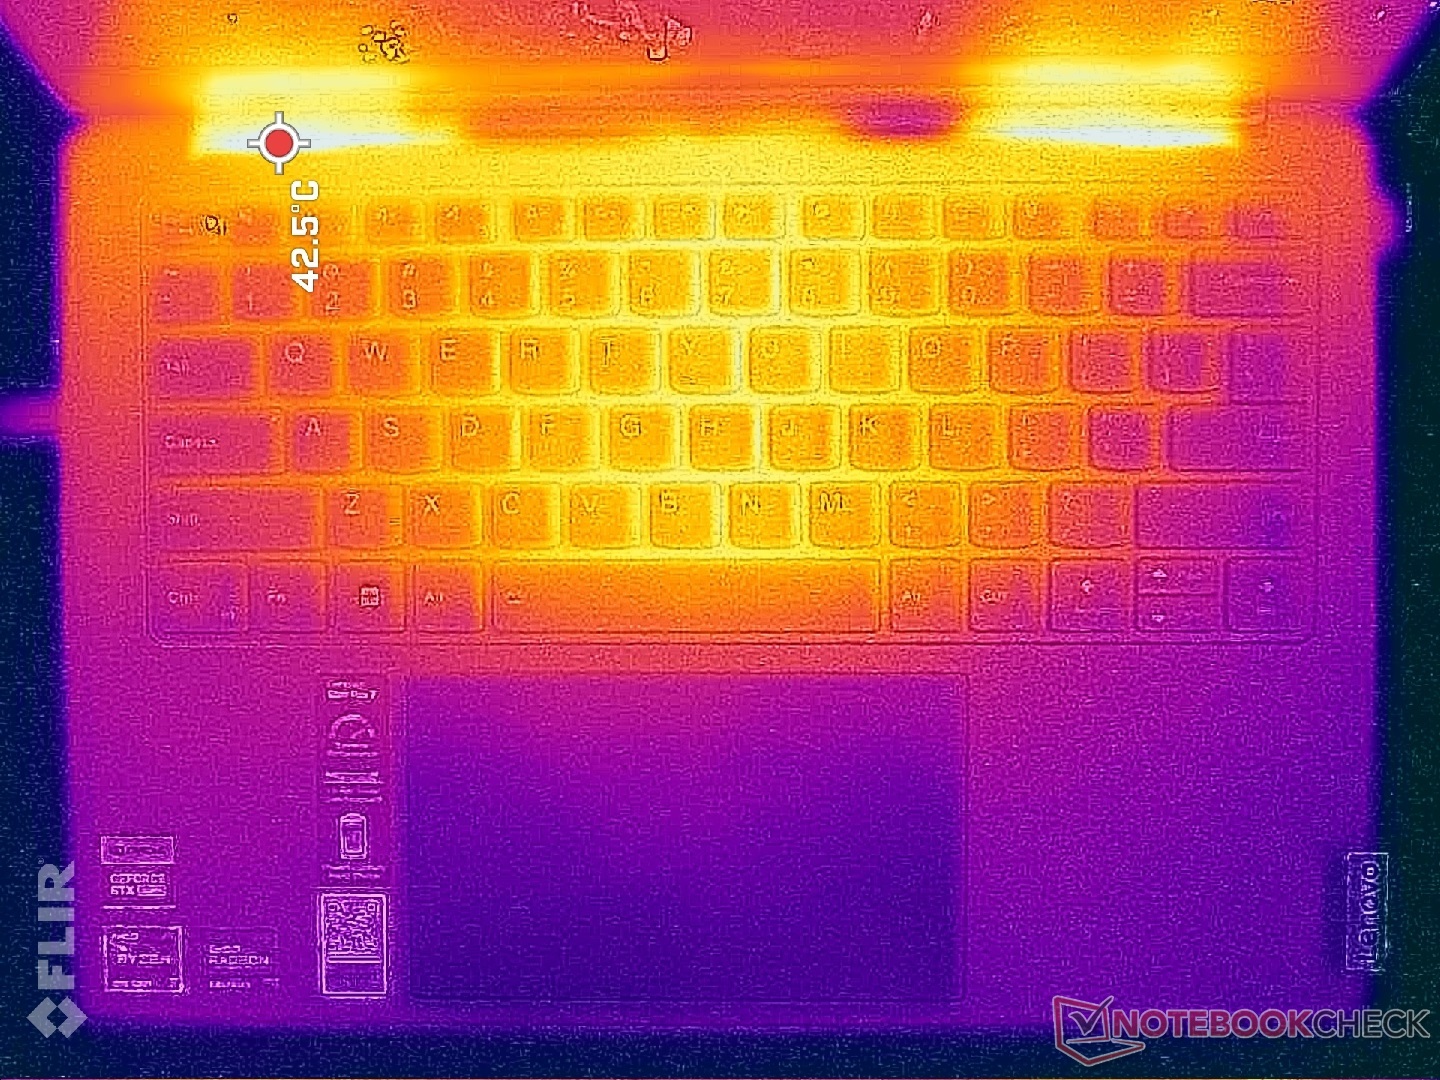
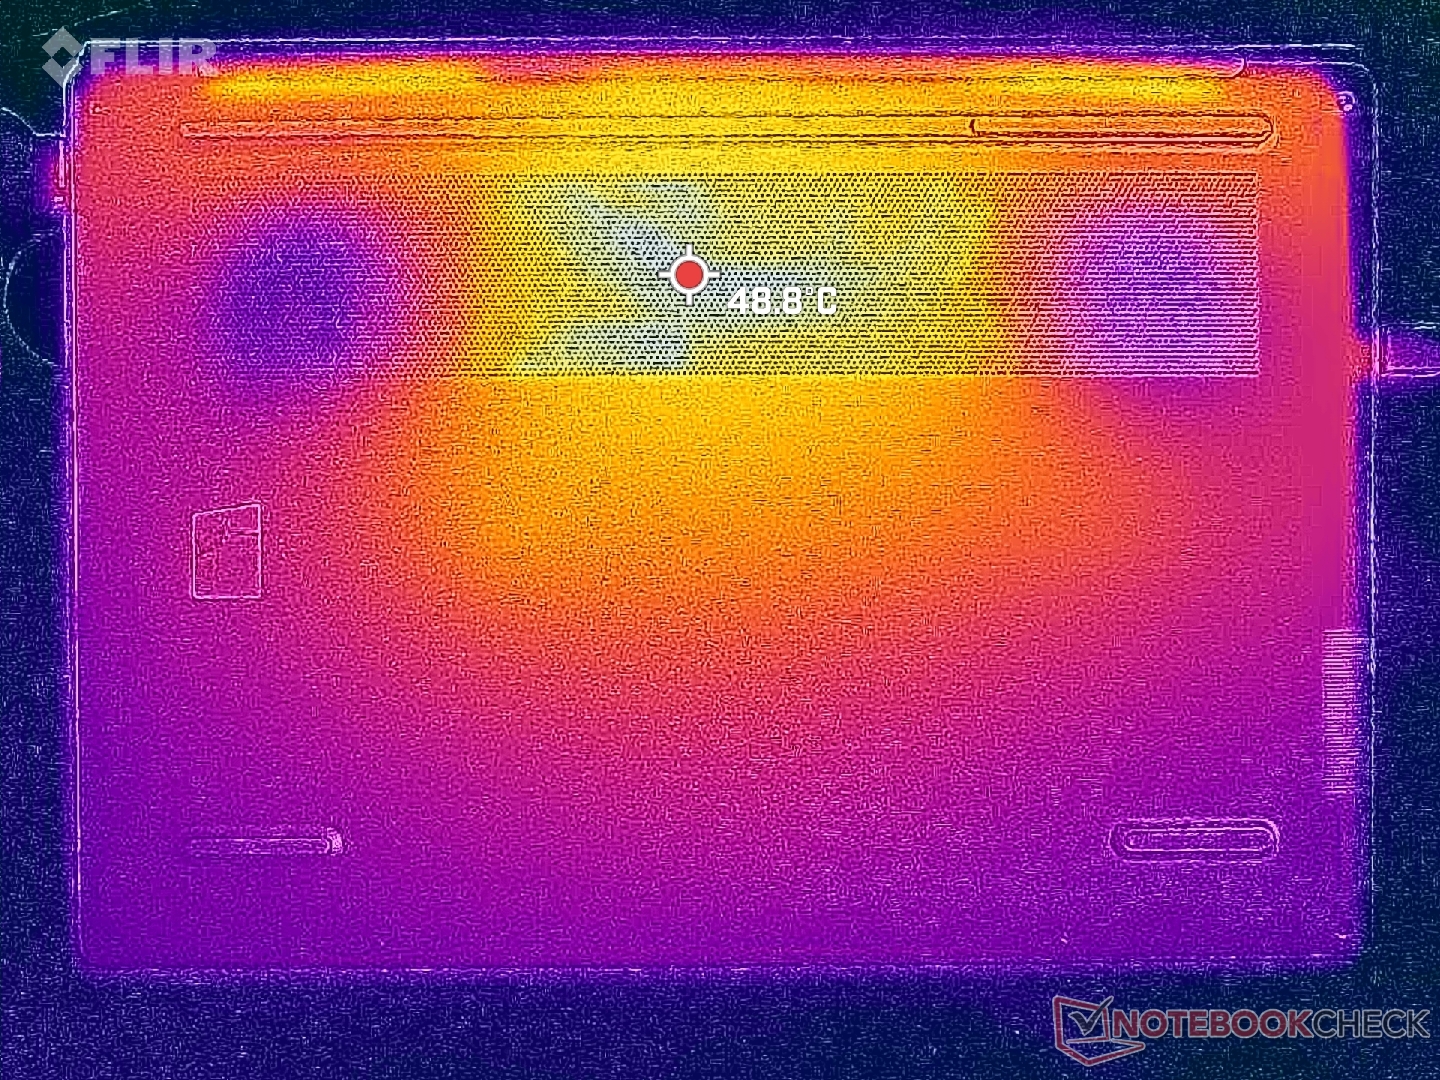
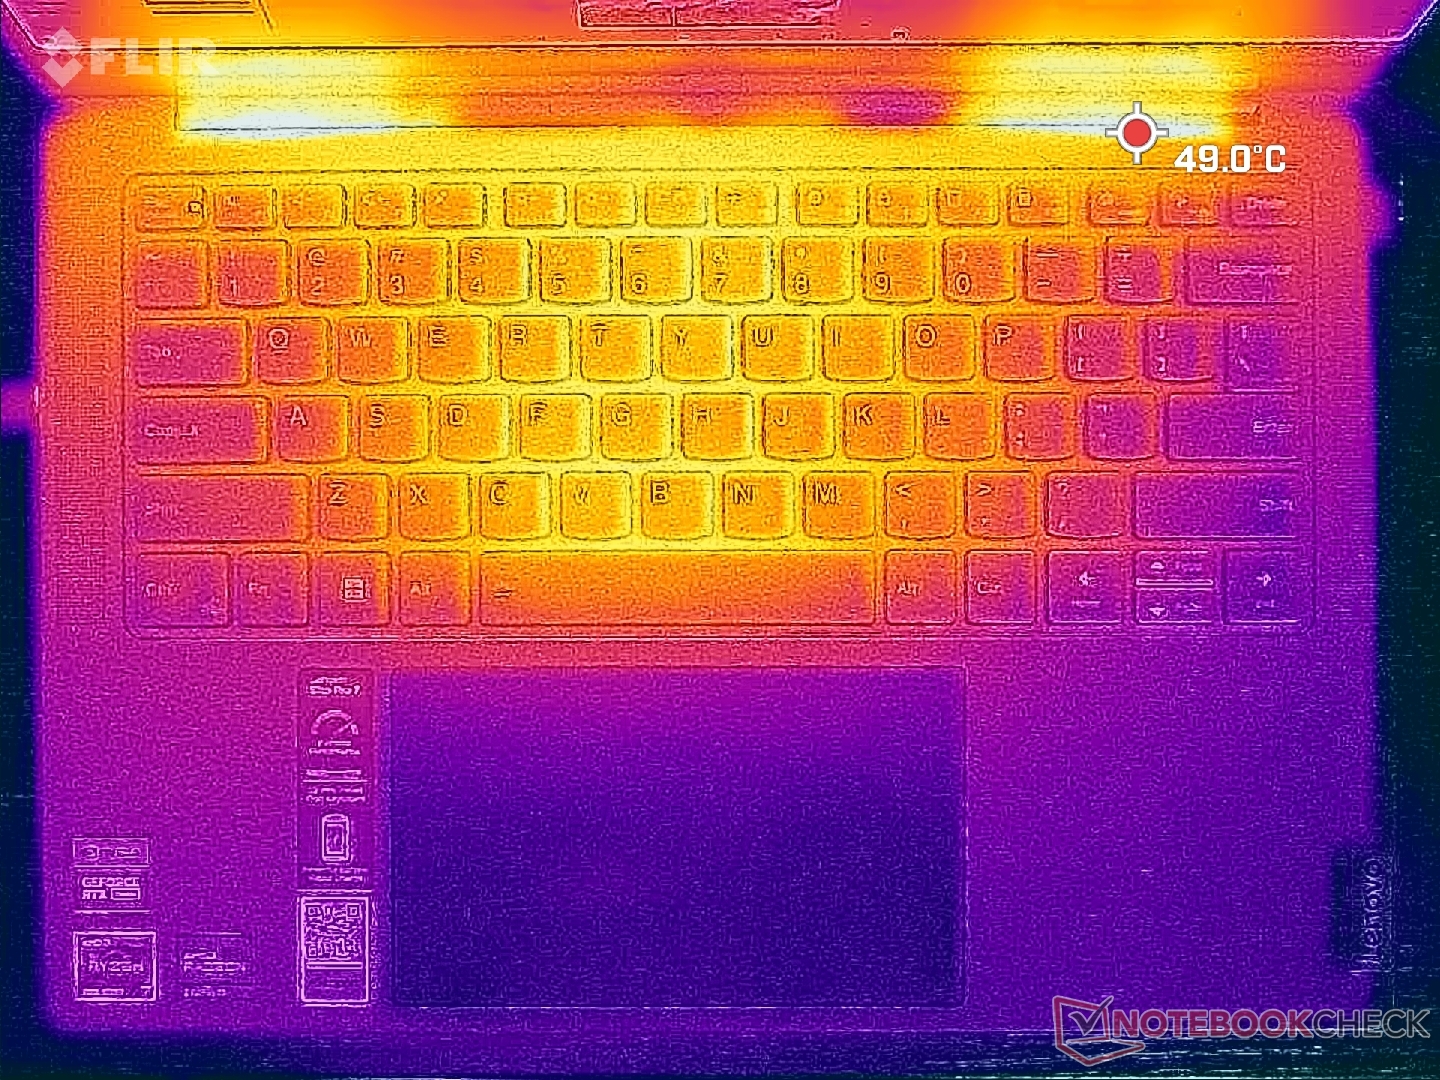
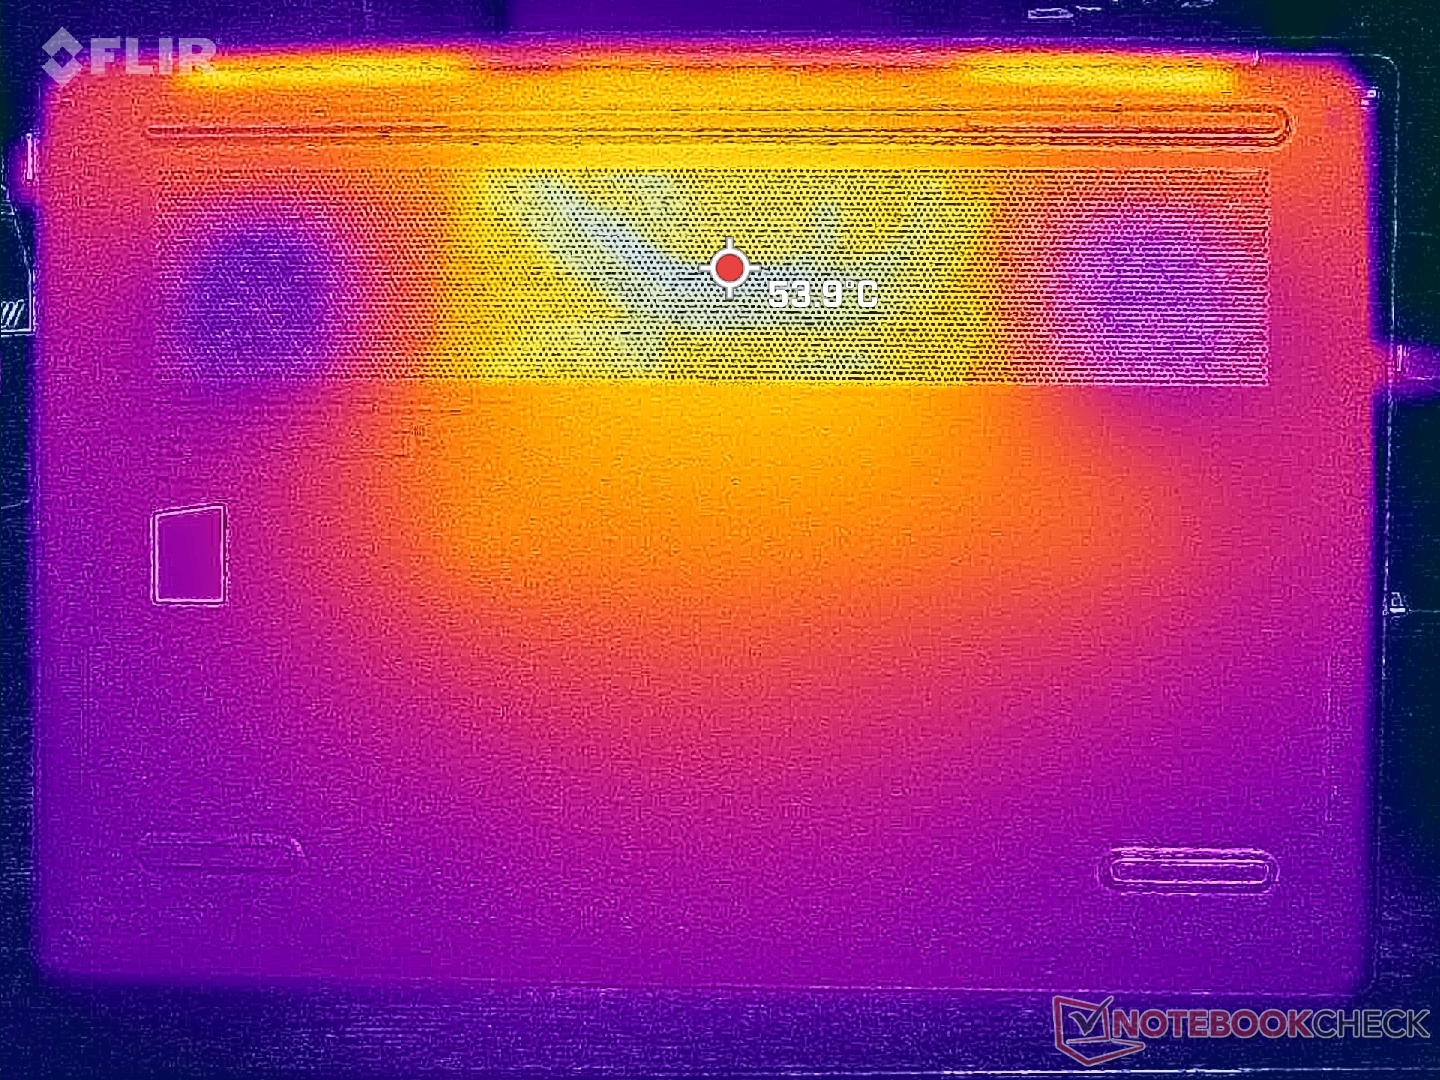
Surface temperature development is symmetrical due to the symmetrical cooling solution within. The warmest spot on the keyboard center can reach 40 C which is similar to what we recorded on the competing Dell Inspiron 14 Plus when under similar conditions.
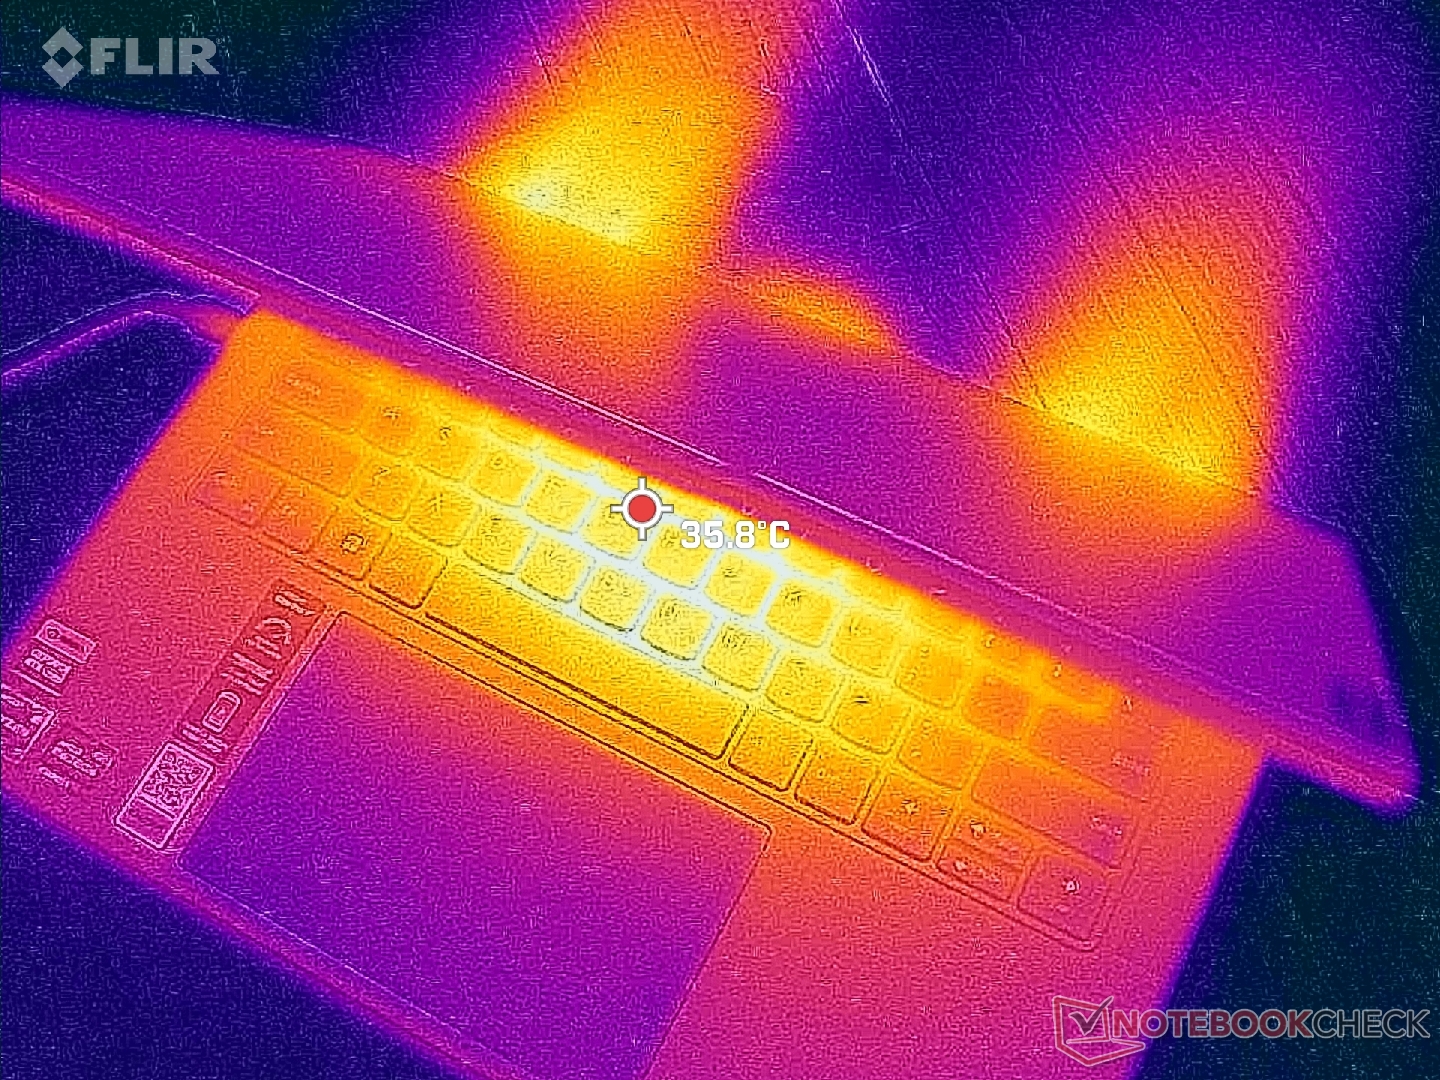
(±) The maximum temperature on the upper side is 42.2 °C / 108 F, compared to the average of 36.9 °C / 98 F, ranging from 21.1 to 71 °C for the class Multimedia.
(-) The bottom heats up to a maximum of 49 °C / 120 F, compared to the average of 39.1 °C / 102 F
(+) In idle usage, the average temperature for the upper side is 22.1 °C / 72 F, compared to the device average of 31.2 °C / 88 F.
(±) Playing The Witcher 3, the average temperature for the upper side is 33.4 °C / 92 F, compared to the device average of 31.2 °C / 88 F.
(+) The palmrests and touchpad are cooler than skin temperature with a maximum of 27.2 °C / 81 F and are therefore cool to the touch.
(±) The average temperature of the palmrest area of similar devices was 28.8 °C / 83.8 F (+1.6 °C / 2.8 F).
| Lenovo Slim Pro 7 14ARP8 AMD Ryzen 7 7735HS, NVIDIA GeForce RTX 3050 6GB Laptop GPU | Lenovo Slim 7 Pro X 14ARH7 AMD Ryzen 9 6900HS, NVIDIA GeForce RTX 3050 4GB Laptop GPU | Lenovo Yoga 9 14IRP G8 Intel Core i7-1360P, Intel Iris Xe Graphics G7 96EUs | Gigabyte Aero 14 OLED BMF Intel Core i7-13700H, NVIDIA GeForce RTX 4050 Laptop GPU | LG Gram 14Z90Q Intel Core i5-1240P, Intel Iris Xe Graphics G7 80EUs | Dell Inspiron 14 Plus 7420 Intel Core i7-12700H, NVIDIA GeForce RTX 3050 4GB Laptop GPU | |
|---|---|---|---|---|---|---|
| Heat | -11% | 1% | -5% | -4% | 1% | |
| Maximum Upper Side * | 42.2 | 41.6 1% | 39.7 6% | 42 -0% | 43 -2% | 40 5% |
| Maximum Bottom * | 49 | 49.2 -0% | 45.4 7% | 52 -6% | 45 8% | 36.4 26% |
| Idle Upper Side * | 24.4 | 29.8 -22% | 25.7 -5% | 26 -7% | 27 -11% | 27 -11% |
| Idle Bottom * | 25.2 | 31.2 -24% | 26.4 -5% | 27 -7% | 28 -11% | 29.2 -16% |
* ... smaller is better
Stress Test — One Hot Processor
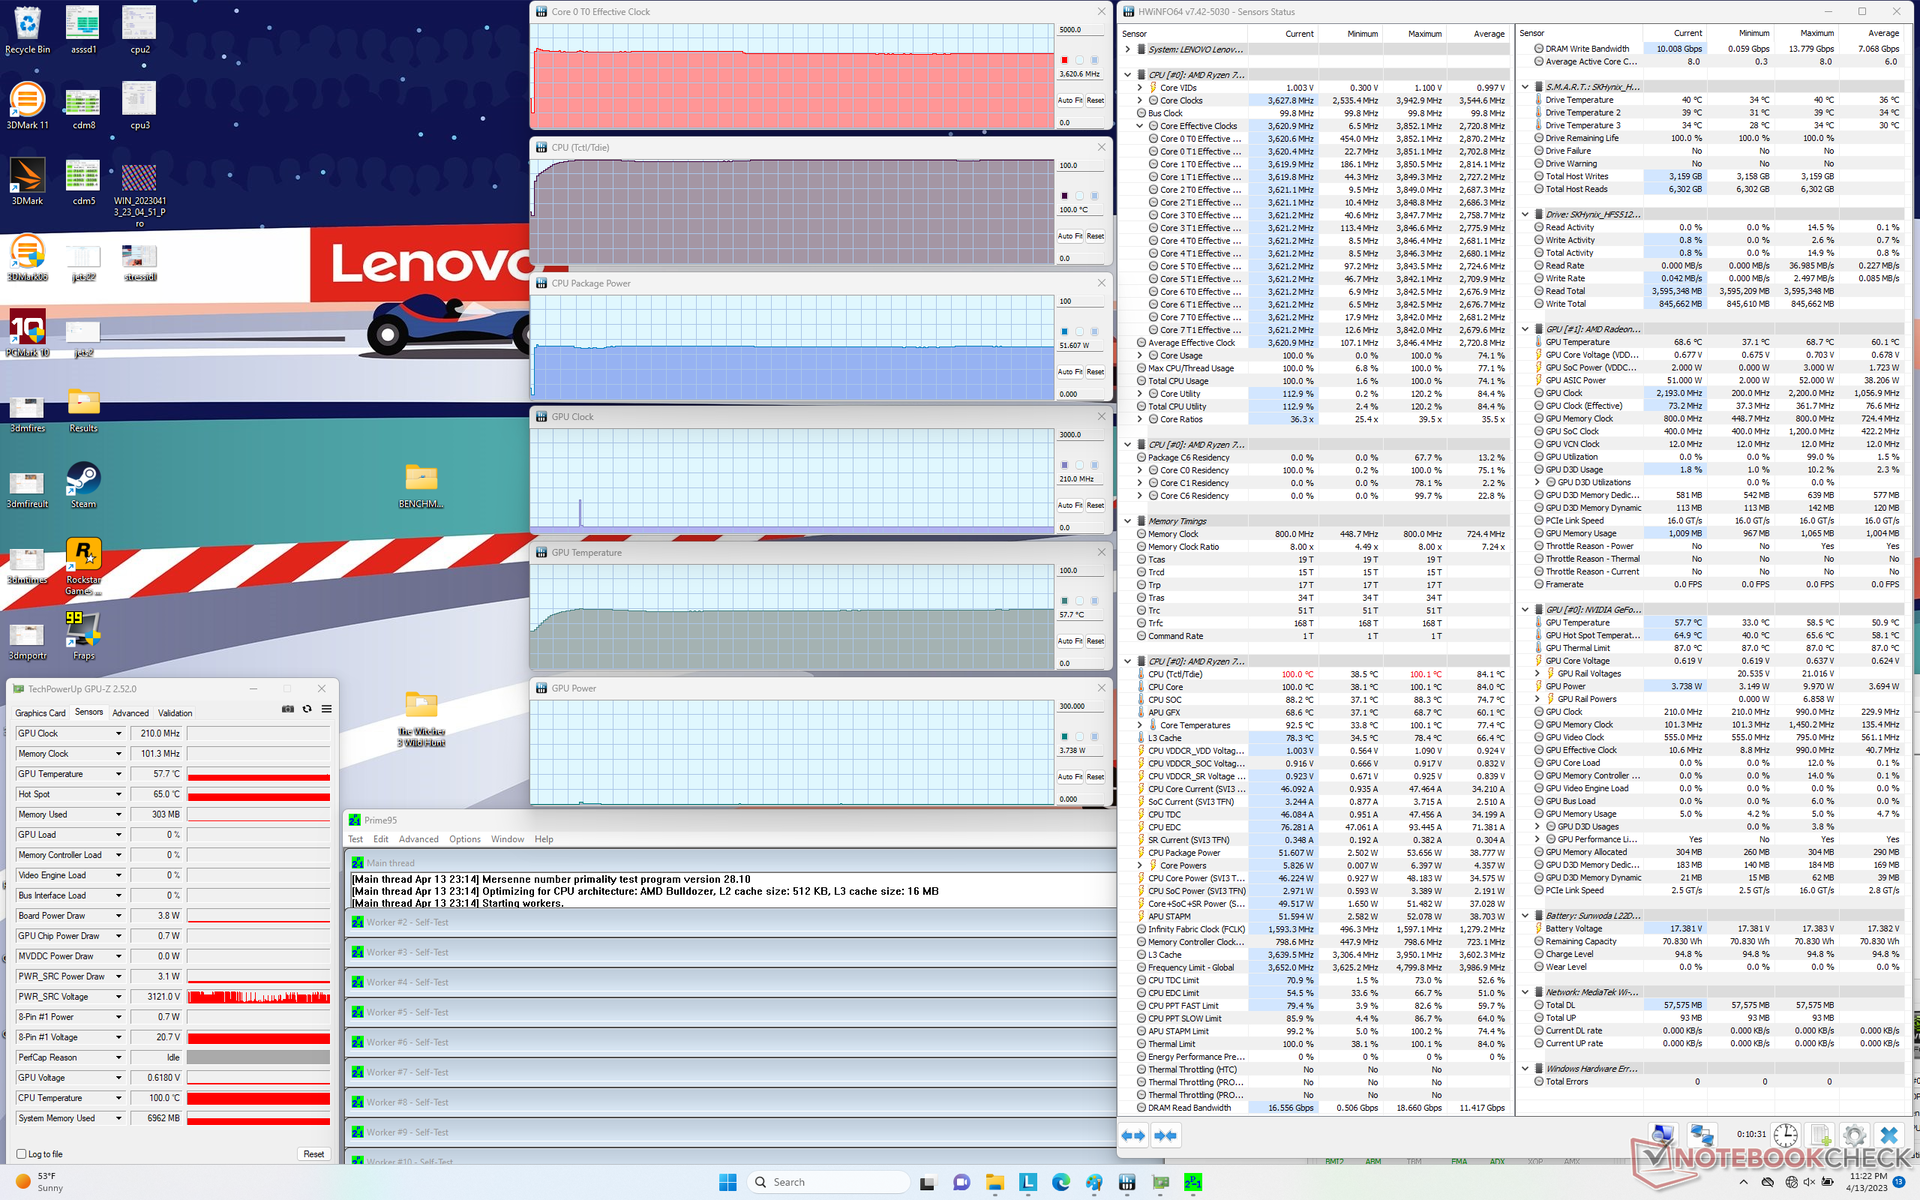
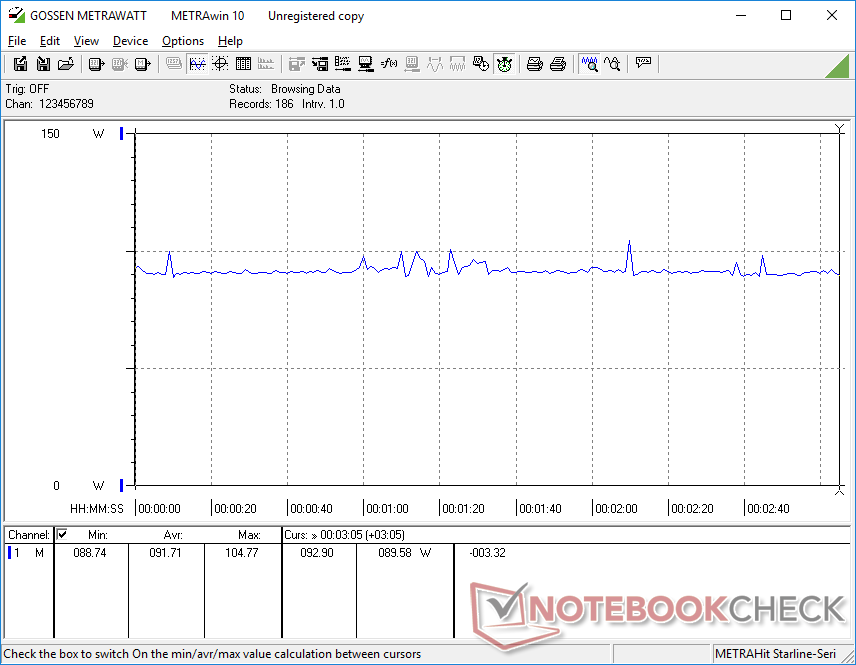
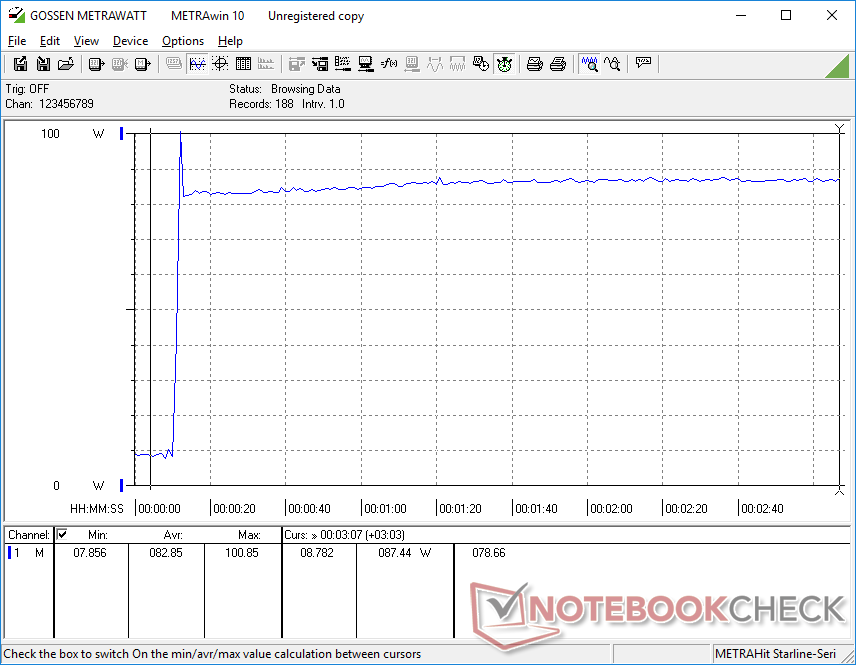
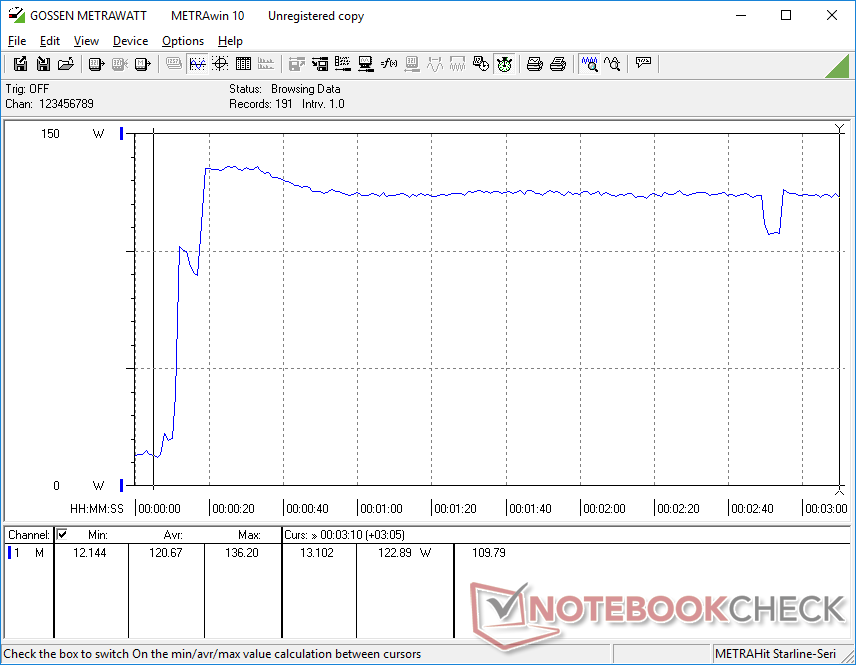
When running Prime95, CPU clock rates and board power draw would spike to 3.8 GHz and 52 W, respectively, before falling just slightly to 3.6 GHz over time. Core temperature, however, would be extremely high at 100 C.
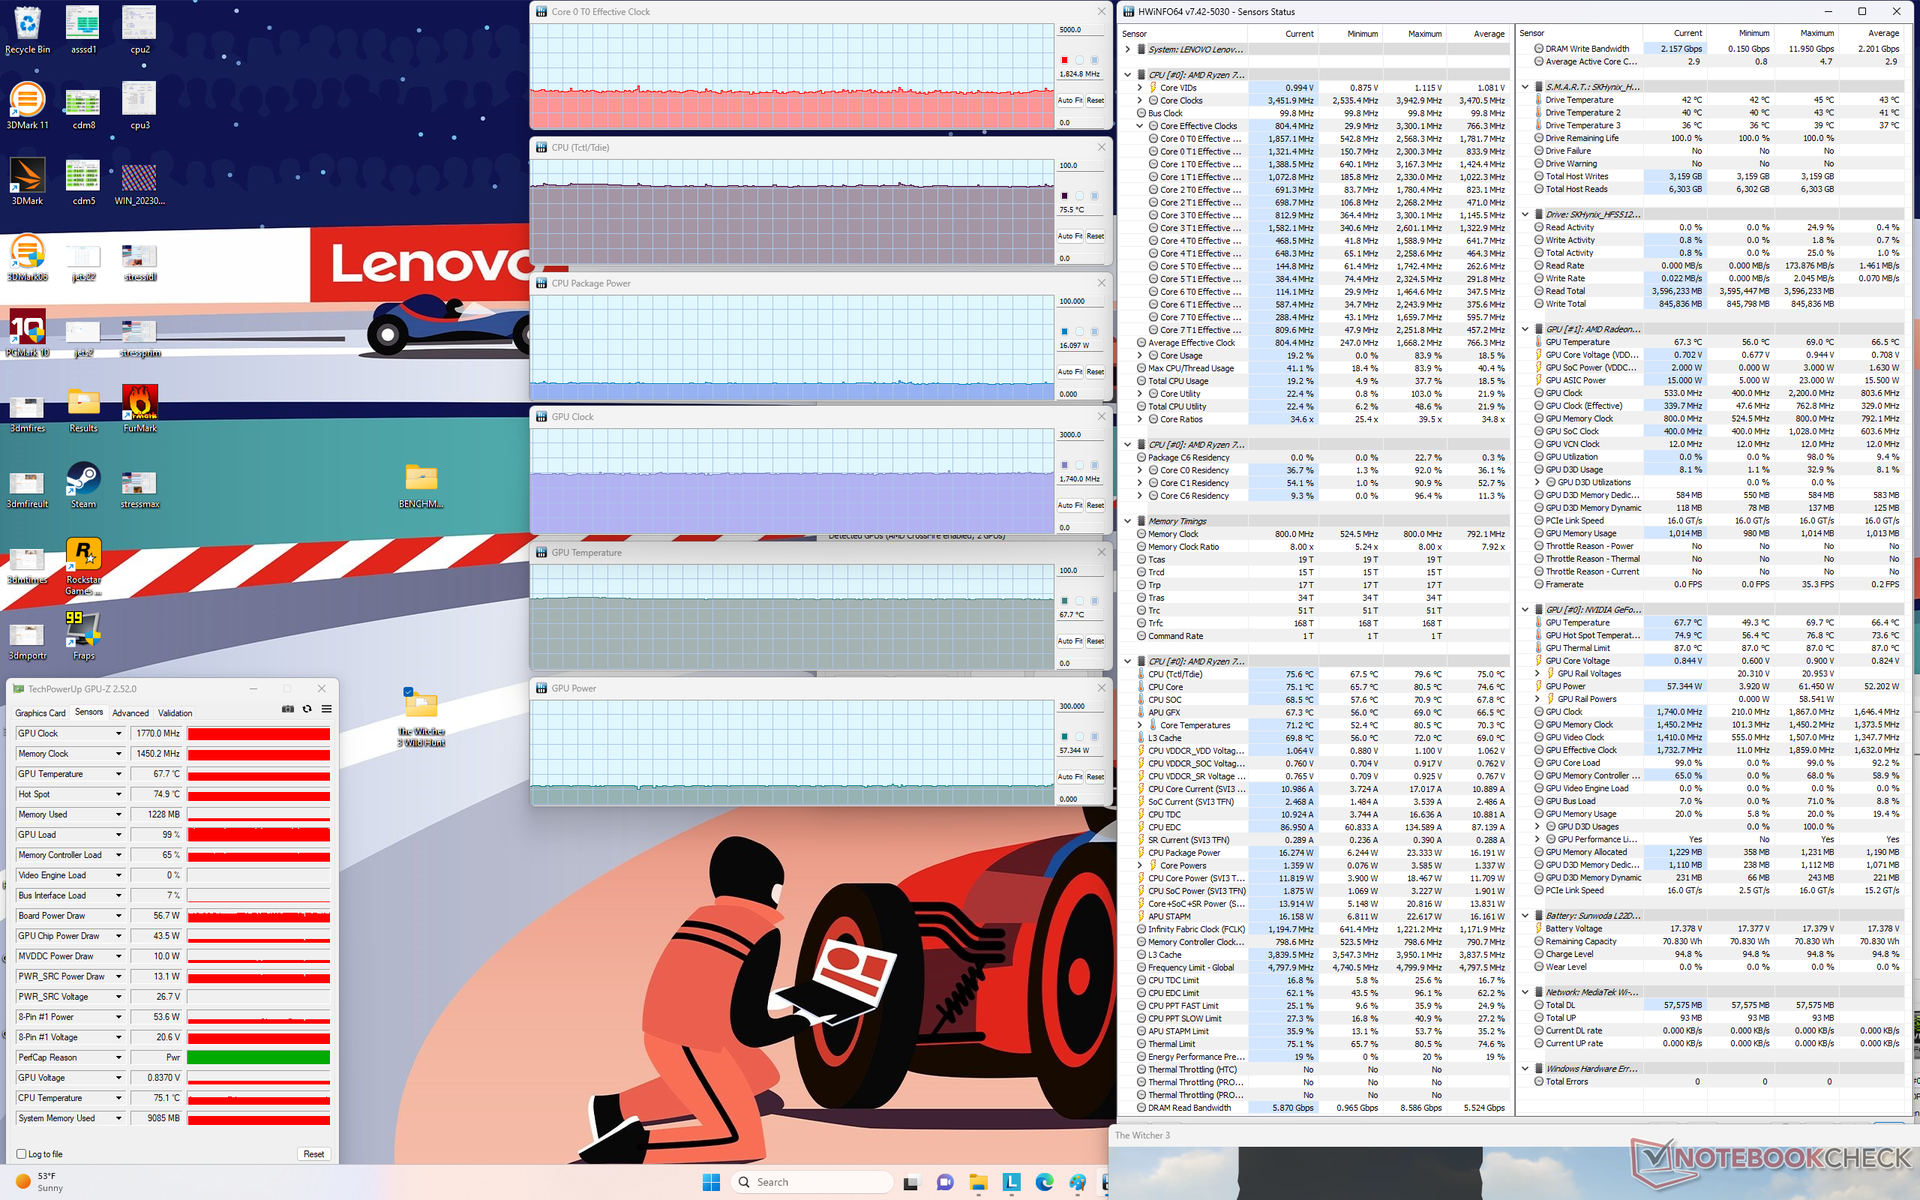
When running Witcher 3 to represent typical gaming loads, the GPU clock rate, temperature, and board power draw would stabilize at 1770 MHz, 68 C, and 57 W, respectively.
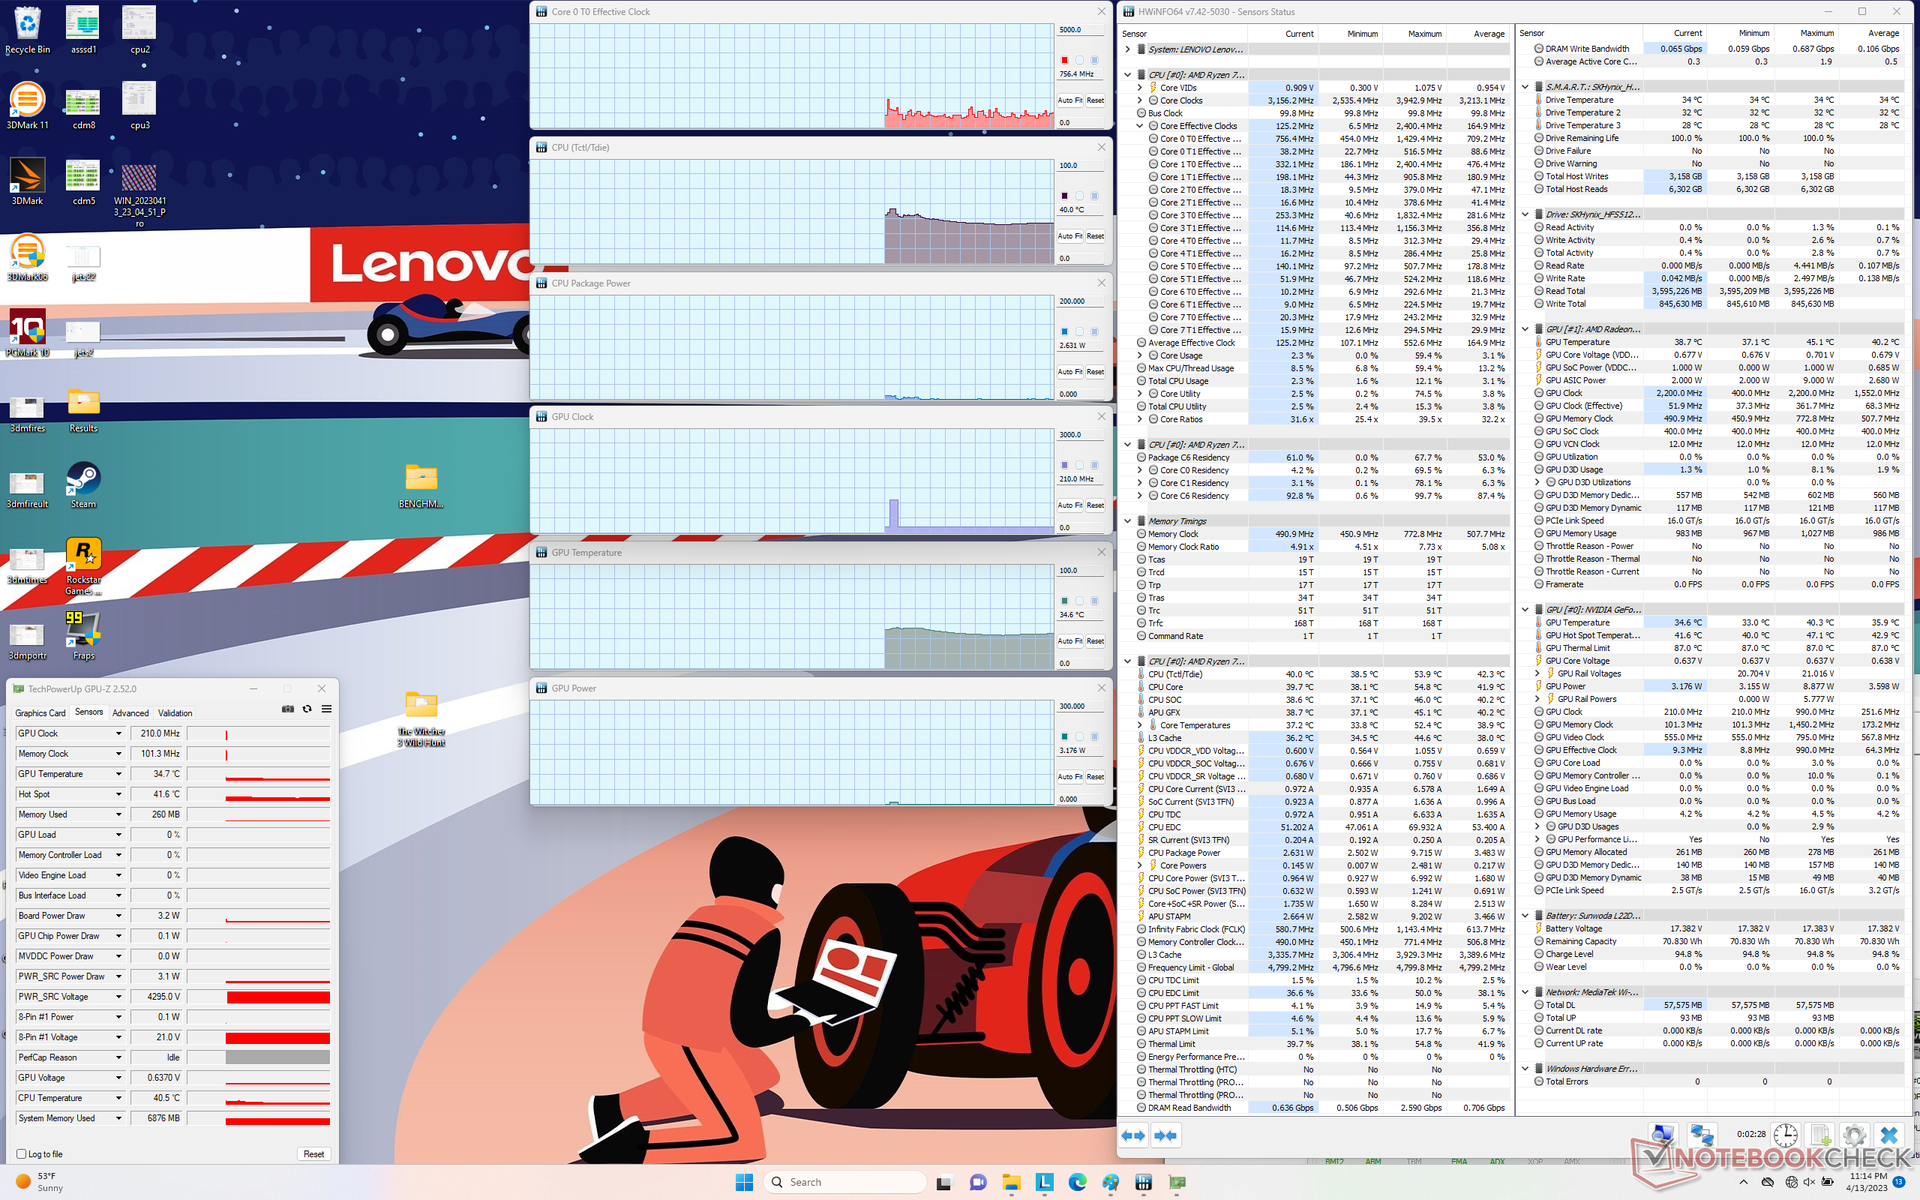

| CPU Clock (GHz) | GPU Clock (MHz) | Average CPU Temperature (°C) | Average GPU Temperature (°C) | |
| System Idle | -- | -- | 40 | 35 |
| Prime95 Stress | 3.6 | -- | 100 | 58 |
| Prime95 + FurMark Stress | 2.8 - 3.4 | 1155 | 87 - 100 | 70 |
| Witcher 3 Stress | 1.8 | 1770 | 76 | 68 |
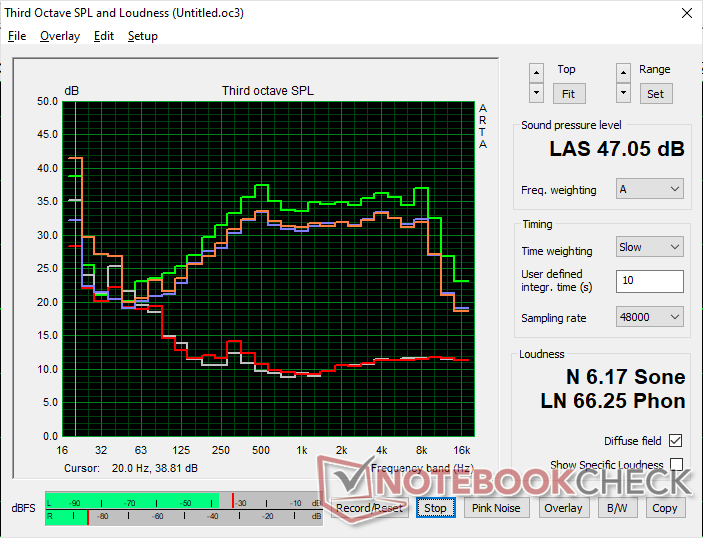
Speakers
Lenovo Slim Pro 7 14ARP8 audio analysis
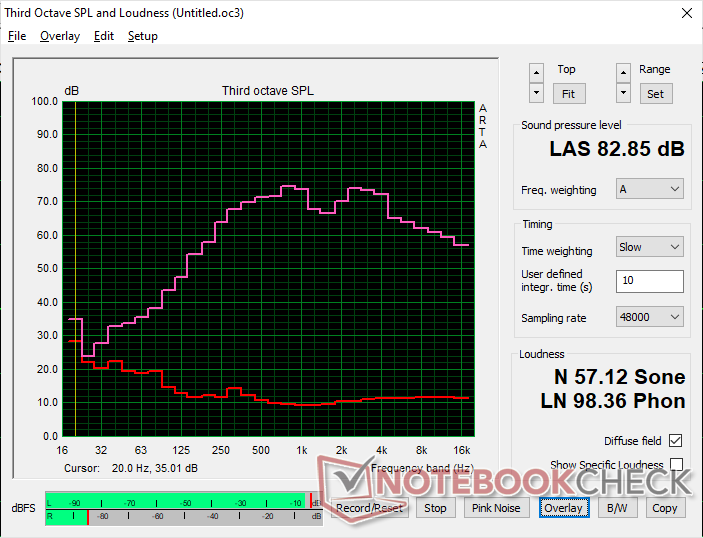
(+) | speakers can play relatively loud (82.9 dB)
Bass 100 - 315 Hz
(±) | reduced bass - on average 11.1% lower than median
(±) | linearity of bass is average (8.9% delta to prev. frequency)
Mids 400 - 2000 Hz
(+) | balanced mids - only 4.2% away from median
(+) | mids are linear (4.3% delta to prev. frequency)
Highs 2 - 16 kHz
(+) | balanced highs - only 4.9% away from median
(+) | highs are linear (4.4% delta to prev. frequency)
Overall 100 - 16.000 Hz
(+) | overall sound is linear (12.8% difference to median)
Compared to same class
» 17% of all tested devices in this class were better, 5% similar, 79% worse
» The best had a delta of 5%, average was 18%, worst was 45%
Compared to all devices tested
» 9% of all tested devices were better, 2% similar, 89% worse
» The best had a delta of 4%, average was 25%, worst was 134%
Apple MacBook Pro 16 2021 M1 Pro audio analysis
(+) | speakers can play relatively loud (84.7 dB)
Bass 100 - 315 Hz
(+) | good bass - only 3.8% away from median
(+) | bass is linear (5.2% delta to prev. frequency)
Mids 400 - 2000 Hz
(+) | balanced mids - only 1.3% away from median
(+) | mids are linear (2.1% delta to prev. frequency)
Highs 2 - 16 kHz
(+) | balanced highs - only 1.9% away from median
(+) | highs are linear (2.7% delta to prev. frequency)
Overall 100 - 16.000 Hz
(+) | overall sound is linear (4.6% difference to median)
Compared to same class
» 0% of all tested devices in this class were better, 0% similar, 100% worse
» The best had a delta of 5%, average was 18%, worst was 45%
Compared to all devices tested
» 0% of all tested devices were better, 0% similar, 100% worse
» The best had a delta of 4%, average was 25%, worst was 134%
Energy Management — Zen 3+ Performance-Per-Watt
Power Consumption
Overall power consumption is almost identical to what we recorded on last year's Ryzen 9 6900HS model. Since the Ryzen 7 7735HS offers roughly the same performance as mentioned above, the performance-per-watt has remained roughly the same as well. The data makes sense as both the 6900HS and 7735HS CPUs are from the same Zen 3+ family.
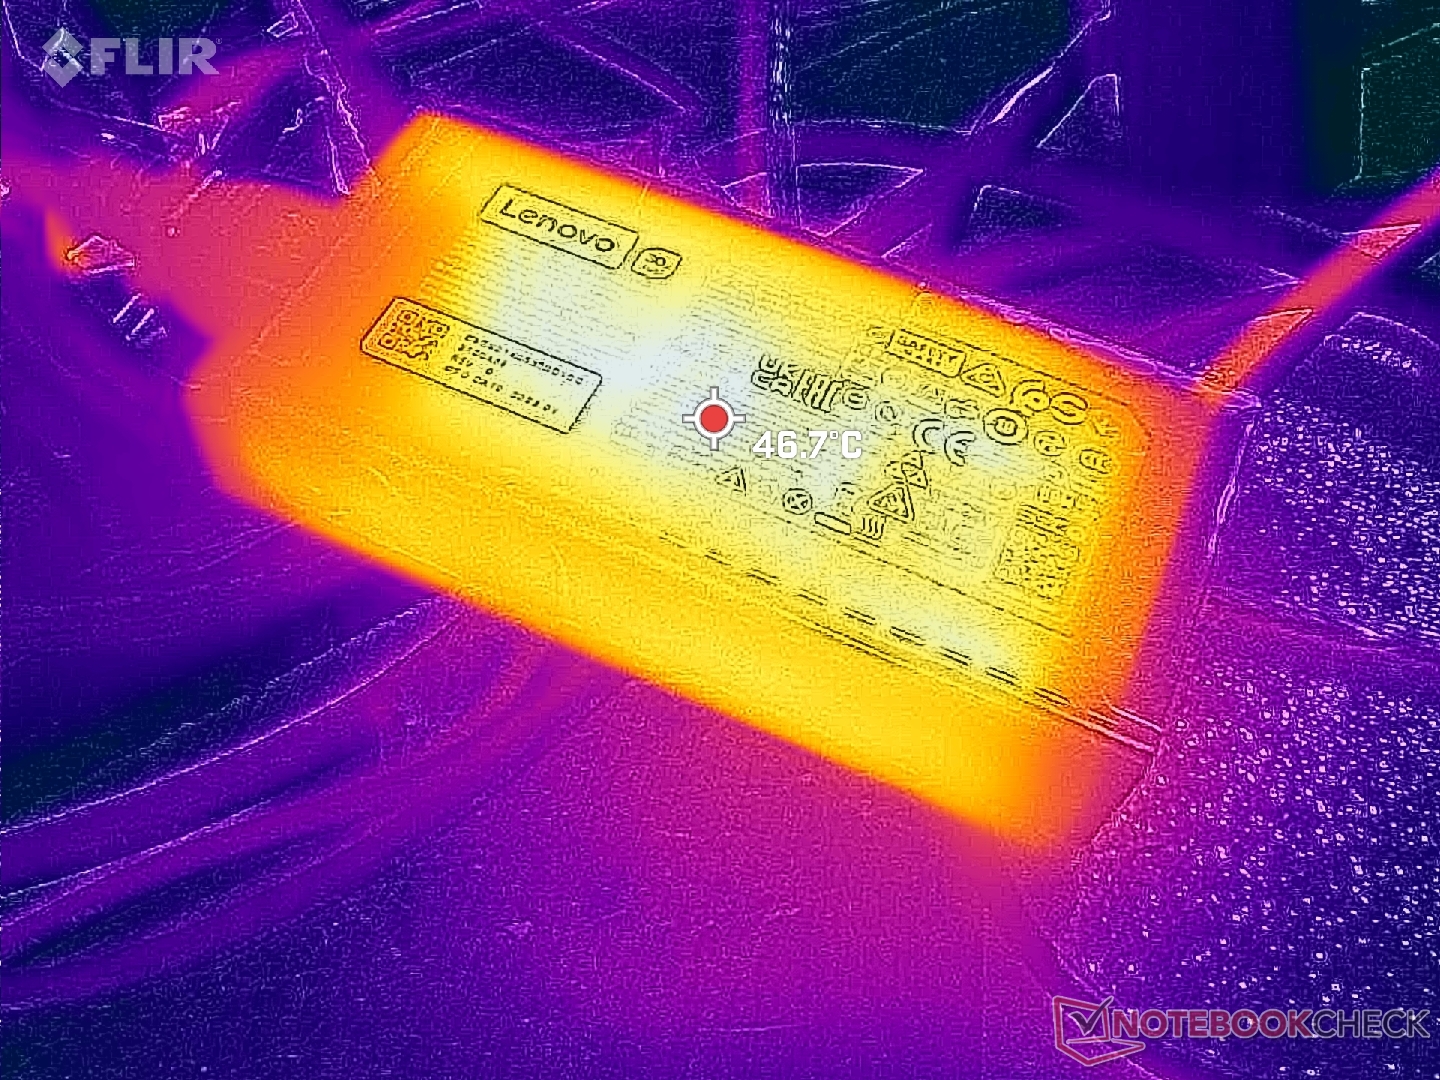
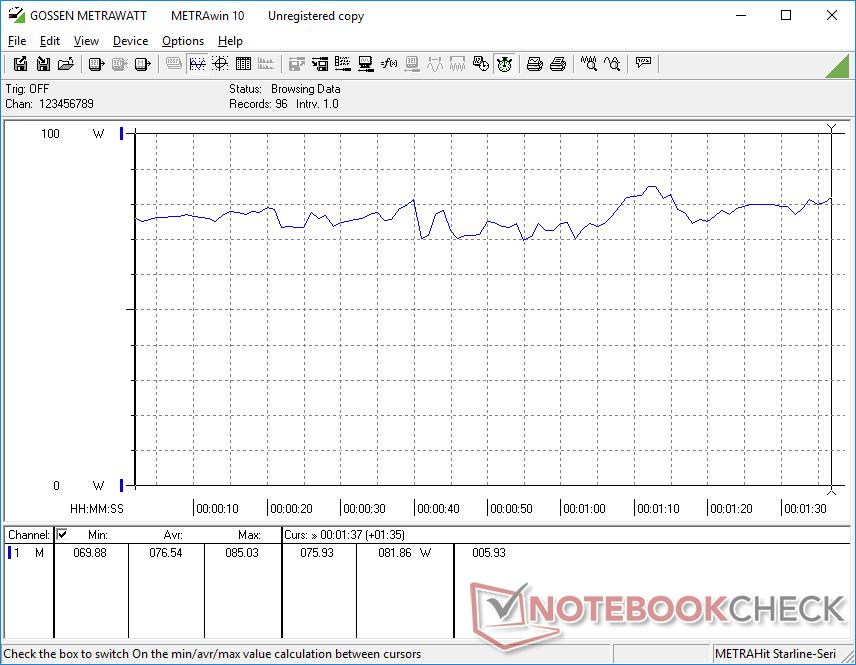
We're able to record a maximum draw of 136 W from the small-medium (12.2 x 6.2 x 2.7 cm) 140 W AC adapter when both Prime95 and FurMark are running. Note that this laptop is one of the few to ship with a 140 W USB-C AC adapter as most USB-C adapters are rated for 100 W at most.
| Off / Standby | |
| Idle | |
| Load |
|
| Lenovo Slim Pro 7 14ARP8 R7 7735HS, GeForce RTX 3050 6GB Laptop GPU, SK hynix PC801 HFS512GEJ9X115N, IPS, 2560x1600, 14.50 | Lenovo Slim 7 Pro X 14ARH7 R9 6900HS, GeForce RTX 3050 4GB Laptop GPU, Samsung PM9A1 MZVL21T0HCLR, IPS, 3072x1920, 14.50 | Lenovo Yoga 9 14IRP G8 i7-1360P, Iris Xe G7 96EUs, SK hynix PC801 HFS512GEJ9X101N BF, OLED, 2880x1800, 14.00 | Gigabyte Aero 14 OLED BMF i7-13700H, NVIDIA GeForce RTX 4050 Laptop GPU, Gigabyte AG470S1TB-SI B10, OLED, 2880x1800, 14.00 | LG Gram 14Z90Q i5-1240P, Iris Xe G7 80EUs, Samsung PM9A1 MZVL2512HCJQ, IPS, 1920x1200, 14.00 | Dell Inspiron 14 Plus 7420 i7-12700H, GeForce RTX 3050 4GB Laptop GPU, SK Hynix BC711 512GB HFM512GD3GX013N, IPS, 2240x1400, 14.00 | |
|---|---|---|---|---|---|---|
| Power Consumption | 2% | 23% | 16% | 47% | -12% | |
| Idle Minimum * | 7.6 | 7.4 3% | 7.8 -3% | 7.4 3% | 3 61% | 6.3 17% |
| Idle Average * | 12.2 | 11 10% | 9.3 24% | 8.3 32% | 6 51% | 10.3 16% |
| Idle Maximum * | 12.8 | 15 -17% | 9.8 23% | 8.7 32% | 12 6% | 20 -56% |
| Load Average * | 76.5 | 81.6 -7% | 62.8 18% | 76 1% | 40 48% | 106.2 -39% |
| Witcher 3 ultra * | 89.5 | 90 -1% | 46.5 48% | 70 22% | 36.5 59% | 96.1 -7% |
| Load Maximum * | 135.7 | 105.6 22% | 96 29% | 132 3% | 63 54% | 136.5 -1% |
* ... smaller is better
Power Consumption Witcher 3 / Stresstest
Power Consumption external Monitor
Battery Life
Lenovo appears to have addressed the battery issues surrounding the Slim 7 Pro series. We're able to record over 10 hours of real-world WLAN use or almost 2x longer than on last year's AMD model when both units are set to the same Balanced power profile. Additionally, charging from empty to full capacity is now faster at around 90 minutes compared to 2 to 3 hours on previous generation models.
| Lenovo Slim Pro 7 14ARP8 R7 7735HS, GeForce RTX 3050 6GB Laptop GPU, 73 Wh | Lenovo Slim 7 Pro X 14ARH7 R9 6900HS, GeForce RTX 3050 4GB Laptop GPU, 70 Wh | Lenovo Yoga 9 14IRP G8 i7-1360P, Iris Xe G7 96EUs, 75 Wh | Gigabyte Aero 14 OLED BMF i7-13700H, NVIDIA GeForce RTX 4050 Laptop GPU, 63 Wh | LG Gram 14Z90Q i5-1240P, Iris Xe G7 80EUs, 72 Wh | Dell Inspiron 14 Plus 7420 i7-12700H, GeForce RTX 3050 4GB Laptop GPU, 64 Wh | |
|---|---|---|---|---|---|---|
| Battery Runtime | -44% | -25% | -27% | 13% | -31% | |
| WiFi v1.3 | 628 | 351 -44% | 472 -25% | 457 -27% | 712 13% | 432 -31% |
| H.264 | 651 | |||||
| Load | 81 | 92 | 169 | 54 | ||
| Reader / Idle | 678 | 1736 | 712 |
Pros
Cons
Verdict — New Processors, Same Performance

Year-to-year updates can sometimes bring significant improvements to performance, but they more often bring just minimal upgrades. Unfortunately, the 2023 Slim Pro 7 is as minimal as it gets when it comes to improvements over last year's model. The Ryzen 7 7735HS CPU and 6 GB GeForce RTX 3050 GPU perform almost the same as the older Core i7-12700H and 4 GB RTX 3050, respectively. Only a small subset of users can truly benefit from the new USB4 support and extra 2 GB of VRAM in real-world scenarios.
The chassis still looks and feels great, but the new CPU and GPU are simply rebrands of last year's options for no significant year-over-year gains in performance.
The best part about the 2023 model is that the older 2022 model is now cheaper because of it. Since they perform almost identically and carry similar display options, users can potentially save a few hundred dollars by opting for the visually identical 2022 model instead.
Price and Availability
The Lenovo Slim Pro 7 is now available at Best Buy for $1199 USD in our exact configuration.
Lenovo Slim Pro 7 14ARP8
-
04/16/2023 v7
Allen Ngo


Transparency
The present review sample was made available to the author as a loan by the manufacturer or a shop for the purposes of review. The lender had no influence on this review, nor did the manufacturer receive a copy of this review before publication. There was no obligation to publish this review.
Pricecompare
