NVIDIA GeForce GTX 1650 Super (Desktop) graphics card review With the GeForce GTX 1650 Super, there's an inexpensive Turing GPU from Nvidia that is equipped with the TU116 graphics chip. The power consumption is 100 watts, which makes operation without an additional power supply impossible. You can find out how well the GeForce GTX 1650 Super does against an AMD Radeon RX 5500 XT in this short review.
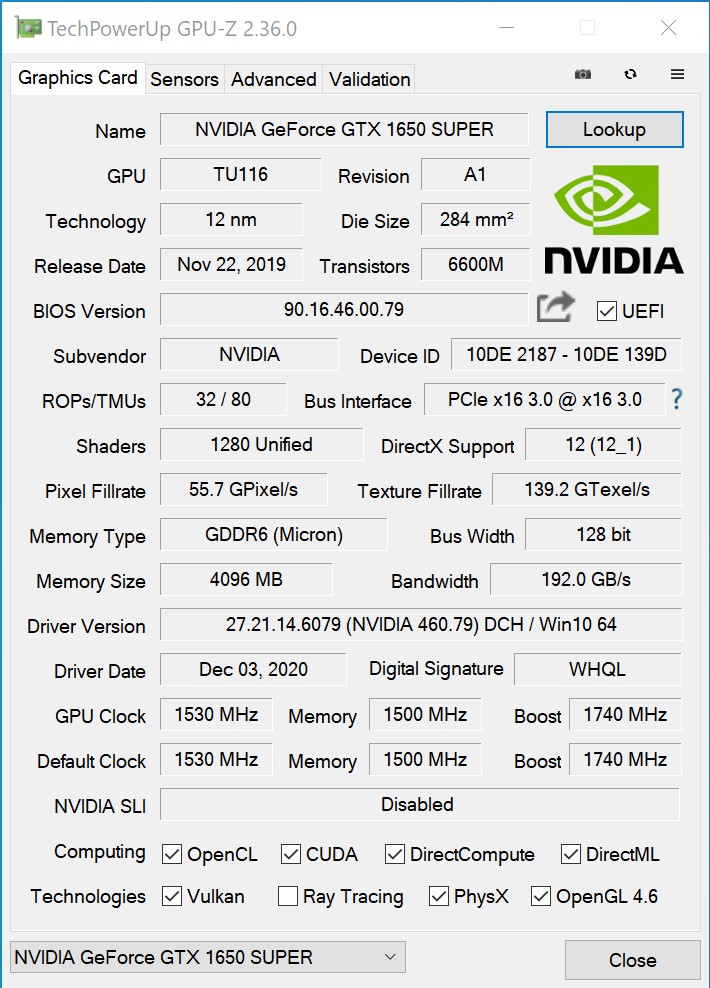
GPU-Z Nvidia's cheapest Turing graphics card is still named GeForce GTX 1650, but the GeForce GTX 1650 Super is now another inexpensive entry-level model. The biggest changes compared with the non-Super version of the GTX 1650 are in the installed graphics chip and VRAM. We're already familiar with the graphics chip from the GeForce GTX 1660 GeForce GTX 1660 Ti
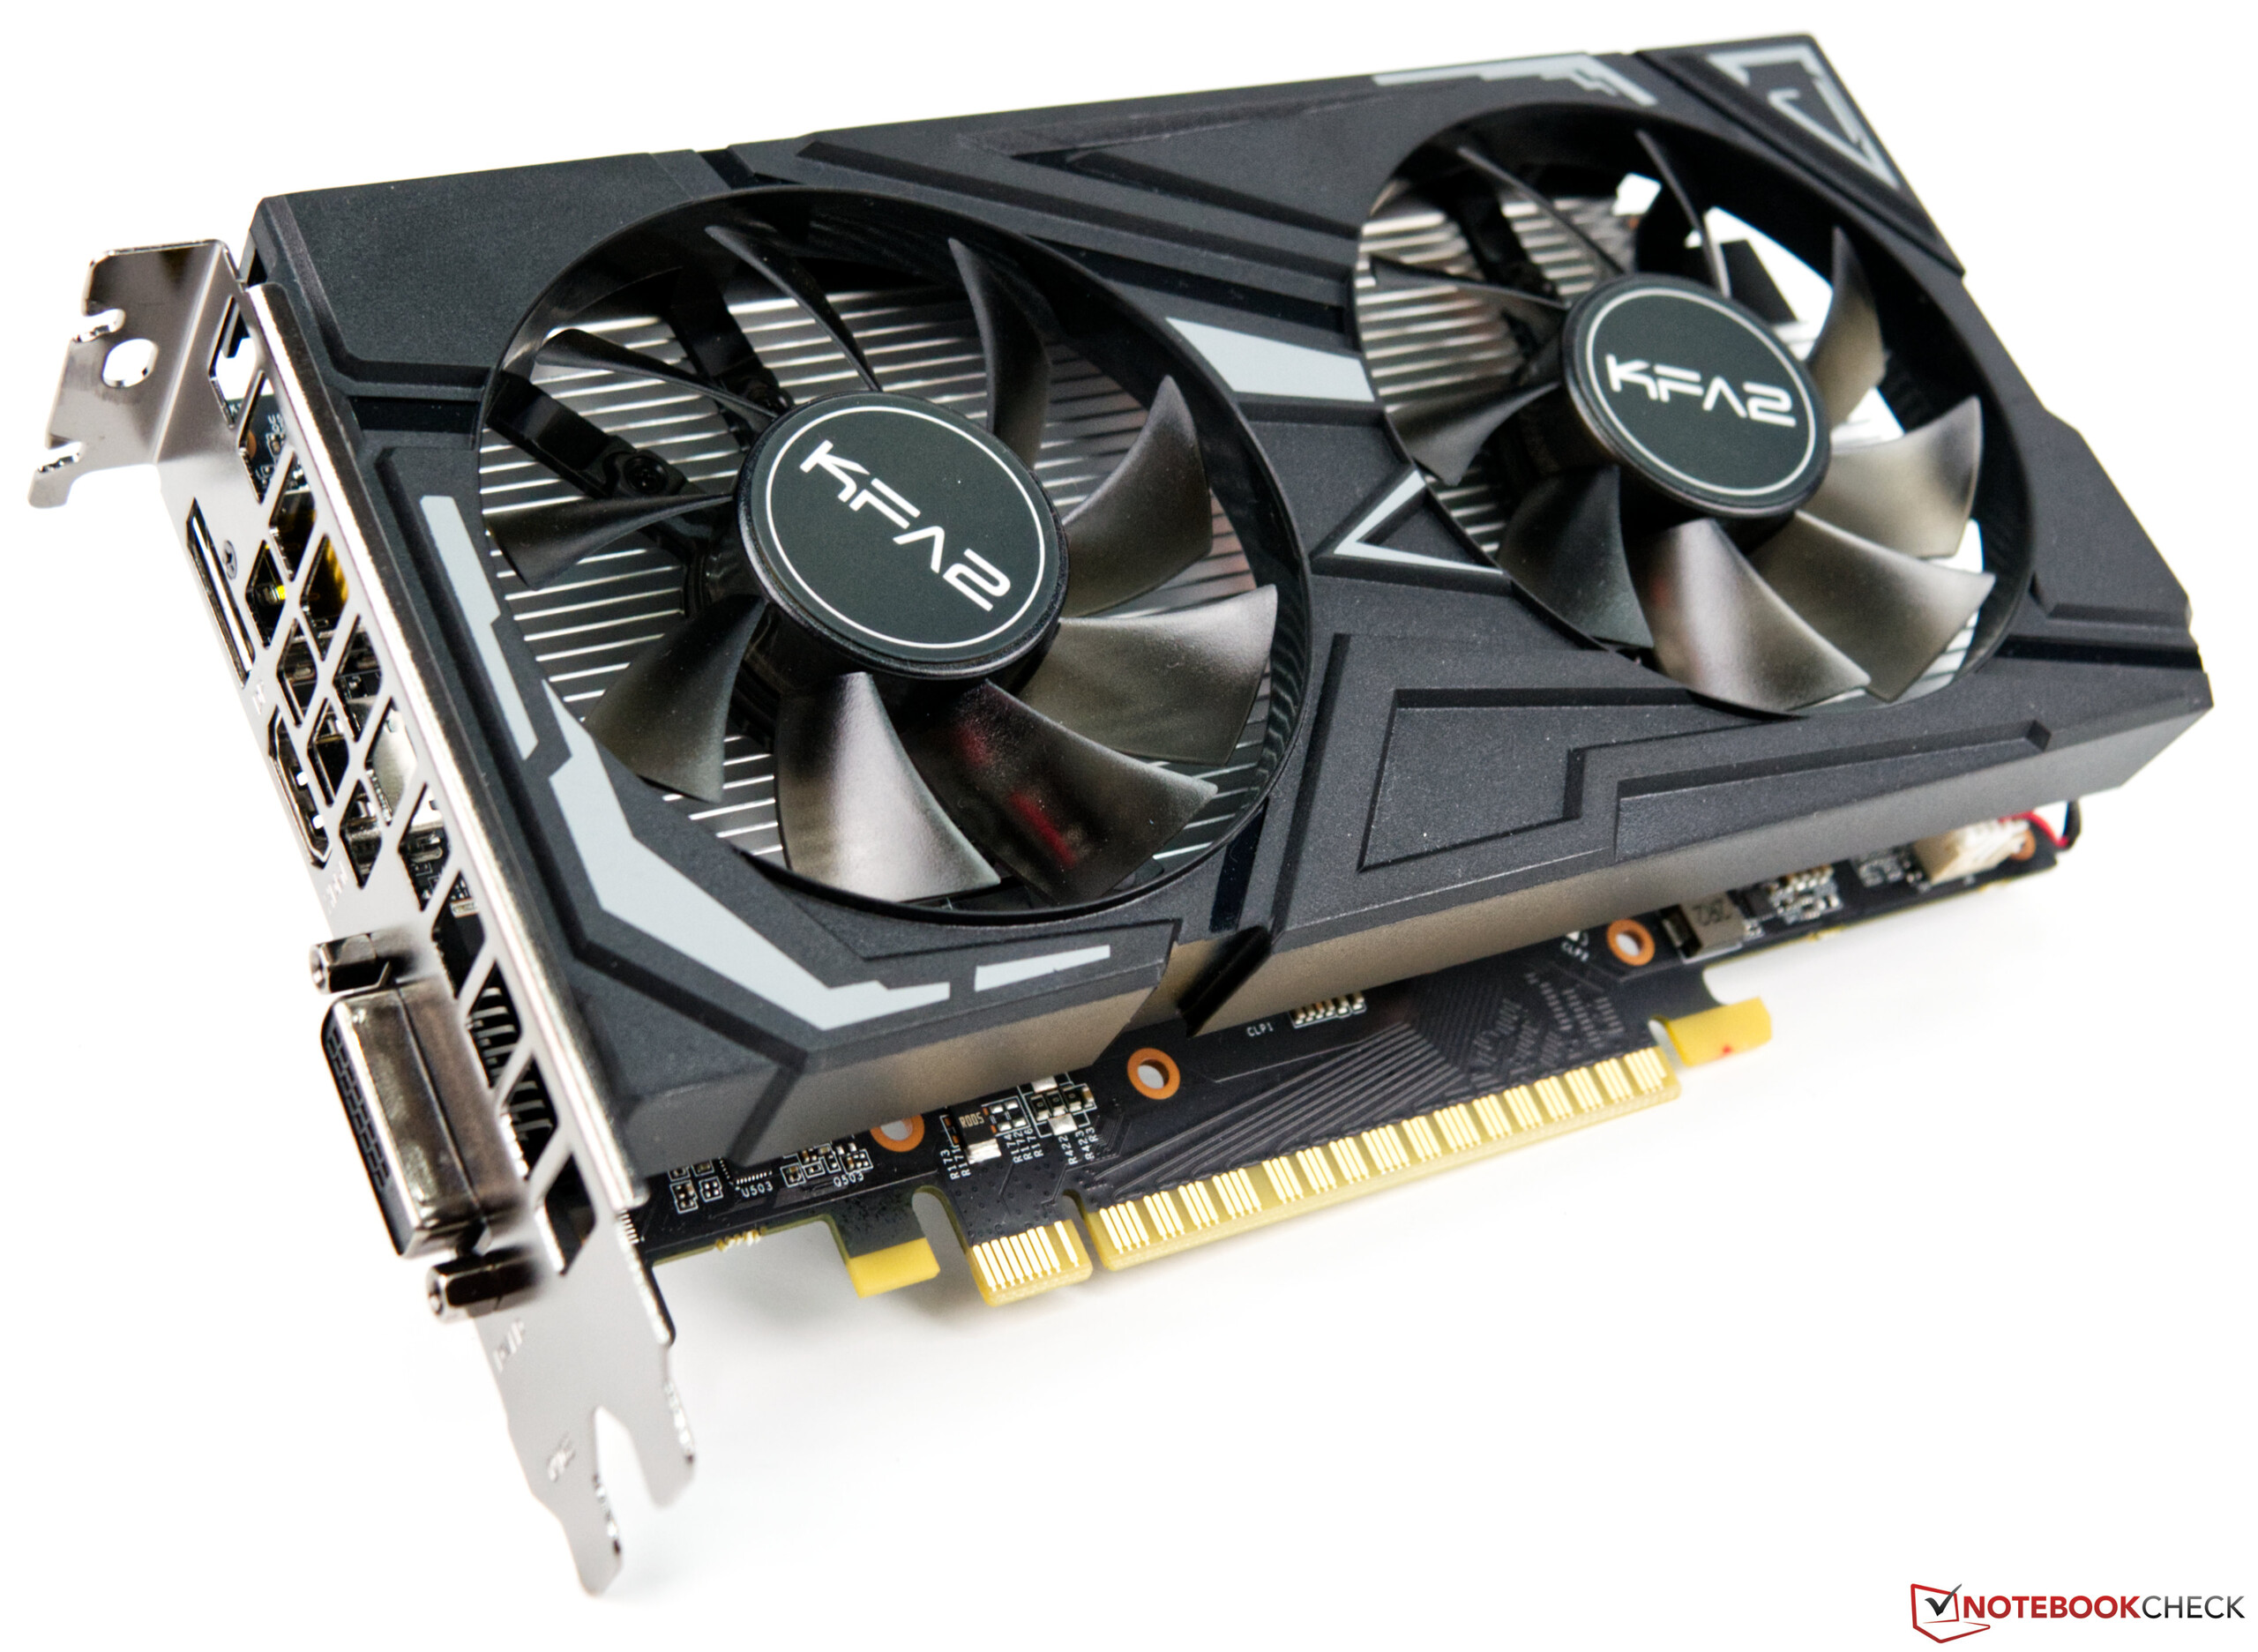
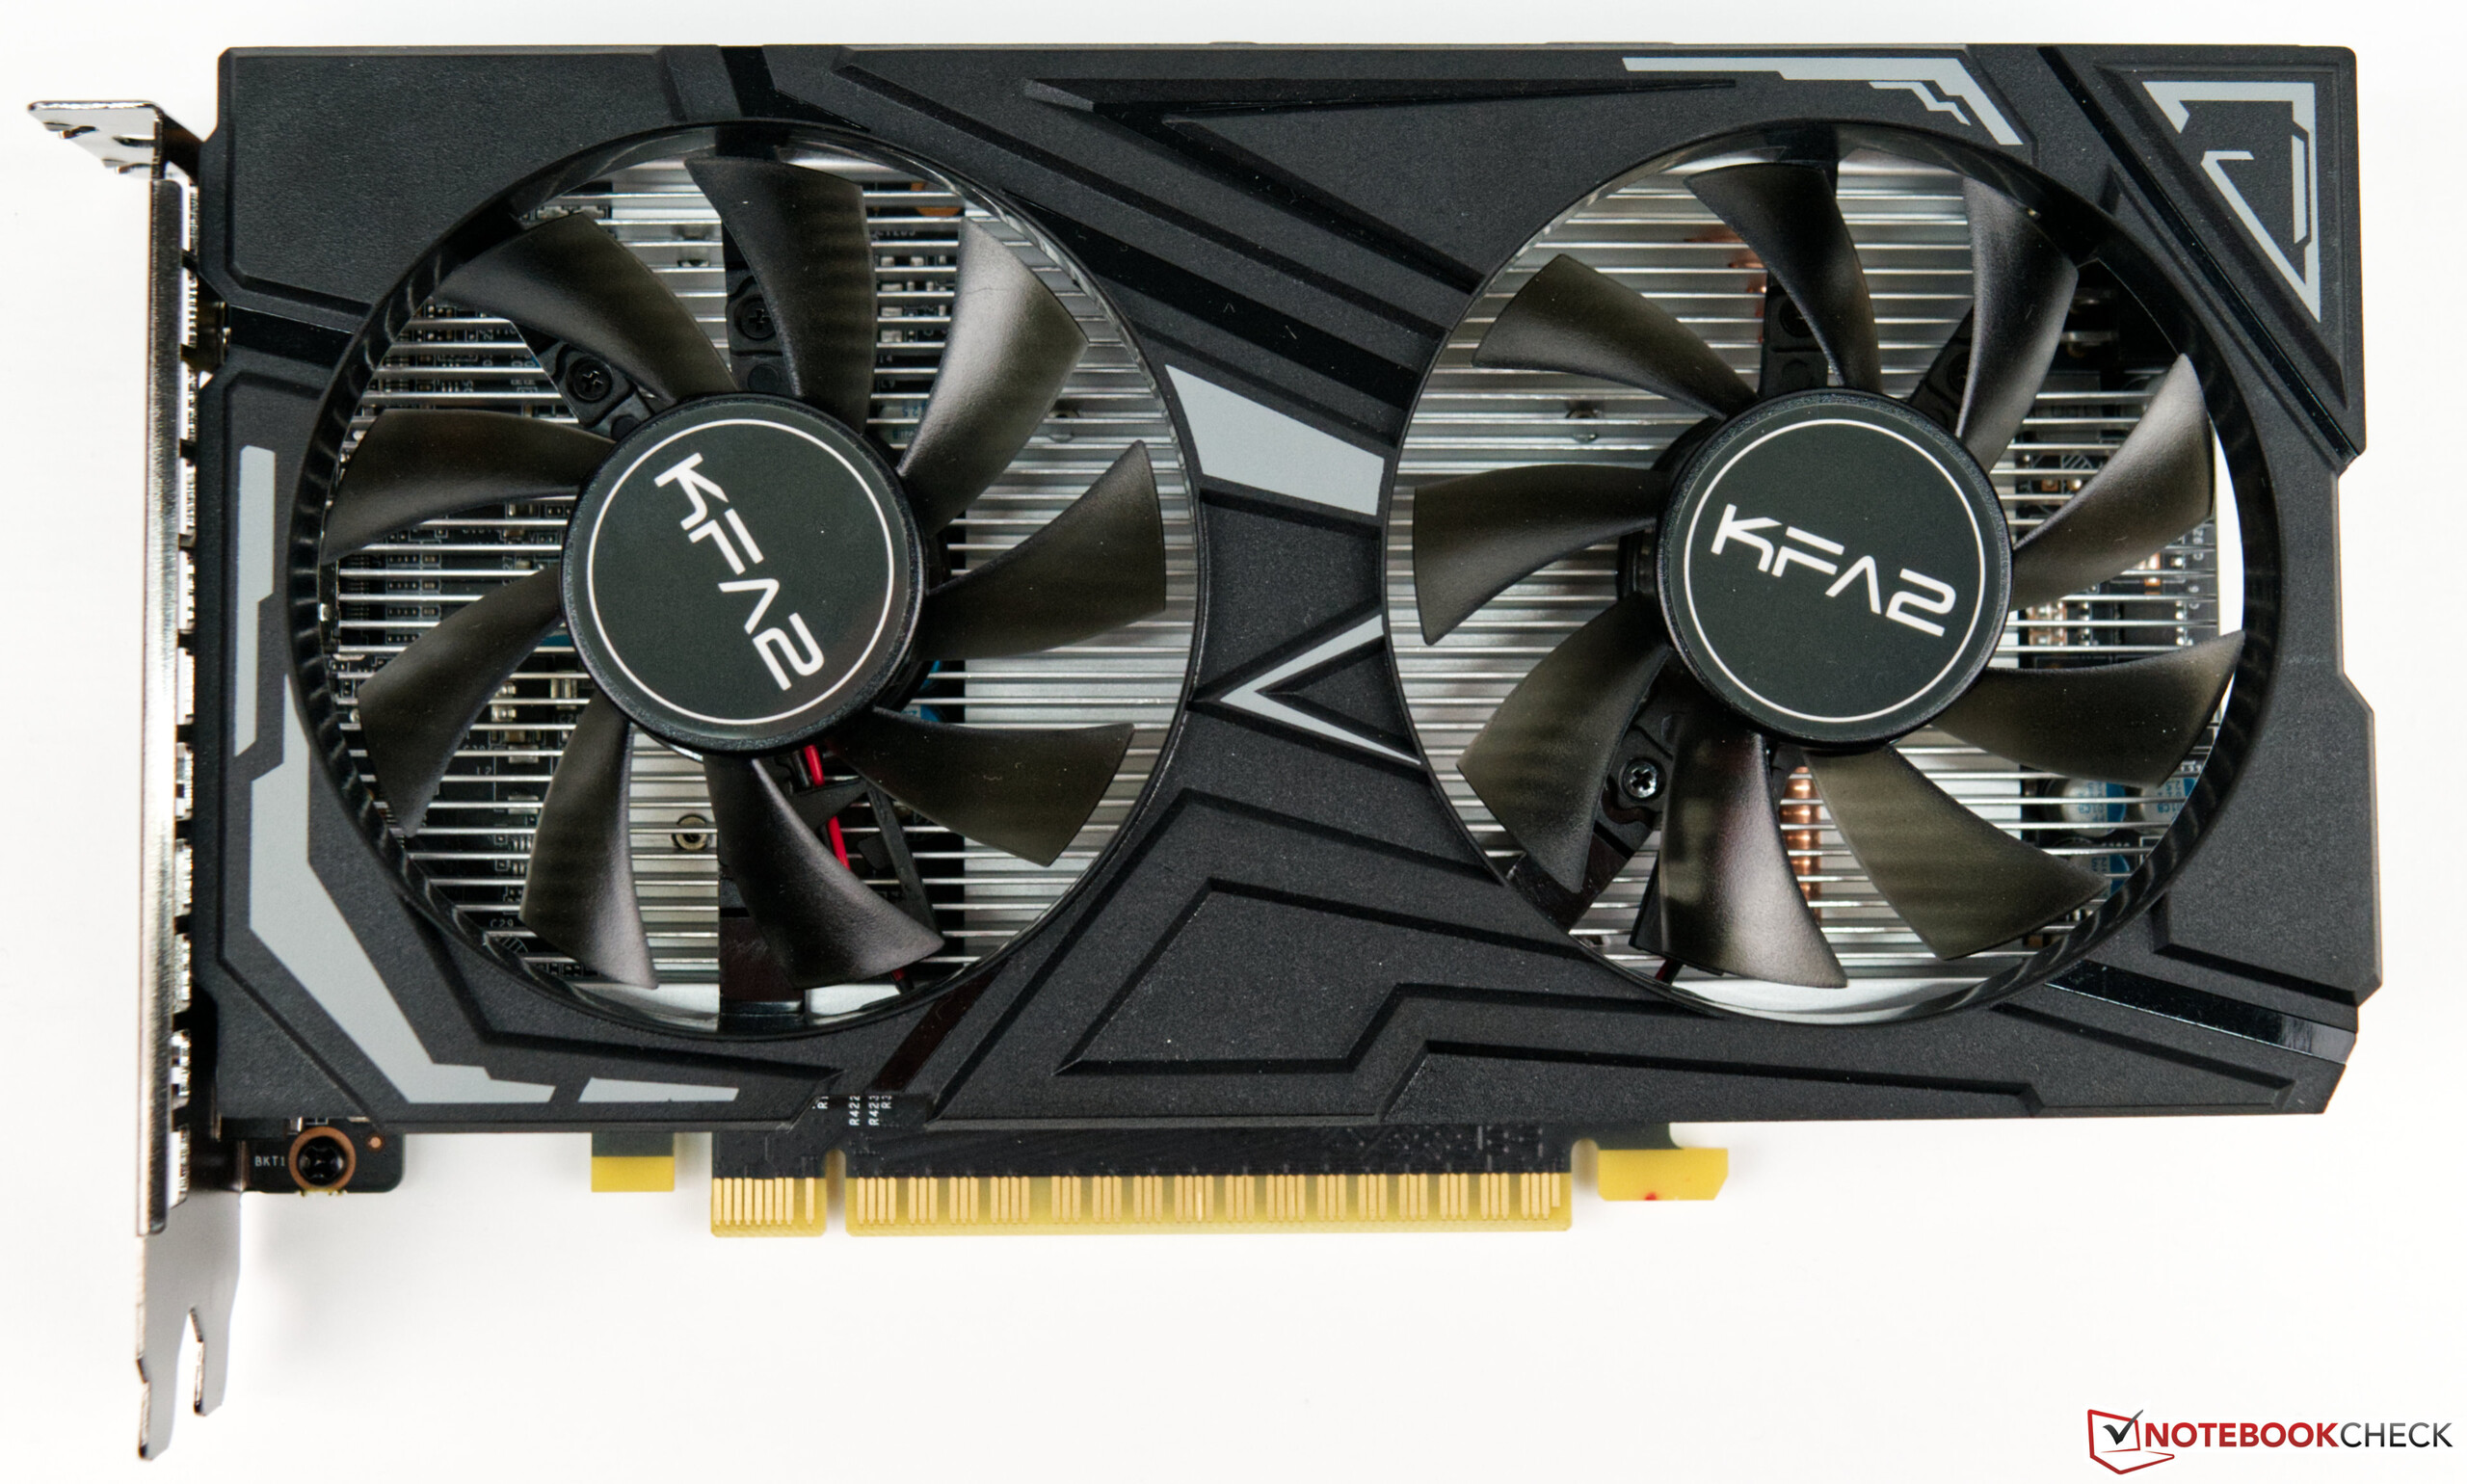
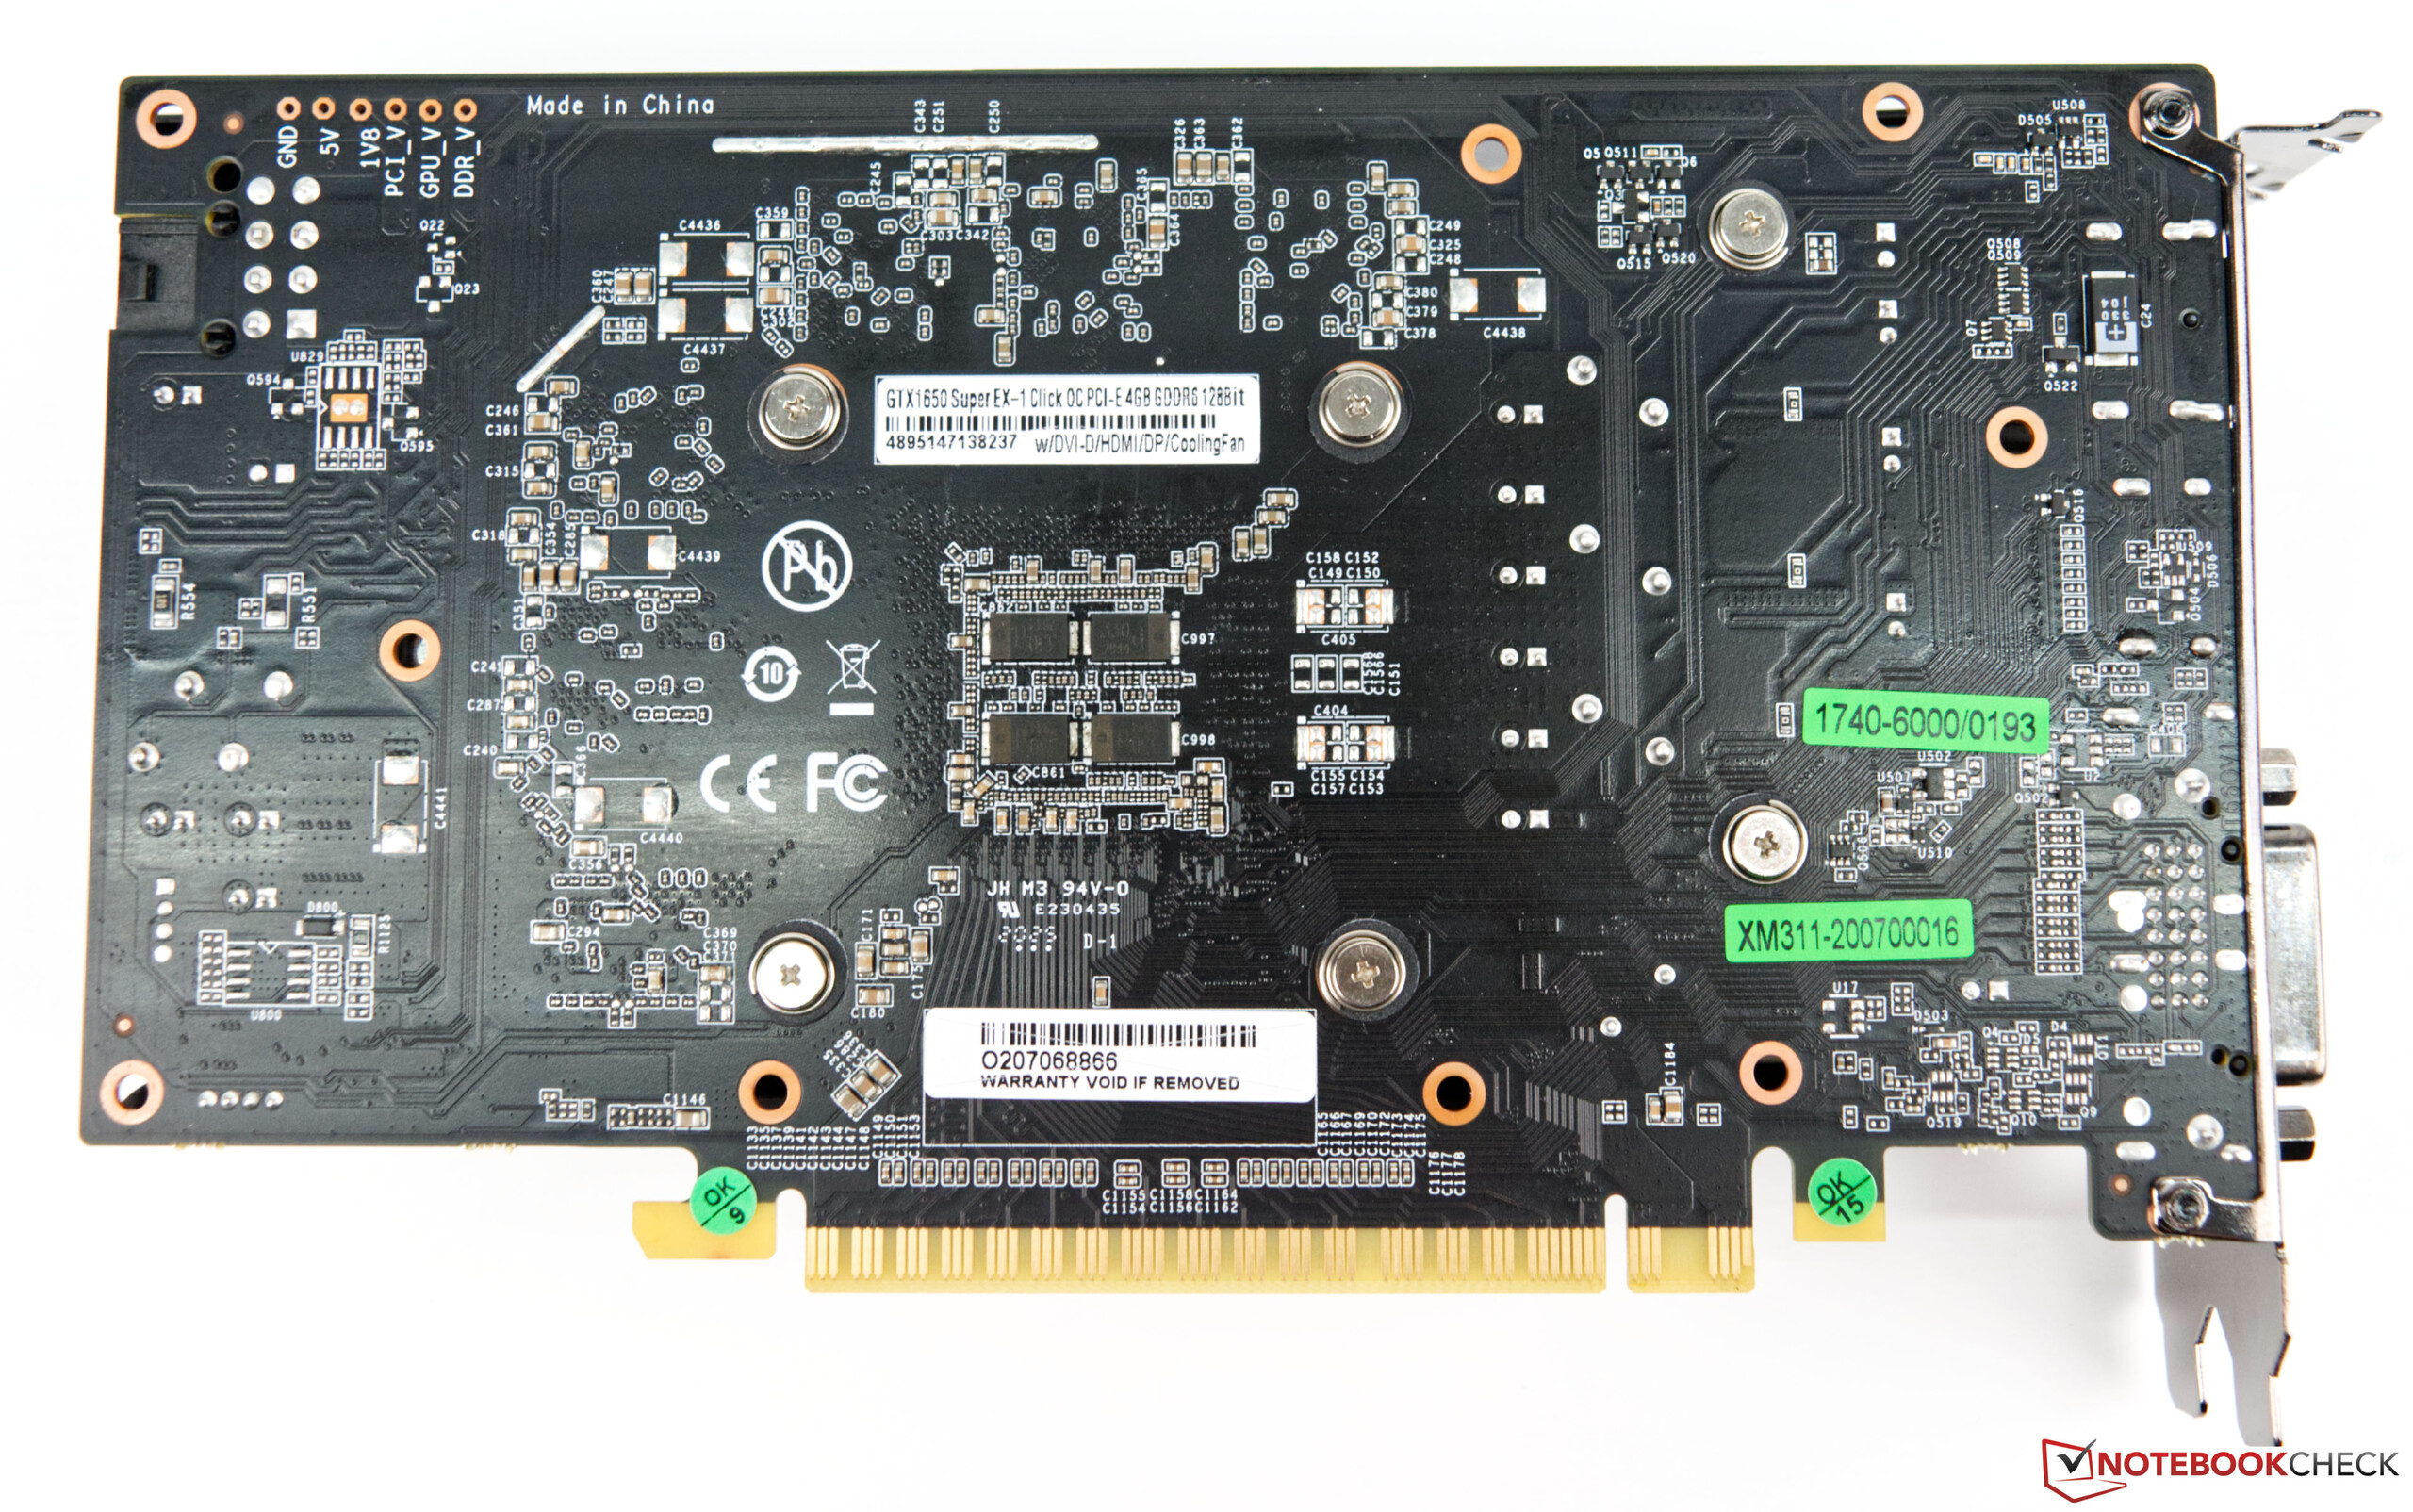
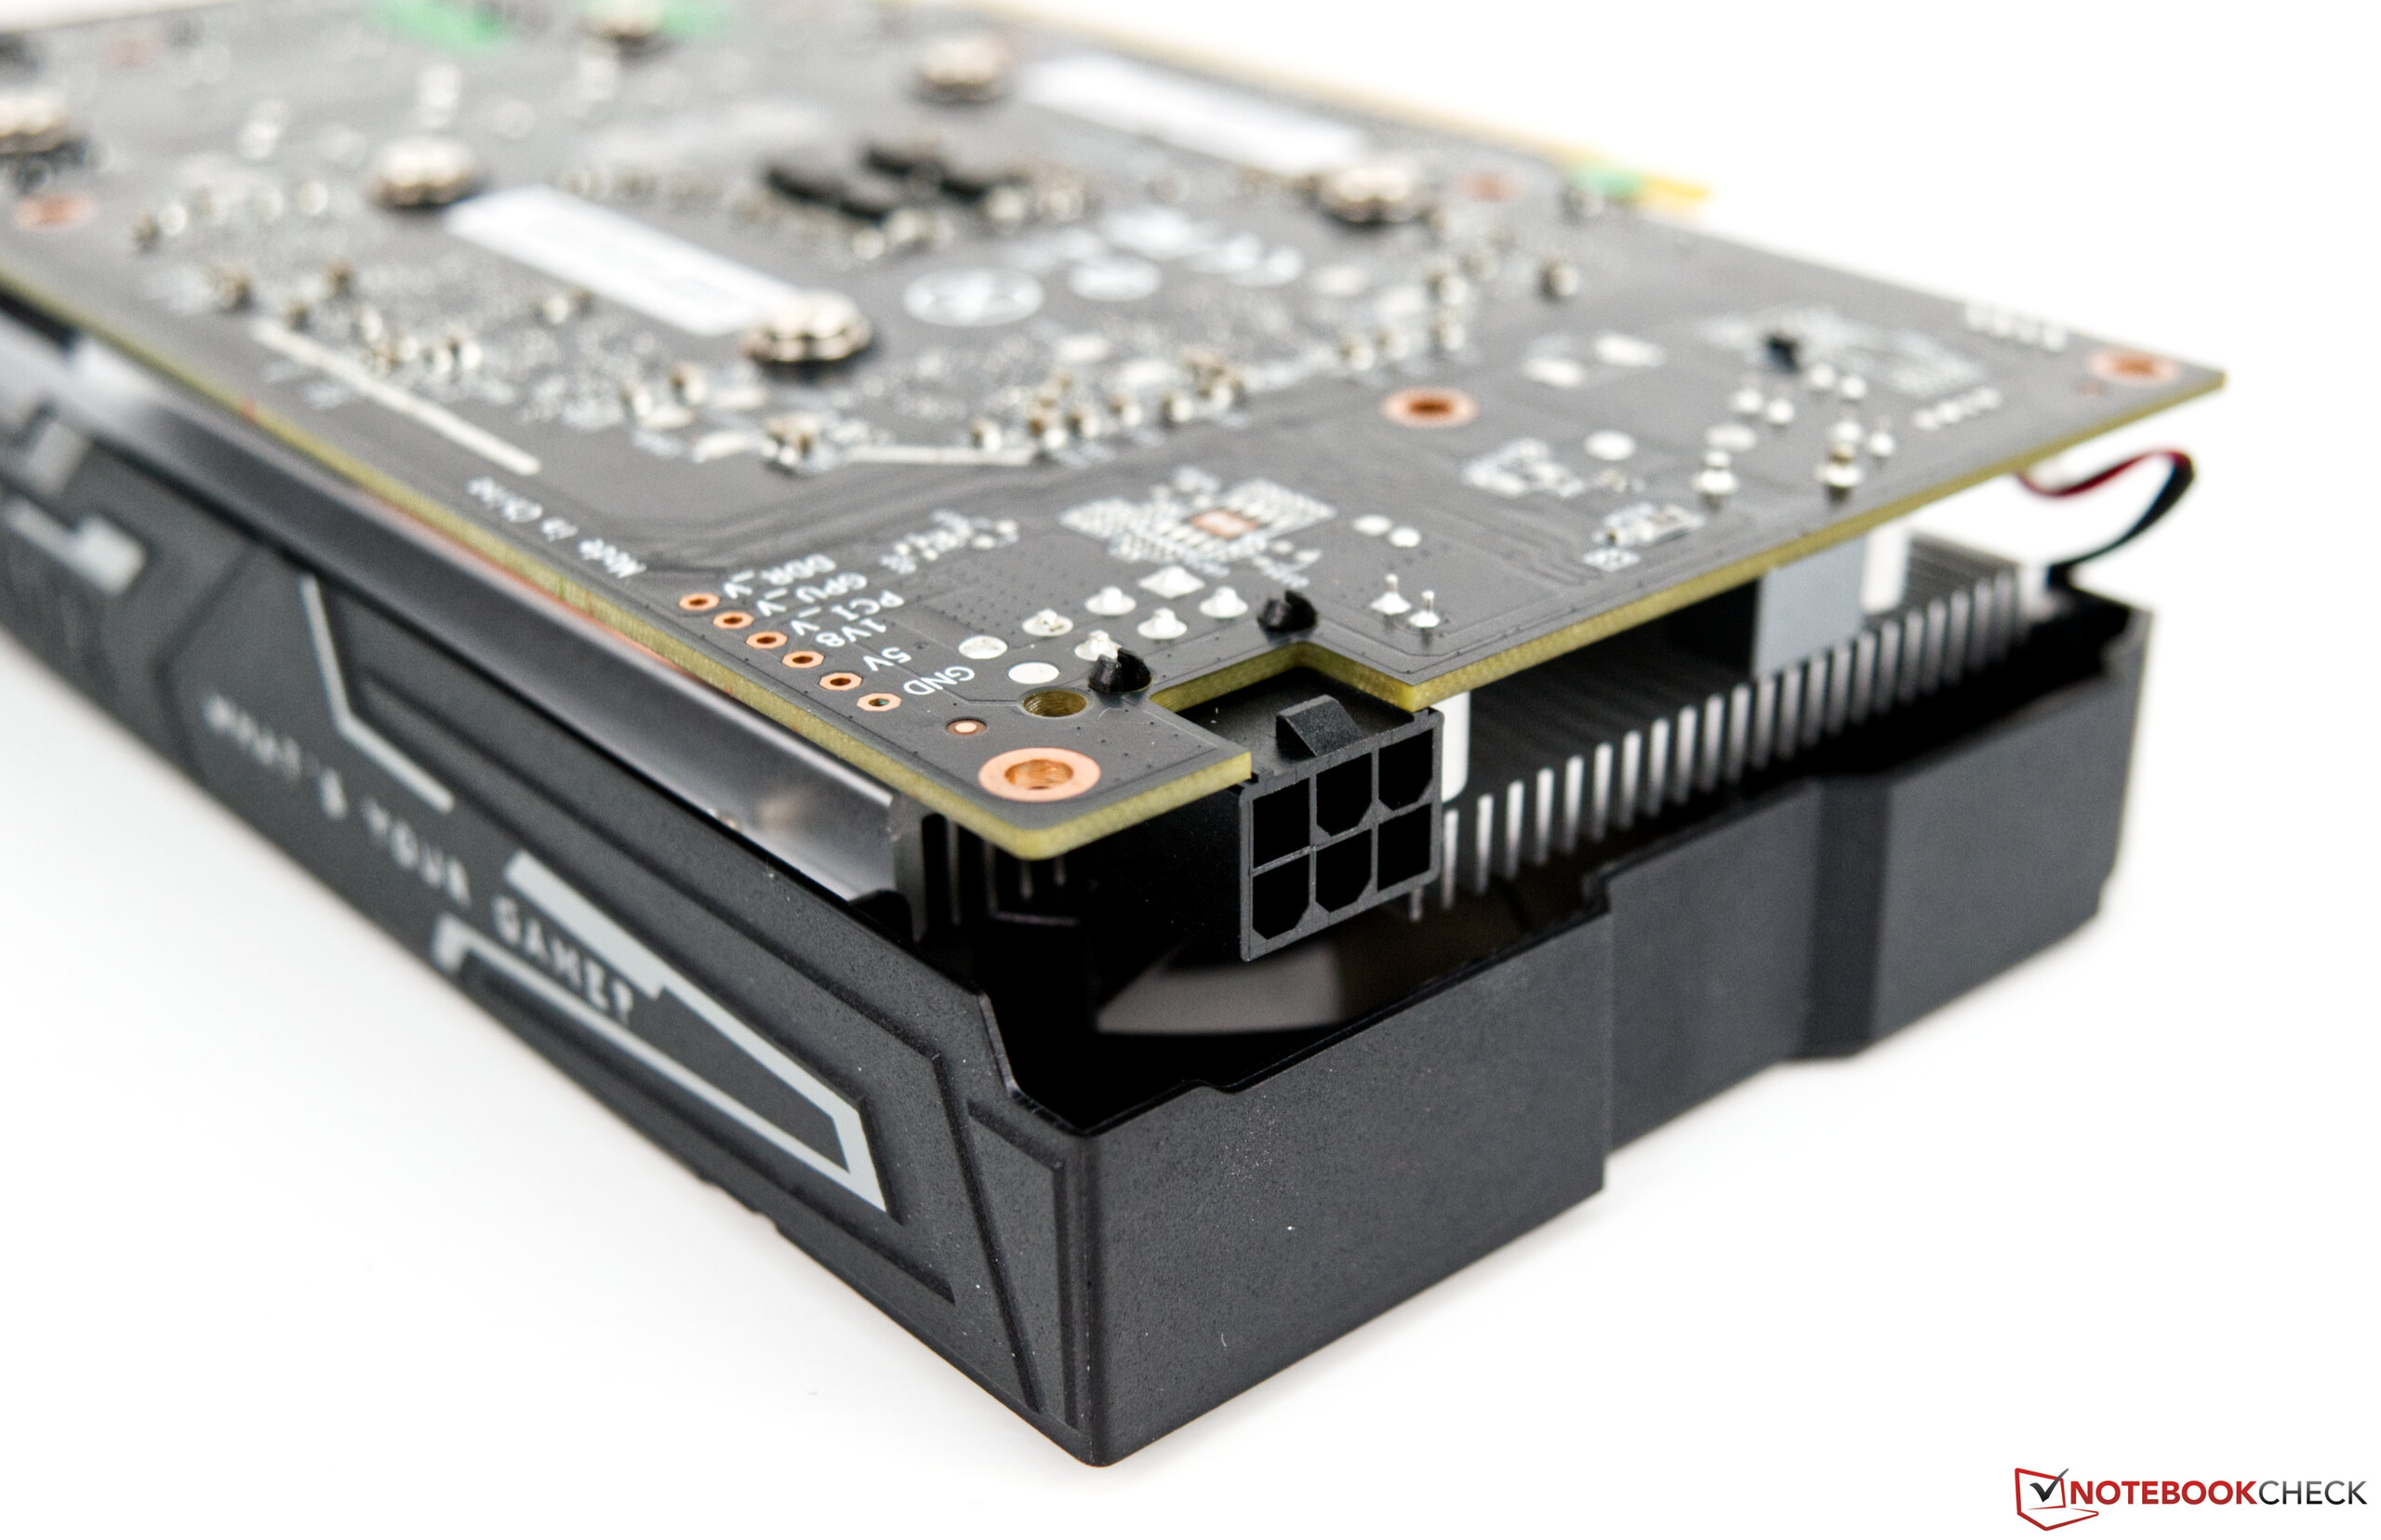
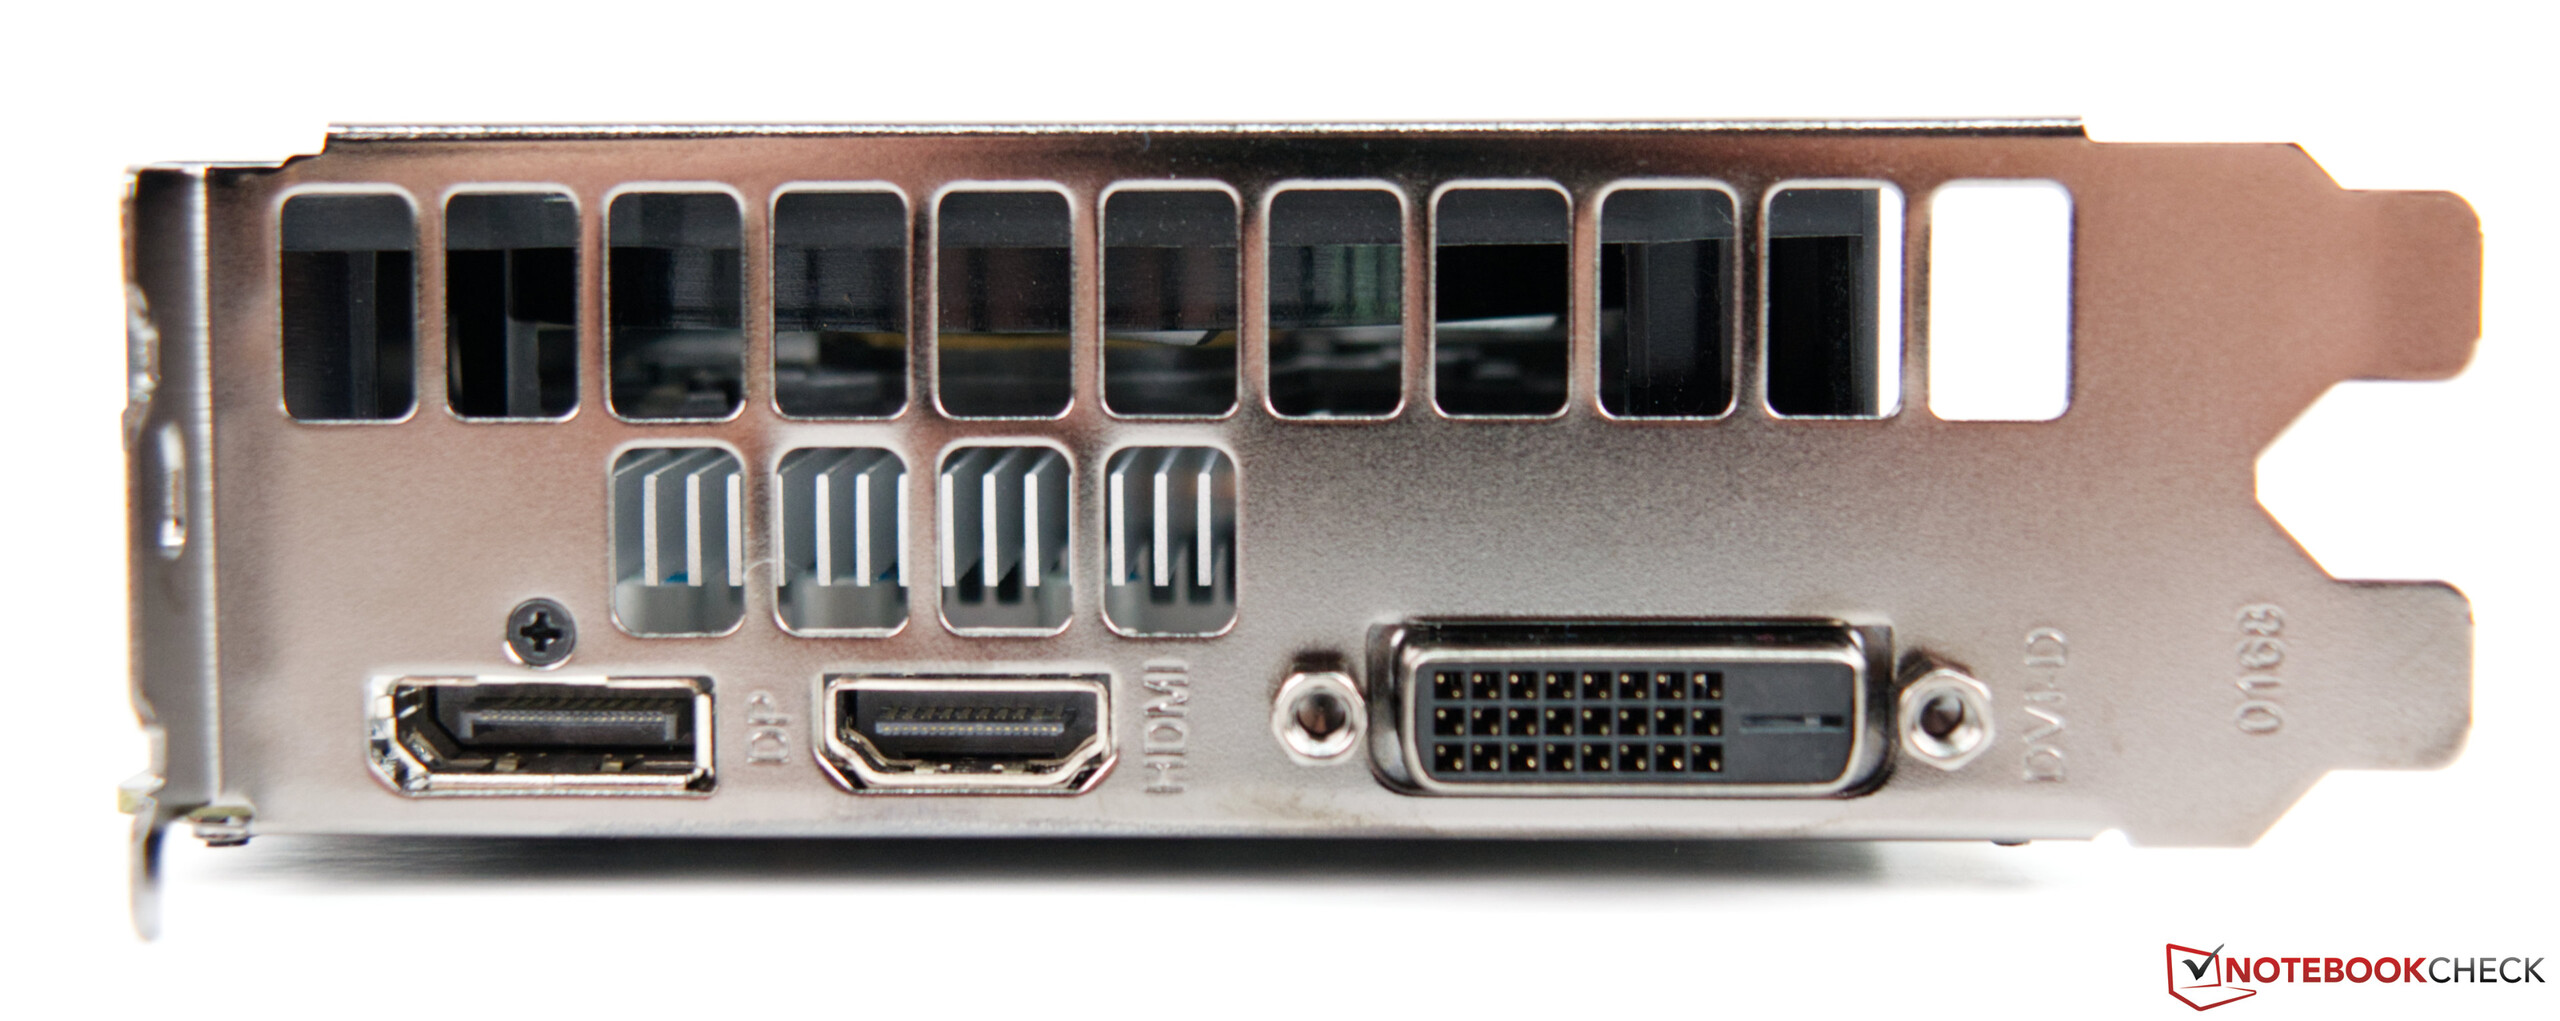
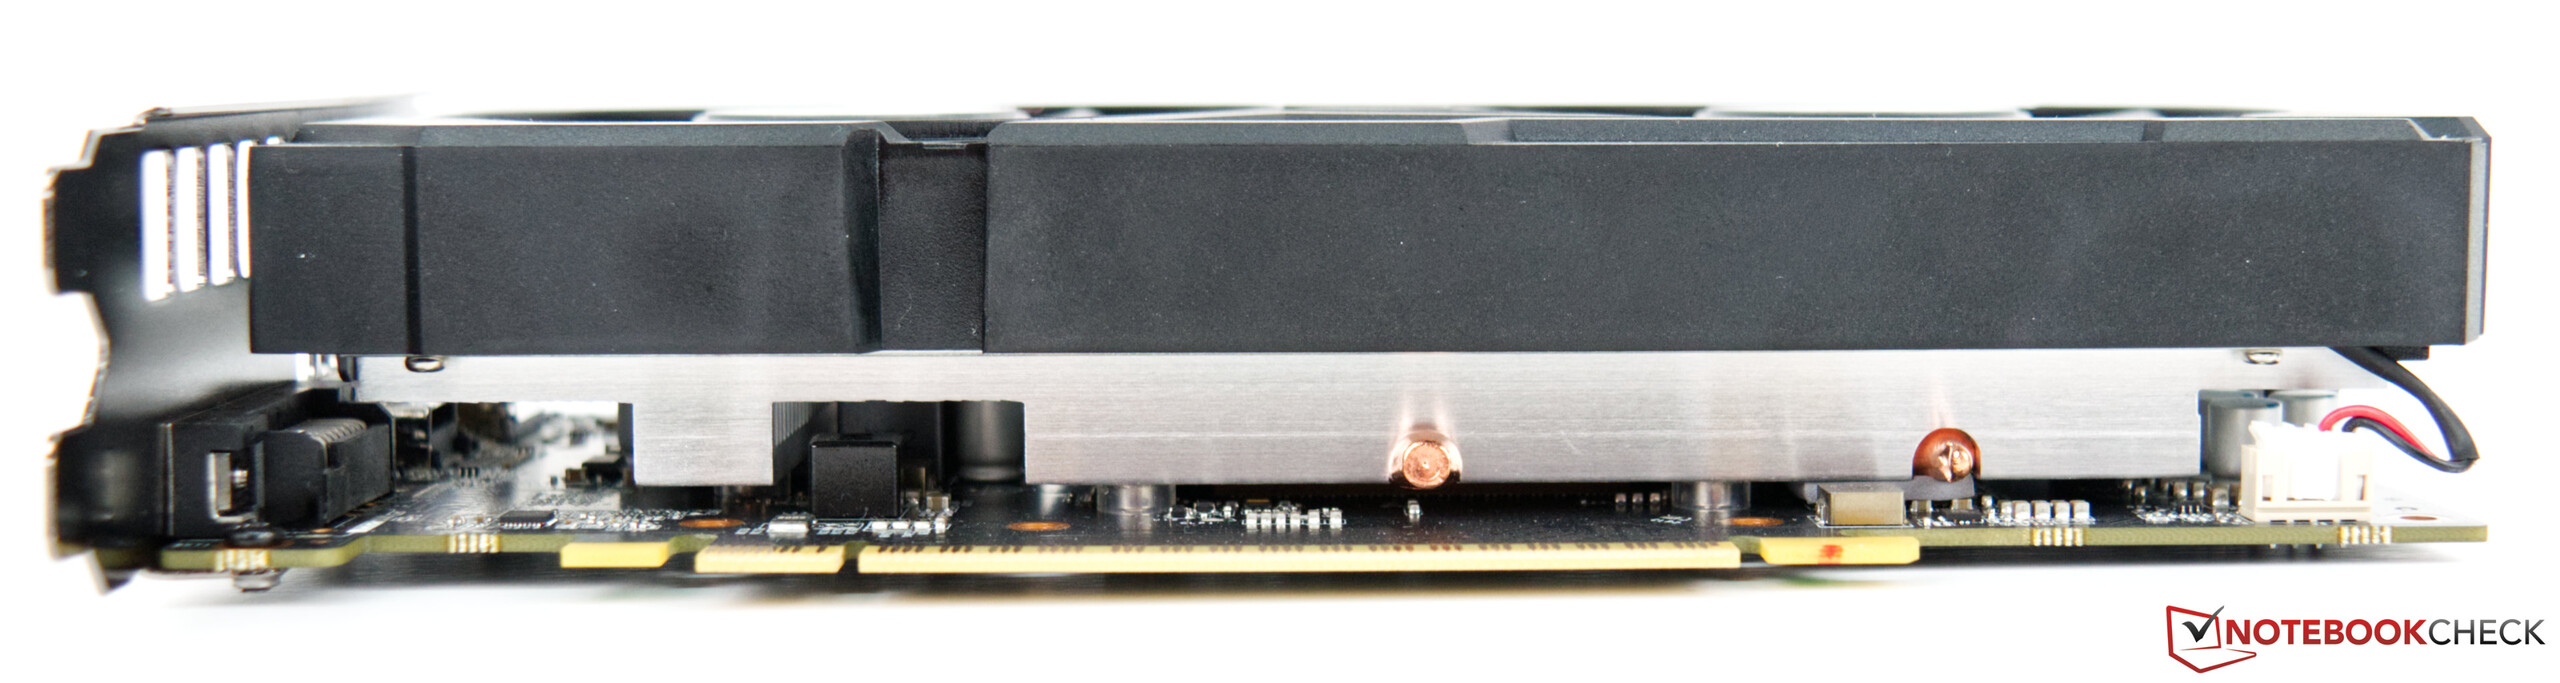
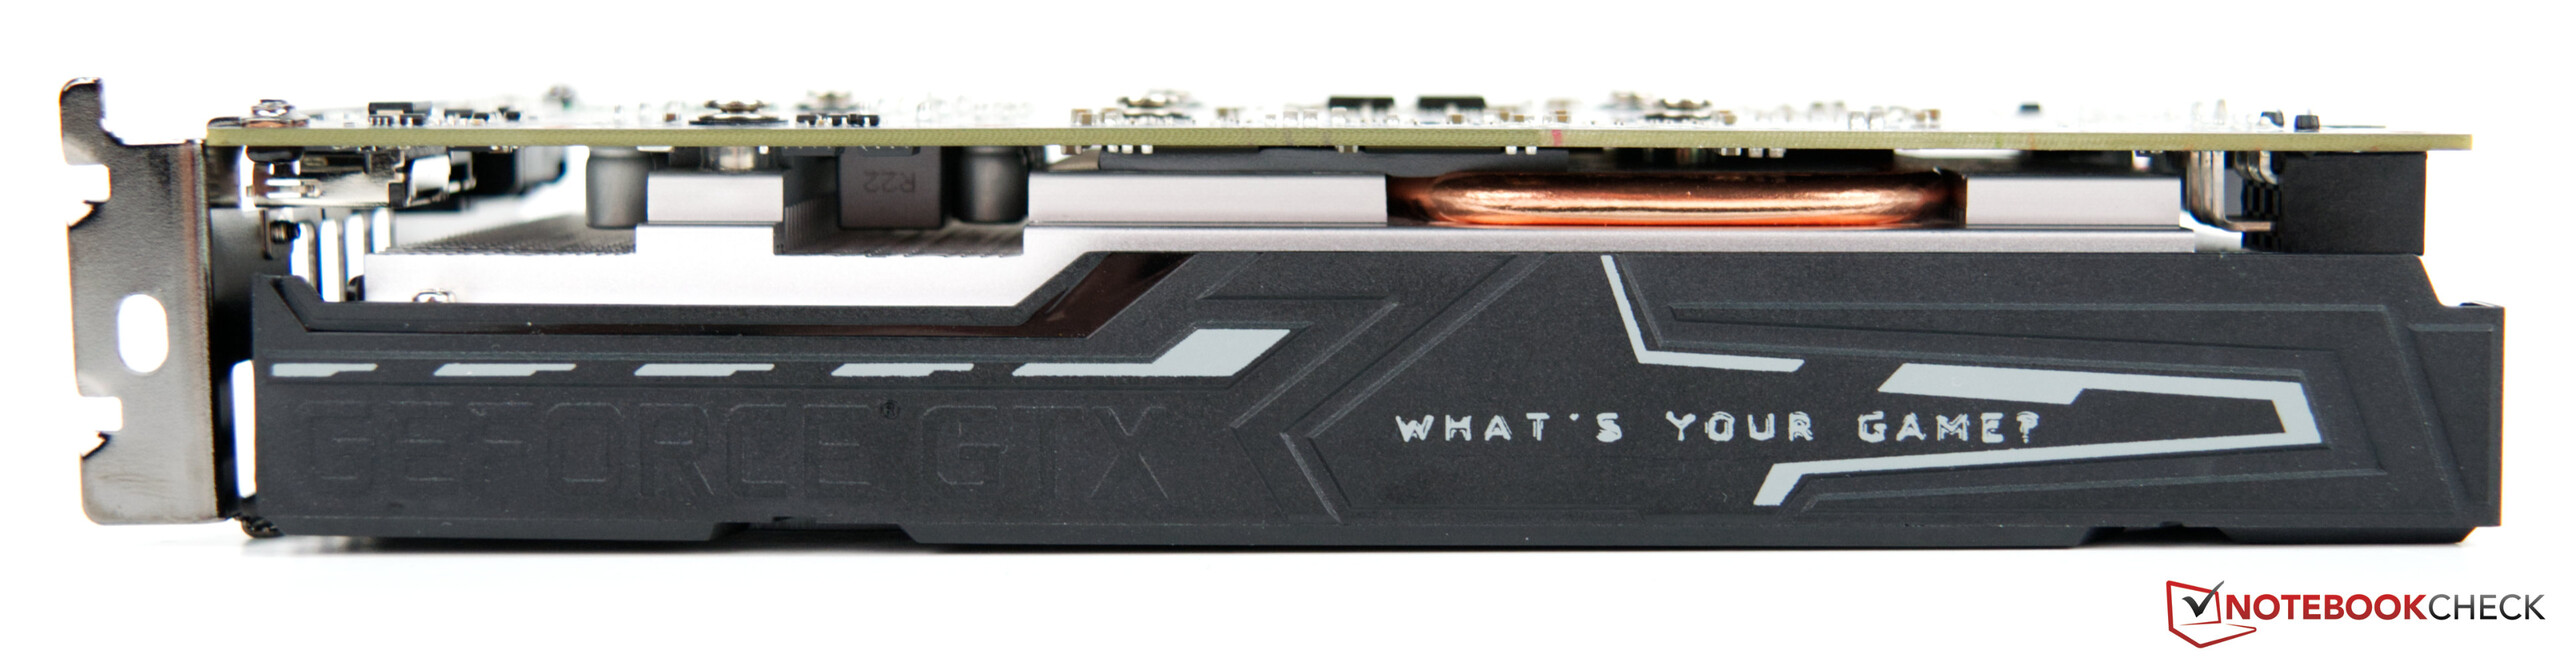
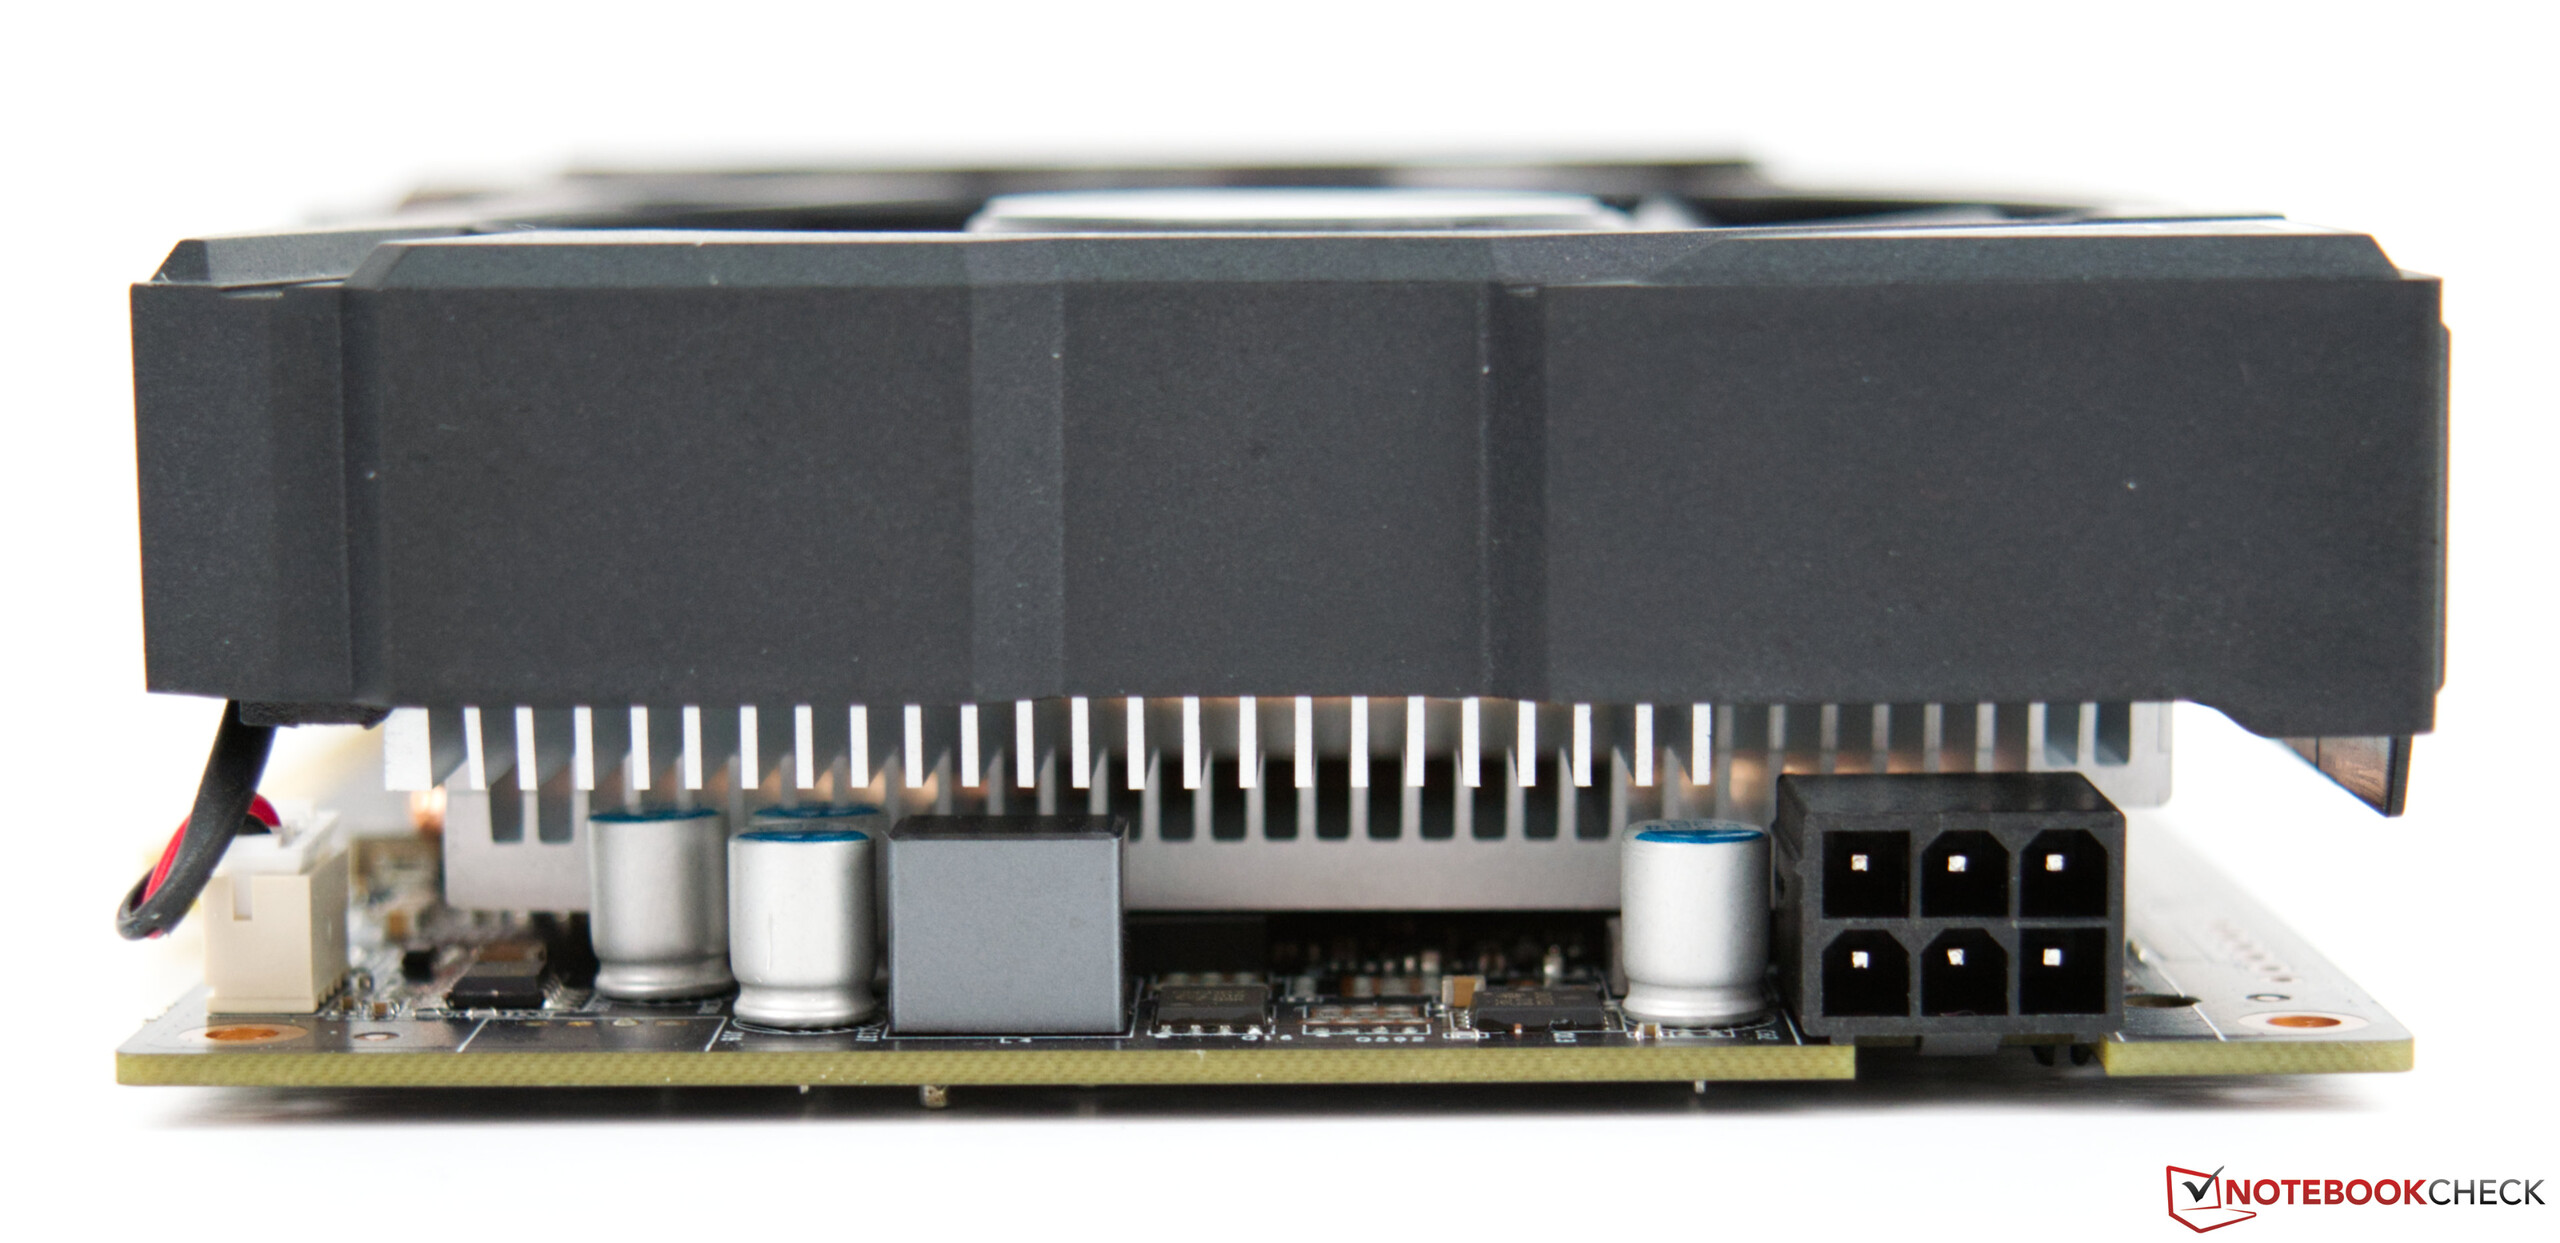
Due to its compactness, the graphics card is suitable for small cases. Power consumption is specified at 100 watts, which closes the gap between the GeForce GTX 1650 and the GeForce GTX 1660. The KFA2 model that we tested has a 6-pin power connector internally and offers one DVI-D, one DisplayPort 1.4, and one HDMI 2.0b port externally. The manufacturer's warranty is two years with KFA2.
NVIDIA GeForce GTX 1650 Super (Desktop)
The Nvidia GeForce GTX 1650 Super for desktops is an entry-level gaming graphics card based on the Turing architecture. The chip, which has been named TU116, was introduced in November 2019. The GTX 1650 series does not offer ray tracing and tensor cores, unlike the more powerful RTX 2000 cards (e.g. RTX 2060 Turing architecture in terms of the CUDA cores. Float and INT operations can now be executed simultaneously, the cache has been unified and improved, and Adaptive Shading has been introduced. As a result, Nvidia speaks of an up to 50% higher performance per core compared to Pascal.
GeForce GTX 1600 Series Architecture Turing Pipelines 1280 - unified Core Speed 1530 MHz Shader Speed 1785 MHz Memory Speed 14000 MHz Memory Bus Width 192 Bit Memory Type GDDR6 Max. Amount of Memory 4 GB Shared Memory no API DirectX 12_1, Shader 6.5, OpenGL 4.6 Power Consumption 125 Watt technology 12 nm Date of Announcement 29.10.2019
v1.26
log 23. 07:02:01
#0 no ids found in url (should be separated by "_") +0s ... 0s
#1 not redirecting to Ajax server +0s ... 0s
#2 did not recreate cache, as it is less than 5 days old! Created at Mon, 22 Apr 2024 05:40:21 +0200 +0.001s ... 0.001s
#3 start showIntegratedCPUs +0.032s ... 0.033s
#4 return log +0.011s ... 0.044s
For the upcoming benchmarks and tests, we use the following system:
Lian Li O11 Dynamic AMD Ryzen 9 5900X KFA2 GeForce GTX 1650 Super (Nvidia driver 460.79) Asus X570 ROG Crosshair VIII Hero Wi-Fi (BIOS 2402, default settings, XMP 1 for DDR4-4000) Corsair RM1000X 1,000-watt power supply Corsair Vengeance RGB Pro DDR4-4000 RAM kit 2x 16 GB Corsair MP600 2 TB M.2 PCIe 4.0 SSD Crucial MX500 2 TB (for games) As you could already guess, our KFA2 GeForce GTX 1650 Super ranks with a clear lead over the GeForce GTX 1650 GTX 1660 The GTX 1650 Super is unable to outperform its AMD counterpart in most benchmarks. Nevertheless, it remains to be seen whether the result shown here will also be carried over to the gaming tests.
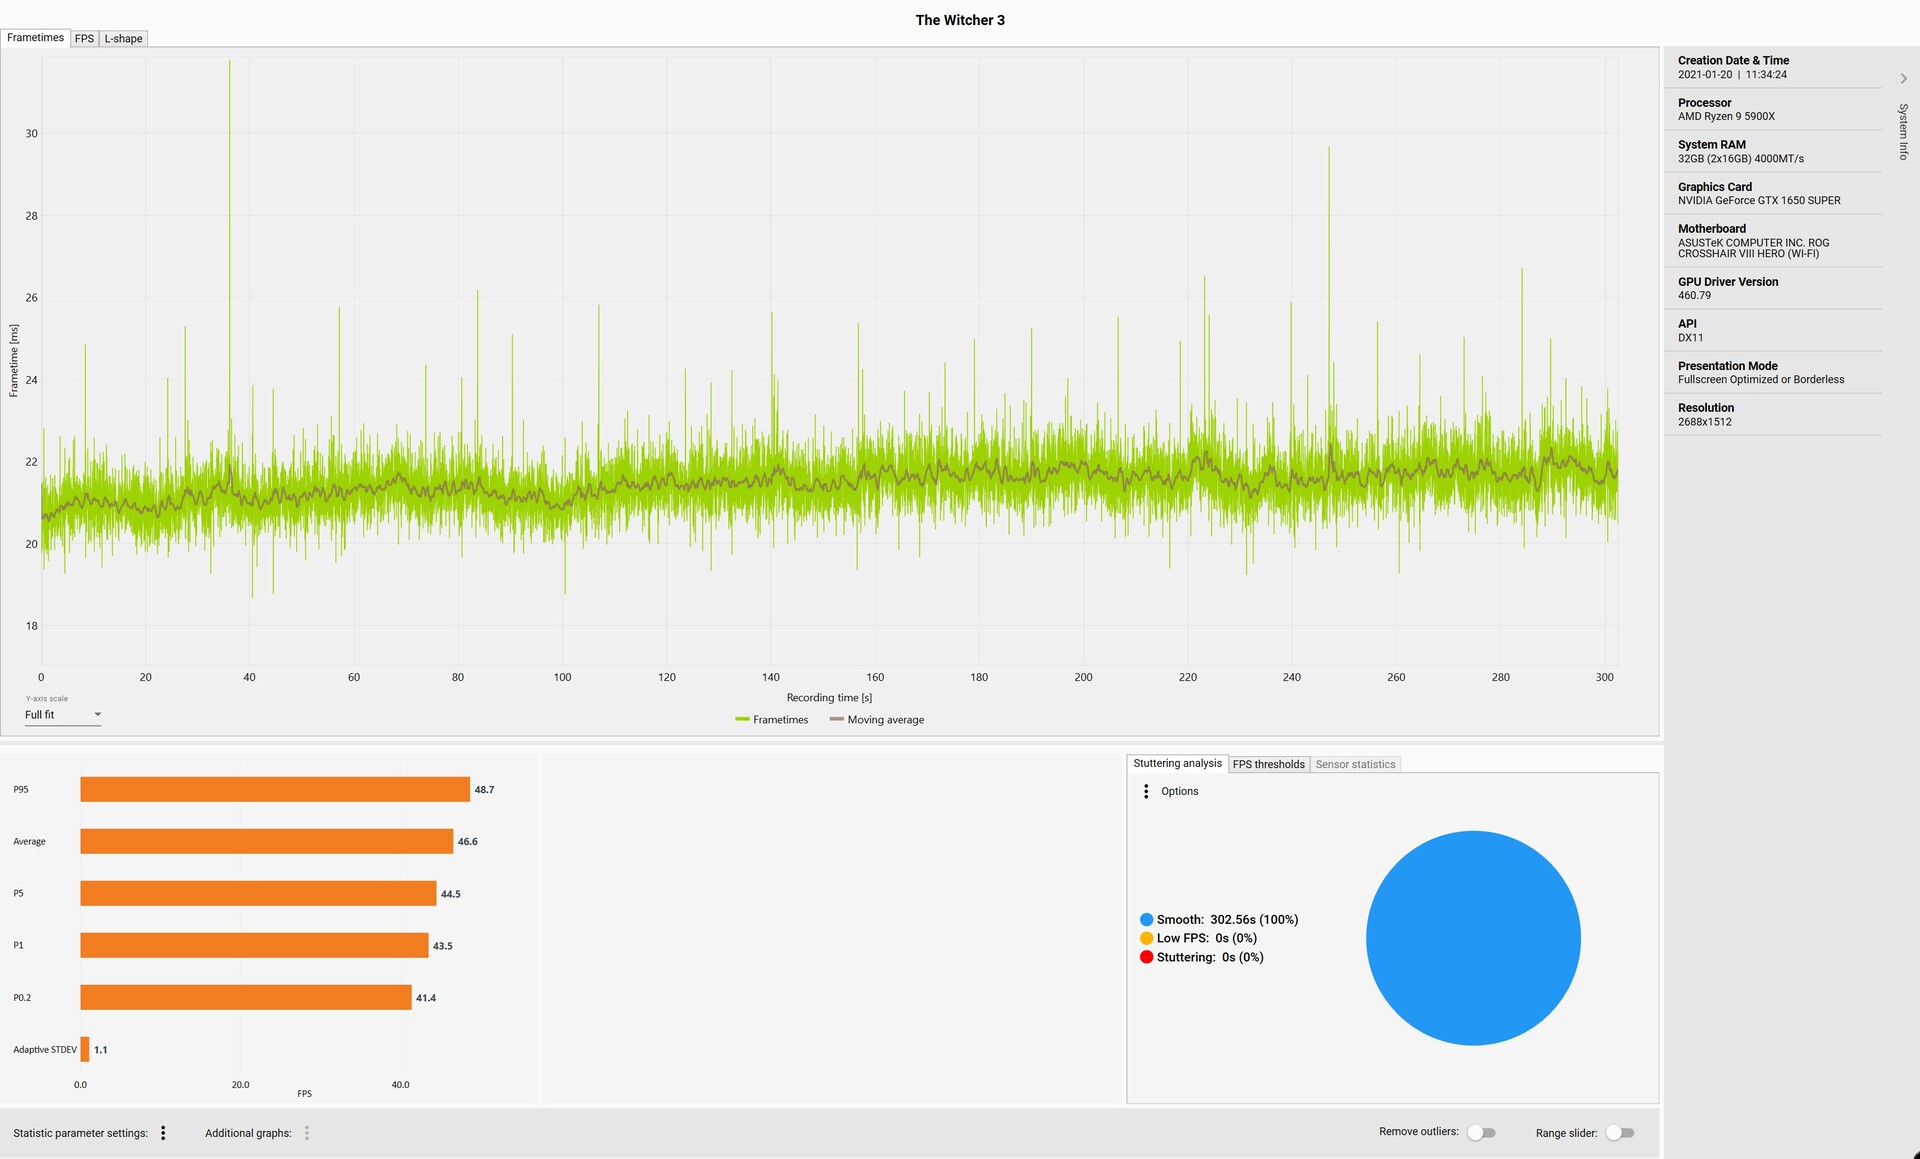
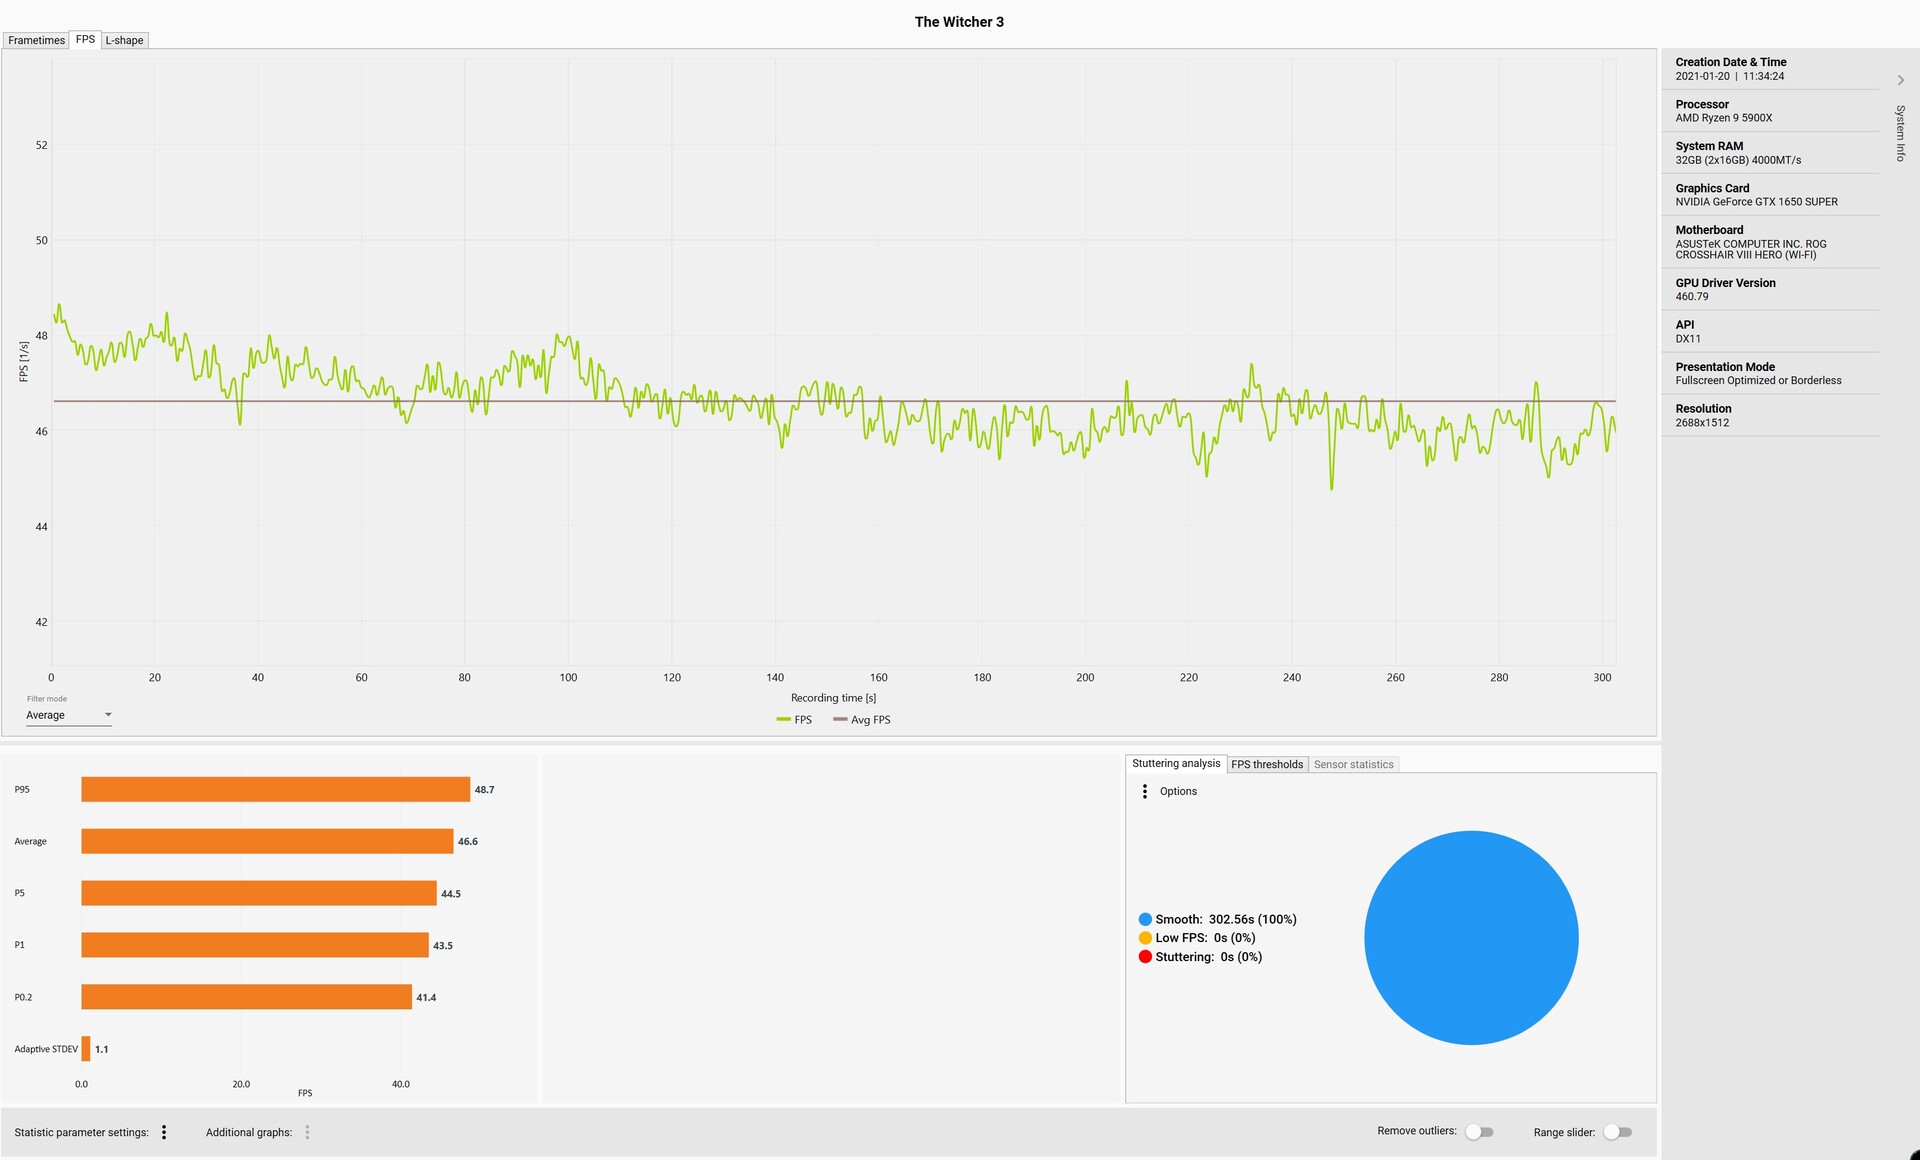
The Witcher 3 frame times (Ultra preset) The Witcher 3 frame rates (Ultra preset) In our gaming benchmarks, the KFA2 GeForce GTX 1650 Super does well, and with a few exceptions, the graphics card masters almost all games in 1080p and maximum details. However, our test sample has to admit defeat against the AMD Radeon RX 5500 XT. The performance gain compared with a GeForce GTX 1650 is clearly noticeable, but it also varies from game to game.
We used The Witcher 3 with the Ultra preset for the frame rates and frame times. It's noticeable here that the FPS can't be kept constant. Nevertheless, we have to say that it's not a noticeable performance drop. There are a few outliers in the recorded frame times now and then, although the smooth gameplay is not significantly affected by this.
KFA 2 GeForce GTX 1660 Super
45.6 (33.6min , 35.4P0.1 , 37.1P1 - 67max ) fps+38%
PNY GeForce GTX 1660
40.8 (32.2min , 32.5P0.1 , 34P1 - 58.7max ) fps+24%
Sapphire AMD Radeon RX 5500 XT KFA2 GeForce GTX 1650 Super EX One Click OC KFA2 GeForce GTX 1650 EX One Click Plus
27.6 (22.5min , 22.7P0.1 , 23.3P1 - 41.4max ) fps-16%
Sapphire AMD Radeon RX 5500 XT
53.1 (27.2min , 41P0.1 , 43.1P1 - 66.5max ) fps+15%
PNY GeForce GTX 1660
50 (32.9min , 38.2P0.1 , 42.8P1 - 60.2max ) fps+8%
KFA2 GeForce GTX 1650 Super EX One Click OC
46.3 (35.4min , 36.8P0.1 , 39.2P1 - 56.1max ) fps
KFA2 GeForce GTX 1650 EX One Click Plus
34.2 (25.1min , 25.9P0.1 , 29P1 - 41.2max ) fps-26%
KFA 2 GeForce GTX 1660 Super
57.2 (23min , 25.4P0.1 , 33P1 - 220max ) fps+55%
PNY GeForce GTX 1660
52.5 (17.8min , 27.2P0.1 , 39P1 - 194max ) fps+42%
Sapphire AMD Radeon RX 5500 XT KFA2 GeForce GTX 1650 Super EX One Click OC KFA2 GeForce GTX 1650 EX One Click Plus
35.6 (26.2min , 26.6P0.1 , 27.9P1 - 62.8max ) fps-4%
KFA 2 GeForce GTX 1660 Super
39.2 (6.1min , 22P0.1 , 32.7P1 - 135max ) fps+31%
PNY GeForce GTX 1660
36.6 (6.64min , 20.8P0.1 , 30.6P1 - 183max ) fps+22%
Sapphire AMD Radeon RX 5500 XT KFA2 GeForce GTX 1650 Super EX One Click OC KFA2 GeForce GTX 1650 EX One Click Plus
23.7 (6.33min , 11.5P0.1 , 19.6P1 - 58.8max ) fps-21%
KFA 2 GeForce GTX 1660 Super
64.7 (28min , 36P0.1 , 43.3P1 - 121max ) fps+22%
PNY GeForce GTX 1660
59 (15.9min , 31.2P0.1 , 39P1 - 112max ) fps+11%
Sapphire AMD Radeon RX 5500 XT KFA2 GeForce GTX 1650 Super EX One Click OC KFA2 GeForce GTX 1650 EX One Click Plus
40.6 (24min , 24.2P0.1 , 25.6P1 - 83.3max ) fps-23%
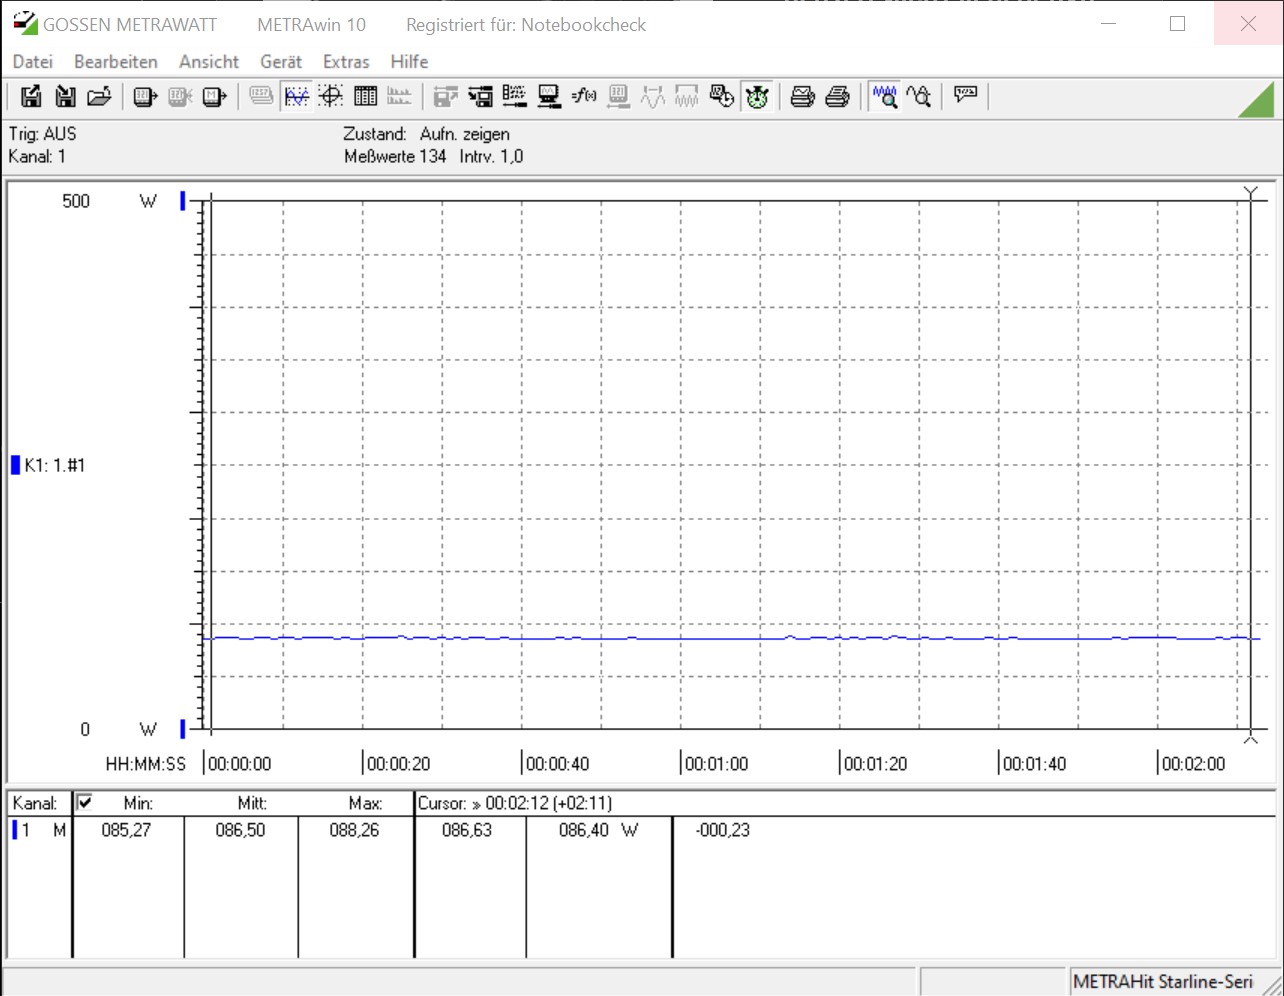
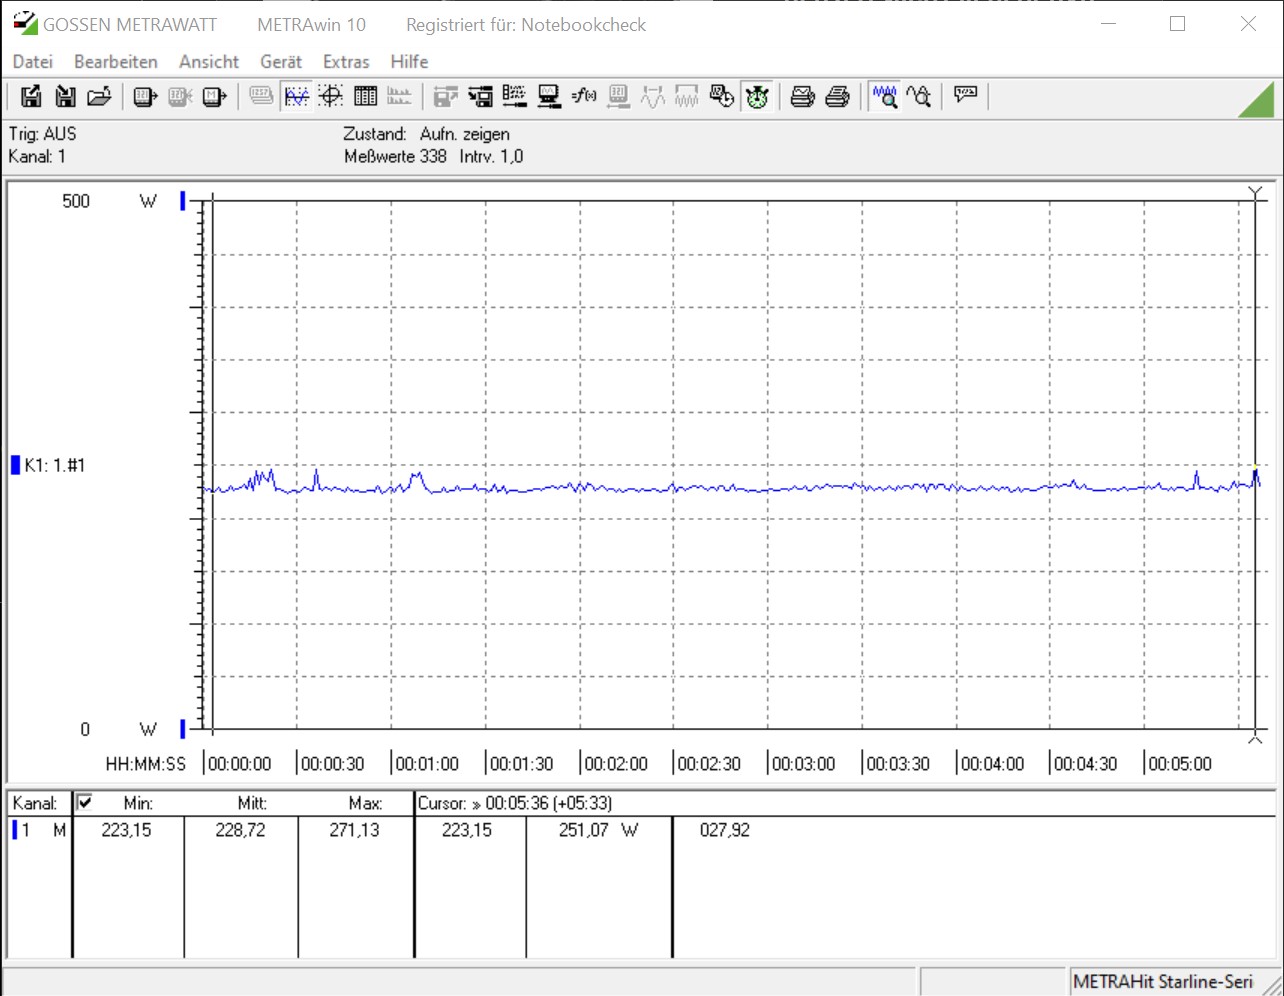
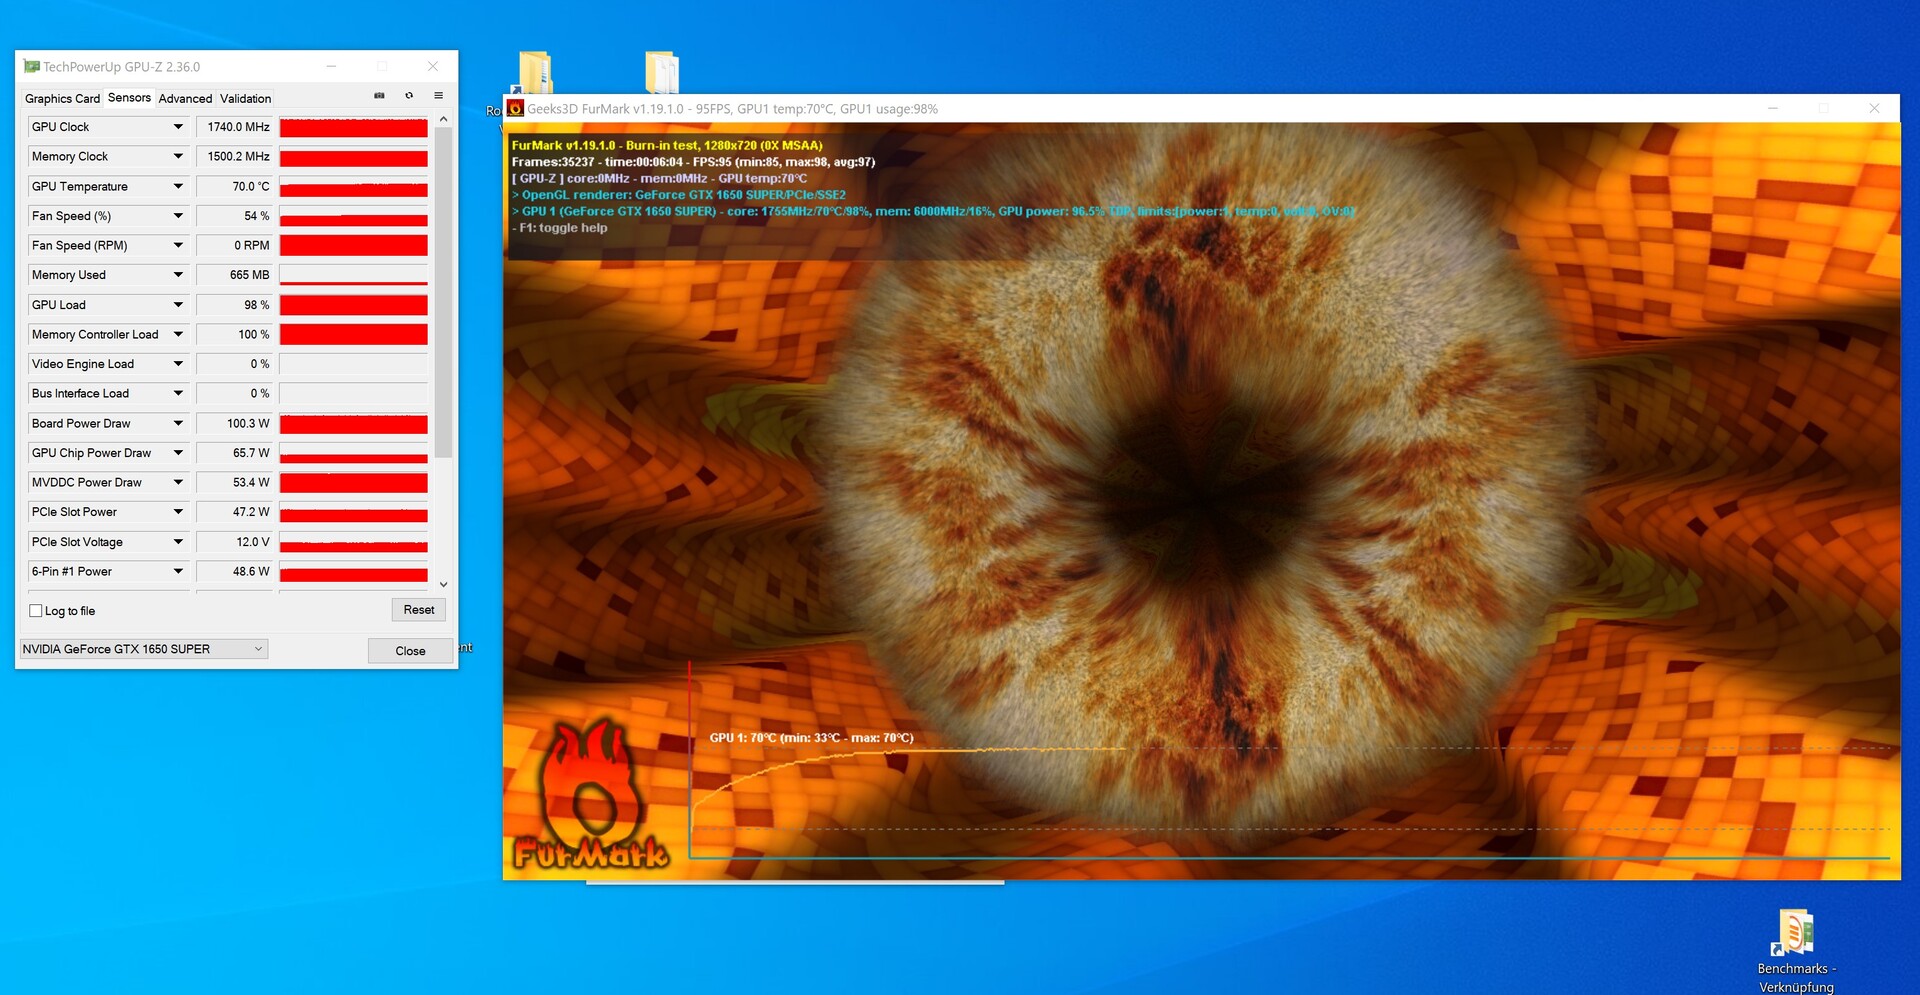
If you decide to buy a GeForce GTX 1650 Super, you will probably mainly look at the graphics card's power consumption. The model is quite efficient at 100 watts, despite the fact that the non-Super model only requires 75 watts. This is also reflected in our measurement results. Our test system only needs 87 watts in idle usage. In the stress test, this value increases to 229 watts, which is, however, significantly lower compared to the test system with the AMD Radeon RX 5500 XT.
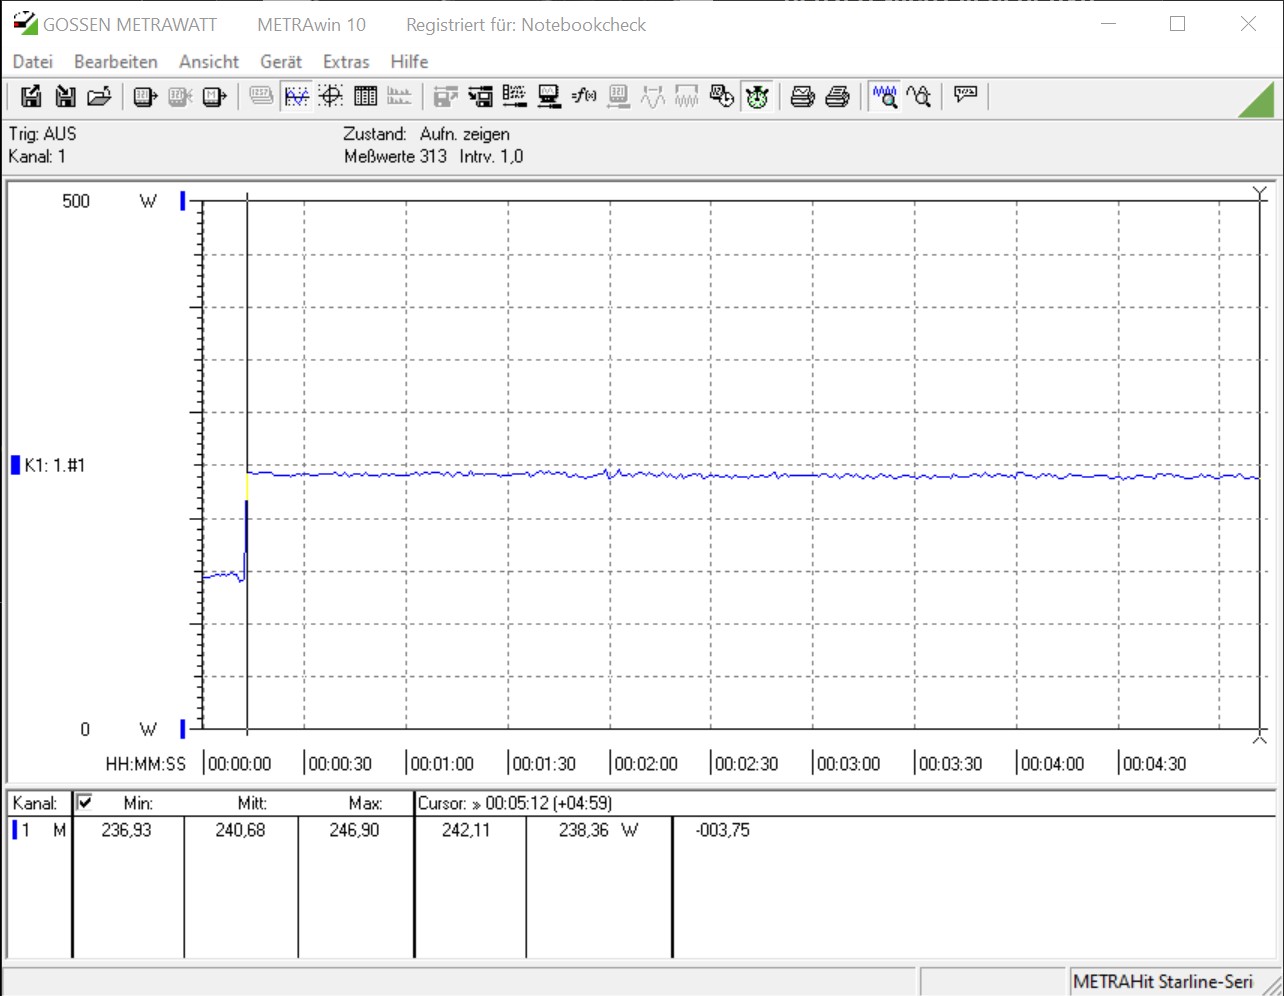
Power consumption while gaming is even a bit higher at 241 watts, but it can still be classified as low in comparison. In contrast to the GeForce GTX 1650, power consumption is almost 40 watts higher. Nevertheless, the KFA2 GeForce GTX 1650 Super is an energy-efficient graphics card for small systems. There's no cause for concern in terms of temperatures, as our test sample only reached 70 °C (~158 °F) in the stress test. However, the cooling unit still deserves criticism. It's audible under load, and the KFA2 model unfortunately does not have a fan-stop mode for 2D use.
Test system power consumption (idle) Test system power consumption (FurMark) Test system power consumption (when gaming - The Witcher 3 Ultra preset) FurMark stress test
KFA 2 GeForce GTX 1660 Super NVIDIA GeForce GTX 1660 Super (Desktop), AMD Ryzen 9 3900X (Idle: 84.76 W)
260.4 (255min - 277max ) Watt * -8%
Sapphire AMD Radeon RX 5500 XTAMD Radeon RX 5500 XT (Desktop), AMD Ryzen 9 5900X (Idle: 83.93 W)
250.2 (246min - 262max ) Watt * -4%
PNY GeForce GTX 1660 NVIDIA GeForce GTX 1660 (Desktop), AMD Ryzen 9 3900X (Idle: 79.88 W)
248.6 (240min - 259max ) Watt * -3%
KFA2 GeForce GTX 1650 Super EX One Click OC NVIDIA GeForce GTX 1650 Super (Desktop), AMD Ryzen 9 5900X (Idle: 86.5 W)
240.7 (237min - 247max ) Watt *
KFA2 GeForce GTX 1650 EX One Click Plus NVIDIA GeForce GTX 1650 (Desktop), AMD Ryzen 9 3900X (Idle: 85.5 W)
202.9 (202min - 204max ) Watt * +16%
Sapphire AMD Radeon RX 5500 XTAMD Radeon RX 5500 XT (Desktop), AMD Ryzen 9 5900X (Idle: 83.93 W)
259.1 (242min - 295max ) Watt * -13%
PNY GeForce GTX 1660 NVIDIA GeForce GTX 1660 (Desktop), AMD Ryzen 9 3900X (Idle: 79.88 W)
247.8 (242min - 282max ) Watt * -8%
KFA 2 GeForce GTX 1660 Super NVIDIA GeForce GTX 1660 Super (Desktop), AMD Ryzen 9 3900X (Idle: 84.76 W)
247.6 (241min - 322max ) Watt * -8%
KFA2 GeForce GTX 1650 Super EX One Click OC NVIDIA GeForce GTX 1650 Super (Desktop), AMD Ryzen 9 5900X (Idle: 86.5 W)
228.7 (223min - 271max ) Watt *
KFA2 GeForce GTX 1650 EX One Click Plus NVIDIA GeForce GTX 1650 (Desktop), AMD Ryzen 9 3900X (Idle: 85.5 W)
200.4 (193min - 230max ) Watt * +12%
* ... smaller is better
In review: The KFA2 GeForce GTX 1650 Super The Nvidia GeForce GTX 1650 Super is an energy-efficient graphics card that is suitable for the home living room PC. With the TU116 graphics chip, the GTX 1650 Super offers the advantages of the GTX 1660 series when it comes to the NVENC video encoding. In terms of price, this graphics card is currently very difficult to categorize, since the problematic availability of graphics cards has now also reached the entry-level models, and even here, we can already see significantly increasing prices. For example, prices starting at 160 Euros (~$192) can be found on the second-hand market.
In terms of pure performance, the GeForce GTX 1650 Super ranks directly behind a GeForce GTX 1660. The VRAM of 4 GB is a bit tight if you're looking for something for the long term. At the moment, however, many games can be played smoothly in 1080p even with this graphics card without having to sacrifice details. Only a few games require a reduction in details in order to achieve smooth frame rates.
If you're looking for a small and yet powerful graphics card, there's currently no way around the GeForce GTX 1650 Super.
Objectively speaking, the KFA2 GeForce GTX 1650 Super is a solid graphics card for the entry level. However, the built-in cooling system deserves some criticism. A fan-stop mode for 2D use would be appreciated, and a lower noise level in 3D applications would make the graphics card more attractive.
Benchmarks Performance Rating - 3DMark 11 + Fire Strike + Time Spy
5.6 pt (17%)
...
NVIDIA GeForce GTX 1650 Super (Desktop)
...
3DMark - 3DMark Time Spy Score
min: 5099 avg: 5168 median: 5184 (15%) max: 5221 Points
...
NVIDIA GeForce GTX 1650 Super (Desktop)
...
3DMark - 3DMark Time Spy Graphics
min: 4632 avg: 4639 median: 4633 (12%) max: 4651 Points
...
NVIDIA GeForce GTX 1650 Super (Desktop)
...
3DMark - 3DMark Ice Storm Unlimited Graphics
min: 450349 avg: 590850 median: 657142 (74%) max: 665060 Points
...
NVIDIA GeForce GTX 1650 Super (Desktop)
Intel Arc A580
...
3DMark - 3DMark Ice Storm Extreme Graphics
min: 221403 avg: 238251 median: 245396 (31%) max: 247955 Points
...
Intel Arc A380
NVIDIA GeForce GTX 1650 Super (Desktop)
...
3DMark - 3DMark Cloud Gate Score
min: 44256 avg: 48694 median: 50706 (54%) max: 51119 Points
...
Intel Arc A380
NVIDIA GeForce GTX 1650 Super (Desktop)
...
3DMark - 3DMark Cloud Gate Graphics
min: 63896 avg: 67340 median: 68578 (18%) max: 69545 Points
...
NVIDIA GeForce GTX 1650 Super (Desktop)
...
3DMark - 3DMark Fire Strike Standard Score
min: 11050 avg: 11422 median: 11544 (20%) max: 11671 Points
...
NVIDIA GeForce GTX 1650 Super (Desktop)
...
3DMark - 3DMark Fire Strike Standard Graphics
min: 11688 avg: 12104 median: 12225 (14%) max: 12400 Points
...
NVIDIA GeForce GTX 1650 Super (Desktop)
...
3DMark - 3DMark Ice Storm Graphics
min: 278896 avg: 303326 median: 312787 (38%) max: 318296 Points
...
NVIDIA GeForce GTX 1650 Super (Desktop)
...
3DMark - 3DMark Night Raid
40490 Points (38%)
...
NVIDIA GeForce GTX 1650 Super (Desktop)
Intel Arc A380
...
3DMark - 3DMark Night Raid Graphics Score
56328 Points (22%)
...
Intel Arc A380
NVIDIA GeForce GTX 1650 Super (Desktop)
...
3DMark 11 - 3DM11 Performance Score
min: 17833 avg: 18723 median: 18949 (26%) max: 19387 Points
...
NVIDIA GeForce GTX 1650 Super (Desktop)
...
3DMark 11 - 3DM11 Performance GPU
min: 17849 avg: 18105 median: 18218 (16%) max: 18247 Points
...
NVIDIA GeForce GTX 1650 Super (Desktop)
...
3DMark Vantage + 3DMark Vantage - 3DM Vant. Perf. total
min: 57390 avg: 62121 median: 64463 (19%) max: 64511 Points
...
NVIDIA GeForce GTX 1650 Super (Desktop)
...
3DM Vant. Perf. GPU no PhysX + 3DMark Vantage - 3DM Vant. Perf. GPU no PhysX
min: 52466 avg: 55647 median: 57106 (32%) max: 57368 Points
...
NVIDIA GeForce GTX 1650 Super (Desktop)
...
3DMark 05 - 3DMark 05 - Standard
min: 84609 avg: 86965 median: 86964.5 (95%) max: 89320 Points
...
NVIDIA GeForce GTX 1650 Super (Desktop)
3DMark 06 3DMark 06 - Standard 1280x1024 +
min: 46823 avg: 59017 median: 64150 (84%) max: 66078 Points
...
Intel Arc A380
NVIDIA GeForce GTX 1650 Super (Desktop)
Intel Arc A580
...
Unigine Valley 1.0 - Unigine Valley 1.0 DX
min: 53.7 avg: 54.3 median: 54.1 (18%) max: 55 fps
...
NVIDIA GeForce GTX 1650 Super (Desktop)
...
SPECviewperf 12 + SPECviewperf 12 - specvp12 sw-03
min: 50.2 avg: 58.3 median: 58.3 (14%) max: 66.3 fps
...
NVIDIA GeForce GTX 1650 Super (Desktop)
...
specvp12 snx-02 + SPECviewperf 12 - specvp12 snx-02
min: 7.98 avg: 8.4 median: 8.4 (1%) max: 8.89 fps
...
NVIDIA GeForce GTX 1650 Super (Desktop)
...
specvp12 showcase-01 + SPECviewperf 12 - specvp12 showcase-01
min: 53 avg: 54.8 median: 54.8 (12%) max: 56.5 fps
...
Intel Arc A380
NVIDIA GeForce GTX 1650 Super (Desktop)
...
specvp12 mediacal-01 + SPECviewperf 12 - specvp12 mediacal-01
min: 25.53 avg: 29.5 median: 29.5 (8%) max: 33.5 fps
...
NVIDIA GeForce GTX 1650 Super (Desktop)
...
specvp12 maya-04 + SPECviewperf 12 - specvp12 maya-04
min: 110 avg: 113 median: 113 (31%) max: 116 fps
...
NVIDIA GeForce GTX 1650 Super (Desktop)
...
specvp12 energy-01 + SPECviewperf 12 - specvp12 energy-01
min: 5.17 avg: 5.4 median: 5.4 (5%) max: 5.59 fps
...
NVIDIA GeForce GTX 1650 Super (Desktop)
...
specvp12 creo-01 + SPECviewperf 12 - specvp12 creo-01
min: 37.62 avg: 40.2 median: 40.2 (16%) max: 42.8 fps
...
Intel Arc A380
NVIDIA GeForce GTX 1650 Super (Desktop)
...
specvp12 catia-04 + SPECviewperf 12 - specvp12 catia-04
min: 53 avg: 55.2 median: 55.2 (9%) max: 57.3 fps
...
NVIDIA GeForce GTX 1650 Super (Desktop)
...
specvp12 3dsmax-05 + SPECviewperf 12 - specvp12 3dsmax-05
min: 119 avg: 127 median: 127 (22%) max: 135 fps
...
NVIDIA GeForce GTX 1650 Super (Desktop)
Intel Arc A580
...
SPECviewperf 13 specvp13 sw-04 + SPECviewperf 13 - specvp13 sw-04
min: 67.8 avg: 83.2 median: 83.2 (22%) max: 98.5 fps
...
Intel Arc A580
NVIDIA GeForce GTX 1650 Super (Desktop)
...
specvp13 snx-03 + SPECviewperf 13 - specvp13 snx-03
min: 14.26 avg: 15.1 median: 15.1 (2%) max: 16 fps
...
NVIDIA GeForce GTX 1650 Super (Desktop)
...
specvp13 showcase-02 + SPECviewperf 13 - specvp13 showcase-02
min: 53.2 avg: 54.9 median: 54.9 (12%) max: 56.6 fps
...
Intel Arc A380
NVIDIA GeForce GTX 1650 Super (Desktop)
...
specvp13 medical-02 + SPECviewperf 13 - specvp13 medical-02
min: 35.4 avg: 35.5 median: 35.5 (7%) max: 35.6 fps
...
Intel Arc A380
NVIDIA GeForce GTX 1650 Super (Desktop)
...
specvp13 maya-05 + SPECviewperf 13 - specvp13 maya-05
min: 161 avg: 164 median: 164 (19%) max: 167 fps
...
NVIDIA GeForce GTX 1650 Super (Desktop)
...
specvp13 energy-02 + SPECviewperf 13 - specvp13 energy-02
min: 7.61 avg: 7.6 median: 7.6 (2%) max: 7.64 fps
...
Intel Arc A380
NVIDIA GeForce GTX 1650 Super (Desktop)
...
specvp13 creo-02 + SPECviewperf 13 - specvp13 creo-02
min: 114 avg: 117 median: 117 (17%) max: 120 fps
...
NVIDIA GeForce GTX 1650 Super (Desktop)
...
specvp13 catia-05 + SPECviewperf 13 - specvp13 catia-05
min: 76.3 avg: 77.9 median: 77.9 (9%) max: 79.4 fps
...
NVIDIA GeForce GTX 1650 Super (Desktop)
...
specvp13 3dsmax-06 + SPECviewperf 13 - specvp13 3dsmax-06
min: 119 avg: 127 median: 127 (22%) max: 135 fps
...
NVIDIA GeForce GTX 1650 Super (Desktop)
...
SPECviewperf 2020 specvp2020 solidworks-05 4k + SPECviewperf 2020 - specvp2020 solidworks-05 4k
26.2 fps (8%)
...
Intel Arc A380
NVIDIA GeForce GTX 1650 Super (Desktop)
Intel Arc A580
...
specvp2020 snx-04 4k + SPECviewperf 2020 - specvp2020 snx-04 4k
min: 10.64 avg: 11.1 median: 11.1 (1%) max: 11.6 fps
...
NVIDIA GeForce GTX 1650 Super (Desktop)
...
specvp2020 medical-03 4k + SPECviewperf 2020 - specvp2020 medical-03 4k
min: 5.29 avg: 5.9 median: 5.9 (6%) max: 6.58 fps
...
Intel Arc A380
NVIDIA GeForce GTX 1650 Super (Desktop)
...
specvp2020 maya-06 4k + SPECviewperf 2020 - specvp2020 maya-06 4k
min: 85.6 avg: 87 median: 87 (14%) max: 88.4 fps
...
Intel Arc A380
NVIDIA GeForce GTX 1650 Super (Desktop)
...
specvp2020 energy-03 4k + SPECviewperf 2020 - specvp2020 energy-03 4k
11 fps (2%)
...
Intel Arc A380
NVIDIA GeForce GTX 1650 Super (Desktop)
...
specvp2020 creo-03 4k + SPECviewperf 2020 - specvp2020 creo-03 4k
min: 43.66 avg: 45 median: 45 (21%) max: 46.4 fps
...
Intel Arc A380
NVIDIA GeForce GTX 1650 Super (Desktop)
Intel Arc A580
...
specvp2020 catia-06 4k + SPECviewperf 2020 - specvp2020 catia-06 4k
min: 13.3 avg: 13.3 median: 13.3 (9%) max: 13.37 fps
NVIDIA GeForce GTX 1650 Super (Desktop)
Intel Arc A380
...
specvp2020 3dsmax-07 4k + SPECviewperf 2020 - specvp2020 3dsmax-07 4k
min: 27.5 avg: 28.4 median: 28.4 (12%) max: 29.3 fps
...
Intel Arc A380
NVIDIA GeForce GTX 1650 Super (Desktop)
...
LuxMark v2.0 64Bit - LuxMark v2.0 Room GPU
min: 1405 avg: 1411 median: 1410.5 (6%) max: 1416 Samples/s
...
NVIDIA GeForce GTX 1650 Super (Desktop)
...
LuxMark v2.0 64Bit - LuxMark v2.0 Sala GPU
min: 2972 avg: 2994 median: 2993.5 (5%) max: 3015 Samples/s
...
NVIDIA GeForce GTX 1650 Super (Desktop)
...
ComputeMark v2.1 - ComputeMark v2.1 Result
min: 9510 avg: 9521 median: 9521 (10%) max: 9532 points
...
NVIDIA GeForce GTX 1650 Super (Desktop)
...
Power Consumption - Furmark Stress Test Power Consumption - external Monitor *
min: 225 avg: 226.9 median: 226.9 (32%) max: 228.7 Watt
GPU TDP ? TDP 100 W 100% 101%
...
NVIDIA GeForce GTX 1650 Super (Desktop)
...
0 15 30 45 60 75 90 105 120 135 150 165 180 195 210 225 240 Tooltip KFA2 GeForce GTX 1650 Super EX (1-Click OC): Ø225 (222-241)
Power Consumption - The Witcher 3 Power Consumption - external Monitor *
min: 220 avg: 230.4 median: 230.4 (32%) max: 240.7 Watt
GPU TDP ? TDP 100 W 100% 104%
...
NVIDIA GeForce GTX 1650 Super (Desktop)
...
0 15 30 45 60 75 90 105 120 135 150 165 180 195 210 225 240 255 270 Tooltip KFA2 GeForce GTX 1650 Super EX (1-Click OC): Ø220 (216-277)
Power Consumption - Witcher 3 ultra Power Efficiency - external Monitor
0.2 fps per Watt (15%)
...
NVIDIA GeForce GTX 1650 Super (Desktop)
...
Clock Speed - GPU Clock Speed Furmark
1740 MHz (69%)
...
NVIDIA GeForce GTX 1650 Super (Desktop)
- Range of benchmark values for this graphics card
- Average benchmark values for this graphics card
* Smaller numbers mean a higher performance
v1.26
log 23. 07:02:02
#0 no ids found in url (should be separated by "_") +0s ... 0s
#1 not redirecting to Ajax server +0s ... 0s
#2 did not recreate cache, as it is less than 5 days old! Created at Mon, 22 Apr 2024 05:40:21 +0200 +0.001s ... 0.001s
#3 getting avg benchmarks for device 10646 +0.018s ... 0.019s
#4 got single benchmarks 10646 +0.016s ... 0.035s
#5 got avg benchmarks for devices +0s ... 0.035s
#6 min, max, avg, median took s +0.836s ... 0.871s
#7 return log +0s ... 0.871s
Game Benchmarks The following benchmarks stem from our benchmarks of review laptops. The performance depends on the used graphics memory, clock rate, processor, system settings, drivers, and operating systems. So the results don't have to be representative for all laptops with this GPU. For detailed information on the benchmark results, click on the fps number.
Intel Arc A380
NVIDIA GeForce GTX 1650 Super (Desktop)
Intel Arc A580
...
Intel Arc A380
NVIDIA GeForce GTX 1650 Super (Desktop)
Intel Arc A580
...
NVIDIA GeForce GTX 1650 Super (Desktop)
Intel Arc A580
...
» The benchmarks indicate that the game is not playable in the tested settings.
Additional Benchmarks
Low Preset 1280x720
42.8 [X] KFA2 GeForce GTX 1650 Super EX (1-Click OC) Intel Core i9-14900K 3.2GHz
GeForce GTX 1650 Super (Desktop)
min:
32.6 fps, P0.1:
32.6 fps, P1:
33.7 fps, max:
54.6 fps
Intel Arc A380
NVIDIA GeForce GTX 1650 Super (Desktop)
Intel Arc A580
...
Intel Arc A380
NVIDIA GeForce GTX 1650 Super (Desktop)
Intel Arc A580
...
Intel Arc A380
NVIDIA GeForce GTX 1650 Super (Desktop)
Intel Arc A580
...
Intel Arc A380
NVIDIA GeForce GTX 1650 Super (Desktop)
Intel Arc A580
...
NVIDIA GeForce GTX 1650 Super (Desktop)
Intel Arc A580
...
» With all tested laptops playable in detail settings med..
Additional Benchmarks
Very Low Preset 1280x720
92.1 [X] KFA2 GeForce GTX 1650 Super EX (1-Click OC) Intel Core i9-14900K 3.2GHz
GeForce GTX 1650 Super (Desktop)
min:
68.1 fps, P0.1:
71 fps, P1:
75.4 fps, max:
144.6 fps
Intel Arc A380
NVIDIA GeForce GTX 1650 Super (Desktop)
Intel Arc A580
...
Intel Arc A380
NVIDIA GeForce GTX 1650 Super (Desktop)
Intel Arc A580
...
Intel Arc A380
NVIDIA GeForce GTX 1650 Super (Desktop)
Intel Arc A580
...
NVIDIA GeForce GTX 1650 Super (Desktop)
Intel Arc A380
...
» With all tested laptops playable in detail settings high.
Additional Benchmarks
Low Preset 1280x720
249 [X] KFA2 GeForce GTX 1650 Super EX (1-Click OC) Intel Core i9-14900K 3.2GHz
GeForce GTX 1650 Super (Desktop)
min:
67.2 fps, P0.1:
122.4 fps, P1:
182.9 fps, max:
496 fps
Intel Arc A380
NVIDIA GeForce GTX 1650 Super (Desktop)
Intel Arc A580
...
Intel Arc A380
NVIDIA GeForce GTX 1650 Super (Desktop)
Intel Arc A580
...
Intel Arc A380
NVIDIA GeForce GTX 1650 Super (Desktop)
Intel Arc A580
...
Intel Arc A380
NVIDIA GeForce GTX 1650 Super (Desktop)
...
NVIDIA GeForce GTX 1650 Super (Desktop)
...
NVIDIA GeForce GTX 1650 Super (Desktop)
...
» With all tested laptops playable in detail settings ultra.
Additional Benchmarks
Very Low Preset 1280x720
298 [X] KFA2 GeForce GTX 1650 Super EX (1-Click OC) Intel Core i9-14900K 3.2GHz
GeForce GTX 1650 Super (Desktop)
min:
28.4 fps, P0.1:
176.6 fps, P1:
242 fps, max:
422 fps
...
Intel Arc A380
NVIDIA GeForce GTX 1650 Super (Desktop)
Intel Arc A580
...
Intel Arc A380
NVIDIA GeForce GTX 1650 Super (Desktop)
Intel Arc A580
...
Intel Arc A380
NVIDIA GeForce GTX 1650 Super (Desktop)
Intel Arc A580
...
Intel Arc A380
NVIDIA GeForce GTX 1650 Super (Desktop)
Intel Arc A580
...
NVIDIA GeForce GTX 1650 Super (Desktop)
Intel Arc A580
...
NVIDIA GeForce GTX 1650 Super (Desktop)
...
NVIDIA GeForce GTX 1650 Super (Desktop)
Intel Arc A580
...
» With all tested laptops playable in detail settings ultra.
Additional Benchmarks
Low Preset TAA 1280x720
91 [X] KFA2 GeForce GTX 1650 Super EX (1-Click OC) Intel Core i9-14900K 3.2GHz
GeForce GTX 1650 Super (Desktop)
Intel Arc A380
NVIDIA GeForce GTX 1650 Super (Desktop)
Intel Arc A580
...
Intel Arc A380
NVIDIA GeForce GTX 1650 Super (Desktop)
Intel Arc A580
...
NVIDIA GeForce GTX 1650 Super (Desktop)
Intel Arc A380
...
NVIDIA GeForce GTX 1650 Super (Desktop)
Intel Arc A380
...
NVIDIA GeForce GTX 1650 Super (Desktop)
...
» With all tested laptops playable in detail settings med..
Additional Benchmarks
Low Preset 1280x720
112.1 [X] KFA2 GeForce GTX 1650 Super EX (1-Click OC) Intel Core i9-14900K 3.2GHz
GeForce GTX 1650 Super (Desktop)
min:
78.4 fps, P0.1:
84.2 fps, P1:
101.7 fps, max:
172.9 fps
Intel Arc A380
NVIDIA GeForce GTX 1650 Super (Desktop)
...
Intel Arc A380
NVIDIA GeForce GTX 1650 Super (Desktop)
...
NVIDIA GeForce GTX 1650 Super (Desktop)
Intel Arc A380
...
NVIDIA GeForce GTX 1650 Super (Desktop)
Intel Arc A380
...
» With all tested laptops playable in detail settings low.
Additional Benchmarks
Max. Performance 1280x720
63.7 [X] KFA2 GeForce GTX 1650 Super EX (1-Click OC) Intel Core i9-14900K 3.2GHz
GeForce GTX 1650 Super (Desktop)
min:
33.5 fps, P0.1:
36 fps, P1:
38.2 fps, max:
121.4 fps
...
Intel Arc A380
NVIDIA GeForce GTX 1650 Super (Desktop)
Intel Arc A580
...
Intel Arc A380
NVIDIA GeForce GTX 1650 Super (Desktop)
Intel Arc A580
...
...
Intel Arc A380
NVIDIA GeForce GTX 1650 Super (Desktop)
Intel Arc A580
...
...
Intel Arc A380
NVIDIA GeForce GTX 1650 Super (Desktop)
Intel Arc A580
...
NVIDIA GeForce GTX 1650 Super (Desktop)
Intel Arc A580
...
NVIDIA GeForce GTX 1650 Super (Desktop)
...
» With all tested laptops playable in detail settings ultra.
Additional Benchmarks
Very Low Preset 1280x720
120.1 [X] KFA2 GeForce GTX 1650 Super EX (1-Click OC) Intel Core i9-14900K 3.2GHz
GeForce GTX 1650 Super (Desktop)
min:
41.7 fps, P0.1:
84.6 fps, P1:
89 fps, max:
307 fps
Intel UHD Graphics 32EUs (Alder Lake)
...
Intel Arc A580
NVIDIA GeForce GTX 1650 Super (Desktop)
...
...
Intel Arc A380
NVIDIA GeForce GTX 1650 Super (Desktop)
...
...
Intel Arc A380
NVIDIA GeForce GTX 1650 Super (Desktop)
...
NVIDIA GeForce GTX 1650 Super (Desktop)
...
NVIDIA GeForce GTX 1650 Super (Desktop)
Intel Arc A580
...
» With all tested laptops playable in detail settings ultra.
...
Intel Arc A380
NVIDIA GeForce GTX 1650 Super (Desktop)
...
...
Intel Arc A380
NVIDIA GeForce GTX 1650 Super (Desktop)
...
...
Intel Arc A380
NVIDIA GeForce GTX 1650 Super (Desktop)
...
...
Intel Arc A380
NVIDIA GeForce GTX 1650 Super (Desktop)
...
NVIDIA GeForce GTX 1650 Super (Desktop)
...
NVIDIA GeForce GTX 1650 Super (Desktop)
...
» With all tested laptops playable in detail settings ultra.
...
NVIDIA GeForce GTX 1650 Super (Desktop)
Intel Arc A580
...
0 100 200 300 400 500 600 700 800 900 1000 1100 Tooltip
Intel UHD Graphics 32EUs (Alder Lake)
...
Intel Arc A380
NVIDIA GeForce GTX 1650 Super (Desktop)
Intel Arc A580
...
Intel UHD Graphics 32EUs (Alder Lake)
...
Intel Arc A380
NVIDIA GeForce GTX 1650 Super (Desktop)
Intel Arc A580
...
Intel UHD Graphics 32EUs (Alder Lake)
...
Intel Arc A380
NVIDIA GeForce GTX 1650 Super (Desktop)
...
NVIDIA GeForce GTX 1650 Super (Desktop)
...
NVIDIA GeForce GTX 1650 Super (Desktop)
...
» With all tested laptops playable in detail settings ultra.
Additional Benchmarks
Low Preset 1280x720
246 [X] KFA2 GeForce GTX 1650 Super EX One Click OC AMD Ryzen 9 7950X 4.5GHz
GeForce GTX 1650 Super (Desktop)
min:
24 fps, P0.1:
131.2 fps, P1:
171.2 fps, max:
494 fps
40 [X] KFA2 GeForce GTX 1650 Super EX One Click OC AMD Ryzen 9 7950X 4.5GHz
GeForce GTX 1650 Super (Desktop)
min:
24 fps, max:
52 fps
fps
+ Compare
- Hide Comparison
...
Intel Arc A380
NVIDIA GeForce GTX 1650 Super (Desktop)
Intel Arc A580
...
36 [X] KFA2 GeForce GTX 1650 Super EX One Click OC AMD Ryzen 9 7950X 4.5GHz
GeForce GTX 1650 Super (Desktop)
min:
22 fps, max:
46 fps
fps
+ Compare
- Hide Comparison
...
Intel Arc A380
NVIDIA GeForce GTX 1650 Super (Desktop)
Intel Arc A580
...
29 [X] KFA2 GeForce GTX 1650 Super EX One Click OC AMD Ryzen 9 7950X 4.5GHz
GeForce GTX 1650 Super (Desktop)
min:
18 fps, max:
37 fps
fps
+ Compare
- Hide Comparison
...
Intel Arc A380
NVIDIA GeForce GTX 1650 Super (Desktop)
Intel Arc A580
...
21 [X] KFA2 GeForce GTX 1650 Super EX One Click OC AMD Ryzen 9 7950X 4.5GHz
GeForce GTX 1650 Super (Desktop)
min:
15 fps, max:
28 fps
fps
+ Compare
- Hide Comparison
...
Intel Arc A380
NVIDIA GeForce GTX 1650 Super (Desktop)
Intel Arc A580
...
16 [X] KFA2 GeForce GTX 1650 Super EX One Click OC AMD Ryzen 9 7950X 4.5GHz
GeForce GTX 1650 Super (Desktop)
min:
11 fps, max:
23 fps
fps
+ Compare
- Hide Comparison
NVIDIA GeForce GTX 1650 Super (Desktop)
Intel Arc A580
...
5 [X] KFA2 GeForce GTX 1650 Super EX One Click OC AMD Ryzen 9 7950X 4.5GHz
GeForce GTX 1650 Super (Desktop)
min:
4 fps, max:
6 fps
fps
+ Compare
- Hide Comparison
NVIDIA GeForce GTX 1650 Super (Desktop)
Intel Arc A580
...
» With all tested laptops playable in detail settings med..
Additional Benchmarks
Low Preset TAA 1280x720
56 [X] KFA2 GeForce GTX 1650 Super EX One Click OC AMD Ryzen 9 7950X 4.5GHz
GeForce GTX 1650 Super (Desktop)
min:
33 fps, max:
75 fps
NVIDIA GeForce GTX 1650 Super (Desktop)
...
NVIDIA GeForce GTX 1650 Super (Desktop)
...
NVIDIA GeForce GTX 1650 Super (Desktop)
...
NVIDIA GeForce GTX 1650 Super (Desktop)
...
NVIDIA GeForce GTX 1650 Super (Desktop)
...
» With all tested laptops playable in detail settings high.
Additional Benchmarks
Minimum Preset 1280x720
113 [X] KFA2 GeForce GTX 1650 Super EX One Click OC AMD Ryzen 9 7950X 4.5GHz
GeForce GTX 1650 Super (Desktop)
...
Intel Arc A380
NVIDIA GeForce GTX 1650 Super (Desktop)
Intel Arc A580
...
...
Intel Arc A380
NVIDIA GeForce GTX 1650 Super (Desktop)
Intel Arc A580
...
Intel Arc A380
NVIDIA GeForce GTX 1650 Super (Desktop)
Intel Arc A580
...
0 100 200 300 400 500 600 700 800 900 1000 1100 1200 1300 1400 1500 1600 Tooltip
Intel Arc A380
NVIDIA GeForce GTX 1650 Super (Desktop)
Intel Arc A580
...
NVIDIA GeForce GTX 1650 Super (Desktop)
Intel Arc A580
...
» With all tested laptops playable in detail settings med..
Additional Benchmarks
Ultra Low Preset LowAA 1280x720
161.5 [X] KFA2 GeForce GTX 1650 Super EX One Click OC AMD Ryzen 9 7950X 4.5GHz
GeForce GTX 1650 Super (Desktop)
min:
48.7 fps, P0.1:
80.1 fps, P1:
94.6 fps, max:
360 fps
...
NVIDIA GeForce GTX 1650 Super (Desktop)
...
...
NVIDIA GeForce GTX 1650 Super (Desktop)
Intel Arc A580
...
...
NVIDIA GeForce GTX 1650 Super (Desktop)
Intel Arc A580
...
NVIDIA GeForce GTX 1650 Super (Desktop)
...
» The benchmarks indicate that the game is not playable in the tested settings.
Additional Benchmarks
Low Preset 1280x720
57.4 [X] KFA2 GeForce GTX 1650 Super EX One Click OC AMD Ryzen 9 7950X 4.5GHz
GeForce GTX 1650 Super (Desktop)
min:
40.3 fps, P0.1:
40.5 fps, P1:
45.4 fps, max:
144.8 fps
0 100 200 300 400 500 600 Tooltip
...
Intel Arc A380
NVIDIA GeForce GTX 1650 Super (Desktop)
Intel Arc A580
...
...
Intel Arc A380
NVIDIA GeForce GTX 1650 Super (Desktop)
...
...
Intel Arc A380
NVIDIA GeForce GTX 1650 Super (Desktop)
...
NVIDIA GeForce GTX 1650 Super (Desktop)
Intel Arc A380
...
NVIDIA GeForce GTX 1650 Super (Desktop)
...
» With all tested laptops playable in detail settings low.
Additional Benchmarks
Low Preset 1280x720
74.8 [X] KFA2 GeForce GTX 1650 Super EX One Click OC AMD Ryzen 9 7950X 4.5GHz
GeForce GTX 1650 Super (Desktop)
min:
23.7 fps, P0.1:
53.5 fps, P1:
58.7 fps, max:
145.4 fps
...
Intel Arc A380
NVIDIA GeForce GTX 1650 Super (Desktop)
...
...
Intel Arc A380
NVIDIA GeForce GTX 1650 Super (Desktop)
...
...
Intel Arc A380
NVIDIA GeForce GTX 1650 Super (Desktop)
...
...
Intel Arc A380
NVIDIA GeForce GTX 1650 Super (Desktop)
...
NVIDIA GeForce GTX 1650 Super (Desktop)
...
NVIDIA GeForce GTX 1650 Super (Desktop)
...
» With all tested laptops playable in detail settings ultra.
Additional Benchmarks
Low Preset 1280x720
360.3 [X] KFA2 GeForce GTX 1650 Super EX One Click OC AMD Ryzen 9 7950X 4.5GHz
GeForce GTX 1650 Super (Desktop)
68 [X] KFA2 GeForce GTX 1650 Super EX One Click OC AMD Ryzen 9 7950X 4.5GHz
GeForce GTX 1650 Super (Desktop)
min:
44 fps, P0.1:
49 fps, P1:
56 fps, max:
79 fps
fps
+ Compare
- Hide Comparison
...
Intel Arc A380
NVIDIA GeForce GTX 1650 Super (Desktop)
Intel Arc A580
...
62 [X] KFA2 GeForce GTX 1650 Super EX One Click OC AMD Ryzen 9 7950X 4.5GHz
GeForce GTX 1650 Super (Desktop)
min:
41 fps, P0.1:
44 fps, P1:
49 fps, max:
87 fps
fps
+ Compare
- Hide Comparison
...
Intel Arc A380
NVIDIA GeForce GTX 1650 Super (Desktop)
Intel Arc A580
...
51 [X] KFA2 GeForce GTX 1650 Super EX One Click OC AMD Ryzen 9 7950X 4.5GHz
GeForce GTX 1650 Super (Desktop)
min:
27 fps, P0.1:
33 fps, P1:
39 fps, max:
70 fps
fps
+ Compare
- Hide Comparison
...
Intel Arc A380
NVIDIA GeForce GTX 1650 Super (Desktop)
...
35 [X] KFA2 GeForce GTX 1650 Super EX One Click OC AMD Ryzen 9 7950X 4.5GHz
GeForce GTX 1650 Super (Desktop)
min:
15 fps, P0.1:
19 fps, P1:
24 fps, max:
46 fps
fps
+ Compare
- Hide Comparison
...
Intel Arc A380
NVIDIA GeForce GTX 1650 Super (Desktop)
Intel Arc A580
...
28 [X] KFA2 GeForce GTX 1650 Super EX One Click OC AMD Ryzen 9 7950X 4.5GHz
GeForce GTX 1650 Super (Desktop)
min:
18 fps, P0.1:
20 fps, P1:
22 fps, max:
36 fps
fps
+ Compare
- Hide Comparison
NVIDIA GeForce GTX 1650 Super (Desktop)
...
14 [X] KFA2 GeForce GTX 1650 Super EX One Click OC AMD Ryzen 9 7950X 4.5GHz
GeForce GTX 1650 Super (Desktop)
min:
11 fps, P0.1:
11 fps, P1:
12 fps, max:
17 fps
fps
+ Compare
- Hide Comparison
NVIDIA GeForce GTX 1650 Super (Desktop)
...
» With all tested laptops playable in detail settings high.
Additional Benchmarks
Low Preset (Adaptive Quality Off) 1280x720
104 [X] KFA2 GeForce GTX 1650 Super EX One Click OC AMD Ryzen 9 7950X 4.5GHz
GeForce GTX 1650 Super (Desktop)
min:
57 fps, P0.1:
68 fps, P1:
83 fps, max:
128 fps
0 100 200 300 400 500 600 700 800 900 1000 Tooltip
...
NVIDIA GeForce GTX 1650 Super (Desktop)
...
NVIDIA GeForce GTX 1650 Super (Desktop)
...
0 100 200 300 400 500 600 Tooltip
NVIDIA GeForce GTX 1650 Super (Desktop)
...
...
NVIDIA GeForce GTX 1650 Super (Desktop)
...
NVIDIA GeForce GTX 1650 Super (Desktop)
...
NVIDIA GeForce GTX 1650 Super (Desktop)
...
» With all tested laptops playable in detail settings ultra.
Additional Benchmarks
Low Preset 1280x720
255 [X] KFA2 GeForce GTX 1650 Super EX One Click OC AMD Ryzen 9 7950X 4.5GHz
GeForce GTX 1650 Super (Desktop)
min:
56.5 fps, P0.1:
182.9 fps, P1:
198.1 fps, max:
392 fps
Intel UHD Graphics 32EUs (Alder Lake)
...
Intel Arc A380
NVIDIA GeForce GTX 1650 Super (Desktop)
Intel Arc A580
...
Intel UHD Graphics 32EUs (Alder Lake)
...
NVIDIA GeForce GTX 1650 Super (Desktop)
Intel Arc A580
...
Intel UHD Graphics 32EUs (Alder Lake)
...
Intel Arc A380
NVIDIA GeForce GTX 1650 Super (Desktop)
Intel Arc A580
...
...
Intel Arc A380
NVIDIA GeForce GTX 1650 Super (Desktop)
Intel Arc A580
...
NVIDIA GeForce GTX 1650 Super (Desktop)
Intel Arc A580
...
NVIDIA GeForce GTX 1650 Super (Desktop)
Intel Arc A580
...
» With all tested laptops playable in detail settings ultra.
Additional Benchmarks
Low Preset 1280x720
323 [X] KFA2 GeForce GTX 1650 Super EX One Click OC AMD Ryzen 9 7950X 4.5GHz
GeForce GTX 1650 Super (Desktop)
min:
57.2 fps, P0.1:
109.2 fps, P1:
152.5 fps, max:
923 fps
61.2 [X] KFA2 GeForce GTX 1650 Super EX One Click OC 2.0
AMD Ryzen 9 7950X 4.5GHz
GeForce GTX 1650 Super (Desktop)
min:
42.6 fps, max:
81.3 fps
fps
+ Compare
- Hide Comparison
...
Intel Arc A380
NVIDIA GeForce GTX 1650 Super (Desktop)
...
48.3 [X] KFA2 GeForce GTX 1650 Super EX One Click OC 2.0
AMD Ryzen 9 7950X 4.5GHz
GeForce GTX 1650 Super (Desktop)
min:
23.8 fps, max:
106.6 fps
fps
+ Compare
- Hide Comparison
...
Intel Arc A380
NVIDIA GeForce GTX 1650 Super (Desktop)
...
39 [X] KFA2 GeForce GTX 1650 Super EX One Click OC 2.0
AMD Ryzen 9 7950X 4.5GHz
GeForce GTX 1650 Super (Desktop)
min:
28.7 fps, max:
56 fps
fps
+ Compare
- Hide Comparison
...
Intel Arc A380
NVIDIA GeForce GTX 1650 Super (Desktop)
...
35.2 [X] KFA2 GeForce GTX 1650 Super EX One Click OC 2.0
AMD Ryzen 9 7950X 4.5GHz
GeForce GTX 1650 Super (Desktop)
min:
24.9 fps, max:
48.6 fps
fps
+ Compare
- Hide Comparison
...
Intel Arc A380
NVIDIA GeForce GTX 1650 Super (Desktop)
...
20.2 [X] KFA2 GeForce GTX 1650 Super EX One Click OC 2.0
AMD Ryzen 9 7950X 4.5GHz
GeForce GTX 1650 Super (Desktop)
min:
14.3 fps, max:
27.1 fps
fps
+ Compare
- Hide Comparison
NVIDIA GeForce GTX 1650 Super (Desktop)
...
3.4 [X] KFA2 GeForce GTX 1650 Super EX One Click OC 2.0
AMD Ryzen 9 7950X 4.5GHz
GeForce GTX 1650 Super (Desktop)
min:
2.6 fps, max:
4.1 fps
fps
+ Compare
- Hide Comparison
NVIDIA GeForce GTX 1650 Super (Desktop)
...
» With all tested laptops playable in detail settings ultra.
Additional Benchmarks
Low Preset (FSR off) 1280x720
95.9 [X] KFA2 GeForce GTX 1650 Super EX One Click OC AMD Ryzen 9 7950X 4.5GHz
GeForce GTX 1650 Super (Desktop)
min:
63.9 fps, max:
179.6 fps
Steam Deck 1280x720
100.5 [X] KFA2 GeForce GTX 1650 Super EX One Click OC AMD Ryzen 9 7950X 4.5GHz
GeForce GTX 1650 Super (Desktop)
min:
63.3 fps, max:
191.1 fps
Ultra Preset (FSR on) 1920x1080
40 [X] KFA2 GeForce GTX 1650 Super EX One Click OC AMD Ryzen 9 7950X 4.5GHz
GeForce GTX 1650 Super (Desktop)
min:
30 fps, max:
57.6 fps
0 100 200 300 400 500 600 700 800 900 1000 1100 1200 1300 Tooltip
...
Intel Arc A380
NVIDIA GeForce GTX 1650 Super (Desktop)
Intel Arc A580
...
...
Intel Arc A380
NVIDIA GeForce GTX 1650 Super (Desktop)
Intel Arc A580
...
...
Intel Arc A380
NVIDIA GeForce GTX 1650 Super (Desktop)
...
...
Intel Arc A380
NVIDIA GeForce GTX 1650 Super (Desktop)
...
NVIDIA GeForce GTX 1650 Super (Desktop)
Intel Arc A580
...
NVIDIA GeForce GTX 1650 Super (Desktop)
...
» With all tested laptops playable in detail settings ultra.
Additional Benchmarks
Low Preset 1280x720
161.5 [X] KFA2 GeForce GTX 1650 Super EX One Click OC AMD Ryzen 9 7950X 4.5GHz
GeForce GTX 1650 Super (Desktop)
min:
66.9 fps, P0.1:
76.2 fps, P1:
96.5 fps, max:
358 fps
...
NVIDIA GeForce GTX 1650 Super (Desktop)
Intel Arc A380
...
Intel Arc A380
NVIDIA GeForce GTX 1650 Super (Desktop)
...
Intel Arc A380
NVIDIA GeForce GTX 1650 Super (Desktop)
...
Intel Arc A380
NVIDIA GeForce GTX 1650 Super (Desktop)
...
NVIDIA GeForce GTX 1650 Super (Desktop)
Intel Arc A580
...
» The benchmarks indicate that the game is not playable in the tested settings.
Additional Benchmarks
Low Preset 1280x720
46.2 [X] KFA2 GeForce GTX 1650 Super EX One Click OC AMD Ryzen 9 7950X 4.5GHz
GeForce GTX 1650 Super (Desktop)
min:
37.8 fps, P0.1:
38 fps, P1:
39.5 fps, max:
68.3 fps
...
Intel Arc A380
NVIDIA GeForce GTX 1650 Super (Desktop)
Intel Arc A580
...
...
NVIDIA GeForce GTX 1650 Super (Desktop)
Intel Arc A580
...
...
Intel Arc A380
NVIDIA GeForce GTX 1650 Super (Desktop)
...
...
NVIDIA GeForce GTX 1650 Super (Desktop)
Intel Arc A380
...
NVIDIA GeForce GTX 1650 Super (Desktop)
...
NVIDIA GeForce GTX 1650 Super (Desktop)
...
» With all tested laptops playable in detail settings high.
Additional Benchmarks
Low Preset 1280x720
117.9 [X] KFA2 GeForce GTX 1650 Super EX One Click OC AMD Ryzen 9 7950X 4.5GHz
GeForce GTX 1650 Super (Desktop)
min:
4.96 fps, P0.1:
54.5 fps, P1:
95 fps, max:
179.4 fps
NVIDIA GeForce GTX 1650 Super (Desktop)
Intel Arc A380
...
NVIDIA GeForce GTX 1650 Super (Desktop)
Intel Arc A380
...
» The benchmarks indicate that the game is not playable in the tested settings.
Additional Benchmarks
Low 1280x720
37.5 [X] KFA2 GeForce GTX 1650 Super EX One Click OC AMD Ryzen 9 7950X 4.5GHz
GeForce GTX 1650 Super (Desktop)
min:
3.71 fps, P0.1:
14.6 fps, P1:
22.5 fps, max:
97.2 fps
...
Intel Arc A380
NVIDIA GeForce GTX 1650 Super (Desktop)
Intel Arc A580
...
...
Intel Arc A380
NVIDIA GeForce GTX 1650 Super (Desktop)
Intel Arc A580
...
...
Intel Arc A380
NVIDIA GeForce GTX 1650 Super (Desktop)
...
...
NVIDIA GeForce GTX 1650 Super (Desktop)
...
NVIDIA GeForce GTX 1650 Super (Desktop)
Intel Arc A580
...
NVIDIA GeForce GTX 1650 Super (Desktop)
Intel Arc A580
...
» With all tested laptops playable in detail settings ultra.
Additional Benchmarks
Low Preset 1280x720
115.3 [X] KFA2 GeForce GTX 1650 Super EX One Click OC AMD Ryzen 9 7950X 4.5GHz
GeForce GTX 1650 Super (Desktop)
min:
51.1 fps, P0.1:
72.1 fps, P1:
92 fps, max:
205 fps
...
Intel Arc A380
NVIDIA GeForce GTX 1650 Super (Desktop)
...
...
Intel Arc A380
NVIDIA GeForce GTX 1650 Super (Desktop)
...
...
Intel Arc A380
NVIDIA GeForce GTX 1650 Super (Desktop)
...
...
NVIDIA GeForce GTX 1650 Super (Desktop)
...
NVIDIA GeForce GTX 1650 Super (Desktop)
...
NVIDIA GeForce GTX 1650 Super (Desktop)
...
» With all tested laptops playable in detail settings ultra.
Additional Benchmarks
Low Preset 1280x720
93.4 [X] KFA2 GeForce GTX 1650 Super EX One Click OC AMD Ryzen 9 7950X 4.5GHz
GeForce GTX 1650 Super (Desktop)
min:
62.1 fps, P0.1:
63.5 fps, P1:
82.7 fps, max:
304 fps
...
Intel Arc A380
NVIDIA GeForce GTX 1650 Super (Desktop)
...
...
Intel Arc A380
NVIDIA GeForce GTX 1650 Super (Desktop)
...
...
Intel Arc A380
NVIDIA GeForce GTX 1650 Super (Desktop)
...
...
Intel Arc A380
NVIDIA GeForce GTX 1650 Super (Desktop)
...
NVIDIA GeForce GTX 1650 Super (Desktop)
...
NVIDIA GeForce GTX 1650 Super (Desktop)
...
» With all tested laptops playable in detail settings med..
Additional Benchmarks
Very Low Preset 1280x720
63.7 [X] KFA2 GeForce GTX 1650 Super EX One Click OC AMD Ryzen 9 7950X 4.5GHz
GeForce GTX 1650 Super (Desktop)
min:
46.9 fps, P0.1:
48.9 fps, P1:
51 fps, max:
91.1 fps
162.7 [X] KFA2 GeForce GTX 1650 Super EX One Click OC 1016022
AMD Ryzen 9 7950X 4.5GHz
GeForce GTX 1650 Super (Desktop)
min:
138 fps, P1:
135 fps, max:
189 fps
fps
+ Compare
- Hide Comparison
...
Intel Arc A380
NVIDIA GeForce GTX 1650 Super (Desktop)
...
140 [X] KFA2 GeForce GTX 1650 Super EX One Click OC 1016022
AMD Ryzen 9 7950X 4.5GHz
GeForce GTX 1650 Super (Desktop)
min:
31 fps, P1:
118 fps, max:
167 fps
fps
+ Compare
- Hide Comparison
...
Intel Arc A380
NVIDIA GeForce GTX 1650 Super (Desktop)
...
93.4 [X] KFA2 GeForce GTX 1650 Super EX One Click OC 1016022
AMD Ryzen 9 7950X 4.5GHz
GeForce GTX 1650 Super (Desktop)
min:
56 fps, P1:
81 fps, max:
107 fps
fps
+ Compare
- Hide Comparison
...
Intel Arc A380
NVIDIA GeForce GTX 1650 Super (Desktop)
...
42.9 [X] KFA2 GeForce GTX 1650 Super EX One Click OC 1016022
AMD Ryzen 9 7950X 4.5GHz
GeForce GTX 1650 Super (Desktop)
min:
11 fps, P1:
14 fps, max:
73 fps
fps
+ Compare
- Hide Comparison
...
NVIDIA GeForce GTX 1650 Super (Desktop)
Intel Arc A580
...
29 [X] KFA2 GeForce GTX 1650 Super EX One Click OC 1016022
AMD Ryzen 9 7950X 4.5GHz
GeForce GTX 1650 Super (Desktop)
min:
10 fps, P1:
1 fps, max:
50 fps
fps
+ Compare
- Hide Comparison
...
NVIDIA GeForce GTX 1650 Super (Desktop)
Intel Arc A580
...
14.3 [X] KFA2 GeForce GTX 1650 Super EX One Click OC 1016022
AMD Ryzen 9 7950X 4.5GHz
GeForce GTX 1650 Super (Desktop)
min:
8 fps, P1:
1 fps, max:
24 fps
fps
+ Compare
- Hide Comparison
...
Intel Arc A580
NVIDIA GeForce GTX 1650 Super (Desktop)
...
» With all tested laptops playable in detail settings ultra.
Additional Benchmarks
Ultra Low Preset TAA 1280x720
296 [X] KFA2 GeForce GTX 1650 Super EX One Click OC AMD Ryzen 9 7950X 4.5GHz
GeForce GTX 1650 Super (Desktop)
min:
240 fps, P1:
222 fps, max:
350 fps
...
NVIDIA GeForce GTX 1650 Super (Desktop)
Intel Arc A580
...
...
NVIDIA GeForce GTX 1650 Super (Desktop)
Intel Arc A580
...
Intel UHD Graphics 32EUs (Alder Lake)
...
NVIDIA GeForce GTX 1650 Super (Desktop)
Intel Arc A580
...
Intel UHD Graphics 32EUs (Alder Lake)
...
NVIDIA GeForce GTX 1650 Super (Desktop)
Intel Arc A580
...
NVIDIA GeForce GTX 1650 Super (Desktop)
...
NVIDIA GeForce GTX 1650 Super (Desktop)
...
» With all tested laptops playable in detail settings ultra.
Additional Benchmarks
Low Preset 1280x720
243 [X] KFA2 GeForce GTX 1650 Super EX One Click OC AMD Ryzen 9 7950X 4.5GHz
GeForce GTX 1650 Super (Desktop)
min:
66.3 fps, P0.1:
136.2 fps, P1:
180.1 fps, max:
562 fps
...
NVIDIA GeForce GTX 1650 Super (Desktop)
Intel Arc A580
...
...
Intel Arc A380
NVIDIA GeForce GTX 1650 Super (Desktop)
...
...
Intel Arc A380
NVIDIA GeForce GTX 1650 Super (Desktop)
...
0 100 200 300 400 500 600 700 800 900 1000 1100 Tooltip
...
Intel Arc A380
NVIDIA GeForce GTX 1650 Super (Desktop)
...
NVIDIA GeForce GTX 1650 Super (Desktop)
...
NVIDIA GeForce GTX 1650 Super (Desktop)
...
» With all tested laptops playable in detail settings low.
Additional Benchmarks
Low Preset 1280x720
77.8 [X] KFA2 GeForce GTX 1650 Super EX One Click OC AMD Ryzen 9 7950X 4.5GHz
GeForce GTX 1650 Super (Desktop)
min:
1.906 fps, P0.1:
44.8 fps, P1:
56.2 fps, max:
187.4 fps
...
Intel Arc A380
NVIDIA GeForce GTX 1650 Super (Desktop)
Intel Arc A580
...
...
NVIDIA GeForce GTX 1650 Super (Desktop)
Intel Arc A580
...
...
Intel Arc A380
NVIDIA GeForce GTX 1650 Super (Desktop)
...
...
Intel Arc A380
NVIDIA GeForce GTX 1650 Super (Desktop)
...
NVIDIA GeForce GTX 1650 Super (Desktop)
...
NVIDIA GeForce GTX 1650 Super (Desktop)
...
» With all tested laptops playable in detail settings ultra.
Additional Benchmarks
Low Preset Low TAA 1280x720
251 [X] KFA2 GeForce GTX 1650 Super EX One Click OC AMD Ryzen 9 7950X 4.5GHz
GeForce GTX 1650 Super (Desktop)
min:
12.4 fps, P0.1:
31.1 fps, P1:
136.2 fps, max:
469 fps
...
Intel Arc A380
NVIDIA GeForce GTX 1650 Super (Desktop)
Intel Arc A580
...
...
Intel Arc A380
NVIDIA GeForce GTX 1650 Super (Desktop)
Intel Arc A580
...
...
Intel Arc A380
NVIDIA GeForce GTX 1650 Super (Desktop)
Intel Arc A580
...
Intel Arc A380
NVIDIA GeForce GTX 1650 Super (Desktop)
Intel Arc A580
...
NVIDIA GeForce GTX 1650 Super (Desktop)
Intel Arc A580
...
» With all tested laptops playable in detail settings high.
Additional Benchmarks
Low Preset 1280x720
79.2 [X] KFA2 GeForce GTX 1650 Super EX One Click OC AMD Ryzen 9 7950X 4.5GHz
GeForce GTX 1650 Super (Desktop)
min:
16.3 fps, P0.1:
61.1 fps, P1:
66.2 fps, max:
179.4 fps
...
Intel Arc A380
NVIDIA GeForce GTX 1650 Super (Desktop)
...
...
Intel Arc A380
NVIDIA GeForce GTX 1650 Super (Desktop)
...
...
Intel Arc A380
NVIDIA GeForce GTX 1650 Super (Desktop)
...
...
NVIDIA GeForce GTX 1650 Super (Desktop)
Intel Arc A380
...
NVIDIA GeForce GTX 1650 Super (Desktop)
Intel Arc A580
...
NVIDIA GeForce GTX 1650 Super (Desktop)
Intel Arc A580
...
» With all tested laptops playable in detail settings high.
Additional Benchmarks
Prioritize Performance Preset 1280x720
120.5 [X] KFA2 GeForce GTX 1650 Super EX One Click OC AMD Ryzen 9 7950X 4.5GHz
GeForce GTX 1650 Super (Desktop)
...
NVIDIA GeForce GTX 1650 Super (Desktop)
Intel Arc A380
...
...
NVIDIA GeForce GTX 1650 Super (Desktop)
Intel Arc A380
...
...
Intel Arc A380
NVIDIA GeForce GTX 1650 Super (Desktop)
...
...
NVIDIA GeForce GTX 1650 Super (Desktop)
...
NVIDIA GeForce GTX 1650 Super (Desktop)
...
NVIDIA GeForce GTX 1650 Super (Desktop)
...
» With all tested laptops playable in detail settings ultra.
Additional Benchmarks
Minimum Settings 1280x720
109.2 [X] KFA2 GeForce GTX 1650 Super EX One Click OC AMD Ryzen 9 7950X 4.5GHz
GeForce GTX 1650 Super (Desktop)
...
Intel Arc A380
NVIDIA GeForce GTX 1650 Super (Desktop)
...
...
NVIDIA GeForce GTX 1650 Super (Desktop)
Intel Arc A580
...
...
NVIDIA GeForce GTX 1650 Super (Desktop)
Intel Arc A580
...
...
Intel Arc A380
NVIDIA GeForce GTX 1650 Super (Desktop)
Intel Arc A580
...
NVIDIA GeForce GTX 1650 Super (Desktop)
Intel Arc A580
...
NVIDIA GeForce GTX 1650 Super (Desktop)
Intel Arc A580
...
» With all tested laptops playable in detail settings ultra.
Additional Benchmarks
Ultra Low Preset 1280x720
88.9 [X] KFA2 GeForce GTX 1650 Super EX One Click OC AMD Ryzen 9 7950X 4.5GHz
GeForce GTX 1650 Super (Desktop)
min:
7.1 fps, P0.1:
22.1 fps, P1:
60.9 fps, max:
158.6 fps
...
Intel Arc A380
NVIDIA GeForce GTX 1650 Super (Desktop)
Intel Arc A580
...
...
Intel Arc A380
NVIDIA GeForce GTX 1650 Super (Desktop)
Intel Arc A580
...
...
Intel Arc A380
NVIDIA GeForce GTX 1650 Super (Desktop)
...
...
Intel Arc A380
NVIDIA GeForce GTX 1650 Super (Desktop)
...
NVIDIA GeForce GTX 1650 Super (Desktop)
...
NVIDIA GeForce GTX 1650 Super (Desktop)
...
» With all tested laptops playable in detail settings high.
Additional Benchmarks
Low Preset 1280x720
160.1 [X] KFA2 GeForce GTX 1650 Super EX One Click OC AMD Ryzen 9 7950X 4.5GHz
GeForce GTX 1650 Super (Desktop)
min:
64.3 fps, P0.1:
124.4 fps, P1:
138.1 fps, max:
281 fps
...
Intel Arc A380
NVIDIA GeForce GTX 1650 Super (Desktop)
...
...
Intel Arc A380
NVIDIA GeForce GTX 1650 Super (Desktop)
...
...
Intel Arc A380
NVIDIA GeForce GTX 1650 Super (Desktop)
...
...
Intel Arc A380
NVIDIA GeForce GTX 1650 Super (Desktop)
...
NVIDIA GeForce GTX 1650 Super (Desktop)
...
NVIDIA GeForce GTX 1650 Super (Desktop)
...
» With all tested laptops playable in detail settings high.
Additional Benchmarks
Low Preset 1280x720
68 [X] KFA2 GeForce GTX 1650 Super EX One Click OC AMD Ryzen 9 7950X 4.5GHz
GeForce GTX 1650 Super (Desktop)
...
NVIDIA GeForce GTX 1650 Super (Desktop)
...
...
NVIDIA GeForce GTX 1650 Super (Desktop)
Intel Arc A580
...
...
NVIDIA GeForce GTX 1650 Super (Desktop)
Intel Arc A580
...
...
NVIDIA GeForce GTX 1650 Super (Desktop)
Intel Arc A580
...
NVIDIA GeForce GTX 1650 Super (Desktop)
...
NVIDIA GeForce GTX 1650 Super (Desktop)
...
» With all tested laptops playable in detail settings high.
Additional Benchmarks
Low Preset Low TAA 1280x720
120.2 [X] KFA2 GeForce GTX 1650 Super EX One Click OC AMD Ryzen 9 7950X 4.5GHz
GeForce GTX 1650 Super (Desktop)
min:
57.8 fps, P0.1:
78.1 fps, P1:
93.7 fps, max:
182.9 fps
...
Intel Arc A380
NVIDIA GeForce GTX 1650 Super (Desktop)
Intel Arc A580
...
...
Intel Arc A380
NVIDIA GeForce GTX 1650 Super (Desktop)
...
...
Intel Arc A380
NVIDIA GeForce GTX 1650 Super (Desktop)
...
0 100 200 300 400 500 600 700 800 900 1000 1100 1200 1300 1400 1500 1600 1700 1800 1900 2000 2100 2200 2300 2400 2500 2600 2700 2800 2900 3000 3100 3200 3300 3400 3500 3600 3700 3800 3900 4000 4100 4200 4300 4400 4500 4600 4700 4800 4900 5000 5100 5200 5300 5400 5500 5600 5700 5800 5900 6000 6100 6200 6300 6400 6500 6600 6700 6800 6900 7000 7100 7200 7300 7400 7500 7600 7700 7800 7900 8000 8100 8200 8300 8400 8500 Tooltip
...
Intel Arc A380
NVIDIA GeForce GTX 1650 Super (Desktop)
...
NVIDIA GeForce GTX 1650 Super (Desktop)
...
» With all tested laptops playable in detail settings med..
Additional Benchmarks
Low Preset TAA 1280x720
76.4 [X] KFA2 GeForce GTX 1650 Super EX One Click OC AMD Ryzen 9 7950X 4.5GHz
GeForce GTX 1650 Super (Desktop)
min:
30.5 fps, P0.1:
36.3 fps, P1:
51.2 fps, max:
209 fps
...
NVIDIA GeForce GTX 1650 Super (Desktop)
...
Intel UHD Graphics 32EUs (Alder Lake)
...
Intel Arc A380
NVIDIA GeForce GTX 1650 Super (Desktop)
...
...
Intel Arc A380
NVIDIA GeForce GTX 1650 Super (Desktop)
...
...
Intel Arc A380
NVIDIA GeForce GTX 1650 Super (Desktop)
...
NVIDIA GeForce GTX 1650 Super (Desktop)
...
NVIDIA GeForce GTX 1650 Super (Desktop)
...
» With all tested laptops playable in detail settings ultra.
Additional Benchmarks
Low Preset / Off 1280x720
187.3 [X] KFA2 GeForce GTX 1650 Super EX One Click OC AMD Ryzen 9 7950X 4.5GHz
GeForce GTX 1650 Super (Desktop)
min:
12.4 fps, P0.1:
46.5 fps, P1:
140.1 fps, max:
407 fps
...
Intel Arc A380
NVIDIA GeForce GTX 1650 Super (Desktop)
...
...
Intel Arc A380
NVIDIA GeForce GTX 1650 Super (Desktop)
...
...
Intel Arc A380
NVIDIA GeForce GTX 1650 Super (Desktop)
...
...
Intel Arc A380
NVIDIA GeForce GTX 1650 Super (Desktop)
...
NVIDIA GeForce GTX 1650 Super (Desktop)
...
NVIDIA GeForce GTX 1650 Super (Desktop)
...
» With all tested laptops playable in detail settings ultra.
Additional Benchmarks
Low Preset 1280x720
227 [X] KFA2 GeForce GTX 1650 Super EX One Click OC AMD Ryzen 9 7950X 4.5GHz
GeForce GTX 1650 Super (Desktop)
min:
55.4 fps, P0.1:
108.4 fps, P1:
132.7 fps, max:
443 fps
...
Intel Arc A380
NVIDIA GeForce GTX 1650 Super (Desktop)
...
...
Intel Arc A380
NVIDIA GeForce GTX 1650 Super (Desktop)
...
...
NVIDIA GeForce GTX 1650 Super (Desktop)
Intel Arc A380
...
...
Intel Arc A380
NVIDIA GeForce GTX 1650 Super (Desktop)
...
NVIDIA GeForce GTX 1650 Super (Desktop)
...
NVIDIA GeForce GTX 1650 Super (Desktop)
...
» With all tested laptops playable in detail settings med..
Additional Benchmarks
Low Preset (without FSR Upscaling) 1280x720
141.7 [X] KFA2 GeForce GTX 1650 Super EX One Click OC AMD Ryzen 9 7950X 4.5GHz
GeForce GTX 1650 Super (Desktop)
0 100 200 300 400 500 600 700 800 Tooltip
...
Intel Arc A380
NVIDIA GeForce GTX 1650 Super (Desktop)
Intel Arc A580
...
...
Intel Arc A380
NVIDIA GeForce GTX 1650 Super (Desktop)
Intel Arc A580
...
...
Intel Arc A380
NVIDIA GeForce GTX 1650 Super (Desktop)
Intel Arc A580
...
...
Intel Arc A380
NVIDIA GeForce GTX 1650 Super (Desktop)
...
NVIDIA GeForce GTX 1650 Super (Desktop)
...
NVIDIA GeForce GTX 1650 Super (Desktop)
...
» With all tested laptops playable in detail settings ultra.
Additional Benchmarks
Low Preset 1280x720
138.2 [X] KFA2 GeForce GTX 1650 Super EX One Click OC AMD Ryzen 9 7950X 4.5GHz
GeForce GTX 1650 Super (Desktop)
min:
27.1 fps, P0.1:
73.5 fps, P1:
96.1 fps, max:
218 fps
...
Intel Arc A380
NVIDIA GeForce GTX 1650 Super (Desktop)
...
...
Intel Arc A380
NVIDIA GeForce GTX 1650 Super (Desktop)
...
...
Intel Arc A380
NVIDIA GeForce GTX 1650 Super (Desktop)
...
...
Intel Arc A380
NVIDIA GeForce GTX 1650 Super (Desktop)
...
NVIDIA GeForce GTX 1650 Super (Desktop)
...
NVIDIA GeForce GTX 1650 Super (Desktop)
...
» With all tested laptops playable in detail settings ultra.
Additional Benchmarks
Very Low Preset 1280x720
104.8 [X] KFA2 GeForce GTX 1650 Super EX One Click OC AMD Ryzen 9 7950X 4.5GHz
GeForce GTX 1650 Super (Desktop)
min:
69.6 fps, P0.1:
72.3 fps, P1:
77.4 fps, max:
237 fps
...
NVIDIA GeForce GTX 1650 Super (Desktop)
...
...
NVIDIA GeForce GTX 1650 Super (Desktop)
...
...
NVIDIA GeForce GTX 1650 Super (Desktop)
...
...
NVIDIA GeForce GTX 1650 Super (Desktop)
...
NVIDIA GeForce GTX 1650 Super (Desktop)
...
NVIDIA GeForce GTX 1650 Super (Desktop)
...
» With all tested laptops playable in detail settings ultra.
Additional Benchmarks
Basic Quality Preset T2X SMAA 1280x720
122 [X] KFA2 GeForce GTX 1650 Super EX One Click OC AMD Ryzen 9 7950X 4.5GHz
GeForce GTX 1650 Super (Desktop)
...
Intel Arc A580
NVIDIA GeForce GTX 1650 Super (Desktop)
...
...
Intel Arc A580
NVIDIA GeForce GTX 1650 Super (Desktop)
...
...
Intel Arc A380
NVIDIA GeForce GTX 1650 Super (Desktop)
Intel Arc A580
...
...
NVIDIA GeForce GTX 1650 Super (Desktop)
Intel Arc A580
...
NVIDIA GeForce GTX 1650 Super (Desktop)
Intel Arc A580
...
» With all tested laptops playable in detail settings med..
Additional Benchmarks
Low Preset 1280x720
73.9 [X] KFA2 GeForce GTX 1650 Super EX One Click OC AMD Ryzen 9 7950X 4.5GHz
GeForce GTX 1650 Super (Desktop)
min:
53.1 fps, P0.1:
54.9 fps, P1:
66 fps, max:
88.3 fps
...
Intel Arc A380
NVIDIA GeForce GTX 1650 Super (Desktop)
...
...
Intel Arc A380
NVIDIA GeForce GTX 1650 Super (Desktop)
...
...
Intel Arc A380
NVIDIA GeForce GTX 1650 Super (Desktop)
...
...
Intel Arc A380
NVIDIA GeForce GTX 1650 Super (Desktop)
...
NVIDIA GeForce GTX 1650 Super (Desktop)
...
NVIDIA GeForce GTX 1650 Super (Desktop)
...
» With all tested laptops playable in detail settings med..
Additional Benchmarks
Low Preset 1280x720
84.7 [X] KFA2 GeForce GTX 1650 Super EX One Click OC AMD Ryzen 9 7950X 4.5GHz
GeForce GTX 1650 Super (Desktop)
min:
16.5 fps, P0.1:
50.8 fps, P1:
68.7 fps, max:
177.5 fps
0 100 200 300 400 500 600 700 800 900 Tooltip
...
NVIDIA GeForce GTX 1650 Super (Desktop)
...
...
NVIDIA GeForce GTX 1650 Super (Desktop)
...
0 100 200 300 400 500 600 700 800 900 1000 1100 Tooltip
...
NVIDIA GeForce GTX 1650 Super (Desktop)
...
...
NVIDIA GeForce GTX 1650 Super (Desktop)
...
NVIDIA GeForce GTX 1650 Super (Desktop)
...
NVIDIA GeForce GTX 1650 Super (Desktop)
...
» With all tested laptops playable in detail settings ultra.
Additional Benchmarks
Low Rendering Quality 1280x720
276 [X] KFA2 GeForce GTX 1650 Super EX One Click OC AMD Ryzen 9 7950X 4.5GHz
GeForce GTX 1650 Super (Desktop)
min:
33.5 fps, P0.1:
189.6 fps, P1:
208 fps, max:
384 fps
79 [X] KFA2 GeForce GTX 1650 Super EX One Click OC AMD Ryzen 9 7900X 4.7GHz
GeForce GTX 1650 Super (Desktop)
min:
22.3 fps, P0.1:
35.6 fps, P1:
67.8 fps, max:
210 fps
80.1 [X] KFA2 GeForce GTX 1650 Super EX One Click OC AMD Ryzen 9 7950X 4.5GHz
GeForce GTX 1650 Super (Desktop)
min:
23.4 fps, P0.1:
41.5 fps, P1:
69.4 fps, max:
273 fps
~ 80 fps
+ Compare
- Hide Comparison
+ 📈 Graph
- 📈 Hide Graph
0 100 Tooltip : Ø81.8 (72.13-125)
: Ø84.1 (71.027-131.4)
...
Intel Arc A380
NVIDIA GeForce GTX 1650 Super (Desktop)
Intel Arc A580
...
55.7 [X] KFA2 GeForce GTX 1650 Super EX One Click OC AMD Ryzen 9 7900X 4.7GHz
GeForce GTX 1650 Super (Desktop)
min:
29.1 fps, P0.1:
39.2 fps, P1:
46.1 fps, max:
138.1 fps
56.5 [X] KFA2 GeForce GTX 1650 Super EX One Click OC AMD Ryzen 9 7950X 4.5GHz
GeForce GTX 1650 Super (Desktop)
min:
25.7 fps, P0.1:
29 fps, P1:
37.7 fps, max:
184.6 fps
~ 56 fps
+ Compare
- Hide Comparison
+ 📈 Graph
- 📈 Hide Graph
0 100 200 Tooltip : Ø61.2 (47.654-218)
: Ø52.9 (38.122-189.2)
...
Intel Arc A380
NVIDIA GeForce GTX 1650 Super (Desktop)
...
44.6 [X] KFA2 GeForce GTX 1650 Super EX One Click OC AMD Ryzen 9 7900X 4.7GHz
GeForce GTX 1650 Super (Desktop)
min:
24.5 fps, P0.1:
30 fps, P1:
37.1 fps, max:
128.1 fps
58.2 [X] KFA2 GeForce GTX 1650 Super EX One Click OC AMD Ryzen 9 7950X 4.5GHz
GeForce GTX 1650 Super (Desktop)
min:
24.2 fps, P0.1:
37.2 fps, P1:
47.3 fps, max:
180.3 fps
~ 51 fps
+ Compare
- Hide Comparison
+ 📈 Graph
- 📈 Hide Graph
0 Tooltip : Ø49.9 (41.72-87.2)
: Ø62.5 (48.601-85.7)
...
NVIDIA GeForce GTX 1650 Super (Desktop)
Intel Arc A580
...
23.8 [X] KFA2 GeForce GTX 1650 Super EX One Click OC AMD Ryzen 9 7900X 4.7GHz
GeForce GTX 1650 Super (Desktop)
min:
12.3 fps, P0.1:
12.5 fps, P1:
16 fps, max:
137.8 fps
33.1 [X] KFA2 GeForce GTX 1650 Super EX One Click OC AMD Ryzen 9 7950X 4.5GHz
GeForce GTX 1650 Super (Desktop)
min:
16.7 fps, P0.1:
17.3 fps, P1:
20.3 fps, max:
119.6 fps
~ 28 fps
+ Compare
- Hide Comparison
+ 📈 Graph
- 📈 Hide Graph
0 100 200 Tooltip : Ø27.8 (22.021-66.8)
: Ø44 (27.507-206.5)
...
Intel Arc A380
NVIDIA GeForce GTX 1650 Super (Desktop)
...
11.7 [X] KFA2 GeForce GTX 1650 Super EX One Click OC AMD Ryzen 9 7900X 4.7GHz
GeForce GTX 1650 Super (Desktop)
min:
3.88 fps, P0.1:
4.38 fps, P1:
6.6 fps, max:
2002 fps
17.6 [X] KFA2 GeForce GTX 1650 Super EX One Click OC AMD Ryzen 9 7950X 4.5GHz
GeForce GTX 1650 Super (Desktop)
min:
8.8 fps, P0.1:
9.52 fps, P1:
10.9 fps, max:
27.3 fps
~ 15 fps
+ Compare
- Hide Comparison
+ 📈 Graph
- 📈 Hide Graph
0 Tooltip : Ø16.9 (9.1-90.8)
: Ø20.8 (14.032-45.9)
NVIDIA GeForce GTX 1650 Super (Desktop)
...
4.2 [X] KFA2 GeForce GTX 1650 Super EX One Click OC AMD Ryzen 9 7900X 4.7GHz
GeForce GTX 1650 Super (Desktop)
min:
1.664 fps, P0.1:
1.75 fps, P1:
2.41 fps, max:
7.71 fps
4.3 [X] KFA2 GeForce GTX 1650 Super EX One Click OC AMD Ryzen 9 7950X 4.5GHz
GeForce GTX 1650 Super (Desktop)
min:
2.41 fps, P0.1:
2.42 fps, P1:
2.67 fps, max:
7.06 fps
~ 4 fps
+ Compare
- Hide Comparison
+ 📈 Graph
- 📈 Hide Graph
0 100 Tooltip : Ø11.9 (2.004-173.1)
: Ø9.09 (3.036-59.1)
...
NVIDIA GeForce GTX 1650 Super (Desktop)
...
» With all tested laptops playable in detail settings high.
Additional Benchmarks
Low Preset 1280x720
119.5 [X] KFA2 GeForce GTX 1650 Super EX One Click OC AMD Ryzen 9 7950X 4.5GHz
GeForce GTX 1650 Super (Desktop)
min:
41.6 fps, P0.1:
72.6 fps, P1:
100.1 fps, max:
260 fps
161.6 [X] KFA2 GeForce GTX 1650 Super EX One Click OC 918016
AMD Ryzen 9 7900X 4.7GHz
GeForce GTX 1650 Super (Desktop)
min:
139 fps, P1:
125 fps, max:
188 fps
173.4 [X] KFA2 GeForce GTX 1650 Super EX One Click OC 928484
AMD Ryzen 9 7950X 4.5GHz
GeForce GTX 1650 Super (Desktop)
min:
148 fps, P1:
133 fps, max:
209 fps
~ 168 fps
+ Compare
- Hide Comparison
...
NVIDIA GeForce GTX 1650 Super (Desktop)
...
142.8 [X] KFA2 GeForce GTX 1650 Super EX One Click OC 918016
AMD Ryzen 9 7900X 4.7GHz
GeForce GTX 1650 Super (Desktop)
min:
123 fps, P1:
114 fps, max:
164 fps
154.1 [X] KFA2 GeForce GTX 1650 Super EX One Click OC 928484
AMD Ryzen 9 7950X 4.5GHz
GeForce GTX 1650 Super (Desktop)
min:
134 fps, P1:
122 fps, max:
184 fps
~ 148 fps
+ Compare
- Hide Comparison
...
NVIDIA GeForce GTX 1650 Super (Desktop)
...
103 [X] KFA2 GeForce GTX 1650 Super EX One Click OC 918016
AMD Ryzen 9 7900X 4.7GHz
GeForce GTX 1650 Super (Desktop)
min:
87 fps, P1:
85 fps, max:
119 fps
107.9 [X] KFA2 GeForce GTX 1650 Super EX One Click OC 928484
AMD Ryzen 9 7950X 4.5GHz
GeForce GTX 1650 Super (Desktop)
min:
90 fps, P1:
87 fps, max:
129 fps
~ 105 fps
+ Compare
- Hide Comparison
...
NVIDIA GeForce GTX 1650 Super (Desktop)
...
72.1 [X] KFA2 GeForce GTX 1650 Super EX One Click OC 918016
AMD Ryzen 9 7900X 4.7GHz
GeForce GTX 1650 Super (Desktop)
min:
60 fps, P1:
59 fps, max:
83 fps
81.4 [X] KFA2 GeForce GTX 1650 Super EX One Click OC 928484
AMD Ryzen 9 7950X 4.5GHz
GeForce GTX 1650 Super (Desktop)
min:
68 fps, P1:
67 fps, max:
98 fps
~ 77 fps
+ Compare
- Hide Comparison
...
NVIDIA GeForce GTX 1650 Super (Desktop)
...
51 [X] KFA2 GeForce GTX 1650 Super EX One Click OC 918016
AMD Ryzen 9 7900X 4.7GHz
GeForce GTX 1650 Super (Desktop)
min:
42 fps, P1:
42 fps, max:
60 fps
55.9 [X] KFA2 GeForce GTX 1650 Super EX One Click OC 928484
AMD Ryzen 9 7950X 4.5GHz
GeForce GTX 1650 Super (Desktop)
min:
47 fps, P1:
47 fps, max:
66 fps
~ 53 fps
+ Compare
- Hide Comparison
...
NVIDIA GeForce GTX 1650 Super (Desktop)
...
25.5 [X] KFA2 GeForce GTX 1650 Super EX One Click OC 918016
AMD Ryzen 9 7900X 4.7GHz
GeForce GTX 1650 Super (Desktop)
min:
20 fps, P1:
20 fps, max:
30 fps
28.4 [X] KFA2 GeForce GTX 1650 Super EX One Click OC 928484
AMD Ryzen 9 7950X 4.5GHz
GeForce GTX 1650 Super (Desktop)
min:
23 fps, P1:
24 fps, max:
33 fps
~ 27 fps
+ Compare
- Hide Comparison
...
NVIDIA GeForce GTX 1650 Super (Desktop)
...
» With all tested laptops playable in detail settings ultra.
Additional Benchmarks
Ultra Low Preset 16xAF TAA 1280x720
285 [X] KFA2 GeForce GTX 1650 Super EX One Click OC AMD Ryzen 9 7900X 4.7GHz
GeForce GTX 1650 Super (Desktop)
min:
239 fps, P1:
203 fps, max:
341 fps
300 [X] KFA2 GeForce GTX 1650 Super EX One Click OC AMD Ryzen 9 7950X 4.5GHz
GeForce GTX 1650 Super (Desktop)
min:
246 fps, P1:
215 fps, max:
353 fps
...
NVIDIA GeForce GTX 1650 Super (Desktop)
...
...
NVIDIA GeForce GTX 1650 Super (Desktop)
...
...
NVIDIA GeForce GTX 1650 Super (Desktop)
...
...
NVIDIA GeForce GTX 1650 Super (Desktop)
...
NVIDIA GeForce GTX 1650 Super (Desktop)
...
NVIDIA GeForce GTX 1650 Super (Desktop)
...
» With all tested laptops playable in detail settings ultra.
Additional Benchmarks
Low Preset 1280x720
322 [X] AMD Ryzen 9 5900X 3.7GHz
GeForce GTX 1650 Super (Desktop)
min:
3.42 fps, P0.1:
183.3 fps, P1:
235 fps, max:
537 fps
...
Intel Arc A380
NVIDIA GeForce GTX 1650 Super (Desktop)
...
0 100 200 300 400 500 600 Tooltip
...
Intel Arc A380
NVIDIA GeForce GTX 1650 Super (Desktop)
...
0 100 200 300 400 500 600 700 800 900 Tooltip
...
Intel Arc A380
NVIDIA GeForce GTX 1650 Super (Desktop)
...
...
Intel Arc A380
NVIDIA GeForce GTX 1650 Super (Desktop)
...
0 100 200 300 400 500 600 Tooltip
NVIDIA GeForce GTX 1650 Super (Desktop)
...
NVIDIA GeForce GTX 1650 Super (Desktop)
...
» With all tested laptops playable in detail settings ultra.
Additional Benchmarks
Lowest Settings 1280x720
137.9 [X] AMD Ryzen 9 5900X 3.7GHz
GeForce GTX 1650 Super (Desktop)
min:
25.1 fps, P0.1:
68.1 fps, P1:
89.2 fps, max:
261 fps
99.2 [X] AMD Ryzen 9 5900X 3.7GHz
GeForce GTX 1650 Super (Desktop)
107.4 [X] KFA2 GeForce GTX 1650 Super EX One Click OC AMD Ryzen 9 7900X 4.7GHz
GeForce GTX 1650 Super (Desktop)
109.1 [X] KFA2 GeForce GTX 1650 Super EX One Click OC AMD Ryzen 9 7950X 4.5GHz
GeForce GTX 1650 Super (Desktop)
~ 105 fps
+ Compare
- Hide Comparison
...
Intel Arc A380
NVIDIA GeForce GTX 1650 Super (Desktop)
...
76 [X] KFA2 GeForce GTX 1650 Super EX One Click OC AMD Ryzen 9 7900X 4.7GHz
GeForce GTX 1650 Super (Desktop)
79.9 [X] AMD Ryzen 9 5900X 3.7GHz
GeForce GTX 1650 Super (Desktop)
85.7 [X] KFA2 GeForce GTX 1650 Super EX One Click OC AMD Ryzen 9 7950X 4.5GHz
GeForce GTX 1650 Super (Desktop)
~ 81 fps
+ Compare
- Hide Comparison
...
Intel Arc A380
NVIDIA GeForce GTX 1650 Super (Desktop)
...
49.8 [X] AMD Ryzen 9 5900X 3.7GHz
GeForce GTX 1650 Super (Desktop)
50.3 [X] KFA2 GeForce GTX 1650 Super EX One Click OC AMD Ryzen 9 7900X 4.7GHz
GeForce GTX 1650 Super (Desktop)
54.8 [X] KFA2 GeForce GTX 1650 Super EX One Click OC AMD Ryzen 9 7950X 4.5GHz
GeForce GTX 1650 Super (Desktop)
~ 52 fps
+ Compare
- Hide Comparison
...
Intel Arc A380
NVIDIA GeForce GTX 1650 Super (Desktop)
...
33.4 [X] KFA2 GeForce GTX 1650 Super EX One Click OC AMD Ryzen 9 7900X 4.7GHz
GeForce GTX 1650 Super (Desktop)
35.2 [X] AMD Ryzen 9 5900X 3.7GHz
GeForce GTX 1650 Super (Desktop)
~ 34 fps
+ Compare
- Hide Comparison
...
Intel Arc A380
NVIDIA GeForce GTX 1650 Super (Desktop)
...
21.4 [X] KFA2 GeForce GTX 1650 Super EX One Click OC AMD Ryzen 9 7900X 4.7GHz
GeForce GTX 1650 Super (Desktop)
22.1 [X] AMD Ryzen 9 5900X 3.7GHz
GeForce GTX 1650 Super (Desktop)
~ 22 fps
+ Compare
- Hide Comparison
NVIDIA GeForce GTX 1650 Super (Desktop)
...
8.5 [X] KFA2 GeForce GTX 1650 Super EX One Click OC AMD Ryzen 9 7900X 4.7GHz
GeForce GTX 1650 Super (Desktop)
10.8 [X] AMD Ryzen 9 5900X 3.7GHz
GeForce GTX 1650 Super (Desktop)
~ 10 fps
+ Compare
- Hide Comparison
NVIDIA GeForce GTX 1650 Super (Desktop)
...
» With all tested laptops playable in detail settings high.
Additional Benchmarks
Lowest Preset (DX12) 1280x720
191.3 [X] AMD Ryzen 9 5900X 3.7GHz
GeForce GTX 1650 Super (Desktop)
214 [X] KFA2 GeForce GTX 1650 Super EX One Click OC AMD Ryzen 9 7950X 4.5GHz
GeForce GTX 1650 Super (Desktop)
59.3 [X] KFA2 GeForce GTX 1650 Super EX One Click OC 1.61
AMD Ryzen 9 7950X 4.5GHz
GeForce GTX 1650 Super (Desktop)
min:
29 fps, max:
153.8 fps
67.4 [X] AMD Ryzen 9 5900X 3.7GHz
GeForce GTX 1650 Super (Desktop)
~ 63 fps
+ Compare
- Hide Comparison
...
Intel Arc A380
NVIDIA GeForce GTX 1650 Super (Desktop)
Intel Arc A580
...
46.6 [X] KFA2 GeForce GTX 1650 Super EX One Click OC 1.61
AMD Ryzen 9 7950X 4.5GHz
GeForce GTX 1650 Super (Desktop)
min:
35.1 fps, max:
59.1 fps
53.3 [X] AMD Ryzen 9 5900X 3.7GHz
GeForce GTX 1650 Super (Desktop)
~ 50 fps
+ Compare
- Hide Comparison
...
Intel Arc A380
NVIDIA GeForce GTX 1650 Super (Desktop)
...
38.7 [X] KFA2 GeForce GTX 1650 Super EX One Click OC 1.61
AMD Ryzen 9 7950X 4.5GHz
GeForce GTX 1650 Super (Desktop)
min:
26.6 fps, max:
52.4 fps
41.1 [X] AMD Ryzen 9 5900X 3.7GHz
GeForce GTX 1650 Super (Desktop)
~ 40 fps
+ Compare
- Hide Comparison
...
Intel Arc A380
NVIDIA GeForce GTX 1650 Super (Desktop)
...
32.1 [X] AMD Ryzen 9 5900X 3.7GHz
GeForce GTX 1650 Super (Desktop)
35 [X] KFA2 GeForce GTX 1650 Super EX One Click OC 1.61
AMD Ryzen 9 7950X 4.5GHz
GeForce GTX 1650 Super (Desktop)
min:
24.6 fps, max:
47.7 fps
~ 34 fps
+ Compare
- Hide Comparison
...
Intel Arc A380
NVIDIA GeForce GTX 1650 Super (Desktop)
...
18.5 [X] AMD Ryzen 9 5900X 3.7GHz
GeForce GTX 1650 Super (Desktop)
20.9 [X] KFA2 GeForce GTX 1650 Super EX One Click OC 1.61
AMD Ryzen 9 7950X 4.5GHz
GeForce GTX 1650 Super (Desktop)
min:
15.2 fps, max:
27.6 fps
~ 20 fps
+ Compare
- Hide Comparison
...
NVIDIA GeForce GTX 1650 Super (Desktop)
...
3.1 [X] KFA2 GeForce GTX 1650 Super EX One Click OC 1.61
AMD Ryzen 9 7950X 4.5GHz
GeForce GTX 1650 Super (Desktop)
min:
2.59 fps, max:
4.09 fps
3.3 [X] AMD Ryzen 9 5900X 3.7GHz
GeForce GTX 1650 Super (Desktop)
~ 3 fps
+ Compare
- Hide Comparison
NVIDIA GeForce GTX 1650 Super (Desktop)
...
» With all tested laptops playable in detail settings high.
Additional Benchmarks
Low Preset 1280x720
83.7 [X] AMD Ryzen 9 5900X 3.7GHz
GeForce GTX 1650 Super (Desktop)
92.3 [X] KFA2 GeForce GTX 1650 Super EX One Click OC AMD Ryzen 9 7950X 4.5GHz
GeForce GTX 1650 Super (Desktop)
min:
40.8 fps, max:
146 fps
...
NVIDIA GeForce GTX 1650 Super (Desktop)
...
...
NVIDIA GeForce GTX 1650 Super (Desktop)
...
...
NVIDIA GeForce GTX 1650 Super (Desktop)
...
NVIDIA GeForce GTX 1650 Super (Desktop)
...
0 100 200 Tooltip : Ø22.9 (8.202-234)
: Ø39.3 (31.327-92.7)
NVIDIA GeForce GTX 1650 Super (Desktop)
...
» With all tested laptops playable in detail settings high.
Additional Benchmarks
Low / Off 1280x720
80.6 [X] AMD Ryzen 9 5900X 3.7GHz
GeForce GTX 1650 Super (Desktop)
min:
8.59 fps, P0.1:
42.9 fps, P1:
64 fps, max:
144 fps
170 [X] AMD Ryzen 9 5900X 3.7GHz
GeForce GTX 1650 Super (Desktop)
172.6 [X] KFA2 GeForce GTX 1650 Super EX One Click OC AMD Ryzen 9 7900X 4.7GHz
GeForce GTX 1650 Super (Desktop)
202 [X] KFA2 GeForce GTX 1650 Super EX One Click OC 623651
AMD Ryzen 9 7950X 4.5GHz
GeForce GTX 1650 Super (Desktop)
min:
60.1 fps, max:
374 fps
~ 182 fps
+ Compare
- Hide Comparison
...
Intel Arc A580
NVIDIA GeForce GTX 1650 Super (Desktop)
...
116 [X] AMD Ryzen 9 5900X 3.7GHz
GeForce GTX 1650 Super (Desktop)
126.3 [X] KFA2 GeForce GTX 1650 Super EX One Click OC AMD Ryzen 9 7900X 4.7GHz
GeForce GTX 1650 Super (Desktop)
147.3 [X] KFA2 GeForce GTX 1650 Super EX One Click OC 623651
AMD Ryzen 9 7950X 4.5GHz
GeForce GTX 1650 Super (Desktop)
min:
62.2 fps, max:
285 fps
~ 130 fps
+ Compare
- Hide Comparison
...
NVIDIA GeForce GTX 1650 Super (Desktop)
Intel Arc A580
...
96 [X] AMD Ryzen 9 5900X 3.7GHz
GeForce GTX 1650 Super (Desktop)
99.3 [X] KFA2 GeForce GTX 1650 Super EX One Click OC AMD Ryzen 9 7900X 4.7GHz
GeForce GTX 1650 Super (Desktop)
113.1 [X] KFA2 GeForce GTX 1650 Super EX One Click OC 623651
AMD Ryzen 9 7950X 4.5GHz
GeForce GTX 1650 Super (Desktop)
min:
63.6 fps, max:
243 fps
~ 103 fps
+ Compare
- Hide Comparison
...
NVIDIA GeForce GTX 1650 Super (Desktop)
Intel Arc A580
...
66 [X] AMD Ryzen 9 5900X 3.7GHz
GeForce GTX 1650 Super (Desktop)
71.8 [X] KFA2 GeForce GTX 1650 Super EX One Click OC AMD Ryzen 9 7900X 4.7GHz
GeForce GTX 1650 Super (Desktop)
78 [X] KFA2 GeForce GTX 1650 Super EX One Click OC 623651
AMD Ryzen 9 7950X 4.5GHz
GeForce GTX 1650 Super (Desktop)
min:
42 fps, max:
128.7 fps
~ 72 fps
+ Compare
- Hide Comparison
...
Intel Arc A380
NVIDIA GeForce GTX 1650 Super (Desktop)
Intel Arc A580
...
50 [X] AMD Ryzen 9 5900X 3.7GHz
GeForce GTX 1650 Super (Desktop)
54.9 [X] KFA2 GeForce GTX 1650 Super EX One Click OC AMD Ryzen 9 7900X 4.7GHz
GeForce GTX 1650 Super (Desktop)
56.6 [X] KFA2 GeForce GTX 1650 Super EX One Click OC 623651
AMD Ryzen 9 7950X 4.5GHz
GeForce GTX 1650 Super (Desktop)
min:
32.6 fps, max:
80.3 fps
~ 54 fps
+ Compare
- Hide Comparison
NVIDIA GeForce GTX 1650 Super (Desktop)
Intel Arc A580
...
25 [X] AMD Ryzen 9 5900X 3.7GHz
GeForce GTX 1650 Super (Desktop)
26.7 [X] KFA2 GeForce GTX 1650 Super EX One Click OC 623651
AMD Ryzen 9 7950X 4.5GHz
GeForce GTX 1650 Super (Desktop)
min:
6.67 fps, max:
281 fps
30.7 [X] KFA2 GeForce GTX 1650 Super EX One Click OC AMD Ryzen 9 7900X 4.7GHz
GeForce GTX 1650 Super (Desktop)
~ 27 fps
+ Compare
- Hide Comparison
NVIDIA GeForce GTX 1650 Super (Desktop)
...
» With all tested laptops playable in detail settings ultra.
Additional Benchmarks
Low Preset 1280x720
230 [X] AMD Ryzen 9 5900X 3.7GHz
GeForce GTX 1650 Super (Desktop)
282 [X] KFA2 GeForce GTX 1650 Super EX One Click OC AMD Ryzen 9 7950X 4.5GHz
GeForce GTX 1650 Super (Desktop)
min:
59.9 fps, max:
434 fps
...
NVIDIA GeForce GTX 1650 Super (Desktop)
...
...
NVIDIA GeForce GTX 1650 Super (Desktop)
...
...
NVIDIA GeForce GTX 1650 Super (Desktop)
...
...
NVIDIA GeForce GTX 1650 Super (Desktop)
...
NVIDIA GeForce GTX 1650 Super (Desktop)
...
NVIDIA GeForce GTX 1650 Super (Desktop)
...
» With all tested laptops playable in detail settings ultra.
...
NVIDIA GeForce GTX 1650 Super (Desktop)
...
...
NVIDIA GeForce GTX 1650 Super (Desktop)
...
...
NVIDIA GeForce GTX 1650 Super (Desktop)
...
NVIDIA GeForce GTX 1650 Super (Desktop)
...
NVIDIA GeForce GTX 1650 Super (Desktop)
...
» With all tested laptops playable in detail settings low.
Additional Benchmarks
Low Quality 1280x720
96.7 [X] AMD Ryzen 9 5900X 3.7GHz
GeForce GTX 1650 Super (Desktop)
min:
37.1 fps, P0.1:
74.1 fps, P1:
84.5 fps, max:
119 fps
...
NVIDIA GeForce GTX 1650 Super (Desktop)
...
...
NVIDIA GeForce GTX 1650 Super (Desktop)
...
...
NVIDIA GeForce GTX 1650 Super (Desktop)
...
...
NVIDIA GeForce GTX 1650 Super (Desktop)
...
NVIDIA GeForce GTX 1650 Super (Desktop)
...
NVIDIA GeForce GTX 1650 Super (Desktop)
...
» With all tested laptops playable in detail settings ultra.
Additional Benchmarks
Ultra Low Preset (with Fixed Resolution Quality) 1280x720
173 [X] AMD Ryzen 9 5900X 3.7GHz
GeForce GTX 1650 Super (Desktop)
66.1 [X] AMD Ryzen 9 5900X 3.7GHz
GeForce GTX 1650 Super (Desktop)
min:
44.1 fps, P0.1:
56.6 fps, P1:
59 fps, max:
131 fps
76.4 [X] KFA2 GeForce GTX 1650 Super EX One Click OC AMD Ryzen 9 7950X 4.5GHz
GeForce GTX 1650 Super (Desktop)
min:
45.9 fps, P0.1:
64.1 fps, P1:
68.7 fps, max:
159 fps
76.6 [X] KFA2 GeForce GTX 1650 Super EX One Click OC AMD Ryzen 9 7900X 4.7GHz
GeForce GTX 1650 Super (Desktop)
min:
61.6 fps, P0.1:
64.3 fps, P1:
68.2 fps, max:
99.1 fps
~ 73 fps
+ Compare
- Hide Comparison
+ 📈 Graph
- 📈 Hide Graph
0 100 Tooltip : Ø71.2 (62.251-102.4)
: Ø78.9 (71.007-90.3)
: Ø81.9 (73.02-121.6)
...
NVIDIA GeForce GTX 1650 Super (Desktop)
Intel Arc A580
...
53.4 [X] AMD Ryzen 9 5900X 3.7GHz
GeForce GTX 1650 Super (Desktop)
min:
43.9 fps, P0.1:
45.9 fps, P1:
48.2 fps, max:
70.7 fps
63.2 [X] KFA2 GeForce GTX 1650 Super EX One Click OC AMD Ryzen 9 7900X 4.7GHz
GeForce GTX 1650 Super (Desktop)
min:
54.6 fps, P0.1:
54.8 fps, P1:
57.3 fps, max:
74.4 fps
63.3 [X] KFA2 GeForce GTX 1650 Super EX One Click OC AMD Ryzen 9 7950X 4.5GHz
GeForce GTX 1650 Super (Desktop)
min:
49.5 fps, P0.1:
54.9 fps, P1:
57.5 fps, max:
80.1 fps
~ 60 fps
+ Compare
- Hide Comparison
+ 📈 Graph
- 📈 Hide Graph
0 100 Tooltip : Ø61.2 (50.719-121.2)
: Ø65.9 (59.674-80.5)
: Ø65.5 (58.19-80.1)
...
NVIDIA GeForce GTX 1650 Super (Desktop)
...
42.3 [X] AMD Ryzen 9 5900X 3.7GHz
GeForce GTX 1650 Super (Desktop)
min:
34.3 fps, P0.1:
36.3 fps, P1:
38.1 fps, max:
54.2 fps
46.3 [X] KFA2 GeForce GTX 1650 Super EX One Click OC AMD Ryzen 9 7950X 4.5GHz
GeForce GTX 1650 Super (Desktop)
min:
15.1 fps, P0.1:
16.7 fps, P1:
19 fps, max:
92 fps
48.3 [X] KFA2 GeForce GTX 1650 Super EX One Click OC AMD Ryzen 9 7900X 4.7GHz
GeForce GTX 1650 Super (Desktop)
min:
39 fps, P0.1:
39.8 fps, P1:
41.2 fps, max:
58.3 fps
~ 46 fps
+ Compare
- Hide Comparison
+ 📈 Graph
- 📈 Hide Graph
0 100 200 300 400 500 600 700 800 900 1000 1100 1200 1300 1400 1500 1600 1700 1800 1900 2000 2100 2200 2300 2400 2500 2600 2700 2800 2900 3000 3100 3200 3300 3400 3500 3600 3700 3800 3900 4000 4100 4200 4300 4400 4500 Tooltip : Ø230 (39.284-4501)
: Ø49.1 (28.498-69.8)
: Ø53.1 (42.085-103.5)
...
Intel Arc A380
NVIDIA GeForce GTX 1650 Super (Desktop)
...
27.2 [X] AMD Ryzen 9 5900X 3.7GHz
GeForce GTX 1650 Super (Desktop)
min:
14.3 fps, P0.1:
15.4 fps, P1:
17.1 fps, max:
43.9 fps
27.6 [X] KFA2 GeForce GTX 1650 Super EX One Click OC AMD Ryzen 9 7950X 4.5GHz
GeForce GTX 1650 Super (Desktop)
min:
13.1 fps, P0.1:
14.3 fps, P1:
18.2 fps, max:
41.5 fps
28.4 [X] KFA2 GeForce GTX 1650 Super EX One Click OC AMD Ryzen 9 7900X 4.7GHz
GeForce GTX 1650 Super (Desktop)
min:
15.9 fps, P0.1:
16.6 fps, P1:
20.7 fps, max:
37.1 fps
~ 28 fps
+ Compare
- Hide Comparison
+ 📈 Graph
- 📈 Hide Graph
0 Tooltip : Ø29.4 (20.023-39.5)
: Ø29.4 (22.41-48.5)
: Ø33.4 (25.13-66)
...
Intel Arc A380
NVIDIA GeForce GTX 1650 Super (Desktop)
...
19.3 [X] AMD Ryzen 9 5900X 3.7GHz
GeForce GTX 1650 Super (Desktop)
min:
12.5 fps, P0.1:
12.5 fps, P1:
12.9 fps, max:
27.4 fps
20.8 [X] KFA2 GeForce GTX 1650 Super EX One Click OC AMD Ryzen 9 7950X 4.5GHz
GeForce GTX 1650 Super (Desktop)
min:
14.7 fps, P0.1:
14.8 fps, P1:
15.4 fps, max:
30.7 fps
21.4 [X] KFA2 GeForce GTX 1650 Super EX One Click OC AMD Ryzen 9 7900X 4.7GHz
GeForce GTX 1650 Super (Desktop)
min:
12.1 fps, P0.1:
13.4 fps, P1:
16.3 fps, max:
28.5 fps
~ 21 fps
+ Compare
- Hide Comparison
+ 📈 Graph
- 📈 Hide Graph
0 100 200 Tooltip : Ø31.9 (16.164-254)
: Ø30.9 (18.365-241)
: Ø29.1 (19.083-200.1)
NVIDIA GeForce GTX 1650 Super (Desktop)
...
5.1 [X] AMD Ryzen 9 5900X 3.7GHz
GeForce GTX 1650 Super (Desktop)
min:
1.36 fps, P0.1:
1.605 fps, P1:
3.34 fps, max:
8.24 fps
8.1 [X] KFA2 GeForce GTX 1650 Super EX One Click OC AMD Ryzen 9 7950X 4.5GHz
GeForce GTX 1650 Super (Desktop)
min:
4.65 fps, P0.1:
5.09 fps, P1:
6.42 fps, max:
28.7 fps
8.4 [X] KFA2 GeForce GTX 1650 Super EX One Click OC AMD Ryzen 9 7900X 4.7GHz
GeForce GTX 1650 Super (Desktop)
min:
4.94 fps, P0.1:
5.47 fps, P1:
6.9 fps, max:
19.9 fps
~ 7 fps
+ Compare
- Hide Comparison
+ 📈 Graph
- 📈 Hide Graph
0 100 Tooltip : Ø8.22 (3.2-32.5)
: Ø13.1 (7.037-139.7)
: Ø11.4 (7.221-56.2)
NVIDIA GeForce GTX 1650 Super (Desktop)
...
» With all tested laptops playable in detail settings high.
Additional Benchmarks
Low Preset 1280x720
101 [X] AMD Ryzen 9 5900X 3.7GHz
GeForce GTX 1650 Super (Desktop)
min:
51.1 fps, P0.1:
67.2 fps, P1:
86.8 fps, max:
251 fps
113.4 [X] KFA2 GeForce GTX 1650 Super EX One Click OC AMD Ryzen 9 7950X 4.5GHz
GeForce GTX 1650 Super (Desktop)
min:
17.1 fps, P0.1:
90.6 fps, P1:
97.4 fps, max:
185.3 fps
...
NVIDIA GeForce GTX 1650 Super (Desktop)
...
...
NVIDIA GeForce GTX 1650 Super (Desktop)
...
...
NVIDIA GeForce GTX 1650 Super (Desktop)
...
...
NVIDIA GeForce GTX 1650 Super (Desktop)
...
...
NVIDIA GeForce GTX 1650 Super (Desktop)
...
» With all tested laptops playable in detail settings ultra.
Additional Benchmarks
Low Preset 1920x1080
84.9 [X] AMD Ryzen 9 5900X 3.7GHz
GeForce GTX 1650 Super (Desktop)
min:
24.8 fps, P0.1:
48.2 fps, P1:
63.9 fps, max:
227 fps
...
NVIDIA GeForce GTX 1650 Super (Desktop)
Intel Arc A580
...
...
Intel Arc A380
NVIDIA GeForce GTX 1650 Super (Desktop)
...
...
Intel Arc A380
NVIDIA GeForce GTX 1650 Super (Desktop)
...
...
Intel Arc A380
NVIDIA GeForce GTX 1650 Super (Desktop)
...
NVIDIA GeForce GTX 1650 Super (Desktop)
...
NVIDIA GeForce GTX 1650 Super (Desktop)
...
» With all tested laptops playable in detail settings ultra.
Additional Benchmarks
Low Preset 1920x1080
245 [X] AMD Ryzen 9 5900X 3.7GHz
GeForce GTX 1650 Super (Desktop)
min:
36.3 fps, P0.1:
122 fps, P1:
174 fps, max:
338 fps
...
NVIDIA GeForce GTX 1650 Super (Desktop)
...
...
NVIDIA GeForce GTX 1650 Super (Desktop)
...
...
NVIDIA GeForce GTX 1650 Super (Desktop)
...
NVIDIA GeForce GTX 1650 Super (Desktop)
...
0 100 200 300 400 500 600 700 800 900 1000 1100 1200 Tooltip
NVIDIA GeForce GTX 1650 Super (Desktop)
...
» With all tested laptops playable in detail settings high.
Additional Benchmarks
Low Preset 1920x1080
86.7 [X] AMD Ryzen 9 5900X 3.7GHz
GeForce GTX 1650 Super (Desktop)
min:
7.8 fps, P0.1:
16.3 fps, P1:
68 fps, max:
162 fps
180 [X] AMD Ryzen 9 5900X 3.7GHz
GeForce GTX 1650 Super (Desktop)
194 [X] KFA2 GeForce GTX 1650 Super EX One Click OC AMD Ryzen 9 7900X 4.7GHz
GeForce GTX 1650 Super (Desktop)
195 [X] KFA2 GeForce GTX 1650 Super EX One Click OC AMD Ryzen 9 7950X 4.5GHz
GeForce GTX 1650 Super (Desktop)
~ 190 fps
+ Compare
- Hide Comparison
...
Intel Arc A380
NVIDIA GeForce GTX 1650 Super (Desktop)
...
88 [X] AMD Ryzen 9 5900X 3.7GHz
GeForce GTX 1650 Super (Desktop)
93 [X] KFA2 GeForce GTX 1650 Super EX One Click OC AMD Ryzen 9 7900X 4.7GHz
GeForce GTX 1650 Super (Desktop)
97 [X] KFA2 GeForce GTX 1650 Super EX One Click OC AMD Ryzen 9 7950X 4.5GHz
GeForce GTX 1650 Super (Desktop)
~ 93 fps
+ Compare
- Hide Comparison
...
Intel Arc A380
NVIDIA GeForce GTX 1650 Super (Desktop)
...
77 [X] AMD Ryzen 9 5900X 3.7GHz
GeForce GTX 1650 Super (Desktop)
82 [X] KFA2 GeForce GTX 1650 Super EX One Click OC AMD Ryzen 9 7900X 4.7GHz
GeForce GTX 1650 Super (Desktop)
85 [X] KFA2 GeForce GTX 1650 Super EX One Click OC AMD Ryzen 9 7950X 4.5GHz
GeForce GTX 1650 Super (Desktop)
~ 81 fps
+ Compare
- Hide Comparison
...
Intel Arc A380
NVIDIA GeForce GTX 1650 Super (Desktop)
...
30 [X] KFA2 GeForce GTX 1650 Super EX One Click OC AMD Ryzen 9 7900X 4.7GHz
GeForce GTX 1650 Super (Desktop)
31 [X] AMD Ryzen 9 5900X 3.7GHz
GeForce GTX 1650 Super (Desktop)
32 [X] KFA2 GeForce GTX 1650 Super EX One Click OC AMD Ryzen 9 7950X 4.5GHz
GeForce GTX 1650 Super (Desktop)
~ 31 fps
+ Compare
- Hide Comparison
...
Intel Arc A380
NVIDIA GeForce GTX 1650 Super (Desktop)
...
26 [X] AMD Ryzen 9 5900X 3.7GHz
GeForce GTX 1650 Super (Desktop)
27 [X] KFA2 GeForce GTX 1650 Super EX One Click OC AMD Ryzen 9 7900X 4.7GHz
GeForce GTX 1650 Super (Desktop)
27 [X] KFA2 GeForce GTX 1650 Super EX One Click OC AMD Ryzen 9 7950X 4.5GHz
GeForce GTX 1650 Super (Desktop)
~ 27 fps
+ Compare
- Hide Comparison
NVIDIA GeForce GTX 1650 Super (Desktop)
...
18 [X] AMD Ryzen 9 5900X 3.7GHz
GeForce GTX 1650 Super (Desktop)
18 [X] KFA2 GeForce GTX 1650 Super EX One Click OC AMD Ryzen 9 7900X 4.7GHz
GeForce GTX 1650 Super (Desktop)
19 [X] KFA2 GeForce GTX 1650 Super EX One Click OC AMD Ryzen 9 7950X 4.5GHz
GeForce GTX 1650 Super (Desktop)
~ 18 fps
+ Compare
- Hide Comparison
NVIDIA GeForce GTX 1650 Super (Desktop)
...
» With all tested laptops playable in detail settings high.
Additional Benchmarks
Low Preset 1920x1080
110 [X] AMD Ryzen 9 5900X 3.7GHz
GeForce GTX 1650 Super (Desktop)
119 [X] KFA2 GeForce GTX 1650 Super EX One Click OC AMD Ryzen 9 7950X 4.5GHz
GeForce GTX 1650 Super (Desktop)
...
NVIDIA GeForce GTX 1650 Super (Desktop)
...
NVIDIA GeForce GTX 1650 Super (Desktop)
...
0 100 200 300 400 500 600 700 Tooltip
...
NVIDIA GeForce GTX 1650 Super (Desktop)
...
...
NVIDIA GeForce GTX 1650 Super (Desktop)
...
...
NVIDIA GeForce GTX 1650 Super (Desktop)
...
...
NVIDIA GeForce GTX 1650 Super (Desktop)
...
» With all tested laptops playable in detail settings ultra.
Additional Benchmarks
Low Preset 1920x1080
69.7 [X] AMD Ryzen 9 5900X 3.7GHz
GeForce GTX 1650 Super (Desktop)
min:
59 fps, P0.1:
62.4 fps, P1:
63.7 fps, max:
86.1 fps
...
NVIDIA GeForce GTX 1650 Super (Desktop)
...
...
NVIDIA GeForce GTX 1650 Super (Desktop)
...
...
NVIDIA GeForce GTX 1650 Super (Desktop)
...
...
NVIDIA GeForce GTX 1650 Super (Desktop)
...
...
NVIDIA GeForce GTX 1650 Super (Desktop)
...
» With all tested laptops playable in detail settings ultra.
Additional Benchmarks
Low Preset 1920x1080
97 [X] AMD Ryzen 9 5900X 3.7GHz
GeForce GTX 1650 Super (Desktop)
...
Intel Arc A380
NVIDIA GeForce GTX 1650 Super (Desktop)
Intel Arc A580
...
...
Intel Arc A380
NVIDIA GeForce GTX 1650 Super (Desktop)
...
...
Intel Arc A380
NVIDIA GeForce GTX 1650 Super (Desktop)
...
...
Intel Arc A380
NVIDIA GeForce GTX 1650 Super (Desktop)
...
NVIDIA GeForce GTX 1650 Super (Desktop)
...
...
NVIDIA GeForce GTX 1650 Super (Desktop)
...
» With all tested laptops playable in detail settings ultra.
Additional Benchmarks
Low Preset 1920x1080
70 [X] AMD Ryzen 9 5900X 3.7GHz
GeForce GTX 1650 Super (Desktop)
...
NVIDIA GeForce GTX 1650 Super (Desktop)
...
...
NVIDIA GeForce GTX 1650 Super (Desktop)
...
0 100 200 300 400 500 600 700 800 900 1000 1100 1200 1300 1400 1500 1600 Tooltip
...
NVIDIA GeForce GTX 1650 Super (Desktop)
...
NVIDIA GeForce GTX 1650 Super (Desktop)
...
NVIDIA GeForce GTX 1650 Super (Desktop)
...
» With all tested laptops playable in detail settings ultra.
Additional Benchmarks
Low Preset (DX12) 1920x1080
179 [X] AMD Ryzen 9 5900X 3.7GHz
GeForce GTX 1650 Super (Desktop)
min:
57.4 fps, P0.1:
95 fps, P1:
108 fps, max:
471 fps
...
NVIDIA GeForce GTX 1650 Super (Desktop)
...
...
NVIDIA GeForce GTX 1650 Super (Desktop)
Intel Arc A380
...
...
Intel Arc A380
NVIDIA GeForce GTX 1650 Super (Desktop)
...
...
NVIDIA GeForce GTX 1650 Super (Desktop)
Intel Arc A380
...
NVIDIA GeForce GTX 1650 Super (Desktop)
...
» With most tested laptops playable in detail settings high.
Additional Benchmarks
Low Graphics Quality 1920x1080
93 [X] AMD Ryzen 9 5900X 3.7GHz
GeForce GTX 1650 Super (Desktop)
min:
64 fps, max:
107 fps
98.2 [X] KFA2 GeForce GTX 1650 Super EX One Click OC AMD Ryzen 9 7950X 4.5GHz
GeForce GTX 1650 Super (Desktop)
min:
89 fps, max:
113 fps
...
NVIDIA GeForce GTX 1650 Super (Desktop)
...
...
NVIDIA GeForce GTX 1650 Super (Desktop)
...
...
NVIDIA GeForce GTX 1650 Super (Desktop)
...
0 100 200 300 400 500 600 700 Tooltip
NVIDIA GeForce GTX 1650 Super (Desktop)
...
» With all tested laptops playable in detail settings high.
Additional Benchmarks
Low Preset 1920x1080
96 [X] AMD Ryzen 9 5900X 3.7GHz
GeForce GTX 1650 Super (Desktop)
min:
32.3 fps, P0.1:
43 fps, P1:
77.4 fps, max:
214 fps
0 100 Tooltip : Ø138.5 (110.83-189.069)
...
NVIDIA GeForce GTX 1650 Super (Desktop)
...
...
NVIDIA GeForce GTX 1650 Super (Desktop)
...
...
NVIDIA GeForce GTX 1650 Super (Desktop)
...
...
NVIDIA GeForce GTX 1650 Super (Desktop)
...
NVIDIA GeForce GTX 1650 Super (Desktop)
...
NVIDIA GeForce GTX 1650 Super (Desktop)
...
» With all tested laptops playable in detail settings ultra.
Additional Benchmarks
Low Video Quality 1920x1080
84.5 [X] AMD Ryzen 9 5900X 3.7GHz
GeForce GTX 1650 Super (Desktop)
min:
53.7 fps, P0.1:
57.7 fps, P1:
65.3 fps, max:
154 fps
...
NVIDIA GeForce GTX 1650 Super (Desktop)
...
...
NVIDIA GeForce GTX 1650 Super (Desktop)
...
...
NVIDIA GeForce GTX 1650 Super (Desktop)
...
3 [X] AMD Ryzen 9 5900X 3.7GHz
GeForce GTX 1650 Super (Desktop)
min:
2.54 fps, P0.1:
2.55 fps, P1:
2.56 fps, max:
3.22 fps
36.7 [X] AMD Ryzen 9 5900X 3.7GHz
GeForce GTX 1650 Super (Desktop)
min:
19.3 fps, P0.1:
26.8 fps, P1:
28.8 fps, max:
56.2 fps
~ 20 fps
+ Compare
- Hide Comparison
+ 📈 Graph
- 📈 Hide Graph
0 100 200 300 400 500 600 700 800 900 1000 1100 1200 1300 1400 1500 1600 1700 1800 1900 2000 2100 2200 2300 2400 2500 2600 2700 2800 2900 3000 3100 3200 3300 3400 3500 3600 3700 3800 Tooltip : Ø254 (2.04-3882)
: Ø45.2 (30.162-141.4)
NVIDIA GeForce GTX 1650 Super (Desktop)
...
NVIDIA GeForce GTX 1650 Super (Desktop)
...
» With all tested laptops playable in detail settings high.
Additional Benchmarks
Low Preset 1920x1080
75 [X] AMD Ryzen 9 5900X 3.7GHz
GeForce GTX 1650 Super (Desktop)
min:
26.8 fps, P0.1:
46.8 fps, P1:
59.9 fps, max:
104 fps
308 [X] 815237
AMD Ryzen 9 5900X 3.7GHz
GeForce GTX 1650 Super (Desktop)
min:
253 fps, P1:
224 fps, max:
354 fps
355 [X] KFA2 GeForce GTX 1650 Super EX One Click OC 874931
AMD Ryzen 9 7900X 4.7GHz
GeForce GTX 1650 Super (Desktop)
min:
297 fps, P1:
255 fps, max:
432 fps
363 [X] KFA2 GeForce GTX 1650 Super EX One Click OC 874931
AMD Ryzen 9 7950X 4.5GHz
GeForce GTX 1650 Super (Desktop)
min:
307 fps, P1:
268 fps, max:
431 fps
~ 342 fps
+ Compare
- Hide Comparison
...
NVIDIA GeForce GTX 1650 Super (Desktop)
...
157 [X] 815237
AMD Ryzen 9 5900X 3.7GHz
GeForce GTX 1650 Super (Desktop)
min:
134 fps, P1:
132 fps, max:
186 fps
168.7 [X] KFA2 GeForce GTX 1650 Super EX One Click OC 874931
AMD Ryzen 9 7900X 4.7GHz
GeForce GTX 1650 Super (Desktop)
min:
145 fps, P1:
144 fps, max:
196 fps
172.7 [X] KFA2 GeForce GTX 1650 Super EX One Click OC 874931
AMD Ryzen 9 7950X 4.5GHz
GeForce GTX 1650 Super (Desktop)
min:
149 fps, P1:
147 fps, max:
200 fps
~ 166 fps
+ Compare
- Hide Comparison
...
NVIDIA GeForce GTX 1650 Super (Desktop)
...
127 [X] 815237
AMD Ryzen 9 5900X 3.7GHz
GeForce GTX 1650 Super (Desktop)
min:
111 fps, P1:
106 fps, max:
142 fps
134.8 [X] KFA2 GeForce GTX 1650 Super EX One Click OC 874931
AMD Ryzen 9 7900X 4.7GHz
GeForce GTX 1650 Super (Desktop)
min:
118 fps, P1:
115 fps, max:
151 fps
138 [X] KFA2 GeForce GTX 1650 Super EX One Click OC 874931
AMD Ryzen 9 7950X 4.5GHz
GeForce GTX 1650 Super (Desktop)
min:
115 fps, P1:
115 fps, max:
157 fps
~ 133 fps
+ Compare
- Hide Comparison
...
NVIDIA GeForce GTX 1650 Super (Desktop)
...
78.3 [X] KFA2 GeForce GTX 1650 Super EX One Click OC 874931
AMD Ryzen 9 7950X 4.5GHz
GeForce GTX 1650 Super (Desktop)
min:
61 fps, P1:
61 fps, max:
90 fps
80.2 [X] KFA2 GeForce GTX 1650 Super EX One Click OC 874931
AMD Ryzen 9 7900X 4.7GHz
GeForce GTX 1650 Super (Desktop)
min:
59 fps, P1:
59 fps, max:
91 fps
80.9 [X] 815237
AMD Ryzen 9 5900X 3.7GHz
GeForce GTX 1650 Super (Desktop)
min:
61 fps, P1:
61 fps, max:
94 fps
~ 80 fps
+ Compare
- Hide Comparison
...
NVIDIA GeForce GTX 1650 Super (Desktop)
...
57.7 [X] 815237
AMD Ryzen 9 5900X 3.7GHz
GeForce GTX 1650 Super (Desktop)
min:
45 fps, P1:
45 fps, max:
67 fps
59.1 [X] KFA2 GeForce GTX 1650 Super EX One Click OC 874931
AMD Ryzen 9 7950X 4.5GHz
GeForce GTX 1650 Super (Desktop)
min:
47 fps, P1:
47 fps, max:
68 fps
60 [X] KFA2 GeForce GTX 1650 Super EX One Click OC 874931
AMD Ryzen 9 7900X 4.7GHz
GeForce GTX 1650 Super (Desktop)
min:
47 fps, P1:
47 fps, max:
68 fps
~ 59 fps
+ Compare
- Hide Comparison
...
NVIDIA GeForce GTX 1650 Super (Desktop)
...
32.1 [X] 815237
AMD Ryzen 9 5900X 3.7GHz
GeForce GTX 1650 Super (Desktop)
min:
16 fps, P1:
26 fps, max:
37 fps
32.8 [X] KFA2 GeForce GTX 1650 Super EX One Click OC 874931
AMD Ryzen 9 7900X 4.7GHz
GeForce GTX 1650 Super (Desktop)
min:
26 fps, P1:
26 fps, max:
40 fps
32.8 [X] KFA2 GeForce GTX 1650 Super EX One Click OC 874931
AMD Ryzen 9 7950X 4.5GHz
GeForce GTX 1650 Super (Desktop)
min:
26 fps, P1:
26 fps, max:
40 fps
~ 33 fps
+ Compare
- Hide Comparison
...
Intel Arc A580
NVIDIA GeForce GTX 1650 Super (Desktop)
...
» With all tested laptops playable in detail settings ultra.
...
NVIDIA GeForce GTX 1650 Super (Desktop)
...
0 100 Tooltip : Ø145.7 (142.245-152.55)
...
NVIDIA GeForce GTX 1650 Super (Desktop)
...
...
NVIDIA GeForce GTX 1650 Super (Desktop)
...
...
NVIDIA GeForce GTX 1650 Super (Desktop)
...
...
NVIDIA GeForce GTX 1650 Super (Desktop)
...
» With all tested laptops playable in detail settings high.
Additional Benchmarks
Low Preset 1920x1080
144 [X] AMD Ryzen 9 5900X 3.7GHz
GeForce GTX 1650 Super (Desktop)
min:
46.6 fps, P0.1:
103 fps, P1:
111 fps, max:
217 fps
0 100 200 300 400 500 600 Tooltip
...
NVIDIA GeForce GTX 1650 Super (Desktop)
...
...
NVIDIA GeForce GTX 1650 Super (Desktop)
...
...
NVIDIA GeForce GTX 1650 Super (Desktop)
...
...
NVIDIA GeForce GTX 1650 Super (Desktop)
...
NVIDIA GeForce GTX 1650 Super (Desktop)
...
NVIDIA GeForce GTX 1650 Super (Desktop)
...
» With all tested laptops playable in detail settings ultra.
Additional Benchmarks
Low Preset 1920x1080
100 [X] AMD Ryzen 9 5900X 3.7GHz
GeForce GTX 1650 Super (Desktop)
min:
33.1 fps, P0.1:
45.4 fps, P1:
60.8 fps, max:
259 fps
...
NVIDIA GeForce GTX 1650 Super (Desktop)
...
...
NVIDIA GeForce GTX 1650 Super (Desktop)
...
...
NVIDIA GeForce GTX 1650 Super (Desktop)
...
NVIDIA GeForce GTX 1650 Super (Desktop)
...
» With all tested laptops playable in detail settings ultra.
...
NVIDIA GeForce GTX 1650 Super (Desktop)
...
...
NVIDIA GeForce GTX 1650 Super (Desktop)
...
...
NVIDIA GeForce GTX 1650 Super (Desktop)
...
...
NVIDIA GeForce GTX 1650 Super (Desktop)
...
NVIDIA GeForce GTX 1650 Super (Desktop)
...
NVIDIA GeForce GTX 1650 Super (Desktop)
...
» With all tested laptops playable in detail settings ultra.
Additional Benchmarks
Prioritize Performance Preset 1920x1080
153 [X] AMD Ryzen 9 5900X 3.7GHz
GeForce GTX 1650 Super (Desktop)
min:
114 fps, P0.1:
116 fps, P1:
118 fps, max:
189 fps
0 100 200 Tooltip : Ø170.4 (129.24-225.035)
...
NVIDIA GeForce GTX 1650 Super (Desktop)
...
NVIDIA GeForce GTX 1650 Super (Desktop)
...
...
NVIDIA GeForce GTX 1650 Super (Desktop)
...
...
NVIDIA GeForce GTX 1650 Super (Desktop)
...
...
NVIDIA GeForce GTX 1650 Super (Desktop)
...
NVIDIA GeForce GTX 1650 Super (Desktop)
...
» With all tested laptops playable in detail settings ultra.
Additional Benchmarks
Low Preset 1920x1080
108 [X] AMD Ryzen 9 5900X 3.7GHz
GeForce GTX 1650 Super (Desktop)
min:
12.2 fps, P0.1:
43.4 fps, P1:
62.2 fps, max:
267 fps
...
NVIDIA GeForce GTX 1650 Super (Desktop)
...
...
NVIDIA GeForce GTX 1650 Super (Desktop)
...
...
NVIDIA GeForce GTX 1650 Super (Desktop)
...
...
NVIDIA GeForce GTX 1650 Super (Desktop)
...
...
NVIDIA GeForce GTX 1650 Super (Desktop)
...
NVIDIA GeForce GTX 1650 Super (Desktop)
...
» With all tested laptops playable in detail settings ultra.
...
NVIDIA GeForce GTX 1650 Super (Desktop)
...
...
NVIDIA GeForce GTX 1650 Super (Desktop)
...
...
NVIDIA GeForce GTX 1650 Super (Desktop)
...
...
NVIDIA GeForce GTX 1650 Super (Desktop)
...
NVIDIA GeForce GTX 1650 Super (Desktop)
...
NVIDIA GeForce GTX 1650 Super (Desktop)
...
» With all tested laptops playable in detail settings high.
Additional Benchmarks
Low Preset 1920x1080
53 [X] AMD Ryzen 9 5900X 3.7GHz
GeForce GTX 1650 Super (Desktop)
...
NVIDIA GeForce GTX 1650 Super (Desktop)
...
...
NVIDIA GeForce GTX 1650 Super (Desktop)
...
...
NVIDIA GeForce GTX 1650 Super (Desktop)
...
...
NVIDIA GeForce GTX 1650 Super (Desktop)
...
...
NVIDIA GeForce GTX 1650 Super (Desktop)
...
...
NVIDIA GeForce GTX 1650 Super (Desktop)
...
» With all tested laptops playable in detail settings ultra.
...
NVIDIA GeForce GTX 1650 Super (Desktop)
...
...
NVIDIA GeForce GTX 1650 Super (Desktop)
...
...
NVIDIA GeForce GTX 1650 Super (Desktop)
...
...
NVIDIA GeForce GTX 1650 Super (Desktop)
...
NVIDIA GeForce GTX 1650 Super (Desktop)
...
NVIDIA GeForce GTX 1650 Super (Desktop)
...
» With all tested laptops playable in detail settings ultra.
...
NVIDIA GeForce GTX 1650 Super (Desktop)
...
...
NVIDIA GeForce GTX 1650 Super (Desktop)
...
...
NVIDIA GeForce GTX 1650 Super (Desktop)
...
NVIDIA GeForce GTX 1650 Super (Desktop)
...
NVIDIA GeForce GTX 1650 Super (Desktop)
...
NVIDIA GeForce GTX 1650 Super (Desktop)
...
» With all tested laptops playable in detail settings ultra.
...
Intel Arc A380
NVIDIA GeForce GTX 1650 Super (Desktop)
...
...
Intel Arc A380
NVIDIA GeForce GTX 1650 Super (Desktop)
...
...
NVIDIA GeForce GTX 1650 Super (Desktop)
Intel Arc A380
...
NVIDIA GeForce GTX 1650 Super (Desktop)
Intel Arc A380
...
NVIDIA GeForce GTX 1650 Super (Desktop)
...
...
NVIDIA GeForce GTX 1650 Super (Desktop)
...
» With all tested laptops playable in detail settings med..
...
NVIDIA GeForce GTX 1650 Super (Desktop)
...
...
Intel Arc A580
NVIDIA GeForce GTX 1650 Super (Desktop)
...
...
Intel Arc A580
NVIDIA GeForce GTX 1650 Super (Desktop)
...
...
Intel Arc A580
NVIDIA GeForce GTX 1650 Super (Desktop)
...
...
NVIDIA GeForce GTX 1650 Super (Desktop)
Intel Arc A580
...
NVIDIA GeForce GTX 1650 Super (Desktop)
...
» With all tested laptops playable in detail settings ultra.
...
Intel Arc A580
NVIDIA GeForce GTX 1650 Super (Desktop)
...
...
NVIDIA GeForce GTX 1650 Super (Desktop)
...
...
NVIDIA GeForce GTX 1650 Super (Desktop)
...
...
NVIDIA GeForce GTX 1650 Super (Desktop)
Intel Arc A380
...
NVIDIA GeForce GTX 1650 Super (Desktop)
...
NVIDIA GeForce GTX 1650 Super (Desktop)
...
» With all tested laptops playable in detail settings high.
...
NVIDIA GeForce GTX 1650 Super (Desktop)
...
...
NVIDIA GeForce GTX 1650 Super (Desktop)
...
...
NVIDIA GeForce GTX 1650 Super (Desktop)
...
...
NVIDIA GeForce GTX 1650 Super (Desktop)
...
...
NVIDIA GeForce GTX 1650 Super (Desktop)
...
...
NVIDIA GeForce GTX 1650 Super (Desktop)
...
» With all tested laptops playable in detail settings ultra.
...
NVIDIA GeForce GTX 1650 Super (Desktop)
...
...
NVIDIA GeForce GTX 1650 Super (Desktop)
...
...
NVIDIA GeForce GTX 1650 Super (Desktop)
...
...
NVIDIA GeForce GTX 1650 Super (Desktop)
...
NVIDIA GeForce GTX 1650 Super (Desktop)
...
NVIDIA GeForce GTX 1650 Super (Desktop)
...
» With all tested laptops playable in detail settings ultra.
...
NVIDIA GeForce GTX 1650 Super (Desktop)
...
...
NVIDIA GeForce GTX 1650 Super (Desktop)
...
...
NVIDIA GeForce GTX 1650 Super (Desktop)
...
...
NVIDIA GeForce GTX 1650 Super (Desktop)
...
NVIDIA GeForce GTX 1650 Super (Desktop)
...
» With all tested laptops playable in detail settings high.
...
NVIDIA GeForce GTX 1650 Super (Desktop)
...
...
NVIDIA GeForce GTX 1650 Super (Desktop)
...
...
NVIDIA GeForce GTX 1650 Super (Desktop)
...
NVIDIA GeForce GTX 1650 Super (Desktop)
...
NVIDIA GeForce GTX 1650 Super (Desktop)
...
NVIDIA GeForce GTX 1650 Super (Desktop)
...
» With all tested laptops playable in detail settings high.
...
NVIDIA GeForce GTX 1650 Super (Desktop)
...
...
NVIDIA GeForce GTX 1650 Super (Desktop)
...
...
NVIDIA GeForce GTX 1650 Super (Desktop)
...
...
NVIDIA GeForce GTX 1650 Super (Desktop)
...
NVIDIA GeForce GTX 1650 Super (Desktop)
...
NVIDIA GeForce GTX 1650 Super (Desktop)
...
» With all tested laptops playable in detail settings high.
...
Intel Arc A580
NVIDIA GeForce GTX 1650 Super (Desktop)
...
...
NVIDIA GeForce GTX 1650 Super (Desktop)
...
...
NVIDIA GeForce GTX 1650 Super (Desktop)
...
...
Intel Arc A380
NVIDIA GeForce GTX 1650 Super (Desktop)
...
...
NVIDIA GeForce GTX 1650 Super (Desktop)
...
NVIDIA GeForce GTX 1650 Super (Desktop)
...
» With all tested laptops playable in detail settings ultra.
...
Intel Arc A380
NVIDIA GeForce GTX 1650 Super (Desktop)
...
...
Intel Arc A380
NVIDIA GeForce GTX 1650 Super (Desktop)
...
...
Intel Arc A380
NVIDIA GeForce GTX 1650 Super (Desktop)
...
...
Intel Arc A380
NVIDIA GeForce GTX 1650 Super (Desktop)
...
...
NVIDIA GeForce GTX 1650 Super (Desktop)
...
NVIDIA GeForce GTX 1650 Super (Desktop)
...
» With all tested laptops playable in detail settings ultra.
257 [X] AMD Ryzen 9 5900X 3.7GHz
GeForce GTX 1650 Super (Desktop)
min:
233 fps, max:
283 fps
316 [X] KFA2 GeForce GTX 1650 Super EX One Click OC 759689
AMD Ryzen 9 7900X 4.7GHz
GeForce GTX 1650 Super (Desktop)
min:
290 fps, max:
350 fps
336 [X] KFA2 GeForce GTX 1650 Super EX One Click OC 759689
AMD Ryzen 9 7950X 4.5GHz
GeForce GTX 1650 Super (Desktop)
min:
306 fps, max:
375 fps
~ 303 fps
+ Compare
- Hide Comparison
...
NVIDIA GeForce GTX 1650 Super (Desktop)
...
134 [X] AMD Ryzen 9 5900X 3.7GHz
GeForce GTX 1650 Super (Desktop)
min:
118 fps, max:
153 fps
156.7 [X] KFA2 GeForce GTX 1650 Super EX One Click OC 759689
AMD Ryzen 9 7900X 4.7GHz
GeForce GTX 1650 Super (Desktop)
min:
132 fps, max:
178 fps
165 [X] KFA2 GeForce GTX 1650 Super EX One Click OC 759689
AMD Ryzen 9 7950X 4.5GHz
GeForce GTX 1650 Super (Desktop)
min:
138 fps, max:
191 fps
~ 152 fps
+ Compare
- Hide Comparison
...
NVIDIA GeForce GTX 1650 Super (Desktop)
...
108 [X] AMD Ryzen 9 5900X 3.7GHz
GeForce GTX 1650 Super (Desktop)
min:
95 fps, max:
124 fps
121.5 [X] KFA2 GeForce GTX 1650 Super EX One Click OC 759689
AMD Ryzen 9 7900X 4.7GHz
GeForce GTX 1650 Super (Desktop)
min:
103 fps, max:
140 fps
127.5 [X] KFA2 GeForce GTX 1650 Super EX One Click OC 759689
AMD Ryzen 9 7950X 4.5GHz
GeForce GTX 1650 Super (Desktop)
min:
107 fps, max:
147 fps
~ 119 fps
+ Compare
- Hide Comparison
...
NVIDIA GeForce GTX 1650 Super (Desktop)
...
75 [X] AMD Ryzen 9 5900X 3.7GHz
GeForce GTX 1650 Super (Desktop)
min:
61 fps, max:
91 fps
83 [X] KFA2 GeForce GTX 1650 Super EX One Click OC 759689
AMD Ryzen 9 7900X 4.7GHz
GeForce GTX 1650 Super (Desktop)
min:
67 fps, max:
99 fps
86.2 [X] KFA2 GeForce GTX 1650 Super EX One Click OC 759689
AMD Ryzen 9 7950X 4.5GHz
GeForce GTX 1650 Super (Desktop)
min:
69 fps, max:
104 fps
~ 81 fps
+ Compare
- Hide Comparison
...
NVIDIA GeForce GTX 1650 Super (Desktop)
...
55 [X] AMD Ryzen 9 5900X 3.7GHz
GeForce GTX 1650 Super (Desktop)
min:
46 fps, max:
66 fps
60.4 [X] KFA2 GeForce GTX 1650 Super EX One Click OC 759689
AMD Ryzen 9 7900X 4.7GHz
GeForce GTX 1650 Super (Desktop)
min:
50 fps, max:
72 fps
62 [X] KFA2 GeForce GTX 1650 Super EX One Click OC 759689
AMD Ryzen 9 7950X 4.5GHz
GeForce GTX 1650 Super (Desktop)
min:
51 fps, max:
74 fps
~ 59 fps
+ Compare
- Hide Comparison
...
NVIDIA GeForce GTX 1650 Super (Desktop)
...
31 [X] AMD Ryzen 9 5900X 3.7GHz
GeForce GTX 1650 Super (Desktop)
min:
26 fps, max:
37 fps
32.6 [X] KFA2 GeForce GTX 1650 Super EX One Click OC 759689
AMD Ryzen 9 7900X 4.7GHz
GeForce GTX 1650 Super (Desktop)
min:
27 fps, max:
38 fps
33.3 [X] KFA2 GeForce GTX 1650 Super EX One Click OC 759689
AMD Ryzen 9 7950X 4.5GHz
GeForce GTX 1650 Super (Desktop)
min:
27 fps, max:
39 fps
~ 32 fps
+ Compare
- Hide Comparison
...
NVIDIA GeForce GTX 1650 Super (Desktop)
...
» With all tested laptops playable in detail settings ultra.
...
NVIDIA GeForce GTX 1650 Super (Desktop)
...
...
NVIDIA GeForce GTX 1650 Super (Desktop)
...
...
NVIDIA GeForce GTX 1650 Super (Desktop)
...
» With all tested laptops playable in detail settings high.
...
NVIDIA GeForce GTX 1650 Super (Desktop)
...
...
NVIDIA GeForce GTX 1650 Super (Desktop)
...
...
NVIDIA GeForce GTX 1650 Super (Desktop)
...
NVIDIA GeForce GTX 1650 Super (Desktop)
...
NVIDIA GeForce GTX 1650 Super (Desktop)
...
» With all tested laptops playable in detail settings high.
...
NVIDIA GeForce GTX 1650 Super (Desktop)
...
...
NVIDIA GeForce GTX 1650 Super (Desktop)
...
...
NVIDIA GeForce GTX 1650 Super (Desktop)
...
...
NVIDIA GeForce GTX 1650 Super (Desktop)
...
...
NVIDIA GeForce GTX 1650 Super (Desktop)
...
» With all tested laptops playable in detail settings ultra.
161 [X] AMD Ryzen 9 5900X 3.7GHz
GeForce GTX 1650 Super (Desktop)
207 [X] KFA2 GeForce GTX 1650 Super EX One Click OC AMD Ryzen 9 7900X 4.7GHz
GeForce GTX 1650 Super (Desktop)
215 [X] KFA2 GeForce GTX 1650 Super EX One Click OC AMD Ryzen 9 7950X 4.5GHz
GeForce GTX 1650 Super (Desktop)
~ 194 fps
+ Compare
- Hide Comparison
...
NVIDIA GeForce GTX 1650 Super (Desktop)
...
81.5 [X] AMD Ryzen 9 5900X 3.7GHz
GeForce GTX 1650 Super (Desktop)
89.5 [X] KFA2 GeForce GTX 1650 Super EX One Click OC AMD Ryzen 9 7900X 4.7GHz
GeForce GTX 1650 Super (Desktop)
90.8 [X] KFA2 GeForce GTX 1650 Super EX One Click OC AMD Ryzen 9 7950X 4.5GHz
GeForce GTX 1650 Super (Desktop)
~ 87 fps
+ Compare
- Hide Comparison
...
NVIDIA GeForce GTX 1650 Super (Desktop)
...
52.8 [X] AMD Ryzen 9 5900X 3.7GHz
GeForce GTX 1650 Super (Desktop)
57.7 [X] KFA2 GeForce GTX 1650 Super EX One Click OC AMD Ryzen 9 7900X 4.7GHz
GeForce GTX 1650 Super (Desktop)
58.2 [X] KFA2 GeForce GTX 1650 Super EX One Click OC AMD Ryzen 9 7950X 4.5GHz
GeForce GTX 1650 Super (Desktop)
~ 56 fps
+ Compare
- Hide Comparison
...
NVIDIA GeForce GTX 1650 Super (Desktop)
...
39.8 [X] AMD Ryzen 9 5900X 3.7GHz
GeForce GTX 1650 Super (Desktop)
43.4 [X] KFA2 GeForce GTX 1650 Super EX One Click OC AMD Ryzen 9 7900X 4.7GHz
GeForce GTX 1650 Super (Desktop)
43.7 [X] KFA2 GeForce GTX 1650 Super EX One Click OC AMD Ryzen 9 7950X 4.5GHz
GeForce GTX 1650 Super (Desktop)
~ 42 fps
+ Compare
- Hide Comparison
...
NVIDIA GeForce GTX 1650 Super (Desktop)
...
23.3 [X] AMD Ryzen 9 5900X 3.7GHz
GeForce GTX 1650 Super (Desktop)
29.5 [X] KFA2 GeForce GTX 1650 Super EX One Click OC AMD Ryzen 9 7900X 4.7GHz
GeForce GTX 1650 Super (Desktop)
29.9 [X] KFA2 GeForce GTX 1650 Super EX One Click OC AMD Ryzen 9 7950X 4.5GHz
GeForce GTX 1650 Super (Desktop)
~ 28 fps
+ Compare
- Hide Comparison
...
NVIDIA GeForce GTX 1650 Super (Desktop)
...
7.9 [X] AMD Ryzen 9 5900X 3.7GHz
GeForce GTX 1650 Super (Desktop)
11.8 [X] KFA2 GeForce GTX 1650 Super EX One Click OC AMD Ryzen 9 7900X 4.7GHz
GeForce GTX 1650 Super (Desktop)
11.8 [X] KFA2 GeForce GTX 1650 Super EX One Click OC AMD Ryzen 9 7950X 4.5GHz
GeForce GTX 1650 Super (Desktop)
~ 10 fps
+ Compare
- Hide Comparison
...
NVIDIA GeForce GTX 1650 Super (Desktop)
...
» With all tested laptops playable in detail settings ultra.
Additional Benchmarks
Very Low Overall Quality (DX11) 1920x1080
137.3 [X] KFA2 GeForce GTX 1650 Super EX One Click OC AMD Ryzen 9 7950X 4.5GHz
GeForce GTX 1650 Super (Desktop)
...
NVIDIA GeForce GTX 1650 Super (Desktop)
...
...
NVIDIA GeForce GTX 1650 Super (Desktop)
...
...
NVIDIA GeForce GTX 1650 Super (Desktop)
...
...
NVIDIA GeForce GTX 1650 Super (Desktop)
...
...
NVIDIA GeForce GTX 1650 Super (Desktop)
...
» With all tested laptops playable in detail settings high.
...
NVIDIA GeForce GTX 1650 Super (Desktop)
Intel Arc A580
...
NVIDIA GeForce GTX 1650 Super (Desktop)
...
...
NVIDIA GeForce GTX 1650 Super (Desktop)
...
...
NVIDIA GeForce GTX 1650 Super (Desktop)
Intel Arc A380
...
...
NVIDIA GeForce GTX 1650 Super (Desktop)
...
...
NVIDIA GeForce GTX 1650 Super (Desktop)
...
» With all tested laptops playable in detail settings high.
...
NVIDIA GeForce GTX 1650 Super (Desktop)
...
...
Intel Arc A380
NVIDIA GeForce GTX 1650 Super (Desktop)
...
...
Intel Arc A380
NVIDIA GeForce GTX 1650 Super (Desktop)
...
...
NVIDIA GeForce GTX 1650 Super (Desktop)
...
...
NVIDIA GeForce GTX 1650 Super (Desktop)
...
...
NVIDIA GeForce GTX 1650 Super (Desktop)
...
» With all tested laptops playable in detail settings ultra.
135 [X] AMD Ryzen 9 5900X 3.7GHz
GeForce GTX 1650 Super (Desktop)
min:
102 fps, max:
178 fps
159 [X] KFA2 GeForce GTX 1650 Super EX One Click OC AMD Ryzen 9 7900X 4.7GHz
GeForce GTX 1650 Super (Desktop)
min:
125 fps, max:
195 fps
162 [X] KFA2 GeForce GTX 1650 Super EX One Click OC AMD Ryzen 9 7950X 4.5GHz
GeForce GTX 1650 Super (Desktop)
min:
128 fps, max:
199 fps
~ 152 fps
+ Compare
- Hide Comparison
+ 📈 Graph
- 📈 Hide Graph
0 100 Tooltip : Ø135.2 (102-178)
: Ø159 (125-195)
: Ø162.4 (128-199)
...
NVIDIA GeForce GTX 1650 Super (Desktop)
...
83 [X] AMD Ryzen 9 5900X 3.7GHz
GeForce GTX 1650 Super (Desktop)
min:
68 fps, max:
98 fps
89 [X] KFA2 GeForce GTX 1650 Super EX One Click OC AMD Ryzen 9 7900X 4.7GHz
GeForce GTX 1650 Super (Desktop)
min:
73 fps, max:
104 fps
91 [X] KFA2 GeForce GTX 1650 Super EX One Click OC AMD Ryzen 9 7950X 4.5GHz
GeForce GTX 1650 Super (Desktop)
min:
74 fps, max:
106 fps
~ 88 fps
+ Compare
- Hide Comparison
+ 📈 Graph
- 📈 Hide Graph
0 100 Tooltip : Ø83.2 (68-98)
: Ø89.5 (73-104)
: Ø90.9 (74-106)
...
NVIDIA GeForce GTX 1650 Super (Desktop)
...
78 [X] AMD Ryzen 9 5900X 3.7GHz
GeForce GTX 1650 Super (Desktop)
min:
63 fps, max:
92 fps
83 [X] KFA2 GeForce GTX 1650 Super EX One Click OC AMD Ryzen 9 7900X 4.7GHz
GeForce GTX 1650 Super (Desktop)
min:
68 fps, max:
97 fps
85 [X] KFA2 GeForce GTX 1650 Super EX One Click OC AMD Ryzen 9 7950X 4.5GHz
GeForce GTX 1650 Super (Desktop)
min:
68 fps, max:
99 fps
~ 82 fps
+ Compare
- Hide Comparison
+ 📈 Graph
- 📈 Hide Graph
0 Tooltip : Ø77.5 (63-92)
: Ø83.4 (68-97)
: Ø84.5 (68-99)
...
NVIDIA GeForce GTX 1650 Super (Desktop)
...
71 [X] AMD Ryzen 9 5900X 3.7GHz
GeForce GTX 1650 Super (Desktop)
min:
55 fps, max:
86 fps
76 [X] KFA2 GeForce GTX 1650 Super EX One Click OC AMD Ryzen 9 7900X 4.7GHz
GeForce GTX 1650 Super (Desktop)
min:
58 fps, max:
92 fps
78 [X] KFA2 GeForce GTX 1650 Super EX One Click OC AMD Ryzen 9 7950X 4.5GHz
GeForce GTX 1650 Super (Desktop)
min:
59 fps, max:
94 fps
~ 75 fps
+ Compare
- Hide Comparison
+ 📈 Graph
- 📈 Hide Graph
0 Tooltip : Ø71 (55-86)
: Ø76.3 (58-92)
: Ø77.9 (59-94)
...
NVIDIA GeForce GTX 1650 Super (Desktop)
...
52 [X] AMD Ryzen 9 5900X 3.7GHz
GeForce GTX 1650 Super (Desktop)
min:
42 fps, max:
62 fps
55 [X] KFA2 GeForce GTX 1650 Super EX One Click OC AMD Ryzen 9 7900X 4.7GHz
GeForce GTX 1650 Super (Desktop)
min:
44 fps, max:
66 fps
56 [X] KFA2 GeForce GTX 1650 Super EX One Click OC AMD Ryzen 9 7950X 4.5GHz
GeForce GTX 1650 Super (Desktop)
min:
44 fps, max:
68 fps
~ 54 fps
+ Compare
- Hide Comparison
+ 📈 Graph
- 📈 Hide Graph
0 Tooltip : Ø52 (42-62)
: Ø54.7 (44-66)
: Ø55.7 (44-68)
...
NVIDIA GeForce GTX 1650 Super (Desktop)
...
26 [X] KFA2 GeForce GTX 1650 Super EX One Click OC AMD Ryzen 9 7950X 4.5GHz
GeForce GTX 1650 Super (Desktop)
min:
22 fps, max:
32 fps
28 [X] AMD Ryzen 9 5900X 3.7GHz
GeForce GTX 1650 Super (Desktop)
min:
23 fps, max:
34 fps
28 [X] KFA2 GeForce GTX 1650 Super EX One Click OC AMD Ryzen 9 7900X 4.7GHz
GeForce GTX 1650 Super (Desktop)
min:
23 fps, max:
34 fps
~ 27 fps
+ Compare
- Hide Comparison
+ 📈 Graph
- 📈 Hide Graph
0 Tooltip : Ø26.4 (22-32)
: Ø27.7 (23-34)
: Ø27.7 (23-34)
...
NVIDIA GeForce GTX 1650 Super (Desktop)
...
» With all tested laptops playable in detail settings ultra.
135 [X] AMD Ryzen 9 5900X 3.7GHz
GeForce GTX 1650 Super (Desktop)
min:
67.36 fps, max:
227.27 fps
141.8 [X] KFA2 GeForce GTX 1650 Super EX One Click OC AMD Ryzen 9 7900X 4.7GHz
GeForce GTX 1650 Super (Desktop)
min:
72.7 fps, max:
231.91 fps
150.7 [X] KFA2 GeForce GTX 1650 Super EX One Click OC AMD Ryzen 9 7950X 4.5GHz
GeForce GTX 1650 Super (Desktop)
min:
75.36 fps, max:
245.52 fps
~ 143 fps
+ Compare
- Hide Comparison
...
NVIDIA GeForce GTX 1650 Super (Desktop)
...
64.4 [X] AMD Ryzen 9 5900X 3.7GHz
GeForce GTX 1650 Super (Desktop)
min:
31.49 fps, max:
146.07 fps
66.7 [X] KFA2 GeForce GTX 1650 Super EX One Click OC AMD Ryzen 9 7900X 4.7GHz
GeForce GTX 1650 Super (Desktop)
min:
32.13 fps, max:
124.42 fps
68.8 [X] KFA2 GeForce GTX 1650 Super EX One Click OC AMD Ryzen 9 7950X 4.5GHz
GeForce GTX 1650 Super (Desktop)
min:
33.75 fps, max:
122.2 fps
~ 67 fps
+ Compare
- Hide Comparison
...
NVIDIA GeForce GTX 1650 Super (Desktop)
...
47 [X] AMD Ryzen 9 5900X 3.7GHz
GeForce GTX 1650 Super (Desktop)
min:
24.44 fps, max:
103.68 fps
48.6 [X] KFA2 GeForce GTX 1650 Super EX One Click OC AMD Ryzen 9 7900X 4.7GHz
GeForce GTX 1650 Super (Desktop)
min:
25.4 fps, max:
86.11 fps
49.9 [X] KFA2 GeForce GTX 1650 Super EX One Click OC AMD Ryzen 9 7950X 4.5GHz
GeForce GTX 1650 Super (Desktop)
min:
25.91 fps, max:
80.96 fps
~ 49 fps
+ Compare
- Hide Comparison
...
NVIDIA GeForce GTX 1650 Super (Desktop)
...
36.6 [X] AMD Ryzen 9 5900X 3.7GHz
GeForce GTX 1650 Super (Desktop)
min:
20.42 fps, max:
76.72 fps
38 [X] KFA2 GeForce GTX 1650 Super EX One Click OC AMD Ryzen 9 7900X 4.7GHz
GeForce GTX 1650 Super (Desktop)
min:
21.62 fps, max:
63.62 fps
38.8 [X] KFA2 GeForce GTX 1650 Super EX One Click OC AMD Ryzen 9 7950X 4.5GHz
GeForce GTX 1650 Super (Desktop)
min:
21.96 fps, max:
62.27 fps
~ 38 fps
+ Compare
- Hide Comparison
...
NVIDIA GeForce GTX 1650 Super (Desktop)
...
28.5 [X] AMD Ryzen 9 5900X 3.7GHz
GeForce GTX 1650 Super (Desktop)
min:
16.88 fps, max:
51.46 fps
29.2 [X] KFA2 GeForce GTX 1650 Super EX One Click OC AMD Ryzen 9 7900X 4.7GHz
GeForce GTX 1650 Super (Desktop)
min:
17.38 fps, max:
45.75 fps
29.8 [X] KFA2 GeForce GTX 1650 Super EX One Click OC AMD Ryzen 9 7950X 4.5GHz
GeForce GTX 1650 Super (Desktop)
min:
17.88 fps, max:
45.34 fps
~ 29 fps
+ Compare
- Hide Comparison
...
NVIDIA GeForce GTX 1650 Super (Desktop)
...
13.8 [X] KFA2 GeForce GTX 1650 Super EX One Click OC AMD Ryzen 9 7950X 4.5GHz
GeForce GTX 1650 Super (Desktop)
min:
7.27 fps, max:
23.73 fps
16.1 [X] AMD Ryzen 9 5900X 3.7GHz
GeForce GTX 1650 Super (Desktop)
min:
9.6 fps, max:
26.07 fps
16.1 [X] KFA2 GeForce GTX 1650 Super EX One Click OC AMD Ryzen 9 7900X 4.7GHz
GeForce GTX 1650 Super (Desktop)
min:
9.73 fps, max:
23.54 fps
~ 15 fps
+ Compare
- Hide Comparison
...
NVIDIA GeForce GTX 1650 Super (Desktop)
...
» With all tested laptops playable in detail settings ultra.
...
NVIDIA GeForce GTX 1650 Super (Desktop)
...
...
NVIDIA GeForce GTX 1650 Super (Desktop)
...
...
NVIDIA GeForce GTX 1650 Super (Desktop)
...
...
NVIDIA GeForce GTX 1650 Super (Desktop)
...
...
NVIDIA GeForce GTX 1650 Super (Desktop)
...
...
NVIDIA GeForce GTX 1650 Super (Desktop)
...
» With all tested laptops playable in detail settings ultra.
181 [X] AMD Ryzen 9 5900X 3.7GHz
GeForce GTX 1650 Super (Desktop)
216 [X] KFA2 GeForce GTX 1650 Super EX One Click OC AMD Ryzen 9 7950X 4.5GHz
GeForce GTX 1650 Super (Desktop)
max:
341.9 fps
220 [X] KFA2 GeForce GTX 1650 Super EX One Click OC AMD Ryzen 9 7900X 4.7GHz
GeForce GTX 1650 Super (Desktop)
max:
341.3 fps
~ 206 fps
+ Compare
- Hide Comparison
...
NVIDIA GeForce GTX 1650 Super (Desktop)
...
85.4 [X] KFA2 GeForce GTX 1650 Super EX One Click OC AMD Ryzen 9 7900X 4.7GHz
GeForce GTX 1650 Super (Desktop)
max:
138.5 fps
85.4 [X] KFA2 GeForce GTX 1650 Super EX One Click OC AMD Ryzen 9 7950X 4.5GHz
GeForce GTX 1650 Super (Desktop)
max:
137.9 fps
86 [X] AMD Ryzen 9 5900X 3.7GHz
GeForce GTX 1650 Super (Desktop)
~ 86 fps
+ Compare
- Hide Comparison
...
NVIDIA GeForce GTX 1650 Super (Desktop)
...
71.7 [X] KFA2 GeForce GTX 1650 Super EX One Click OC AMD Ryzen 9 7950X 4.5GHz
GeForce GTX 1650 Super (Desktop)
max:
109.2 fps
71.9 [X] KFA2 GeForce GTX 1650 Super EX One Click OC AMD Ryzen 9 7900X 4.7GHz
GeForce GTX 1650 Super (Desktop)
max:
108.7 fps
73 [X] AMD Ryzen 9 5900X 3.7GHz
GeForce GTX 1650 Super (Desktop)
~ 72 fps
+ Compare
- Hide Comparison
...
NVIDIA GeForce GTX 1650 Super (Desktop)
...
58.9 [X] KFA2 GeForce GTX 1650 Super EX One Click OC AMD Ryzen 9 7950X 4.5GHz
GeForce GTX 1650 Super (Desktop)
max:
101.5 fps
61.9 [X] KFA2 GeForce GTX 1650 Super EX One Click OC AMD Ryzen 9 7900X 4.7GHz
GeForce GTX 1650 Super (Desktop)
max:
104.7 fps
63 [X] AMD Ryzen 9 5900X 3.7GHz
GeForce GTX 1650 Super (Desktop)
~ 61 fps
+ Compare
- Hide Comparison
...
NVIDIA GeForce GTX 1650 Super (Desktop)
...
38.9 [X] KFA2 GeForce GTX 1650 Super EX One Click OC AMD Ryzen 9 7950X 4.5GHz
GeForce GTX 1650 Super (Desktop)
max:
61.6 fps
39.8 [X] KFA2 GeForce GTX 1650 Super EX One Click OC AMD Ryzen 9 7900X 4.7GHz
GeForce GTX 1650 Super (Desktop)
max:
64.2 fps
40 [X] AMD Ryzen 9 5900X 3.7GHz
GeForce GTX 1650 Super (Desktop)
~ 40 fps
+ Compare
- Hide Comparison
...
NVIDIA GeForce GTX 1650 Super (Desktop)
...
19 [X] AMD Ryzen 9 5900X 3.7GHz
GeForce GTX 1650 Super (Desktop)
19.1 [X] KFA2 GeForce GTX 1650 Super EX One Click OC AMD Ryzen 9 7900X 4.7GHz
GeForce GTX 1650 Super (Desktop)
max:
29.6 fps
19.3 [X] KFA2 GeForce GTX 1650 Super EX One Click OC AMD Ryzen 9 7950X 4.5GHz
GeForce GTX 1650 Super (Desktop)
max:
30 fps
~ 19 fps
+ Compare
- Hide Comparison
...
NVIDIA GeForce GTX 1650 Super (Desktop)
...
» With all tested laptops playable in detail settings ultra.
Additional Benchmarks
Lowest Preset 1920x1080
145.3 [X] KFA2 GeForce GTX 1650 Super EX One Click OC AMD Ryzen 9 7950X 4.5GHz
GeForce GTX 1650 Super (Desktop)
max:
226.1 fps
258 [X] 1.47.22.14 D3D12
AMD Ryzen 9 5900X 3.7GHz
GeForce GTX 1650 Super (Desktop)
min:
11.5 fps, P1:
151 fps, max:
478 fps
303 [X] KFA2 GeForce GTX 1650 Super EX One Click OC 1.47.22.14 D3D12
AMD Ryzen 9 7900X 4.7GHz
GeForce GTX 1650 Super (Desktop)
min:
60 fps, P1:
265 fps, max:
658 fps
313 [X] KFA2 GeForce GTX 1650 Super EX One Click OC 1.47.22.14 D3D12
AMD Ryzen 9 7950X 4.5GHz
GeForce GTX 1650 Super (Desktop)
min:
52.9 fps, P1:
268 fps, max:
601 fps
~ 291 fps
+ Compare
- Hide Comparison
...
NVIDIA GeForce GTX 1650 Super (Desktop)
...
114 [X] 1.47.22.14 D3D12
AMD Ryzen 9 5900X 3.7GHz
GeForce GTX 1650 Super (Desktop)
min:
16.6 fps, P1:
89.2 fps, max:
223 fps
121.2 [X] KFA2 GeForce GTX 1650 Super EX One Click OC 1.47.22.14 D3D12
AMD Ryzen 9 7900X 4.7GHz
GeForce GTX 1650 Super (Desktop)
min:
56.7 fps, P1:
108 fps, max:
598 fps
121.7 [X] KFA2 GeForce GTX 1650 Super EX One Click OC 1.47.22.14 D3D12
AMD Ryzen 9 7950X 4.5GHz
GeForce GTX 1650 Super (Desktop)
min:
5 fps, P1:
108.1 fps, max:
424 fps
~ 119 fps
+ Compare
- Hide Comparison
...
NVIDIA GeForce GTX 1650 Super (Desktop)
...
94.4 [X] 1.47.22.14 D3D12
AMD Ryzen 9 5900X 3.7GHz
GeForce GTX 1650 Super (Desktop)
min:
15.2 fps, P1:
74.5 fps, max:
187 fps
100.8 [X] KFA2 GeForce GTX 1650 Super EX One Click OC 1.47.22.14 D3D12
AMD Ryzen 9 7900X 4.7GHz
GeForce GTX 1650 Super (Desktop)
min:
44.1 fps, P1:
80.1 fps, max:
521 fps
102.4 [X] KFA2 GeForce GTX 1650 Super EX One Click OC 1.47.22.14 D3D12
AMD Ryzen 9 7950X 4.5GHz
GeForce GTX 1650 Super (Desktop)
min:
63 fps, P1:
82.2 fps, max:
472 fps
~ 99 fps
+ Compare
- Hide Comparison
...
Intel Arc A380
NVIDIA GeForce GTX 1650 Super (Desktop)
...
80.7 [X] 1.47.22.14 D3D12
AMD Ryzen 9 5900X 3.7GHz
GeForce GTX 1650 Super (Desktop)
min:
55 fps, P1:
63.7 fps, max:
107 fps
83.1 [X] KFA2 GeForce GTX 1650 Super EX One Click OC 1.47.22.14 D3D12
AMD Ryzen 9 7950X 4.5GHz
GeForce GTX 1650 Super (Desktop)
min:
41.8 fps, P1:
62.5 fps, max:
460 fps
84.2 [X] KFA2 GeForce GTX 1650 Super EX One Click OC 1.47.22.14 D3D12
AMD Ryzen 9 7900X 4.7GHz
GeForce GTX 1650 Super (Desktop)
min:
41.4 fps, P1:
66.8 fps, max:
533 fps
~ 83 fps
+ Compare
- Hide Comparison
...
NVIDIA GeForce GTX 1650 Super (Desktop)
...
59.1 [X] 1.47.22.14 D3D12
AMD Ryzen 9 5900X 3.7GHz
GeForce GTX 1650 Super (Desktop)
min:
42.3 fps, P1:
49.4 fps, max:
76.8 fps
59.5 [X] KFA2 GeForce GTX 1650 Super EX One Click OC 1.47.22.14 D3D12
AMD Ryzen 9 7900X 4.7GHz
GeForce GTX 1650 Super (Desktop)
min:
33.9 fps, P1:
49.3 fps, max:
498 fps
59.9 [X] KFA2 GeForce GTX 1650 Super EX One Click OC 1.47.22.14 D3D12
AMD Ryzen 9 7950X 4.5GHz
GeForce GTX 1650 Super (Desktop)
min:
49.1 fps, P1:
50.3 fps, max:
104.2 fps
~ 60 fps
+ Compare
- Hide Comparison
...
NVIDIA GeForce GTX 1650 Super (Desktop)
...
29.5 [X] KFA2 GeForce GTX 1650 Super EX One Click OC 1.47.22.14 D3D12
AMD Ryzen 9 7950X 4.5GHz
GeForce GTX 1650 Super (Desktop)
min:
20.7 fps, P1:
22.1 fps, max:
59 fps
30.4 [X] KFA2 GeForce GTX 1650 Super EX One Click OC 1.47.22.14 D3D12
AMD Ryzen 9 7900X 4.7GHz
GeForce GTX 1650 Super (Desktop)
min:
21.3 fps, P1:
22.5 fps, max:
48.7 fps
32.9 [X] 1.47.22.14 D3D12
AMD Ryzen 9 5900X 3.7GHz
GeForce GTX 1650 Super (Desktop)
min:
27.2 fps, P1:
29 fps, max:
42.5 fps
~ 31 fps
+ Compare
- Hide Comparison
...
NVIDIA GeForce GTX 1650 Super (Desktop)
...
» With all tested laptops playable in detail settings ultra.
...
NVIDIA GeForce GTX 1650 Super (Desktop)
...
NVIDIA GeForce GTX 1650 Super (Desktop)
...
...
NVIDIA GeForce GTX 1650 Super (Desktop)
...
...
NVIDIA GeForce GTX 1650 Super (Desktop)
...
...
NVIDIA GeForce GTX 1650 Super (Desktop)
...
...
NVIDIA GeForce GTX 1650 Super (Desktop)
...
» With all tested laptops playable in detail settings ultra.
156 [X] AMD Ryzen 9 5900X 3.7GHz
GeForce GTX 1650 Super (Desktop)
min:
110 fps, max:
185 fps
180 [X] KFA2 GeForce GTX 1650 Super EX One Click OC AMD Ryzen 9 7900X 4.7GHz
GeForce GTX 1650 Super (Desktop)
min:
131 fps, max:
200 fps
185 [X] KFA2 GeForce GTX 1650 Super EX One Click OC AMD Ryzen 9 7950X 4.5GHz
GeForce GTX 1650 Super (Desktop)
min:
159 fps, max:
204 fps
~ 174 fps
+ Compare
- Hide Comparison
+ 📈 Graph
- 📈 Hide Graph
0 100 200 Tooltip : Ø156.2 (110-185)
: Ø179.7 (131-200)
: Ø184.7 (159-204)
...
NVIDIA GeForce GTX 1650 Super (Desktop)
...
89 [X] AMD Ryzen 9 5900X 3.7GHz
GeForce GTX 1650 Super (Desktop)
min:
78 fps, max:
104 fps
93 [X] KFA2 GeForce GTX 1650 Super EX One Click OC AMD Ryzen 9 7900X 4.7GHz
GeForce GTX 1650 Super (Desktop)
min:
81 fps, max:
110 fps
95 [X] KFA2 GeForce GTX 1650 Super EX One Click OC AMD Ryzen 9 7950X 4.5GHz
GeForce GTX 1650 Super (Desktop)
min:
83 fps, max:
112 fps
~ 92 fps
+ Compare
- Hide Comparison
+ 📈 Graph
- 📈 Hide Graph
0 100 Tooltip : Ø88.6 (78-104)
: Ø93.4 (81-110)
: Ø95.1 (83-112)
...
NVIDIA GeForce GTX 1650 Super (Desktop)
...
81 [X] AMD Ryzen 9 5900X 3.7GHz
GeForce GTX 1650 Super (Desktop)
min:
70 fps, max:
95 fps
86 [X] KFA2 GeForce GTX 1650 Super EX One Click OC AMD Ryzen 9 7900X 4.7GHz
GeForce GTX 1650 Super (Desktop)
min:
75 fps, max:
101 fps
87 [X] KFA2 GeForce GTX 1650 Super EX One Click OC AMD Ryzen 9 7950X 4.5GHz
GeForce GTX 1650 Super (Desktop)
min:
78 fps, max:
104 fps
~ 85 fps
+ Compare
- Hide Comparison
+ 📈 Graph
- 📈 Hide Graph
0 100 Tooltip : Ø81.2 (70-95)
: Ø85.6 (75-101)
: Ø86.9 (78-104)
...
NVIDIA GeForce GTX 1650 Super (Desktop)
...
75 [X] AMD Ryzen 9 5900X 3.7GHz
GeForce GTX 1650 Super (Desktop)
min:
66 fps, max:
87 fps
79 [X] KFA2 GeForce GTX 1650 Super EX One Click OC AMD Ryzen 9 7900X 4.7GHz
GeForce GTX 1650 Super (Desktop)
min:
70 fps, max:
91 fps
81 [X] KFA2 GeForce GTX 1650 Super EX One Click OC AMD Ryzen 9 7950X 4.5GHz
GeForce GTX 1650 Super (Desktop)
min:
72 fps, max:
93 fps
~ 78 fps
+ Compare
- Hide Comparison
+ 📈 Graph
- 📈 Hide Graph
0 Tooltip : Ø75.2 (66-87)
: Ø79.5 (70-91)
: Ø80.8 (72-93)
...
NVIDIA GeForce GTX 1650 Super (Desktop)
...
52 [X] AMD Ryzen 9 5900X 3.7GHz
GeForce GTX 1650 Super (Desktop)
min:
46 fps, max:
63 fps
54 [X] KFA2 GeForce GTX 1650 Super EX One Click OC AMD Ryzen 9 7900X 4.7GHz
GeForce GTX 1650 Super (Desktop)
min:
47 fps, max:
63 fps
54 [X] KFA2 GeForce GTX 1650 Super EX One Click OC AMD Ryzen 9 7950X 4.5GHz
GeForce GTX 1650 Super (Desktop)
min:
48 fps, max:
65 fps
~ 53 fps
+ Compare
- Hide Comparison
+ 📈 Graph
- 📈 Hide Graph
0 Tooltip : Ø52.4 (46-63)
: Ø53.6 (47-63)
: Ø54.3 (48-65)
...
NVIDIA GeForce GTX 1650 Super (Desktop)
...
24 [X] KFA2 GeForce GTX 1650 Super EX One Click OC AMD Ryzen 9 7900X 4.7GHz
GeForce GTX 1650 Super (Desktop)
min:
21 fps, max:
30 fps
24 [X] KFA2 GeForce GTX 1650 Super EX One Click OC AMD Ryzen 9 7950X 4.5GHz
GeForce GTX 1650 Super (Desktop)
min:
22 fps, max:
31 fps
27 [X] AMD Ryzen 9 5900X 3.7GHz
GeForce GTX 1650 Super (Desktop)
min:
24 fps, max:
33 fps
~ 25 fps
+ Compare
- Hide Comparison
+ 📈 Graph
- 📈 Hide Graph
0 Tooltip : Ø23.6 (21-30)
: Ø24.4 (22-31)
: Ø26.8 (24-33)
...
NVIDIA GeForce GTX 1650 Super (Desktop)
...
» With all tested laptops playable in detail settings ultra.
Additional Benchmarks
Low Preset TAA 1920x1080
108 [X] KFA2 GeForce GTX 1650 Super EX One Click OC AMD Ryzen 9 7950X 4.5GHz
GeForce GTX 1650 Super (Desktop)
min:
91 fps, max:
124 fps
149 [X] AMD Ryzen 9 5900X 3.7GHz
GeForce GTX 1650 Super (Desktop)
224 [X] KFA2 GeForce GTX 1650 Super EX One Click OC AMD Ryzen 9 7950X 4.5GHz
GeForce GTX 1650 Super (Desktop)
226 [X] KFA2 GeForce GTX 1650 Super EX One Click OC AMD Ryzen 9 7900X 4.7GHz
GeForce GTX 1650 Super (Desktop)
~ 200 fps
+ Compare
- Hide Comparison
...
NVIDIA GeForce GTX 1650 Super (Desktop)
...
138 [X] AMD Ryzen 9 5900X 3.7GHz
GeForce GTX 1650 Super (Desktop)
196.4 [X] KFA2 GeForce GTX 1650 Super EX One Click OC AMD Ryzen 9 7900X 4.7GHz
GeForce GTX 1650 Super (Desktop)
196.8 [X] KFA2 GeForce GTX 1650 Super EX One Click OC AMD Ryzen 9 7950X 4.5GHz
GeForce GTX 1650 Super (Desktop)
~ 177 fps
+ Compare
- Hide Comparison
...
NVIDIA GeForce GTX 1650 Super (Desktop)
...
106 [X] AMD Ryzen 9 5900X 3.7GHz
GeForce GTX 1650 Super (Desktop)
150.6 [X] KFA2 GeForce GTX 1650 Super EX One Click OC AMD Ryzen 9 7950X 4.5GHz
GeForce GTX 1650 Super (Desktop)
156.9 [X] KFA2 GeForce GTX 1650 Super EX One Click OC AMD Ryzen 9 7900X 4.7GHz
GeForce GTX 1650 Super (Desktop)
~ 138 fps
+ Compare
- Hide Comparison
...
NVIDIA GeForce GTX 1650 Super (Desktop)
...
87.8 [X] AMD Ryzen 9 5900X 3.7GHz
GeForce GTX 1650 Super (Desktop)
95.4 [X] KFA2 GeForce GTX 1650 Super EX One Click OC AMD Ryzen 9 7900X 4.7GHz
GeForce GTX 1650 Super (Desktop)
95.9 [X] KFA2 GeForce GTX 1650 Super EX One Click OC AMD Ryzen 9 7950X 4.5GHz
GeForce GTX 1650 Super (Desktop)
~ 93 fps
+ Compare
- Hide Comparison
...
NVIDIA GeForce GTX 1650 Super (Desktop)
...
» With all tested laptops playable in detail settings high.
126 [X] 1.3
AMD Ryzen 9 5900X 3.7GHz
GeForce GTX 1650 Super (Desktop)
142.1 [X] KFA2 GeForce GTX 1650 Super EX One Click OC 1.3
AMD Ryzen 9 7900X 4.7GHz
GeForce GTX 1650 Super (Desktop)
145.5 [X] KFA2 GeForce GTX 1650 Super EX One Click OC 1.3
AMD Ryzen 9 7950X 4.5GHz
GeForce GTX 1650 Super (Desktop)
~ 138 fps
+ Compare
- Hide Comparison
...
NVIDIA GeForce GTX 1650 Super (Desktop)
...
67.8 [X] 1.3
AMD Ryzen 9 5900X 3.7GHz
GeForce GTX 1650 Super (Desktop)
72.6 [X] KFA2 GeForce GTX 1650 Super EX One Click OC 1.3
AMD Ryzen 9 7900X 4.7GHz
GeForce GTX 1650 Super (Desktop)
73.3 [X] KFA2 GeForce GTX 1650 Super EX One Click OC 1.3
AMD Ryzen 9 7950X 4.5GHz
GeForce GTX 1650 Super (Desktop)
~ 71 fps
+ Compare
- Hide Comparison
...
NVIDIA GeForce GTX 1650 Super (Desktop)
...
47.3 [X] 1.3
AMD Ryzen 9 5900X 3.7GHz
GeForce GTX 1650 Super (Desktop)
50.6 [X] KFA2 GeForce GTX 1650 Super EX One Click OC 1.3
AMD Ryzen 9 7950X 4.5GHz
GeForce GTX 1650 Super (Desktop)
51.5 [X] KFA2 GeForce GTX 1650 Super EX One Click OC 1.3
AMD Ryzen 9 7900X 4.7GHz
GeForce GTX 1650 Super (Desktop)
~ 50 fps
+ Compare
- Hide Comparison
...
NVIDIA GeForce GTX 1650 Super (Desktop)
...
34.2 [X] 1.3
AMD Ryzen 9 5900X 3.7GHz
GeForce GTX 1650 Super (Desktop)
35.9 [X] KFA2 GeForce GTX 1650 Super EX One Click OC 1.3
AMD Ryzen 9 7900X 4.7GHz
GeForce GTX 1650 Super (Desktop)
36.7 [X] KFA2 GeForce GTX 1650 Super EX One Click OC 1.3
AMD Ryzen 9 7950X 4.5GHz
GeForce GTX 1650 Super (Desktop)
~ 36 fps
+ Compare
- Hide Comparison
...
NVIDIA GeForce GTX 1650 Super (Desktop)
...
19 [X] 1.3
AMD Ryzen 9 5900X 3.7GHz
GeForce GTX 1650 Super (Desktop)
19.1 [X] KFA2 GeForce GTX 1650 Super EX One Click OC 1.3
AMD Ryzen 9 7950X 4.5GHz
GeForce GTX 1650 Super (Desktop)
20 [X] KFA2 GeForce GTX 1650 Super EX One Click OC 1.3
AMD Ryzen 9 7900X 4.7GHz
GeForce GTX 1650 Super (Desktop)
~ 19 fps
+ Compare
- Hide Comparison
...
NVIDIA GeForce GTX 1650 Super (Desktop)
...
» With all tested laptops playable in detail settings high.
...
NVIDIA GeForce GTX 1650 Super (Desktop)
...
...
NVIDIA GeForce GTX 1650 Super (Desktop)
...
...
NVIDIA GeForce GTX 1650 Super (Desktop)
...
...
NVIDIA GeForce GTX 1650 Super (Desktop)
...
...
NVIDIA GeForce GTX 1650 Super (Desktop)
...
» With all tested laptops playable in detail settings ultra.
182.8 [X] AMD Ryzen 9 5900X 3.7GHz
GeForce GTX 1650 Super (Desktop)
min:
148.5 fps, max:
-1 fps
293.4 [X] KFA2 GeForce GTX 1650 Super EX One Click OC AMD Ryzen 9 7900X 4.7GHz
GeForce GTX 1650 Super (Desktop)
min:
240.7 fps, max:
-1 fps
303.8 [X] KFA2 GeForce GTX 1650 Super EX One Click OC AMD Ryzen 9 7950X 4.5GHz
GeForce GTX 1650 Super (Desktop)
min:
259.7 fps, max:
-1 fps
~ 260 fps
+ Compare
- Hide Comparison
...
NVIDIA GeForce GTX 1650 Super (Desktop)
...
166.7 [X] AMD Ryzen 9 5900X 3.7GHz
GeForce GTX 1650 Super (Desktop)
min:
132.3 fps, max:
-1 fps
258.4 [X] KFA2 GeForce GTX 1650 Super EX One Click OC AMD Ryzen 9 7900X 4.7GHz
GeForce GTX 1650 Super (Desktop)
min:
223.6 fps, max:
-1 fps
269.8 [X] KFA2 GeForce GTX 1650 Super EX One Click OC AMD Ryzen 9 7950X 4.5GHz
GeForce GTX 1650 Super (Desktop)
min:
231.6 fps, max:
-1 fps
~ 232 fps
+ Compare
- Hide Comparison
...
NVIDIA GeForce GTX 1650 Super (Desktop)
...
156.8 [X] AMD Ryzen 9 5900X 3.7GHz
GeForce GTX 1650 Super (Desktop)
min:
128.7 fps, max:
-1 fps
209.3 [X] KFA2 GeForce GTX 1650 Super EX One Click OC AMD Ryzen 9 7900X 4.7GHz
GeForce GTX 1650 Super (Desktop)
min:
179.2 fps, max:
-1 fps
210.4 [X] KFA2 GeForce GTX 1650 Super EX One Click OC AMD Ryzen 9 7950X 4.5GHz
GeForce GTX 1650 Super (Desktop)
min:
182.8 fps, max:
-1 fps
~ 192 fps
+ Compare
- Hide Comparison
...
NVIDIA GeForce GTX 1650 Super (Desktop)
...
141.1 [X] AMD Ryzen 9 5900X 3.7GHz
GeForce GTX 1650 Super (Desktop)
min:
115 fps, max:
-1 fps
190.8 [X] KFA2 GeForce GTX 1650 Super EX One Click OC AMD Ryzen 9 7900X 4.7GHz
GeForce GTX 1650 Super (Desktop)
min:
162.3 fps, max:
-1 fps
193.8 [X] KFA2 GeForce GTX 1650 Super EX One Click OC AMD Ryzen 9 7950X 4.5GHz
GeForce GTX 1650 Super (Desktop)
min:
166.1 fps, max:
-1 fps
~ 175 fps
+ Compare
- Hide Comparison
...
NVIDIA GeForce GTX 1650 Super (Desktop)
...
78.3 [X] AMD Ryzen 9 5900X 3.7GHz
GeForce GTX 1650 Super (Desktop)
min:
70.6 fps, max:
-1 fps
79.5 [X] KFA2 GeForce GTX 1650 Super EX One Click OC AMD Ryzen 9 7900X 4.7GHz
GeForce GTX 1650 Super (Desktop)
min:
73.8 fps, max:
-1 fps
79.8 [X] KFA2 GeForce GTX 1650 Super EX One Click OC AMD Ryzen 9 7950X 4.5GHz
GeForce GTX 1650 Super (Desktop)
min:
74.1 fps, max:
-1 fps
~ 79 fps
+ Compare
- Hide Comparison
...
NVIDIA GeForce GTX 1650 Super (Desktop)
...
» With all tested laptops playable in detail settings ultra.
206.8 [X] AMD Ryzen 9 5900X 3.7GHz
GeForce GTX 1650 Super (Desktop)
270 [X] KFA2 GeForce GTX 1650 Super EX One Click OC AMD Ryzen 9 7900X 4.7GHz
GeForce GTX 1650 Super (Desktop)
min:
14.3 fps, P0.1:
129.7 fps, P1:
221 fps, max:
984 fps
285 [X] KFA2 GeForce GTX 1650 Super EX One Click OC AMD Ryzen 9 7950X 4.5GHz
GeForce GTX 1650 Super (Desktop)
min:
13.1 fps, P0.1:
141.7 fps, P1:
237 fps, max:
1028 fps
~ 254 fps
+ Compare
- Hide Comparison
+ 📈 Graph
- 📈 Hide Graph
0 100 200 300 400 500 600 700 800 900 1000 Tooltip : Ø290 (247.92-1004)
: Ø291 (259.55-373.2)
...
NVIDIA GeForce GTX 1650 Super (Desktop)
...
130.7 [X] AMD Ryzen 9 5900X 3.7GHz
GeForce GTX 1650 Super (Desktop)
171.4 [X] KFA2 GeForce GTX 1650 Super EX One Click OC AMD Ryzen 9 7900X 4.7GHz
GeForce GTX 1650 Super (Desktop)
min:
22.4 fps, P0.1:
107.1 fps, P1:
144 fps, max:
769 fps
177.4 [X] KFA2 GeForce GTX 1650 Super EX One Click OC AMD Ryzen 9 7950X 4.5GHz
GeForce GTX 1650 Super (Desktop)
min:
66.1 fps, P0.1:
109.8 fps, P1:
149.3 fps, max:
682 fps
~ 160 fps
+ Compare
- Hide Comparison
+ 📈 Graph
- 📈 Hide Graph
0 100 200 Tooltip : Ø175.6 (157.475-199.6)
: Ø183.1 (163.6-228.5)
...
NVIDIA GeForce GTX 1650 Super (Desktop)
...
80.3 [X] AMD Ryzen 9 5900X 3.7GHz
GeForce GTX 1650 Super (Desktop)
90.3 [X] KFA2 GeForce GTX 1650 Super EX One Click OC AMD Ryzen 9 7900X 4.7GHz
GeForce GTX 1650 Super (Desktop)
min:
52.5 fps, P0.1:
65.1 fps, P1:
77.4 fps, max:
398 fps
95.9 [X] KFA2 GeForce GTX 1650 Super EX One Click OC AMD Ryzen 9 7950X 4.5GHz
GeForce GTX 1650 Super (Desktop)
min:
16.6 fps, P0.1:
69.8 fps, P1:
82.2 fps, max:
522 fps
~ 89 fps
+ Compare
- Hide Comparison
+ 📈 Graph
- 📈 Hide Graph
0 100 200 300 400 500 600 700 800 900 1000 1100 1200 1300 1400 1500 1600 1700 1800 1900 Tooltip : Ø94.7 (80.153-154.3)
: Ø155.4 (87.227-1975)
...
NVIDIA GeForce GTX 1650 Super (Desktop)
...
43.6 [X] AMD Ryzen 9 5900X 3.7GHz
GeForce GTX 1650 Super (Desktop)
49.5 [X] KFA2 GeForce GTX 1650 Super EX One Click OC AMD Ryzen 9 7900X 4.7GHz
GeForce GTX 1650 Super (Desktop)
min:
34.6 fps, P0.1:
38.9 fps, P1:
42.7 fps, max:
77.6 fps
54.2 [X] KFA2 GeForce GTX 1650 Super EX One Click OC AMD Ryzen 9 7950X 4.5GHz
GeForce GTX 1650 Super (Desktop)
min:
38.8 fps, P0.1:
43.1 fps, P1:
47.2 fps, max:
79 fps
~ 49 fps
+ Compare
- Hide Comparison
+ 📈 Graph
- 📈 Hide Graph
0 100 200 300 400 500 Tooltip : Ø61.9 (44.187-503)
: Ø59.5 (49.387-214.2)
...
NVIDIA GeForce GTX 1650 Super (Desktop)
...
29.5 [X] AMD Ryzen 9 5900X 3.7GHz
GeForce GTX 1650 Super (Desktop)
31.8 [X] KFA2 GeForce GTX 1650 Super EX One Click OC AMD Ryzen 9 7900X 4.7GHz
GeForce GTX 1650 Super (Desktop)
min:
14.7 fps, P0.1:
15.9 fps, P1:
16.6 fps, max:
623 fps
32.9 [X] KFA2 GeForce GTX 1650 Super EX One Click OC AMD Ryzen 9 7950X 4.5GHz
GeForce GTX 1650 Super (Desktop)
min:
12.1 fps, P0.1:
15.9 fps, P1:
16.6 fps, max:
613 fps
~ 31 fps
+ Compare
- Hide Comparison
+ 📈 Graph
- 📈 Hide Graph
0 100 200 300 400 500 600 700 800 900 1000 1100 1200 1300 1400 1500 Tooltip : Ø61.5 (28.106-1506)
: Ø42.5 (30.122-196.1)
...
NVIDIA GeForce GTX 1650 Super (Desktop)
...
» With all tested laptops playable in detail settings ultra.
Additional Benchmarks
Ultra Graphics & Postprocessing (HBAO+) 3840x2160
22.3 [X] KFA2 GeForce GTX 1650 Super EX One Click OC AMD Ryzen 9 7950X 4.5GHz
GeForce GTX 1650 Super (Desktop)
min:
10.6 fps, P0.1:
13.5 fps, P1:
20 fps, max:
25 fps
Medium Graphics & Postprocessing 1920x1080
111.2 [X] KFA2 GeForce GTX 1650 Super EX One Click OC AMD Ryzen 9 7950X 4.5GHz
GeForce GTX 1650 Super (Desktop)
min:
72.4 fps, P0.1:
80 fps, P1:
96.5 fps, max:
244 fps
185 [X] AMD Ryzen 9 5900X 3.7GHz
GeForce GTX 1650 Super (Desktop)
min:
1.897 fps, P1:
143 fps, max:
485 fps
187 [X] AMD Ryzen 9 5900X 3.7GHz
GeForce GTX 1650 Super (Desktop)
min:
2.25 fps, P1:
167 fps, max:
487 fps
187.5 [X] KFA2 GeForce GTX 1650 Super EX One Click OC AMD Ryzen 9 7900X 4.7GHz
GeForce GTX 1650 Super (Desktop)
min:
18.8 fps, P1:
200 fps, max:
611 fps
188.3 [X] KFA2 GeForce GTX 1650 Super EX One Click OC AMD Ryzen 9 7950X 4.5GHz
GeForce GTX 1650 Super (Desktop)
min:
2.84 fps, P1:
200 fps, max:
802 fps
~ 187 fps
+ Compare
- Hide Comparison
...
NVIDIA GeForce GTX 1650 Super (Desktop)
Intel Arc A380
...
185 [X] AMD Ryzen 9 5900X 3.7GHz
GeForce GTX 1650 Super (Desktop)
min:
2.37 fps, P1:
143 fps, max:
447 fps
187.5 [X] KFA2 GeForce GTX 1650 Super EX One Click OC AMD Ryzen 9 7900X 4.7GHz
GeForce GTX 1650 Super (Desktop)
min:
3.21 fps, P1:
200 fps, max:
605 fps
187.8 [X] KFA2 GeForce GTX 1650 Super EX One Click OC AMD Ryzen 9 7950X 4.5GHz
GeForce GTX 1650 Super (Desktop)
min:
7.96 fps, P1:
200 fps, max:
672 fps
~ 187 fps
+ Compare
- Hide Comparison
...
NVIDIA GeForce GTX 1650 Super (Desktop)
...
132 [X] AMD Ryzen 9 5900X 3.7GHz
GeForce GTX 1650 Super (Desktop)
min:
7.5 fps, P1:
90.9 fps, max:
272 fps
140.8 [X] KFA2 GeForce GTX 1650 Super EX One Click OC AMD Ryzen 9 7900X 4.7GHz
GeForce GTX 1650 Super (Desktop)
min:
6.36 fps, P1:
100 fps, max:
300 fps
143.2 [X] KFA2 GeForce GTX 1650 Super EX One Click OC AMD Ryzen 9 7950X 4.5GHz
GeForce GTX 1650 Super (Desktop)
min:
6.2 fps, P1:
100 fps, max:
272 fps
~ 139 fps
+ Compare
- Hide Comparison
...
NVIDIA GeForce GTX 1650 Super (Desktop)
...
62.9 [X] AMD Ryzen 9 5900X 3.7GHz
GeForce GTX 1650 Super (Desktop)
min:
4.62 fps, P1:
41.7 fps, max:
129 fps
64.9 [X] KFA2 GeForce GTX 1650 Super EX One Click OC AMD Ryzen 9 7900X 4.7GHz
GeForce GTX 1650 Super (Desktop)
min:
3.09 fps, P1:
45.5 fps, max:
132 fps
65.7 [X] KFA2 GeForce GTX 1650 Super EX One Click OC AMD Ryzen 9 7950X 4.5GHz
GeForce GTX 1650 Super (Desktop)
min:
3.07 fps, P1:
45.5 fps, max:
136.7 fps
~ 65 fps
+ Compare
- Hide Comparison
...
NVIDIA GeForce GTX 1650 Super (Desktop)
...
44.1 [X] AMD Ryzen 9 5900X 3.7GHz
GeForce GTX 1650 Super (Desktop)
min:
6.92 fps, P1:
28.6 fps, max:
120 fps
45.3 [X] KFA2 GeForce GTX 1650 Super EX One Click OC AMD Ryzen 9 7900X 4.7GHz
GeForce GTX 1650 Super (Desktop)
min:
19.1 fps, P1:
31.3 fps, max:
101.5 fps
46 [X] KFA2 GeForce GTX 1650 Super EX One Click OC AMD Ryzen 9 7950X 4.5GHz
GeForce GTX 1650 Super (Desktop)
min:
10.7 fps, P1:
31.3 fps, max:
233 fps
~ 45 fps
+ Compare
- Hide Comparison
...
Intel Arc A580
NVIDIA GeForce GTX 1650 Super (Desktop)
...
44 [X] AMD Ryzen 9 5900X 3.7GHz
GeForce GTX 1650 Super (Desktop)
min:
4.74 fps, P1:
32.3 fps, max:
258 fps
45 [X] KFA2 GeForce GTX 1650 Super EX One Click OC AMD Ryzen 9 7900X 4.7GHz
GeForce GTX 1650 Super (Desktop)
min:
4.98 fps, P1:
33.3 fps, max:
171.6 fps
45.2 [X] KFA2 GeForce GTX 1650 Super EX One Click OC AMD Ryzen 9 7950X 4.5GHz
GeForce GTX 1650 Super (Desktop)
min:
14.1 fps, P1:
33.3 fps, max:
184.8 fps
~ 45 fps
+ Compare
- Hide Comparison
...
Intel Arc A580
NVIDIA GeForce GTX 1650 Super (Desktop)
...
» With all tested laptops playable in detail settings ultra.
Additional Benchmarks
Highest Settings possible 16xAF 4xMSAA + FXAA 3840x2160
20.6 [X] AMD Ryzen 9 5900X 3.7GHz
GeForce GTX 1650 Super (Desktop)
min:
2.25 fps, P1:
9.9 fps, max:
135 fps
16.3 [X] KFA2 GeForce GTX 1650 Super EX One Click OC AMD Ryzen 9 7900X 4.7GHz
GeForce GTX 1650 Super (Desktop)
min:
3.12 fps, P1:
7.69 fps, max:
271 fps
14.4 [X] KFA2 GeForce GTX 1650 Super EX One Click OC AMD Ryzen 9 7950X 4.5GHz
GeForce GTX 1650 Super (Desktop)
min:
1.811 fps, P1:
6.94 fps, max:
219 fps
Normal/Off 4xAF 1920x1080
185 [X] AMD Ryzen 9 5900X 3.7GHz
GeForce GTX 1650 Super (Desktop)
min:
2.12 fps, P1:
143 fps, max:
470 fps
187.5 [X] KFA2 GeForce GTX 1650 Super EX One Click OC AMD Ryzen 9 7900X 4.7GHz
GeForce GTX 1650 Super (Desktop)
min:
9.5 fps, P1:
200 fps, max:
417 fps
188.1 [X] KFA2 GeForce GTX 1650 Super EX One Click OC AMD Ryzen 9 7950X 4.5GHz
GeForce GTX 1650 Super (Desktop)
min:
8.85 fps, P1:
200 fps, max:
720 fps
Lowest Settings possible 1920x1080
187 [X] AMD Ryzen 9 5900X 3.7GHz
GeForce GTX 1650 Super (Desktop)
min:
2.06 fps, P1:
167 fps, max:
464 fps
187.5 [X] KFA2 GeForce GTX 1650 Super EX One Click OC AMD Ryzen 9 7900X 4.7GHz
GeForce GTX 1650 Super (Desktop)
min:
12.7 fps, P1:
200 fps, max:
281 fps
187.9 [X] KFA2 GeForce GTX 1650 Super EX One Click OC AMD Ryzen 9 7950X 4.5GHz
GeForce GTX 1650 Super (Desktop)
min:
9.17 fps, P1:
200 fps, max:
715 fps
low med. high ultra QHD 4K Dragon's Dogma 2 31 26.3 18.4 Horizon Forbidden West 48.4 36.7 22.7 15.3 13 Alone in the Dark 135.4 104.3 86.2 22 Last Epoch 128.6 99.2 83.6 51.6 32.4 14.4 Skull & Bones 67 59 45 39 27 13 Helldivers 2 48.8 37.4 29.7 29 20.8 Enshrouded 35.1 30.7 20.5 17.1 Palworld 70.9 53.4 51.3 47.4 26 11.8 Prince of Persia The Lost Crown 359 296 282 169.8 83 Ready or Not 118.1 100.8 94.7 49 26.8 5.6 The Finals 142.1 98.9 85.9 61.3 35.9 11.1 Avatar Frontiers of Pandora 40 36 29 21 16 5 Call of Duty Modern Warfare 3 2023 66 59 44 34 23 EA Sports WRC 71.3 55.3 31.4 27.4 10.7 Alan Wake 2 33.9 28.3 25.7 16.5 Lords of the Fallen 45.6 34.4 24.1 15.8 8.7 Total War Pharaoh 201.9 136.5 75.4 59.5 38.7 19.2 Assassin's Creed Mirage 68 62 51 35 28 14 EA Sports FC 24 157.3 144 114.6 103.5 65.8 7.5 Counter-Strike 2 248 201 117.2 74.3 51.8 19.7 Cyberpunk 2077 2.0 Phantom Liberty 61.2 48.3 39 35.2 20.2 3.36 Lies of P 94.3 81.8 69.7 61 35.6 9 Starfield 24 20 13 10 6.1 Armored Core 6 94.2 75.8 68.3 28.7 22.8 12.3 Immortals of Aveum 21.6 15.5 Atlas Fallen 73.5 68.5 63.2 44 29.9 13 Baldur's Gate 3 61.8 49.1 40.1 39.3 26.2 3.5 Ratchet & Clank Rift Apart 45 38.4 29.5 22.8 12.2 6.74 F1 23 162.7 140 93.4 42.9 29 14.3 Diablo 4 124.8 108.4 97.1 82.1 55.3 27.2 Star Wars Jedi Survivor 43.6 34.7 32.9 28.8 15.4 5.15 Dead Island 2 142.2 119.4 64.4 54.2 39.2 10.3 The Last of Us 53.1 40.8 35.7 26.7 15.9 Resident Evil 4 Remake 71.4 46.4 39.6 17.8 14.7 9.21 Company of Heroes 3 62.8 52.8 46.9 42.7 30.5 18.1 Sons of the Forest 57.8 41.7 39.3 39 26.7 14.5 Atomic Heart 98.9 73.4 42.4 33.2 24 10.1 Returnal 52 48 43 30 21 10 Hogwarts Legacy 72.4 54.3 41.4 33.4 22.4 6.81 Dead Space Remake 46.5 41.9 32.9 30.3 5.23 The Witcher 3 v4.00 112.6 83.9 70.4 56.1 37.2 13.5 High On Life 139.4 76.9 60.1 50.7 31.3 7.78 The Callisto Protocol 85.4 58.1 34.3 31.9 17.5 7.9 Need for Speed Unbound 90.2 68.4 50.7 35.4 23.7 11.4 Spider-Man Miles Morales 75.8 65.8 54.9 43.4 27.6 15.8 Call of Duty Modern Warfare 2 2022 79 46 48 42 29 17 Uncharted Legacy of Thieves Collection 50.9 45 28.7 26.5 13.2 A Plague Tale Requiem 60.4 44.7 32.2 23.9 14.1 6.84 FIFA 23 172.2 160.4 105 103.2 37.2 7.91 The Quarry 80 56 51 28 15 4 F1 22 168 148 105 77 53 27 Vampire Bloodhunt 193.7 104.3 100.8 95.8 53.1 20.9 Ghostwire Tokyo 73.3 76.8 75.8 75.2 45.1 15.1 Tiny Tina's Wonderlands 105 81 52 34 22 10 Cyberpunk 2077 1.6 63 50 40 34 20 3 Elex 2 60.9 54.8 47.1 25.9 23 GRID Legends 182 130 103 72 54 27 Elden Ring 58.9 52.2 45 37.2 27.6 14.4 Dying Light 2 69.1 34.8 28.2 18.5 8.62 Rainbow Six Extraction 99 91 88 68 31 17 God of War 73 60 46 28 21 7 Halo Infinite 73.4 71.3 68.9 63.6 36.3 Farming Simulator 22 294 136 102 79.4 58.6 34.8 Battlefield 2042 133 74.2 62.2 20.1 4.87 Forza Horizon 5 190 93 81 31 27 18 Call of Duty Vanguard 85.7 63.1 74.6 63.7 53.6 38.9 Riders Republic 130 75 58 51 34 Guardians of the Galaxy 98 67 67 65 31 15 Back 4 Blood 128 113 102 63.7 30 Far Cry 6 148 55 51 32 6 Alan Wake Remastered 91.9 86.4 84 54.8 New World 136 66.6 60.8 47.2 33.7 21.2 Deathloop 105 62.8 49.6 20 24.9 F1 2021 342 166 133 80 59 33 Monster Hunter Stories 2 144 144 143 118 70.9 Days Gone 143 82.2 72 52.1 36.8 20 Mass Effect Legendary Edition 111 109 89.3 45.4 Resident Evil Village 234 100 90.1 77.7 50.6 20.9 Outriders 168 89.5 70.3 55.4 36.6 29.5 Hitman 3 185 105 87 79 51 25 Cyberpunk 2077 1.0 78 44 36 30 18 7 Immortals Fenyx Rising 116 82 67 59 48 34 Yakuza Like a Dragon 107 61.8 59.1 53 34.3 16.7 Call of Duty Black Ops Cold War 126 77 56 37 26 2 Assassin´s Creed Valhalla 88 53 26 15 13 5 Dirt 5 139 69.1 54 46.3 35.6 21 Watch Dogs Legion 110 71.3 60.6 20.9 14.3 8.09 FIFA 21 180.9 180.2 179.9 176.7 163.5 109.5 Star Wars Squadrons 257.9 139 128.1 118.5 83.7 31.2 Mafia Definitive Edition 120 61 58 38 20 Serious Sam 4 138.9 71.7 53.2 24.3 21.1 15.4 Crysis Remastered 161 72 41 33 22 13 Horizon Zero Dawn 125 74 62 54 39 9 Death Stranding 116 84 68 67 46 22 F1 2020 303 152 119 81 59 32 Doom Eternal 235 115 96 Red Dead Redemption 2 129 71 45 14 11 Star Wars Jedi Fallen Order 84.2 73.7 65.6 44.3 21 Borderlands 3 194 87 56 42 28 10 Control 171 62 45 28 13 Anno 1800 165 110 60 31 21 13 The Division 2 104 83 66 49 33 16 Far Cry New Dawn 152 88 82 75 54 27 Metro Exodus 143 67 49 38 29 15 Apex Legends 142 69 82 81 61 32 Battlefield V 121 72 58 57 42 24 Shadow of the Tomb Raider 206 86 72 61 40 19 Strange Brigade 291 119 99 83 60 31 Monster Hunter World 206 95 77 49 35 24 Far Cry 5 174 92 85 78 53 25 X-Plane 11.11 200 177 138 93 Final Fantasy XV Benchmark 138 71 50 36 19 Rise of the Tomb Raider 250 147 86 67 30 Dota 2 Reborn 260 232 192 175 79 The Witcher 3 254 160 89 49 31 GTA V 187 187 139 65 45 45 < 30 fps < 60 fps < 120 fps ≥ 120 fps 2 15 40 54 2 32 59 20 13 43 51 8 23 47 31 3 55 42 9 2 76 15 5
For more games that might be playable and a list of all games and graphics cards visit our Gaming List
v1.26
log 23. 07:02:08
#0 no ids found in url (should be separated by "_") +0s ... 0s
#1 not redirecting to Ajax server +0s ... 0s
#2 did not recreate cache, as it is less than 5 days old! Created at Mon, 22 Apr 2024 05:40:21 +0200 +0.001s ... 0.001s
#3 before gaming benchmark output +0.001s ... 0.002s
#4 Got 864 rows for game benchmarks. +0.072s ... 0.074s
#5 composed SQL query for gamebenchmarks +0s ... 0.074s
#6 got data and put it in $dataArray +0.062s ... 0.136s
#7 benchmarks composed for output. +5.84s ... 5.977s
#8 return log +0.007s ... 5.984s
I was already interested in technology from an early age, and I was able to study for my dream job as an IT Systems Electronics Engineer. Subsequently, I started 12 years of military service, during which I learned a lot about technology and constantly kept my knowledge up to date with the latest developments. As I like to share my knowledge, I found Notebookcheck was a very good opportunity for this. In addition, I also work a lot with water cooling and network security.
I've been fascinated with technology ever since I got my very first Android smartphone, which was quite a while ago. The power packed into such a small footprint still amazes me. Learning to program made my understanding of technology deeper, and at the same time, it expanded my interest to the area of desktop computers and laptops. All this led me to enjoy reading and watching reviews of new devices, and that's how I stumbled upon Notebookcheck. I immediately found their reviews to be very comprehensive, and luckily, I've even had the chance of translating them since 2019. When it comes to the huge field of technology, I'm currently also interested in specializing in Java programming.
Please share our article, every link counts!
Class 1 Arc A580
Class 2 Arc A380
Class 3 UHD Graphics 32EUs
UHD Graphics 750
Class 4 * Approximate position of the graphics adapter
Working For Notebookcheck
Are you a techie who knows how to translate? Then join our Team!
Details here
Top 10 Laptops Multimedia , Budget Multimedia , Gaming , Budget Gaming , Lightweight Gaming , Business , Budget Office , Workstation , Subnotebooks , Ultrabooks , Chromebooks
under 300 USD/Euros , under 500 USD/Euros , 1,000 USD/Euros , for University Students , Best Displays
Top 10 Smartphones Smartphones , Phablets , ≤6-inch , Camera Smartphones
Sebastian Bade, 2021-02- 3 (Update: 2021-02- 3)
 Deutsch
 English
 Español
 Français
 Italiano
 Nederlands
 Polski
 Português
 Русский
 Türkçe
 Svenska
 Chinese
 Magyar