 Deutsch
 English
 Español
 Français
 Italiano
 Nederlands
 Polski
 Português
 Русский
 Türkçe
 Svenska
 Chinese
 Magyar
Microsoft Surface Pro 4 (Core m3) First Impressions
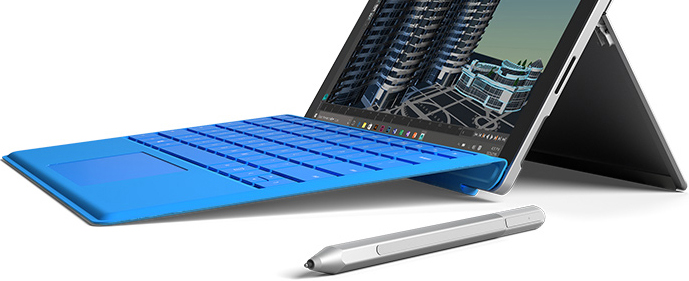
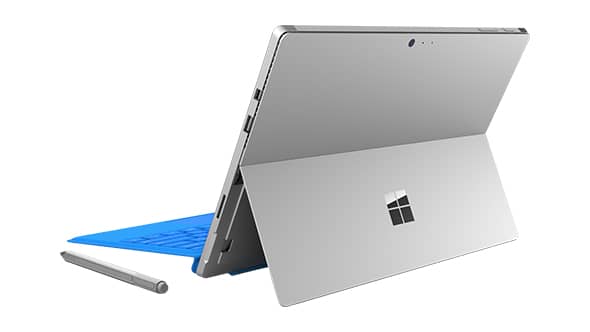
With the Surface Pro 3 predecessor (see review), Microsoft set a new standard for 2in1 devices and convertibles. Notebook performance in tablet shape was announced, but it could not fully keep the promise. A bit more than a year later, the Microsoft Surface Pro 4, the 7th generation of the Surface series (Surface RT, Surface Pro, Surface 2, Surface Pro 2, Surface Pro 3, Surface 3) tries to combine tablet and notebook even better.
Currently, our test model is going through our intensive tests. First measurements of display and emissions are already available, which we will share in this article. The complete review of the new Microsoft Surface Pro 4 is available here.
Display
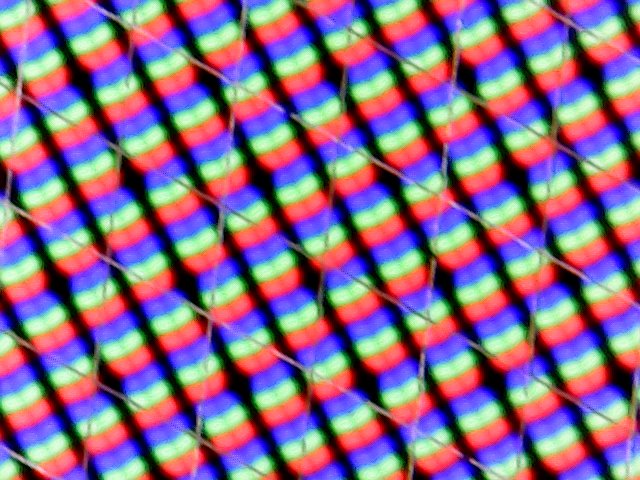
Not only the display diagonal grew from 12.0 to 12.3-inch, but the pixel density was also significantly increased. While the Surface Pro 3 predecessor still used a resolution of 2160x1440 (216.3 ppi), you can appreciate a gorgeous 2736x1824 pixels (267.3 ppi) now. Even if this does not bring a direct advantage for the user, the new display features an even finer resolution as the often mentioned Retina display of the latest Apple MacBook Pro 13.
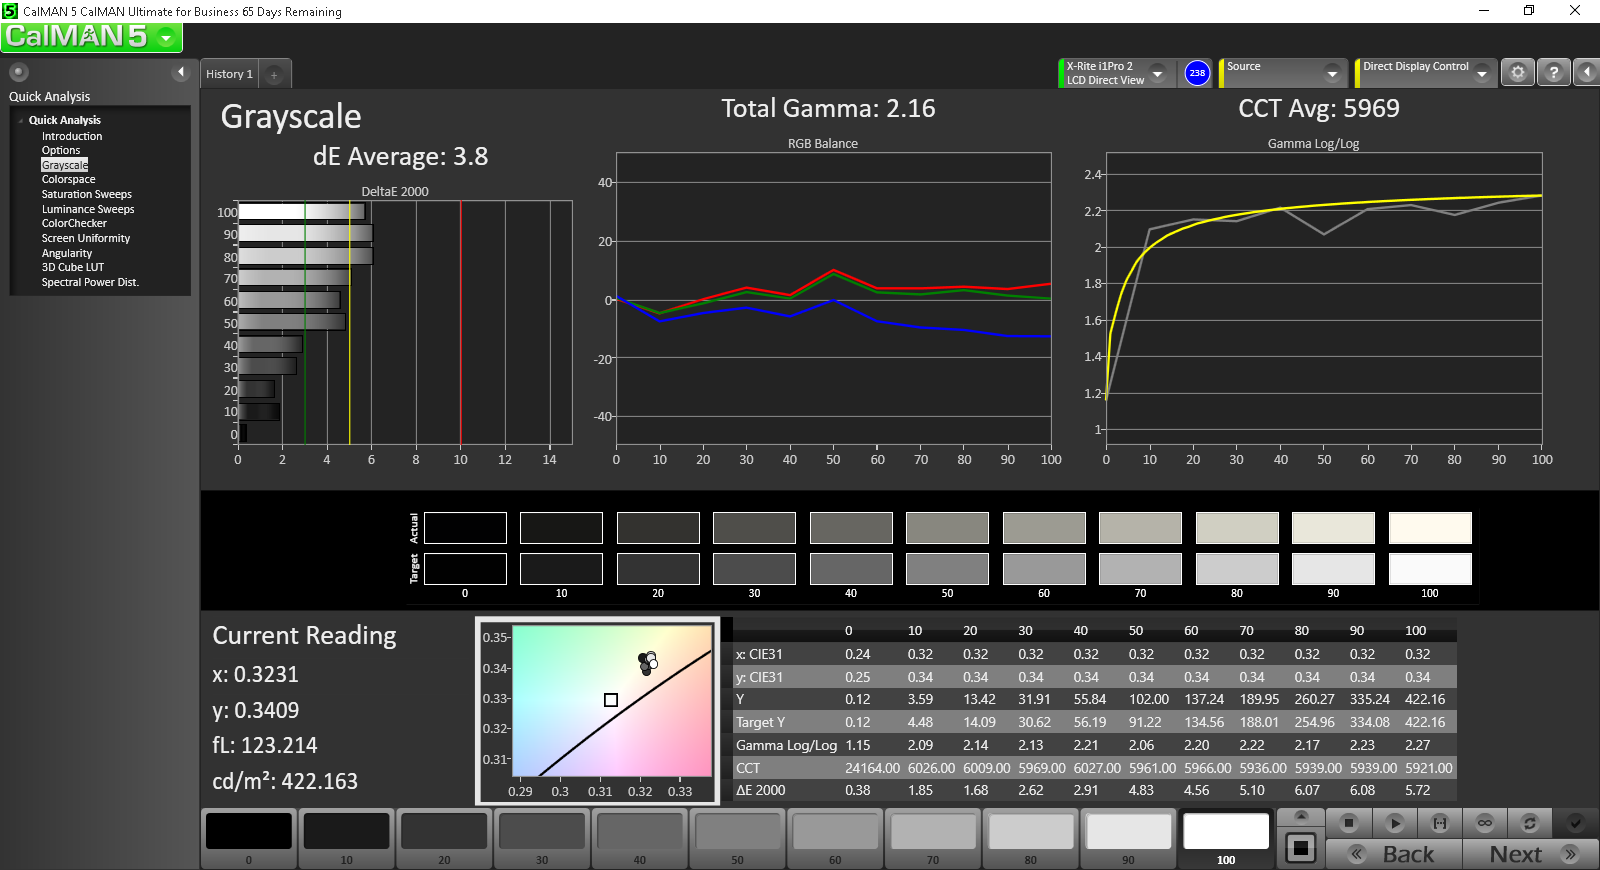
According to our first measurements, the other characteristics of the used display got better, too. The average brightness increased to just under 400 cd/m2, while the brightness distribution of 93% remained very good. Together with a low black value of 0.27 cd/m2, the maximum contrast increased to an excellent 1441:1. Alike the predecessor, the new Microsoft Surface Pro 4 can keep its maximum brightness on battery.
Microsoft Surface Pro 4
| |||||||||||||||||||||||||
Brightness Distribution: 87 %
Center on Battery: 413 cd/m²
Contrast: 1147:1 (Black: 0.36 cd/m²)
ΔE Color 3.09 | 0.5-29.43 Ø5
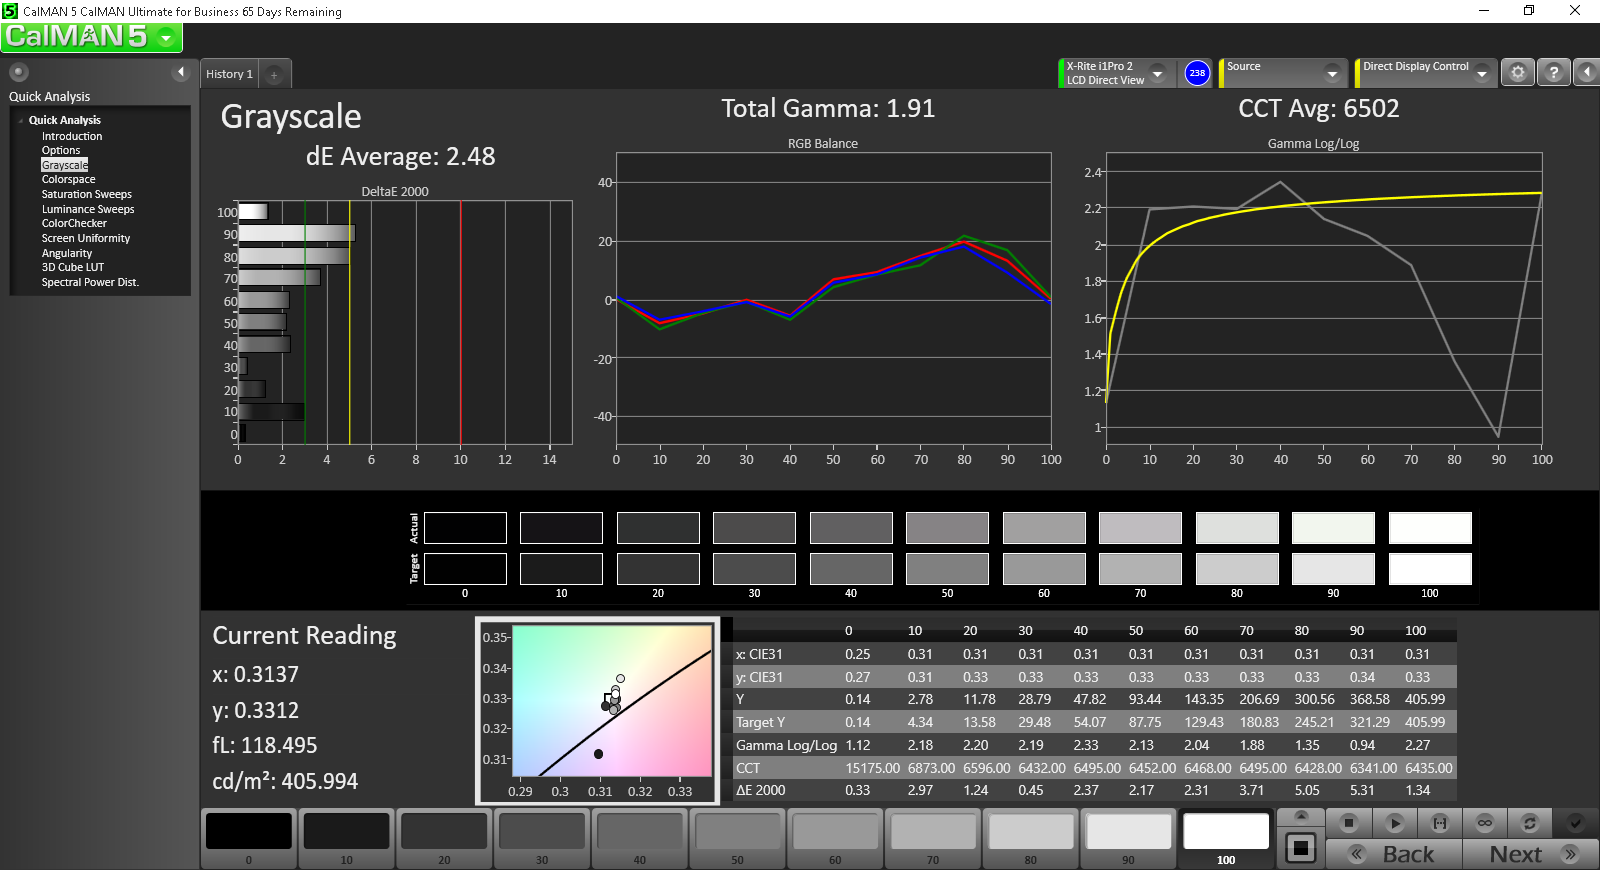
ΔE Greyscale 3.92 | 0.57-98 Ø5.3
97% sRGB (Argyll 1.6.3 3D)
61% AdobeRGB 1998 (Argyll 1.6.3 3D)
67% AdobeRGB 1998 (Argyll 2.2.0 3D)
96.5% sRGB (Argyll 2.2.0 3D)
65% Display P3 (Argyll 2.2.0 3D)
Gamma: 2.3
Microsoft Surface Pro 3
| |||||||||||||||||||||||||
Brightness Distribution: 91 %
Center on Battery: 355.3 cd/m²
Contrast: 1077:1 (Black: 0.33 cd/m²)
ΔE Color 4.72 | 0.5-29.43 Ø5
ΔE Greyscale 6.53 | 0.57-98 Ø5.3
59.37% AdobeRGB 1998 (Argyll 1.6.3 3D)
65.6% AdobeRGB 1998 (Argyll 2.2.0 3D)
88.8% sRGB (Argyll 2.2.0 3D)
63.6% Display P3 (Argyll 2.2.0 3D)
Gamma: 2.17
Microsoft Surface Book
| |||||||||||||||||||||||||
Brightness Distribution: 93 %
Center on Battery: 430.9 cd/m²
Contrast: 1696:1 (Black: 0.254 cd/m²)
ΔE Color 2.06 | 0.5-29.43 Ø5
ΔE Greyscale 2.22 | 0.57-98 Ø5.3
96% sRGB (Argyll 1.6.3 3D)
64% AdobeRGB 1998 (Argyll 1.6.3 3D)
68.9% AdobeRGB 1998 (Argyll 2.2.0 3D)
95.8% sRGB (Argyll 2.2.0 3D)
67% Display P3 (Argyll 2.2.0 3D)
Gamma: 2.13
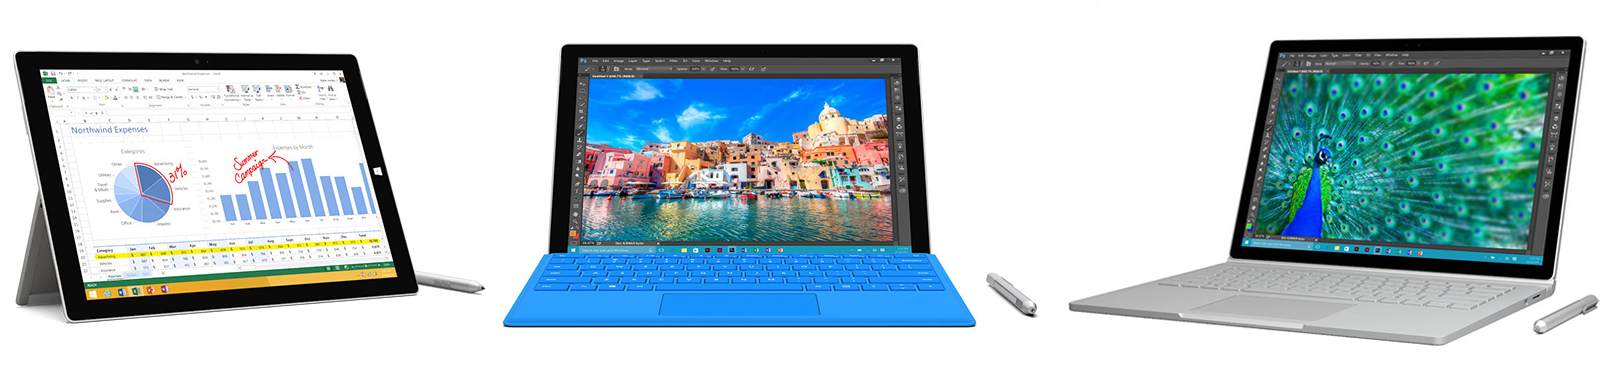
Microsoft also introduced the Surface Book, which comes with a slightly bigger 13.5-inch display with a resolution of 3000x2000 pixels and also an aspect ratio of 3:2. According to our first measurements, the Surface Book performs even better than the Surface Pro 4 in brightness and contrast.
| Microsoft Surface Pro 4, Core i5, 128GB HD Graphics 520, 6300U, Samsung MZFLV128 NVMe | Microsoft Surface Pro 3 HD Graphics 4400, 4300U, Hynix HFS128G3MNM | Microsoft Surface 3 HD Graphics (Cherry Trail), Z8700, 128 GB eMMC Flash | Microsoft Surface Book Core i5 Maxwell GPU (940M, GDDR5), 6300U, Samsung MZFLV256 NVMe | |
|---|---|---|---|---|
| Display | -4% | 4% | 2% | |
| Display P3 Coverage | 65 | 63.6 -2% | 68.8 6% | 67 3% |
| sRGB Coverage | 96.5 | 88.8 -8% | 98.7 2% | 95.8 -1% |
| AdobeRGB 1998 Coverage | 67 | 65.6 -2% | 70.4 5% | 68.9 3% |
| Response Times | -5% | |||
| Response Time Grey 50% / Grey 80% * | 46 ? | 48.4 ? -5% | ||
| Response Time Black / White * | 31.2 ? | 32.8 ? -5% | ||
| PWM Frequency | 50 ? | |||
| Screen | -18% | 2% | 19% | |
| Brightness middle | 413 | 355.3 -14% | 399 -3% | 430.9 4% |
| Brightness | 396 | 338 -15% | 380 -4% | 410 4% |
| Brightness Distribution | 87 | 91 5% | 90 3% | 93 7% |
| Black Level * | 0.36 | 0.33 8% | 0.49 -36% | 0.254 29% |
| Contrast | 1147 | 1077 -6% | 814 -29% | 1696 48% |
| Colorchecker dE 2000 * | 3.09 | 4.72 -53% | 1.66 46% | 2.06 33% |
| Greyscale dE 2000 * | 3.92 | 6.53 -67% | 2.75 30% | 2.22 43% |
| Gamma | 2.3 96% | 2.17 101% | 2.22 99% | 2.13 103% |
| CCT | 7333 89% | 6707 97% | 6358 102% | 6520 100% |
| Color Space (Percent of AdobeRGB 1998) | 61 | 59.37 -3% | 64.4 6% | 64 5% |
| Color Space (Percent of sRGB) | 97 | 98.8 2% | 96 -1% | |
| Colorchecker dE 2000 max. * | 3.24 | |||
| Total Average (Program / Settings) | -11% /
-14% | 3% /
2% | 5% /
12% |
* ... smaller is better
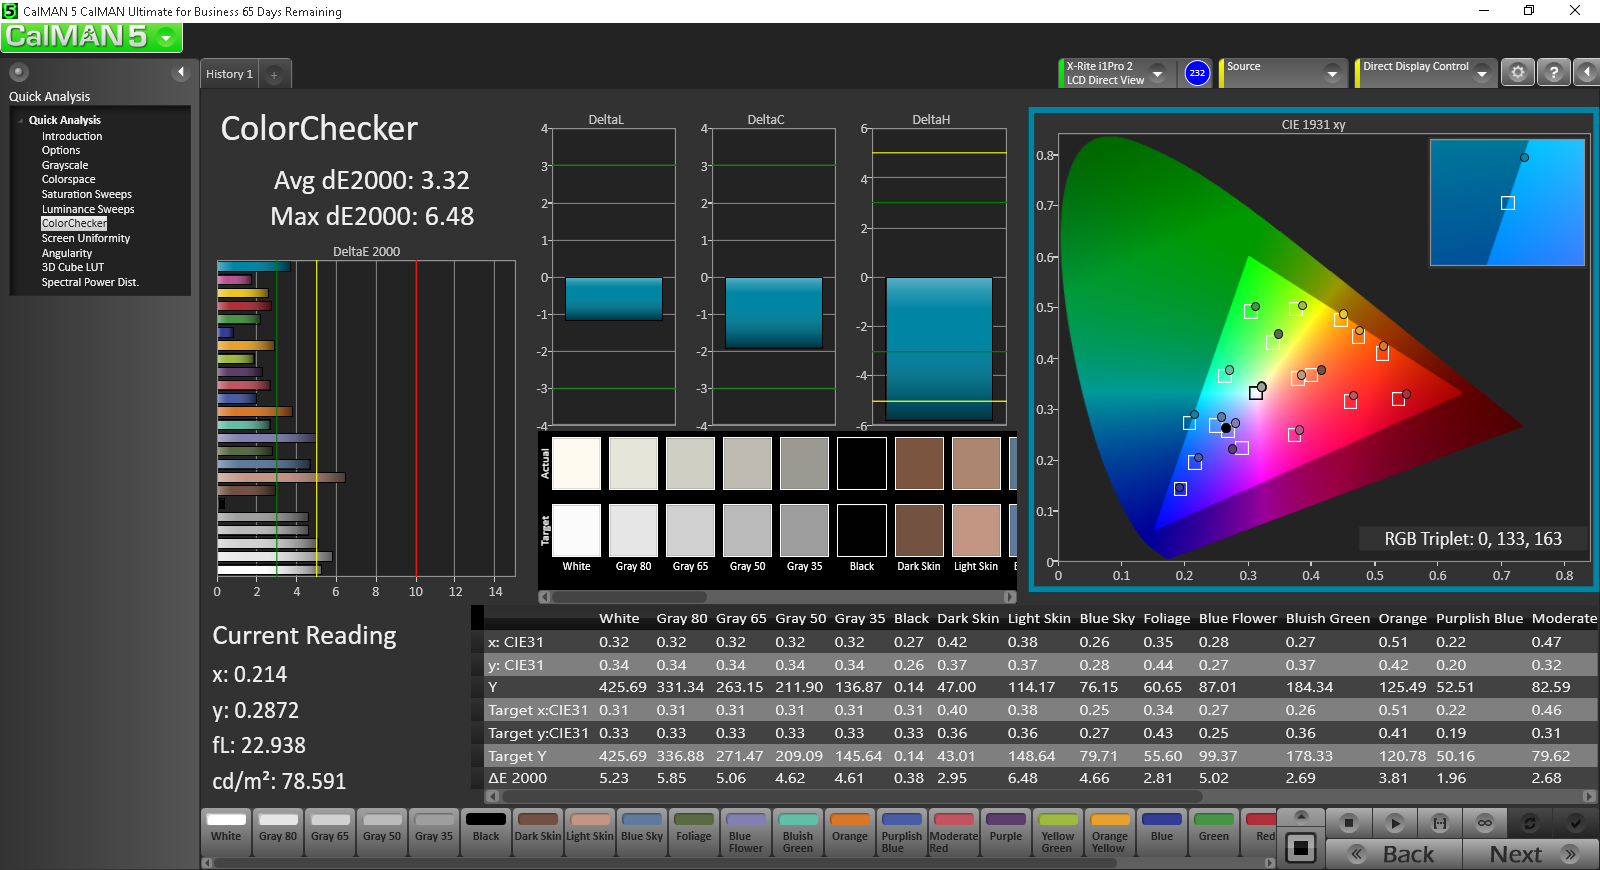
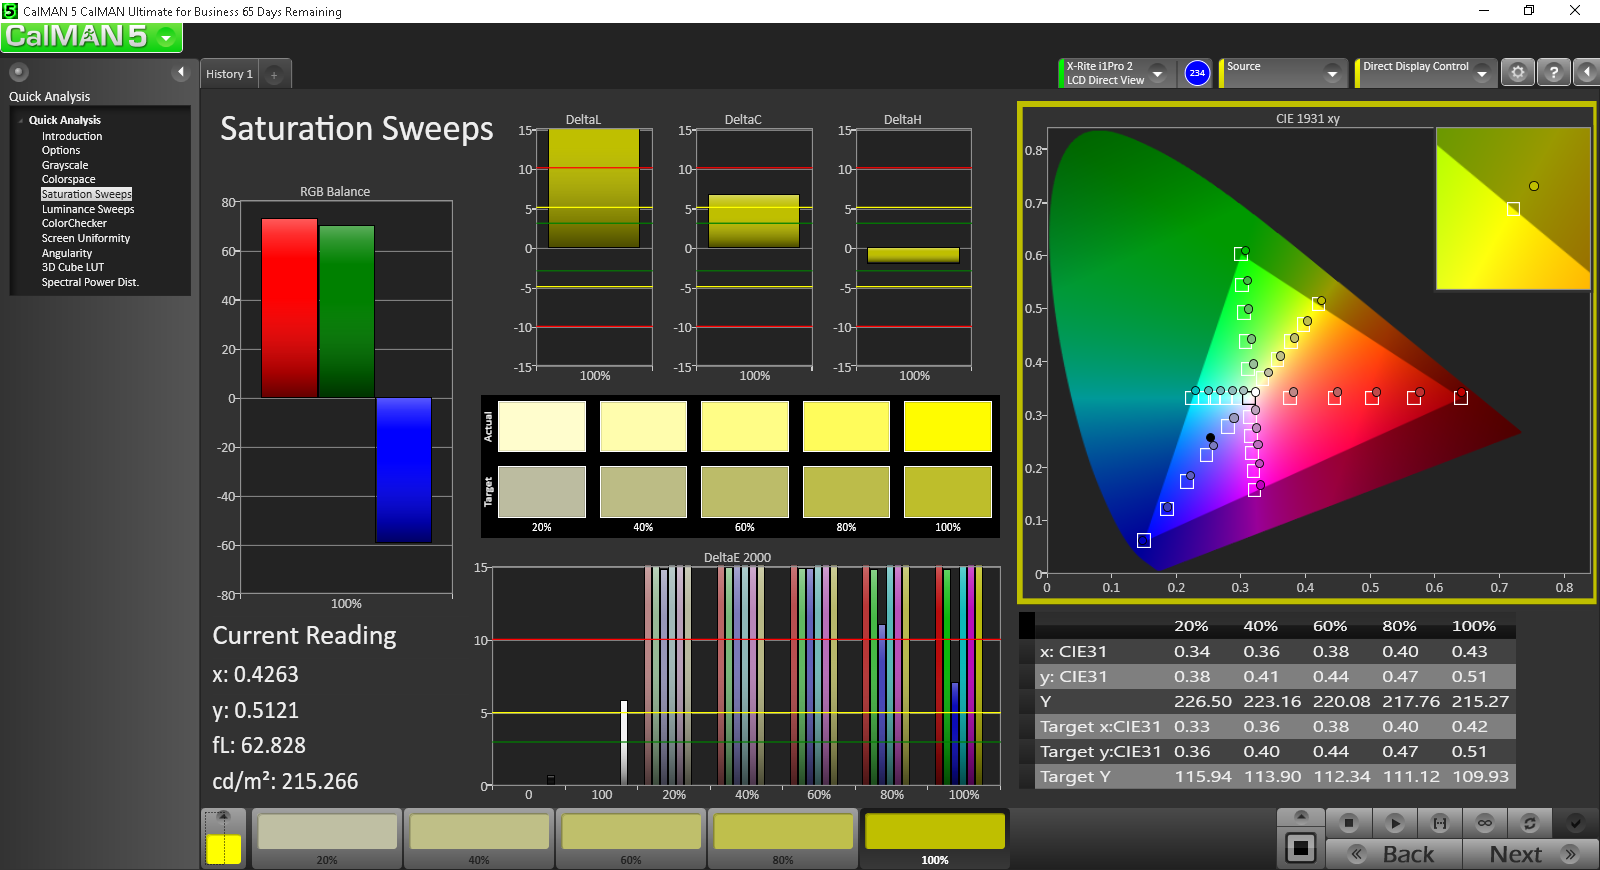
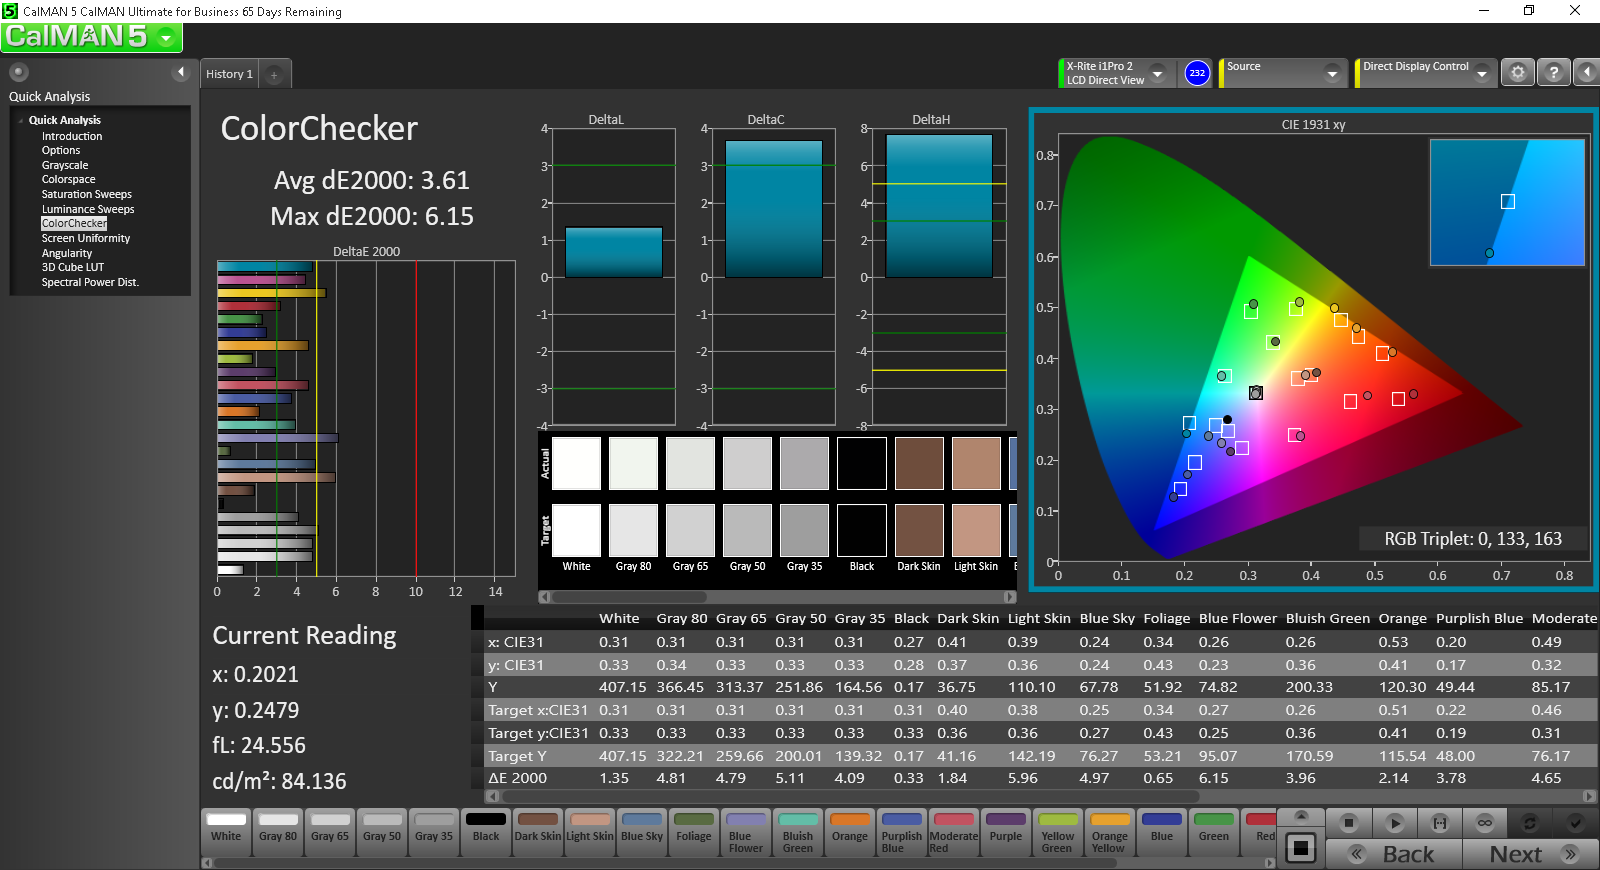
Our color analysis shows relatively accurate, yet not perfect colors compared to the sRGB reference. Calibration only insignificantly improved the color precision.

Display Response Times
| ↔ Response Time Black to White | ||
|---|---|---|
| 31.2 ms ... rise ↗ and fall ↘ combined | ↗ 6 ms rise | 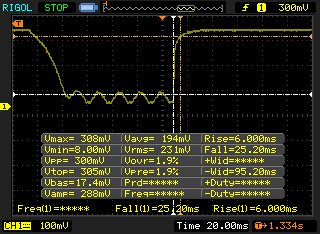 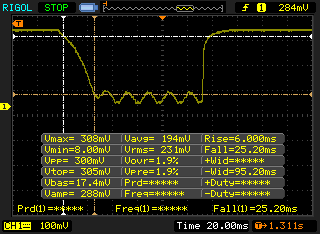 |
| ↘ 25.2 ms fall | ||
| The screen shows slow response rates in our tests and will be unsatisfactory for gamers. In comparison, all tested devices range from 0.1 (minimum) to 240 (maximum) ms. » 82 % of all devices are better. This means that the measured response time is worse than the average of all tested devices (21.5 ms). | ||
| ↔ Response Time 50% Grey to 80% Grey | ||
| 46 ms ... rise ↗ and fall ↘ combined | ↗ 17.2 ms rise | 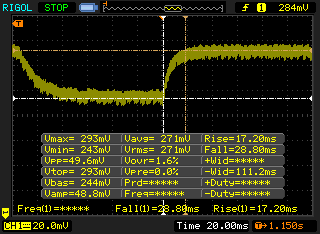  |
| ↘ 28.8 ms fall | ||
| The screen shows slow response rates in our tests and will be unsatisfactory for gamers. In comparison, all tested devices range from 0.2 (minimum) to 636 (maximum) ms. » 76 % of all devices are better. This means that the measured response time is worse than the average of all tested devices (33.7 ms). | ||
Emissions
In addition, we already have measurements of the surface temperatures available. The new Surface Pro 4 tends to be cooler than our Surface Pro 3 test model with i5-4300U processor while idle and when the core components are permanently stressed. However, you should take these results with a grain of salt, since the ambient temperature was significantly higher when we measured the temperature of the predecessor.
Microsoft Surface Pro 4
(-) The maximum temperature on the upper side is 52.3 °C / 126 F, compared to the average of 35.3 °C / 96 F, ranging from 19.6 to 55.7 °C for the class Convertible.
(-) The bottom heats up to a maximum of 51.4 °C / 125 F, compared to the average of 36.8 °C / 98 F
(±) In idle usage, the average temperature for the upper side is 36 °C / 97 F, compared to the device average of 30.2 °C / 86 F.
(-) The palmrests and touchpad can get very hot to the touch with a maximum of 52.3 °C / 126.1 F.
(-) The average temperature of the palmrest area of similar devices was 28.1 °C / 82.6 F (-24.2 °C / -43.5 F).
Microsoft Surface Pro 3
(-) The maximum temperature on the upper side is 45.2 °C / 113 F, compared to the average of 35.3 °C / 96 F, ranging from 19.6 to 55.7 °C for the class Convertible.
(-) The bottom heats up to a maximum of 46.4 °C / 116 F, compared to the average of 36.8 °C / 98 F
(±) In idle usage, the average temperature for the upper side is 33.8 °C / 93 F, compared to the device average of 30.2 °C / 86 F.
(-) The palmrests and touchpad can get very hot to the touch with a maximum of 42.4 °C / 108.3 F.
(-) The average temperature of the palmrest area of similar devices was 28.1 °C / 82.6 F (-14.3 °C / -25.7 F).
Verdict
We only have a few measurements of the Surface Pro 4 available, but display and emissions are slightly better than the predecessor's. It remains interesting to see how the device will perform in our performance tests and how long its realistic battery life is. The complete review will be available in about 1-2 weeks. Stay tuned!
Pricecompare
