 Deutsch
 English
 Español
 Français
 Italiano
 Nederlands
 Polski
 Português
 Русский
 Türkçe
 Svenska
 Chinese
 Magyar
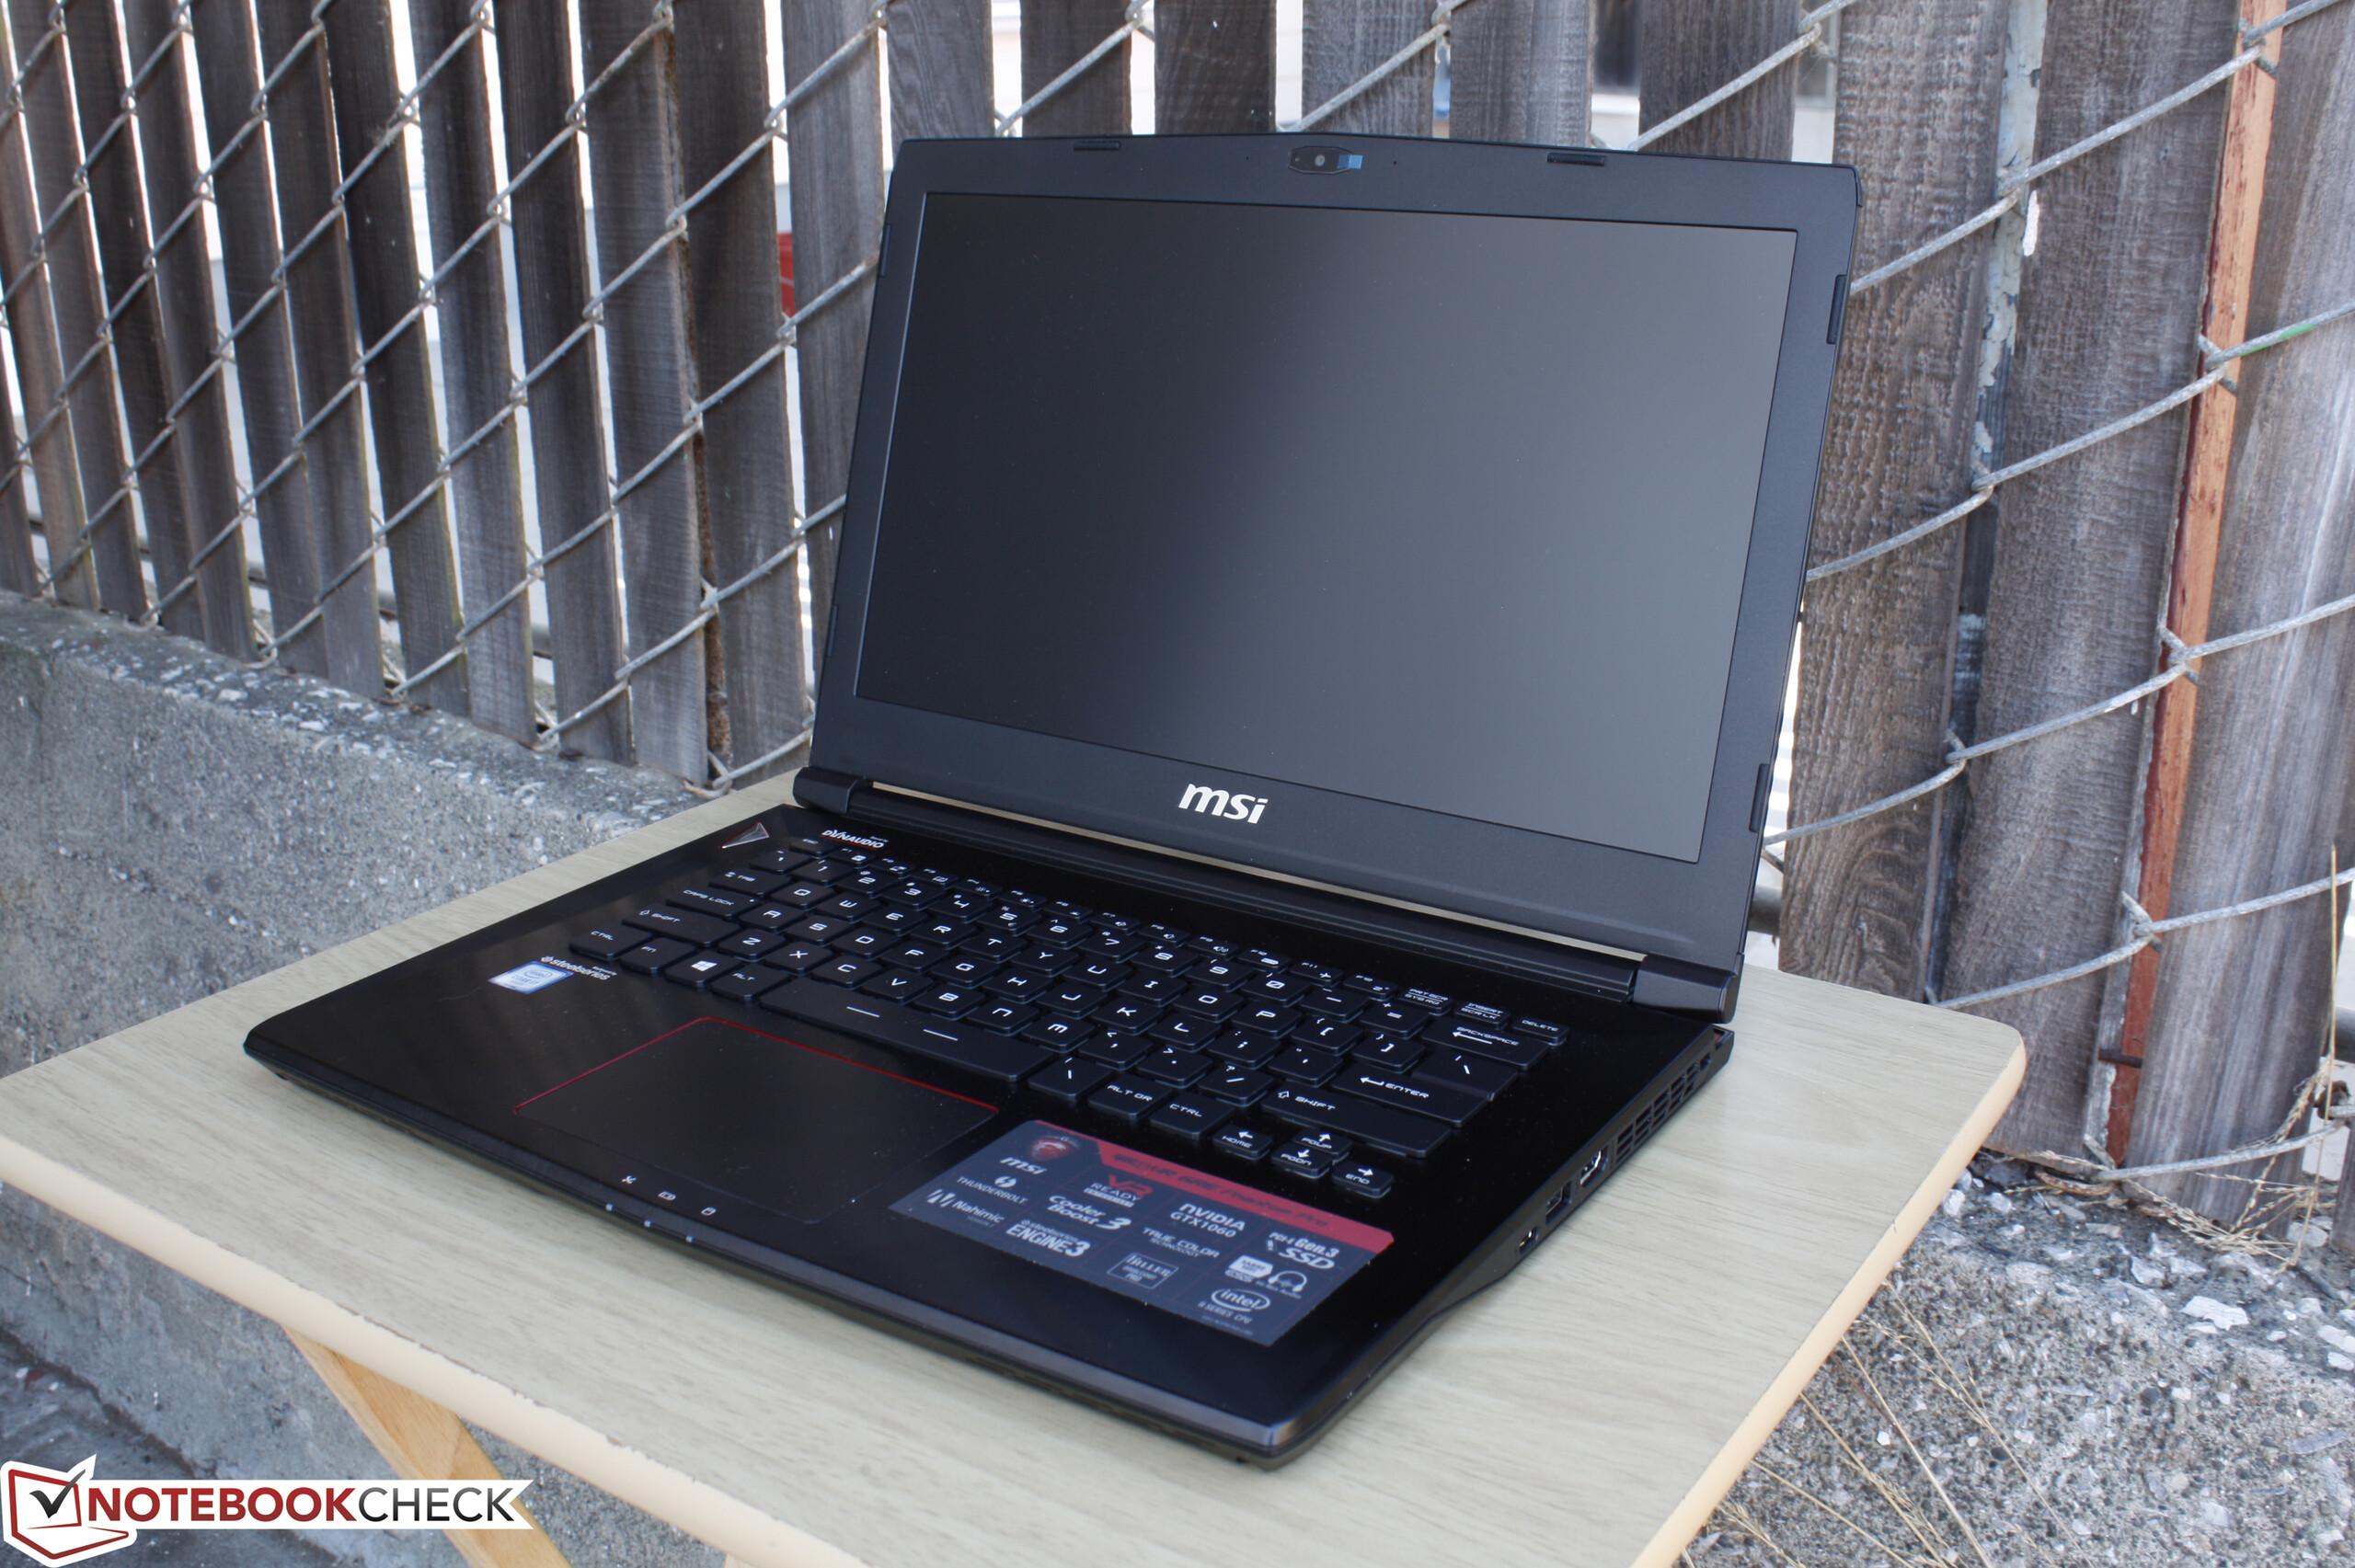
MSI GS43VR 6RE Phantom Pro Notebook Review

Gaming notebooks are becoming more and more popular especially in the 15-inch and 17-inch sizes. The 14-inch segment, however, is still quite small with more limited choices. MSI is one of the first to refresh its 14-inch offering from the GS40 to the GS43VR to be in line with the rest of its VR Ready G Series family.
Unlike the jump from the GS70 to the GS73VR or the GT72 to the GT73VR, the GS43VR is only an internal Pascal update from the GTX 970M in the GS40. The display, chassis, processor, and keyboard all remain identical and we recommend checking out our previous page on the GS40 since much of the review also applies to the GS43VR.
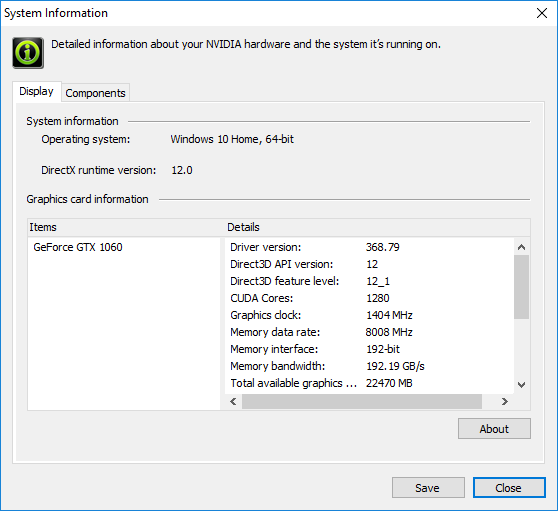
We've already seen the GTX 1060 in action and it has proven itself to be even more powerful than the GTX 980M at more mainstream prices. We'll check out in this review update how the GPU performs in an even smaller form factor than the GS73VR and if temperatures and noise are any different from the GS40. The GS43VR is currently available with a starting price of just under $1500 USD.
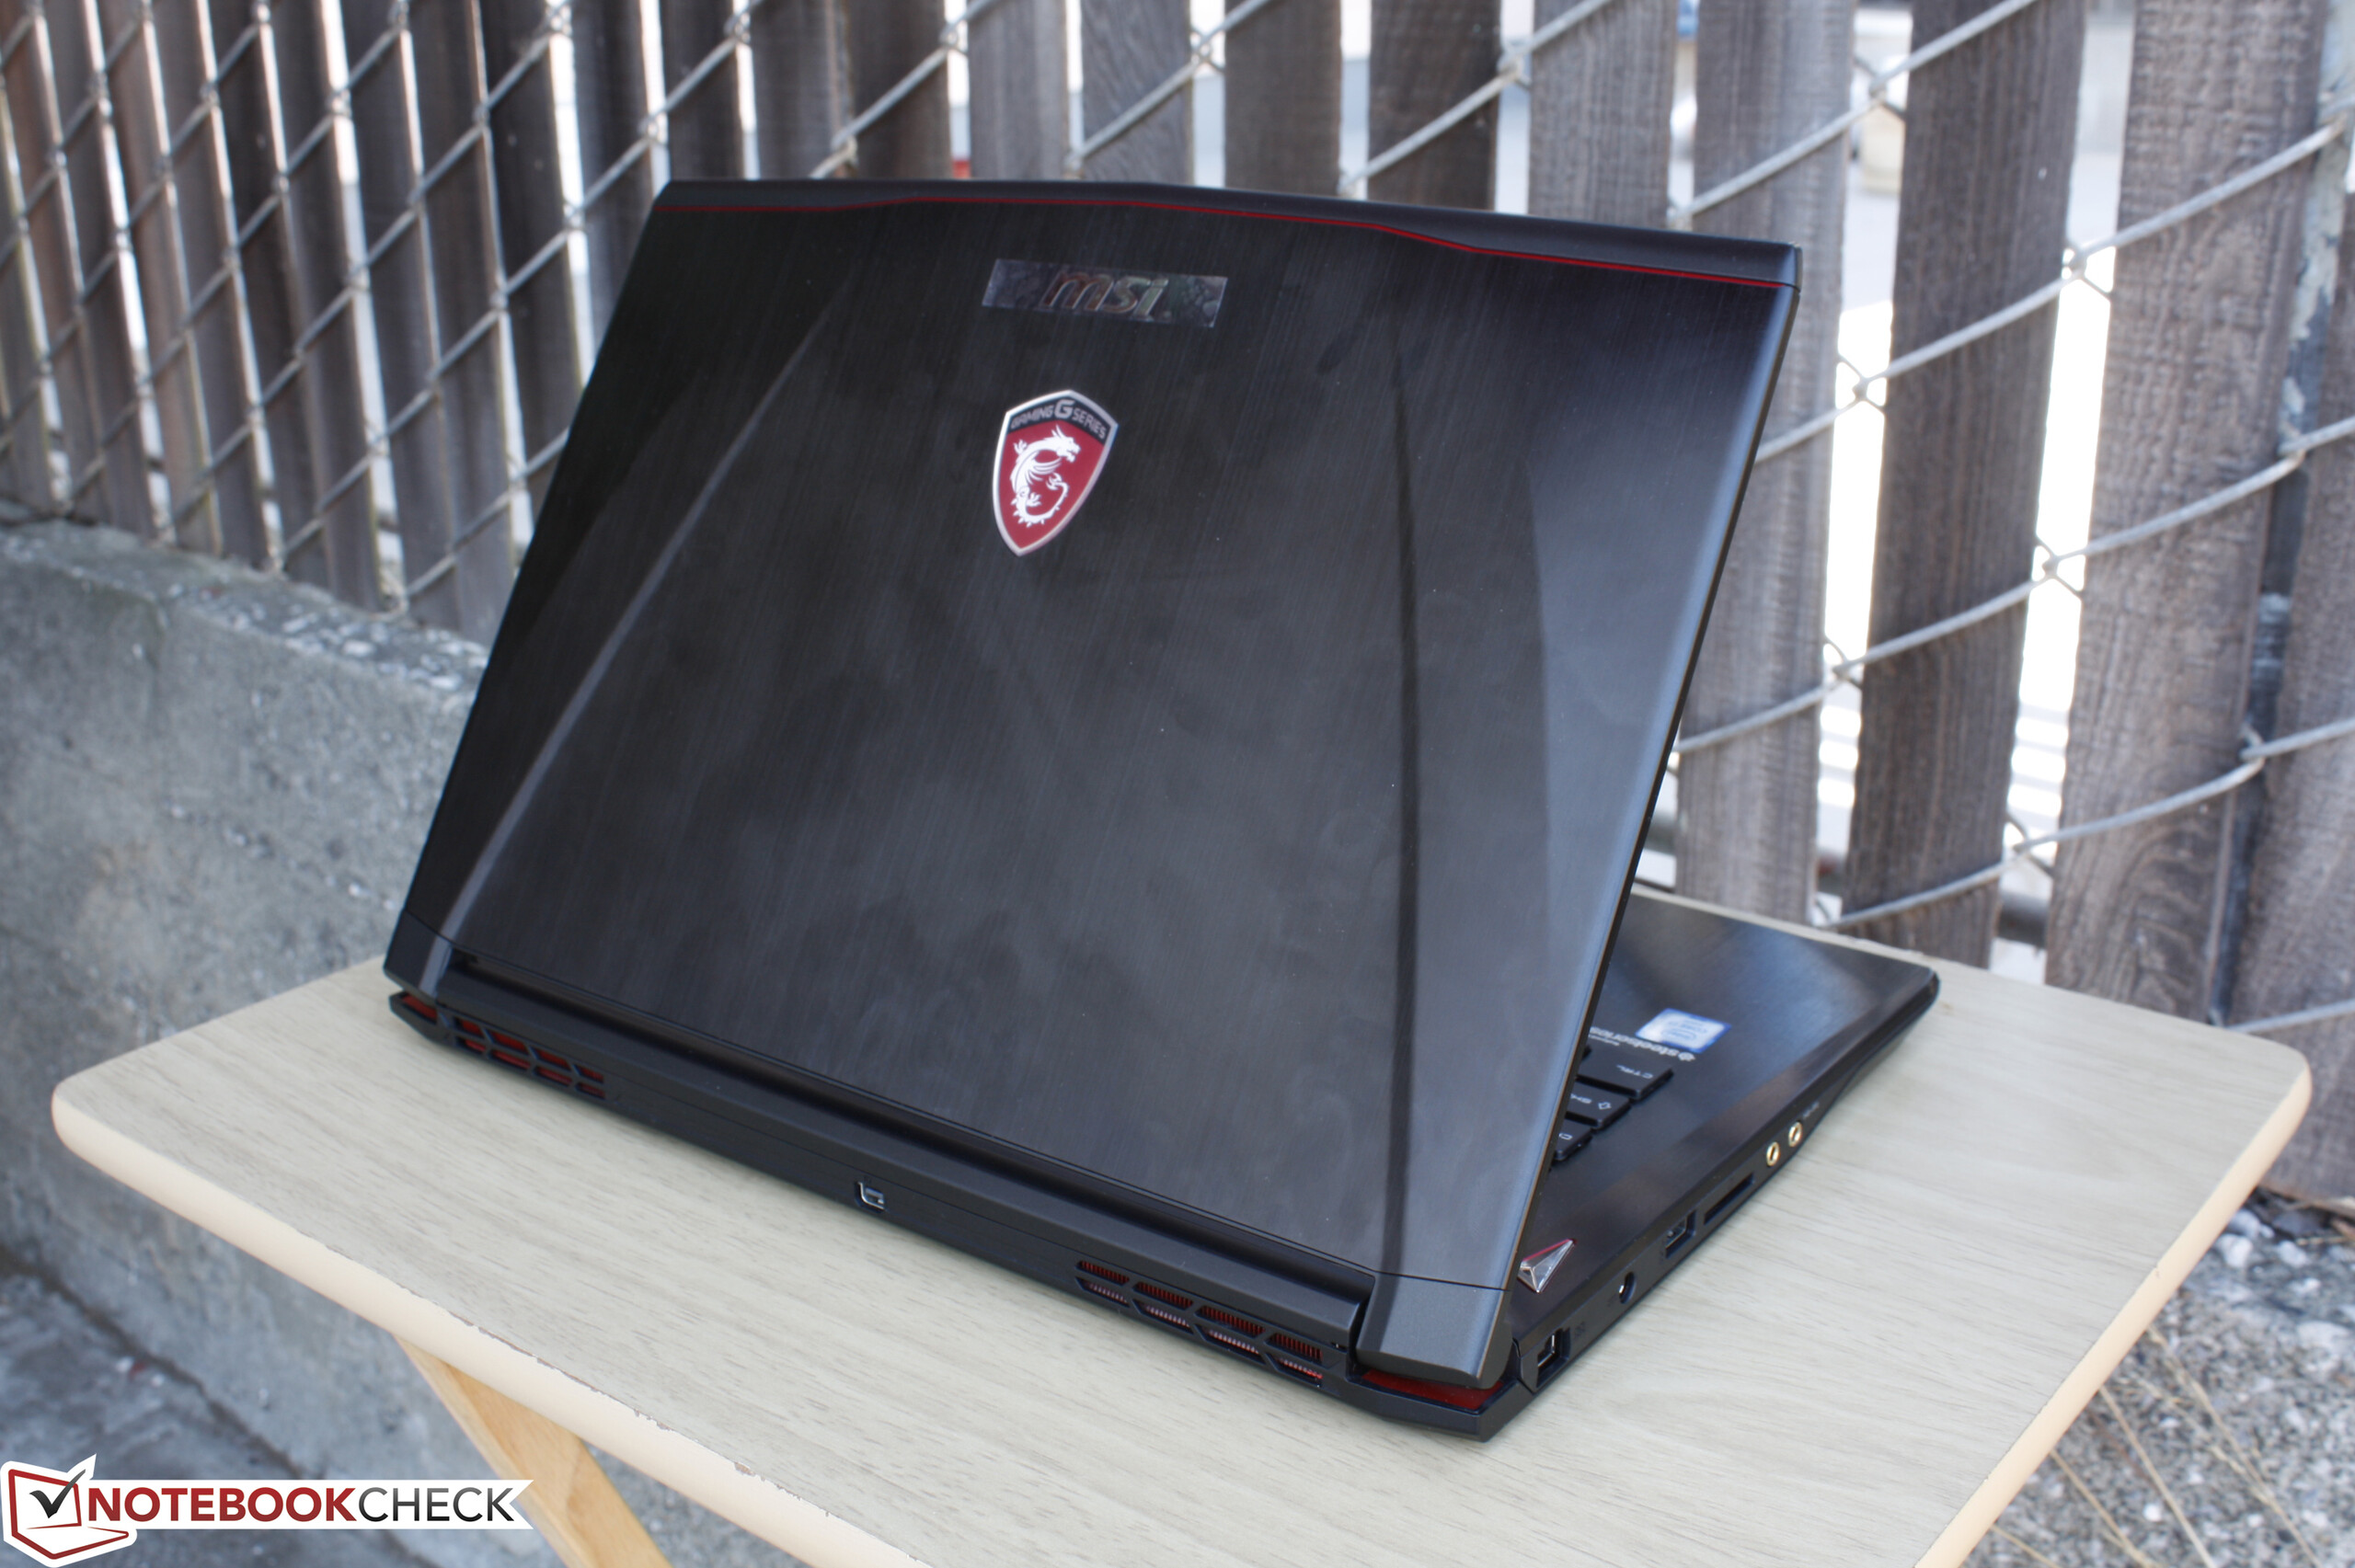
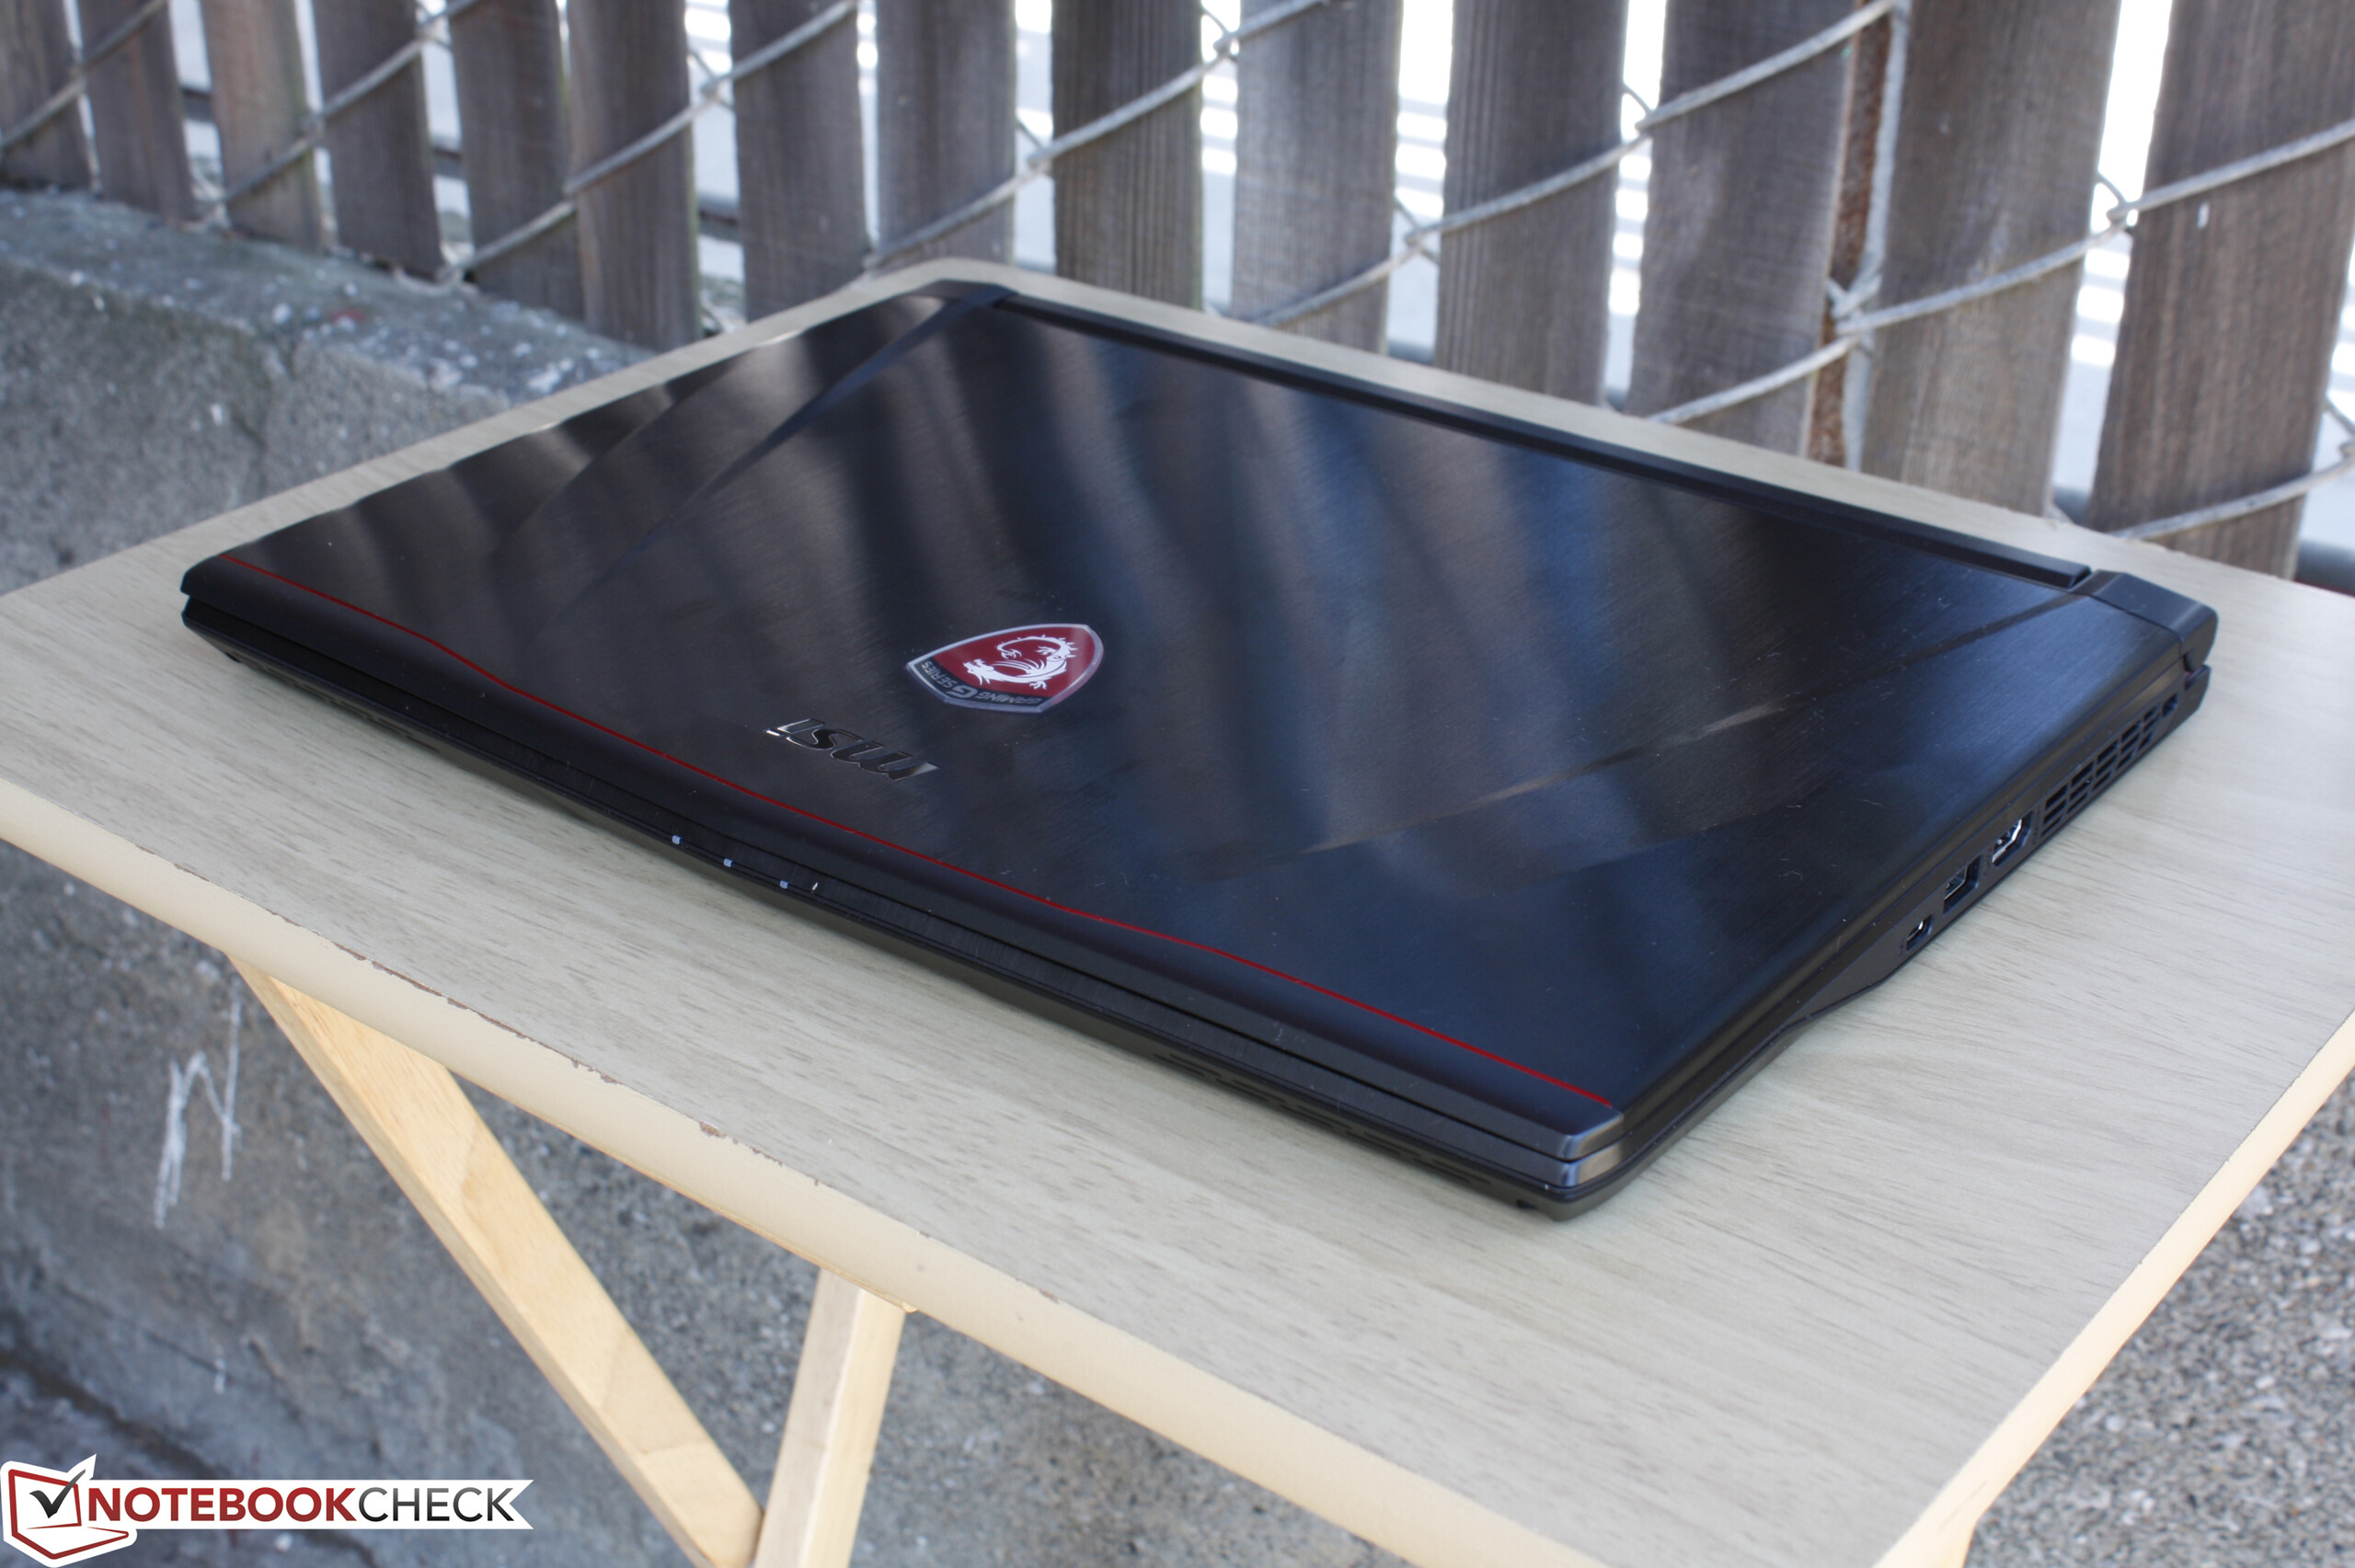
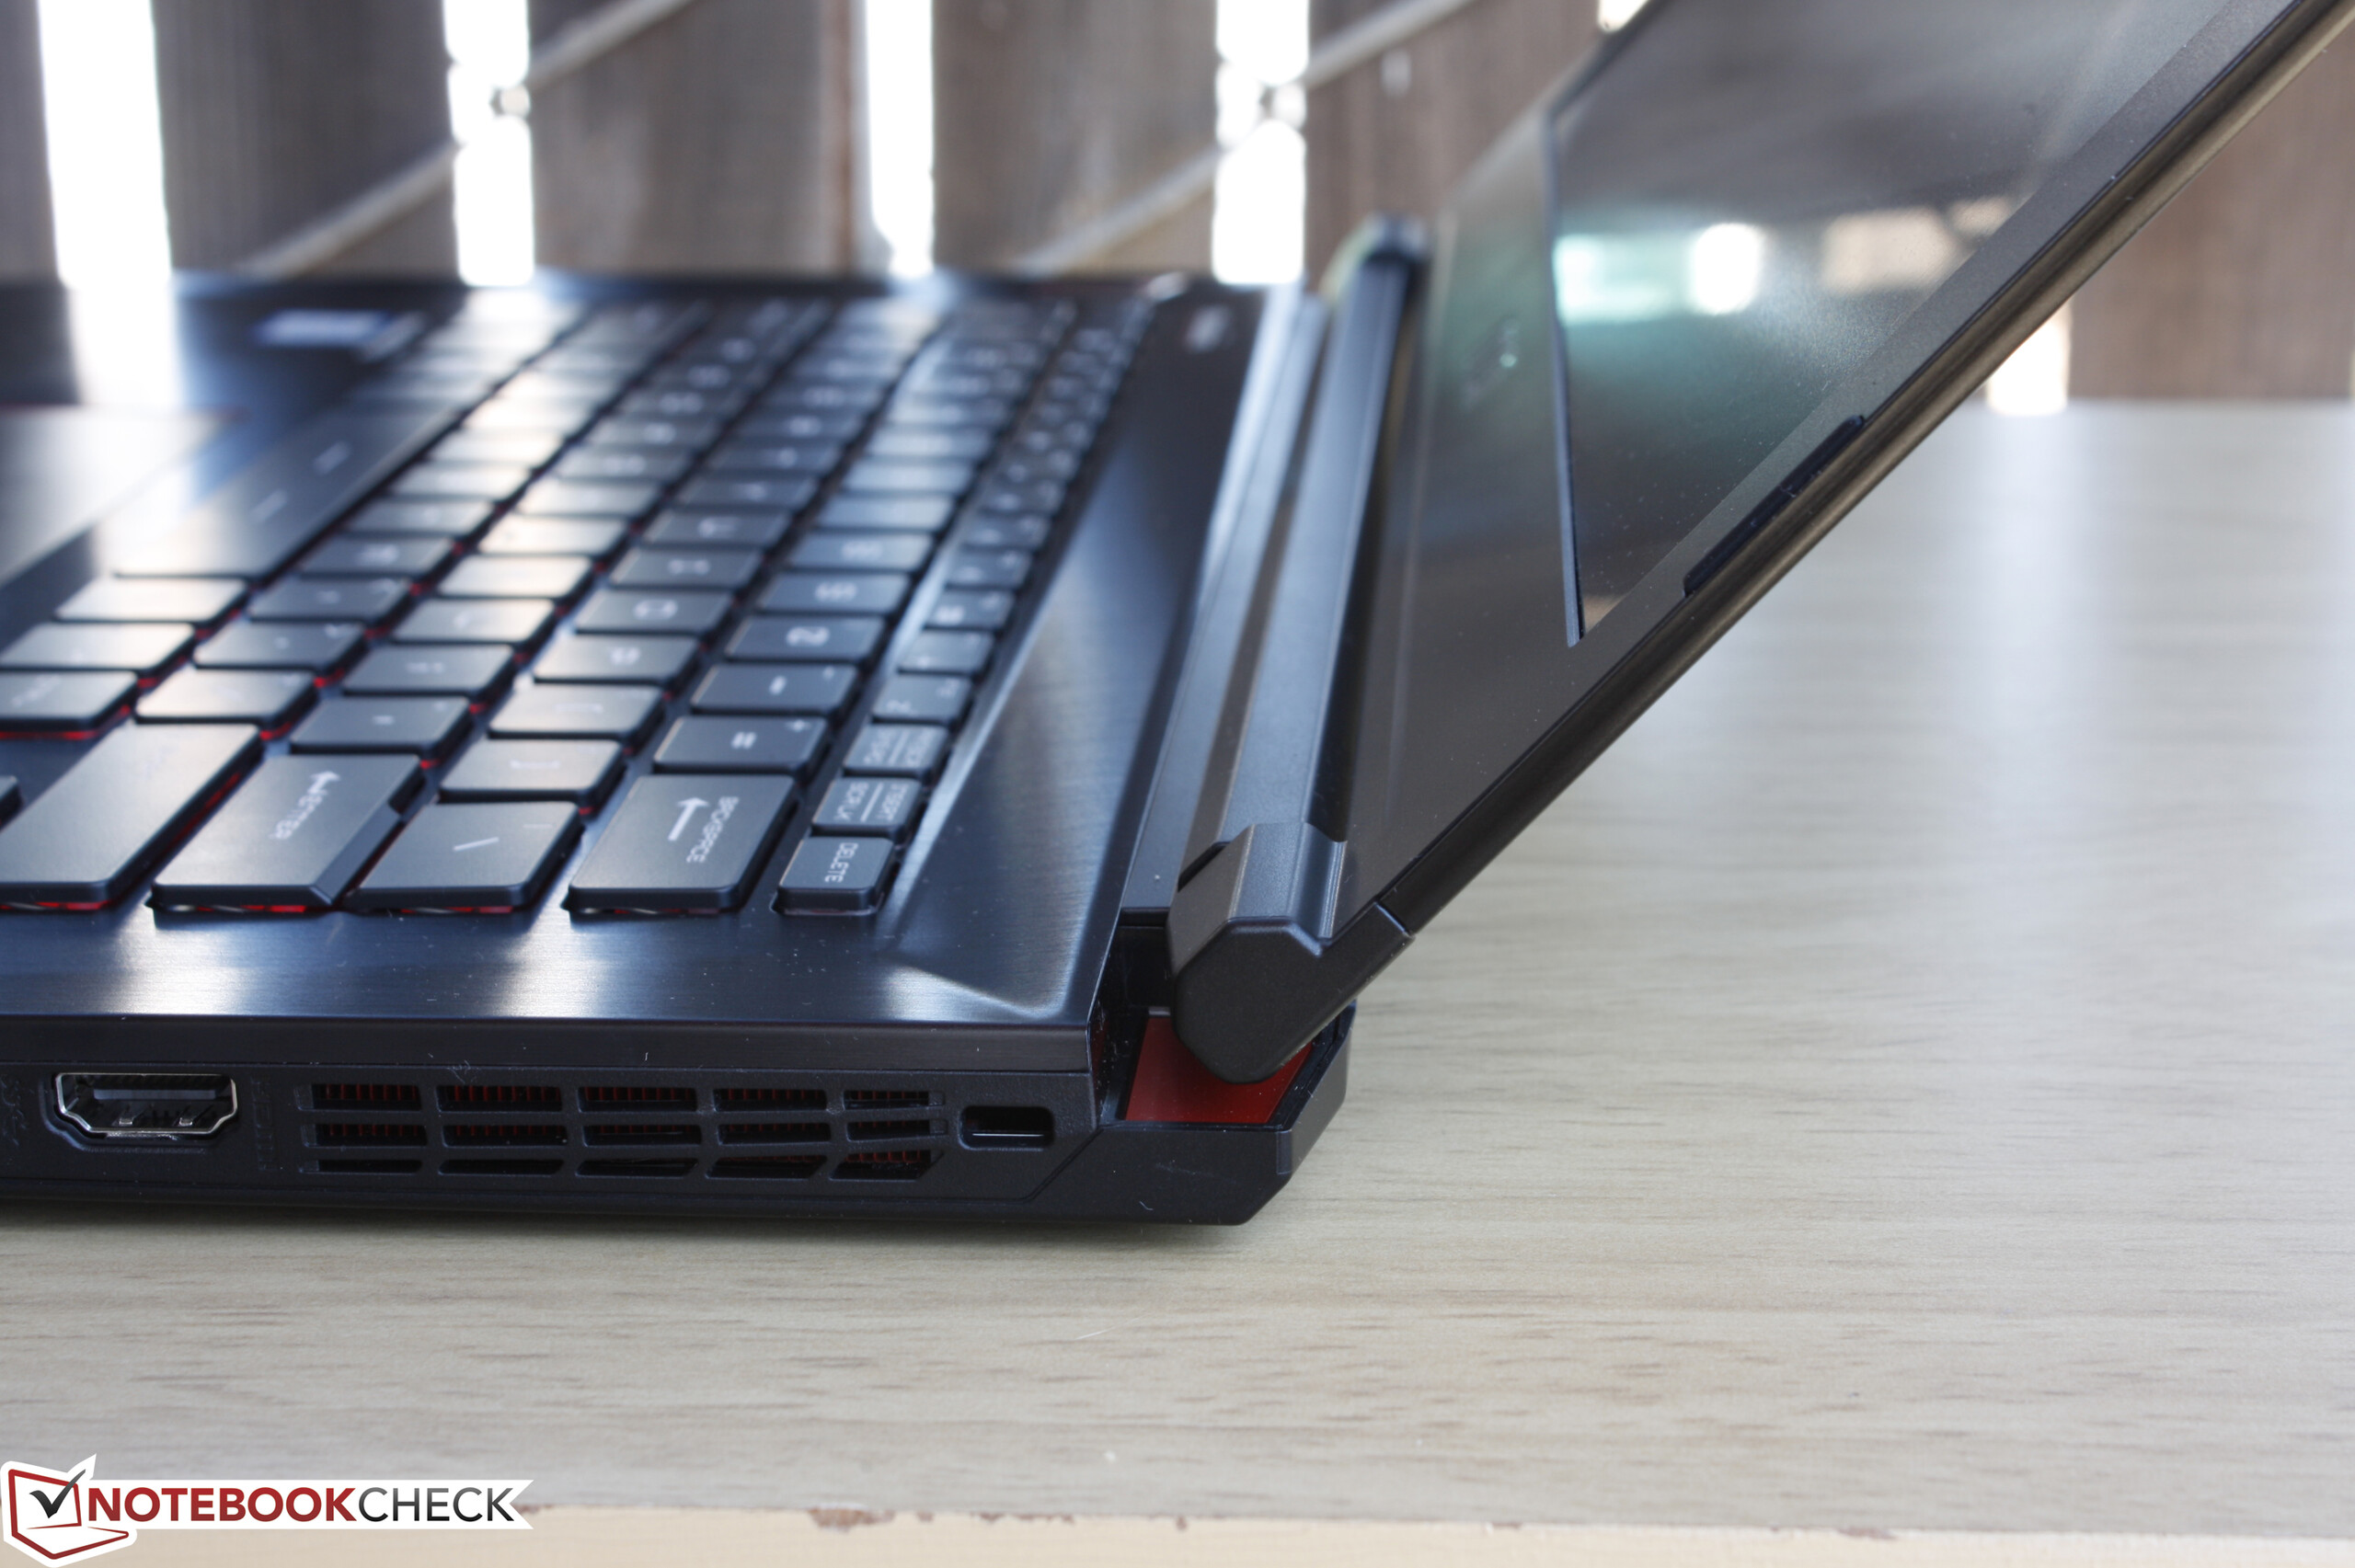
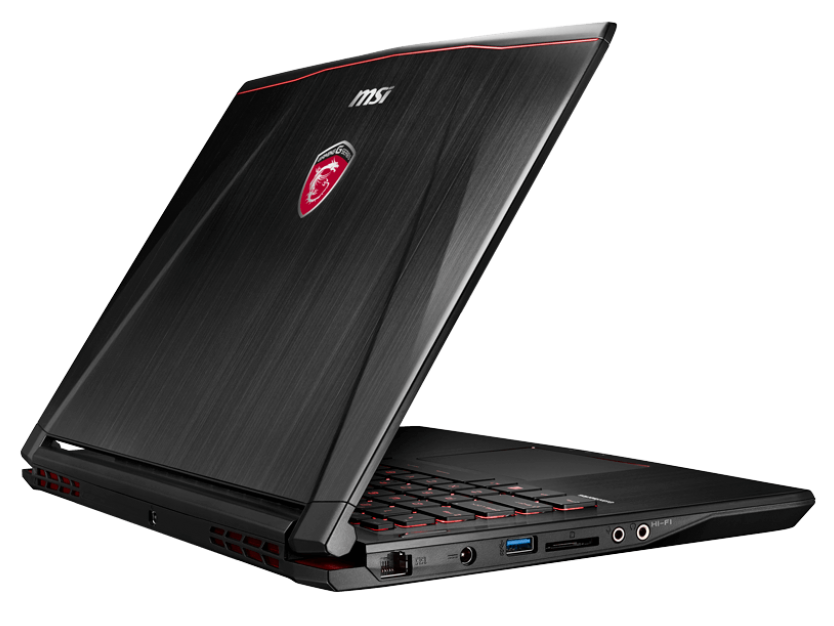
Case
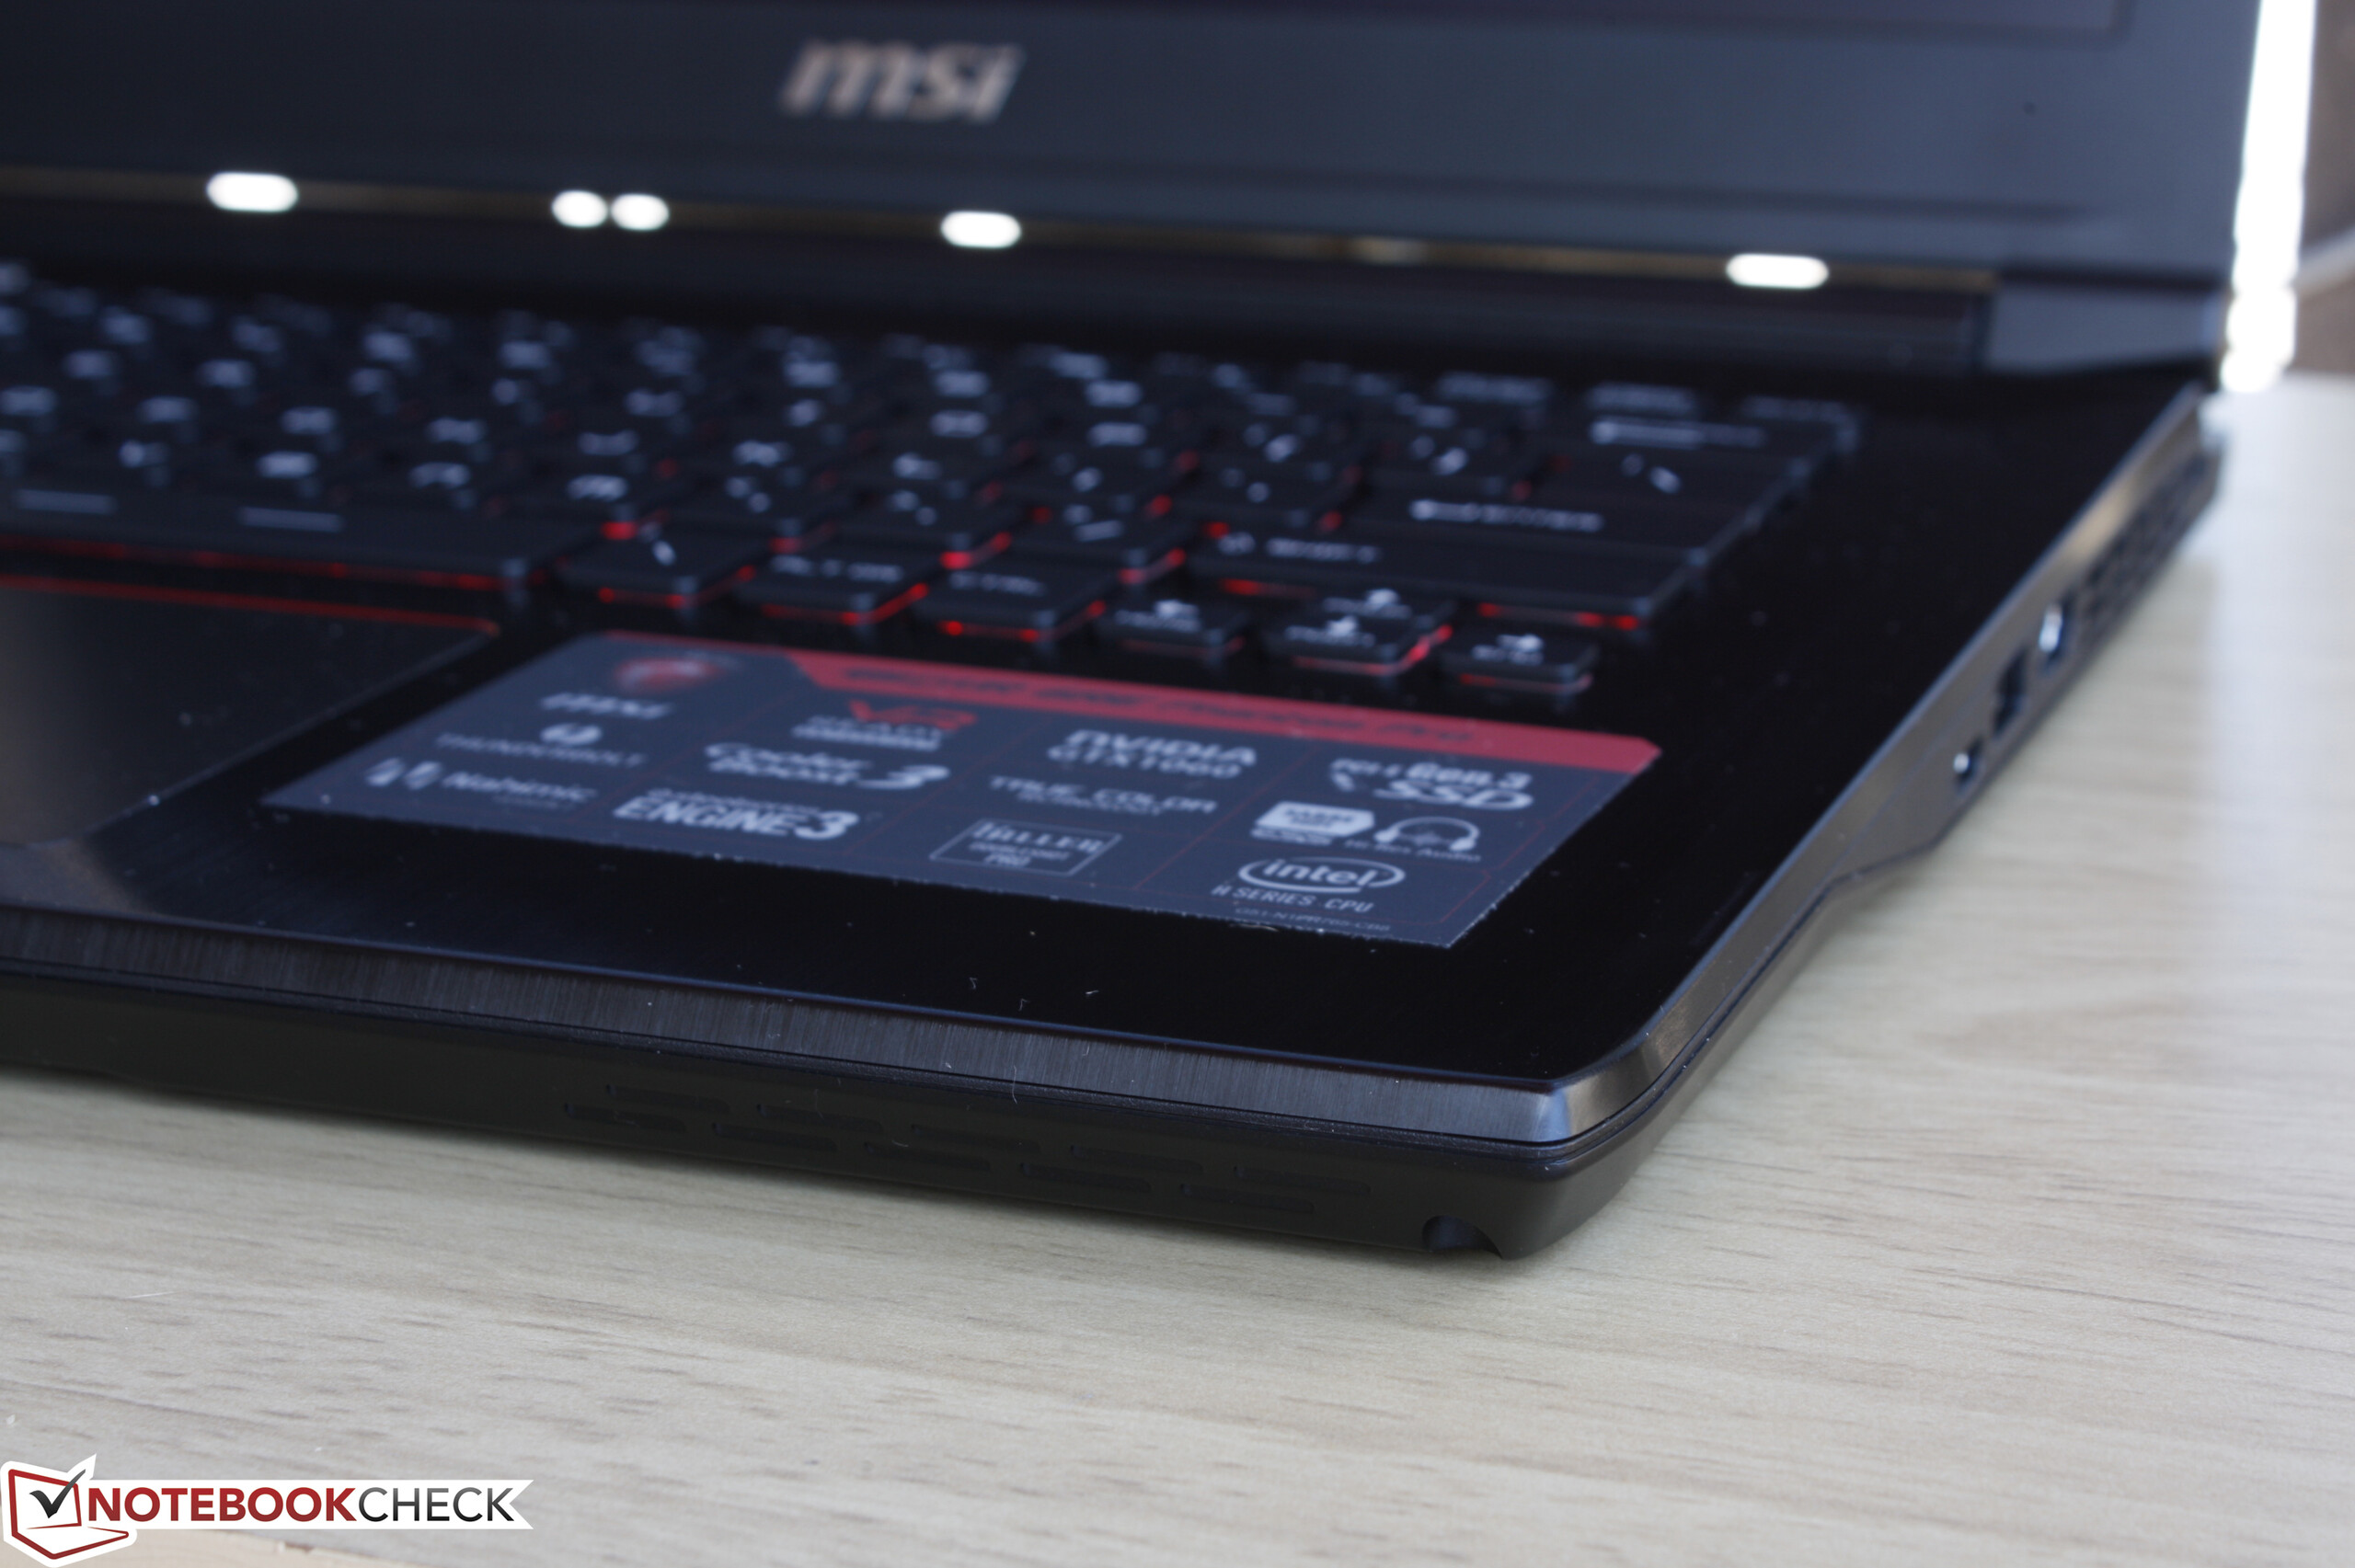
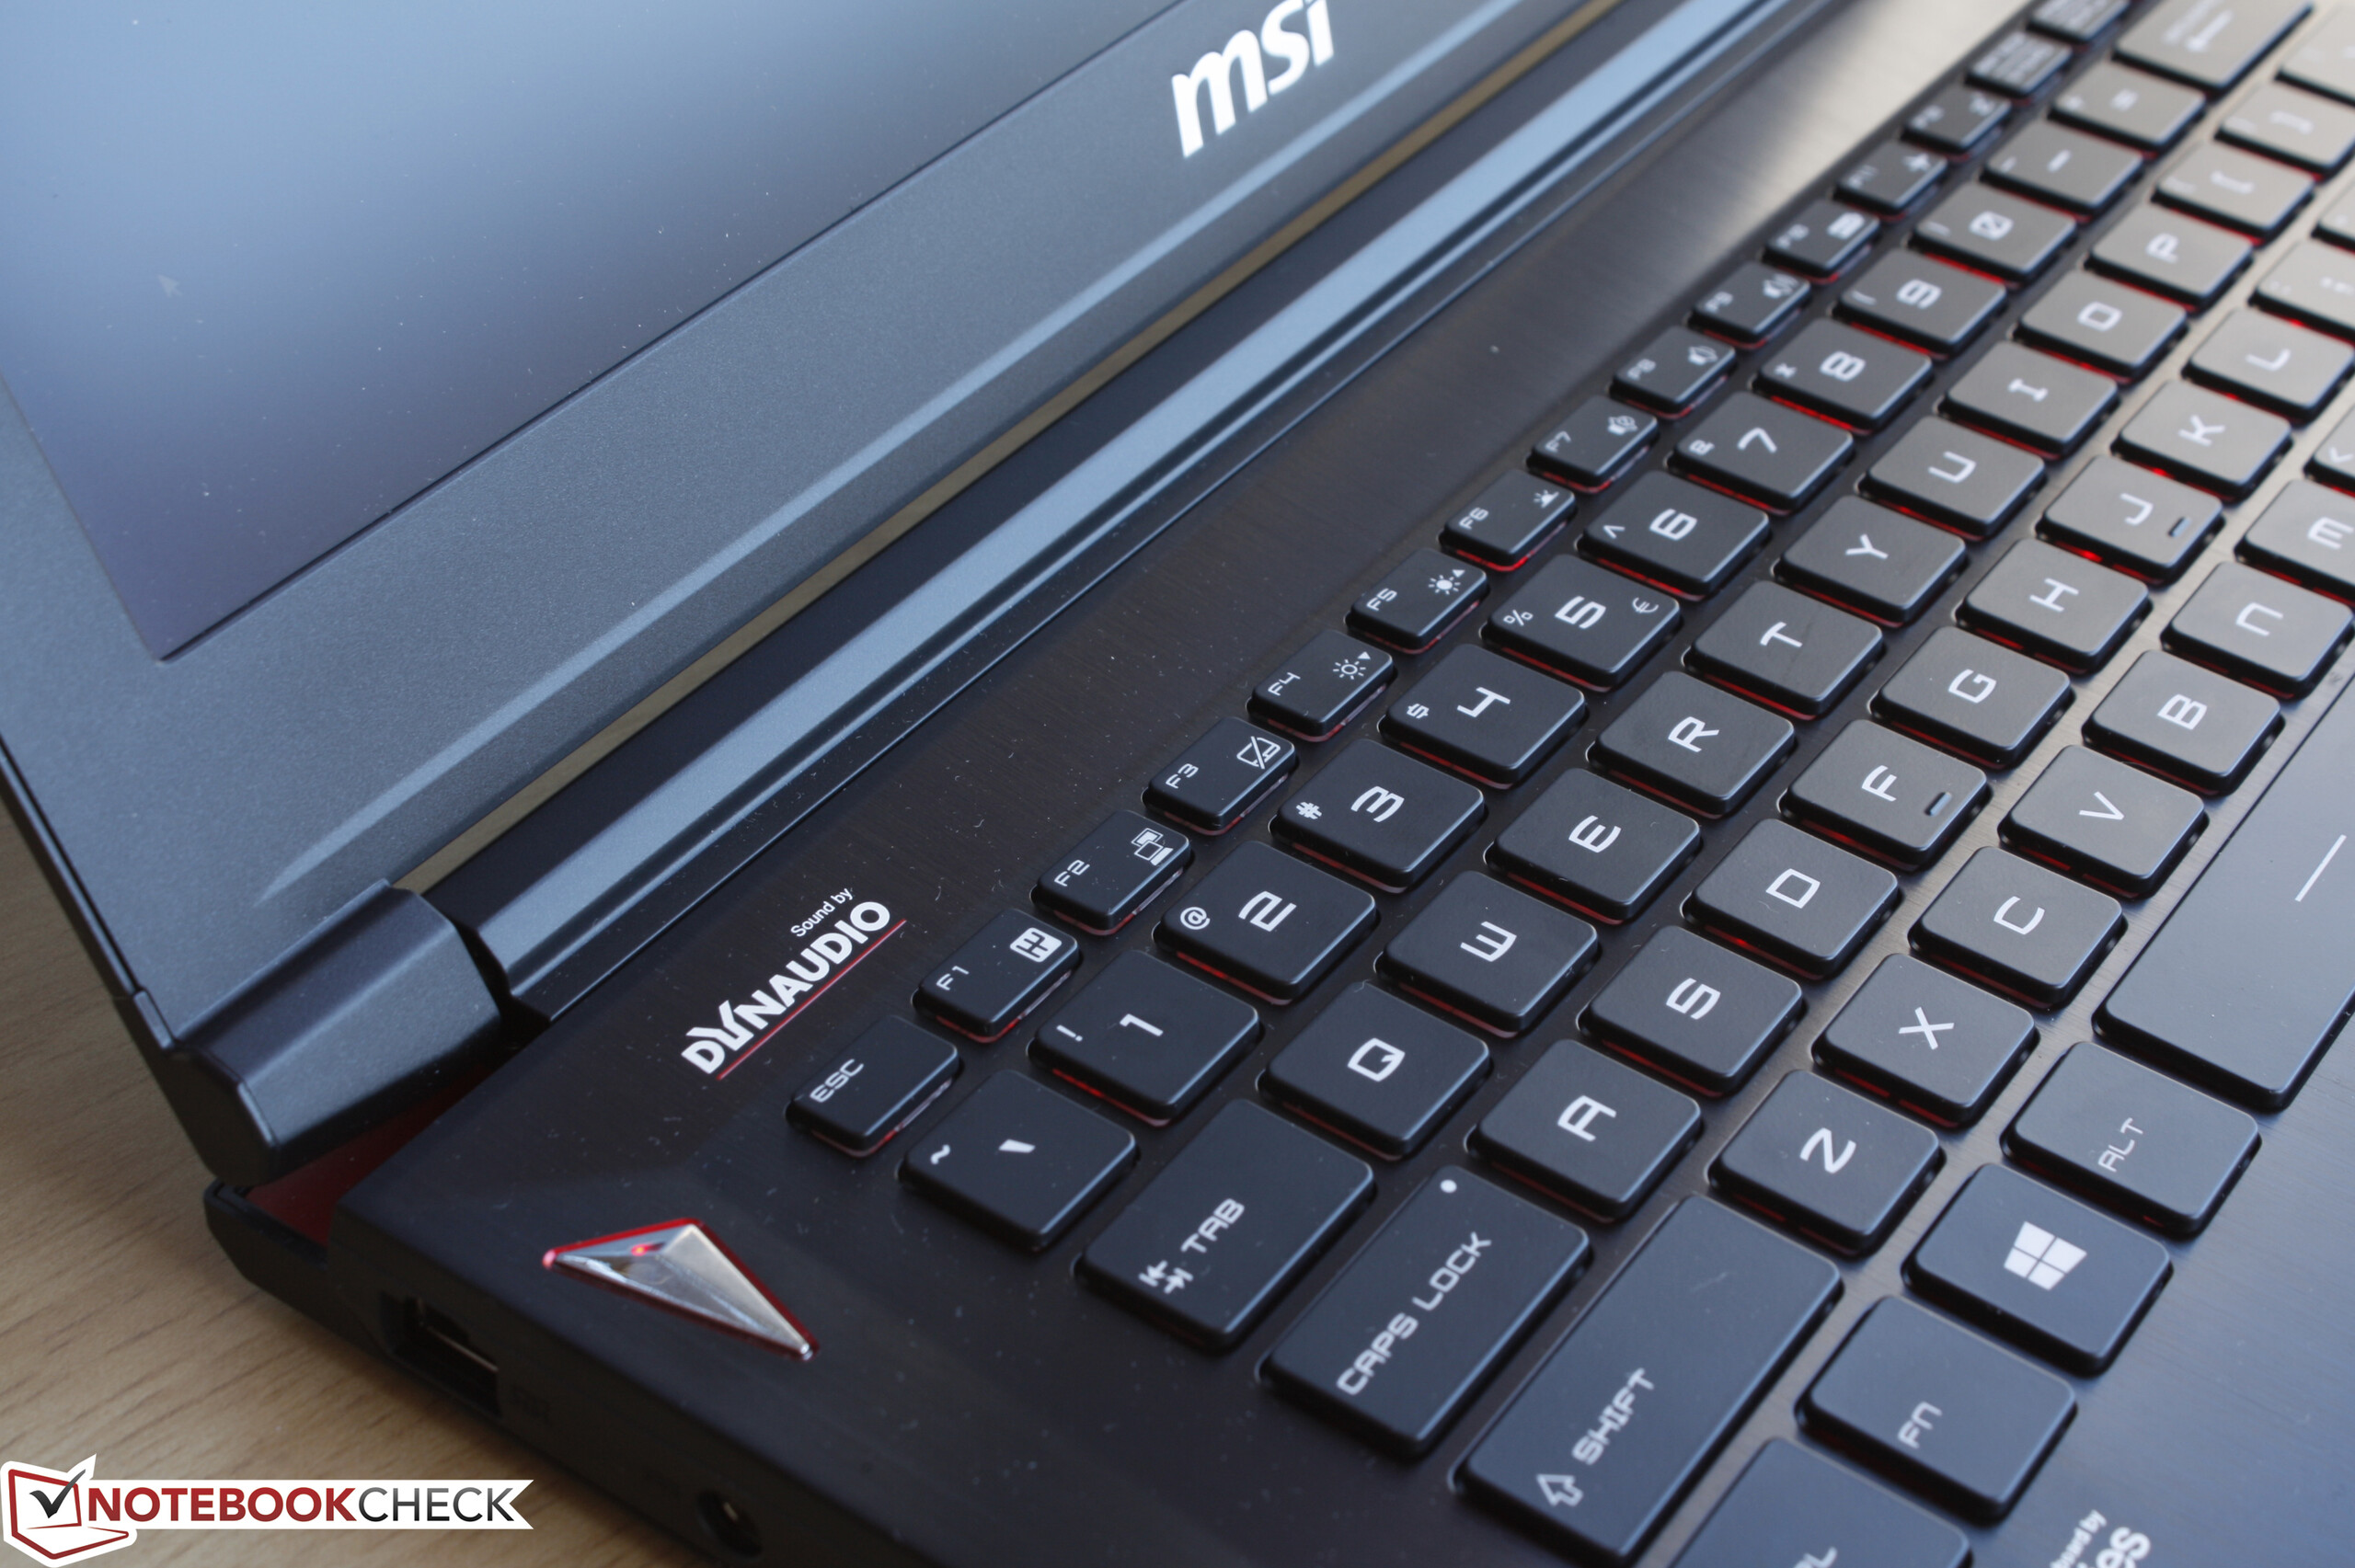
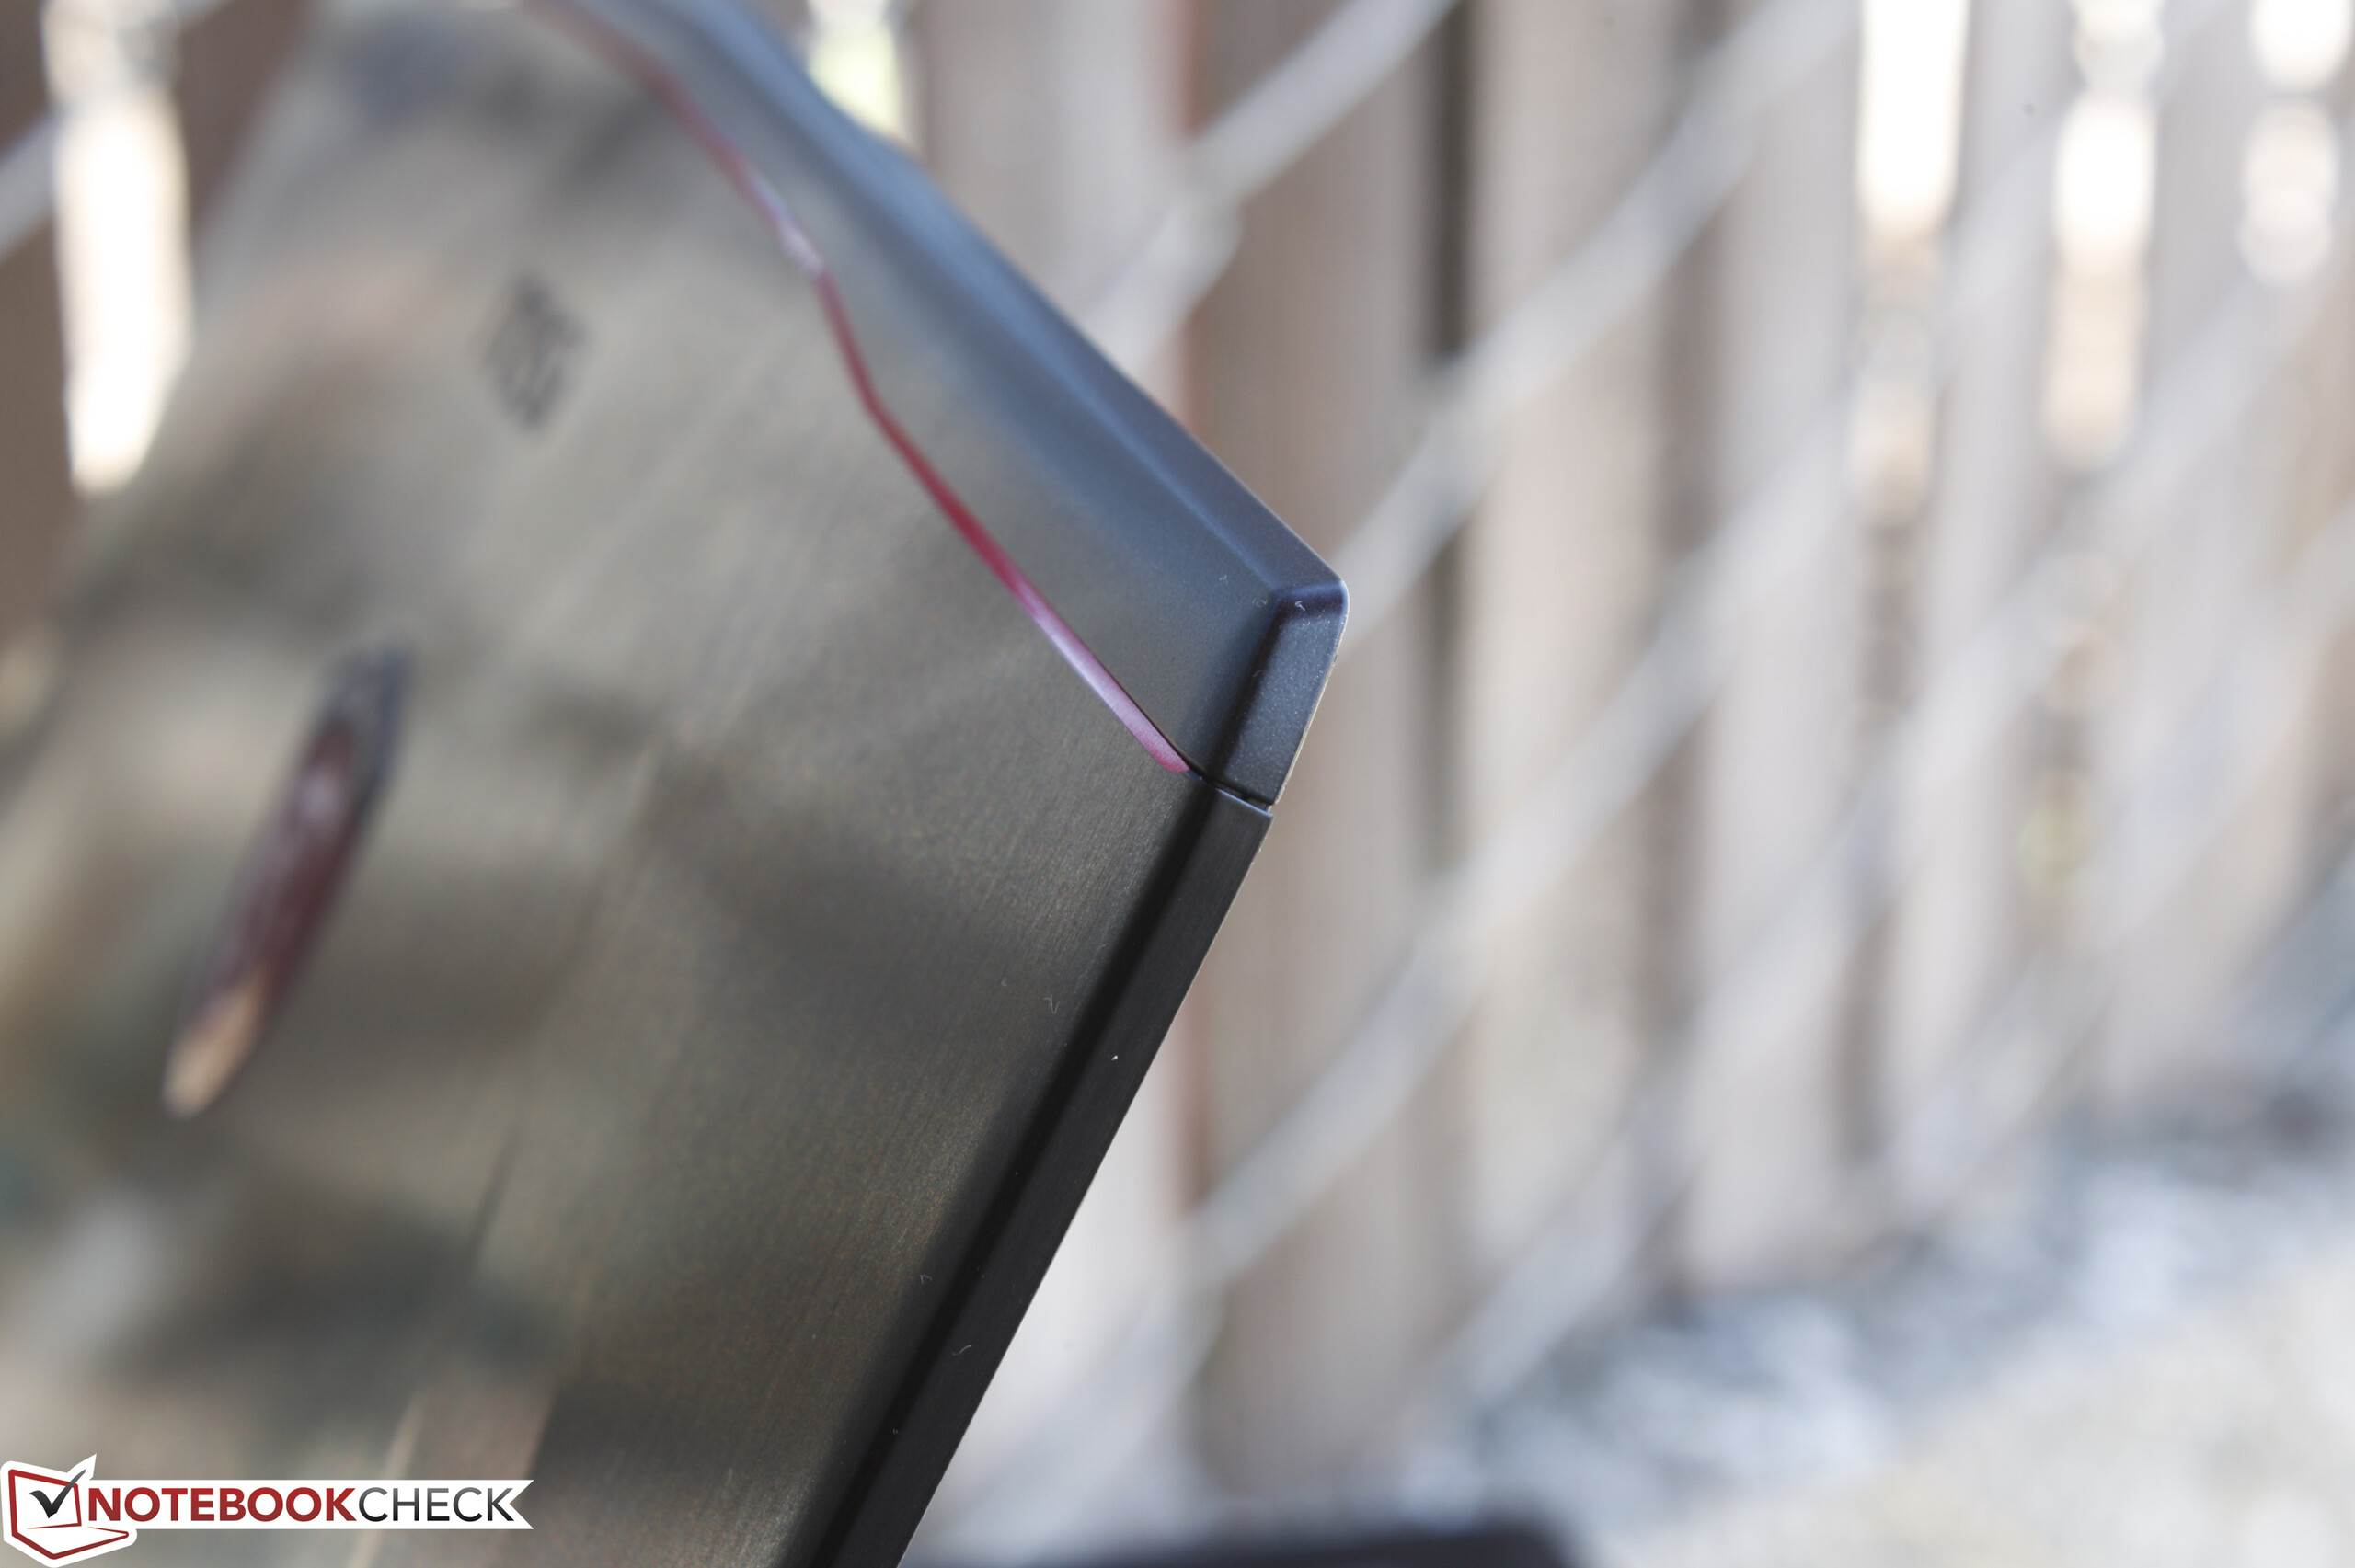
We've already described the case and its quality in detail on our previous review of the GS40. The overall workmanship of our unit is excellent with no unintended gaps or creaking when handling the device and the outer lid benefits from the small screen size with less warping down its center. Applying pressure down the center of the keyboard and around the palm rests will result in just minor flexing that shouldn't be a cause for any concern as the base is already resistant to twists. The lid continues to be the weakest part of the notebook as it bends from its two corners easily even when compared to other 14-inch gaming notebooks like the Razer Blade 14. Its inner plastic bezel also appears cheap in contrast to the attractive brushed aluminum surfaces of the outer lid and palm rests.
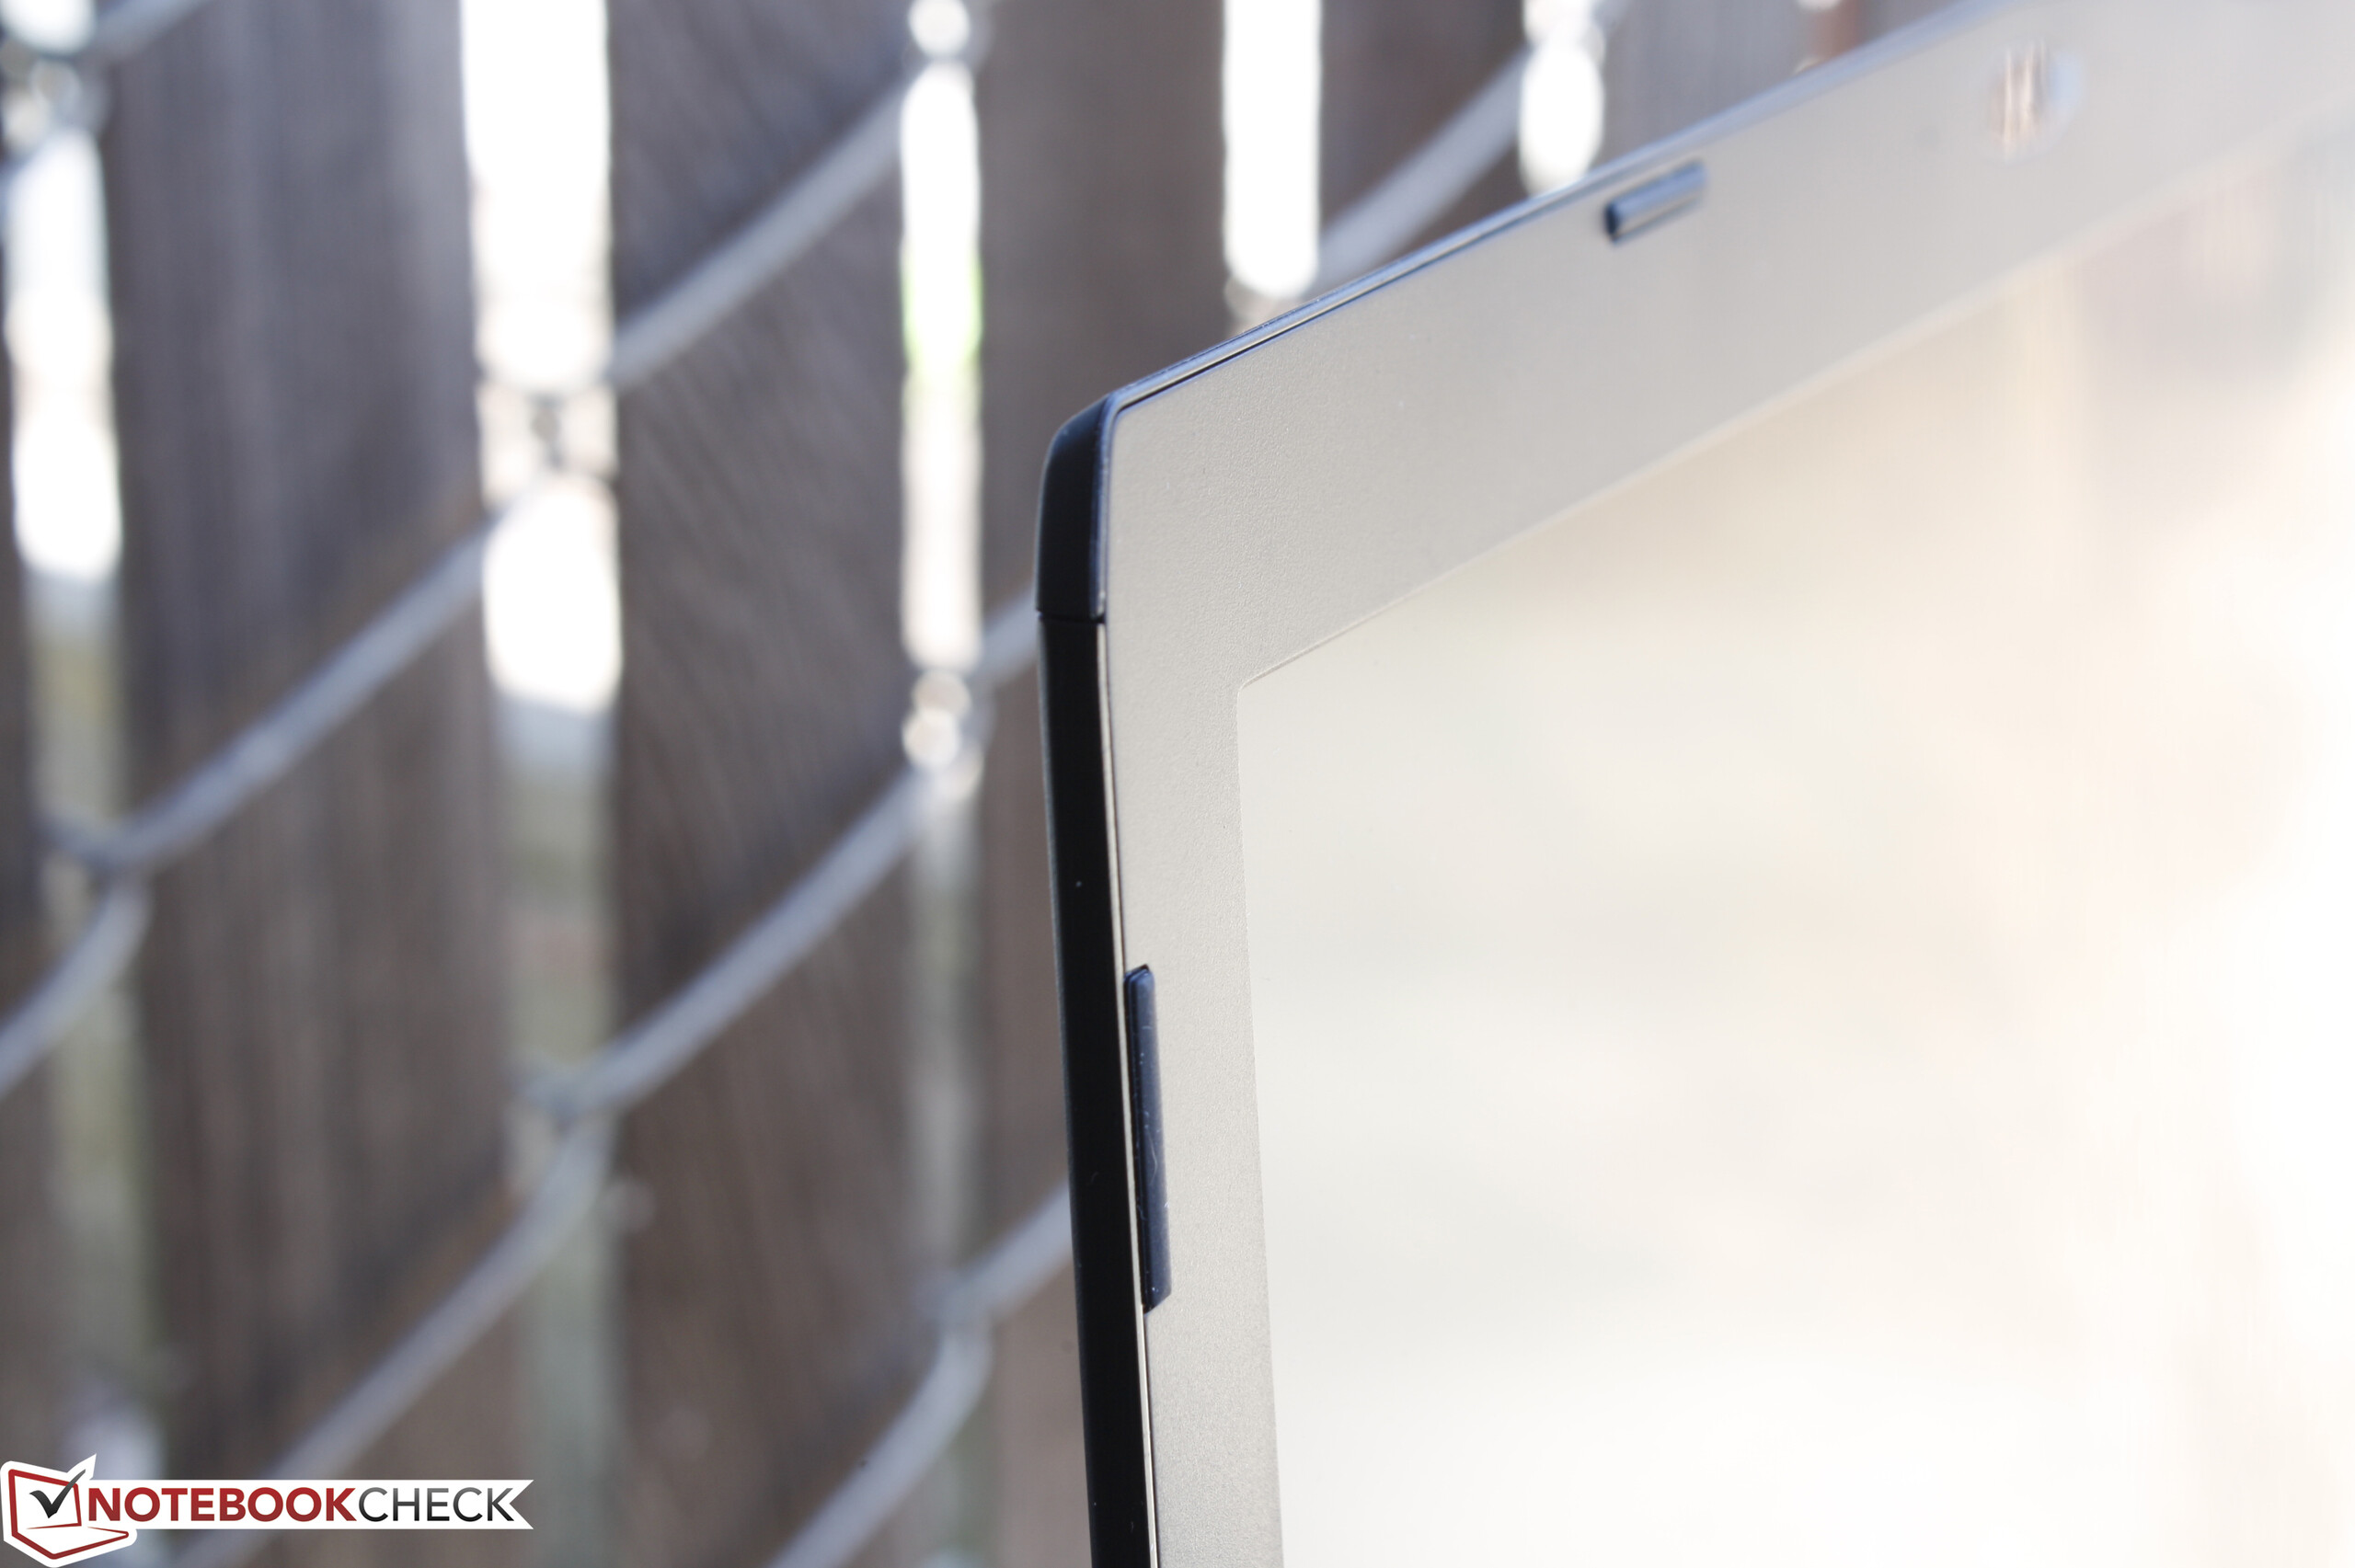
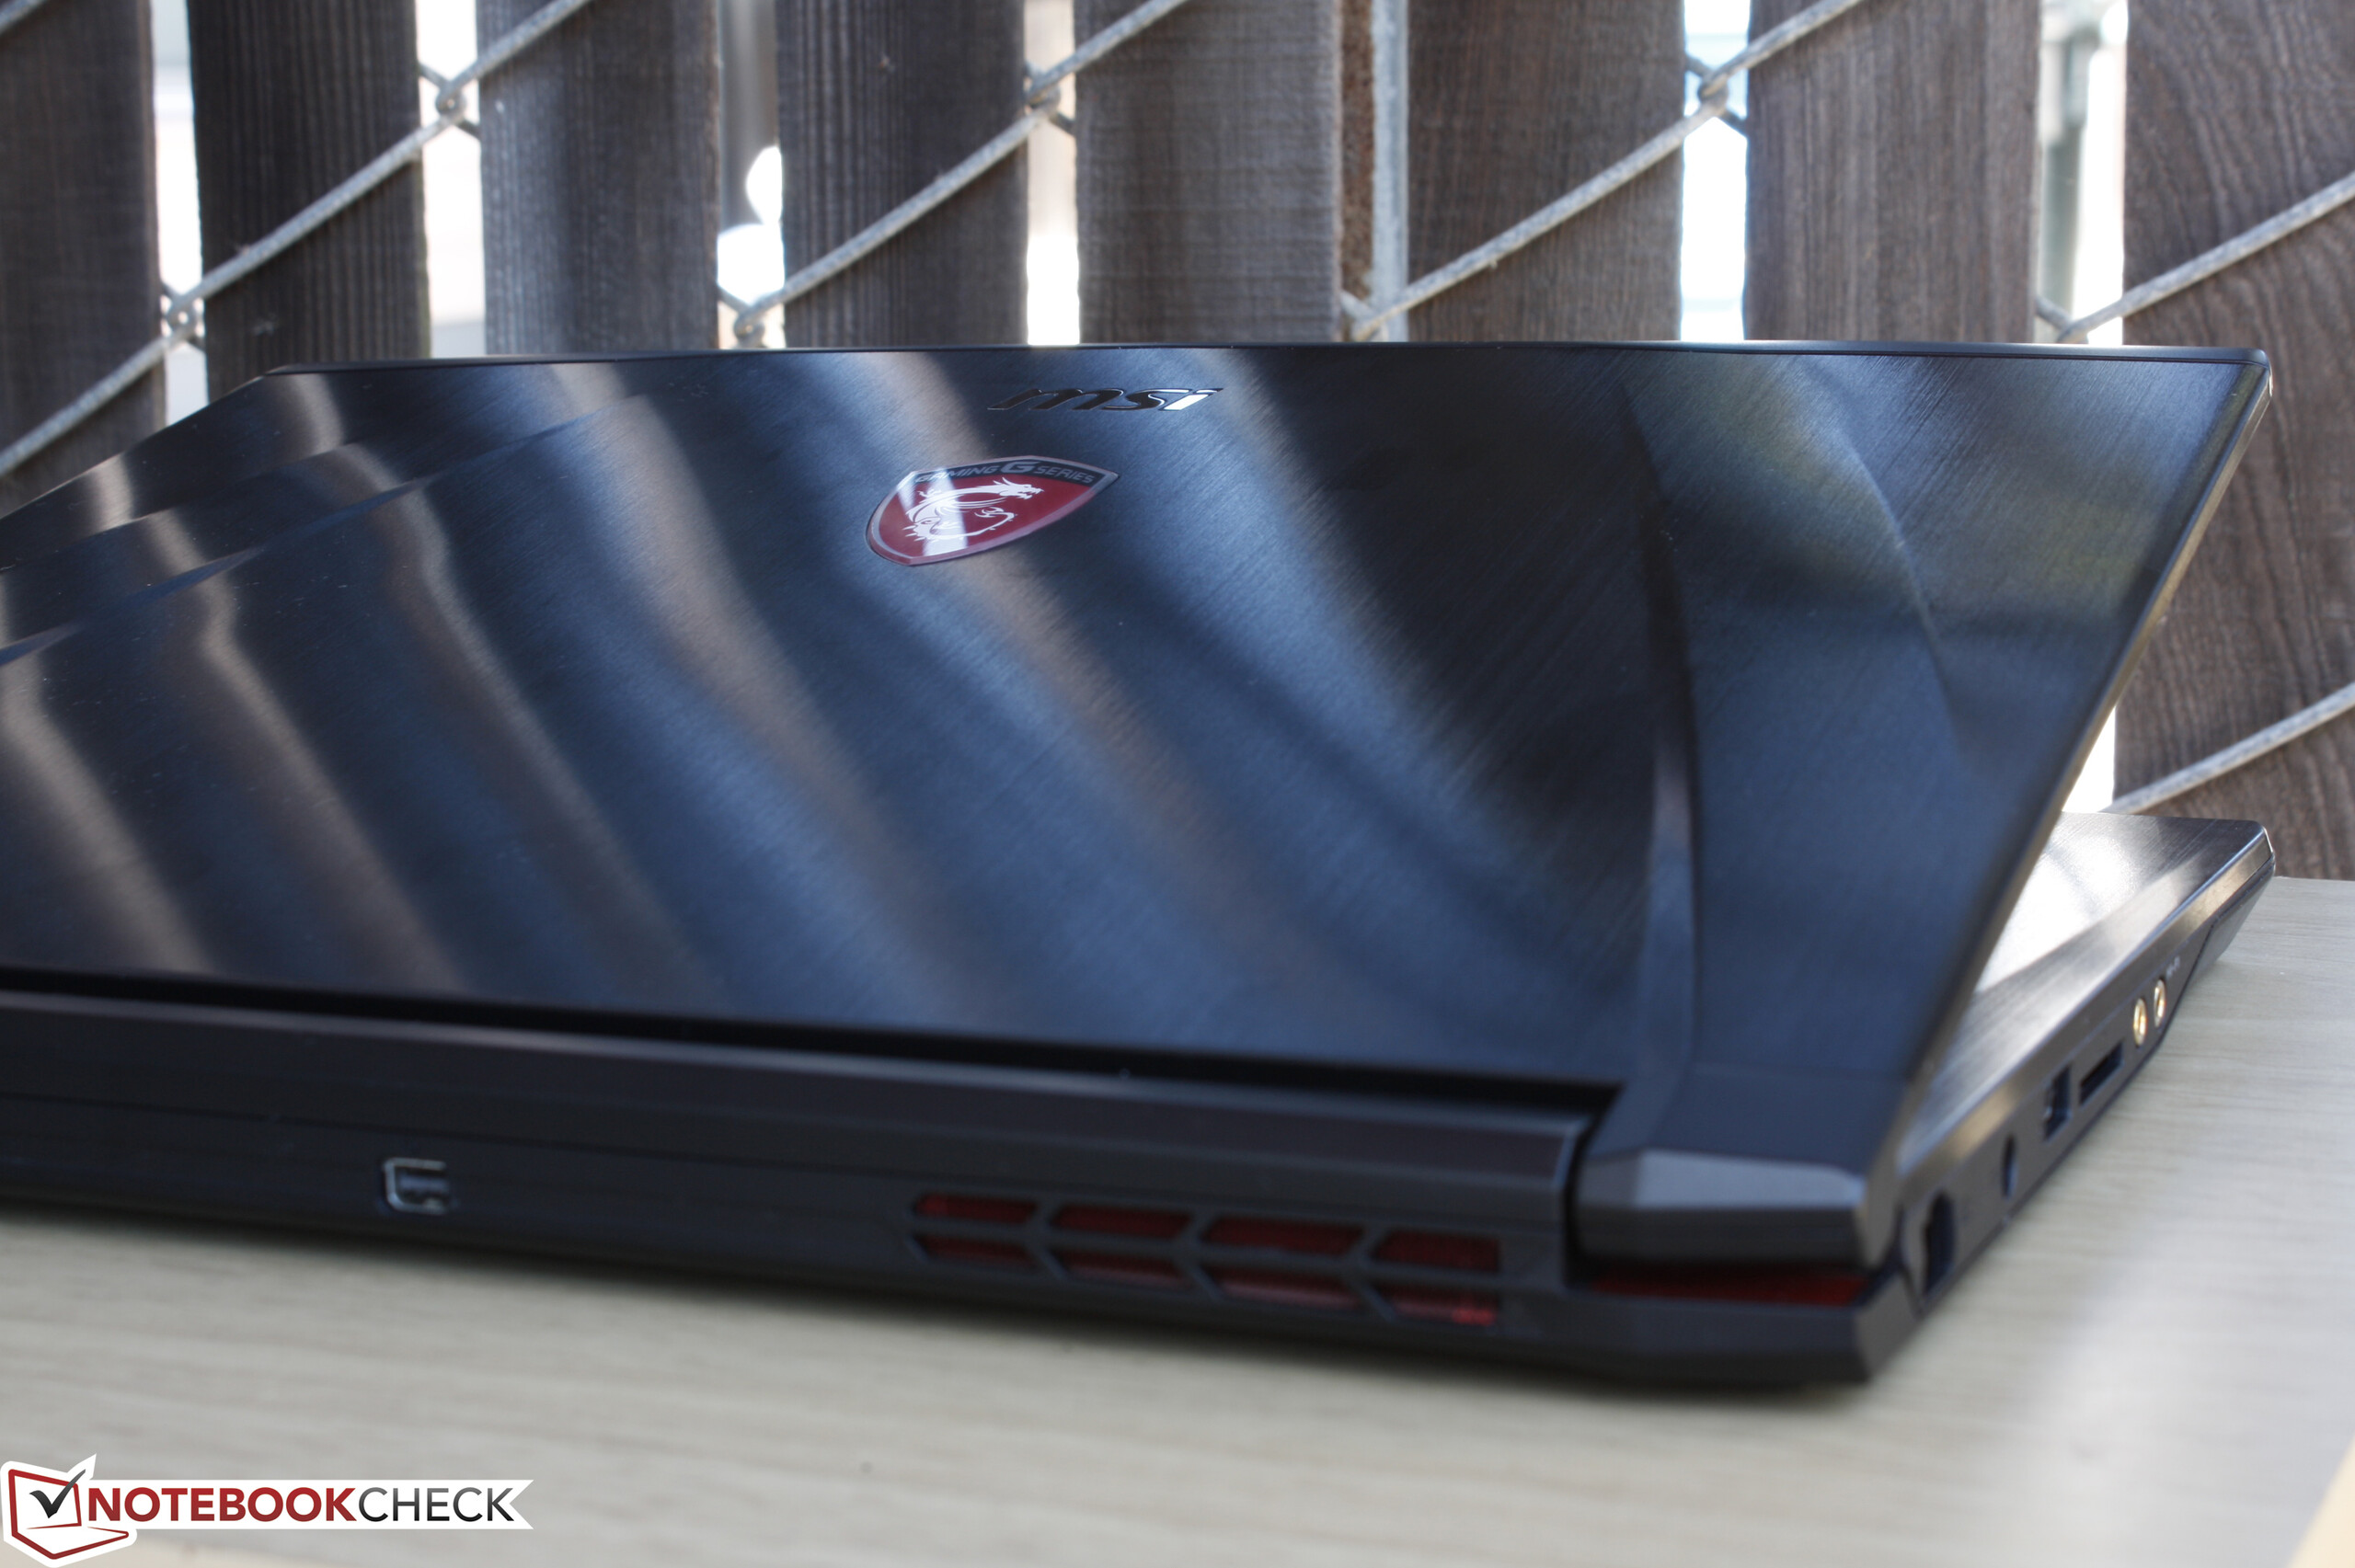
In terms of size and weight, the MSI is not significantly heavier or lighter than competing 14-inch gaming notebooks since they average pretty tightly around the 2 kg mark. Its overall dimensions are nonetheless slightly larger than its closest competitors including the Gigabyte P34W, Alienware 13, and Razer Blade 14. This can be attributed to the comparatively wider display bezel of the GS43VR at about 1.6 cm from the edge of the screen to the edge of the outer lid.
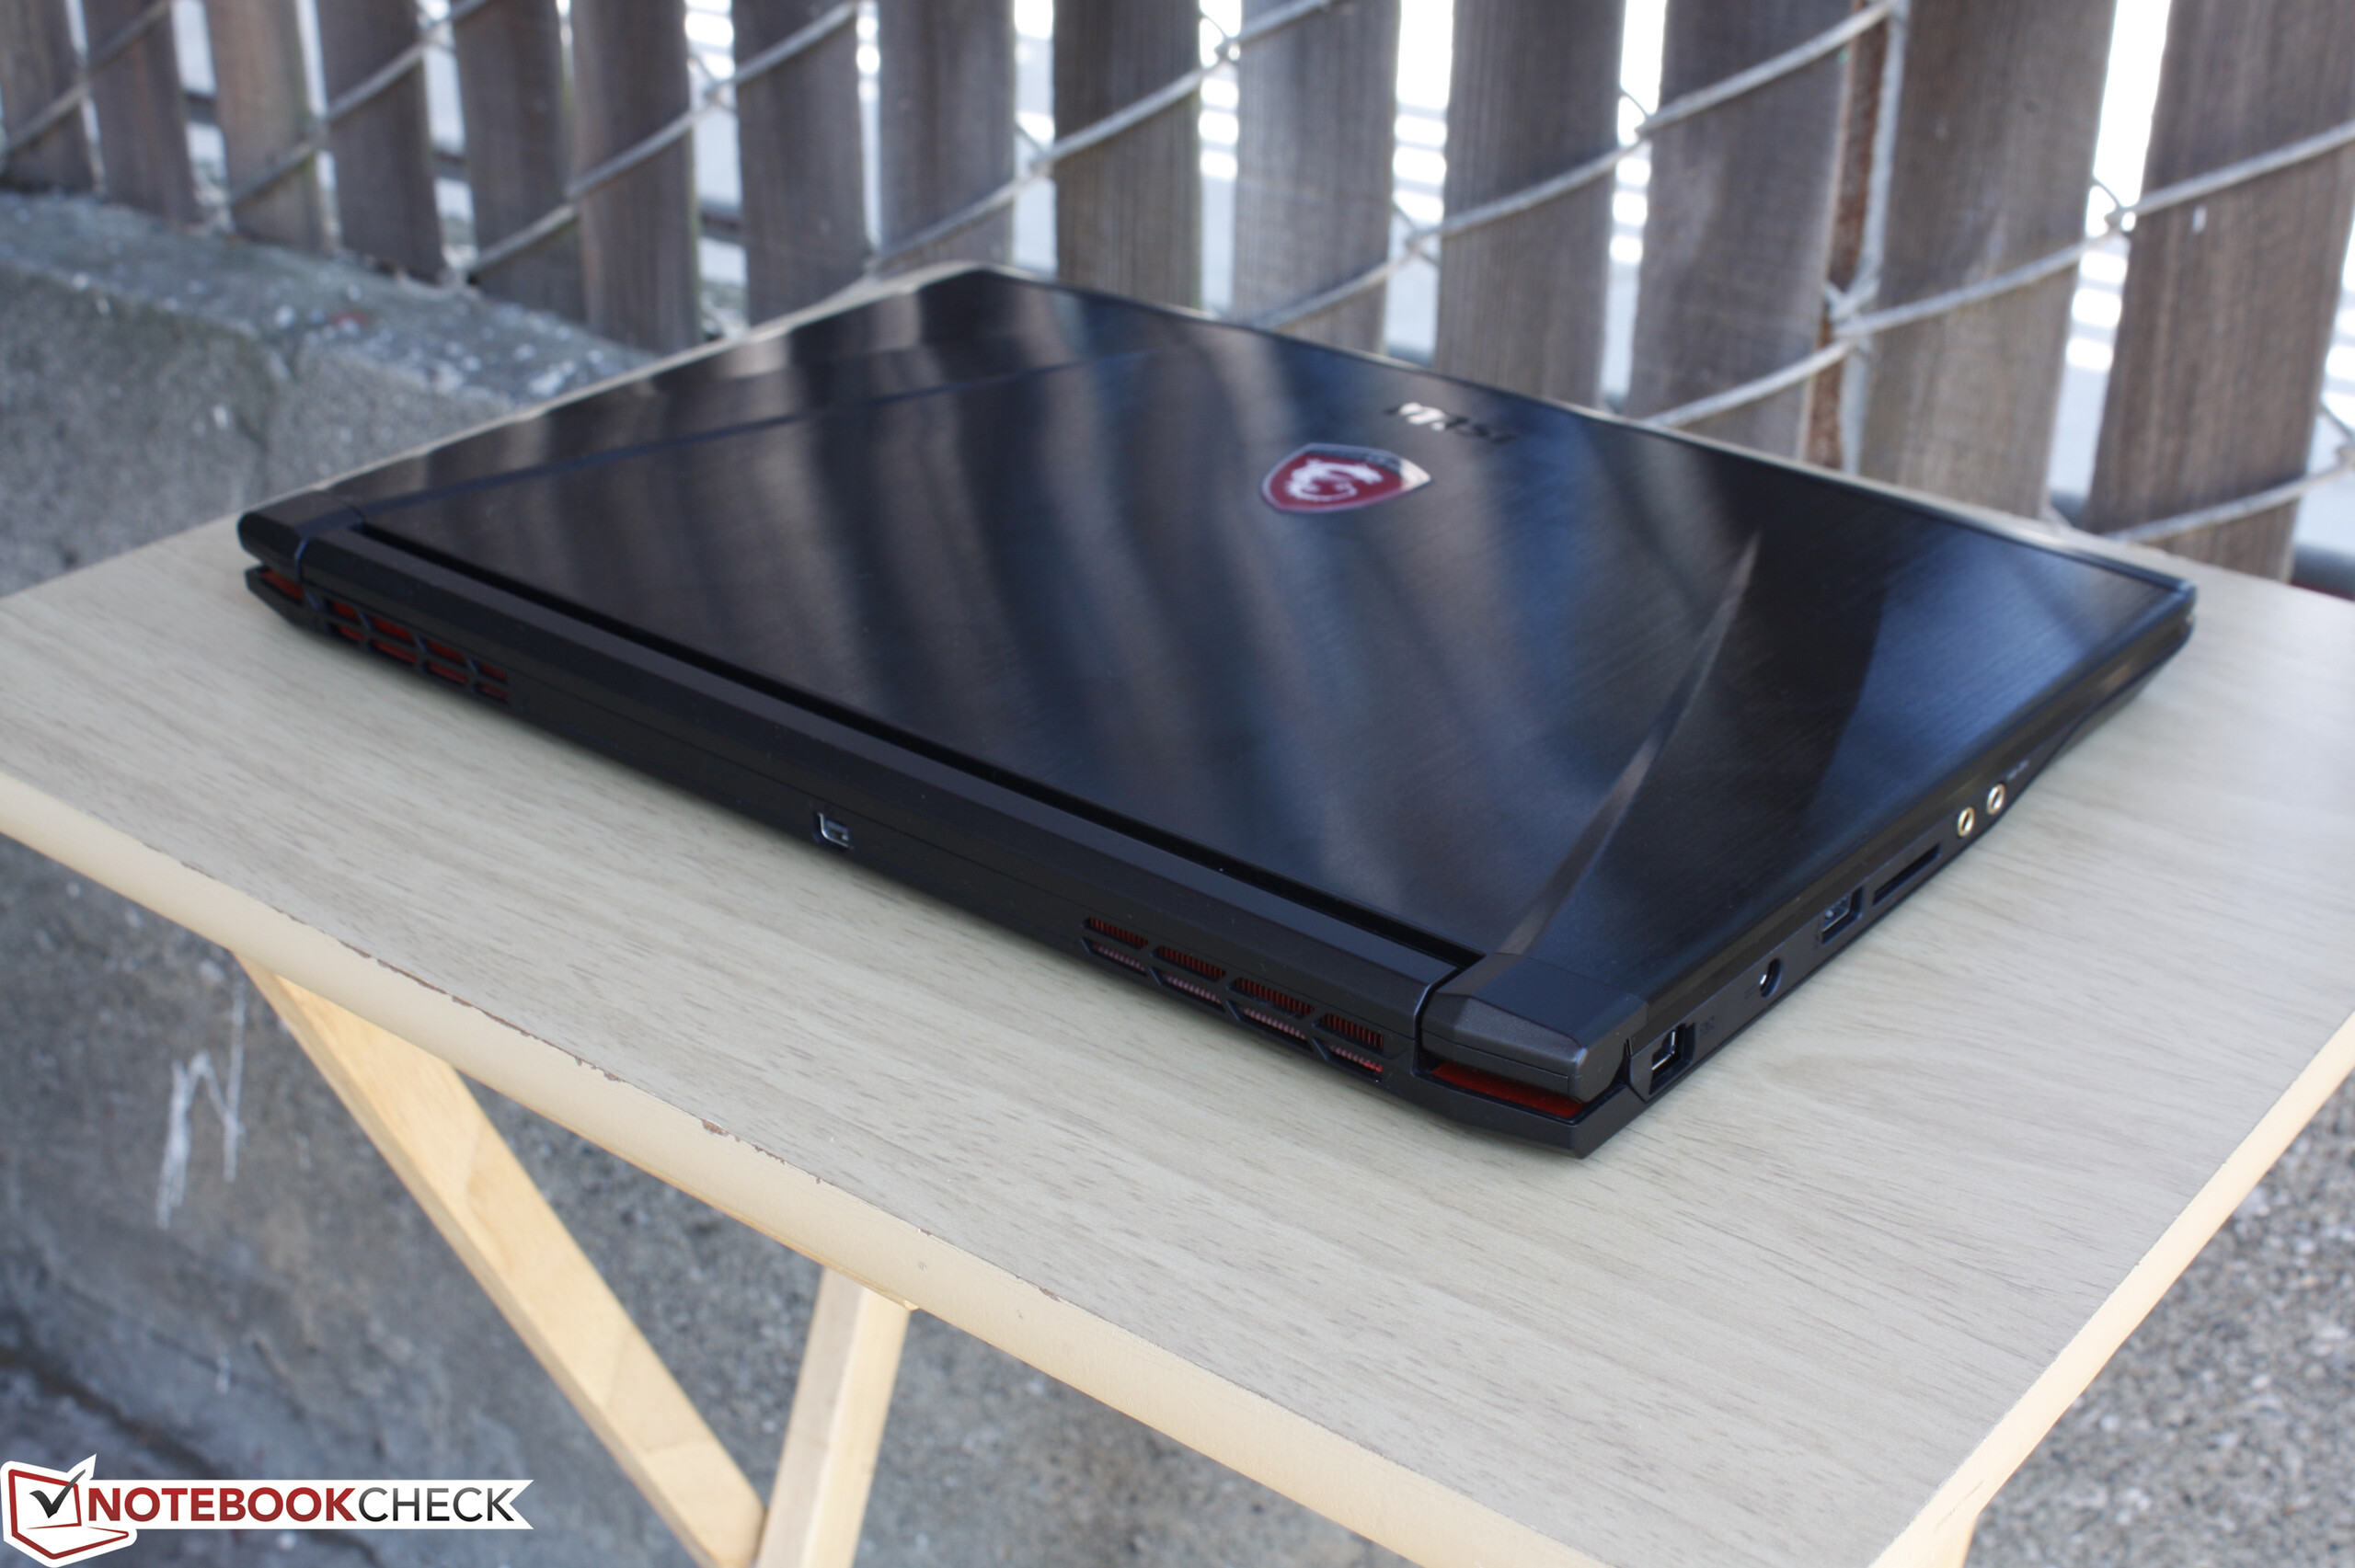
Connectivity
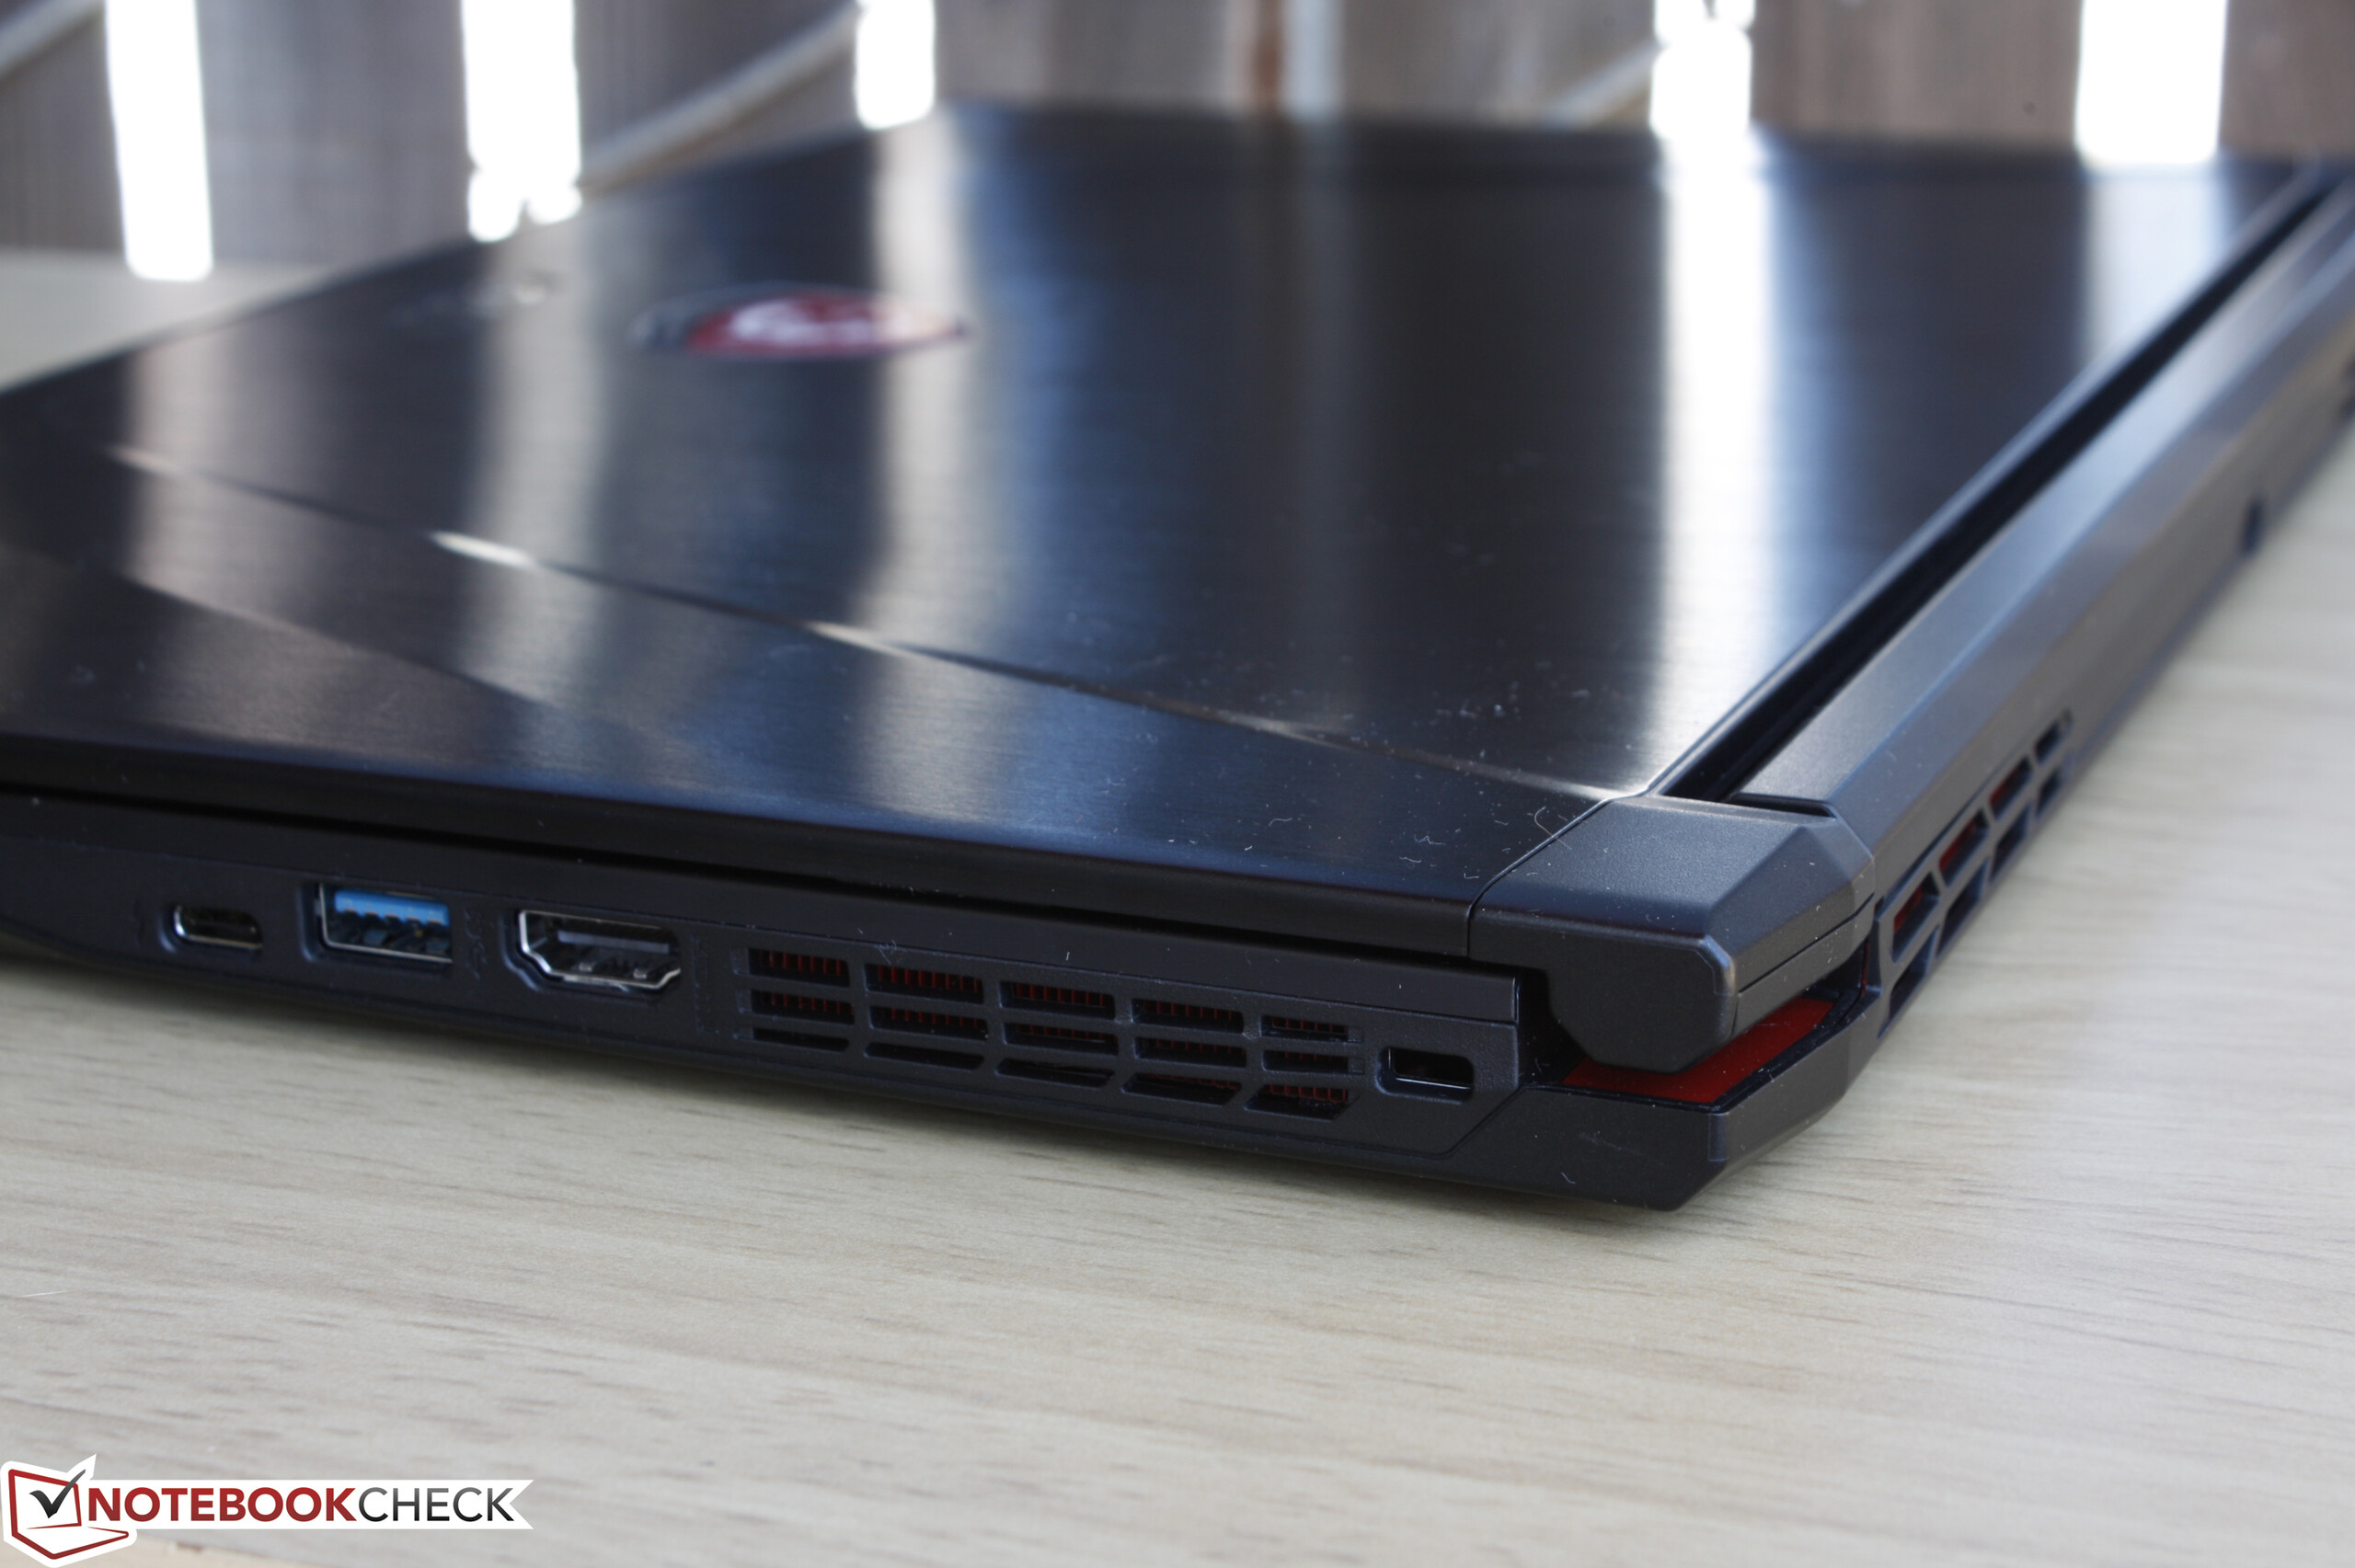
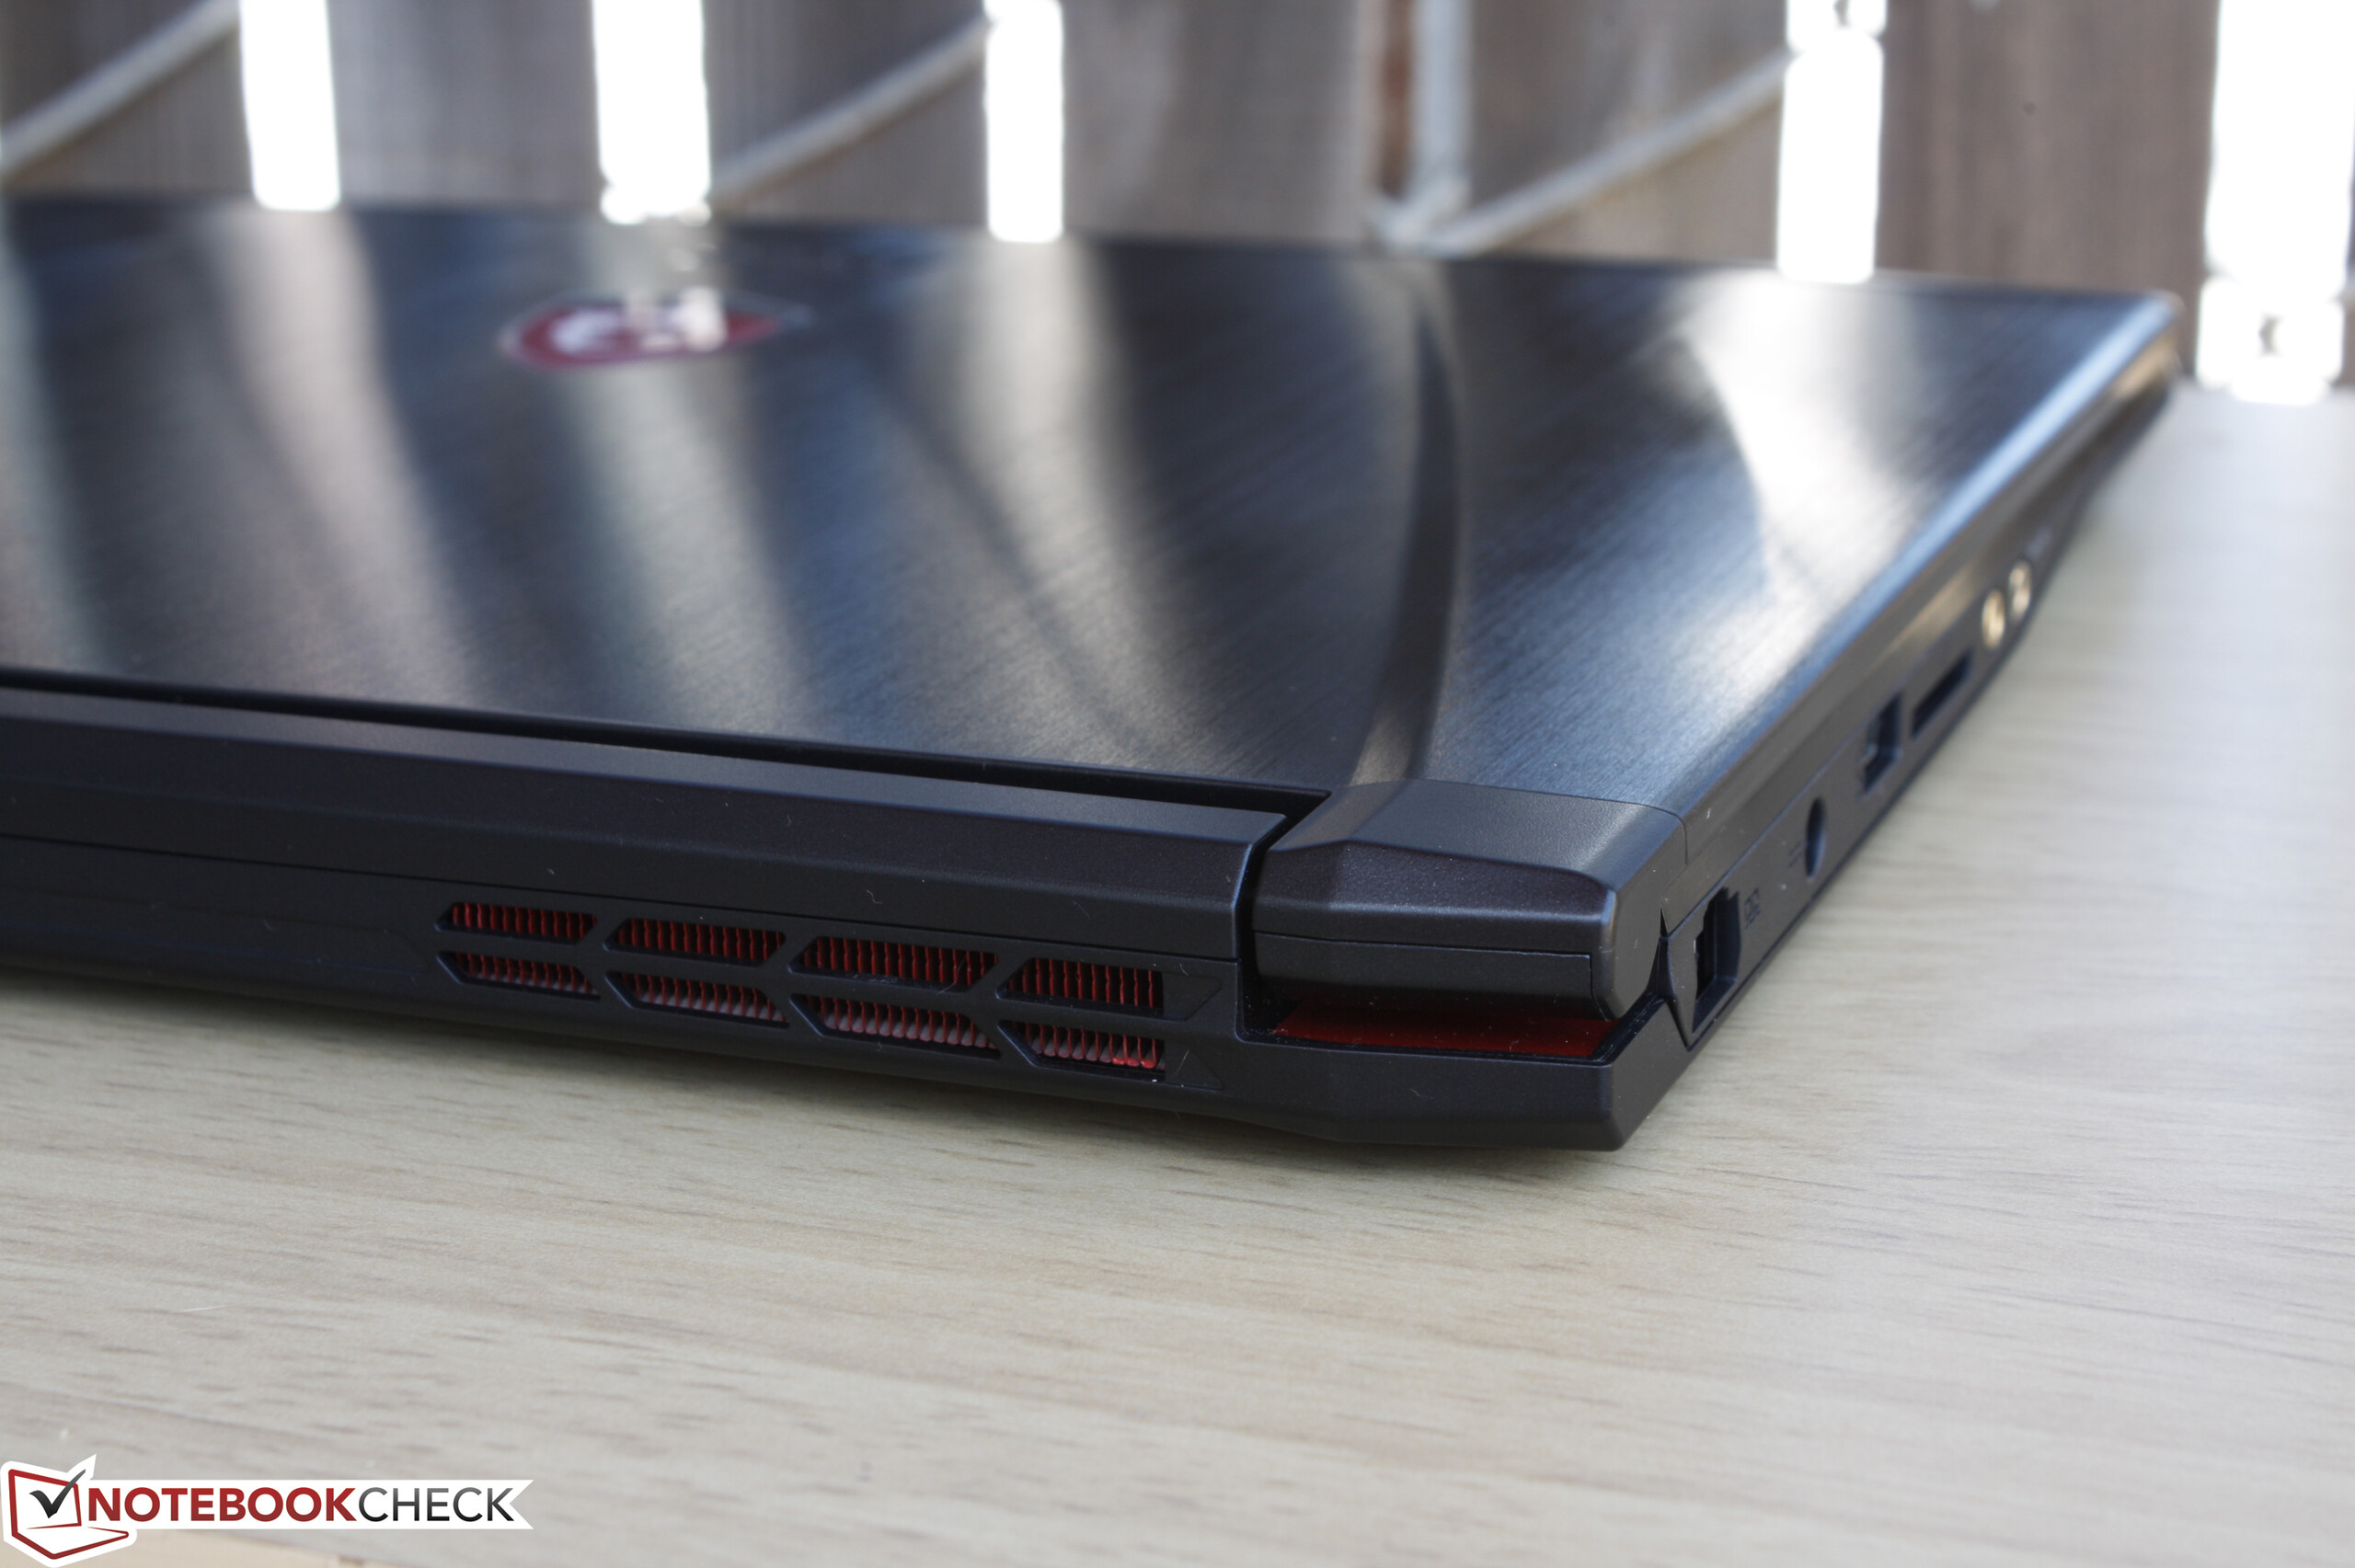
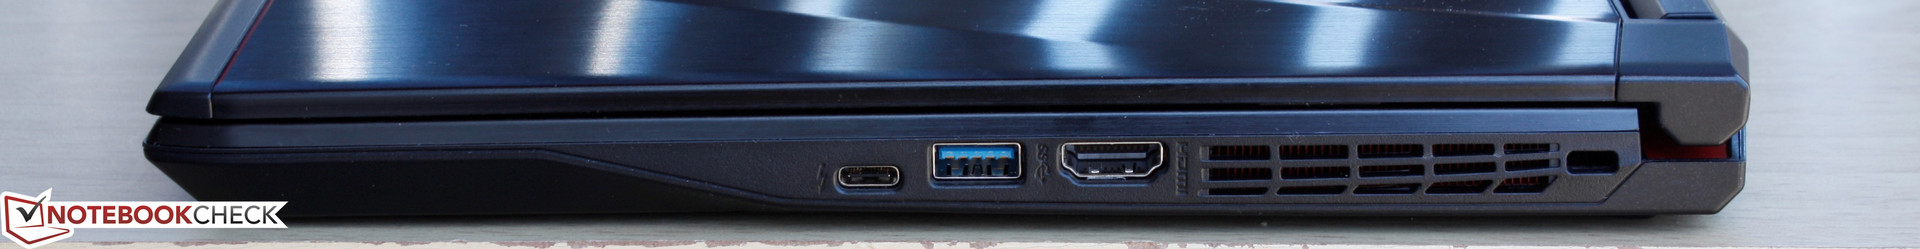
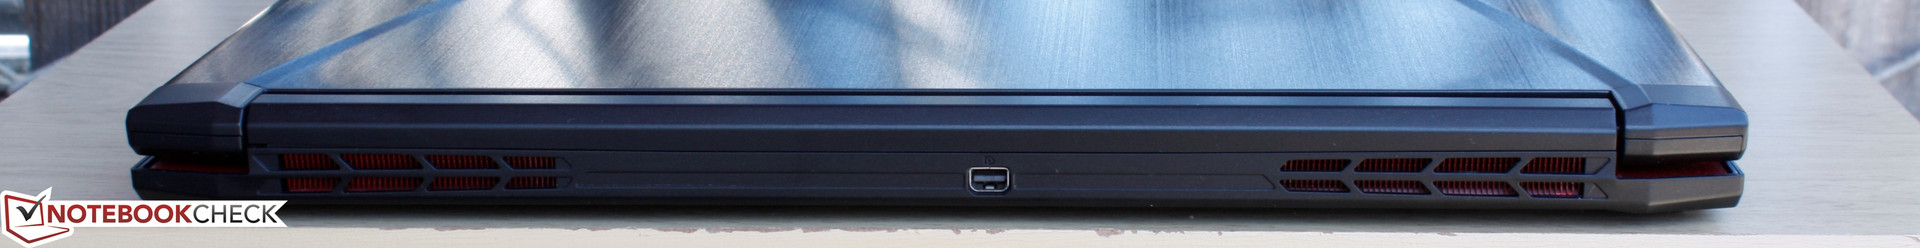
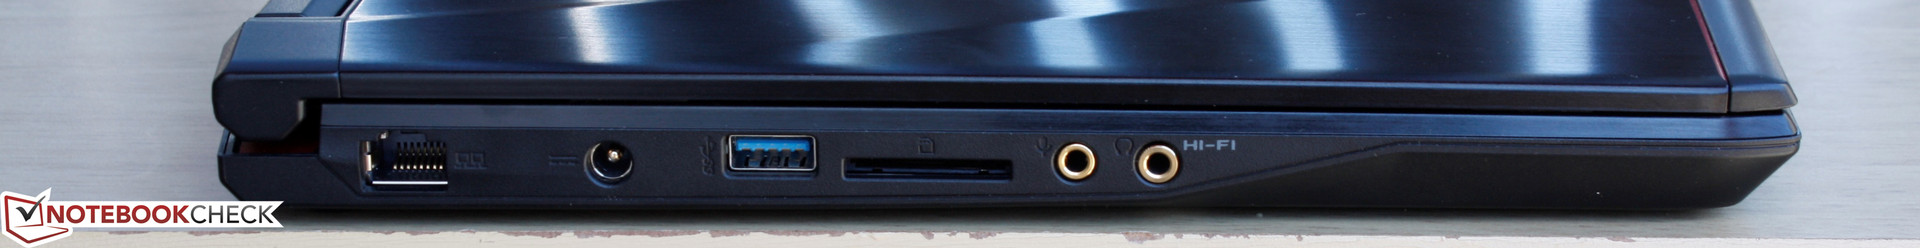
Available ports are again similar to the GS40 with no updates or changes. The all-important USB Type-C port with Thunderbolt 3 remains, but the placement of the thick HDMI port is quite close upfront and can potentially take up valuable desk space. In turn, all ports are accessible and easy to reach. We would like to see at least one more USB Type-A port in the future as many 14-inch gaming notebooks tend to carry a total of three.
SD Card Reader
The card reader is slow with read rates of just under 26 MB/s according to AS SSD with our Toshiba Exceria Pro SDXC 64 GB UHS-II test card. In comparison, the card reader on the GT72VR returns read rates of over 180 MB/s. Transferring 1 GB worth of images from the SD card to desktop will take roughly 45 seconds.
| SD Card Reader | |
| average JPG Copy Test (av. of 3 runs) | |
| Alienware 17 R3 (A17-9935) | |
| MSI GS73VR 6RF | |
| MSI GS43VR 6RE-006US | |
| maximum AS SSD Seq Read Test (1GB) | |
| Alienware 17 R3 (A17-9935) | |
| MSI GS73VR 6RF | |
| MSI GS43VR 6RE-006US | |
Communication
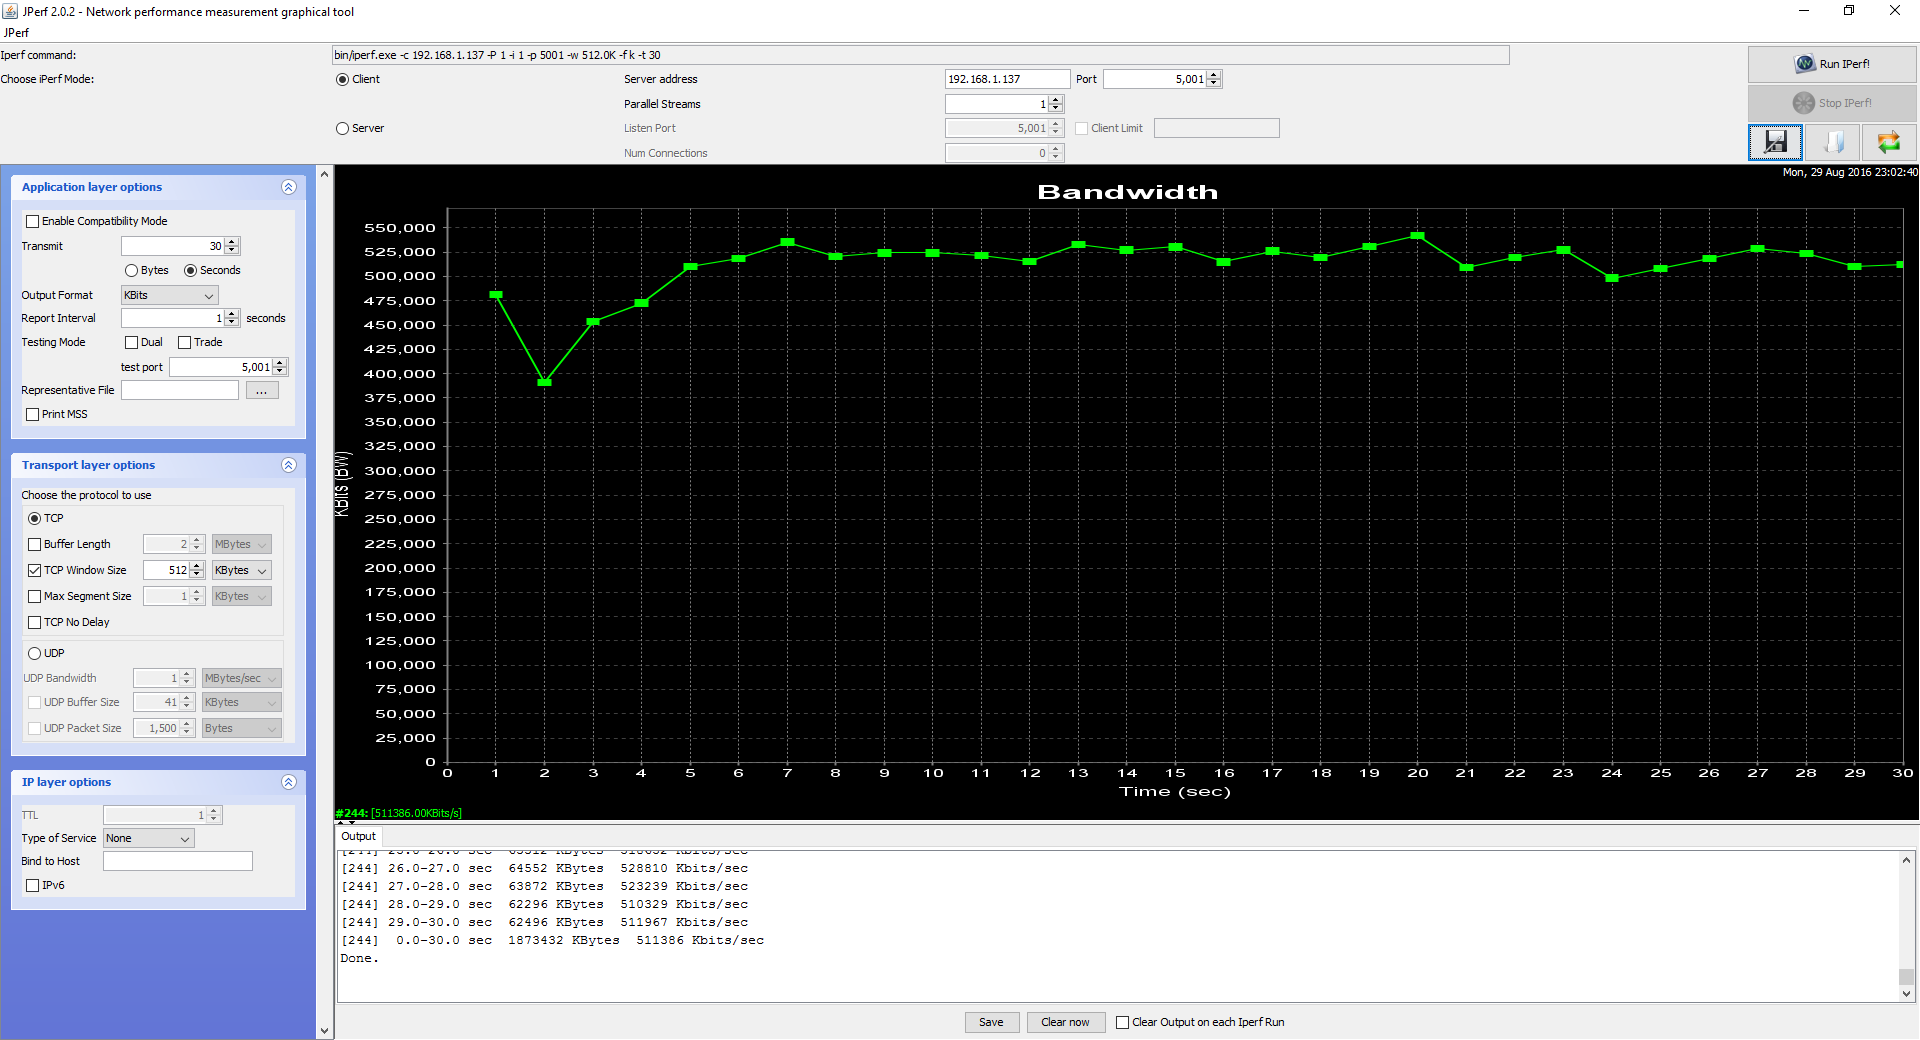
The dual-band Killer 1535 M.2 WLAN card employs MU-MIMO, DoubleShot Pro, and Bluetooth 4.1 with a maximum theoretical throughput of 867 Mbps. Our Jperf tests and settings below return very stable transfer rates and a real-world throughput of about 511 MB/s when standing one meter away from our Linksys EA8500 test router.
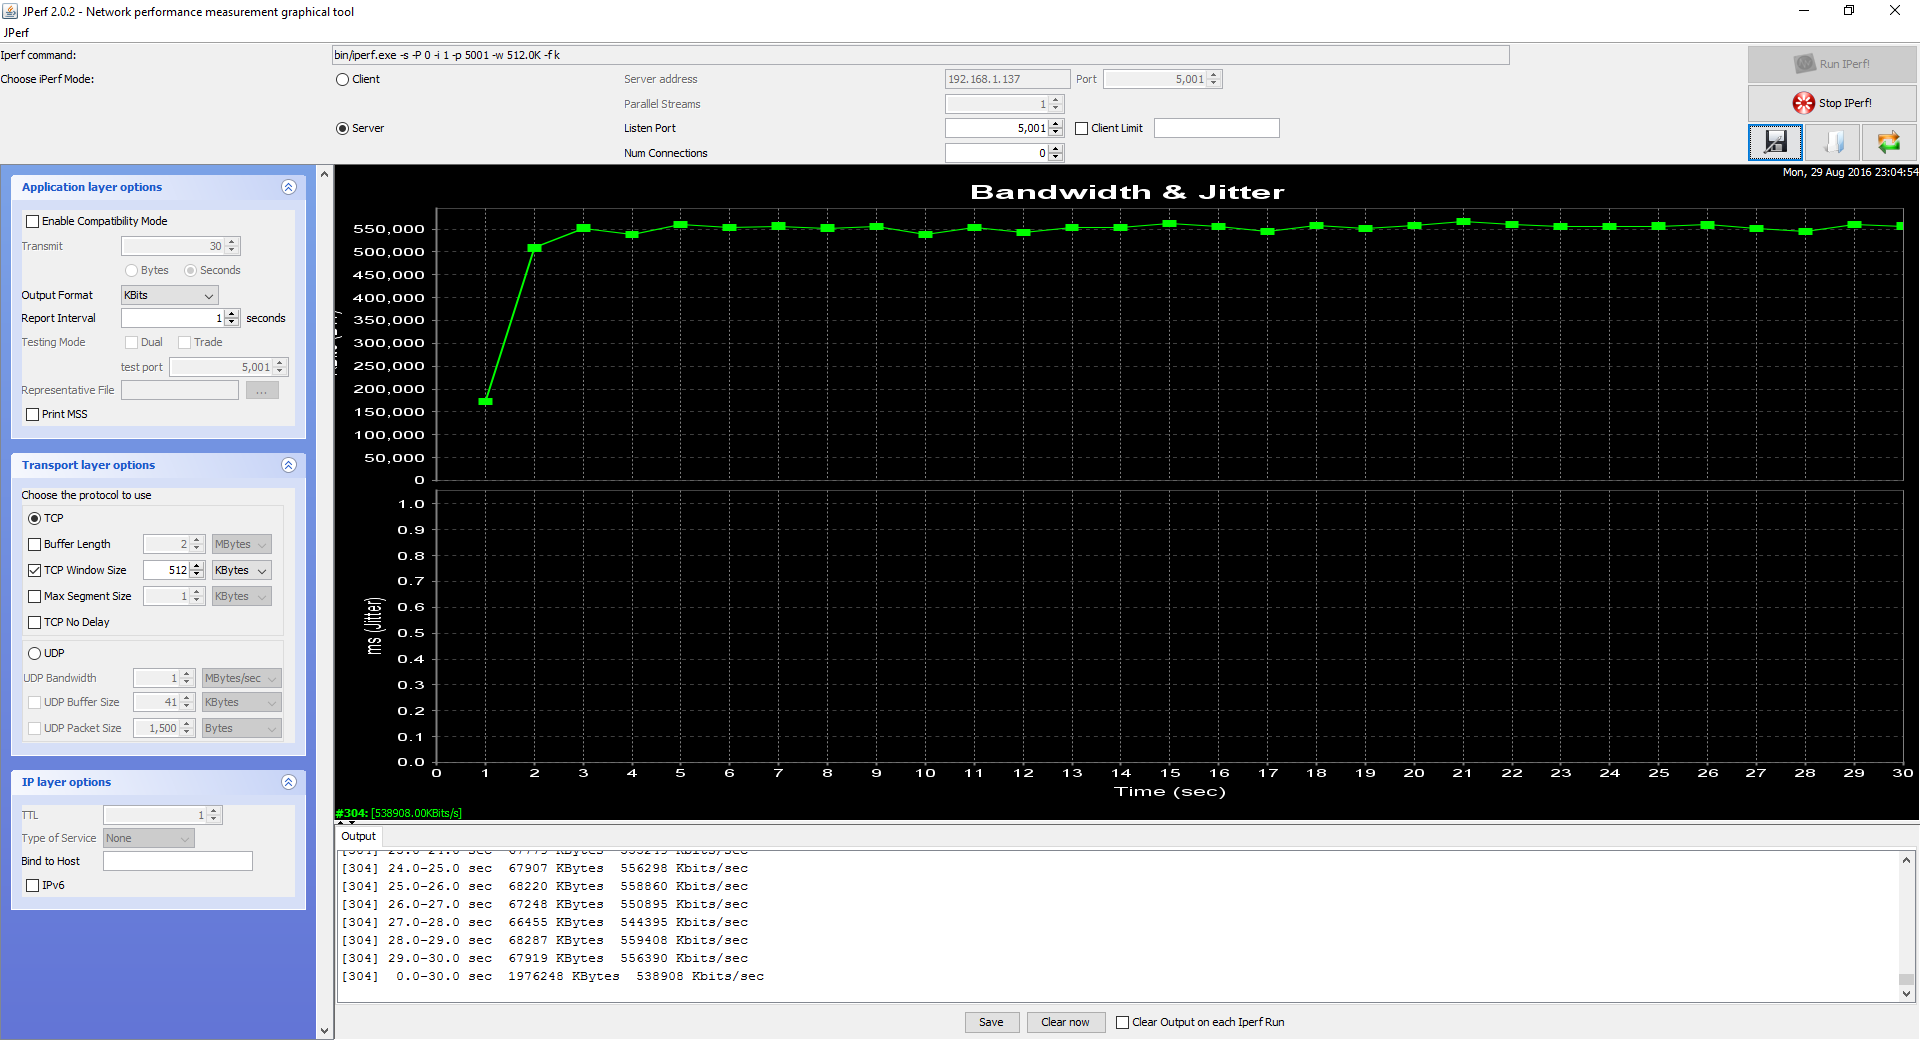
| Networking | |
| iperf Server (receive) TCP 1 m 512KB | |
| MSI GS43VR 6RE-006US | |
| iperf Client (transmit) TCP 1 m 512KB | |
| MSI GS43VR 6RE-006US | |
Accessories
Included extras are a cleaning cloth and the usual Quick Start guide and warranty card. Case covers and other G series branded accessories are sold separately. We recommend taking advantage of the Thunderbolt 3 port for external 4K options and docking stations.
Maintenance
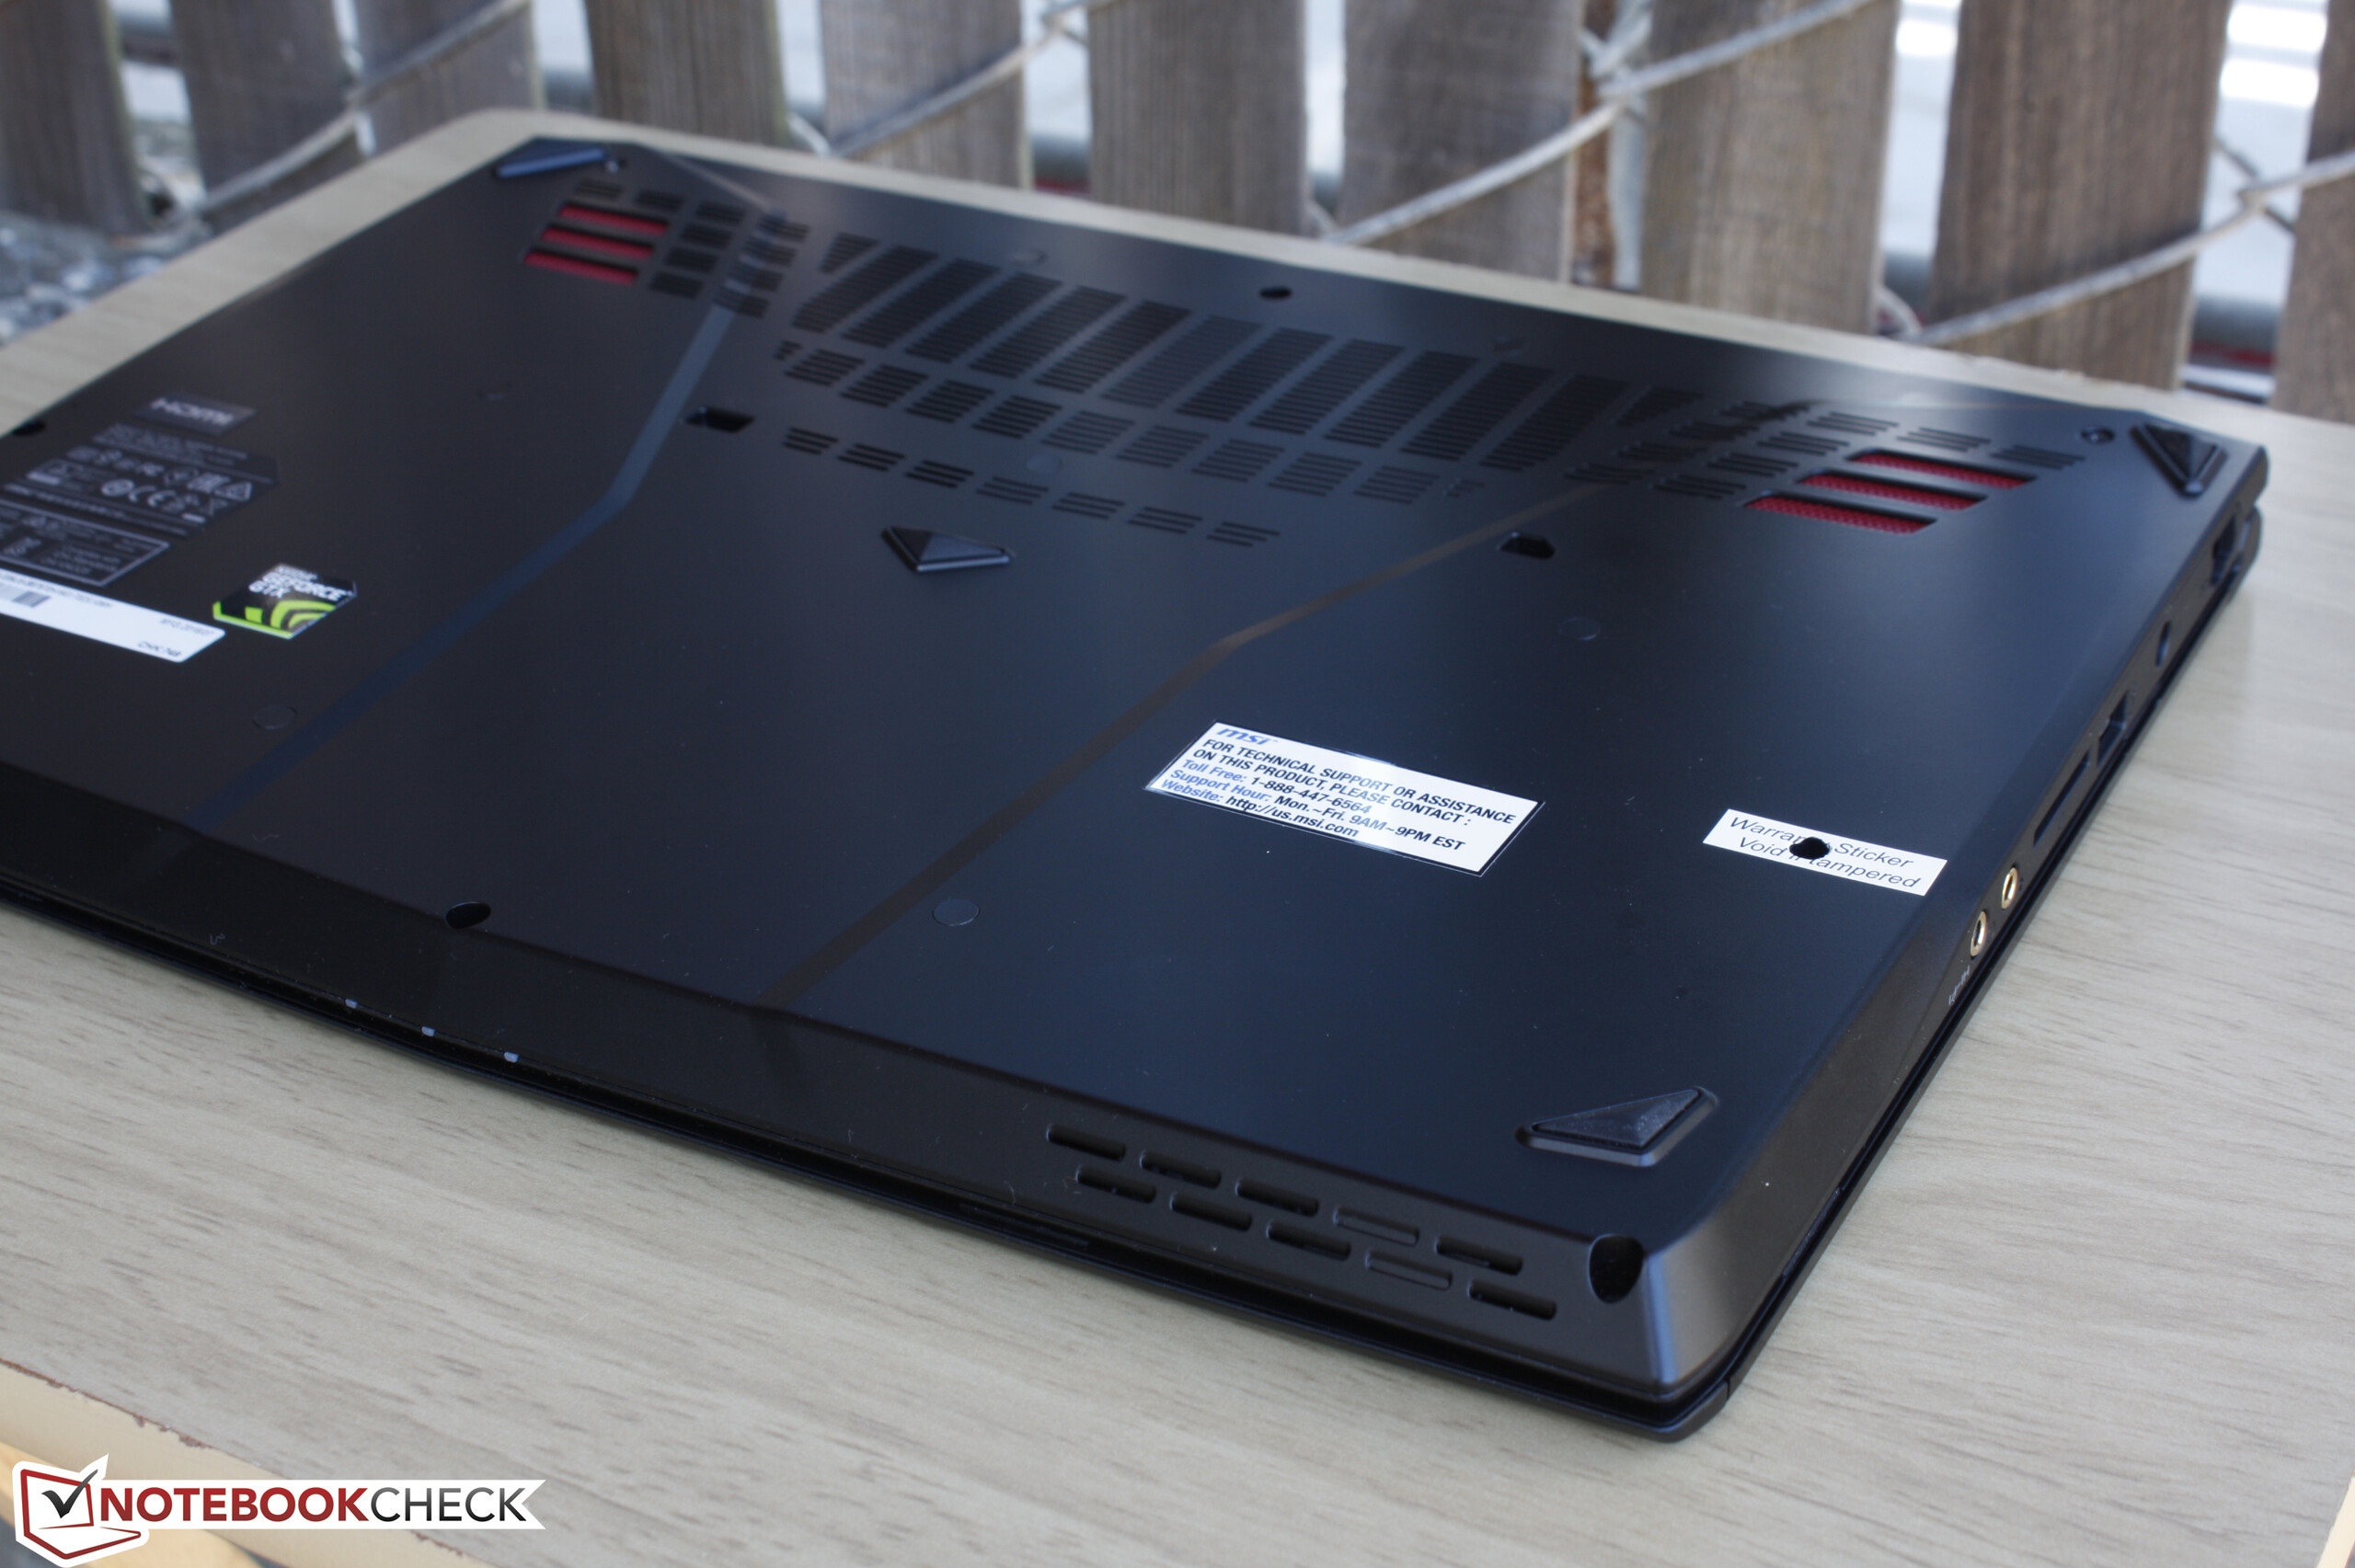
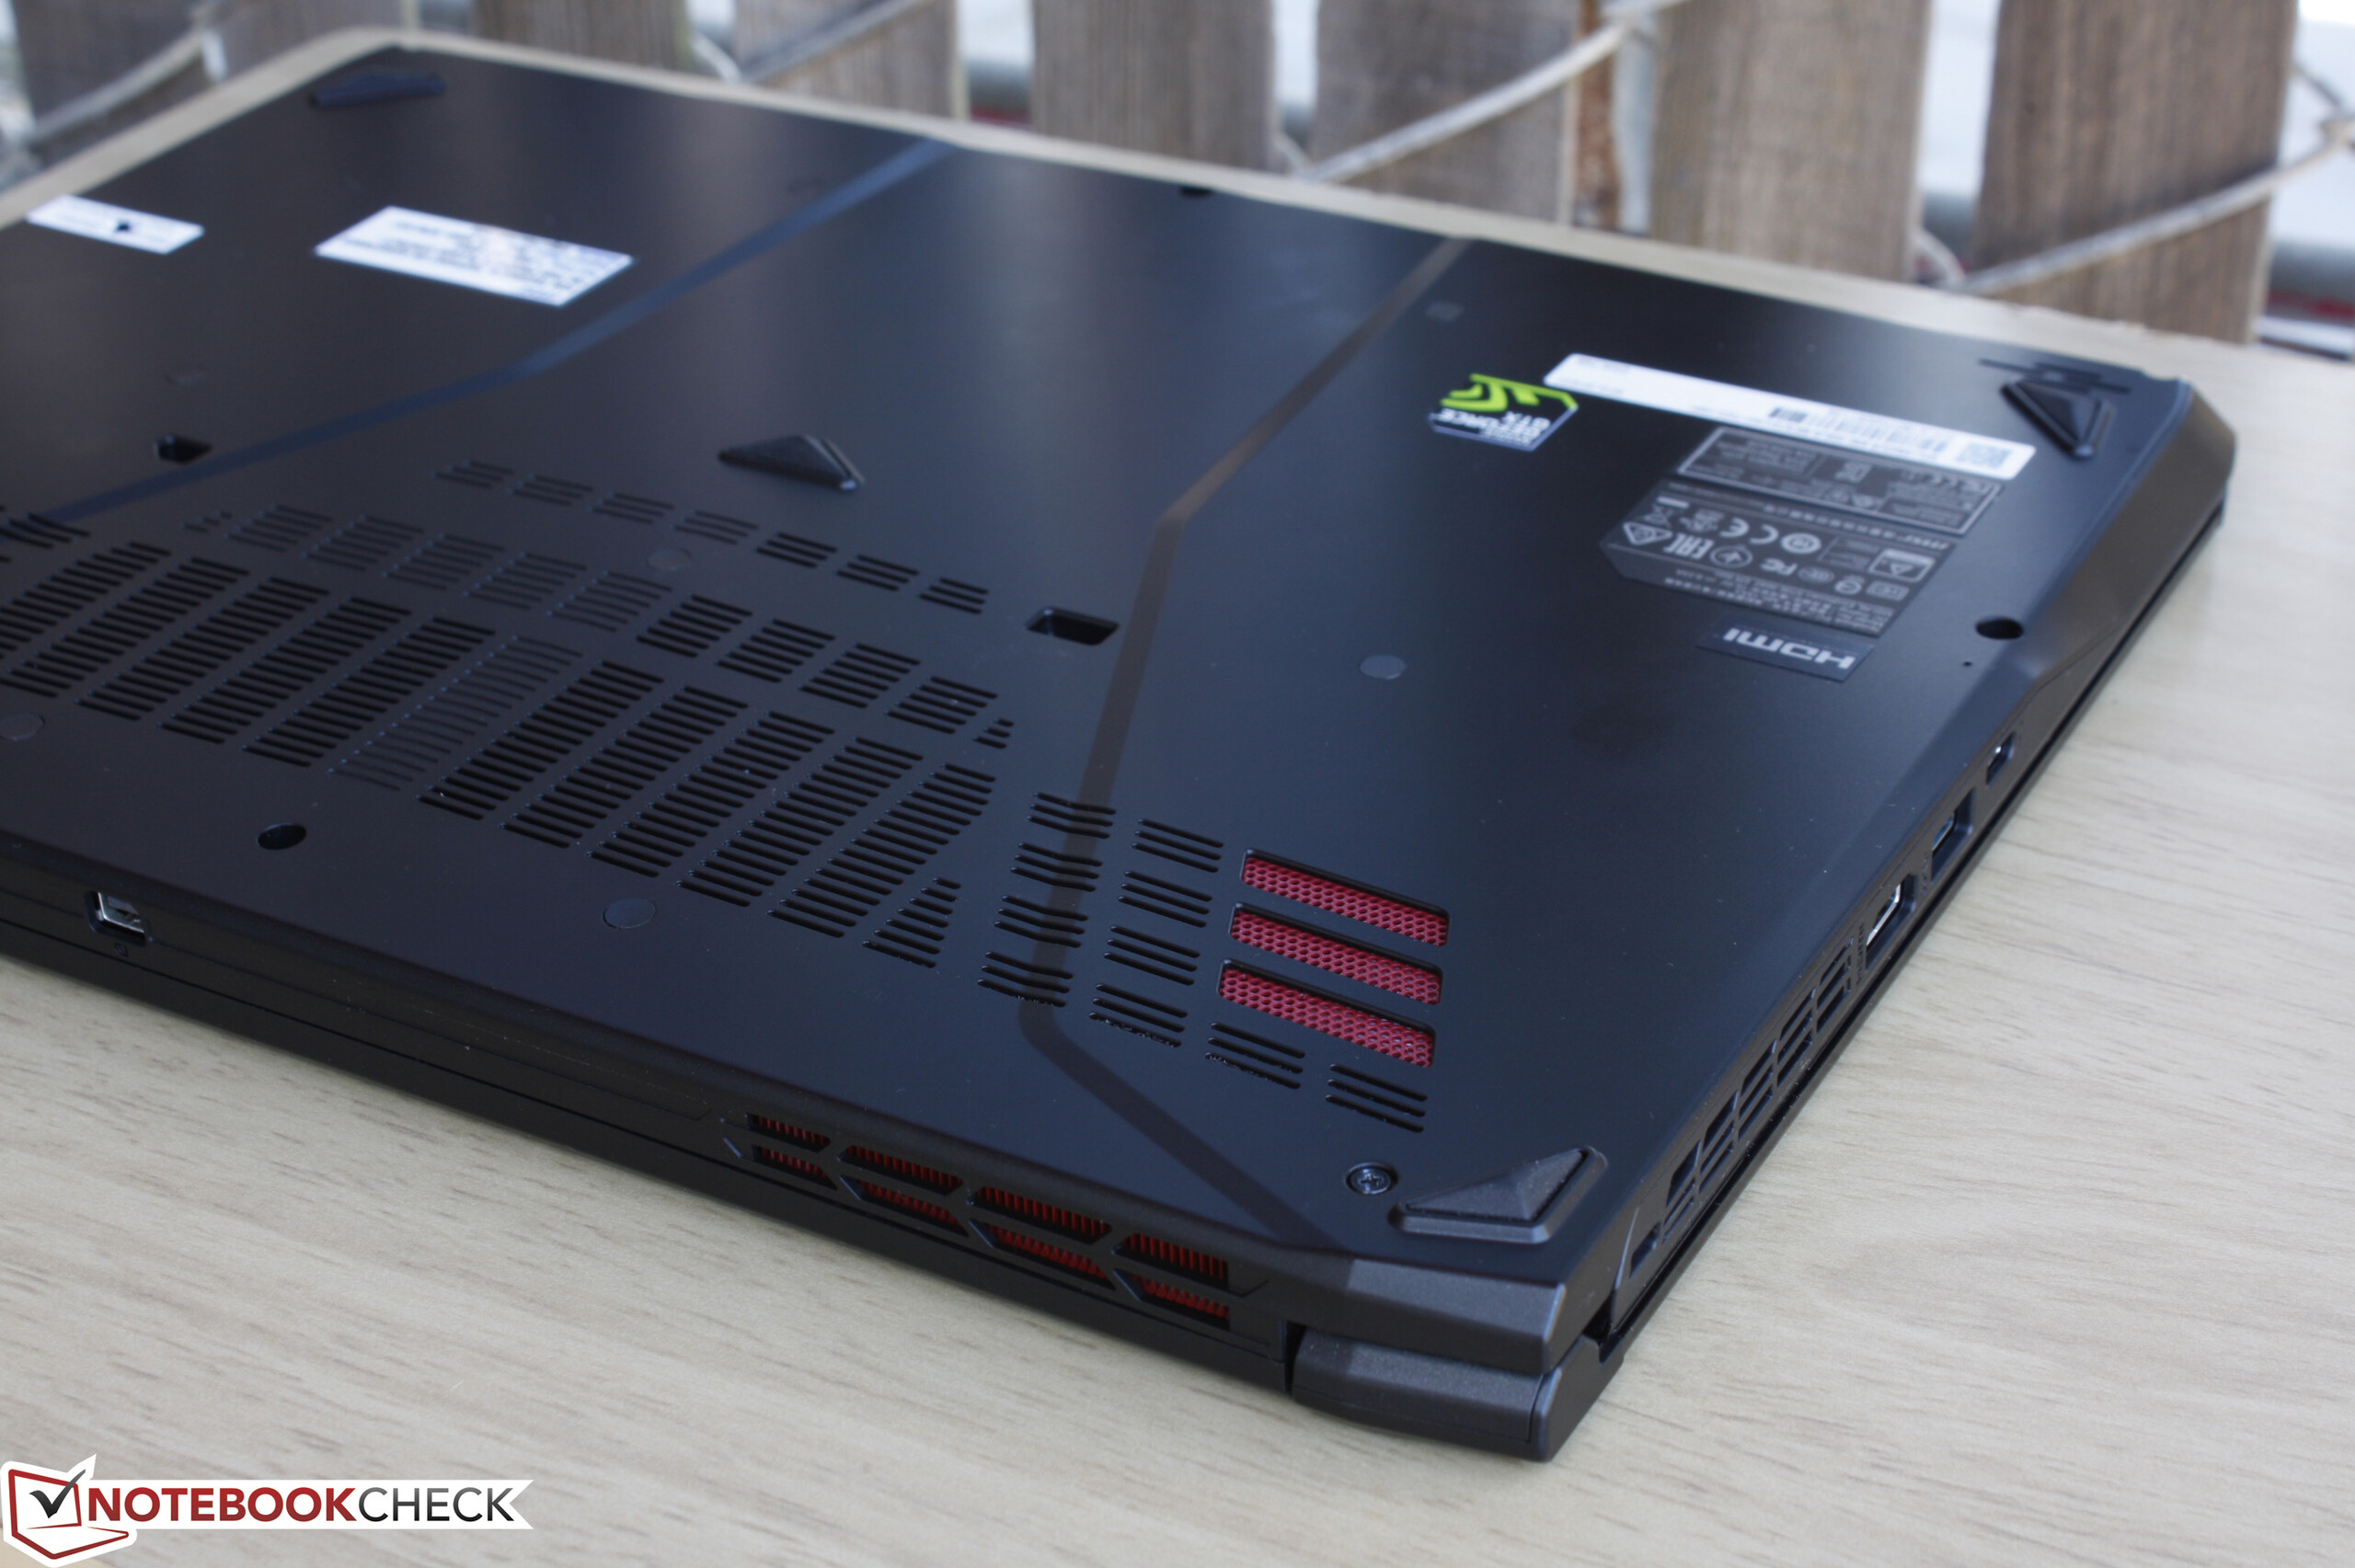
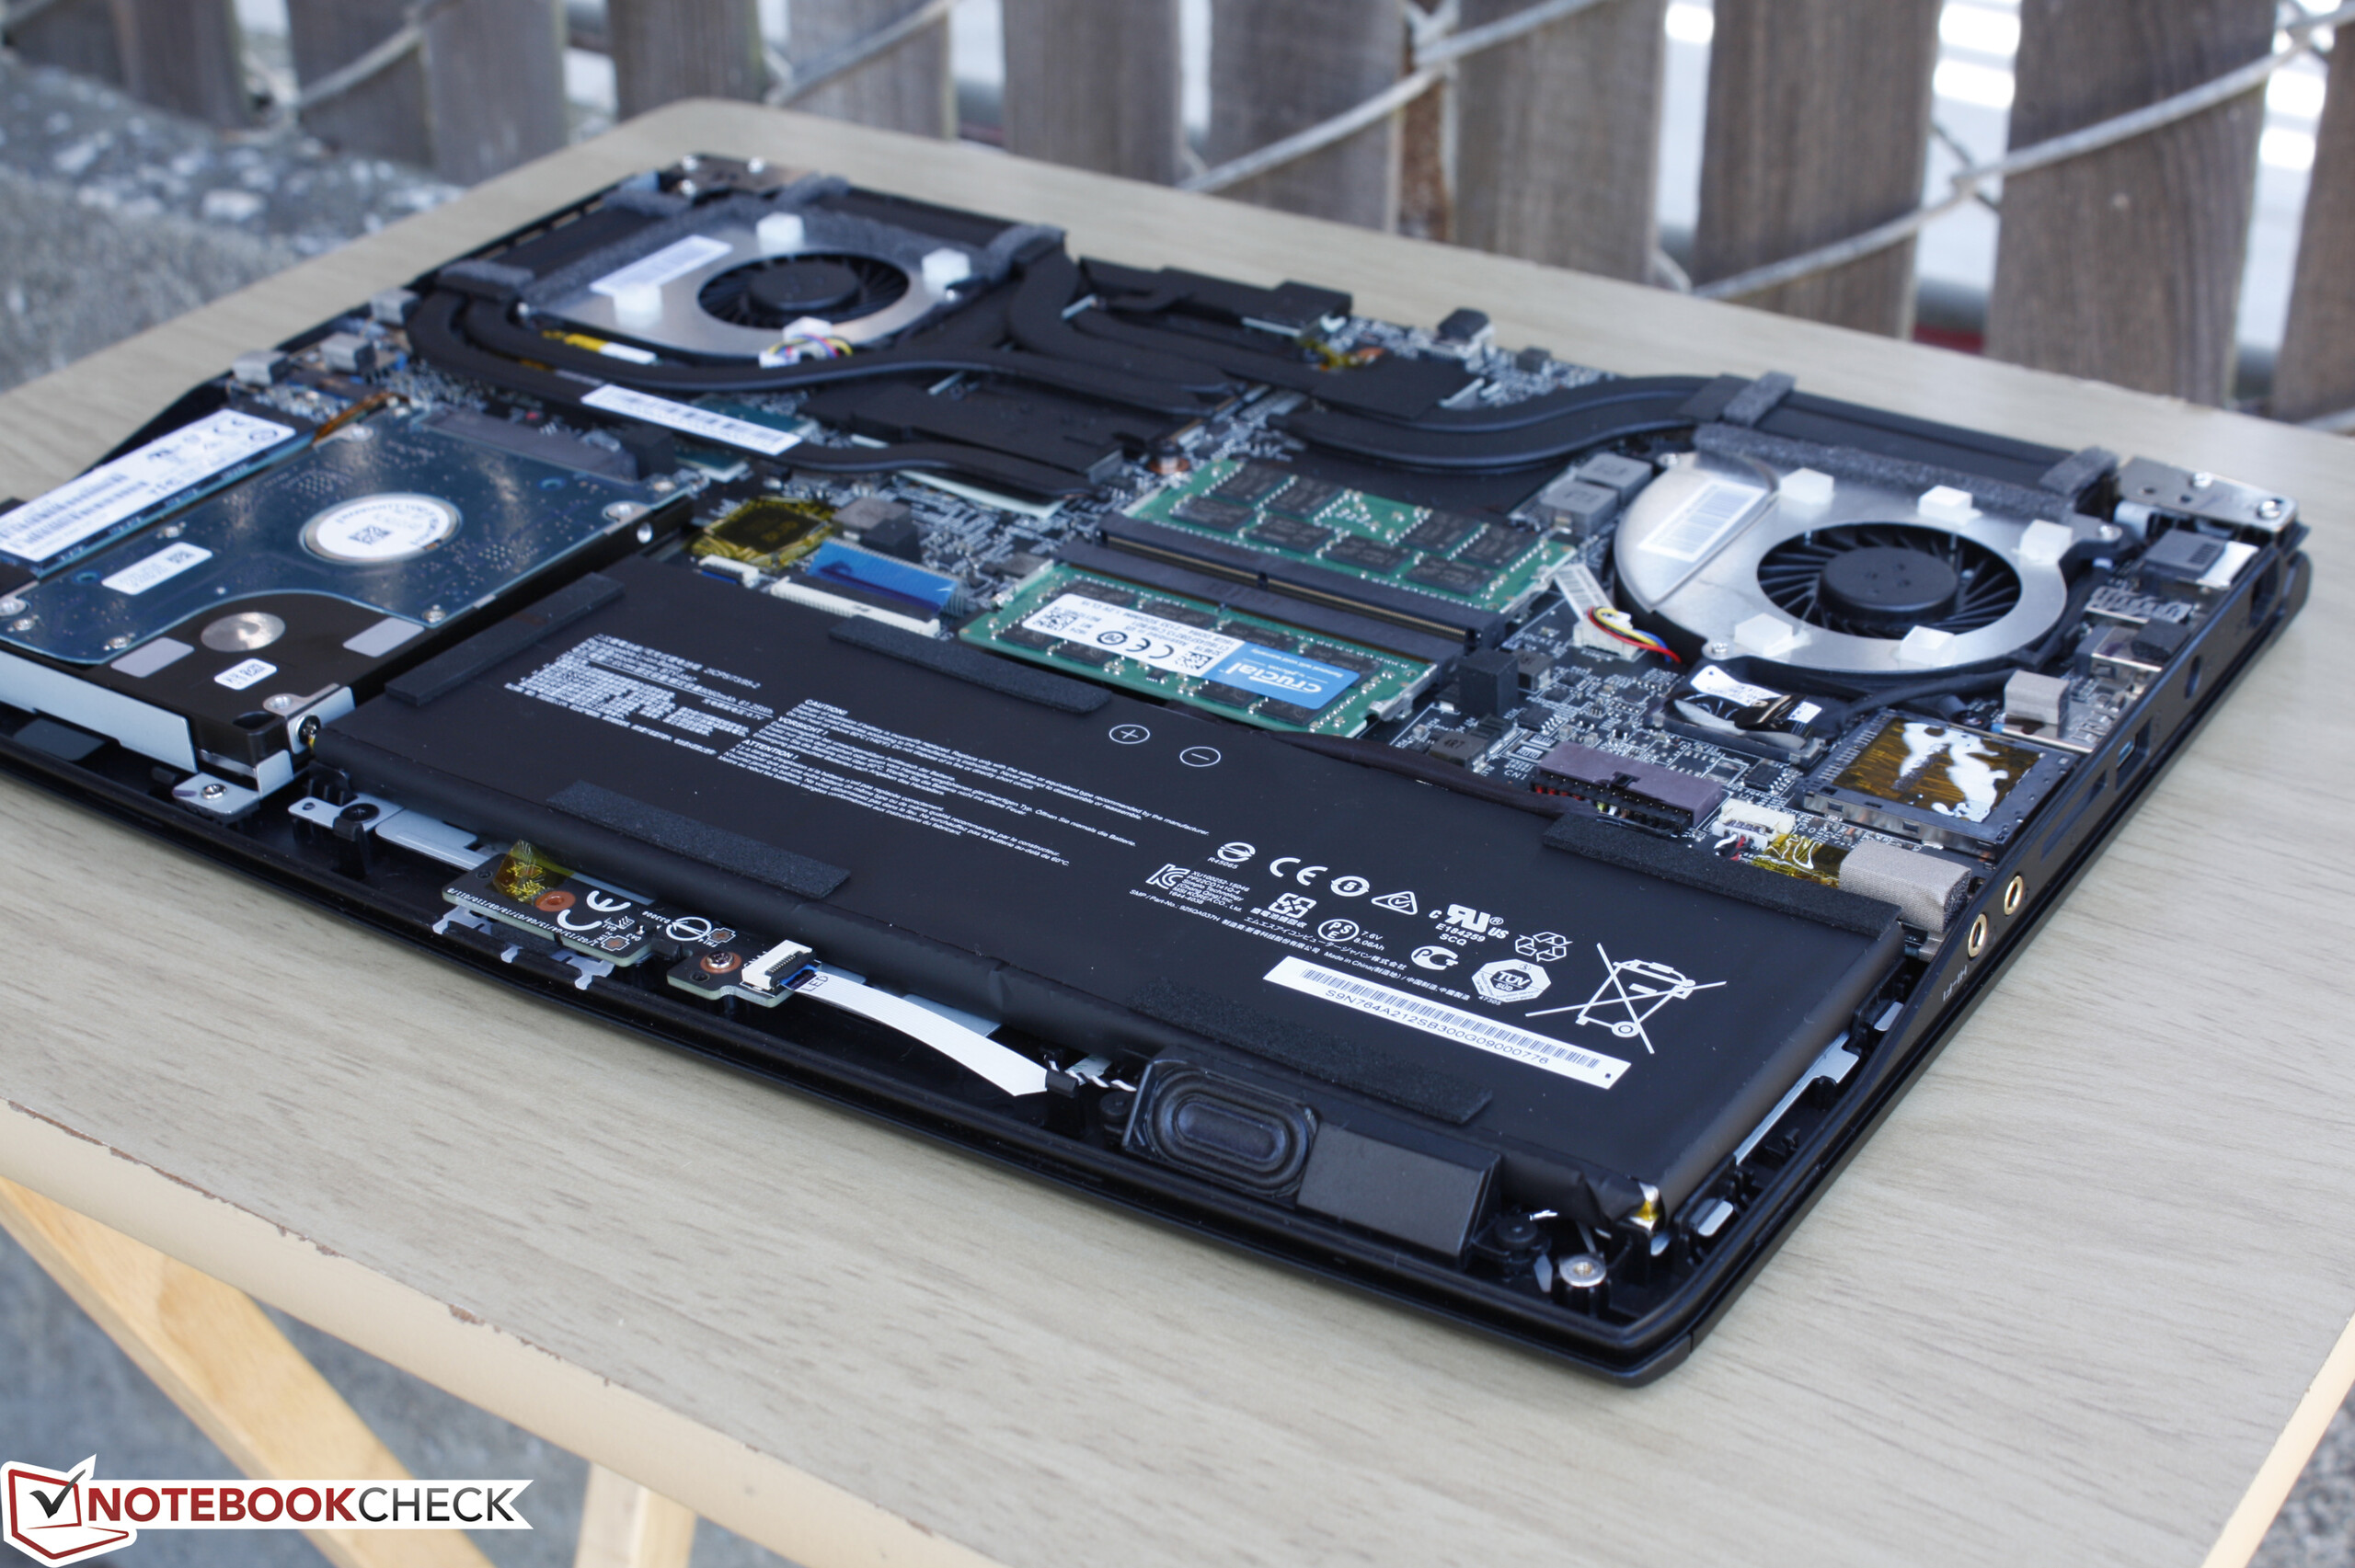
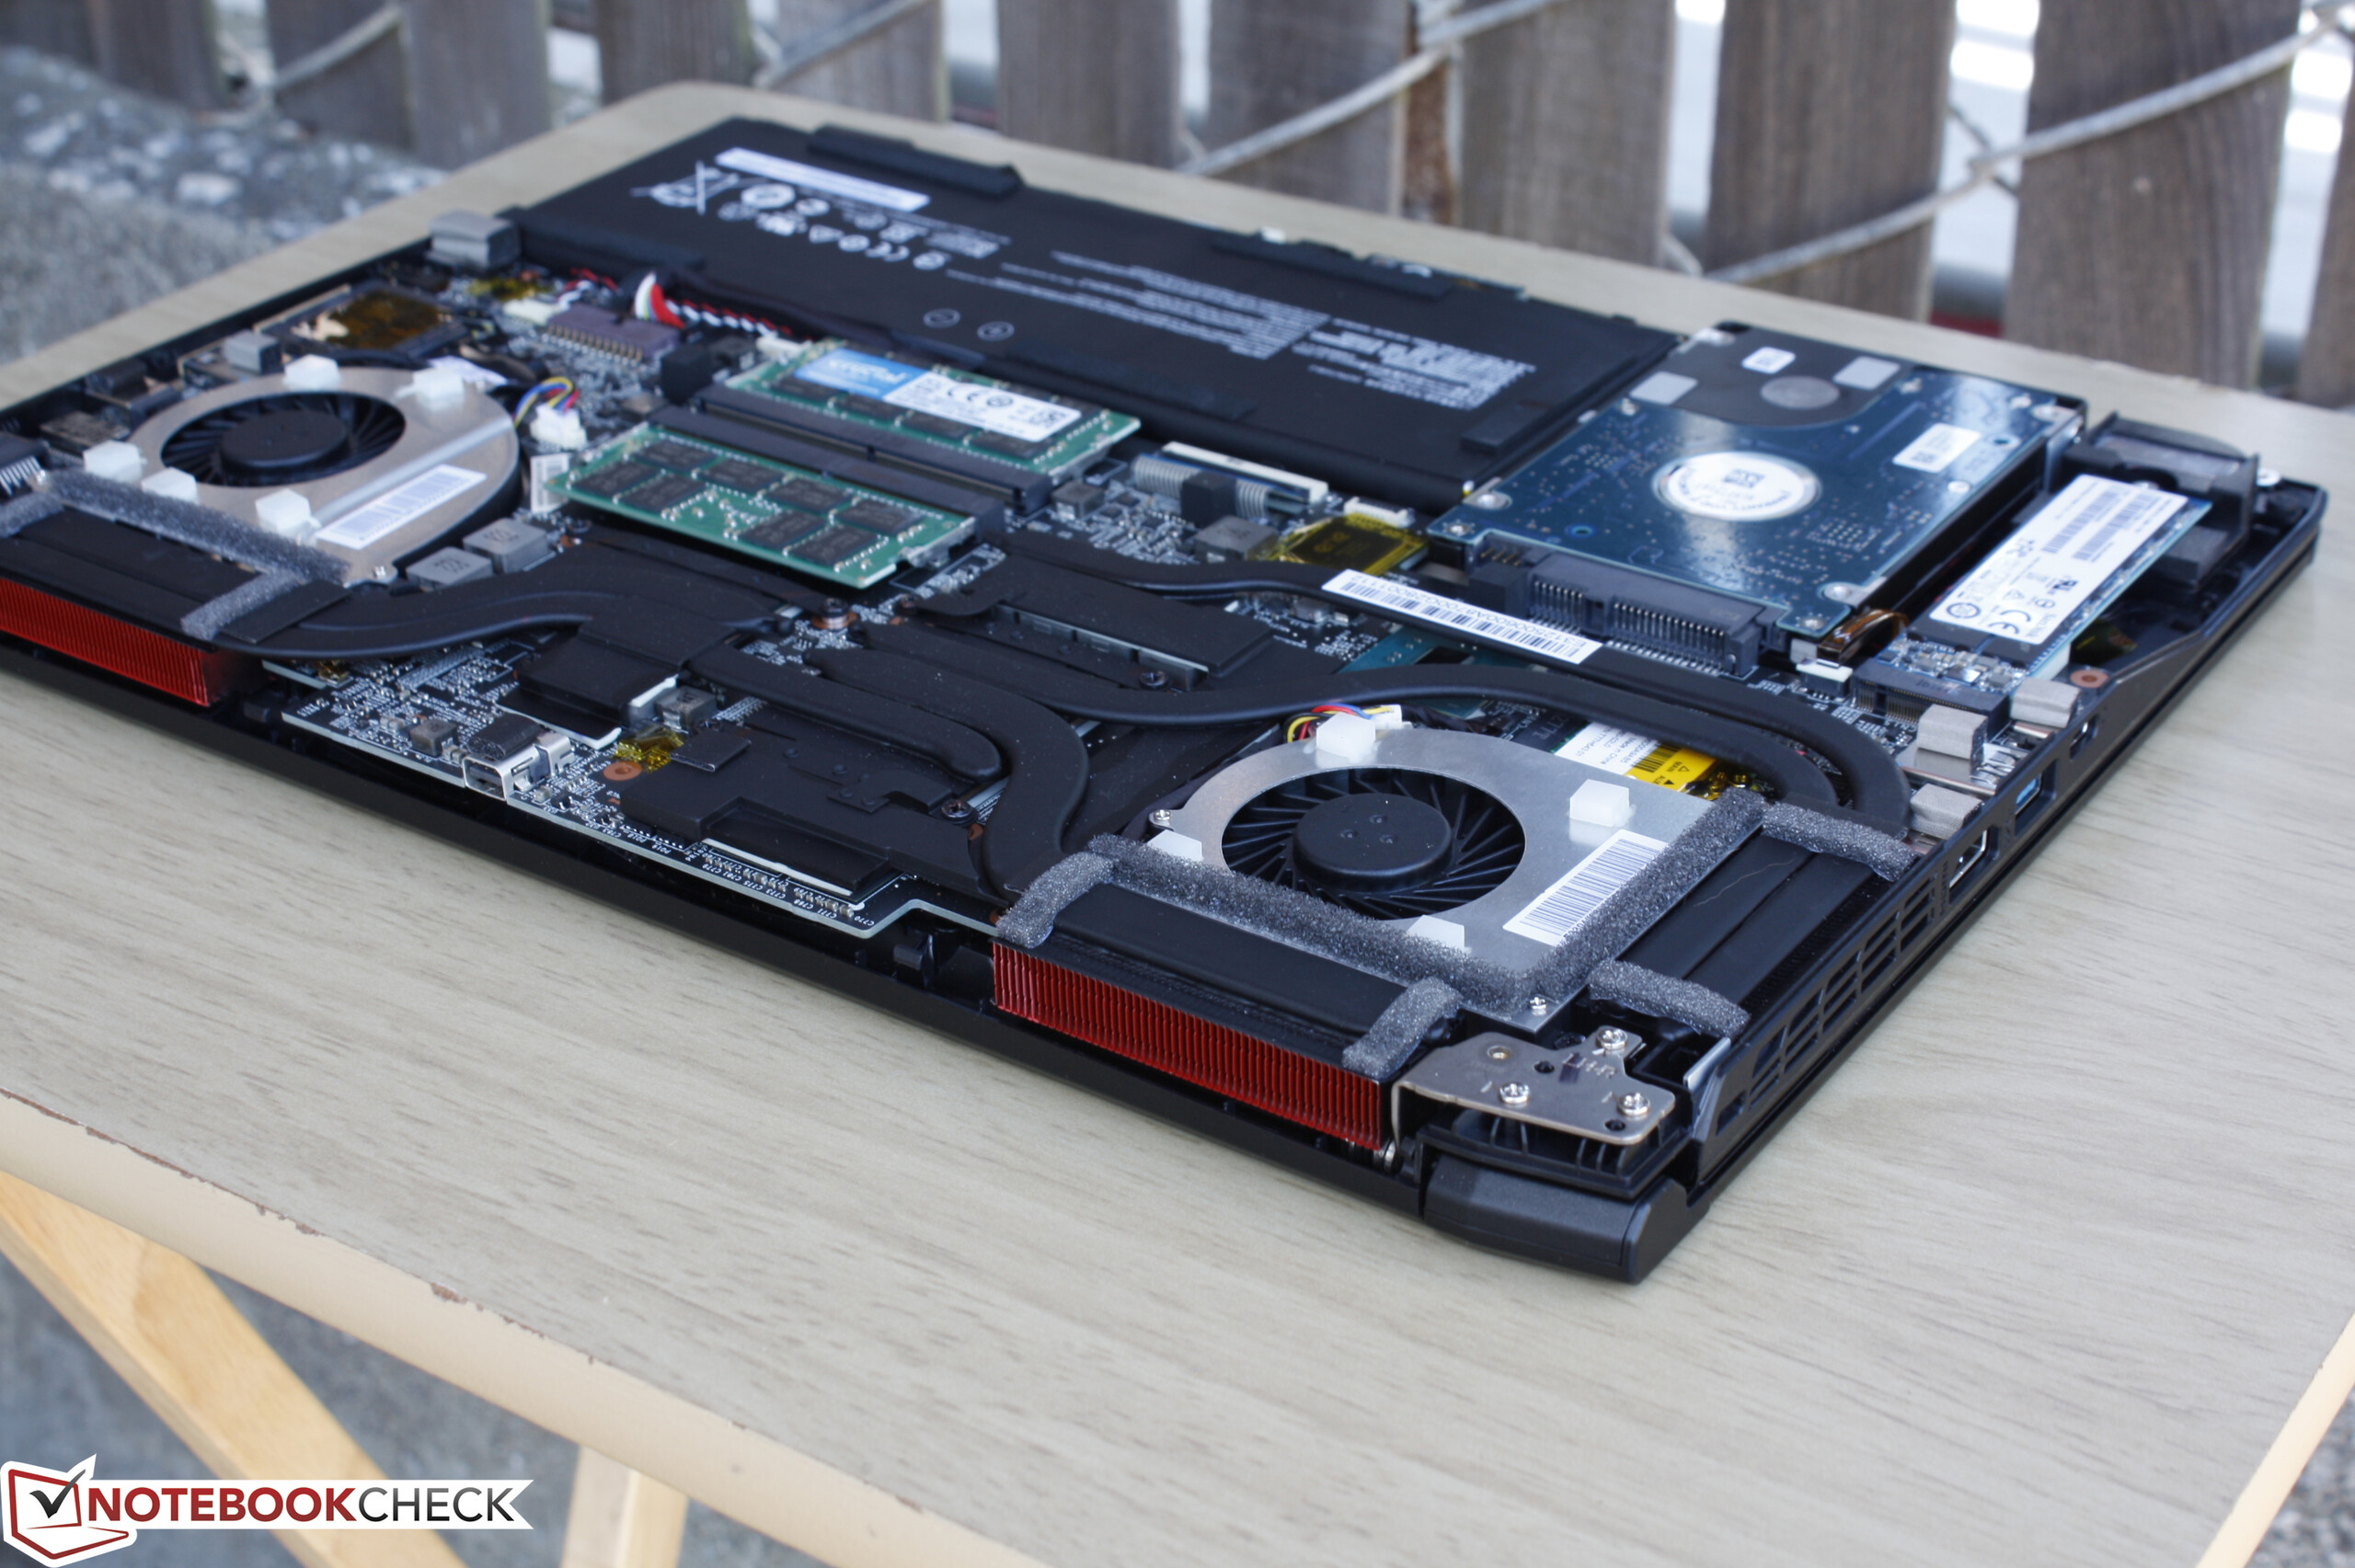
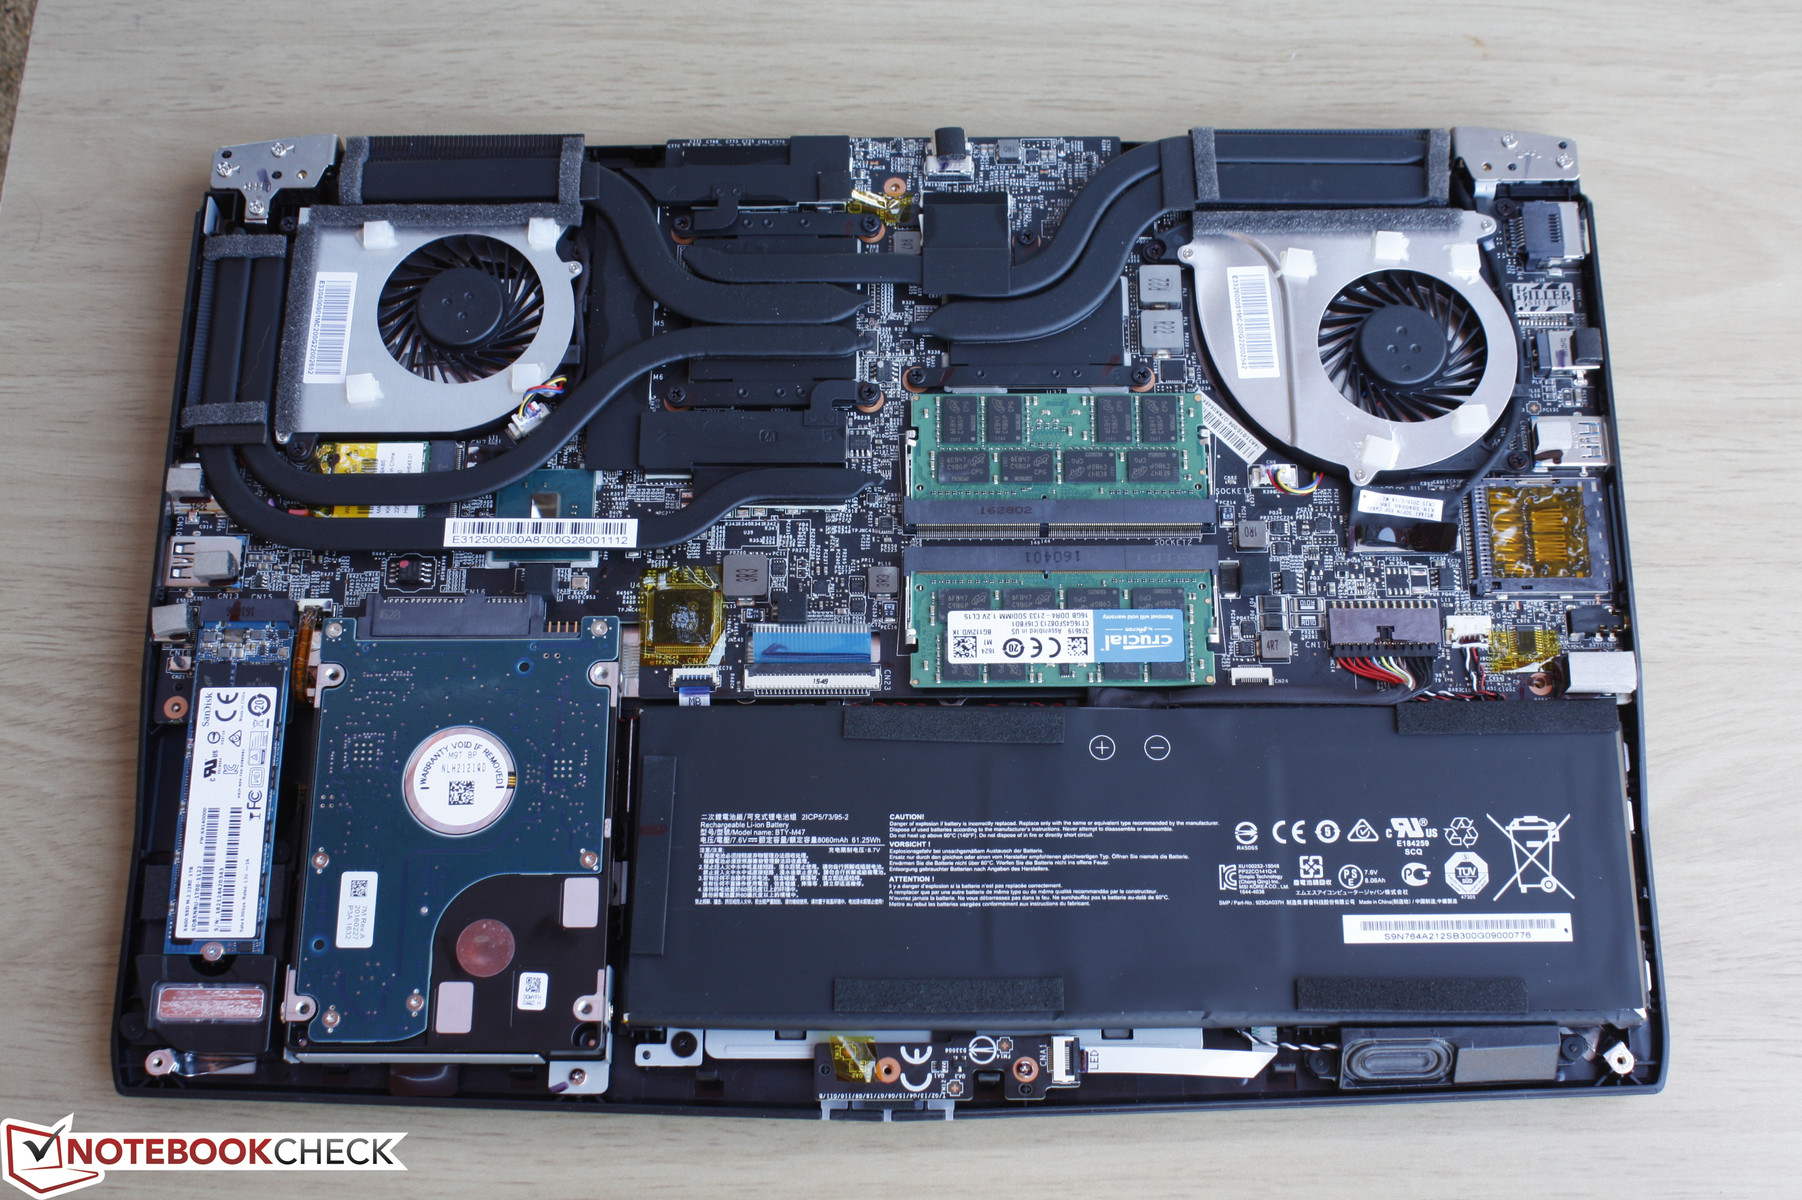
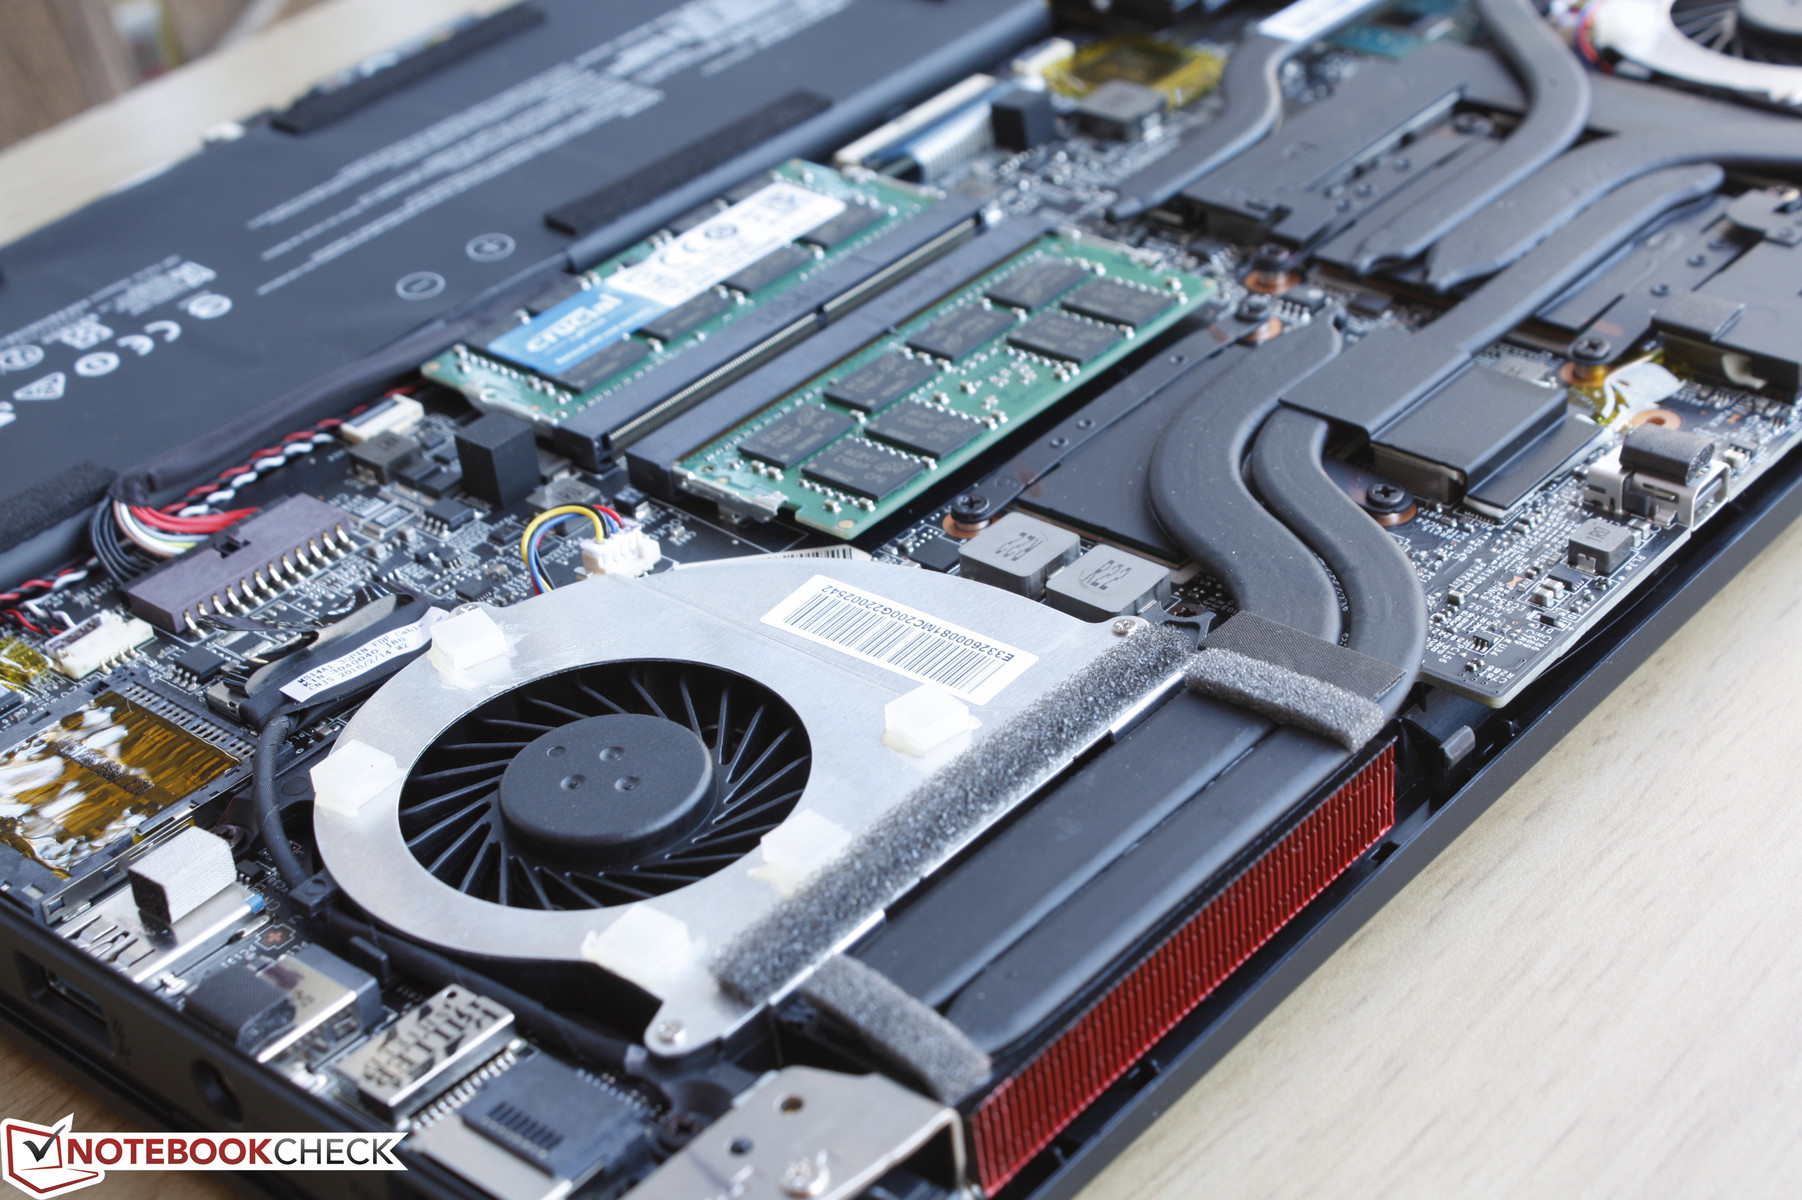
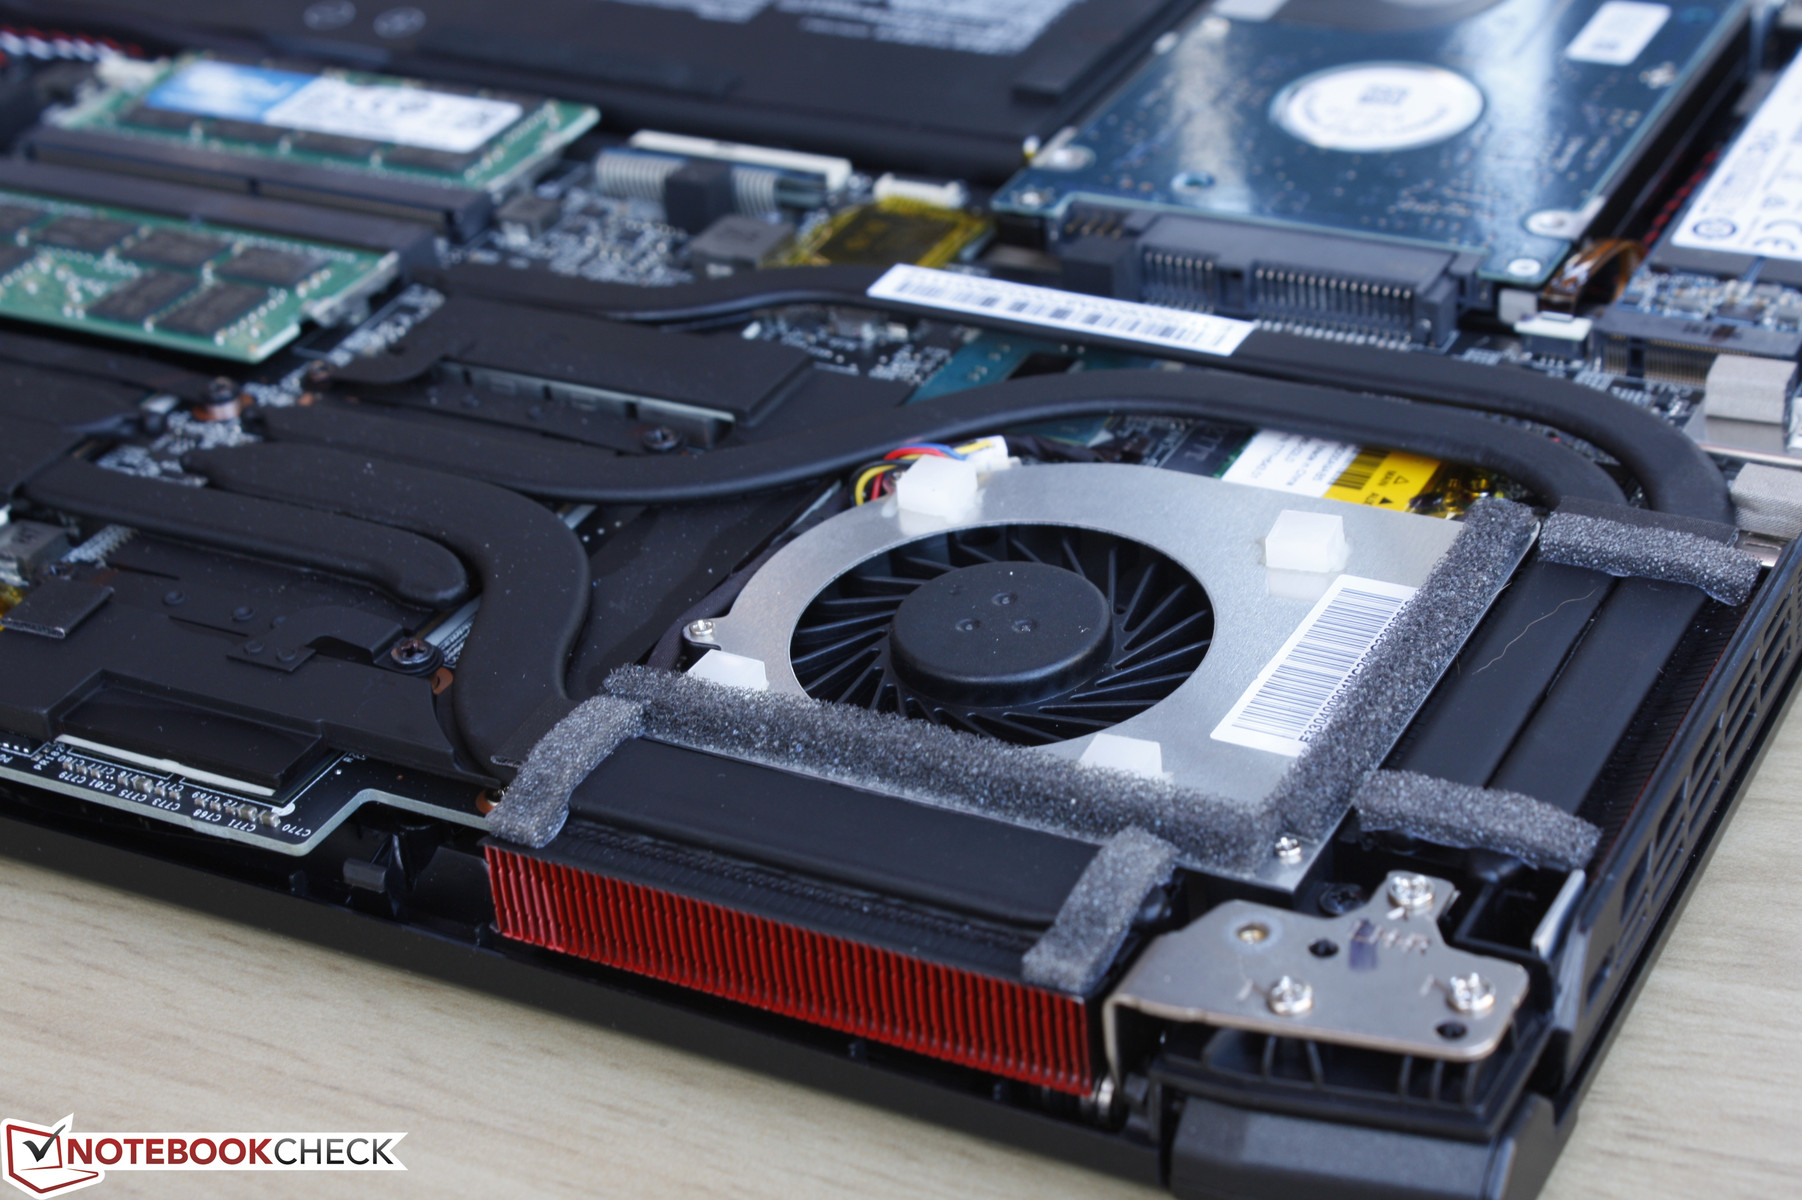
The bottom panel can be removed very easily with just a single Philips screwdriver. Unfortunately, removing this panel will automatically break the warranty seal like the GS40 before it. This is a bummer as core components are easily upgradeable including the M.2 SSD, 2.5-inch SATA drive, and both RAM modules. Note that the M.2 WLAN module is underneath the GPU heat pipes, so replacing and upgrading WLAN will be a bit trickier. Both the CPU and GPU are soldered as expected.
Warranty
The manufacturer offers 24-month limited warranty as standard with a dead pixel policy covering at least 5 abnormal pixels. Furthermore, CUKUSA covers any components installed by the reseller for up to three years including RAM and disk drives. Registering the notebook with MSI will extend the base warranty by another three months.
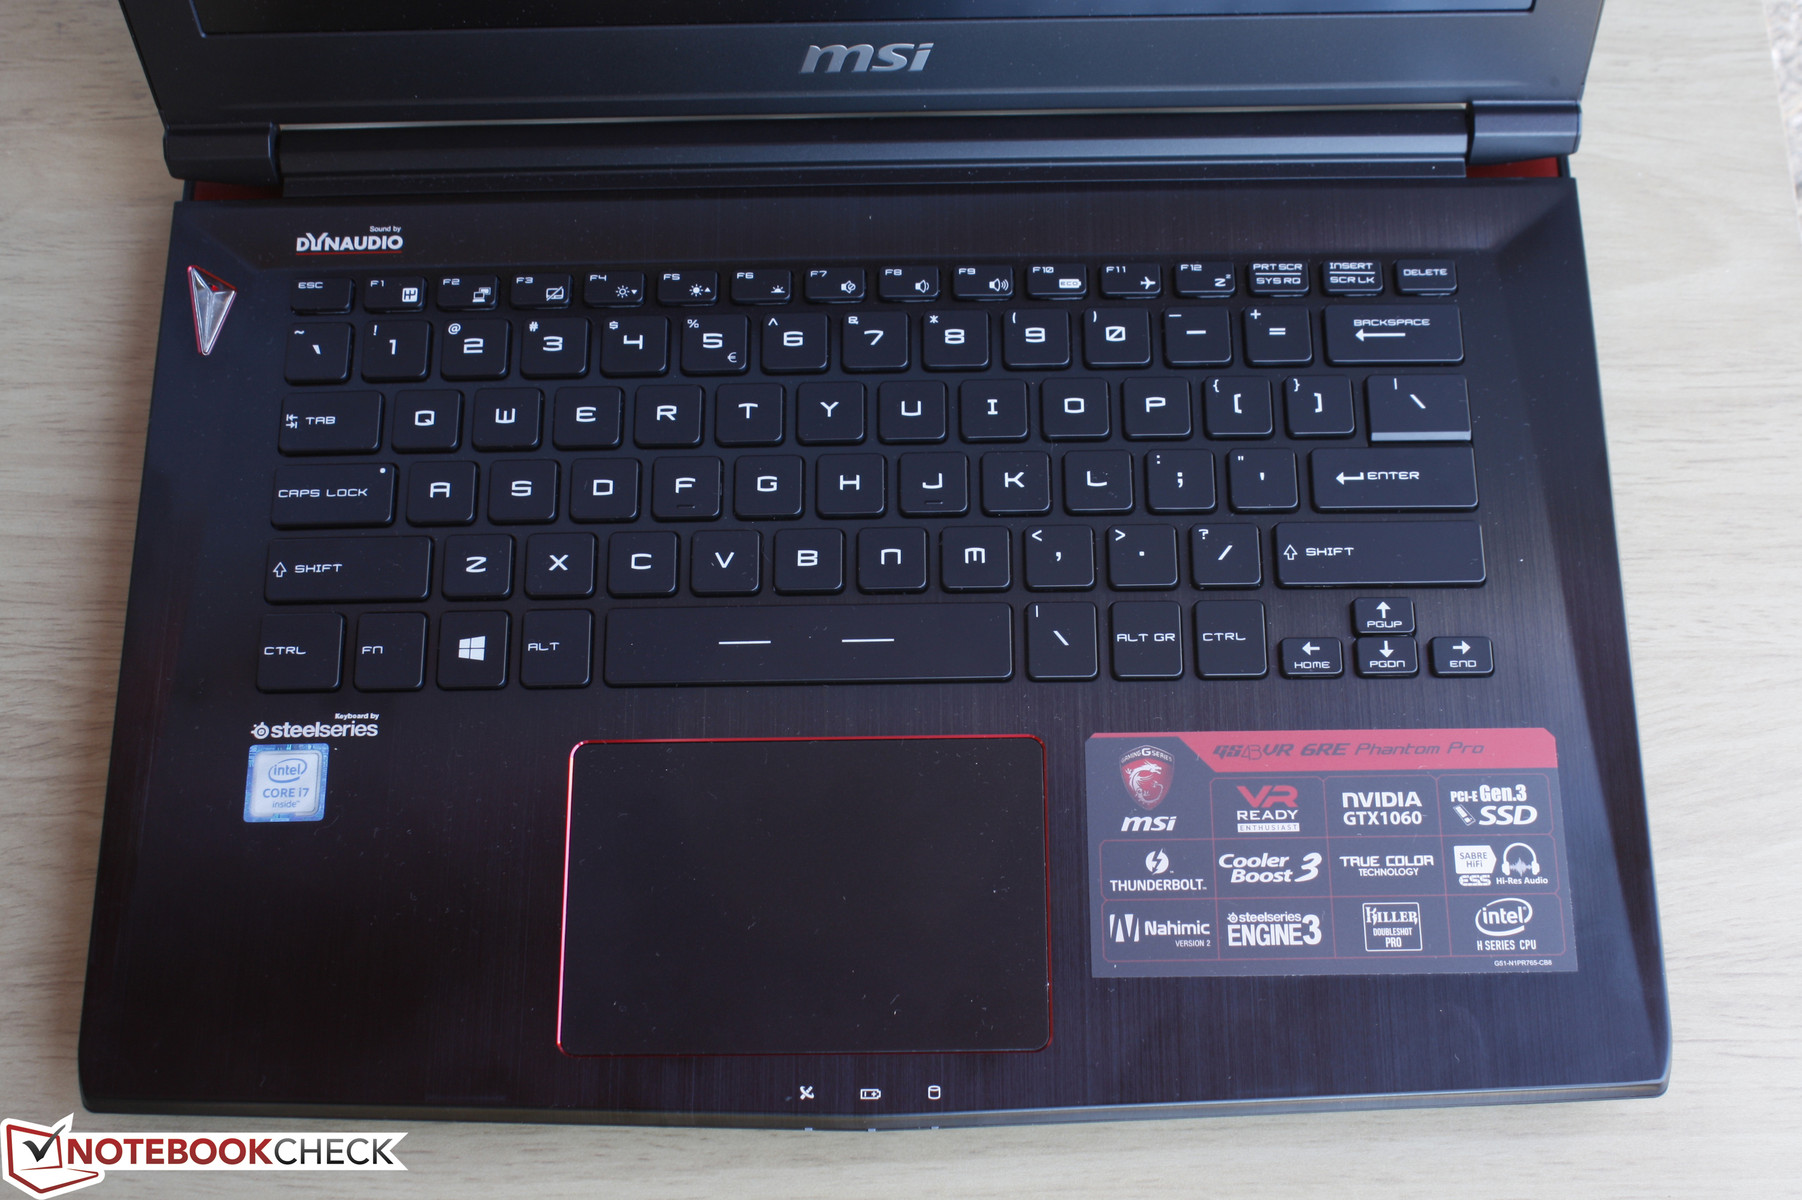
Input Devices
Keyboard and Touchpad
The GS43VR uses the same SteelSeries keyboard (28.0 x 10.5 cm) and red-trimmed touchpad (10.5 x 7.0 cm) as on the GS40, so our previous comments also apply here. That is, we find the keyboard keys to offer ample travel and feedback that are held back a bit by the flexible surface of the base surrounding them. Pushing down on the keys will depress the base ever so slightly, which causes the keys to feel softer than they really are. This isn't an issue in the long run as users will simply acclimate to feel of the keyboard over time. We are, however, a bit disappointed that MSI did not update the keyboard keys with translucent white edges and RGB options as found on its larger and higher-end GS/GT series.
We encountered no problems with the integrated touchpad as it is responsive and reliable for both simple cursor movement and multi-touch inputs. Its integrated clickpad keys are shallow in travel and could have been firmer in feedback, so we find it easier and quicker to tap on the surface instead. The force required to push down and input a click makes it difficult to use for long periods without an external mouse.

Display
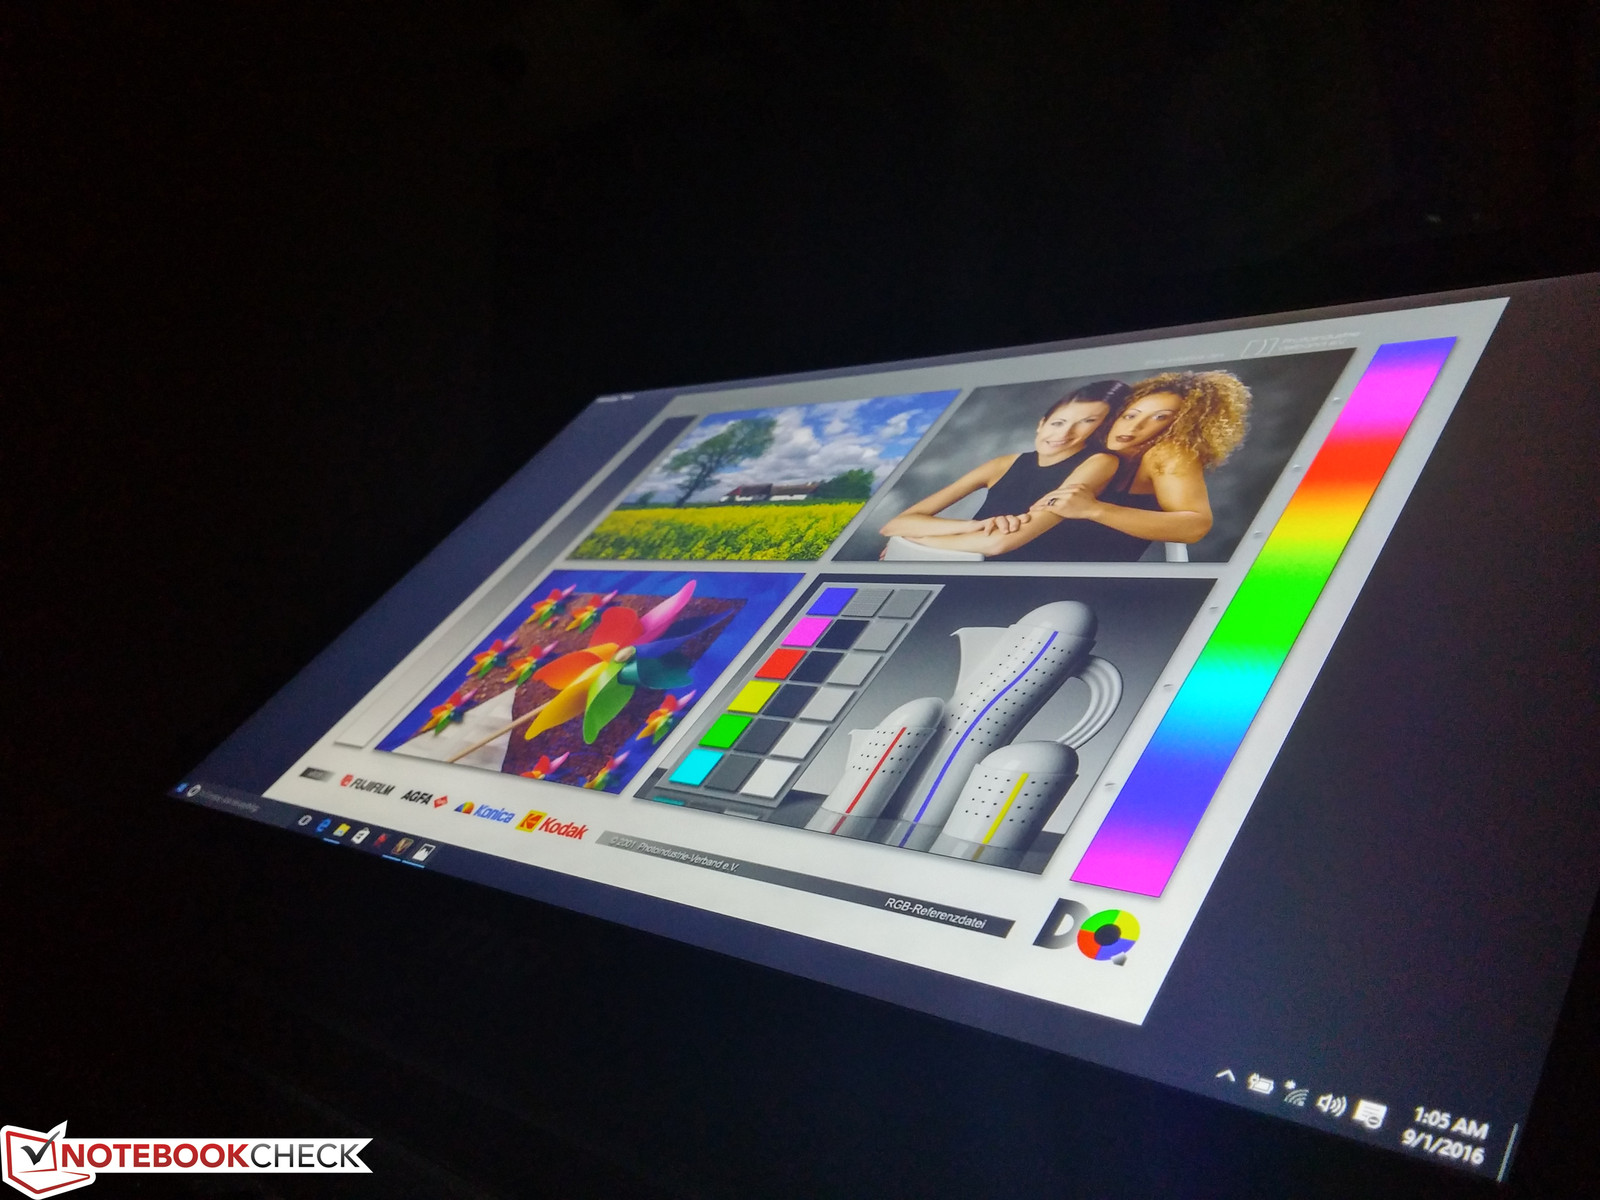
MSI has not updated the 1080p IPS panel on the GS43VR as it uses the same LG Philips LP140WF3-SPD1 panel as the outgoing GS40. This isn't necessarily bad as we found the display to be good for a 14-inch notebook, but it would have been nice to see 2K or 3K options or even 120 Hz/5 ms options as found on MSI's 17-inch VR Ready systems. Our display and brightness measurements are close to what we measured on the older GS40. The bright matte panel is clean with very minimal graininess when viewed up close.
Our test unit exhibited light-moderate backlight bleeding on the bottom right corner and top edge that is only noticeable during dimly lit scenes or movies with black borders.


| |||||||||||||||||||||||||
Brightness Distribution: 83 %
Center on Battery: 288.4 cd/m²
Contrast: 824:1 (Black: 0.35 cd/m²)
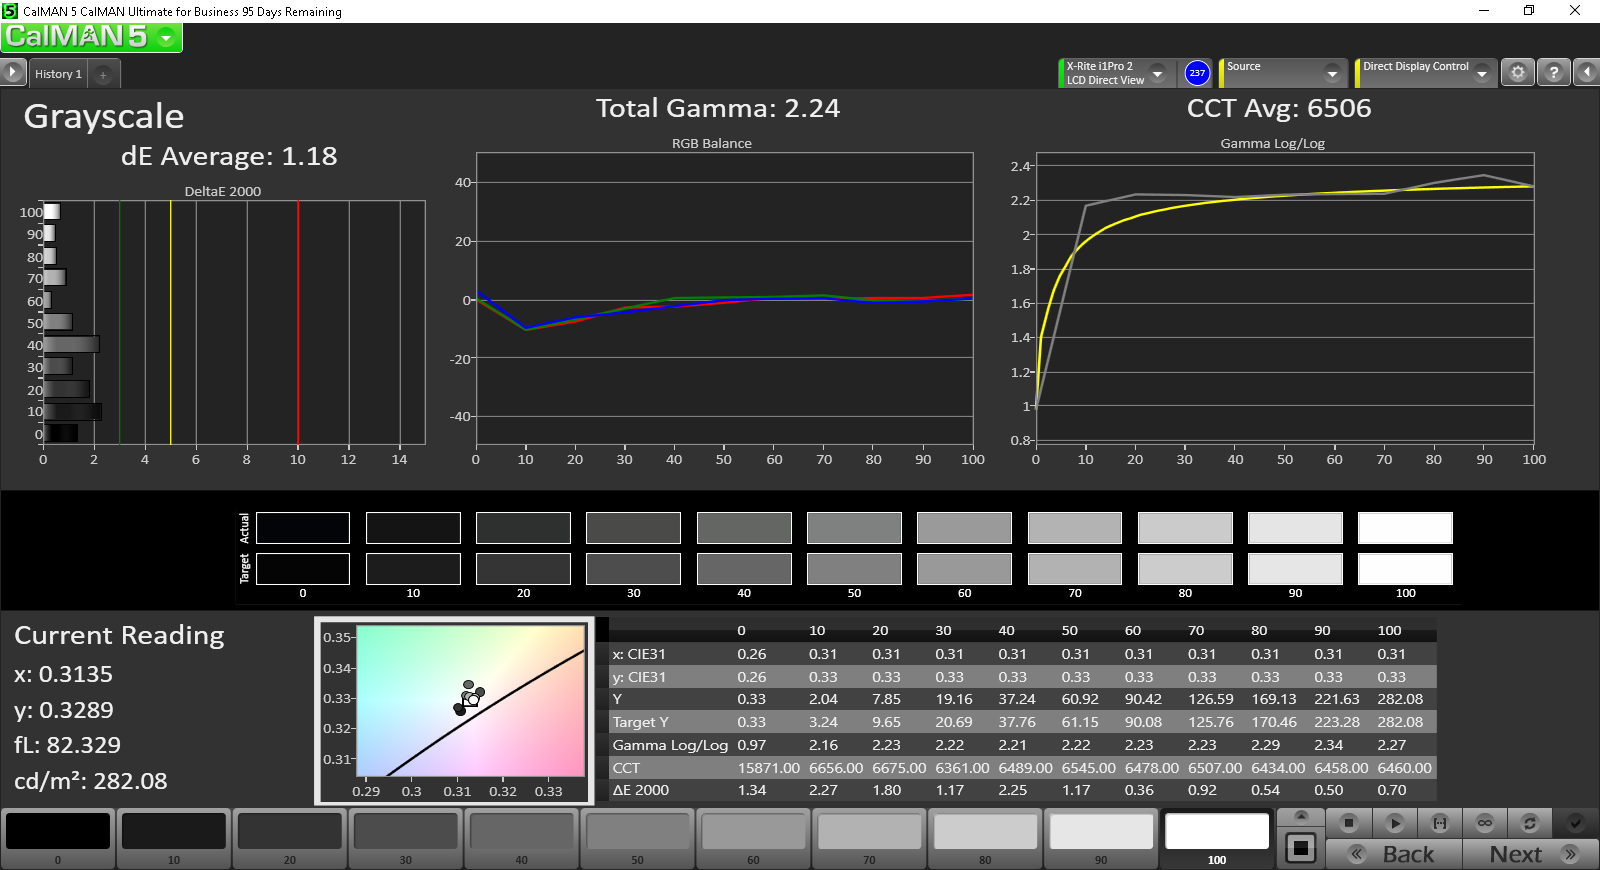
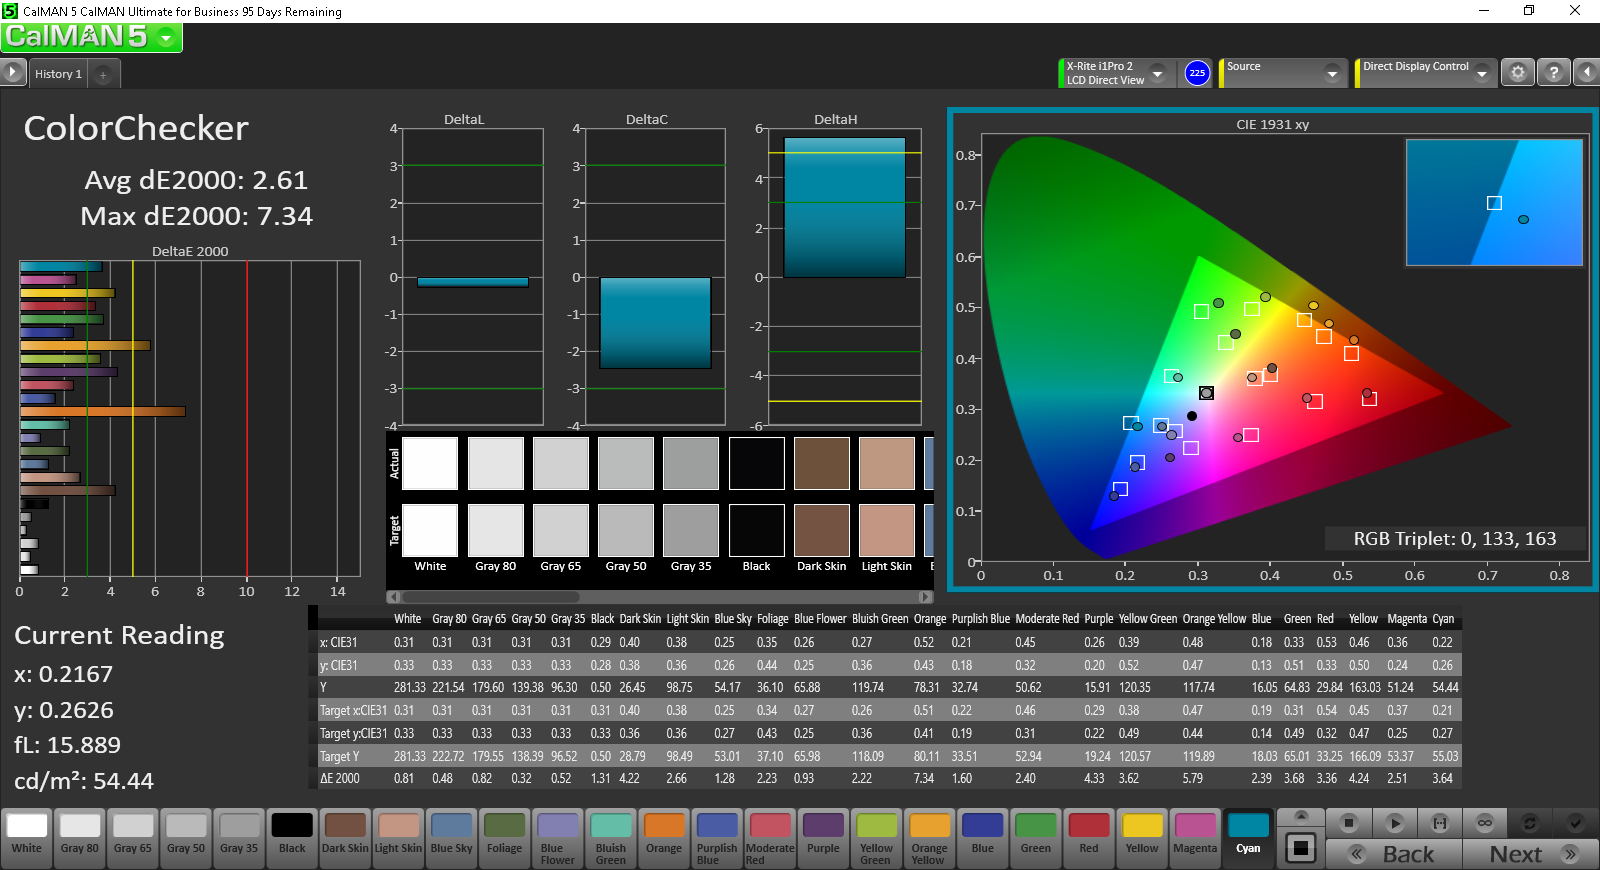
ΔE Color 2.61 | 0.5-29.43 Ø5
ΔE Greyscale 1.18 | 0.57-98 Ø5.3
86.4% sRGB (Argyll 1.6.3 3D)
56.4% AdobeRGB 1998 (Argyll 1.6.3 3D)
63.1% AdobeRGB 1998 (Argyll 2.2.0 3D)
86.4% sRGB (Argyll 2.2.0 3D)
65.5% Display P3 (Argyll 2.2.0 3D)
Gamma: 2.24
| MSI GS43VR 6RE-006US Name: LG Philips LP140WF3-SPD1, ID: LGD046D, IPS, 14.00, 1920x1080 | Gigabyte P34W v5 IPS, 14.00, 2560x1440 | MSI GS40-6QE16H11 LG Philips LP140WF3-SPD1 (LGD046D), IPS, 14.00, 1920x1080 | Aorus X3 Plus v5 IPS, 13.90, 3200x1800 | Razer Blade 14 2015 IPS, 14.00, 3200x1800 | |
|---|---|---|---|---|---|
| Display | -16% | -0% | 9% | 11% | |
| Display P3 Coverage | 65.5 | 51.4 -22% | 66.2 1% | 67.9 4% | 70.3 7% |
| sRGB Coverage | 86.4 | 76.6 -11% | 85.7 -1% | 98.2 14% | 97.1 12% |
| AdobeRGB 1998 Coverage | 63.1 | 52.8 -16% | 62.6 -1% | 69.2 10% | 71.1 13% |
| Response Times | -17% | 4% | -80% | ||
| Response Time Grey 50% / Grey 80% * | 31.6 ? | 41.2 ? -30% | 31 ? 2% | 52.4 ? -66% | |
| Response Time Black / White * | 24.4 ? | 25.4 ? -4% | 23 ? 6% | 47.2 ? -93% | |
| PWM Frequency | 198 ? | ||||
| Screen | -11% | -70% | -27% | -50% | |
| Brightness middle | 288.4 | 277.8 -4% | 304 5% | 394.8 37% | 318.4 10% |
| Brightness | 282 | 270 -4% | 282 0% | 370 31% | 311 10% |
| Brightness Distribution | 83 | 83 0% | 88 6% | 79 -5% | 78 -6% |
| Black Level * | 0.35 | 0.38 -9% | 0.37 -6% | 0.293 16% | 0.416 -19% |
| Contrast | 824 | 731 -11% | 822 0% | 1347 63% | 765 -7% |
| Colorchecker dE 2000 * | 2.61 | 2.71 -4% | 7.47 -186% | 4.8 -84% | 3.67 -41% |
| Colorchecker dE 2000 max. * | 7.34 | 5.47 25% | |||
| Greyscale dE 2000 * | 1.18 | 2.11 -79% | 6.51 -452% | 5.04 -327% | 5.41 -358% |
| Gamma | 2.24 98% | 2.19 100% | 3.71 59% | 2.26 97% | 2.26 97% |
| CCT | 6506 100% | 6314 103% | 7840 83% | 7343 89% | 7118 91% |
| Color Space (Percent of AdobeRGB 1998) | 56.4 | 48.5 -14% | 56 -1% | 63.4 12% | 64.64 15% |
| Color Space (Percent of sRGB) | 86.4 | 76.9 -11% | 86 0% | 98.1 14% | |
| Total Average (Program / Settings) | -15% /
-13% | -22% /
-45% | -33% /
-27% | -20% /
-33% |
* ... smaller is better
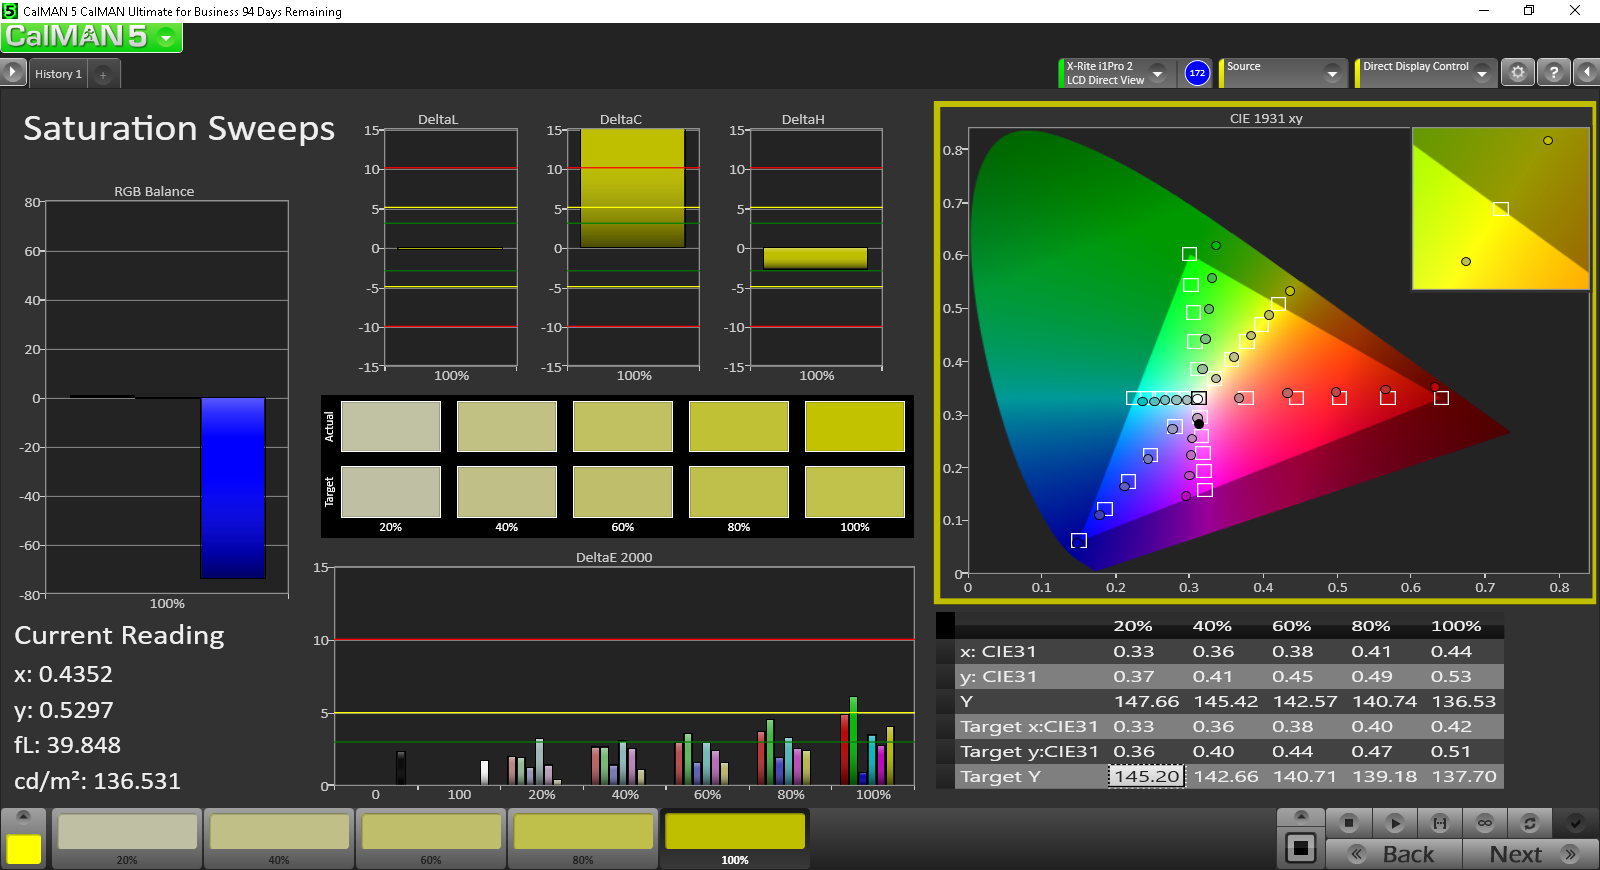
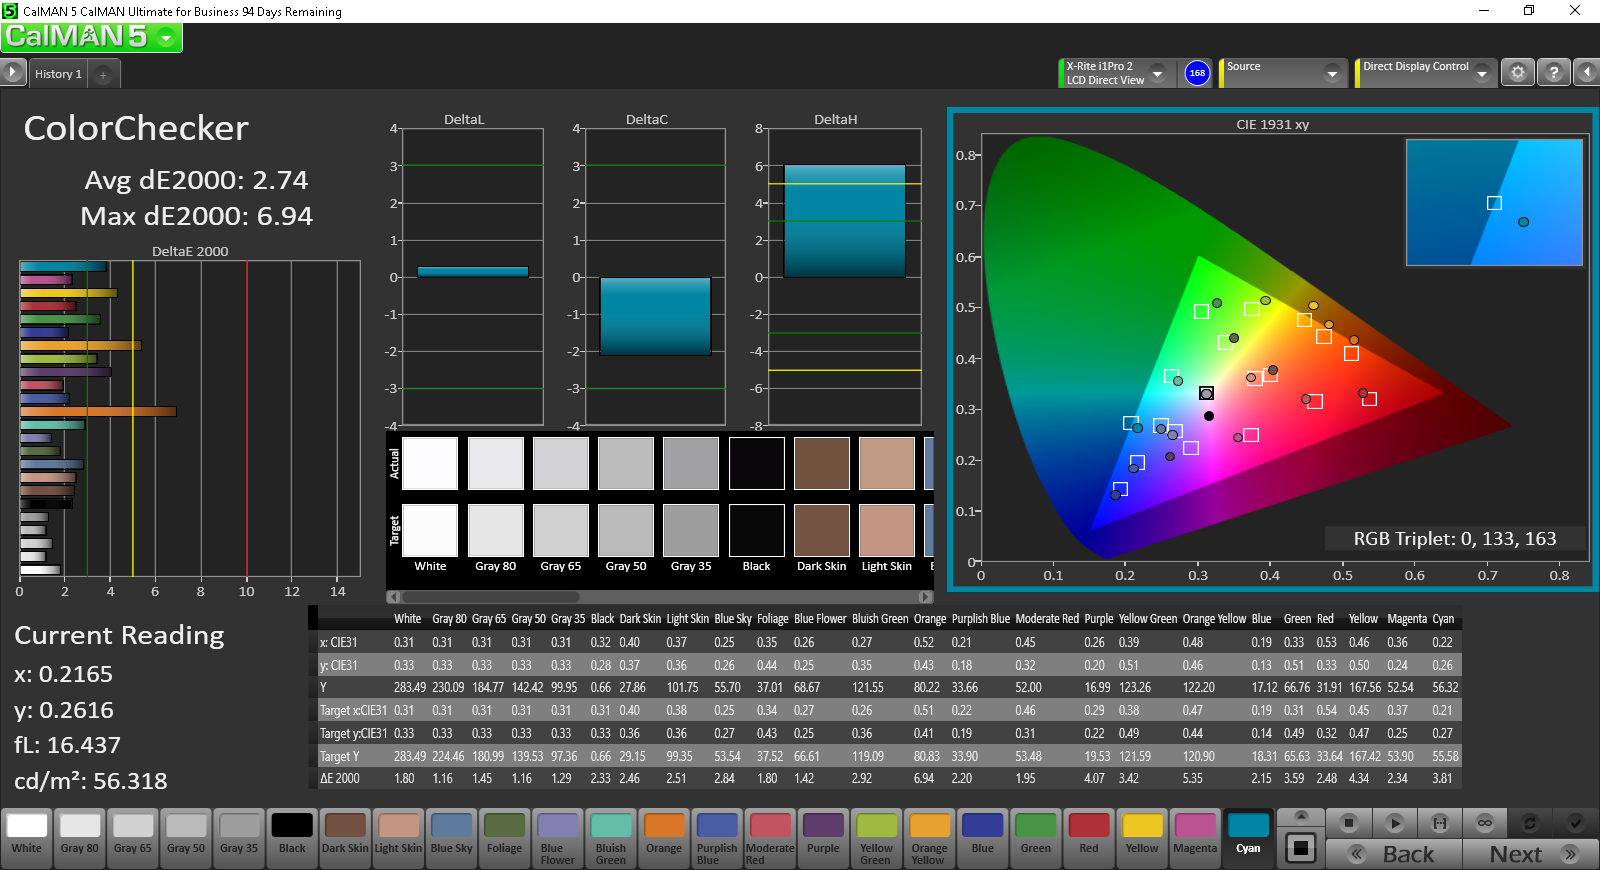
Color coverage is high at about 86 percent of the sRGB standard. Larger gaming notebooks tend to offer panels with 95 percent sRGB or even complete sRGB coverage, though the wide gamut has little impact on gaming and is instead geared more towards digital artists.
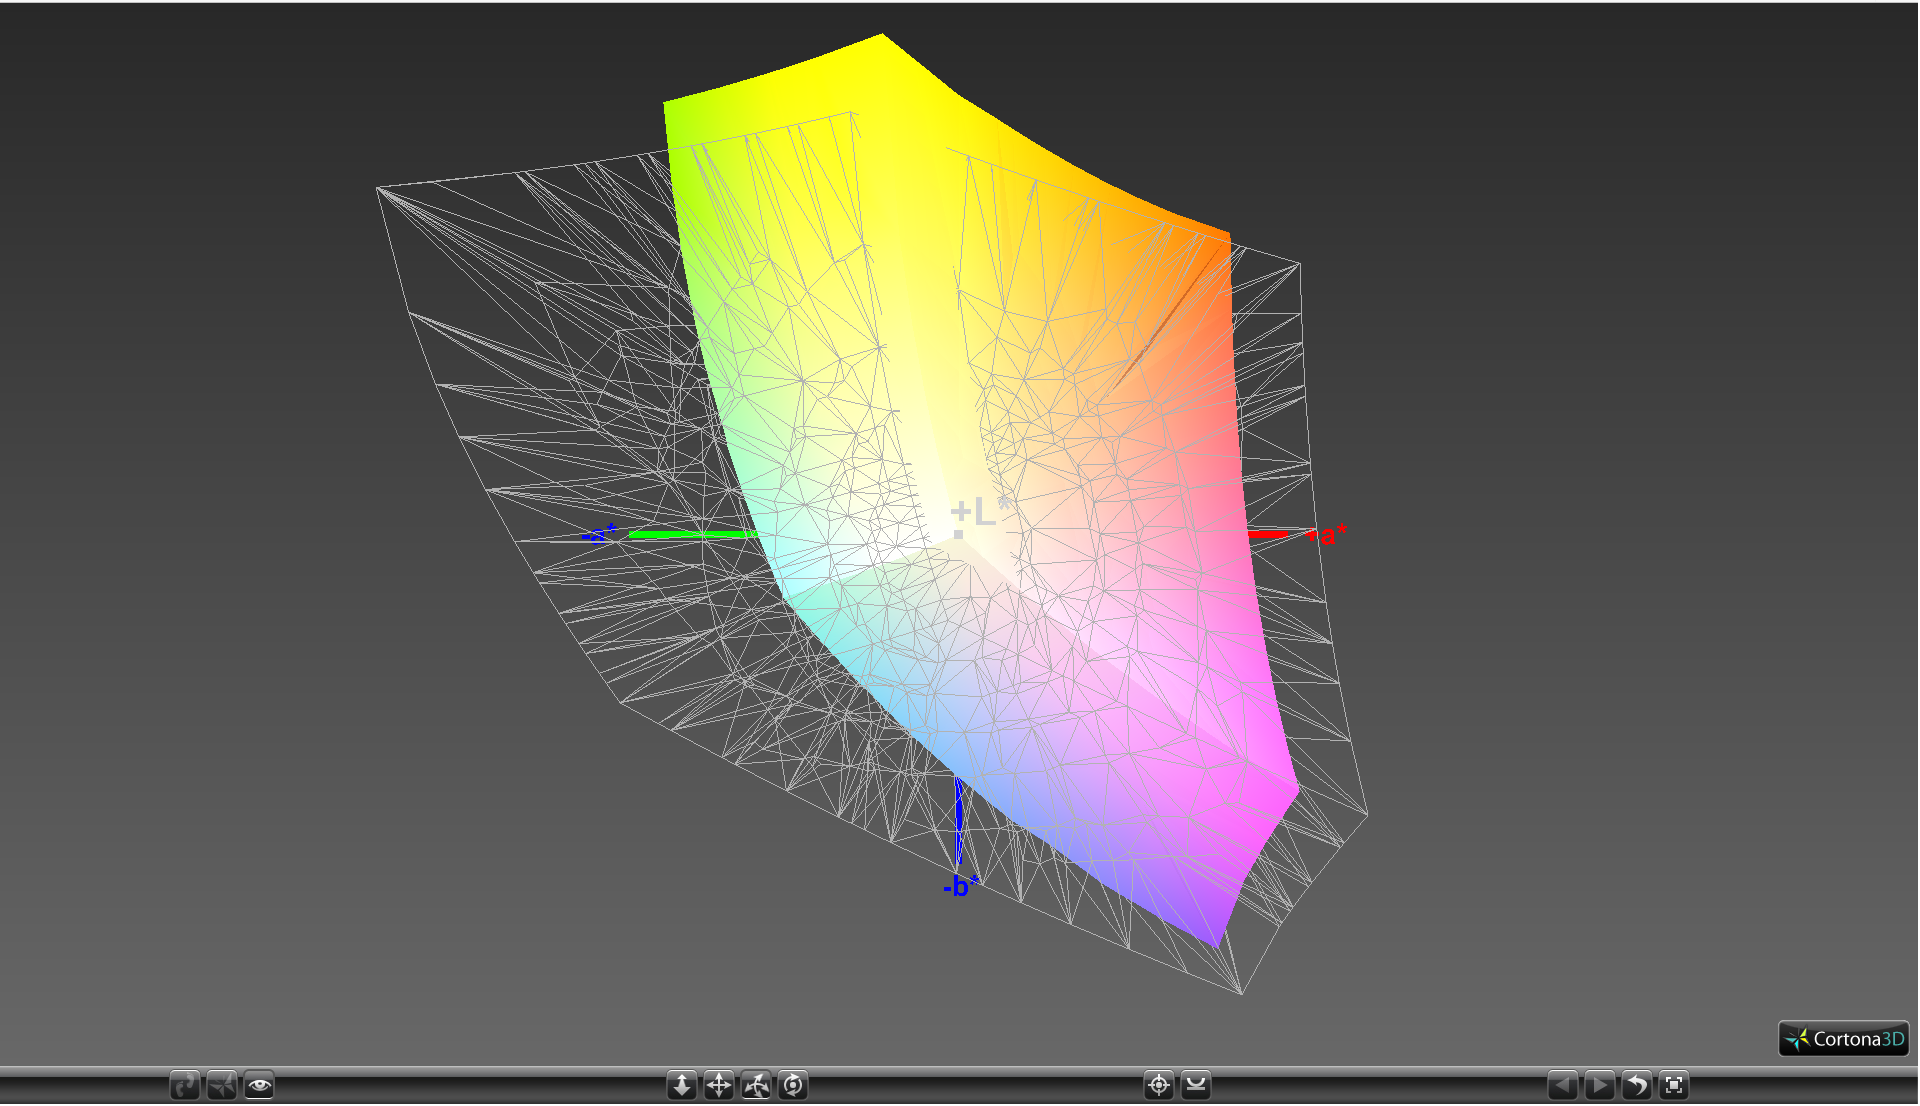

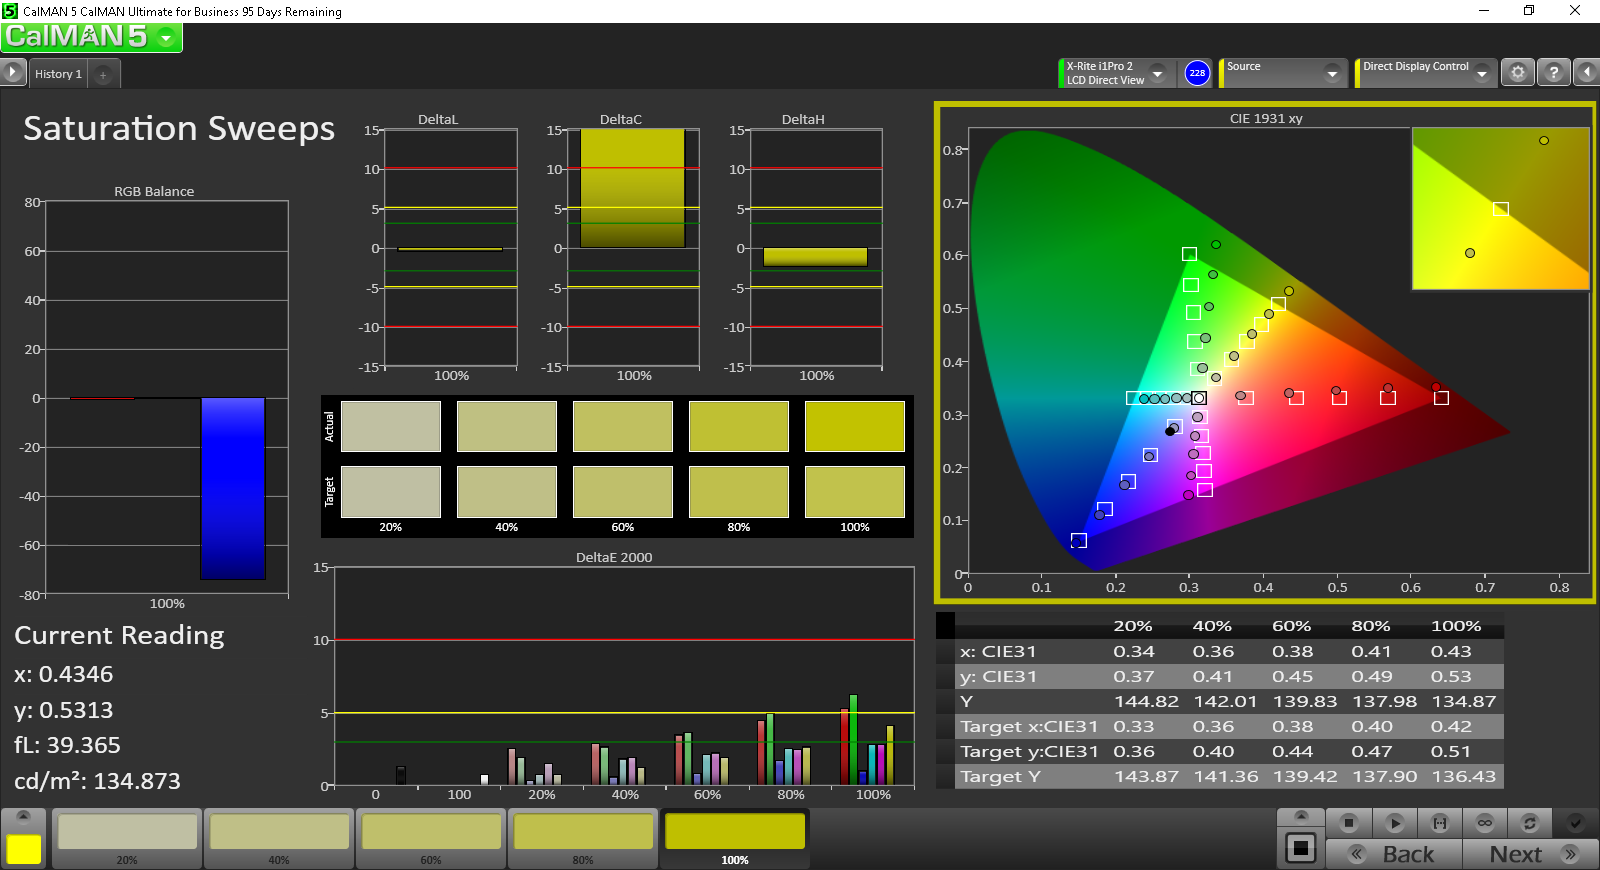
Unlike on our GS40 test unit, our GS43VR doesn't require further calibration as grayscale and colors are already accurate out-of-the-box. Colors still become increasingly inaccurate at higher saturation levels due to the panel's imperfect sRGB coverage.
Display Response Times
| ↔ Response Time Black to White | ||
|---|---|---|
| 24.4 ms ... rise ↗ and fall ↘ combined | ↗ 5.2 ms rise |  |
| ↘ 19.2 ms fall | ||
| The screen shows good response rates in our tests, but may be too slow for competitive gamers. In comparison, all tested devices range from 0.1 (minimum) to 240 (maximum) ms. » 52 % of all devices are better. This means that the measured response time is worse than the average of all tested devices (21.5 ms). | ||
| ↔ Response Time 50% Grey to 80% Grey | ||
| 31.6 ms ... rise ↗ and fall ↘ combined | ↗ 10.4 ms rise | 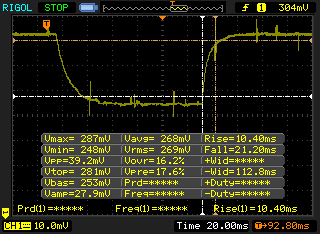 |
| ↘ 21.2 ms fall | ||
| The screen shows slow response rates in our tests and will be unsatisfactory for gamers. In comparison, all tested devices range from 0.2 (minimum) to 636 (maximum) ms. » 36 % of all devices are better. This means that the measured response time is similar to the average of all tested devices (33.7 ms). | ||
Screen Flickering / PWM (Pulse-Width Modulation)
| Screen flickering / PWM not detected | 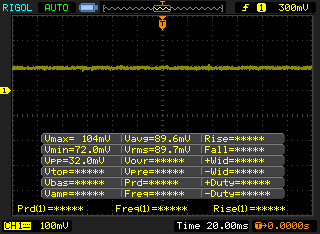 | ||
In comparison: 53 % of all tested devices do not use PWM to dim the display. If PWM was detected, an average of 17903 (minimum: 5 - maximum: 3846000) Hz was measured. | |||
Viewing angles are excellent as expected from an IPS panel and the ~280 nit backlight works well with the small size and matte screen for good visibility outdoors when under shade. The hinges can open up to about 140 degrees to reduce glare from an overcast or sunny day. Viewing too far off angle should be avoided as apparent brightness will decrease.

Performance
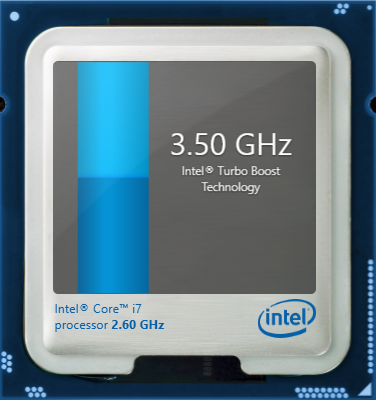
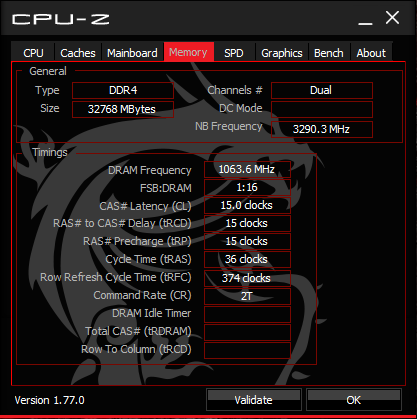
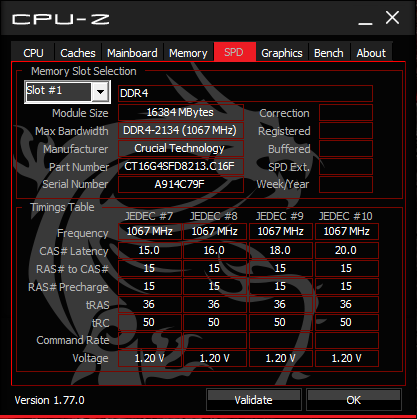
Core components remain identical to the GS40 other than the GPU update from Maxwell to Pascal. Thus, the GS43VR ships with the same Core i7-6700HQ CPU and RAM options of up to 32 GB of DDR4. It's worth noting that the GS43VR uses the same CPU as most larger gaming notebooks, so users are not necessarily sacrificing processor performance for the smaller form factor. Nonetheless, we were able to record inferior Turbo Boost speeds out of the i7-6700HQ in the GS43VR as detailed in the next few sections.
Optimus is still supported for automatic graphics switching to the integrated HD Graphics 530 when appropriate. As a result, G-Sync is unavailable on this series.


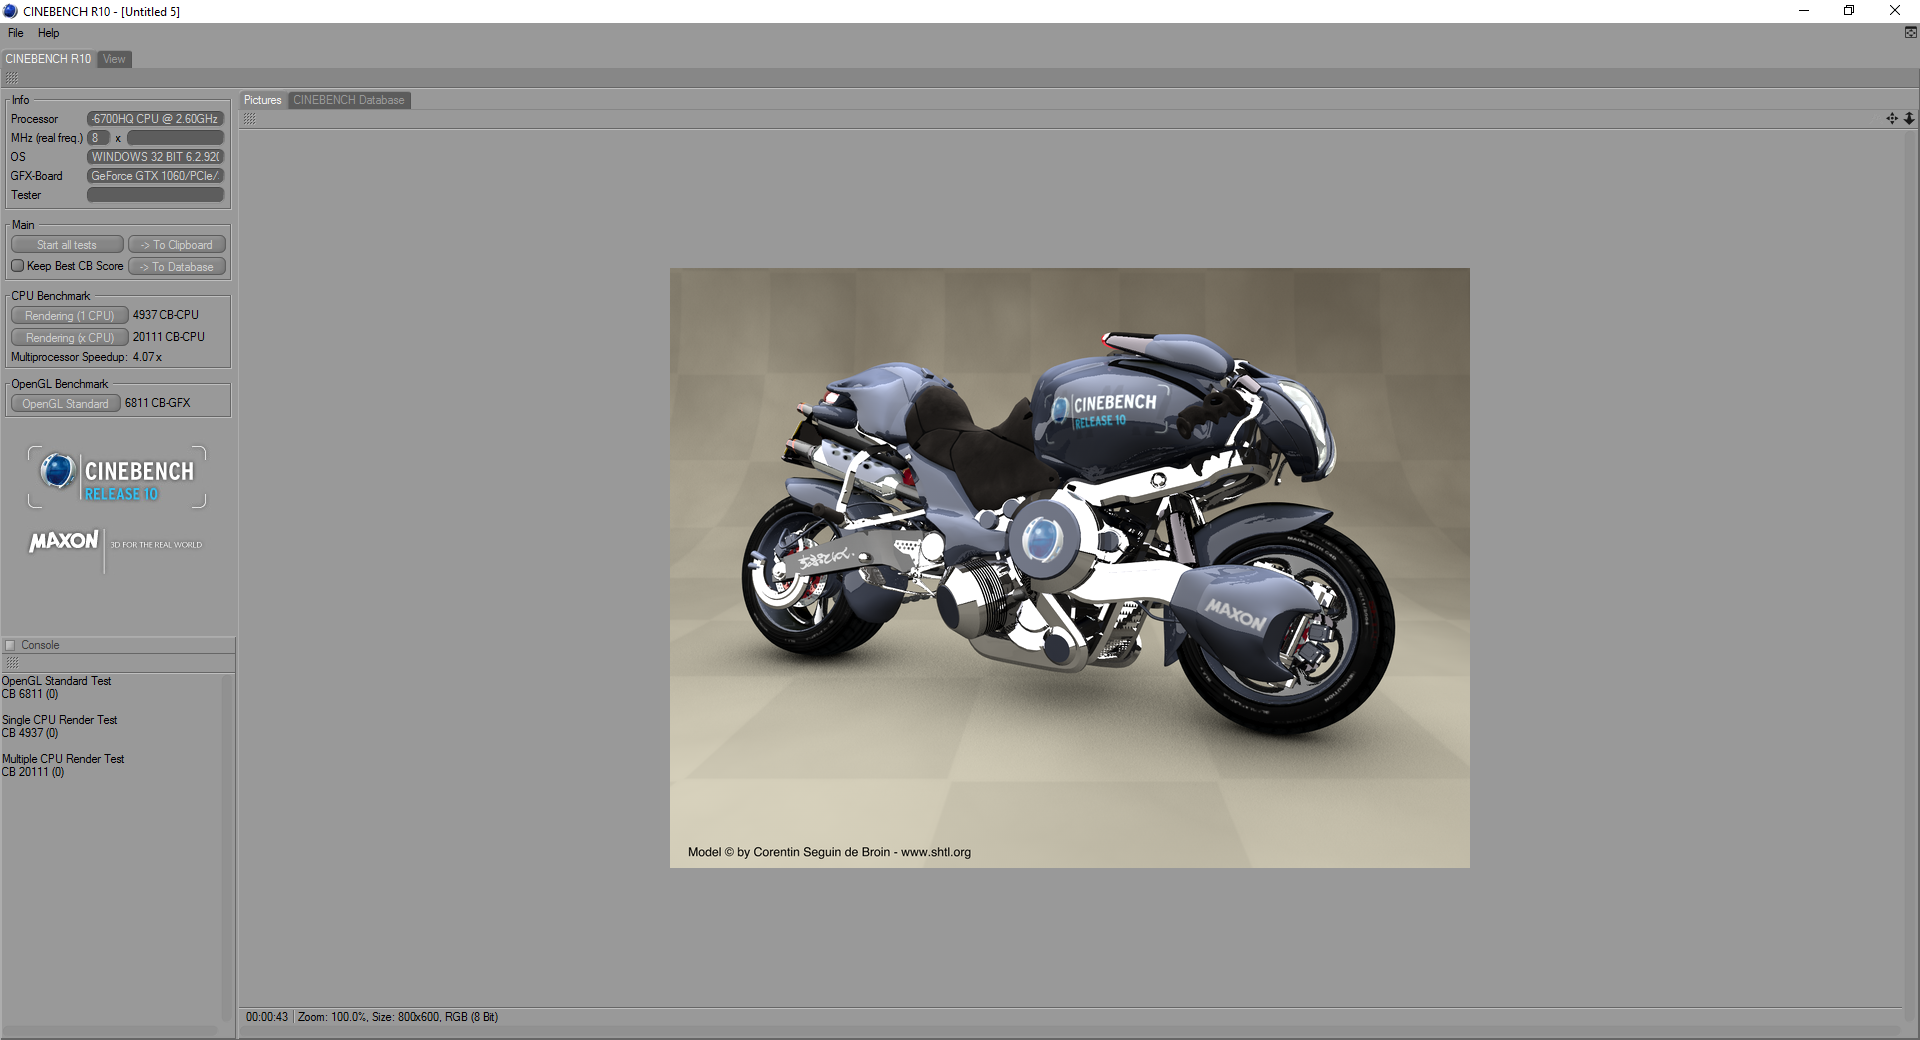
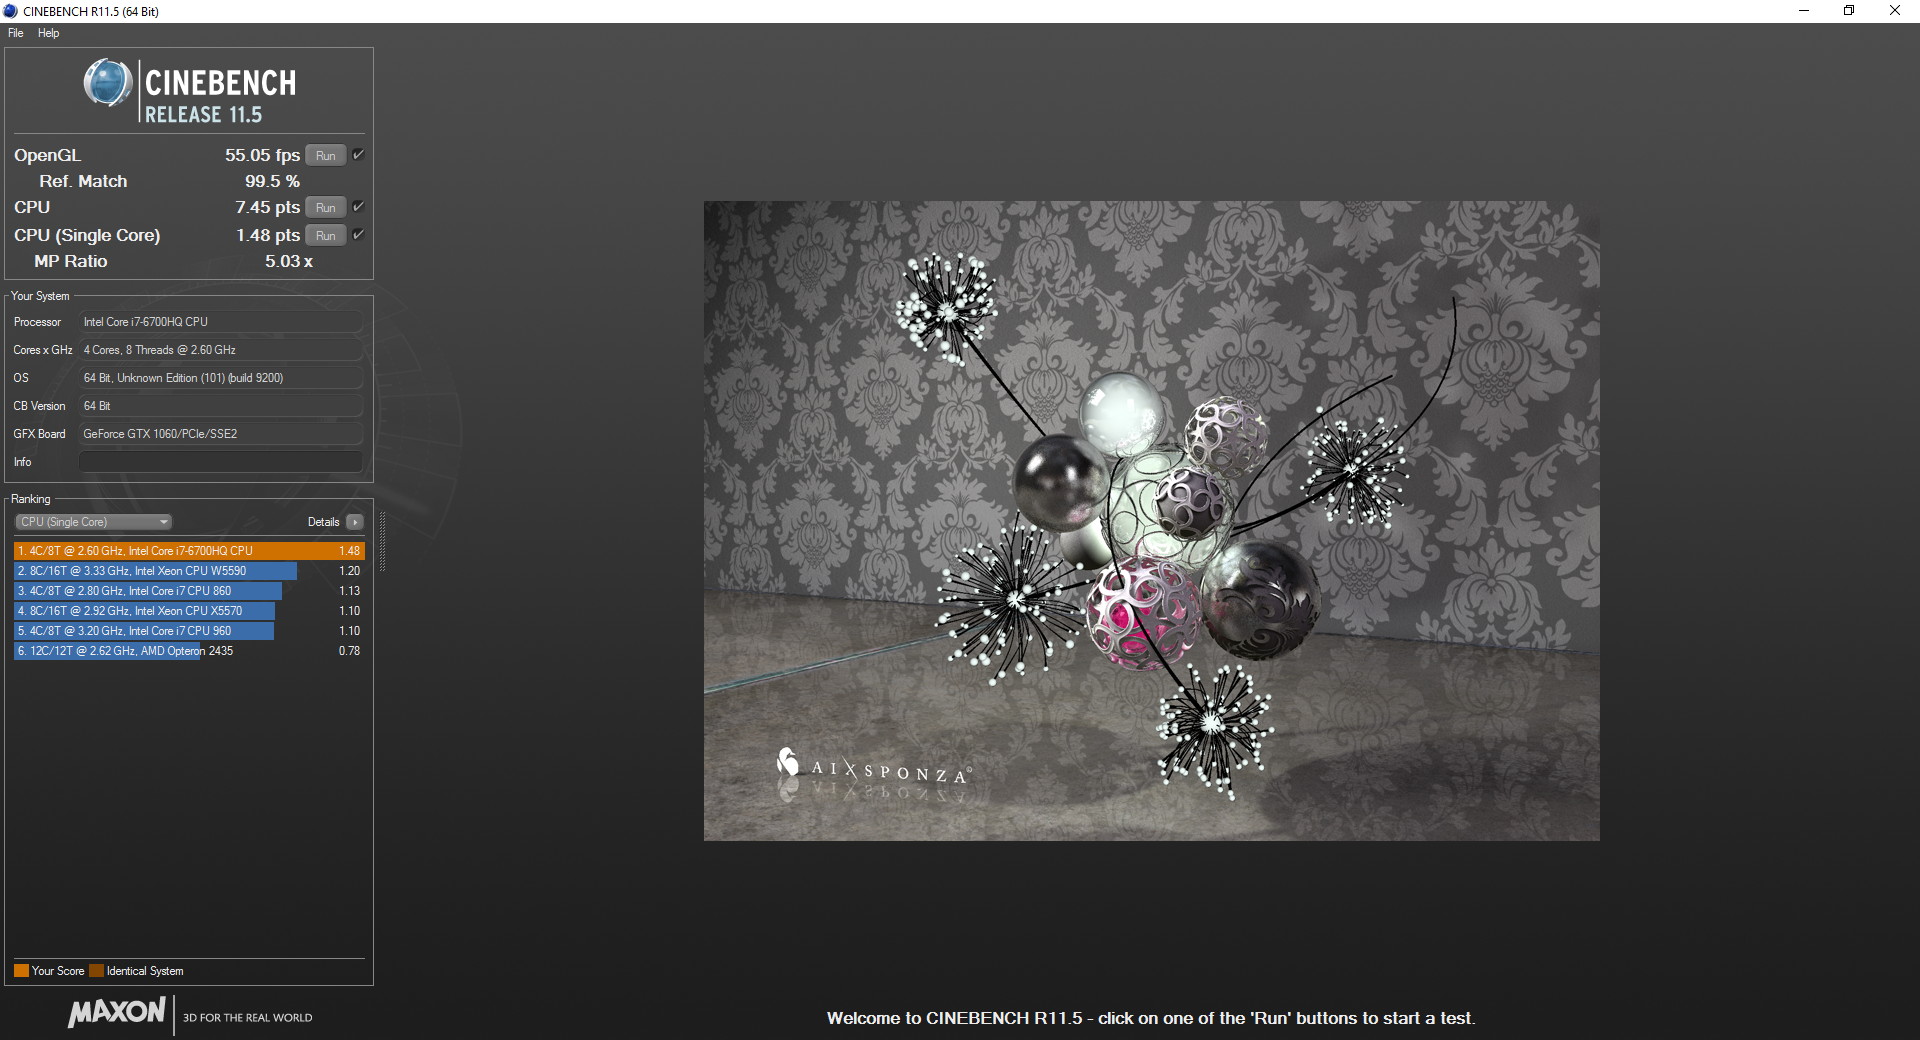
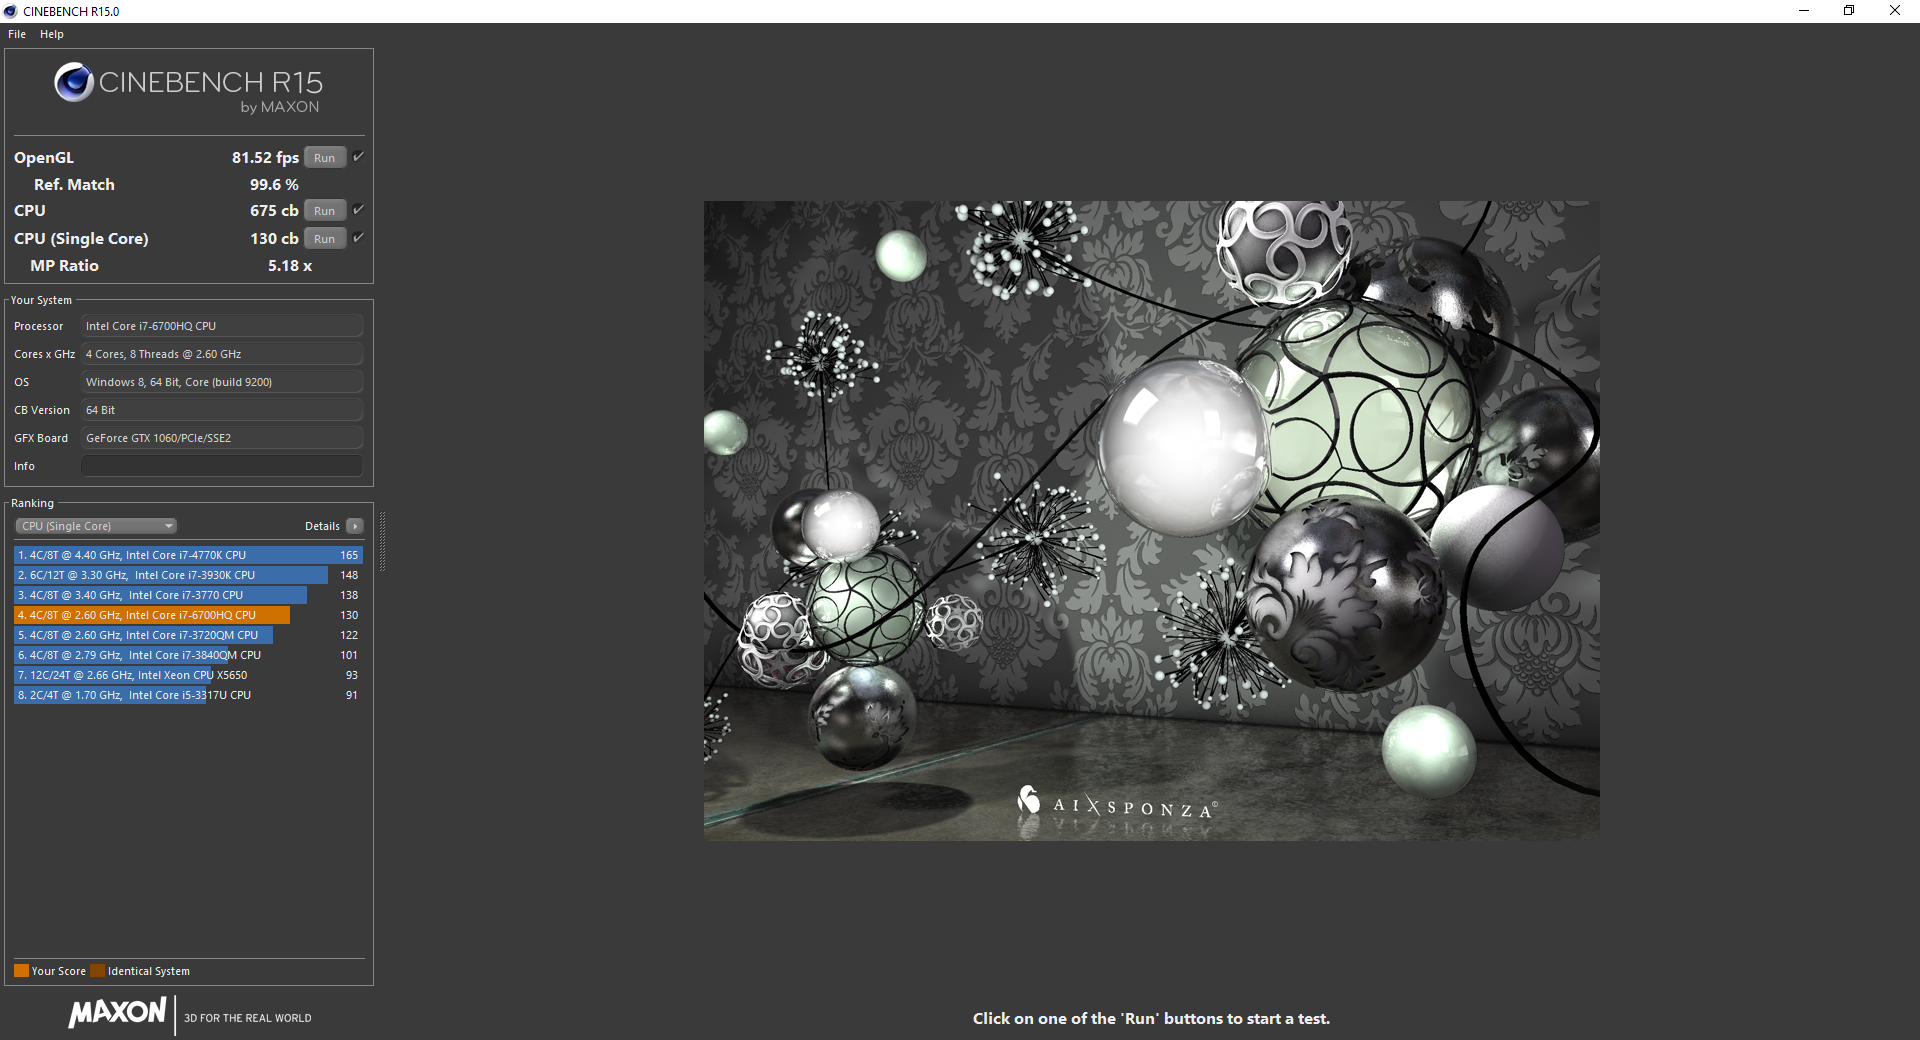
Processor
The Skylake i7-6700HQ is very common on newer gaming notebooks and our database shows it to offer only minor raw CPU performance boosts over the Broadwell Core i7-5700HQ. According to CineBench, the processor is slightly slower than expected on the GS43VR since it is unable to sustain its rated maximum Turbo Boost of 3.1 GHz to 3.5 GHz when under extreme loads. We were able to repeat this when subjecting the system to Prime95 stress, its maximum Turbo Boost rate is only temporary. The desktop-class i7-6700K offers a 30 percent raw performance boost in both single- and multi-threaded workloads.
See our dedicated CPU page on the Core i7-6700HQ for more technical details and benchmark comparisons.
| Cinebench R10 | |
| Rendering Multiple CPUs 32Bit | |
| DogHouse Systems Mobius SS | |
| Gigabyte P55 V4 | |
| MSI GS43VR 6RE-006US | |
| Lenovo IdeaPad Y50 | |
| Rendering Single 32Bit | |
| DogHouse Systems Mobius SS | |
| Gigabyte P55 V4 | |
| Lenovo IdeaPad Y50 | |
| MSI GS43VR 6RE-006US | |
| wPrime 2.10 - 1024m | |
| Lenovo IdeaPad Y50 | |
| MSI GS43VR 6RE-006US | |
| Gigabyte P55 V4 | |
| DogHouse Systems Mobius SS | |
| Super Pi Mod 1.5 XS 32M - 32M | |
| MSI GS43VR 6RE-006US | |
| Gigabyte P55 V4 | |
| Lenovo IdeaPad Y50 | |
| DogHouse Systems Mobius SS | |
* ... smaller is better
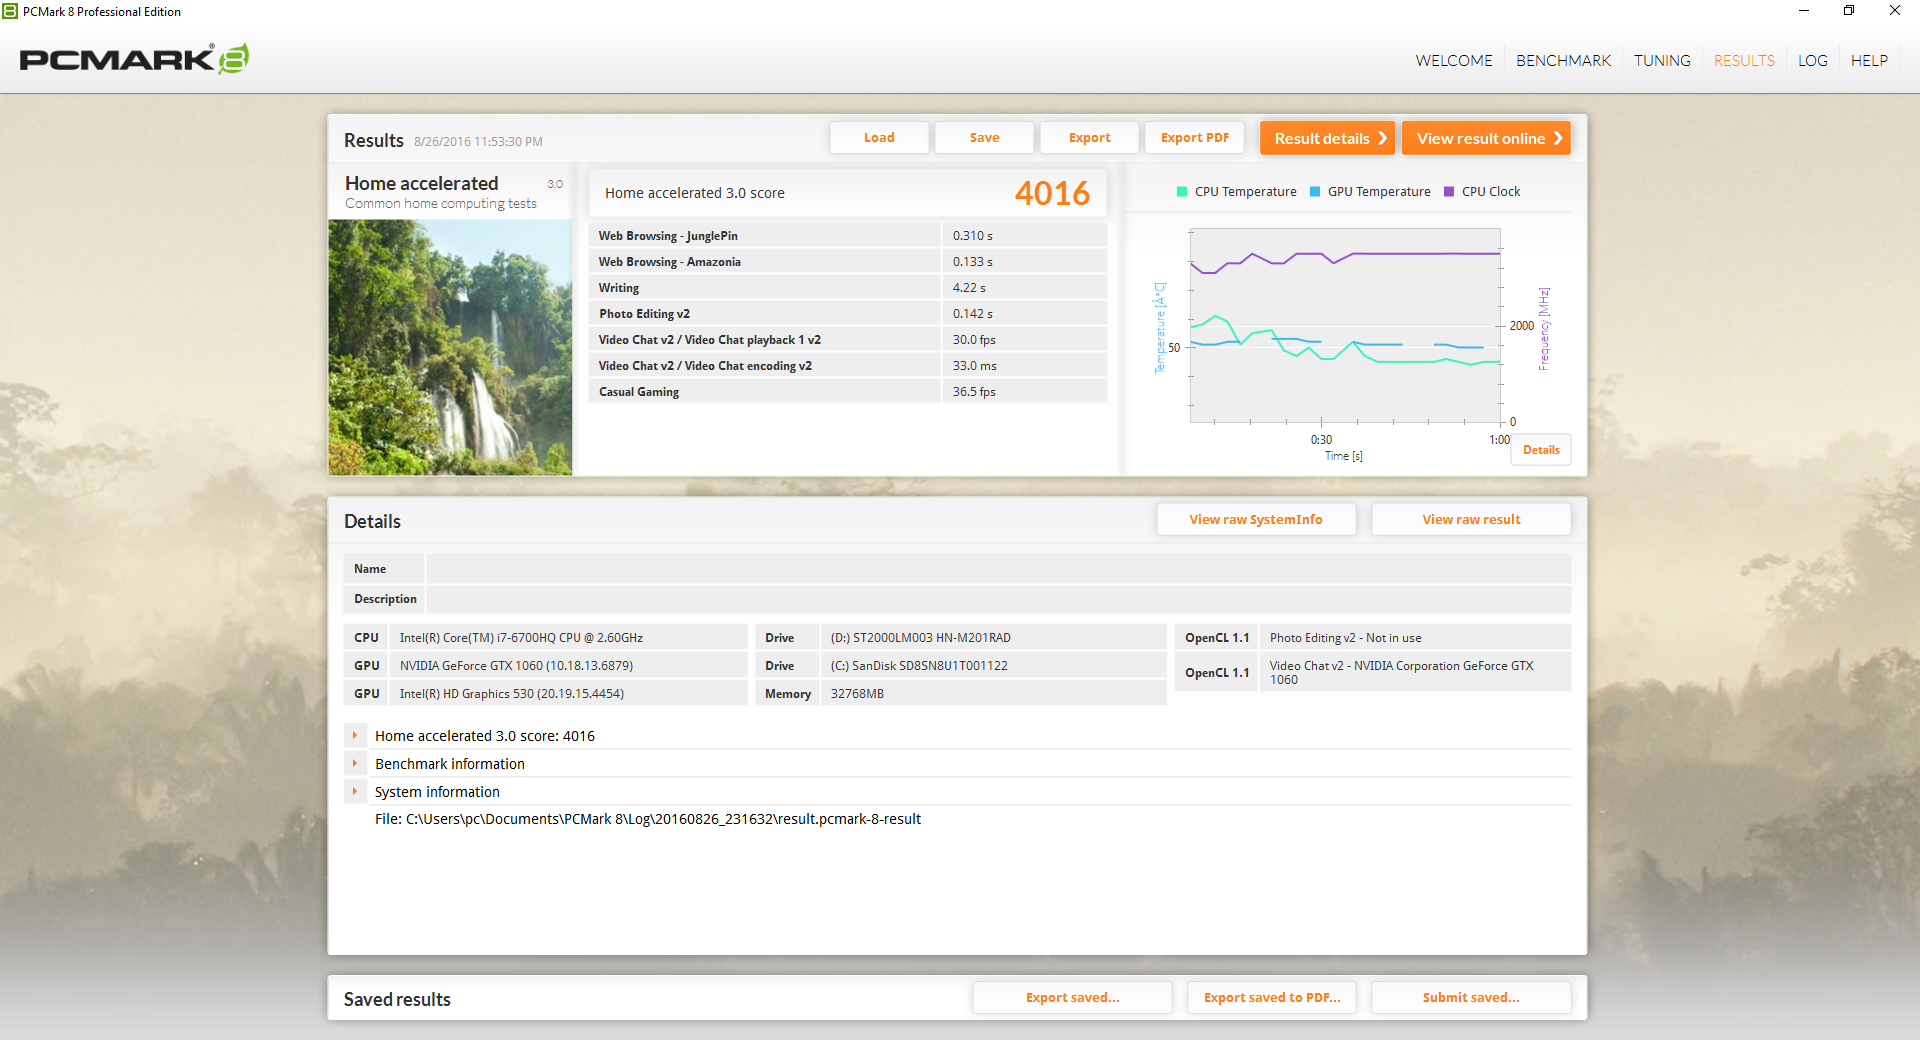
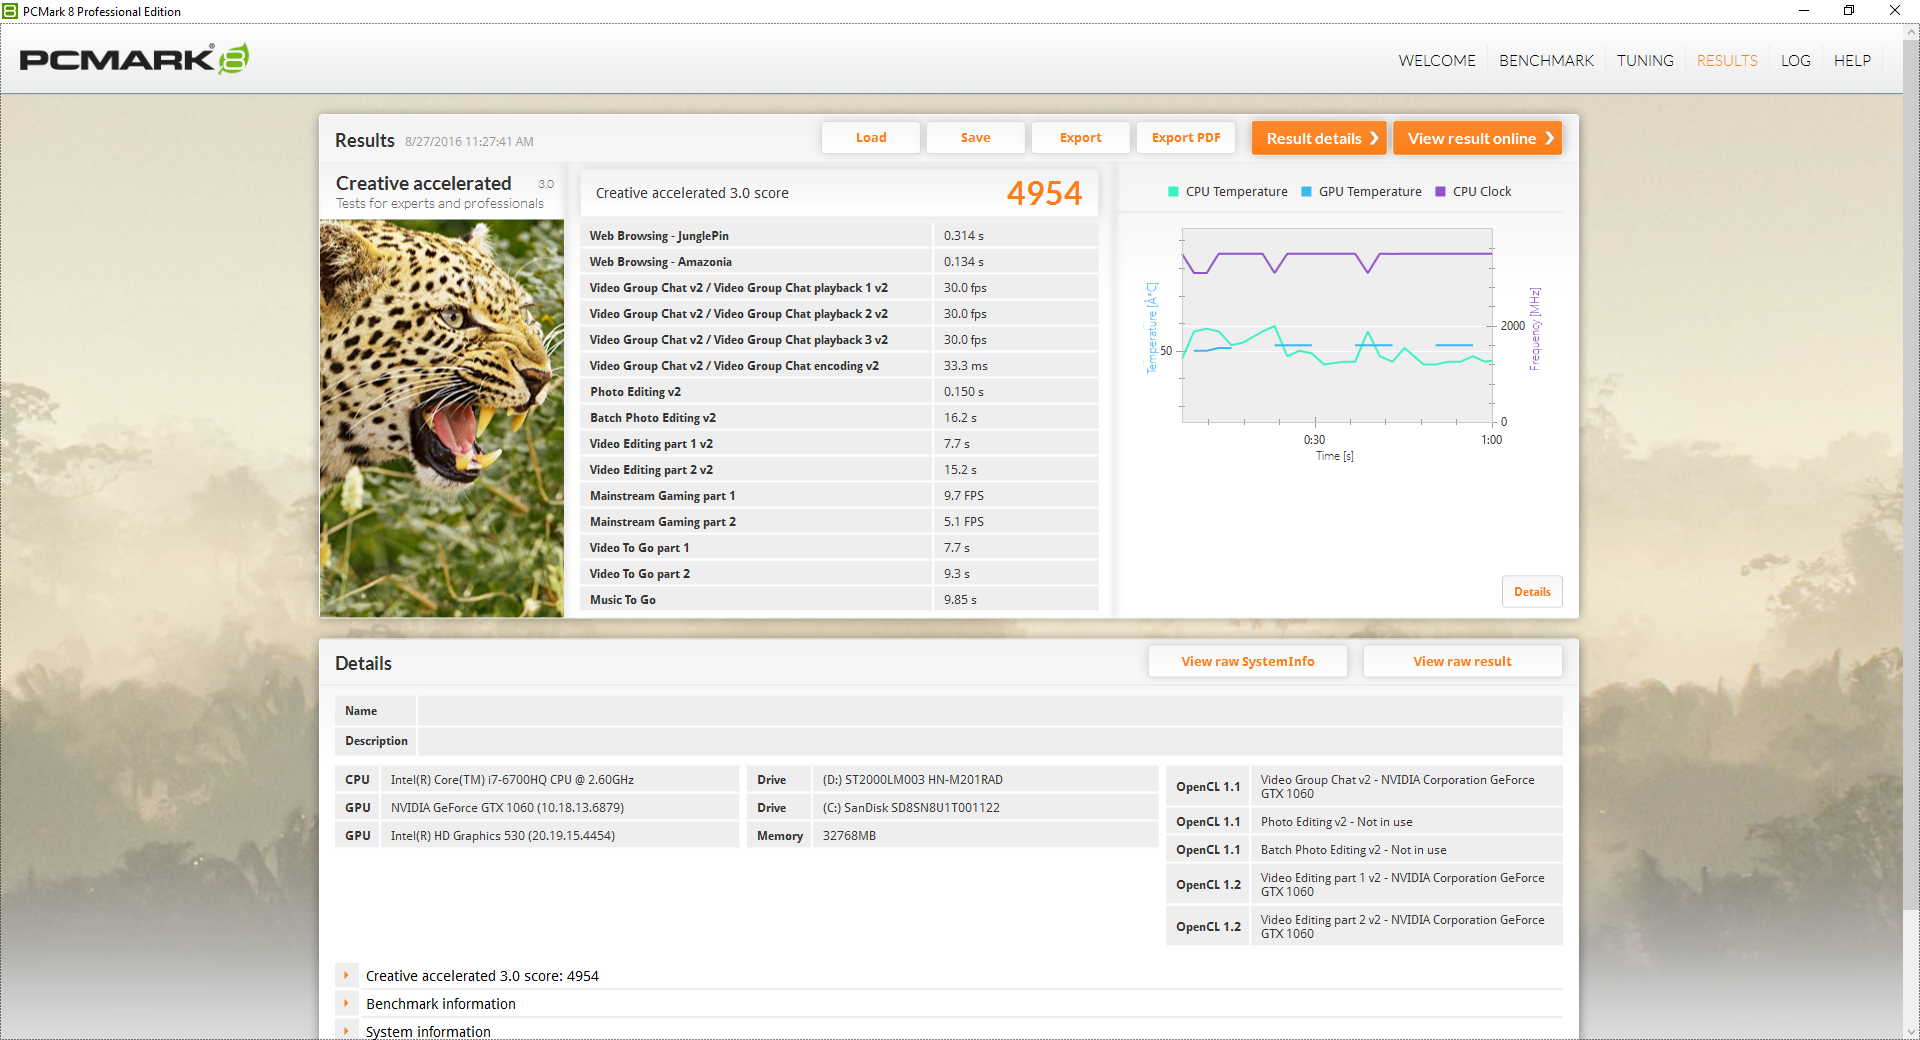
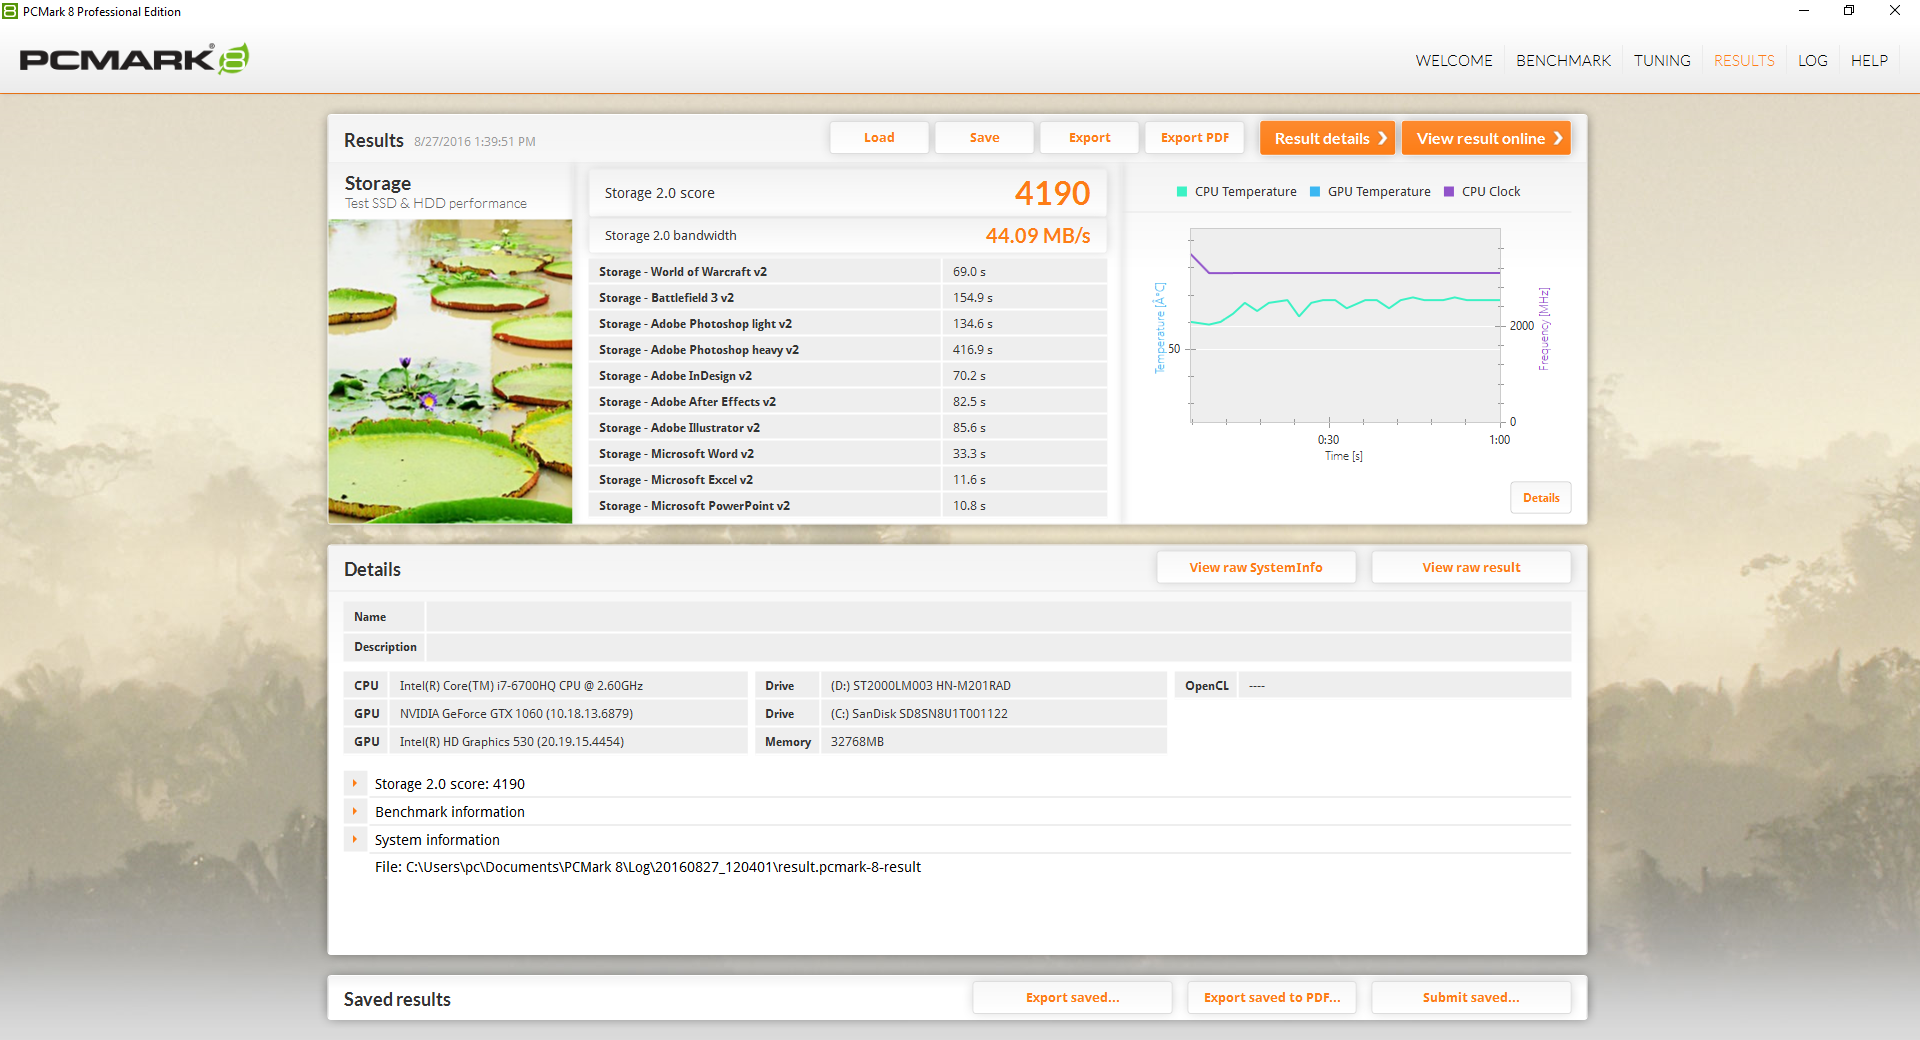
System Performance
PCMark benchmarks show the MSI to be in the same ballpark as competing 14-inch gaming notebooks. We experienced no recurring hardware or software issues during our time with the test unit. We did, however, experience one Windows crash that we were unable to repeat and the system would sometimes take longer than usual when waking from sleep.
| PCMark 8 | |
| Home Score Accelerated v2 | |
| Eurocom Sky DLX7 | |
| MSI GS43VR 6RE-006US | |
| Gigabyte P34W v5 | |
| Razer Blade 14 2015 | |
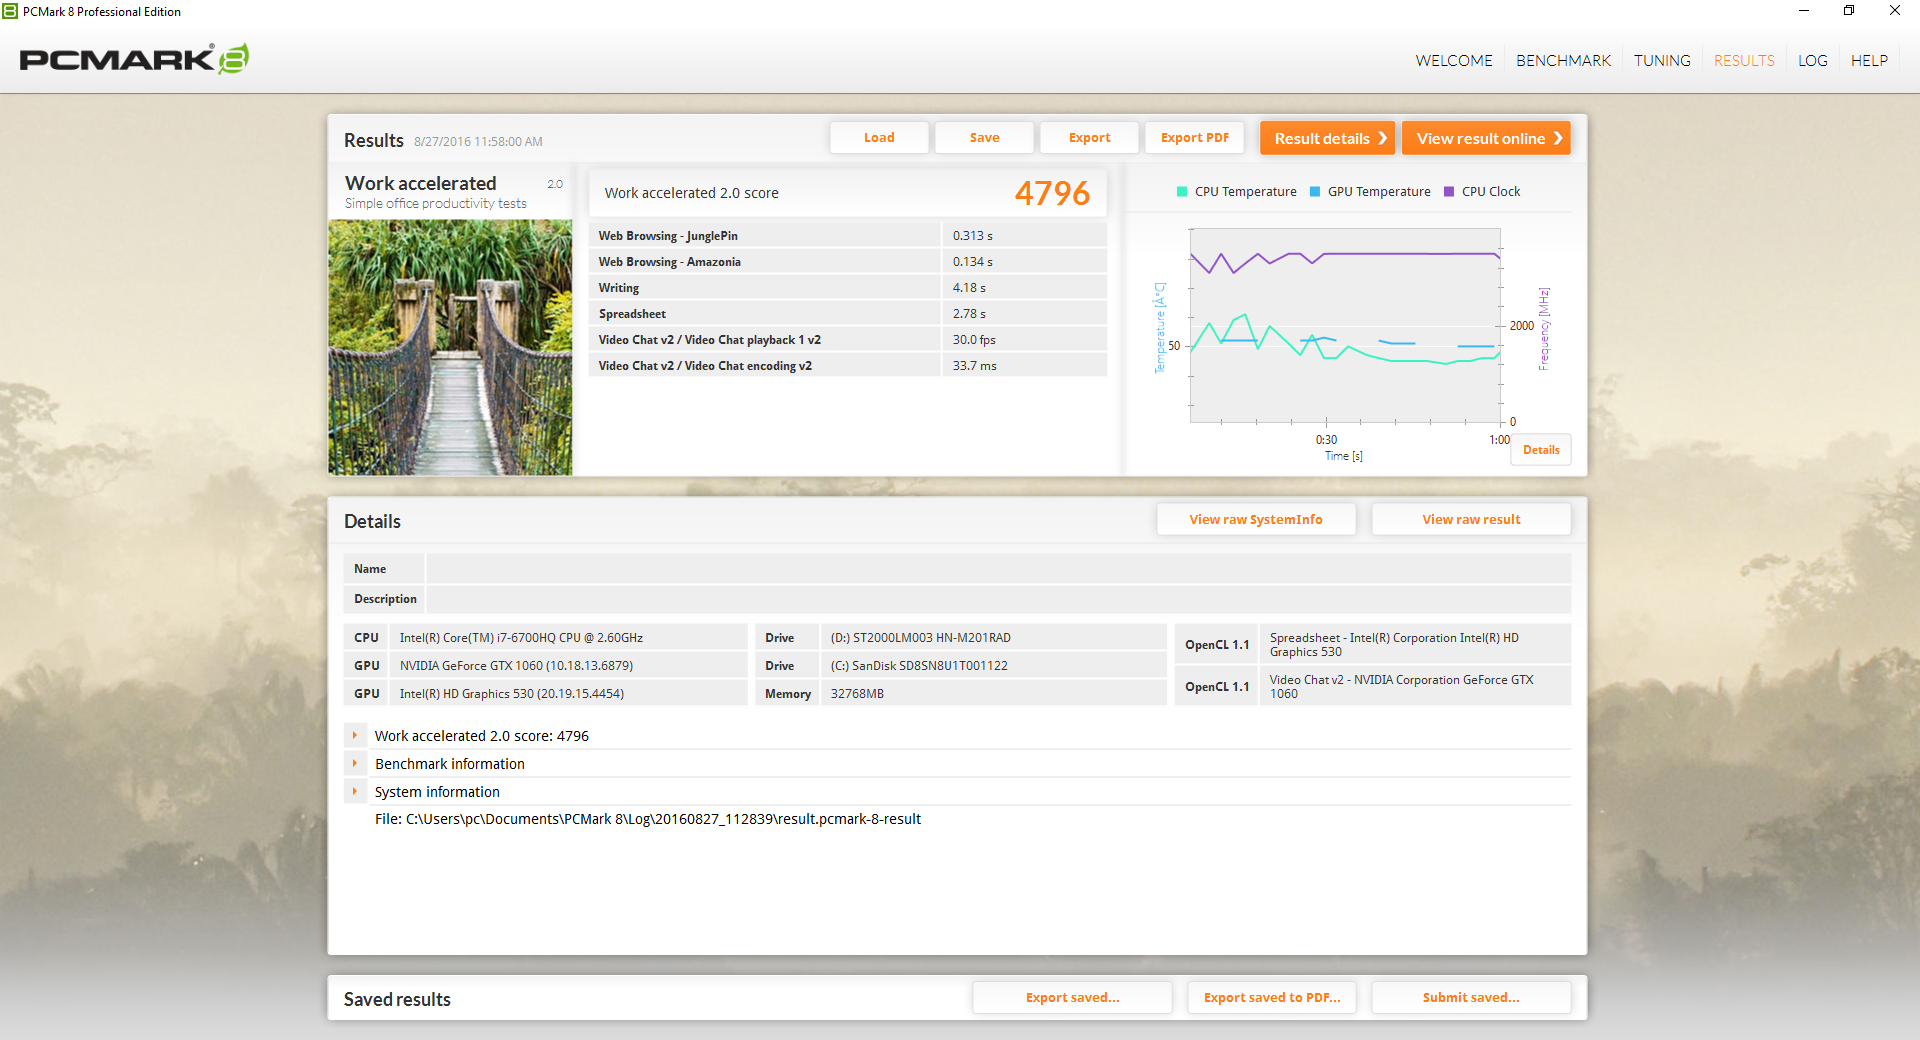
| Work Score Accelerated v2 | |
| MSI GS43VR 6RE-006US | |
| Gigabyte P34W v5 | |
| Eurocom Sky DLX7 | |
| Razer Blade 14 2015 | |
| Creative Score Accelerated v2 | |
| Eurocom Sky DLX7 | |
| MSI GS43VR 6RE-006US | |
| Gigabyte P34W v5 | |
| Razer Blade 14 2015 | |
| PCMark 8 Home Score Accelerated v2 | 4016 points | |
| PCMark 8 Creative Score Accelerated v2 | 4954 points | |
| PCMark 8 Work Score Accelerated v2 | 4796 points | |
Help | ||
Storage Devices
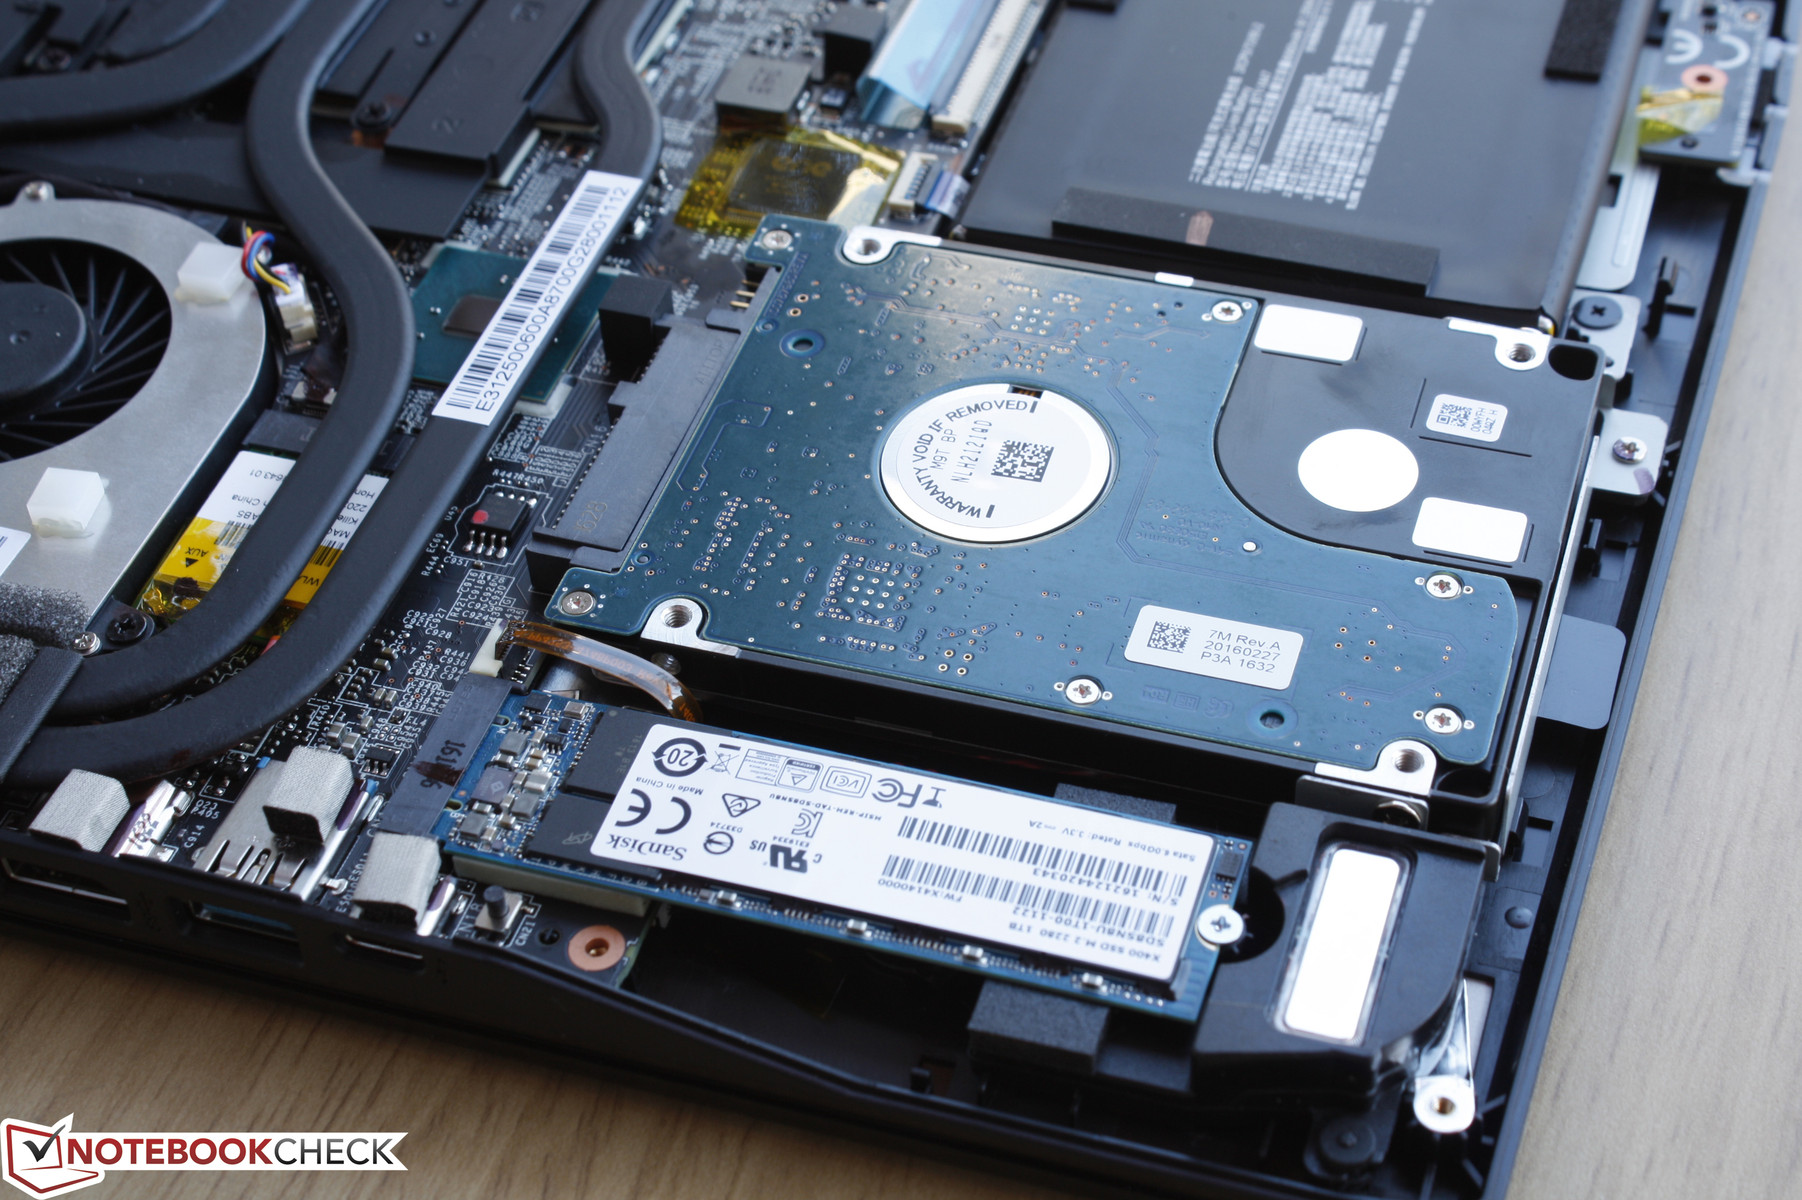
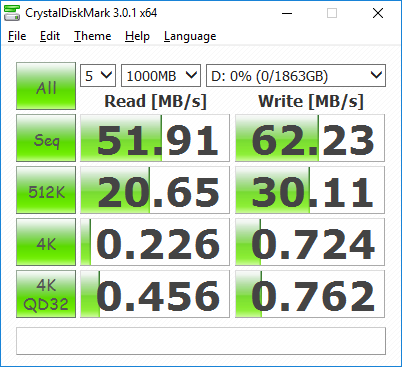
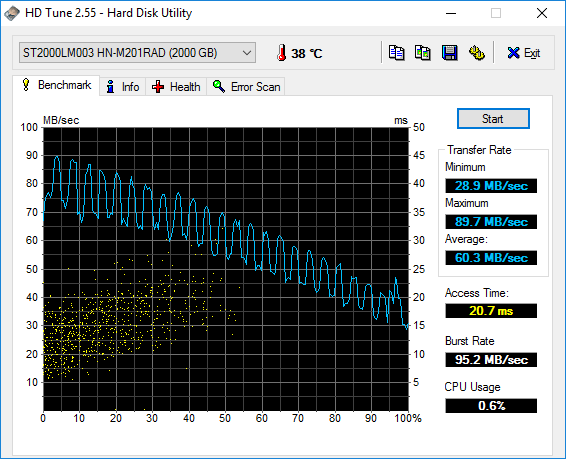
Two accessible storage bays are available (M.2 and 2.5-inch SATA III) with no RAID options, but the M.2 slot in particular will support NVMe SSDs for very fast transfer rates. Our test unit has been outfitted with a 1 TB SanDisk SD8SN8U1T001122 M.2 SATA SSD and a secondary 2 TB Seagate ST2000LM003 HN-M201RAD 2.5-inch HDD for additional storage.
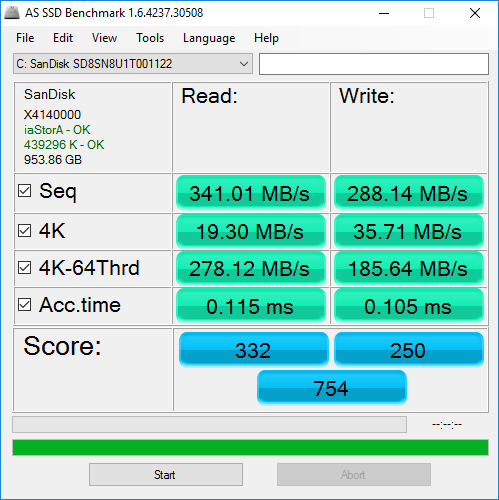
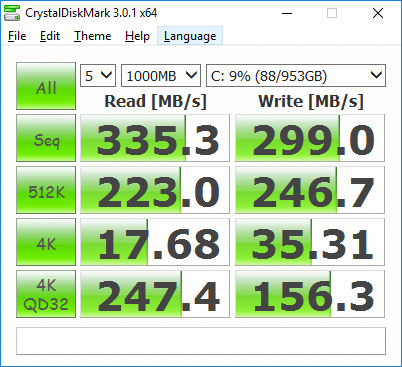
Transfer rates from our SanDisk SSD are average according to both AS SSD and CDM even for a drive limited by the SATA III controller. We recorded sequential read and write rates of 335 MB/s and 299 MB/s, respectively, compared to 497 MB/s and 419 MB/s from the Lite-On SSD in our older Razer Blade 14. Other 14-inch gaming systems with NVMe SSDs easily outperform our SanDisk. Meanwhile, the secondary 5400 RPM Seagate HDD is quite slow with an average transfer rate of just over 60 MB/s according to HD Tune. Most mechanical drives average above 80 Mb/s or closer to 100 MB/s for 7200 RPM drives.
See our comparison table of HDDs and SSDs for more benchmarks.
| MSI GS43VR 6RE-006US SanDisk SD8SN8U1T001122 | Gigabyte P34W v5 Samsung SSD 950 Pro 512GB m.2 NVMe | MSI GS40-6QE16H11 Samsung MZFLV128 NVMe | Aorus X3 Plus v5 Samsung SM951 MZVPV512HDGL m.2 PCI-e | Razer Blade 14 2015 Lite-On IT L8T-256L9G | |
|---|---|---|---|---|---|
| CrystalDiskMark 3.0 | 338% | 196% | 307% | 66% | |
| Read Seq | 335.3 | 2269 577% | 1332 297% | 1529 356% | 496.6 48% |
| Write Seq | 299 | 1524 410% | 687 130% | 1565 423% | 418.6 40% |
| Read 512 | 223 | 937 320% | 936 320% | 929 317% | 371 66% |
| Write 512 | 246.7 | 1483 501% | 650 163% | 1536 523% | 392.6 59% |
| Read 4k | 17.68 | 53.8 204% | 49.57 180% | 51.7 192% | 31.25 77% |
| Write 4k | 35.31 | 167.3 374% | 138.8 293% | 147.2 317% | 64.4 82% |
| Read 4k QD32 | 247.4 | 622 151% | 559 126% | 636 157% | 357.6 45% |
| Write 4k QD32 | 156.3 | 418.9 168% | 247.3 58% | 421.4 170% | 323.2 107% |

GPU Performance
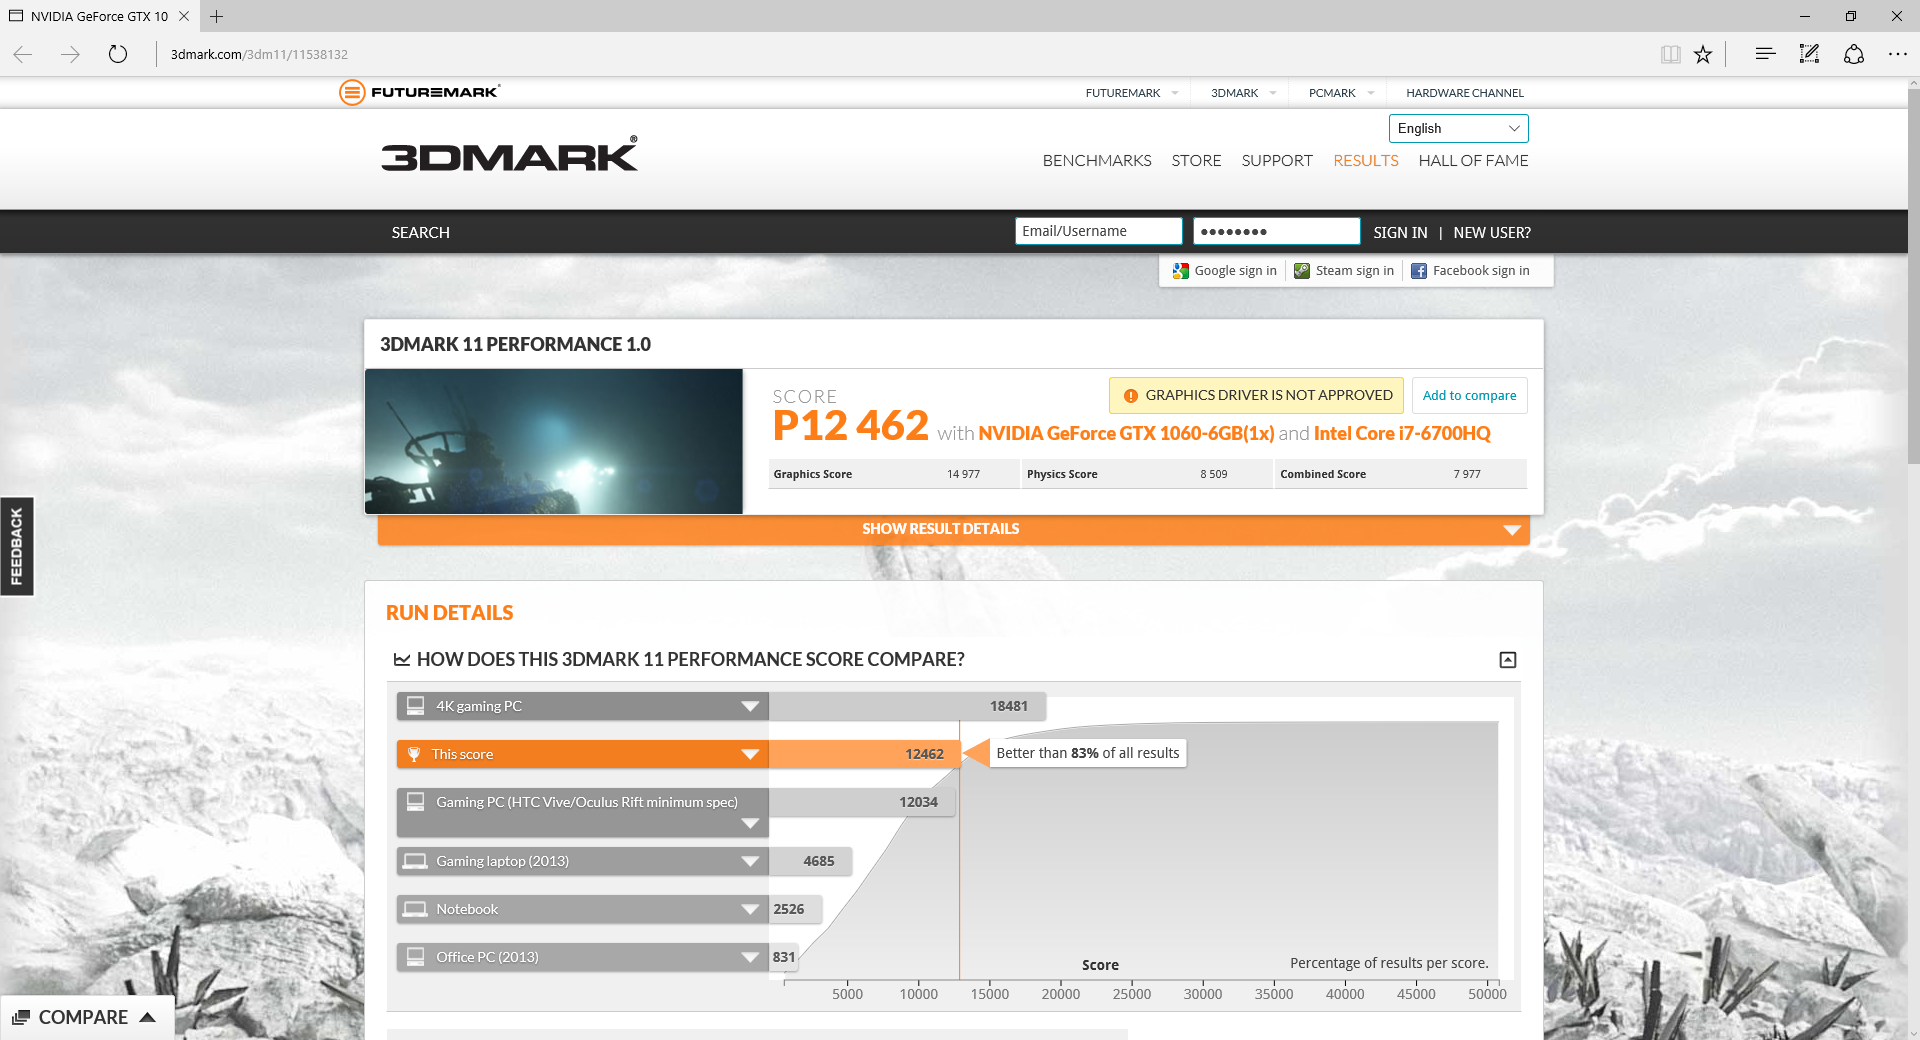
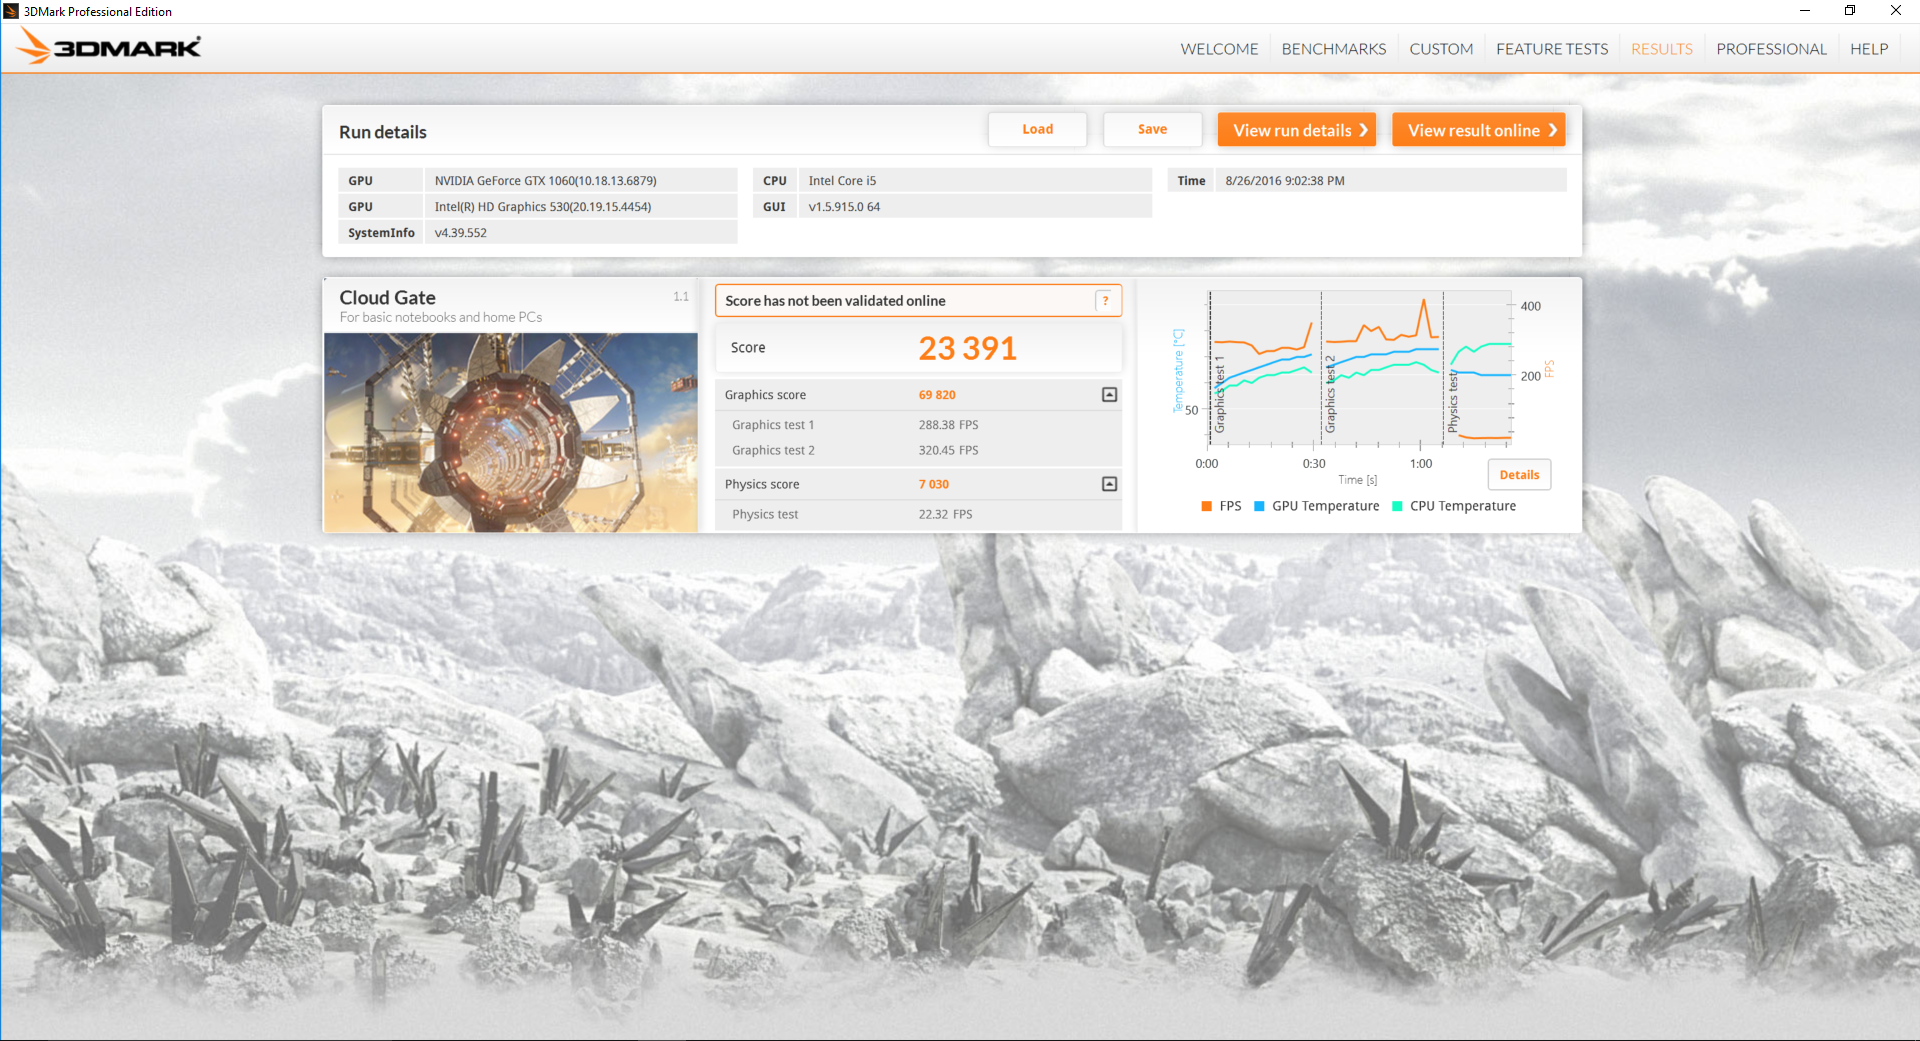
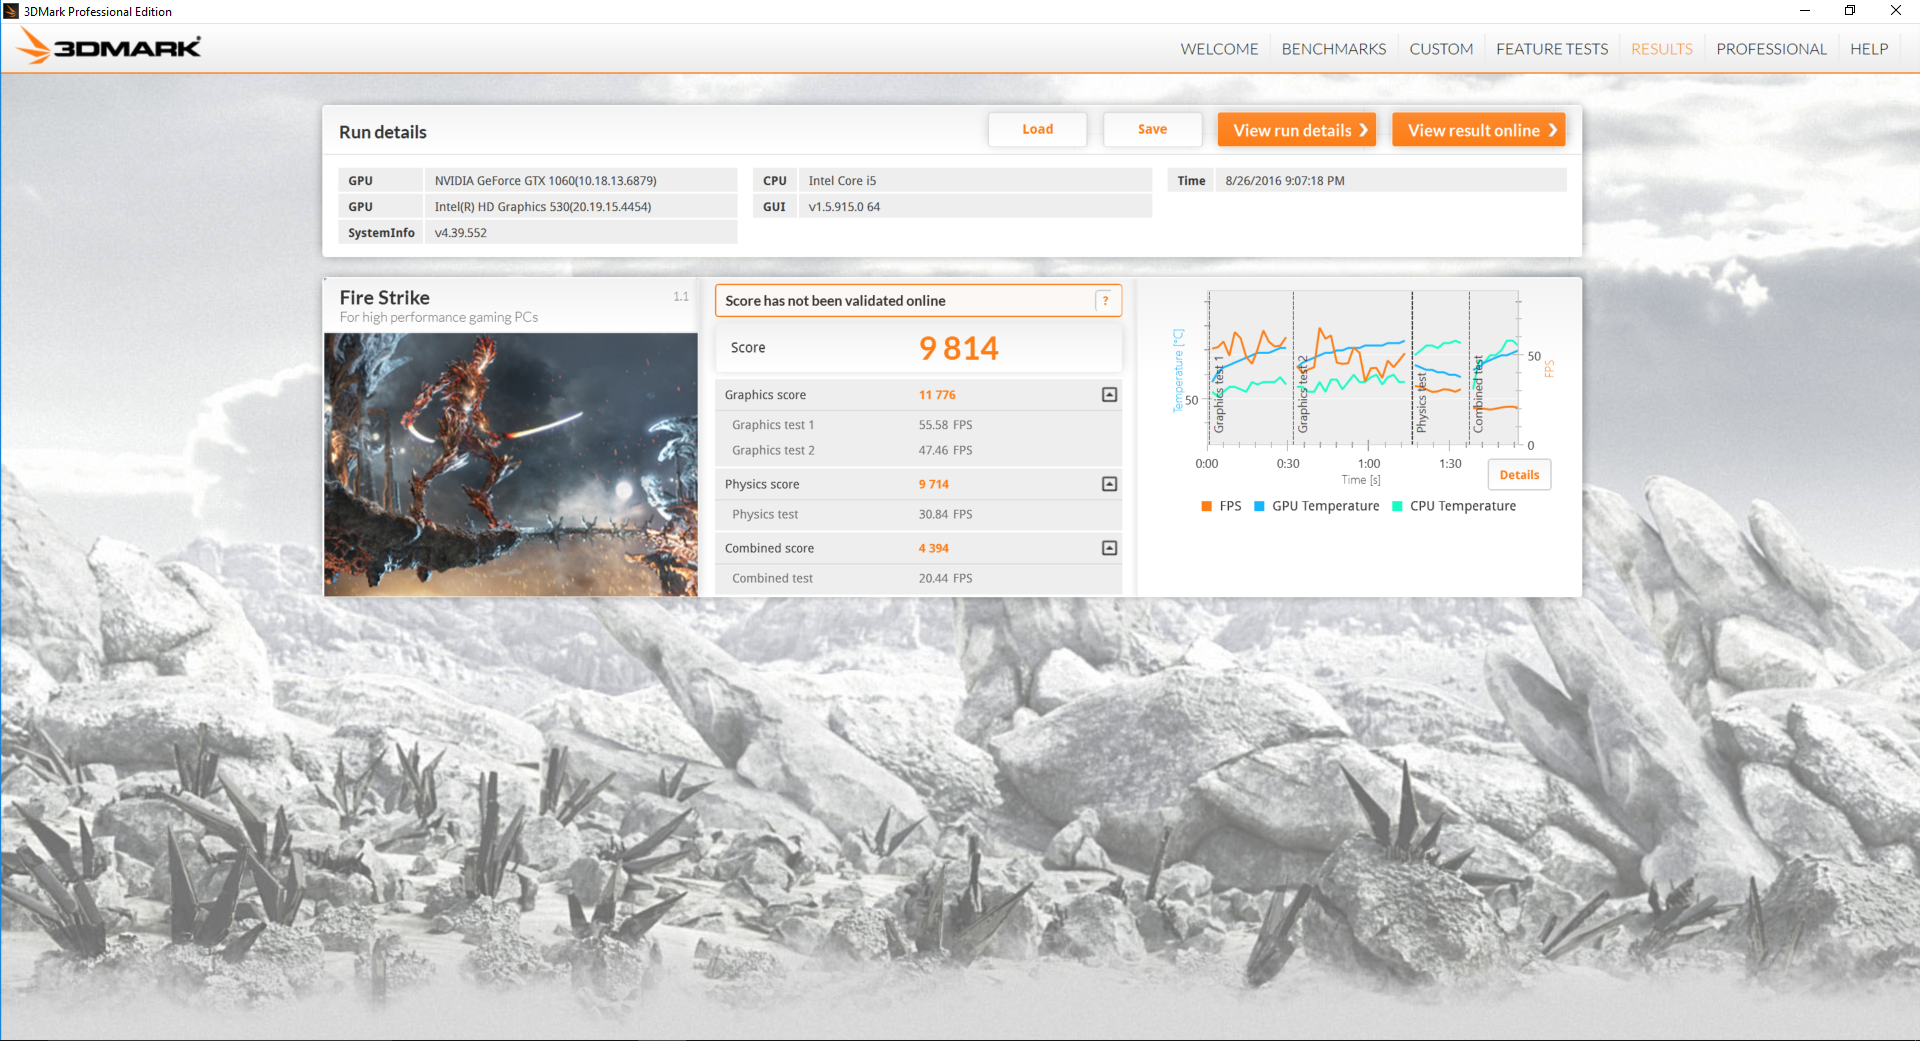
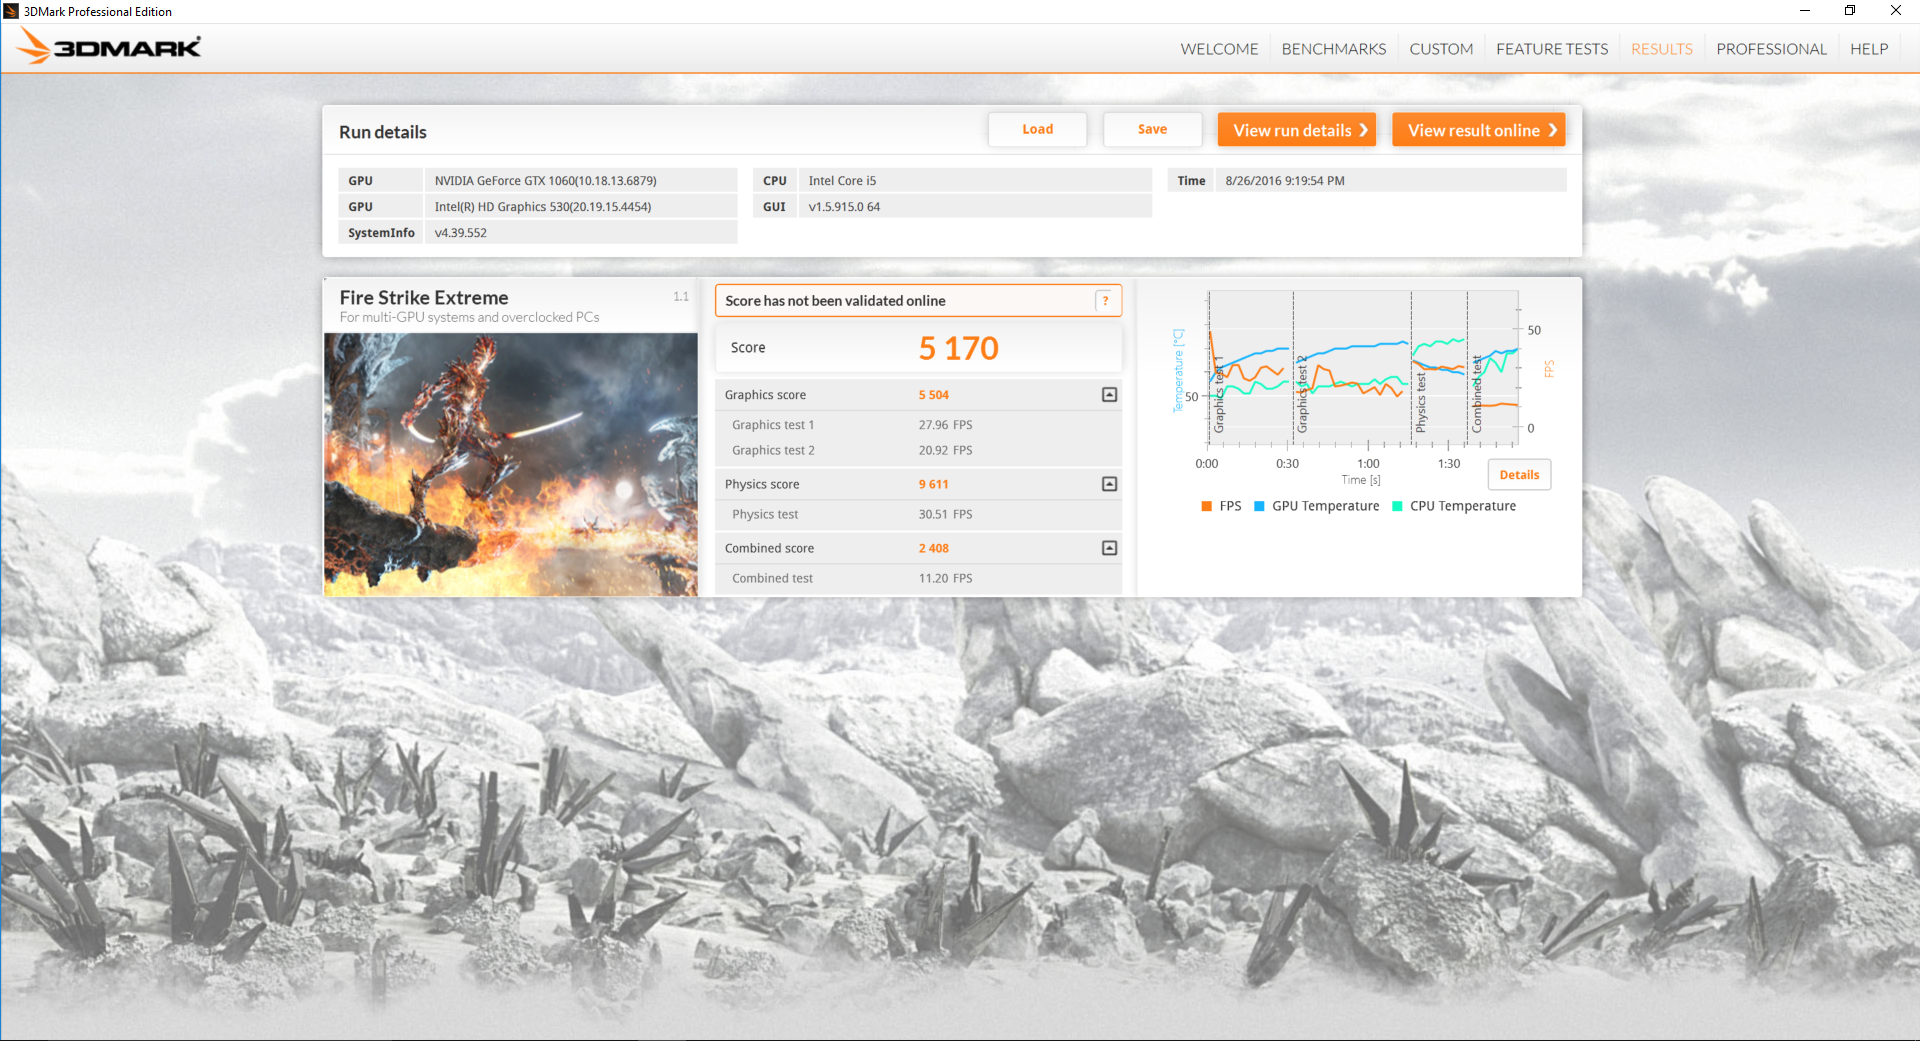
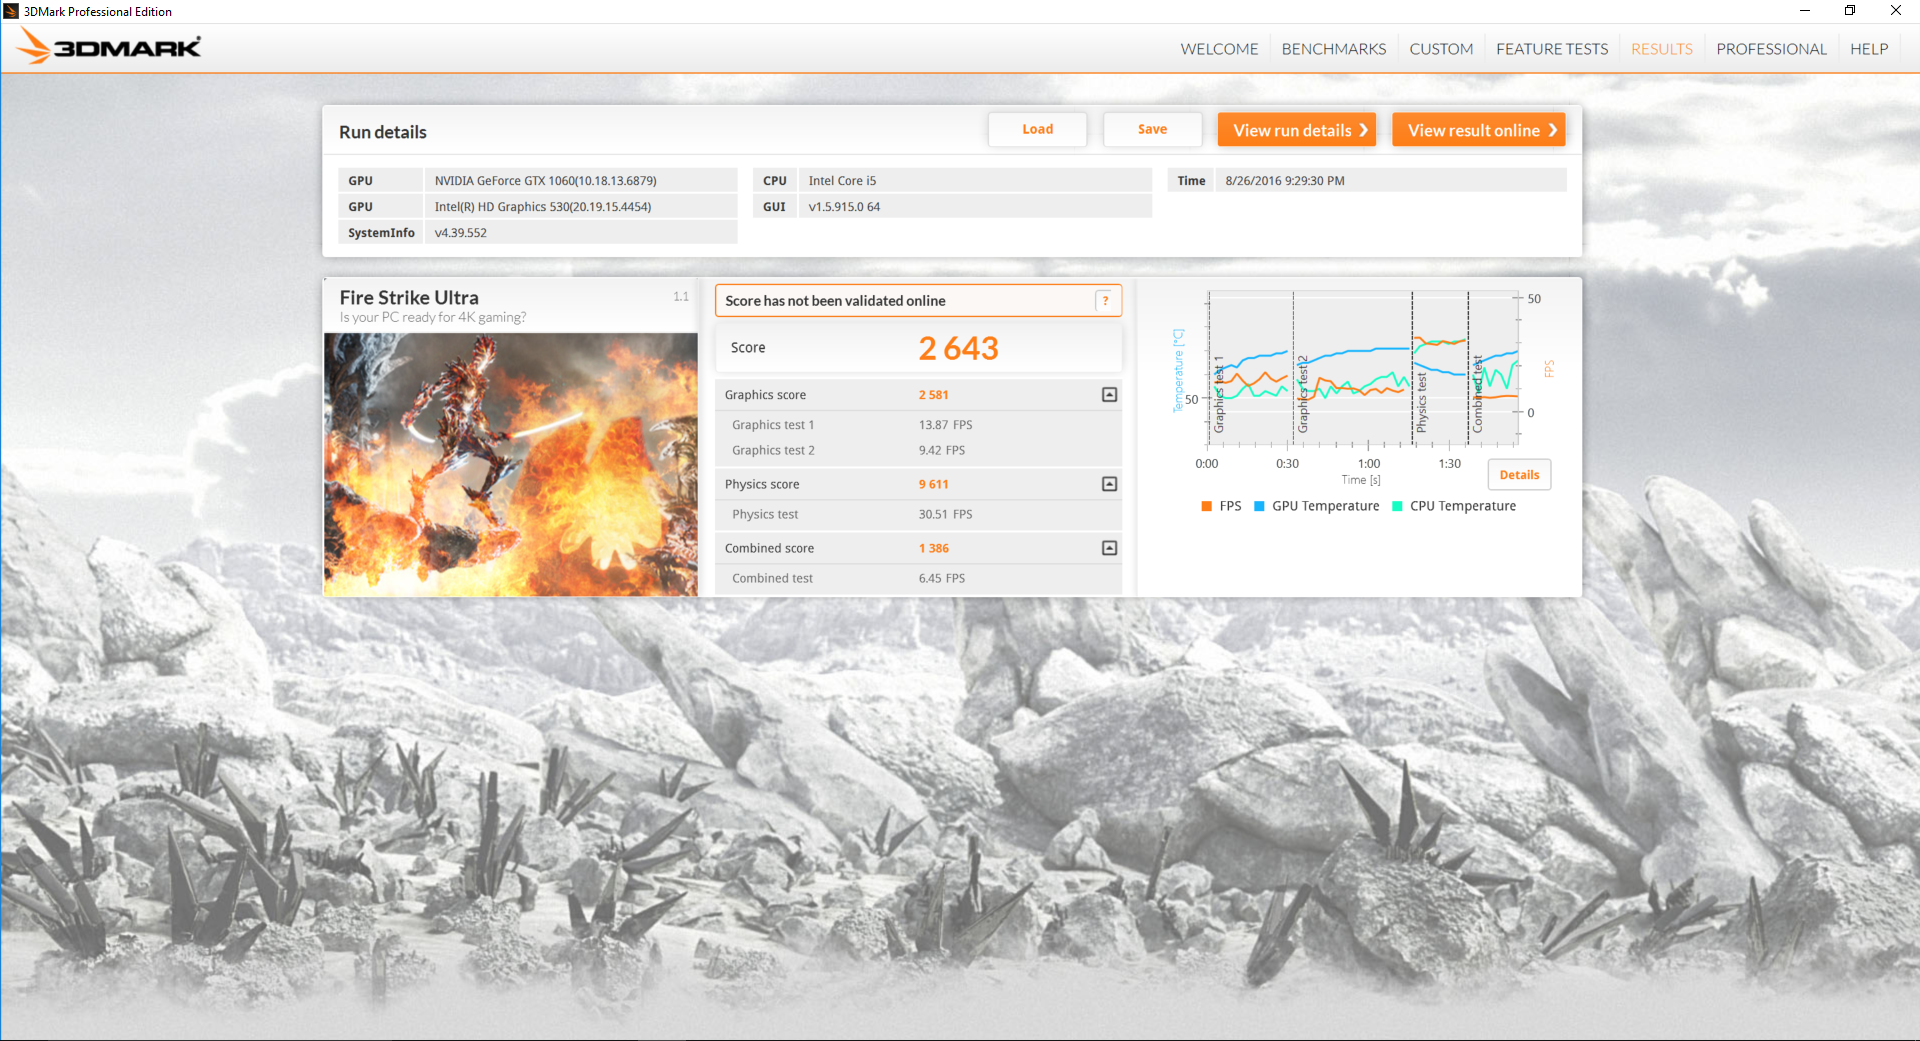
We can't stop praising Pascal even after publishing on at least a dozen gaming notebooks equipped with the new generation of Nvidia GPUs. 3DMark benchmarks show the GTX 1060 to be comfortably in between the GTX 980M and the notebook version of the GTX 980 in raw graphics performance. Upgrading from the previous generation GTX 960M to the GTX 1060 will net users a performance increase of about 150 to 200 percent while a jump from the GTX 970M in the older GS40 will be about 60 percent.
See our dedicated overview on the new Pascal series for more technical information and benchmarks.

| 3DMark | |
| 1920x1080 Fire Strike Graphics | |
| MSI GT73VR-6RE16SR451 | |
| Asus G701VO-CS74K | |
| MSI GS43VR 6RE-006US | |
| Aorus X5S v5 | |
| Asus Strix GL502VT-DS74 | |
| HP Pavilion 15 UHD T9Y85AV | |
| Fire Strike Extreme Graphics | |
| Asus G701VO-CS74K | |
| MSI GS43VR 6RE-006US | |
| Aorus X5S v5 | |
| Asus Strix GL502VT-DS74 | |
| HP Pavilion 15 UHD T9Y85AV | |
| 3840x2160 Fire Strike Ultra Graphics | |
| MSI GT73VR-6RE16SR451 | |
| Asus G701VO-CS74K | |
| MSI GS43VR 6RE-006US | |
| Aorus X5S v5 | |
| HP Pavilion 15 UHD T9Y85AV | |
| 3DMark 11 | |
| 1280x720 Performance GPU | |
| MSI GT73VR-6RE16SR451 | |
| Asus G701VO-CS74K | |
| MSI GS43VR 6RE-006US | |
| Aorus X5S v5 | |
| Asus Strix GL502VT-DS74 | |
| HP Pavilion 15 UHD T9Y85AV | |
| 1280x720 Performance Combined | |
| MSI GT73VR-6RE16SR451 | |
| Asus G701VO-CS74K | |
| MSI GS43VR 6RE-006US | |
| Asus Strix GL502VT-DS74 | |
| Aorus X5S v5 | |
| HP Pavilion 15 UHD T9Y85AV | |
| 3DMark 11 Performance | 12462 points | |
| 3DMark Ice Storm Standard Score | 83301 points | |
| 3DMark Cloud Gate Standard Score | 23391 points | |
| 3DMark Fire Strike Score | 9814 points | |
| 3DMark Fire Strike Extreme Score | 5170 points | |
Help | ||
Gaming Performance
Nearly all tested games can play at 1080p60 on the highest graphical settings whereas the last generation GTX 960M or GTX 970M was more fit for 1080p30 gaming on Medium to Ultra settings. The GTX 1060 was designed to be a balanced card for enthusiast 1080p gamers, so pairing a GTX 1070 or 1080 with a 60 Hz 1080p display can be considered overkill for even the latest titles.
See our dedicated GPU page on the GTX 1060 for more comparisons and gaming benchmarks.
| BioShock Infinite - 1920x1080 Ultra Preset, DX11 (DDOF) | |
| Asus G752VS-XB78K | |
| Asus G701VO-CS74K | |
| MSI GS43VR 6RE-006US | |
| Asus Strix GL502VY-DS71 | |
| Asus Strix GL502VT-DS74 | |
| HP Pavilion 15 UHD T9Y85AV | |
| Metro: Last Light - 1920x1080 Very High (DX11) AF:16x | |
| Asus G701VO-CS74K | |
| MSI GS43VR 6RE-006US | |
| Asus Strix GL502VT-DS74 | |
| HP Pavilion 15 UHD T9Y85AV | |
| Thief - 1920x1080 Very High Preset AA:FXAA & High SS AF:8x | |
| Asus G752VS-XB78K | |
| Asus G701VO-CS74K | |
| MSI GS43VR 6RE-006US | |
| Asus Strix GL502VY-DS71 | |
| Asus Strix GL502VT-DS74 | |
| HP Pavilion 15 UHD T9Y85AV | |
| Batman: Arkham Knight - 1920x1080 High / On AA:SM AF:16x | |
| Asus G752VS-XB78K | |
| Asus G701VO-CS74K | |
| MSI GS43VR 6RE-006US | |
| Asus Strix GL502VT-DS74 | |
| HP Pavilion 15 UHD T9Y85AV | |
| Fallout 4 - 1920x1080 Ultra Preset AA:T AF:16x | |
| Asus G701VO-CS74K | |
| MSI GS43VR 6RE-006US | |
| Asus Strix GL502VY-DS71 | |
| Asus Strix GL502VT-DS74 | |
| HP Pavilion 15 UHD T9Y85AV | |
| Rise of the Tomb Raider - 1920x1080 Very High Preset AA:FX AF:16x | |
| Asus G752VS-XB78K | |
| MSI GS43VR 6RE-006US | |
| Asus G701VO-CS74K | |
| Asus Strix GL502VY-DS71 | |
| Asus Strix GL502VT-DS74 | |
| HP Pavilion 15 UHD T9Y85AV | |
| Doom - 1920x1080 Ultra Preset AA:SM | |
| Asus G701VO-CS74K | |
| MSI GS43VR 6RE-006US | |
| Asus Strix GL502VY-DS71 | |
| Overwatch - 1920x1080 Epic (Render Scale 100 %) AA:SM AF:16x | |
| Asus G701VO-CS74K | |
| MSI GS43VR 6RE-006US | |
| Asus Strix GL502VY-DS71 | |
| HP Pavilion 15 UHD T9Y85AV | |
| low | med. | high | ultra | |
| Guild Wars 2 (2012) | 50.1 | |||
| BioShock Infinite (2013) | 102.1 | |||
| Metro: Last Light (2013) | 78.6 | |||
| Thief (2014) | 65.6 | |||
| Batman: Arkham Knight (2015) | 80 | 58 | ||
| Metal Gear Solid V (2015) | 60 | |||
| Fallout 4 (2015) | 68.5 | |||
| Rise of the Tomb Raider (2016) | 66.8 | |||
| Doom (2016) | 77.8 | |||
| Overwatch (2016) | 106.7 |
Stress Test
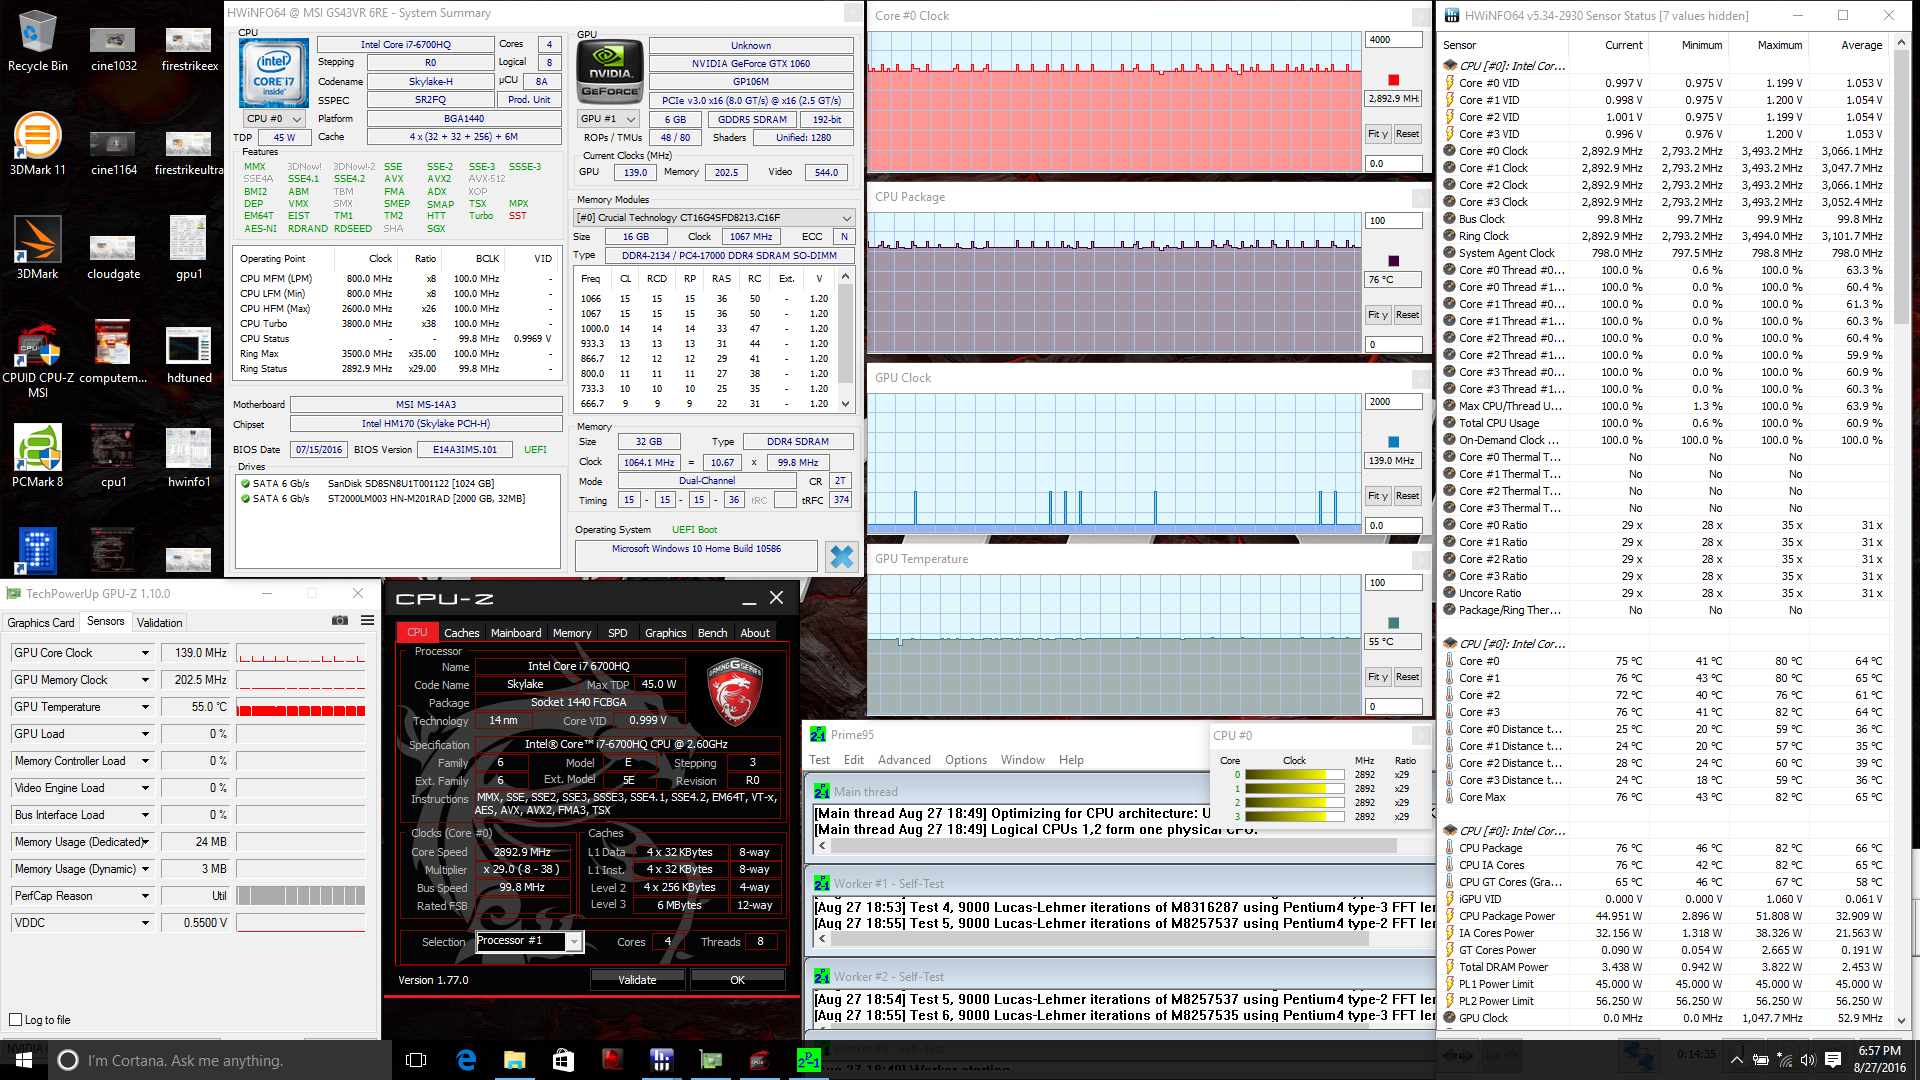
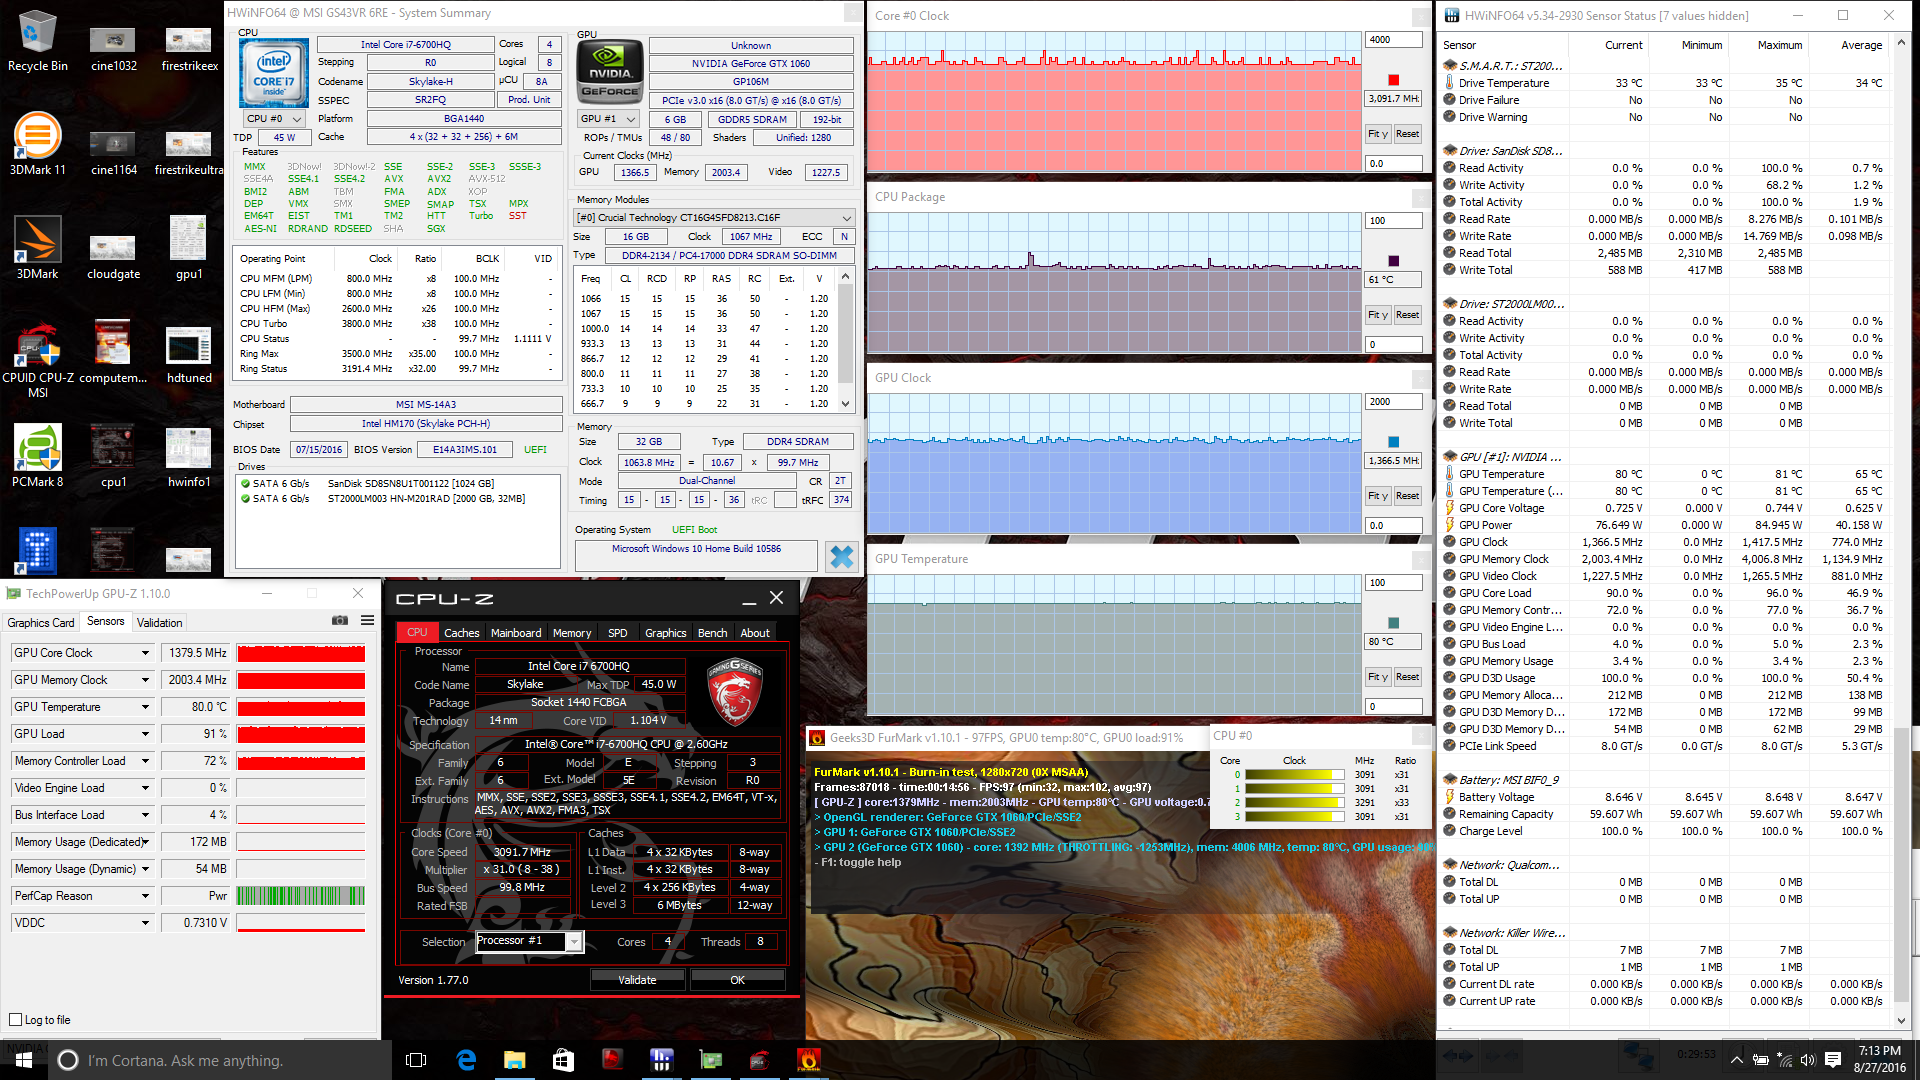
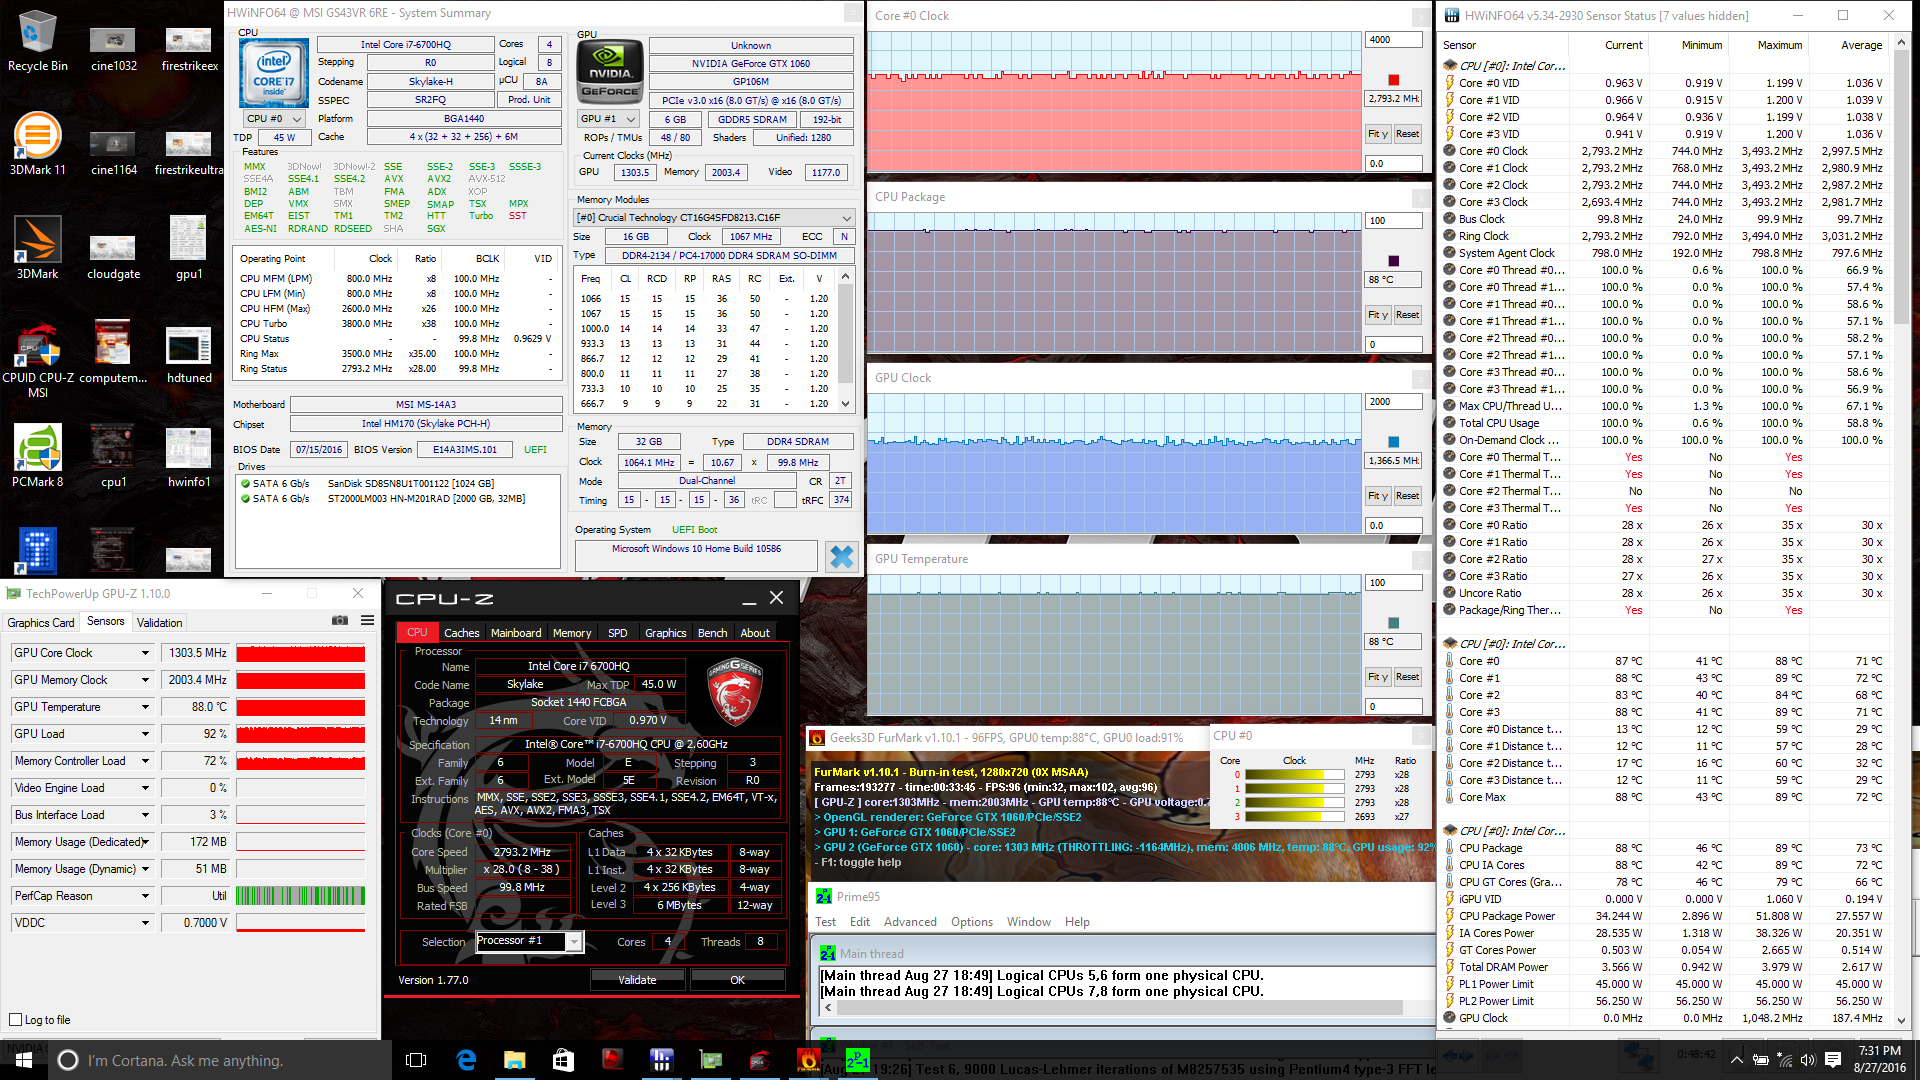
We subject the system to extreme stress levels to test for potential throttling or stability issues. When under Prime95 load, the CPU would plateau in the 2.8 to 2.9 GHz clock range and a core temperature of 76 C. Note that the CPU itself is rated for a multi-thread maximum of 3.1 GHz, so the GS43VR is unable to maintain its maximum CPU Turbo Boost. Running FurMark stresses the GPU to a maximum core temperature of 80 C and running both Prime95 and FurMark simultaneously will bring both cores to 88 C. The GPU throttles just slightly as expected, but the CPU remains slightly above its base clock rate at all times.
Running Unigine Valley is more representative of gaming loads. Both the CPU and GPU are able to maintain their respective Boost clock rates with CPU and GPU temperatures stabilizing at around 70 C and 80 C, respectively. These are very warm temperatures for those who are accustomed to desktop setups, but the high 70s to 80s is a standard range for small or super-thin gaming notebooks. Larger gaming systems that can afford more powerful cooling solutions like the GT72VR or ROG G752VS will run at cooler core temperatures. Nonetheless, users need not worry about CPU or GPU throttling when gaming on the 14-inch MSI.
Running on battery power will throttle GPU performance while the CPU is relatively unaffected. A 3DMark 11 run on batteries returns Physics and Graphics scores of 8231 points and 5661 points, respectively, compared to 8509 points and 14977 points when on mains.

| CPU Clock (GHz) | GPU Clock (MHz) | Average CPU Temperature (°C) | Average GPU Temperature (°C) | |
| Prime95 Stress | 2.8 - 2.9 | -- | 76 | 55 |
| FurMark Stress | -- | 1367 - 1380 | 61 | 80 |
| Prime95 + FurMark Stress | 2.7 - 2.8 | 1304 - 1367 | 88 | 88 |
| Unigine Valley Stress | 3.2+ | 1658 | 69 | 81 |
Emissions
System Noise
The cooling solution remains identical to the one employed on the previous GS40 with twin ~45 mm fans and five heat pipes across the CPU, GPU, and VRAM modules. The fans run independently each with their own control options via the Dragon Center utility not unlike on the GT72VR.
The CPU fan on the GS43VR is always active no matter the workload or system settings. The GPU fan, however, will periodically pulsate between idle and active, so overall fan noise during low loads is in the 32 to 33.5 dB(A) range. Bump the notebook to High performance with the dGPU selected and the system will pulsate more frequently. Overall fan noise is fortunately not loud enough to be bothersome in office or classroom environments, though it is audible nonetheless. We recommend the lowest power settings if using the notebook in noise-sensitive environments.
Gaming load will bump fan noise up considerably to a stable 50 dB(A). This is uncomfortably loud if gaming without earphones and is louder than many other super-thin gaming notebooks as illustrated in the table below. Games where footsteps and ambient sounds are crucial to gameplay, like in MGS V, can be difficult to play. The difference in fan noise between gaming and maximum load with Prime95 and FurMark is only 1 to 2 dB(A), so the fans are already close to their maximum speeds when gaming.
Noise Level
| Idle |
| 32 / 32 / 33.5 dB(A) |
| Load |
| 50 / 51.5 dB(A) |
 | ||
30 dB silent 40 dB(A) audible 50 dB(A) loud |
||
min: | ||
| MSI GS43VR 6RE-006US GeForce GTX 1060 Mobile, 6700HQ, SanDisk SD8SN8U1T001122 | Gigabyte P34W v5 GeForce GTX 970M, 6700HQ, Samsung SSD 950 Pro 512GB m.2 NVMe | MSI GS40-6QE16H11 GeForce GTX 970M, 6700HQ, Samsung MZFLV128 NVMe | Aorus X3 Plus v5 GeForce GTX 970M, 6700HQ, Samsung SM951 MZVPV512HDGL m.2 PCI-e | Razer Blade 14 2015 GeForce GTX 970M, 4720HQ, Lite-On IT L8T-256L9G | |
|---|---|---|---|---|---|
| Noise | 2% | -2% | 3% | 5% | |
| off / environment * | 29.1 | ||||
| Idle Minimum * | 32 | 31.6 1% | 33 -3% | 32.1 -0% | 29.7 7% |
| Idle Average * | 32 | 31.6 1% | 34 -6% | 32.4 -1% | 29.9 7% |
| Idle Maximum * | 33.5 | 32.5 3% | 38 -13% | 32.5 3% | 30 10% |
| Load Average * | 50 | 46.5 7% | 44 12% | 40.1 20% | 42.1 16% |
| Load Maximum * | 51.5 | 52.5 -2% | 52 -1% | 54.6 -6% | 59 -15% |
* ... smaller is better
Temperature
Surface temperatures when idling are cool on both sides with some warm spots on the bottom. In particular, surfaces that are closer to the storage drives, RAM modules, and processors can be as warm as 37 C even during very low workloads.
The tight positioning of the heat pipes and processors on the rear center of the unit means a very steep temperature gradient when under heavy and extreme loads. We were able to record maximum surface temperatures as high as 56 C on top and 63 C on the bottom. Fortunately, these hot surfaces are above the very top row of keys and on the rear of the notebook, respectively, to draw heat away from the frontal quadrants. The temperature gradient behaves like a point source, so the center of the keyboard will be much warmer than the left- and right-hand sides when gaming.
When compared to other 14-inch gaming notebooks, both the older GS40 and Gigabyte P34W run warmer slightly warmer under extreme loads while the Aorus X3 Plus v5 is much cooler at under 50 C on its warmest spots.

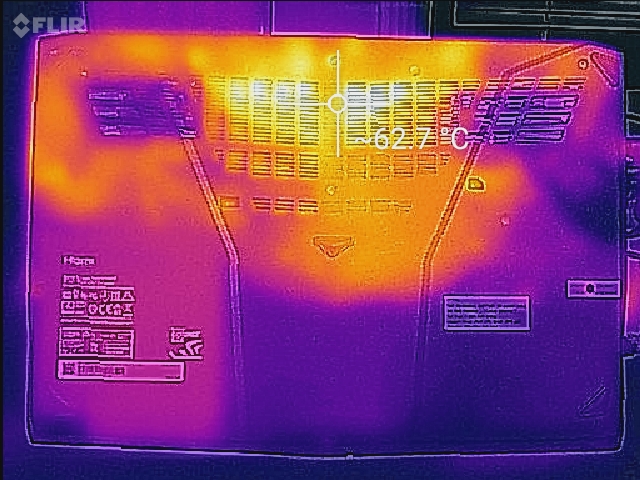
(-) The maximum temperature on the upper side is 55.6 °C / 132 F, compared to the average of 40.4 °C / 105 F, ranging from 21.2 to 68.8 °C for the class Gaming.
(-) The bottom heats up to a maximum of 62.4 °C / 144 F, compared to the average of 43.2 °C / 110 F
(+) In idle usage, the average temperature for the upper side is 30.5 °C / 87 F, compared to the device average of 33.8 °C / 93 F.
(+) The palmrests and touchpad are reaching skin temperature as a maximum (32.2 °C / 90 F) and are therefore not hot.
(-) The average temperature of the palmrest area of similar devices was 28.9 °C / 84 F (-3.3 °C / -6 F).
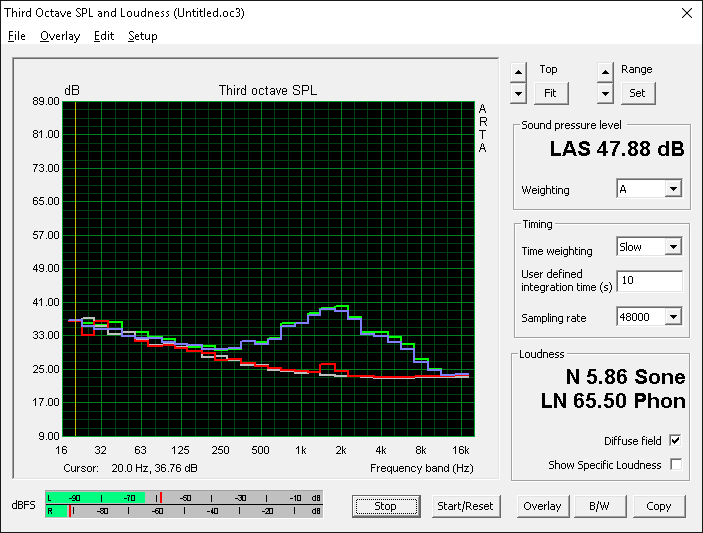
Speakers
")
The front-facing 2 W stereo speakers are sufficiently loud with acceptable sound quality considering the small size. Its lack of a dedicated subwoofer is apparent during music playback and our microphone measurements show two distinct peaks to suggest an unbalanced sound experience at maximum volume. The case does not reverberate from its internal speakers.
Like its larger siblings in the G series, the GS43VR integrates the same Sabre audio DAC to support high quality external studio headphones or speakers - a feature that is uncommon in this screen size.
MSI GS43VR 6RE-006US audio analysis
(±) | speaker loudness is average but good (76.7 dB)
Bass 100 - 315 Hz
(-) | nearly no bass - on average 17.5% lower than median
(±) | linearity of bass is average (12% delta to prev. frequency)
Mids 400 - 2000 Hz
(+) | balanced mids - only 3.9% away from median
(±) | linearity of mids is average (9.5% delta to prev. frequency)
Highs 2 - 16 kHz
(±) | higher highs - on average 6.4% higher than median
(±) | linearity of highs is average (8.5% delta to prev. frequency)
Overall 100 - 16.000 Hz
(±) | linearity of overall sound is average (28.9% difference to median)
Compared to same class
» 94% of all tested devices in this class were better, 2% similar, 5% worse
» The best had a delta of 6%, average was 18%, worst was 132%
Compared to all devices tested
» 84% of all tested devices were better, 3% similar, 13% worse
» The best had a delta of 4%, average was 25%, worst was 134%
Apple MacBook 12 (Early 2016) 1.1 GHz audio analysis
(+) | speakers can play relatively loud (83.6 dB)
Bass 100 - 315 Hz
(±) | reduced bass - on average 11.3% lower than median
(±) | linearity of bass is average (14.2% delta to prev. frequency)
Mids 400 - 2000 Hz
(+) | balanced mids - only 2.4% away from median
(+) | mids are linear (5.5% delta to prev. frequency)
Highs 2 - 16 kHz
(+) | balanced highs - only 2% away from median
(+) | highs are linear (4.5% delta to prev. frequency)
Overall 100 - 16.000 Hz
(+) | overall sound is linear (10.2% difference to median)
Compared to same class
» 5% of all tested devices in this class were better, 2% similar, 93% worse
» The best had a delta of 5%, average was 19%, worst was 53%
Compared to all devices tested
» 3% of all tested devices were better, 1% similar, 96% worse
» The best had a delta of 4%, average was 25%, worst was 134%
Frequency Comparison (Checkbox selectable!)
Graph 1: Pink Noise 100% Vol.; Graph 2: Audio off
Energy Management
Power Consumption
The GS43VR demands just over 12 W of power when idling on Power Saver and 19 W when idling on High Performance and on the maximum screen brightness. Gaming will draw about 107 W to be roughly comparable to the 17-inch Acer Predator 17 with GTX 980M graphics. The system here appears to be slightly more demanding than the GS40 when under high loads.
We were able to record a maximum draw of just under 160 W when running both Prime95 and FurMark against a power adapter (~16 x 7.5 x 3 cm) rated for 180 W. The overhead of about 10 percent is satisfactory, albeit narrow.
| Off / Standby | |
| Idle | |
| Load |
|
| MSI GS43VR 6RE-006US 6700HQ, GeForce GTX 1060 Mobile, SanDisk SD8SN8U1T001122, IPS, 1920x1080, 14.00 | MSI GT72VR 6RE-015US 6700HQ, GeForce GTX 1070 Mobile, SanDisk SD8SNAT256G1122, IPS, 1920x1080, 17.30 | MSI GS40-6QE16H11 6700HQ, GeForce GTX 970M, Samsung MZFLV128 NVMe, IPS, 1920x1080, 14.00 | Acer Predator 17 G9-792-71EF 6700HQ, GeForce GTX 980M, Samsung SSD PM871 MZNLN512HCJH, IPS, 3840x2160, 17.30 | HP Pavilion 15 UHD T9Y85AV 6700HQ, GeForce GTX 960M, SanDisk Z400s SD8SNAT-128G, IPS, 3840x2160, 15.60 | |
|---|---|---|---|---|---|
| Power Consumption | -51% | 6% | -22% | 25% | |
| Idle Minimum * | 12.1 | 22.3 -84% | 10 17% | 14 -16% | 8.3 31% |
| Idle Average * | 19 | 27.3 -44% | 14 26% | 24 -26% | 14.8 22% |
| Idle Maximum * | 19.5 | 30 -54% | 24 -23% | 32 -64% | 16.8 14% |
| Load Average * | 106.7 | 152.2 -43% | 90 16% | 108 -1% | 71 33% |
| Load Maximum * | 159 | 204.2 -28% | 172 -8% | 164 -3% | 119.2 25% |
* ... smaller is better
Battery Life
Runtimes are not significantly better or worse than the outgoing GS40 and is more or less in the same ballpark as other 14-inch gaming notebooks under similar WLAN conditions. Thus, users can expect around 4.5 hours of real-world use out of the GS43VR. The system can last for a surprisingly long time when idling on the minimum brightness setting at over 9 hours, so users who are very conservative with power settings can stretch out the battery for quite a bit.
Charging from near empty to full capacity will take roughly 2.5 to 3 hours.
| MSI GS43VR 6RE-006US 6700HQ, GeForce GTX 1060 Mobile, 61 Wh | Gigabyte P34W v5 6700HQ, GeForce GTX 970M, 61 Wh | MSI GS40-6QE16H11 6700HQ, GeForce GTX 970M, 61 Wh | Aorus X3 Plus v5 6700HQ, GeForce GTX 970M, 73 Wh | Razer Blade 14 2015 4720HQ, GeForce GTX 970M, 71 Wh | |
|---|---|---|---|---|---|
| Battery Runtime | -28% | -18% | -10% | -21% | |
| Reader / Idle | 577 | 392 -32% | 313 -46% | 481 -17% | 380 -34% |
| WiFi v1.3 | 261 | 232 -11% | 297 14% | 305 17% | 222 -15% |
| Load | 78 | 47 -40% | 60 -23% | 55 -29% | 66 -15% |
Pros
Cons
Verdict

We concluded that the GS40 was a "good compromise between performance and compact dimensions", but the introduction of Pascal means users no longer need to sacrifice nearly as much performance for a smaller design. It was insane to think that gaming on maximum 1080p60 settings would be possible on a 14-inch form factor even a year ago, yet here we are with a notebook that is quite literally half the size of previous generation Maxwell gaming notebooks with graphics performance surpassing that of the GTX 980M.
Drawbacks continue to be the usual for small and thin form factors: Loud fan noise, less features, and higher operating temperatures. In this regard, the GS43VR provides no significant upgrades over the GS40 as it does not run significantly cooler, quieter, or even longer than the outgoing model. In fact, our measurements show the GS43VR to be just as loud if not louder under gaming loads with core GPU temperatures hovering in the low 80 C range.
We would like to see a revised cooling system for future revisions of the 14-inch GS series. While the keyboard is good as is, a stiffer base would make it even better. We realize that G-Sync isn't currently possible with Optimus, but having the option with higher resolution panels or even support for external G-Sync displays could increase the versatility of the system both at home and on-the-go.
The GS43VR is only recommended if you value its portability above all else. Otherwise, larger and tougher systems like the GT72VR or GE62VR with the same GPU are both cooler and quieter and carry more features in the same price range.
MSI GS43VR 6RE-006US
-
09/08/2016 v5.1(old)
Allen Ngo
Pricecompare
