 Deutsch
 English
 Español
 Français
 Italiano
 Nederlands
 Polski
 Português
 Русский
 Türkçe
 Svenska
 Chinese
 Magyar
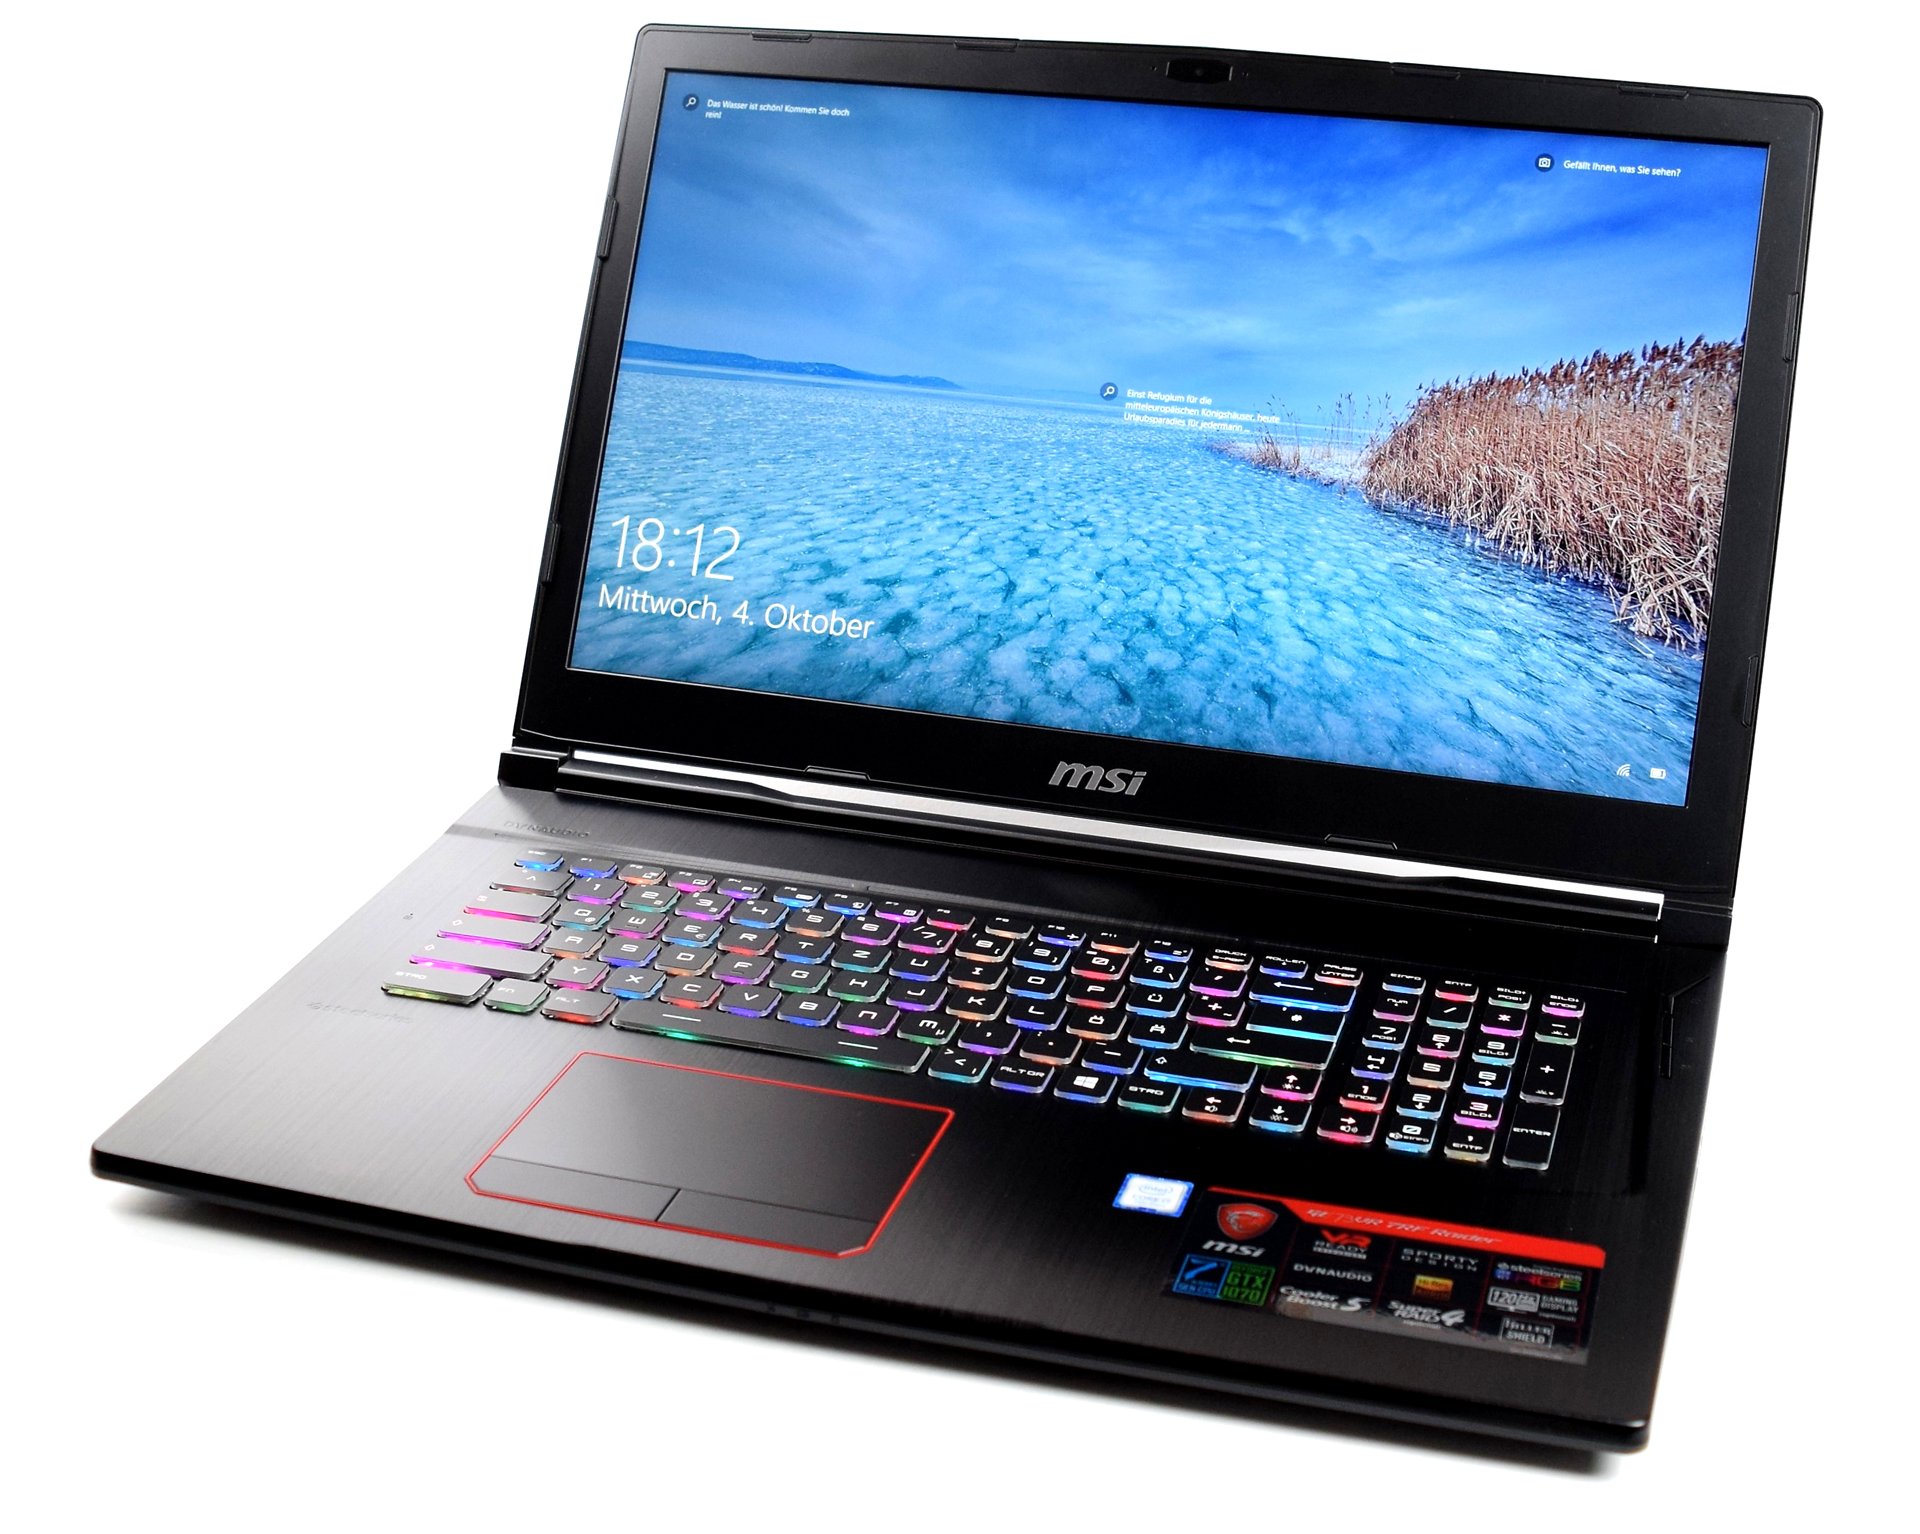
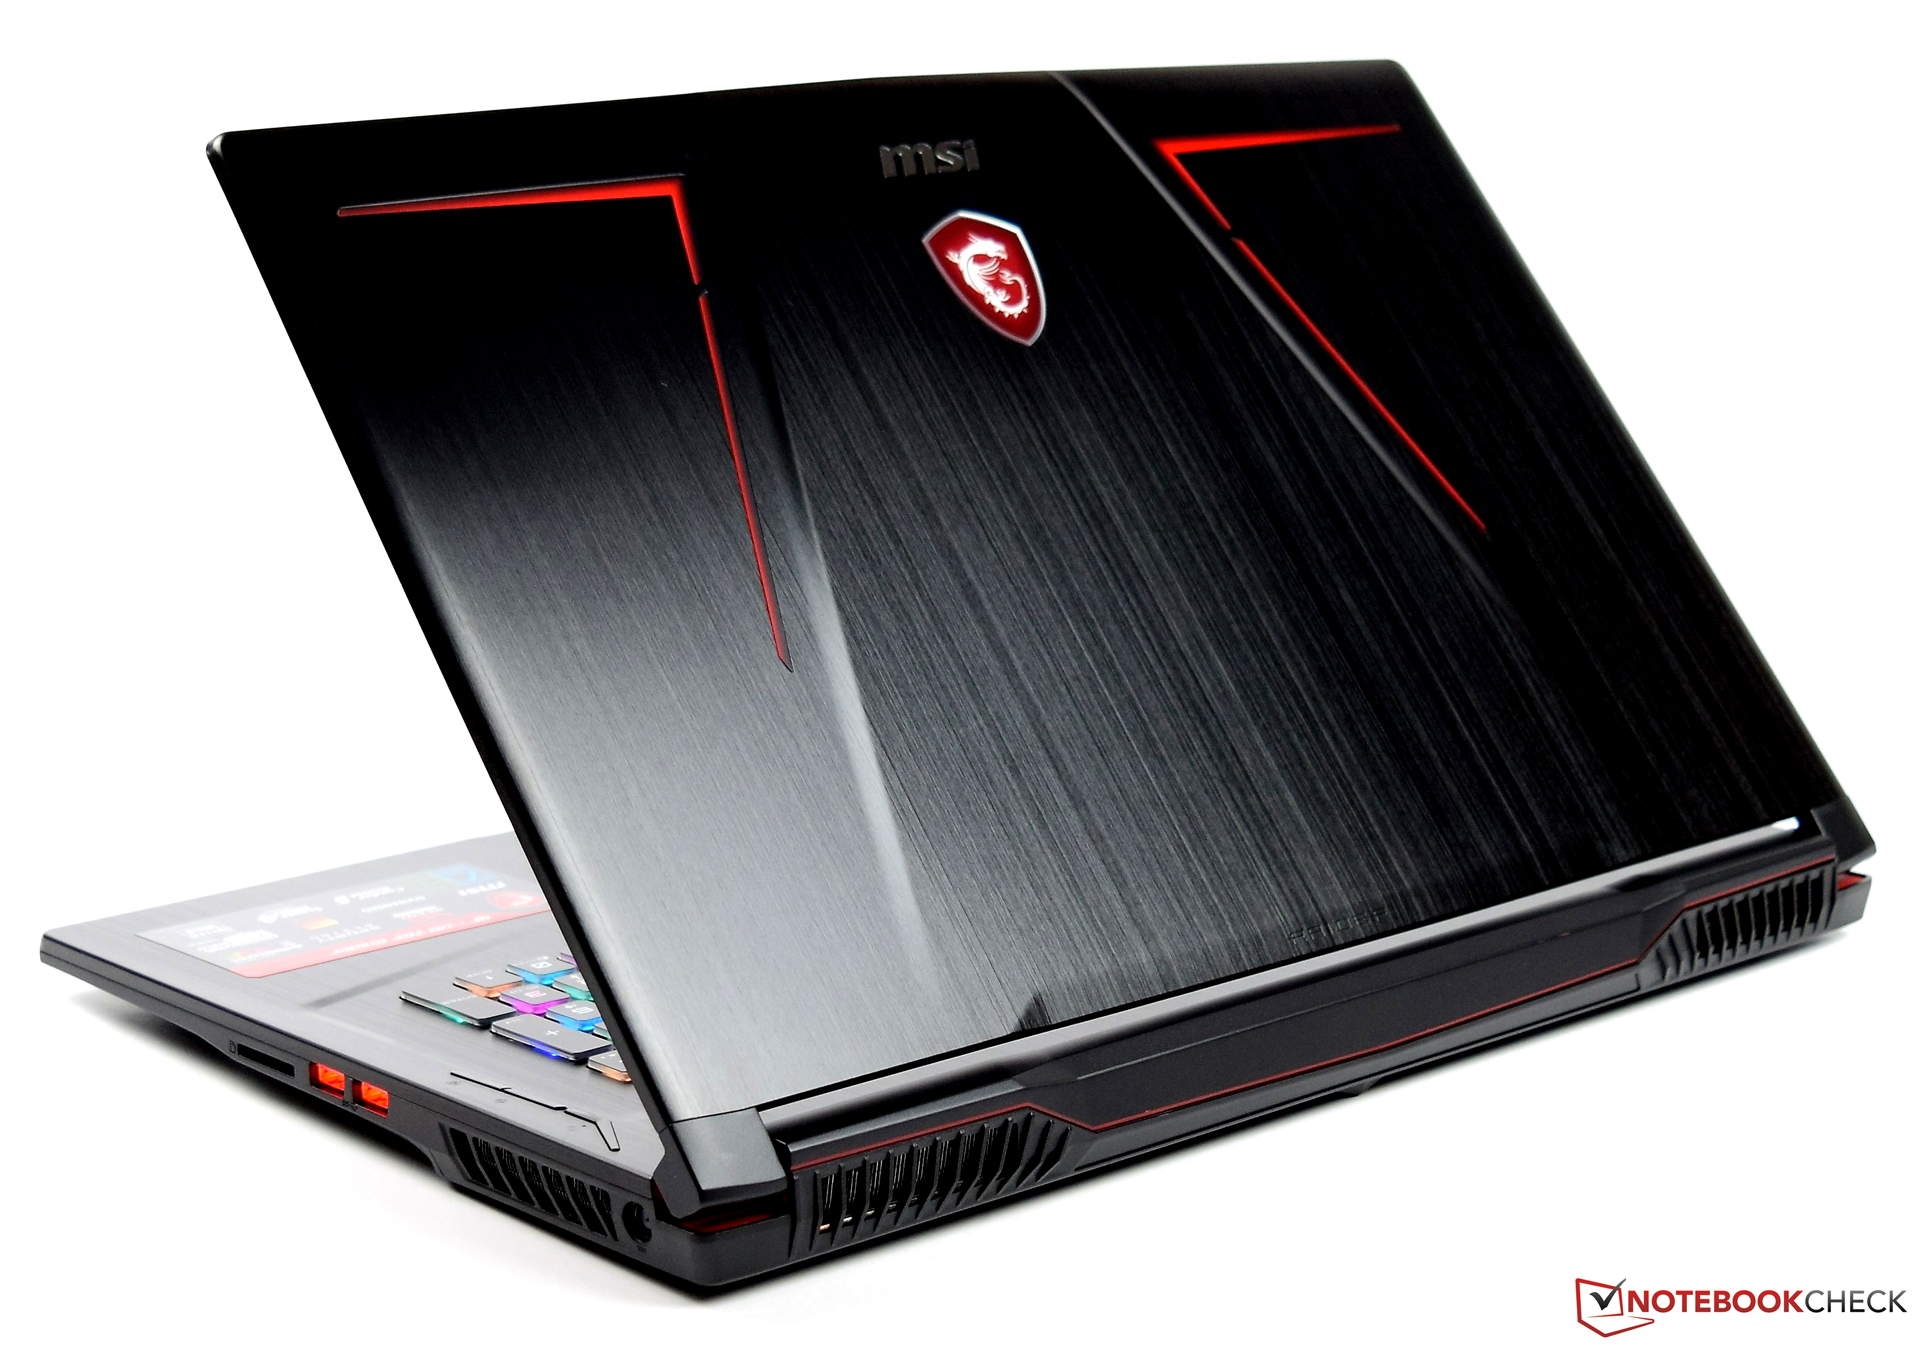
MSI GE73 8RF Raider RGB (i7-8750H, GTX 1070, Full-HD) Laptop Review

We are already familiar with the MSI GE73 8RF. It is an identically constructed successor to the GE73VR 7RF. The biggest improvement is the hexa-core Coffee Lake processor, which provides a significant performance boost. Nothing changes in the GPU compartment: Both the GE73 8RF and GE73VR 7RF each house a GeForce GTX 1070 graphics processing unit. Competitors include the Acer Predator Helios 500, the Schenker XMG Pro 17 and the HP Omen X 17.
Since the GE73 8RF and the GE73VR 7RF are identically constructed, we will not go into details about the case, equipment, input devices, display, and speakers. This information can be found in the review of the GE73VR 7RF.

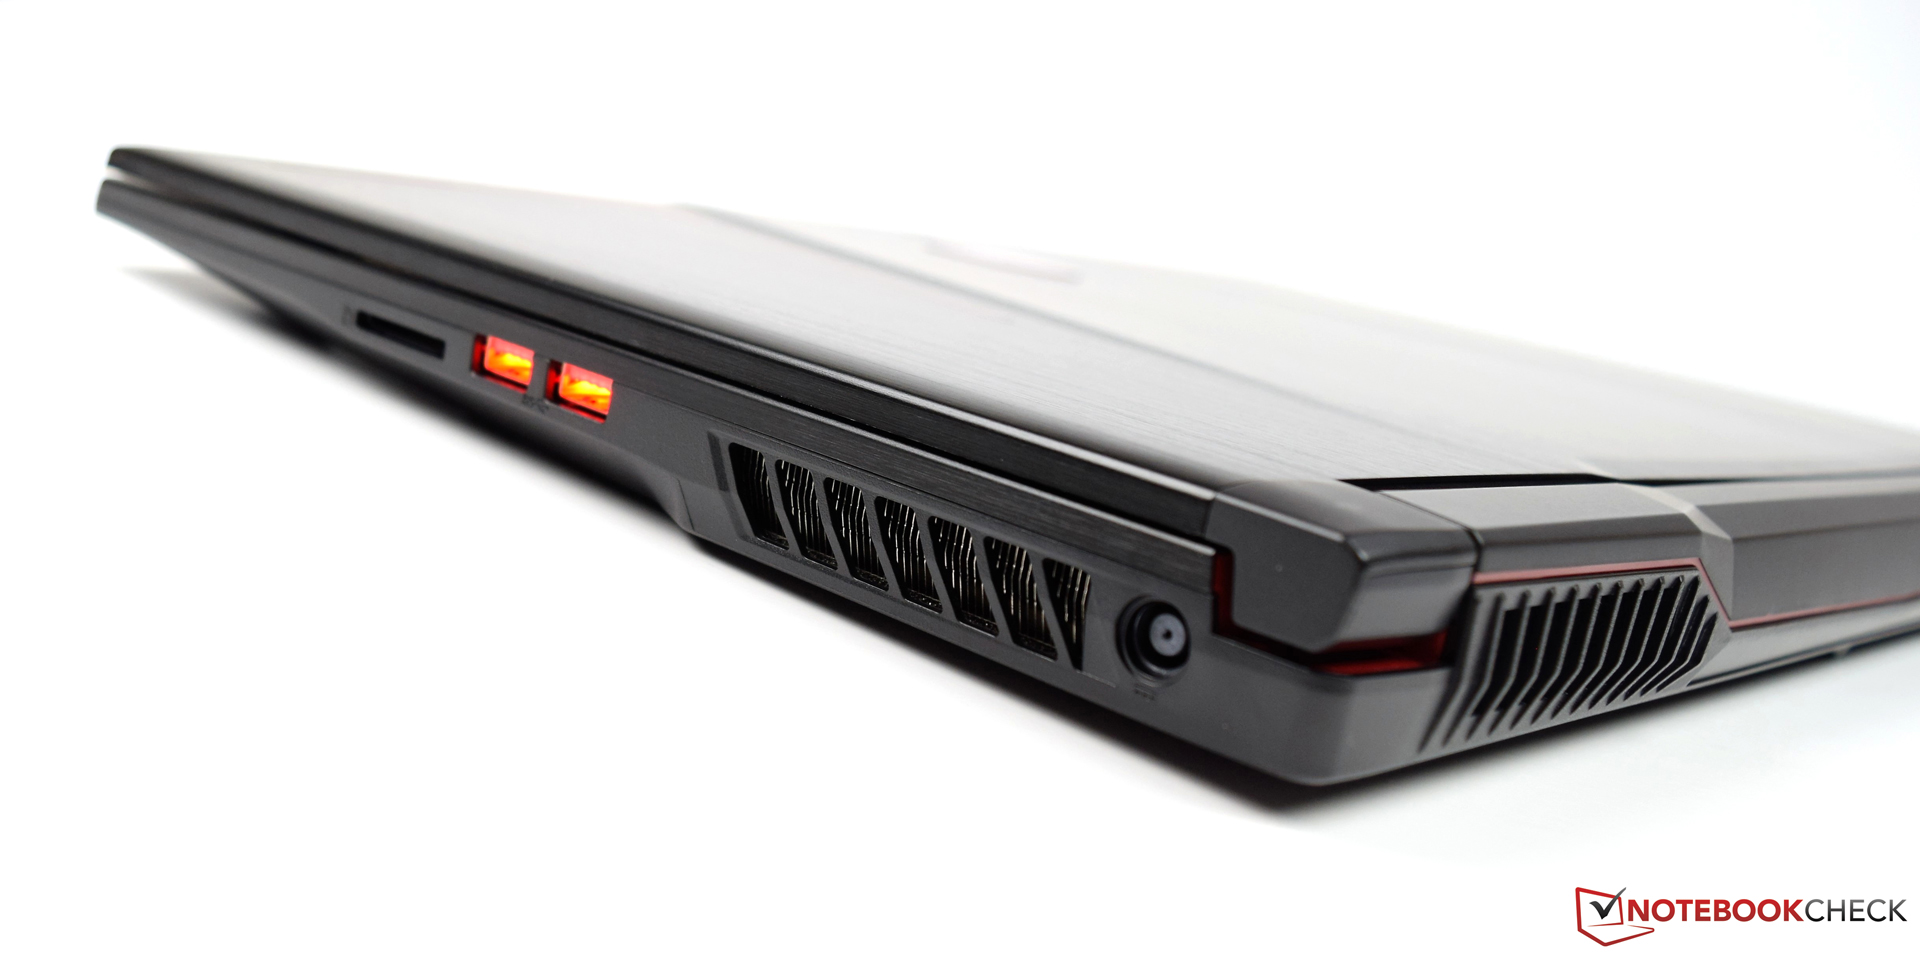
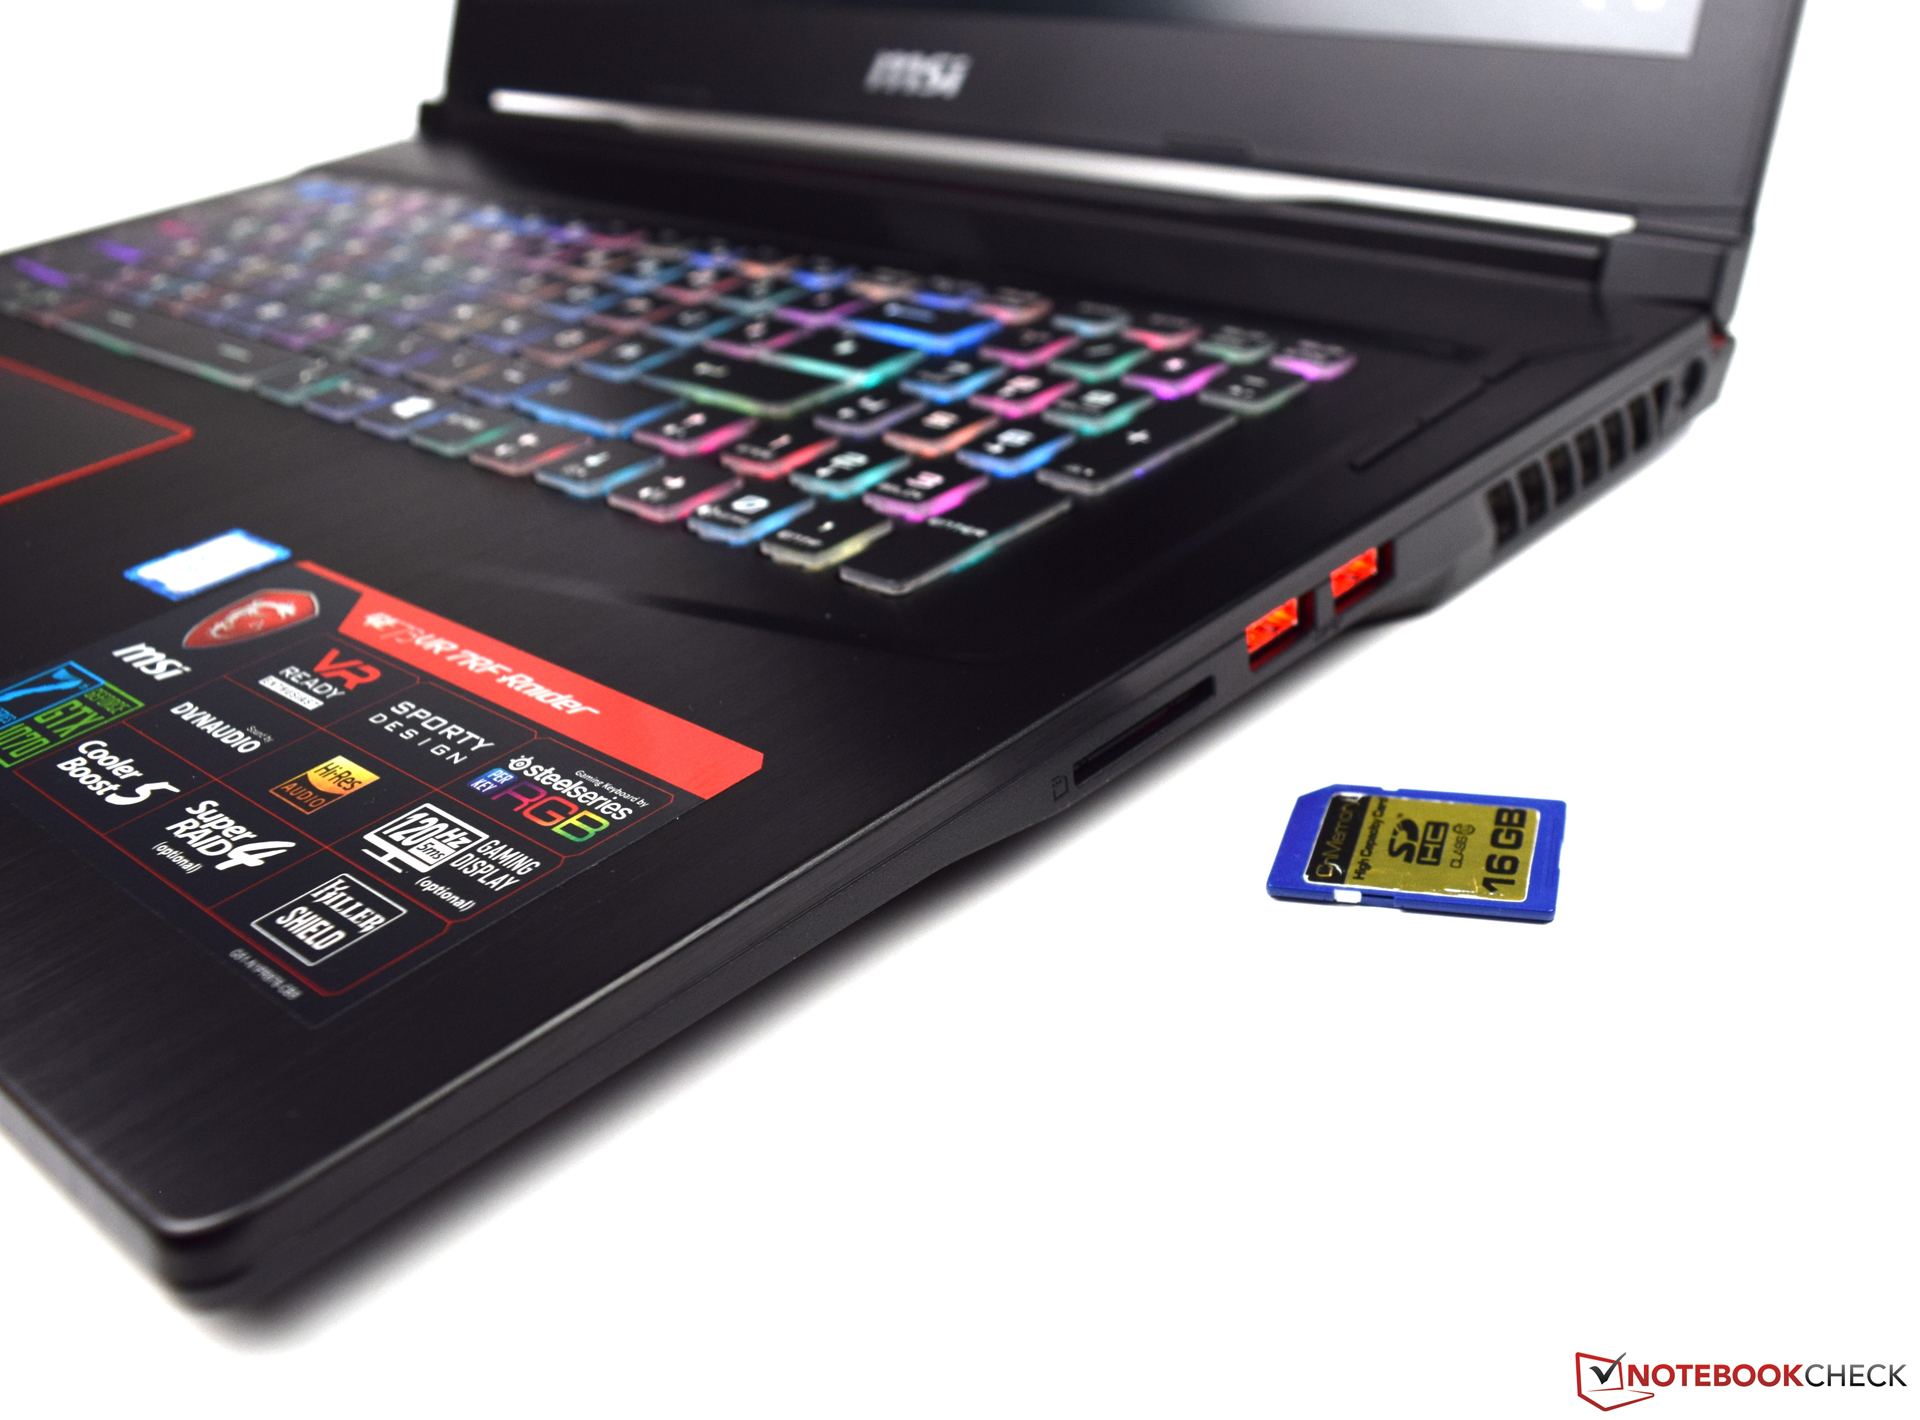
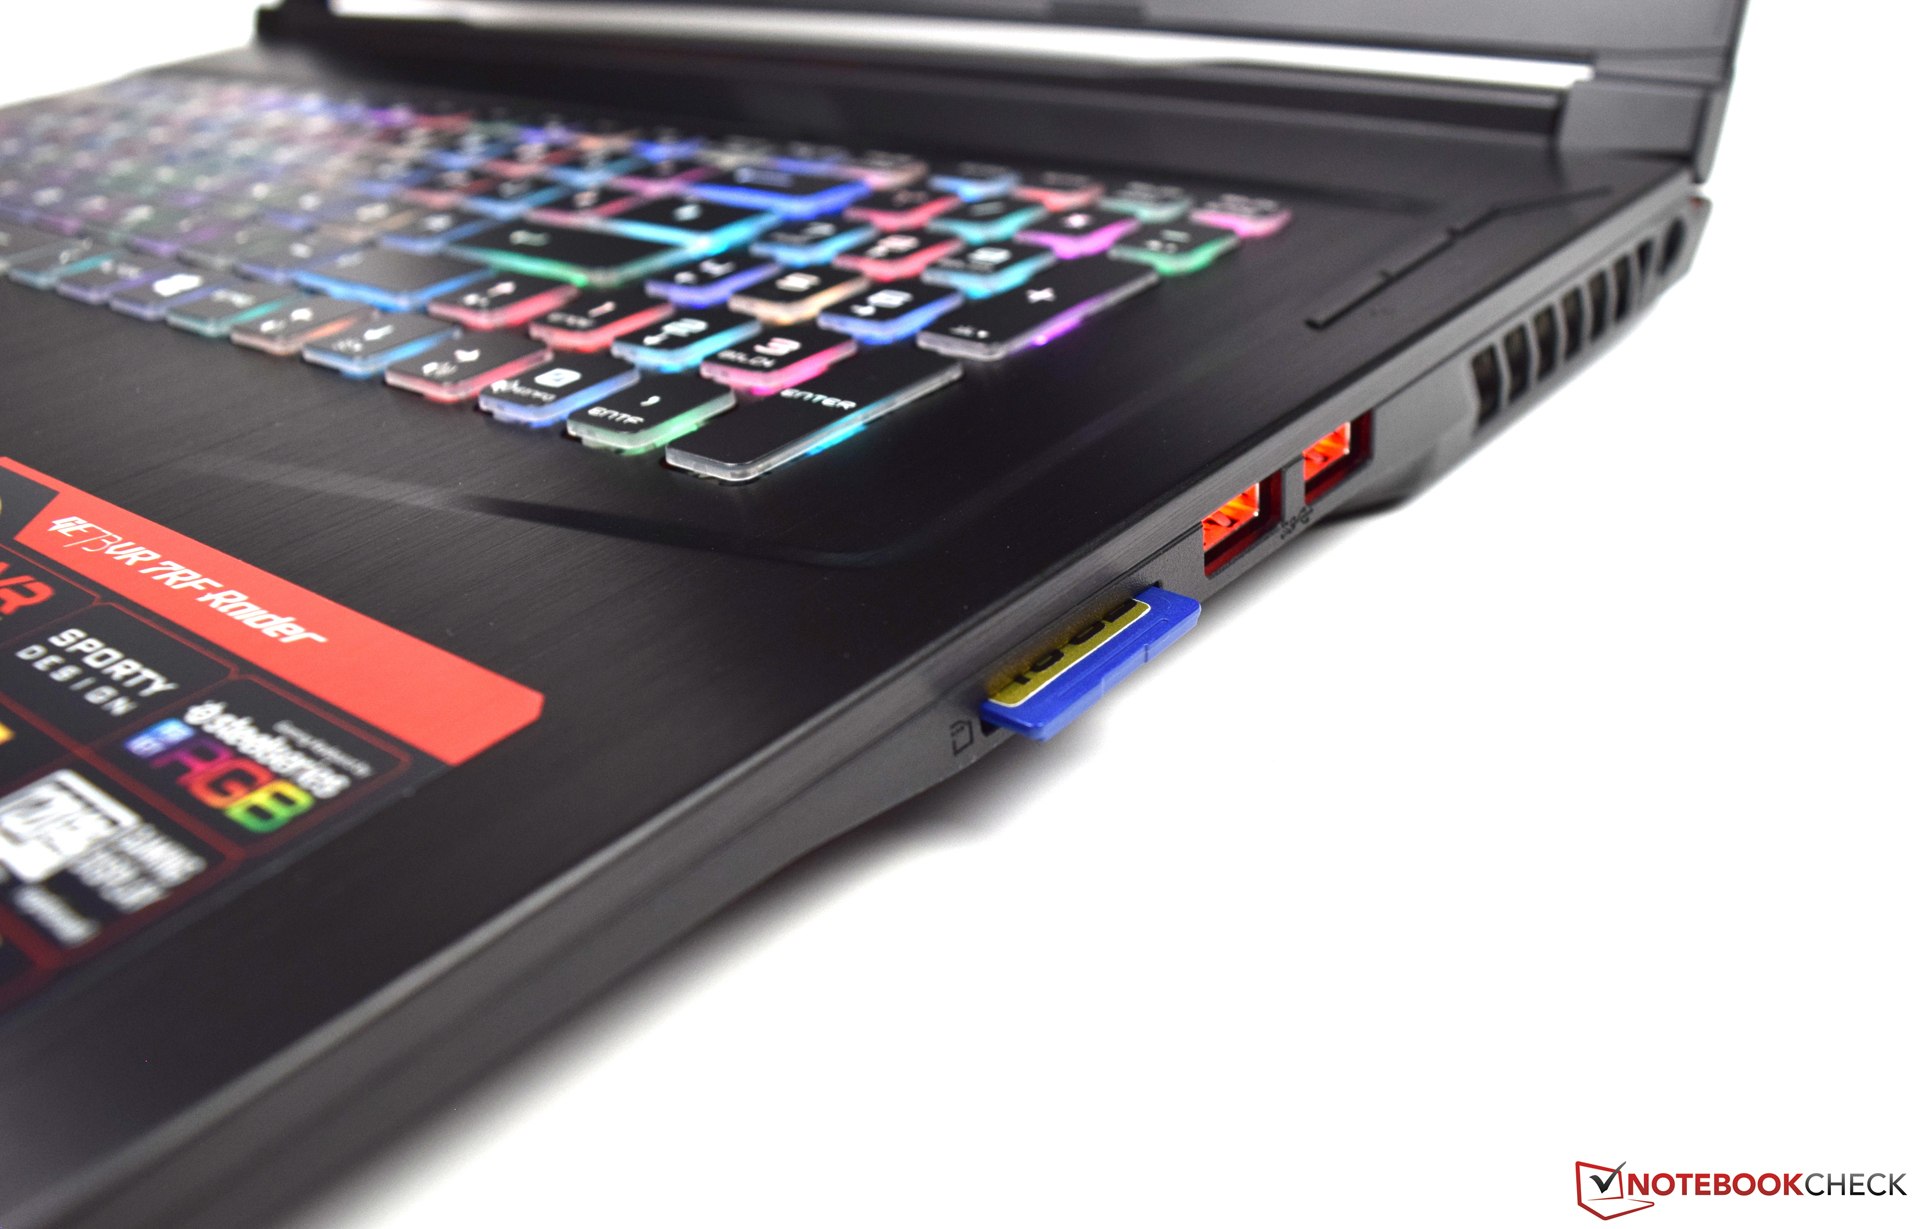
Equipment – Slow Memory Card Reader
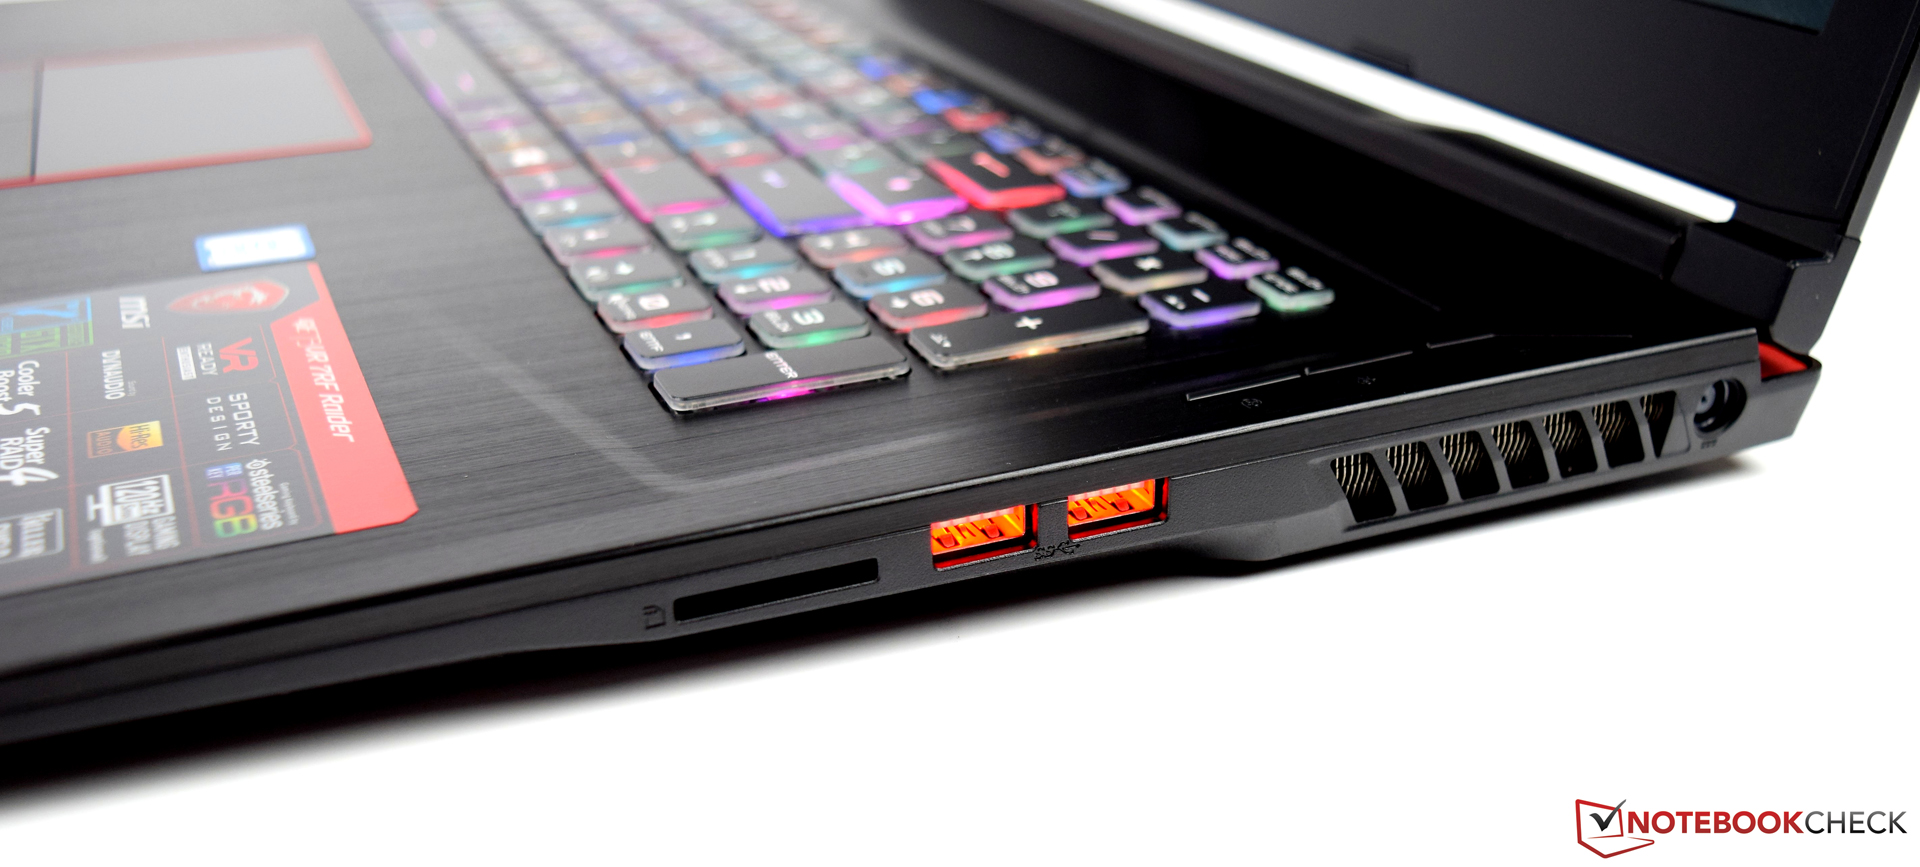
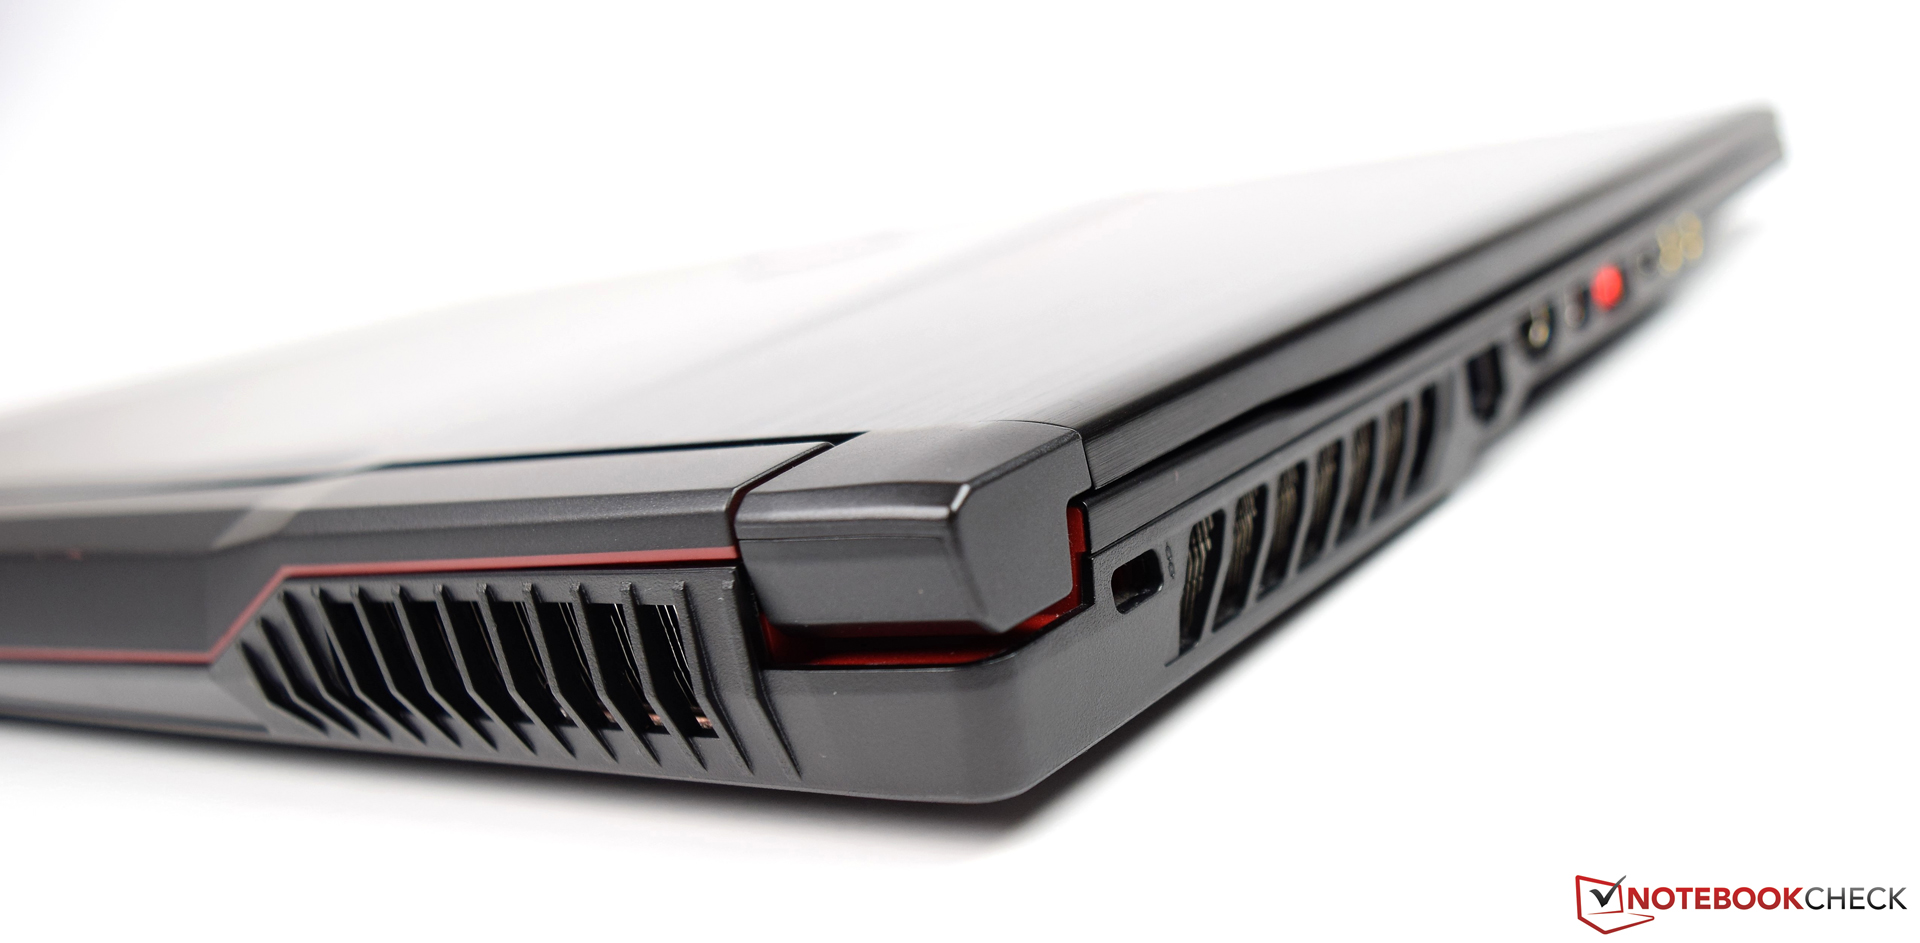
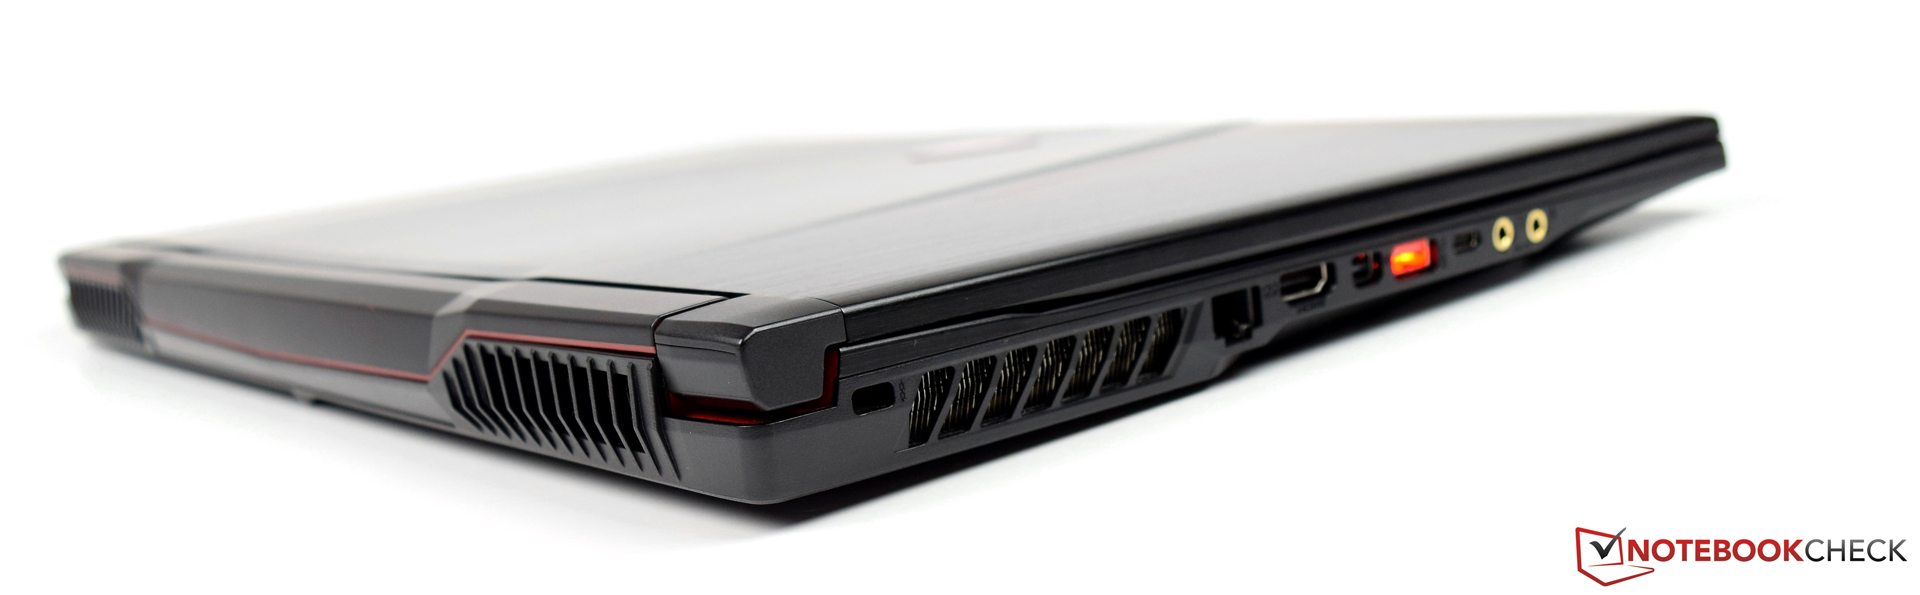
MSI makes several changes to the equipment compared to the GE73VR 7RF. The GE73 8RF, for example, uses slightly more powerful speakers (3 watts instead of 2 watts). Additionally, the USB 3.1 Gen 1 (type A) gets upgraded to a USB 3.1 Gen 2 (type C) The total number of USB ports remains unchanged. There is also a deterioration: the memory card reader of the GE73 8RF operates at significantly lower speeds than it was the case in the GE73VR 7FR.
| SD Card Reader | |
| average JPG Copy Test (av. of 3 runs) | |
| SCHENKER XMG Pro 17 (Toshiba Exceria Pro SDXC 64 GB UHS-II) | |
| MSI GE73VR 7RF Raider (Toshiba Exceria Pro SDXC 64 GB UHS-II) | |
| Average of class Gaming (19 - 202, n=100, last 2 years) | |
| HP Omen X 17-ap0xx (Toshiba Exceria Pro SDXC 64 GB UHS-II) | |
| MSI GE73 8RF-008 Raider RGB (Toshiba Exceria Pro SDXC 64 GB UHS-II) | |
| maximum AS SSD Seq Read Test (1GB) | |
| SCHENKER XMG Pro 17 (Toshiba Exceria Pro SDXC 64 GB UHS-II) | |
| MSI GE73VR 7RF Raider (Toshiba Exceria Pro SDXC 64 GB UHS-II) | |
| Average of class Gaming (26 - 269, n=93, last 2 years) | |
| HP Omen X 17-ap0xx (Toshiba Exceria Pro SDXC 64 GB UHS-II) | |
| MSI GE73 8RF-008 Raider RGB (Toshiba Exceria Pro SDXC 64 GB UHS-II) | |
The Keyboard – And How to Fix It
After setting up the system, we updated the operating system to Windows 10 Home Version 1803 via USB drive. After that, the keyboard of the GE73 stopped working. To be precise, inputs could not be registered anymore; the backlight and the function keys however remained operable. Presumably, the pre-installed version of the keyboard driver (SteelSeries software) was not compatible with said Windows version. Installing a newer software version (SteelSeries 3.12.3) restored the keyboard’s full functionality again. The software can be found in the download section of the MSI website.
Display – Responsive Full-HD Panel
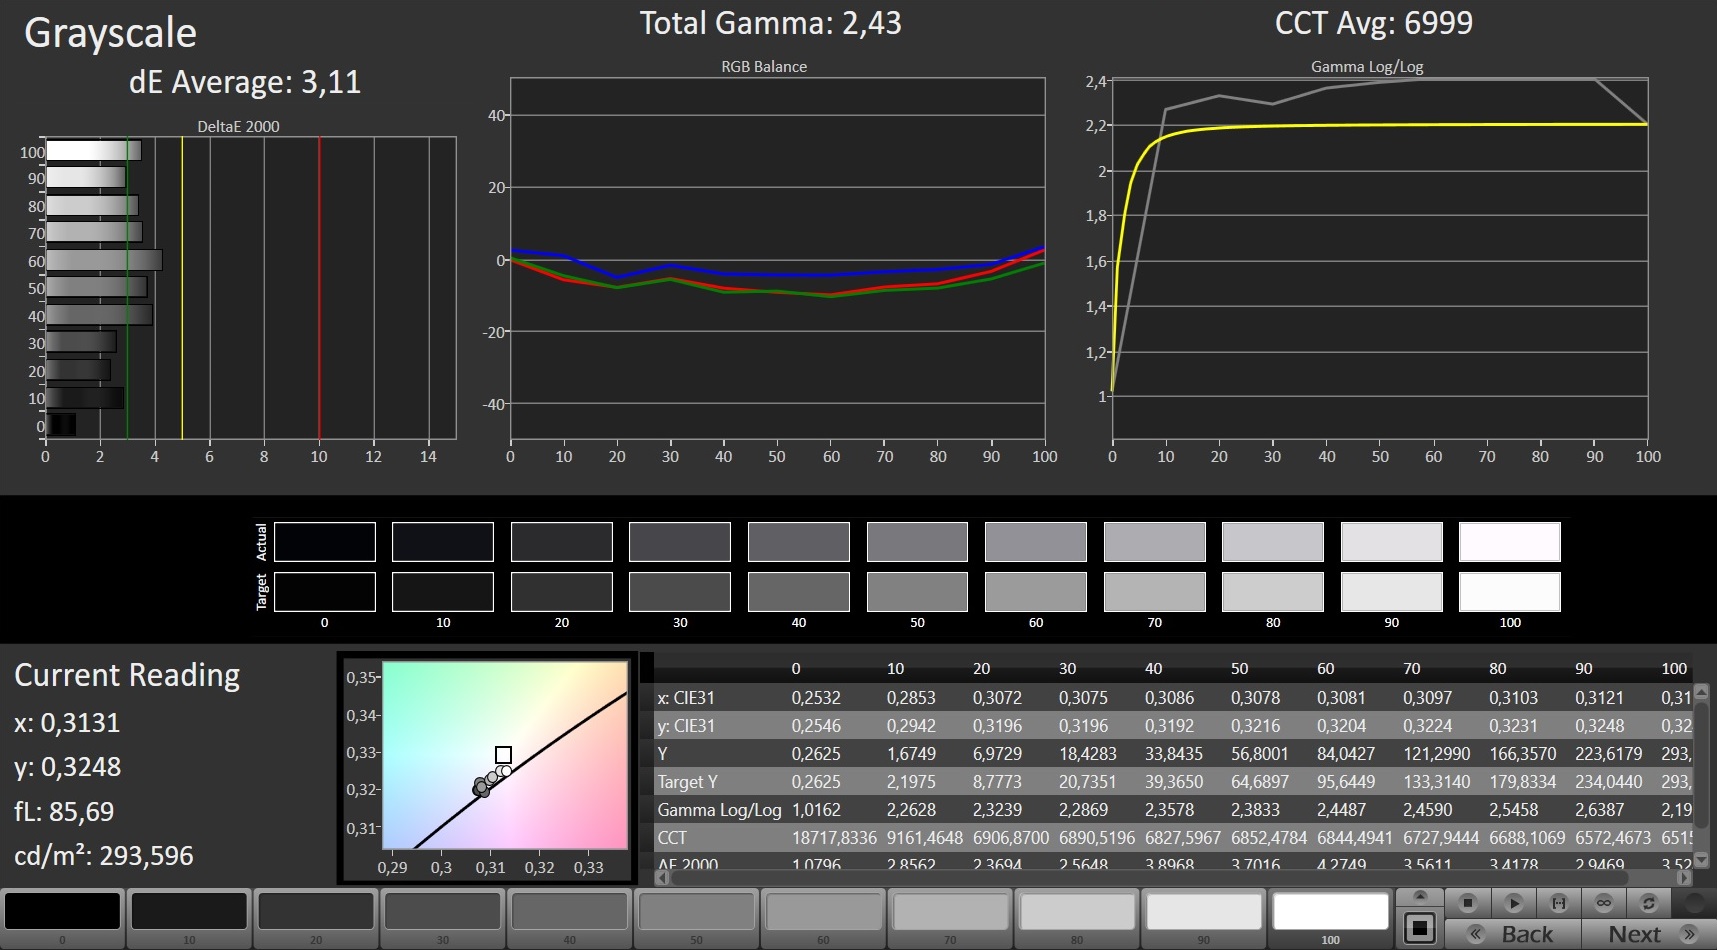
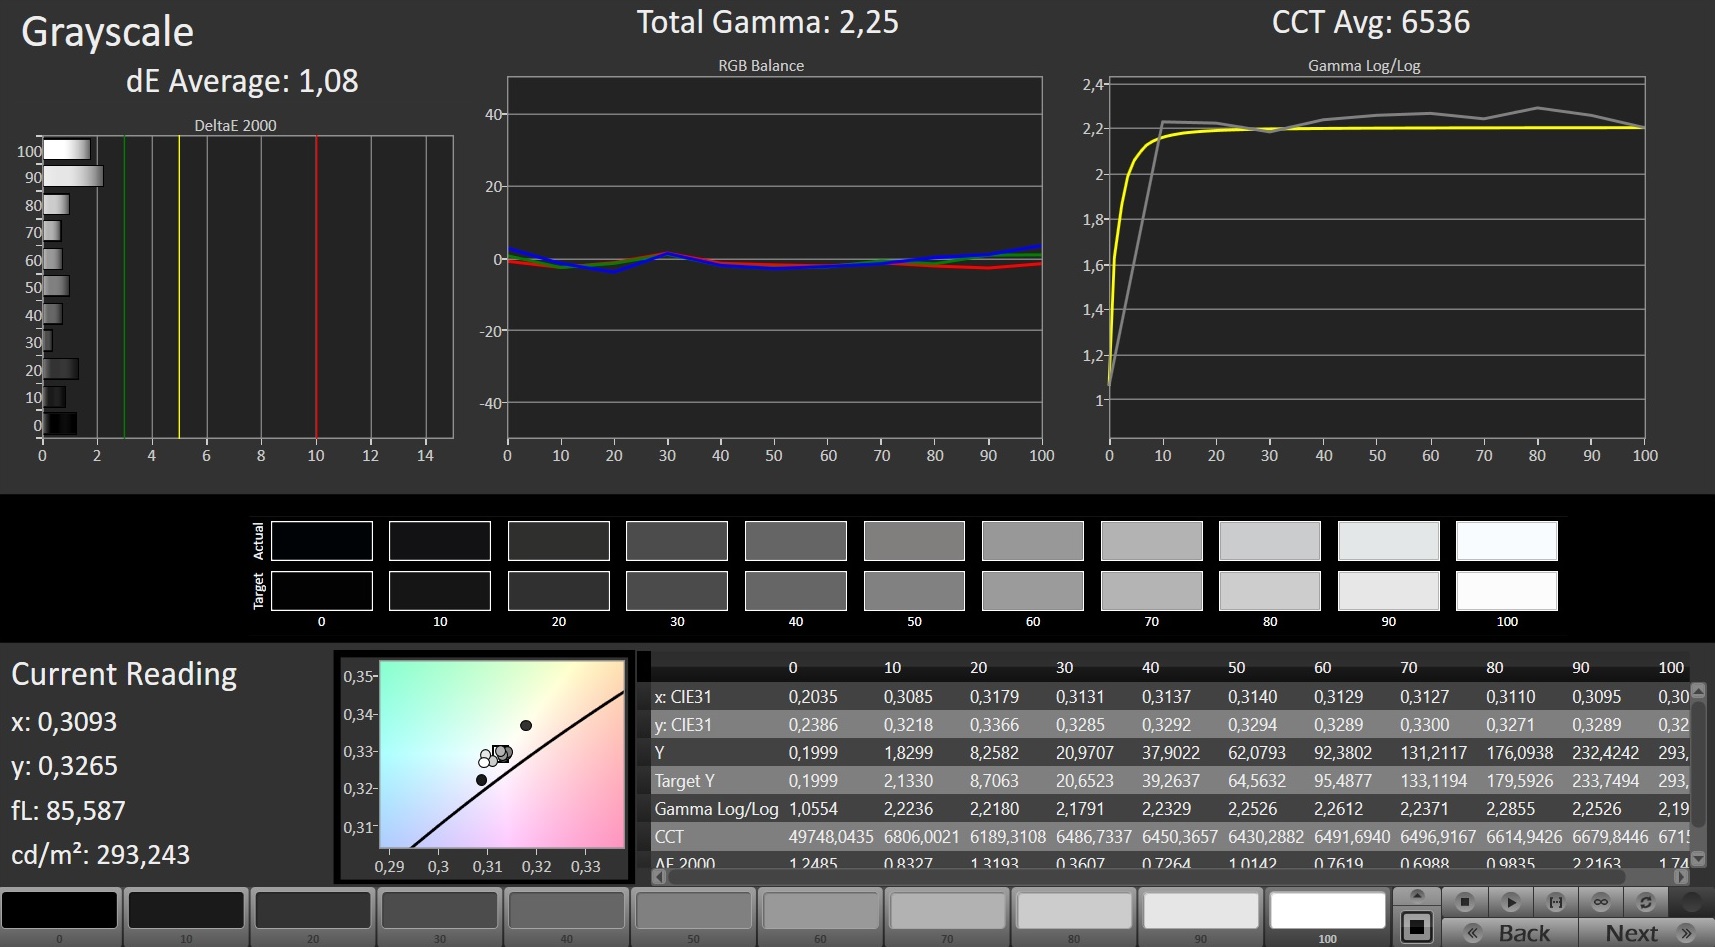
The GE73 8RF features a matt TN screen with good contrast and fast response times. It is the same Full-HD display used in the previous iteration. Nevertheless, the measurements differ slightly, but this is expected, as two identically constructed displays never match one hundred percent.
| |||||||||||||||||||||||||
Brightness Distribution: 90 %
Center on Battery: 273 cd/m²
Contrast: 1050:1 (Black: 0.26 cd/m²)
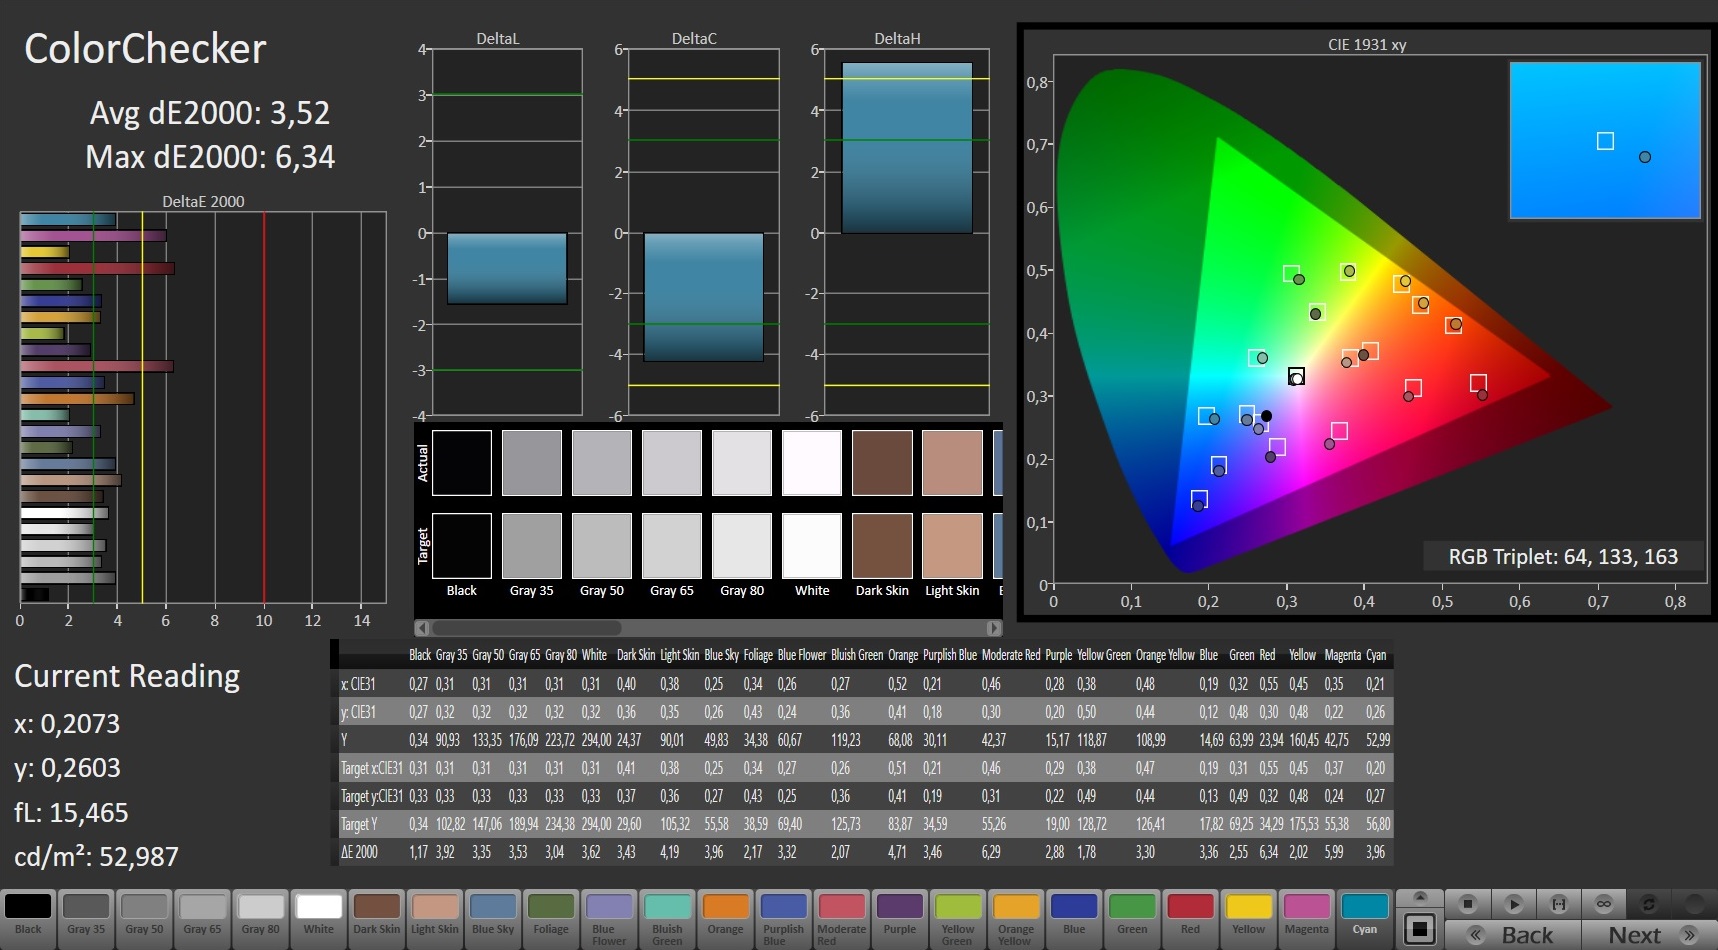
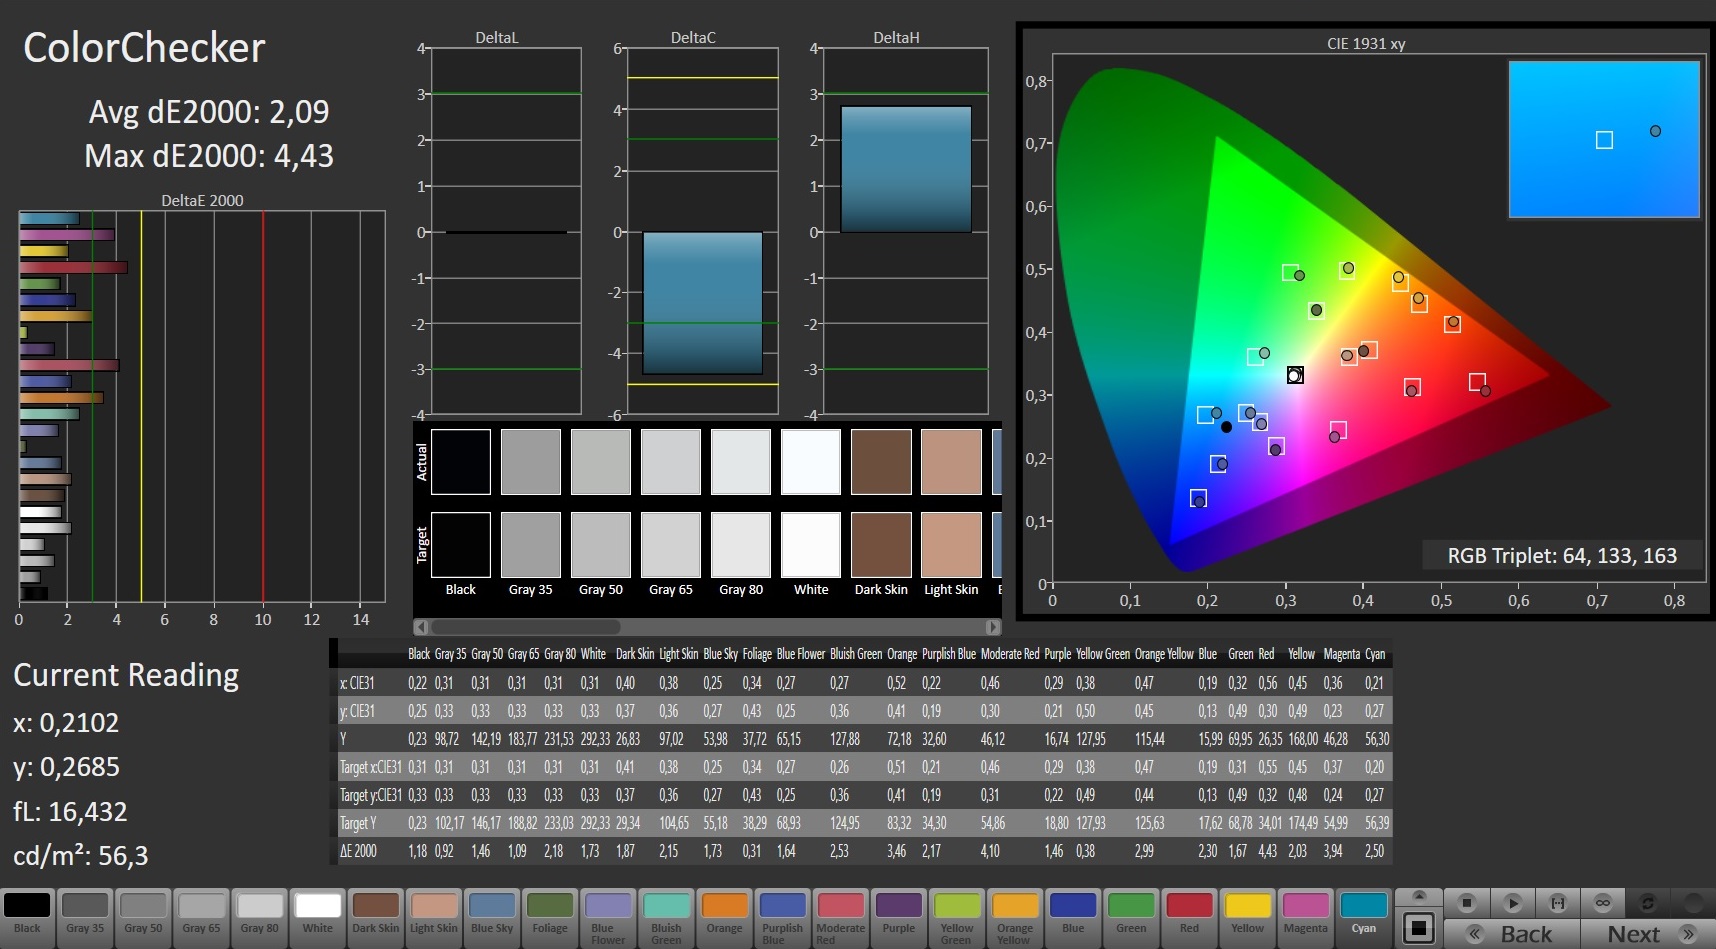
ΔE Color 3.52 | 0.5-29.43 Ø5, calibrated: 2.09
ΔE Greyscale 3.11 | 0.57-98 Ø5.3
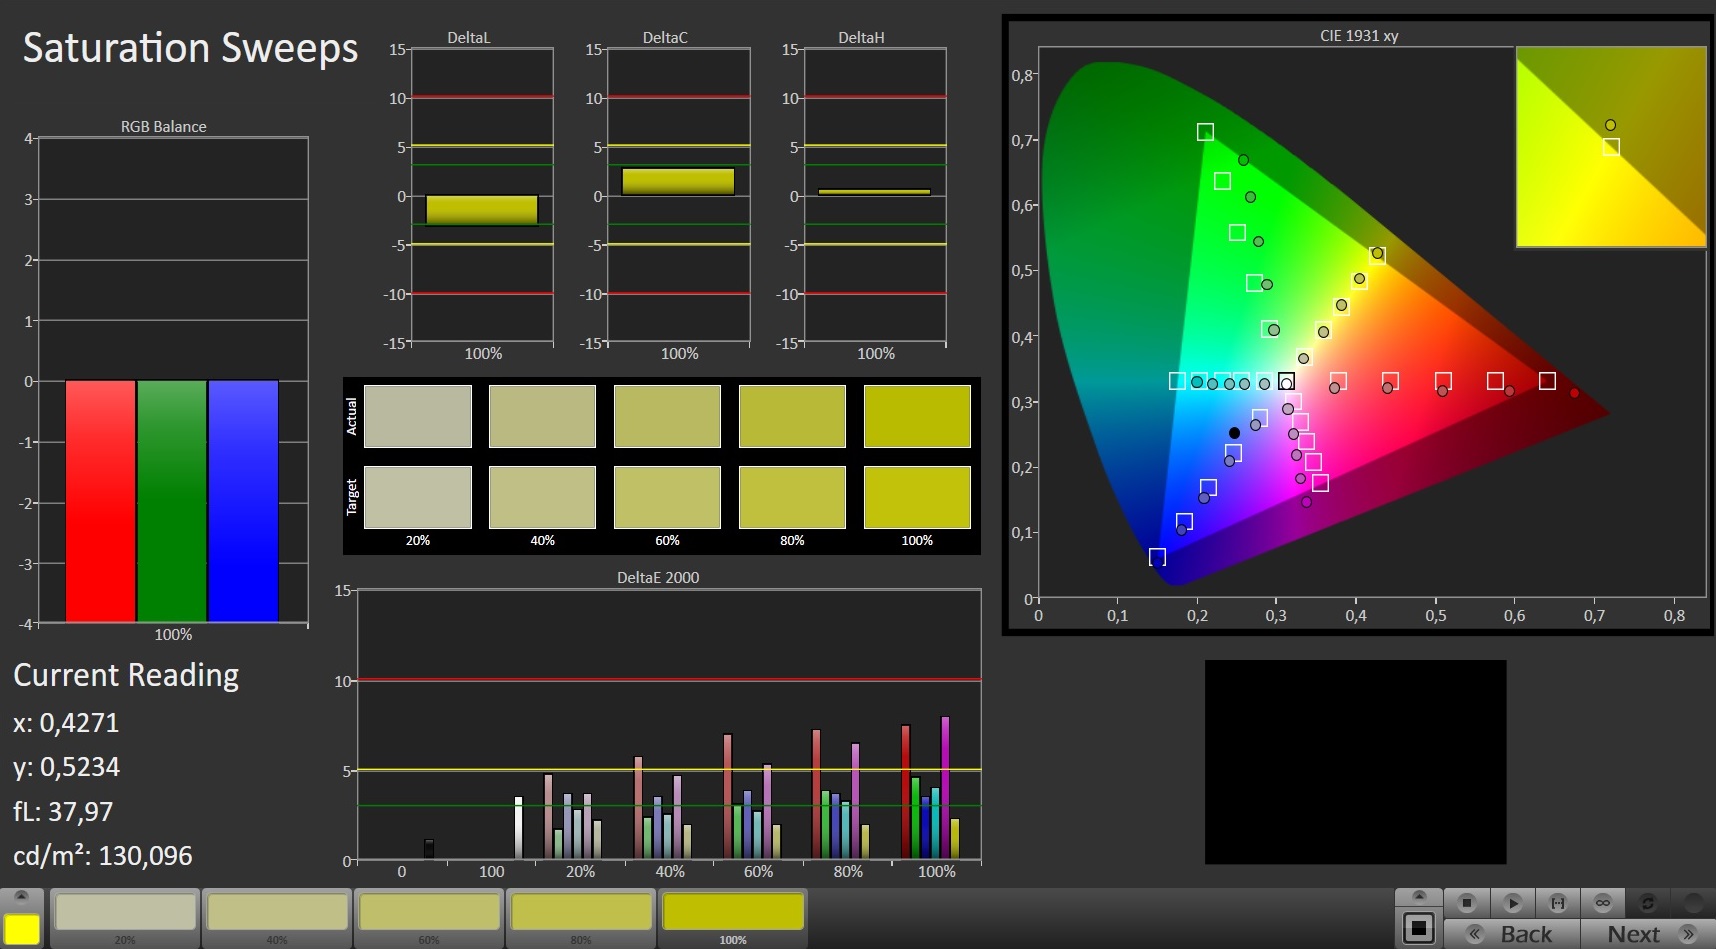
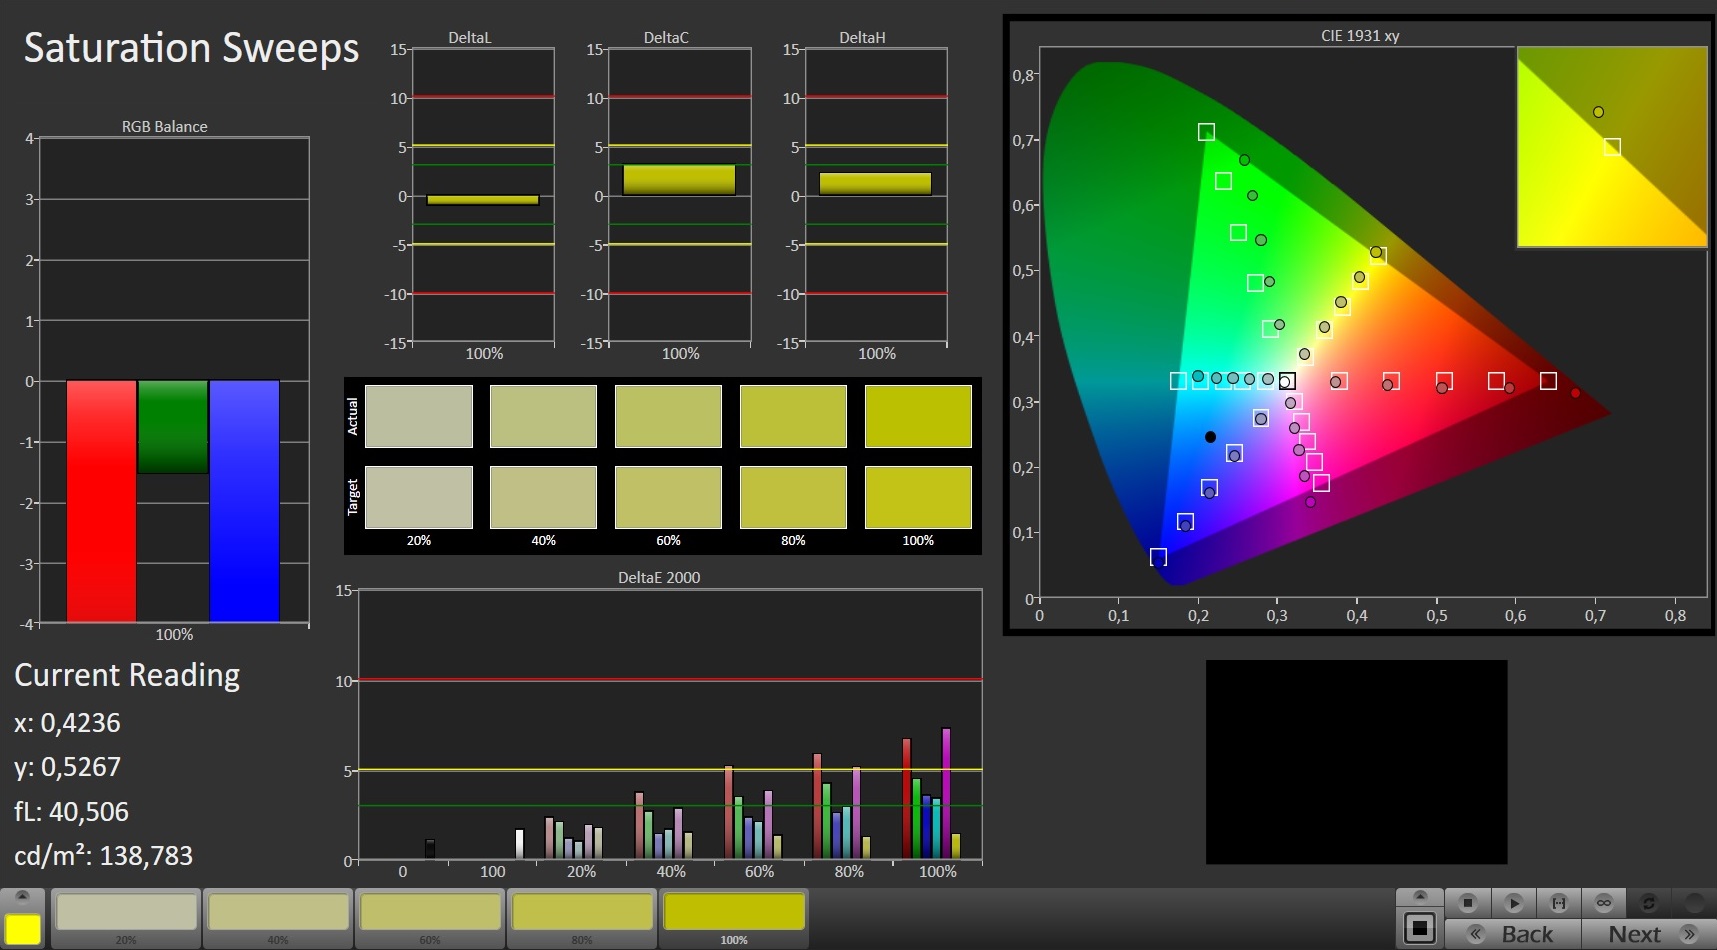
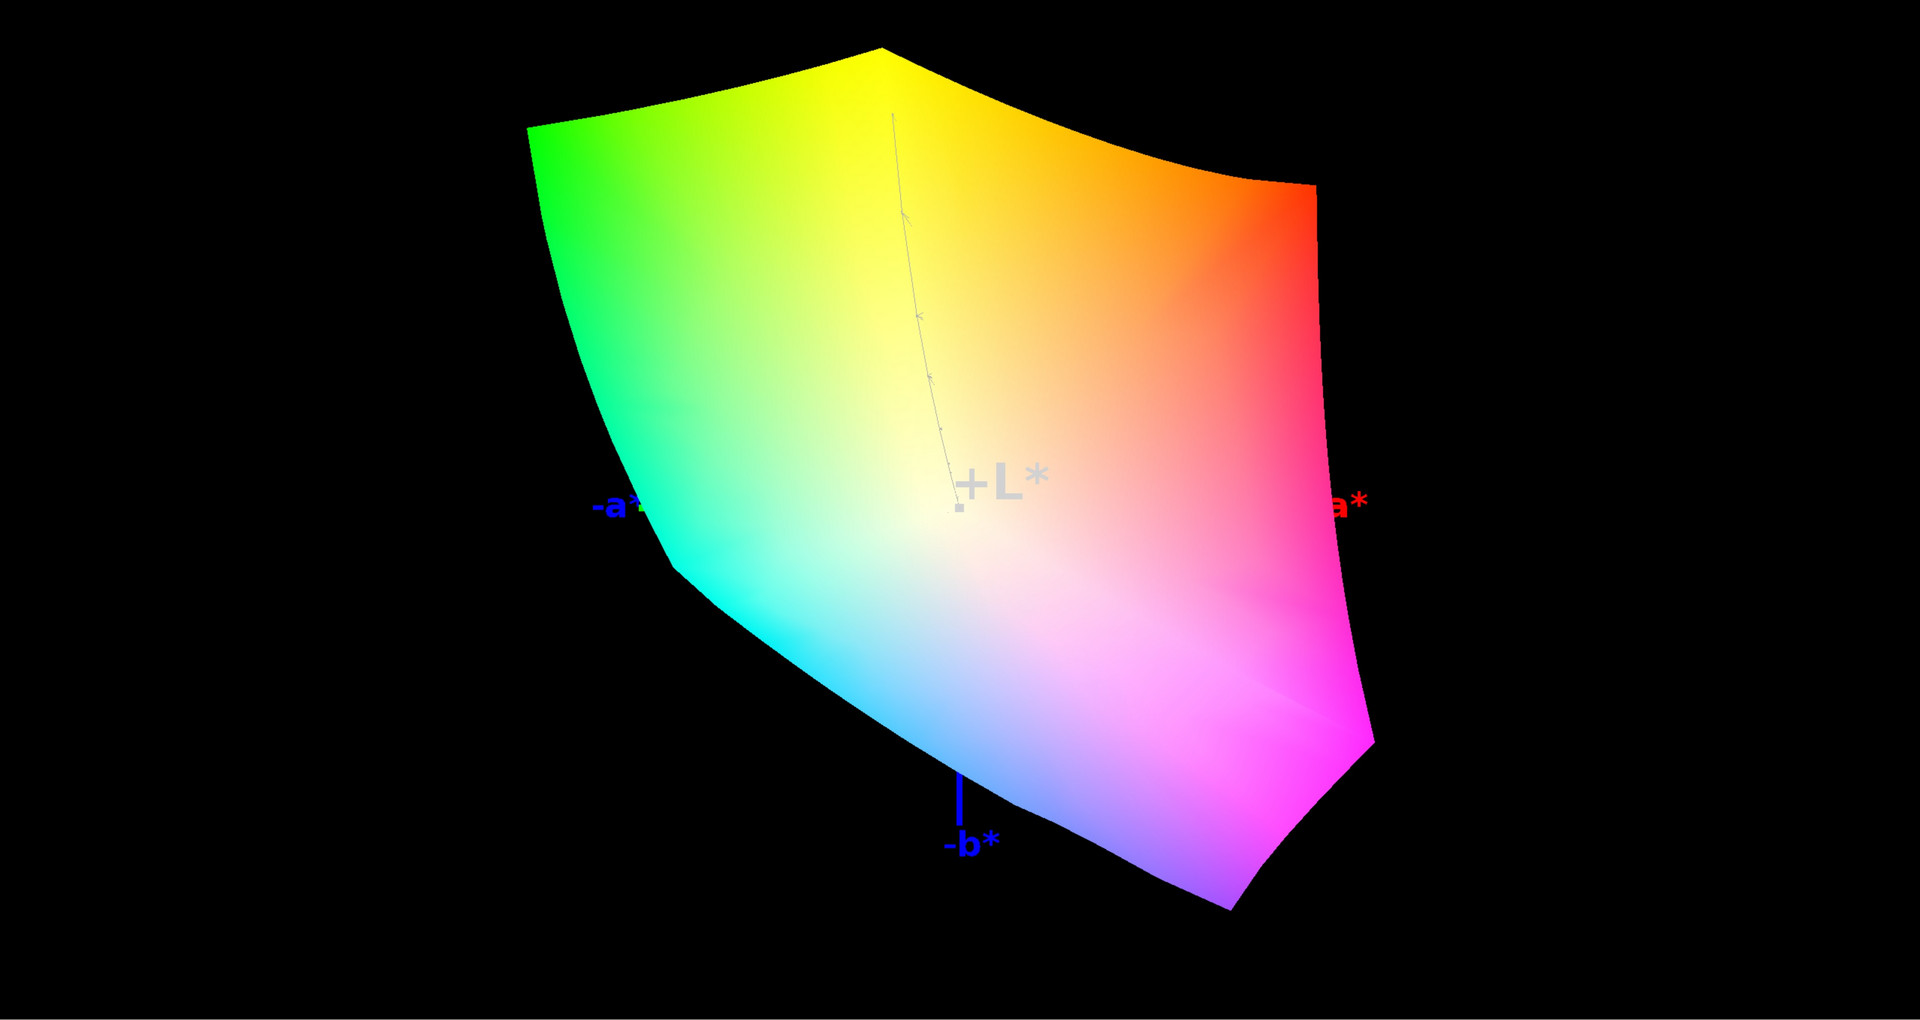
100% sRGB (Argyll 1.6.3 3D)
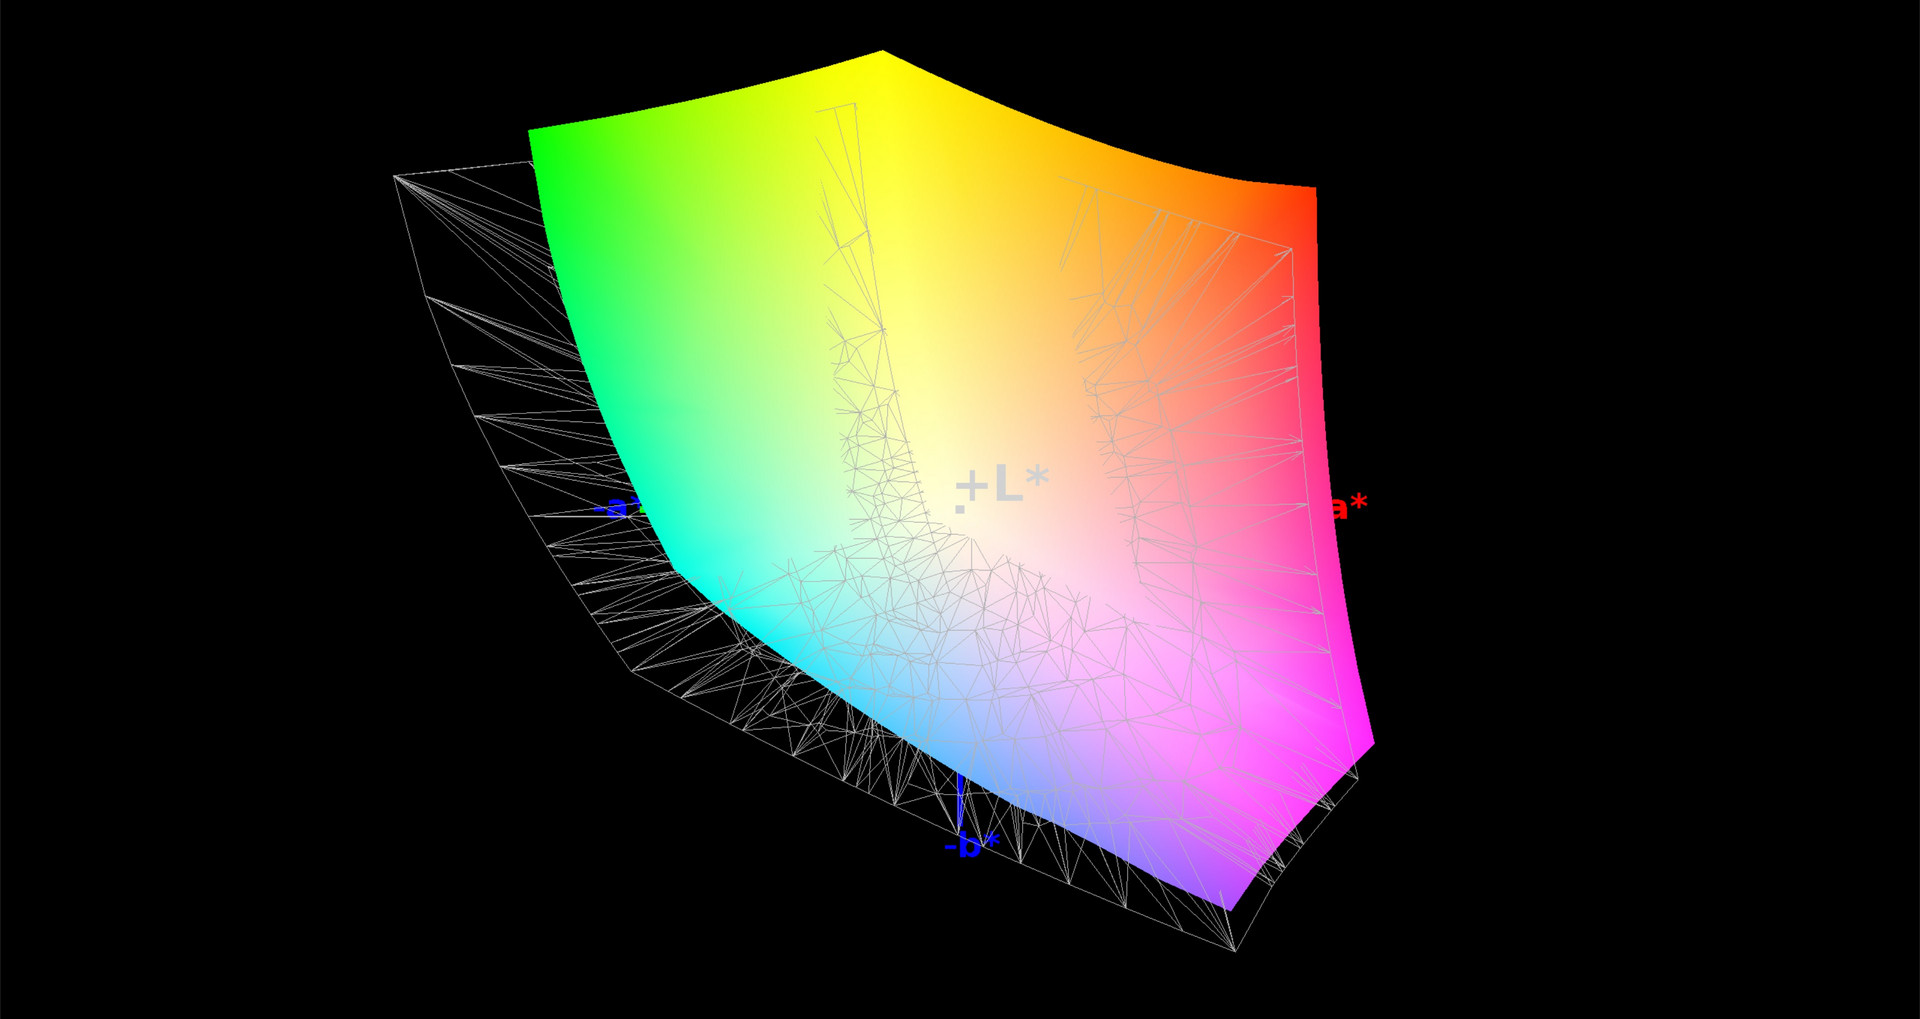
76% AdobeRGB 1998 (Argyll 1.6.3 3D)
85.8% AdobeRGB 1998 (Argyll 2.2.0 3D)
99.9% sRGB (Argyll 2.2.0 3D)
90.8% Display P3 (Argyll 2.2.0 3D)
Gamma: 2.43
| MSI GE73 8RF-008 Raider RGB TN WLED, 1920x1080, 17.30 | Acer Predator Helios 500 PH517-51-79BY IPS, 1920x1080, 17.30 | SCHENKER XMG Pro 17 IPS, 3840x2160, 17.30 | HP Omen X 17-ap0xx IPS, 1920x1080, 17.30 | MSI GE73VR 7RF Raider TN WLED, 1920x1080, 17.30 | |
|---|---|---|---|---|---|
| Display | -21% | 3% | -22% | -0% | |
| Display P3 Coverage | 90.8 | 64.4 -29% | 85.9 -5% | 63.7 -30% | 90.5 0% |
| sRGB Coverage | 99.9 | 91.3 -9% | 99.9 0% | 88.2 -12% | 99.9 0% |
| AdobeRGB 1998 Coverage | 85.8 | 65.6 -24% | 98.9 15% | 64.2 -25% | 84.8 -1% |
| Response Times | 42% | -70% | -95% | 1% | |
| Response Time Grey 50% / Grey 80% * | 28 ? | 14 ? 50% | 44 ? -57% | 44 ? -57% | 28.8 ? -3% |
| Response Time Black / White * | 13.6 ? | 9 ? 34% | 24.8 ? -82% | 31.6 ? -132% | 13.4 ? 1% |
| PWM Frequency | 25000 ? | 26000 ? 4% | |||
| Screen | -34% | -9% | -2% | 8% | |
| Brightness middle | 273 | 335 23% | 303 11% | 343 26% | 296 8% |
| Brightness | 273 | 300 10% | 287 5% | 332 22% | 279 2% |
| Brightness Distribution | 90 | 82 -9% | 83 -8% | 83 -8% | 90 0% |
| Black Level * | 0.26 | 0.7 -169% | 0.25 4% | 0.35 -35% | 0.21 19% |
| Contrast | 1050 | 479 -54% | 1212 15% | 980 -7% | 1410 34% |
| Colorchecker dE 2000 * | 3.52 | 4.99 -42% | 4.38 -24% | 3.35 5% | 3.09 12% |
| Colorchecker dE 2000 max. * | 6.34 | 9.32 -47% | 7.42 -17% | 5.62 11% | 5.97 6% |
| Colorchecker dE 2000 calibrated * | 2.09 | 1.93 8% | 2.5 -20% | ||
| Greyscale dE 2000 * | 3.11 | 5.2 -67% | 5.96 -92% | 2.4 23% | 3.06 2% |
| Gamma | 2.43 91% | 2.49 88% | 2.31 95% | 2.35 94% | 2.19 100% |
| CCT | 6999 93% | 7719 84% | 6247 104% | 6495 100% | 7315 89% |
| Color Space (Percent of AdobeRGB 1998) | 76 | 59 -22% | 87 14% | 57 -25% | 75 -1% |
| Color Space (Percent of sRGB) | 100 | 91 -9% | 100 0% | 88 -12% | 100 0% |
| Total Average (Program / Settings) | -4% /
-22% | -25% /
-15% | -40% /
-17% | 3% /
5% |
* ... smaller is better
Screen Flickering / PWM (Pulse-Width Modulation)
| Screen flickering / PWM detected | 25000 Hz | ≤ 14 % brightness setting | 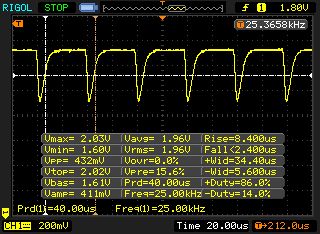 |
The display backlight flickers at 25000 Hz (worst case, e.g., utilizing PWM) Flickering detected at a brightness setting of 14 % and below. There should be no flickering or PWM above this brightness setting. The frequency of 25000 Hz is quite high, so most users sensitive to PWM should not notice any flickering. In comparison: 53 % of all tested devices do not use PWM to dim the display. If PWM was detected, an average of 17924 (minimum: 5 - maximum: 3846000) Hz was measured. | |||
Display Response Times
| ↔ Response Time Black to White | ||
|---|---|---|
| 13.6 ms ... rise ↗ and fall ↘ combined | ↗ 11.8 ms rise |  |
| ↘ 1.8 ms fall | ||
| The screen shows good response rates in our tests, but may be too slow for competitive gamers. In comparison, all tested devices range from 0.1 (minimum) to 240 (maximum) ms. » 29 % of all devices are better. This means that the measured response time is better than the average of all tested devices (21.5 ms). | ||
| ↔ Response Time 50% Grey to 80% Grey | ||
| 28 ms ... rise ↗ and fall ↘ combined | ↗ 16.4 ms rise | 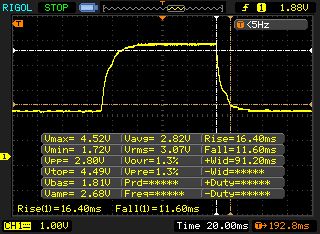 |
| ↘ 11.6 ms fall | ||
| The screen shows relatively slow response rates in our tests and may be too slow for gamers. In comparison, all tested devices range from 0.2 (minimum) to 636 (maximum) ms. » 32 % of all devices are better. This means that the measured response time is better than the average of all tested devices (33.7 ms). | ||
Performance – A Computing Power House
With the GE73 8RF, MSI offers a 17.3-inch gaming notebook. It runs all current titles smoothly and cuts a good figure in all other areas of applications. Our test device is available for around 2,000 to 2,100 Euros ($2,049 to $2,190). Other configurations are available according to the manufacturer.
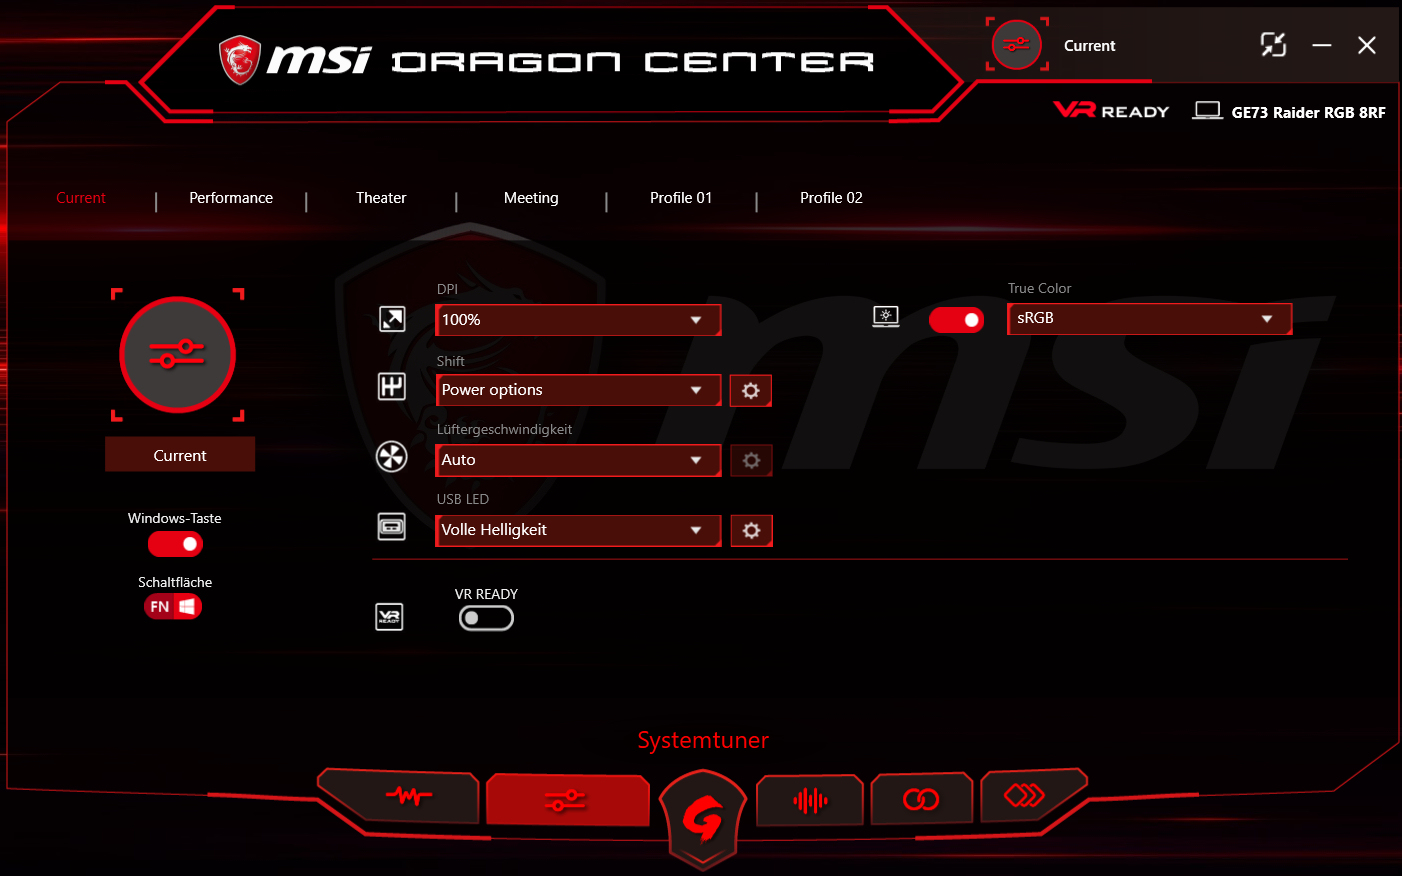
Test Conditions
The pre-installed Dragon Center features customizable fan speeds and energy profiles. All our tests were conducted with automatic fan controls activated. We further activated the shift mode “Power options”, i.e. the energy profiles of Windows 10 are employed. Of note: Occasionally, but not always, the Dragon Center switches into the shift mode “Turbo” after a restart of the computer. Users who do not wish to have this energy profile need to keep an eye on the Dragon Center.
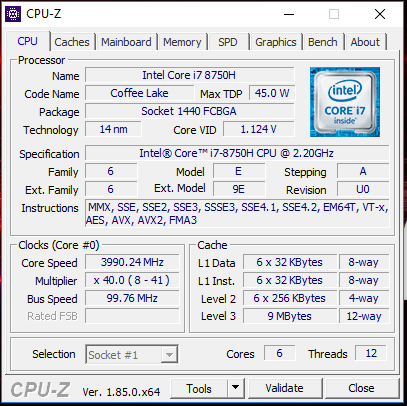
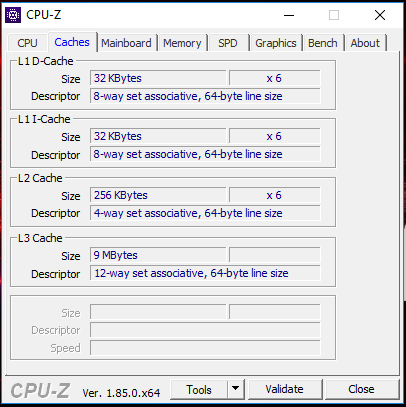
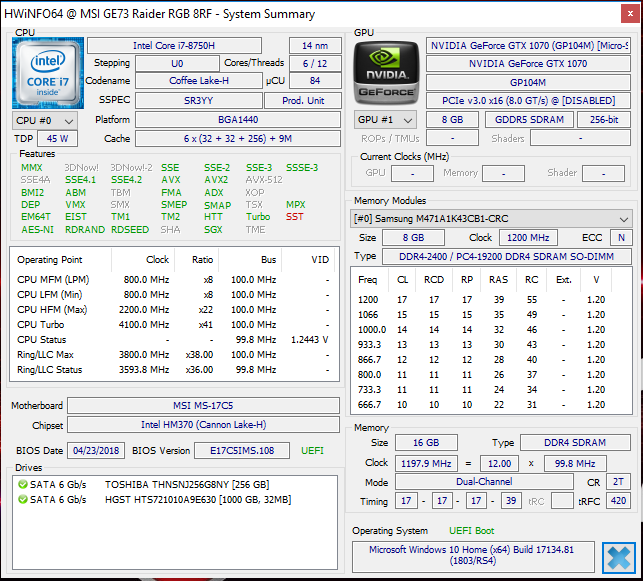
Processor
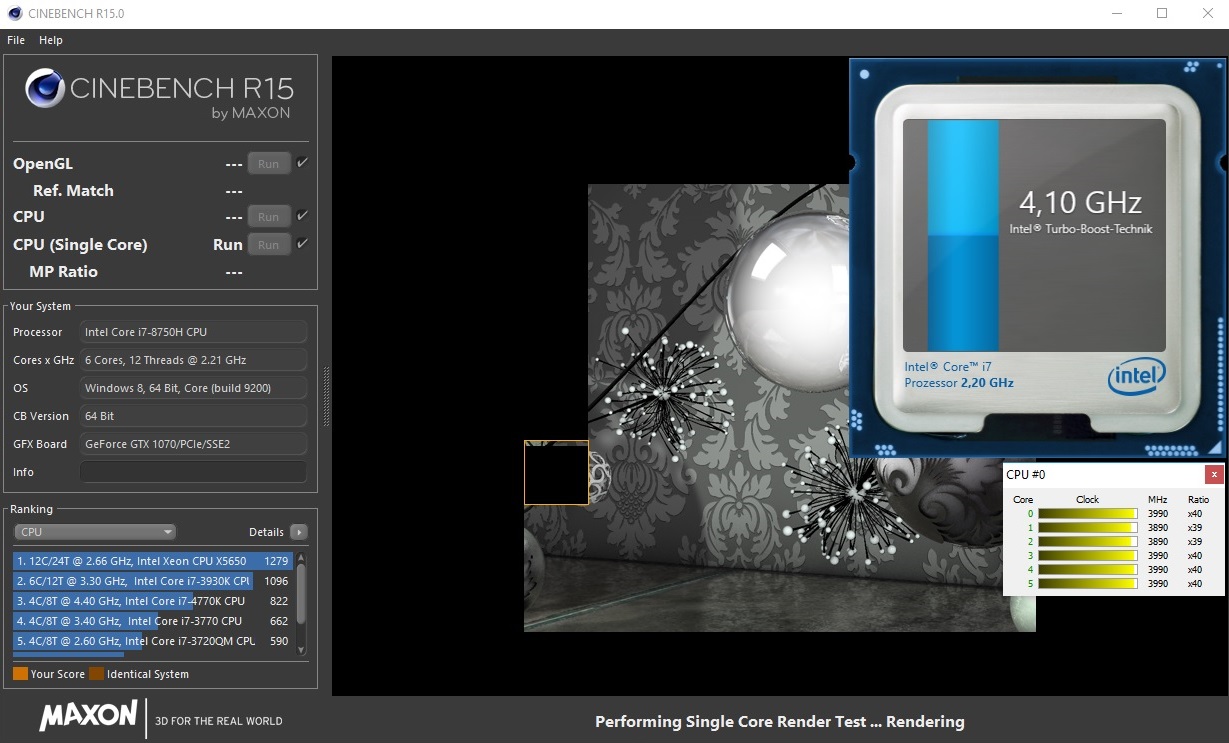
The GE73 is powered by a Core i7-8750H (Coffee Lake) hexa-core processor. It is a mobile chip with a TDP of 45 watts, but it can be briefly increased to 90 watts. The processor operates at a base clock speed of 2.2 GHz. The clock speed can be increased to 3.9 GHz (six cores), 4 GHz (four cores) or 4.1 GHz (one or two cores) via turbo.
The Cinebench benchmark single-thread tests are processed in mains and battery operation at 3.9 to 4.1 GHz.
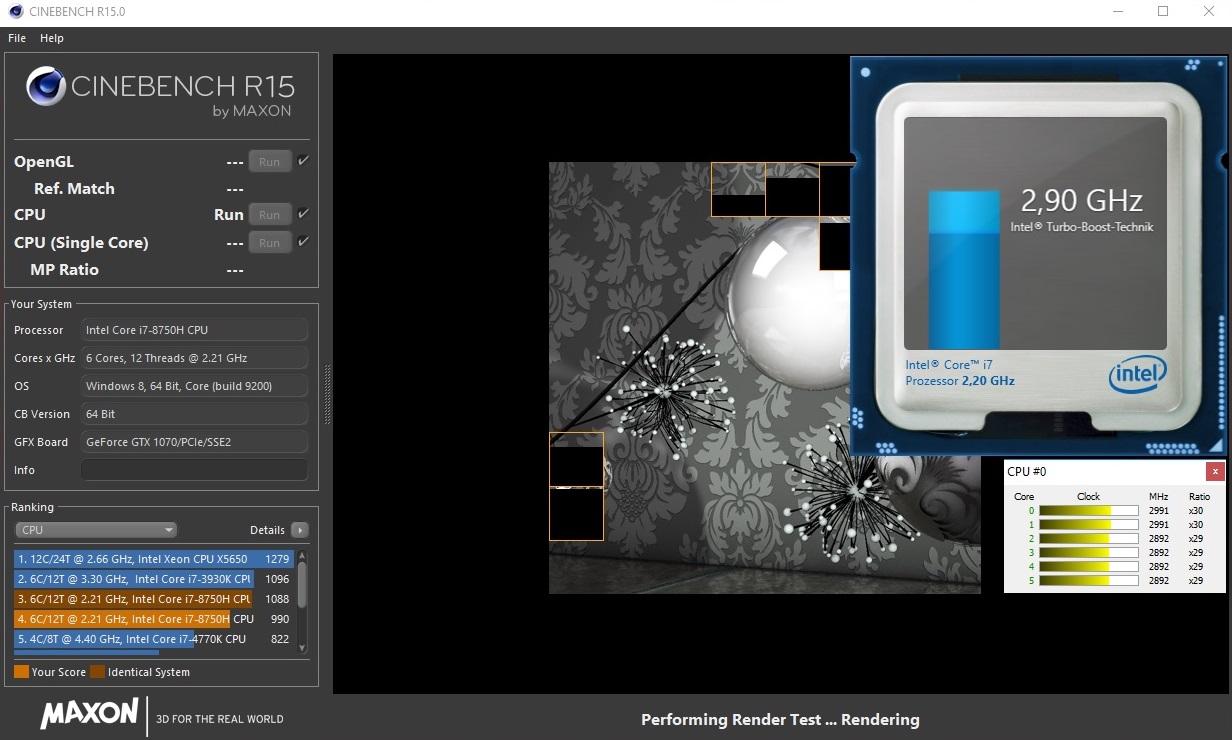
We check whether the turbo speeds can be kept long-term using a 30-minute continuous loop of the Cinebench R15 multi-thread test. The values decrease from the first to the second run and then remain largely on this level. The turbo is utilized, but not at its full power.
The results in our CPU benchmark tests give no reason to complain. The MSI gaming laptop delivers the expected performance. It performs better than many competitors, such as the Acer Predator Helios 500, which is equipped with the same CPU.
| Cinebench R10 | |
| Rendering Multiple CPUs 32Bit | |
| Average of class Gaming (32456 - 112749, n=24, last 2 years) | |
| MSI GE73 8RF-008 Raider RGB | |
| HP Omen X 17-ap0xx | |
| MSI GE73VR 7RF Raider | |
| Rendering Single 32Bit | |
| Average of class Gaming (5719 - 15819, n=24, last 2 years) | |
| MSI GE73 8RF-008 Raider RGB | |
| HP Omen X 17-ap0xx | |
| MSI GE73VR 7RF Raider | |
| Geekbench 3 | |
| 32 Bit Multi-Core Score | |
| MSI GE73 8RF-008 Raider RGB | |
| 32 Bit Single-Core Score | |
| MSI GE73 8RF-008 Raider RGB | |
| Geekbench 4.0 | |
| 64 Bit Multi-Core Score | |
| Average of class Gaming (31808 - 41034, n=3, last 2 years) | |
| MSI GE73 8RF-008 Raider RGB | |
| 64 Bit Single-Core Score | |
| Average of class Gaming (6453 - 7348, n=3, last 2 years) | |
| MSI GE73 8RF-008 Raider RGB | |
| Geekbench 4.4 | |
| 64 Bit Multi-Core Score | |
| Average of class Gaming (31241 - 71700, n=26, last 2 years) | |
| MSI GE73 8RF-008 Raider RGB | |
| 64 Bit Single-Core Score | |
| Average of class Gaming (5986 - 8936, n=26, last 2 years) | |
| MSI GE73 8RF-008 Raider RGB | |
| Mozilla Kraken 1.1 - Total | |
| MSI GE73 8RF-008 Raider RGB (Edge 42) | |
| HP Omen X 17-ap0xx (40.15063.674.0) | |
| MSI GE73VR 7RF Raider (EDGE: 40.15063.0.0) | |
| Acer Predator Helios 500 PH517-51-79BY | |
| Average of class Gaming (421 - 824, n=208, last 2 years) | |
| Octane V2 - Total Score | |
| Average of class Gaming (69893 - 111243, n=52, last 2 years) | |
| Acer Predator Helios 500 PH517-51-79BY | |
| MSI GE73VR 7RF Raider (EDGE: 40.15063.0.0) | |
| MSI GE73 8RF-008 Raider RGB (Edge 42) | |
| HP Omen X 17-ap0xx (40.15063.674.0) | |
| JetStream 1.1 - Total Score | |
| Average of class Gaming (357 - 650, n=27, last 2 years) | |
| MSI GE73VR 7RF Raider (EDGE: 40.15063.0.0) | |
| MSI GE73 8RF-008 Raider RGB (Edge 42) | |
| HP Omen X 17-ap0xx (40.15063.674.0) | |
| Acer Predator Helios 500 PH517-51-79BY | |
* ... smaller is better
System Performance
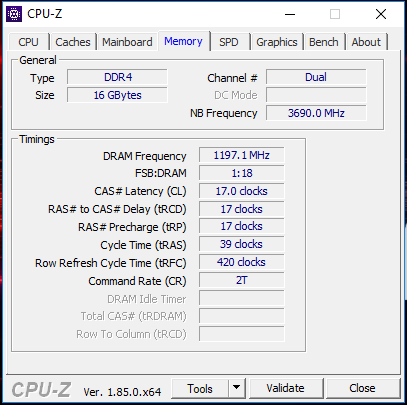
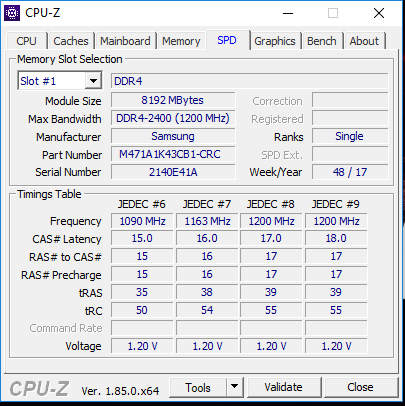
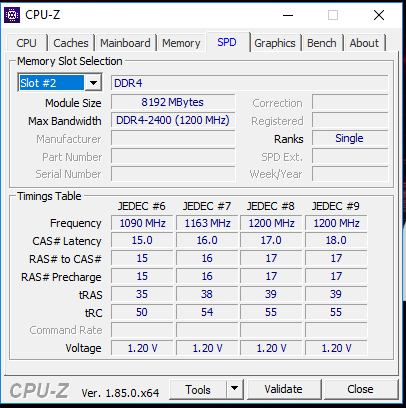
A solid-state drive, a powerful processor, and a dual-channel enabled working memory ensure a snappy system. The very good results of the PCMark benchmarks confirm that the MSI computer has more than enough power to handle gaming and video and photo editing applications. The Acer Predator Helios 500 is equipped with the same CPU-GPU combination and performs slightly better. We attribute this to the NVMe SSD on the one hand and to the deactivated integrated graphics core on the other hand. An increase in overall performance of the MSI GE73 would be possible by swapping the SATA-III SSD for an NVMe SSD, which would decrease loading times.
| PCMark 8 Home Score Accelerated v2 | 4498 points | |
| PCMark 8 Work Score Accelerated v2 | 5342 points | |
| PCMark 10 Score | 5465 points | |
Help | ||
| PCMark 10 - Score | |
| Average of class Gaming (5235 - 9852, n=197, last 2 years) | |
| Acer Predator Helios 500 PH517-51-79BY | |
| MSI GE73 8RF-008 Raider RGB | |
| HP Omen X 17-ap0xx | |
| MSI GS73VR 7RG | |
| SCHENKER XMG Pro 17 | |
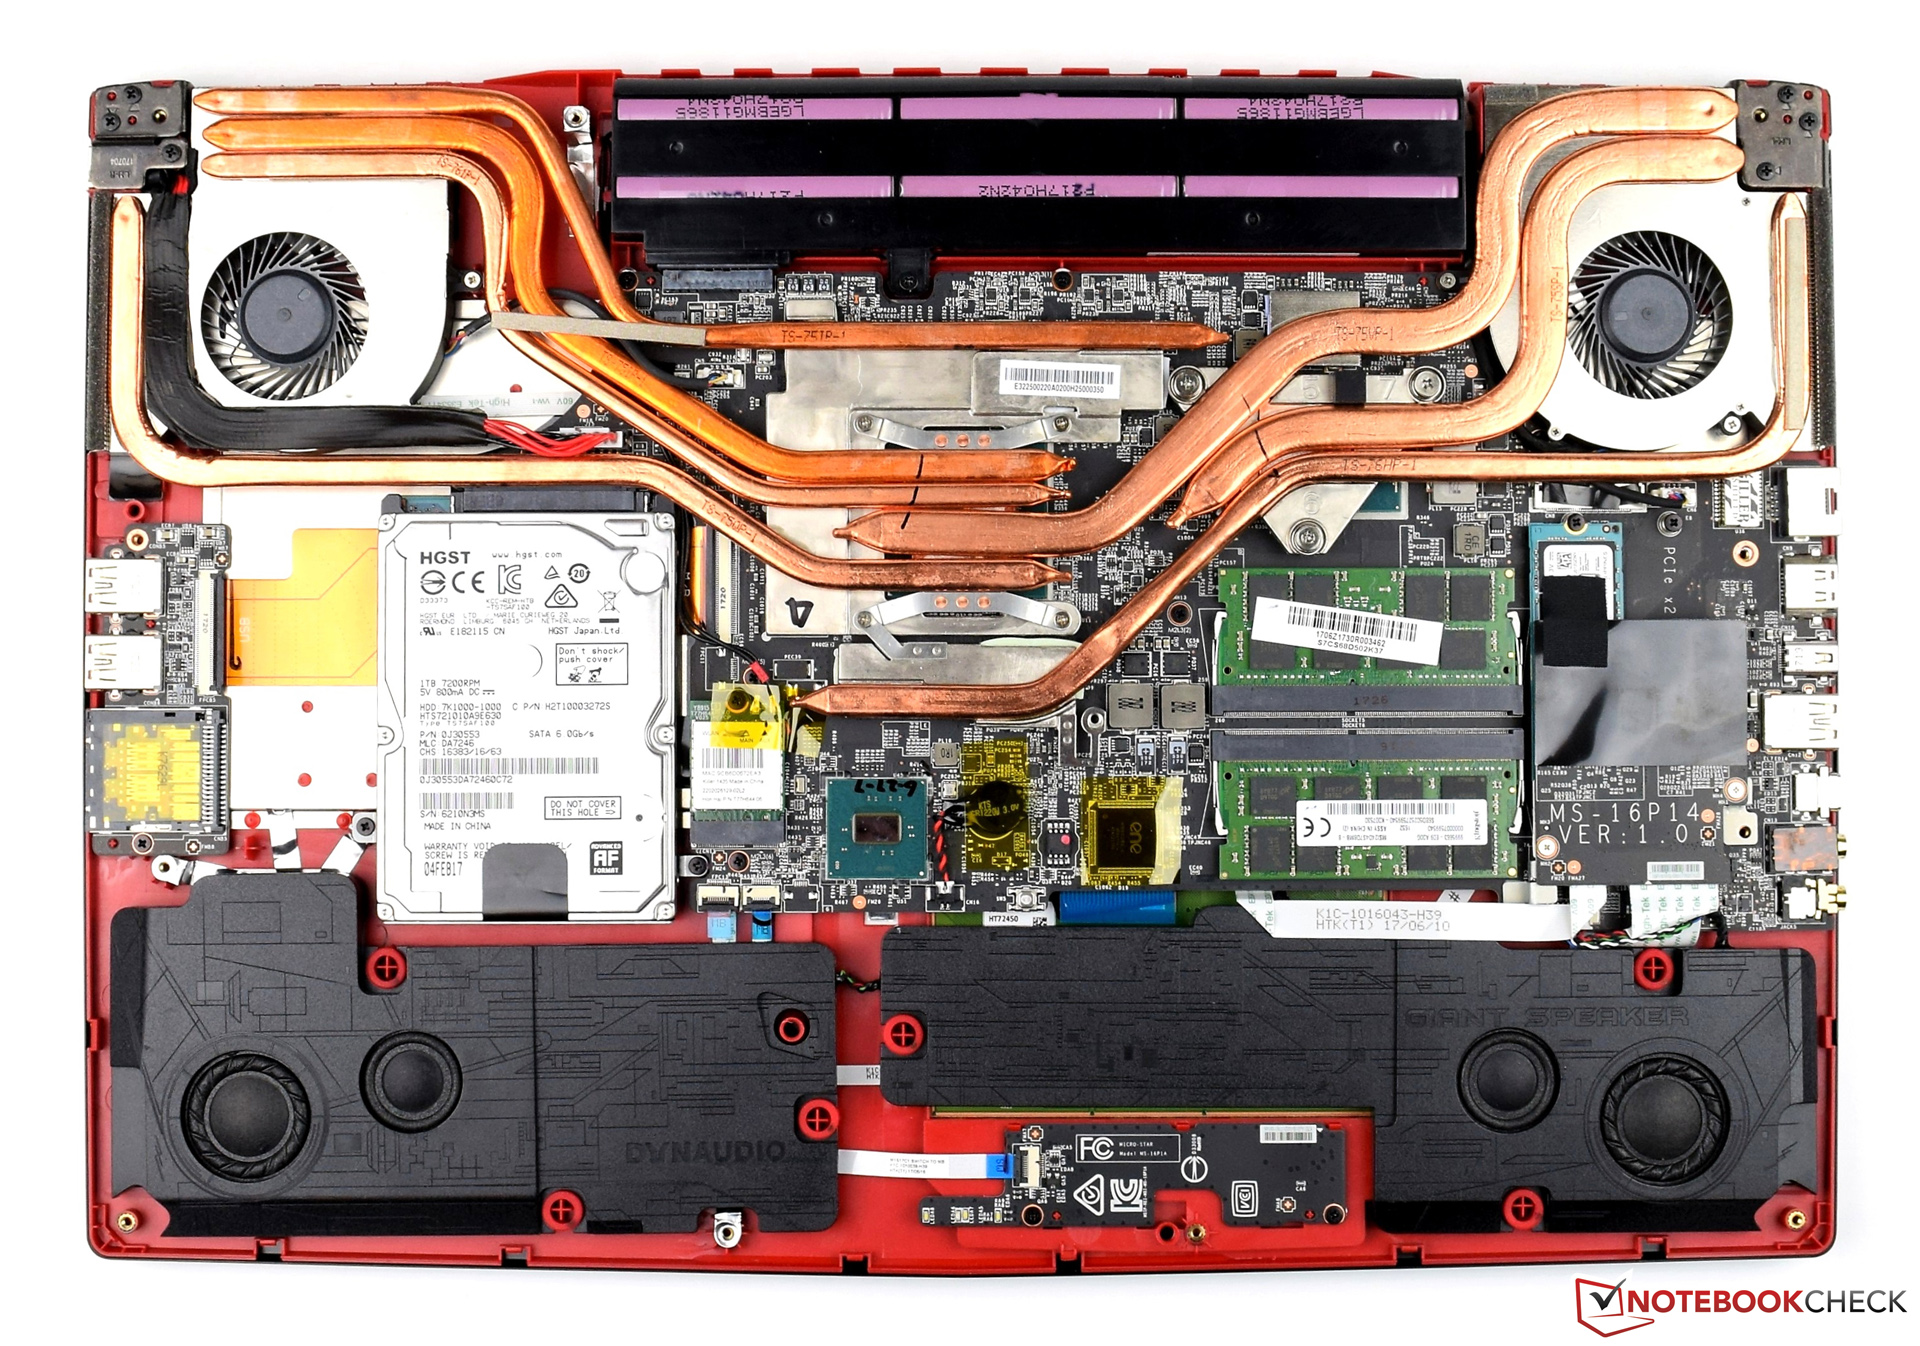
Storage Solution
MSI furnished our model with an M.2-2880 SATA-III SSD from Toshiba with a storage capacity of 256 GB out of which around 191 GB are available to the user. The occupied disk space is divided between the recovery partition and the Windows installation. The storage required for a gaming notebook is provided by a 1 TB 2.5-inch hard drive from HGST.
The GE73 packs two M.2-2880 slots, both of which support the NVMe standard and one of them additionally supports SATA-III. Thus, users have the possibility to install an NVMe drive that is able to reach much higher transfer speeds thanks to its PCI Express 3.0 x4 connection.

| MSI GE73 8RF-008 Raider RGB Toshiba HG6 THNSNJ256G8NY | Acer Predator Helios 500 PH517-51-79BY SK hynix SSD Canvas SC300 HFS256GD9MNE-6200A | SCHENKER XMG Pro 17 Samsung SSD 960 Evo 500GB m.2 NVMe | HP Omen X 17-ap0xx Samsung PM961 MZVLW256HEHP | MSI GE73VR 7RF Raider Toshiba HG6 THNSNJ256G8NY | |
|---|---|---|---|---|---|
| CrystalDiskMark 5.2 / 6 | 108% | 294% | 237% | 26% | |
| Read Seq Q32T1 | 545 | 1488 173% | 3319 509% | 3450 533% | 540 -1% |
| Write Seq Q32T1 | 283.8 | 948 234% | 1840 548% | 1210 326% | 489.9 73% |
| Read 4K Q32T1 | 207.9 | 304 46% | 561 170% | 535 157% | 313.5 51% |
| Write 4K Q32T1 | 139.8 | 189.6 36% | 481 244% | 444 218% | 189.1 35% |
| Read Seq | 527 | 1087 106% | 1788 239% | 1461 177% | 521 -1% |
| Write Seq | 412.9 | 950 130% | 1656 301% | 1216 195% | 427.6 4% |
| Read 4K | 19.43 | 39.69 104% | 45.55 134% | 46.64 140% | 20.41 5% |
| Write 4K | 58.8 | 79.2 35% | 179.4 205% | 148.8 153% | 83.3 42% |
Graphics Card
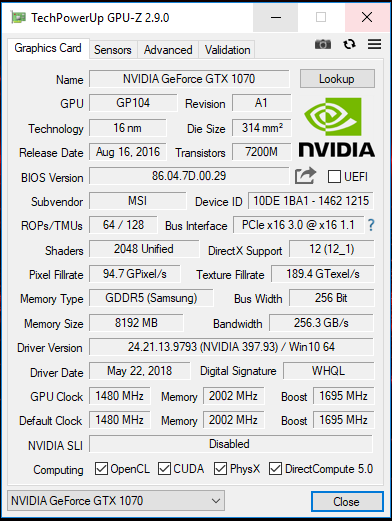
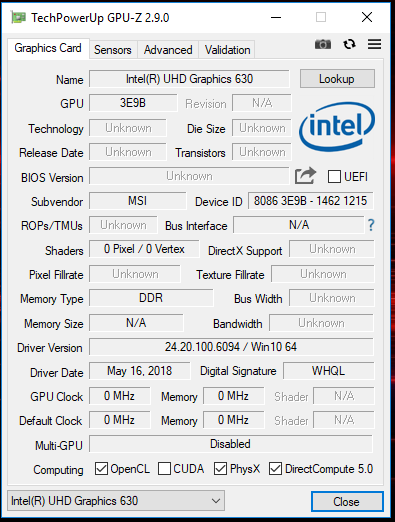
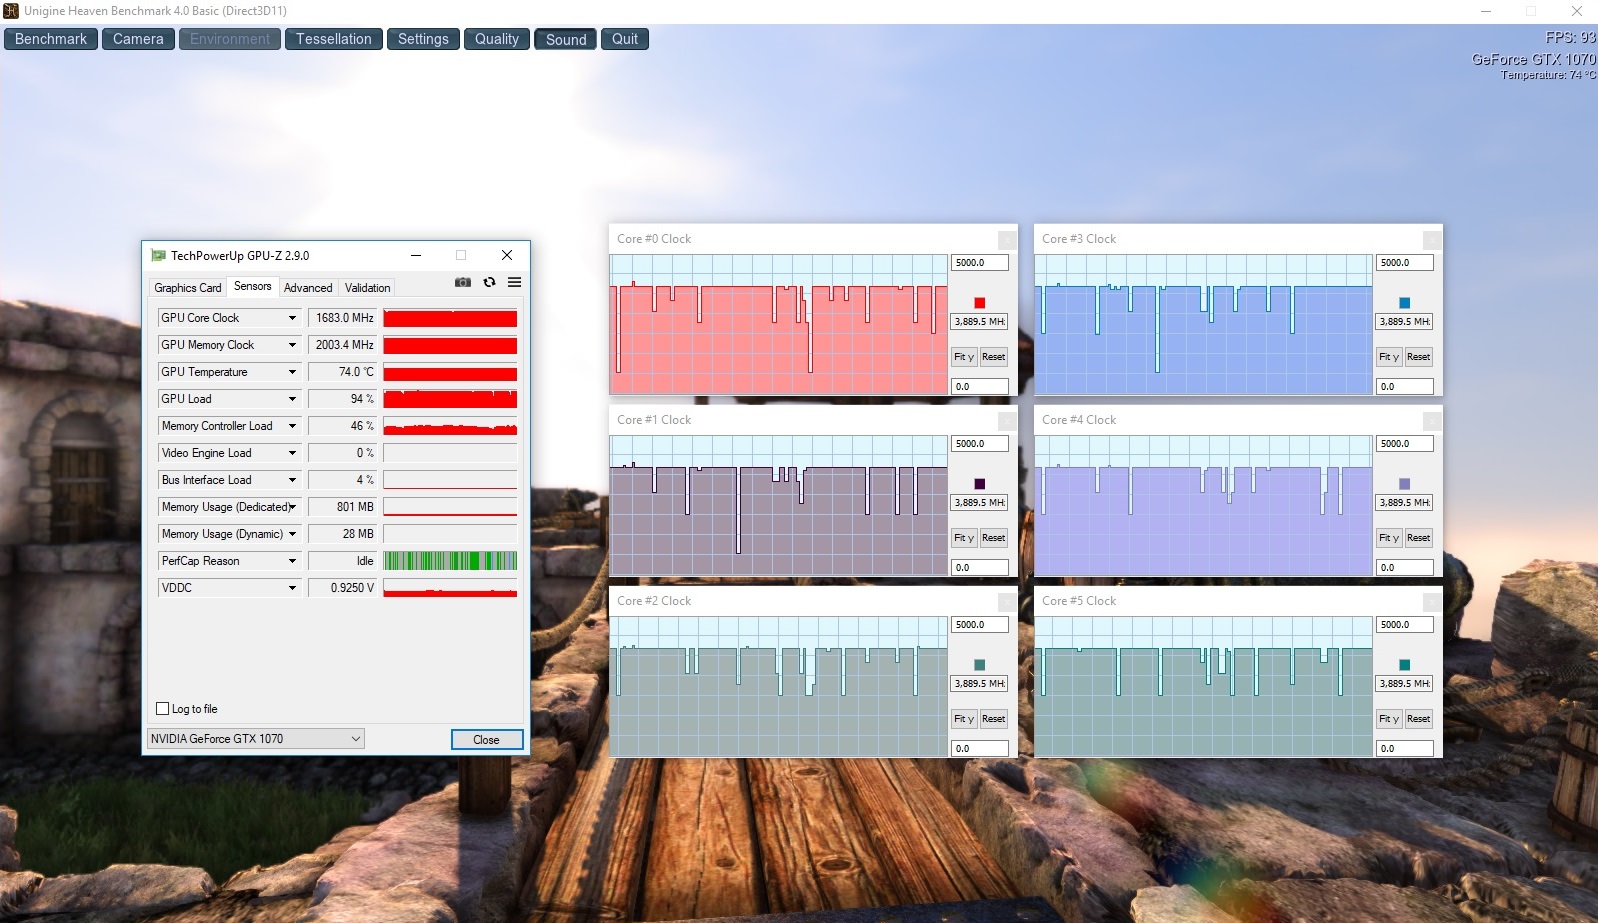
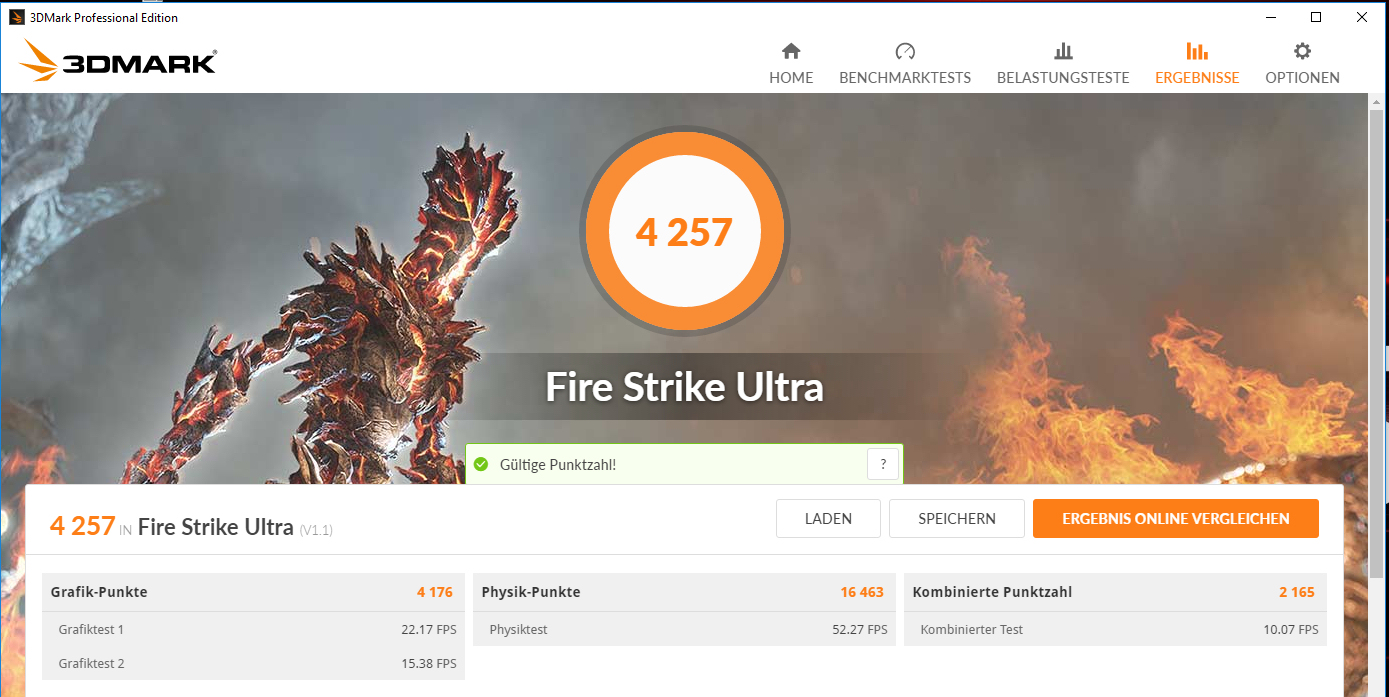
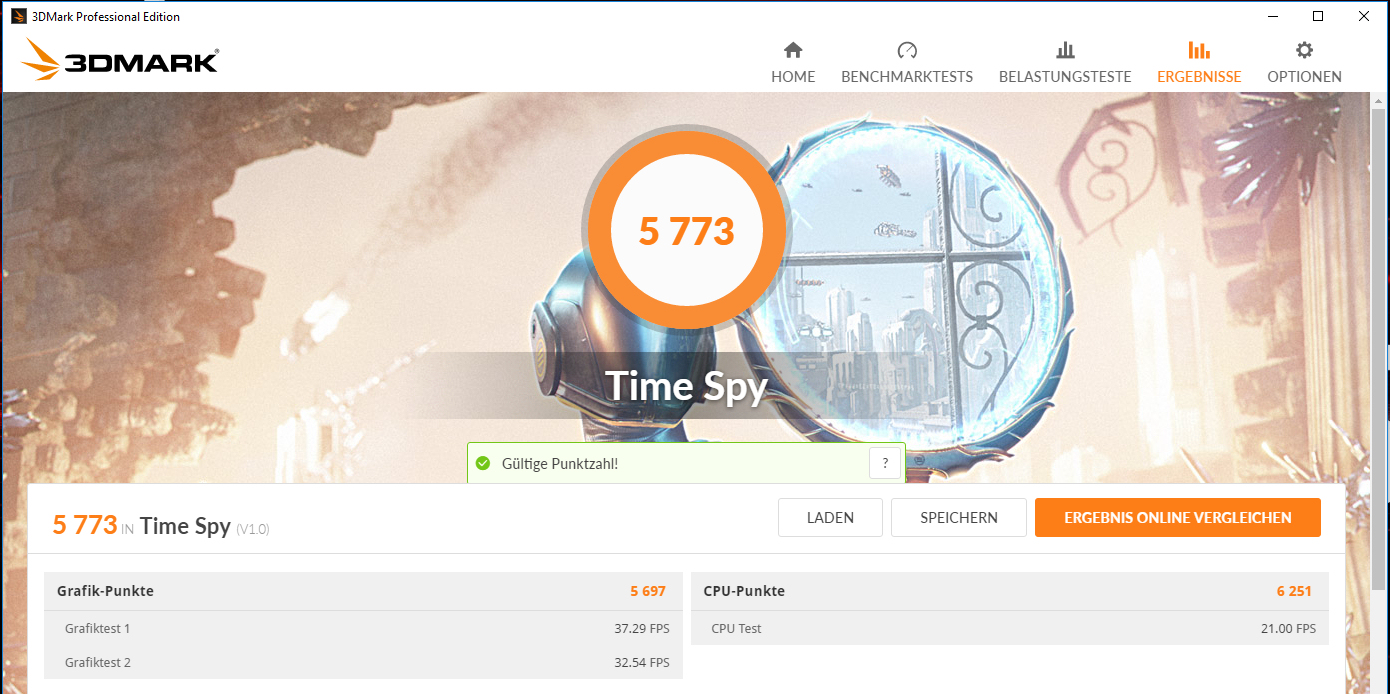
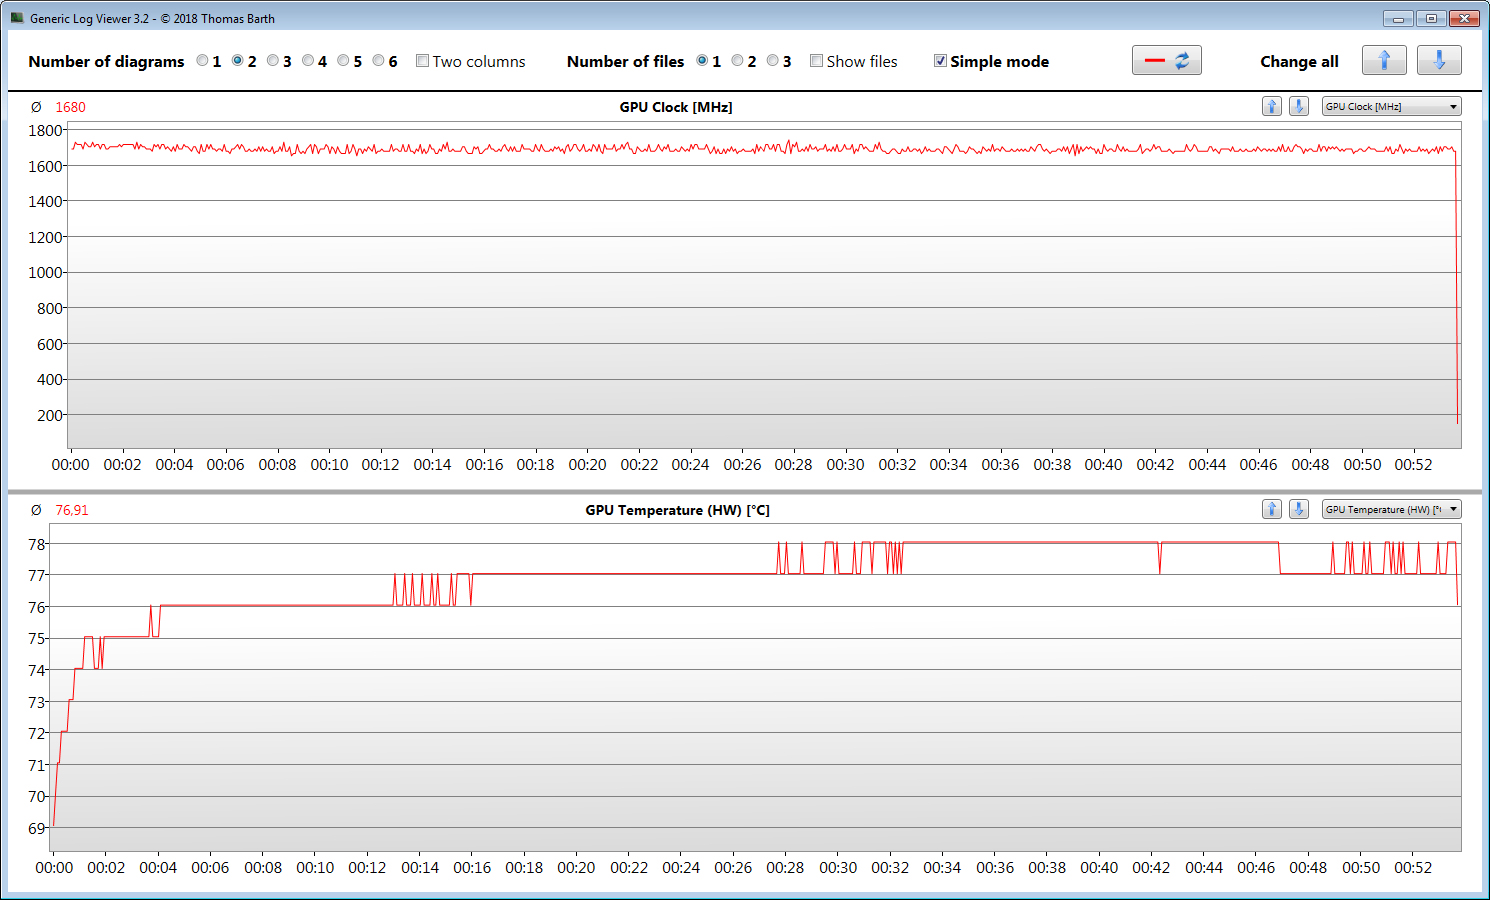
The MSI comes with an Nvidia GeForce GTX 1070 graphics processing unit. This Pascal-based GPU supports DirectX 12 and clocks up to a maximum of 1,873 MHz. However, this clock speed cannot be kept very long. In our test, we record an average of 1,683 MHz. The graphics core is backed by 8,192 MB of GDDR5 memory. The 3D Mark results of this GPU are well within the normal range.
The integrated UHD Graphics 630 of the processor is activated. Nvidia Optimus controls the switching between discrete and integrated GPU depending on the application.

| 3DMark 06 Standard Score | 35100 points | |
| 3DMark 11 Performance | 18568 points | |
| 3DMark Ice Storm Standard Score | 97741 points | |
| 3DMark Cloud Gate Standard Score | 33305 points | |
| 3DMark Fire Strike Score | 15656 points | |
| 3DMark Fire Strike Extreme Score | 8048 points | |
| 3DMark Time Spy Score | 5773 points | |
Help | ||
| 3DMark 11 - 1280x720 Performance GPU | |
| Average of class Gaming (1029 - 72070, n=229, last 2 years) | |
| HP Omen X 17-ap0xx | |
| MSI GE73VR 7RF Raider | |
| MSI GE73 8RF-008 Raider RGB | |
| SCHENKER XMG Pro 17 | |
Gaming Performance
The hardware of the MSI computer is potent enough to bring all current games smoothly to the screen. Most titles can be enjoyed in Full-HD with high to maximum details. The GTX 1070 still has reserves for higher resolutions. If a 4K screen were connected, many games should still run smoothly at this resolution.

We check whether the frame rates remain largely constant during gaming by loading up The Witcher 3. We let the title run for about 60 minutes with Full-HD resolution and maximum quality settings while not moving the character embodied by the player during the entire session. Frame rates drop from about 61 to 63 fps down to 57 to 60 fps. This change can barely be considered a slump. In battery mode, frame rates of 21 fps render The Witcher 3 virtually impossible to play.
| The Witcher 3 - 1920x1080 Ultra Graphics & Postprocessing (HBAO+) | |
| Average of class Gaming (8.61 - 216, n=225, last 2 years) | |
| HP Omen X 17-ap0xx | |
| MSI GE73 8RF-008 Raider RGB | |
| SCHENKER XMG Pro 17 | |
| MSI GE73VR 7RF Raider | |
| Acer Predator Helios 500 PH517-51-79BY | |
| low | med. | high | ultra | |
| Tomb Raider (2013) | 442.2 | 390.4 | 352.8 | 207.3 |
| BioShock Infinite (2013) | 284.7 | 246.3 | 231 | 139.6 |
| The Witcher 3 (2015) | 254.6 | 184.7 | 113.8 | 62.9 |
| Assassin´s Creed Origins (2017) | 88 | 77 | 75 | 65 |
| X-Plane 11.11 (2018) | 93 | 79.6 | 68 | |
| Far Cry 5 (2018) | 118 | 93 | 90 | 86 |
Emissions – No Excessive Heat
Noise Emissions
When idling, the fans usually operate at low speeds resulting in an acceptable background noise. However, even with the fans stopping from time to time, the 2.5-inch hard drive produces a constant noise. Under full load, the sound pressure level rises up to 54 dB(A). In everyday gaming, values between 41 and 54 dB(A) can be expected. During a session of The Witcher 3 we measured a value of 50 dB(A). The comparison with MSI’s identically constructed predecessor GE73VR 7RF yields a positive assessment for our current test device: It produces slightly less noise under low to medium load – despite a more powerful CPU.
Noise Level
| Idle |
| 32 / 33 / 34 dB(A) |
| HDD |
| 33 dB(A) |
| Load |
| 41 / 54 dB(A) |
 | ||
30 dB silent 40 dB(A) audible 50 dB(A) loud |
||
min: | ||
| MSI GE73 8RF-008 Raider RGB i7-8750H, GeForce GTX 1070 Mobile | Acer Predator Helios 500 PH517-51-79BY i7-8750H, GeForce GTX 1070 Mobile | SCHENKER XMG Pro 17 i7-7700HQ, GeForce GTX 1070 Mobile | HP Omen X 17-ap0xx i7-7820HK, GeForce GTX 1080 Mobile | MSI GE73VR 7RF Raider i7-7700HQ, GeForce GTX 1070 Mobile | Average of class Gaming | |
|---|---|---|---|---|---|---|
| Noise | 2% | -4% | 5% | -5% | 10% | |
| off / environment * | 30 | 30.4 -1% | 29 3% | 28.3 6% | 30 -0% | 24.1 ? 20% |
| Idle Minimum * | 32 | 31.2 2% | 32 -0% | 31.5 2% | 33 -3% | 25.6 ? 20% |
| Idle Average * | 33 | 35.3 -7% | 33 -0% | 31.6 4% | 34 -3% | 27.4 ? 17% |
| Idle Maximum * | 34 | 35.3 -4% | 35 -3% | 31.6 7% | 39 -15% | 30.8 ? 9% |
| Load Average * | 41 | 44.4 -8% | 50 -22% | 36.8 10% | 47 -15% | 43 ? -5% |
| Witcher 3 ultra * | 50 | 41 18% | 52 -4% | 48.2 4% | 49 2% | |
| Load Maximum * | 54 | 45.2 16% | 56 -4% | 52.1 4% | 54 -0% | 53.4 ? 1% |
* ... smaller is better
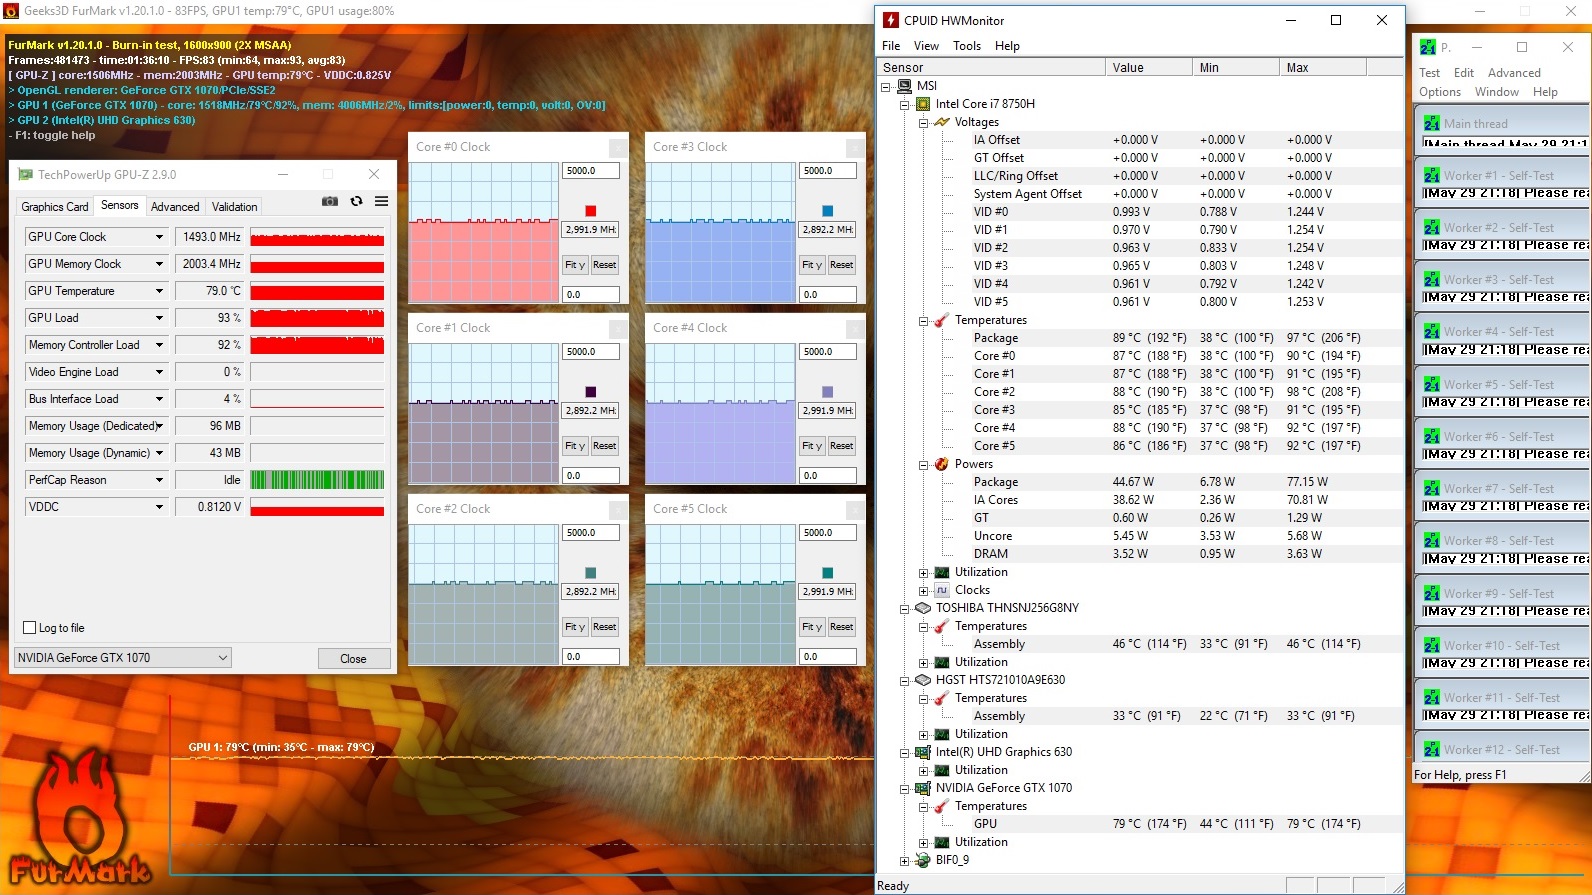
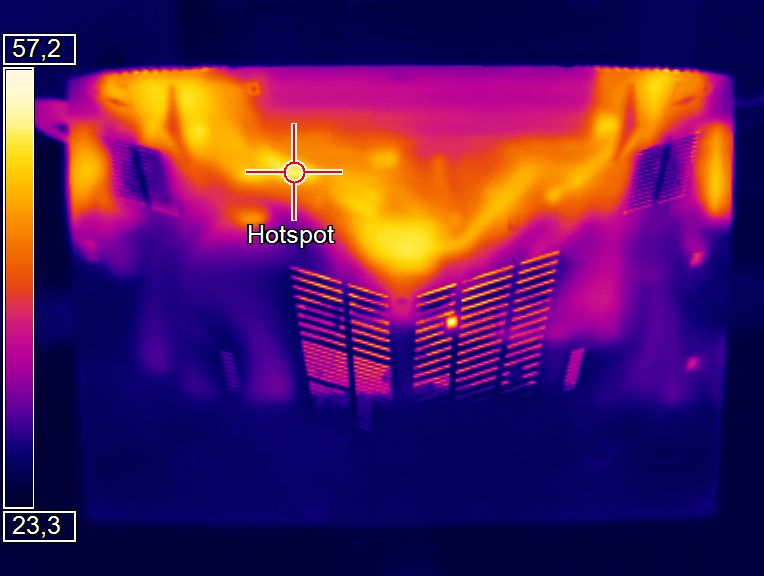
Temperature
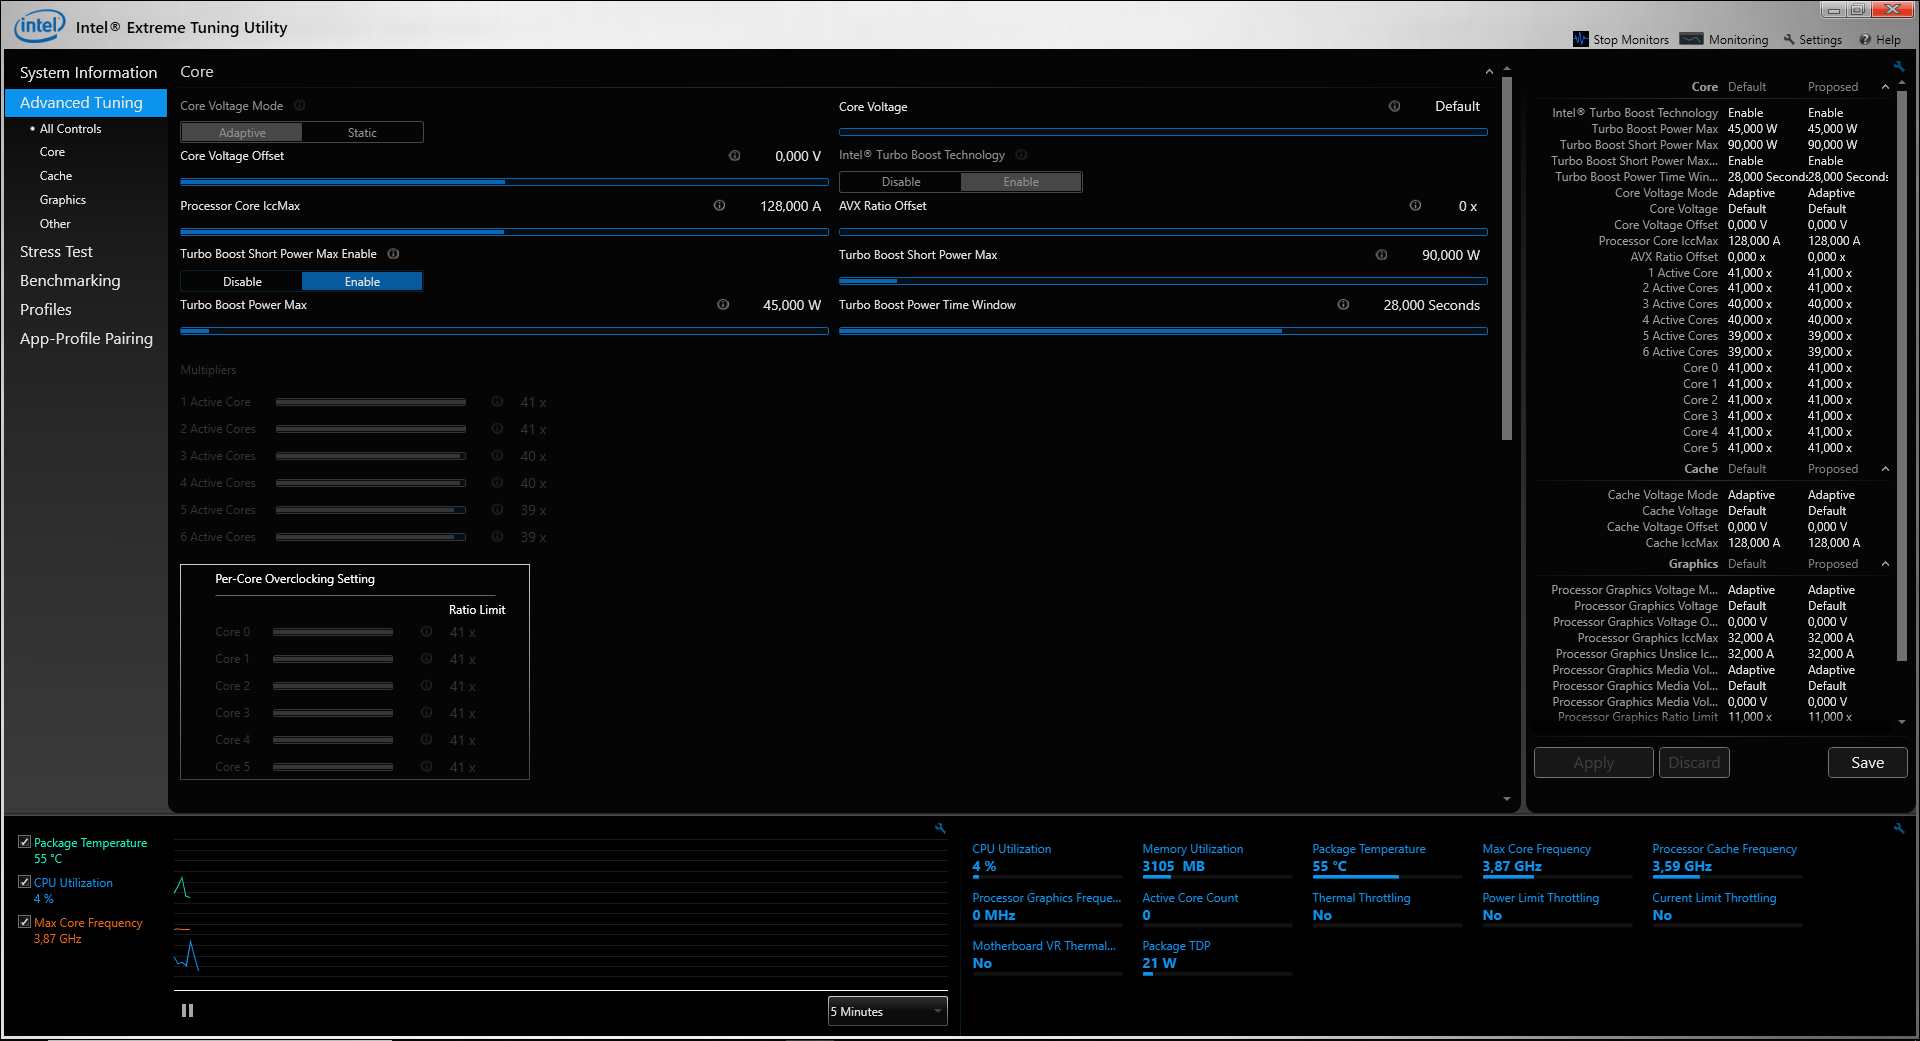
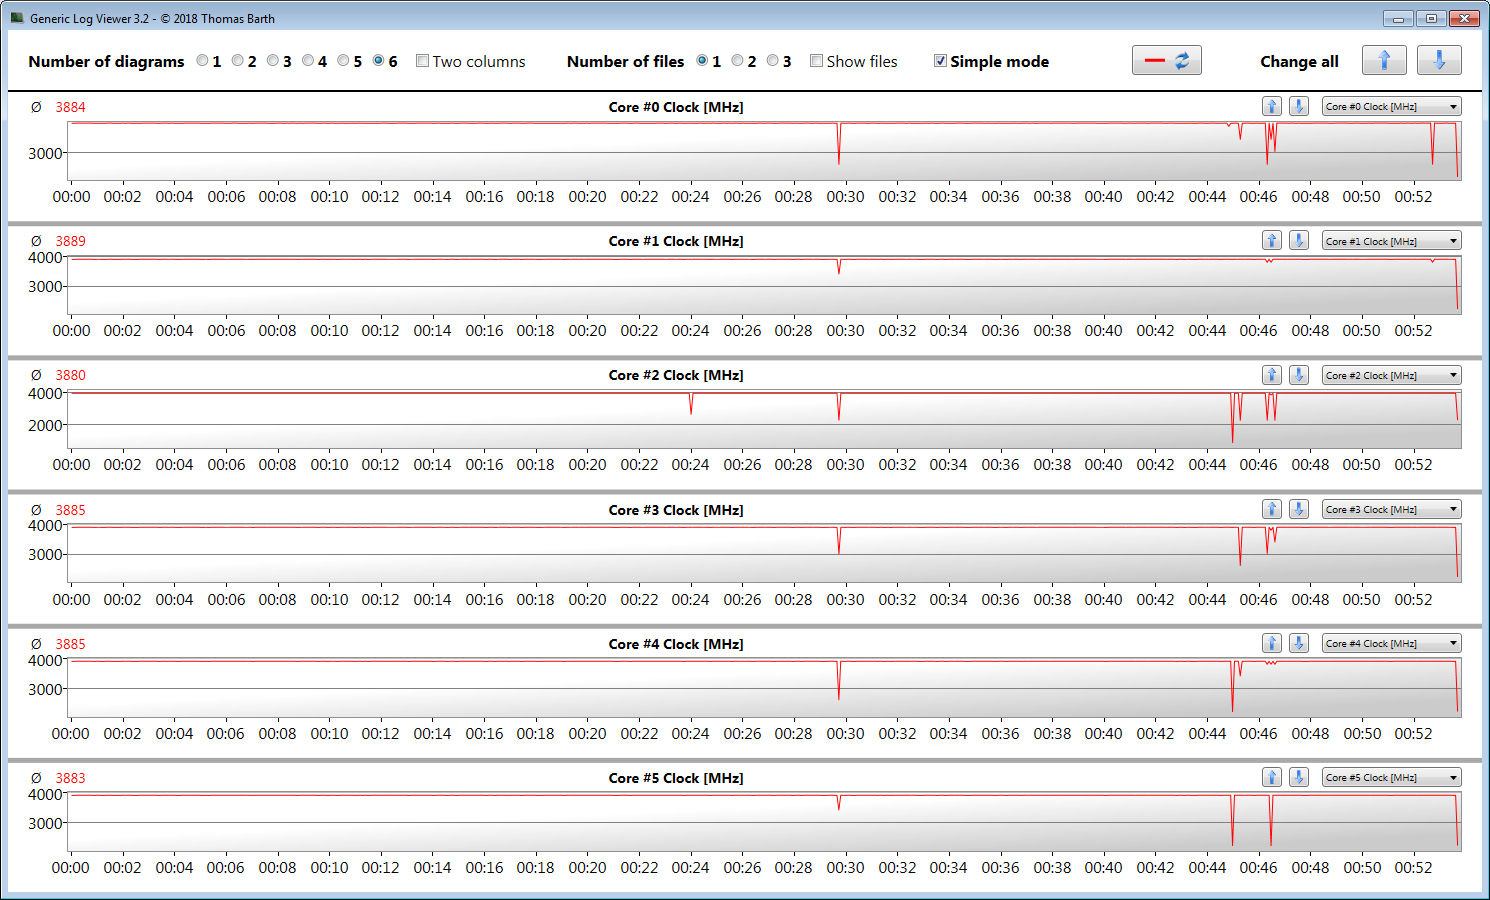
Our stress tests in which Prime95 and FurMark run for at least one hour yield different results. In mains operation, the CPU operates at clock speeds of 2.9 to 3.0 GHz and the GPU operates at clock speeds of 1,400 to 1,500 MHz. In battery mode, the clock speeds drop to 800 MHz for the processor and to 139 MHz for the graphics core.
When putting the power of the GE73 into perspective, the heat generation is quite within limits. During the stress test, temperatures between 45 and 49 °C (113 to 120 °F) are recorded at several points on the outside of the case. The temperature rise during our The Witcher 3 test (the game runs for one hour on Full-HD resolution and maximum details) is slightly lower.
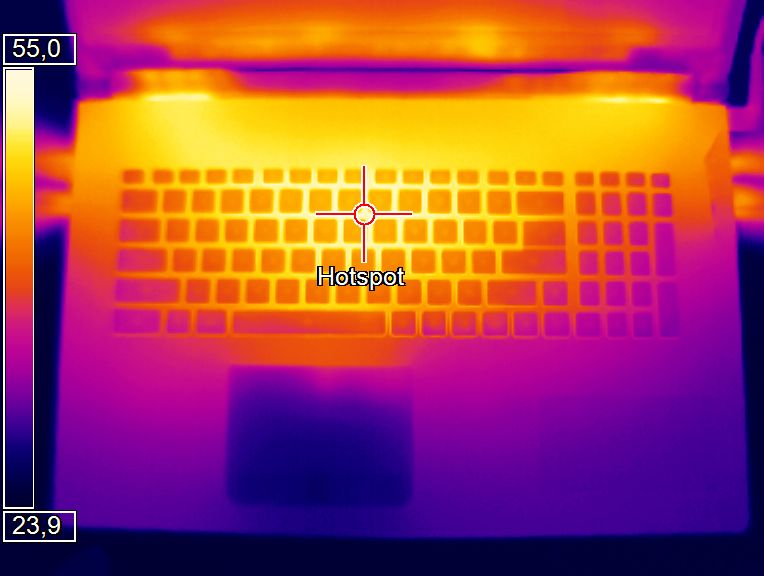
(-) The maximum temperature on the upper side is 47 °C / 117 F, compared to the average of 40.4 °C / 105 F, ranging from 21.2 to 68.8 °C for the class Gaming.
(-) The bottom heats up to a maximum of 49 °C / 120 F, compared to the average of 43.2 °C / 110 F
(+) In idle usage, the average temperature for the upper side is 29 °C / 84 F, compared to the device average of 33.8 °C / 93 F.
(-) Playing The Witcher 3, the average temperature for the upper side is 40.2 °C / 104 F, compared to the device average of 33.8 °C / 93 F.
(+) The palmrests and touchpad are reaching skin temperature as a maximum (32 °C / 89.6 F) and are therefore not hot.
(-) The average temperature of the palmrest area of similar devices was 28.9 °C / 84 F (-3.1 °C / -5.6 F).
| MSI GE73 8RF-008 Raider RGB i7-8750H, GeForce GTX 1070 Mobile | Acer Predator Helios 500 PH517-51-79BY i7-8750H, GeForce GTX 1070 Mobile | SCHENKER XMG Pro 17 i7-7700HQ, GeForce GTX 1070 Mobile | HP Omen X 17-ap0xx i7-7820HK, GeForce GTX 1080 Mobile | MSI GE73VR 7RF Raider i7-7700HQ, GeForce GTX 1070 Mobile | Average of class Gaming | |
|---|---|---|---|---|---|---|
| Heat | 9% | 4% | 22% | 11% | 2% | |
| Maximum Upper Side * | 47 | 42.6 9% | 55 -17% | 35.6 24% | 48 -2% | 46 ? 2% |
| Maximum Bottom * | 49 | 37.2 24% | 56 -14% | 39 20% | 49 -0% | 49.5 ? -1% |
| Idle Upper Side * | 32 | 33.6 -5% | 25 22% | 24.2 24% | 25 22% | 31.4 ? 2% |
| Idle Bottom * | 34 | 31 9% | 26 24% | 27.4 19% | 26 24% | 32.5 ? 4% |
* ... smaller is better
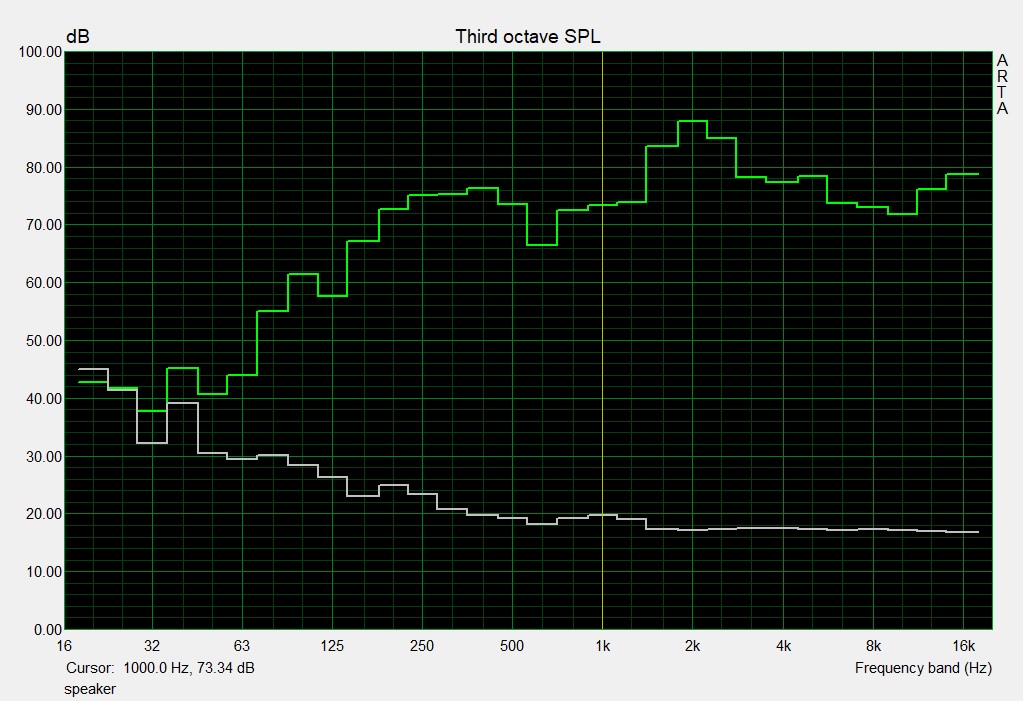
Speakers
The GE73 accommodates two speakers and two subwoofers. The speakers have an increased wattage of 3 watts compared to the predecessor’s 2 watts. The subwoofers remain unchanged. Except for the somewhat muffled bass, the sound is largely convincing. To increase the sound experience in notebooks, we suggest the use of external speakers or headphones.
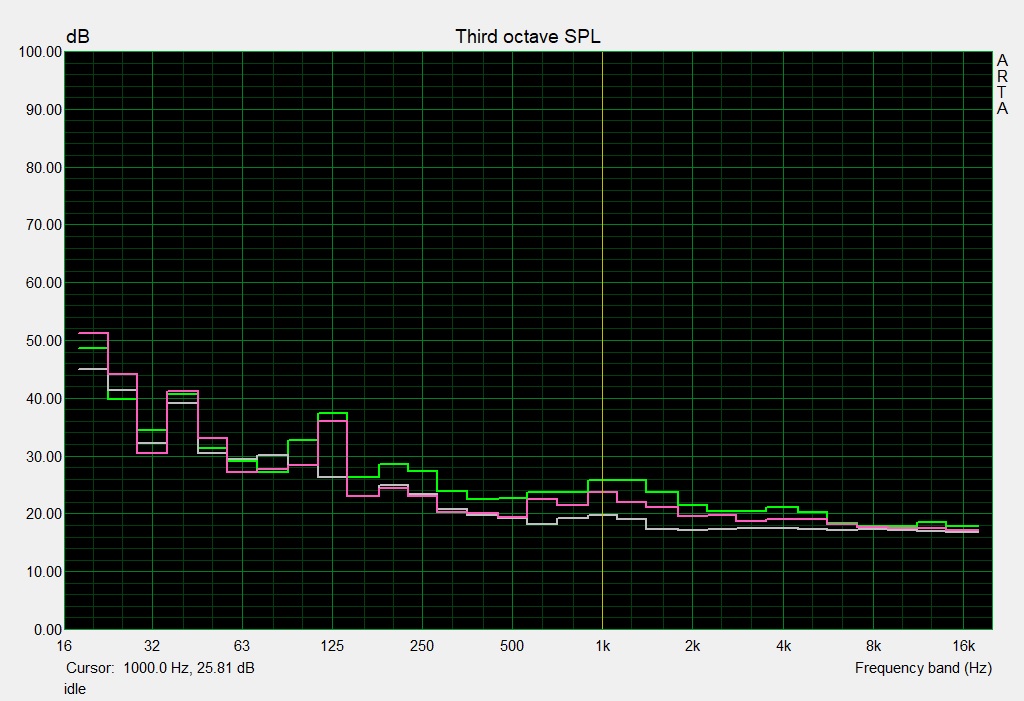
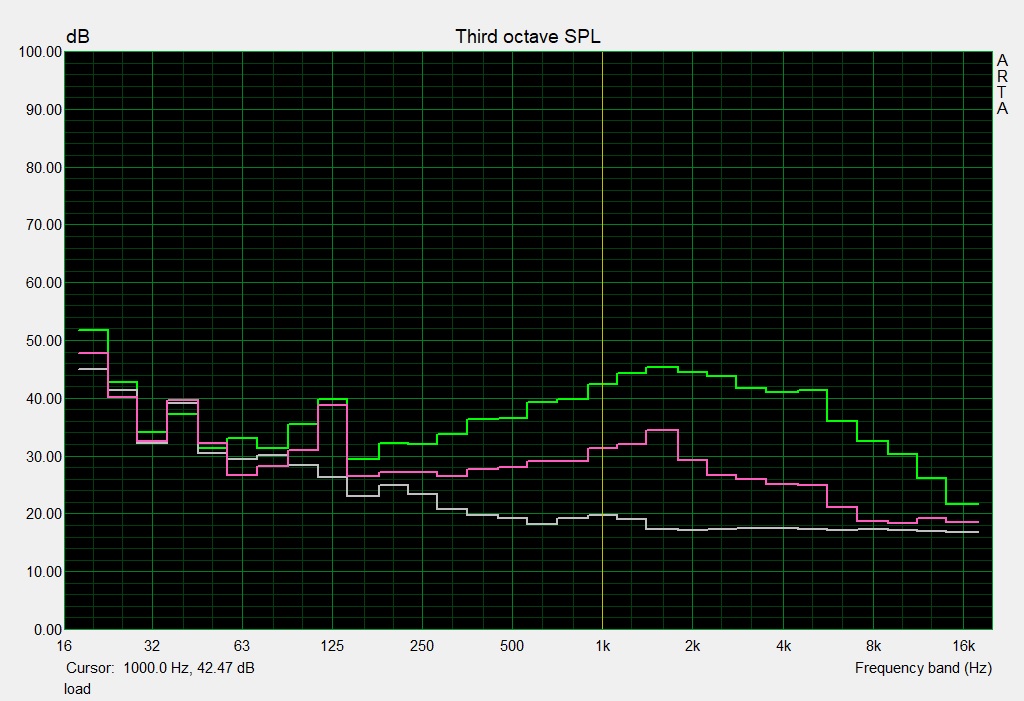
MSI GE73 8RF-008 Raider RGB audio analysis
(+) | speakers can play relatively loud (93 dB)
Bass 100 - 315 Hz
(±) | reduced bass - on average 7% lower than median
(±) | linearity of bass is average (8.1% delta to prev. frequency)
Mids 400 - 2000 Hz
(+) | balanced mids - only 4.8% away from median
(±) | linearity of mids is average (7.1% delta to prev. frequency)
Highs 2 - 16 kHz
(+) | balanced highs - only 3.6% away from median
(+) | highs are linear (4.6% delta to prev. frequency)
Overall 100 - 16.000 Hz
(+) | overall sound is linear (10.2% difference to median)
Compared to same class
» 4% of all tested devices in this class were better, 3% similar, 93% worse
» The best had a delta of 6%, average was 18%, worst was 132%
Compared to all devices tested
» 3% of all tested devices were better, 1% similar, 96% worse
» The best had a delta of 4%, average was 25%, worst was 134%
Acer Predator Helios 500 PH517-51-79BY audio analysis
(-) | not very loud speakers (65 dB)
Bass 100 - 315 Hz
(±) | reduced bass - on average 6.5% lower than median
(±) | linearity of bass is average (7.6% delta to prev. frequency)
Mids 400 - 2000 Hz
(+) | balanced mids - only 2.3% away from median
(+) | mids are linear (5.2% delta to prev. frequency)
Highs 2 - 16 kHz
(+) | balanced highs - only 1.9% away from median
(±) | linearity of highs is average (7.9% delta to prev. frequency)
Overall 100 - 16.000 Hz
(+) | overall sound is linear (11.7% difference to median)
Compared to same class
» 9% of all tested devices in this class were better, 3% similar, 87% worse
» The best had a delta of 6%, average was 18%, worst was 132%
Compared to all devices tested
» 6% of all tested devices were better, 2% similar, 92% worse
» The best had a delta of 4%, average was 25%, worst was 134%
Energy Management – Meager Endurance
Energy Consumption
The GE73 8RF does not show any peculiarities in terms of energy consumption in any of the tested workloads. At idle, we measure power consumption between 15 and 26 watts with several outlier measurements at higher consumption levels. The Acer Predator Helios 500 with an identical CPU-GPU combination consumes more energy when idling at all times due to its deactivated integrated GPU. During the stress test, the energy consumption increases to 239 watts thereby exceeding the rated output of the 230-watt power supply. Apparently, MSI was aware of this and implemented a sufficient cushion into the power supply since the battery does not drain. During everyday gaming, the notebook is content with less power. When playing The Witcher 3 for example, we measured an energy requirement of around 186 watts.
| Off / Standby | |
| Idle | |
| Load |
|
| MSI GE73 8RF-008 Raider RGB i7-8750H, GeForce GTX 1070 Mobile | Acer Predator Helios 500 PH517-51-79BY i7-8750H, GeForce GTX 1070 Mobile | SCHENKER XMG Pro 17 i7-7700HQ, GeForce GTX 1070 Mobile | HP Omen X 17-ap0xx i7-7820HK, GeForce GTX 1080 Mobile | MSI GE73VR 7RF Raider i7-7700HQ, GeForce GTX 1070 Mobile | Average of class Gaming | |
|---|---|---|---|---|---|---|
| Power Consumption | -22% | 5% | -13% | 8% | -2% | |
| Idle Minimum * | 15 | 20.4 -36% | 13 13% | 21.6 -44% | 10 33% | 13.7 ? 9% |
| Idle Average * | 20 | 26.5 -33% | 19 5% | 26.4 -32% | 18 10% | 19.1 ? 4% |
| Idle Maximum * | 26 | 37 -42% | 26 -0% | 26.6 -2% | 26 -0% | 26.8 ? -3% |
| Load Average * | 97 | 129 -33% | 95 2% | 95.6 1% | 97 -0% | 110.9 ? -14% |
| Witcher 3 ultra * | 186 | 186 -0% | 179 4% | 221.7 -19% | 183 2% | |
| Load Maximum * | 239 | 216 10% | 220 8% | 199.6 16% | 230 4% | 250 ? -5% |
* ... smaller is better
Battery Life
The GE73 8RF achieves a runtime of 3:06 h in our realistic Wi-Fi test in which we activate a script to simulate the hardware utilization when loading web sites. For the test, the energy profile is set to “Balanced”, power-saving functions are activated, and the screen brightness is set around 150 cd/m². The 17.3 incher shuts down after 3:13 h in a continuous video playback loop of the short film Big Buck Bunny (H.264 coding, 1,920 x 1,080 pixels). Here, all wireless functions are deactivated (flight mode), power saving options are deactivated, and the screen brightness is set to 150 cd/m².
All in all, the runtimes of its predecessor are not achieved. However, the battery of our test device reports a wear of just below 10 percent. Thus, the full battery capacity is no longer available and GE73 8RF models with intact batteries are expected to last a little longer.
| MSI GE73 8RF-008 Raider RGB i7-8750H, GeForce GTX 1070 Mobile, 51 Wh | Acer Predator Helios 500 PH517-51-79BY i7-8750H, GeForce GTX 1070 Mobile, 72 Wh | SCHENKER XMG Pro 17 i7-7700HQ, GeForce GTX 1070 Mobile, 66 Wh | HP Omen X 17-ap0xx i7-7820HK, GeForce GTX 1080 Mobile, 99 Wh | MSI GE73VR 7RF Raider i7-7700HQ, GeForce GTX 1070 Mobile, 51 Wh | Average of class Gaming | |
|---|---|---|---|---|---|---|
| Battery Runtime | 36% | 51% | 101% | 9% | 102% | |
| Reader / Idle | 303 | 253 -17% | 397 31% | 348 15% | 264 -13% | 544 ? 80% |
| H.264 | 193 | 222 15% | 206 7% | 399 ? 107% | ||
| WiFi v1.3 | 186 | 174 -6% | 218 17% | 333 79% | 240 29% | 368 ? 98% |
| Load | 38 | 88 132% | 91 139% | 117 208% | 43 13% | 84.2 ? 122% |
| Witcher 3 ultra | 66 | 81.6 ? |
Verdict
Pros
Cons
The MSI GE73 8RF-008 features a Coffee Lake Core i7-8750H hexa-core processor that has significantly more horsepower than the predecessor’s Core i7-7700HQ quad-core processor. The increase in performance is markedly higher on the multi-thread side of things than in single-core scenarios.
In combination with the GeForce GTX 1070, the processor smoothly runs all current games in Full-HD resolution with high to maximum details on its 120-Hz panel. The screen itself offers a good contrast ratio and fast response times. However, the maximum brightness could be even higher. Despite not being an IPS-screen, it delivers visibly wider viewing angles than what we are used to with TN models.
With the GE73 8RF, MSI offers a well-made gaming notebook. Despite its price tag of just above $2,000, it is not void of weaknesses.
The noise development is at a normal level for a gaming laptop of its class. The outside of the device does not heat up excessively. A SATA-III SSD ensures a snappy system. However, there is still room for improvement: Alternatively, a much faster NVMe SSD could have been used instead. In fact, we expect it to be standard equipment on a $2,000-notebook such as the GE73.
The GE73 8RF has some distinct features compared to its predecessor, the GE73VR 7RF, which do not immediately catch the eye: The GE73 8RF accommodates more powerful speakers (3 watts instead of 2 watts) and a second USB 3.1 Gen 2 port. The memory card reader strikes negatively: it operates significantly slower than the one in the predecessor.
MSI GE73 8RF-008 Raider RGB
-
06/13/2018 v6(old)
Sascha Mölck


Pricecompare
