 Deutsch
 English
 Español
 Français
 Italiano
 Nederlands
 Polski
 Português
 Русский
 Türkçe
 Svenska
 Chinese
 Magyar
MSI Creator Z16: Creative laptop with AdobeRGB in review
")
MSI fills the niche between handy 15-inchers and usually-too-large 17-inchers with the 16-inch Creator Z16. There is no 4K screen or OLED here, but rather a 3K, 16:10, AdobeRGB display and two Thunderbolt 4 ports.
While the RTX 3060 might be overwhelmed with 4K in current games, it should be able to handle 3K. Does MSI forgo oversizing here in favor of an accurate resolution for the offered performance? Can the slim 3-fan case in combination with the 180-watt power supply utilize the components to the best of its ability? It should, because the expectations for a 2000 Euro (~$2263) laptop are high.
Intel's Tiger Lake H processor is supposed to set the tone in terms of performance, and the RTX 3060 is already known for its high gaming power. Add to that good upgradeability and a keypad with RGB lights for each key individually - is this a brightly colored all-round creator?
We compare MSI's 16 incher with some current contenders, including the brand new Apple MacBook Pro 16 2021 M1 Pro, the HP ZBook Studio G7 and the Razer Blade 15 Advanced (Mid 2021), all laptops with a rating of "Very Good".
Possible competitors in comparison
Rating | Date | Model | Weight | Height | Size | Resolution | Best Price |
|---|---|---|---|---|---|---|---|
| 86.7 % | 11/2021 | MSI Creator Z16 A11UET-209 i7-11800H, GeForce RTX 3060 Laptop GPU | 2.2 kg | 15.9 mm | 16.00" | 2560x1600 | |
| 90.6 % | 03/2021 | HP ZBook Studio G7 i9-10885H, Quadro RTX 3000 Max-Q | 2 kg | 18 mm | 15.60" | 3840x2160 | |
| 88.9 % | 07/2021 | Razer Blade 15 Advanced (Mid 2021) i7-11800H, GeForce RTX 3080 Laptop GPU | 2 kg | 16.99 mm | 15.60" | 1920x1080 | |
| 87 % | 09/2021 | Lenovo ThinkBook 16p G2 ACH R9 5900HX, GeForce RTX 3060 Laptop GPU | 2 kg | 19.5 mm | 16.00" | 2560x1600 | |
| 87.9 % | 07/2021 | Dell XPS 17 9710 Core i7 RTX 3060 i7-11800H, GeForce RTX 3060 Laptop GPU | 2.5 kg | 19.5 mm | 17.00" | 3840x2400 | |
| 88.4 % | 08/2021 | Dell XPS 15 9510 11800H RTX 3050 Ti OLED i7-11800H, GeForce RTX 3050 Ti Laptop GPU | 1.9 kg | 18 mm | 15.60" | 3456x2160 | |
| 93.2 % | 11/2021 | Apple MacBook Pro 16 2021 M1 Pro M1 Pro, M1 Pro 16-Core GPU | 2.2 kg | 16.8 mm | 16.20" | 3456x2234 |
Case - Stable creative laptop
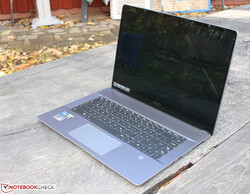
While our colleagues criticized the chassis of the Creator 17, we don't have to complain about the Z16: The aluminum and plastic construction offers good - though not excellent - torsional stiffness. A 16-inch width is susceptible to bending, and the chassis does bend a bit (2.2 kg/~4.9 lb) when we lift it at a corner. The work area as well as the lid are made of aluminum, which has been polished at the edges and anodized on the surface. The screen has good strength, and the back cannot be dented.
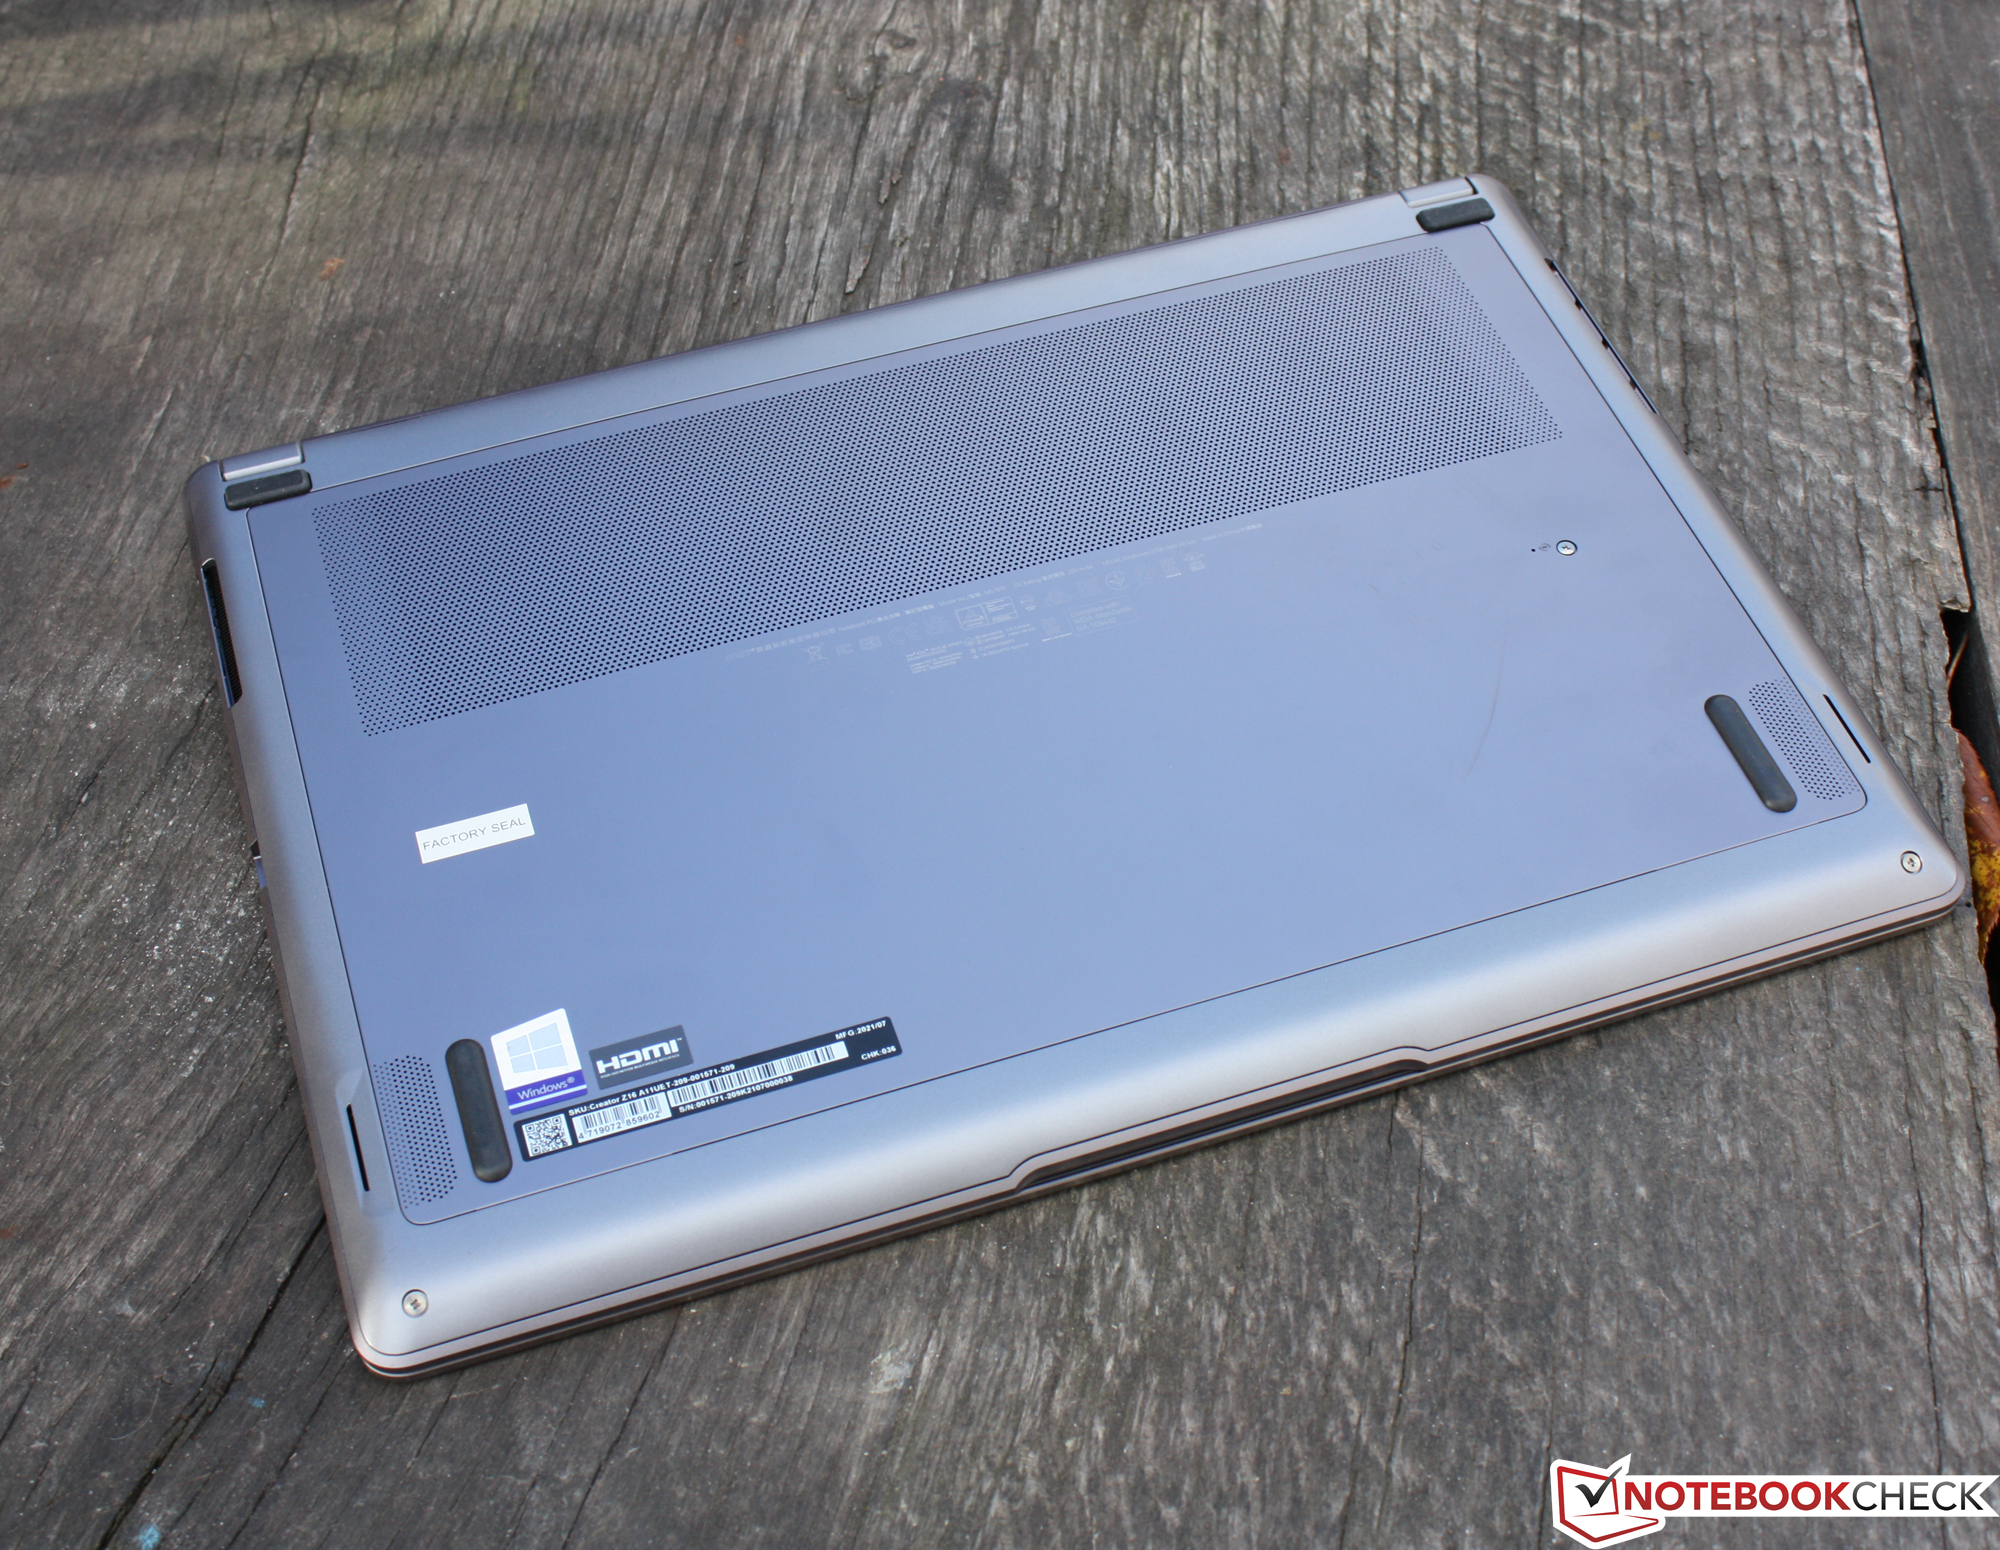
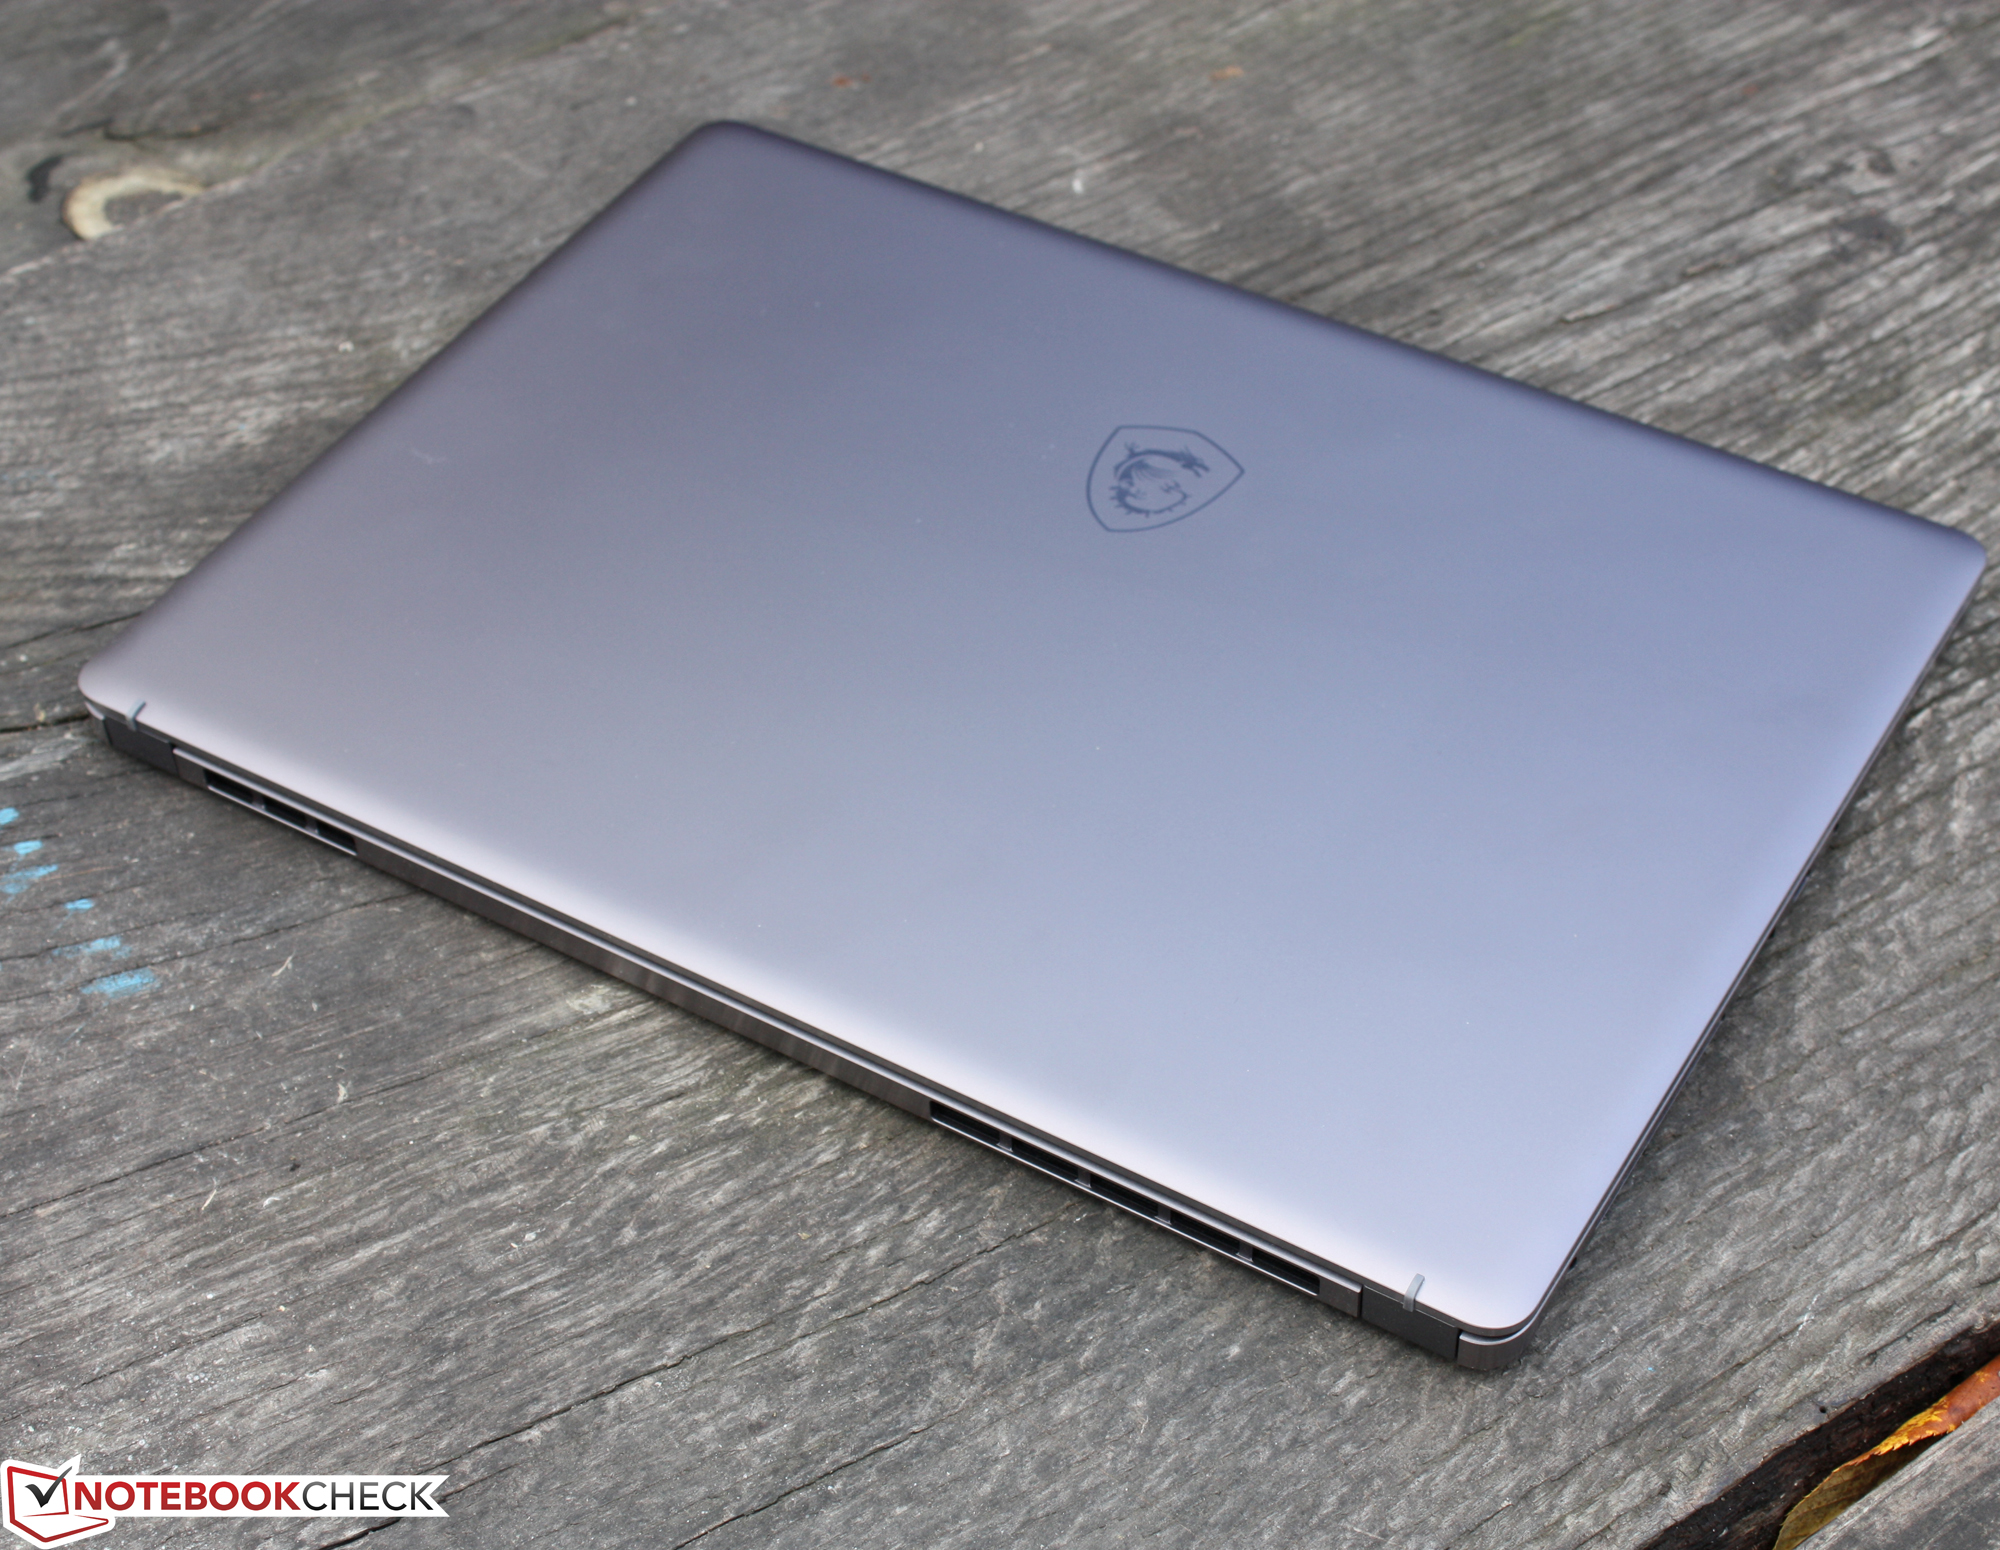
The 16-incher has a slightly larger footprint than Apple's MacBook Pro 16 2021, but it is marginally thinner with the same weight. If you look in the direction of the 15.6, you will see a Razer Blade 15 Advanced with significantly less depth at roughly the same width, but 200 grams (~7 oz) less. The 17-incher in the round, Dell XPS 17 9710 is 300 grams (~11 oz) heavier and significantly wider than the Z16.
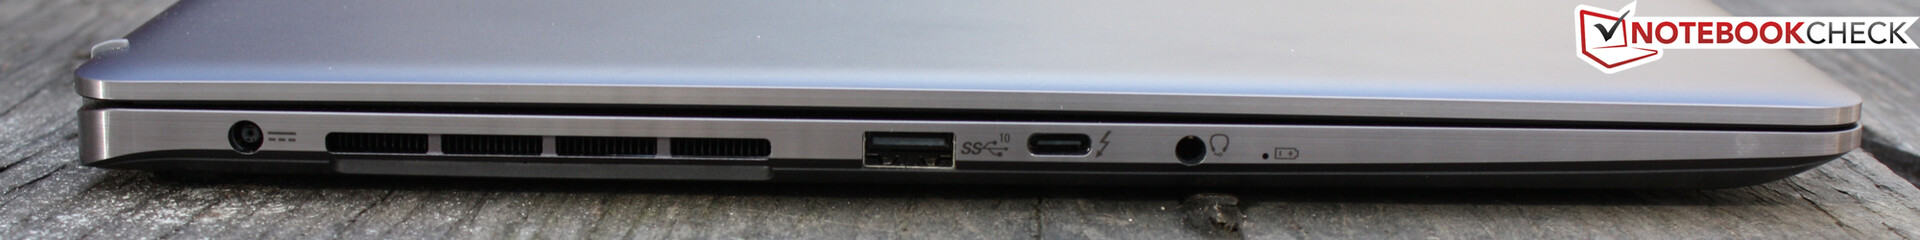
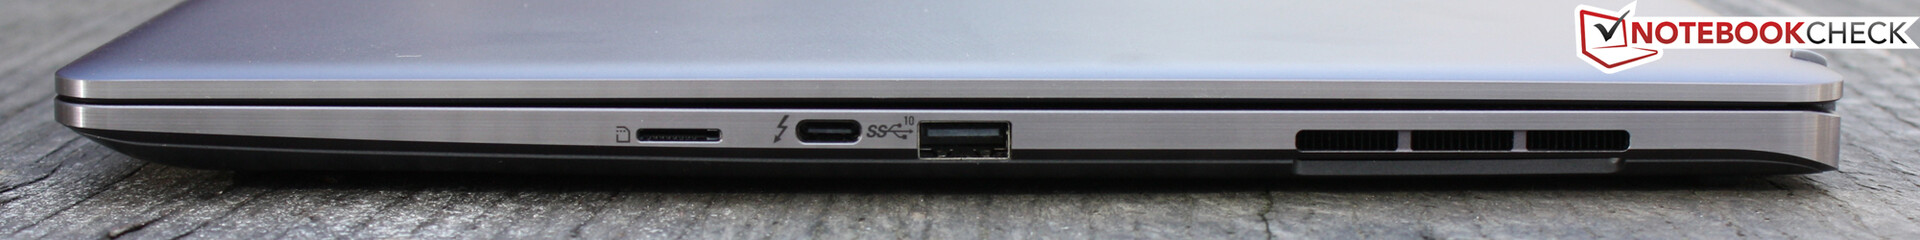
Equipment - Modern with Thunderbolt 4 & USB 4.0
MSI offers modern ports, which is to be expected in this price range: Type-C peripherals can be connected to the two Thunderbolt 4 ports, or one or two flat screens (DisplayPort via Type-C). The power supply is not via Type-C, which would not be appropriate for 180 watts, and one port would also be blocked. The 16-incher does not have any other display outputs.
SD Card Reader
We use our reference SD card (AV Pro V60) to test the performance of the card reader used. The maximum transfer rate is up to 185 MB/s when copying large data blocks, while even 225 MB/s can be expected for common JPG image files (around 5 MB each).
| SD Card Reader | |
| average JPG Copy Test (av. of 3 runs) | |
| MSI Creator Z16 A11UET-209 (AV Pro SD microSD 128 GB V60) | |
| Dell XPS 15 9510 11800H RTX 3050 Ti OLED (AV Pro V60) | |
| Dell XPS 17 9710 Core i7 RTX 3060 (AV PRO microSD 128 GB V60) | |
| HP ZBook Studio G7 (AV Pro V60) | |
| Apple MacBook Pro 16 2021 M1 Pro (Angelbird AV Pro V60) | |
| Average of class Multimedia (17.6 - 205, n=65, last 2 years) | |
| Lenovo ThinkBook 16p G2 ACH | |
| maximum AS SSD Seq Read Test (1GB) | |
| Dell XPS 15 9510 11800H RTX 3050 Ti OLED (AV Pro V60) | |
| MSI Creator Z16 A11UET-209 (AV Pro SD microSD 128 GB V60) | |
| HP ZBook Studio G7 (AV Pro V60) | |
| Dell XPS 17 9710 Core i7 RTX 3060 (AV PRO microSD 128 GB V60) | |
| Average of class Multimedia (16.8 - 266, n=61, last 2 years) | |
| Lenovo ThinkBook 16p G2 ACH | |
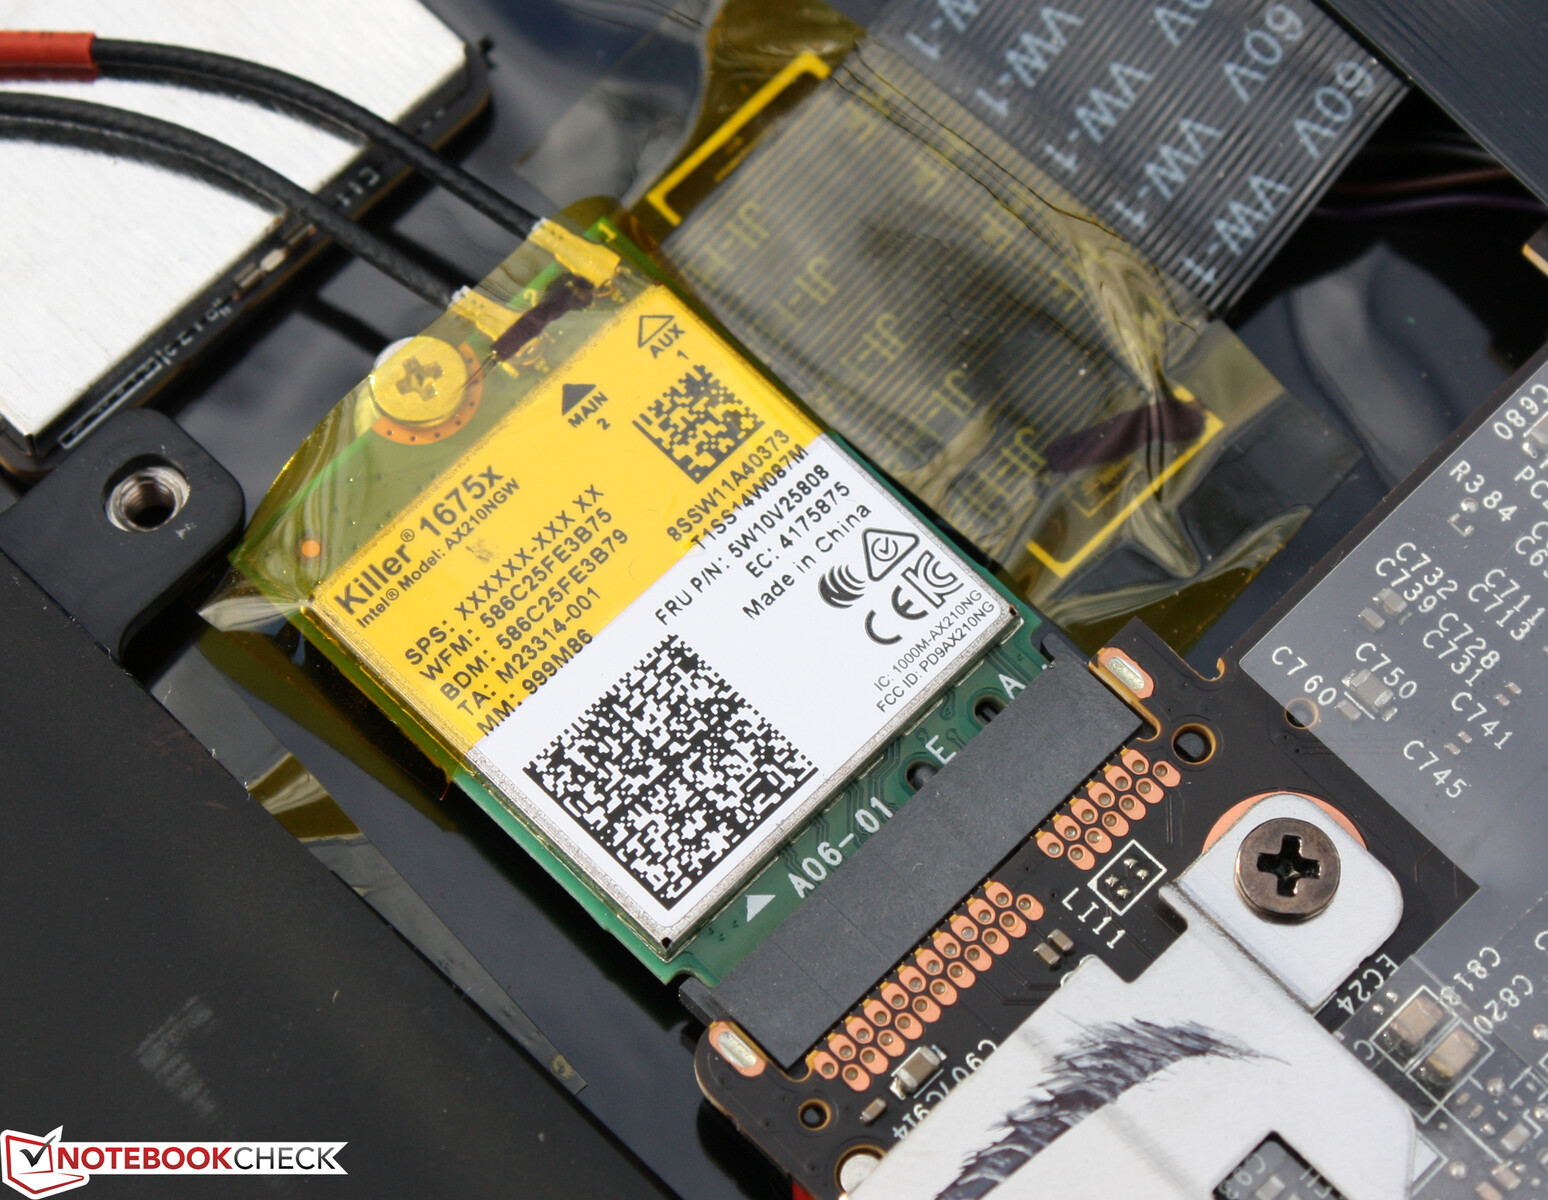
Communication
With the Intel Killer Wi-Fi 6 AX1650s, Wi-Fi 6E is on board. Wi-Fi 6E uses the 6 GHz frequency for the first time and relieves the congested 2.4 and 5 GHz frequency bands. This requires an appropriate router, for example the FRITZ!Boxes 7530 AX or 6660 Cable.
The Killer WLAN is not particularly fast in the test with a 5 GHz router, but the card is still well above average. Competitors like the HP ZBook Studio G7, which only has a "simple" Intel Wi-Fi 6 AX201, are clearly ahead. Interestingly, the Apple MacBook Pro 16 2021 M1 Pro is clearly lagging behind the others.
Logging in is done via fingerprint scan or facial recognition with Windows Hello. The latter works smoothly and quickly.
Webcam
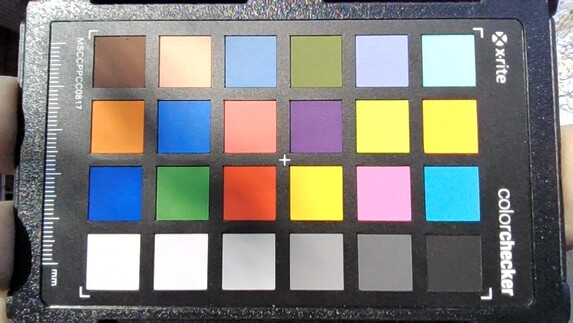
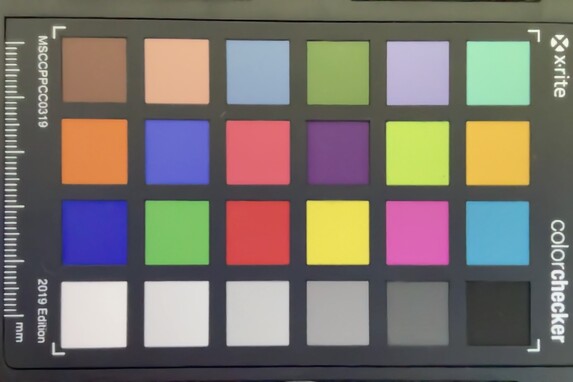
As is often the case, the webcam was neglected. Its resolution and quality defy description - just like almost all laptops in the comparison field. Hardly any manufacturer managed to put a high-quality camera in the frame in this comparison - Apple is the only exception, as the test chart picture below shows.


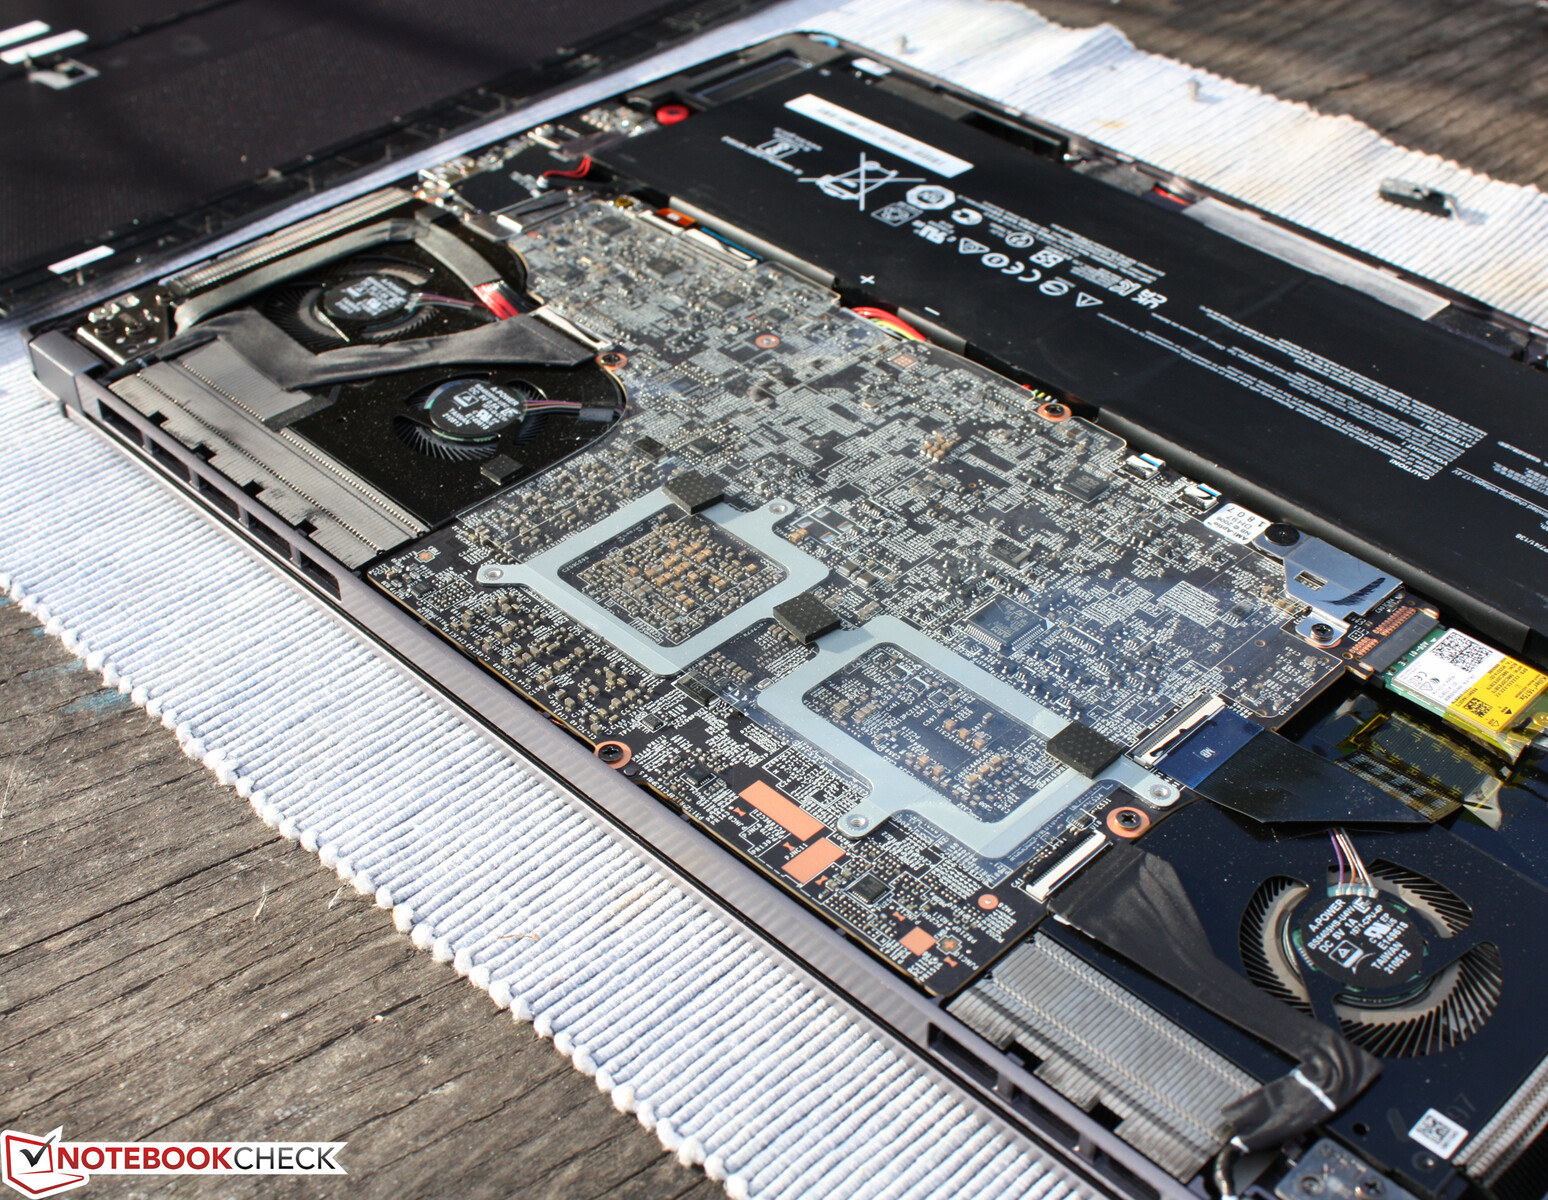
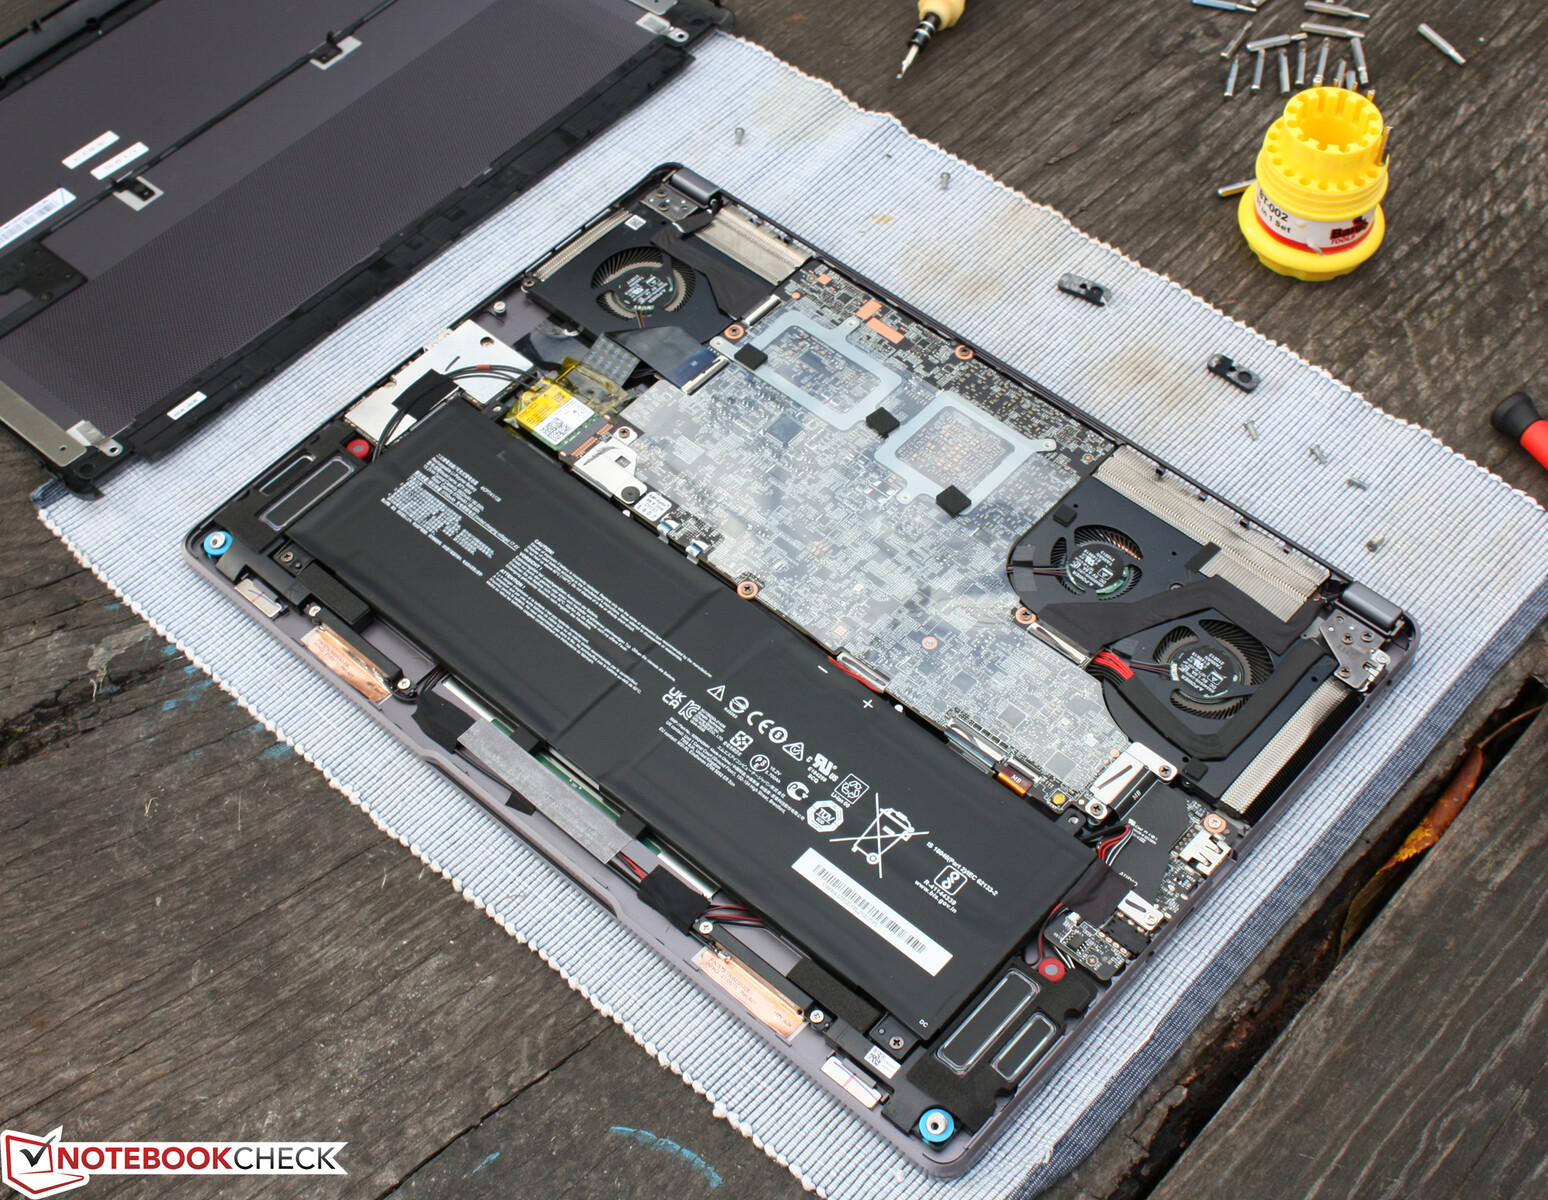
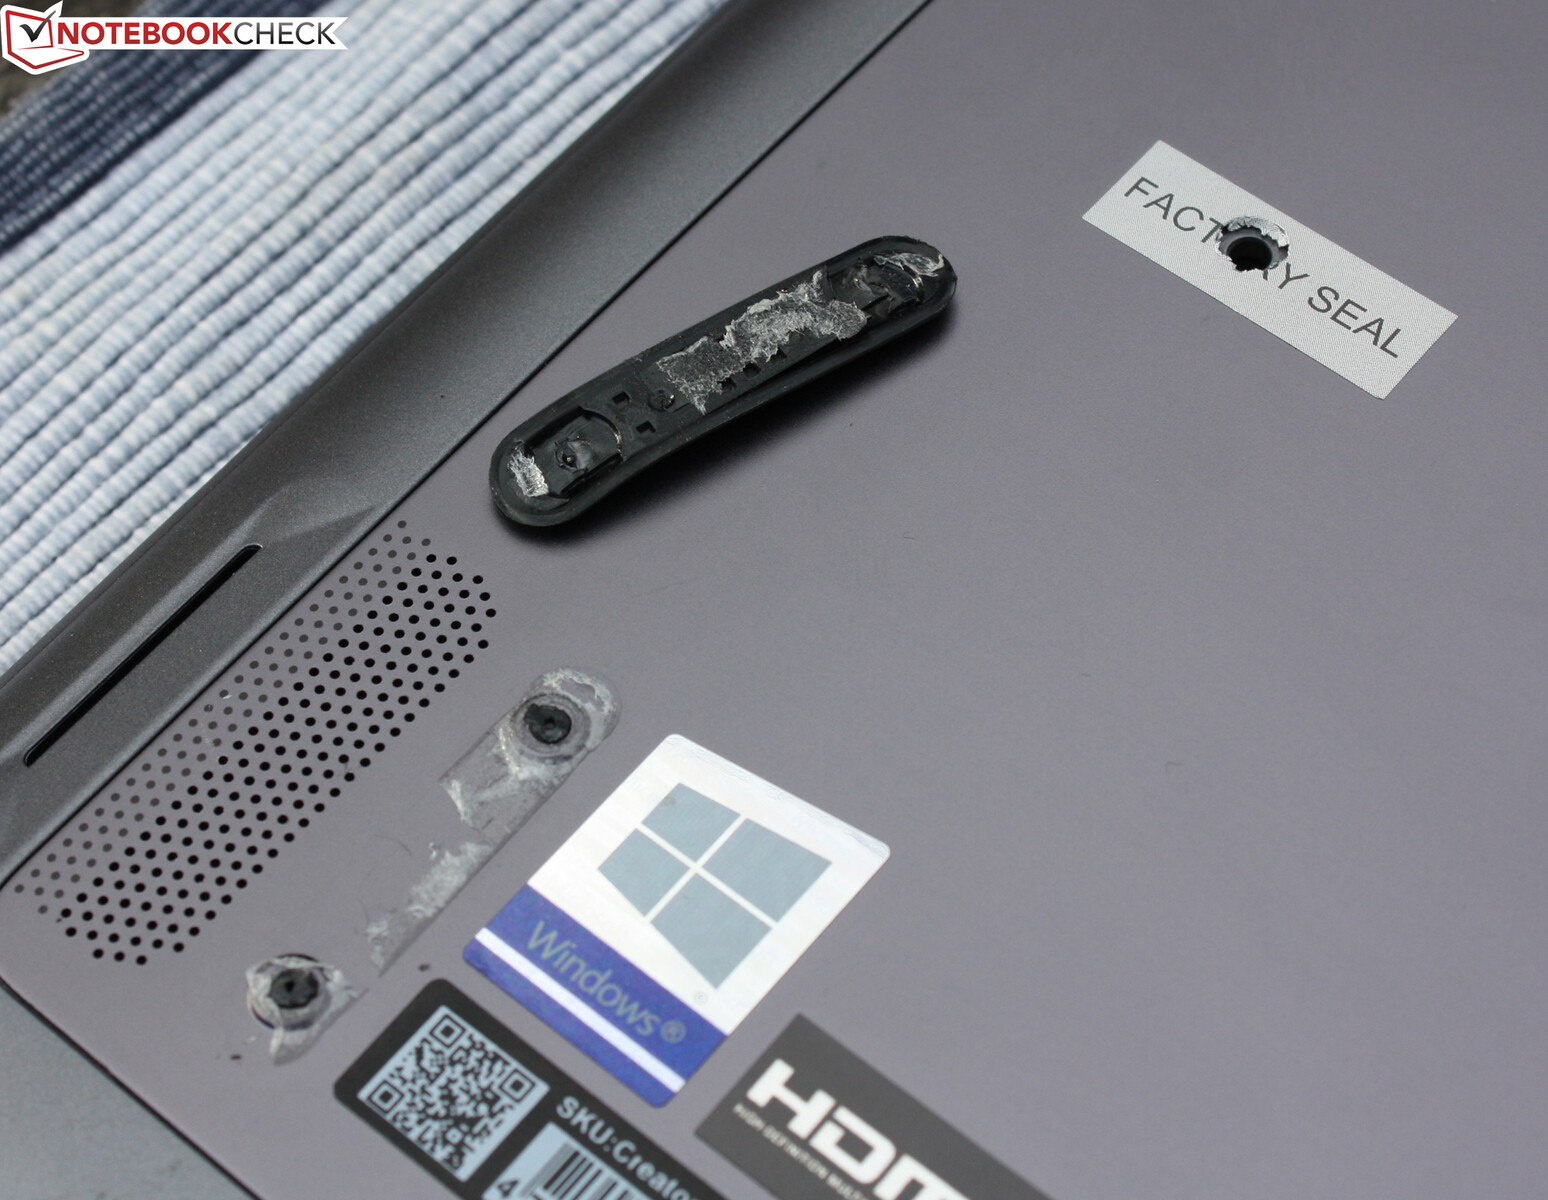
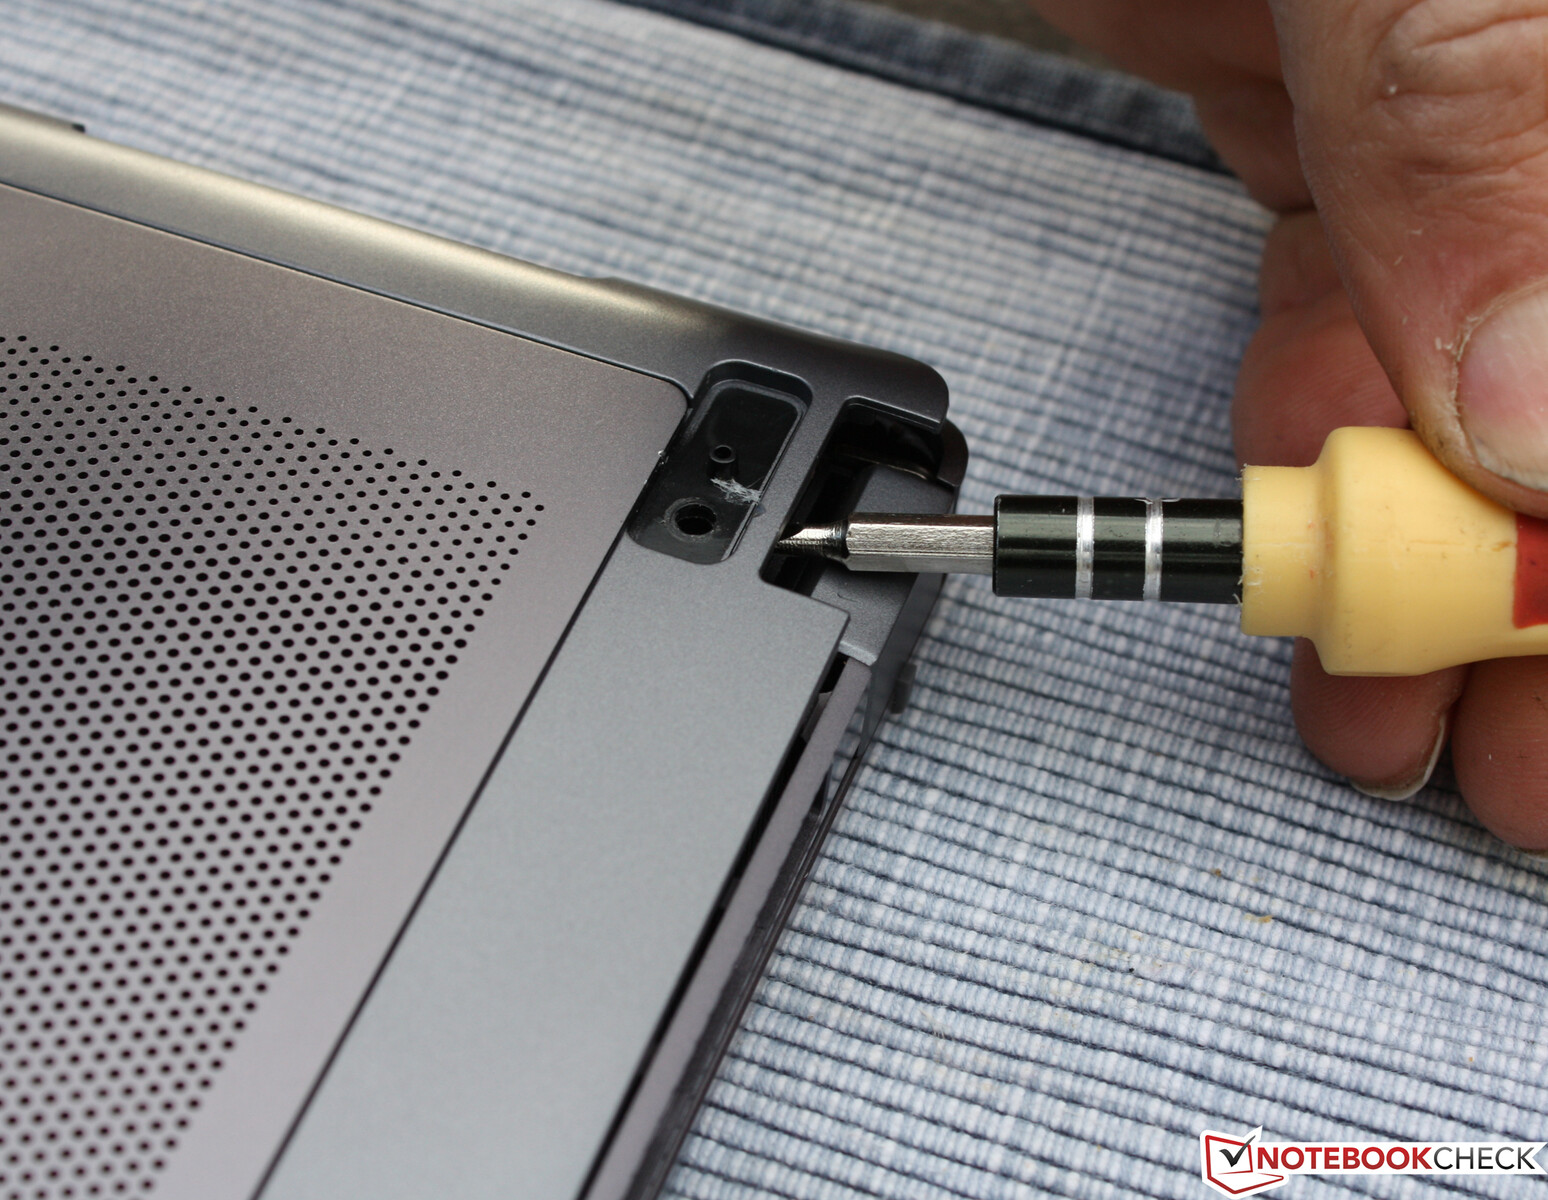
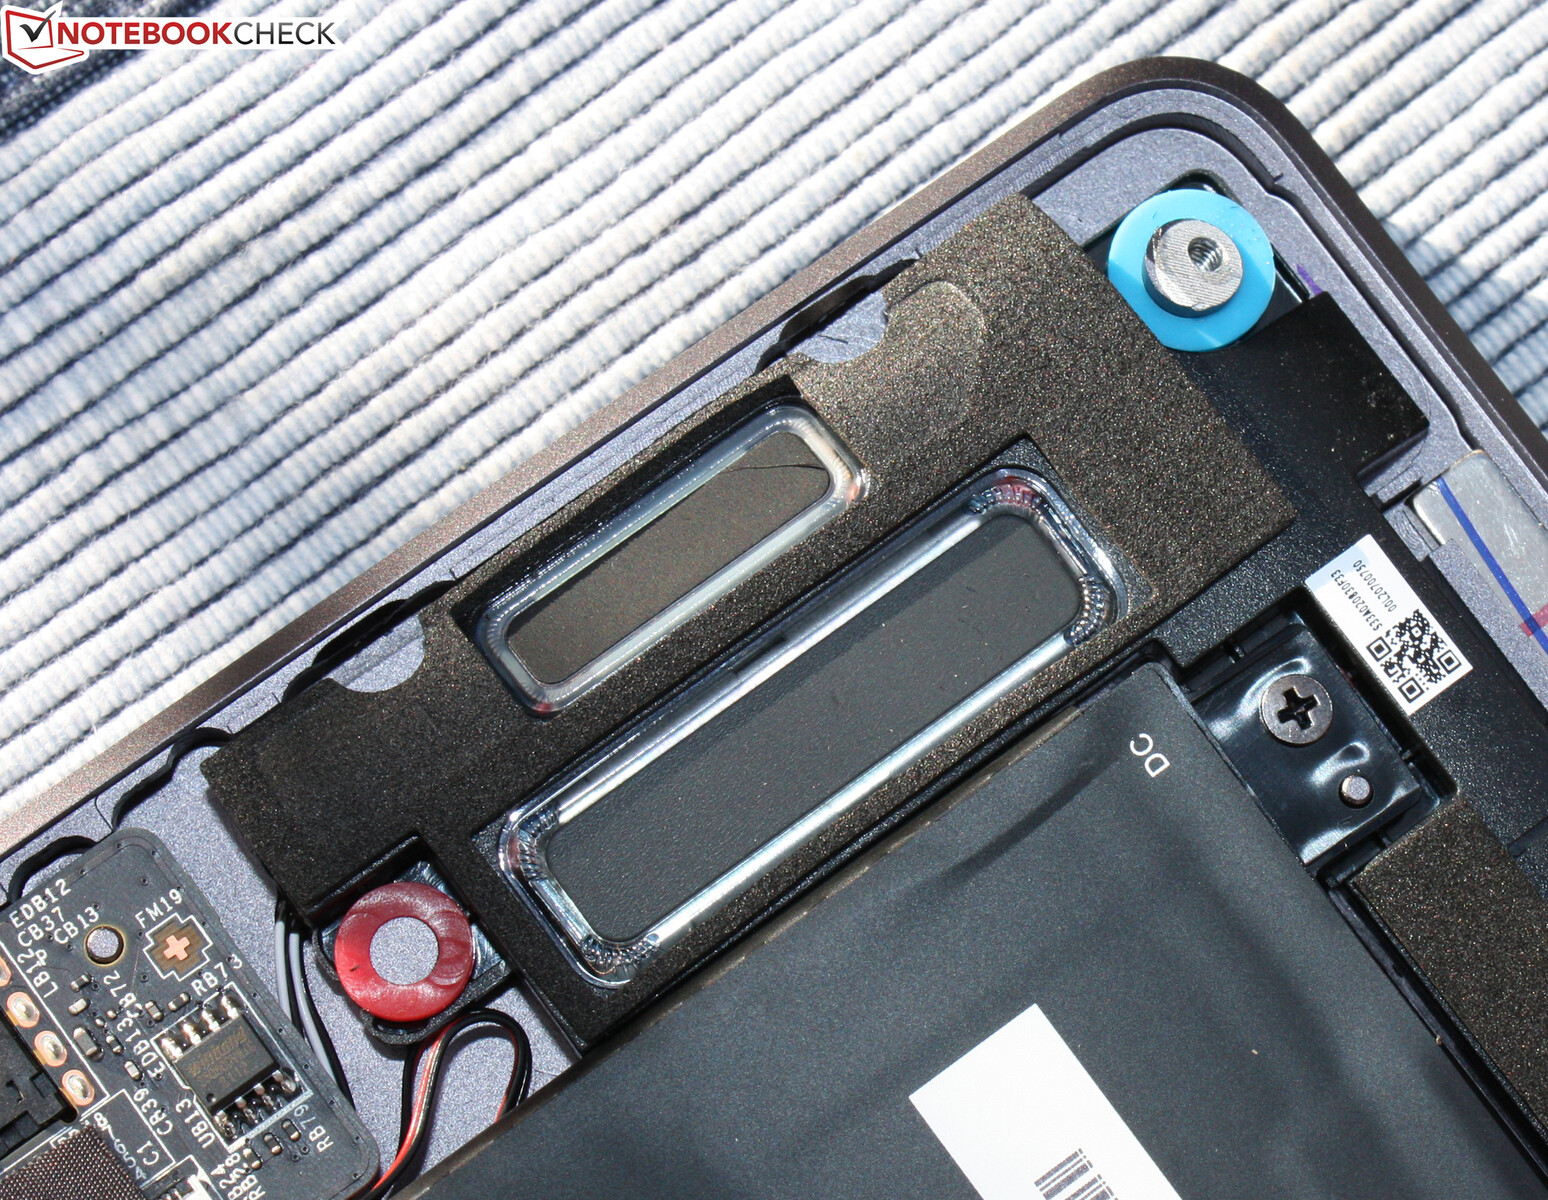
Maintenance
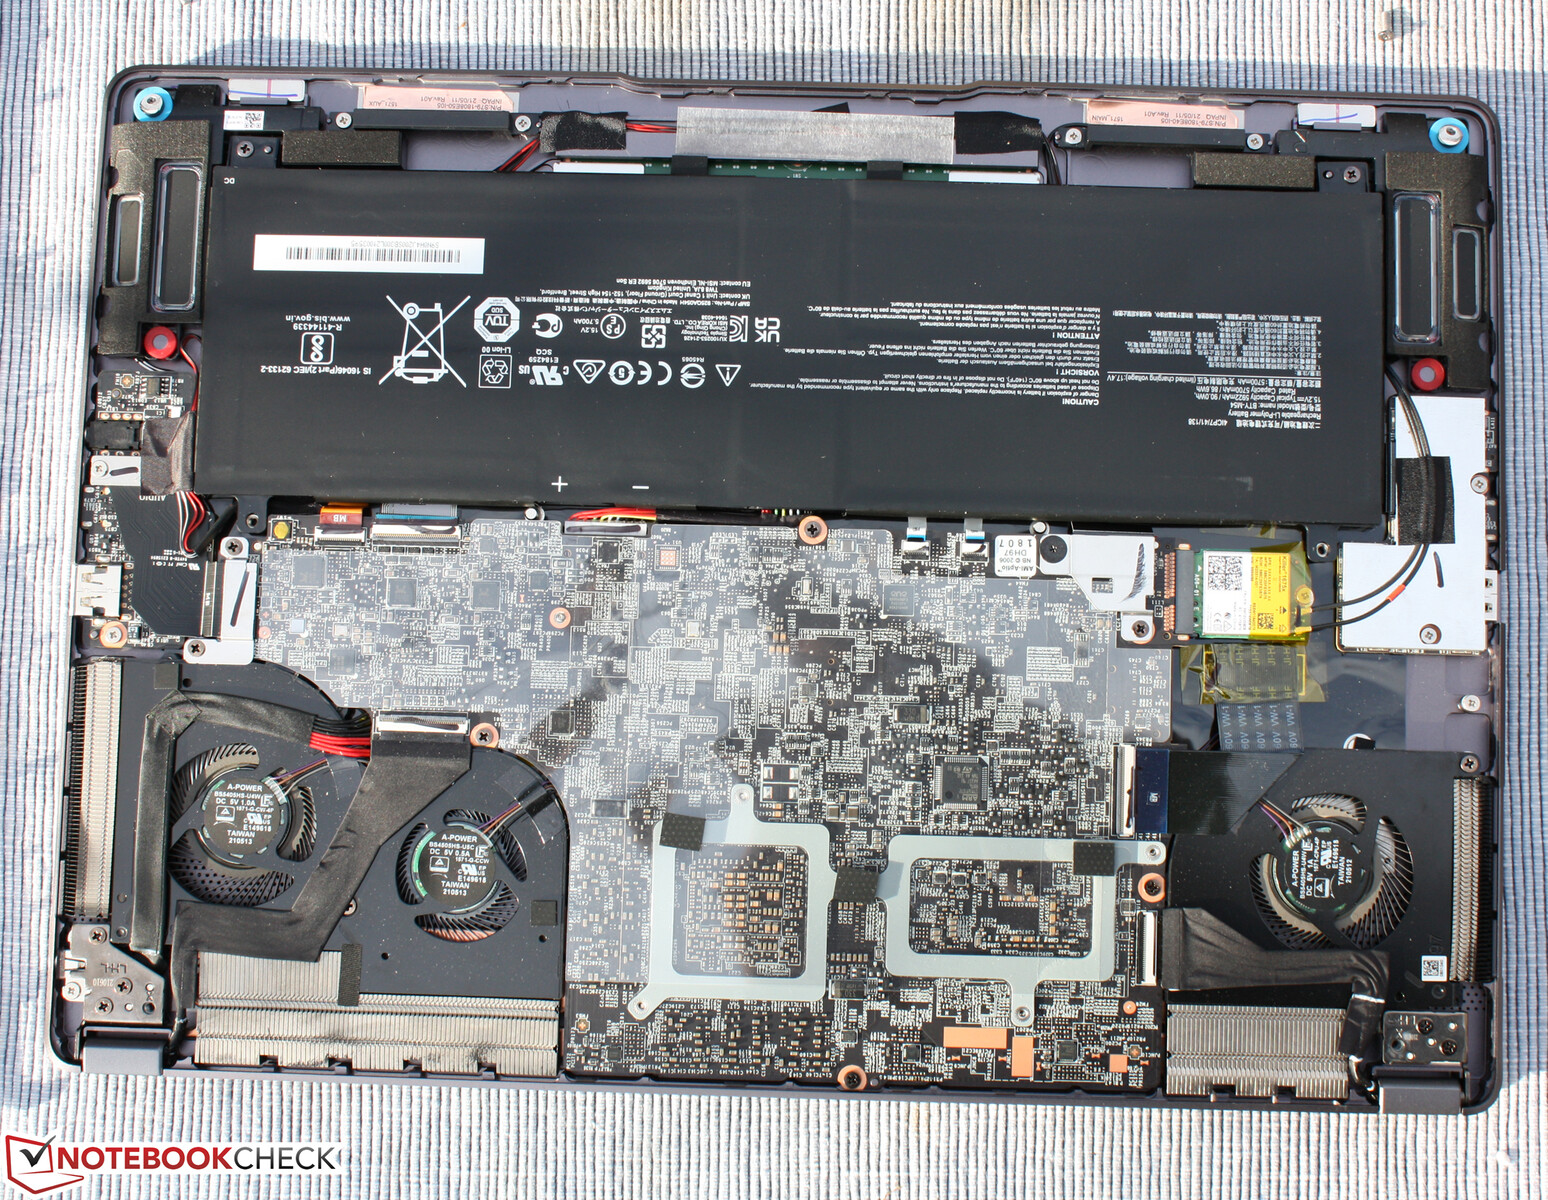
Upgrading the Z16 is possible, but more difficult than it appears: Two M.2 slots are available, one of which is occupied by the Phison SSD. The RAM can be upgraded to 64 GB, for which there are two slots. These are occupied with two 16 GB dual-channels in the sample, unless you purchase the Z16 variant with 16 GB, in which case one slot is free.
If you want to upgrade, you should read the how-to: What looks like a centered maintenance hatch on the underside is not one at all. We only realized this after removing the front feet - which were then unfortunately irreparably broken. The entire base plate is held in place by visible screws and such under the rear feet.
You can quickly access the first maintenance level, where battery, Wi-Fi chip and two SSD can be replaced. However, the mainboard has to be removed completely to get to the RAM sockets. This is a big effort, because all cables have to be removed. Here is a very good video how-to: MSI Creator Z16 Upgrade Tutorial.
Accessories
The slim 180-watt power supply is the only accessory in the box.
Warranty
In Germany, the manufacturer provides a two-year warranty (pick-up & return).
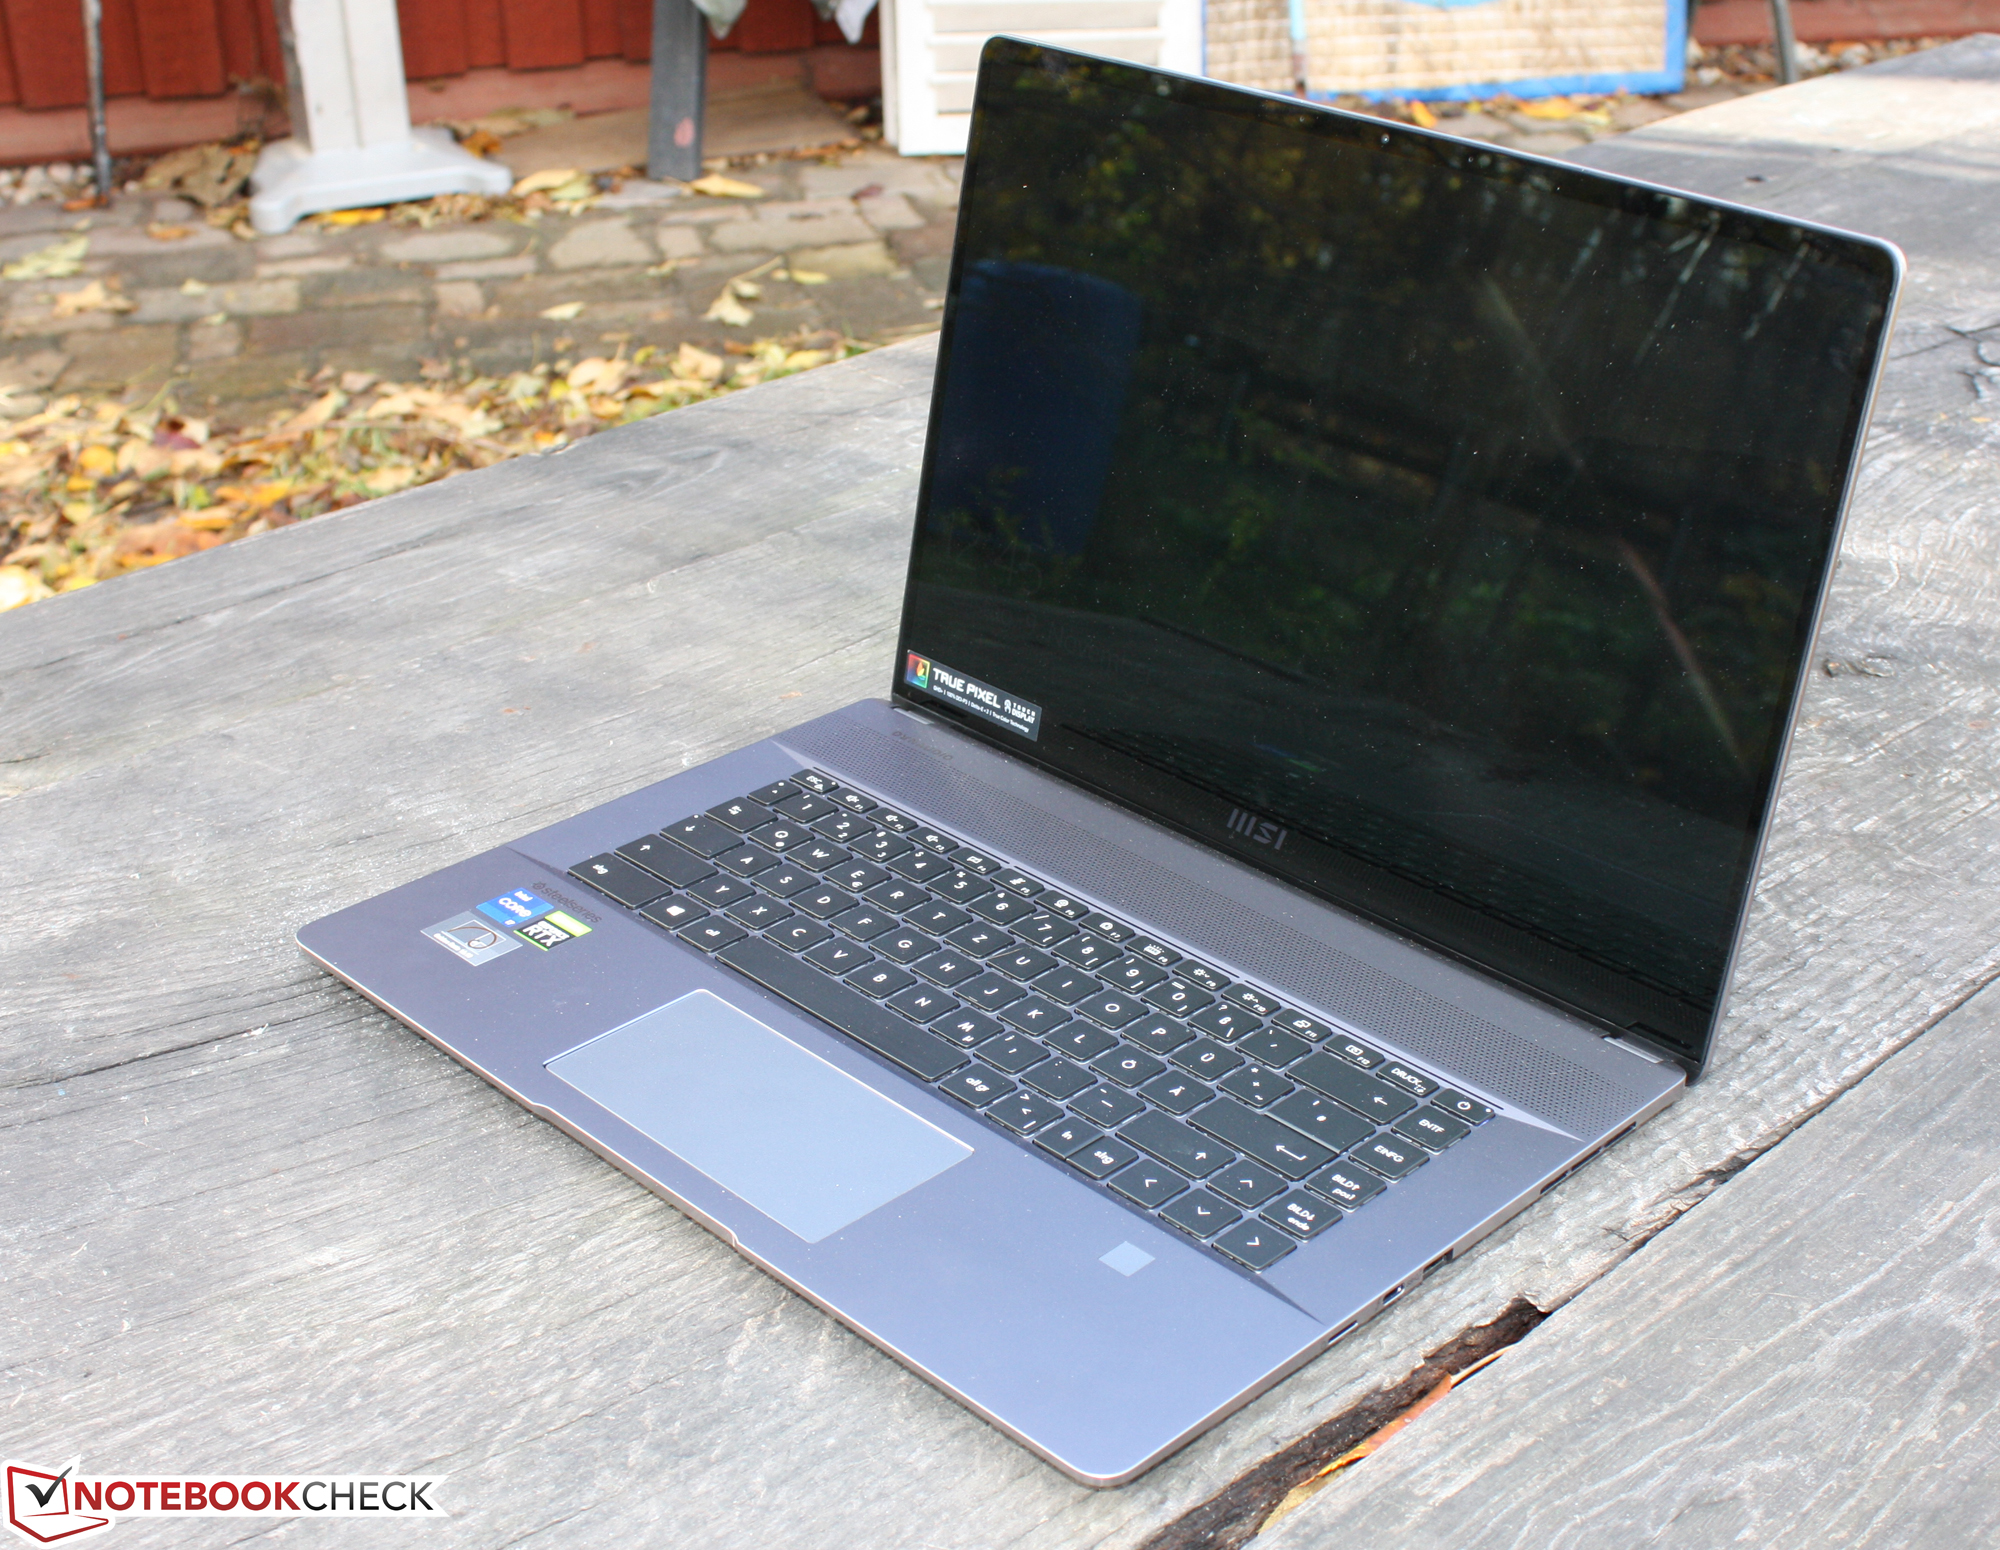
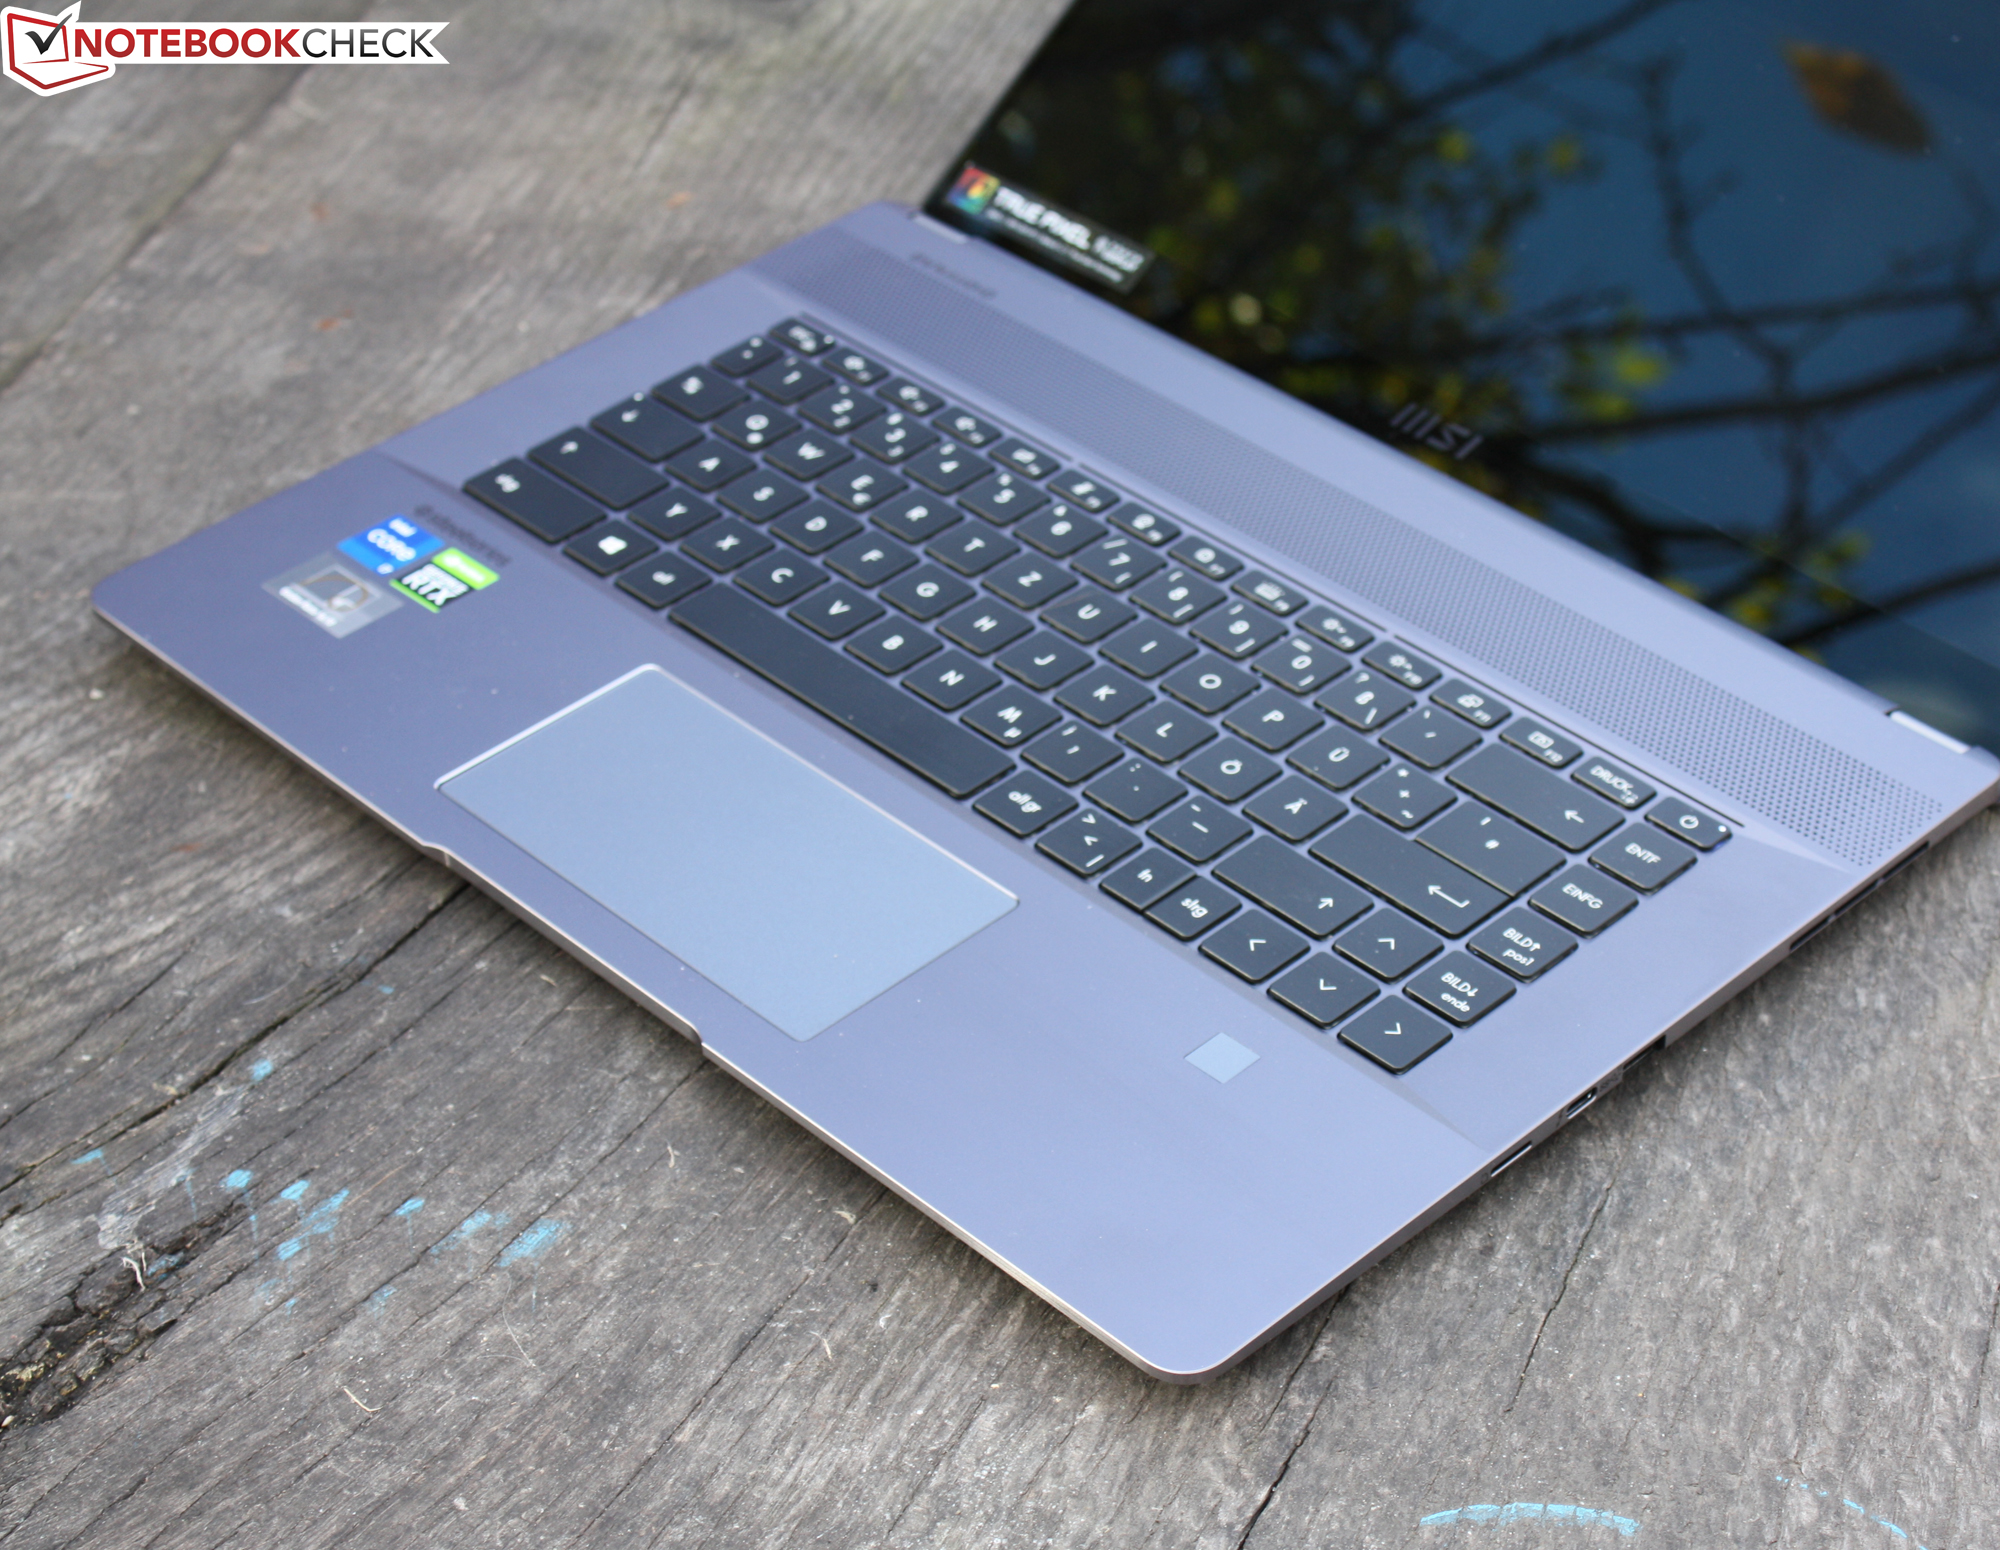
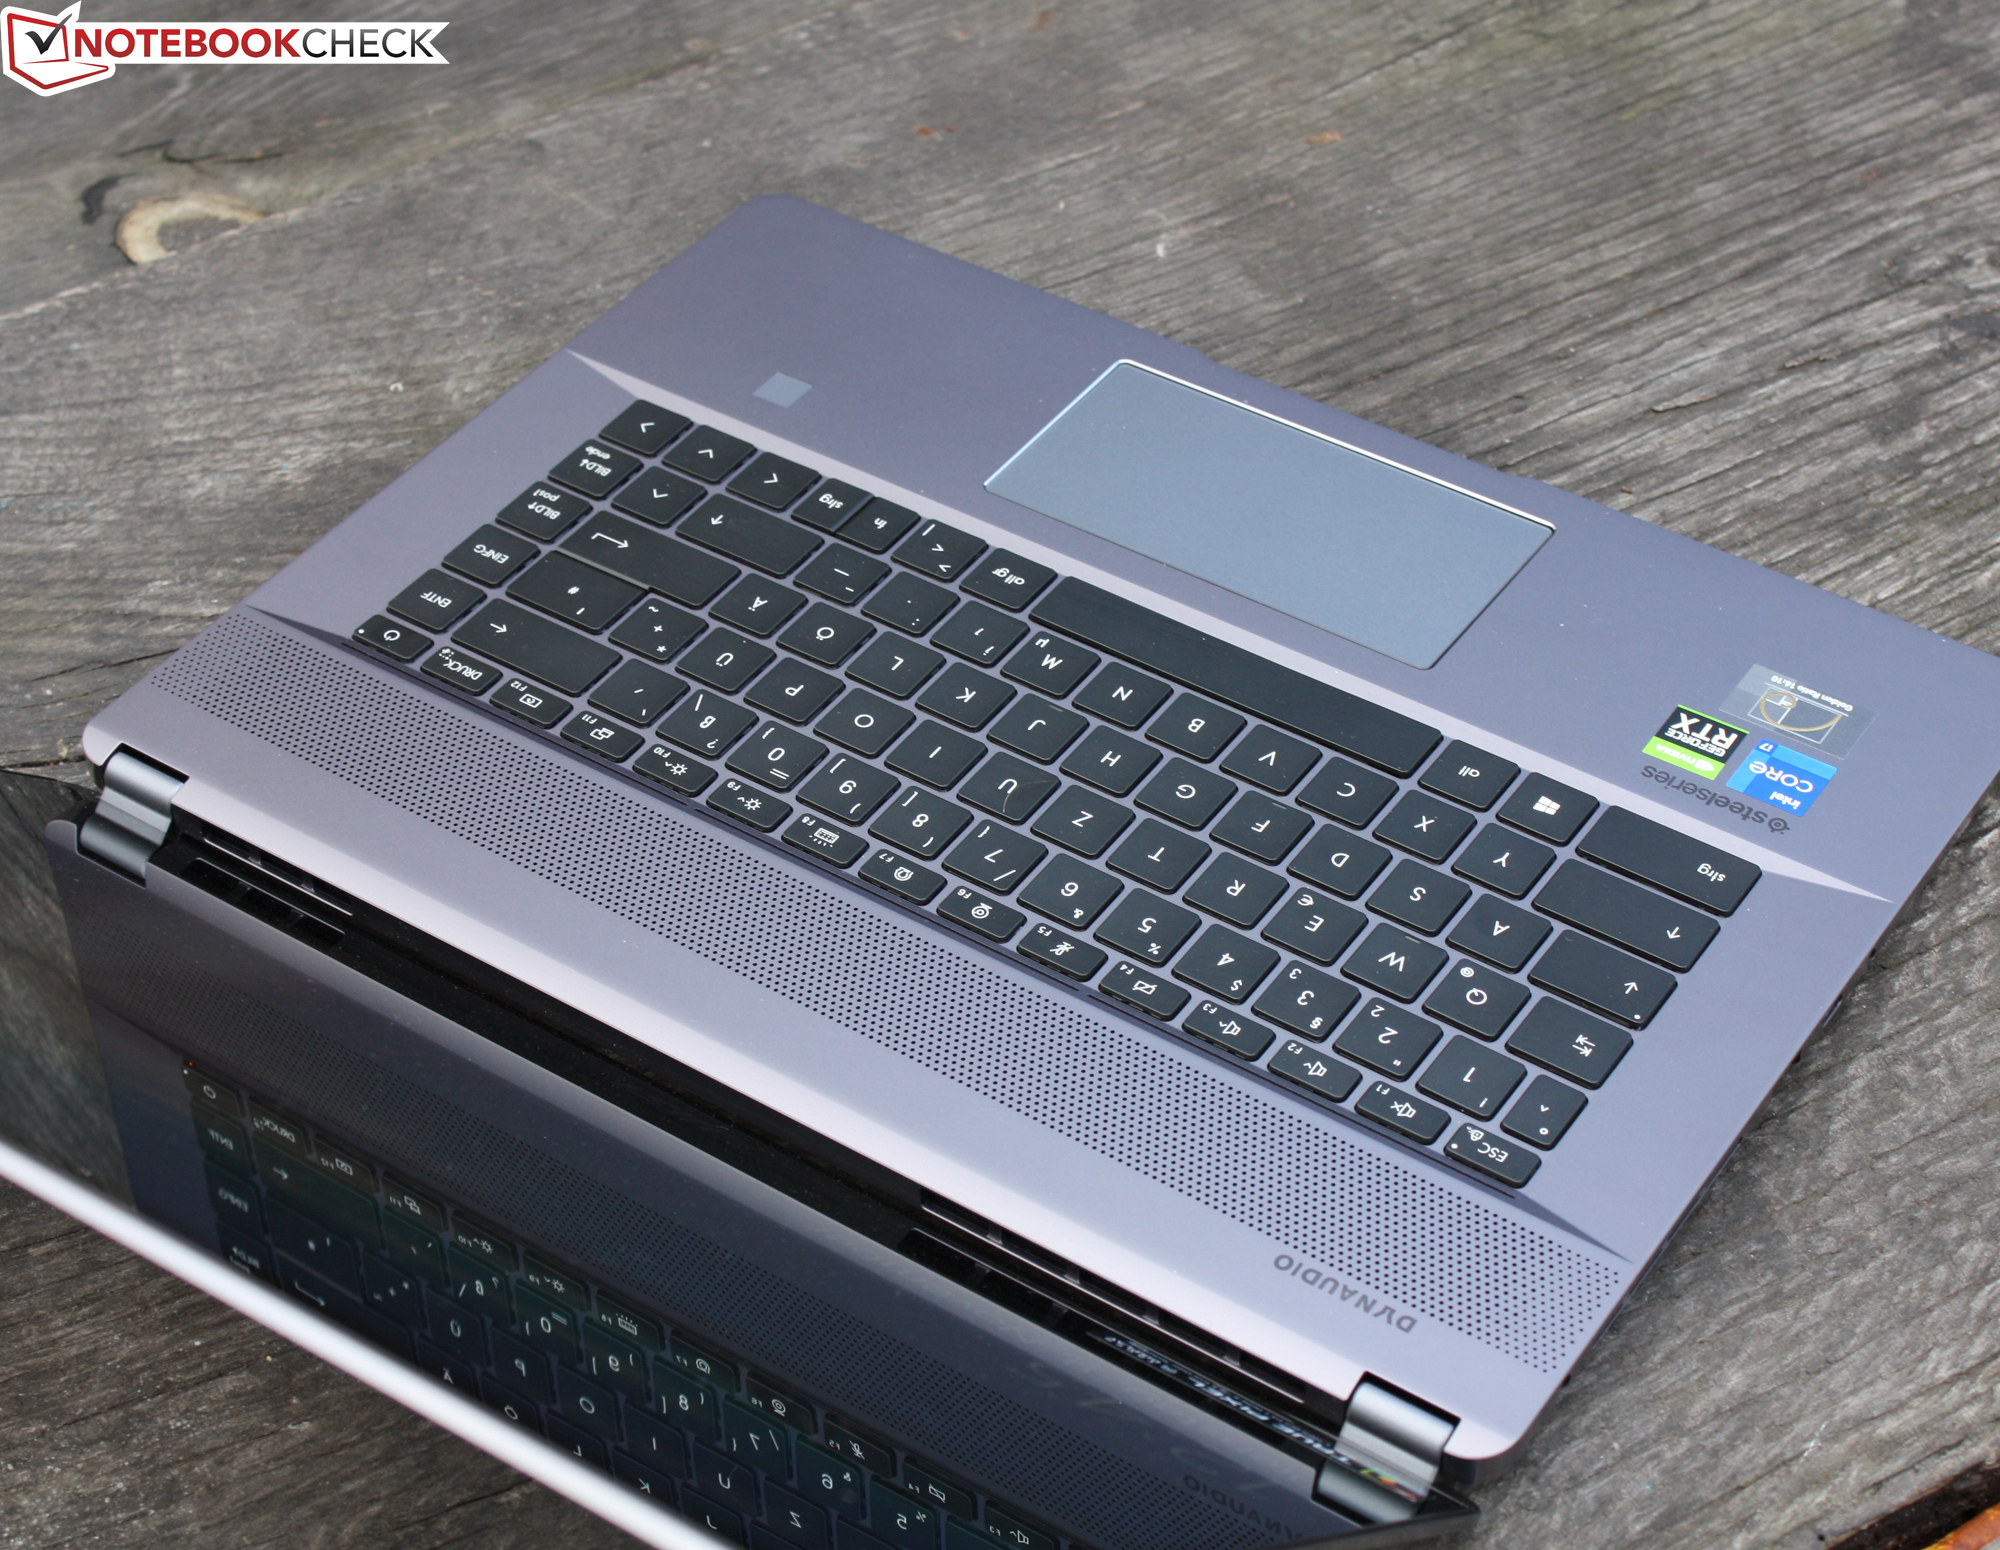
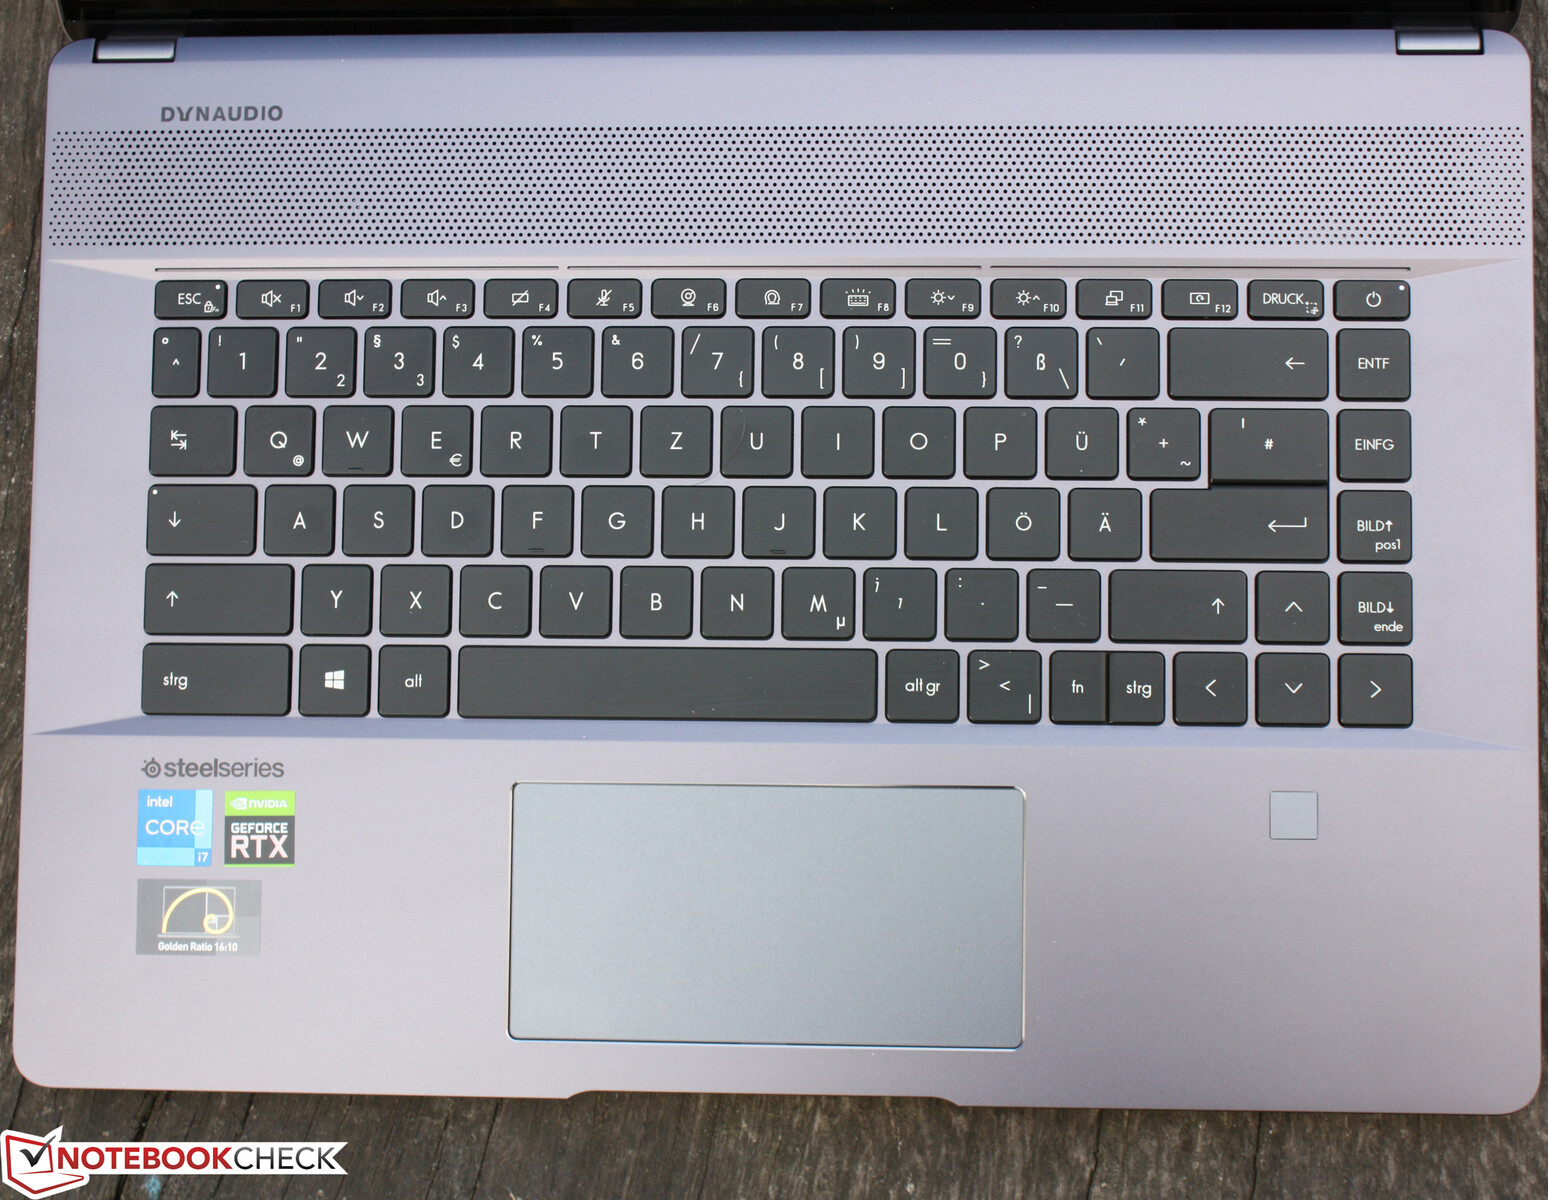
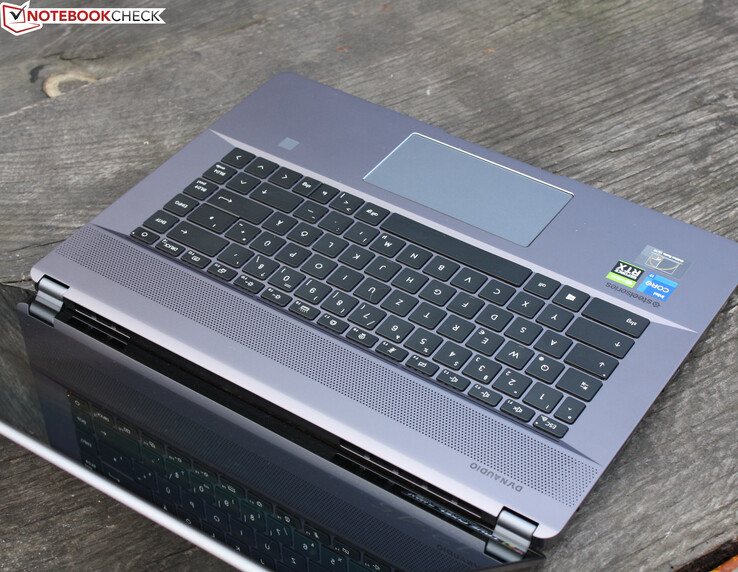
Input devices - RGB light effects under laptop keyboard
Keyboard
The keypad comes with a mini-LED keyboard backlight, which means each letter can be illuminated in a different color. The pre-installed setting is a moving light. If that bothers you or if you want to set other colors or mixtures, then Mystic Light has to be installed. MSI Center Pro unfortunately does not allow modifying the key illumination.
The SteelSeries input presents a very hard stroke, wide keys as well as a firm base, which doesn't give in even with a firm stroke. What we like about the keys is the crisp pressure point, which provides good feedback despite the short travel. On the other hand, the firm stroke and short travel make typing tiresome. In short: The SteelSeries is by far not a bad keyboard, and large hands can manage well on it. However, the speed could be better with more travel.
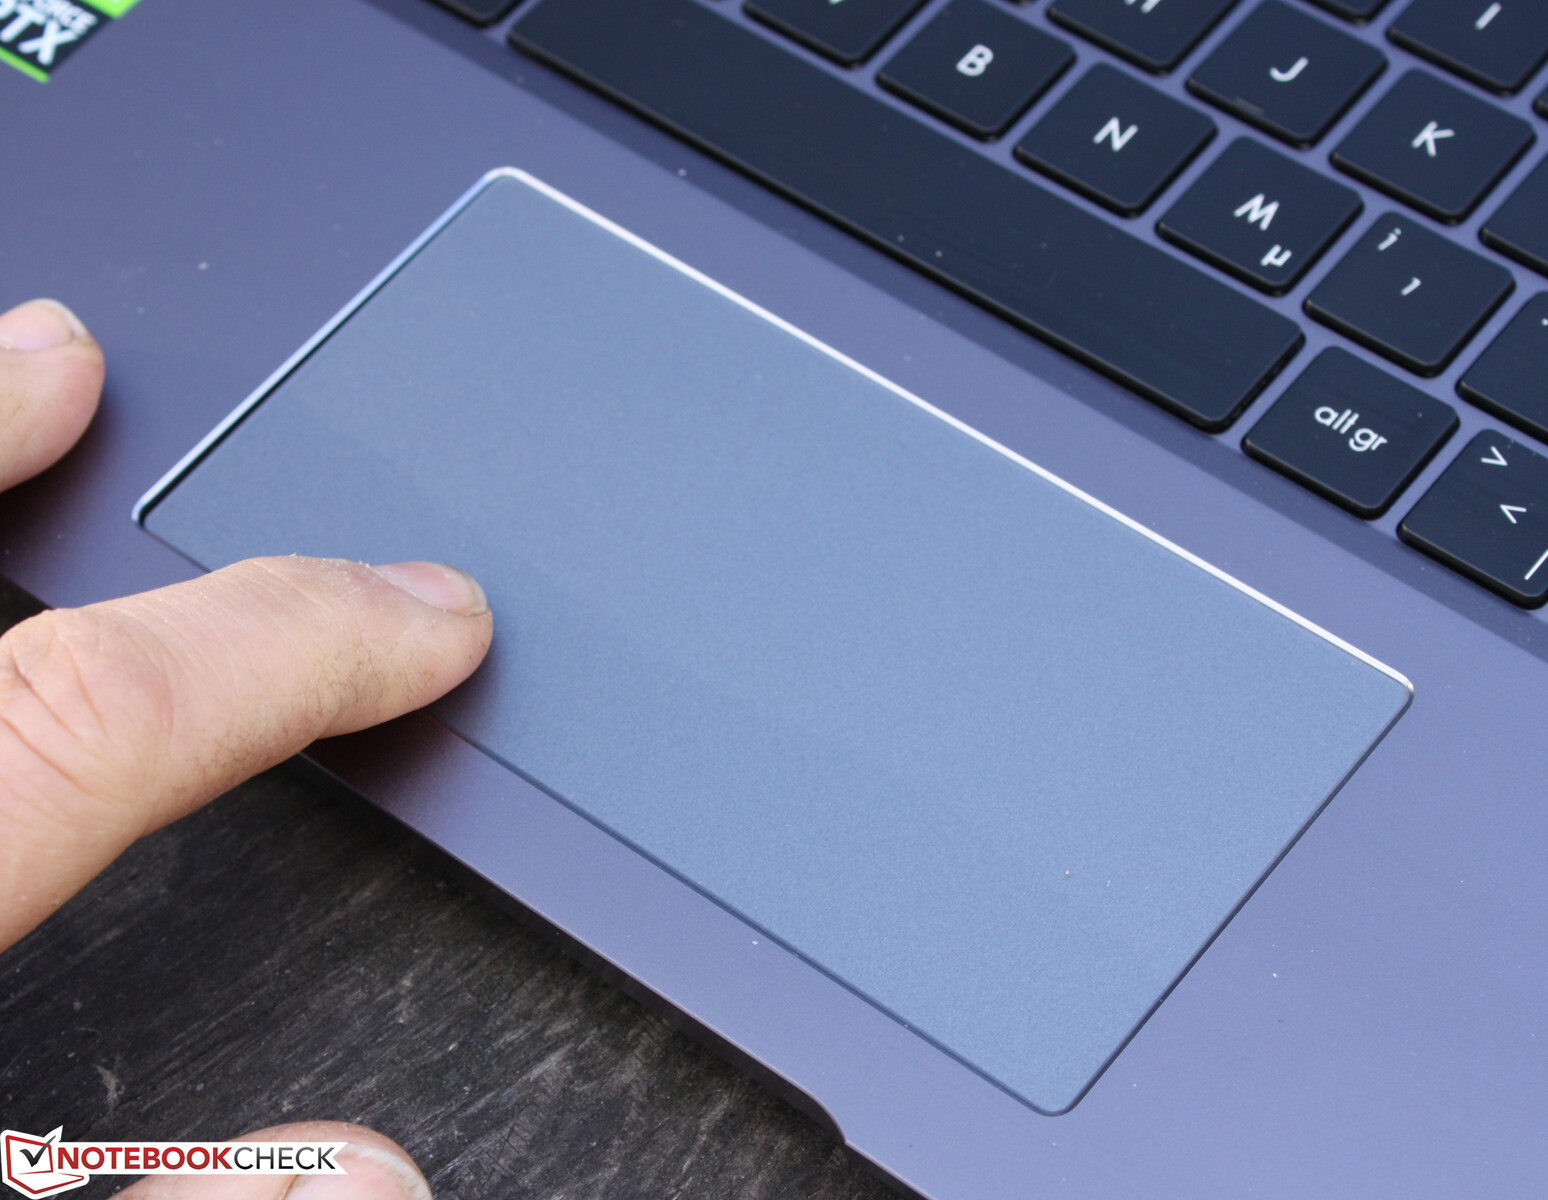
Touchpad
The narrow ClickPad is a design fail for some: While the rivals such as the MacBook Pro 16 2021 M1 or Dell XPS 15 9510 (15 x 9 cm/~5.9 x 3.5 in), often furnish huge ClickPads, the MSI uses just 12 x 6 cm (~4.7 x 2.4 in). Especially when sliding objects vertically, the low height can be very annoying.
This is a pity because the pad itself is easy to use with a clear pressure point and moderate stroke in the lower area of the pad, as well as a smooth surface.
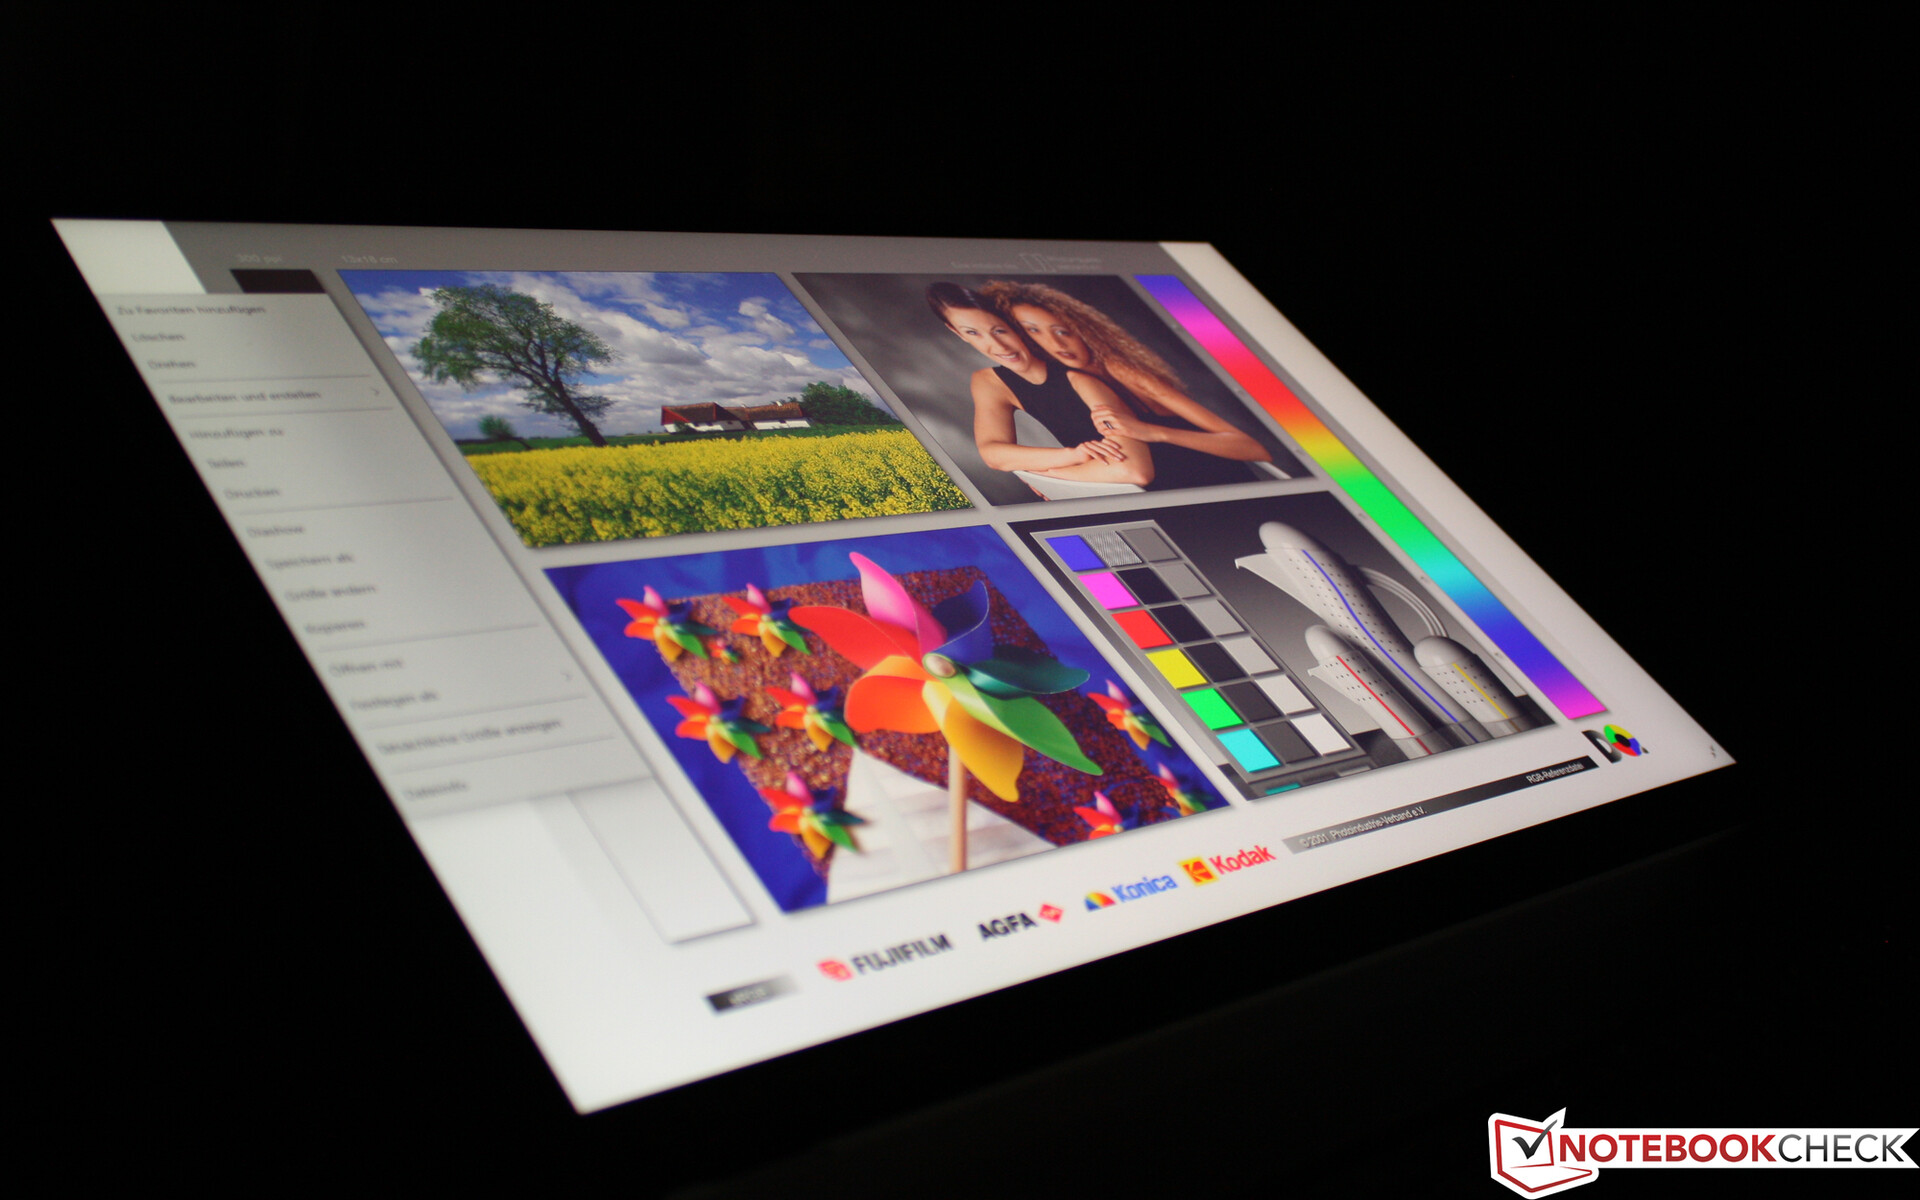
Touchscreen
The smooth surface allows speedy work directly on the screen, which can be wiped easily. Unfortunately, the lid bobs a bit, and the typing finger pushes the display down unintentionally from an opening of about 140 degrees.
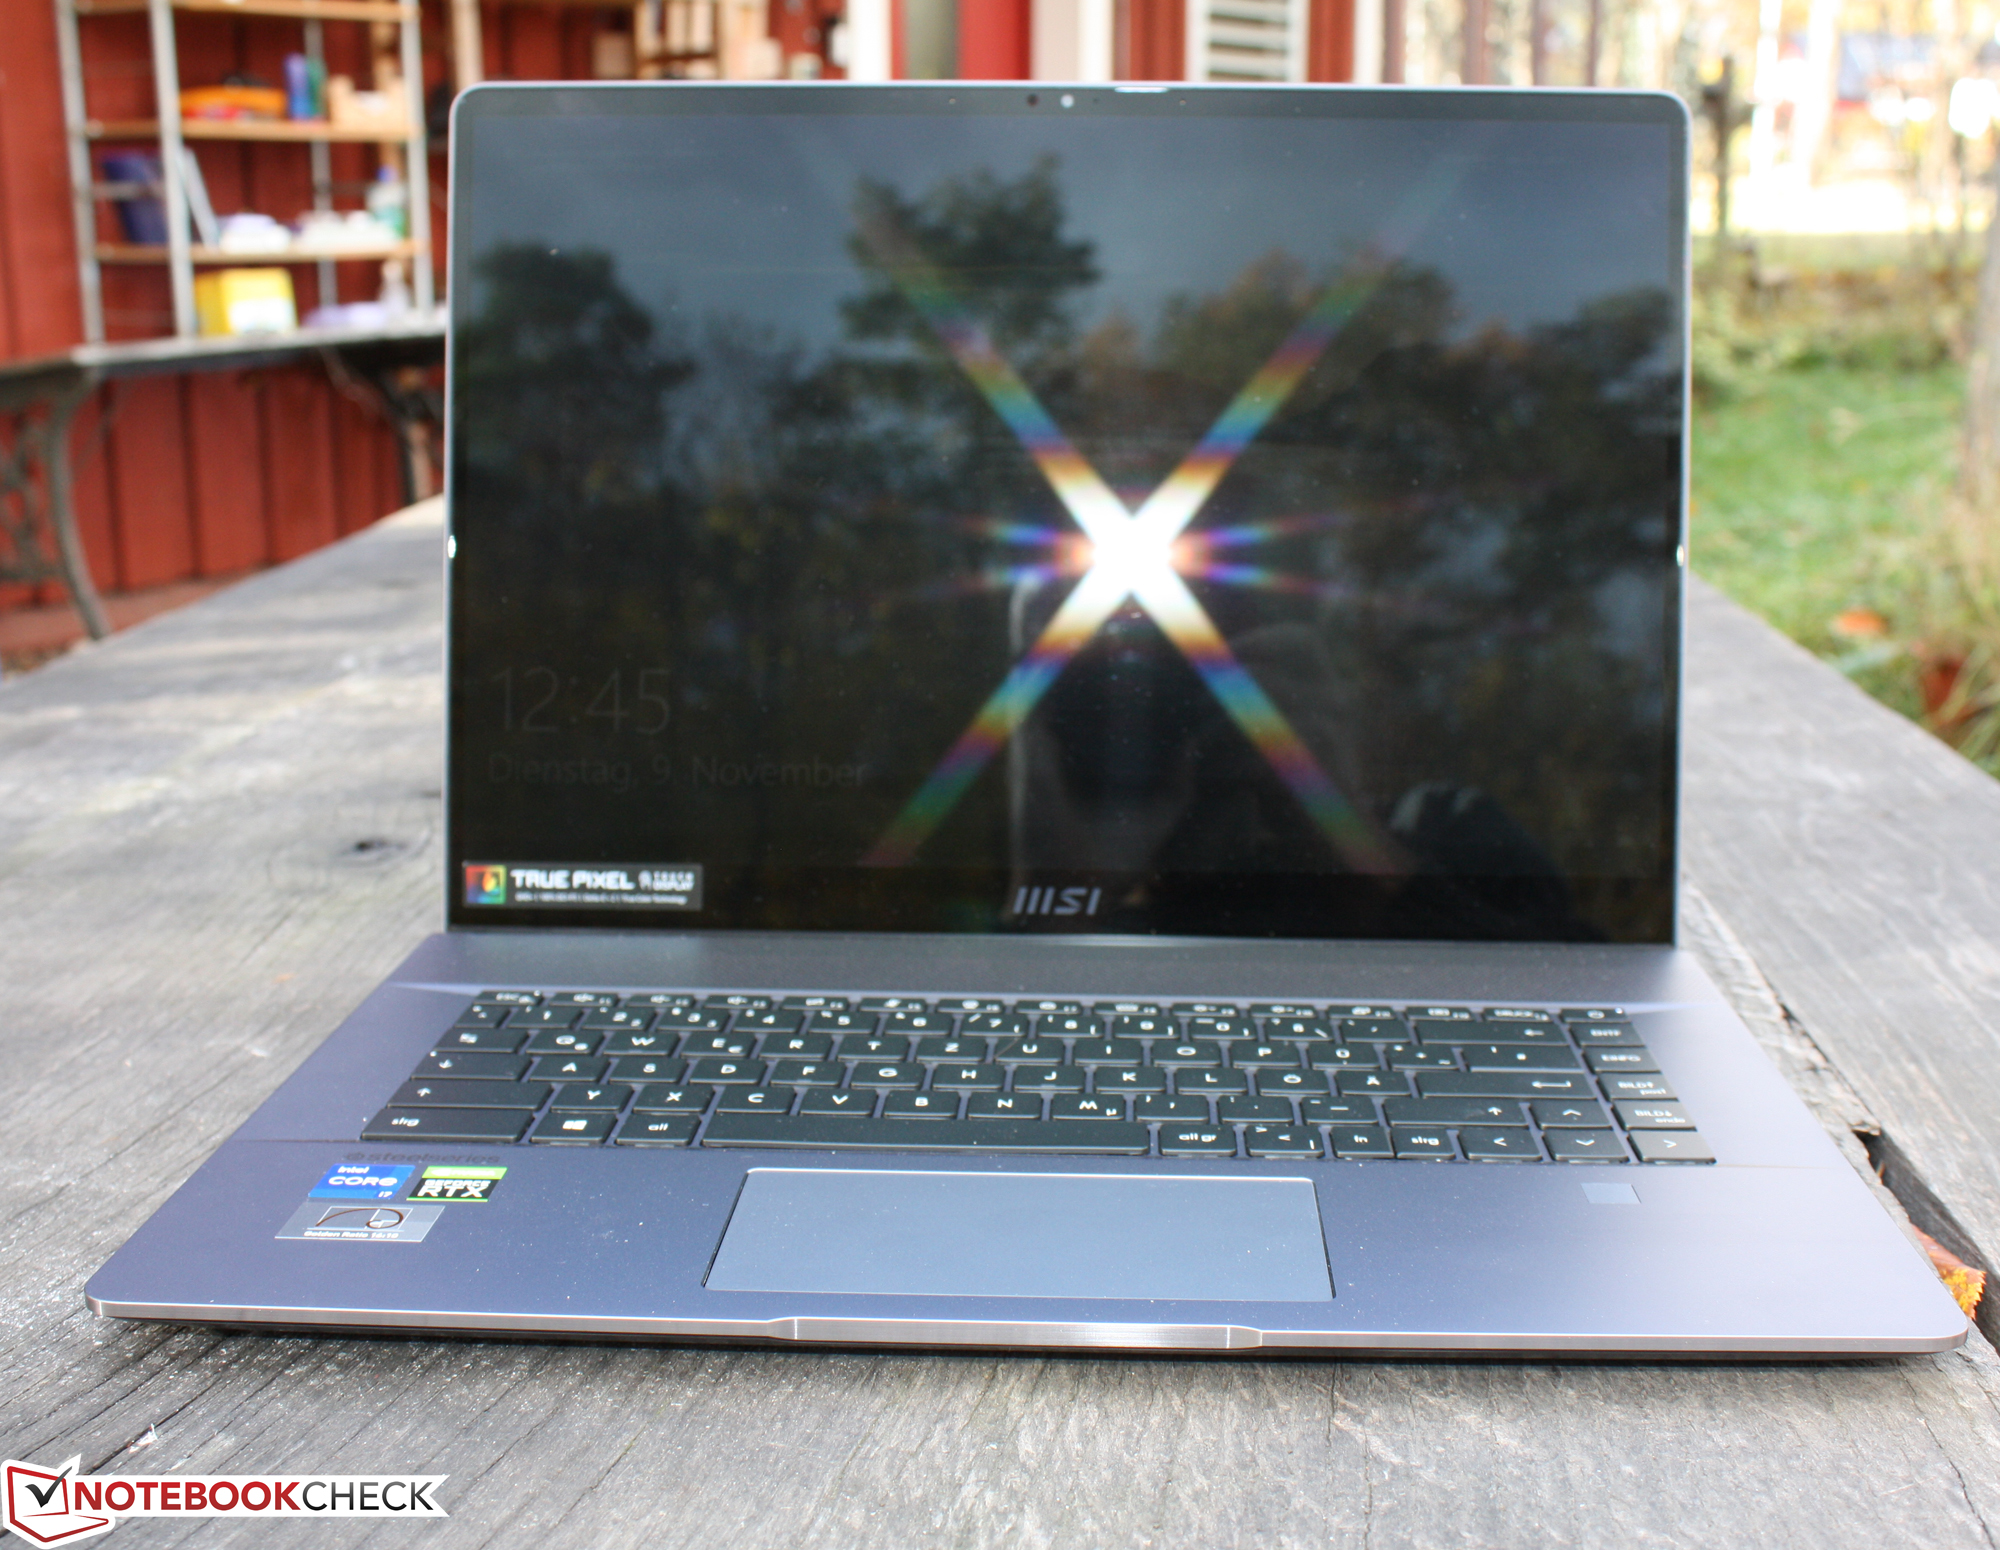
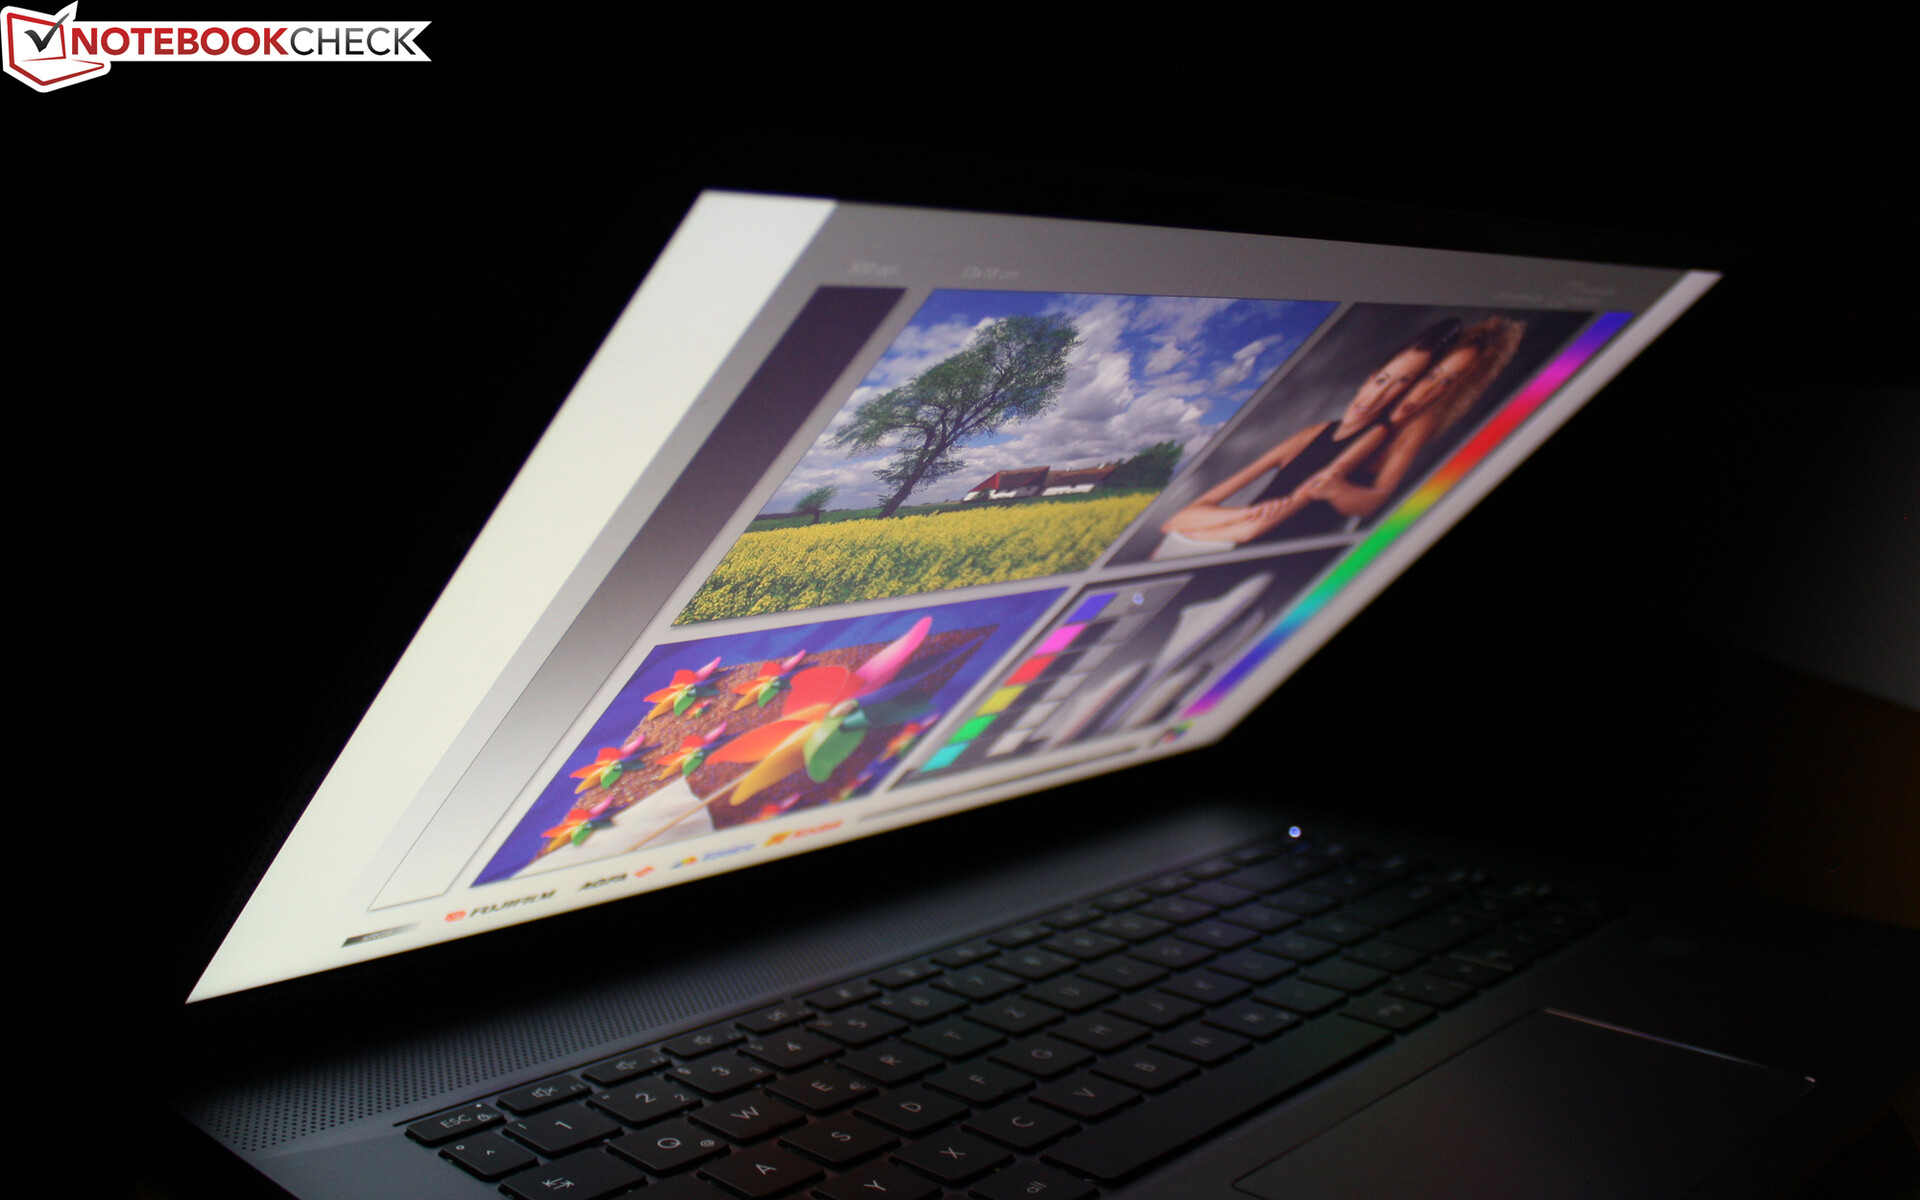
Display - Notebook with almost AdobeRGB color space

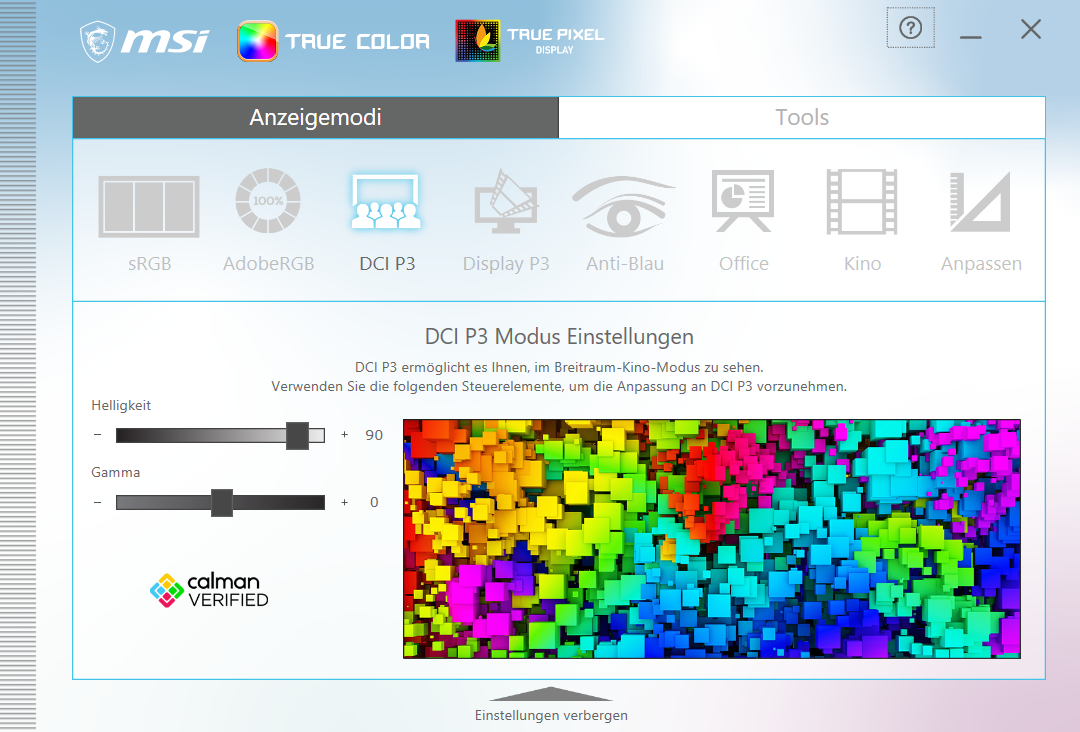
The 16-inch panel is a Wide View IPS with 120 Hz and a QHD+ resolution (2,560 x 1,600 pixels). MSI states a full coverage of DCI-P3 and calls it True Pixel. The display is in 16:10 format. MSI advertises the Golden Ratio here.
Those who do not want a touchscreen but prefer anti-glare can purchase one of the three anti-glare variants, which also have a 120 Hz True Pixel screen.
We measured 347 cd/m² brightness on average and 347 at maximum. The brightness is homogeneously distributed, which is what the 89% stands for. Positive: MSI does not use PWM to regulate the brightness. The response times of 7 and 14 ms are very good.
We do not know why MSI does not offer an OLED variant. Against the background of OLED options in the competition, the advantages of good IPS panels have to be pointed out: OLED panels should not be operated at maximum brightness permanently, OLED screens need more energy, and (disable-able) forced screensavers are preinstalled because of the burn-in issue. The OLED screen's unnecessarily high need for energy we experienced in our review of the Asus Zenbook 14X OLED. This is particularly annoying in battery mode.
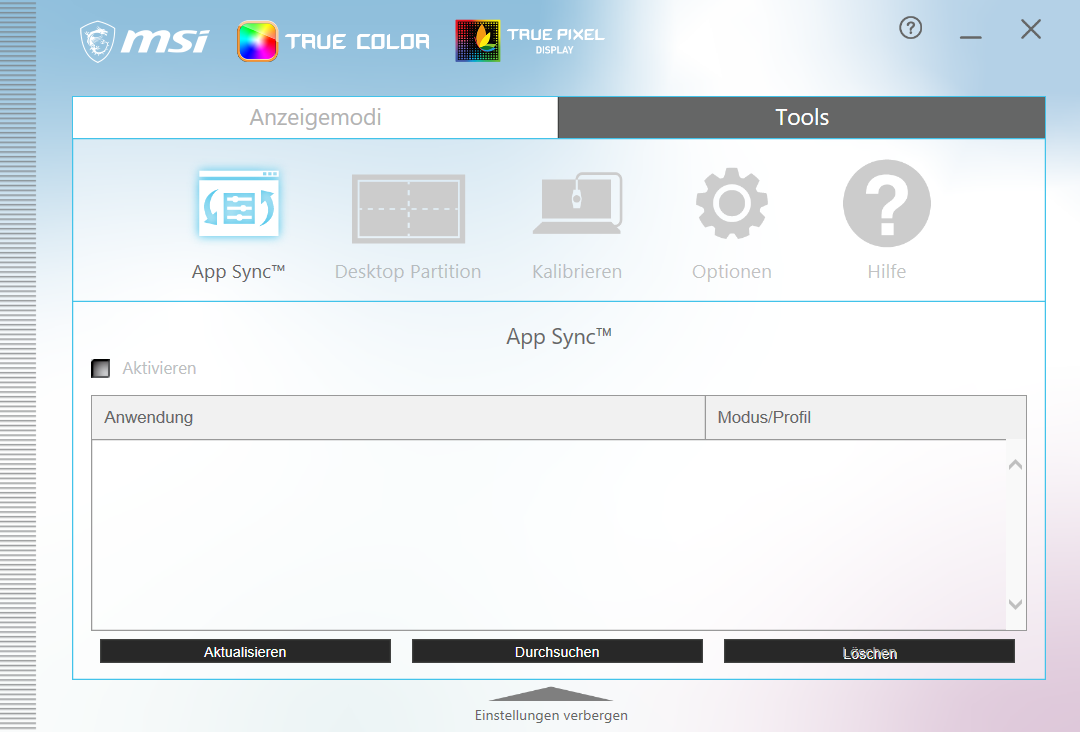
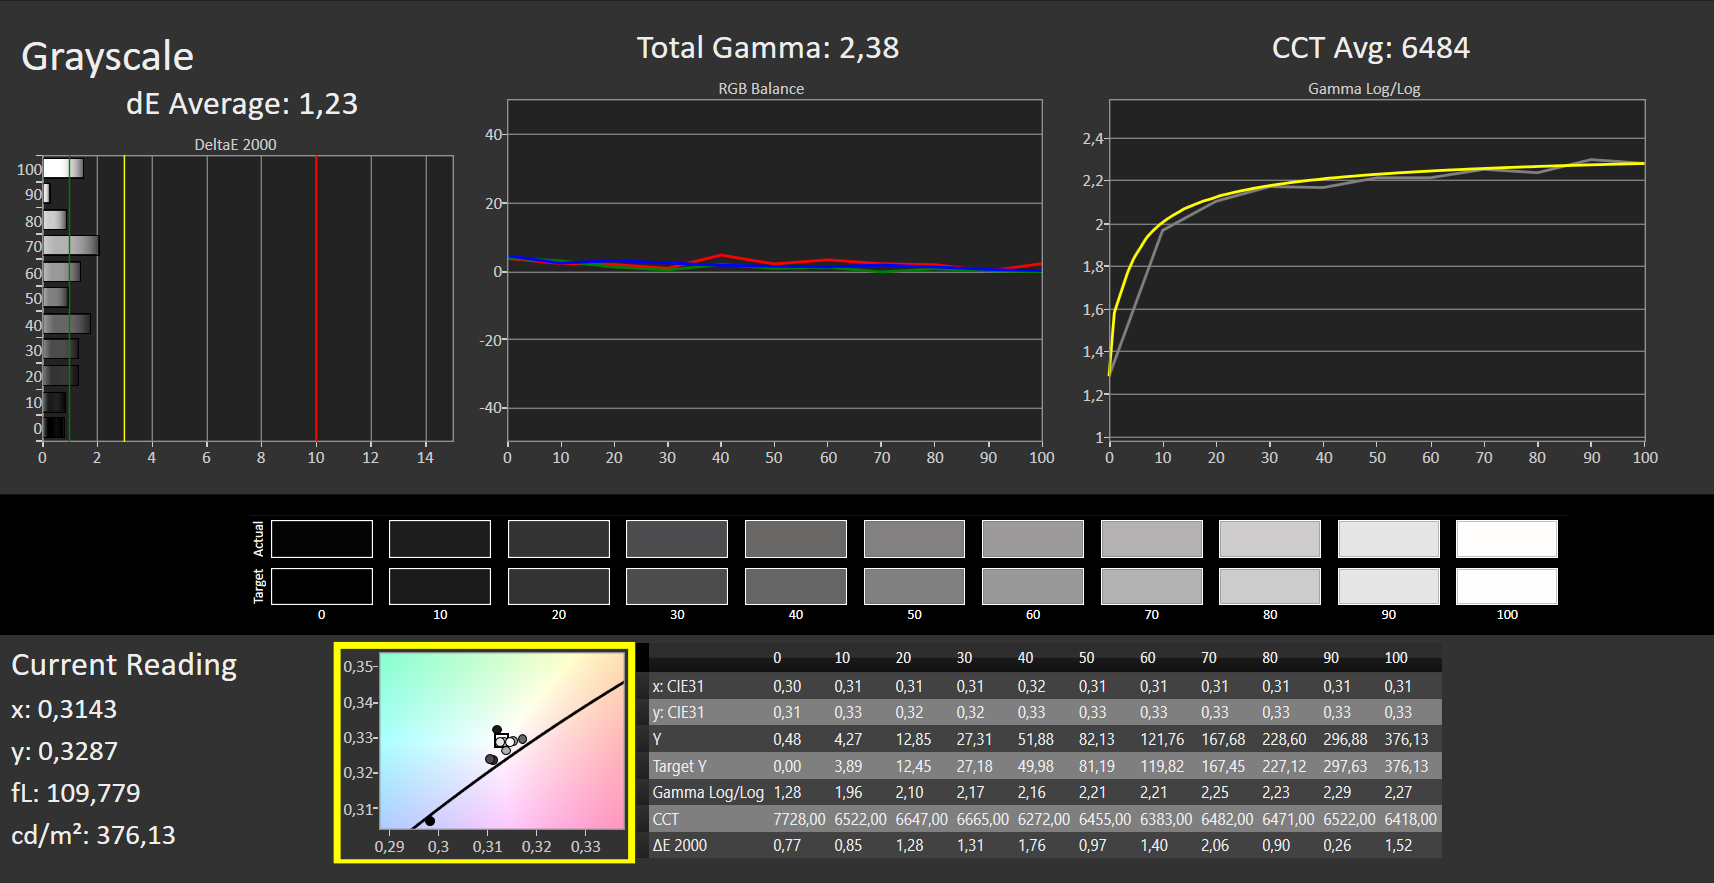
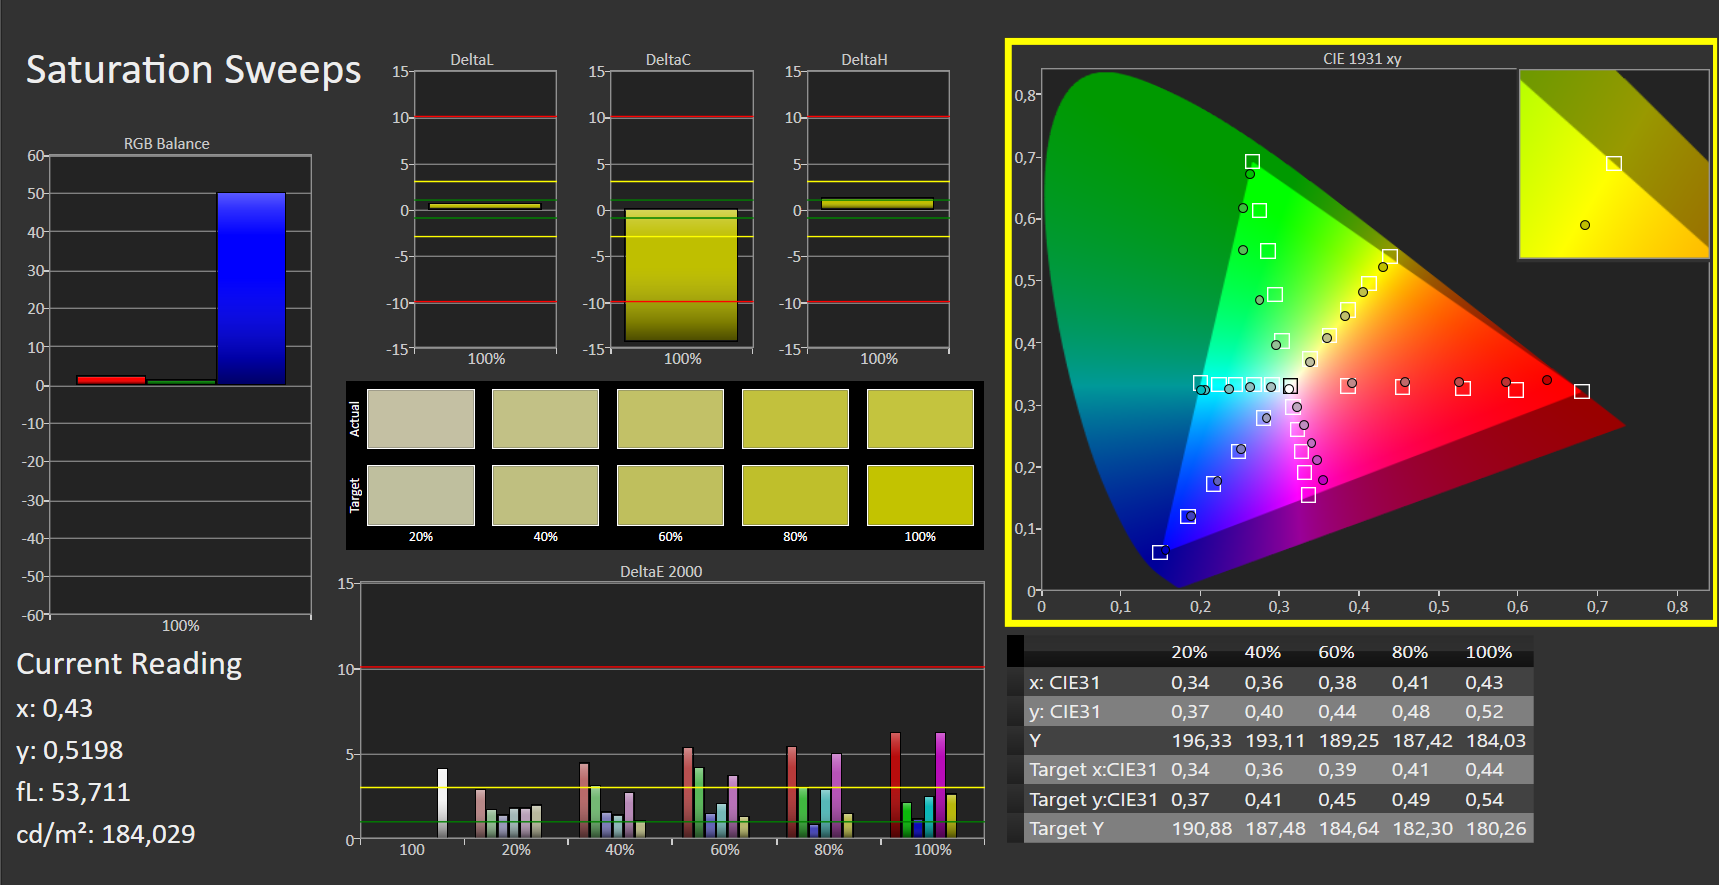
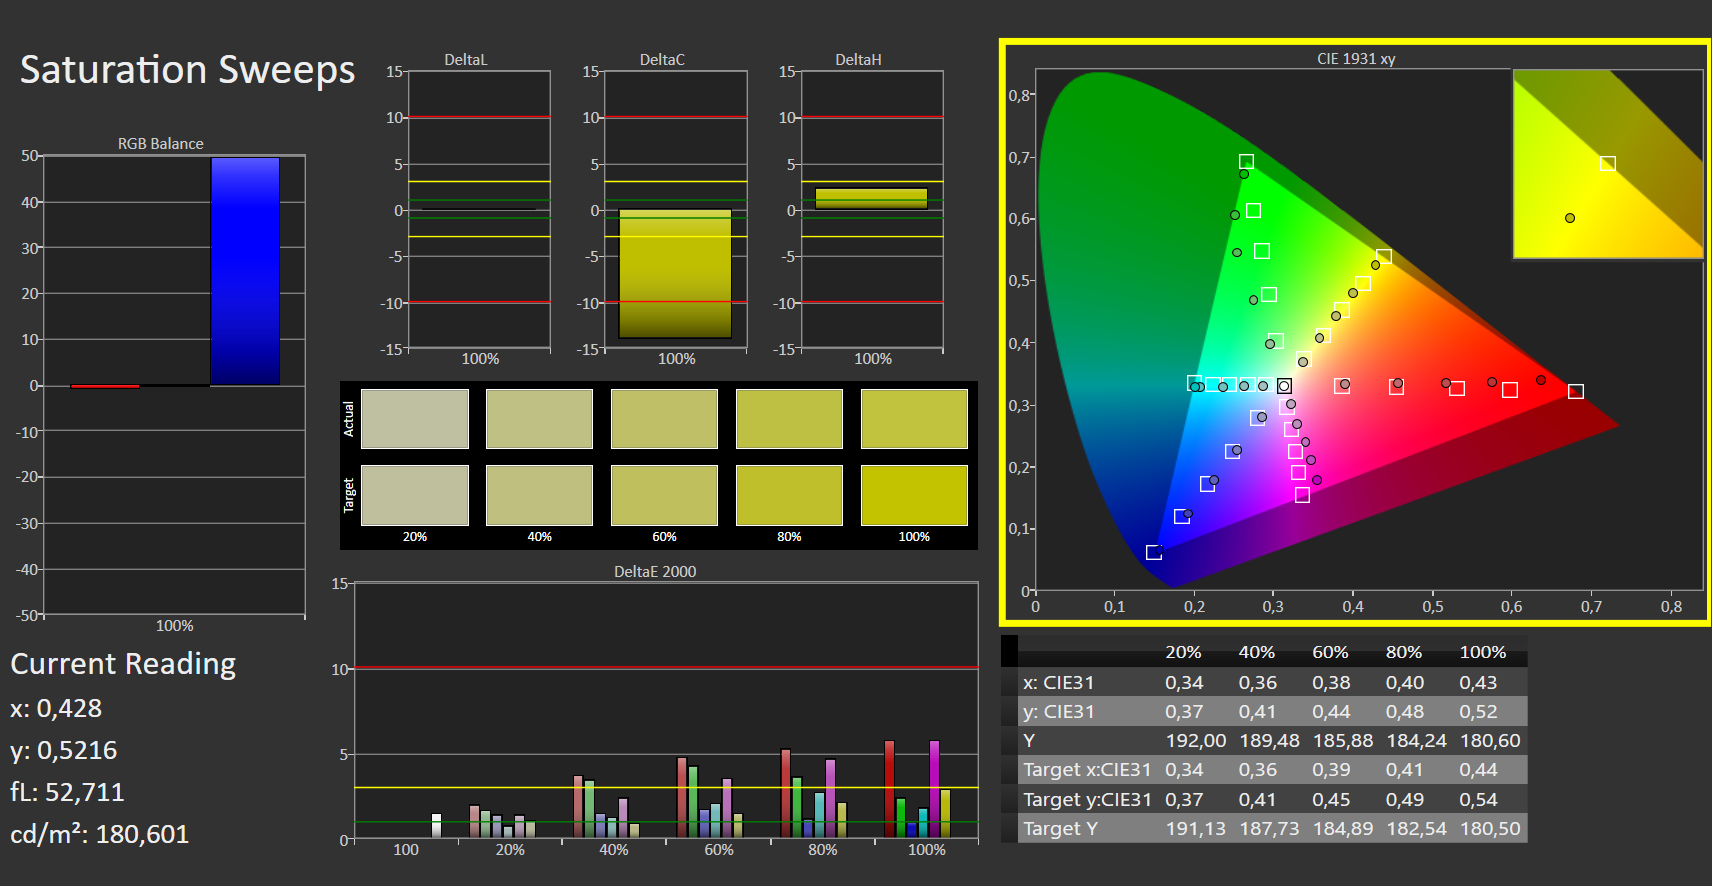
The factory-calibrated display fully covers the DCI-P3 color space. However, this extended space is not always needed and can be annoying, for example in Office use with Outlook and Excel. This is where MSI True Color comes into play. There, the display mode that fits the scenario can be selected. Programs can be assigned with App Sync. Thus, the matching color profile is automatically activated the next time Photoshop is started.
| |||||||||||||||||||||||||
Brightness Distribution: 89 %
Center on Battery: 375 cd/m²
Contrast: 915:1 (Black: 0.41 cd/m²)
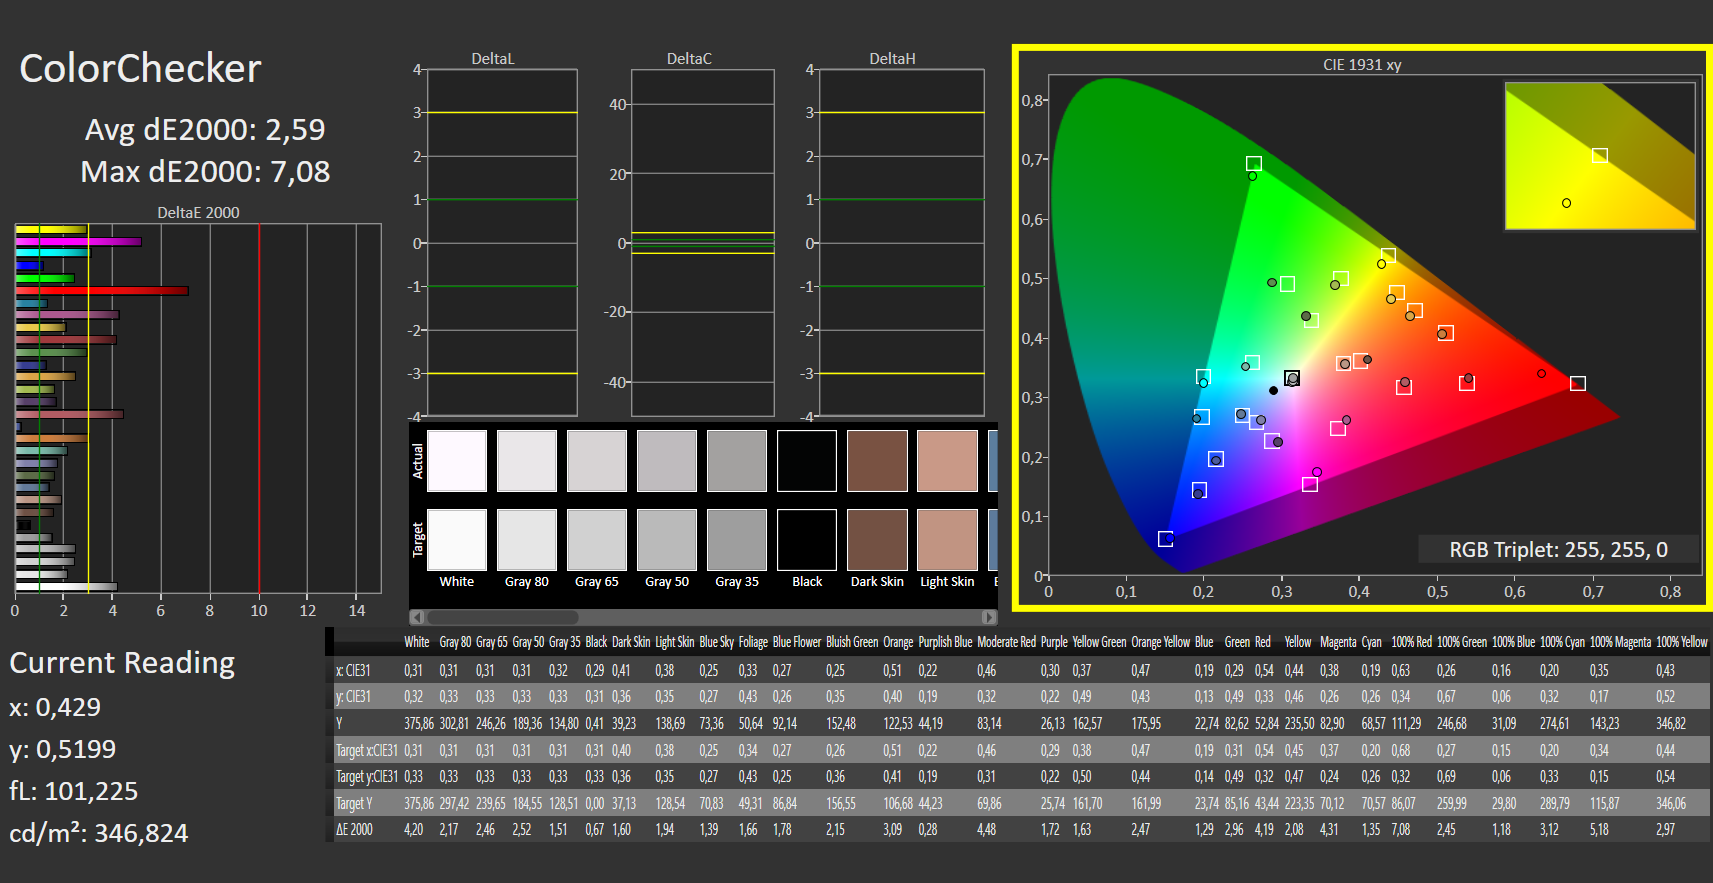
ΔE Color 2.59 | 0.5-29.43 Ø5, calibrated: 2.18
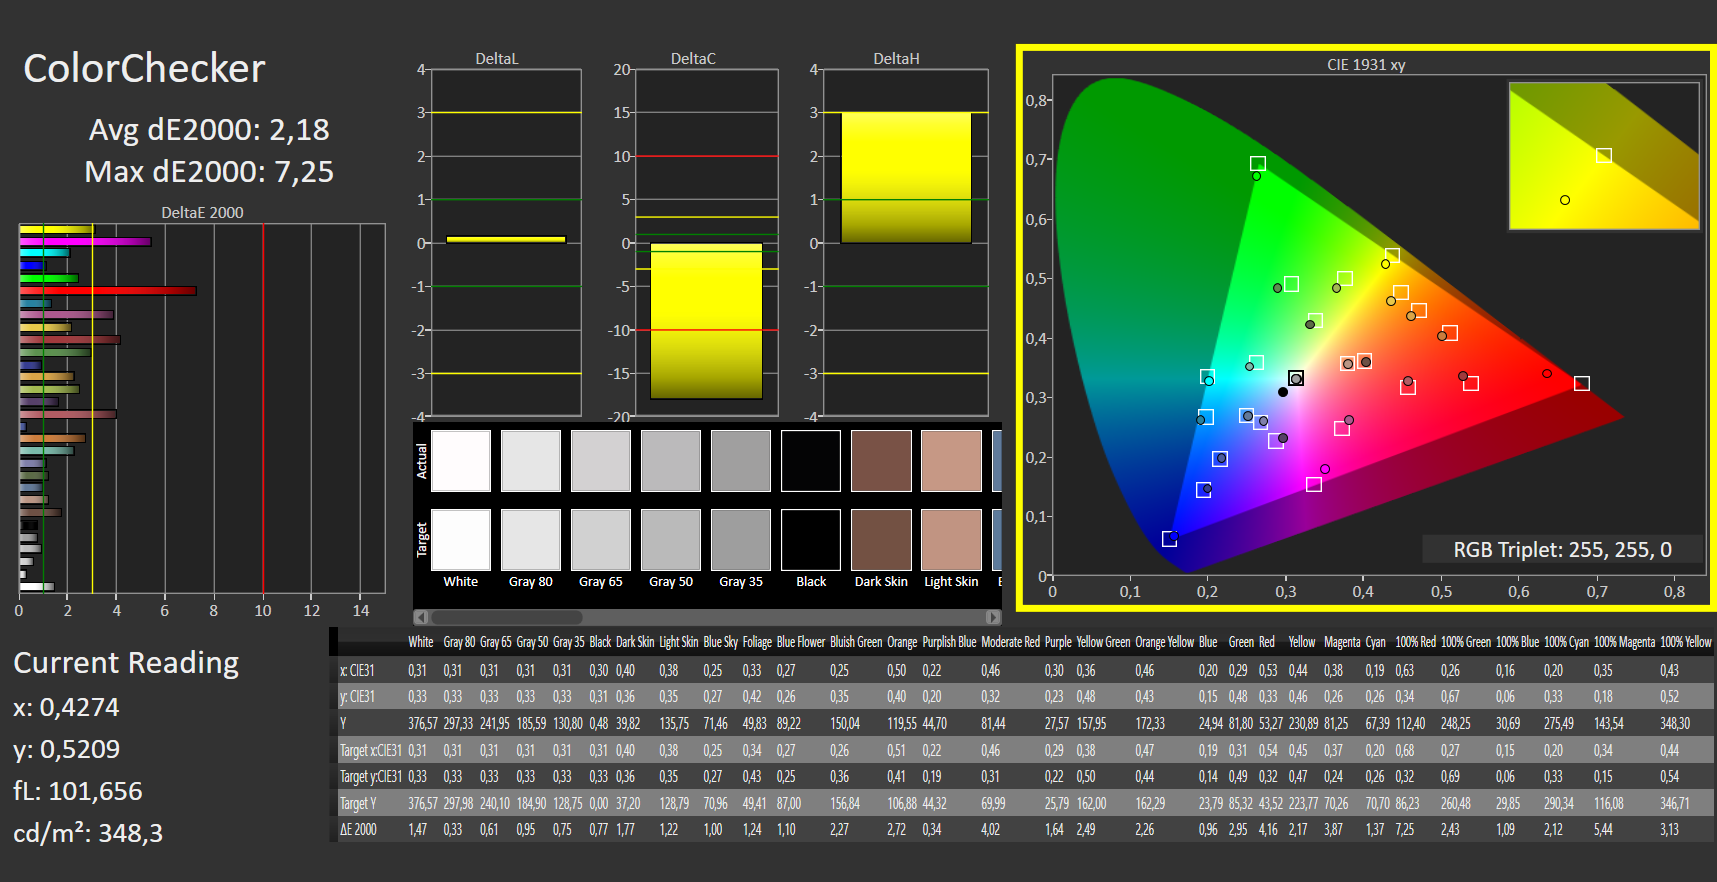
ΔE Greyscale 1.88 | 0.57-98 Ø5.3
96% AdobeRGB 1998 (Argyll 2.2.0 3D)
100% sRGB (Argyll 2.2.0 3D)
100% Display P3 (Argyll 2.2.0 3D)
Gamma: 2.37
| MSI Creator Z16 A11UET-209 AUO B160QAN02.P, IPS True Pixel, 2560x1600, 16.00 | HP ZBook Studio G7 LGD0661, IPS, 3840x2160, 15.60 | Razer Blade 15 Advanced (Mid 2021) TL156VDXP02-0, IPS, 1920x1080, 15.60 | Lenovo ThinkBook 16p G2 ACH Lenovo LEN8A95 (AUO B160QAN02.M), IPS, 2560x1600, 16.00 | Dell XPS 17 9710 Core i7 RTX 3060 Sharp LQ170R1, IPS, 3840x2400, 17.00 | Dell XPS 15 9510 11800H RTX 3050 Ti OLED SDC414D, OLED, 3456x2160, 15.60 | Apple MacBook Pro 16 2021 M1 Pro Liquid Retina XDR, Mini-LED, 3456x2234, 16.20 | |
|---|---|---|---|---|---|---|---|
| Display | -4% | -21% | -14% | -0% | 1% | -3% | |
| Display P3 Coverage | 100 | 98.2 -2% | 66.9 -33% | 76.4 -24% | 94.8 -5% | 99.9 0% | 99.1 -1% |
| sRGB Coverage | 100 | 99.9 0% | 97.1 -3% | 100 0% | 100 0% | 100 0% | 100 0% |
| AdobeRGB 1998 Coverage | 96 | 86.5 -10% | 69 -28% | 77.4 -19% | 100 4% | 98.1 2% | 88 -8% |
| Response Times | -370% | 14% | -146% | -289% | 67% | -708% | |
| Response Time Grey 50% / Grey 80% * | 14 ? | 56.4 ? -303% | 4.2 ? 70% | 36 -157% | 44.8 ? -220% | 3.6 ? 74% | 42.8 ? -206% |
| Response Time Black / White * | 7 ? | 37.6 ? -437% | 10 ? -43% | 16.4 -134% | 32 ? -357% | 2.8 ? 60% | 91.6 ? -1209% |
| PWM Frequency | 59.5 ? | 14880 | |||||
| Screen | 57% | 6% | 19% | 12% | 81% | 372% | |
| Brightness middle | 375 | 723 93% | 353.4 -6% | 439 17% | 536.5 43% | 362 -3% | 514 37% |
| Brightness | 348 | 707 103% | 340 -2% | 397 14% | 489 41% | 367 5% | 497 43% |
| Brightness Distribution | 89 | 92 3% | 92 3% | 83 -7% | 85 -4% | 97 9% | 95 7% |
| Black Level * | 0.41 | 0.35 15% | 0.31 24% | 0.44 -7% | 0.37 10% | 0.06 85% | 0.02 95% |
| Contrast | 915 | 2066 126% | 1140 25% | 998 9% | 1450 58% | 6033 559% | 25700 2709% |
| Colorchecker dE 2000 * | 2.59 | 1.4 46% | 2.17 16% | 1.68 35% | 2.46 5% | 2.1 19% | 1.4 46% |
| Colorchecker dE 2000 max. * | 7.08 | 2.9 59% | 5.69 20% | 2.36 67% | 7.74 -9% | 4.1 42% | 2.8 60% |
| Colorchecker dE 2000 calibrated * | 2.18 | 0.5 77% | 1.05 52% | 1.57 28% | 1.85 15% | 2.5 -15% | |
| Greyscale dE 2000 * | 1.88 | 2 -6% | 3.4 -81% | 1.64 13% | 2.9 -54% | 1.4 26% | 2.3 -22% |
| Gamma | 2.37 93% | 2.14 103% | 2.2 100% | 2.39 92% | 2.12 104% | 2.18 101% | 2.27 97% |
| CCT | 6470 100% | 6484 100% | 6830 95% | 6616 98% | 6868 95% | 6608 98% | 6792 96% |
| Color Space (Percent of AdobeRGB 1998) | 77.3 | ||||||
| Color Space (Percent of sRGB) | 99.9 | ||||||
| Total Average (Program / Settings) | -106% /
-17% | -0% /
1% | -47% /
-12% | -92% /
-34% | 50% /
62% | -113% /
119% |
* ... smaller is better
We calibrated the panel and created our own color profile. We only marginally improved the already good values. The factory calibration seems to be very good. MSI promises a DeltaE <2, which is how accurate the factory calibration is supposed to be. Our measurements confirm this for the grayscale, and the value for the colors is just above that (2.5).
Display Response Times
| ↔ Response Time Black to White | ||
|---|---|---|
| 7 ms ... rise ↗ and fall ↘ combined | ↗ 3 ms rise |  |
| ↘ 4 ms fall | ||
| The screen shows very fast response rates in our tests and should be very well suited for fast-paced gaming. In comparison, all tested devices range from 0.1 (minimum) to 240 (maximum) ms. » 15 % of all devices are better. This means that the measured response time is better than the average of all tested devices (21.5 ms). | ||
| ↔ Response Time 50% Grey to 80% Grey | ||
| 14 ms ... rise ↗ and fall ↘ combined | ↗ 8 ms rise |  |
| ↘ 6 ms fall | ||
| The screen shows good response rates in our tests, but may be too slow for competitive gamers. In comparison, all tested devices range from 0.2 (minimum) to 636 (maximum) ms. » 22 % of all devices are better. This means that the measured response time is better than the average of all tested devices (33.8 ms). | ||
Screen Flickering / PWM (Pulse-Width Modulation)
| Screen flickering / PWM not detected |  | ||
In comparison: 53 % of all tested devices do not use PWM to dim the display. If PWM was detected, an average of 17942 (minimum: 5 - maximum: 3846000) Hz was measured. | |||
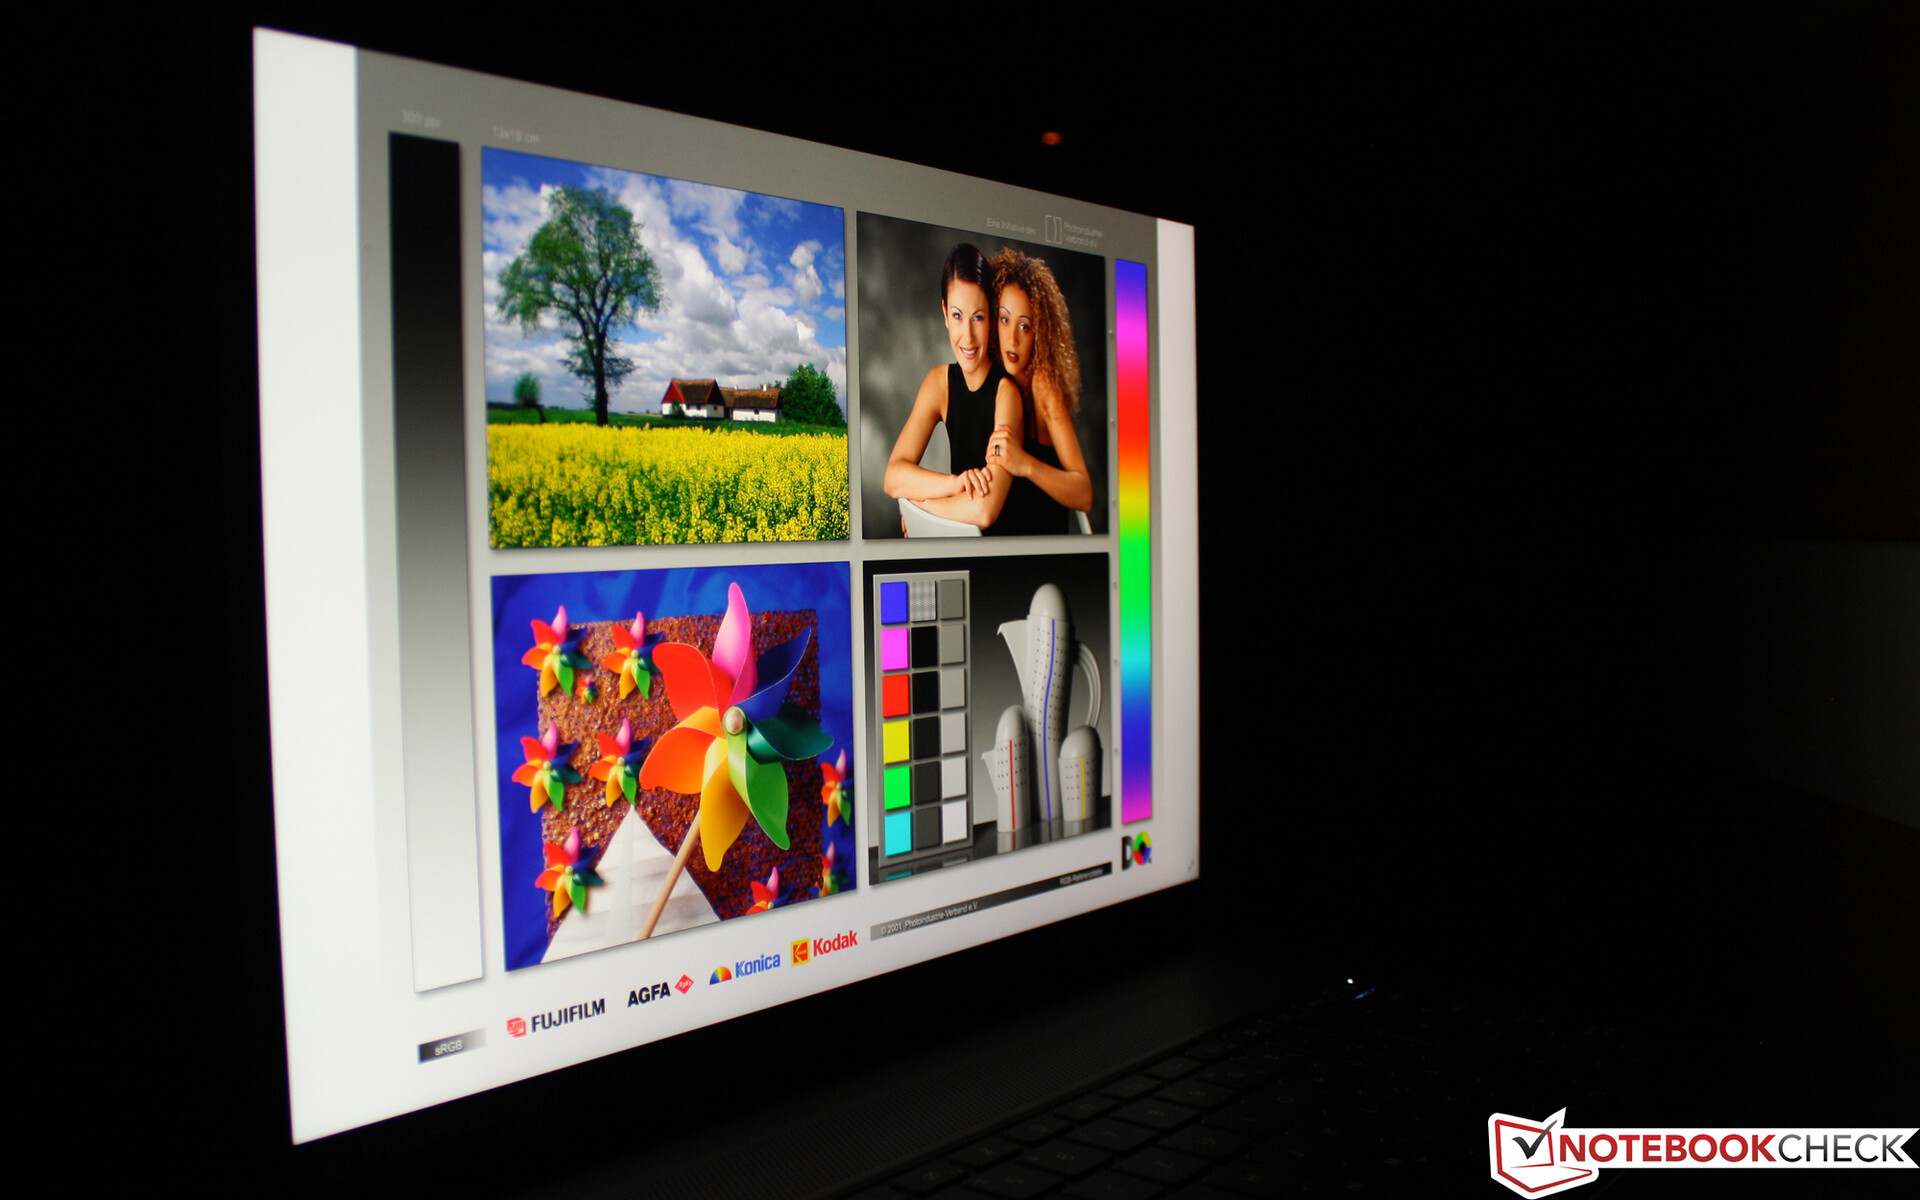
The TFT can only be used outdoors in the sun to a limited extent with its reflective surface, and the maximum brightness, just under 350 cd/m² (average), is of little use.
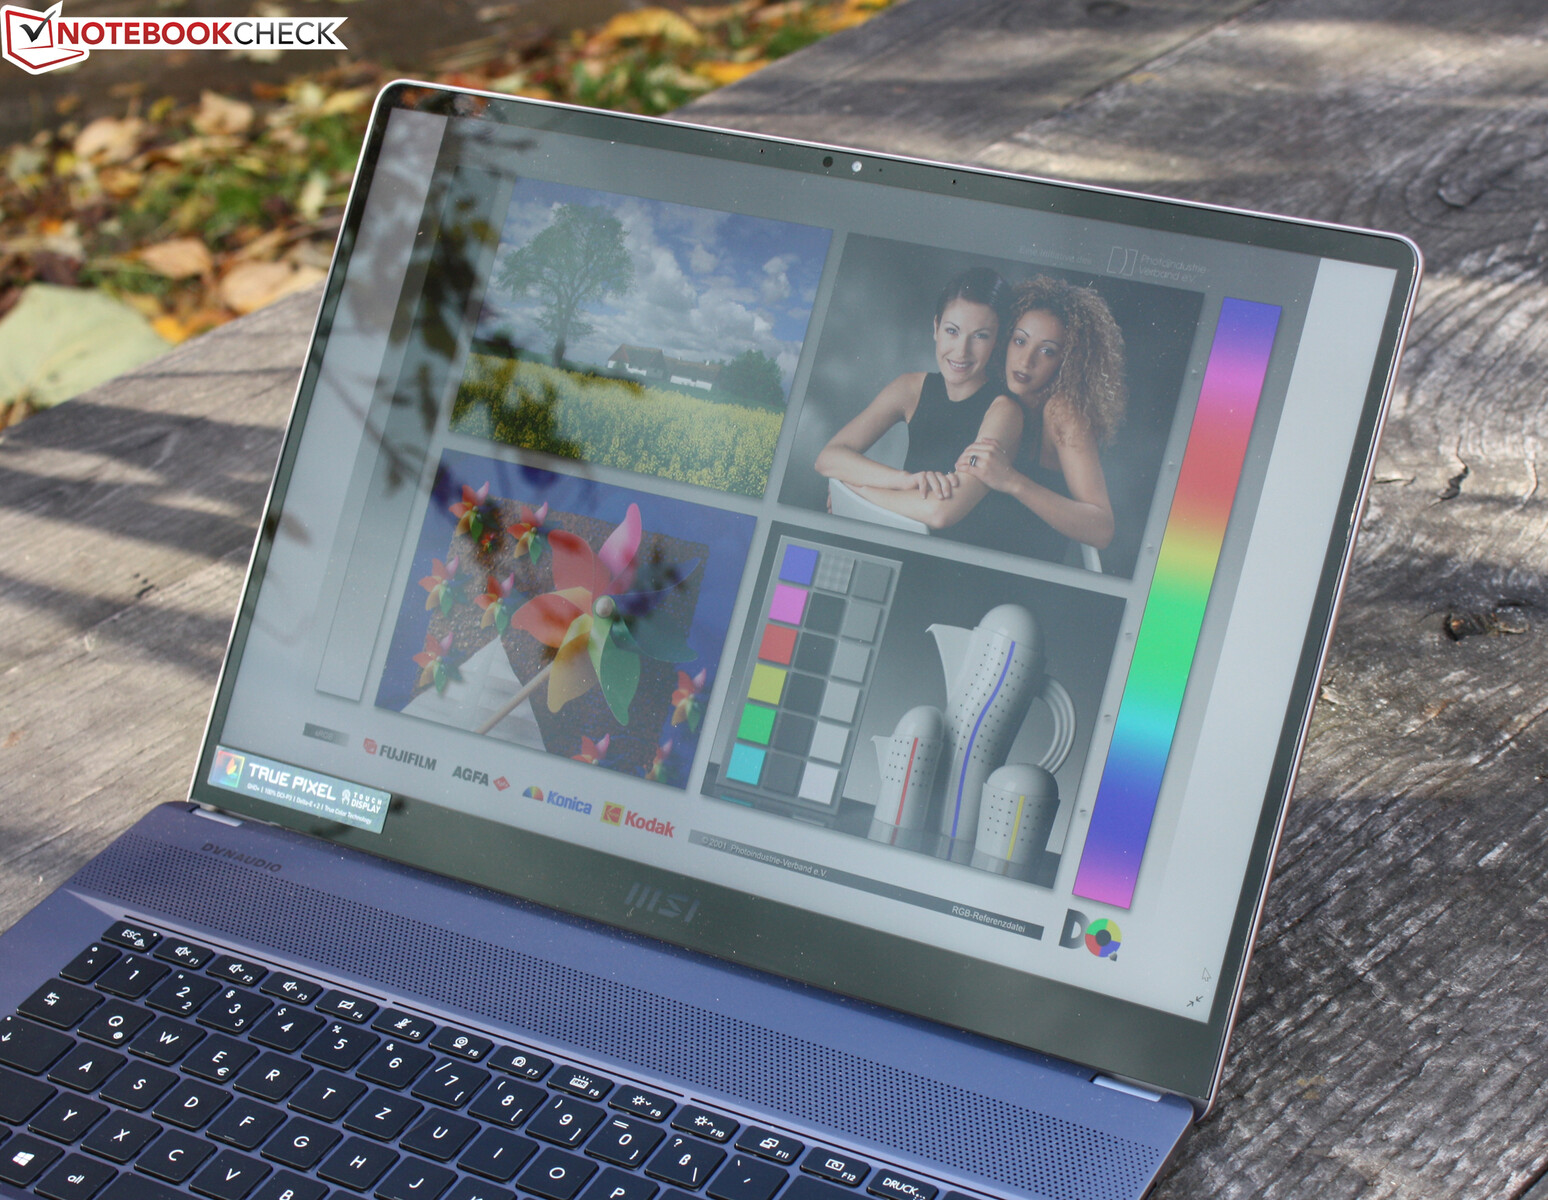
The viewing angles are very wide, typical for IPS panels. Colors remain crisp and contours sharp from every viewing direction.
Performance - Intel Core i7 puts on the pressure
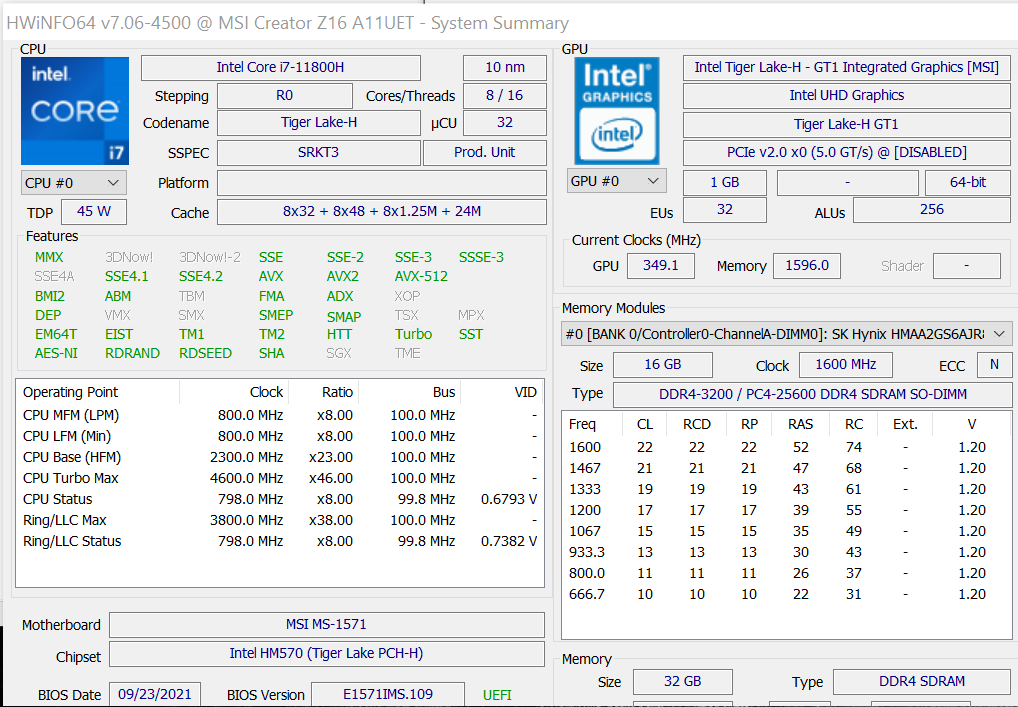
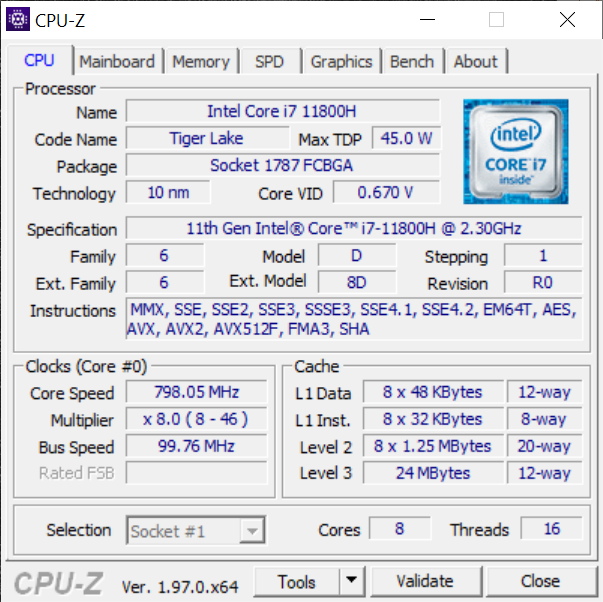
The Tiger Lake H45 chip (Willow Cove, 10 nm) is a 45-watt model that currently belongs to the spearhead of mobile processors. The Intel Core i7-11800H (8 cores) workat up to 4.60 GHz and has an enormous cache of 24 MB + 10 MB.
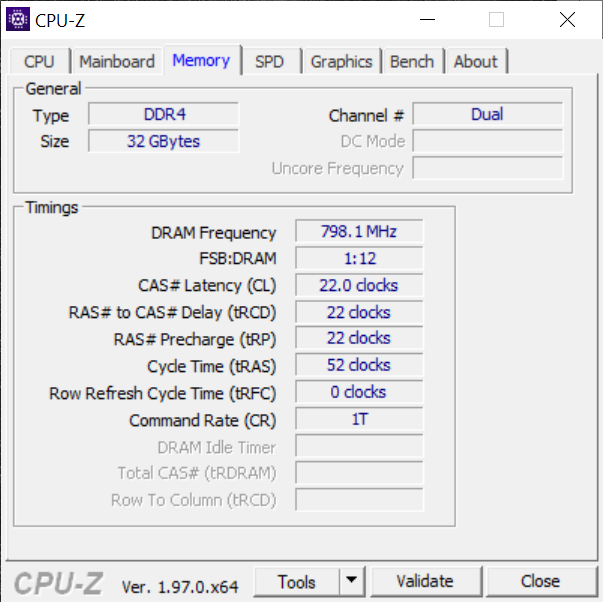
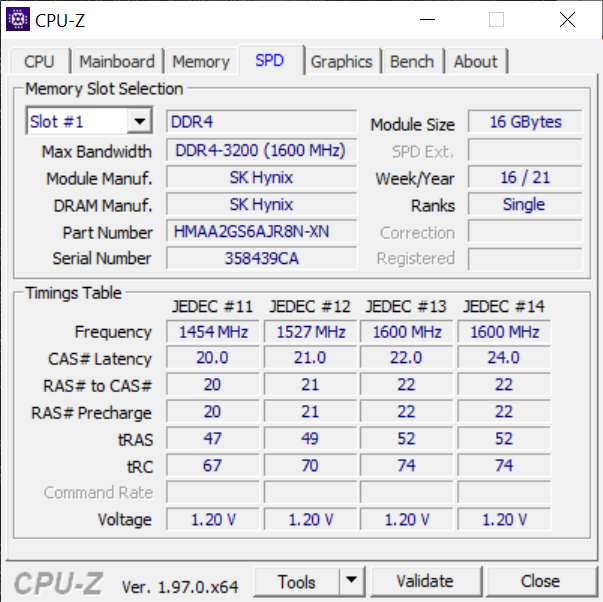
With both RAM sockets equipped in the test device (2x 16 GB), we have 32 GB DDR4-3200. However, the system can do even more, namely up to 64 GB (2x 32 GB).
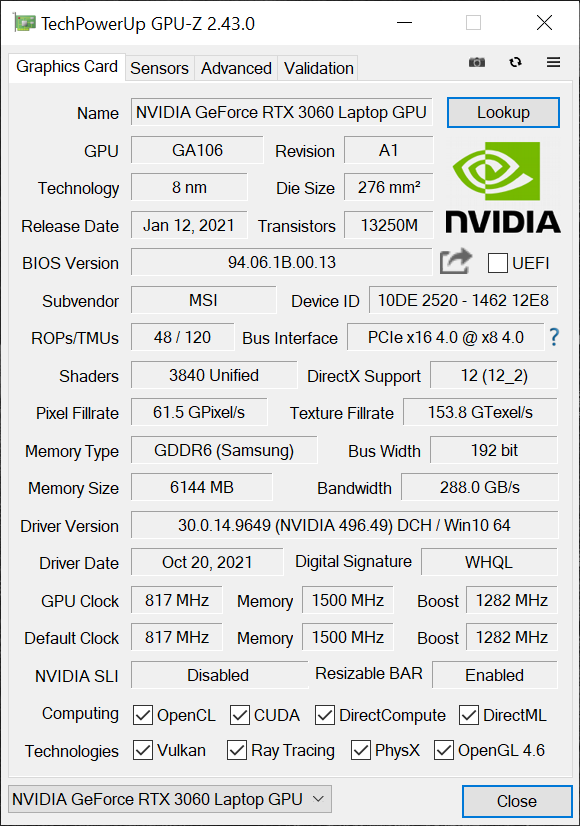
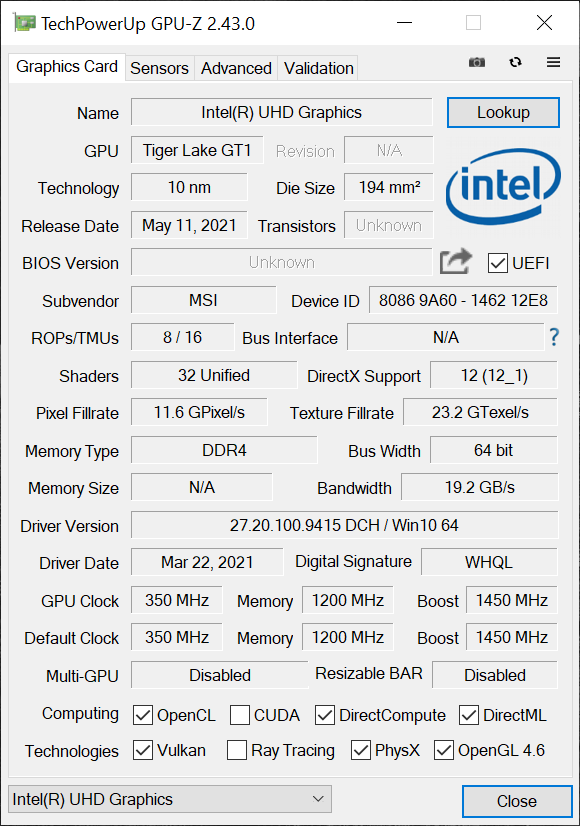
The Nvidia GeForce RTX 3060 is standard for the Z16, and it can't be deselected. The GA106 (Ampere, 8 nm) has 65 W of maximum GPU power. When idle or doing simple work, the RTX turns itself off in favor of the Intel Xe (32 EUs).
Test conditions
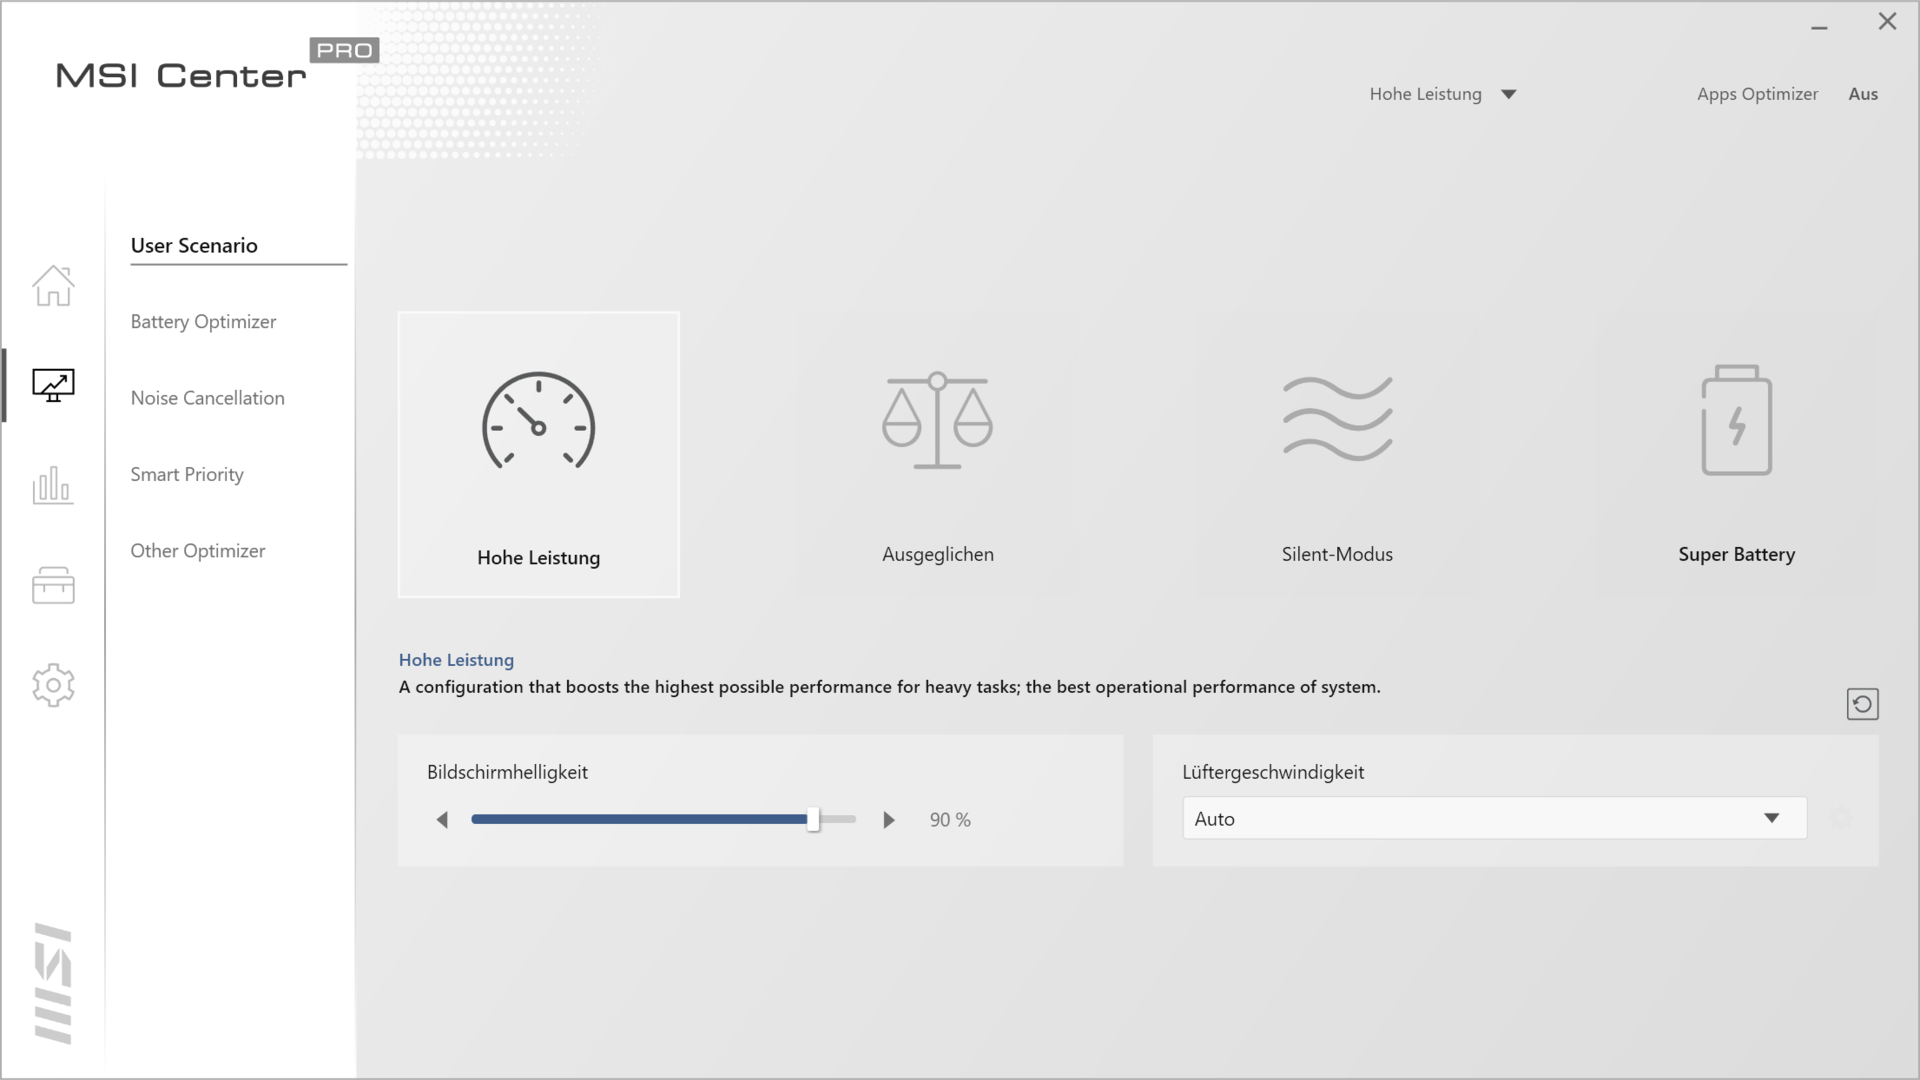
In the MSI Center Pro - alternatively via a function key - you can switch between the power profiles. We selected High Performance for benchmarks. We left the fan speed, which can only be set from Auto to Extended/Cooler Boost under High Performance, on Auto. Cooler Boost provides a permanent, unbearably loud noise that hardly anyone would activate when present. The mentioned profiles are anchored in the BIOS on the hardware side and can also be set there.
Processor
The 8-core processor i7-11800H can perform up to 4.60 GHz, but only selectively on one core. In multi-core practice, it is then at best 4 GHz on all cores, as we see in Cinebench. But this is not permanent, because the SoC wants to avert overheating above 90 °C (194 °F), which is why it is reduced to up to 3.6 GHz. In this case, the CPU package power drops from an initial 75 to 62 watts.
In the loop, the achieved R15 scores thus slip from 1,933 to an average of 1,820 (-6%). The following are identically positioned with the same SoC Razer Blade 15 Advanced (Mid 2021) and the XPS 17, but these models have a lower starting level (1,840). Dell's XPS 15 9510 with its 11800H shows that the power output is not always that constant. Even in performance mode, the 15.6-inch model drops by 28% in the R15 loop. In short: The performance of the Z16 is impressive, which is why the CPU benchmarks are above average across the board.
With Prime95, we noticed a very similar behavior as in Cinebench. Here, the continuous work on all cores even runs with only 3.0 GHz because the temperature has increased to just over 90 °C (194 °F).
Cinebench R15 Multi Endurance test
Cinebench R23: Multi Core | Single Core
Cinebench R20: CPU (Multi Core) | CPU (Single Core)
Cinebench R15: CPU Multi 64Bit | CPU Single 64Bit
Blender: v2.79 BMW27 CPU
7-Zip 18.03: 7z b 4 | 7z b 4 -mmt1
Geekbench 5.5: Multi-Core | Single-Core
HWBOT x265 Benchmark v2.2: 4k Preset
LibreOffice : 20 Documents To PDF
R Benchmark 2.5: Overall mean
| CPU Performance Rating | |
| Average of class Multimedia | |
| Apple MacBook Pro 16 2021 M1 Pro -5! | |
| Lenovo ThinkBook 16p G2 ACH | |
| MSI Creator Z16 A11UET-209 -3! | |
| Razer Blade 15 Advanced (Mid 2021) -2! | |
| Average Intel Core i7-11800H | |
| Dell XPS 17 9710 Core i7 RTX 3060 -2! | |
| Dell XPS 15 9510 11800H RTX 3050 Ti OLED | |
| HP ZBook Studio G7 | |
| Cinebench R23 / Multi Core | |
| Average of class Multimedia (4624 - 30789, n=100, last 2 years) | |
| Lenovo ThinkBook 16p G2 ACH | |
| Apple MacBook Pro 16 2021 M1 Pro | |
| Razer Blade 15 Advanced (Mid 2021) | |
| MSI Creator Z16 A11UET-209 | |
| Dell XPS 17 9710 Core i7 RTX 3060 | |
| Average Intel Core i7-11800H (6508 - 14088, n=48) | |
| Dell XPS 15 9510 11800H RTX 3050 Ti OLED | |
| HP ZBook Studio G7 | |
| Cinebench R23 / Single Core | |
| Average of class Multimedia (878 - 2110, n=98, last 2 years) | |
| Apple MacBook Pro 16 2021 M1 Pro | |
| Razer Blade 15 Advanced (Mid 2021) | |
| MSI Creator Z16 A11UET-209 | |
| Dell XPS 17 9710 Core i7 RTX 3060 | |
| Dell XPS 15 9510 11800H RTX 3050 Ti OLED | |
| Average Intel Core i7-11800H (1386 - 1522, n=45) | |
| Lenovo ThinkBook 16p G2 ACH | |
| HP ZBook Studio G7 | |
| Cinebench R20 / CPU (Multi Core) | |
| Average of class Multimedia (1783 - 11768, n=96, last 2 years) | |
| Lenovo ThinkBook 16p G2 ACH | |
| MSI Creator Z16 A11UET-209 | |
| Razer Blade 15 Advanced (Mid 2021) | |
| Average Intel Core i7-11800H (2498 - 5408, n=50) | |
| Dell XPS 17 9710 Core i7 RTX 3060 | |
| Dell XPS 15 9510 11800H RTX 3050 Ti OLED | |
| HP ZBook Studio G7 | |
| Apple MacBook Pro 16 2021 M1 Pro | |
| Cinebench R20 / CPU (Single Core) | |
| Average of class Multimedia (341 - 812, n=96, last 2 years) | |
| Razer Blade 15 Advanced (Mid 2021) | |
| Dell XPS 15 9510 11800H RTX 3050 Ti OLED | |
| Lenovo ThinkBook 16p G2 ACH | |
| MSI Creator Z16 A11UET-209 | |
| Dell XPS 17 9710 Core i7 RTX 3060 | |
| Average Intel Core i7-11800H (520 - 586, n=47) | |
| HP ZBook Studio G7 | |
| Apple MacBook Pro 16 2021 M1 Pro | |
| Cinebench R15 / CPU Multi 64Bit | |
| Average of class Multimedia (785 - 4703, n=105, last 2 years) | |
| Lenovo ThinkBook 16p G2 ACH | |
| Dell XPS 15 9510 11800H RTX 3050 Ti OLED | |
| Dell XPS 15 9510 11800H RTX 3050 Ti OLED | |
| MSI Creator Z16 A11UET-209 | |
| Average Intel Core i7-11800H (1342 - 2173, n=50) | |
| Razer Blade 15 Advanced (Mid 2021) | |
| Dell XPS 17 9710 Core i7 RTX 3060 | |
| HP ZBook Studio G7 | |
| Apple MacBook Pro 16 2021 M1 Pro | |
| Cinebench R15 / CPU Single 64Bit | |
| Average of class Multimedia (142.6 - 308, n=98, last 2 years) | |
| Lenovo ThinkBook 16p G2 ACH | |
| Dell XPS 15 9510 11800H RTX 3050 Ti OLED | |
| Razer Blade 15 Advanced (Mid 2021) | |
| Dell XPS 17 9710 Core i7 RTX 3060 | |
| Average Intel Core i7-11800H (201 - 231, n=46) | |
| HP ZBook Studio G7 | |
| Apple MacBook Pro 16 2021 M1 Pro | |
| MSI Creator Z16 A11UET-209 | |
| Blender / v2.79 BMW27 CPU | |
| Dell XPS 15 9510 11800H RTX 3050 Ti OLED | |
| HP ZBook Studio G7 | |
| Average Intel Core i7-11800H (217 - 454, n=46) | |
| Average of class Multimedia (107 - 662, n=94, last 2 years) | |
| Dell XPS 17 9710 Core i7 RTX 3060 | |
| Razer Blade 15 Advanced (Mid 2021) | |
| MSI Creator Z16 A11UET-209 | |
| Lenovo ThinkBook 16p G2 ACH | |
| Apple MacBook Pro 16 2021 M1 Pro | |
| 7-Zip 18.03 / 7z b 4 | |
| Lenovo ThinkBook 16p G2 ACH | |
| Average of class Multimedia (20166 - 119900, n=89, last 2 years) | |
| Razer Blade 15 Advanced (Mid 2021) | |
| Dell XPS 17 9710 Core i7 RTX 3060 | |
| Average Intel Core i7-11800H (33718 - 56758, n=46) | |
| HP ZBook Studio G7 | |
| Dell XPS 15 9510 11800H RTX 3050 Ti OLED | |
| 7-Zip 18.03 / 7z b 4 -mmt1 | |
| Lenovo ThinkBook 16p G2 ACH | |
| HP ZBook Studio G7 | |
| Average of class Multimedia (3398 - 7163, n=89, last 2 years) | |
| Average Intel Core i7-11800H (5138 - 5732, n=46) | |
| Dell XPS 17 9710 Core i7 RTX 3060 | |
| Razer Blade 15 Advanced (Mid 2021) | |
| Dell XPS 15 9510 11800H RTX 3050 Ti OLED | |
| Geekbench 5.5 / Multi-Core | |
| Apple MacBook Pro 16 2021 M1 Pro | |
| Average of class Multimedia (3828 - 23059, n=99, last 2 years) | |
| MSI Creator Z16 A11UET-209 | |
| MSI Creator Z16 A11UET-209 | |
| Lenovo ThinkBook 16p G2 ACH | |
| Average Intel Core i7-11800H (4655 - 9851, n=40) | |
| Dell XPS 15 9510 11800H RTX 3050 Ti OLED | |
| HP ZBook Studio G7 | |
| Geekbench 5.5 / Single-Core | |
| Apple MacBook Pro 16 2021 M1 Pro | |
| Average of class Multimedia (926 - 2342, n=99, last 2 years) | |
| MSI Creator Z16 A11UET-209 | |
| MSI Creator Z16 A11UET-209 | |
| Average Intel Core i7-11800H (1429 - 1625, n=40) | |
| Lenovo ThinkBook 16p G2 ACH | |
| Dell XPS 15 9510 11800H RTX 3050 Ti OLED | |
| HP ZBook Studio G7 | |
| HWBOT x265 Benchmark v2.2 / 4k Preset | |
| Lenovo ThinkBook 16p G2 ACH | |
| Average of class Multimedia (4.99 - 30.5, n=87, last 2 years) | |
| Razer Blade 15 Advanced (Mid 2021) | |
| Dell XPS 17 9710 Core i7 RTX 3060 | |
| MSI Creator Z16 A11UET-209 | |
| Average Intel Core i7-11800H (7.38 - 17.4, n=46) | |
| HP ZBook Studio G7 | |
| Dell XPS 15 9510 11800H RTX 3050 Ti OLED | |
| LibreOffice / 20 Documents To PDF | |
| HP ZBook Studio G7 | |
| Lenovo ThinkBook 16p G2 ACH | |
| Average of class Multimedia (6.7 - 84.9, n=91, last 2 years) | |
| Dell XPS 15 9510 11800H RTX 3050 Ti OLED | |
| Average Intel Core i7-11800H (38.6 - 59.9, n=45) | |
| Razer Blade 15 Advanced (Mid 2021) | |
| Dell XPS 17 9710 Core i7 RTX 3060 | |
| R Benchmark 2.5 / Overall mean | |
| Dell XPS 15 9510 11800H RTX 3050 Ti OLED | |
| Average Intel Core i7-11800H (0.548 - 0.615, n=46) | |
| HP ZBook Studio G7 | |
| MSI Creator Z16 A11UET-209 | |
| Dell XPS 17 9710 Core i7 RTX 3060 | |
| Razer Blade 15 Advanced (Mid 2021) | |
| Lenovo ThinkBook 16p G2 ACH | |
| Average of class Multimedia (0.3826 - 0.723, n=89, last 2 years) | |
* ... smaller is better
AIDA64: FP32 Ray-Trace | FPU Julia | CPU SHA3 | CPU Queen | FPU SinJulia | FPU Mandel | CPU AES | CPU ZLib | FP64 Ray-Trace | CPU PhotoWorxx
| Performance Rating | |
| Average of class Multimedia | |
| Average Intel Core i7-11800H | |
| MSI Creator Z16 A11UET-209 -7! | |
| HP ZBook Studio G7 | |
| Razer Blade 15 Advanced (Mid 2021) -9! | |
| Dell XPS 17 9710 Core i7 RTX 3060 -9! | |
| Dell XPS 15 9510 11800H RTX 3050 Ti OLED -9! | |
| AIDA64 / FP32 Ray-Trace | |
| Average Intel Core i7-11800H (8772 - 15961, n=20) | |
| Average of class Multimedia (3804 - 27411, n=87, last 2 years) | |
| HP ZBook Studio G7 | |
| AIDA64 / FPU Julia | |
| Average of class Multimedia (16379 - 136048, n=87, last 2 years) | |
| HP ZBook Studio G7 | |
| Average Intel Core i7-11800H (39404 - 65636, n=20) | |
| AIDA64 / CPU SHA3 | |
| Average Intel Core i7-11800H (2599 - 4439, n=20) | |
| HP ZBook Studio G7 | |
| Average of class Multimedia (1099 - 6681, n=87, last 2 years) | |
| AIDA64 / CPU Queen | |
| Average of class Multimedia (21547 - 134321, n=87, last 2 years) | |
| HP ZBook Studio G7 | |
| Average Intel Core i7-11800H (85233 - 91941, n=20) | |
| AIDA64 / FPU SinJulia | |
| HP ZBook Studio G7 | |
| Average Intel Core i7-11800H (6420 - 9792, n=20) | |
| Average of class Multimedia (3099 - 15484, n=87, last 2 years) | |
| AIDA64 / FPU Mandel | |
| Average Intel Core i7-11800H (23365 - 39464, n=20) | |
| Average of class Multimedia (9602 - 68591, n=87, last 2 years) | |
| HP ZBook Studio G7 | |
| AIDA64 / CPU AES | |
| Average Intel Core i7-11800H (74617 - 149388, n=20) | |
| Average of class Multimedia (23702 - 169946, n=87, last 2 years) | |
| HP ZBook Studio G7 | |
| AIDA64 / CPU ZLib | |
| Average of class Multimedia (302 - 1901, n=87, last 2 years) | |
| MSI Creator Z16 A11UET-209 | |
| HP ZBook Studio G7 | |
| Average Intel Core i7-11800H (461 - 830, n=43) | |
| Razer Blade 15 Advanced (Mid 2021) | |
| Dell XPS 17 9710 Core i7 RTX 3060 | |
| Dell XPS 15 9510 11800H RTX 3050 Ti OLED | |
| AIDA64 / FP64 Ray-Trace | |
| MSI Creator Z16 A11UET-209 | |
| Average Intel Core i7-11800H (4545 - 8717, n=21) | |
| Average of class Multimedia (1996 - 14590, n=87, last 2 years) | |
| HP ZBook Studio G7 | |
| AIDA64 / CPU PhotoWorxx | |
| Average of class Multimedia (7419 - 52727, n=87, last 2 years) | |
| MSI Creator Z16 A11UET-209 | |
| Average Intel Core i7-11800H (11898 - 26757, n=21) | |
| HP ZBook Studio G7 | |
System performance
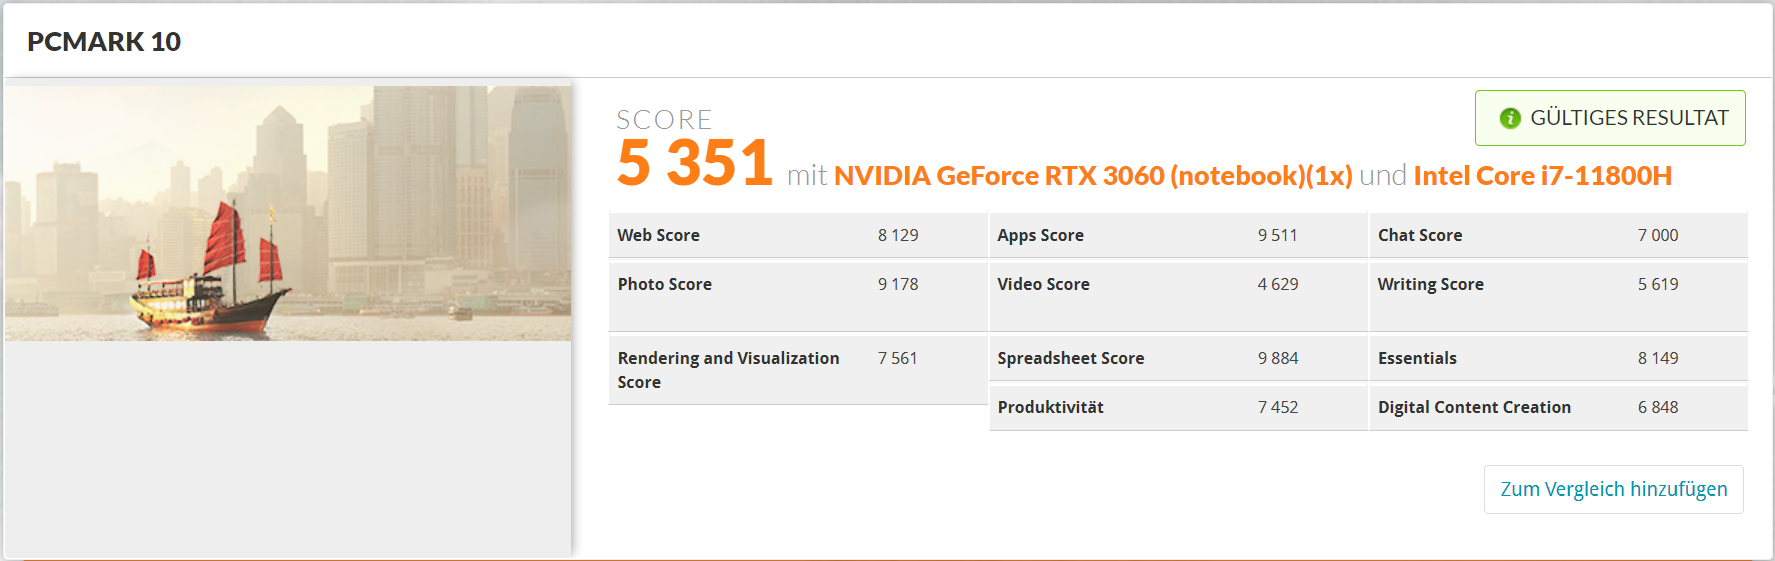
The application performance according to PCMark 10 is below average, which is surprising considering the processor rates. This is not primarily due to the Phison SSD, as the SSD benchmarks subsequently show. This is probably due to the interaction of the components, which are solved better in the Razer Blade 15 Advanced or Lenovo ThinkBook 16p. The PCMark 10 score drops from 6,156 to 5,351 points (-13%) in battery mode (maximum performance profile). Accordingly, almost the full performance is available on the go.
| PCMark 10 / Score | |
| Razer Blade 15 Advanced (Mid 2021) | |
| Lenovo ThinkBook 16p G2 ACH | |
| Dell XPS 17 9710 Core i7 RTX 3060 | |
| Average of class Multimedia (4635 - 8670, n=84, last 2 years) | |
| Average Intel Core i7-11800H, NVIDIA GeForce RTX 3060 Laptop GPU (6156 - 6865, n=4) | |
| MSI Creator Z16 A11UET-209 | |
| Dell XPS 15 9510 11800H RTX 3050 Ti OLED | |
| HP ZBook Studio G7 | |
| PCMark 10 / Essentials | |
| Razer Blade 15 Advanced (Mid 2021) | |
| Average of class Multimedia (8480 - 12420, n=84, last 2 years) | |
| Lenovo ThinkBook 16p G2 ACH | |
| Dell XPS 17 9710 Core i7 RTX 3060 | |
| Average Intel Core i7-11800H, NVIDIA GeForce RTX 3060 Laptop GPU (9063 - 10522, n=4) | |
| Dell XPS 15 9510 11800H RTX 3050 Ti OLED | |
| MSI Creator Z16 A11UET-209 | |
| HP ZBook Studio G7 | |
| PCMark 10 / Productivity | |
| Lenovo ThinkBook 16p G2 ACH | |
| Razer Blade 15 Advanced (Mid 2021) | |
| Average of class Multimedia (5845 - 11186, n=84, last 2 years) | |
| Dell XPS 17 9710 Core i7 RTX 3060 | |
| Average Intel Core i7-11800H, NVIDIA GeForce RTX 3060 Laptop GPU (8200 - 8874, n=4) | |
| Dell XPS 15 9510 11800H RTX 3050 Ti OLED | |
| MSI Creator Z16 A11UET-209 | |
| HP ZBook Studio G7 | |
| PCMark 10 / Digital Content Creation | |
| Razer Blade 15 Advanced (Mid 2021) | |
| Dell XPS 17 9710 Core i7 RTX 3060 | |
| Average Intel Core i7-11800H, NVIDIA GeForce RTX 3060 Laptop GPU (8520 - 9423, n=4) | |
| Lenovo ThinkBook 16p G2 ACH | |
| Average of class Multimedia (4688 - 13548, n=84, last 2 years) | |
| MSI Creator Z16 A11UET-209 | |
| Dell XPS 15 9510 11800H RTX 3050 Ti OLED | |
| HP ZBook Studio G7 | |
| PCMark 10 Score | 6156 points | |
Help | ||
| AIDA64 / Memory Copy | |
| Average of class Multimedia (20513 - 92745, n=87, last 2 years) | |
| MSI Creator Z16 A11UET-209 | |
| Lenovo ThinkPad P15s Gen2-20W6000GGE | |
| Average Intel Core i7-11800H (24508 - 48144, n=21) | |
| Lenovo ThinkBook 16p G2 ACH | |
| HP ZBook Studio G7 | |
| AIDA64 / Memory Read | |
| Average of class Multimedia (22917 - 90142, n=87, last 2 years) | |
| Lenovo ThinkPad P15s Gen2-20W6000GGE | |
| Lenovo ThinkBook 16p G2 ACH | |
| Average Intel Core i7-11800H (25882 - 50365, n=20) | |
| HP ZBook Studio G7 | |
| AIDA64 / Memory Write | |
| Average of class Multimedia (20226 - 95196, n=87, last 2 years) | |
| Lenovo ThinkPad P15s Gen2-20W6000GGE | |
| Average Intel Core i7-11800H (22240 - 46214, n=20) | |
| Lenovo ThinkBook 16p G2 ACH | |
| HP ZBook Studio G7 | |
| AIDA64 / Memory Latency | |
| Average of class Multimedia (75 - 346, n=86, last 2 years) | |
| MSI Creator Z16 A11UET-209 | |
| Lenovo ThinkBook 16p G2 ACH | |
| Lenovo ThinkPad P15s Gen2-20W6000GGE | |
| HP ZBook Studio G7 | |
| Average Intel Core i7-11800H (71.9 - 104.1, n=44) | |
| Razer Blade 15 Advanced (Mid 2021) | |
| Dell XPS 17 9710 Core i7 RTX 3060 | |
| Dell XPS 15 9510 11800H RTX 3050 Ti OLED | |
* ... smaller is better
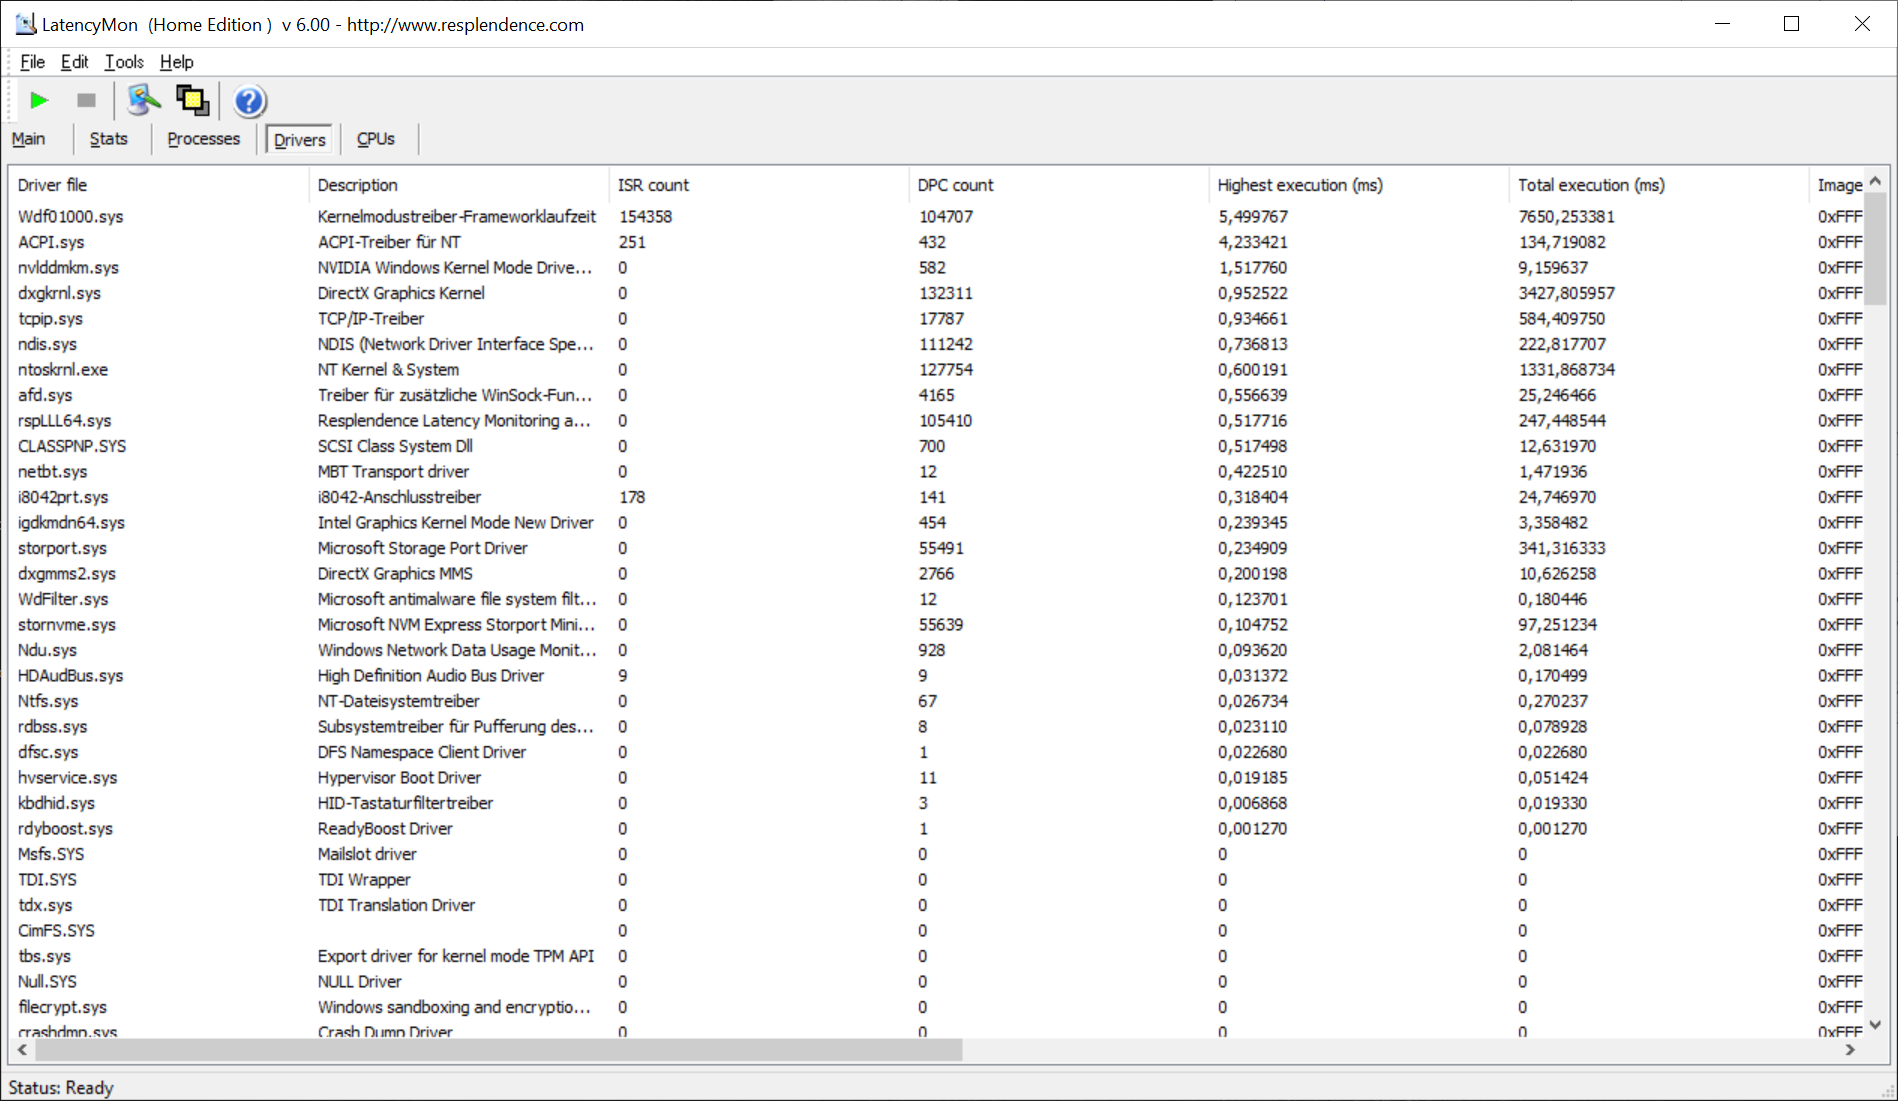
DPC latencies
The Latency Monitor observes high latencies driven by kernel & ACPI drivers. For Real-Time Audio and Video this can be a problem. The measurement is based on the present driver and hardware configuration.
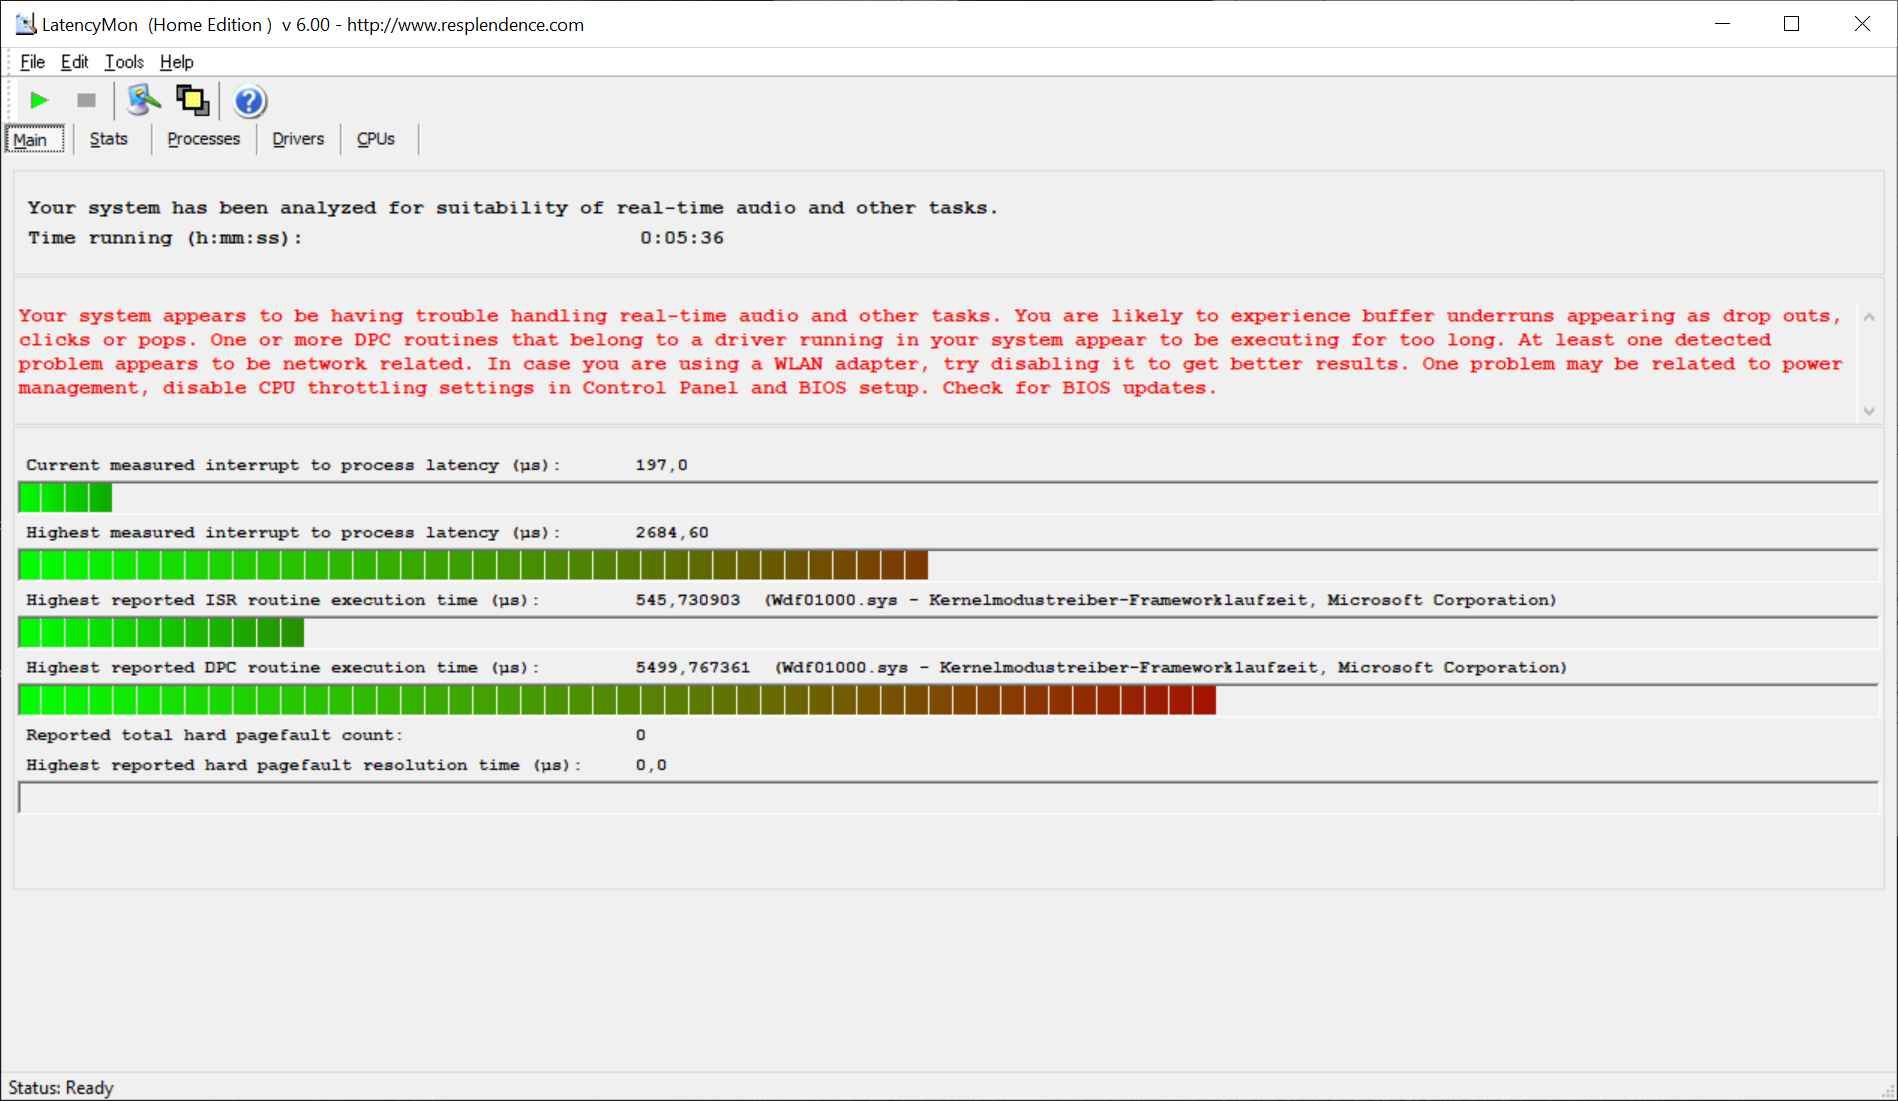
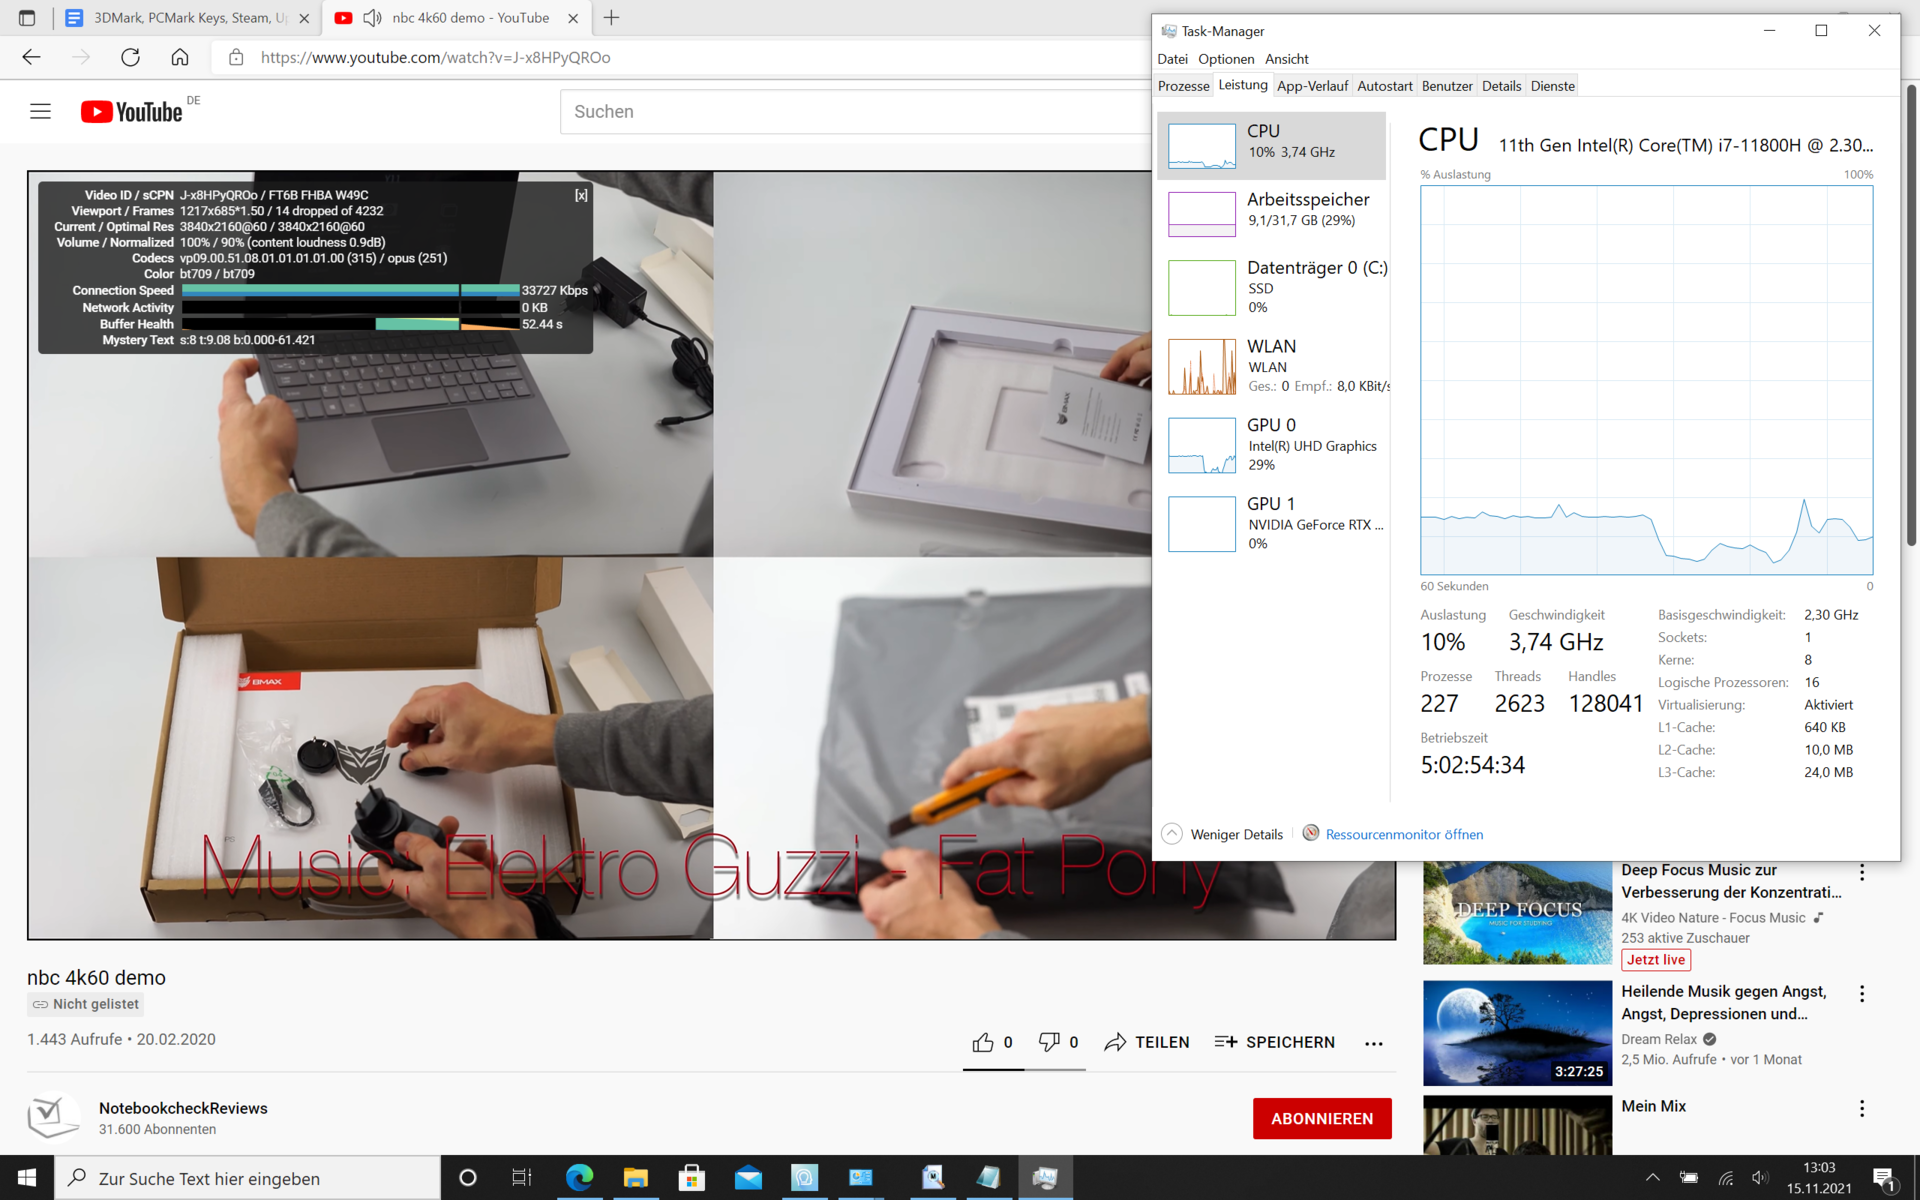
| DPC Latencies / LatencyMon - interrupt to process latency (max), Web, Youtube, Prime95 | |
| HP ZBook Studio G7 | |
| Lenovo ThinkPad P15s Gen2-20W6000GGE | |
| Razer Blade 15 Advanced (Mid 2021) | |
| MSI Creator Z16 A11UET-209 | |
| Dell XPS 15 9510 11800H RTX 3050 Ti OLED | |
| Dell XPS 17 9710 Core i7 RTX 3060 | |
| Lenovo ThinkBook 16p G2 ACH | |
* ... smaller is better
Mass storage
The Phison SSD with a gross capacity of one terabyte occupies one of the two M.2 sockets, so there is potential for upgrading. RAID is apparently not possible, and the BIOS does not offer any corresponding options - at least not in the upgrade state with an SSD.
The Drive Performance Rating summarizes different measurements. The Phison SSD is right behind the SSSTC from the Razer and leaves all other models behind. In particular, it is in the reading and writing of small blocks where the Phison appears particularly good.

* ... smaller is better
Continuous load read: DiskSpd Read Loop, Queue Depth 8
Graphics card
The GeForce RTX 3060 graphics card is known for its good price-performance ratio, and it brings upper mid-range gaming power to the office. In the Z16, it can access 6 GB of VRAM and works with up to 1,357 MHz boost clock.
| 3DMark 11 Performance | 21117 points | |
| 3DMark Fire Strike Score | 15753 points | |
| 3DMark Time Spy Score | 6721 points | |
Help | ||
Gaming performance
The 3DMark Performance Rating bundles 3DMark and 3DMark 11 into one number. Here the RTX 3060 falls behind its own average, so it scores less than the Lenovo ThinkBook 16p and Dell XPS 17 9710. No question, the RTX 3080, as a benchmark, clearly stands above all others.
| GTA V - 1920x1080 Highest Settings possible AA:4xMSAA + FX AF:16x | |
| Razer Blade 15 Advanced (Mid 2021) | |
| Average NVIDIA GeForce RTX 3060 Laptop GPU (69.2 - 109.8, n=46) | |
| MSI Creator Z16 A11UET-209 | |
| Lenovo ThinkBook 16p G2 ACH | |
| Dell XPS 17 9710 Core i7 RTX 3060 | |
| Dell XPS 15 9510 11800H RTX 3050 Ti OLED | |
| Average of class Multimedia (4.24 - 123, n=87, last 2 years) | |
| Final Fantasy XV Benchmark - 2560x1440 High Quality | |
| Average NVIDIA GeForce RTX 3060 Laptop GPU (41.1 - 73.7, n=25) | |
| Dell XPS 17 9710 Core i7 RTX 3060 | |
| MSI Creator Z16 A11UET-209 | |
| Average of class Multimedia (7.31 - 132.7, n=55, last 2 years) | |
| Dell XPS 15 9510 11800H RTX 3050 Ti OLED | |
| X-Plane 11.11 - 3840x2160 high (fps_test=3) | |
| MSI Creator Z16 A11UET-209 | |
| Average NVIDIA GeForce RTX 3060 Laptop GPU (58.5 - 92.3, n=12) | |
| Average of class Multimedia (22.2 - 95.2, n=23, last 2 years) | |
| HP ZBook Studio G7 | |
| Dell XPS 17 9710 Core i7 RTX 3060 | |
| Far Cry 5 - 2560x1440 Ultra Preset AA:T | |
| Average NVIDIA GeForce RTX 3060 Laptop GPU (58 - 92, n=12) | |
| Average of class Multimedia (18 - 117, n=37, last 2 years) | |
| MSI Creator Z16 A11UET-209 | |
| Dell XPS 15 9510 11800H RTX 3050 Ti OLED | |
| New World - 2560x1440 Very High Video Quality | |
| Average NVIDIA GeForce RTX 3060 Laptop GPU (52.9 - 54.2, n=3) | |
| MSI Creator Z16 A11UET-209 | |
MSI specifies the maximum graphics power with Dynamic Boost as 65 W. The sample Witcher 3 Ultra quality settings approximately confirms this. We see 60 watts under constant load. The frame rates are constant as a result, they do not drop.
The Witcher 3 FPS chart shows the RTX 3060 in the lower midfield, Lenovo ThinkBook 16p and Dell XPS 17 9710 with identical graphics do better. Thus, the competition squeezes more performance out of the RTX. The gaming benchmarks confirm this, the Lenovo ThinkBook 16p and Dell XPS 17 9710 are always ahead. The average RTX 3060 - across all laptops in our database equipped with it - performs more frames than the one installed in the Z16.
Witcher 3 FPS Chart
| low | med. | high | ultra | QHD | 4K | |
| GTA V (2015) | 89 | 74 | ||||
| The Witcher 3 (2015) | 204 | 81 | 62.4 | |||
| Dota 2 Reborn (2015) | 164 | 146 | 140 | 131 | 84.8 | |
| Final Fantasy XV Benchmark (2018) | 64.4 | 48.3 | ||||
| X-Plane 11.11 (2018) | 123 | 103 | 83.4 | 73.4 | ||
| Far Cry 5 (2018) | 92 | 86 | 59 | |||
| Strange Brigade (2018) | 339 | 159 | 129 | 114 | ||
| New World (2021) | 71 | 65 | 53 |
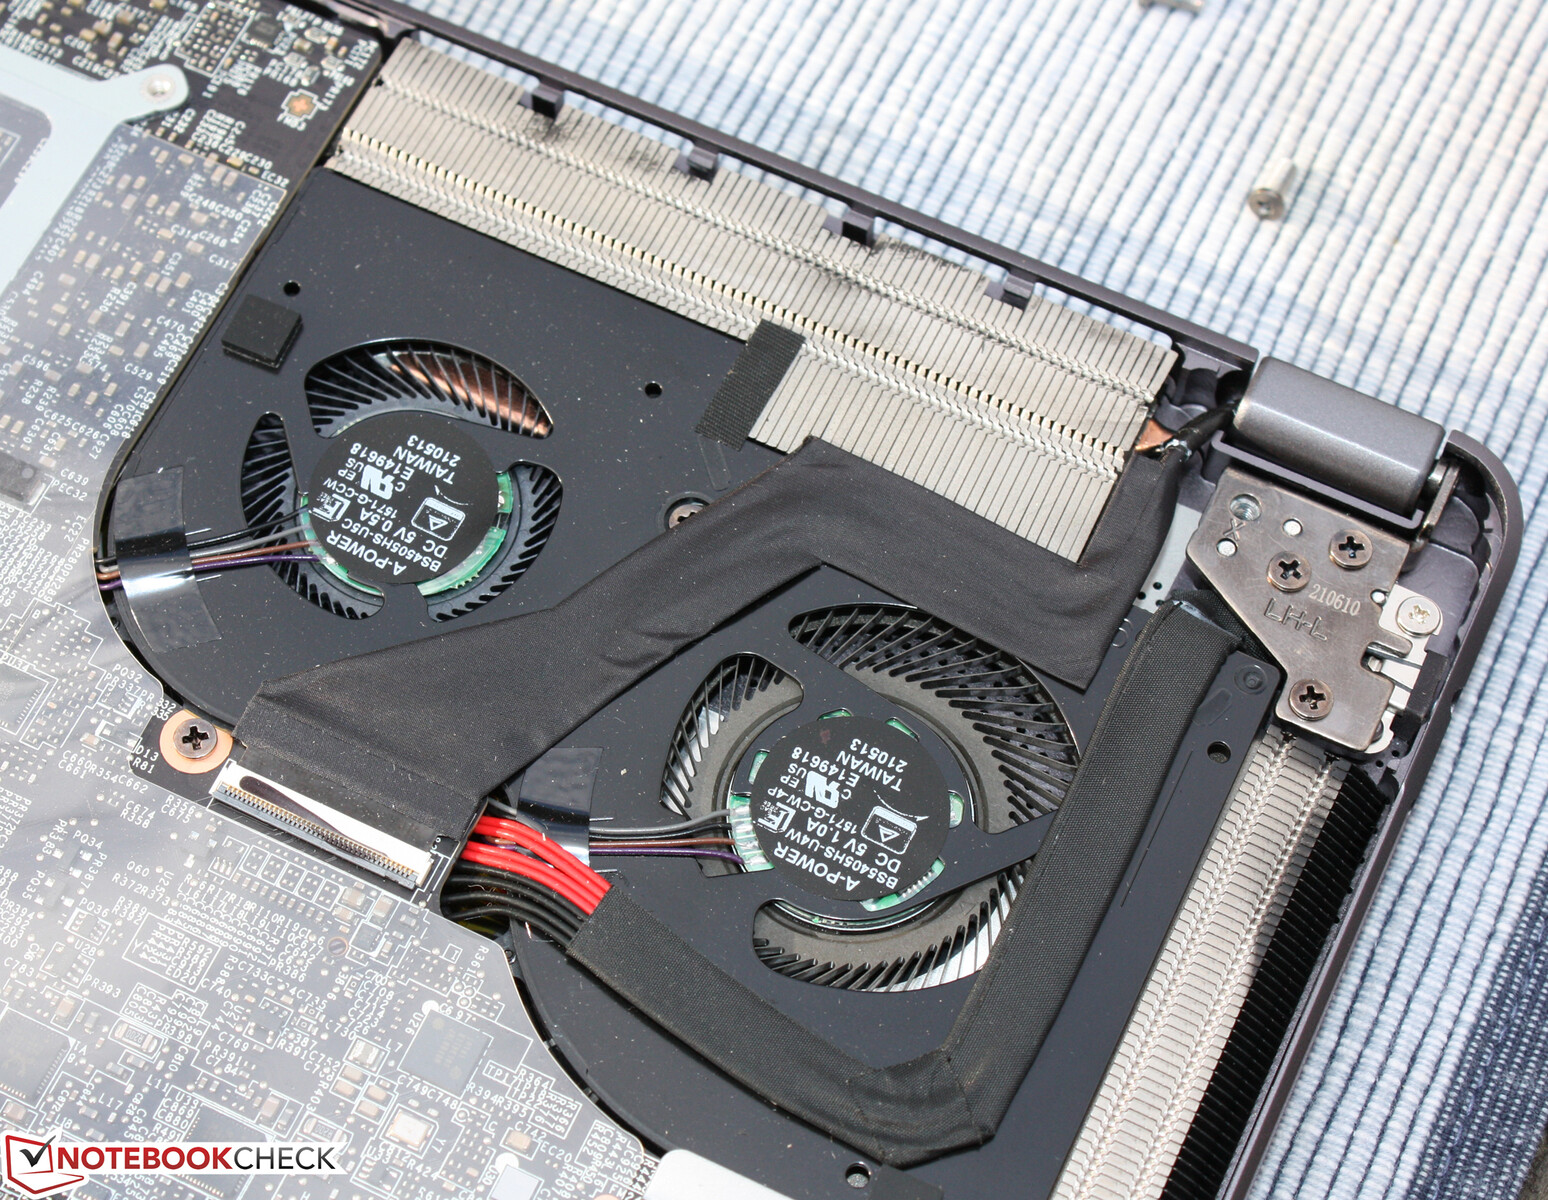
Emissions - Comfortable at idle, loud under load
Noise emissions
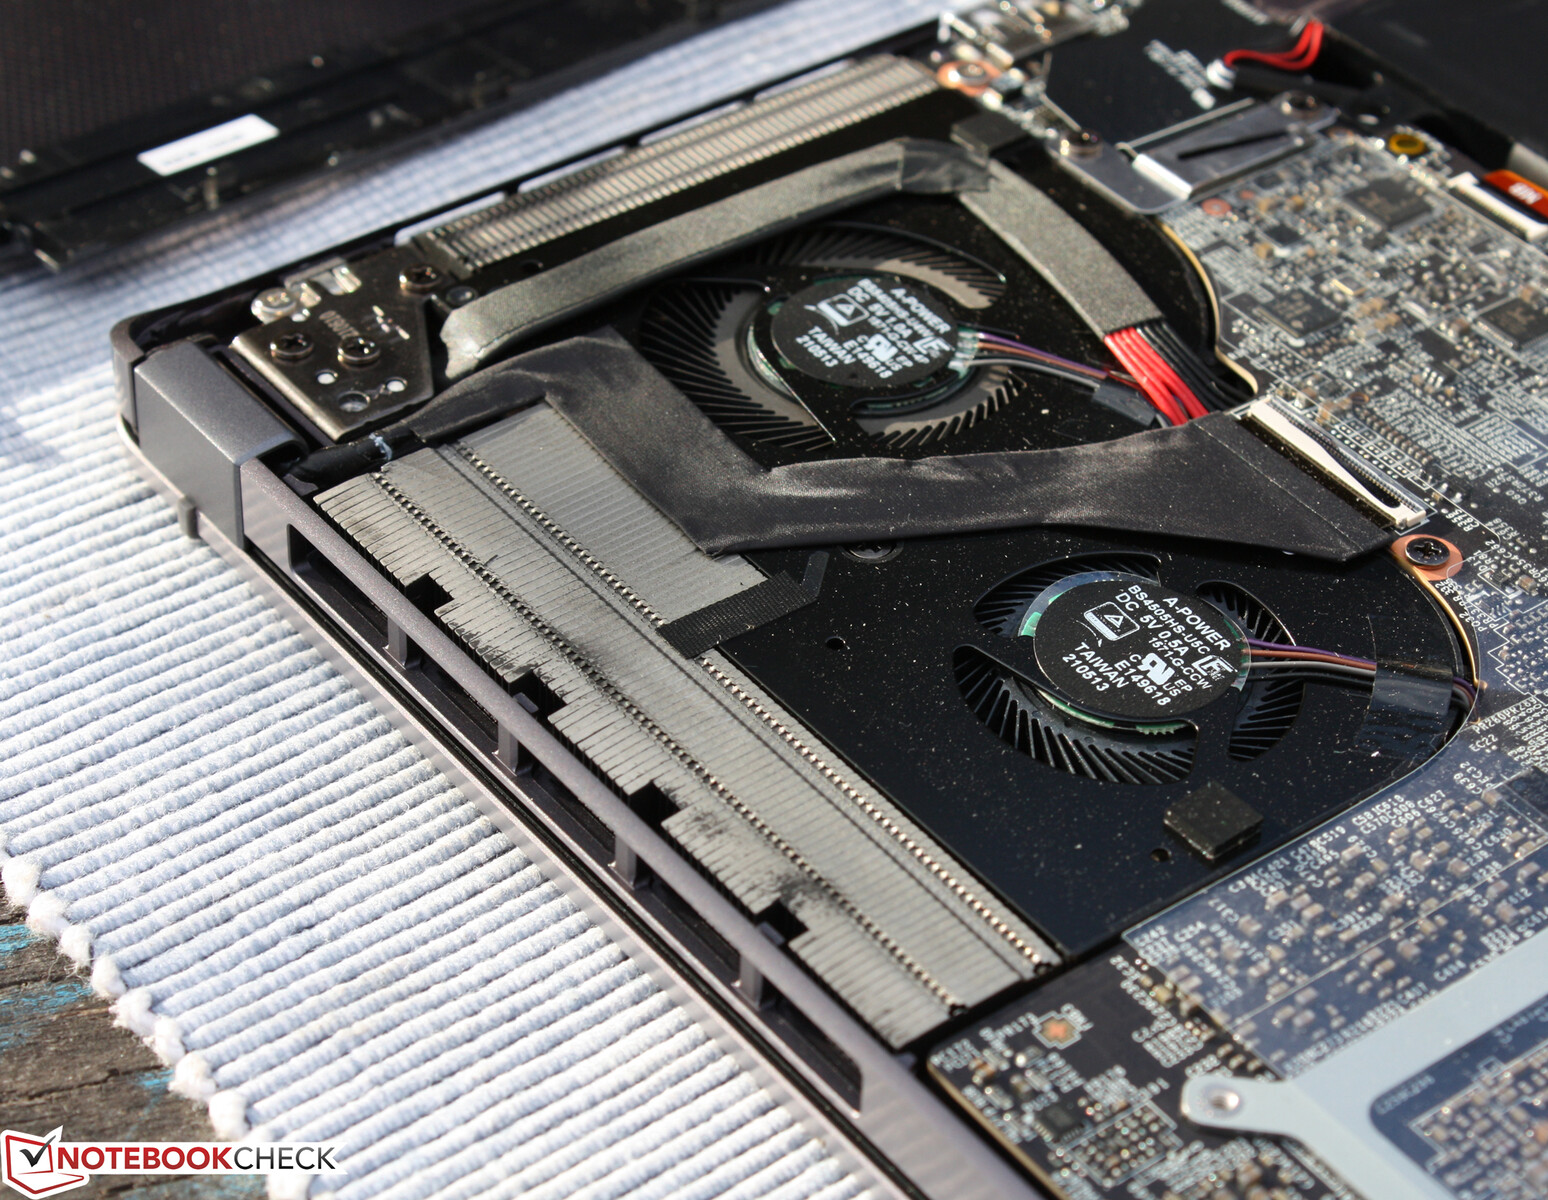
The noise emissions and fan characteristics essentially convinced us. The fans regularly shut down in idle mode, even in performance mode. The Silent Mode brings permanent silence, but of course only when there is nothing for the CPU/GPU to do. When the fans are running - there are three of them - they are also audible, but only marginally stronger than the background noise in the office.
Under load, the fans gradually increase in speed, but it is not possible to tell which fan starts. We measured 54 and 55 dB(A) under moderate load (Witcher 3 on Ultra quality setting) and in the stress test. Thus, there is no significant difference between high and maximum load; the decisive factor for the noise is how long it lasts.
Noise Level
| Idle |
| 26.3 / 26.3 / 26.3 dB(A) |
| Load |
| 53.9 / 54.8 dB(A) |
 | ||
30 dB silent 40 dB(A) audible 50 dB(A) loud |
||
min: | ||
| MSI Creator Z16 A11UET-209 GeForce RTX 3060 Laptop GPU, i7-11800H, Phison 1TB SM2801T24GKBB4S-E162 | HP ZBook Studio G7 Quadro RTX 3000 Max-Q, i9-10885H, Micron 2300 1TB MTFDHBA1T0TDV | Razer Blade 15 Advanced (Mid 2021) GeForce RTX 3080 Laptop GPU, i7-11800H, SSSTC CA6-8D1024 | Lenovo ThinkBook 16p G2 ACH GeForce RTX 3060 Laptop GPU, R9 5900HX, WDC PC SN730 SDBPNTY-1T00 | Dell XPS 17 9710 Core i7 RTX 3060 GeForce RTX 3060 Laptop GPU, i7-11800H, Micron 2300 1TB MTFDHBA1T0TDV | Dell XPS 15 9510 11800H RTX 3050 Ti OLED GeForce RTX 3050 Ti Laptop GPU, i7-11800H, Micron 2300 512GB MTFDHBA512TDV | |
|---|---|---|---|---|---|---|
| Noise | 10% | 9% | 15% | 7% | 19% | |
| off / environment * | 26.3 | 24.4 7% | 25.1 5% | 23 13% | 25.5 3% | 23.8 10% |
| Idle Minimum * | 26.3 | 24.4 7% | 25.3 4% | 23 13% | 25.2 4% | 23.8 10% |
| Idle Average * | 26.3 | 24.4 7% | 25.3 4% | 23 13% | 25.2 4% | 23.8 10% |
| Idle Maximum * | 26.3 | 27.9 -6% | 25.3 4% | 23 13% | 25.2 4% | 23.8 10% |
| Load Average * | 53.9 | 38.8 28% | 42 22% | 35.66 34% | 45.9 15% | 36 33% |
| Witcher 3 ultra * | 53.9 | 46.3 14% | 45.6 15% | 48.7 10% | 49 9% | 36 33% |
| Load Maximum * | 54.8 | 46.3 16% | 51.6 6% | 48.13 12% | 50.4 8% | 38.2 30% |
* ... smaller is better
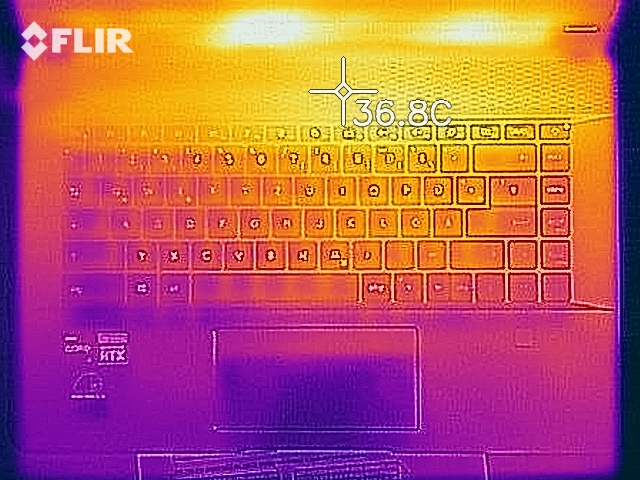
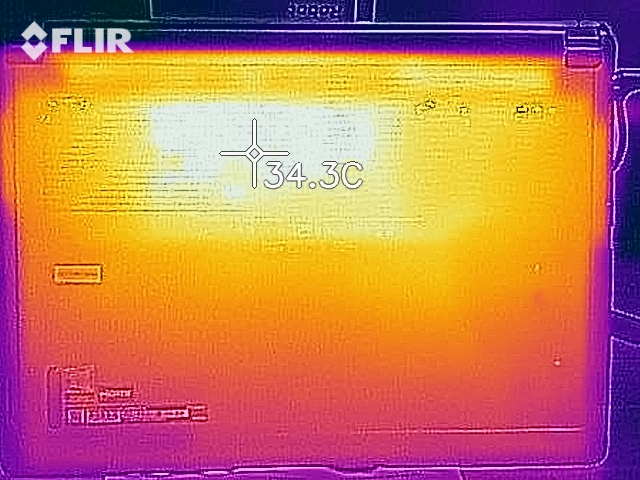
Temperature
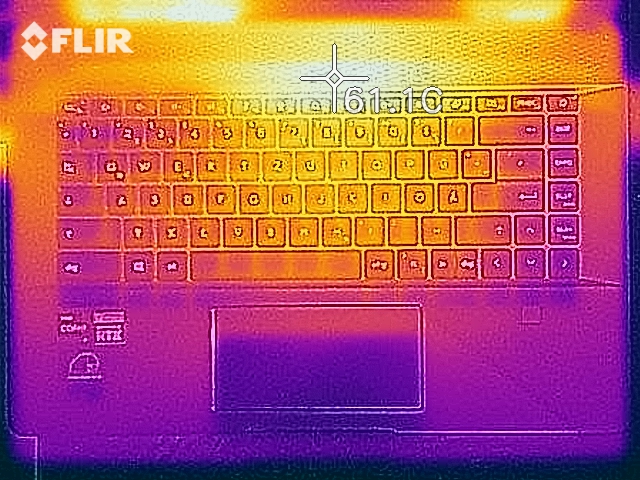
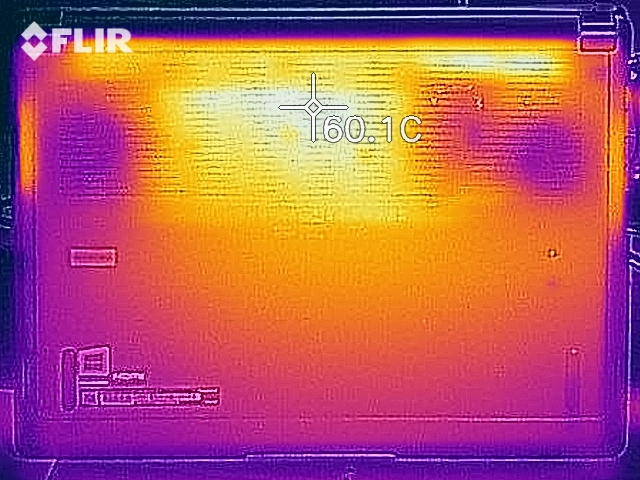
The Z16 stays almost cool in idle, with an average of 30 °C (86 °F) on the top and bottom. In silent mode, the fans rarely start and only very briefly, as long as no load is applied. The temperatures increase drastically under load reaching 57 °C (134.6 °F) on the underside in some spots and 42 °C (107.6 °F) on average.
(-) The maximum temperature on the upper side is 52.5 °C / 127 F, compared to the average of 36.9 °C / 98 F, ranging from 21.1 to 71 °C for the class Multimedia.
(-) The bottom heats up to a maximum of 56.7 °C / 134 F, compared to the average of 39.1 °C / 102 F
(+) In idle usage, the average temperature for the upper side is 29.9 °C / 86 F, compared to the device average of 31.2 °C / 88 F.
(+) The palmrests and touchpad are reaching skin temperature as a maximum (35.3 °C / 95.5 F) and are therefore not hot.
(-) The average temperature of the palmrest area of similar devices was 28.8 °C / 83.8 F (-6.5 °C / -11.7 F).
| MSI Creator Z16 A11UET-209 Intel Core i7-11800H, NVIDIA GeForce RTX 3060 Laptop GPU | HP ZBook Studio G7 Intel Core i9-10885H, NVIDIA Quadro RTX 3000 Max-Q | Razer Blade 15 Advanced (Mid 2021) Intel Core i7-11800H, NVIDIA GeForce RTX 3080 Laptop GPU | Lenovo ThinkBook 16p G2 ACH AMD Ryzen 9 5900HX, NVIDIA GeForce RTX 3060 Laptop GPU | Dell XPS 17 9710 Core i7 RTX 3060 Intel Core i7-11800H, NVIDIA GeForce RTX 3060 Laptop GPU | Dell XPS 15 9510 11800H RTX 3050 Ti OLED Intel Core i7-11800H, NVIDIA GeForce RTX 3050 Ti Laptop GPU | Apple MacBook Pro 16 2021 M1 Pro Apple M1 Pro, Apple M1 Pro 16-Core GPU | |
|---|---|---|---|---|---|---|---|
| Heat | 18% | -2% | 9% | 5% | 18% | 27% | |
| Maximum Upper Side * | 52.5 | 45.7 13% | 51 3% | 50 5% | 50.2 4% | 45.5 13% | 41 22% |
| Maximum Bottom * | 56.7 | 50.6 11% | 52 8% | 53 7% | 38.4 32% | 44.2 22% | 39 31% |
| Idle Upper Side * | 33.9 | 24.8 27% | 35.2 -4% | 29 14% | 37.6 -11% | 27 20% | 24 29% |
| Idle Bottom * | 32.7 | 26.1 20% | 37.8 -16% | 30 8% | 34.2 -5% | 26.7 18% | 24 27% |
* ... smaller is better
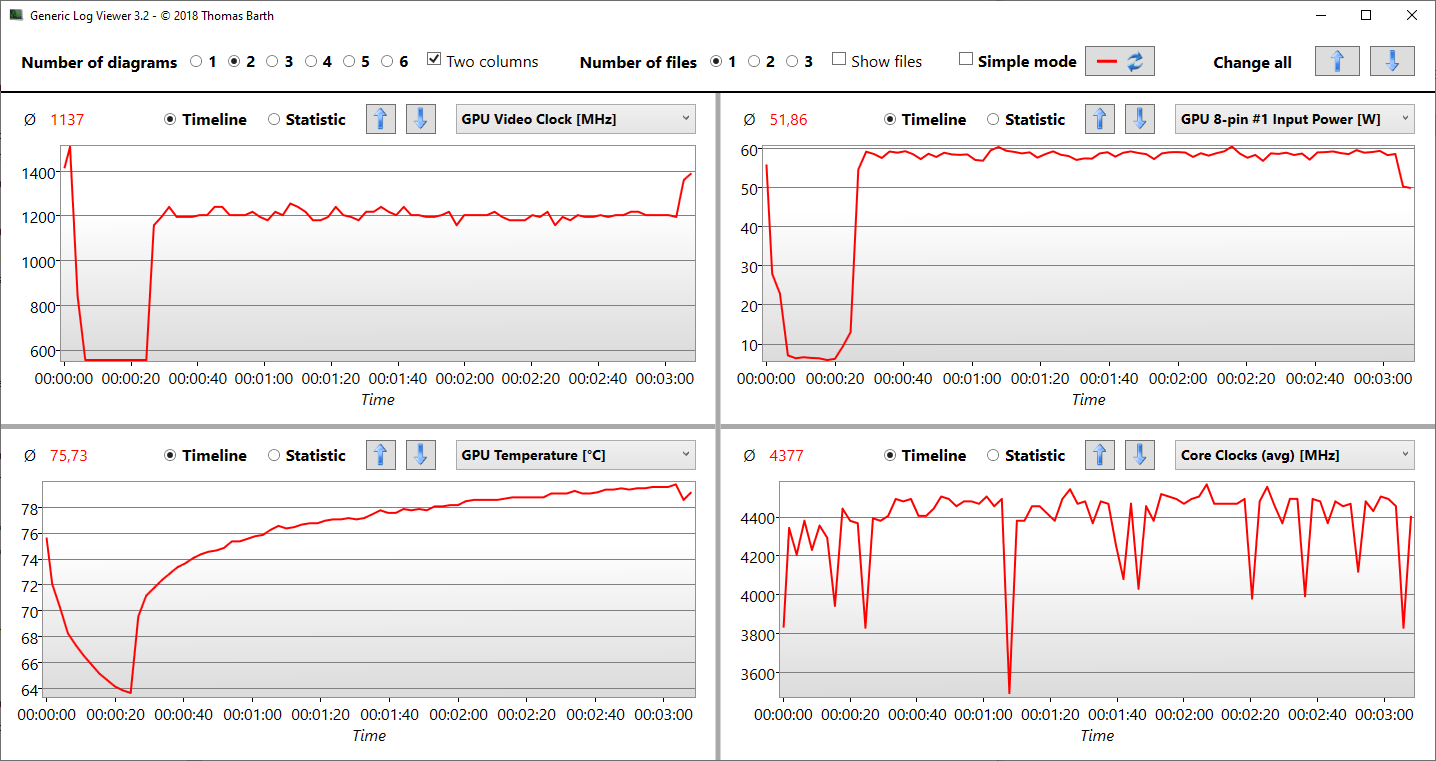
Stress test
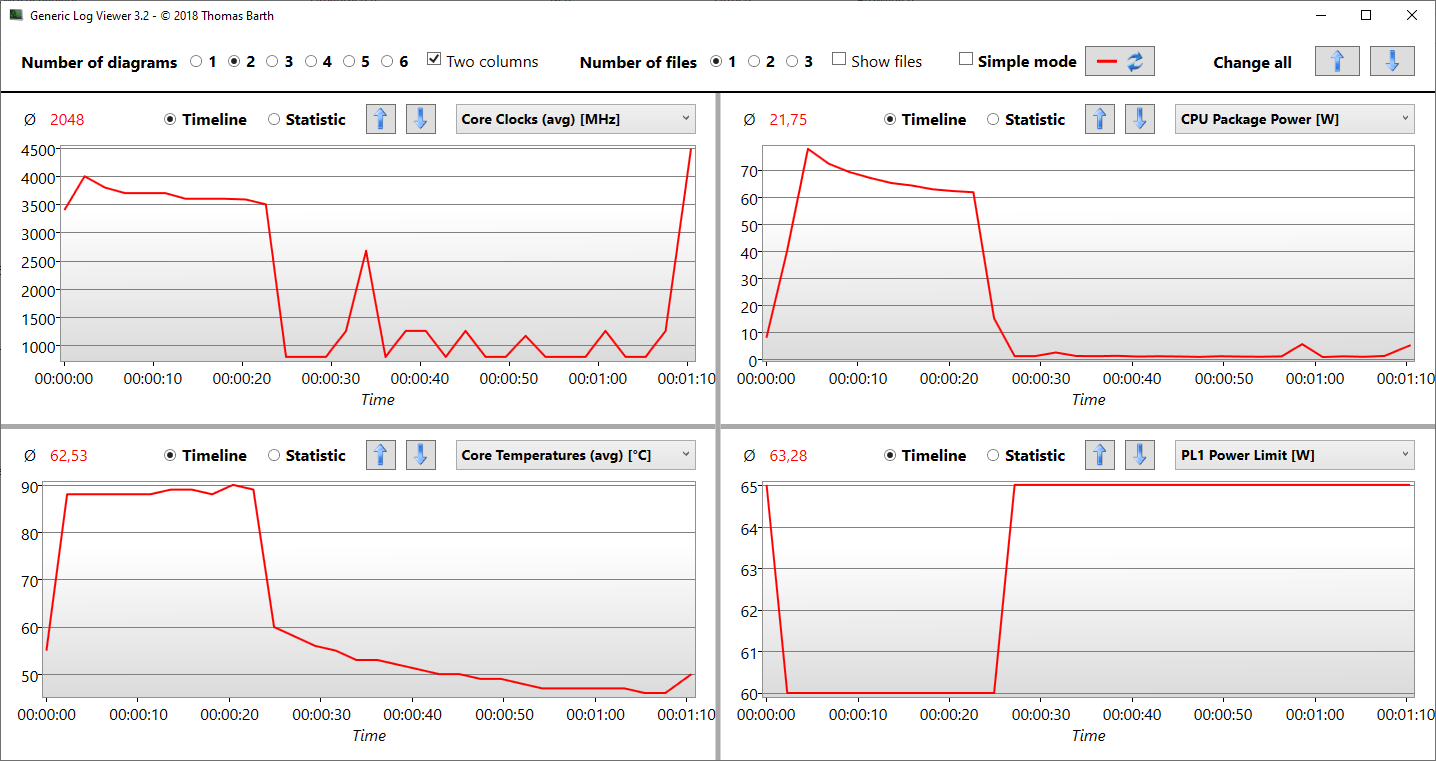
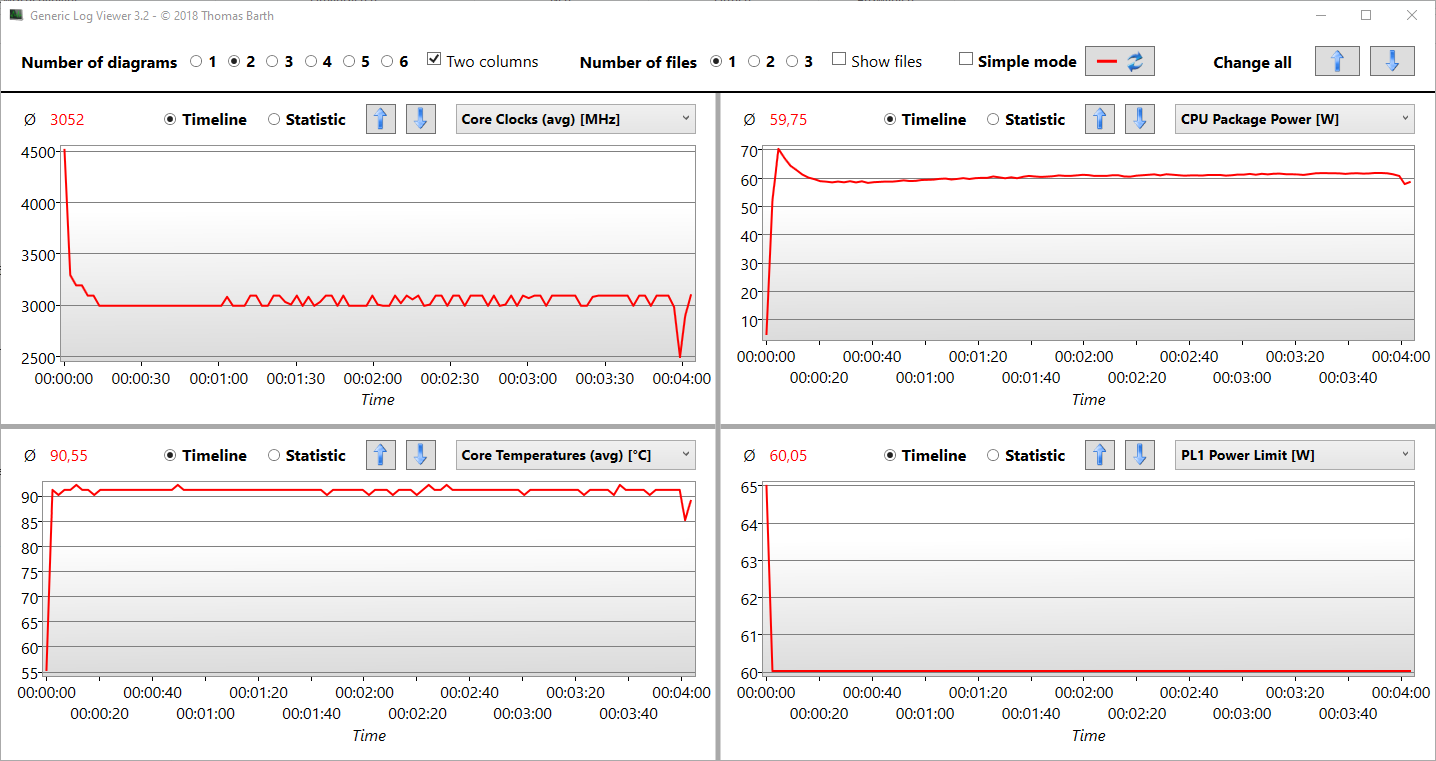
The stress test is an extreme scenario that provides information about how the thermals and thus the computing performance behave in case of 100% GPU and CPU load. Prime95 and FurMark run simultaneously for this. The CPU reduces the clock significantly from almost 4.5 to 2.8 GHz. It does this because the SoC temperature quickly reaches 90 °C (194 °F) and further heating needs to be prevented.
Remarkable: While the GPU temperature of the RTX rises slower, the graphics card can permanently draw 60 watts. Either the GPU thermal is completely separated from the CPU, or the GPU has priority.
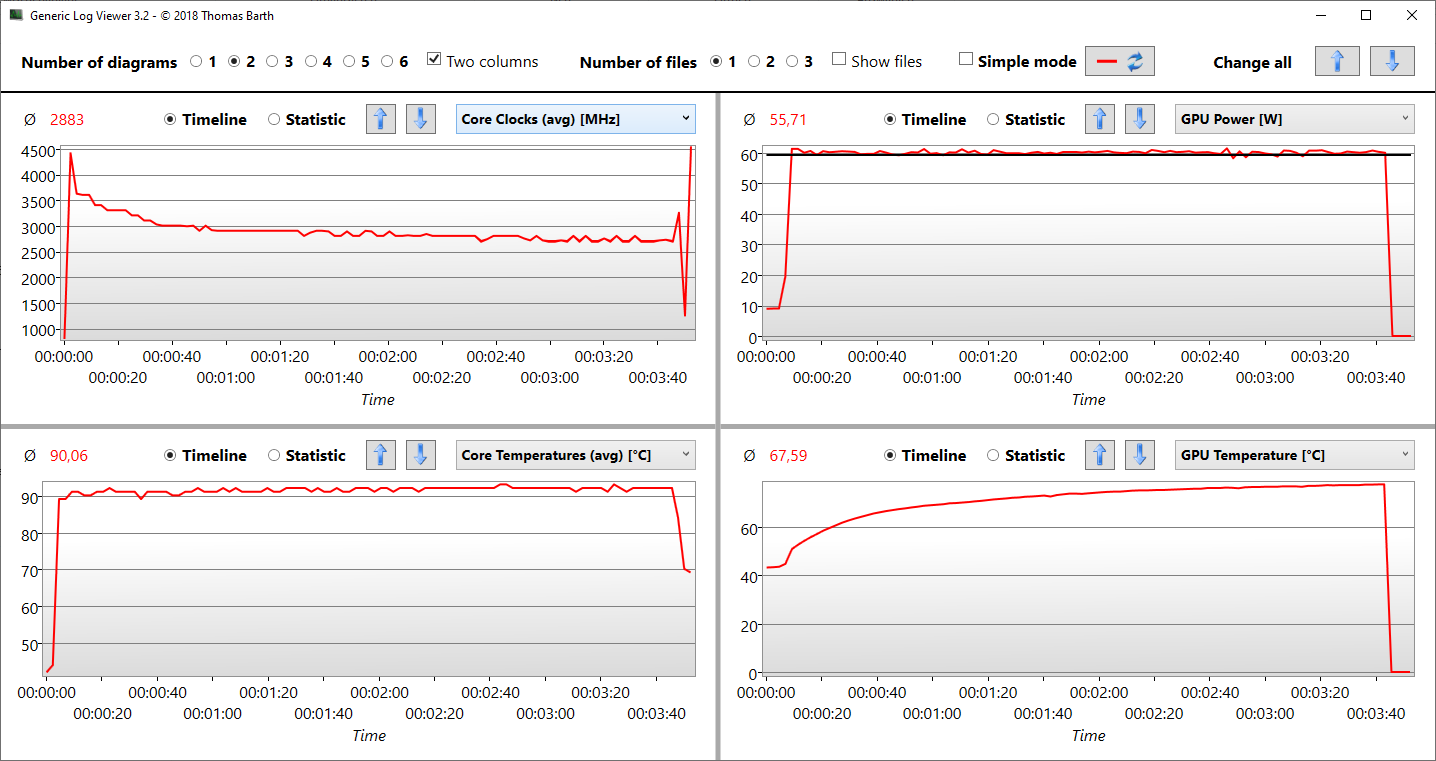
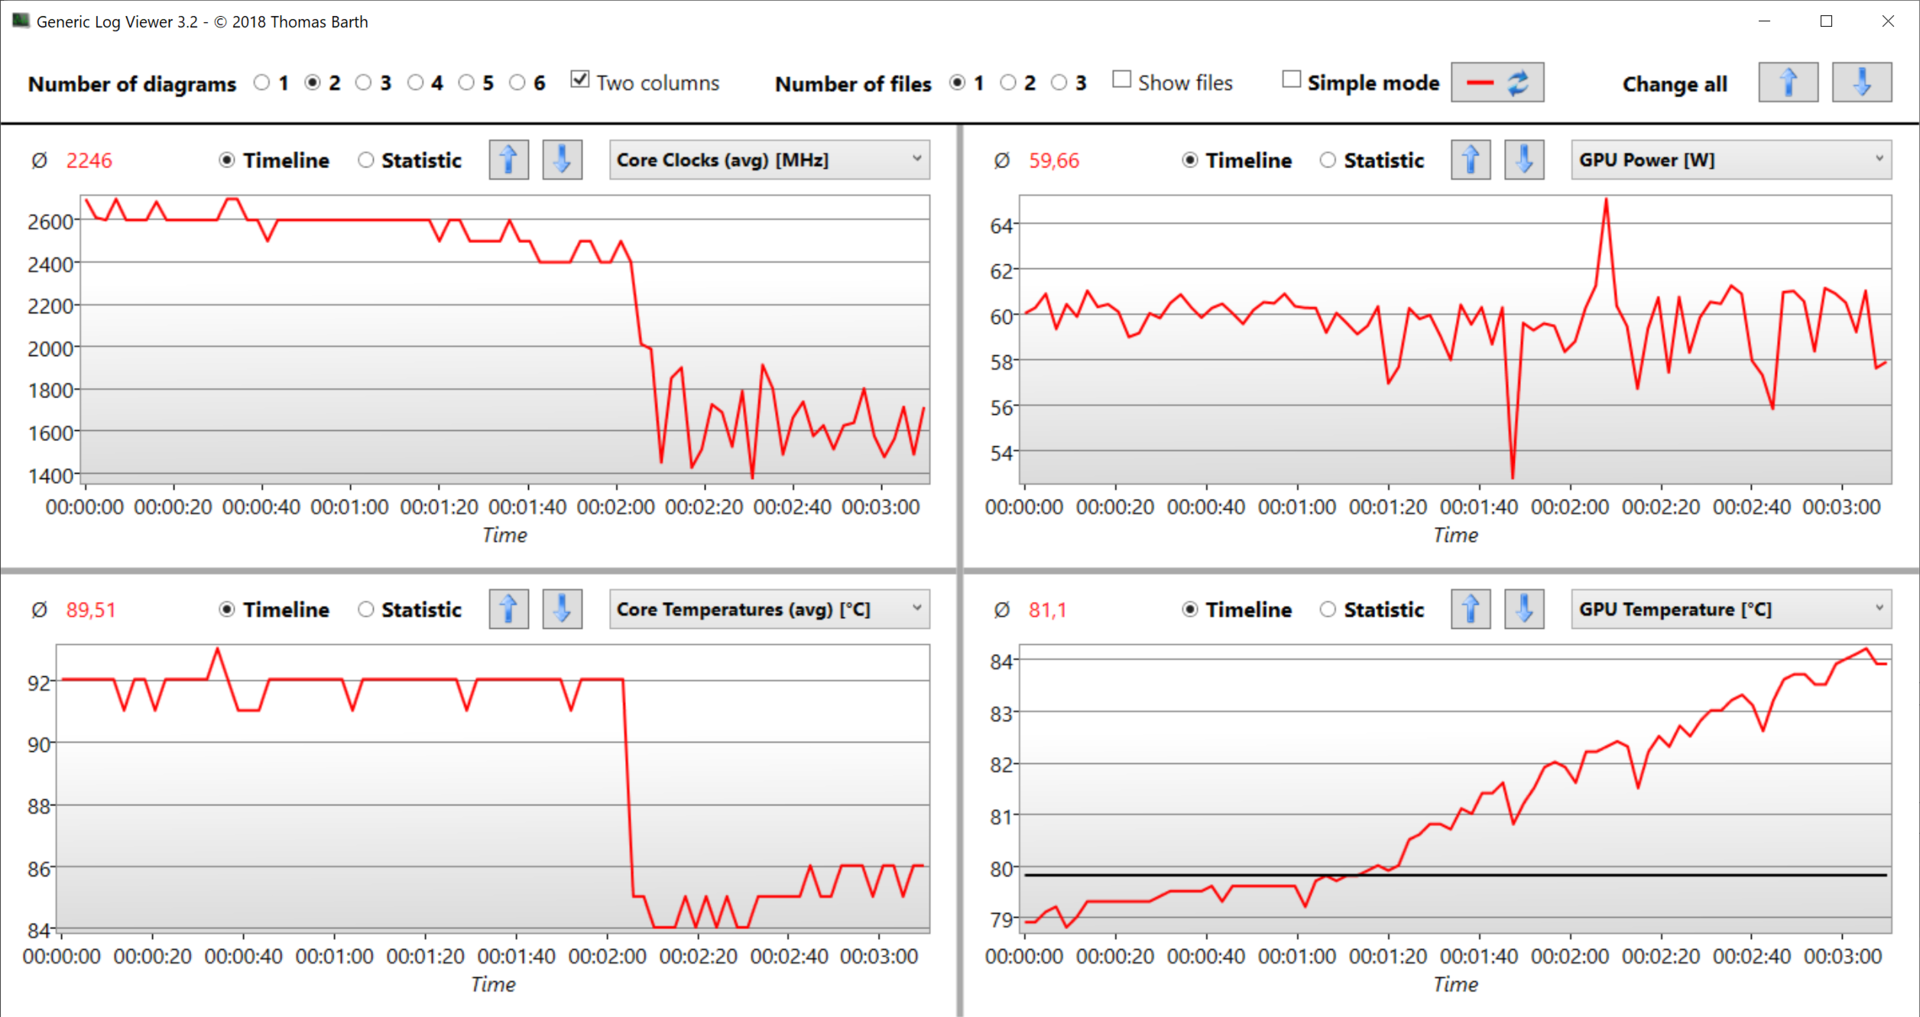
| CPU Clock(GHz) | GPUClock (MHz) | AverageCPU Temperature (°C) | AverageGPU Temperature (°C) |
| System Idle | 1.5 | 210 | 43 |
| Prime95 Stress | 2.9 | 210 | 92 |
| Prime95 + FurMark Stress | 2.6 | 1200 | 89 |
| Witcher 3 Stress | 4,2 | 1556 | 83 |
Speaker
Dynaudio's two-way stereo speakers are based on one tweeter and one woofer. This allows you to better delineate highs and lows, and you can hear that in music and games, but especially in speech. We perceive clarity and a high volume that can fill a medium-sized room of 20 m² (215 ft²). Bass is not present, though.
The dual-array microphone only records the voice with a constant level when we stop in front of the notebook. Walking around the room or even looking in a different direction results in significant volume fluctuations. The quality on the other hand is good everywhere, i.e. noise-free. The MSI Center offers a voice amplifier mode.
MSI Creator Z16 A11UET-209 audio analysis
(+) | speakers can play relatively loud (86.1 dB)
Bass 100 - 315 Hz
(-) | nearly no bass - on average 19.8% lower than median
(±) | linearity of bass is average (10.1% delta to prev. frequency)
Mids 400 - 2000 Hz
(+) | balanced mids - only 4.3% away from median
(+) | mids are linear (6.1% delta to prev. frequency)
Highs 2 - 16 kHz
(+) | balanced highs - only 2.8% away from median
(±) | linearity of highs is average (7.8% delta to prev. frequency)
Overall 100 - 16.000 Hz
(+) | overall sound is linear (14% difference to median)
Compared to same class
» 24% of all tested devices in this class were better, 3% similar, 73% worse
» The best had a delta of 5%, average was 18%, worst was 45%
Compared to all devices tested
» 13% of all tested devices were better, 3% similar, 84% worse
» The best had a delta of 4%, average was 25%, worst was 134%
Dell XPS 15 9510 11800H RTX 3050 Ti OLED audio analysis
(+) | speakers can play relatively loud (88.8 dB)
Bass 100 - 315 Hz
(±) | reduced bass - on average 5.6% lower than median
(+) | bass is linear (4.3% delta to prev. frequency)
Mids 400 - 2000 Hz
(+) | balanced mids - only 3.9% away from median
(+) | mids are linear (4.1% delta to prev. frequency)
Highs 2 - 16 kHz
(+) | balanced highs - only 2.4% away from median
(+) | highs are linear (4.9% delta to prev. frequency)
Overall 100 - 16.000 Hz
(+) | overall sound is linear (8.4% difference to median)
Compared to same class
» 6% of all tested devices in this class were better, 1% similar, 93% worse
» The best had a delta of 5%, average was 18%, worst was 45%
Compared to all devices tested
» 1% of all tested devices were better, 0% similar, 98% worse
» The best had a delta of 4%, average was 25%, worst was 134%
Apple MacBook Pro 16 2021 M1 Pro audio analysis
(+) | speakers can play relatively loud (84.7 dB)
Bass 100 - 315 Hz
(+) | good bass - only 3.8% away from median
(+) | bass is linear (5.2% delta to prev. frequency)
Mids 400 - 2000 Hz
(+) | balanced mids - only 1.3% away from median
(+) | mids are linear (2.1% delta to prev. frequency)
Highs 2 - 16 kHz
(+) | balanced highs - only 1.9% away from median
(+) | highs are linear (2.7% delta to prev. frequency)
Overall 100 - 16.000 Hz
(+) | overall sound is linear (4.6% difference to median)
Compared to same class
» 0% of all tested devices in this class were better, 0% similar, 100% worse
» The best had a delta of 5%, average was 18%, worst was 45%
Compared to all devices tested
» 0% of all tested devices were better, 0% similar, 100% worse
» The best had a delta of 4%, average was 25%, worst was 134%
Power management
Energy consumption
The idle power consumption is between 9 and 27 watts, which is more than most of the competitors (Performance mode). However, if we take the idle average as a basis (14 watts), the Z16 is in the good range. The RTX 3060 is disabled by Optimus, then the Iris Xe is active, which is very conducive to frugality. In comparison, only the Razer Blade 15 Advanced is clearly out of the ordinary, which is probably due to its RTX 3080 which is not disabled in manual mode.
The load average of 119 watts is another indication for the good power development - i.e. Turbo utilization - of the 11800h in the Z16. Comparable devices with the same SoC do not have such a value.
Witcher 3 on Ultra quality setting, which is a high gaming load for the RTX 3060, we specify with 125 watts. As the chart below shows, the power consumption is constant, and the GPU computes with consistent performance.
The 180-watt power supply really has to work under maximum load in the stress test. It has to supply 190 watts in a short peak at the beginning. As the stress test shows, throttling reduces the power consumption to 150 watts after three minutes.
Dell's XPS 15 9510 drops in power consumption during Witcher 3 and even more in the stress test (-47%!).
| Off / Standby | |
| Idle | |
| Load |
|
| MSI Creator Z16 A11UET-209 i7-11800H, GeForce RTX 3060 Laptop GPU, Phison 1TB SM2801T24GKBB4S-E162, IPS True Pixel, 2560x1600, 16.00 | HP ZBook Studio G7 i9-10885H, Quadro RTX 3000 Max-Q, Micron 2300 1TB MTFDHBA1T0TDV, IPS, 3840x2160, 15.60 | Razer Blade 15 Advanced (Mid 2021) i7-11800H, GeForce RTX 3080 Laptop GPU, SSSTC CA6-8D1024, IPS, 1920x1080, 15.60 | Lenovo ThinkBook 16p G2 ACH R9 5900HX, GeForce RTX 3060 Laptop GPU, WDC PC SN730 SDBPNTY-1T00, IPS, 2560x1600, 16.00 | Dell XPS 17 9710 Core i7 RTX 3060 i7-11800H, GeForce RTX 3060 Laptop GPU, Micron 2300 1TB MTFDHBA1T0TDV, IPS, 3840x2400, 17.00 | Apple MacBook Pro 16 2021 M1 Pro M1 Pro, M1 Pro 16-Core GPU, Apple SSD AP1024R, Mini-LED, 3456x2234, 16.20 | Average NVIDIA GeForce RTX 3060 Laptop GPU | Average of class Multimedia | |
|---|---|---|---|---|---|---|---|---|
| Power Consumption | 10% | -48% | 1% | 12% | 35% | -4% | 28% | |
| Idle Minimum * | 9 | 5.5 39% | 19.5 -117% | 13.2 -47% | 7.5 17% | 5 44% | 10.4 ? -16% | 7.27 ? 19% |
| Idle Average * | 14 | 13.7 2% | 23.3 -66% | 17 -21% | 15.7 -12% | 15.1 -8% | 14.5 ? -4% | 11.7 ? 16% |
| Idle Maximum * | 26.7 | 16.6 38% | 40.1 -50% | 18.6 30% | 23.1 13% | 15.5 42% | 21.4 ? 20% | 14.5 ? 46% |
| Load Average * | 119 | 118.4 1% | 98.9 17% | 88.8 25% | 87.2 27% | 54 55% | 109.3 ? 8% | 77.3 ? 35% |
| Witcher 3 ultra * | 125 | 120 4% | 174 -39% | 123 2% | 116 7% | |||
| Load Maximum * | 160 | 203.3 -27% | 214 -34% | 132 17% | 131.6 18% | 90 44% | 206 ? -29% | 119.6 ? 25% |
* ... smaller is better
Energy consumption Witcher 3 / Stress test
Battery life
The runtime of the Z16 is good to very good. It lasted 9:30 hours in the Wi-Fi test and 13 hours in idle (flight mode, lowest brightness). We performed the Wi-Fi test in Balanced mode and the idle test in Super Battery. The minimum runtime is about 1.5 hours.
The Zenbook has 90 Wh in its battery, while models like the Dell XPS 17 9710 (97 Wh) have even more on board, but are still 20% shorter at the start. The Apple MacBook Pro 16 2021 M1 (100 Wh) beats the Z16 with a brilliant 17 hours in the Wi-Fi test. However, such a strong GPU is not installed here.
| MSI Creator Z16 A11UET-209 i7-11800H, GeForce RTX 3060 Laptop GPU, 90 Wh | HP ZBook Studio G7 i9-10885H, Quadro RTX 3000 Max-Q, 83 Wh | Razer Blade 15 Advanced (Mid 2021) i7-11800H, GeForce RTX 3080 Laptop GPU, 80 Wh | Lenovo ThinkBook 16p G2 ACH R9 5900HX, GeForce RTX 3060 Laptop GPU, 71 Wh | Dell XPS 17 9710 Core i7 RTX 3060 i7-11800H, GeForce RTX 3060 Laptop GPU, 97 Wh | Apple MacBook Pro 16 2021 M1 Pro M1 Pro, M1 Pro 16-Core GPU, 99.6 Wh | Average of class Multimedia | |
|---|---|---|---|---|---|---|---|
| Battery Runtime | -5% | -38% | 12% | 31% | 79% | 10% | |
| Reader / Idle | 779 | 1060 36% | 933 ? 20% | ||||
| WiFi v1.3 | 567 | 468 -17% | 353 -38% | 509 -10% | 453 -20% | 1016 79% | 568 ? 0% |
| Load | 89 | 96 8% | 118 33% | 157 76% | 97.6 ? 10% | ||
| H.264 | 647 | 420 | 1048 | 698 ? |
Pros
Cons
Verdict - Contender for the creative throne
MSI offers a super slim but powerful creative behemoth with its Z16. The build quality, the ports and the screen are impressive. The case is high-quality and stable for everyday use, but it can still be upgraded with some effort (RAM, SSD 2x M.2, Wi-Fi chip).
Thunderbolt 4 is on board, as is USB 4.0. Screens run via DisplayPort via Type-C, there are no clunky HDMI or Ethernet ports. The 2,560 x 1,600 pixel display (QHD+) packs 96% of the AdobeRGB color space, and P3 is completely visable. The touch panel makes the use more flexible, but inevitably prevents a matte surface. However, the good brightness and high contrast make up for the shortcoming; MSI also offers a non-glare version that is supposed to contain an identical True Pixel panel.
The performance is on a high level, especially the processor. The 45 watt i7 SoC 11800H plays in a league with the Apple MacBook Pro 16 2021 M1 Pro, Razer Blade 15 and XPS 17, which - apart from Apple - rely on the identical Intel chip.
As our random tests show, the performance unfolds in favor of the RTX 3060 - CPU and GPU are loaded equally. Thus, the GPU continues to compute with 60 of 65 watts during a CPU stress test. Consequently, the gaming performance is stable over time. Nevertheless, the RTX 3060 is slightly below average (in games and synthetic benchmarks), but this does not affect the general gaming suitability.
Modern ports, matte display option, a fast TFT with AdobeRGB and excellent processor performance. It is then details like keyboard and load volume that screw up the Z16's Very Good rating.
Thermally, the Z16 is passably positioned. In balanced mode, the fans mostly stay off in idle, but they occasionally turn on under performance. The waste heat is appropriate for the performance and is mainly noticed in the laptop's rear area. Under load, the three fans produce a fair amount of noise, but at least it is steady, never hectic.
Weaknesses show up in the input devices: With the short travel and the hard stroke, we experience a tiring and loud typing experience, which even the RGB key illumination does not hide. The Z16 is not a typing world champion. Windows Hello works very well with the IR camera and fingerprint, but webcam snapshots defy description.
What does the competition look like? The XPS 17 seems to be a bit better in terms of display (brightness, resolution). The XPS 15 (15.6 inch, more resolution) offers an OLED. Apple's MacBook Pro 16 2021 M1 Pro does not pack quite as much AdobeRGB and has worse response times. In return, the Liquid Retina XDR is much brighter.
If you are into gaming, you will find better devices than the MSI with its RTX 3060 Here the Razer Blade 15 Advanced (Mid 2021) is at the top, but its screen is inferior on balance. The MacBook Pro 16 2021 is not an option for gaming, due to the available games as well as the weak GPU.
The bottom line is that the Z16 is very good or at least well-served in every respect. The 16-incher does not have any serious weaknesses. The input devices, the volume, the camera and the comparatively high weight scratch at the rating. If these are not no-go issues for you, then the Z16 would be a candidate for you at a reasonable price.
Price and availability
Currently, the test configuration Creator Z16 A11UET-209 with Core i7-11800H1 TB memory and 32 GB DDR4-3200 at Amazon for 2,400 Euro (~$2716) a price that is on par with equivalent competitors.
MSI Creator Z16 A11UET-209
-
11/18/2021 v7
Sebastian Jentsch

Pricecompare

