 Deutsch
 English
 Español
 Français
 Italiano
 Nederlands
 Polski
 Português
 Русский
 Türkçe
 Svenska
 Chinese
 Magyar
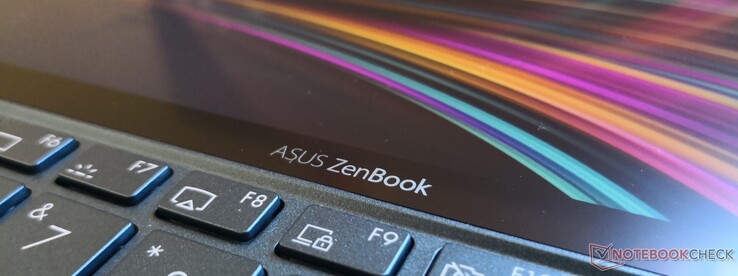
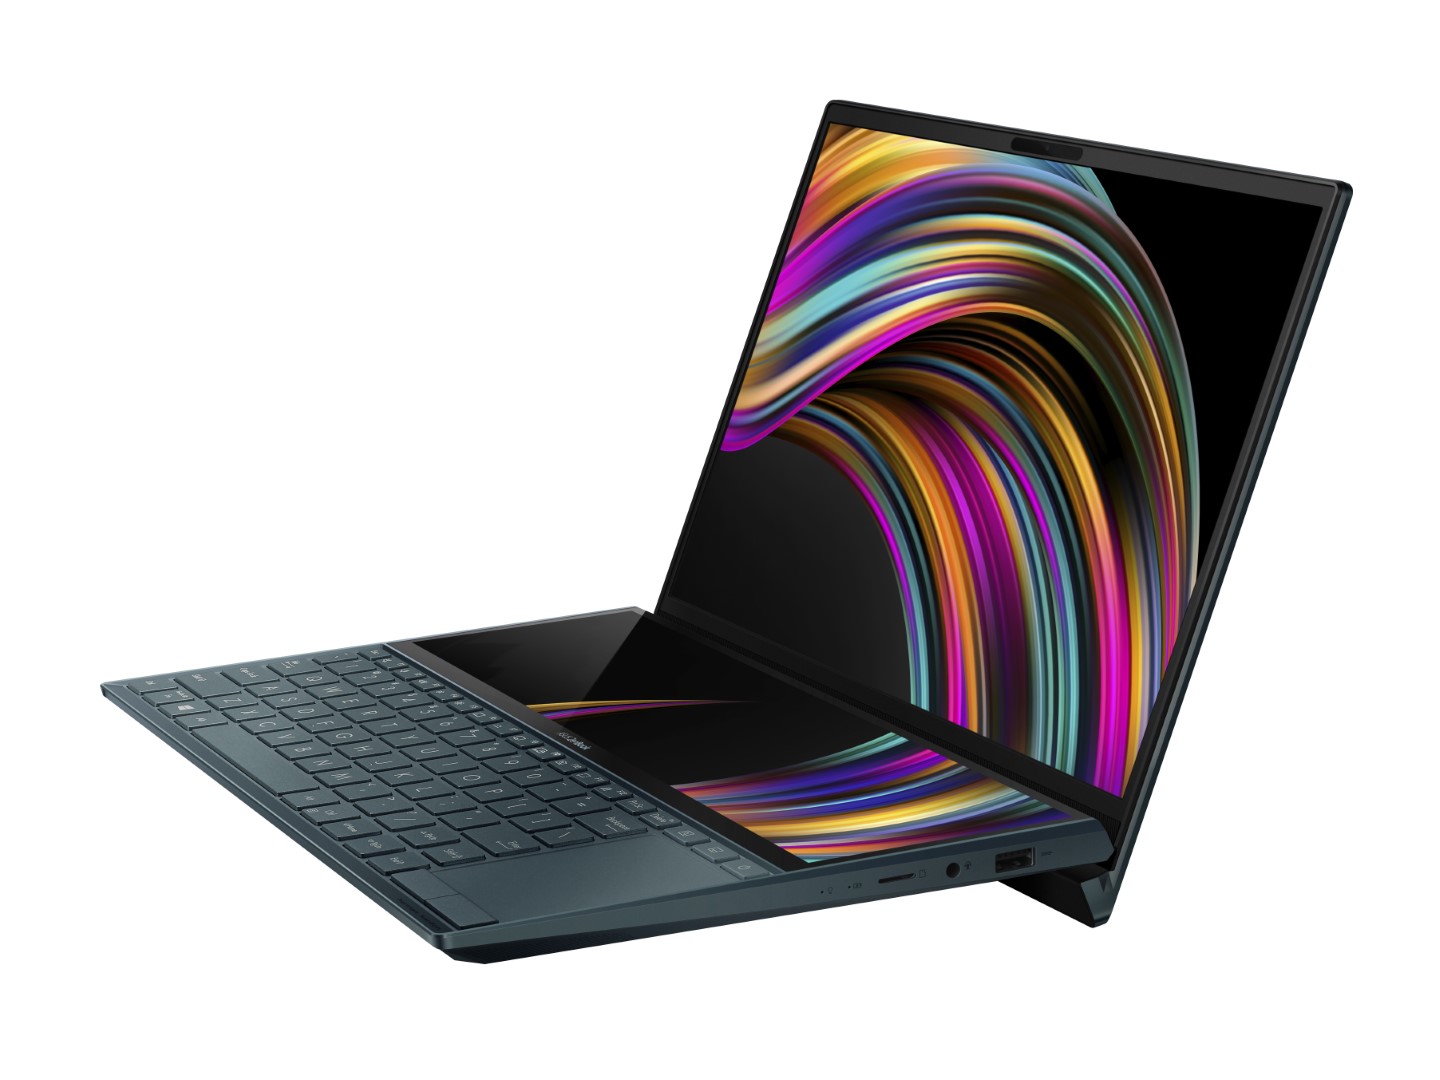
Like The Apple Touch Bar, But Better: Asus ZenBook Duo UX481 Laptop Review
In our review of the 15.6-inch ZenBook Pro Duo 15, we noted that its secondary ScreenPad display might work better on a 14-inch form factor because users would be more likely to travel with a 14-inch subnotebook than a full-size 15.6-inch model. Asus were apparently thinking the same — the 14-inch ZenBook Duo replaces the Core H-series CPU and GeForce GTX GPU as found on its larger sibling with more power-efficient Core U-series and GeForce MX parts. To put simply, the ZenBook Duo UX481 combines the looks and features of the high-end ZenBook Pro 15 with the processors of an affordable VivoBook S15.
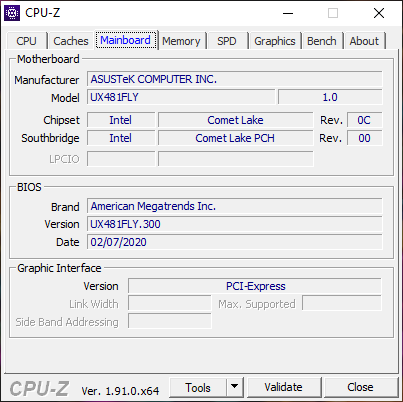
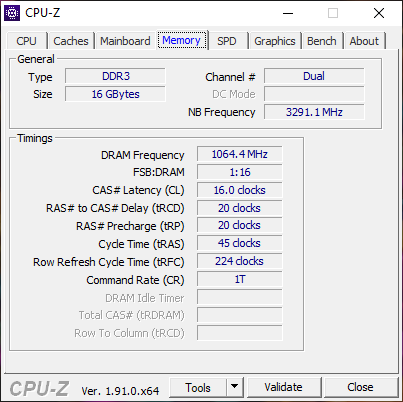
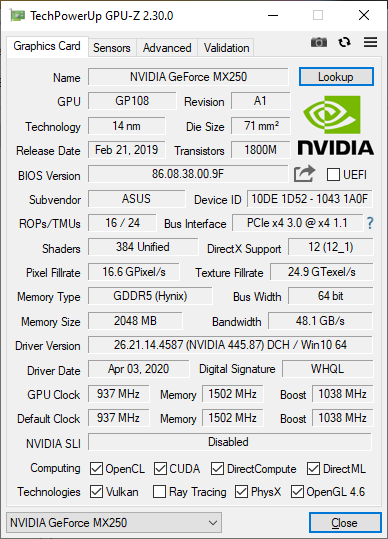
The unit we are testing comes fully loaded with a Core i7-10510U Comet Lake-U CPU, GeForce MX250 GPU, 16 GB of LPDDR3 RAM, and a 1 TB Intel NVMe SSD for $1500. The 14-inch 1080p primary touchscreen and 12.6-inch secondary (1920 x 515) touchscreen come standard on all configurations. Retailers like Amazon and B&H are carrying this particular SKU. Lesser SKUs exist with the Core i5-10210U.
The ZenBook Duo has no equal in its 14-inch size category because of its unique ScreenPad feature, but we'll be comparing it to classic flagship Ultrabooks like the Microsoft Surface Laptop 3, Lenovo IdeaPad S940, Dell XPS 13, Huawei MateBook X Pro, and Asus' own ZenBook 14 to see what advantages and disadvantages the novel system brings to the table. HP offers laptops with second displays as well, but these only apply to gaming models at the moment.
More Asus reviews:
Rating | Date | Model | Weight | Height | Size | Resolution | Best Price |
|---|---|---|---|---|---|---|---|
| 82.7 % | 05/2020 | Asus ZenBook Duo UX481FL i7-10510U, GeForce MX250 | 1.8 kg | 19 mm | 14.00" | 1920x1080 | |
| 84.2 % | 02/2020 | MSI Prestige 14 A10SC-009 i7-10710U, GeForce GTX 1650 Max-Q | 1.3 kg | 16 mm | 14.00" | 3840x2160 | |
| 85 % | 06/2019 | Lenovo IdeaPad S940-14IWL i7-8565U, UHD Graphics 620 | 1.2 kg | 12 mm | 14.00" | 3840x2160 | |
| 84 % | 02/2020 | Microsoft Surface Laptop 3 13 Core i5-1035G7 i5-1035G7, Iris Plus Graphics G7 (Ice Lake 64 EU) | 1.3 kg | 14.5 mm | 13.50" | 2256x1504 | |
| 81.2 % | 02/2020 | Asus ZenBook 14 UM431DA-AM020T R7 3700U, Vega 10 | 1.4 kg | 16 mm | 14.00" | 1920x1080 |
Case
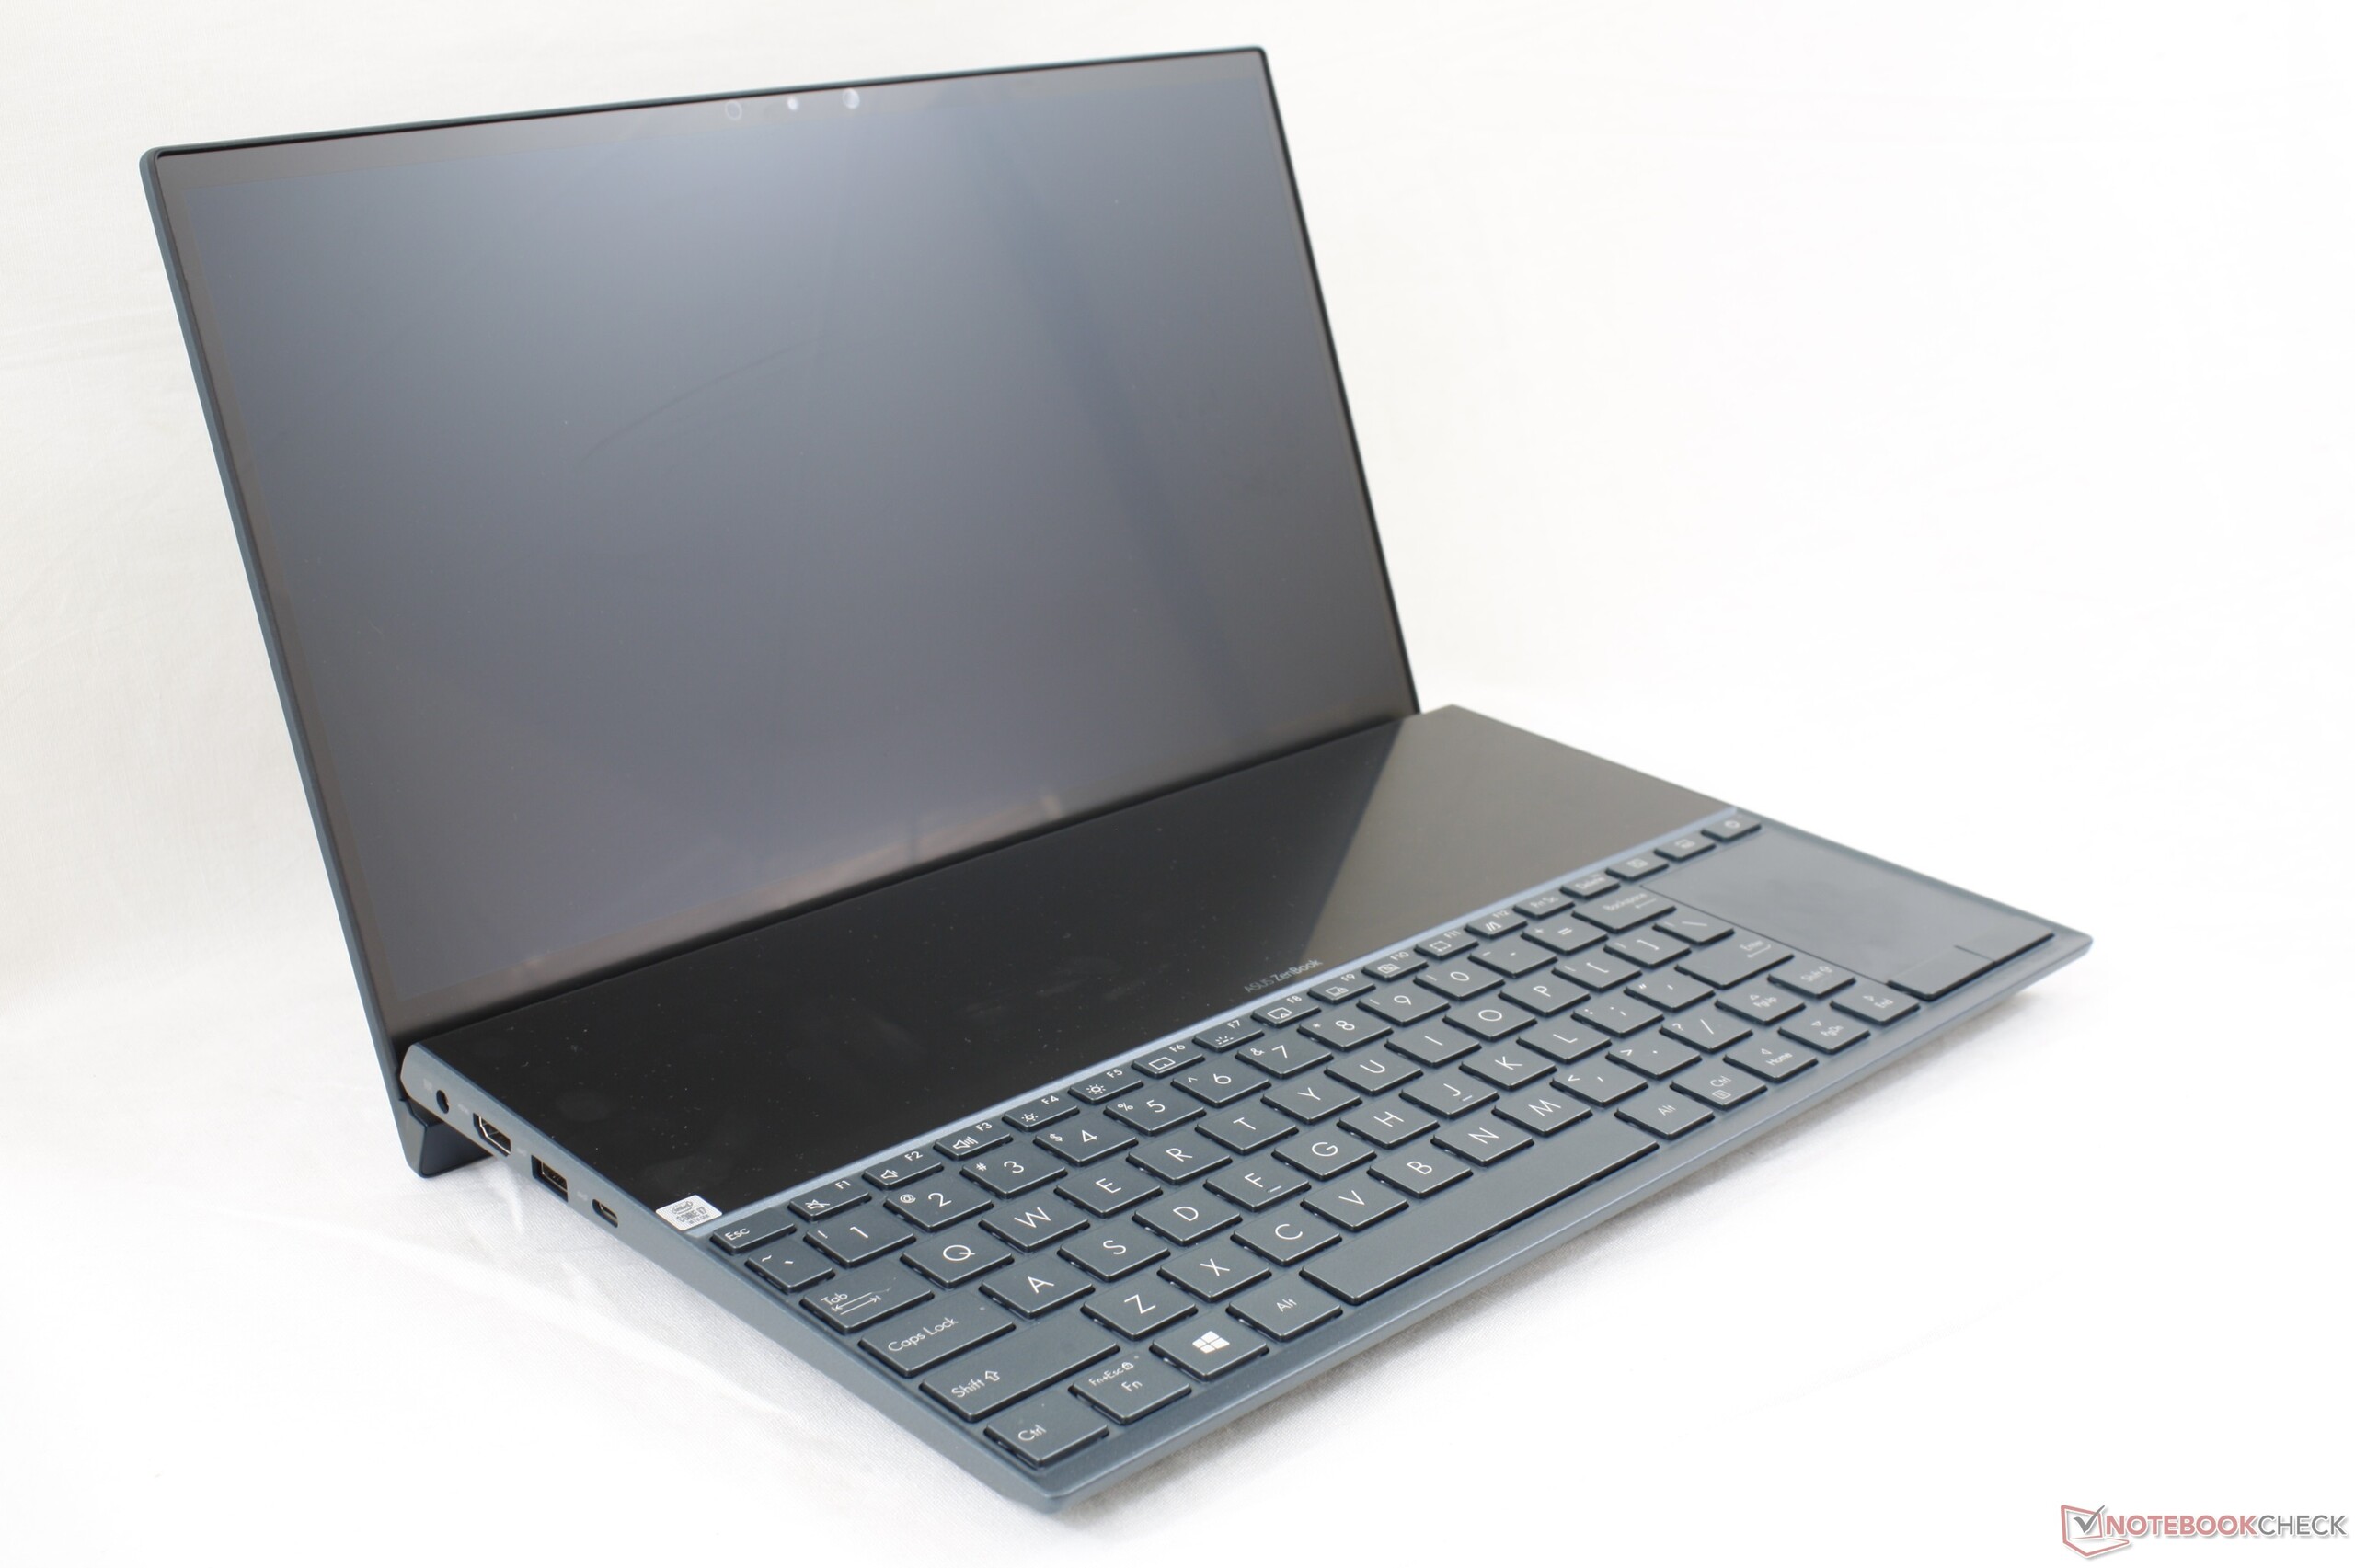
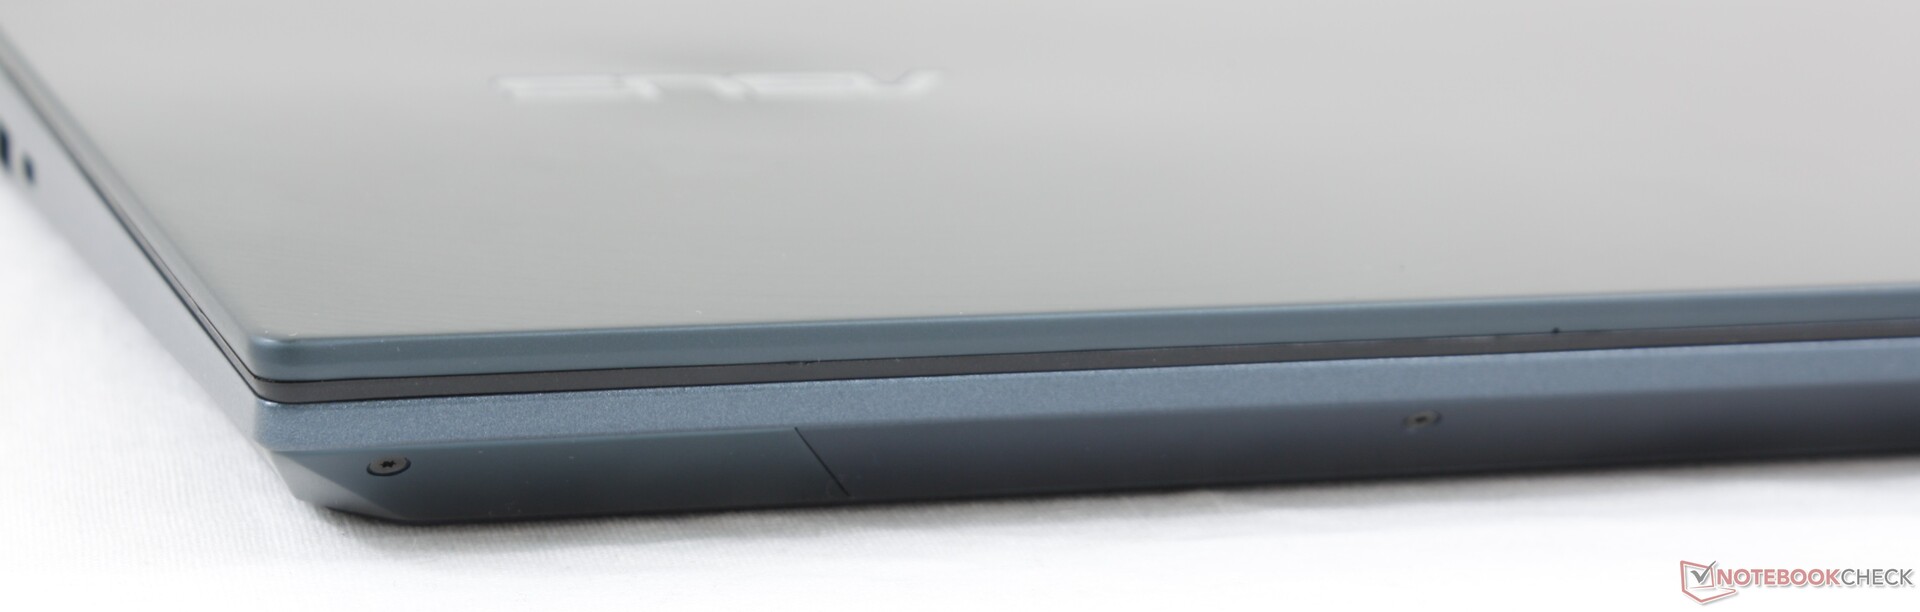
The chassis can best be described as a miniature ZenBook Pro Duo. Asus has shrunken the ginormous 15.6-inch version into a more manageable 14-inch size while retaining the solid build and impression of the original. The lid in particular is strong and more resistant to twisting and warping than the lids on many other subnotebooks like the Acer Aspire A514 or MSI Prestige 14. The base is also firm with no bending or creaking when applying moderate pressure likely because of its dense build and tightly packed components within.
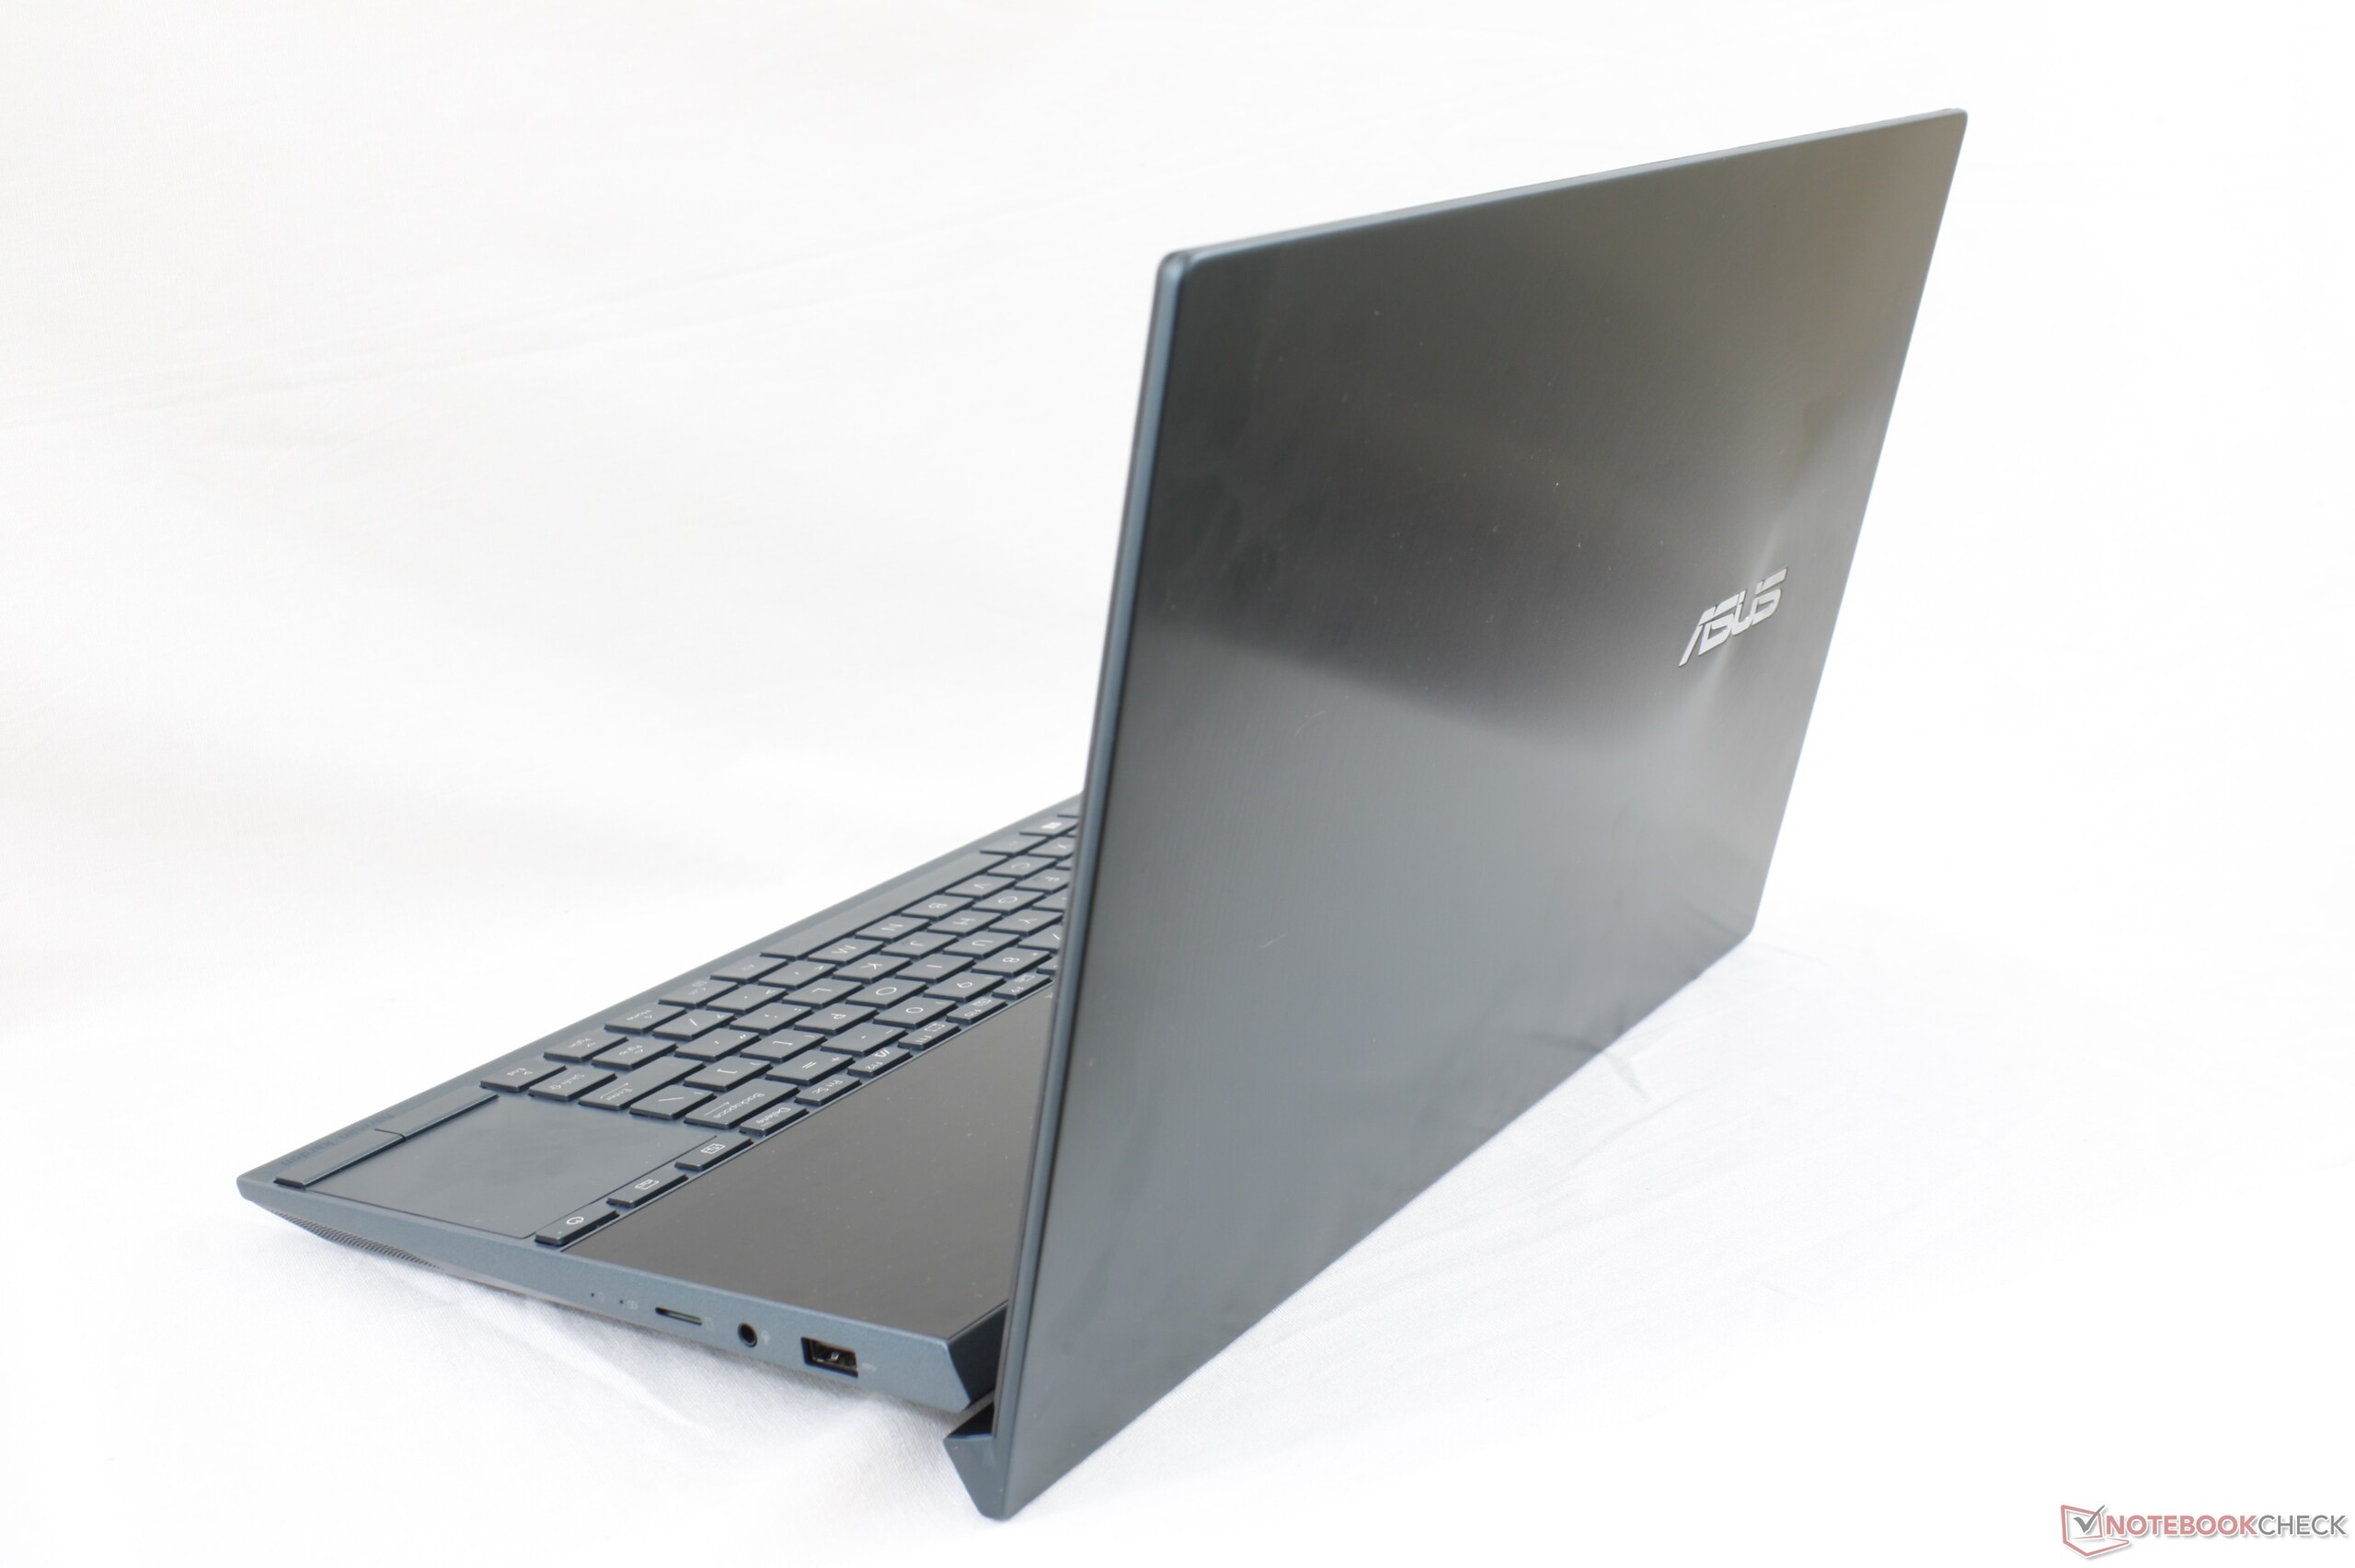
Speaking of density, the drawbacks of having an integrated secondary screen become obvious when first picking up the system. At 1.8 kg and 19 mm thick, the system is roughly 500 g heavier and a few millimeters thicker than most ordinary 13.9-inch or 14-inch laptops like the Lenovo IdeaPad S940, Huawei MateBook X Pro, or Asus' own ZenBook 14. In fact, the ZenBook Duo is almost as heavy as the 15.6-inch Dell XPS 15 (1.9 kg) and so weight is definitely something to consider if you plan on traveling frequently with the dual-screen laptop.
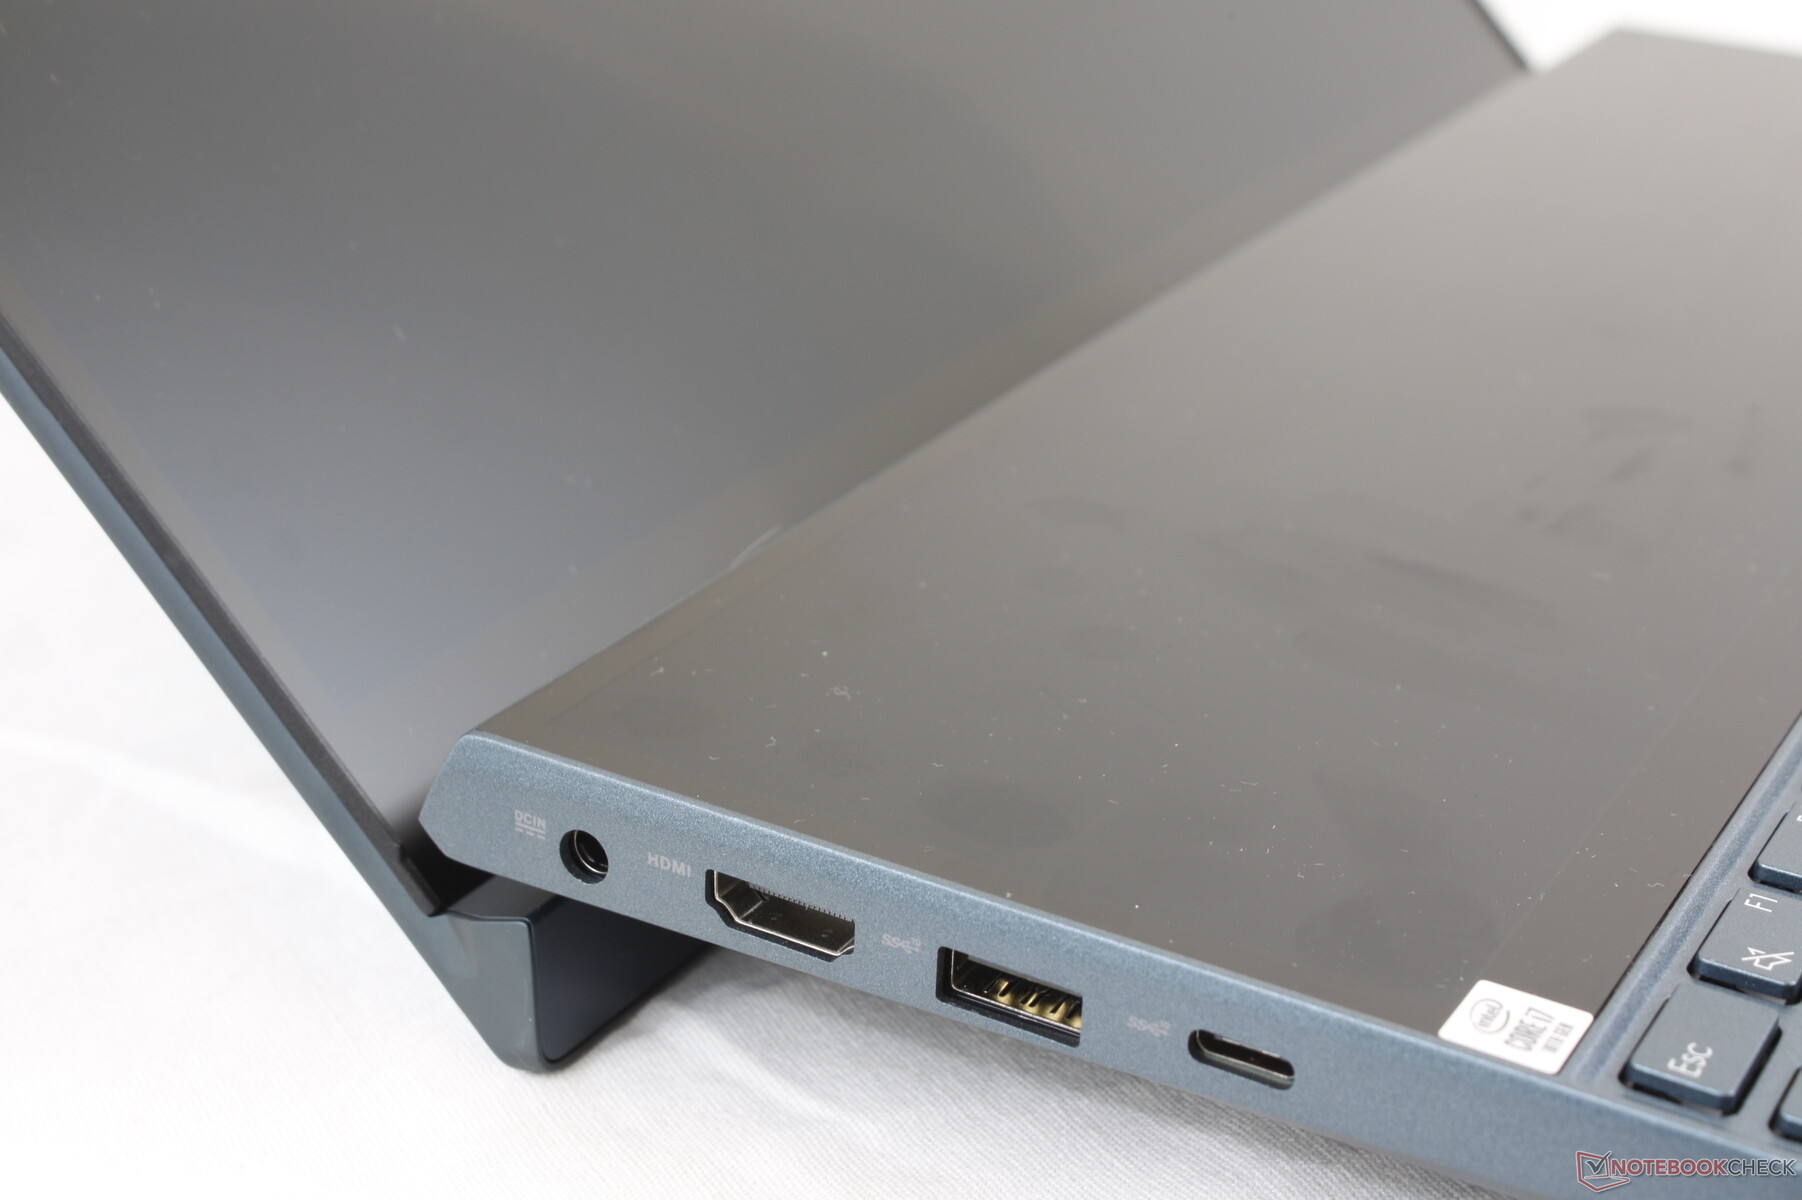
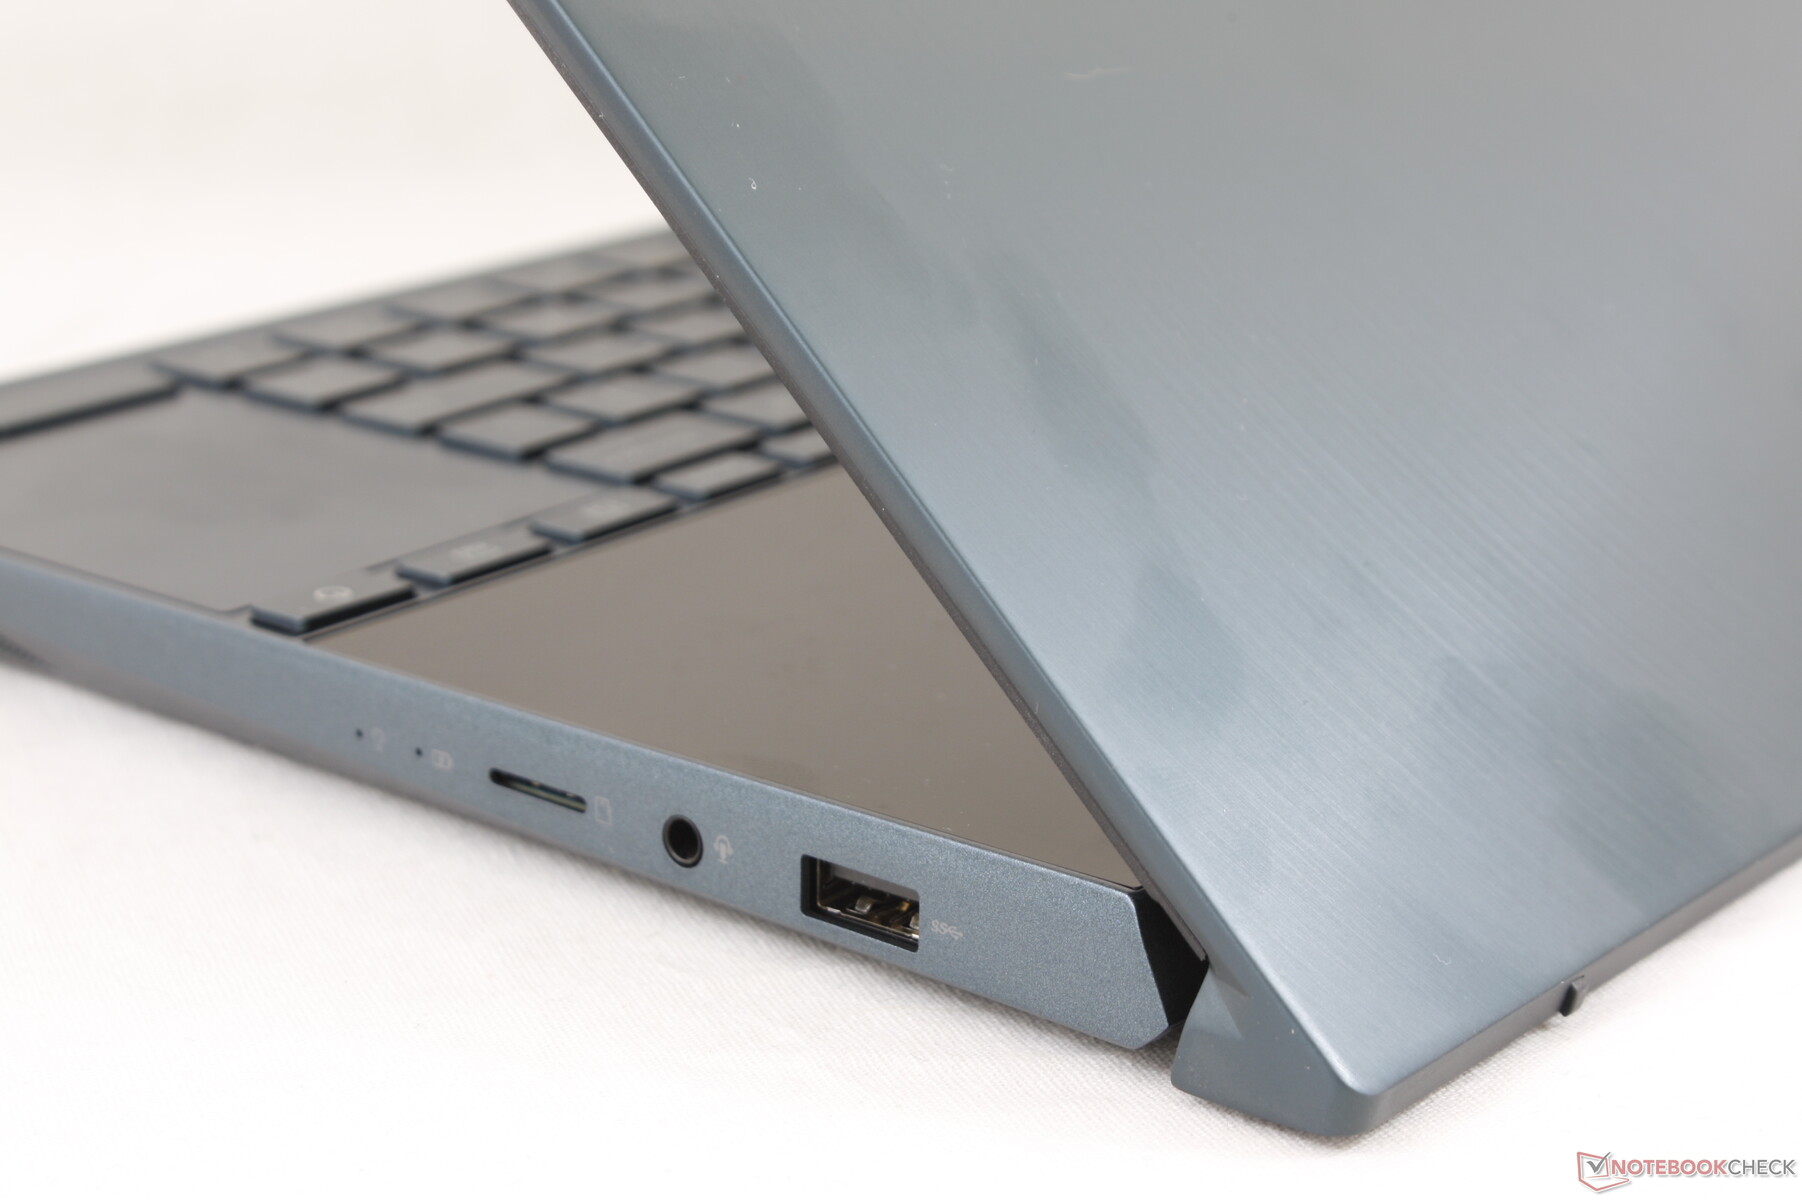
Connectivity
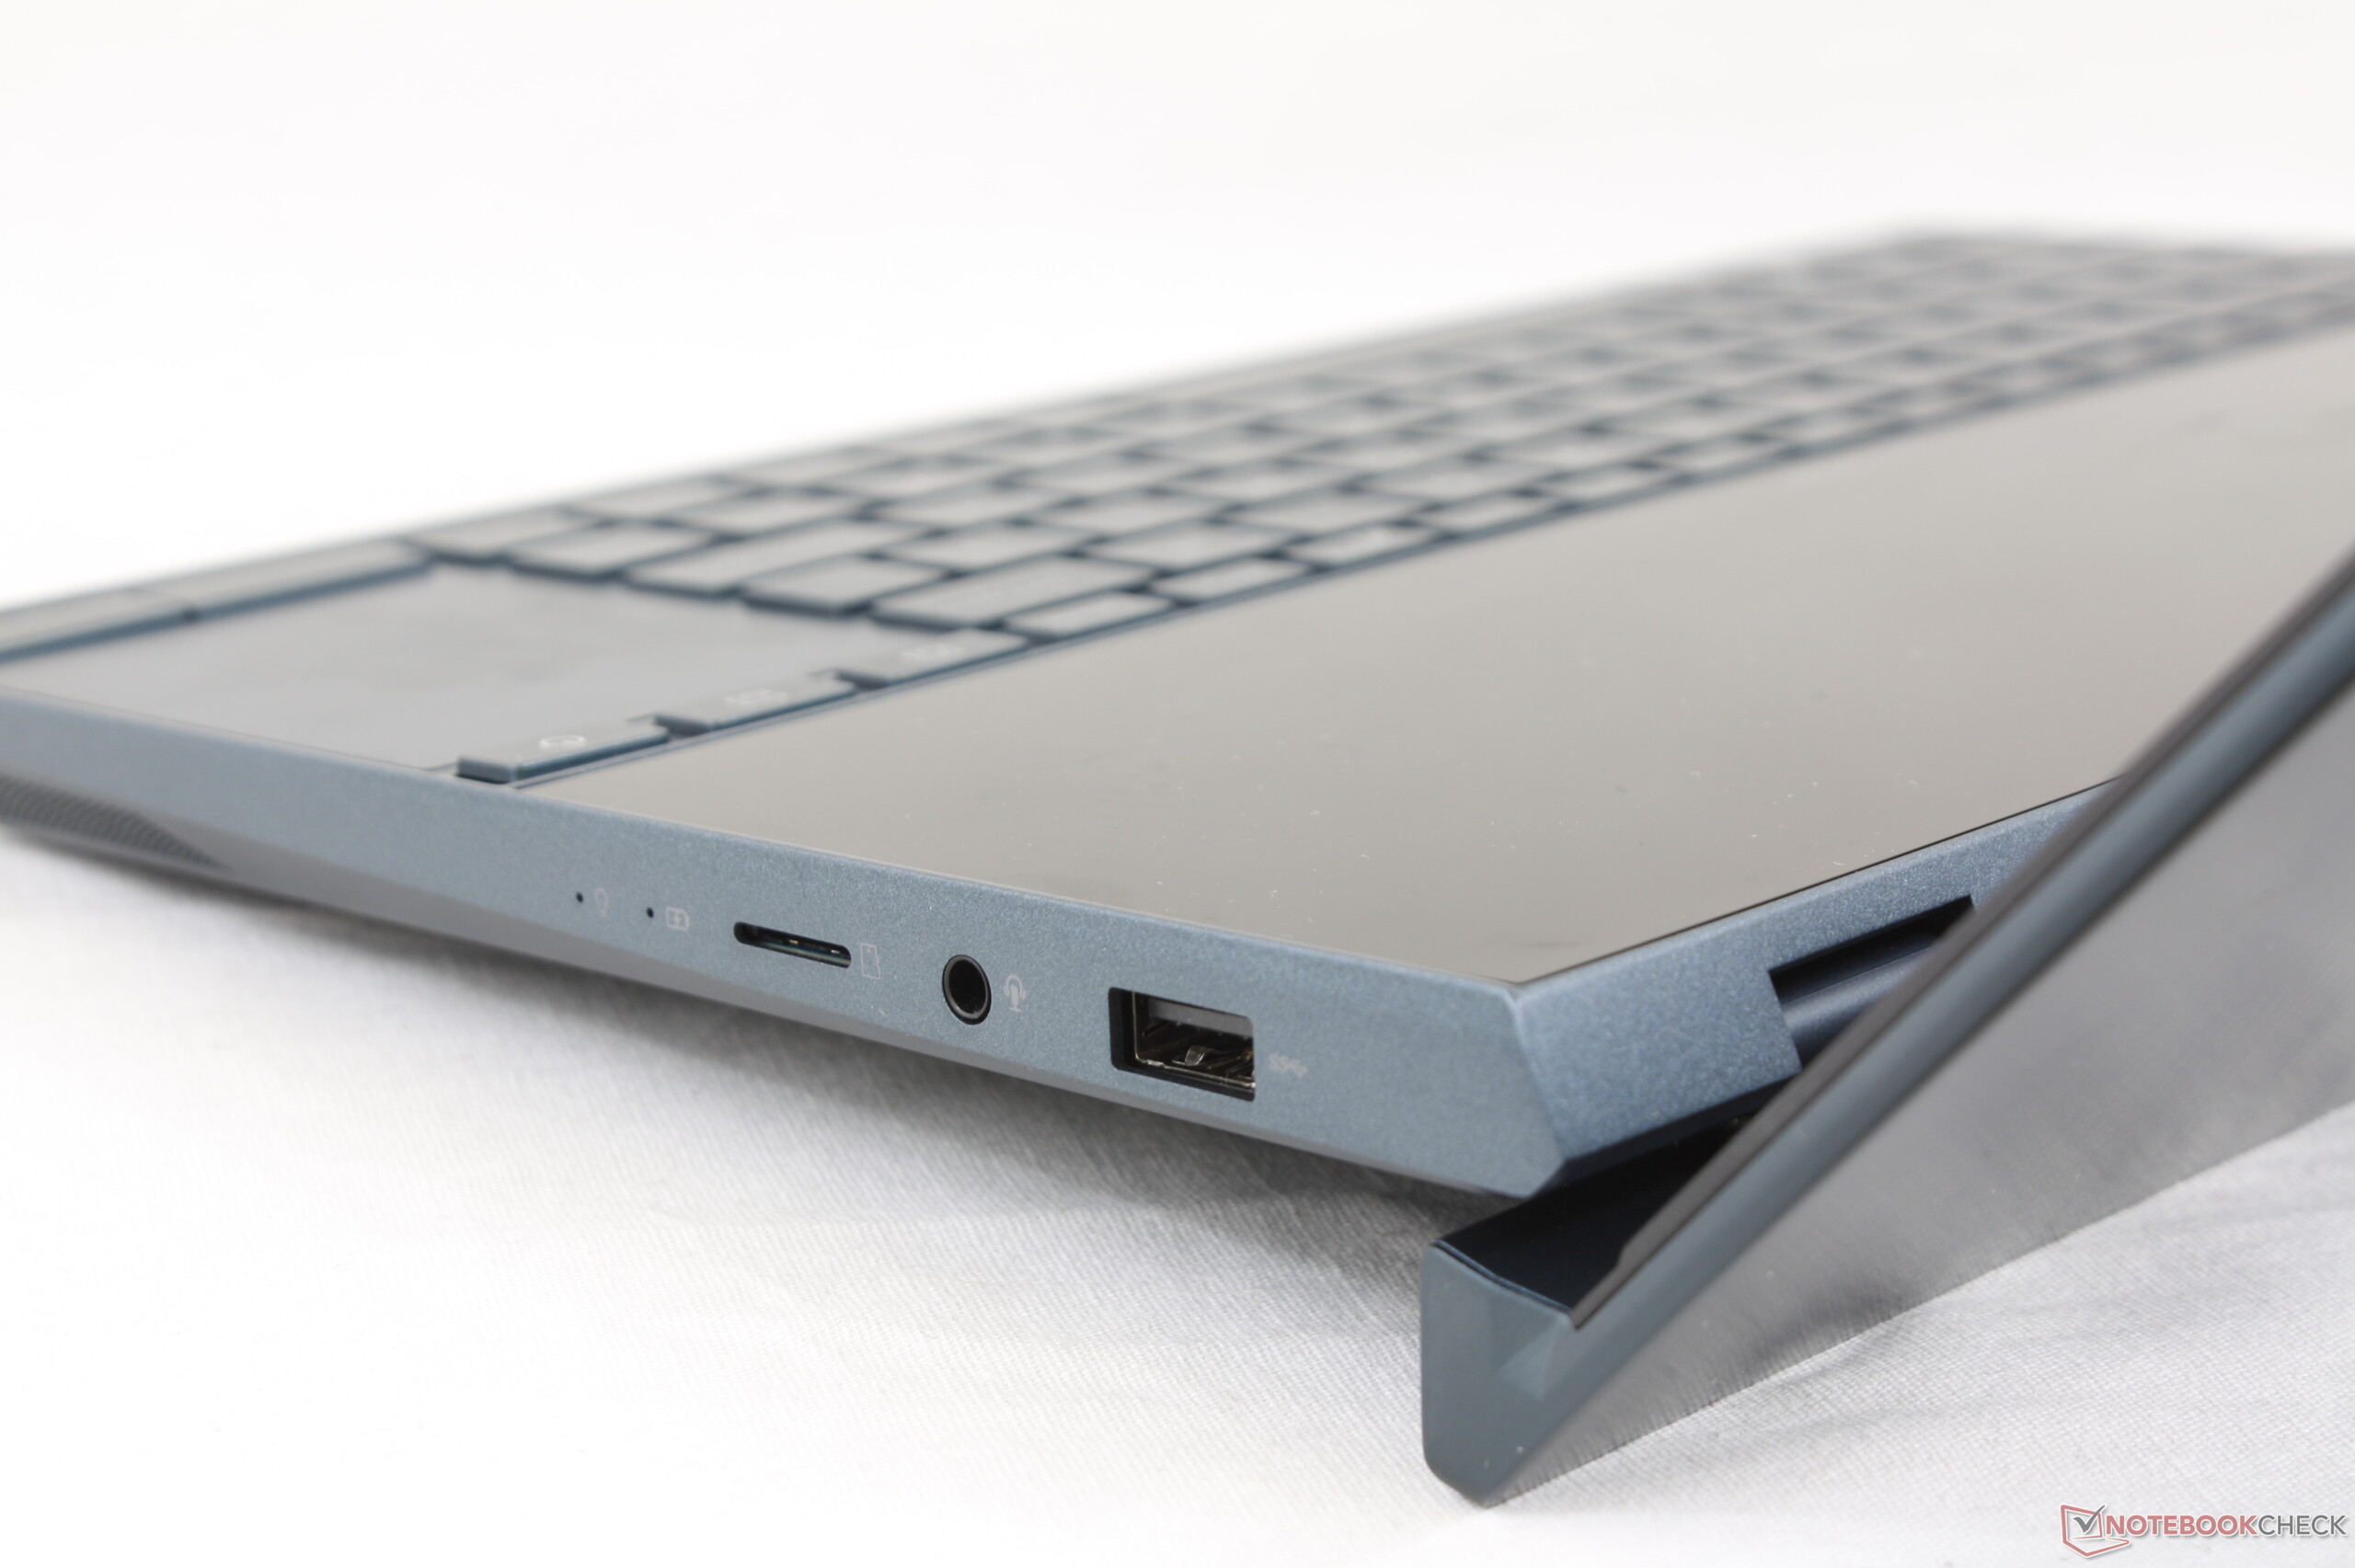
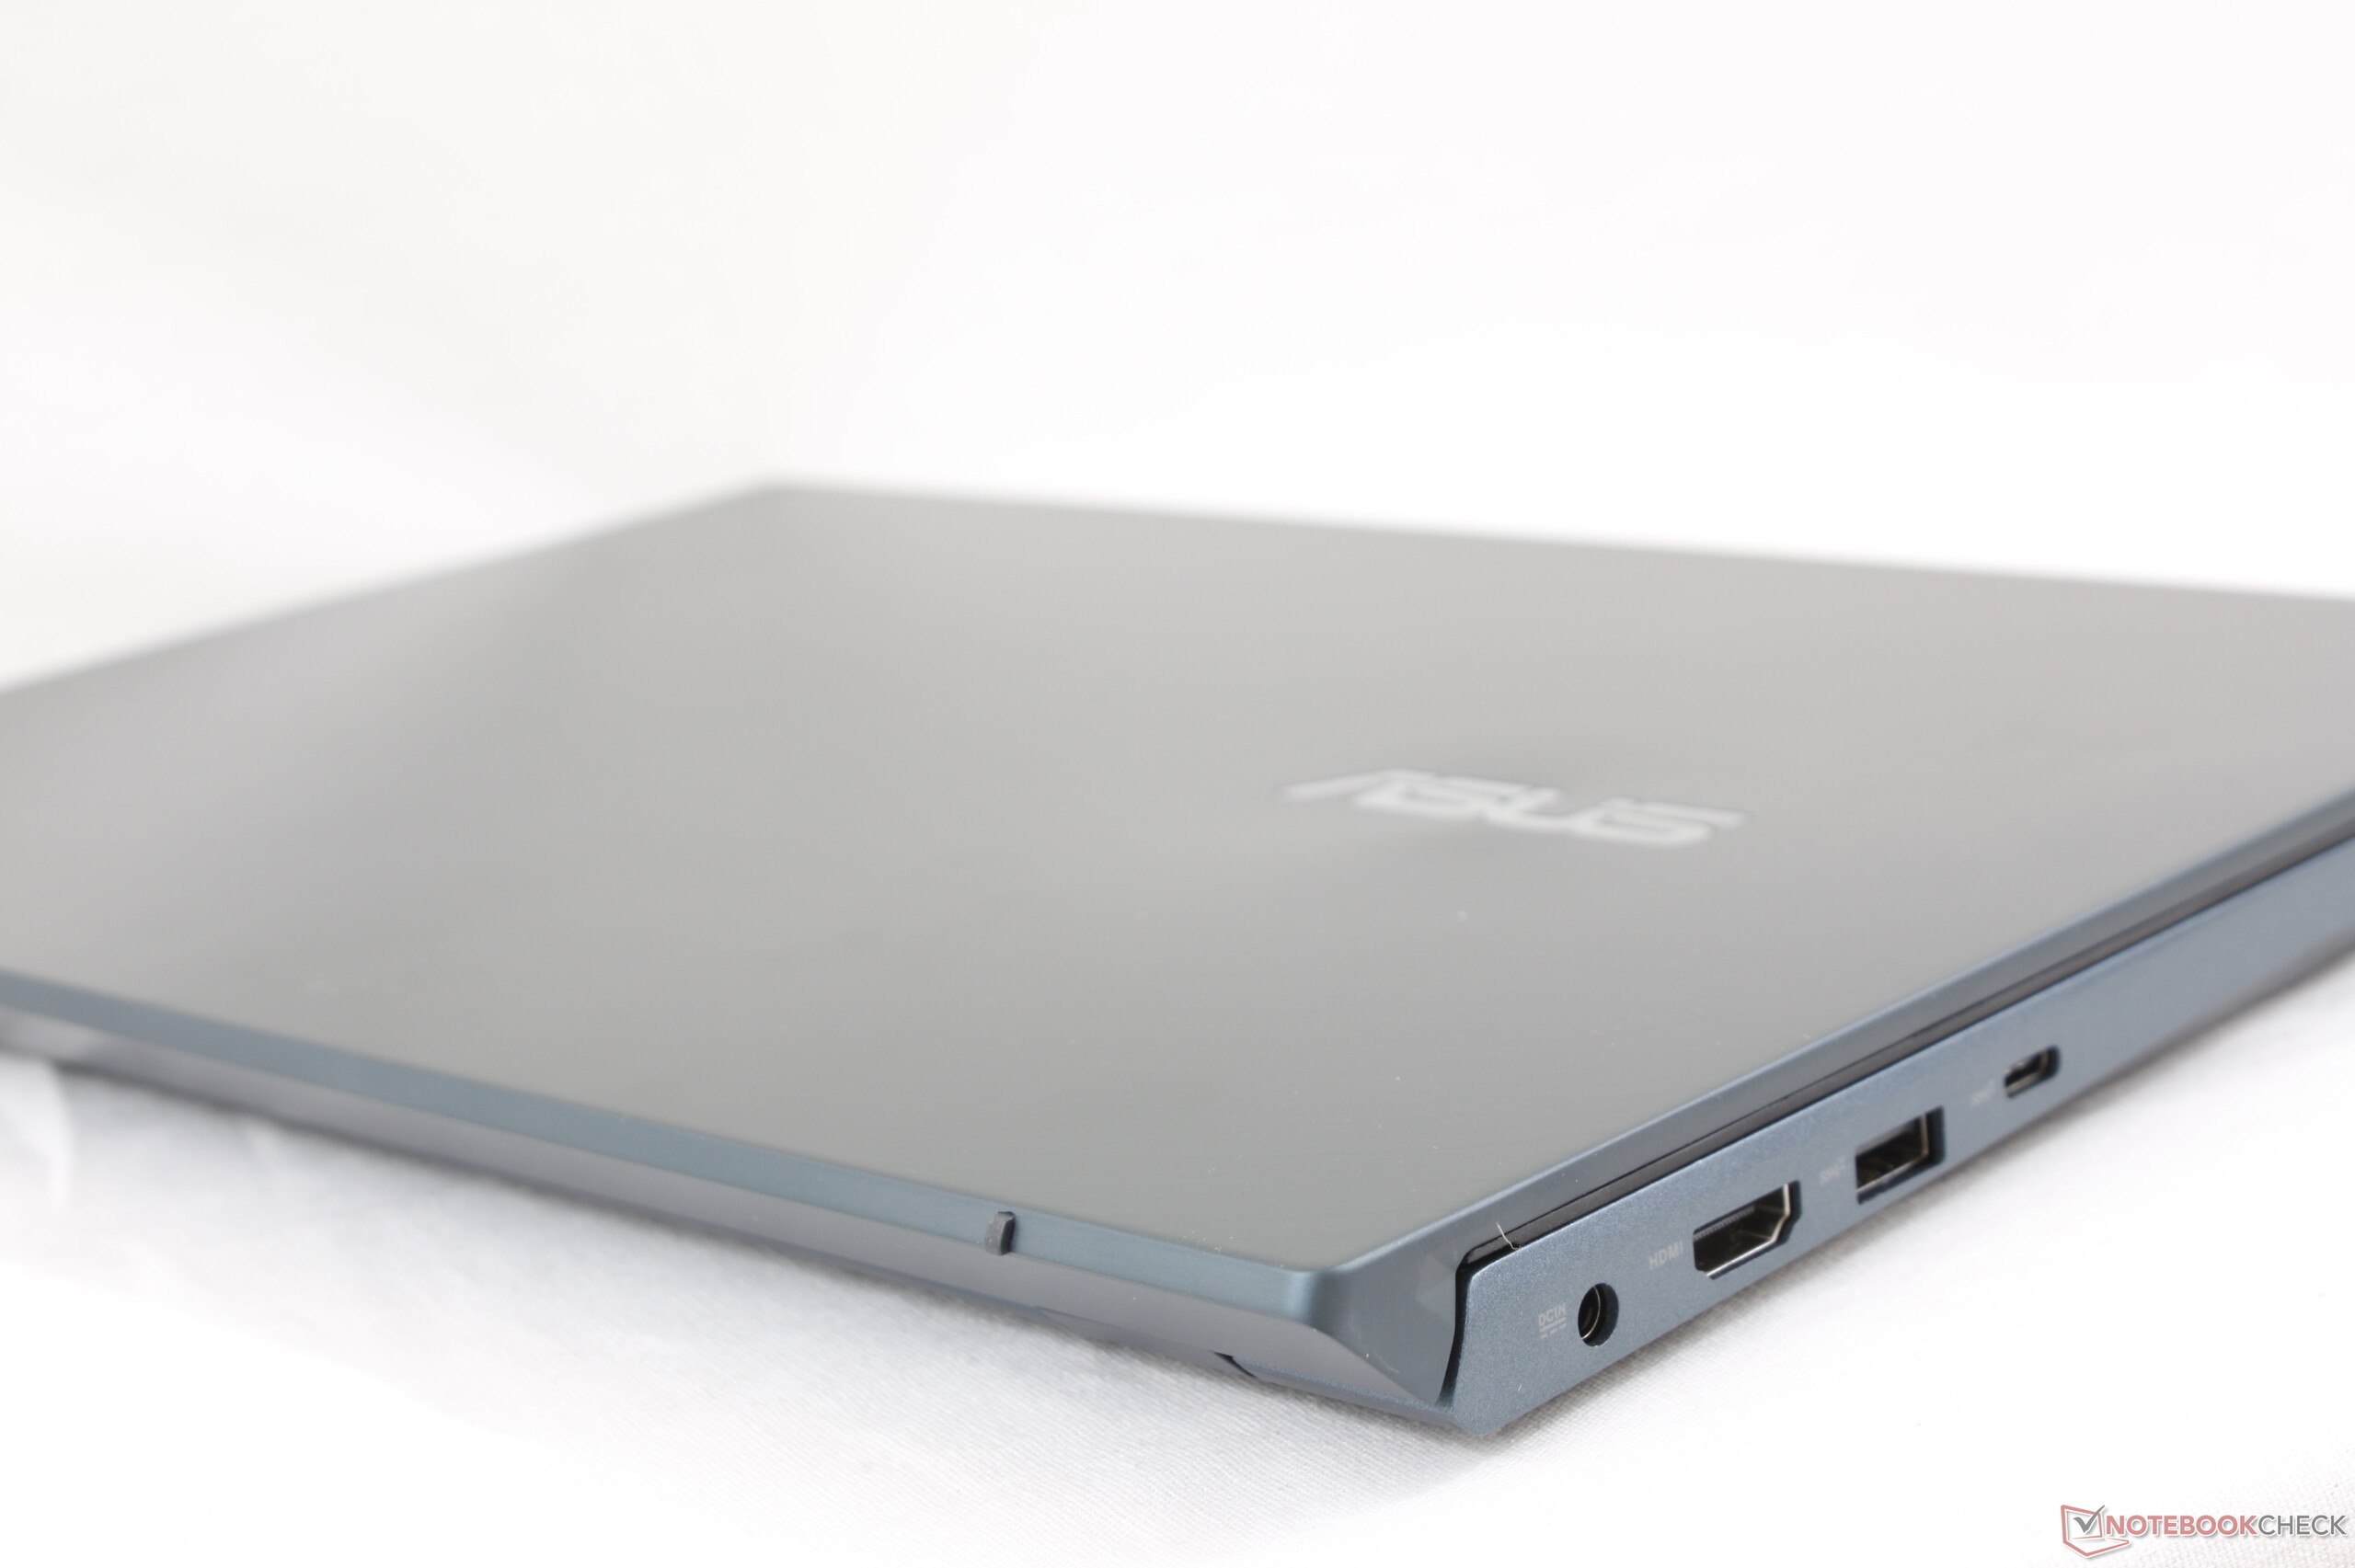
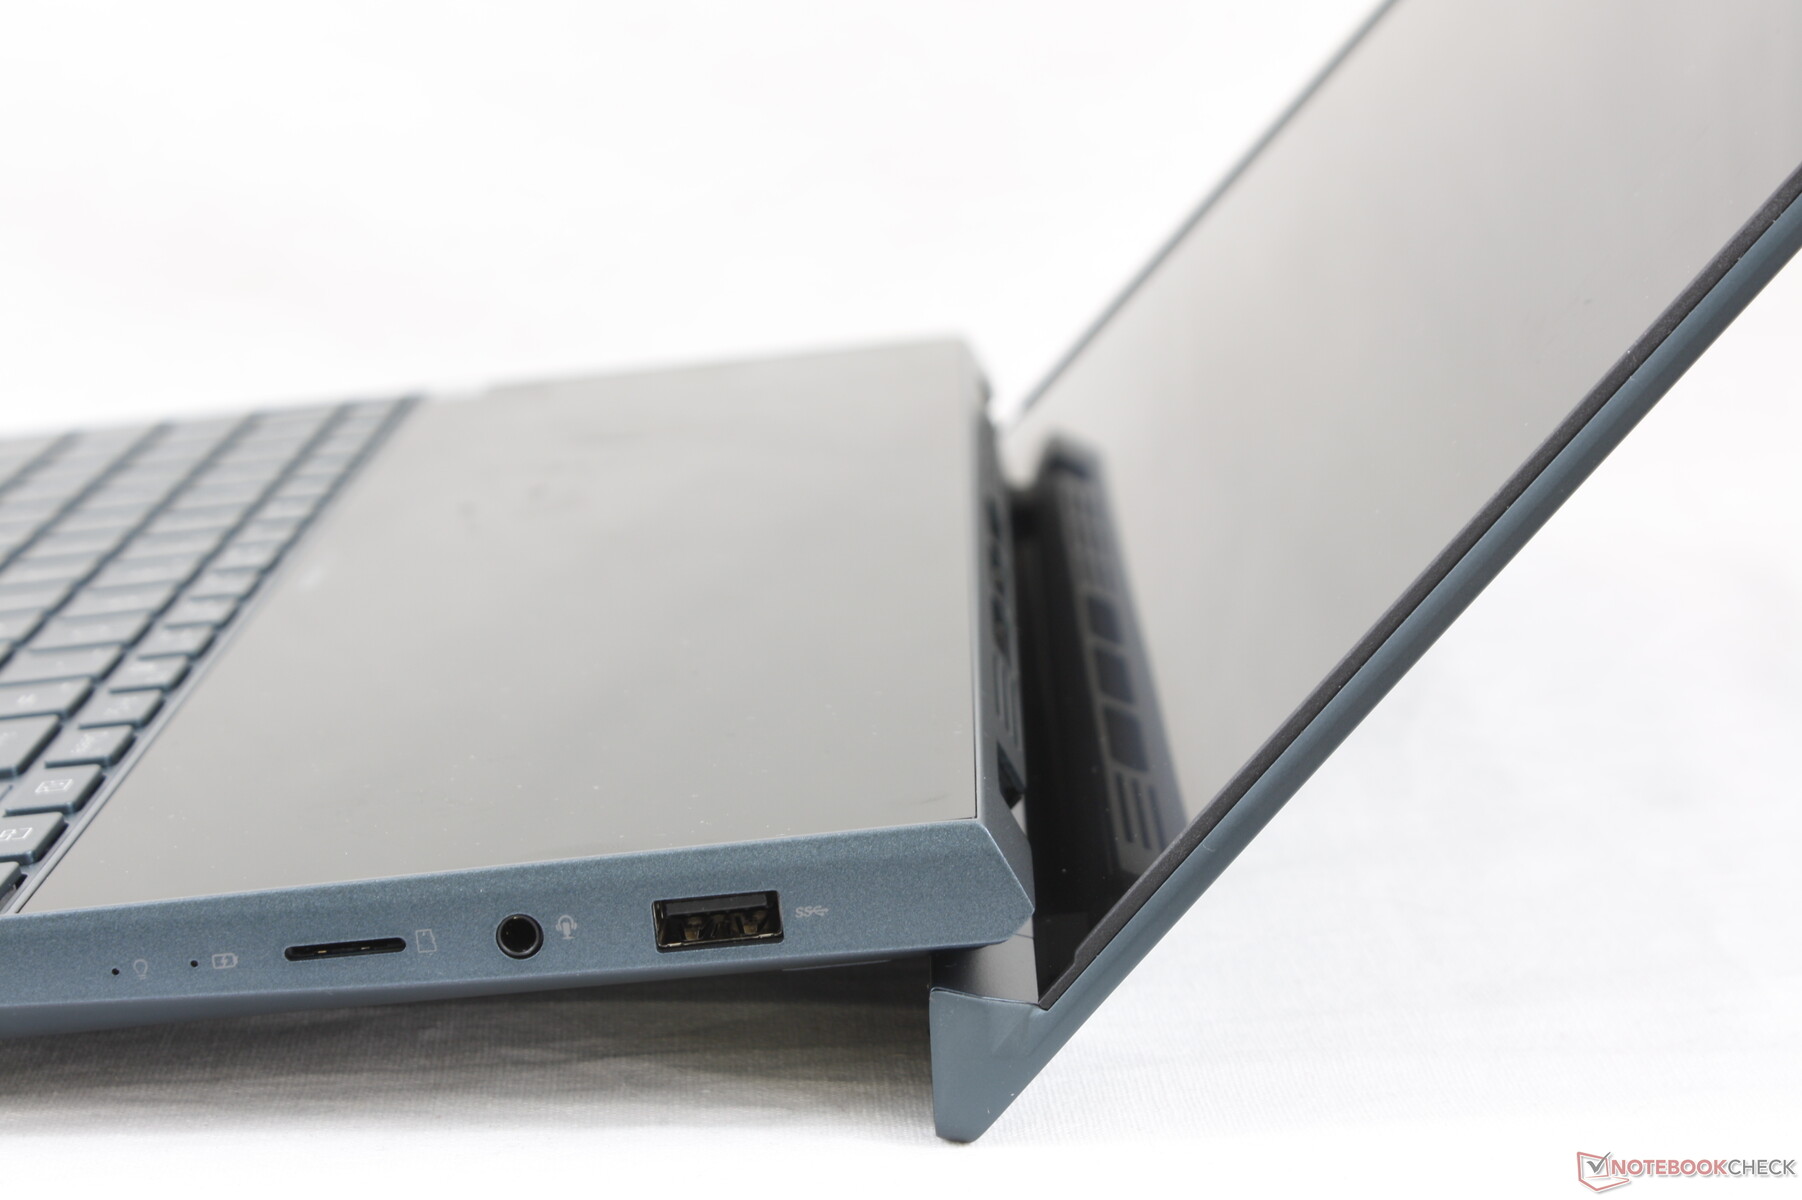
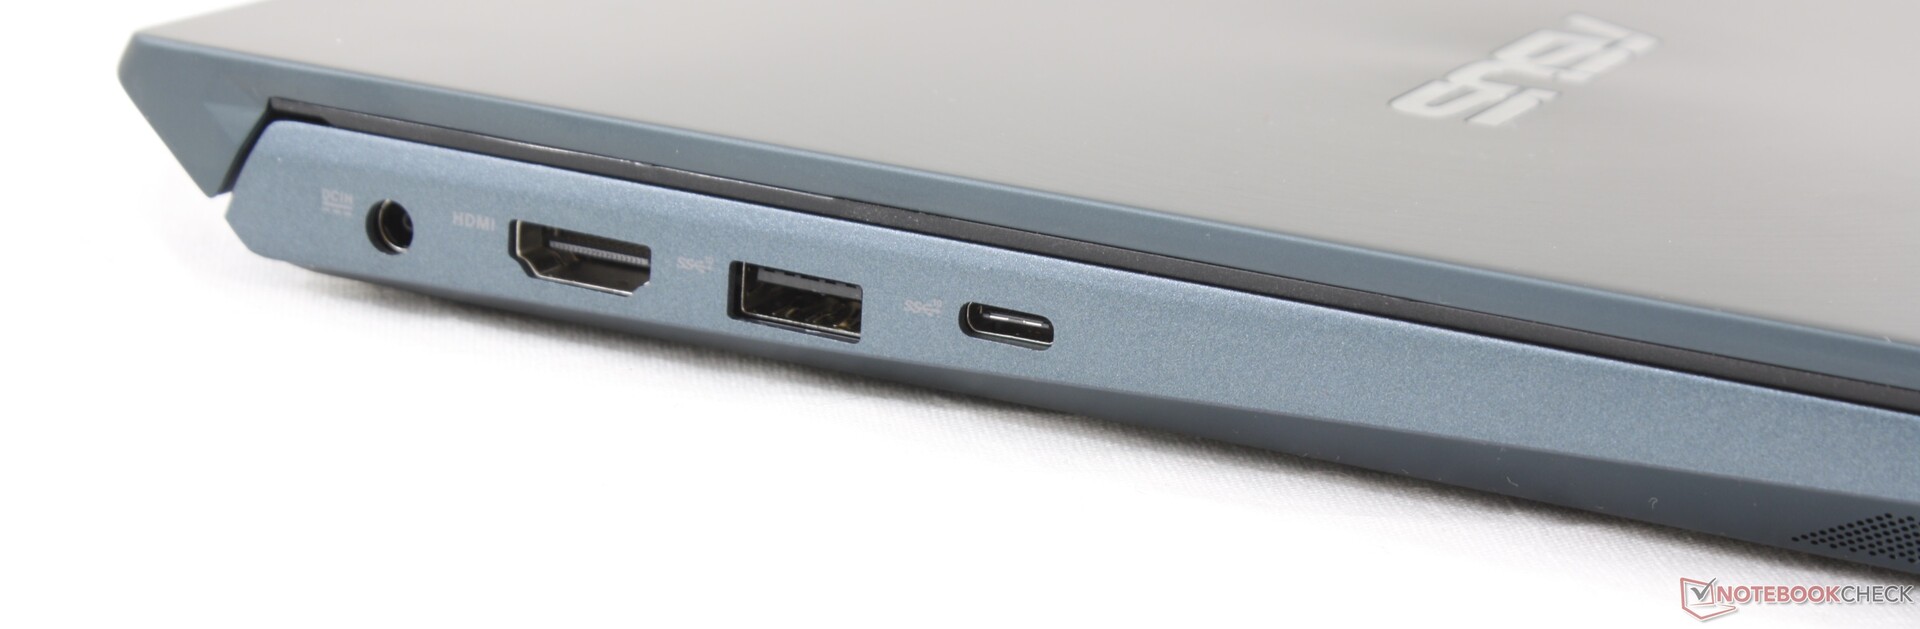
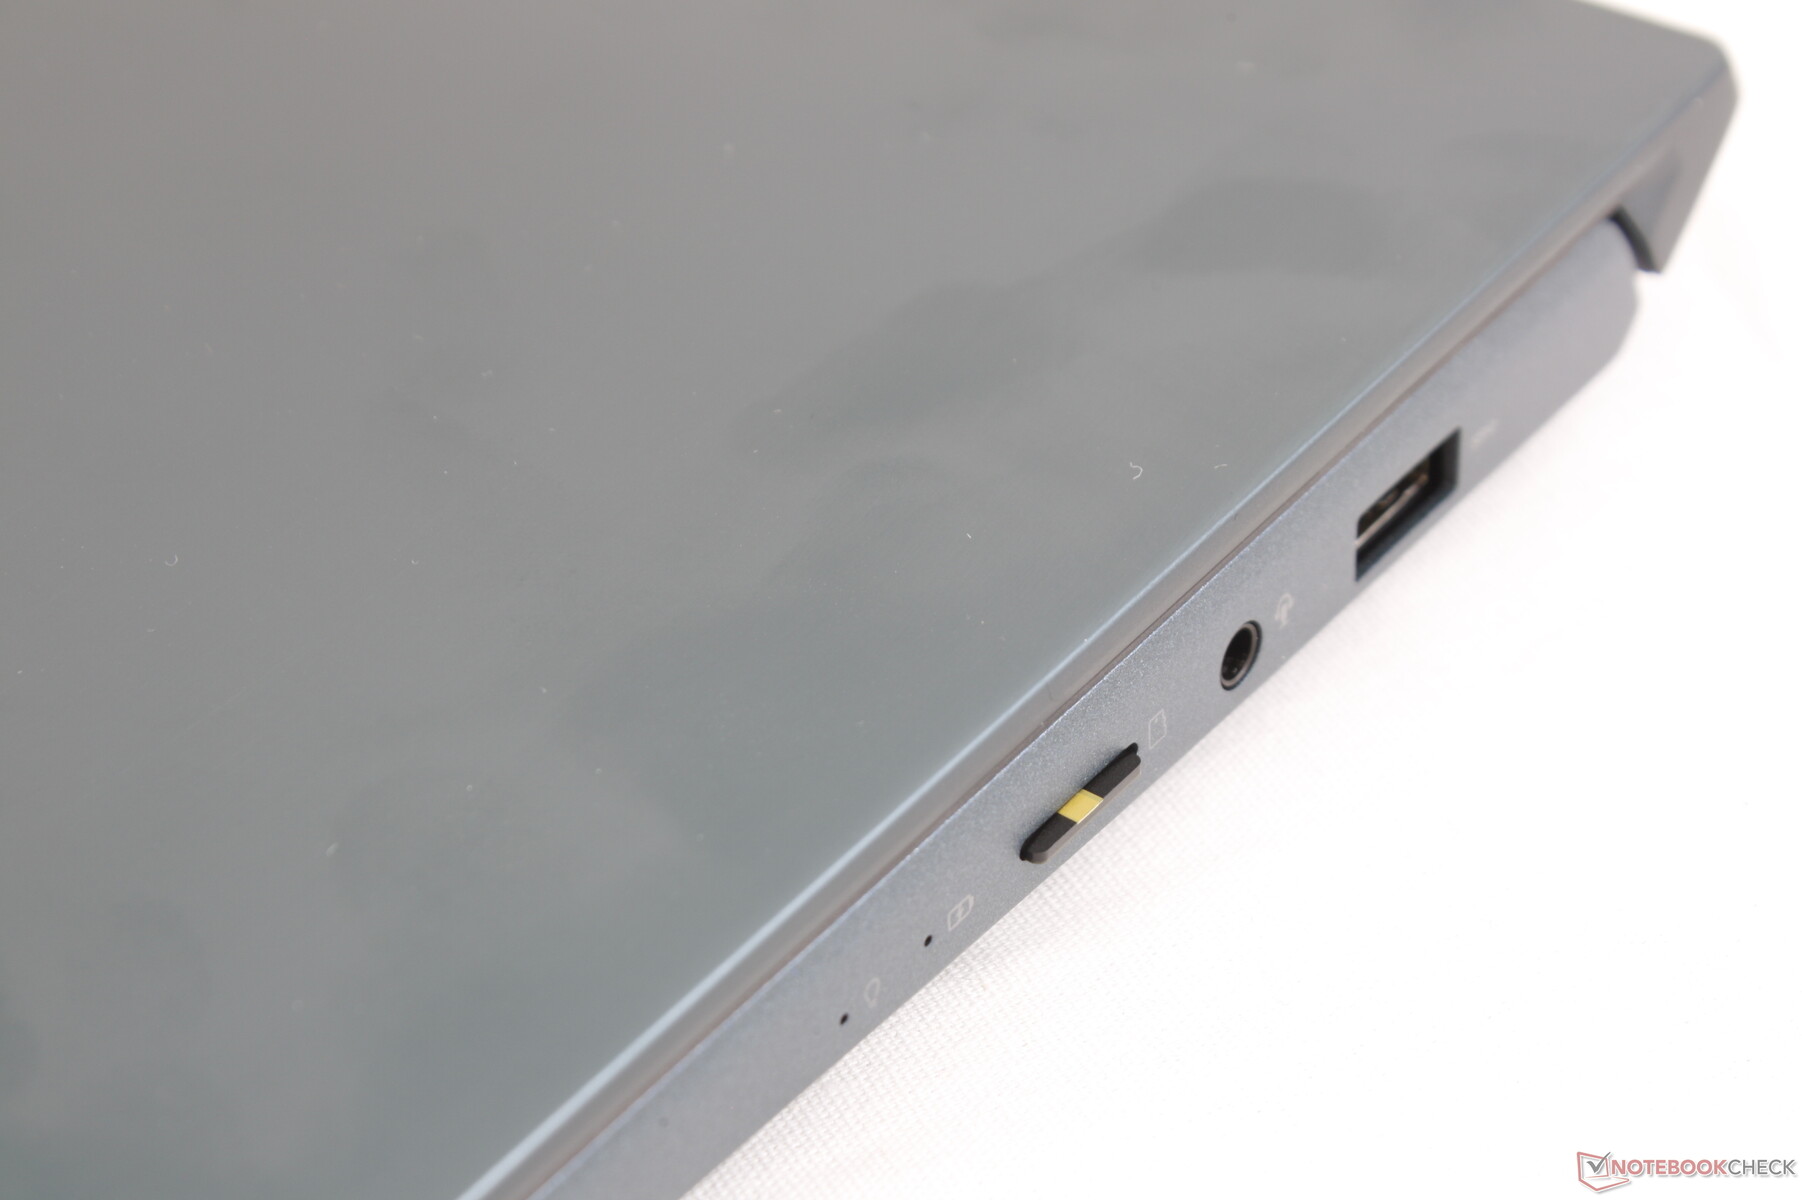
All ports found on the larger 15.6-inch ZenBook Pro Duo are present here but with two important differences. First, the ZenBook Duo integrates a MicroSD reader while the larger version does not. Secondly, the USB Type-C port on the 14-inch model does not support Thunderbolt 3 much like on the ZenBook 14 clamshells. Port positioning is otherwise a non-issue.
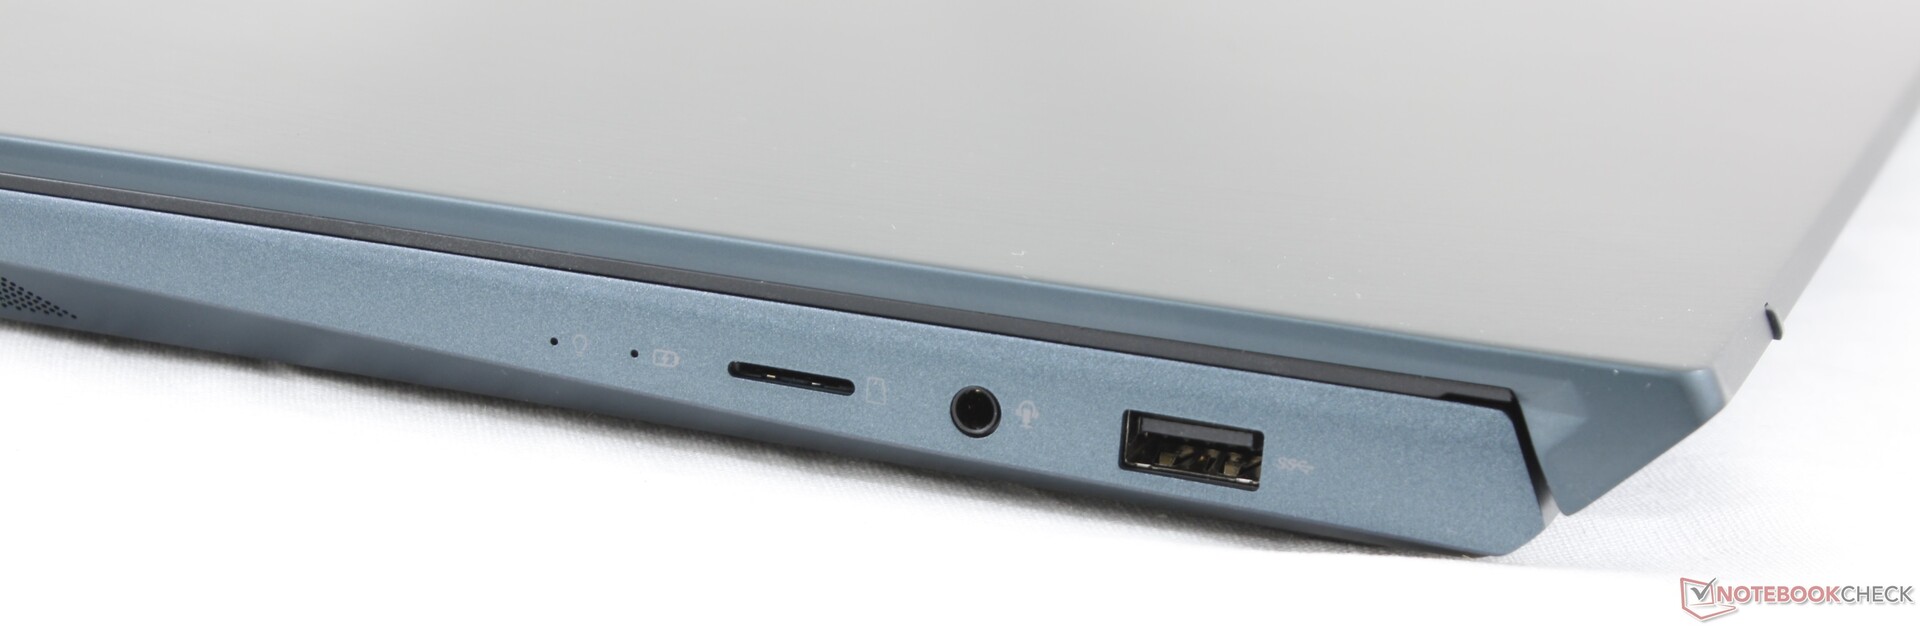
SD Card Reader
The integrated spring-loaded MicroSD reader offers average transfer rates. Moving 1 GB worth of pictures from our UHS-II MicroSD card to desktop takes about 13 seconds compared to 7 seconds on the XPS 13 or 26 seconds on the ZenBook 14.
| SD Card Reader | |
| average JPG Copy Test (av. of 3 runs) | |
| MSI Prestige 14 A10SC-009 (Toshiba Exceria Pro M501 microSDXC 64GB) | |
| Dell XPS 13 9300 Core i7-1065G7 (Toshiba Exceria Pro M501 64 GB UHS-II) | |
| Asus ZenBook Duo UX481FL (Toshiba Exceria Pro M501 microSDXC 64GB) | |
| Asus ZenBook 14 UM431DA-AM020T (Toshiba Exceria Pro SDXC 64 GB UHS-II) | |
| maximum AS SSD Seq Read Test (1GB) | |
| Dell XPS 13 9300 Core i7-1065G7 (Toshiba Exceria Pro M501 64 GB UHS-II) | |
| MSI Prestige 14 A10SC-009 (Toshiba Exceria Pro M501 microSDXC 64GB) | |
| Asus ZenBook Duo UX481FL (Toshiba Exceria Pro M501 microSDXC 64GB) | |
| Asus ZenBook 14 UM431DA-AM020T (Toshiba Exceria Pro SDXC 64 GB UHS-II) | |
Communication
We experienced no connectivity or stability issues when paired with our Netgear RAX200 router.
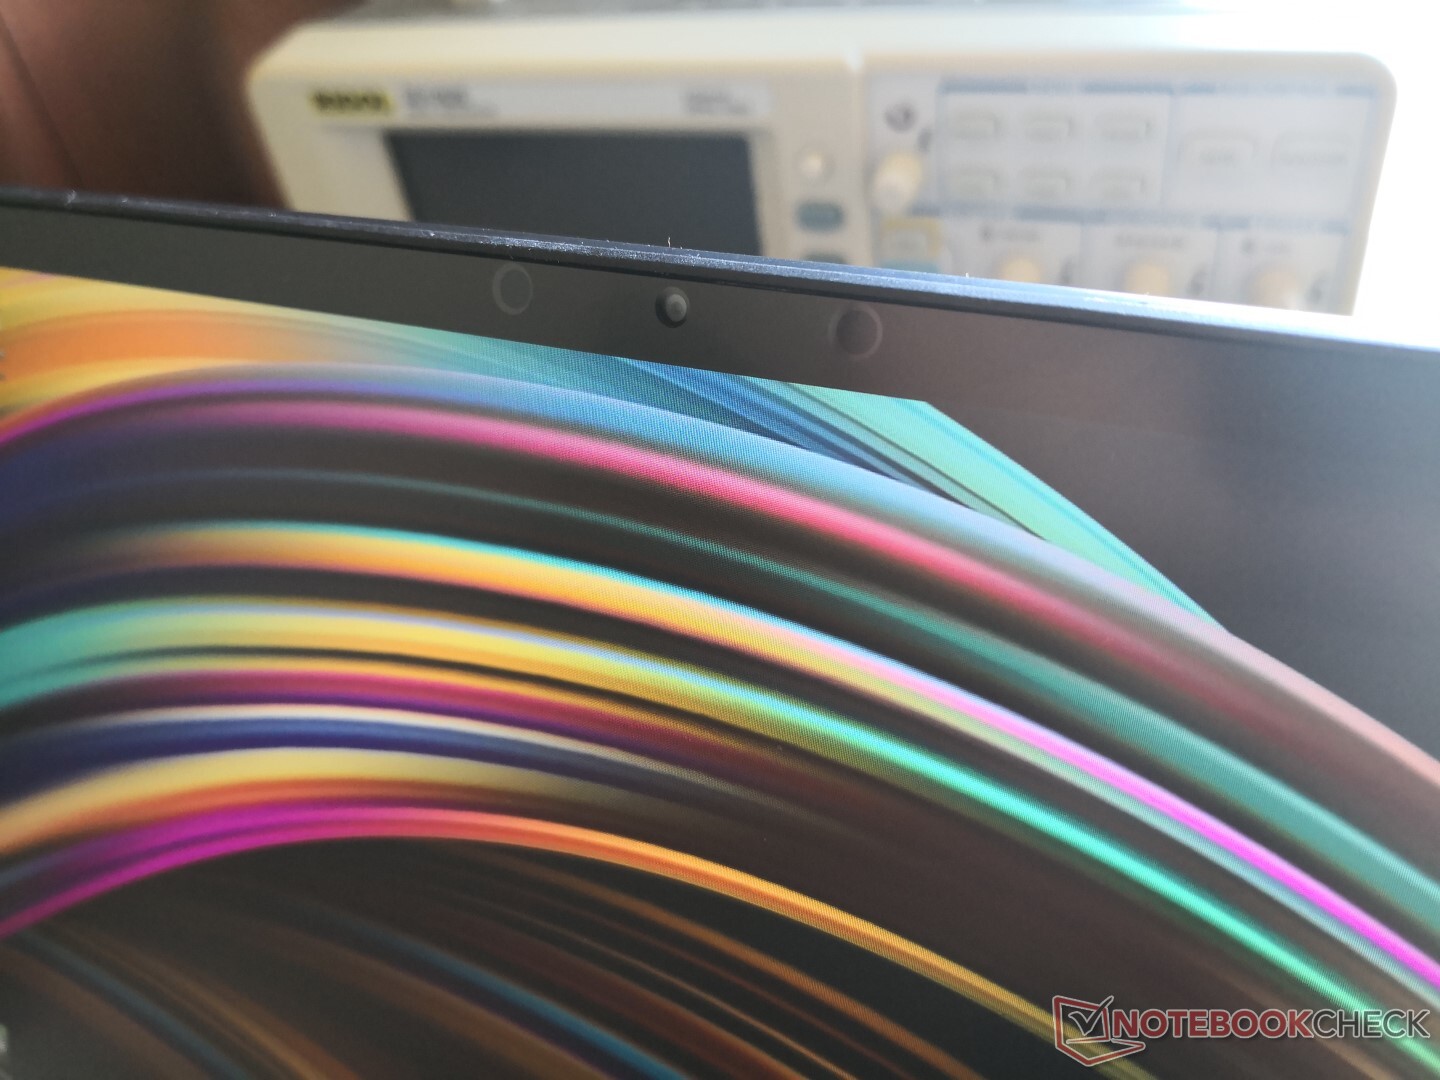
Webcam


Maintenance
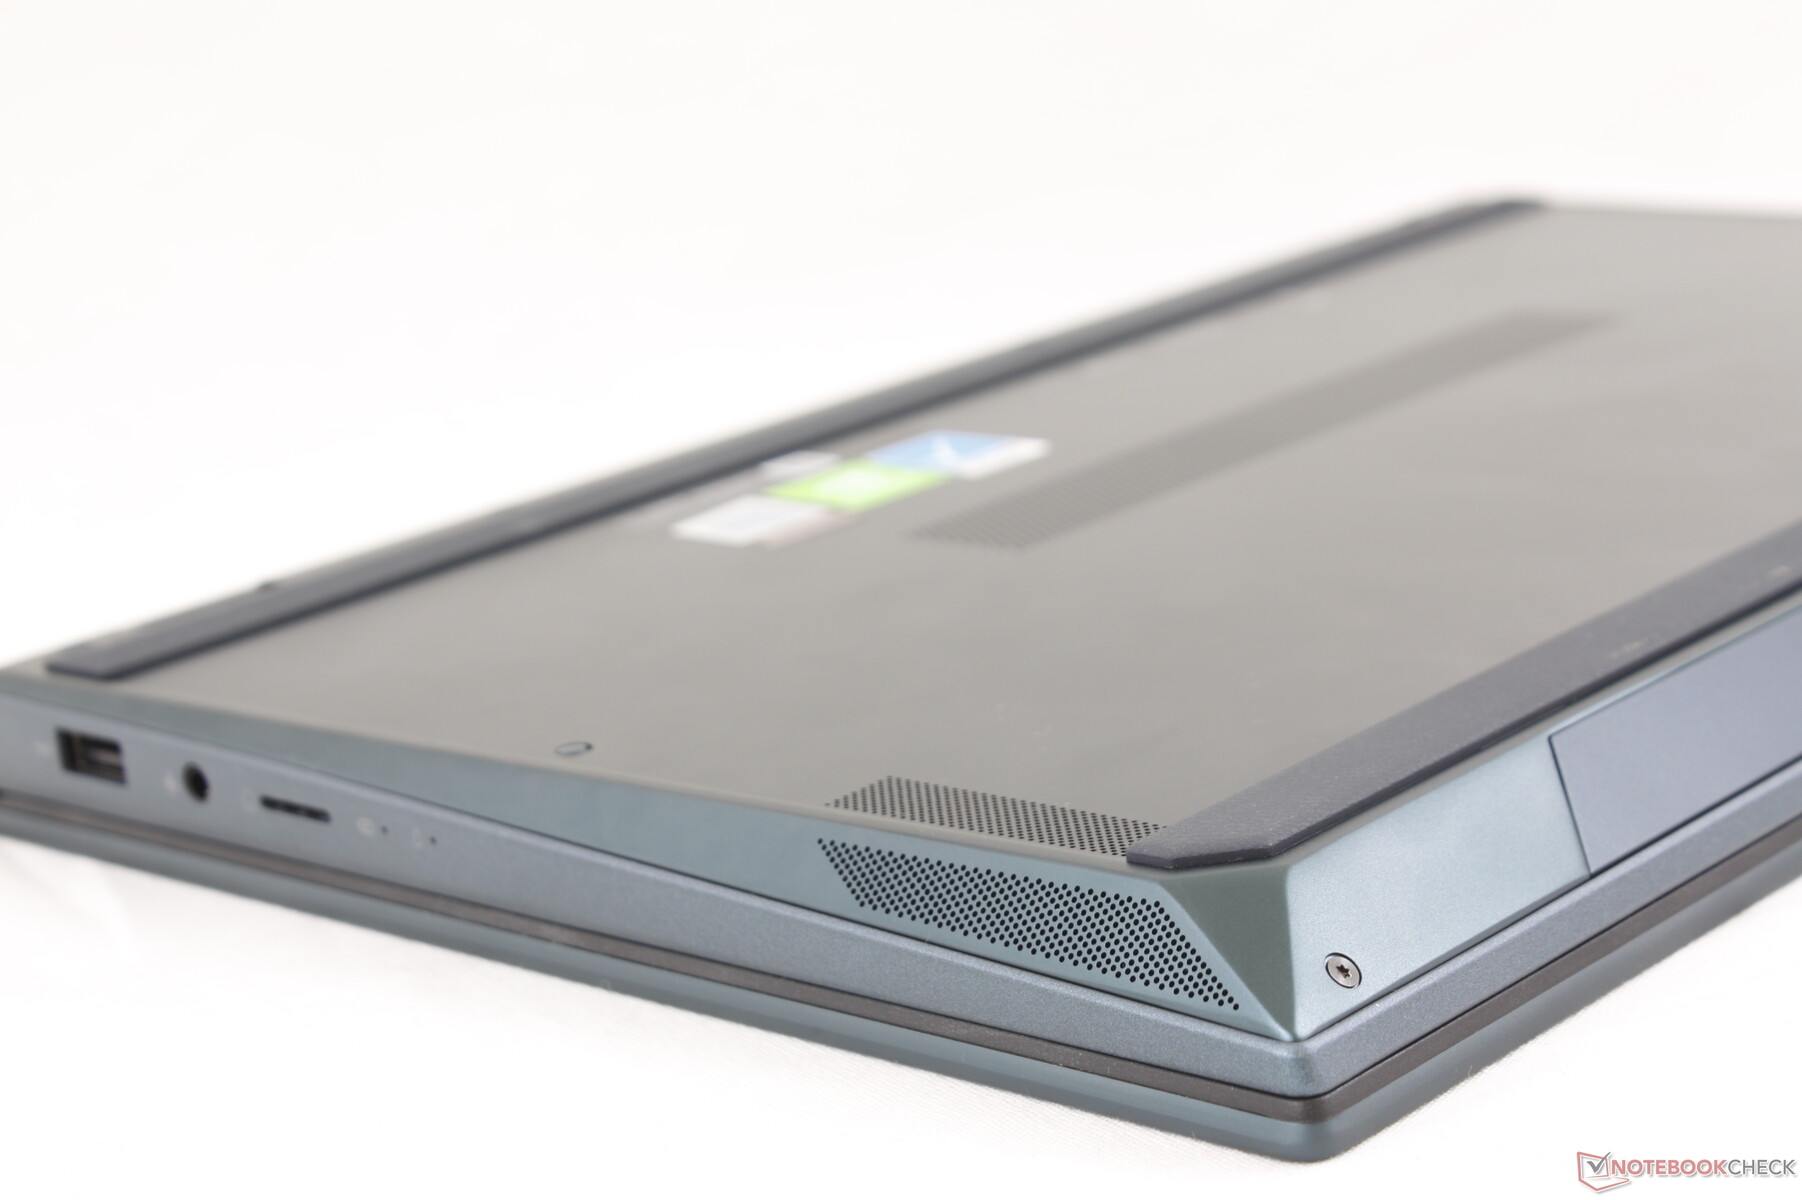
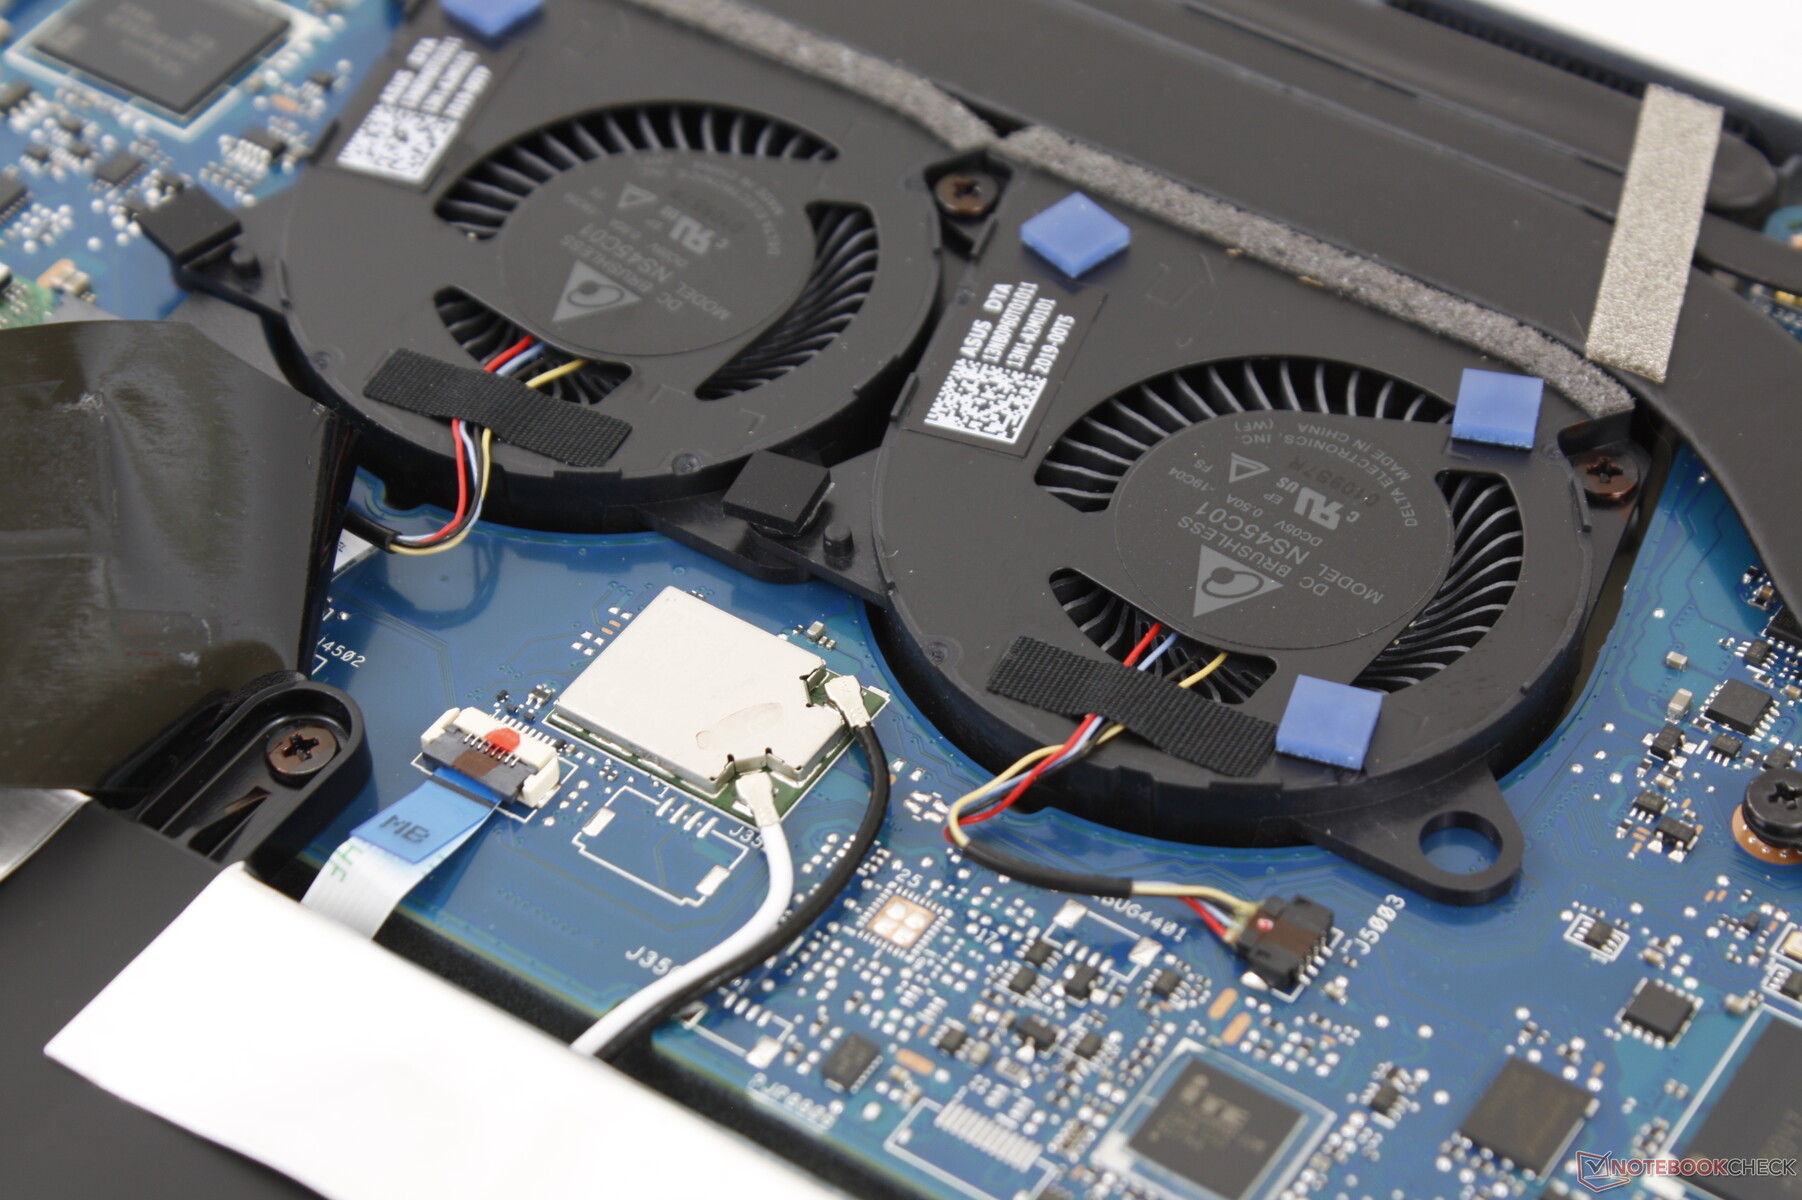
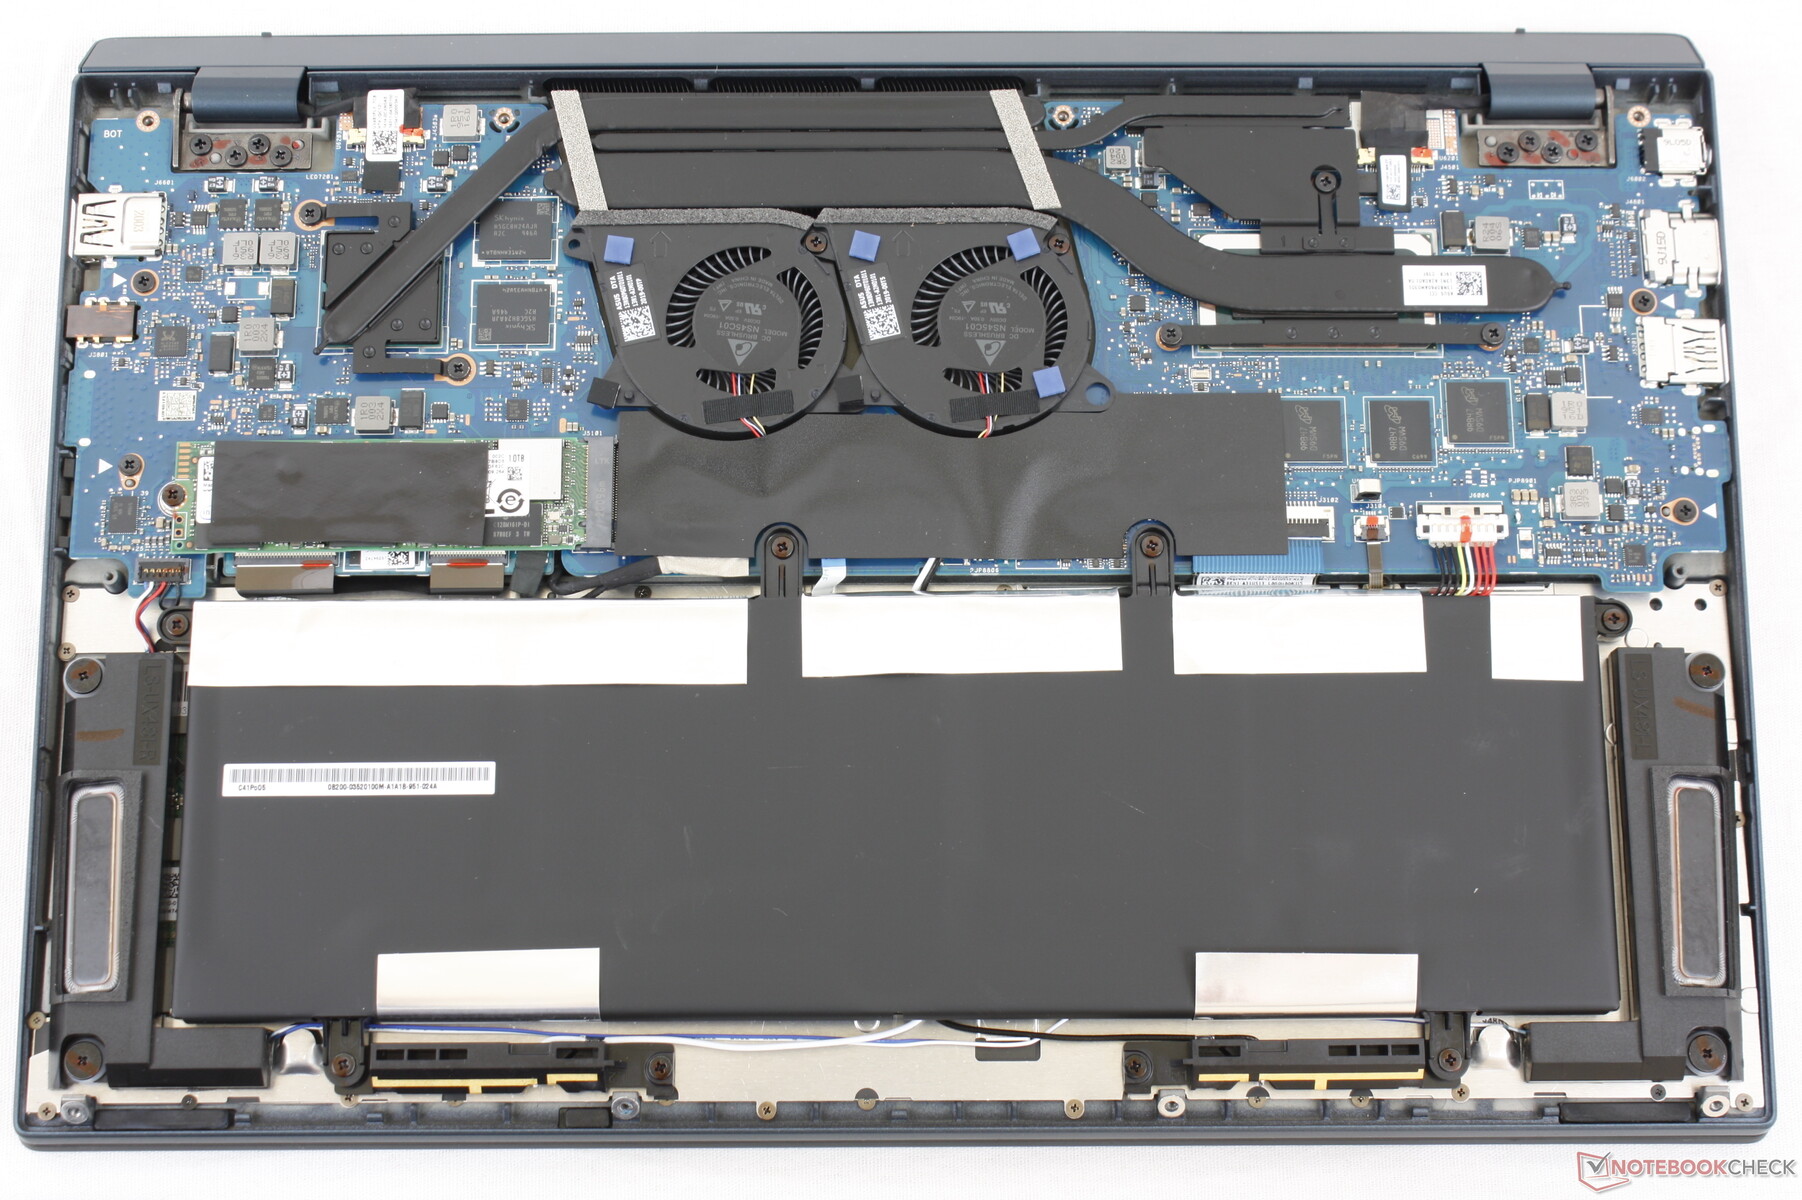
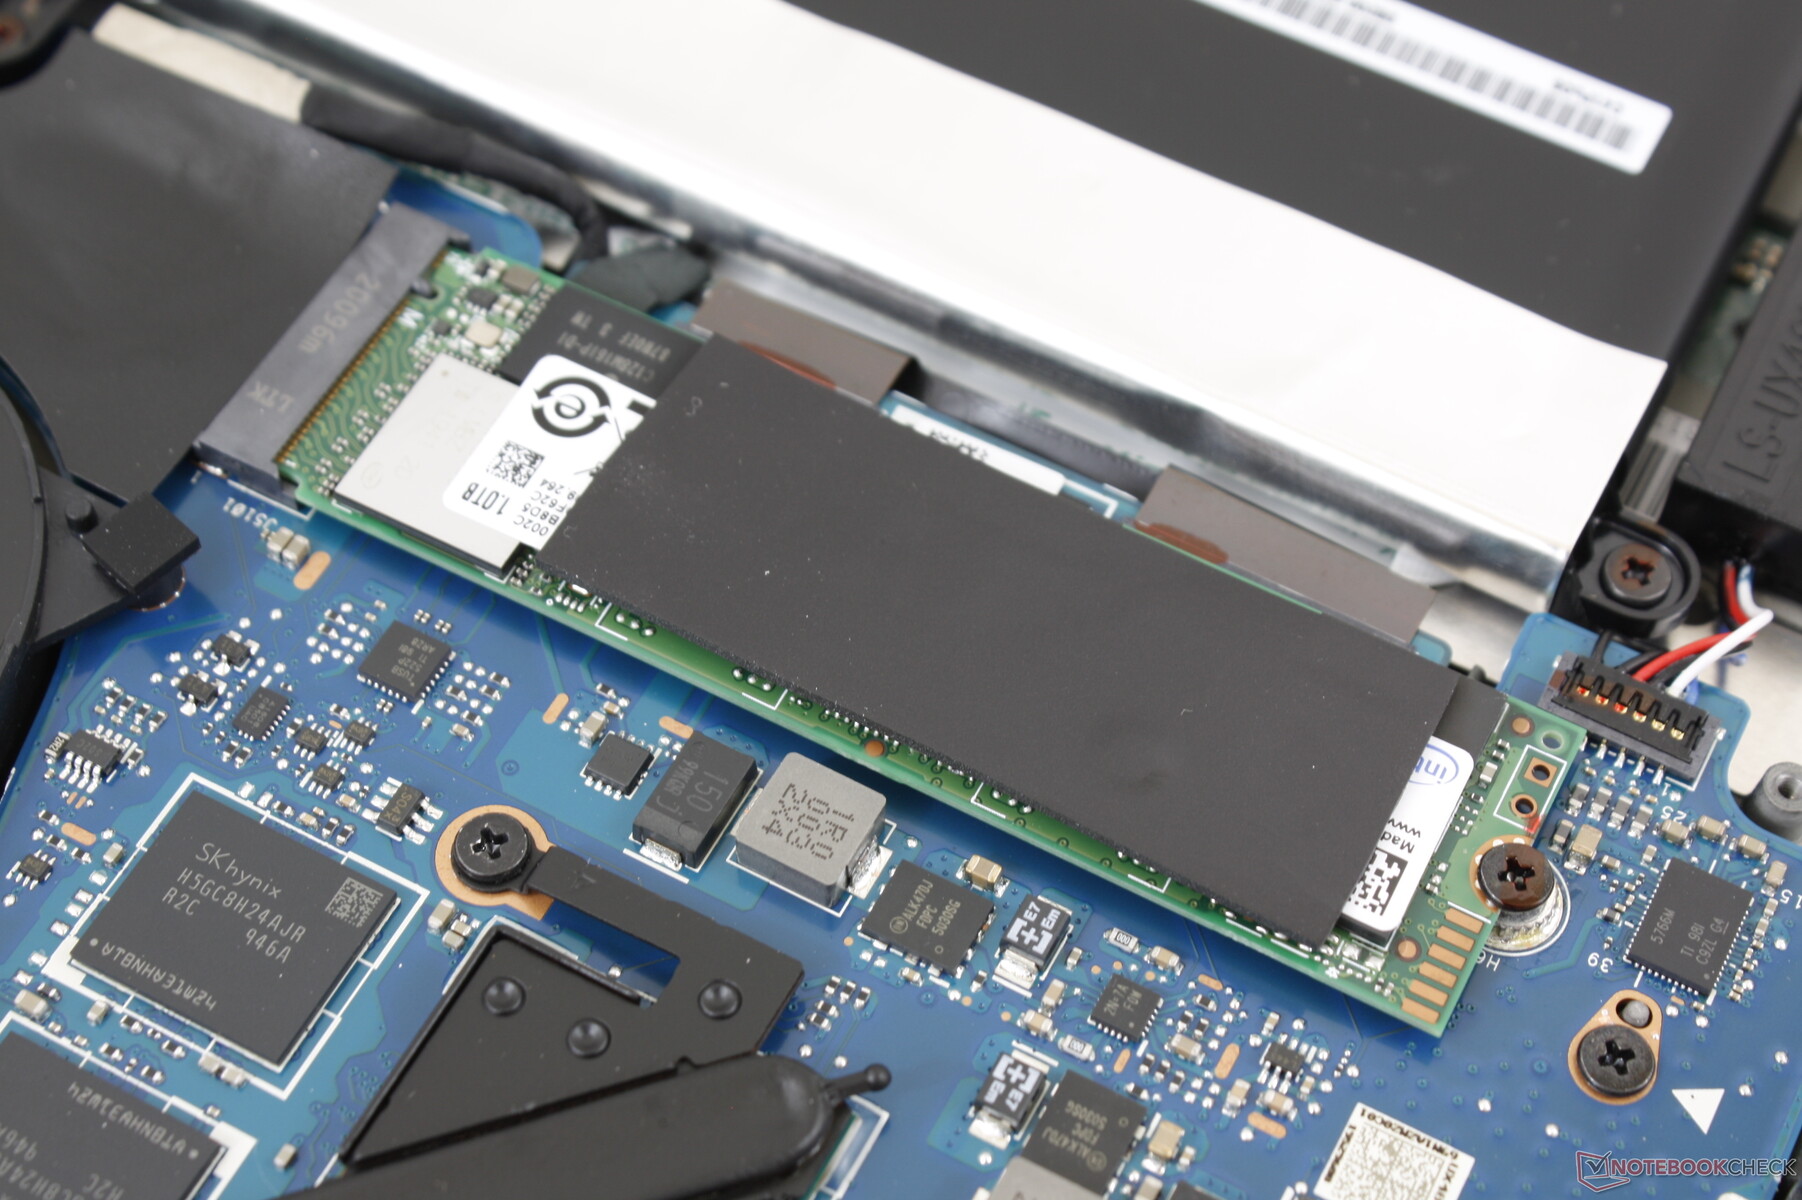
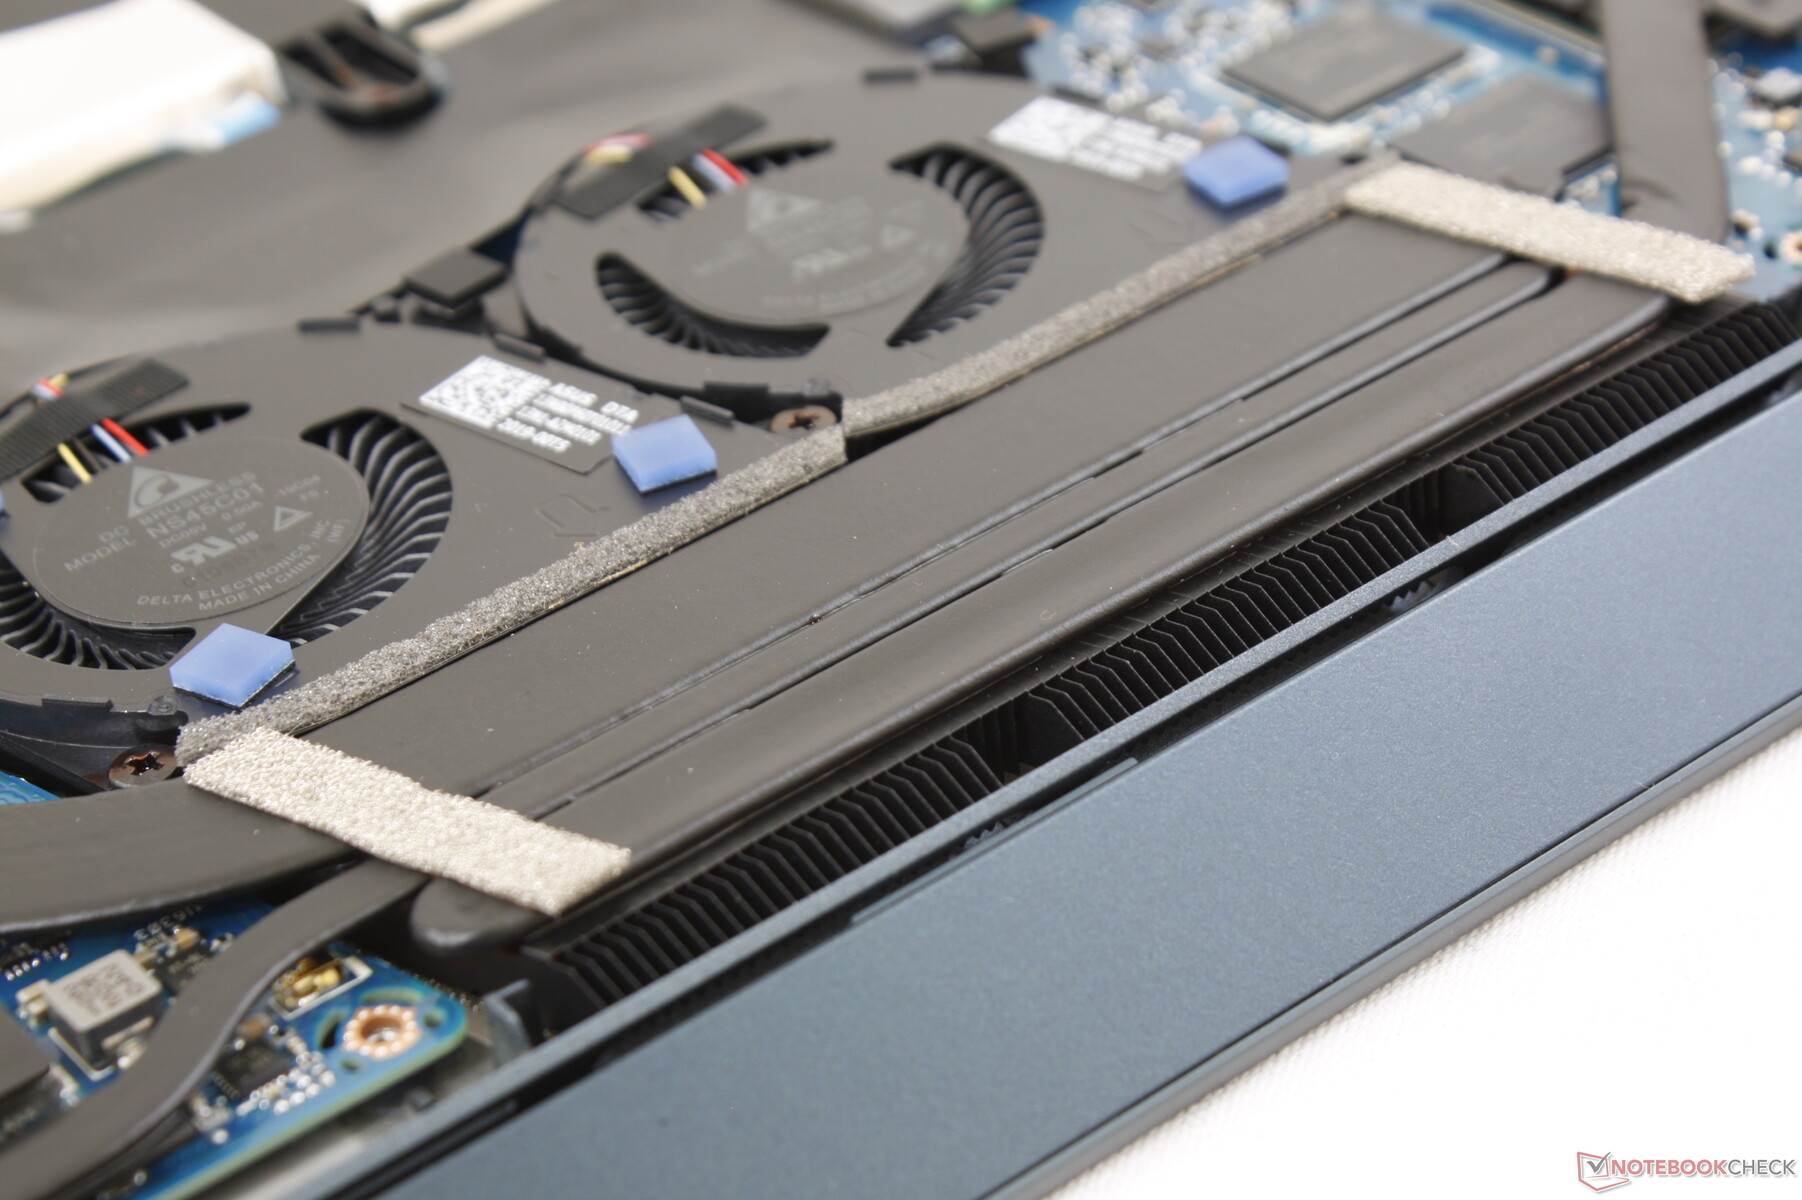
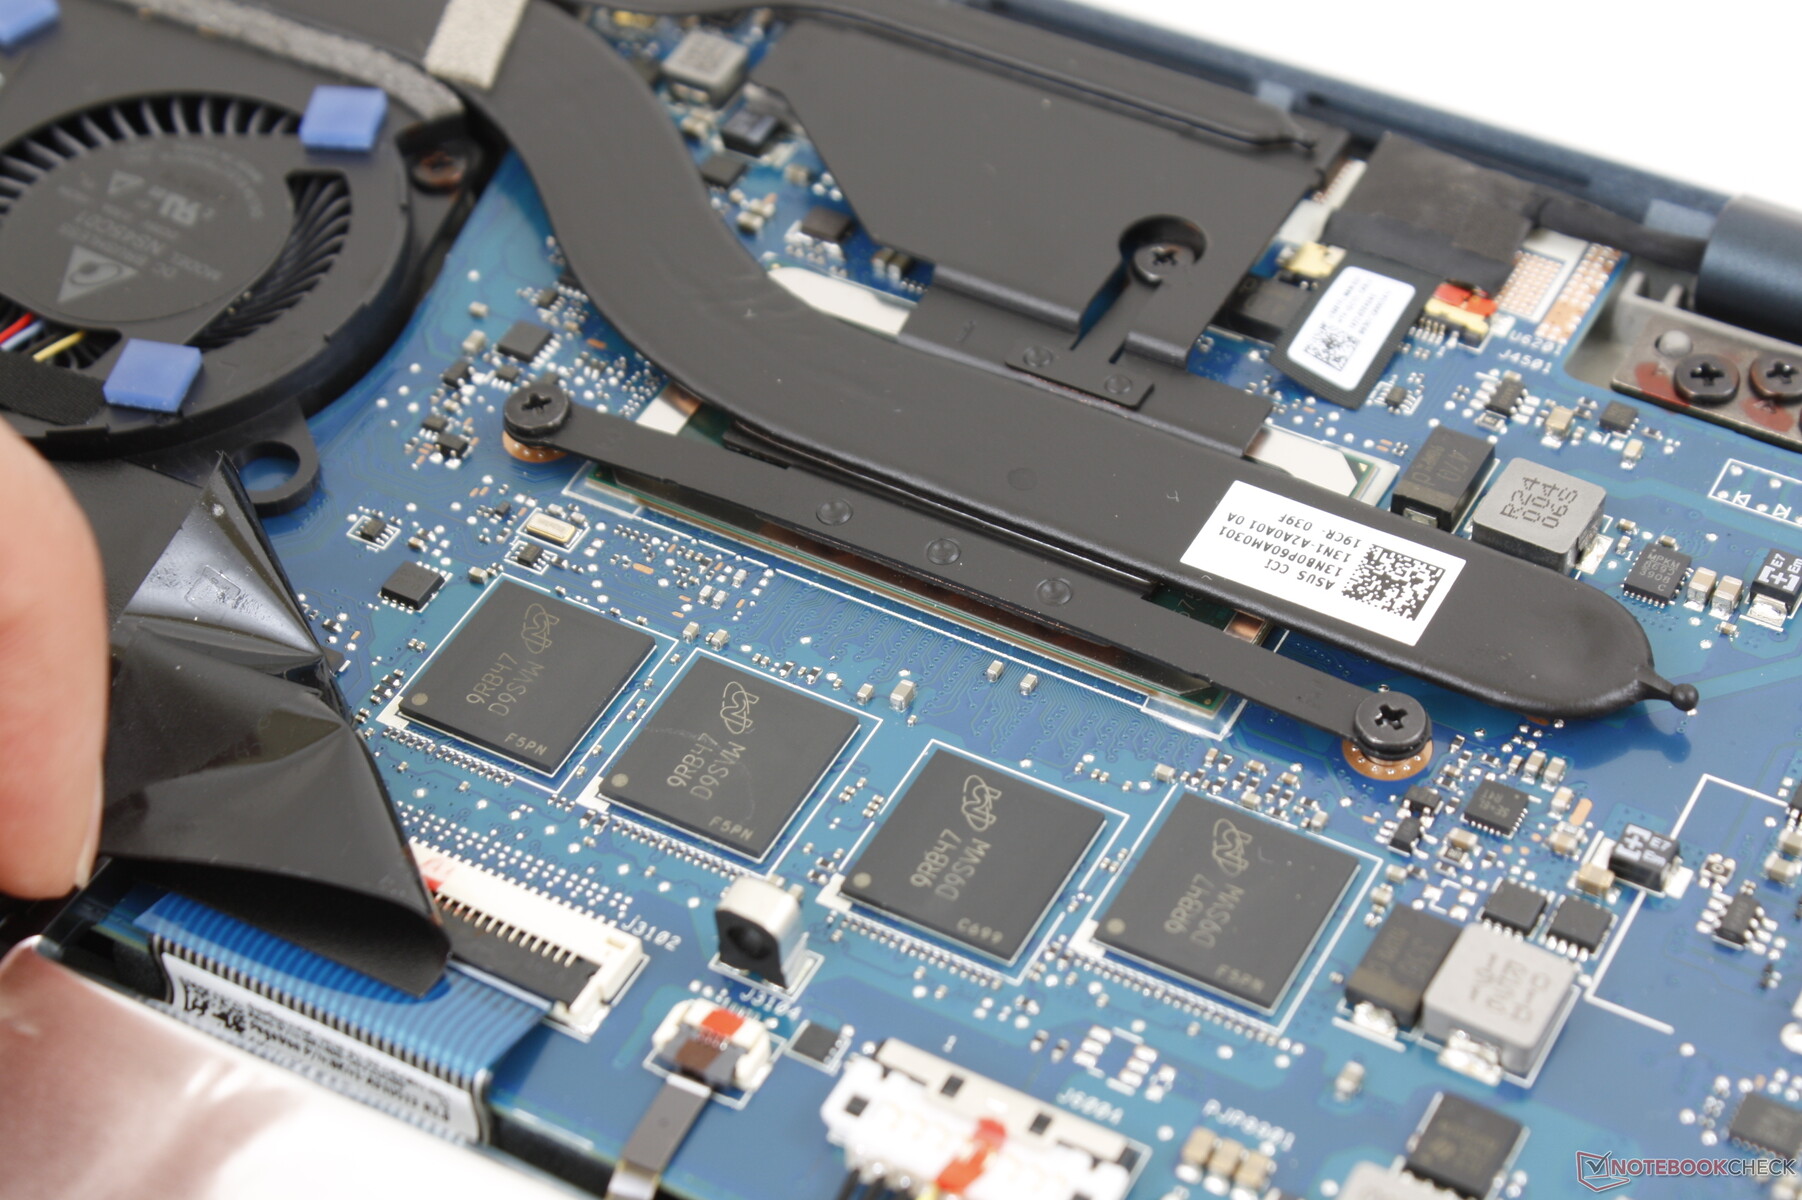
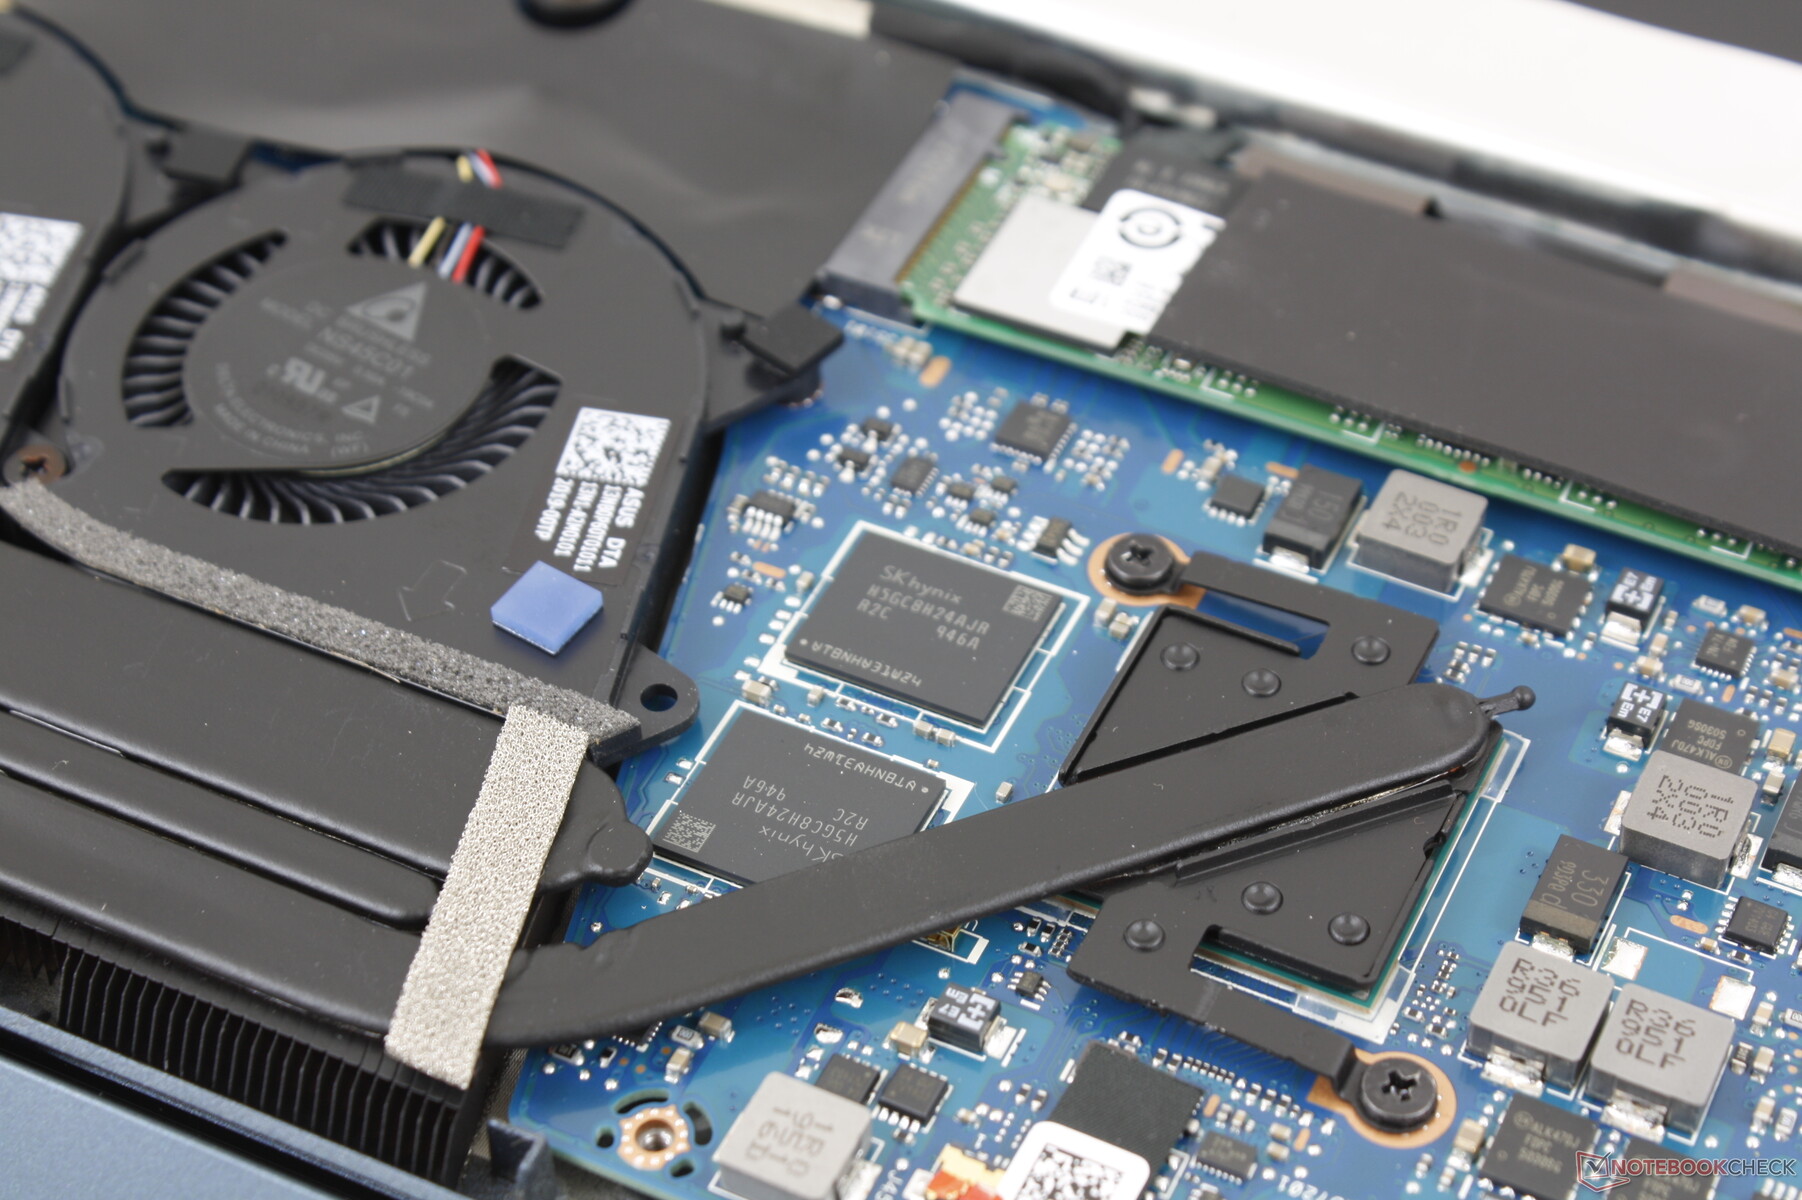
The bottom panel is secured by ten T5 Torx screws. Most of these screws are behind rubber inserts that are difficult to remove without a pair of very small tweezers. Once inside, users can only upgrade the single M.2 storage drive.
Accessories and Warranty
Asus includes an active stylus pen and a carrying sleeve in each retail box. The standard one-year limited warranty applies.
Input Devices
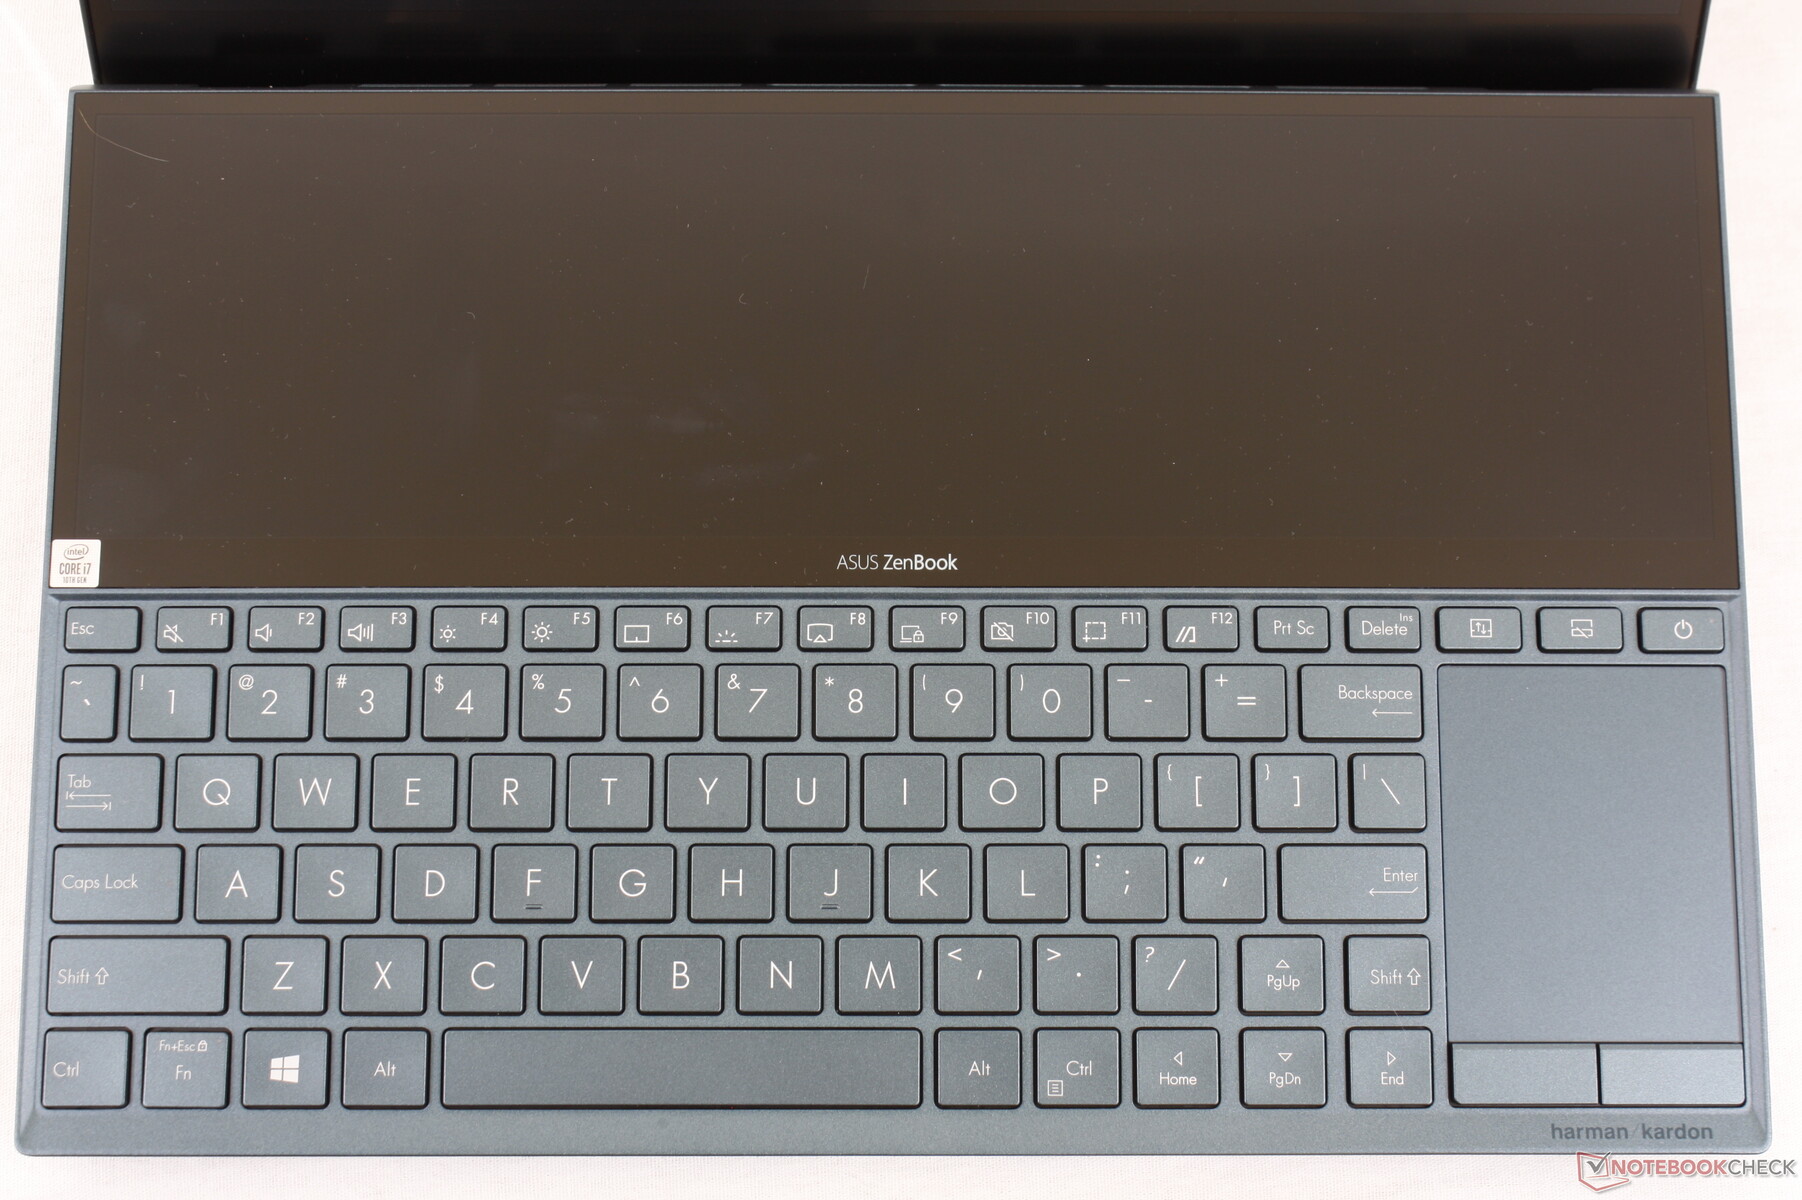
Keyboard
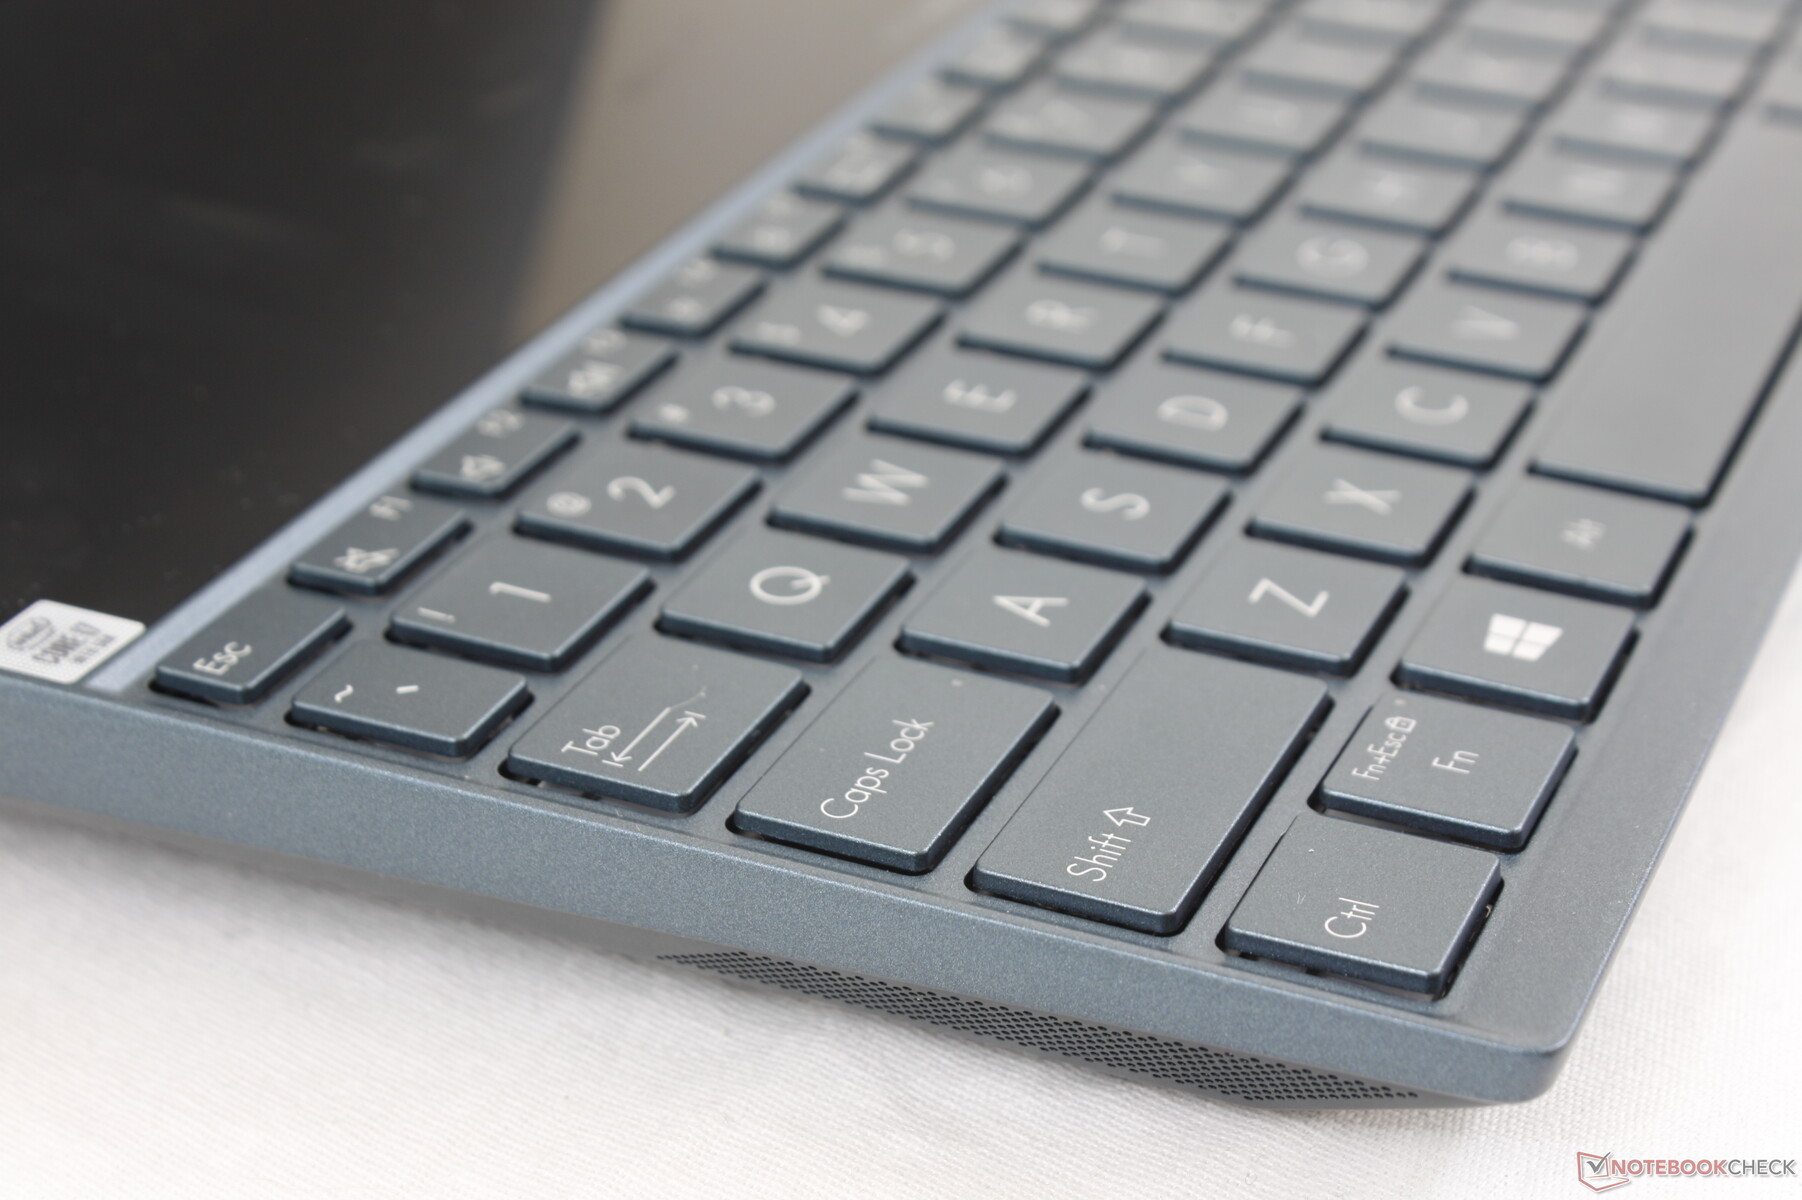
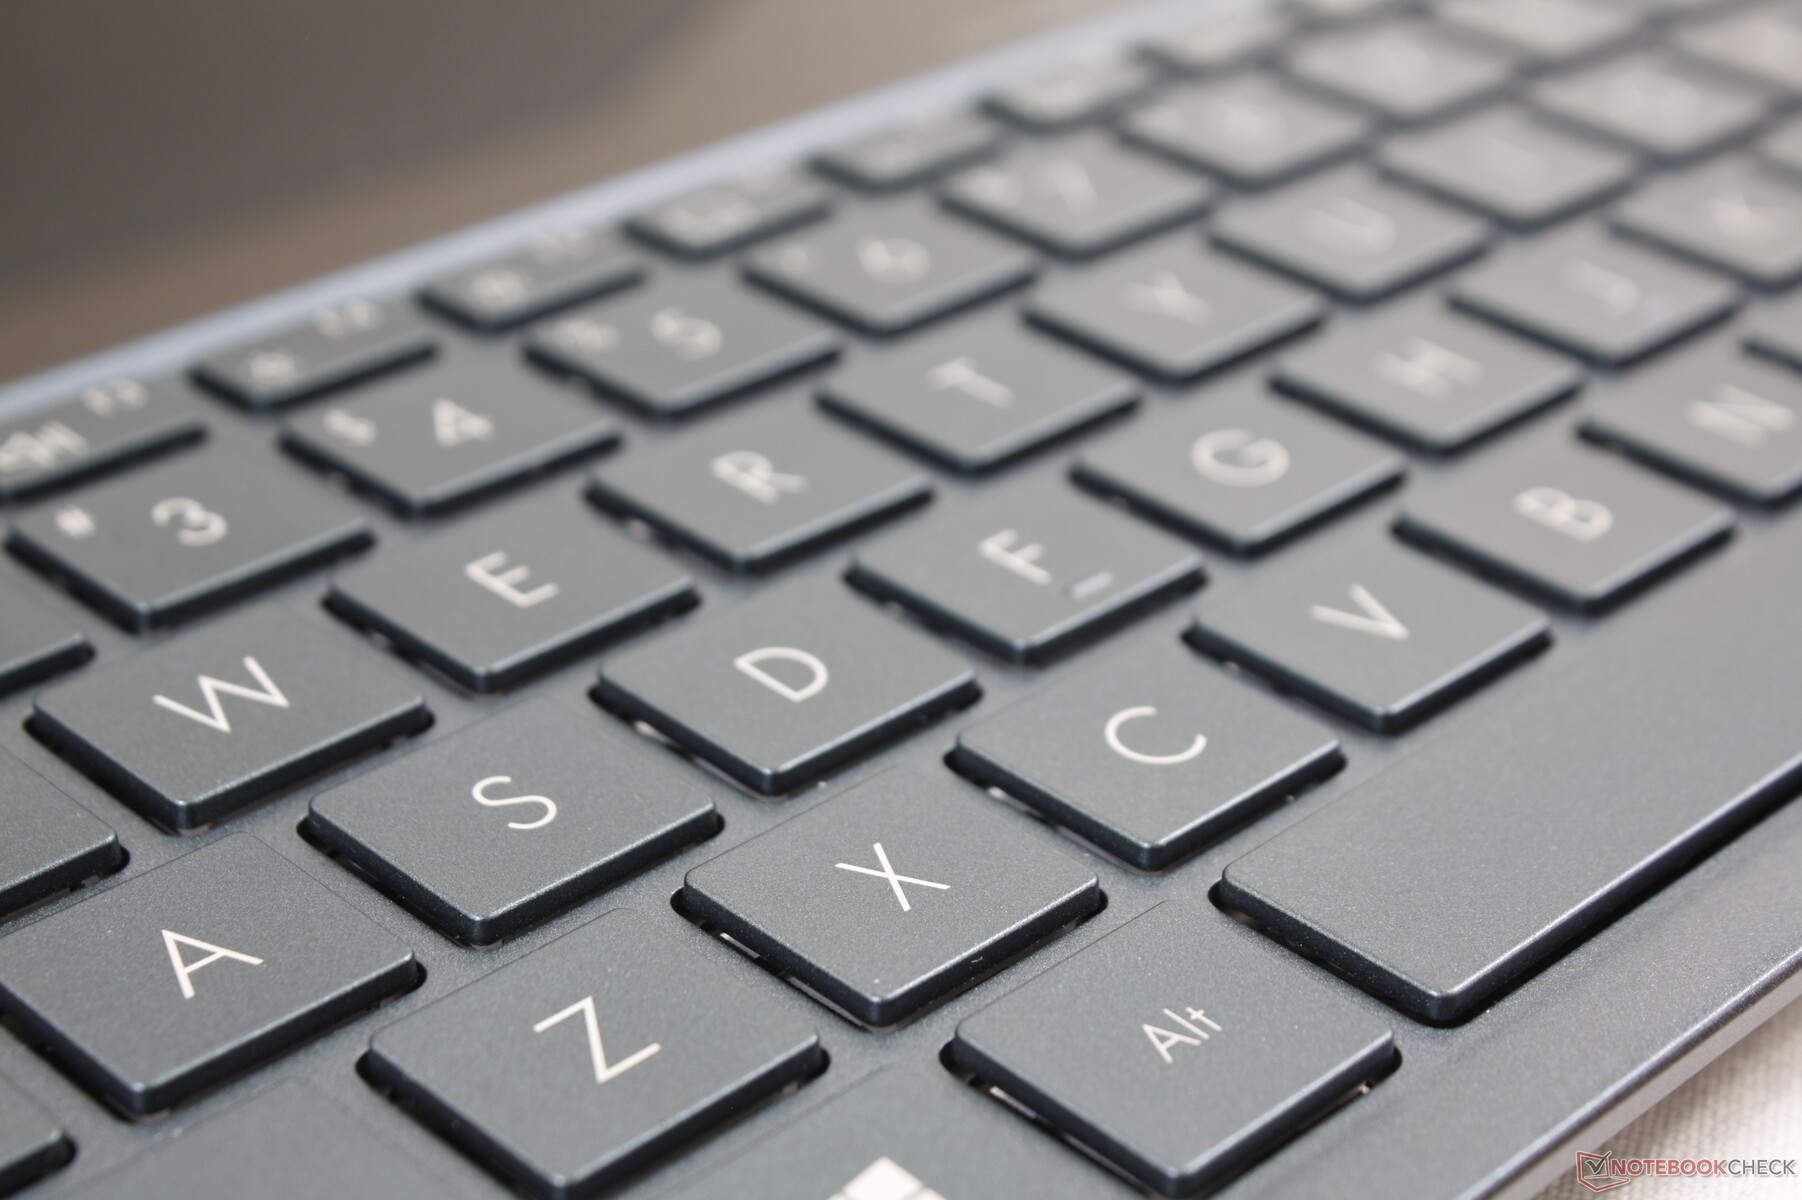
The backlit keys offer 1.4 mm of travel with crisp feedback and quiet clatter when pressed. We find the keyboard to be an improvement over the spongier keys of the older Zephyrus GX501. The upfront positioning of the keyboard, however, means users will have to sit further away from the laptop for a more comfortable typing experience and provide their own palm rests as well. It takes some getting used and it could be tricky if working in tight spaces like airplanes or even in trains with no tables at all.
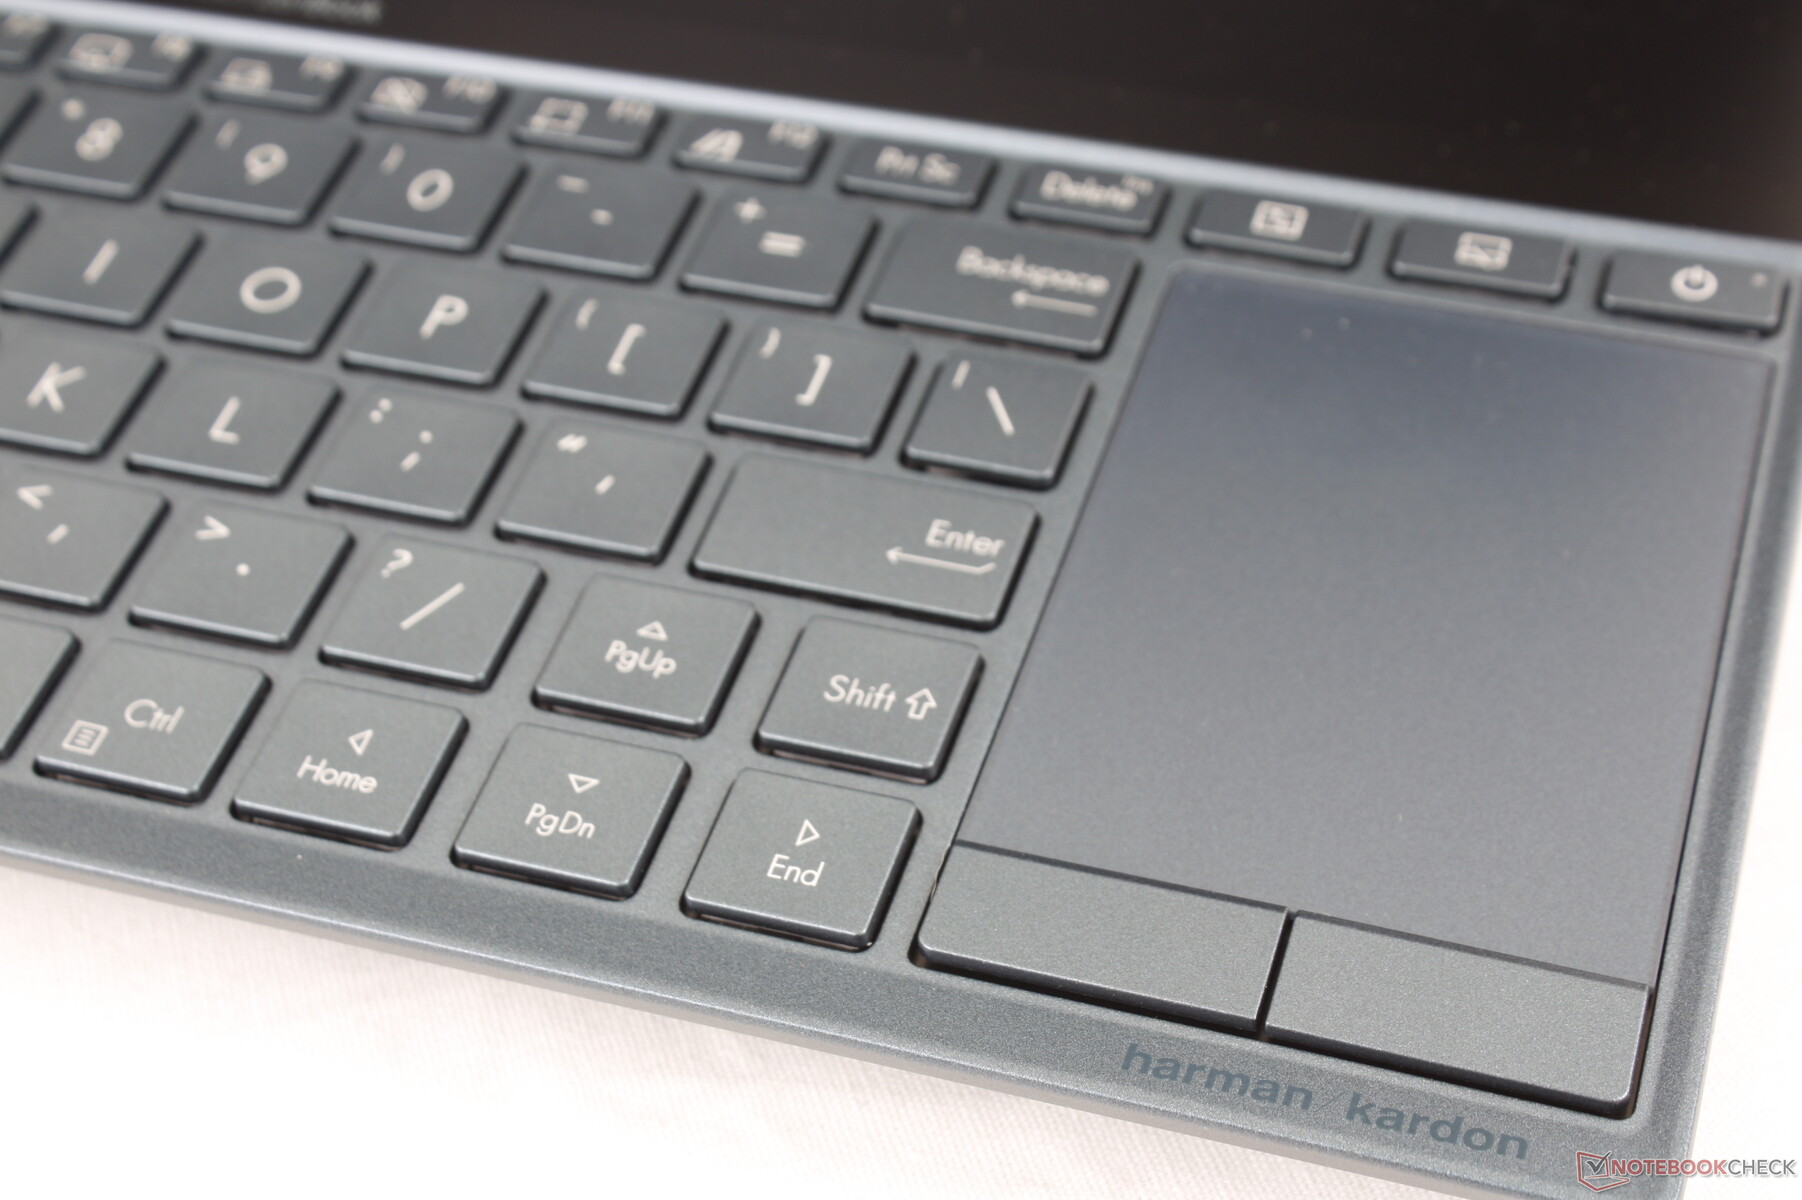
Touchpad
Understandably, the touchpad got the short end of the stick since much of the surface area has been reserved for the keyboard and ScreenPad. At just 5.5 x 7 cm, it's way too cramped for any kind of serious workload. The smooth surface and dedicated mouse keys make accurate clicks a little bit easier, but you're going to want to use the touchscreen, included pen, or an external mouse whenever possible.
Display
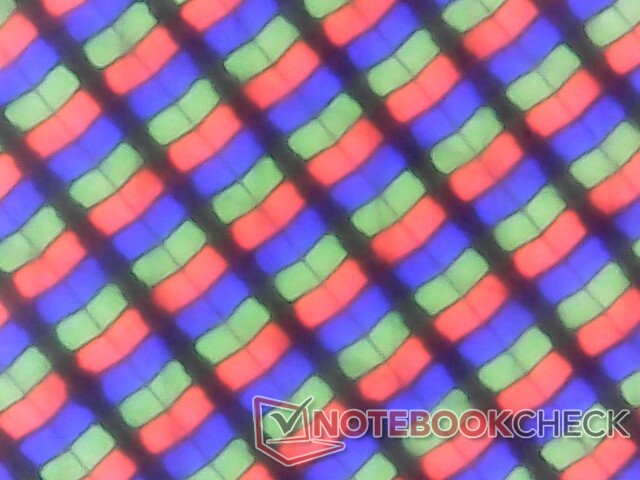
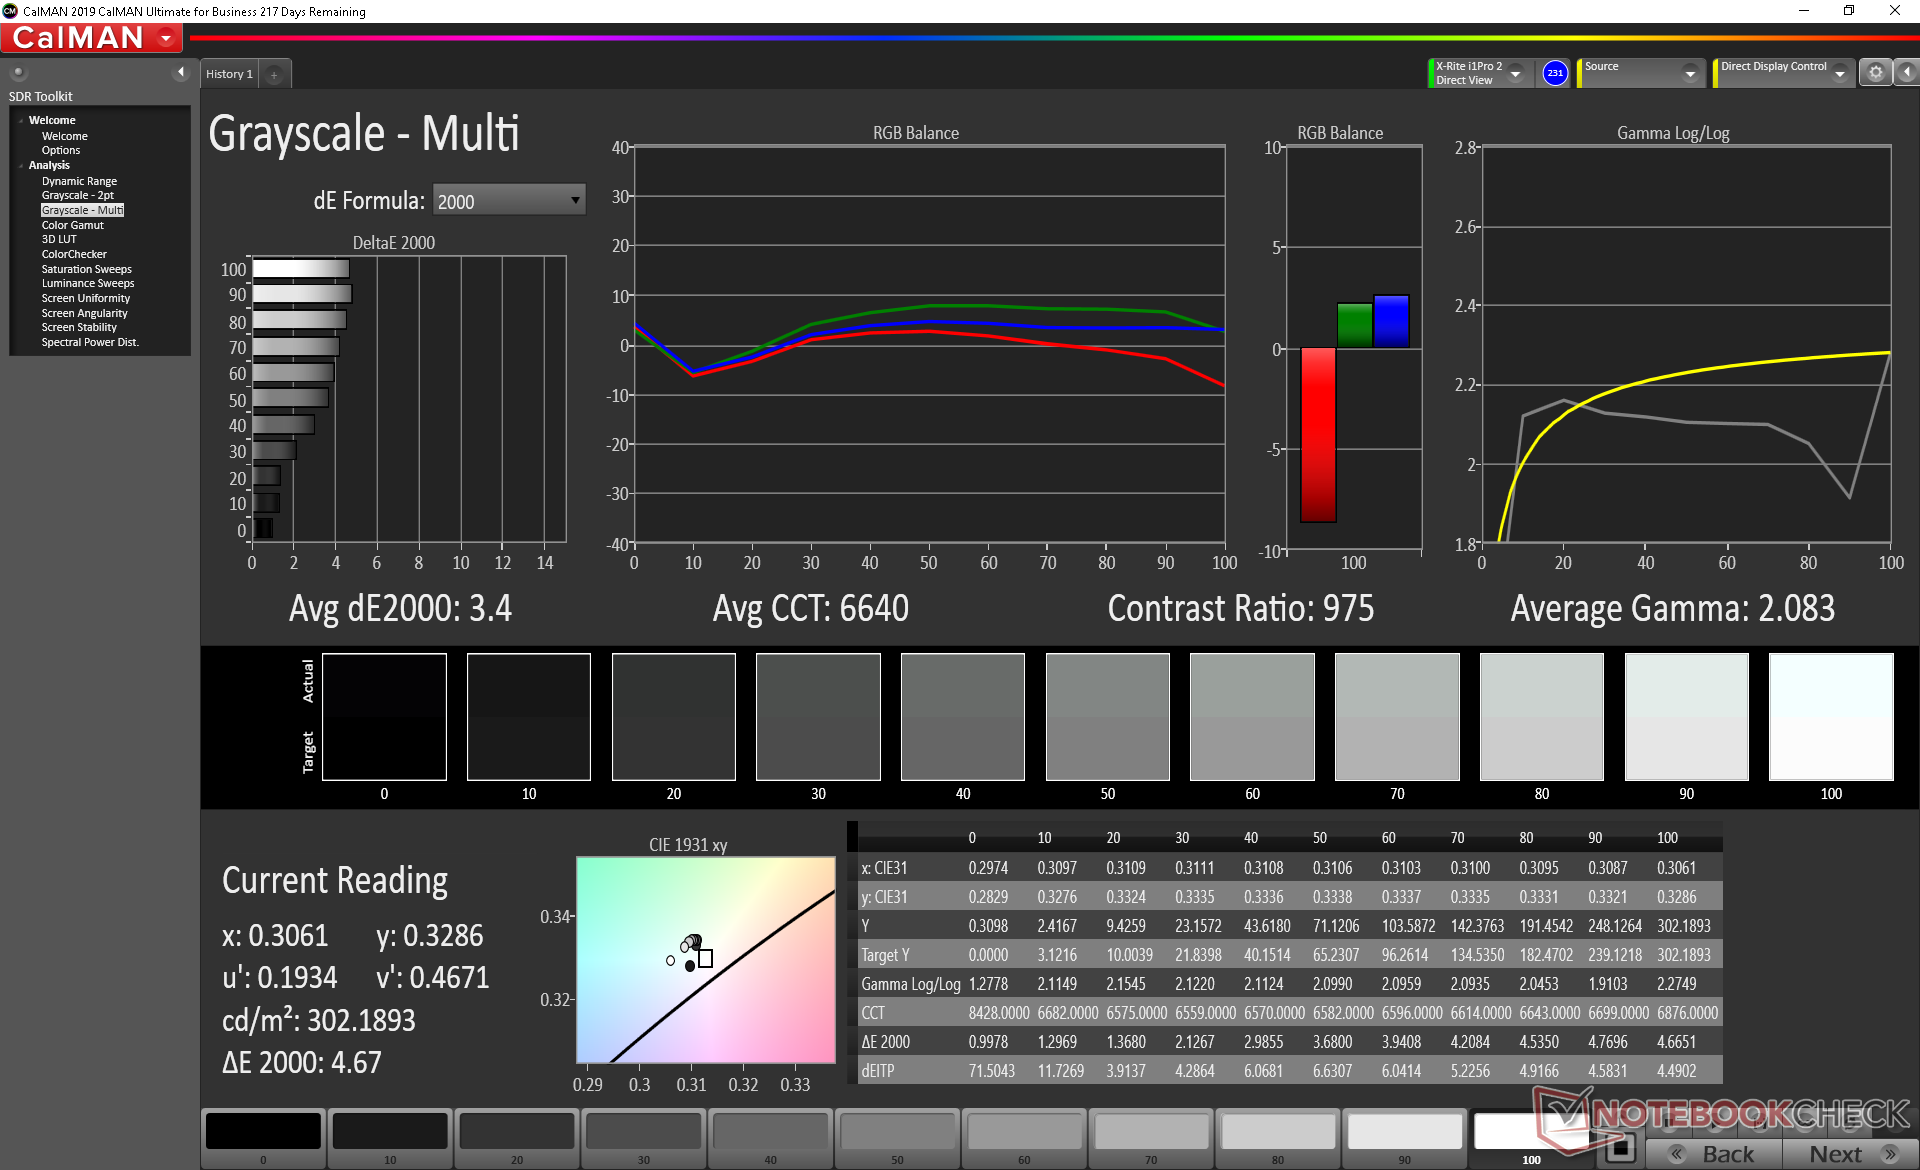
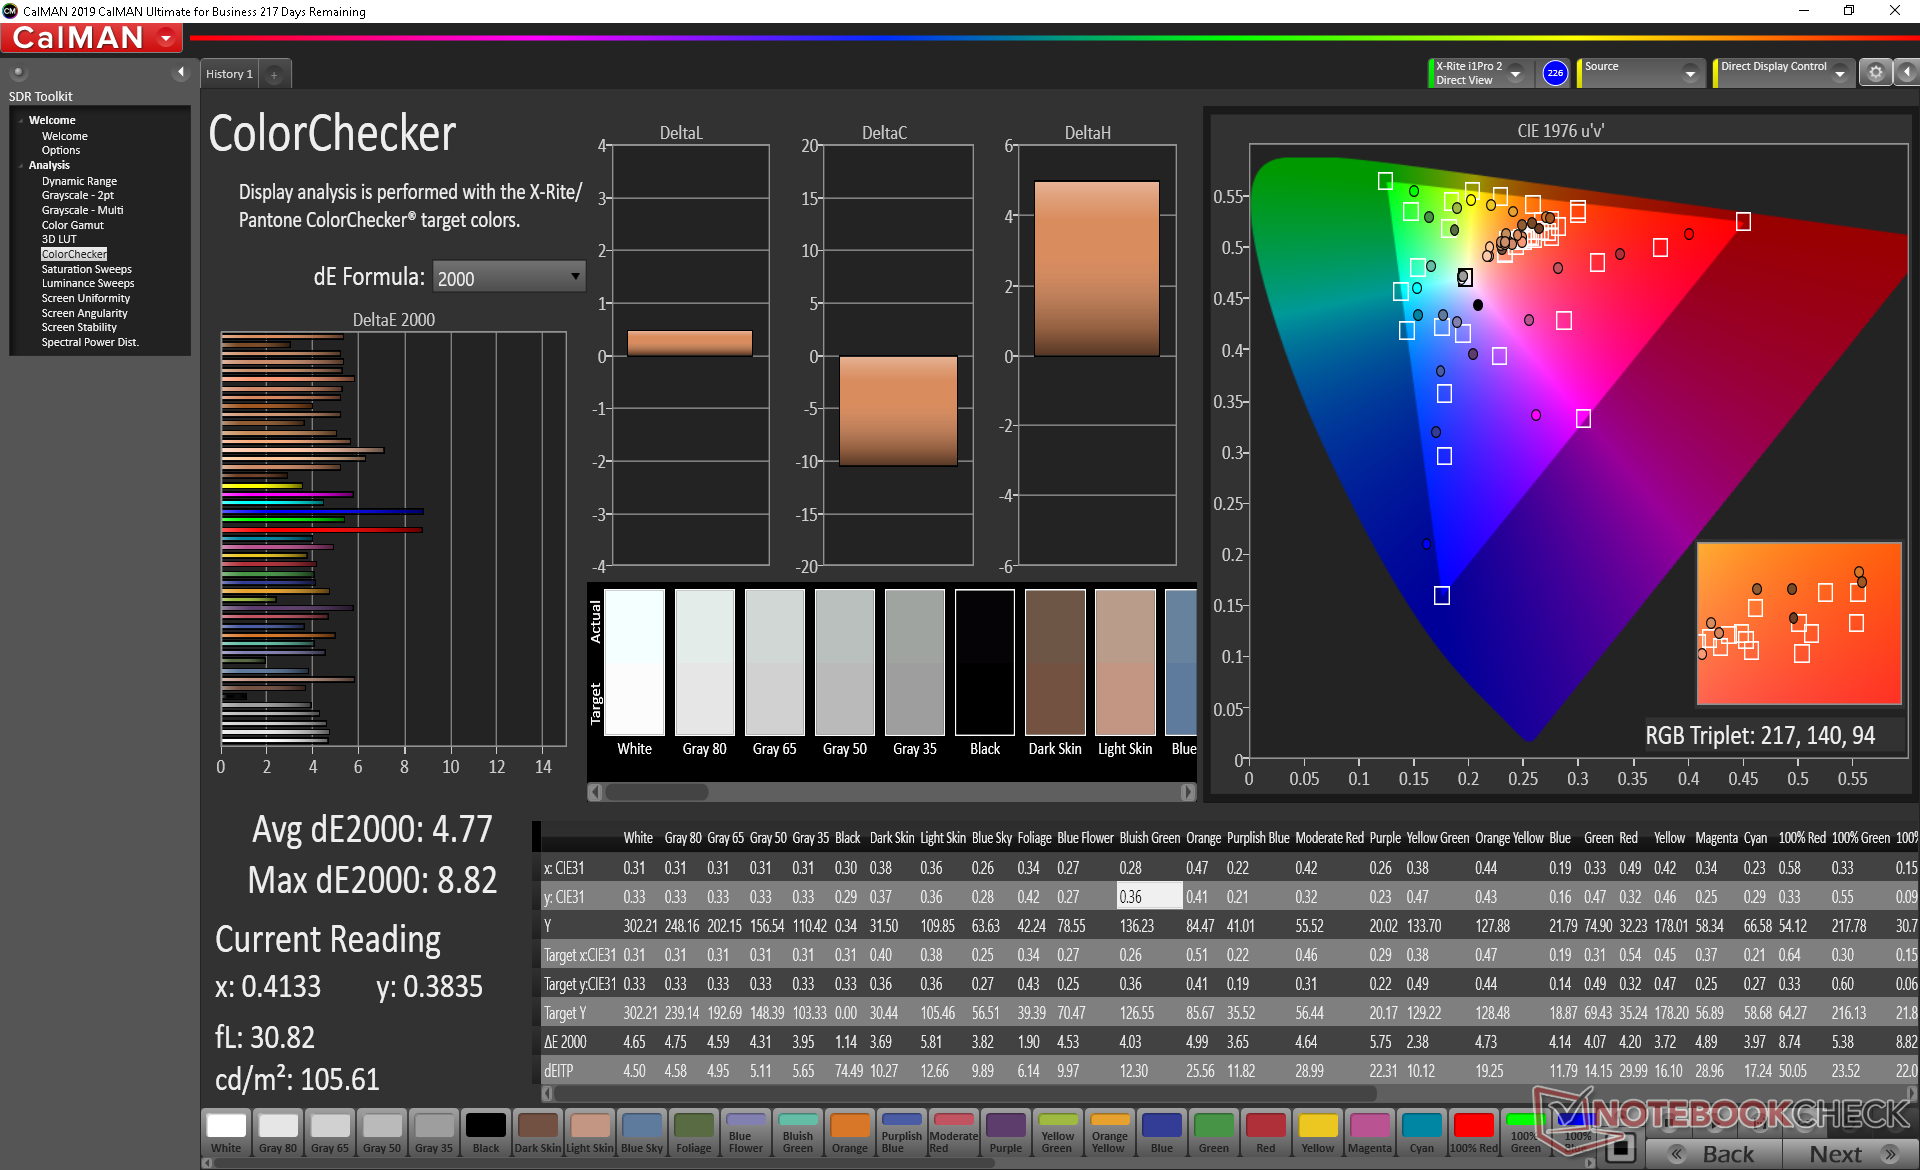
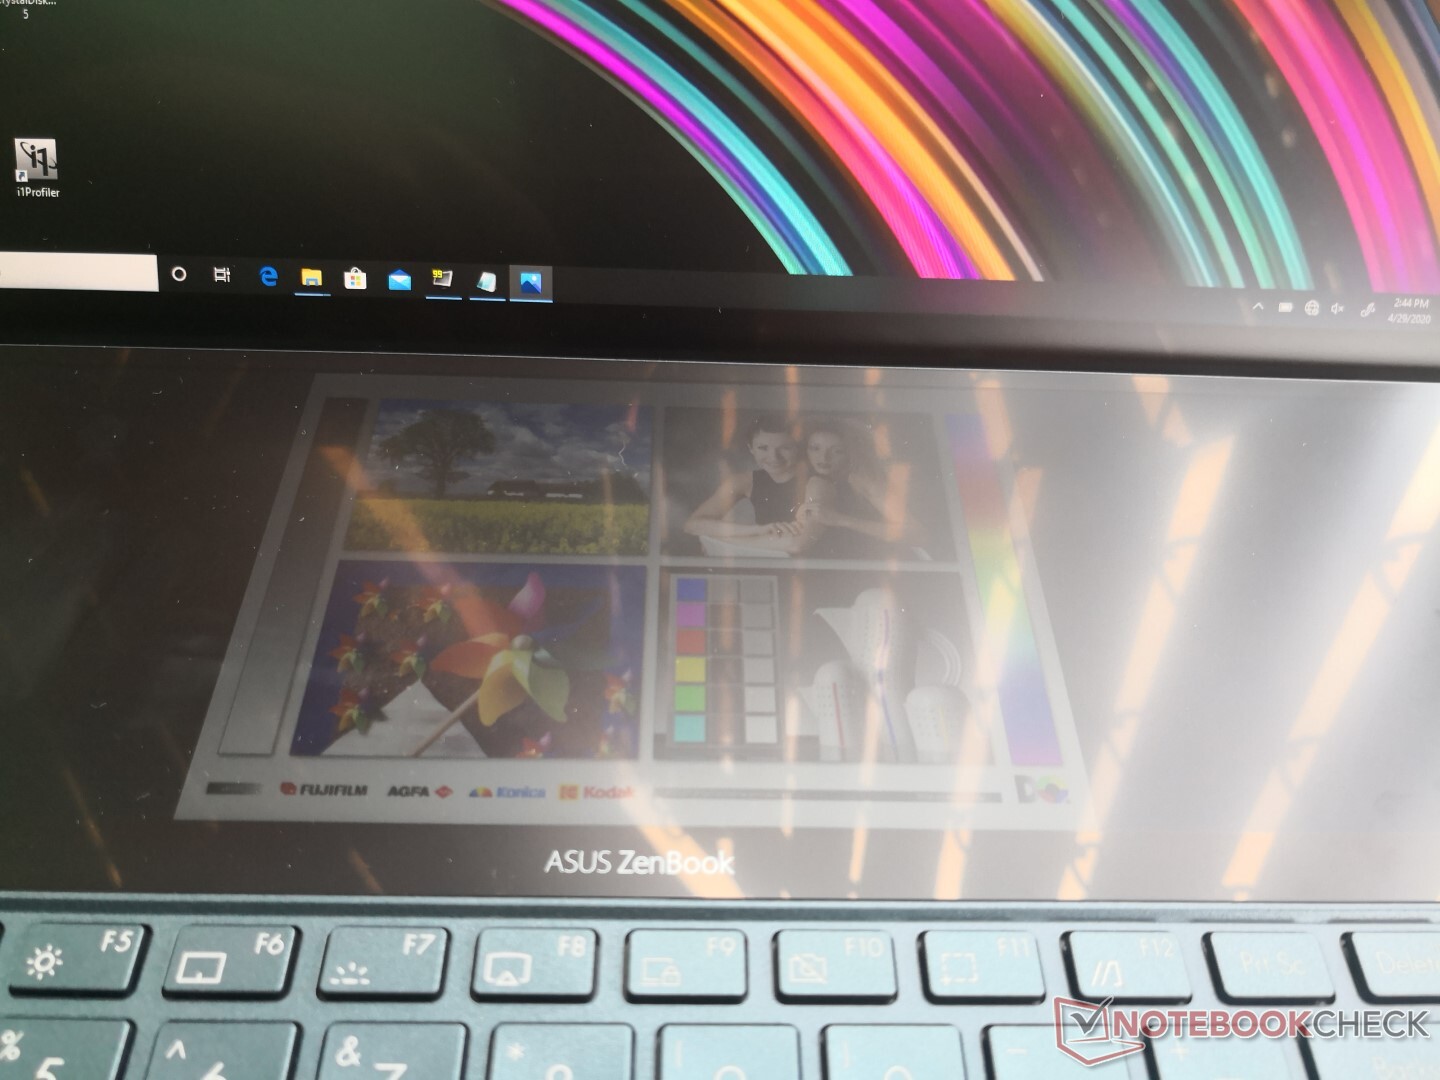
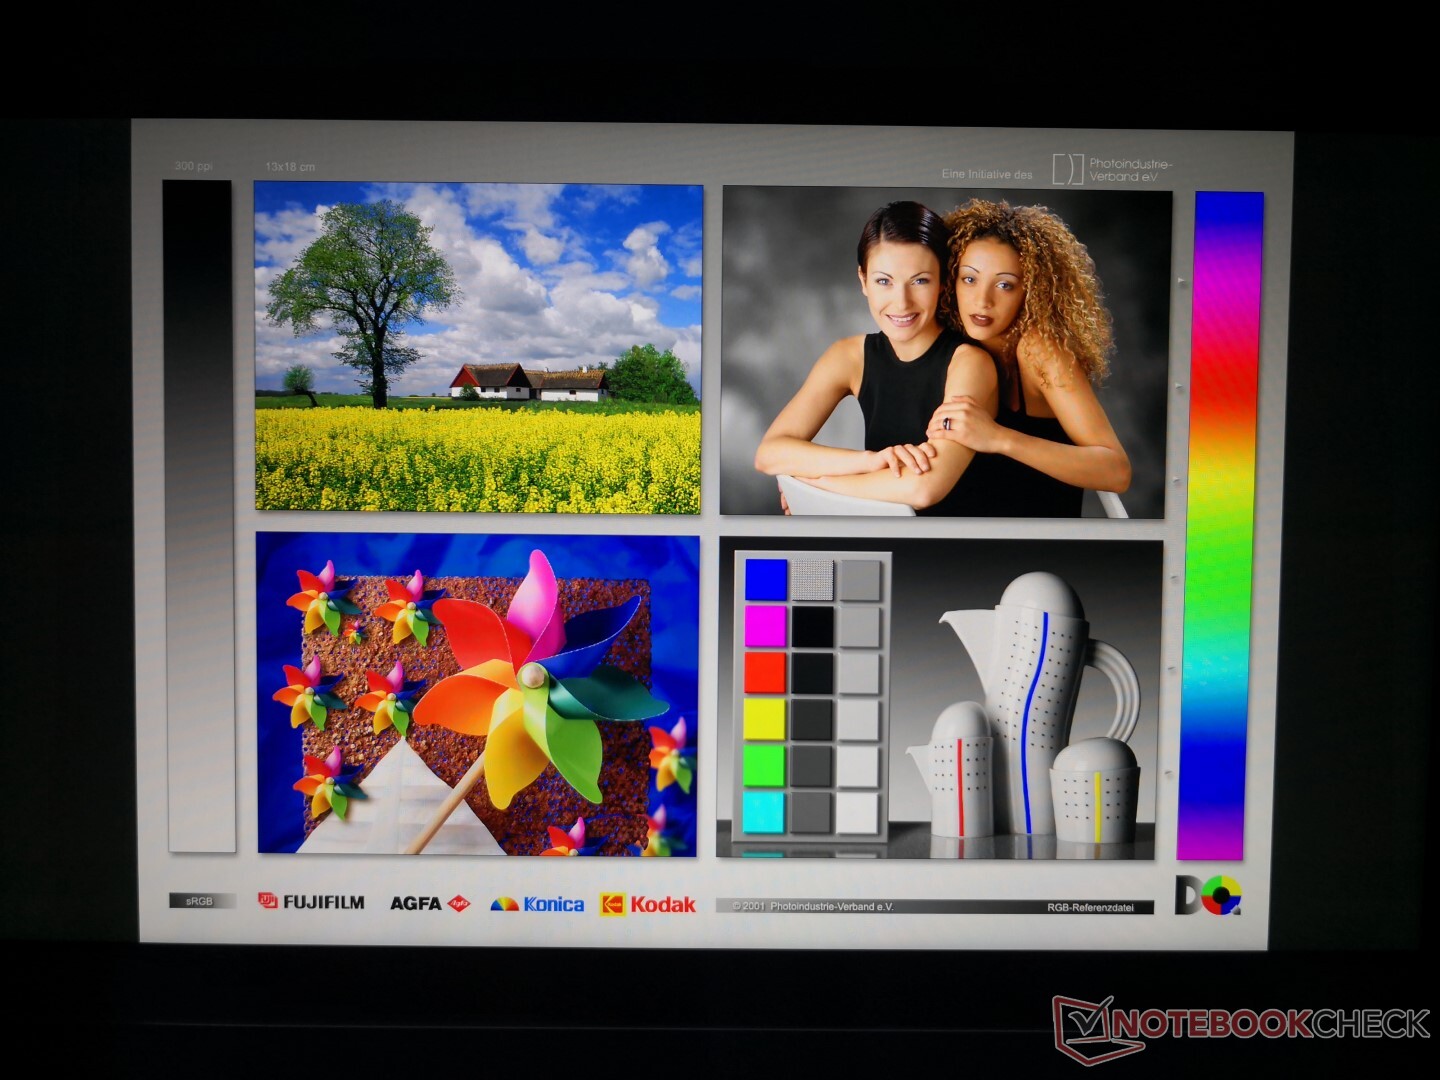
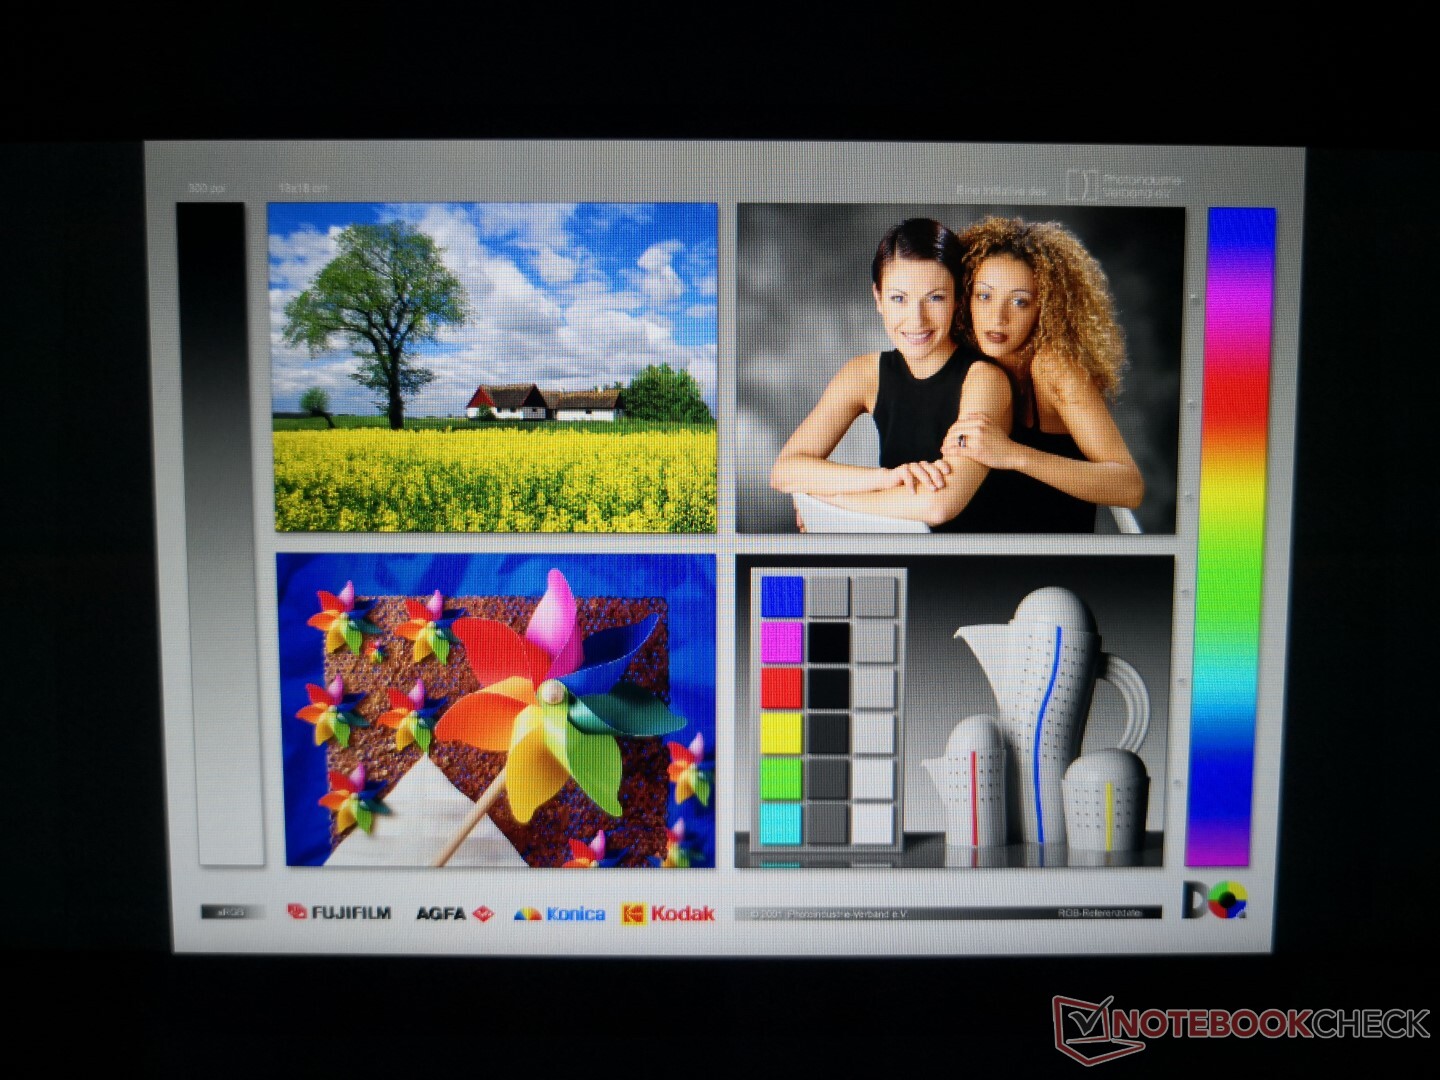
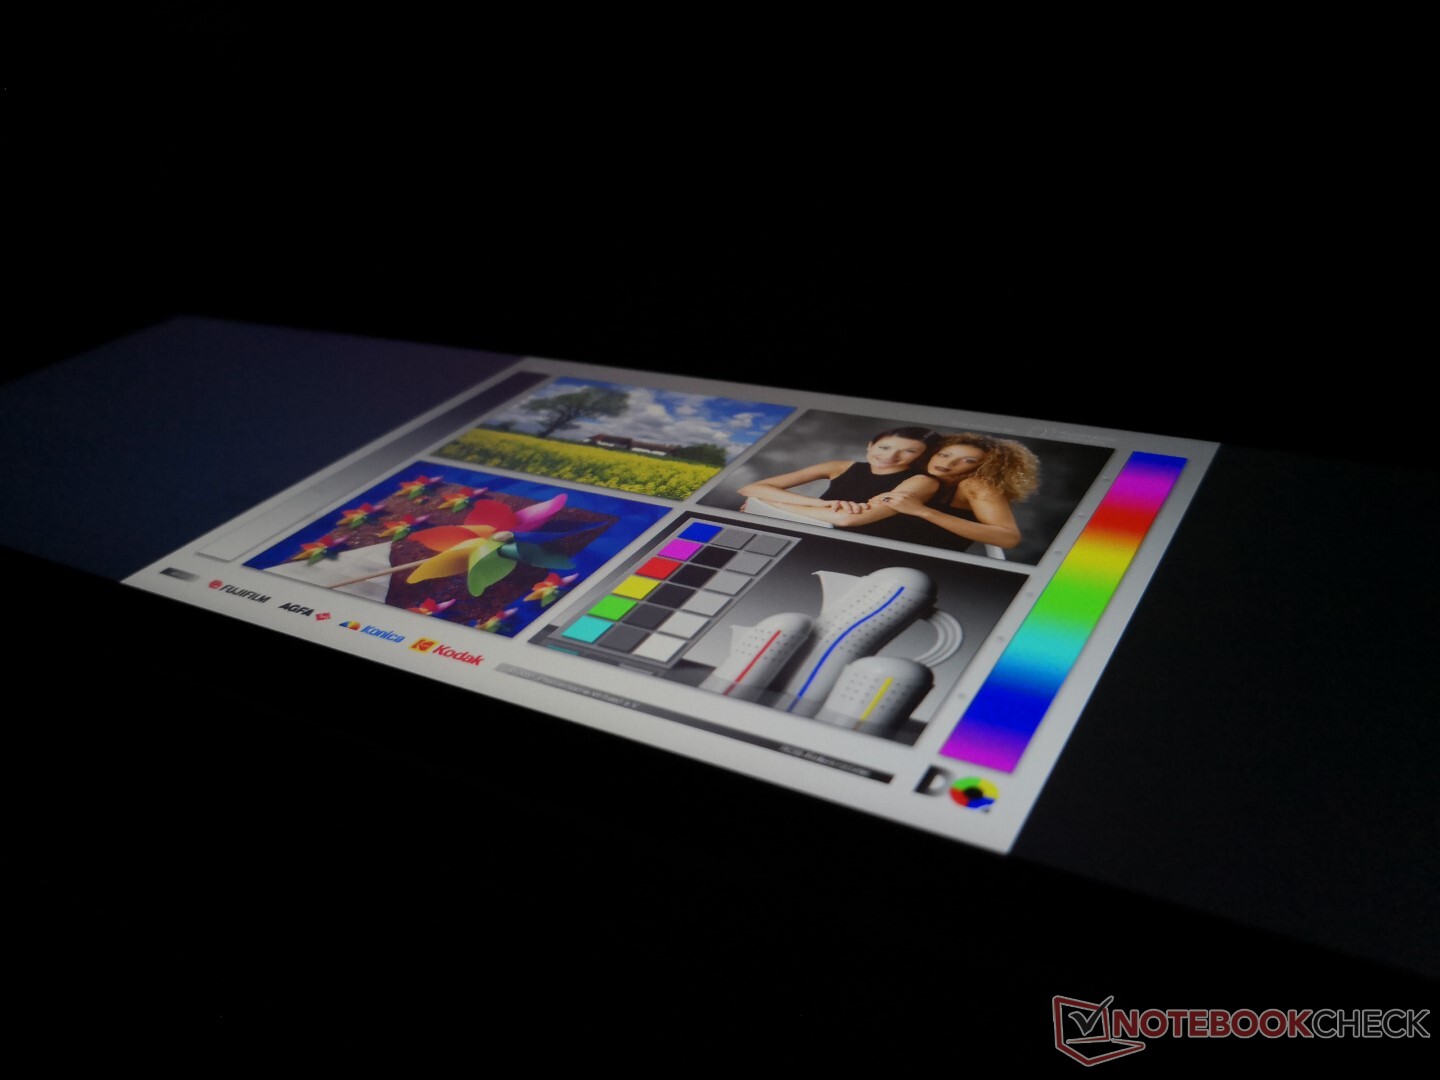
The primary display is a Chi Mei N140HCE-EN2 IPS panel that can also be found on the MSI PS42, MSI Modern 14, and Acer Swift 3 SF314. Thus, the ZenBook Duo doesn't offer many surprises here as these four systems share similar display features including the decent contrast ratio, decent response times, and full sRGB coverage. However, Asus has incorporated a matte touchscreen overlay that thickens the display a bit when compared to the aforementioned 14-inch models. Picture is slightly grainier than a glossy alternative as a result, but this is common on most matte panels.
Display brightness is not nearly as bright as most flagship Ultrabooks like the XPS 13, Surface Laptop 3, or IdeaPad S940. It'll be fine for indoor or classroom use, but there are better options out there if you plan on using the laptop outdoors frequently.
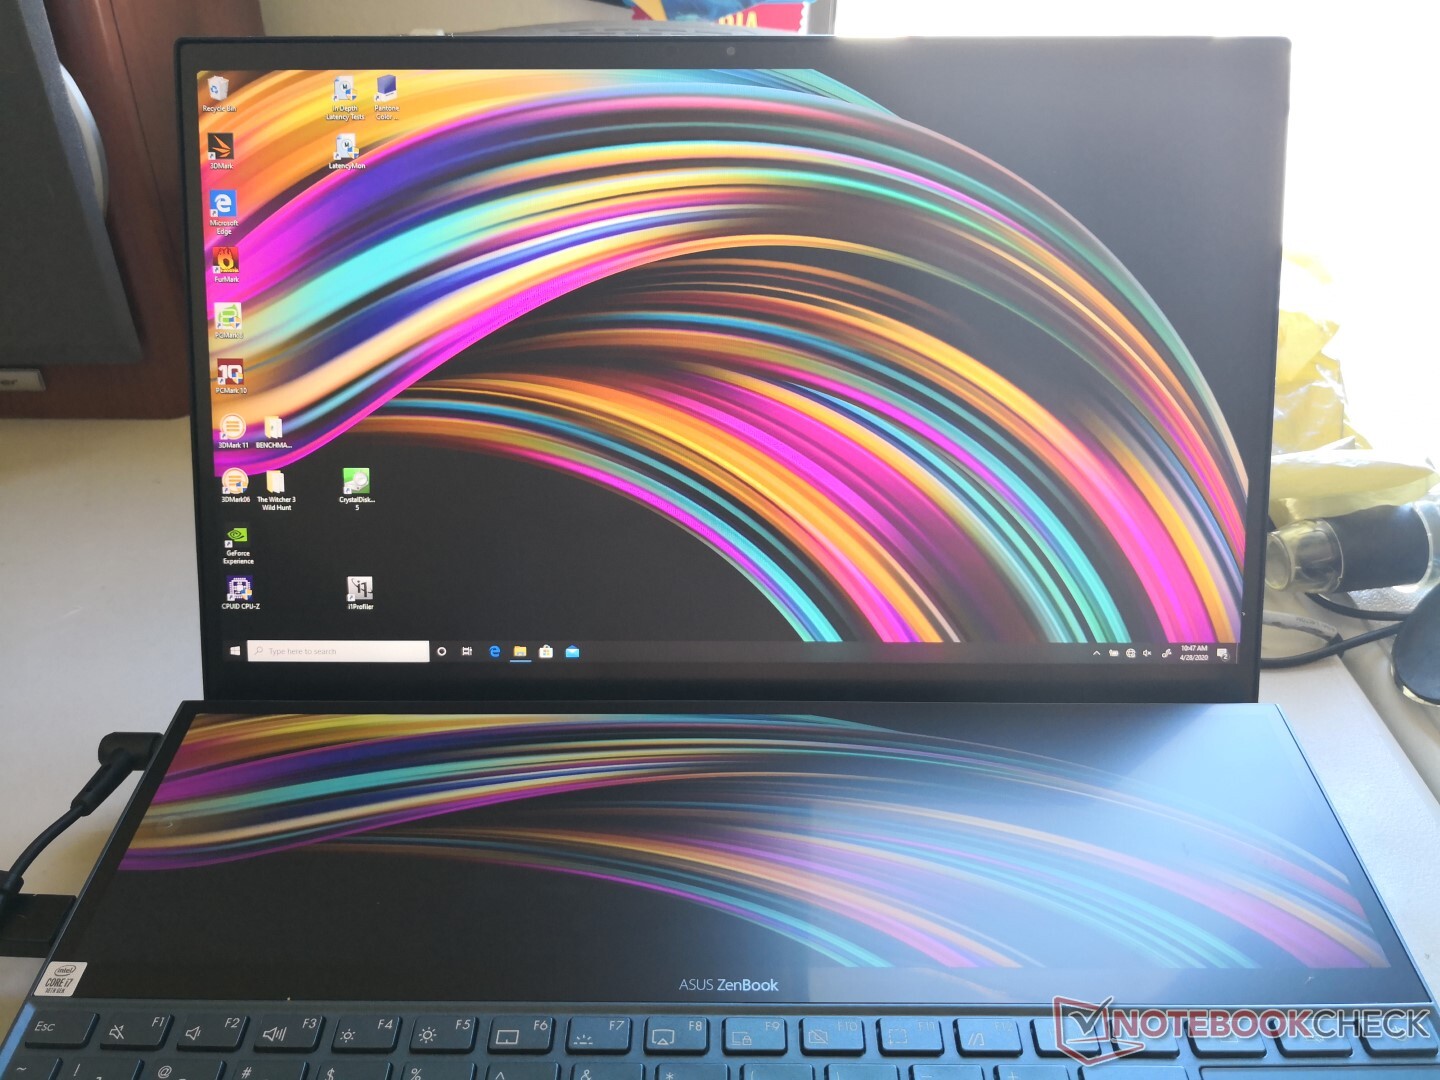
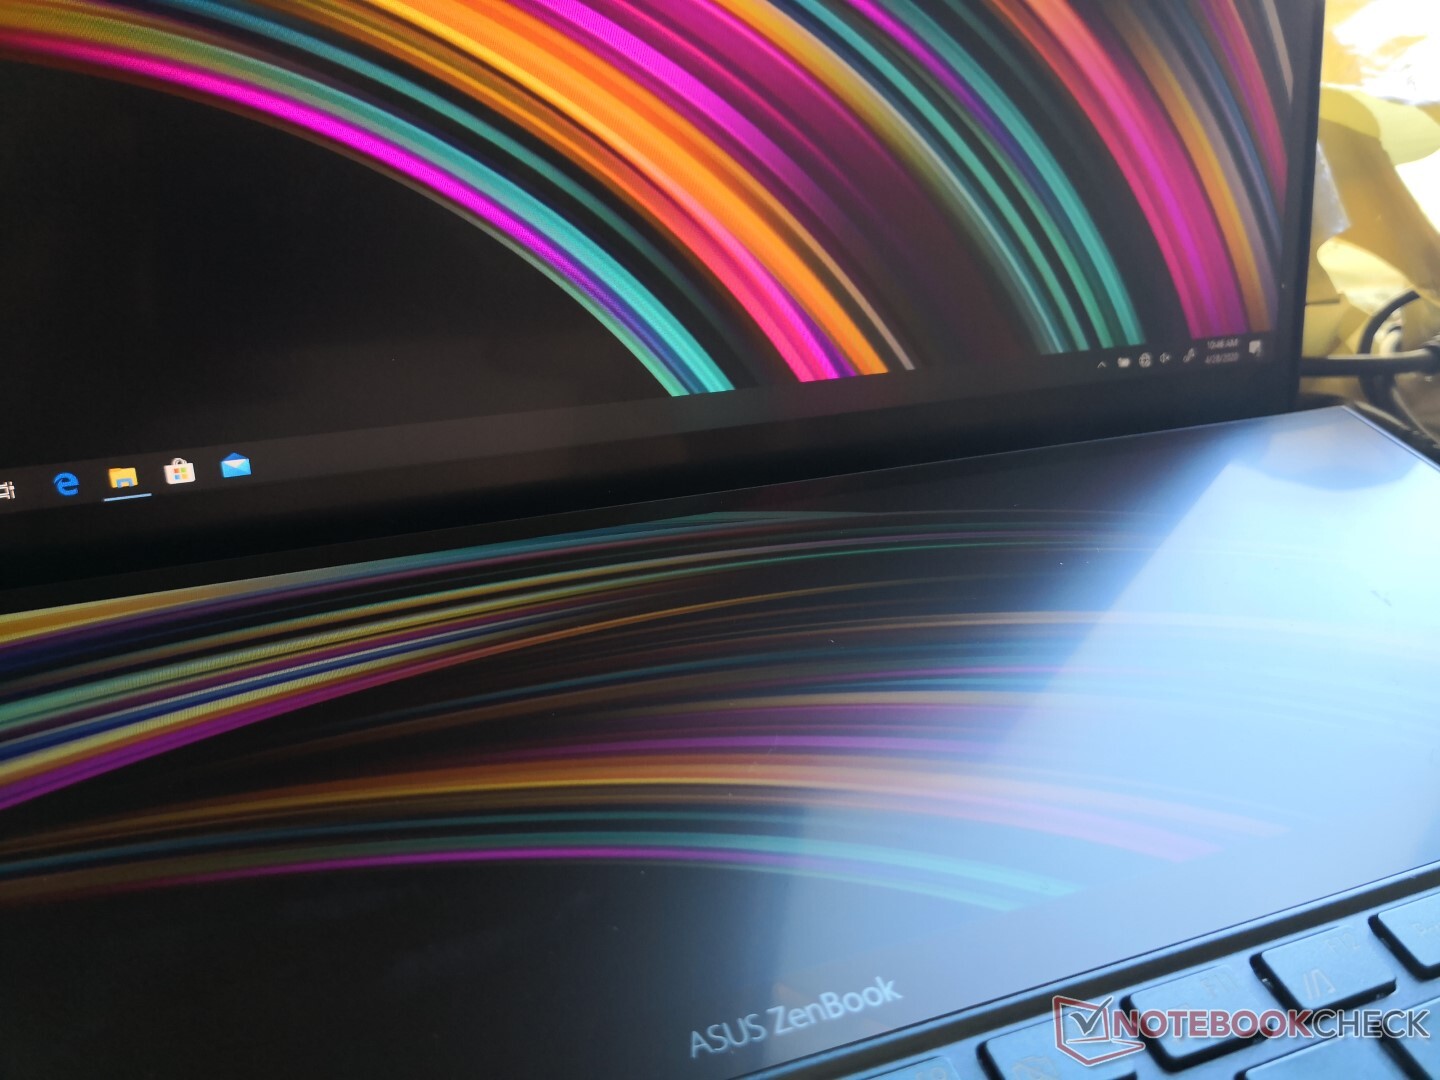
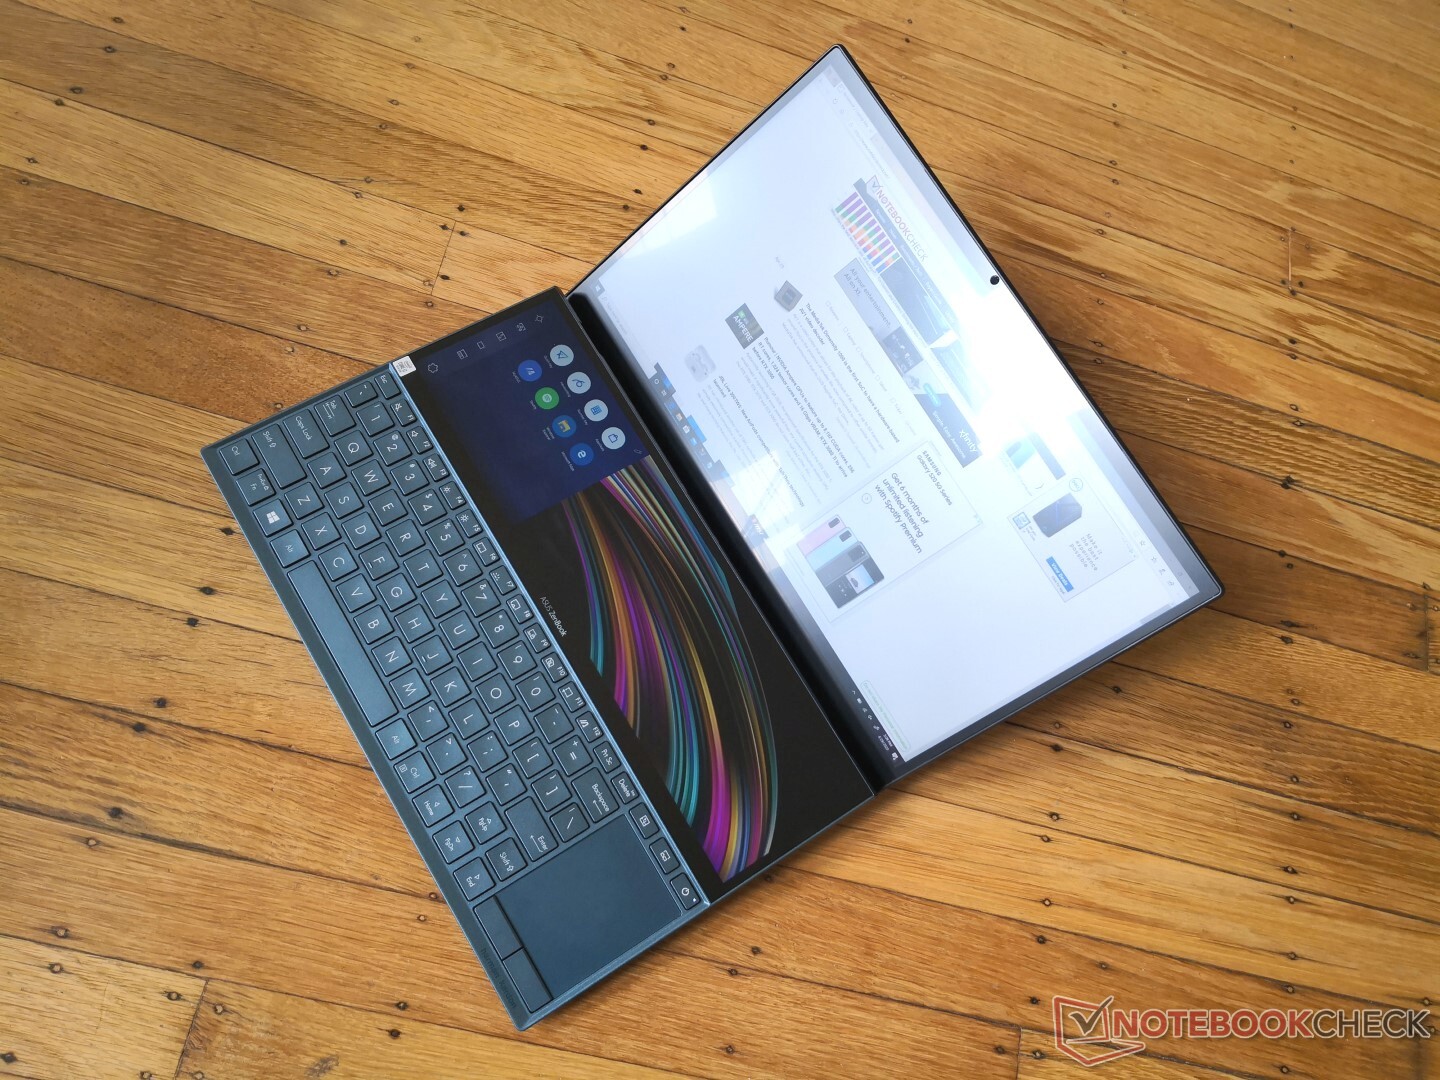
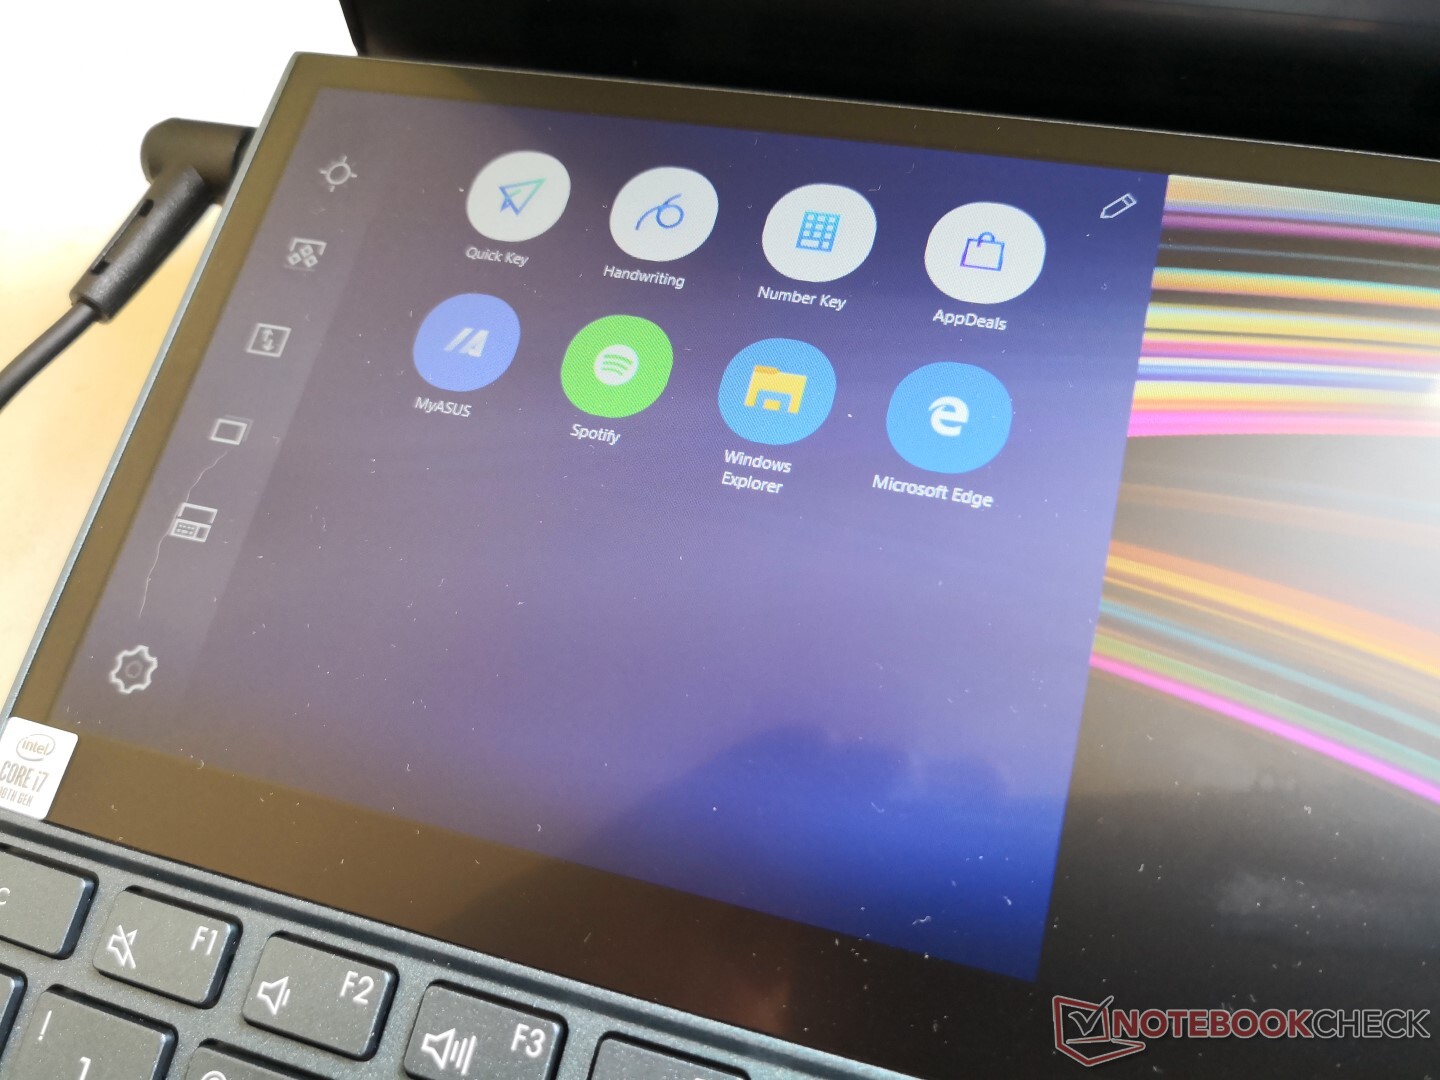
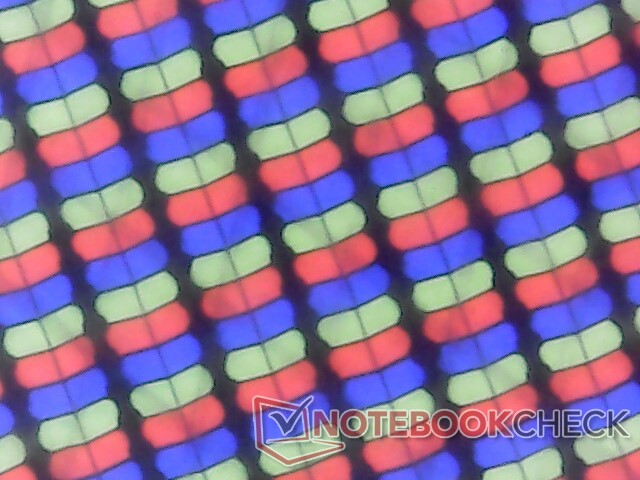
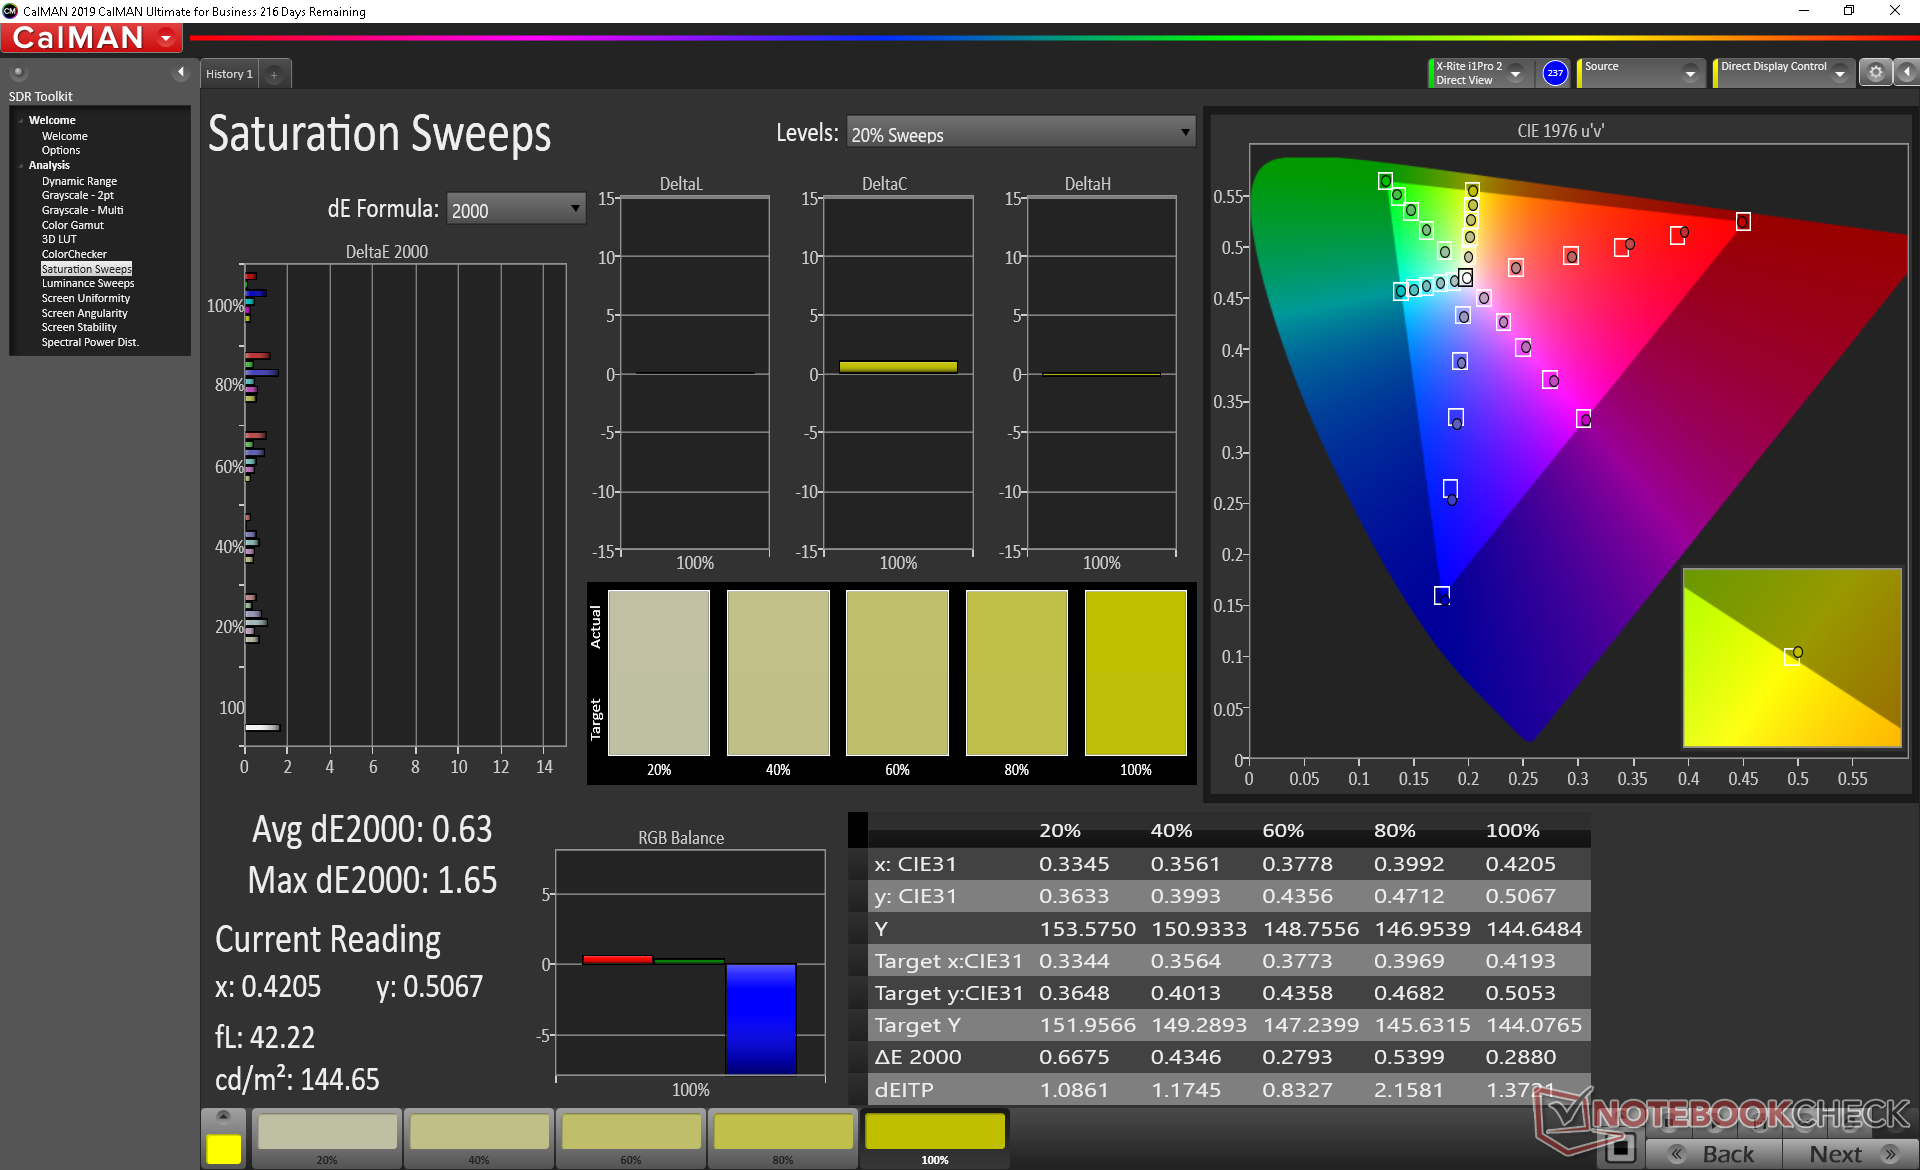
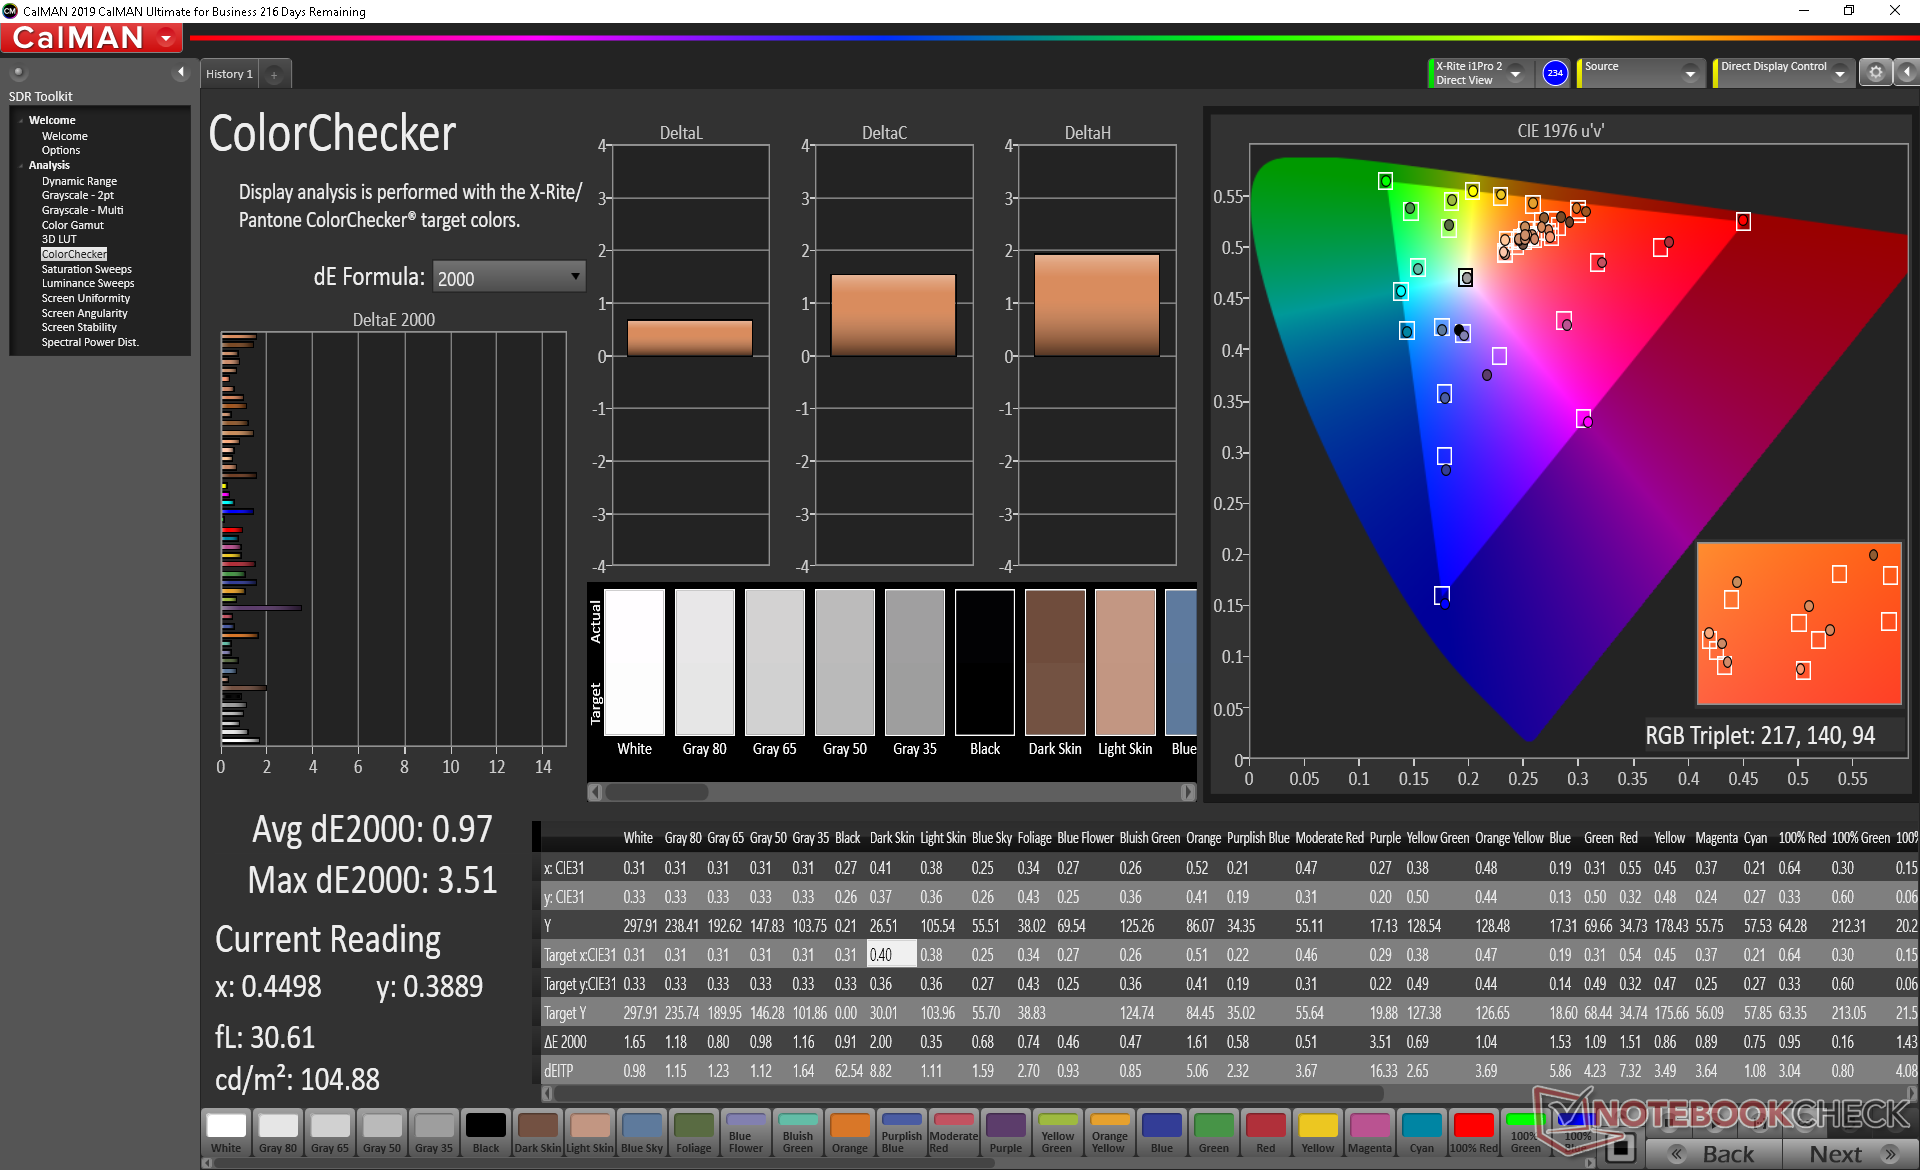
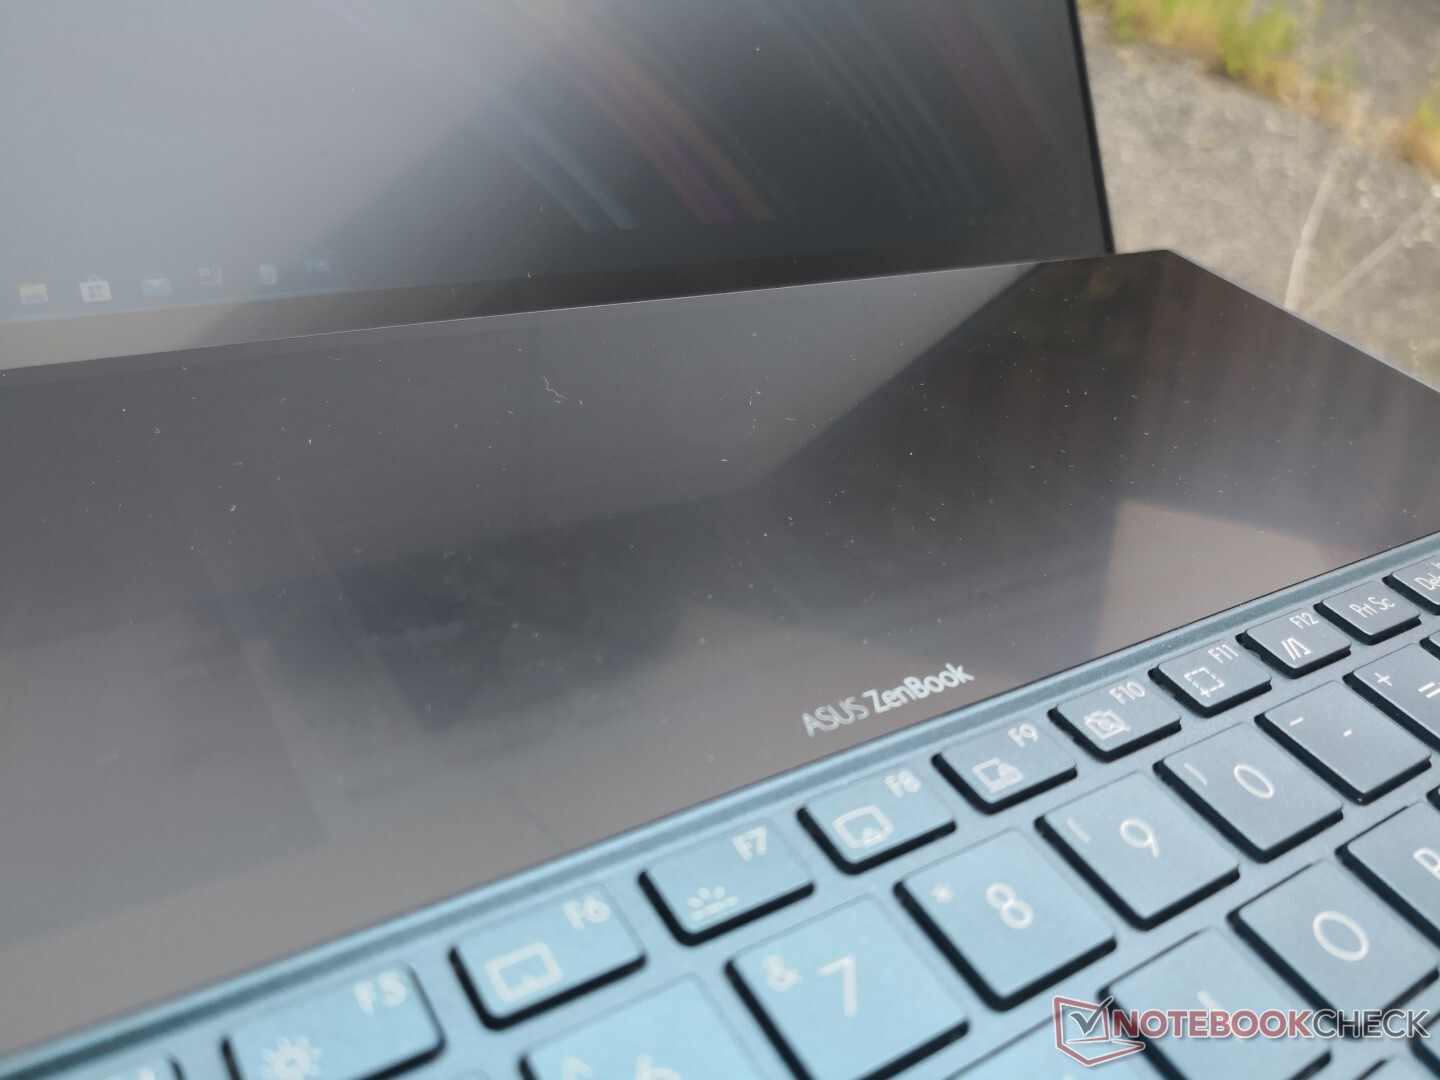
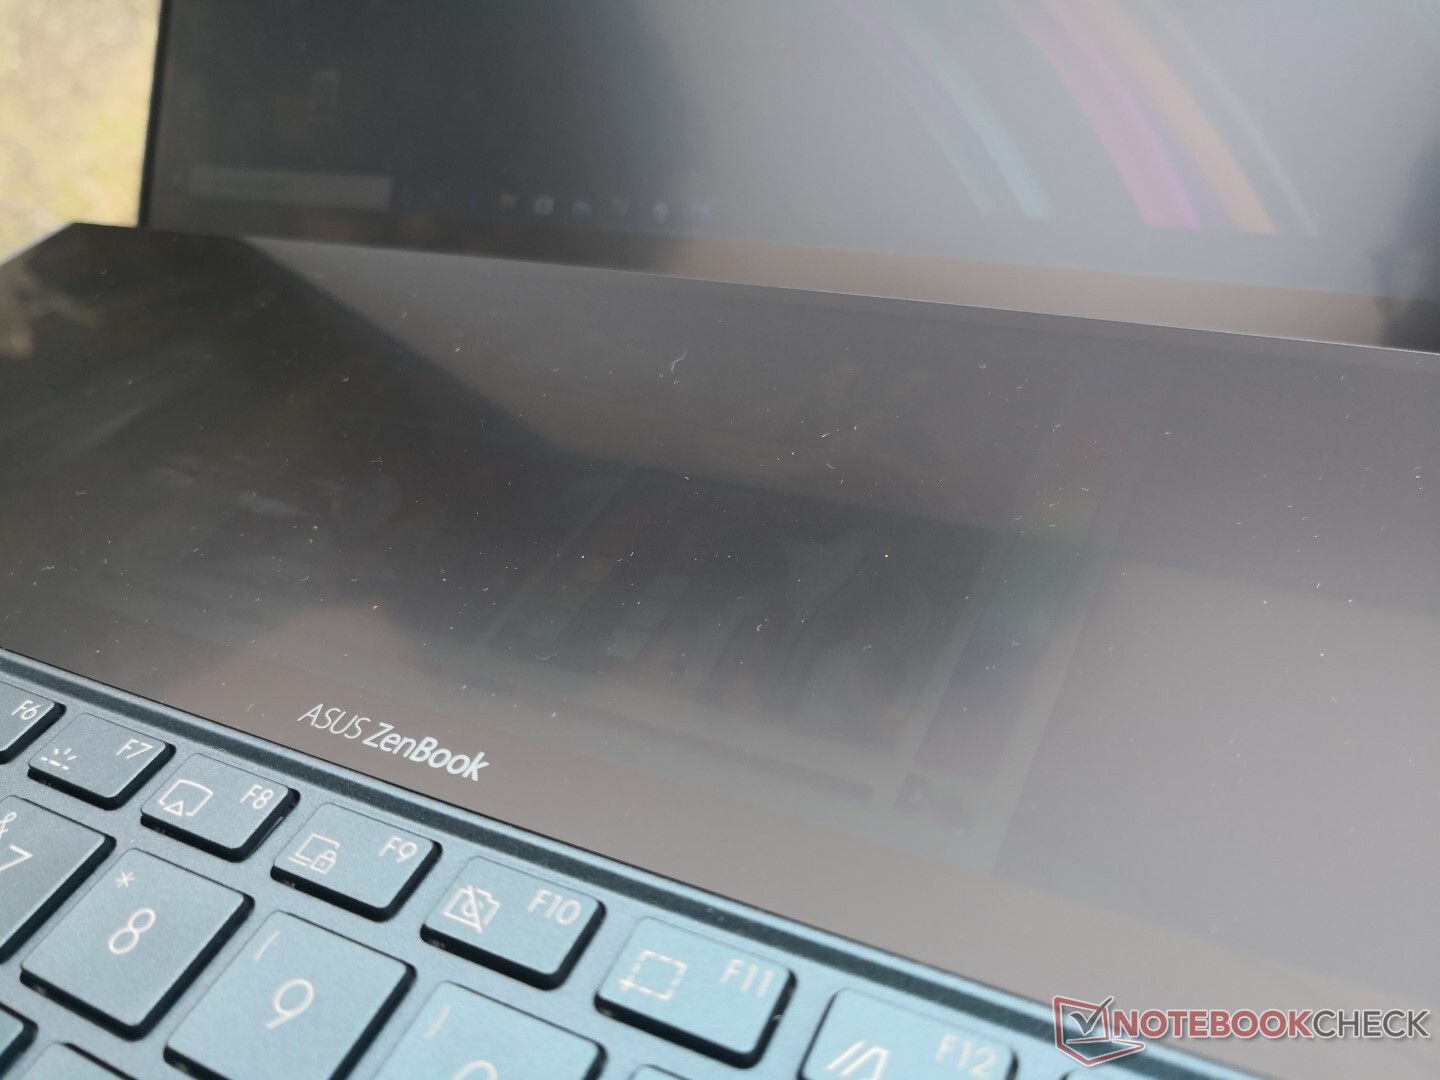
Of course, the star of the show is the 12.6-inch secondary matte touchscreen that Asus has dubbed the ScreenPad Plus. It offers the same screen width and PPI as the primary display for a true 1:1 dual-screen experience. When viewing conditions are perfect, the ScreenPad becomes invaluable for multi-tasking, chatting, emailing, and most any other application because it behaves exactly like a second monitor on a desktop PC.
The biggest disadvantage of the second display is that the viewing angle between it and your eyes will almost always be wider than the viewing angle between you and the main display. Try looking at an IPS display from an obtuse angle and you'll notice that colors, contrast, and brightness may shift and the same can be said for the ScreenPad. Thus, onscreen content on the second display tends to be dimmer and not as vivid as the main screen. Combine this with its poorer color reproduction and more intense glare and you have a screen that works best for multimedia control and large texts rather than video playback or professional editing.
| ScreenPad Plus | |
| Response Time Grey 50% / Grey 80% | 34.4 ms combined |
| Response Time Black / White * | 26.8 ms combined |
| Brightness Middle | 301 nits (280 if on battery power) |
| Contrast | 772:1 |
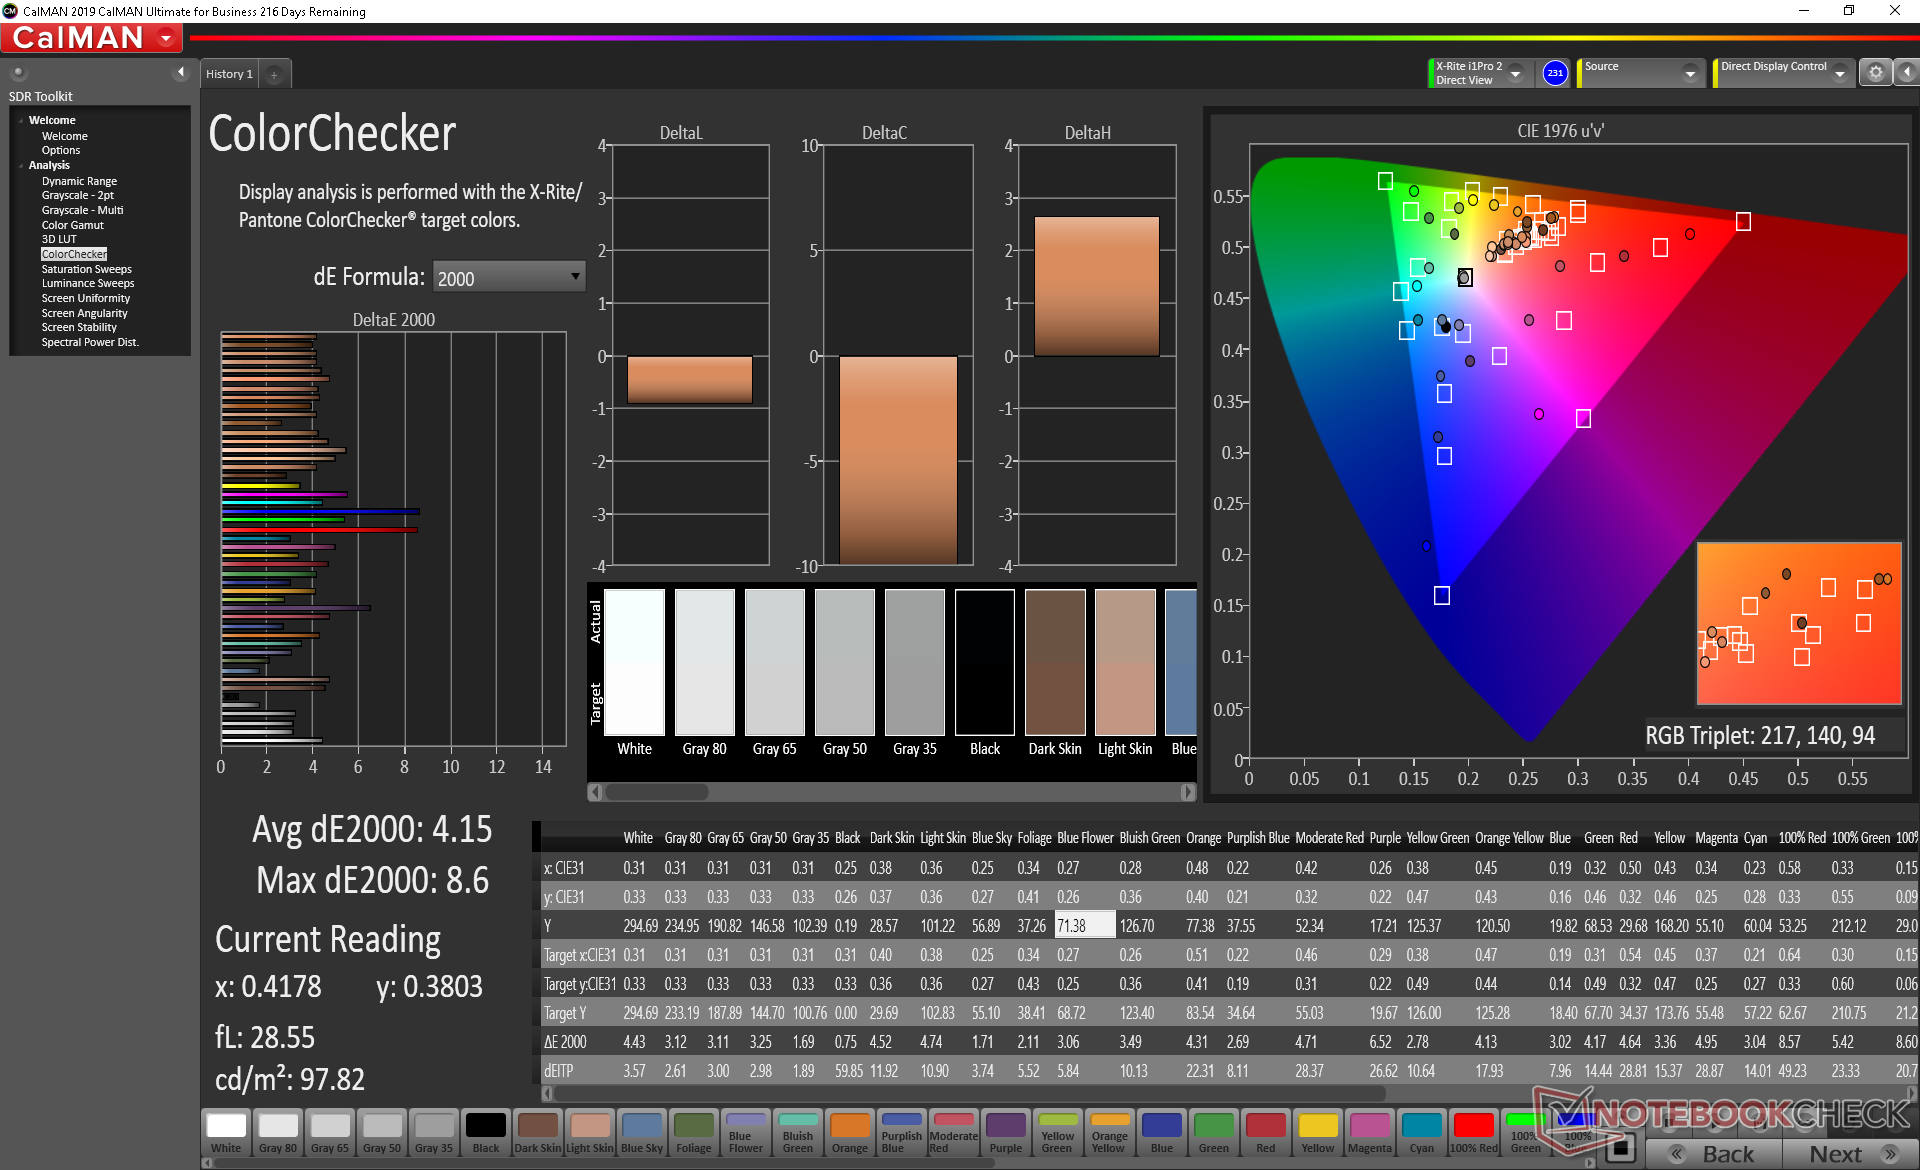
| Colorchecker DeltaE2000 | 4.77 |
| Colorchecker DeltaE2000 max. | 8.82 |
| Colorchecker DeltaE2000 calibrated | 4.15 |
| Greyscale DeltaE2000 | 3.4 |
| Gamma | 2.08 |
| CCT | 6640 |
| Color Space (Percent of AdobeRGB 1998) | 37.7 percent |
| Color Space (Percent of sRGB) | 59.4 percent |
| |||||||||||||||||||||||||
Brightness Distribution: 89 %
Center on Battery: 301 cd/m²
Contrast: 717:1 (Black: 0.42 cd/m²)
ΔE Color 1.01 | 0.5-29.43 Ø5, calibrated: 0.97
ΔE Greyscale 2.2 | 0.57-98 Ø5.3
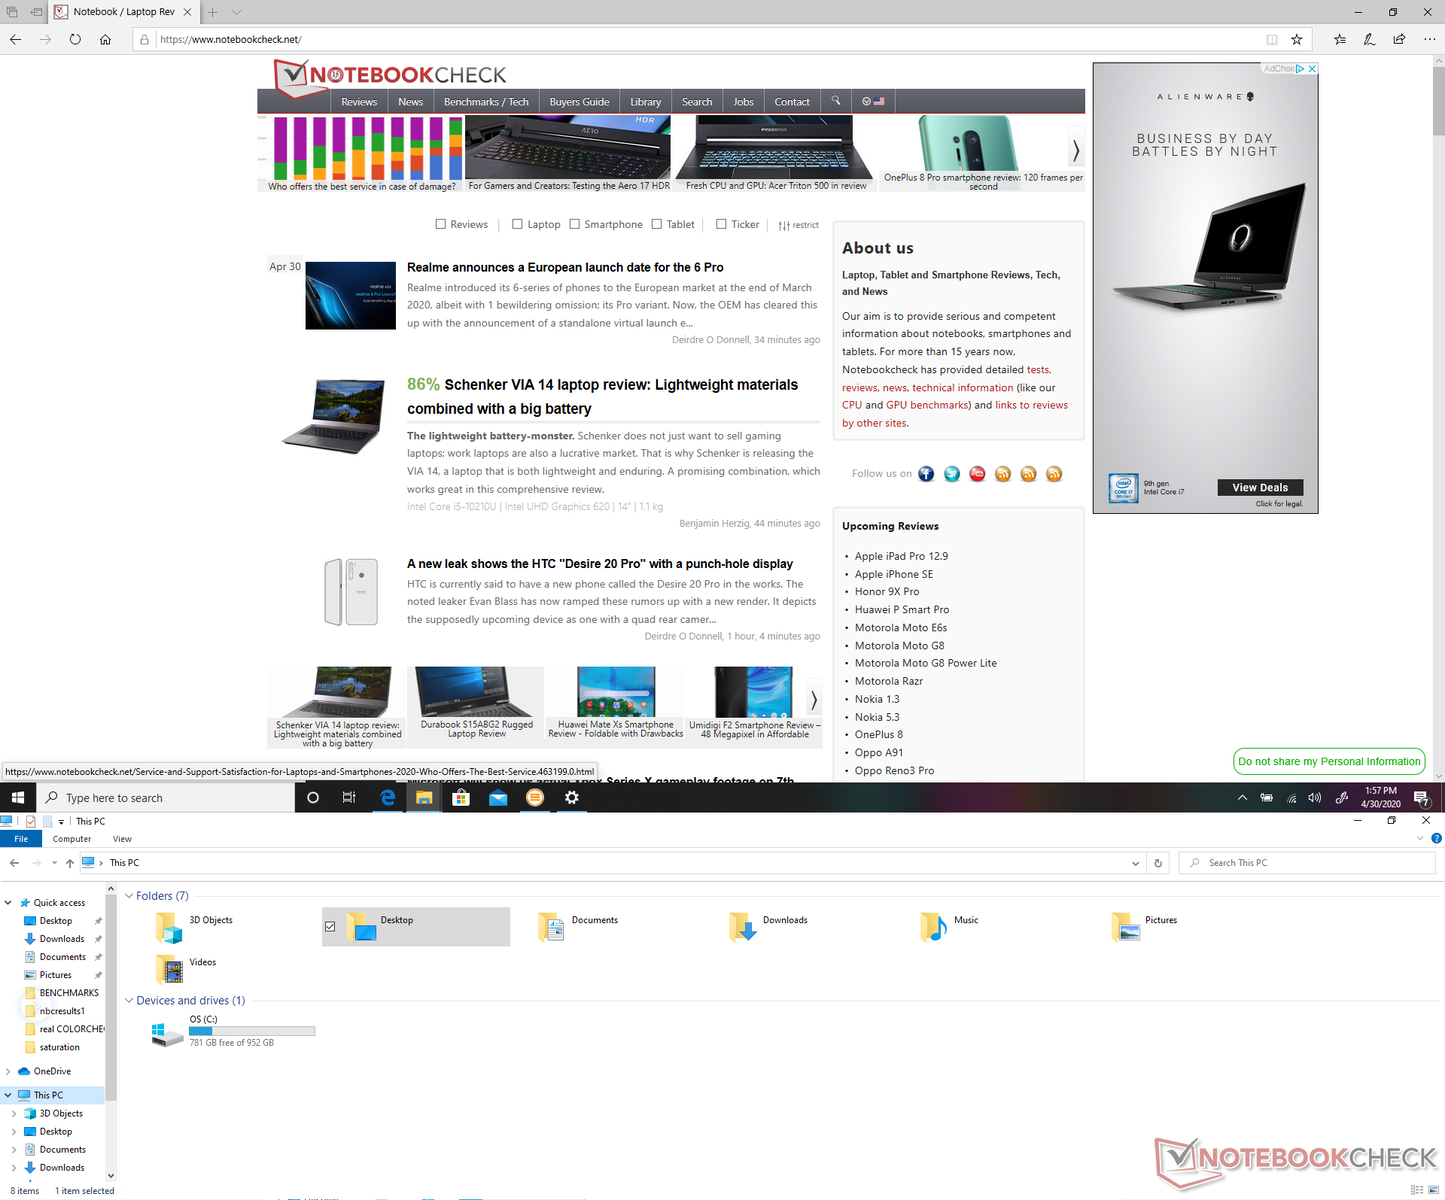
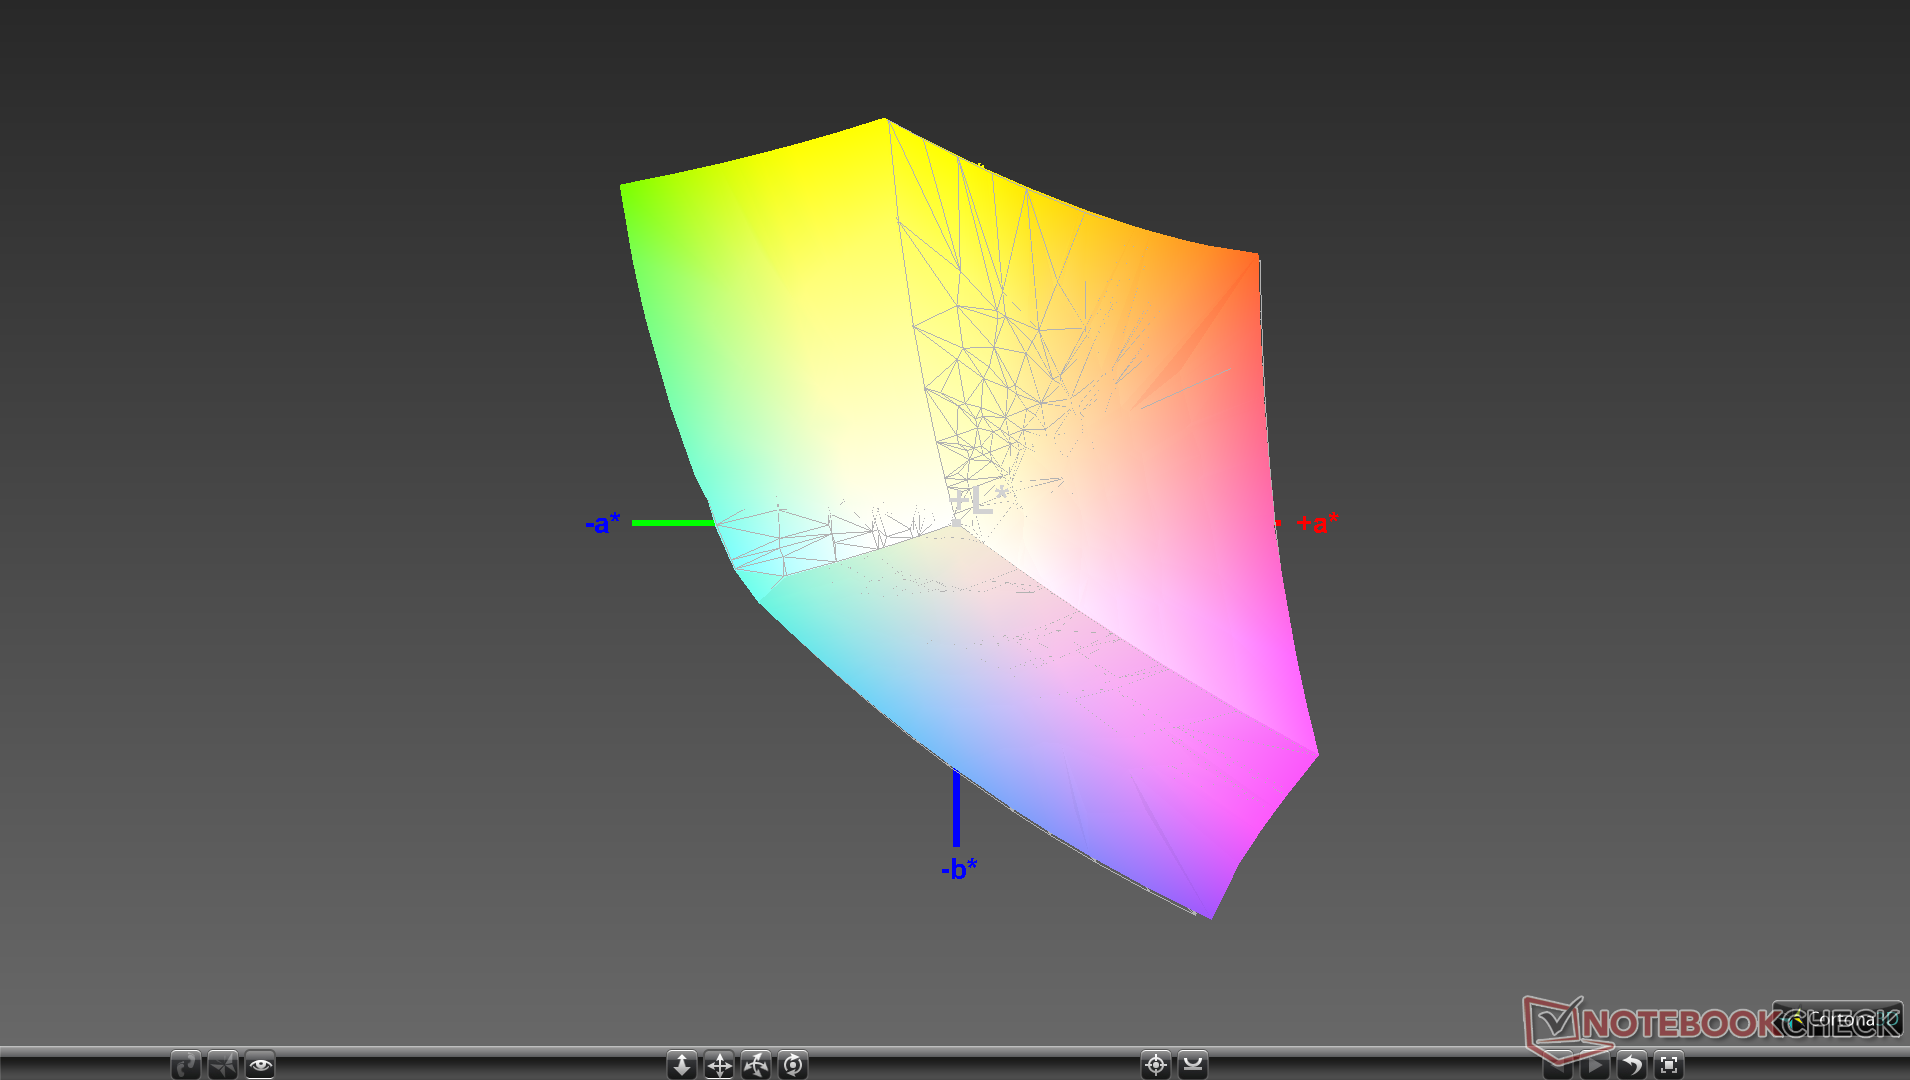
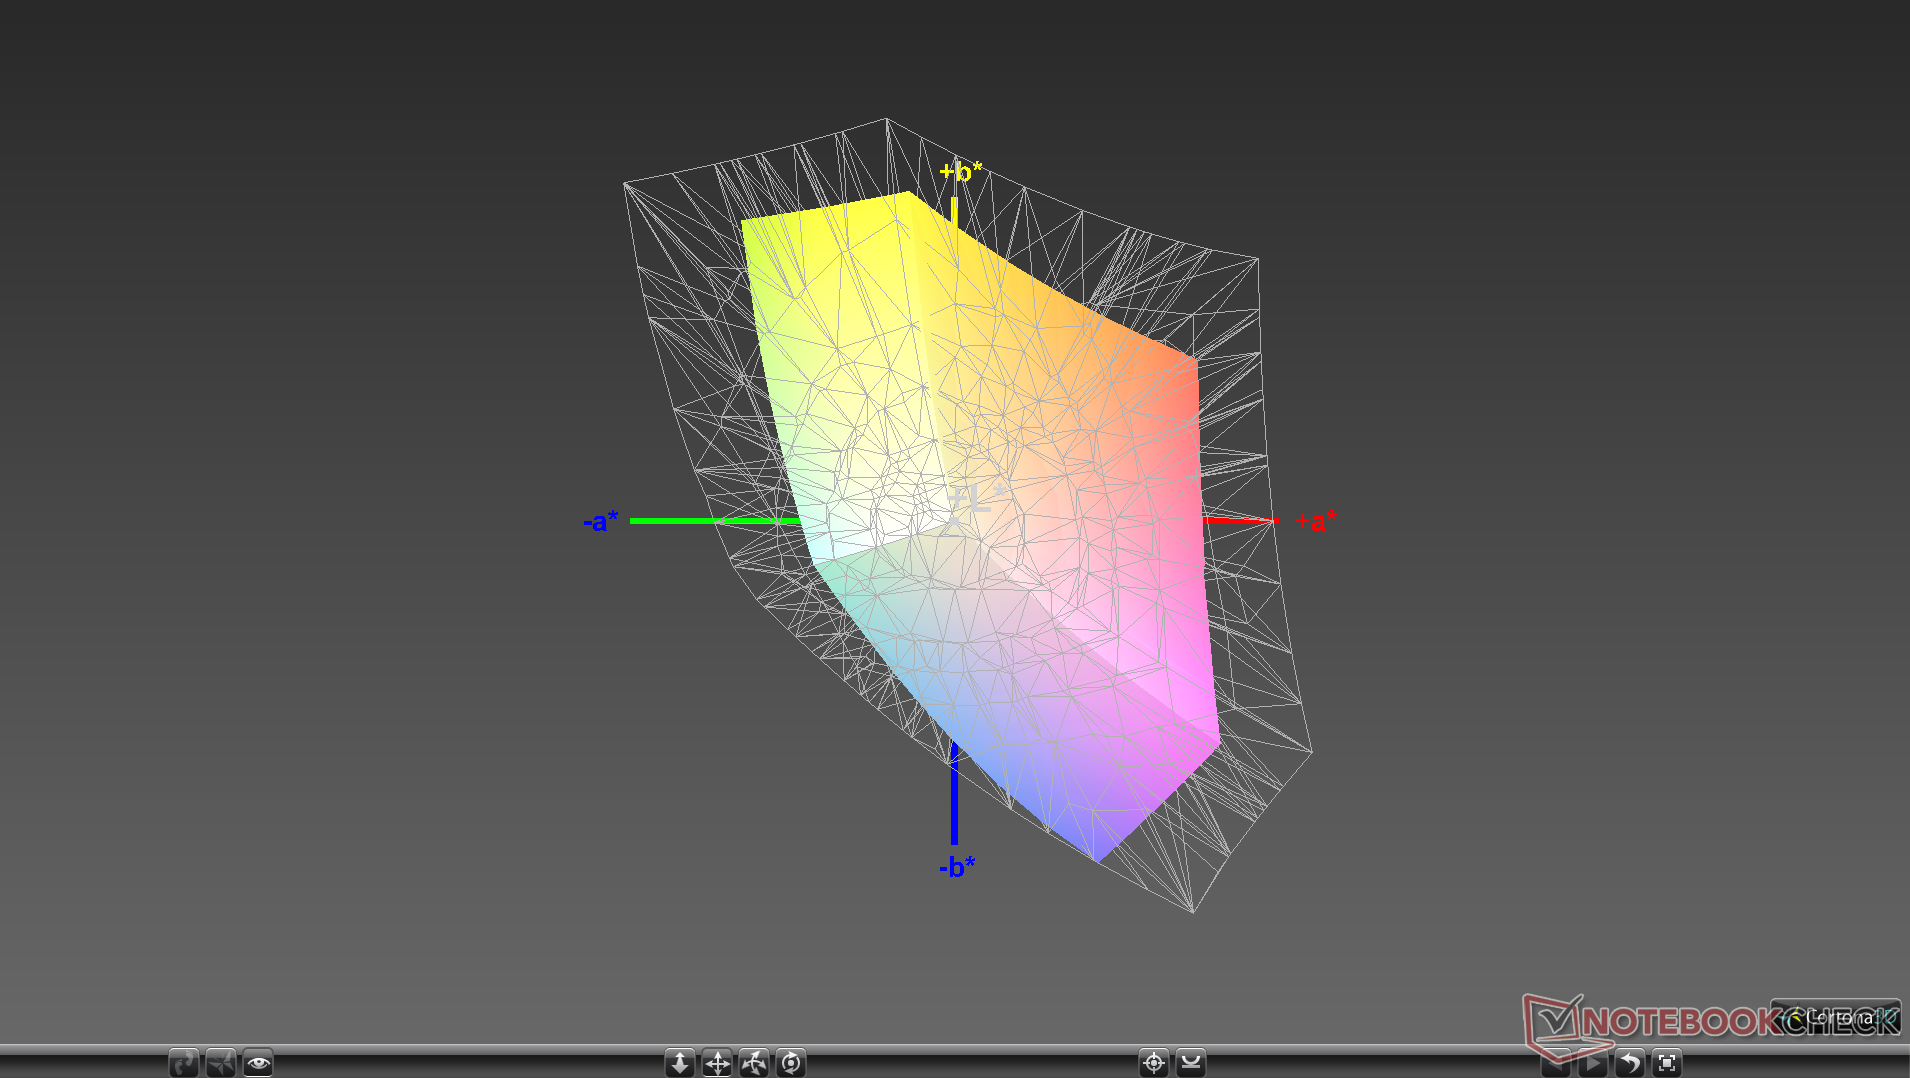
99.5% sRGB (Argyll 1.6.3 3D)
63.2% AdobeRGB 1998 (Argyll 1.6.3 3D)
68.9% AdobeRGB 1998 (Argyll 2.2.0 3D)
99.5% sRGB (Argyll 2.2.0 3D)
67.1% Display P3 (Argyll 2.2.0 3D)
Gamma: 2.19
| Asus ZenBook Duo UX481FL Chi Mei N140HCE-EN2, IPS, 14.00, 1920x1080 | Asus ZenBook 14 UM431DA-AM020T CEC PA LM140LF-3L03, IPS, 14.00, 1920x1080 | Huawei Matebook X Pro i5 Tianma XM, IPS, 13.90, 3000x2000 | Lenovo IdeaPad S940-14IWL B140ZAN01.3, IPS, 14.00, 3840x2160 | Lenovo ThinkPad X1 Carbon G7 20R1-000YUS BOE NV140QUM-N53, IPS, 14.00, 3840x2160 | MSI Prestige 14 A10SC-009 IPS, 14.00, 3840x2160 | |
|---|---|---|---|---|---|---|
| Display | -3% | -3% | 16% | 15% | ||
| Display P3 Coverage | 67.1 | 66.7 -1% | 65.9 -2% | 87.5 30% | 83 24% | |
| sRGB Coverage | 99.5 | 92.3 -7% | 95.2 -4% | 99.7 0% | 99.7 0% | |
| AdobeRGB 1998 Coverage | 68.9 | 67.5 -2% | 67.6 -2% | 81.1 18% | 83.1 21% | |
| Response Times | -39% | -15% | -54% | -61% | -59% | |
| Response Time Grey 50% / Grey 80% * | 31.2 ? | 36 ? -15% | 40.4 ? -29% | 57.2 ? -83% | 49.2 ? -58% | 55 ? -76% |
| Response Time Black / White * | 25.6 ? | 26 ? -2% | 25.6 ? -0% | 32 ? -25% | 32.2 ? -26% | 36 ? -41% |
| PWM Frequency | 24750 ? | 44 ? -100% | 201.6 ? -99% | |||
| Screen | -124% | -34% | -57% | -103% | 16% | |
| Brightness middle | 301 | 253 -16% | 442.7 47% | 594.5 98% | 532 77% | 567 88% |
| Brightness | 285 | 245 -14% | 428 50% | 536 88% | 513 80% | 516 81% |
| Brightness Distribution | 89 | 78 -12% | 84 -6% | 83 -7% | 90 1% | 86 -3% |
| Black Level * | 0.42 | 0.225 46% | 0.31 26% | 0.43 -2% | 0.41 2% | 0.445 -6% |
| Contrast | 717 | 1124 57% | 1428 99% | 1383 93% | 1298 81% | 1274 78% |
| Colorchecker dE 2000 * | 1.01 | 8.89 -780% | 2.24 -122% | 4.87 -382% | 6.88 -581% | 1.55 -53% |
| Colorchecker dE 2000 max. * | 3.42 | 4.56 -33% | 7.19 -110% | 7.9 -131% | 12.65 -270% | 5.14 -50% |
| Colorchecker dE 2000 calibrated * | 0.97 | 4.9 -405% | 1.11 -14% | 2.83 -192% | 2.52 -160% | 1.24 -28% |
| Greyscale dE 2000 * | 2.2 | 6.33 -188% | 9.7 -341% | 6.7 -205% | 10.5 -377% | 1.48 33% |
| Gamma | 2.19 100% | 2.52 87% | 1.42 155% | 2.091 105% | 1.98 111% | 2.19 100% |
| CCT | 6605 98% | 6745 96% | 6227 104% | 6891 94% | 7394 88% | 6741 96% |
| Color Space (Percent of AdobeRGB 1998) | 63.2 | 60 -5% | 61.6 -3% | 72 14% | 74.1 17% | |
| Color Space (Percent of sRGB) | 99.5 | 91 -9% | 95 -5% | 100 1% | 99.7 0% | |
| Total Average (Program / Settings) | -55% /
-87% | -17% /
-26% | -32% /
-43% | -50% /
-75% | -22% /
2% |
* ... smaller is better
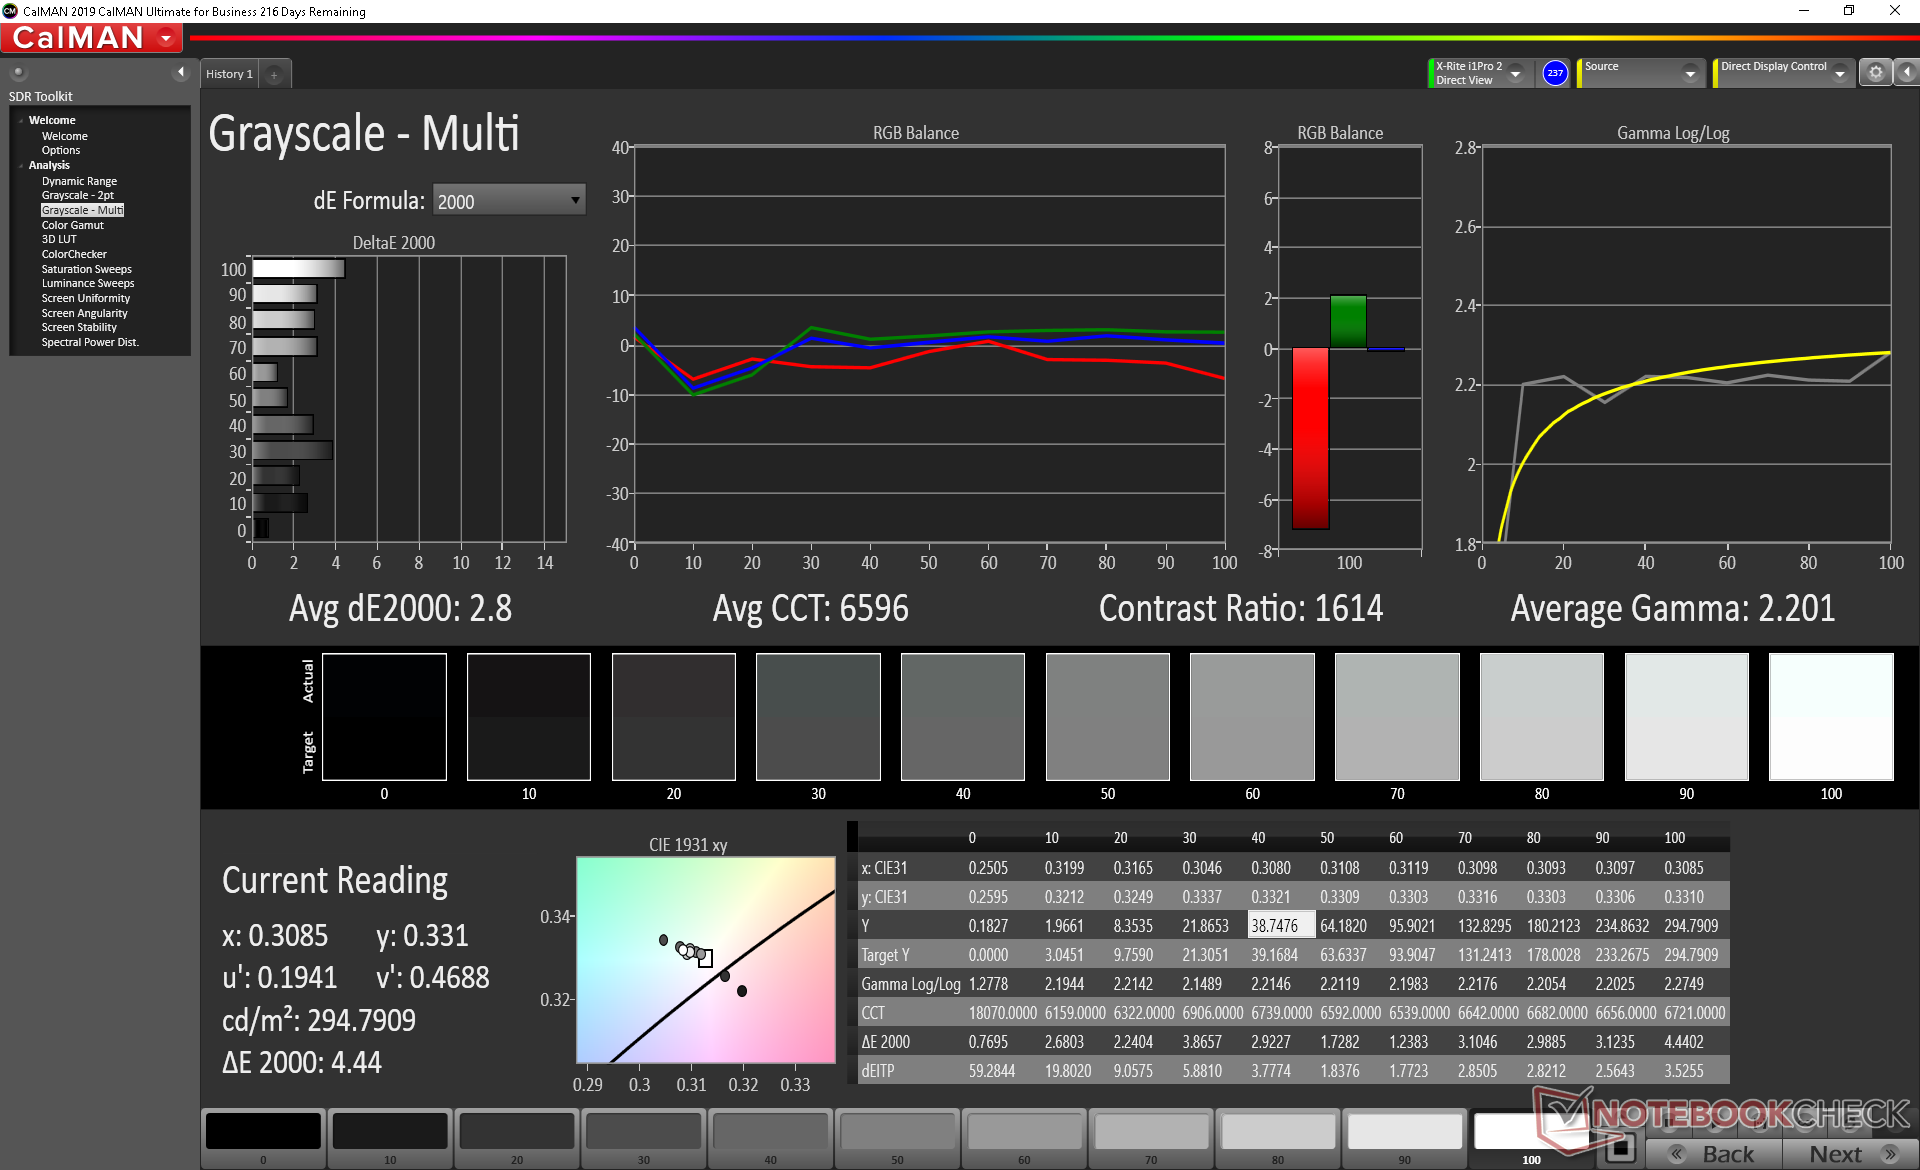
Asus advertises 72 percent NTSC or full sRGB coverage for its ZenBook Duo laptop. The catch, however, is that this applies only to the main display. The secondary display covers only 59 percent and 38 percent of sRGB and AdobeRGB, respectively, compared to 100 percent and 63 percent on the main screen. Graphics editors should still be using the main screen for important workloads as colors will not be 1:1 between the two screens.

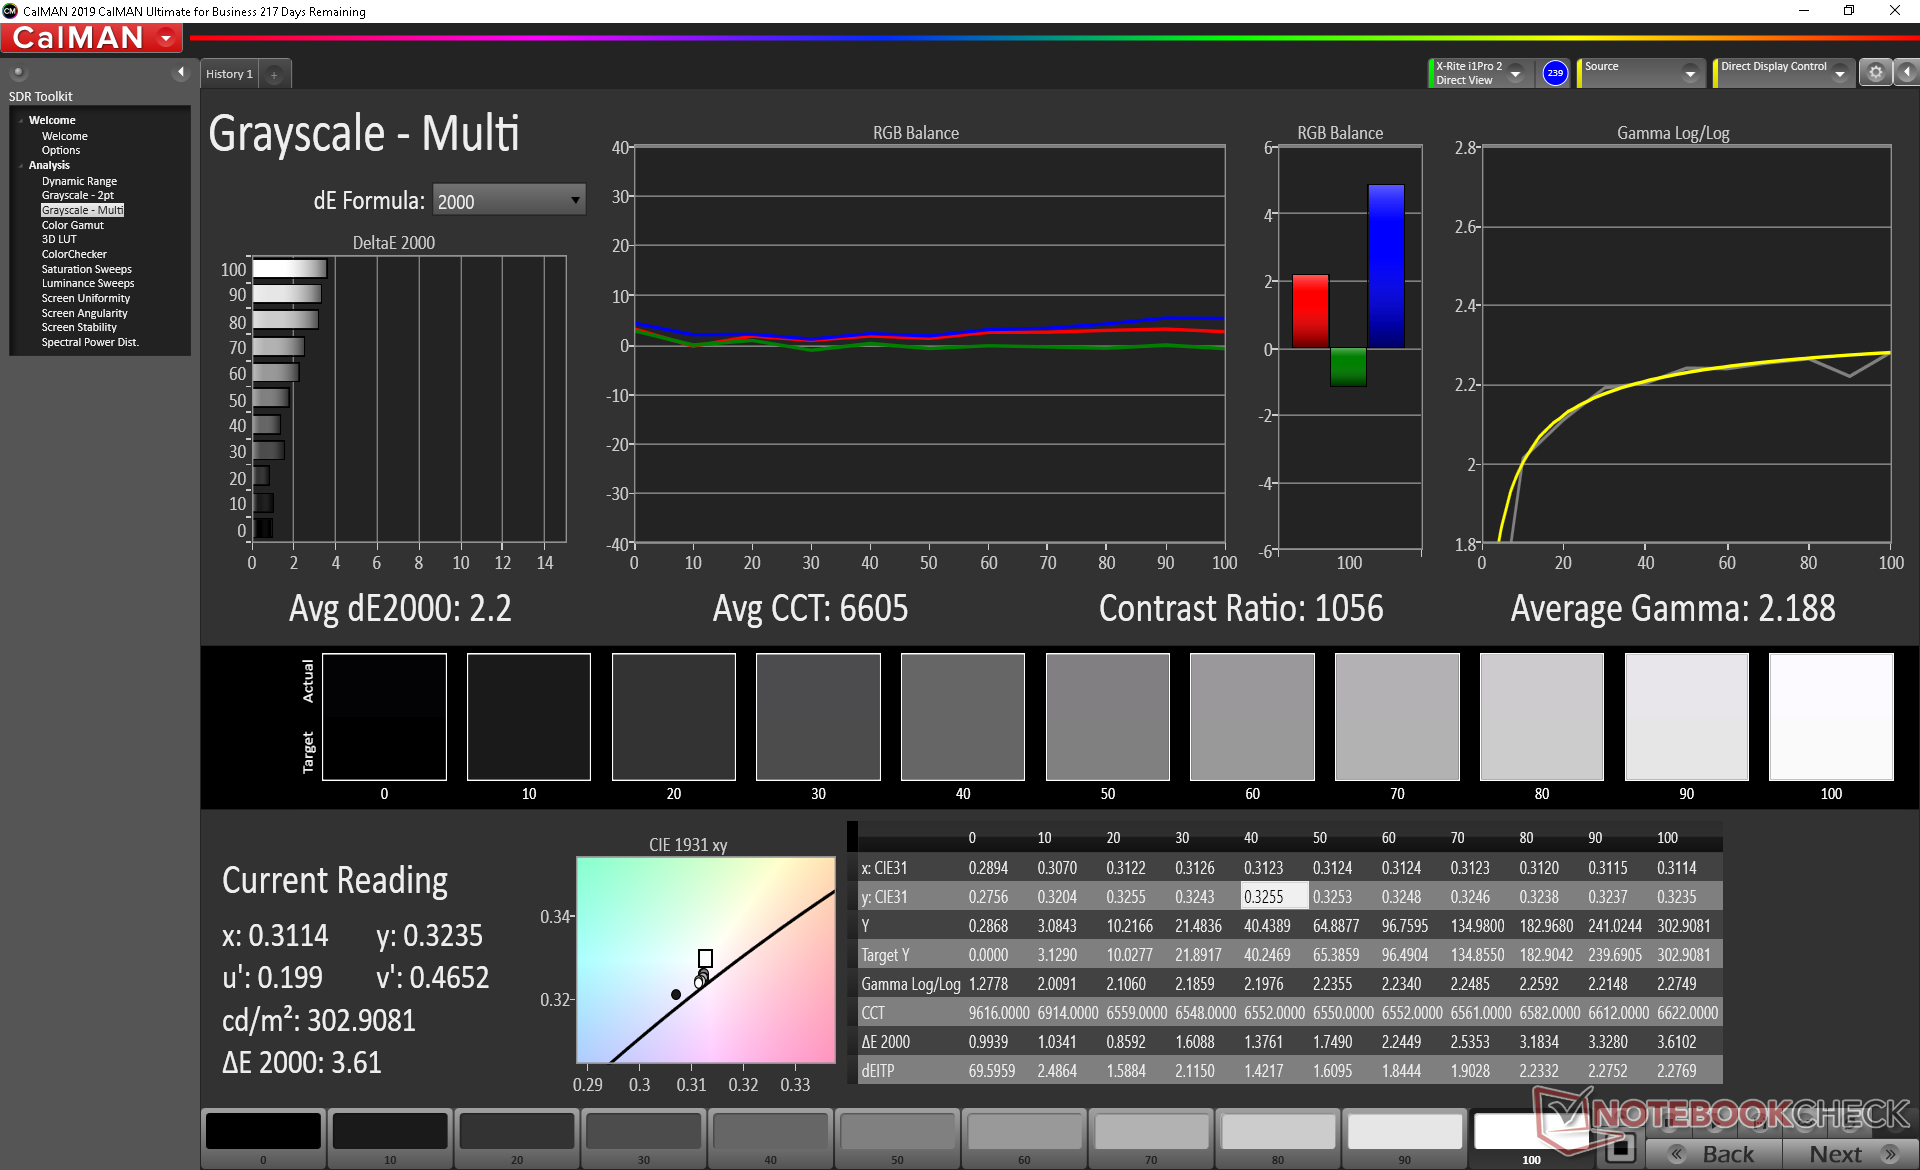
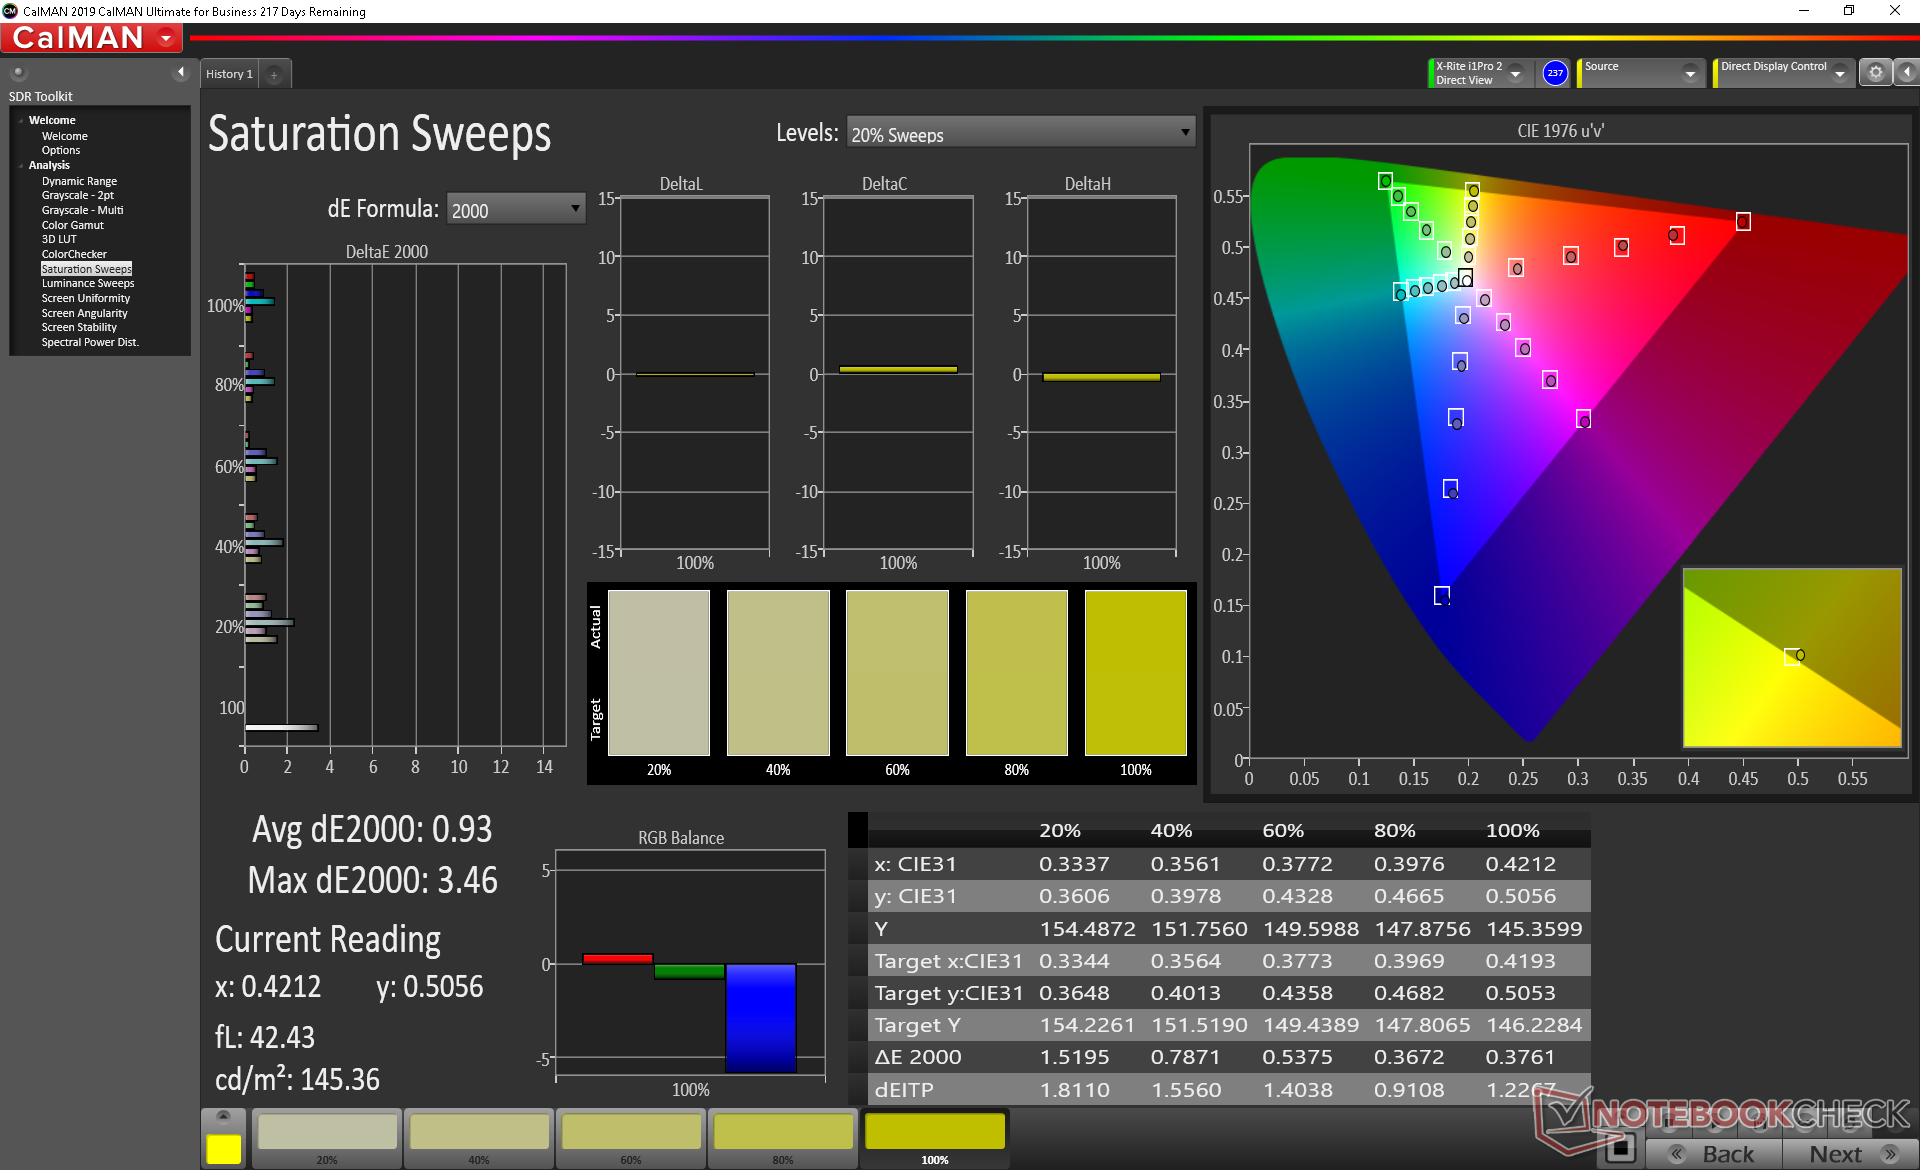
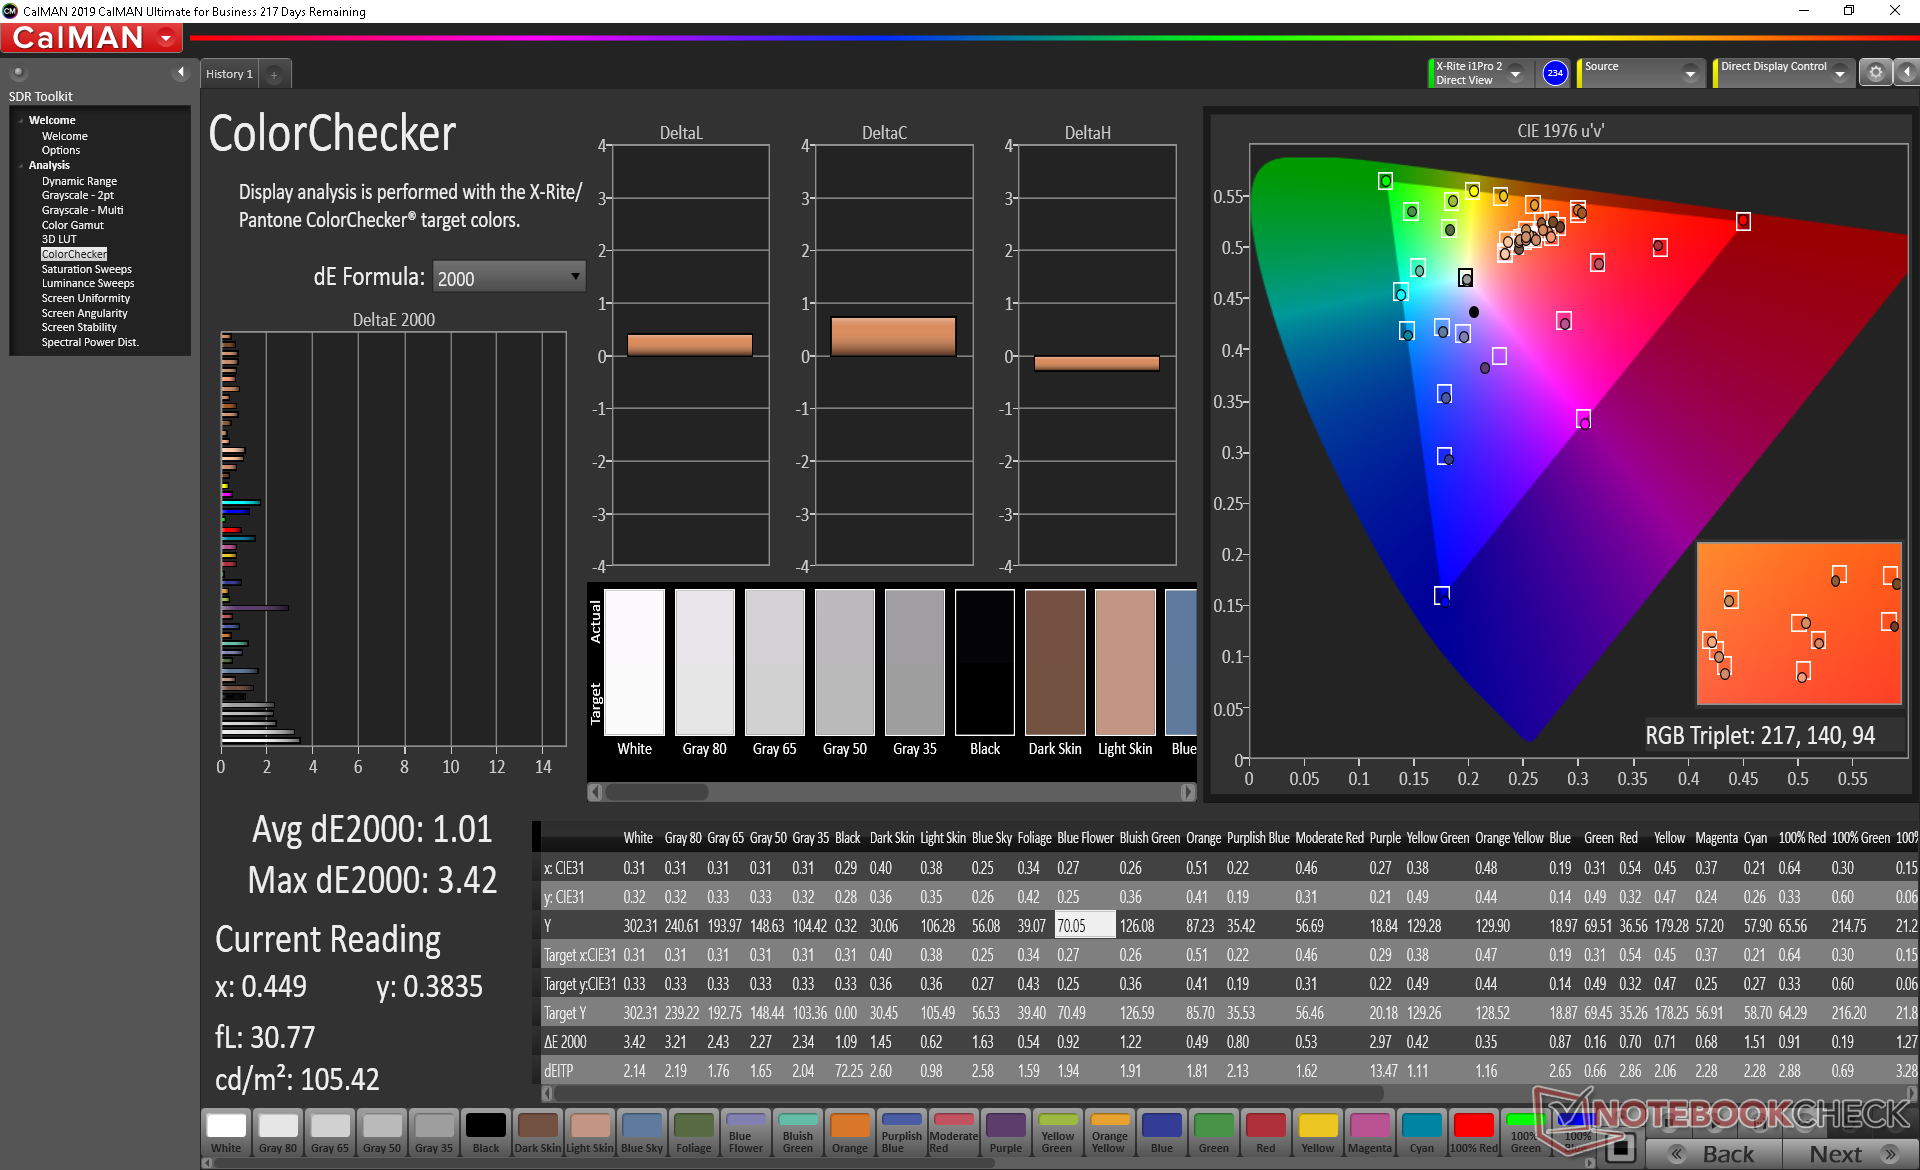
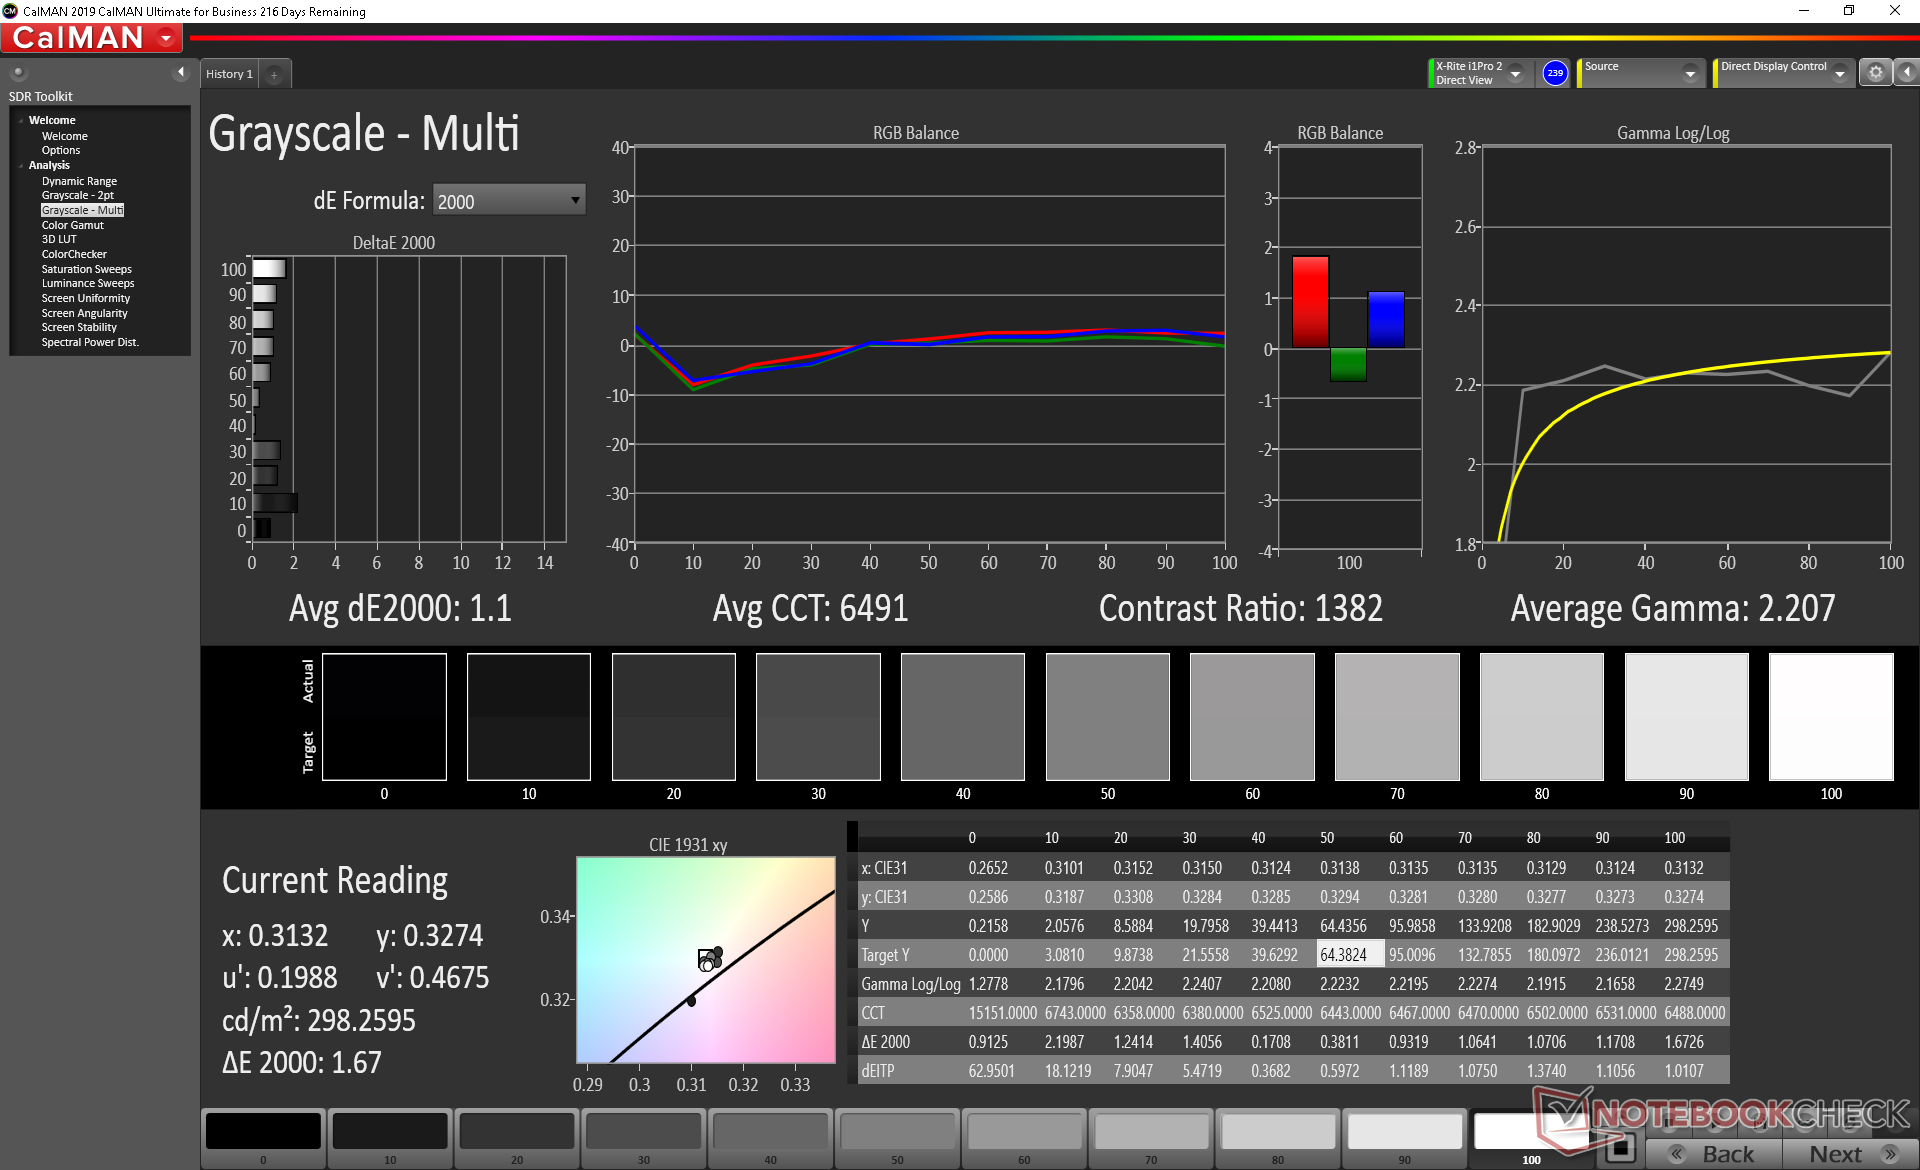
Asus advertises Pantone-certified calibration for its ZenBook Duo but, again, this applies only to the main screen. Our independent measurements with an X-Rite colorimeter do indeed show very accurate grayscale and colors on the main panel with average DeltaE values of just 2.2 and 0.93, respectively. In comparison, the average grayscale and color DeltaE values on the second screen are higher at 3.4 and 4.38, respectively. Attempting to calibrate the second screen even further ourselves would not result in significant improvements due to the limited color space of the panel. This isn't to say that colors on the second screen are poor, but they are not as vibrant when compared to the main screen.

Display Response Times
| ↔ Response Time Black to White | ||
|---|---|---|
| 25.6 ms ... rise ↗ and fall ↘ combined | ↗ 14.8 ms rise | 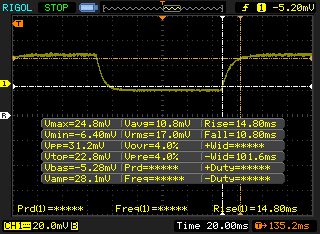 |
| ↘ 10.8 ms fall | ||
| The screen shows relatively slow response rates in our tests and may be too slow for gamers. In comparison, all tested devices range from 0.1 (minimum) to 240 (maximum) ms. » 56 % of all devices are better. This means that the measured response time is worse than the average of all tested devices (21.5 ms). | ||
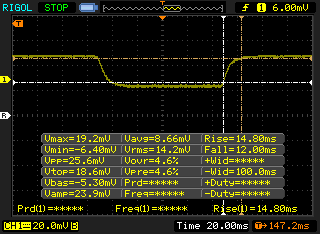
| ↔ Response Time 50% Grey to 80% Grey | ||
| 31.2 ms ... rise ↗ and fall ↘ combined | ↗ 15.6 ms rise | 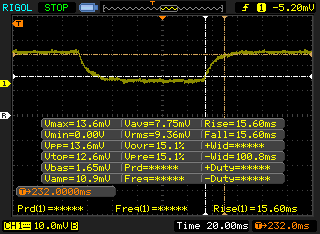 |
| ↘ 15.6 ms fall | ||
| The screen shows slow response rates in our tests and will be unsatisfactory for gamers. In comparison, all tested devices range from 0.2 (minimum) to 636 (maximum) ms. » 36 % of all devices are better. This means that the measured response time is similar to the average of all tested devices (33.7 ms). | ||
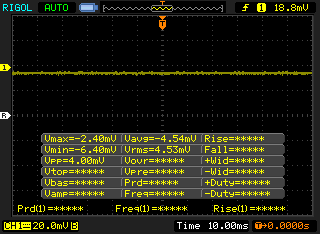
Screen Flickering / PWM (Pulse-Width Modulation)
| Screen flickering / PWM detected | 24750 Hz | ≤ 29 % brightness setting | 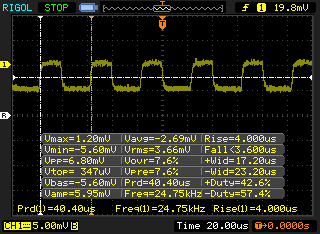 |
The display backlight flickers at 24750 Hz (worst case, e.g., utilizing PWM) Flickering detected at a brightness setting of 29 % and below. There should be no flickering or PWM above this brightness setting. The frequency of 24750 Hz is quite high, so most users sensitive to PWM should not notice any flickering. In comparison: 53 % of all tested devices do not use PWM to dim the display. If PWM was detected, an average of 17900 (minimum: 5 - maximum: 3846000) Hz was measured. | |||
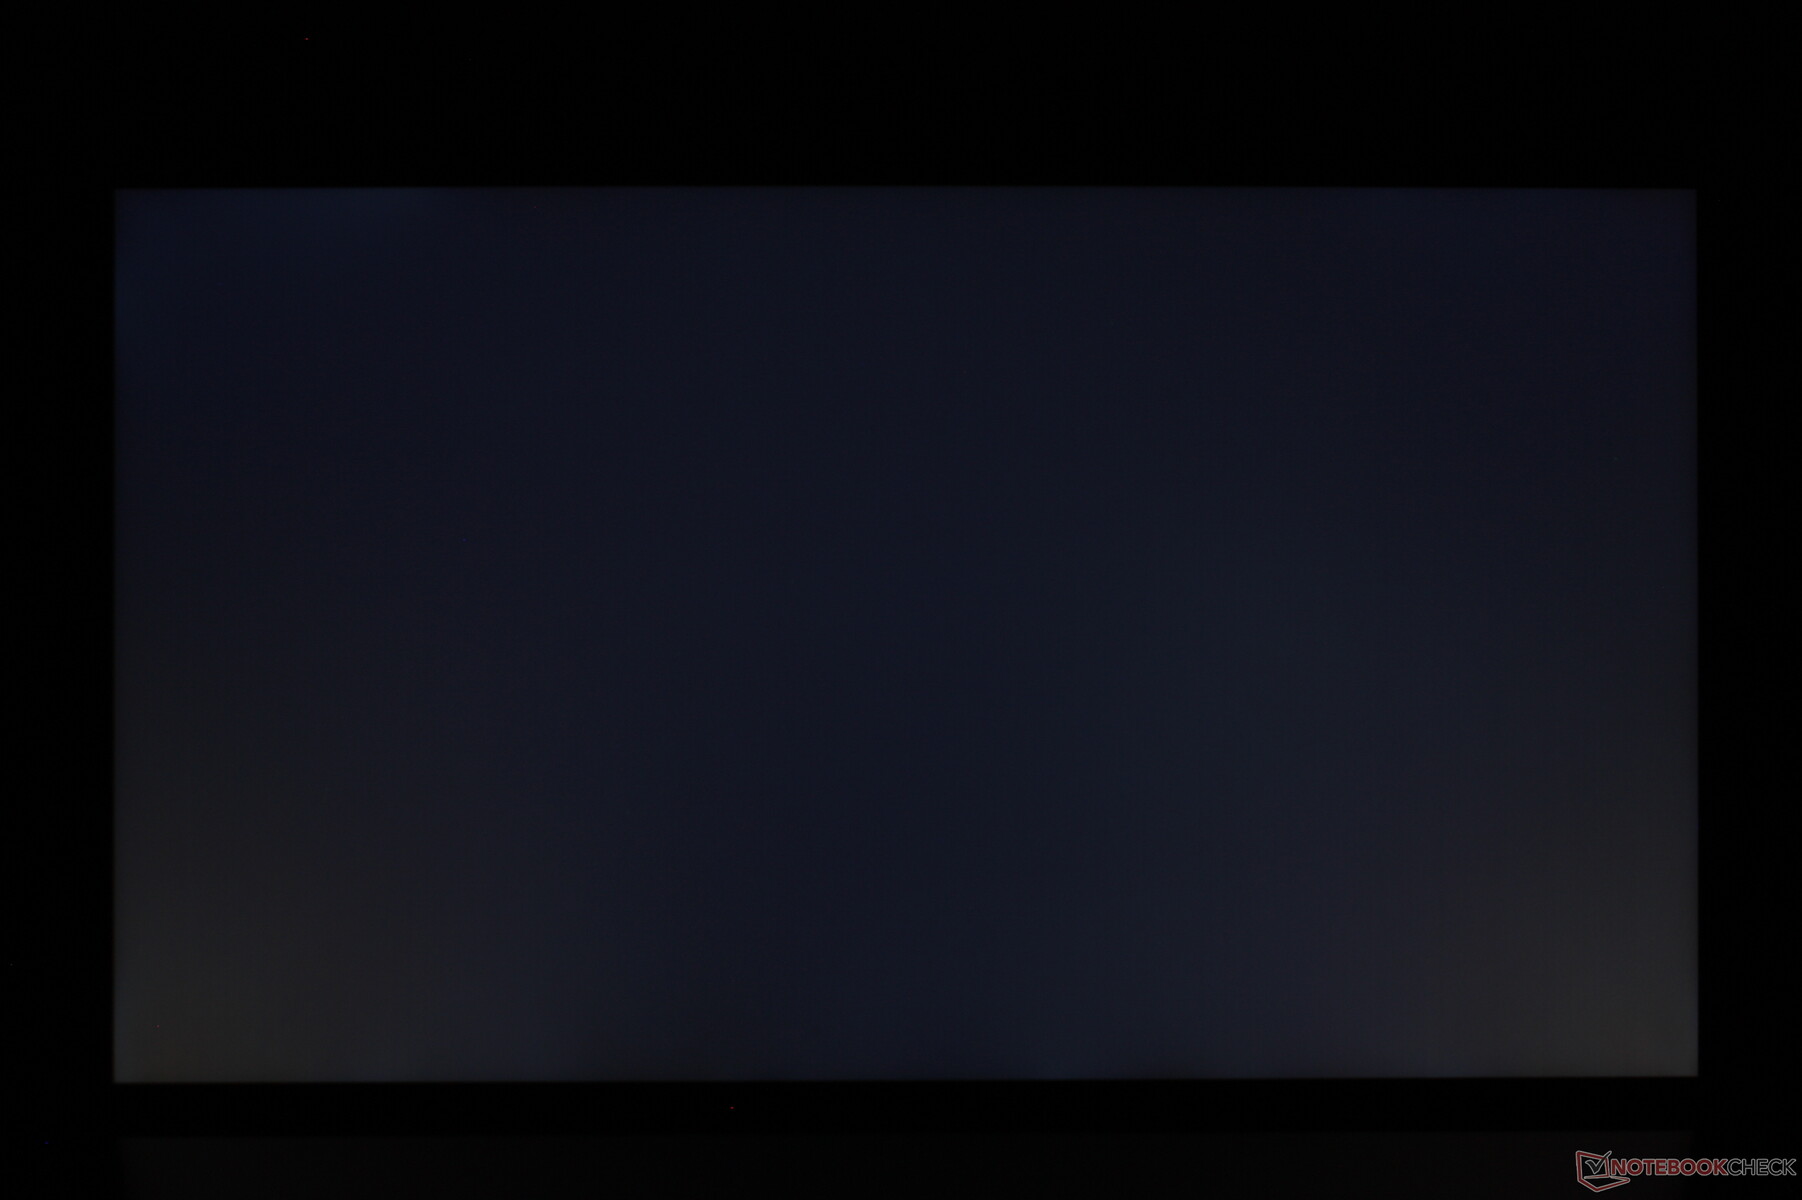
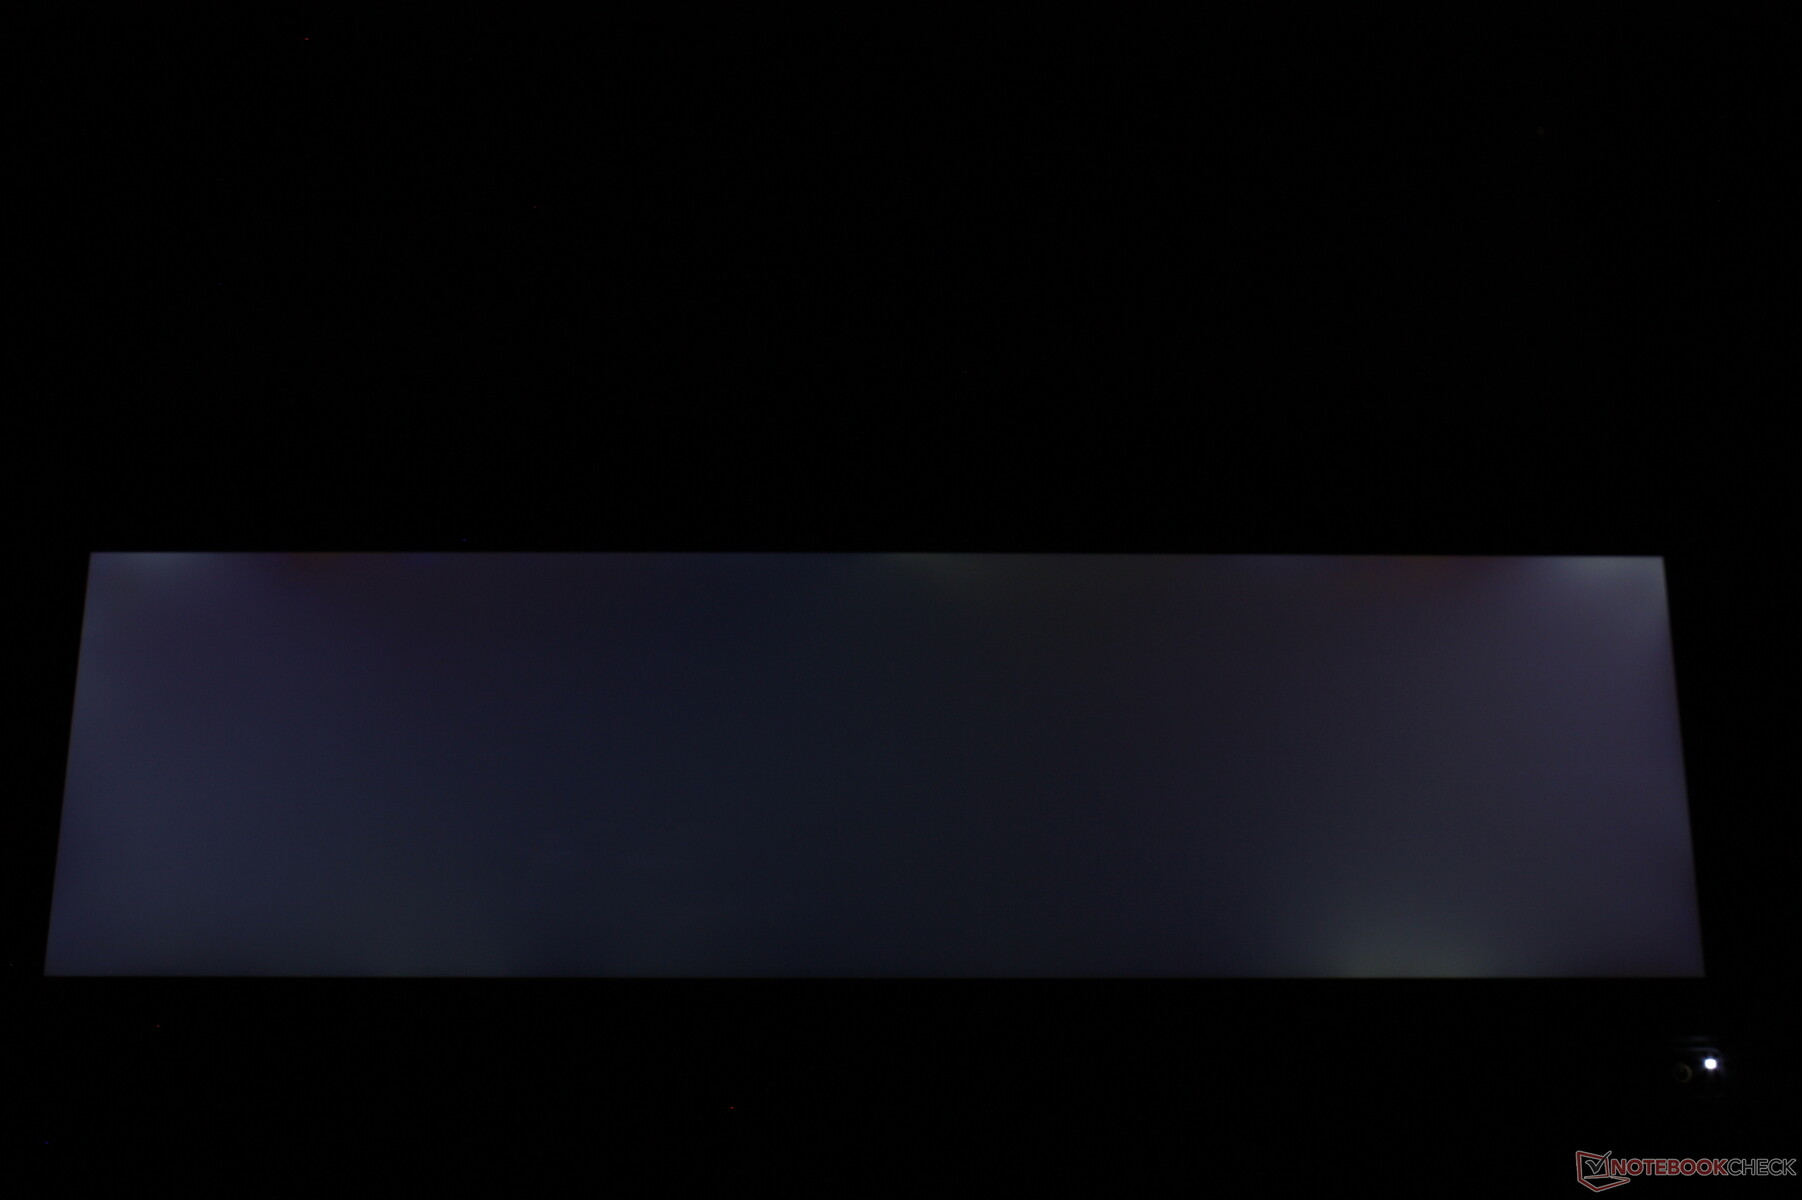
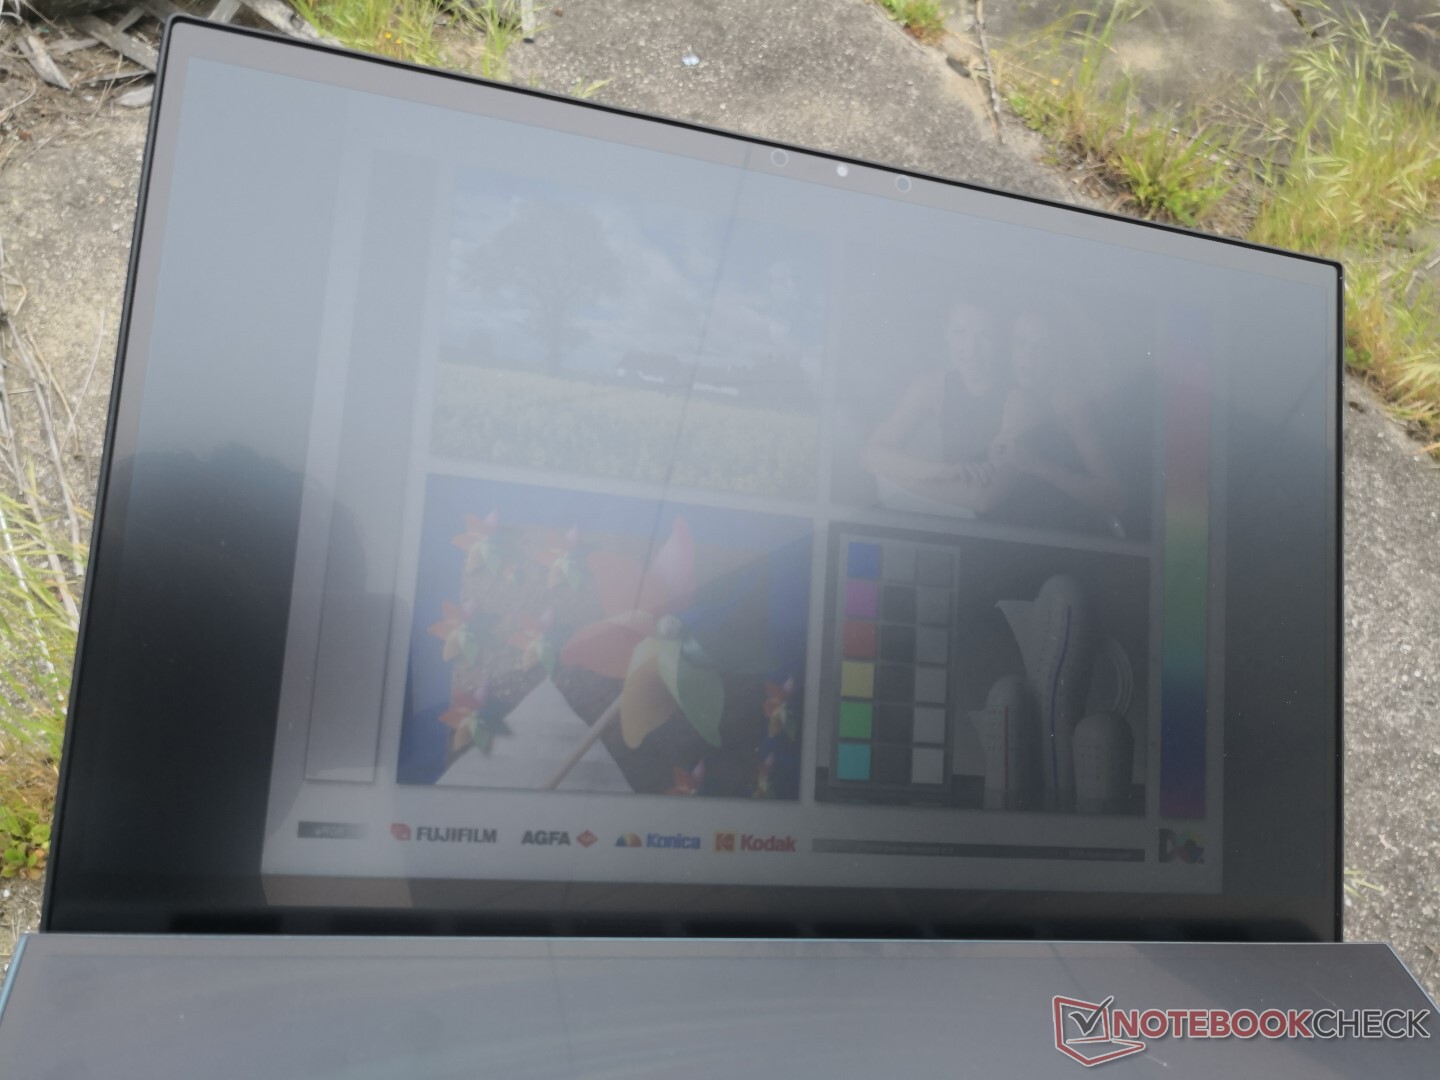
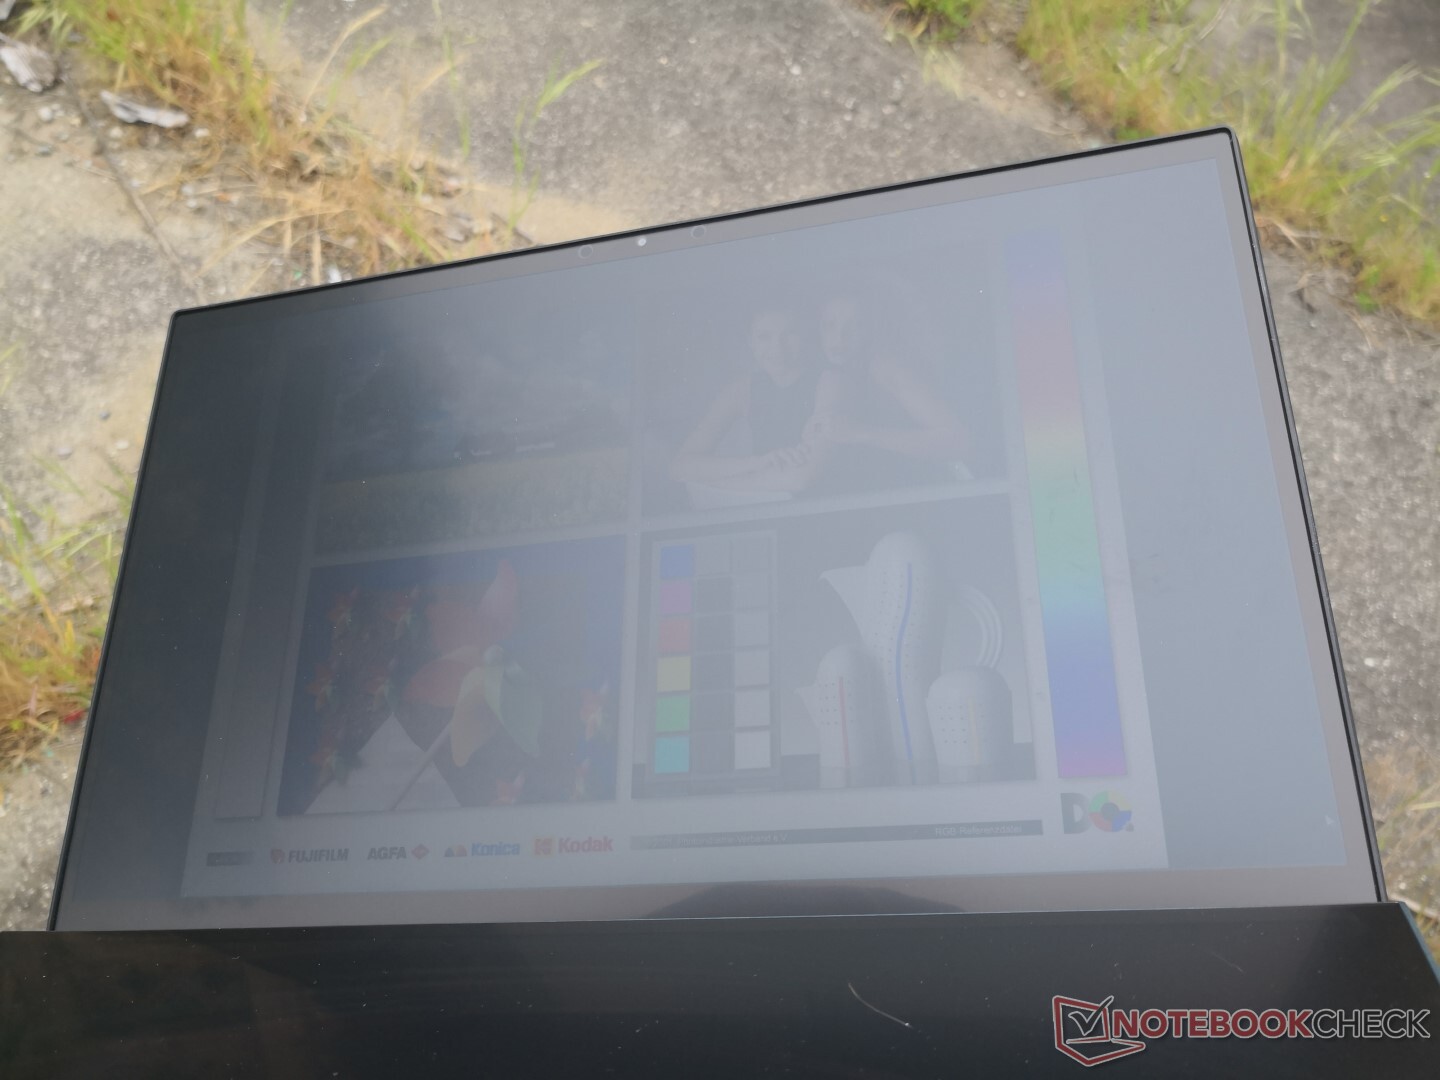
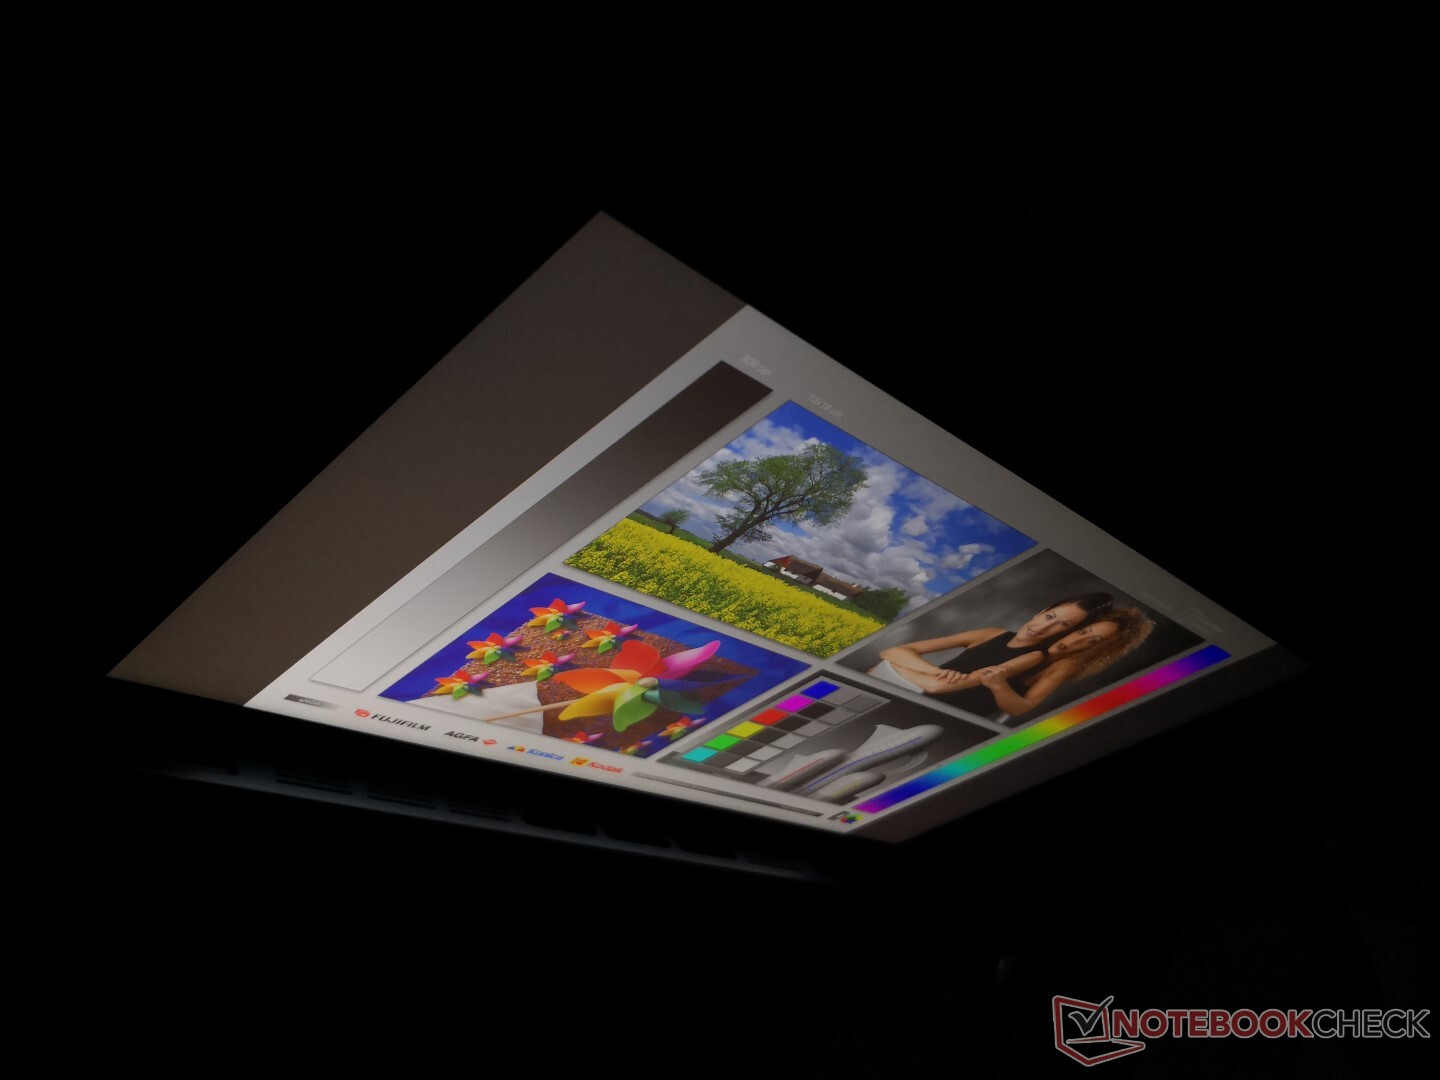
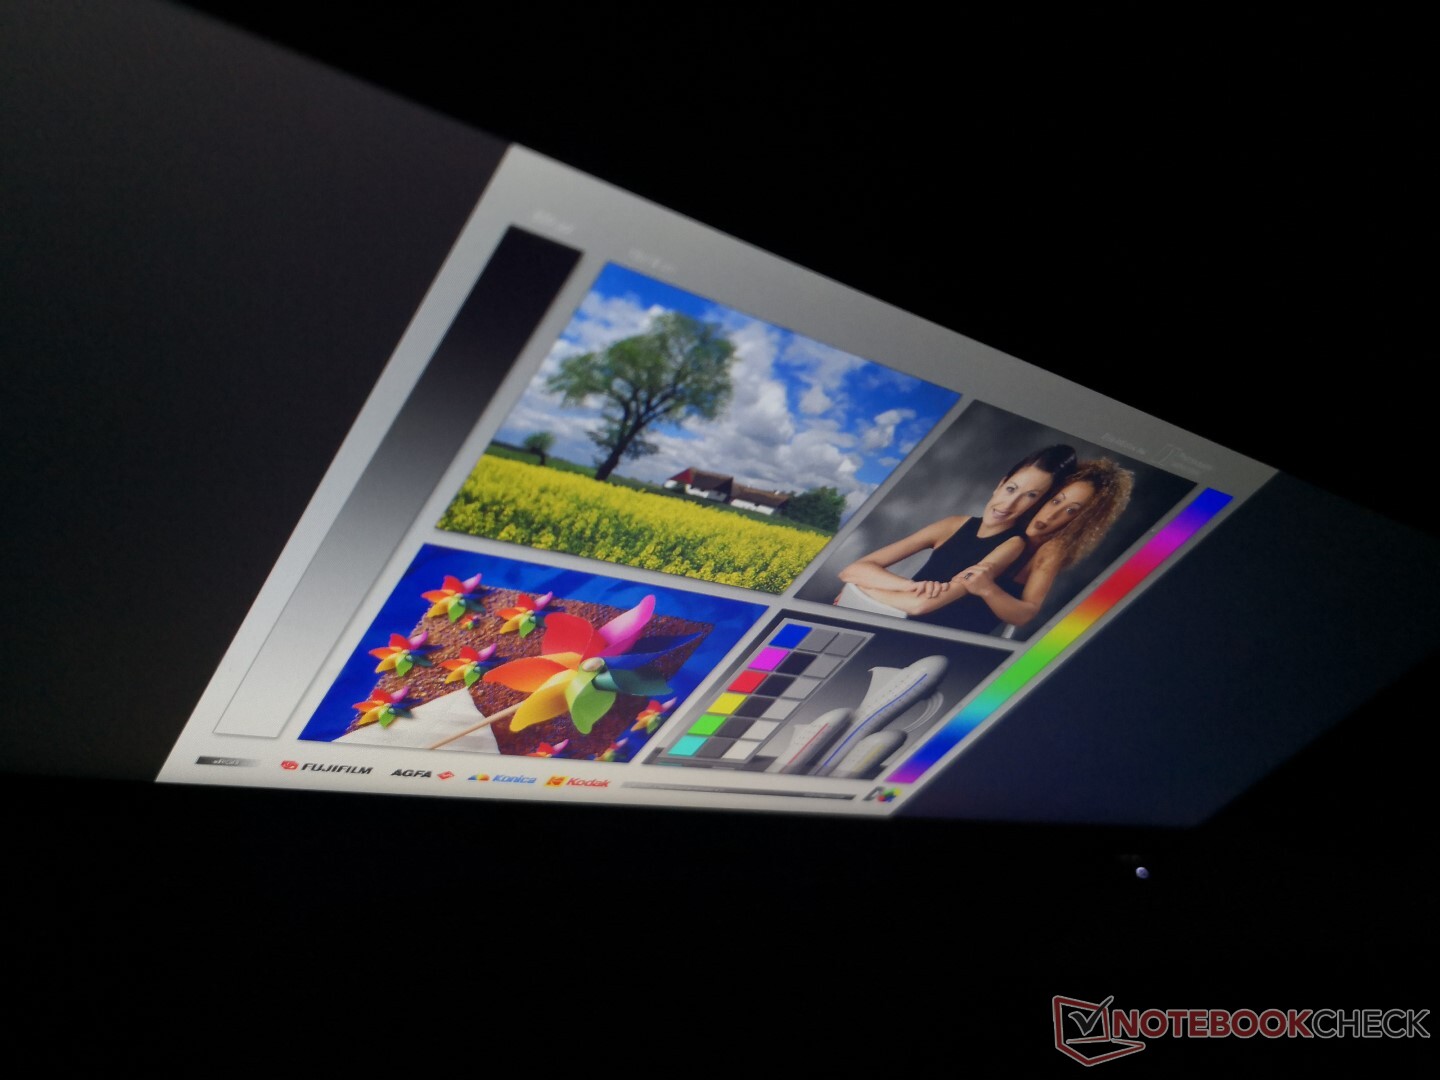
Though small in screen size, the ZenBook Duo is not the best laptop to use outdoors on a frequent basis. The display backlight is not bright enough to overcome ambient and there is glare in spite of the matte overlay. This becomes worse on the ScreenPad due to its atypical viewing angle relative to the user. Our screenshots below show how both screens become washed out when outdoors.
Viewing angles on both displays are still excellent as one would expect from any IPS panel. However, wide viewing angles alone aren't enough to fend off glare.
Performance
The Core U-class CPU and GeForce MX GPU are common finds on both mid-range and high-end Ultrabooks in contrast to the Core H-series and GTX GPUs that target high-performance users. The ZenBook Duo currently maxes out at the quad-core Core i7-10510U with no Ice Lake or AMD options available.
Meanwhile, the GeForce MX250 in our Asus is the slower '1D52' version compared to the faster '1D13' version as found on the MSI Modern 14. Base GPU and memory clock rates are therefore slower at 937 MHz and 1502 MHz, respectively, compared to 1519 MHz and 1752 MHz on the MSI.
System RAM is soldered and not user-upgradeable. We recommend going for the 16 GB configurations if possible since this laptop is all about multi-tasking between its two screens.
Processor
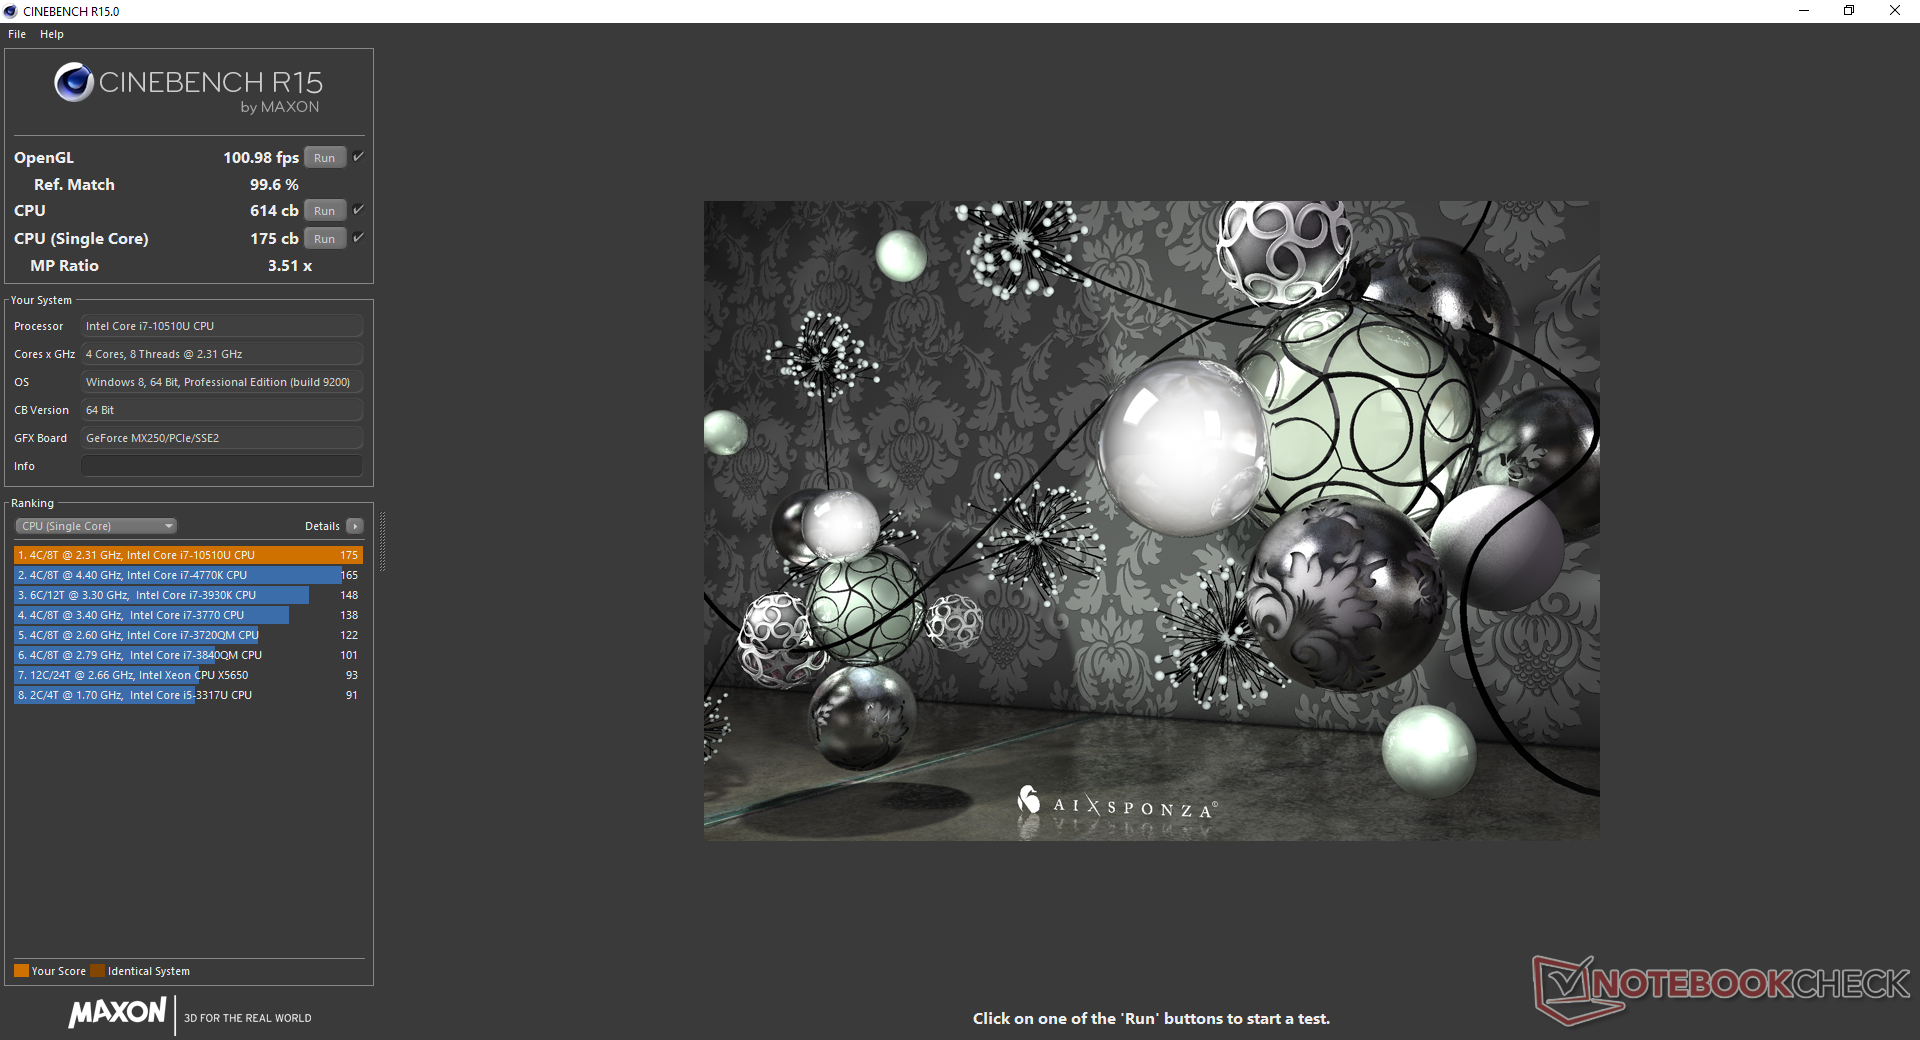
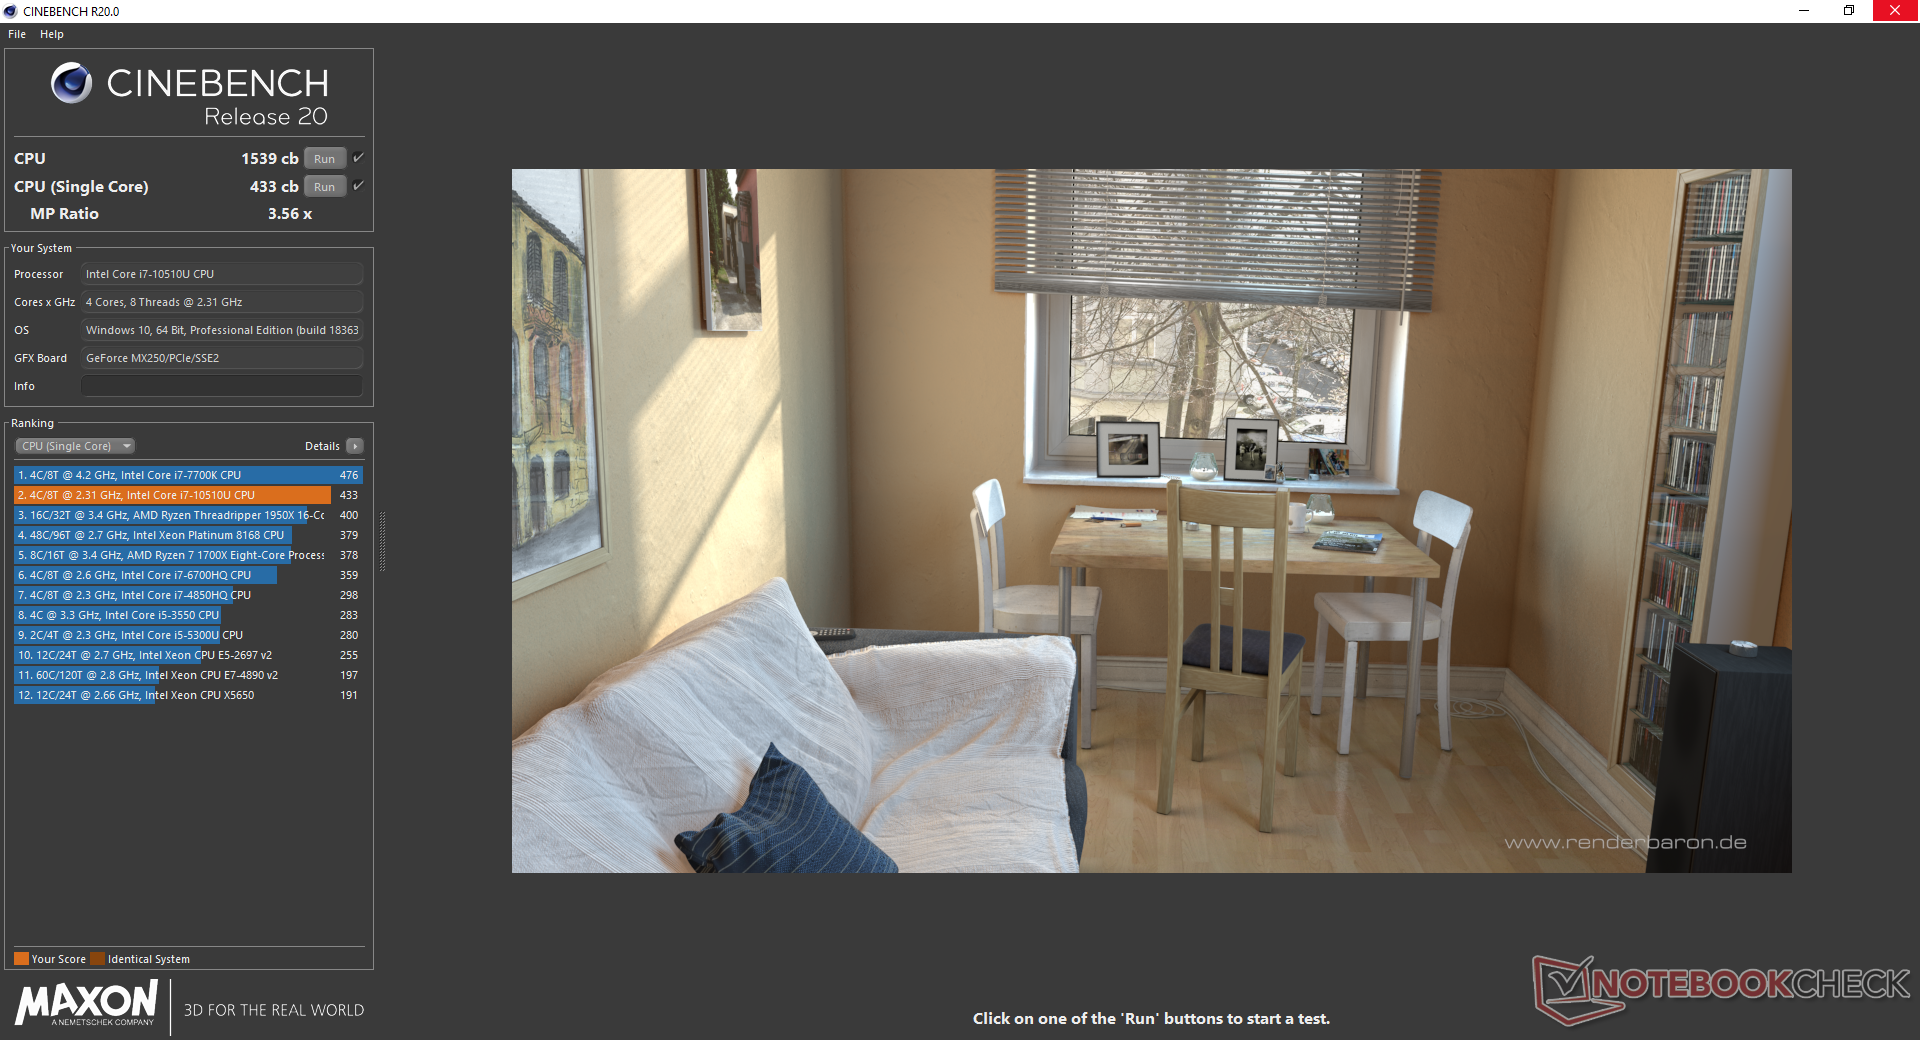
CPU performance is excellent on the surface, but running stressful benchmarks repeatedly will reveal the poor performance sustainability of the laptop over time. As an example, running CineBench R15 Multi-Thread in a loop results in an initial high score of 767 points before falling and stabilizing at 539 points to represent a performance drop of almost 30 percent. In comparison, the Core i7 Ice Lake CPU in the 15-inch Surface Book 3 would drop by only 6 to 7 percent over time in the same loop test. This is explored further in our Stress Test section below.
See our dedicated page on the Core i7-10510U for more technical information and benchmark comparisons. The hexa-core Core i7-10710U, which would have boosted multi-thread performance by about 50 percent, is not an option here.
Cinebench R15: CPU Single 64Bit | CPU Multi 64Bit
Blender: v2.79 BMW27 CPU
7-Zip 18.03: 7z b 4 -mmt1 | 7z b 4
Geekbench 5.5: Single-Core | Multi-Core
HWBOT x265 Benchmark v2.2: 4k Preset
LibreOffice : 20 Documents To PDF
R Benchmark 2.5: Overall mean
| Blender / v2.79 BMW27 CPU | |
| HP Elite Dragonfly-8MK79EA | |
| Average Intel Core i7-10510U (628 - 1051, n=31) | |
| Asus ZenBook Duo UX481FL | |
| Microsoft Surface Laptop 3 13 Core i5-1035G7 | |
| Dell XPS 13 7390 Core i7-10710U | |
| 7-Zip 18.03 / 7z b 4 -mmt1 | |
| Asus ZenBook Duo UX481FL | |
| Average Intel Core i7-10510U (3747 - 4981, n=31) | |
| Dell XPS 13 7390 Core i7-10710U | |
| Microsoft Surface Laptop 3 13 Core i5-1035G7 | |
| HP Elite Dragonfly-8MK79EA | |
| 7-Zip 18.03 / 7z b 4 | |
| Dell XPS 13 7390 Core i7-10710U | |
| Asus ZenBook Duo UX481FL | |
| Microsoft Surface Laptop 3 13 Core i5-1035G7 | |
| Average Intel Core i7-10510U (12196 - 21298, n=31) | |
| HP Elite Dragonfly-8MK79EA | |
| Geekbench 5.5 / Single-Core | |
| Asus ZenBook Duo UX481FL | |
| Average Intel Core i7-10510U (977 - 1287, n=31) | |
| Geekbench 5.5 / Multi-Core | |
| Asus ZenBook Duo UX481FL | |
| Average Intel Core i7-10510U (2474 - 4484, n=31) | |
| HWBOT x265 Benchmark v2.2 / 4k Preset | |
| Dell XPS 13 7390 Core i7-10710U | |
| Asus ZenBook Duo UX481FL | |
| Average Intel Core i7-10510U (3.41 - 6.04, n=31) | |
| Microsoft Surface Laptop 3 13 Core i5-1035G7 | |
| HP Elite Dragonfly-8MK79EA | |
| LibreOffice / 20 Documents To PDF | |
| Asus ZenBook Duo UX481FL | |
| Average Intel Core i7-10510U (50.7 - 77.8, n=27) | |
| R Benchmark 2.5 / Overall mean | |
| Asus ZenBook Duo UX481FL | |
| Average Intel Core i7-10510U (0.637 - 0.81, n=28) | |
* ... smaller is better
System Performance
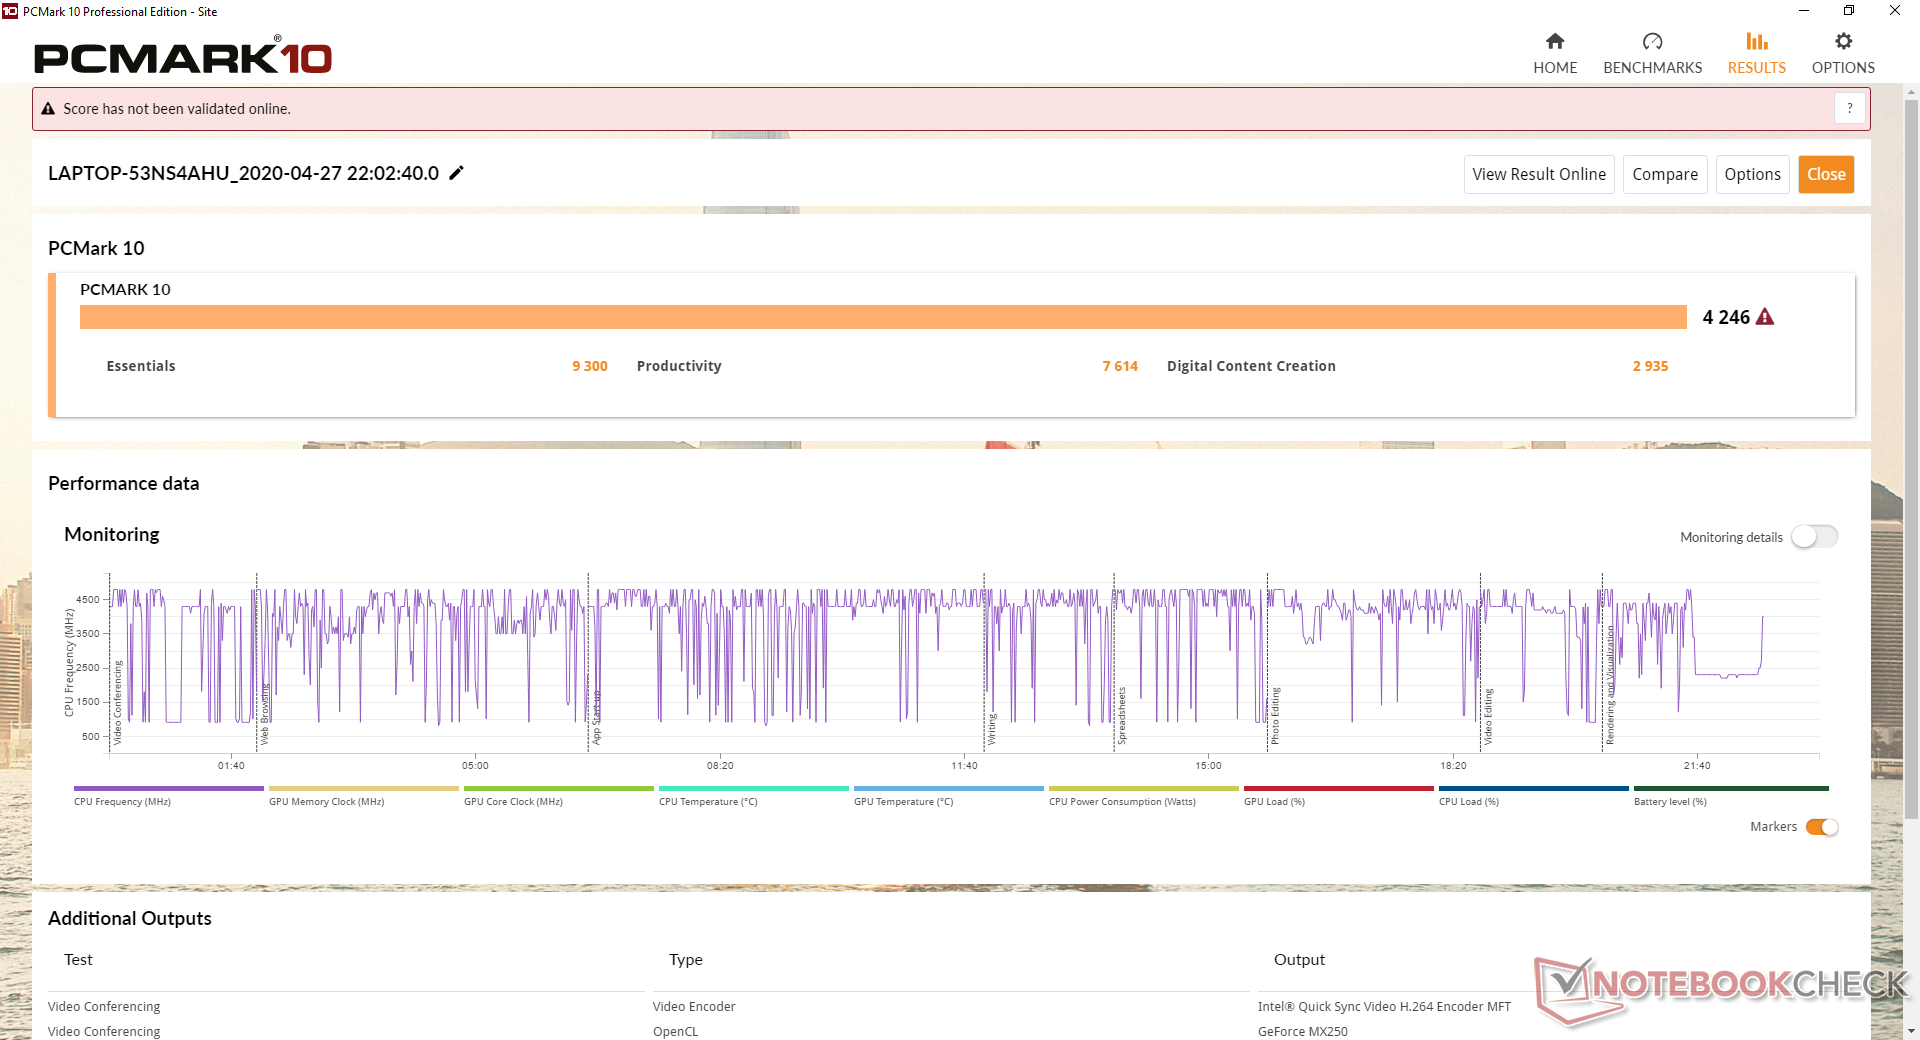
PCMark benchmarks are where we expect them to be relative to other laptops equipped with the Core i7 CPU and GeForce MX250 GPU. The PCMark 10 Digital Content Creation score, however, is lower than average. This particular benchmark has never been very accurate when it comes to assessing GPU performance between different laptops.
We experienced no software or hardware issues during our time with the test unit. Keep in mind that there is a slight learning curve to using the second screen before it becomes second nature. The positioning of the screen makes it much more ergonomic to use than the original ScreenPad on the ZenBook Pro UX580.
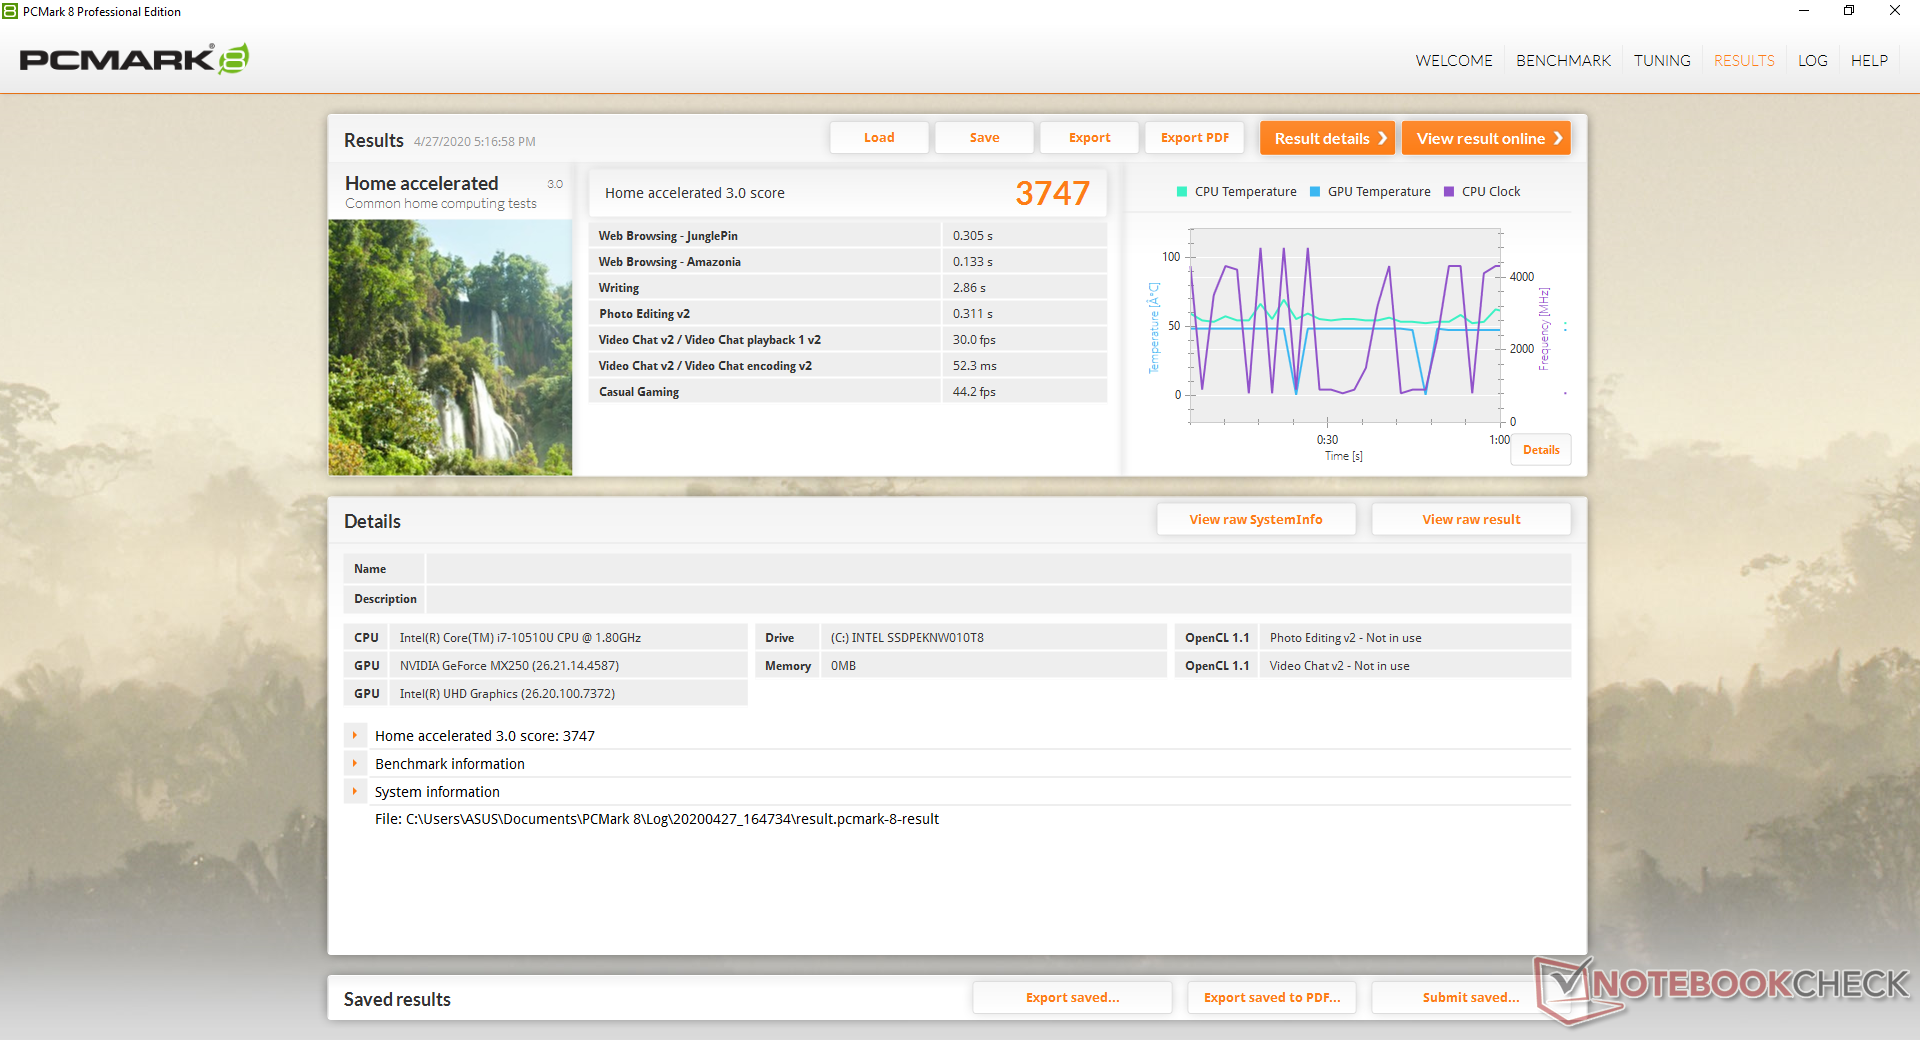
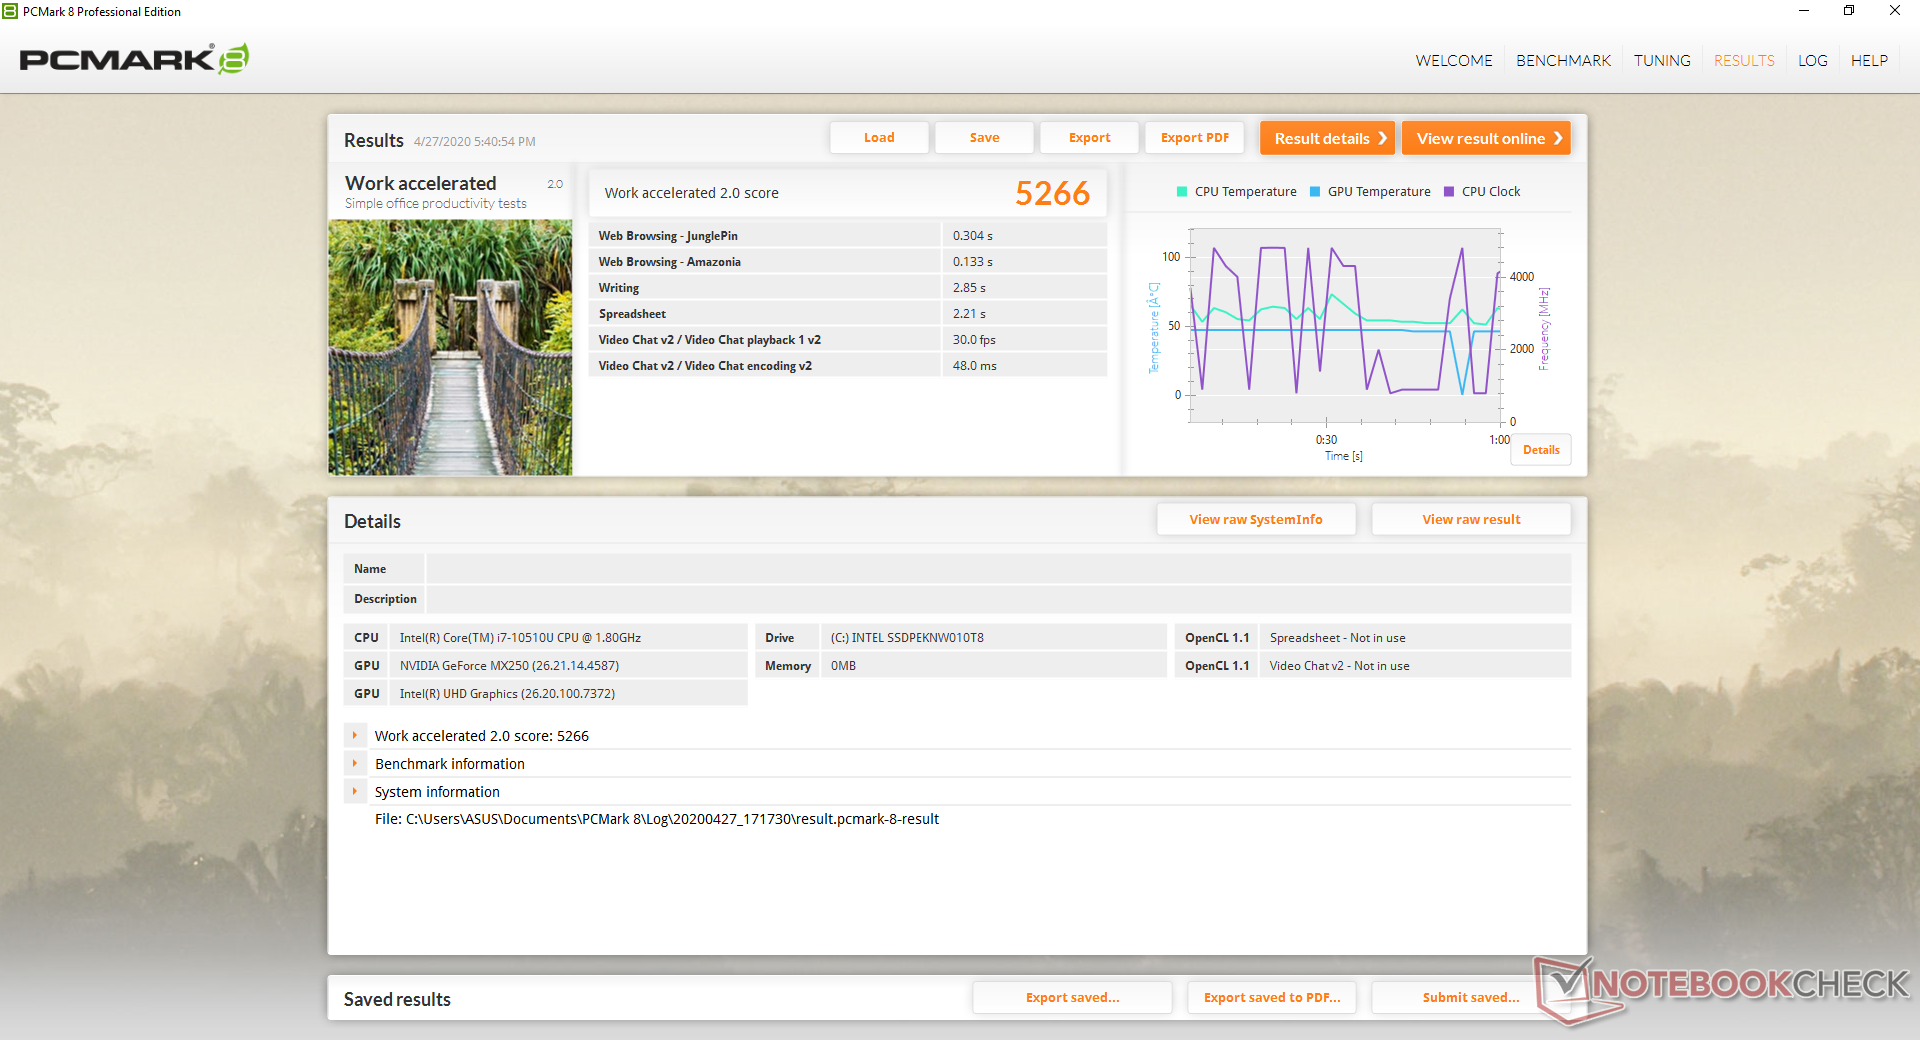
| PCMark 8 Home Score Accelerated v2 | 3747 points | |
| PCMark 8 Work Score Accelerated v2 | 5266 points | |
| PCMark 10 Score | 4246 points | |
Help | ||
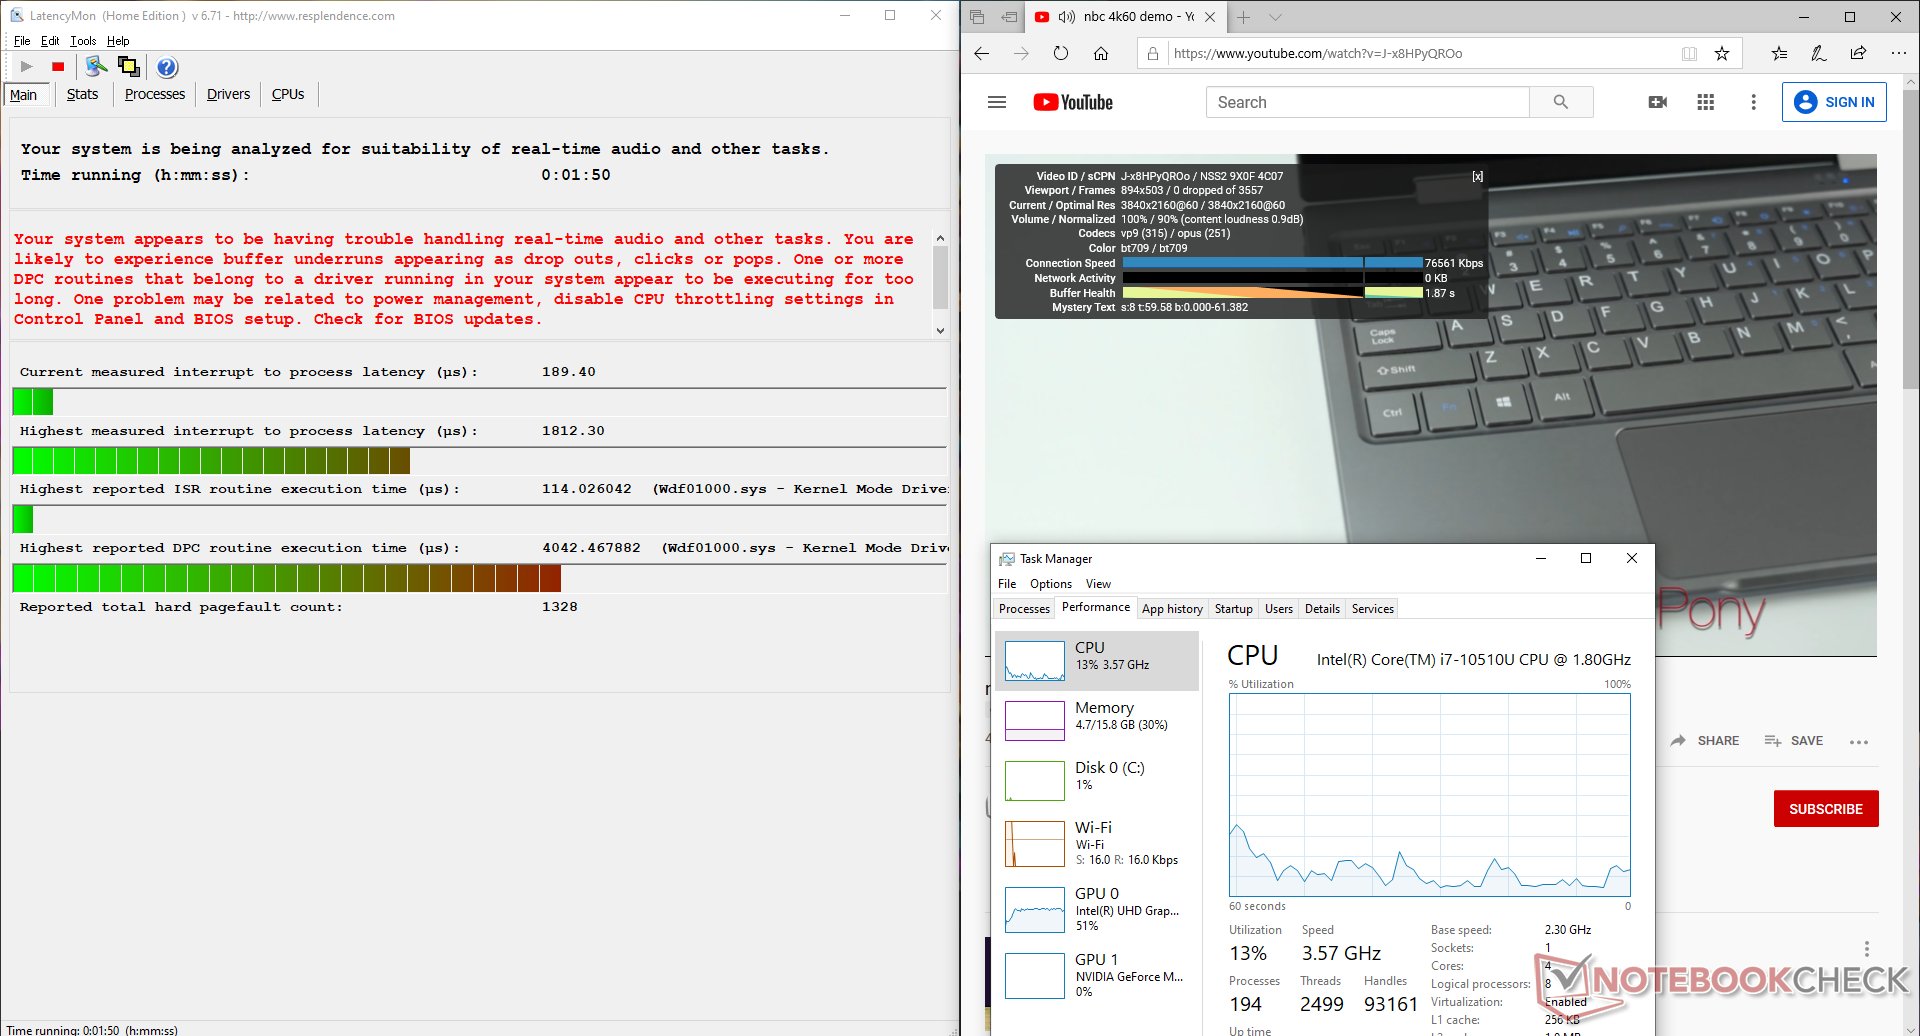
DPC Latency
LatencyMon shows DPC latency issues when opening multiple browser tabs and running Prime95 in sequence. Fortunately, our 4K video playback test on YouTube reveals no dropped frames. The integrated Intel GPU can be observed doing all the heavy lifting during cideo playback.
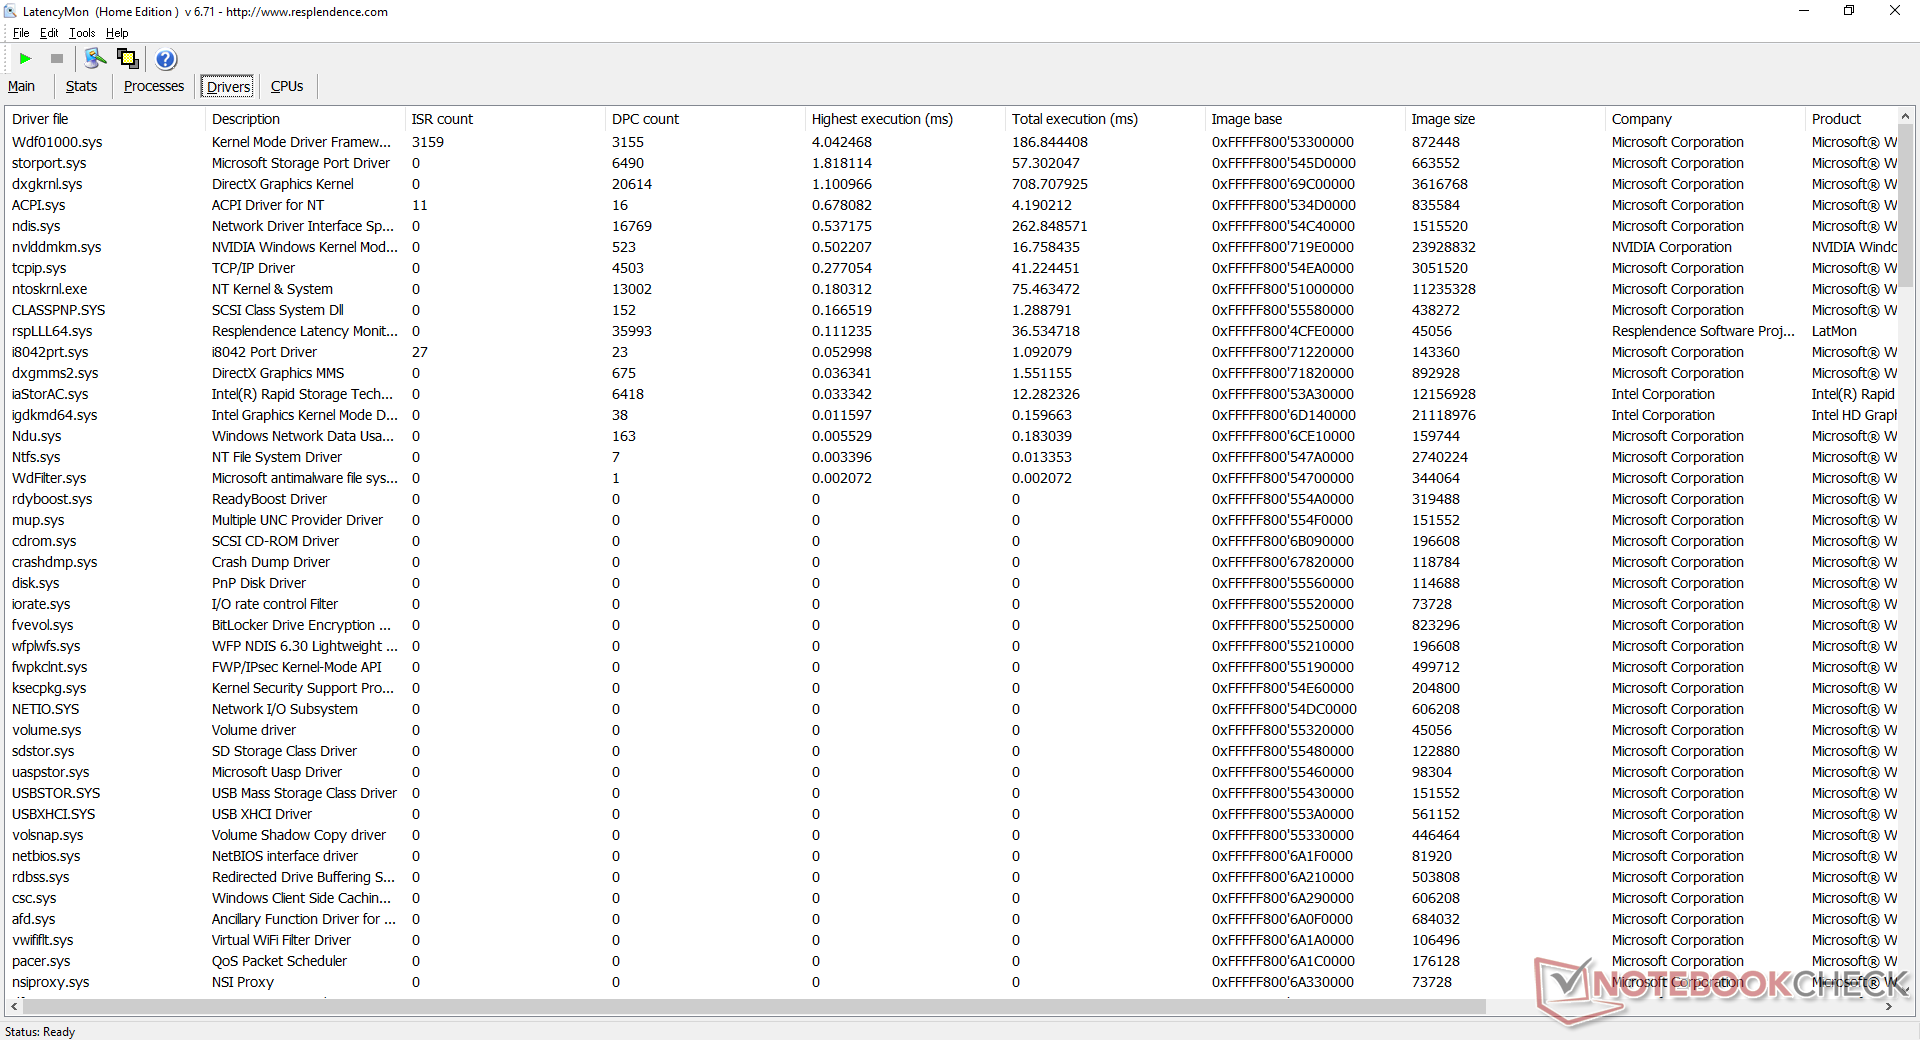
| DPC Latencies / LatencyMon - interrupt to process latency (max), Web, Youtube, Prime95 | |
| Asus ZenBook Duo UX481FL | |
* ... smaller is better
Storage Devices
Understandably, there is just one M.2 2280 slot with no secondary options due to space constraints. Note that some SKUs may come with PCIe x2 SSDs instead of PCIe x4.
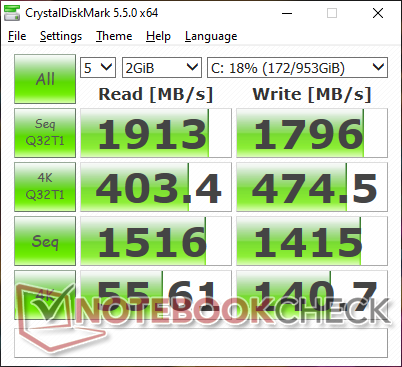
The 1 TB Intel 660p NVMe SSD in our test unit returns roughly half the sequential read and write rates of the pricier Samsung PM981 according to AS SSD benchmarks. This balances well with the U-class CPU and power-efficient GeForce MX GPU involved.
See our table of SSDs and HDDs for more benchmark comparisons.
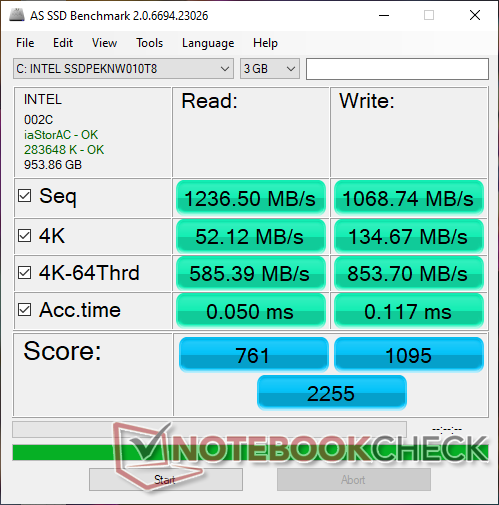
| Asus ZenBook Duo UX481FL Intel SSD 660p 1TB SSDPEKNW010T8 | Asus ZenBook 14 UM431DA-AM020T SK hynix BC501 HFM512GDHTNG-8310A | Huawei Matebook X Pro i5 Samsung PM961 MZVLW256HEHP | Lenovo ThinkPad X1 Carbon G7 20R1-000YUS WDC PC SN730 SDBPNTY-512G | MSI Prestige 14 A10SC-009 Samsung SSD PM981 MZVLB1T0HALR | |
|---|---|---|---|---|---|
| AS SSD | 0% | 3% | 14% | 74% | |
| Seq Read | 1237 | 1417 15% | 2416 95% | 1786 44% | 2300 86% |
| Seq Write | 1069 | 781 -27% | 1170 9% | 1259 18% | 2051 92% |
| 4K Read | 52.1 | 37.03 -29% | 48.33 -7% | 45.86 -12% | 46.23 -11% |
| 4K Write | 134.7 | 80.1 -41% | 103.1 -23% | 147.9 10% | 84.6 -37% |
| 4K-64 Read | 585 | 740 26% | 1039 78% | 885 51% | 1552 165% |
| 4K-64 Write | 854 | 748 -12% | 399.6 -53% | 950 11% | 1789 109% |
| Access Time Read * | 0.05 | 0.047 6% | 0.058 -16% | 0.058 -16% | 0.049 2% |
| Access Time Write * | 0.117 | 0.045 62% | 0.036 69% | 0.074 37% | 0.045 62% |
| Score Read | 761 | 918 21% | 1329 75% | 1110 46% | 1828 140% |
| Score Write | 1095 | 906 -17% | 620 -43% | 1224 12% | 2079 90% |
| Score Total | 2255 | 2270 1% | 2575 14% | 2885 28% | 4831 114% |
| Copy ISO MB/s | 1714 | 739 -57% | 1384 -19% | ||
| Copy Program MB/s | 511 | 312.3 -39% | 525 3% | ||
| Copy Game MB/s | 1187 | 486.3 -59% | 1008 -15% | ||
| CrystalDiskMark 5.2 / 6 | -32% | -17% | 24% | 20% | |
| Write 4K | 140.7 | 118.8 -16% | 116.5 -17% | 151.5 8% | 163.8 16% |
| Read 4K | 55.6 | 41.62 -25% | 42.18 -24% | 45.83 -18% | 48.6 -13% |
| Write Seq | 1415 | 796 -44% | 1079 -24% | 2060 46% | 2269 60% |
| Read Seq | 1516 | 1101 -27% | 1030 -32% | 1973 30% | 1963 29% |
| Write 4K Q32T1 | 474.5 | 234.7 -51% | 225.7 -52% | 489.8 3% | 289.8 -39% |
| Read 4K Q32T1 | 403.4 | 313.8 -22% | 302.9 -25% | 386.2 -4% | 373.6 -7% |
| Write Seq Q32T1 | 1796 | 842 -53% | 1174 -35% | 2703 51% | 2395 33% |
| Read Seq Q32T1 | 1913 | 1645 -14% | 3394 77% | 3376 76% | 3479 82% |
| Total Average (Program / Settings) | -16% /
-13% | -7% /
-4% | 19% /
18% | 47% /
51% |
* ... smaller is better

GPU Performance
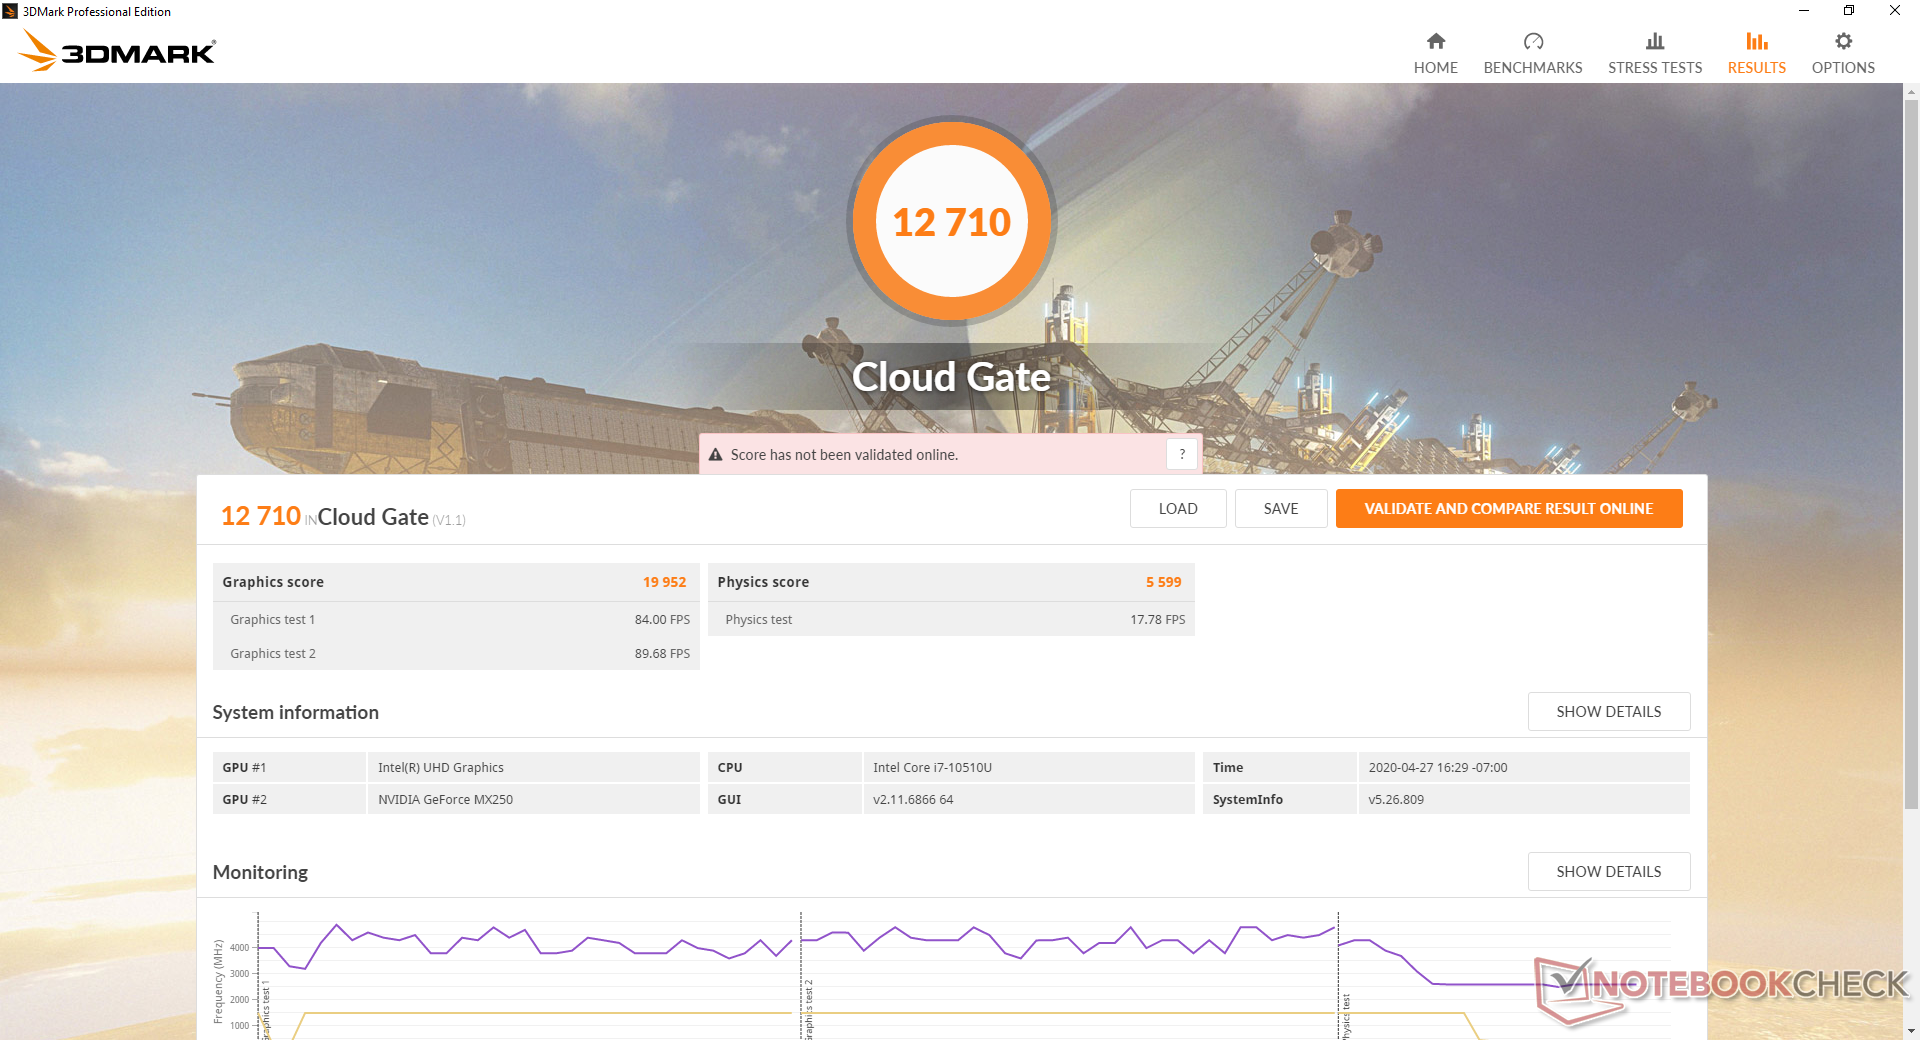
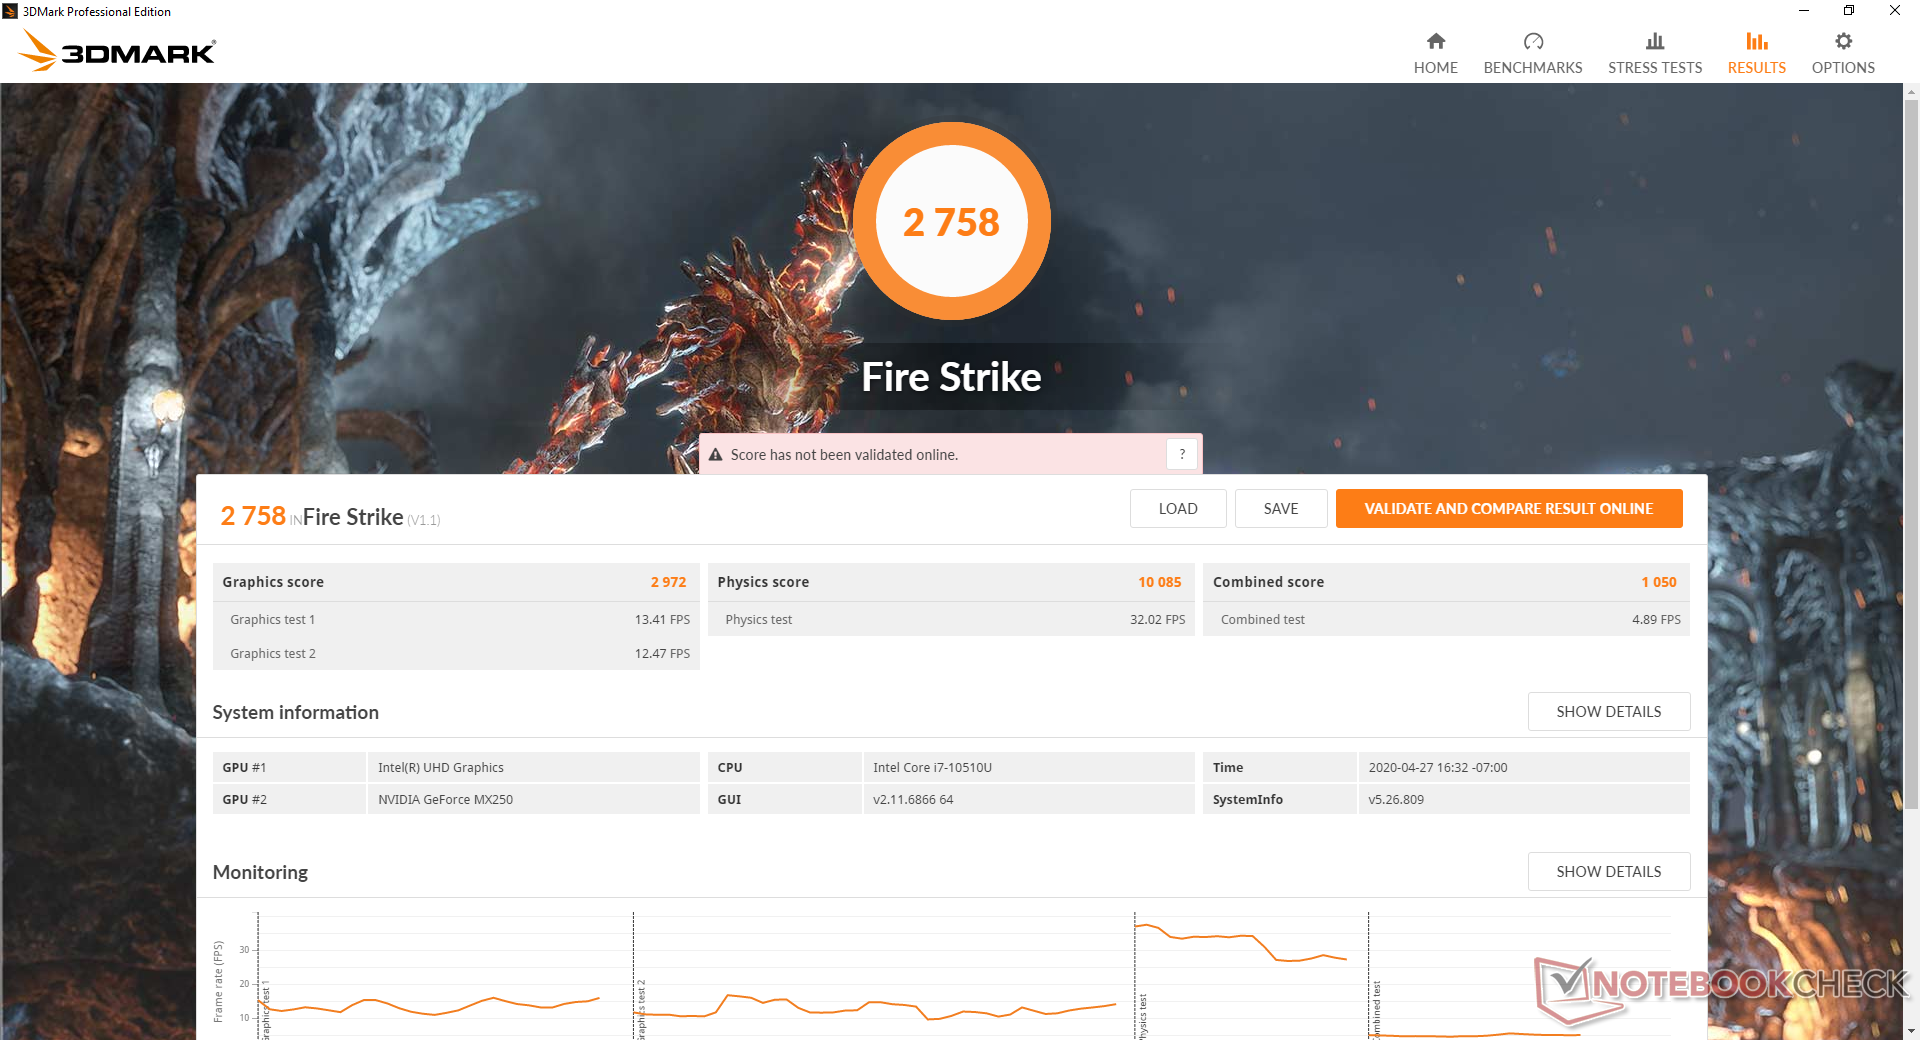
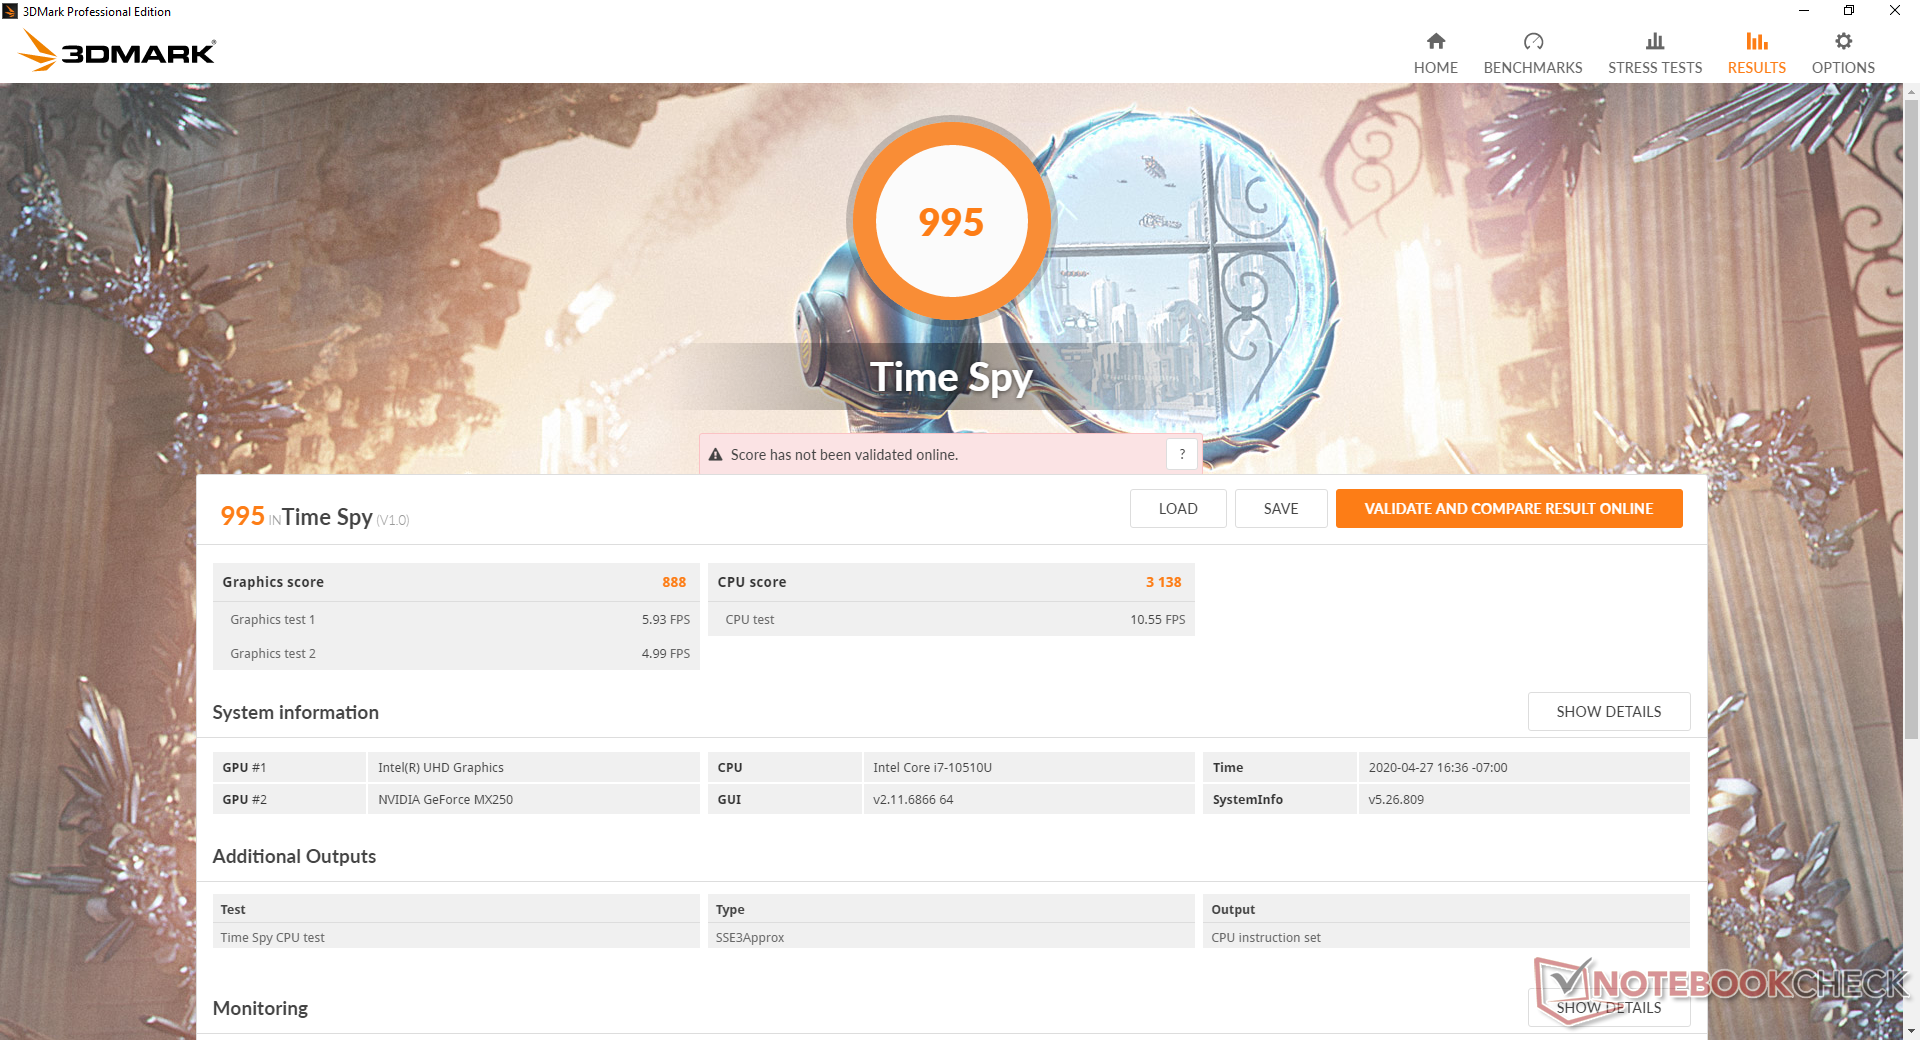
3DMark benchmarks show the GeForce MX250 in our Asus unit to be about 16 to 18 percent slower than the average MX250 in our database taken from 21 other laptops. Evidently, supporting two internal displays takes its toll on the GPU. Expect performance to be most similar to the ZenBook 14 UX433 equipped with the older 10 W GeForce MX150.
On the flip side, the second screen will come in handy for chat programs or videos when playing a game on the main screen. Just keep in mind that any user input on the second screen will shift the focus away from the main game and possibly minimize or crash the window.
See our dedicated page on the GeForce MX250 for more technical information and benchmark comparisons.
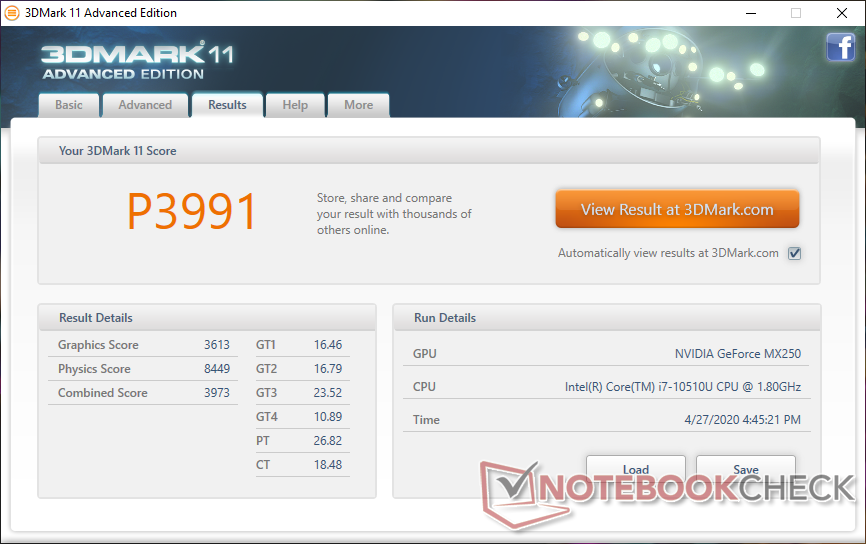
| 3DMark 11 Performance | 3991 points | |
| 3DMark Cloud Gate Standard Score | 12710 points | |
| 3DMark Fire Strike Score | 2758 points | |
| 3DMark Time Spy Score | 995 points | |
Help | ||
| low | med. | high | ultra | |
| The Witcher 3 (2015) | 58.3 | 33.8 | 18 | 9.8 |
| Dota 2 Reborn (2015) | 114 | 102 | 62.3 | 56 |
| X-Plane 11.11 (2018) | 64.8 | 45.5 | 42.5 |
Emissions
System Noise
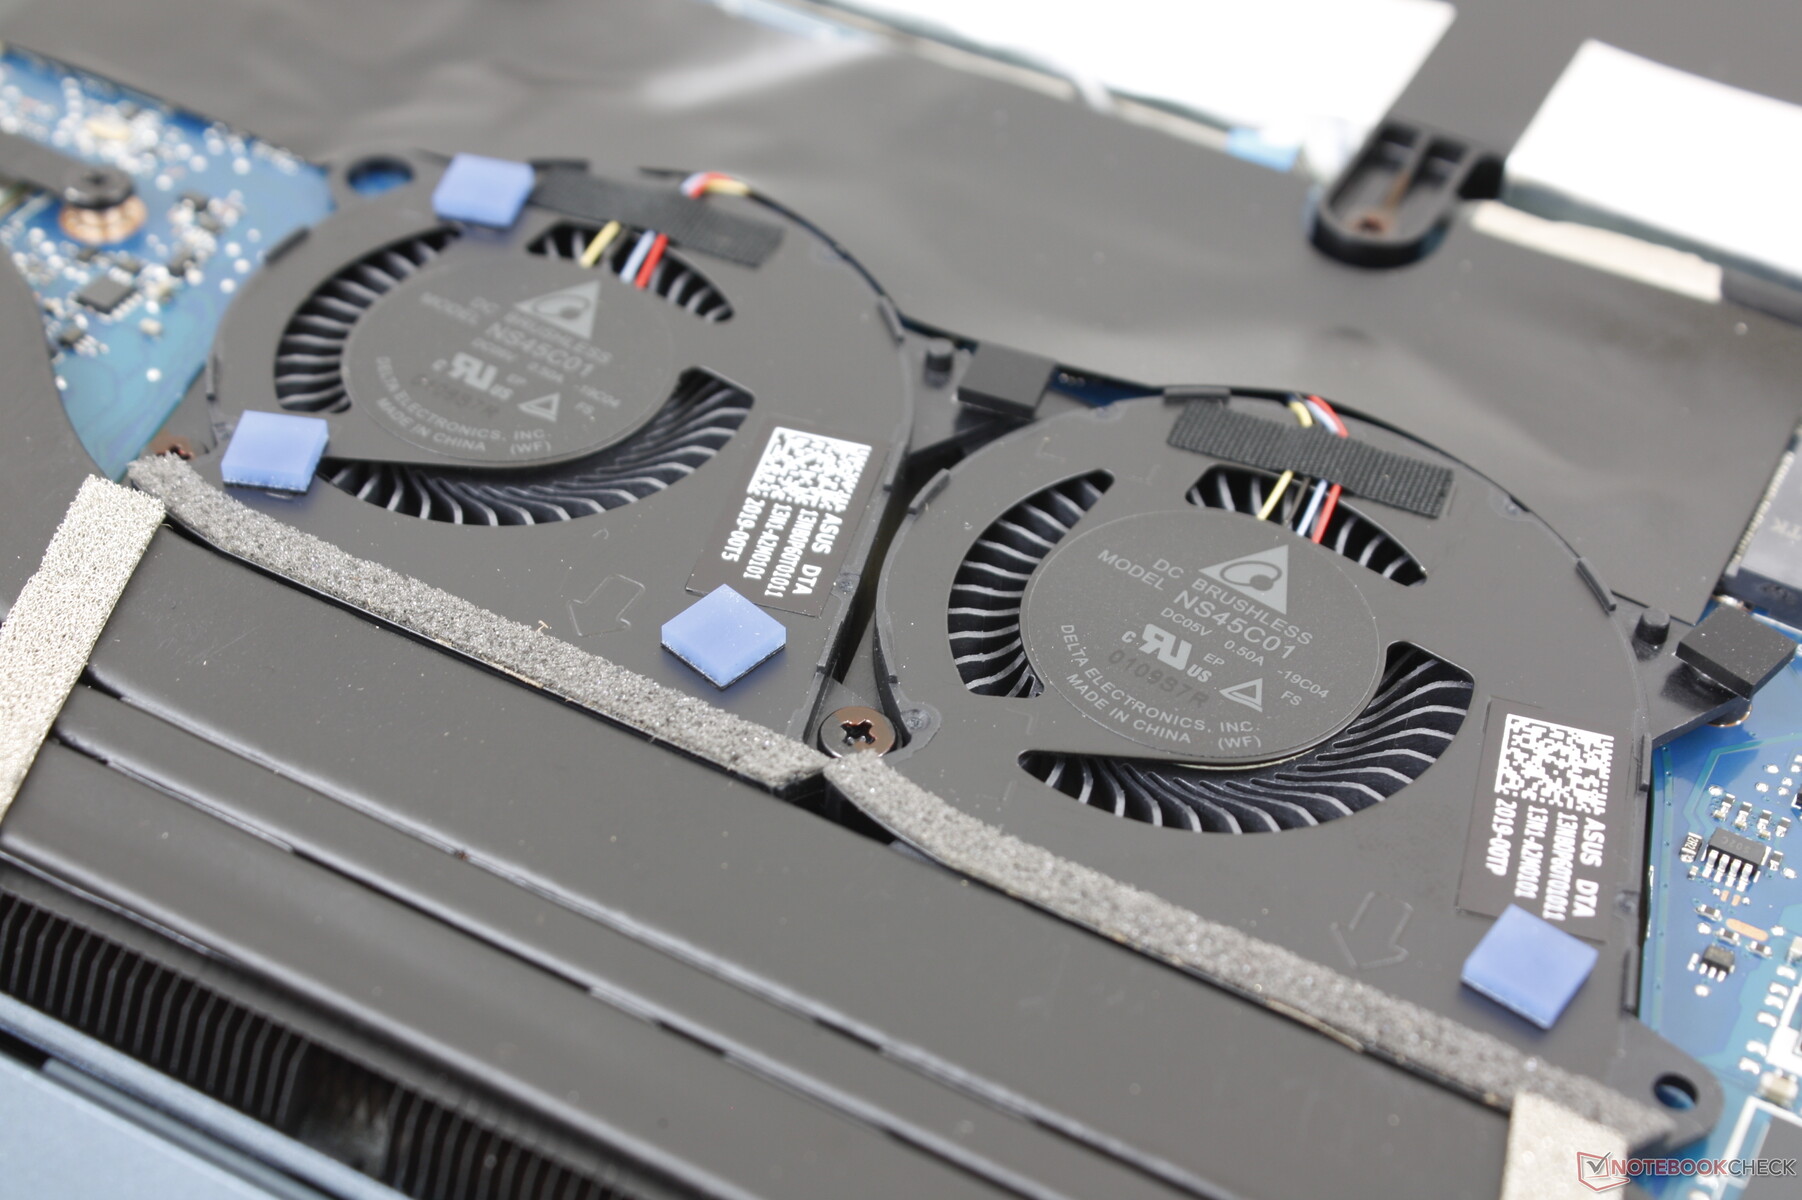
The cooling solution consists of twin 30 mm to 35 mm fans with three heat pipes. When idling on desktop, the fans remain idle for a completely silent experience. If multi-tasking or video streaming, fan noise will hover in the 29.1 dB(A) range to still be very quiet and generally unnoticeable.
Running higher loads like 3DMark 06 will steadily increase the fan noise until it hits a ceiling of 39.1 dB(A) towards the end of the first benchmark scene. This appears to be the maximum fan noise of the system as results are the same when gaming or when running Prime95 and FurMark loads. Perhaps not coincidentally, this 39 dB(A) maximum can also be observed on the ZenBook 14 UM431DA and Zenbook 14 UX433FN.
We're not able to notice any coil whine or electronic noise from our test unit.
| Asus ZenBook Duo UX481FL GeForce MX250, i7-10510U, Intel SSD 660p 1TB SSDPEKNW010T8 | Asus ZenBook 14 UM431DA-AM020T Vega 10, R7 3700U, SK hynix BC501 HFM512GDHTNG-8310A | Huawei Matebook X Pro i5 GeForce MX150, i5-8250U, Samsung PM961 MZVLW256HEHP | MSI Prestige 14 A10SC-009 GeForce GTX 1650 Max-Q, i7-10710U, Samsung SSD PM981 MZVLB1T0HALR | Asus Zenbook 14 UX433FN-A6023T GeForce MX150, i7-8565U, Intel SSD 660p SSDPEKNW512G8 | |
|---|---|---|---|---|---|
| Noise | 1% | -3% | -7% | -5% | |
| off / environment * | 28.3 | 29.8 -5% | 27.9 1% | 30.3 -7% | 30.7 -8% |
| Idle Minimum * | 28.3 | 28 1% | 27.9 1% | 30.3 -7% | 30.7 -8% |
| Idle Average * | 28.3 | 28 1% | 27.9 1% | 30.3 -7% | 30.7 -8% |
| Idle Maximum * | 28.3 | 28 1% | 27.9 1% | 30.3 -7% | 30.7 -8% |
| Load Average * | 39.1 | 36.8 6% | 36.2 7% | 40.2 -3% | 38.8 1% |
| Witcher 3 ultra * | 39.1 | 45 -15% | |||
| Load Maximum * | 39.1 | 39 -0% | 45.2 -16% | 43.5 -11% | 39.3 -1% |
* ... smaller is better
Noise Level
| Idle |
| 28.3 / 28.3 / 28.3 dB(A) |
| Load |
| 39.1 / 39.1 dB(A) |
 | ||
30 dB silent 40 dB(A) audible 50 dB(A) loud |
||
min: | ||
Temperature
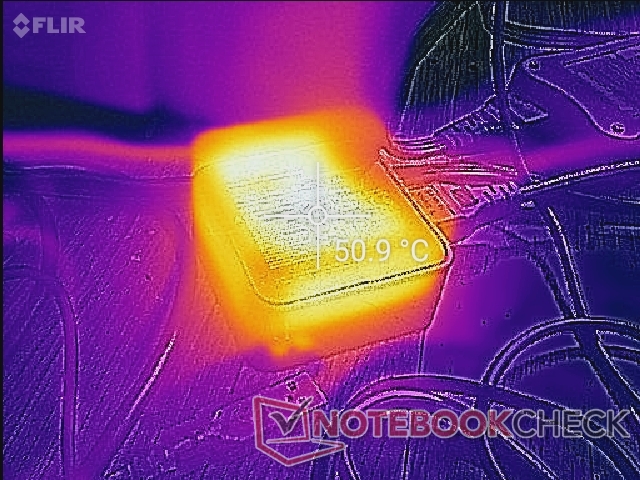
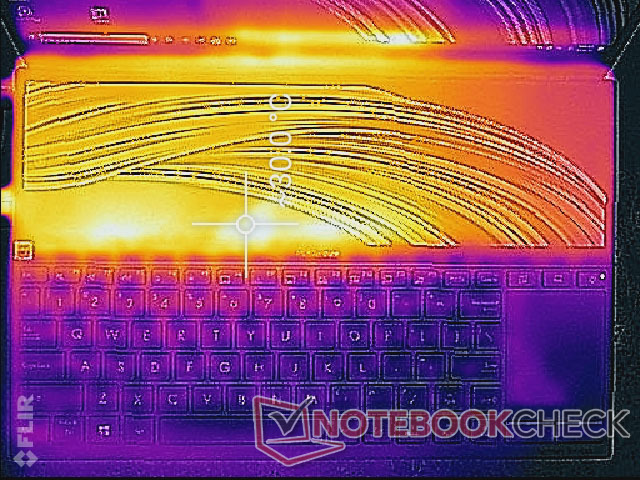
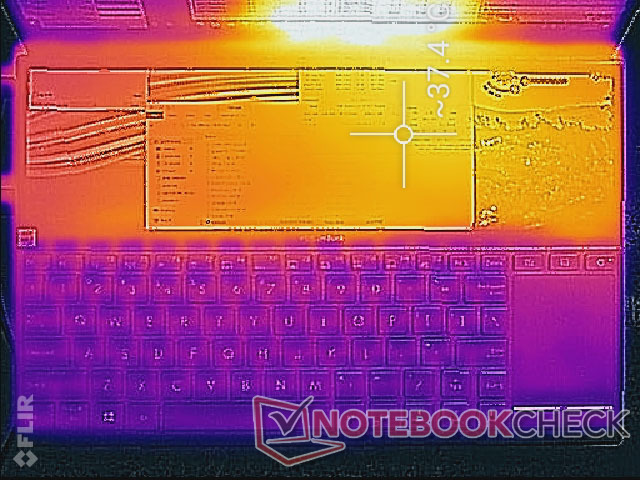
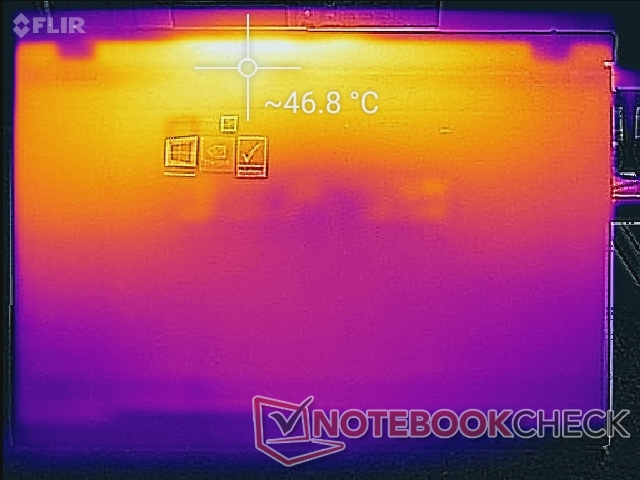
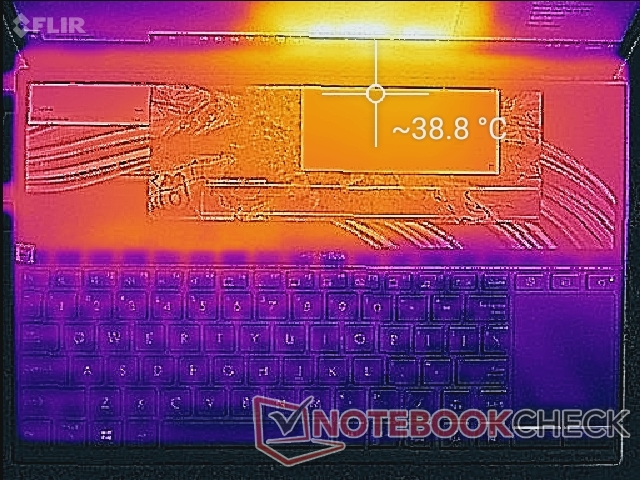
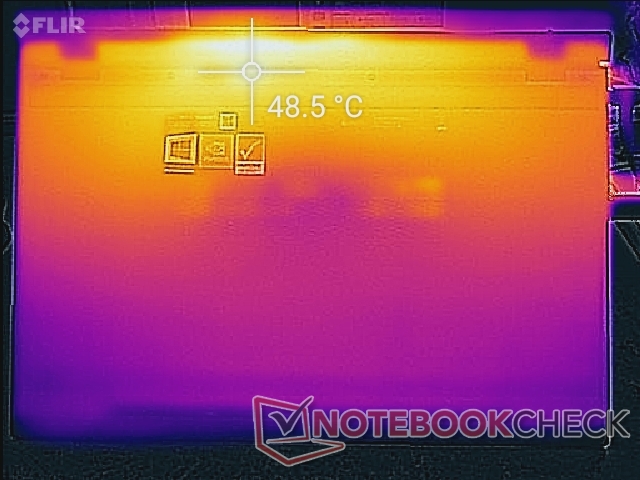
Surface temperature development is more similar to the gaming Zephyrus GX501 or GX531 than to the namesake ZenBook 15 or ZenBook 14 due to the positioning of the keyboard. Owners can expect the keys to be cool at around 28 C no matter the onscreen load whereas sections of the keyboards on most other laptops like the ZenBook 14 can become as warm as 47 C when under high processing stress. The bottom hot spot can reach almost 48 C when gaming as shown by our temperature maps below. We think that surface temperatures could have been even cooler had Asus installed more ventilation grilles instead of the small ones here.
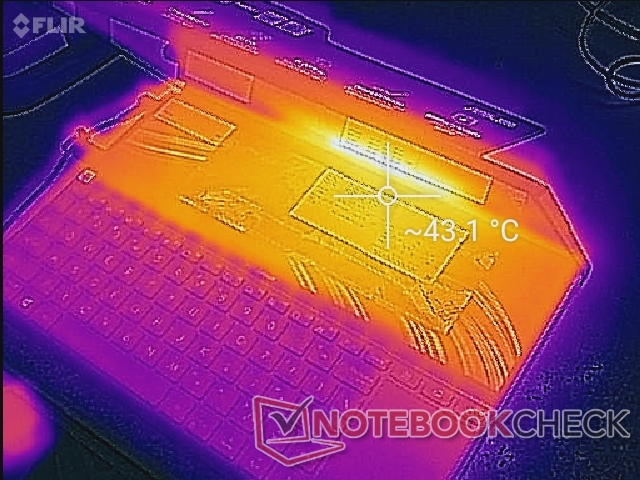
(+) The maximum temperature on the upper side is 38.4 °C / 101 F, compared to the average of 36.9 °C / 98 F, ranging from 21.1 to 71 °C for the class Multimedia.
(-) The bottom heats up to a maximum of 48 °C / 118 F, compared to the average of 39.1 °C / 102 F
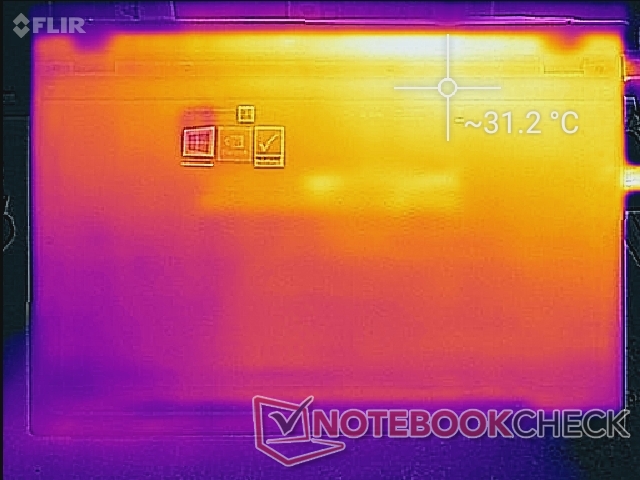
(+) In idle usage, the average temperature for the upper side is 27.8 °C / 82 F, compared to the device average of 31.2 °C / 88 F.
(±) Playing The Witcher 3, the average temperature for the upper side is 32.6 °C / 91 F, compared to the device average of 31.2 °C / 88 F.
(+) The palmrests and touchpad are cooler than skin temperature with a maximum of 28 °C / 82.4 F and are therefore cool to the touch.
(±) The average temperature of the palmrest area of similar devices was 28.8 °C / 83.8 F (+0.8 °C / 1.4 F).
Stress Test
We stress the system with synthetic loads to identify for any potential throttling or stability issues. When running Prime95, the CPU would boost up to 3.8 GHz for the first few 20 seconds or so until hitting a core temperature of 96 C. Thereafter, clock rates drop to just 2.3 to 2.4 GHz in order to maintain a cooler core temperature of 65 C. The significant dip in Turbo Boost performance from 3.8 GHz to 2.4 GHz is reflective of the steep drop in performance observed during our CineBench loop test mentioned above.
Running Witcher 3 is more representative of real-world stressful loads. The CPU and GPU would stabilize at 65 C and 67 C, respectively, compared to 73 C and 75 C on the Huawei MateBook X Pro with the GeForce MX150 when under similar conditions. These temperatures are reasonable considering the low-power CPU and GPU involved.
Running on batteries will limit performance. A 3DMark 11 run on battery power returns Physics and Graphics scores of 7725 and 1163, respectively, compared to 8449 and 3613 points when on mains.
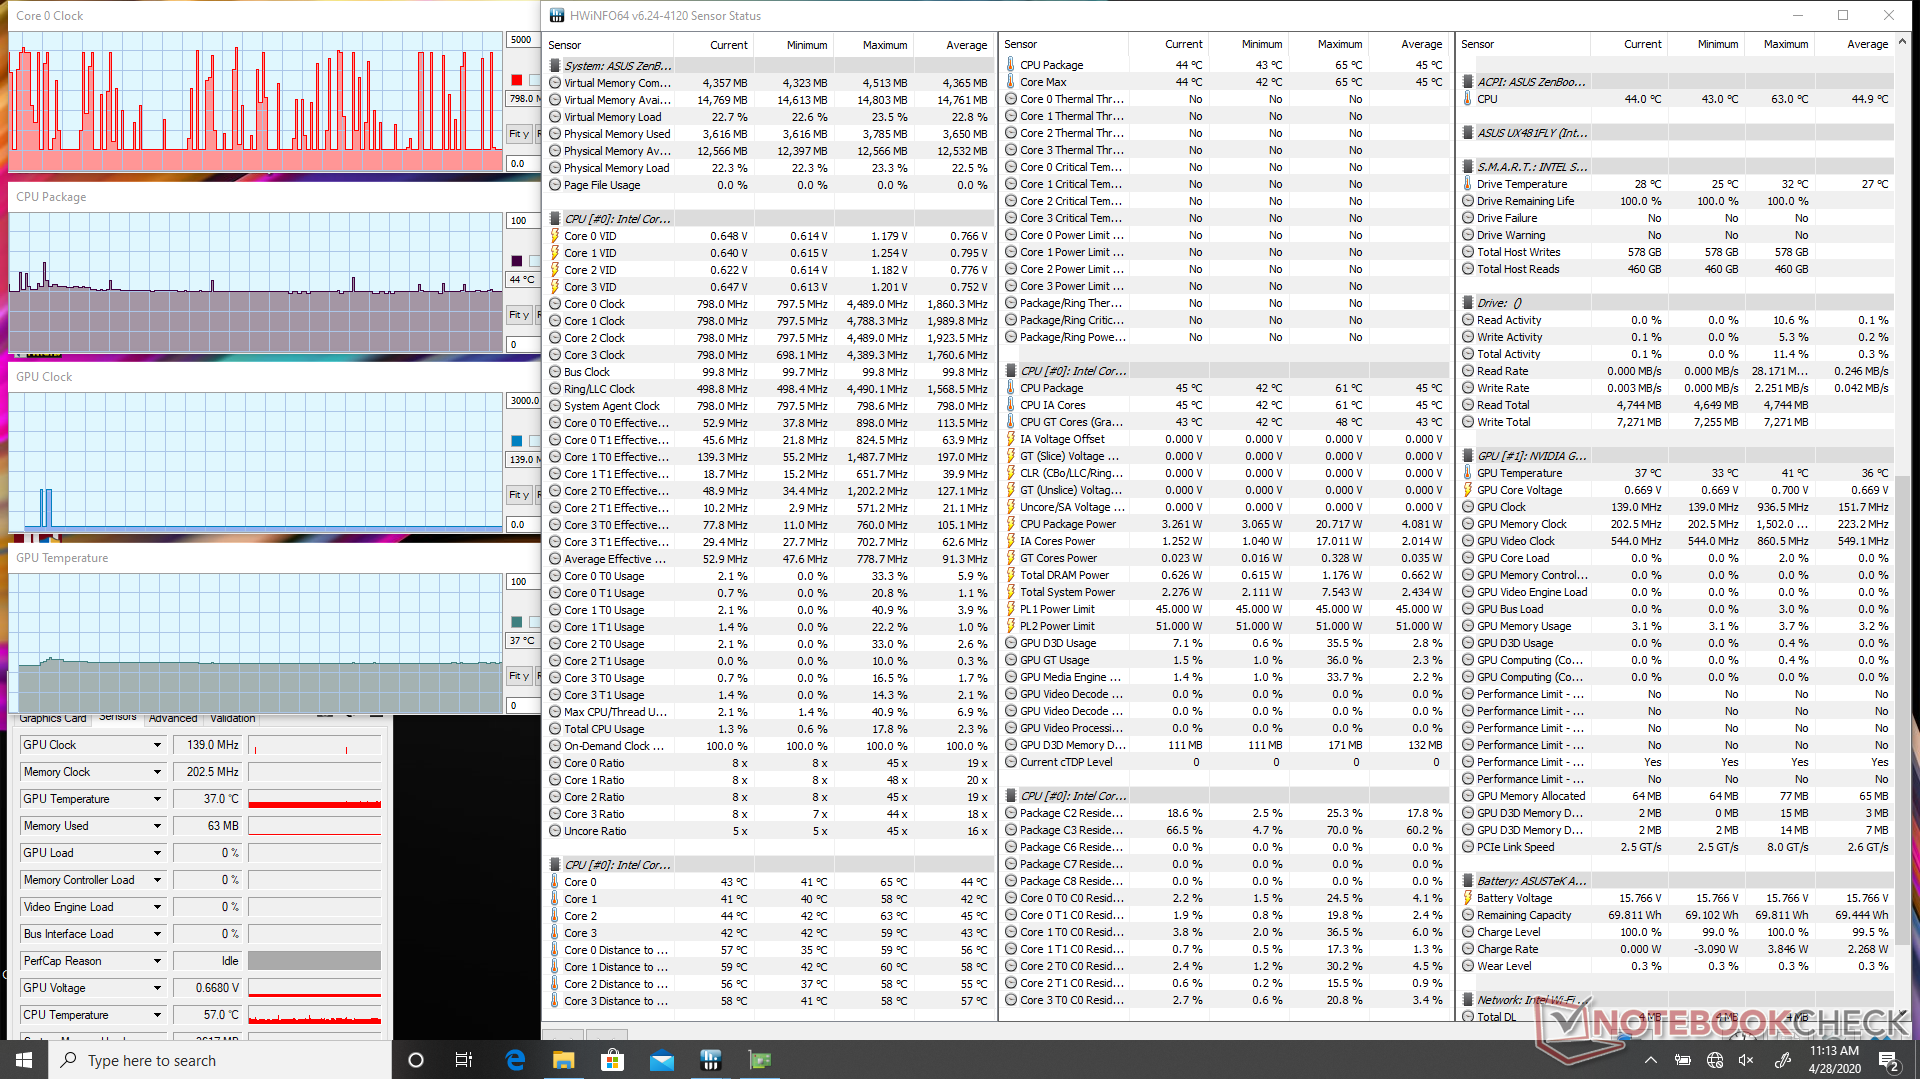
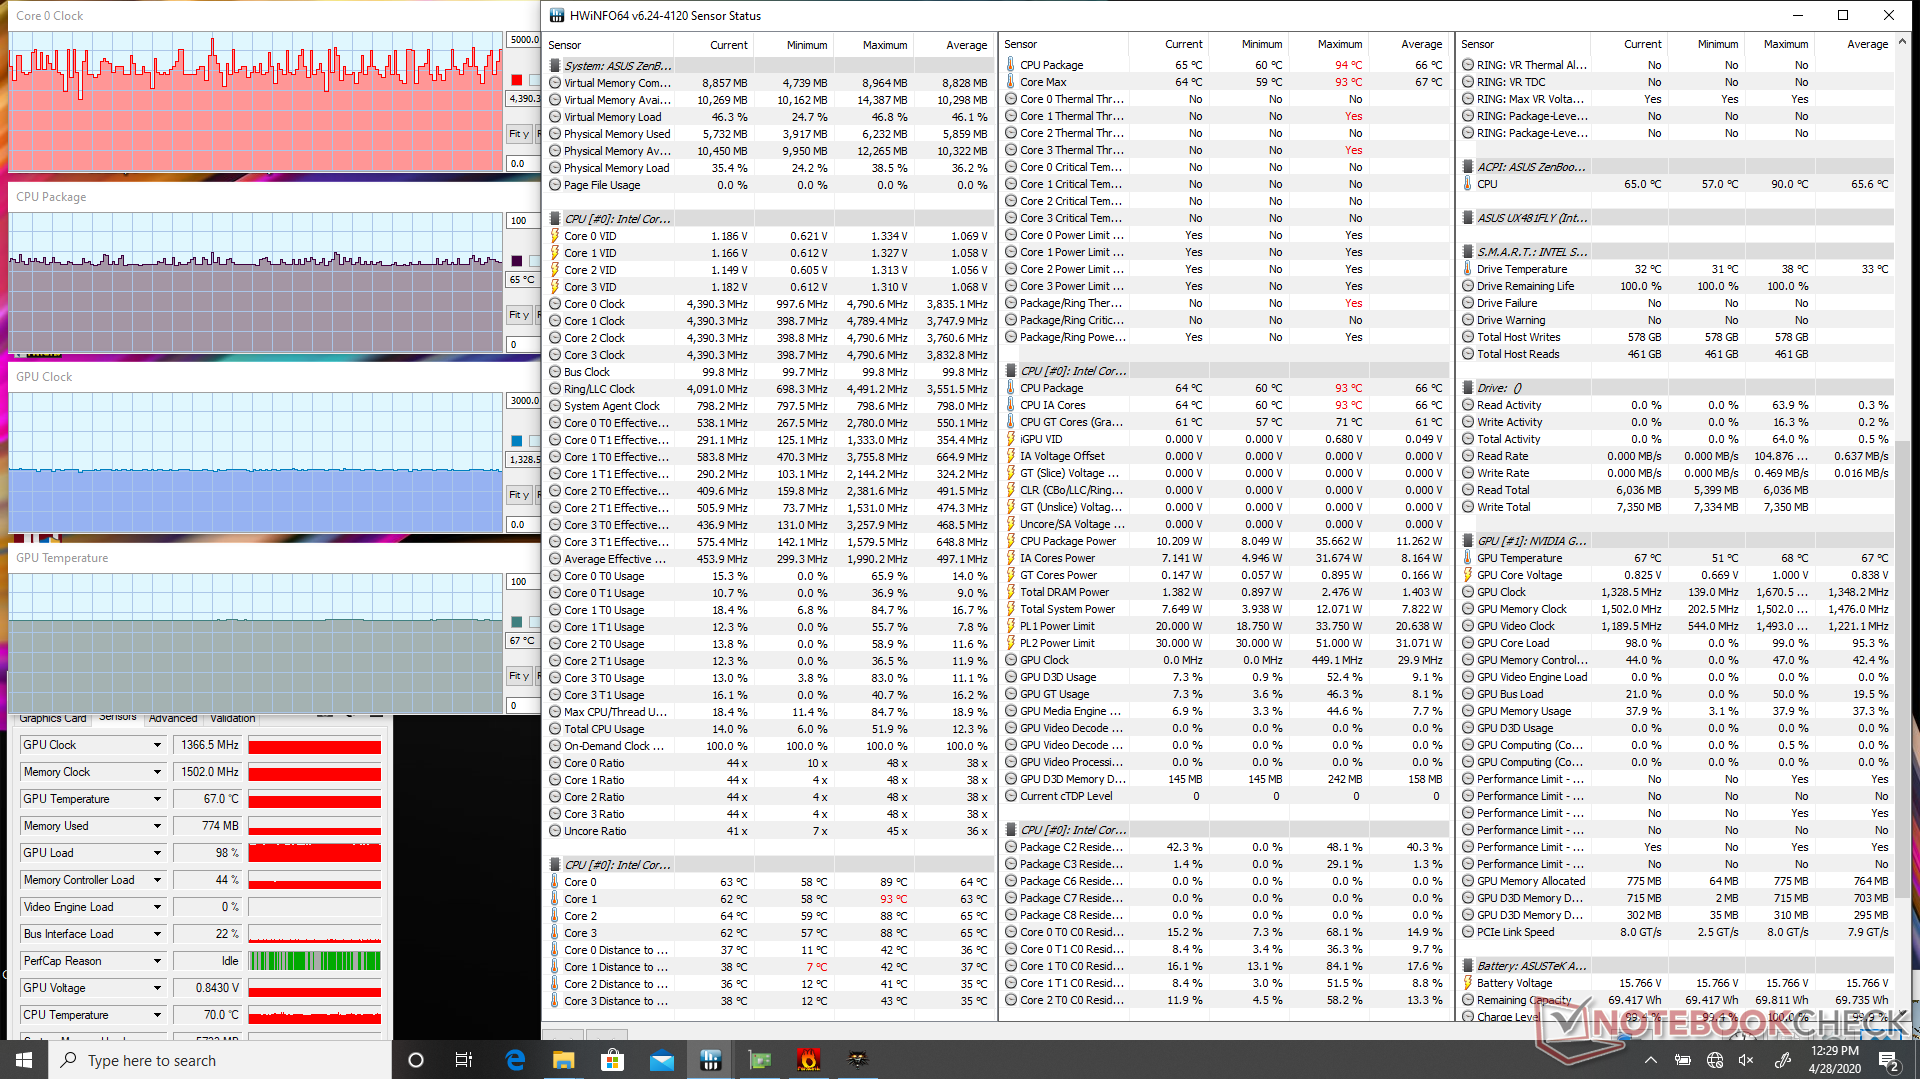
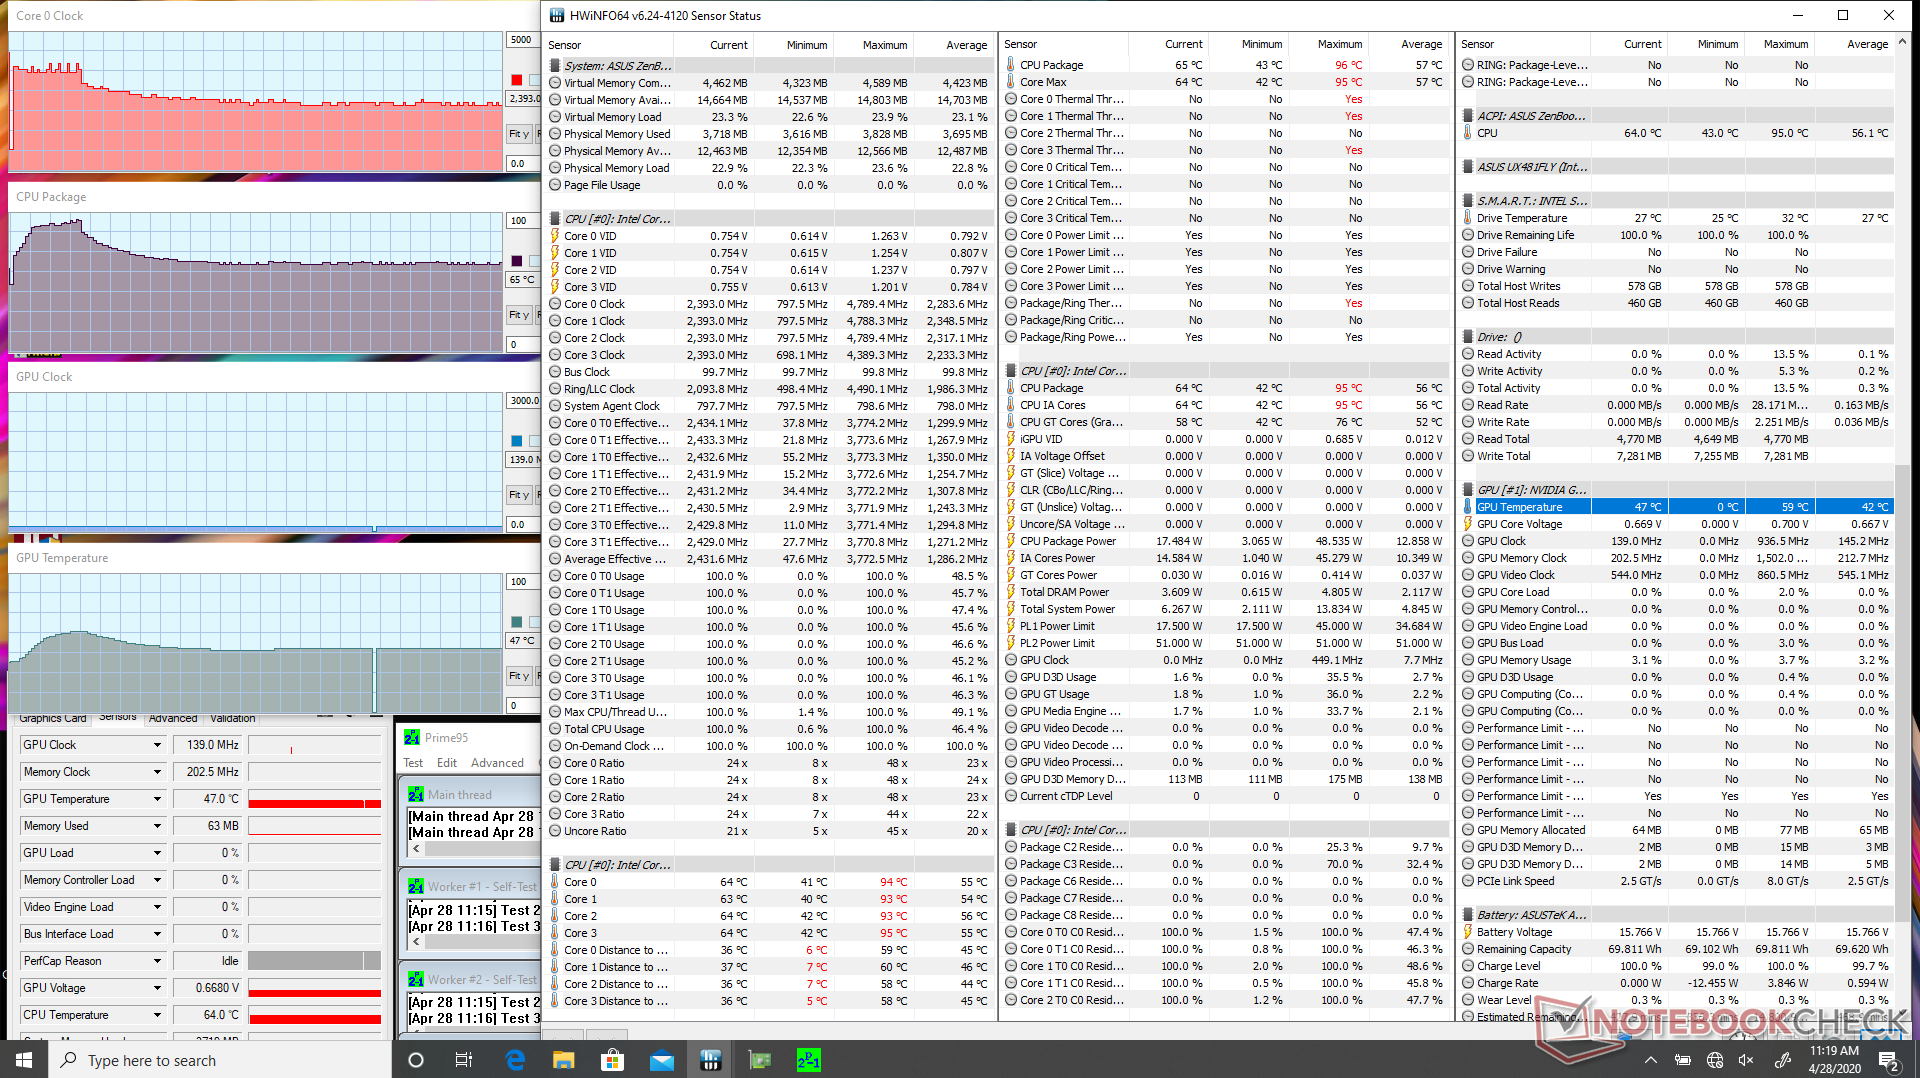
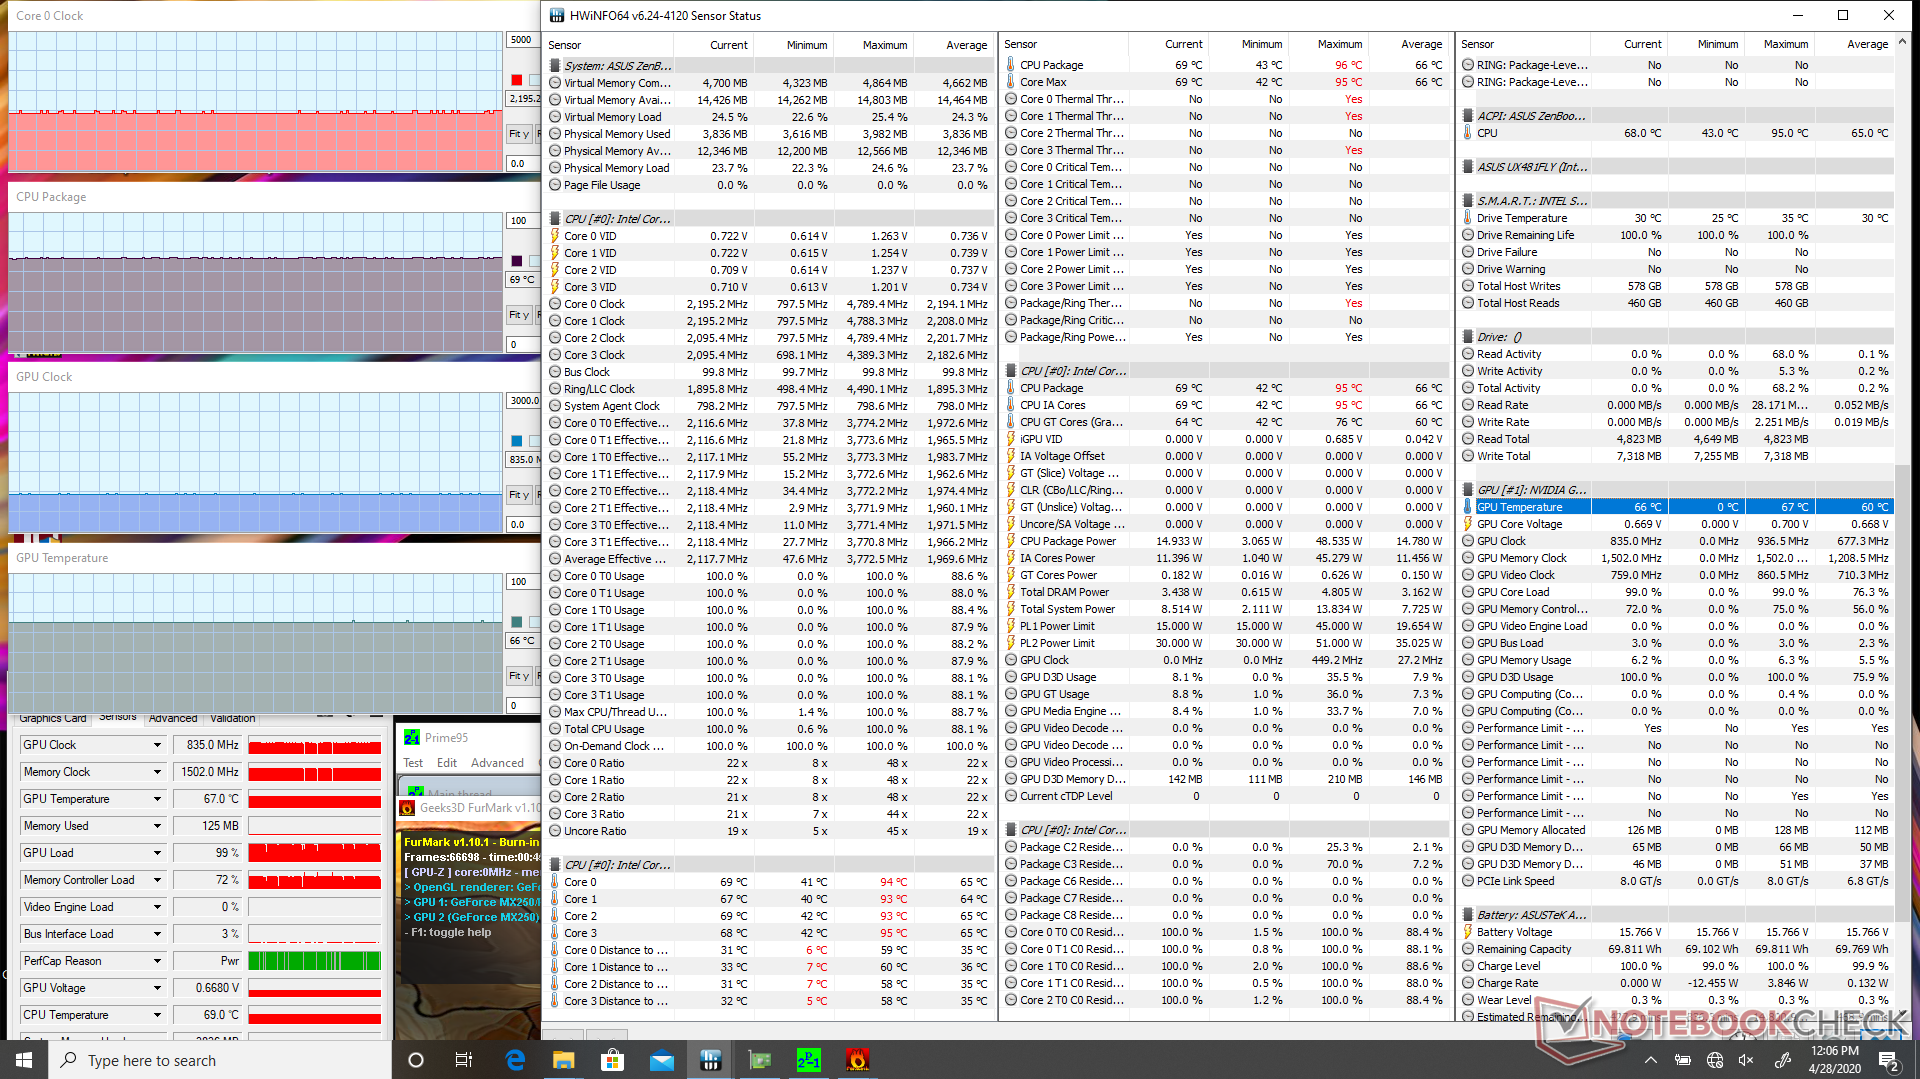
| CPU Clock (GHz) | GPU Clock (MHz) | Average CPU Temperature (°C) | Average GPU Temperature (°C) | |
| System Idle | -- | -- | 44 | 37 |
| Prime95 Stress | 2.3 - 2.4 | -- | 65 | 47 |
| Prime95 + FurMark Stress | 2.1 - 2.2 | 835 | 69 | 66 |
| Witcher 3 Stress | ~4.2 | 1366 | 65 | 67 |
Speakers


Asus ZenBook Duo UX481FL audio analysis
(±) | speaker loudness is average but good (78.7 dB)
Bass 100 - 315 Hz
(±) | reduced bass - on average 9.8% lower than median
(-) | bass is not linear (16.6% delta to prev. frequency)
Mids 400 - 2000 Hz
(±) | higher mids - on average 5.5% higher than median
(+) | mids are linear (6.1% delta to prev. frequency)
Highs 2 - 16 kHz
(+) | balanced highs - only 1.9% away from median
(+) | highs are linear (4.7% delta to prev. frequency)
Overall 100 - 16.000 Hz
(±) | linearity of overall sound is average (18.9% difference to median)
Compared to same class
» 54% of all tested devices in this class were better, 8% similar, 38% worse
» The best had a delta of 5%, average was 18%, worst was 45%
Compared to all devices tested
» 39% of all tested devices were better, 8% similar, 54% worse
» The best had a delta of 4%, average was 25%, worst was 134%
Apple MacBook 12 (Early 2016) 1.1 GHz audio analysis
(+) | speakers can play relatively loud (83.6 dB)
Bass 100 - 315 Hz
(±) | reduced bass - on average 11.3% lower than median
(±) | linearity of bass is average (14.2% delta to prev. frequency)
Mids 400 - 2000 Hz
(+) | balanced mids - only 2.4% away from median
(+) | mids are linear (5.5% delta to prev. frequency)
Highs 2 - 16 kHz
(+) | balanced highs - only 2% away from median
(+) | highs are linear (4.5% delta to prev. frequency)
Overall 100 - 16.000 Hz
(+) | overall sound is linear (10.2% difference to median)
Compared to same class
» 5% of all tested devices in this class were better, 2% similar, 93% worse
» The best had a delta of 5%, average was 19%, worst was 53%
Compared to all devices tested
» 3% of all tested devices were better, 1% similar, 96% worse
» The best had a delta of 4%, average was 25%, worst was 134%
Energy Management
Power Consumption
Idling on desktop consumes between 3 W and 11 W depending on the brightness level and if the secondary display is on. Enabling the second display will consume an additional 4 W to 5 W.
When running 3DMark 06, our system consumes an average of 53 W compared to 47 W on the Asus Zenbook 14 UX433 with the GeForce MX150 even though the ZenBook Duo offers about the same level of GPU performance. It's safe to assume that the slightly higher power consumption can be at least partly attributed to the second display.
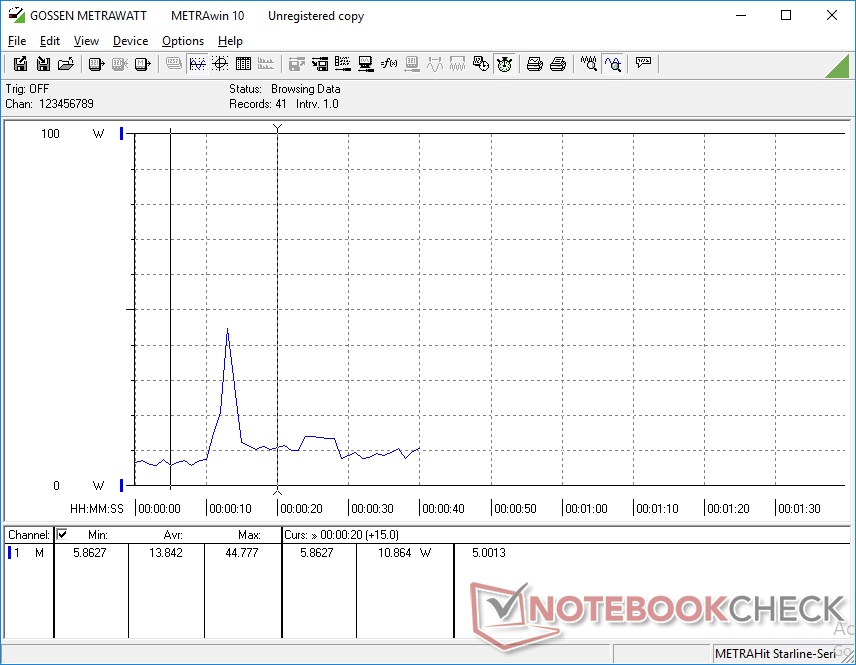
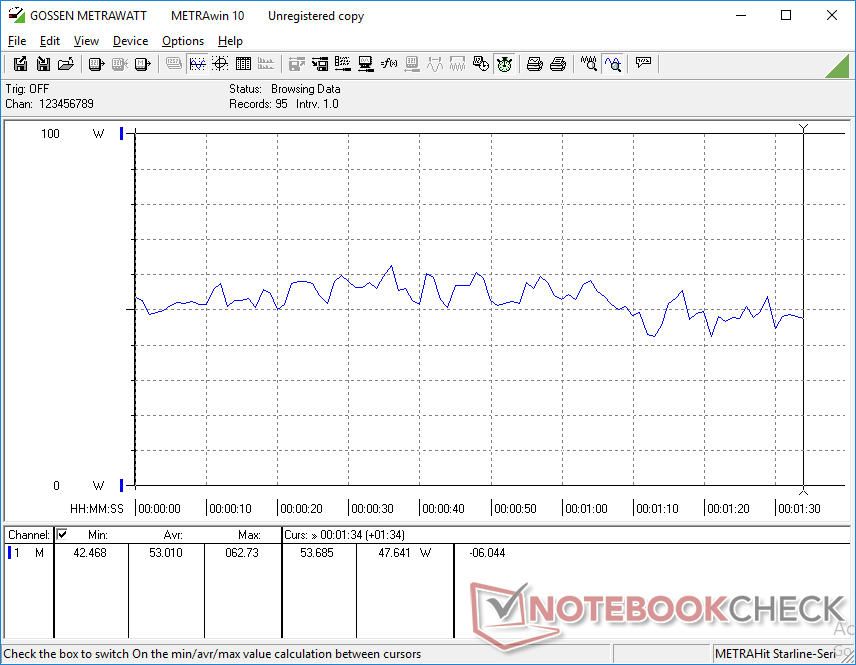
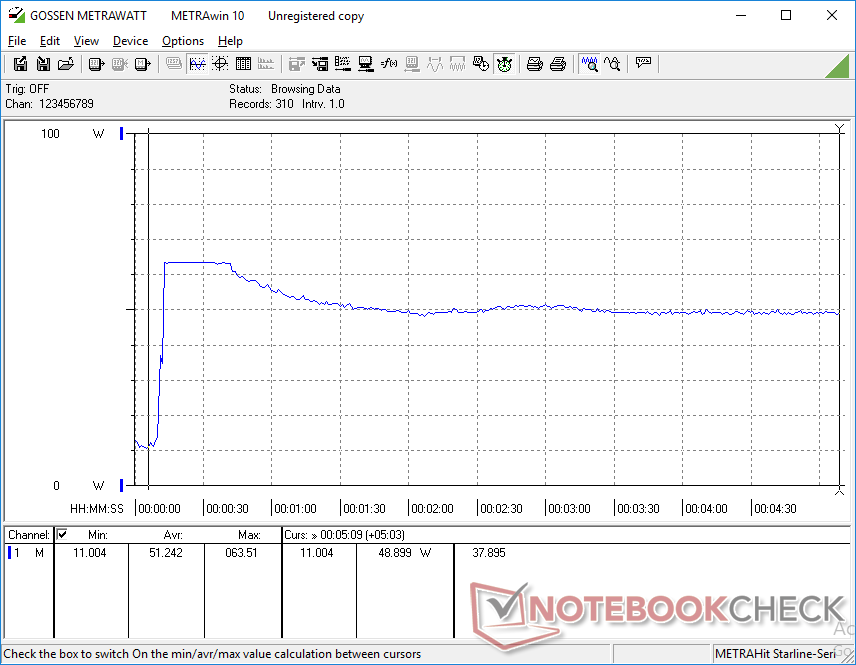
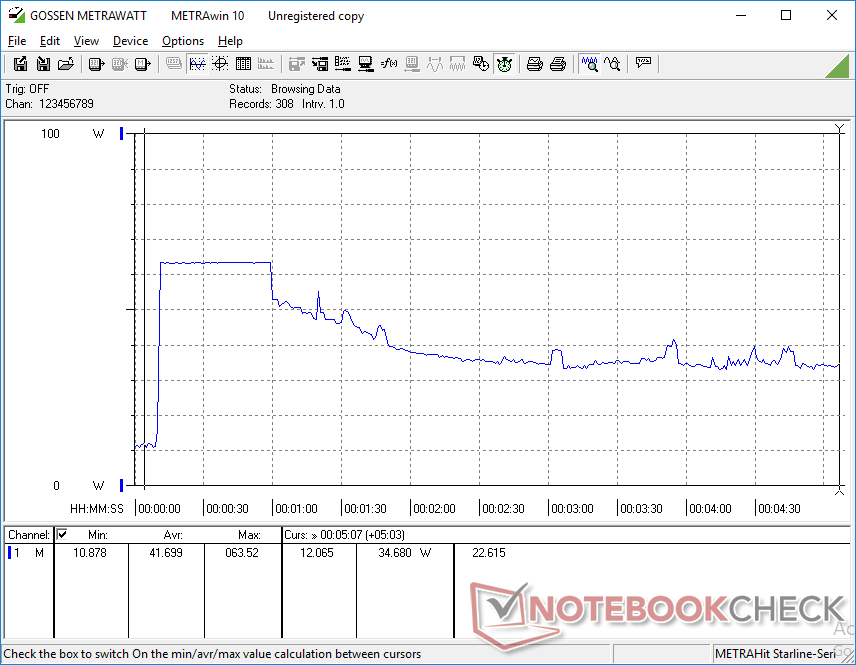
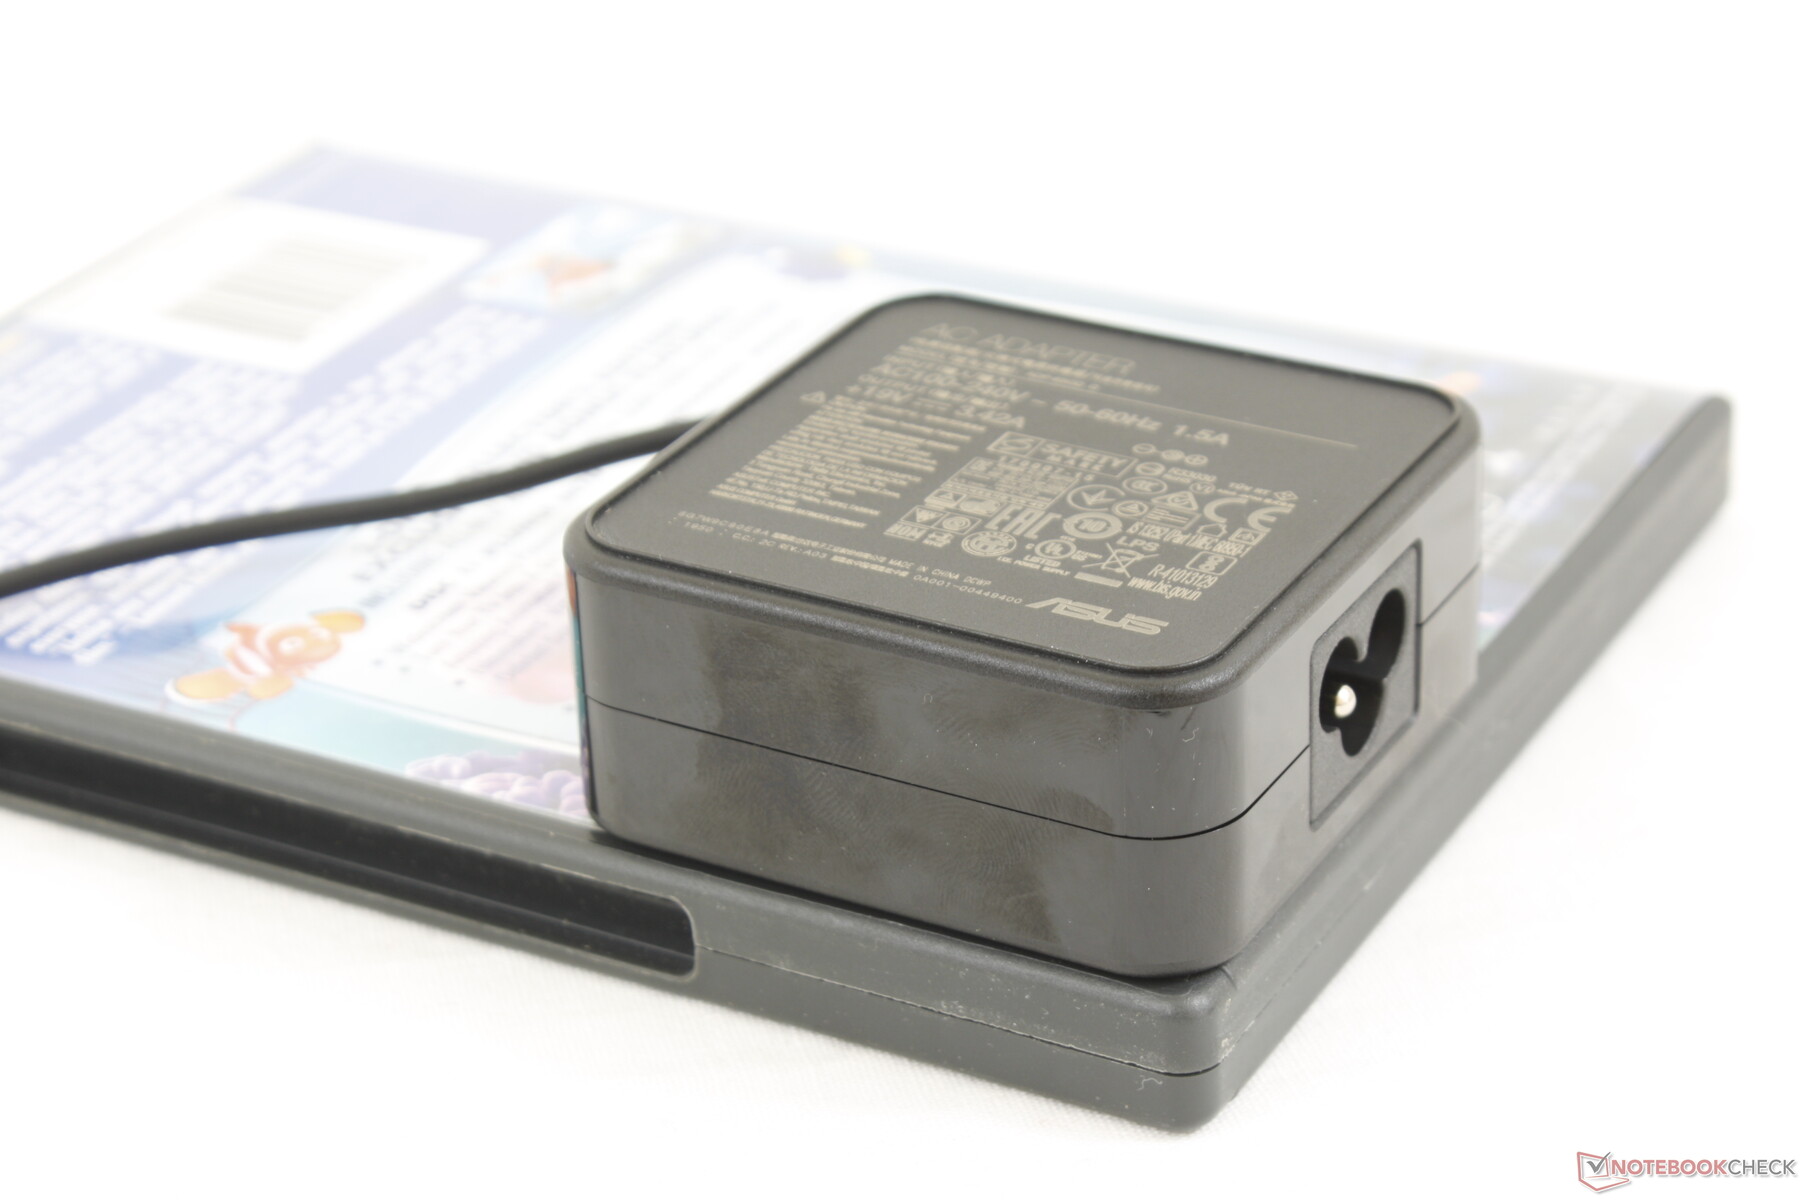
We're able to record a maximum draw of 63.6 W from the small (6.5 x 6.5 x 3 cm) 65 W AC adapter when running Prime95 and FurMark simultaneously. This high of a consumption rate is only temporary as shown by our graphs below. The observation reinforces both the falling clock rates and declining CineBench loop test scores mentioned above.
| Off / Standby | |
| Idle | |
| Load |
|
| Asus ZenBook Duo UX481FL i7-10510U, GeForce MX250, Intel SSD 660p 1TB SSDPEKNW010T8, IPS, 1920x1080, 14.00 | Asus ZenBook 14 UM431DA-AM020T R7 3700U, Vega 10, SK hynix BC501 HFM512GDHTNG-8310A, IPS, 1920x1080, 14.00 | Huawei Matebook X Pro i5 i5-8250U, GeForce MX150, Samsung PM961 MZVLW256HEHP, IPS, 3000x2000, 13.90 | Lenovo ThinkPad X1 Carbon G7 20R1-000YUS i7-10510U, UHD Graphics 620, WDC PC SN730 SDBPNTY-512G, IPS, 3840x2160, 14.00 | MSI Prestige 14 A10SC-009 i7-10710U, GeForce GTX 1650 Max-Q, Samsung SSD PM981 MZVLB1T0HALR, IPS, 3840x2160, 14.00 | Lenovo IdeaPad S940-14IWL i7-8565U, UHD Graphics 620, Samsung SSD PM981 MZVLB512HAJQ, IPS, 3840x2160, 14.00 | |
|---|---|---|---|---|---|---|
| Power Consumption | 17% | -1% | -4% | -26% | -4% | |
| Idle Minimum * | 3.5 | 3.6 -3% | 3.5 -0% | 3.5 -0% | 5.2 -49% | 5.2 -49% |
| Idle Average * | 10 | 7.2 28% | 8.9 11% | 10.8 -8% | 12.2 -22% | 10.2 -2% |
| Idle Maximum * | 11 | 10.8 2% | 12.3 -12% | 12.5 -14% | 14.3 -30% | 11.9 -8% |
| Load Average * | 53 | 38 28% | 54.2 -2% | 47.2 11% | 67 -26% | 42.1 21% |
| Witcher 3 ultra * | 35.6 | 42.4 -19% | ||||
| Load Maximum * | 63.6 | 45.2 29% | 52.1 18% | 68.8 -8% | 67 -5% | 53.6 16% |
* ... smaller is better
Battery Life
Asus isn't putting that extra girth to waste; the ZenBook Duo integrates a much larger 70 Wh battery for its size compared to just ~50 Wh on most other 14-inch Ultrabooks like the IdeaPad S940 or ThinkPad X1 Carbon. This approach ensures runtimes that are just as long or even longer than the typical subnotebook despite the power-hungry displays of the ZenBook Duo. We're able to record a real-world WLAN runtime of 9.5 hours even with the secondary display enabled to be longer-lasting than the standard ZenBook 14 by almost three hours.
Charging from empty to full capacity will take just under two hours. The system cannot be charged via USB Type-C.
| Asus ZenBook Duo UX481FL i7-10510U, GeForce MX250, 70 Wh | Asus ZenBook 14 UM431DA-AM020T R7 3700U, Vega 10, 47 Wh | Huawei Matebook X Pro i5 i5-8250U, GeForce MX150, 57.4 Wh | Lenovo ThinkPad X1 Carbon G7 20R1-000YUS i7-10510U, UHD Graphics 620, 51 Wh | MSI Prestige 14 A10SC-009 i7-10710U, GeForce GTX 1650 Max-Q, 52 Wh | Lenovo IdeaPad S940-14IWL i7-8565U, UHD Graphics 620, 52 Wh | |
|---|---|---|---|---|---|---|
| Battery Runtime | -30% | -16% | 5% | -46% | -54% | |
| Reader / Idle | 1323 | 1068 -19% | 1243 -6% | 596 -55% | 506 -62% | |
| WiFi v1.3 | 571 | 404 -29% | 557 -2% | 598 5% | 351 -39% | 299 -48% |
| Load | 220 | 125 -43% | 133 -40% | 125 -43% | 103 -53% |
Pros
Cons
Verdict
As any desktop user can attest, having two screens instead of one can really boost productivity and the ZenBook Duo is no different in this regard. It's tough going back to just one screen after becoming accustomed to spacious dual-screen setups and this is the key advantage that Asus is banking on.
For a laptop form factor, however, users will have to accept some compromises. Firstly, weight is the most obvious drawback as the system is several hundred grams heavier than a regular ZenBook 14. Secondly, colors on the second screen will not be as vivid as on the Pantone-certified main display. Thirdly, the wide viewing angle between the user and second screen will both accentuate glare and reduce apparent brightness more noticeably unless if ambient conditions are perfect. Fourthly, the uncommon keyboard positioning can be a learning curve especially if typing in tight work spaces. And lastly, the screens don't do very well when outdoors despite the compact 14-inch size and surprisingly long battery life. OLED could have potentially addressed many of these issues, but such an approach would have likely driven prices up significantly.
There are a couple other missing features we'd like to see on future revisions. A physical webcam privacy shutter and the ability to charge via USB Type-C, for example, are not available here even though they have become standard on most other flagship laptops.
If the above disadvantages don't bother you or if you think you can overcome them, then you'll find the portable ZenBook Duo and its second screen to be invaluable for your multi-tasking needs.
The Asus ZenBook Duo is at its best when working in an environment with controlled lighting and an external mouse to maximize the visibility and ergonomics of the secondary display. If you travel and like to save space, then the ZenBook Duo makes a lot of sense. If you have table space to spare, however, then a standard ZenBook 14 and a proper external monitor would get you further.
Asus ZenBook Duo UX481FL
-
05/01/2020 v7
Allen Ngo
More articles related to this device
Asus ZenBook Duo UX481FL (ZenBook Duo UX481 Series)Related Articles


Pricecompare
