 Deutsch
 English
 Español
 Français
 Italiano
 Nederlands
 Polski
 Português
 Русский
 Türkçe
 Svenska
 Chinese
 Magyar
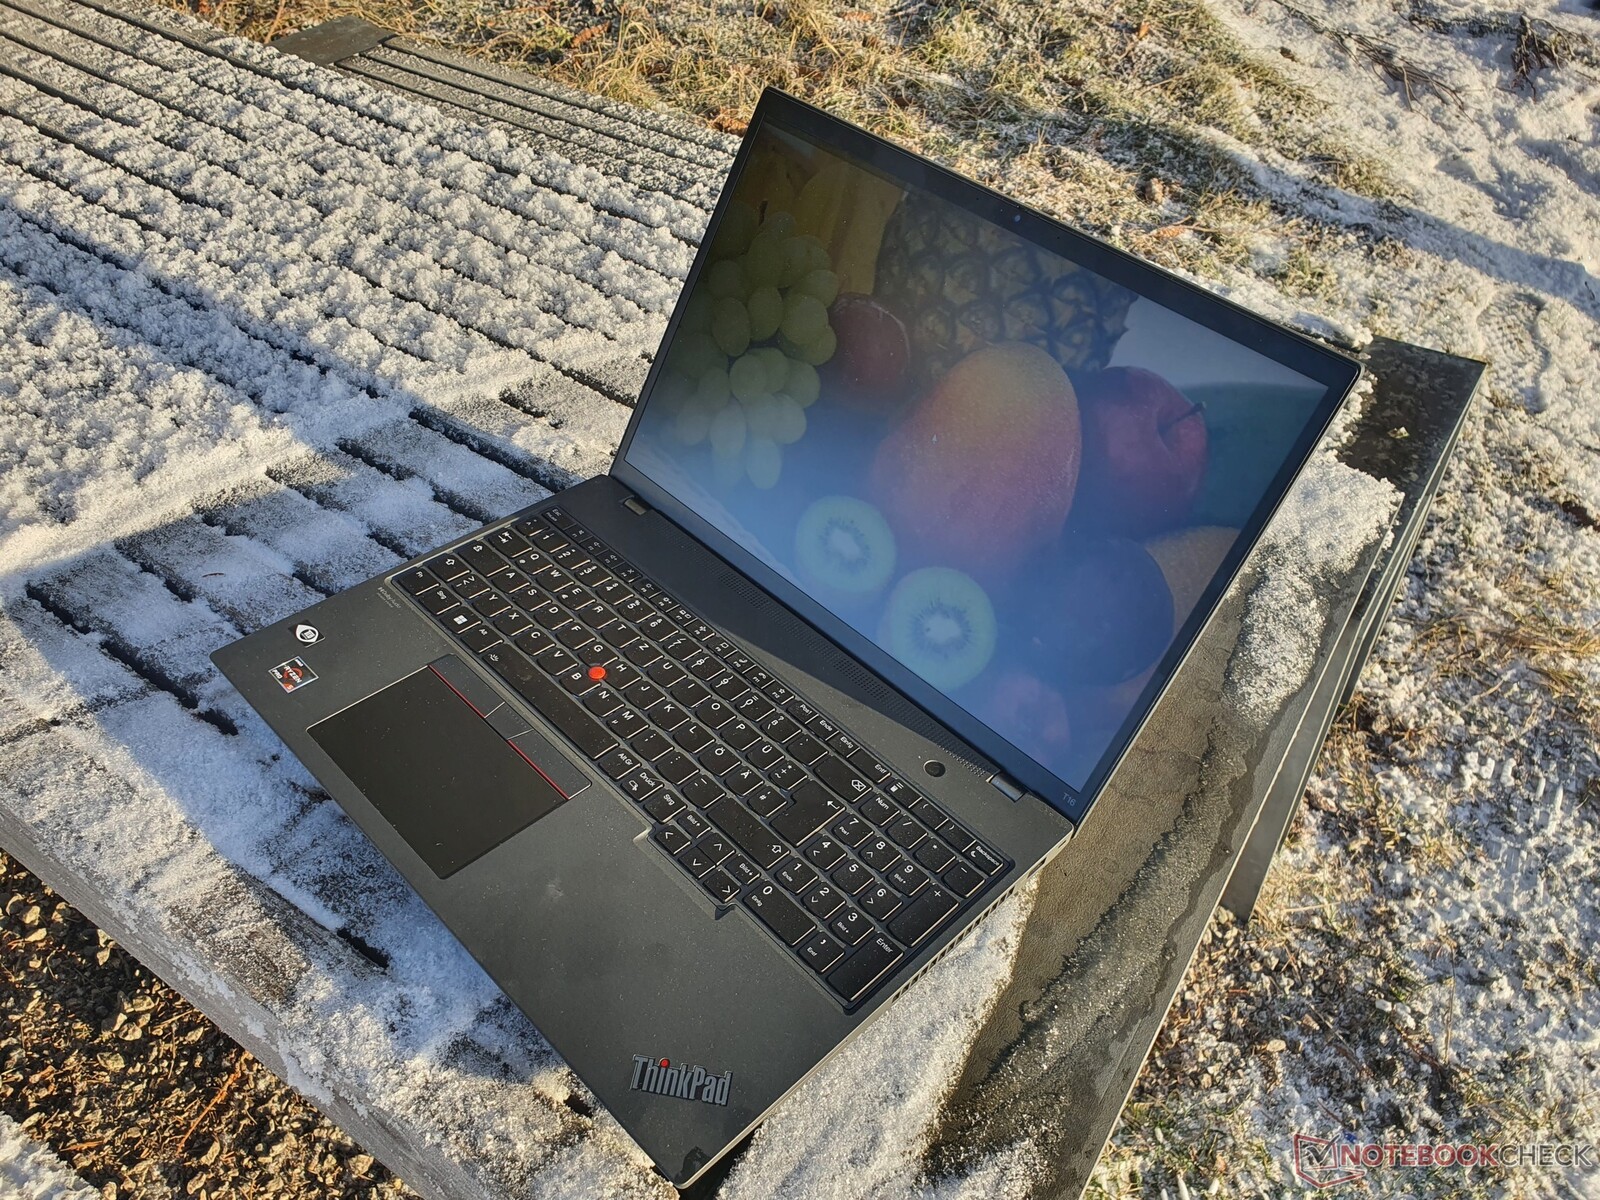
Lenovo ThinkPad T16 G1 AMD laptop review: Efficient and faster than Intel
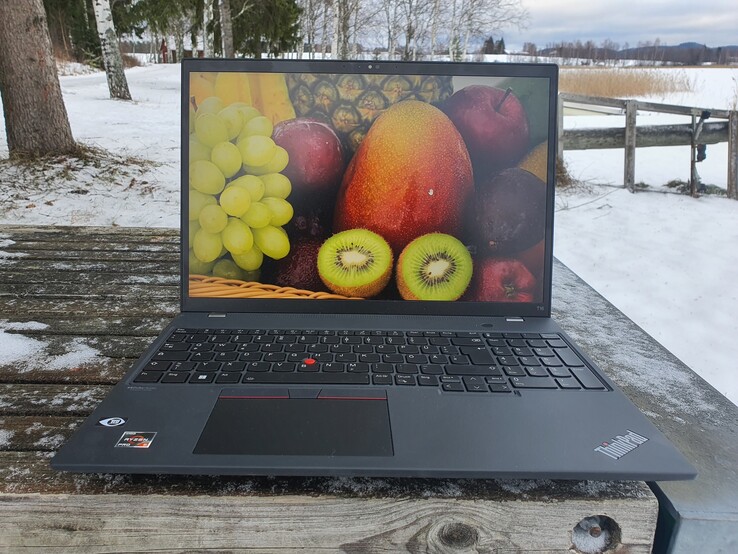
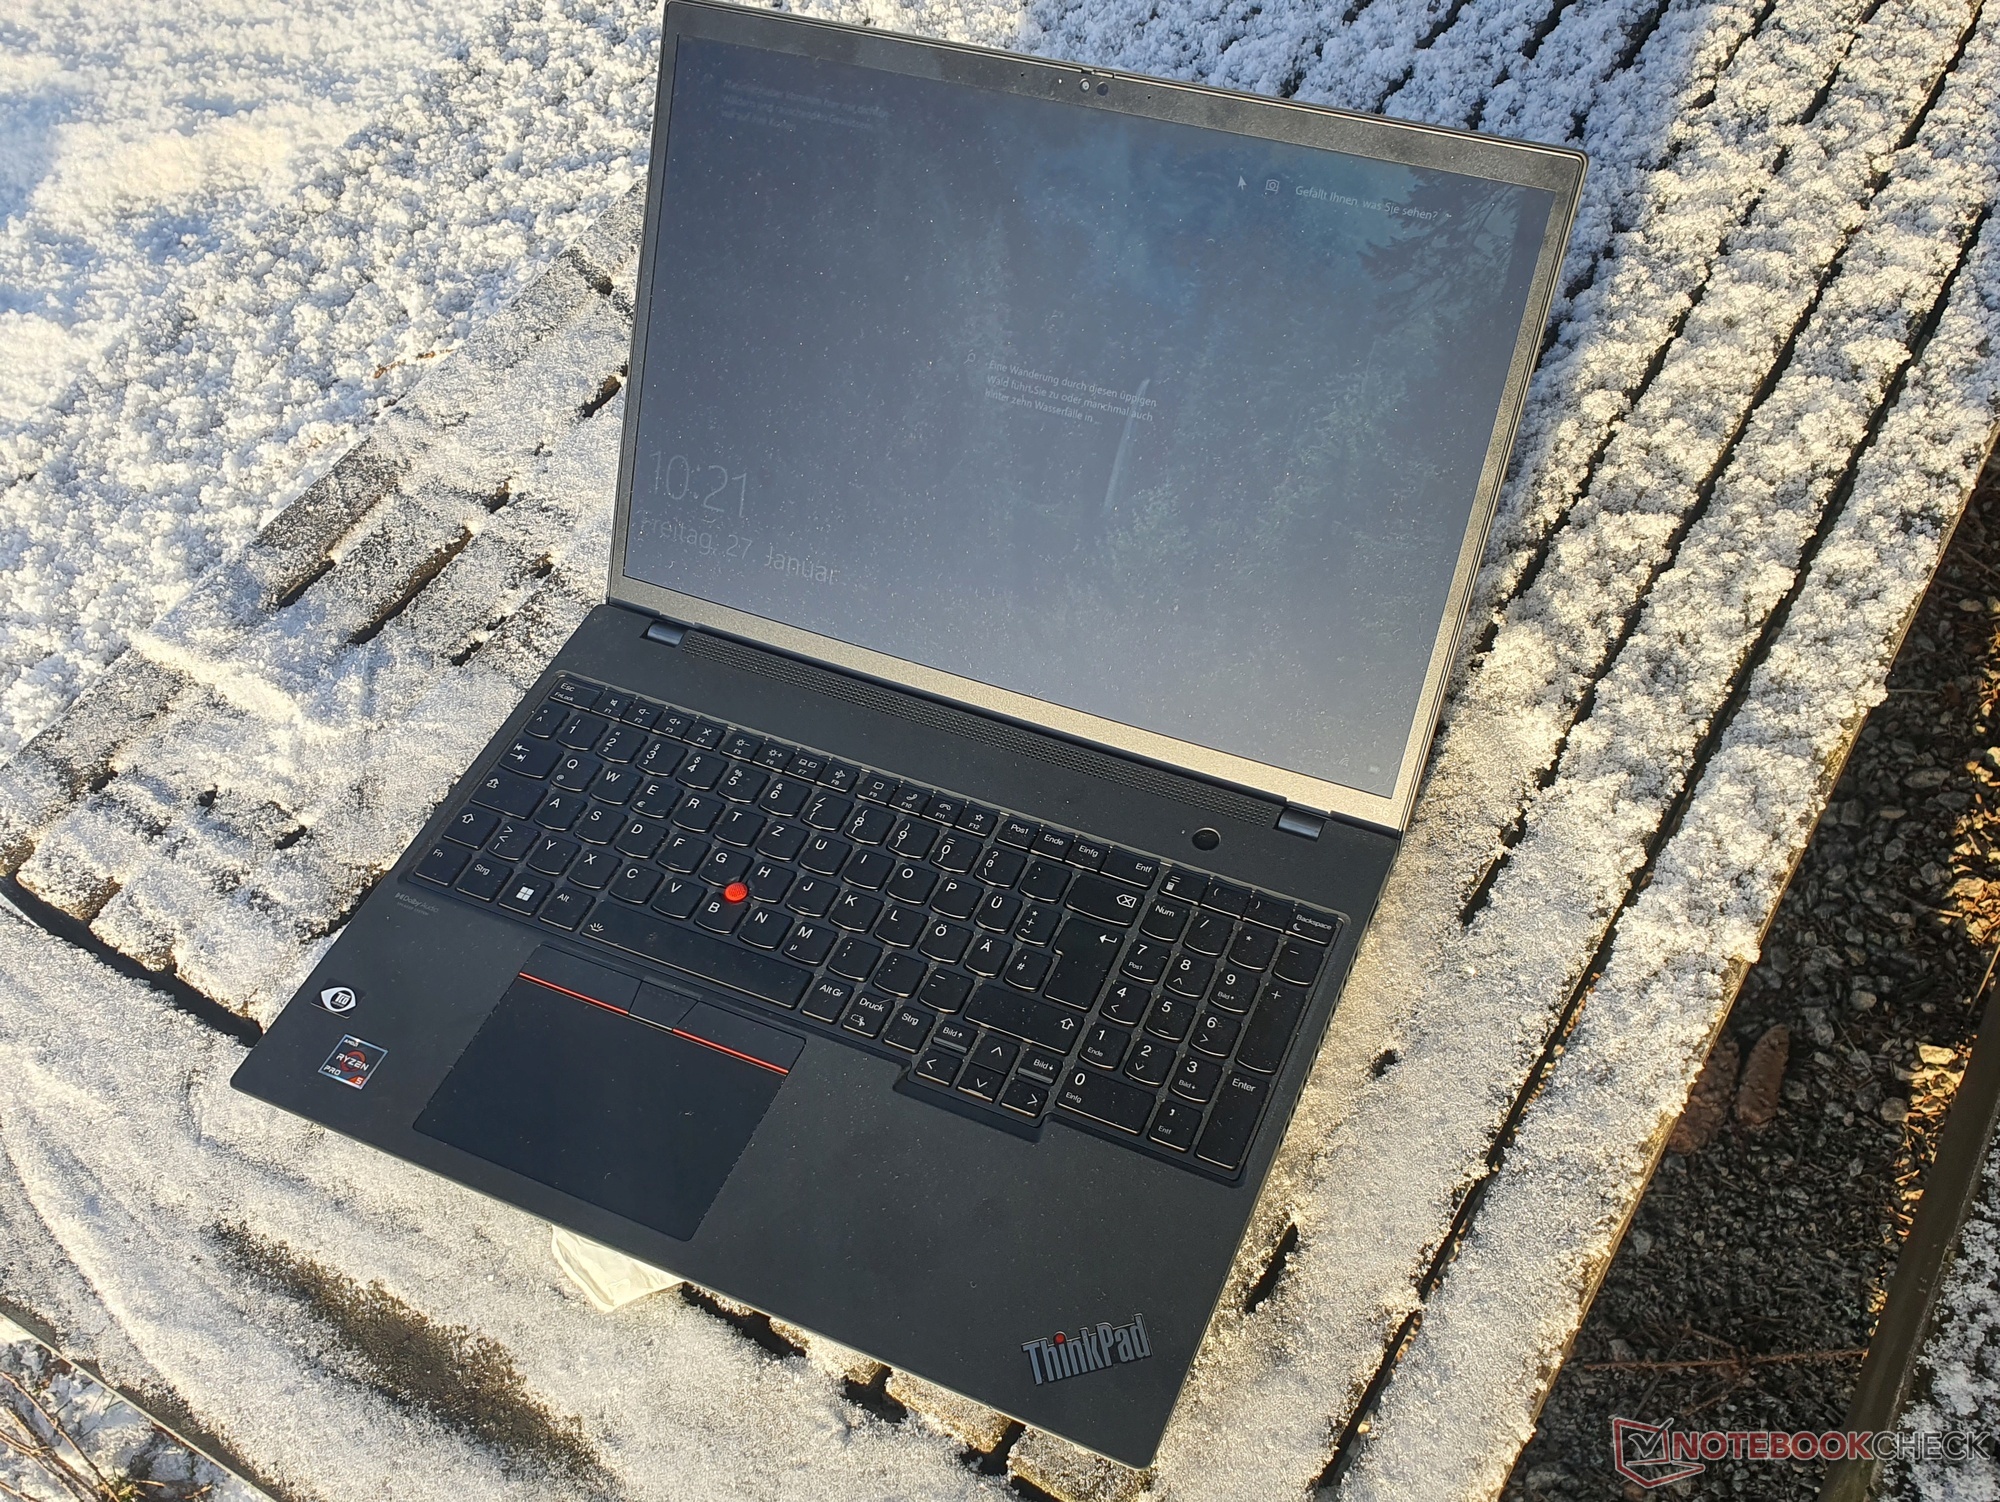
In this review, we take a look at the AMD version of the Lenovo ThinkPad T16, after we have already tested the Intel version and saw many positive aspects in that. However, we were still disappointed in its performance, leading us to hope for more from the current Ryzen CPUs in the largest T-series ThinkPad. We also want to see whether the long-lasting T16 G1 will be even more efficient with an AMD processor.
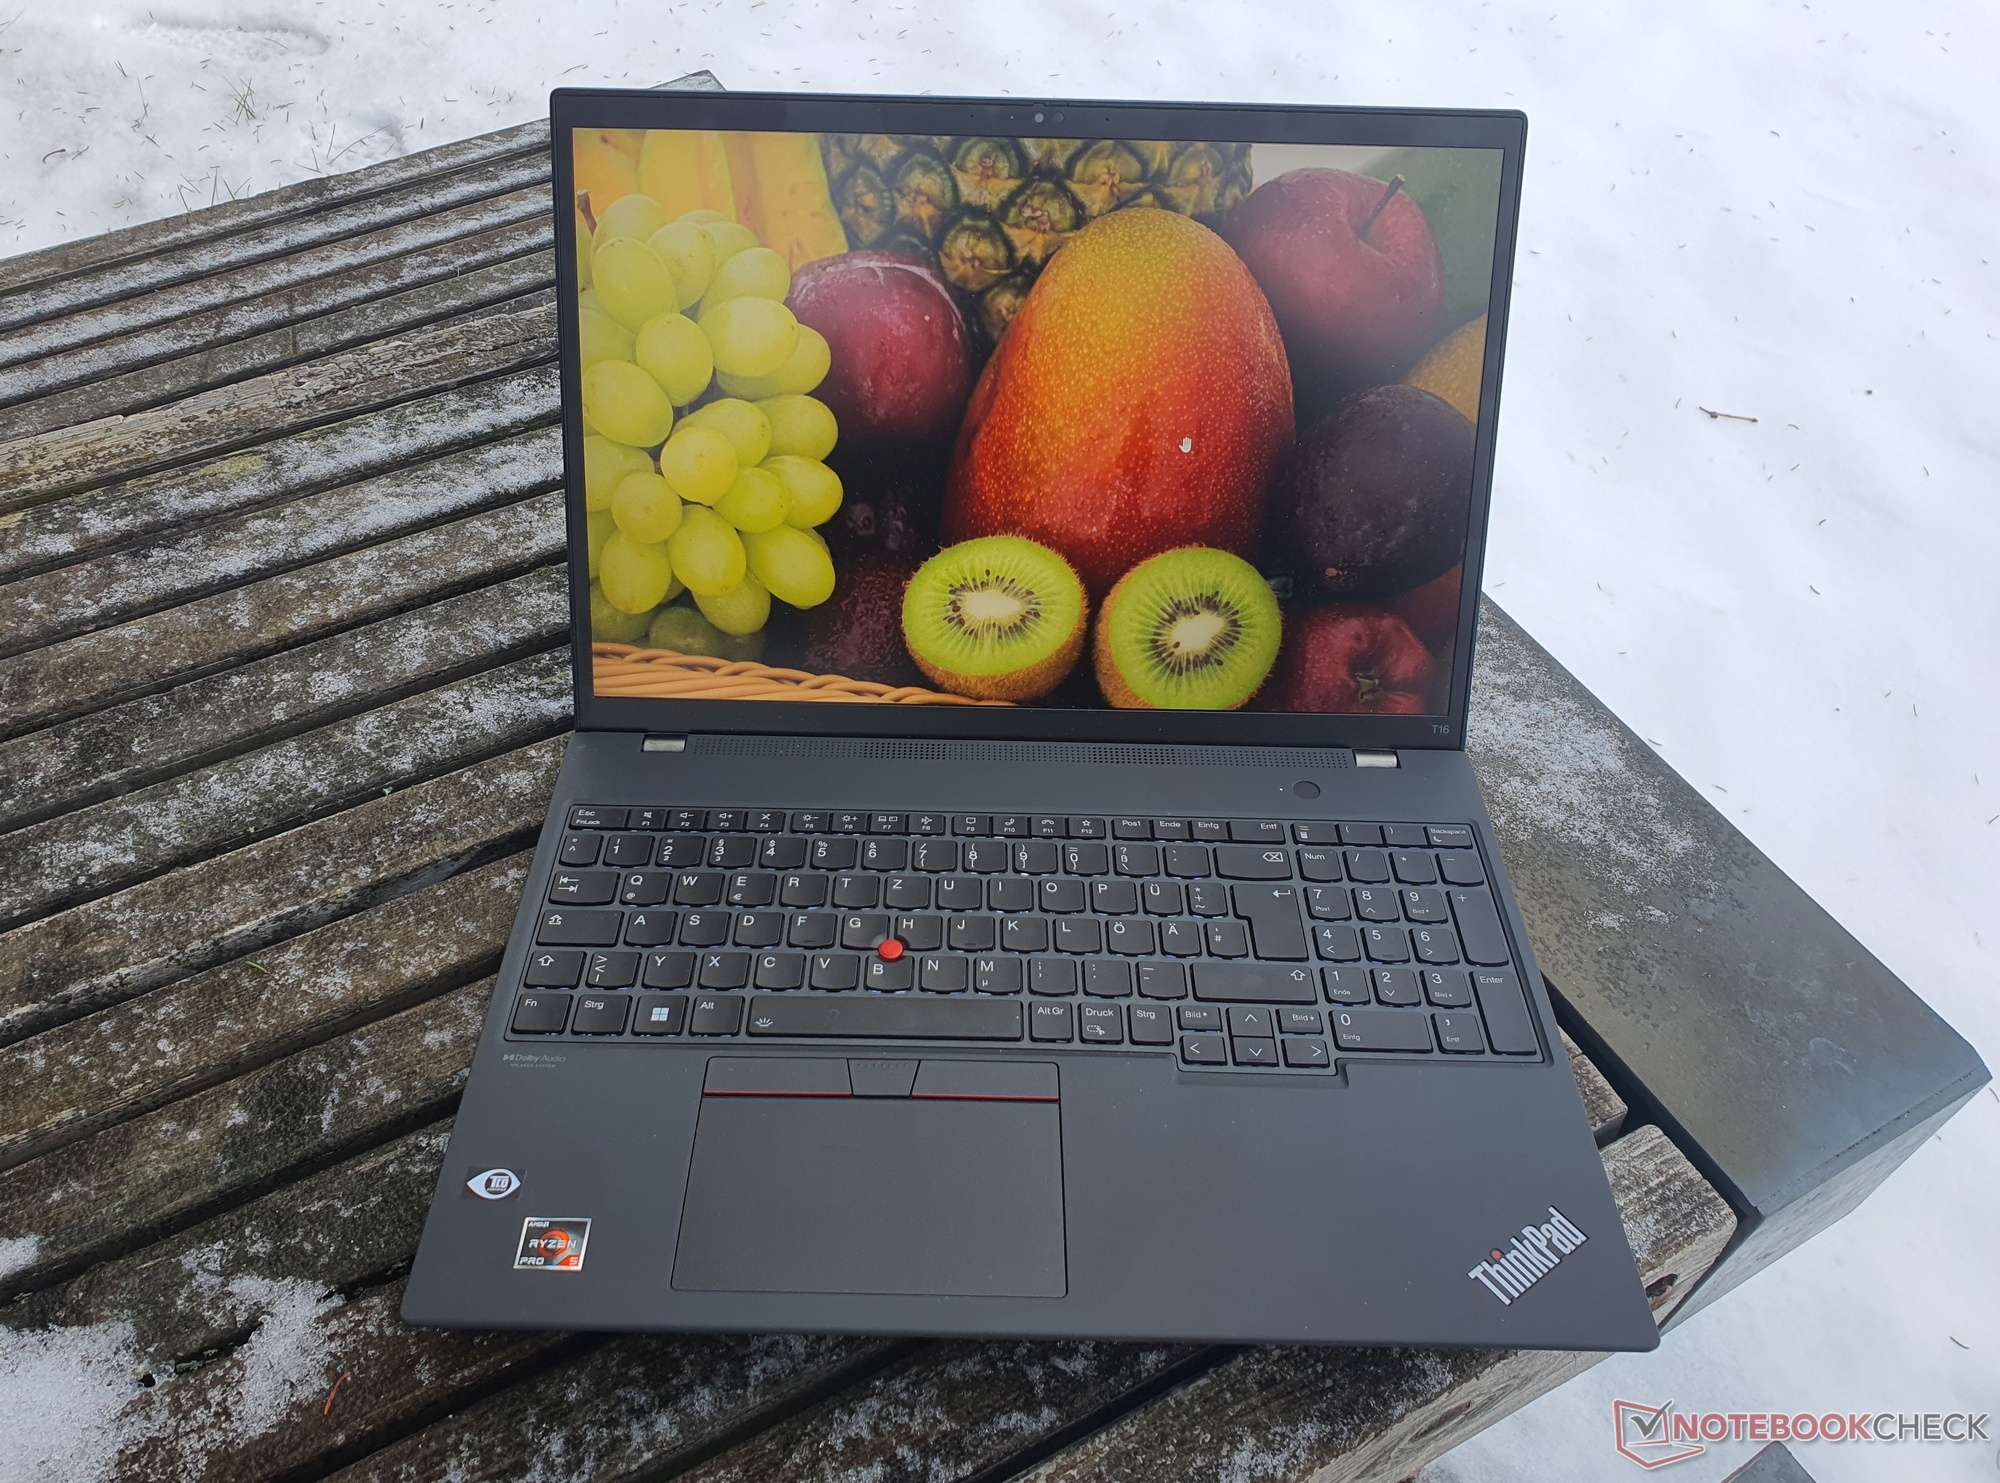
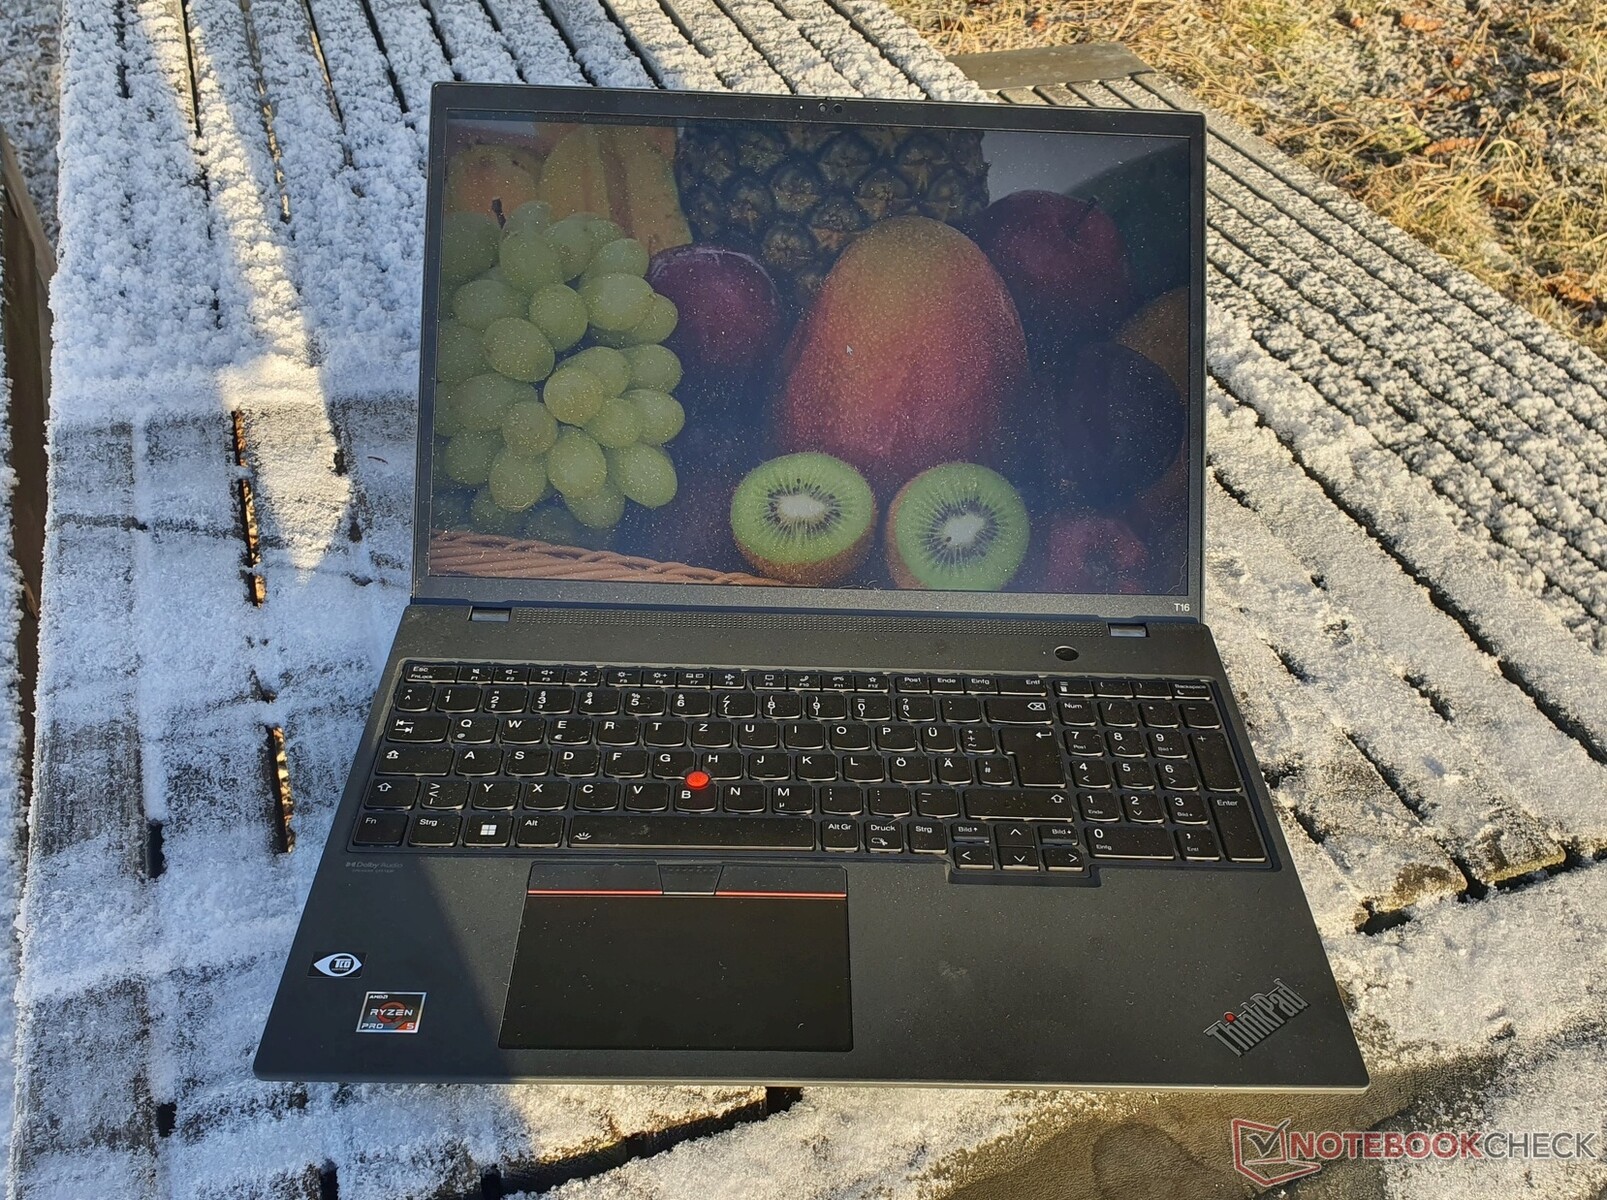
We test a model version with the smaller 52.5-Wh battery, high-resolution WQXGA display, and AMD's hexa-core Ryzen 5 PRO 6650U. In addition, there is 16 GB of LPDDR5-RAM, which is completely soldered in with the AMD ThinkPads T16 and T14, and a 512-GB PCIe 4.0 SSD. The integrated Radeon 660M handles graphics operations.
The competitors include particularly the HP EliteBook 865 G9, but the comparison to other 16-inch ThinkPads such as the ThinkPad Z16 or even the ThinkPad X1 Extreme should be really interesting as well. We also include several test results of an additional T16 model with a Ryzen 7 PRO 6850U and otherwise identical equipment.
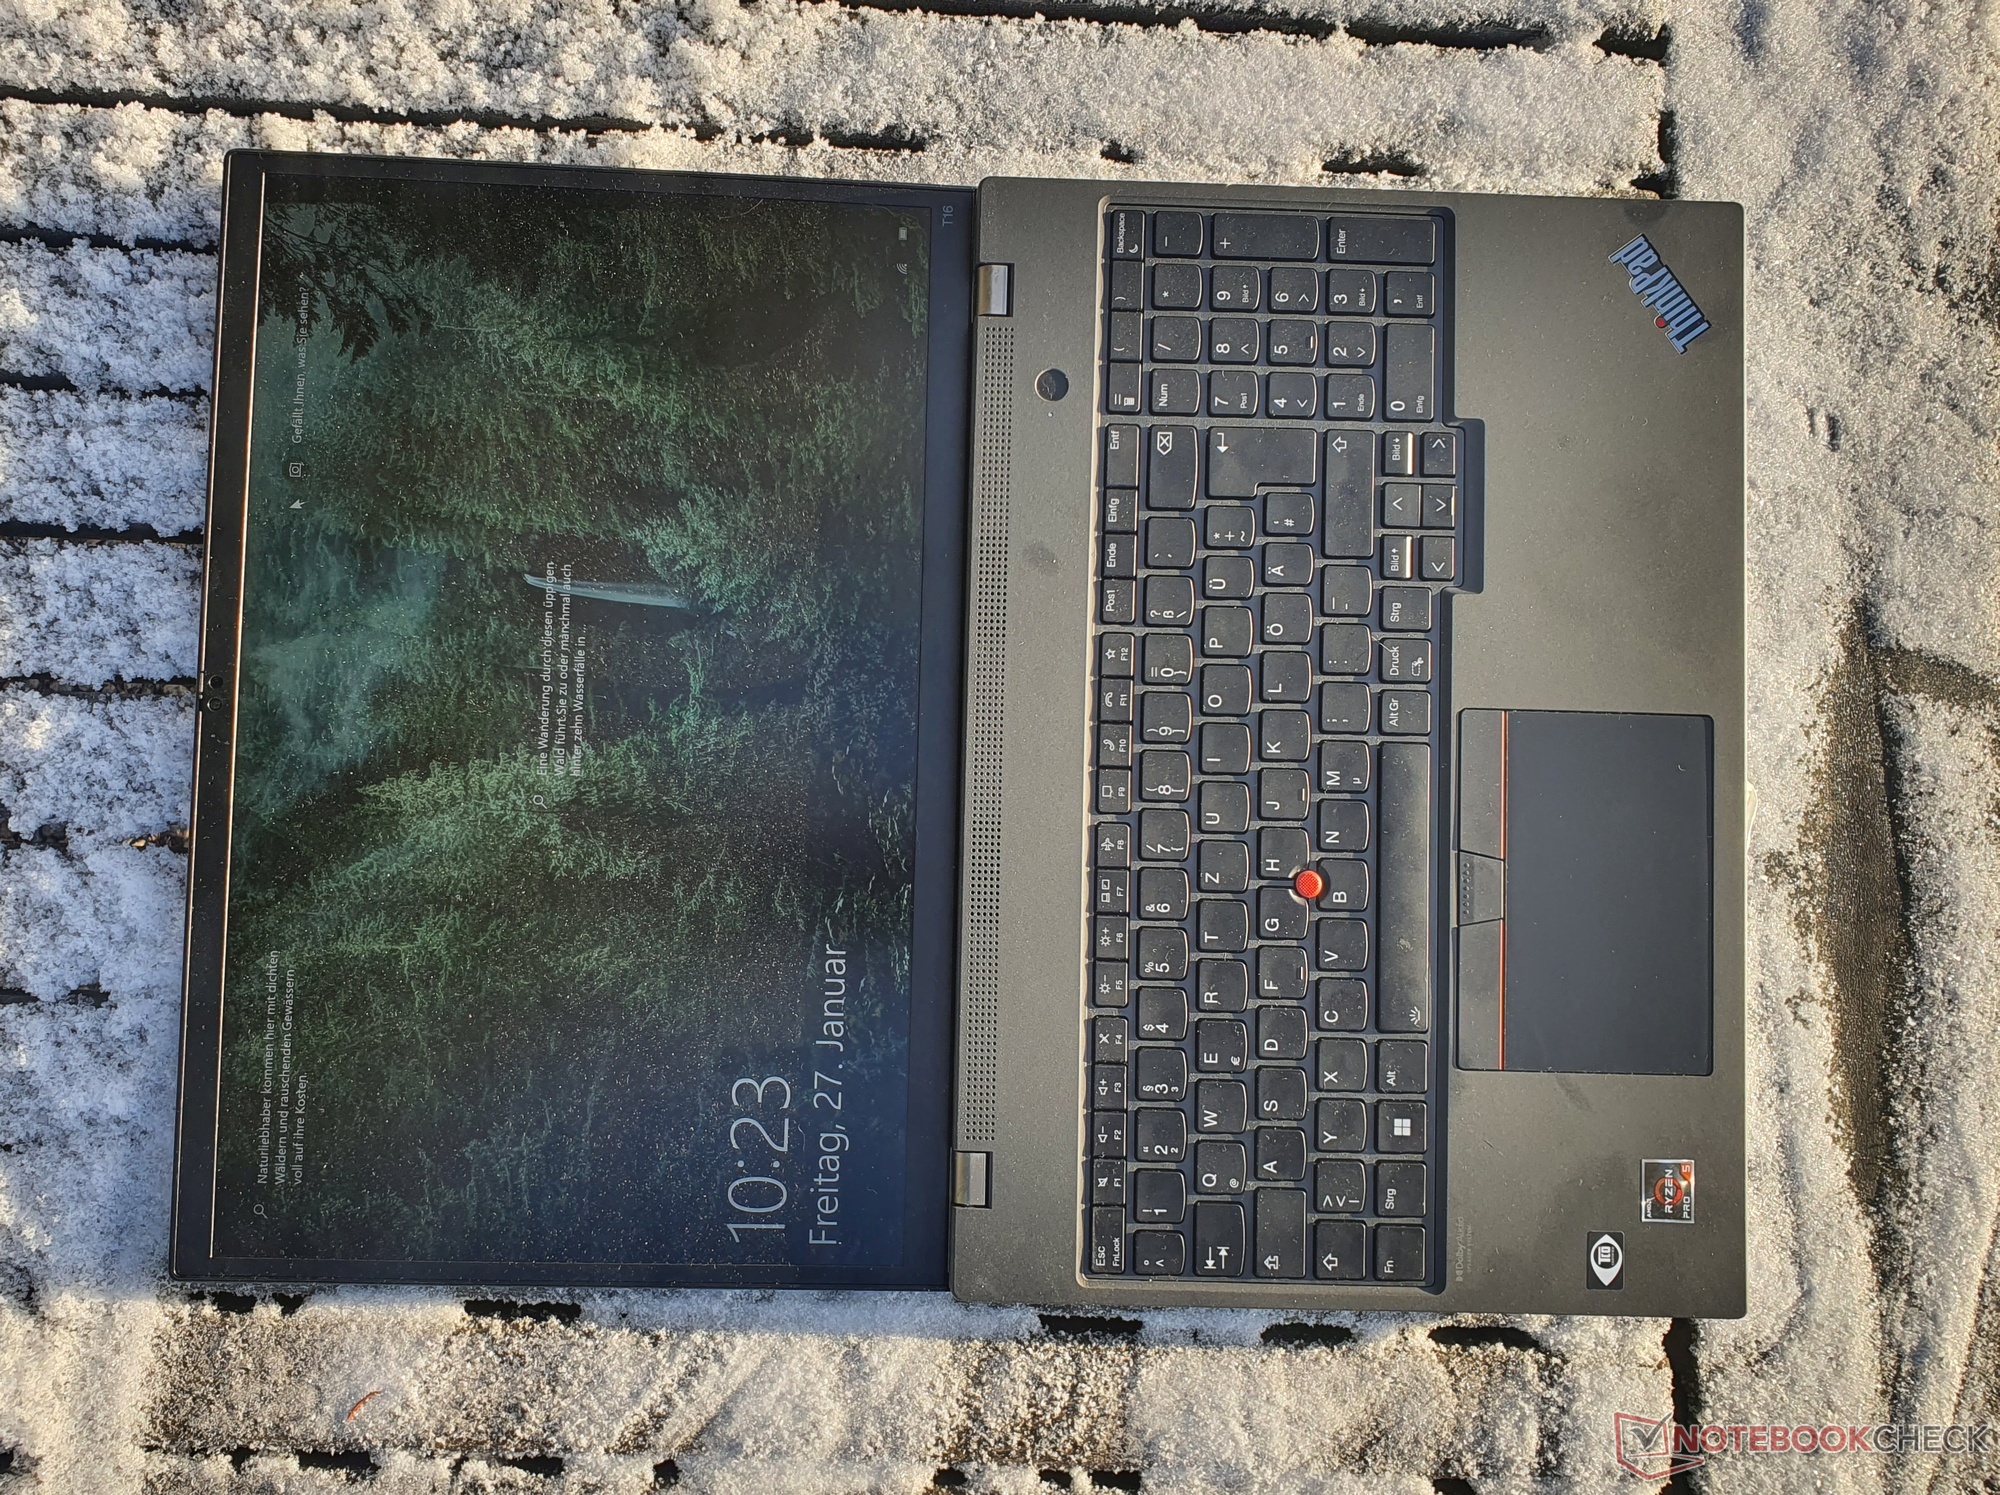
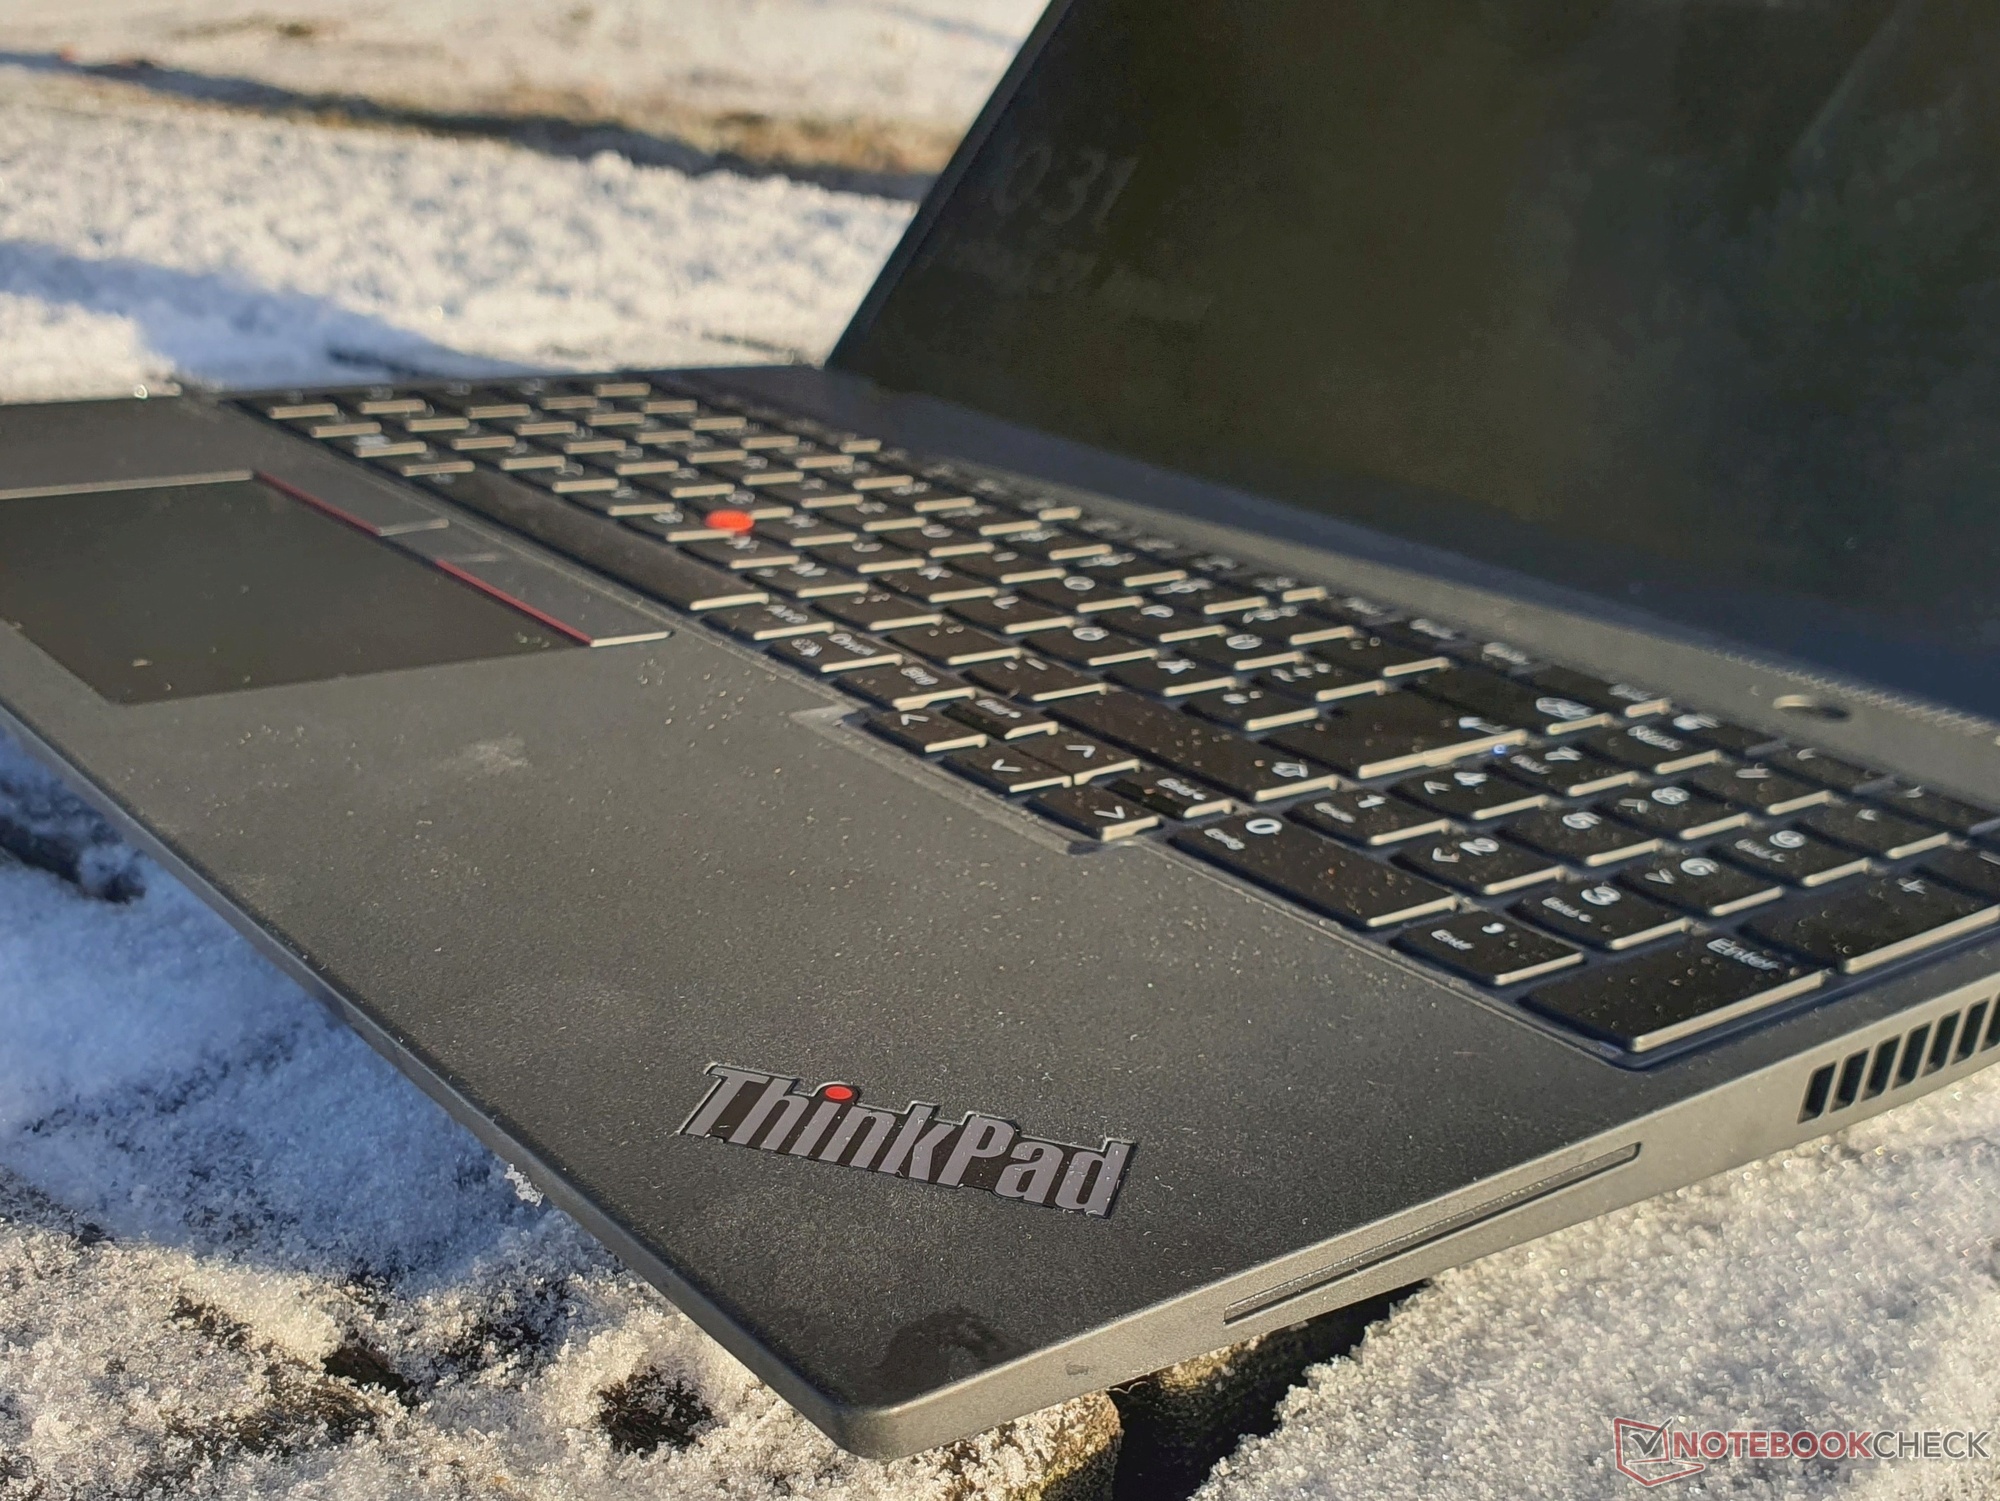
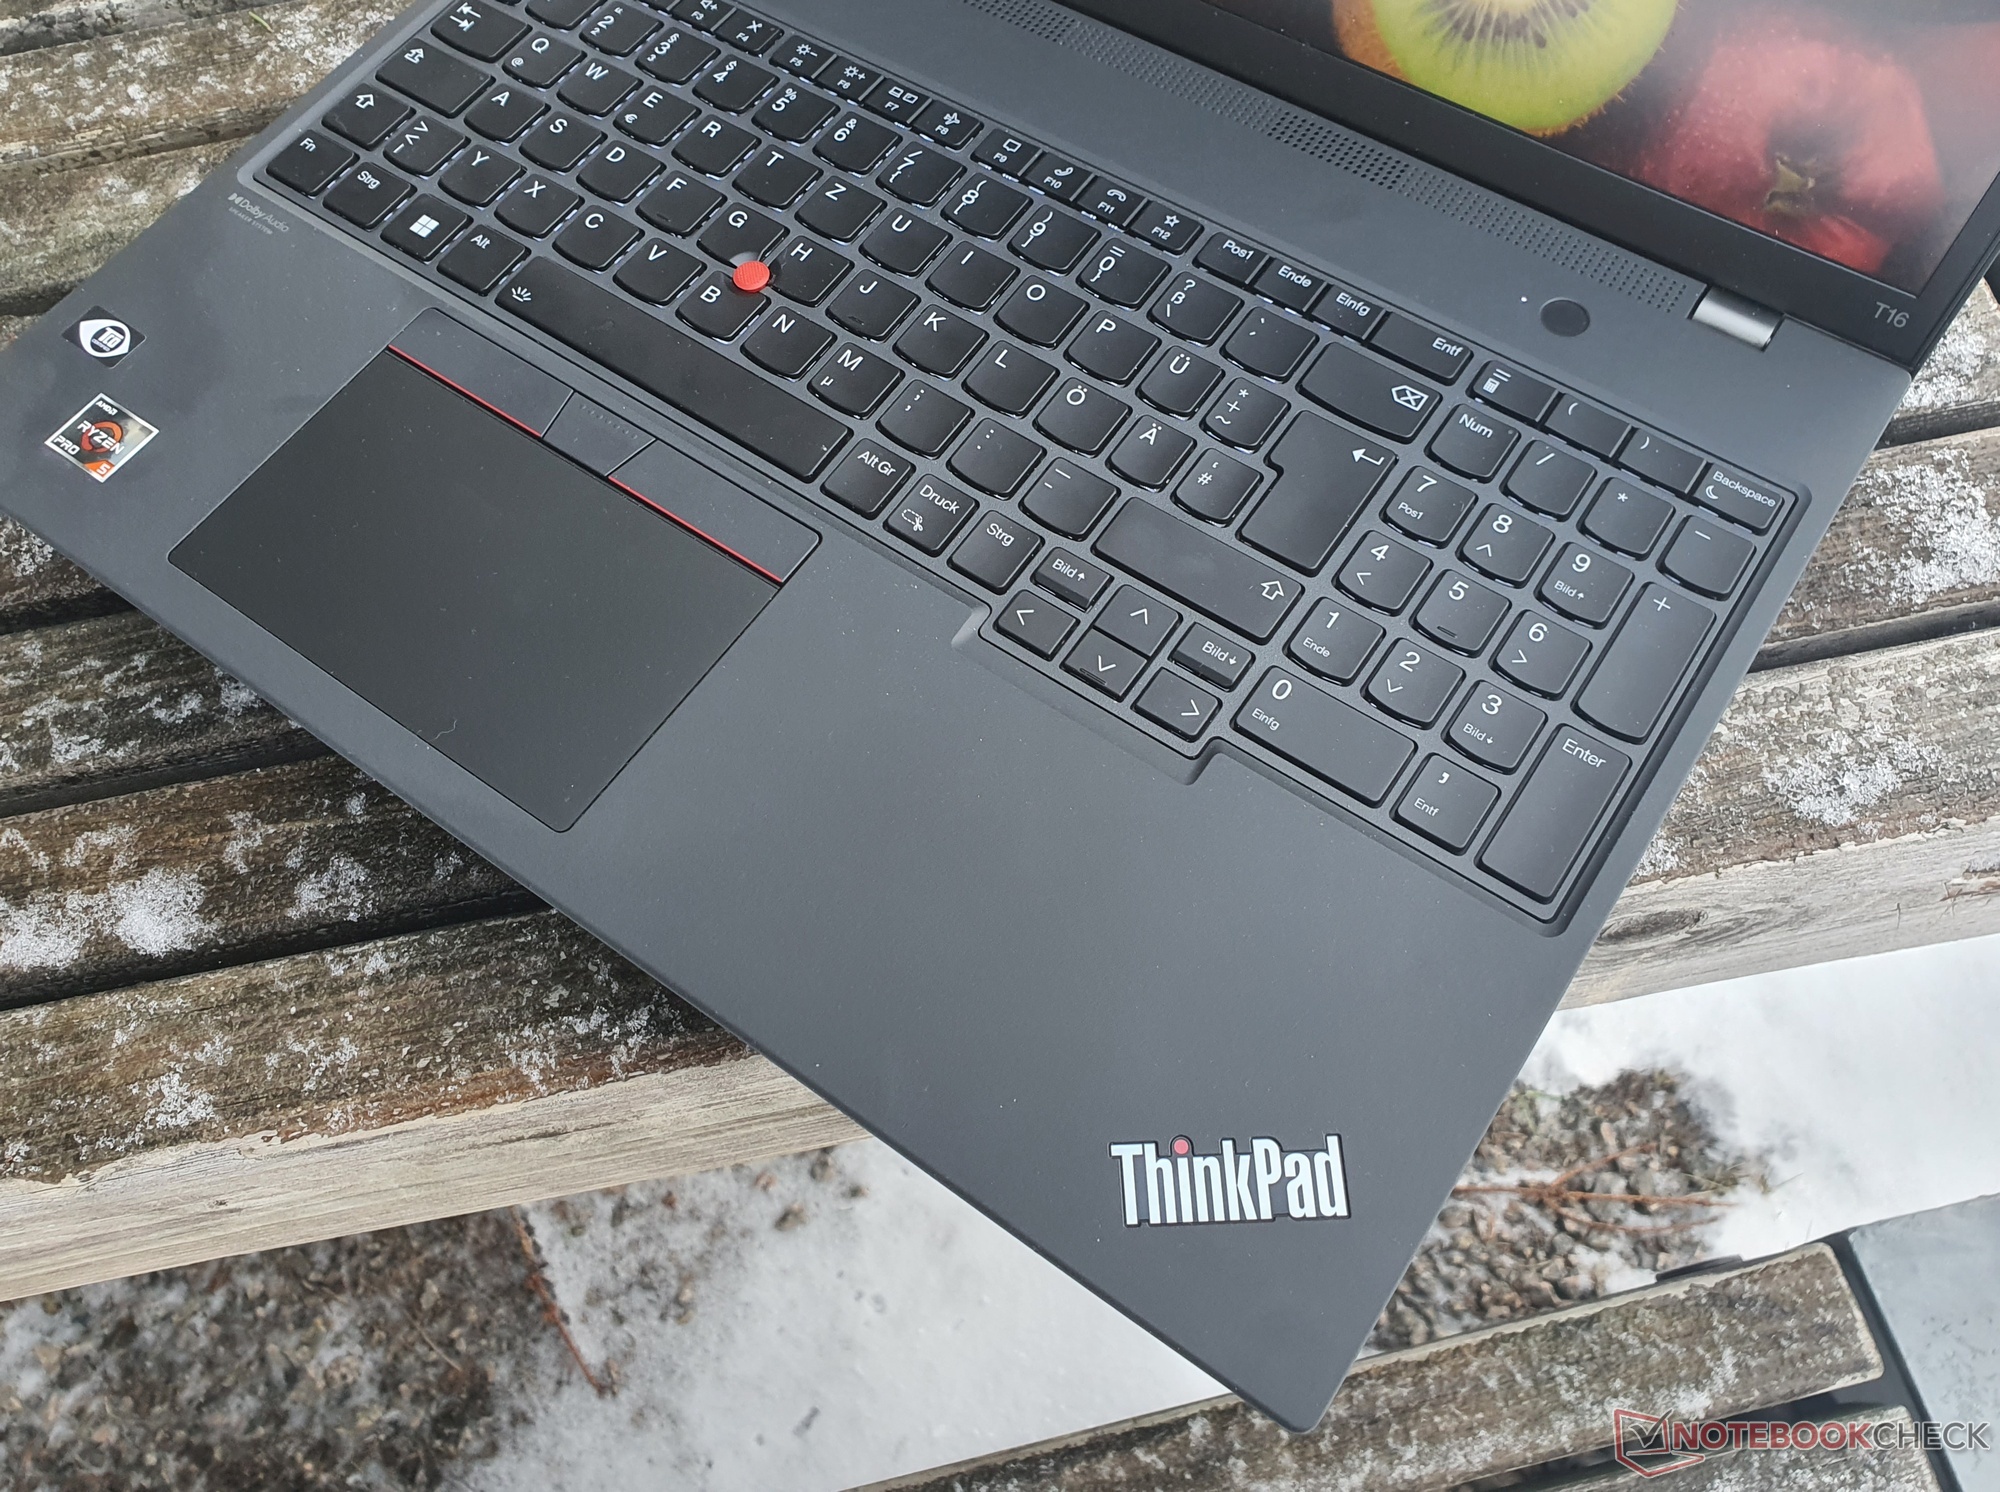
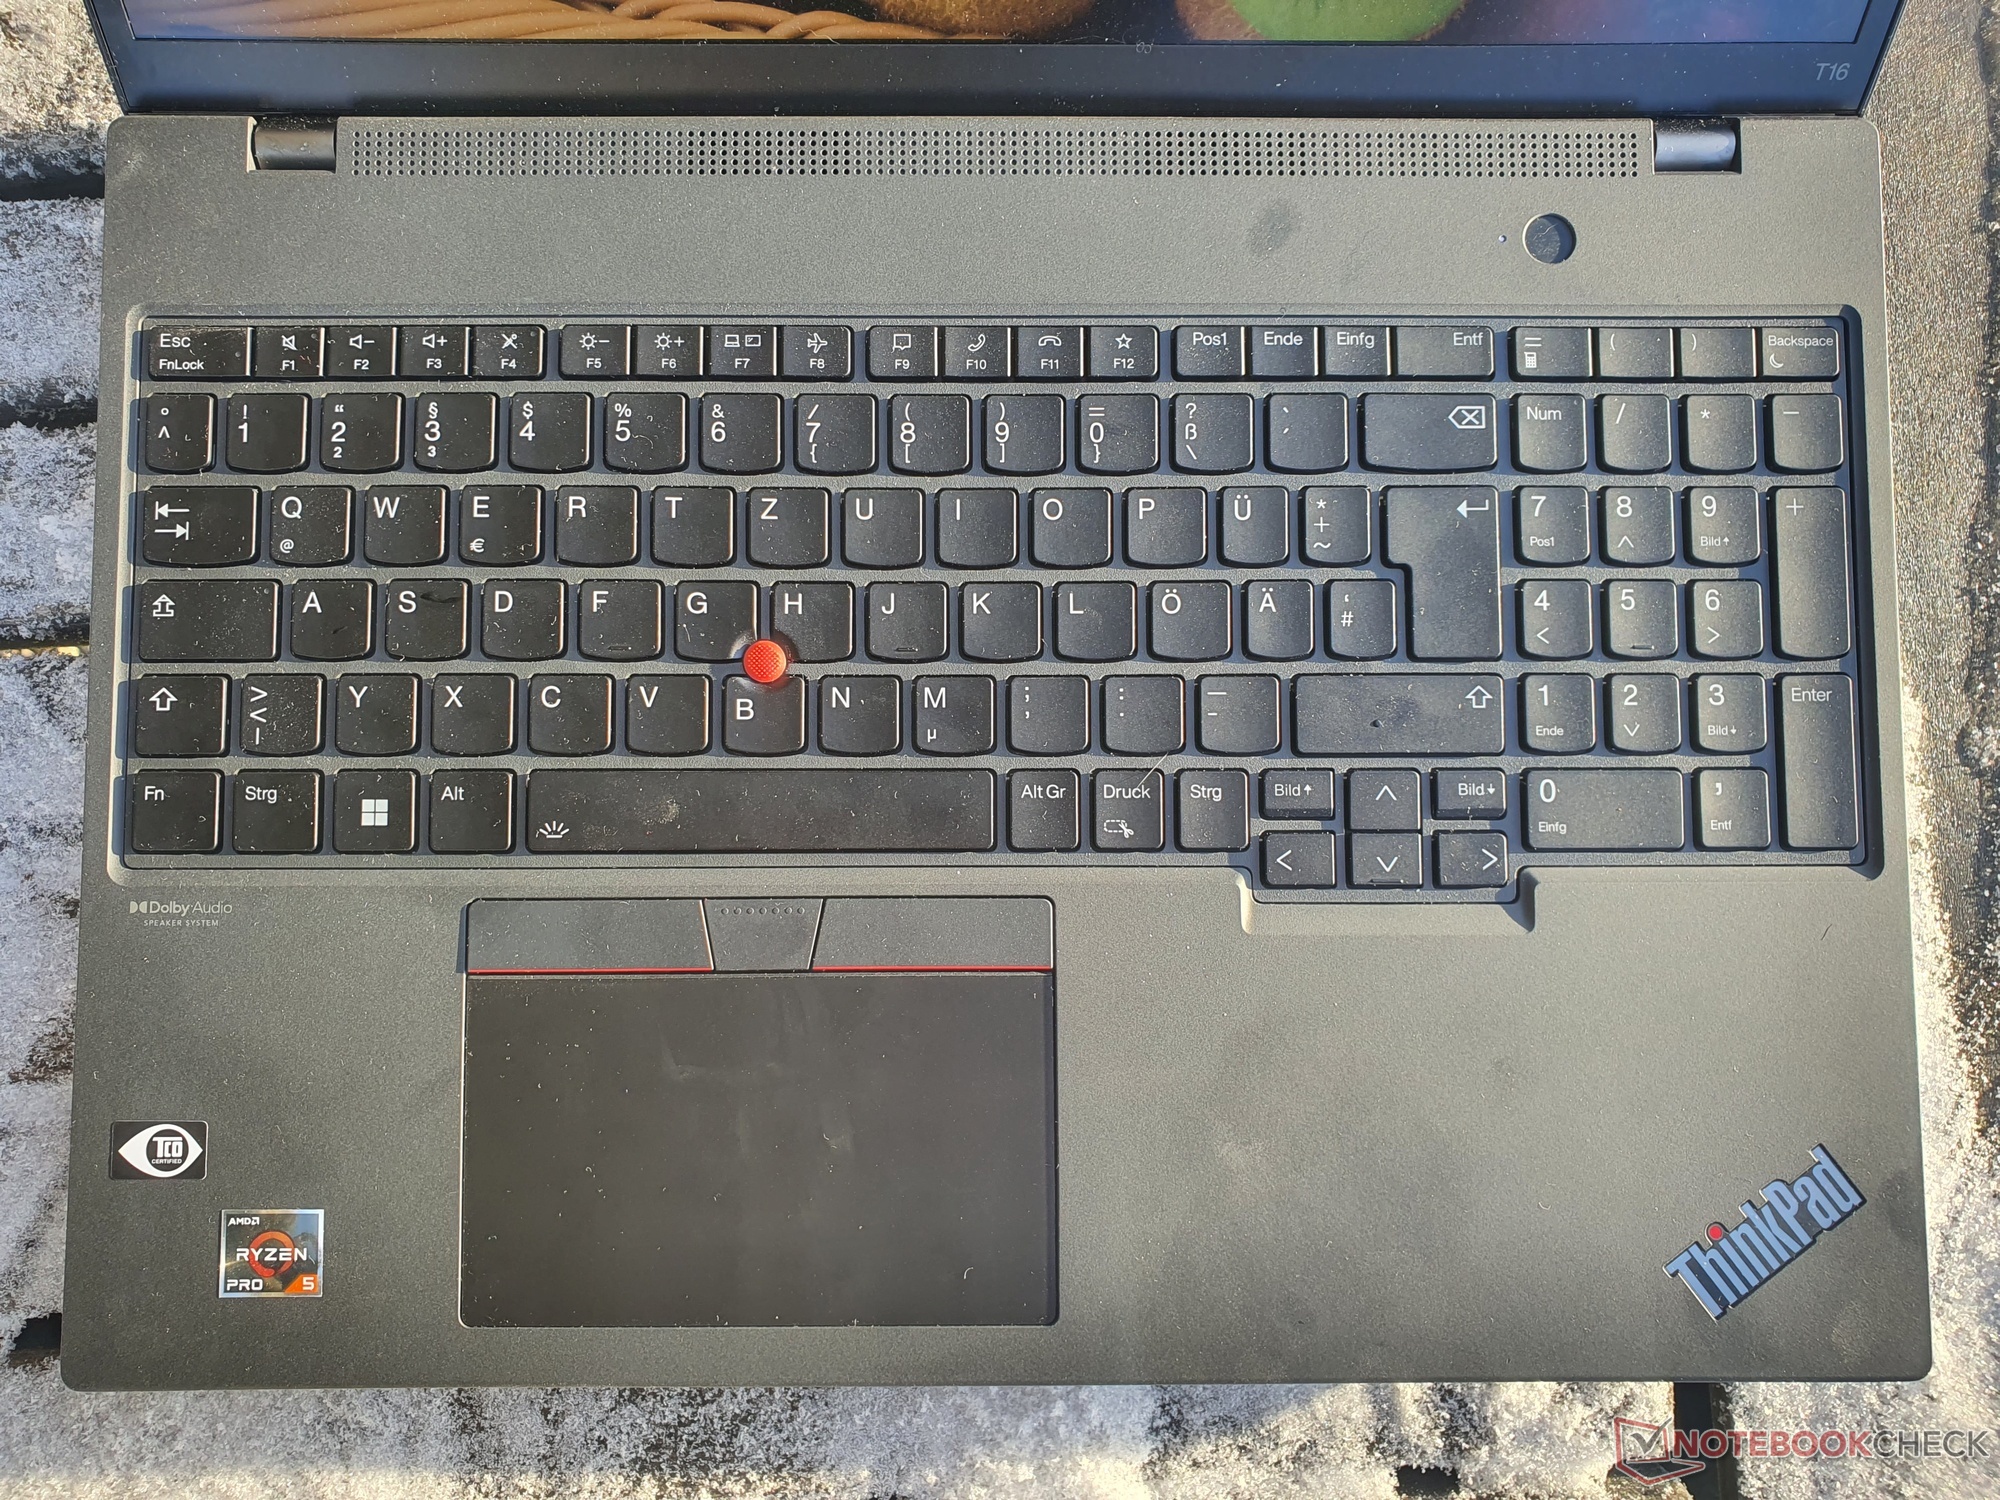
Since the case, connection equipment, and input devices are basically the same, you can find detailed information on that in our review of the ThinkPad T16 G1 Intel.
Additional Lenovo ThinkPad reviews:
ThinkPad P16 G1
ThinkPad T14s G3 AMD
ThinkPad T14s G3 Intel
ThinkPad X1 Carbon G10
ThinkPad X13 G3 Intel
ThinkPad X13s G1
ThinkPad Z13 G1 OLED
Possible Competitors in Comparison
Rating | Date | Model | Weight | Height | Size | Resolution | Best Price |
|---|---|---|---|---|---|---|---|
| 90.2 % | 02/2023 | Lenovo ThinkPad T16 G1 21CH004MGE R5 PRO 6650U, Radeon 660M | 1.8 kg | 20.5 mm | 16.00" | 2560x1600 | |
| 89.3 % | 09/2022 | Lenovo ThinkPad T16 G1 21BWS00200 i5-1240P, Iris Xe G7 80EUs | 1.9 kg | 20.5 mm | 16.00" | 1920x1200 | |
| 87.2 % | 12/2022 | HP EliteBook 865 G9 R7 PRO 6850U, Radeon 680M | 1.9 kg | 19 mm | 16.00" | 1920x1200 | |
| 87.3 % | 10/2022 | Lenovo ThinkPad Z16 G1 21D5S00T00 R7 PRO 6850H, Radeon RX 6500M | 1.9 kg | 15.8 mm | 16.00" | 1920x1200 | |
| 88.7 % | 12/2022 | Lenovo ThinkPad X1 Extreme G5-21DE003RGE i7-12700H, GeForce RTX 3060 Laptop GPU | 2.1 kg | 17.9 mm | 16.00" | 3840x2400 | |
| 86.2 % | 06/2022 | Lenovo ThinkPad P15v G2 21A9000XGE i7-11800H, T1200 Laptop GPU | 2.3 kg | 22.7 mm | 15.60" | 1920x1080 | |
| 87.4 % | 01/2023 | HP ZBook Power 15 G9 6B8C4EA i7-12700H, RTX A2000 Laptop GPU | 2 kg | 22.8 mm | 15.60" | 3840x2160 |


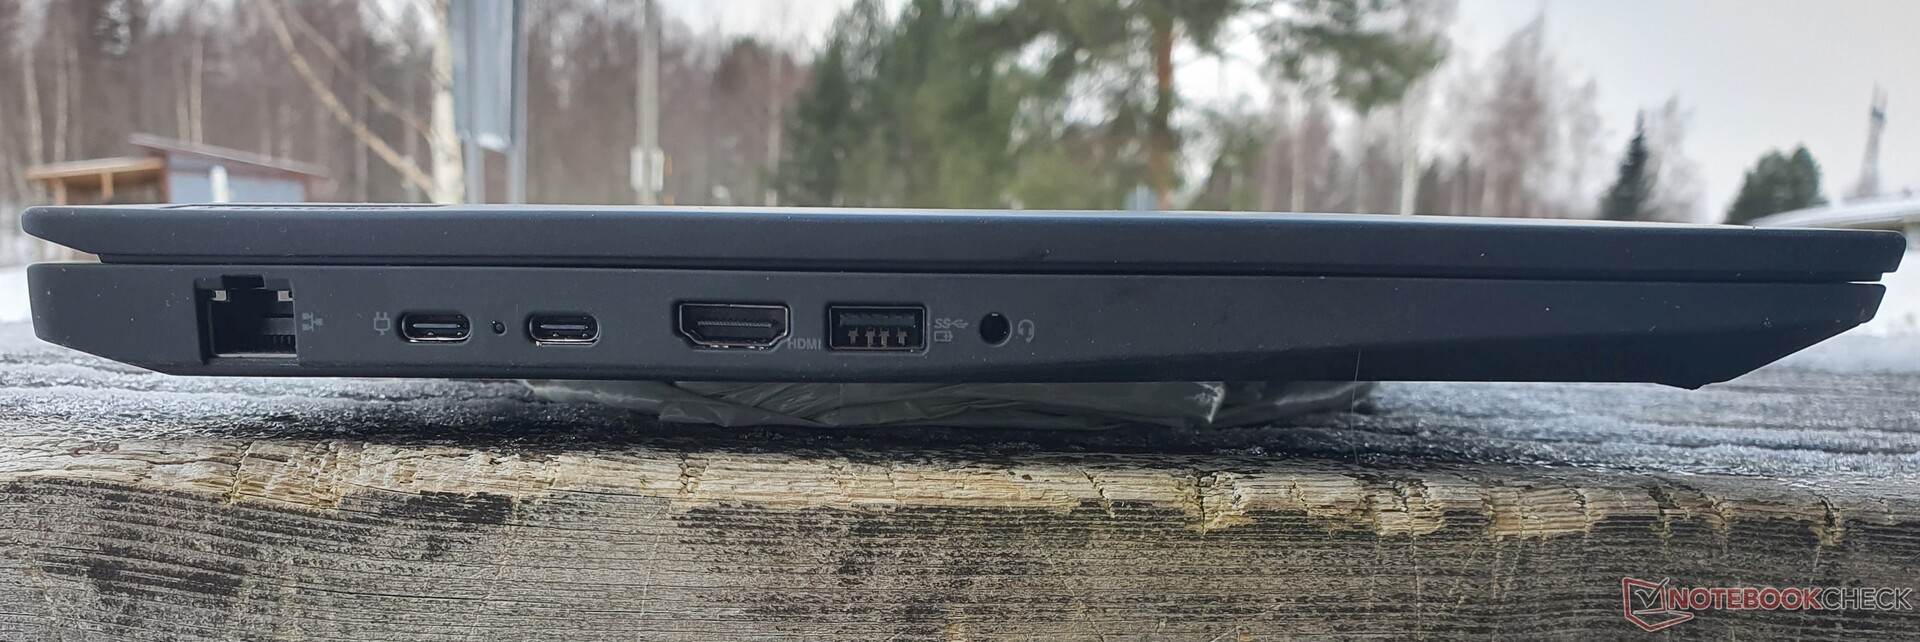
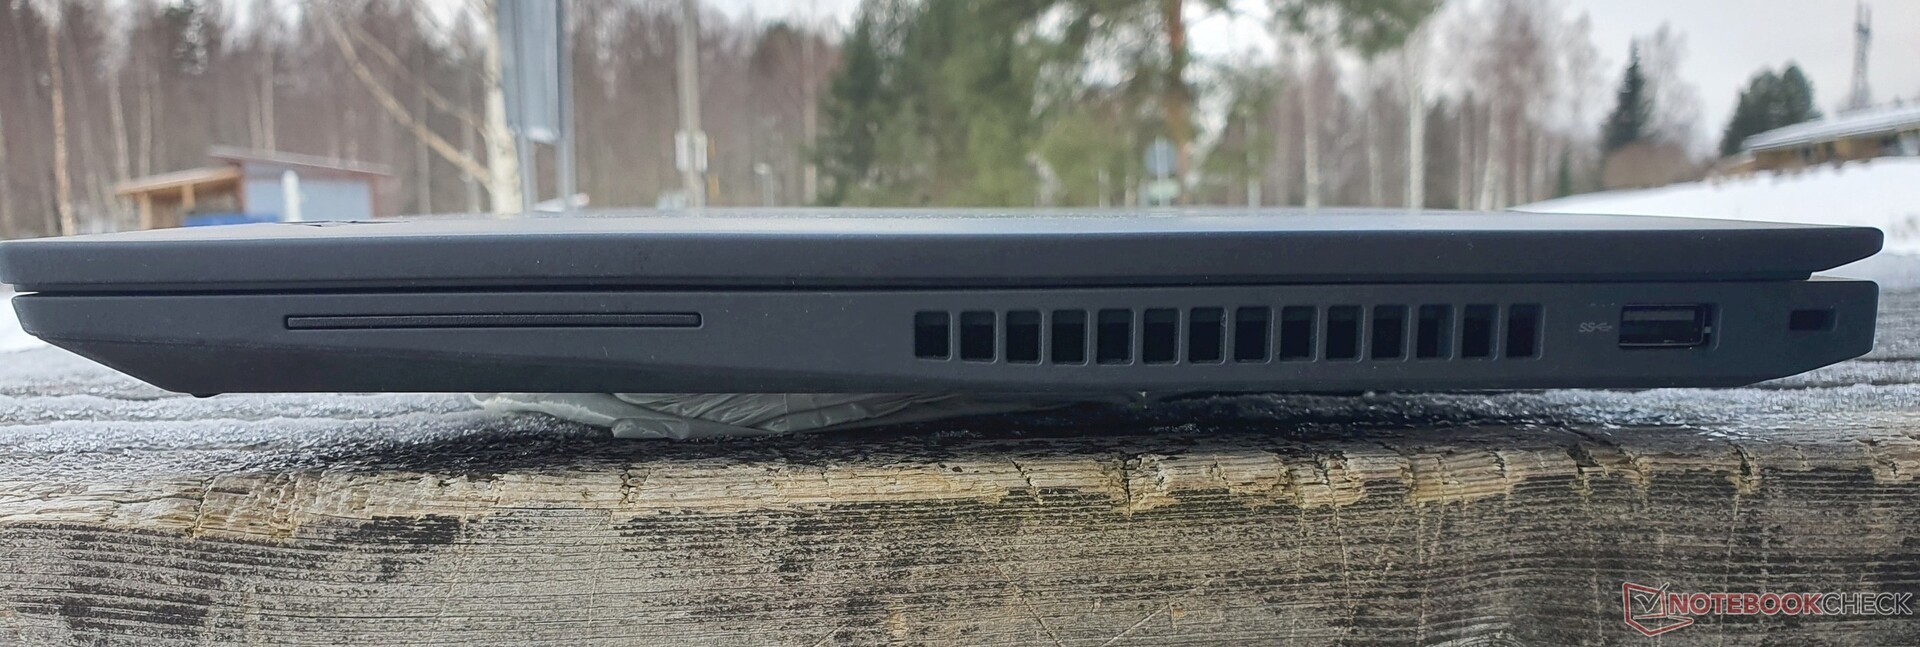
Connections
The connections are basically the same as in the Intel model, with the only difference of lacking Thunderbolt 4 and USB 4.
Communication
Like in the ThinkPad T14 AMD and ThinkPad Z16, Qualcomm's WCN685x Wi-Fi 6E module including Bluetooth 5.2 is also used here, leading to very fast transfer speeds. In our comparison field, all the devices are similarly fast in this regard. Even though our test unit doesn't have a WWAN module, it still includes the necessary antennas.
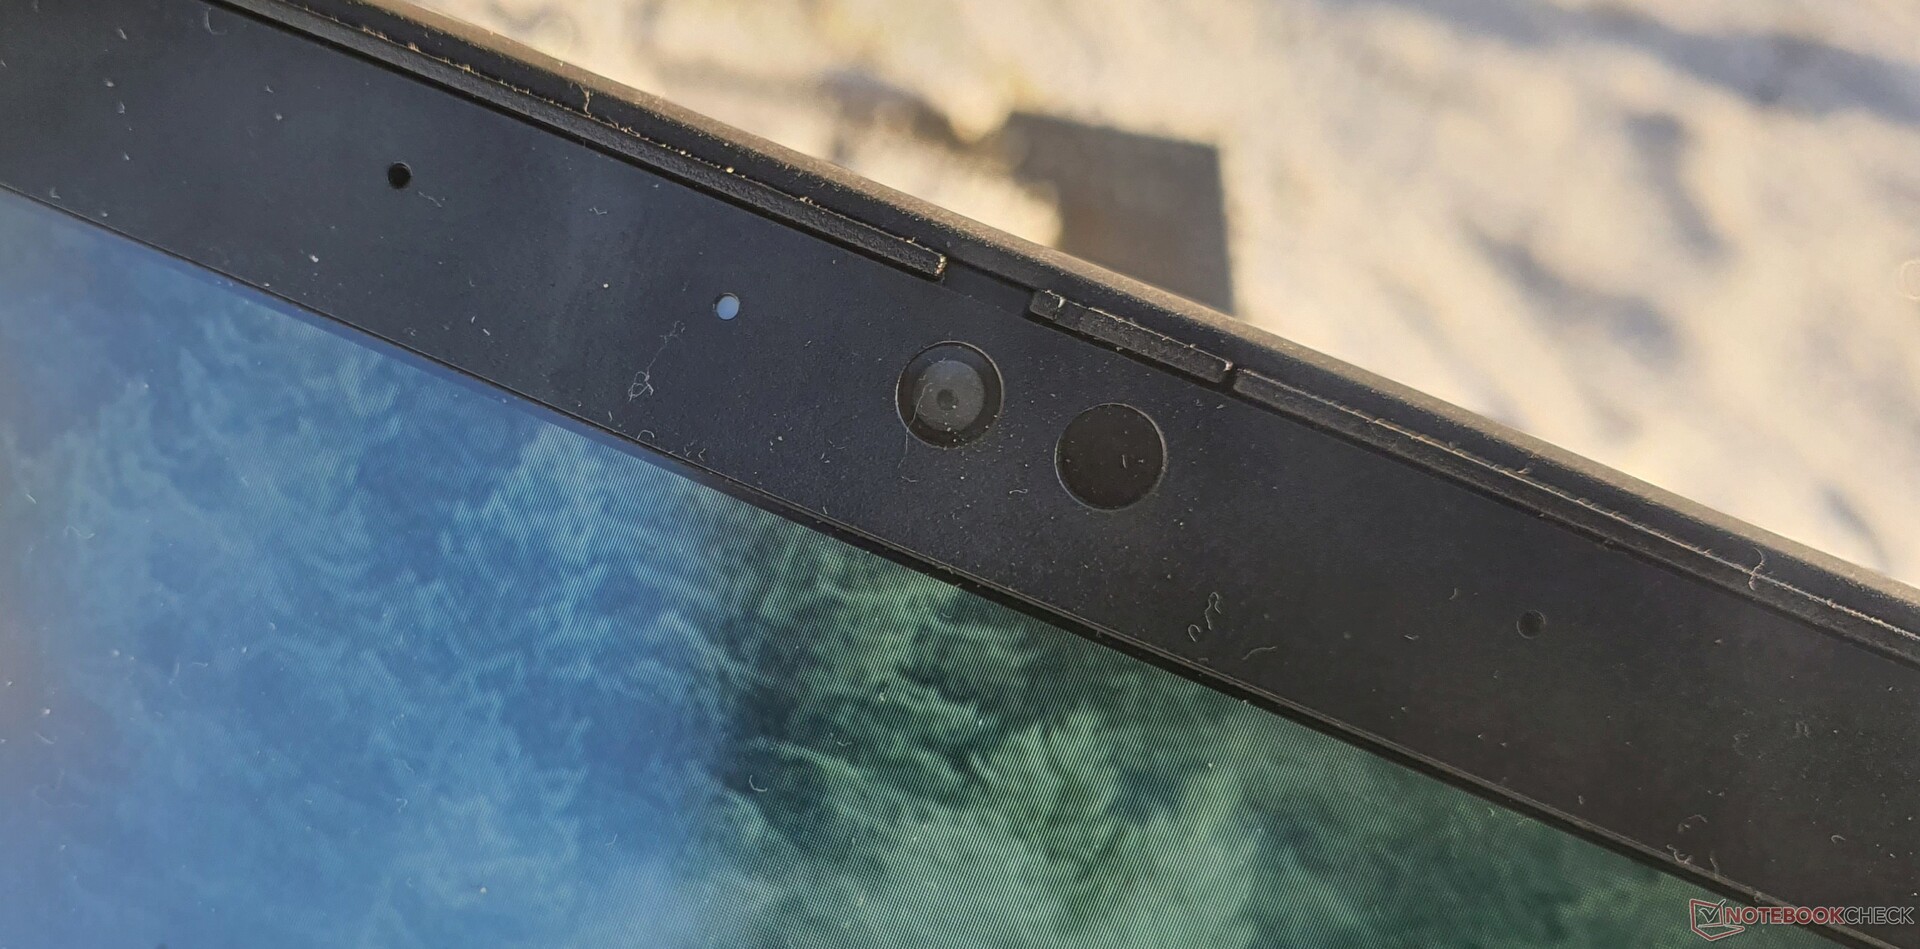
Webcam
The 1.080p webcam is identical to that in the ThinkPad T16 Intel.
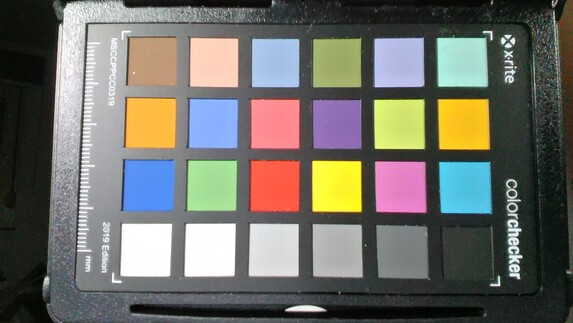


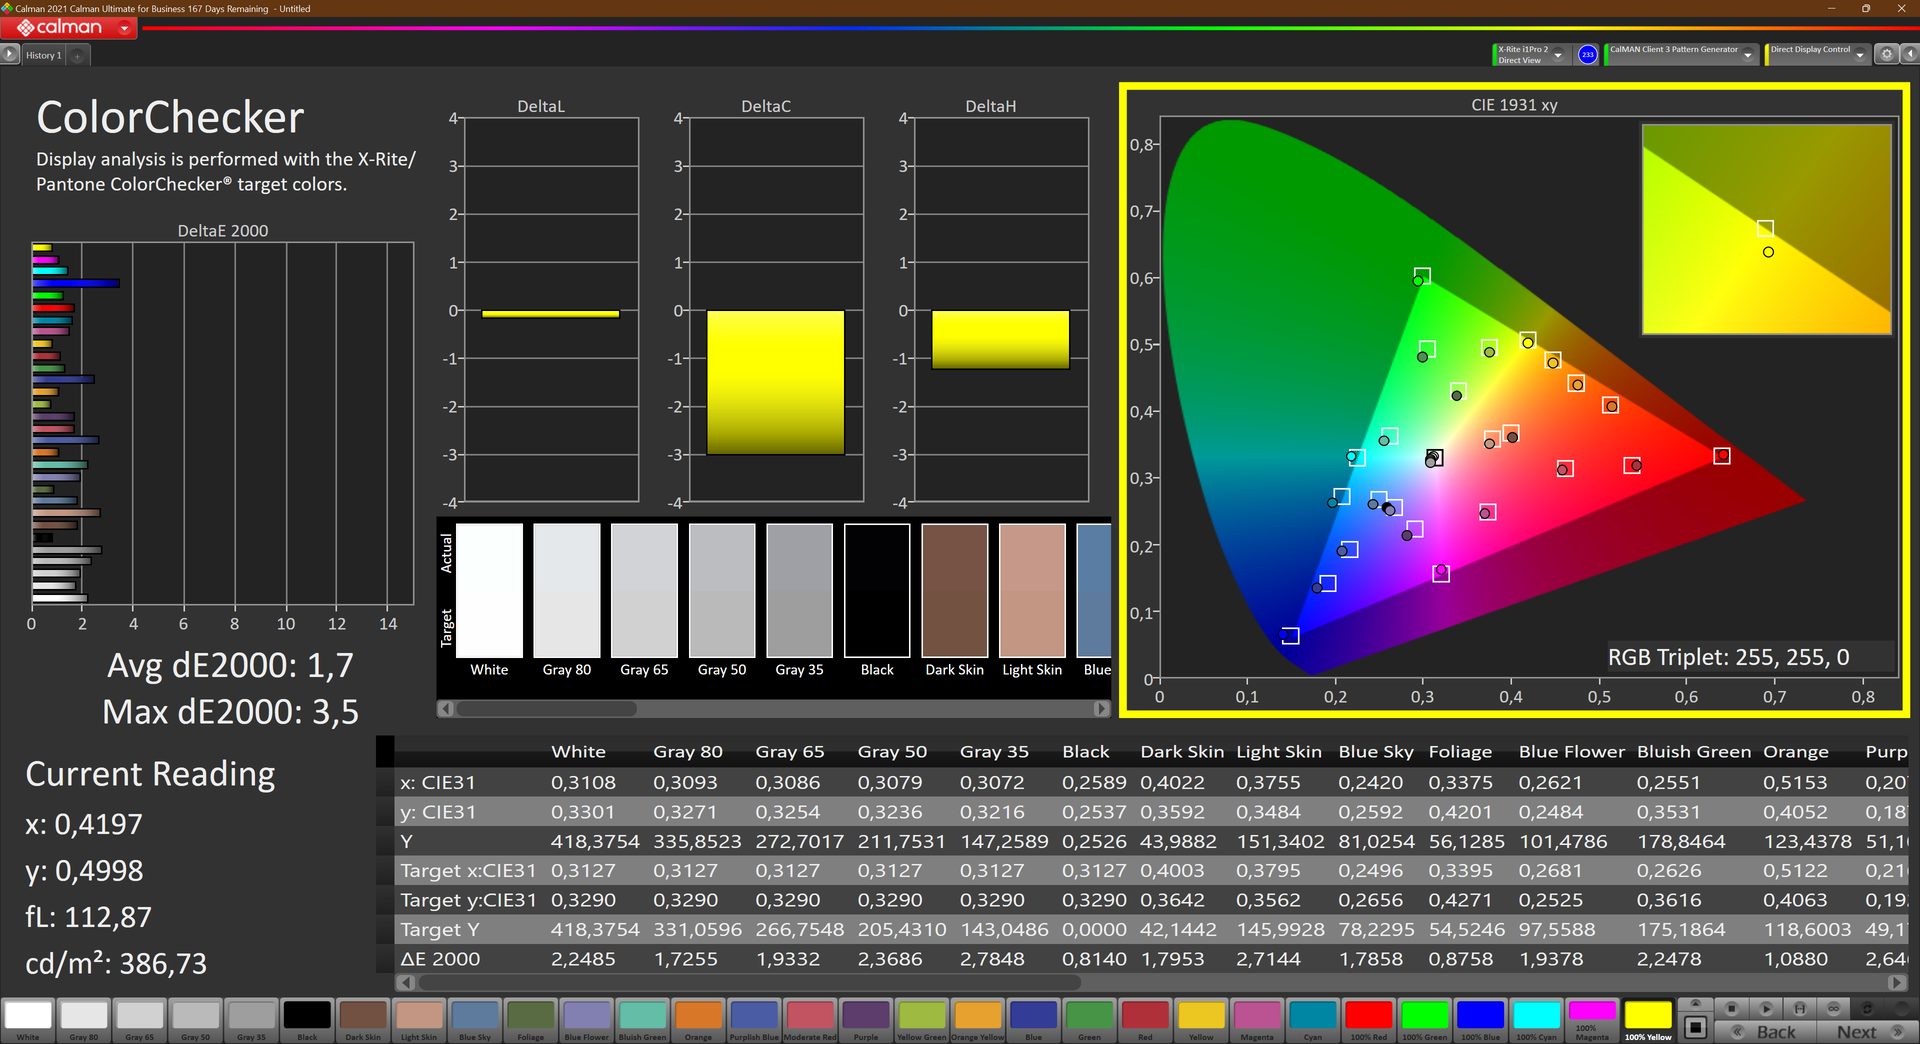
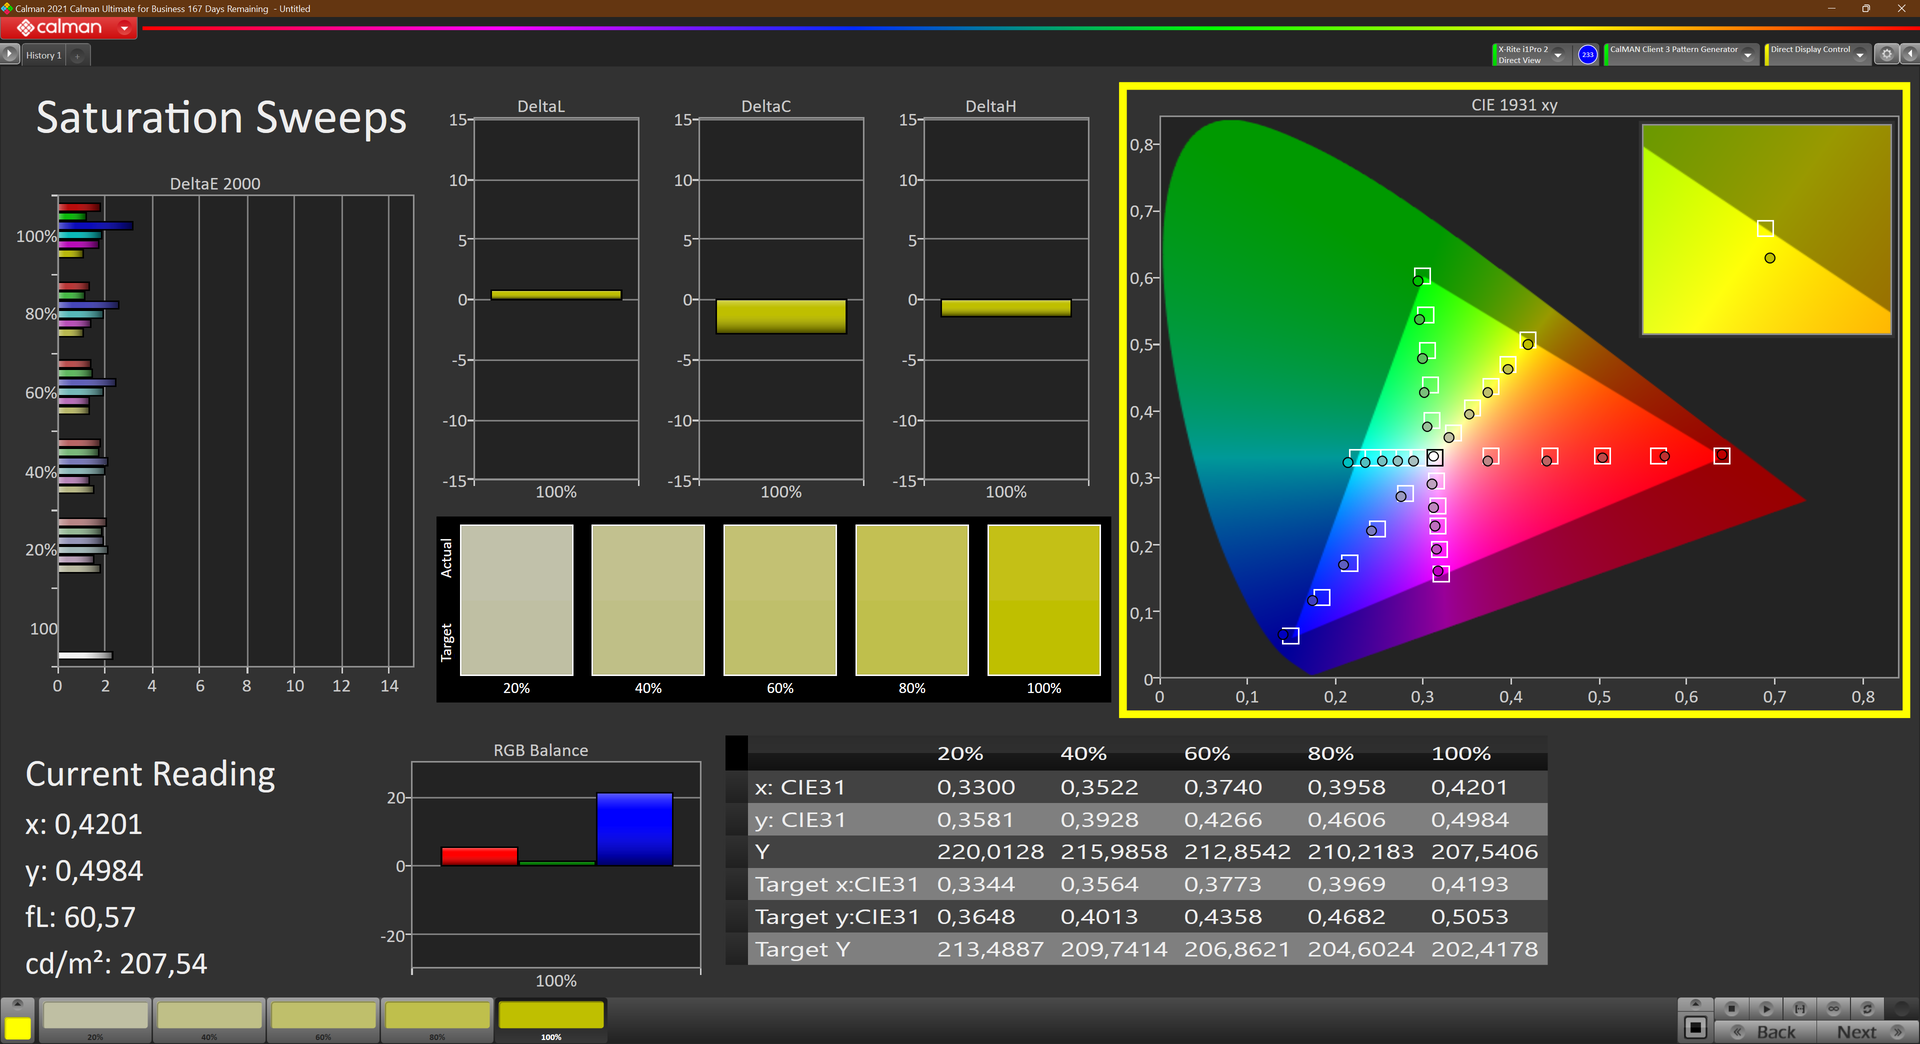
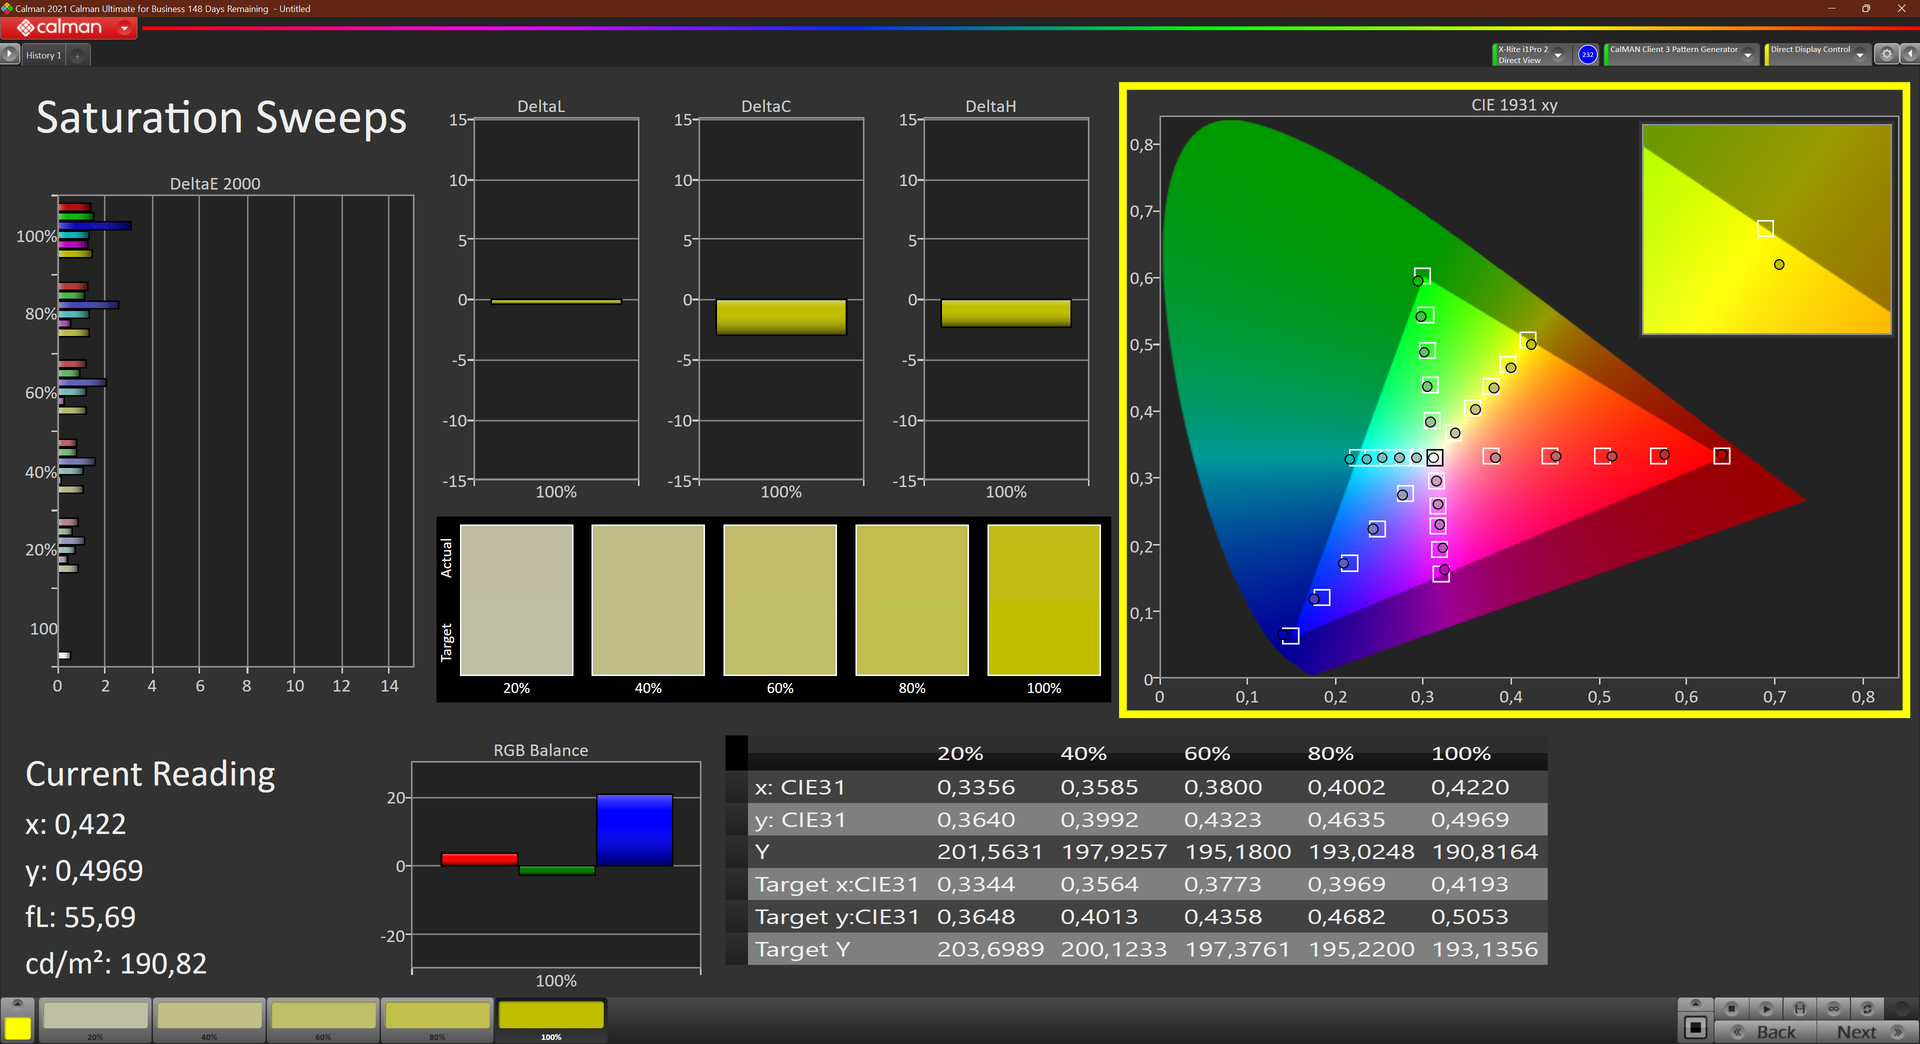
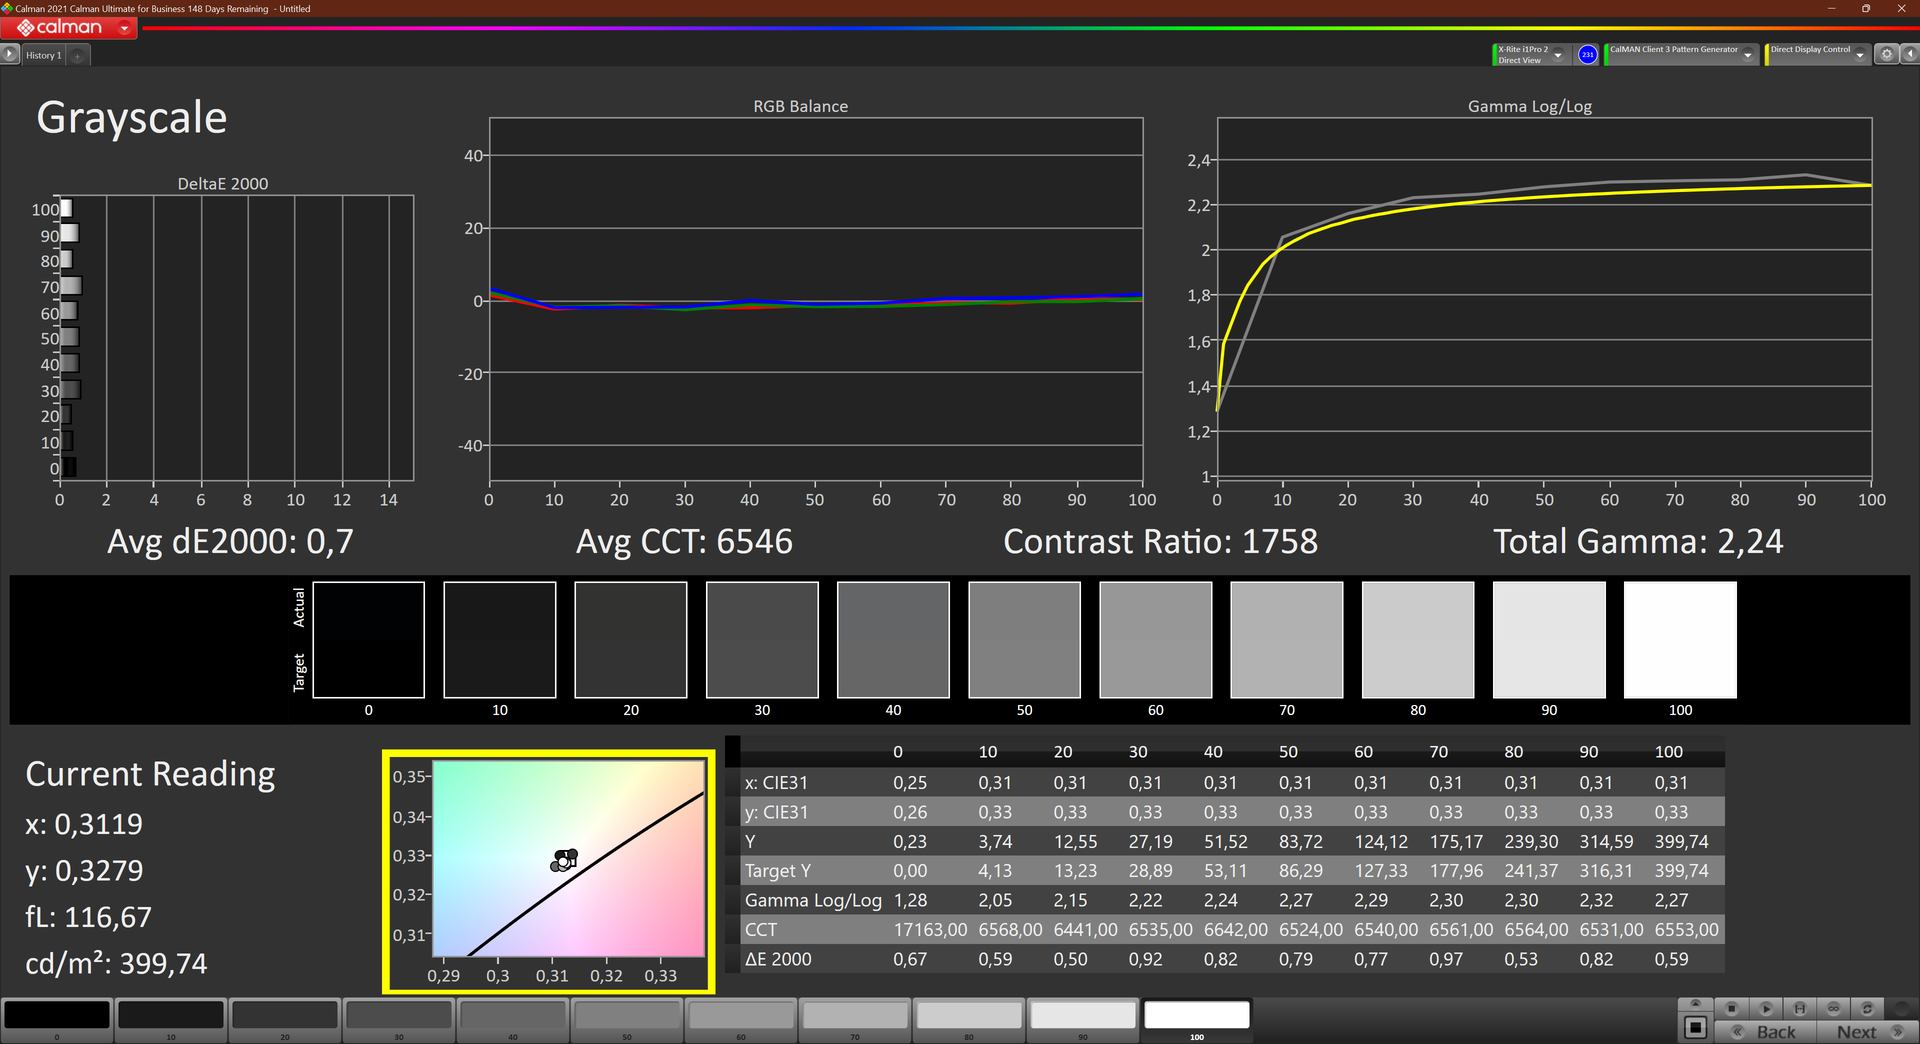
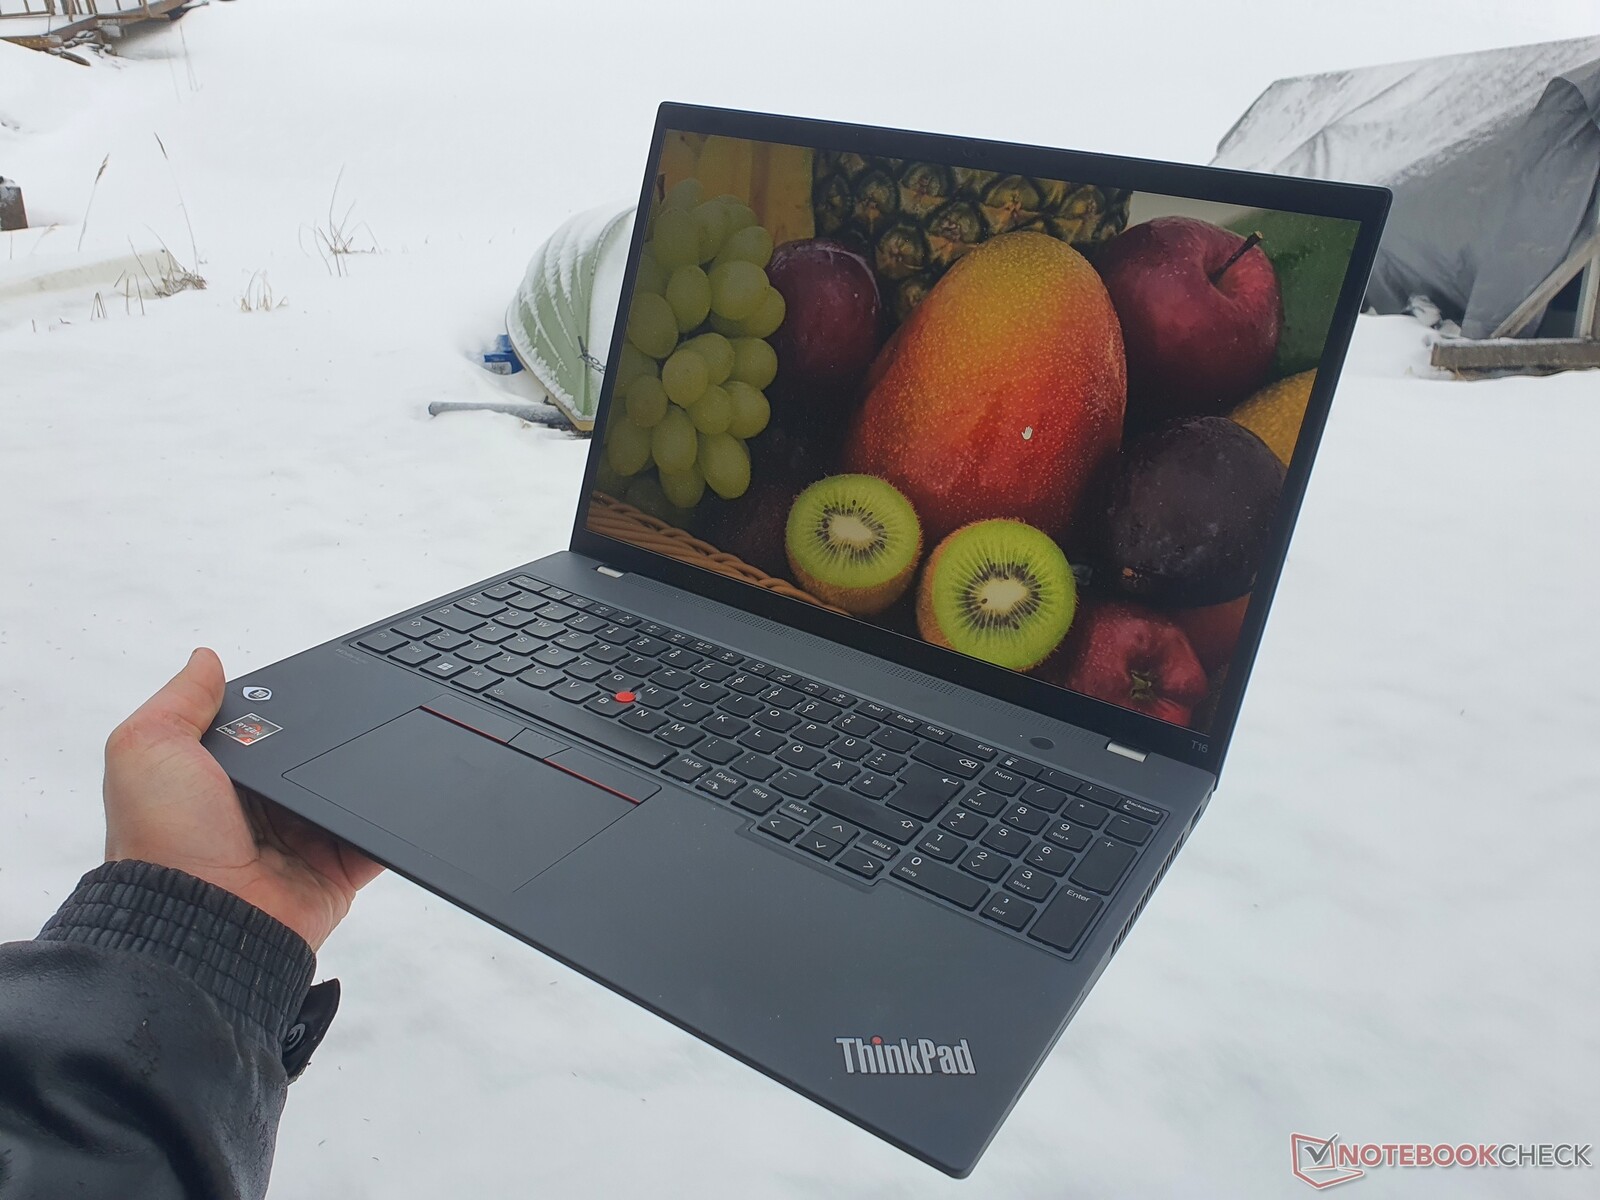
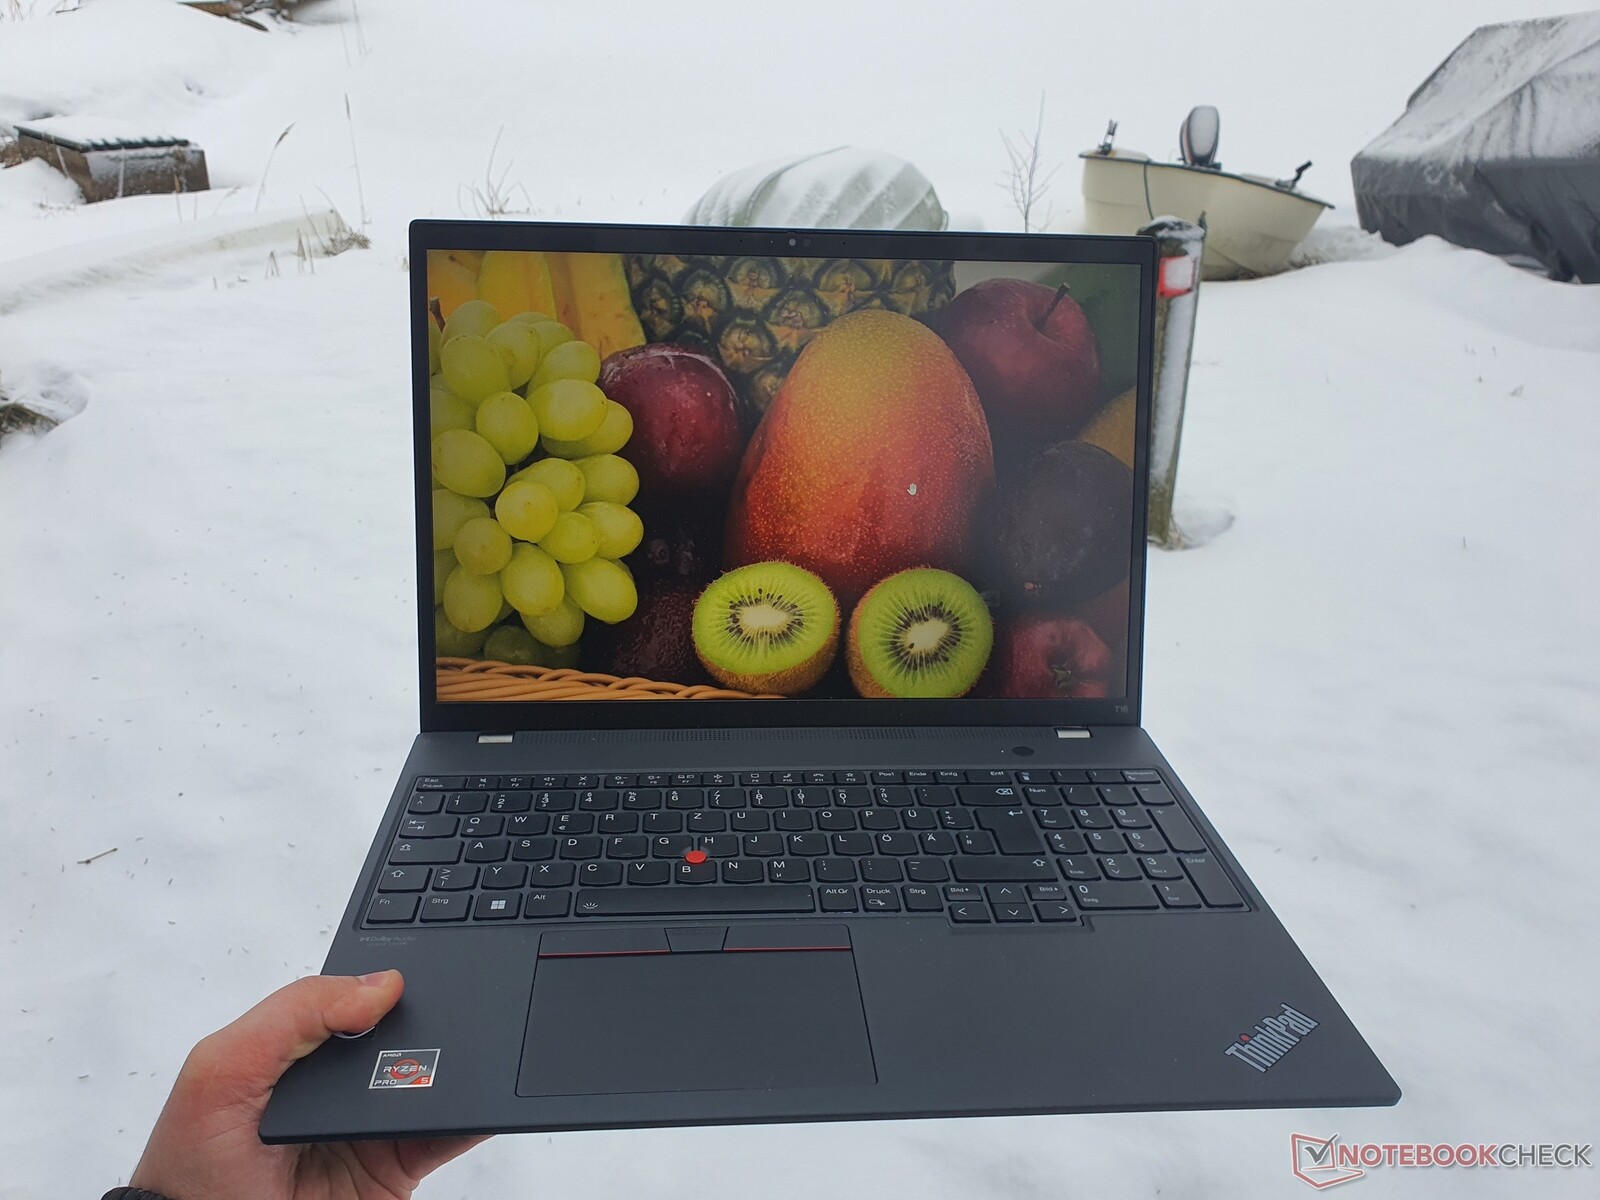
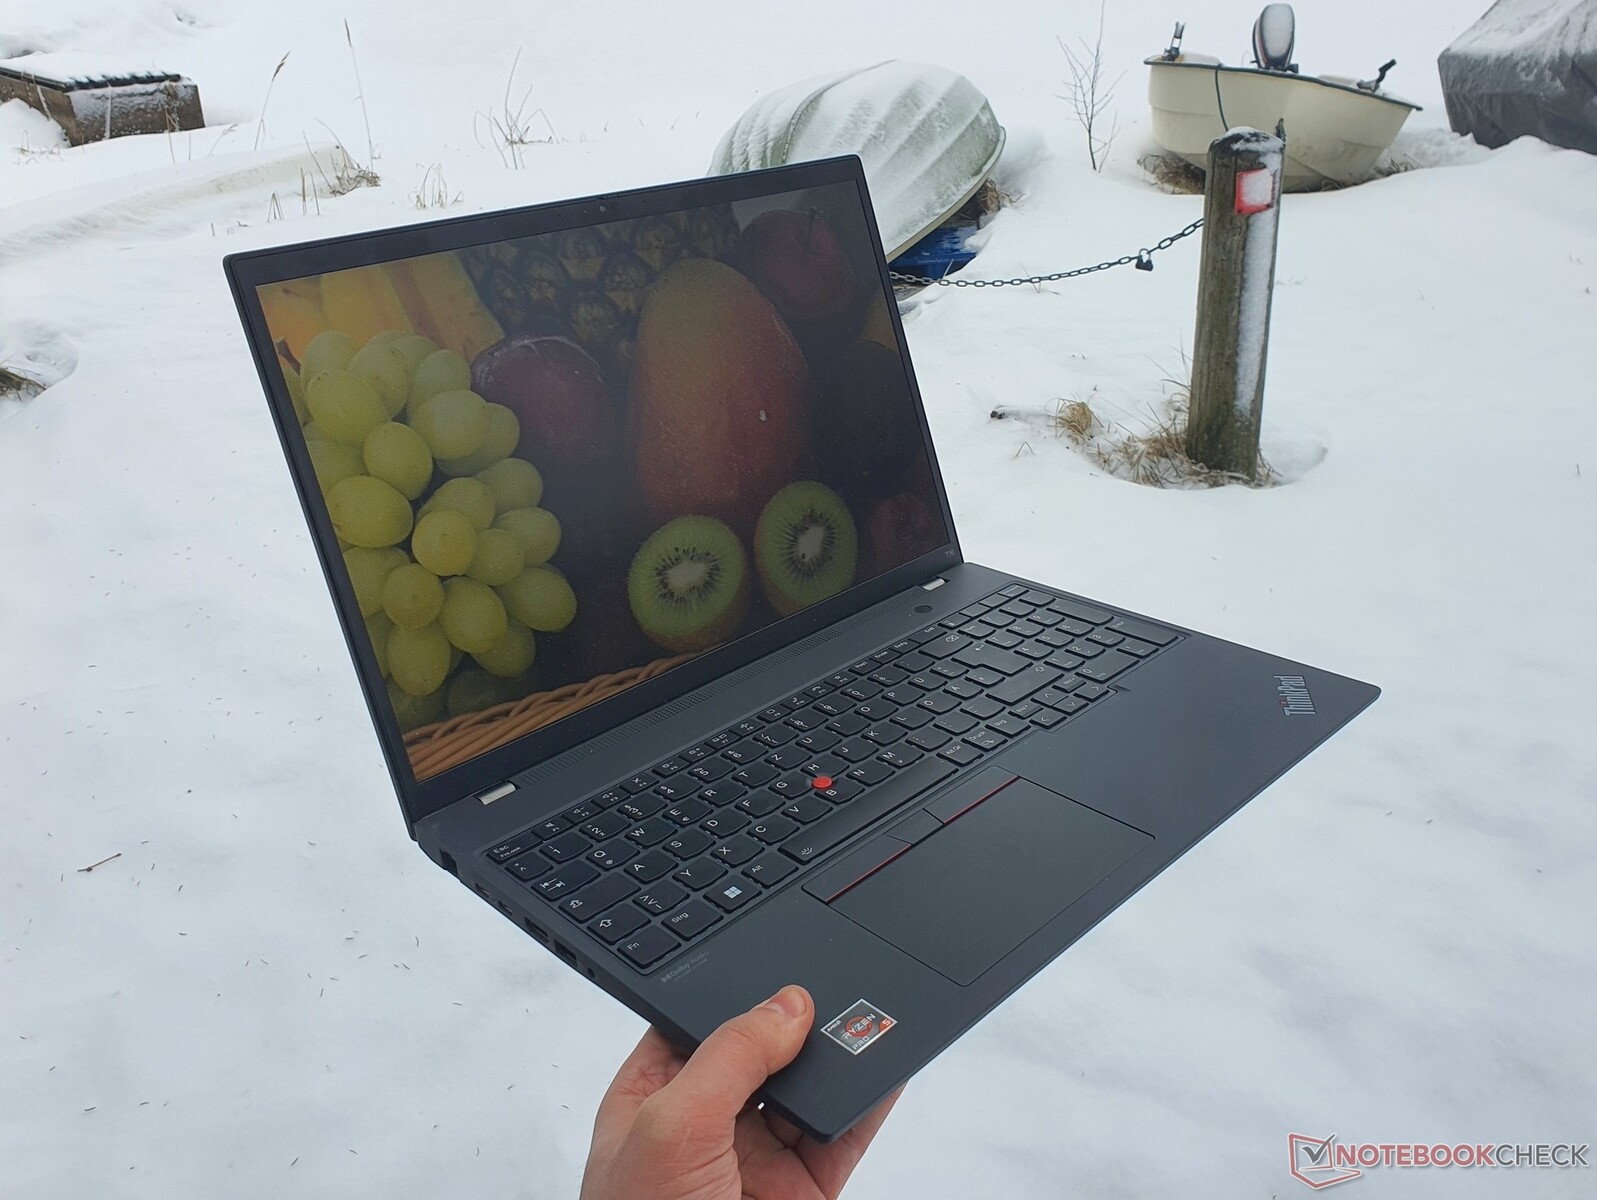
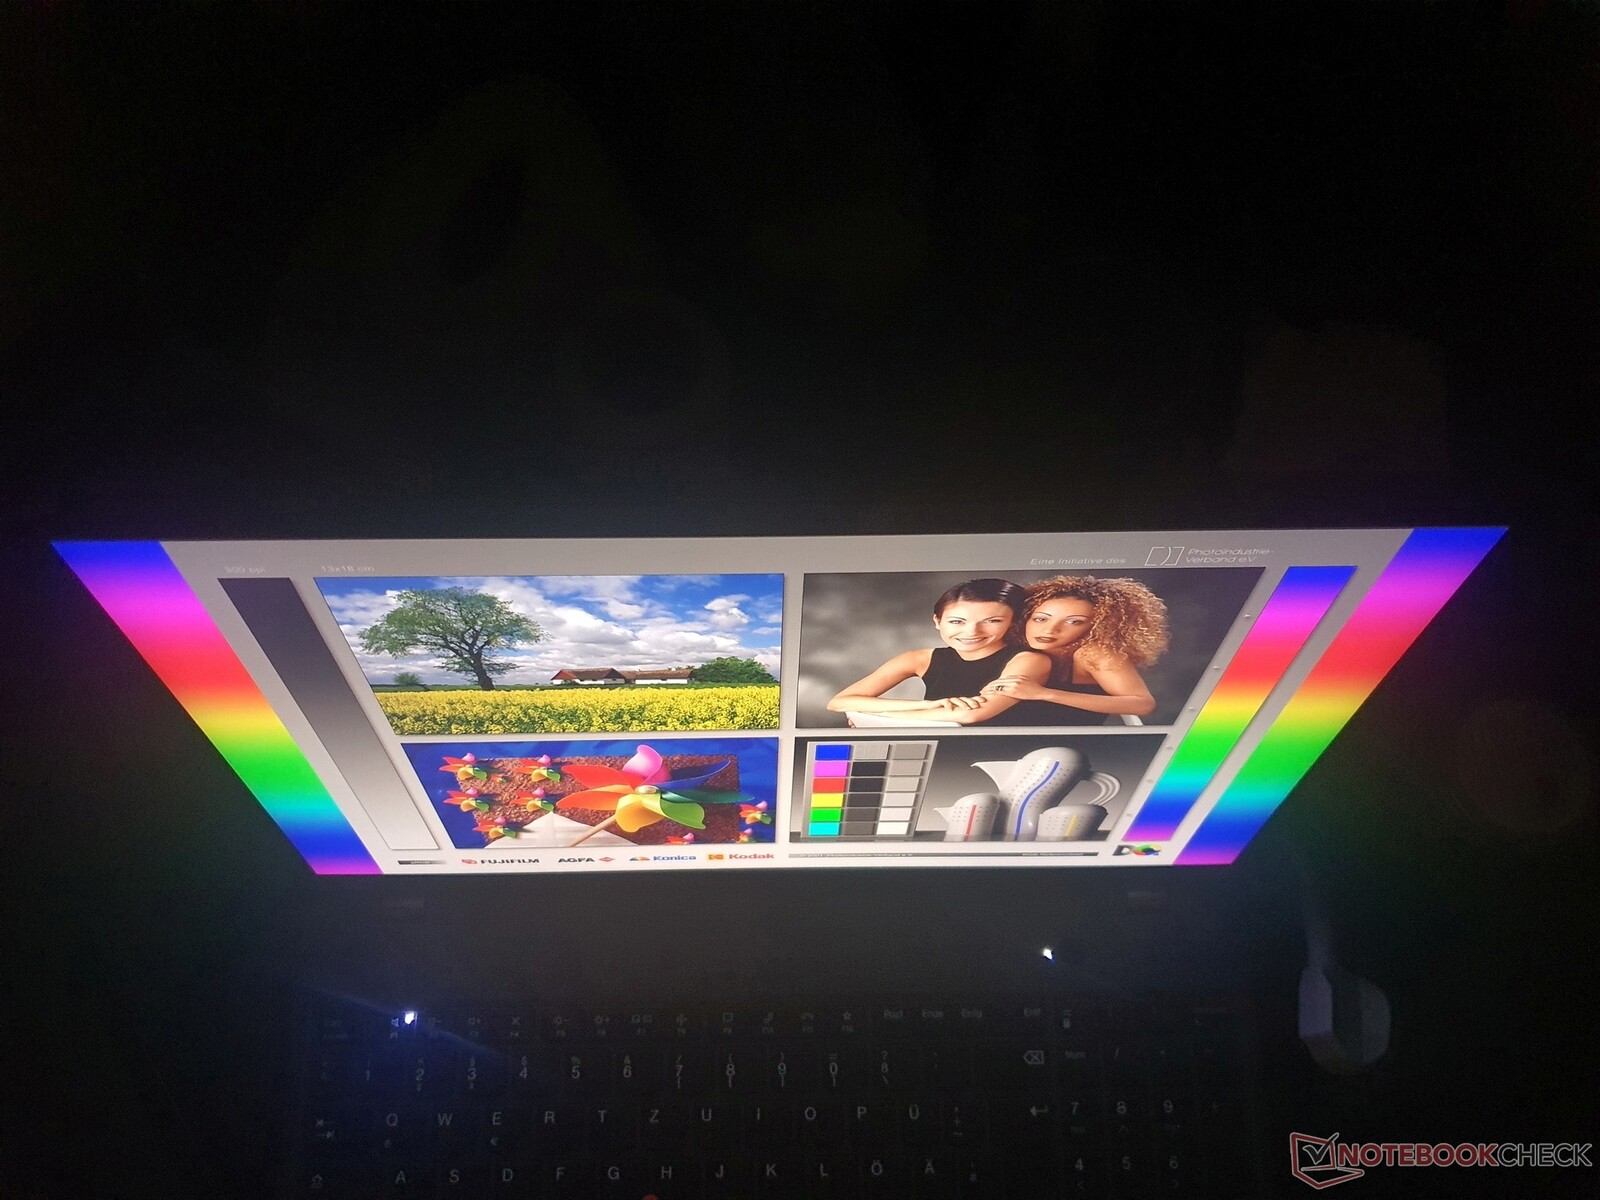
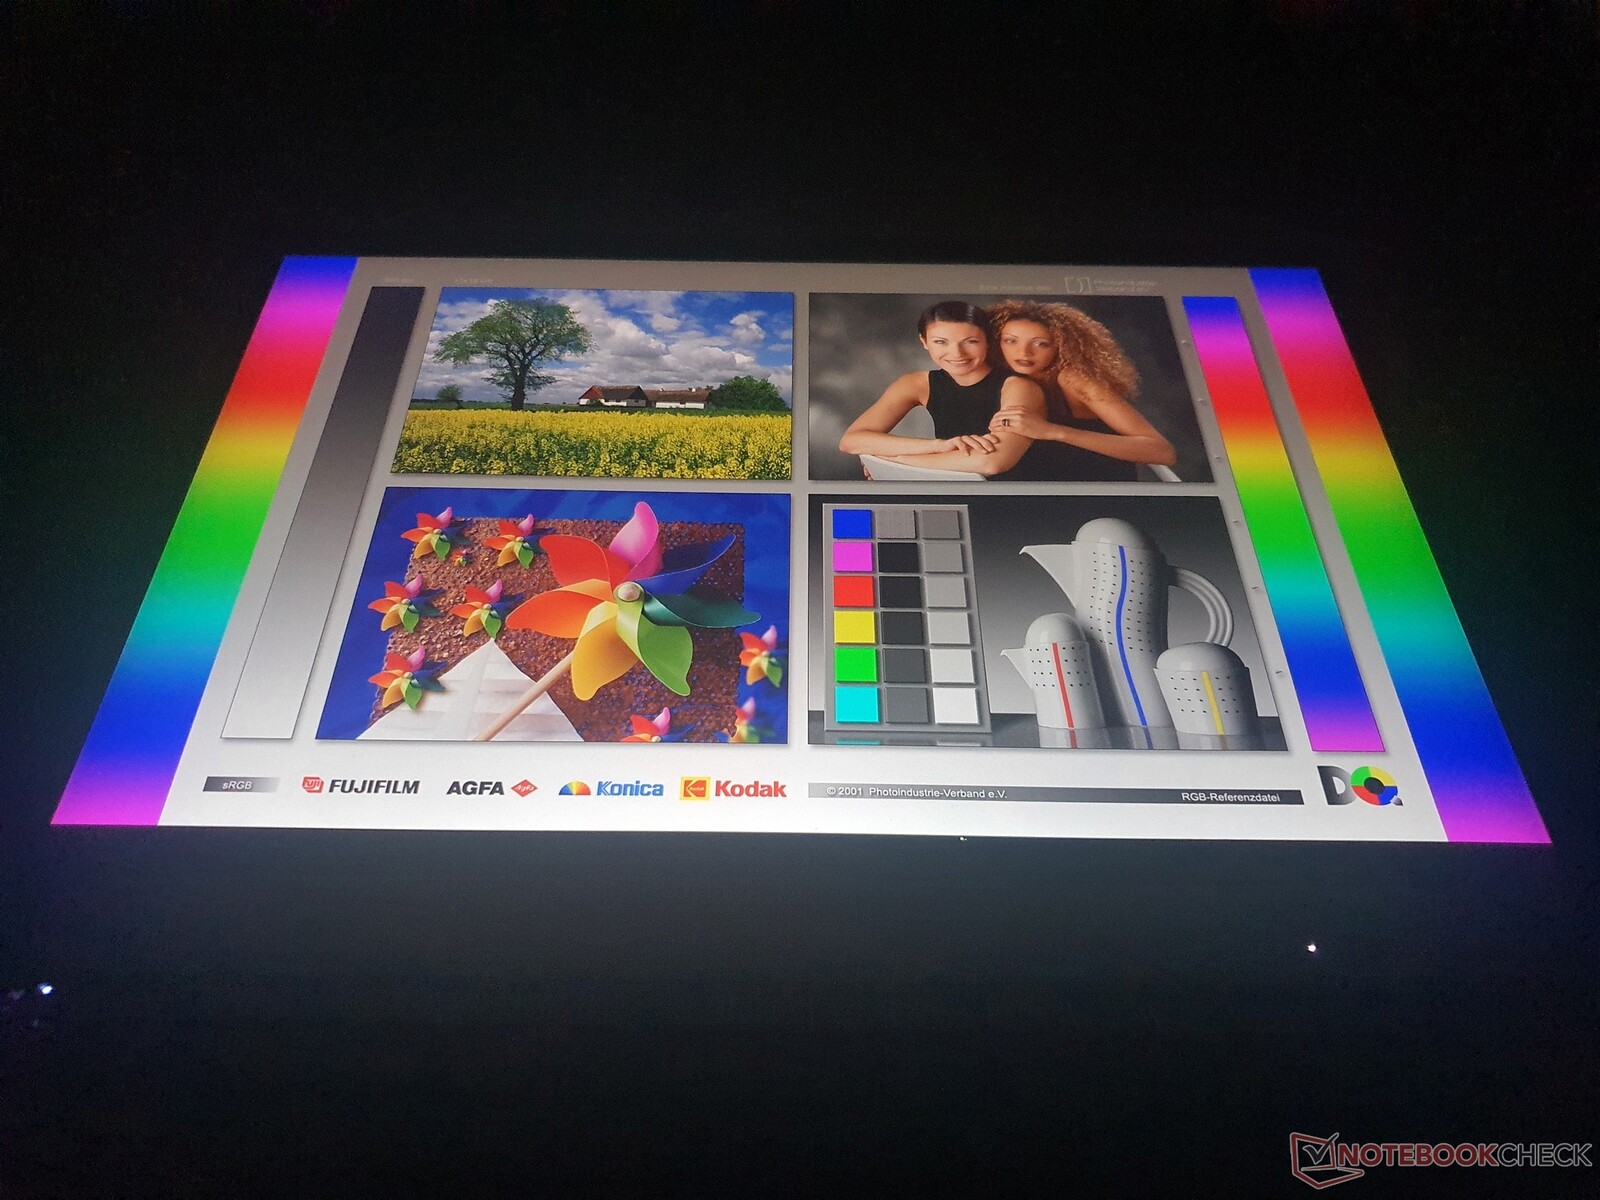
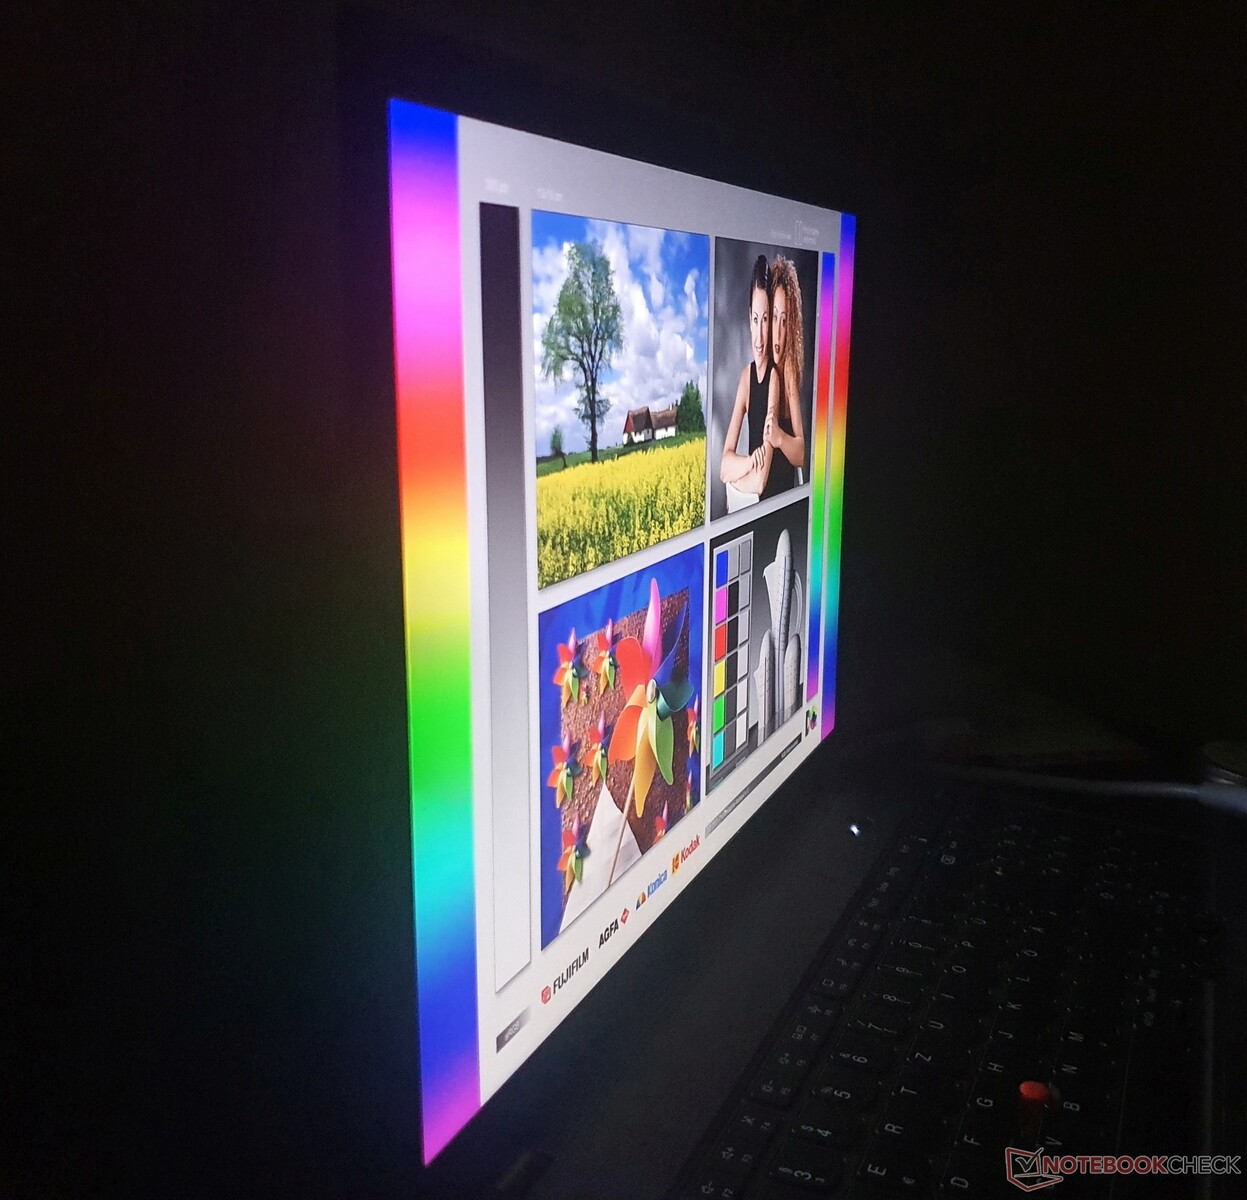
Display: Rich in contrast, bright, and high-resolution in the ThinkPad T16
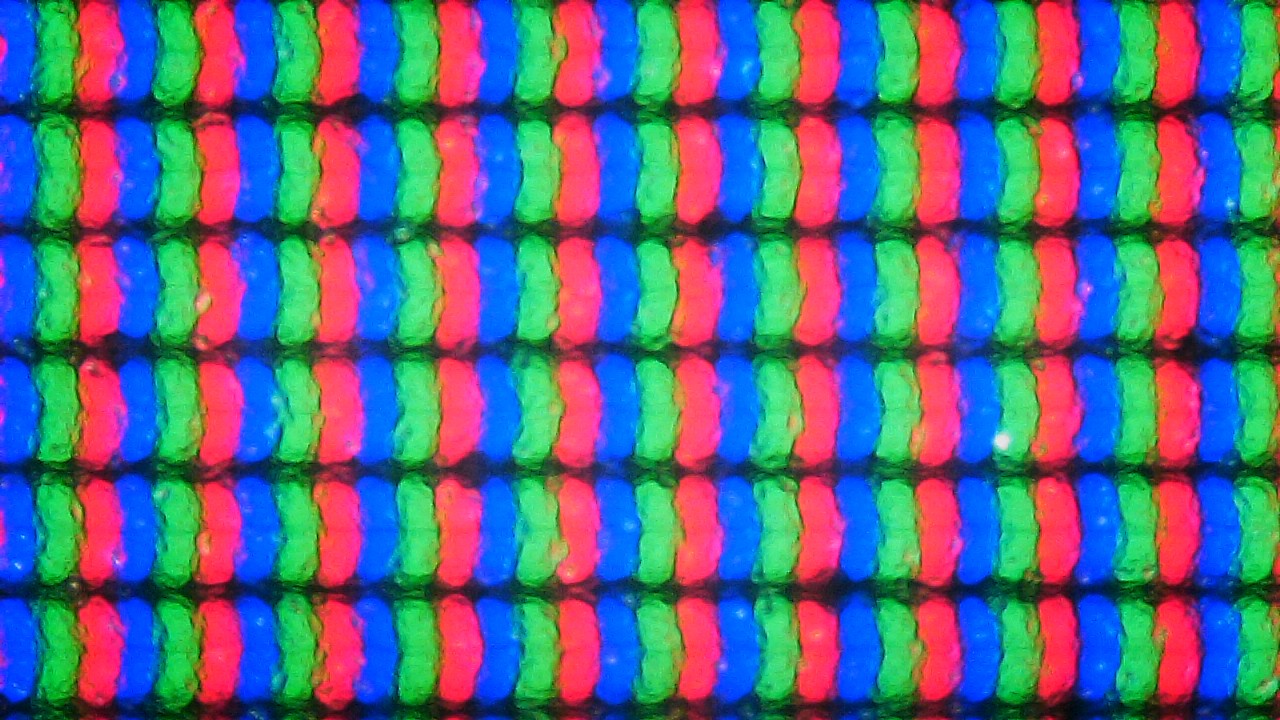

Lenovo has equipped our test unit of the ThinkPad T16 AMD with a matte, 16-inch IPS panel from CSOT with a 2,560 x 1,600 pixel resolution in the 16:10 format.
In contrast to the WUXGA panel of the ThinkPad T16 Intel, this display is not a so-called "low-power LCD." The measured values of both panels are fairly similar, leaving mainly the better calibration of the WQXGA panel to stand out in the state of delivery, but we also notice the slightly lower color space coverage.
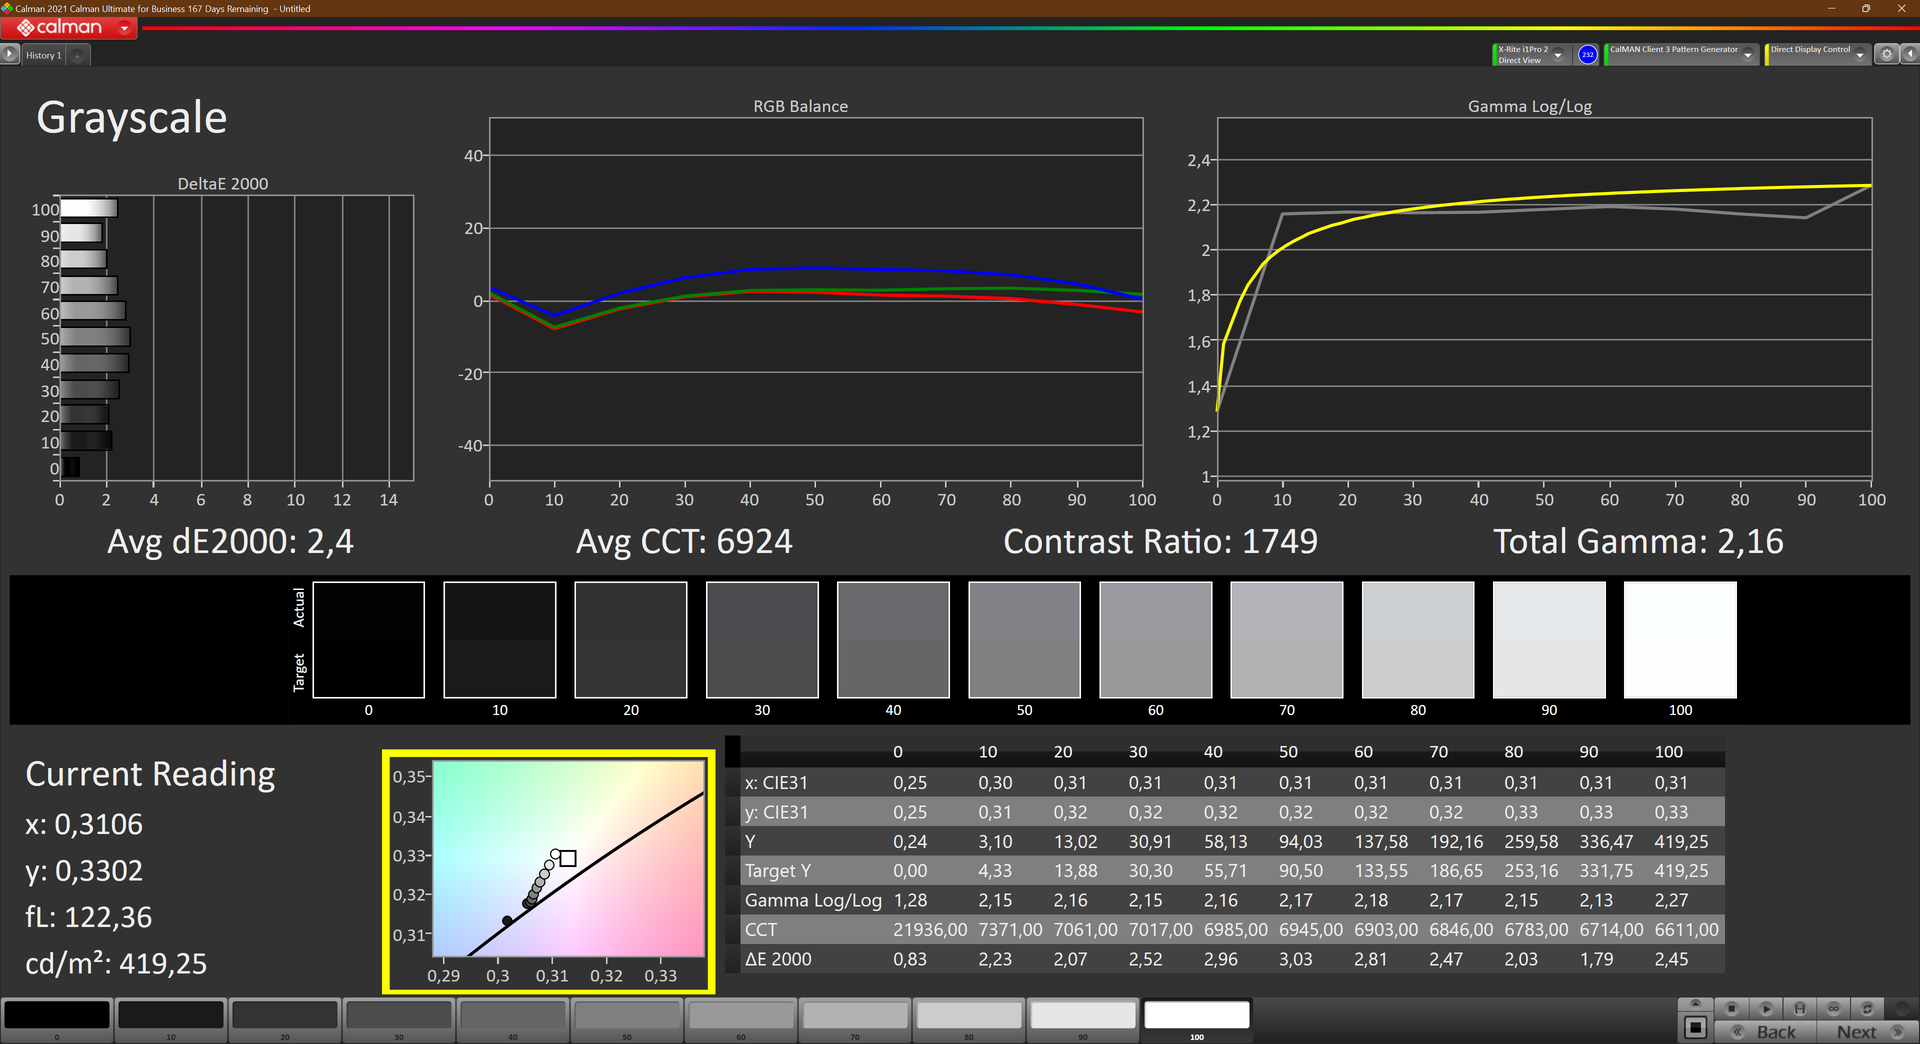
The brightness is also the same at 388 cd/m², but the contrast we measure is higher at 1738:1, and the black value slightly lower with a good 0.24 cd/m². This makes black appear very saturated, while the image quality looks very good overall, and the subjective difference to the FHD+ low-power panel doesn't appear to be very pronounced.
| |||||||||||||||||||||||||
Brightness Distribution: 81 %
Center on Battery: 417 cd/m²
Contrast: 1738:1 (Black: 0.24 cd/m²)
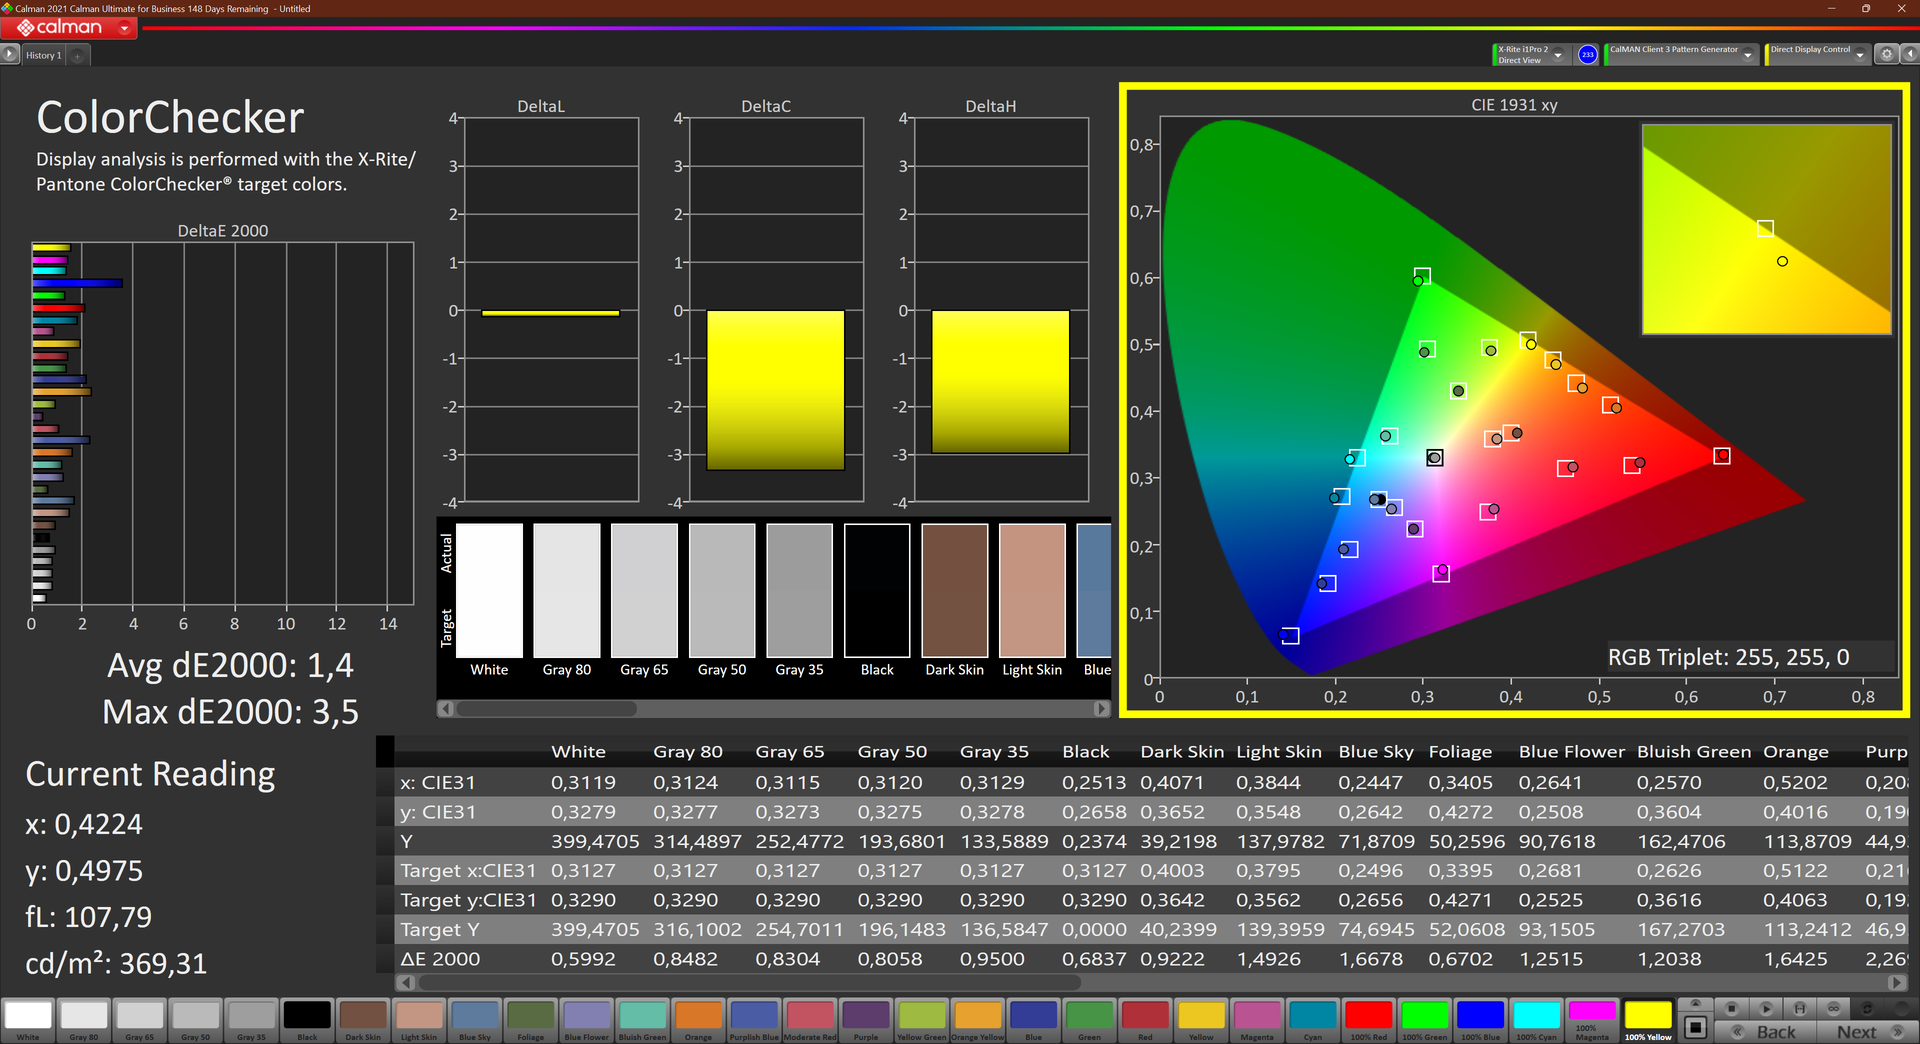
ΔE Color 1.7 | 0.5-29.43 Ø5, calibrated: 1.4
ΔE Greyscale 2.4 | 0.57-98 Ø5.3
69.1% AdobeRGB 1998 (Argyll 2.2.0 3D)
95.7% sRGB (Argyll 2.2.0 3D)
66.7% Display P3 (Argyll 2.2.0 3D)
Gamma: 2.16
| Lenovo ThinkPad T16 G1 21CH004MGE MNG007DA1-C, IPS-LED, 2560x1600, 16.00 | Lenovo ThinkPad T16 G1 21BWS00200 B160UAN01.K, IPS, 1920x1200, 16.00 | HP EliteBook 865 G9 X160NV42, IPS, 1920x1200, 16.00 | Lenovo ThinkPad Z16 G1 21D5S00T00 NE160WUM-N62 , IPS LED, 1920x1200, 16.00 | Lenovo ThinkPad X1 Extreme G5-21DE003RGE LP160UQ1-SPB1, IPS, 3840x2400, 16.00 | Lenovo ThinkPad P15v G2 21A9000XGE N156HCA-EAC, IPS LED, 1920x1080, 15.60 | HP ZBook Power 15 G9 6B8C4EA LGD073F, IPS, 3840x2160, 15.60 | |
|---|---|---|---|---|---|---|---|
| Display | 13% | 6% | 4% | 24% | -33% | 2% | |
| Display P3 Coverage | 66.7 | 80.1 20% | 71.4 7% | 70 5% | 84.6 27% | 43.7 -34% | 69.1 4% |
| sRGB Coverage | 95.7 | 100 4% | 99.3 4% | 99.7 4% | 99.2 4% | 65.1 -32% | 97.7 2% |
| AdobeRGB 1998 Coverage | 69.1 | 80.5 16% | 73.2 6% | 72.1 4% | 97.7 41% | 45.3 -34% | 69.6 1% |
| Response Times | 13% | -18% | -29% | -23% | -49% | -47% | |
| Response Time Grey 50% / Grey 80% * | 32.1 ? | 27 ? 16% | 35.5 ? -11% | 40 ? -25% | 46 ? -43% | 48 ? -50% | 45.8 ? -43% |
| Response Time Black / White * | 18.9 ? | 17 ? 10% | 23.5 ? -24% | 25 ? -32% | 19.2 ? -2% | 28 ? -48% | 28.6 ? -51% |
| PWM Frequency | 56.7 | ||||||
| Screen | -51% | 7% | 5% | -7% | -132% | -21% | |
| Brightness middle | 417 | 404 -3% | 865 107% | 487 17% | 476 14% | 305 -27% | 392 -6% |
| Brightness | 388 | 391 1% | 771 99% | 446 15% | 470 21% | 281 -28% | 388 0% |
| Brightness Distribution | 81 | 80 -1% | 72 -11% | 83 2% | 90 11% | 88 9% | 88 9% |
| Black Level * | 0.24 | 0.29 -21% | 0.3 -25% | 0.31 -29% | 0.35 -46% | 0.32 -33% | 0.15 37% |
| Contrast | 1738 | 1393 -20% | 2883 66% | 1571 -10% | 1360 -22% | 953 -45% | 2613 50% |
| Colorchecker dE 2000 * | 1.7 | 3.9 -129% | 2.4 -41% | 1.8 -6% | 1.9 -12% | 5.9 -247% | 3.2 -88% |
| Colorchecker dE 2000 max. * | 3.5 | 8.5 -143% | 5.8 -66% | 3.3 6% | 4.7 -34% | 20.1 -474% | 7 -100% |
| Colorchecker dE 2000 calibrated * | 1.4 | 1.7 -21% | 1.5 -7% | 0.8 43% | 1.3 7% | 4.5 -221% | 1.2 14% |
| Greyscale dE 2000 * | 2.4 | 5.4 -125% | 3.8 -58% | 2.3 4% | 2.4 -0% | 5.3 -121% | 4.9 -104% |
| Gamma | 2.16 102% | 2.21 100% | 2.36 93% | 2.16 102% | 2.24 98% | 2.1 105% | 2.13 103% |
| CCT | 6924 94% | 6242 104% | 6922 94% | 6867 95% | 6377 102% | 6307 103% | 5982 109% |
| Total Average (Program / Settings) | -8% /
-28% | -2% /
3% | -7% /
-0% | -2% /
-2% | -71% /
-99% | -22% /
-20% |
* ... smaller is better
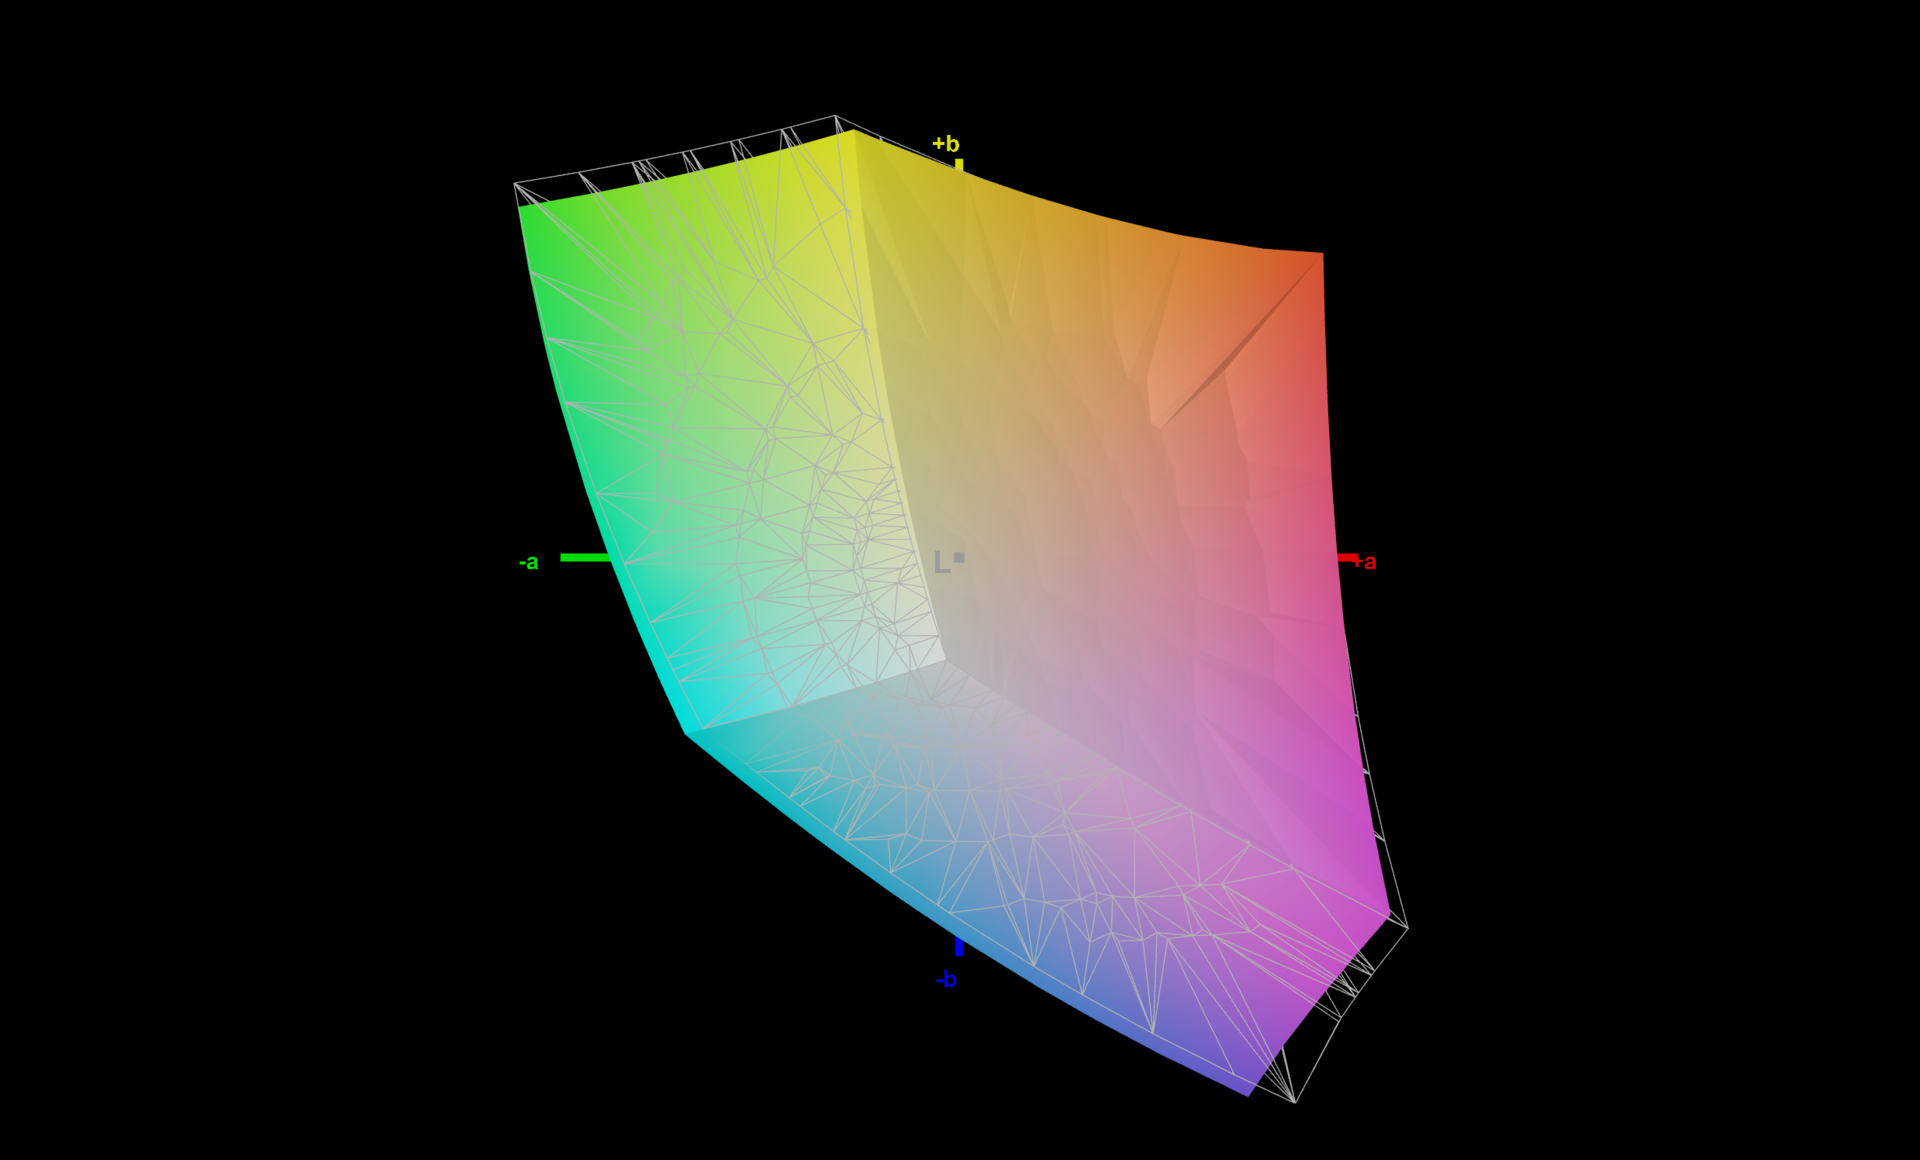
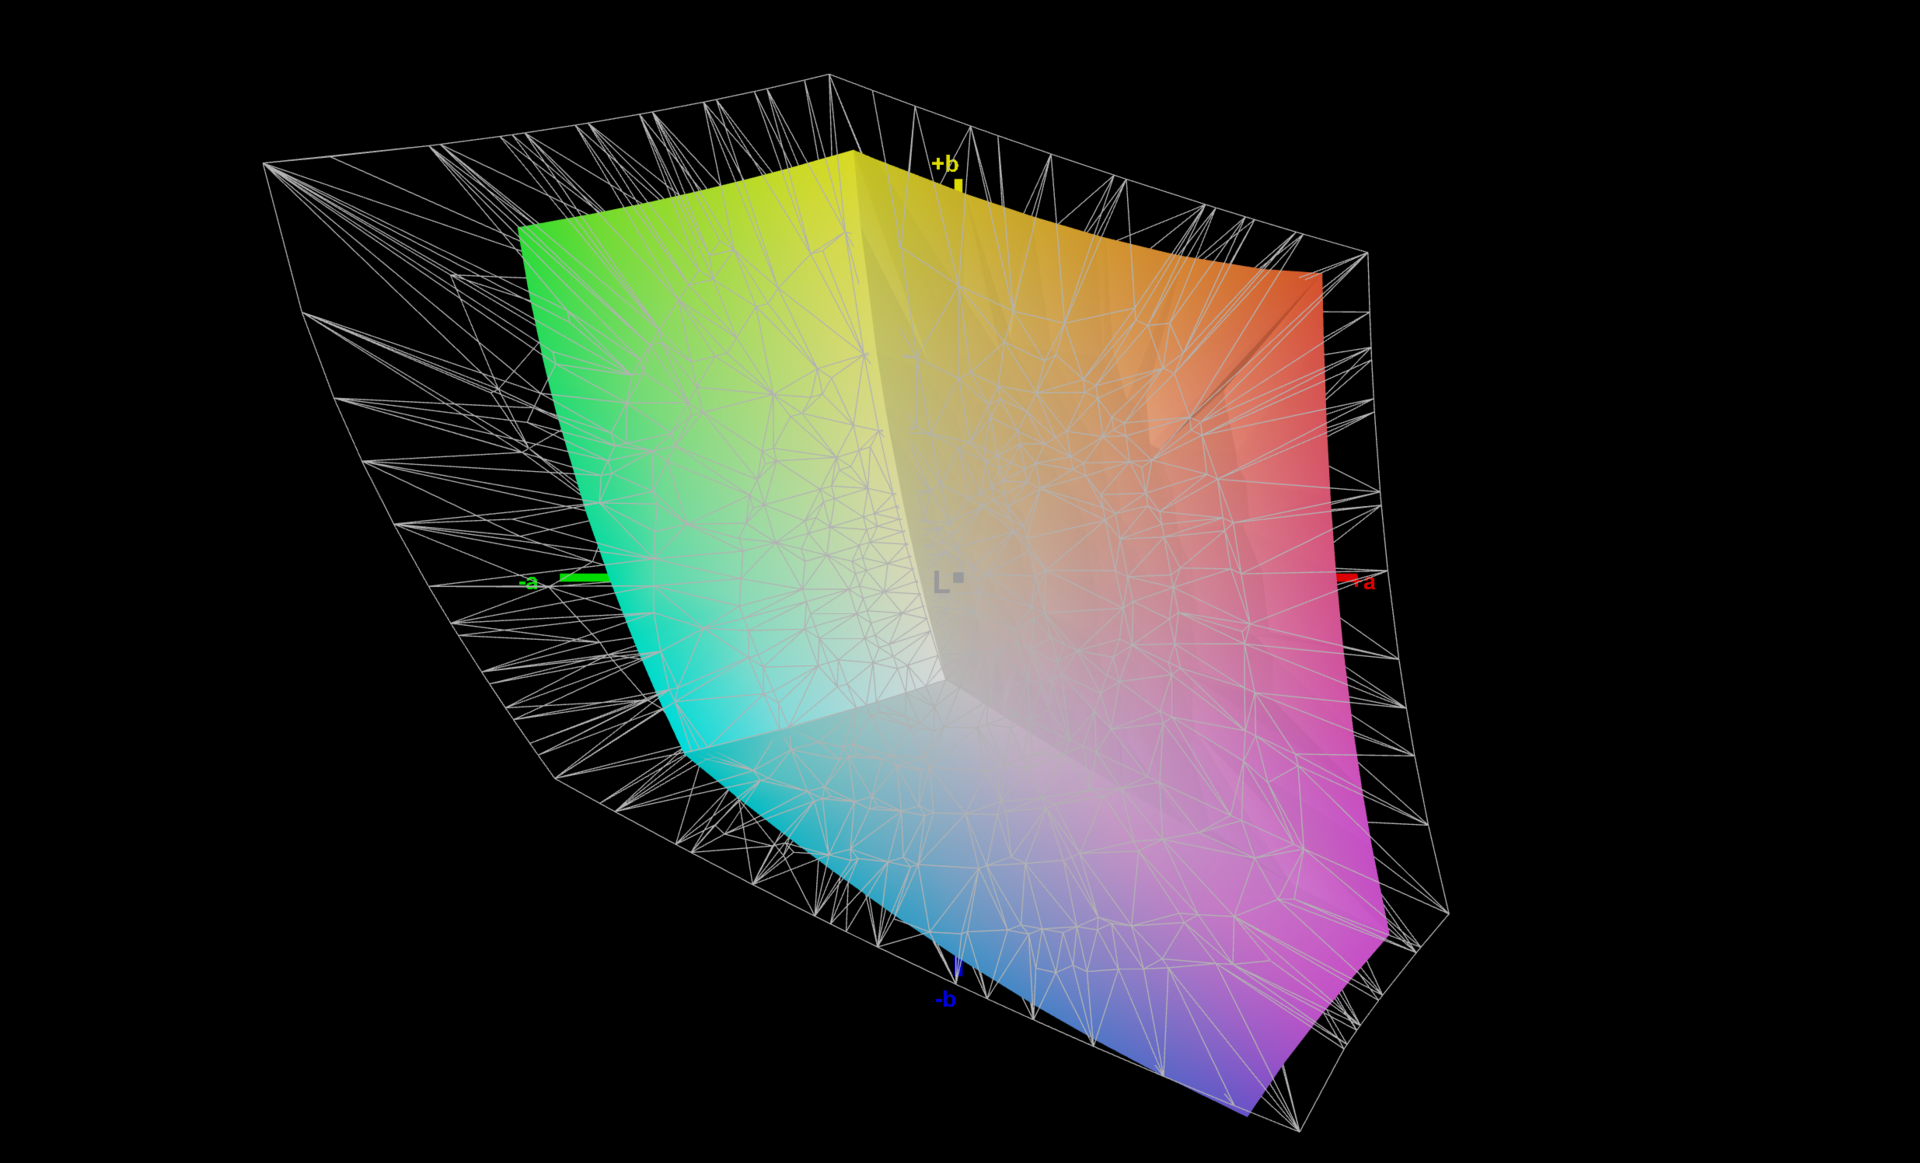
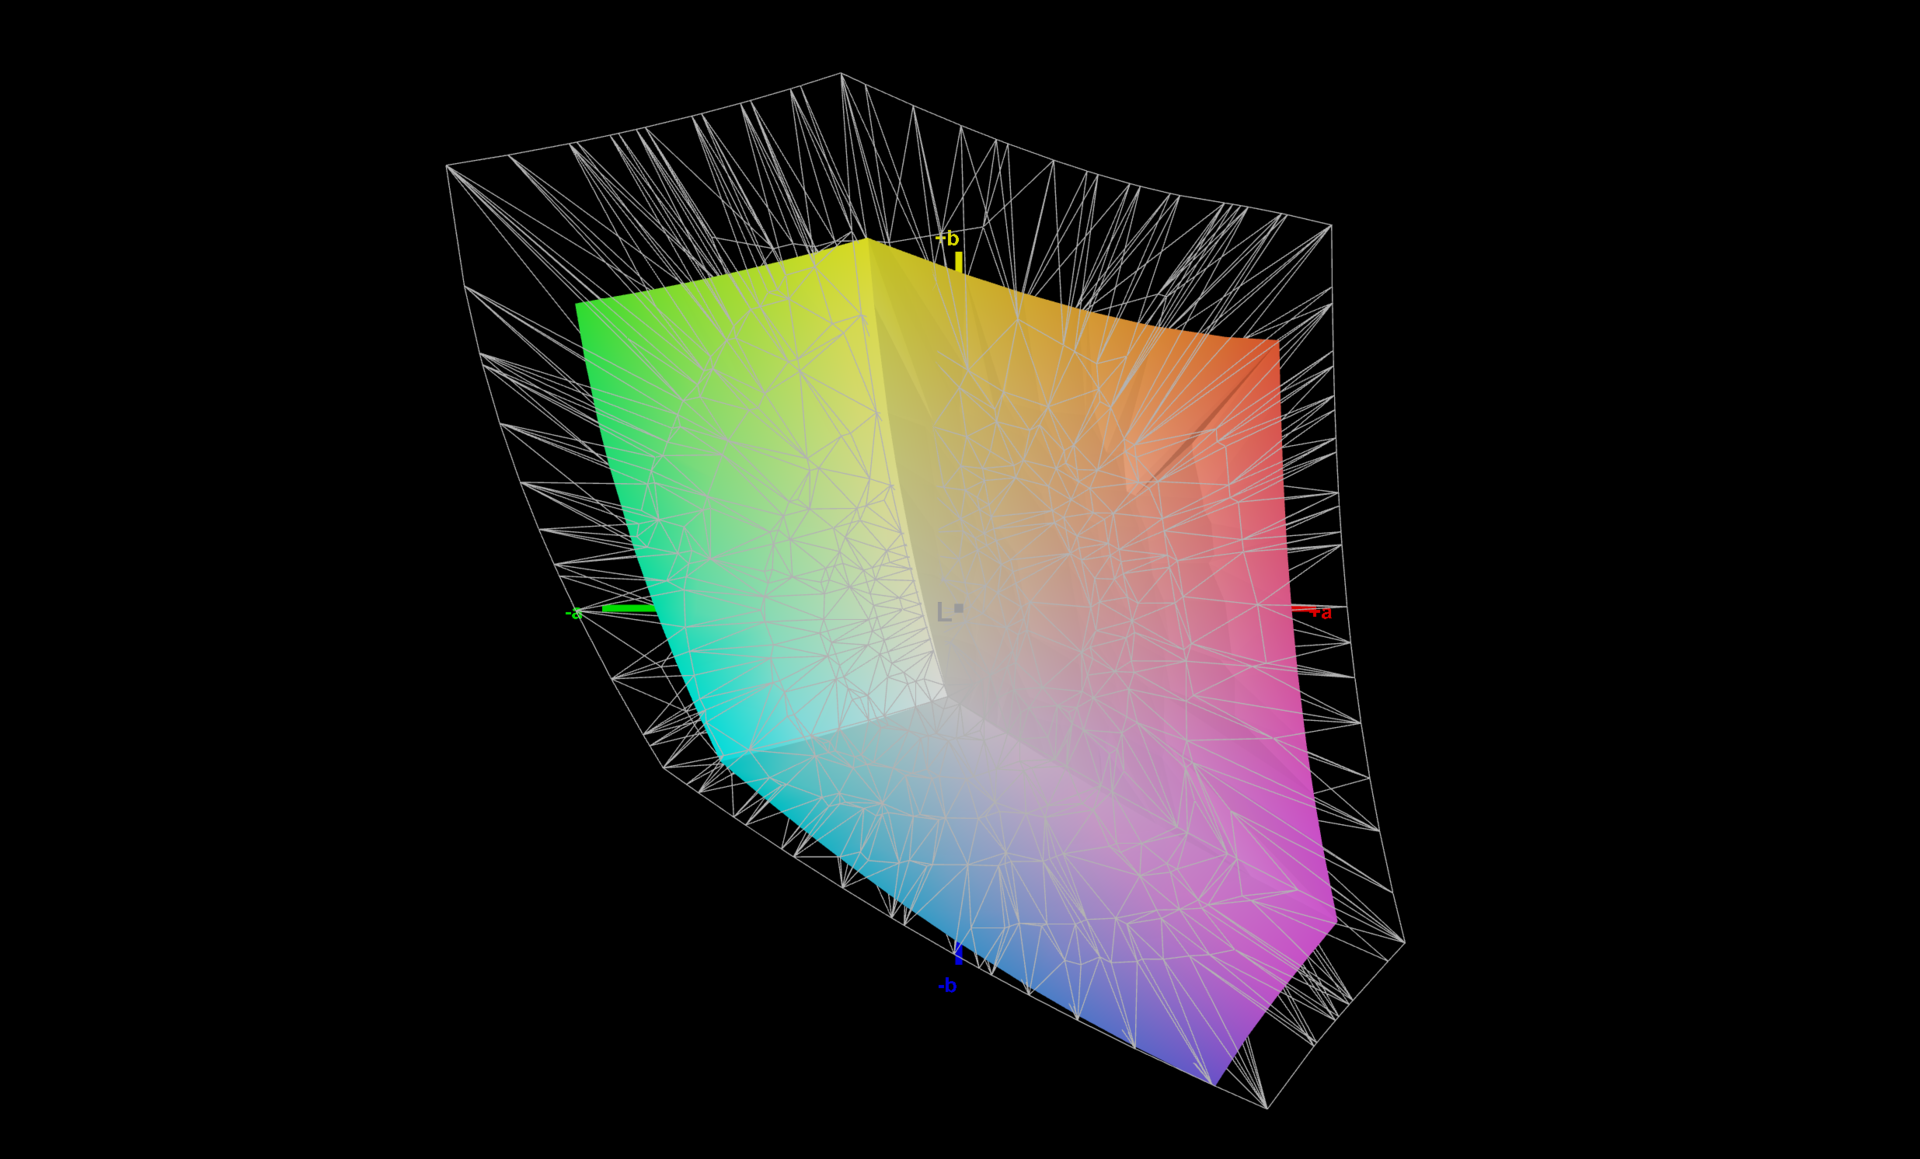
The sRGB color space is sufficiently covered at 95.7%, which should allow for professional image processing in the digital area. However, even after our calibration, blue color is still deviating from the target with a DeltaE 2000 value of 3.5, although we were able to remedy the blue tint. As usual, you can download our calibrated color profile from the link above, to the right of the brightness distribution graphic.
Display Response Times
| ↔ Response Time Black to White | ||
|---|---|---|
| 18.9 ms ... rise ↗ and fall ↘ combined | ↗ 9.4 ms rise | 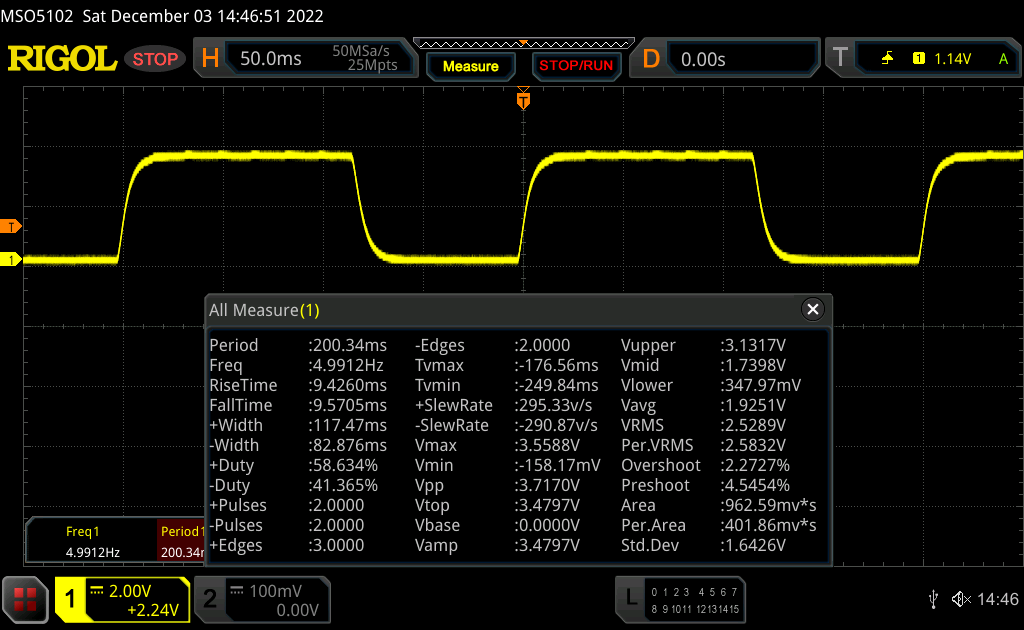 |
| ↘ 9.5 ms fall | ||
| The screen shows good response rates in our tests, but may be too slow for competitive gamers. In comparison, all tested devices range from 0.1 (minimum) to 240 (maximum) ms. » 36 % of all devices are better. This means that the measured response time is better than the average of all tested devices (21.5 ms). | ||
| ↔ Response Time 50% Grey to 80% Grey | ||
| 32.1 ms ... rise ↗ and fall ↘ combined | ↗ 15.6 ms rise | 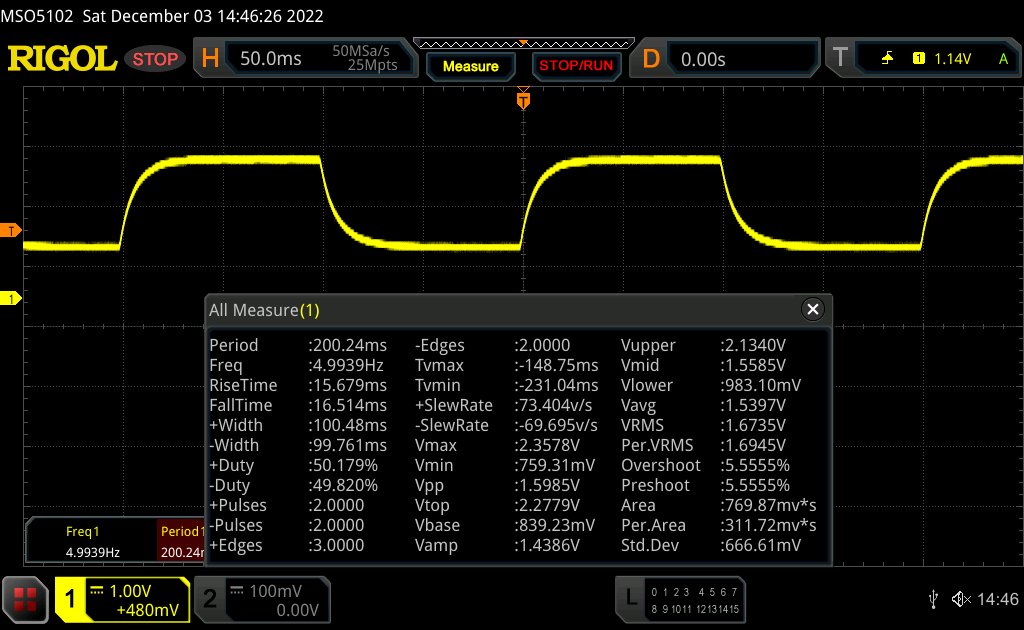 |
| ↘ 16.5 ms fall | ||
| The screen shows slow response rates in our tests and will be unsatisfactory for gamers. In comparison, all tested devices range from 0.2 (minimum) to 636 (maximum) ms. » 37 % of all devices are better. This means that the measured response time is similar to the average of all tested devices (33.8 ms). | ||
Screen Flickering / PWM (Pulse-Width Modulation)
| Screen flickering / PWM not detected |  | ||
In comparison: 53 % of all tested devices do not use PWM to dim the display. If PWM was detected, an average of 17933 (minimum: 5 - maximum: 3846000) Hz was measured. | |||
Thanks to the fairly high brightness of ~390 cd/m², the contents of the matte display remain easily readable outdoors, as long as you avoid direct sunlight.
Performance: AMD hexa-core already faster than T16 Intel
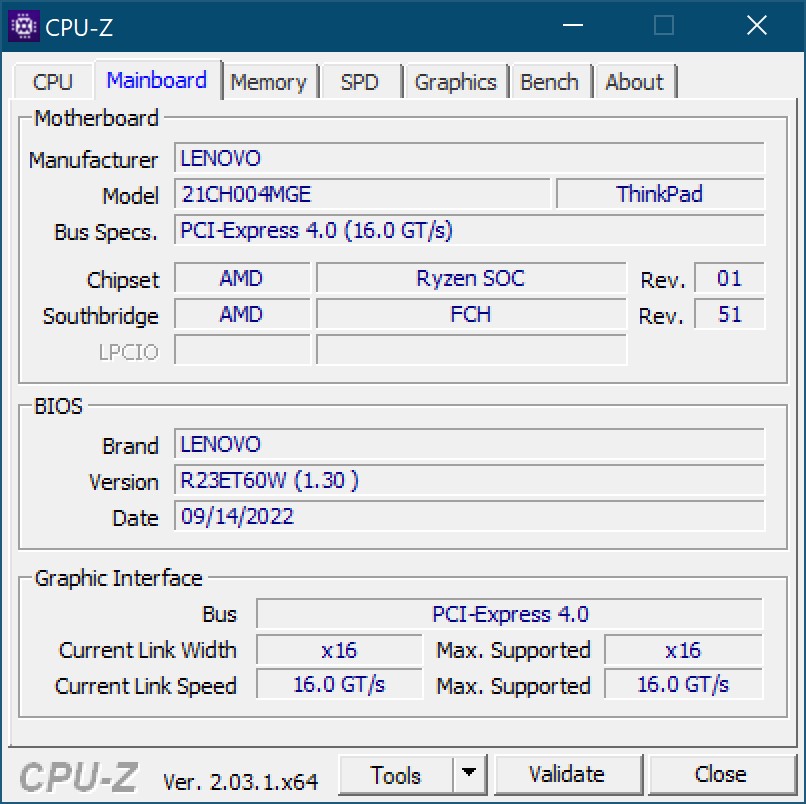
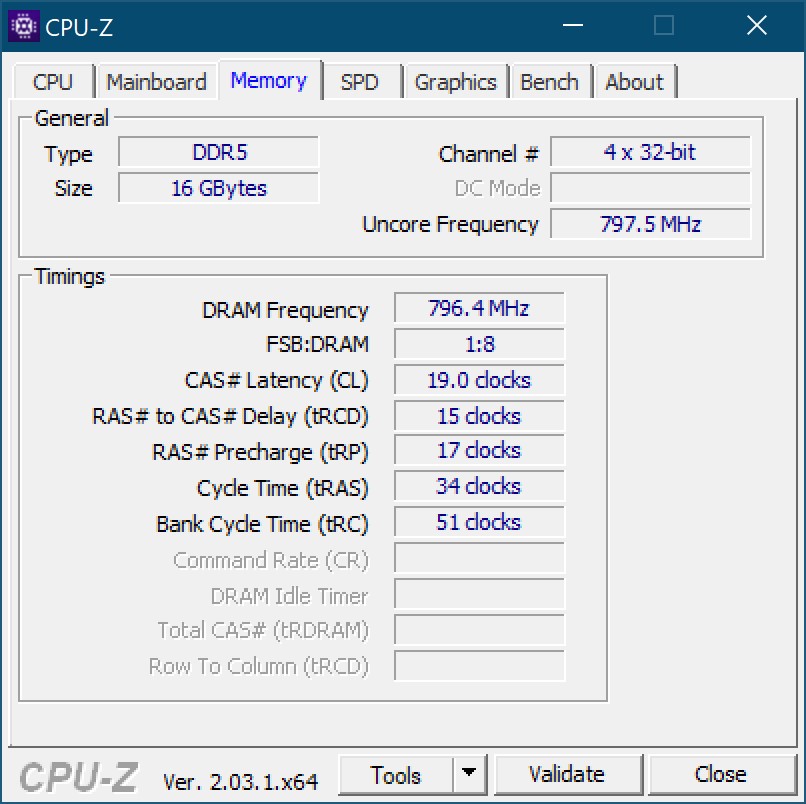
Our test unit of the ThinkPad T16 AMD comes with 16 GB of soldered LPDDR5-6400 RAM, while the Intel model offers a RAM slot for a DDR4-3200 module. The maximum available for the AMD version is 32 GB, and for the Intel version it is 48 GB.
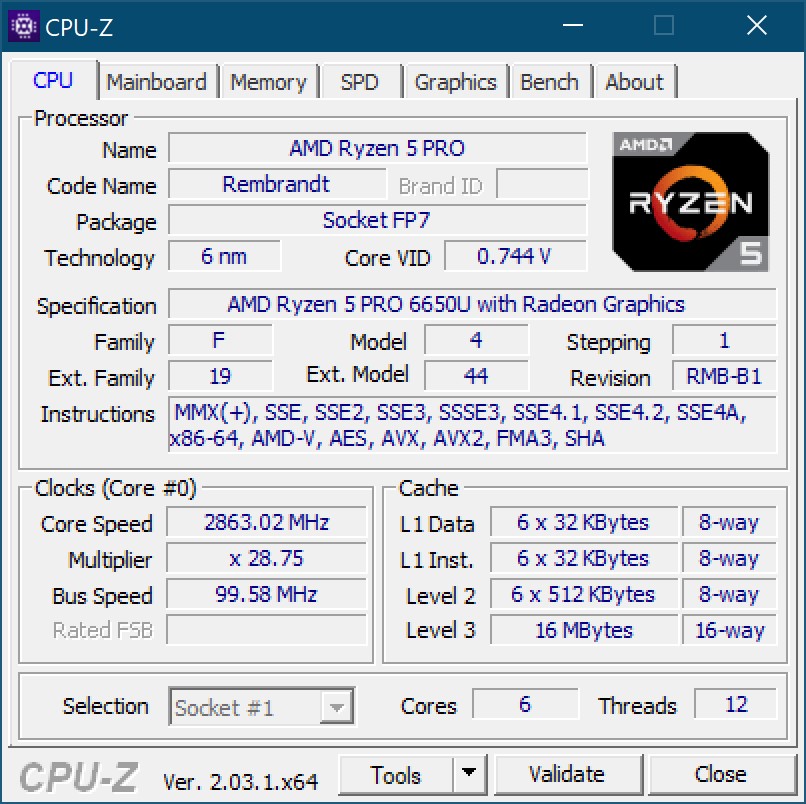
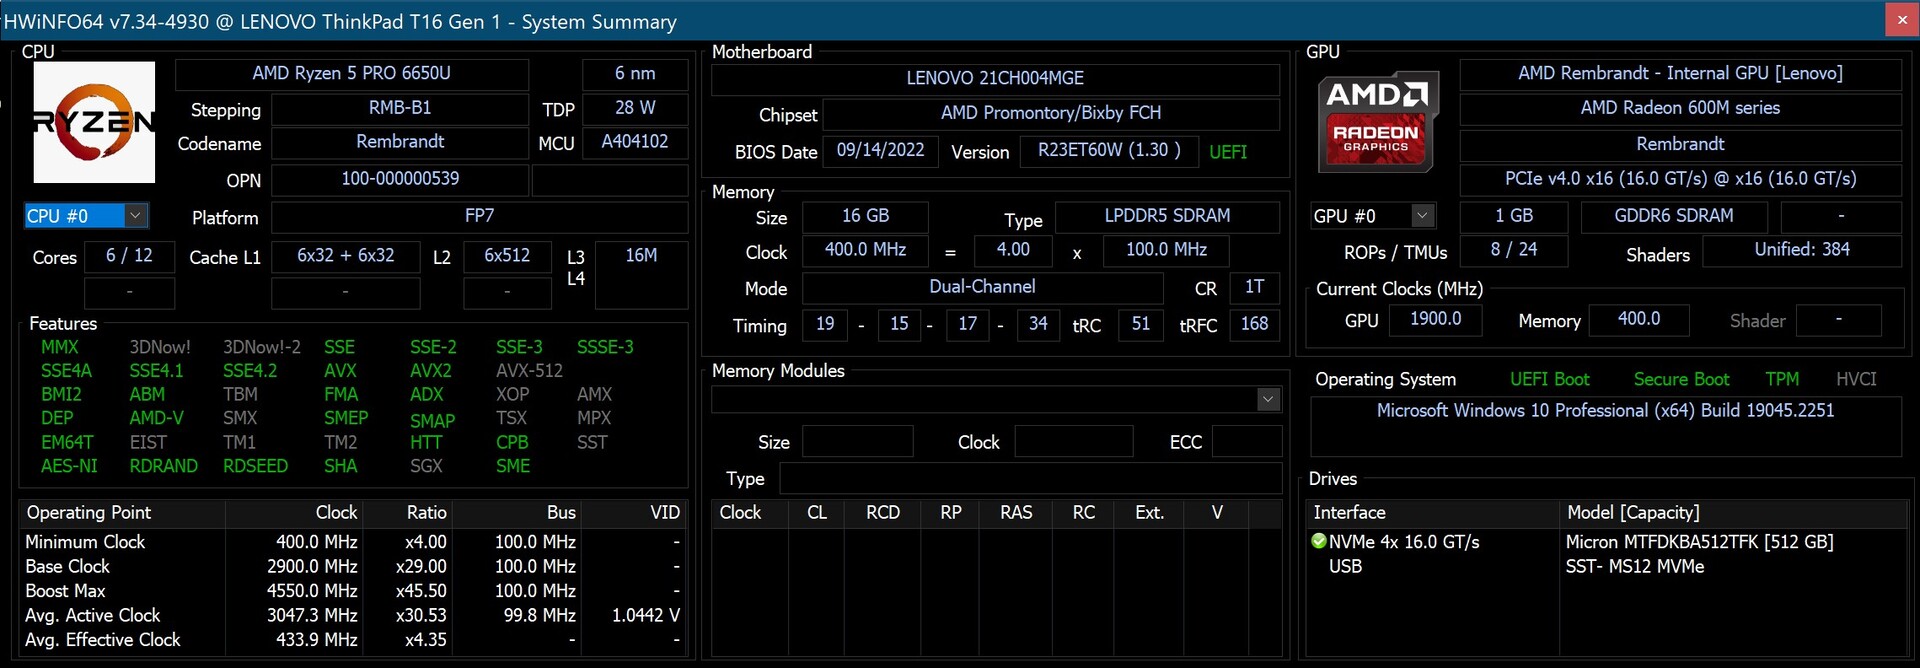
The heart of the device is the AMD Ryzen 5 PRO 6650U with its six cores, and we also have a T16 with an octa-core Ryzen 7 PRO 6850U available for several benchmarks. With a 512-GB PCIe 4.0 SSD and solely the integrated graphics solution (Radeon 660M or Radeon 680M), the target usage is clearly in the office area.

Test Conditions
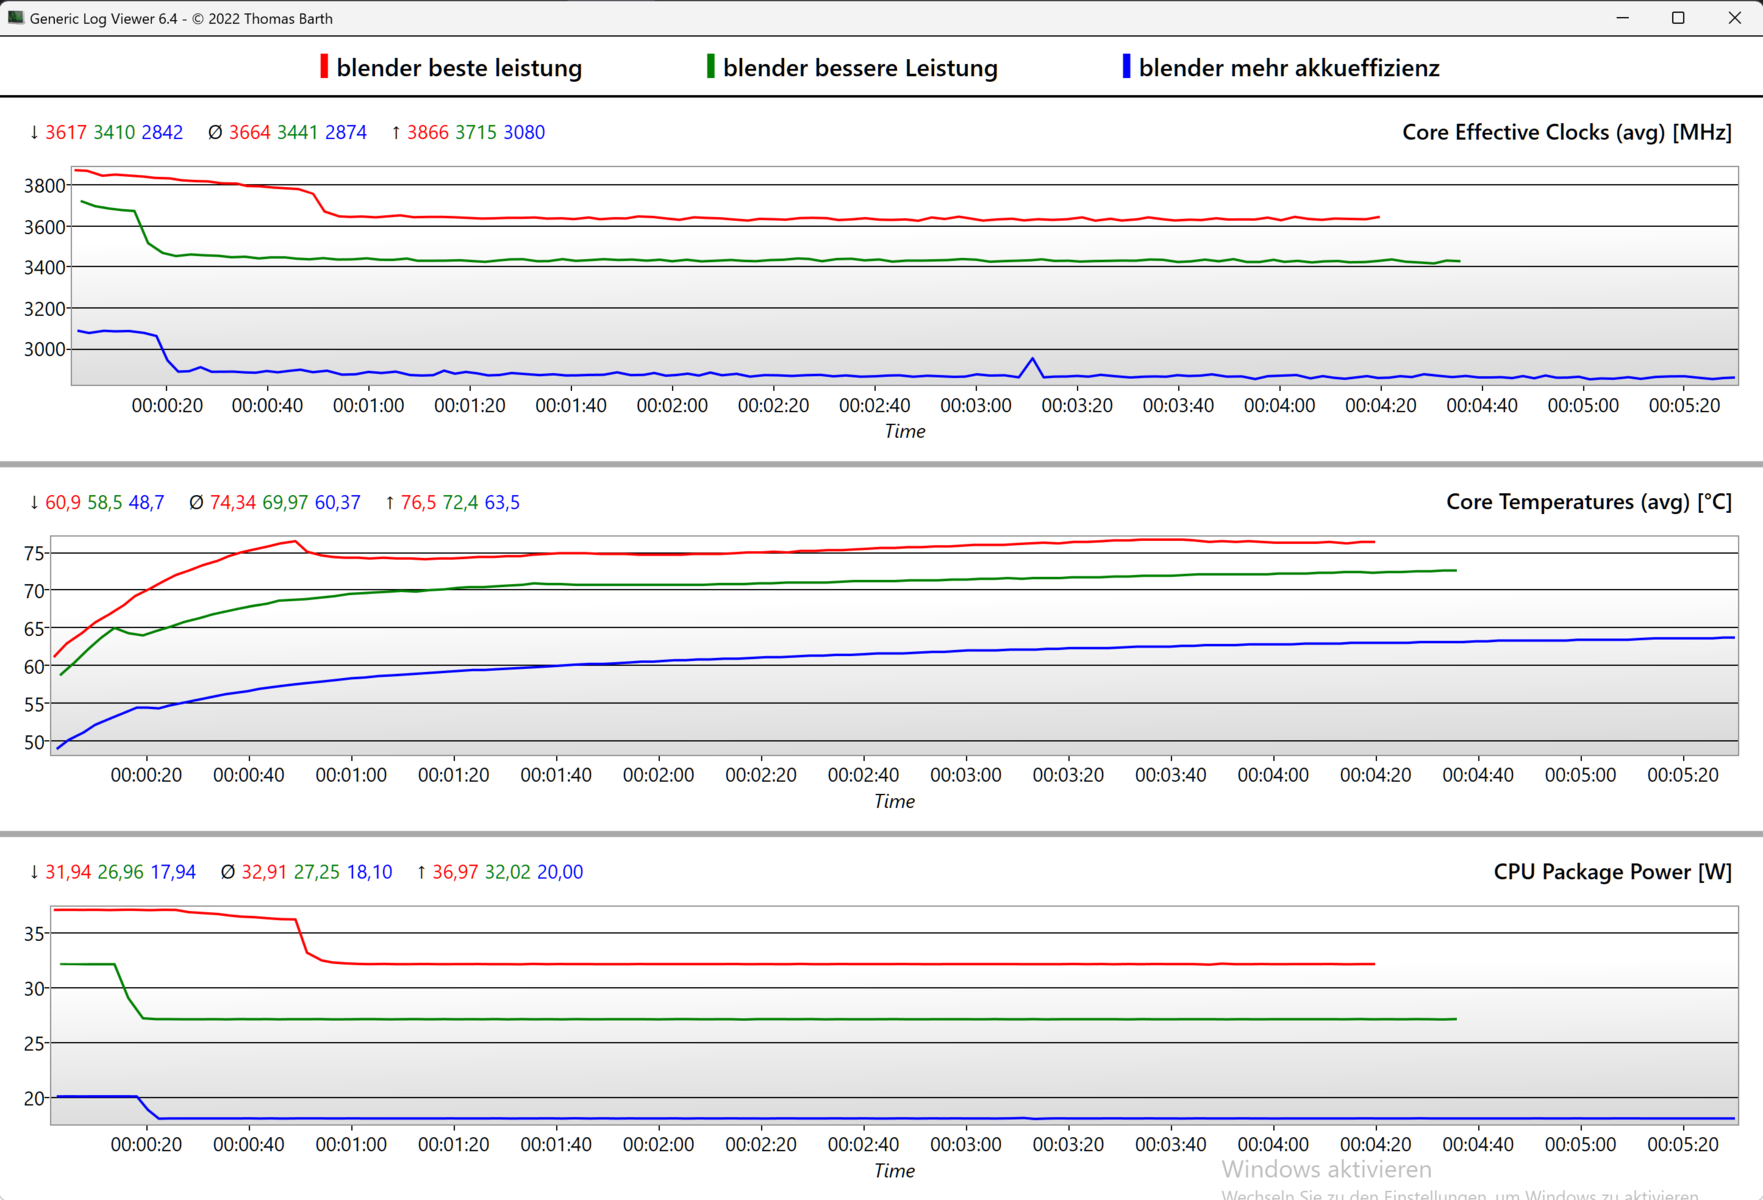
Lenovo doesn't offer its own controls of the performance modes with its ThinkPads, but they are integrated in the Windows power settings. This allows you to select among three profiles with different power limits for the short-time Turbo (PL2) and long-time Boost (PL1):
- Best power efficiency: 20 W (PL2) / 18 W (PL1)
- Balanced: 32 W (PL2) / 27 W (PL1)
- Best performance: 37 W (PL2) / 32 W (PL1)
We ran all our performance tests with the "Best performance" mode activated. The Wi-Fi and video battery life was determined using the "Balanced" mode.
Processor
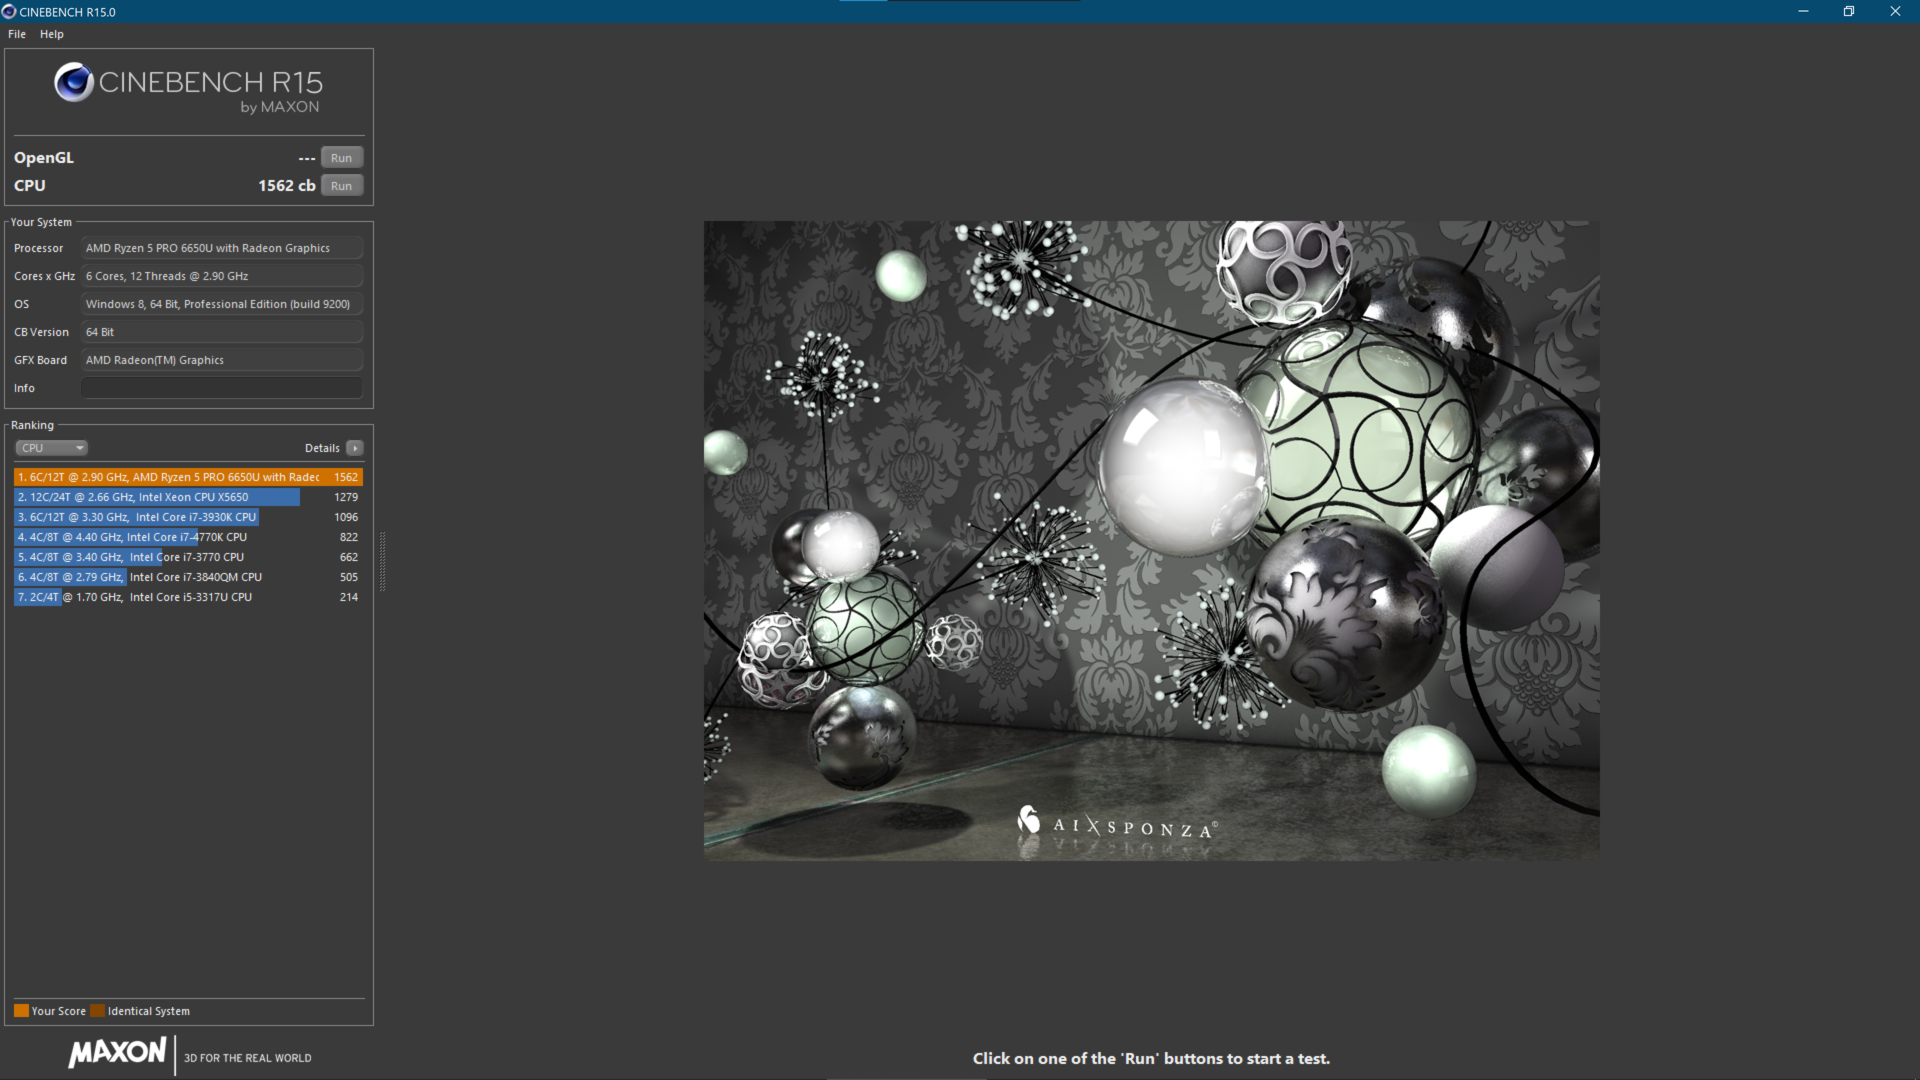
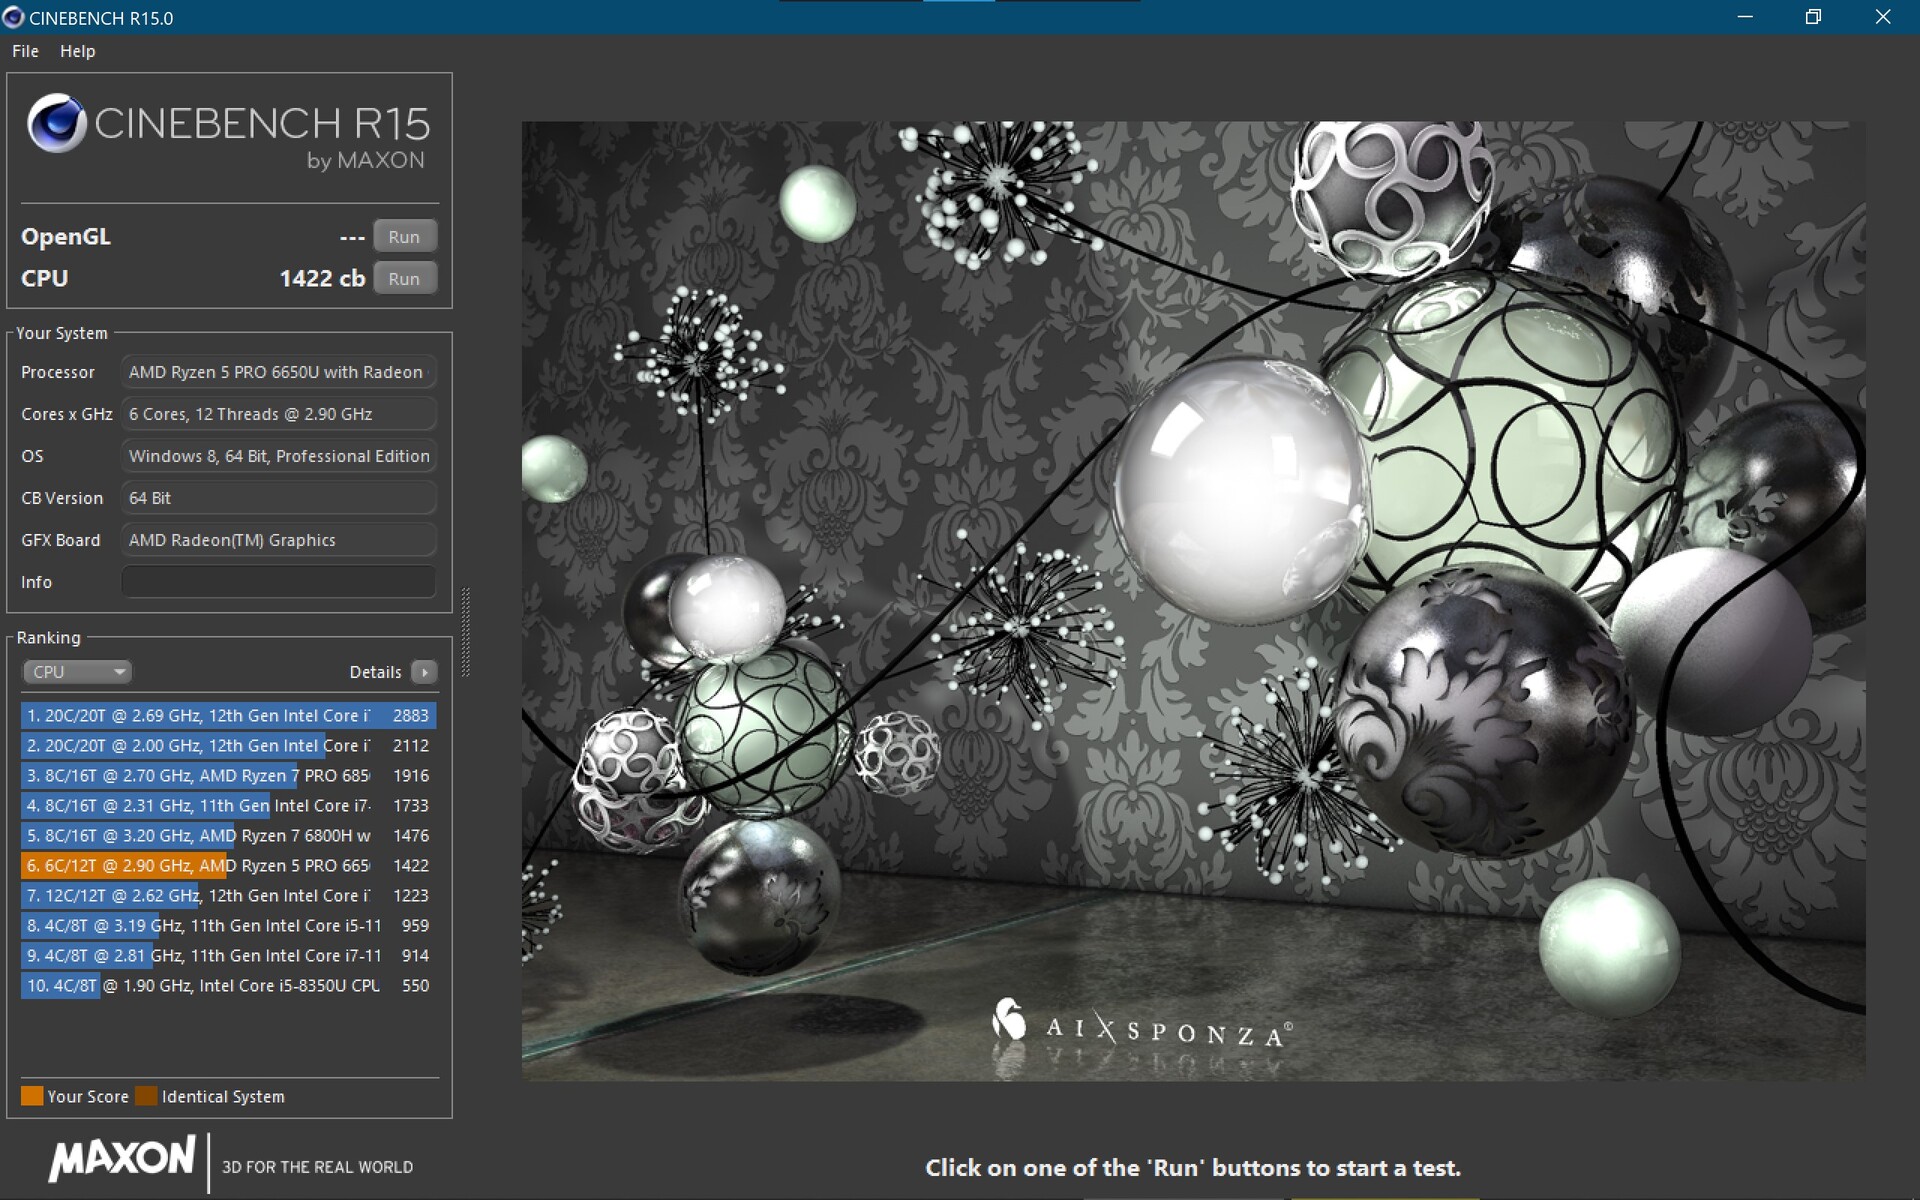
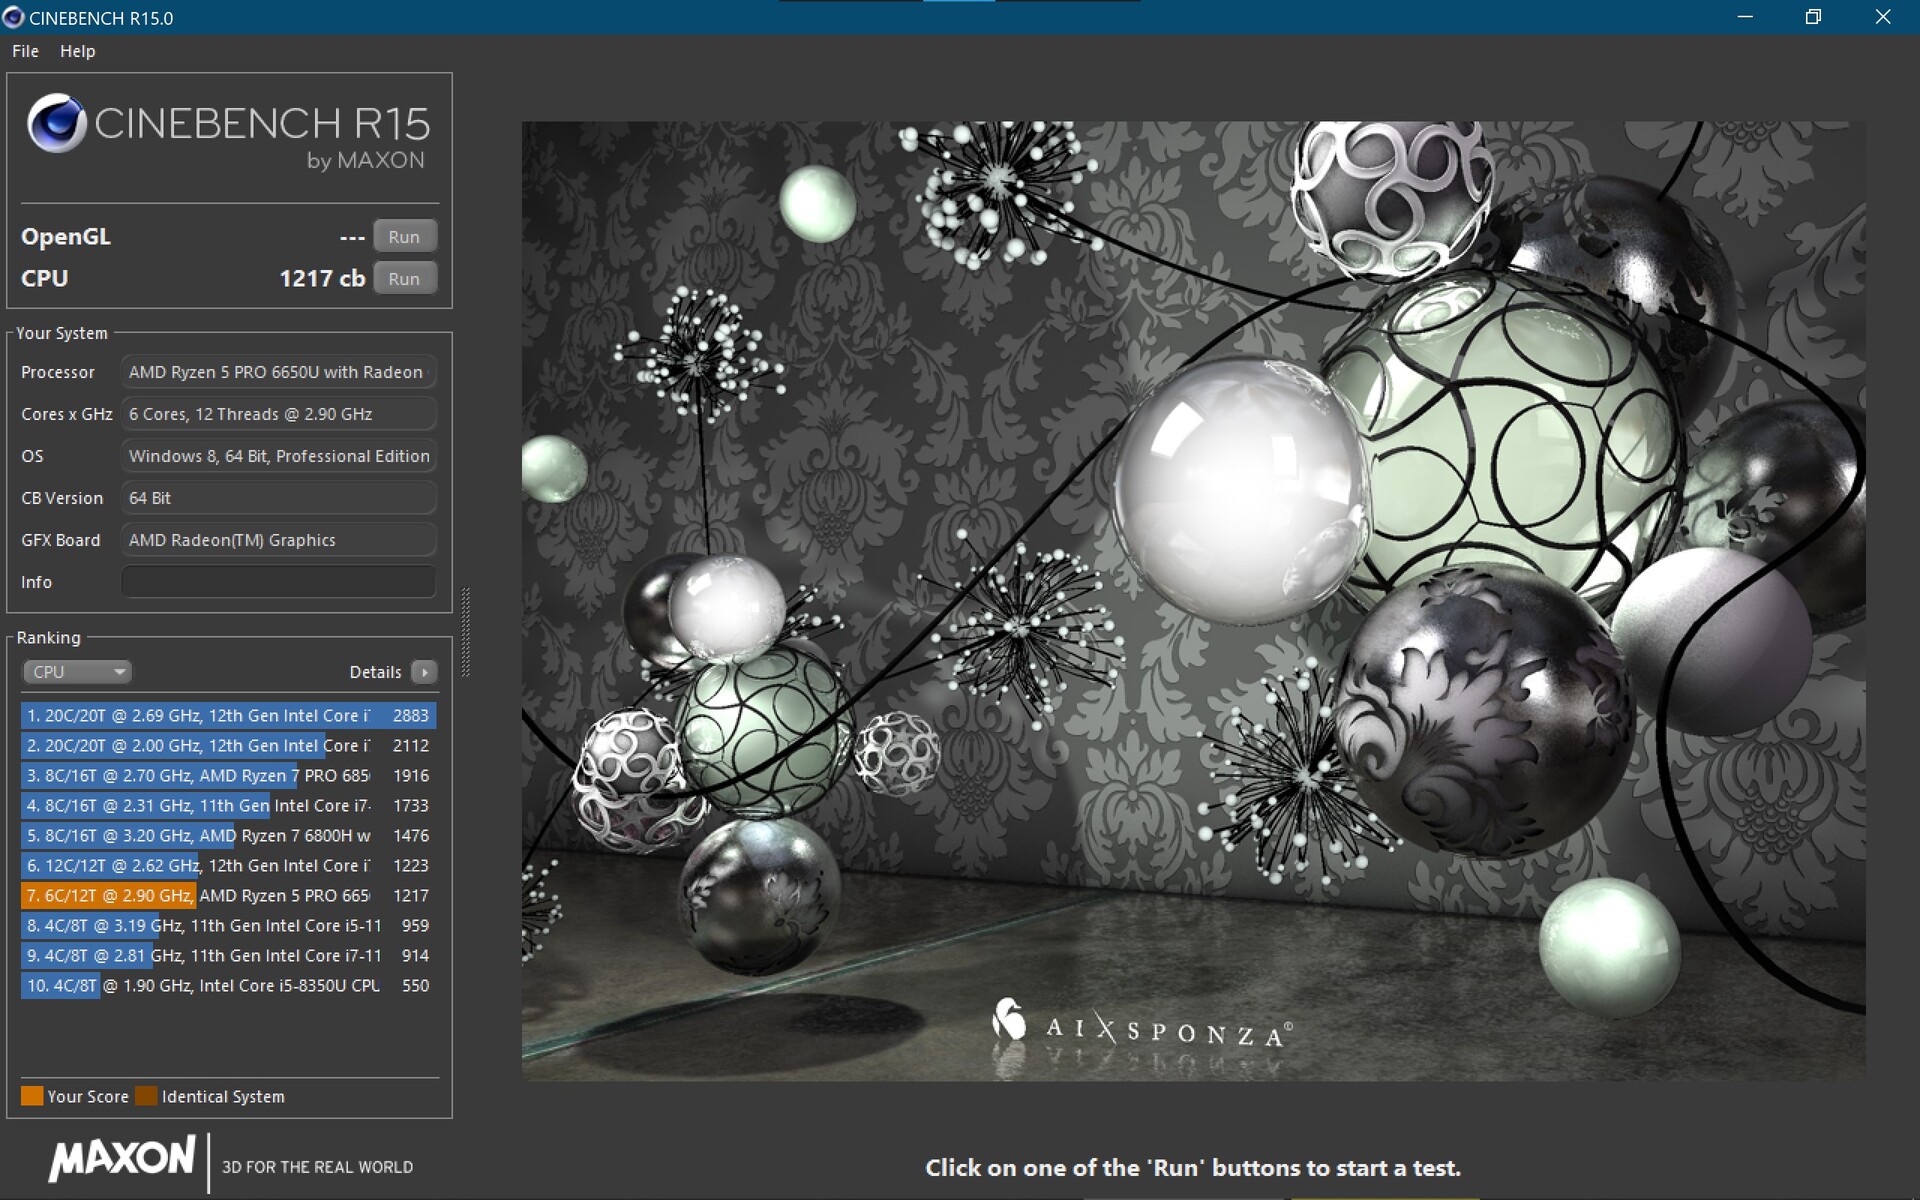
The AMD Ryzen 5 Pro 6650U is a hexa-core processor. It is able to maintain its maximum clock speed of 3.8 GHz in all cores for about 45 seconds in the ThinkPad T16 G1, before it levels out afterwards only barely below that at 3.65 GHz.
This results in significantly higher performance values than for the Intel model, which Lenovo limits to a low 20 watts. In our Cinebench R15 loop, we measure results that are 50% higher on average than with the corresponding Intel Core i5-1240P, which at least is ahead during the first run.
Our second T16 test unit with a Ryzen 7 Pro 6850U brings about 20% additional performance in this benchmark. On the other hand, the EliteBook 865 G9 with the same octa-core chip is at the same level as the weaker-equipped T16 with its R5 6650U. Intel's Core i7-12700H in the ThinkPad X1 Extreme G5 ran almost twice as fast in the multicore benchmarks than the Ryzen 5 Pro 6650U, and in the single-core test it still performed around 23% higher.
In battery operation, the performance is not decreased. However, in the T16 with the more powerful octa-core processor, we observe a performance drop of 20%.

Cinebench R15 Multi Constant Load Test
Cinebench R23: Multi Core | Single Core
Cinebench R20: CPU (Multi Core) | CPU (Single Core)
Cinebench R15: CPU Multi 64Bit | CPU Single 64Bit
Blender: v2.79 BMW27 CPU
7-Zip 18.03: 7z b 4 | 7z b 4 -mmt1
Geekbench 5.5: Multi-Core | Single-Core
HWBOT x265 Benchmark v2.2: 4k Preset
LibreOffice : 20 Documents To PDF
R Benchmark 2.5: Overall mean
| CPU Performance Rating | |
| Lenovo ThinkPad X1 Extreme G5-21DE003RGE | |
| HP ZBook Power 15 G9 6B8C4EA | |
| Lenovo ThinkPad Z16 G1 21D5S00T00 | |
| Lenovo ThinkPad T16 G1 21CHCTO1WW | |
| HP EliteBook 865 G9 | |
| Lenovo ThinkPad T16 G1 21CH004MGE | |
| Lenovo ThinkPad T16 G1 21BWS00200 | |
| Average AMD Ryzen 5 PRO 6650U | |
| Average of class Office | |
| Cinebench R23 / Multi Core | |
| Lenovo ThinkPad X1 Extreme G5-21DE003RGE | |
| HP ZBook Power 15 G9 6B8C4EA | |
| Lenovo ThinkPad Z16 G1 21D5S00T00 | |
| Lenovo ThinkPad T16 G1 21CHCTO1WW | |
| HP EliteBook 865 G9 | |
| Lenovo ThinkPad T16 G1 21CH004MGE | |
| Average AMD Ryzen 5 PRO 6650U (7805 - 9534, n=4) | |
| Average of class Office (1056 - 15743, n=121, last 2 years) | |
| Lenovo ThinkPad T16 G1 21BWS00200 | |
| Cinebench R23 / Single Core | |
| Lenovo ThinkPad X1 Extreme G5-21DE003RGE | |
| HP ZBook Power 15 G9 6B8C4EA | |
| Lenovo ThinkPad T16 G1 21BWS00200 | |
| Lenovo ThinkPad T16 G1 21CHCTO1WW | |
| Lenovo ThinkPad Z16 G1 21D5S00T00 | |
| Lenovo ThinkPad T16 G1 21CH004MGE | |
| Average AMD Ryzen 5 PRO 6650U (1439 - 1476, n=4) | |
| Average of class Office (529 - 1995, n=120, last 2 years) | |
| HP EliteBook 865 G9 | |
| Cinebench R20 / CPU (Multi Core) | |
| Lenovo ThinkPad X1 Extreme G5-21DE003RGE | |
| HP ZBook Power 15 G9 6B8C4EA | |
| Lenovo ThinkPad Z16 G1 21D5S00T00 | |
| Lenovo ThinkPad T16 G1 21CHCTO1WW | |
| HP EliteBook 865 G9 | |
| Lenovo ThinkPad T16 G1 21CH004MGE | |
| Average AMD Ryzen 5 PRO 6650U (3057 - 3684, n=4) | |
| Average of class Office (356 - 5904, n=119, last 2 years) | |
| Lenovo ThinkPad T16 G1 21BWS00200 | |
| Cinebench R20 / CPU (Single Core) | |
| Lenovo ThinkPad X1 Extreme G5-21DE003RGE | |
| HP ZBook Power 15 G9 6B8C4EA | |
| Lenovo ThinkPad T16 G1 21CHCTO1WW | |
| HP EliteBook 865 G9 | |
| Lenovo ThinkPad Z16 G1 21D5S00T00 | |
| Lenovo ThinkPad T16 G1 21BWS00200 | |
| Lenovo ThinkPad T16 G1 21CH004MGE | |
| Average AMD Ryzen 5 PRO 6650U (548 - 578, n=4) | |
| Average of class Office (181.3 - 764, n=119, last 2 years) | |
| Cinebench R15 / CPU Multi 64Bit | |
| Lenovo ThinkPad X1 Extreme G5-21DE003RGE | |
| Lenovo ThinkPad Z16 G1 21D5S00T00 | |
| HP ZBook Power 15 G9 6B8C4EA | |
| Lenovo ThinkPad T16 G1 21CHCTO1WW | |
| Lenovo ThinkPad T16 G1 21BWS00200 | |
| Lenovo ThinkPad T16 G1 21BWS00200 | |
| HP EliteBook 865 G9 | |
| Lenovo ThinkPad T16 G1 21CH004MGE | |
| Average AMD Ryzen 5 PRO 6650U (1299 - 1555, n=4) | |
| Average of class Office (160.8 - 2642, n=119, last 2 years) | |
| Cinebench R15 / CPU Single 64Bit | |
| Lenovo ThinkPad X1 Extreme G5-21DE003RGE | |
| HP ZBook Power 15 G9 6B8C4EA | |
| Lenovo ThinkPad Z16 G1 21D5S00T00 | |
| Lenovo ThinkPad T16 G1 21CHCTO1WW | |
| Lenovo ThinkPad T16 G1 21CH004MGE | |
| HP EliteBook 865 G9 | |
| Average AMD Ryzen 5 PRO 6650U (230 - 234, n=4) | |
| Lenovo ThinkPad T16 G1 21BWS00200 | |
| Average of class Office (82.6 - 284, n=117, last 2 years) | |
| Blender / v2.79 BMW27 CPU | |
| Average of class Office (214 - 2844, n=120, last 2 years) | |
| Lenovo ThinkPad T16 G1 21BWS00200 | |
| Average AMD Ryzen 5 PRO 6650U (328 - 548, n=5) | |
| Lenovo ThinkPad T16 G1 21CH004MGE | |
| HP EliteBook 865 G9 | |
| Lenovo ThinkPad T16 G1 21CHCTO1WW | |
| Lenovo ThinkPad Z16 G1 21D5S00T00 | |
| HP ZBook Power 15 G9 6B8C4EA | |
| Lenovo ThinkPad X1 Extreme G5-21DE003RGE | |
| 7-Zip 18.03 / 7z b 4 | |
| Lenovo ThinkPad X1 Extreme G5-21DE003RGE | |
| HP ZBook Power 15 G9 6B8C4EA | |
| Lenovo ThinkPad Z16 G1 21D5S00T00 | |
| Lenovo ThinkPad T16 G1 21CHCTO1WW | |
| HP EliteBook 865 G9 | |
| Lenovo ThinkPad T16 G1 21CH004MGE | |
| Average AMD Ryzen 5 PRO 6650U (32613 - 41530, n=4) | |
| Average of class Office (4226 - 62349, n=120, last 2 years) | |
| Lenovo ThinkPad T16 G1 21BWS00200 | |
| 7-Zip 18.03 / 7z b 4 -mmt1 | |
| Lenovo ThinkPad X1 Extreme G5-21DE003RGE | |
| HP ZBook Power 15 G9 6B8C4EA | |
| HP EliteBook 865 G9 | |
| Lenovo ThinkPad Z16 G1 21D5S00T00 | |
| Lenovo ThinkPad T16 G1 21CHCTO1WW | |
| Lenovo ThinkPad T16 G1 21CH004MGE | |
| Average AMD Ryzen 5 PRO 6650U (5175 - 5427, n=4) | |
| Average of class Office (2233 - 6687, n=120, last 2 years) | |
| Lenovo ThinkPad T16 G1 21BWS00200 | |
| Geekbench 5.5 / Multi-Core | |
| Lenovo ThinkPad X1 Extreme G5-21DE003RGE | |
| HP ZBook Power 15 G9 6B8C4EA | |
| Lenovo ThinkPad Z16 G1 21D5S00T00 | |
| Lenovo ThinkPad T16 G1 21CHCTO1WW | |
| Lenovo ThinkPad T16 G1 21CH004MGE | |
| Lenovo ThinkPad T16 G1 21BWS00200 | |
| HP EliteBook 865 G9 | |
| Average of class Office (1018 - 11980, n=121, last 2 years) | |
| Average AMD Ryzen 5 PRO 6650U (6171 - 7227, n=4) | |
| Geekbench 5.5 / Single-Core | |
| Lenovo ThinkPad X1 Extreme G5-21DE003RGE | |
| HP ZBook Power 15 G9 6B8C4EA | |
| Lenovo ThinkPad T16 G1 21BWS00200 | |
| Lenovo ThinkPad T16 G1 21CH004MGE | |
| Lenovo ThinkPad Z16 G1 21D5S00T00 | |
| Average of class Office (510 - 1974, n=121, last 2 years) | |
| Lenovo ThinkPad T16 G1 21CHCTO1WW | |
| Average AMD Ryzen 5 PRO 6650U (1433 - 1487, n=4) | |
| HP EliteBook 865 G9 | |
| HWBOT x265 Benchmark v2.2 / 4k Preset | |
| Lenovo ThinkPad X1 Extreme G5-21DE003RGE | |
| HP ZBook Power 15 G9 6B8C4EA | |
| Lenovo ThinkPad Z16 G1 21D5S00T00 | |
| Lenovo ThinkPad T16 G1 21CHCTO1WW | |
| Lenovo ThinkPad T16 G1 21CH004MGE | |
| HP EliteBook 865 G9 | |
| Average AMD Ryzen 5 PRO 6650U (8.71 - 11.8, n=4) | |
| Average of class Office (1.55 - 17.4, n=119, last 2 years) | |
| Lenovo ThinkPad T16 G1 21BWS00200 | |
| LibreOffice / 20 Documents To PDF | |
| Average AMD Ryzen 5 PRO 6650U (50.3 - 63.2, n=4) | |
| Average of class Office (31.3 - 117.5, n=119, last 2 years) | |
| HP EliteBook 865 G9 | |
| Lenovo ThinkPad Z16 G1 21D5S00T00 | |
| Lenovo ThinkPad T16 G1 21CH004MGE | |
| Lenovo ThinkPad T16 G1 21BWS00200 | |
| Lenovo ThinkPad T16 G1 21CHCTO1WW | |
| HP ZBook Power 15 G9 6B8C4EA | |
| Lenovo ThinkPad X1 Extreme G5-21DE003RGE | |
| R Benchmark 2.5 / Overall mean | |
| Average of class Office (0.4244 - 1.397, n=118, last 2 years) | |
| Average AMD Ryzen 5 PRO 6650U (0.521 - 0.59, n=4) | |
| Lenovo ThinkPad T16 G1 21CHCTO1WW | |
| Lenovo ThinkPad T16 G1 21CH004MGE | |
| Lenovo ThinkPad T16 G1 21BWS00200 | |
| HP EliteBook 865 G9 | |
| Lenovo ThinkPad Z16 G1 21D5S00T00 | |
| HP ZBook Power 15 G9 6B8C4EA | |
| Lenovo ThinkPad X1 Extreme G5-21DE003RGE | |
* ... smaller is better
AIDA64: FP32 Ray-Trace | FPU Julia | CPU SHA3 | CPU Queen | FPU SinJulia | FPU Mandel | CPU AES | CPU ZLib | FP64 Ray-Trace | CPU PhotoWorxx
| Performance Rating | |
| Lenovo ThinkPad X1 Extreme G5-21DE003RGE | |
| Lenovo ThinkPad Z16 G1 21D5S00T00 | |
| HP ZBook Power 15 G9 6B8C4EA | |
| Lenovo ThinkPad T16 G1 21CHCTO1WW | |
| Lenovo ThinkPad T16 G1 21CH004MGE | |
| HP EliteBook 865 G9 | |
| Lenovo ThinkPad P15v G2 21A9000XGE | |
| Average AMD Ryzen 5 PRO 6650U | |
| Average of class Office | |
| Lenovo ThinkPad T16 G1 21BWS00200 | |
| AIDA64 / FP32 Ray-Trace | |
| Lenovo ThinkPad X1 Extreme G5-21DE003RGE | |
| Lenovo ThinkPad Z16 G1 21D5S00T00 | |
| HP ZBook Power 15 G9 6B8C4EA | |
| Lenovo ThinkPad T16 G1 21CHCTO1WW | |
| Lenovo ThinkPad P15v G2 21A9000XGE | |
| HP EliteBook 865 G9 | |
| Lenovo ThinkPad T16 G1 21CH004MGE | |
| Average AMD Ryzen 5 PRO 6650U (8854 - 10630, n=4) | |
| Average of class Office (763 - 24250, n=119, last 2 years) | |
| Lenovo ThinkPad T16 G1 21BWS00200 | |
| AIDA64 / FPU Julia | |
| Lenovo ThinkPad Z16 G1 21D5S00T00 | |
| Lenovo ThinkPad X1 Extreme G5-21DE003RGE | |
| Lenovo ThinkPad T16 G1 21CHCTO1WW | |
| HP EliteBook 865 G9 | |
| Lenovo ThinkPad T16 G1 21CH004MGE | |
| HP ZBook Power 15 G9 6B8C4EA | |
| Average AMD Ryzen 5 PRO 6650U (56214 - 68106, n=4) | |
| Lenovo ThinkPad P15v G2 21A9000XGE | |
| Average of class Office (4027 - 102228, n=119, last 2 years) | |
| Lenovo ThinkPad T16 G1 21BWS00200 | |
| AIDA64 / CPU SHA3 | |
| Lenovo ThinkPad X1 Extreme G5-21DE003RGE | |
| Lenovo ThinkPad P15v G2 21A9000XGE | |
| HP ZBook Power 15 G9 6B8C4EA | |
| Lenovo ThinkPad Z16 G1 21D5S00T00 | |
| Lenovo ThinkPad T16 G1 21CHCTO1WW | |
| HP EliteBook 865 G9 | |
| Lenovo ThinkPad T16 G1 21CH004MGE | |
| Average AMD Ryzen 5 PRO 6650U (1881 - 2326, n=4) | |
| Average of class Office (279 - 4442, n=118, last 2 years) | |
| Lenovo ThinkPad T16 G1 21BWS00200 | |
| AIDA64 / CPU Queen | |
| Lenovo ThinkPad Z16 G1 21D5S00T00 | |
| Lenovo ThinkPad X1 Extreme G5-21DE003RGE | |
| HP ZBook Power 15 G9 6B8C4EA | |
| Lenovo ThinkPad P15v G2 21A9000XGE | |
| Lenovo ThinkPad T16 G1 21CHCTO1WW | |
| HP EliteBook 865 G9 | |
| Lenovo ThinkPad T16 G1 21CH004MGE | |
| Lenovo ThinkPad T16 G1 21BWS00200 | |
| Average AMD Ryzen 5 PRO 6650U (69023 - 78797, n=4) | |
| Average of class Office (8031 - 113016, n=119, last 2 years) | |
| AIDA64 / FPU SinJulia | |
| Lenovo ThinkPad Z16 G1 21D5S00T00 | |
| Lenovo ThinkPad T16 G1 21CHCTO1WW | |
| HP EliteBook 865 G9 | |
| Lenovo ThinkPad X1 Extreme G5-21DE003RGE | |
| Lenovo ThinkPad T16 G1 21CH004MGE | |
| Average AMD Ryzen 5 PRO 6650U (8320 - 9488, n=4) | |
| Lenovo ThinkPad P15v G2 21A9000XGE | |
| HP ZBook Power 15 G9 6B8C4EA | |
| Average of class Office (404 - 14288, n=119, last 2 years) | |
| Lenovo ThinkPad T16 G1 21BWS00200 | |
| AIDA64 / FPU Mandel | |
| Lenovo ThinkPad Z16 G1 21D5S00T00 | |
| Lenovo ThinkPad T16 G1 21CHCTO1WW | |
| HP EliteBook 865 G9 | |
| Lenovo ThinkPad X1 Extreme G5-21DE003RGE | |
| Lenovo ThinkPad T16 G1 21CH004MGE | |
| Average AMD Ryzen 5 PRO 6650U (30969 - 37461, n=4) | |
| HP ZBook Power 15 G9 6B8C4EA | |
| Lenovo ThinkPad P15v G2 21A9000XGE | |
| Average of class Office (2054 - 54365, n=119, last 2 years) | |
| Lenovo ThinkPad T16 G1 21BWS00200 | |
| AIDA64 / CPU AES | |
| Lenovo ThinkPad T16 G1 21CH004MGE | |
| Lenovo ThinkPad X1 Extreme G5-21DE003RGE | |
| Lenovo ThinkPad P15v G2 21A9000XGE | |
| HP ZBook Power 15 G9 6B8C4EA | |
| Lenovo ThinkPad Z16 G1 21D5S00T00 | |
| Average AMD Ryzen 5 PRO 6650U (37259 - 93914, n=4) | |
| HP EliteBook 865 G9 | |
| Average of class Office (5226 - 147611, n=119, last 2 years) | |
| Lenovo ThinkPad T16 G1 21CHCTO1WW | |
| Lenovo ThinkPad T16 G1 21BWS00200 | |
| AIDA64 / CPU ZLib | |
| Lenovo ThinkPad X1 Extreme G5-21DE003RGE | |
| HP ZBook Power 15 G9 6B8C4EA | |
| Lenovo ThinkPad Z16 G1 21D5S00T00 | |
| Lenovo ThinkPad T16 G1 21CHCTO1WW | |
| Lenovo ThinkPad P15v G2 21A9000XGE | |
| HP EliteBook 865 G9 | |
| Lenovo ThinkPad T16 G1 21BWS00200 | |
| Lenovo ThinkPad T16 G1 21CH004MGE | |
| Average AMD Ryzen 5 PRO 6650U (504 - 602, n=4) | |
| Average of class Office (67.6 - 1018, n=119, last 2 years) | |
| AIDA64 / FP64 Ray-Trace | |
| Lenovo ThinkPad X1 Extreme G5-21DE003RGE | |
| Lenovo ThinkPad Z16 G1 21D5S00T00 | |
| HP ZBook Power 15 G9 6B8C4EA | |
| Lenovo ThinkPad P15v G2 21A9000XGE | |
| Lenovo ThinkPad T16 G1 21CHCTO1WW | |
| HP EliteBook 865 G9 | |
| Lenovo ThinkPad T16 G1 21CH004MGE | |
| Average AMD Ryzen 5 PRO 6650U (4620 - 5468, n=4) | |
| Average of class Office (432 - 12755, n=119, last 2 years) | |
| Lenovo ThinkPad T16 G1 21BWS00200 | |
| AIDA64 / CPU PhotoWorxx | |
| HP ZBook Power 15 G9 6B8C4EA | |
| Lenovo ThinkPad Z16 G1 21D5S00T00 | |
| Lenovo ThinkPad T16 G1 21CH004MGE | |
| Lenovo ThinkPad T16 G1 21CHCTO1WW | |
| Average of class Office (4814 - 48177, n=119, last 2 years) | |
| Average AMD Ryzen 5 PRO 6650U (19643 - 26137, n=4) | |
| Lenovo ThinkPad X1 Extreme G5-21DE003RGE | |
| HP EliteBook 865 G9 | |
| Lenovo ThinkPad T16 G1 21BWS00200 | |
| Lenovo ThinkPad P15v G2 21A9000XGE | |
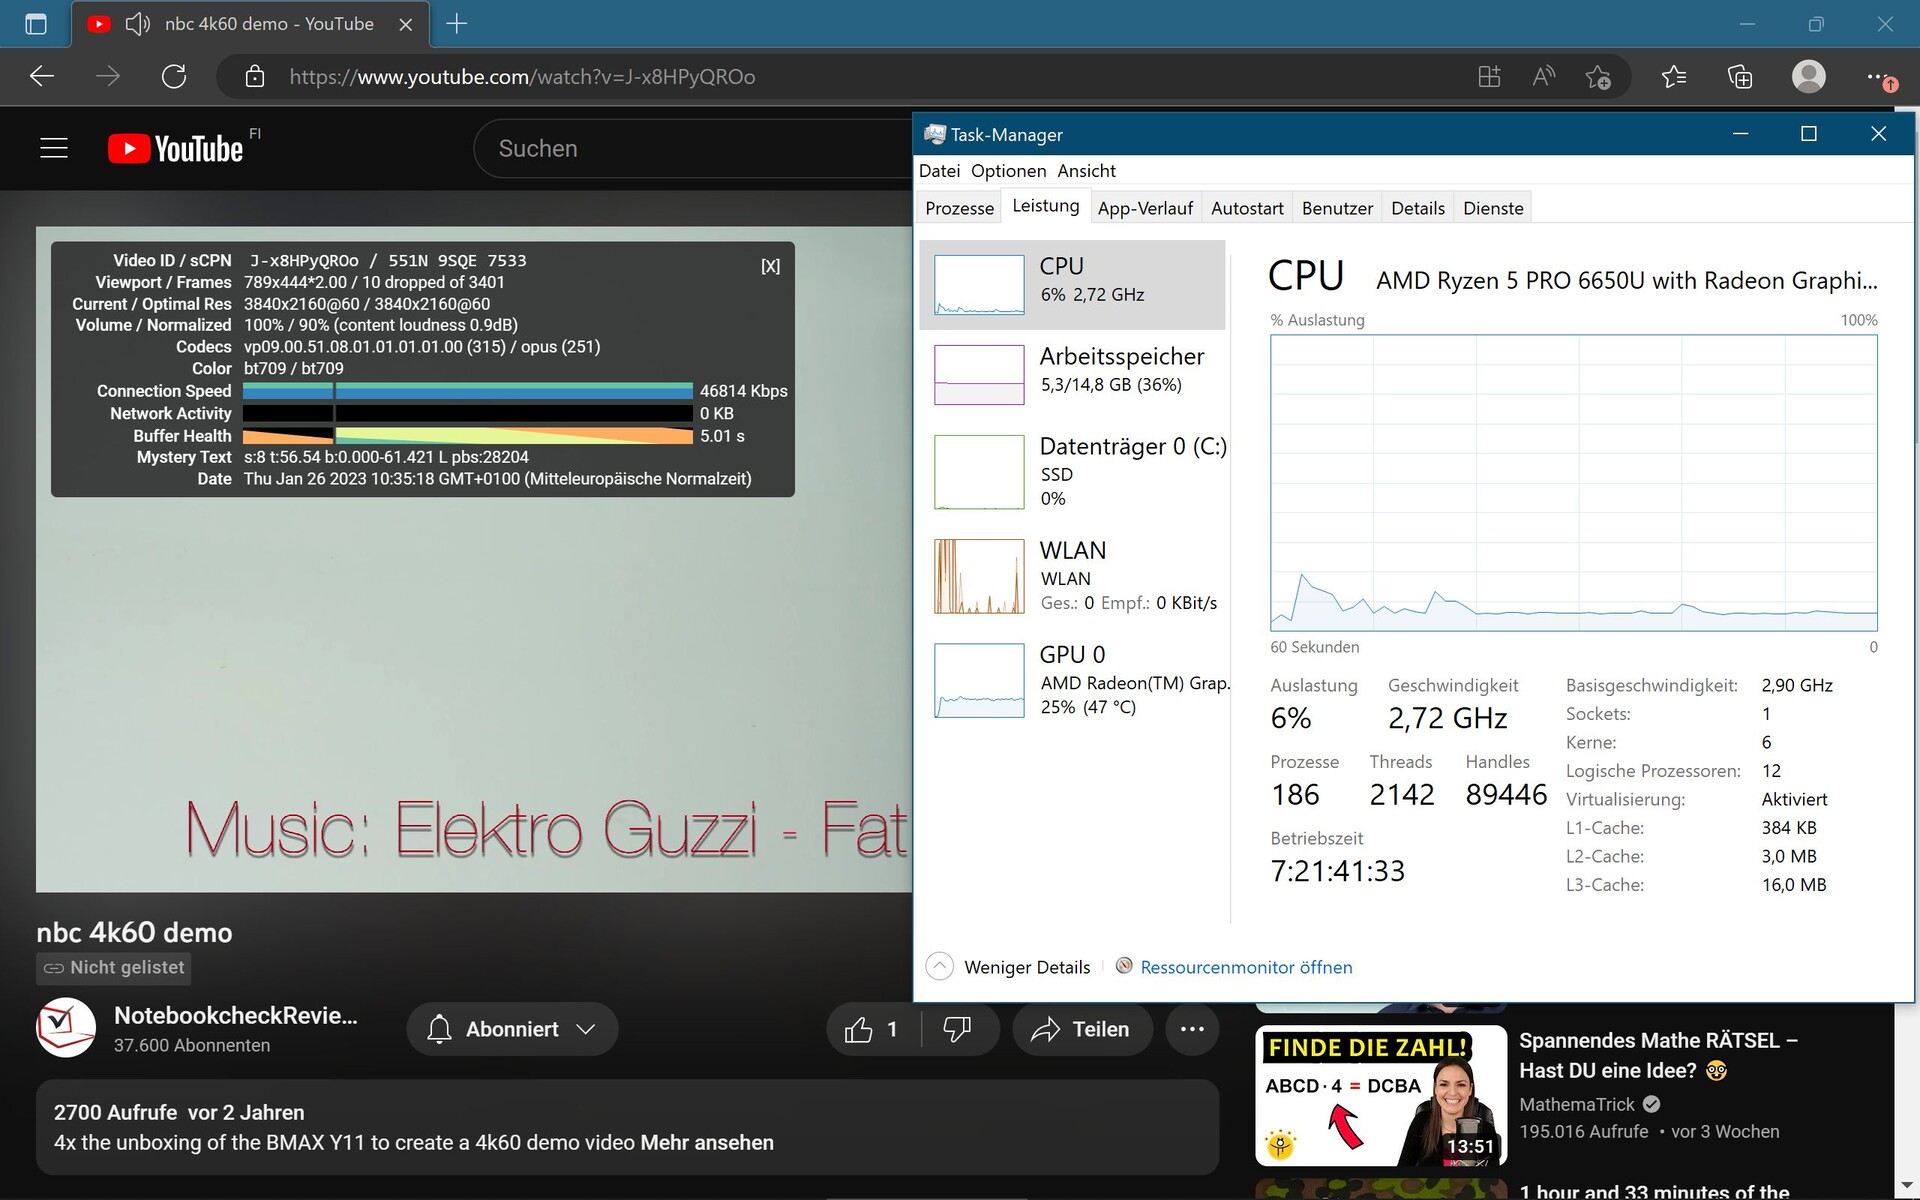
System Performance
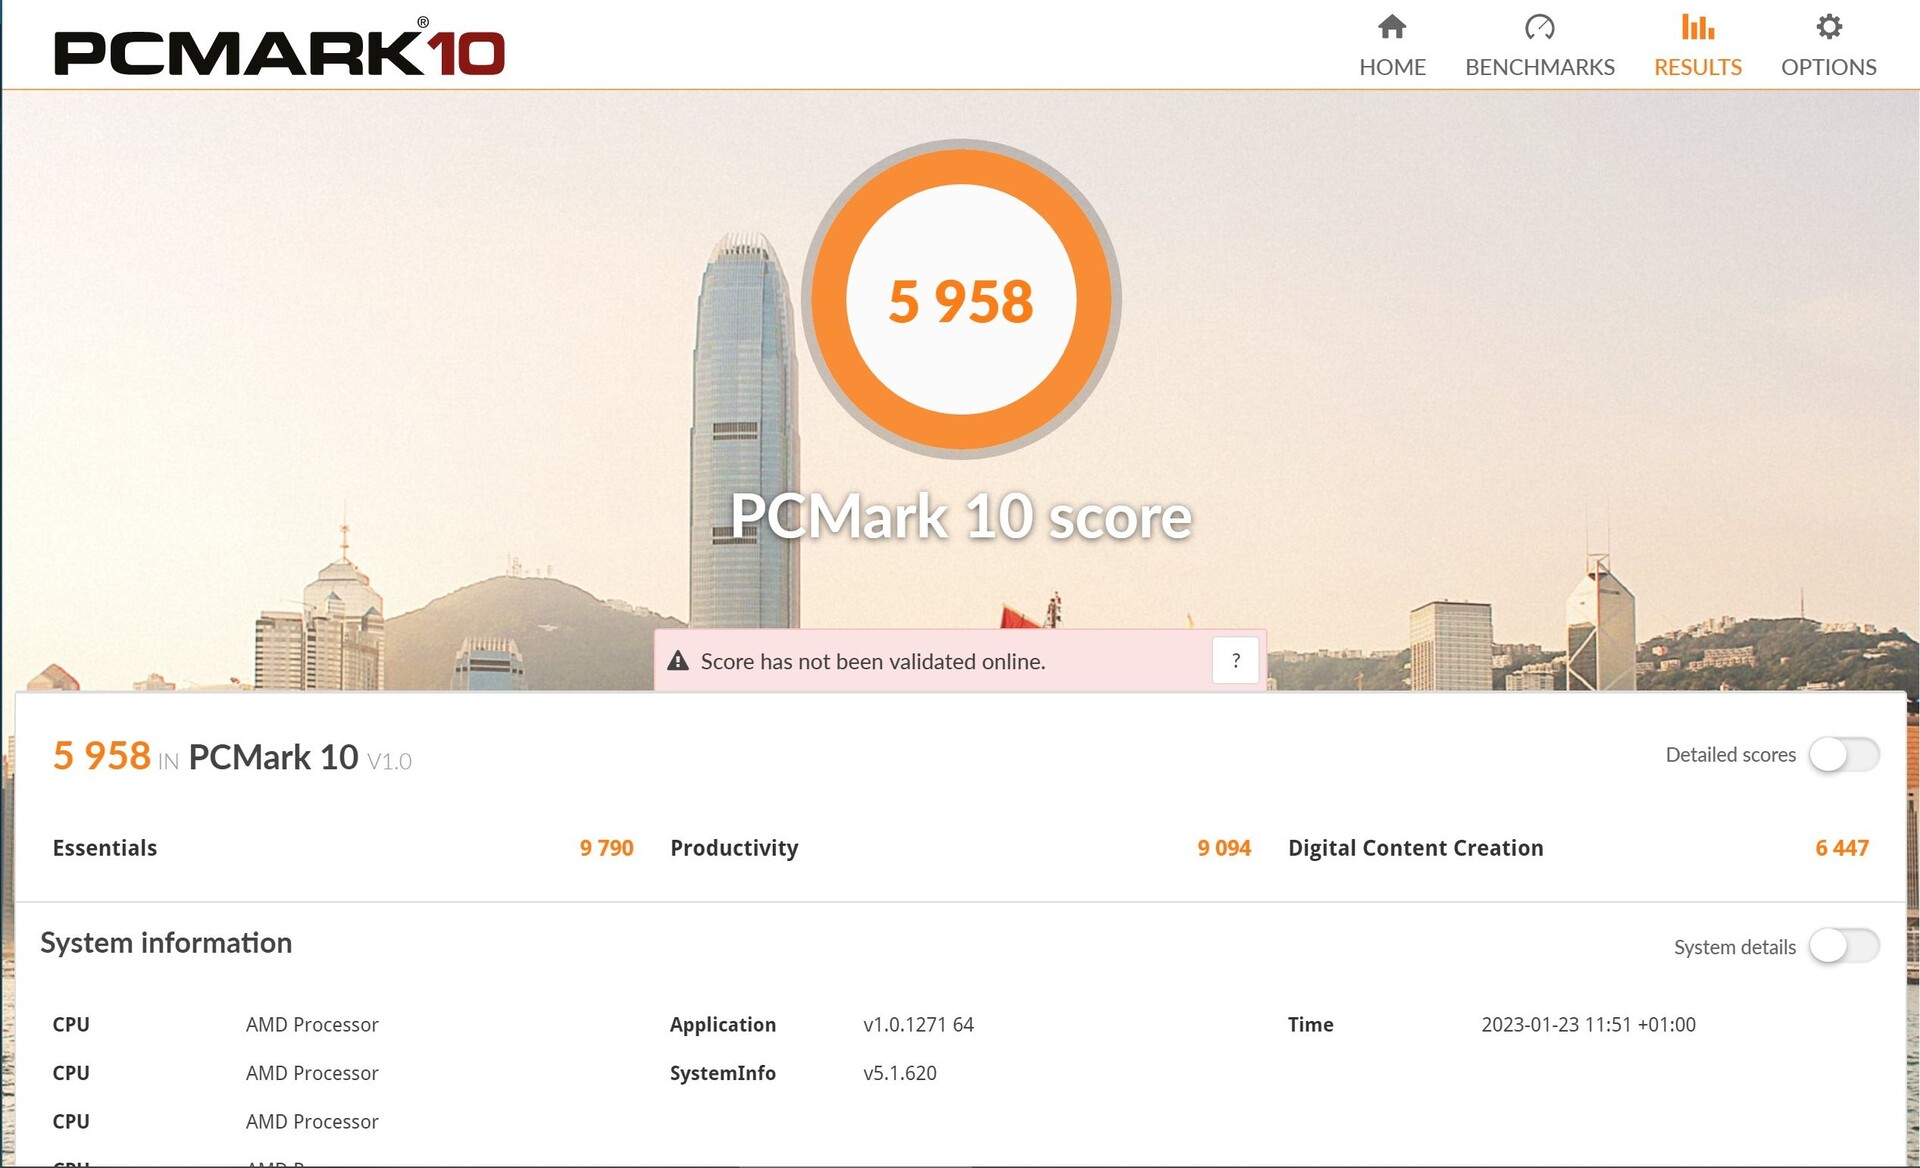
Smooth web browsing with several tabs and simultaneous 4K YouTube video reproduction poses absolutely no problem for the ThinkPad T16 AMD. However, due to its more powerful Turbo, the T16 Intel still keeps a slight advantage in browser benchmarks such as Mozilla Kraken or Octane v2. On the other hand, the Intel version is throttled heavily by its single-channel RAM configuration in the PCMark and Crossmark benchmarks.
CrossMark: Overall | Productivity | Creativity | Responsiveness
Mozilla Kraken 1.1: Total
Speedometer 2.0: Result
Octane V2: Total Score
Jetstream 2: Total Score
WebXPRT 3: Overall
WebXPRT 4: Overall
| PCMark 10 / Score | |
| Lenovo ThinkPad X1 Extreme G5-21DE003RGE | |
| Lenovo ThinkPad Z16 G1 21D5S00T00 | |
| HP ZBook Power 15 G9 6B8C4EA | |
| Lenovo ThinkPad T16 G1 21CHCTO1WW | |
| Lenovo ThinkPad T16 G1 21CH004MGE | |
| Lenovo ThinkPad P15v G2 21A9000XGE | |
| HP EliteBook 865 G9 | |
| Average AMD Ryzen 5 PRO 6650U, AMD Radeon 660M (5513 - 5958, n=4) | |
| Average of class Office (2325 - 7157, n=104, last 2 years) | |
| Lenovo ThinkPad T16 G1 21BWS00200 | |
| PCMark 10 / Essentials | |
| Lenovo ThinkPad X1 Extreme G5-21DE003RGE | |
| Lenovo ThinkPad T16 G1 21CHCTO1WW | |
| Lenovo ThinkPad Z16 G1 21D5S00T00 | |
| Average of class Office (5095 - 20841, n=104, last 2 years) | |
| HP ZBook Power 15 G9 6B8C4EA | |
| Lenovo ThinkPad T16 G1 21CH004MGE | |
| Lenovo ThinkPad P15v G2 21A9000XGE | |
| Average AMD Ryzen 5 PRO 6650U, AMD Radeon 660M (9578 - 9982, n=4) | |
| Lenovo ThinkPad T16 G1 21BWS00200 | |
| HP EliteBook 865 G9 | |
| PCMark 10 / Productivity | |
| Lenovo ThinkPad X1 Extreme G5-21DE003RGE | |
| Lenovo ThinkPad T16 G1 21CH004MGE | |
| Lenovo ThinkPad T16 G1 21CHCTO1WW | |
| HP EliteBook 865 G9 | |
| Average AMD Ryzen 5 PRO 6650U, AMD Radeon 660M (7848 - 9094, n=4) | |
| Lenovo ThinkPad Z16 G1 21D5S00T00 | |
| Lenovo ThinkPad P15v G2 21A9000XGE | |
| HP ZBook Power 15 G9 6B8C4EA | |
| Average of class Office (3041 - 10198, n=104, last 2 years) | |
| Lenovo ThinkPad T16 G1 21BWS00200 | |
| PCMark 10 / Digital Content Creation | |
| Lenovo ThinkPad X1 Extreme G5-21DE003RGE | |
| Lenovo ThinkPad Z16 G1 21D5S00T00 | |
| HP ZBook Power 15 G9 6B8C4EA | |
| HP EliteBook 865 G9 | |
| Lenovo ThinkPad P15v G2 21A9000XGE | |
| Lenovo ThinkPad T16 G1 21CHCTO1WW | |
| Lenovo ThinkPad T16 G1 21CH004MGE | |
| Average AMD Ryzen 5 PRO 6650U, AMD Radeon 660M (5837 - 6447, n=4) | |
| Average of class Office (1912 - 9056, n=104, last 2 years) | |
| Lenovo ThinkPad T16 G1 21BWS00200 | |
| CrossMark / Overall | |
| Lenovo ThinkPad X1 Extreme G5-21DE003RGE | |
| HP ZBook Power 15 G9 6B8C4EA | |
| Lenovo ThinkPad Z16 G1 21D5S00T00 | |
| Lenovo ThinkPad T16 G1 21CH004MGE | |
| Average AMD Ryzen 5 PRO 6650U, AMD Radeon 660M (1338 - 1432, n=3) | |
| Lenovo ThinkPad T16 G1 21BWS00200 | |
| Lenovo ThinkPad P15v G2 21A9000XGE | |
| Lenovo ThinkPad T16 G1 21CHCTO1WW | |
| HP EliteBook 865 G9 | |
| Average of class Office (348 - 1891, n=105, last 2 years) | |
| CrossMark / Productivity | |
| Lenovo ThinkPad X1 Extreme G5-21DE003RGE | |
| HP ZBook Power 15 G9 6B8C4EA | |
| Lenovo ThinkPad Z16 G1 21D5S00T00 | |
| Lenovo ThinkPad T16 G1 21CH004MGE | |
| Average AMD Ryzen 5 PRO 6650U, AMD Radeon 660M (1366 - 1440, n=3) | |
| Lenovo ThinkPad T16 G1 21BWS00200 | |
| Lenovo ThinkPad P15v G2 21A9000XGE | |
| HP EliteBook 865 G9 | |
| Average of class Office (393 - 1870, n=105, last 2 years) | |
| Lenovo ThinkPad T16 G1 21CHCTO1WW | |
| CrossMark / Creativity | |
| HP ZBook Power 15 G9 6B8C4EA | |
| Lenovo ThinkPad X1 Extreme G5-21DE003RGE | |
| Lenovo ThinkPad Z16 G1 21D5S00T00 | |
| Lenovo ThinkPad T16 G1 21CH004MGE | |
| Average AMD Ryzen 5 PRO 6650U, AMD Radeon 660M (1397 - 1517, n=3) | |
| Lenovo ThinkPad T16 G1 21CHCTO1WW | |
| Lenovo ThinkPad P15v G2 21A9000XGE | |
| Lenovo ThinkPad T16 G1 21BWS00200 | |
| HP EliteBook 865 G9 | |
| Average of class Office (340 - 1982, n=105, last 2 years) | |
| CrossMark / Responsiveness | |
| Lenovo ThinkPad X1 Extreme G5-21DE003RGE | |
| HP ZBook Power 15 G9 6B8C4EA | |
| Lenovo ThinkPad T16 G1 21BWS00200 | |
| Lenovo ThinkPad Z16 G1 21D5S00T00 | |
| Lenovo ThinkPad T16 G1 21CH004MGE | |
| Average of class Office (258 - 2017, n=105, last 2 years) | |
| Average AMD Ryzen 5 PRO 6650U, AMD Radeon 660M (1106 - 1229, n=3) | |
| Lenovo ThinkPad P15v G2 21A9000XGE | |
| HP EliteBook 865 G9 | |
| Lenovo ThinkPad T16 G1 21CHCTO1WW | |
| Mozilla Kraken 1.1 / Total | |
| Average of class Office (479 - 1966, n=111, last 2 years) | |
| Lenovo ThinkPad T16 G1 21CHCTO1WW | |
| Average AMD Ryzen 5 PRO 6650U, AMD Radeon 660M (615 - 707, n=4) | |
| Lenovo ThinkPad P15v G2 21A9000XGE | |
| Lenovo ThinkPad T16 G1 21CH004MGE | |
| HP EliteBook 865 G9 | |
| Lenovo ThinkPad T16 G1 21BWS00200 | |
| Lenovo ThinkPad Z16 G1 21D5S00T00 | |
| HP ZBook Power 15 G9 6B8C4EA | |
| Lenovo ThinkPad X1 Extreme G5-21DE003RGE | |
| Speedometer 2.0 / Result | |
| HP ZBook Power 15 G9 6B8C4EA | |
| Lenovo ThinkPad X1 Extreme G5-21DE003RGE | |
| Lenovo ThinkPad T16 G1 21BWS00200 | |
| HP EliteBook 865 G9 | |
| Average of class Office (26.1 - 350, n=47, last 2 years) | |
| Lenovo ThinkPad T16 G1 21CH004MGE | |
| Average AMD Ryzen 5 PRO 6650U, AMD Radeon 660M () | |
| Octane V2 / Total Score | |
| Lenovo ThinkPad X1 Extreme G5-21DE003RGE | |
| HP ZBook Power 15 G9 6B8C4EA | |
| Lenovo ThinkPad T16 G1 21BWS00200 | |
| Lenovo ThinkPad T16 G1 21CH004MGE | |
| Average AMD Ryzen 5 PRO 6650U, AMD Radeon 660M () | |
| HP EliteBook 865 G9 | |
| Average of class Office (21416 - 93596, n=51, last 2 years) | |
| Jetstream 2 / Total Score | |
| HP ZBook Power 15 G9 6B8C4EA | |
| Lenovo ThinkPad T16 G1 21BWS00200 | |
| Lenovo ThinkPad X1 Extreme G5-21DE003RGE | |
| Average AMD Ryzen 5 PRO 6650U, AMD Radeon 660M () | |
| Lenovo ThinkPad T16 G1 21CH004MGE | |
| Average of class Office (72.4 - 418, n=70, last 2 years) | |
| HP EliteBook 865 G9 | |
| WebXPRT 3 / Overall | |
| HP ZBook Power 15 G9 6B8C4EA | |
| Lenovo ThinkPad X1 Extreme G5-21DE003RGE | |
| HP EliteBook 865 G9 | |
| Lenovo ThinkPad T16 G1 21BWS00200 | |
| Lenovo ThinkPad P15v G2 21A9000XGE | |
| Lenovo ThinkPad Z16 G1 21D5S00T00 | |
| Average of class Office (99.2 - 368, n=106, last 2 years) | |
| Lenovo ThinkPad T16 G1 21CH004MGE | |
| Average AMD Ryzen 5 PRO 6650U, AMD Radeon 660M (225 - 242, n=4) | |
| Lenovo ThinkPad T16 G1 21CHCTO1WW | |
| WebXPRT 4 / Overall | |
| HP ZBook Power 15 G9 6B8C4EA | |
| Lenovo ThinkPad X1 Extreme G5-21DE003RGE | |
| Lenovo ThinkPad T16 G1 21BWS00200 | |
| HP EliteBook 865 G9 | |
| Lenovo ThinkPad T16 G1 21CH004MGE | |
| Average of class Office (80 - 328, n=94, last 2 years) | |
| Lenovo ThinkPad Z16 G1 21D5S00T00 | |
| Average AMD Ryzen 5 PRO 6650U, AMD Radeon 660M (176.4 - 206, n=4) | |
| Lenovo ThinkPad T16 G1 21CHCTO1WW | |
* ... smaller is better
| PCMark 10 Score | 5958 points | |
Help | ||
| AIDA64 / Memory Copy | |
| HP ZBook Power 15 G9 6B8C4EA | |
| Lenovo ThinkPad Z16 G1 21D5S00T00 | |
| Lenovo ThinkPad T16 G1 21CHCTO1WW | |
| Lenovo ThinkPad T16 G1 21CH004MGE | |
| Average AMD Ryzen 5 PRO 6650U (31014 - 48558, n=4) | |
| Average of class Office (7158 - 84290, n=120, last 2 years) | |
| Lenovo ThinkPad X1 Extreme G5-21DE003RGE | |
| HP EliteBook 865 G9 | |
| Lenovo ThinkPad P15v G2 21A9000XGE | |
| Lenovo ThinkPad T16 G1 21BWS00200 | |
| AIDA64 / Memory Read | |
| HP ZBook Power 15 G9 6B8C4EA | |
| Average of class Office (7325 - 75550, n=120, last 2 years) | |
| Lenovo ThinkPad Z16 G1 21D5S00T00 | |
| Lenovo ThinkPad T16 G1 21CHCTO1WW | |
| Lenovo ThinkPad T16 G1 21CH004MGE | |
| Average AMD Ryzen 5 PRO 6650U (34690 - 39833, n=4) | |
| Lenovo ThinkPad X1 Extreme G5-21DE003RGE | |
| HP EliteBook 865 G9 | |
| Lenovo ThinkPad P15v G2 21A9000XGE | |
| Lenovo ThinkPad T16 G1 21BWS00200 | |
| AIDA64 / Memory Write | |
| HP ZBook Power 15 G9 6B8C4EA | |
| Lenovo ThinkPad Z16 G1 21D5S00T00 | |
| Lenovo ThinkPad T16 G1 21CH004MGE | |
| Lenovo ThinkPad T16 G1 21CHCTO1WW | |
| Average AMD Ryzen 5 PRO 6650U (34563 - 51117, n=4) | |
| Average of class Office (7579 - 94965, n=120, last 2 years) | |
| HP EliteBook 865 G9 | |
| Lenovo ThinkPad X1 Extreme G5-21DE003RGE | |
| Lenovo ThinkPad T16 G1 21BWS00200 | |
| Lenovo ThinkPad P15v G2 21A9000XGE | |
| AIDA64 / Memory Latency | |
| Lenovo ThinkPad T16 G1 21CHCTO1WW | |
| Lenovo ThinkPad Z16 G1 21D5S00T00 | |
| Lenovo ThinkPad T16 G1 21CH004MGE | |
| Average AMD Ryzen 5 PRO 6650U (91.6 - 126.5, n=4) | |
| Average of class Office (44.3 - 188.3, n=121, last 2 years) | |
| Lenovo ThinkPad P15v G2 21A9000XGE | |
| Lenovo ThinkPad T16 G1 21BWS00200 | |
| HP EliteBook 865 G9 | |
| HP ZBook Power 15 G9 6B8C4EA | |
| Lenovo ThinkPad X1 Extreme G5-21DE003RGE | |
* ... smaller is better
DPC Latencies
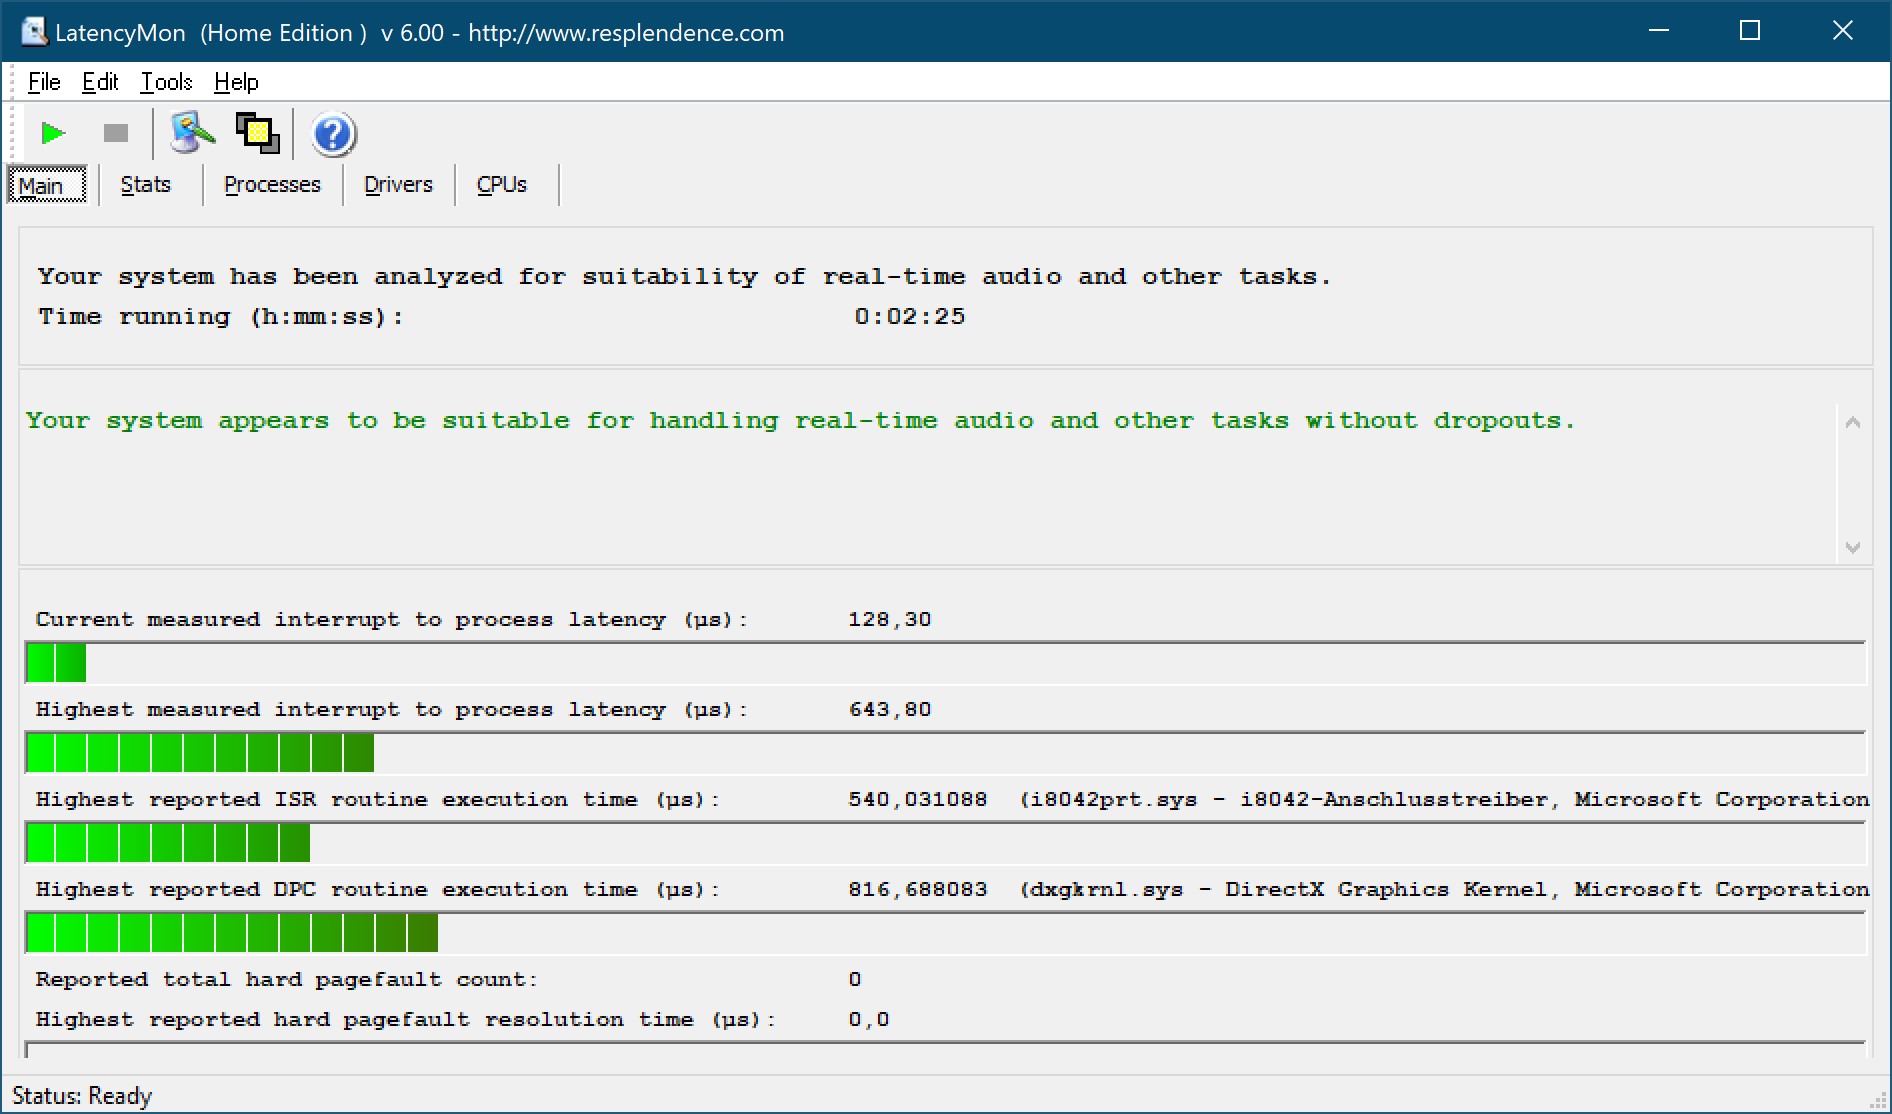
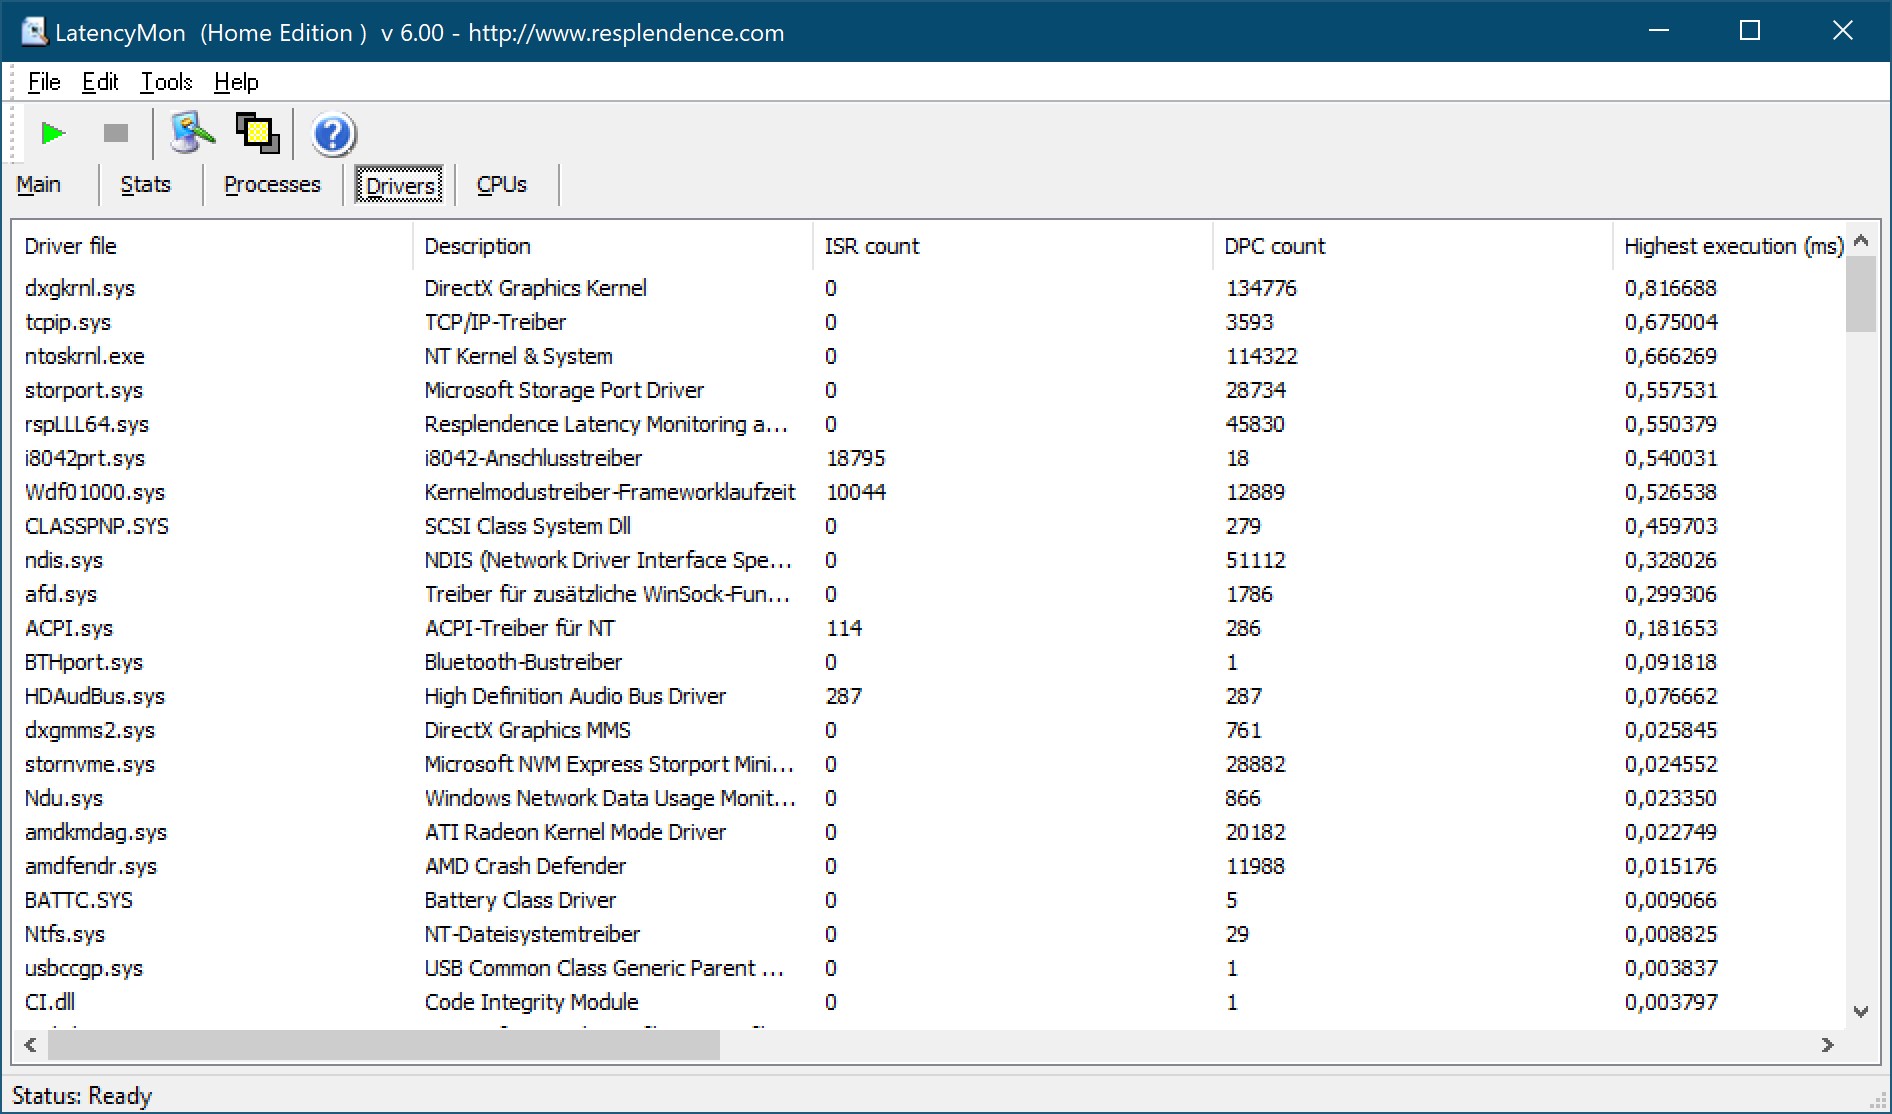
| DPC Latencies / LatencyMon - interrupt to process latency (max), Web, Youtube, Prime95 | |
| Lenovo ThinkPad T16 G1 21BWS00200 | |
| Lenovo ThinkPad X1 Extreme G5-21DE003RGE | |
| HP ZBook Power 15 G9 6B8C4EA | |
| Lenovo ThinkPad T16 G1 21CH004MGE | |
| Lenovo ThinkPad Z16 G1 21D5S00T00 | |
| HP EliteBook 865 G9 | |
* ... smaller is better
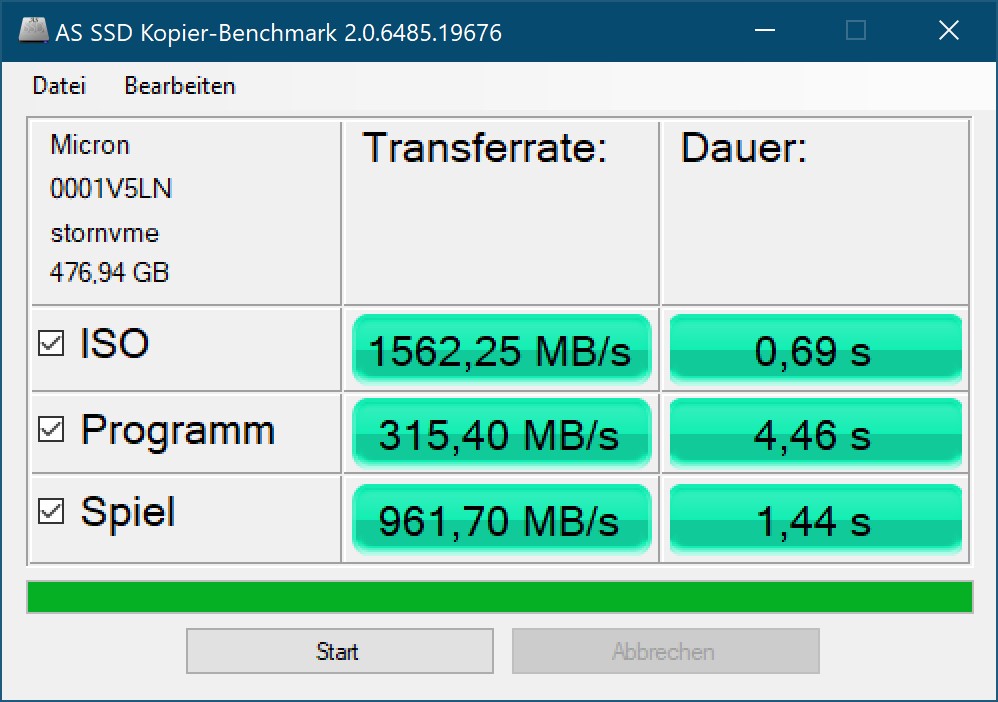
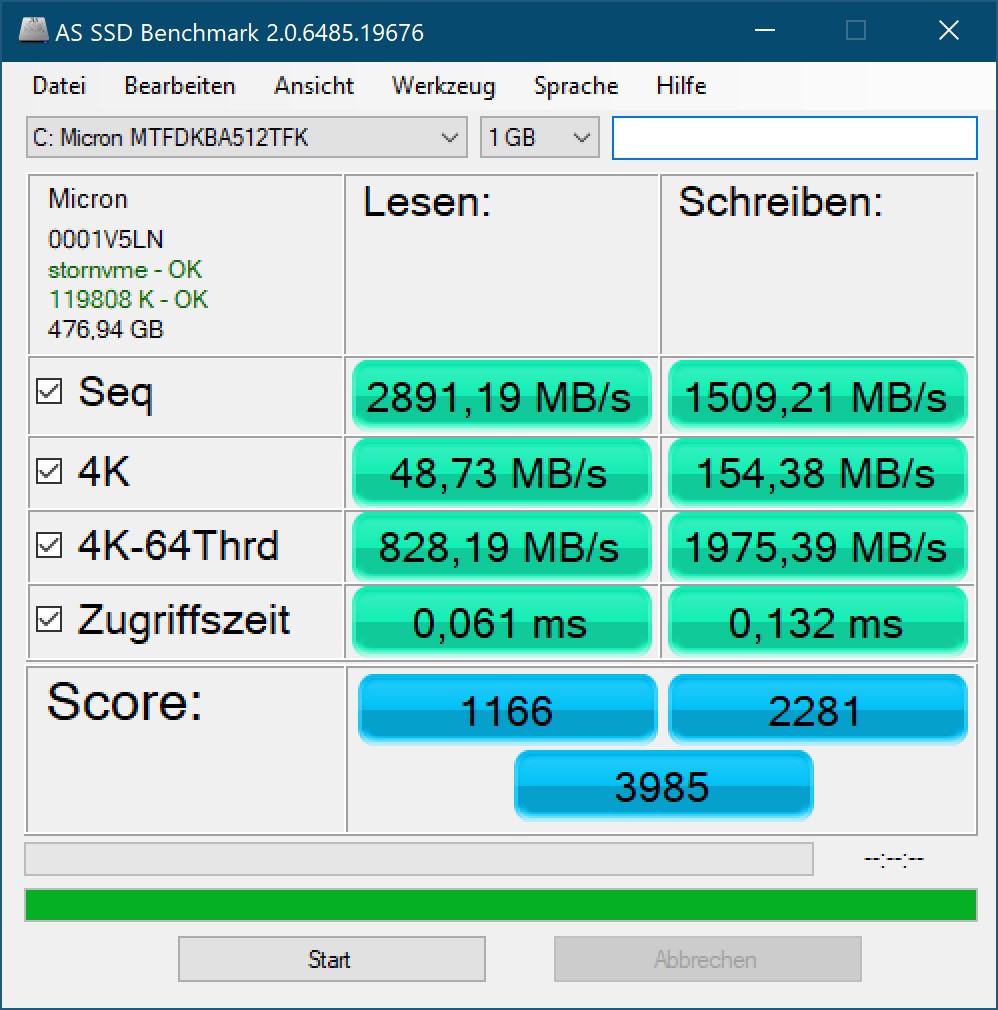
Storage Solution
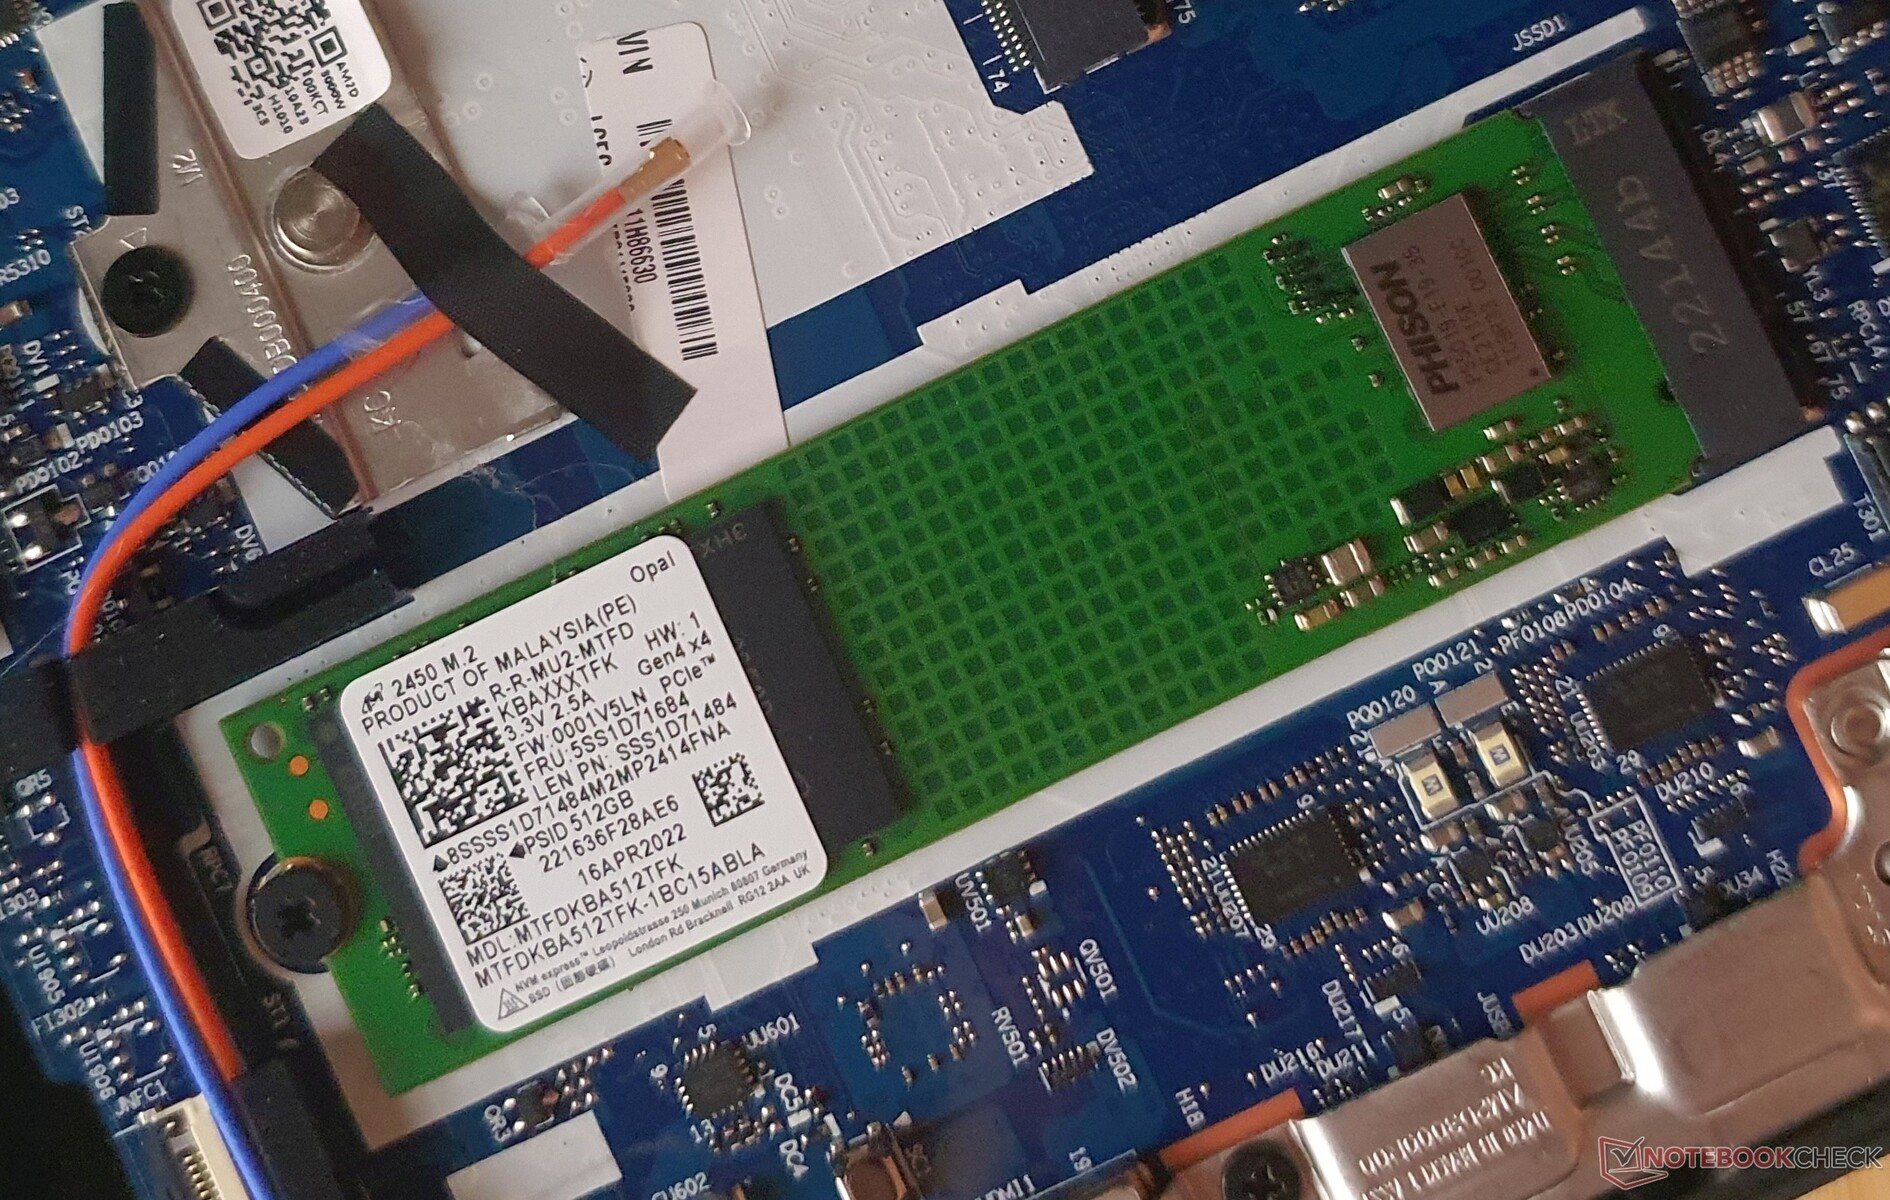
The 512-GB Micron 2450 PCIe 4.0 SSD reads and writes data at speeds corresponding more to the PCIe 3.0 standard. The Samsung PM9A1 in the Intel model of the T16 reads faster but drops to a similar level as the Micron SSD in our constant read test.
| Lenovo ThinkPad T16 G1 21CH004MGE Micron 2450 512GB MTFDKBA512TFK | Lenovo ThinkPad T16 G1 21BWS00200 Samsung PM9A1 MZVL2512HCJQ | Lenovo ThinkPad T16 G1 21CHCTO1WW Micron 2450 512GB MTFDKBA512TFK | HP EliteBook 865 G9 Samsung PM991 MZVLQ512HBLU | Lenovo ThinkPad Z16 G1 21D5S00T00 Samsung PM9A1 MZVL21T0HCLR | Lenovo ThinkPad X1 Extreme G5-21DE003RGE Micron 3400 1TB MTFDKBA1T0TFH | Lenovo ThinkPad P15v G2 21A9000XGE Toshiba XG6 KXG6AZNV512G | HP ZBook Power 15 G9 6B8C4EA Samsung PM9A1 MZVL21T0HCLR | |
|---|---|---|---|---|---|---|---|---|
| AS SSD | 16% | 20% | 2% | 32% | 38% | -8% | 50% | |
| Seq Read | 2891 | 3225 12% | 3107 7% | 2485 -14% | 4572.06 58% | 4766 65% | 2684 -7% | 5081 76% |
| Seq Write | 1509 | 1567 4% | 2965 96% | 1119 -26% | 2339.86 55% | 2159 43% | 1352 -10% | 1785 18% |
| 4K Read | 48.73 | 69.7 43% | 70 44% | 43.99 -10% | 63.1 29% | 44.61 -8% | 43.68 -10% | 76.86 58% |
| 4K Write | 154.38 | 170.9 11% | 166 8% | 117.89 -24% | 138.07 -11% | 141.69 -8% | 105.56 -32% | 197.01 28% |
| 4K-64 Read | 828 | 720 -13% | 1339 62% | 760.82 -8% | 863.66 4% | 877.37 6% | 976.92 18% | 912.6 10% |
| 4K-64 Write | 1975 | 2682 36% | 2101 6% | 1041.52 -47% | 2682.07 36% | 2594.6 31% | 1452.09 -26% | 3010.2 52% |
| Access Time Read * | 0.061 | 0.059 3% | 0.024 61% | 0.049 20% | 0.045 26% | 0.03 51% | 0.124 -103% | 0.02 67% |
| Access Time Write * | 0.132 | 0.024 82% | 0.171 -30% | 0.033 75% | 0.028 79% | 0.025 81% | 0.038 71% | 0.02 85% |
| Score Read | 1166 | 1112 -5% | 1719 47% | 1053 -10% | 1384 19% | 1399 20% | 1289 11% | 1498 28% |
| Score Write | 2281 | 3010 32% | 2563 12% | 1271 -44% | 3054 34% | 2952 29% | 1693 -26% | 3386 48% |
| Score Total | 3985 | 4630 16% | 5170 30% | 2805 -30% | 5050 27% | 4942 24% | 3582 -10% | 5506 38% |
| Copy ISO MB/s | 1562 | 1639 5% | 651 -58% | 1450.27 -7% | 2156.8 38% | 3591.64 130% | 1760.5 13% | 3596.51 130% |
| Copy Program MB/s | 315 | 326.8 4% | 408 30% | 681.41 116% | 426.1 35% | 422.46 34% | 355 13% | 418.84 33% |
| Copy Game MB/s | 962 | 942.7 -2% | 596 -38% | 1251.03 30% | 1157.07 20% | 1239.49 29% | 849 -12% | 1249.83 30% |
| DiskSpd | 22% | 57% | -24% | 32% | 21% | -13% | 37% | |
| seq read | 2012 | 3645 81% | 2309 15% | 1772 -12% | 3695 84% | 3210 60% | 2260 12% | 3945 96% |
| seq write | 2458 | 2809 14% | 3301 34% | 1535 -38% | 3294 34% | 2889 18% | 1837 -25% | 3039 24% |
| seq q8 t1 read | 3507 | 6524 86% | 3589 2% | 2741 -22% | 6628 89% | 6553 87% | 3290 -6% | 6481 85% |
| seq q8 t1 write | 3339 | 4812 44% | 3351 0% | 1606 -52% | 4957 48% | 4703 41% | 2902 -13% | 4914 47% |
| 4k q1 t1 read | 52.1 | 68.2 31% | 58.5 12% | 44.5 -15% | 65.4 26% | 48.7 -7% | 44.3 -15% | 78 50% |
| 4k q1 t1 write | 169.6 | 134.8 -21% | 66.6 -61% | 118 -30% | 134.8 -21% | 148.8 -12% | 113.3 -33% | 162.3 -4% |
| 4k q32 t16 read | 1066 | 683 -36% | 1445 36% | 814 -24% | 898 -16% | 883 -17% | 890 -17% | 866 -19% |
| 4k q32 t16 write | 365 | 293 -20% | 1877 414% | 361 -1% | 399 9% | 370 1% | 332 -9% | 426 17% |
| Total Average (Program / Settings) | 19% /
19% | 39% /
33% | -11% /
-8% | 32% /
32% | 30% /
32% | -11% /
-10% | 44% /
45% |
* ... smaller is better
* ... smaller is better
Disk Throttling: DiskSpd Read Loop, Queue Depth 8
Graphics Card
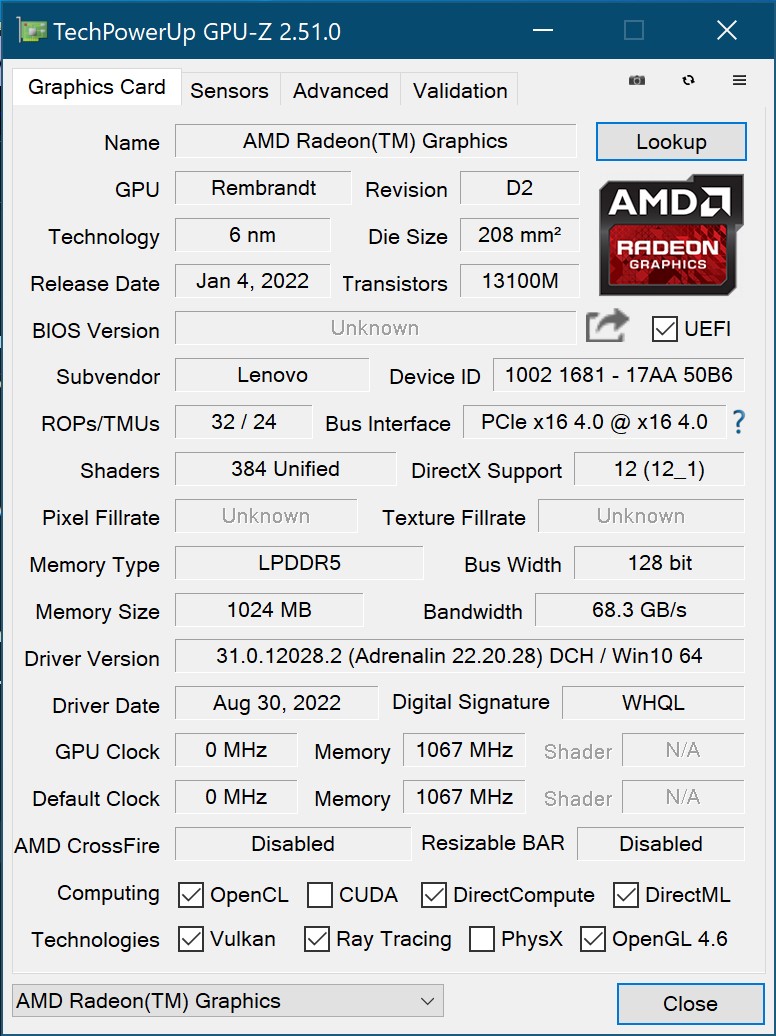

The AMD Radeon 660M of the Ryzen 5 PRO used here is the weaker of the two solely available integrated graphics solutions of the ThinkPad T16 AMD. While older games can be played at medium to high detail settings, new games are at most just barely playable in low settings, since the T16 is not designed for gaming.
During games, an Intel Xe7 (96EUs) remains about 20% behind, while the Radeon 680M computes about 45% faster. In battery operation, the full graphics performance is available.
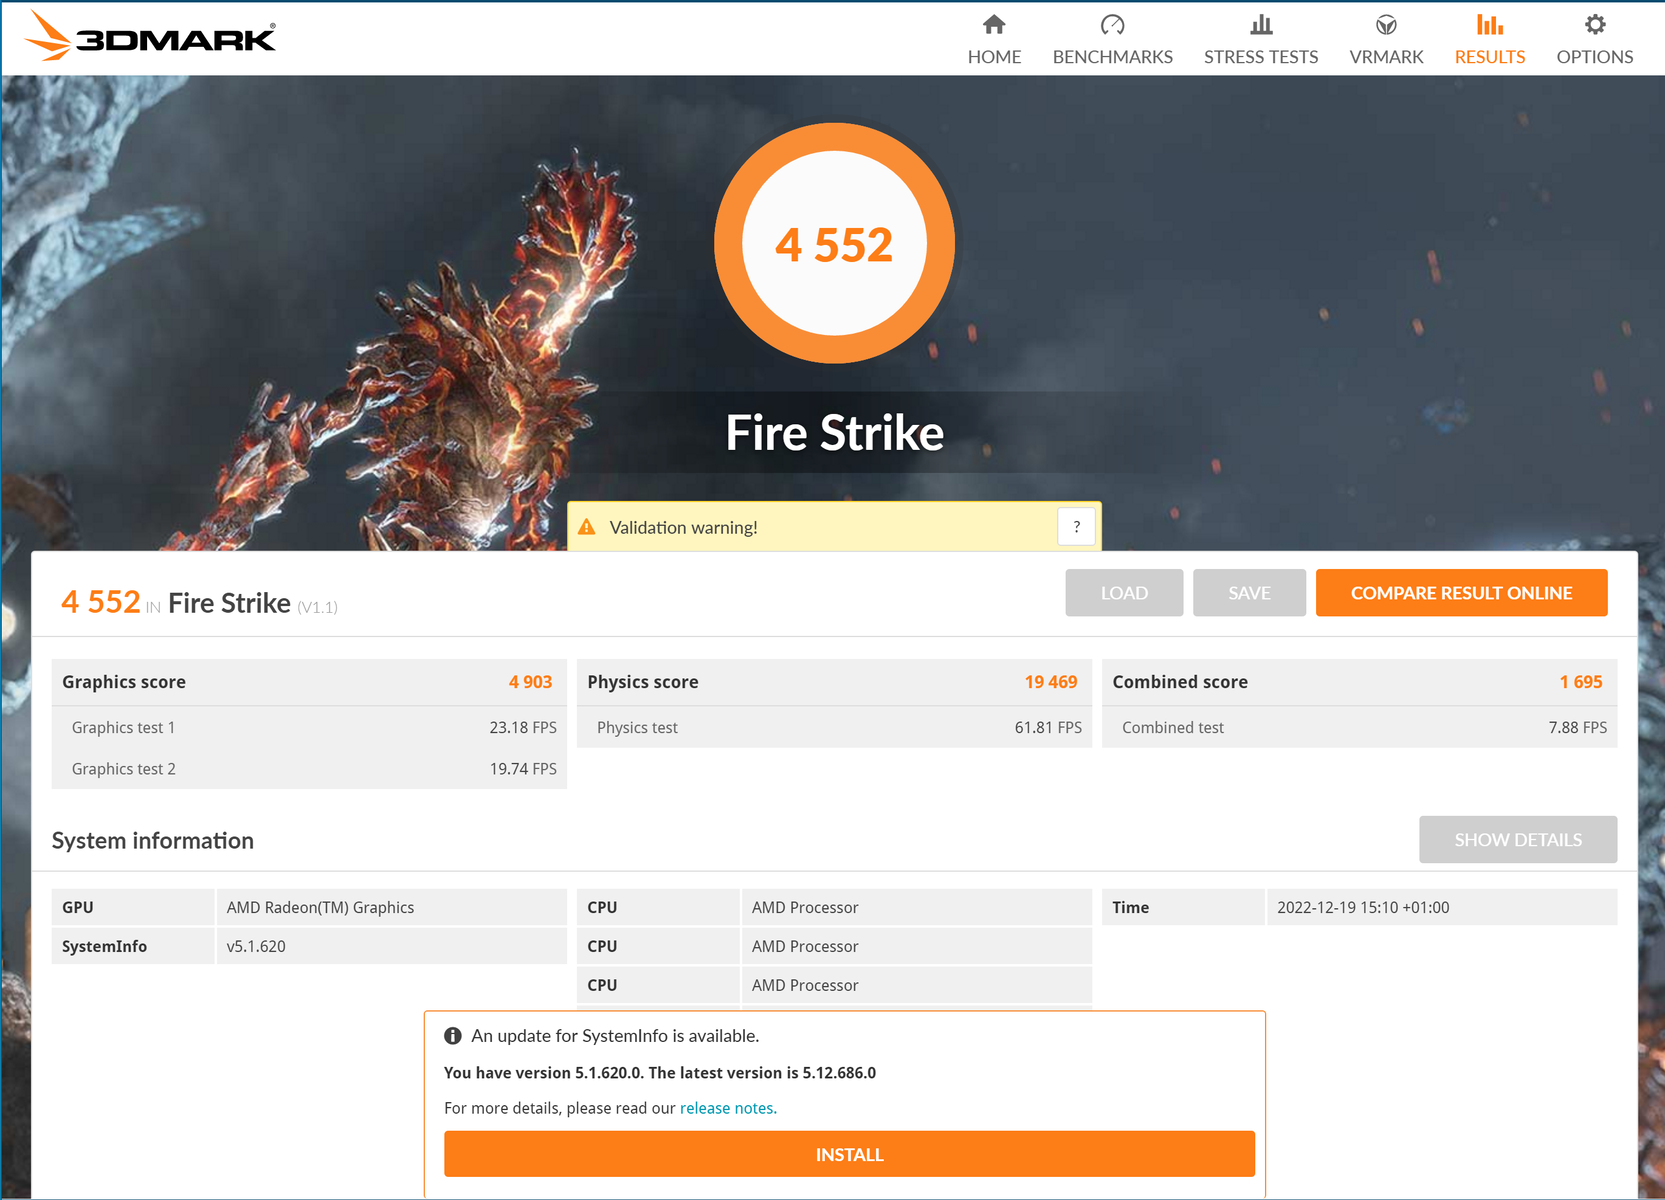

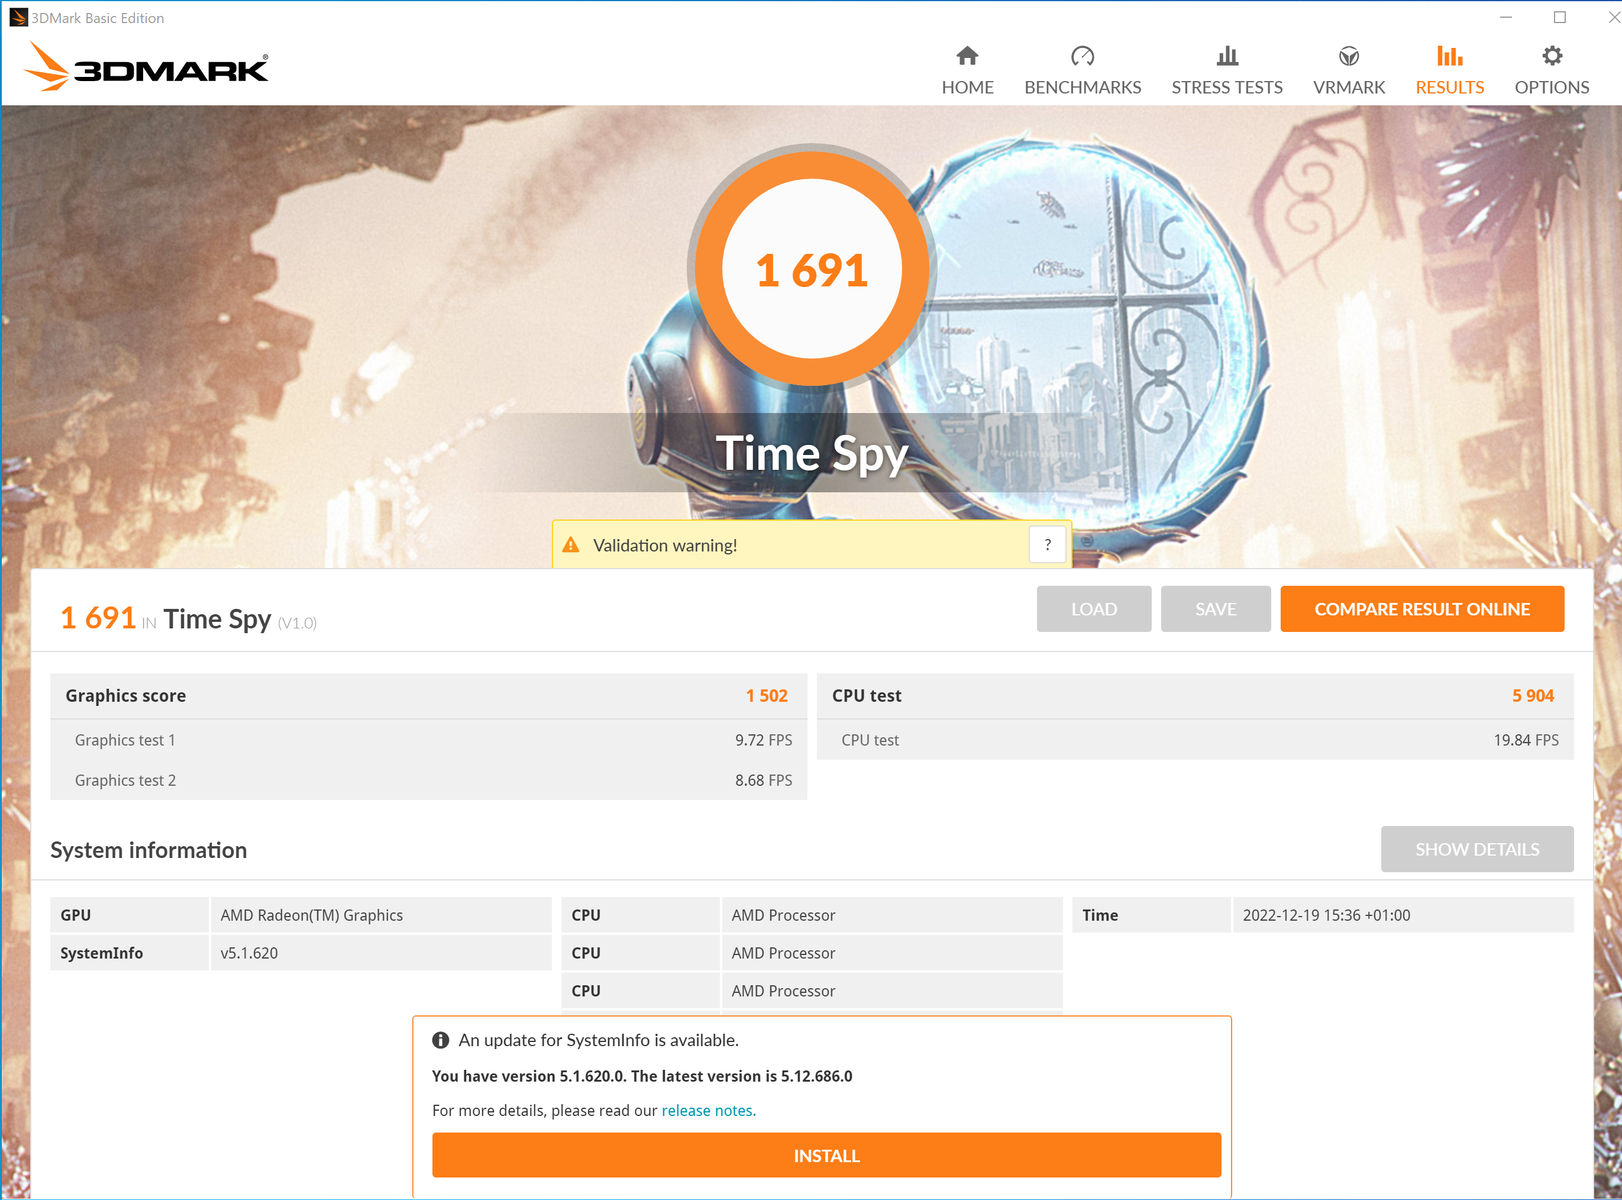

| 3DMark 11 Performance | 7403 points | |
| 3DMark Cloud Gate Standard Score | 24538 points | |
| 3DMark Fire Strike Score | 4552 points | |
| 3DMark Time Spy Score | 1691 points | |
Help | ||
| Blender | |
| v3.3 Classroom HIP/AMD | |
| Average of class Office (322 - 1215, n=18, last 2 years) | |
| Average AMD Radeon 660M (505 - 755, n=5) | |
| Lenovo ThinkPad T16 G1 21CH004MGE | |
| HP EliteBook 865 G9 | |
| Lenovo ThinkPad T16 G1 21CHCTO1WW | |
| Lenovo ThinkPad T14 G3-21CF004NGE | |
| Lenovo ThinkPad Z16 G1 21D5S00T00 | |
| v3.3 Classroom OPTIX/RTX | |
| Average of class Office (94 - 236, n=4, last 2 years) | |
| HP ZBook Power 15 G9 6B8C4EA | |
| v3.3 Classroom CPU | |
| Average of class Office (343 - 3786, n=108, last 2 years) | |
| Lenovo ThinkPad T16 G1 21BWS00200 | |
| Lenovo ThinkPad T16 Gen 1 Core i7-1270P | |
| Average AMD Radeon 660M (323 - 968, n=6) | |
| Lenovo ThinkPad T16 G1 21CH004MGE | |
| Lenovo ThinkPad Z16 G1 21D5S00T00 | |
| Lenovo ThinkPad T14 G3-21CF004NGE | |
| HP EliteBook 865 G9 | |
| Lenovo ThinkPad T16 G1 21CHCTO1WW | |
| HP ZBook Power 15 G9 6B8C4EA | |
* ... smaller is better
The Witcher 3 FPS Chart
| low | med. | high | ultra | |
| GTA V (2015) | 132.5 | 120 | 40.7 | 18 |
| The Witcher 3 (2015) | 90.5 | 52.5 | 27.1 | 17.9 |
| Dota 2 Reborn (2015) | 109.3 | 99.3 | 61 | 52.9 |
| Final Fantasy XV Benchmark (2018) | 51.6 | 24.3 | 17.4 | |
| X-Plane 11.11 (2018) | 49.1 | 33.7 | 29.3 | |
| Far Cry 5 (2018) | 61 | 31 | 26 | 25 |
| Strange Brigade (2018) | 120.7 | 44.5 | 35.3 | 29.7 |
| Shadow of the Tomb Raider (2018) | 77 | 29 | 27 | 23 |
| God of War (2022) | 23.9 | 18.9 | 16.1 | 10.8 |
Emissions: Most of the time ThinkPad T16 AMD remains silent
Noise Levels
During idle operation and while performing simple tasks such as web surfing, starting applications, and office work, the fan remains mostly turned off or barely audible. Only under constant or combined load (games), the fan revs up after several minutes. Although it then won't be quiet anymore at a maximum of 39 dB(A), it produces a comfortable low sound frequency.
On the other hand, our second ThinkPad T16 AMD test unit has a very high-frequency fan, which is also mentioned by other users of the T16/T14 and P16s/P14s.
Noise Level
| Idle |
| 23.1 / 23.1 / 23.1 dB(A) |
| Load |
| 25.4 / 39.1 dB(A) |
 | ||
30 dB silent 40 dB(A) audible 50 dB(A) loud |
||
min: | ||
| Lenovo ThinkPad T16 G1 21CH004MGE Radeon 660M, R5 PRO 6650U, Micron 2450 512GB MTFDKBA512TFK | Lenovo ThinkPad T16 G1 21BWS00200 Iris Xe G7 80EUs, i5-1240P, Samsung PM9A1 MZVL2512HCJQ | HP EliteBook 865 G9 Radeon 680M, R7 PRO 6850U, Samsung PM991 MZVLQ512HBLU | Lenovo ThinkPad Z16 G1 21D5S00T00 Radeon RX 6500M, R7 PRO 6850H, Samsung PM9A1 MZVL21T0HCLR | Lenovo ThinkPad T14 G3-21CF004NGE Radeon 680M, R7 PRO 6850U, Kioxia BG5 KBG5AZNV512G | Lenovo ThinkPad P15v G2 21A9000XGE T1200 Laptop GPU, i7-11800H, Toshiba XG6 KXG6AZNV512G | HP ZBook Power 15 G9 6B8C4EA RTX A2000 Laptop GPU, i7-12700H, Samsung PM9A1 MZVL21T0HCLR | |
|---|---|---|---|---|---|---|---|
| Noise | 3% | 3% | -9% | -7% | -15% | -18% | |
| off / environment * | 23.1 | 23.3 -1% | 23 -0% | 23.7 -3% | 24.2 -5% | 25.21 -9% | 23.8 -3% |
| Idle Minimum * | 23.1 | 23.3 -1% | 23 -0% | 23.7 -3% | 24.2 -5% | 25.21 -9% | 23.8 -3% |
| Idle Average * | 23.1 | 23.3 -1% | 23 -0% | 23.7 -3% | 24.2 -5% | 25.21 -9% | 23.8 -3% |
| Idle Maximum * | 23.1 | 23.3 -1% | 23 -0% | 23.7 -3% | 25.8 -12% | 25.21 -9% | 23.8 -3% |
| Load Average * | 25.4 | 25.1 1% | 29.1 -15% | 25.9 -2% | 32.2 -27% | 39.09 -54% | 42.9 -69% |
| Witcher 3 ultra * | 35.93 | 32.1 11% | 29.1 19% | 46.9 -31% | 34.1 5% | 36.6 -2% | 44.5 -24% |
| Load Maximum * | 39.1 | 34 13% | 32.9 16% | 46.9 -20% | 38.8 1% | 43.53 -11% | 47.9 -23% |
* ... smaller is better
Temperatures
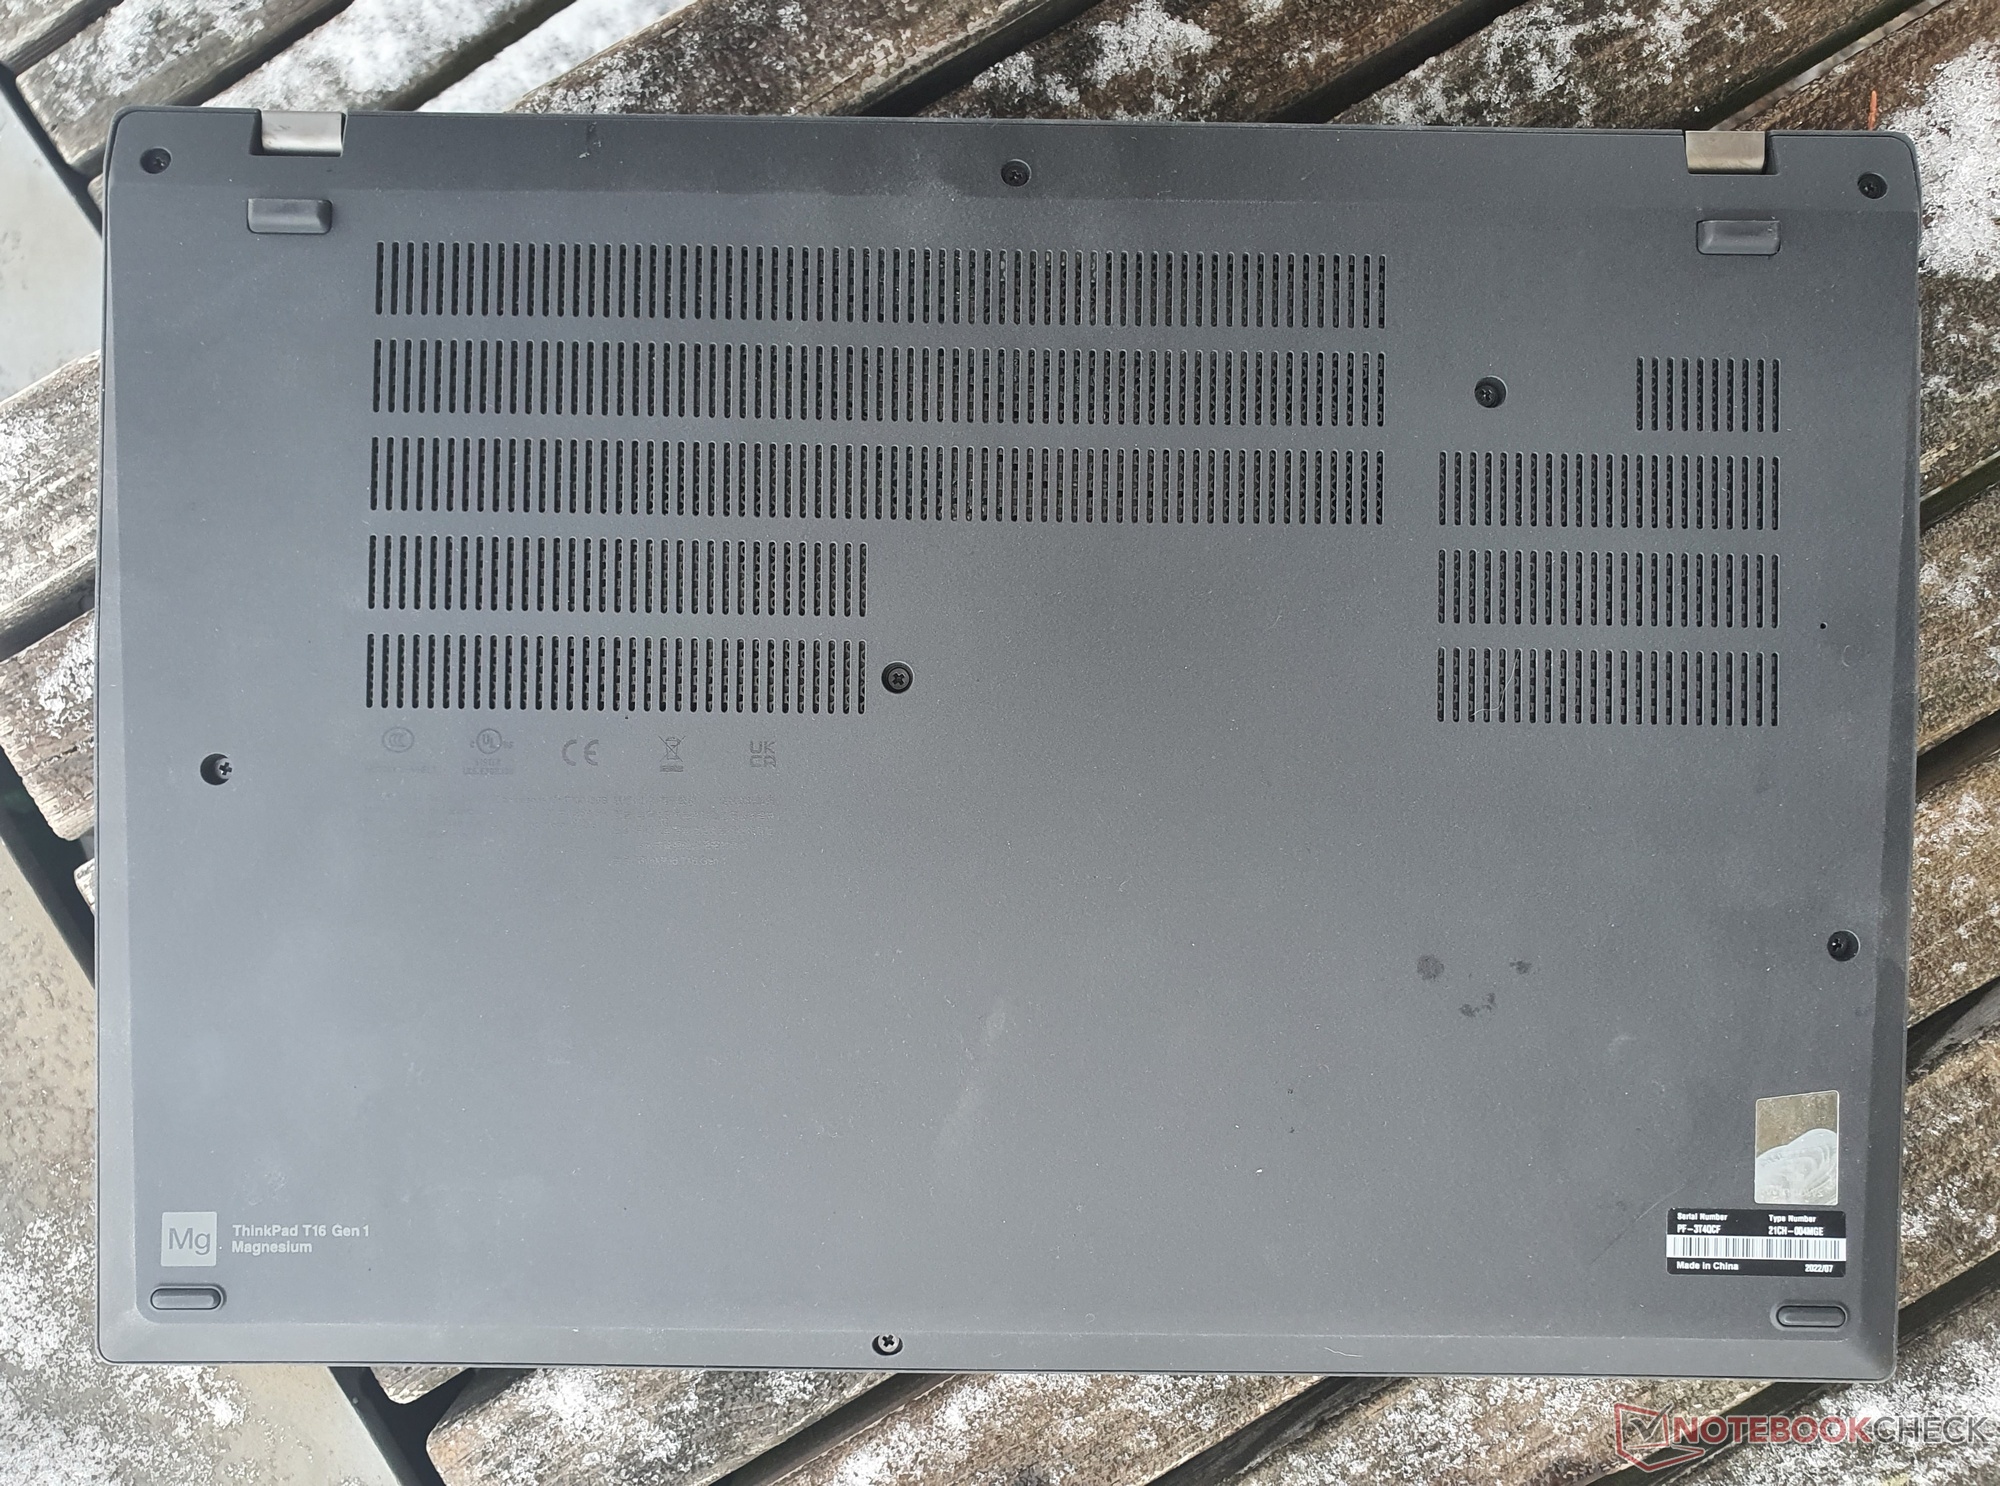
At all times, the temperatures of the Lenovo ThinkPad T16 G1 AMD remain extraordinarily low. During the highest load, we measure a maximum of 41.5 °C (106.7 °F) in one area at the case bottom. At 34.6 °C (94.3°F) during the load scenario, the top of the case remains significantly cooler than that of the Intel model with 45 °C (113 °F).
(+) The maximum temperature on the upper side is 34.6 °C / 94 F, compared to the average of 34.2 °C / 94 F, ranging from 21.2 to 62.5 °C for the class Office.
(±) The bottom heats up to a maximum of 41.5 °C / 107 F, compared to the average of 36.7 °C / 98 F
(+) In idle usage, the average temperature for the upper side is 21.9 °C / 71 F, compared to the device average of 29.5 °C / 85 F.
(+) Playing The Witcher 3, the average temperature for the upper side is 29.6 °C / 85 F, compared to the device average of 29.5 °C / 85 F.
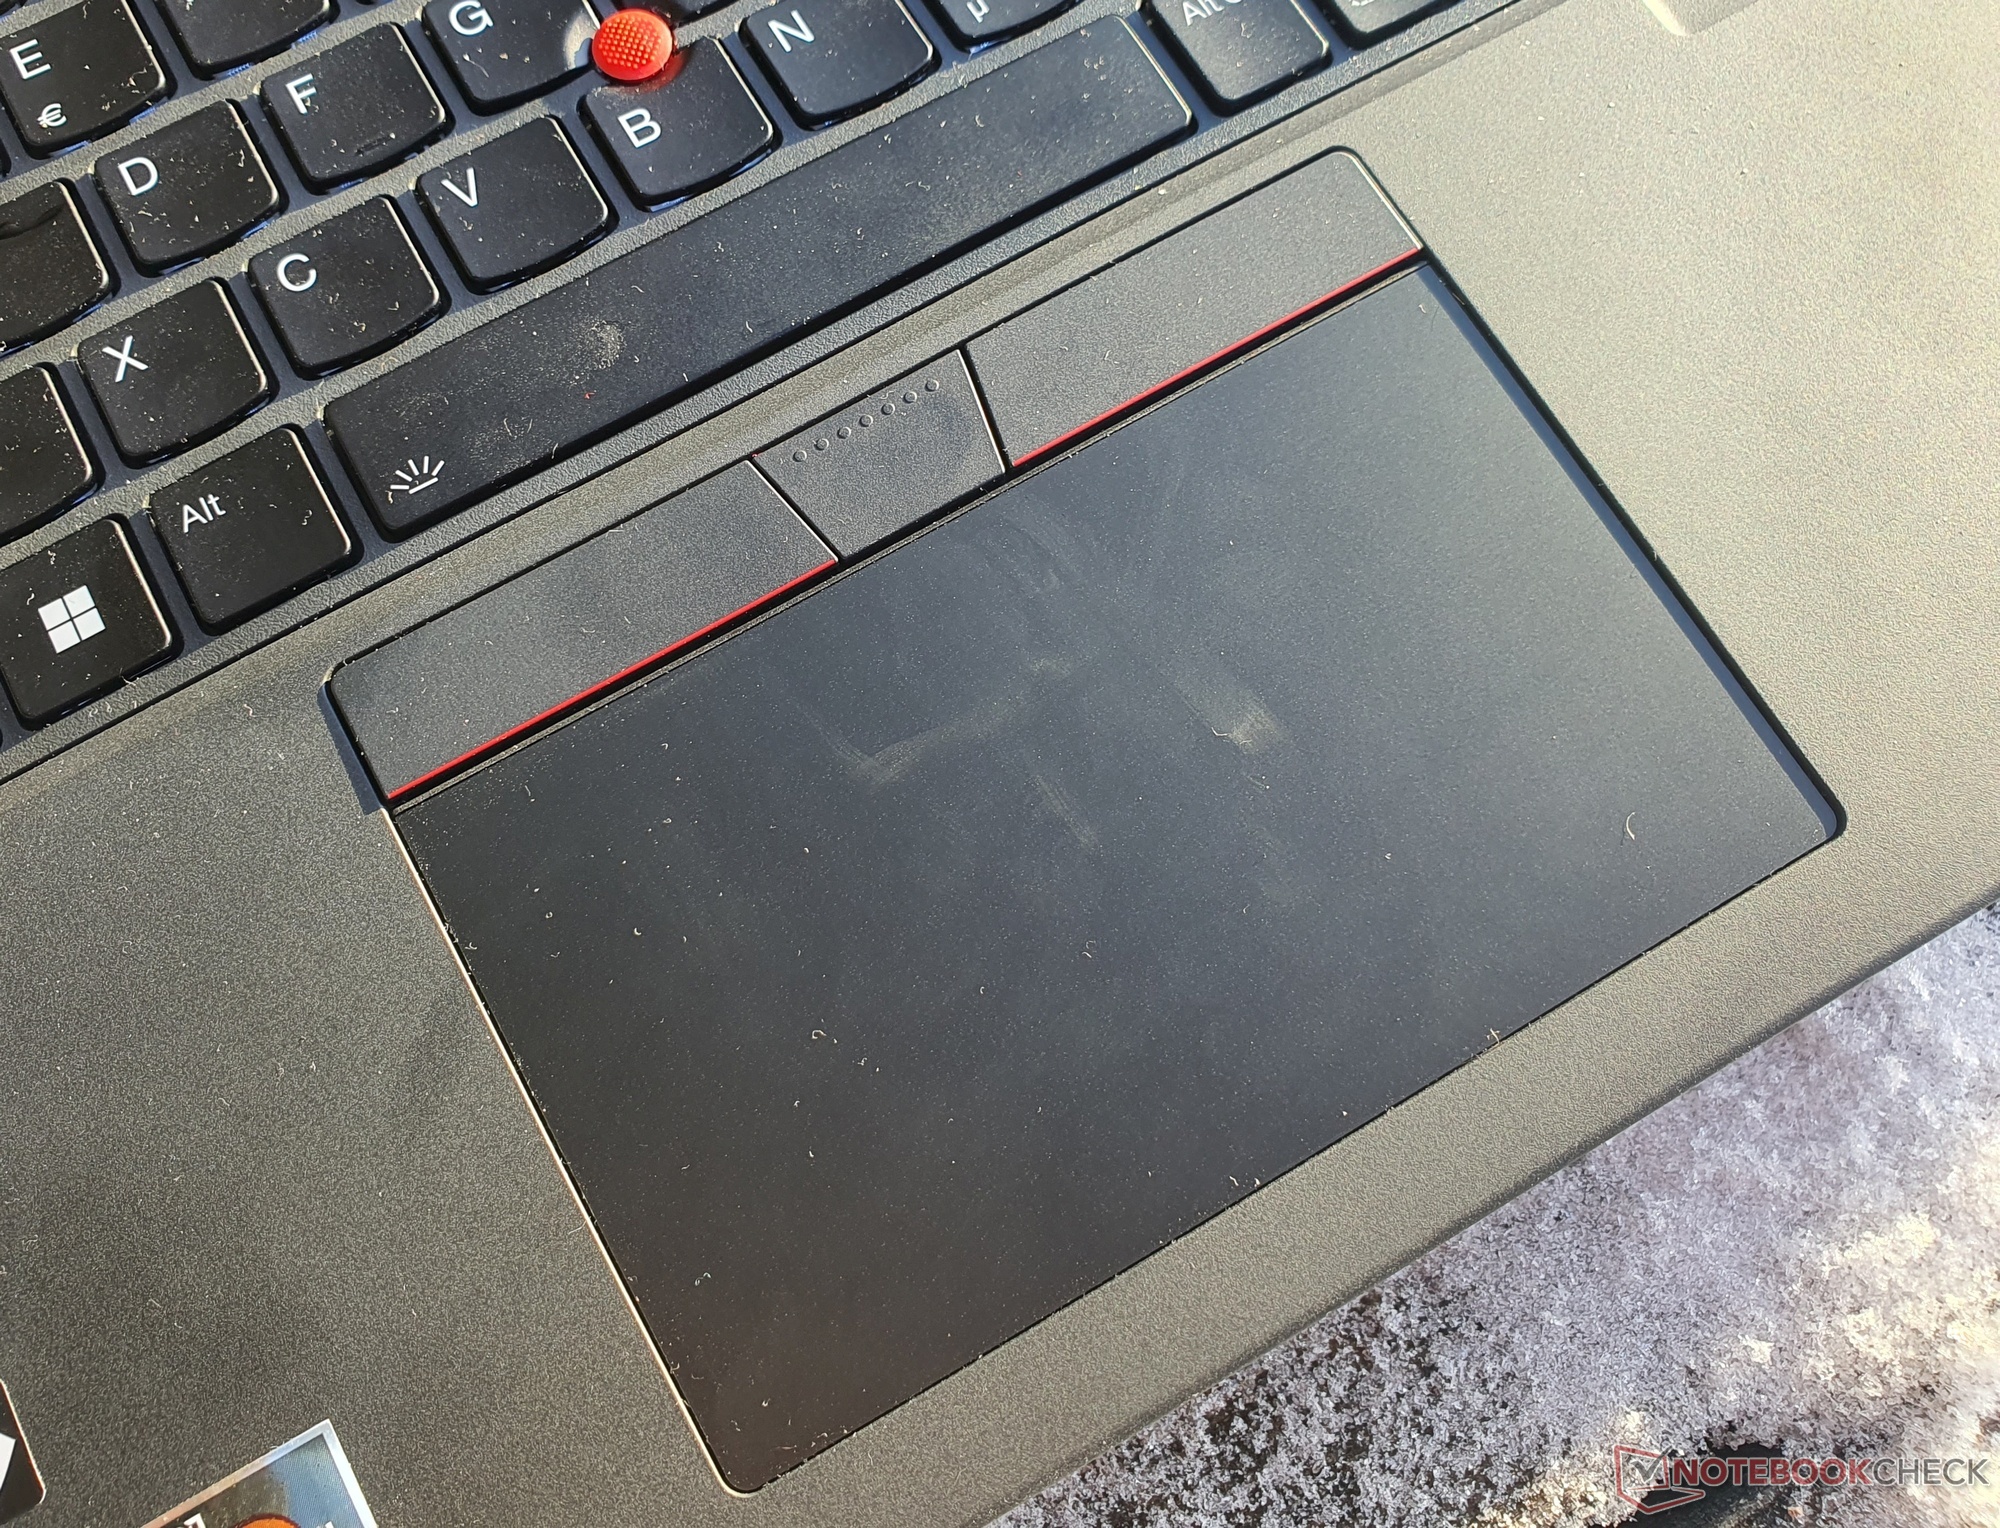
(+) The palmrests and touchpad are cooler than skin temperature with a maximum of 29 °C / 84.2 F and are therefore cool to the touch.
(±) The average temperature of the palmrest area of similar devices was 27.7 °C / 81.9 F (-1.3 °C / -2.3 F).
| Lenovo ThinkPad T16 G1 21CH004MGE AMD Ryzen 5 PRO 6650U, AMD Radeon 660M | Lenovo ThinkPad T16 G1 21BWS00200 Intel Core i5-1240P, Intel Iris Xe Graphics G7 80EUs | HP EliteBook 865 G9 AMD Ryzen 7 PRO 6850U, AMD Radeon 680M | Lenovo ThinkPad Z16 G1 21D5S00T00 AMD Ryzen 7 PRO 6850H, AMD Radeon RX 6500M | Lenovo ThinkPad T14 G3-21CF004NGE AMD Ryzen 7 PRO 6850U, AMD Radeon 680M | Lenovo ThinkPad P15v G2 21A9000XGE Intel Core i7-11800H, NVIDIA T1200 Laptop GPU | HP ZBook Power 15 G9 6B8C4EA Intel Core i7-12700H, NVIDIA RTX A2000 Laptop GPU | |
|---|---|---|---|---|---|---|---|
| Heat | -29% | -8% | -34% | -19% | -29% | -9% | |
| Maximum Upper Side * | 34.6 | 45 -30% | 39.4 -14% | 56.8 -64% | 48.2 -39% | 53.8 -55% | 40.3 -16% |
| Maximum Bottom * | 41.5 | 42.8 -3% | 47.6 -15% | 53.3 -28% | 52.8 -27% | 52.1 -26% | 48.3 -16% |
| Idle Upper Side * | 22.6 | 33 -46% | 23.6 -4% | 28.2 -25% | 24.4 -8% | 27.6 -22% | 23.7 -5% |
| Idle Bottom * | 24.5 | 33.6 -37% | 24.1 2% | 29.4 -20% | 24.5 -0% | 27.7 -13% | 23.8 3% |
* ... smaller is better
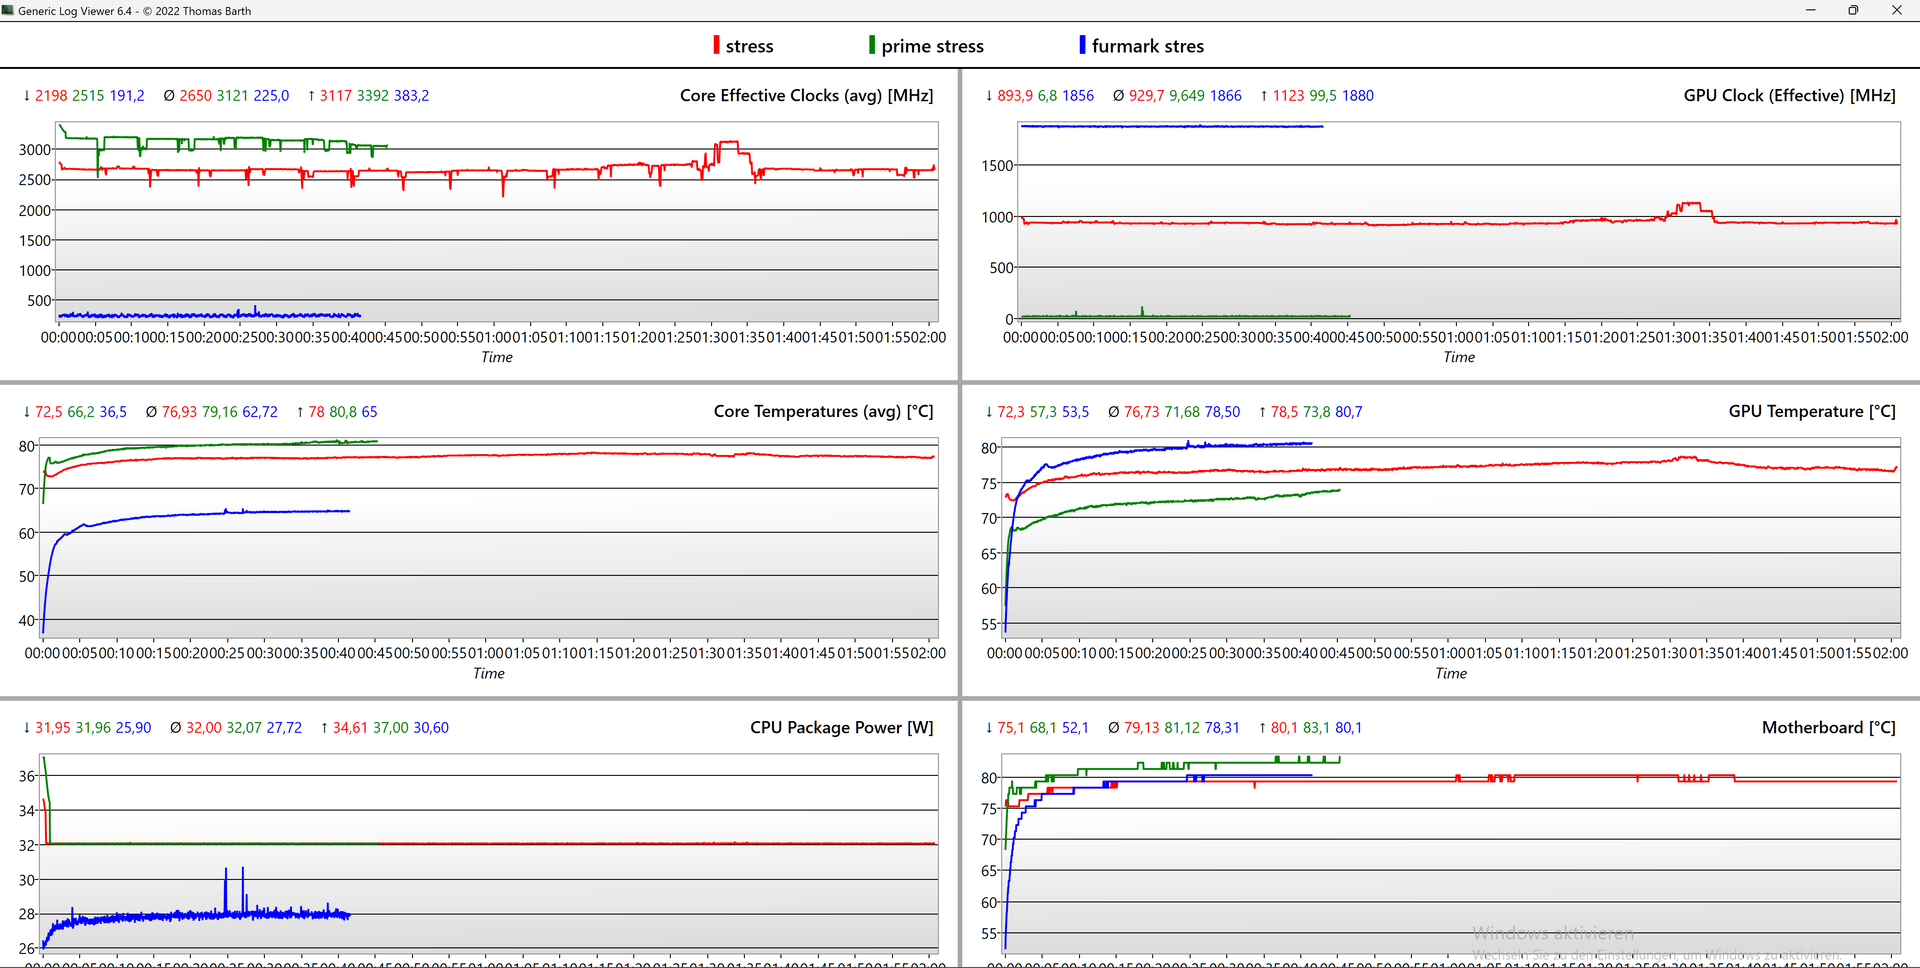
Stress Test
At 2.65 GHz under combined load (Prime95 + FurMark), the CPU speed drops slightly below the basic clock speed of 2.9 GHz, with the core temperatures only reaching 77 °C (171 °F). At that time, the iGPU only runs at about half of its maximum speed, reaching a temperature of 79 °C (174 °F).
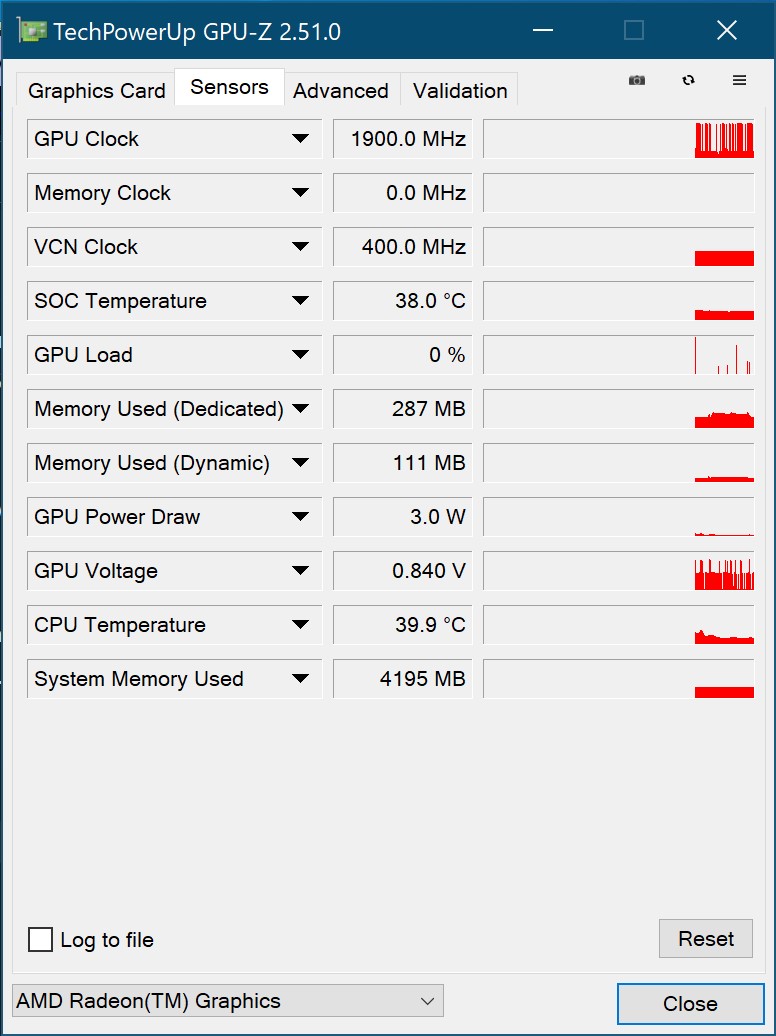
During pure CPU stress, the basic clock speed is surpassed by 200 MHz, and during pure GPU stress, the Radeon iGPU runs at its full speed of ~1,900 MHz.
| CPU Clock (GHz) | GPU Clock (MHz) | Average CPU Temperature (°C) | Average GPU Temperature (°C) | |
| System Idle | 0.15 | 18 | 35 | 35 |
| Prime95 + FurMark Stress | 2.65 | 930 | 77 | 77 |
| Prime95 Stress | 3.12 | 10 | 79 | 72 |
| FurMark-Stress | 0.23 | 1.866 | 63 | 79 |
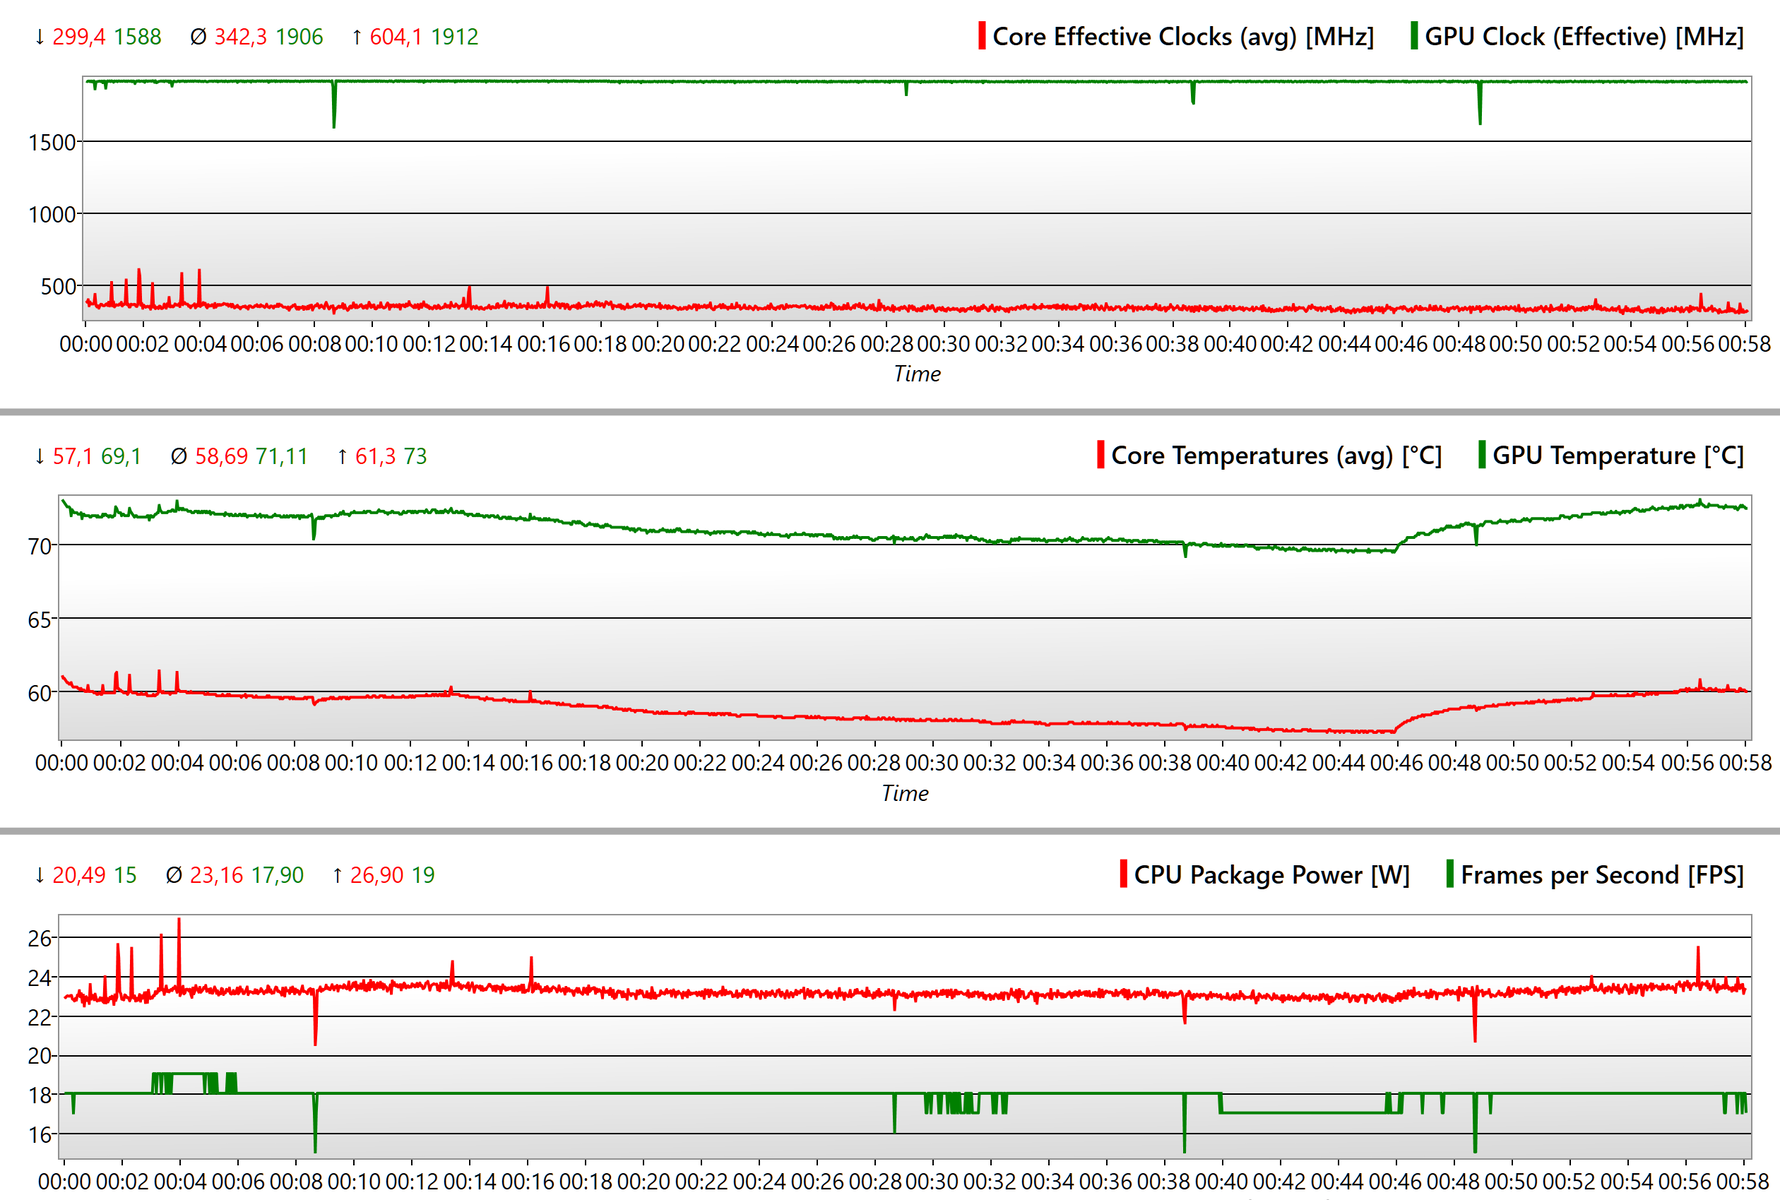
| The Witcher 3 Stress | 0.34 | 1.906 | 59 | 71 |
Speakers
The upward-pointing stereo speakers of the 16-inch ThinkPad are average overall. They lack bass, and the high frequencies are too high. You also cannot expect a high volume.
Lenovo ThinkPad T16 G1 21CH004MGE audio analysis
(-) | not very loud speakers (71.8 dB)
Bass 100 - 315 Hz
(-) | nearly no bass - on average 18.5% lower than median
(±) | linearity of bass is average (12.3% delta to prev. frequency)
Mids 400 - 2000 Hz
(+) | balanced mids - only 4.5% away from median
(±) | linearity of mids is average (7.8% delta to prev. frequency)
Highs 2 - 16 kHz
(±) | higher highs - on average 5.3% higher than median
(±) | linearity of highs is average (7.5% delta to prev. frequency)
Overall 100 - 16.000 Hz
(±) | linearity of overall sound is average (22.5% difference to median)
Compared to same class
» 55% of all tested devices in this class were better, 9% similar, 35% worse
» The best had a delta of 7%, average was 22%, worst was 53%
Compared to all devices tested
» 61% of all tested devices were better, 6% similar, 33% worse
» The best had a delta of 4%, average was 25%, worst was 134%
HP EliteBook 865 G9 audio analysis
(+) | speakers can play relatively loud (82.5 dB)
Bass 100 - 315 Hz
(-) | nearly no bass - on average 19.6% lower than median
(±) | linearity of bass is average (10.9% delta to prev. frequency)
Mids 400 - 2000 Hz
(+) | balanced mids - only 1.2% away from median
(+) | mids are linear (2.2% delta to prev. frequency)
Highs 2 - 16 kHz
(+) | balanced highs - only 3.5% away from median
(+) | highs are linear (4% delta to prev. frequency)
Overall 100 - 16.000 Hz
(+) | overall sound is linear (13.8% difference to median)
Compared to same class
» 5% of all tested devices in this class were better, 4% similar, 92% worse
» The best had a delta of 7%, average was 22%, worst was 53%
Compared to all devices tested
» 12% of all tested devices were better, 3% similar, 85% worse
» The best had a delta of 4%, average was 25%, worst was 134%
Power Management: T16 with a long battery life despite the small battery
Power Consumption
During idle operation and under load, the power consumption of the ThinkPad T16 AMD remains below that of the Intel model and the ThinkPad T14 G3 AMD with the same mainboard.
The reasons for this can be found in the higher-resolution display without low-power characteristics and the higher CPU performance limits. Since the short-time Turbo of the AMD CPU turns out significantly lower, the device consumes a maximum of only 59 watts, which means that the 65-Watt charger is sufficient.
| Off / Standby | |
| Idle | |
| Load |
|
| Lenovo ThinkPad T16 G1 21CH004MGE R5 PRO 6650U, Radeon 660M, Micron 2450 512GB MTFDKBA512TFK, IPS-LED, 2560x1600, 16.00 | Lenovo ThinkPad T16 G1 21BWS00200 i5-1240P, Iris Xe G7 80EUs, Samsung PM9A1 MZVL2512HCJQ, IPS, 1920x1200, 16.00 | Lenovo ThinkPad T14 G3-21CF004NGE R7 PRO 6850U, Radeon 680M, Kioxia BG5 KBG5AZNV512G, IPS, 1920x1200, 14.00 | HP EliteBook 865 G9 R7 PRO 6850U, Radeon 680M, Samsung PM991 MZVLQ512HBLU, IPS, 1920x1200, 16.00 | Lenovo ThinkPad Z16 G1 21D5S00T00 R7 PRO 6850H, Radeon RX 6500M, Samsung PM9A1 MZVL21T0HCLR, IPS LED, 1920x1200, 16.00 | Lenovo ThinkPad P15v G2 21A9000XGE i7-11800H, T1200 Laptop GPU, Toshiba XG6 KXG6AZNV512G, IPS LED, 1920x1080, 15.60 | HP ZBook Power 15 G9 6B8C4EA i7-12700H, RTX A2000 Laptop GPU, Samsung PM9A1 MZVL21T0HCLR, IPS, 3840x2160, 15.60 | Average AMD Radeon 660M | Average of class Office | |
|---|---|---|---|---|---|---|---|---|---|
| Power Consumption | 9% | 19% | -35% | -64% | -77% | -59% | -3% | -4% | |
| Idle Minimum * | 3.2 | 2.9 9% | 2.4 25% | 5.3 -66% | 5.3 -66% | 5.96 -86% | 3.9 -22% | 3.97 ? -24% | 4.29 ? -34% |
| Idle Average * | 8.1 | 6 26% | 5.3 35% | 12.8 -58% | 8.6 -6% | 8.37 -3% | 7.2 11% | 6.43 ? 21% | 7.33 ? 10% |
| Idle Maximum * | 8.6 | 6.9 20% | 5.6 35% | 14.1 -64% | 9.5 -10% | 9.05 -5% | 8.5 1% | 8.43 ? 2% | 9.15 ? -6% |
| Load Average * | 45.4 | 27.3 40% | 39.7 13% | 48.5 -7% | 65.2 -44% | 91.82 -102% | 87.2 -92% | 48.1 ? -6% | 41.1 ? 9% |
| Witcher 3 ultra * | 40 | 42.6 -7% | 42.8 -7% | 48.7 -22% | 93.6 -134% | 102 -155% | 86.8 -117% | ||
| Load Maximum * | 59.6 | 81.53 -37% | 50.6 15% | 56.6 5% | 133.81 -125% | 126.38 -112% | 139 -133% | 65.6 ? -10% | 58 ? 3% |
* ... smaller is better
Power Consumption The Witcher 3 / Stress Test
Power Consumption With External Monitor
Battery Life
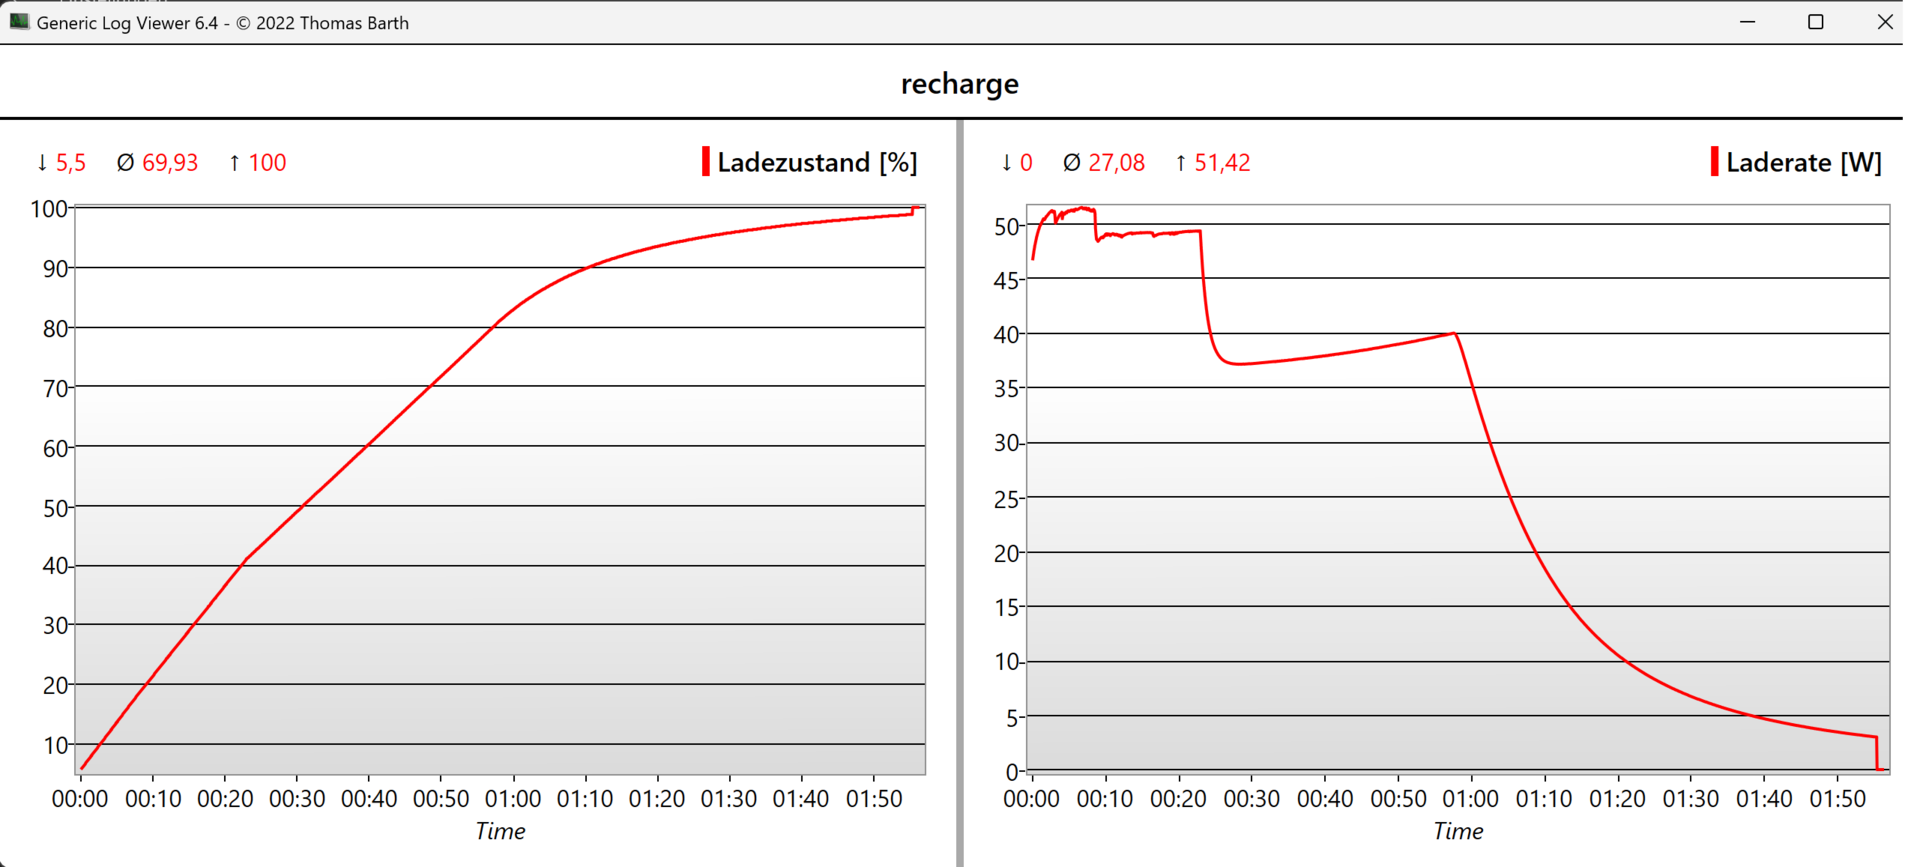
Even though the significantly smaller 52.5-Wh battery is used in our test unit, you can surf for 10:35 hours in the web. The Intel model with the 86-Wh battery and power-saving display reaches 14 hours. For a long batter life, you should therefore get the larger battery and low-power display.
Judging from the ThinkPad T14 G3 AMD with the same mainboard and low-power display, you could calculate a battery life of up to 20 hours for the T16 AMD with this. However, due to the lack of real measurements, we are unable to confirm this.
| Lenovo ThinkPad T16 G1 21CH004MGE R5 PRO 6650U, Radeon 660M, 52.5 Wh | Lenovo ThinkPad T16 G1 21BWS00200 i5-1240P, Iris Xe G7 80EUs, 86 Wh | Lenovo ThinkPad T14 G3-21CF004NGE R7 PRO 6850U, Radeon 680M, 52.5 Wh | HP EliteBook 865 G9 R7 PRO 6850U, Radeon 680M, 76 Wh | Lenovo ThinkPad Z16 G1 21D5S00T00 R7 PRO 6850H, Radeon RX 6500M, 72 Wh | Lenovo ThinkPad P15v G2 21A9000XGE i7-11800H, T1200 Laptop GPU, 68 Wh | HP ZBook Power 15 G9 6B8C4EA i7-12700H, RTX A2000 Laptop GPU, 83 Wh | Lenovo ThinkPad X1 Extreme G5-21DE003RGE i7-12700H, GeForce RTX 3060 Laptop GPU, 90 Wh | |
|---|---|---|---|---|---|---|---|---|
| Battery Runtime | 85% | 31% | 60% | 32% | -24% | -6% | -4% | |
| H.264 | 652 | 623 -4% | 984 51% | 1112 71% | 715 10% | 482 -26% | 435 -33% | |
| WiFi v1.3 | 635 | 846 33% | 772 22% | 899 42% | 594 -6% | 452 -29% | 599 -6% | 399 -37% |
| Load | 64 | 208 225% | 76 19% | 106 66% | 123 92% | 54 -16% | 101 58% |
Pros
Cons
Verdict: The ThinkPad T16 AMD is powerful, cool, and quiet

With an AMD APU, the Lenovo ThinkPad T16 gets even better. Not only do you get a very powerful CPU with higher power limits than in the T16 Intel, but the integrated Radeon GPU is also more convincing than an iGPU from Intel. With this, the business laptop is also prepared for demanding, CPU-heavy tasks.
We recommend choosing the larger battery and low-power display for a maximum battery life. However, those who are looking for a real entry-level workstation should pick the ThinkPad P15v or HP Zbook Power 15 G9. On the other hand, the ThinkPad X1 Extreme G5 and ThinkPad Z16 represent a good compromise between slim and powerful.
In addition to the good equipment, the robust ThinkPad T16 AMD also benefits from being very quiet and cool, having good input devices, and the bright 16-inch display with vibrant colors.
The HP EliteBook 865 G9, whose particular advantages compared to the 1499-Euro T16 AMD are the expandable RAM and USB4, represents a real alternative.
The quality control of the T series from 2022 also doesn't seem to be optimal: Not only did our second test unit suffer from a very high-frequency fan, it also produced clear creaking noises in the area of the palm rest, and the left TrackPoint key often did not get triggered. In addition, the powerful chemical smell is also still present even after one week, and the hinges already got slightly looser. On the other hand, the model we tested more extensively does not show any of these problems that have been frequently mentioned by users.
Price and Availability
Lenovo sells various configurations of the ThinkPad T16 AMD starting from $969.50, and Amazon also offers several versions starting from $990.
Lenovo ThinkPad T16 G1 21CH004MGE
-
01/31/2023 v7
Marvin Gollor
Transparency
The present review sample was made available to the author as a loan by the manufacturer or a shop for the purposes of review. The lender had no influence on this review, nor did the manufacturer receive a copy of this review before publication. There was no obligation to publish this review.
More articles related to this device
Lenovo ThinkPad T16 G1 21CH004MGE (ThinkPad T16 Series)Related Articles


Pricecompare

