 Deutsch
 English
 Español
 Français
 Italiano
 Nederlands
 Polski
 Português
 Русский
 Türkçe
 Svenska
 Chinese
 Magyar
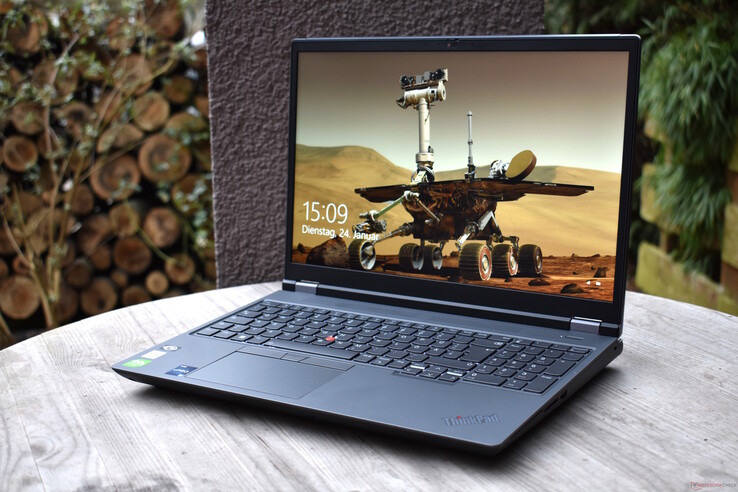
Lenovo ThinkPad P16 G1 laptop review: A powerful, newly-designed HX55 workstation
Since 2015, Lenovo has had two models in the classic, mobile workstation segment where the focus is mainly on performance. Most recently, those models went by the name of the Lenovo ThinkPad P15 Gen 2 and the Lenovo ThinkPad P17 Gen 2. As the name suggests, each device came with a 15-inch and 17-inch display. In 2022, Lenovo decided to end this workstation duality and now they offer one full-fat mobile workstation: the Lenovo ThinkPad P16 Gen 1, which replaces both previous models. In particular, a comparison with its direct competitors from Dell and Asus will show how well it fares with similar devices where mobile performance is a priority.
Possible competitors compared
Rating | Date | Model | Weight | Height | Size | Resolution | Best Price |
|---|---|---|---|---|---|---|---|
| 88.2 % | 02/2023 | Lenovo ThinkPad P16 G1 21D6001DMB i7-12850HX, RTX A2000 Laptop GPU | 3 kg | 30.23 mm | 16.00" | 2560x1600 | |
| 87.2 % | 10/2021 | Lenovo ThinkPad P15 G2-20YQ001JGE i7-11800H, RTX A3000 Laptop GPU | 2.9 kg | 31.5 mm | 15.60" | 1920x1080 | |
| 87.8 % | 10/2021 | Lenovo ThinkPad P17 G2-20YU0025G i7-11800H, RTX A2000 Laptop GPU | 3.6 kg | 28.38 mm | 17.30" | 1920x1080 | |
| 89.7 % | 02/2022 | HP ZBook Fury 17 G8-4A6A9EA i9-11950H, RTX A3000 Laptop GPU | 2.9 kg | 27 mm | 17.30" | 3840x2160 | |
| 88.4 % | 10/2022 | Dell Precision 7670 i7-12850HX, RTX A2000 Laptop GPU | 2.7 kg | 24.7 mm | 16.00" | 3840x2400 | |
| 89.6 % | 01/2023 | Asus ExpertBook B6 Flip B6602FC2 i9-12950HX, RTX A2000 Laptop GPU | 2.8 kg | 27.2 mm | 16.00" | 2560x1600 |
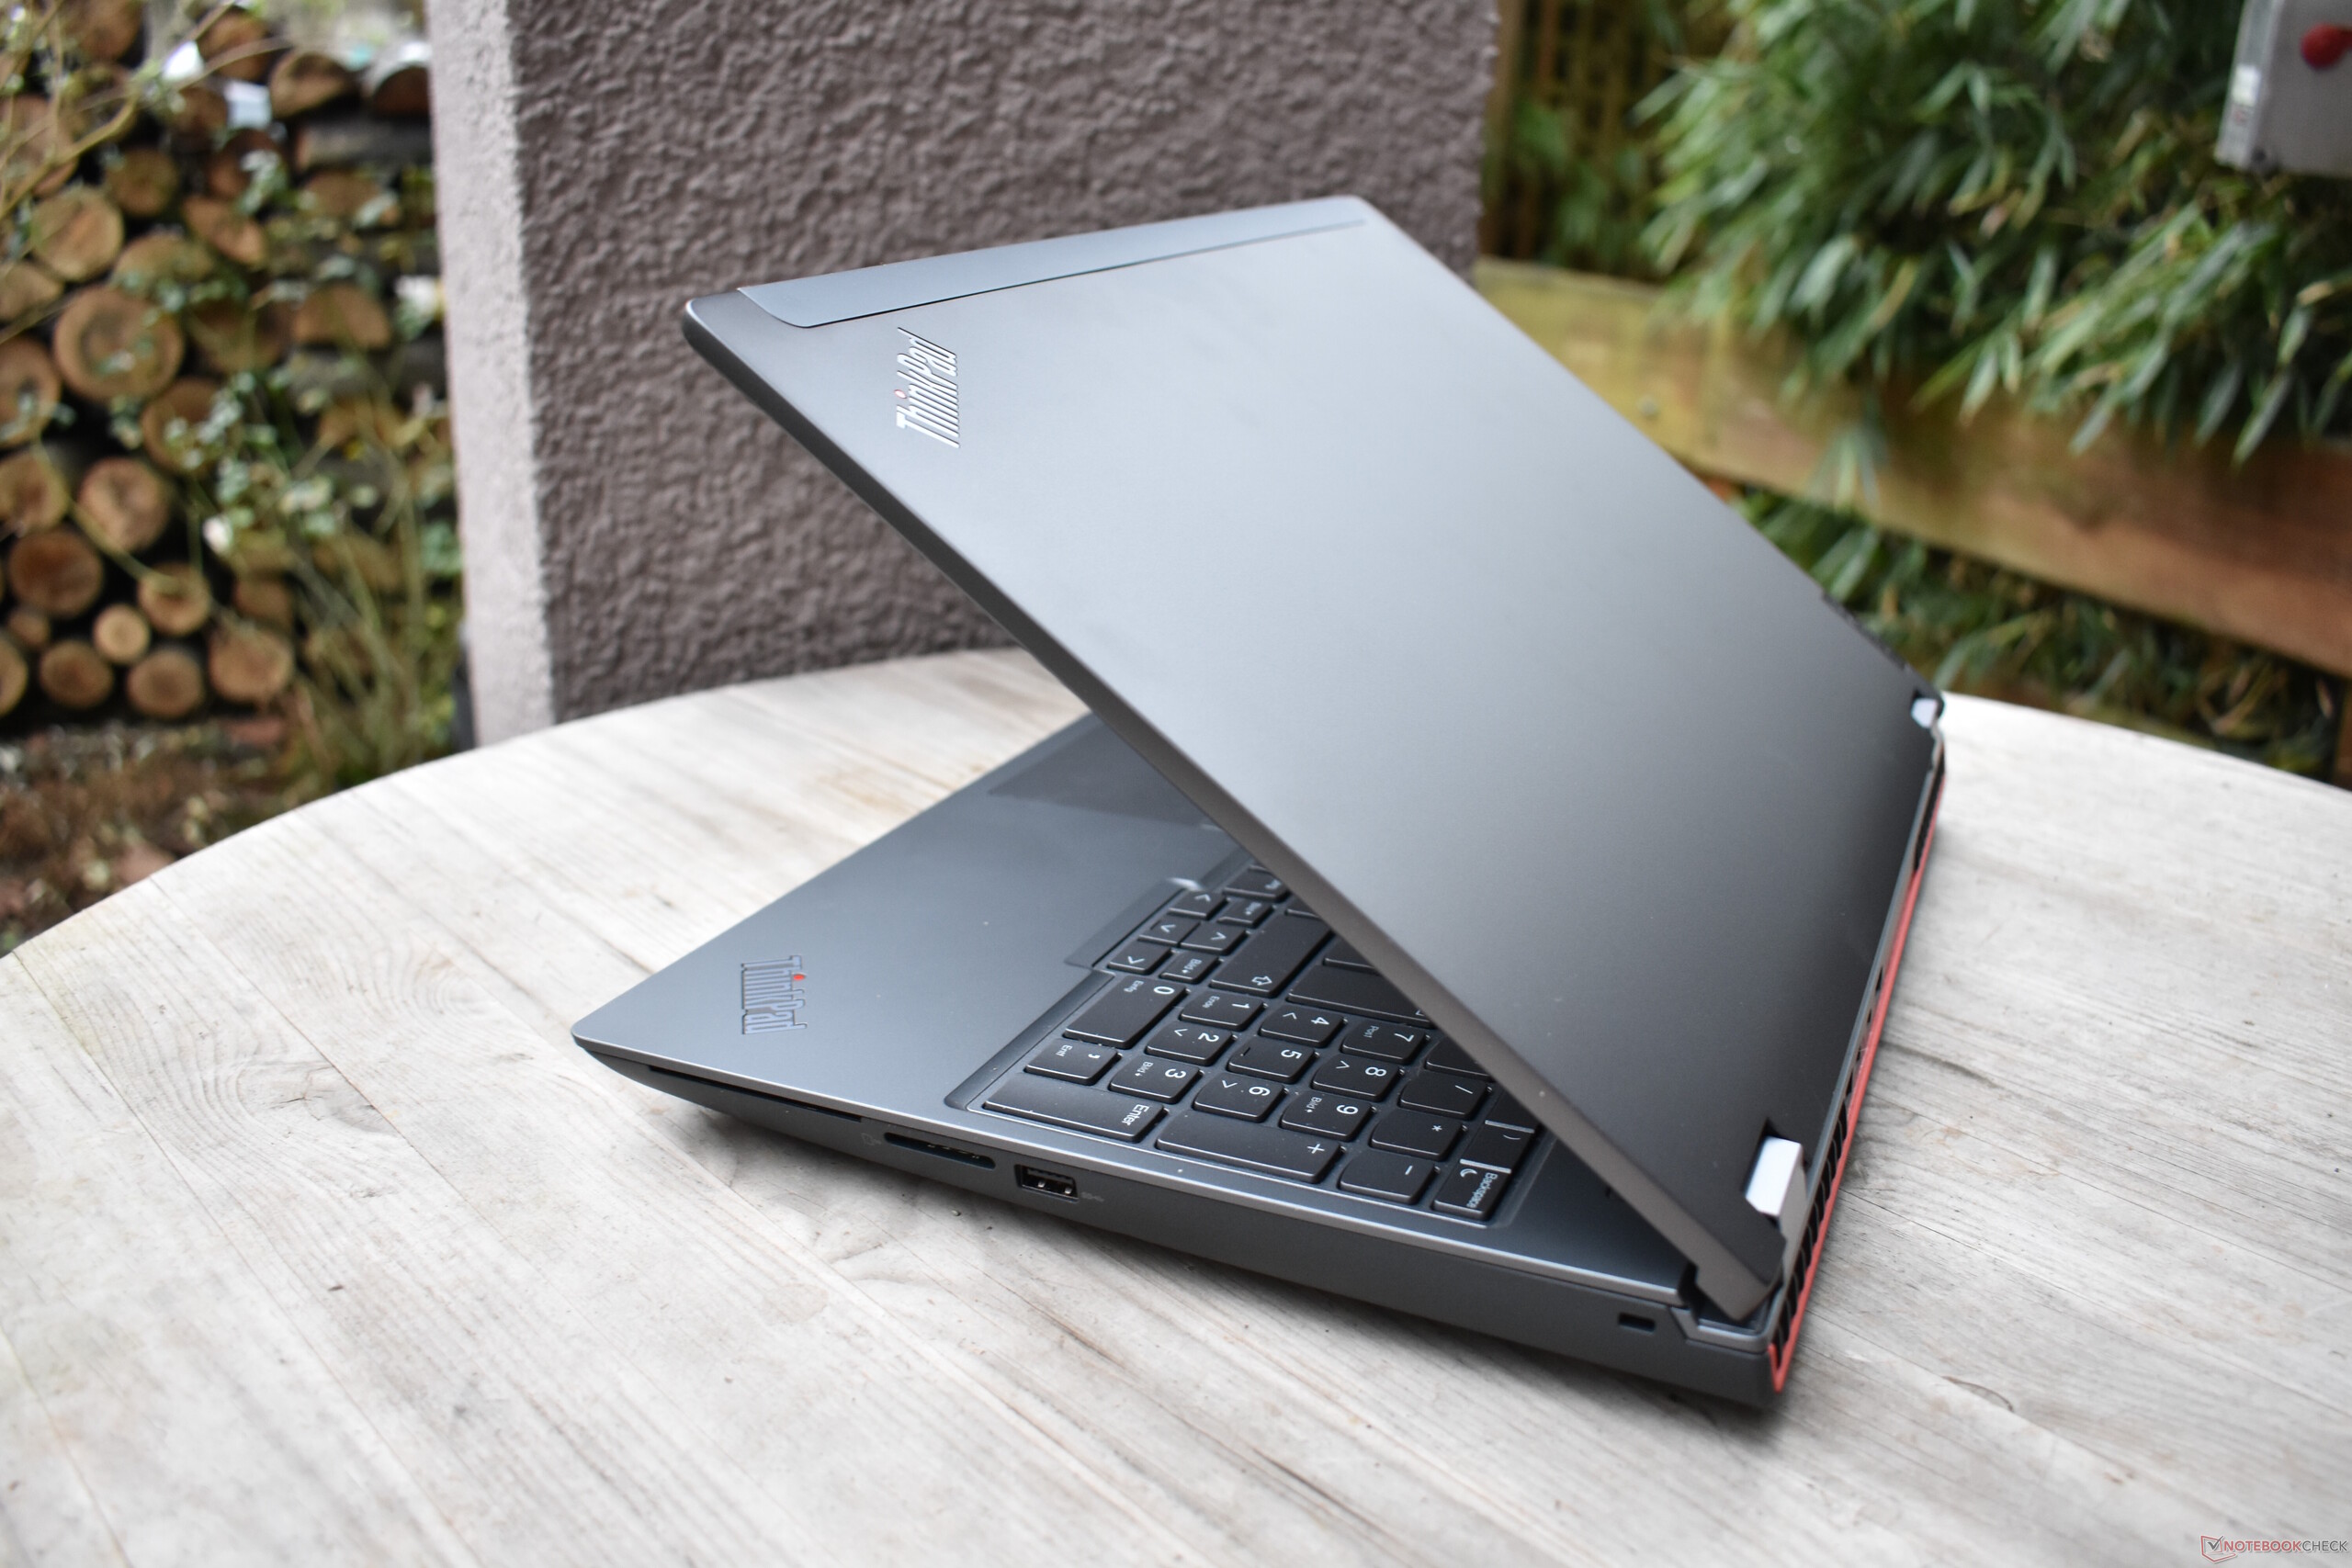
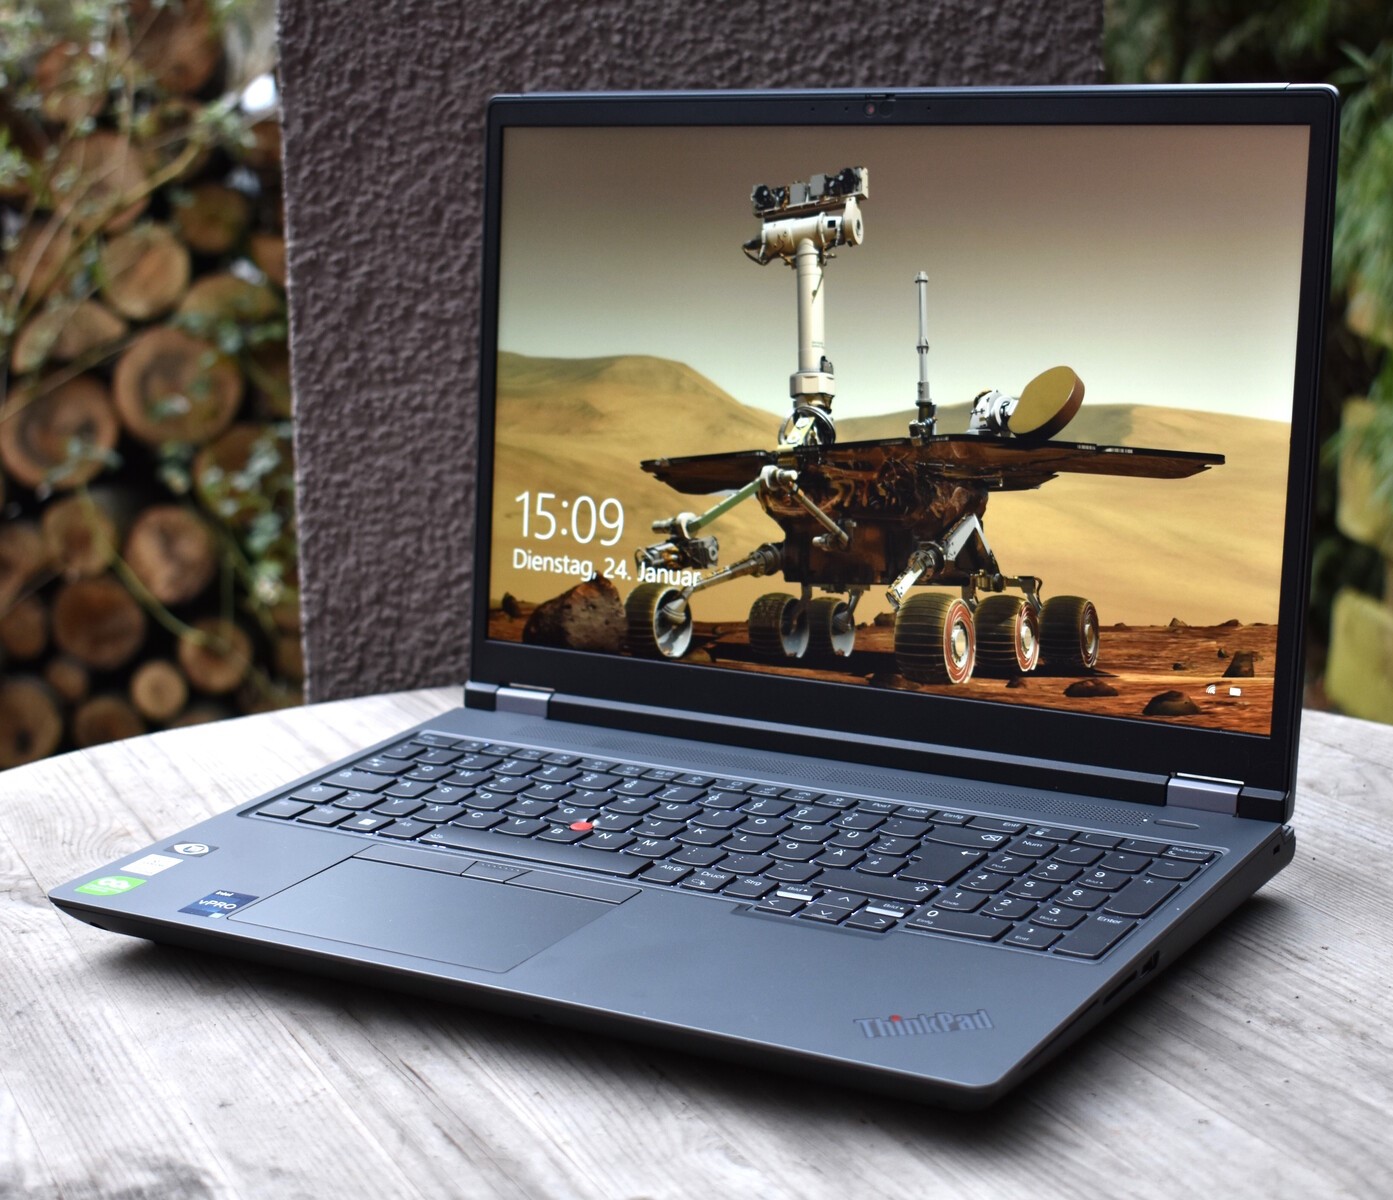
Case: A gray, aluminum lid with a magnesium frame
Since the inception of the ThinkPad P series, the P15 and P17 were the most classic representation of the ThinkPad design. With their boxy, magnesium-framed plastic cases and the classic hinge mechanism on the base, they were the ThinkPad laptops that came closest to models such as the classic Lenovo ThinkPad T60. For ThinkPad fans, certainly, a positive feature but the design could also be regarded as being past its sell-by date - especially concerning the large display bezels.
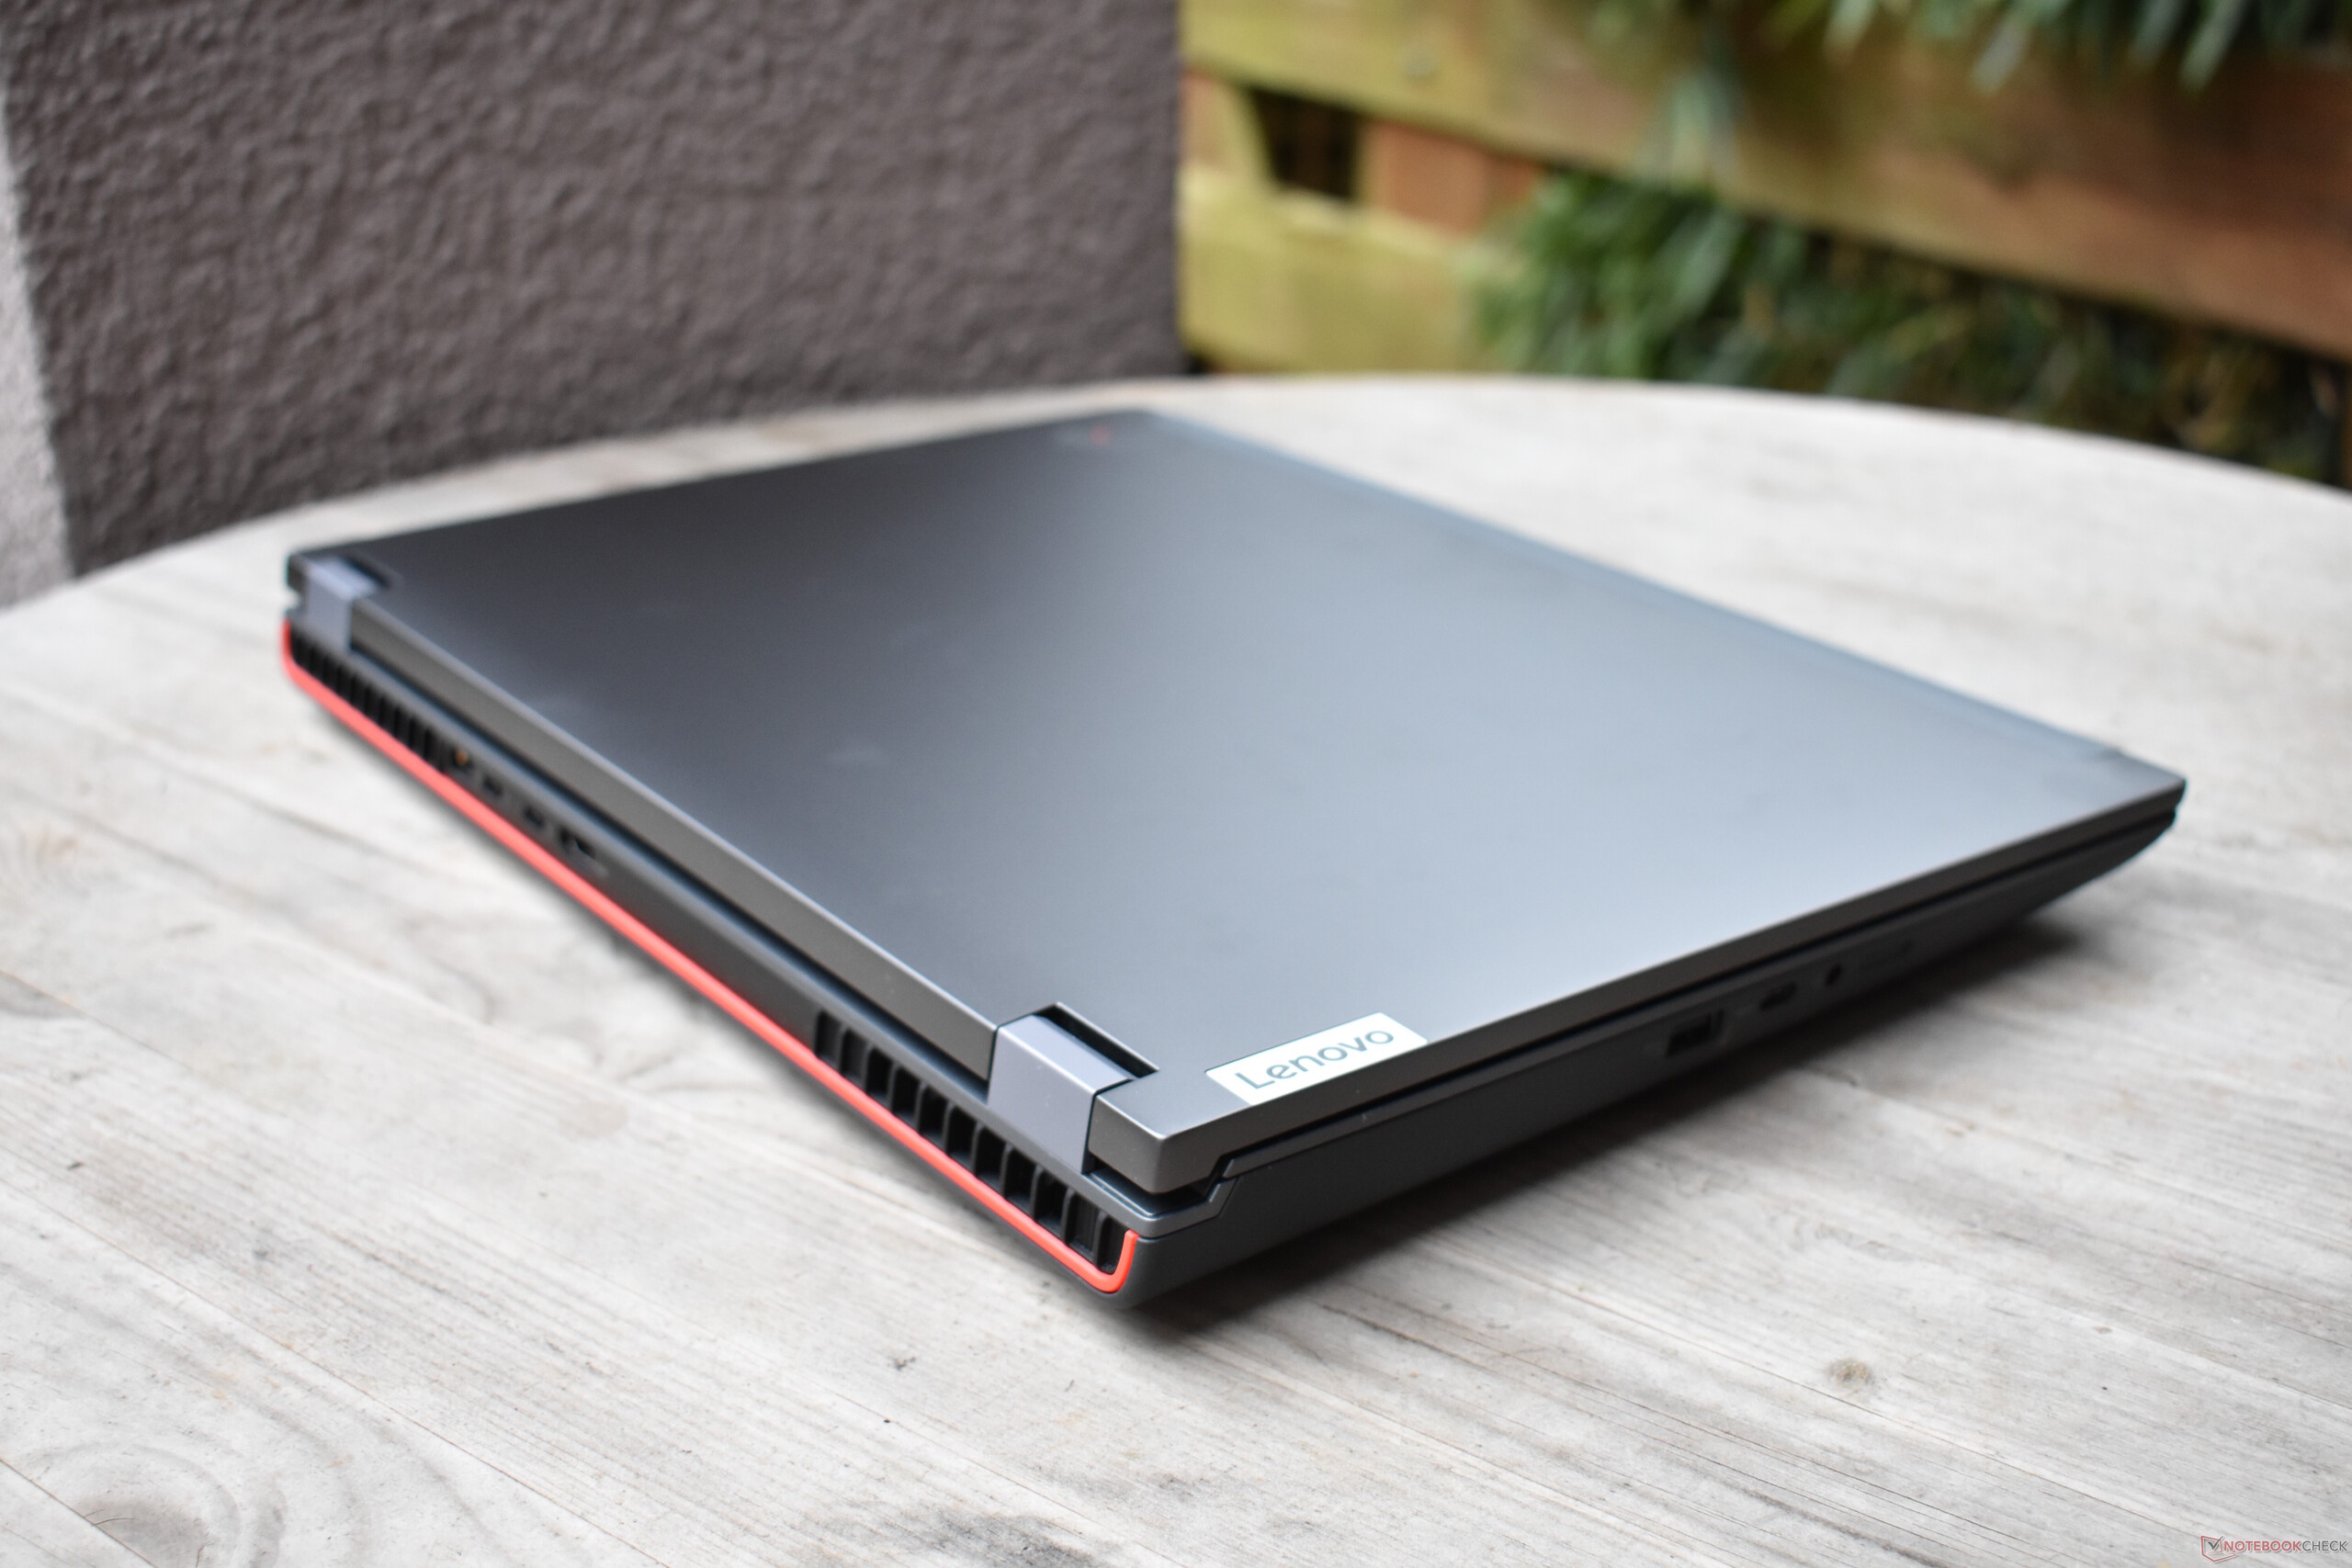
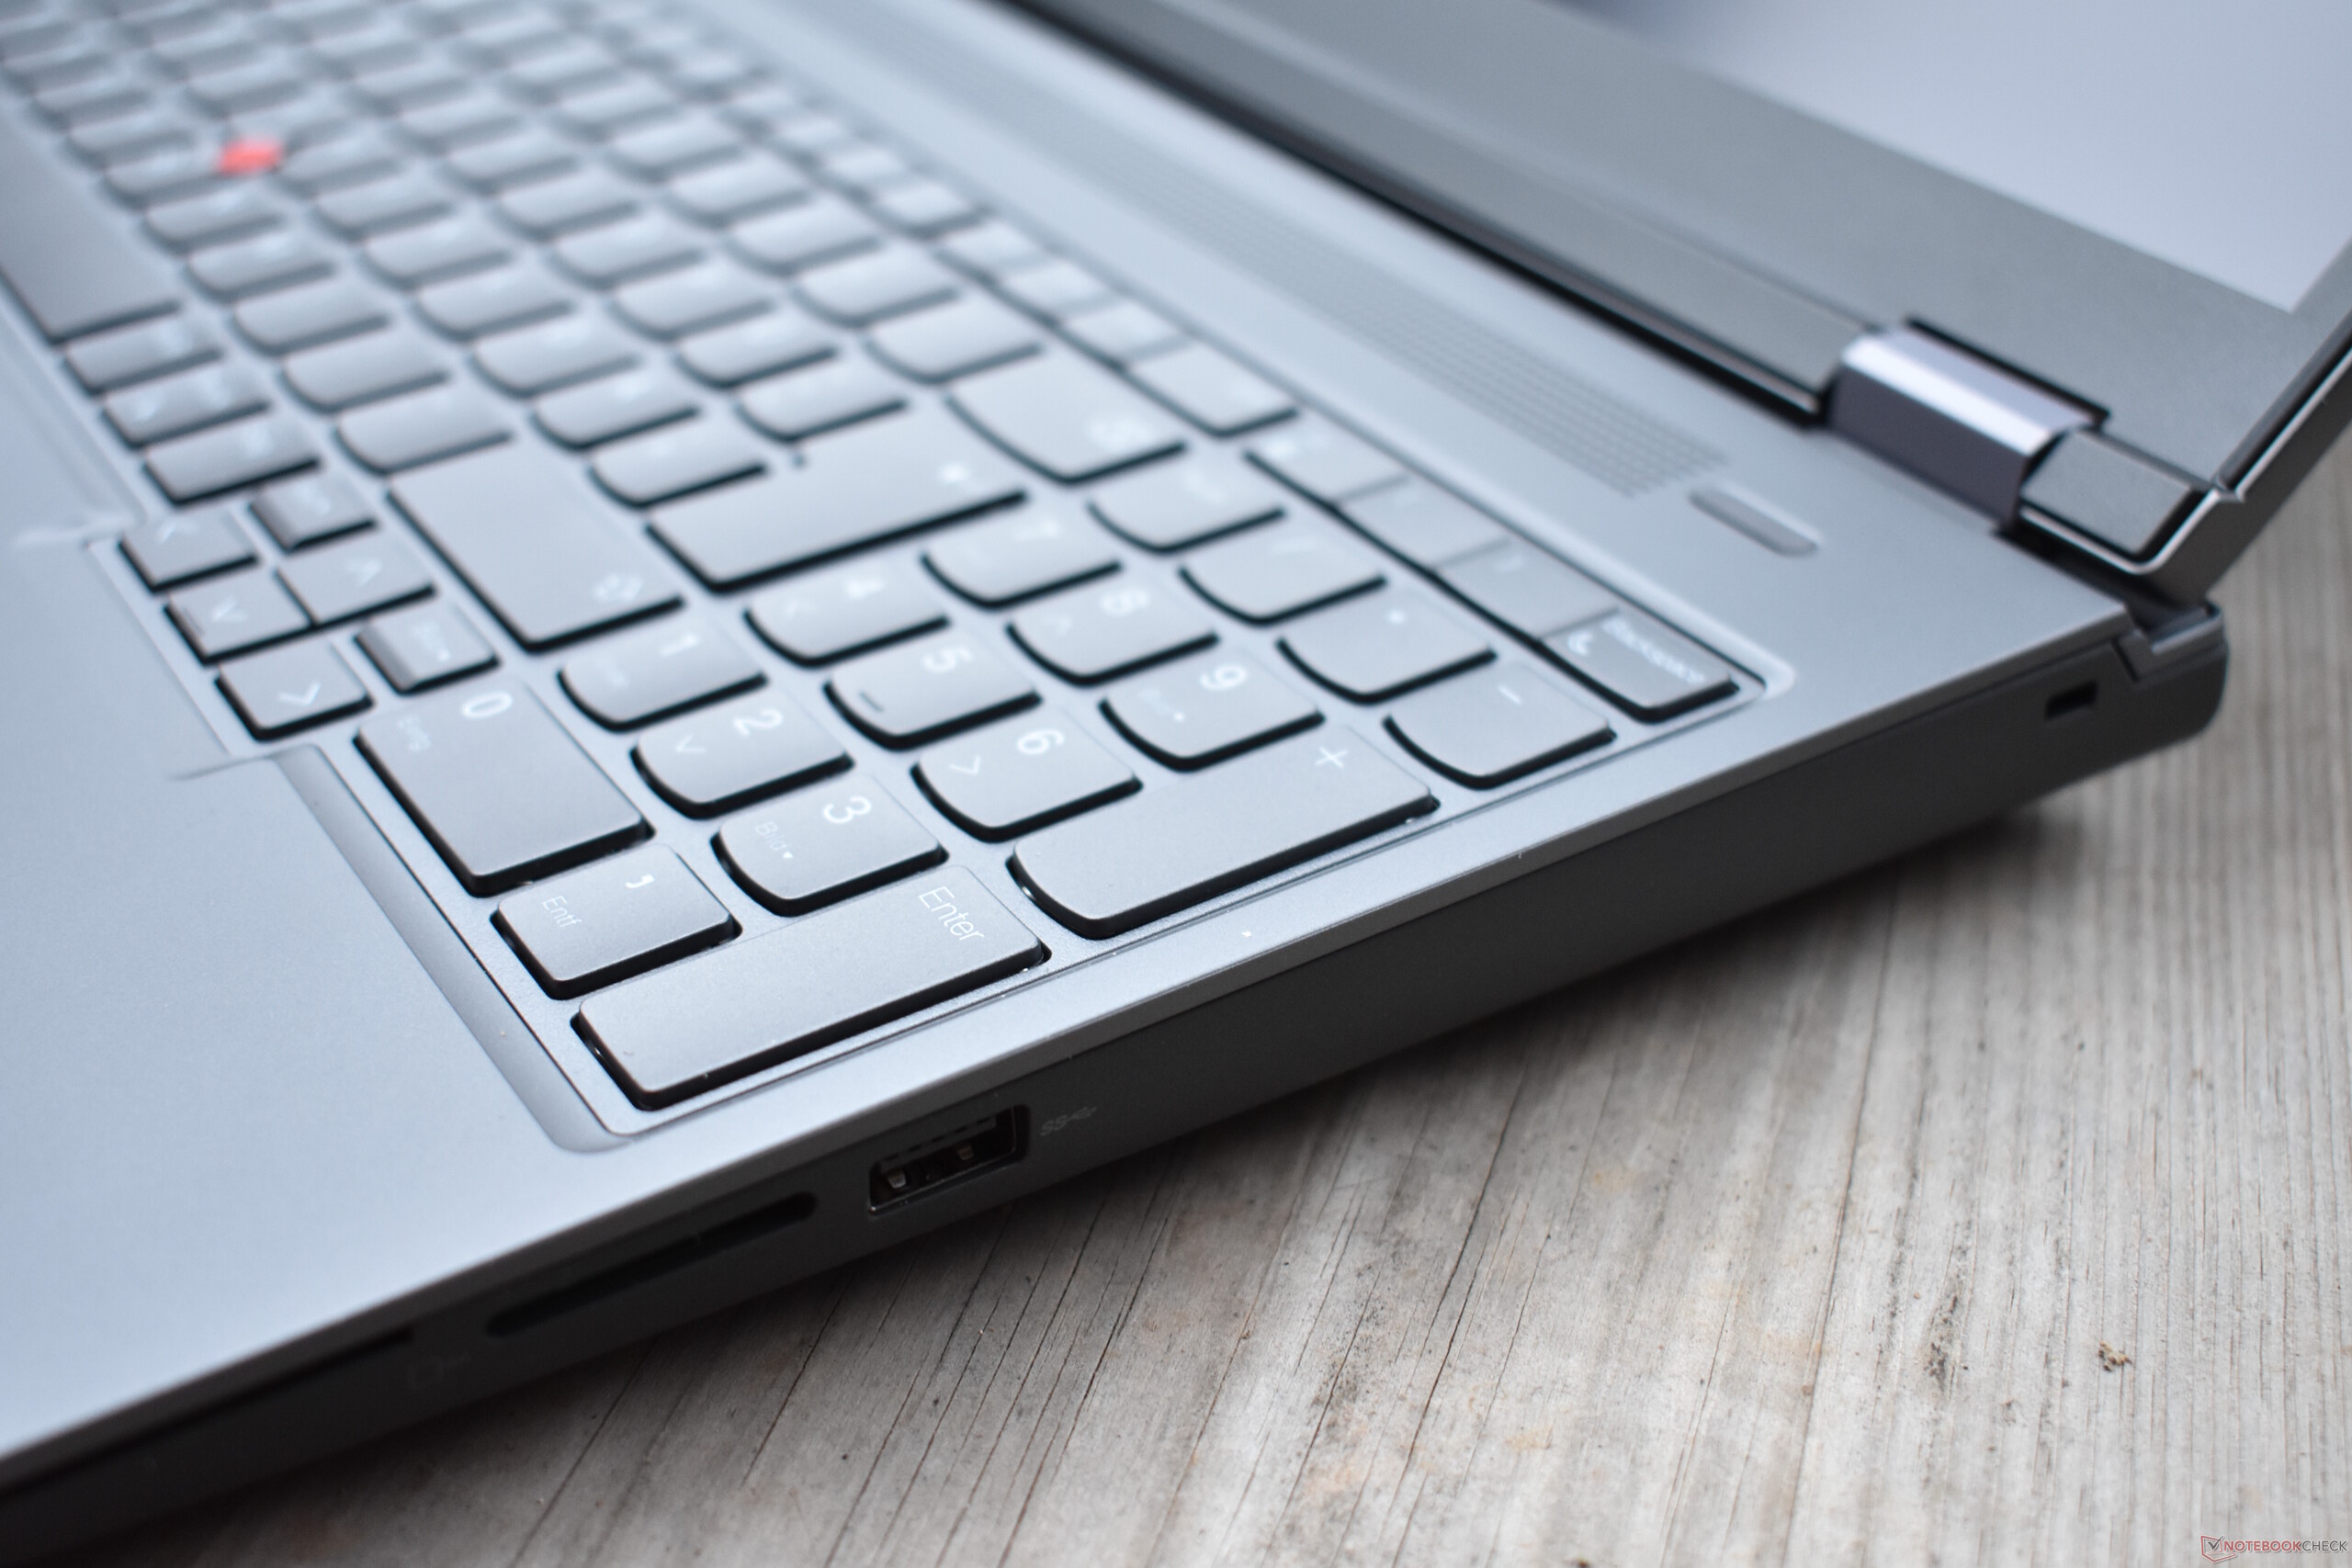
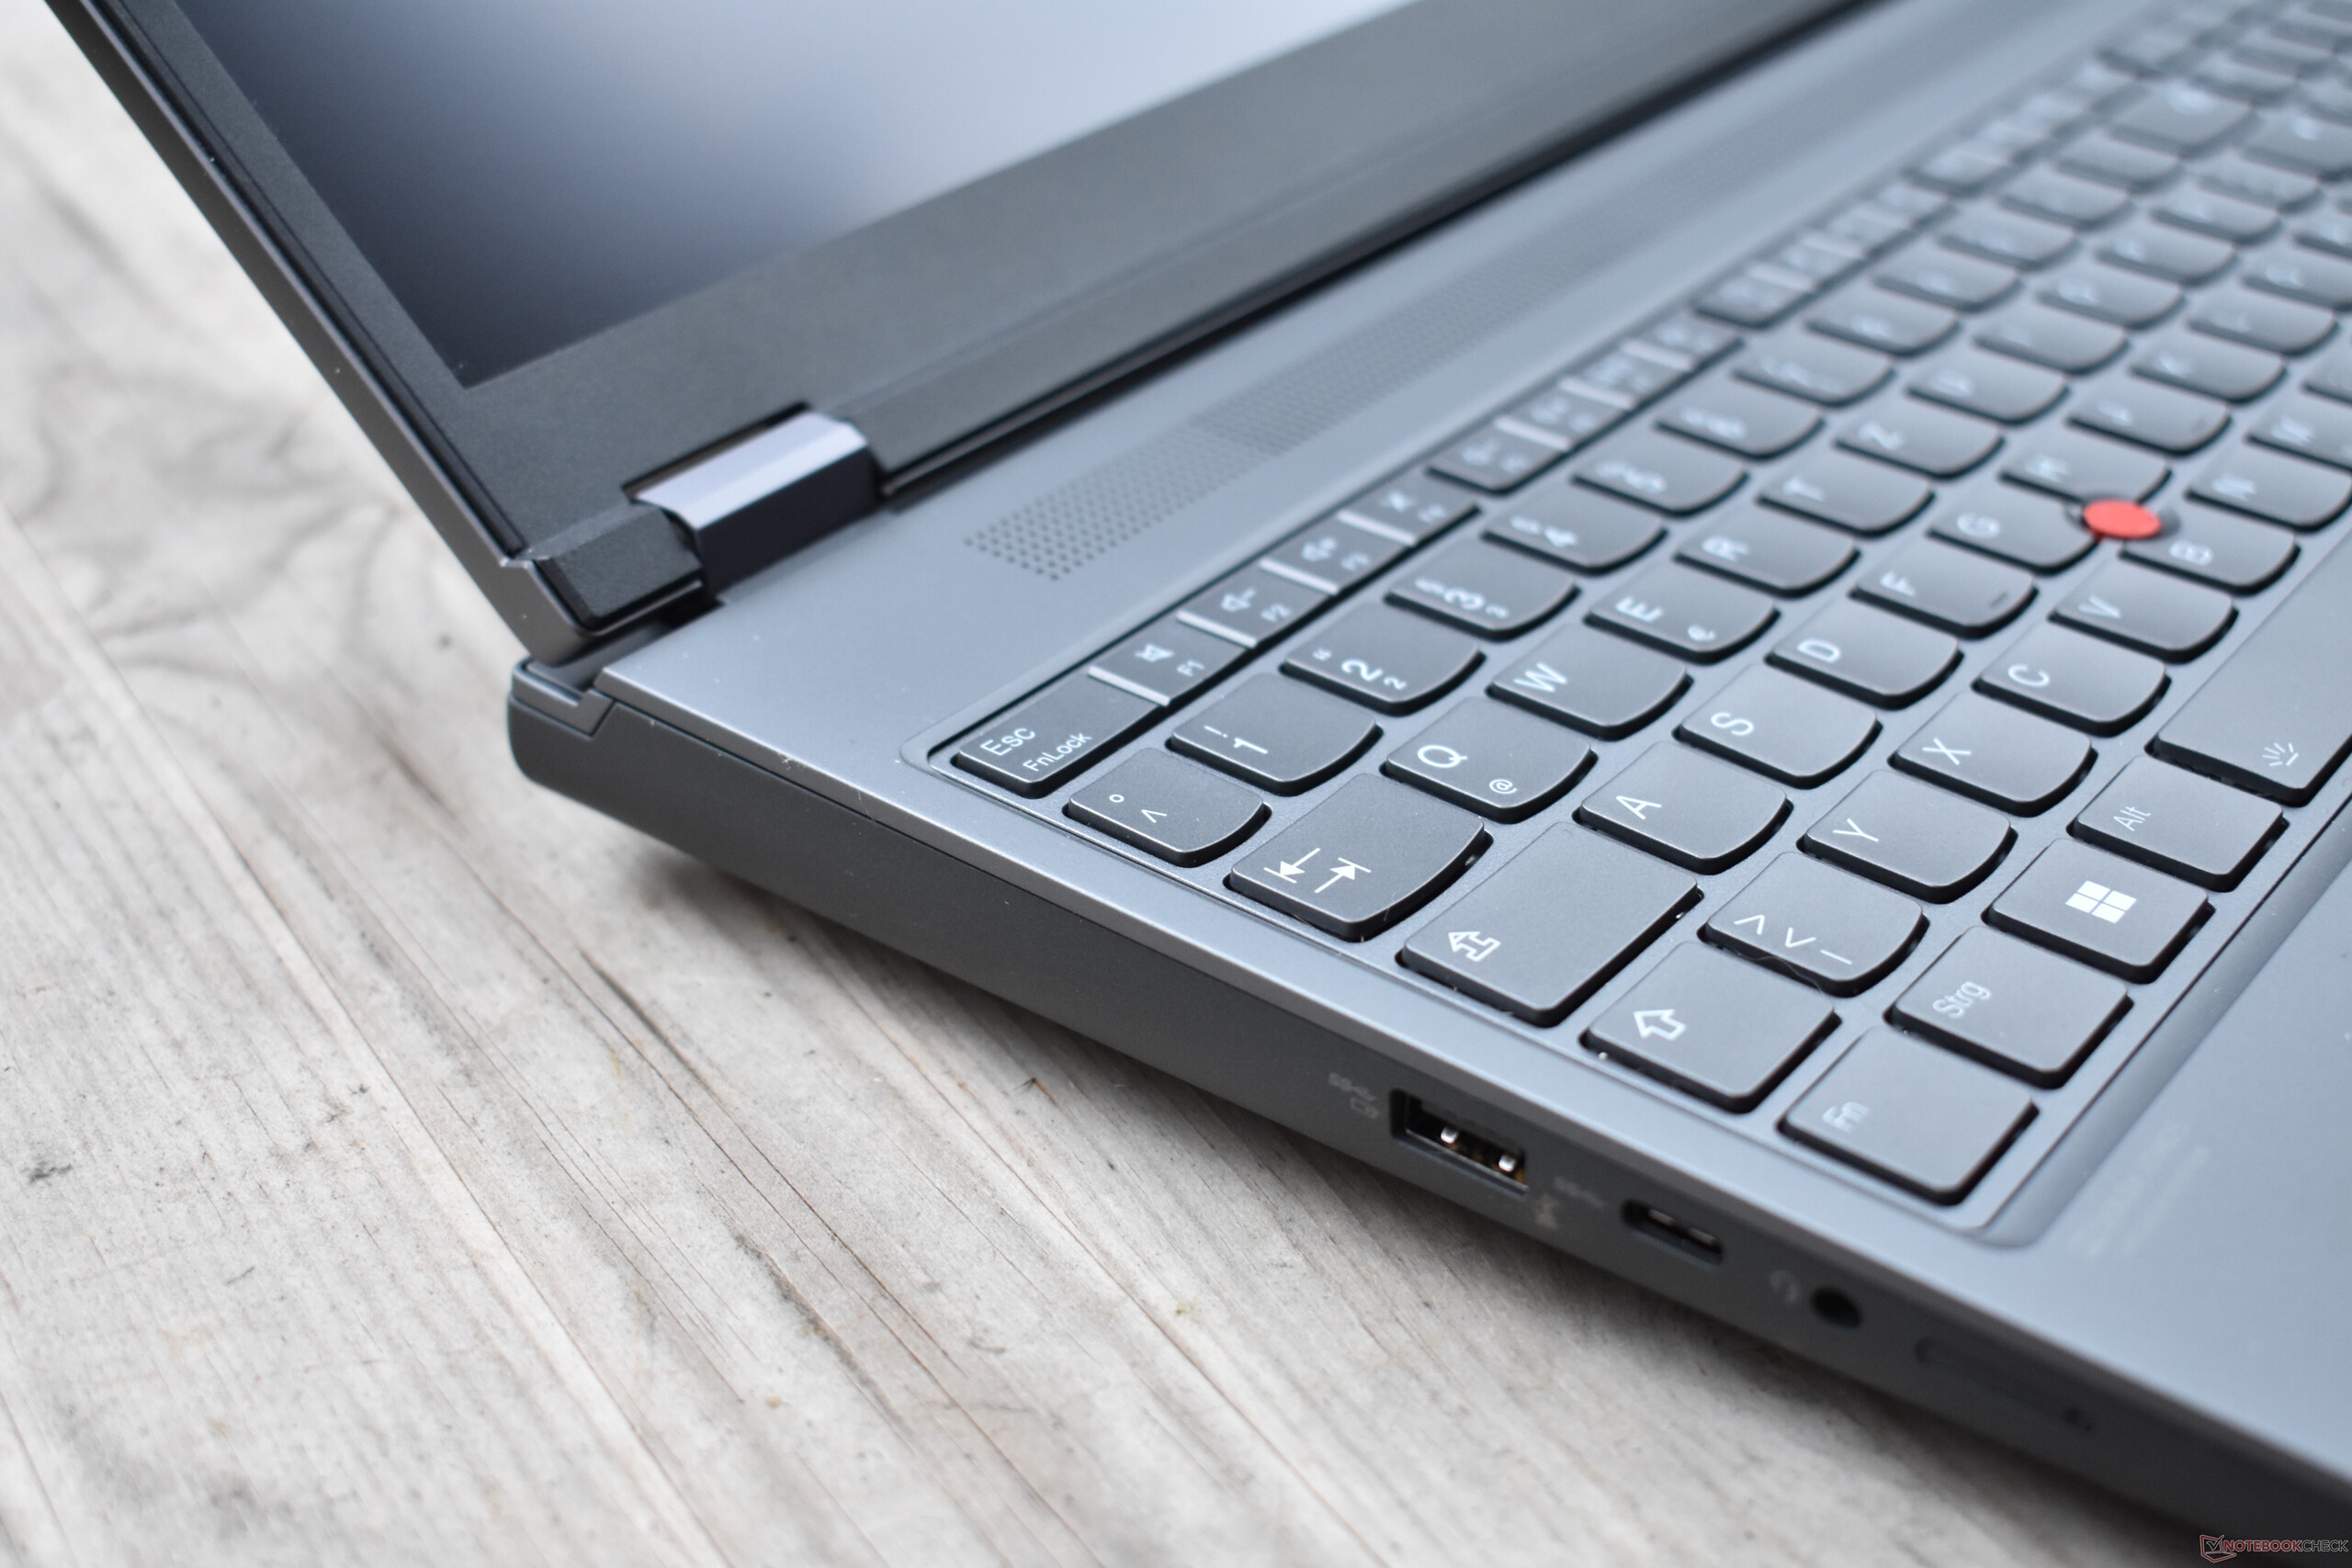
The ThinkPad P16 changes many things. The palm rest, keyboard and display cover are entirely in "Storm Gray". The rounded edges ensure a slightly less boxy shape. Regarding the rear of the device, Lenovo has shown itself to be keen to experiment as this area is emblazoned with red highlights. The P16 also looks more modern than its predecessor as the display bezels are much slimmer. However, for a modern device, they are still relatively large, in particular, at the bottom of the display.
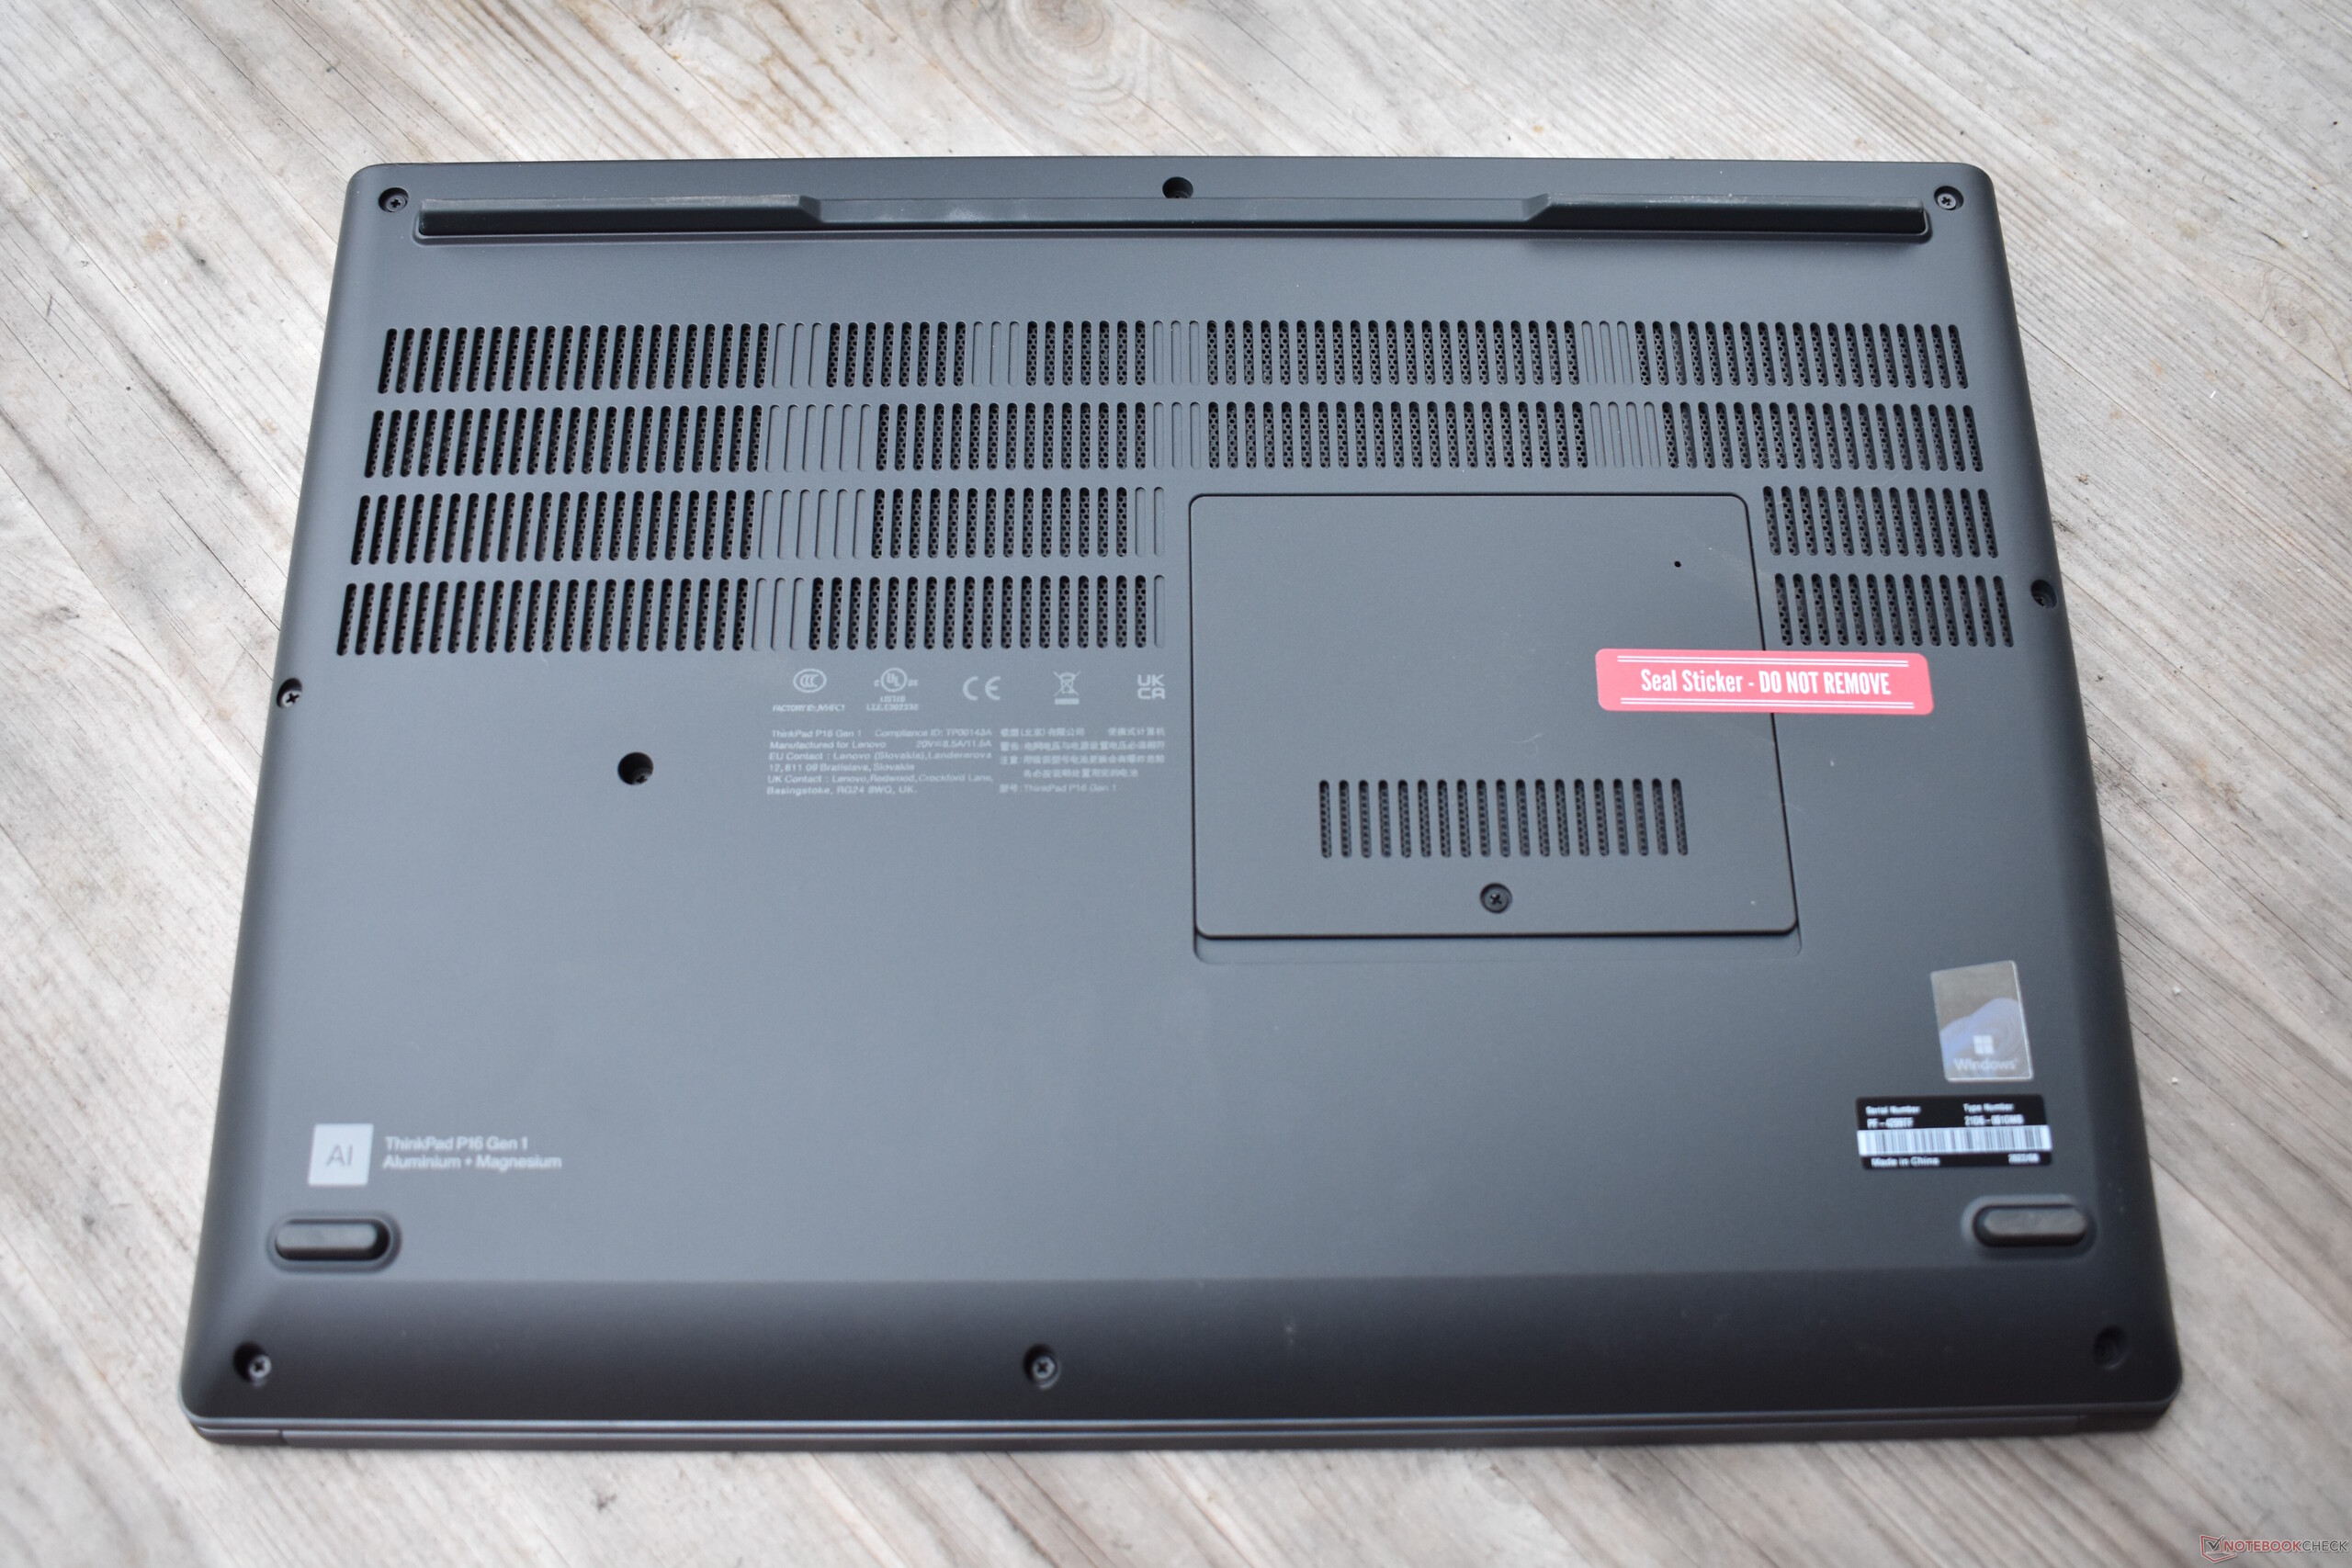
The base unit is made of fibreglass plastic which is reinforced with a magnesium frame; just like the previous ones. The surfaces have a velvety coating and the gray plastic is less prone to fingerprints than the black plastic found in earlier ThinkPad models. The base cannot be twisted and the only weak area is the smartcard reader where the palm rest flexes slightly. Lenovo has chosen to use aluminum for the LCD cover and, likewise, it has received additional reinforcement in the form of a magnesium roll cage. The display cover's stability is much improved compared to the P15 and P17.
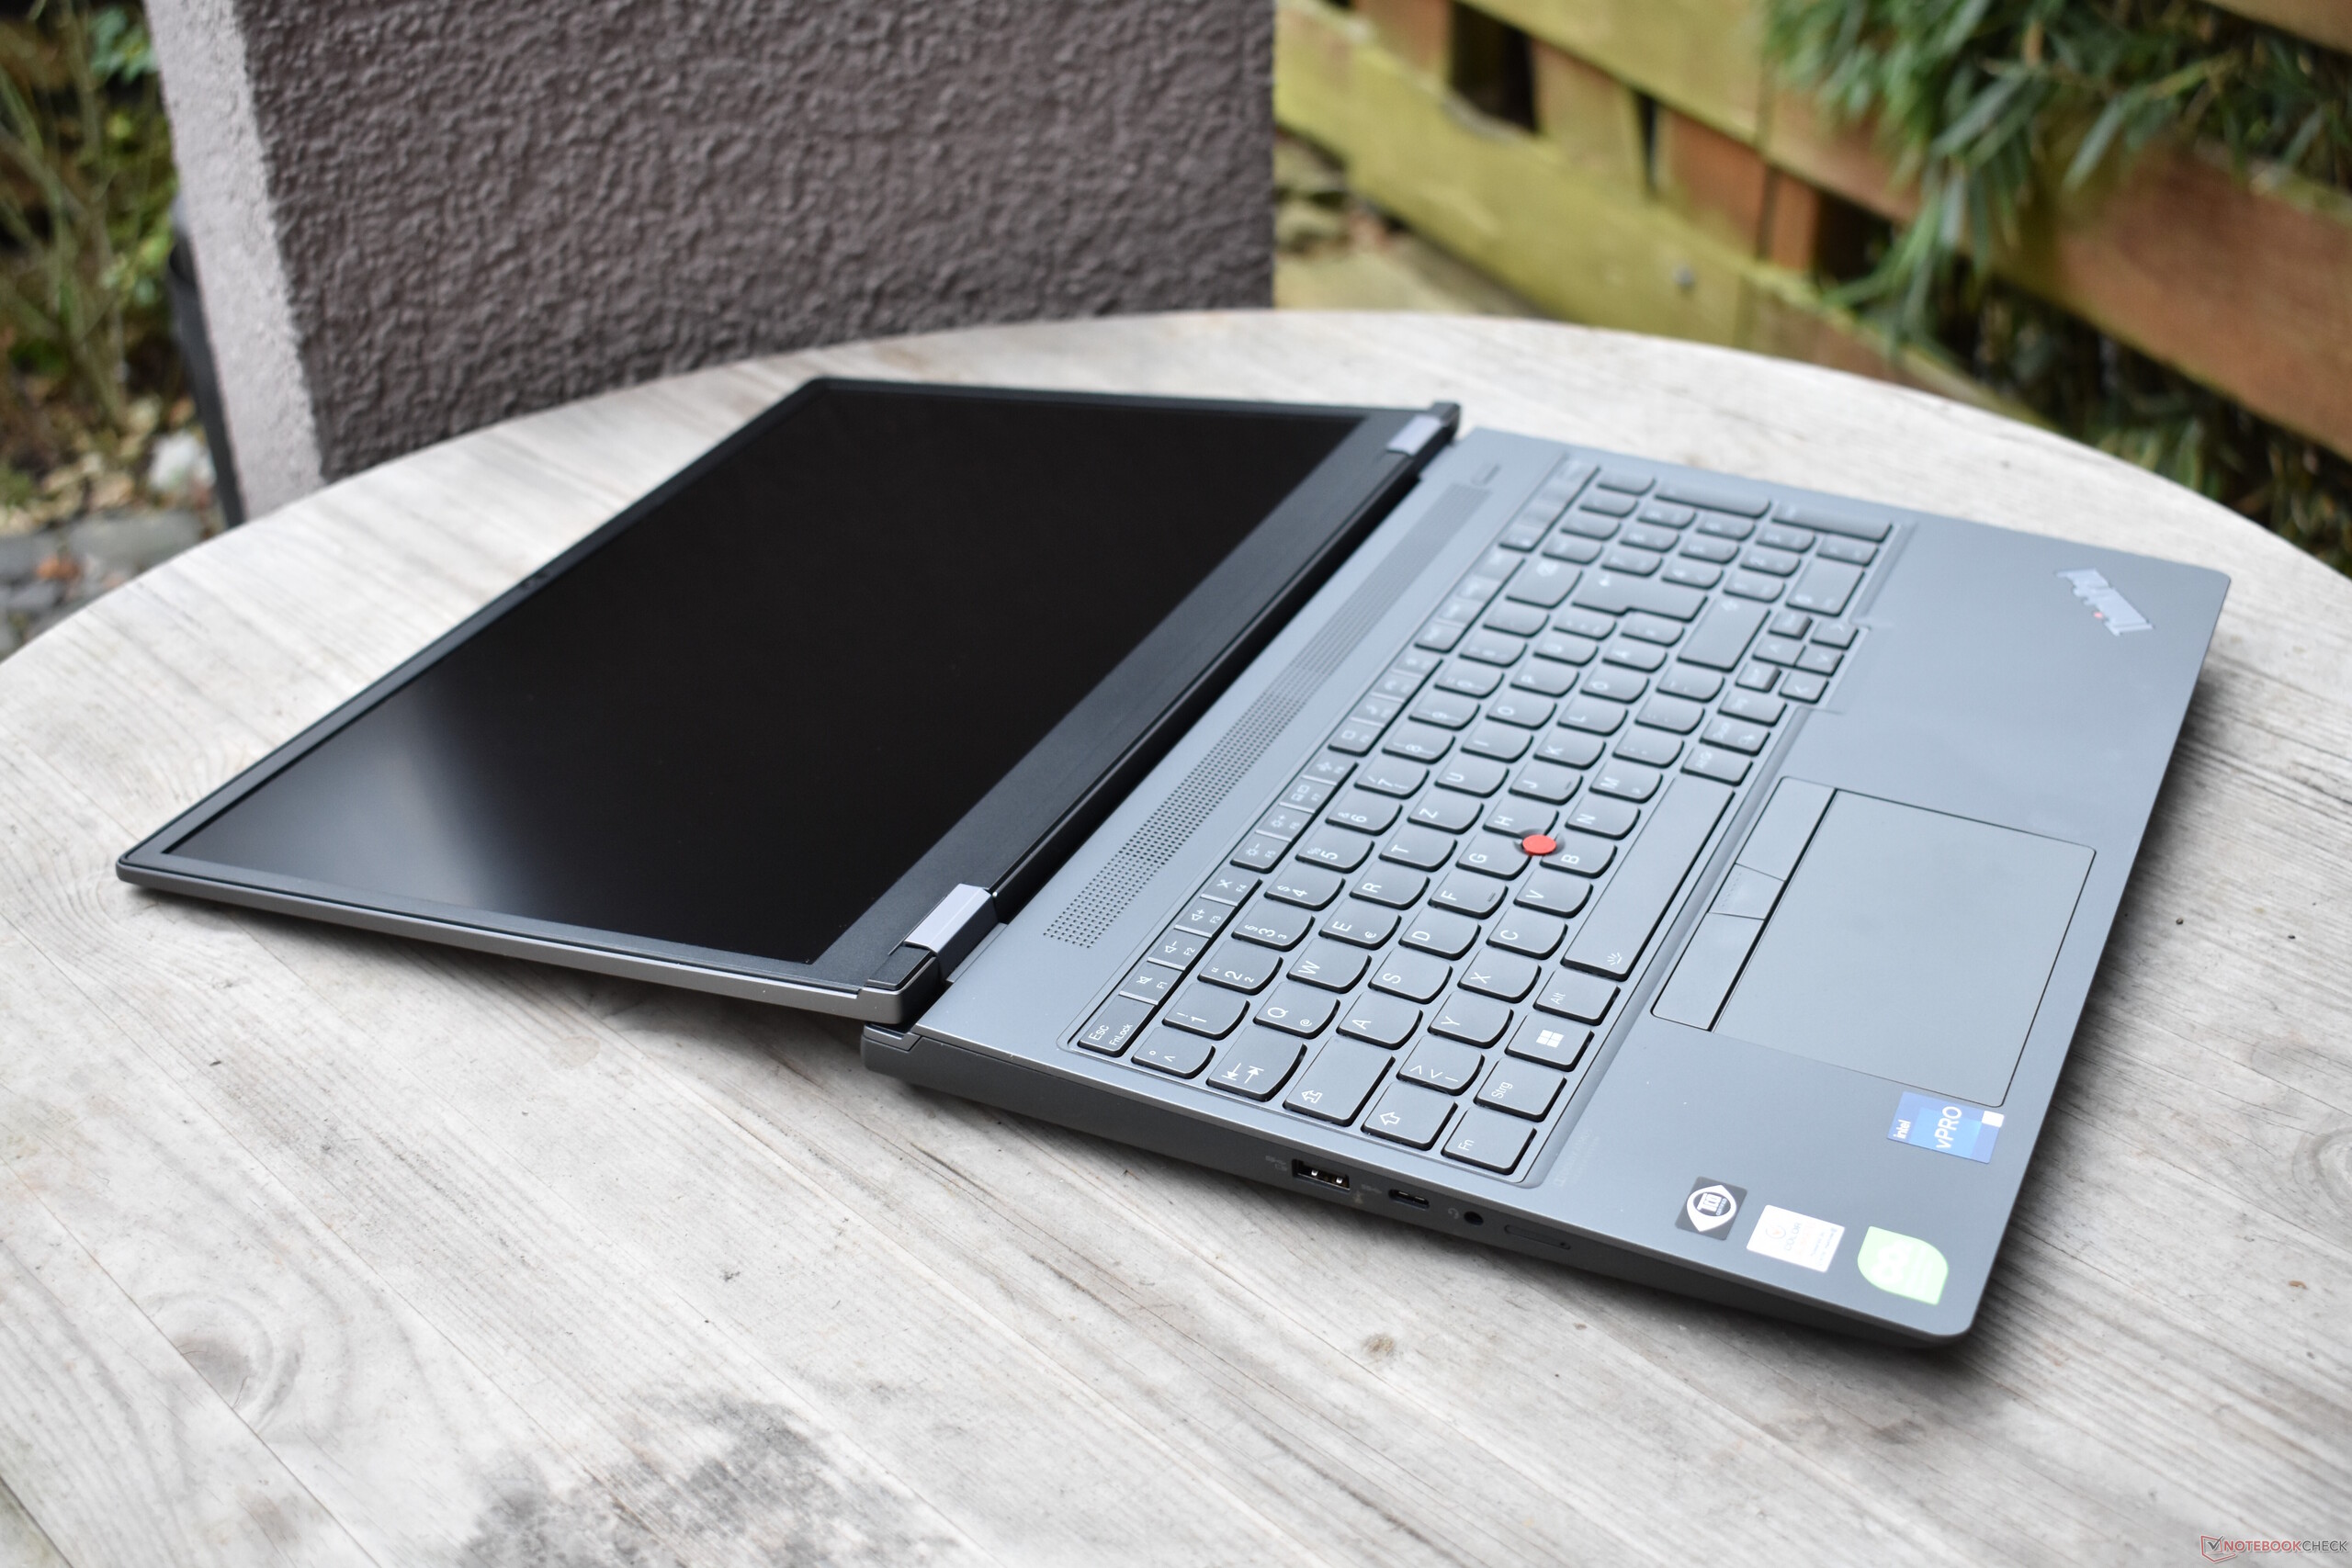
The large, top and base hinges, with their stand-out silver caps, are practically identical to those models and keep the display solidly in place without any hint of wobbling. The display can be opened with one hand to an angle of over 180 degrees.
More a ThinkPad P15 G3 than a P17 G3: In terms of size and weight, the Lenovo ThinkPad P16 G1 is much closer to its smaller predecessor rather than the bigger one.
A comparison with the Dell Precision 7670 is also interesting: The 16-inch Dell workstation is more mobile in every way as it is not only smaller but also slimmer and lighter. With the Precision 7770, Dell continues to offer an even larger and more powerful 17-inch LCD variant.
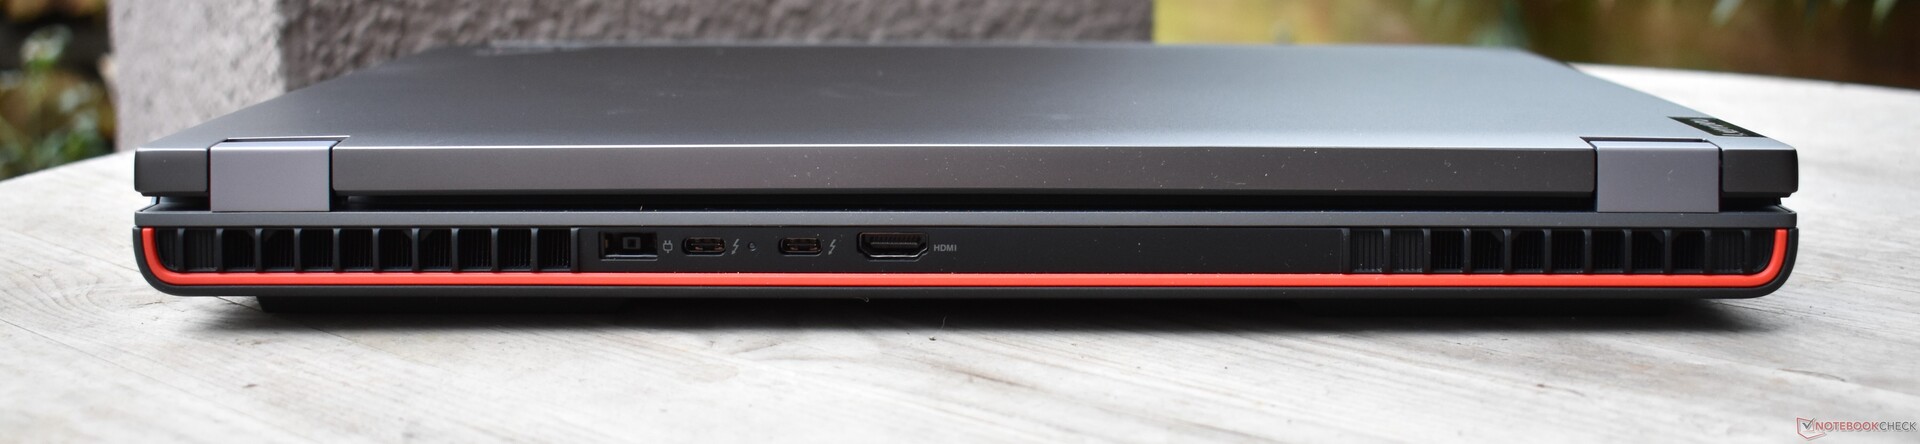
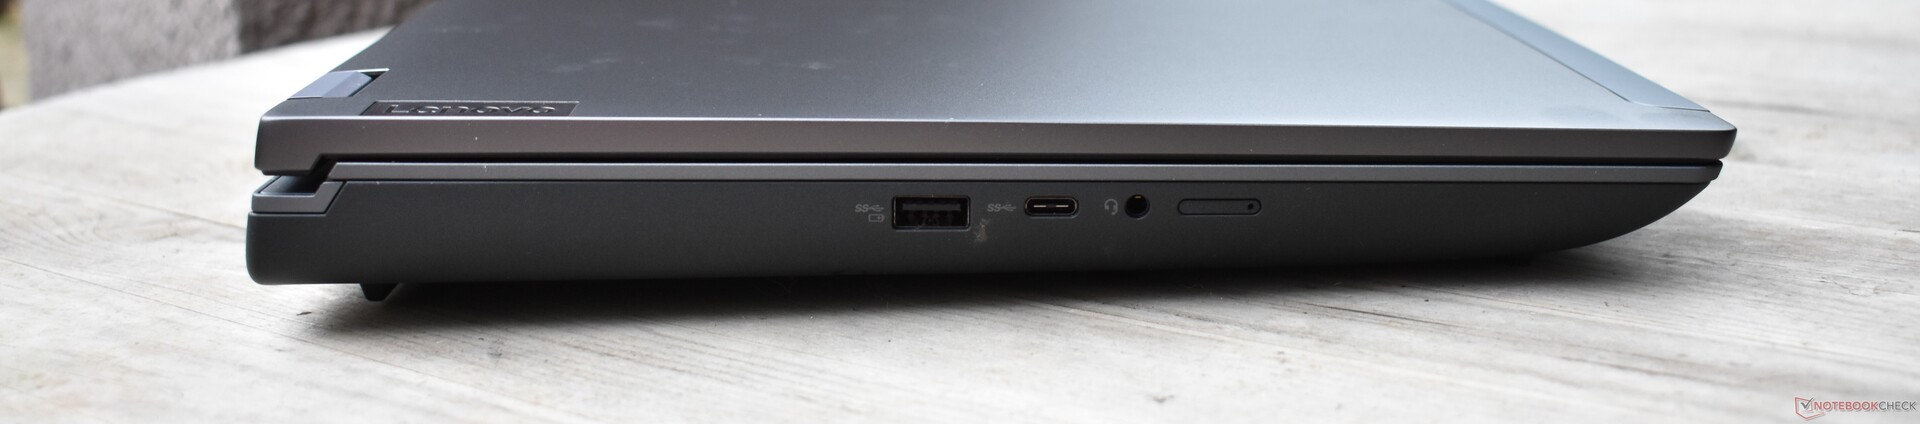
Features: A ThinkPad P16 without RJ45
Lenovo has updated the design without drastically altering the connectivity options. The is only one change in addition to the port locations: RJ45 ethernet functionality has been dropped. Wired internet use is served by a dock or one of the Thunderbolt ports.
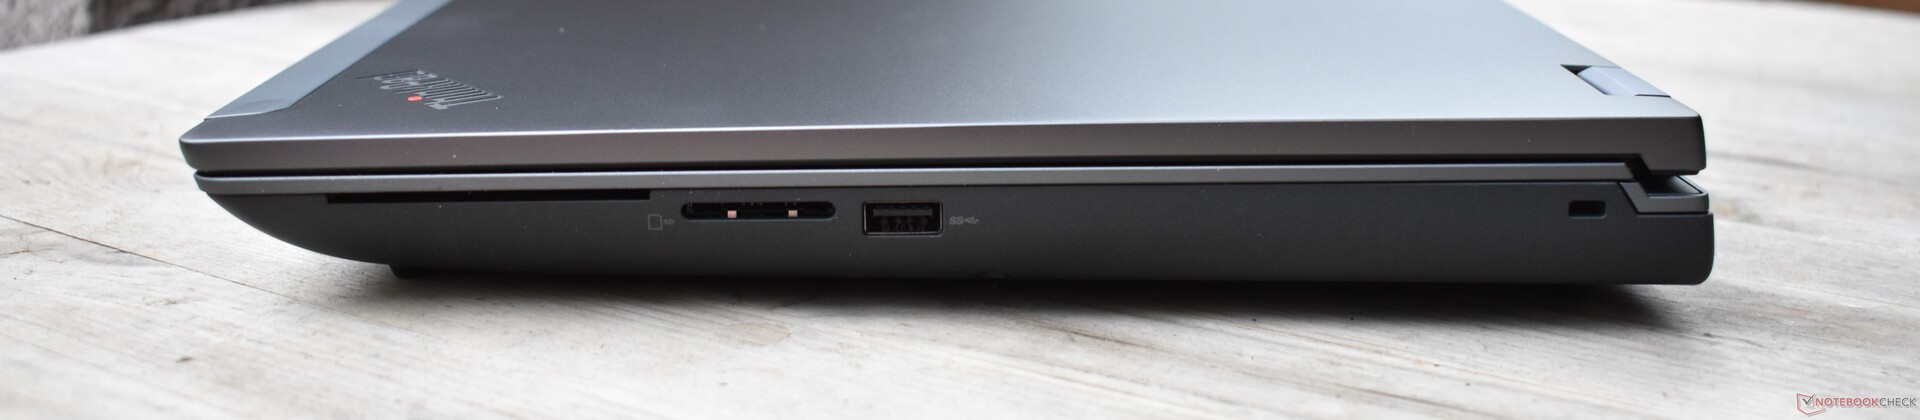
SD Card Reader
The SD card reader's benchmark results - which we tested with our reference AV Pro microSD 128 GB card - are surprisingly bad. The scores are well below average for a workstation-class device as well as its own predecessor.
| SD Card Reader | |
| average JPG Copy Test (av. of 3 runs) | |
| Lenovo ThinkPad P15 G2-20YQ001JGE (AV Pro V60) | |
| Dell Precision 7670 (Toshiba Exceria Pro SDXC 64 GB UHS-II) | |
| Lenovo ThinkPad P17 G2-20YU0025G (Toshiba Exceria Pro SDXC 64 GB UHS-II) | |
| Average of class Workstation (54.8 - 200, n=16, last 2 years) | |
| HP ZBook Fury 17 G8-4A6A9EA (Angelbird AV Pro V60) | |
| Lenovo ThinkPad P16 G1 21D6001DMB (AV Pro V60) | |
| maximum AS SSD Seq Read Test (1GB) | |
| Lenovo ThinkPad P15 G2-20YQ001JGE (AV Pro V60) | |
| Lenovo ThinkPad P17 G2-20YU0025G (Toshiba Exceria Pro SDXC 64 GB UHS-II) | |
| Dell Precision 7670 (Toshiba Exceria Pro SDXC 64 GB UHS-II) | |
| Average of class Workstation (78.6 - 226, n=16, last 2 years) | |
| HP ZBook Fury 17 G8-4A6A9EA (Angelbird AV Pro V60) | |
| Lenovo ThinkPad P16 G1 21D6001DMB (AV Pro V60) | |
Communication
The Intel AX211WiFi-6E card's performance is better than the AX210 found in the predecessor models ThinkPad P15 and P17. Above all, it performs well in the area of reception but sending data is a little slower and less stable.
Our review model didn't possess a WWAN module (4G LTE) but can be fitted with one.
| Networking | |
| Lenovo ThinkPad P16 G1 21D6001DMB | |
| iperf3 transmit AXE11000 |
|
| iperf3 receive AXE11000 |
|
| Lenovo ThinkPad P15 G2-20YQ001JGE | |
| iperf3 transmit AX12 |
|
| iperf3 receive AX12 |
|
| Lenovo ThinkPad P17 G2-20YU0025G | |
| iperf3 transmit AX12 |
|
| iperf3 receive AX12 |
|
| HP ZBook Fury 17 G8-4A6A9EA | |
| iperf3 transmit AX12 |
|
| iperf3 receive AX12 |
|
| Dell Precision 7670 | |
| iperf3 transmit AXE11000 6GHz |
|
| iperf3 receive AXE11000 6GHz |
|
| Asus ExpertBook B6 Flip B6602FC2 | |
| iperf3 transmit AXE11000 6GHz |
|
| iperf3 receive AXE11000 6GHz |
|
| iperf3 transmit AXE11000 |
|
| iperf3 receive AXE11000 |
|
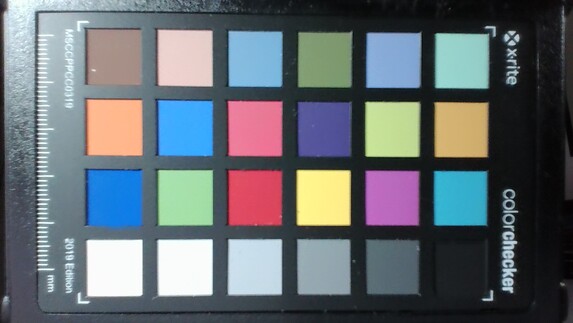
Webcam
Overall, the 1080p webcam produces washed-out, blurry, noisy images.


Security
In addition to the fingerprint reader built into the power button, the Lenovo ThinkPad P16 2022 has a Windows Hello compatible infrared camera. The Kensington lock can offer protection and there is also an optional smartcard reader. The Lenovo ThinkPad P16 has a dedicated TPM chip and the webcam possesses a mechanical camera shutter.
Accessories
Apart from the 170-watt power supply, complete with a Slim Tip connector, the laptop comes without additional accessories. The most important optional accessory ought to be a dock such as the ThinkPad Thunderbolt 4 Workstation dock
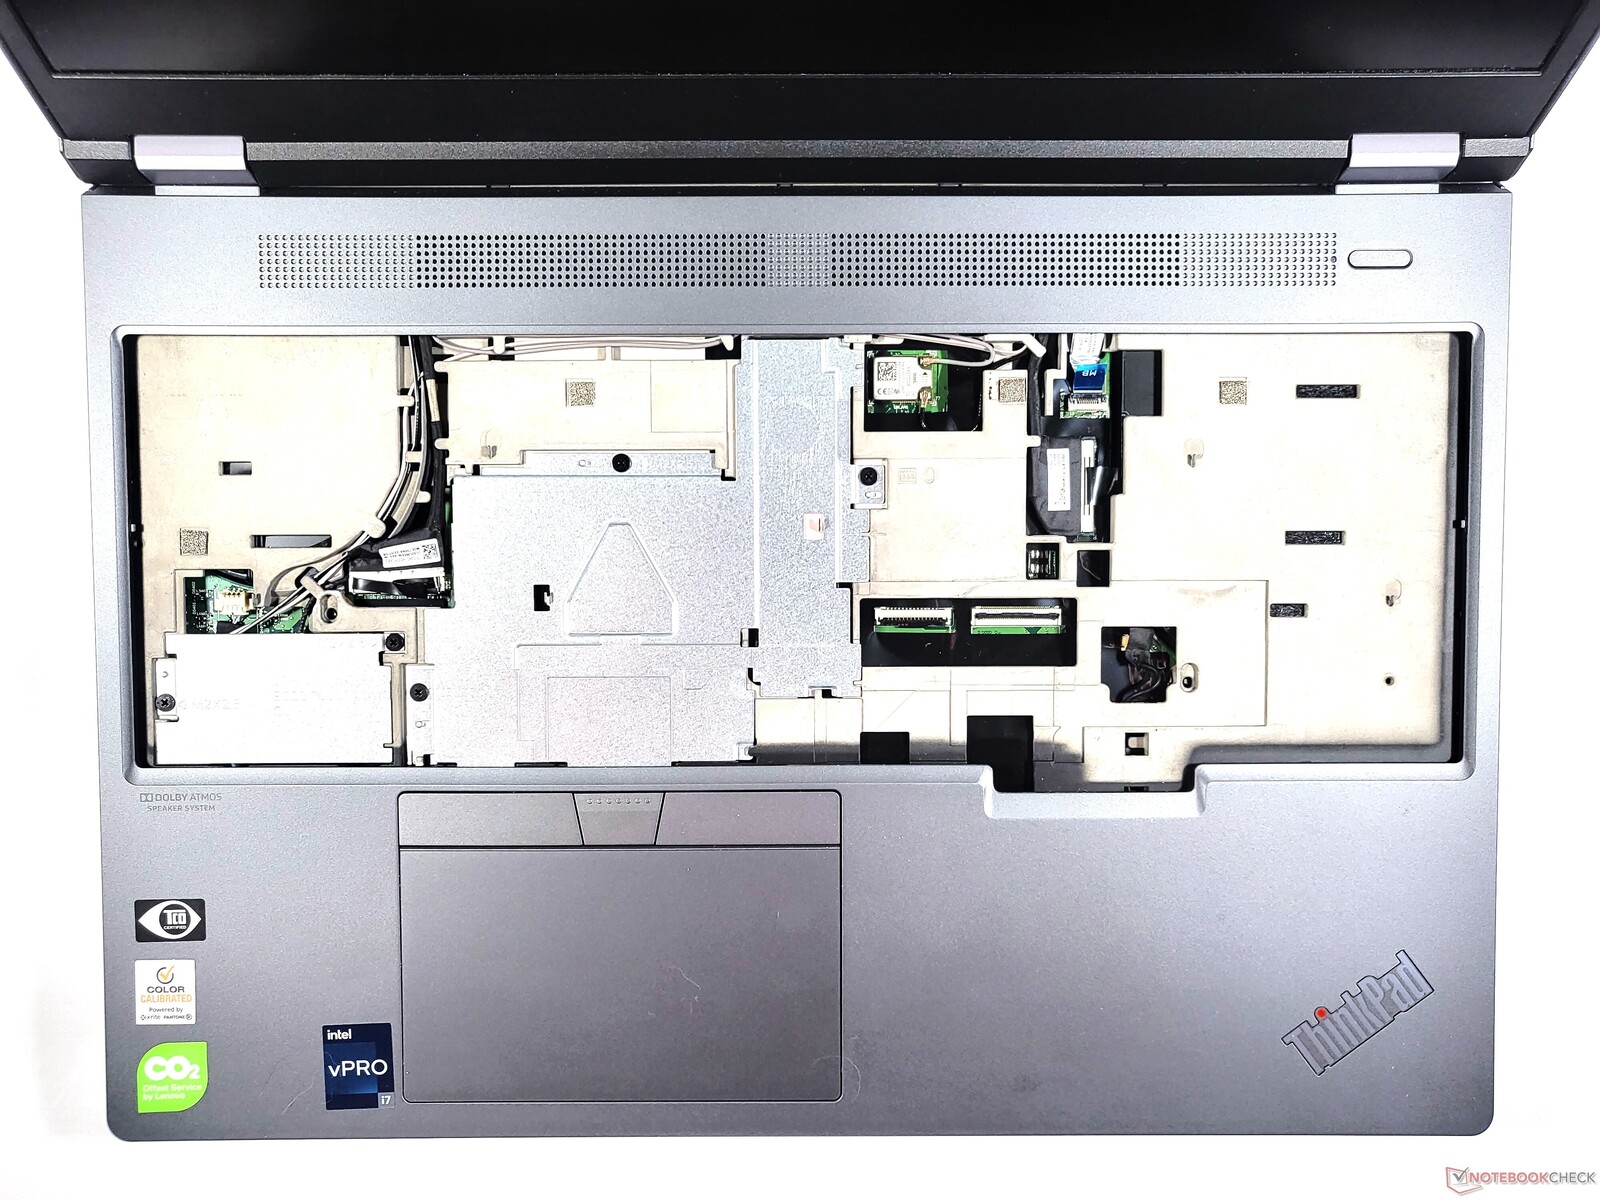
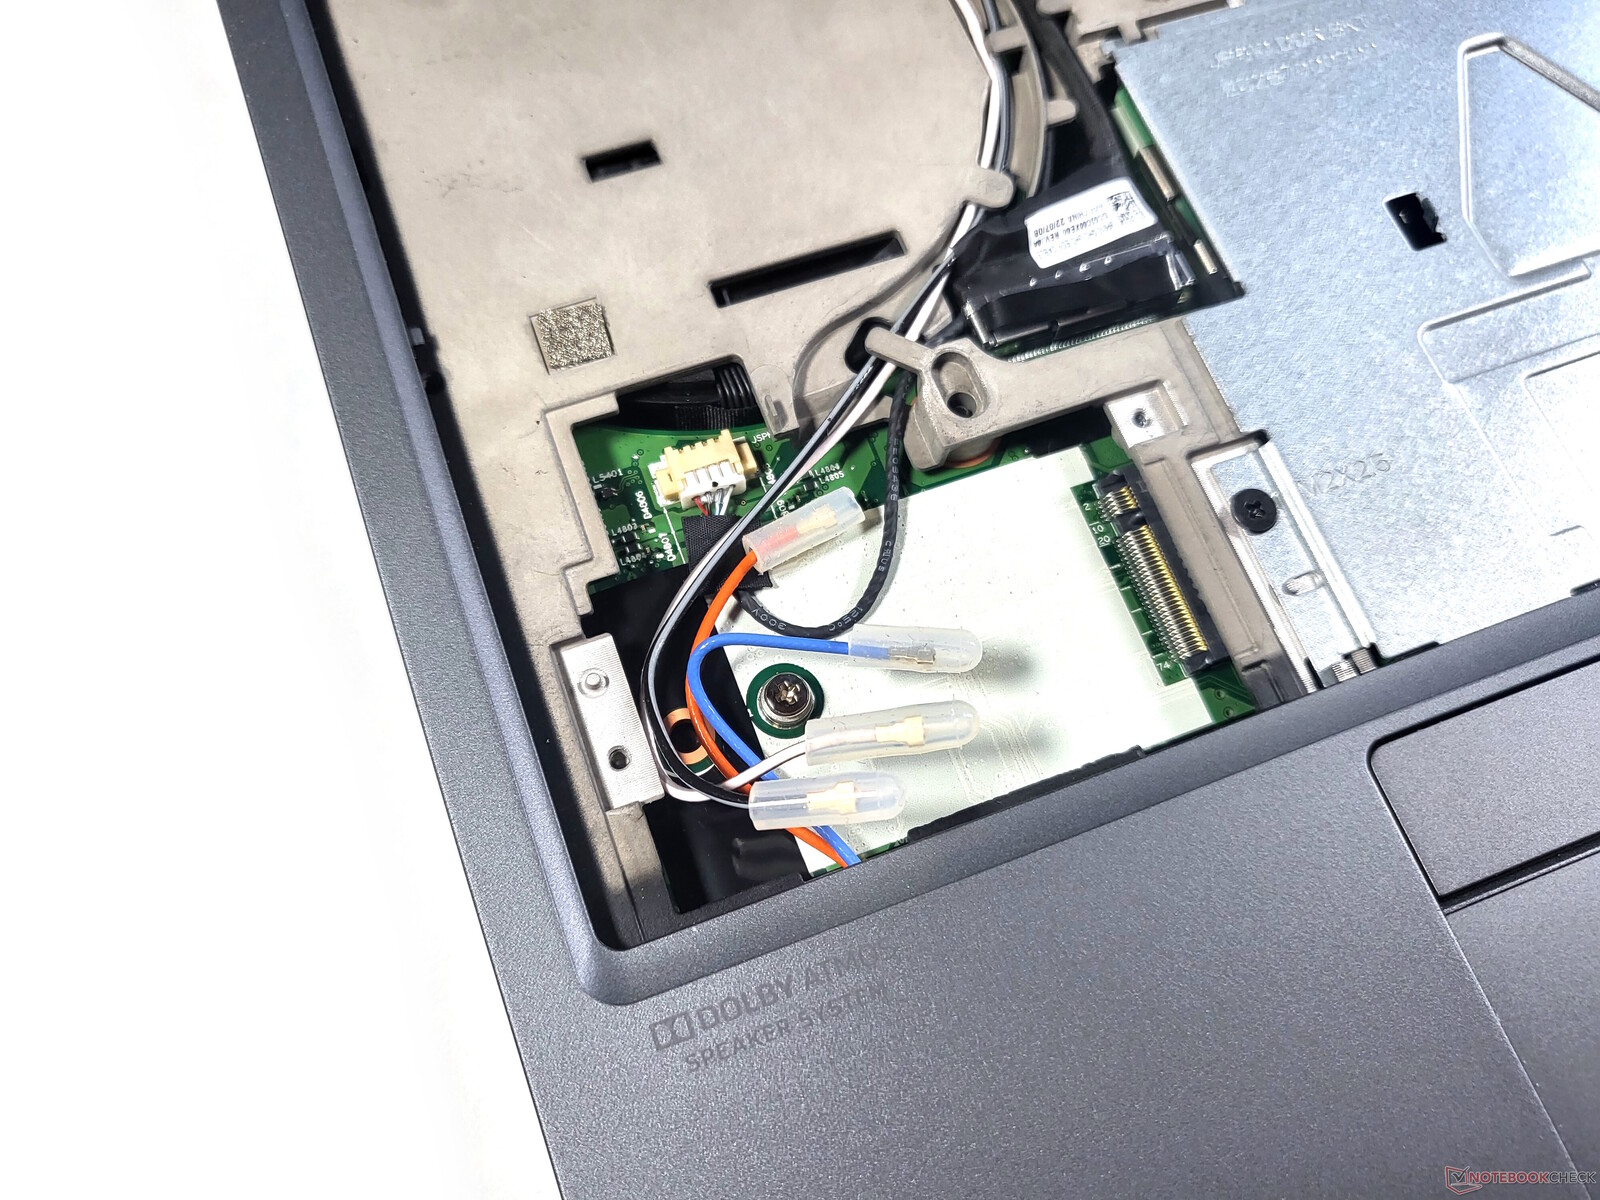
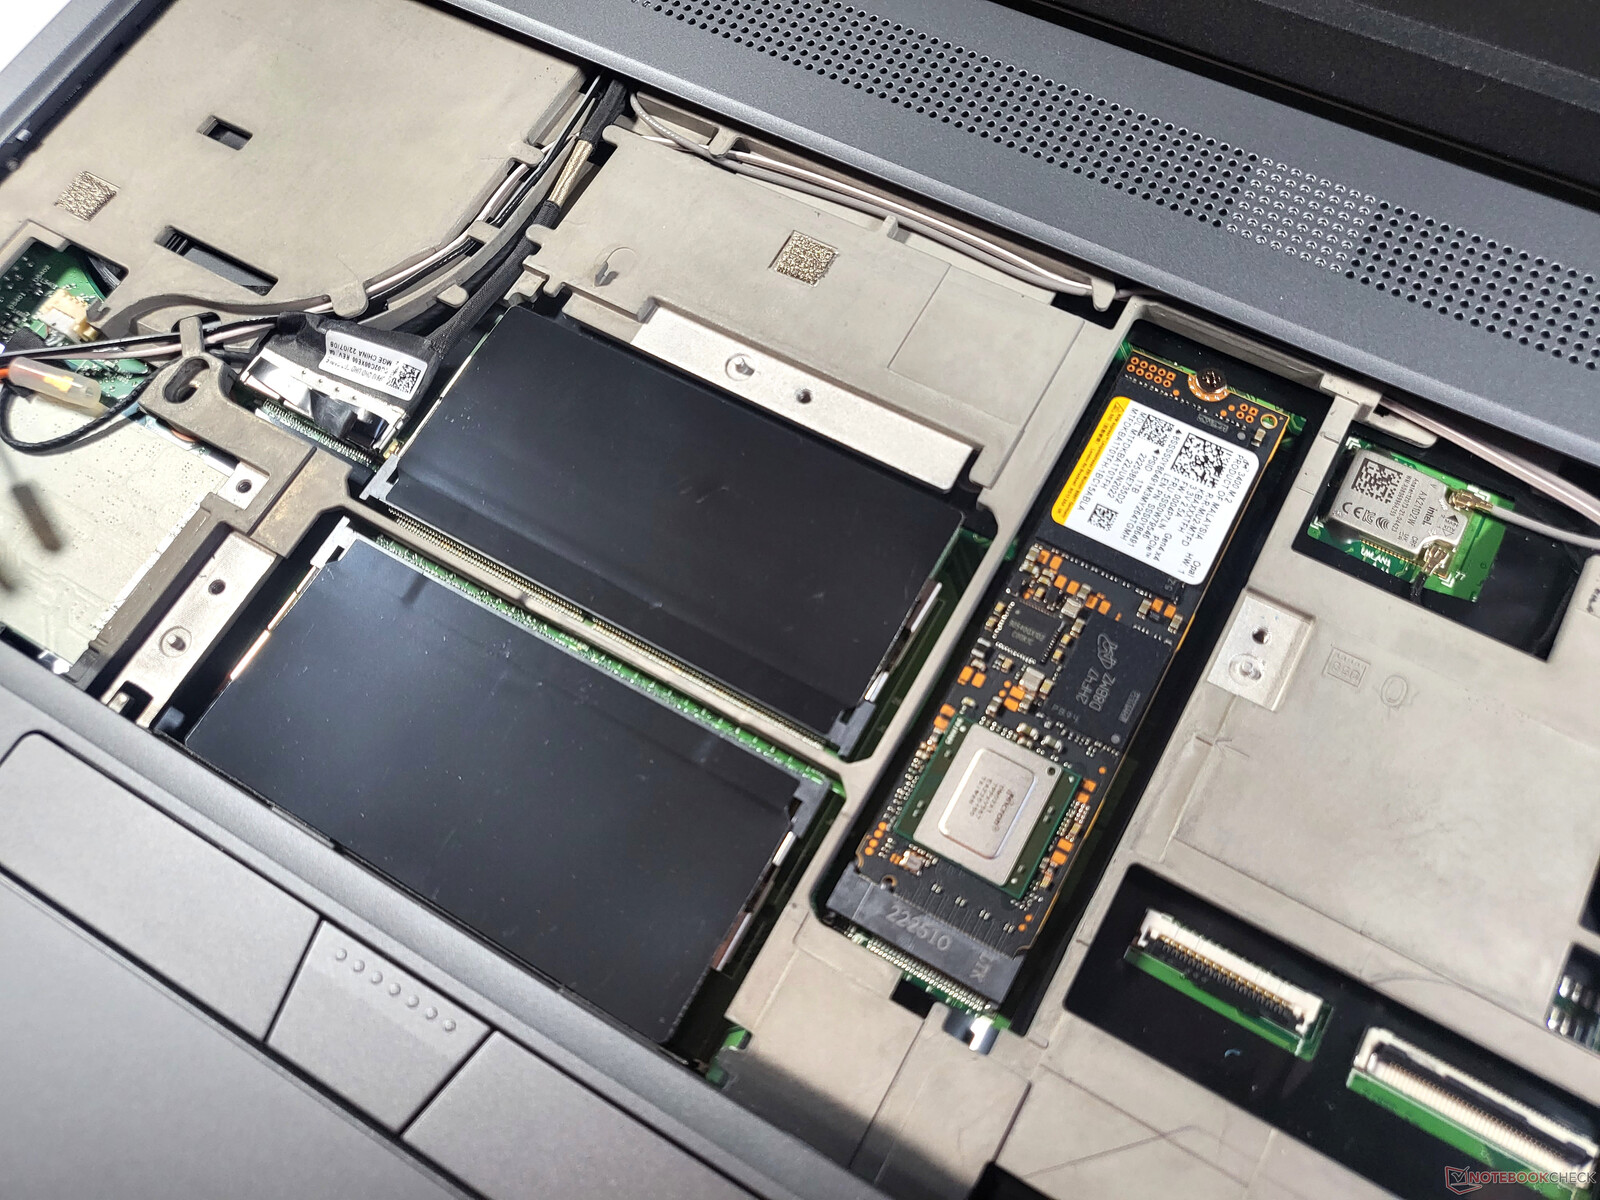
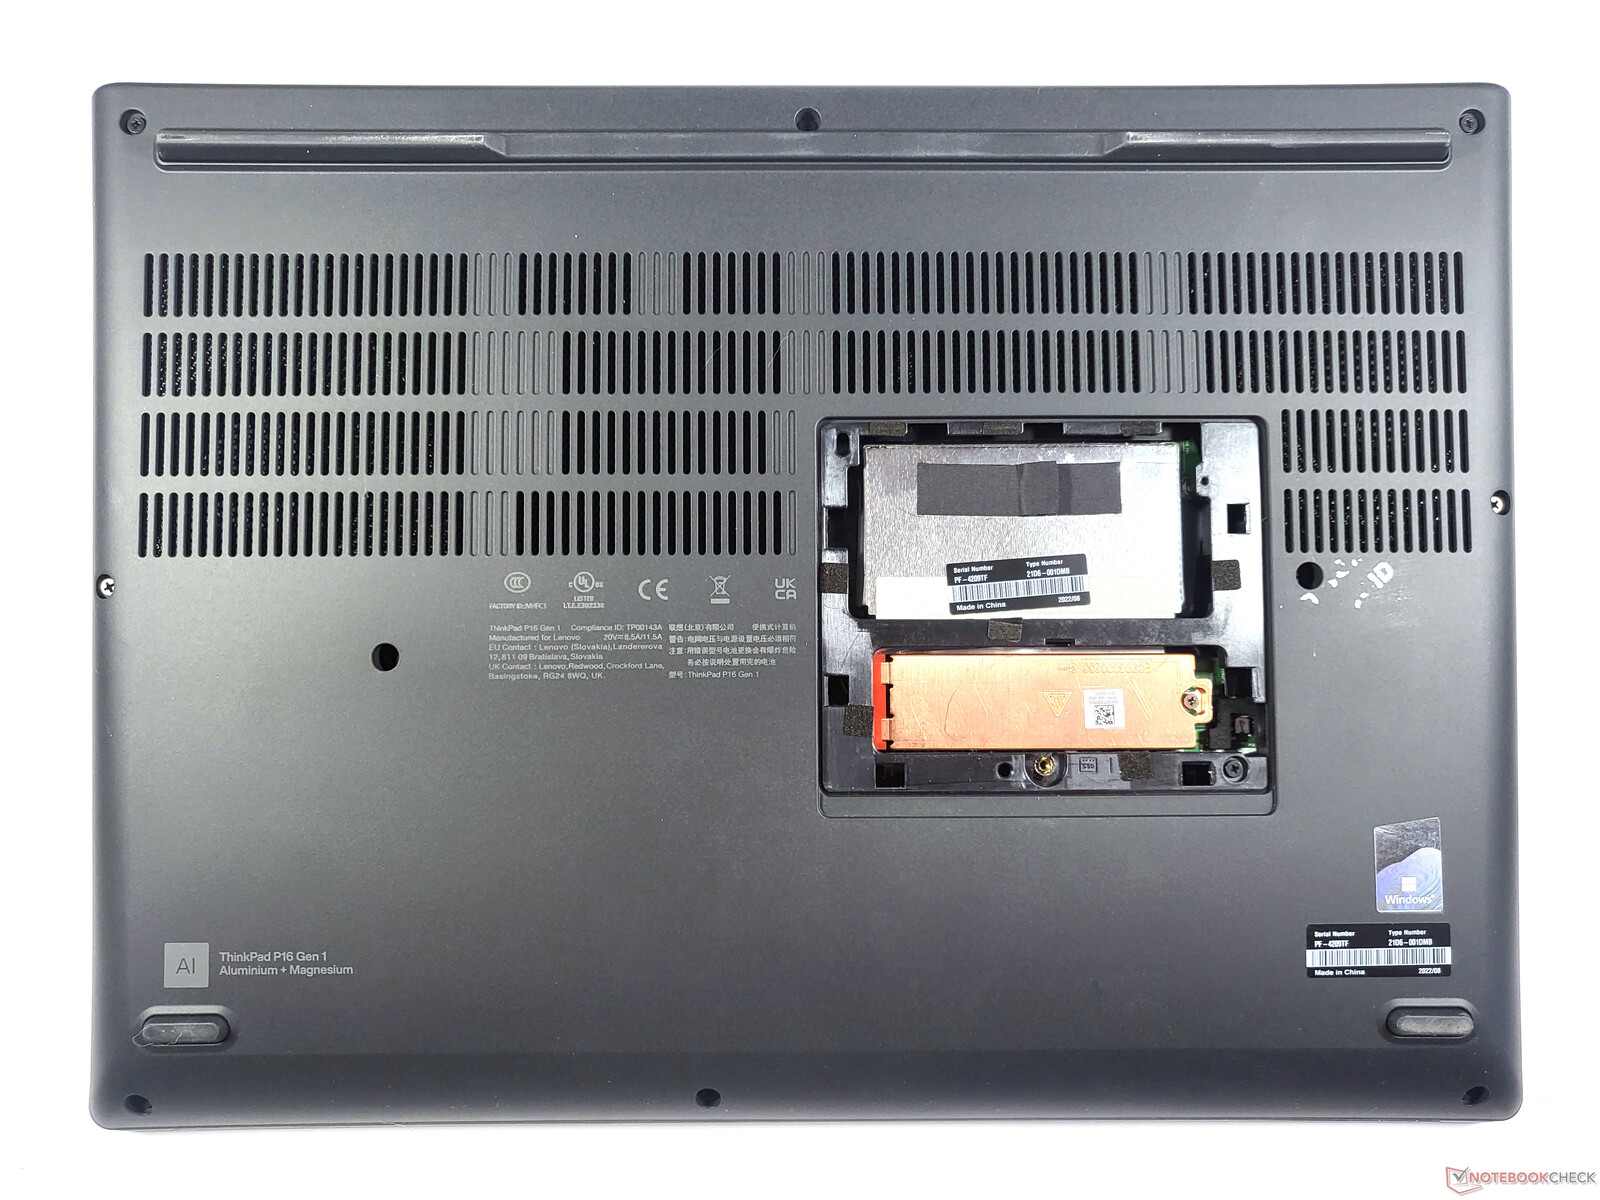
Maintenance
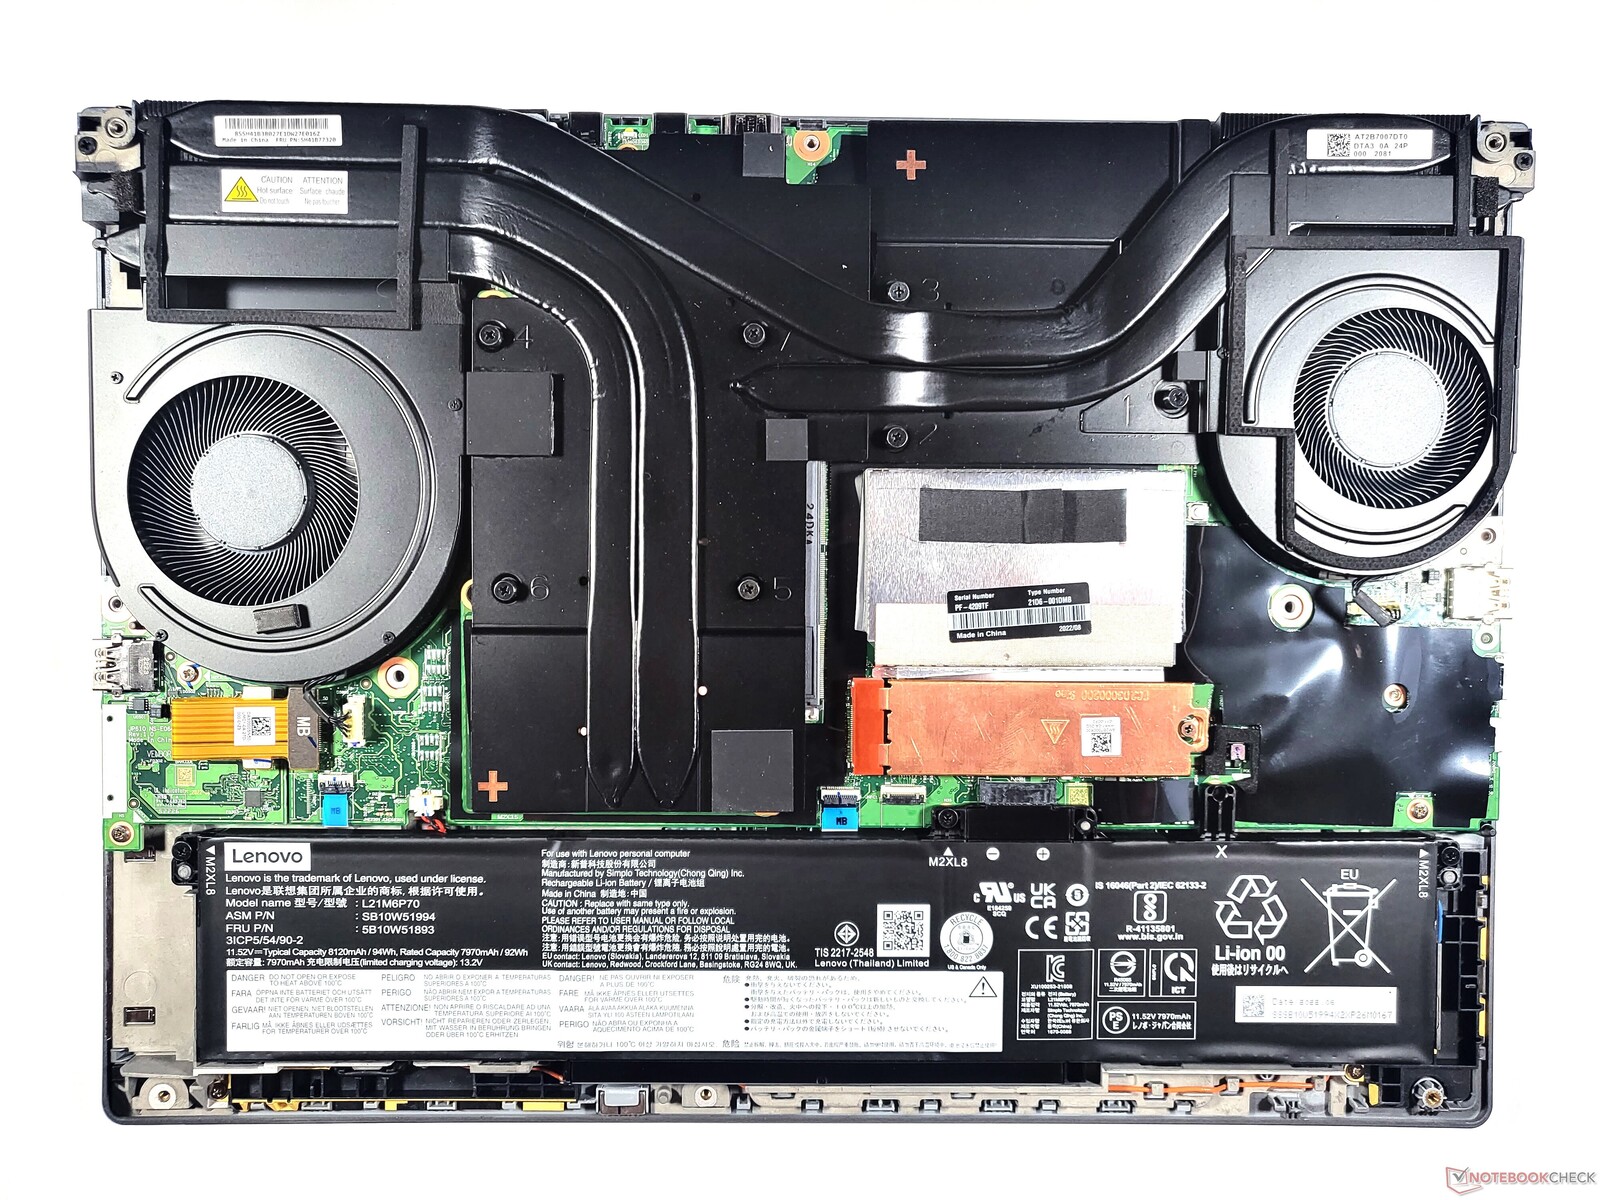
Lenovo has made it very easy to reach two of the four RAM slots as only the small cover on the bottom of the device has to be removed. Here you can also find a free M.2 2280 slot. It is slightly harder to access the other RAM slots, the second M.2 slot, the soldered WiFi module as well as the WWAN slot: the keyboard has to make way for that. The final hurdle presents itself in the shape of two metal covers. In total, another ten additional crosshead screws secured with plastic hooks are on the bottom of the laptop. On removing this part, you get a clear view of the large cooling system with a total of two fans and the internal battery.
All of these steps can be carried out without voiding the warranty. With the Hardware Maintenance Manual, Lenovo has provided a suitable set of instructions.
Warranty
Out of the box, the Lenovo ThinkPad P16 Gen 1 business laptop comes with a 3-year warranty. For a surcharge, this can also be extended to five years. Our review device has Premier Support with on-site service. However, most ThinkPad P16 configurations require the additional surcharge to enjoy this feature. Customers are only entitled to these extended service options in Germany. Internationally, the Bring In guarantee is available.
Input devices: The ThinkPad P now also has 1.5 mm key travel
Keyboard
Starting with the color, Lenovo has completely overhauled the ThinkPad P16's keyboard. The keyboard is now gray throughout, which, in our opinion, doesn't look quite as premium. While this is a relatively insignificant point of criticism, the decision to reduce the backlit keyboard's key travel from 1.8 to now only 1.5 mm as well as the reduced key height, weighs heavily: As a result, the ThinkPad keyboard loses a bit of the special flair it had before. Nevertheless, we're still dealing with a very good keyboard offering a wonderfully pleasant typing experience - although there's now not much that separates the Lenovo device from its HP and Dell competitors. It's a mystery why Lenovo themselves would choose to shorten the key travel in such a large and thick workstation.
Lenovo has not made any changes to the layout with everything as it was before. One change is of an optical nature as the outer keys are now square instead of rounded. As these are not the letter keys, it hasn't caused a negative impact on the typing experience. Similar to the rounded keys, the square keys are somewhat concave in shape.
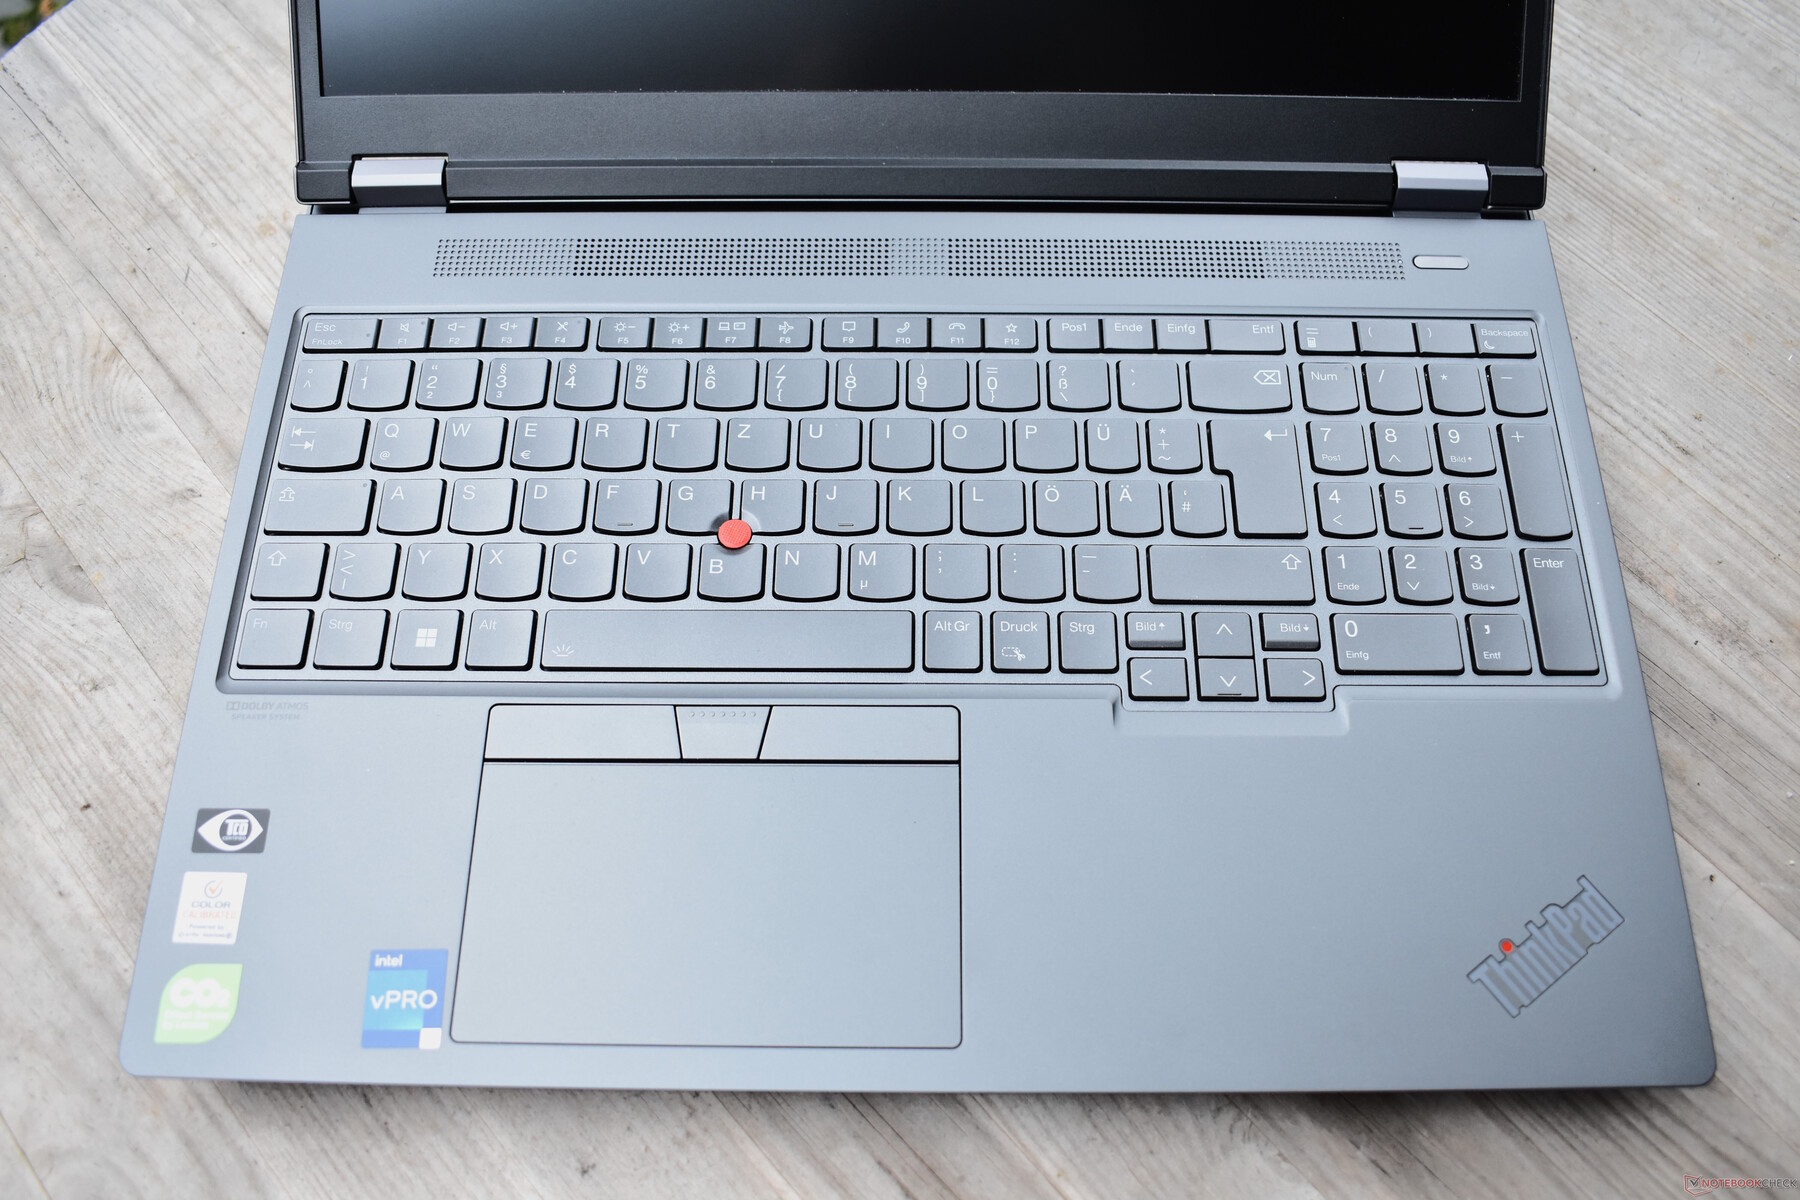
Touchpad & TrackPoint
The Lenovo ThinkPad P16 G1's touchpad appears wider than the predecessor models and, width-wise, it has now grown 11.5 cm. The surface is made of plastic which feels even smoother than its predecessor. In terms of handling, the touchpad is very good and translates multitouch gestures excellently. However, the haptic feedback falls short of trackpads made of glass. As we are dealing with a mechanical trackpad, it is only possible to apply clicks to the lower part of the pad. The click mechanism is rather dull but doesn't rattle or wobble.
The TrackPoint continues to provide a good alternative to the touchpad if the mouse pointer has to be moved quickly while typing. Compared to its predecessor, the red, rubber-capped pointing stick has remained unchanged. By contrast, Lenovo has redesigned the dedicated TrackPoint keys which now look more modern without losing anything in the way of usability.
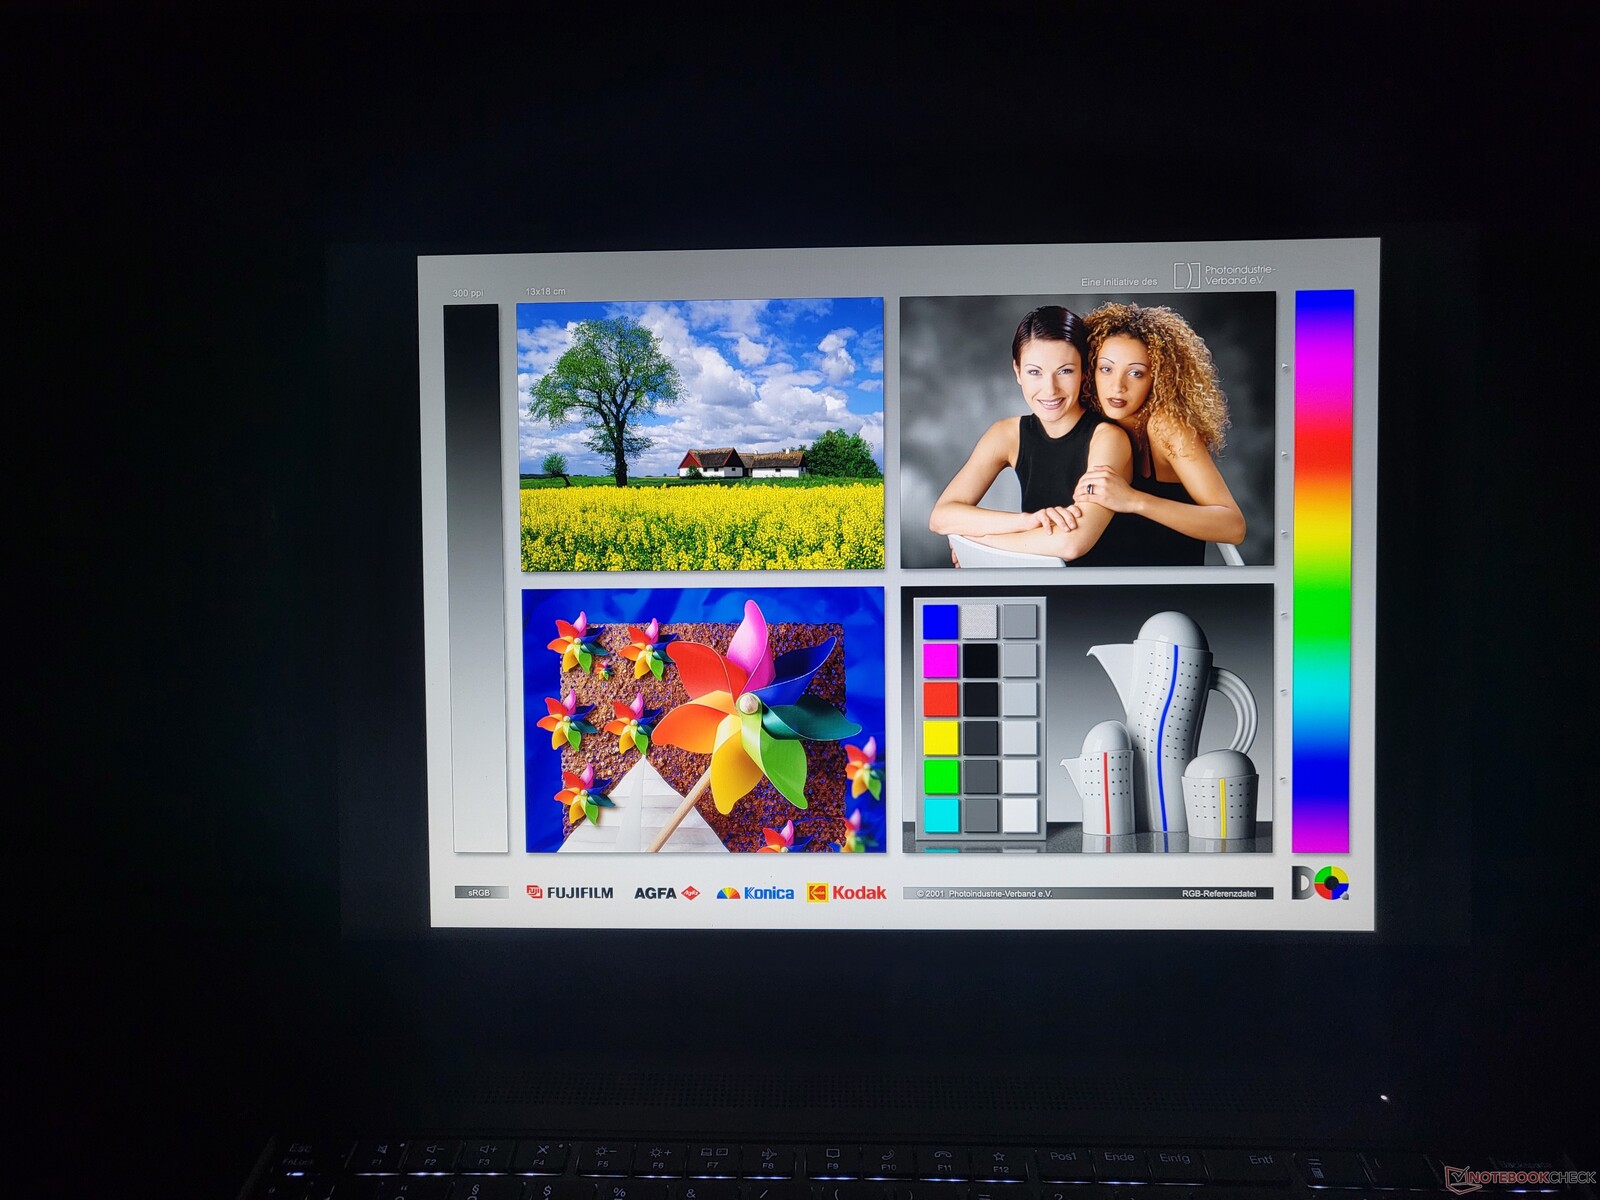
Display: A new WQXGA LCD option for the Thinkpad workstation
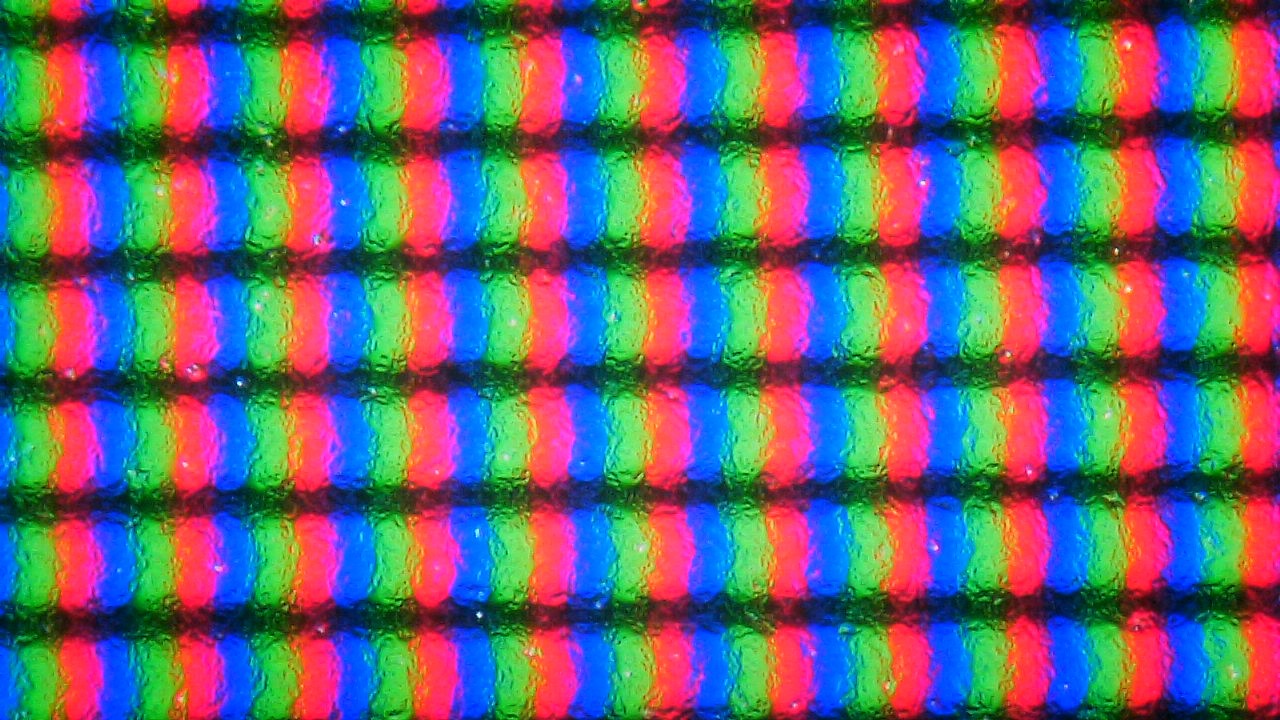
As is usual for ThinkPad laptops, the Lenovo ThinkPad P16 2022 offers a selection of various display options which cover a variety of applications and price categories. What they all have in common is a 16:10 aspect ratio as well as being 16-inch panels:
- WUXGA (1920 x 1200), IPS, 300 cd/m², 100 % sRGB, matte
- WQXGA (2560 x 1600), IPS, 400 cd/m², 100 % sRGB, matte
- WQUXGA (3840 x 2400), IPS, 600 cd/m², 100 % AdobeRGB, matte
- WQUXGA (3840 x 2400), OLED, 400 cd/m², 100 % DCI-P3, anti-glare, multi-touch
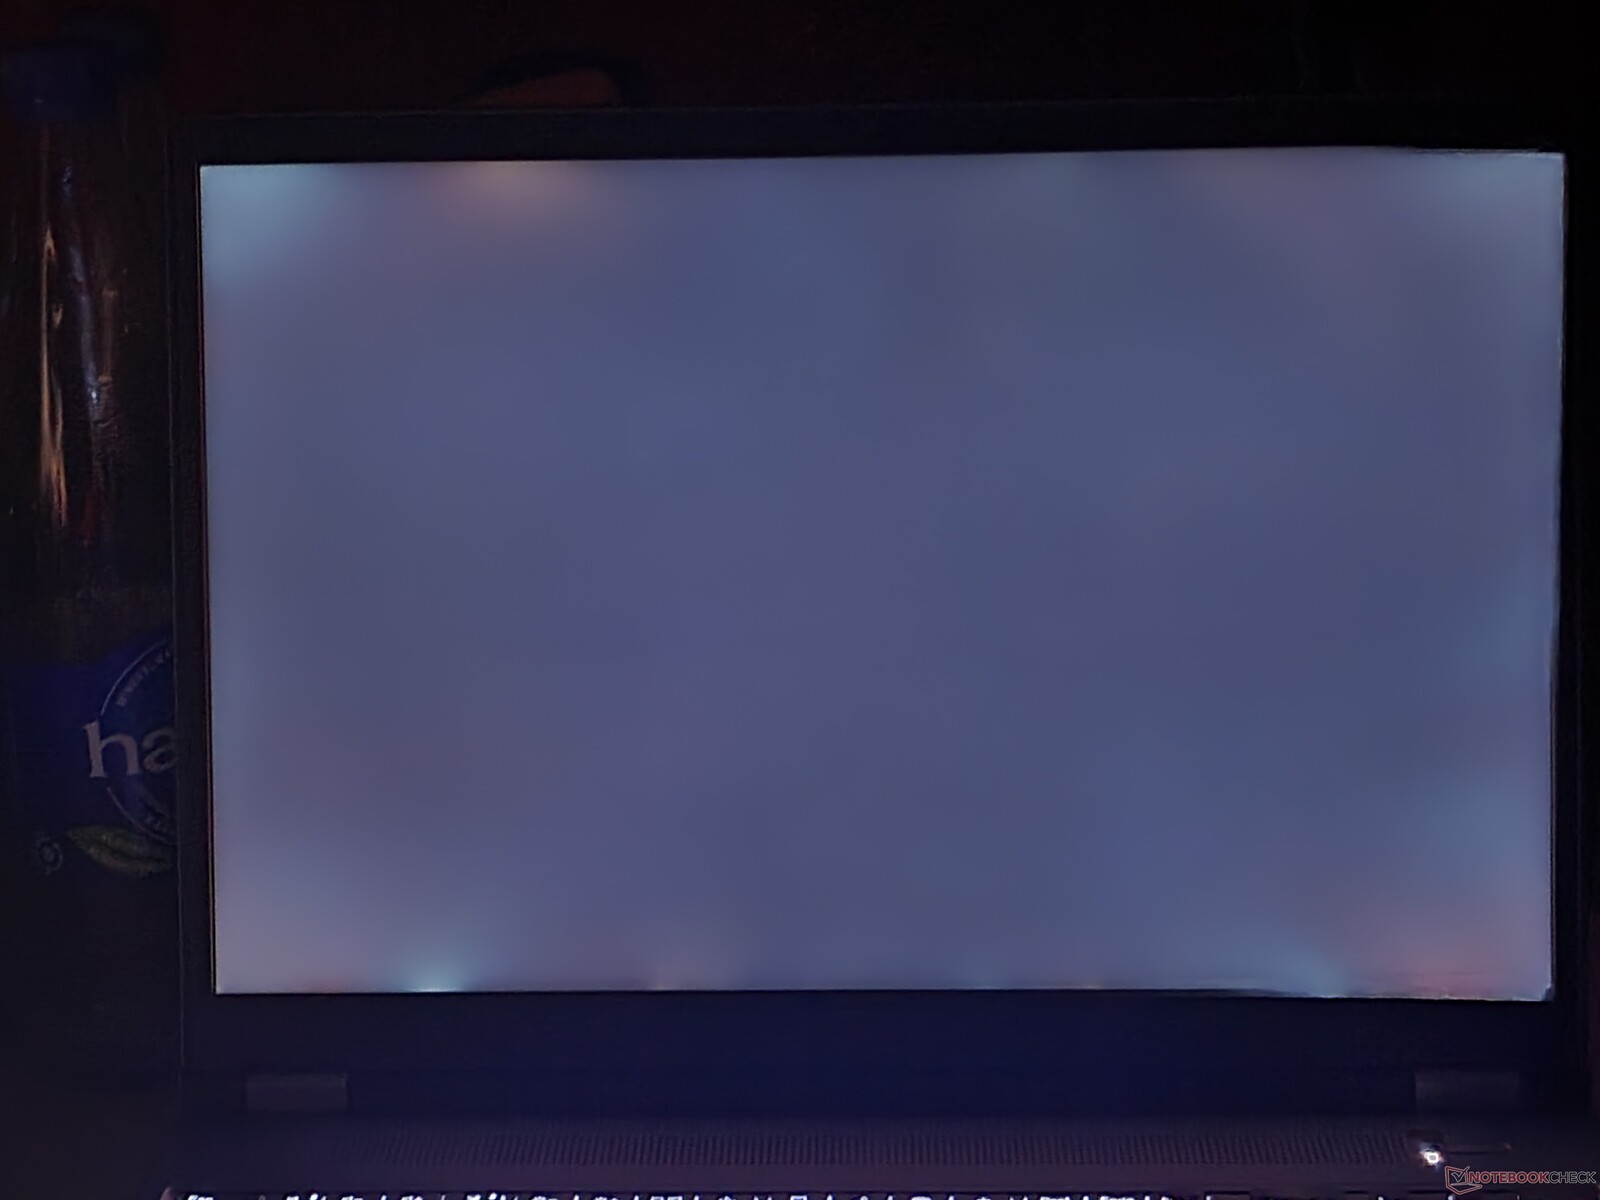
The mid-resolution level of 2.5K found in the P16 is new as the P15 and P17 were only available in 16:9 with either Full-HD (1920 x 1080) or 4K UHD (3840 x 2160). The built-in WQXGA display delivers the advertised 400 cd/m² almost on the button with an average of 398 cd/m². Compared to its direct counterparts, this puts it in the middle of the pack. The Asus ExpertBook B6 Flip's display is marginally brighter.
| |||||||||||||||||||||||||
Brightness Distribution: 90 %
Center on Battery: 424 cd/m²
Contrast: 1767:1 (Black: 0.24 cd/m²)
ΔE Color 2.6 | 0.5-29.43 Ø5, calibrated: 0.8
ΔE Greyscale 4.1 | 0.57-98 Ø5.3
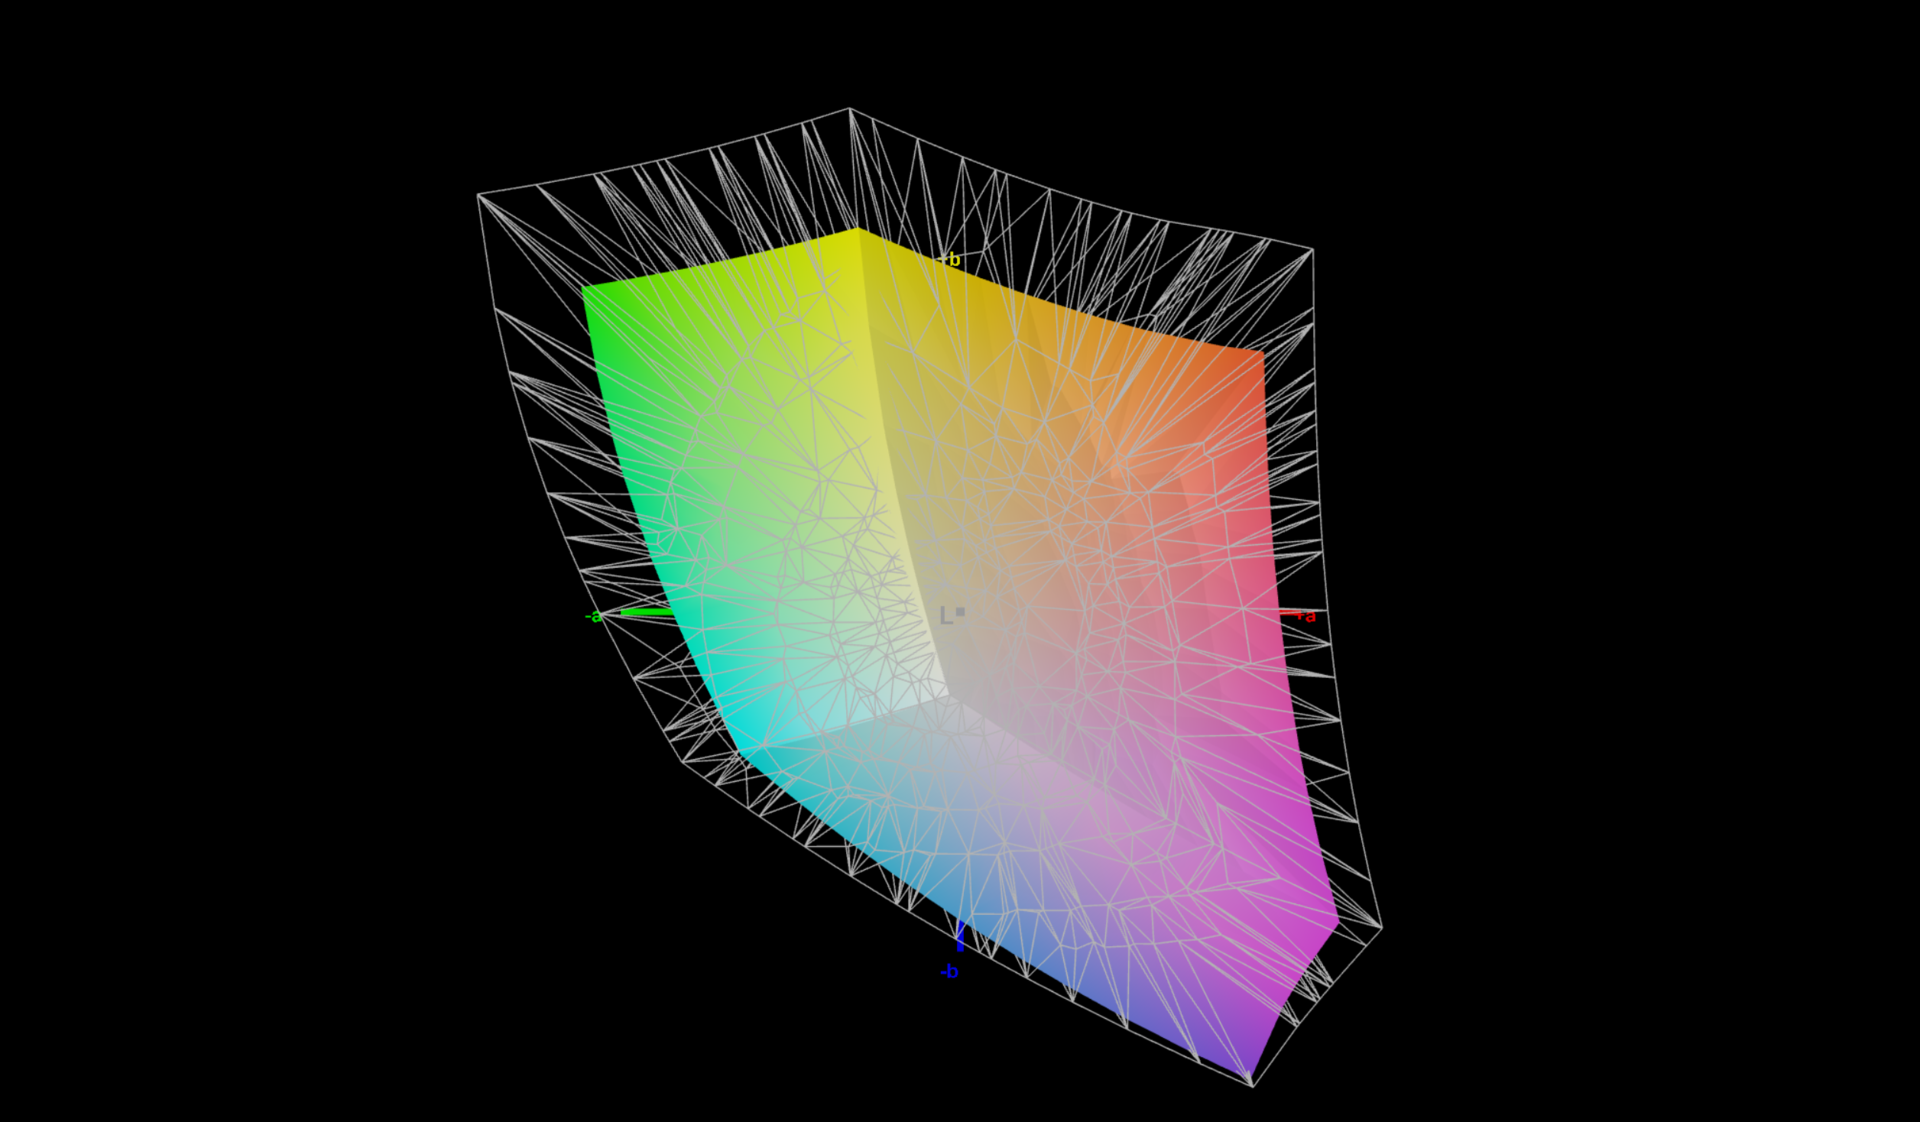
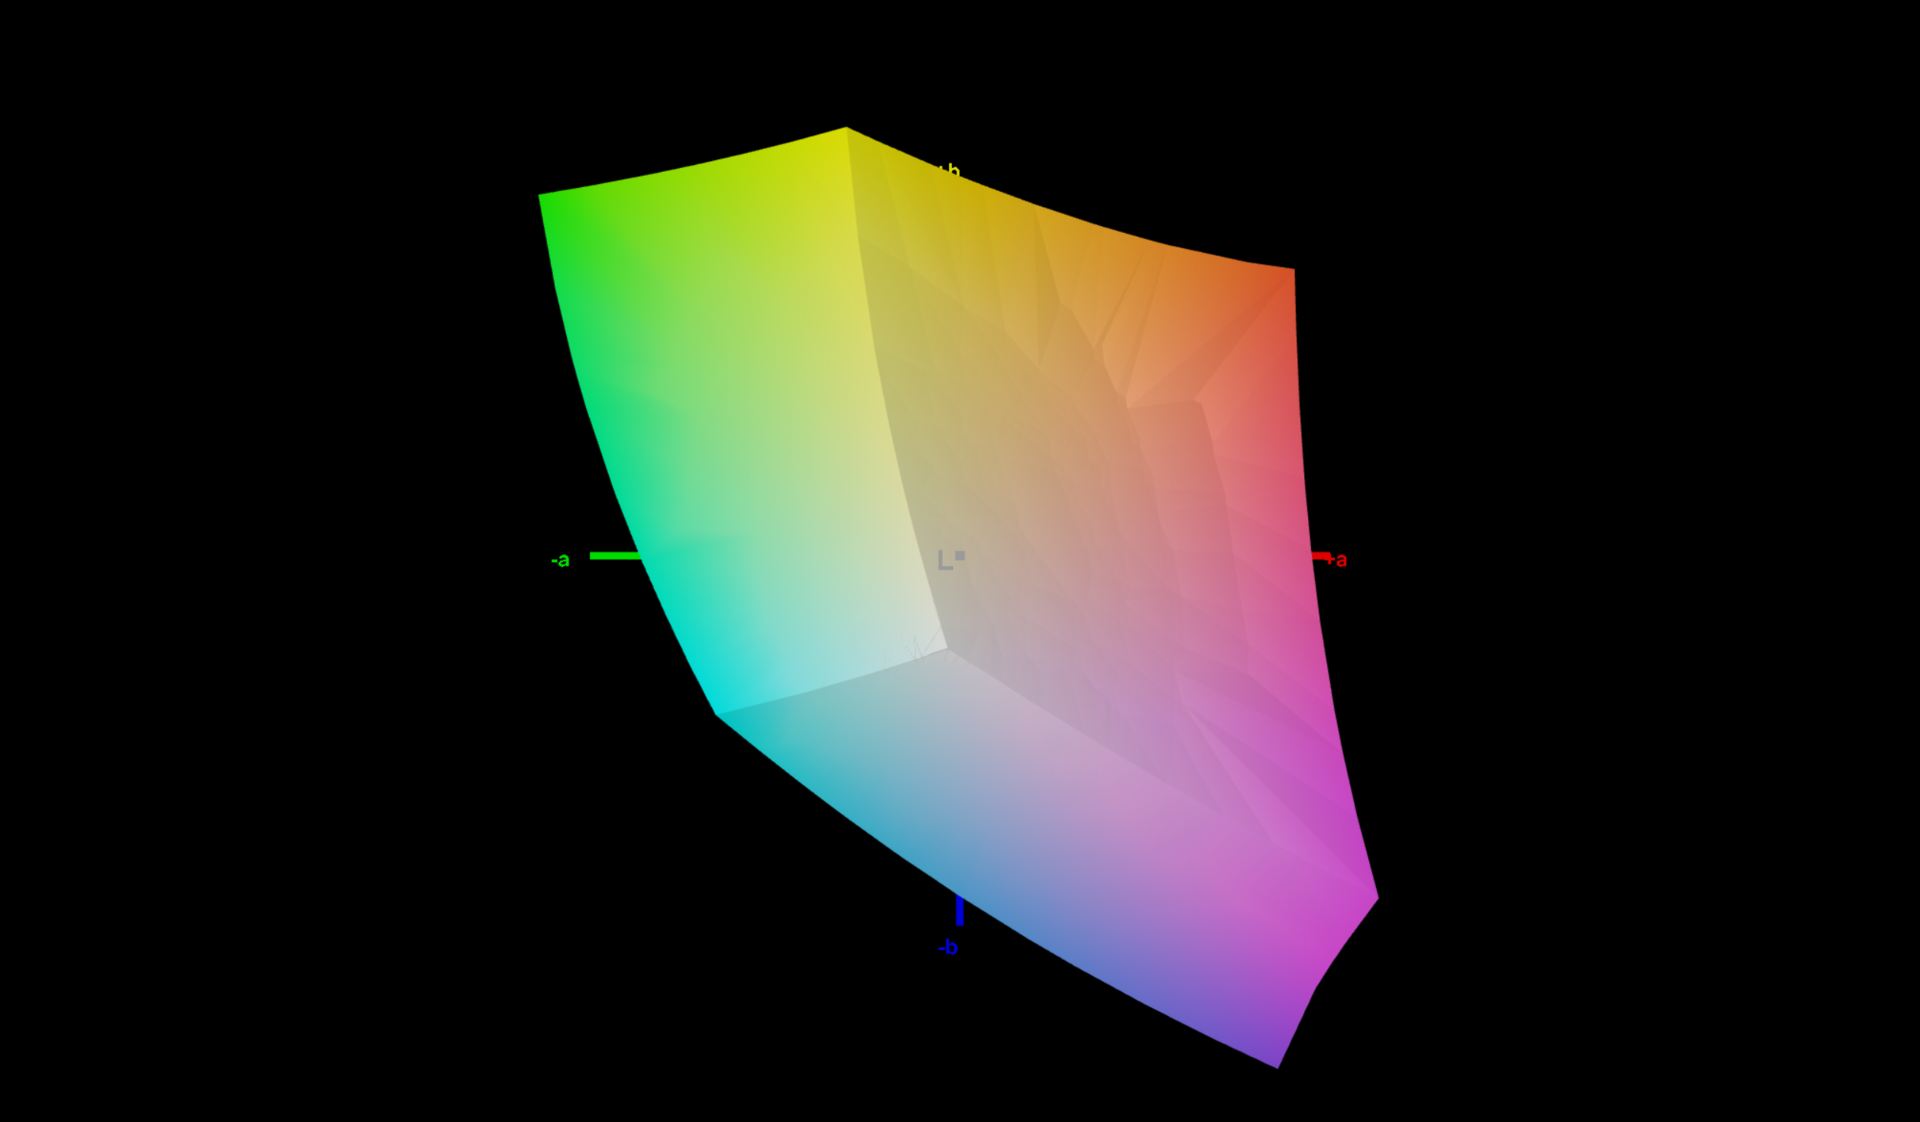
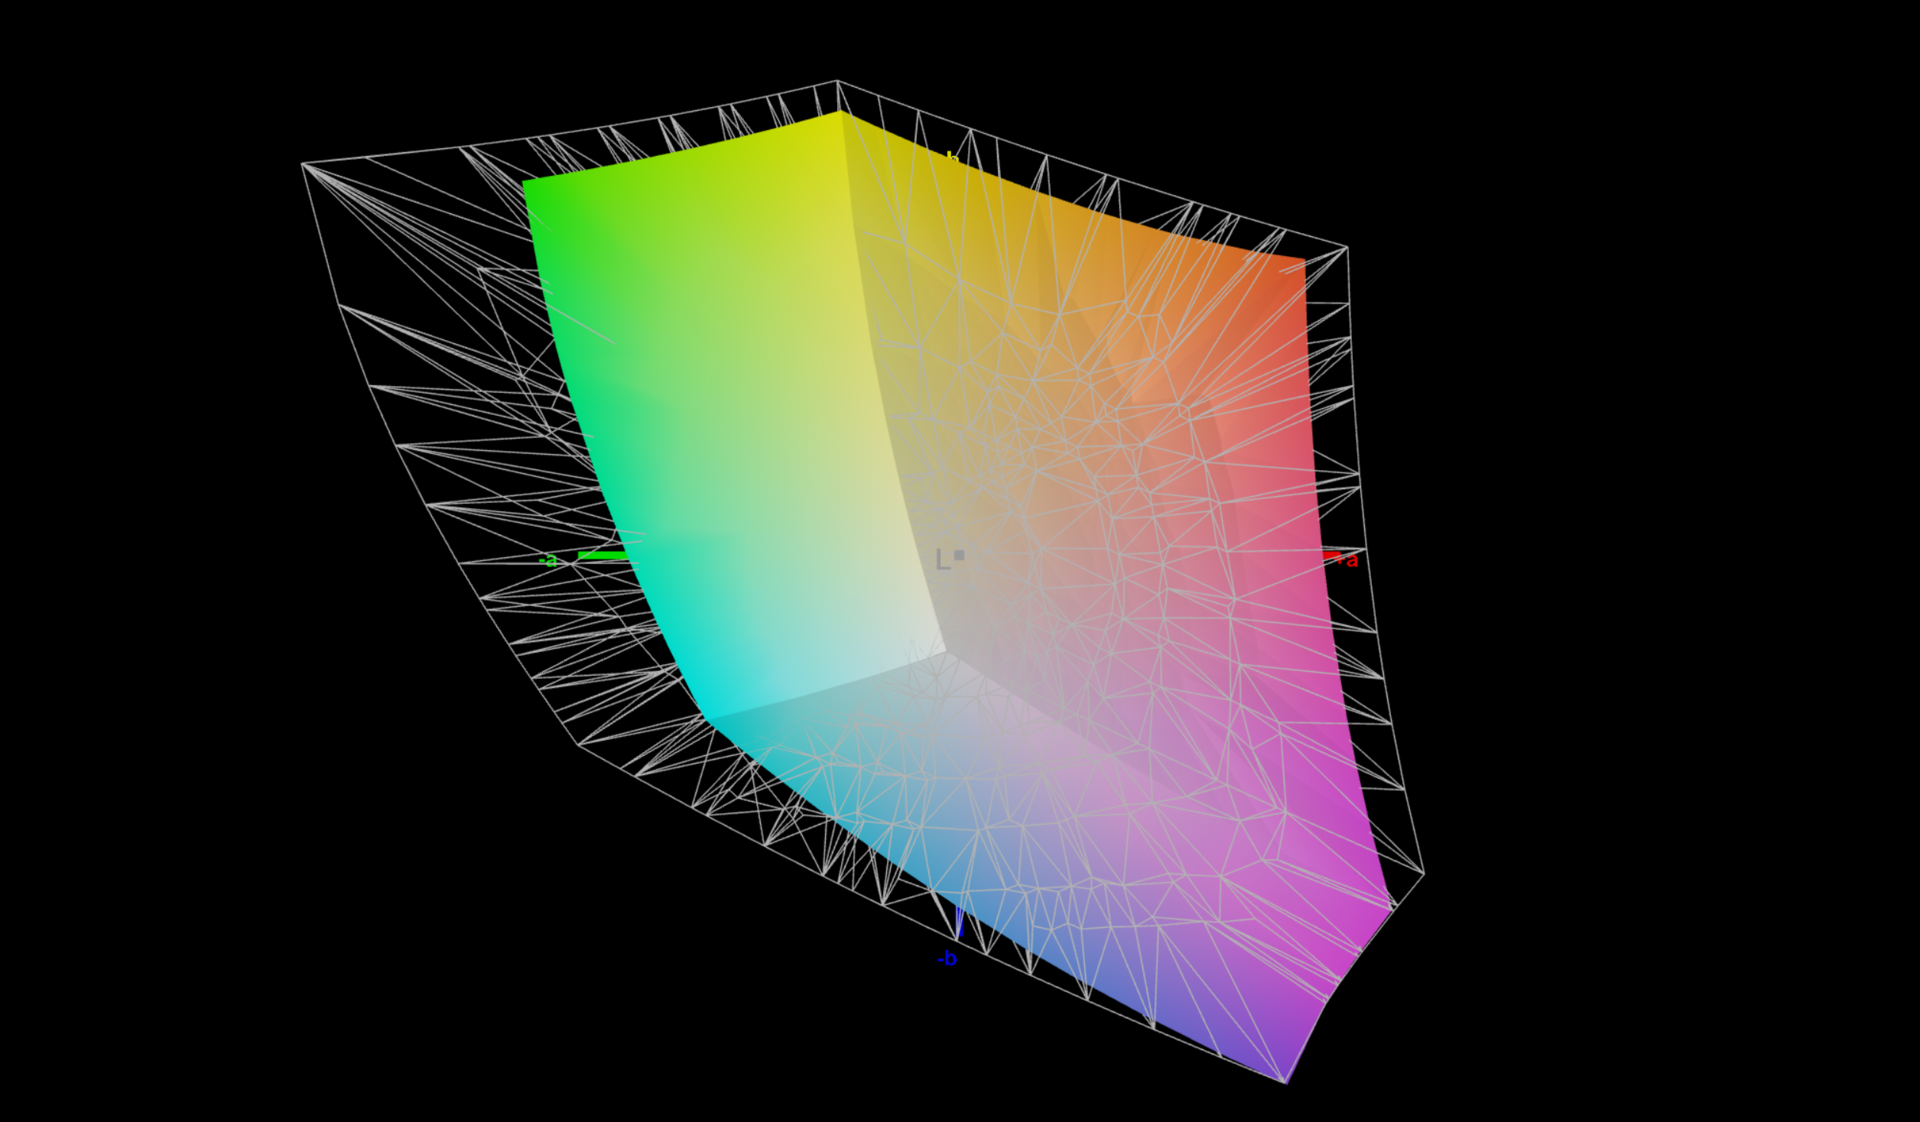
73.3% AdobeRGB 1998 (Argyll 2.2.0 3D)
100% sRGB (Argyll 2.2.0 3D)
71.5% Display P3 (Argyll 2.2.0 3D)
Gamma: 2.13
| Lenovo ThinkPad P16 G1 21D6001DMB NE160QDM-N63 , IPS LED, 2560x1600, 16.00 | Lenovo ThinkPad P15 G2-20YQ001JGE N156HCE_GN1, IPS, 1920x1080, 15.60 | Lenovo ThinkPad P17 G2-20YU0025G LP173WF4-SPF7, IPS LED, 1920x1080, 17.30 | HP ZBook Fury 17 G8-4A6A9EA AUOCD8C, IPS, 3840x2160, 17.30 | Dell Precision 7670 Samsung 160YV03, OLED, 3840x2400, 16.00 | Asus ExpertBook B6 Flip B6602FC2 AU Optronics Model: AUOE495, IPS, 2560x1600, 16.00 | |
|---|---|---|---|---|---|---|
| Display | -3% | -10% | 19% | 24% | 18% | |
| Display P3 Coverage | 71.5 | 68.6 -4% | 67.9 -5% | 99.1 39% | 99.9 40% | 97.9 37% |
| sRGB Coverage | 100 | 99.8 0% | 87.3 -13% | 100 0% | 100 0% | 99.89 0% |
| AdobeRGB 1998 Coverage | 73.3 | 70.6 -4% | 63.9 -13% | 86.8 18% | 97.5 33% | 85.52 17% |
| Response Times | 20% | 6% | -41% | 94% | 20% | |
| Response Time Grey 50% / Grey 80% * | 37.7 ? | 37.6 ? -0% | 39.2 ? -4% | 67.6 ? -79% | 1.9 ? 95% | 36 ? 5% |
| Response Time Black / White * | 26.3 ? | 16 ? 39% | 22.4 ? 15% | 26.8 ? -2% | 2 ? 92% | 17 ? 35% |
| PWM Frequency | 26040 ? | 59.5 ? | ||||
| Screen | -3% | -77% | 27% | -12% | -27% | |
| Brightness middle | 424 | 498 17% | 361 -15% | 568 34% | 340.1 -20% | 440 4% |
| Brightness | 398 | 490 23% | 334 -16% | 564 42% | 342 -14% | 418 5% |
| Brightness Distribution | 90 | 95 6% | 87 -3% | 88 -2% | 98 9% | 82 -9% |
| Black Level * | 0.24 | 0.39 -63% | 0.35 -46% | 0.33 -38% | 0.3 -25% | |
| Contrast | 1767 | 1277 -28% | 1031 -42% | 1721 -3% | 1467 -17% | |
| Colorchecker dE 2000 * | 2.6 | 2.1 19% | 5.4 -108% | 1 62% | 2.5 4% | 2.81 -8% |
| Colorchecker dE 2000 max. * | 4.9 | 5.6 -14% | 9.9 -102% | 2.4 51% | 8.19 -67% | 4.62 6% |
| Colorchecker dE 2000 calibrated * | 0.8 | 0.8 -0% | 3.2 -300% | 0.5 37% | 2.99 -274% | |
| Greyscale dE 2000 * | 4.1 | 3.4 17% | 6.5 -59% | 1.7 59% | 3.5 15% | 0.91 78% |
| Gamma | 2.13 103% | 2.32 95% | 2.23 99% | 2.18 101% | 2.12 104% | 2.2 100% |
| CCT | 7252 90% | 7162 91% | 7351 88% | 6461 101% | 6704 97% | 6600 98% |
| Total Average (Program / Settings) | 5% /
1% | -27% /
-51% | 2% /
16% | 35% /
17% | 4% /
-10% |
* ... smaller is better
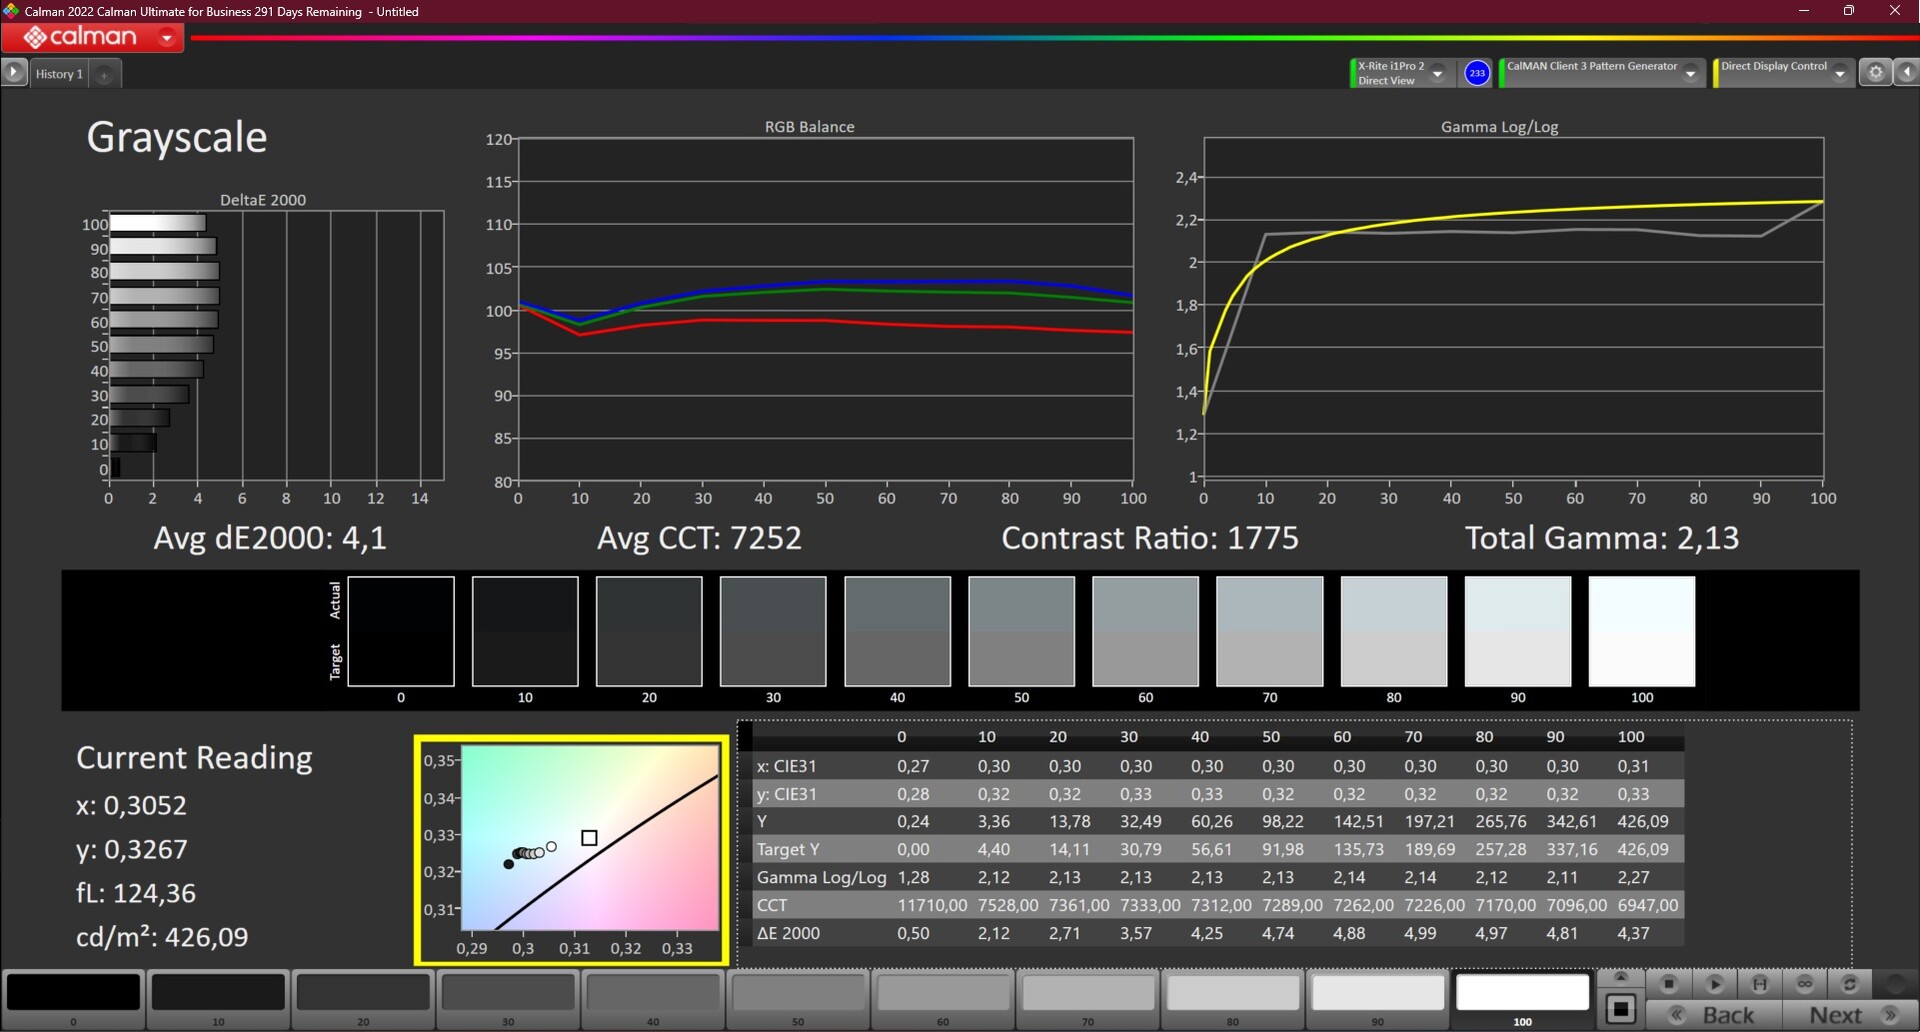
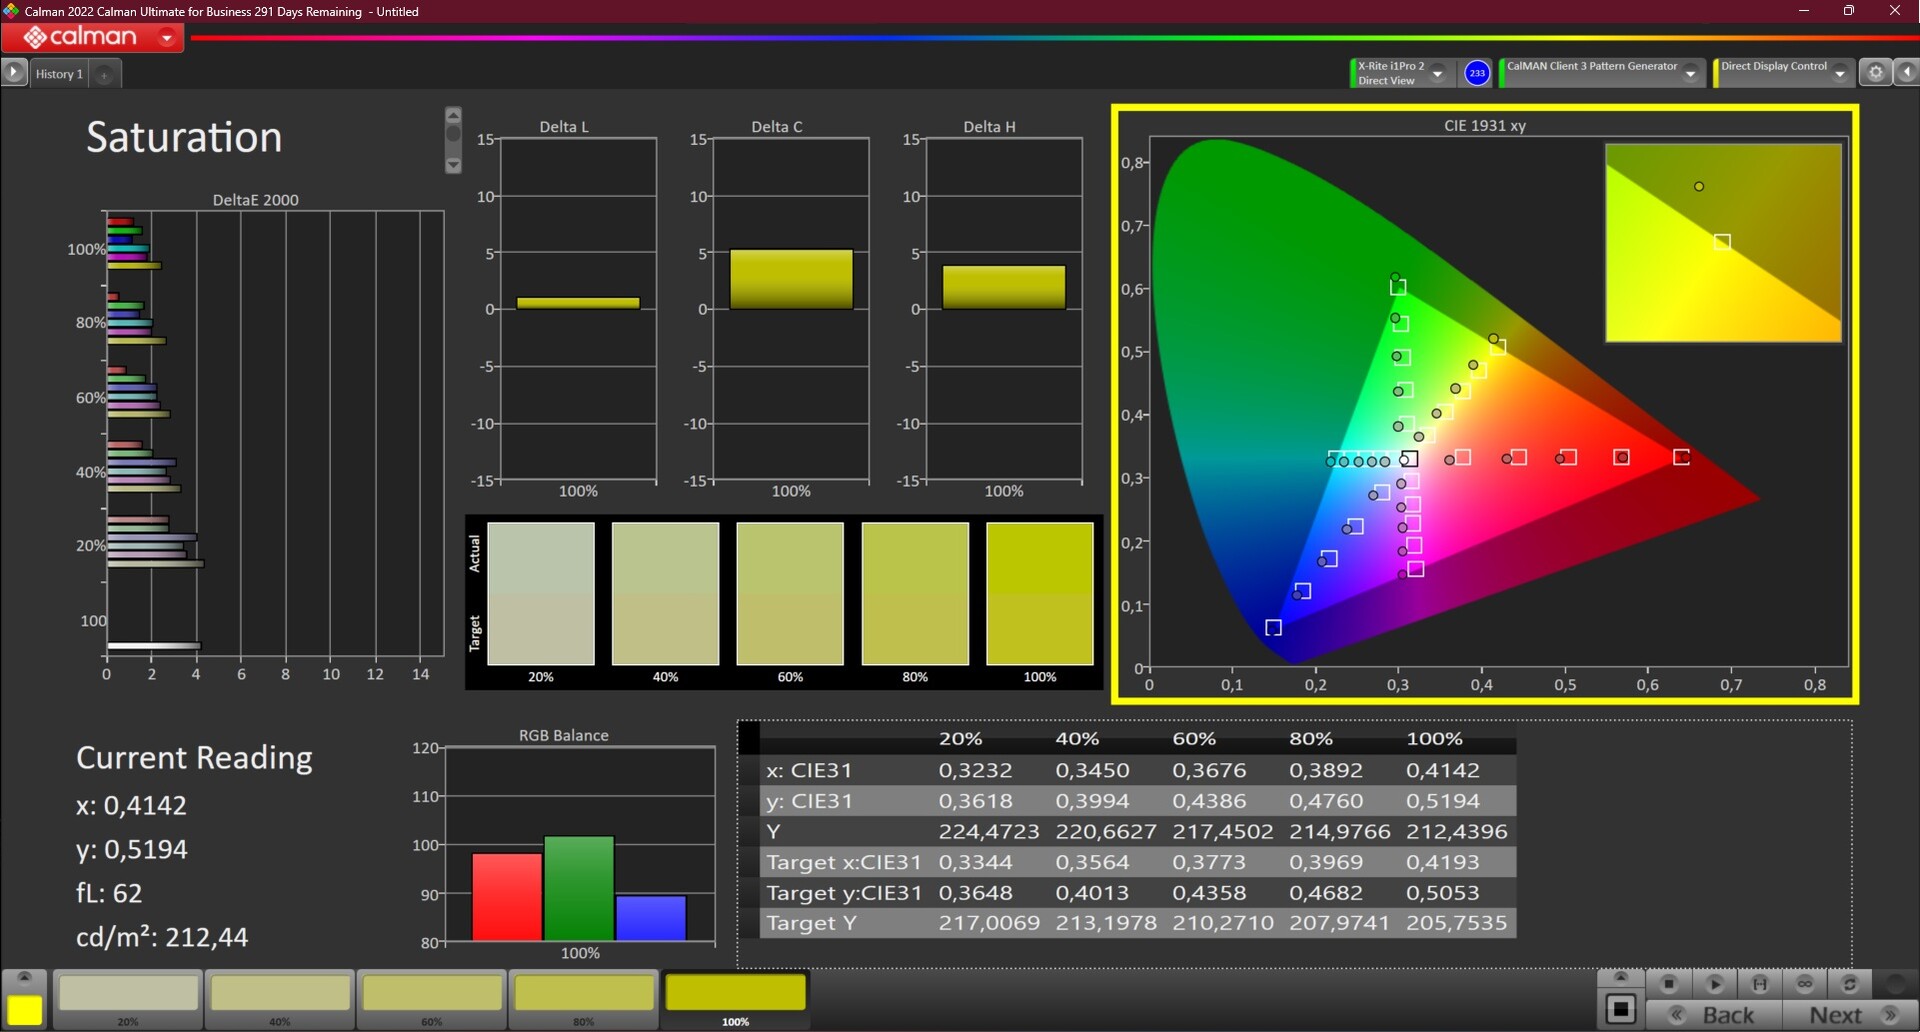
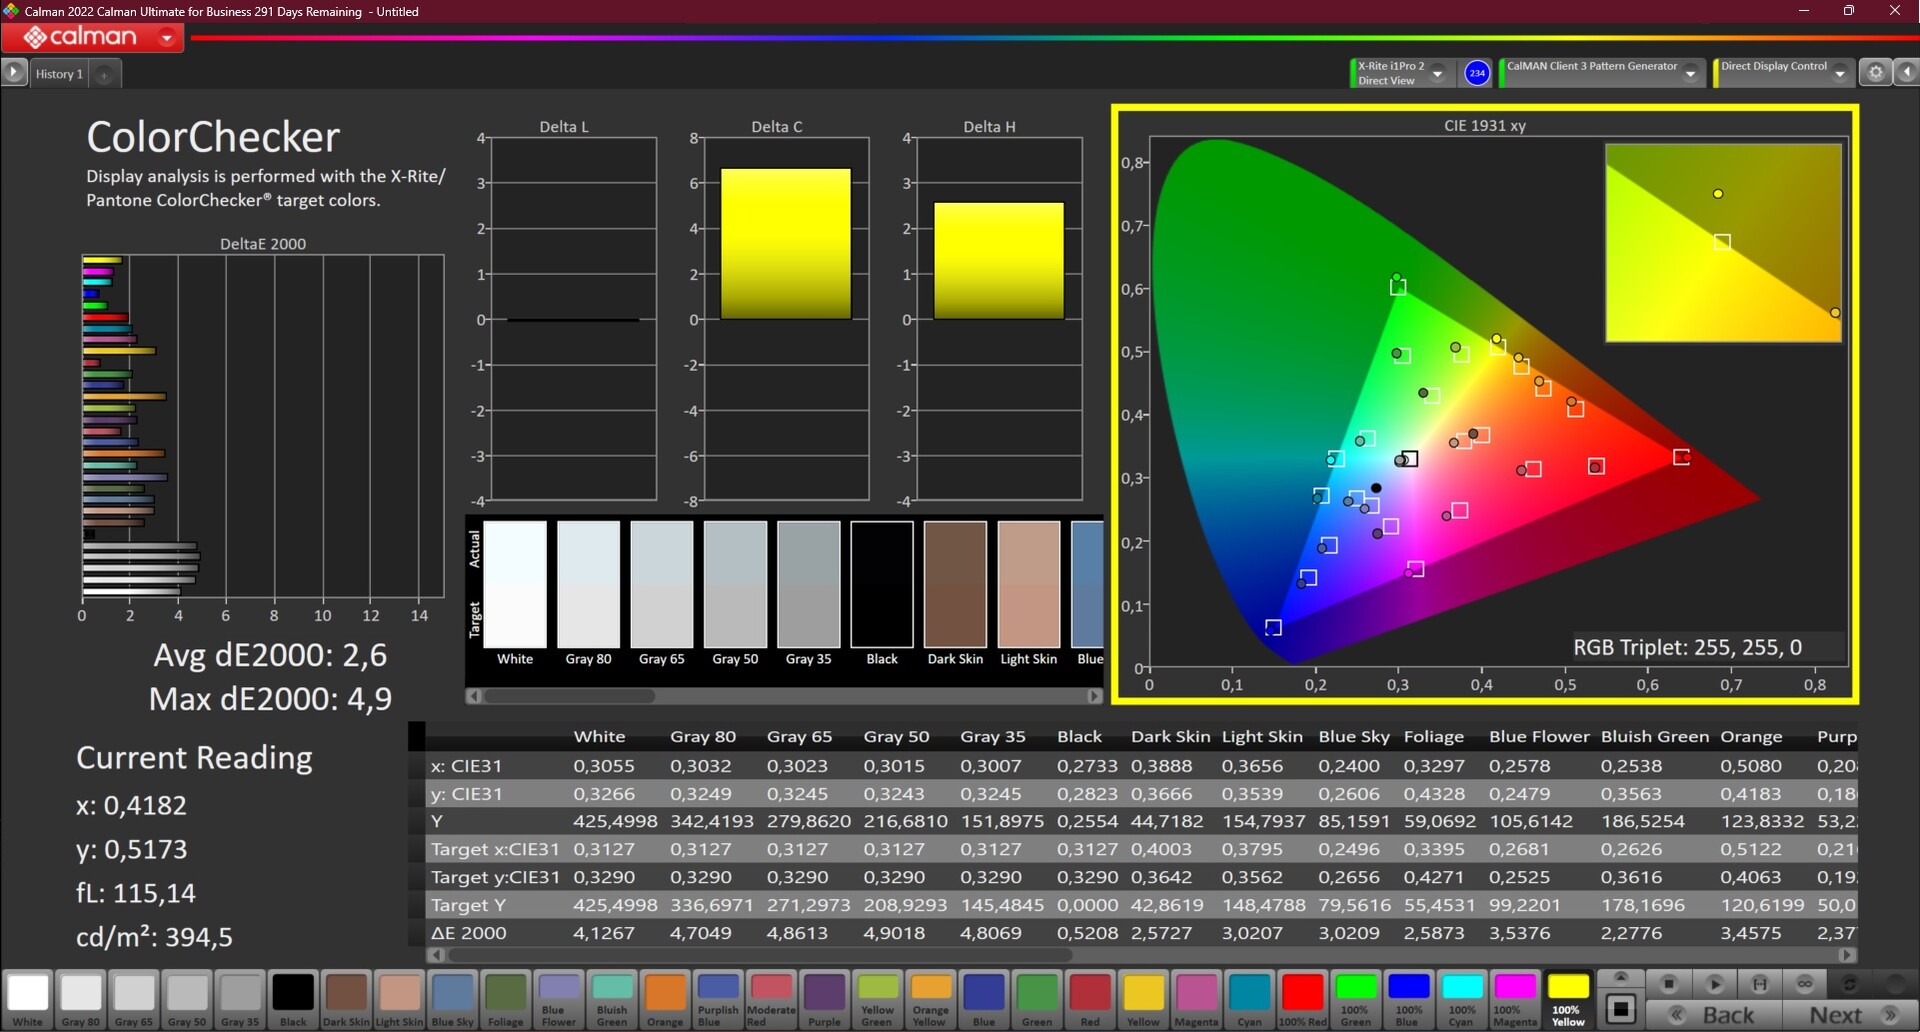
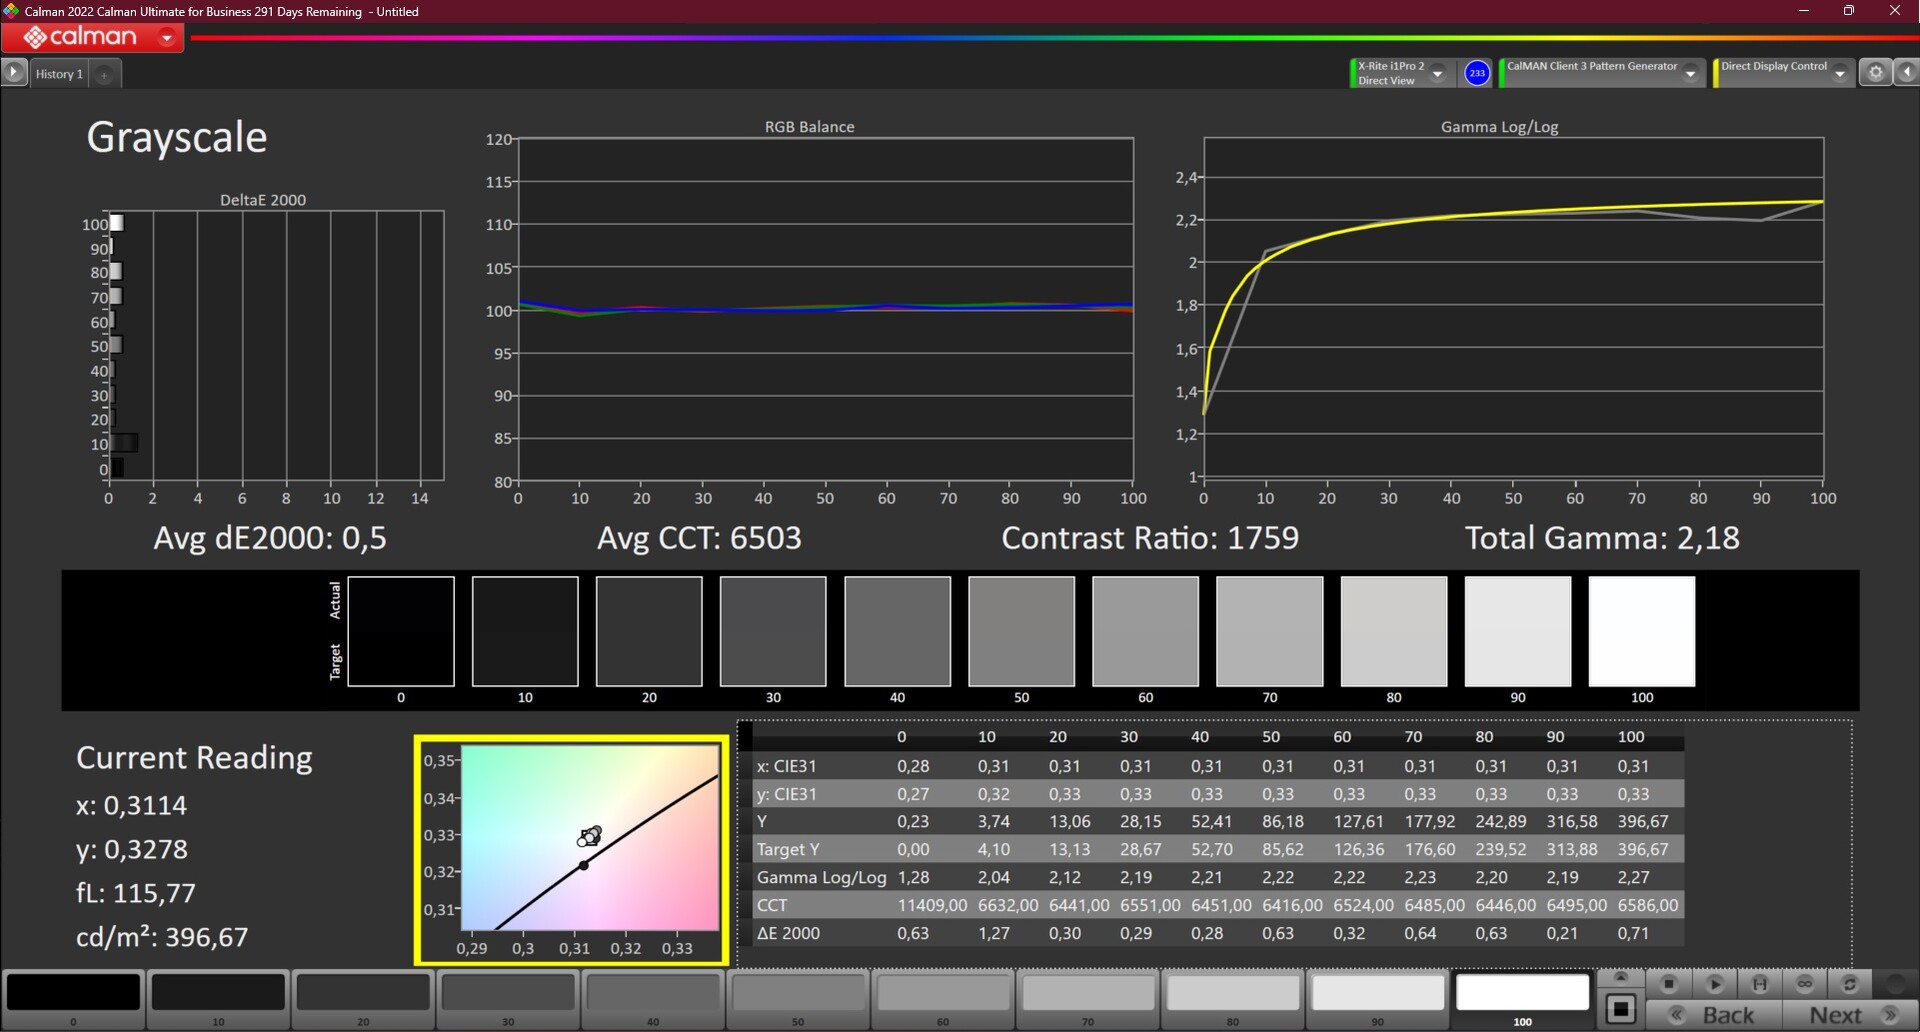
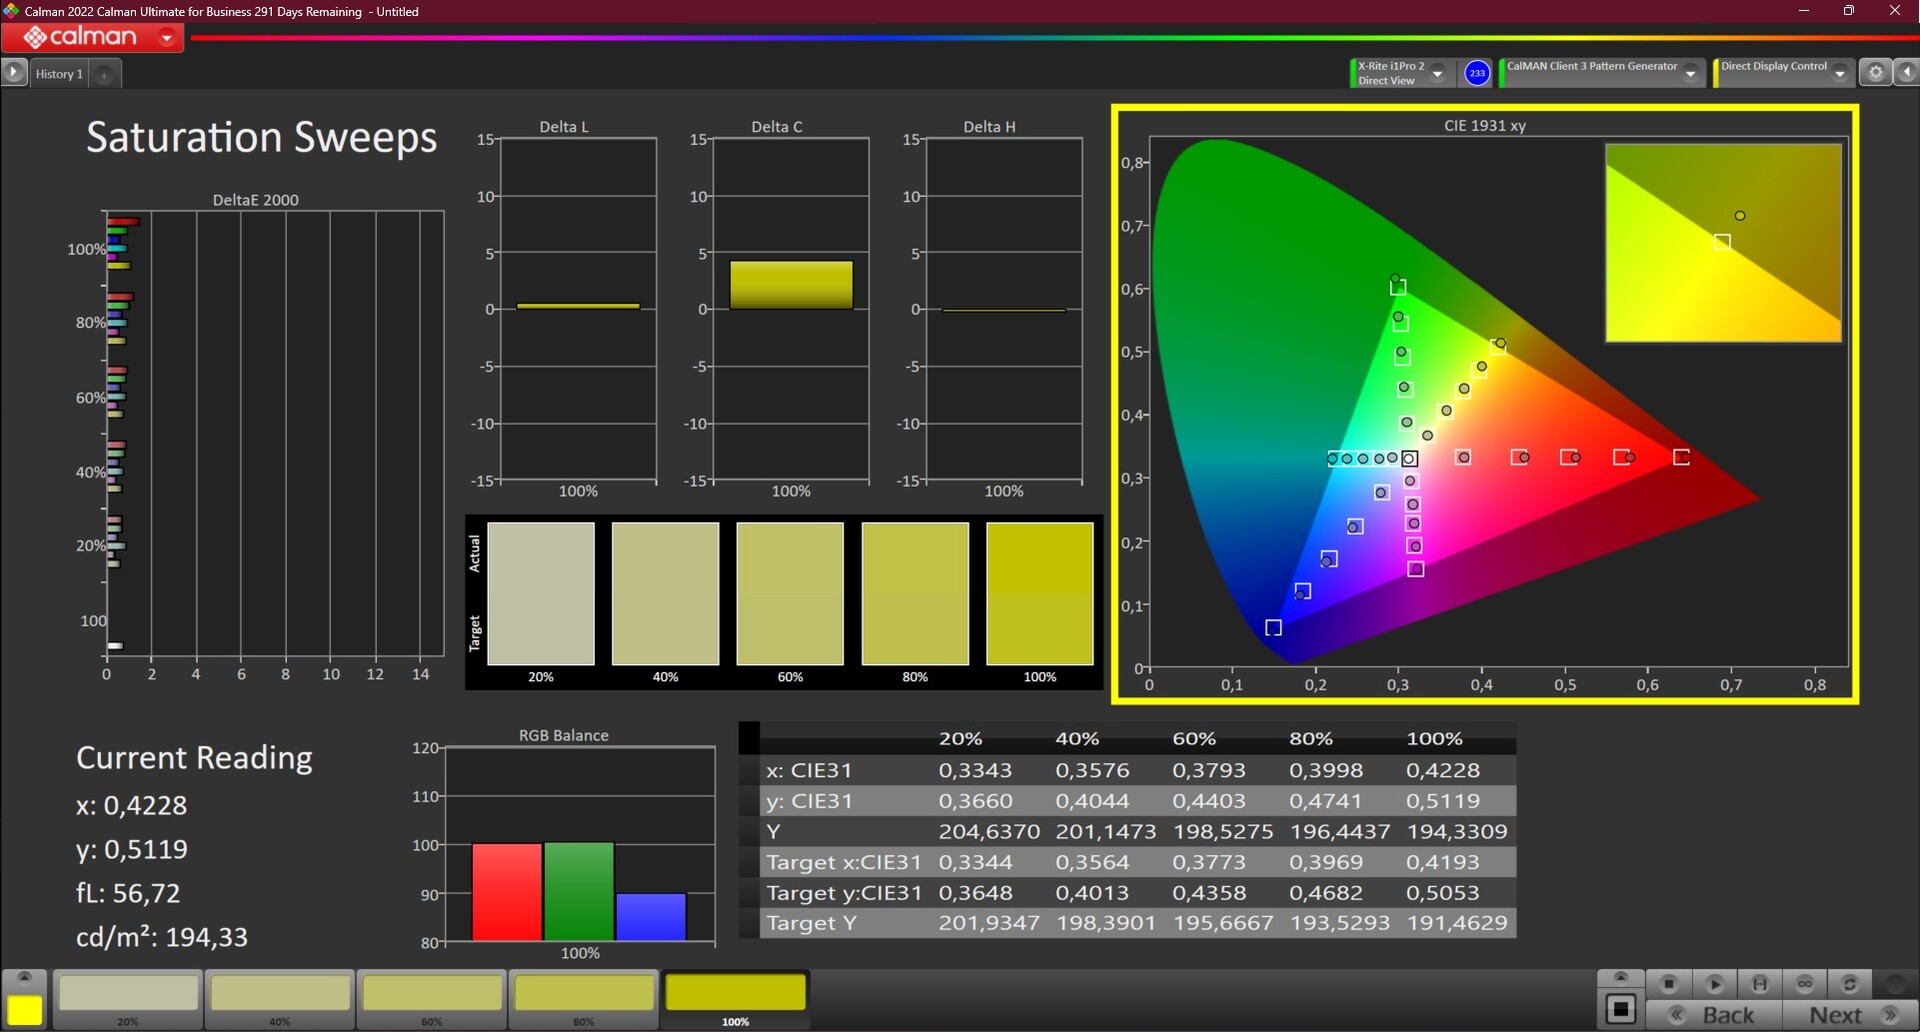
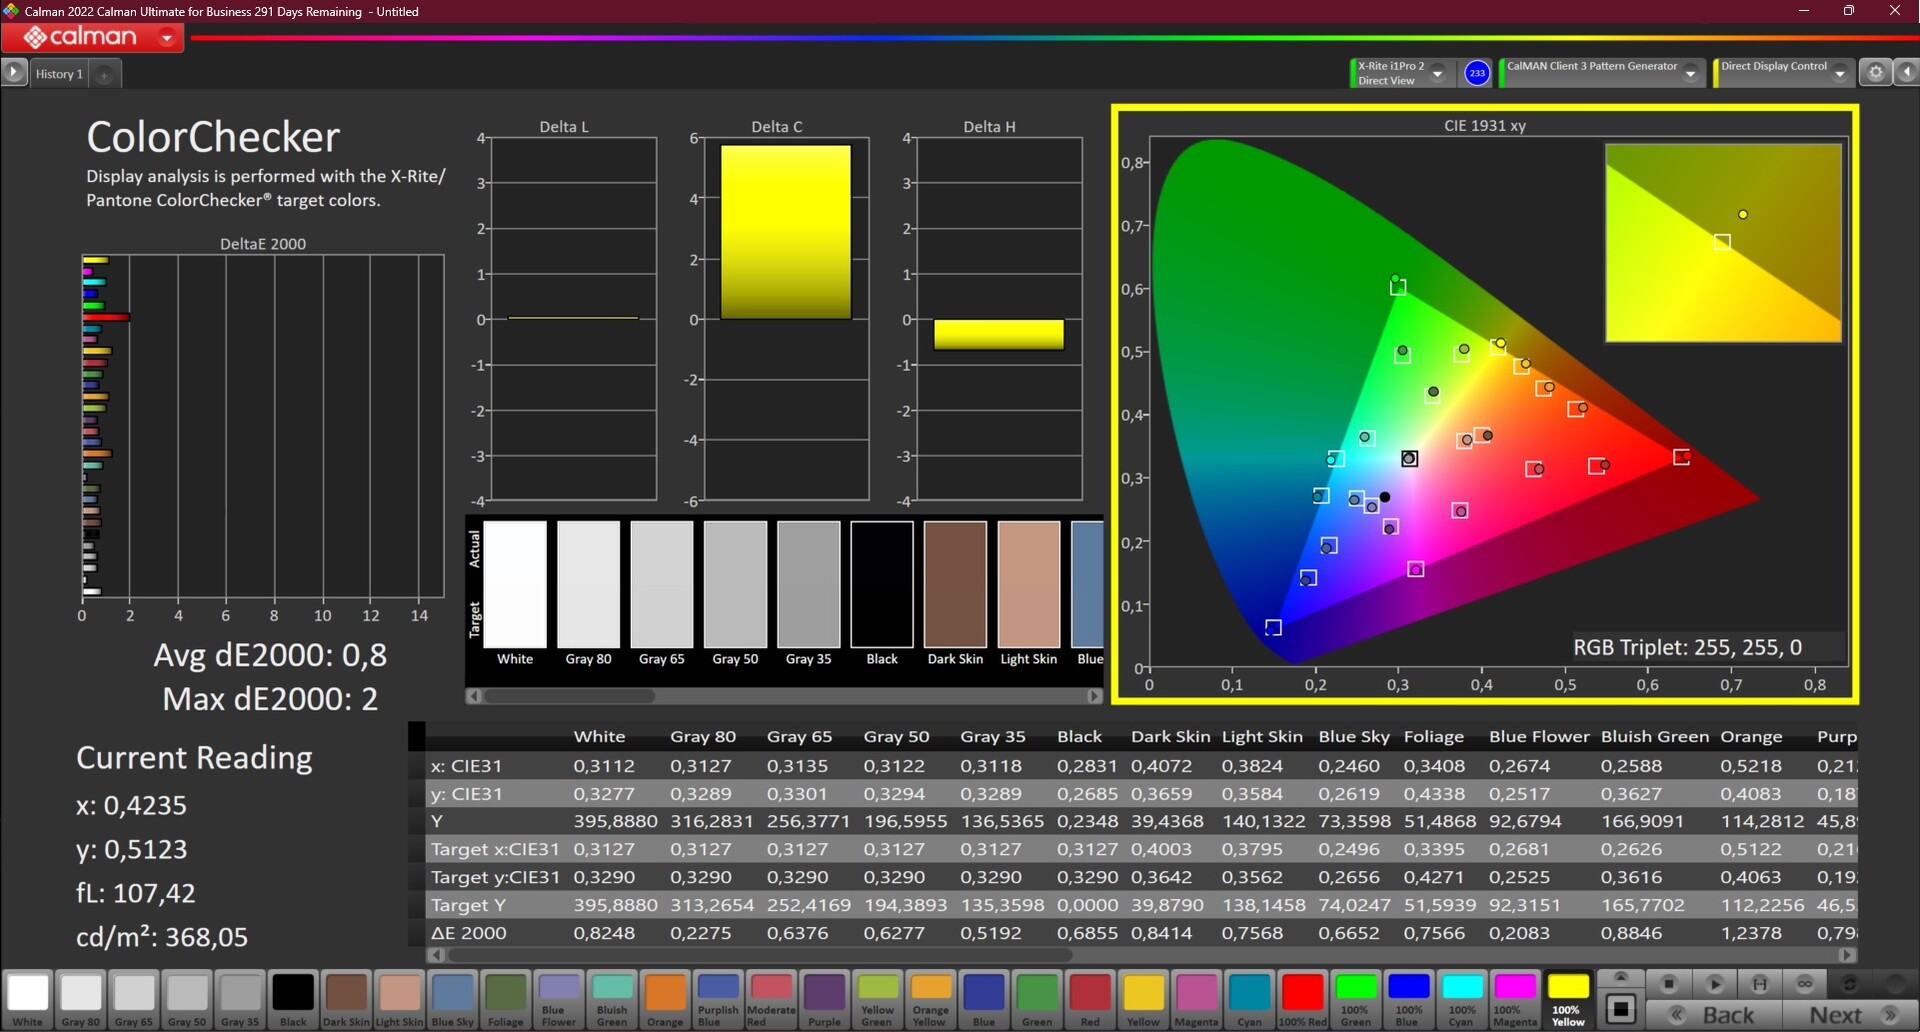
Out of the box, the colors were set a little too cold which we were able to measure using CalMan and the X-Rite i1Pro 2 Colorimeter. Calibration helped correct this and also contributed to achieving an excellent DeltaE value of 0.8. As always, the profile we created is available to download, free of charge.
Once calibrated, the display can also be used for simple image processing as it completely covers the sRGB color space. For larger color spaces, one of the WQUXGA options should be selected.
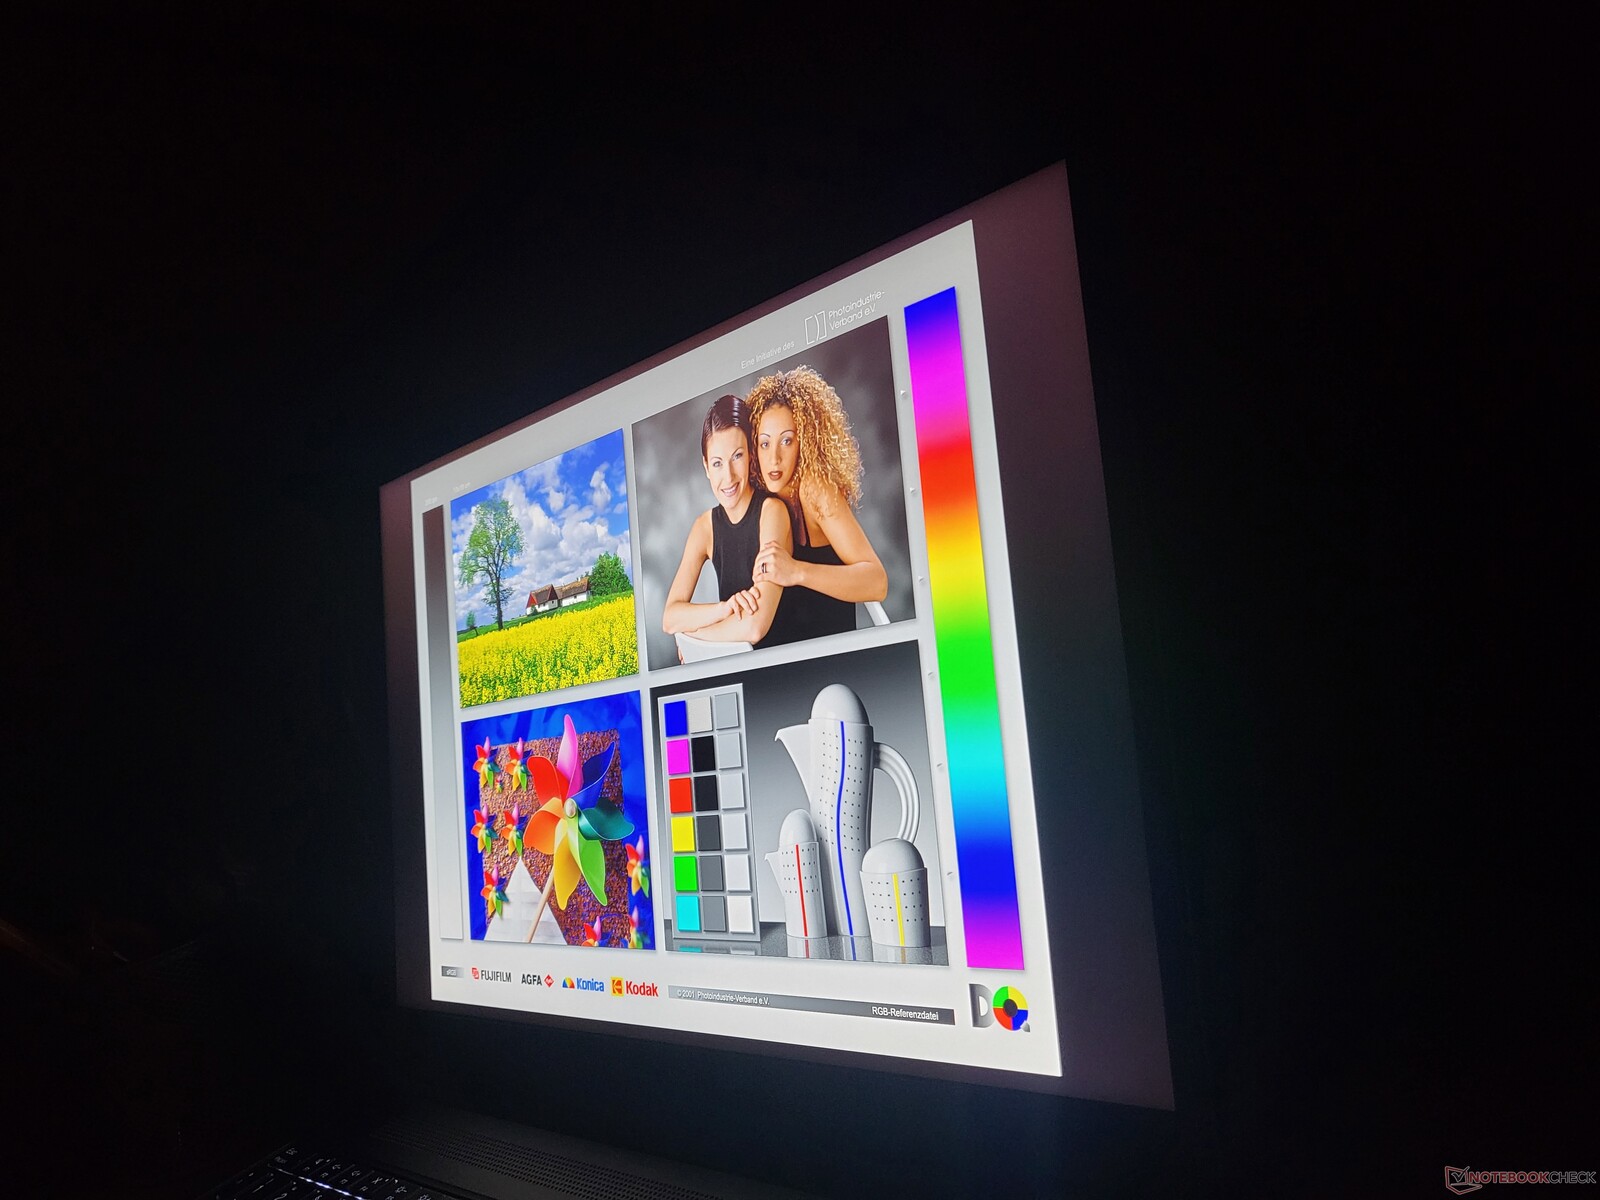
Outdoors, the Lenovo ThinkPad P16 G1 does very well thanks to the matte display's good brightness levels.
Display Response Times
| ↔ Response Time Black to White | ||
|---|---|---|
| 26.3 ms ... rise ↗ and fall ↘ combined | ↗ 14 ms rise | 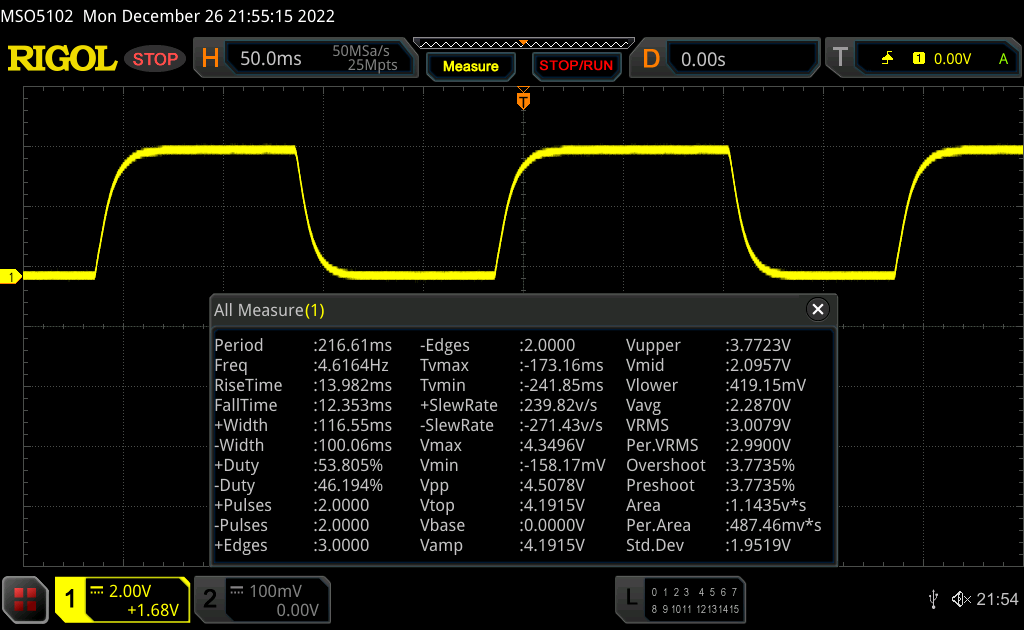 |
| ↘ 12.3 ms fall | ||
| The screen shows relatively slow response rates in our tests and may be too slow for gamers. In comparison, all tested devices range from 0.1 (minimum) to 240 (maximum) ms. » 61 % of all devices are better. This means that the measured response time is worse than the average of all tested devices (21.5 ms). | ||
| ↔ Response Time 50% Grey to 80% Grey | ||
| 37.7 ms ... rise ↗ and fall ↘ combined | ↗ 18.6 ms rise | 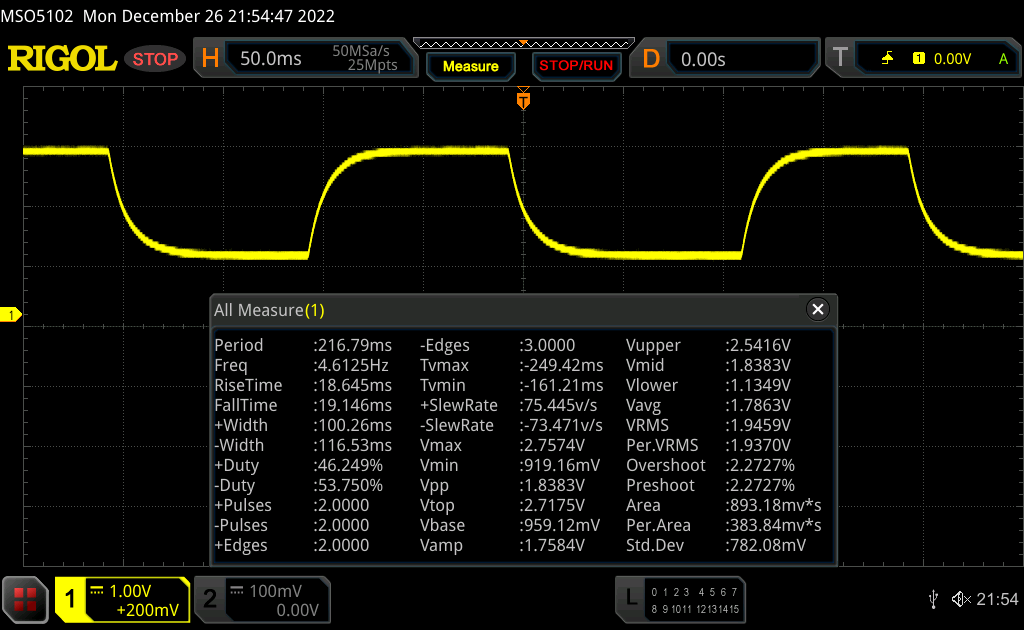 |
| ↘ 19.1 ms fall | ||
| The screen shows slow response rates in our tests and will be unsatisfactory for gamers. In comparison, all tested devices range from 0.2 (minimum) to 636 (maximum) ms. » 49 % of all devices are better. This means that the measured response time is worse than the average of all tested devices (33.7 ms). | ||
Screen Flickering / PWM (Pulse-Width Modulation)
| Screen flickering / PWM not detected | 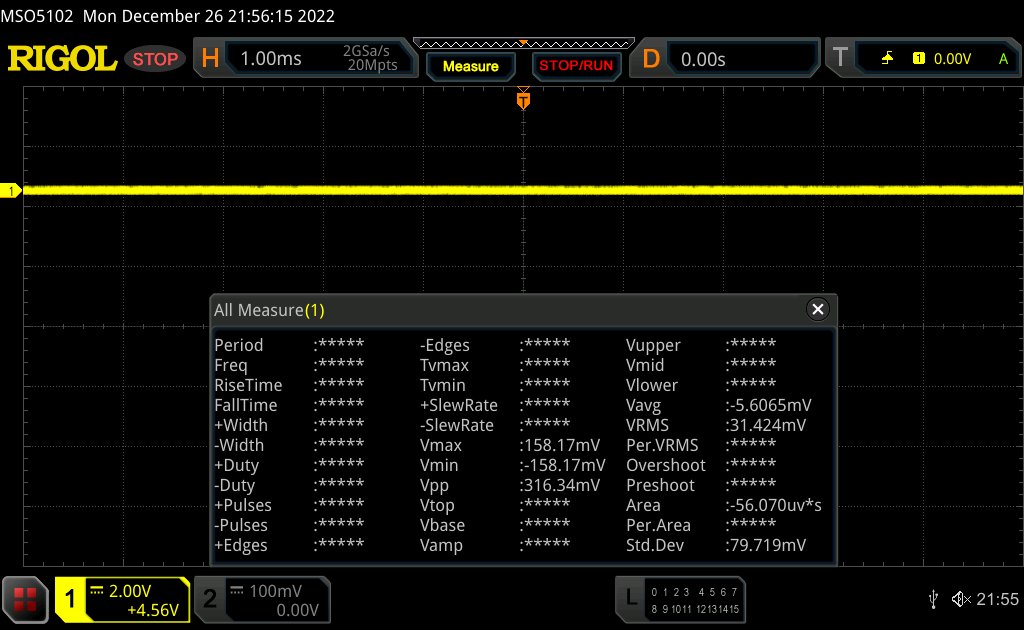 | ||
In comparison: 53 % of all tested devices do not use PWM to dim the display. If PWM was detected, an average of 17900 (minimum: 5 - maximum: 3846000) Hz was measured. | |||
Performance: A powerful Intel CPU and a rather weak Nvidia GPU
Lenovo offers the ThinkPad P16 G1 in a wide variety of configurations. All contain an Intel processor from the Alder Lake HX series with the options being the Intel Core i5-12600HX, i7-12800HX, i7-12850HX, i9-12900HX as well as the i9-12950HX. Unfortunately, Xeon CPUs are no longer available and their job is now being done by the CPUs which end in 50. As Lenovo doesn't solder its GPUs, every one of these processors can be configured with one of the following GPUs: Intel ARC Pro A30M, Nvidia RTX A1000, RTX A2000, RTX A3000, RTX A4500 and RTX A5500.
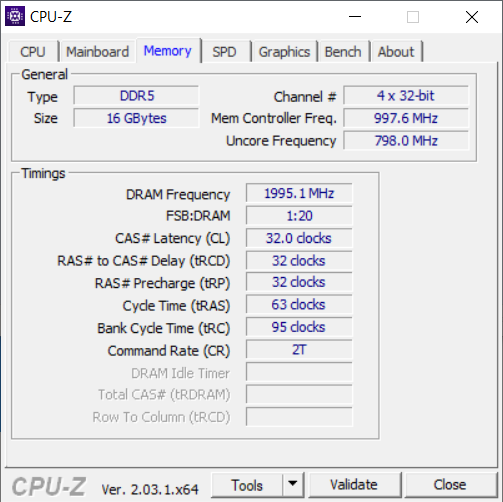
The possible variations don't end here as the Lenovo ThinkPad P16 G1 has four RAM slots. That makes it possible to have up to 128 GB of DDR5-3600 RAM whereby also ECC RAM is available for 50 model CPUs. There are a total of two SSD slots and both can accept M.2 2280 SSDs. The maximum capacity mass storage Lenovo sells in its ThinkPad laptop is up to eight terabytes and comes in the shape of two 4-terabyte SSDs.
Test conditions
Lenovo uses Windows' own power modes for its ThinkPads power modes. For a short time, the processor can consume up to 125 watts but is limited to 95 watts for longer periods. If the power mode "Better Performance" is selected instead of "Best Performance" the consumption sits briefly at 100 watts and 80 watts under continuous load. Using the "More Battery Efficiency" mode, the limitations are considerably more severe with the turbo at 70 watts and the sustained consumption sitting at 30 watts. Apart from the WiFi battery test, our tests were carried out using "Best Performance" mode.
One special feature of our review device: It still comes with Windows 10 Pro. For most tests, this is not a problem but this older version of Windows was responsible for a very low score in Cinebench R15. For this reason we decided against the Cinebench R15 loop with this device.
Processor
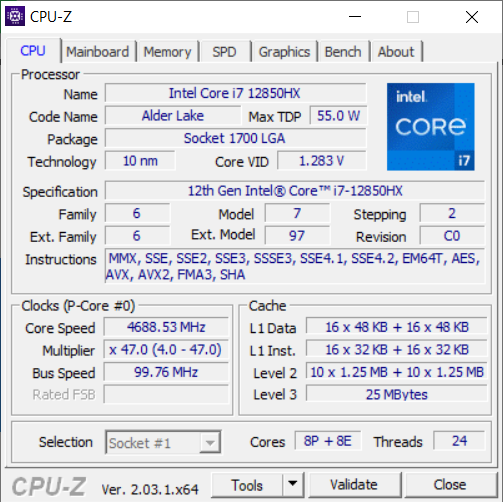
The Intel Core i7-12850HX is a processor with a total of 16 cores. Since "Alder Lake" architecture possesses an asymmetric structure, eight of these cores are the powerful P-cores (2.1 to 4.8 GHz) with the other eight cores being the efficient E-cores (1.5 to 3.4 GHz). Thanks to hyperthreading, the processor has over 24 threads. As a member of the HX55 series, the typical TDP hovers at around 55 watts. For detailed comparisons with other current processors, check our CPU list.
The system's CPU performance is excellent and above average for this processor. The ThinkPad P16 beats the Dell Precision 7670 quite convincingly. However, the Asus ExpertBook B6 Flip is faster thanks to its i9. Interestingly, the X1 Extreme G5 is almost on par with the P16 although has just the six P-cores. Compared to the P15 G2 and P17 G2, the CPU performance is around 31 to 35 % better.
In battery mode, the ThinkPad P16 scored 14.844 points in Cinebench R23. Without a connected power supply unit, the CPU performance is around 15 percent lower.
Cinebench R23 Multi Endurance Test
Cinebench R23: Multi Core | Single Core
Cinebench R20: CPU (Multi Core) | CPU (Single Core)
Cinebench R15: CPU Multi 64Bit | CPU Single 64Bit
Blender: v2.79 BMW27 CPU
7-Zip 18.03: 7z b 4 | 7z b 4 -mmt1
Geekbench 5.5: Multi-Core | Single-Core
HWBOT x265 Benchmark v2.2: 4k Preset
LibreOffice : 20 Documents To PDF
R Benchmark 2.5: Overall mean
| CPU Performance Rating | |
| Asus ExpertBook B6 Flip B6602FC2 | |
| Lenovo ThinkPad P16 G1 21D6001DMB | |
| Lenovo ThinkPad X1 Extreme G5-21DE003RGE | |
| Average Intel Core i7-12850HX | |
| Average of class Workstation | |
| Dell Precision 7670 | |
| HP ZBook Fury 17 G8-4A6A9EA | |
| Lenovo ThinkPad Z16 G1 21D5S00T00 | |
| Lenovo ThinkPad P17 G2-20YU0025G | |
| Lenovo ThinkPad P15 G2-20YQ001JGE | |
| Cinebench R23 / Multi Core | |
| Asus ExpertBook B6 Flip B6602FC2 | |
| Lenovo ThinkPad X1 Extreme G5-21DE003RGE | |
| Lenovo ThinkPad P16 G1 21D6001DMB | |
| Average Intel Core i7-12850HX (15093 - 17510, n=2) | |
| Average of class Workstation (4332 - 24560, n=28, last 2 years) | |
| Dell Precision 7670 | |
| HP ZBook Fury 17 G8-4A6A9EA | |
| Lenovo ThinkPad P17 G2-20YU0025G | |
| Lenovo ThinkPad Z16 G1 21D5S00T00 | |
| Lenovo ThinkPad P15 G2-20YQ001JGE | |
| Cinebench R23 / Single Core | |
| Asus ExpertBook B6 Flip B6602FC2 | |
| Lenovo ThinkPad P16 G1 21D6001DMB | |
| Lenovo ThinkPad X1 Extreme G5-21DE003RGE | |
| Average of class Workstation (1144 - 2106, n=28, last 2 years) | |
| Average Intel Core i7-12850HX (1596 - 1845, n=2) | |
| HP ZBook Fury 17 G8-4A6A9EA | |
| Dell Precision 7670 | |
| Lenovo ThinkPad P17 G2-20YU0025G | |
| Lenovo ThinkPad P15 G2-20YQ001JGE | |
| Lenovo ThinkPad Z16 G1 21D5S00T00 | |
| Cinebench R20 / CPU (Multi Core) | |
| Asus ExpertBook B6 Flip B6602FC2 | |
| Lenovo ThinkPad X1 Extreme G5-21DE003RGE | |
| Lenovo ThinkPad P16 G1 21D6001DMB | |
| Average Intel Core i7-12850HX (6217 - 6764, n=2) | |
| Dell Precision 7670 | |
| Average of class Workstation (1669 - 9329, n=29, last 2 years) | |
| Lenovo ThinkPad P17 G2-20YU0025G | |
| HP ZBook Fury 17 G8-4A6A9EA | |
| Lenovo ThinkPad Z16 G1 21D5S00T00 | |
| Lenovo ThinkPad P15 G2-20YQ001JGE | |
| Cinebench R20 / CPU (Single Core) | |
| Asus ExpertBook B6 Flip B6602FC2 | |
| Lenovo ThinkPad P16 G1 21D6001DMB | |
| Lenovo ThinkPad X1 Extreme G5-21DE003RGE | |
| Average Intel Core i7-12850HX (687 - 708, n=2) | |
| Dell Precision 7670 | |
| Average of class Workstation (528 - 816, n=29, last 2 years) | |
| HP ZBook Fury 17 G8-4A6A9EA | |
| Lenovo ThinkPad Z16 G1 21D5S00T00 | |
| Lenovo ThinkPad P17 G2-20YU0025G | |
| Lenovo ThinkPad P15 G2-20YQ001JGE | |
| Cinebench R15 / CPU Multi 64Bit | |
| Asus ExpertBook B6 Flip B6602FC2 | |
| Lenovo ThinkPad P16 G1 21D6001DMB | |
| Lenovo ThinkPad X1 Extreme G5-21DE003RGE | |
| Average Intel Core i7-12850HX (2432 - 2926, n=2) | |
| Dell Precision 7670 | |
| Average of class Workstation (706 - 3625, n=28, last 2 years) | |
| Lenovo ThinkPad P17 G2-20YU0025G | |
| HP ZBook Fury 17 G8-4A6A9EA | |
| Lenovo ThinkPad Z16 G1 21D5S00T00 | |
| Lenovo ThinkPad P15 G2-20YQ001JGE | |
| Cinebench R15 / CPU Single 64Bit | |
| Asus ExpertBook B6 Flip B6602FC2 | |
| Lenovo ThinkPad P16 G1 21D6001DMB | |
| Average Intel Core i7-12850HX (253 - 268, n=2) | |
| Lenovo ThinkPad X1 Extreme G5-21DE003RGE | |
| Average of class Workstation (166.2 - 301, n=28, last 2 years) | |
| Dell Precision 7670 | |
| HP ZBook Fury 17 G8-4A6A9EA | |
| Lenovo ThinkPad Z16 G1 21D5S00T00 | |
| Lenovo ThinkPad P17 G2-20YU0025G | |
| Lenovo ThinkPad P15 G2-20YQ001JGE | |
| Blender / v2.79 BMW27 CPU | |
| Lenovo ThinkPad P15 G2-20YQ001JGE | |
| Lenovo ThinkPad P17 G2-20YU0025G | |
| Average of class Workstation (137 - 684, n=28, last 2 years) | |
| HP ZBook Fury 17 G8-4A6A9EA | |
| Lenovo ThinkPad Z16 G1 21D5S00T00 | |
| Dell Precision 7670 | |
| Average Intel Core i7-12850HX (181 - 205, n=2) | |
| Asus ExpertBook B6 Flip B6602FC2 | |
| Lenovo ThinkPad X1 Extreme G5-21DE003RGE | |
| Lenovo ThinkPad P16 G1 21D6001DMB | |
| 7-Zip 18.03 / 7z b 4 | |
| Asus ExpertBook B6 Flip B6602FC2 | |
| Lenovo ThinkPad P16 G1 21D6001DMB | |
| Lenovo ThinkPad X1 Extreme G5-21DE003RGE | |
| Average Intel Core i7-12850HX (53893 - 69464, n=2) | |
| Average of class Workstation (20087 - 99351, n=28, last 2 years) | |
| Lenovo ThinkPad Z16 G1 21D5S00T00 | |
| Dell Precision 7670 | |
| HP ZBook Fury 17 G8-4A6A9EA | |
| Lenovo ThinkPad P15 G2-20YQ001JGE | |
| Lenovo ThinkPad P17 G2-20YU0025G | |
| 7-Zip 18.03 / 7z b 4 -mmt1 | |
| Asus ExpertBook B6 Flip B6602FC2 | |
| HP ZBook Fury 17 G8-4A6A9EA | |
| Lenovo ThinkPad P16 G1 21D6001DMB | |
| Average of class Workstation (4777 - 6670, n=28, last 2 years) | |
| Lenovo ThinkPad X1 Extreme G5-21DE003RGE | |
| Average Intel Core i7-12850HX (5608 - 5916, n=2) | |
| Dell Precision 7670 | |
| Lenovo ThinkPad P15 G2-20YQ001JGE | |
| Lenovo ThinkPad P17 G2-20YU0025G | |
| Lenovo ThinkPad Z16 G1 21D5S00T00 | |
| Geekbench 5.5 / Multi-Core | |
| Asus ExpertBook B6 Flip B6602FC2 | |
| Lenovo ThinkPad P16 G1 21D6001DMB | |
| Average Intel Core i7-12850HX (11509 - 13095, n=2) | |
| Average of class Workstation (5022 - 17487, n=28, last 2 years) | |
| Lenovo ThinkPad X1 Extreme G5-21DE003RGE | |
| Dell Precision 7670 | |
| Lenovo ThinkPad P15 G2-20YQ001JGE | |
| Lenovo ThinkPad Z16 G1 21D5S00T00 | |
| HP ZBook Fury 17 G8-4A6A9EA | |
| Lenovo ThinkPad P17 G2-20YU0025G | |
| Geekbench 5.5 / Single-Core | |
| Asus ExpertBook B6 Flip B6602FC2 | |
| Average of class Workstation (1474 - 2095, n=28, last 2 years) | |
| Lenovo ThinkPad X1 Extreme G5-21DE003RGE | |
| Lenovo ThinkPad P16 G1 21D6001DMB | |
| Average Intel Core i7-12850HX (1777 - 1787, n=2) | |
| Dell Precision 7670 | |
| HP ZBook Fury 17 G8-4A6A9EA | |
| Lenovo ThinkPad P15 G2-20YQ001JGE | |
| Lenovo ThinkPad P17 G2-20YU0025G | |
| Lenovo ThinkPad Z16 G1 21D5S00T00 | |
| HWBOT x265 Benchmark v2.2 / 4k Preset | |
| Asus ExpertBook B6 Flip B6602FC2 | |
| Dell Precision 7670 | |
| Average Intel Core i7-12850HX (17.2 - 17.3, n=2) | |
| Lenovo ThinkPad P16 G1 21D6001DMB | |
| Lenovo ThinkPad X1 Extreme G5-21DE003RGE | |
| Average of class Workstation (5.09 - 26, n=28, last 2 years) | |
| Lenovo ThinkPad Z16 G1 21D5S00T00 | |
| Lenovo ThinkPad P17 G2-20YU0025G | |
| HP ZBook Fury 17 G8-4A6A9EA | |
| Lenovo ThinkPad P15 G2-20YQ001JGE | |
| LibreOffice / 20 Documents To PDF | |
| HP ZBook Fury 17 G8-4A6A9EA | |
| Lenovo ThinkPad P17 G2-20YU0025G | |
| Lenovo ThinkPad Z16 G1 21D5S00T00 | |
| Dell Precision 7670 | |
| Lenovo ThinkPad P15 G2-20YQ001JGE | |
| Average of class Workstation (36.5 - 95.2, n=28, last 2 years) | |
| Average Intel Core i7-12850HX (46.9 - 48.6, n=2) | |
| Lenovo ThinkPad P16 G1 21D6001DMB | |
| Asus ExpertBook B6 Flip B6602FC2 | |
| Lenovo ThinkPad X1 Extreme G5-21DE003RGE | |
| R Benchmark 2.5 / Overall mean | |
| Lenovo ThinkPad P17 G2-20YU0025G | |
| Lenovo ThinkPad P15 G2-20YQ001JGE | |
| HP ZBook Fury 17 G8-4A6A9EA | |
| Lenovo ThinkPad Z16 G1 21D5S00T00 | |
| Dell Precision 7670 | |
| Average of class Workstation (0.3876 - 0.544, n=28, last 2 years) | |
| Lenovo ThinkPad X1 Extreme G5-21DE003RGE | |
| Average Intel Core i7-12850HX (0.45 - 0.4698, n=2) | |
| Asus ExpertBook B6 Flip B6602FC2 | |
| Lenovo ThinkPad P16 G1 21D6001DMB | |
* ... smaller is better
AIDA64: FP32 Ray-Trace | FPU Julia | CPU SHA3 | CPU Queen | FPU SinJulia | FPU Mandel | CPU AES | CPU ZLib | FP64 Ray-Trace | CPU PhotoWorxx
| Performance Rating | |
| Lenovo ThinkPad P16 G1 21D6001DMB | |
| Asus ExpertBook B6 Flip B6602FC2 | |
| Average of class Workstation | |
| Average Intel Core i7-12850HX | |
| HP ZBook Fury 17 G8-4A6A9EA | |
| Dell Precision 7670 | |
| AIDA64 / FP32 Ray-Trace | |
| Lenovo ThinkPad P16 G1 21D6001DMB | |
| Asus ExpertBook B6 Flip B6602FC2 | |
| HP ZBook Fury 17 G8-4A6A9EA | |
| Average of class Workstation (2619 - 25776, n=28, last 2 years) | |
| Average Intel Core i7-12850HX (12983 - 16752, n=2) | |
| Dell Precision 7670 | |
| AIDA64 / FPU Julia | |
| Lenovo ThinkPad P16 G1 21D6001DMB | |
| Asus ExpertBook B6 Flip B6602FC2 | |
| Average of class Workstation (12909 - 109059, n=28, last 2 years) | |
| Average Intel Core i7-12850HX (68219 - 87231, n=2) | |
| Dell Precision 7670 | |
| HP ZBook Fury 17 G8-4A6A9EA | |
| AIDA64 / CPU SHA3 | |
| HP ZBook Fury 17 G8-4A6A9EA | |
| Lenovo ThinkPad P16 G1 21D6001DMB | |
| Asus ExpertBook B6 Flip B6602FC2 | |
| Average Intel Core i7-12850HX (3098 - 3818, n=2) | |
| Average of class Workstation (824 - 4981, n=28, last 2 years) | |
| Dell Precision 7670 | |
| AIDA64 / CPU Queen | |
| Asus ExpertBook B6 Flip B6602FC2 | |
| HP ZBook Fury 17 G8-4A6A9EA | |
| Average of class Workstation (26716 - 131931, n=28, last 2 years) | |
| Lenovo ThinkPad P16 G1 21D6001DMB | |
| Average Intel Core i7-12850HX (26716 - 95664, n=2) | |
| Dell Precision 7670 | |
| AIDA64 / FPU SinJulia | |
| Lenovo ThinkPad P16 G1 21D6001DMB | |
| Asus ExpertBook B6 Flip B6602FC2 | |
| Average Intel Core i7-12850HX (9869 - 11286, n=2) | |
| HP ZBook Fury 17 G8-4A6A9EA | |
| Average of class Workstation (3105 - 14742, n=28, last 2 years) | |
| Dell Precision 7670 | |
| AIDA64 / FPU Mandel | |
| Lenovo ThinkPad P16 G1 21D6001DMB | |
| Asus ExpertBook B6 Flip B6602FC2 | |
| Average of class Workstation (6967 - 58181, n=28, last 2 years) | |
| HP ZBook Fury 17 G8-4A6A9EA | |
| Average Intel Core i7-12850HX (34218 - 42580, n=2) | |
| Dell Precision 7670 | |
| AIDA64 / CPU AES | |
| HP ZBook Fury 17 G8-4A6A9EA | |
| Lenovo ThinkPad P16 G1 21D6001DMB | |
| Asus ExpertBook B6 Flip B6602FC2 | |
| Average of class Workstation (19489 - 132156, n=28, last 2 years) | |
| Average Intel Core i7-12850HX (63362 - 80775, n=2) | |
| Dell Precision 7670 | |
| AIDA64 / CPU ZLib | |
| Lenovo ThinkPad P16 G1 21D6001DMB | |
| Asus ExpertBook B6 Flip B6602FC2 | |
| Average Intel Core i7-12850HX (817 - 1102, n=2) | |
| Average of class Workstation (314 - 1472, n=28, last 2 years) | |
| Dell Precision 7670 | |
| HP ZBook Fury 17 G8-4A6A9EA | |
| AIDA64 / FP64 Ray-Trace | |
| Lenovo ThinkPad P16 G1 21D6001DMB | |
| Asus ExpertBook B6 Flip B6602FC2 | |
| HP ZBook Fury 17 G8-4A6A9EA | |
| Average Intel Core i7-12850HX (7671 - 9145, n=2) | |
| Average of class Workstation (1473 - 13800, n=28, last 2 years) | |
| Dell Precision 7670 | |
| AIDA64 / CPU PhotoWorxx | |
| Dell Precision 7670 | |
| Average Intel Core i7-12850HX (33415 - 42035, n=2) | |
| Average of class Workstation (18157 - 51637, n=28, last 2 years) | |
| Asus ExpertBook B6 Flip B6602FC2 | |
| Lenovo ThinkPad P16 G1 21D6001DMB | |
| HP ZBook Fury 17 G8-4A6A9EA | |
System Performance
Although the PCMark 10 scores are comparatively lower, the Lenovo ThinkPad P16 G1 offers very good performance in everday use - something that is logical considering the powerful components. Accordingly, CrossMark turns out to be considerably better.
CrossMark: Overall | Productivity | Creativity | Responsiveness
| PCMark 10 / Score | |
| Asus ExpertBook B6 Flip B6602FC2 | |
| Average of class Workstation (5488 - 8587, n=27, last 2 years) | |
| Dell Precision 7670 | |
| Lenovo ThinkPad P15 G2-20YQ001JGE | |
| Average Intel Core i7-12850HX, NVIDIA RTX A2000 Laptop GPU (6226 - 6663, n=2) | |
| Lenovo ThinkPad P17 G2-20YU0025G | |
| Lenovo ThinkPad P16 G1 21D6001DMB | |
| HP ZBook Fury 17 G8-4A6A9EA | |
| PCMark 10 / Essentials | |
| Asus ExpertBook B6 Flip B6602FC2 | |
| Average of class Workstation (9151 - 12197, n=27, last 2 years) | |
| Dell Precision 7670 | |
| Average Intel Core i7-12850HX, NVIDIA RTX A2000 Laptop GPU (10128 - 10555, n=2) | |
| Lenovo ThinkPad P15 G2-20YQ001JGE | |
| Lenovo ThinkPad P16 G1 21D6001DMB | |
| Lenovo ThinkPad P17 G2-20YU0025G | |
| HP ZBook Fury 17 G8-4A6A9EA | |
| PCMark 10 / Productivity | |
| Asus ExpertBook B6 Flip B6602FC2 | |
| Lenovo ThinkPad P16 G1 21D6001DMB | |
| Average Intel Core i7-12850HX, NVIDIA RTX A2000 Laptop GPU (9008 - 9349, n=2) | |
| Average of class Workstation (7846 - 10820, n=27, last 2 years) | |
| Dell Precision 7670 | |
| Lenovo ThinkPad P15 G2-20YQ001JGE | |
| Lenovo ThinkPad P17 G2-20YU0025G | |
| HP ZBook Fury 17 G8-4A6A9EA | |
| PCMark 10 / Digital Content Creation | |
| Average of class Workstation (5399 - 13947, n=27, last 2 years) | |
| HP ZBook Fury 17 G8-4A6A9EA | |
| Asus ExpertBook B6 Flip B6602FC2 | |
| Lenovo ThinkPad P15 G2-20YQ001JGE | |
| Lenovo ThinkPad P17 G2-20YU0025G | |
| Dell Precision 7670 | |
| Average Intel Core i7-12850HX, NVIDIA RTX A2000 Laptop GPU (6918 - 8443, n=2) | |
| Lenovo ThinkPad P16 G1 21D6001DMB | |
| CrossMark / Overall | |
| Asus ExpertBook B6 Flip B6602FC2 | |
| Average of class Workstation (1154 - 1972, n=27, last 2 years) | |
| Lenovo ThinkPad P16 G1 21D6001DMB | |
| Average Intel Core i7-12850HX, NVIDIA RTX A2000 Laptop GPU (1509 - 1720, n=2) | |
| Dell Precision 7670 | |
| HP ZBook Fury 17 G8-4A6A9EA | |
| CrossMark / Productivity | |
| Asus ExpertBook B6 Flip B6602FC2 | |
| Average of class Workstation (1188 - 1842, n=27, last 2 years) | |
| Lenovo ThinkPad P16 G1 21D6001DMB | |
| Average Intel Core i7-12850HX, NVIDIA RTX A2000 Laptop GPU (1445 - 1611, n=2) | |
| HP ZBook Fury 17 G8-4A6A9EA | |
| Dell Precision 7670 | |
| CrossMark / Creativity | |
| Asus ExpertBook B6 Flip B6602FC2 | |
| Lenovo ThinkPad P16 G1 21D6001DMB | |
| Average of class Workstation (1180 - 2248, n=27, last 2 years) | |
| Average Intel Core i7-12850HX, NVIDIA RTX A2000 Laptop GPU (1682 - 1943, n=2) | |
| Dell Precision 7670 | |
| HP ZBook Fury 17 G8-4A6A9EA | |
| CrossMark / Responsiveness | |
| Asus ExpertBook B6 Flip B6602FC2 | |
| Average of class Workstation (990 - 1865, n=27, last 2 years) | |
| Lenovo ThinkPad P16 G1 21D6001DMB | |
| Average Intel Core i7-12850HX, NVIDIA RTX A2000 Laptop GPU (1238 - 1454, n=2) | |
| Dell Precision 7670 | |
| HP ZBook Fury 17 G8-4A6A9EA | |
| PCMark 10 Score | 6226 points | |
Help | ||
| AIDA64 / Memory Copy | |
| Dell Precision 7670 | |
| Average of class Workstation (30324 - 95718, n=28, last 2 years) | |
| Asus ExpertBook B6 Flip B6602FC2 | |
| Average Intel Core i7-12850HX (53840 - 62841, n=2) | |
| Lenovo ThinkPad P16 G1 21D6001DMB | |
| HP ZBook Fury 17 G8-4A6A9EA | |
| AIDA64 / Memory Read | |
| Dell Precision 7670 | |
| Average Intel Core i7-12850HX (58944 - 68747, n=2) | |
| Asus ExpertBook B6 Flip B6602FC2 | |
| Lenovo ThinkPad P16 G1 21D6001DMB | |
| Average of class Workstation (30787 - 85570, n=28, last 2 years) | |
| HP ZBook Fury 17 G8-4A6A9EA | |
| AIDA64 / Memory Write | |
| Dell Precision 7670 | |
| Average of class Workstation (32728 - 93871, n=28, last 2 years) | |
| Asus ExpertBook B6 Flip B6602FC2 | |
| Average Intel Core i7-12850HX (52160 - 64365, n=2) | |
| Lenovo ThinkPad P16 G1 21D6001DMB | |
| HP ZBook Fury 17 G8-4A6A9EA | |
| AIDA64 / Memory Latency | |
| Average of class Workstation (83.4 - 139.3, n=28, last 2 years) | |
| Lenovo ThinkPad P16 G1 21D6001DMB | |
| Asus ExpertBook B6 Flip B6602FC2 | |
| Average Intel Core i7-12850HX (88.5 - 95.4, n=2) | |
| Dell Precision 7670 | |
| HP ZBook Fury 17 G8-4A6A9EA | |
| Lenovo ThinkPad P17 G2-20YU0025G | |
| Lenovo ThinkPad P15 G2-20YQ001JGE | |
* ... smaller is better
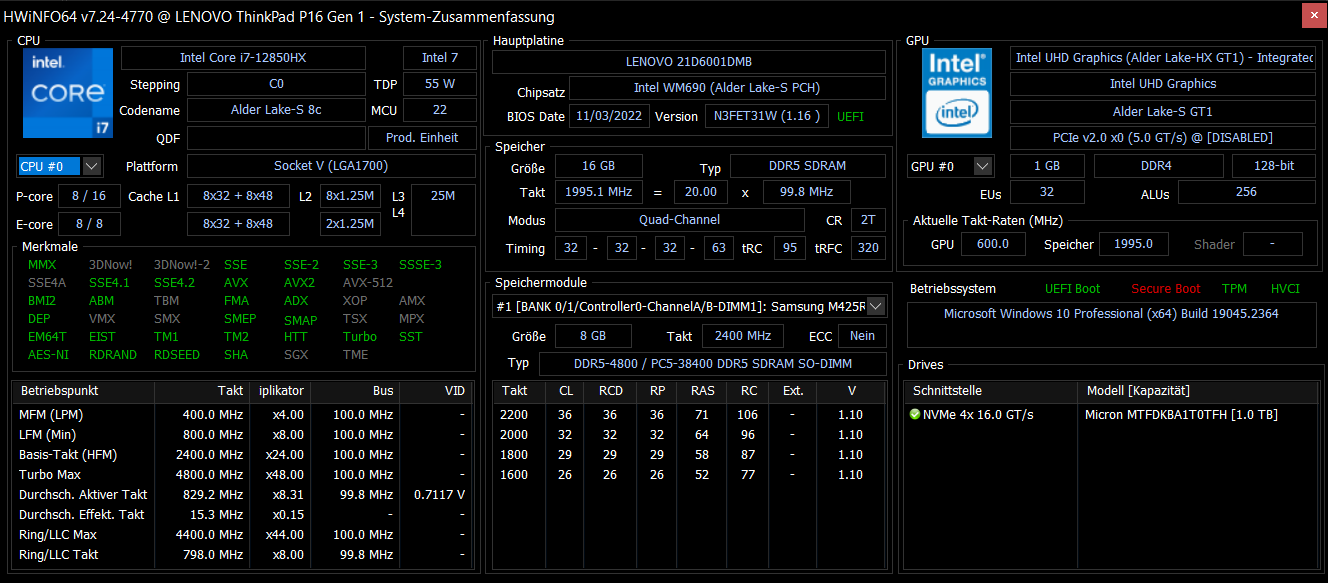
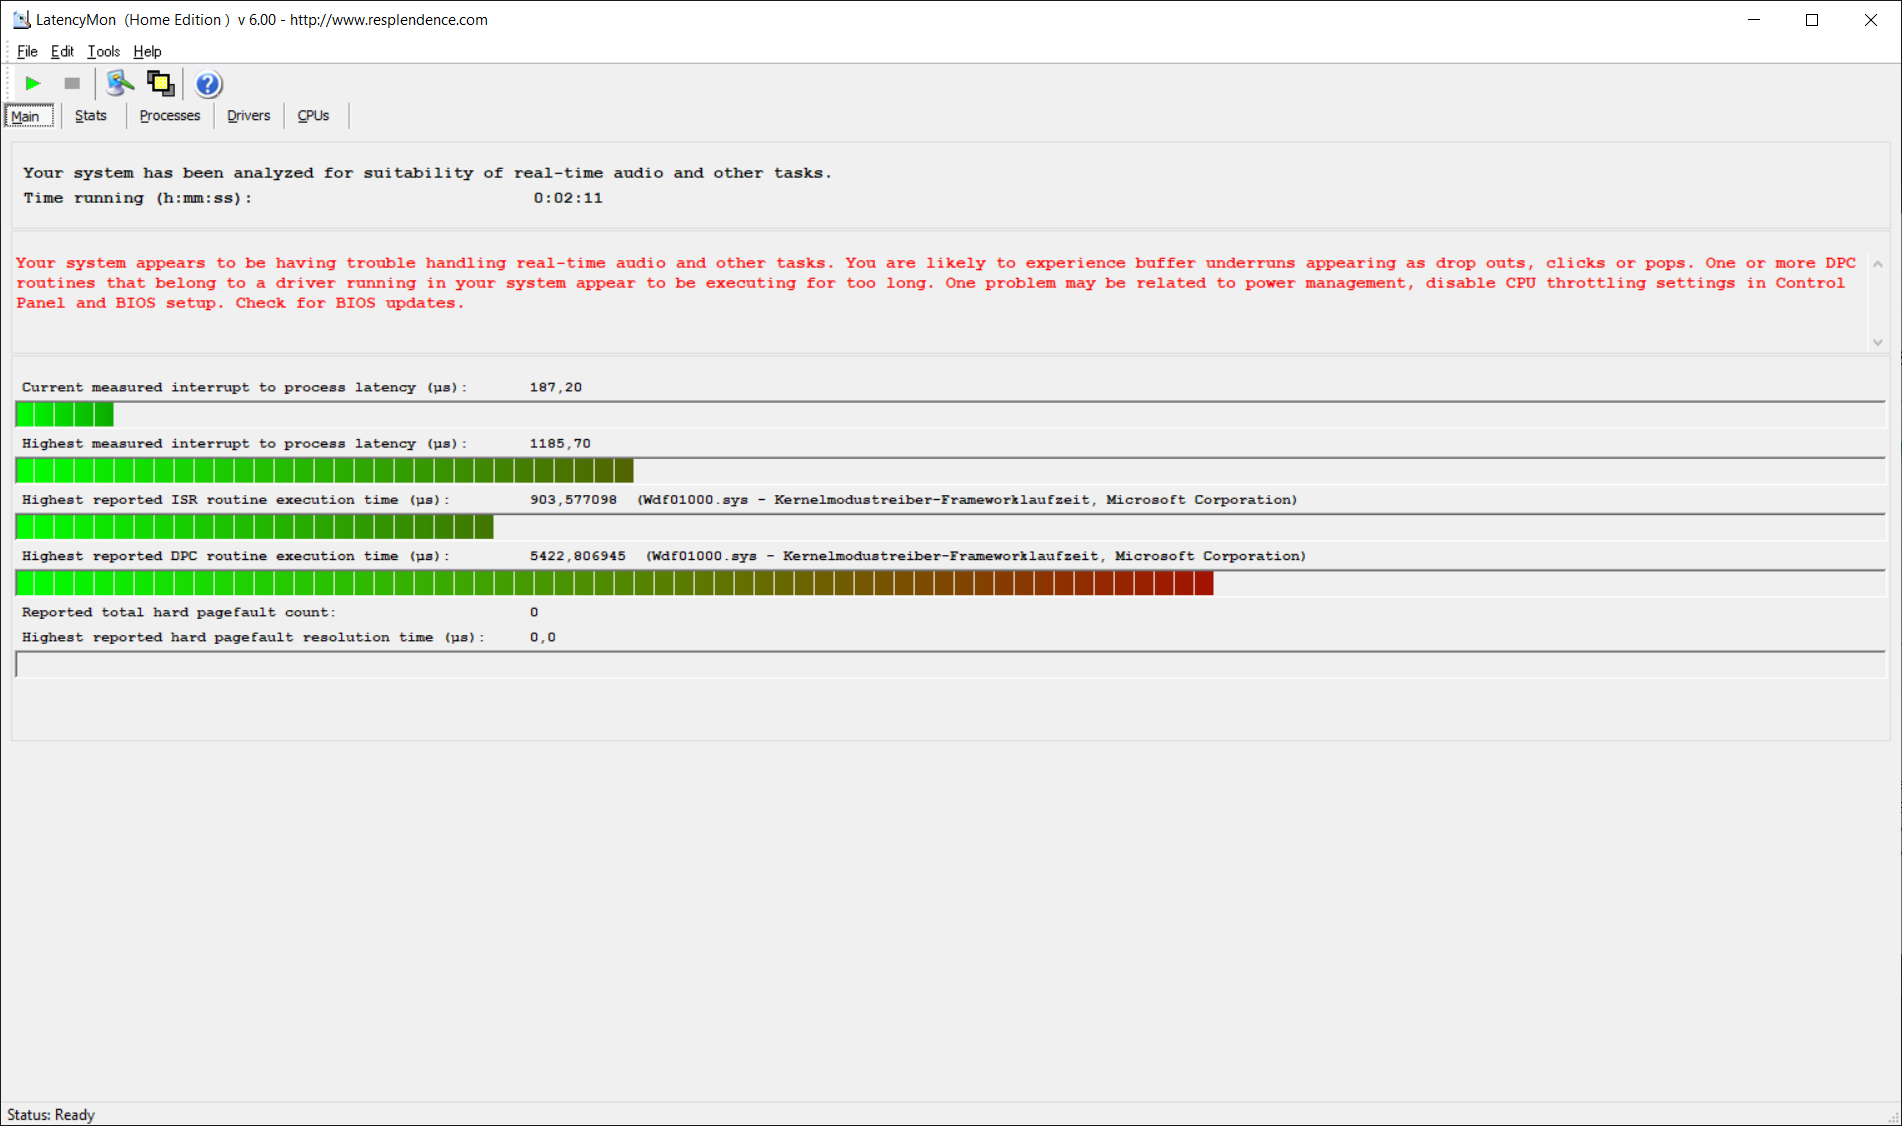
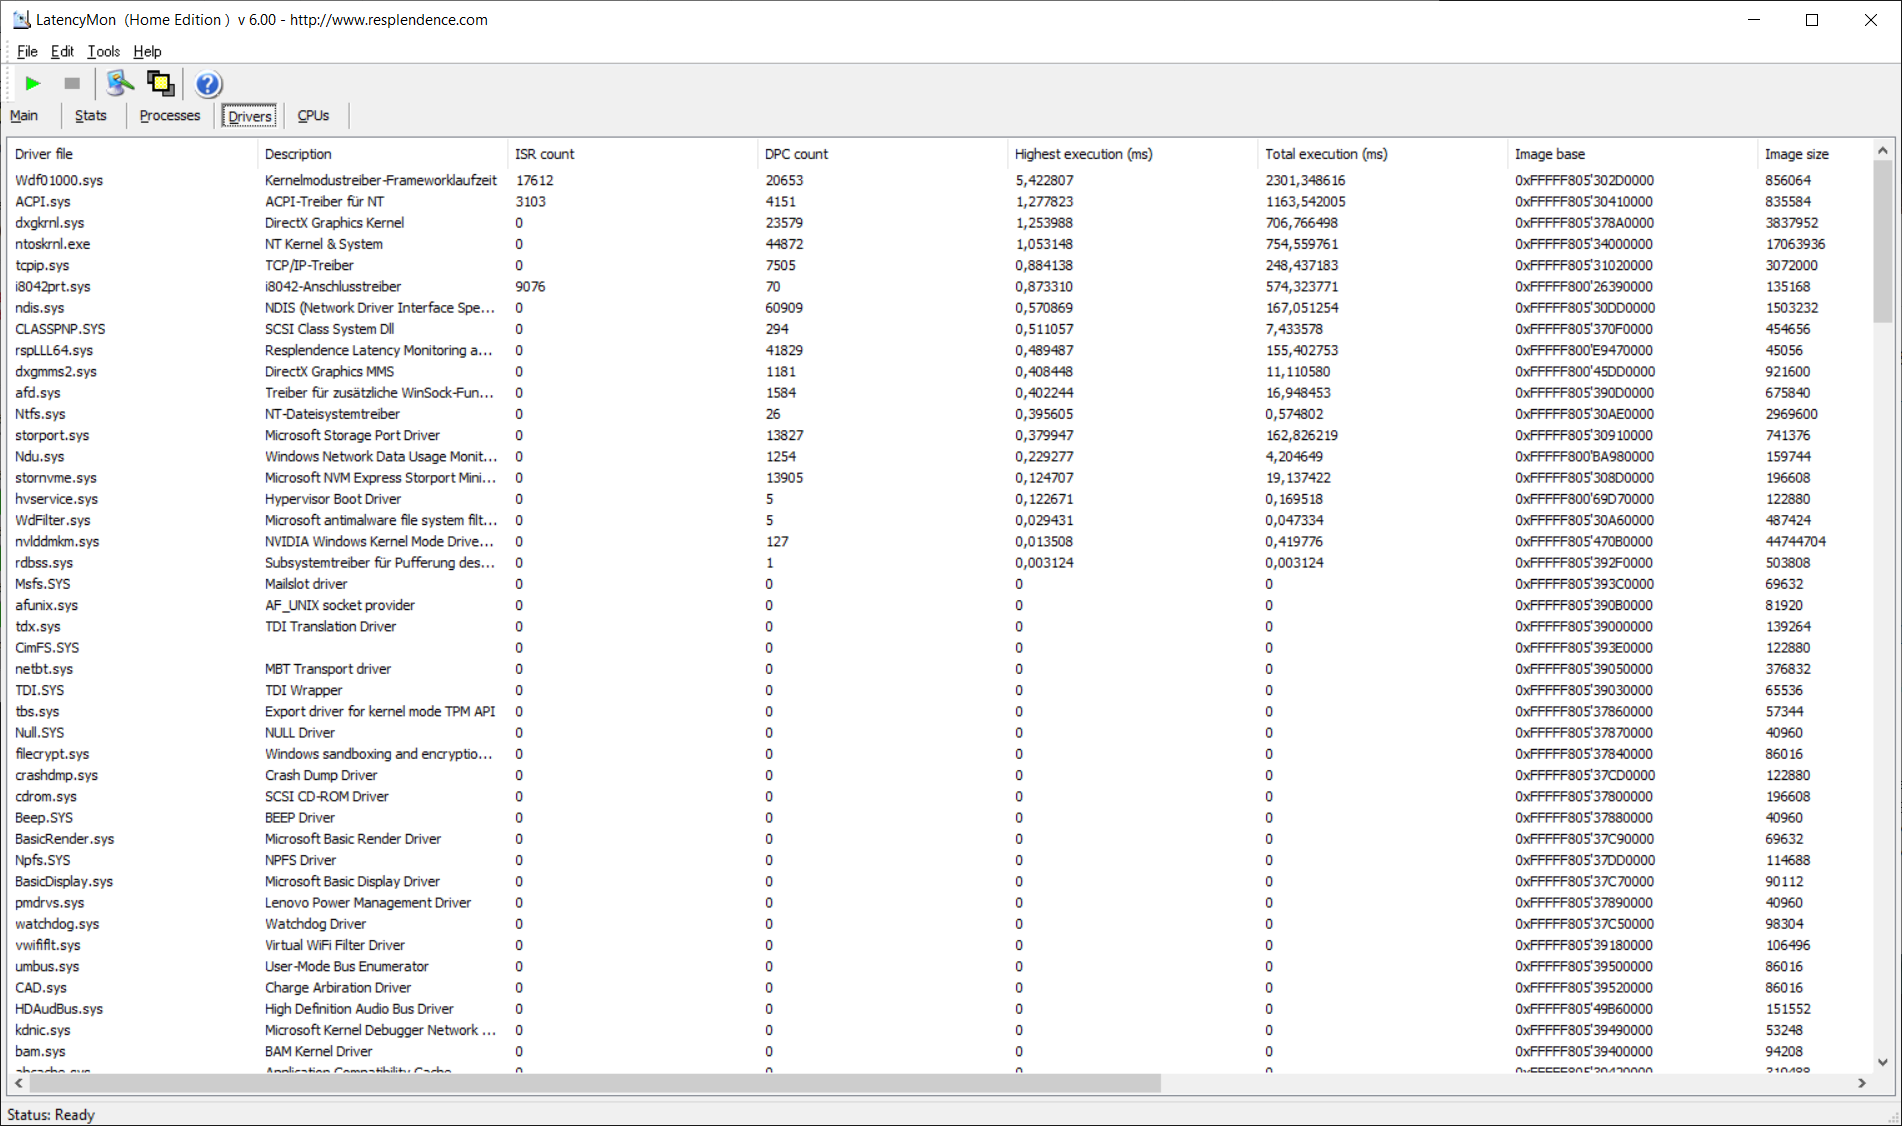
DPC latencies
The DPC latencies are significantly lower than its predecessor but still too high. Nevertheless, this can change at any point with the help of driver updates.
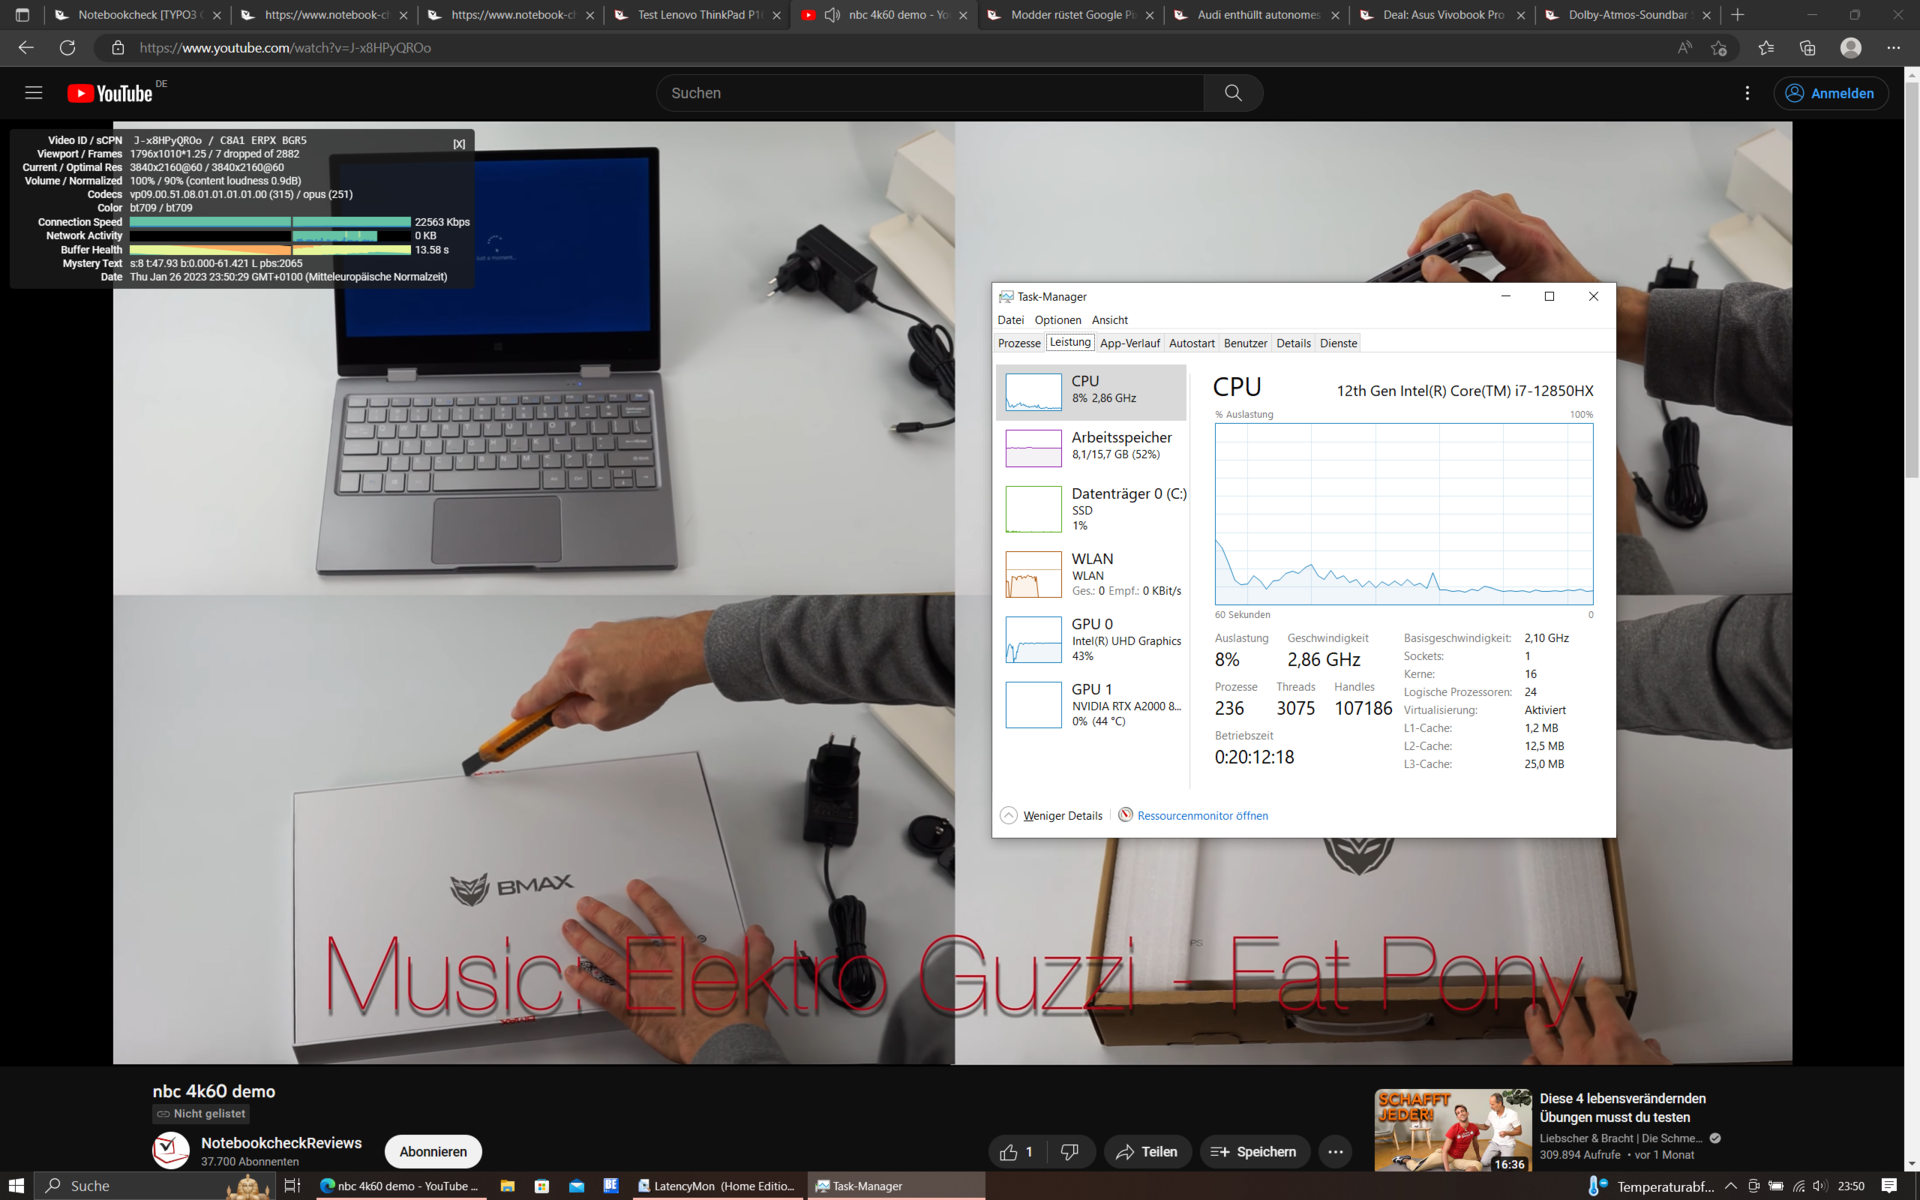
| DPC Latencies / LatencyMon - interrupt to process latency (max), Web, Youtube, Prime95 | |
| Lenovo ThinkPad P17 G2-20YU0025G | |
| Lenovo ThinkPad P15 G2-20YQ001JGE | |
| Asus ExpertBook B6 Flip B6602FC2 | |
| Dell Precision 7670 | |
| Lenovo ThinkPad P16 G1 21D6001DMB | |
| HP ZBook Studio 16 G9 62U04EA | |
* ... smaller is better
Mass storage
The Lenovo ThinkPad P16 G1's SSD is from Micron, has a capacity of one terabyte and is a very speedy NVMe PCIe 4.0 SSD in the M.2 2280 format. The SSD is slower than the Samsung SSD found in the Asus ExpertBook but faster than the rest of its competitors.

* ... smaller is better
Continuous Performance Read: DiskSpd Read Loop, Queue Depth 8
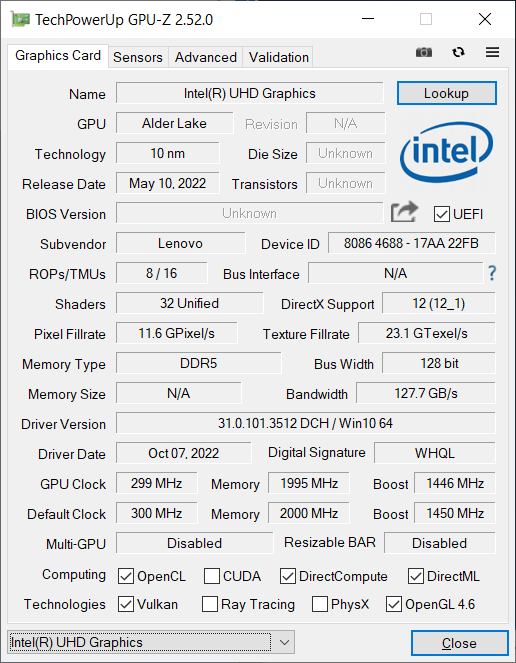
Graphics card
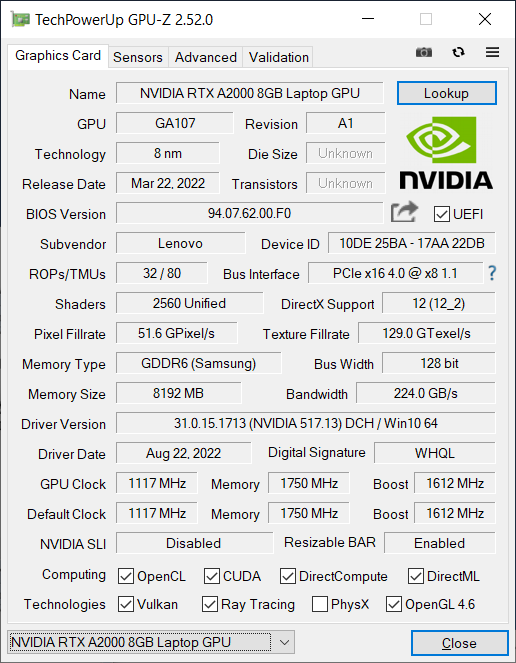
The Nvidia RTX A2000 is an Ampere generation GPU from Nvidia's professional RTX series, formerly known as "Quadro". The 2560 shader units have a maximum clock speed of 1.678 GHz. The typical TDP for this graphics chip ranges between 35 and 95 watts; the RTX A2000 has 8 GB of dedicated RAM attached to a 128-bit memory bus. The GPU list is an excellent resource for benchmark comparisons with other graphics chips.
The RTX A2000 in the Lenovo ThinkPad P16 can consume up to 60 watts, making it one of the entry-level options with the next best GPU, the RTX A3000 able to consume up to 115 watts. In accordance with the limited consumption, the RTX A2000's performance is not particularly outstanding. Of all the compared workstations, the Lenovo ThinkPad P16 performed the worst, regardless of whether it was in the 3DMark test or the workstation-specific SPECviewperf benchmark. In particular, the Dell Precision 7670, as well as the Asus ExpertBook B6 Flip, fare better with almost the same GPUs which run at 90 and 95 watts TDP, respectively, in these laptops.
This result is also reflected in the Blender test: In the GPU acceleration tests, the ThinkPad P16 G1 is slower than the competition. However, in the Blender CPU test, it is the fastest mobile workstation.
As with the processor, GPU performance is limited in battery mode with the performance dropping around 15 % compared to power supply operation.
| 3DMark 11 Performance | 15998 points | |
| 3DMark Cloud Gate Standard Score | 40815 points | |
| 3DMark Fire Strike Score | 10381 points | |
| 3DMark Time Spy Score | 5184 points | |
Help | ||
* ... smaller is better
Gaming Performance
As a mobile workstation, the Lenovo ThinkPad P16 is no gaming laptop. However, newer games are also possible, if not in 4K. As in the synthetic benchmarks, the direct competition is faster than the P16. The low TDP is made even more difficult by the fact that the P16 does not manage to maintain constant GPU performance under constant load.
| The Witcher 3 - 1920x1080 Ultra Graphics & Postprocessing (HBAO+) | |
| Lenovo ThinkPad P15 G2-20YQ001JGE | |
| Asus ExpertBook B6 Flip B6602FC2 | |
| Average of class Workstation (19.6 - 156.5, n=29, last 2 years) | |
| HP ZBook Fury 17 G8-4A6A9EA | |
| Dell Precision 7670 | |
| Lenovo ThinkPad P17 G2-20YU0025G | |
| Lenovo ThinkPad P16 G1 21D6001DMB | |
Witcher 3 FPS diagram
| low | med. | high | ultra | QHD | |
| The Witcher 3 (2015) | 273 | 150.5 | 79.7 | 43.6 | |
| Dota 2 Reborn (2015) | 177.5 | 160.8 | 149.3 | 139.5 | |
| Final Fantasy XV Benchmark (2018) | 96.7 | 51.9 | 38.3 | 31.1 | |
| X-Plane 11.11 (2018) | 140.3 | 119.2 | 95.6 | ||
| Strange Brigade (2018) | 280 | 118.6 | 91.1 | 77.8 | 54.3 |
Emissions: The fan get loud but the ThinkPad laptop stays cool
Noise emissions
When idle, the Lenovo ThinkPad P16"s fans stay silent. At 56,3 dB(a) under load, they can get loud - even louder than the laptop's direct counterparts. However, that is not the case with every application. In the Witcher 3 test, the fans ran comparatively quietly, measuring only 34,1 dB(a).
We were unable to detect any coil whine in the Lenovo laptop.
Noise Level
| Idle |
| 23.2 / 23.2 / 23.2 dB(A) |
| Load |
| 47.8 / 56.3 dB(A) |
 | ||
30 dB silent 40 dB(A) audible 50 dB(A) loud |
||
min: | ||
| Lenovo ThinkPad P16 G1 21D6001DMB RTX A2000 Laptop GPU, i7-12850HX, Micron 3400 1TB MTFDKBA1T0TFH | Lenovo ThinkPad P15 G2-20YQ001JGE RTX A3000 Laptop GPU, i7-11800H, Kioxia XG7 KXG7AZNV512G | Lenovo ThinkPad P17 G2-20YU0025G RTX A2000 Laptop GPU, i7-11800H, Kioxia XG7 KXG7AZNV512G | HP ZBook Fury 17 G8-4A6A9EA RTX A3000 Laptop GPU, i9-11950H, Toshiba XG6 KXG60ZNV1T02 | Dell Precision 7670 RTX A2000 Laptop GPU, i7-12850HX, SK Hynix HFS001TEJ9X115N | Asus ExpertBook B6 Flip B6602FC2 RTX A2000 Laptop GPU, i9-12950HX, Samsung PM9A1 MZVL21T0HCLR | |
|---|---|---|---|---|---|---|
| Noise | -6% | -4% | -5% | -4% | -22% | |
| off / environment * | 23.2 | 24.3 -5% | 26.4 -14% | 24.5 -6% | 22.7 2% | 26 -12% |
| Idle Minimum * | 23.2 | 24.3 -5% | 26.4 -14% | 24.5 -6% | 22.9 1% | 32.4 -40% |
| Idle Average * | 23.2 | 24.3 -5% | 26.4 -14% | 24.5 -6% | 22.9 1% | 32.4 -40% |
| Idle Maximum * | 23.2 | 28.6 -23% | 26.4 -14% | 26.8 -16% | 24.5 -6% | 32.4 -40% |
| Load Average * | 47.8 | 47.5 1% | 38.1 20% | 41.8 13% | 48.7 -2% | 51.9 -9% |
| Witcher 3 ultra * | 34.1 | 38.1 -12% | 44.9 -32% | 45.2 -33% | ||
| Load Maximum * | 56.3 | 54.9 2% | 45 20% | 47.1 16% | 52.1 7% | 52.1 7% |
* ... smaller is better
Temperature
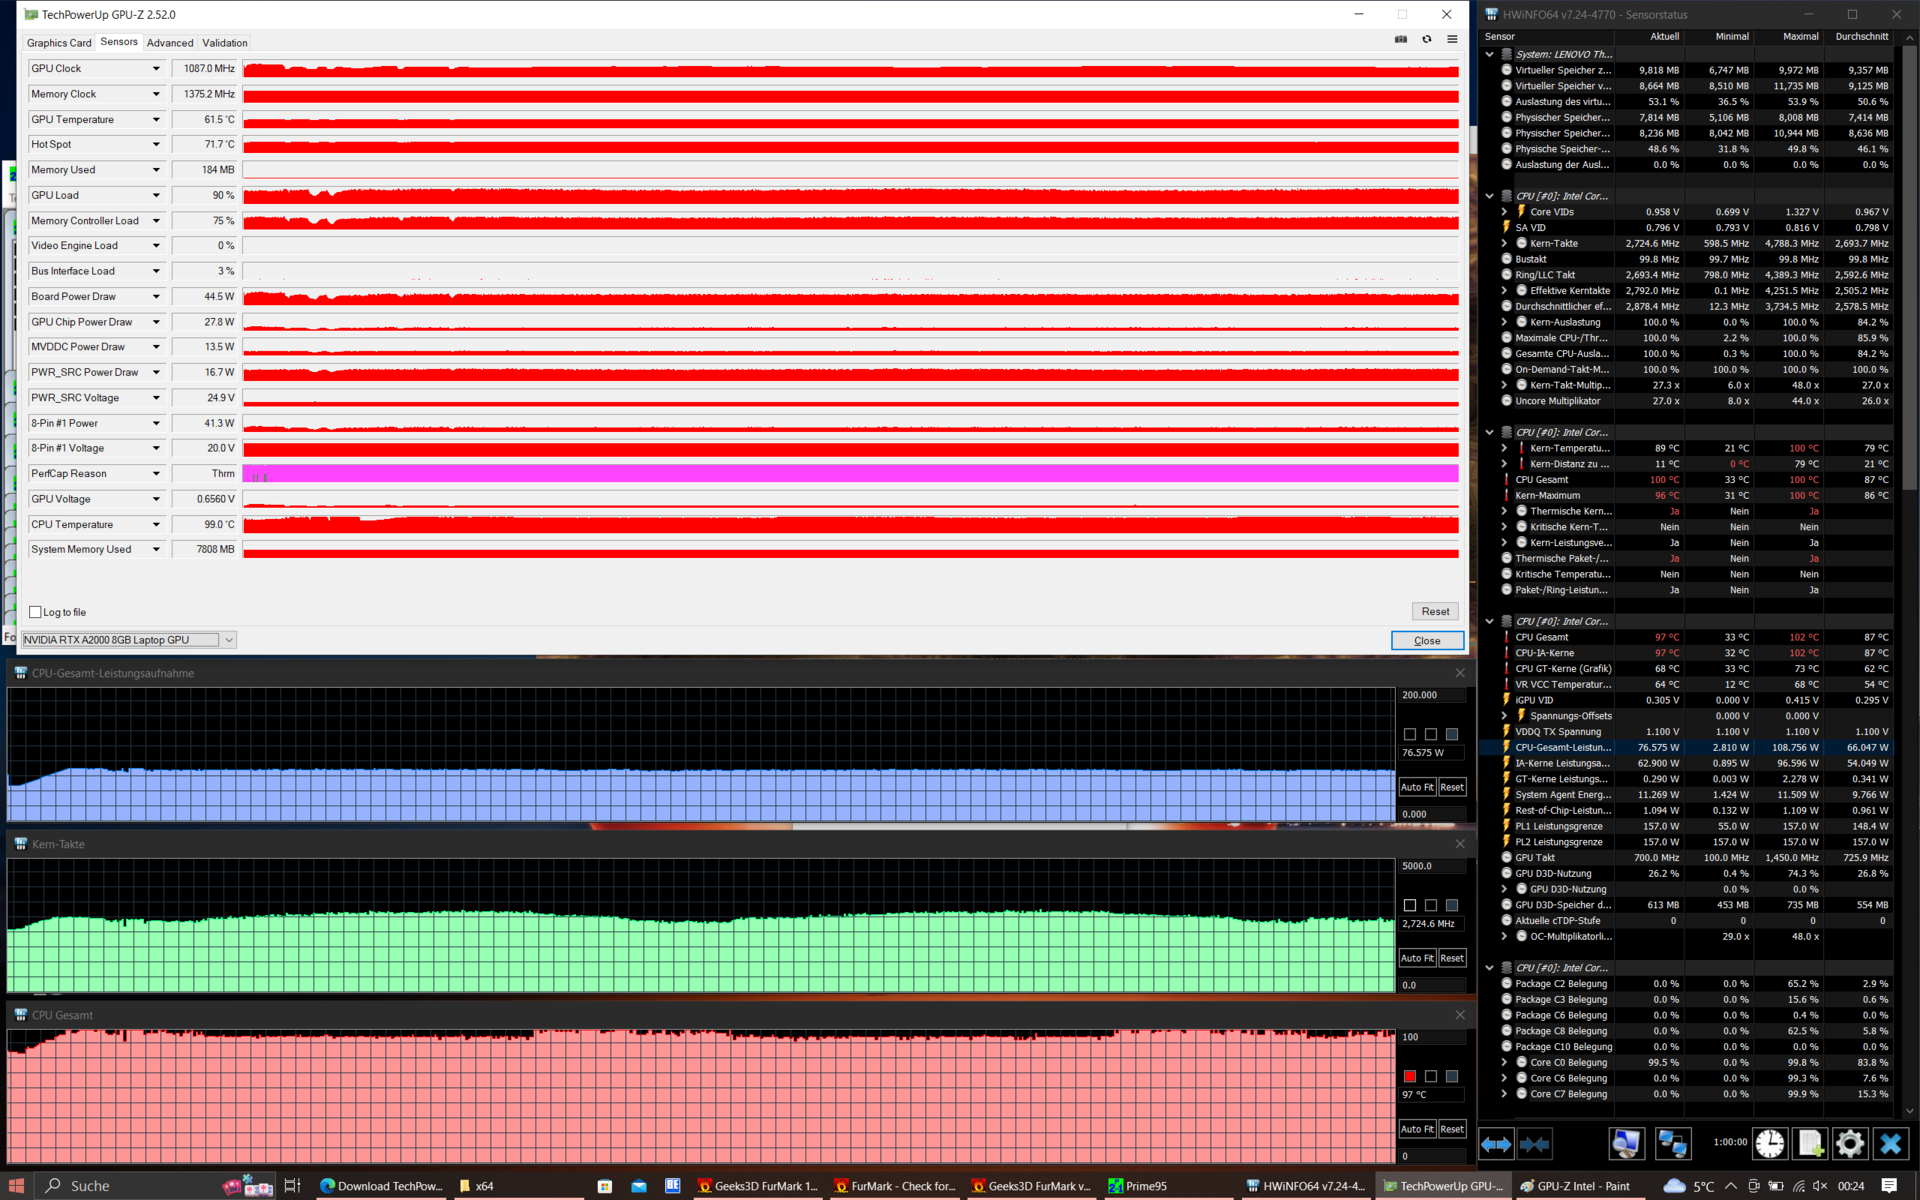
The spacious case, with its roll cage construction and vapor chamber, ensures a relatively even distribution of waste heat. As a result, the Lenovo ThinkPad P16's palm rest gets a little warm but the maximum temperatures stayed within acceptable limits. In the stress test, the hotspot temperature measured 43,1 degrees and can be considered a good result.
Although the processor was not throttled during the stress test, the GPU performance dropped: After one hour, it can only consume 45 watts instead of 60.
(±) The maximum temperature on the upper side is 43.1 °C / 110 F, compared to the average of 38.1 °C / 101 F, ranging from 22.2 to 69.8 °C for the class Workstation.
(+) The bottom heats up to a maximum of 39.9 °C / 104 F, compared to the average of 41.3 °C / 106 F
(+) In idle usage, the average temperature for the upper side is 24.7 °C / 76 F, compared to the device average of 32 °C / 90 F.
(+) Playing The Witcher 3, the average temperature for the upper side is 31.2 °C / 88 F, compared to the device average of 32 °C / 90 F.
(±) The palmrests and touchpad can get very hot to the touch with a maximum of 36.7 °C / 98.1 F.
(-) The average temperature of the palmrest area of similar devices was 27.8 °C / 82 F (-8.9 °C / -16.1 F).
| Lenovo ThinkPad P16 G1 21D6001DMB Intel Core i7-12850HX, NVIDIA RTX A2000 Laptop GPU | Lenovo ThinkPad P15 G2-20YQ001JGE Intel Core i7-11800H, NVIDIA RTX A3000 Laptop GPU | Lenovo ThinkPad P17 G2-20YU0025G Intel Core i7-11800H, NVIDIA RTX A2000 Laptop GPU | HP ZBook Fury 17 G8-4A6A9EA Intel Core i9-11950H, NVIDIA RTX A3000 Laptop GPU | Dell Precision 7670 Intel Core i7-12850HX, NVIDIA RTX A2000 Laptop GPU | Asus ExpertBook B6 Flip B6602FC2 Intel Core i9-12950HX, NVIDIA RTX A2000 Laptop GPU | |
|---|---|---|---|---|---|---|
| Heat | -21% | -12% | -12% | -18% | -15% | |
| Maximum Upper Side * | 43.1 | 49.7 -15% | 49.6 -15% | 41.9 3% | 51 -18% | 48.4 -12% |
| Maximum Bottom * | 39.9 | 63.2 -58% | 52.1 -31% | 52.9 -33% | 45.8 -15% | 52.3 -31% |
| Idle Upper Side * | 26 | 27.1 -4% | 26 -0% | 28.2 -8% | 31.8 -22% | 27.8 -7% |
| Idle Bottom * | 27.6 | 29.8 -8% | 27.6 -0% | 30.7 -11% | 32.6 -18% | 30.3 -10% |
* ... smaller is better
Speakers
The stereo speakers sit at the top of the keyboard. Compared to the ThinkPad P15 G2, the speakers are a little quieter overall but produce more balanced sound with additional bass. Although the sound quality is good for a laptop, it is still no match for an external sound system.
Lenovo ThinkPad P16 G1 21D6001DMB audio analysis
(±) | speaker loudness is average but good (73.8 dB)
Bass 100 - 315 Hz
(±) | reduced bass - on average 9.7% lower than median
(±) | linearity of bass is average (12.8% delta to prev. frequency)
Mids 400 - 2000 Hz
(+) | balanced mids - only 2.9% away from median
(+) | mids are linear (6.3% delta to prev. frequency)
Highs 2 - 16 kHz
(+) | balanced highs - only 3.1% away from median
(+) | highs are linear (4.3% delta to prev. frequency)
Overall 100 - 16.000 Hz
(+) | overall sound is linear (13% difference to median)
Compared to same class
» 16% of all tested devices in this class were better, 6% similar, 78% worse
» The best had a delta of 7%, average was 18%, worst was 35%
Compared to all devices tested
» 10% of all tested devices were better, 2% similar, 88% worse
» The best had a delta of 4%, average was 25%, worst was 134%
Lenovo ThinkPad P15 G2-20YQ001JGE audio analysis
(±) | speaker loudness is average but good (78 dB)
Bass 100 - 315 Hz
(-) | nearly no bass - on average 15.5% lower than median
(±) | linearity of bass is average (9.6% delta to prev. frequency)
Mids 400 - 2000 Hz
(±) | higher mids - on average 7.5% higher than median
(+) | mids are linear (6.6% delta to prev. frequency)
Highs 2 - 16 kHz
(+) | balanced highs - only 2.4% away from median
(+) | highs are linear (5.8% delta to prev. frequency)
Overall 100 - 16.000 Hz
(±) | linearity of overall sound is average (20.6% difference to median)
Compared to same class
» 68% of all tested devices in this class were better, 6% similar, 25% worse
» The best had a delta of 7%, average was 18%, worst was 35%
Compared to all devices tested
» 50% of all tested devices were better, 8% similar, 42% worse
» The best had a delta of 4%, average was 25%, worst was 134%
Power management: The GPU negatively impacts power management
Power consumption
The Lenovo ThinkPad P16 runs more efficiently than comparable devices. Even when idle, it is more energy efficient than the competition. However, to be fair, it must also be said that similar laptops from HP and Dell have 4K displays. Similarly, despite its higher resolution WQXGA LCD, it is more efficient than the P15 and P17 with their Full HD panels.
The Slim Tip power adapter delivers 170 watts - pretty spot on for the maximum consumption of 168.9 watts.
| Off / Standby | |
| Idle | |
| Load |
|
| Lenovo ThinkPad P16 G1 21D6001DMB i7-12850HX, RTX A2000 Laptop GPU, Micron 3400 1TB MTFDKBA1T0TFH, IPS LED, 2560x1600, 16.00 | Lenovo ThinkPad P15 G2-20YQ001JGE i7-11800H, RTX A3000 Laptop GPU, Kioxia XG7 KXG7AZNV512G, IPS, 1920x1080, 15.60 | Lenovo ThinkPad P17 G2-20YU0025G i7-11800H, RTX A2000 Laptop GPU, Kioxia XG7 KXG7AZNV512G, IPS LED, 1920x1080, 17.30 | HP ZBook Fury 17 G8-4A6A9EA i9-11950H, RTX A3000 Laptop GPU, Toshiba XG6 KXG60ZNV1T02, IPS, 3840x2160, 17.30 | Dell Precision 7670 i7-12850HX, RTX A2000 Laptop GPU, SK Hynix HFS001TEJ9X115N, OLED, 3840x2400, 16.00 | Asus ExpertBook B6 Flip B6602FC2 i9-12950HX, RTX A2000 Laptop GPU, Samsung PM9A1 MZVL21T0HCLR, IPS, 2560x1600, 16.00 | Average NVIDIA RTX A2000 Laptop GPU | Average of class Workstation | |
|---|---|---|---|---|---|---|---|---|
| Power Consumption | -23% | -15% | -49% | -56% | -67% | -24% | -30% | |
| Idle Minimum * | 5.1 | 6.3 -24% | 6.1 -20% | 7.6 -49% | 7.5 -47% | 10.5 -106% | 6.6 ? -29% | 7.82 ? -53% |
| Idle Average * | 9.2 | 10.7 -16% | 10.9 -18% | 16.7 -82% | 9.5 -3% | 11.9 -29% | 11.8 ? -28% | 12.7 ? -38% |
| Idle Maximum * | 9.9 | 11.6 -17% | 12.3 -24% | 17.5 -77% | 28.4 -187% | 18 -82% | 16.7 ? -69% | 18.7 ? -89% |
| Load Average * | 124.1 | 99.3 20% | 106.3 14% | 117 6% | 139.1 -12% | 182 -47% | 116.3 ? 6% | 96.5 ? 22% |
| Witcher 3 ultra * | 87.7 | 154 -76% | 124 -41% | 150 -71% | 134 -53% | 177.5 -102% | ||
| Load Maximum * | 168.9 | 210 -24% | 168.9 -0% | 202 -20% | 220.8 -31% | 229 -36% | 171.3 ? -1% | 158.9 ? 6% |
* ... smaller is better
Power consumption Witcher 3 / stress test
Power consumption with an external monitor
Battery life
Lenovo has undertaken no changes to the internal 94-watt-hour lithium polymer battery. Accordingly, battery runtime is on a similar level to its predecessors at around nine hours in the WiFi test (150 cd/m² display brightness). The ThinkPad P16 has one clear advantage over the Dell Precision 7670 which doesn't last nearly as long in the WiFi test due to its smaller 83-watt-hour battery and 4K display.
| Lenovo ThinkPad P16 G1 21D6001DMB i7-12850HX, RTX A2000 Laptop GPU, 94 Wh | Lenovo ThinkPad P15 G2-20YQ001JGE i7-11800H, RTX A3000 Laptop GPU, 94 Wh | Lenovo ThinkPad P17 G2-20YU0025G i7-11800H, RTX A2000 Laptop GPU, 94 Wh | HP ZBook Fury 17 G8-4A6A9EA i9-11950H, RTX A3000 Laptop GPU, 94 Wh | Dell Precision 7670 i7-12850HX, RTX A2000 Laptop GPU, 83 Wh | Asus ExpertBook B6 Flip B6602FC2 i9-12950HX, RTX A2000 Laptop GPU, 90 Wh | Average of class Workstation | |
|---|---|---|---|---|---|---|---|
| Battery Runtime | -10% | -9% | -5% | -33% | -5% | -14% | |
| WiFi v1.3 | 564 | 596 6% | 588 4% | 445 -21% | 355 -37% | 524 -7% | 541 ? -4% |
| Load | 106 | 78 -26% | 84 -21% | 119 12% | 75 -29% | 104 -2% | 81.3 ? -23% |
Pros
Cons
Verdict: The new ThinkPad workstation is exposed by the graphics chip
With the ThinkPad P16 Gen 1, Lenovo has made a big step away from having two, 15 and 17-inch workstations to just a single 16-inch model - a rare but welcome simplification of the lineup. At the same time, Lenovo has also dared to shake up the ThinkPad P series' previous design language. All in all, the result is a very good workstation which, however, is not free from flaws.
One of the strengths of the Lenovo laptop is, without a doubt, its expandability. Only these kinds of workstations can offer up to four RAM slots. The device also comes feature-packed and is pre-prepared for WWAN. However, we miss the RJ45 ethernet port. Whether the new design is an optical improvement, is a matter of taste but the new metal-reinforced display lid is, without question, very solid. The matte, WQXGA display impresses with its high brightness but it's a pity Lenovo doesn't offer the 165 Hz panel found in the X1 Extreme Gen 5. The ThinkPad P16's input devices continue to be very good but reduced key travel puts it not quite on the same level as its predecessor, the ThinkPad P17.
When it comes to mobile workstations, performance is key. Here we can see the processor performance has been improved significantly. However, that doesn't apply to the GPU: unnecessarily, Lenovo has left the RTX A2000 at a consumption of only 60 watts. Strangely, the fans don't run powerfully under pure CPU load so for this reason, the laptop's performance under load is throttled. Talking of the fan: Under sustained load, the active cooling runs very loudly. However, this has the benefit that the in almost every area, the ThinkPad P16 stays considerably cooler than its hot-headed predecessor models, the P15 and P17.
Powerful CPU performance, but the GPU falls behind in this review version of the ThinkPad P16.
In summary, our review model Lenovo ThinkPad P16 G1 is an excellent choice when asked to perform CPU-heavy tasks. If the GPU is important, you should refrain from purchasing the RTX-A2000 version. However, that doesn't mean that a ThinkPad P16 with one of the more powerful GPUs suffers from the same problem - our review of the Nvidia RTX A5500 model is now online.
For someone seeking a more mobile workstation, an interesting alternative could be the Dell Precision 7670, with its thinner, more compact case. The Asus ExpertBook B6 Flip combines a workstation's power with a convertible design and could be an exciting choice for users who work frequently with a stylus.
Price and availability
High performance comes at a price: The ThinkPad P16 costs at least 2,050 US dollars with the better-equipped models coming in at over 3500 US dollars. A similar device to our review model costs around 2,800 US dollars on Amazon.
Lenovo ThinkPad P16 G1 21D6001DMB
-
01/27/2023 v7
Benjamin Herzig
More articles related to this device
Lenovo ThinkPad P16 G1 21D6001DMB (ThinkPad P16 Series)Related Articles


Pricecompare

