 Deutsch
 English
 Español
 Français
 Italiano
 Nederlands
 Polski
 Português
 Русский
 Türkçe
 Svenska
 Chinese
 Magyar
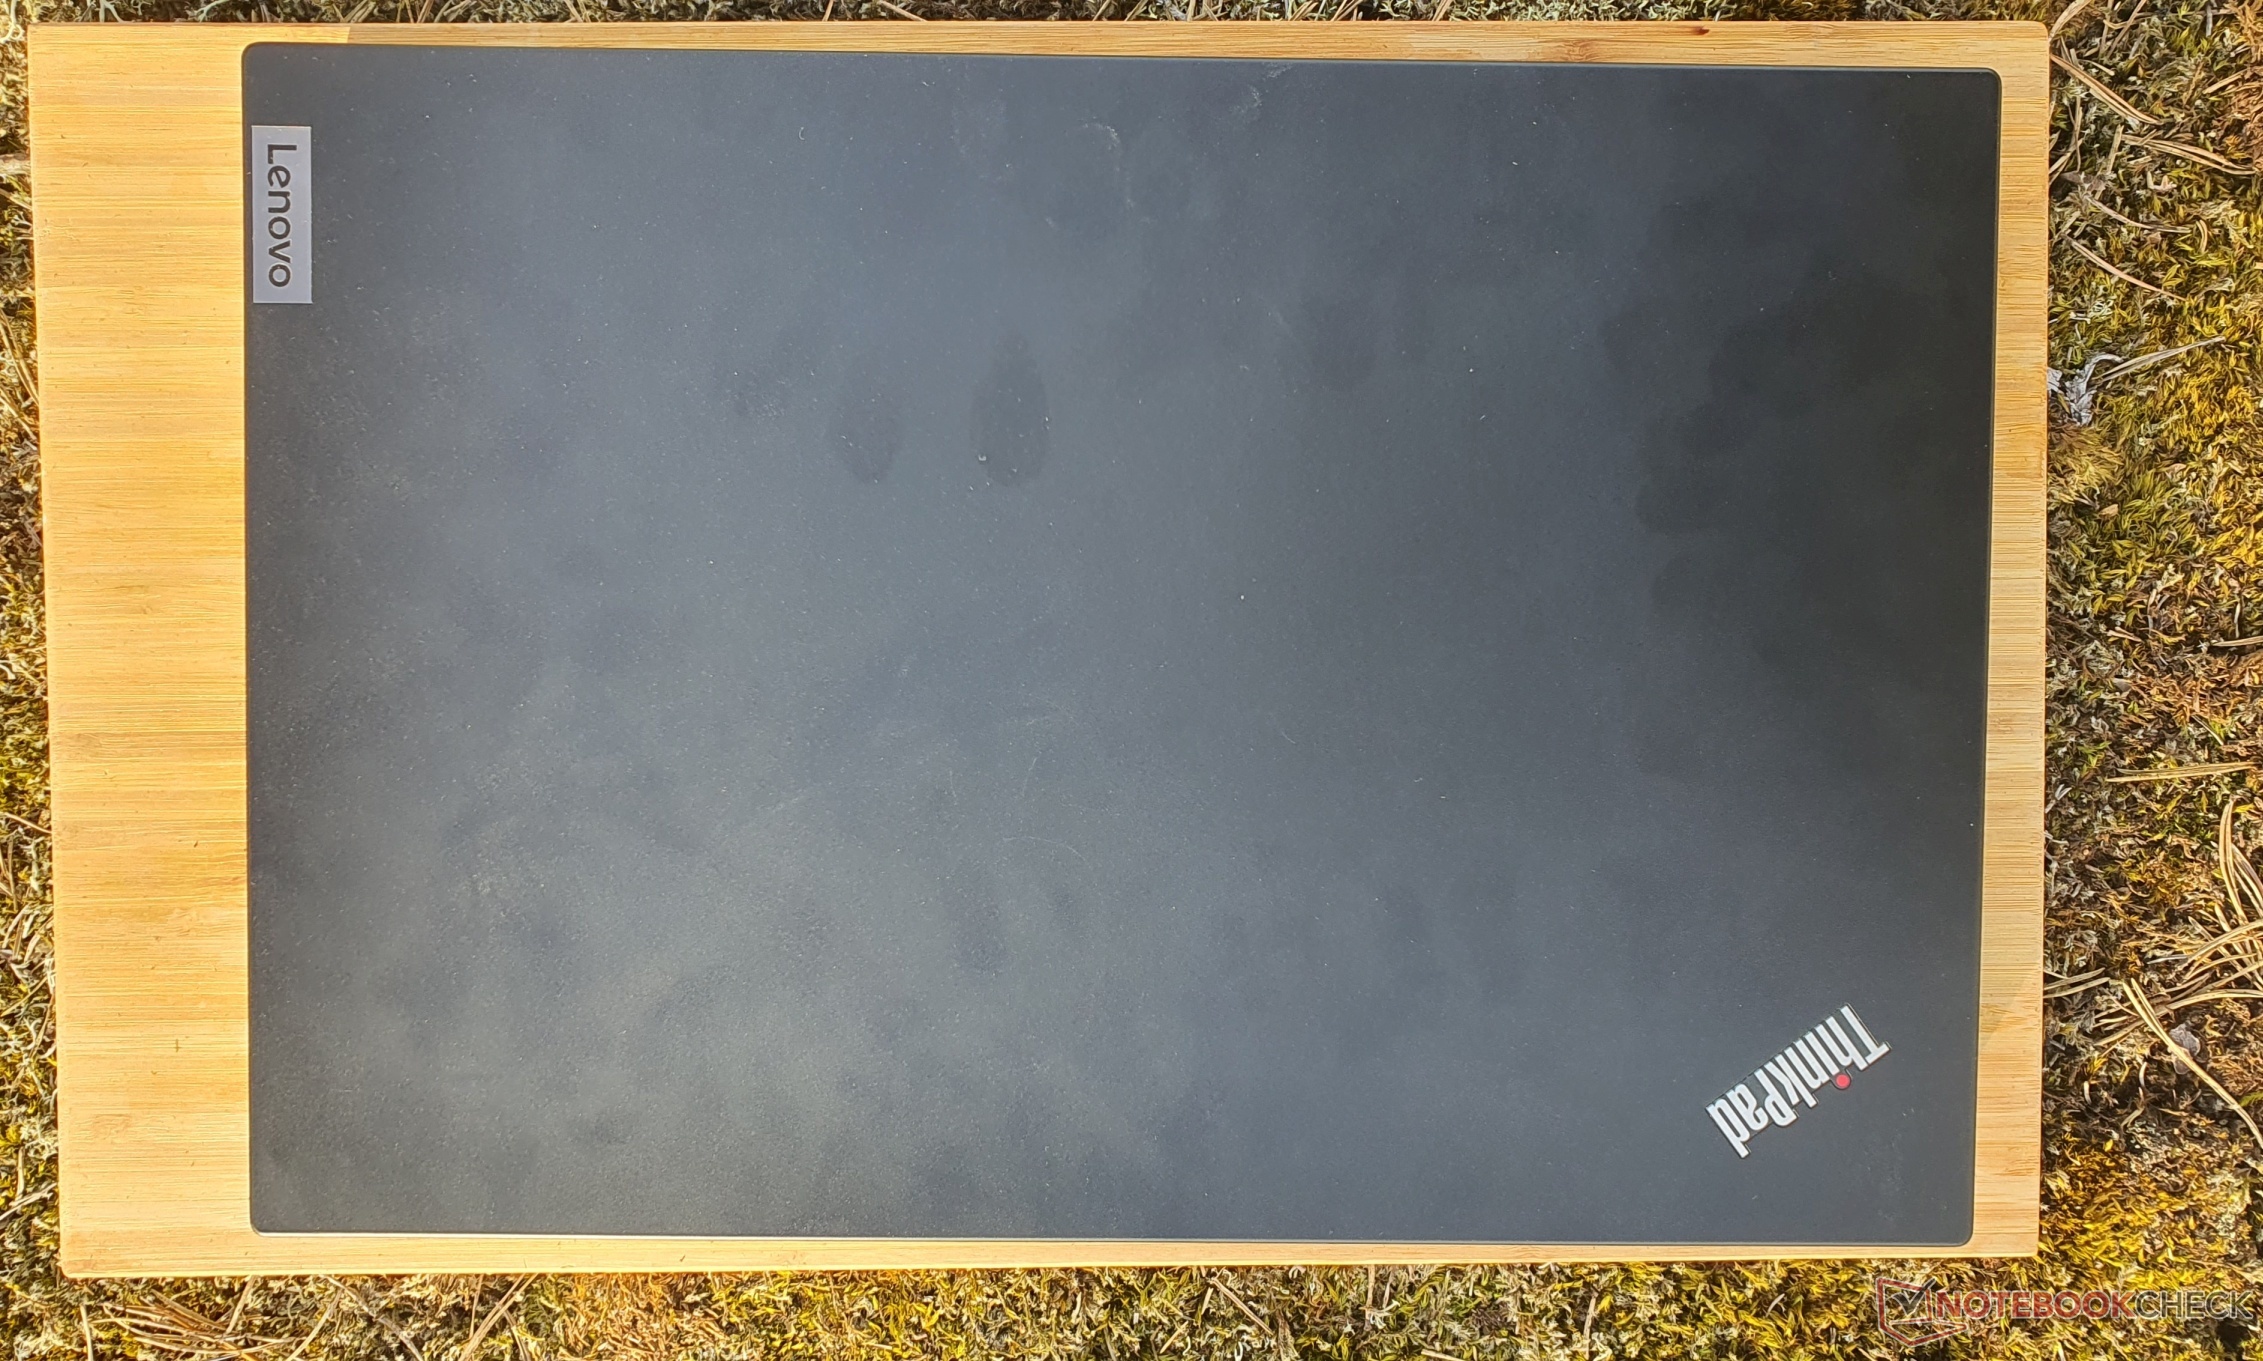
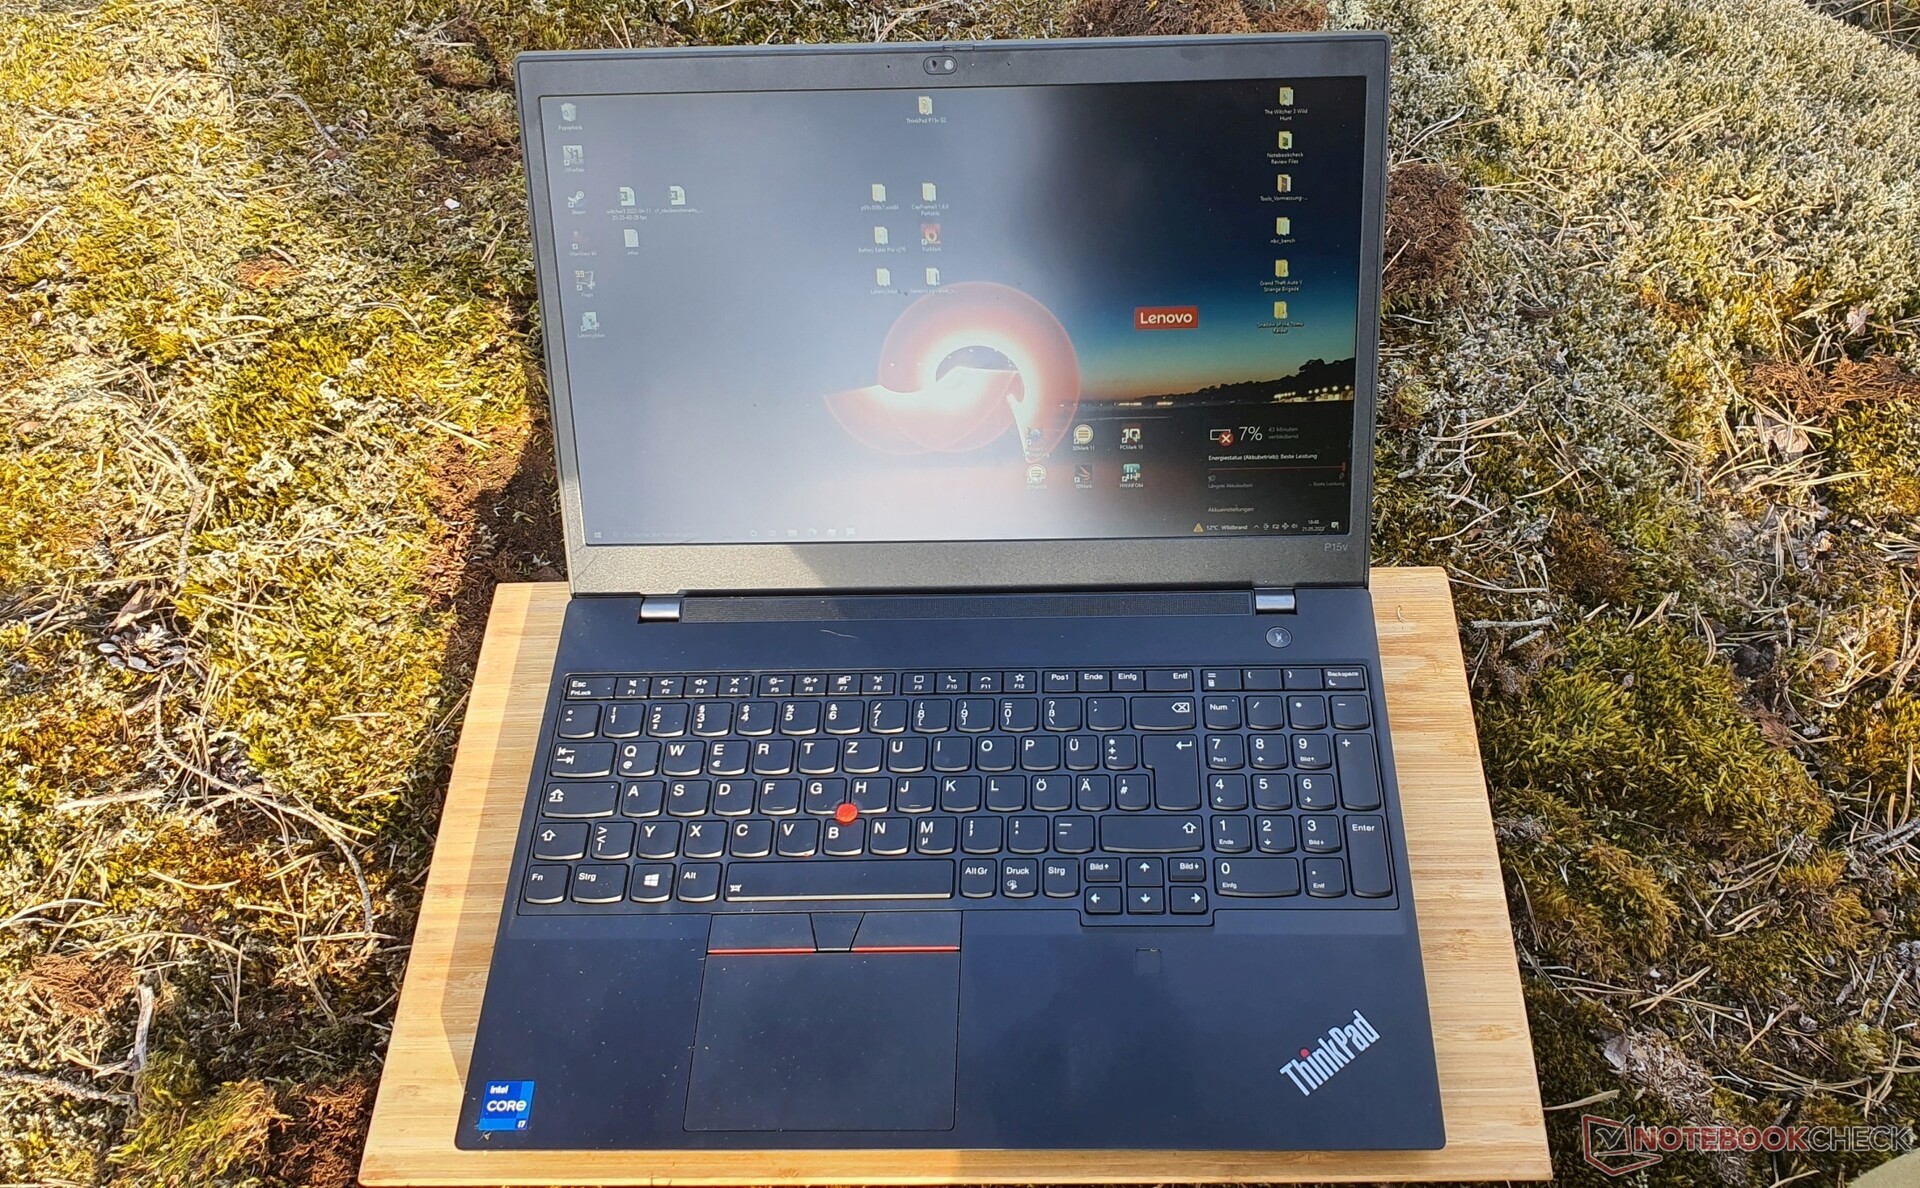
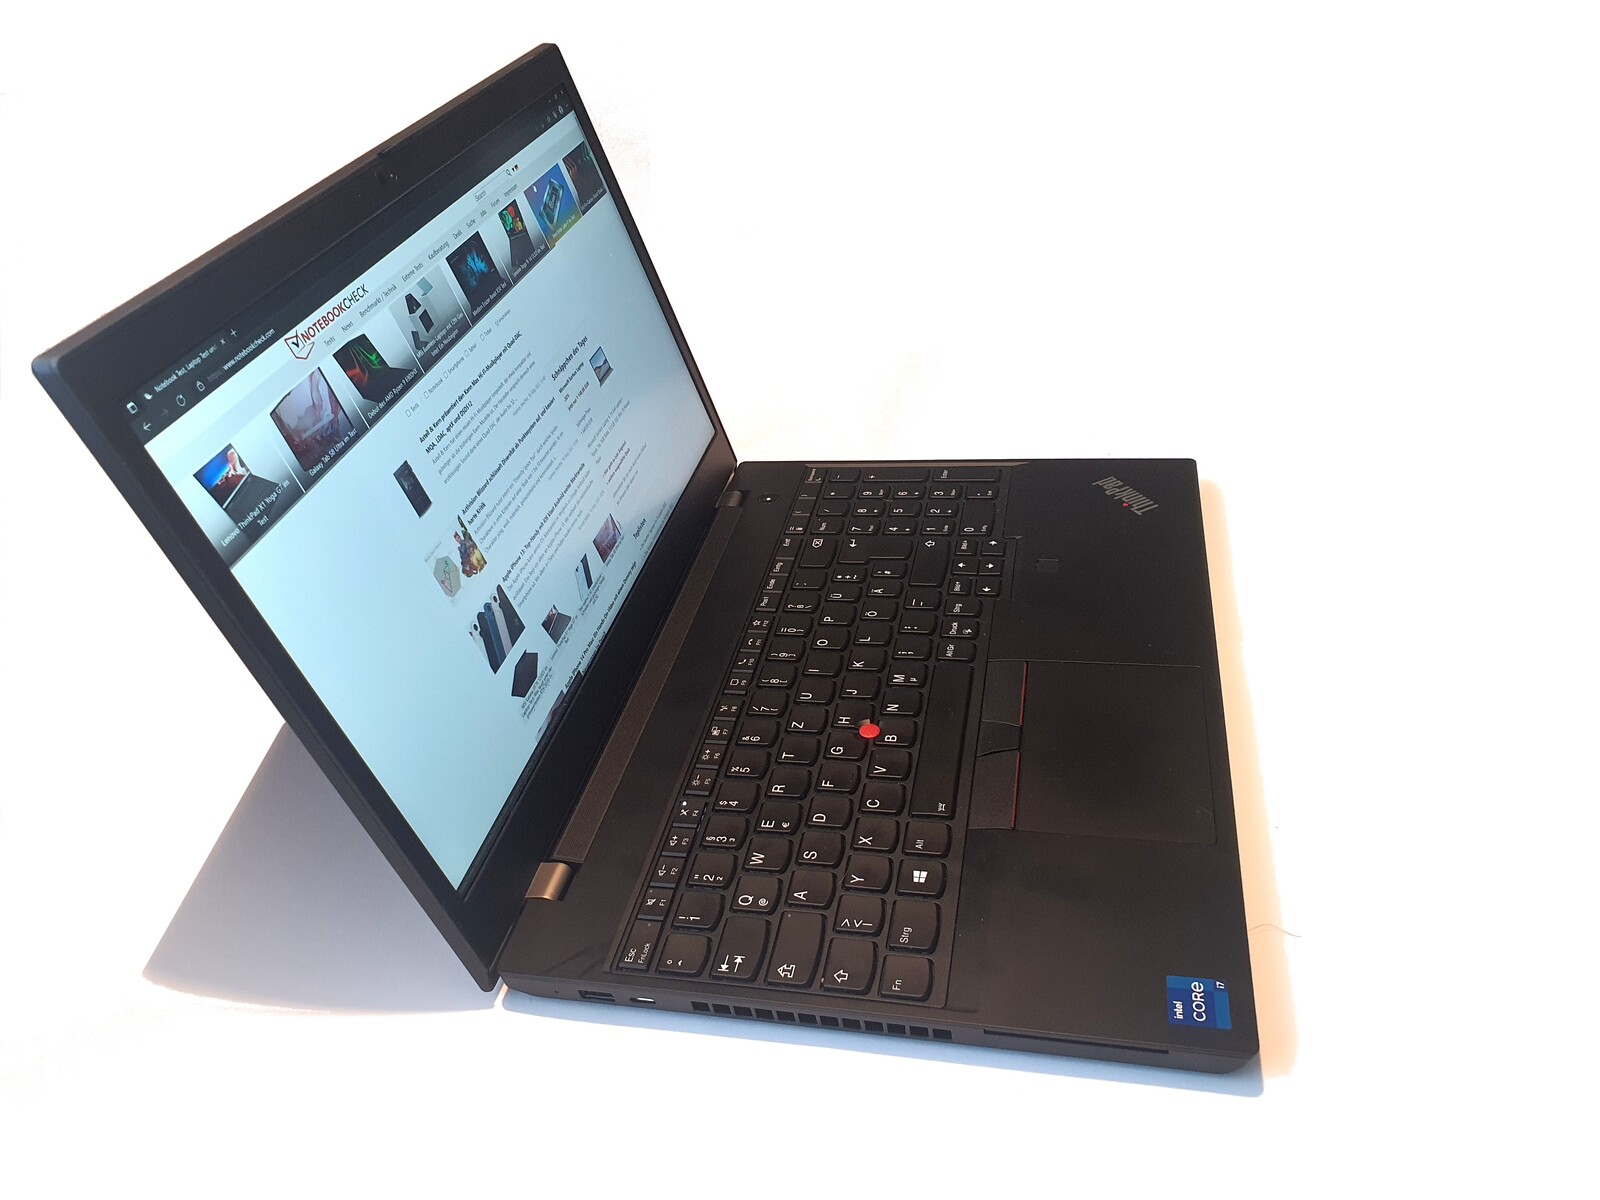
Lenovo ThinkPad P15v G2 laptop review: Affordable business workstation
The Lenovo ThinkPad P15v Gen2 is a 15-inch workstation that is positioned between the ThinkPad P15s and P15 groups of laptops in terms of features and price. Like the latter group, it uses a Intel Core i7-11800H, but comes with the option of a Nvidia GeForce RTX A2000 as the most powerful GPU available for this variant. The ThinkPad T15p Gen2 uses the slower Nvidia GeForce GTX 1650, which is configured as a professional variant (Nvidia T1200) in our P15v G2.
Both devices can be equipped with a 4K display (600 nits), just like the T15p Gen1. The more bulky ThinkPad T15g, on the other hand, is a workstation variant of the ThinkPad P15 that has shifted in the direction of gaming. The P15v series thus offers powerful components at a not too high weight and price (around 1,800 Euros). Lenovo advertises its workstation for creative individuals: whether this claim is justified, particularly in regard to the display, will be revealed in the following review.
Note for international readers: The Lenovo ThinkPad P15v Gen2 is also available in other countries in various configurations at various prices (see "Price and Availability" at the end of this review for examples).
| Modell | Area of application |
|---|---|
| ThinkPad P15 | Classic workstation |
| ThinkPad T15g | Gaming workstation |
| ThinkPad P15s | Ultrabook workstation |
| ThinkPad T15 | Business |
| ThinkPad P15v | Entry-level workstation |
| ThinkPad T15p | Business performance |
Possible Competitors in Comparision
Rating | Date | Model | Weight | Height | Size | Resolution | Best Price |
|---|---|---|---|---|---|---|---|
| 86.2 % | 06/2022 | Lenovo ThinkPad P15v G2 21A9000XGE i7-11800H, T1200 Laptop GPU | 2.3 kg | 22.7 mm | 15.60" | 1920x1080 | |
| 87.2 % | 10/2021 | Lenovo ThinkPad P15 G2-20YQ001JGE i7-11800H, RTX A3000 Laptop GPU | 2.9 kg | 31.5 mm | 15.60" | 1920x1080 | |
| 86.3 % | 03/2021 | Lenovo ThinkPad T15g-20UR000GGE i7-10750H, GeForce RTX 2070 Super Max-Q | 2.8 kg | 31.45 mm | 15.60" | 1920x1080 | |
| 86.6 % | 02/2021 | Lenovo ThinkPad T15p-20TN0006GE i7-10750H, GeForce GTX 1050 Mobile | 2.2 kg | 22.7 mm | 15.60" | 3840x2160 | |
| 85.3 % | 06/2021 | Lenovo ThinkPad P15s Gen2-20W6000GGE i7-1165G7, T500 Laptop GPU | 1.9 kg | 19.1 mm | 15.60" | 3840x2160 | |
| 87.7 % | 07/2022 | HP ZBook Power 15 G8 313S5EA i7-11800H, T600 Laptop GPU | 2 kg | 22.8 mm | 15.60" | 1920x1080 | |
| 88.3 % | 10/2021 | Dell Precision 5000 5560 i7-11850H, RTX A2000 Laptop GPU | 2 kg | 18 mm | 15.60" | 3840x2400 |
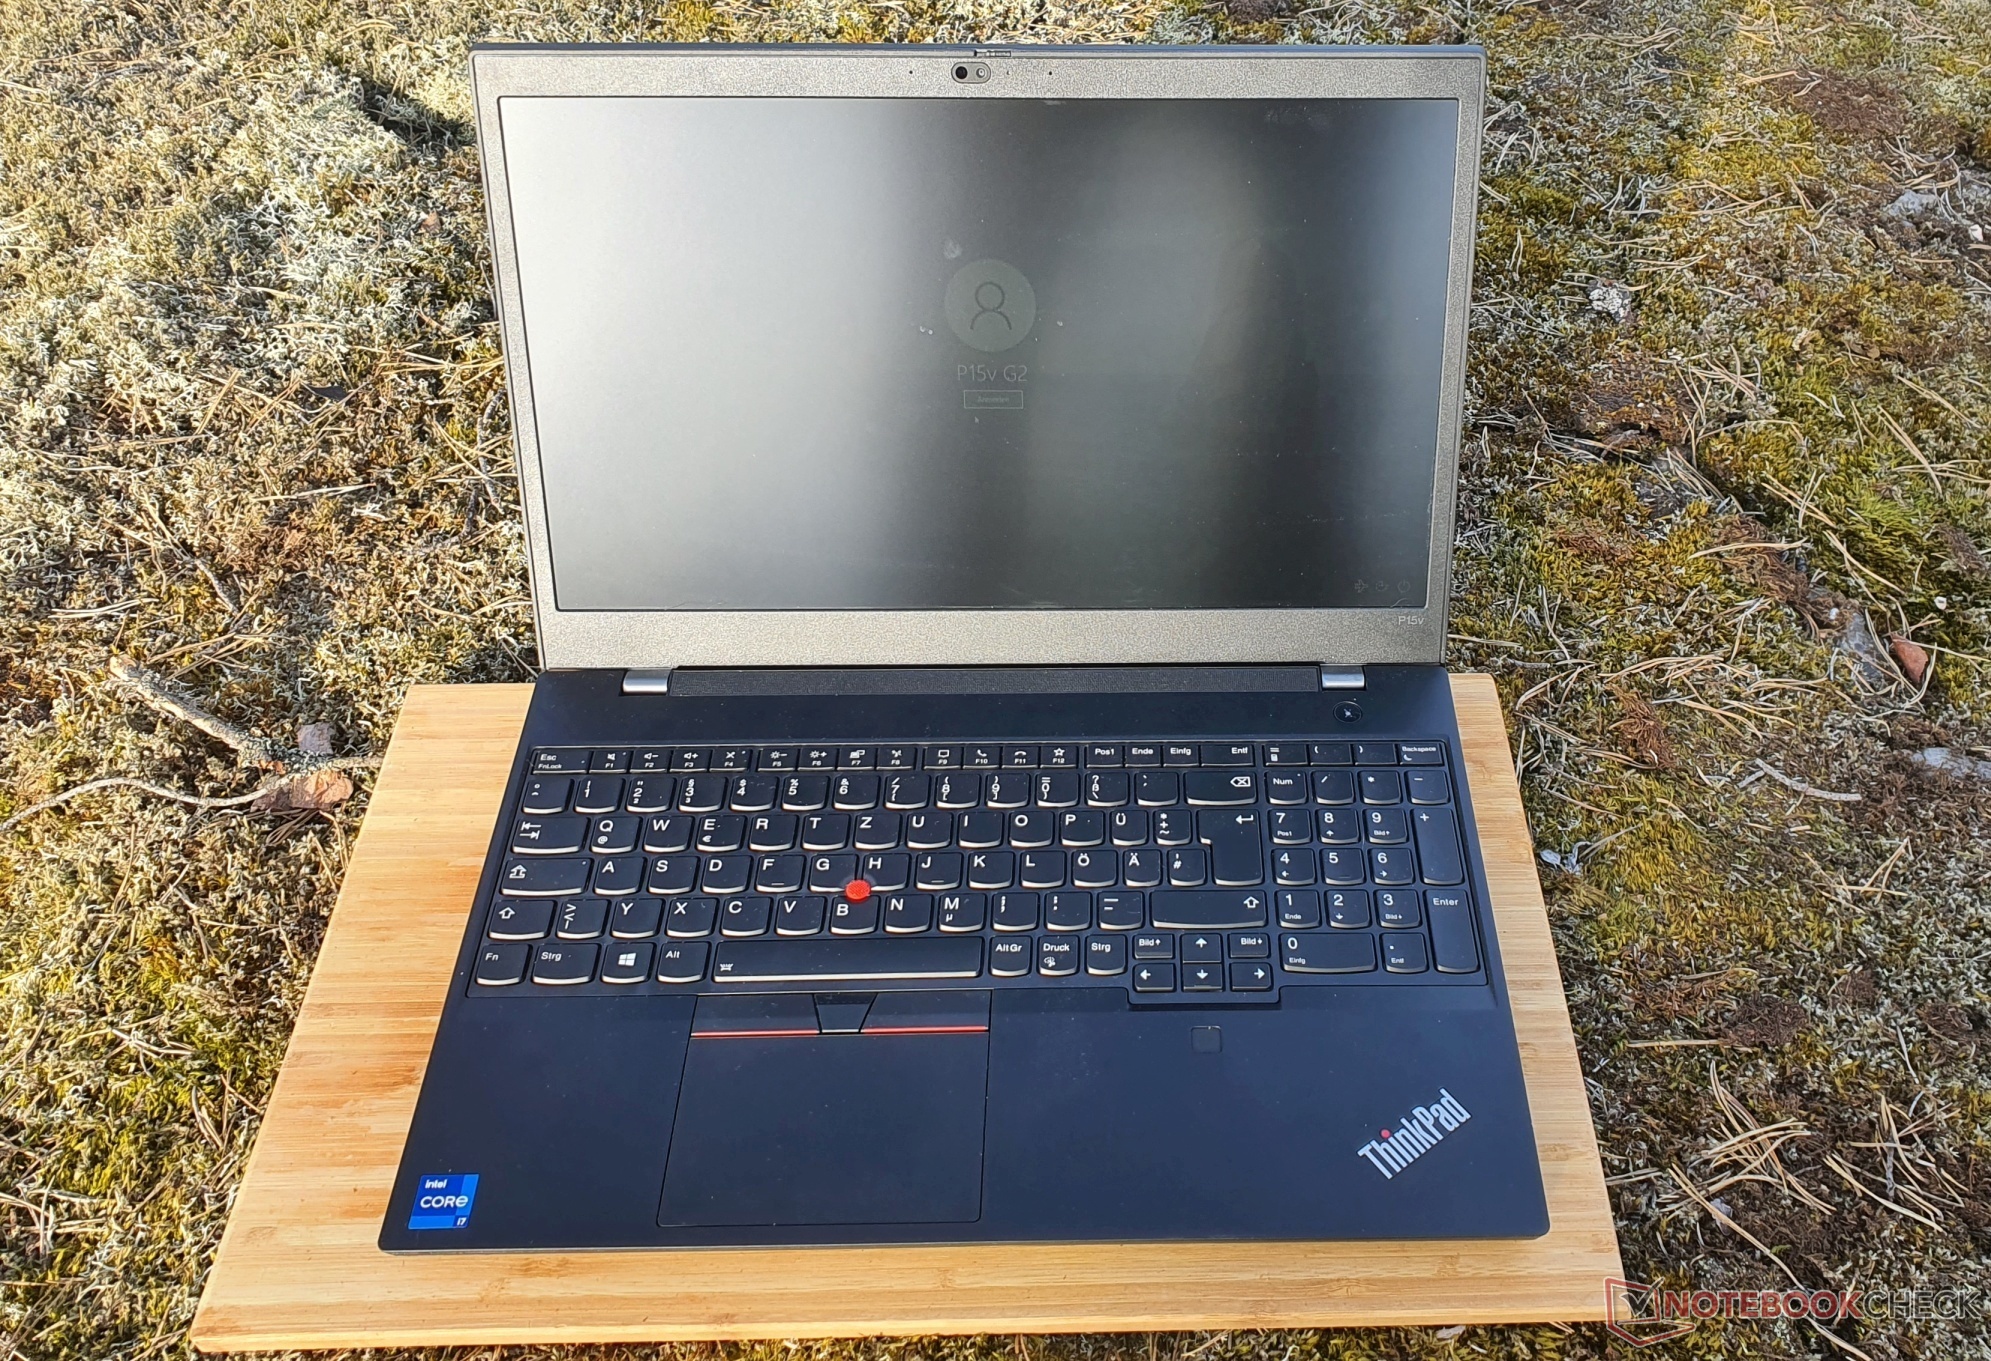
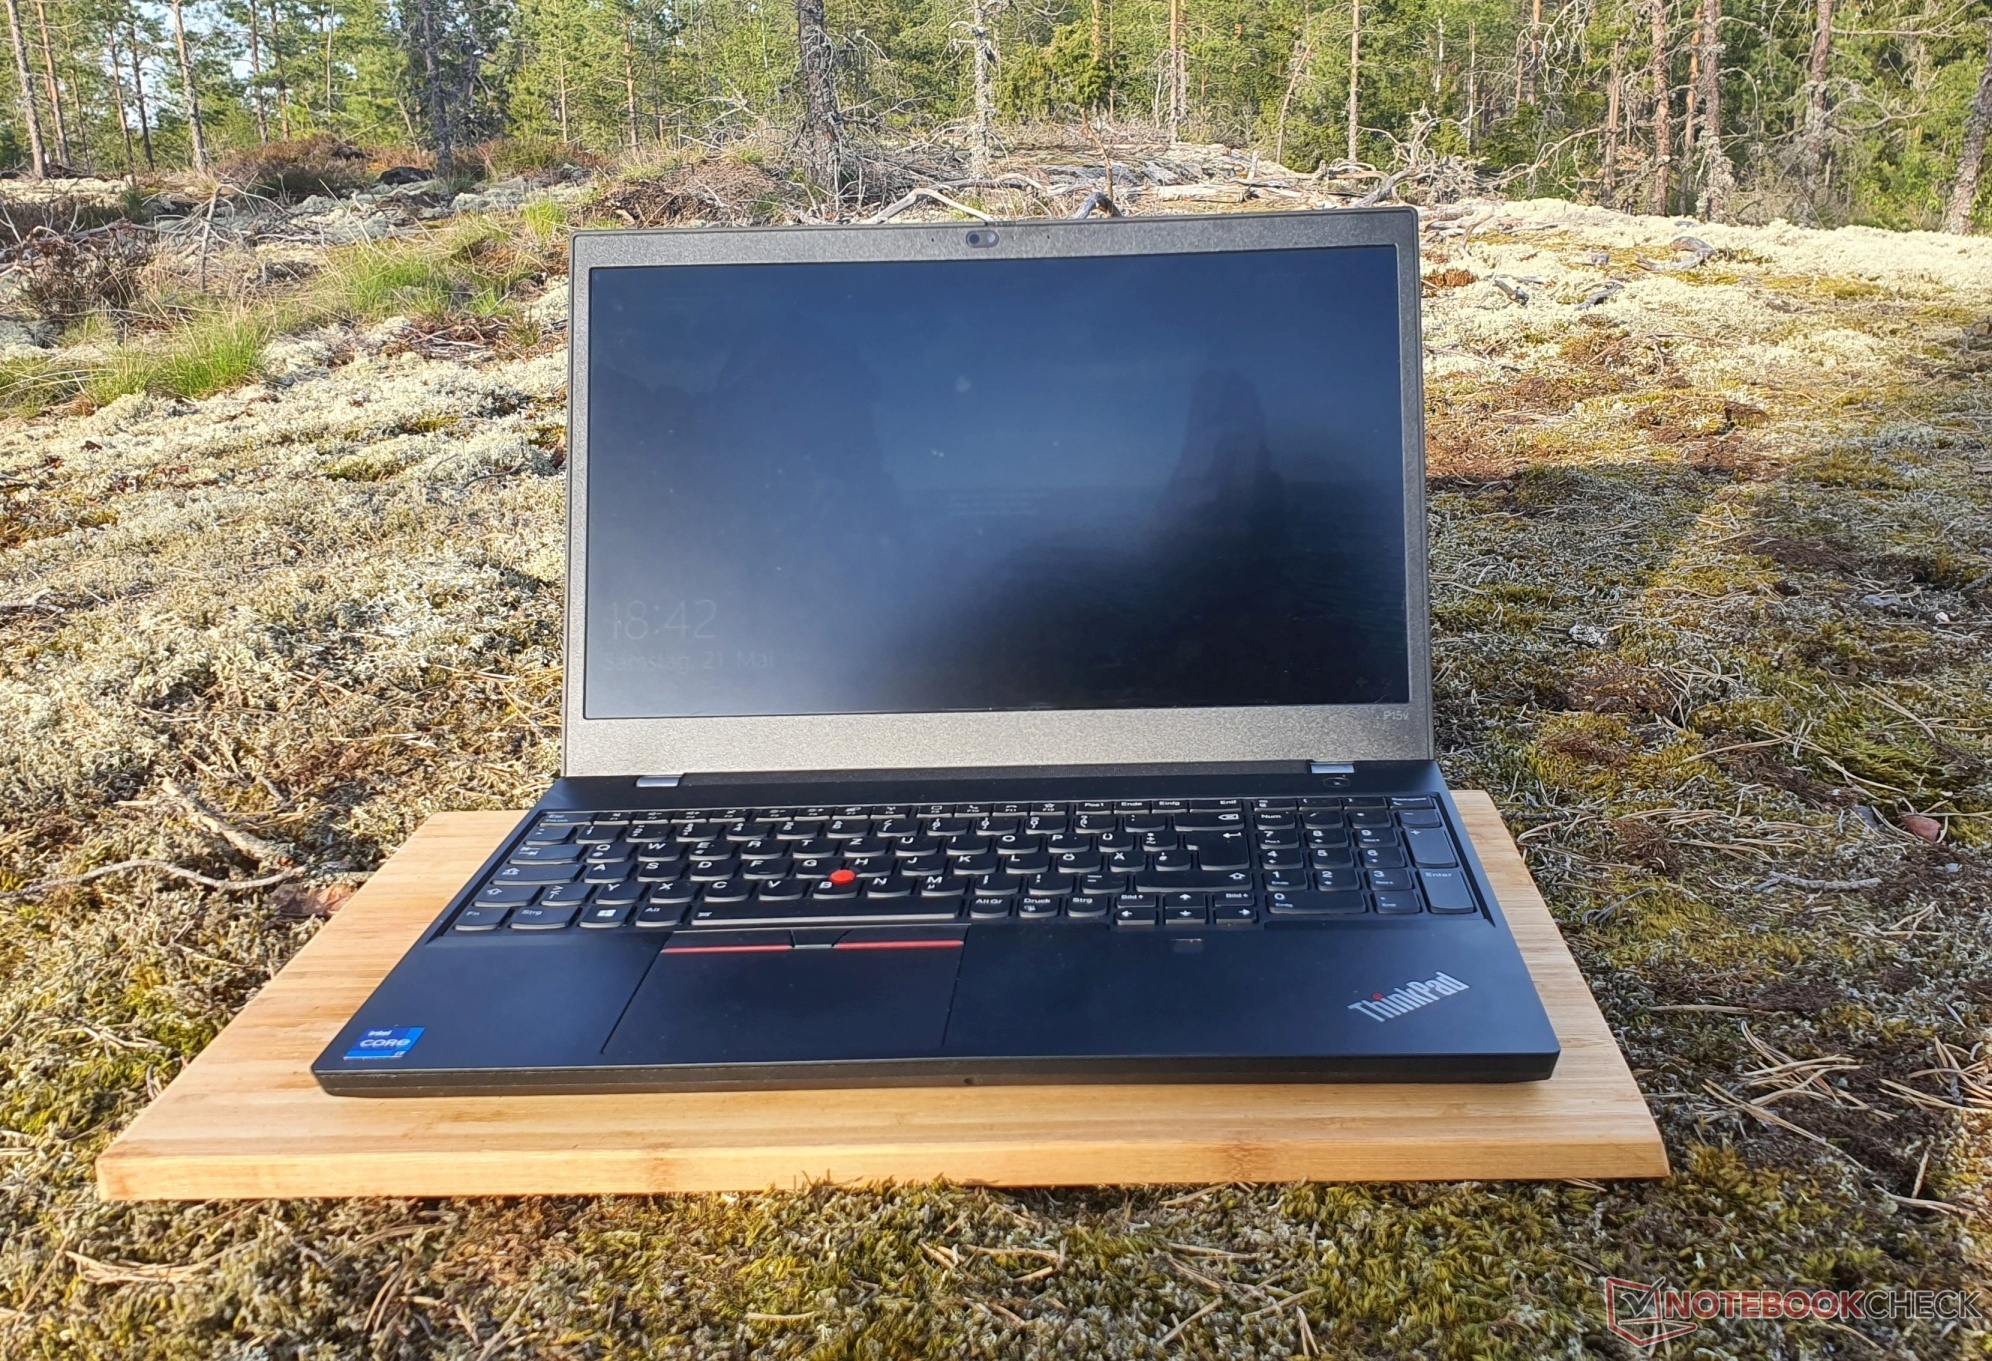
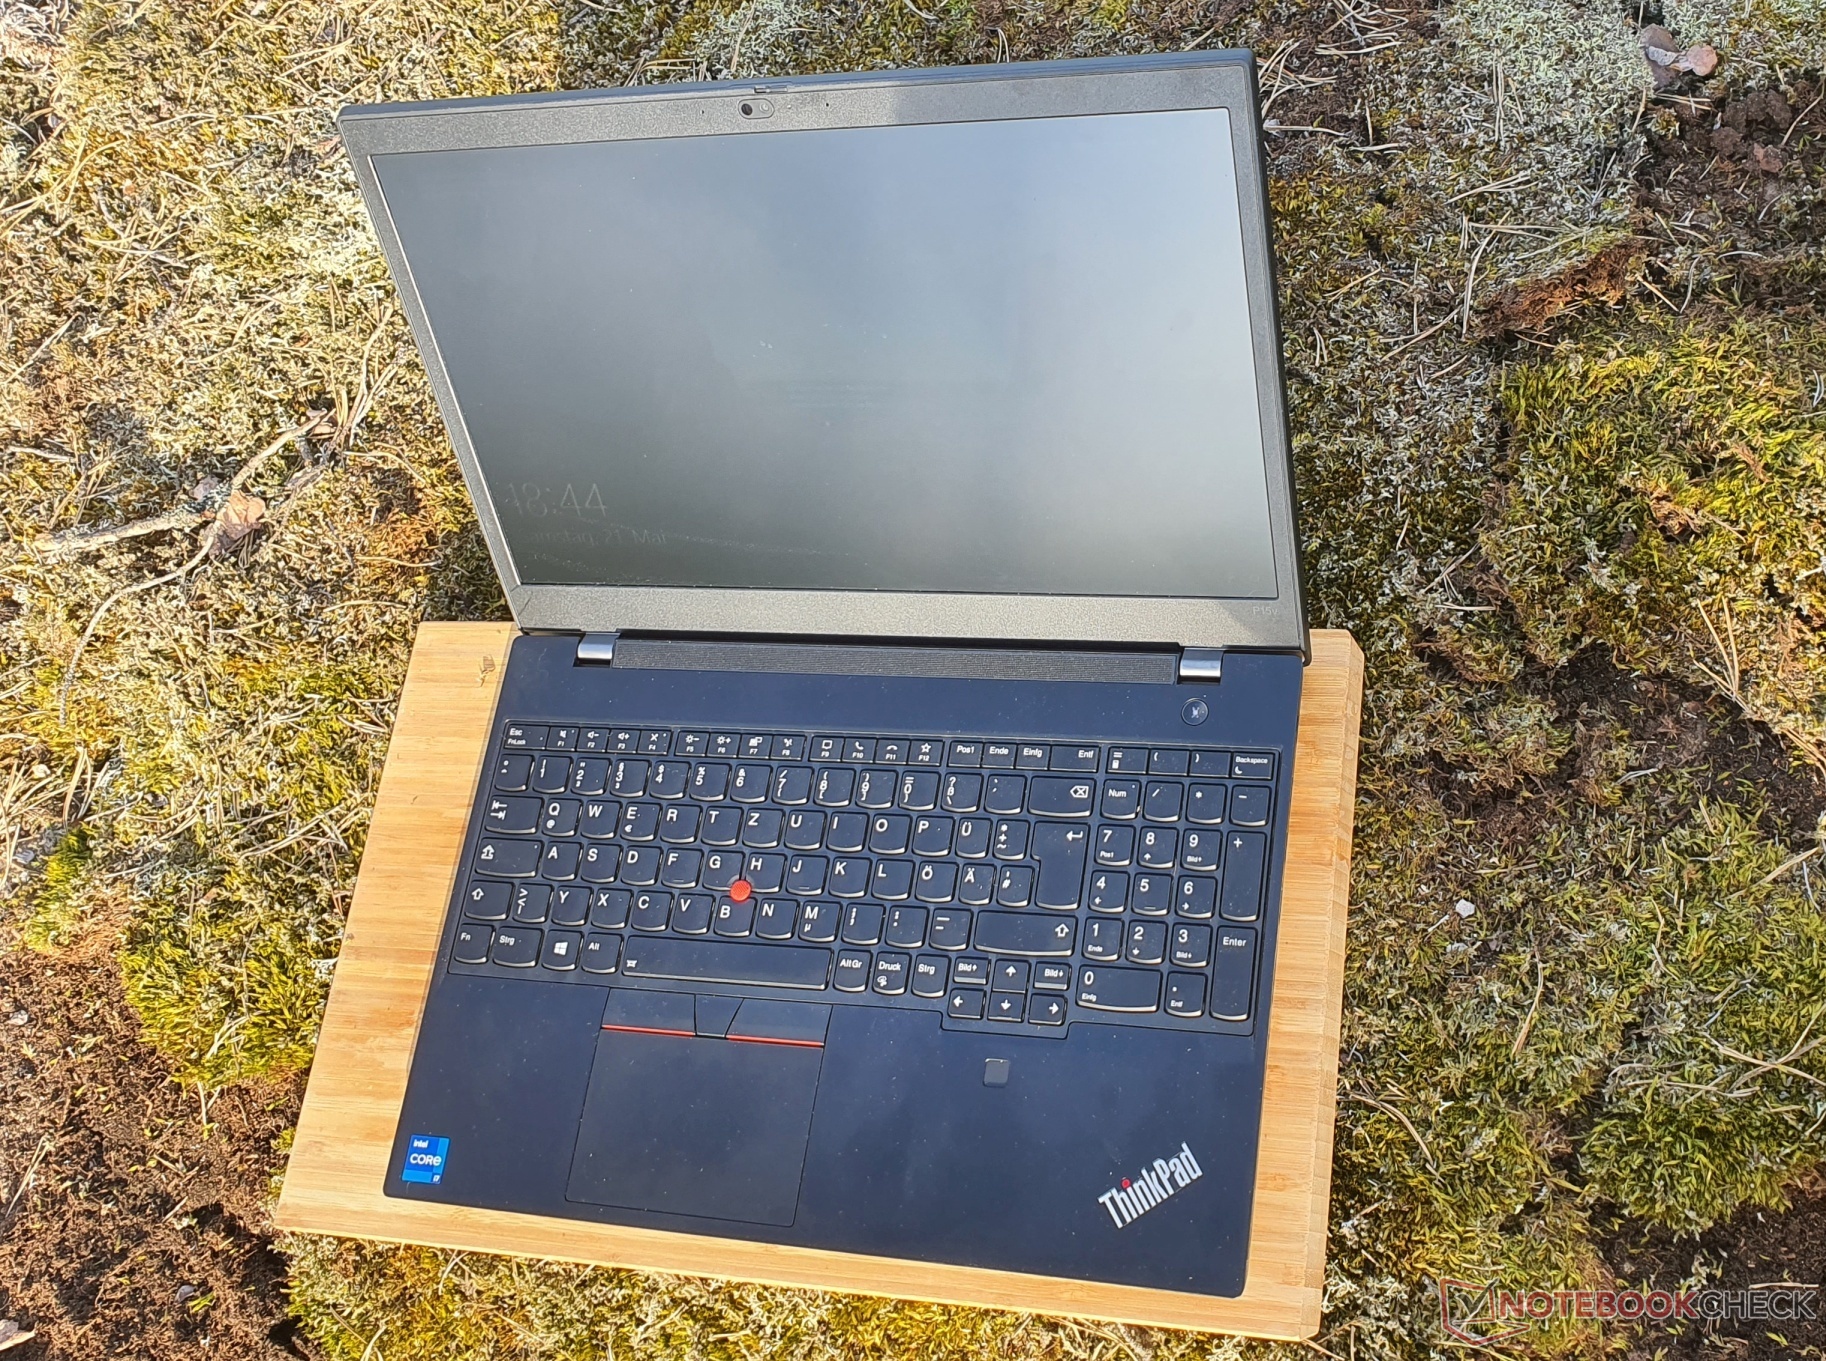
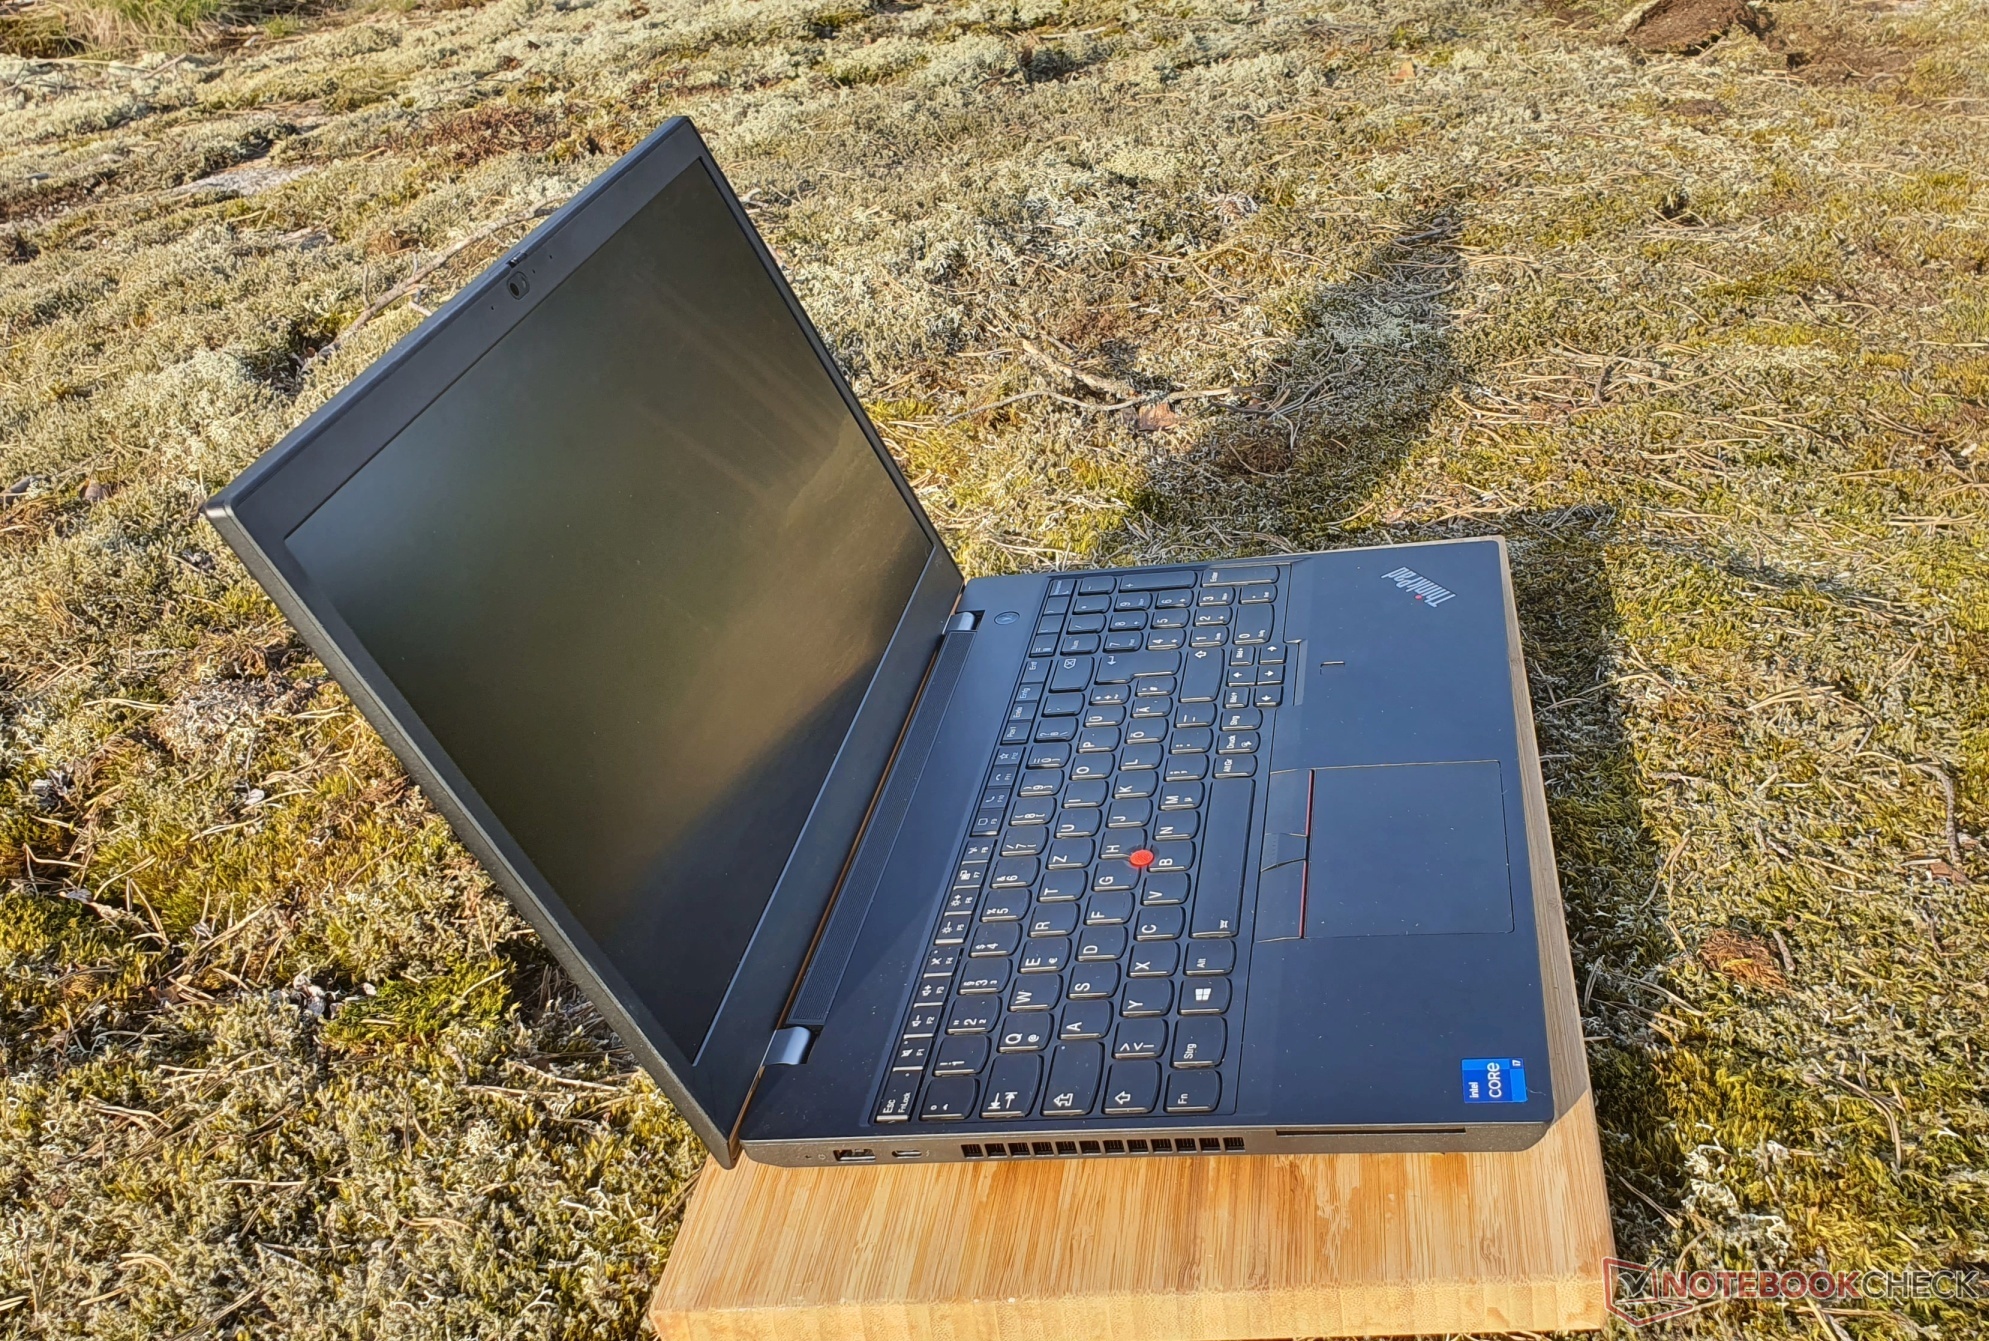
Case: Stable plastic for the matte ThinkPad

The case of the ThinkPad P15v appears similar to the ThinkPad P15s, but is higher (by around 3.6 mm) and heavier (by 360 grams). The lid is also considerably thicker, offering more resistance to torsion, but it can still be twisted noticeably.
The same case as the ThinkPad T15p is used here, which means stable, matte-rough ABS plastic all around, but without the fiberglass reinforcement of the P15s. Also missing are the haptically pleasing rubber coatings, which makes for a very rough underside as known from budget ThinkPads such as the L15, or the ThinkPad R500 of the distant past.
There are no flaws in the workmanship, and stability is on a high level. The magnesium-reinforced base unit cannot be twisted by any stretch of the imagination, and the keyboard unit only yields slightly in the center when targeted pressure is applied. The hinges are very taut, but still allow for one-handed opening up to a 180° angle. Unfortunately, the ThinkPad is a magnet for fingerprints.
Due to their more powerful graphics cards and overall stronger cooling systems, the ThinkPad P15 and T15g laptops are significantly thicker laptops at around 31.5 mm compared to the 22.7 mm "thin" and thus lighter P15v, resulting in a weight difference of 600 grams.
According to the s-suffix (slim), the ThinkPad P15s is even thinner and lighter. Dell's Precision 5560 remains unbeatable with its 14-inch laptop size, while HP's ZBook Power 15 has similar dimensions to the ThinkPad P15v, but is almost 300 grams lighter at 1.97 kg.
Connectivity: Lenovo with fixed Wi-Fi 6 and SD card reader
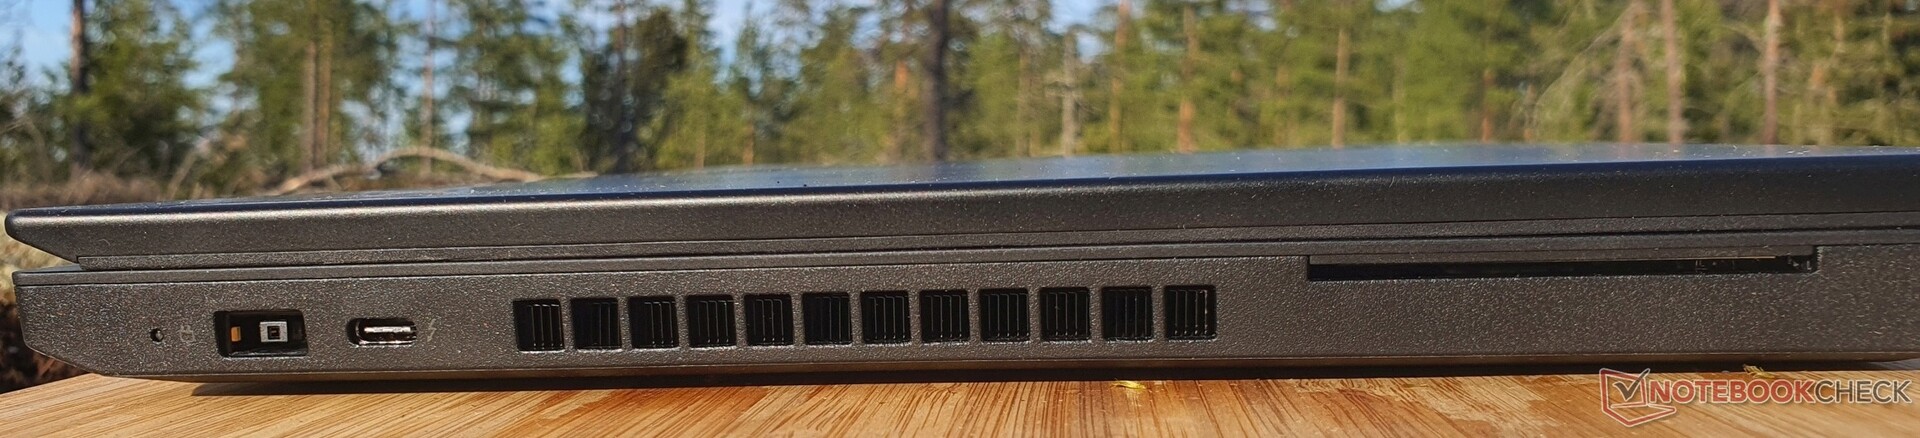
The ThinkPad P15v G2 offers a lot of ports: on the left side is the proprietary slim-tip charging port and a Thunderbolt 4 port, which unfortunately does not support charging. In addition, there is a smart card reader and ventilation slots, so that waste heat does not pose an issue when using a mouse on the right side.
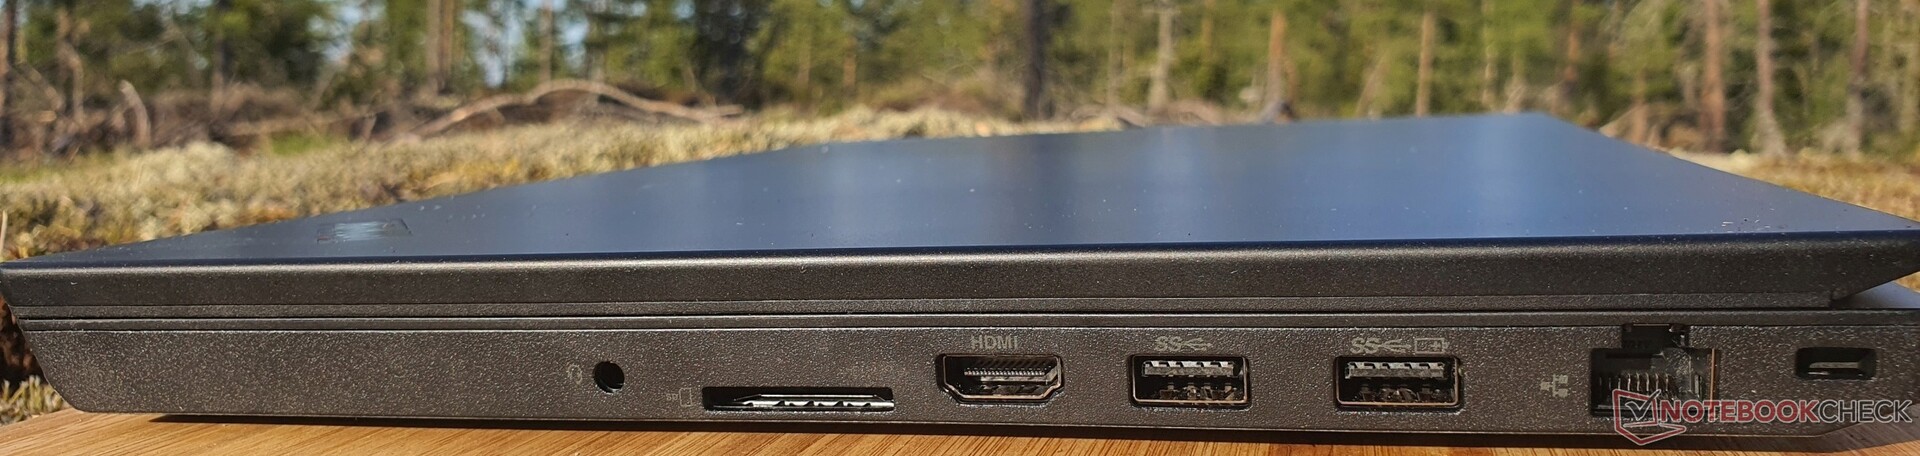
Features on the right side include two USB-A 3.2 Gen1 (Always On) ports, HDMI 2.0, GBit Ethernet and a full-sized SD card reader, which are no longer offered in pure business ThinkPads such as the P15s. Models with WWAN have a SIM card slot on the back of the device that acts as a µSD card slot if no WWAN has been configured.
SD Card Reader
Regarding read rates of 1 GB files, the ThinkPad P15v G2 comes out on top in its class. In the copy test, however, it falls well behind the 200 MB/s of the ThinkPad P15 and Dell Precision 5560 workstations with around 96 MB/s.
| SD Card Reader | |
| average JPG Copy Test (av. of 3 runs) | |
| Lenovo ThinkPad P15 G2-20YQ001JGE (AV Pro V60) | |
| Dell Precision 5000 5560 (AV Pro V60) | |
| Lenovo ThinkPad T15g-20UR000GGE (Toshiba Exceria Pro SDXC 64 GB UHS-II) | |
| Lenovo ThinkPad P15v G2 21A9000XGE | |
| Average of class Workstation (54.8 - 200, n=16, last 2 years) | |
| Lenovo ThinkPad T15p-20TN0006GE (Toshiba Exceria Pro SDXC 64 GB UHS-II) | |
| Lenovo ThinkPad P15s Gen2-20W6000GGE (AV Pro V60) | |
| maximum AS SSD Seq Read Test (1GB) | |
| Lenovo ThinkPad P15v G2 21A9000XGE | |
| Lenovo ThinkPad P15 G2-20YQ001JGE (AV Pro V60) | |
| Lenovo ThinkPad T15g-20UR000GGE (Toshiba Exceria Pro SDXC 64 GB UHS-II) | |
| Dell Precision 5000 5560 (AV Pro V60) | |
| Lenovo ThinkPad T15p-20TN0006GE (Toshiba Exceria Pro SDXC 64 GB UHS-II) | |
| Average of class Workstation (78.6 - 226, n=16, last 2 years) | |
| Lenovo ThinkPad P15s Gen2-20W6000GGE (AV Pro V60) | |
Communication
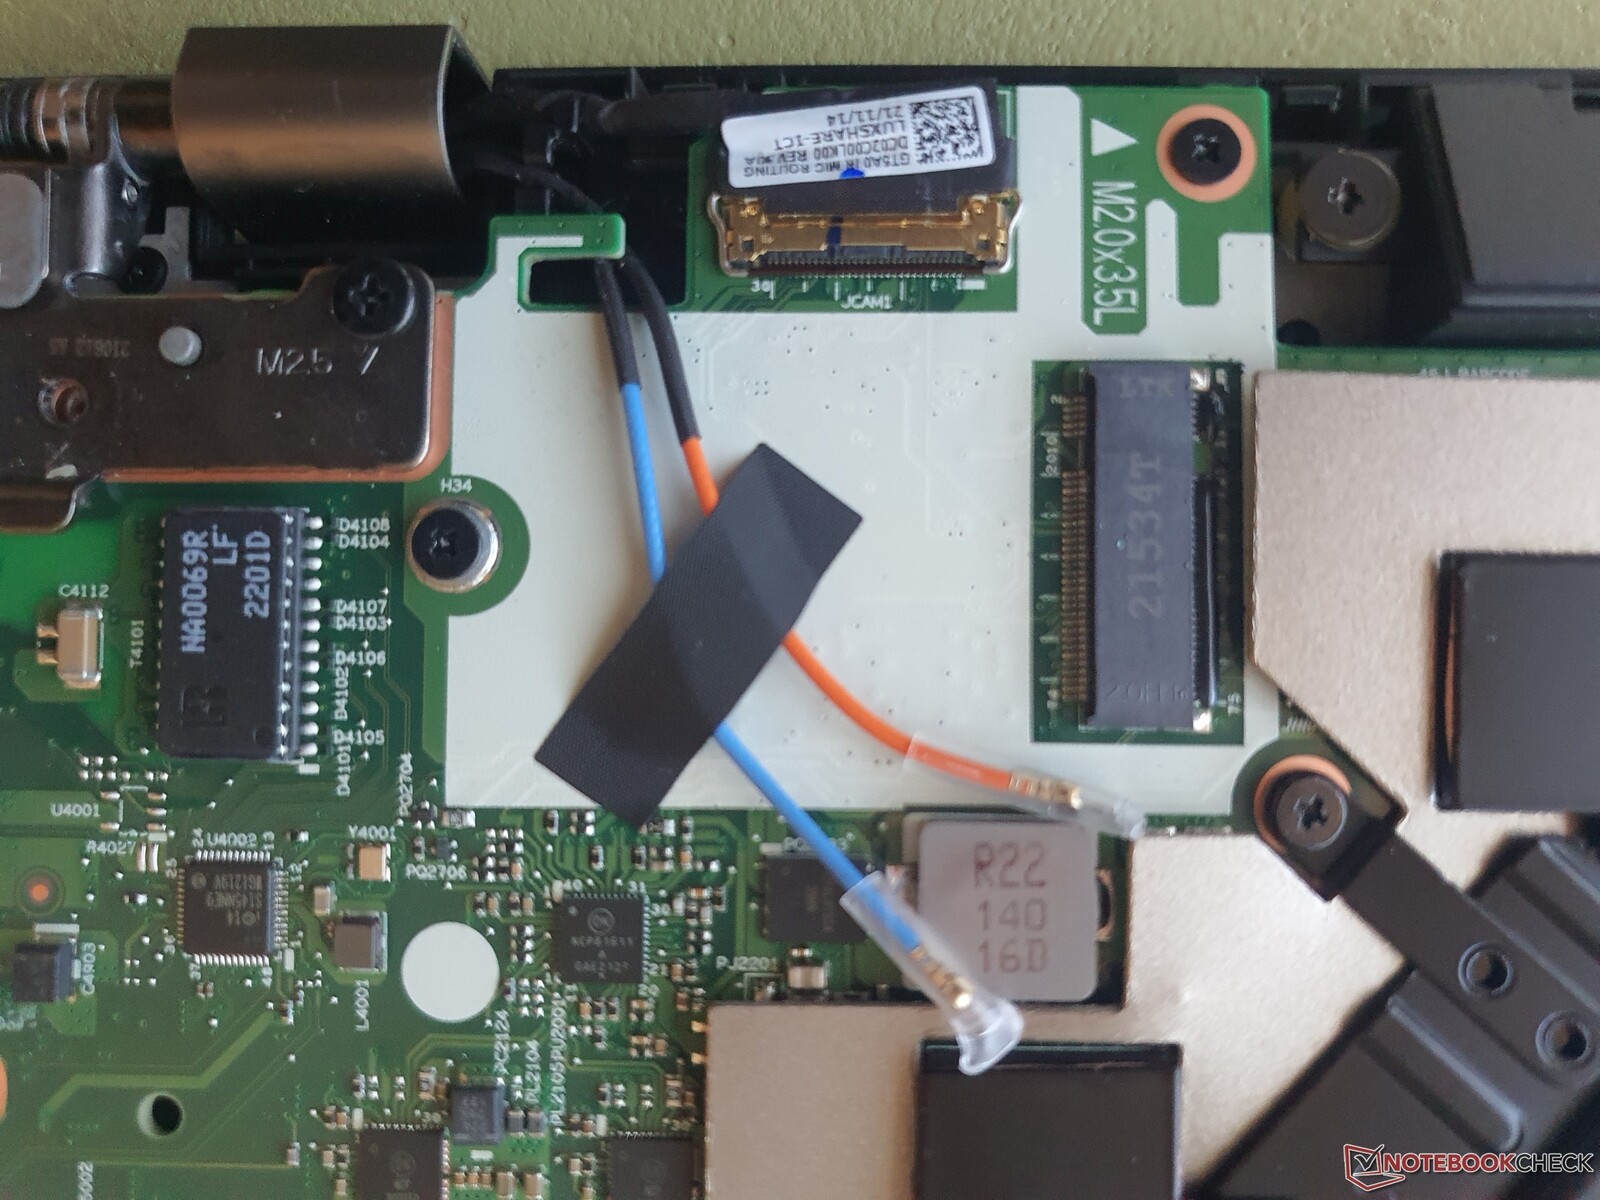
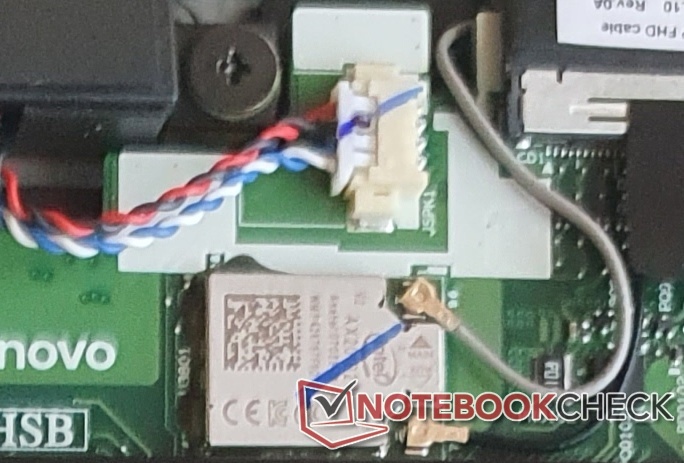
RJ45 Ethernet (1 GBit/s) is available. There is also Intel's Wi-Fi 6 AX201 (permanently installed), which allows the ThinkPad P15v G2 to transfer network data ten times faster than via cable, which is on the high level of the competition. An existing M.2-Slot (and the corresponding antenna cables) allows for the installation of a WWAN card, but this can be also ordered preinstalled
Webcam

Although the camera only offers a lousy 720p, the model qualities of the reviewer can be seen.


Security
Pure business laptops like the ThinkPad P15v offer numerous security features such as a smart card reader, a fingerprint reader in the palm rest, a Kensington security lock, TPM 2.0, and an infrared camera for Windows Hello with an integrated ThinkShutter (webcam shutter).
Accessories
Outside the rather compact 135 watt slim power adapter, no accessories are included upon purchase. An explicit docking port is also omitted and Thunderbolt solutions are lacking due to the impossibility of charging via USB-C. Only a special docking variant that combines the proprietary charging port with Thunderbolt can be used: the ThinkPad Thunderbolt 3 Workstation Dock Gen 2.
Lenovo's packaging cannot be really described as environmentally friendly, even if the packaging and the box are kept very simple.
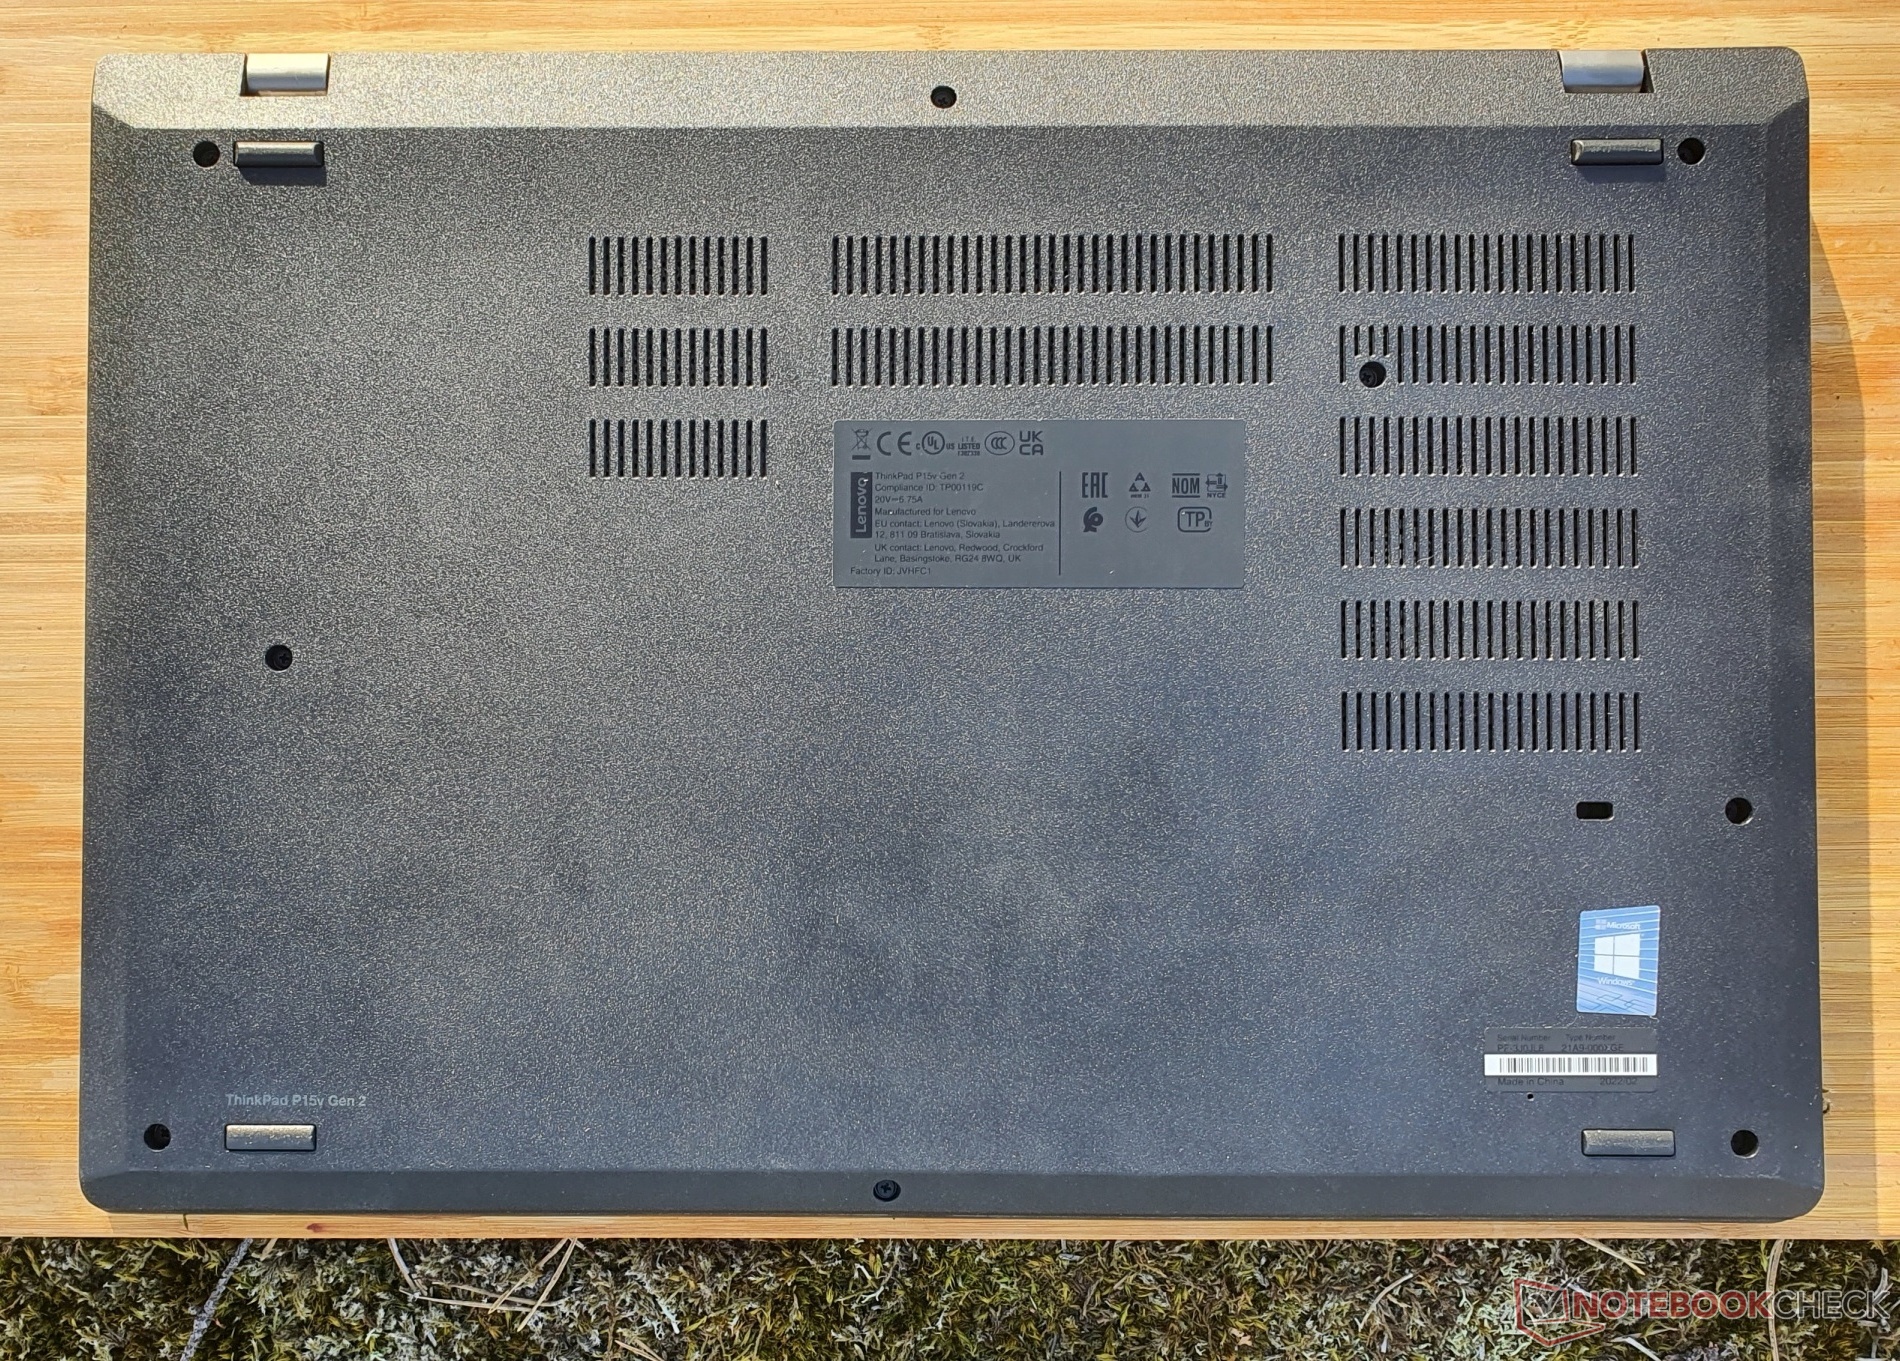
Maintenance
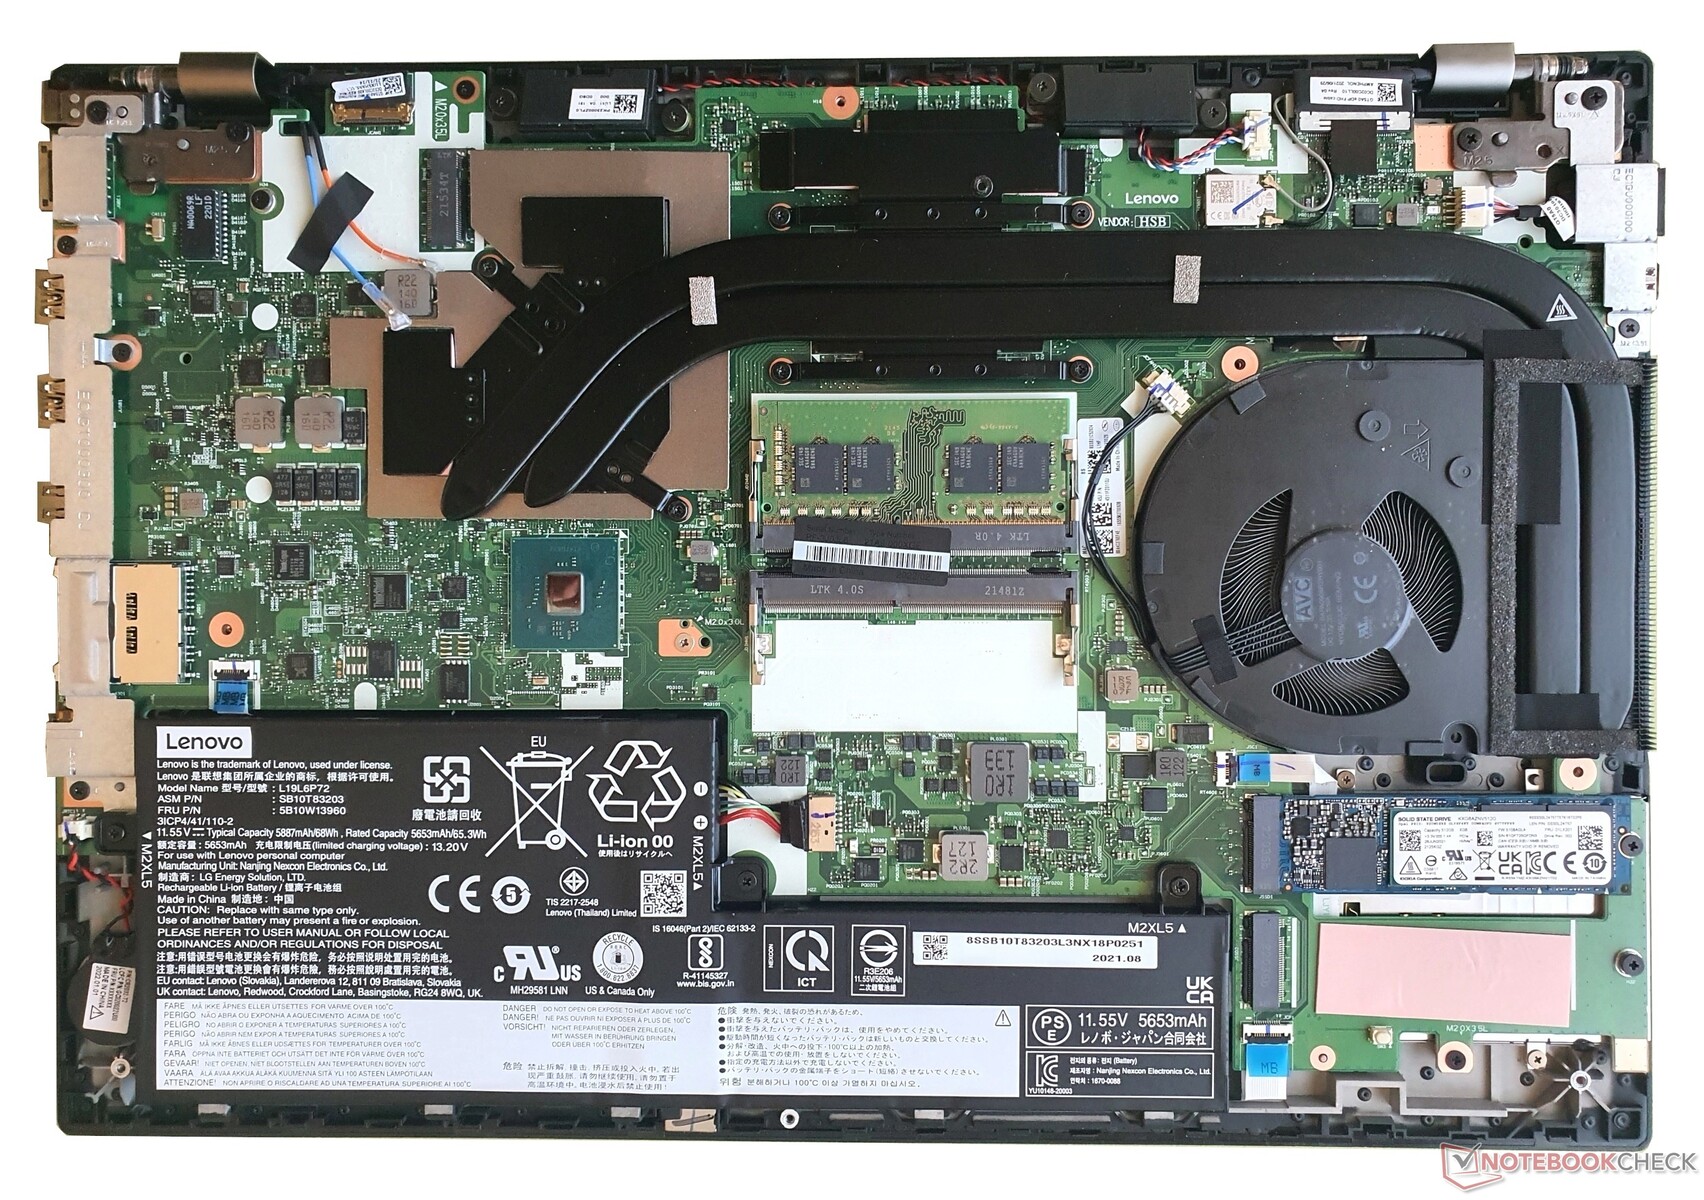
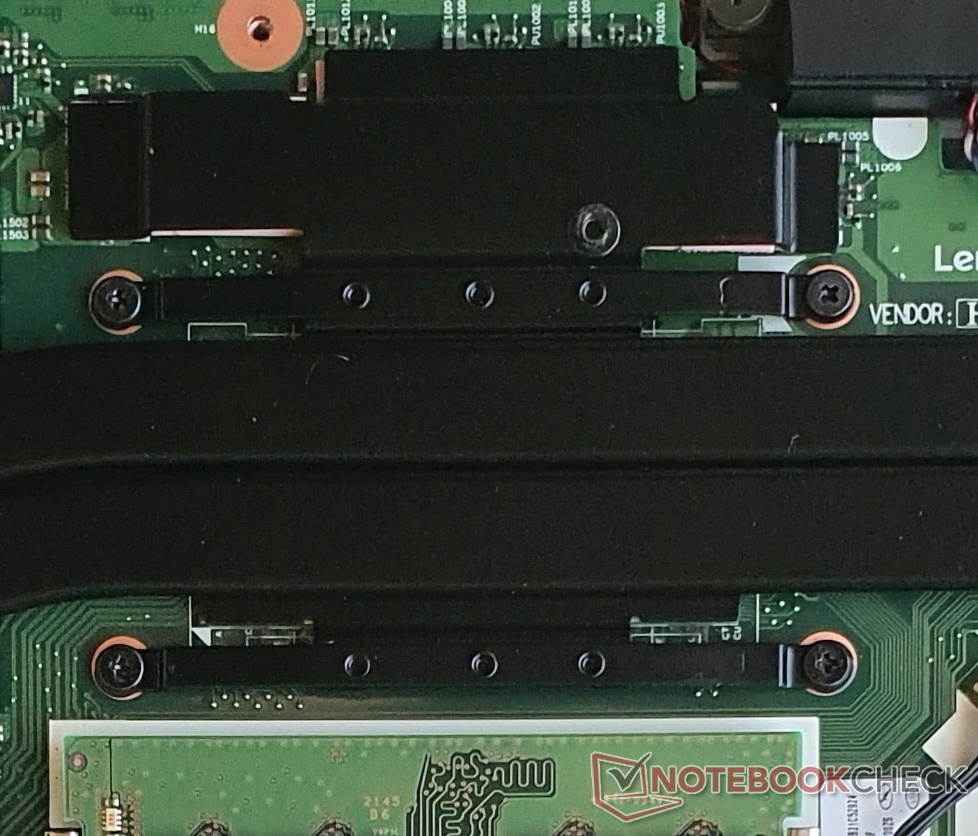
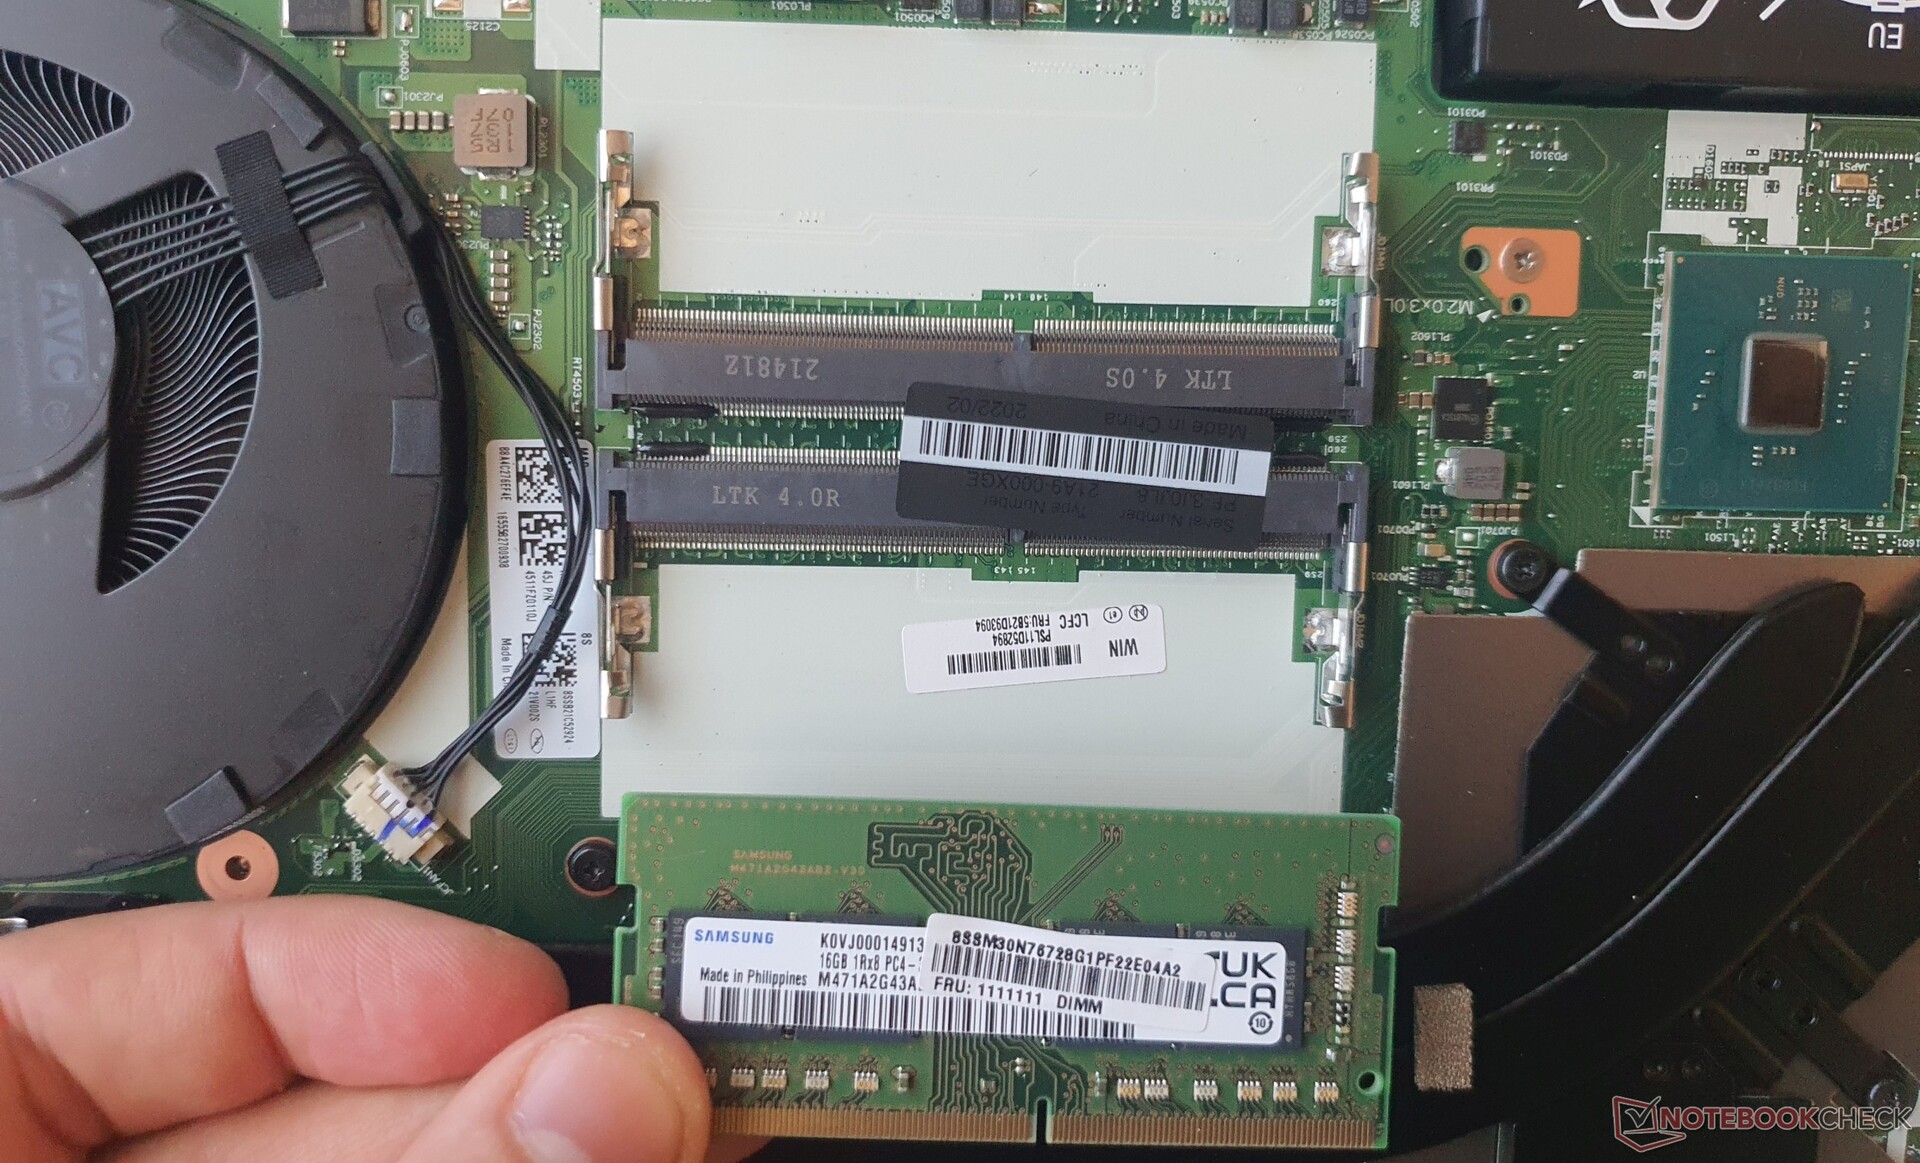
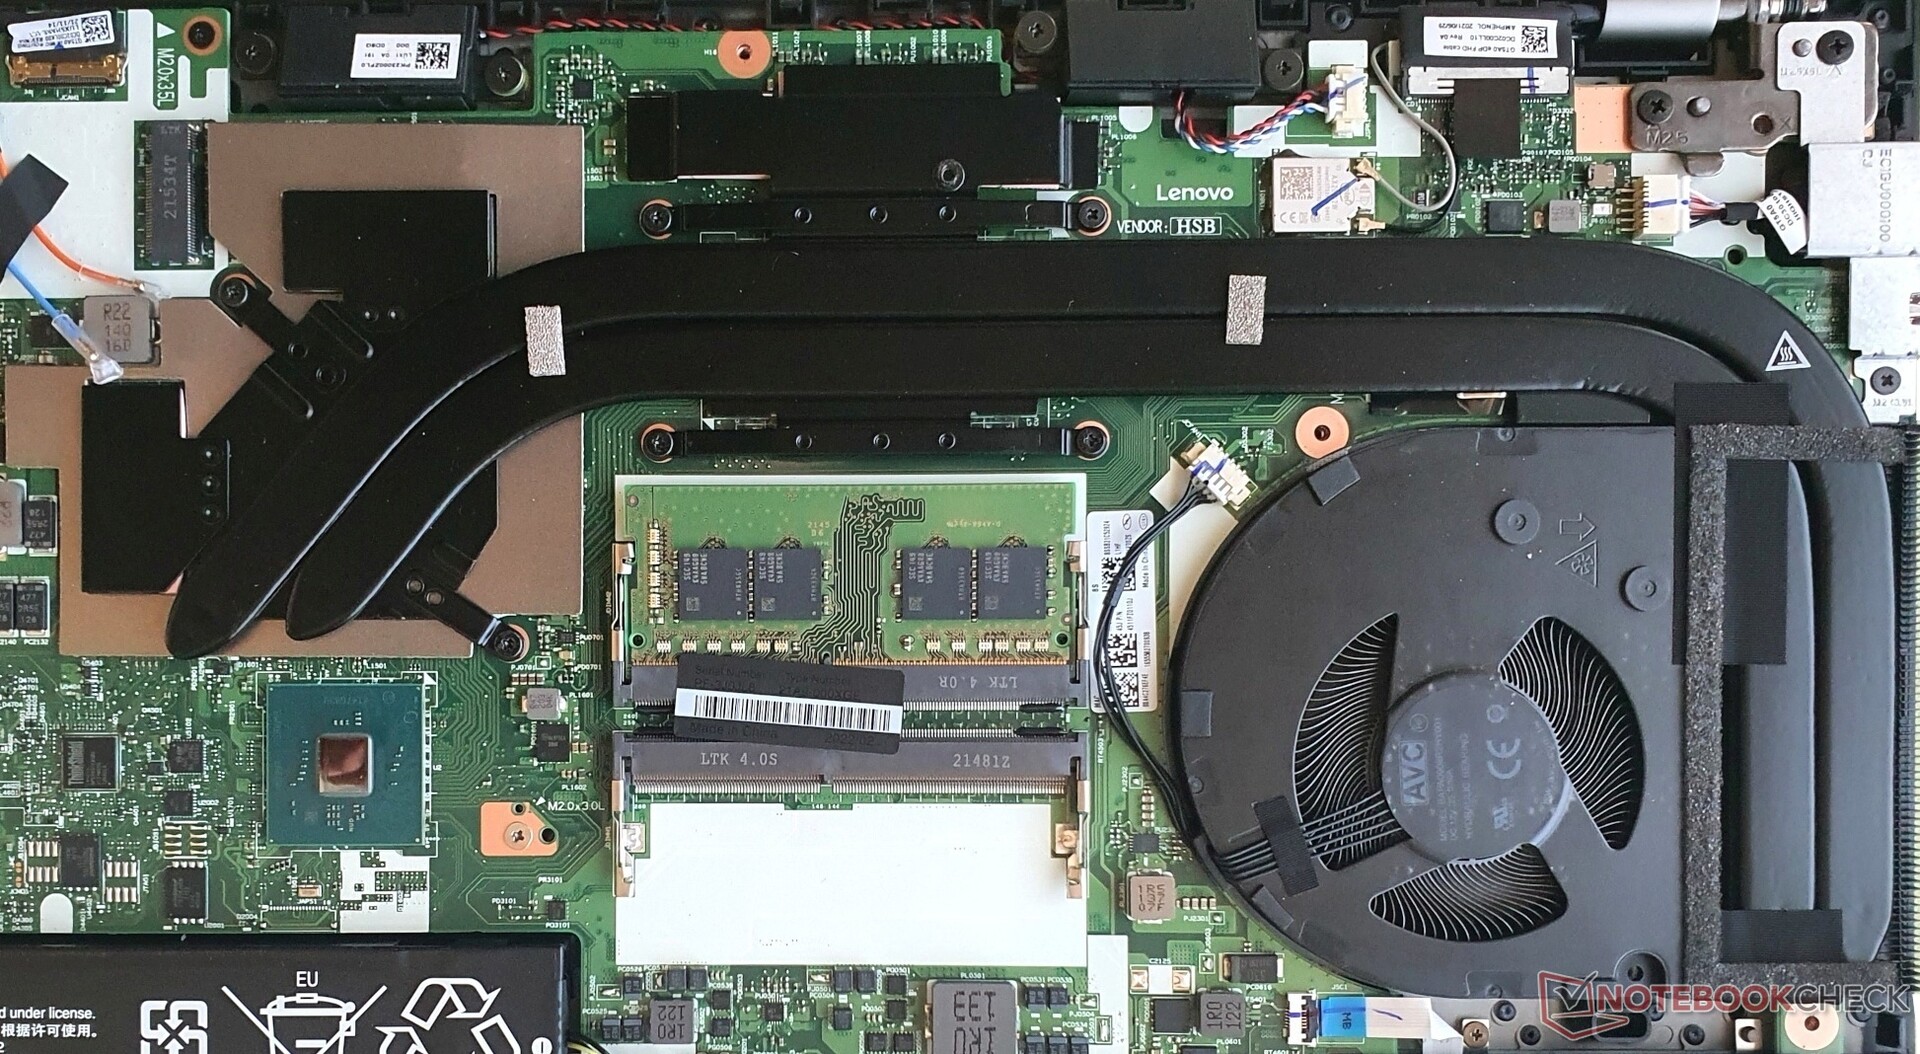
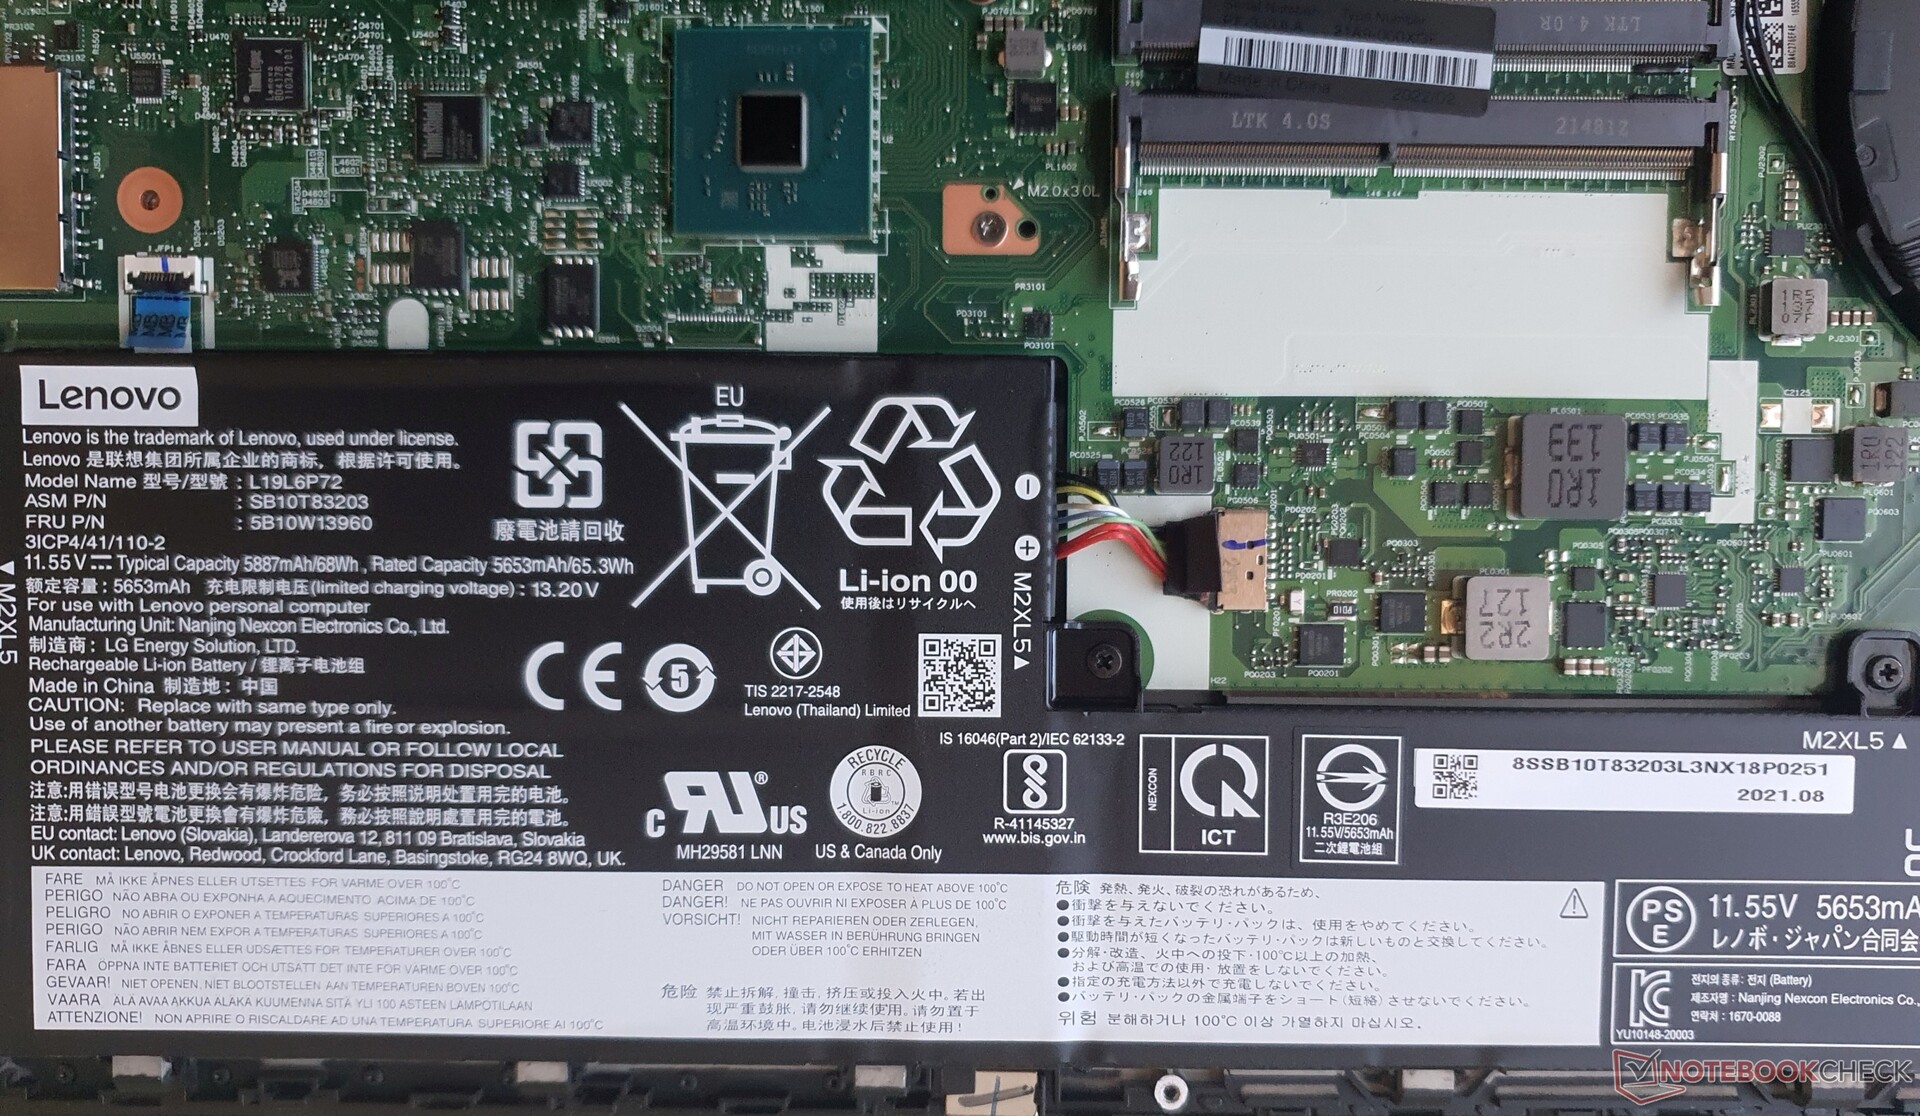
Despite several plastic clips, the base plate is fairly easy to remove. The nine screws are quickly loosened, while some of them remain stuck in the case. Upon opening, you have access to the RAM (1 free slot), the M.2-2280-SSD (1 free slot), the fan, which is replaceable (including the heat pipe), and the 68 Wh battery, which is also replaceable. The WLAN module is permanently installed.
Another useful aspect is that the keyboard can be easily replaced if it becomes worn-out or defective after years of typing.
Warranty
Like all upper-range ThinkPads (T/X/P series), Lenovo Germany offers a three-year warranty for the P15v G2 laptop, including Pickup & Return. On-site repairs are also possible for a surcharge, just like Accidental Damage Protection, Premier Support or extension of the warranty to 5 years.
Note for international readers: Lenovo's warranty policy may differ from region to region, so be sure to check Lenovo's website (where applicable) for the country of purchase.
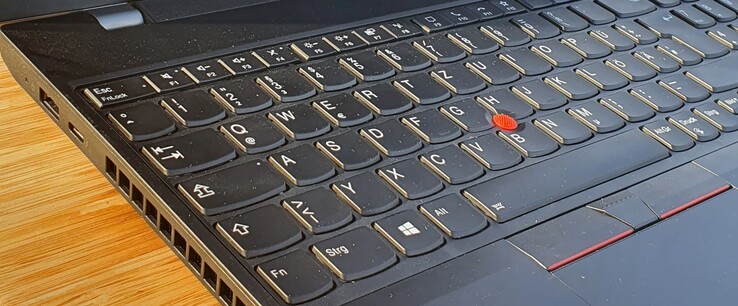
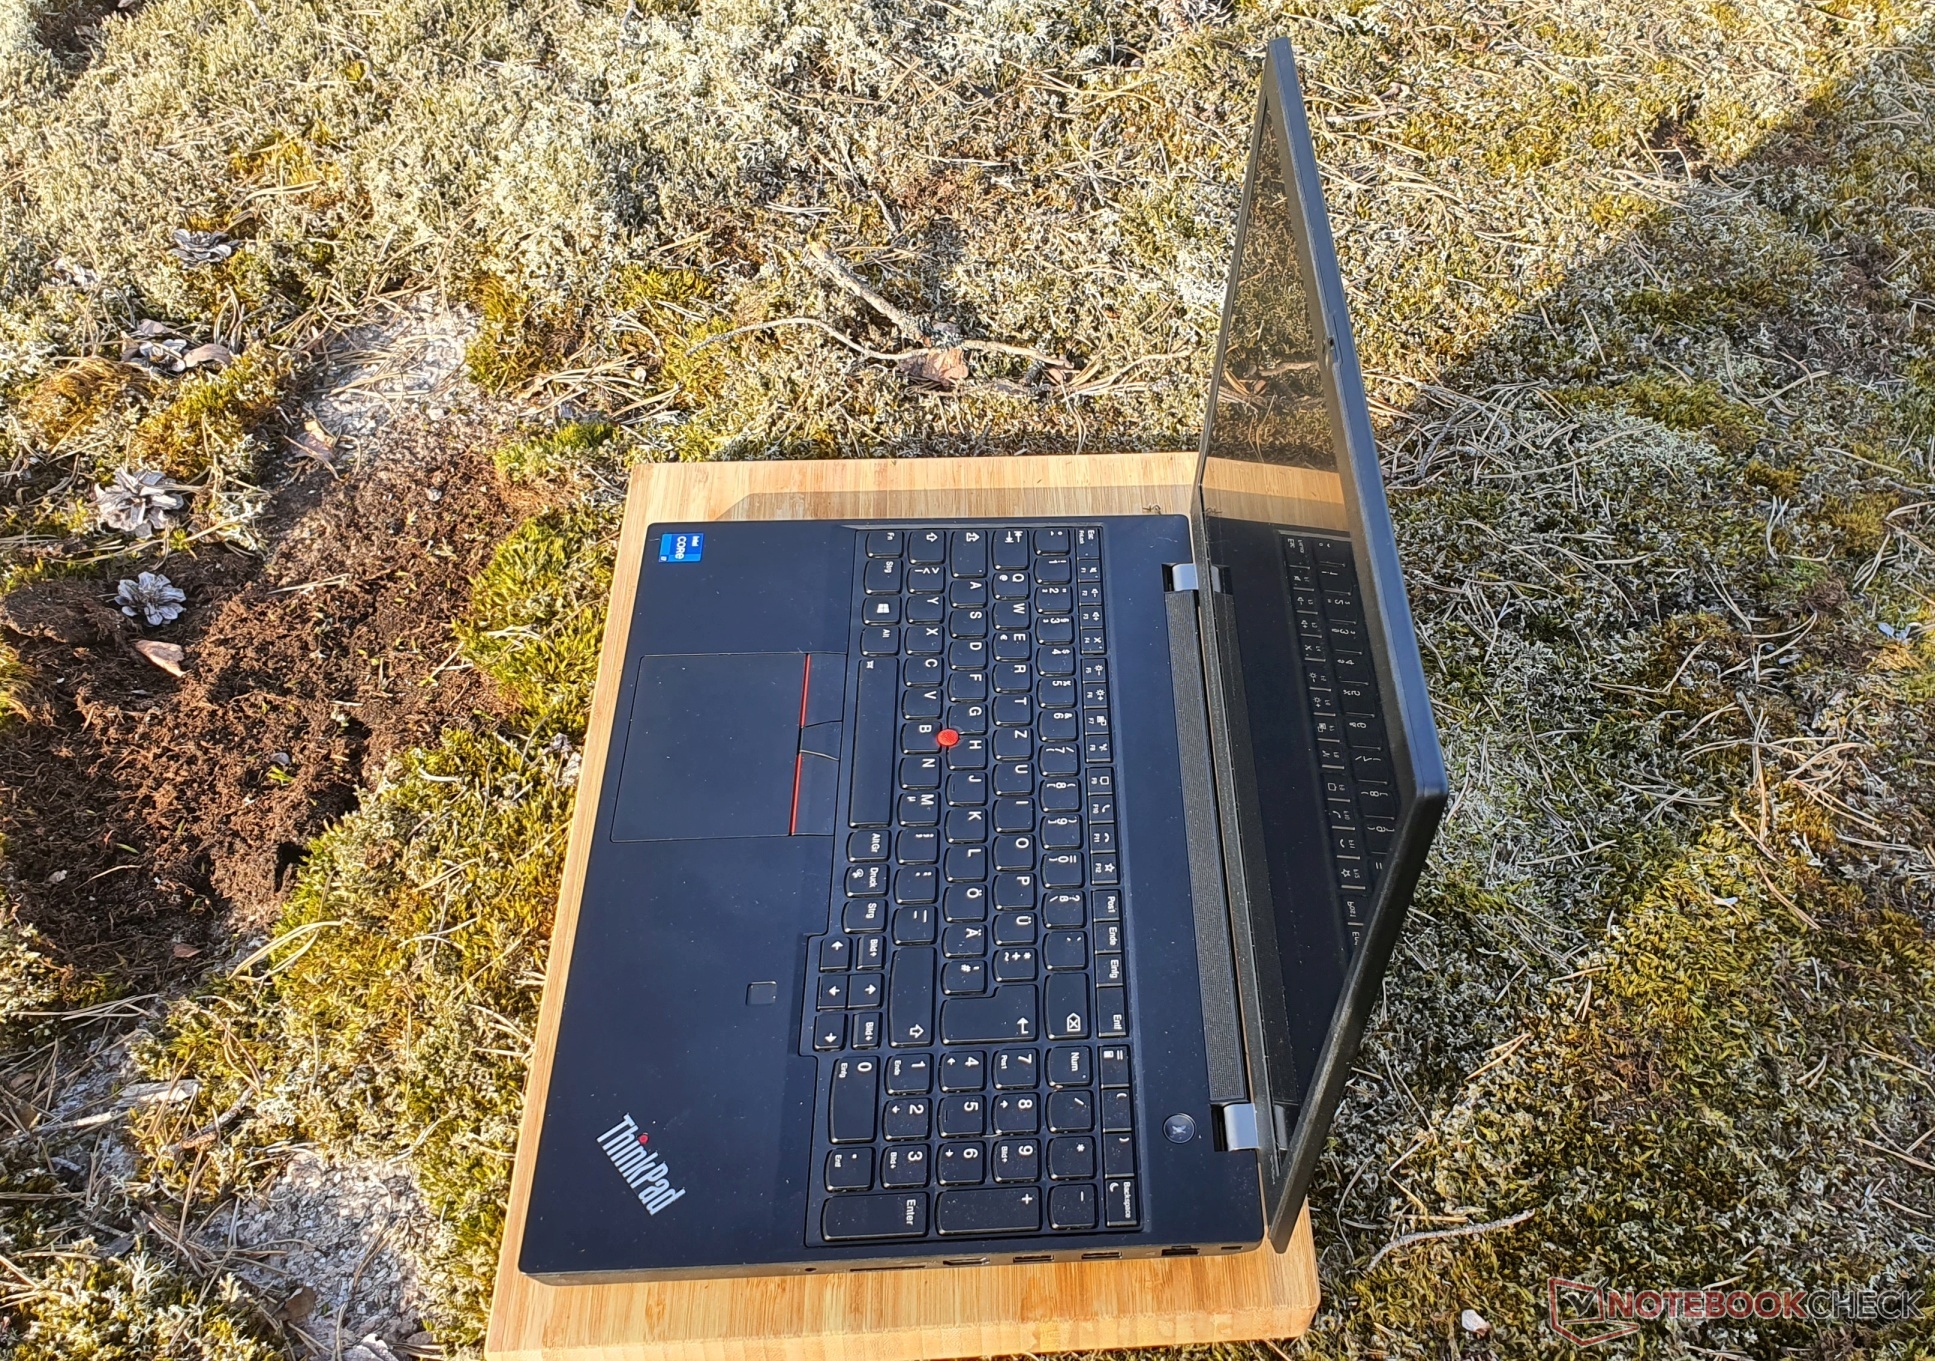
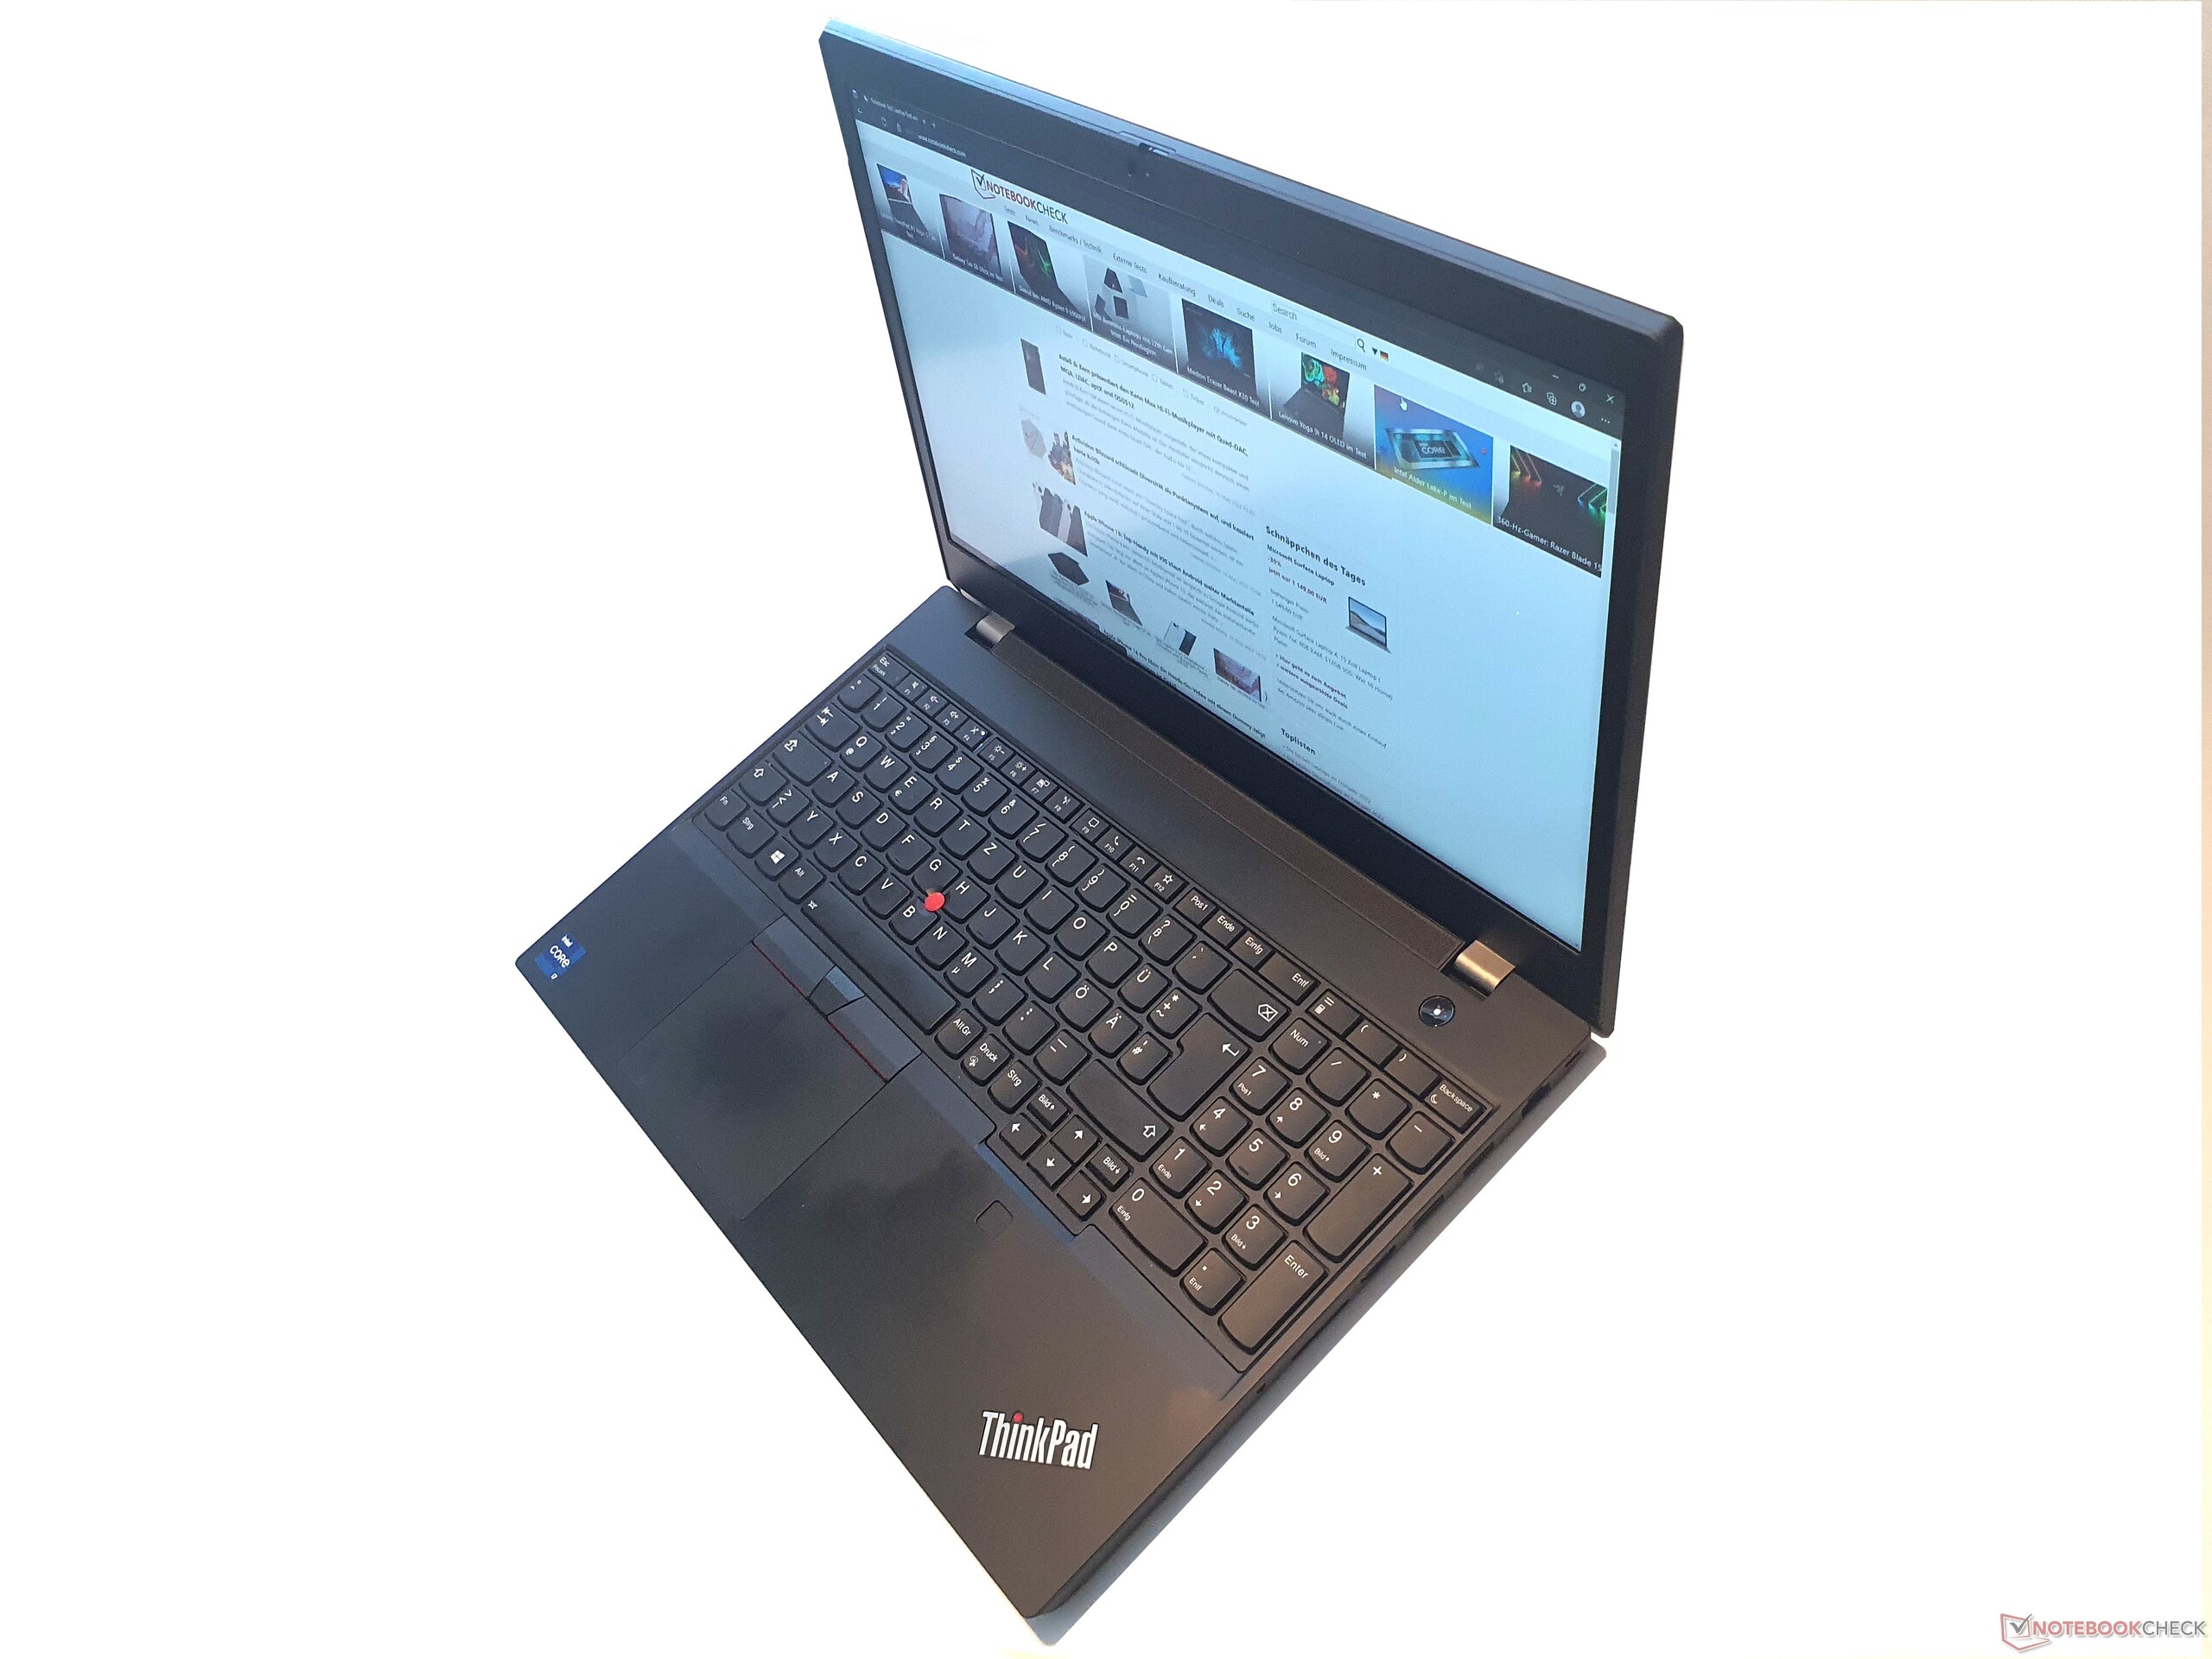
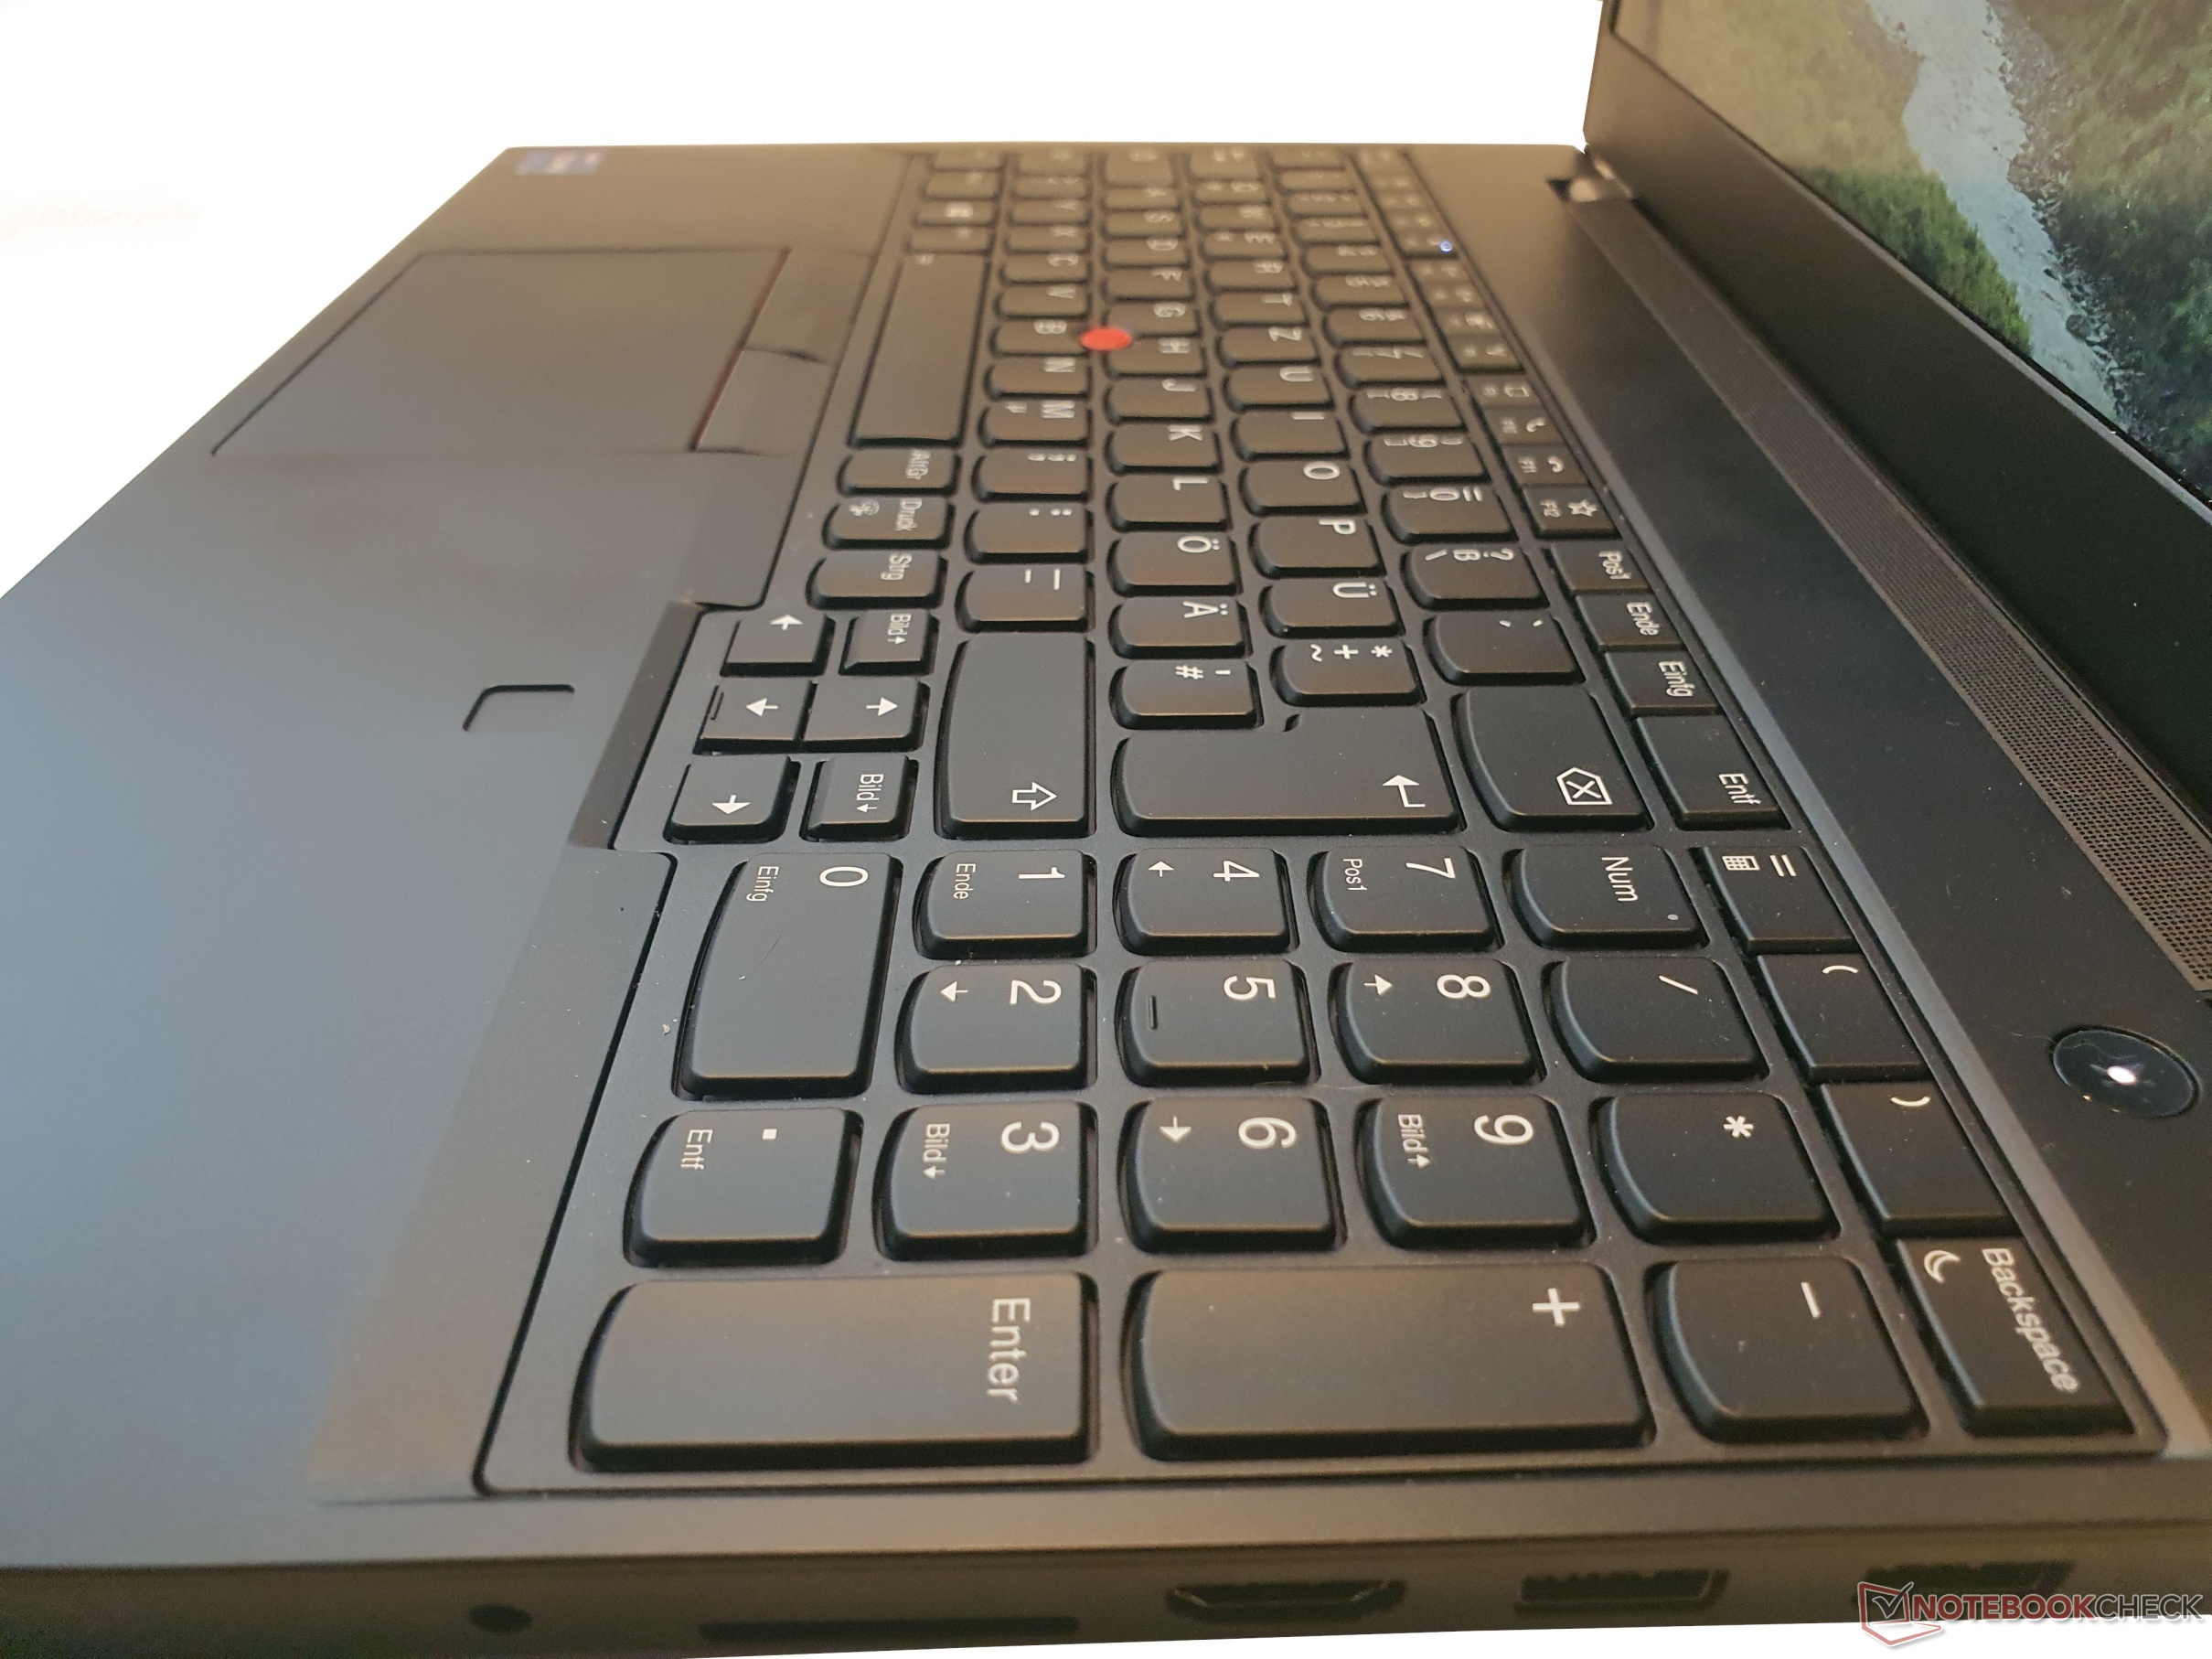
ThinkPad Input Devices: Lenovo with decent 1.8 mm travel
Keyboard
Lenovo's splash-proof keyboard is very comfortable to use with its 15 x 15 mm keys and 1.8 mm travel. This has already been reduced to 1.5 mm in many ThinkPads. The pressure point of the smooth, slightly concave keys is clearly noticeable and the stroke very satisfactory. On the other hand, the keyboard of the HP ZBook Power 15 has an even crisper pressure point (in the tester's opinion), but a shorter travel. When in doubt, test the keyboards before buying.
Overall, the layout is very good, also thanks to dedicated navigation and the rather large arrow keys. Only the four keys to the left of the Enter and those in the top row are somewhat smaller. There is also a number pad, which can simplify the input of workstation-related data. Even under targeted pressure, the keyboard does not yield. The background lighting has two adjustment levels.
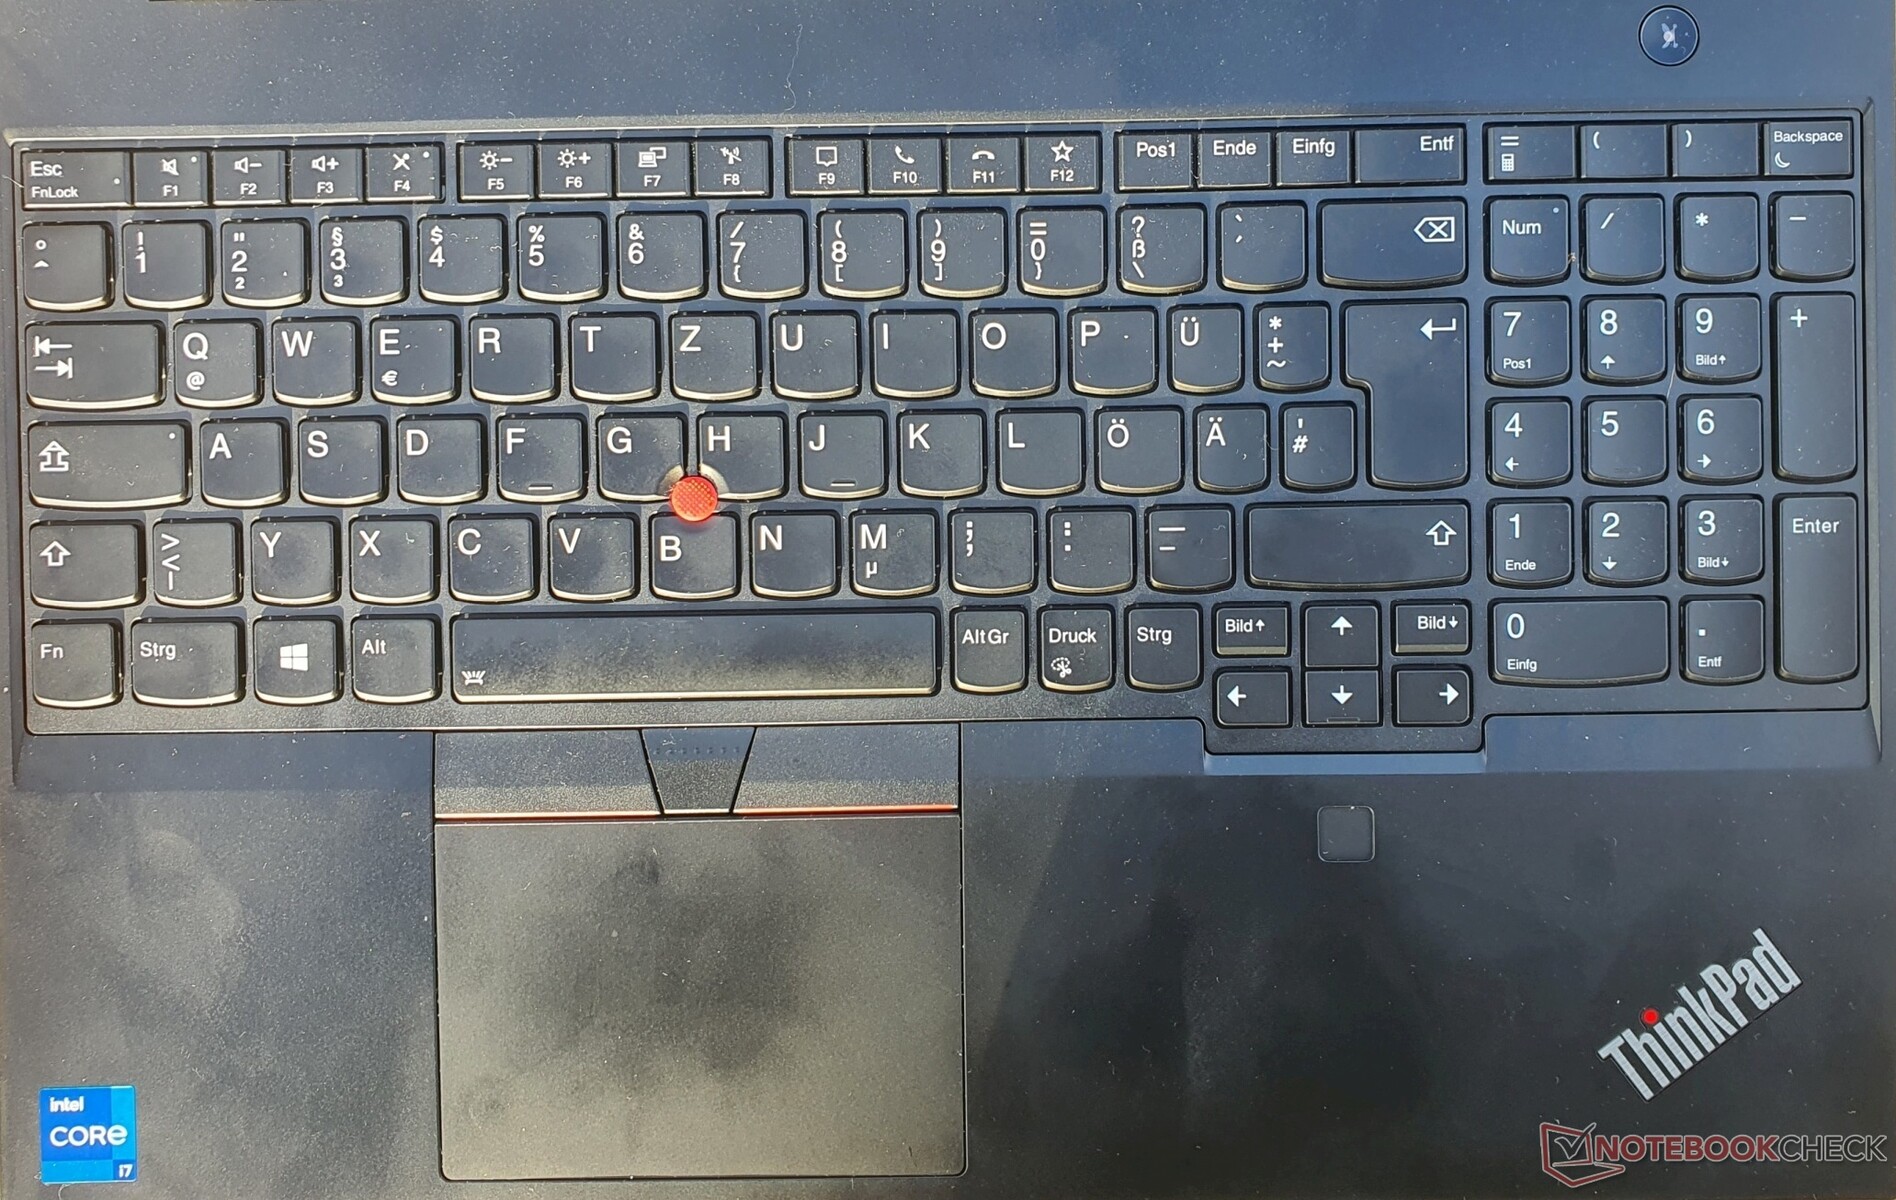
Touchpad & TrackPoint
The medium-sized touchpad measures 10 x 7 cm and has a smooth Mylar surface with decent gliding qualities. The integrated click buttons have a full drop and a well-dosed pressure point.
With a little practice, the TrackPoint and its three buttons enable the mouse cursor to be controlled very accurately and has the advantage that you don't have to take your hand off the keyboard. Scrolling in combination with the middle button is also useful.
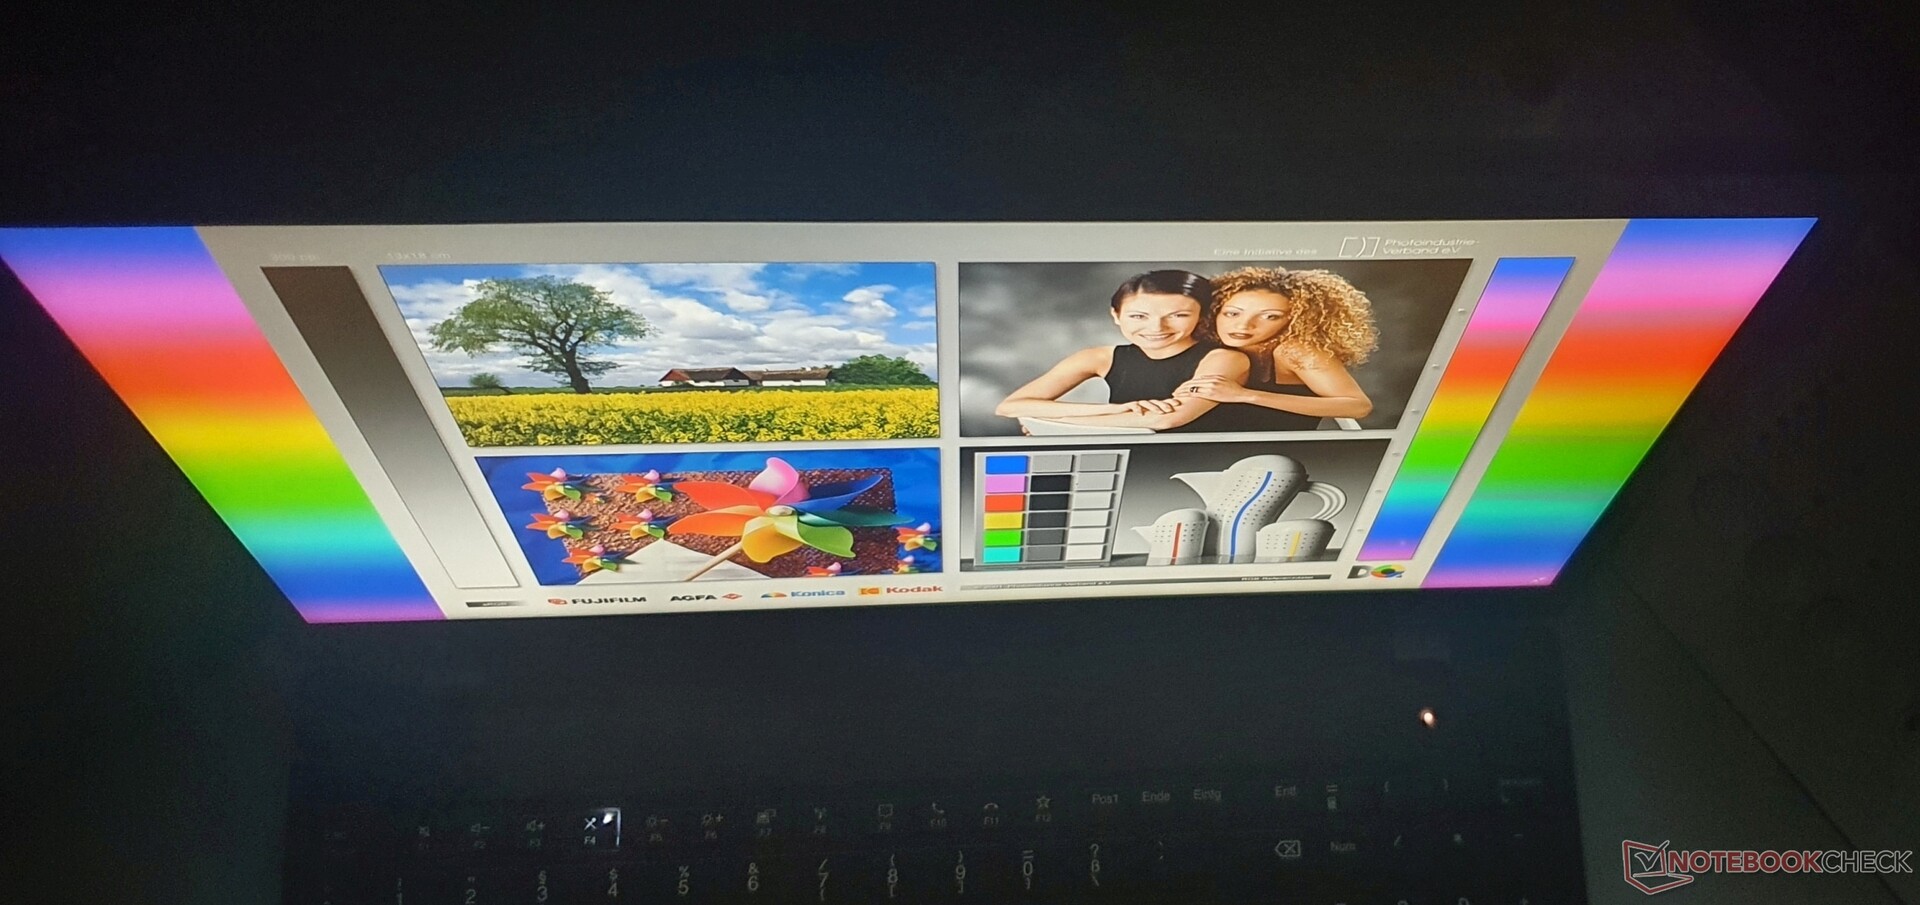
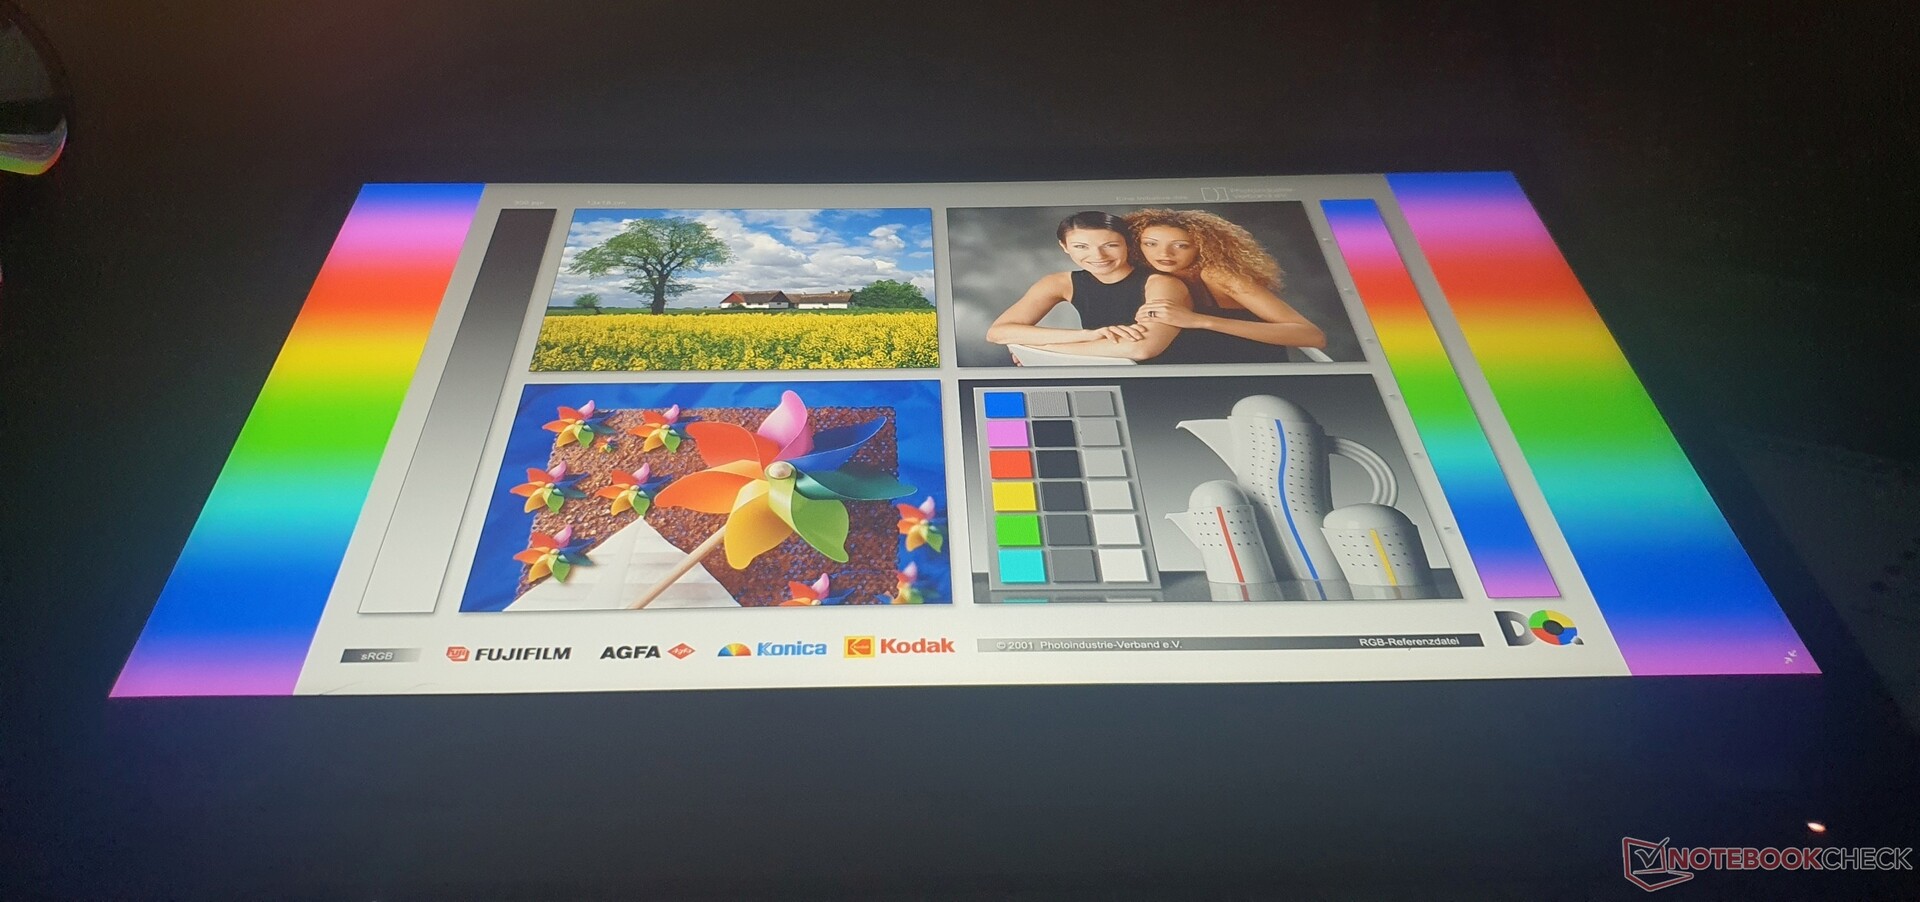
Optional 4K display on the ThinkPad P15v G2


Lenovo offers a total of four matte 15.6-inch display options in 16:9 format for the ThinkPad P15v G2:
FHD (1920 x 1080) IPS, 300 nits, 45% NTSC.
FHD (1920 x 1080) IPS touch, 300 nits, 45% sRGB
FHD (1920 x 1080) IPS, 300 nits, 100% sRGB
UHD (3840 x 2160) IPS, 600 Nits, 100% AdobeRGB, HDR400, X-Rite
Our panel represents the entry-level variant and has a resolution of 1920x1080, so content is displayed sufficiently sharp. The scaling, which can be set to 100%, is also advantageous, providing for even sharper looking content and preventing scaling problems.
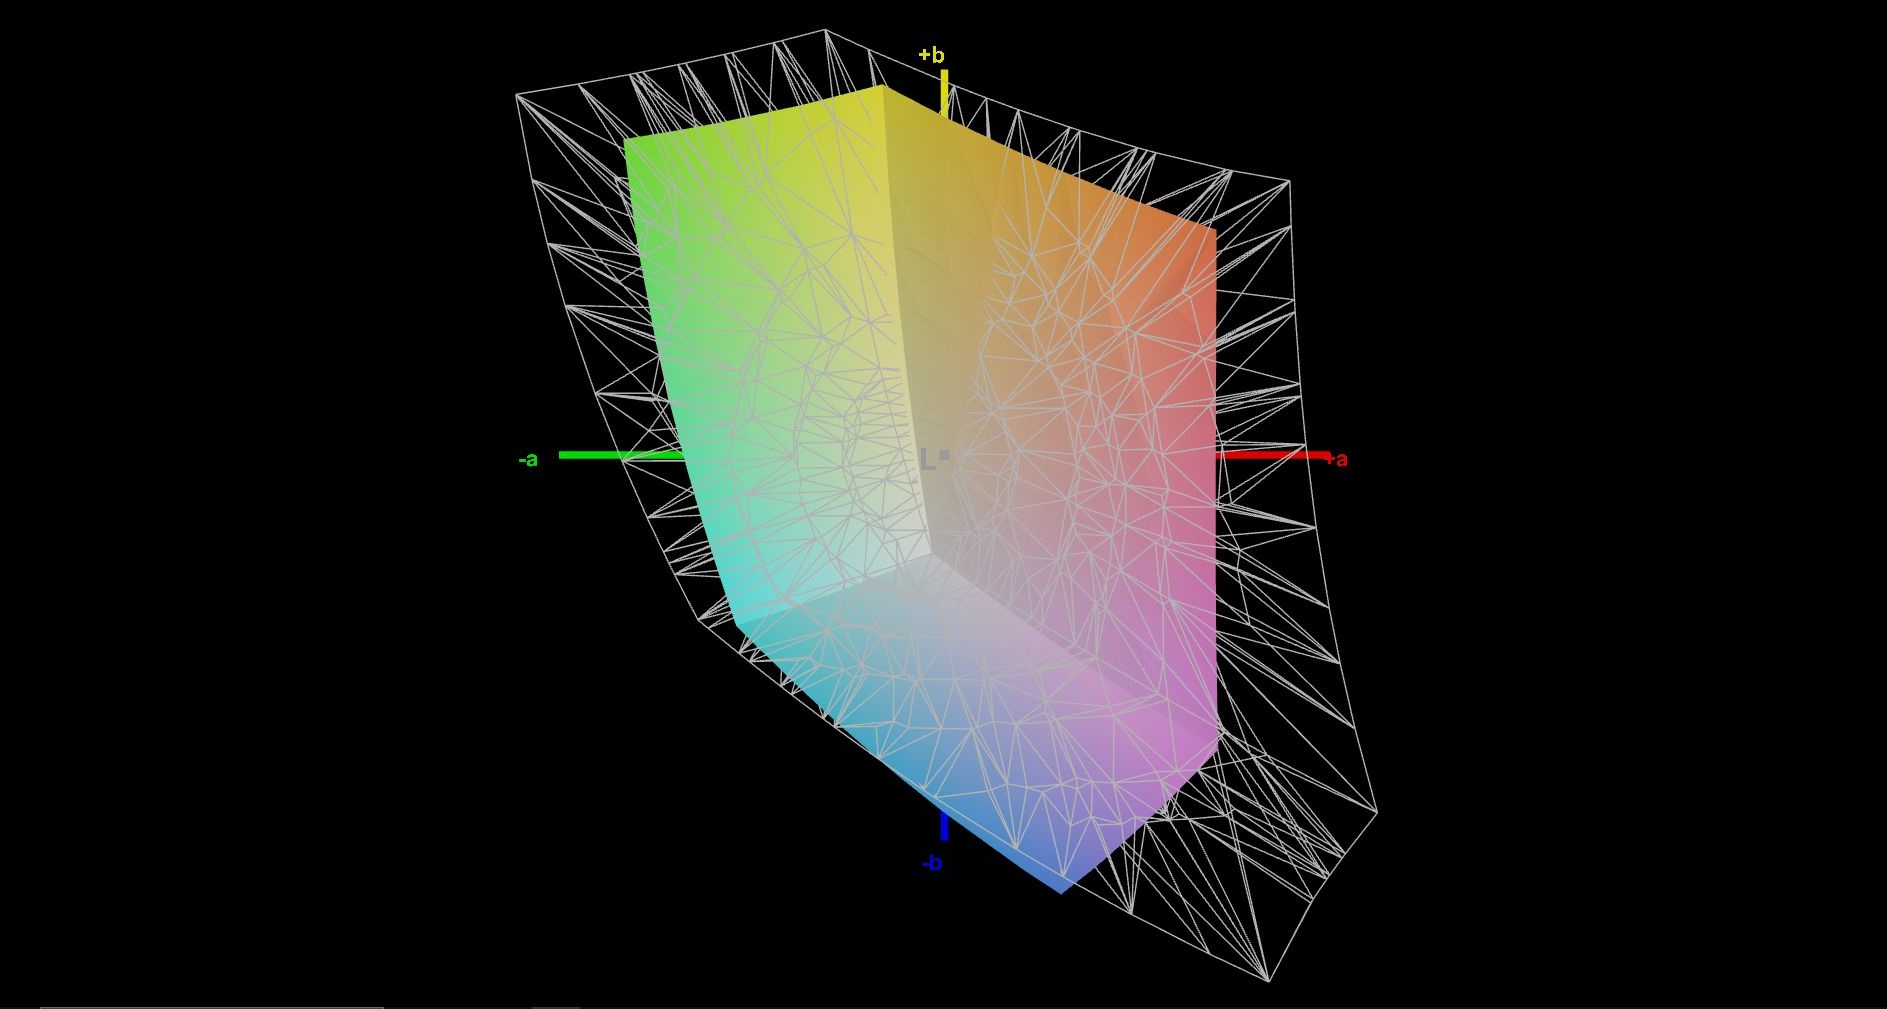
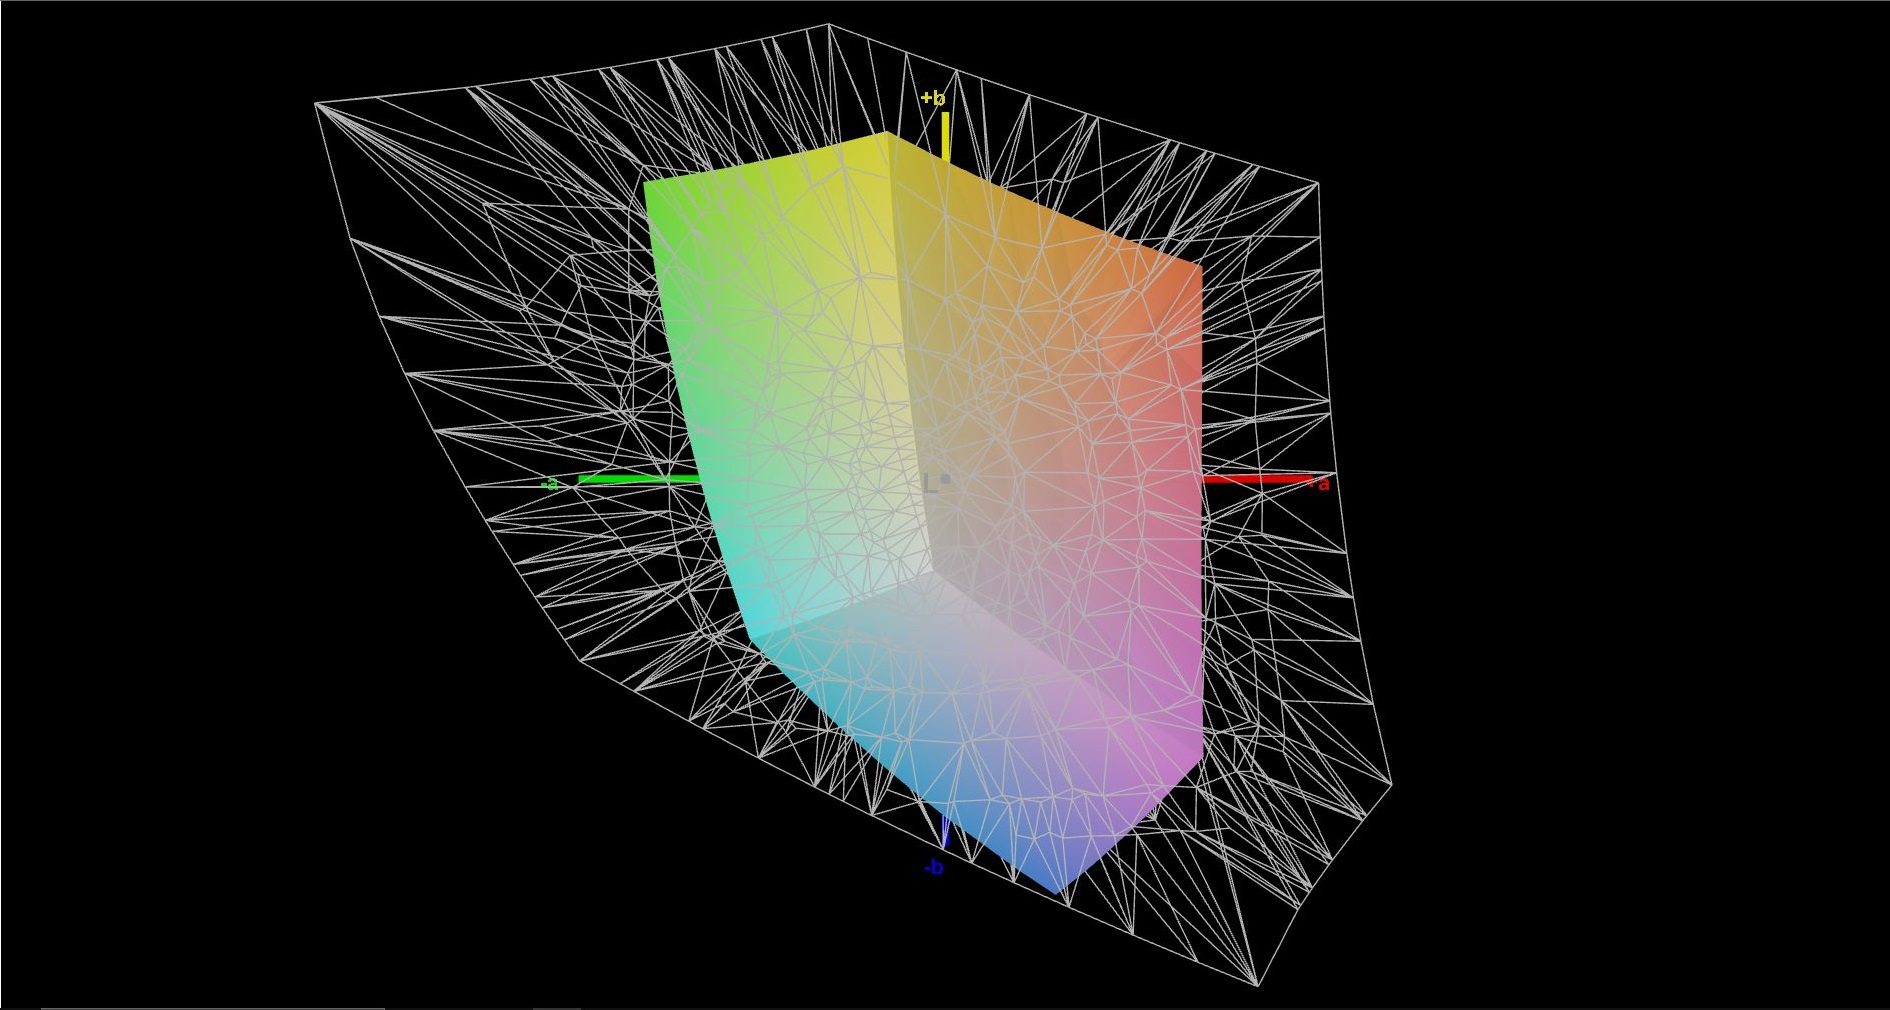
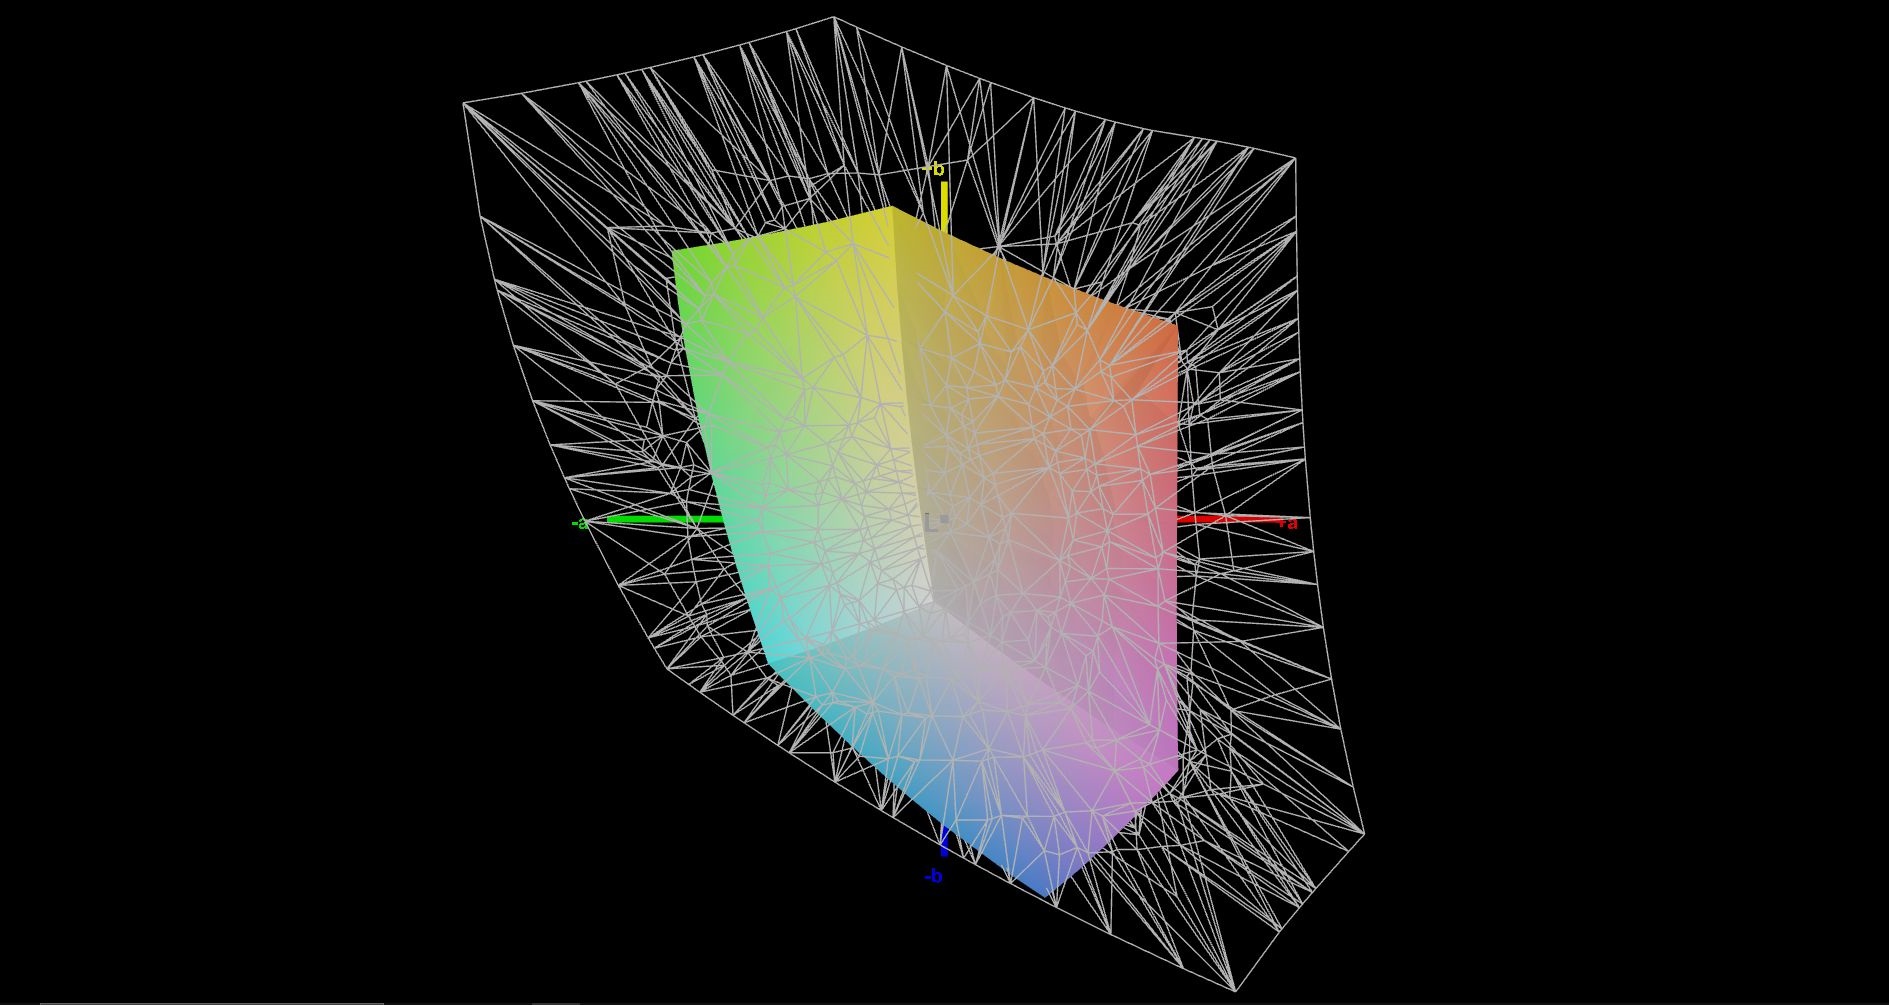
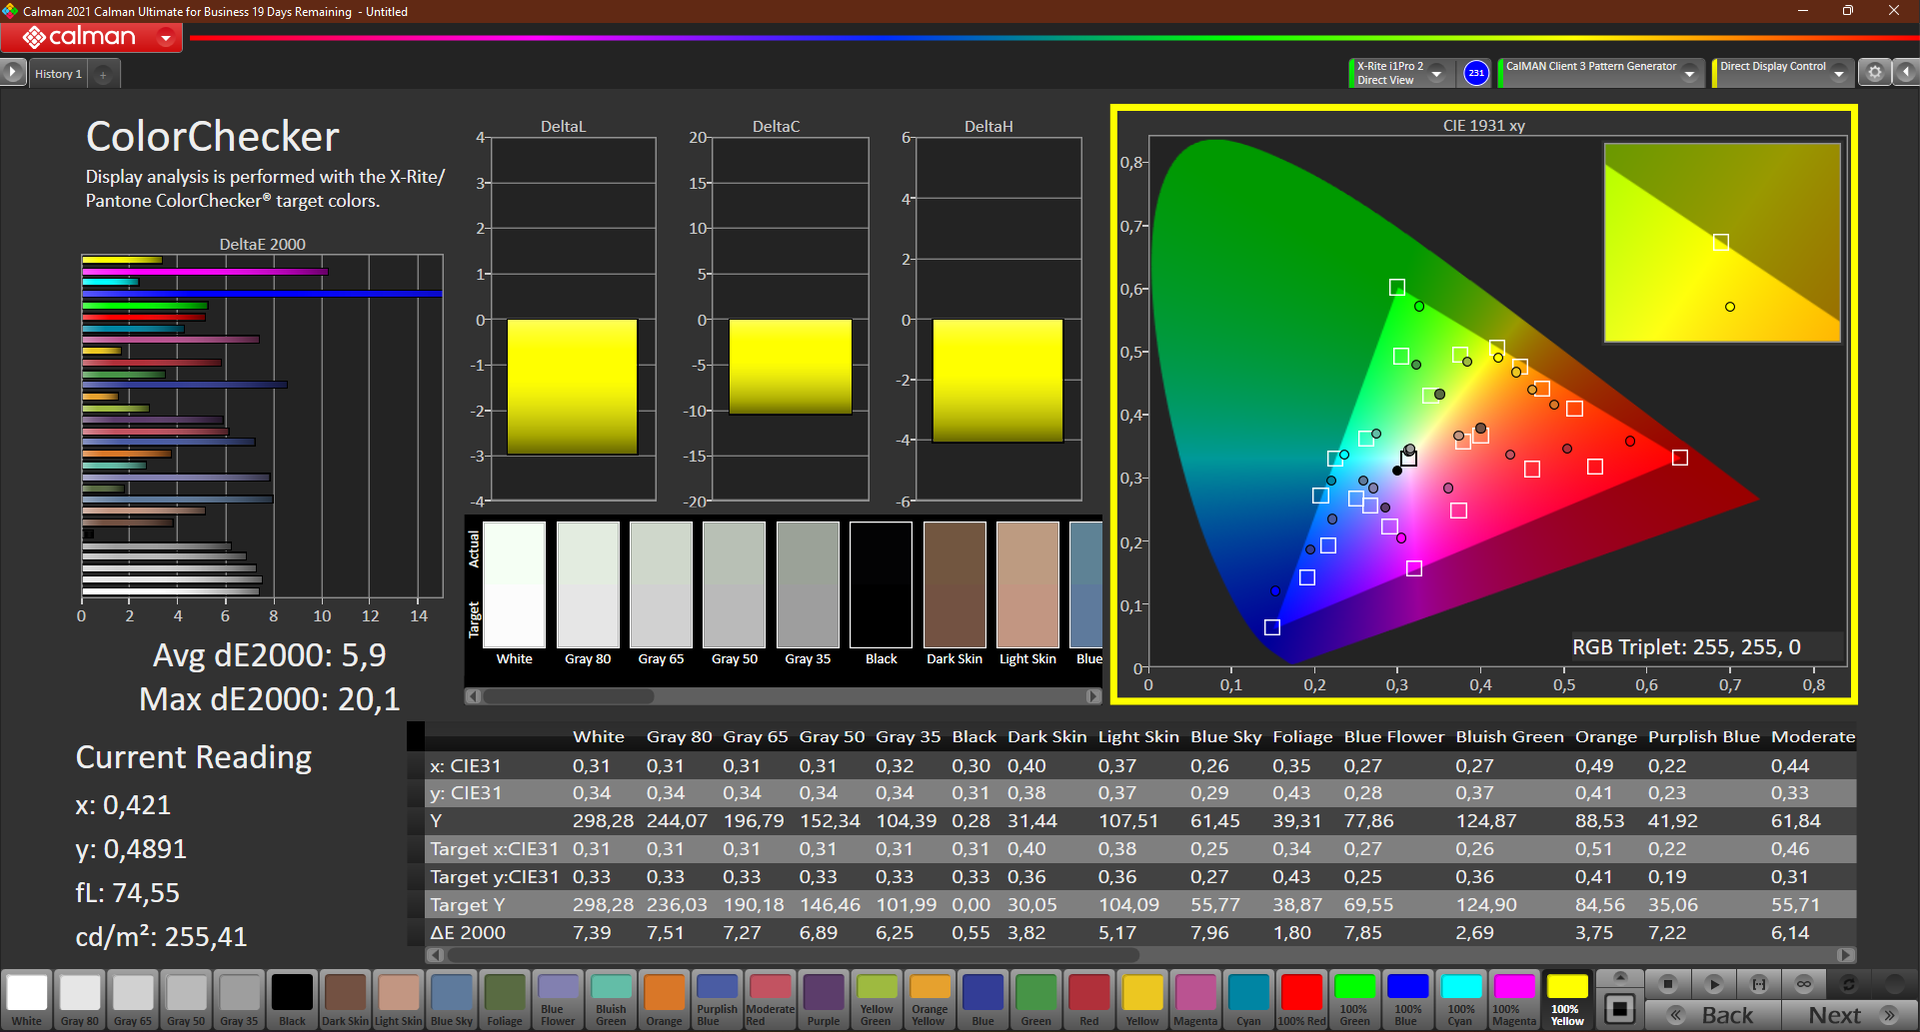
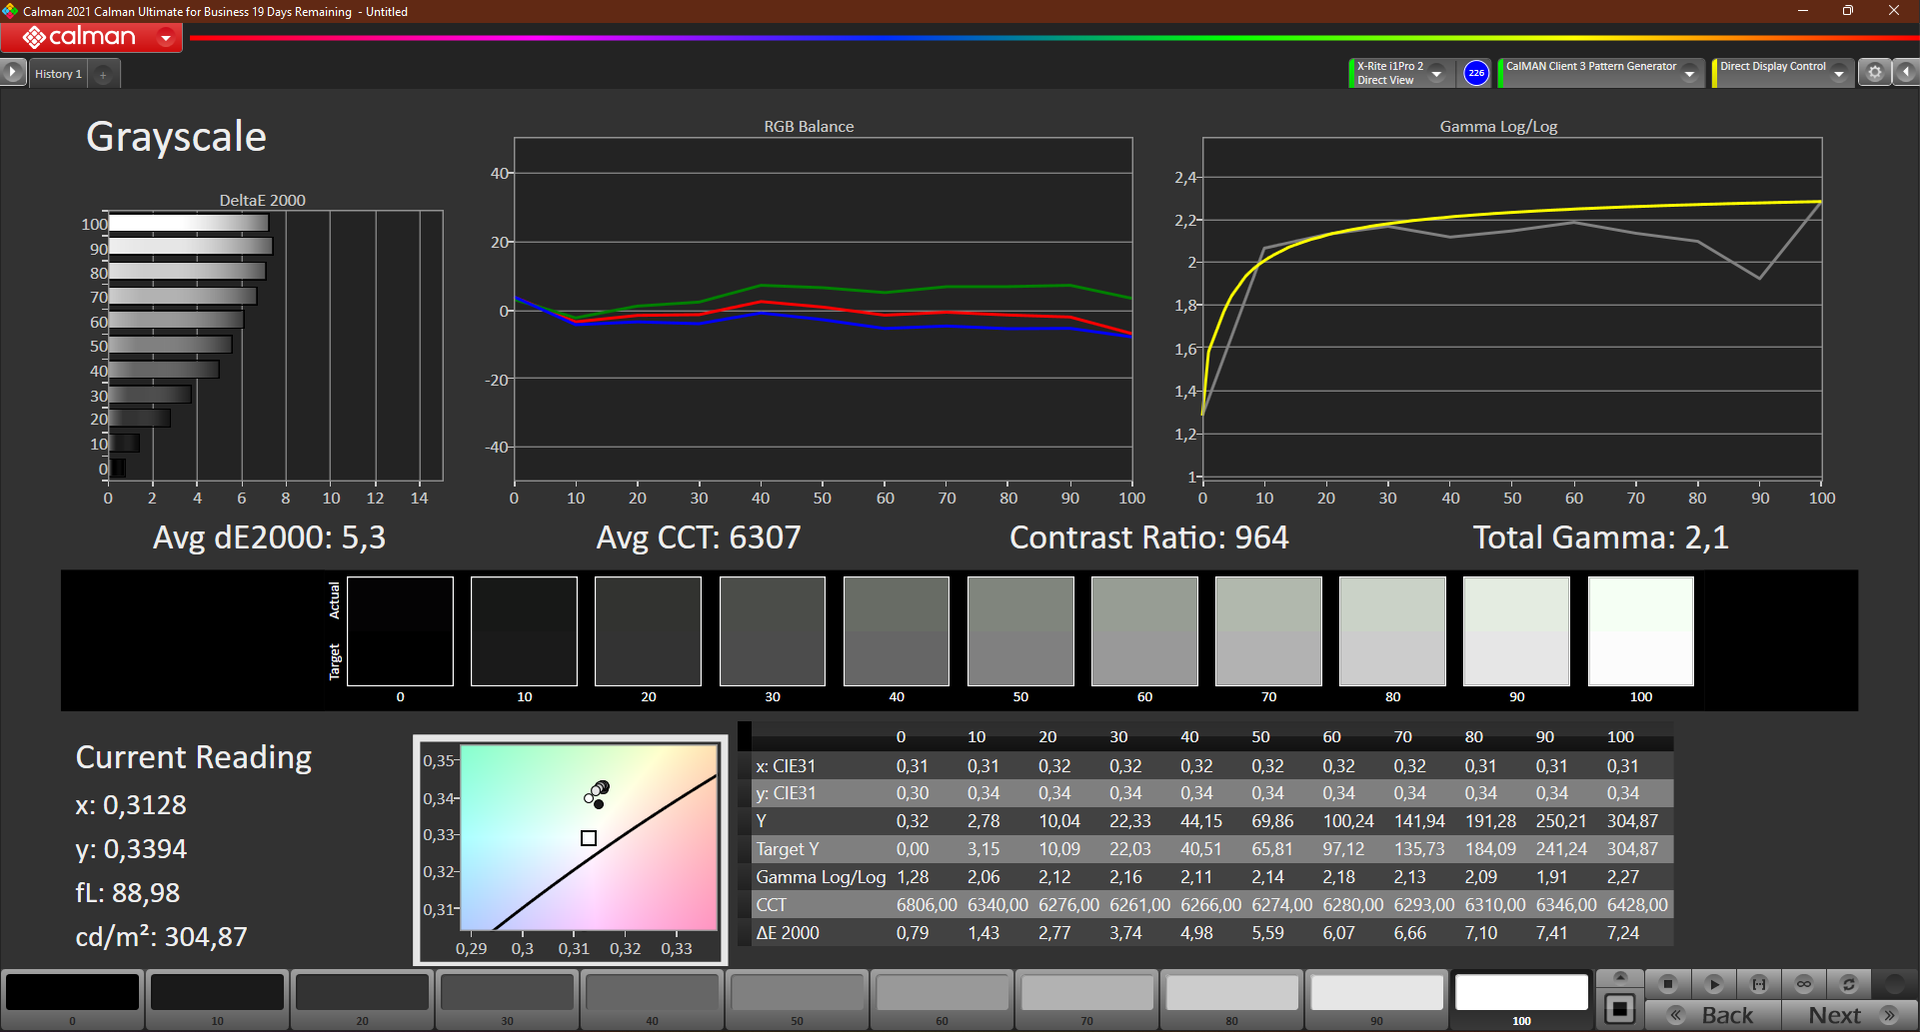
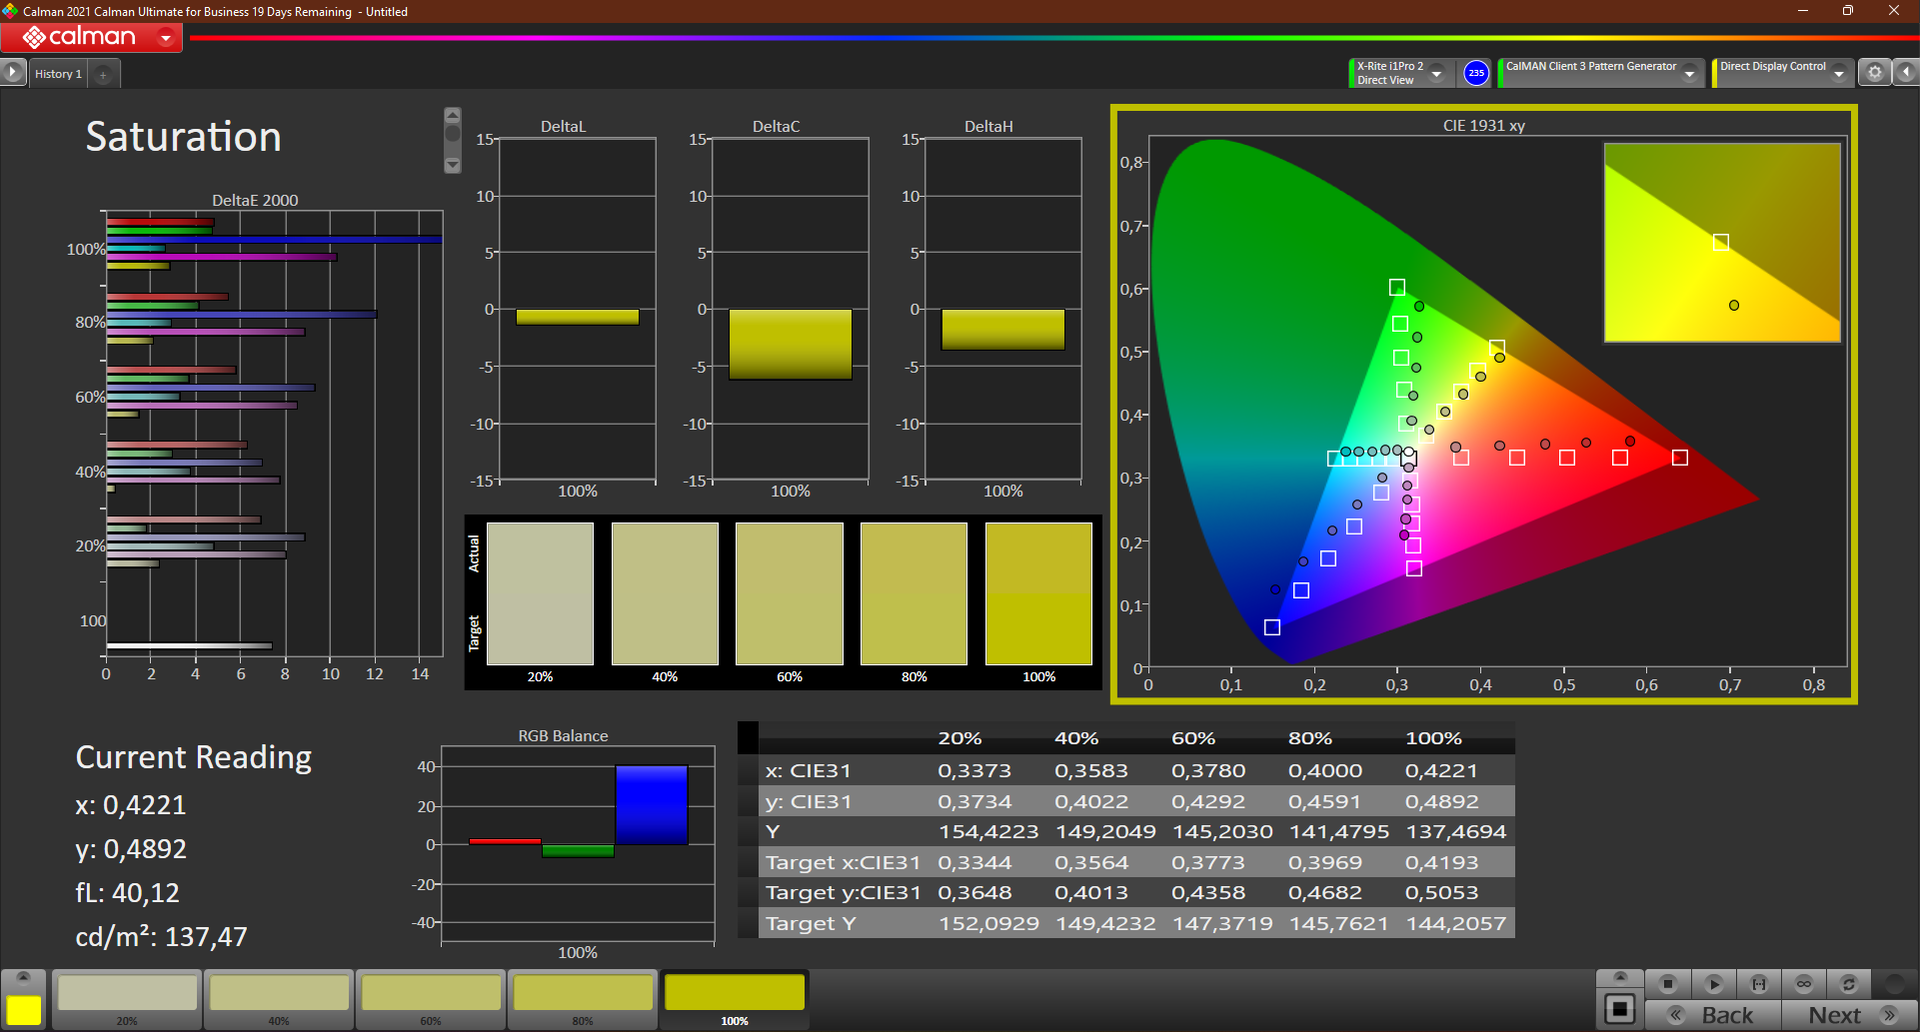
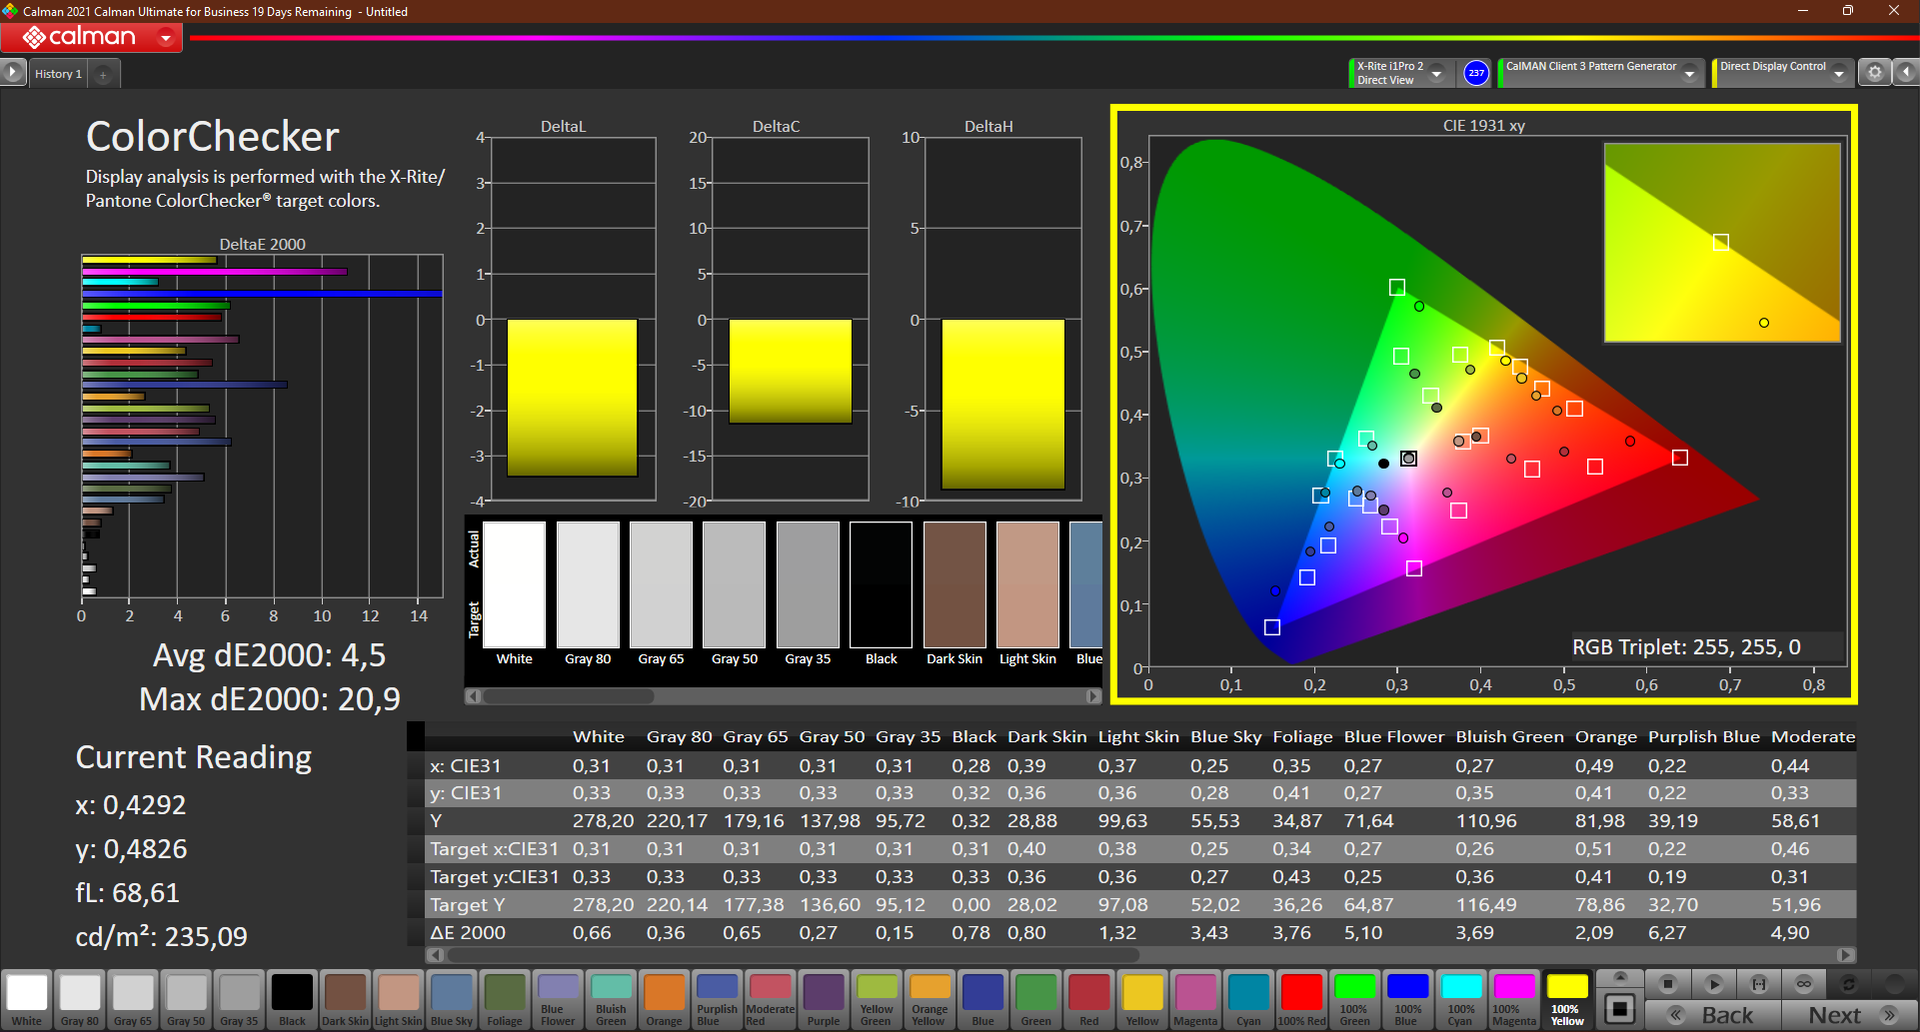
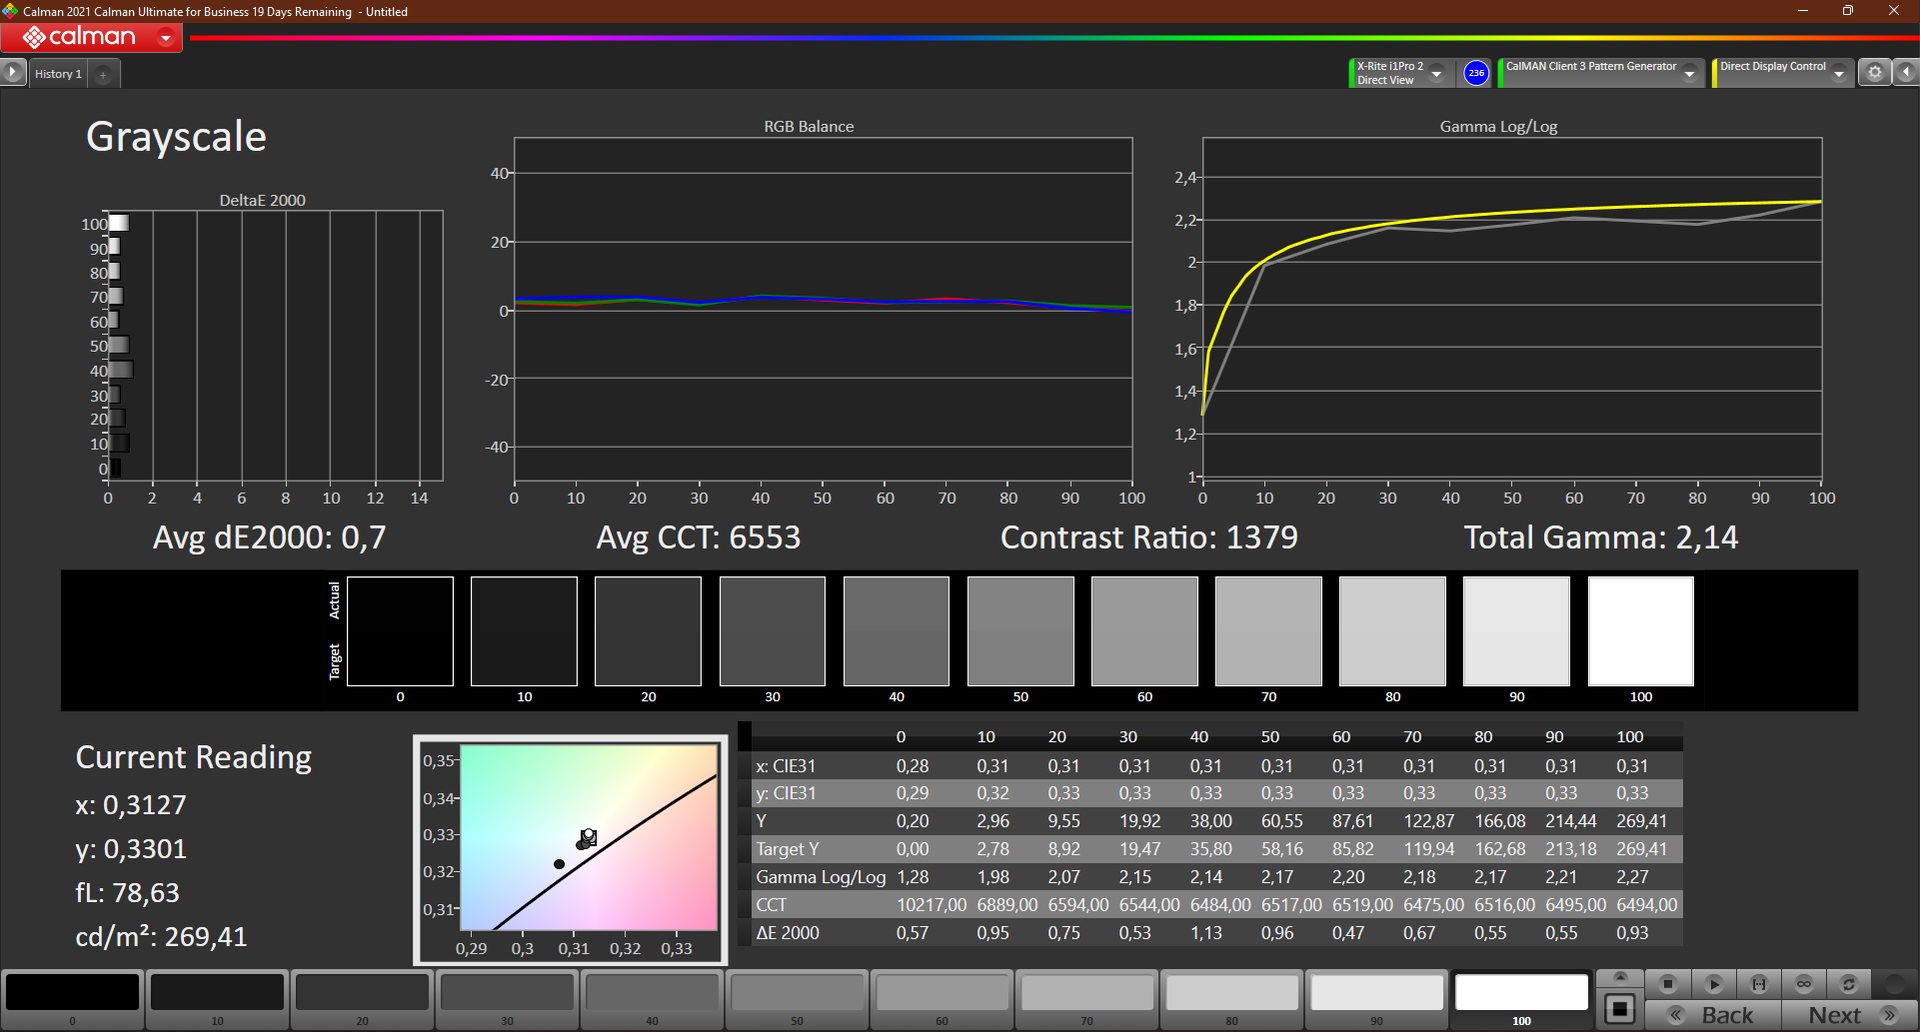
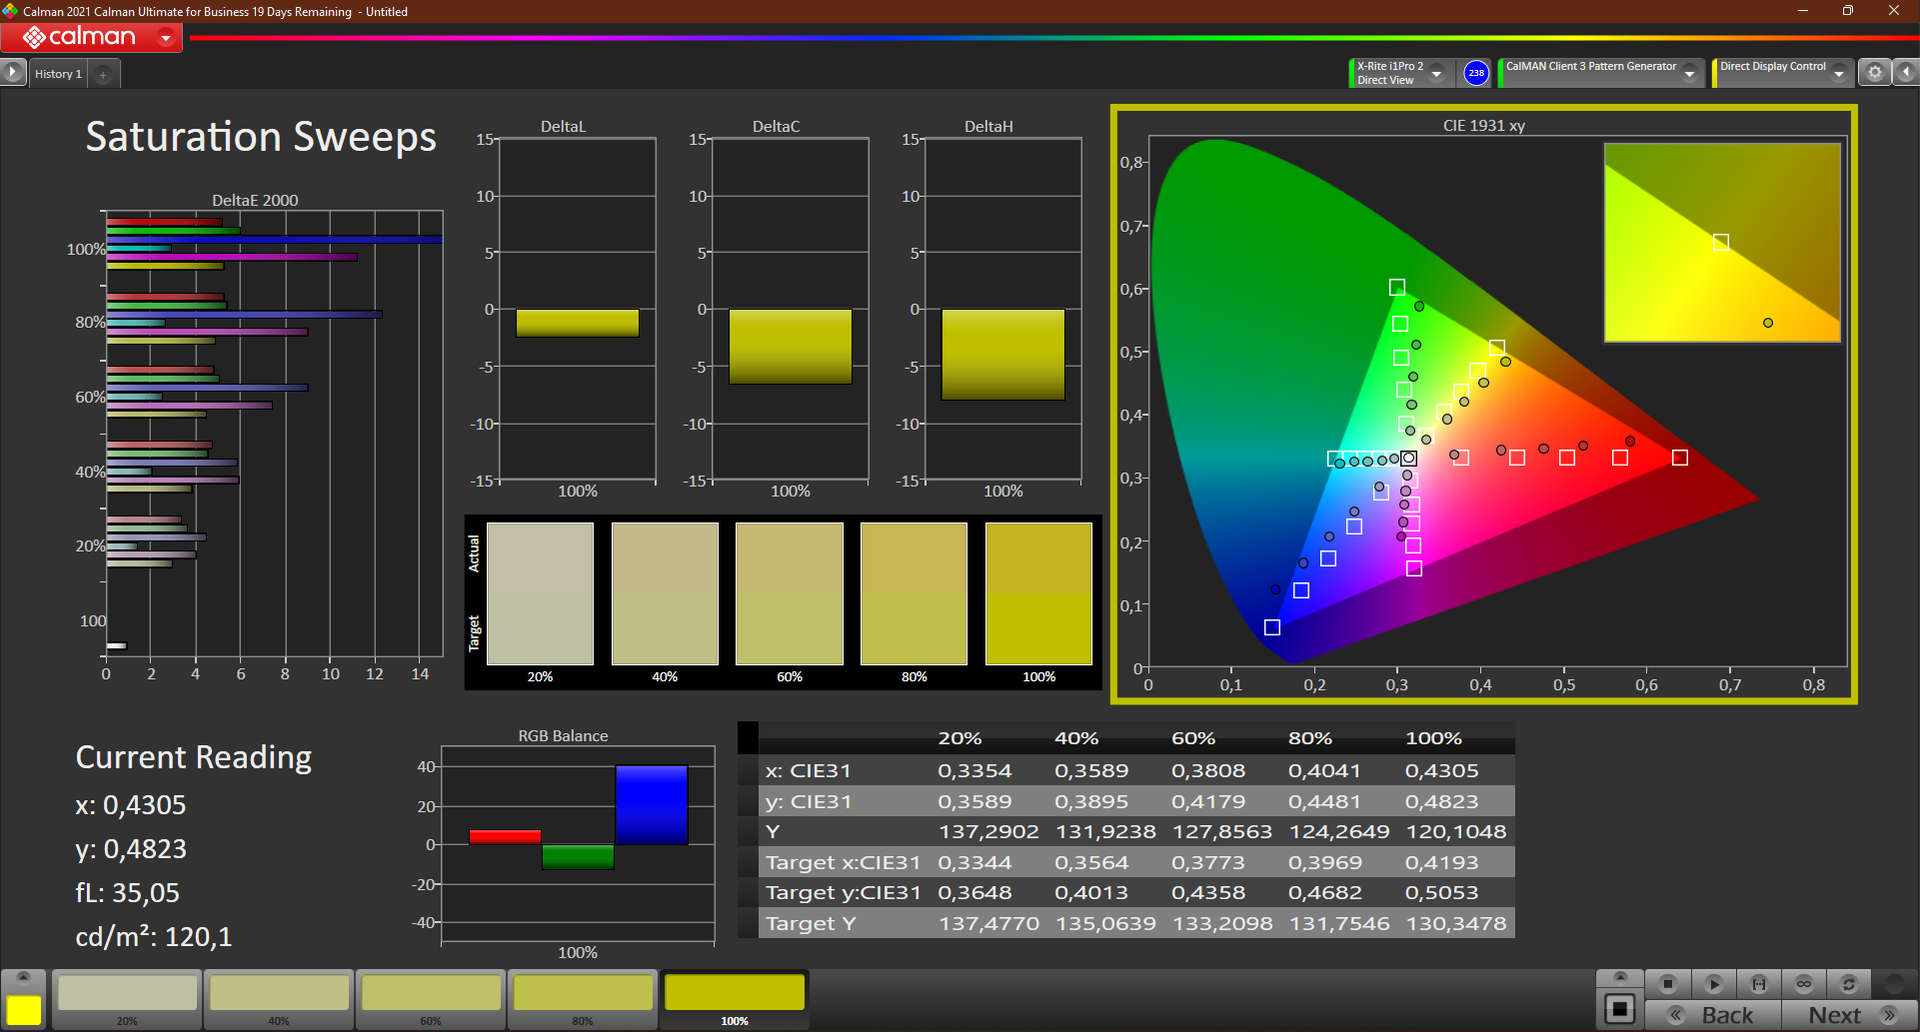
The brightness of around 280 nits is not optimal, but is still acceptable indoors. The contrast ratio of 953:1 is OK, as well as the black value of 0.32. Calibration results in a richer black, and we were also able to reduce the corresponding DeltaE grayscale value from 5.3 to a good 0.9. However, the Delta E color value remains high at 4.5.
Subjectively, the image quality is good, not least because of the relatively clear subpixels and the rich black. But the HP ZBook Power 15 and all other comparison devices offer much better rates on paper. The panel's response times are mediocre to slow and thus not optimal for gaming. No PWM flickering was detected.
| |||||||||||||||||||||||||
Brightness Distribution: 88 %
Center on Battery: 305 cd/m²
Contrast: 953:1 (Black: 0.32 cd/m²)
ΔE Color 5.9 | 0.5-29.43 Ø5, calibrated: 4.5
ΔE Greyscale 5.3 | 0.57-98 Ø5.3
45.3% AdobeRGB 1998 (Argyll 2.2.0 3D)
65.1% sRGB (Argyll 2.2.0 3D)
43.7% Display P3 (Argyll 2.2.0 3D)
Gamma: 2.1
| Lenovo ThinkPad P15v G2 21A9000XGE N156HCA-EAC, IPS LED, 1920x1080, 15.60 | Lenovo ThinkPad P15 G2-20YQ001JGE N156HCE_GN1, IPS, 1920x1080, 15.60 | Lenovo ThinkPad T15g-20UR000GGE N156HCE-GN1, IPS, 1920x1080, 15.60 | Lenovo ThinkPad T15p-20TN0006GE MNF601EA1-1, IPS LED, 3840x2160, 15.60 | Lenovo ThinkPad P15s Gen2-20W6000GGE MNF601EA1-1, IPS LED, 3840x2160, 15.60 | HP ZBook Power 15 G8 313S5EA AUOA08B, IPS LED, 1920x1080, 15.60 | Dell Precision 5000 5560 Sharp LQ156R1, IPS, 3840x2400, 15.60 | |
|---|---|---|---|---|---|---|---|
| Display | 55% | 39% | 90% | 87% | 57% | 97% | |
| Display P3 Coverage | 43.7 | 68.6 57% | 61.3 40% | 86.8 99% | 84.5 93% | 70.5 61% | 94.9 117% |
| sRGB Coverage | 65.1 | 99.8 53% | 90.5 39% | 99.3 53% | 98.7 52% | 99 52% | 100 54% |
| AdobeRGB 1998 Coverage | 45.3 | 70.6 56% | 62.3 38% | 98.5 117% | 97.8 116% | 71.3 57% | 100 121% |
| Response Times | 33% | 31% | 19% | 17% | -32% | -4% | |
| Response Time Grey 50% / Grey 80% * | 48 ? | 37.6 ? 22% | 38 ? 21% | 41.6 ? 13% | 40 ? 17% | 61 -27% | 47.2 ? 2% |
| Response Time Black / White * | 28 ? | 16 ? 43% | 16.8 ? 40% | 21.2 ? 24% | 23.2 ? 17% | 38 ? -36% | 30.4 ? -9% |
| PWM Frequency | 26040 ? | 26040 ? | |||||
| Screen | 46% | 44% | 70% | 70% | 49% | 34% | |
| Brightness middle | 305 | 498 63% | 504 65% | 595 95% | 604 98% | 393 29% | 501.5 64% |
| Brightness | 281 | 490 74% | 476 69% | 594 111% | 609 117% | 385 37% | 467 66% |
| Brightness Distribution | 88 | 95 8% | 90 2% | 94 7% | 91 3% | 78 -11% | 83 -6% |
| Black Level * | 0.32 | 0.39 -22% | 0.34 -6% | 0.32 -0% | 0.34 -6% | 0.25 22% | 0.44 -38% |
| Contrast | 953 | 1277 34% | 1482 56% | 1859 95% | 1776 86% | 1572 65% | 1140 20% |
| Colorchecker dE 2000 * | 5.9 | 2.1 64% | 2.9 51% | 1.2 80% | 0.9 85% | 1.5 75% | 4.73 20% |
| Colorchecker dE 2000 max. * | 20.1 | 5.6 72% | 7.1 65% | 2.5 88% | 2.6 87% | 4.3 79% | 8.45 58% |
| Colorchecker dE 2000 calibrated * | 4.5 | 0.8 82% | 1.3 71% | 1 78% | 0.8 82% | 1.4 69% | 0.51 89% |
| Greyscale dE 2000 * | 5.3 | 3.4 36% | 4.3 19% | 1.4 74% | 1.1 79% | 1.3 75% | 3.6 32% |
| Gamma | 2.1 105% | 2.32 95% | 2.25 98% | 2.1 105% | 2.15 102% | 2.26 97% | 2.08 106% |
| CCT | 6307 103% | 7162 91% | 7265 89% | 6492 100% | 6656 98% | 6435 101% | 6447 101% |
| Color Space (Percent of AdobeRGB 1998) | 57.7 | 85.3 | 84.5 | ||||
| Color Space (Percent of sRGB) | 90.8 | 99.2 | 98.6 | ||||
| Total Average (Program / Settings) | 45% /
46% | 38% /
41% | 60% /
67% | 58% /
66% | 25% /
39% | 42% /
42% |
* ... smaller is better
The smallest color space we measured (sRGB) is covered at just 65%. If you need larger color spaces, you should use other display options since our tested model proves unsuitable for ambitious image editing.
The RGB balance saw minor improvement after calibration using CalMan and the X-Rite i1 Pro 2 colorimeter. Blue in particular deviates significantly with a DeltaE value of ~15. The contrast ratio also increased by 45% to 1,379:1. However, the brightness decreased by about 20 nits due to the process. As always, our ICC color profile is available for download next to the illumination graphic.
Display Response Times
| ↔ Response Time Black to White | ||
|---|---|---|
| 28 ms ... rise ↗ and fall ↘ combined | ↗ 17 ms rise | 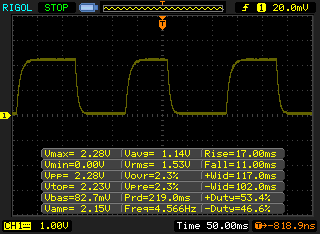 |
| ↘ 11 ms fall | ||
| The screen shows relatively slow response rates in our tests and may be too slow for gamers. In comparison, all tested devices range from 0.1 (minimum) to 240 (maximum) ms. » 67 % of all devices are better. This means that the measured response time is worse than the average of all tested devices (21.5 ms). | ||
| ↔ Response Time 50% Grey to 80% Grey | ||
| 48 ms ... rise ↗ and fall ↘ combined | ↗ 26 ms rise | 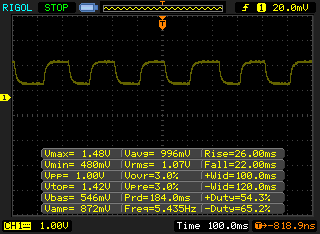 |
| ↘ 22 ms fall | ||
| The screen shows slow response rates in our tests and will be unsatisfactory for gamers. In comparison, all tested devices range from 0.2 (minimum) to 636 (maximum) ms. » 80 % of all devices are better. This means that the measured response time is worse than the average of all tested devices (33.7 ms). | ||
Screen Flickering / PWM (Pulse-Width Modulation)
| Screen flickering / PWM not detected | 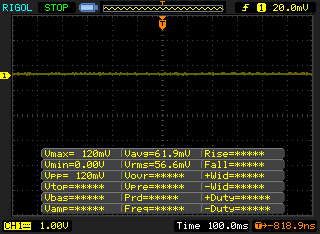 | ||
In comparison: 53 % of all tested devices do not use PWM to dim the display. If PWM was detected, an average of 17900 (minimum: 5 - maximum: 3846000) Hz was measured. | |||
Outdoors in the sun, the display with its 280 nits is not bright enough despite the matte surface. But the P15v can be used in the shade.
The readability of the display is very good up to a viewing angle of approximately 170°, which is typical for IPS. OLEDs perform even better.
Performance: ThinkPad P15v G2 better with Intel Core i9
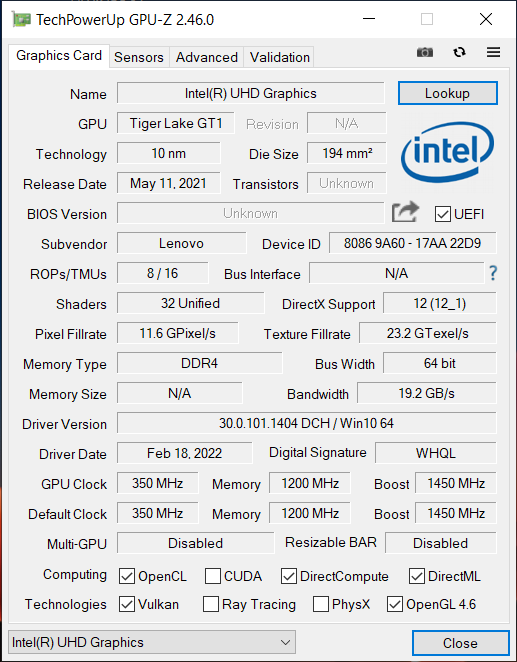
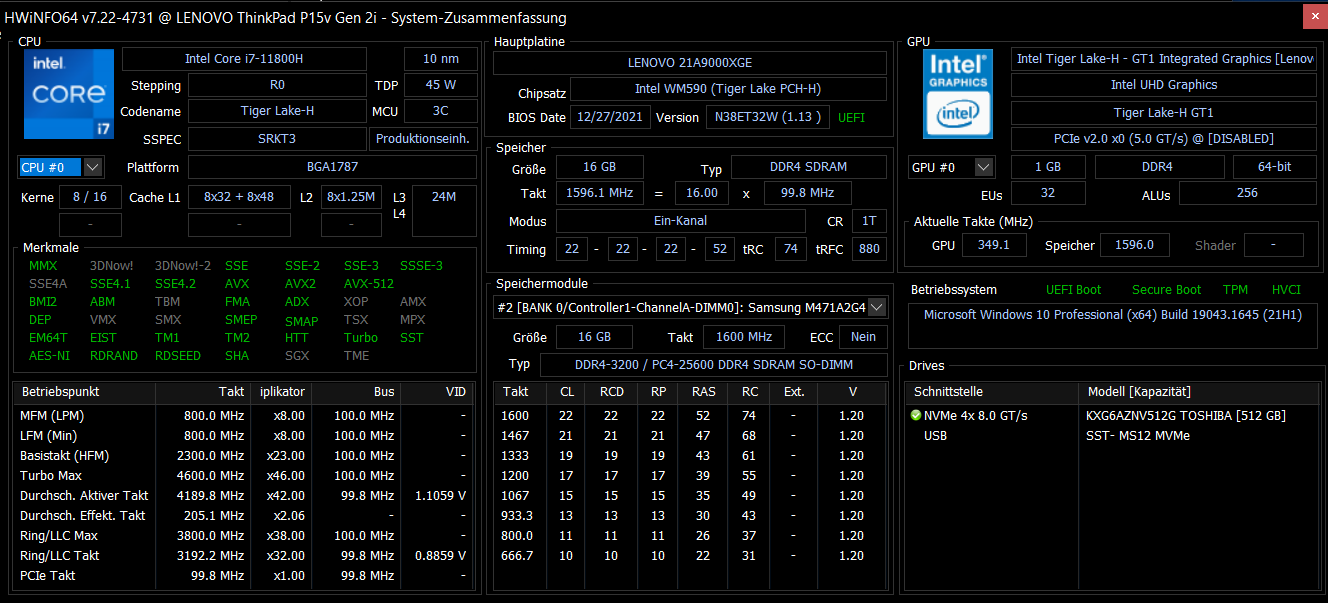
Our review model comes with an Intel Tiger-Lake Core i7-11800H octa-core CPU. Alternatively, you can opt for a Core i9-11950H. On the graphics side, alongside the integrated Intel Xe-iGPU (32/16 EUs), you can choose from a Nvidia T600, T1200 (our model) or a RTX A2000, each with ISV certifications. Xeon CPUs and ECC RAM are not intended for what is supposed to be an inexpensive workstation.
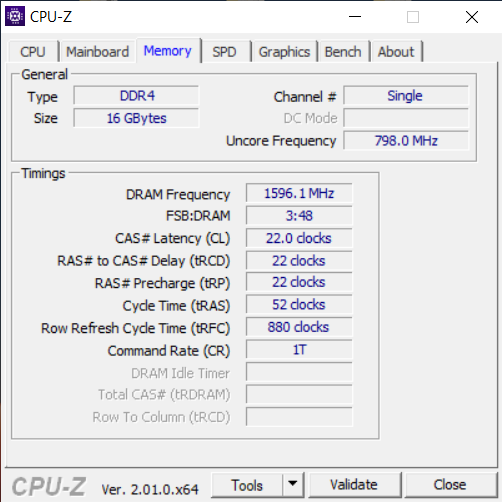
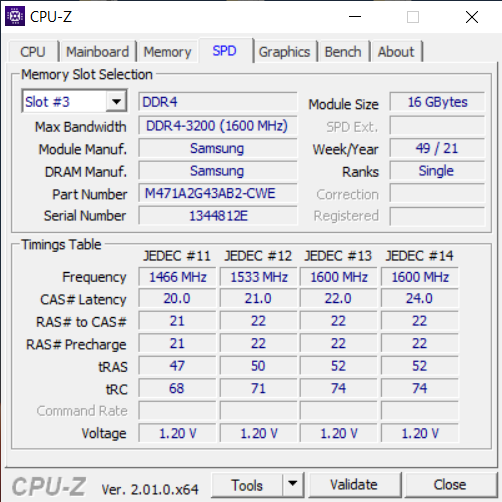
Two SODIMMs hold up to 64 GB of DDR4-3200 RAM, while our model is equipped with a 16 GB module in single-channel mode. There are also two PCIe 4.0 slots which each allow a maximum of 2 TB NVMe SSDs in M.2 2280 format.
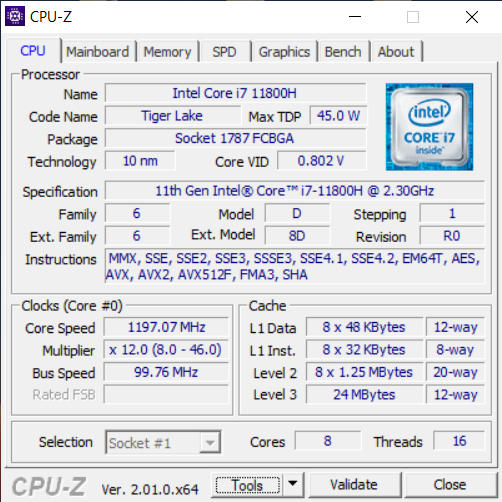

Processor
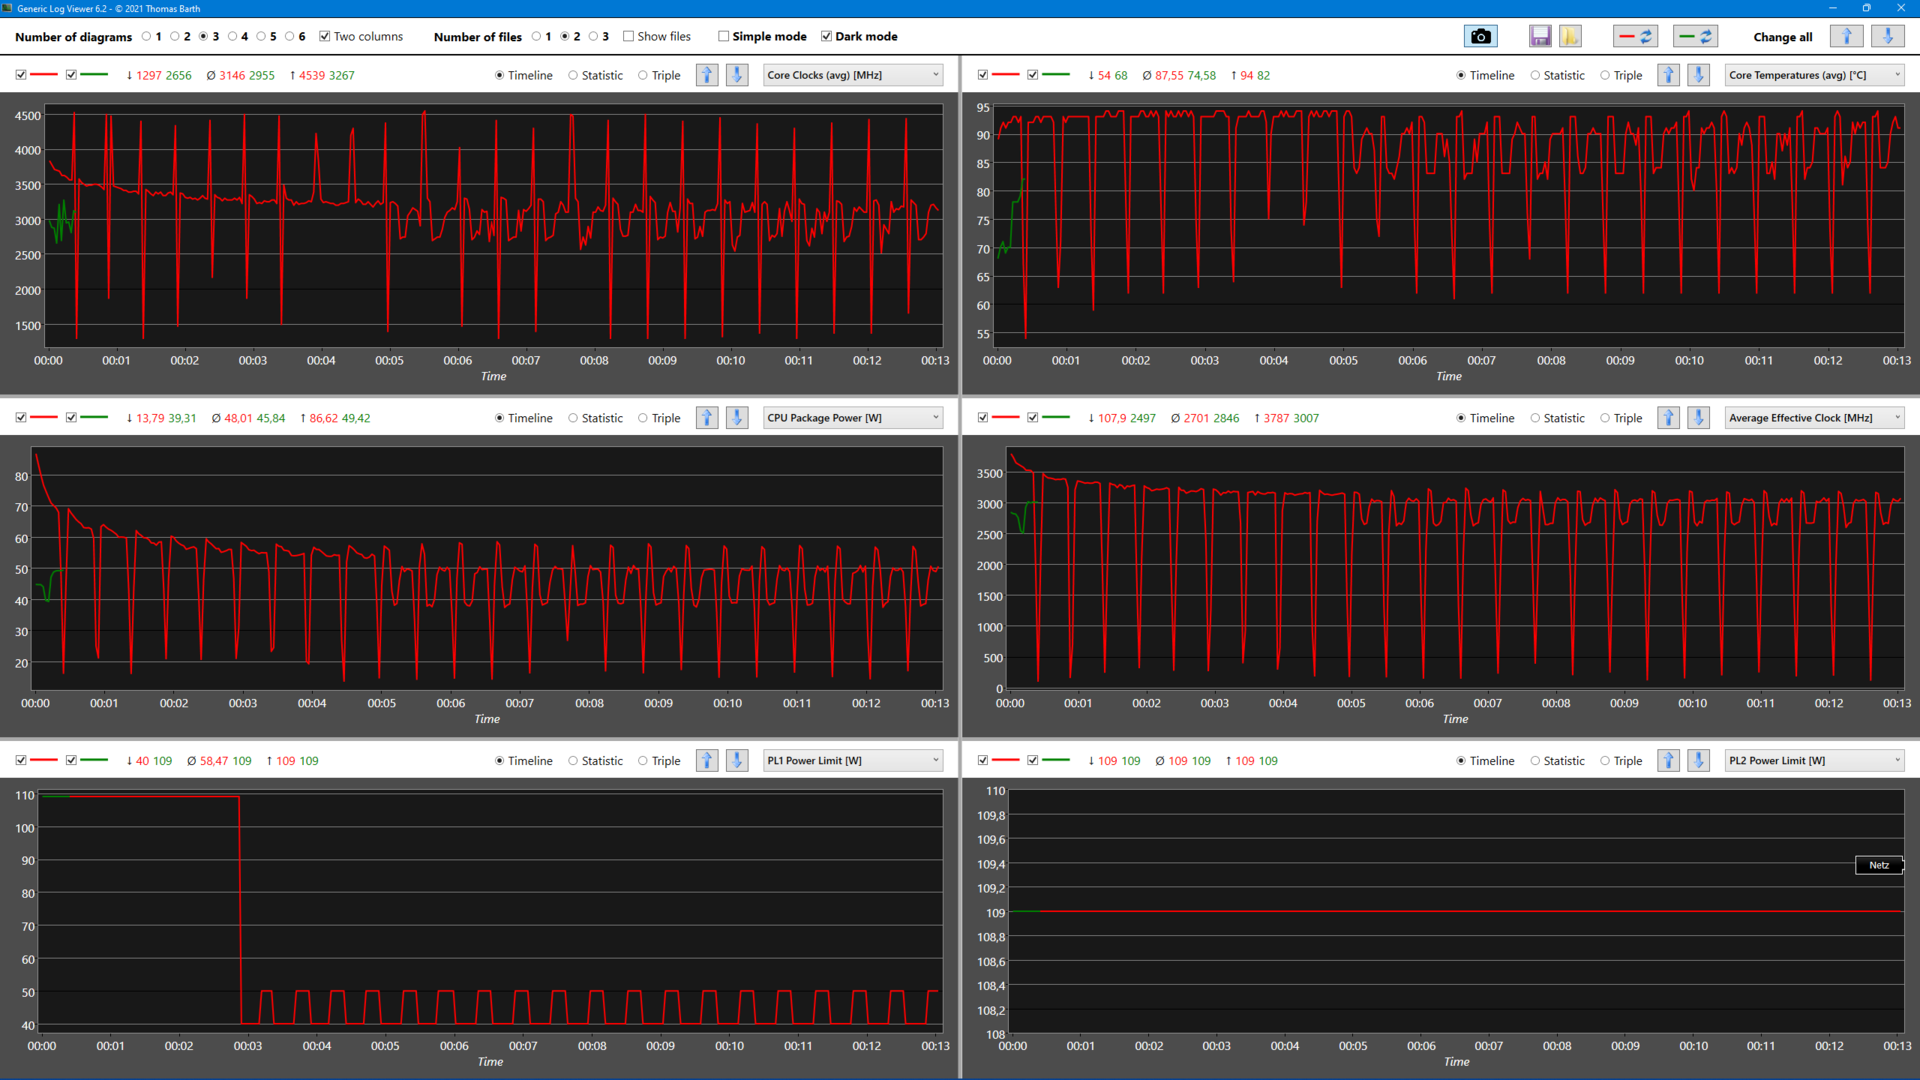
Intel's Core i7-11800H promises a lot of power with its eight cores, but the CPU is not optimally configured in the ThinkPad P15v G2 in practice. In the course of the CB15 loop, 4.6 GHz is repeatedly reached, while the average is 3.15 GHz. After 10 runs, only 1,400 points are achieved consistently. The thick ThinkPad P15 G2 achieves 1,768 points with the same CPU.
Even the tester's much thinner ThinkPad P1 G3 achieves a sustainted ~1,700 points with the pre-generation Core i9. From the PL2 (initial), 87 of 109 watts are utilized, but the problem arises from the 60 watts (@4.6 GHz) pushed beyond PL1 (50 watts). As a result, the CPU regularly hits the 94 °C mark and is subject to phased thermal throttling.
About 25% of the performance is wasted in some applications. A manual TDP limitation to 50 or even 45 watts via the "ThrottleStop" tool still results in fluctuating behavior. Interestingly, there was no throttling under a constant consumption of 50 watts during the stress test with Prime95. A BIOS update did not help. It remains questionable whether this performance drop can be remedied with a more adjustable Core i9, which is also very expensive. At the very least, the predecessor is clearly outperformed here, but HP's ZBook Power 15 is ~30% faster with the same Core i7.
The workstation-related OpenCL score is only half as good as that of the ThinkPad P15, mainly due to the weaker GPU. This discrepancy is even more extreme in V-Ray 5 CUDA. In battery mode, performance drops by around 20% (@45 watts).
Cinebench R15 Multi Sustained Load
Cinebench R23: Multi Core | Single Core
Cinebench R20: CPU (Multi Core) | CPU (Single Core)
Cinebench R15: CPU Multi 64Bit | CPU Single 64Bit
Blender: v2.79 BMW27 CPU
7-Zip 18.03: 7z b 4 | 7z b 4 -mmt1
Geekbench 5.5: Multi-Core | Single-Core
HWBOT x265 Benchmark v2.2: 4k Preset
LibreOffice : 20 Documents To PDF
R Benchmark 2.5: Overall mean
V-Ray 5 Benchmark: GPU CUDA
Geekbench 5.5: OpenCL Score
SPECviewperf 13: Solidworks (sw-04) | Siemens NX (snx-03) | Showcase (showcase-02) | Medical (medical-02) | Maya (maya-05) | Energy (energy-02) | Creo (creo-02) | Catia (catia-05) | 3ds Max (3dsmax-06)
SPECviewperf 2020: 1920x1080 Solidworks (solidworks-05) | 1920x1080 Siemens NX (snx-04) | 1920x1080 Medical (medical-03) | 1920x1080 Maya (maya-06) | 1920x1080 Energy (energy-03) | 1920x1080 Creo (creo-03) | 1920x1080 CATIA (catia-06) | 1920x1080 3ds Max (3dsmax-07)
| CPU Performance Rating | |
| Average of class Workstation | |
| Lenovo ThinkPad P15 G2-20YQ001JGE -1! | |
| Dell Precision 5000 5560 -4! | |
| Average Intel Core i7-11800H | |
| Lenovo ThinkPad T15g-20UR000GGE -1! | |
| HP ZBook Power 15 G8 313S5EA | |
| Lenovo ThinkPad P15v G2 21A9000XGE -1! | |
| Lenovo ThinkPad T15p-20TN0006GE -18! | |
| Lenovo ThinkPad P15s Gen2-20W6000GGE -1! | |
| Cinebench R23 / Multi Core | |
| Average of class Workstation (4332 - 24560, n=28, last 2 years) | |
| HP ZBook Power 15 G8 313S5EA | |
| Average Intel Core i7-11800H (6508 - 14088, n=48) | |
| Lenovo ThinkPad P15 G2-20YQ001JGE | |
| Lenovo ThinkPad P15v G2 21A9000XGE | |
| Dell Precision 5000 5560 | |
| Lenovo ThinkPad T15g-20UR000GGE | |
| Lenovo ThinkPad T15p-20TN0006GE | |
| Lenovo ThinkPad P15s Gen2-20W6000GGE | |
| Cinebench R23 / Single Core | |
| Average of class Workstation (1144 - 2106, n=28, last 2 years) | |
| HP ZBook Power 15 G8 313S5EA | |
| Dell Precision 5000 5560 | |
| Lenovo ThinkPad P15 G2-20YQ001JGE | |
| Average Intel Core i7-11800H (1386 - 1522, n=45) | |
| Lenovo ThinkPad P15s Gen2-20W6000GGE | |
| Lenovo ThinkPad T15g-20UR000GGE | |
| Lenovo ThinkPad T15p-20TN0006GE | |
| Cinebench R20 / CPU (Multi Core) | |
| Average of class Workstation (1669 - 9329, n=29, last 2 years) | |
| Average Intel Core i7-11800H (2498 - 5408, n=50) | |
| Lenovo ThinkPad P15 G2-20YQ001JGE | |
| HP ZBook Power 15 G8 313S5EA | |
| Dell Precision 5000 5560 | |
| Lenovo ThinkPad P15v G2 21A9000XGE | |
| Lenovo ThinkPad T15p-20TN0006GE | |
| Lenovo ThinkPad T15g-20UR000GGE | |
| Lenovo ThinkPad P15s Gen2-20W6000GGE | |
| Cinebench R20 / CPU (Single Core) | |
| Average of class Workstation (528 - 816, n=29, last 2 years) | |
| HP ZBook Power 15 G8 313S5EA | |
| Dell Precision 5000 5560 | |
| Lenovo ThinkPad P15 G2-20YQ001JGE | |
| Average Intel Core i7-11800H (520 - 586, n=47) | |
| Lenovo ThinkPad P15v G2 21A9000XGE | |
| Lenovo ThinkPad P15s Gen2-20W6000GGE | |
| Lenovo ThinkPad T15g-20UR000GGE | |
| Lenovo ThinkPad T15p-20TN0006GE | |
| Cinebench R15 / CPU Multi 64Bit | |
| Average of class Workstation (706 - 3625, n=28, last 2 years) | |
| HP ZBook Power 15 G8 313S5EA | |
| HP ZBook Power 15 G8 313S5EA | |
| Average Intel Core i7-11800H (1342 - 2173, n=50) | |
| Lenovo ThinkPad P15 G2-20YQ001JGE | |
| Lenovo ThinkPad P15v G2 21A9000XGE | |
| Dell Precision 5000 5560 | |
| Lenovo ThinkPad T15g-20UR000GGE | |
| Lenovo ThinkPad T15p-20TN0006GE | |
| Lenovo ThinkPad P15s Gen2-20W6000GGE | |
| Cinebench R15 / CPU Single 64Bit | |
| Average of class Workstation (166.2 - 301, n=28, last 2 years) | |
| Dell Precision 5000 5560 | |
| HP ZBook Power 15 G8 313S5EA | |
| Lenovo ThinkPad P15 G2-20YQ001JGE | |
| Average Intel Core i7-11800H (201 - 231, n=46) | |
| Lenovo ThinkPad P15v G2 21A9000XGE | |
| Lenovo ThinkPad P15s Gen2-20W6000GGE | |
| Lenovo ThinkPad T15g-20UR000GGE | |
| Lenovo ThinkPad T15p-20TN0006GE | |
| Blender / v2.79 BMW27 CPU | |
| Lenovo ThinkPad P15s Gen2-20W6000GGE | |
| Lenovo ThinkPad T15p-20TN0006GE | |
| Lenovo ThinkPad T15g-20UR000GGE | |
| Lenovo ThinkPad P15v G2 21A9000XGE | |
| Dell Precision 5000 5560 | |
| Average Intel Core i7-11800H (217 - 454, n=46) | |
| Lenovo ThinkPad P15 G2-20YQ001JGE | |
| HP ZBook Power 15 G8 313S5EA | |
| Average of class Workstation (137 - 684, n=28, last 2 years) | |
| 7-Zip 18.03 / 7z b 4 | |
| Average of class Workstation (20087 - 99351, n=28, last 2 years) | |
| Lenovo ThinkPad P15 G2-20YQ001JGE | |
| HP ZBook Power 15 G8 313S5EA | |
| Average Intel Core i7-11800H (33718 - 56758, n=46) | |
| Dell Precision 5000 5560 | |
| Lenovo ThinkPad P15v G2 21A9000XGE | |
| Lenovo ThinkPad T15g-20UR000GGE | |
| Lenovo ThinkPad T15p-20TN0006GE | |
| Lenovo ThinkPad P15s Gen2-20W6000GGE | |
| 7-Zip 18.03 / 7z b 4 -mmt1 | |
| Average of class Workstation (4777 - 6670, n=28, last 2 years) | |
| Dell Precision 5000 5560 | |
| HP ZBook Power 15 G8 313S5EA | |
| Average Intel Core i7-11800H (5138 - 5732, n=46) | |
| Lenovo ThinkPad P15 G2-20YQ001JGE | |
| Lenovo ThinkPad P15s Gen2-20W6000GGE | |
| Lenovo ThinkPad T15g-20UR000GGE | |
| Lenovo ThinkPad P15v G2 21A9000XGE | |
| Lenovo ThinkPad T15p-20TN0006GE | |
| Geekbench 5.5 / Multi-Core | |
| Average of class Workstation (5022 - 17487, n=28, last 2 years) | |
| Lenovo ThinkPad P15 G2-20YQ001JGE | |
| Average Intel Core i7-11800H (4655 - 9851, n=40) | |
| HP ZBook Power 15 G8 313S5EA | |
| Lenovo ThinkPad T15g-20UR000GGE | |
| Lenovo ThinkPad P15v G2 21A9000XGE | |
| Lenovo ThinkPad T15p-20TN0006GE | |
| Lenovo ThinkPad P15s Gen2-20W6000GGE | |
| Geekbench 5.5 / Single-Core | |
| Average of class Workstation (1474 - 2095, n=28, last 2 years) | |
| Lenovo ThinkPad P15 G2-20YQ001JGE | |
| Average Intel Core i7-11800H (1429 - 1625, n=40) | |
| Lenovo ThinkPad P15s Gen2-20W6000GGE | |
| HP ZBook Power 15 G8 313S5EA | |
| Lenovo ThinkPad P15v G2 21A9000XGE | |
| Lenovo ThinkPad T15g-20UR000GGE | |
| Lenovo ThinkPad T15p-20TN0006GE | |
| HWBOT x265 Benchmark v2.2 / 4k Preset | |
| Average of class Workstation (5.09 - 26, n=28, last 2 years) | |
| Lenovo ThinkPad P15 G2-20YQ001JGE | |
| HP ZBook Power 15 G8 313S5EA | |
| Average Intel Core i7-11800H (7.38 - 17.4, n=46) | |
| Dell Precision 5000 5560 | |
| Lenovo ThinkPad P15v G2 21A9000XGE | |
| Lenovo ThinkPad T15g-20UR000GGE | |
| Lenovo ThinkPad T15p-20TN0006GE | |
| Lenovo ThinkPad P15s Gen2-20W6000GGE | |
| LibreOffice / 20 Documents To PDF | |
| Lenovo ThinkPad P15v G2 21A9000XGE | |
| Lenovo ThinkPad P15 G2-20YQ001JGE | |
| Lenovo ThinkPad T15g-20UR000GGE | |
| Dell Precision 5000 5560 | |
| Average of class Workstation (36.5 - 95.2, n=28, last 2 years) | |
| Average Intel Core i7-11800H (38.6 - 59.9, n=45) | |
| Lenovo ThinkPad P15s Gen2-20W6000GGE | |
| Lenovo ThinkPad T15p-20TN0006GE | |
| HP ZBook Power 15 G8 313S5EA | |
| R Benchmark 2.5 / Overall mean | |
| Lenovo ThinkPad T15p-20TN0006GE | |
| HP ZBook Power 15 G8 313S5EA | |
| Lenovo ThinkPad P15v G2 21A9000XGE | |
| Lenovo ThinkPad T15g-20UR000GGE | |
| Lenovo ThinkPad P15 G2-20YQ001JGE | |
| Average Intel Core i7-11800H (0.548 - 0.615, n=46) | |
| Lenovo ThinkPad P15s Gen2-20W6000GGE | |
| Dell Precision 5000 5560 | |
| Average of class Workstation (0.3876 - 0.544, n=28, last 2 years) | |
| V-Ray 5 Benchmark / GPU CUDA | |
| Average of class Workstation (380 - 2124, n=13, last 2 years) | |
| Average Intel Core i7-11800H (164 - 1238, n=16) | |
| Lenovo ThinkPad P15v G2 21A9000XGE | |
| HP ZBook Power 15 G8 313S5EA | |
| Geekbench 5.5 / OpenCL Score | |
| Lenovo ThinkPad P15 G2-20YQ001JGE | |
| Lenovo ThinkPad T15g-20UR000GGE | |
| Average of class Workstation (4201 - 174402, n=28, last 2 years) | |
| Average Intel Core i7-11800H (8476 - 129333, n=46) | |
| Lenovo ThinkPad P15v G2 21A9000XGE | |
| HP ZBook Power 15 G8 313S5EA | |
| Lenovo ThinkPad P15s Gen2-20W6000GGE | |
| Lenovo ThinkPad T15p-20TN0006GE | |
| SPECviewperf 13 / Solidworks (sw-04) | |
| Lenovo ThinkPad P15 G2-20YQ001JGE | |
| Average of class Workstation (91.8 - 227, n=27, last 2 years) | |
| Dell Precision 5000 5560 | |
| Lenovo ThinkPad P15v G2 21A9000XGE | |
| Average Intel Core i7-11800H (45.5 - 156.7, n=10) | |
| HP ZBook Power 15 G8 313S5EA | |
| Lenovo ThinkPad P15s Gen2-20W6000GGE | |
| Lenovo ThinkPad T15g-20UR000GGE | |
| SPECviewperf 13 / Siemens NX (snx-03) | |
| Lenovo ThinkPad P15 G2-20YQ001JGE | |
| Average of class Workstation (48.9 - 551, n=27, last 2 years) | |
| Dell Precision 5000 5560 | |
| Lenovo ThinkPad P15v G2 21A9000XGE | |
| HP ZBook Power 15 G8 313S5EA | |
| Average Intel Core i7-11800H (5.45 - 250, n=10) | |
| Lenovo ThinkPad P15s Gen2-20W6000GGE | |
| Lenovo ThinkPad T15g-20UR000GGE | |
| SPECviewperf 13 / Showcase (showcase-02) | |
| Lenovo ThinkPad T15g-20UR000GGE | |
| Lenovo ThinkPad P15 G2-20YQ001JGE | |
| Average of class Workstation (24.8 - 190.3, n=27, last 2 years) | |
| Average Intel Core i7-11800H (11.3 - 138, n=10) | |
| Dell Precision 5000 5560 | |
| Lenovo ThinkPad P15v G2 21A9000XGE | |
| HP ZBook Power 15 G8 313S5EA | |
| Lenovo ThinkPad P15s Gen2-20W6000GGE | |
| SPECviewperf 13 / Medical (medical-02) | |
| Average of class Workstation (34.5 - 176.2, n=27, last 2 years) | |
| Lenovo ThinkPad P15 G2-20YQ001JGE | |
| Dell Precision 5000 5560 | |
| Average Intel Core i7-11800H (4.96 - 89.2, n=10) | |
| Lenovo ThinkPad P15v G2 21A9000XGE | |
| Lenovo ThinkPad T15g-20UR000GGE | |
| HP ZBook Power 15 G8 313S5EA | |
| Lenovo ThinkPad P15s Gen2-20W6000GGE | |
| SPECviewperf 13 / Maya (maya-05) | |
| Average of class Workstation (77.5 - 449, n=27, last 2 years) | |
| Lenovo ThinkPad P15 G2-20YQ001JGE | |
| Lenovo ThinkPad T15g-20UR000GGE | |
| Average Intel Core i7-11800H (32 - 337, n=10) | |
| Dell Precision 5000 5560 | |
| Lenovo ThinkPad P15v G2 21A9000XGE | |
| HP ZBook Power 15 G8 313S5EA | |
| Lenovo ThinkPad P15s Gen2-20W6000GGE | |
| SPECviewperf 13 / Energy (energy-02) | |
| Average of class Workstation (7.71 - 109.7, n=27, last 2 years) | |
| Lenovo ThinkPad P15 G2-20YQ001JGE | |
| Dell Precision 5000 5560 | |
| Average Intel Core i7-11800H (1.15 - 41.2, n=10) | |
| Lenovo ThinkPad T15g-20UR000GGE | |
| Lenovo ThinkPad P15v G2 21A9000XGE | |
| HP ZBook Power 15 G8 313S5EA | |
| Lenovo ThinkPad P15s Gen2-20W6000GGE | |
| SPECviewperf 13 / Creo (creo-02) | |
| Lenovo ThinkPad P15 G2-20YQ001JGE | |
| Average of class Workstation (76.8 - 398, n=26, last 2 years) | |
| Dell Precision 5000 5560 | |
| Lenovo ThinkPad T15g-20UR000GGE | |
| Average Intel Core i7-11800H (22.5 - 225, n=10) | |
| Lenovo ThinkPad P15v G2 21A9000XGE | |
| HP ZBook Power 15 G8 313S5EA | |
| Lenovo ThinkPad P15s Gen2-20W6000GGE | |
| SPECviewperf 13 / Catia (catia-05) | |
| Lenovo ThinkPad P15 G2-20YQ001JGE | |
| Average of class Workstation (99.5 - 409, n=27, last 2 years) | |
| Dell Precision 5000 5560 | |
| Average Intel Core i7-11800H (31.9 - 257, n=10) | |
| Lenovo ThinkPad P15v G2 21A9000XGE | |
| HP ZBook Power 15 G8 313S5EA | |
| Lenovo ThinkPad T15g-20UR000GGE | |
| Lenovo ThinkPad P15s Gen2-20W6000GGE | |
| SPECviewperf 13 / 3ds Max (3dsmax-06) | |
| Lenovo ThinkPad P15 G2-20YQ001JGE | |
| Lenovo ThinkPad T15g-20UR000GGE | |
| Average of class Workstation (61.6 - 284, n=26, last 2 years) | |
| Average Intel Core i7-11800H (27.2 - 235, n=10) | |
| Dell Precision 5000 5560 | |
| Lenovo ThinkPad P15v G2 21A9000XGE | |
| HP ZBook Power 15 G8 313S5EA | |
| Lenovo ThinkPad P15s Gen2-20W6000GGE | |
| SPECviewperf 2020 / Solidworks (solidworks-05) | |
| Average of class Workstation (46.3 - 347, n=27, last 2 years) | |
| Lenovo ThinkPad T15g-20UR000GGE | |
| Lenovo ThinkPad P15 G2-20YQ001JGE | |
| Dell Precision 5000 5560 | |
| Average Intel Core i7-11800H (73.4 - 147.9, n=6) | |
| Lenovo ThinkPad P15v G2 21A9000XGE | |
| HP ZBook Power 15 G8 313S5EA | |
| Lenovo ThinkPad P15s Gen2-20W6000GGE | |
| SPECviewperf 2020 / Siemens NX (snx-04) | |
| Lenovo ThinkPad P15 G2-20YQ001JGE | |
| Average of class Workstation (48.5 - 554, n=28, last 2 years) | |
| Dell Precision 5000 5560 | |
| Lenovo ThinkPad P15v G2 21A9000XGE | |
| Average Intel Core i7-11800H (18.7 - 250, n=8) | |
| HP ZBook Power 15 G8 313S5EA | |
| Lenovo ThinkPad P15s Gen2-20W6000GGE | |
| Lenovo ThinkPad T15g-20UR000GGE | |
| SPECviewperf 2020 / Medical (medical-03) | |
| Average of class Workstation (13.5 - 97, n=28, last 2 years) | |
| Lenovo ThinkPad P15 G2-20YQ001JGE | |
| Dell Precision 5000 5560 | |
| Average Intel Core i7-11800H (18.7 - 42.7, n=8) | |
| Lenovo ThinkPad T15g-20UR000GGE | |
| Lenovo ThinkPad P15v G2 21A9000XGE | |
| HP ZBook Power 15 G8 313S5EA | |
| Lenovo ThinkPad P15s Gen2-20W6000GGE | |
| SPECviewperf 2020 / Maya (maya-06) | |
| Average of class Workstation (86.9 - 460, n=28, last 2 years) | |
| Lenovo ThinkPad P15 G2-20YQ001JGE | |
| Lenovo ThinkPad T15g-20UR000GGE | |
| Dell Precision 5000 5560 | |
| Average Intel Core i7-11800H (125 - 294, n=8) | |
| Lenovo ThinkPad P15v G2 21A9000XGE | |
| HP ZBook Power 15 G8 313S5EA | |
| Lenovo ThinkPad P15s Gen2-20W6000GGE | |
| SPECviewperf 2020 / Energy (energy-03) | |
| Lenovo ThinkPad P15 G2-20YQ001JGE | |
| Average of class Workstation (6.72 - 109.7, n=28, last 2 years) | |
| Dell Precision 5000 5560 | |
| Average Intel Core i7-11800H (16 - 43.1, n=8) | |
| Lenovo ThinkPad T15g-20UR000GGE | |
| Lenovo ThinkPad P15v G2 21A9000XGE | |
| HP ZBook Power 15 G8 313S5EA | |
| Lenovo ThinkPad P15s Gen2-20W6000GGE | |
| SPECviewperf 2020 / Creo (creo-03) | |
| Lenovo ThinkPad P15 G2-20YQ001JGE | |
| Average of class Workstation (44.5 - 169.5, n=28, last 2 years) | |
| Dell Precision 5000 5560 | |
| Average Intel Core i7-11800H (67.3 - 124.5, n=8) | |
| Lenovo ThinkPad T15g-20UR000GGE | |
| Lenovo ThinkPad P15v G2 21A9000XGE | |
| HP ZBook Power 15 G8 313S5EA | |
| Lenovo ThinkPad P15s Gen2-20W6000GGE | |
| SPECviewperf 2020 / CATIA (catia-06) | |
| Lenovo ThinkPad P15 G2-20YQ001JGE | |
| Average of class Workstation (21 - 130, n=28, last 2 years) | |
| Dell Precision 5000 5560 | |
| Average Intel Core i7-11800H (33.1 - 80.5, n=8) | |
| Lenovo ThinkPad T15g-20UR000GGE | |
| Lenovo ThinkPad P15v G2 21A9000XGE | |
| HP ZBook Power 15 G8 313S5EA | |
| Lenovo ThinkPad P15s Gen2-20W6000GGE | |
| SPECviewperf 2020 / 3ds Max (3dsmax-07) | |
| Lenovo ThinkPad T15g-20UR000GGE | |
| Average of class Workstation (28.3 - 174.7, n=28, last 2 years) | |
| Lenovo ThinkPad P15 G2-20YQ001JGE | |
| Average Intel Core i7-11800H (40.9 - 109.4, n=8) | |
| Dell Precision 5000 5560 | |
| Lenovo ThinkPad P15v G2 21A9000XGE | |
| HP ZBook Power 15 G8 313S5EA | |
| Lenovo ThinkPad P15s Gen2-20W6000GGE | |
* ... smaller is better
AIDA64: FP32 Ray-Trace | FPU Julia | CPU SHA3 | CPU Queen | FPU SinJulia | FPU Mandel | CPU AES | CPU ZLib | FP64 Ray-Trace | CPU PhotoWorxx
| Performance Rating | |
| Average of class Workstation | |
| HP ZBook Power 15 G8 313S5EA | |
| Average Intel Core i7-11800H | |
| Lenovo ThinkPad P15v G2 21A9000XGE | |
| Lenovo ThinkPad T15g-20UR000GGE | |
| Lenovo ThinkPad T15p-20TN0006GE | |
| Lenovo ThinkPad P15s Gen2-20W6000GGE | |
| AIDA64 / FP32 Ray-Trace | |
| Average of class Workstation (2619 - 25776, n=28, last 2 years) | |
| HP ZBook Power 15 G8 313S5EA | |
| Average Intel Core i7-11800H (8772 - 15961, n=20) | |
| Lenovo ThinkPad P15v G2 21A9000XGE | |
| Lenovo ThinkPad T15g-20UR000GGE | |
| Lenovo ThinkPad T15p-20TN0006GE | |
| Lenovo ThinkPad P15s Gen2-20W6000GGE | |
| AIDA64 / FPU Julia | |
| Average of class Workstation (12909 - 109059, n=28, last 2 years) | |
| HP ZBook Power 15 G8 313S5EA | |
| Average Intel Core i7-11800H (39404 - 65636, n=20) | |
| Lenovo ThinkPad P15v G2 21A9000XGE | |
| Lenovo ThinkPad T15g-20UR000GGE | |
| Lenovo ThinkPad T15p-20TN0006GE | |
| Lenovo ThinkPad P15s Gen2-20W6000GGE | |
| AIDA64 / CPU SHA3 | |
| HP ZBook Power 15 G8 313S5EA | |
| Average Intel Core i7-11800H (2599 - 4439, n=20) | |
| Average of class Workstation (824 - 4981, n=28, last 2 years) | |
| Lenovo ThinkPad P15v G2 21A9000XGE | |
| Lenovo ThinkPad T15g-20UR000GGE | |
| Lenovo ThinkPad T15p-20TN0006GE | |
| Lenovo ThinkPad P15s Gen2-20W6000GGE | |
| AIDA64 / CPU Queen | |
| Average of class Workstation (26716 - 131931, n=28, last 2 years) | |
| HP ZBook Power 15 G8 313S5EA | |
| Average Intel Core i7-11800H (85233 - 91941, n=20) | |
| Lenovo ThinkPad P15v G2 21A9000XGE | |
| Lenovo ThinkPad T15p-20TN0006GE | |
| Lenovo ThinkPad T15g-20UR000GGE | |
| Lenovo ThinkPad P15s Gen2-20W6000GGE | |
| AIDA64 / FPU SinJulia | |
| Average of class Workstation (3105 - 14742, n=28, last 2 years) | |
| HP ZBook Power 15 G8 313S5EA | |
| Average Intel Core i7-11800H (6420 - 9792, n=20) | |
| Lenovo ThinkPad P15v G2 21A9000XGE | |
| Lenovo ThinkPad T15p-20TN0006GE | |
| Lenovo ThinkPad T15g-20UR000GGE | |
| Lenovo ThinkPad P15s Gen2-20W6000GGE | |
| AIDA64 / FPU Mandel | |
| Average of class Workstation (6967 - 58181, n=28, last 2 years) | |
| HP ZBook Power 15 G8 313S5EA | |
| Average Intel Core i7-11800H (23365 - 39464, n=20) | |
| Lenovo ThinkPad P15v G2 21A9000XGE | |
| Lenovo ThinkPad T15g-20UR000GGE | |
| Lenovo ThinkPad T15p-20TN0006GE | |
| Lenovo ThinkPad P15s Gen2-20W6000GGE | |
| AIDA64 / CPU AES | |
| Average Intel Core i7-11800H (74617 - 149388, n=20) | |
| HP ZBook Power 15 G8 313S5EA | |
| Lenovo ThinkPad P15v G2 21A9000XGE | |
| Lenovo ThinkPad P15s Gen2-20W6000GGE | |
| Average of class Workstation (19489 - 132156, n=28, last 2 years) | |
| Lenovo ThinkPad T15p-20TN0006GE | |
| Lenovo ThinkPad T15g-20UR000GGE | |
| AIDA64 / CPU ZLib | |
| Average of class Workstation (314 - 1472, n=28, last 2 years) | |
| HP ZBook Power 15 G8 313S5EA | |
| Lenovo ThinkPad P15v G2 21A9000XGE | |
| Lenovo ThinkPad T15g-20UR000GGE | |
| Lenovo ThinkPad T15p-20TN0006GE | |
| Lenovo ThinkPad P15s Gen2-20W6000GGE | |
| Average Intel Core i7-11800H (461 - 830, n=43) | |
| AIDA64 / FP64 Ray-Trace | |
| Average of class Workstation (1473 - 13800, n=28, last 2 years) | |
| HP ZBook Power 15 G8 313S5EA | |
| Average Intel Core i7-11800H (4545 - 8717, n=21) | |
| Lenovo ThinkPad P15v G2 21A9000XGE | |
| Lenovo ThinkPad T15g-20UR000GGE | |
| Lenovo ThinkPad T15p-20TN0006GE | |
| Lenovo ThinkPad P15s Gen2-20W6000GGE | |
| AIDA64 / CPU PhotoWorxx | |
| Average of class Workstation (18157 - 51637, n=28, last 2 years) | |
| Lenovo ThinkPad P15s Gen2-20W6000GGE | |
| Lenovo ThinkPad T15g-20UR000GGE | |
| Average Intel Core i7-11800H (11898 - 26757, n=21) | |
| HP ZBook Power 15 G8 313S5EA | |
| Lenovo ThinkPad T15p-20TN0006GE | |
| Lenovo ThinkPad P15v G2 21A9000XGE | |
System Performance
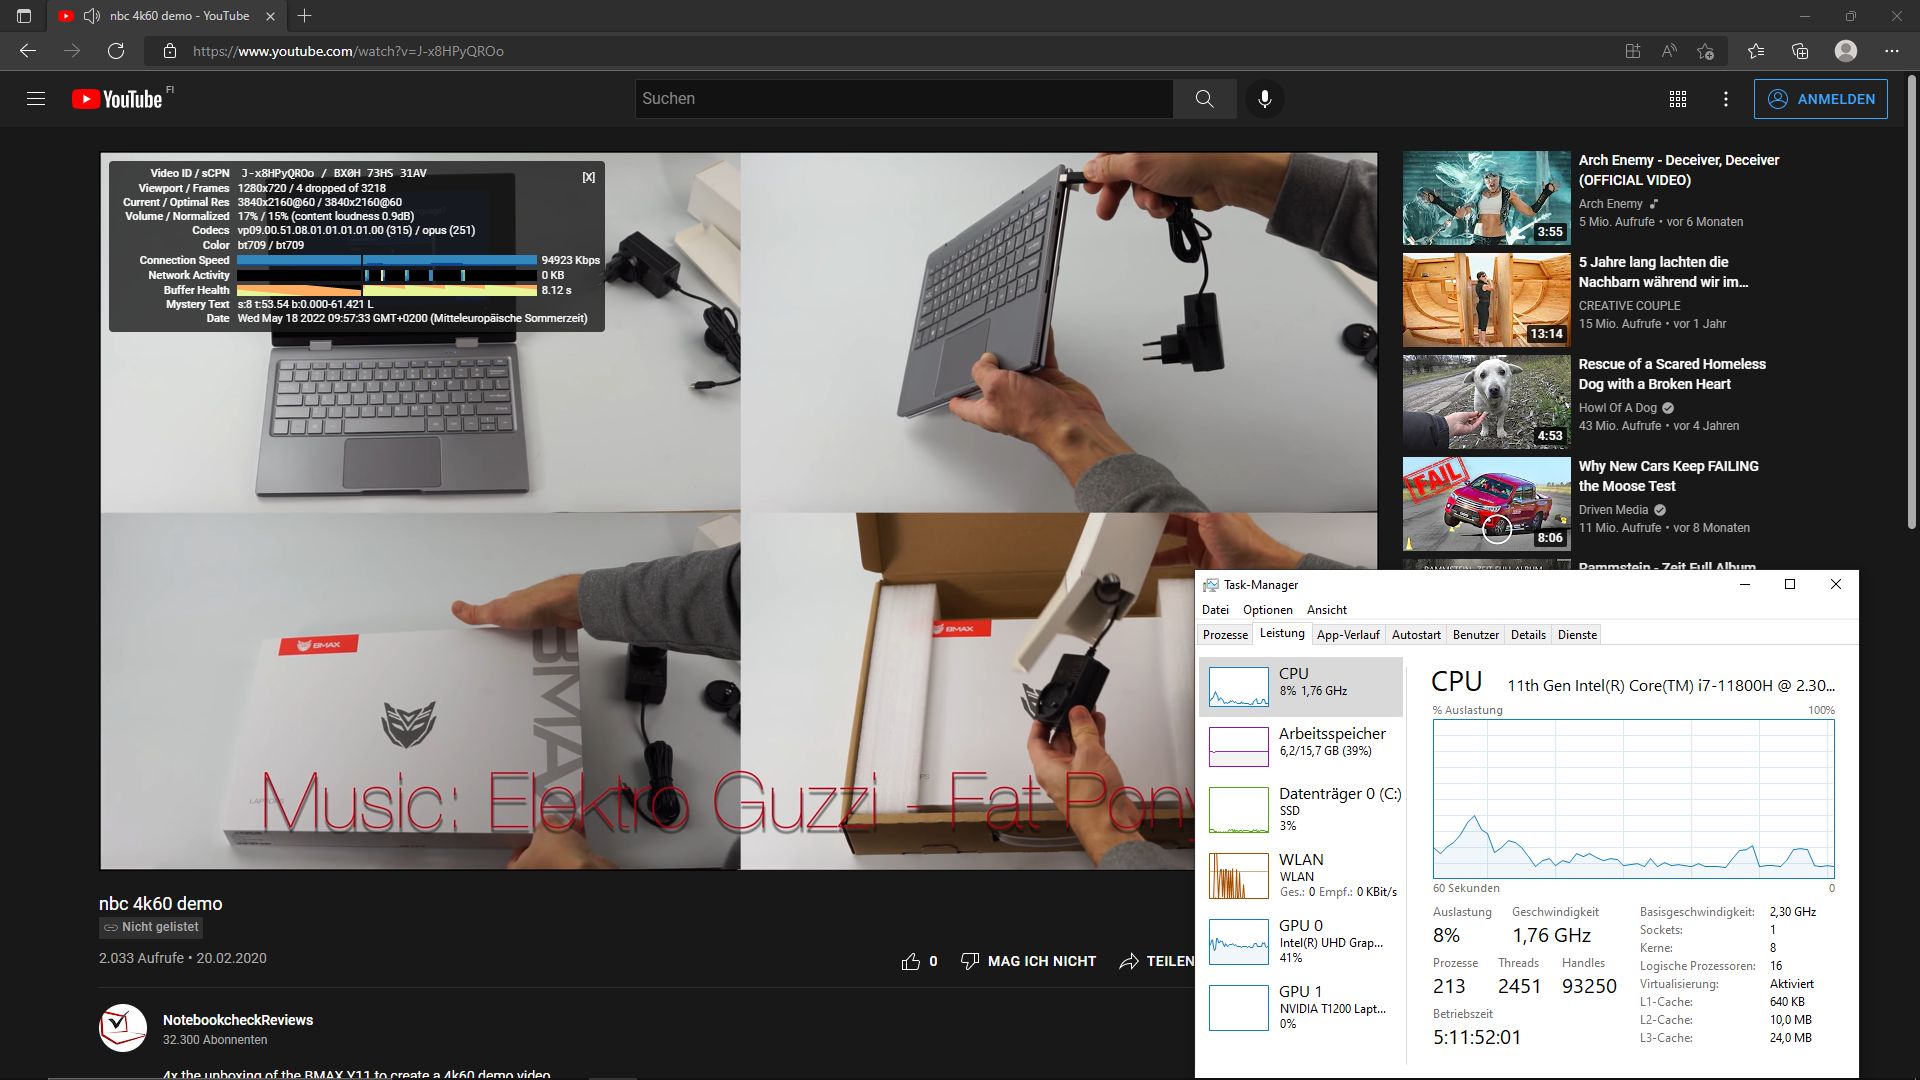
Browsing, even with multiple tabs while playing a 4k YouTube video, runs smoothly.
The benchmark results are on a good level, which can be further improved using a second RAM module (dual-channel mode).
CrossMark: Overall | Productivity | Creativity | Responsiveness
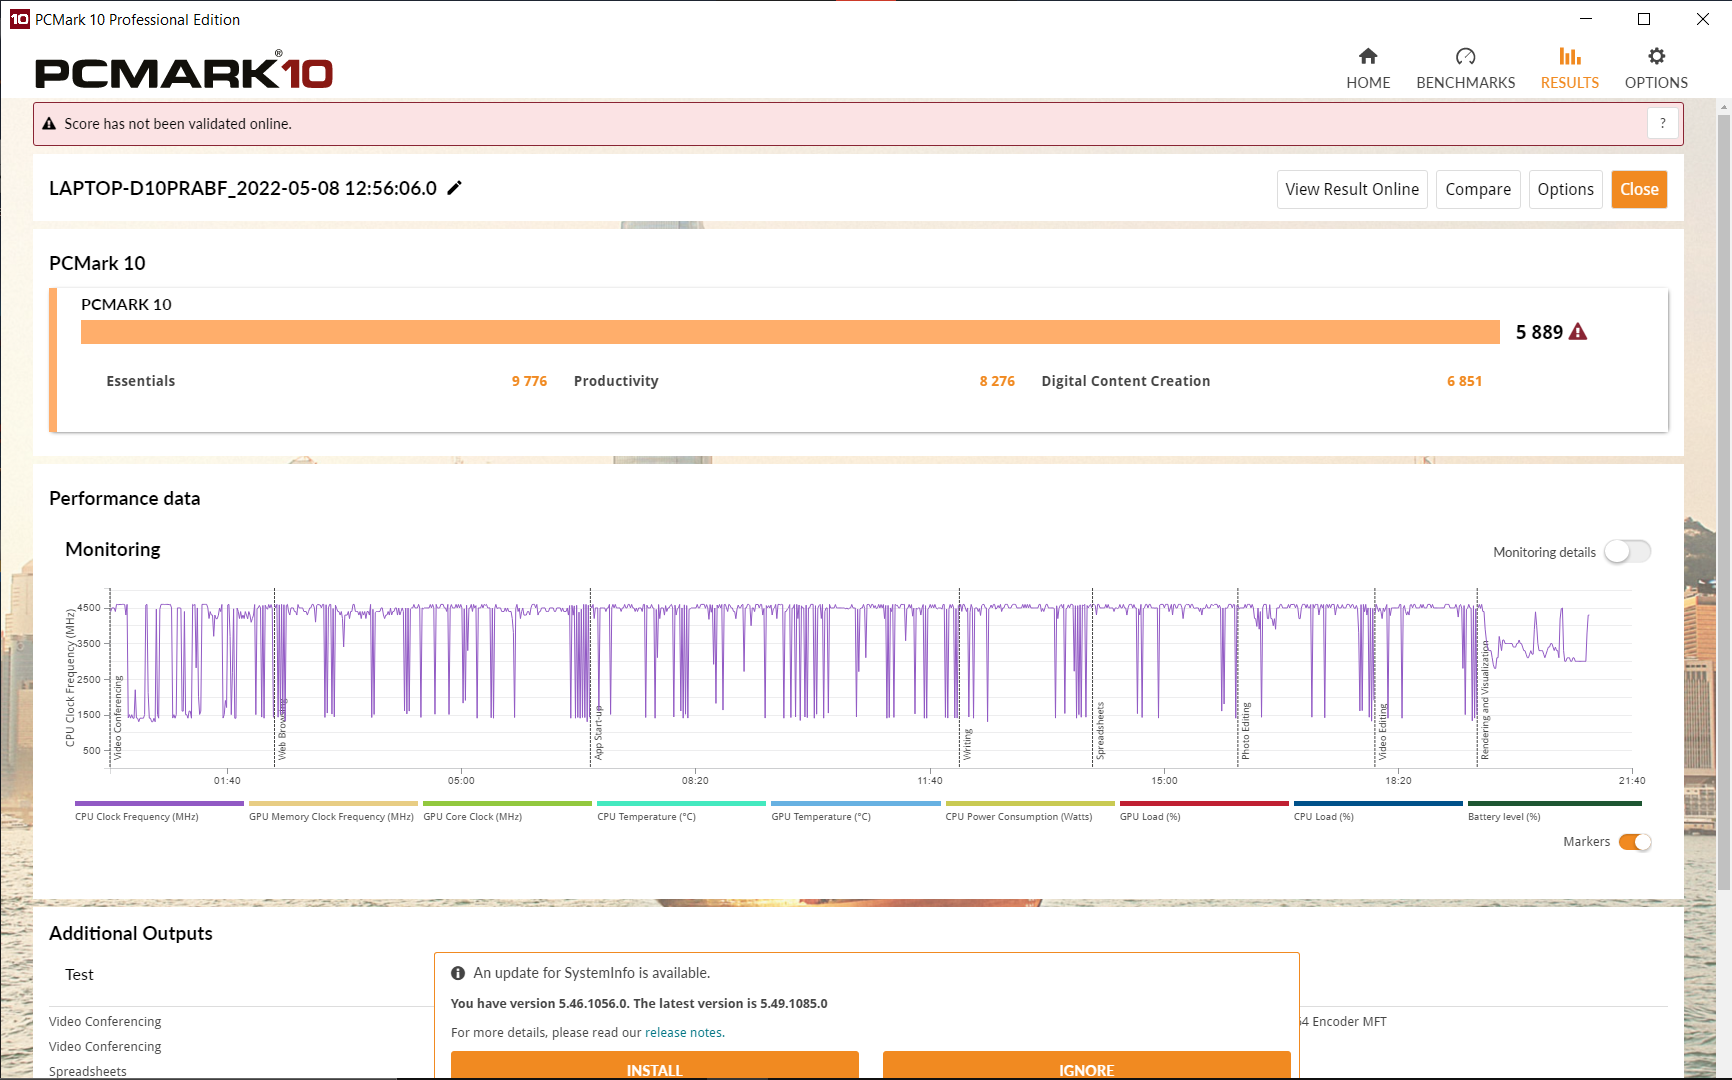
| PCMark 10 / Score | |
| Average of class Workstation (5488 - 8587, n=27, last 2 years) | |
| Dell Precision 5000 5560 | |
| Lenovo ThinkPad P15 G2-20YQ001JGE | |
| Lenovo ThinkPad T15g-20UR000GGE | |
| Average Intel Core i7-11800H, NVIDIA T1200 Laptop GPU (5889 - 6147, n=3) | |
| Lenovo ThinkPad P15v G2 21A9000XGE | |
| Lenovo ThinkPad P15s Gen2-20W6000GGE | |
| Lenovo ThinkPad T15p-20TN0006GE | |
| HP ZBook Power 15 G8 313S5EA | |
| PCMark 10 / Essentials | |
| Dell Precision 5000 5560 | |
| Average of class Workstation (9151 - 12197, n=27, last 2 years) | |
| Lenovo ThinkPad P15 G2-20YQ001JGE | |
| Average Intel Core i7-11800H, NVIDIA T1200 Laptop GPU (9776 - 9956, n=3) | |
| Lenovo ThinkPad P15v G2 21A9000XGE | |
| Lenovo ThinkPad P15s Gen2-20W6000GGE | |
| Lenovo ThinkPad T15g-20UR000GGE | |
| Lenovo ThinkPad T15p-20TN0006GE | |
| HP ZBook Power 15 G8 313S5EA | |
| PCMark 10 / Productivity | |
| Lenovo ThinkPad P15s Gen2-20W6000GGE | |
| Average of class Workstation (7846 - 10820, n=27, last 2 years) | |
| Dell Precision 5000 5560 | |
| Lenovo ThinkPad P15 G2-20YQ001JGE | |
| Average Intel Core i7-11800H, NVIDIA T1200 Laptop GPU (8276 - 8445, n=3) | |
| Lenovo ThinkPad P15v G2 21A9000XGE | |
| Lenovo ThinkPad T15g-20UR000GGE | |
| HP ZBook Power 15 G8 313S5EA | |
| Lenovo ThinkPad T15p-20TN0006GE | |
| PCMark 10 / Digital Content Creation | |
| Average of class Workstation (5399 - 13947, n=27, last 2 years) | |
| Lenovo ThinkPad P15 G2-20YQ001JGE | |
| Dell Precision 5000 5560 | |
| Lenovo ThinkPad T15g-20UR000GGE | |
| Average Intel Core i7-11800H, NVIDIA T1200 Laptop GPU (6851 - 7581, n=3) | |
| Lenovo ThinkPad P15v G2 21A9000XGE | |
| Lenovo ThinkPad T15p-20TN0006GE | |
| HP ZBook Power 15 G8 313S5EA | |
| Lenovo ThinkPad P15s Gen2-20W6000GGE | |
| CrossMark / Overall | |
| Average of class Workstation (1154 - 1972, n=27, last 2 years) | |
| HP ZBook Power 15 G8 313S5EA | |
| Average Intel Core i7-11800H, NVIDIA T1200 Laptop GPU (1367 - 1526, n=2) | |
| Lenovo ThinkPad P15v G2 21A9000XGE | |
| CrossMark / Productivity | |
| Average of class Workstation (1188 - 1842, n=27, last 2 years) | |
| HP ZBook Power 15 G8 313S5EA | |
| Average Intel Core i7-11800H, NVIDIA T1200 Laptop GPU (1389 - 1521, n=2) | |
| Lenovo ThinkPad P15v G2 21A9000XGE | |
| CrossMark / Creativity | |
| Average of class Workstation (1180 - 2248, n=27, last 2 years) | |
| HP ZBook Power 15 G8 313S5EA | |
| Average Intel Core i7-11800H, NVIDIA T1200 Laptop GPU (1430 - 1606, n=2) | |
| Lenovo ThinkPad P15v G2 21A9000XGE | |
| CrossMark / Responsiveness | |
| Average of class Workstation (990 - 1865, n=27, last 2 years) | |
| Average Intel Core i7-11800H, NVIDIA T1200 Laptop GPU (1137 - 1323, n=2) | |
| HP ZBook Power 15 G8 313S5EA | |
| Lenovo ThinkPad P15v G2 21A9000XGE | |
| PCMark 10 Score | 5889 points | |
Help | ||
| AIDA64 / Memory Copy | |
| Average of class Workstation (30324 - 95718, n=28, last 2 years) | |
| Lenovo ThinkPad P15s Gen2-20W6000GGE | |
| Average Intel Core i7-11800H (24508 - 48144, n=21) | |
| Lenovo ThinkPad T15g-20UR000GGE | |
| HP ZBook Power 15 G8 313S5EA | |
| Lenovo ThinkPad P15v G2 21A9000XGE | |
| Lenovo ThinkPad T15p-20TN0006GE | |
| AIDA64 / Memory Read | |
| Average of class Workstation (30787 - 85570, n=28, last 2 years) | |
| Lenovo ThinkPad P15s Gen2-20W6000GGE | |
| Average Intel Core i7-11800H (25882 - 50365, n=20) | |
| Lenovo ThinkPad T15g-20UR000GGE | |
| HP ZBook Power 15 G8 313S5EA | |
| Lenovo ThinkPad P15v G2 21A9000XGE | |
| Lenovo ThinkPad T15p-20TN0006GE | |
| AIDA64 / Memory Write | |
| Average of class Workstation (32728 - 93871, n=28, last 2 years) | |
| Lenovo ThinkPad P15s Gen2-20W6000GGE | |
| Lenovo ThinkPad T15g-20UR000GGE | |
| Average Intel Core i7-11800H (22240 - 46214, n=20) | |
| HP ZBook Power 15 G8 313S5EA | |
| Lenovo ThinkPad P15v G2 21A9000XGE | |
| Lenovo ThinkPad T15p-20TN0006GE | |
| AIDA64 / Memory Latency | |
| Average of class Workstation (83.4 - 139.3, n=28, last 2 years) | |
| Lenovo ThinkPad P15v G2 21A9000XGE | |
| Lenovo ThinkPad P15s Gen2-20W6000GGE | |
| Lenovo ThinkPad T15p-20TN0006GE | |
| HP ZBook Power 15 G8 313S5EA | |
| Lenovo ThinkPad T15g-20UR000GGE | |
| Average Intel Core i7-11800H (71.9 - 104.1, n=44) | |
* ... smaller is better
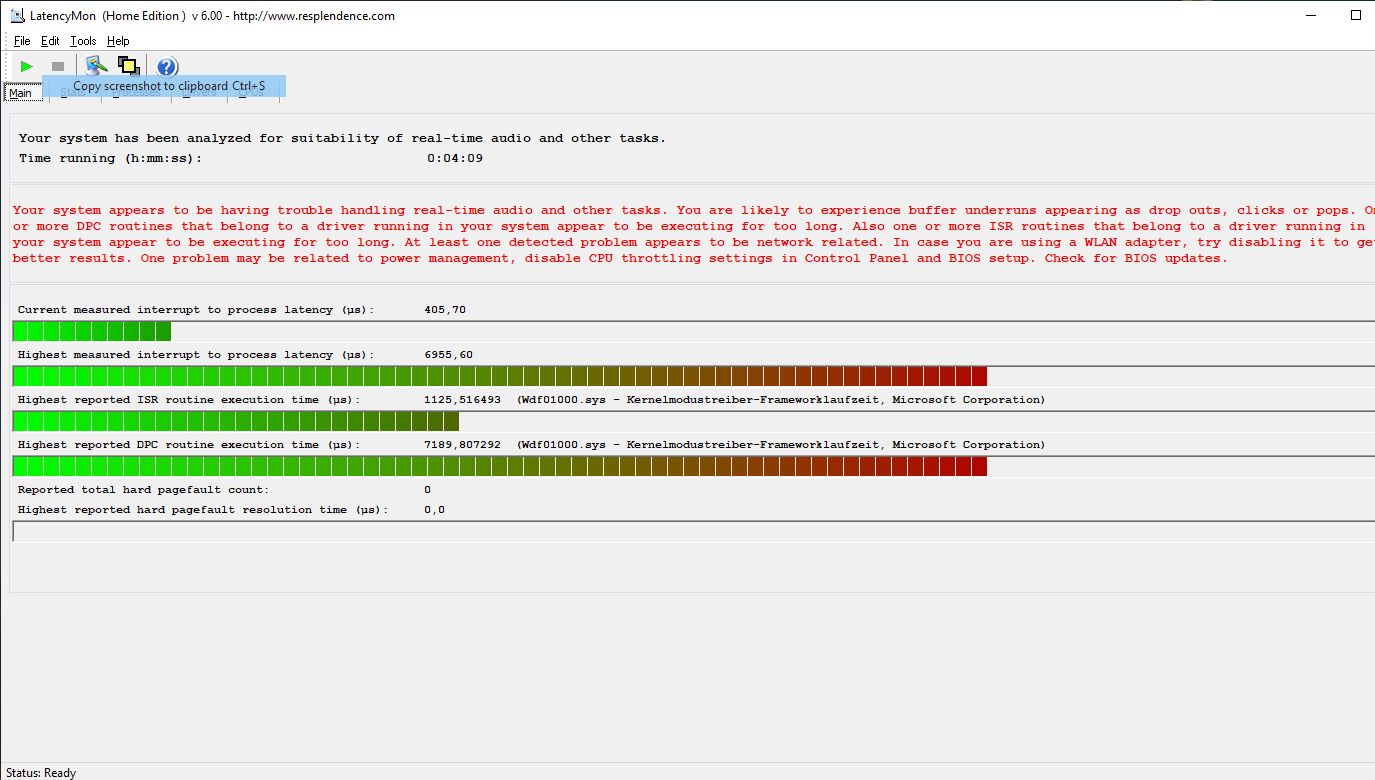
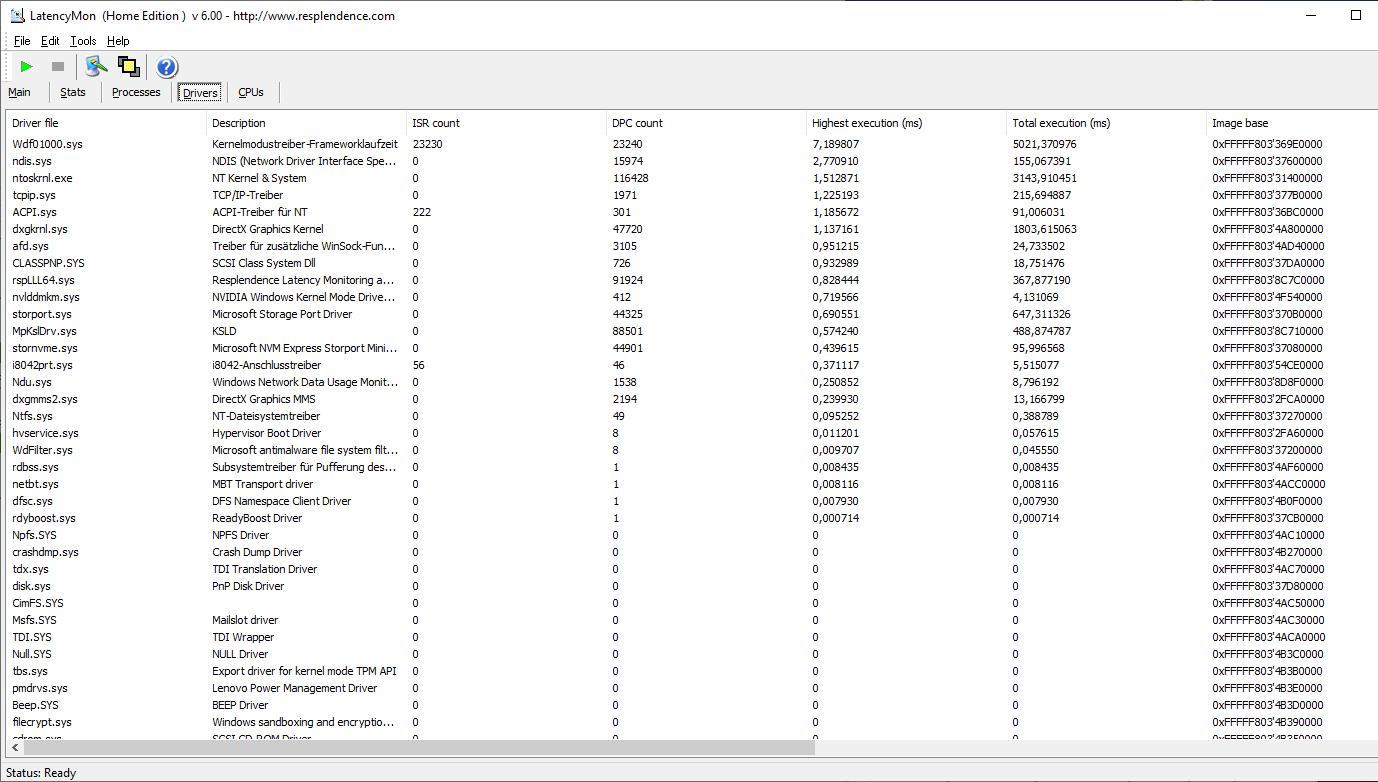
DPC Latencies
Like the thicker ThinkPad P15 G2, DPC latencies proved to be lousy with the latest drivers and BIOS at the time of testing. As so often, the kernel module and network drivers are responsible. The P15v G2 is therefore unsuitable for real-time video and audio processing. Dell's Precision 5560 fares much better here.
| DPC Latencies / LatencyMon - interrupt to process latency (max), Web, Youtube, Prime95 | |
| Lenovo ThinkPad P15v G2 21A9000XGE | |
| Lenovo ThinkPad P15 G2-20YQ001JGE | |
| Lenovo ThinkPad P15s Gen2-20W6000GGE | |
| Lenovo ThinkPad T15g-20UR000GGE | |
| Lenovo ThinkPad T15p-20TN0006GE | |
| Dell Precision 5000 5560 | |
| HP ZBook Power 15 G8 313S5EA | |
* ... smaller is better
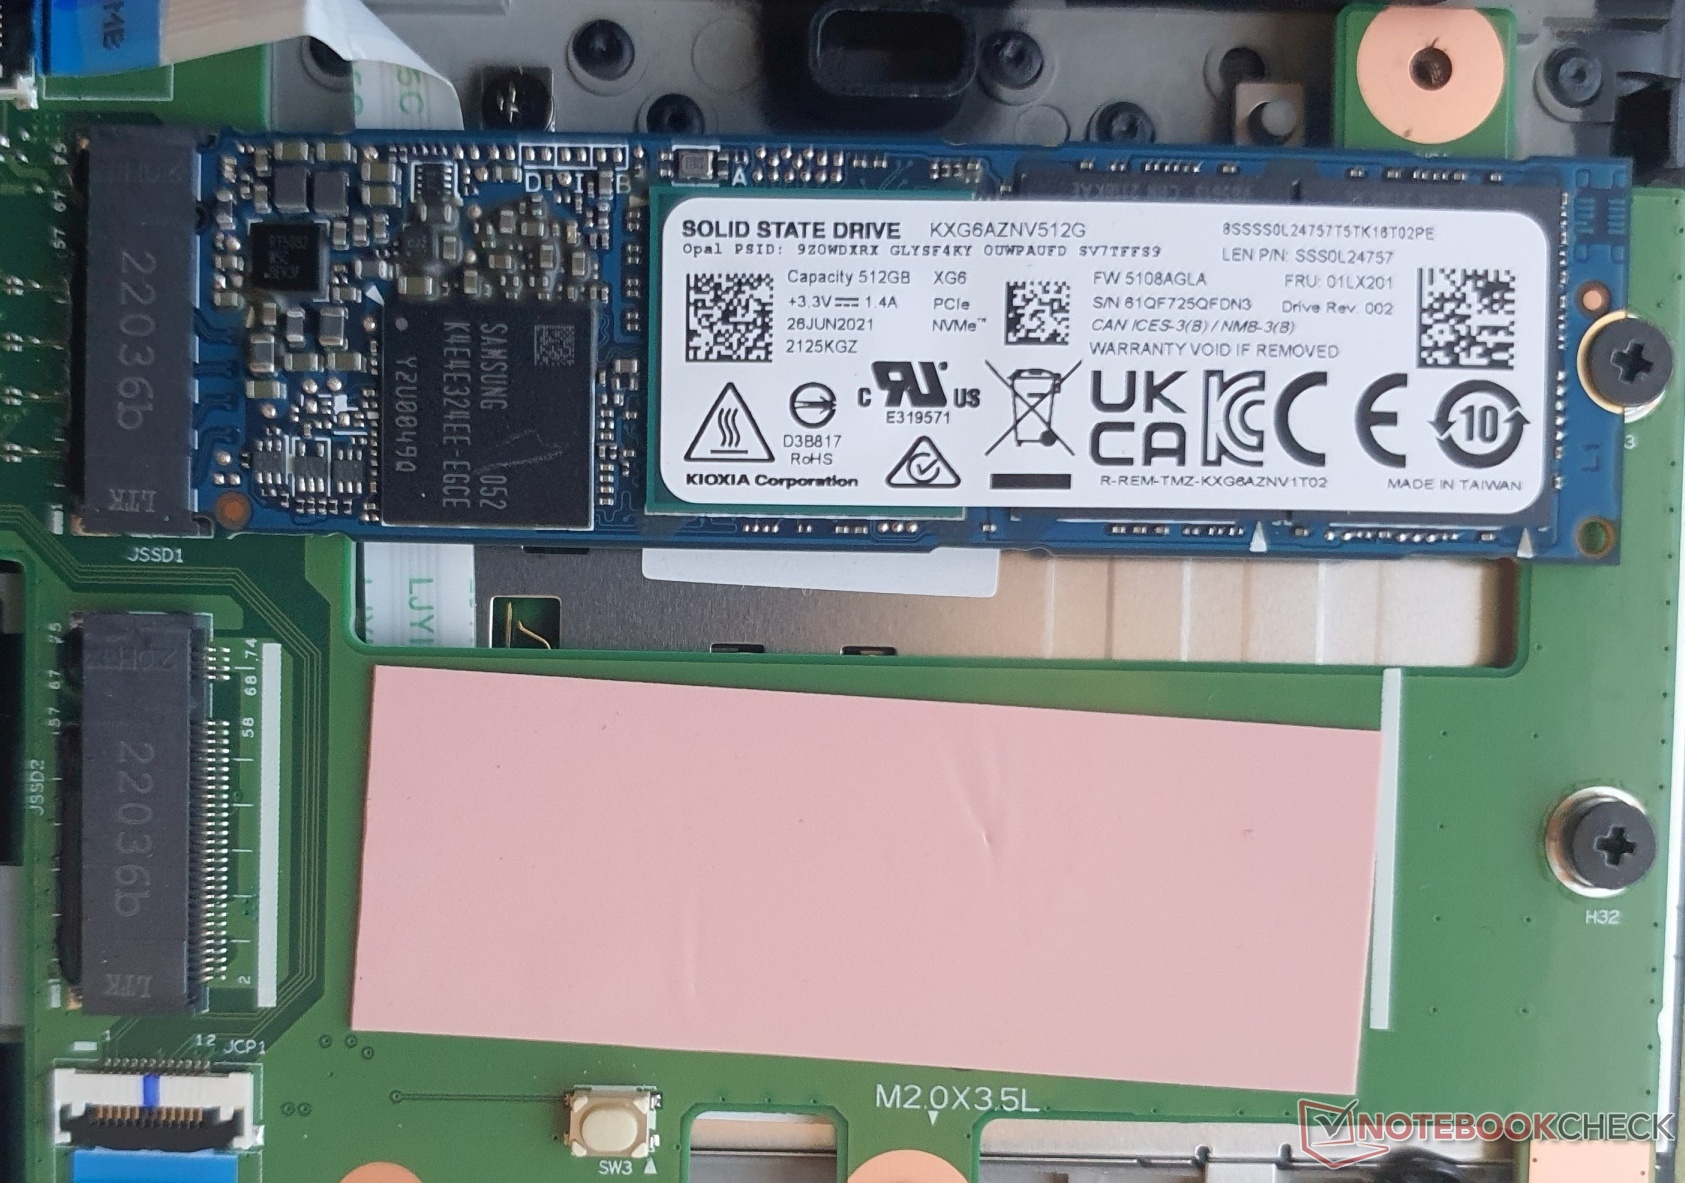
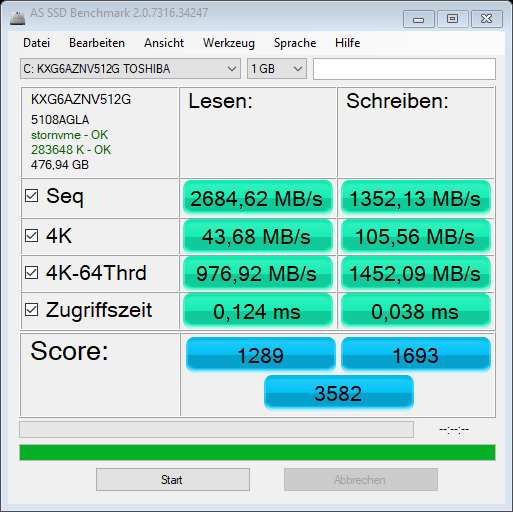
Storage Devices
The NVMe SSD from Toshiba has a capacity of 512 GB. The speed is as expected for PCIe 3.0, but not always necessarily sufficient for a workstation.
On the other hand, you can upgrade up to two faster PCIe 4.0 SSDs and also operate them in a RAID (0 or 1) configuration. HP's ZBook Power 15 G8, Dell's Precision 5560 and the ThinkPad P15 achieve around double the speeds.
| Lenovo ThinkPad P15v G2 21A9000XGE T1200 Laptop GPU, i7-11800H, Toshiba XG6 KXG6AZNV512G | Lenovo ThinkPad P15 G2-20YQ001JGE RTX A3000 Laptop GPU, i7-11800H, Kioxia XG7 KXG7AZNV512G | Lenovo ThinkPad T15g-20UR000GGE GeForce RTX 2070 Super Max-Q, i7-10750H, SK Hynix PC401 512GB M.2 (HFS512GD9TNG) | Lenovo ThinkPad T15p-20TN0006GE GeForce GTX 1050 Mobile, i7-10750H, WDC PC SN730 SDBQNTY-512GB | Lenovo ThinkPad P15s Gen2-20W6000GGE T500 Laptop GPU, i7-1165G7, WDC PC SN720 SDAQNTW-1T00 | Dell Precision 5000 5560 RTX A2000 Laptop GPU, i7-11850H, Samsung PM9A1 MZVL22T0HBLB | |
|---|---|---|---|---|---|---|
| AS SSD | 53% | 49% | 16% | 32% | 57% | |
| Seq Read | 2684 | 5105 90% | 2889 8% | 2505 -7% | 2796 4% | 5169 93% |
| Seq Write | 1352 | 1815 34% | 2424 79% | 1230 -9% | 2525 87% | 1986 47% |
| 4K Read | 43.68 | 47.46 9% | 55.6 27% | 42.4 -3% | 50.9 17% | 78 79% |
| 4K Write | 105.56 | 137.3 30% | 144.6 37% | 116.5 10% | 211.9 101% | 214.6 103% |
| 4K-64 Read | 976.92 | 2112 116% | 1569 61% | 1416 45% | 1505 54% | 1232 26% |
| 4K-64 Write | 1452.09 | 1702 17% | 1922 32% | 1809 25% | 949 -35% | 2719 87% |
| Access Time Read * | 0.124 | 0.065 48% | 0.07 44% | 0.109 12% | 0.081 35% | 0.024 81% |
| Access Time Write * | 0.038 | 0.03 21% | 0.026 32% | 0.032 16% | 0.019 50% | 0.059 -55% |
| Score Read | 1289 | 2670 107% | 1914 48% | 1708 33% | 1835 42% | 1827 42% |
| Score Write | 1693 | 2021 19% | 2309 36% | 2048 21% | 1413 -17% | 3133 85% |
| Score Total | 3582 | 5885 64% | 5185 45% | 4568 28% | 4177 17% | 5753 61% |
| Copy ISO MB/s | 1760.5 | 2054 17% | 2489 41% | 3201 82% | ||
| Copy Program MB/s | 355 | 714 101% | 728 105% | 415.8 17% | ||
| Copy Game MB/s | 849 | 1431 69% | 1670 97% | 1212 43% |
* ... smaller is better

* ... smaller is better
Sustained Read Performance: DiskSpd Read Loop, Queue Depth 8
Graphics Card
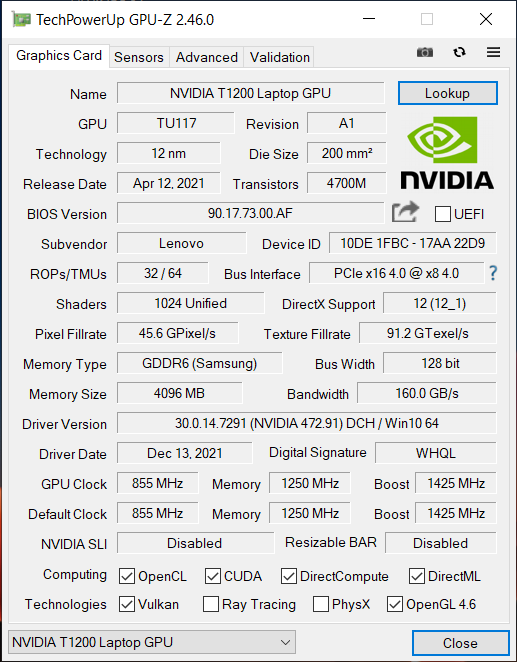
The Nvidia T1200 is the professional variant of the GeForce GTX 1650 Ti, has 4 GB GDDR6 VRAM and runs up to 1,425 MHz. It is more than twice as fast as the GeForce GTX 1050 of the predecessor and its sister model in many benchmarks. An even bigger difference results from the optional RTX A2000.
In battery mode, the 40-W TGP is reduced to 30 watts and the clock speed falls by 250 MHz. Performance drops by 15% as a result. In this scenario, the CPU treats itself to 7 more watts more from the shared TDP.
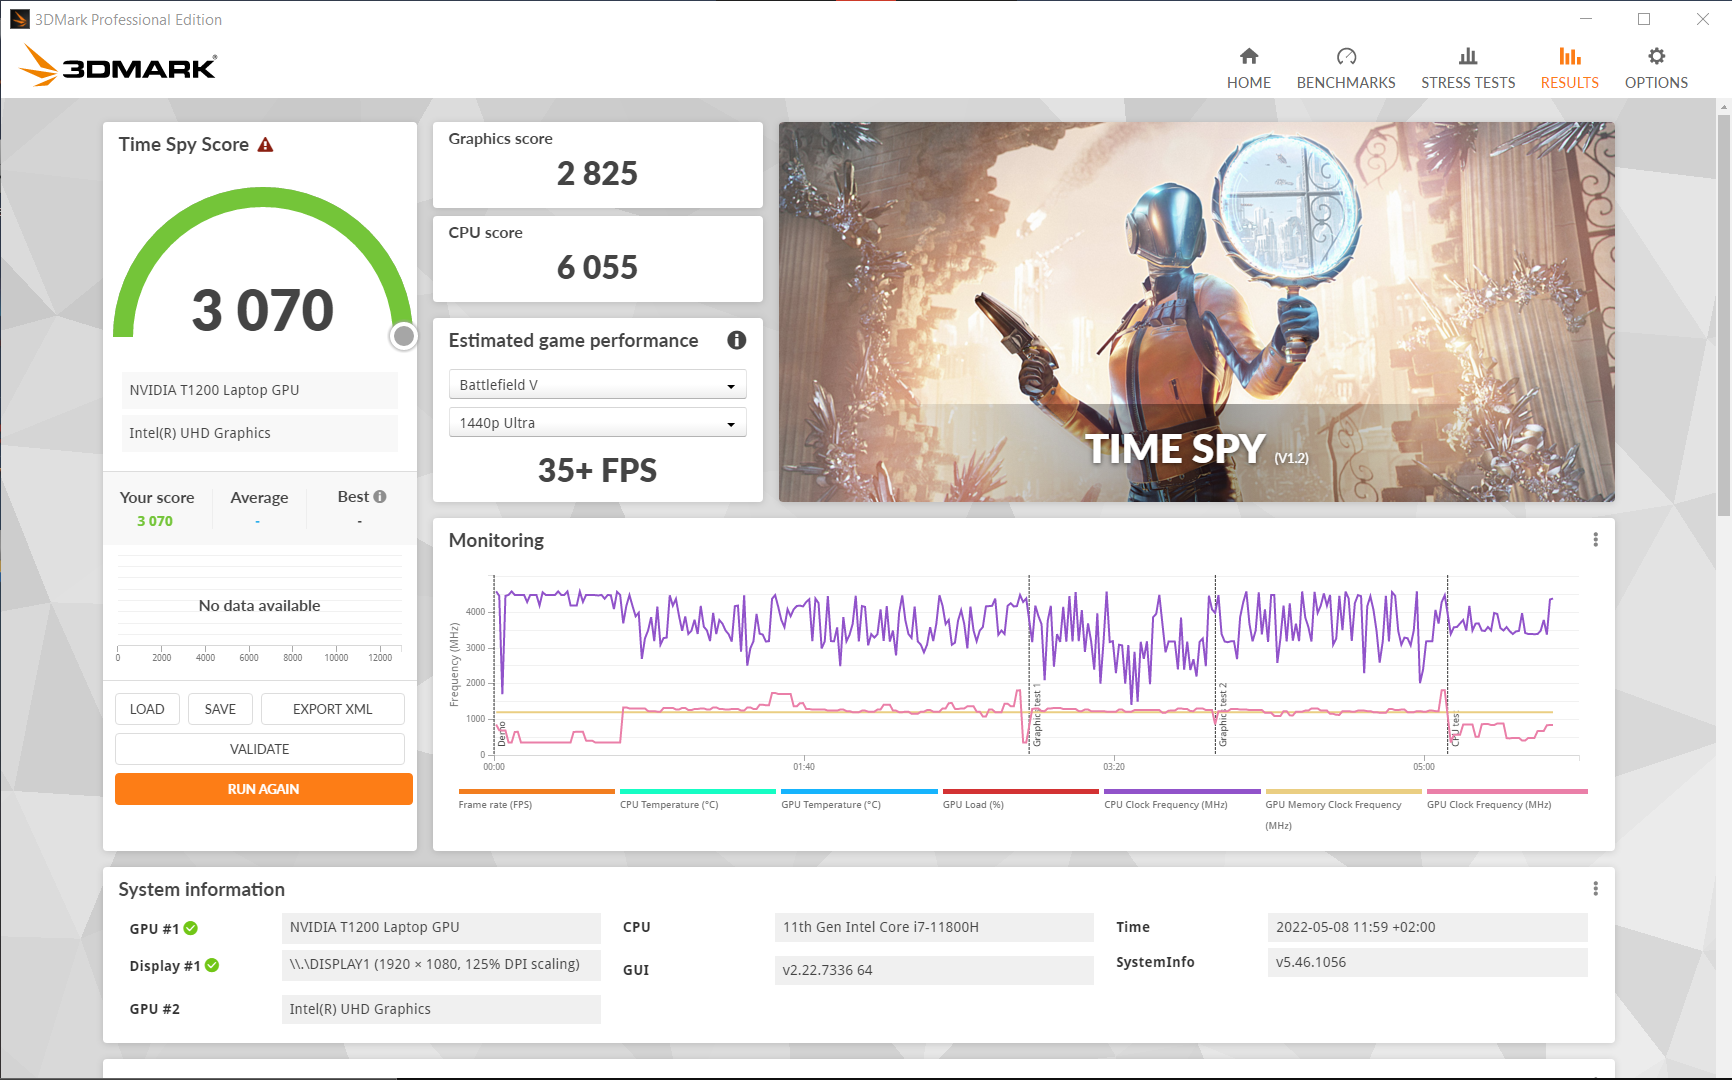
| 3DMark 06 Standard Score | 38139 points | |
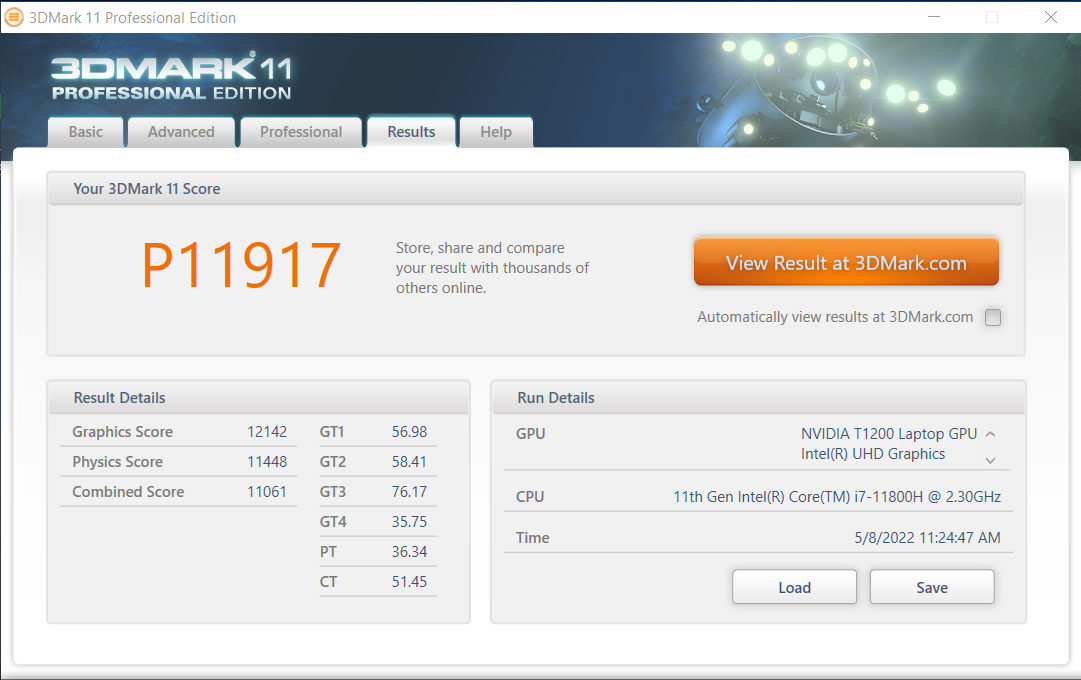
| 3DMark 11 Performance | 11917 points | |
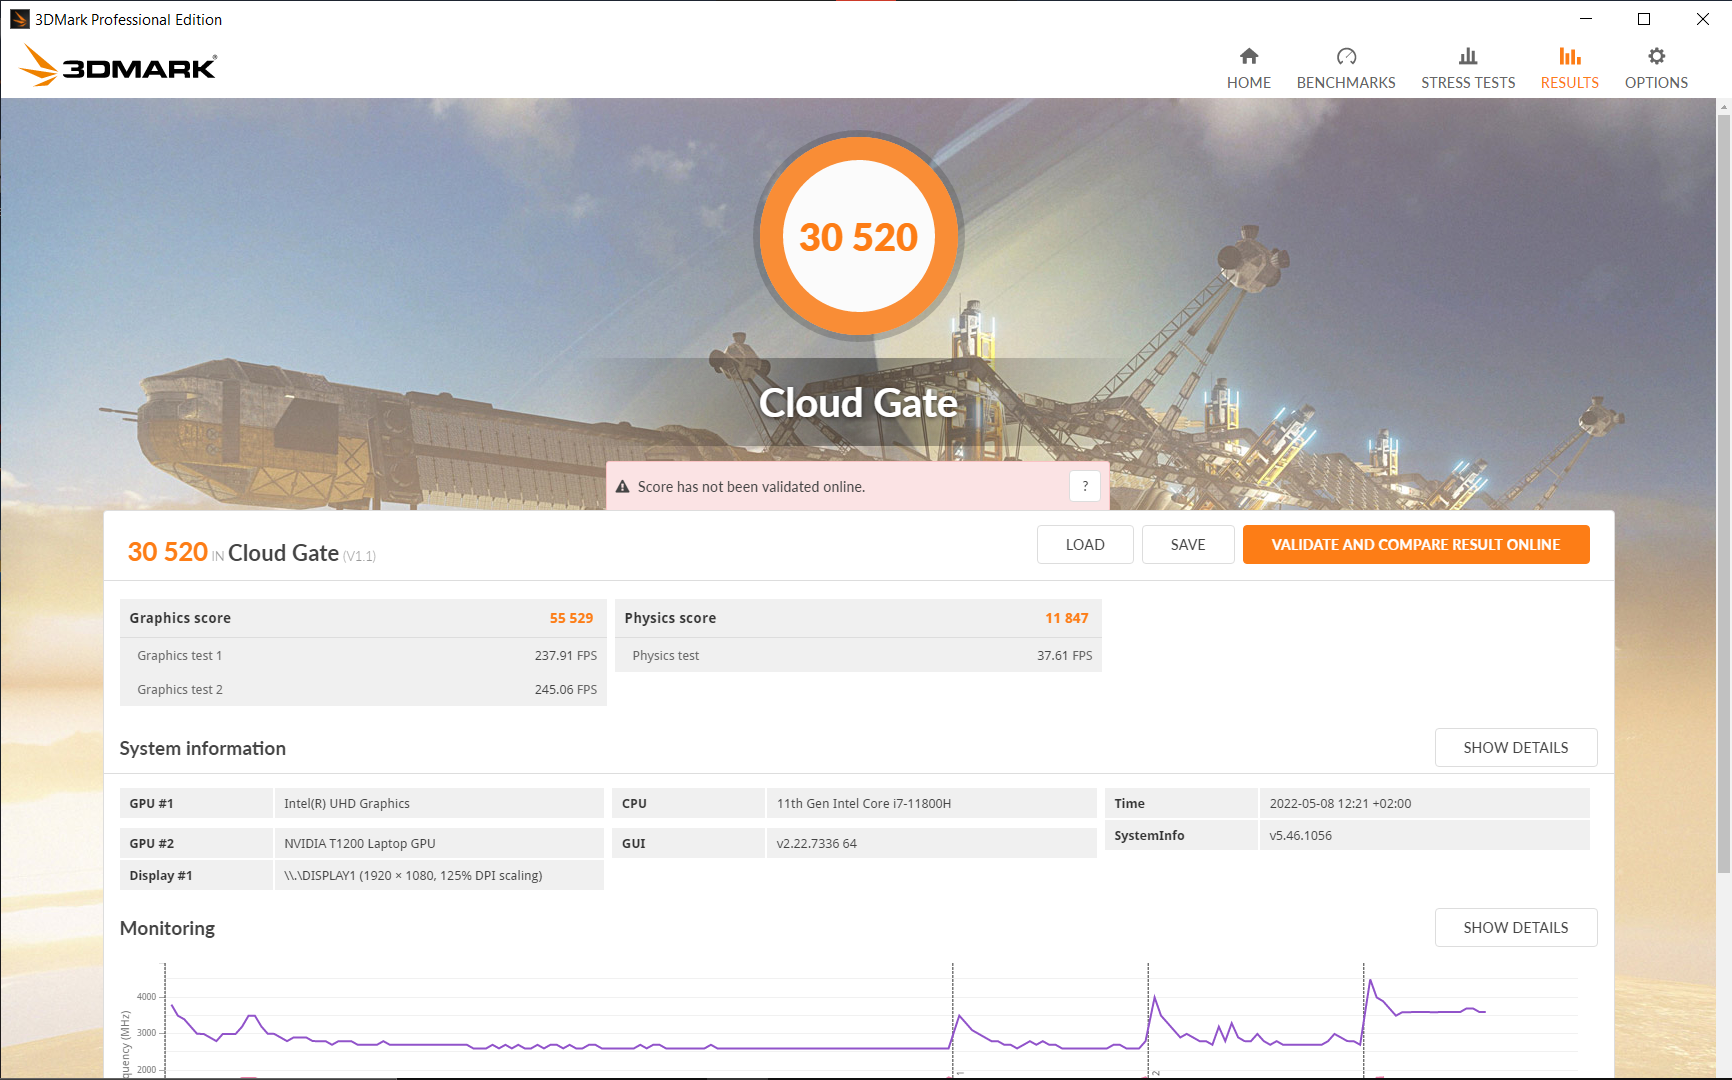
| 3DMark Cloud Gate Standard Score | 30520 points | |
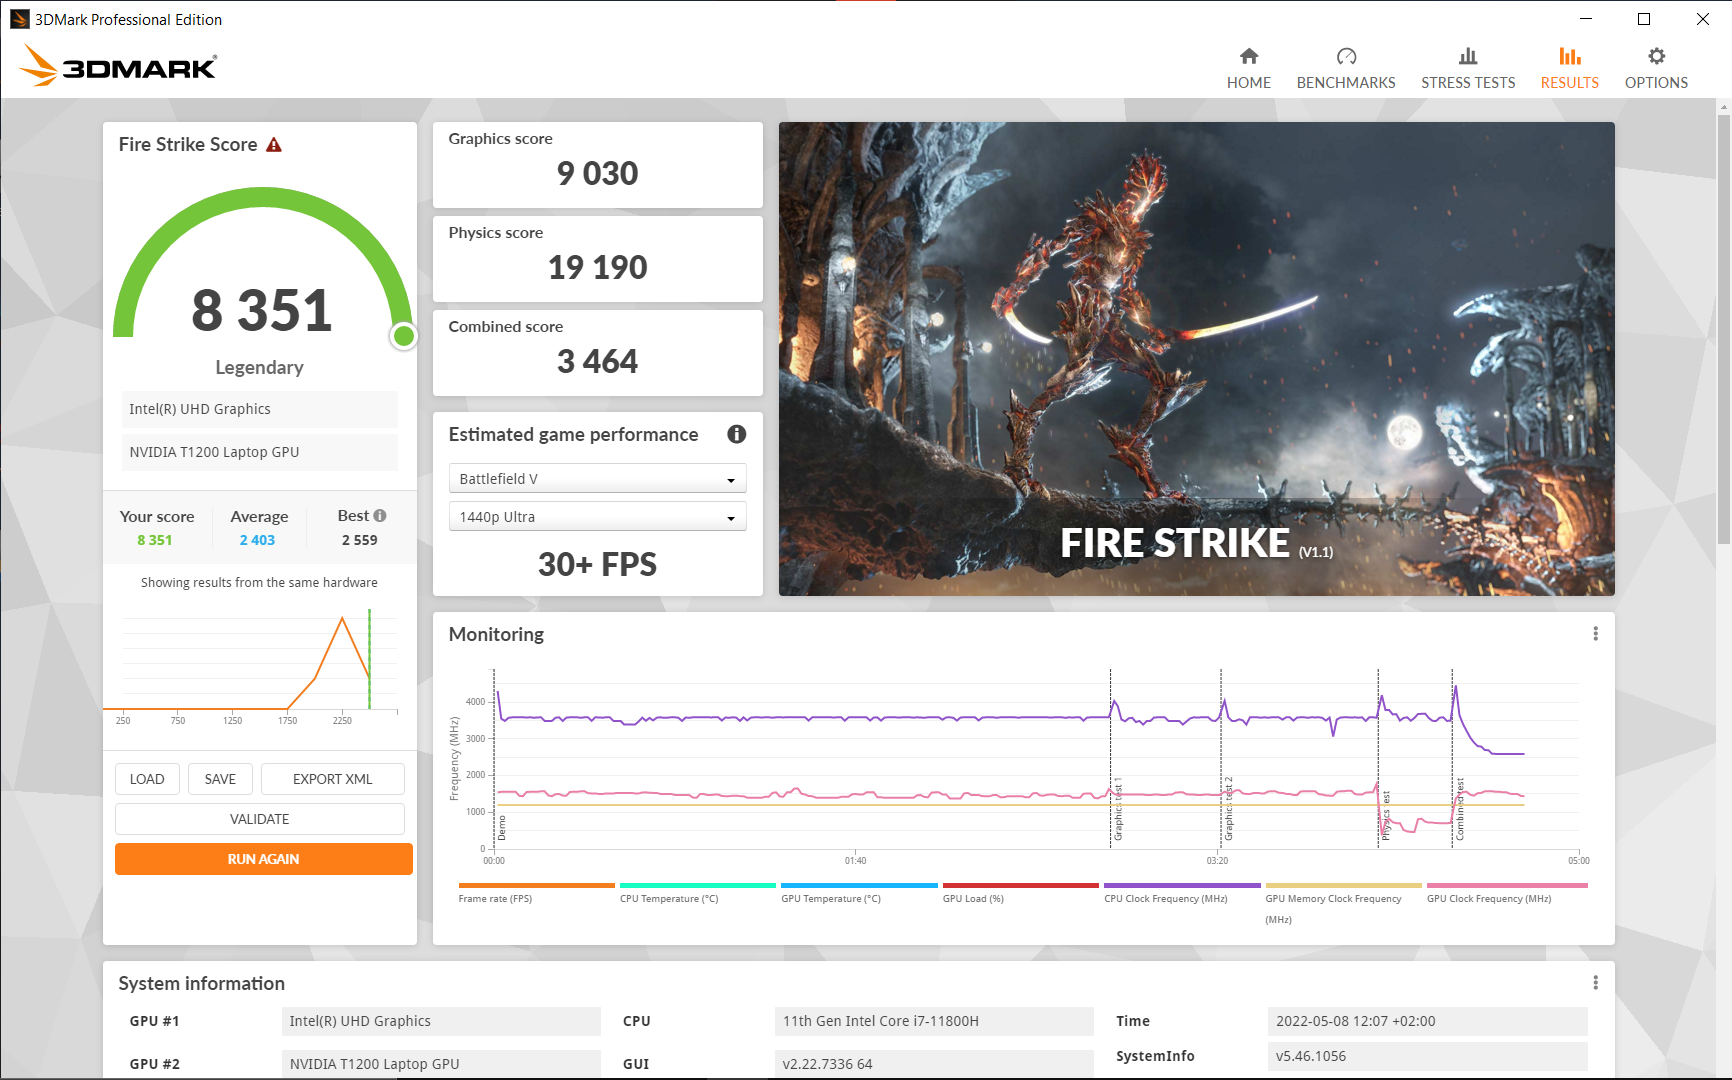
| 3DMark Fire Strike Score | 8351 points | |
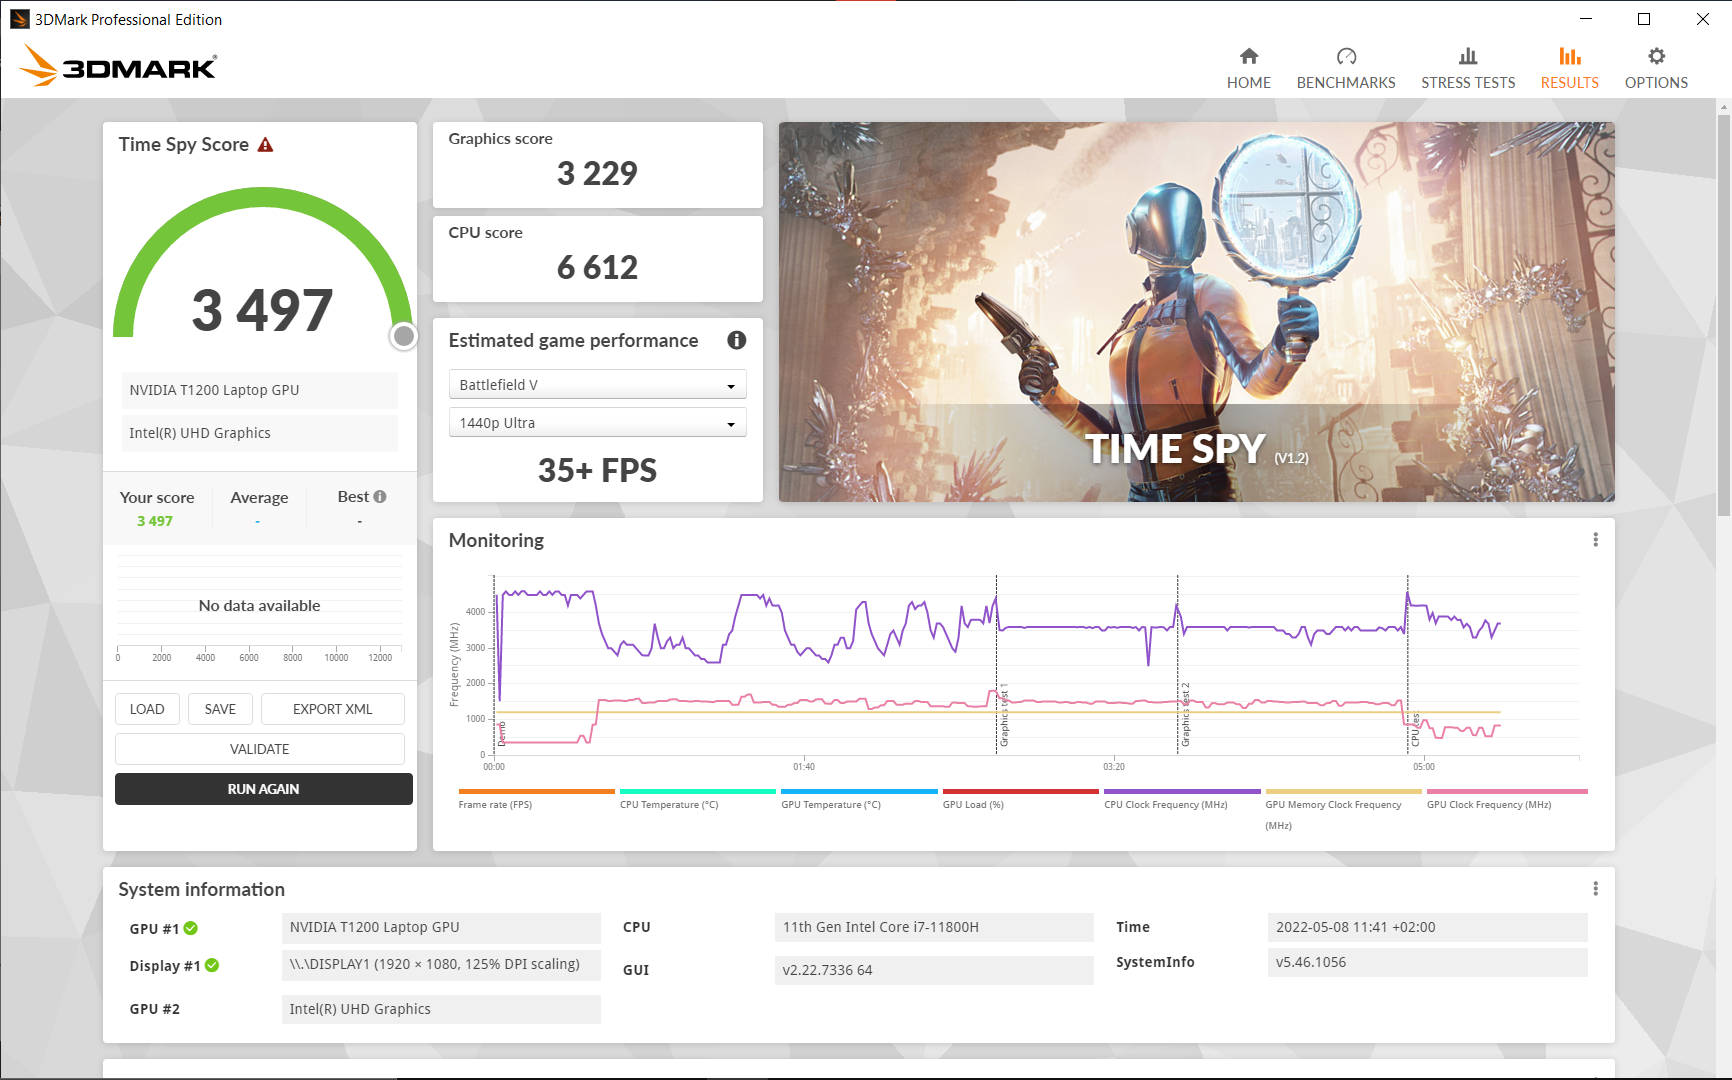
| 3DMark Time Spy Score | 3497 points | |
Help | ||
Gaming Performance
The Nvidia T1200 can run older games at high detail free of issue. New games are playable in medium details at most. No performance drops were observed during the one-hour Witcher 3 test.
Witcher 3 FPS Chart
| low | med. | high | ultra | |
| BioShock Infinite (2013) | 352.2 | 235.8 | 207.9 | 88.1 |
| GTA V (2015) | 169.9 | 158.5 | 89.7 | 48.5 |
| The Witcher 3 (2015) | 59 | 33.2 | ||
| Dota 2 Reborn (2015) | 133.3 | 116.5 | 107.8 | 100.4 |
| Final Fantasy XV Benchmark (2018) | 88 | 49.5 | 35 | |
| X-Plane 11.11 (2018) | 96.2 | 77.5 | 64.8 | |
| Far Cry 5 (2018) | 107 | 60 | 53 | 51 |
| Strange Brigade (2018) | 208 | 84 | 68.5 | 59.3 |
| Shadow of the Tomb Raider (2018) | 96 | 59 | 48 | 39 |
| Mafia Definitive Edition (2020) | 84 | 43.4 | 39.2 | |
| Resident Evil Village (2021) | 114.3 | 64.3 | 57.9 | 49.8 |
| Riders Republic (2021) | 93 | 50 | 41 | 40 |
| Farming Simulator 22 (2021) | 171.9 | 96.6 | 70.1 | 61.2 |
| Dying Light 2 (2022) | 36.1 | 25.7 | 21.2 | |
| GRID Legends (2022) | 103 | 73 | 61.7 | 45.7 |
| Elden Ring (2022) | 52.9 | 47 | 39.5 | 36.8 |
| Elex 2 (2022) | 43.1 | 39.3 | 34.2 | 29.6 |
| Ghostwire Tokyo (2022) | 50.7 | 47.3 | 44.6 | 41.2 |
| Vampire Bloodhunt (2022) | 121.8 | 72.9 | 69.9 | 69.5 |
Emissions: Quiet Lenovo laptop with hotspots
Noise
The fan remains silent while idling and also while surfing. Only under load is the ThinkPad clearly audible at 39 dB. We measured 43.5 dB in the absolute stress test. The fan also becomes noticeable during intensive web surfing, but it is anything but loud. No coil whining was detected.
All devices in our comparison field are generally louder, such as the HP ZBook Power 15, which registers around 10% more noise in load scenarios.
Noise Level
| Idle |
| 25.21 / 25.21 / 25.21 dB(A) |
| Load |
| 39.09 / 43.53 dB(A) |
 | ||
30 dB silent 40 dB(A) audible 50 dB(A) loud |
||
min: | ||
| Lenovo ThinkPad P15v G2 21A9000XGE T1200 Laptop GPU, i7-11800H, Toshiba XG6 KXG6AZNV512G | Lenovo ThinkPad P15 G2-20YQ001JGE RTX A3000 Laptop GPU, i7-11800H, Kioxia XG7 KXG7AZNV512G | Lenovo ThinkPad T15g-20UR000GGE GeForce RTX 2070 Super Max-Q, i7-10750H, SK Hynix PC401 512GB M.2 (HFS512GD9TNG) | Lenovo ThinkPad T15p-20TN0006GE GeForce GTX 1050 Mobile, i7-10750H, WDC PC SN730 SDBQNTY-512GB | Lenovo ThinkPad P15s Gen2-20W6000GGE T500 Laptop GPU, i7-1165G7, WDC PC SN720 SDAQNTW-1T00 | HP ZBook Power 15 G8 313S5EA T600 Laptop GPU, i7-11800H, Samsung PM9A1 MZVL2512HCJQ | Dell Precision 5000 5560 RTX A2000 Laptop GPU, i7-11850H, Samsung PM9A1 MZVL22T0HBLB | |
|---|---|---|---|---|---|---|---|
| Noise | -8% | -1% | -13% | 5% | -10% | 8% | |
| off / environment * | 25.21 | 24.3 4% | 24 5% | 29.3 -16% | 24.3 4% | 25.54 -1% | 23.4 7% |
| Idle Minimum * | 25.21 | 24.3 4% | 24 5% | 29.3 -16% | 25.5 -1% | 25.54 -1% | 23.6 6% |
| Idle Average * | 25.21 | 24.3 4% | 24 5% | 29.3 -16% | 25.5 -1% | 25.54 -1% | 23.6 6% |
| Idle Maximum * | 25.21 | 28.6 -13% | 24 5% | 30.6 -21% | 25.5 -1% | 25.54 -1% | 23.6 6% |
| Load Average * | 39.09 | 47.5 -22% | 36.1 8% | 42.7 -9% | 35.65 9% | 48.85 -25% | 25.8 34% |
| Witcher 3 ultra * | 36.6 | 46 -26% | 42.7 -17% | 46.58 -27% | 40.1 -10% | ||
| Load Maximum * | 43.53 | 54.9 -26% | 46 -6% | 42.7 2% | 35.65 18% | 50.98 -17% | 41.4 5% |
* ... smaller is better
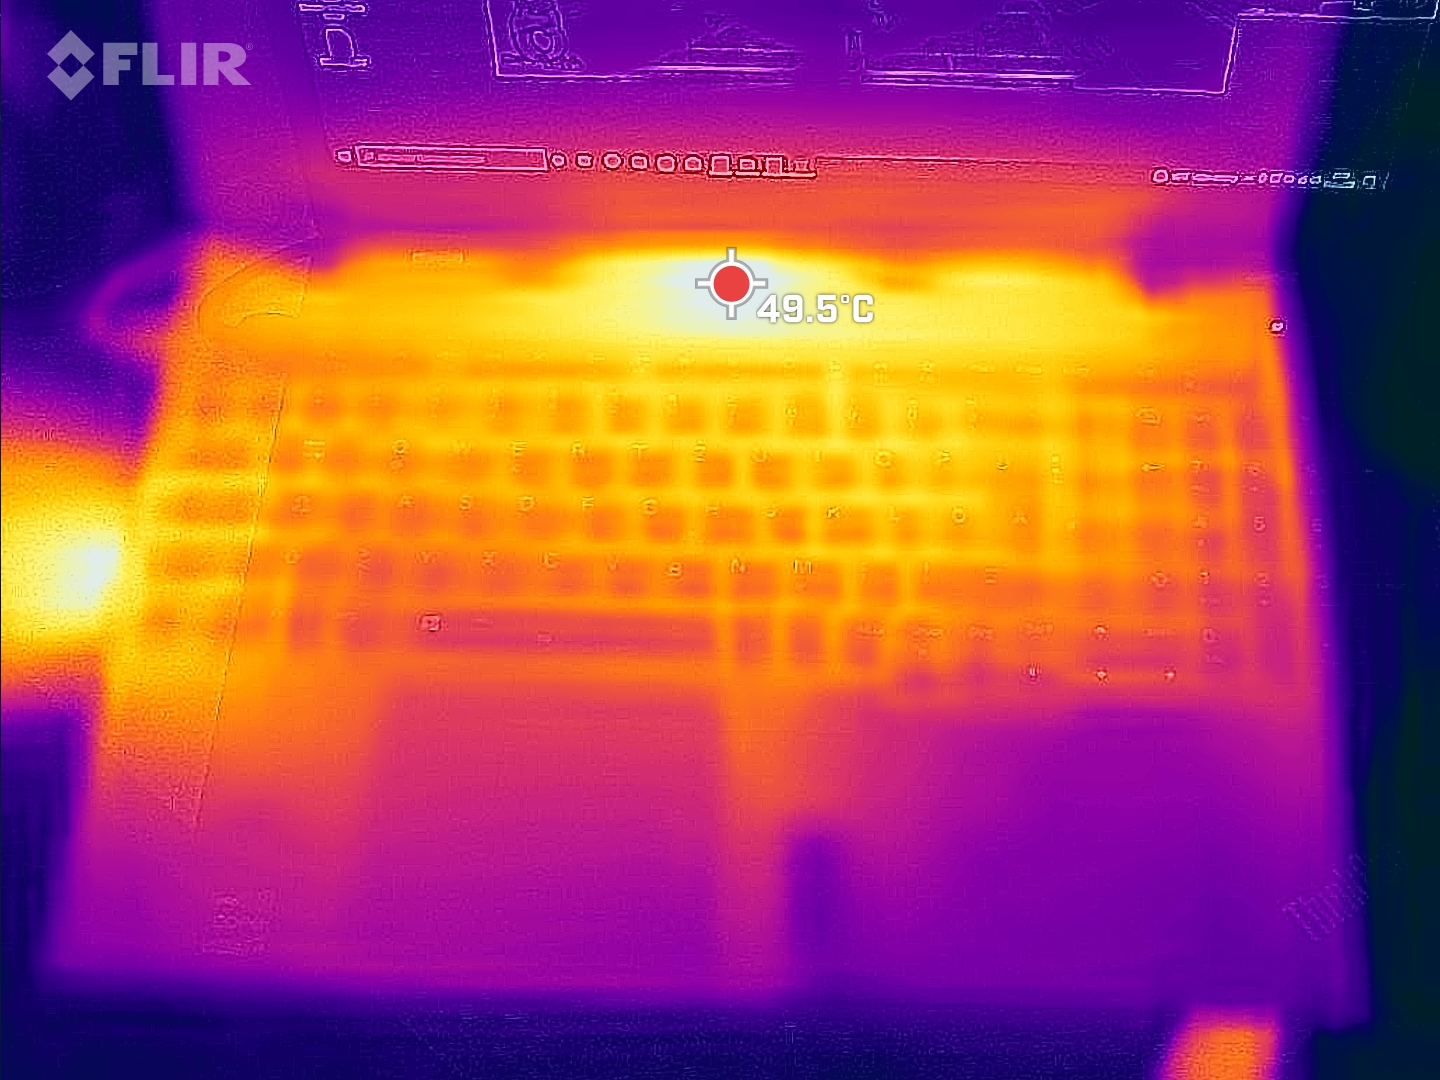
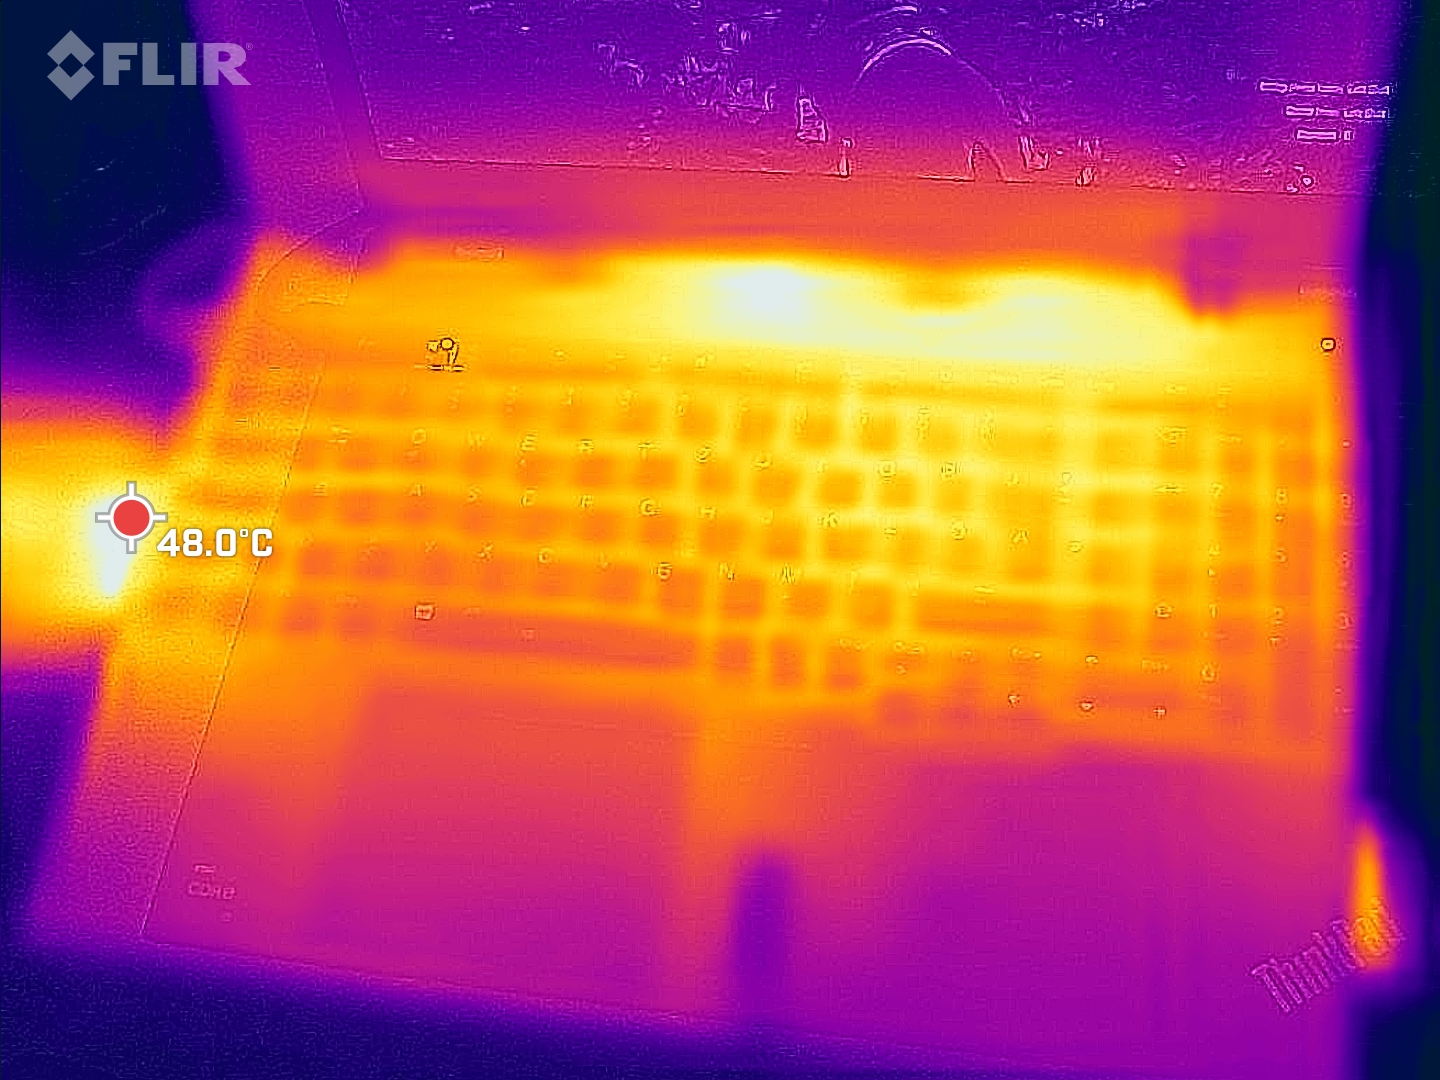
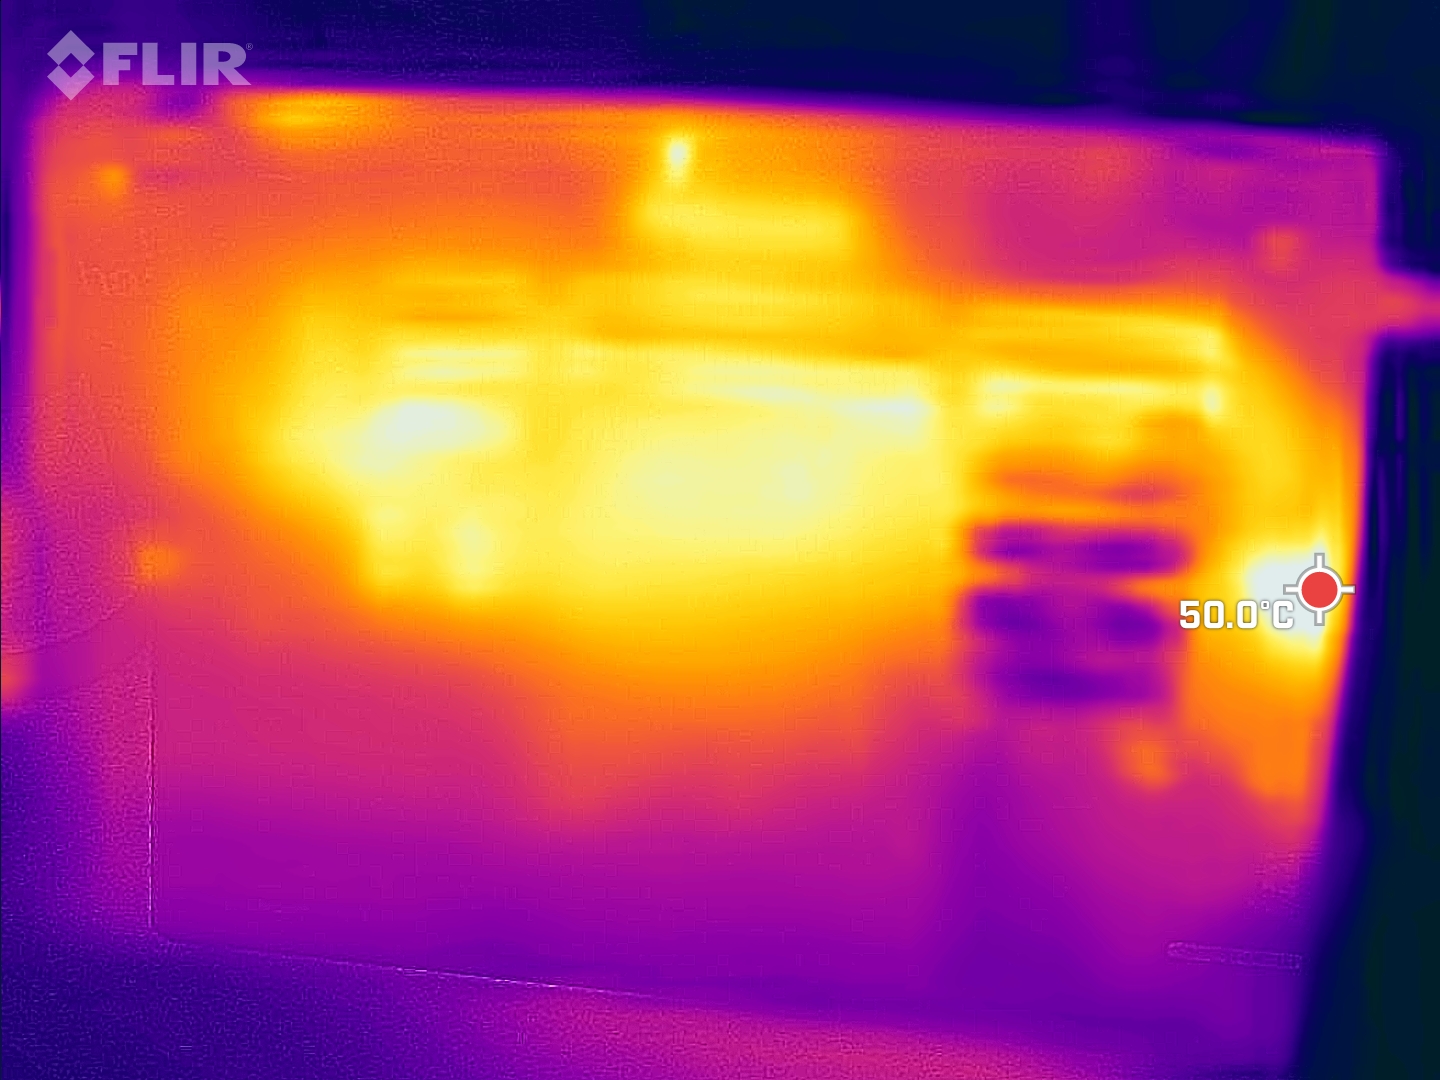
Temperature
Under load and also during gaming, the ThinkPad P15v becomes very hot at 53.8 °C in the center above the keyboard. The ZBook Power 15 is significantly cooler at 41.5 °C, but at the cost of much higher noise levels.
(-) The maximum temperature on the upper side is 53.8 °C / 129 F, compared to the average of 38.1 °C / 101 F, ranging from 22.2 to 69.8 °C for the class Workstation.
(-) The bottom heats up to a maximum of 52.1 °C / 126 F, compared to the average of 41.3 °C / 106 F
(+) In idle usage, the average temperature for the upper side is 25.6 °C / 78 F, compared to the device average of 32 °C / 90 F.
(-) Playing The Witcher 3, the average temperature for the upper side is 41.4 °C / 107 F, compared to the device average of 32 °C / 90 F.
(+) The palmrests and touchpad are reaching skin temperature as a maximum (35.6 °C / 96.1 F) and are therefore not hot.
(-) The average temperature of the palmrest area of similar devices was 27.8 °C / 82 F (-7.8 °C / -14.1 F).
| Lenovo ThinkPad P15v G2 21A9000XGE Intel Core i7-11800H, NVIDIA T1200 Laptop GPU | Lenovo ThinkPad P15 G2-20YQ001JGE Intel Core i7-11800H, NVIDIA RTX A3000 Laptop GPU | Lenovo ThinkPad T15g-20UR000GGE Intel Core i7-10750H, NVIDIA GeForce RTX 2070 Super Max-Q | Lenovo ThinkPad T15p-20TN0006GE Intel Core i7-10750H, NVIDIA GeForce GTX 1050 Mobile | Lenovo ThinkPad P15s Gen2-20W6000GGE Intel Core i7-1165G7, NVIDIA T500 Laptop GPU | HP ZBook Power 15 G8 313S5EA Intel Core i7-11800H, NVIDIA T600 Laptop GPU | Dell Precision 5000 5560 Intel Core i7-11850H, NVIDIA RTX A2000 Laptop GPU | |
|---|---|---|---|---|---|---|---|
| Heat | -5% | -15% | 4% | 2% | 17% | -6% | |
| Maximum Upper Side * | 53.8 | 49.7 8% | 47.7 11% | 53.8 -0% | 42.8 20% | 41.4 23% | 48.2 10% |
| Maximum Bottom * | 52.1 | 63.2 -21% | 62.1 -19% | 56.6 -9% | 59.1 -13% | 41.5 20% | 42.6 18% |
| Idle Upper Side * | 27.6 | 27.1 2% | 31.3 -13% | 24.7 11% | 26.4 4% | 23.8 14% | 34.8 -26% |
| Idle Bottom * | 27.7 | 29.8 -8% | 38.8 -40% | 24.2 13% | 28.9 -4% | 25 10% | 35.2 -27% |
* ... smaller is better
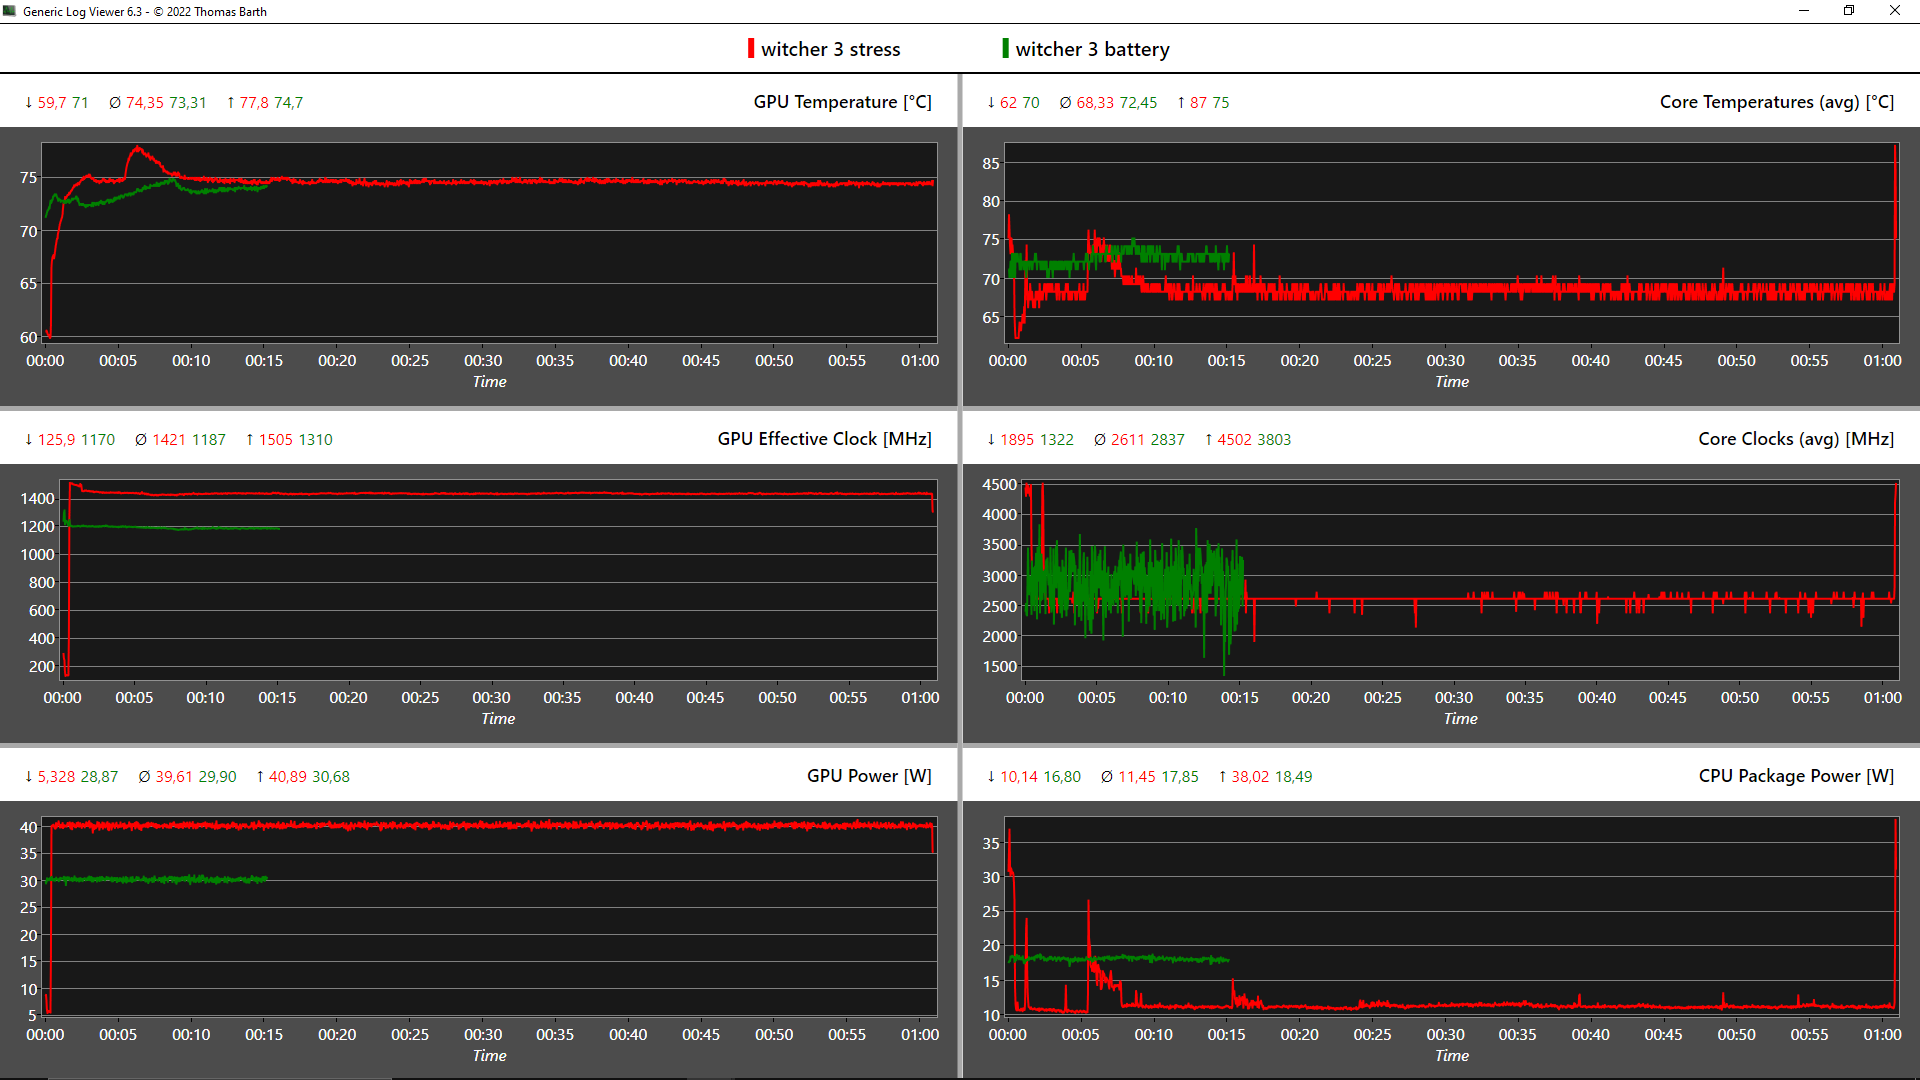
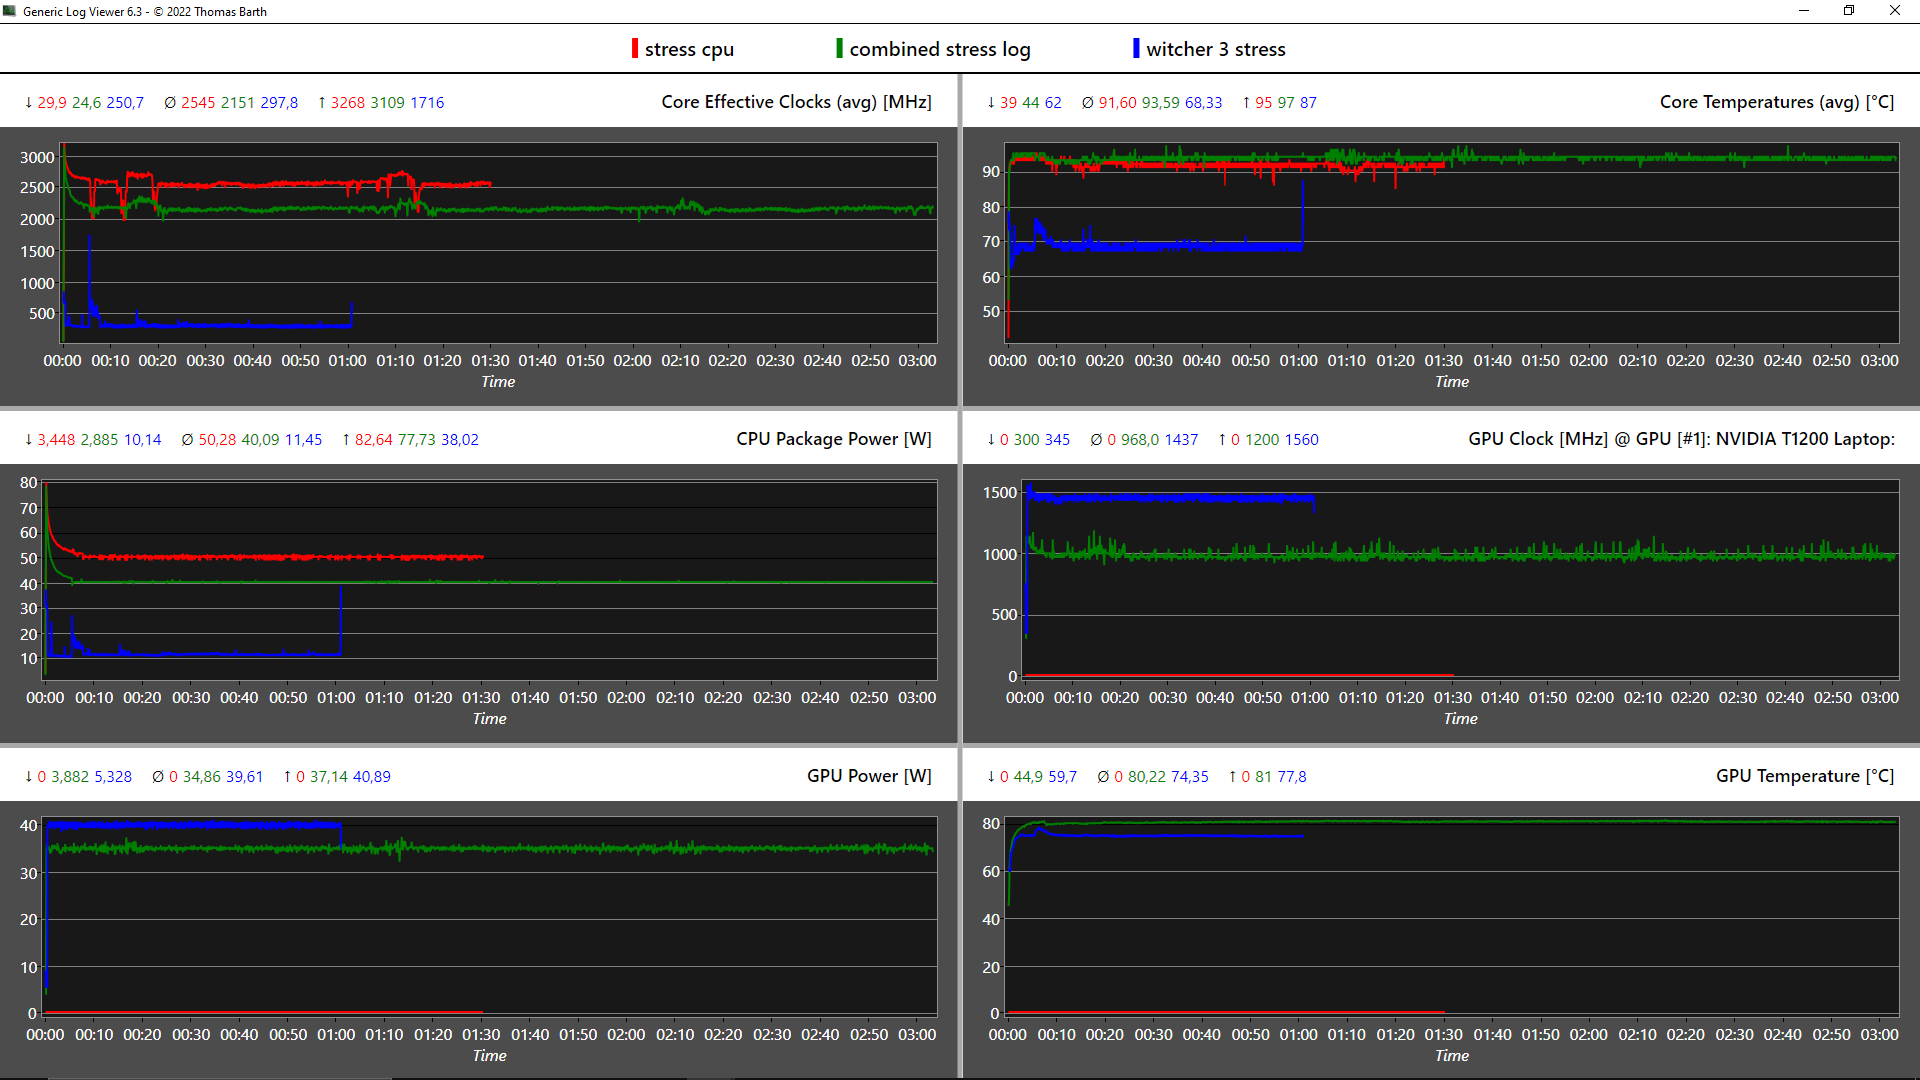
Stress Test
After an hour of combined stress tests (FurMark + Prime95), the CPU hovers around 2.15 GHz, which is only slightly below the base clock of 2.3 GHz. Temperatures reach almost 94 °C and the consumption is 40 watts, while the Nvidia GPU draws its specified 35 watts, but does not fully exploit its clock potential at 986 MHz.
Under pure GPU stress, the graphics card extracts 40 watts and thus reaches the full 1,445 MHz at uncritical temperatures. Under sole CPU stress, the Core i7-11800H clocks at a stable 2.55 GHz, consumes a constant 50 watts and heats up to 91.6 °C.
| CPU Clock (GHz) | GPU Clock (MHz) | Average CPU Temperature (°C) | Average GPU Temperature (°C) | |
| System Idle | 1,2 | 300 | 42 | 44,8 |
| Prime95 Stress | 2,5 | 300 | 91,6 | 46,4 |
| Prime95 + FurMark Stress | 2,2 | 970 | 93,6 | 80,2 |
| Witcher 3 Stress | 0,3 | 1.445 | 68,3 | 74,4 |
Speakers
The upward-facing 2x 2-watt speakers are not particularly loud, but the sound is clear and bass is present to some extent. Overall, they serve their purpose and outperform the speakers of many other office notebooks.
Lenovo ThinkPad P15v G2 21A9000XGE audio analysis
(-) | not very loud speakers (70.7 dB)
Bass 100 - 315 Hz
(±) | reduced bass - on average 13.4% lower than median
(±) | linearity of bass is average (13.6% delta to prev. frequency)
Mids 400 - 2000 Hz
(+) | balanced mids - only 4.7% away from median
(+) | mids are linear (6.2% delta to prev. frequency)
Highs 2 - 16 kHz
(+) | balanced highs - only 3.2% away from median
(+) | highs are linear (5.7% delta to prev. frequency)
Overall 100 - 16.000 Hz
(±) | linearity of overall sound is average (21.2% difference to median)
Compared to same class
» 71% of all tested devices in this class were better, 7% similar, 22% worse
» The best had a delta of 7%, average was 18%, worst was 35%
Compared to all devices tested
» 54% of all tested devices were better, 7% similar, 39% worse
» The best had a delta of 4%, average was 25%, worst was 134%
HP ZBook Power 15 G8 313S5EA audio analysis
(±) | speaker loudness is average but good (72.3 dB)
Bass 100 - 315 Hz
(-) | nearly no bass - on average 23.3% lower than median
(±) | linearity of bass is average (11.8% delta to prev. frequency)
Mids 400 - 2000 Hz
(+) | balanced mids - only 2.5% away from median
(+) | mids are linear (5.1% delta to prev. frequency)
Highs 2 - 16 kHz
(+) | balanced highs - only 4.1% away from median
(+) | highs are linear (3.1% delta to prev. frequency)
Overall 100 - 16.000 Hz
(±) | linearity of overall sound is average (21.4% difference to median)
Compared to same class
» 72% of all tested devices in this class were better, 6% similar, 22% worse
» The best had a delta of 7%, average was 18%, worst was 35%
Compared to all devices tested
» 55% of all tested devices were better, 7% similar, 38% worse
» The best had a delta of 4%, average was 25%, worst was 134%
Energy Management: Average for the ThinkPad P15v
Power Consumption
The 1.6-watt consumption in standby suggests that a runtime of 2 days is not possible. On the other hand, the idle rates are very good for a workstation and can only be outclassed by the ZBook Power 15.
At the beginning of the stress test, 127 watts are consumed and 108 watts continuously. The 135 W power supply is therefore sufficiently sized and capable of absorbing any load peaks. A full recharge of the ThinkPad lasts around 90 minutes.
| Off / Standby | |
| Idle | |
| Load |
|
| Lenovo ThinkPad P15v G2 21A9000XGE i7-11800H, T1200 Laptop GPU, Toshiba XG6 KXG6AZNV512G, IPS LED, 1920x1080, 15.60 | Lenovo ThinkPad P15 G2-20YQ001JGE i7-11800H, RTX A3000 Laptop GPU, Kioxia XG7 KXG7AZNV512G, IPS, 1920x1080, 15.60 | Lenovo ThinkPad T15g-20UR000GGE i7-10750H, GeForce RTX 2070 Super Max-Q, SK Hynix PC401 512GB M.2 (HFS512GD9TNG), IPS, 1920x1080, 15.60 | Lenovo ThinkPad T15p-20TN0006GE i7-10750H, GeForce GTX 1050 Mobile, WDC PC SN730 SDBQNTY-512GB, IPS LED, 3840x2160, 15.60 | Lenovo ThinkPad P15s Gen2-20W6000GGE i7-1165G7, T500 Laptop GPU, WDC PC SN720 SDAQNTW-1T00, IPS LED, 3840x2160, 15.60 | HP ZBook Power 15 G8 313S5EA i7-11800H, T600 Laptop GPU, Samsung PM9A1 MZVL2512HCJQ, IPS LED, 1920x1080, 15.60 | Dell Precision 5000 5560 i7-11850H, RTX A2000 Laptop GPU, Samsung PM9A1 MZVL22T0HBLB, IPS, 3840x2400, 15.60 | Average NVIDIA T1200 Laptop GPU | Average of class Workstation | |
|---|---|---|---|---|---|---|---|---|---|
| Power Consumption | -31% | -36% | -20% | 6% | 23% | -38% | -23% | -44% | |
| Idle Minimum * | 5.96 | 6.3 -6% | 5.8 3% | 6 -1% | 5.8 3% | 4.17 30% | 6.2 -4% | 7.85 ? -32% | 7.82 ? -31% |
| Idle Average * | 8.37 | 10.7 -28% | 11.4 -36% | 12.8 -53% | 13.3 -59% | 6.32 24% | 13.9 -66% | 11.4 ? -36% | 12.7 ? -52% |
| Idle Maximum * | 9.05 | 11.6 -28% | 13.9 -54% | 16.1 -78% | 15.6 -72% | 7.1 22% | 23.8 -163% | 12 ? -33% | 18.7 ? -107% |
| Load Average * | 91.82 | 99.3 -8% | 93.2 -2% | 95.6 -4% | 43.2 53% | 80.41 12% | 95.7 -4% | 93.8 ? -2% | 96.5 ? -5% |
| Witcher 3 ultra * | 102 | 154 -51% | 145 -42% | 84 18% | 37.1 64% | 62.3 39% | 87 15% | ||
| Load Maximum * | 126.38 | 210 -66% | 234 -85% | 131.1 -4% | 67.3 47% | 110.18 13% | 132.6 -5% | 143.7 ? -14% | 158.9 ? -26% |
* ... smaller is better
Power Consumption Witcher 3 / Stresstest
Power Consumption Witcher 3 / Stress test (external monitor)
Battery Life
The 68 Wh battery manages to power our Wi-Fi test for 7.5 hours, corresponding to Lenovo's own claims. Other workstations achieve significantly longer runtimes with larger batteries.
HP's ZBook Power 15 also lasts significantly longer in web browsing at almost 12.5 hours. Dell's Precision 5560, with its 4K display, registers a meager 6.5 hours.
| Lenovo ThinkPad P15v G2 21A9000XGE i7-11800H, T1200 Laptop GPU, 68 Wh | Lenovo ThinkPad P15 G2-20YQ001JGE i7-11800H, RTX A3000 Laptop GPU, 94 Wh | Lenovo ThinkPad T15g-20UR000GGE i7-10750H, GeForce RTX 2070 Super Max-Q, 94 Wh | Lenovo ThinkPad T15p-20TN0006GE i7-10750H, GeForce GTX 1050 Mobile, 68 Wh | Lenovo ThinkPad P15s Gen2-20W6000GGE i7-1165G7, T500 Laptop GPU, 57 Wh | HP ZBook Power 15 G8 313S5EA i7-11800H, T600 Laptop GPU, 83 Wh | Dell Precision 5000 5560 i7-11850H, RTX A2000 Laptop GPU, 86 Wh | Average of class Workstation | |
|---|---|---|---|---|---|---|---|---|
| Battery Runtime | 33% | 46% | 4% | 46% | 52% | 19% | 22% | |
| Reader / Idle | 1029 | 893 -13% | 722 -30% | 700 ? -32% | ||||
| H.264 | 482 | 599 24% | 761 58% | 461 -4% | 591 23% | 603 25% | 717 ? 49% | |
| WiFi v1.3 | 452 | 596 32% | 673 49% | 436 -4% | 464 3% | 739 63% | 380 -16% | 541 ? 20% |
| Load | 54 | 78 44% | 71 31% | 64 19% | 115 113% | 126 133% | 110 104% | 81.3 ? 51% |
Pros
Cons
Verdict: ThinkPad P15v G2 for price-conscious creatives?

The ThinkPad P15v G2 manages the balancing act between business laptop and workstation quite well, considering that it is aimed at a target group that can do without certain high-end features such as Xeon CPUs, ECC RAM, the fastest hardware and a few other things. That said, the performance is generally good, although a 25% drop can be seen in some scenarios.
The display option will only suffice for creative people and in the CAD field if an external monitor is mainly used and for those who primarily have to do more complex calculations at a fair price. The graphics performance is adequate considering the price of less than 2,000 Euros, and the input devices are on a high level. There are some drawbacks in regard to somewhat dark display with low color space coverage. Fortunately, there is a 4K option.
The connectivity is broad and the ThinkPad is easily expandable. Overall, it scores very well against the thinner ThinkPad P15s. The case is also robust, even if other ThinkPads have a reinforced display lid. The amount of plastic may be displeasing to some in terms of feel and look. Battery runtimes are not the best, but emissions are business-oriented and very good, except for some minor hotspots away from the keyboard and the palm rest. The cooling system has been kept rather simple overall in favor of the price. Charging via USB-C is also not available, and the Wi-Fi module is soldered. But WWAN can be retrofitted.
The ThinkPad P15v G2 does not necessarily need a Core i9 and 4K display to be a solid workhorse. While it primarily shines due to its reasonable entry-level price, it remains a niche product with limitations, especially in terms of the display and CPU.
Excluding the sister model (T15p G2), there are two direct alternatives in the same price segment: HP's ZBook Power 15, which consistently performs at a high level, has a much brighter and better display, a well-designed keyboard as well as much better battery runtimes, but it is also annoyingly loud. Dell's Precision 3651 weighs only 1.79 kg, offers a 4K panel and USB-C charging.
Price and Availability
Lenovo's official website offers theLenovo ThinkPad P15v G2 in various configurations at various prices, depending on the country of purchase. For example:
US, starting at US$ 1,391.42
UK, starting at GBP£ 1,758.63
Canada, starting at CAD$ 1,780.02
Australia, starting at AUD$ 2,119.47
New Zealand, starting at NZ$ 4,699.00
The prices listed here are from the date of publication (June 7, 2022) and may be subject to change.
Lenovo ThinkPad P15v G2 21A9000XGE
-
05/30/2022 v7
Marvin Gollor
More articles related to this device
Lenovo ThinkPad P15v G2 21A9000XGE (ThinkPad P15v Series)Related Articles

Pricecompare

