 Deutsch
 English
 Español
 Français
 Italiano
 Nederlands
 Polski
 Português
 Русский
 Türkçe
 Svenska
 Chinese
 Magyar
Lenovo IdeaPad L340-17IRH Review: The well-rounded mid-range gaming notebook is unable to reach its full performance potential

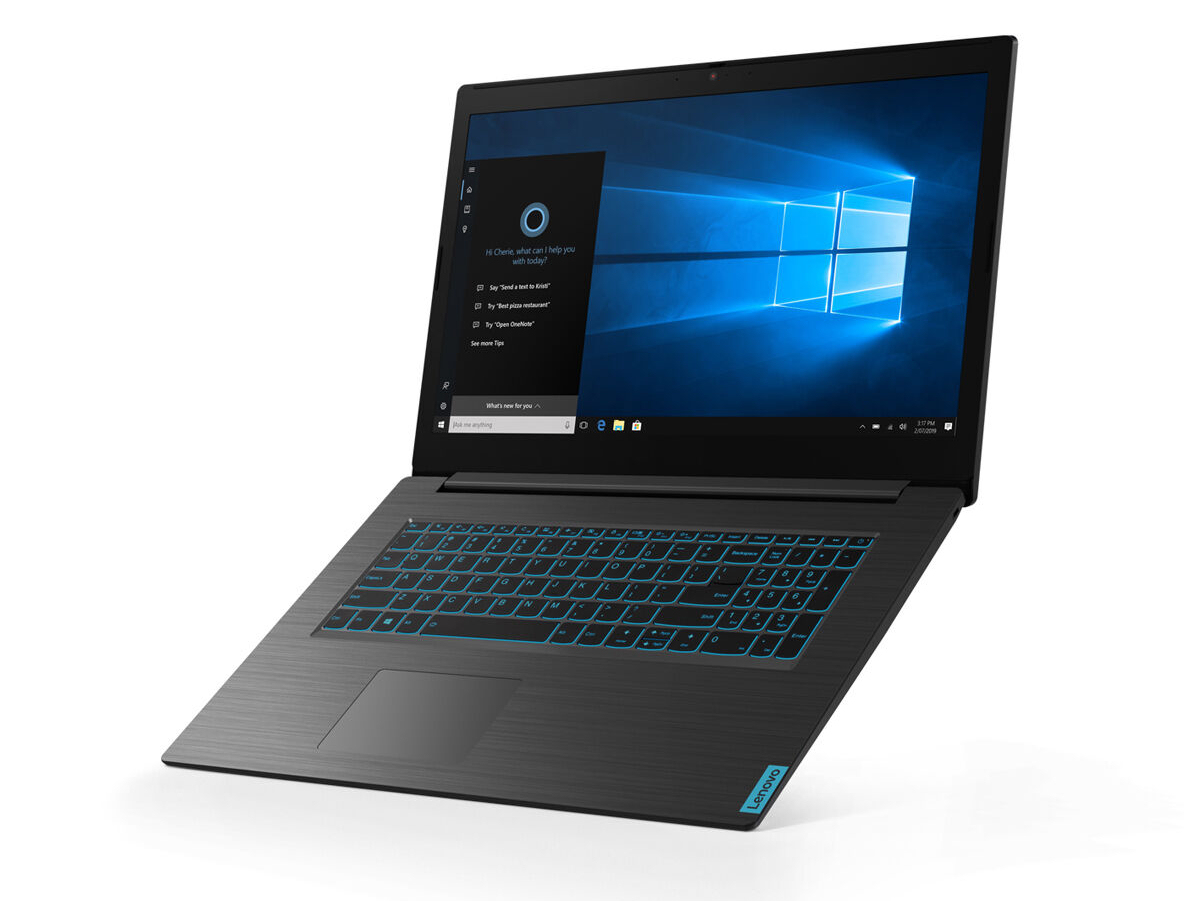
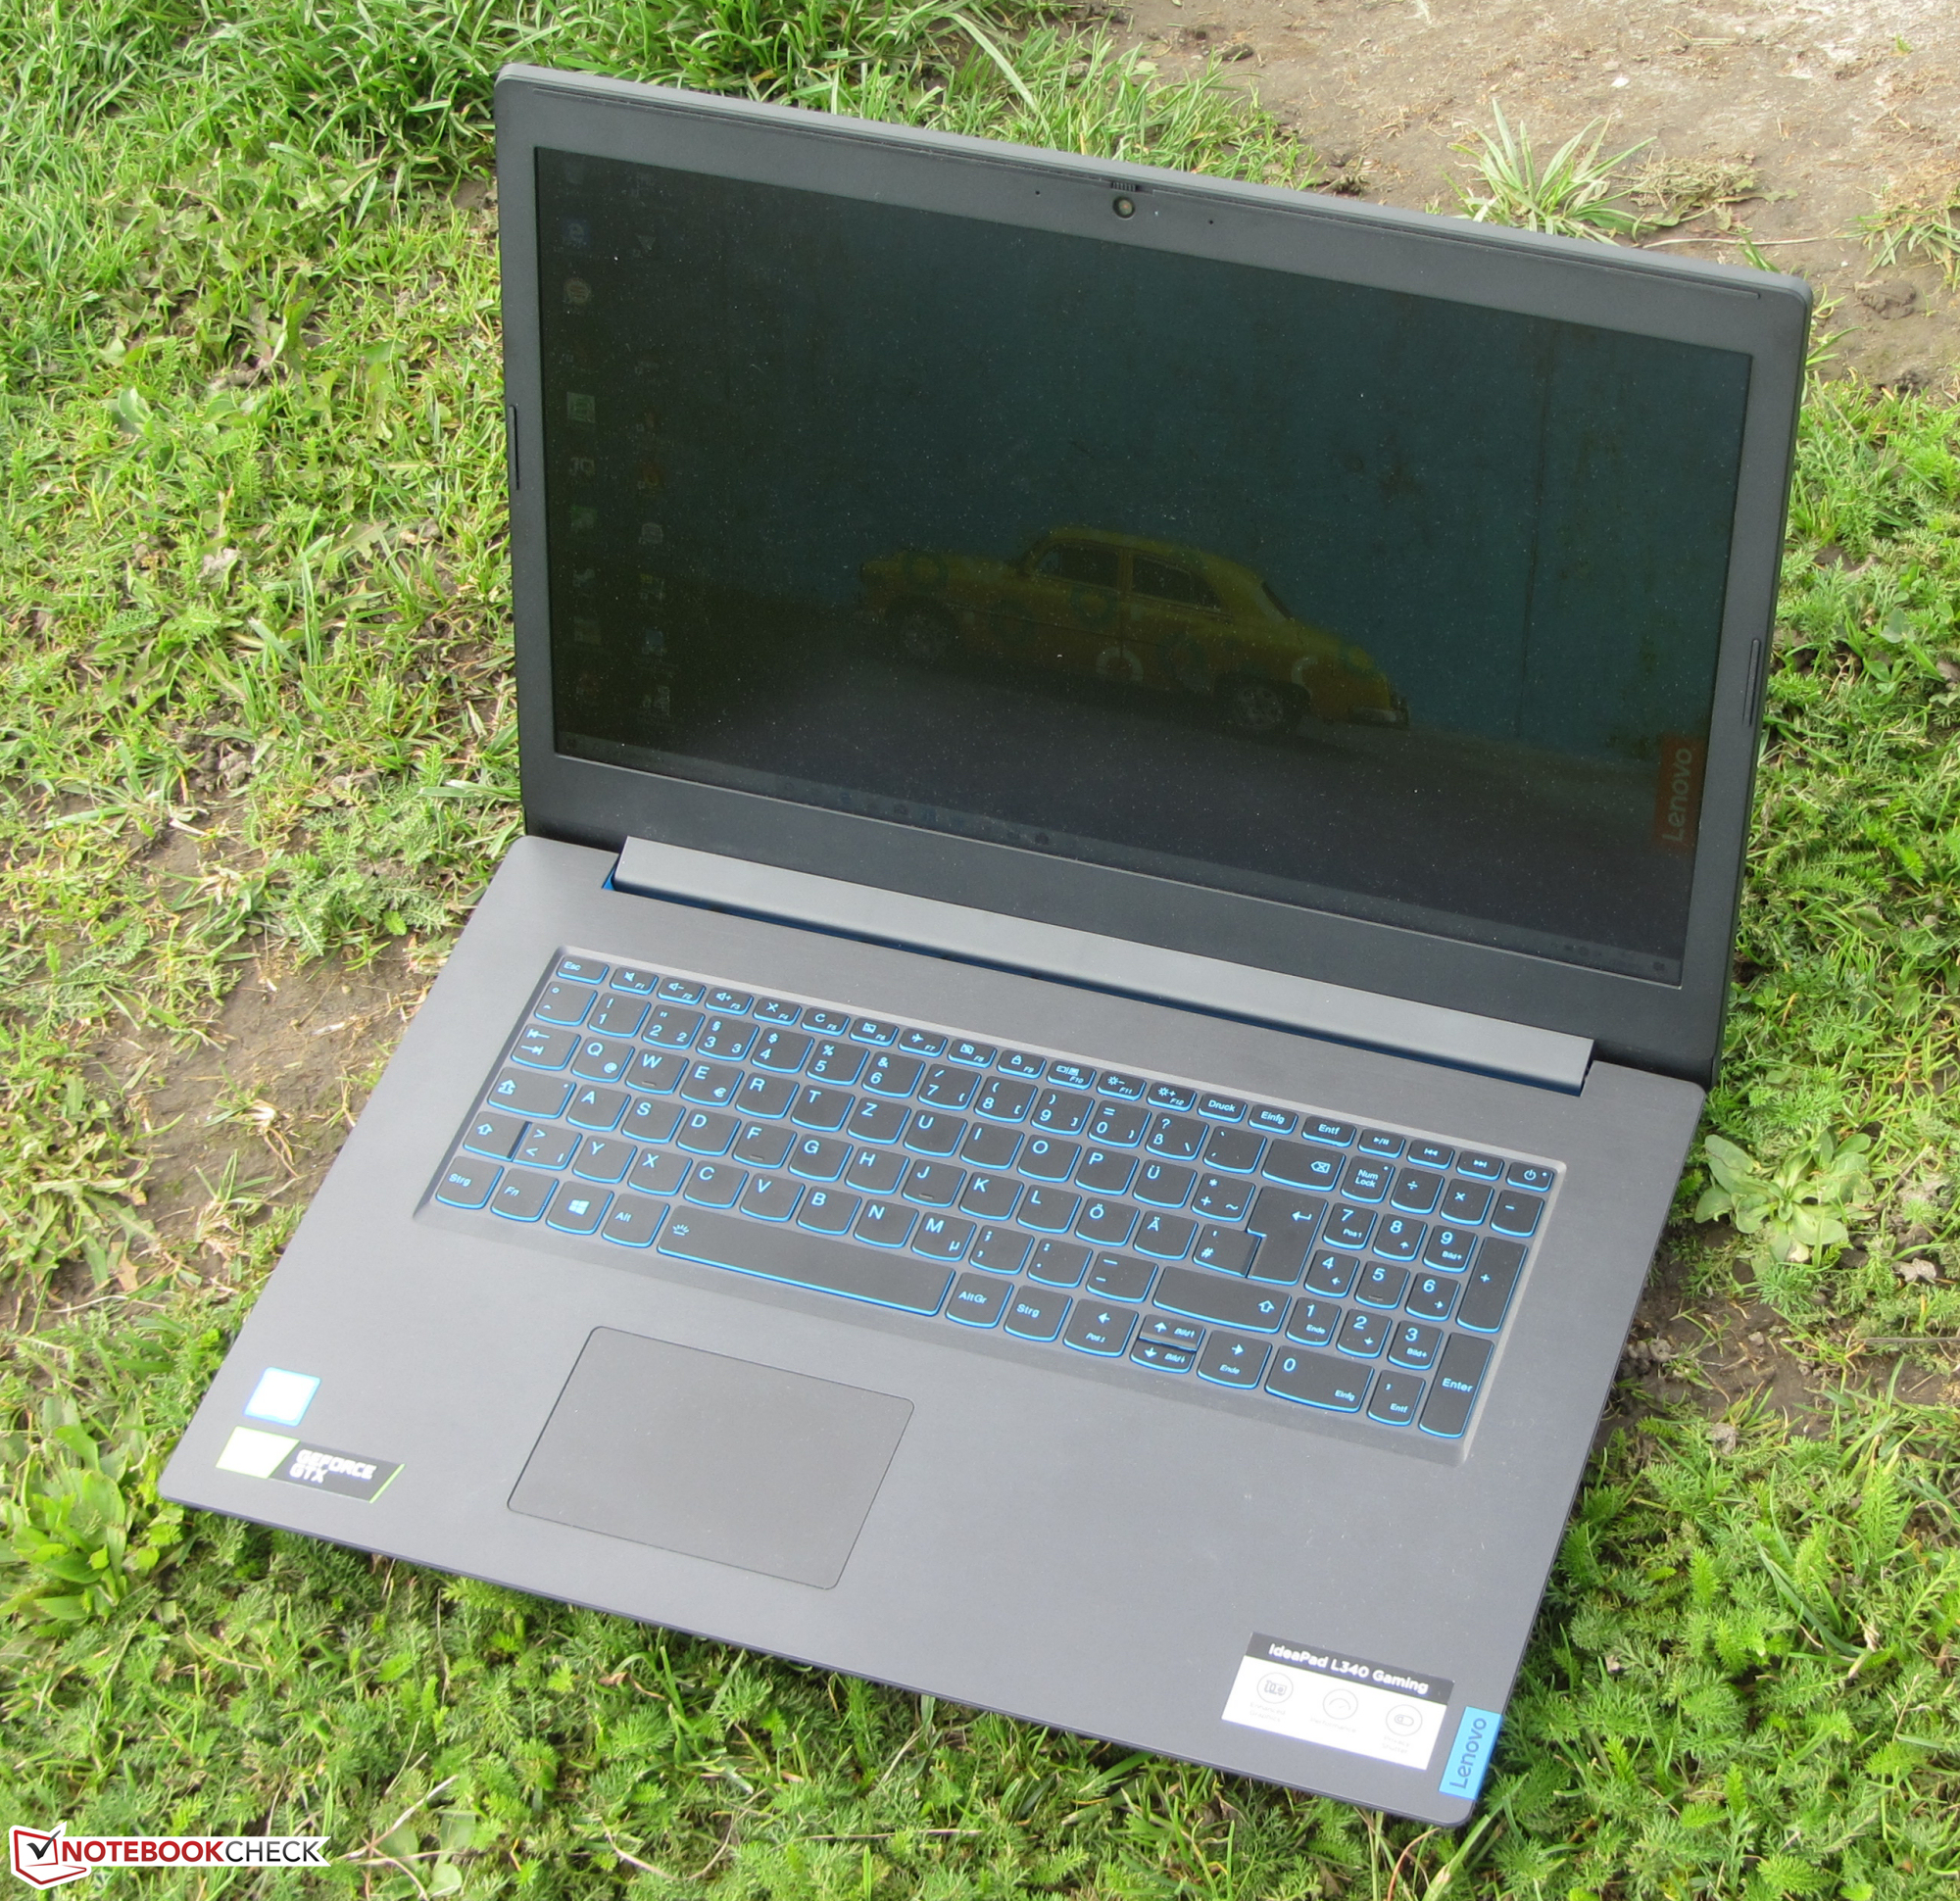
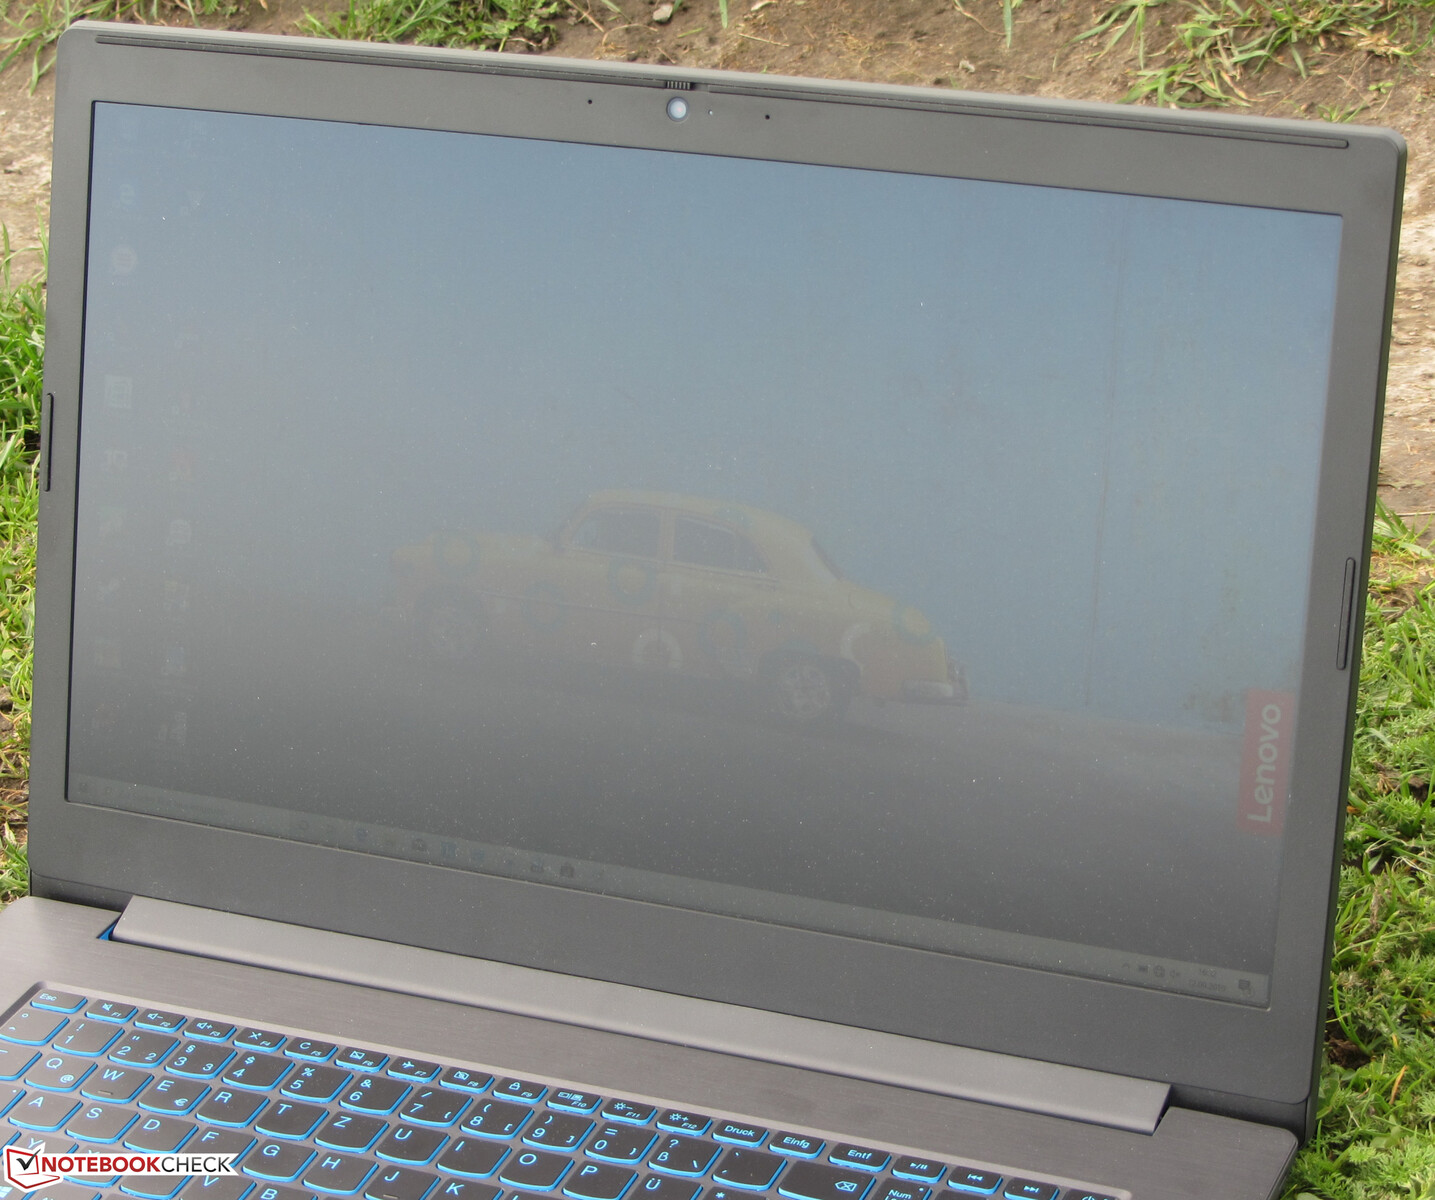
With the IdeaPad L340-17IRH, Lenovo offers a mid-range 17.3-inch gaming notebook that is targeted towards users who want a visually discrete gaming notebook. In this context, Lenovo is using the term "undercover gaming." The notebook is very similar to the IdeaPad L340-17API that we tested recently. However, there are some differences in the detail. The competitors include devices such as the HP Pavilion Gaming 17, the MSI GF75 Thin 9SC, the Dell G3 17 3779, and the Asus TUF FX705DT.
Case and Equipment - Lenovo uses plastic
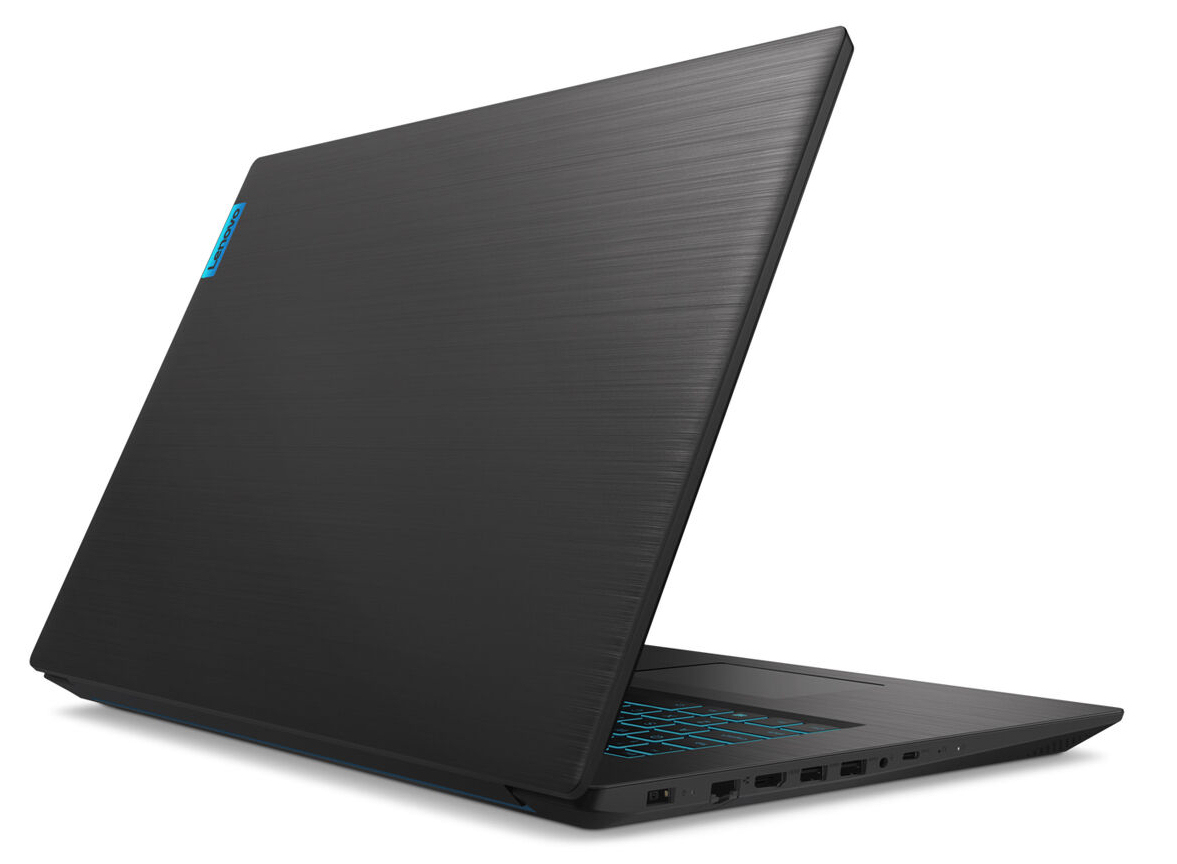
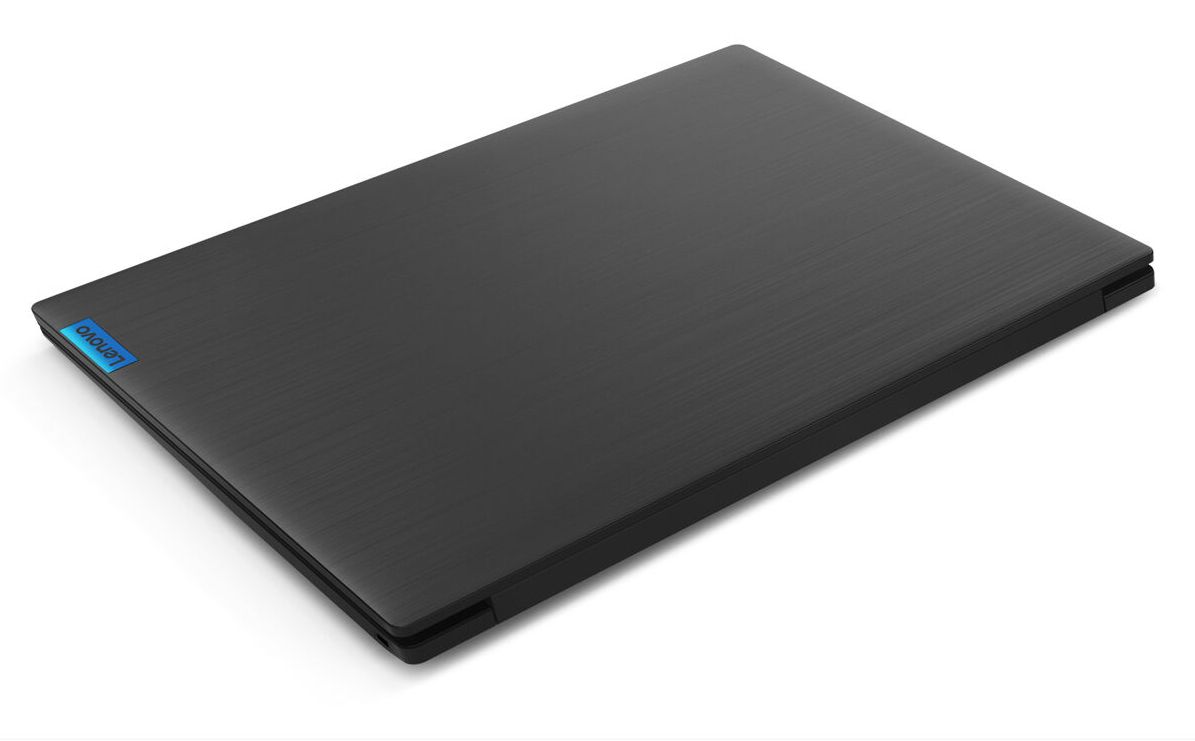
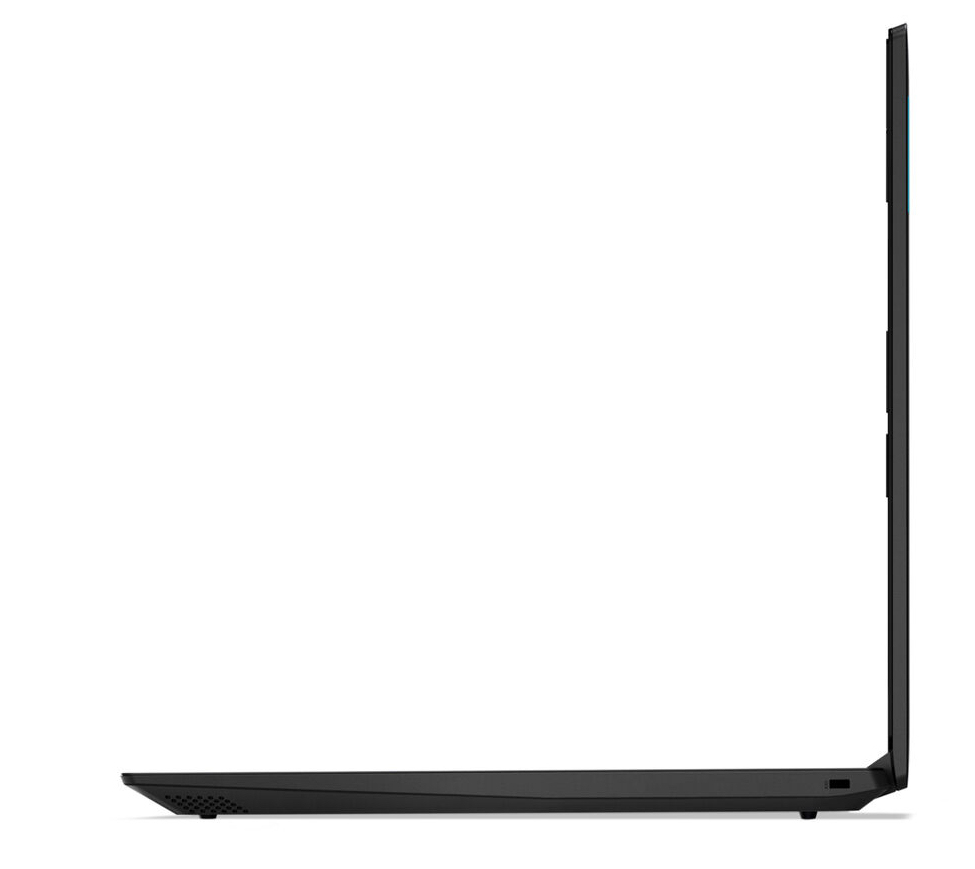
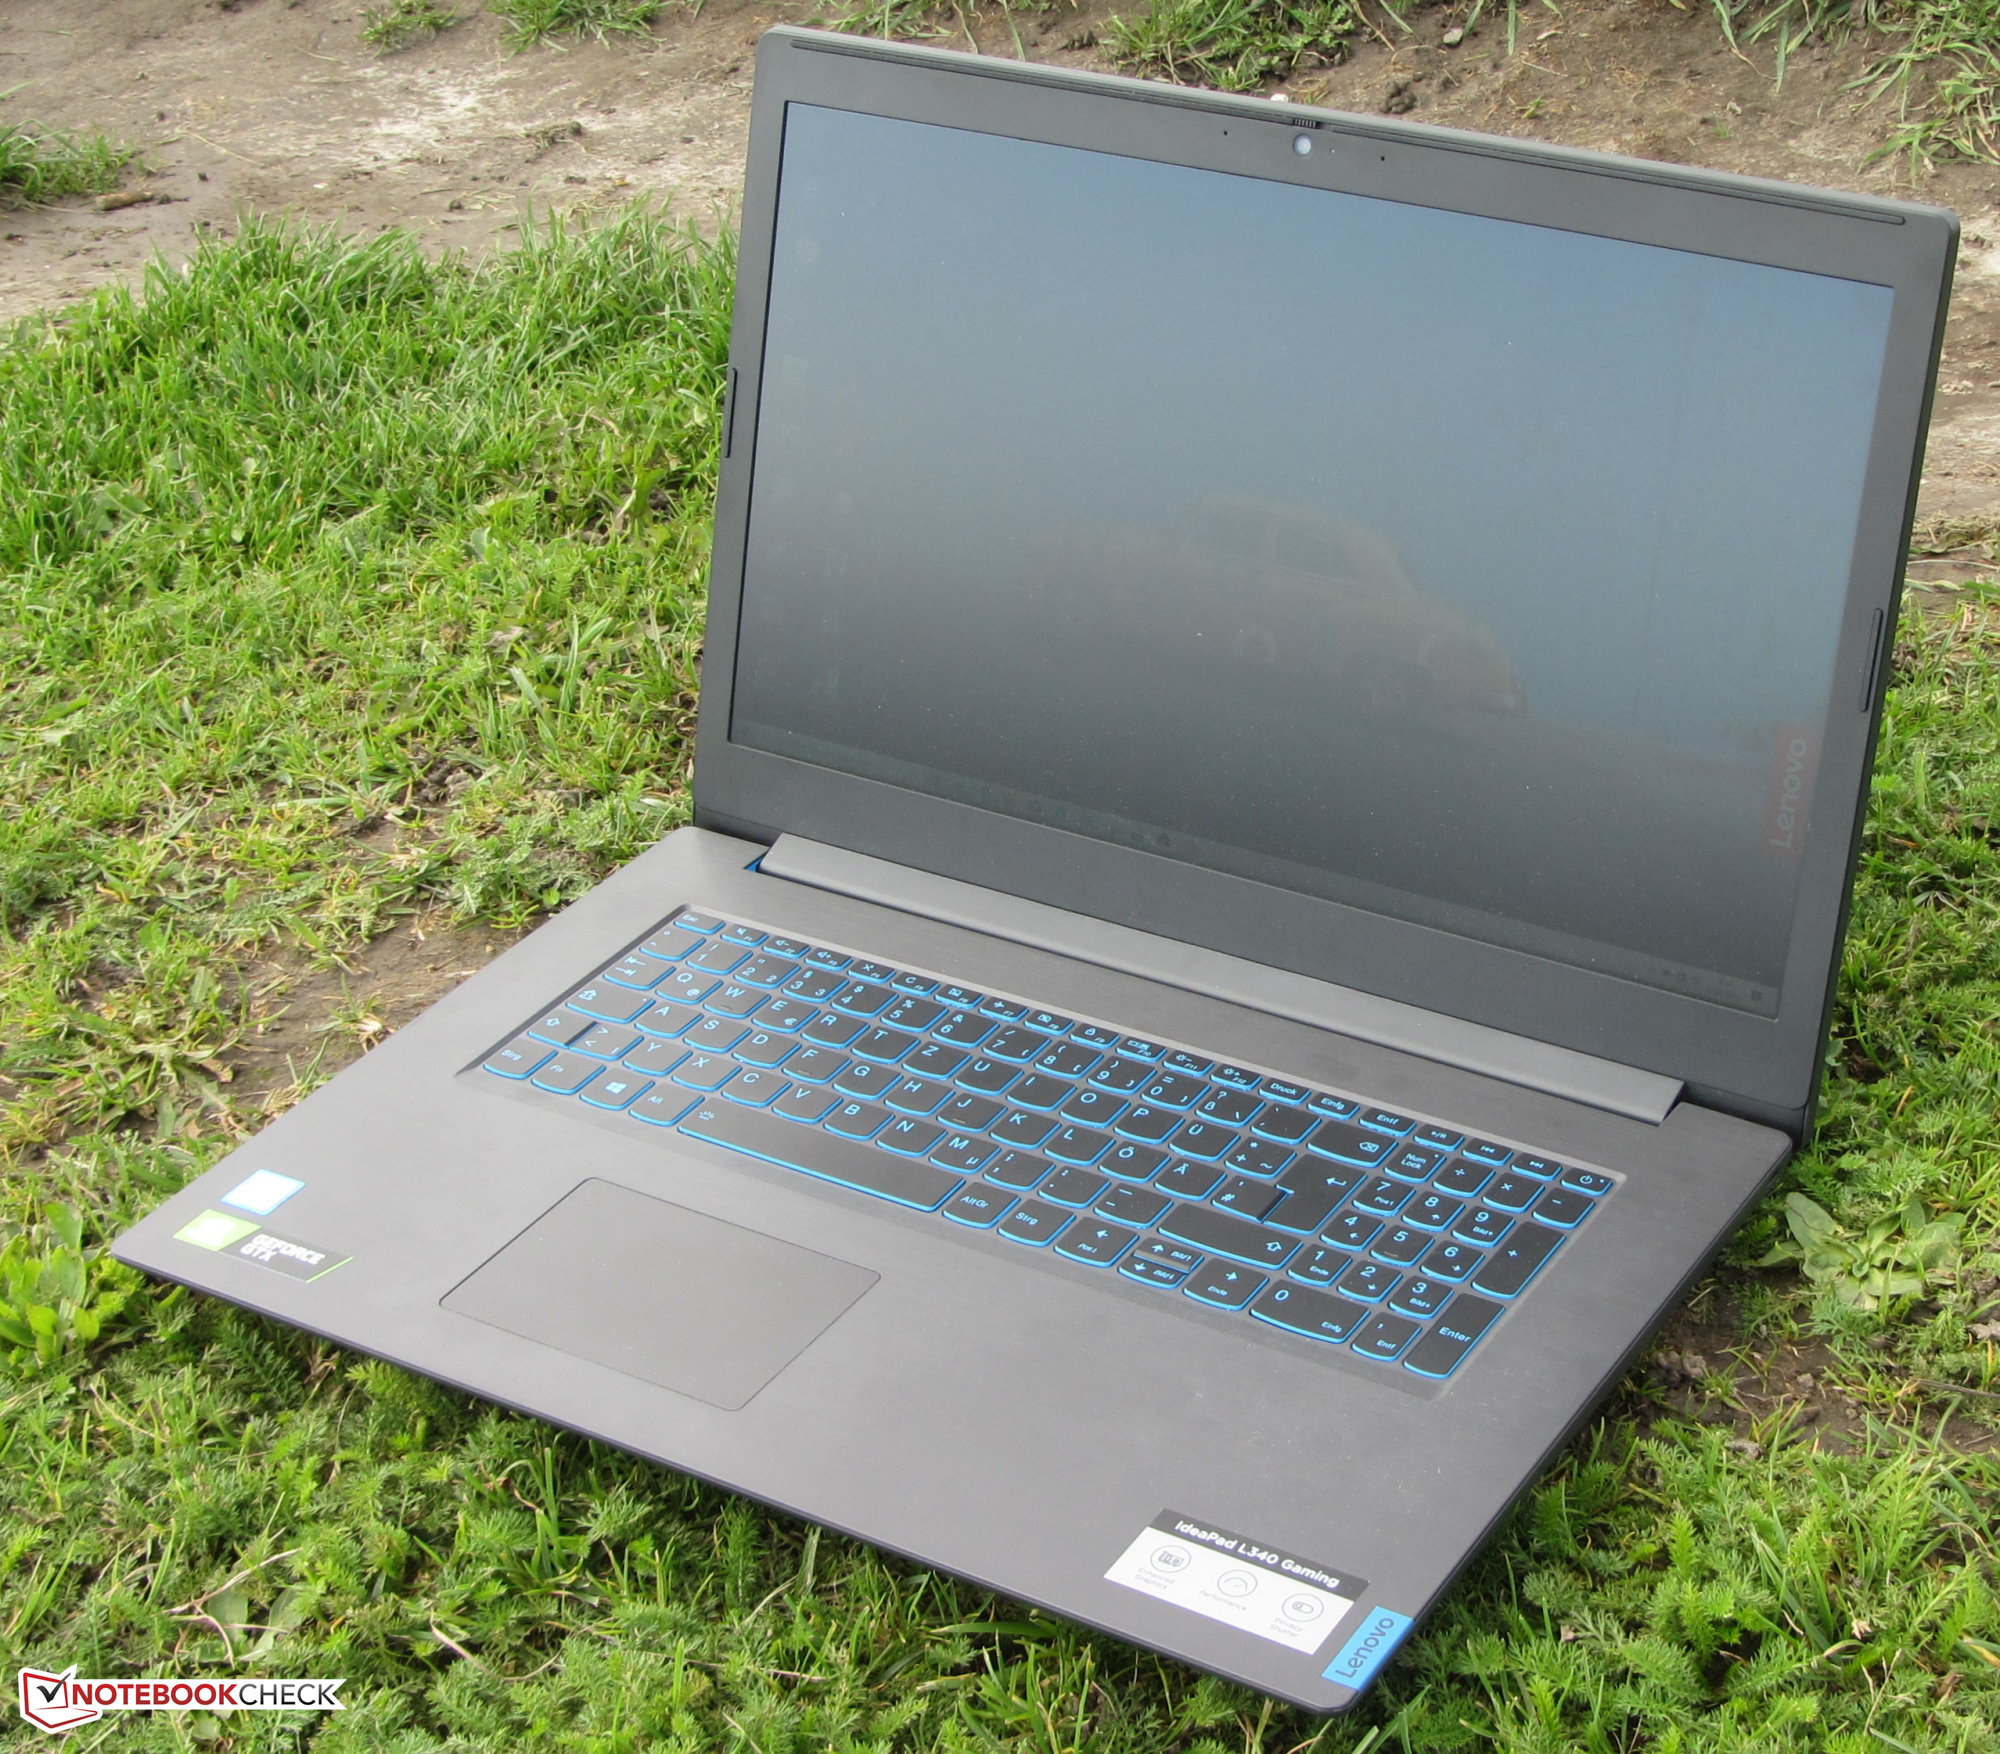
The case of the IdeaPad L340 is completely made of plastic. The case color is called "granite black." The top of the base unit and the back of the lid have a brushed-metal look, and the display frame has a black color. The notebook is 10 mm (~0.4 in) thicker than the IdeaPad L340-17API we tested recently. In terms of the workmanship, there are no complaints. The clearances are right, and we do not notice any sharp edges. However, there is some room for improvement in terms of the stability. The base unit and the lid in particular should offer more stiffness. The notebook does not offer an optical drive, and you also cannot add one later, so if you need an optical drive, you have to use a USB model. This is another difference compared to the L340-17API.
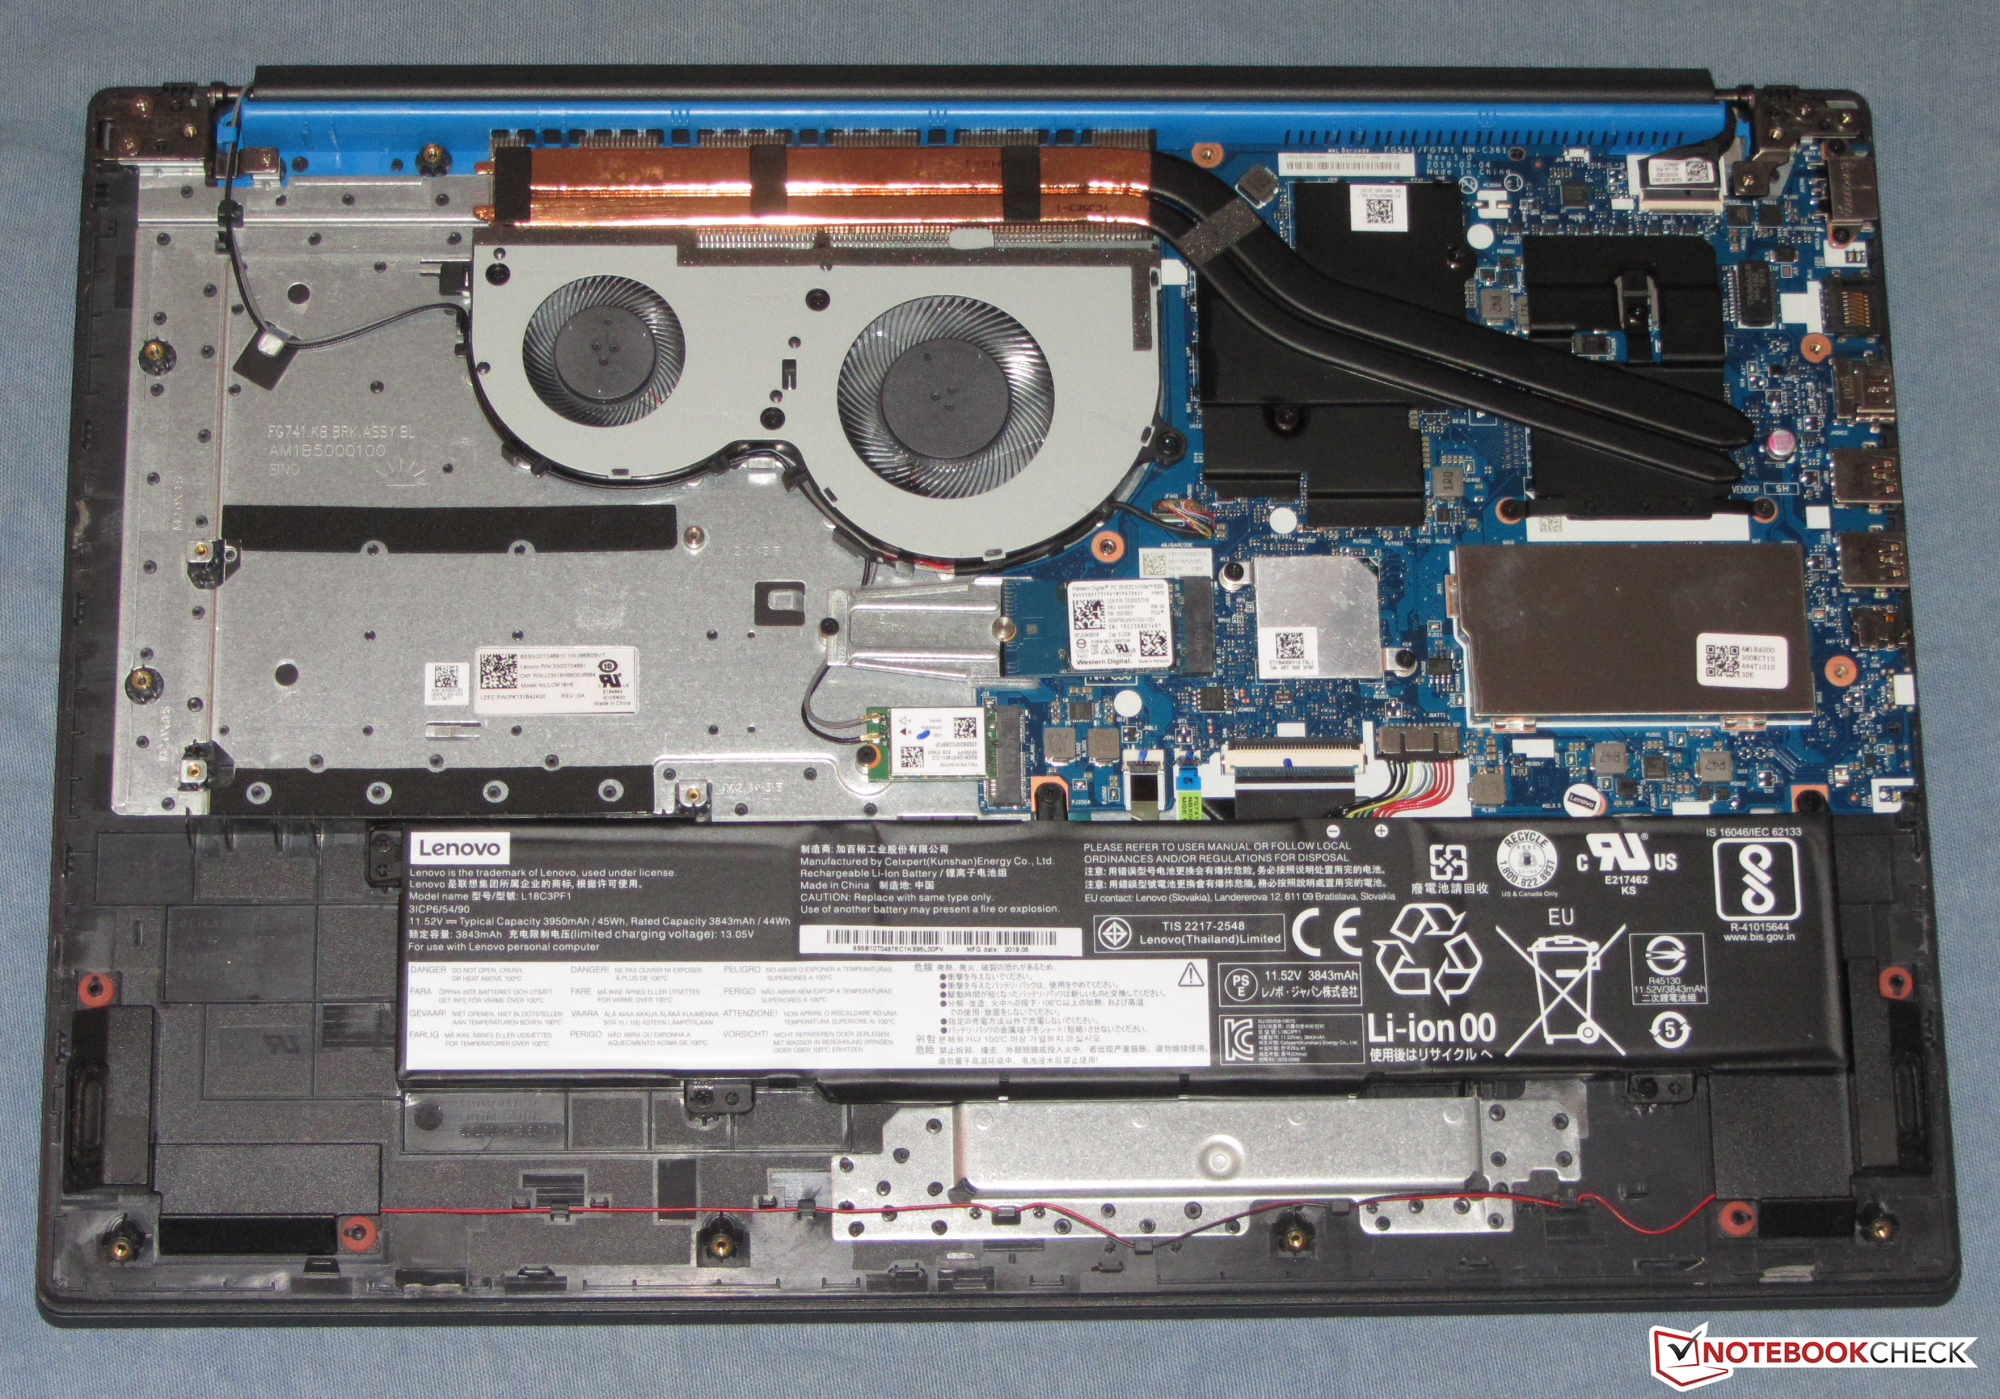
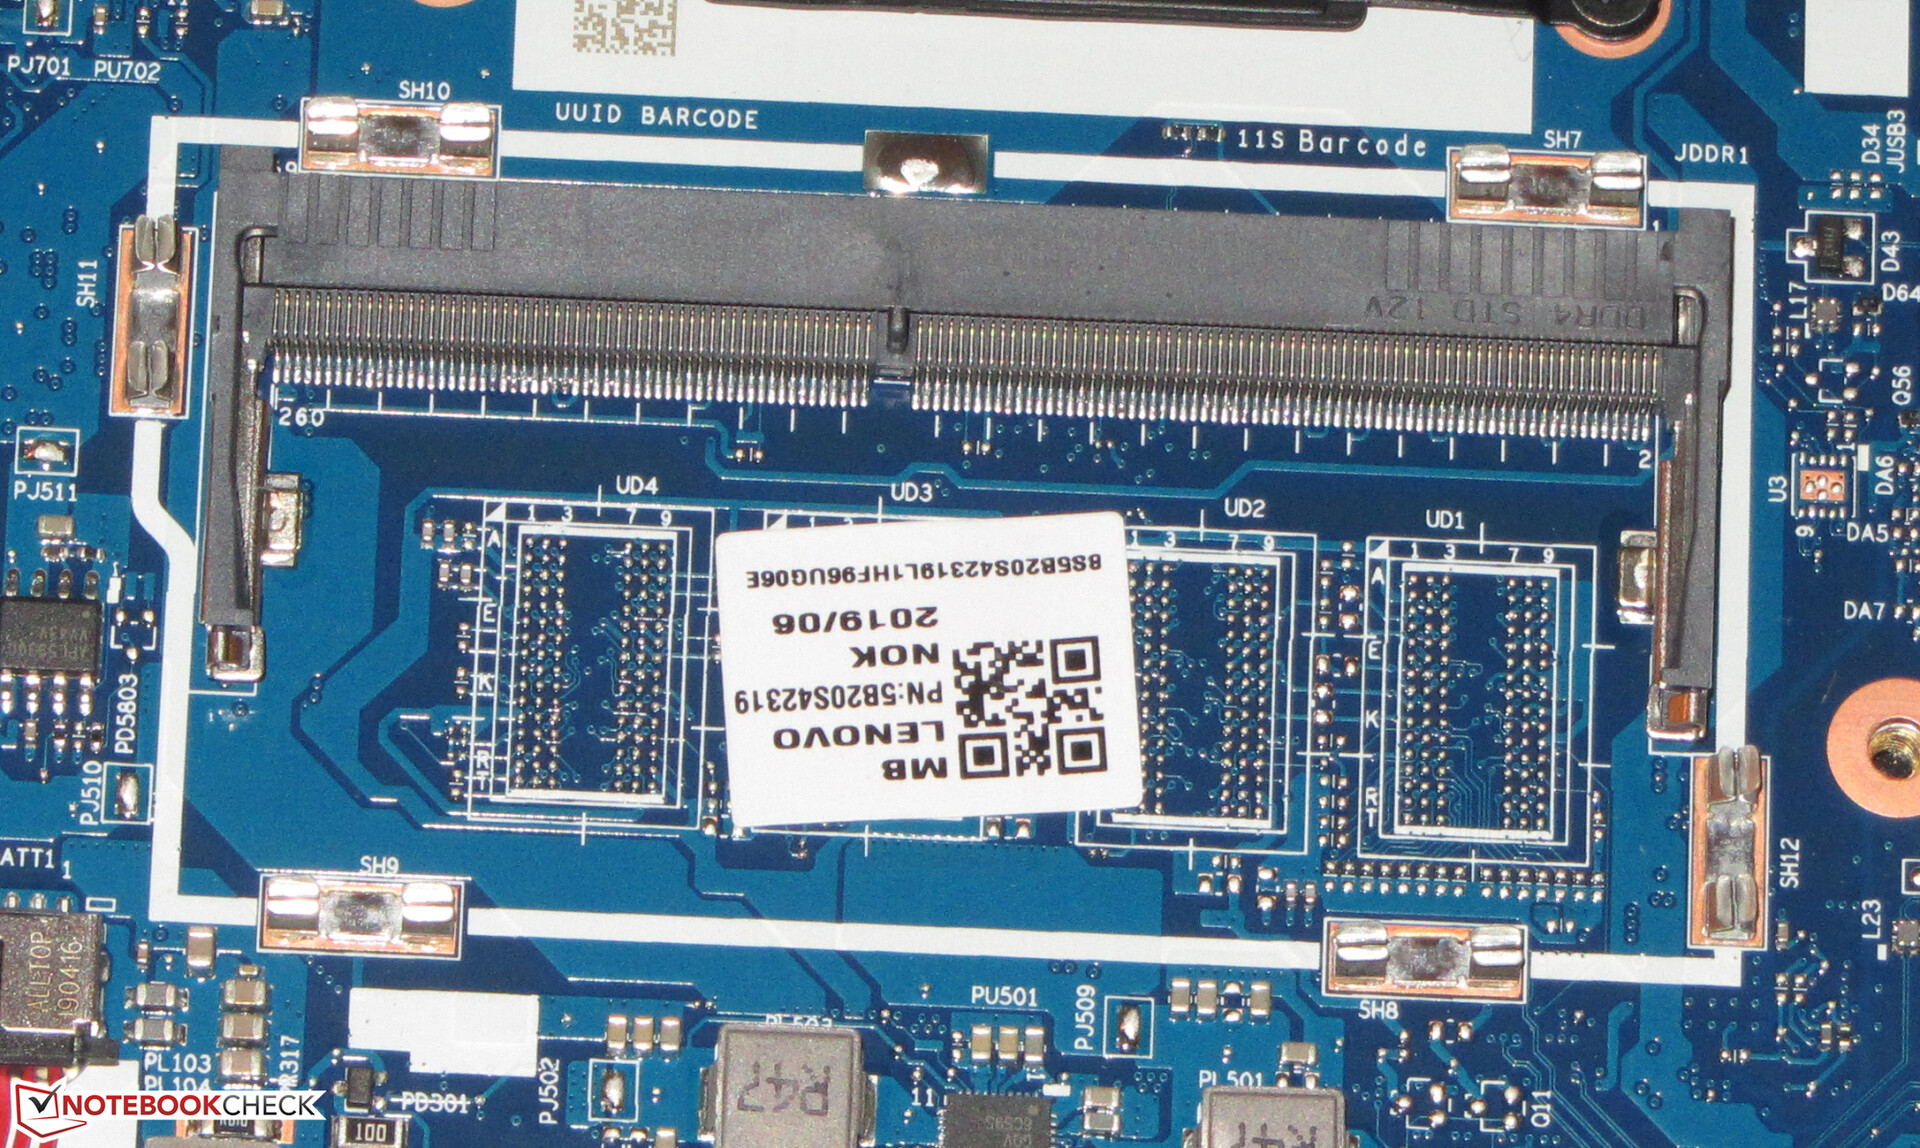
The L340 also does not have a maintenance flap. In order to access the insides, you have to remove the bottom of the case. To do this, all the screws on the bottom of the case have to be removed. Then you can remove the bottom of the case by using a thin prying tool or spatula, before you get access to the solid state disk, the fans, the WLAN module, the working memory, and the battery.
The number of connections is limited. The computer offers two Type-A USB connection and one Type-C USB connection, all of which operate according to the USB-3.2 Gen-1 standard. They are accompanied by an HDMI and a Gigabit Ethernet connection. The IdeaPad does not offer a storage card reader. All the connections are placed in the back section of the left side, so the areas on both sides of the palm rests will remain free from cables.
The WLAN module uses a Qualcomm chip (QCA9377). In addition to the 802.11a/b/g/n WLAN standards, it also supports the fast ac standard. The transfer speeds we measure under optimal conditions (no additional WLAN devices in close proximity and the notebook and server PCs are within a close distance) turn out mediocre.


Connections


Input Devices - Keyboard illumination included
The IdeaPad L340 brings an illuminated chiclet keyboard that includes a number block. The flat, smooth keys offer a short stroke and clear pressure point. We like the resistance offered by the keys. While typing, the keyboard is stable and does not yield. The blue keyboard illumination is controlled by a function key. There are two steps of brightness. Overall, Lenovo offers a successful keyboard here that is suitable for everyday tasks.
The multitouch-capable ClickPad occupies an area of about 10.5 x 7 cm (~4.1 x 2.8 in), so there is a lot of space for using gesture control. The smooth surface of the pad allows fingers to slide easily. The pad also responds to input in the corners. It has a short stroke and clear pressure point.

Display - IPS on board

The matte 17.3-inch display of the IdeaPad has a native resolution of 1920x1080 pixels. While the display offers a good contrast (1514:1), the brightness turns out slightly too low (292 cd/m²). We consider values larger than 300 cd/m² to be good.
At brightness levels of 20% and lower, the display unfortunately produces some flickering at a frequency of 250 Hz. This relatively low frequency could lead to headaches or eye problems for sensitive users.
| |||||||||||||||||||||||||
Brightness Distribution: 85 %
Center on Battery: 328 cd/m²
Contrast: 1514:1 (Black: 0.21 cd/m²)
ΔE Color 4.04 | 0.5-29.43 Ø5, calibrated: 2.06
ΔE Greyscale 4.21 | 0.57-98 Ø5.3
93% sRGB (Argyll 1.6.3 3D)
60% AdobeRGB 1998 (Argyll 1.6.3 3D)
66.6% AdobeRGB 1998 (Argyll 2.2.0 3D)
92.7% sRGB (Argyll 2.2.0 3D)
66.3% Display P3 (Argyll 2.2.0 3D)
Gamma: 2.5
| Lenovo Ideapad L340-17IRH 81LL001YGE IPS, 1920x1080, 17.30 | Lenovo Ideapad L340-17API-81LY0004GE TN LED, 1600x900, 17.30 | Asus TUF FX705DT-AU068T IPS, 1920x1080, 17.30 | MSI GF75 Thin 9SC IPS, 1920x1080, 17.30 | HP Pavilion Gaming 17-cd0085cl IPS, 1920x1080, 17.30 | Dell G3 17 3779 IPS, 1920x1080, 17.30 | |
|---|---|---|---|---|---|---|
| Display | -21% | -5% | -4% | -4% | -3% | |
| Display P3 Coverage | 66.3 | 51.1 -23% | 62.3 -6% | 62.5 -6% | 63.3 -5% | 63.9 -4% |
| sRGB Coverage | 92.7 | 73.9 -20% | 89.1 -4% | 90 -3% | 90.2 -3% | 89.8 -3% |
| AdobeRGB 1998 Coverage | 66.6 | 52.7 -21% | 63.7 -4% | 64 -4% | 64.3 -3% | 64.9 -3% |
| Response Times | 11% | -29% | -19% | 8% | -16% | |
| Response Time Grey 50% / Grey 80% * | 32 ? | 42 ? -31% | 41 ? -28% | 34 ? -6% | 31.6 ? 1% | 38 ? -19% |
| Response Time Black / White * | 23 ? | 11 ? 52% | 30 ? -30% | 30.4 ? -32% | 19.6 ? 15% | 26 ? -13% |
| PWM Frequency | 250 ? | |||||
| Screen | -85% | -5% | -5% | -15% | -16% | |
| Brightness middle | 318 | 230 -28% | 316 -1% | 344.7 8% | 299.6 -6% | 323 2% |
| Brightness | 292 | 201 -31% | 294 1% | 332 14% | 285 -2% | 306 5% |
| Brightness Distribution | 85 | 78 -8% | 84 -1% | 91 7% | 86 1% | 89 5% |
| Black Level * | 0.21 | 0.46 -119% | 0.32 -52% | 0.3 -43% | 0.33 -57% | 0.31 -48% |
| Contrast | 1514 | 500 -67% | 988 -35% | 1149 -24% | 908 -40% | 1042 -31% |
| Colorchecker dE 2000 * | 4.04 | 10.36 -156% | 3.39 16% | 3.08 24% | 3.68 9% | 4.96 -23% |
| Colorchecker dE 2000 max. * | 6.59 | 18.63 -183% | 5.56 16% | 6.32 4% | 8.05 -22% | 8.25 -25% |
| Colorchecker dE 2000 calibrated * | 2.06 | 2.14 -4% | 2.94 -43% | 3.15 -53% | ||
| Greyscale dE 2000 * | 4.21 | 13.32 -216% | 3.17 25% | 3.8 10% | 3.8 10% | 5.65 -34% |
| Gamma | 2.5 88% | 2.54 87% | 2.39 92% | 2.17 101% | 2.12 104% | 2.24 98% |
| CCT | 7189 90% | 14124 46% | 7098 92% | 7284 89% | 7240 90% | 7441 87% |
| Color Space (Percent of AdobeRGB 1998) | 60 | 48 -20% | 51 -15% | 58 -3% | 58.1 -3% | 58 -3% |
| Color Space (Percent of sRGB) | 93 | 74 -20% | 89 -4% | 89.6 -4% | 89.8 -3% | 90 -3% |
| Total Average (Program / Settings) | -32% /
-59% | -13% /
-8% | -9% /
-6% | -4% /
-10% | -12% /
-13% |
* ... smaller is better
Display Response Times
| ↔ Response Time Black to White | ||
|---|---|---|
| 23 ms ... rise ↗ and fall ↘ combined | ↗ 14 ms rise | 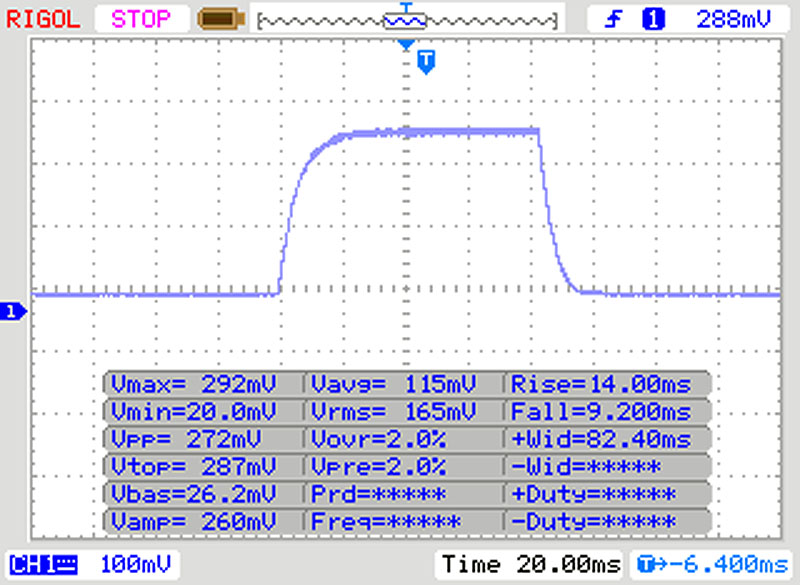 |
| ↘ 9 ms fall | ||
| The screen shows good response rates in our tests, but may be too slow for competitive gamers. In comparison, all tested devices range from 0.1 (minimum) to 240 (maximum) ms. » 45 % of all devices are better. This means that the measured response time is similar to the average of all tested devices (21.5 ms). | ||
| ↔ Response Time 50% Grey to 80% Grey | ||
| 32 ms ... rise ↗ and fall ↘ combined | ↗ 16 ms rise | 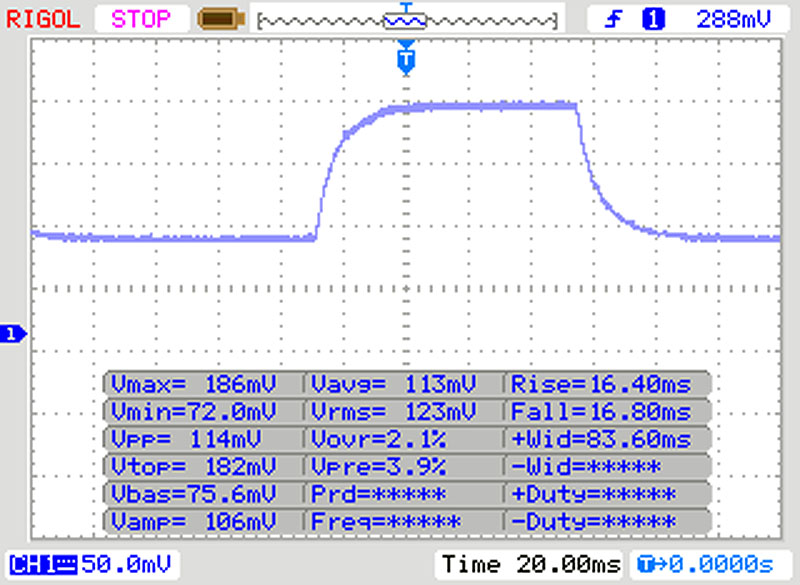 |
| ↘ 16 ms fall | ||
| The screen shows slow response rates in our tests and will be unsatisfactory for gamers. In comparison, all tested devices range from 0.2 (minimum) to 636 (maximum) ms. » 36 % of all devices are better. This means that the measured response time is similar to the average of all tested devices (33.8 ms). | ||
Screen Flickering / PWM (Pulse-Width Modulation)
| Screen flickering / PWM detected | 250 Hz | ≤ 20 % brightness setting | 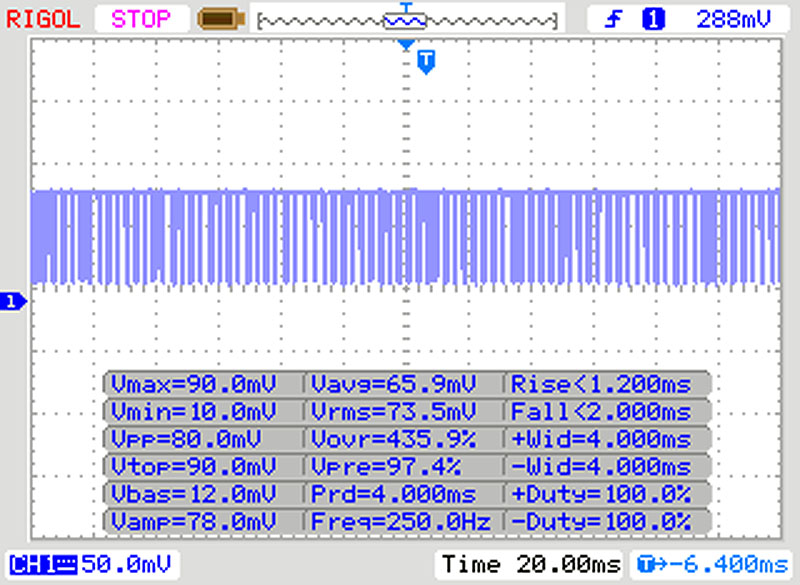 |
The display backlight flickers at 250 Hz (worst case, e.g., utilizing PWM) Flickering detected at a brightness setting of 20 % and below. There should be no flickering or PWM above this brightness setting. The frequency of 250 Hz is relatively low, so sensitive users will likely notice flickering and experience eyestrain at the stated brightness setting and below. In comparison: 53 % of all tested devices do not use PWM to dim the display. If PWM was detected, an average of 17933 (minimum: 5 - maximum: 3846000) Hz was measured. | |||
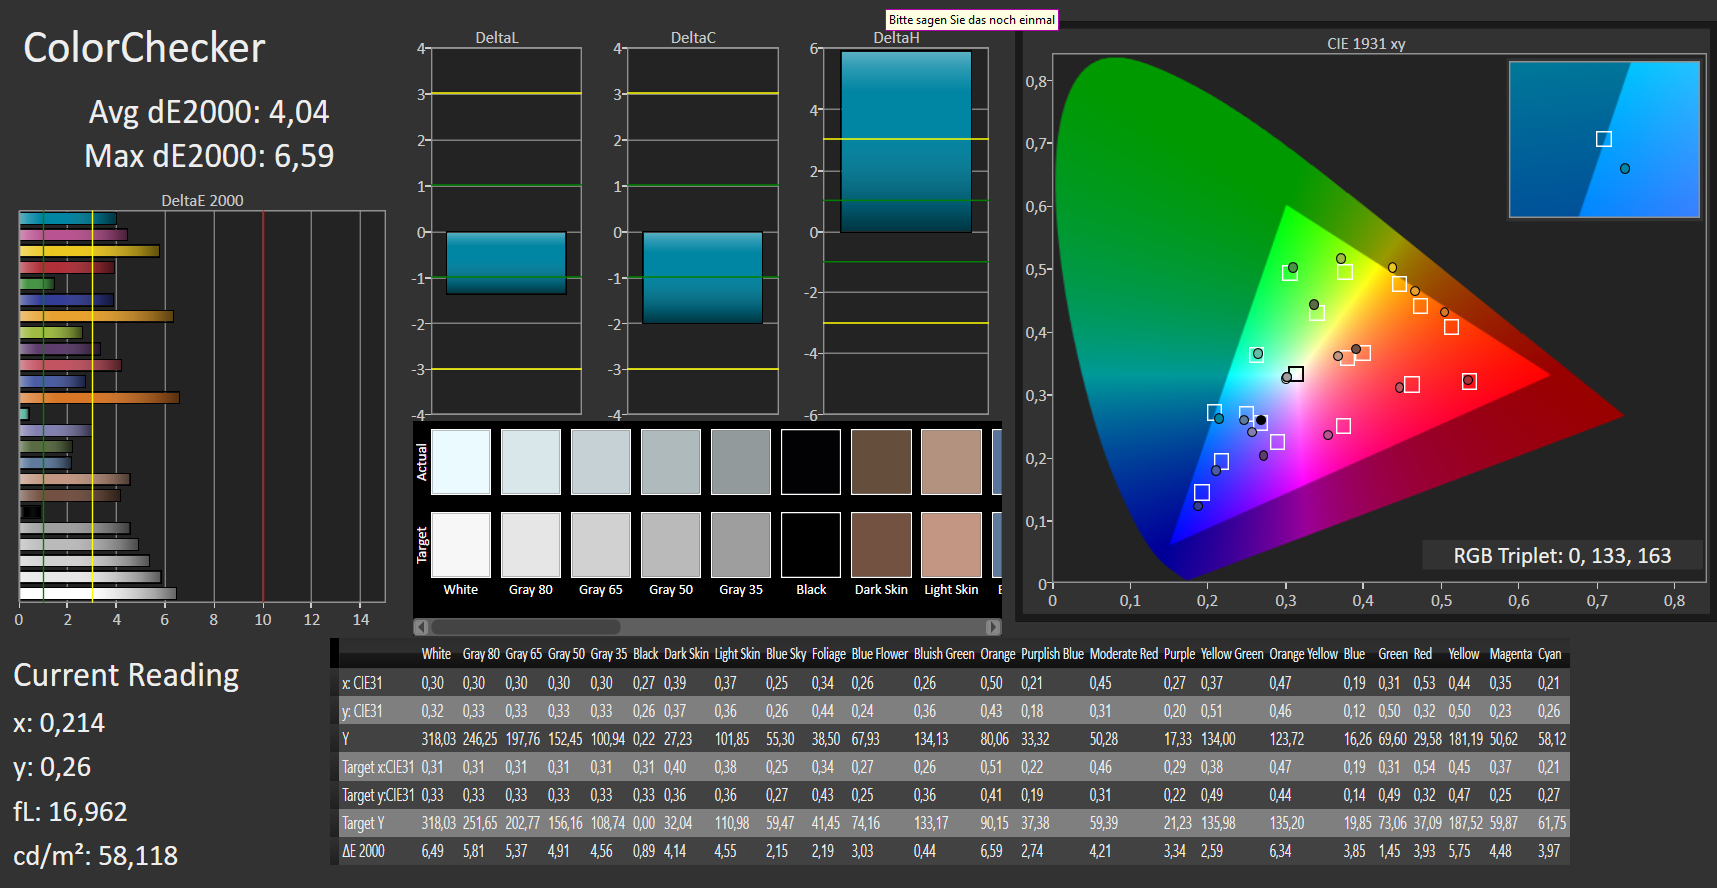
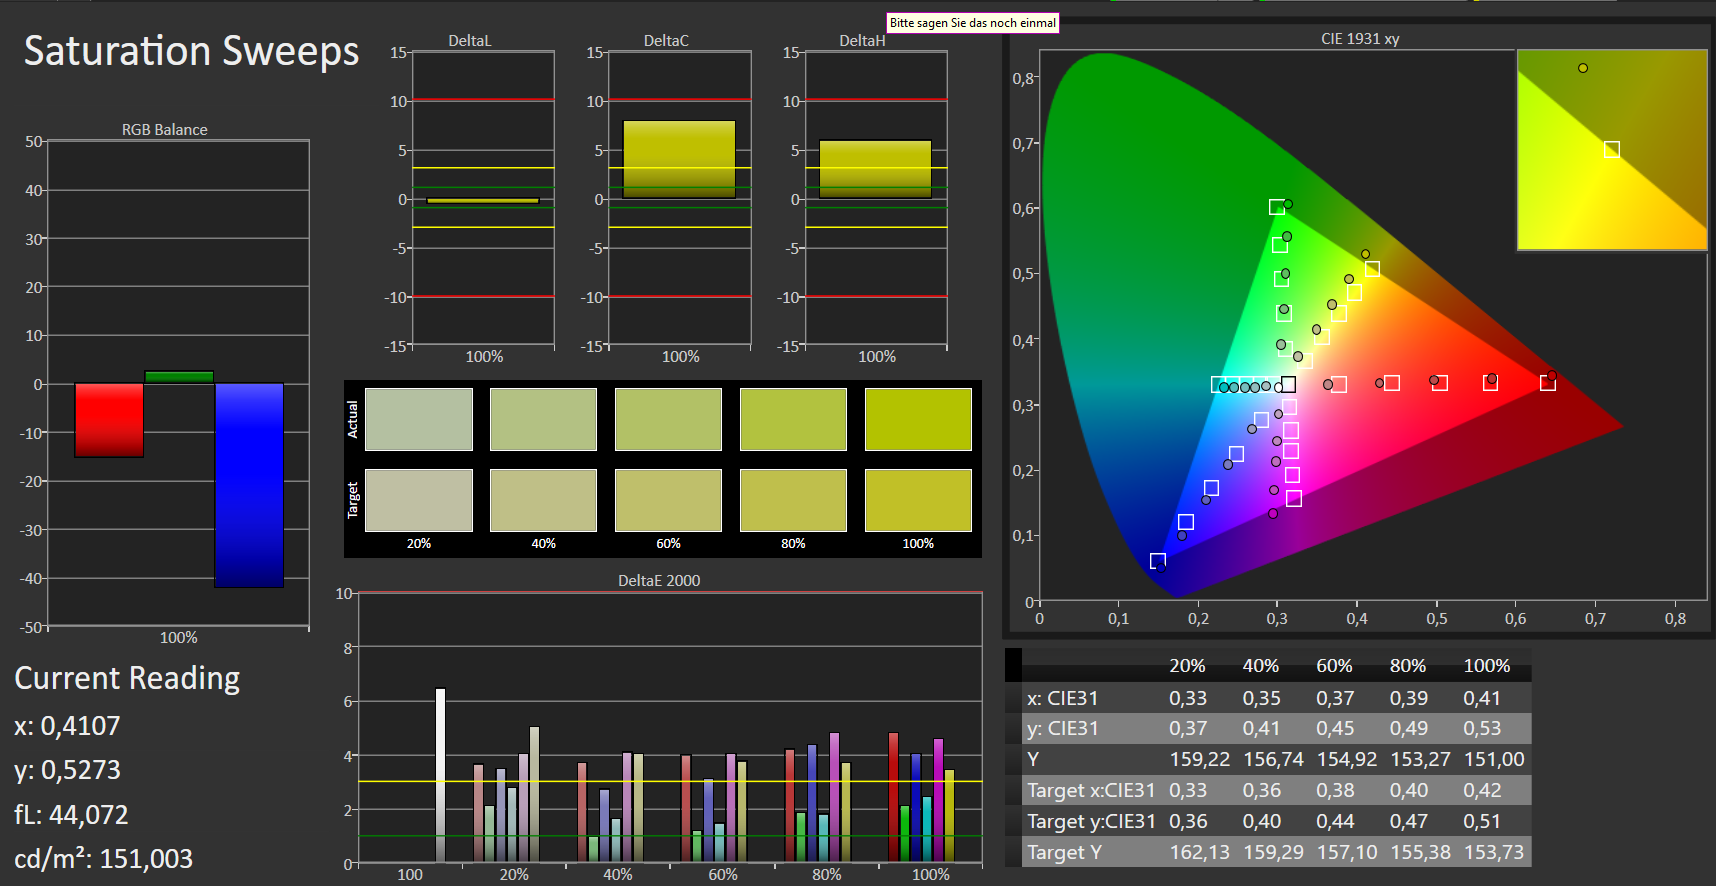
The display of the IdeaPad offers a fairly decent color reproduction already in the state of delivery. With a DeltaE-2000 color deviation of 4.04, the target of DeltaE smaller than 3 is barely missed. In addition, the display has a minimal blue tint. The color reproduction can be improved via calibration. This reduces the color deviation to a value of 2.06, the blue tint disappears, and the grayscale is reproduced significantly more balanced. The AdobeRGB and sRGB color spaces are not covered completely. The coverage is 60 percent (AdobeRGB) and 93 percent (sRGB).
Using the color profile we are offering, the color reproduction of the display can be adjusted according to our calibration. However, you have to make sure that you have the same display model (manufacturer + model number) as our test unit, since otherwise the color reproduction can become worse instead of improving. Often displays from various manufacturers are used within one notebook model series.


The Lenovo notebook is equipped with an IPS panel with stable viewing angles, so you can read the display from any angle. Outdoors, you can only read the display when the sunlight is not too bright.
Performance - Mid-range gaming power
With the IdeaPad L340-17IRH, Lenovo has a 17.3-inch gaming notebook in its portfolio that offers sufficient computing performance for all the usual application areas. Our test unit can be purchased for about 1000 Euros (~$1109), and there are also other equipment variants. Prices start from about 750 Euros (~$832).
Processor
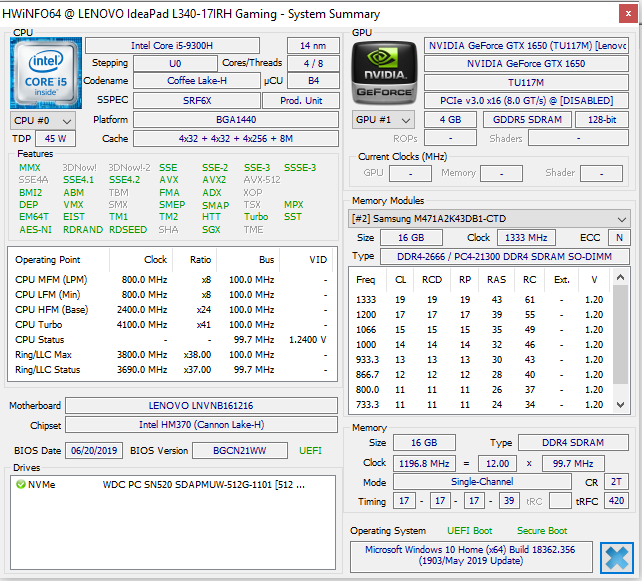
The IdeaPad is run by a Core i5-9300H quad-core processor. The CPU is based on the Coffee Lake architecture and runs at a base clock speed of 2.4 GHz. Via Turbo, the clock speed can be increased to 4 GHz (four cores) or 4.1 GHz (one core). Hyper-threading (two threads running per core) is supported.
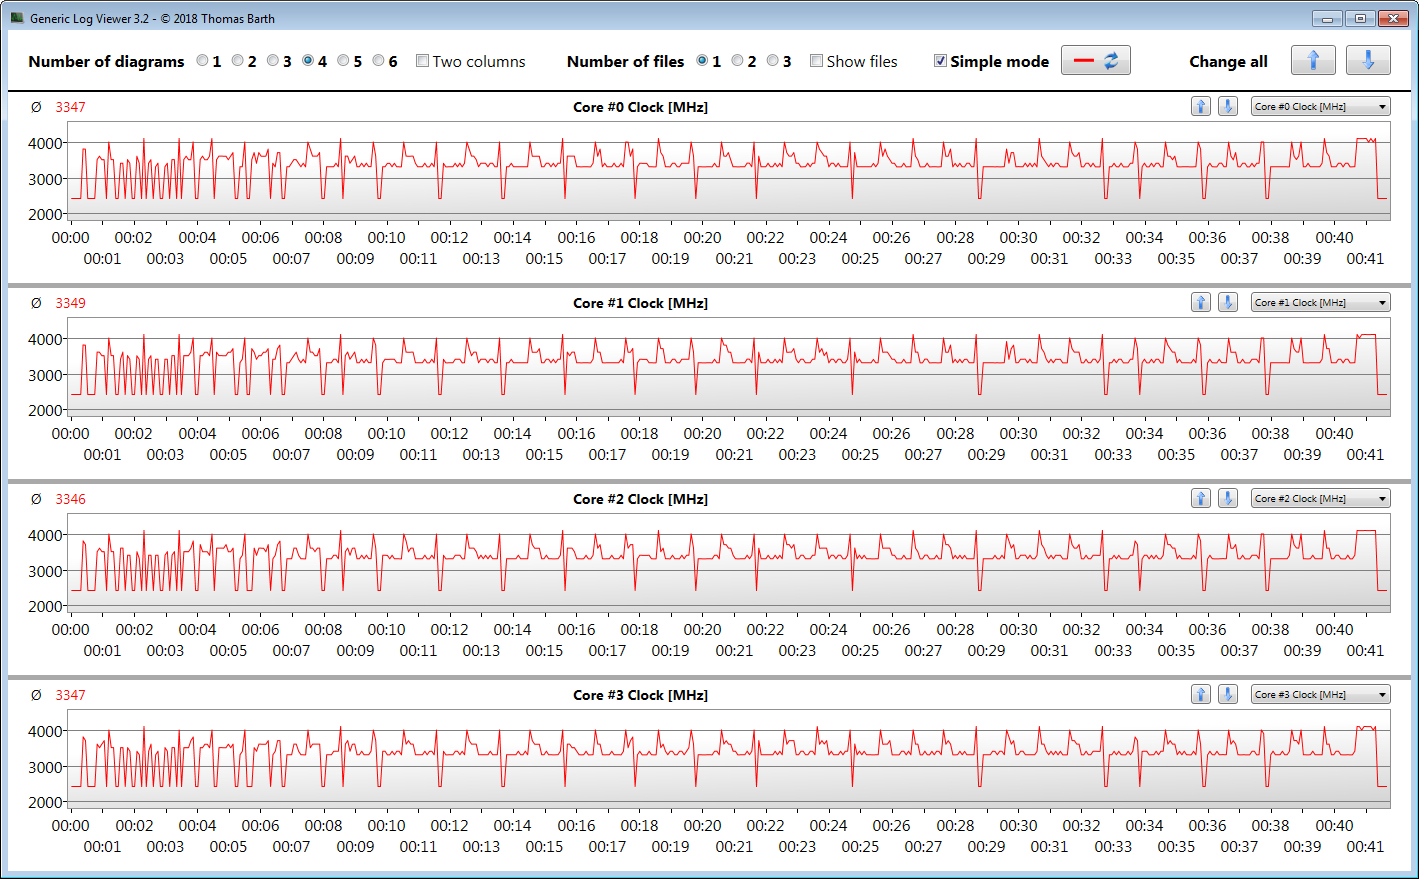
The processor runs through the multi-thread tests of the CineBench benchmarks at 3.7 to 4 GHz for a short period, before the clock speed drops to between 3.2 and 3.5 GHz. However, from time to time, the processor is also throttled down to 2.4 GHz. In battery operation, the clock speed is between 2.7 and 3.9 GHz. The single-thread tests are run at 4 to 4.1 GHz in mains as well as in battery operation.

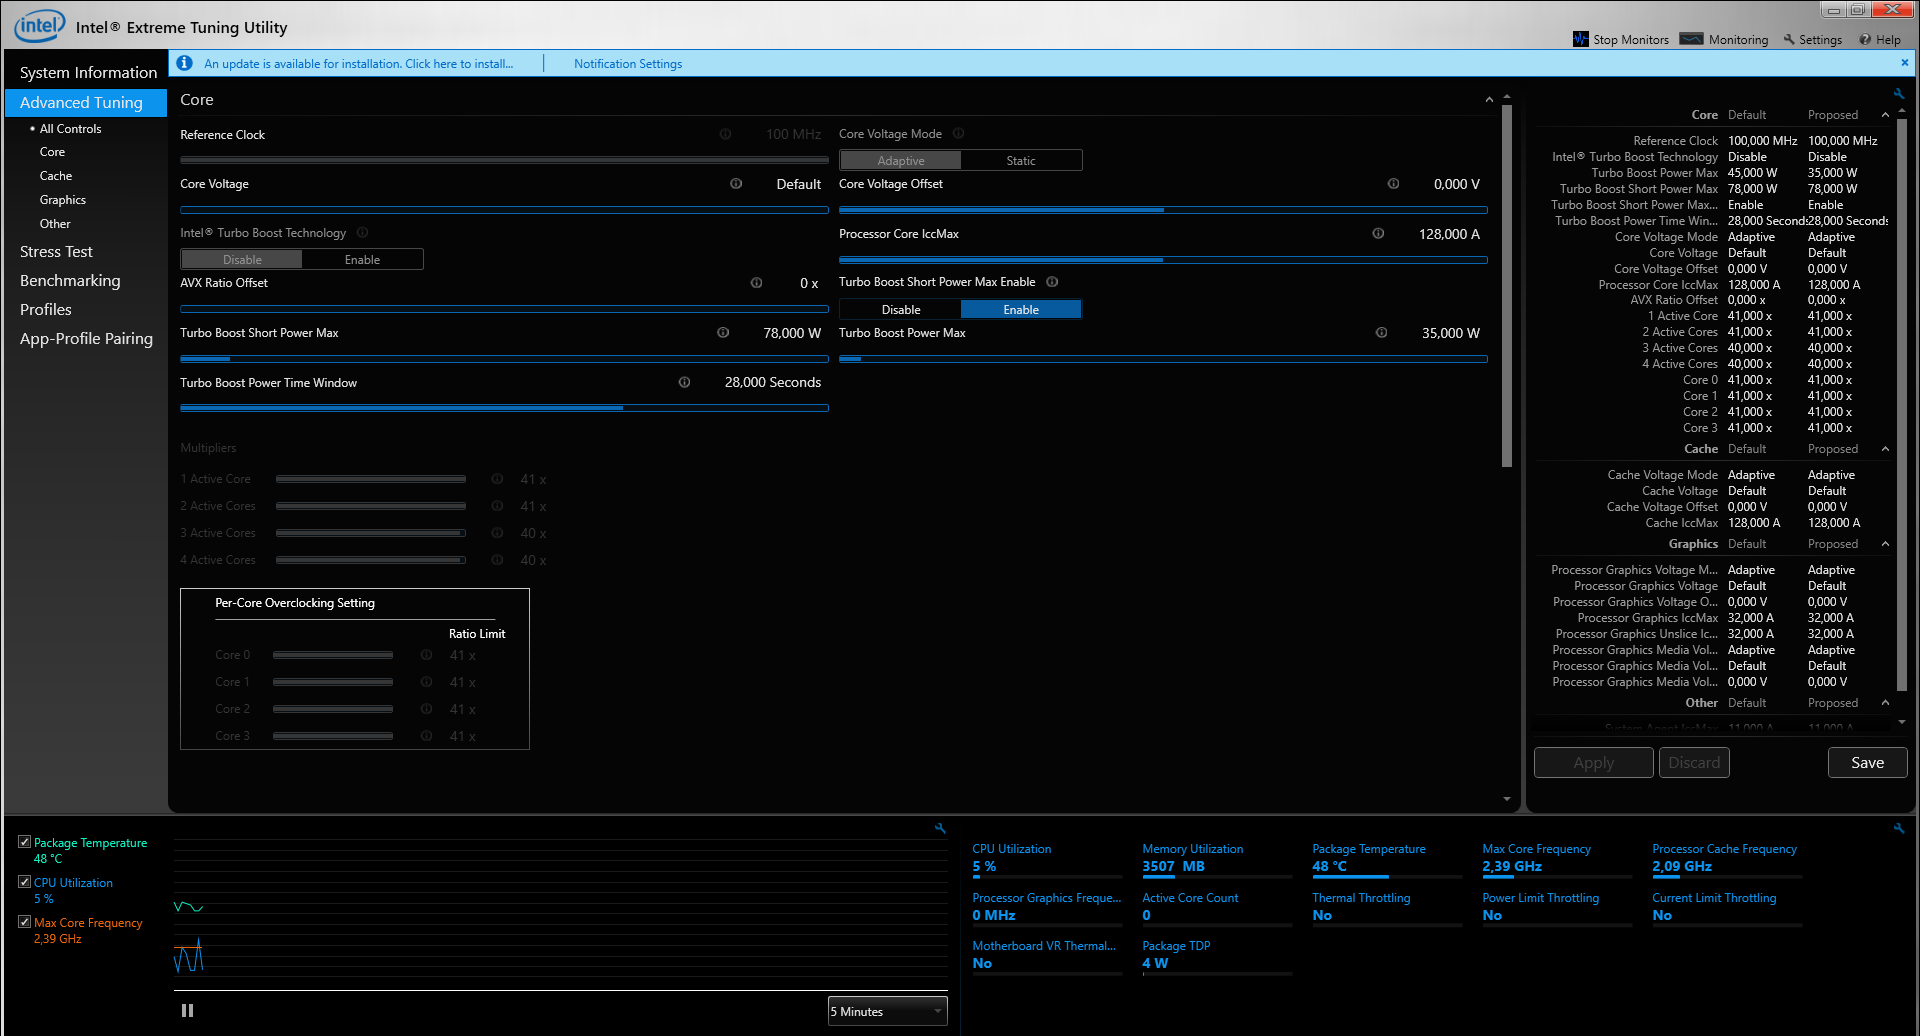
We evaluate whether the CPU Turbo can also be maintained constantly in mains operation by running the multi-thread test of the CineBench R15 benchmark for at least 30 minutes in a constant loop. From the first to the third run, the results drop slightly, but then they increase with a significant jump. Our measurements show that the Turbo fluctuates strongly during the first few runs. It only levels out at a fairly constant value later.
The results of the CB15 loop are not outstanding. Together with the Acer Nitro 5, the IdeaPad produces the worst results among the Core i5-9300H notebooks we have tested so far. The Legion Y540-17IRH, which is also made by Lenovo, produces values that are about 20 percent higher.
| Mozilla Kraken 1.1 - Total | |
| Lenovo Ideapad L340-17API-81LY0004GE (Edge 44) | |
| Asus TUF FX705DT-AU068T (Edge 44) | |
| Dell G3 17 3779 (Edge 42.17134.1.0) | |
| Average Intel Core i5-9300H (1079 - 1349, n=8) | |
| Lenovo Ideapad L340-17IRH 81LL001YGE (Edge 44) | |
| MSI GF75 Thin 9SC (Edge 44.17763.1.0) | |
| HP Pavilion Gaming 17-cd0085cl (Edge 44.17763.1.0) | |
| Average of class Gaming (421 - 824, n=208, last 2 years) | |
| Octane V2 - Total Score | |
| Average of class Gaming (69893 - 111243, n=52, last 2 years) | |
| MSI GF75 Thin 9SC (Edge 44.17763.1.0) | |
| HP Pavilion Gaming 17-cd0085cl (Edge 44.17763.1.0) | |
| Lenovo Ideapad L340-17IRH 81LL001YGE (Edge 44) | |
| Dell G3 17 3779 (Edge 42.17134.1.0) | |
| Average Intel Core i5-9300H (22225 - 34957, n=7) | |
| Lenovo Ideapad L340-17API-81LY0004GE (Edge 44) | |
| Asus TUF FX705DT-AU068T (Edge 44) | |
| JetStream 1.1 - Total Score | |
| Average of class Gaming (357 - 650, n=27, last 2 years) | |
| MSI GF75 Thin 9SC (Edge 44.17763.1.0) | |
| HP Pavilion Gaming 17-cd0085cl (Edge 44.17763.1.0) | |
| Lenovo Ideapad L340-17IRH 81LL001YGE (Edge 44) | |
| Dell G3 17 3779 (Edge 42.17134.1.0) | |
| Average Intel Core i5-9300H (150.3 - 254, n=7) | |
| Lenovo Ideapad L340-17API-81LY0004GE (Edge 44) | |
| Asus TUF FX705DT-AU068T (Edge 44) | |
* ... smaller is better
System Performance
The L340-17IRH does not lack performance. A strong processor and a fast NVMe SSD ensure a fast and smooth running system. They are accompanied by a mid-range GPU that is able to bring all the current computer games onto the screen. The results in the PC-Mark benchmark turn out good.
Unfortunately, Lenovo leaves part of the performance potential unused, since the working memory can only run in single-channel mode exclusively. The dual-channel mode also cannot be activated later, because the notebook only has a single slot for the working memory. However, there are also other equipment models of the IdeaPad L340 that allow using the dual-channel mode. Those model are equipped with an additional 4 GB of working memory that is soldered in.

| PCMark 8 Home Score Accelerated v2 | 3582 points | |
| PCMark 8 Creative Score Accelerated v2 | 3438 points | |
| PCMark 8 Work Score Accelerated v2 | 4922 points | |
| PCMark 10 Score | 4821 points | |
Help | ||
Storage Solution
An NVMe SSD from Western Digital serves as the system drive. This is a model in the M.2-2242 format that offers 512 GB of storage space. In the state of delivery, 438 GB of that is still available, and the rest of the storage is used by the recovery partition and the Windows installation. While the transfer rates turn out good, the built-in model does not belong to the top range of SSDs. The SSD supports only PCI Express Gen3 x2 and is thus connected with two lanes. Faster models use four lanes (PCI Express Gen3 x4).


| Lenovo Ideapad L340-17IRH 81LL001YGE WDC PC SN520 SDAPMUW-512 | Lenovo Ideapad L340-17API-81LY0004GE Samsung SSD PM871b MZ7LN256HAJQ | Asus TUF FX705DT-AU068T WDC PC SN520 SDAPNUW-256G | MSI GF75 Thin 9SC Crucial P1 SSD CT1000P1SSD8 | HP Pavilion Gaming 17-cd0085cl Samsung SSD PM981 MZVLB256HAHQ | Dell G3 17 3779 SK hynix SC311 SATA | Average WDC PC SN520 SDAPMUW-512 | Average of class Gaming | |
|---|---|---|---|---|---|---|---|---|
| CrystalDiskMark 5.2 / 6 | -44% | 4% | 27% | 43% | -59% | 3% | 159% | |
| Write 4K | 100.7 | 94.4 -6% | 145 44% | 133 32% | 135.3 34% | 62.8 -38% | 115.1 ? 14% | 216 ? 114% |
| Read 4K | 40.26 | 32.45 -19% | 45.28 12% | 55.6 38% | 63.7 58% | 24.63 -39% | 41.4 ? 3% | 70.3 ? 75% |
| Write Seq | 1196 | 482.8 -60% | 1301 9% | 1623 36% | 1337 12% | 203.9 -83% | 1208 ? 1% | 3724 ? 211% |
| Read Seq | 1091 | 524 -52% | 1362 25% | 1386 27% | 1617 48% | 550 -50% | 1121 ? 3% | 3701 ? 239% |
| Write 4K Q32T1 | 376 | 232 -38% | 249.1 -34% | 501 33% | 568 51% | 160.1 -57% | 421 ? 12% | 552 ? 47% |
| Read 4K Q32T1 | 418.6 | 253.6 -39% | 342.1 -18% | 584 40% | 645 54% | 184.3 -56% | 393 ? -6% | 735 ? 76% |
| Write Seq Q32T1 | 1459 | 496.5 -66% | 1301 -11% | 1696 16% | 1428 -2% | 235 -84% | 1388 ? -5% | 4782 ? 228% |
| Read Seq Q32T1 | 1684 | 540 -68% | 1732 3% | 1572 -7% | 3184 89% | 554 -67% | 1697 ? 1% | 6445 ? 283% |
Graphics Card
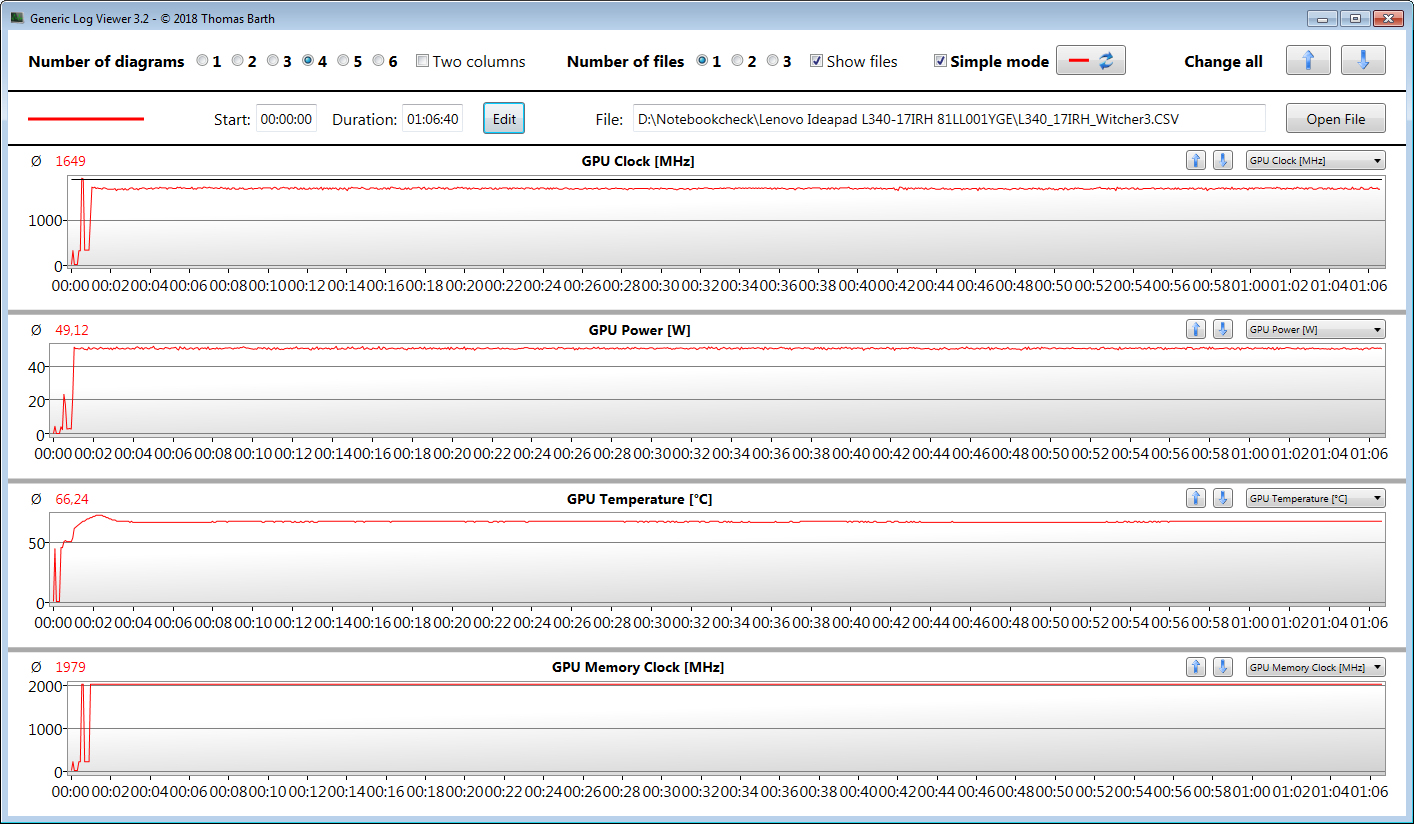
The IdeaPad L340 uses a dedicated GeForce GTX-1650 graphics core from Nvidia. The GPU belongs to the GPU upper mid-range and is based on the Turing architecture. In contrast to the Turing GPUs of the RTX-2000 series, the GTX 1650 does not offer ray tracing or tensor cores. The GTX 1650 supports DirectX 12 and runs at a base speed of 1395 MHz. Via Boost, this can be increased up to 1560 MHz. If the GPU does not exceed a set temperature and power limit, even higher speeds can be achieved. We register a maximum of 1887 MHz, which can only be maintained for a short time, however. The Witcher-3 test runs at an average speed of 1671 MHz. The GPU is able to use the fast GDDR5 graphics storage (4096 GB).
The results in the 3D-Mark benchmarks range at a normal level for this GPU. The UHD Graphics-630 GPU integrated into the processor is active, and the notebook uses Nvidia's Optimus graphics switching solution.

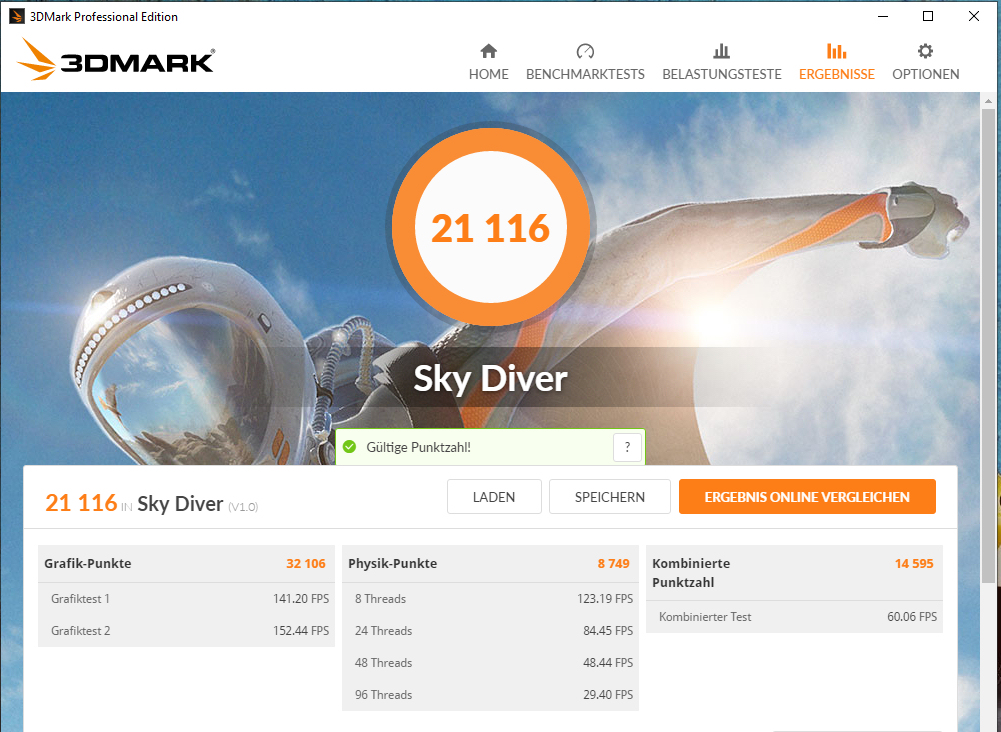


| 3DMark 11 Performance | 10990 points | |
| 3DMark Ice Storm Standard Score | 72776 points | |
| 3DMark Cloud Gate Standard Score | 22820 points | |
| 3DMark Fire Strike Score | 7863 points | |
Help | ||
Gaming Performance
The hardware of the Lenovo notebook is able to bring all the games that are in our database smoothly to the screen. Usually, Full HD resolution and medium to high quality settings can be used, and in some cases even more is possible. The built-in GPU is not made for resolutions beyond Full HD (you would need an external monitor). The corresponding resolutions can only be used for games that do not make very high demands on the hardware.
However, the frame rates remain behind the potential of the notebook, since the working memory can only run in single-channel mode. The difference in the frame rates between dual and single-channel mode depends on the game and the selected resolution and quality level. We recently tested the HP Omen 15 that is equipped with the same CPU/GPU combination in single as well as in dual channel mode. In dual-channel mode, up to 30 percent higher frame rates can be achieved.
| BioShock Infinite - 1920x1080 Ultra Preset, DX11 (DDOF) | |
| HP Pavilion Gaming 17-cd0085cl | |
| HP Omen 15-dc1020ng (Dual-Channel-Modus) | |
| MSI GF75 Thin 9SC | |
| HP Omen 15-dc1020ng | |
| Average NVIDIA GeForce GTX 1650 Mobile (68.5 - 99.4, n=18) | |
| Lenovo Ideapad L340-17IRH 81LL001YGE | |
| Asus TUF FX705DT-AU068T | |
| Dell G3 17 3779 | |
| Asus TUF FX705DY-AU072 | |
| Lenovo Ideapad L340-17API-81LY0004GE | |
| The Witcher 3 - 1920x1080 High Graphics & Postprocessing (Nvidia HairWorks Off) | |
| Average of class Gaming (17.5 - 449, n=165, last 2 years) | |
| HP Pavilion Gaming 17-cd0085cl | |
| MSI GF75 Thin 9SC | |
| HP Omen 15-dc1020ng | |
| Average NVIDIA GeForce GTX 1650 Mobile (45 - 70.4, n=29) | |
| Acer Aspire Nitro 5 AN515-54-53Z2 | |
| Asus TUF FX705DT-AU068T | |
| Lenovo Ideapad L340-17IRH 81LL001YGE | |
| Dell G3 17 3779 | |
| Asus TUF FX705DY-AU072 | |
| Battlefield V - 1920x1080 Ultra Preset | |
| Average NVIDIA GeForce GTX 1650 Mobile (44.3 - 64.8, n=5) | |
| Lenovo Ideapad L340-17IRH 81LL001YGE | |
| Asus TUF FX705DY-AU072 | |
| Apex Legends - 1920x1080 Maximum Settings AA:TS AF:16x | |
| Average of class Gaming (last 2 years) | |
| Lenovo Ideapad L340-17IRH 81LL001YGE | |
| Average NVIDIA GeForce GTX 1650 Mobile (65.4 - 71.7, n=3) | |
| Asus TUF FX705DY-AU072 | |
| Final Fantasy XV Benchmark - 1280x720 Lite Quality | |
| Average of class Gaming (24.6 - 234, n=139, last 2 years) | |
| Average NVIDIA GeForce GTX 1650 Mobile (54.8 - 87.4, n=4) | |
| Asus TUF FX705DT-AU068T | |
| Lenovo Ideapad L340-17IRH 81LL001YGE | |
| F1 2019 - 1920x1080 Ultra High Preset AA:T AF:16x | |
| HP Omen 15-dc1020ng (Dual-Channel-Modus) | |
| Average NVIDIA GeForce GTX 1650 Mobile (59 - 65, n=5) | |
| HP Omen 15-dc1020ng | |
| Lenovo Ideapad L340-17IRH 81LL001YGE | |
| Lenovo Ideapad L340-17API-81LY0004GE | |
In order to evaluate whether the frame rates remain mostly constant also over a longer time period, we run the game "The Witcher 3" for about 60 minutes at Full HD resolution and maximum quality settings. The character of the gamer is not moved during the whole time period. We do not detect a drop in the frame rates.
| low | med. | high | ultra | |
| BioShock Infinite (2013) | 195.6 | 159.4 | 152.2 | 80.5 |
| The Witcher 3 (2015) | 135.8 | 100.1 | 57.5 | 34.2 |
| Final Fantasy XV Benchmark (2018) | 54.8 | 49.1 | 35.4 | |
| Battlefield V (2018) | 83.7 | 60.4 | 57.7 | 54.3 |
| Apex Legends (2019) | 144 | 95.1 | 71.9 | 71.7 |
| Anthem (2019) | 43.9 | 33.4 | 34.2 | 29.1 |
| Total War: Three Kingdoms (2019) | 114.8 | 57.7 | 38.9 | 26.1 |
| F1 2019 (2019) | 111 | 84 | 70 | 59 |
| Control (2019) | 126.7 | 45.2 | 33.4 |
Emissions and Power Management - Within the green range
Noise Emissions
The IdeaPad L340 does not produce an excessive amount of noise across the whole range of loads. During idle operation, the fans are often turned off and there is silence. Under load, the fans rev up. During the stress test, we measure a noise level of 40.9 dB(A). Things become slightly louder during gaming operation, and we register a level of 43.8 dB(A) while running the Witcher-3 test.
Noise Level
| Idle |
| 30 / 30 / 30.4 dB(A) |
| Load |
| 40.9 / 40.9 dB(A) |
 | ||
30 dB silent 40 dB(A) audible 50 dB(A) loud |
||
min: | ||
Temperature
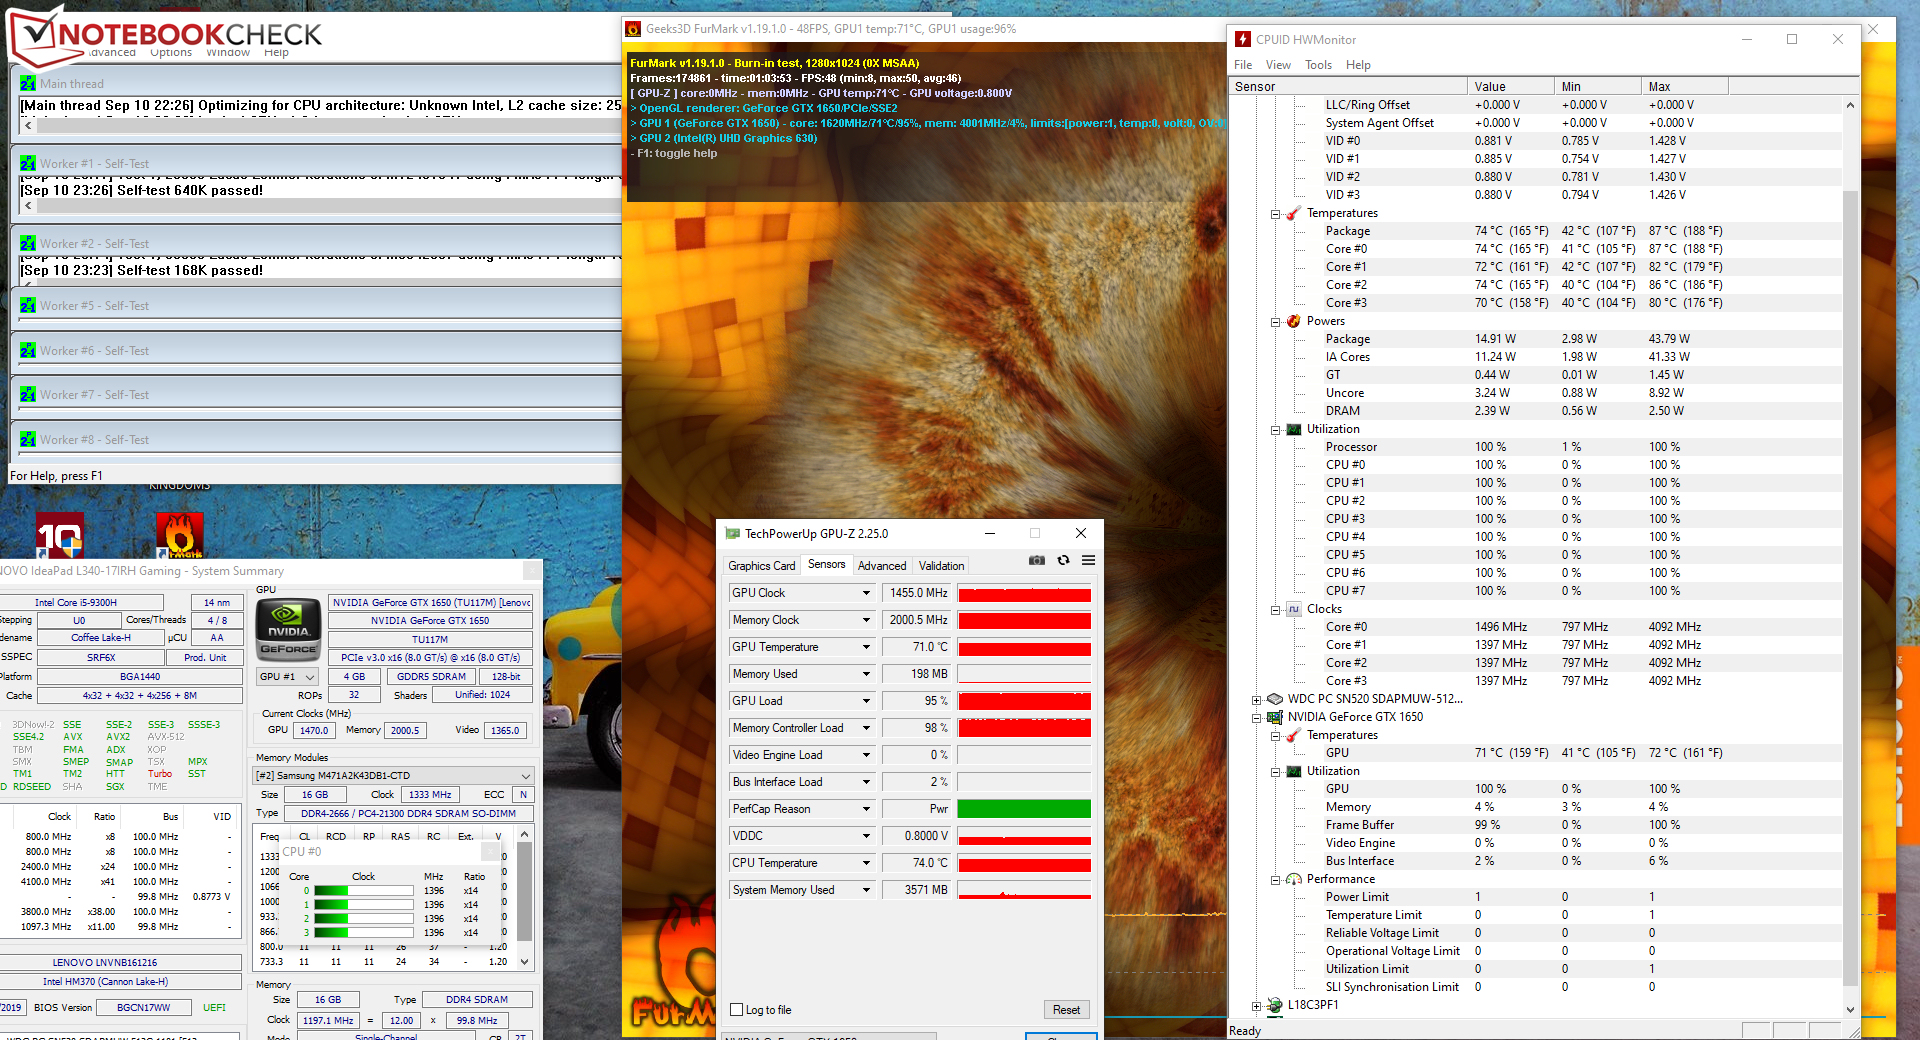
The Lenovo notebook runs through our stress test (Prime95 and FurMark run for at least one hour) in different ways in mains and battery operation. In mains operation, the processor runs at 2.4 GHz for a short time, before the clock speed drops to 1.4 GHz and then remains at that level. The graphics core reaches speeds between 1400 and 1500 MHz. In battery operation, the clock speeds are at 800 MHz (CPU) and 800 to 900 MHz (GPU). The stress test represents an extreme scenario that does not occur in everyday operation. We use this test to evaluate whether the system also remains stable under full load.
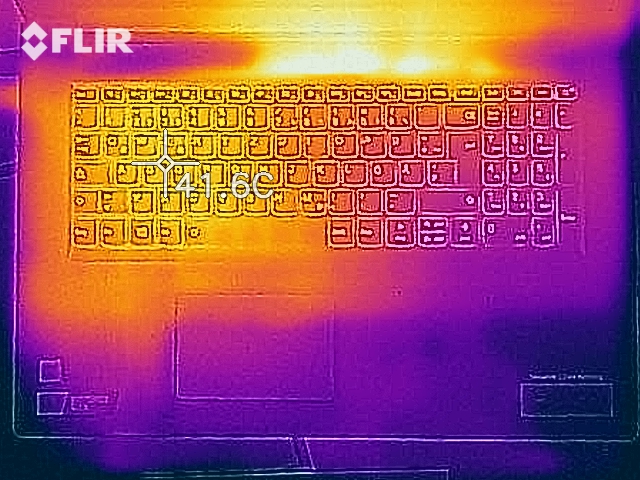
During the stress test, we register a temperature above 50 °C (122 °F) at one measurement point on the bottom of the case. The warming turns out significantly lower while running the Witcher-3 test (the game runs for one hour in Full HD resolution and at maximum quality settings). During idle operation, the temperatures remain within the green range.
(±) The maximum temperature on the upper side is 45 °C / 113 F, compared to the average of 40.4 °C / 105 F, ranging from 21.2 to 68.8 °C for the class Gaming.
(-) The bottom heats up to a maximum of 54 °C / 129 F, compared to the average of 43.2 °C / 110 F
(+) In idle usage, the average temperature for the upper side is 26 °C / 79 F, compared to the device average of 33.8 °C / 93 F.
(±) Playing The Witcher 3, the average temperature for the upper side is 32.7 °C / 91 F, compared to the device average of 33.8 °C / 93 F.
(+) The palmrests and touchpad are reaching skin temperature as a maximum (35.5 °C / 95.9 F) and are therefore not hot.
(-) The average temperature of the palmrest area of similar devices was 28.9 °C / 84 F (-6.6 °C / -11.9 F).


Speakers
The stereo speakers are placed in the front area of the case bottom. They produce a decent sound that lacks bass, however. For a better sound experience, you have to use headphones or external speakers.
Lenovo Ideapad L340-17IRH 81LL001YGE audio analysis
(-) | not very loud speakers (61.5 dB)
Bass 100 - 315 Hz
(-) | nearly no bass - on average 17% lower than median
(±) | linearity of bass is average (13.9% delta to prev. frequency)
Mids 400 - 2000 Hz
(±) | higher mids - on average 6.9% higher than median
(±) | linearity of mids is average (10.5% delta to prev. frequency)
Highs 2 - 16 kHz
(+) | balanced highs - only 1.7% away from median
(+) | highs are linear (5.9% delta to prev. frequency)
Overall 100 - 16.000 Hz
(±) | linearity of overall sound is average (25.2% difference to median)
Compared to same class
» 89% of all tested devices in this class were better, 3% similar, 8% worse
» The best had a delta of 6%, average was 18%, worst was 132%
Compared to all devices tested
» 73% of all tested devices were better, 6% similar, 21% worse
» The best had a delta of 4%, average was 25%, worst was 134%
Asus TUF FX705DT-AU068T audio analysis
(-) | not very loud speakers (65.9 dB)
Bass 100 - 315 Hz
(-) | nearly no bass - on average 18.9% lower than median
(±) | linearity of bass is average (12.2% delta to prev. frequency)
Mids 400 - 2000 Hz
(+) | balanced mids - only 4.2% away from median
(±) | linearity of mids is average (10.7% delta to prev. frequency)
Highs 2 - 16 kHz
(±) | higher highs - on average 7.3% higher than median
(±) | linearity of highs is average (7.1% delta to prev. frequency)
Overall 100 - 16.000 Hz
(±) | linearity of overall sound is average (28.9% difference to median)
Compared to same class
» 94% of all tested devices in this class were better, 2% similar, 5% worse
» The best had a delta of 6%, average was 18%, worst was 132%
Compared to all devices tested
» 84% of all tested devices were better, 3% similar, 13% worse
» The best had a delta of 4%, average was 25%, worst was 134%
Power Consumption
The IdeaPad does not show any unusual behavior in terms of the power consumption. During idle operation, we measure a maximum power consumption of 9.6 watts, which is a good value. During our stress test, the value increases up to 135 watts. During gaming operation, the consumption is lower. While running our Witcher-3 test, we measure an average power consumption of 92 watts (86 to 102 watts). The power supply is rated at 135 watts.
| Off / Standby | |
| Idle | |
| Load |
|
Battery Life
Our realistic WLAN test simulates the load when opening web sites, based on a script. The "Balanced" profile is active, the power saving functions are deactivated, and the display brightness is adjusted to about 150 cd/m². The L340 achieves a runtime of 6:11 hours, which is a good value for a gaming notebook.
Pros
Cons
Verdict
With the IdeaPad L340-17IRH, Lenovo offers a mid-range 17.3-inch gaming notebook. The built-in combination of the Core i5-9300H processor and GeForce GTX-1650 GPU brings all the current computer games to the screen smoothly. In general, you can use Full-HD resolution and medium to high quality settings.
Thanks to its discrete visuals, the IdeaPad L340-17IRH might also be interesting beyond gaming for many users.
However, the frame rates remain below the potential of the notebook, since the working memory only runs in single channel mode. Activating dual-channel mode is not possible, since the notebook only has a single slot for the working memory.
The build-in NVMe SSD ensures a fast and smoothly running system. You should be able to replace it with a faster or higher-capacity model, but in order to do that, you would need to open the case. The matte IPS display scores with stable viewing angles, a good contrast, and great color reproduction. The brightness of the displays is okay, but should be better in a notebook of this price range.
The chiclet keyboard is proving suitable for everyday tasks. A positive point is that it offers illumination. This is accompanied by a good battery life. While the connection equipment of the notebook is not too rich, the most necessary connections are there. On the other hand, you have to make do without a storage card reader.
Lenovo Ideapad L340-17IRH 81LL001YGE
-
09/13/2019 v7
Sascha Mölck
More articles related to this device
Lenovo Ideapad L340-17IRH 81LL001YGE (Ideapad L340-17 Series)Related Articles


Pricecompare

