 Deutsch
 English
 Español
 Français
 Italiano
 Nederlands
 Polski
 Português
 Русский
 Türkçe
 Svenska
 Chinese
 Magyar
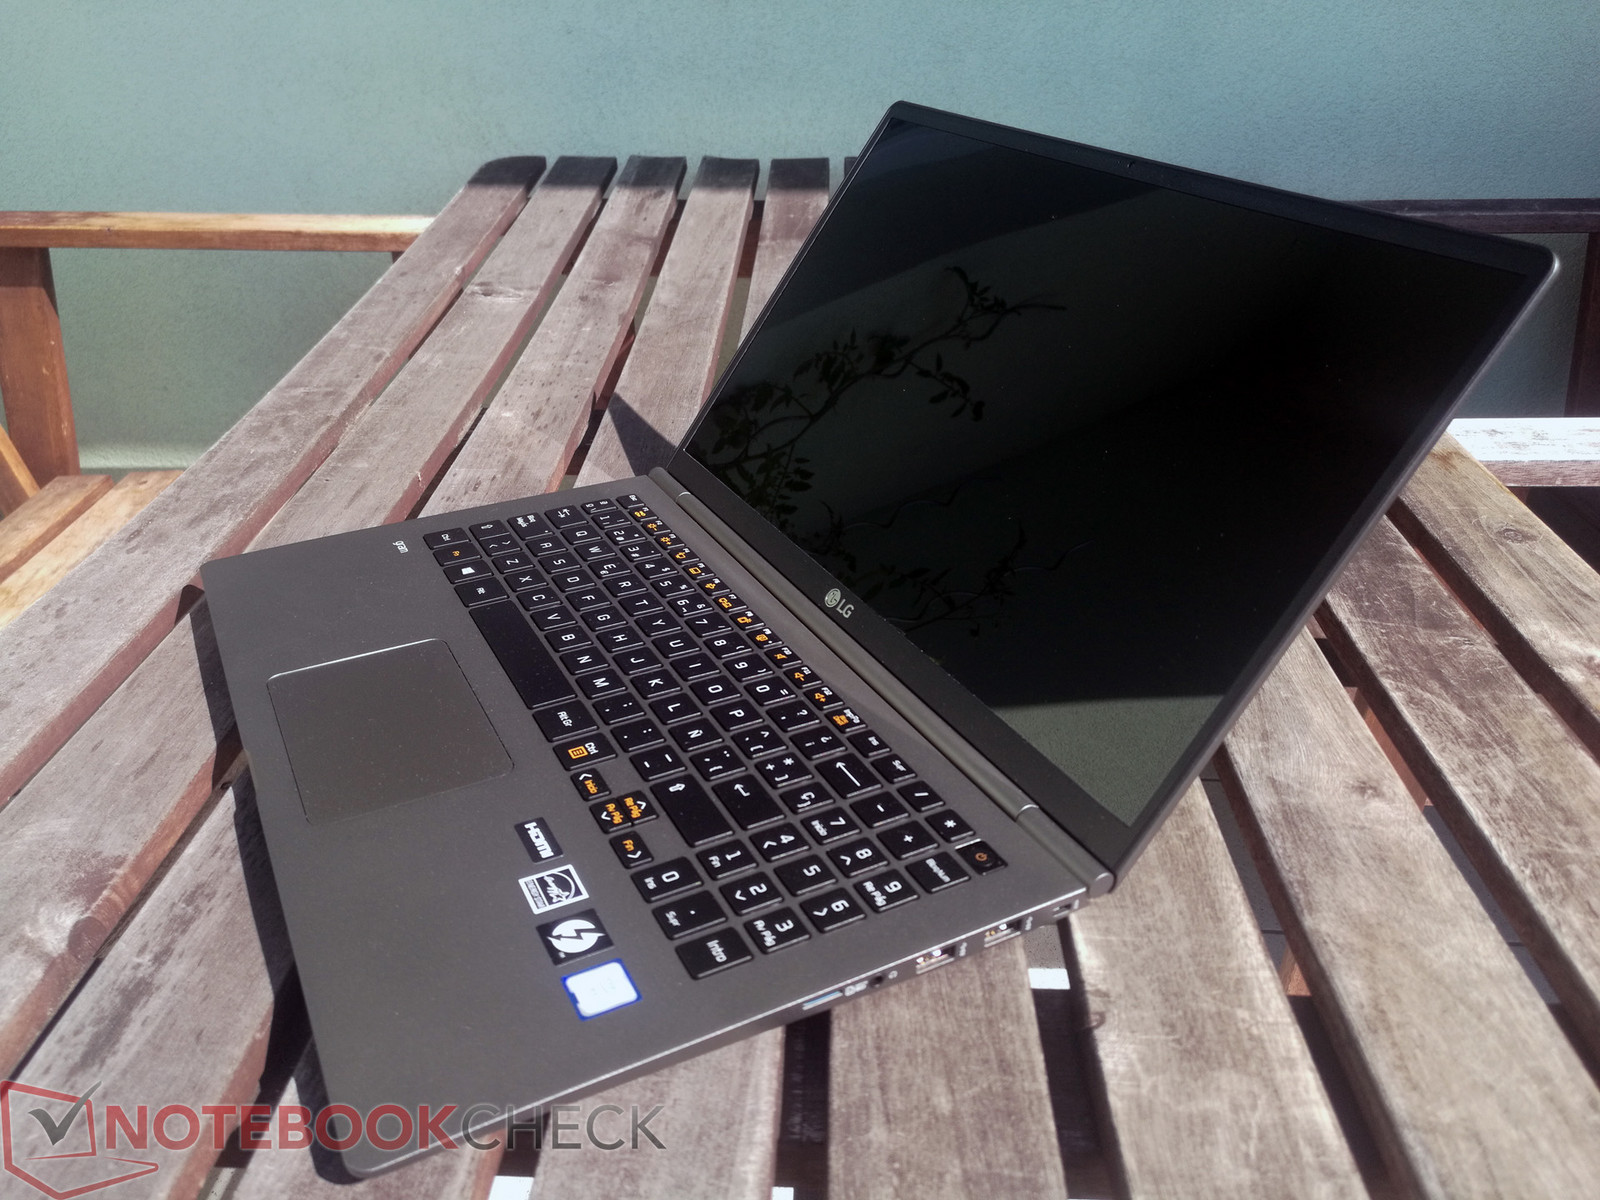
LG Gram 15Z980 (i7-8550U, Full-HD) Laptop Review

We should let you know about some good news and bad news from the outset. Unfortunately, the LG Gram 15 is unavailable in Germany. However, the device is available on Amazon.es and can be ordered from other EU countries.
We have already reviewed last year’s LG Gram 15Z975 and the smaller LG Gram 13Z980. Our test device is the LG Gram 15Z980, which is equipped with an Intel Core i7-8550U processor, 16 GB RAM and a 512 GB SSD.
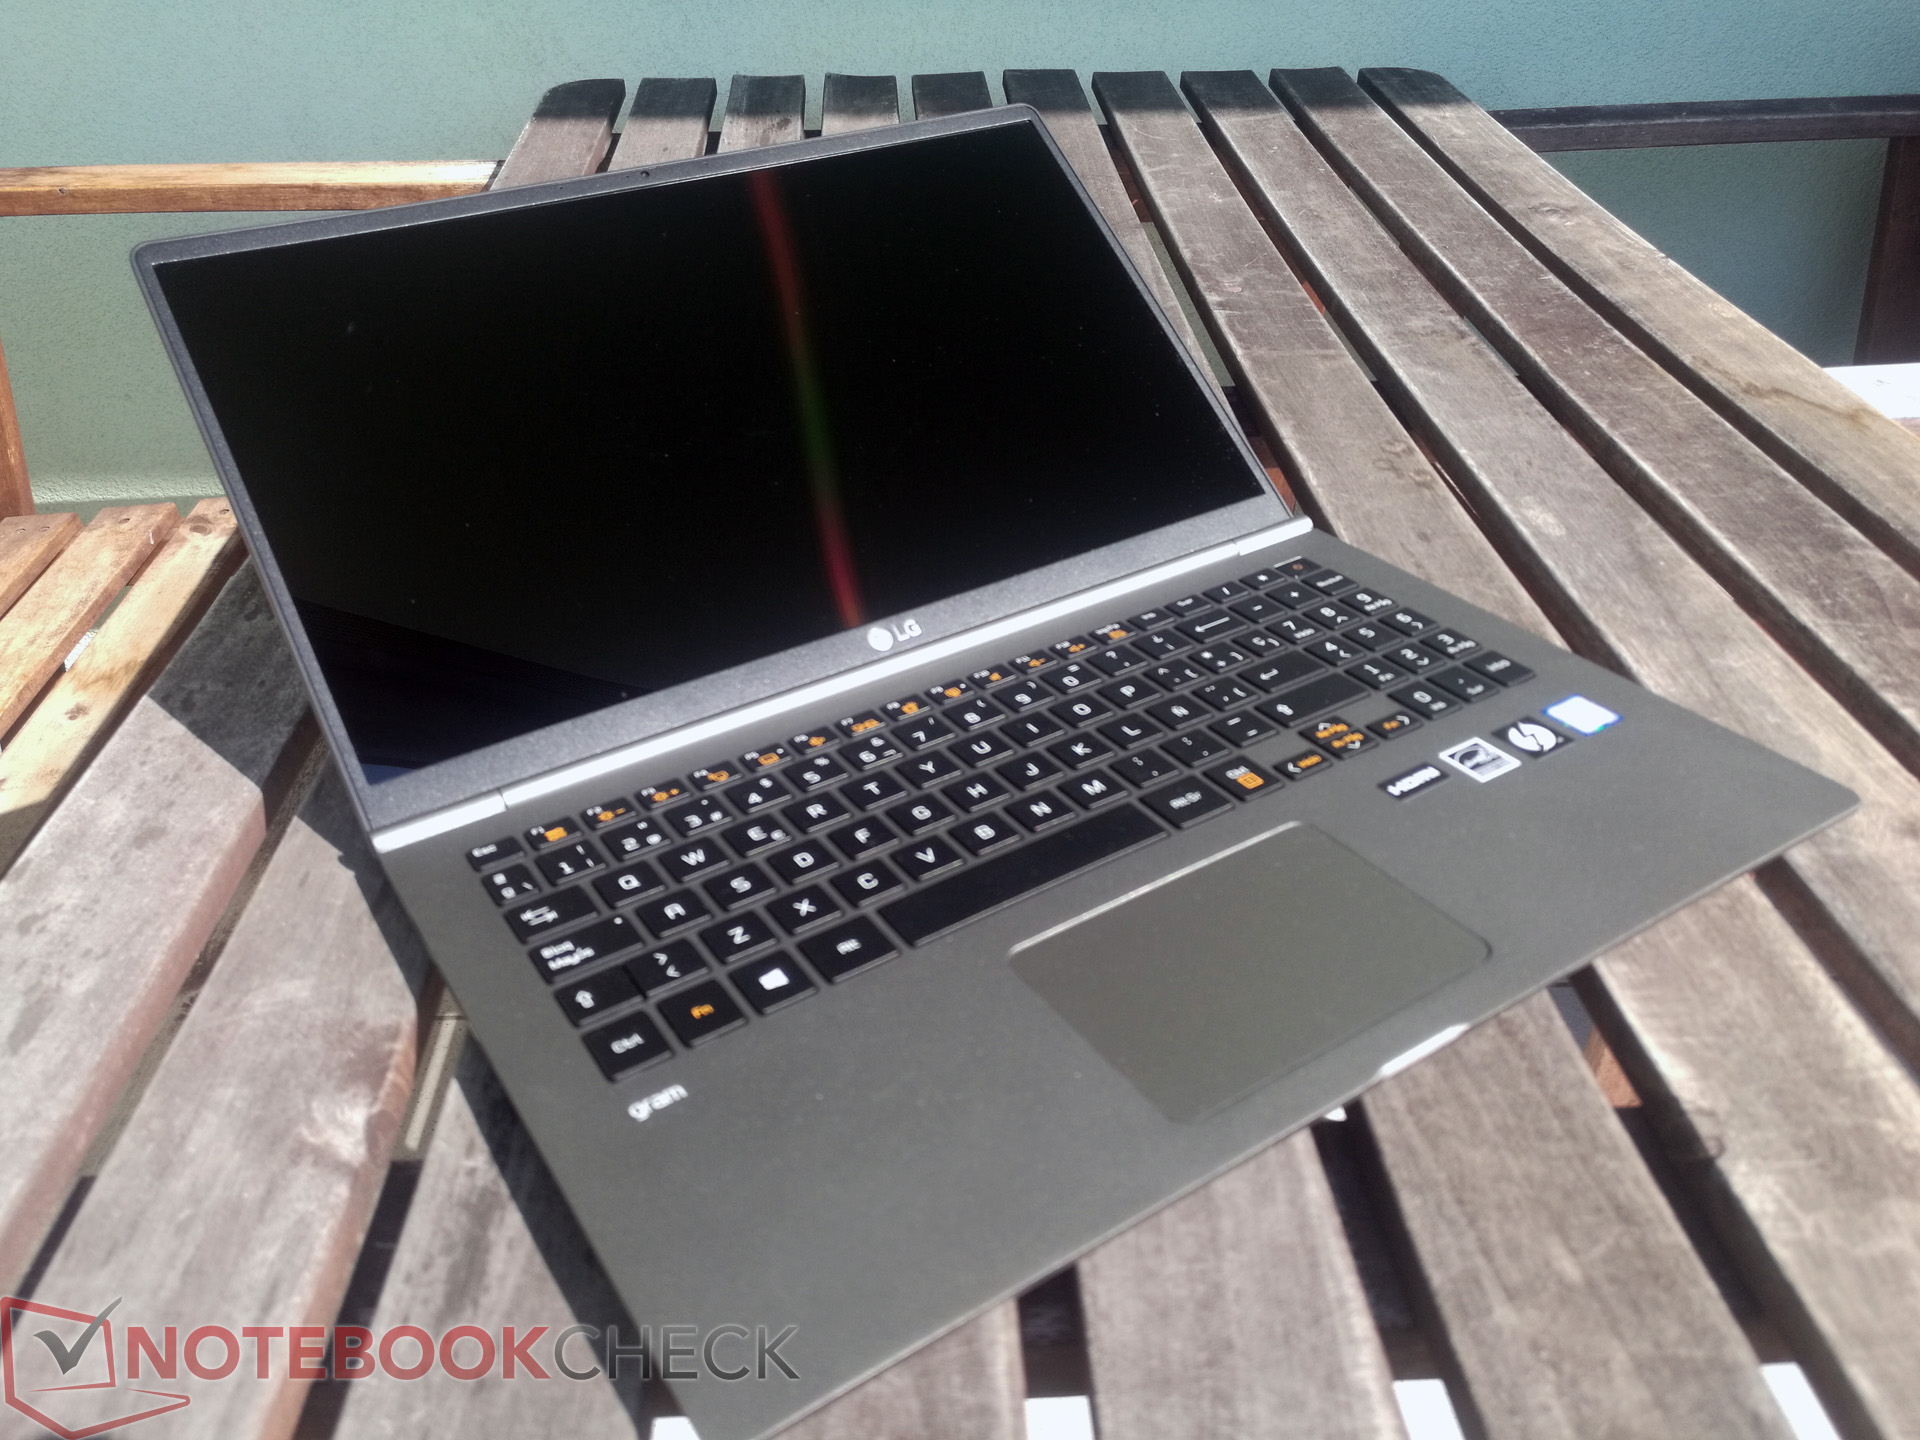
Case
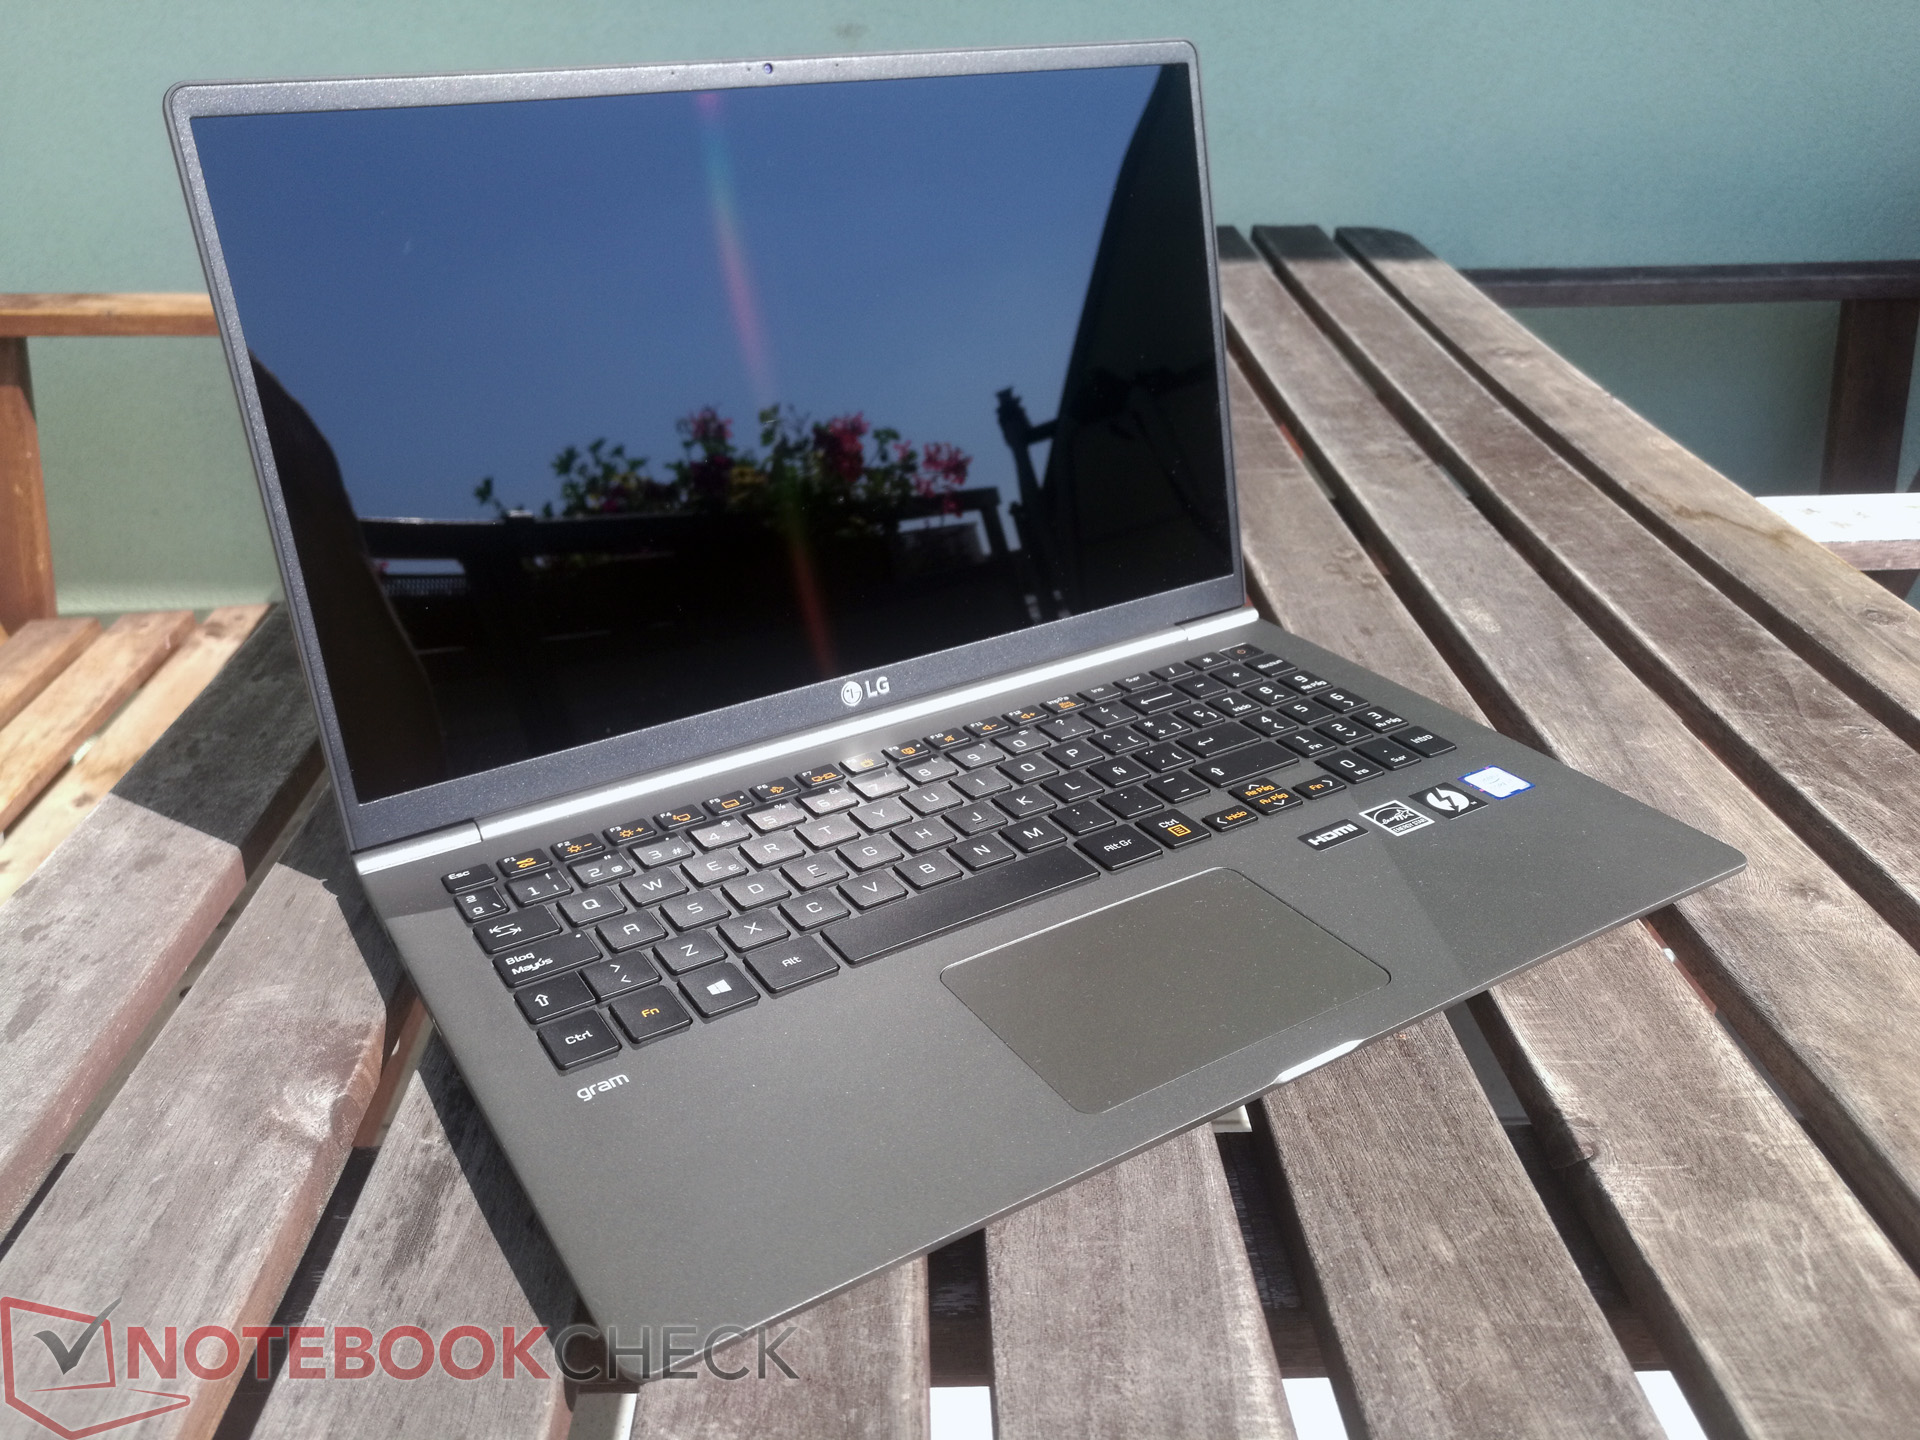
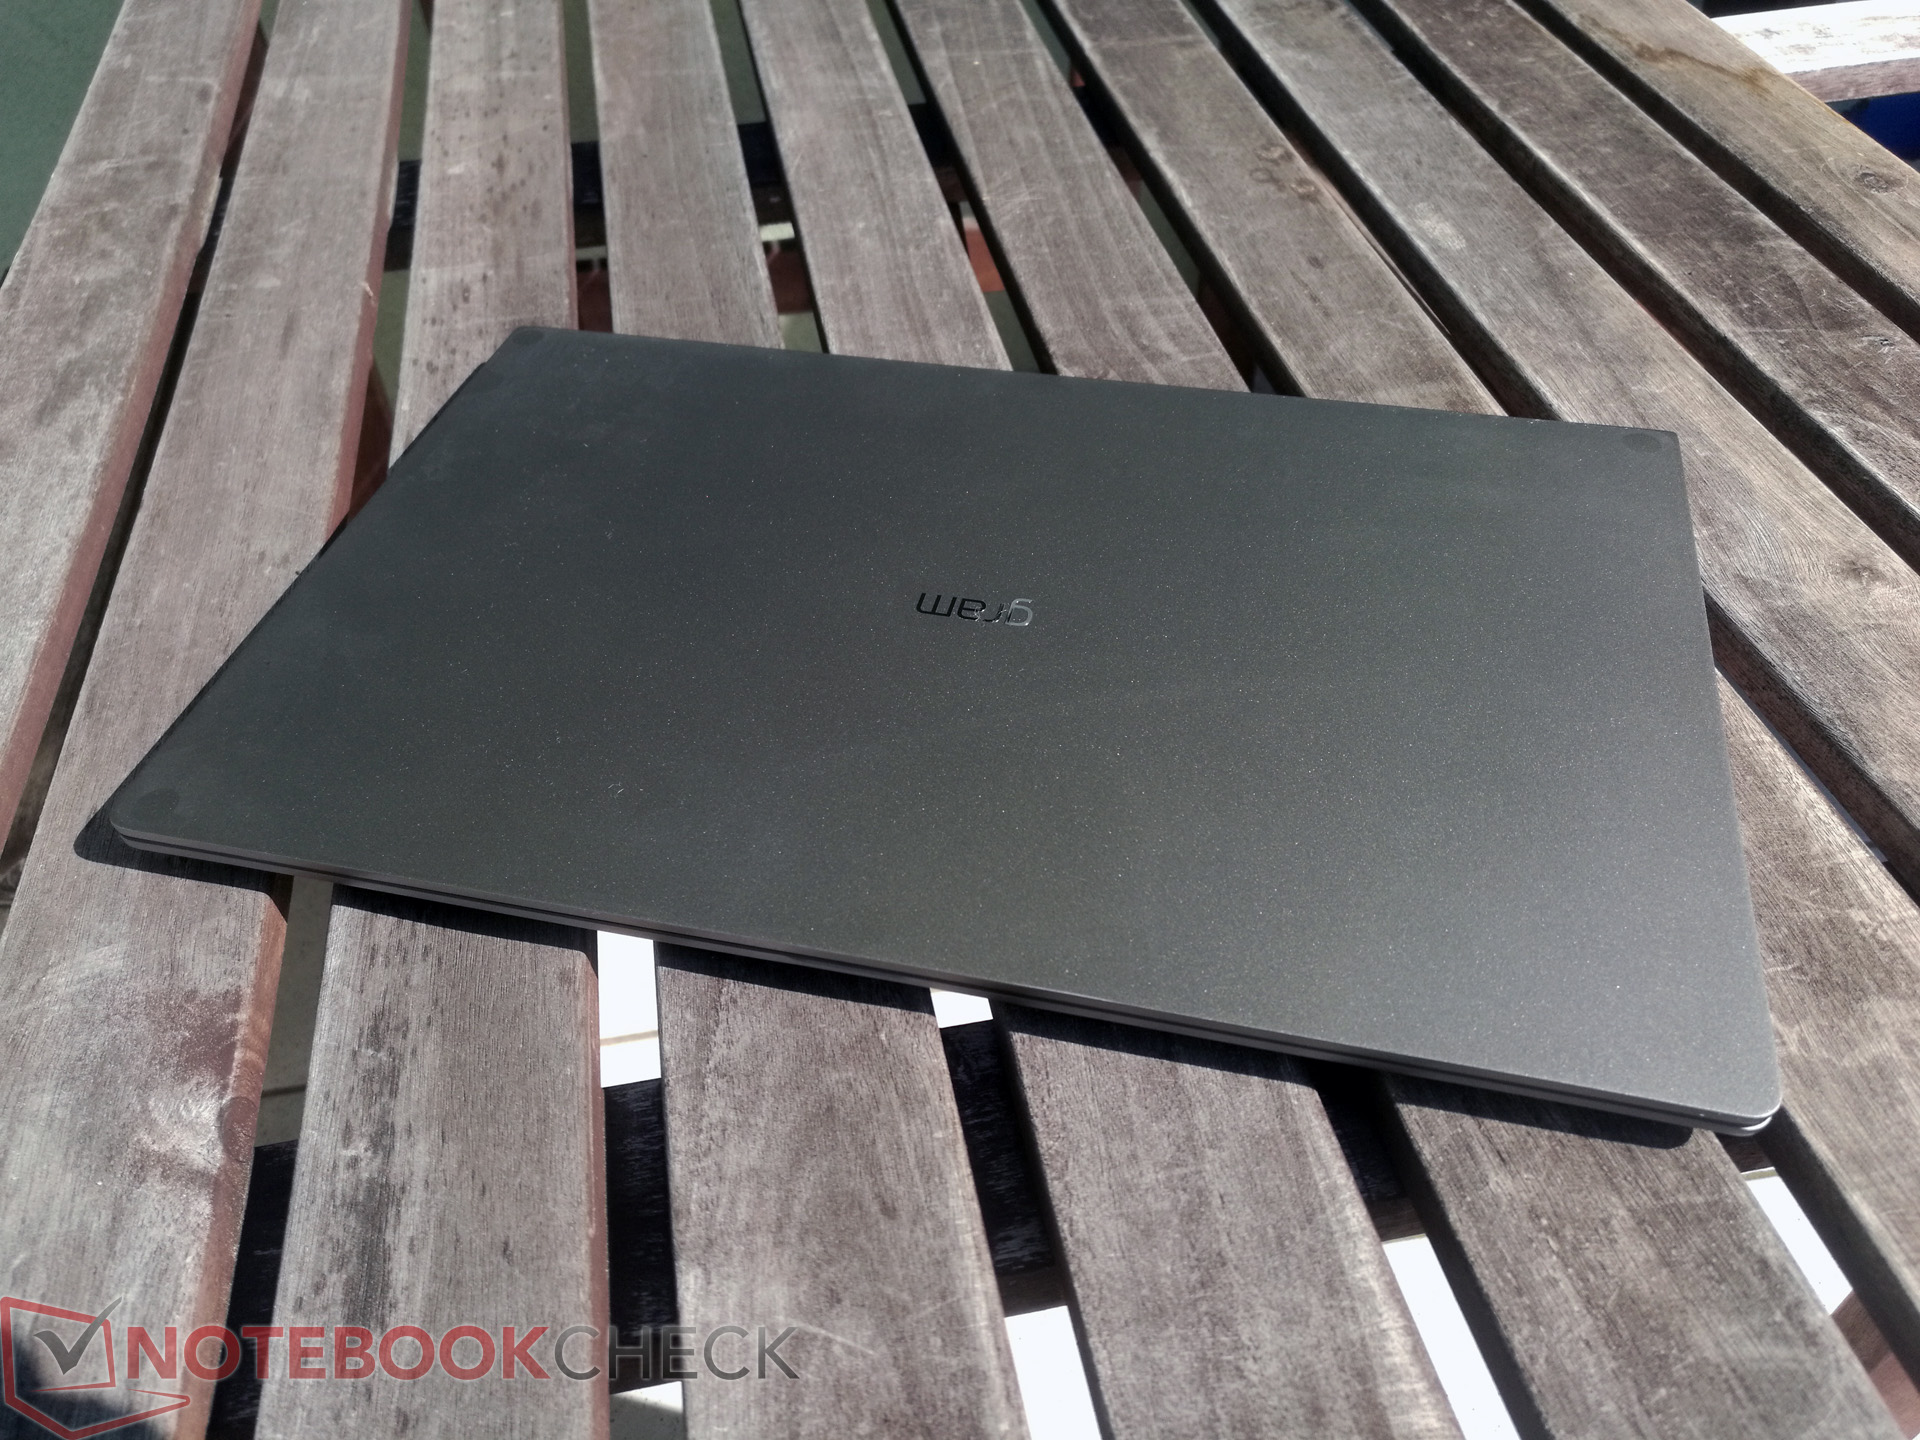
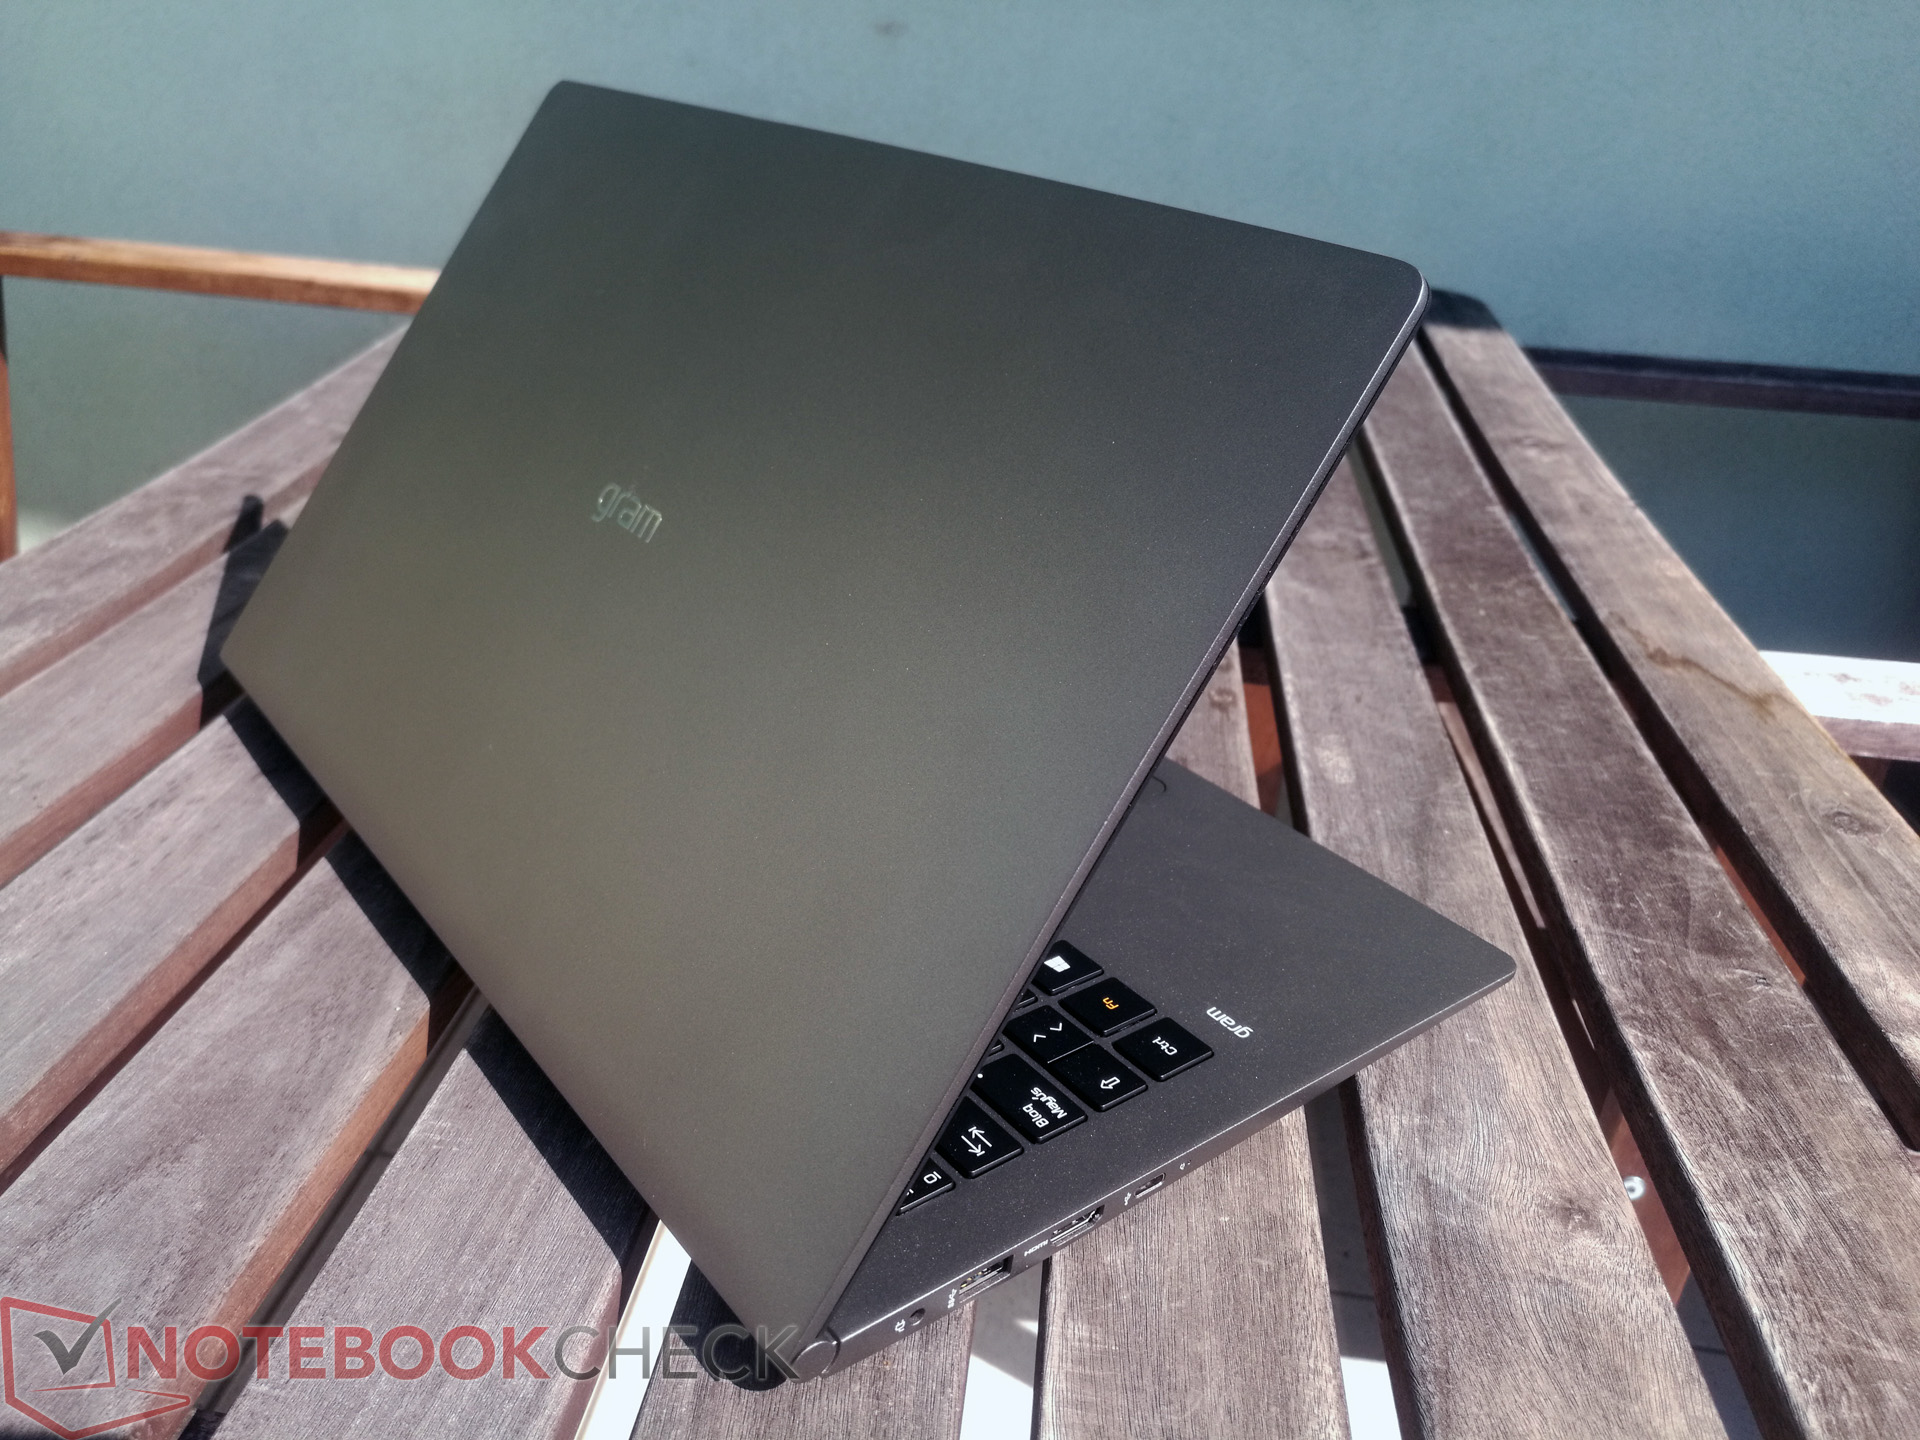
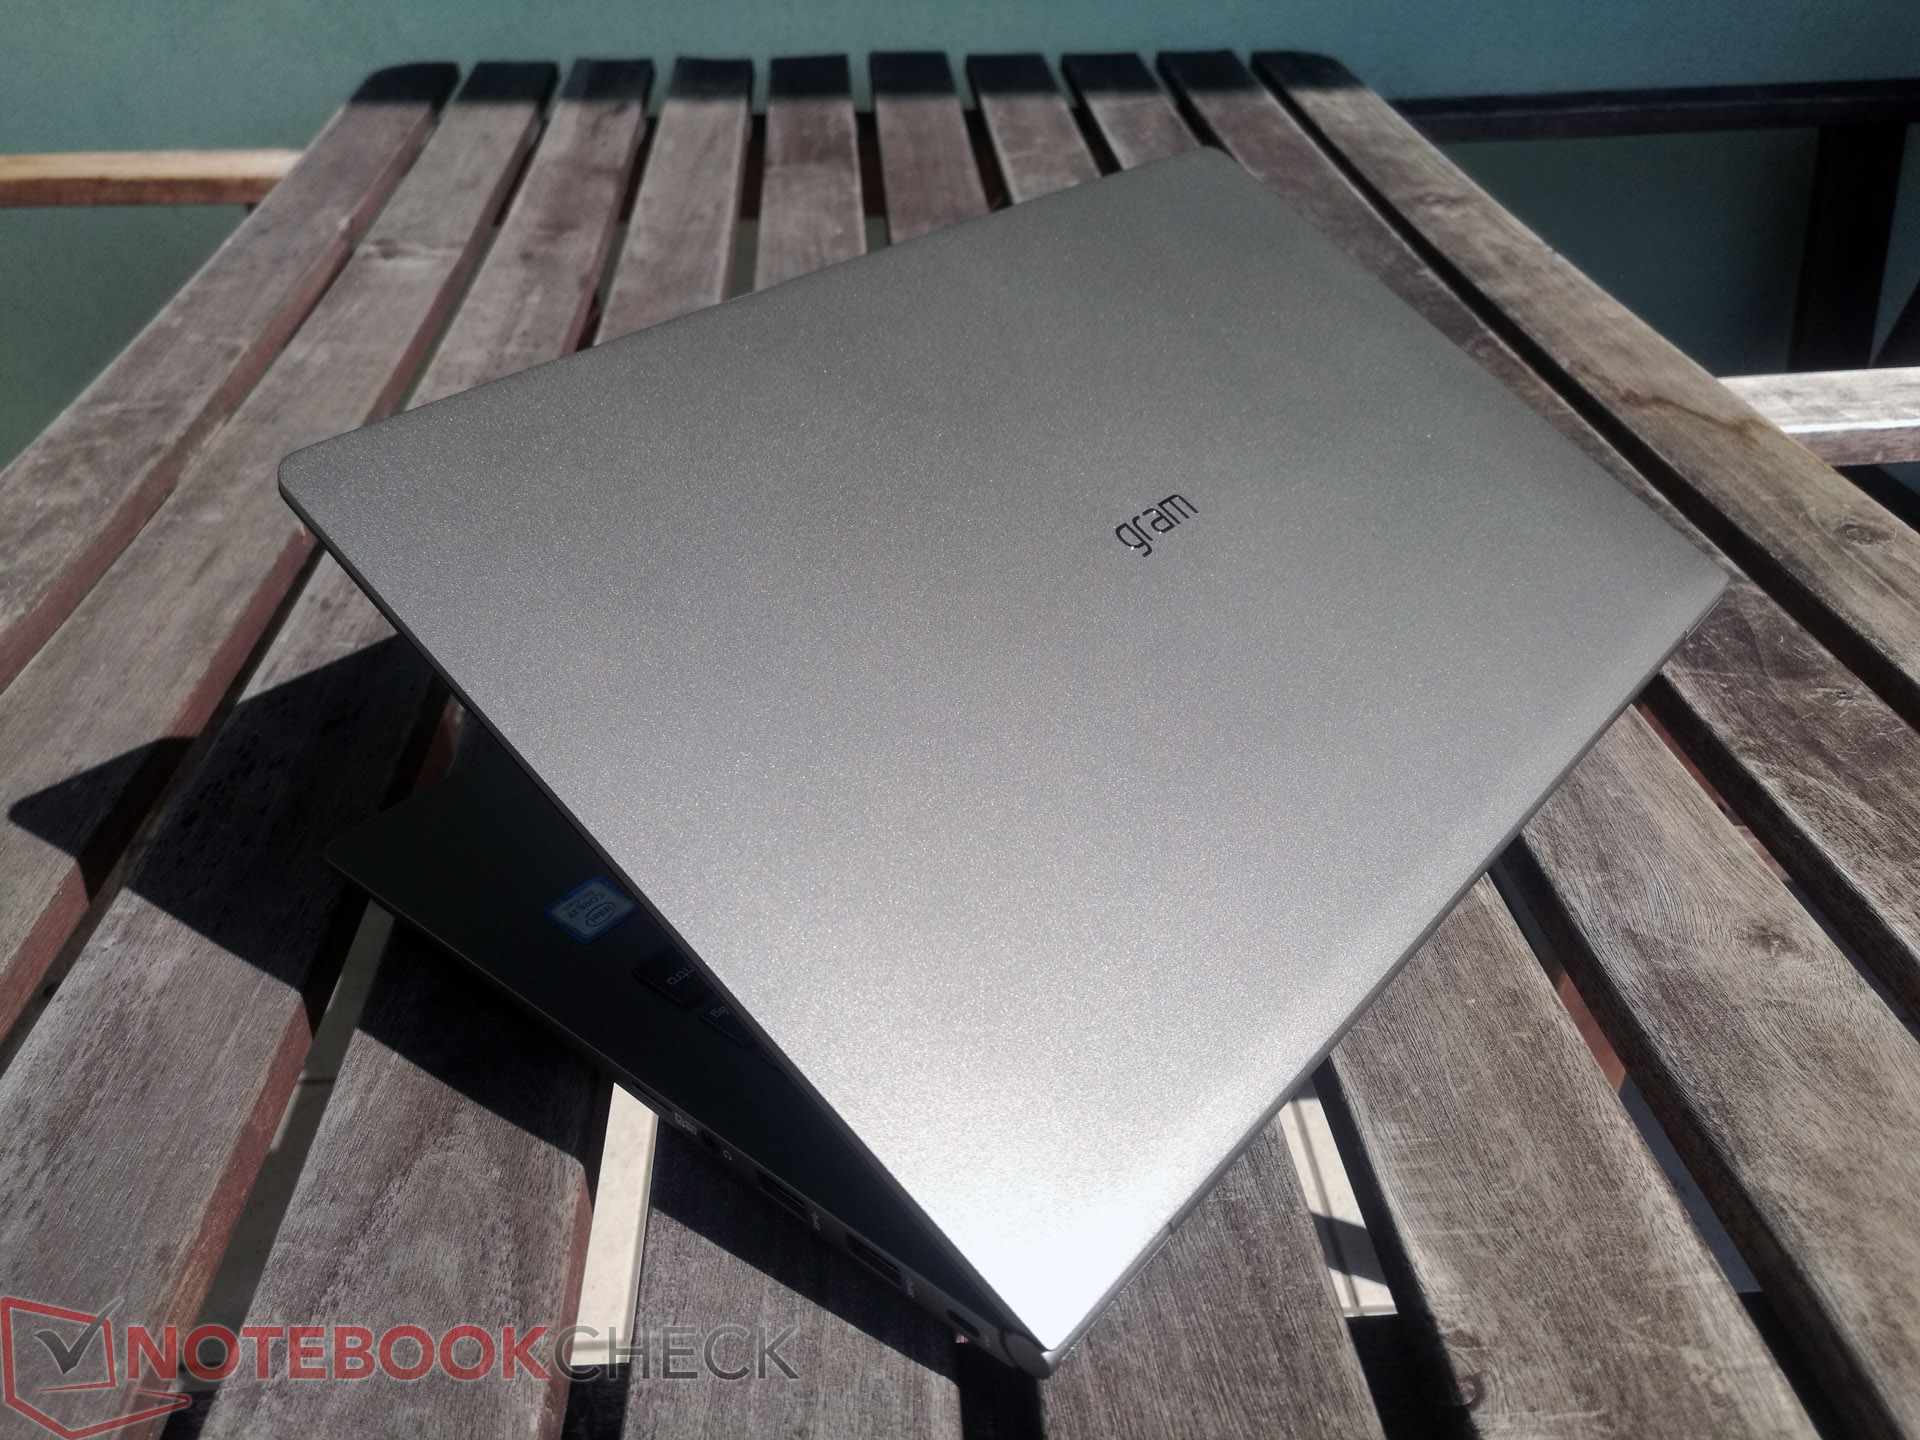
The 15Z980 is made of a nano-carbon magnesium alloy, a material that we have primarily seen used in high-end business notebooks. The base unit is strong and cannot be twisted, but we can leave a temporary impression in the case by applying only moderate pressure. This is also the case with the display lid. However, the latter is considerably more flexible. The cover visibly twists even when just opening the device with one hand. Overall, the magnesium is high quality and strong, but its flexibility makes the case feel cheaper than those made from aluminum, for example.
The 15Z980 weighs 1.095 kg (~2.4 lbs), which is noticeably lighter than other fifteen-inch devices to the point of feeling delicate. LG promises that this does not come at a cost of durability though by advertising the 15Z980 as being MIL-STD-810G certified. MIL-STD-810G certification means that a device has successfully passed fourteen environmental and climatic tests. However, no independent organization or agency certifies MIL-STD-810 compliance, so take the certification with a pinch of salt.
Incidentally, last year’s model fared well in durability tests on JerryRigEverything’s YouTube channel. The 15Z980 and its predecessor are structurally and visually alike, so we would expect this durability to carry over to this year’s model.
The case is broadly the same as last year’s model, except that the webcam has moved to the top of the display. This marginally increases the display frame, but not noticeably so.

The 15Z980 has few 15-inch comparison devices, with the next lightest device of those that we have tested being the 1.6 kg (~3.5 lbs) ASUS VivoBook S15. This is nearly 50% heavier than the 15Z980, so we have chosen to compare the 15Z980 against a series of 14-inch devices, all of which weigh less than 1.2 kg (~2.7 lbs). These devices are the Acer Swift 5, the ASUS ZenBook 3 Deluxe UX490UA, the ASUS ASUSPRO B9440UA and the Lenovo ThinkPad X1 Carbon 2018. This difference between screen size equates to the 15Z980 being around 4 cm (~1.6 in) wider than our comparison devices.
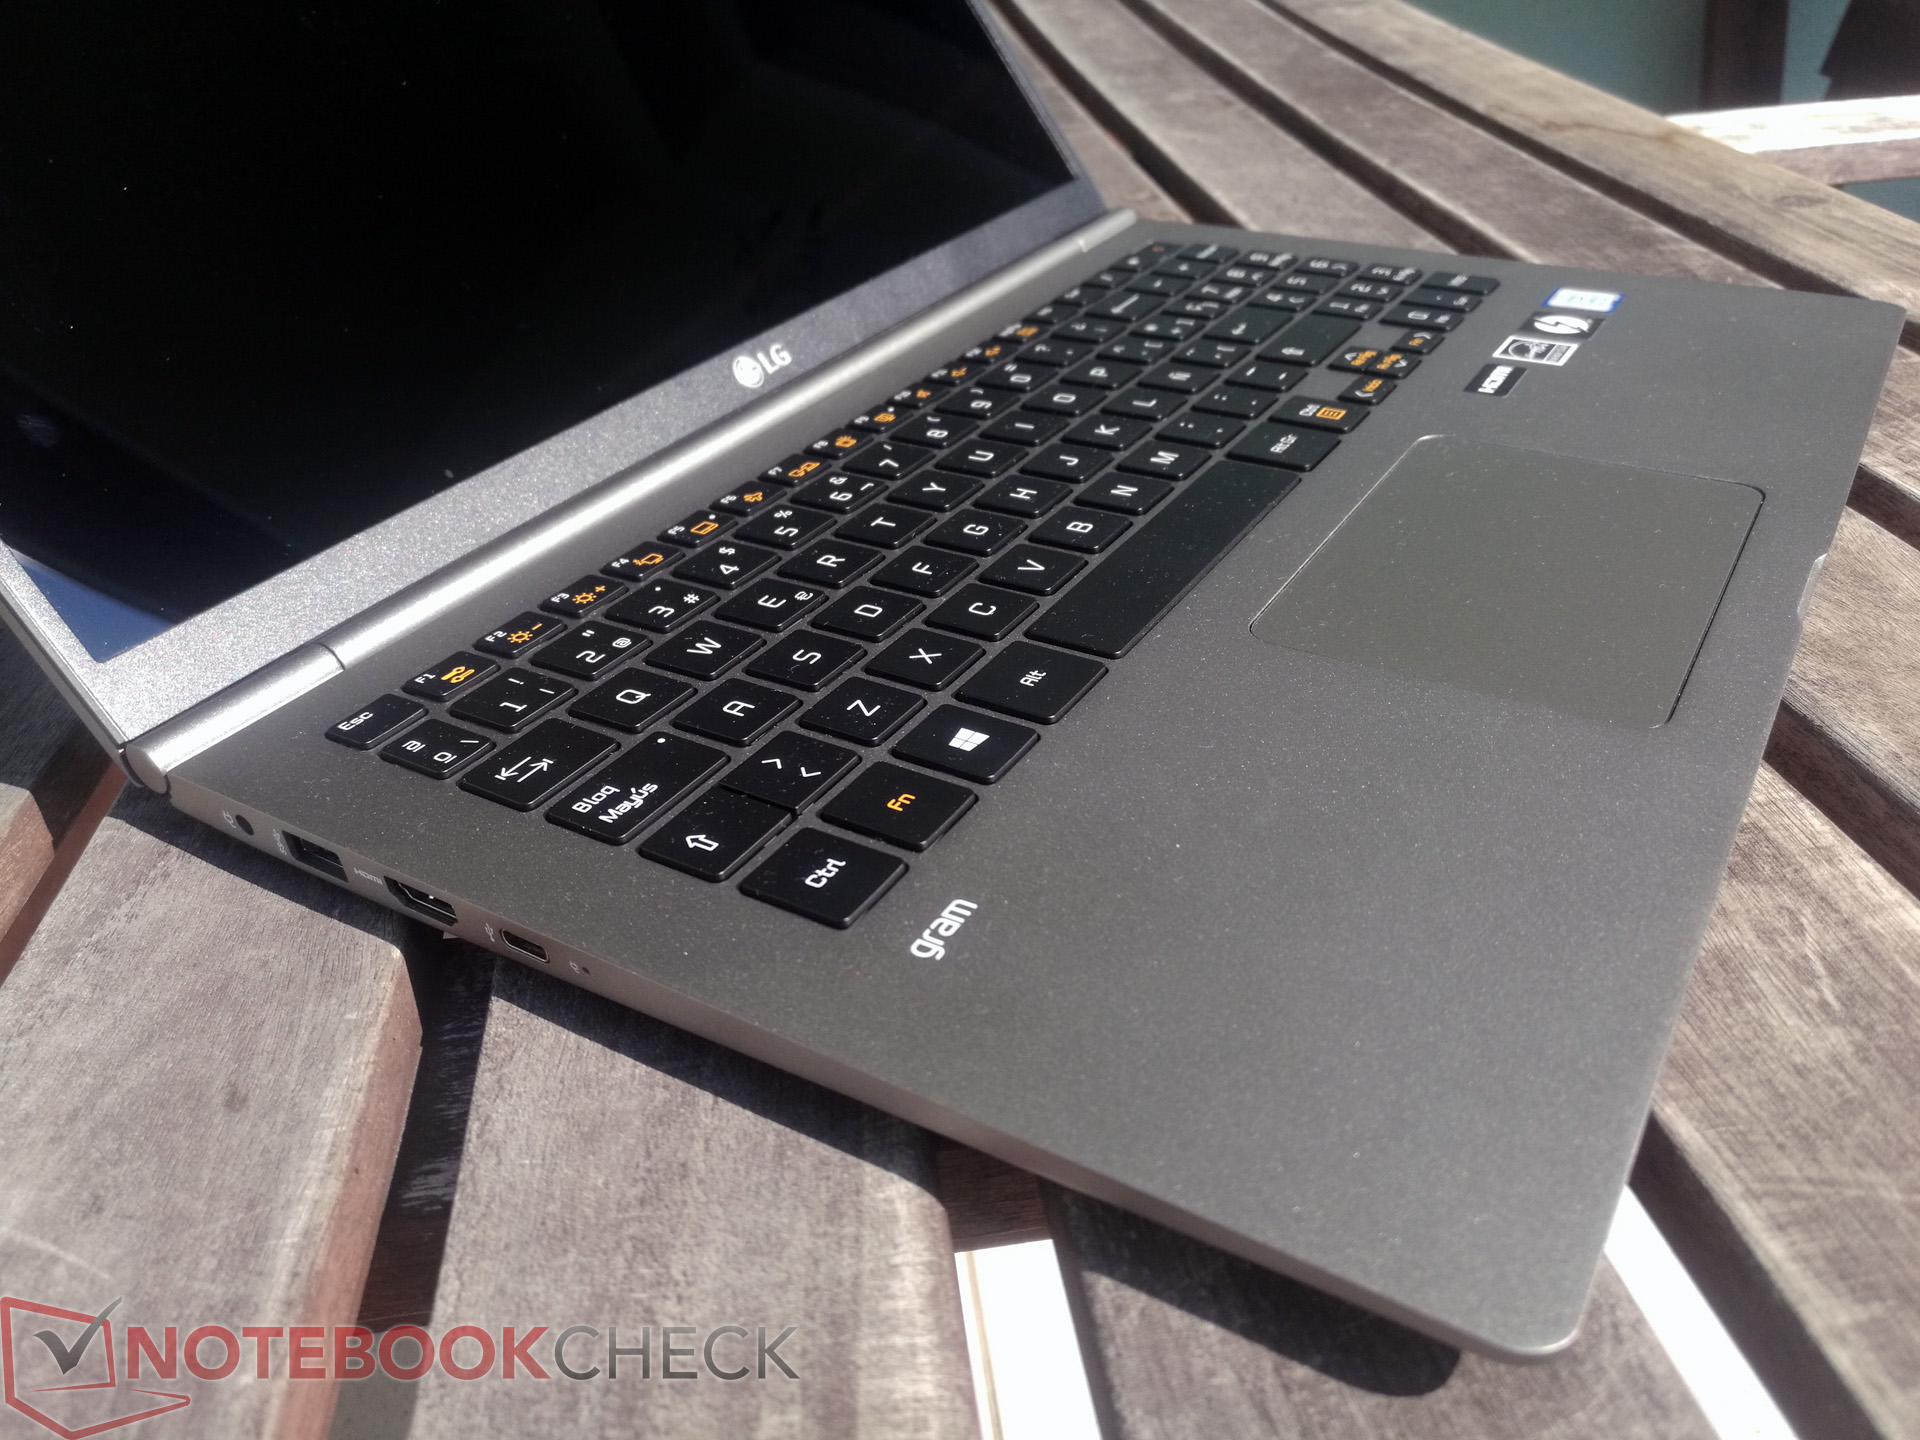
Connectivity
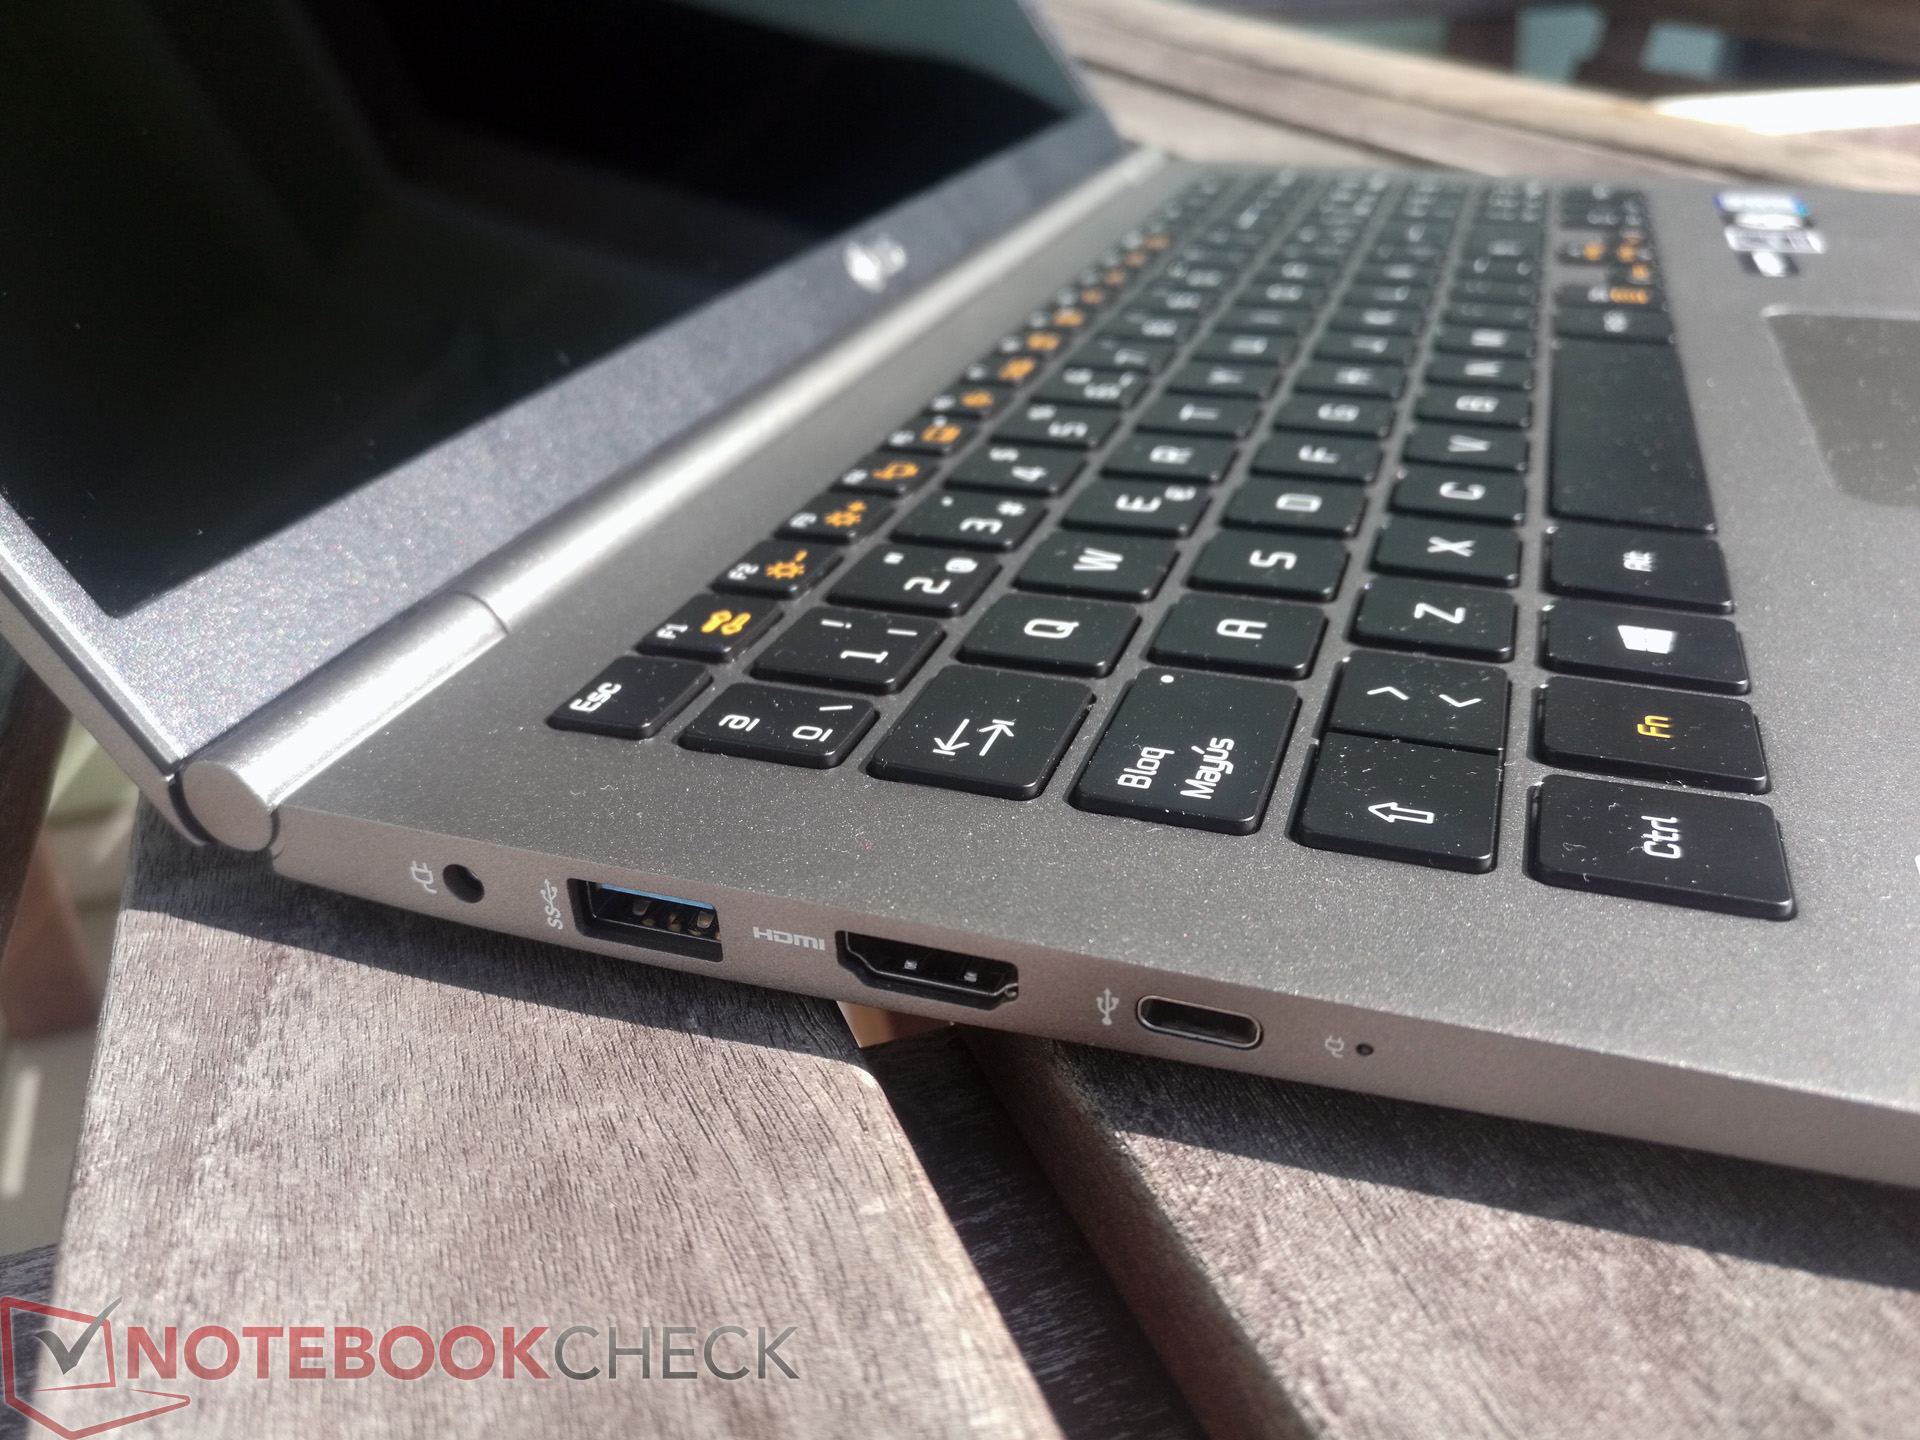
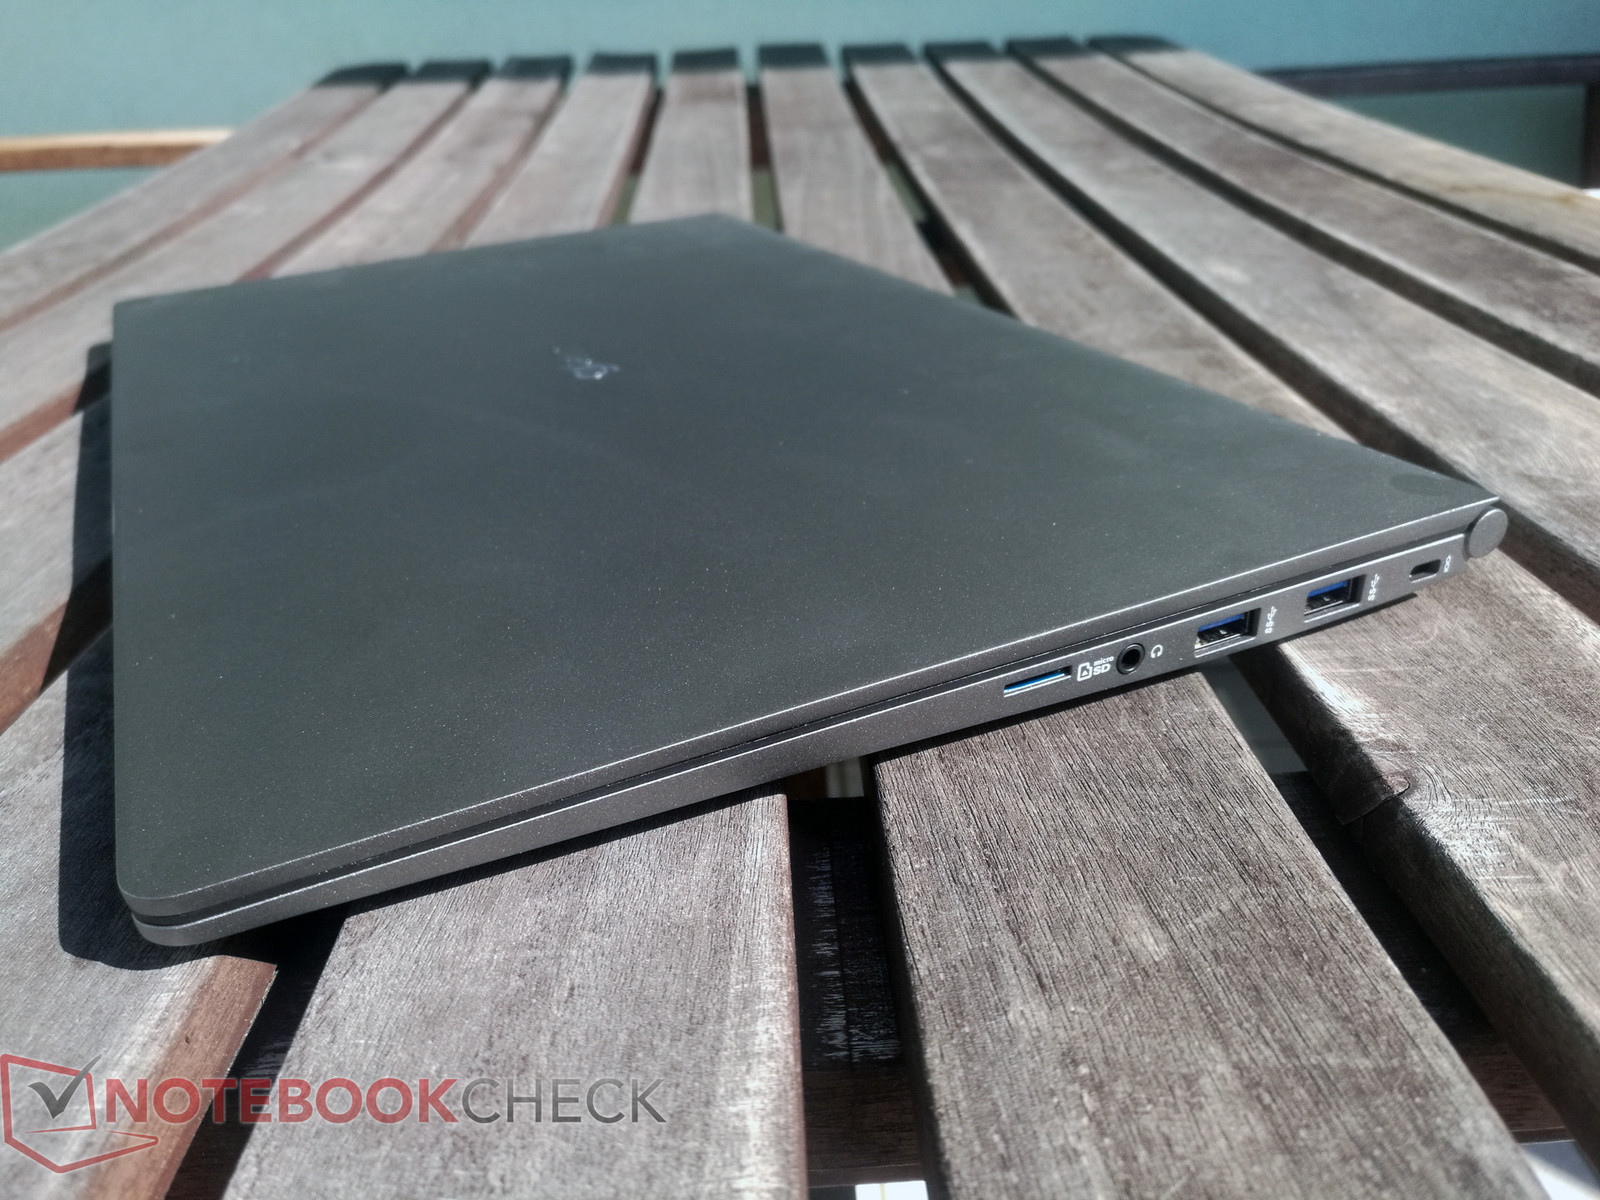
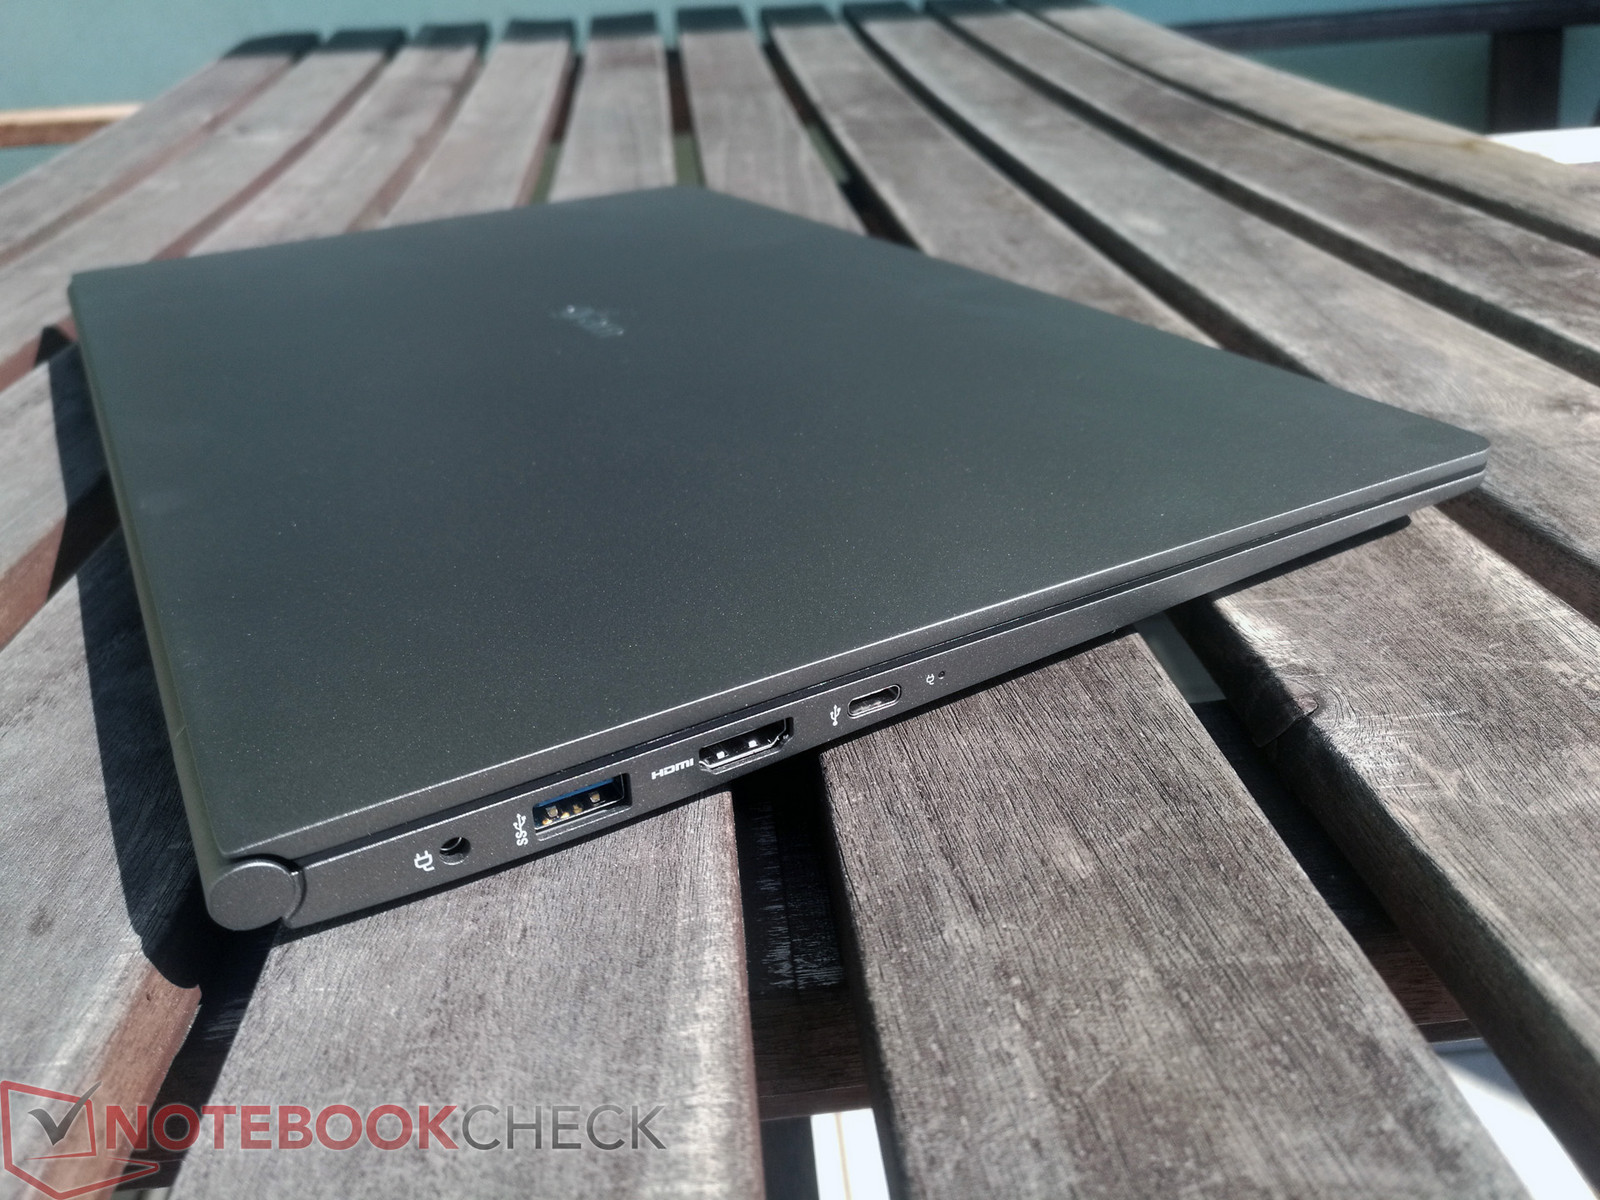
The 15Z980 has a plethora of ports including three USB 3.0 Type-A ports, a headphone jack and an HDMI port. There is also a microSD card slot and a proprietary power connector. Notably, LG includes a USB Type-C Thunderbolt 3 port that works with both our 60 W Satechi USB Type-C power supply and an HP Omen Accelerator eGPU powering an AMD Radeon RX550. We first had to update the latter’s firmware though, so it was not completely plug and play.
Overall, the 15Z980 has a comprehensive port selection that is not compromised by the device’s small footprint.
SD card reader
Our test device’s microSD card performance is above average, but it cannot compete with the ThinkPad X1 Carbon 2018. While our test device averaged 75.9 MB/s when copying JPG files and 86.5 MB/s in our sequential read speed test, the X1 Carbon 2018 managed 191.2 MB/s and 223.9 MB/s respectively. The 15Z980 should be suitable for occasionally copying files, but not in a professional setting.
| SD Card Reader | |
| average JPG Copy Test (av. of 3 runs) | |
| Lenovo ThinkPad X1 Carbon 2018-20KGS03900 (Toshiba Exceria Pro M501) | |
| LG Gram 15Z980-B.AA78B (Toshiba Exceria Pro M501 64BG) | |
| Average of class Subnotebook (18.9 - 193.9, n=17, last 2 years) | |
| maximum AS SSD Seq Read Test (1GB) | |
| Lenovo ThinkPad X1 Carbon 2018-20KGS03900 (Toshiba Exceria Pro M501) | |
| LG Gram 15Z980-B.AA78B (Toshiba Exceria Pro M501 64BG) | |
| Average of class Subnotebook (23.6 - 239, n=17, last 2 years) | |
Communication
The 15Z980 performed comparatively well in iperf3 Client Wi-Fi speed tests. Our test device achieved 606 MBit/s in the receive test and 540 MBit/s in the transmission test. This is only second to the ThinkPad X1 Carbon 2018 in the receive test and the ZenBook 3 Deluxe UX490UA in the transmission test.
Security
The 15Z980 has a Kensington Lock slot that is easy to use. There is also Windows Hello support thanks to the fingerprint scanner, which is integrated within the power button.
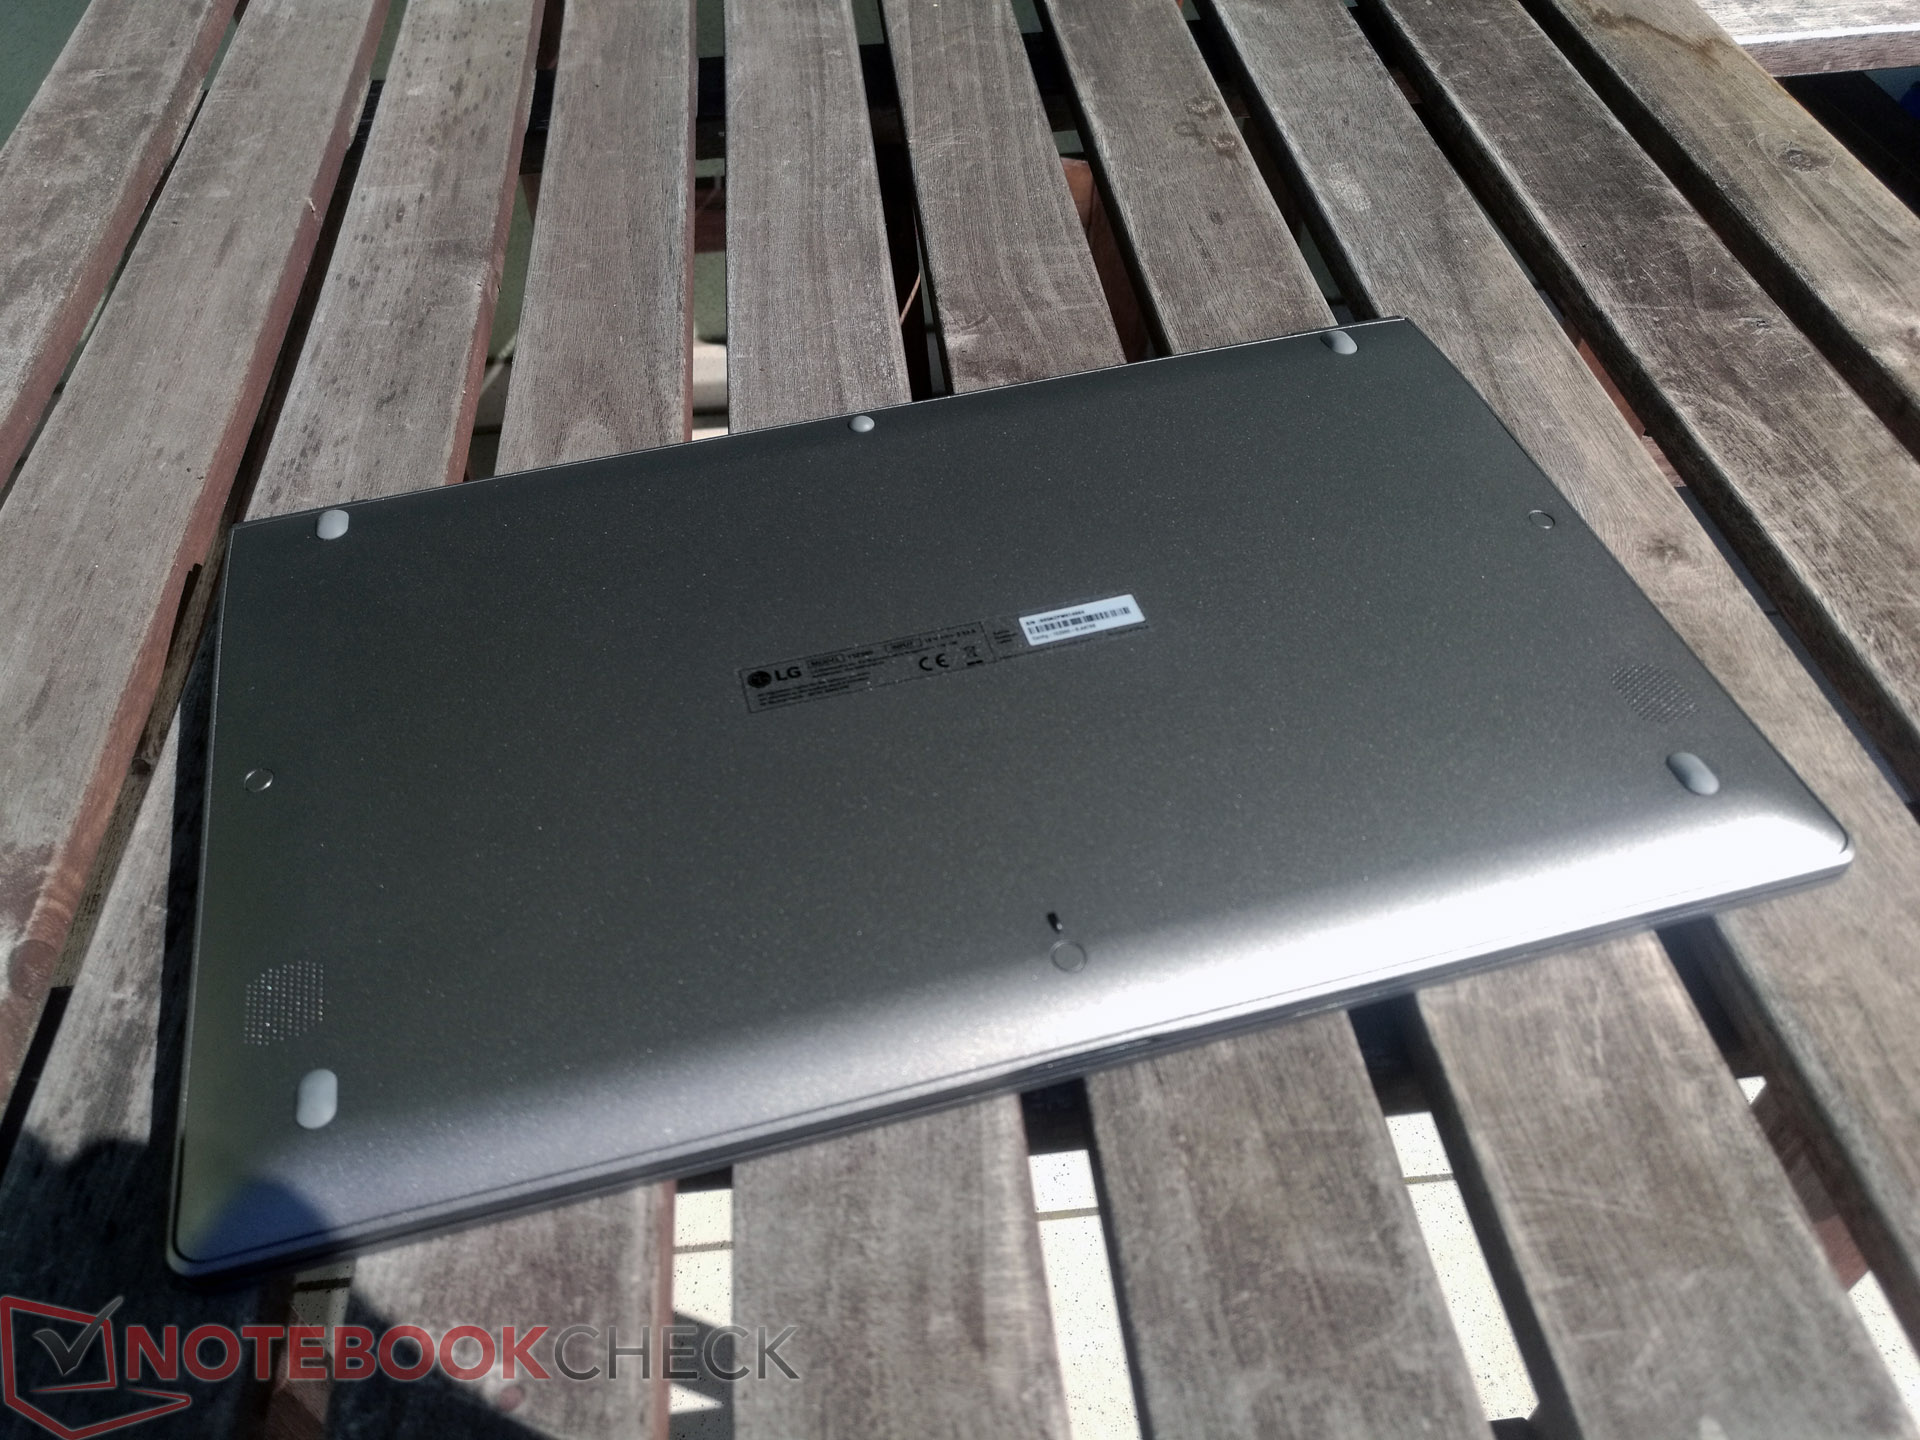
Maintenance
The 15Z980 can be opened with a little know-how. The folks over at iFixit have published a detailed guide for the largely identical 15Z975, which can be found here.
Once inside, you will have immediate access to the fan, the heatsink, the battery, the RAM and the two M.2-2280 slots. Our test device is equipped with one M.2-2280 drive, but it is a rarity for manufacturers to include two M.2-2280 slots.
Warranty
Our test device comes with two years manufacturer’s warranty and one year’s battery warranty. Unfortunately, importing the device from Spain means that you will have to send the device back to Spain for a warranty claim. However, Amazon will send a replacement device out before you return the first if the first is damaged in the post. Amazon will also refund the return costs in this instance too. Please see our Guarantees, Return policies and Warranties FAQ for country-specific information.
Input Devices
Keyboard
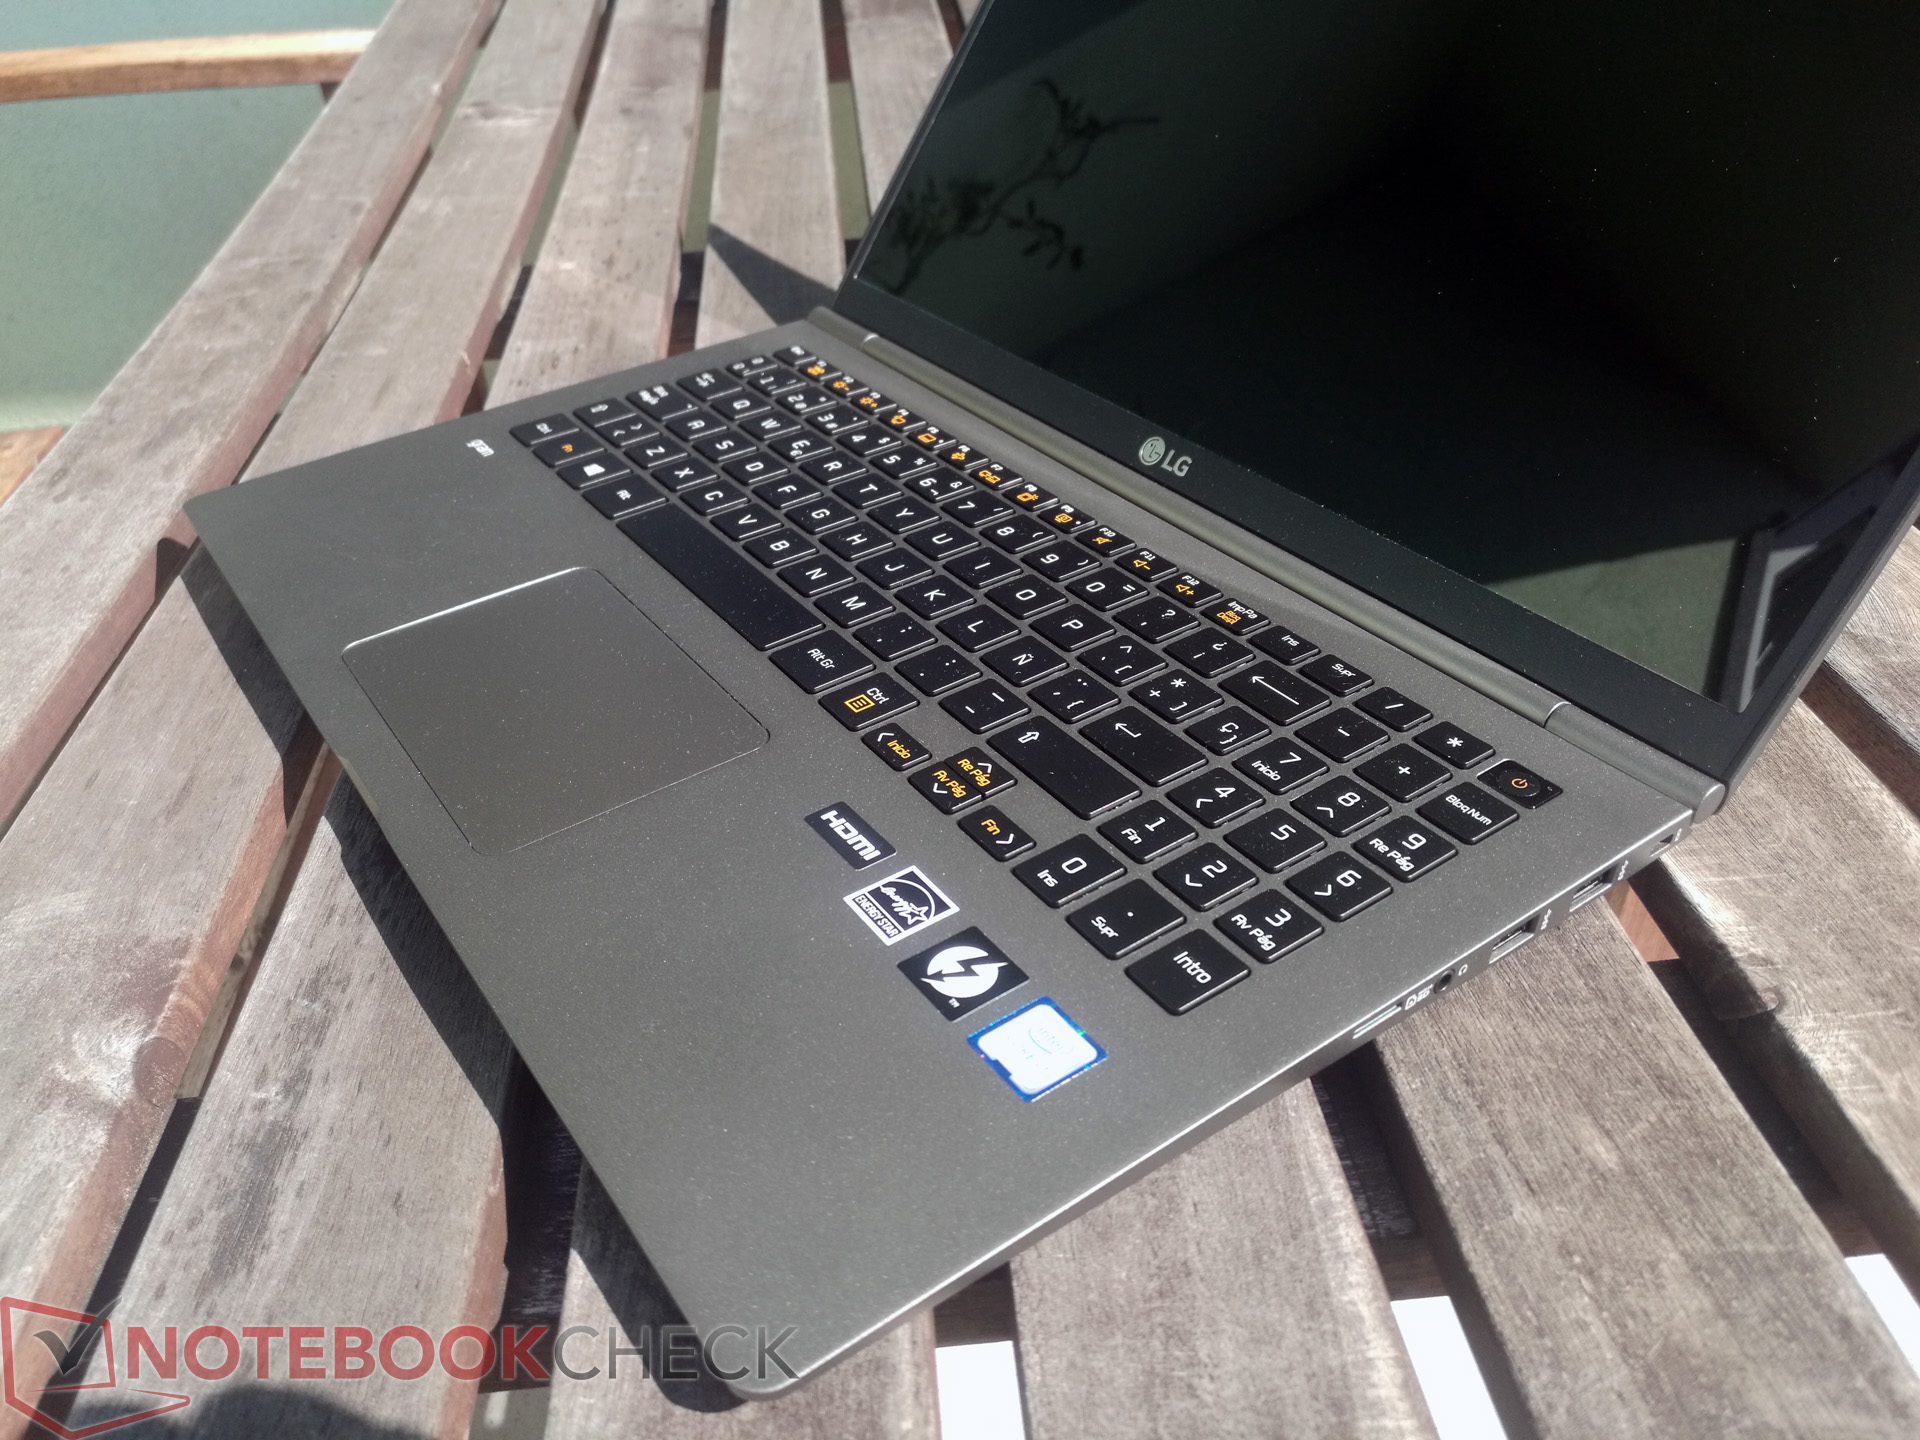
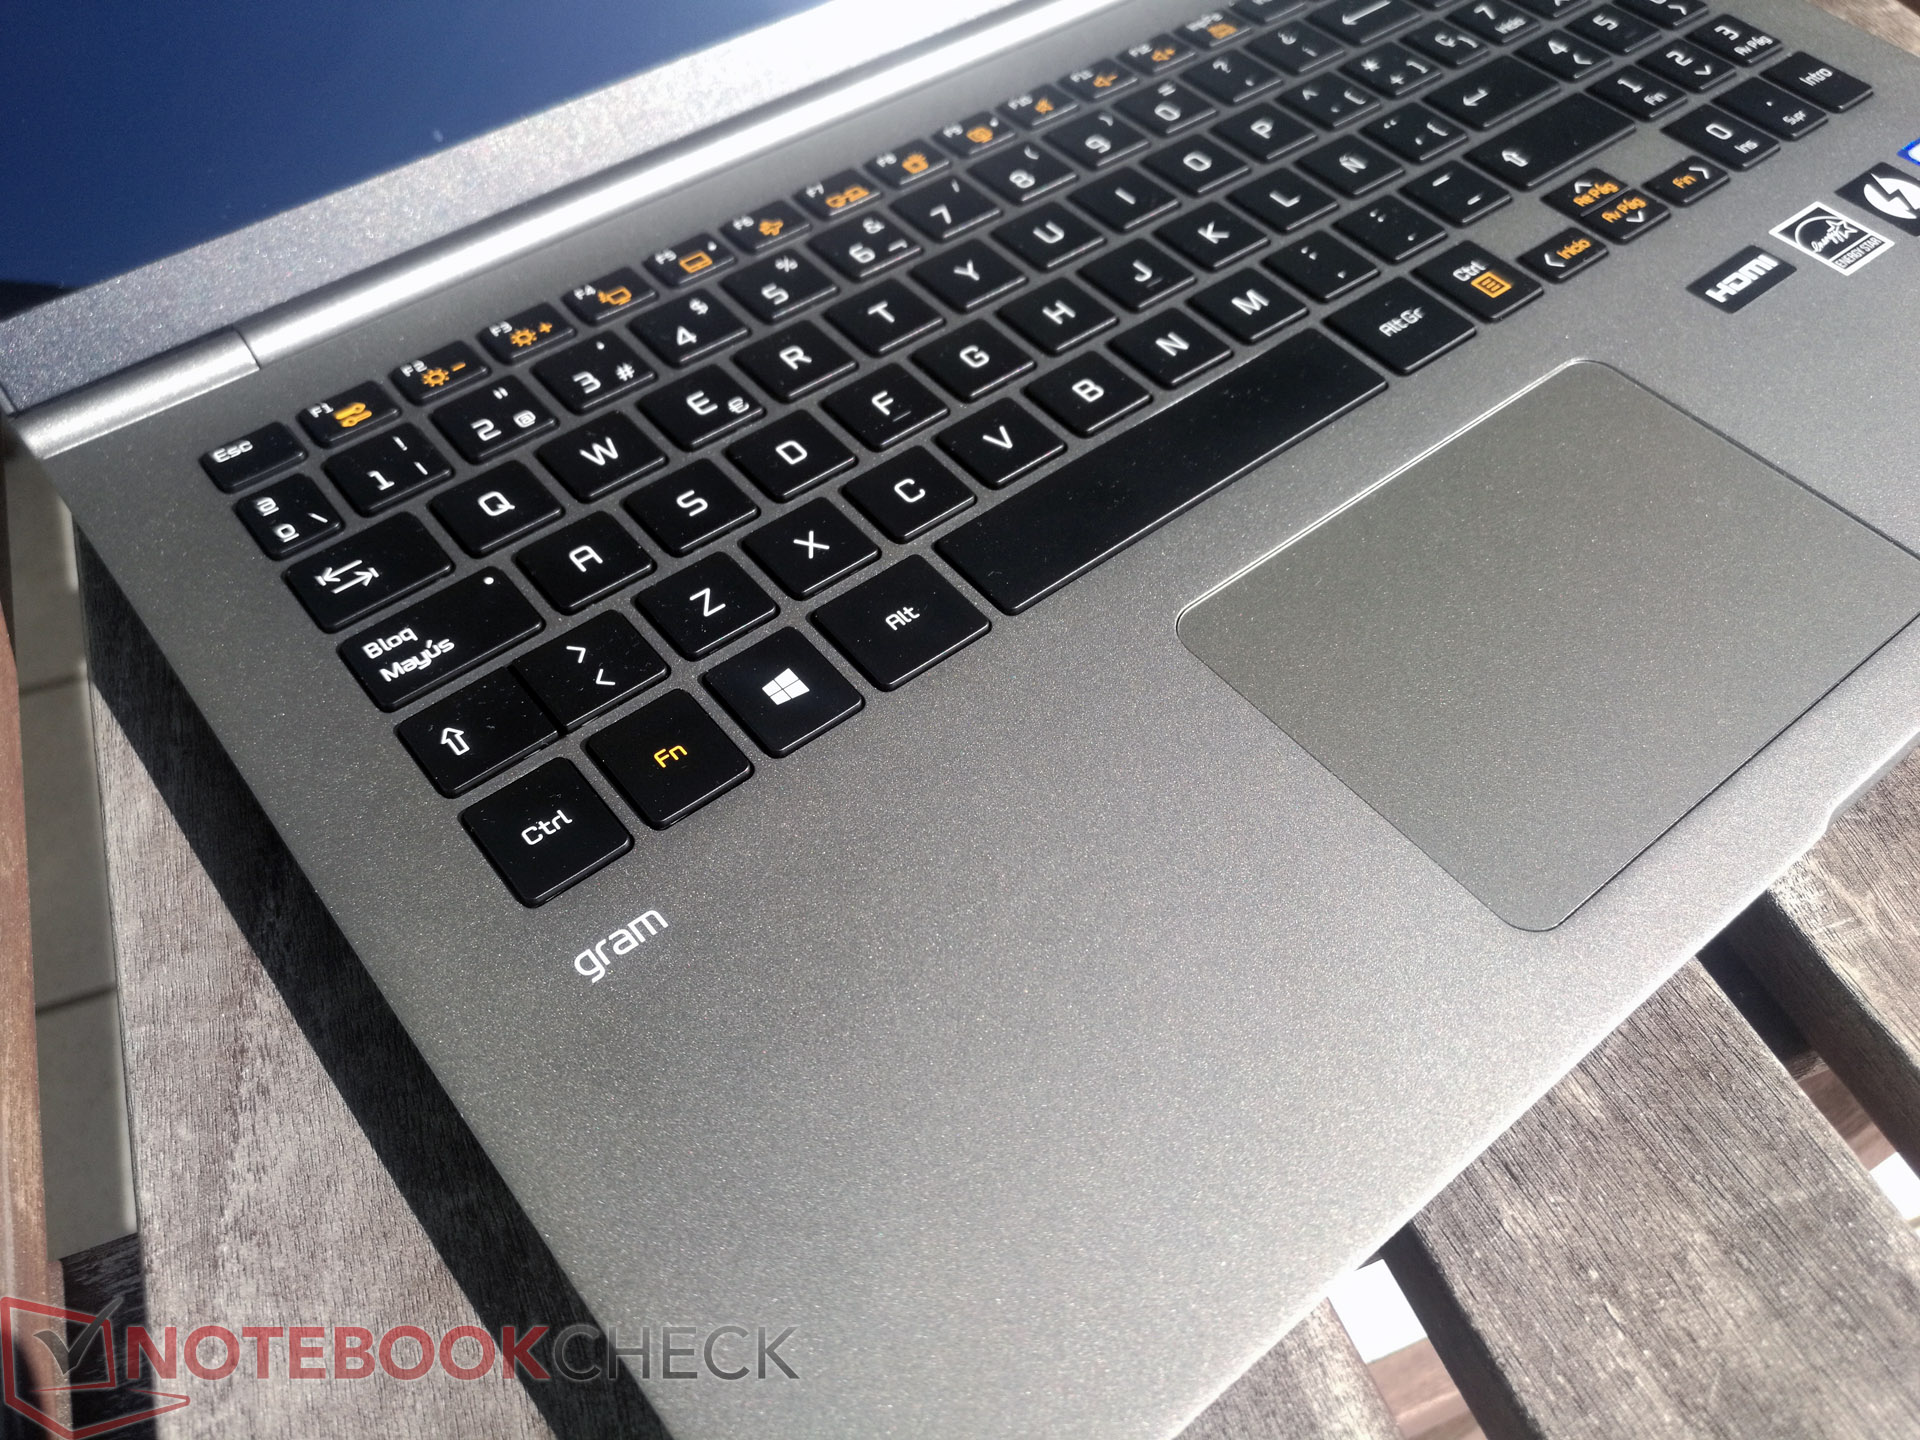
The 15Z980 has the same keyboard as its predecessor. Our test device has a Spanish QWERTY keyboard layout, which differs slightly from English QWERTY. We have included photos of our test device’s keyboard to highlight these differences.
There are a few peculiarities specific to the 15Z980 though. The left shift key is half-sized and directly next to the <> key without a break. Equally, the Enter and Delete keys are smaller than on most laptops, all of which will take some getting used to.
The keys have a pleasantly deep stroke and a clear pressure point, which combine to create a good typing experience. The fingerprint sensor works well too and its integration within the power button is well thought out. Overall, the 15Z980 has a solid keyboard that will take some acclimatization.
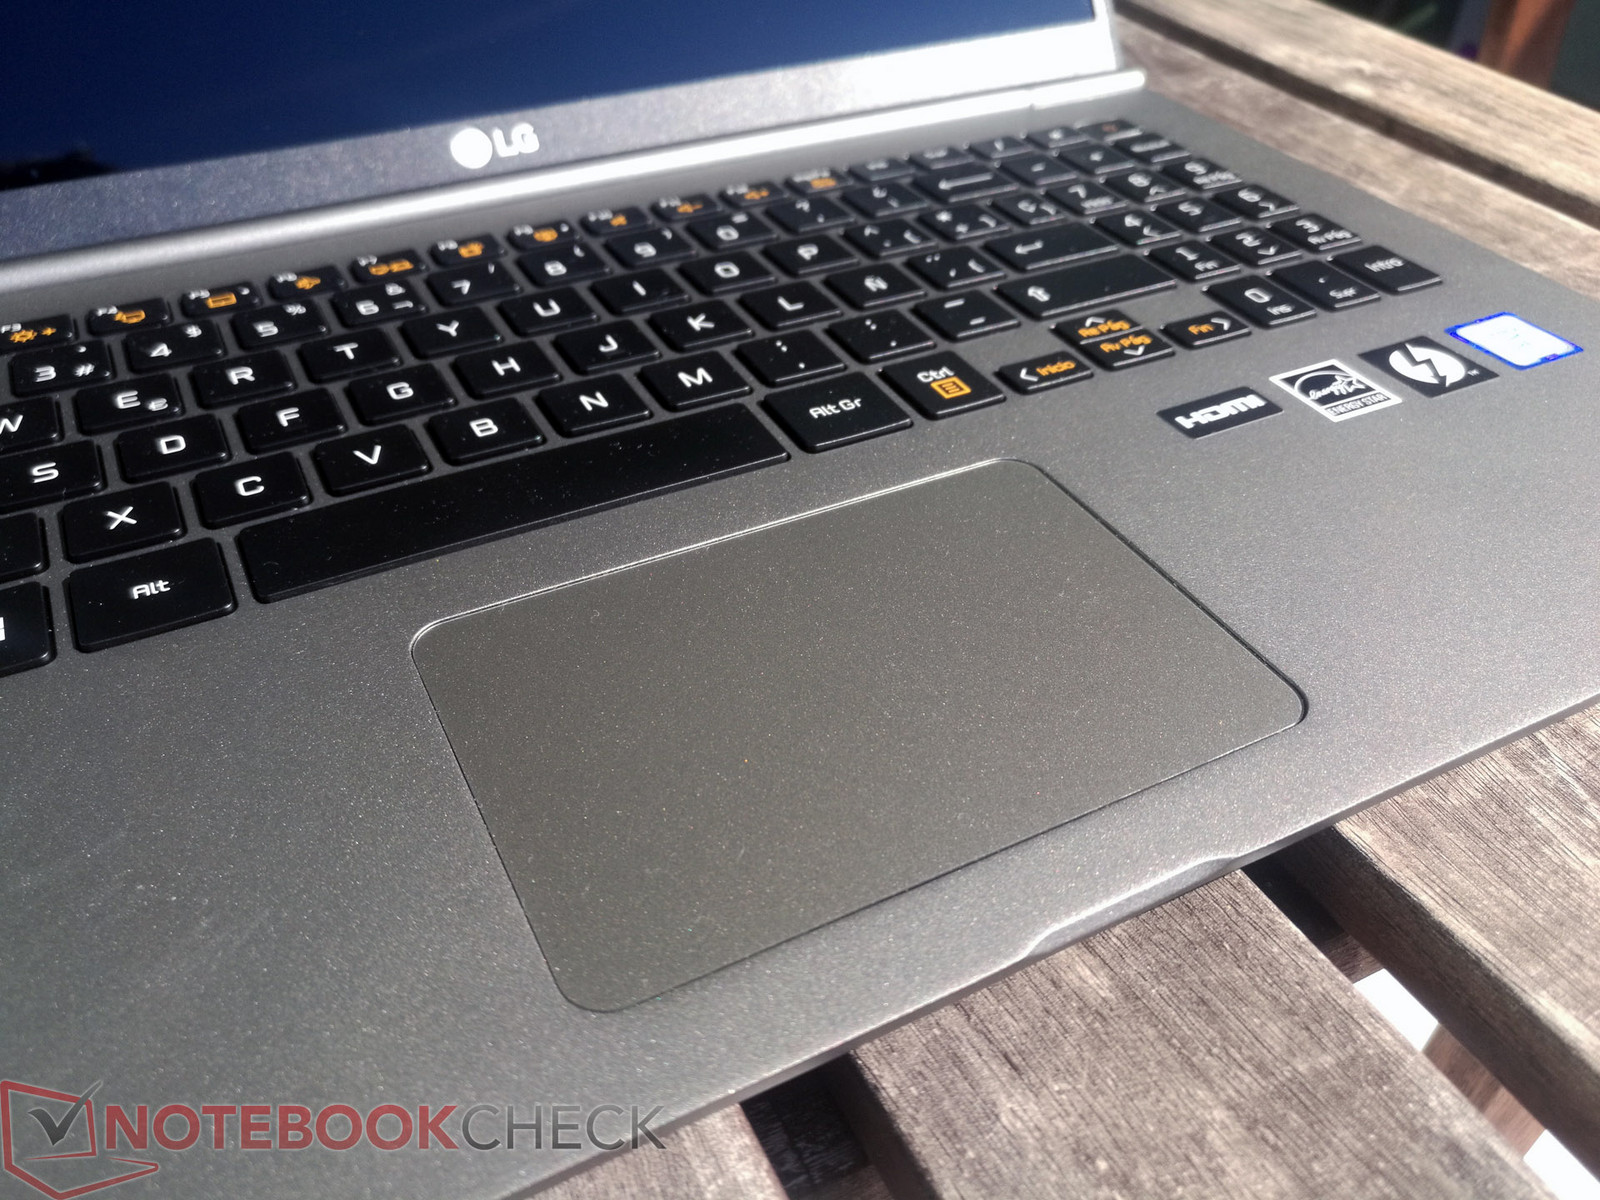
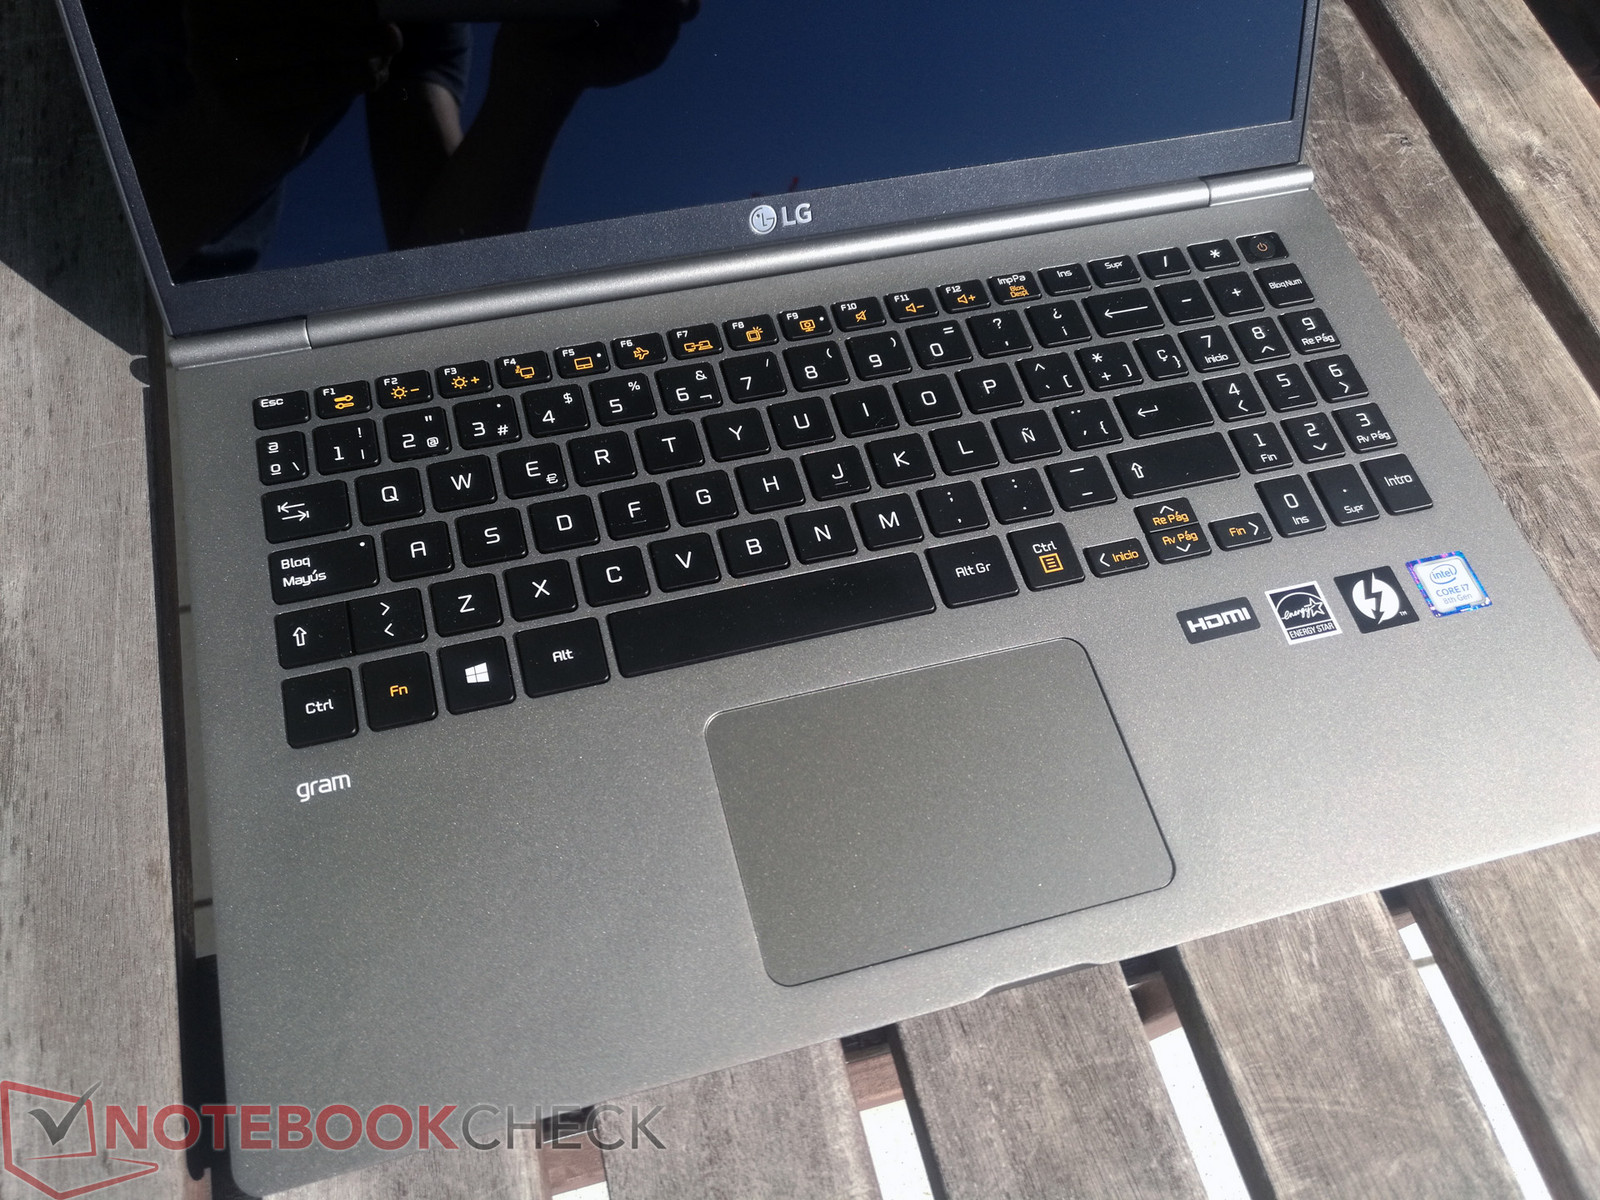
TouchPad
The TouchPad measures 10.3 x 6.9 cm (~4 x 2.7 in), which could be larger. It is easy to use too, thanks to its smooth finish and good responsiveness. There are no dedicated mouse buttons, but this is typical of many thin and light notebooks.
The TouchPad has an integrated mechanical click, the sound of which is clearly audible but disturbingly so. It should be noted that the clicking mechanism is easier to use at the bottom of the TouchPad than it is at the top. Microsoft Precision drivers make tap-to-click and multi-finger gestures easy though and are a welcome feature given that our test device does not have a touchscreen.
Display
The 15Z980 comes in a choice of two Full HD displays, one with a touch screen and one without. Our test device is equipped with the latter, which HWiNFO identifies as an LGD05A8 LP156WF9 panel. This is currently the only display available in Spain.
The 1,920 x 1,080 resolution is adequate, but there are devices with higher resolution displays, like the ThinkPad X1 Carbon 2018 with its 2,560 x 1,440 display. Images on a higher resolution display will look sharper, but they will also consume more power so there is a trade-off between image sharpness and battery life.
Our test device achieves an average maximum brightness of 331 cd/m², which dims to 273 cd/m² on battery. These values are relatively low and are resoundingly beaten by the ThinkPad X1 Carbon 2018. Frustratingly, the display only reaches a minimum of 22.6 cd/m², which will look bright when using the device in dark environments. The display has 84% brightness uniformity too, which is on par with our comparison devices.
The 15Z980 achieved a relatively high 0.32 cd/m² black value that is beaten by all comparison devices except for the ThinkPad X1 Carbon 2018. This black value contributes to 1,091:1 contrast ratio, which is considerably lower than the ZenBook 3 Deluxe UX490UA and the X1 Carbon 2018.
| |||||||||||||||||||||||||
Brightness Distribution: 84 %
Center on Battery: 273 cd/m²
Contrast: 1091:1 (Black: 0.32 cd/m²)
ΔE Color 3.1 | 0.5-29.43 Ø5, calibrated: 1.5
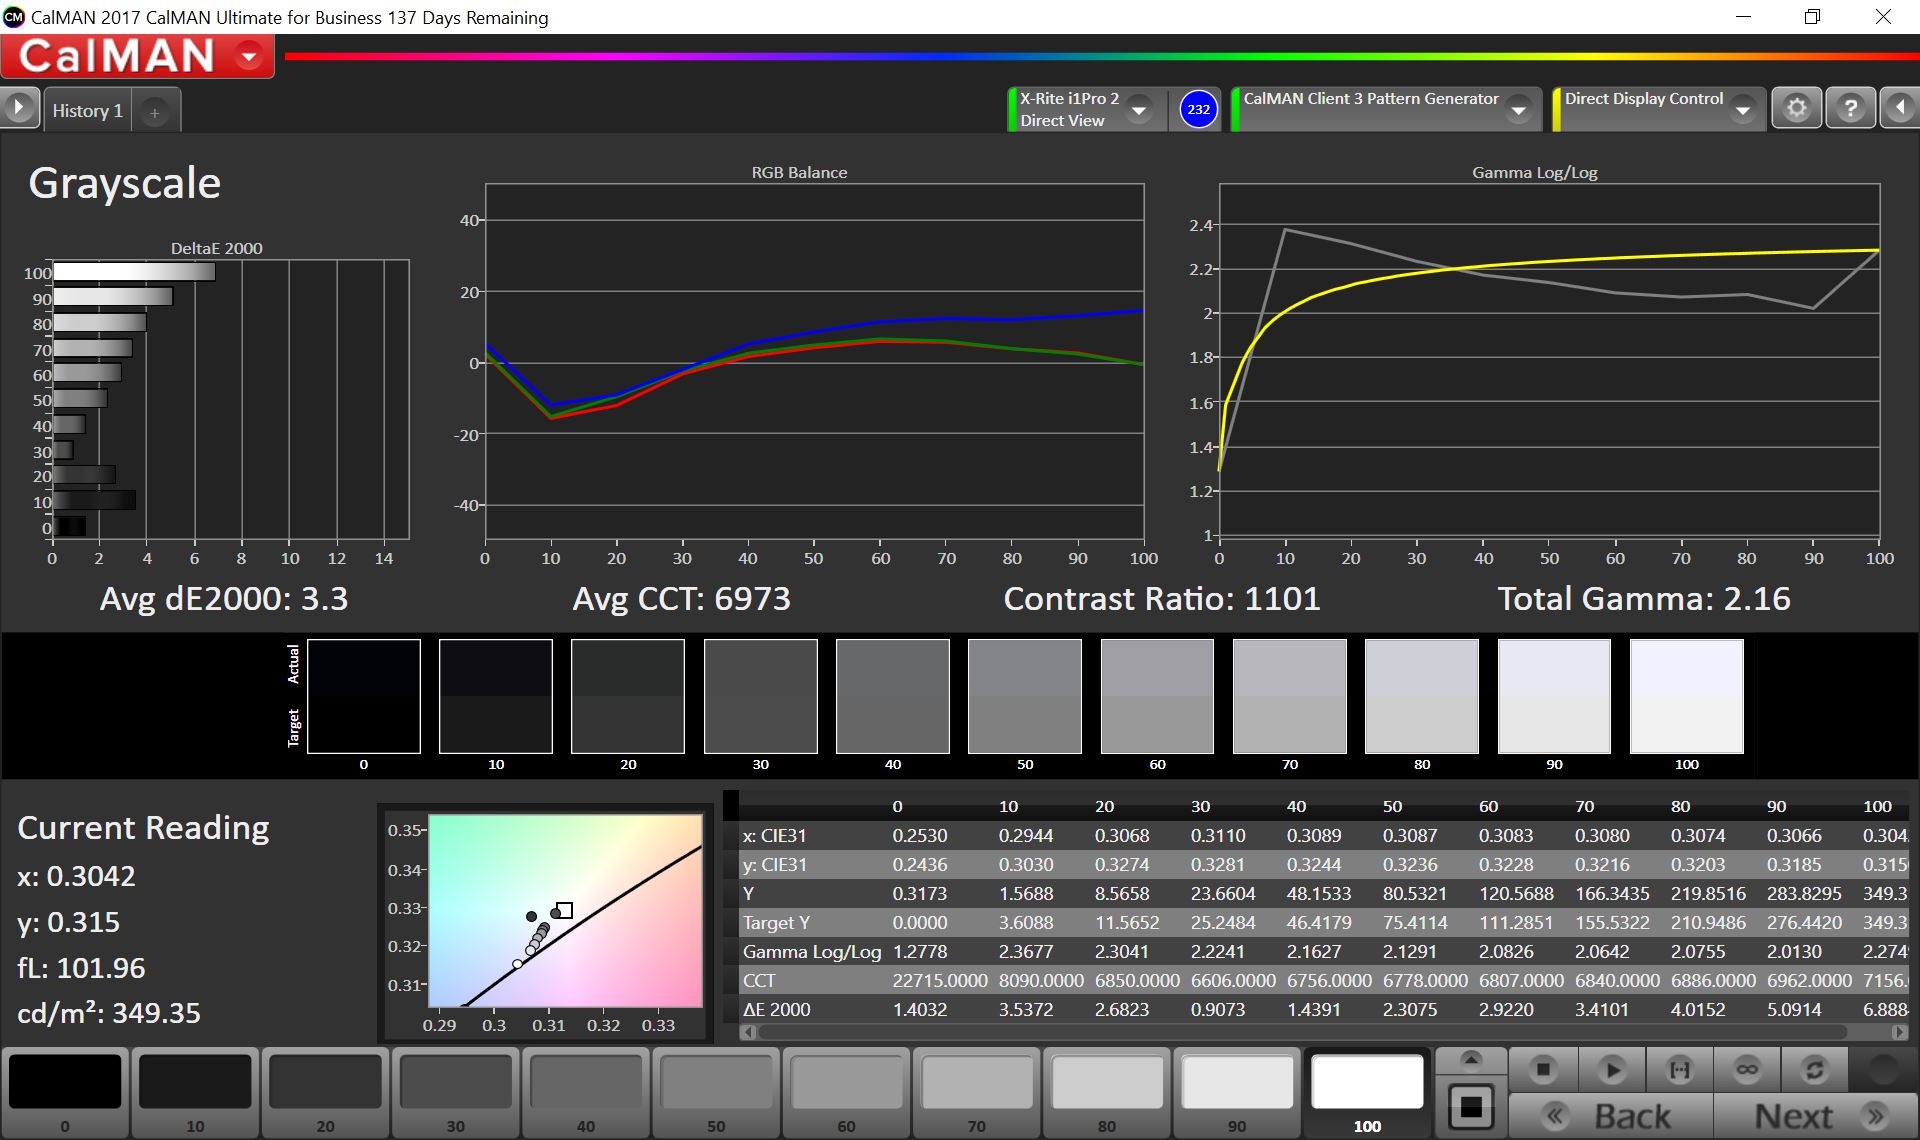
ΔE Greyscale 3.3 | 0.57-98 Ø5.3
98.2% sRGB (Calman 2D)
96.05% sRGB (Argyll 1.6.3 3D)
61.46% AdobeRGB 1998 (Argyll 1.6.3 3D)
66.3% AdobeRGB 1998 (Argyll 2.2.0 3D)
96.2% sRGB (Argyll 2.2.0 3D)
65.3% Display P3 (Argyll 2.2.0 3D)
Gamma: 2.16
| LG Gram 15Z980-B.AA78B LP156WF9-SPN1, , 1920x1080, 15.60 | Acer Swift 5 SF514-52T-59HY AU Optronics AUO203D, , 1920x1080, 14.00 | Asus Zenbook 3 Deluxe UX490UA AU Optronics AUO383D / B140HAN03.8, , 1920x1080, 14.00 | Lenovo ThinkPad X1 Carbon 2018-20KGS03900 B140QAN02.0, , 2560x1440, 14.00 | Asus ASUSPRO B9440UA-GV0100T AU Optronics AUO353D / B140HAN03.5, , 1920x1080, 14.00 | |
|---|---|---|---|---|---|
| Display | 5% | -10% | 30% | -4% | |
| Display P3 Coverage | 65.3 | 69.7 7% | 58.7 -10% | 87.7 34% | 64 -2% |
| sRGB Coverage | 96.2 | 97.1 1% | 86.9 -10% | 100 4% | 89.1 -7% |
| AdobeRGB 1998 Coverage | 66.3 | 71 7% | 59.9 -10% | 99.9 51% | 65.2 -2% |
| Response Times | -3% | 6% | -59% | -36% | |
| Response Time Grey 50% / Grey 80% * | 34.3 ? | 37 ? -8% | 24 ? 30% | 59.2 ? -73% | 48.8 ? -42% |
| Response Time Black / White * | 23.7 ? | 23 ? 3% | 28 ? -18% | 34.4 ? -45% | 30.8 ? -30% |
| PWM Frequency | |||||
| Screen | -21% | -7% | 30% | -44% | |
| Brightness middle | 349 | 254 -27% | 337 -3% | 578 66% | 319 -9% |
| Brightness | 331 | 231 -30% | 295 -11% | 533 61% | 294 -11% |
| Brightness Distribution | 84 | 86 2% | 81 -4% | 84 0% | 87 4% |
| Black Level * | 0.32 | 0.25 22% | 0.21 34% | 0.38 -19% | 0.26 19% |
| Contrast | 1091 | 1016 -7% | 1605 47% | 1521 39% | 1227 12% |
| Colorchecker dE 2000 * | 3.1 | 3.85 -24% | 4.89 -58% | 1.9 39% | 7.1 -129% |
| Colorchecker dE 2000 max. * | 6.6 | 7.05 -7% | 8.43 -28% | 3.8 42% | 13.7 -108% |
| Colorchecker dE 2000 calibrated * | 1.5 | 3.66 -144% | 0.8 47% | ||
| Greyscale dE 2000 * | 3.3 | 4.1 -24% | 4.28 -30% | 3 9% | 9.61 -191% |
| Gamma | 2.16 102% | 2.43 91% | 2.25 98% | 2.14 103% | 2.33 94% |
| CCT | 6973 93% | 7369 88% | 7352 88% | 6377 102% | 6021 108% |
| Color Space (Percent of AdobeRGB 1998) | 61.46 | 63 3% | 56 -9% | 88.8 44% | 54.01 -12% |
| Color Space (Percent of sRGB) | 96.05 | 97 1% | 87 -9% | 100 4% | 83.02 -14% |
| Total Average (Program / Settings) | -6% /
-14% | -4% /
-6% | 0% /
19% | -28% /
-35% |
* ... smaller is better
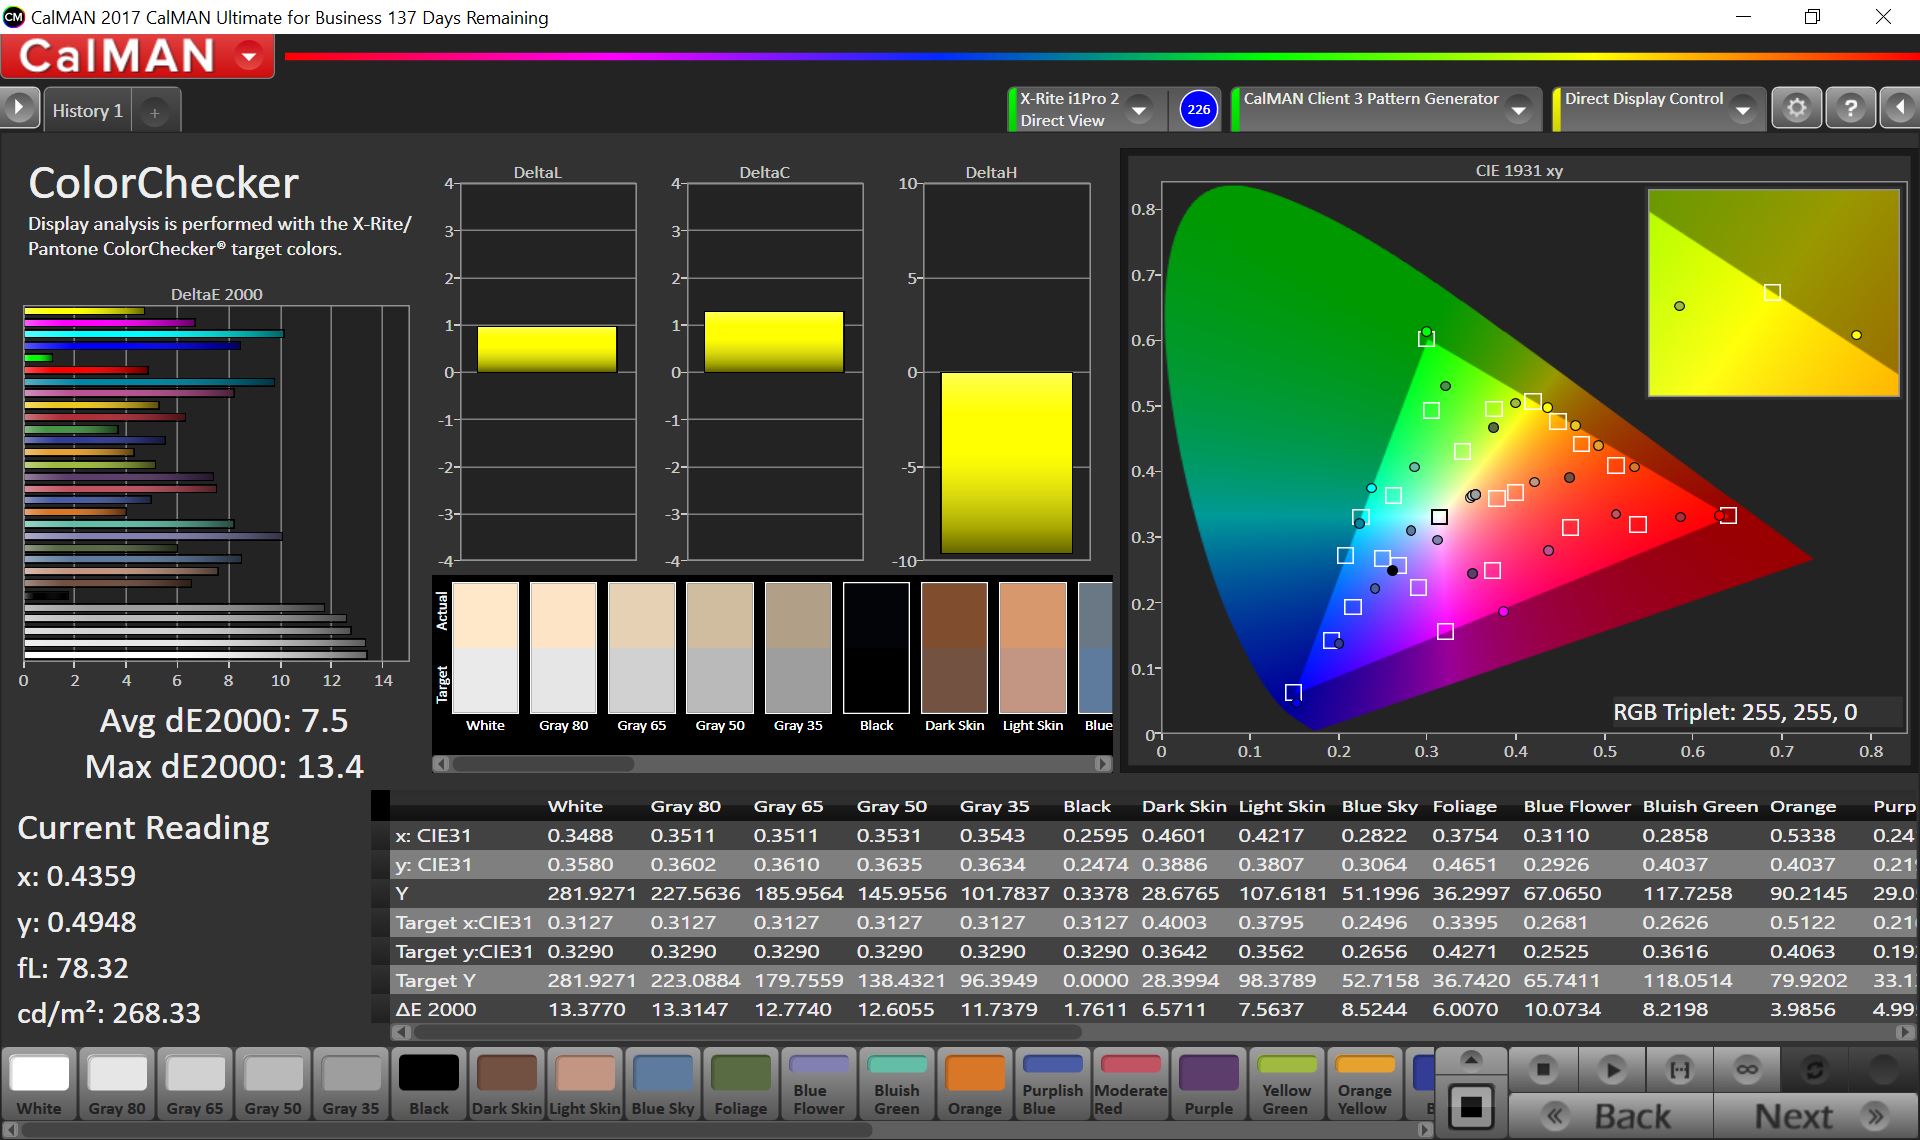
Our test device is relatively color accurate out of the box, with a practically ideal DeltaE ColorChecker sRGB deviation of 3.1. However, there are visible deviations in blue tones, which make the display look rather cold. Thankfully, LG includes a color temperature tool that improves color accuracy. Setting the display to one step warmer than default reduces DeltaE deviations to 2.3, which is optimal. Unfortunately, changing the color temperature has no influence on the blue tint.
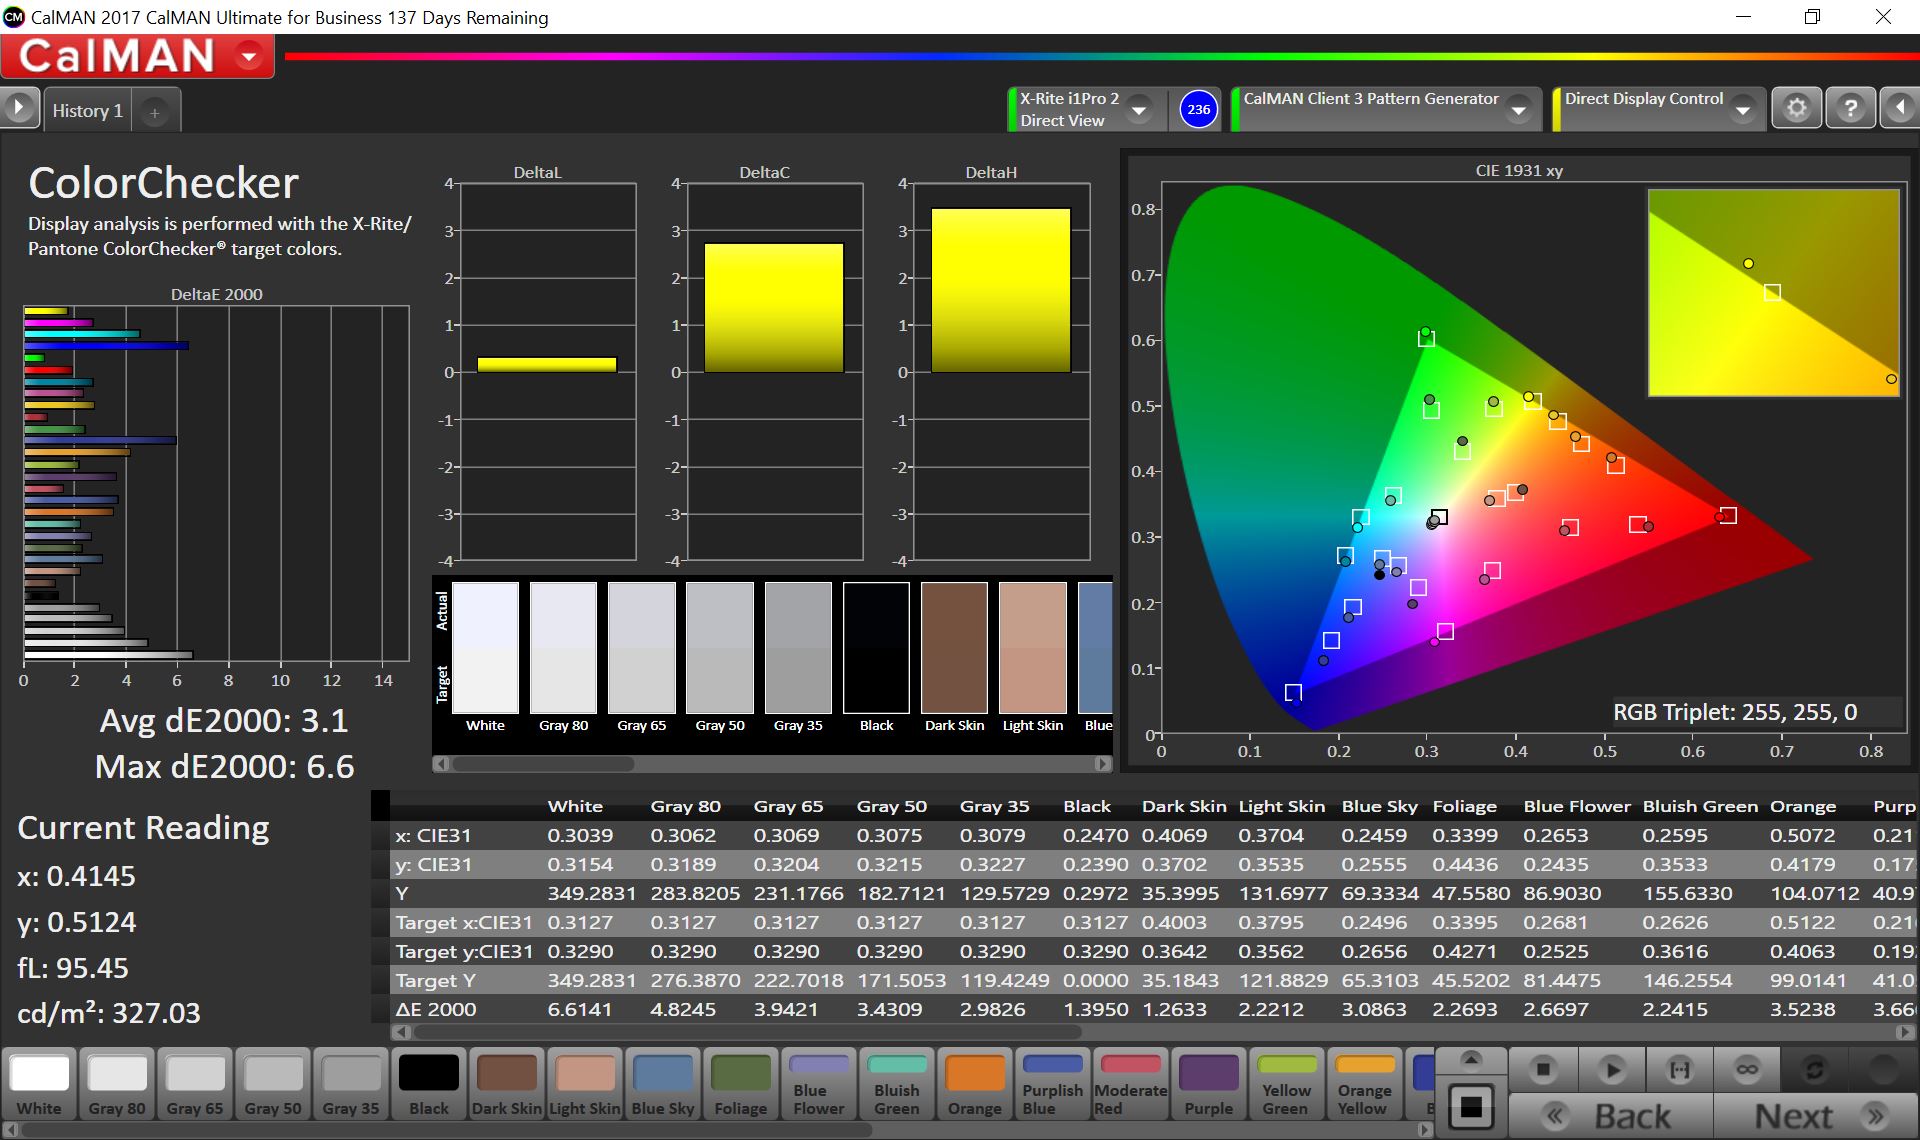
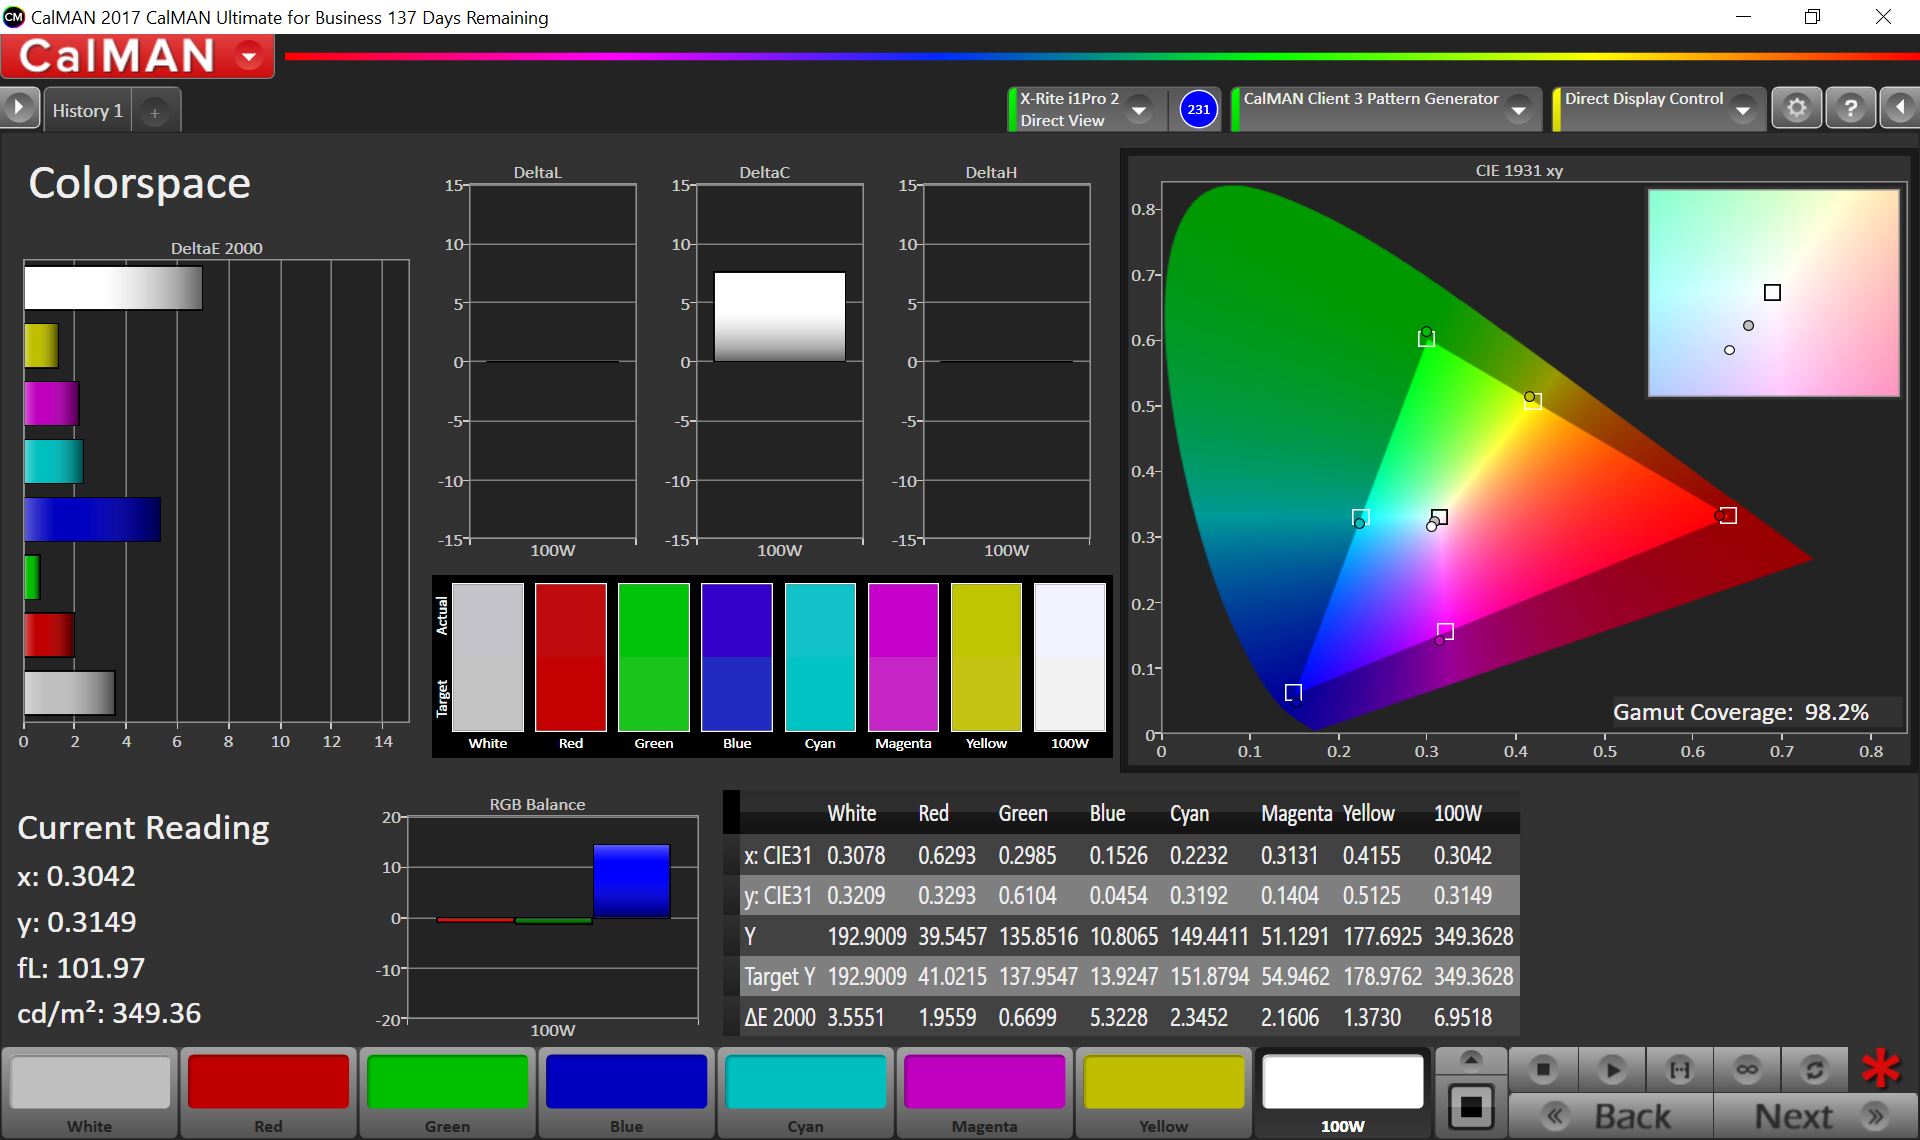
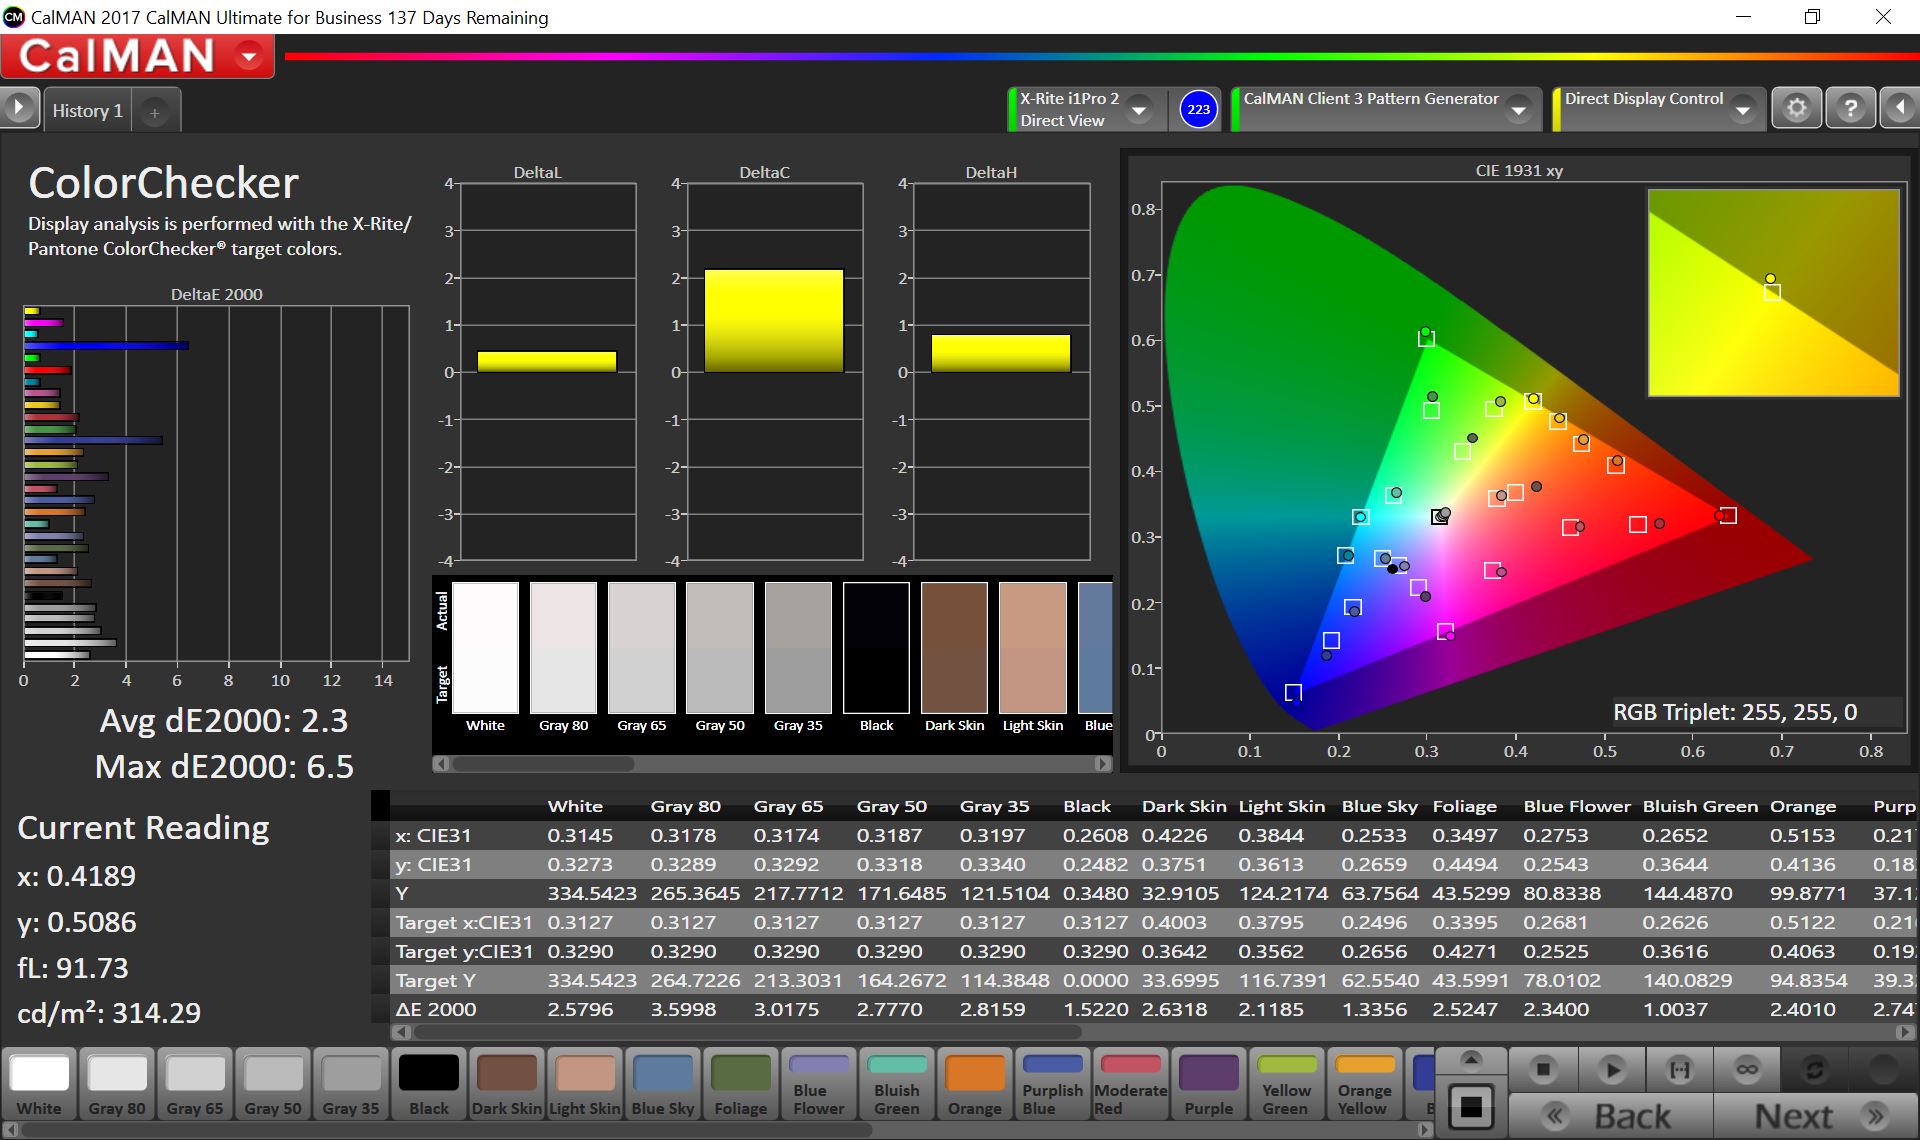
The 15Z980 achieves 96% sRGB and 61% AdobeRGB color space accuracy, which is only bettered by the X1 Carbon 2018 with its HDR display. Response times are some of the best of our comparison devices with no device beating our test device in both response time tests. Thankfully, there is no pulse-width modulation (PWM) either. Manufacturers often use PWM to regulate brightness, but this can cause headaches and eye strain with some people.
Display Response Times
| ↔ Response Time Black to White | ||
|---|---|---|
| 23.7 ms ... rise ↗ and fall ↘ combined | ↗ 13.1 ms rise | 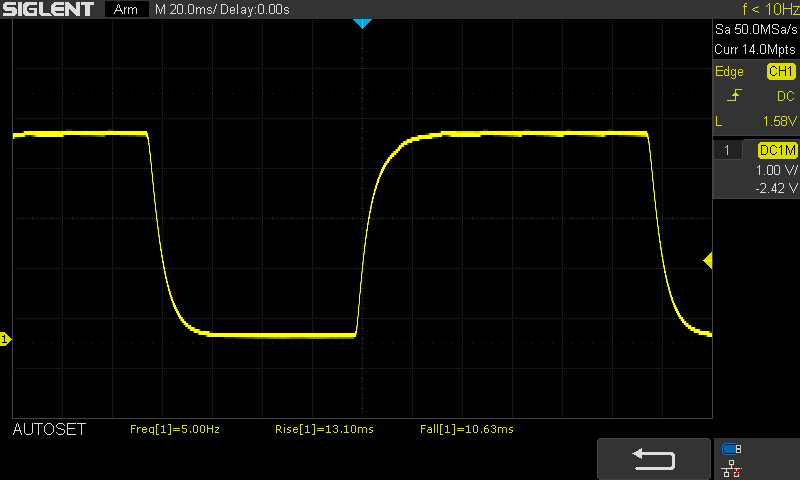 |
| ↘ 10.6 ms fall | ||
| The screen shows good response rates in our tests, but may be too slow for competitive gamers. In comparison, all tested devices range from 0.1 (minimum) to 240 (maximum) ms. » 48 % of all devices are better. This means that the measured response time is worse than the average of all tested devices (21.5 ms). | ||
| ↔ Response Time 50% Grey to 80% Grey | ||
| 34.3 ms ... rise ↗ and fall ↘ combined | ↗ 16.4 ms rise | 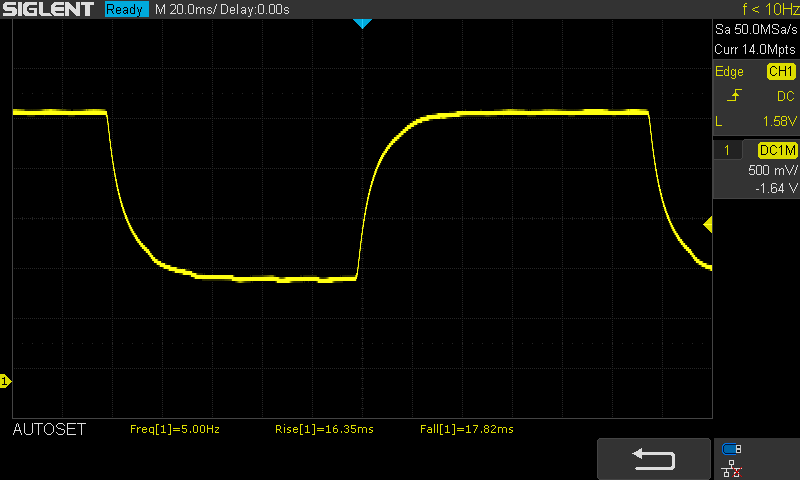 |
| ↘ 17.9 ms fall | ||
| The screen shows slow response rates in our tests and will be unsatisfactory for gamers. In comparison, all tested devices range from 0.2 (minimum) to 636 (maximum) ms. » 42 % of all devices are better. This means that the measured response time is similar to the average of all tested devices (33.7 ms). | ||
Screen Flickering / PWM (Pulse-Width Modulation)
| Screen flickering / PWM not detected | 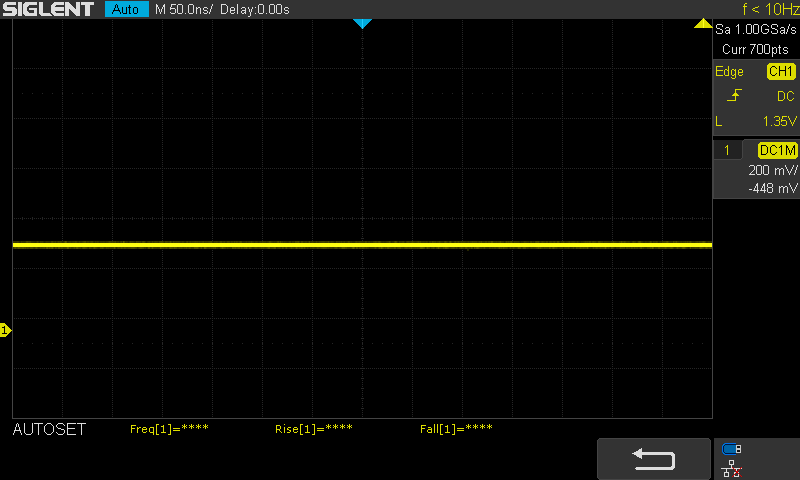 | ||
In comparison: 53 % of all tested devices do not use PWM to dim the display. If PWM was detected, an average of 17900 (minimum: 5 - maximum: 3846000) Hz was measured. | |||
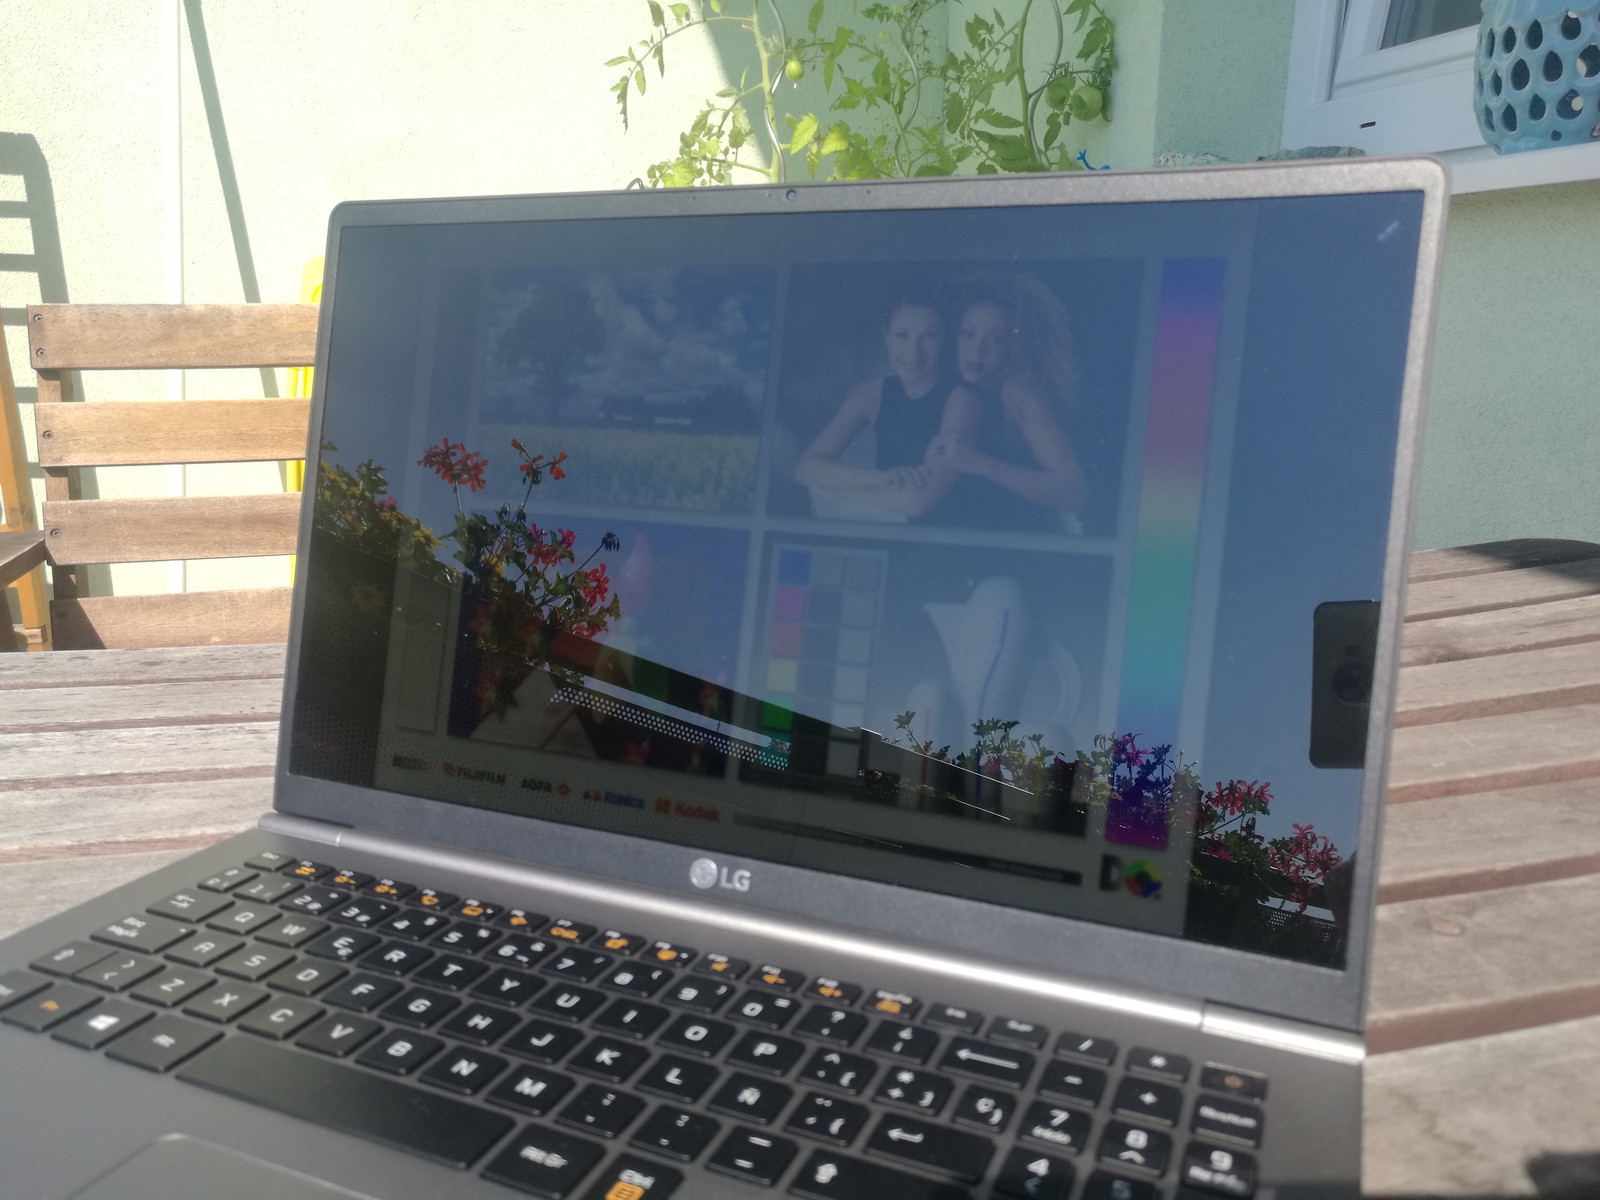
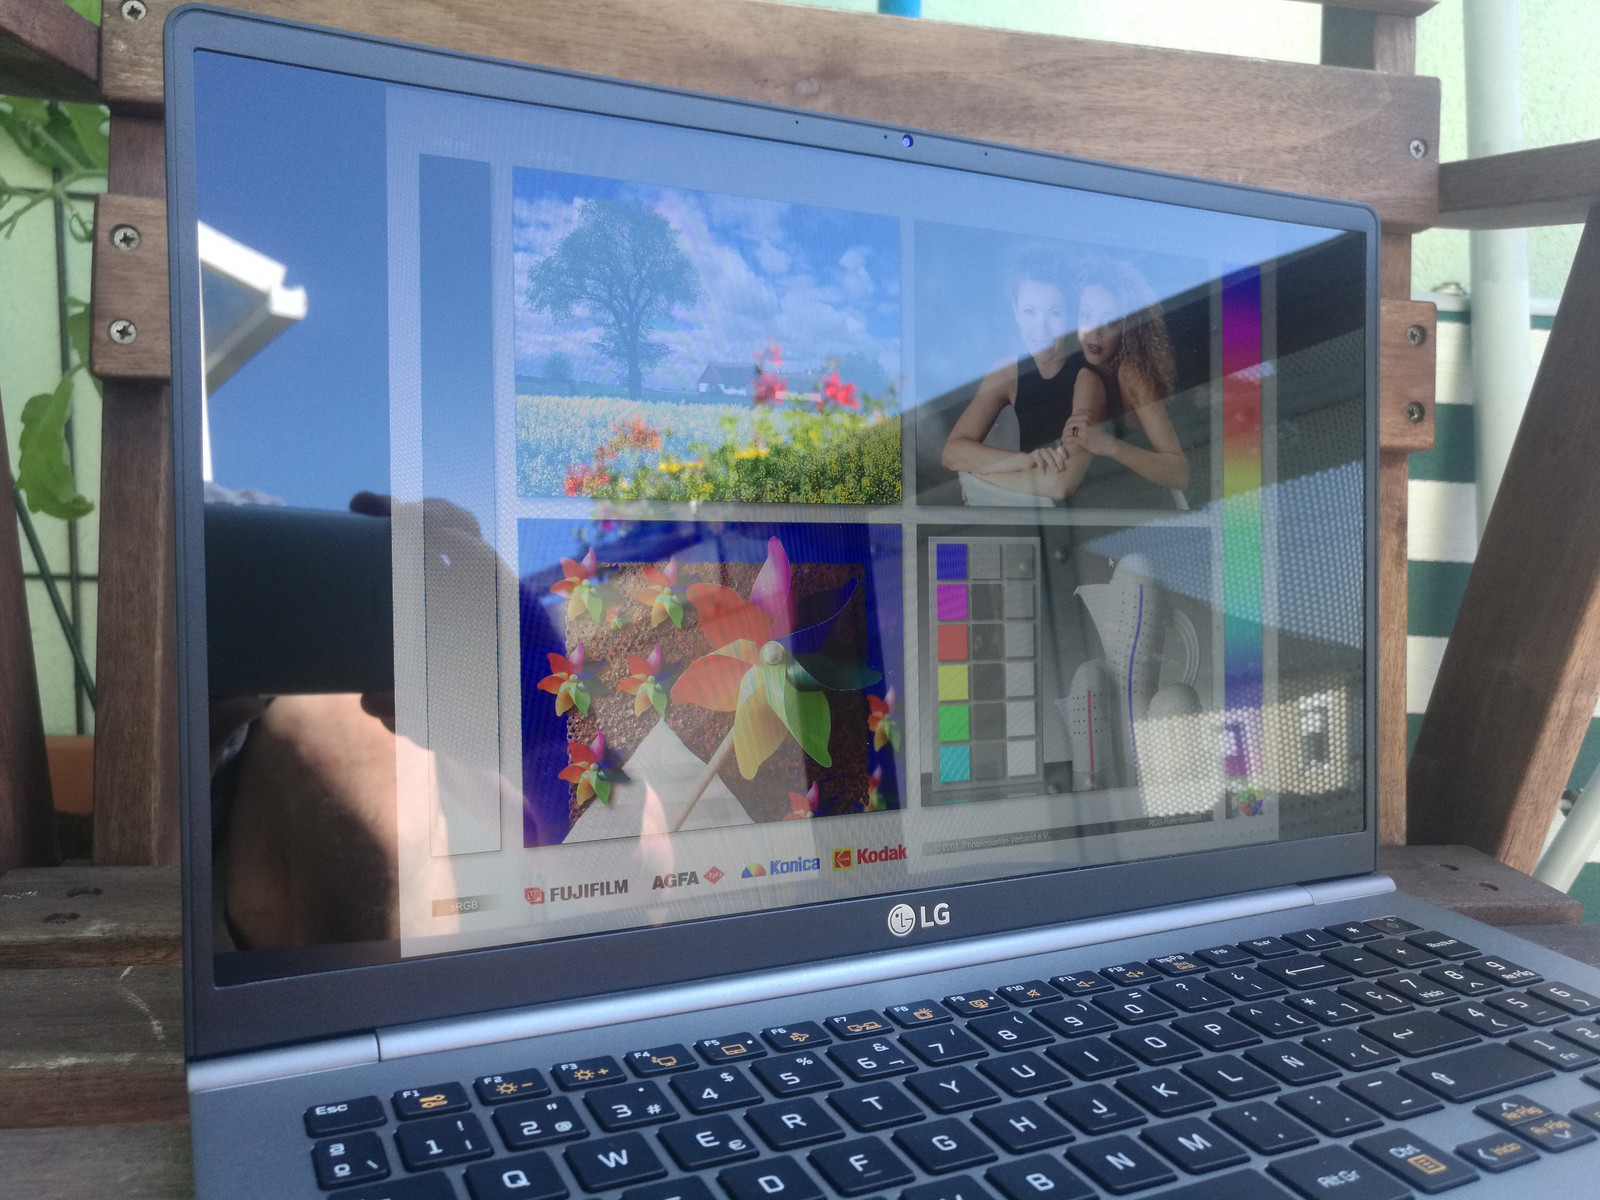
The 15Z980 has solid viewing angles thanks to its IPS display. Unfortunately, our test device is difficult to use outdoors because of the display’s highly reflective finish and relatively low maximum brightness on battery. A matte display would solve this.
Performance
Our test device is equipped with an Intel Core i7-8550U processor, 16 GB and a 512 GB M.2-2280 SSD. This model currently retails for €1,615 (~$1845). The 15Z980 can also be configured with an Intel Core i5-8250U, 8 GB RAM and a 256 GB SSD. The 16 GB RAM can only be selected with the Core i7-8550U variant. Both processors are quad-core chips with a 15 W thermal design power (TDP).
Processor
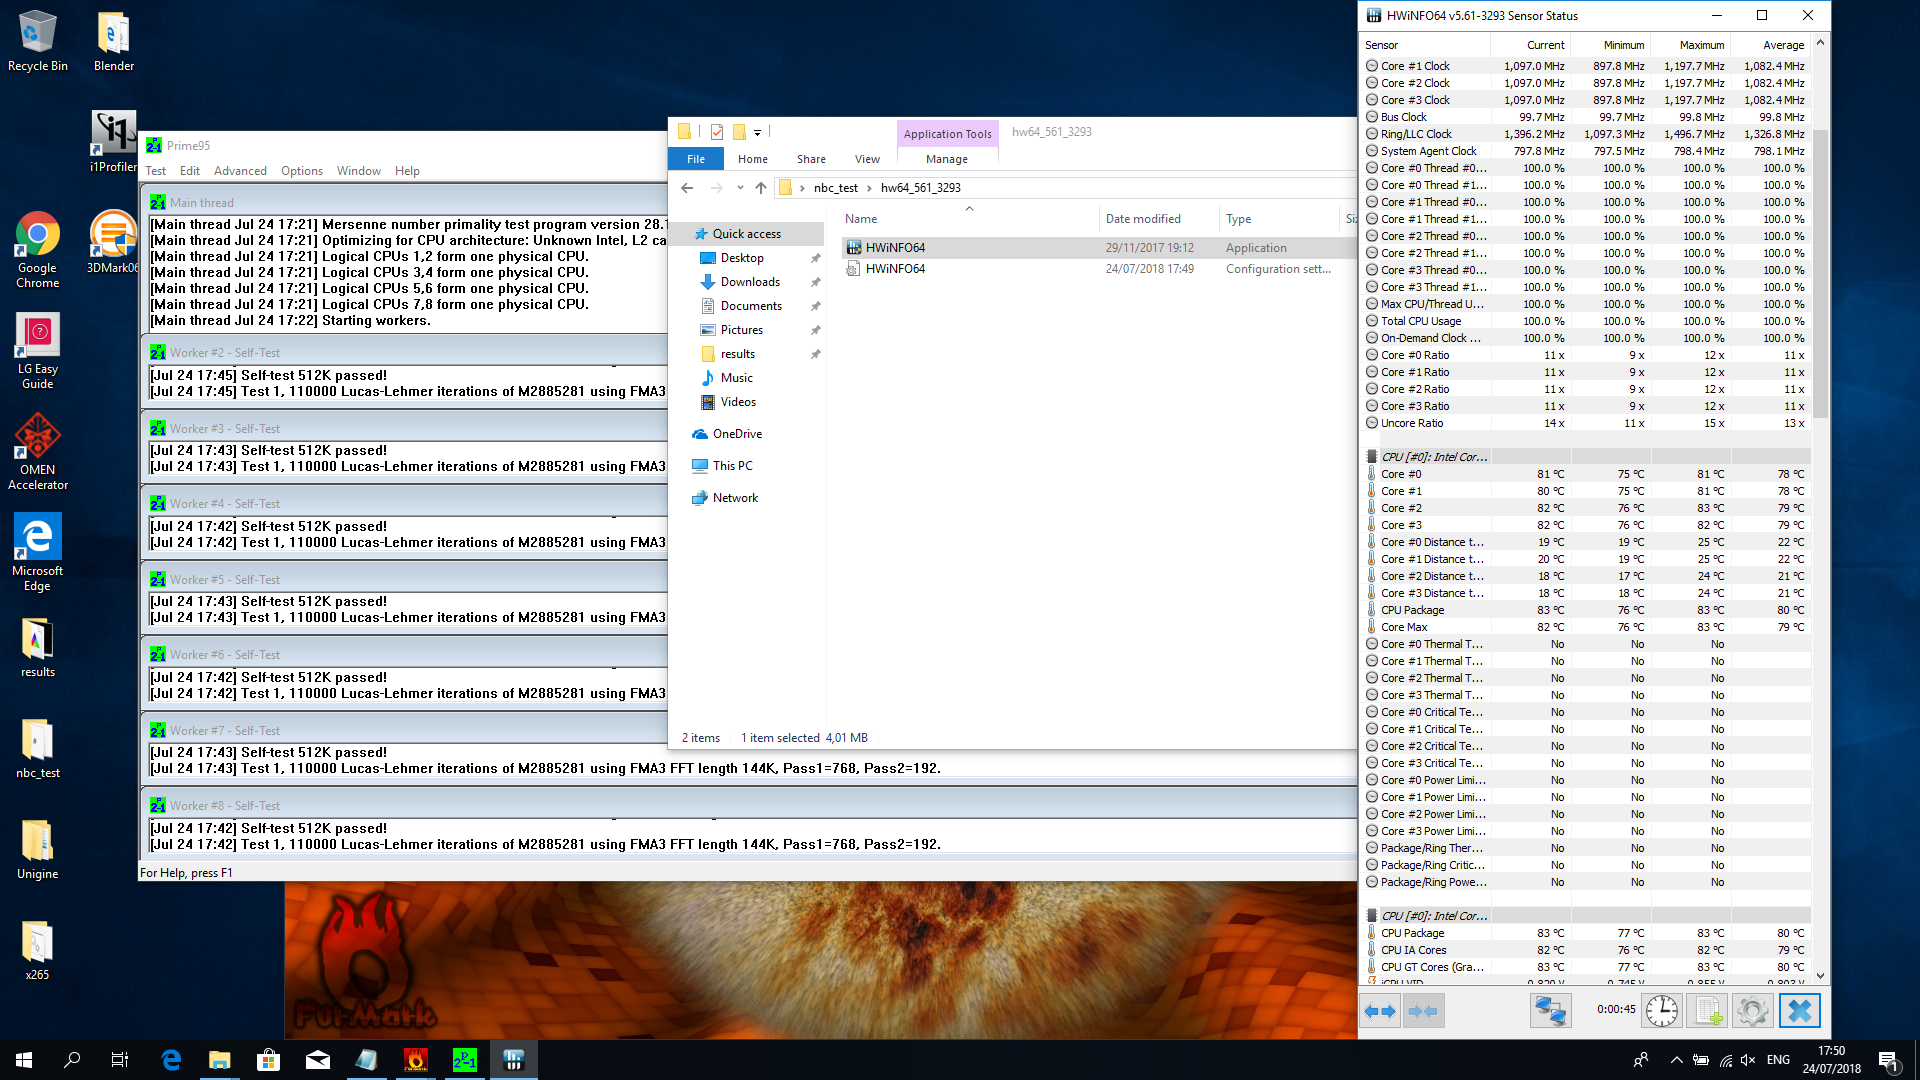
Our test device delivers underwhelming CPU performance despite being 17 mm thick. While this case thickness should help with heat dissipation, our test device can only achieve 501 points in the first run of the multi-threaded Cinebench R15 benchmark. This score then steadily drops on subsequent loops of the benchmark until it levels out at around 465 points. This puts the 15Z980 15% behind the average of Core i7-8550U powered devices that we have tested. The 15Z980 trails the X1 Carbon 2018 by 29% in these tests and a whopping 41% when we undervolted the latter. Worse still, the 15Z980 only scores 1% higher than the Core i5-8250U equipped Acer Swift 5.
Our test device performs better in the single-threaded Cinebench R15 benchmark, but it is still 2% below average and 6% slower than the X1 Carbon 2018.
Overall, we would not recommend the 15Z980 for those who need the best possible performance from their CPU; the 15Z980 is below average in this regard.
System Performance
Our test device scores relatively poorly in PCMark benchmarks, being between 20 and 30% below the average of Core i7-8550U powered devices that we have tested. This is mainly because of the comparatively slow SSD that is used, which we will discuss below.
| PCMark 8 Home Score Accelerated v2 | 3255 points | |
| PCMark 8 Creative Score Accelerated v2 | 3515 points | |
| PCMark 8 Work Score Accelerated v2 | 3518 points | |
| PCMark 10 Score | 2733 points | |
Help | ||
Storage Devices
Our test device is equipped with an SK Hynix Canvas SC300 512 GB SSD. This is an M.2-2280 SATA III SSD that SK Hynix claims has 530 MB/s sequential read and 470 MB/s sequential write speeds. CrystalDiskMark demonstrates that the SSD in our test device can only reach 488 MB/s sequential read and 446 MB/s sequential write speeds.
The SSD is on par with the other SATA III equipped devices. However, it is considerably slower than the Samsung PM981 NVMe SSD used in the X1 Carbon 2018, which achieves 2,236 MB/s sequential read and 1,807 MB/s sequential write speeds.
| LG Gram 15Z980-B.AA78B SK Hynix Canvas SC300 512GB M.2 (HFS512G39TNF) | Acer Swift 5 SF514-52T-59HY Intel SSD 600p SSDPEKKW256G7 | Asus Zenbook 3 Deluxe UX490UA Micron 1100 MTFDDAV256TBN | Lenovo ThinkPad X1 Carbon 2018-20KGS03900 Samsung SSD PM981 MZVLB512HAJQ | Asus ASUSPRO B9440UA-GV0100T Micron SSD 1100 (MTFDDAV256TBN) | Average SK Hynix Canvas SC300 512GB M.2 (HFS512G39TNF) | |
|---|---|---|---|---|---|---|
| CrystalDiskMark 3.0 | 38% | -2% | 160% | 2% | 0% | |
| Read Seq | 488.2 | 1113 128% | 435.3 -11% | 2327 377% | 462 -5% | 488 ? 0% |
| Write Seq | 446.7 | 597 34% | 413.3 -7% | 1808 305% | 441.4 -1% | 447 ? 0% |
| Read 512 | 367 | 642 75% | 325.9 -11% | 419.3 14% | 323.2 -12% | 367 ? 0% |
| Write 512 | 413.8 | 472.8 14% | 357 -14% | 1272 207% | 398.8 -4% | 414 ? 0% |
| Read 4k | 23.6 | 29.58 25% | 26.28 11% | 60.6 157% | 26.81 14% | 23.6 ? 0% |
| Write 4k | 71.1 | 89.2 25% | 85.6 20% | 132.9 87% | 87.8 23% | 71.1 ? 0% |
| Read 4k QD32 | 251.5 | 289.5 15% | 246.7 -2% | 340.7 35% | 247.3 -2% | 252 ? 0% |
| Write 4k QD32 | 224.2 | 203.3 -9% | 224.4 0% | 439.7 96% | 232.1 4% | 224 ? 0% |

Graphics Card
Conversely, the 15Z980 is top in 3DMark benchmarks, albeit practically tied with the X1 Carbon 2018. Our test device is equipped with the Intel UHD Graphics 620, which are integrated on the processor. The 15Z980 is around 20% faster than the average of Core i7-8550U devices that we have tested thanks to its fast 16 GB RAM that runs in dual channel mode. Dual channel mode helps the device extract the best GPU performance, with benchmarks typically around 20% higher in dual channel mode than in single channel mode.
The integrated graphics is suitable for office applications and casual gaming. We would recommend connecting an external GPU via Thunderbolt 3 if you would like to play games that are more demanding.
| 3DMark 06 Standard Score | 11397 points | |
| 3DMark Cloud Gate Standard Score | 8533 points | |
| 3DMark Fire Strike Score | 1168 points | |
| 3DMark Time Spy Score | 427 points | |
Help | ||
Gaming Performance
The 15Z980 can be used for some light gaming. Our test device achieves decent FPS in Dirt 4, FIFA 18, Fortnite and Overwatch but only when we set the resolution to 1,280 x 720 and graphics at low. Team Fortress 2 is playable at 1,920 x 1,080 with high graphics.
We would recommend investing in an external GPU if you would like to play more complex games on the 15Z980 or games at higher resolutions and graphics settings.
| Final Fantasy XV Benchmark - 1280x720 Lite Quality | |
| Average of class Subnotebook (18.9 - 130.6, n=54, last 2 years) | |
| Apple MacBook Pro 13 2018 Touchbar i5 | |
| Average Intel UHD Graphics 620 (5.61 - 14.7, n=14) | |
| LG Gram 15Z980-B.AA78B | |
| HP Spectre 13-af033ng | |
| Dell Latitude 7390 | |
| Unigine Valley 1.0 | |
| 1920x1080 Extreme HD DirectX AA:x8 | |
| Average of class Subnotebook (last 2 years) | |
| LG Gram 15Z980-B.AA78B | |
| Acer Spin 5 SP513-52N-566U | |
| Average Intel UHD Graphics 620 (3.9 - 5.5, n=3) | |
| Dell XPS 13 9360 QHD+ i5 | |
| Dell XPS 13 9360 QHD+ i7 | |
| 1920x1080 Extreme HD Preset OpenGL AA:x8 | |
| Average of class Subnotebook (last 2 years) | |
| Apple MacBook Pro 13 2018 Touchbar i5 | |
| low | med. | high | ultra | |
| Final Fantasy XV Benchmark (2018) | 10.2 |
Emissions
Fan Noise
The 15Z980 is a relatively quiet device that works silently in short bursts. Fan noise can reach up to 30 dB(A) at idle, but this only increases to 35 dB(A) under load.
Noise Level
| Idle |
| 30.3 / 30.3 / 31.1 dB(A) |
| Load |
| 34.9 / 34.9 dB(A) |
 | ||
30 dB silent 40 dB(A) audible 50 dB(A) loud |
||
min: | ||
Temperature
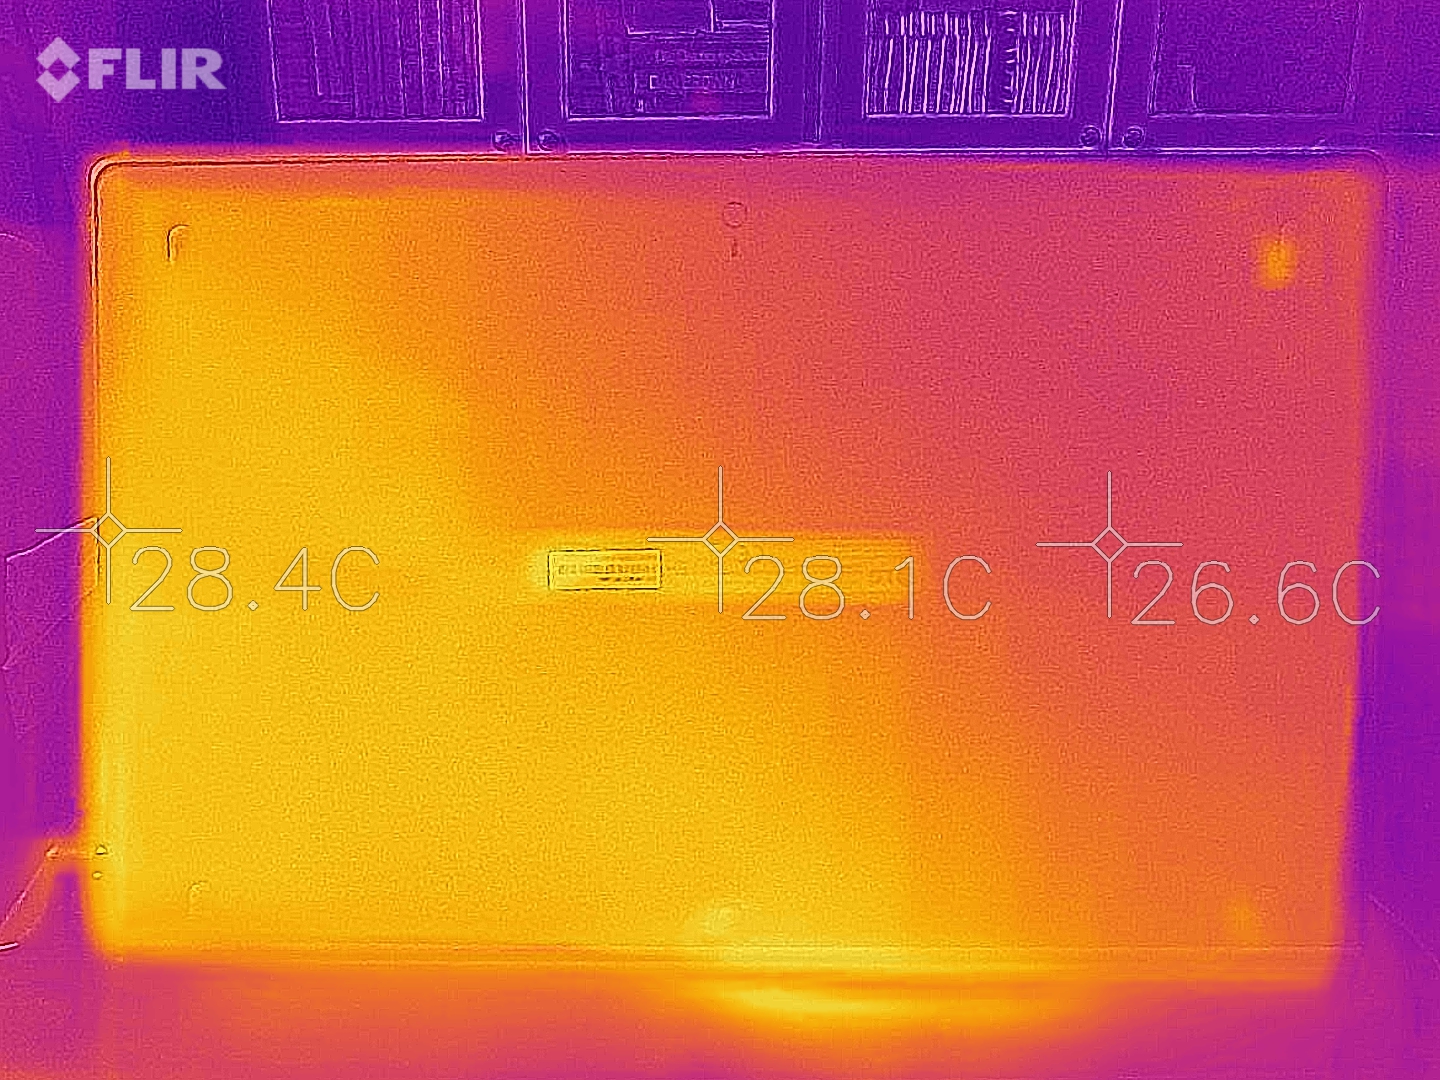
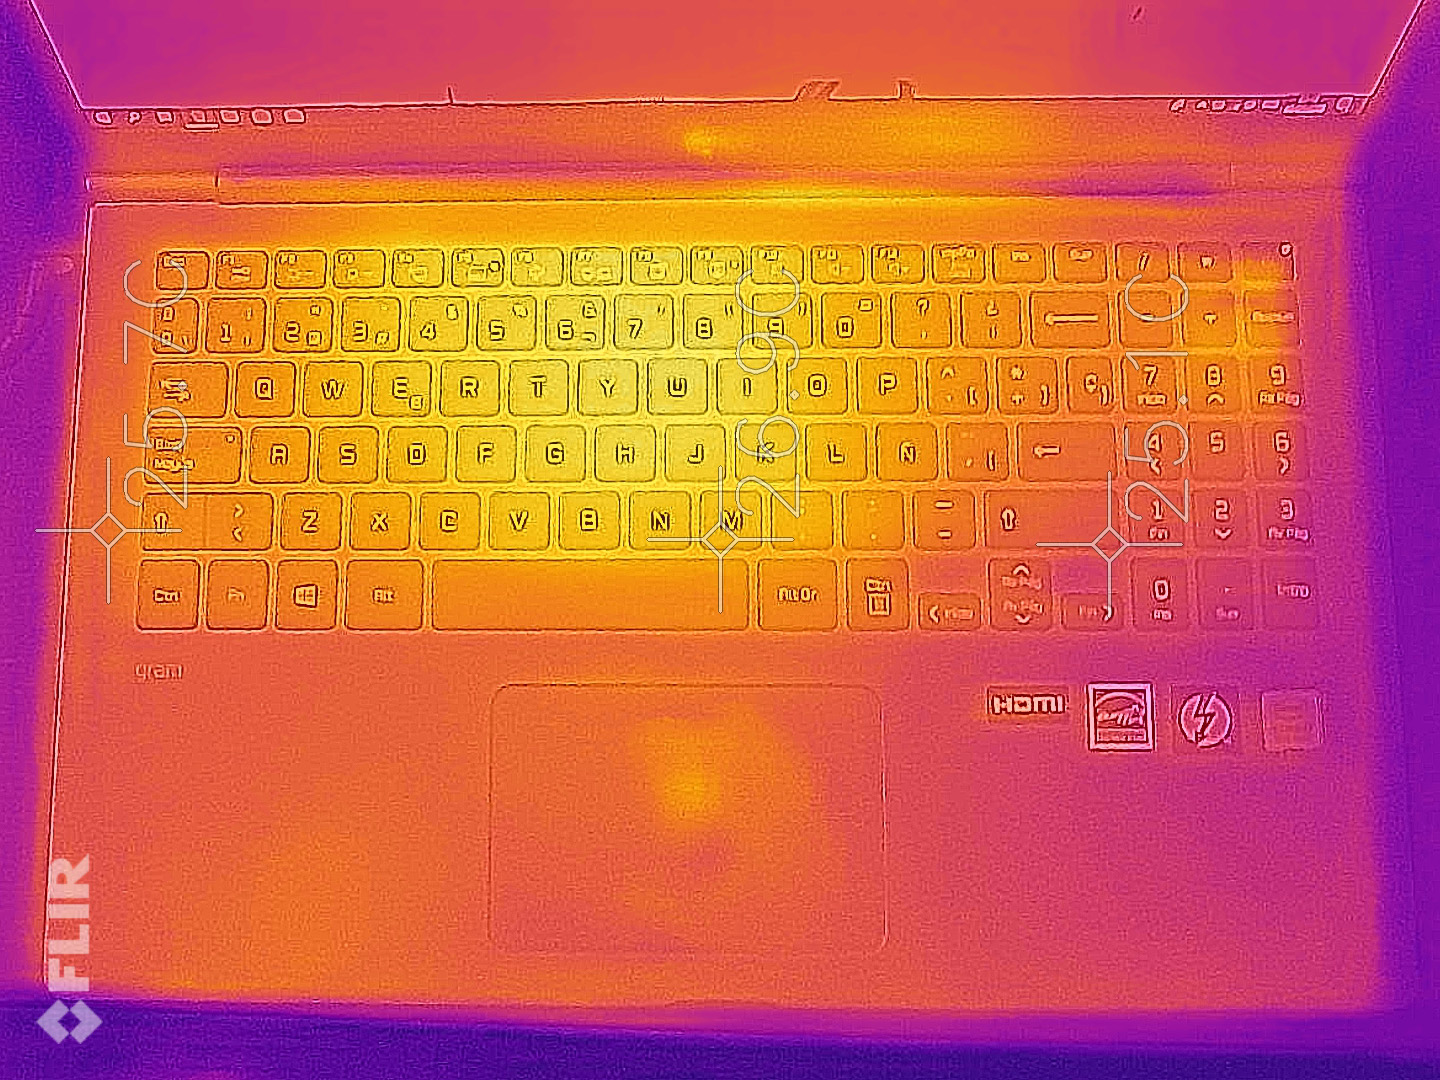
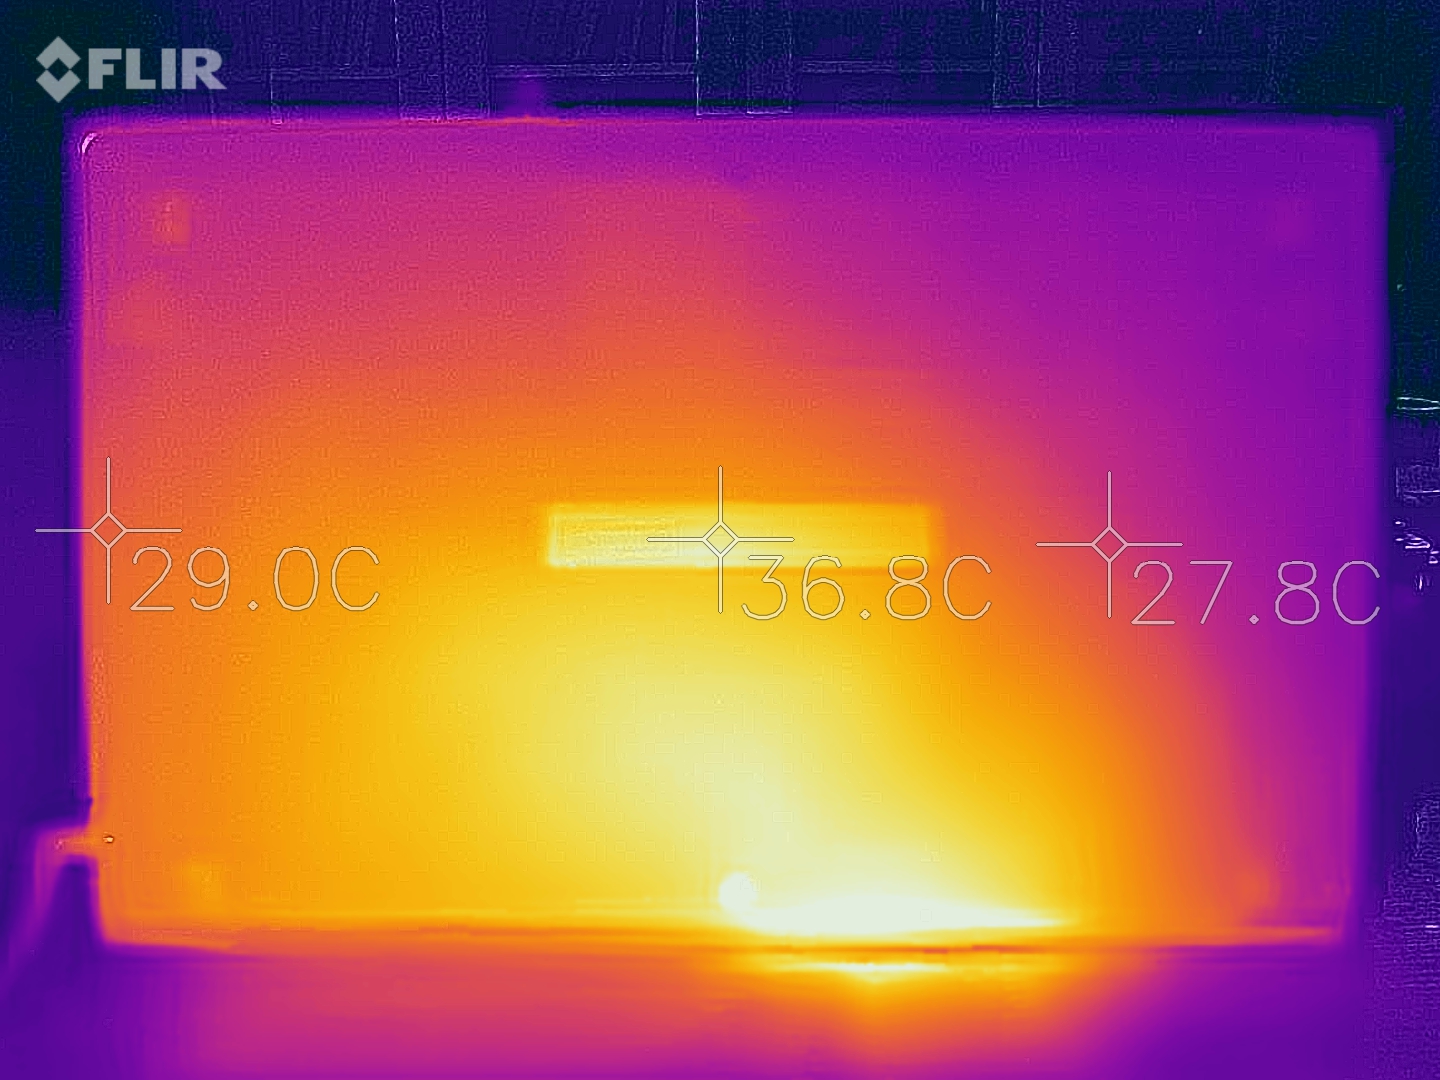
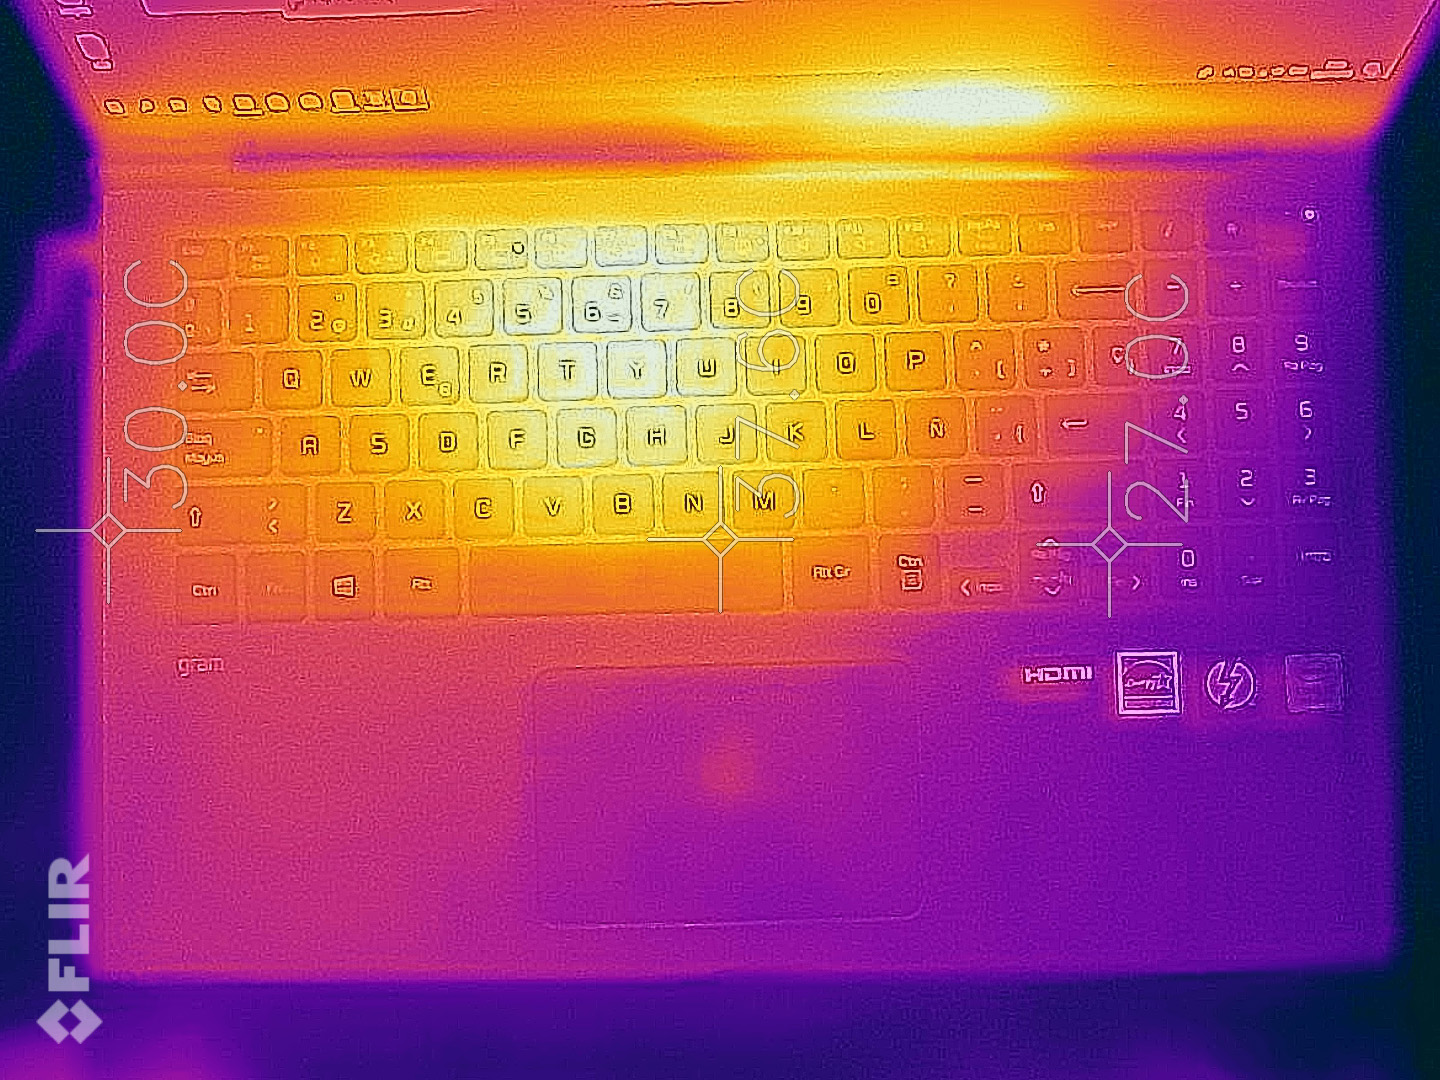
The 15Z980 runs relatively coolly too. Our test device averages 26.5 °C (79.7 °F) at idle with an ambient air temperature of 21 °C (69.8 °F). Temperatures ramp up to an average of 33.1 °C (91.6 °F) under load, with the palm rest averaging 27 °C (80.6 °F). Three areas reach above 40 °C (104 °F), but these are not dangerous temperatures.
We should point out that our test device performed worse at 35 °C (95 °F) ambient temperatures. Our test device achieved 480 points in Cinebench R15 on its first run, which is about a 5% performance drop compared to when we tested the device in cooler temperatures.
(±) The maximum temperature on the upper side is 43 °C / 109 F, compared to the average of 35.9 °C / 97 F, ranging from 21.4 to 59 °C for the class Subnotebook.
(±) The bottom heats up to a maximum of 41 °C / 106 F, compared to the average of 39.4 °C / 103 F
(+) In idle usage, the average temperature for the upper side is 26.4 °C / 80 F, compared to the device average of 30.7 °C / 87 F.
(+) The palmrests and touchpad are cooler than skin temperature with a maximum of 28 °C / 82.4 F and are therefore cool to the touch.
(±) The average temperature of the palmrest area of similar devices was 28.3 °C / 82.9 F (+0.3 °C / 0.5 F).
Speakers
The 15Z980 has two speakers on the bottom of the device. This allows the sound to reverberate off surfaces like tables and reaches a maximum volume of 82.2 dB(A). The positioning of the speakers causes the speakers to be obstructed when resting the device on your lap, for example.
The sound quality is good for notebooks, but there is a distinct lack of bass tones. Overall, the sound quality is good enough for occasional music and video playback.
LG Gram 15Z980-B.AA78B audio analysis
(+) | speakers can play relatively loud (82.2 dB)
Bass 100 - 315 Hz
(-) | nearly no bass - on average 24.1% lower than median
(±) | linearity of bass is average (12.3% delta to prev. frequency)
Mids 400 - 2000 Hz
(±) | higher mids - on average 5.4% higher than median
(+) | mids are linear (6.5% delta to prev. frequency)
Highs 2 - 16 kHz
(+) | balanced highs - only 1.1% away from median
(+) | highs are linear (3.7% delta to prev. frequency)
Overall 100 - 16.000 Hz
(±) | linearity of overall sound is average (19.3% difference to median)
Compared to same class
» 54% of all tested devices in this class were better, 7% similar, 38% worse
» The best had a delta of 5%, average was 19%, worst was 53%
Compared to all devices tested
» 41% of all tested devices were better, 8% similar, 51% worse
» The best had a delta of 4%, average was 25%, worst was 134%
Apple MacBook 12 (Early 2016) 1.1 GHz audio analysis
(+) | speakers can play relatively loud (83.6 dB)
Bass 100 - 315 Hz
(±) | reduced bass - on average 11.3% lower than median
(±) | linearity of bass is average (14.2% delta to prev. frequency)
Mids 400 - 2000 Hz
(+) | balanced mids - only 2.4% away from median
(+) | mids are linear (5.5% delta to prev. frequency)
Highs 2 - 16 kHz
(+) | balanced highs - only 2% away from median
(+) | highs are linear (4.5% delta to prev. frequency)
Overall 100 - 16.000 Hz
(+) | overall sound is linear (10.2% difference to median)
Compared to same class
» 5% of all tested devices in this class were better, 2% similar, 93% worse
» The best had a delta of 5%, average was 19%, worst was 53%
Compared to all devices tested
» 3% of all tested devices were better, 1% similar, 96% worse
» The best had a delta of 4%, average was 25%, worst was 134%
Acer Swift 5 SF514-52T-59HY audio analysis
(-) | not very loud speakers (67.7 dB)
Bass 100 - 315 Hz
(±) | reduced bass - on average 7.7% lower than median
(+) | bass is linear (6.4% delta to prev. frequency)
Mids 400 - 2000 Hz
(±) | higher mids - on average 5.5% higher than median
(+) | mids are linear (6.8% delta to prev. frequency)
Highs 2 - 16 kHz
(+) | balanced highs - only 2.7% away from median
(+) | highs are linear (6.5% delta to prev. frequency)
Overall 100 - 16.000 Hz
(±) | linearity of overall sound is average (18.9% difference to median)
Compared to same class
» 52% of all tested devices in this class were better, 7% similar, 41% worse
» The best had a delta of 5%, average was 19%, worst was 53%
Compared to all devices tested
» 39% of all tested devices were better, 8% similar, 54% worse
» The best had a delta of 4%, average was 25%, worst was 134%
Power Management
Power Consumption
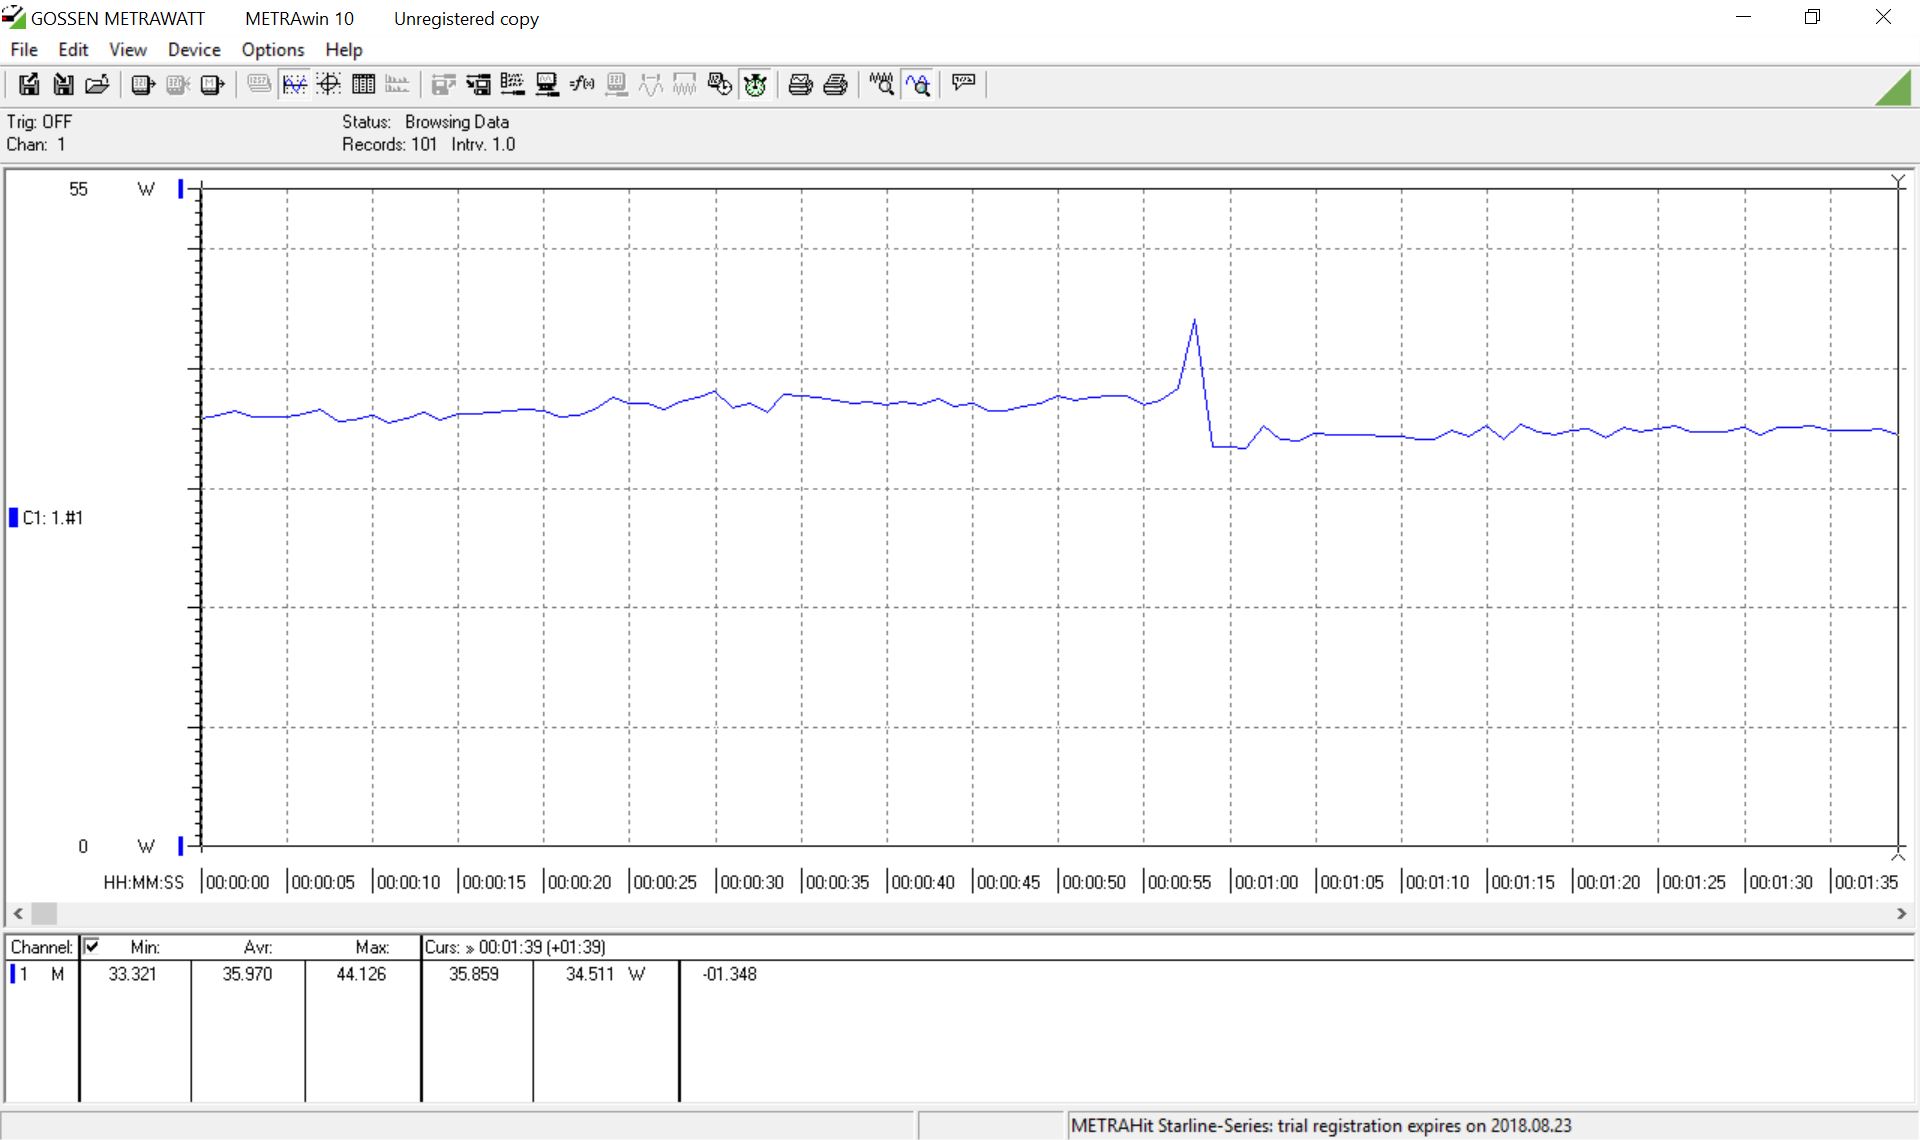
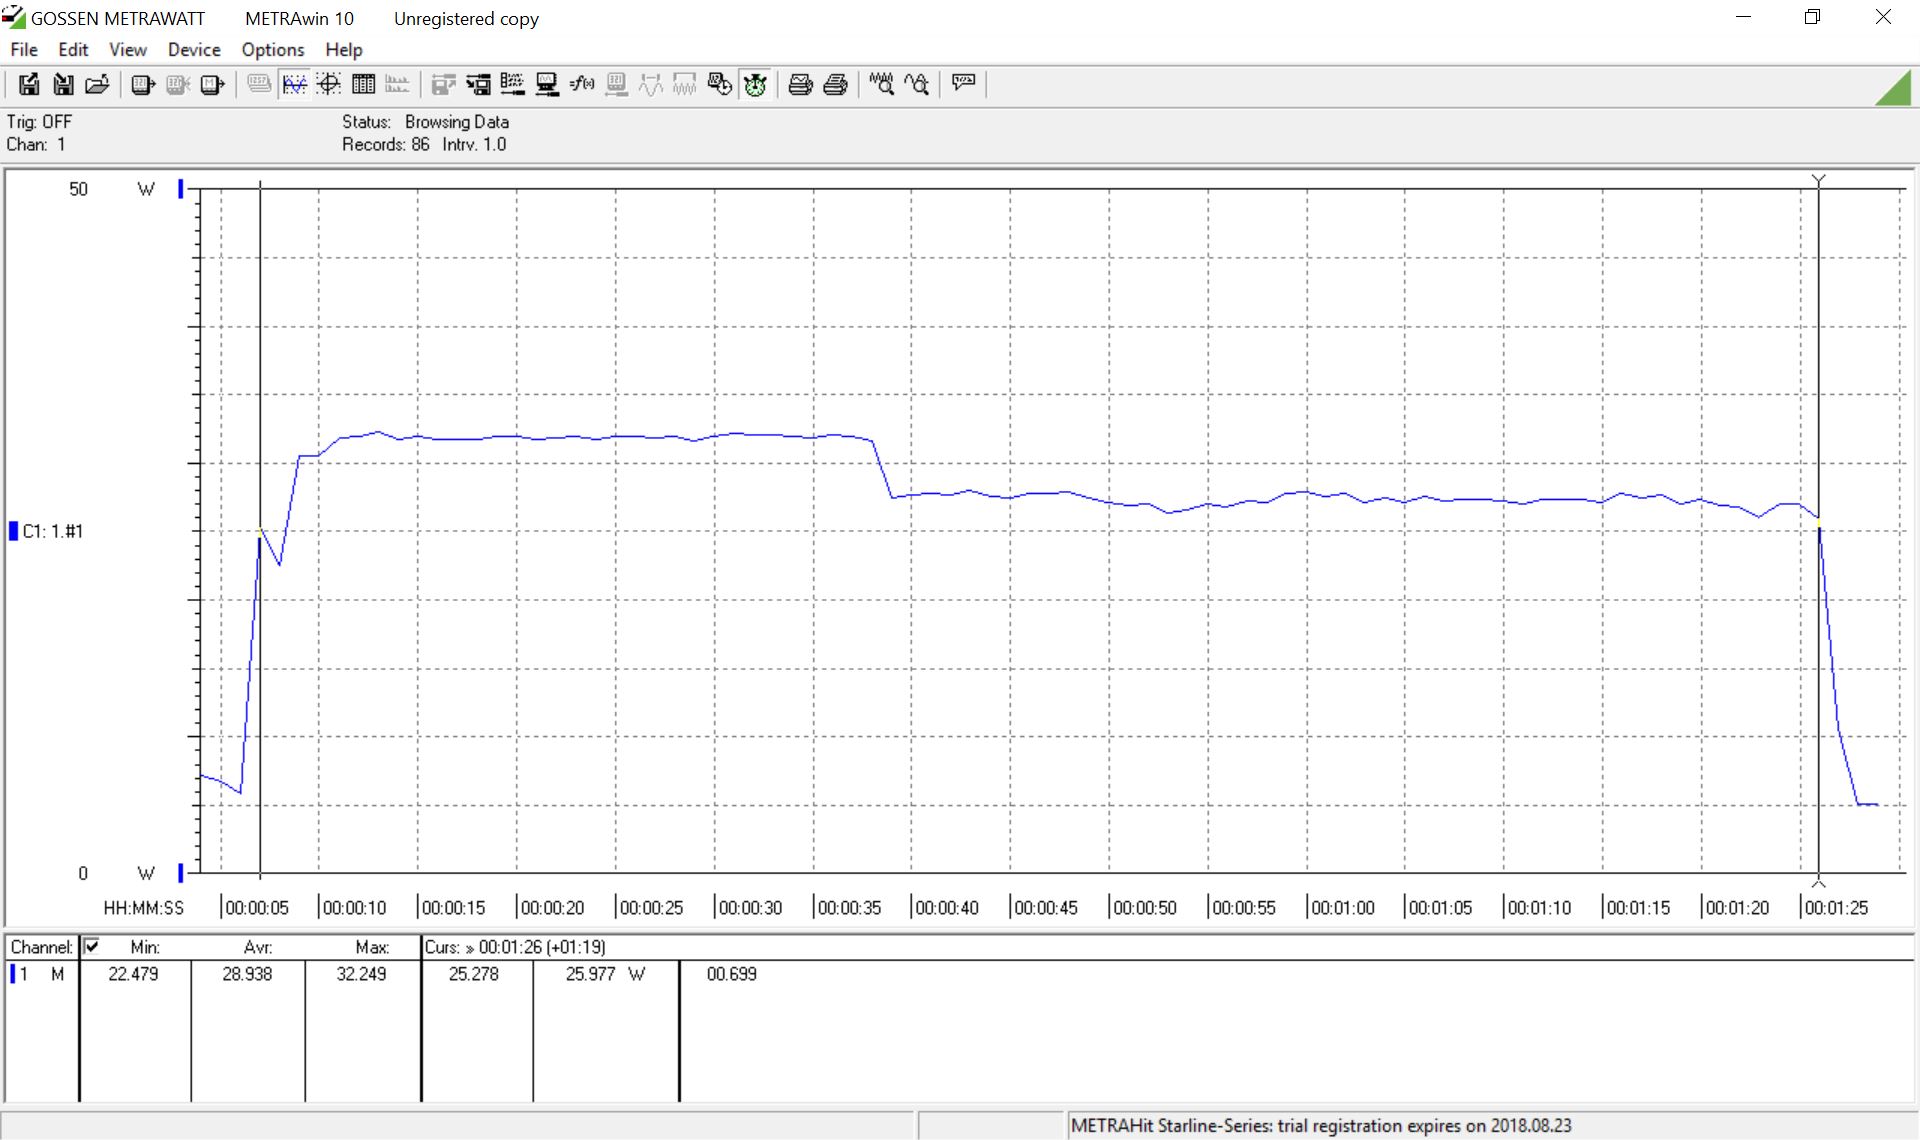
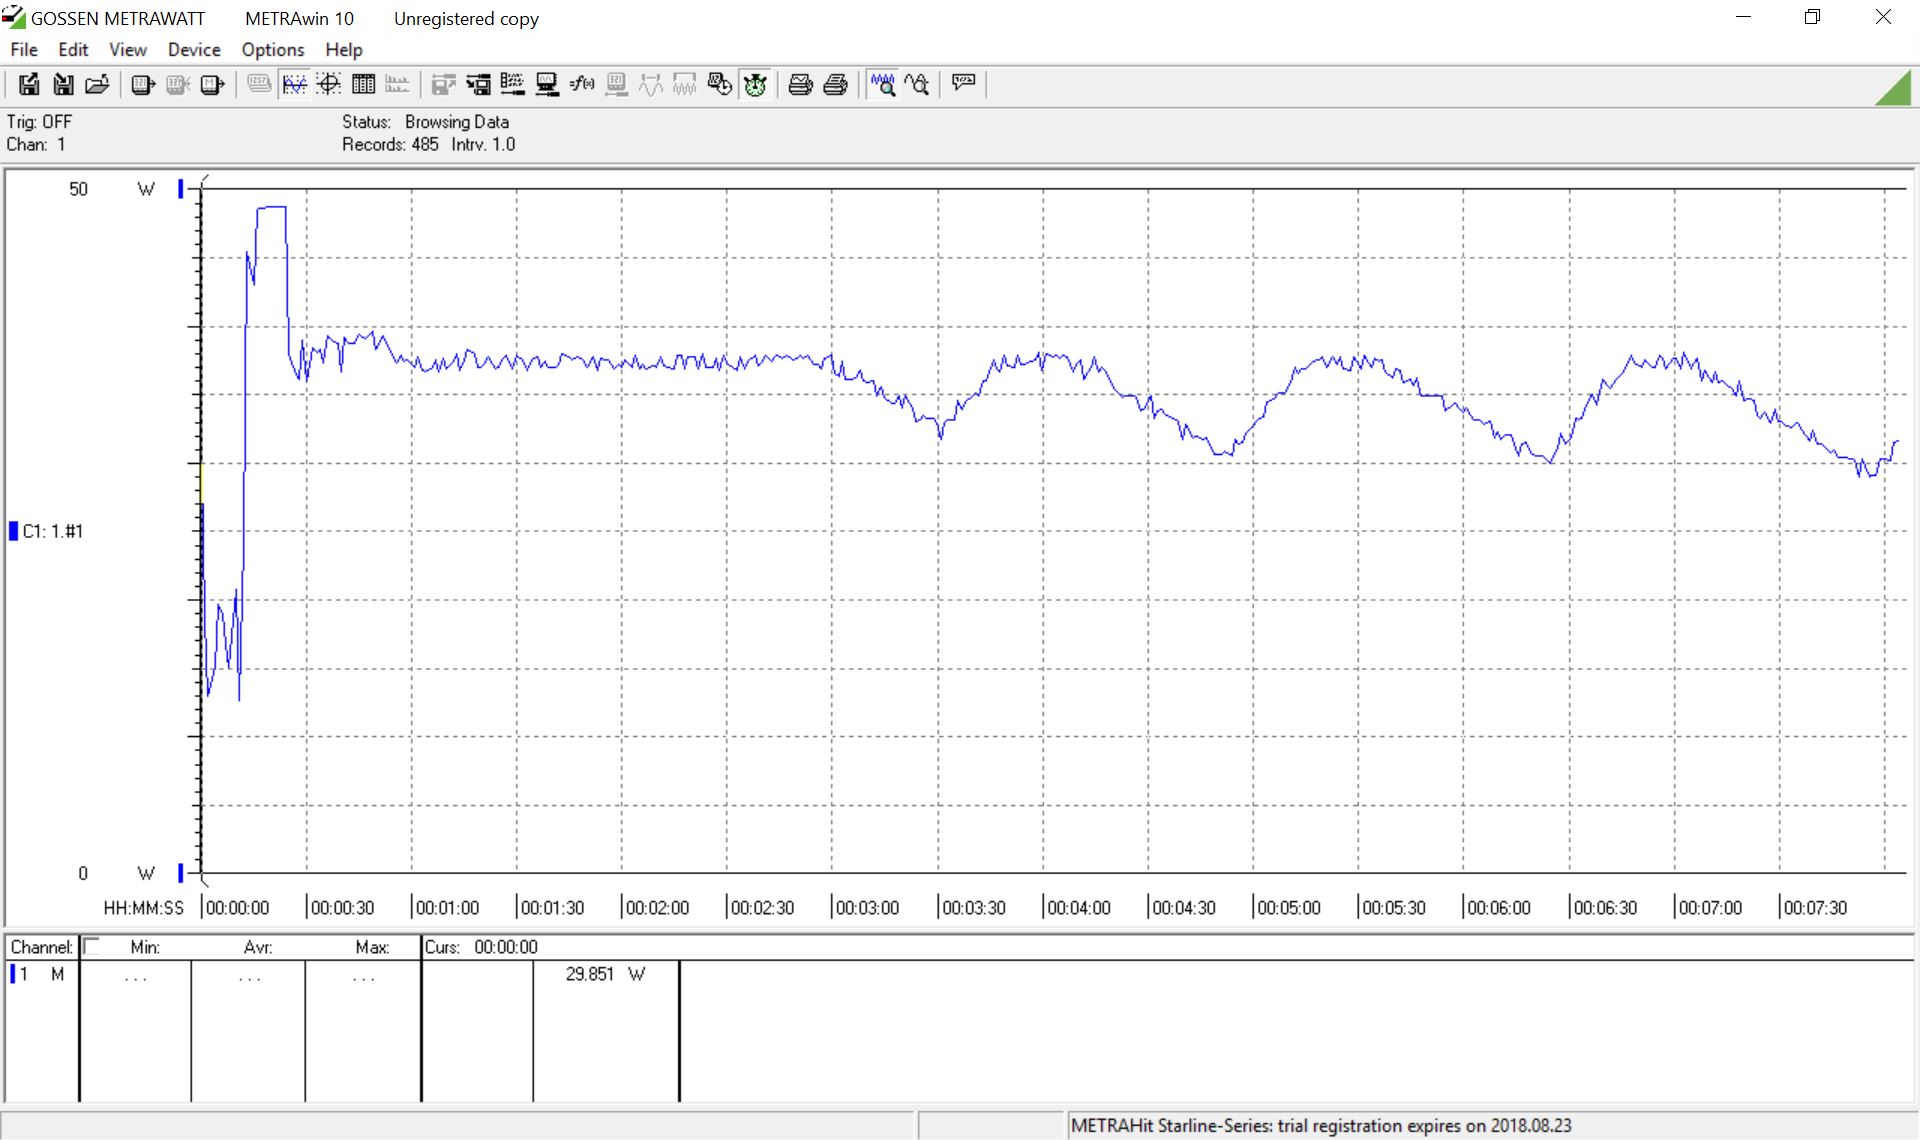
The 15Z980’s power consumption is comparable to that of the X1 Carbon 2018. Our test device consumes a minimum of 3.7 W and a maximum of 10 W at idle, which is on par with our comparison devices. The 15Z980 consumes a maximum of 48.7 W under load, which averages out at 36 W. The latter value is significantly lower than the X1 Carbon 2018.
Interestingly, our test device reaches 50 W after around twenty seconds of stress testing, which then drops to between 40 and 45 W. This then starts fluctuating between 30 and 40 W after three minutes. The device could probably be consistent in its power consumption if LG alters the device’s thermal limits. This would allow the 15Z980 to run at higher clock speeds for longer, which would improve overall performance.
| Off / Standby | |
| Idle | |
| Load |
|
| LG Gram 15Z980-B.AA78B i5-8550U, UHD Graphics 620, SK Hynix Canvas SC300 512GB M.2 (HFS512G39TNF), IPS LED, 1920x1080, 15.60 | Acer Swift 5 SF514-52T-59HY i5-8250U, UHD Graphics 620, Intel SSD 600p SSDPEKKW256G7, IPS, 1920x1080, 14.00 | Asus Zenbook 3 Deluxe UX490UA i5-7200U, HD Graphics 620, Micron 1100 MTFDDAV256TBN, IPS, 1920x1080, 14.00 | Lenovo ThinkPad X1 Carbon 2018-20KGS03900 i5-8550U, UHD Graphics 620, Samsung SSD PM981 MZVLB512HAJQ, IPS, 2560x1440, 14.00 | Asus ASUSPRO B9440UA-GV0100T i5-7200U, HD Graphics 620, Micron SSD 1100 (MTFDDAV256TBN), IPS, 1920x1080, 14.00 | Dell XPS 13 9360 QHD+ i7 i7-7500U, HD Graphics 620, Toshiba NVMe THNSN5256GPUK, IPS, 3200x1800, 13.30 | Average Intel UHD Graphics 620 | Average of class Subnotebook | |
|---|---|---|---|---|---|---|---|---|
| Power Consumption | 40% | 25% | -13% | 22% | 8% | 6% | -20% | |
| Idle Minimum * | 3.7 | 2.8 24% | 3.3 11% | 3.8 -3% | 3.1 16% | 6.4 -73% | 3.81 ? -3% | 4.9 ? -32% |
| Idle Average * | 8.5 | 4.8 44% | 6.1 28% | 8.9 -5% | 6.1 28% | 6.6 22% | 6.94 ? 18% | 8.36 ? 2% |
| Idle Maximum * | 10 | 6.3 37% | 10.1 -1% | 11.9 -19% | 6.8 32% | 6.8 32% | 8.75 ? 12% | 10.4 ? -4% |
| Load Average * | 36 | 21 42% | 24.6 32% | 47.5 -32% | 27.4 24% | 27.5 24% | 35 ? 3% | 45.9 ? -28% |
| Load Maximum * | 48.7 | 23 53% | 22 55% | 52.5 -8% | 43.7 10% | 32.4 33% | 47.5 ? 2% | 66 ? -36% |
* ... smaller is better
Battery Life
The 15Z980 has first-class battery life thanks to its 72 Wh battery. This is considerably larger than all our comparison devices. Our test device lasted thirteen hours and five minutes in our Wi-Fi battery test during which we run a script that simulates the load required to render websites. This is over four hours longer than most of our comparison devices. The comparison device with the best runtime is the Apple MacBook Pro 13 2018, but this only lasts nine hours and forty-one minutes.
| LG Gram 15Z980-B.AA78B i5-8550U, UHD Graphics 620, 72 Wh | Acer Swift 5 SF514-52T-59HY i5-8250U, UHD Graphics 620, 36 Wh | Asus Zenbook 3 Deluxe UX490UA i5-7200U, HD Graphics 620, 46 Wh | Lenovo ThinkPad X1 Carbon 2018-20KGS03900 i5-8550U, UHD Graphics 620, 57 Wh | Asus ASUSPRO B9440UA-GV0100T i5-7200U, HD Graphics 620, 48 Wh | Apple MacBook Pro 13 2018 Touchbar i5 i5-8259U, Iris Plus Graphics 655, 58 Wh | Average of class Subnotebook | |
|---|---|---|---|---|---|---|---|
| Battery Runtime | -56% | -30% | -38% | -34% | -30% | -19% | |
| H.264 | 950 | 466 -51% | 566 -40% | 651 -31% | 794 ? -16% | ||
| WiFi v1.3 | 805 | 313 -61% | 562 -30% | 519 -36% | 531 -34% | 581 -28% | 629 ? -22% |
| Witcher 3 ultra | 94 |
Verdict
Pros
Cons
The LG Gram 15Z980 is unrivalled for the crown of thin and light 15-inch notebooks. There are compromises that come with this 1.1 kg (~2.4 lbs) device though. In general, we like LG’s approach to making the device lighter but not making the device thin for the sake of it.
The magnesium alloy case feels premium, but it is susceptible to pressure and twisting. The combination of the material and low weight makes the device feel fragile. However, the MIL-STD-810G certification and endurance tests from popular YouTube channels go some way to combat this impression.
Overall, the LG Gram 15Z980 is an impressive ultra-mobile workhorse that is extremely light and has great battery life. It is just a shame that LG does not offer the device in more markets.
Moreover, the 15Z980 cannot fully make use of its Core i7-8550U CPU. Our test device only matched Core i5-8250U powered competitors in benchmarks. Furthermore, LG has equipped our test device with a slow SATA III SSD that cannot compete with much faster NVMe drives. Unfortunately, the device only accepts the slower SATA III standard. A nice touch is the second M.2-2280 slot should you need it.
There are plenty of other positives too. The 16 GB RAM operating in dual channel mode helps extract the most from the integrated GPU. The 15Z980 offers a solid selection of ports too including three USB 3.0 Type-A ports and a Thunderbolt 3 port.
The keyboard offers a good typing experience overall, but it will take some getting used to. There are a few non-standard key sizes that will feel awkward at first. Additionally, we could only choose a Spanish QWERTY keyboard. However, the inclusion of a numpad is useful, particularly as not all 15-inch devices include one.
The Full HD display is sufficiently bright with a good contrast ratio and decent color accuracy. Frustratingly, maximum brightness is significantly reduced on battery. There could be a setting somewhere to rectify this, but we could not find one during testing. This combined with a highly reflective display make using the 15Z980 outside a chore.
Additionally, our test device stays relatively cool and quiet even under extreme load conditions. Furthermore, the 15Z980 has exceptionally long battery life that blows away our comparison devices.
Interestingly, the 15Z980 would have scored 84% as an office notebook but 86% as a sub-notebook. We have chosen to class the device in the latter category because of its mobility compared with other 15-inch devices.
LG Gram 15Z980-B.AA78B
-
08/06/2018 v6(old)
J. Simon Leitner, Alexander Fagot


Pricecompare

