 Deutsch
 English
 Español
 Français
 Italiano
 Nederlands
 Polski
 Português
 Русский
 Türkçe
 Svenska
 Chinese
 Magyar
Intel Core i9-9900KS with 5 GHz All-Core-Boost Review
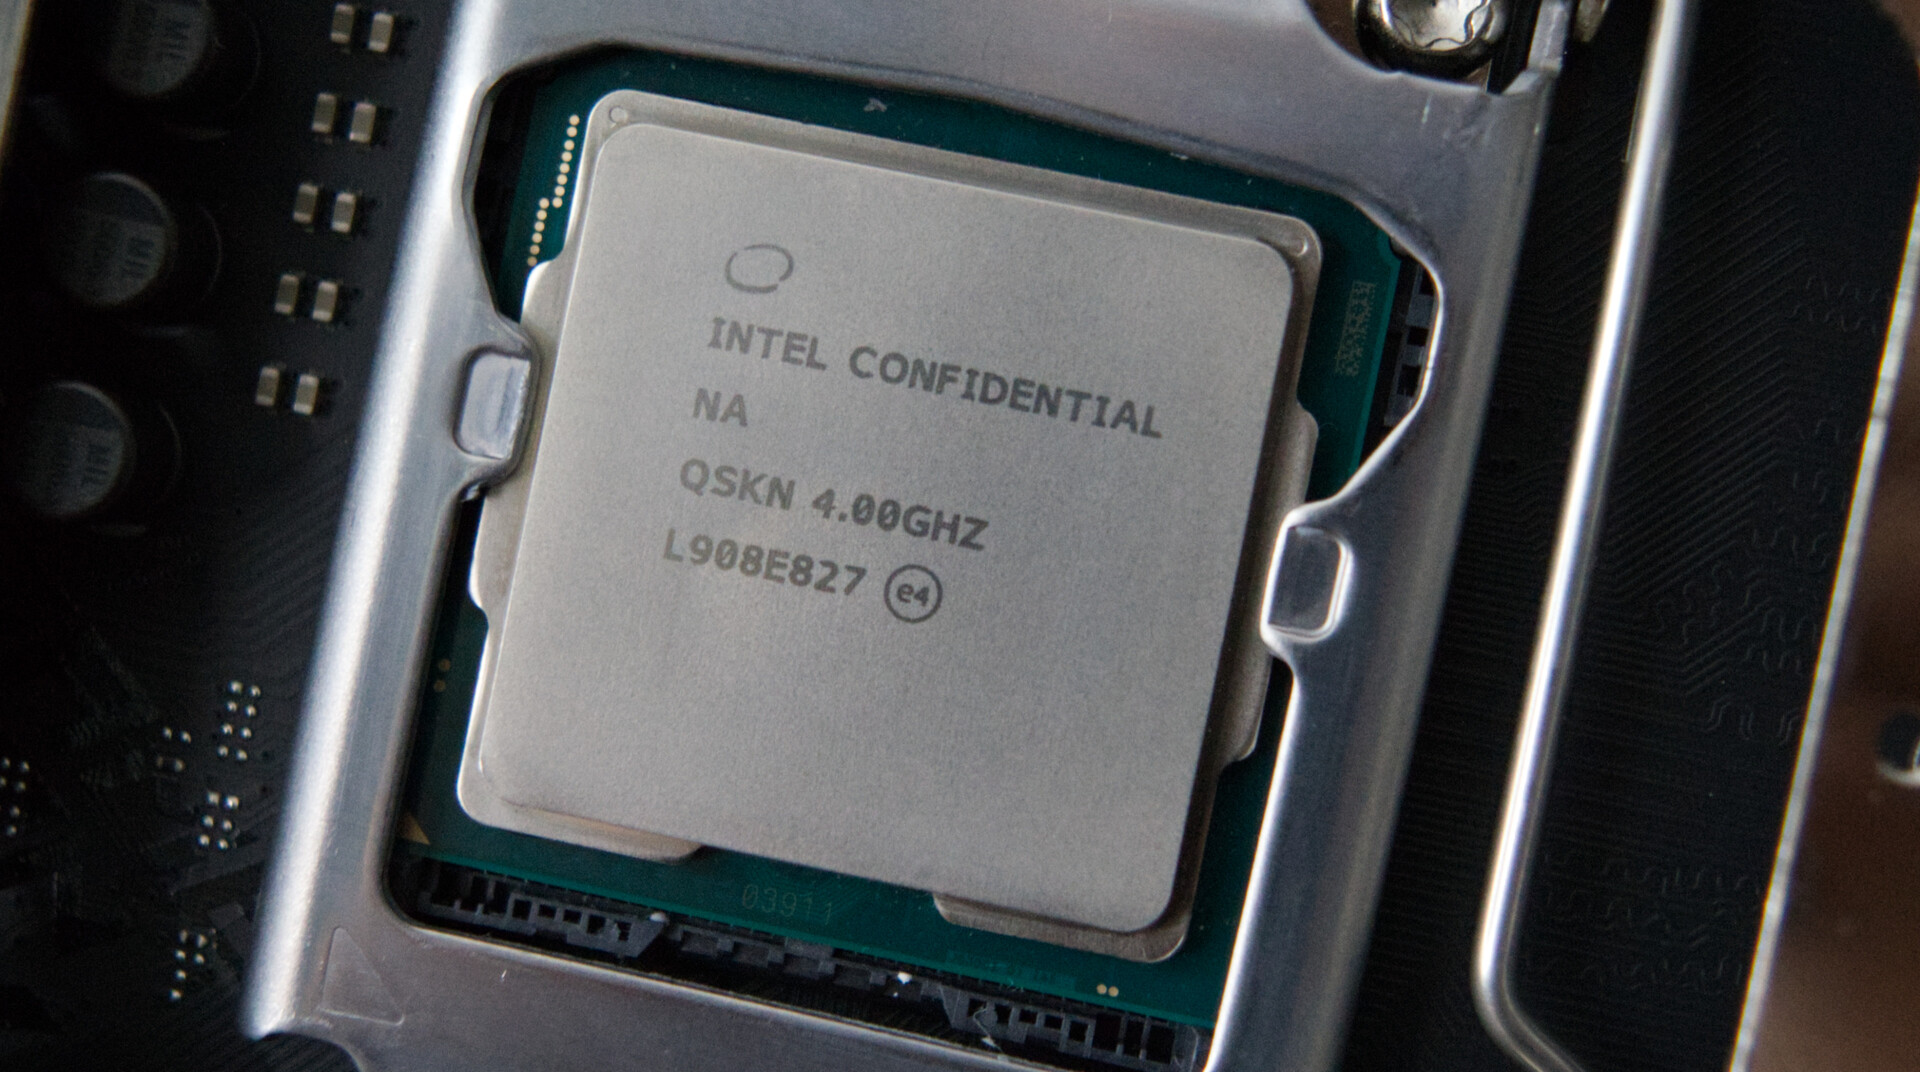
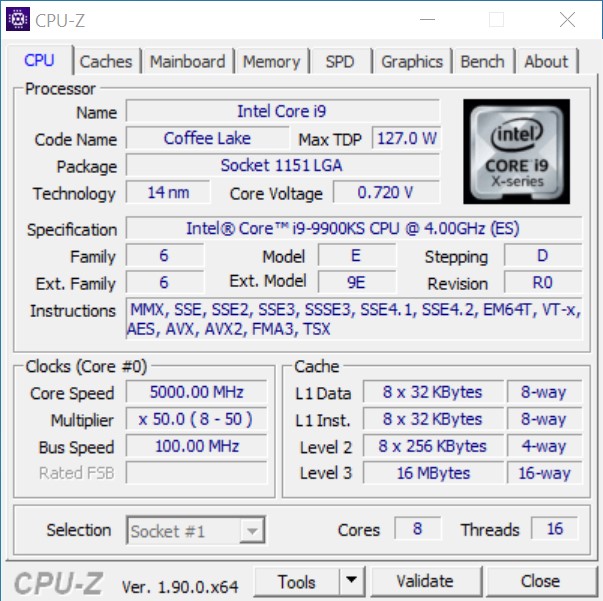
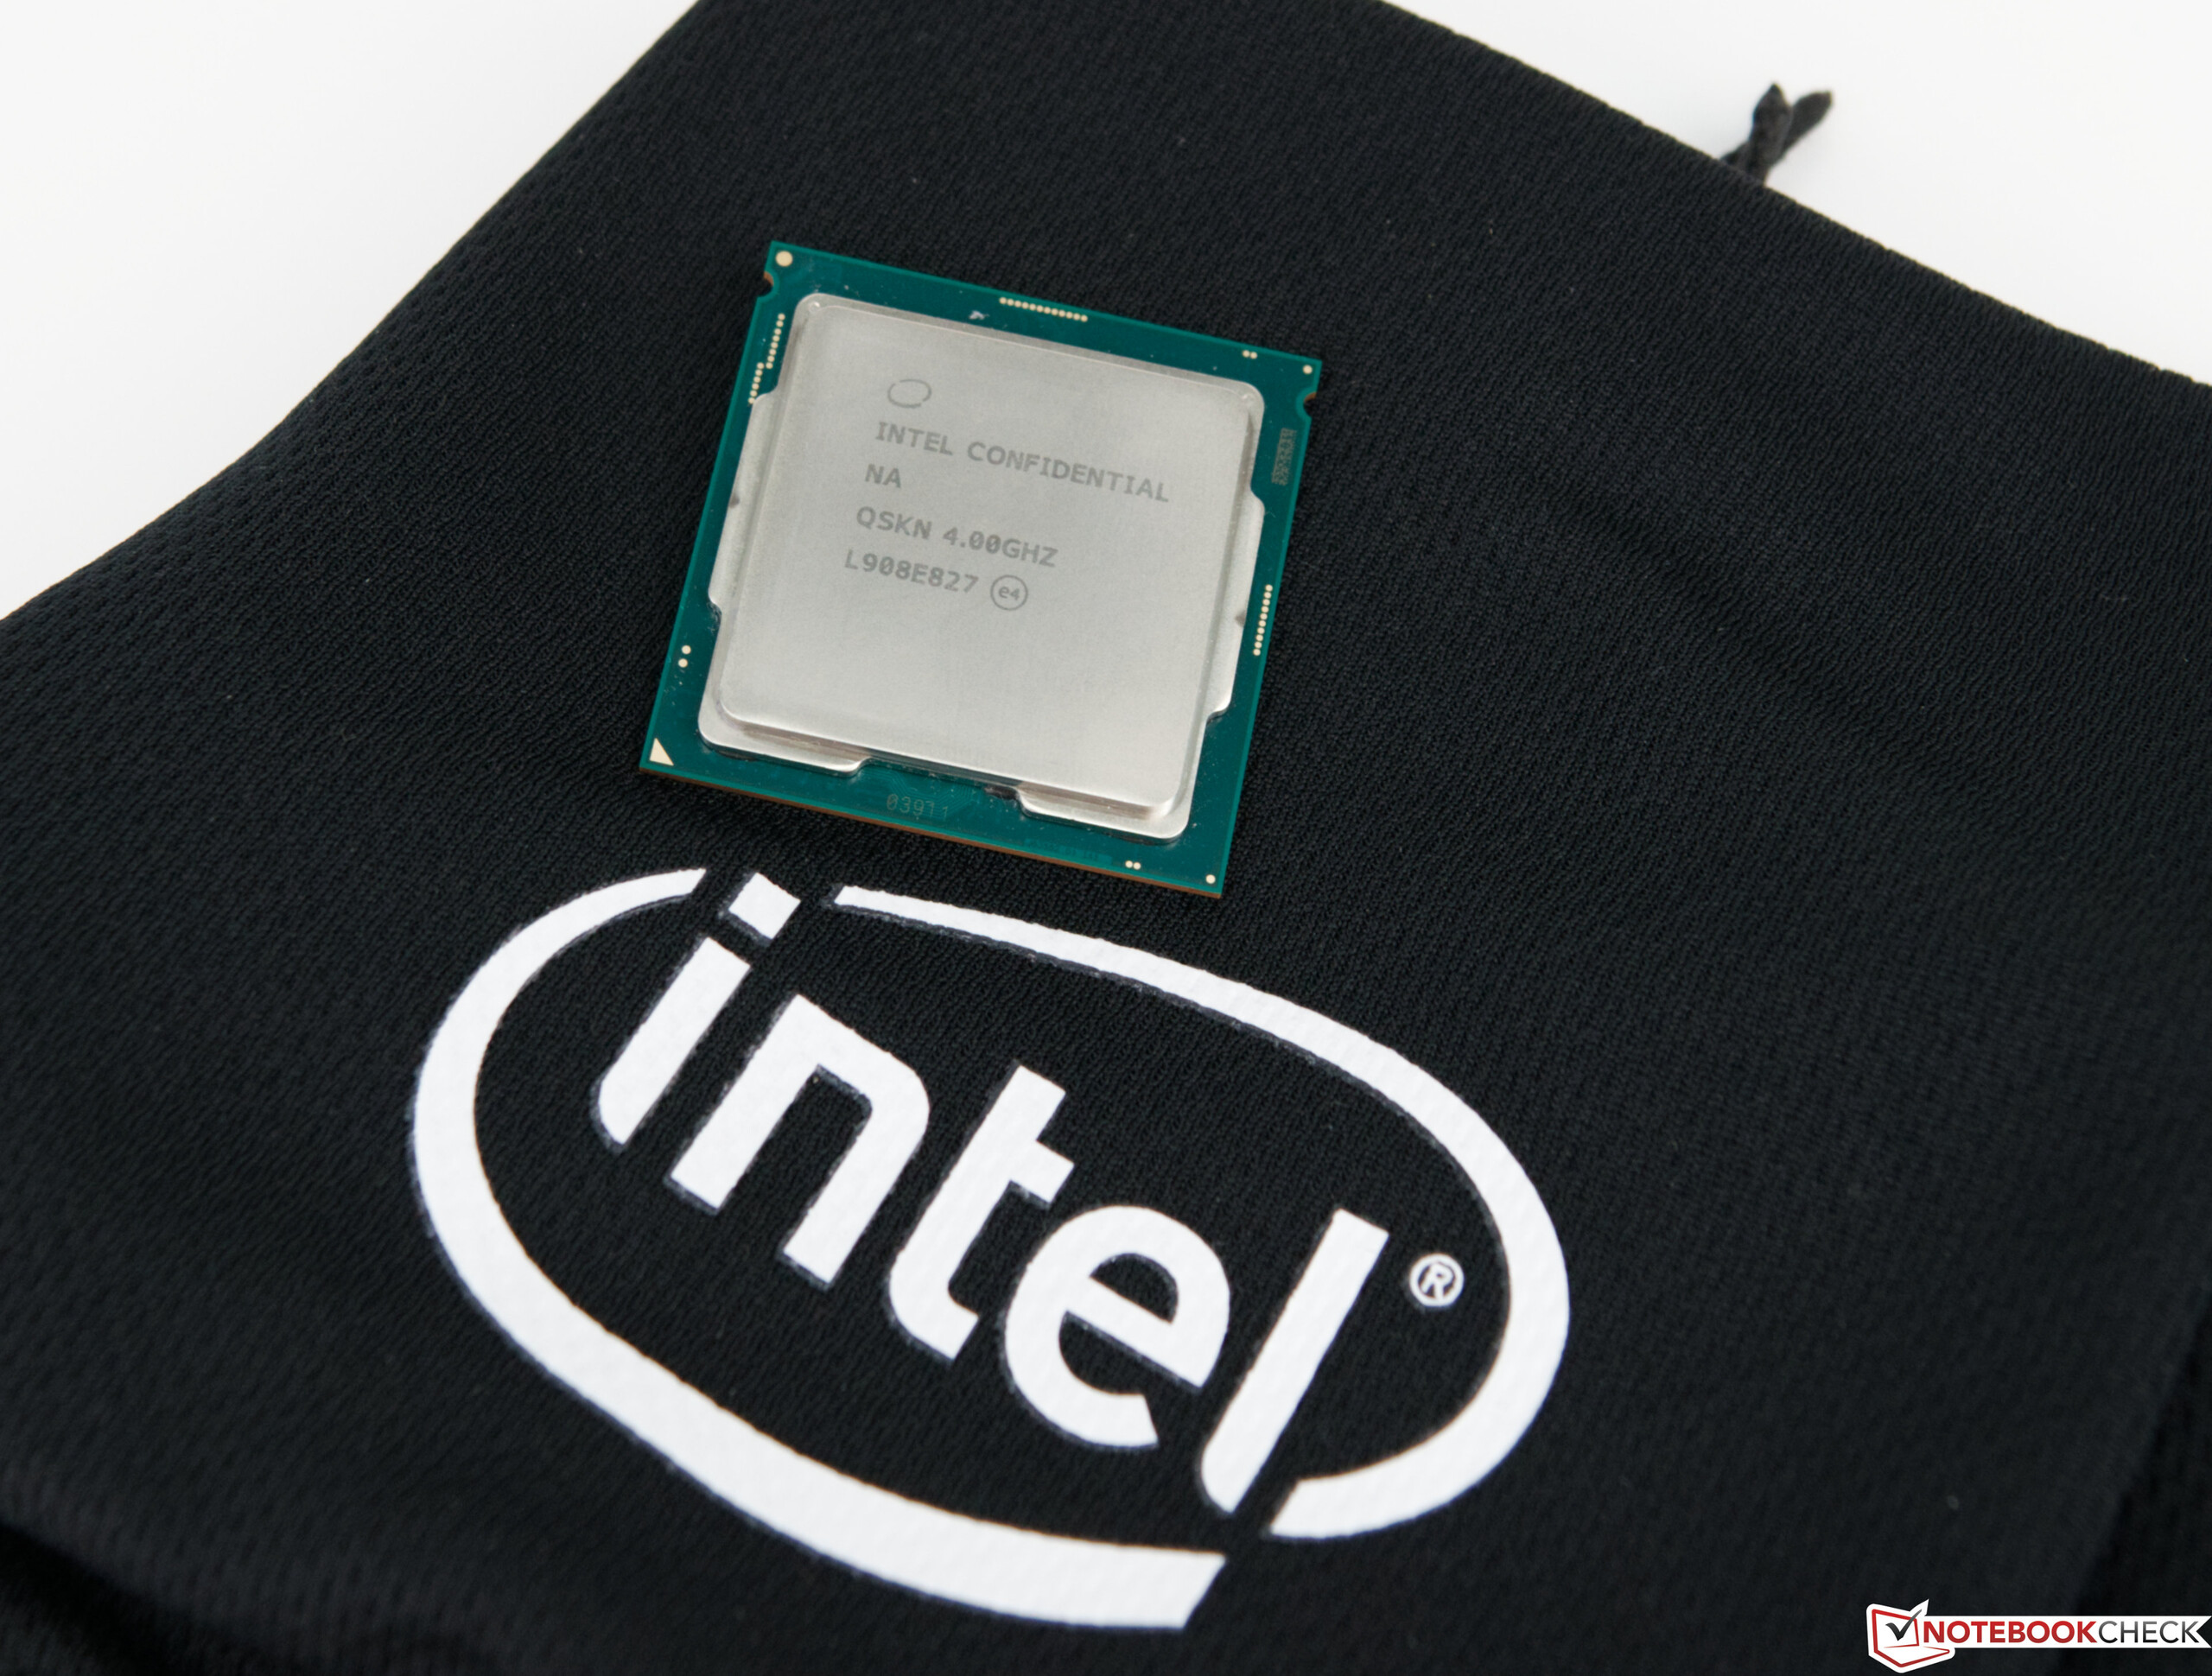
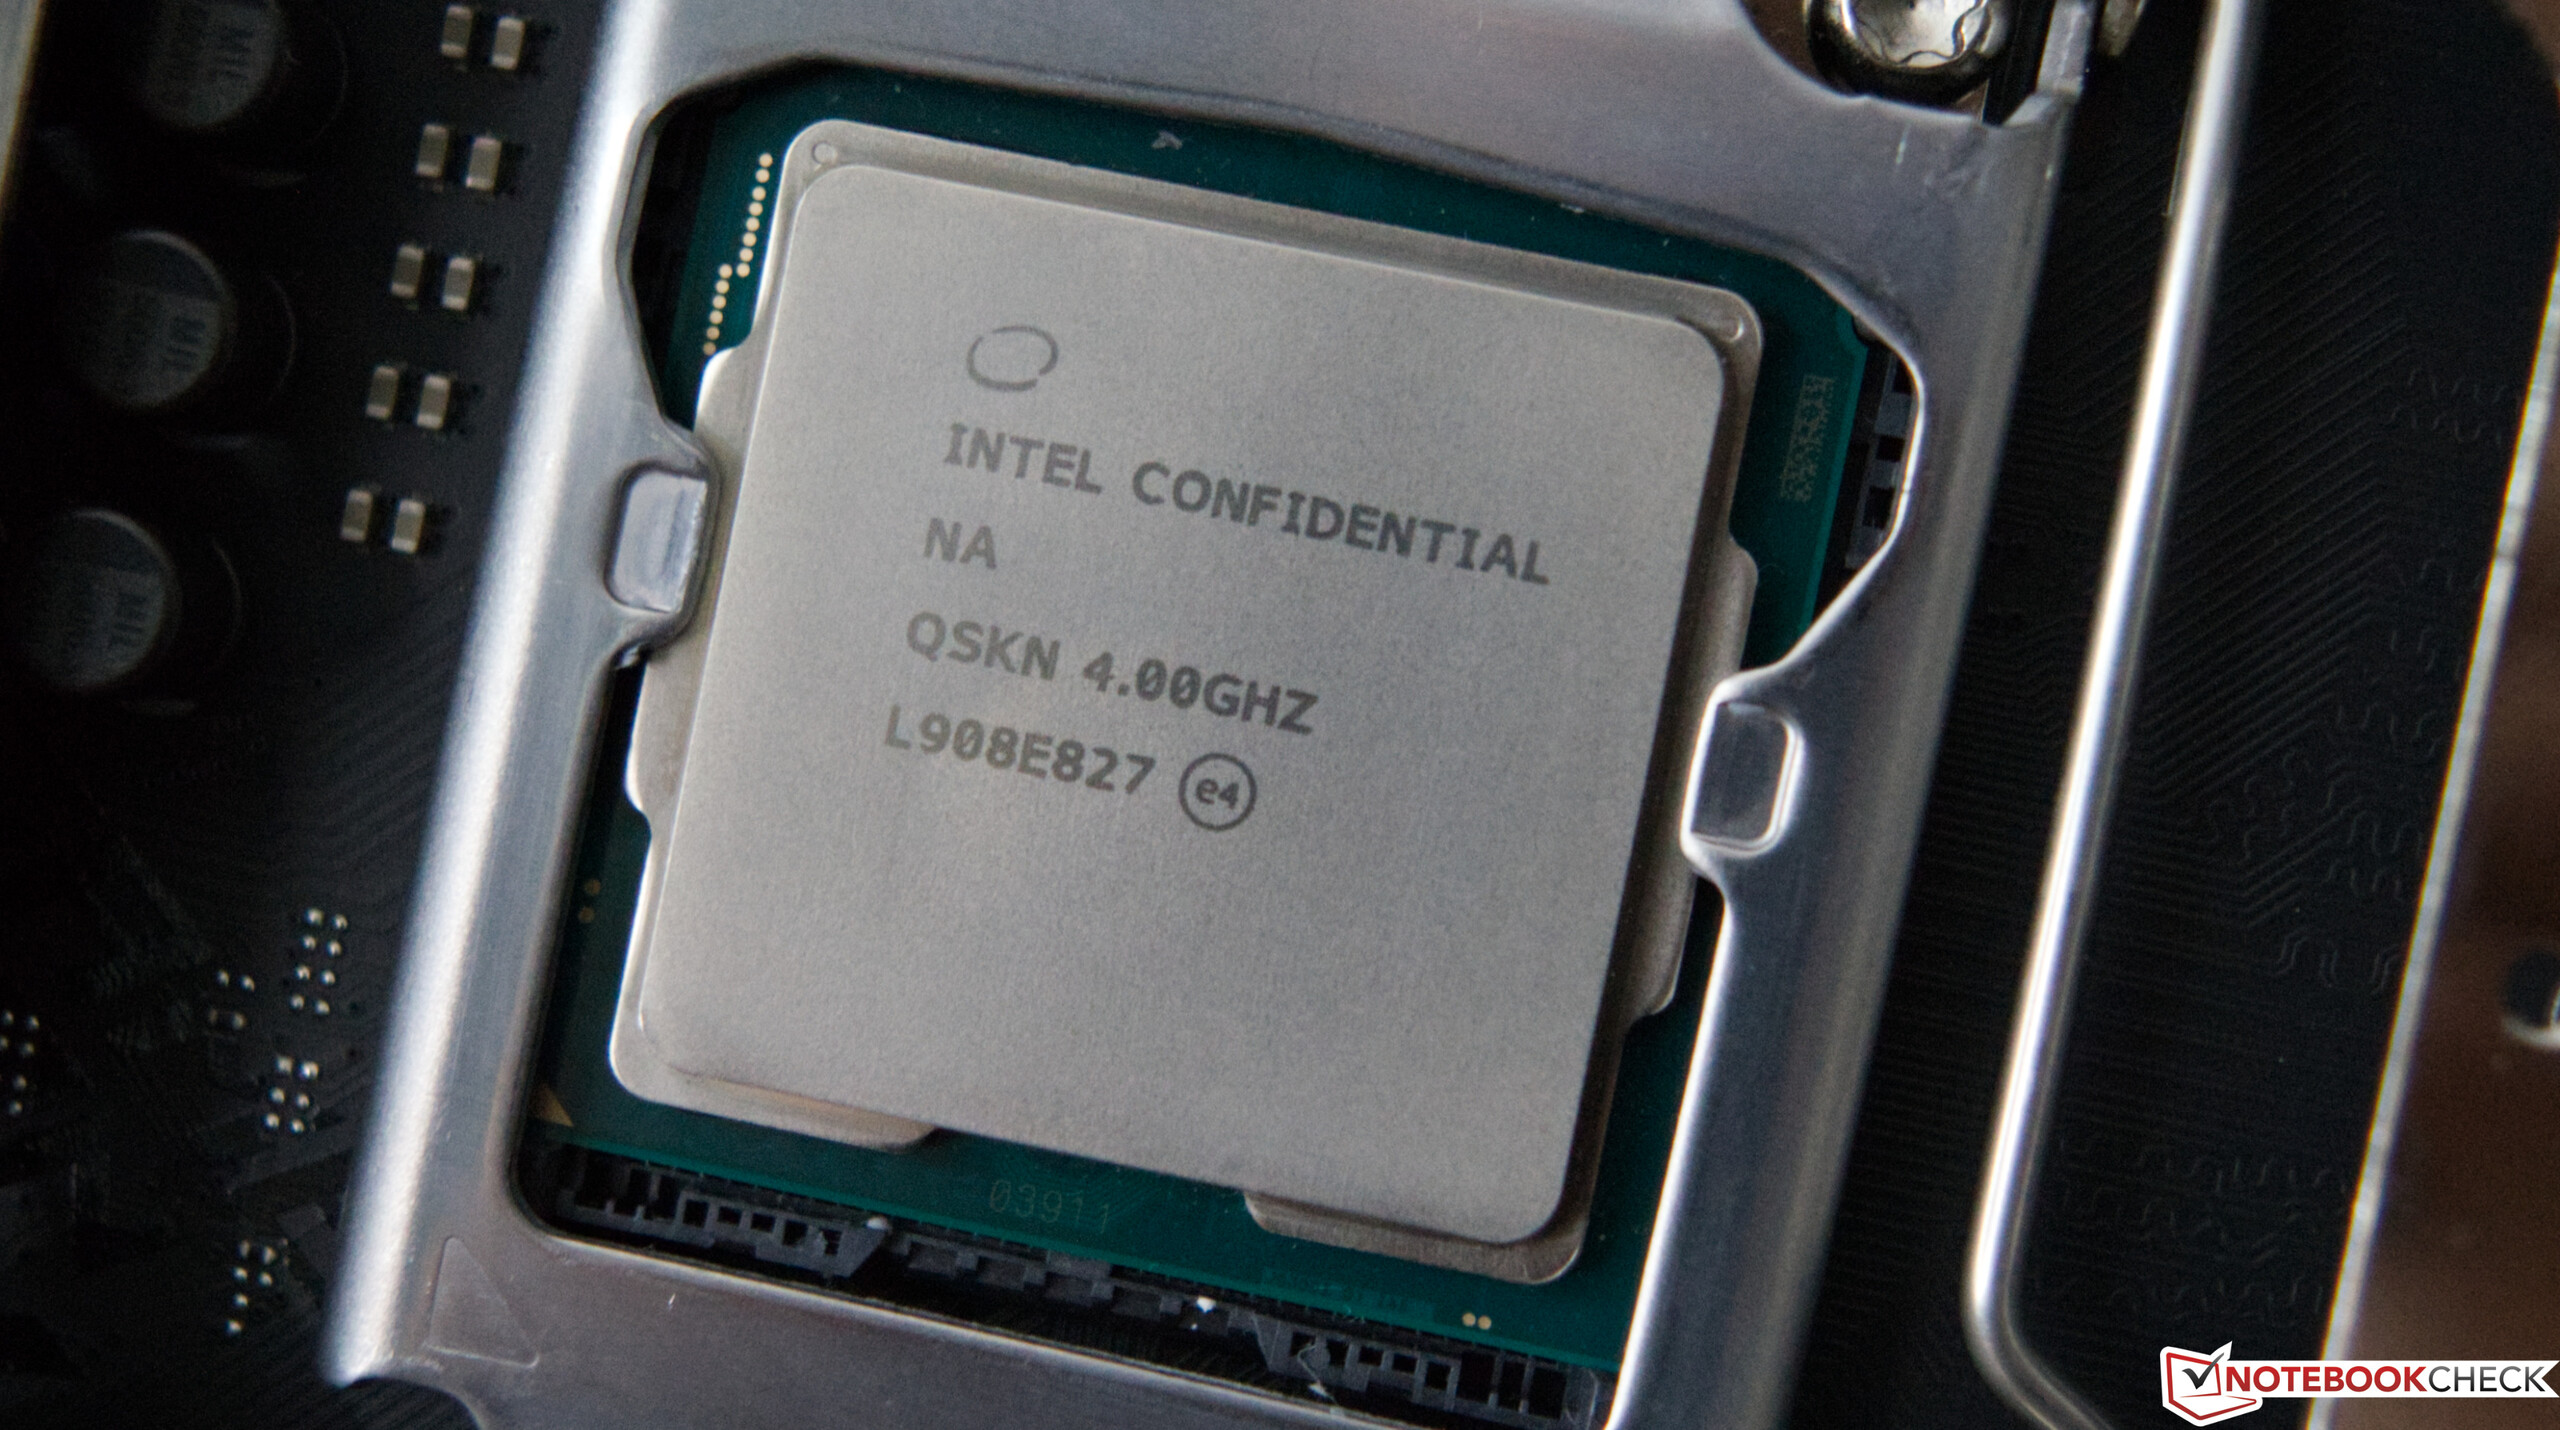
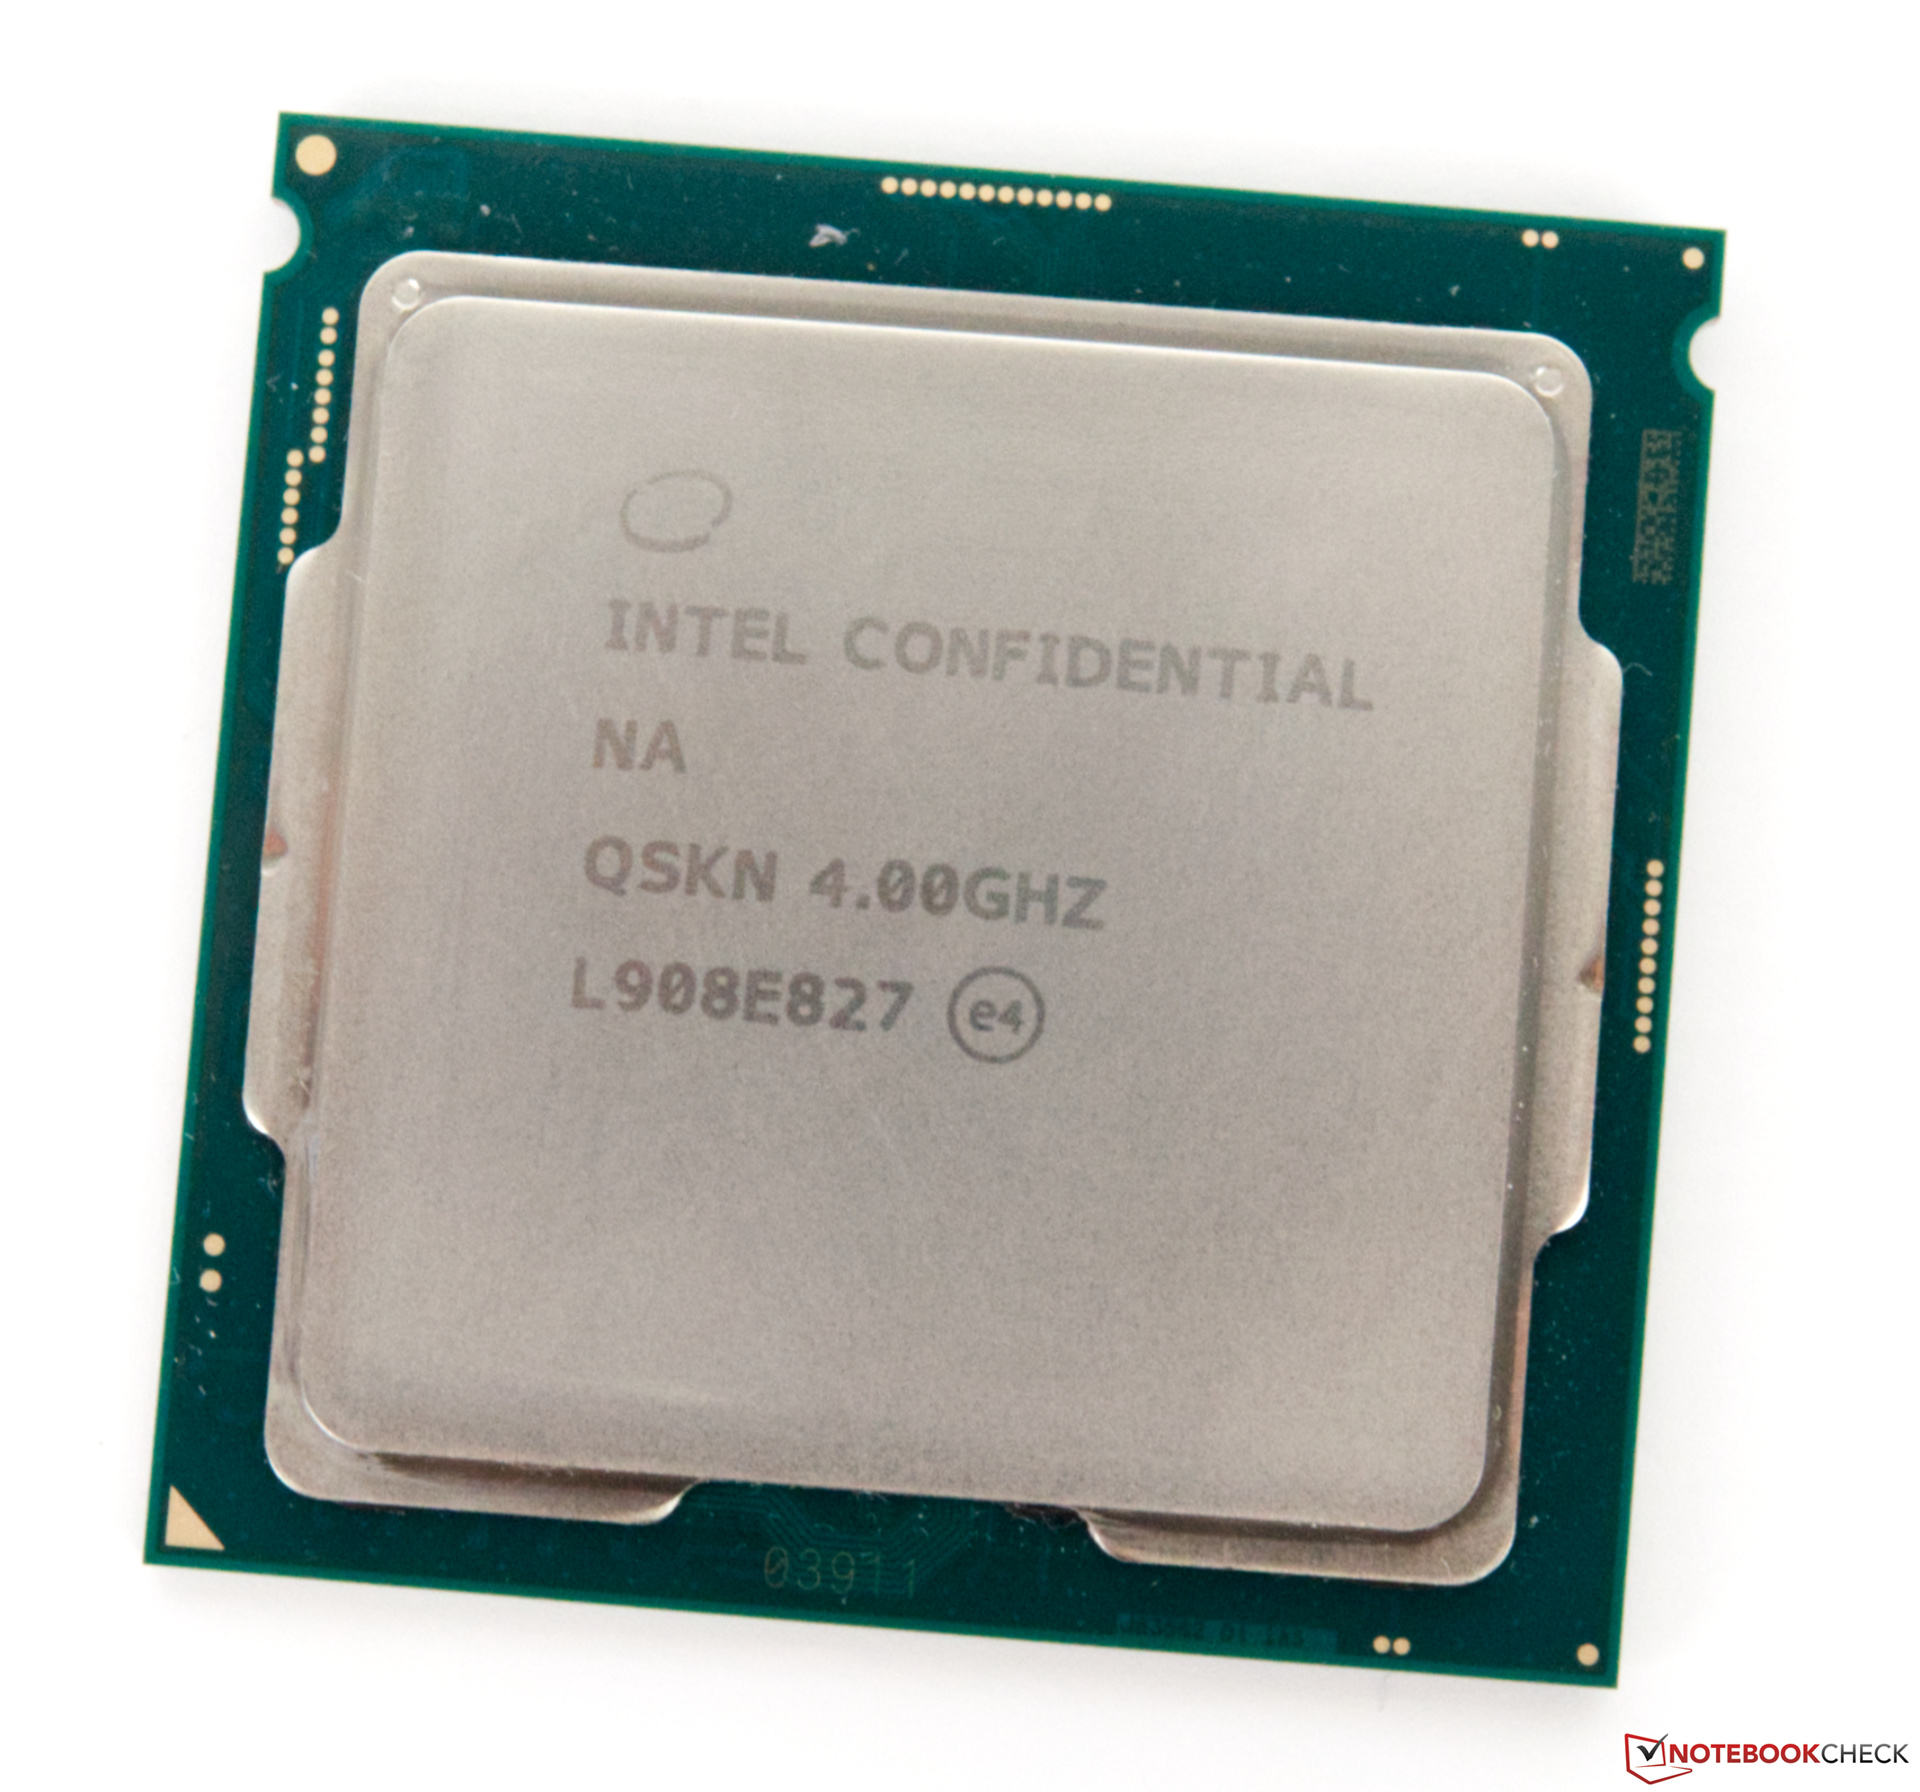
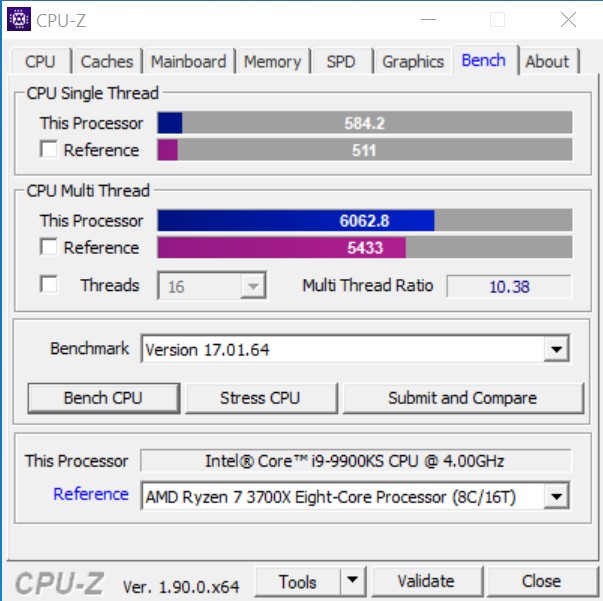
Intel Core i9-9900KS With 4 GHz Base Clock Speed
With the introduction of the 9th generation of Intel Core desktop processors, the manufacturer addresses mainly gamers. This does not change with the release of the Intel Core i9-9900KS. The Core i9-9900KS is based on the Core i9-9900K, also offering 8 cores with 16 threads. With this, Intel will be unable to go against the new Ryzen 9 processors, since those offer significantly higher multithread performance with 12 or 16 cores, respectively. This makes the AMD Ryzen 7 3700X and AMD Ryzen 7 2700X the real competitors.
Intel has continued to release the Core i9-9900KS as an octa-core CPU. The significant performance advantage compared to the Intel Core i7-8700K could already be seen last year due to the two additional computing cores. Now Intel has raised the Turbo to 5 GHz for all the cores in the Core i9-9900KS, resulting in an additional performance increase. However, this turns out very small in the comparison with the Intel Core i9-9900K.
The Core i9-9900KS is manufactured in the 14 nm++ process and uses a soldered-on heat spreader that is supposed to dissipate the heat fast and reliably. According to Intel, the Core i9-9900KS is specified with a TDP of 127 watts, which is a significant increase compared to the Core i9-9900K (95 watts). However, there was already a lively discussion last year that this was only a theoretical value. The Core i9-9900KS will also need significantly more power under load when the TDP limitations are lifted in the UEFI. We can already tell you that much here.
On the other hand, this also means that sufficient cooling must be used. Our recommendation to cool the processor reliably is an AiO 280.
Overview of the 8th and 9th Generation
| Model | Cores - Threads | Base Clock Speed | Turbo 1/2/4/6/8 Cores | L3 Cache | Graphics | TDP | Launch Price |
|---|---|---|---|---|---|---|---|
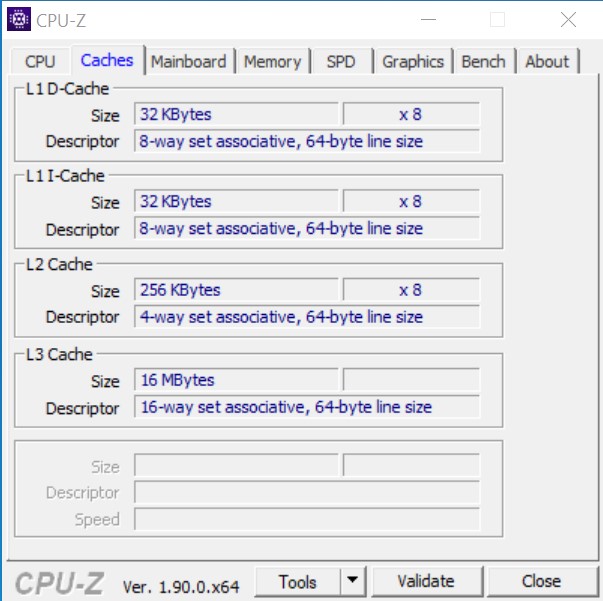
| Intel Core i9-9900KS | 8-16 | 4.0 GHz | 5.0/5.0/5.0/5.0/5.0 GHz | 16 MB | UHD 630 | 127 Watt | 513 USD |
| Intel Core i9-9900K | 8-16 | 3.6 GHz | 5.0/5.0/4.8/4.7/4.7 GHz | 16 MB | UHD 630 | 95 Watt | 488 USD |
| Intel Core i7-9700K | 8-8 | 3.6 GHz | 4.9/4.8/4.7/4.6/4.6 GHz | 12 MB | UHD 630 | 95 Watt | 374 USD |
| Intel Core i5-9600K | 6-6 | 3.7 GHz | 4.6/4.5/4.4/4.3/- GHz | 9 MB | UHD 630 | 95 Watt | 262 USD |
| Intel Core i7-8700K | 6-12 | 3.7 GHz | 4.7/4.6/4.4/4.3/- GHz | 12 MB | UHD 630 | 95 Watt | 359 USD |
| Intel Core i5-8600K | 6-6 | 3.6 GHz | 4.3/4.2/4.2/4.1/- GHz | 9 MB | UHD 630 | 95 Watt | 257 USD |
Price and Availability
The limitations in the availability of the Core i9-9900KS processors are not quite as dramatic as last year. However, the inventory is still very low in parts, and often long wait times are also specified. Those who want to buy an Intel Core i9-9900KS have to part with 599 Euros (~$666; starting from $524 in the US) at least, and the prices are often higher than 600 Euros (~$667).
The Test System
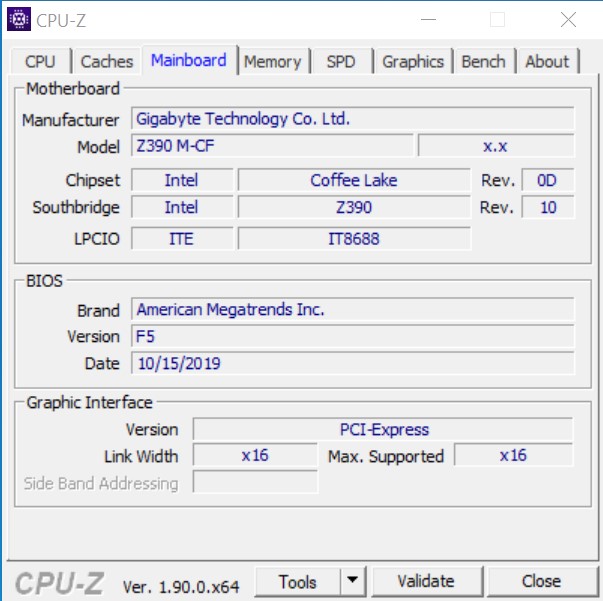
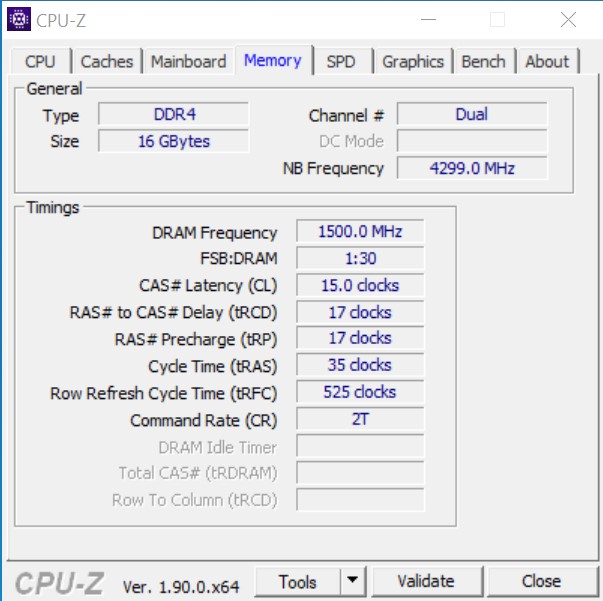
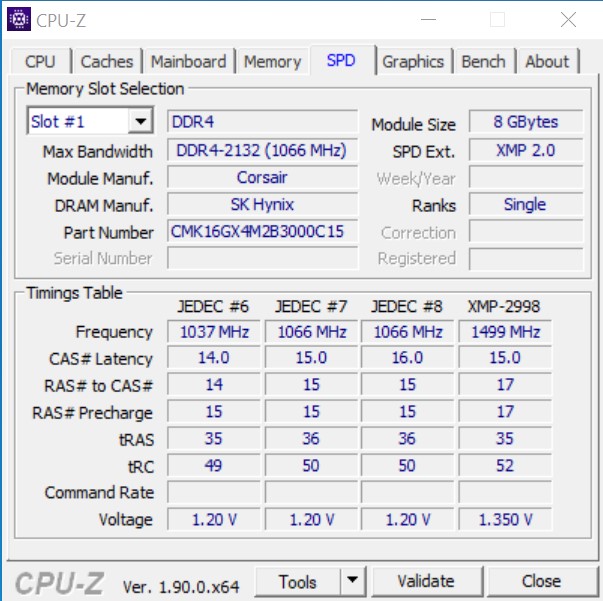
As our test platform, we are using a Gigabyte Z390 M with 16 GB of DDR4-RAM from Corsair. This has a clock speed of 3000 MHz and was loaded as XMP profile in the BIOS. In addition, we deactivated the TDP restrictions of the processor in the BIOS. For cooling, the Alphacool Eisbaer 280 is used. We received this from Alphacool for testing. The case is a Raijintek Paean Benchtable, which comes from Caseking.
The following hardware was provided by Intel, Alphacool, and Caseking for the benchmarks and testing below:
- Intel Core i9-9900KS
- Gigabyte Z390 M (BIOS F5, default settings, XMP profile DDR4-3000)
- Corsair Vengeance DDR4-3000 storage kit 2x 8GB
- Alphacool Eisbaer 280 (AIO)
- Case: Raijintek PAEAN Benchtable
Additional hardware used for our test system:
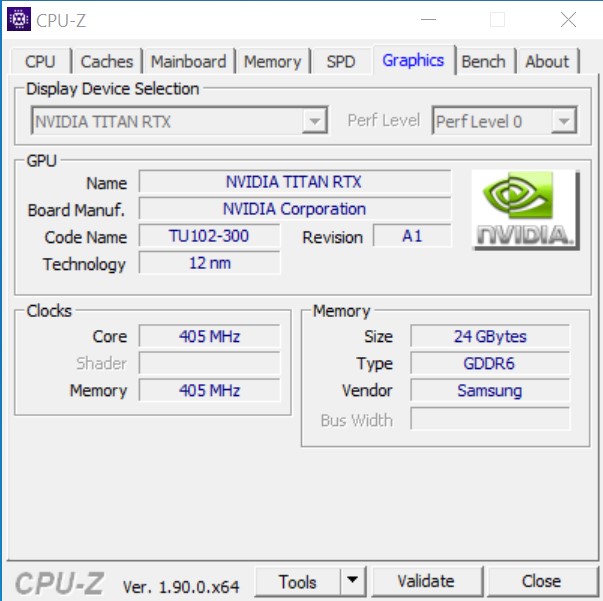
- Nvidia Titan RTX
- LC Power 1200-watt power supply
- Intel Optane SSD (480 GB)
Processor Benchmarks - Intel with the faster eight cores
The Intel Core i9-9900KS wins by a small margin in the direct comparison with the Intel Core i9-9900K, but the performance increase is only 2 to 6%. The single-core as well as the multi-core performance were increased, even though last year's model already achieved 5.0 GHz during boost. Our test unit also wins the comparison with the AMD Ryzen 7 3700X by a small margin. However, the comparison with the AMD Ryzen 7 2700X, which lags far behind at the lower places, shows that AMD already made some significant improvements. This also shows that Intel cannot rest on its accomplishments, since there are already rumors about the next Ryzen generation. If that will again be able to achieve a similar performance jump similar to Zen+ to Zen 2, things will start to become very tight for Intel.
If we look closer at the AMD Ryzen 9 3900X in the same price segment, it offers significantly more performance than the Intel Core i9-9900KS. In addition, there is also the support of PCIe 4.0, but this does not offer a real advantage at this point yet.
| Cinebench R20 | |
| CPU (Single Core) | |
| AMD Ryzen 9 3900X | |
| Intel Core i9-9900KS | |
| AMD Ryzen 7 3700X | |
| CPU (Multi Core) | |
| AMD Ryzen 9 3900X | |
| Intel Core i9-9900KS | |
| AMD Ryzen 7 3700X | |
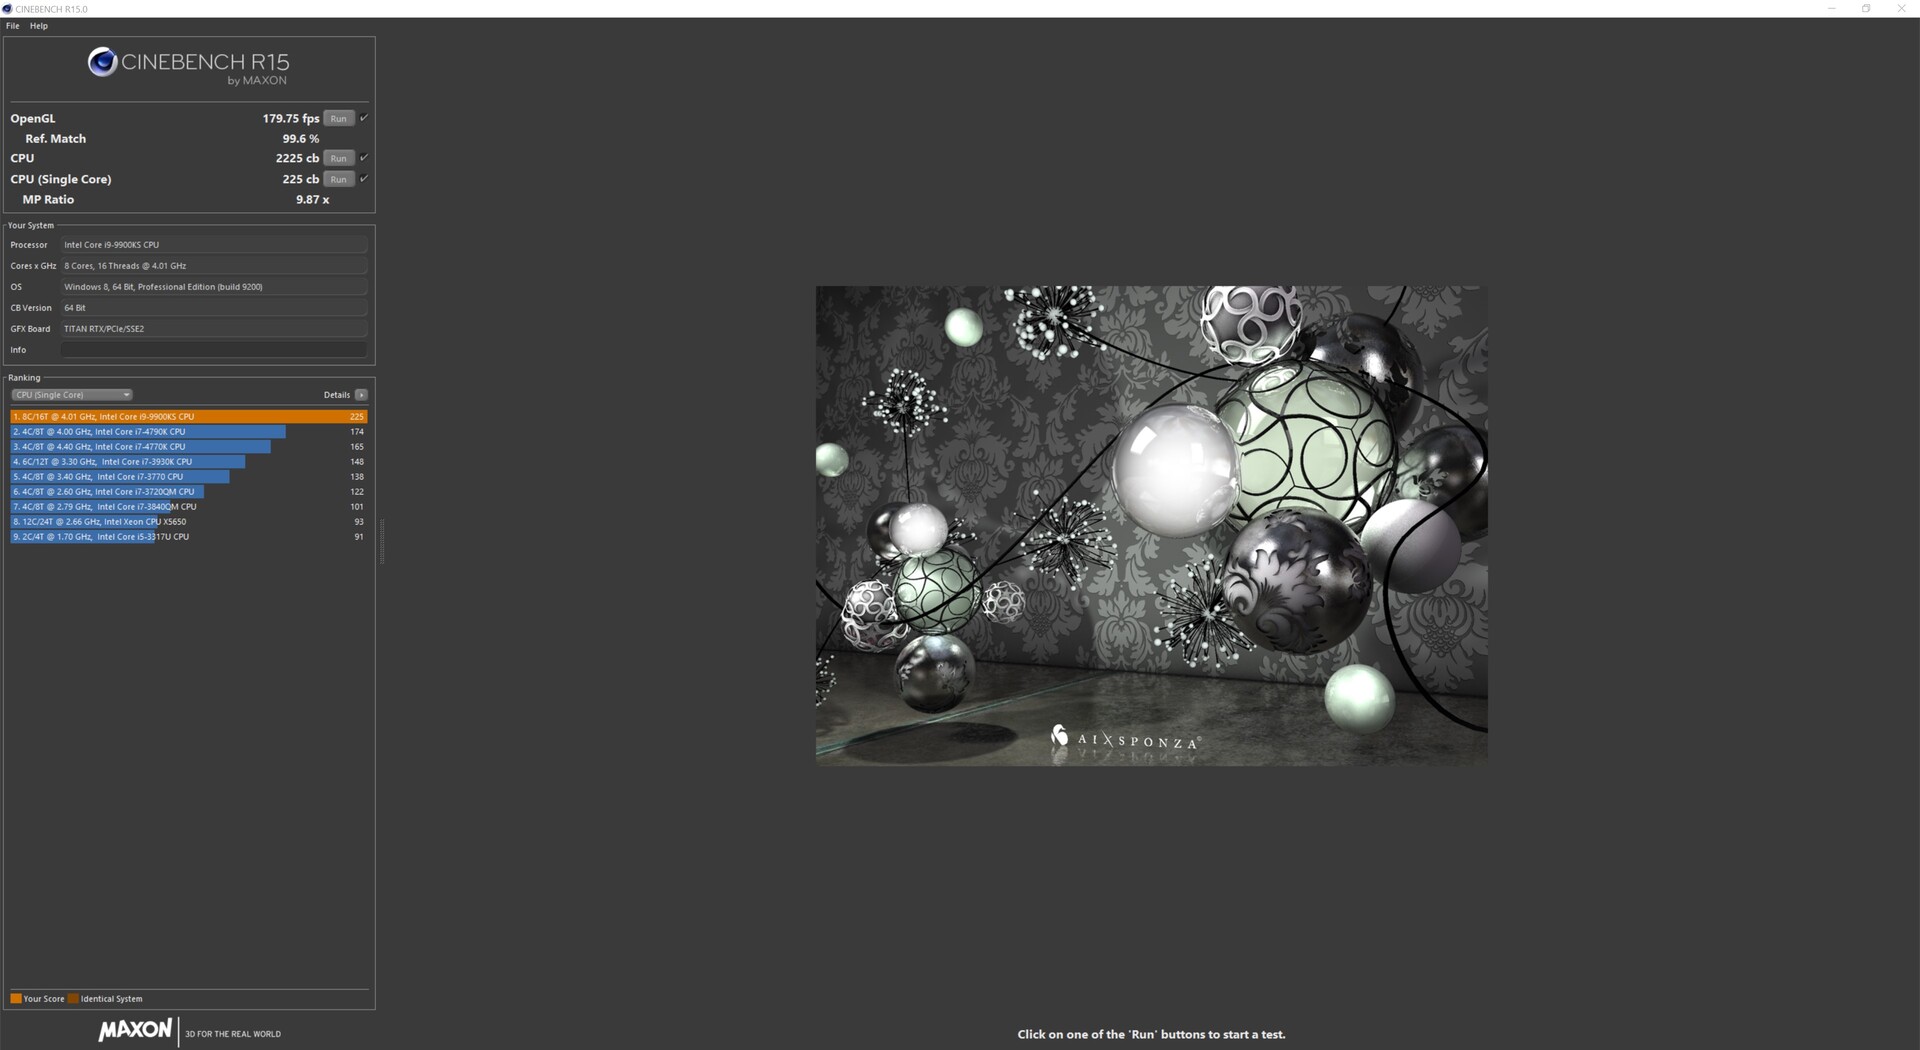
| Cinebench R15 | |
| CPU Single 64Bit | |
| Intel Core i9-9900KS | |
| Intel Core i9-9900K | |
| AMD Ryzen 9 3900X | |
| AMD Ryzen 7 3700X | |
| Intel Core i7-8700K | |
| AMD Ryzen 7 2700X | |
| CPU Multi 64Bit | |
| AMD Ryzen 9 3900X | |
| Intel Core i9-9900KS | |
| AMD Ryzen 7 3700X | |
| Intel Core i9-9900K | |
| AMD Ryzen 7 2700X | |
| Intel Core i7-8700K | |
| Cinebench R11.5 | |
| CPU Multi 64Bit | |
| AMD Ryzen 9 3900X | |
| Intel Core i9-9900KS | |
| AMD Ryzen 7 3700X | |
| Intel Core i9-9900K | |
| AMD Ryzen 7 2700X | |
| Intel Core i7-8700K | |
| CPU Single 64Bit | |
| Intel Core i9-9900KS | |
| Intel Core i9-9900K | |
| AMD Ryzen 9 3900X | |
| AMD Ryzen 7 3700X | |
| Intel Core i7-8700K | |
| AMD Ryzen 7 2700X | |
| Blender - v2.79 BMW27 CPU | |
| AMD Ryzen 7 2700X | |
| Intel Core i9-9900K | |
| Intel Core i9-9900KS | |
| AMD Ryzen 7 3700X | |
| AMD Ryzen 9 3900X | |
| wPrime 2.10 | |
| 32m | |
| Intel Core i9-9900K | |
| Intel Core i7-8700K | |
| Intel Core i9-9900KS | |
| AMD Ryzen 7 3700X | |
| AMD Ryzen 7 2700X | |
| AMD Ryzen 9 3900X | |
| 1024m | |
| Intel Core i7-8700K | |
| AMD Ryzen 7 2700X | |
| AMD Ryzen 7 3700X | |
| Intel Core i9-9900K | |
| Intel Core i9-9900KS | |
| AMD Ryzen 9 3900X | |
| HWBOT x265 Benchmark v2.2 - 4k Preset | |
| AMD Ryzen 9 3900X | |
| Intel Core i9-9900KS | |
| Intel Core i9-9900K | |
| AMD Ryzen 7 3700X | |
| X264 HD Benchmark 4.0 | |
| Pass 1 | |
| Intel Core i9-9900KS | |
| Intel Core i9-9900K | |
| AMD Ryzen 7 3700X | |
| AMD Ryzen 9 3900X | |
| Intel Core i7-8700K | |
| AMD Ryzen 7 2700X | |
| Pass 2 | |
| AMD Ryzen 9 3900X | |
| Intel Core i9-9900KS | |
| Intel Core i9-9900K | |
| AMD Ryzen 7 3700X | |
| AMD Ryzen 7 2700X | |
| Intel Core i7-8700K | |
| WinRAR - Result | |
| Intel Core i9-9900KS | |
| Intel Core i9-9900K | |
| AMD Ryzen 9 3900X | |
| AMD Ryzen 7 3700X | |
| Intel Core i7-8700K | |
| AMD Ryzen 7 2700X | |
| TrueCrypt | |
| AES Mean 100MB | |
| Intel Core i9-9900KS | |
| Intel Core i9-9900K | |
| AMD Ryzen 7 3700X | |
| AMD Ryzen 9 3900X | |
| AMD Ryzen 7 2700X | |
| Intel Core i7-8700K | |
| Twofish Mean 100MB | |
| AMD Ryzen 9 3900X | |
| Intel Core i9-9900KS | |
| AMD Ryzen 7 3700X | |
| Intel Core i9-9900K | |
| AMD Ryzen 7 2700X | |
| Intel Core i7-8700K | |
| Serpent Mean 100MB | |
| AMD Ryzen 9 3900X | |
| Intel Core i9-9900K | |
| Intel Core i9-9900KS | |
| AMD Ryzen 7 3700X | |
| AMD Ryzen 7 2700X | |
| Intel Core i7-8700K | |
| Geekbench 4.4 | |
| 64 Bit Single-Core Score | |
| Intel Core i9-9900K | |
| Intel Core i9-9900KS | |
| Intel Core i7-8700K | |
| AMD Ryzen 9 3900X | |
| AMD Ryzen 7 3700X | |
| AMD Ryzen 7 2700X | |
| 64 Bit Multi-Core Score | |
| AMD Ryzen 9 3900X | |
| Intel Core i9-9900KS | |
| AMD Ryzen 7 3700X | |
| Intel Core i9-9900K | |
| AMD Ryzen 7 2700X | |
| Intel Core i7-8700K | |
* ... smaller is better
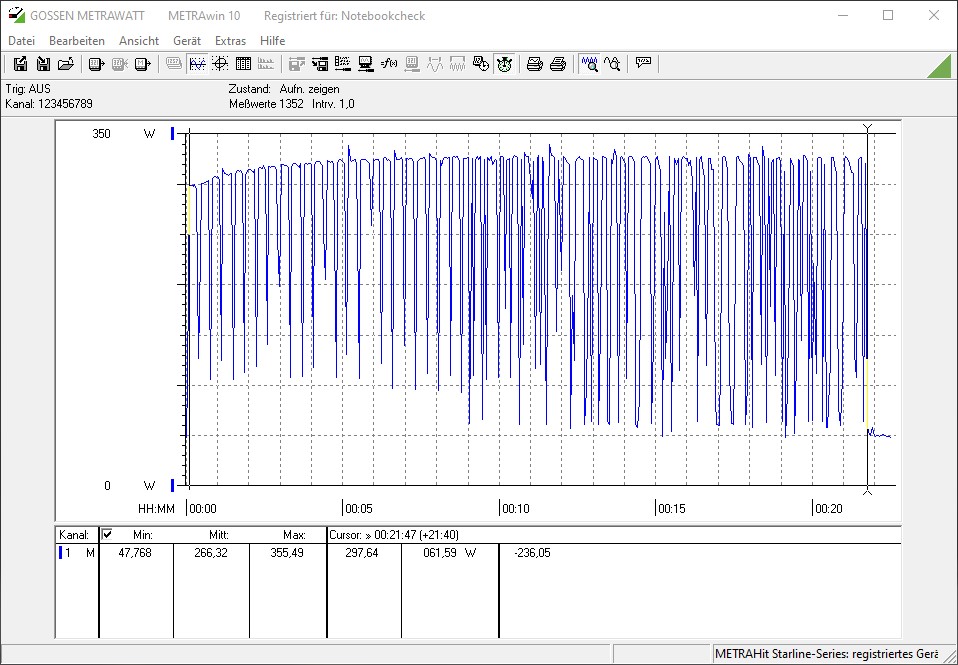
Cinebench R15 Multi Loop
We evaluate the performance of the processor during constant load with the Cinebench-R15 multi loop. During stock operation, there are no difficulties in the beginning. However, after about 20 runs, the processor reaches critical temperatures, so that the clock frequency has to be throttled. With an average of 1952 points, the Core i9-9900KS is only barely able to save itself from the Core i9-9900K, which runs more stable. With 2075 points, the AMD Ryzen 7 3700X is clearly better.
Gaming Performance - Continuing to be the measure of all things
After we have now retired the AMD Radeon RX Vega 64 and replaced it with the Nvidia Titan RTX, the results are on a very high level as expected. However, our gaming tests revealed that the AMD Ryzen 9 3900X is unable to keep up with the Intel Core i9-9900KS. While with lower resolutions, our test unit is able to move ahead by up to 16% (Call of Duty Modern Warfare 2019), with increasing resolutions and quality levels, the results are closer, so that the two processors have almost the same speed in this example.
Since most games are unable to optimally make use of the many cores of the AMD processors, the 12-core Ryzen 9 3900X is unable to move ahead here. Currently 8 cores are still the optimum if you want to create a gaming system. In addition, Intel also scores here with the high IPC, which still makes the difference in games. However, with the Ryzen on the Zen2 base, AMD has caught up considerably and is not necessarily a worse alternative.
| 3DMark 11 | |
| 1280x720 Performance GPU | |
| NVIDIA Titan RTX | |
| NVIDIA Titan RTX | |
| AMD Radeon RX Vega 64 | |
| AMD Radeon RX Vega 64 | |
| AMD Radeon RX Vega 64 | |
| AMD Radeon RX Vega 64 | |
| 1280x720 Performance Physics | |
| AMD Radeon RX Vega 64 | |
| NVIDIA Titan RTX | |
| NVIDIA Titan RTX | |
| AMD Radeon RX Vega 64 | |
| AMD Radeon RX Vega 64 | |
| AMD Radeon RX Vega 64 | |
| The Witcher 3 | |
| 1024x768 Low Graphics & Postprocessing | |
| NVIDIA Titan RTX | |
| NVIDIA GeForce RTX 2080 Ti (Desktop) | |
| NVIDIA Titan RTX | |
| AMD Radeon RX Vega 64 | |
| NVIDIA Titan RTX | |
| 1920x1080 Ultra Graphics & Postprocessing (HBAO+) | |
| NVIDIA Titan RTX | |
| NVIDIA GeForce RTX 2080 Ti (Desktop) | |
| NVIDIA Titan RTX | |
| NVIDIA Titan RTX | |
| AMD Radeon RX Vega 64 | |
| Final Fantasy XV Benchmark | |
| 1280x720 Lite Quality | |
| NVIDIA Titan RTX | |
| NVIDIA GeForce RTX 2080 Ti (Desktop) | |
| NVIDIA Titan RTX | |
| NVIDIA Titan RTX | |
| 1920x1080 High Quality | |
| NVIDIA Titan RTX | |
| NVIDIA GeForce RTX 2080 Ti (Desktop) | |
| NVIDIA Titan RTX | |
| NVIDIA Titan RTX | |
| Far Cry 5 | |
| 1280x720 Low Preset AA:T | |
| NVIDIA Titan RTX | |
| NVIDIA GeForce RTX 2080 Ti (Desktop) | |
| NVIDIA Titan RTX | |
| AMD Radeon RX Vega 64 | |
| NVIDIA Titan RTX | |
| 1920x1080 Ultra Preset AA:T | |
| NVIDIA GeForce RTX 2080 Ti (Desktop) | |
| NVIDIA Titan RTX | |
| NVIDIA Titan RTX | |
| NVIDIA Titan RTX | |
| AMD Radeon RX Vega 64 | |
| Forza Horizon 4 | |
| 1280x720 Very Low Preset | |
| AMD Radeon RX Vega 64 | |
| NVIDIA Titan RTX | |
| NVIDIA GeForce RTX 2080 Ti (Desktop) | |
| NVIDIA Titan RTX | |
| NVIDIA Titan RTX | |
| 1920x1080 Ultra Preset AA:2xMS | |
| NVIDIA Titan RTX | |
| NVIDIA Titan RTX | |
| NVIDIA GeForce RTX 2080 Ti (Desktop) | |
| NVIDIA Titan RTX | |
| AMD Radeon RX Vega 64 | |
| Far Cry New Dawn | |
| 1280x720 Low Preset | |
| NVIDIA Titan RTX | |
| NVIDIA GeForce RTX 2080 Ti (Desktop) | |
| NVIDIA Titan RTX | |
| AMD Radeon RX Vega 64 | |
| 1920x1080 Ultra Preset | |
| NVIDIA Titan RTX | |
| NVIDIA GeForce RTX 2080 Ti (Desktop) | |
| AMD Radeon RX Vega 64 | |
| NVIDIA Titan RTX | |
| Need for Speed Heat | |
| 1280x720 Low Preset | |
| NVIDIA Titan RTX | |
| NVIDIA Titan RTX | |
| AMD Radeon RX Vega 64 | |
| 1920x1080 Ultra Preset | |
| NVIDIA Titan RTX | |
| NVIDIA Titan RTX | |
| AMD Radeon RX Vega 64 | |
| Anno 1800 | |
| 1280x720 Low Graphics Quality (DX11) | |
| NVIDIA Titan RTX | |
| NVIDIA GeForce RTX 2080 Ti (Desktop) | |
| AMD Radeon RX Vega 64 | |
| 1920x1080 Ultra Graphics Quality (DX11) | |
| NVIDIA Titan RTX | |
| NVIDIA GeForce RTX 2080 Ti (Desktop) | |
| AMD Radeon RX Vega 64 | |
| Control | |
| 1280x720 Low Quality Preset (DX11) | |
| NVIDIA Titan RTX | |
| AMD Radeon RX Vega 64 | |
| 1920x1080 High Quality Preset (DX11) | |
| NVIDIA Titan RTX | |
| AMD Radeon RX Vega 64 | |
| Star Wars Jedi Fallen Order | |
| 1920x1080 Medium Preset | |
| NVIDIA Titan RTX | |
| NVIDIA Titan RTX | |
| AMD Radeon RX Vega 64 | |
| 1920x1080 Epic Preset | |
| NVIDIA Titan RTX | |
| NVIDIA Titan RTX | |
| AMD Radeon RX Vega 64 | |
| Borderlands 3 | |
| 1280x720 Very Low Overall Quality (DX11) | |
| NVIDIA Titan RTX | |
| NVIDIA Titan RTX | |
| AMD Radeon RX Vega 64 | |
| 1920x1080 Badass Overall Quality (DX11) | |
| NVIDIA Titan RTX | |
| NVIDIA Titan RTX | |
| AMD Radeon RX Vega 64 | |
| Ghost Recon Breakpoint | |
| 1280x720 Low Preset | |
| NVIDIA Titan RTX | |
| NVIDIA Titan RTX | |
| AMD Radeon RX Vega 64 | |
| 1920x1080 Ultra Preset AA:T | |
| NVIDIA Titan RTX | |
| NVIDIA Titan RTX | |
| AMD Radeon RX Vega 64 | |
| Call of Duty Modern Warfare 2019 | |
| 1280x720 Minimum Settings | |
| NVIDIA Titan RTX | |
| NVIDIA Titan RTX | |
| AMD Radeon RX Vega 64 | |
| 1920x1080 Maximum Settings AA:T2X Filmic SM | |
| NVIDIA Titan RTX | |
| NVIDIA Titan RTX | |
| AMD Radeon RX Vega 64 | |
| Metro Exodus | |
| 1280x720 Low Quality AF:4x | |
| NVIDIA Titan RTX | |
| NVIDIA GeForce RTX 2080 Ti (Desktop) | |
| NVIDIA Titan RTX | |
| 1920x1080 Ultra Quality AF:16x | |
| NVIDIA Titan RTX | |
| NVIDIA Titan RTX | |
| NVIDIA GeForce RTX 2080 Ti (Desktop) | |
The Intel Core i9-9900KS together with the Nvidia Titan RTX
| low | med. | high | ultra | QHD | 4K | |
| The Witcher 3 (2015) | 426 | 362 | 249 | 130 | 98 | |
| Dota 2 Reborn (2015) | 183 | 167.8 | 163 | 154.5 | 153.1 | |
| Final Fantasy XV Benchmark (2018) | 219 | 172 | 127 | 59.9 | ||
| X-Plane 11.11 (2018) | 148 | 133 | 109 | 94 | ||
| Far Cry 5 (2018) | 184 | 148 | 140 | 131 | 120 | 78 |
| Forza Horizon 4 (2018) | 232 | 204 | 204 | 185 | 160 | 110 |
| Far Cry New Dawn (2019) | 147 | 135 | 129 | 116 | 103 | 79 |
| Metro Exodus (2019) | 180.9 | 150.2 | 120.8 | 101.8 | 81.5 | 52.5 |
| Anno 1800 (2019) | 131 | 125 | 96 | 54.5 | 50.9 | 40.4 |
| Control (2019) | 240 | 176 | 135 | 89 | 45.2 | |
| Borderlands 3 (2019) | 164 | 148 | 132 | 112 | 84 | 46 |
| Ghost Recon Breakpoint (2019) | 170 | 146 | 135 | 104 | 80 | 49 |
| Call of Duty Modern Warfare 2019 (2019) | 241 | 220 | 189 | 170 | 129 | 78 |
| Need for Speed Heat (2019) | 133 | 128 | 118 | 107 | 105 | 68 |
| Star Wars Jedi Fallen Order (2019) | 127 | 127 | 123 | 118 | 73 |
Application Performance
In PCMark 10, the Intel Core i9-9900KS is able to clearly move ahead. In addition, Intel is now able to place ahead of AMD again, thus showing that it is not only a pure gaming CPU. Our test unit is able to achieve a fat 11% advantage ahead of the Ryzen 9 3900X. The new Intel CPU masters all kinds of applications and even high-resolution videos can be processed without any problems by the new processor.
In everyday operation, the test system does not show any larger weaknesses. The disadvantage to an AMD Ryzen 9 3900X with 12 cores and 24 threads is not noticeable in everyday operation.
| PCMark 10 - Score | |
| Intel Core i9-9900KS | |
| Intel Core i9-9900KS | |
| AMD Ryzen 9 3900X | |
| AMD Ryzen 9 3900X | |
| AMD Ryzen 7 3700X | |
| Intel Core i9-9900K | |
| Intel Core i7-8700K | |
| PCMark 8 | |
| Work Score Accelerated v2 | |
| Intel Core i9-9900K | |
| Intel Core i9-9900KS | |
| Intel Core i9-9900KS | |
| AMD Ryzen 7 3700X | |
| AMD Ryzen 9 3900X | |
| AMD Ryzen 9 3900X | |
| Intel Core i7-8700K | |
| Creative Score Accelerated v2 | |
| Intel Core i9-9900KS | |
| AMD Ryzen 9 3900X | |
| AMD Ryzen 7 3700X | |
| Intel Core i9-9900KS | |
| Intel Core i9-9900K | |
| AMD Ryzen 9 3900X | |
| Intel Core i7-8700K | |
| Home Score Accelerated v2 | |
| Intel Core i9-9900KS | |
| Intel Core i9-9900K | |
| AMD Ryzen 9 3900X | |
| Intel Core i9-9900KS | |
| AMD Ryzen 9 3900X | |
| AMD Ryzen 7 3700X | |
| Intel Core i7-8700K | |
Emissions - Close to the limit
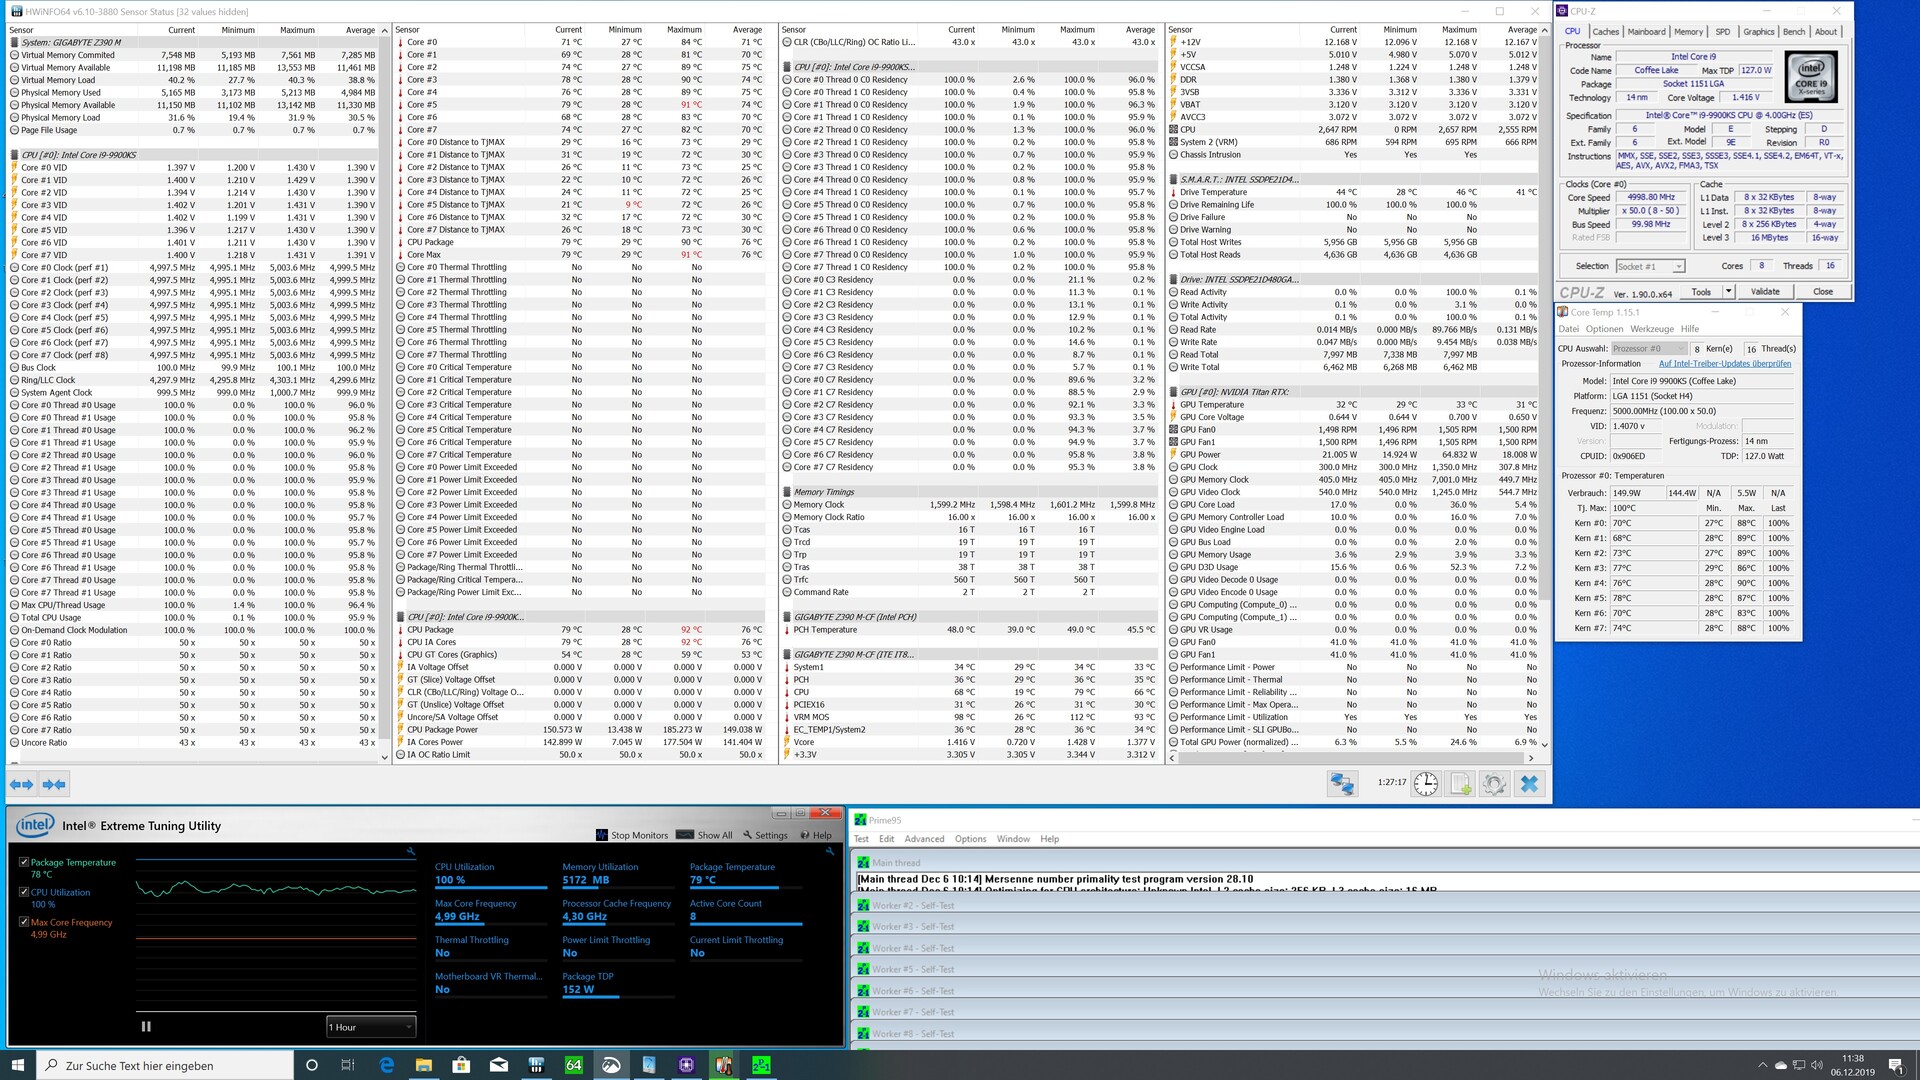
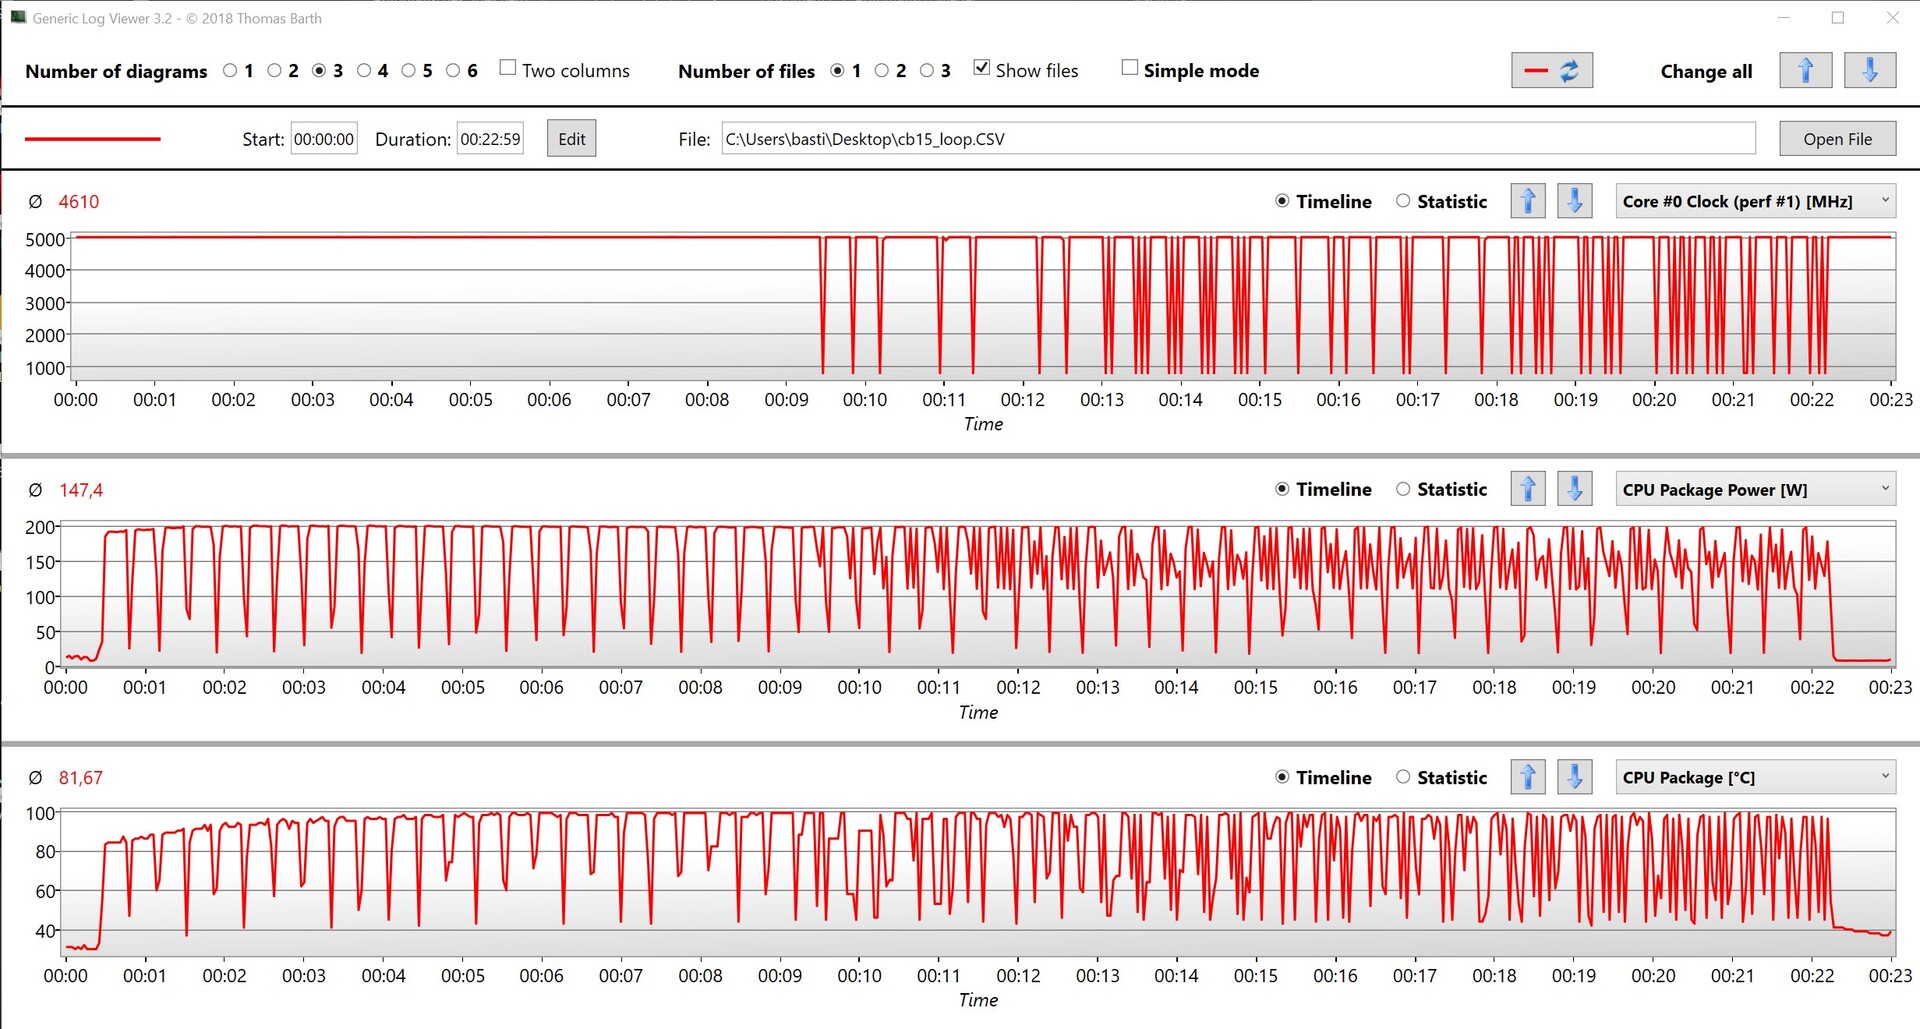
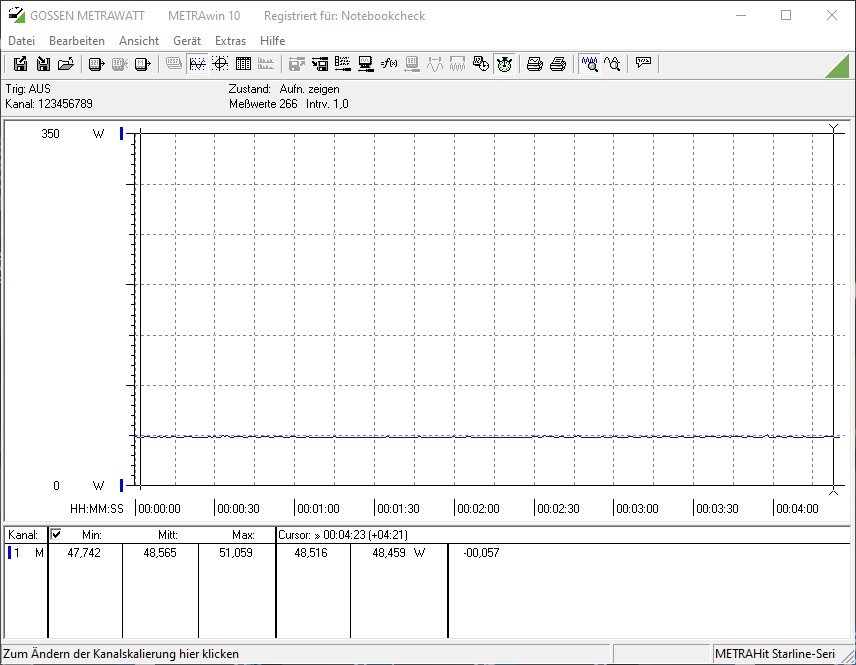
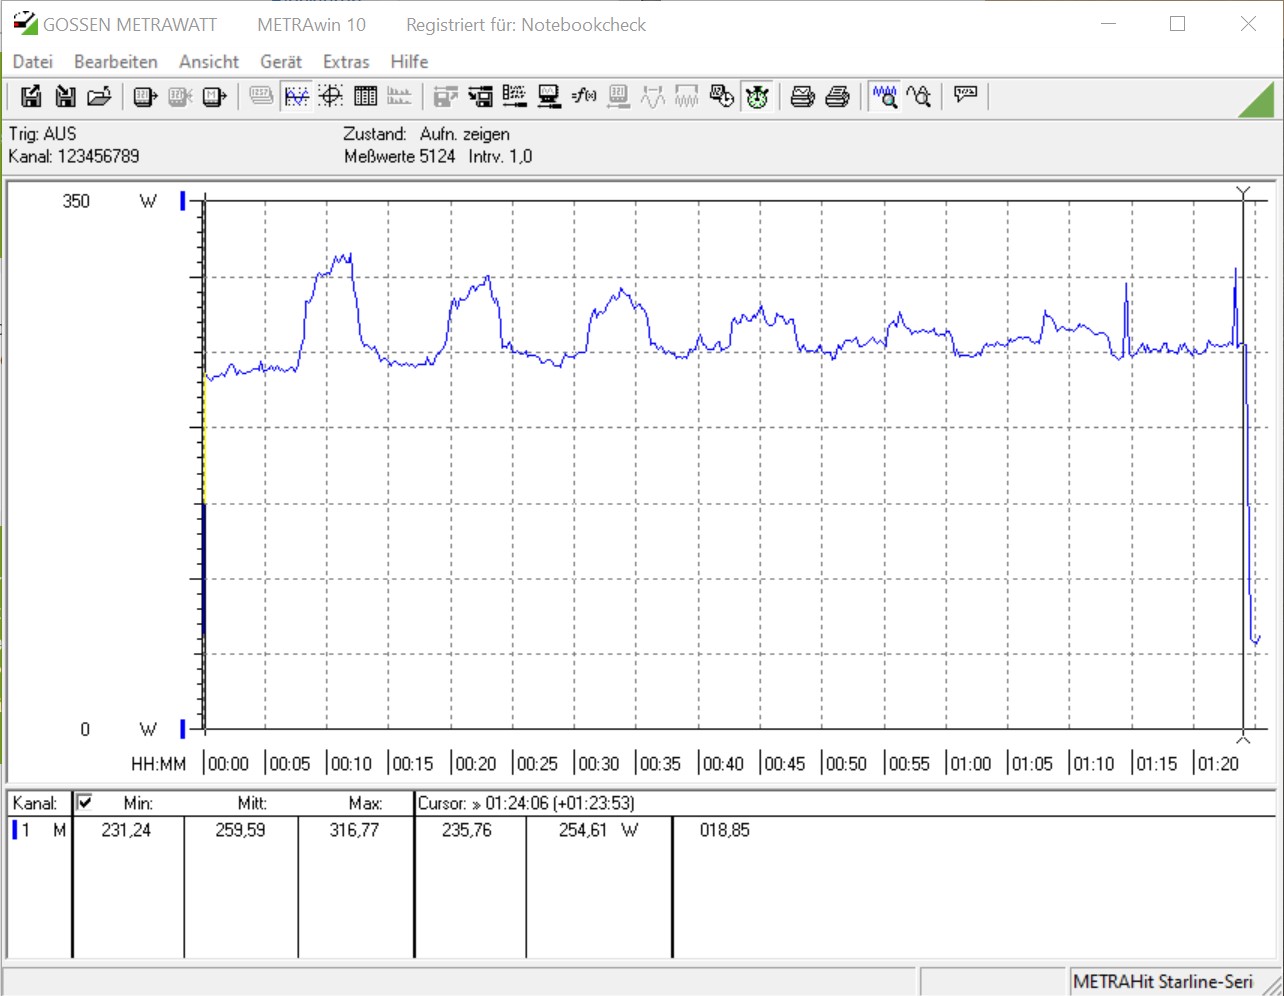
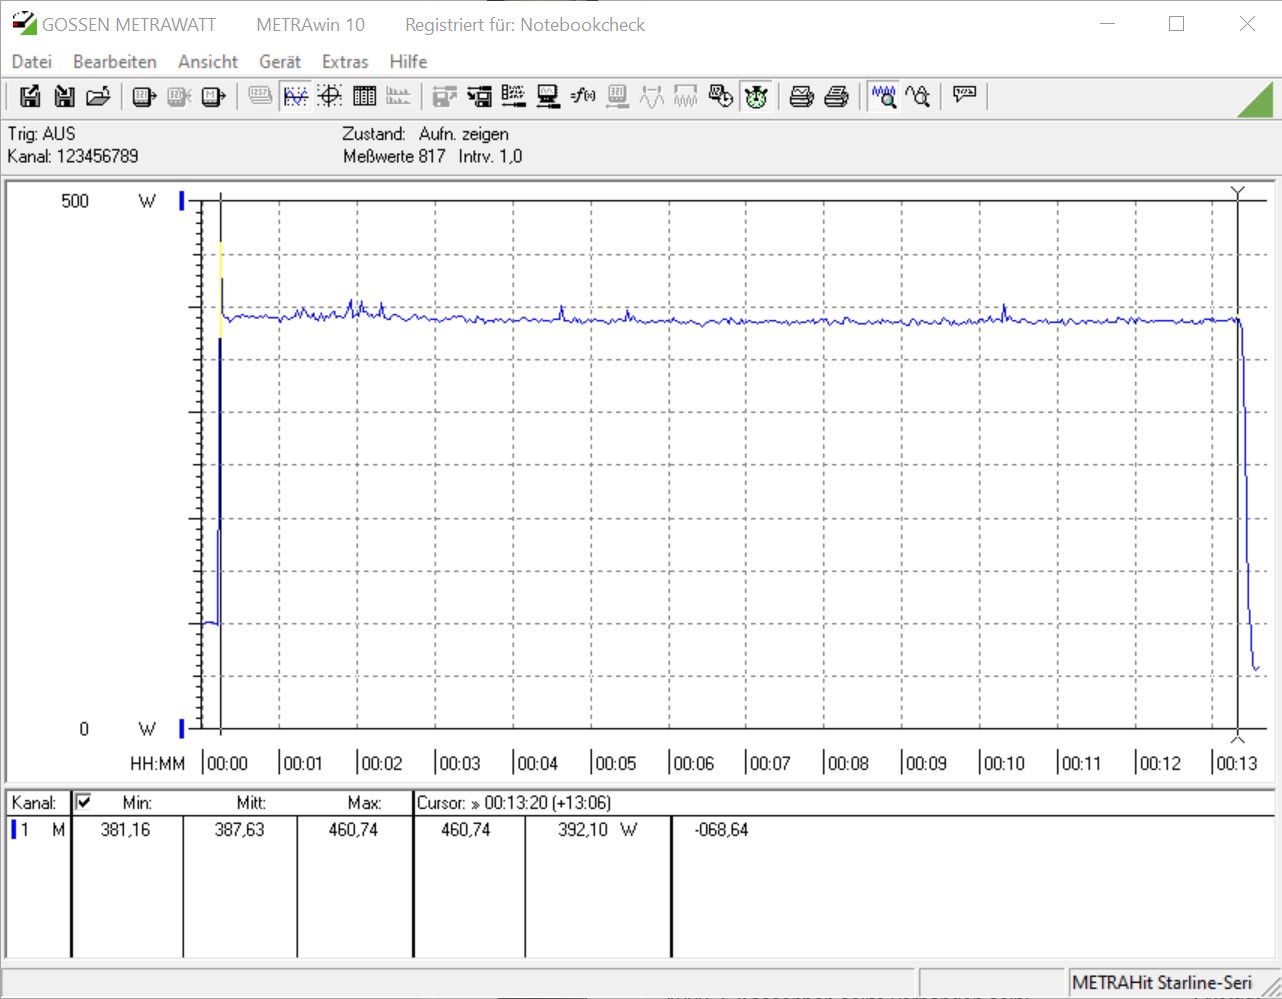
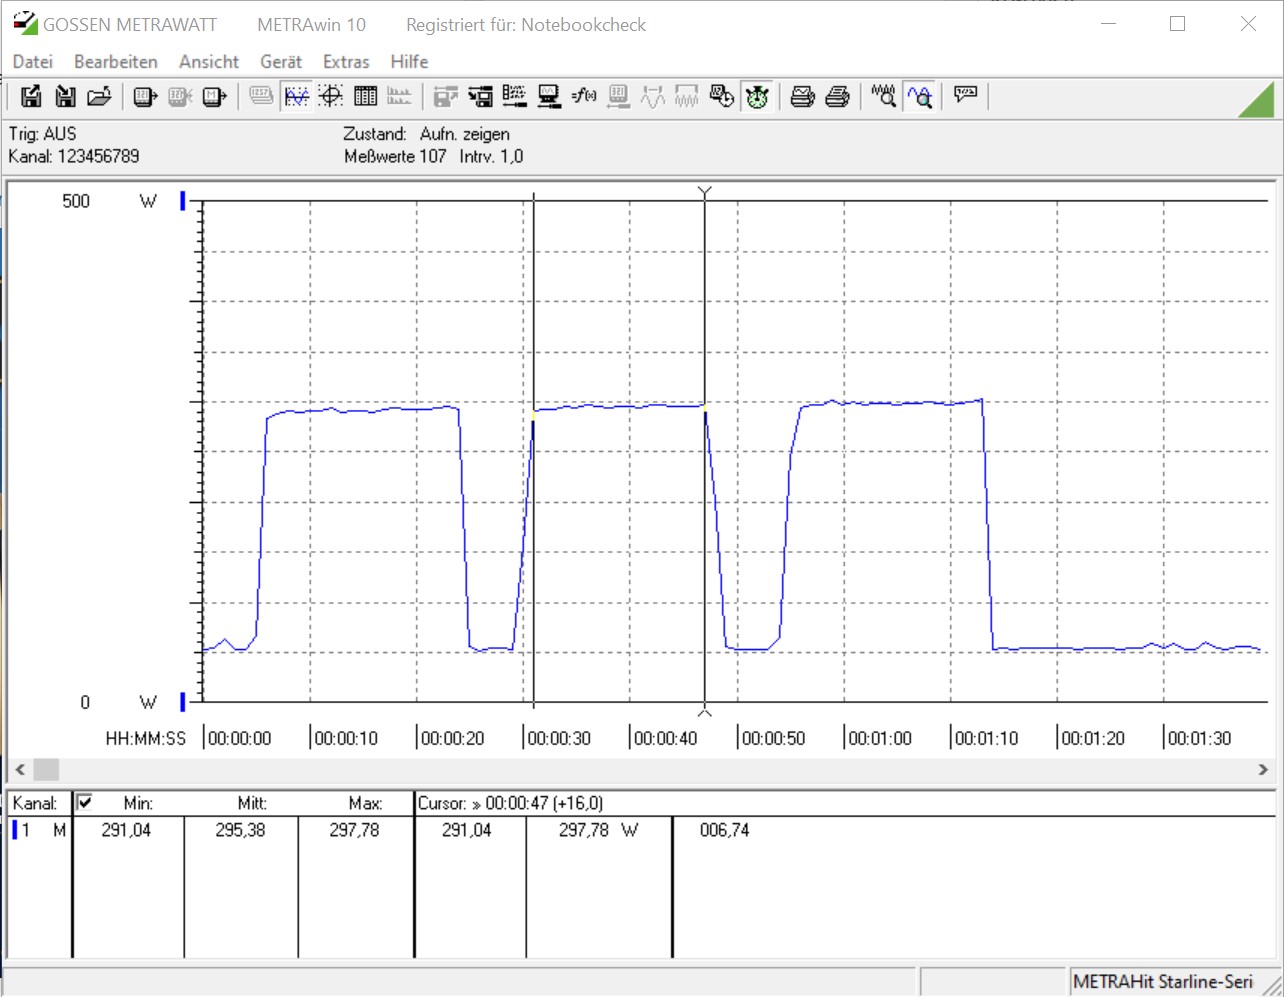
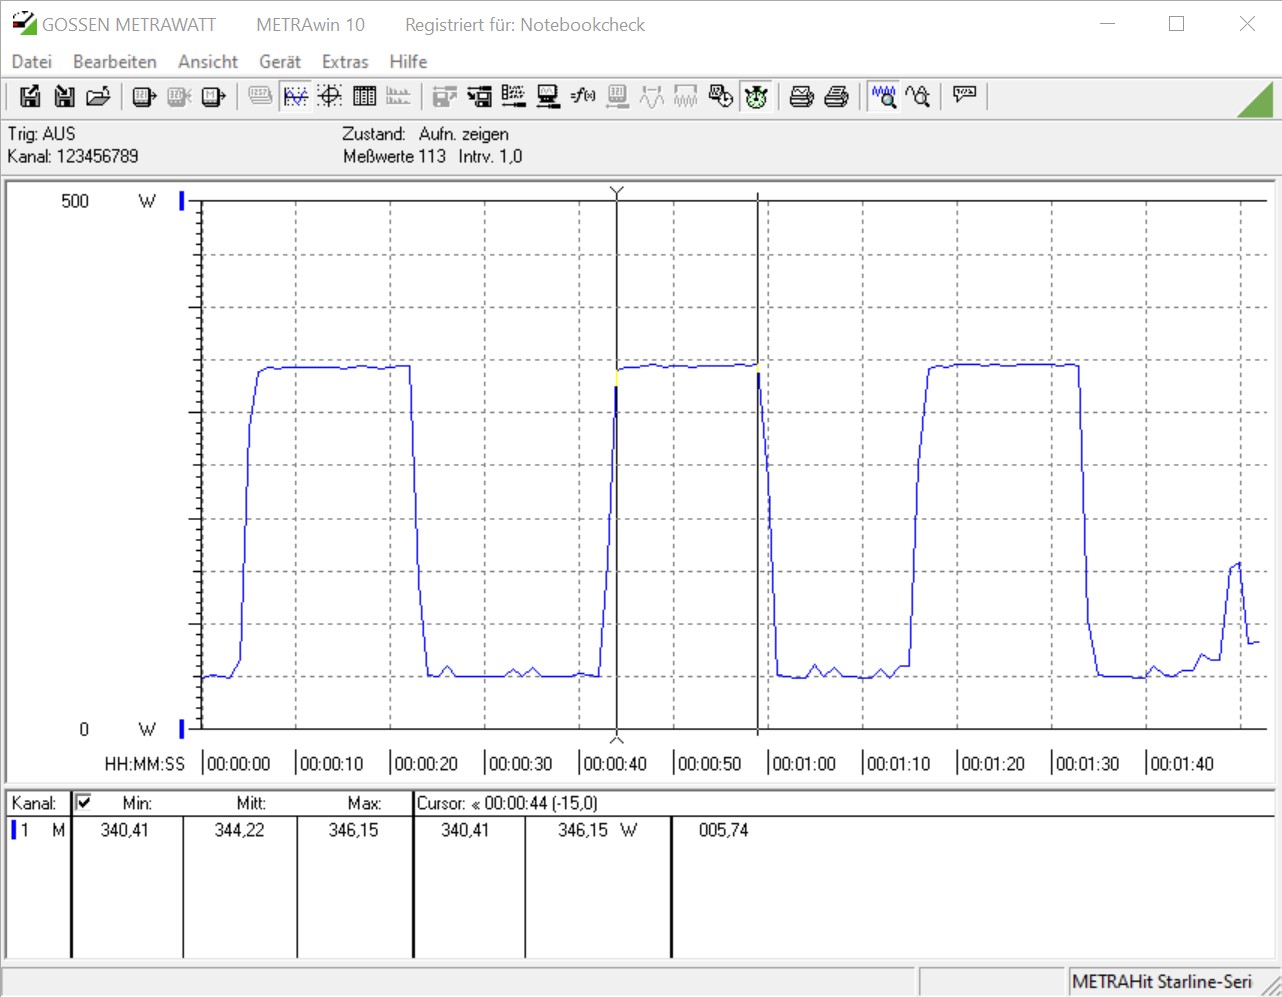
Intel specifies a TDP of 127 watts for the Intel Core i9-9900KS. For the Core i9-9900K it still was 95 watts at that time. However, our first tests quickly showed that this value only exists on paper. The same goes for our test unit, although the system is pleasantly efficient with only 48 watts during idle operation. During the hour-long load test, the power consumption of the processor is 149 watts on average, according to HWiNFO. During some peaks, it was even 185 watts. At almost 260 watts, the whole system uses significantly more power than our comparison systems.
During the Cinebench R15 multi test, the power consumption even increased up to 295 watts, and during gaming we reached an average value of 387 watts. However, we should also mention that the graphics card contributes to a significant part of this.
During the stress test (Prime 95 v28.10), the temperatures are high but not yet critical. We measure a maximum of 92 °C (198 °F) during the test. Here, even the AiO from Alphacool hits its limits, and it would be better to use an AiO with a 360-mm radiator (~14.2 in). Taking the head off, as was still possible without any problems with the Core i7-8700K, is connected with a significantly higher risk in the i9-9900KS. Intel solders the heat spreader tightly onto the 9-er series.
Power Consumption of Our Test System
| Power Consumption | |
| 1920x1080 The Witcher 3 ultra (external Monitor) | |
| AMD Ryzen 9 3900X, AMD Radeon RX Vega 64 (Idle: 81.56 W) | |
| Intel Core i9-9900KS, NVIDIA Titan RTX (Idle: 48.6 W) | |
| AMD Ryzen 7 3700X, AMD Radeon RX Vega 64 (Idle: 79.2 W) | |
| Intel Core i9-9900KS, AMD Radeon RX Vega 64 (Idle: 49.5 W) | |
| Intel Core i9-9900K, AMD Radeon RX Vega 64 (80 fps) | |
| Cinebench R15 Multi (external Monitor) | |
| Intel Core i9-9900KS, NVIDIA Titan RTX (Idle: 48.6 W) | |
| Intel Core i9-9900KS, AMD Radeon RX Vega 64 (Idle: 49.5 W) | |
| AMD Ryzen 9 3900X, AMD Radeon RX Vega 64 (Idle: 81.56 W) | |
| Intel Core i9-9900K, AMD Radeon RX Vega 64 | |
| AMD Ryzen 7 3700X, AMD Radeon RX Vega 64 (Idle: 79.2 W) | |
| Prime95 V2810 Stress (external Monitor) | |
| Intel Core i9-9900KS, NVIDIA Titan RTX (Idle: 48.6 W) | |
| AMD Ryzen 9 3900X, AMD Radeon RX Vega 64 (Idle: 81.56 W) | |
| Intel Core i9-9900K, AMD Radeon RX Vega 64 | |
| AMD Ryzen 7 3700X, AMD Radeon RX Vega 64 (Idle: 79.2 W) | |
* ... smaller is better
Overclocking - Not recommended
Those for whom the 5 GHz on all eight cores is not sufficient might try to squeeze even slightly more performance from the processor. We dared the attempt and overclocked our test unit. Since it possesses a free multiplier, this is really easy, provided the cooling is sized sufficiently large. However, since the Alphacool Eisbaer AiO 280 already came close to its limits during the test, we were only able to overclock our test unit by an additional 200 MHz. Unfortunately, a stable operation was not possible anymore at 5.3 GHz.
In Cinebench R15, we were able to slightly increase the results some more. However, the power consumption also increased by an additional 50 watts. In conclusion, we do not recommend constant overclocking, since the performance gains are very small compared to the higher power consumption.
Pros
Cons
Verdict - 5 GHz at any cost

After AMD raised the bar with the new Ryzen processors, Intel now had to follow suit. Unfortunately, it is no more than a small upgrade of the Intel Core i9-9900K. We continue to wait for a completely new architecture, and the move to 10nm is also getting delayed further and further. While on one hand, Intel was able to increase the performance with the Core i9-9900KS, on the other hand, the power consumption became worse. There continue to be 8 cores and 16 threads, even though with up to 16 cores and 32 threads, AMD has moved ahead of the Core i9-9900KS in multithread performance. However in actuality, games do not benefit from having more than 8 cores, but this could change in the future.
Overall, the Intel Core i9-9900KS delivers a very good performance. The processor masters games as well as applications without any trouble. For gaming, the processor is still the first choice, if you only consider the performance comparison. However, compared to AMD, Intel has clearly lost some ground this year. In order to avoid getting left behind, there must be a larger performance jump next year, since sooner or later Zen 3 will come next year.
An upgrade to the Intel Core i9-9900KS is only worthwhile if you already have the corresponding support for it.
In the direct comparison, the Intel chip has to go against the AMD Ryzen 7 3700X, which also offers 8 cores and 16 threads but currently costs about 150 Euros (~$167) less than the top model from Intel. So we can only say that the price-performance ratio is not right here, and that the Intel Core i9-9900KS costs at least 100 Euros (~$111) too much.


