Intel Arc A730M
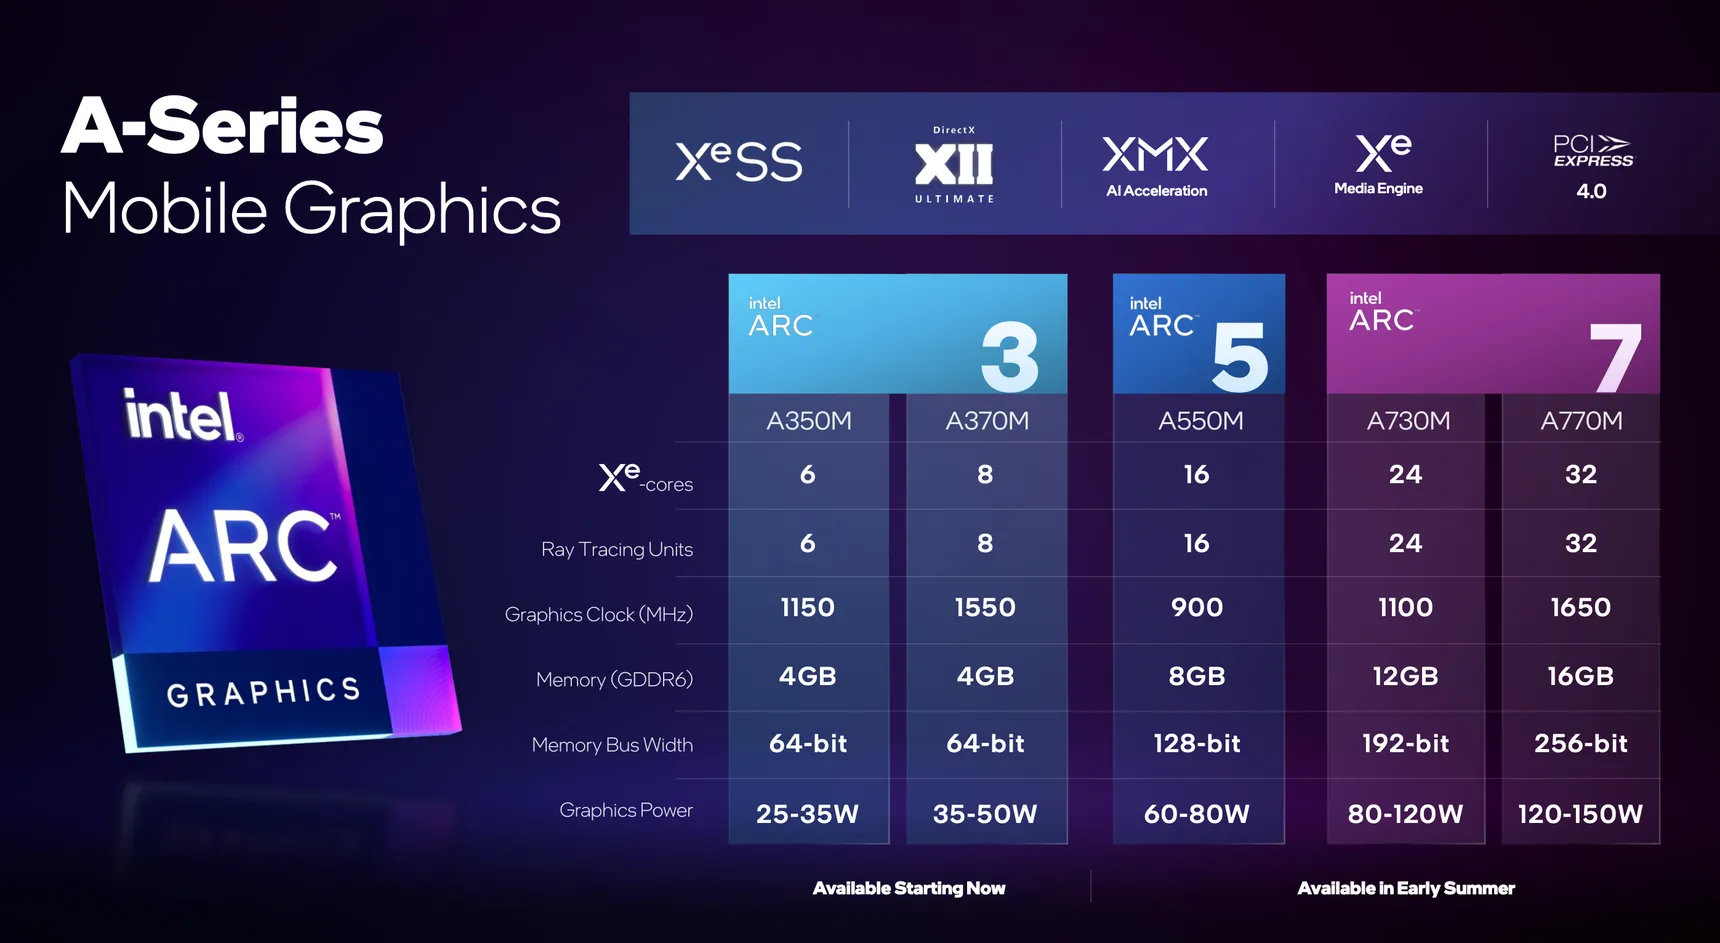
The Intel Arc A730M (device ID 5691) is a dedicated mobile lower- mid-range graphics card for laptops based on Xe HPG microarchitecture. It uses the ACM-G10 chip and offers 24 of the 32 Xe-cores (384 ALUs), 24 ray tracing units and a 192-bit memory bus for 12 GB GDDR6 graphics memory. The cores can clock from 300 MHz (low frequency mode) to 1100 MHz (high frequency) or in short bursts 2050 MHz (Turbo). The chip integrates 21.7 billion transistors, uses a BGA2660 package (soldered), and the die measures 406 mm2.
The performance of the Arc A730M is not yet known. The power consumption is similar to a RTX 3060 and therefore we see the performance slightly below a RTX 3060 mobile .
The chip also integrates two media engines for VP9, AVC, HEVC, and AV1 8k en- and decoding. The 4 display pipes support up to 4x 4k120 HDR via DMI 2.0B or DisplayPort 2.0 10G.
The A730M is produced in 6nm at TSMC (N6 process) and supports dynamic power share (using Deep Link) with 12th gen Intel CPUs (Alder Lake).
Arc Series Arc A770 4096 @ 2.1 - 2.4 GHz 256 Bit @ 16000 MHz Arc A750 3584 @ 2.05 - 2.4 GHz 256 Bit @ 16000 MHz Arc A580 3072 @ 1.7 - 2 GHz 256 Bit @ 16000 MHz A770M 512 @ 1.65 GHz 256 Bit @ 16000 MHz A730M 384 @ 1.1 GHz 192 Bit @ 14000 MHz A570M 16 @ 0.9 - 1.3 GHz 128 Bit @ 14000 MHz A550M 16 @ 0.9 - 2.01 GHz 128 Bit @ 14000 MHz A530M 12 @ 0.9 - 1.3 GHz 128 Bit @ 14000 MHz A370M 8 @ 1.55 GHz 64 Bit @ 14000 MHz Arc A380 1024 @ 2 GHz 96 Bit @ 15500 MHz A310 6 @ 2 GHz 64 Bit @ 15500 MHz A350M 6 @ 1.15 GHz 64 Bit @ 14000 MHz
Codename Alchemist Architecture Xe HPG Pipelines 384 - unified Raytracing Cores 24 Core Speed 1100 MHz Cache L1: 4.5 MB, L2: 16 MB Memory Speed 14000 MHz Memory Bus Width 192 Bit Memory Type GDDR6 Max. Amount of Memory 12 GB Shared Memory no Memory Bandwidth 336 GB/s API DirectX 12_2, OpenGL 4.6, Vulkan 1.3 Power Consumption 120 Watt (80 - 120 Watt TGP) Transistor Count 21.7 Billion Die Size 406 mm² technology 6 nm PCIe 4 16x Displays 4 Displays (max.), HDMI 2.0b, DisplayPort 2.0 10G Ready Notebook Size medium sized Date of Announcement 30.03.2022 Link to Manufacturer Page ark.intel.com
Benchmarks Performance Rating - 3DMark 11 + Fire Strike + Time Spy
9.7 pt (29%)
...
...
max:
3DMark - 3DMark Time Spy Score
min: 7653 avg: 9041 median: 8919.5 (26%) max: 10670 Points
GPU TDP ? TDP 85 W TDP 120 W 100% 78% 89%
...
...
max:
3DMark - 3DMark Time Spy Graphics
min: 7212 avg: 8798 median: 8813 (23%) max: 10352 Points
GPU TDP ? TDP 85 W TDP 120 W 100% 76% 94%
...
...
max:
3DMark - 3DMark Ice Storm Unlimited Graphics
467230 Points (53%)
...
...
max:
3DMark - 3DMark Ice Storm Extreme Graphics
309114 Points (40%)
...
...
max:
3DMark - 3DMark Cloud Gate Score
min: 42200 avg: 44782 median: 45257 (48%) max: 46415 Points
GPU TDP ? TDP 85 W TDP 120 W 98% 100% 91%
...
...
max:
3DMark - 3DMark Cloud Gate Graphics
min: 75370 avg: 86896 median: 83396 (22%) max: 105420 Points
GPU TDP ? TDP 85 W TDP 120 W 72% 86% 100%
...
...
max:
3DMark - 3DMark Fire Strike Standard Score
min: 16910 avg: 18480 median: 18213.5 (32%) max: 20584 Points
GPU TDP ? TDP 85 W TDP 120 W 100% 91% 86%
...
...
max:
3DMark - 3DMark Fire Strike Standard Graphics
min: 19850 avg: 21265 median: 21294 (24%) max: 22620 Points
GPU TDP ? TDP 85 W TDP 120 W 94% 88% 100%
...
...
max:
3DMark - 3DMark Ice Storm Graphics
min: 131746 avg: 207940 median: 134036 (16%) max: 358039 Points
GPU TDP ? TDP 120 W 37% 100%
...
...
max:
3DMark 11 - 3DM11 Performance Score
min: 23160 avg: 24539 median: 24285.5 (34%) max: 26424 Points
GPU TDP ? TDP 85 W TDP 120 W 100% 91% 96%
...
...
max:
3DMark 11 - 3DM11 Performance GPU
min: 24928 avg: 28692 median: 29144 (25%) max: 31551 Points
GPU TDP ? TDP 85 W TDP 120 W 92% 79% 100%
...
...
max:
3DMark Vantage + 3DMark Vantage - 3DM Vant. Perf. total
min: 62916 avg: 63380 median: 63380 (18%) max: 63844 Points
GPU TDP ? TDP 120 W 100% 99%
...
...
max:
3DM Vant. Perf. GPU no PhysX + 3DMark Vantage - 3DM Vant. Perf. GPU no PhysX
min: 64146 avg: 66003 median: 66003 (37%) max: 67860 Points
GPU TDP ? TDP 120 W 95% 100%
...
...
max:
3DMark 05 - 3DMark 05 - Standard
43138 Points (47%)
...
...
max:
3DMark 06 3DMark 06 - Standard 1280x1024 +
min: 43017 avg: 44798 median: 44798 (59%) max: 46579 Points
GPU TDP ? TDP 120 W 100% 92%
...
...
max:
Unigine Valley 1.0 - Unigine Valley 1.0 DX
61 fps (20%)
...
...
max:
SPECviewperf 12 + SPECviewperf 12 - specvp12 sw-03
58.8 fps (15%)
...
...
max:
specvp12 snx-02 + SPECviewperf 12 - specvp12 snx-02
1.3 fps (0%)
...
max:
specvp12 showcase-01 + SPECviewperf 12 - specvp12 showcase-01
81.4 fps (18%)
...
...
max:
specvp12 mediacal-01 + SPECviewperf 12 - specvp12 mediacal-01
35.3 fps (9%)
...
...
max:
specvp12 maya-04 + SPECviewperf 12 - specvp12 maya-04
127 fps (35%)
...
...
max:
specvp12 energy-01 + SPECviewperf 12 - specvp12 energy-01
1.8 fps (2%)
...
...
max:
specvp12 creo-01 + SPECviewperf 12 - specvp12 creo-01
37 fps (15%)
...
...
max:
specvp12 catia-04 + SPECviewperf 12 - specvp12 catia-04
130 fps (21%)
...
...
max:
specvp12 3dsmax-05 + SPECviewperf 12 - specvp12 3dsmax-05
121 fps (21%)
...
...
max:
SPECviewperf 13 specvp13 sw-04 + SPECviewperf 13 - specvp13 sw-04
63.8 fps (17%)
...
...
max:
specvp13 snx-03 + SPECviewperf 13 - specvp13 snx-03
2.3 fps (0%)
...
max:
specvp13 showcase-02 + SPECviewperf 13 - specvp13 showcase-02
83 fps (18%)
...
...
max:
specvp13 medical-02 + SPECviewperf 13 - specvp13 medical-02
61.1 fps (13%)
...
...
max:
specvp13 maya-05 + SPECviewperf 13 - specvp13 maya-05
230 fps (26%)
...
...
max:
specvp13 energy-02 + SPECviewperf 13 - specvp13 energy-02
8.1 fps (3%)
...
...
specvp13 creo-02 + SPECviewperf 13 - specvp13 creo-02
72.9 fps (11%)
...
...
max:
specvp13 catia-05 + SPECviewperf 13 - specvp13 catia-05
194 fps (22%)
...
...
max:
specvp13 3dsmax-06 + SPECviewperf 13 - specvp13 3dsmax-06
122 fps (21%)
...
...
max:
SPECviewperf 2020 specvp2020 solidworks-05 1080p + SPECviewperf 2020 - specvp2020 solidworks-05 1080p
min: 29.92 avg: 61.5 median: 61.5 (12%) max: 93.1 fps
GPU TDP ? TDP 85 W 32% 100%
...
...
specvp2020 snx-04 1080p + SPECviewperf 2020 - specvp2020 snx-04 1080p
min: 2.54 avg: 2.7 median: 2.7 (0%) max: 2.93 fps
GPU TDP ? TDP 85 W 100% 87%
...
max:
specvp2020 medical-03 1080p + SPECviewperf 2020 - specvp2020 medical-03 1080p
min: 23.48 avg: 24 median: 24 (26%) max: 24.6 fps
GPU TDP ? TDP 85 W 95% 100%
...
...
max:
specvp2020 maya-06 1080p + SPECviewperf 2020 - specvp2020 maya-06 1080p
min: 123.11 avg: 173.1 median: 173.1 (25%) max: 223.03 fps
GPU TDP ? TDP 85 W 55% 100%
...
...
max:
specvp2020 energy-03 1080p + SPECviewperf 2020 - specvp2020 energy-03 1080p
min: 14.1 avg: 23 median: 23 (19%) max: 31.88 fps
GPU TDP ? TDP 85 W 100% 44%
...
...
max:
specvp2020 creo-03 1080p + SPECviewperf 2020 - specvp2020 creo-03 1080p
min: 51.98 avg: 54.5 median: 54.5 (27%) max: 57 fps
GPU TDP ? TDP 85 W 91% 100%
...
...
max:
specvp2020 catia-06 1080p + SPECviewperf 2020 - specvp2020 catia-06 1080p
min: 19.92 avg: 20.3 median: 20.3 (13%) max: 20.7 fps
GPU TDP ? TDP 85 W 96% 100%
...
max:
specvp2020 3dsmax-07 1080p + SPECviewperf 2020 - specvp2020 3dsmax-07 1080p
min: 47.41 avg: 47.5 median: 47.5 (22%) max: 47.5 fps
GPU TDP ? TDP 85 W 100% 100%
...
...
max:
specvp2020 solidworks-05 4k + SPECviewperf 2020 - specvp2020 solidworks-05 4k
37 fps (11%)
...
max:
specvp2020 snx-04 4k + SPECviewperf 2020 - specvp2020 snx-04 4k
2.3 fps (0%)
...
max:
specvp2020 medical-03 4k + SPECviewperf 2020 - specvp2020 medical-03 4k
11.9 fps (11%)
...
...
max:
specvp2020 maya-06 4k + SPECviewperf 2020 - specvp2020 maya-06 4k
125 fps (20%)
...
...
max:
specvp2020 energy-03 4k + SPECviewperf 2020 - specvp2020 energy-03 4k
17.2 fps (4%)
...
...
max:
specvp2020 creo-03 4k + SPECviewperf 2020 - specvp2020 creo-03 4k
41.7 fps (20%)
...
...
max:
specvp2020 catia-06 4k + SPECviewperf 2020 - specvp2020 catia-06 4k
26.4 fps (17%)
...
...
max:
specvp2020 3dsmax-07 4k + SPECviewperf 2020 - specvp2020 3dsmax-07 4k
25.8 fps (11%)
...
...
max:
Cinebench R10 Cinebench R10 Shading (32bit) + Cinebench R10 - Cinebench R10 Shading (32bit)
min: 15298 avg: 16779 median: 16778.5 (12%) max: 18259 points
GPU TDP ? TDP 120 W 84% 100%
...
...
Cinebench R11.5 Cinebench R11.5 OpenGL 64 Bit + Cinebench R11.5 - Cinebench R11.5 OpenGL 64 Bit
min: 127.86 avg: 129 median: 129 (45%) max: 130.14 fps
GPU TDP ? TDP 120 W 100% 98%
...
...
max:
Cinebench R15 + Cinebench R15 - Cinebench R15 OpenGL 64 Bit
min: 196.3 avg: 197.6 median: 196.4 (11%) max: 200 fps
GPU TDP ? TDP 85 W TDP 120 W 100% 98% 98%
...
...
Cinebench R15 OpenGL Ref. Match 64 Bit + Cinebench R15 - Cinebench R15 OpenGL Ref. Match 64 Bit
97.8 % (98%)
GPU TDP ? TDP 85 W TDP 120 W 100% 100% 100%
...
...
GFXBench - GFXBench 5.0 4K Aztec Ruins High Tier Offscreen
84.3 fps (34%)
...
...
GFXBench - GFXBench 5.0 Aztec Ruins High Tier Offscreen
187 fps (34%)
...
...
GFXBench - GFXBench 5.0 Aztec Ruins Normal Tier Offscreen
448 fps (33%)
...
...
Basemark GPU 1.2 - Basemark GPU 1.2 Vulkan Official Medium Offscreen 1080
104.6 fps (1%)
...
...
max:
Basemark GPU 1.2 - Basemark GPU 1.2 Vulkan Official High Offscreen 2160
3.6 fps (1%)
...
Geekbench 6.2 - Geekbench 6.2 GPU OpenCL
min: 74442 avg: 74865 median: 74865 (22%) max: 75288 points
GPU TDP 85 W TDP 120 W 100% 99%
...
...
max:
Geekbench 6.2 - Geekbench 6.2 GPU Vulkan
min: 74820 avg: 75687 median: 75686.5 (25%) max: 76553 points
GPU TDP 85 W TDP 120 W 100% 98%
...
...
max:
LuxMark v2.0 64Bit - LuxMark v2.0 Room GPU
2971 Samples/s (13%)
...
...
max:
LuxMark v2.0 64Bit - LuxMark v2.0 Sala GPU
9344 Samples/s (16%)
...
...
max:
ComputeMark v2.1 - ComputeMark v2.1 Result
min: 12878 avg: 14039 median: 14038.5 (15%) max: 15199 points
GPU TDP ? TDP 120 W 85% 100%
...
...
max:
Power Consumption - Furmark Stress Test Power Consumption - external Monitor *
min: 131.6 avg: 149.8 median: 140 (20%) max: 177.9 Watt
GPU TDP ? TDP 85 W TDP 120 W 109% 107% 100%
...
...
max:
0 15 30 45 60 75 90 105 120 135 150 165 180 195 210 Tooltip Medion Erazer Major X10: Ø131.6 (129.2-152.8)
Intel NUC X15 LAPAC71H: Ø140.2 (133.37-143.02)
Minisforum Neptune Series HN2673: Ø177.9 (169.8-217)
Power Consumption - The Witcher 3 Power Consumption - external Monitor *
min: 145.7 avg: 154.4 median: 149 (21%) max: 168.6 Watt
GPU TDP ? TDP 85 W TDP 120 W 104% 104% 100%
...
...
max:
0 10 20 30 40 50 60 70 80 90 100 110 120 130 140 150 160 170 180 Tooltip Medion Erazer Major X10: Ø145.7 (141.1-159.1)
Intel NUC X15 LAPAC71H: Ø149 (142.21-186.46)
Minisforum Neptune Series HN2673: Ø168.6 (161-176.5)
Power Consumption - Witcher 3 Power Consumption *
min: 155.6 avg: 160.8 median: 160.8 (35%) max: 166 Watt
GPU TDP ? TDP 85 W 104% 100%
...
...
0 15 30 45 60 75 90 105 120 135 150 165 180 195 Tooltip Medion Erazer Major X10: Ø155.6 (150.9-202)
Intel NUC X15 LAPAC71H: Ø165.5 (121.7-197.37)
Power Consumption - Witcher 3 ultra Power Efficiency
0.3 fps per Watt (32%)
...
...
Power Consumption - Witcher 3 ultra Power Efficiency - external Monitor
0.3 fps per Watt (28%)
...
...
Emissions Witcher 3 Fan Noise + Emissions - Witcher 3 Fan Noise
min: 40.5 avg: 47.1 median: 50 (80%) max: 50.65 dB(A)
GPU TDP ? TDP 85 W TDP 120 W 99% 100% 80%
...
...
Clock Speed - GPU Clock Witcher 3 ultra
1800 MHz (71%)
...
...
- Range of benchmark values for this graphics card
- Average benchmark values for this graphics card
* Smaller numbers mean a higher performance
Game Benchmarks The following benchmarks stem from our benchmarks of review laptops. The performance depends on the used graphics memory, clock rate, processor, system settings, drivers, and operating systems. So the results don't have to be representative for all laptops with this GPU. For detailed information on the benchmark results, click on the fps number.
0 Tooltip Neptune Series HN2673: Ø43.5 (36.5-54.5)
max:
0 Tooltip Neptune Series HN2673: Ø42 (38.1-50.4)
max:
0 Tooltip Neptune Series HN2673: Ø25.6 (21-32.1)
...
max:
0 Tooltip Neptune Series HN2673: Ø22.5 (16.2-27.8)
...
max:
0 Tooltip Neptune Series HN2673: Ø18.3 (15.6-22.8)
...
max:
» With all tested laptops playable in detail settings med..
Additional Benchmarks
Very Low Preset 1280x720
0 100 Tooltip Neptune Series HN2673: Ø108.3 (70.7-158.1)
...
max:
0 100 Tooltip Neptune Series HN2673: Ø96.4 (63.7-146.7)
...
max:
0 100 Tooltip Neptune Series HN2673: Ø90.5 (65.4-126.9)
...
max:
0 Tooltip Neptune Series HN2673: Ø57.2 (48.8-65.6)
...
max:
0 Tooltip Neptune Series HN2673: Ø29.9 (21.9-37)
max:
» With all tested laptops playable in detail settings ultra.
Additional Benchmarks
Low Preset 1280x720
0 100 Tooltip Neptune Series HN2673: Ø163 (149.6-181.6)
max:
0 100 Tooltip Neptune Series HN2673: Ø131.5 (123.6-141.5)
...
max:
0 100 Tooltip Neptune Series HN2673: Ø111.4 (103.6-123.7)
max:
0 Tooltip Neptune Series HN2673: Ø88.6 (81.4-93.5)
max:
0 Tooltip Neptune Series HN2673: Ø58.6 (54-61.5)
max:
0 Tooltip Neptune Series HN2673: Ø27.6 (26.5-28.9)
max:
» With all tested laptops playable in detail settings ultra.
Additional Benchmarks
Very Low Preset 1280x720
max:
max:
...
max:
max:
max:
max:
max:
» With all tested laptops playable in detail settings ultra.
Additional Benchmarks
Low Preset TAA 1280x720
0 Tooltip Neptune Series HN2673: Ø79.5 (74.9-87.3)
max:
0 Tooltip Neptune Series HN2673: Ø62.3 (58.6-66.7)
max:
0 Tooltip Neptune Series HN2673: Ø57.8 (53.5-63.1)
max:
0 Tooltip Neptune Series HN2673: Ø55.9 (51.9-60.9)
max:
0 Tooltip Neptune Series HN2673: Ø36.7 (31.3-41.8)
max:
0 Tooltip Neptune Series HN2673: Ø17.9 (14.4-20.1)
max:
» With all tested laptops playable in detail settings ultra.
Additional Benchmarks
Low Preset 1280x720
0 Tooltip Neptune Series HN2673: Ø55 (47.6-66.4)
...
max:
0 Tooltip Neptune Series HN2673: Ø49.9 (43-60.3)
...
max:
0 Tooltip Neptune Series HN2673: Ø42.5 (35.6-52.5)
max:
0 Tooltip Neptune Series HN2673: Ø36.1 (29.8-45.3)
max:
0 Tooltip Neptune Series HN2673: Ø26.2 (22.4-30.9)
max:
0 Tooltip Neptune Series HN2673: Ø11.8 (10.7-12.9)
max:
0 Tooltip Neptune Series HN2673: Ø18.8 (16.6-21.6)
max:
» With all tested laptops playable in detail settings ultra.
Additional Benchmarks
Max. Performance 1280x720
0 Tooltip Neptune Series HN2673: Ø80.1 (59.1-94.8)
...
max:
0 Tooltip Neptune Series HN2673: Ø67.3 (45.2-82.7)
max:
0 Tooltip Neptune Series HN2673: Ø53.6 (35.5-62.8)
max:
0 Tooltip Neptune Series HN2673: Ø50.7 (43.3-58)
max:
0 Tooltip Neptune Series HN2673: Ø36.4 (30.5-41.5)
max:
0 Tooltip Neptune Series HN2673: Ø18.9 (16.9-20.8)
max:
» With all tested laptops playable in detail settings ultra.
Additional Benchmarks
Very Low Preset 1280x720
0 100 200 300 Tooltip Neptune Series HN2673: Ø347 (298-359)
...
max:
0 100 200 300 Tooltip Neptune Series HN2673: Ø333 (284-359)
...
max:
0 100 200 300 Tooltip Neptune Series HN2673: Ø316 (270-357)
...
max:
0 100 200 Tooltip Neptune Series HN2673: Ø215 (188.8-231)
max:
0 100 Tooltip Neptune Series HN2673: Ø116.1 (101-126.5)
max:
» With all tested laptops playable in detail settings ultra.
0 100 200 300 400 500 Tooltip Neptune Series HN2673: Ø145 (81.11-522)
...
max:
0 100 Tooltip Neptune Series HN2673: Ø114.1 (75.34-137.14)
...
max:
0 100 Tooltip Neptune Series HN2673: Ø97.8 (38.47-183.7)
...
...
max:
0 100 Tooltip Neptune Series HN2673: Ø76.2 (31.38-129.2)
...
max:
0 Tooltip Neptune Series HN2673: Ø45.2 (22.841-63)
max:
0 Tooltip Neptune Series HN2673: Ø17.7 (6.002-39.2)
max:
» With all tested laptops playable in detail settings ultra.
0 100 200 300 Tooltip Neptune Series HN2673: Ø150.4 (115.01-309.1)
...
max:
0 100 Tooltip Neptune Series HN2673: Ø112.2 (83.171-179.5)
...
max:
0 100 200 300 Tooltip Neptune Series HN2673: Ø111.1 (75.691-347)
...
...
max:
0 100 Tooltip Neptune Series HN2673: Ø79 (57.264-116.1)
...
max:
0 Tooltip Neptune Series HN2673: Ø52.5 (39.221-76.9)
max:
0 Tooltip Neptune Series HN2673: Ø26.3 (18.03-55.5)
max:
» With all tested laptops playable in detail settings ultra.
Additional Benchmarks
Low Preset 1280x720
...
max:
...
...
max:
...
...
max:
...
max:
...
max:
...
max:
» With all tested laptops playable in detail settings med..
Additional Benchmarks
Low Preset TAA 1280x720
max:
...
max:
max:
...
max:
...
max:
» With all tested laptops playable in detail settings high.
Additional Benchmarks
Minimum Preset 1280x720
0 Tooltip Neptune Series HN2673: Ø67.8 (27.37-94.3)
...
max:
0 100 200 300 400 Tooltip Neptune Series HN2673: Ø59.6 (11.46-468)
...
max:
0 100 200 300 Tooltip Neptune Series HN2673: Ø50.4 (-0.37061-369)
...
max:
0 Tooltip Neptune Series HN2673: Ø44.2 (2.918-77.1)
...
max:
0 100 200 300 400 500 600 700 800 900 1000 1100 1200 1300 1400 1500 1600 1700 1800 1900 2000 2100 2200 2300 2400 2500 2600 2700 2800 2900 3000 Tooltip Neptune Series HN2673: Ø73.9 (2.071-3093)
...
max:
» With all tested laptops playable in detail settings ultra.
Additional Benchmarks
Ultra Low Preset LowAA 1280x720
0 100 Tooltip Neptune Series HN2673: Ø38.3 (31.641-91.3)
Neptune Series HN2673: Ø47.6 (38.199-120.6)
...
...
max:
0 100 200 Tooltip Neptune Series HN2673: Ø43.5 (24.175-273)
Neptune Series HN2673: Ø46.6 (34.381-128.9)
...
...
max:
0 100 200 300 400 500 Tooltip Neptune Series HN2673: Ø57.7 (28.802-540)
Neptune Series HN2673: Ø40.5 (28.036-114.4)
...
...
max:
0 Tooltip Neptune Series HN2673: Ø13.5 (11.003-23.2)
...
max:
0 Tooltip Neptune Series HN2673: Ø9.2 (6.074-64.2)
...
max:
» With most tested laptops playable in detail settings low.
Additional Benchmarks
Low Preset 1280x720
0 100 Tooltip NUC X15 LAPAC71H: Ø49.4 (42.011-113.5)
Neptune Series HN2673: Ø50.4 (41.127-82.4)
...
max:
0 100 200 Tooltip NUC X15 LAPAC71H: Ø43.8 (34.26-88.2)
Neptune Series HN2673: Ø50.9 (36.038-217.4)
...
...
max:
0 100 Tooltip Neptune Series HN2673: Ø37.3 (29.965-75.1)
NUC X15 LAPAC71H: Ø42.8 (30.072-120.4)
...
...
max:
0 Tooltip Neptune Series HN2673: Ø26.7 (21.015-56.1)
NUC X15 LAPAC71H: Ø37.5 (32.282-54.2)
...
...
max:
0 Tooltip Neptune Series HN2673: Ø9.13 (3.039-86.5)
...
max:
» With all tested laptops playable in detail settings med..
Additional Benchmarks
Low Preset 1280x720
...
max:
...
...
max:
...
...
max:
...
...
max:
...
max:
...
max:
» With all tested laptops playable in detail settings ultra.
Additional Benchmarks
Low Preset 1280x720
...
...
max:
...
...
max:
...
...
max:
...
...
max:
...
max:
...
max:
» With all tested laptops playable in detail settings ultra.
Additional Benchmarks
Low Preset (Adaptive Quality Off) 1280x720
0 100 200 300 Tooltip NUC X15 LAPAC71H: Ø129.7 (108.295-357)
...
max:
» With all tested laptops playable in detail settings ultra.
0 100 200 300 Tooltip Neptune Series HN2673: Ø174.7 (83.8-334.7)
...
max:
0 100 200 Tooltip Neptune Series HN2673: Ø155.9 (89.513-223.7)
...
...
max:
0 100 200 300 Tooltip Neptune Series HN2673: Ø121.2 (84.021-331)
...
...
max:
0 100 Tooltip Neptune Series HN2673: Ø84.8 (62.09-118.3)
...
...
max:
0 100 Tooltip Neptune Series HN2673: Ø57.6 (39.526-121.2)
...
max:
0 100 Tooltip Neptune Series HN2673: Ø21 (11.005-146)
...
max:
» With all tested laptops playable in detail settings ultra.
Additional Benchmarks
Low Preset 1280x720
...
...
max:
...
...
max:
...
...
max:
...
...
max:
...
max:
» With all tested laptops playable in detail settings ultra.
Additional Benchmarks
Low Preset (FSR off) 1280x720
Ray Tracing Ultra Preset (DLSS off) 1920x1080
0 100 200 Tooltip NUC X15 LAPAC71H: Ø103.6 (89.903-280.4)
Neptune Series HN2673: Ø101.7 (90.07-153.8)
...
max:
0 100 Tooltip NUC X15 LAPAC71H: Ø90.5 (79.099-152.5)
Neptune Series HN2673: Ø111.4 (97.124-181.9)
...
...
max:
0 100 Tooltip NUC X15 LAPAC71H: Ø80.1 (68.25-141.6)
Neptune Series HN2673: Ø89 (74.221-120.9)
...
...
max:
0 Tooltip NUC X15 LAPAC71H: Ø68.4 (59.788-79.7)
Neptune Series HN2673: Ø76.3 (68.132-91.06)
...
...
max:
0 Tooltip Neptune Series HN2673: Ø25.4 (21.012-45.1)
...
max:
» With all tested laptops playable in detail settings ultra.
Additional Benchmarks
Low Preset 1280x720
...
...
...
...
max:
...
...
max:
...
max:
» With all tested laptops playable in detail settings ultra.
Additional Benchmarks
Low Preset 1280x720
0 100 200 300 Tooltip NUC X15 LAPAC71H: Ø54 (29.326-349)
...
...
max:
0 Tooltip NUC X15 LAPAC71H: Ø32 (26.032-63.7)
...
...
max:
0 Tooltip NUC X15 LAPAC71H: Ø26.1 (23.31-31.31)
...
max:
0 Tooltip NUC X15 LAPAC71H: Ø28.9 (20.131-75.5)
...
max:
» The benchmarks indicate that the game is not playable in the tested settings.
Additional Benchmarks
Low Preset 1280x720
0 100 Tooltip Neptune Series HN2673: Ø72.3 (48.541-105.16)
...
max:
0 100 Tooltip Neptune Series HN2673: Ø68.2 (48.166-104.9)
...
...
max:
0 100 200 Tooltip Neptune Series HN2673: Ø71.7 (49.615-203.5)
...
...
max:
0 Tooltip Neptune Series HN2673: Ø62.7 (51.13-95.1)
...
...
max:
0 Tooltip Neptune Series HN2673: Ø27.6 (24.026-57.4)
...
max:
» With all tested laptops playable in detail settings ultra.
Additional Benchmarks
Low Preset 1280x720
0 Tooltip Neptune Series HN2673: Ø23.5 (17.104-97.7)
...
max:
0 Tooltip Neptune Series HN2673: Ø20 (13.007-46.8)
...
max:
» The benchmarks indicate that the game is not playable in the tested settings.
Additional Benchmarks
Low 1280x720
0 100 200 Tooltip NUC X15 LAPAC71H: Ø80.2 (70.255-94.4)
Neptune Series HN2673: Ø105.5 (84.259-296.8)
...
max:
0 100 Tooltip NUC X15 LAPAC71H: Ø77.4 (66.11-91.4)
Neptune Series HN2673: Ø90.9 (72.231-133.3)
...
...
max:
0 100 200 300 400 500 600 700 800 900 1000 1100 1200 1300 Tooltip NUC X15 LAPAC71H: Ø136.9 (65.602-1358)
Neptune Series HN2673: Ø97 (69.564-365)
...
...
max:
0 Tooltip Neptune Series HN2673: Ø27.8 (20.613-96.6)
NUC X15 LAPAC71H: Ø61.9 (55.74-74.1)
...
...
max:
» With most tested laptops playable in detail settings ultra.
Additional Benchmarks
Low Preset 1280x720
0 100 200 300 400 500 600 700 800 900 Tooltip NUC X15 LAPAC71H: Ø107 (65.091-955)
Neptune Series HN2673: Ø87.7 (72.51-102.94)
...
...
max:
0 100 200 300 Tooltip Neptune Series HN2673: Ø73 (48.216-350)
NUC X15 LAPAC71H: Ø66.2 (56.2-95.5)
...
...
max:
0 100 Tooltip NUC X15 LAPAC71H: Ø58.1 (50.37-78.4)
Neptune Series HN2673: Ø73.2 (61.018-101.2)
...
...
max:
0 100 Tooltip NUC X15 LAPAC71H: Ø54.4 (48.906-65)
Neptune Series HN2673: Ø64.9 (54.025-140.9)
...
...
max:
0 100 200 Tooltip Neptune Series HN2673: Ø19.2 (8.047-252)
...
max:
» With all tested laptops playable in detail settings ultra.
Additional Benchmarks
Low Preset 1280x720
0 100 Tooltip Neptune Series HN2673: Ø58.2 (45.441-111.9)
NUC X15 LAPAC71H: Ø58.2 (35.21-76.58)
...
...
max:
0 100 200 300 Tooltip Neptune Series HN2673: Ø48.8 (39.04-82.2)
NUC X15 LAPAC71H: Ø64.1 (34.349-339)
...
...
max:
0 100 200 300 Tooltip Neptune Series HN2673: Ø56.3 (27.543-325)
NUC X15 LAPAC71H: Ø47 (39.368-82.2)
...
...
max:
0 Tooltip Neptune Series HN2673: Ø33.4 (25.6-51.9)
NUC X15 LAPAC71H: Ø47.7 (30.76-83.6)
...
...
max:
» With most tested laptops playable in detail settings ultra.
Additional Benchmarks
Very Low Preset 1280x720
Very High Preset + Very High Raytracing TAA 1920x1080
...
...
max:
...
...
max:
...
...
max:
...
...
max:
...
max:
» With all tested laptops playable in detail settings high.
Additional Benchmarks
Ultra Low Preset TAA 1280x720
0 100 200 Tooltip NUC X15 LAPAC71H: Ø139.9 (111.86-238.9)
Neptune Series HN2673: Ø151.2 (126.51-204.9)
...
...
max:
0 100 Tooltip NUC X15 LAPAC71H: Ø116.9 (96.175-126.209)
Neptune Series HN2673: Ø134.2 (111.34-158.8)
...
...
max:
0 100 Tooltip NUC X15 LAPAC71H: Ø106.4 (86.444-120.89)
Neptune Series HN2673: Ø121.8 (104.618-158.3)
...
...
max:
0 100 Tooltip Neptune Series HN2673: Ø93.7 (78.868-164.4)
NUC X15 LAPAC71H: Ø89.2 (55.225-106.5)
...
...
max:
0 100 Tooltip Neptune Series HN2673: Ø36 (27.029-110.3)
...
max:
» With all tested laptops playable in detail settings ultra.
Additional Benchmarks
Low Preset 1280x720
0 100 200 300 400 500 600 700 Tooltip NUC X15 LAPAC71H: Ø70.3 (37.16-771)
Neptune Series HN2673: Ø52.9 (45.288-69.69)
...
...
max:
0 Tooltip NUC X15 LAPAC71H: Ø44.4 (33.251-78.7)
Neptune Series HN2673: Ø47.1 (41.66-55.75)
...
...
max:
0 100 200 300 400 Tooltip NUC X15 LAPAC71H: Ø53.3 (31.963-472)
Neptune Series HN2673: Ø43.9 (37.151-57.4)
...
...
max:
0 Tooltip NUC X15 LAPAC71H: Ø36.4 (29.278-40.43)
Neptune Series HN2673: Ø40.6 (34.777-58)
...
...
max:
0 100 200 Tooltip Neptune Series HN2673: Ø26.9 (10.384-286)
...
max:
» With most tested laptops playable in detail settings ultra.
Additional Benchmarks
Low Preset 1280x720
Epic Preset + Ray Tracing 1920x1080
0 100 200 Tooltip Neptune Series HN2673: Ø150.2 (122.122-202.3)
...
...
max:
0 100 Tooltip Neptune Series HN2673: Ø122.4 (20.219-164.5)
...
...
max:
0 100 Tooltip Neptune Series HN2673: Ø94.5 (71.094-110.28)
...
...
max:
0 100 Tooltip Neptune Series HN2673: Ø78.8 (60.82-123.4)
...
...
max:
0 Tooltip Neptune Series HN2673: Ø29.7 (16.262-53.8)
...
max:
» With all tested laptops playable in detail settings ultra.
Additional Benchmarks
Low Preset Low TAA 1280x720
0 Tooltip NUC X15 LAPAC71H: Ø37.2 (22.21-59.1)
...
...
max:
0 Tooltip NUC X15 LAPAC71H: Ø35.1 (21.069-59.3)
...
...
max:
0 100 Tooltip NUC X15 LAPAC71H: Ø35.2 (17.149-133.3)
...
...
max:
0 Tooltip NUC X15 LAPAC71H: Ø31.5 (20.178-88.3)
...
max:
» The benchmarks indicate that the game is not playable in the tested settings.
Additional Benchmarks
Low Preset 1280x720
0 100 Tooltip NUC X15 LAPAC71H: Ø92.5 (78.068-175.9)
Neptune Series HN2673: Ø110.3 (94.921-182.1)
...
...
max:
0 100 200 Tooltip NUC X15 LAPAC71H: Ø68.8 (60.319-89.3)
Neptune Series HN2673: Ø84.2 (69.265-217.3)
...
...
max:
0 100 Tooltip NUC X15 LAPAC71H: Ø63.4 (54.036-95.5)
Neptune Series HN2673: Ø76.4 (64.22-197.8)
...
...
max:
0 100 Tooltip NUC X15 LAPAC71H: Ø44 (37.835-86.2)
Neptune Series HN2673: Ø52.1 (42.24-108.9)
...
...
max:
0 100 200 Tooltip Neptune Series HN2673: Ø21.2 (8.001-270)
max:
» With all tested laptops playable in detail settings ultra.
Additional Benchmarks
Prioritize Performance Preset 1280x720
...
...
max:
...
...
max:
...
...
max:
...
...
max:
...
max:
» With all tested laptops playable in detail settings ultra.
Additional Benchmarks
Minimum Settings 1280x720
0 100 Tooltip NUC X15 LAPAC71H: Ø59.1 (19.528-121.8)
Neptune Series HN2673: Ø58 (40.075-83.6)
...
...
max:
0 Tooltip NUC X15 LAPAC71H: Ø38.5 (13.174-81.1)
Neptune Series HN2673: Ø41.4 (34.338-64.1)
...
...
max:
0 100 200 300 Tooltip NUC X15 LAPAC71H: Ø46.2 (13.09-308)
Neptune Series HN2673: Ø38 (31.157-54.7)
...
...
max:
0 100 200 300 Tooltip Neptune Series HN2673: Ø33.1 (25.223-55.2)
NUC X15 LAPAC71H: Ø52.5 (14.236-371)
...
...
max:
0 100 200 Tooltip Neptune Series HN2673: Ø25.7 (12.037-227)
...
max:
» With all tested laptops playable in detail settings med..
Additional Benchmarks
Ultra Low Preset 1280x720
0 100 200 Tooltip Neptune Series HN2673: Ø43.1 (36.009-124.2)
NUC X15 LAPAC71H: Ø105.6 (92.954-241.6)
...
...
max:
0 100 Tooltip Neptune Series HN2673: Ø34.8 (25.797-125.8)
NUC X15 LAPAC71H: Ø77.4 (67.506-126.3)
...
...
max:
0 100 Tooltip Neptune Series HN2673: Ø39.2 (28.078-161.9)
NUC X15 LAPAC71H: Ø53.1 (47.109-75.5)
...
...
max:
0 100 200 300 400 500 600 700 800 900 Tooltip Neptune Series HN2673: Ø50.3 (28.018-987)
NUC X15 LAPAC71H: Ø40.7 (34.159-71.3)
...
...
max:
0 Tooltip Neptune Series HN2673: Ø31.2 (25.59-69.2)
max:
» With most tested laptops playable in detail settings high.
Additional Benchmarks
Low Preset 1280x720
...
...
max:
...
...
max:
...
...
max:
...
...
max:
...
max:
» With all tested laptops playable in detail settings ultra.
Additional Benchmarks
Low Preset 1280x720
Epic Preset + Epic Ray-Tracing 1920x1080
0 100 200 Tooltip NUC X15 LAPAC71H: Ø81.1 (37.711-215.6)
...
...
max:
0 Tooltip NUC X15 LAPAC71H: Ø51.4 (32.001-94.1)
...
...
max:
0 Tooltip NUC X15 LAPAC71H: Ø45.2 (39.946-55.5)
...
...
max:
0 Tooltip NUC X15 LAPAC71H: Ø37.9 (20.12-67.6)
...
...
max:
» With all tested laptops playable in detail settings high.
Additional Benchmarks
Low Preset Low TAA 1280x720
Ultra Preset + Full Ray Tracing High TAA 1920x1080
0 Tooltip NUC X15 LAPAC71H: Ø52.8 (44.43-73.2)
Neptune Series HN2673: Ø55.3 (47.25-69.194)
...
...
max:
0 Tooltip NUC X15 LAPAC71H: Ø50.1 (39.025-65.8)
Neptune Series HN2673: Ø55.3 (46.323-90.5)
...
...
max:
0 Tooltip NUC X15 LAPAC71H: Ø44.2 (37.185-57.94)
Neptune Series HN2673: Ø49 (41.67-58.662)
...
...
max:
0 Tooltip NUC X15 LAPAC71H: Ø44.3 (37.077-58.4)
Neptune Series HN2673: Ø50.4 (39.117-70.9)
...
...
max:
» With all tested laptops playable in detail settings ultra.
Additional Benchmarks
Low Preset TAA 1280x720
0 100 200 300 400 500 600 Tooltip NUC X15 LAPAC71H: Ø141.6 (120.411-616)
...
...
max:
0 100 200 300 Tooltip NUC X15 LAPAC71H: Ø110.1 (93.454-320)
...
...
max:
0 Tooltip NUC X15 LAPAC71H: Ø54.3 (48.189-81.2)
...
...
max:
0 100 Tooltip NUC X15 LAPAC71H: Ø48.6 (40.233-112.5)
...
...
max:
» With all tested laptops playable in detail settings ultra.
Additional Benchmarks
Low Preset / Off 1280x720
RT Ultra Preset / On FXAA 1920x1080
0 100 200 Tooltip NUC X15 LAPAC71H: Ø151.2 (105.469-213.44)
...
...
max:
0 100 Tooltip NUC X15 LAPAC71H: Ø114.5 (79.013-168)
...
...
max:
0 100 Tooltip NUC X15 LAPAC71H: Ø82.9 (57.592-102.8)
...
...
max:
0 Tooltip NUC X15 LAPAC71H: Ø67 (51.215-78.55)
...
...
max:
» With all tested laptops playable in detail settings ultra.
Additional Benchmarks
Low Preset 1280x720
...
...
max:
...
...
max:
...
...
max:
...
...
max:
...
max:
» With all tested laptops playable in detail settings ultra.
Additional Benchmarks
Low Preset (without FSR Upscaling) 1280x720
0 100 200 300 400 500 600 700 800 Tooltip NUC X15 LAPAC71H: Ø82.8 (35.9-898)
...
...
max:
0 Tooltip NUC X15 LAPAC71H: Ø53.6 (32.146-79)
...
...
max:
0 Tooltip NUC X15 LAPAC71H: Ø48.9 (28.25-83.8)
...
...
max:
0 100 200 300 400 500 600 700 800 900 1000 1100 1200 1300 1400 1500 1600 1700 1800 1900 2000 2100 2200 2300 2400 Tooltip NUC X15 LAPAC71H: Ø105.2 (24.173-2451)
...
...
max:
» With all tested laptops playable in detail settings ultra.
Additional Benchmarks
Low Preset 1280x720
0 Tooltip NUC X15 LAPAC71H: Ø63.7 (44.073-90)
...
...
max:
0 100 200 300 400 500 600 700 800 900 1000 1100 1200 1300 1400 1500 1600 1700 1800 1900 2000 2100 2200 2300 2400 2500 2600 2700 2800 2900 3000 3100 3200 3300 3400 3500 3600 3700 3800 3900 4000 4100 4200 4300 4400 4500 4600 4700 4800 4900 5000 5100 5200 5300 5400 5500 5600 5700 5800 5900 6000 6100 6200 6300 6400 6500 6600 6700 6800 6900 7000 7100 7200 7300 7400 7500 7600 7700 7800 7900 8000 8100 8200 8300 8400 8500 8600 8700 8800 8900 9000 9100 9200 9300 9400 9500 9600 9700 9800 9900 Tooltip NUC X15 LAPAC71H: Ø544 (40.11-12185)
...
...
max:
0 100 Tooltip NUC X15 LAPAC71H: Ø58.5 (42.815-136.8)
...
...
max:
0 100 Tooltip NUC X15 LAPAC71H: Ø61.2 (38.14-155.2)
...
...
max:
» With all tested laptops playable in detail settings ultra.
Additional Benchmarks
Very Low Preset 1280x720
Very High Preset + Ray-Tracing TAA 1920x0180
...
max:
...
...
max:
...
...
max:
...
...
max:
» With all tested laptops playable in detail settings ultra.
Additional Benchmarks
Basic Quality Preset T2X SMAA 1280x720
0 Tooltip NUC X15 LAPAC71H: Ø33 (29.144-41.1)
...
...
max:
0 Tooltip NUC X15 LAPAC71H: Ø36.7 (32.012-44.33)
...
...
max:
0 Tooltip NUC X15 LAPAC71H: Ø28.7 (25.602-33.21)
...
...
max:
0 Tooltip NUC X15 LAPAC71H: Ø29.9 (22.126-50.6)
...
...
max:
» With all tested laptops playable in detail settings med..
0 Tooltip Neptune Series HN2673: Ø70 (53.007-92.5)
...
...
max:
0 Tooltip Neptune Series HN2673: Ø60.7 (51.143-75.87)
...
...
max:
0 100 200 300 400 Tooltip Neptune Series HN2673: Ø58.2 (39.115-411)
...
...
max:
0 Tooltip Neptune Series HN2673: Ø35 (29.161-47)
...
...
max:
0 100 200 Tooltip Neptune Series HN2673: Ø22.1 (11.128-250)
...
max:
» With all tested laptops playable in detail settings high.
Additional Benchmarks
Low Preset 1280x720
0 Tooltip Erazer Major X10: Ø60.8 (42.219-85.2)
...
...
max:
0 Tooltip Erazer Major X10: Ø49.4 (34.36-69.7)
...
...
max:
0 100 200 300 400 Tooltip Erazer Major X10: Ø50.6 (29.296-406)
...
...
max:
0 100 Tooltip Erazer Major X10: Ø30.4 (20.033-126.4)
...
max:
» With all tested laptops playable in detail settings ultra.
...
...
max:
...
...
max:
...
...
max:
...
...
max:
...
max:
...
max:
» With most tested laptops playable in detail settings ultra.
Additional Benchmarks
Ultra Low Preset 16xAF TAA 1280x720
0 100 Tooltip Erazer Major X10: Ø137.8 (114.65-173.53)
...
...
max:
0 100 Tooltip Erazer Major X10: Ø123.6 (102.326-154.665)
...
...
max:
0 100 Tooltip Erazer Major X10: Ø115.8 (96.027-152.9)
...
...
max:
0 100 200 300 400 500 600 700 800 900 1000 1100 1200 1300 1400 1500 1600 1700 1800 1900 2000 2100 2200 2300 2400 2500 2600 2700 2800 2900 3000 3100 3200 3300 3400 Tooltip Erazer Major X10: Ø191.7 (61.2-3497)
...
max:
» With all tested laptops playable in detail settings ultra.
0 100 Tooltip Erazer Major X10: Ø88.2 (70.204-107.9)
...
...
max:
0 100 Tooltip Erazer Major X10: Ø88.2 (71.077-155.6)
...
...
max:
0 100 Tooltip Erazer Major X10: Ø85.2 (73.34-104.3)
...
...
max:
0 100 Tooltip Erazer Major X10: Ø56 (50.037-139.7)
...
max:
» With all tested laptops playable in detail settings ultra.
Additional Benchmarks
Highest Settings + Maximum Ray Tracing 1920x1080
...
...
max:
...
...
max:
...
...
max:
...
...
max:
...
max:
...
max:
» With all tested laptops playable in detail settings ultra.
Additional Benchmarks
Lowest Preset (DX12) 1280x720
...
...
max:
...
...
max:
...
...
max:
...
...
max:
...
...
max:
» With all tested laptops playable in detail settings ultra.
Additional Benchmarks
Low Preset 1280x720
Ray Tracing Ultra Preset (DLSS off) 1920x1080
0 100 Tooltip Erazer Major X10: Ø56.5 (44.256-113.5)
...
...
0 Tooltip Erazer Major X10: Ø51.1 (38.836-67.96)
...
...
0 100 Tooltip Erazer Major X10: Ø51.5 (37.32-163.5)
...
...
0 100 Tooltip Erazer Major X10: Ø45.8 (33.27-184.8)
...
» With all tested laptops playable in detail settings ultra.
...
...
max:
...
...
max:
...
...
max:
...
...
max:
...
max:
...
max:
» With all tested laptops playable in detail settings ultra.
Additional Benchmarks
Low Preset 1280x720
0 Tooltip Erazer Major X10: Ø62.5 (59.028-76.5)
...
max:
0 100 Tooltip Erazer Major X10: Ø70.2 (56.981-176.9)
...
...
max:
0 Tooltip Erazer Major X10: Ø61 (54.06-89.1)
...
...
max:
0 Tooltip Erazer Major X10: Ø47.2 (43.09-61.27)
...
max:
» With all tested laptops playable in detail settings ultra.
0 Tooltip Erazer Major X10: Ø64.4 (48.11-84.6)
...
...
max:
0 100 200 Tooltip Erazer Major X10: Ø65.6 (48.16-246)
...
...
max:
0 Tooltip Erazer Major X10: Ø40.4 (33.83-94.7)
...
max:
» With all tested laptops playable in detail settings high.
Additional Benchmarks
High Quality Raytracing 1920x1080
...
...
max:
...
...
max:
...
...
max:
...
max:
» With all tested laptops playable in detail settings ultra.
0 100 Tooltip Neptune Series HN2673: Ø61.4 (48.402-109.6)
...
...
max:
0 Tooltip Erazer Major X10: Ø55.2 (37.981-82.9)
Neptune Series HN2673: Ø59.2 (46.844-86.8)
...
...
max:
0 100 200 Tooltip Erazer Major X10: Ø46.5 (22.891-65.8)
Neptune Series HN2673: Ø58.9 (44.02-233.7)
...
...
max:
0 Tooltip Erazer Major X10: Ø38.9 (23.264-57.7)
Neptune Series HN2673: Ø42.3 (35.907-54.9)
...
...
max:
0 Tooltip Erazer Major X10: Ø35.1 (24.316-63.6)
...
max:
0 Tooltip Neptune Series HN2673: Ø26.5 (20.19-70.9)
...
max:
» With all tested laptops playable in detail settings ultra.
Additional Benchmarks
Low Preset 1280x720
0 Tooltip Erazer Major X10: Ø68.9 (60.247-78.12)
...
...
0 Tooltip Erazer Major X10: Ø61.7 (55.086-87.6)
...
...
0 100 Tooltip Erazer Major X10: Ø61.1 (49.034-131)
...
...
0 100 200 Tooltip Erazer Major X10: Ø54.5 (38.055-228.4)
...
» With all tested laptops playable in detail settings ultra.
0 100 200 Tooltip Erazer Major X10: Ø138.1 (-0.0389-216.5)
...
...
max:
0 100 Tooltip Erazer Major X10: Ø115.4 (85.66-171.8)
...
...
max:
0 100 200 Tooltip Erazer Major X10: Ø111.4 (-0.0871-212.3)
...
...
max:
0 100 200 300 400 Tooltip Erazer Major X10: Ø93.8 (-0.05271-443)
...
max:
» With all tested laptops playable in detail settings ultra.
...
...
max:
...
...
max:
...
...
max:
...
max:
» With all tested laptops playable in detail settings ultra.
...
...
max:
...
...
max:
...
...
max:
...
max:
» With all tested laptops playable in detail settings ultra.
...
...
max:
...
...
max:
...
...
max:
...
max:
» With all tested laptops playable in detail settings ultra.
Additional Benchmarks
Ultra Preset + Ultra Ray-Tracing 1920x1080
0 100 Tooltip Erazer Major X10: Ø136.7 (114.051-184.81)
...
...
0 100 Tooltip Erazer Major X10: Ø117.4 (93.828-157.96)
...
...
0 100 Tooltip Erazer Major X10: Ø109.3 (90.76-160.7)
...
...
0 Tooltip Erazer Major X10: Ø70.4 (58.003-88.92)
...
» With all tested laptops playable in detail settings ultra.
0 100 Tooltip Neptune Series HN2673: Ø100.1 (83-127)
...
...
max:
0 100 Tooltip Neptune Series HN2673: Ø93.4 (84-106)
...
...
max:
0 Tooltip Neptune Series HN2673: Ø79.9 (70-88)
...
...
max:
0 Tooltip Neptune Series HN2673: Ø62.4 (48-74)
...
...
max:
...
max:
0 Tooltip Neptune Series HN2673: Ø26.3 (22-30)
...
...
max:
» With all tested laptops playable in detail settings ultra.
Additional Benchmarks
Low Graphics Quality 1920x1080
Ultra Graphics Quality + HD Textures + DXR TAA 1920x1080
0 100 200 Tooltip Erazer Major X10: Ø124.3 (111.026-200.1)
...
0 100 Tooltip Erazer Major X10: Ø102.4 (90.2-146.5)
...
max:
0 Tooltip Erazer Major X10: Ø70.8 (64.331-94.8)
max:
» With all tested laptops playable in detail settings high.
0 100 Tooltip Erazer Major X10: Ø80.7 (65.03-129.4)
...
...
0 100 200 300 400 500 Tooltip Erazer Major X10: Ø92.9 (59.38-508)
...
...
0 100 Tooltip Erazer Major X10: Ø59.1 (47.053-107.5)
...
...
0 Tooltip Erazer Major X10: Ø39.2 (31.426-54.4)
...
» With all tested laptops playable in detail settings ultra.
...
max:
...
...
max:
...
...
max:
...
...
max:
...
...
max:
...
...
max:
» With all tested laptops playable in detail settings ultra.
0 100 Tooltip Erazer Major X10: Ø82.7 (64.055-106.6)
...
...
0 100 Tooltip Erazer Major X10: Ø79.8 (68.359-146.6)
...
...
0 Tooltip Erazer Major X10: Ø60.1 (54.188-76.4)
...
...
max:
0 100 Tooltip Erazer Major X10: Ø45.9 (40.258-100.2)
...
max:
» With all tested laptops playable in detail settings ultra.
0 100 200 Tooltip Erazer Major X10: Ø96.3 (49.366-253.9)
...
...
0 100 Tooltip Erazer Major X10: Ø86.2 (52.09-128.406)
...
...
» With all tested laptops playable in detail settings ultra.
0 100 Tooltip Erazer Major X10: Ø121.9 (88.738-152.11)
...
...
max:
0 100 Tooltip Erazer Major X10: Ø109.1 (92.768-145.8)
...
...
max:
0 100 Tooltip Erazer Major X10: Ø99 (79.063-163.1)
...
...
0 100 200 300 400 500 600 Tooltip Erazer Major X10: Ø95.1 (54.236-631)
...
...
max:
» With all tested laptops playable in detail settings ultra.
Additional Benchmarks
Ray Tracing Preset 1920x1080
0 100 200 Tooltip Erazer Major X10: Ø99.2 (73.695-270.2)
...
...
max:
0 100 Tooltip Erazer Major X10: Ø82.7 (54.377-139.7)
...
...
max:
0 Tooltip Erazer Major X10: Ø70.8 (56.359-91.709)
...
...
max:
0 Tooltip Erazer Major X10: Ø46.6 (37.261-66.6)
...
max:
» With all tested laptops playable in detail settings ultra.
...
...
max:
...
...
max:
...
...
max:
...
...
max:
» With all tested laptops playable in detail settings ultra.
0 Tooltip Erazer Major X10: Ø52.5 (32.43-81.139)
...
...
0 Tooltip Erazer Major X10: Ø49 (26.1-84)
...
...
0 100 Tooltip Erazer Major X10: Ø51.2 (19.07-138.6)
...
...
0 100 Tooltip Erazer Major X10: Ø47.9 (30.373-177.6)
...
» With all tested laptops playable in detail settings ultra.
...
...
max:
...
...
max:
...
...
max:
...
...
max:
» With all tested laptops playable in detail settings ultra.
...
...
max:
...
...
max:
...
...
max:
...
...
max:
» With all tested laptops playable in detail settings ultra.
...
...
max:
...
...
max:
...
...
max:
...
...
max:
» With all tested laptops playable in detail settings ultra.
Additional Benchmarks
Ultra Preset + Ultra Ray Tracing (DX12) 1920x1080
0 100 200 Tooltip Erazer Major X10: Ø173.1 (152.02-263)
...
...
max:
0 100 200 Tooltip Erazer Major X10: Ø156.2 (136.2-221.9)
...
...
max:
0 100 Tooltip Erazer Major X10: Ø143.2 (124.801-164.8)
...
...
max:
0 100 Tooltip Erazer Major X10: Ø104.5 (83.134-200)
...
...
max:
» With all tested laptops playable in detail settings ultra.
0 Tooltip Erazer Major X10: Ø59.7 (52.678-95.7)
...
...
max:
0 Tooltip Erazer Major X10: Ø55.9 (48.303-70.1)
...
...
max:
0 Tooltip Erazer Major X10: Ø41.2 (34.201-61.3)
...
max:
» With all tested laptops playable in detail settings high.
...
...
max:
...
...
max:
...
...
max:
...
max:
» With all tested laptops playable in detail settings ultra.
0 100 200 Tooltip Erazer Major X10: Ø131.9 (102.66-220.3)
...
...
max:
0 100 200 300 400 500 600 700 800 900 1000 1100 1200 1300 1400 1500 1600 1700 1800 1900 2000 2100 2200 2300 2400 2500 2600 2700 2800 2900 3000 3100 3200 3300 3400 3500 3600 3700 3800 Tooltip Erazer Major X10: Ø255 (54.05-3898)
...
...
max:
0 Tooltip Erazer Major X10: Ø52.9 (44.993-70.5)
...
...
max:
0 Tooltip Erazer Major X10: Ø36.7 (31.406-40.42)
...
max:
» With all tested laptops playable in detail settings ultra.
0 100 Tooltip NUC X15 LAPAC71H: Ø75.3 (61.234-143.4)
...
...
0 Tooltip NUC X15 LAPAC71H: Ø47.7 (36.285-78)
...
...
0 Tooltip NUC X15 LAPAC71H: Ø37.6 (29.51-85.7)
...
...
0 100 Tooltip NUC X15 LAPAC71H: Ø30.6 (25.018-121.4)
...
...
» With all tested laptops playable in detail settings med..
Additional Benchmarks
Low-End TAAAA 1920x1080
0 100 200 Tooltip Erazer Major X10: Ø95.6 (82.06-232)
...
...
max:
0 100 Tooltip Erazer Major X10: Ø88.2 (80.011-189.5)
...
...
max:
0 Tooltip Erazer Major X10: Ø84.3 (79.41-97.1)
...
...
max:
0 100 Tooltip Erazer Major X10: Ø66.4 (56.93-140.4)
...
...
max:
» With all tested laptops playable in detail settings ultra.
...
...
max:
...
...
max:
...
...
max:
...
...
max:
...
...
max:
...
...
max:
» With all tested laptops playable in detail settings ultra.
...
...
max:
...
...
max:
...
...
max:
...
...
max:
» With all tested laptops playable in detail settings ultra.
0 100 Tooltip Erazer Major X10: Ø115.2 (101.003-143.1)
...
...
max:
0 100 200 300 400 500 600 Tooltip Erazer Major X10: Ø134.5 (87.57-641)
...
...
max:
0 100 200 300 Tooltip Erazer Major X10: Ø116.1 (94.906-311)
...
...
max:
0 100 Tooltip Erazer Major X10: Ø74.6 (66.472-108.4)
...
max:
» With all tested laptops playable in detail settings ultra.
0 100 200 Tooltip Erazer Major X10: Ø102 (75.622-272.7)
...
...
0 Tooltip Erazer Major X10: Ø74.5 (63.327-95)
...
...
0 Tooltip Erazer Major X10: Ø52.4 (46.228-65.9)
...
...
max:
» With all tested laptops playable in detail settings high.
...
...
max:
...
...
max:
...
...
max:
...
...
max:
...
...
max:
» With all tested laptops playable in detail settings ultra.
Additional Benchmarks
Very Low Overall Quality (DX11) 1920x1080
0 100 Tooltip NUC X15 LAPAC71H: Ø148.5 (120.083-174.28)
...
...
max:
0 Tooltip NUC X15 LAPAC71H: Ø68.6 (60.737-78.8)
...
...
max:
0 Tooltip NUC X15 LAPAC71H: Ø56.1 (45.393-96.2)
...
...
max:
» With all tested laptops playable in detail settings high.
Additional Benchmarks
High Quality Preset & High Ray Tracing Preset (DX12) 1920x1080
0 100 Tooltip Neptune Series HN2673: Ø97.7 (69-145)
...
...
max:
0 100 Tooltip Neptune Series HN2673: Ø84.5 (62-125)
...
...
max:
0 100 Tooltip Neptune Series HN2673: Ø81.3 (63-122)
...
...
max:
0 100 Tooltip Neptune Series HN2673: Ø73.5 (55-114)
...
...
max:
0 Tooltip Neptune Series HN2673: Ø38.9 (32-49)
...
...
max:
» With all tested laptops playable in detail settings ultra.
...
...
max:
...
...
max:
...
...
max:
...
...
max:
...
...
max:
» With all tested laptops playable in detail settings high.
...
...
max:
...
...
max:
...
...
max:
...
...
max:
...
...
max:
» With all tested laptops playable in detail settings ultra.
Additional Benchmarks
Lowest Preset 1920x1080
...
...
max:
...
...
max:
...
...
max:
...
...
max:
...
...
max:
» With all tested laptops playable in detail settings ultra.
0 100 Tooltip Neptune Series HN2673: Ø116.5 (93-160)
...
...
max:
0 100 Tooltip Neptune Series HN2673: Ø93.4 (80-109)
...
...
max:
0 100 Tooltip Neptune Series HN2673: Ø87.9 (71-102)
...
...
max:
0 Tooltip Neptune Series HN2673: Ø84.3 (67-98)
...
...
max:
0 Tooltip Neptune Series HN2673: Ø35 (30-43)
...
...
max:
» With all tested laptops playable in detail settings ultra.
Additional Benchmarks
Low Preset TAA 1920x1080
...
...
max:
...
...
max:
...
...
max:
...
max:
» With most tested laptops playable in detail settings med..
...
...
max:
...
...
max:
...
...
max:
...
...
max:
...
...
max:
» With all tested laptops playable in detail settings high.
...
...
max:
...
...
max:
...
...
max:
...
...
max:
...
...
max:
» With all tested laptops playable in detail settings ultra.
...
...
max:
...
...
max:
...
...
max:
0 Tooltip NUC X15 LAPAC71H: Ø38.8 (33-41)
Erazer Major X10: Ø48.4 (46-52)
...
...
max:
» With all tested laptops playable in detail settings ultra.
...
...
max:
...
...
max:
...
...
max:
...
...
max:
...
...
max:
» With all tested laptops playable in detail settings ultra.
Additional Benchmarks
Highest Settings possible 16xAF 4xMSAA + FXAA 3840x2160
Normal/Off 4xAF 1920x1080
Lowest Settings possible 1920x1080
low med. high ultra QHD 4K Horizon Forbidden West 44 42.4 25.6 22.6 18.4 Alone in the Dark 108.4 95.9 90.4 57.2 30.1 Last Epoch 162.7 131.4 111.2 88.5 58.6 27.5 Skull & Bones 58 53 45 36 29 17 Helldivers 2 79.6 62.4 57.8 55.9 36.9 17.9 Enshrouded 54.9 49.8 42.5 36.1 26.2 11.8 Palworld 80.1 67.4 53.8 50.7 36.5 18.9 Prince of Persia The Lost Crown 347 333 316 215 116.1 Ready or Not 128.7 112.9 93.6 69.3 42.8 15 The Finals 144.7 109.2 97 77.4 48.9 22.7 Avatar Frontiers of Pandora 45 40 33 24 15 5.7 Call of Duty Modern Warfare 3 2023 96 86 67 29 17 EA Sports WRC 65.9 48.8 42.9 40.2 27.8 Alan Wake 2 38 35 34 11.6 6.3 Lords of the Fallen 46 40 34 30 3.51 Total War Pharaoh 234 139 84 67 53.3 27.3 Assassin's Creed Mirage 63 56 55 49 38 21 EA Sports FC 24 121.8 Counter-Strike 2 169 154.9 113.9 81.7 52.8 14.2 Cyberpunk 2077 2.0 Phantom Liberty 78 63 54 43 11.5 Lies of P 97 96 80 71 22.9 The Crew Motorfest 60 57 50 46 Starfield 34 30.1 24.8 22 Armored Core 6 70.9 64.3 63.9 58.5 25.2 Immortals of Aveum 19.1 16.3 Atlas Fallen 87 80 74 42 Baldur's Gate 3 80 60 63 56 8.91 Ratchet & Clank Rift Apart 54 48 38 36 F1 23 175 156 111 33 2.15 Diablo 4 138 124 111 86 30.4 Star Wars Jedi Survivor 47 43 39 36 11.6 Dead Island 2 147.1 120.5 93.4 74 26.1 The Last of Us 34.3 32.2 31.3 28.7 Resident Evil 4 Remake 94 70 64 44 9.89 Company of Heroes 3 102 87 62 61 15.8 Sons of the Forest 54 37 35 33 15.4 Atomic Heart 69 52 40 33 27.8 Returnal 59 57 52 41 15 Hogwarts Legacy 69.6 48.6 43.7 34.3 Dead Space Remake 51 49 45 44 The Witcher 3 v4.00 126.2 102.8 51.2 44.4 High On Life 147.9 110.1 80.9 64.7 The Callisto Protocol 95 78 73 51 21 Need for Speed Unbound 59.8 52.5 44.7 37.9 Spider-Man Miles Morales 60.5 58 53.4 51.4 Call of Duty Modern Warfare 2 2022 77 65 56 55 Uncharted Legacy of Thieves Collection 31.3 35.3 27.6 26.7 A Plague Tale Requiem 67.8 58.3 43.6 33.2 12.9 The Quarry 58.9 47.5 38.1 24.8 F1 22 152 130 104 36 15 1.97 Vampire Bloodhunt 135.8 121.5 111.9 71.4 Ghostwire Tokyo 85.4 83.6 83.3 52.3 Tiny Tina's Wonderlands 133.4 96 66 53 35.5 17.2 Cyberpunk 2077 1.6 70.5 64 54 52 30.9 Elex 2 49.7 48.8 43.3 36.5 GRID Legends 114 103 89 71 56.9 34.7 Elden Ring 59.9 59.7 56.9 46.2 Dying Light 2 60.9 51.2 35.6 Rainbow Six Extraction 103 99 83 55 God of War 56 54 47 38 30.7 21.2 Halo Infinite 67.2 59.8 56.2 42.3 Farming Simulator 22 136.6 110.8 107.2 80.5 Forza Horizon 5 86 80 50 41 Riders Republic 60 51 47 34 Guardians of the Galaxy 81 76 73 52 Back 4 Blood 132.9 115.4 105.9 68.3 Far Cry 6 100.1 90 77 64 47 26.3 Alan Wake Remastered 116.7 98.6 67.5 Deathloop 76.2 65.5 54.6 37 F1 2021 317 227 179.2 75.3 55.5 26.8 Days Gone 80.2 76 58.2 42 Mass Effect Legendary Edition 88.5 81.9 Resident Evil Village 119.9 107.8 93.3 61.1 Outriders 90 76.1 69 43.9 Hitman 3 123 109 102 65 Yakuza Like a Dragon 51.3 47.3 46.1 39.4 Assassin´s Creed Valhalla 64 54 48 37 Dirt 5 80.6 64.5 54 44.2 Watch Dogs Legion 85 75 48 35 Star Wars Squadrons 167.1 149.4 140.6 97.4 Mafia Definitive Edition 55.4 52.7 36.9 Serious Sam 4 72.7 54.8 42.5 34.7 Crysis Remastered 125.4 60.7 50.1 34.8 Flight Simulator 2020 69.3 44.2 33.7 25.7 Death Stranding 89.8 82.9 81.9 60 F1 2020 225 152.7 127.3 87.9 66.3 39.5 Gears Tactics 147 99.2 79.7 52 Doom Eternal 112.4 104.2 101.7 70.9 Hunt Showdown 88.2 72.3 50.1 Borderlands 3 93.2 79.3 67.7 57 21.2 Control 145.7 66 51.1 Far Cry New Dawn 98 84 81 74 39 Metro Exodus 80.5 55.6 40.6 32.1 20.5 Shadow of the Tomb Raider 101.7 69.5 67.9 60.9 27.7 Strange Brigade 405 184 153 126 54.1 Far Cry 5 117 93 86 81 35 X-Plane 11.11 52 40 34 11.3 Final Fantasy XV Benchmark 104 72 44 33.7 21.8 Dota 2 Reborn 108 106 95 86 60.6 The Witcher 3 267.3 201 110 45 GTA V 177.4 165 99 42 34.2 < 30 fps < 60 fps < 120 fps ≥ 120 fps 1 17 31 18 31 47 20 4 41 48 6 7 50 31 4 9 37 11 1 37 7 2
For more games that might be playable and a list of all games and graphics cards visit our Gaming List
v1.26
log 21. 02:26:17
#0 no ids found in url (should be separated by "_") +0s ... 0s
#1 not redirecting to Ajax server +0s ... 0s
#2 did not recreate cache, as it is less than 5 days old! Created at Fri, 19 Apr 2024 05:40:26 +0200 +0.001s ... 0.001s
#3 composed specs +0.047s ... 0.049s
#4 did output specs +0s ... 0.049s
#5 start showIntegratedCPUs +0s ... 0.049s
#6 getting avg benchmarks for device 11311 +0.032s ... 0.081s
#7 got single benchmarks 11311 +0.022s ... 0.103s
#8 got avg benchmarks for devices +0s ... 0.103s
#9 min, max, avg, median took s +1.199s ... 1.302s
#10 before gaming benchmark output +0s ... 1.303s
#11 Got 594 rows for game benchmarks. +0.101s ... 1.403s
#12 composed SQL query for gamebenchmarks +0s ... 1.403s
#13 got data and put it in $dataArray +0.067s ... 1.47s
#14 benchmarks composed for output. +4.527s ... 5.997s
#15 return log +0.052s ... 6.05s
Please share our article, every link counts!
» Comparison of GPUs
» Benchmark List
» Notebook Gaming List
Class 1
Class 2 Radeon PRO W6600M *
Class 3 UHD Graphics 32EUs
UHD Graphics 750
Class 4
Class 5 * Approximate position of the graphics adapter
Working For Notebookcheck
Are you a techie who knows how to translate? Then join our Team!
Details here
Top 10 Laptops Multimedia , Budget Multimedia , Gaming , Budget Gaming , Lightweight Gaming , Business , Budget Office , Workstation , Subnotebooks , Ultrabooks , Chromebooks
under 300 USD/Euros , under 500 USD/Euros , 1,000 USD/Euros , for University Students , Best Displays
Top 10 Smartphones Smartphones , Phablets , ≤6-inch , Camera Smartphones
Klaus Hinum (Update: 2022-06-22)
 Deutsch
 English
 Español
 Français
 Italiano
 Nederlands
 Polski
 Português
 Русский
 Türkçe
 Svenska
 Chinese
 Magyar