 Deutsch
 English
 Español
 Français
 Italiano
 Nederlands
 Polski
 Português
 Русский
 Türkçe
 Svenska
 Chinese
 Magyar
Intel 8th gen Kaby Lake-R vs 7th gen Kaby Lake performance comparison
A New Generation Begins
2017 has been a great year for CPU releases so far. The Intel 7th generation Kaby Lake platform debuted in late 2016 (with wide availability in early 2017) and has since been the staple of many laptops and desktops. AMD, after a longer than usual pause, demoed its Zen-architecture based Ryzen chips starting with the flagship Ryzen 7 1800X, which was received very well by both consumers and the press for its good price-to-performance ratio. There has been a lot of buzz in the High End Desktop (HEDT) segment as well, both with AMD unleashing the Threadripper 1950X with a massive 16-core/32-thread configuration and Intel revealing the Skylake-X (Core i9-7900X) and Kaby Lake-X (Core i7-7740X) CPUs in a variety of SKUs. Even in the server segment, AMD's EPYC and Intel's Skylake-SP are all set to bring high-end computing to datacenters worldwide.
In the midst of all these developments, Intel has announced the next iteration of its CPUs — the 8th generation Cores. However, unlike earlier where each generation brought with it an underlying architectural or lithography change, the new 8th generation CPUs will be an assortment of multiple micro-architectures. Intel's processor nomenclature can be somewhat bewildering for those uninitiated and the new generation takes this confusion a notch up further: The 8th generation Intel CPUs will have a refreshed Kaby Lake lineup called the Kaby Lake-R (14nm+), which includes the 15W U-processor family, Coffee Lake (14nm++), which is purported to include the K-processor family from 65W to to 95W TDP, and Canon Lake (10nm). The first of the 8th generation CPUs, the Kaby Lake-R was unveiled on August 21 with the launch of the Core i5-8250U, Core i5-8350U, Core i7-8550U and Core i7-8650U. All these processors are of the 15W TDP type (though TDP is configurable by the OEM) and, unlike their previous 7th generation counterparts, they now feature quad cores with hyperthreading.
Intel has managed to retain the TDP at 15W by reducing the base clock of these processors. While the 7th gen Core i5-7200U clocked a 2.5 GHz base and 3.1 GHz turbo, the new 8th gen equivalent Core i5-8250U clocks a 1.6 GHz base with a 3.4 GHz turbo. Despite the lower base clocks, there should not be a major performance hit in notebooks incorporating the new 8th generation chips for routine workloads (Office, web browsing, and very light gaming) given the turbo clock is still the same as the previous generation. However, how OEMs implement these chips and what sort of throttling measures they incorporate remains to be seen.
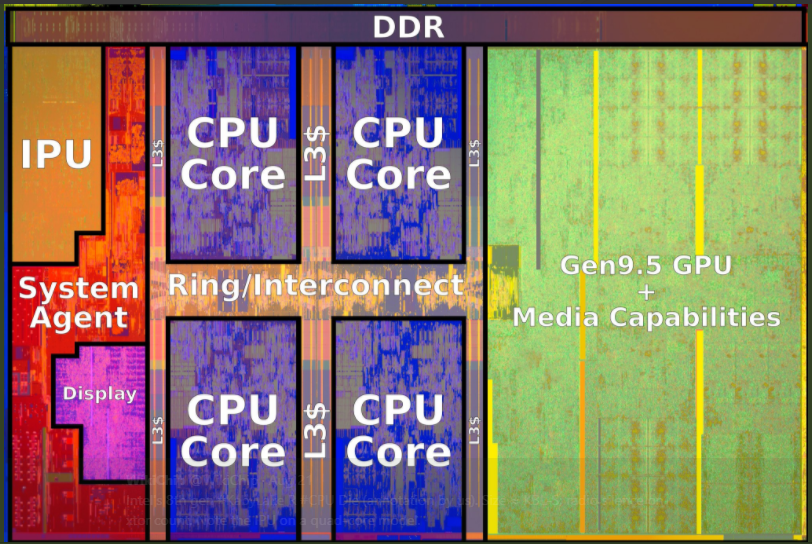
In terms of the integrated GPU, there is only a change in the way Intel addresses the name. Technically, it is still the same Intel HD Graphics 620 that is found in the 7th generation Kaby Lake CPUs but Intel has decided to change the branding to "UHD Graphics" to better convey the 4K/HEVC decoding that the iGPU is capable of. It is still the Gen9.2/GT2 engine as the previous generation but it now comes with native support for HDCP 2.2. Therefore, the GPU part is relatively unchanged, and for the most part, Intel has limited its tinkering to the CPU side.
Overall, the company claims that the new generation will have a 40% performance improvement over Kaby Lake. With some of the recent notebook launches at IFA 2017 featuring 8th generation Intel CPUs and getting our own sample from Acer, we were able to get an idea of how exactly the new chips perform.
Preliminary Benchmarks
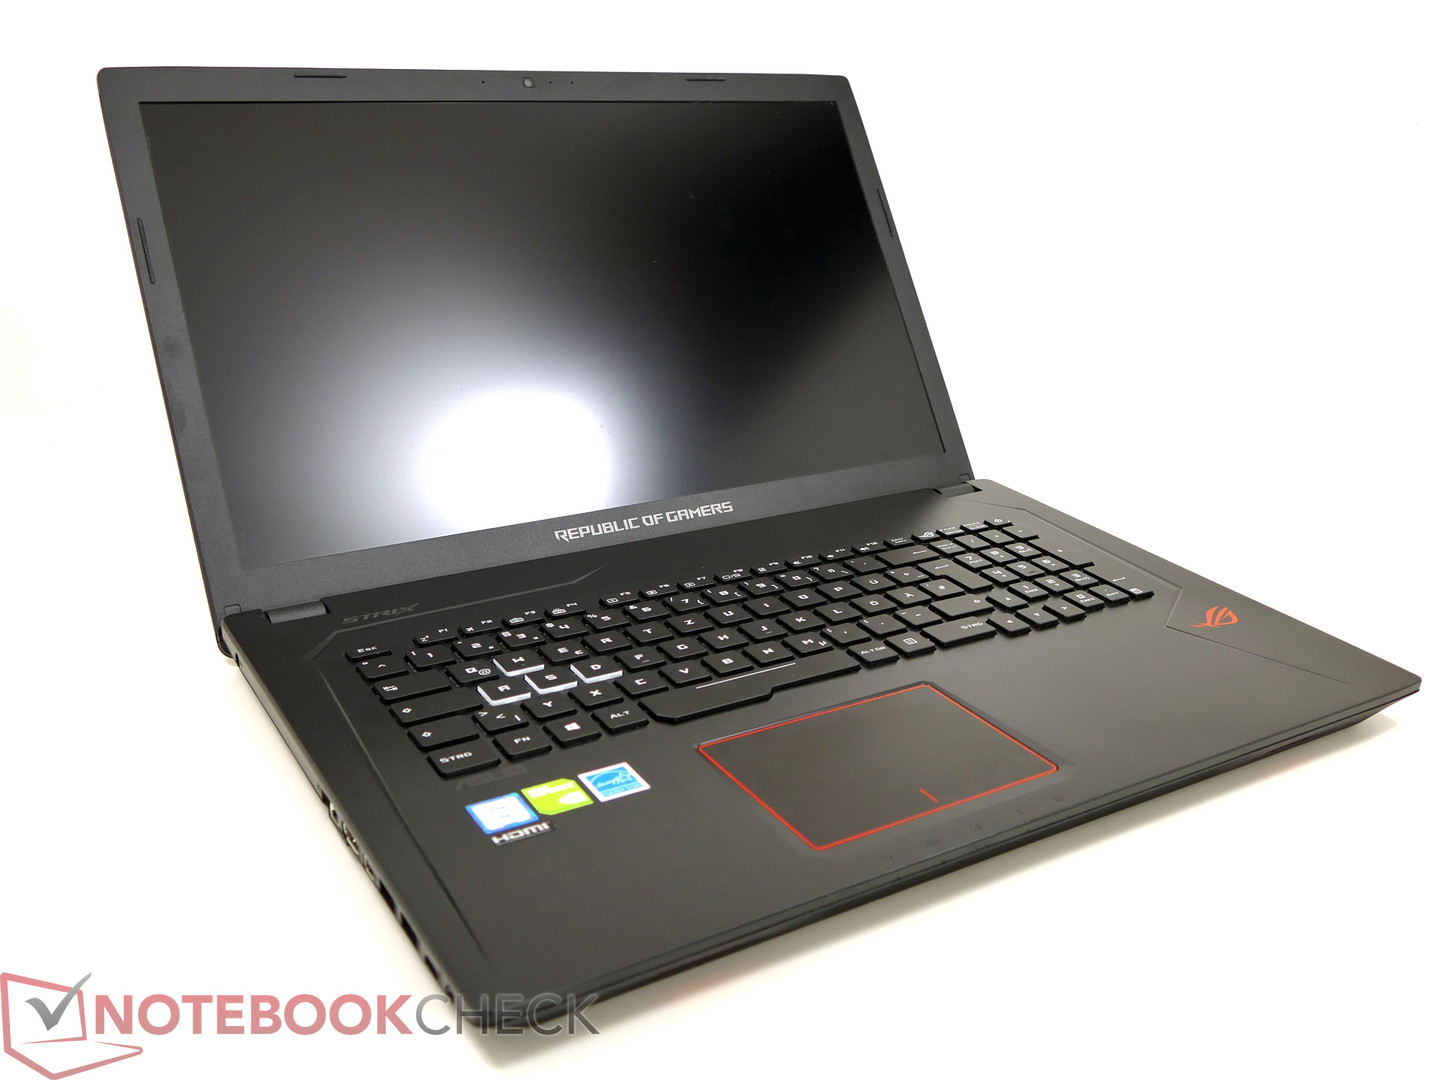
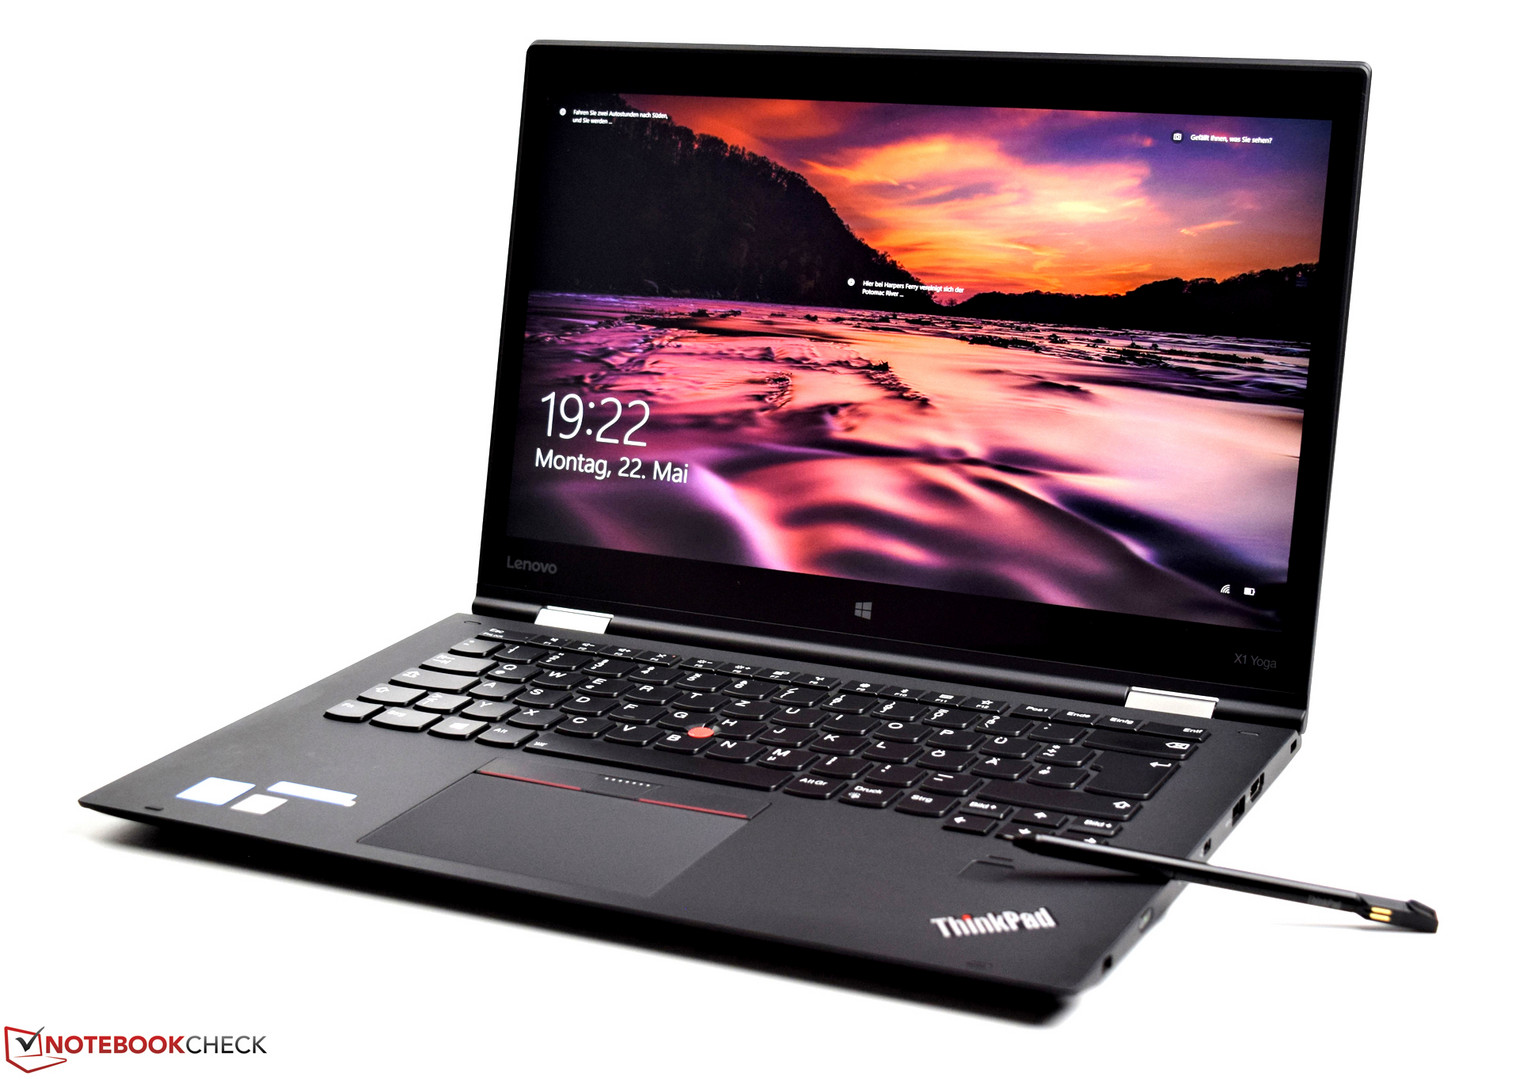
For evaluating the new Kaby Lake-R CPU, we used a pre-production sample of an Acer Spin 5 SP513 13-inch laptop powered by the Intel Core i5-8250U processor, integrated UHD 620, Micron 1100 SSD and 8 GB RAM. The laptop has been made official at this year's IFA event in Berlin and comes in 13-inch and 15-inch variants. The 15-inch variant comes with the option of an NVIDIA GeForce GTX 1050. Most ultrabooks and laptops that will soon sport the 8250U are likely to be reliant on the iGPU for all graphics work. Hence, we chose the 13-inch SP513 model, which does not come with dedicated graphics, for a more realistic evaluation. We compared the performance of the Core i5-8250U to two of its cousins: one is the i5-8250U's predecessor of the 7th generation, the Core i5-7200U, which powers the Lenovo ThinkPad X1 Yoga. The other CPU for comparison is a Core i7-7700HQ found in the Asus Strix GL753VD. While the Asus Strix also features the NVIDIA GeForce GTX 1050, it was disabled to allow for an even comparison between the capabilities of the CPUs along with their iGPUs.
As the Core i5-8250U incorporates a quad-core architecture, it will be interesting to see how it fares in comparison with the higher-end 7700HQ, which is a 45W CPU. As you will see below, the results can be quite surprising. We divided the benchmarks into CPU and GPU-based to put things in better perspective. We also evaluated the power consumption of the chip under various workloads.
CPU Benchmarks
We ran a multitude of CPU benchmarks to see how the new Core i5-8250U was performing and how it stacked up to the other aforementioned CPUs. Cinebench evaluates the CPU across single and multiple cores. As seen in the Cinebench scores below, the 8250U has at least a 10% improvement in the single core scores. This is a fair improvement, but it is the multi-core score where it gets interesting, as the 8250U posts at least a 41% improvement over the 7200U in some benchmarks. The 8250U also seems to achieve some interesting standalone scores in Geekbench 4.1 suggesting a strong multi-core and GPU compute OpenCL performance. Similarly, PCMark 10 shows anywhere between 5% to 25% improvement over the 7200U depending on the test performed. The increase in core count shows its effects on the TrueCrypt, WinRAR, SuperPi Mod and wPrime benchmarks as well. The 8250U has managed to have a significant lead across the battery of CPU tests resulting in performance gains close to Intel's claims.
| Super Pi mod 1.5 XS 1M - 1M | |
| Apple MacBook Pro 13 2017 Touchbar i5 | |
| Acer Spin 5 SP513-52N-566U | |
| Apple MacBook Pro 15 2017 (2.8 GHz, 555) | |
| Apple MacBook Pro 13 2017 | |
| WinRAR - Result | |
| Acer Spin 5 SP513-52N-566U | |
| Apple MacBook Pro 13 2017 | |
| Apple MacBook Pro 13 2017 Touchbar i5 | |
| Lenovo ThinkPad X1 Yoga 2017 20JD0015US | |
| Super Pi mod 1.5 XS 2M - 2M | |
| Apple MacBook Pro 13 2017 Touchbar i5 | |
| Acer Spin 5 SP513-52N-566U | |
| Apple MacBook Pro 13 2017 | |
| Apple MacBook Pro 15 2017 (2.8 GHz, 555) | |
| Apple MacBook Pro 15 2017 (2.8 GHz, 555) | |
| Super Pi Mod 1.5 XS 32M - 32M | |
| Apple MacBook Pro 13 2017 Touchbar i5 | |
| Acer Spin 5 SP513-52N-566U | |
| Apple MacBook Pro 15 2017 (2.8 GHz, 555) | |
| Apple MacBook Pro 13 2017 | |
* ... smaller is better
Since Intel has kept the turbo clock unchanged, we thought it would be interesting to see how well the 8250U sustains the turbo boost. We ran Cinebench R15 for 30 runs and evaluated the multi-core scores in each run. We found that the first run had the highest turbo boost (around 15s according to the power consumption) and therefore, the maximum score. The subsequent runs had a minimum 7% decrease in Cinebench R15 scores, with the lowest score being 13.5% less than the first run. The scores reached a plateau close to about 30 runs. These results indicate that while the CPU can give good turbo boosts for shorter workloads, it might not be able to sustain the peak boost and seems to operate within a 15% margin to the maximum clock speed. This is the i5-8250U and not the i7 variant with higher clockspeeds, however. If Kaby Lake-R is similar to Kaby Lake (and it is) then we can assume that the i7 will likely exhibit even more throttling than the i5 in sustained workloads. We will report on this once we have a Kaby Lake-R i7 to test.
The single thread performance however in the Cinebench R15 loop showed consistent results and varied only 1 point. This is similar to the results we observed for the i5-7200U in the Lenovo ThinkPad X1 Yoga. Some of our earlier testing with the 7700HQ revealed that the CPU doesn't show much variance in the multi-thread Cinebench R15 scores, implying that it is able to sustain its turbo boost during the looping tests. This is unlike what we see with the 8250U and could probably be due to the 15W TDP limit of the new chip. It will be interesting to see how the 28W chips fare in comparison to the 15W ones in this regard. Keep in mind, however, that these results also depend on the system design and cooling of the CPU.
Power Consumption
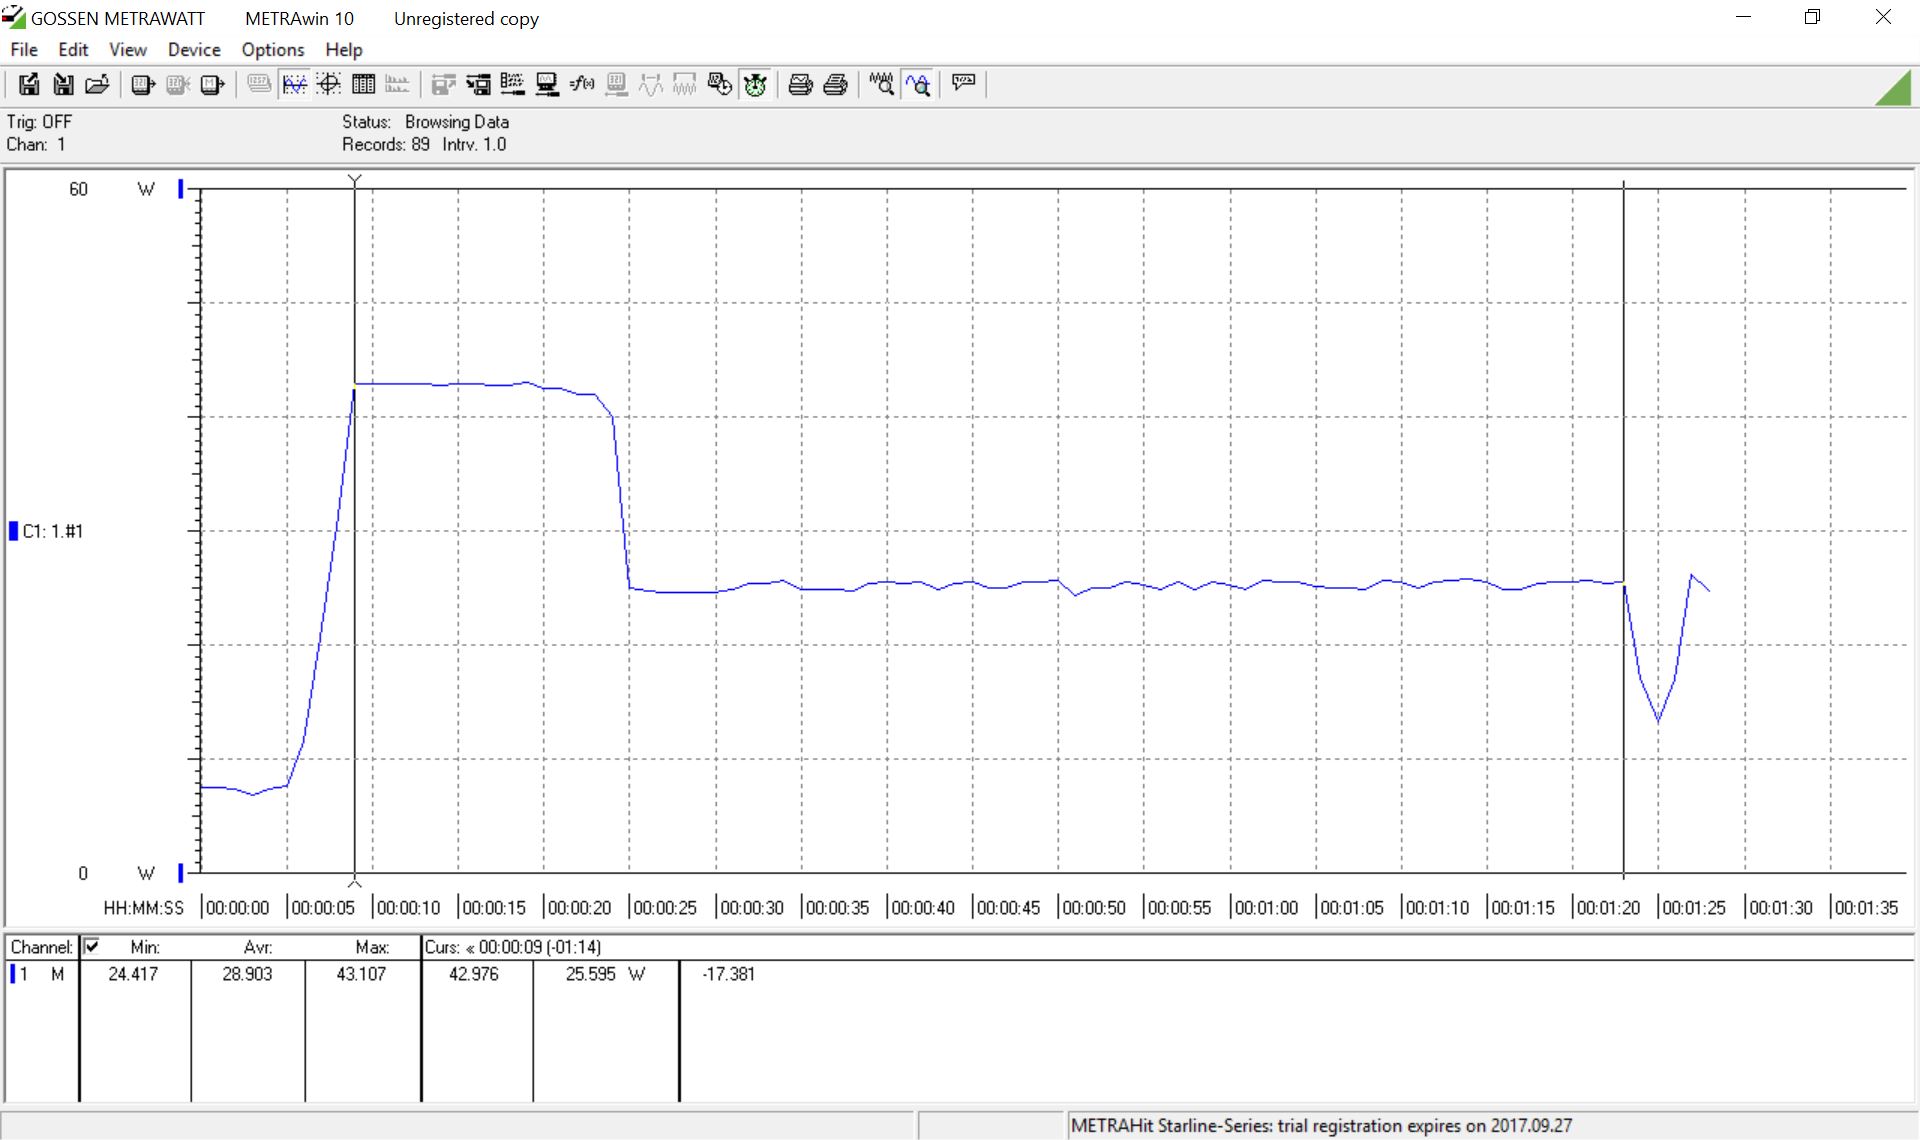
Despite the fact that the new Kaby Lake-R chips are still based on the 14nm+ Kaby-Lake architecture, improvements in the process technology (but still 14nm+) and lower base clocks have ensured that the power consumption of notebooks featuring these chips are quite low. We compared the power consumption of the Acer Spin 5 SP513 with a few notebooks featuring Kaby Lake chips while running CPU intensive benchmarks such as Prime95 and Cinebench R15 (both with external monitors). The difference in power consumption with respect to the 7700HQ in the Apple MacBook Pro 15 was staggering, with the MacBook Pro consuming close to 139% more power at 72.6W and 61.7W while running Prime95 and Cinebench R15 Multi respectively. The U-series Kaby Lake processors were seen to consume about 40% more power than the 8250U. Even in a GPU-intensive benchmark like The Witcher 3, the maximum power consumption was found to be 30W in ultra settings. Of course, the GPU used here is the iGPU, which is not expected to contribute a whole lot to the power draws vis-a-vis a dedicated GPU configuration. Idle power draws were more or less consistent across all the U-series processors thereby making it clear that Intel had optimized the power draws under CPU load in a bid to increase battery life.
| Acer Spin 5 SP513-52N-566U i5-8250U, UHD Graphics 620, Micron 1100 MTFDDAV256TBN, , 1920x1080, 13.30 | Apple MacBook Pro 15 2017 (2.8 GHz, 555) i7-7700HQ, Radeon Pro 555, Apple SSD SM0256L, IPS, 2880x1800, 15.40 | Apple MacBook Pro 13 2017 Touchbar i5 i5-7267U, Iris Plus Graphics 650, Apple SSD AP0256, IPS, 2560x1600, 13.30 | Lenovo ThinkPad P51s 20HB000SGE i7-7600U, Quadro M520, Samsung SSD PM961 1TB M.2 PCIe 3.0 x4 NVMe (MZVLW1T0), IPS, 3840x2160, 15.60 | Microsoft Surface Pro (2017) i7 i7-7660U, Iris Plus Graphics 640, Samsung PM971 KUS040202M, IPS, 2736x1824, 12.30 | |
|---|---|---|---|---|---|
| Power Consumption | -108% | -58% | -45% | -30% | |
| Witcher 3 ultra Efficiency (external Monitor) | 0.2668 | ||||
| Witcher 3 ultra Efficiency | 0.2401 | ||||
| Cinebench R15 Multi Efficiency (external Monitor) | 18.8 | 11.9 -37% | 13 -31% | 10.7 -43% | 10.5 -44% |
| Witcher 3 ultra * | 30 | 57.9 -93% | 38.1 -27% | ||
| Prime95 V2810 Stress (external Monitor) * | 27.5 | 72.6 ? -164% | 42.8 ? -56% | 42.3 -54% | 39.2 ? -43% |
| Cinebench R15 Multi (external Monitor) * | 28.9 ? | 61.7 ? -113% | 29.5 ? -2% | 35.4 -22% | 39.2 ? -36% |
| 1280x720 FurMark 1.19 GPU Stress Test (external Monitor) * | 26 ? | 61 ? -135% | 51.4 ? -98% | 34.6 ? -33% | 30.8 ? -18% |
| 1920x1080 The Witcher 3 ultra (external Monitor) * | 25.1 ? | 52.1 ? -108% | 51.4 ? -105% | 43.4 ? -73% | 28 ? -12% |
| Power Consumption | -86% | -33% | -67% | -20% | |
| Idle Minimum * | 3.6 | 3.4 6% | 2.8 22% | 5.8 -61% | 4.2 -17% |
| Idle Average * | 9.5 | 13.9 -46% | 10.9 -15% | 10.4 -9% | 10.1 -6% |
| Idle Maximum * | 9.5 | 17.6 -85% | 11.4 -20% | 13.5 -42% | 14 -47% |
| Load Average * | 32.9 | 71.1 -116% | 55.4 -68% | 62.4 -90% | 37.4 -14% |
| Witcher 3 ultra * | 30 | 57.9 -93% | 38.1 -27% | ||
| Load Maximum * | 31.4 | 88.5 -182% | 57.5 -83% | 73.1 -133% | 34 -8% |
| Total Average (Program / Settings) | -97% /
-97% | -46% /
-46% | -56% /
-56% | -25% /
-25% |
* ... smaller is better
GPU Benchmarks
The 8250U shows considerable improvements over the 7200U and comes close to the Intel HD Graphics 630 in the 7700HQ in many tests. As noted earlier, the UHD Graphics 620 in the 8250U and the HD Graphics 620 in the 7200U are one and the same, including having the same 24 execution units and same clocks. Hence, the combined 3DMark scores gave a significant lead to the 8250U due to its four physical cores while the GPU specific 3DMark test results were more or less similar to the 7200U.
When it comes to games, the Asus Strix had an expected lead over the Acer 8250U sample. This could be due to the slightly higher clocks of the HD Graphics 630 and the higher-TDP 7700HQ quad-core CPU. Still, it is commendable that the 8250U manages to hold its own and comes well within a 20% margin of the 45W 7700HQ. However, the GPU performance might not sustain well for continued gaming as we will see in the next section.
| 3DMark | |
| 1920x1080 Fire Strike Combined | |
| Acer Spin 5 SP513-52N-566U | |
| Asus Strix GL753VD-GC045T | |
| 1920x1080 Fire Strike Physics | |
| Asus Strix GL753VD-GC045T | |
| Acer Spin 5 SP513-52N-566U | |
| Lenovo ThinkPad X1 Yoga 2017 20JD0015US | |
| 1920x1080 Fire Strike Graphics | |
| Acer Spin 5 SP513-52N-566U | |
| Lenovo ThinkPad X1 Yoga 2017 20JD0015US | |
| Asus Strix GL753VD-GC045T | |
| 1920x1080 Fire Strike Score | |
| Acer Spin 5 SP513-52N-566U | |
| Lenovo ThinkPad X1 Yoga 2017 20JD0015US | |
| Asus Strix GL753VD-GC045T | |
| Sky Diver Stress Test | |
| Acer Spin 5 SP513-52N-566U | |
| 1280x720 Cloud Gate Standard Physics | |
| Asus Strix GL753VD-GC045T | |
| Acer Spin 5 SP513-52N-566U | |
| Lenovo ThinkPad X1 Yoga 2017 20JD0015US | |
| 1280x720 Cloud Gate Standard Graphics | |
| Asus Strix GL753VD-GC045T | |
| Acer Spin 5 SP513-52N-566U | |
| Lenovo ThinkPad X1 Yoga 2017 20JD0015US | |
| 1280x720 Cloud Gate Standard Score | |
| Asus Strix GL753VD-GC045T | |
| Acer Spin 5 SP513-52N-566U | |
| Lenovo ThinkPad X1 Yoga 2017 20JD0015US | |
| 1280x720 offscreen Ice Storm Unlimited Physics | |
| Acer Spin 5 SP513-52N-566U | |
| 1280x720 offscreen Ice Storm Unlimited Graphics Score | |
| Acer Spin 5 SP513-52N-566U | |
| 1280x720 offscreen Ice Storm Unlimited Score | |
| Acer Spin 5 SP513-52N-566U | |
| Dota 2 Reborn | |
| 1920x1080 high (2/3) | |
| Asus Strix GL753VD-GC045T | |
| Acer Spin 5 SP513-52N-566U | |
| 1366x768 med (1/3) | |
| Asus Strix GL753VD-GC045T | |
| Acer Spin 5 SP513-52N-566U | |
Light Gaming and Power Limits
As described earlier in the CPU benchmarks, it was observed that in CPU-related tasks, the turbo frequency was unexpectedly high even in CPU-based tests. Unfortunately this only happens in shorter tests, when the generous (for an ultrabook) 28W short power limit is in play. After the long power limit of 15W comes into play, the unit slows down considerably, usually in the low 2 GHz range for CPU-based tests. This is further hindered by using the iGPU, such as when engaging in light gaming: playing a simple game of Hearthstone (1600 x 900, windowed mode) led the CPU to sit at its base clock of 1.6 GHz, using most of all 8 threads just to play Hearthstone at 60 frames per second. This shows that the 15W limitation is simply not enough for a full quad-core with hyperthreading CPU and its GPU. This means that even light games that one may wish to play and relax with on such a notebook may not provide a very nice experience.
There is also the chance that notebooks may reduce power limits further when operating on battery. If this is the case, then it might even be possible that the older, dual core notebooks might simply function better due to the extra speed they will have from needing less power. Our analysis is that this chip seems to be designed to provide an improvement in basic office/multitasking environments, but likely has reduced benefits for games or any other tasks which use both the iGPU and the CPU. NVIDIA cards, for example, force all DirectX 11 titles to split the scheduler load across up to 4 available cores. In essence, this can force a higher total CPU load if a game was otherwise heavily single-threaded. eGPU owners and units with NVIDIA's discrete GPUs installed may notice that, even though the iGPU is not being used much, it may still draw a lot of CPU power and cause more performance throttling than one would expect.
In order to achieve universally improved performance, Intel would either have to decouple the iGPU power draw from the CPU power limits or set a higher limit overall (closer to 25W). Of course, that will be a bit difficult for ultrabooks to cool for extended periods of time, but if that were done then Kaby Lake-R would be less of a sidegrade and be more of an objective upgrade from the last generation.
Analysis
The 8th generation Kaby Lake-R CPUs promise to bring more performance per watt at more or less similar prices to the older generation chips. We had the chance to run some preliminary benchmarks on Acer Spin 5 SP513 powered by the Core i5-8250U CPU. Intel's claims of a 40% performance increase could very well be real as evident from our benchmark comparisons. The 100% increase in core count shows itself in the CPU tests where we could clearly observe that the additional cores are paying off. This could be a blessing for ultrabooks, which have been traditionally limited to dual-core platforms. It is to be appreciated that Intel could manage to retain the TDP at 15W despite increase in core count. Although the trade off is a lower base clock, the impact of this should be invisible in most use cases, unless heavy work is done on the laptop for longer periods of time. Although the boost clock attains 3.4 GHz for this CPU, it is quite short lived as was evident with the Cinebench R15 multi-core results and our observations with the Hearthstone game. A commendable feat is that in some benchmarks, the 8250U does indeed have a close to 40% performance increase over the previous generation, while still consuming 40% less power compared to other U-series Kaby Lake CPUs.
The GPU benchmarks are promising as well and should be more than enough for routine productivity tasks like Office work or browsing with some little gaming thrown in. Games from yesteryear should work fine in low to medium settings and so should titles from the Windows Store (barring some of the more taxing ones such as Gears of War 4 or Forza). Modern games like Overwatch, World of Warships and even Battlefield 1 should achieve playable frame rates at low settings. The fact that the 8250U has scored some good points in Geekbench 4.1 should bring delight to users planning light computational loads in Photoshop or Premiere Pro. Notebooks with dedicated GPUs could benefit DirectCompute and OpenCL workloads even more but it might not bode well for increased game performance as dGPUs tend to distribute loads across all the four cores, which are now having lower base clocks and unsustainable turbo boosts. The target audience for these chips are not gamers, but it is good to know that casual gaming is covered.
With hardware support for VT-x and VT-d, native virtualization is also possible. OEMs will be given the opportunity to tune the clock frequencies as needed in order to achieve their own TDP and battery life goals. Therefore, the exact CPU performance and the purported gains are OEM dependent and needs to be individually evaluated for each notebook. Overall, the 8250U seems quite cut-out for its task in bringing enhanced computing within the reach of many users.
Conclusion
A 15W TDP might not afford much headroom for a quad-core CPU but Intel has gone the extra mile to ensure that the new Kaby Lake-R chips can deliver even with restricted thermal limits. With the TDP well within its limits and without much compromise in performance for the tasks it is meant to, the Kaby Lake-R might be just what the doctor ordered for upcoming ultrabooks and general performance notebooks.
Those already using existing 7th gen Kaby Lake 15W chips might not see a need to throw in the towel just yet. The 40% increase in performance might not translate into real tangible benefits depending on the workflow. But those on the lookout for a new ultrabook or notebook will definitely want to wait until the Kaby Lake-R chips become more mainstream. The performance-per-watt improvements alone are definitely worth a consideration, and products such as Apple's Macbook 13 lineup stand to improve greatly from a Kaby Lake-R upgrade (especially with Apple's 28W TDP limit).
Overall, it seems that Intel is making the right noises with the new generation. The fact that these chips are breaking ground even before AMD's Raven Ridge has started to make any appearance and that their performance sits right in between the previous 7th gen Kaby Lake U-series and the HQ-series could see them gaining considerable market share. Pair these with a capable dedicated GPU such as the MX150 or a GTX 1050 and you could be the proverbial road warrior you've always dreamt of being.
