 Deutsch
 English
 Español
 Français
 Italiano
 Nederlands
 Polski
 Português
 Русский
 Türkçe
 Svenska
 Chinese
 Magyar
Huawei Mate 20 X Smartphone Review

Huawei sets new standards for smartphones with the release of its Mate 20 series. The Mate 20 Pro impressed us with its powerful SoC, great cameras and excellent display. The Mate 20 also scored top marks despite having less memory, a cheaper display and inferior cameras, while the Mate 20 Lite is a highly competitive budget alternative to its more expensive siblings.
The Mate 20 X sits at the top of the Mate 20 series line-up in size, but is technically inferior to the Mate 20 Pro. The Mate 20 X has a 7.2-inch AMOLED display and the Leica triple rear-facing camera array that we first saw with the Mate 20 Pro. The HiSilicon Kirin 980 SoC that integrates an ARM Mali-G76 MP10 GPU makes another appearance too and is complemented by 6 GB of RAM. There is also 128 GB of UFS 2.1 flash storage.
There are few phablets that are the size of the Mate 20 X, which somewhat limits our choice of comparison devices. We have chosen to compare our test device against the Apple iPhone XS Max, the Google Pixel 3 XL, the Samsung Galaxy Note 9 and the Xiaomi Mi Max 3. We will also be pitting the Mate 20 X against its sibling, the Mate 20 Pro and even some small tablets such as the Amazon Fire 7 (2017). We appreciate that some of our comparison devices are considerably smaller than the Mate 20 X, but they represent the largest flagship devices that are currently on the market.
| Device | SoC | GPU | RAM | Storage | Screen size | Rear-facing cameras |
|---|---|---|---|---|---|---|
| Huawei Mate 20 X | HiSilicon Kirin 980 | ARM Mali-G76 MP10 | 6 GB | 128GB UFS 2.1 | 7.2-inches | 40 + 20 + 8 MP |
| Huawei Mate 20 Pro | HiSilicon Kirin 980 | ARM Mali-G76 MP10 | 6 GB | 128GB UFS 2.1 | 6.3-inch | 40 + 20 + 8 MP |
| Huawei Mate 20 | HiSilicon Kirin 980 | ARM Mali-G76 MP10 | 4 GB | 128GB UFS 2.1 | 6.53-inches | 12 + 16 + 8 MP |
| Huawei Mate 20 Lite | HiSilicon Kirin 710 | ARM Mali-G51 MP4 | 4 GB | 64GB eMMC | 6.3-inches | 20 + 2 MP |
Case
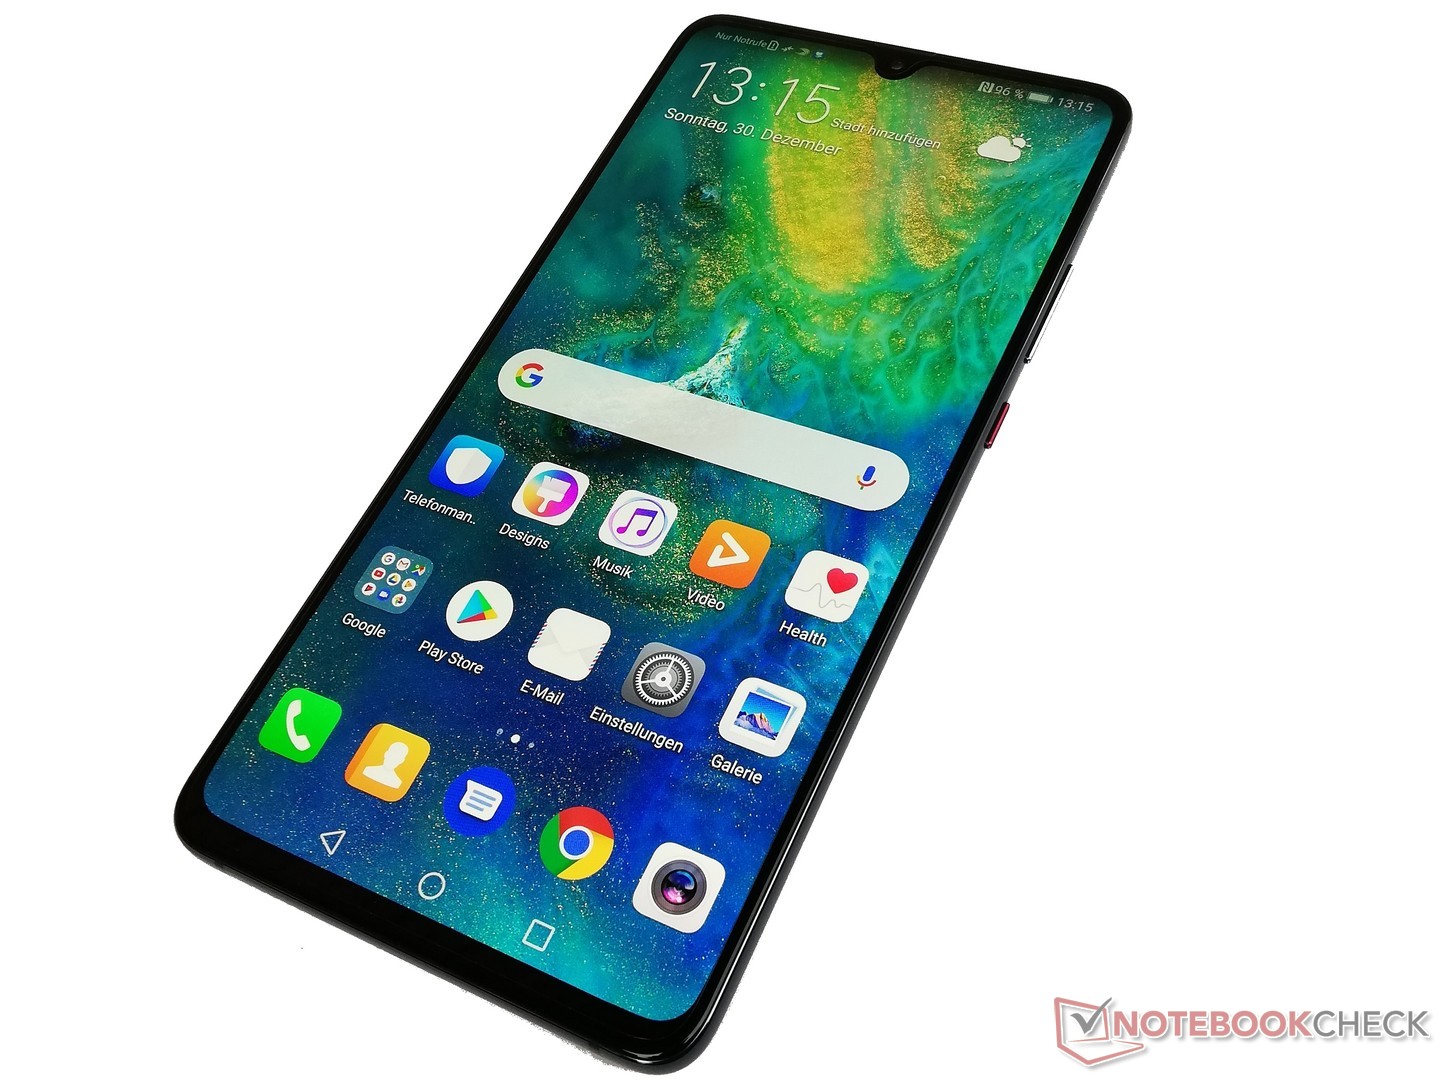
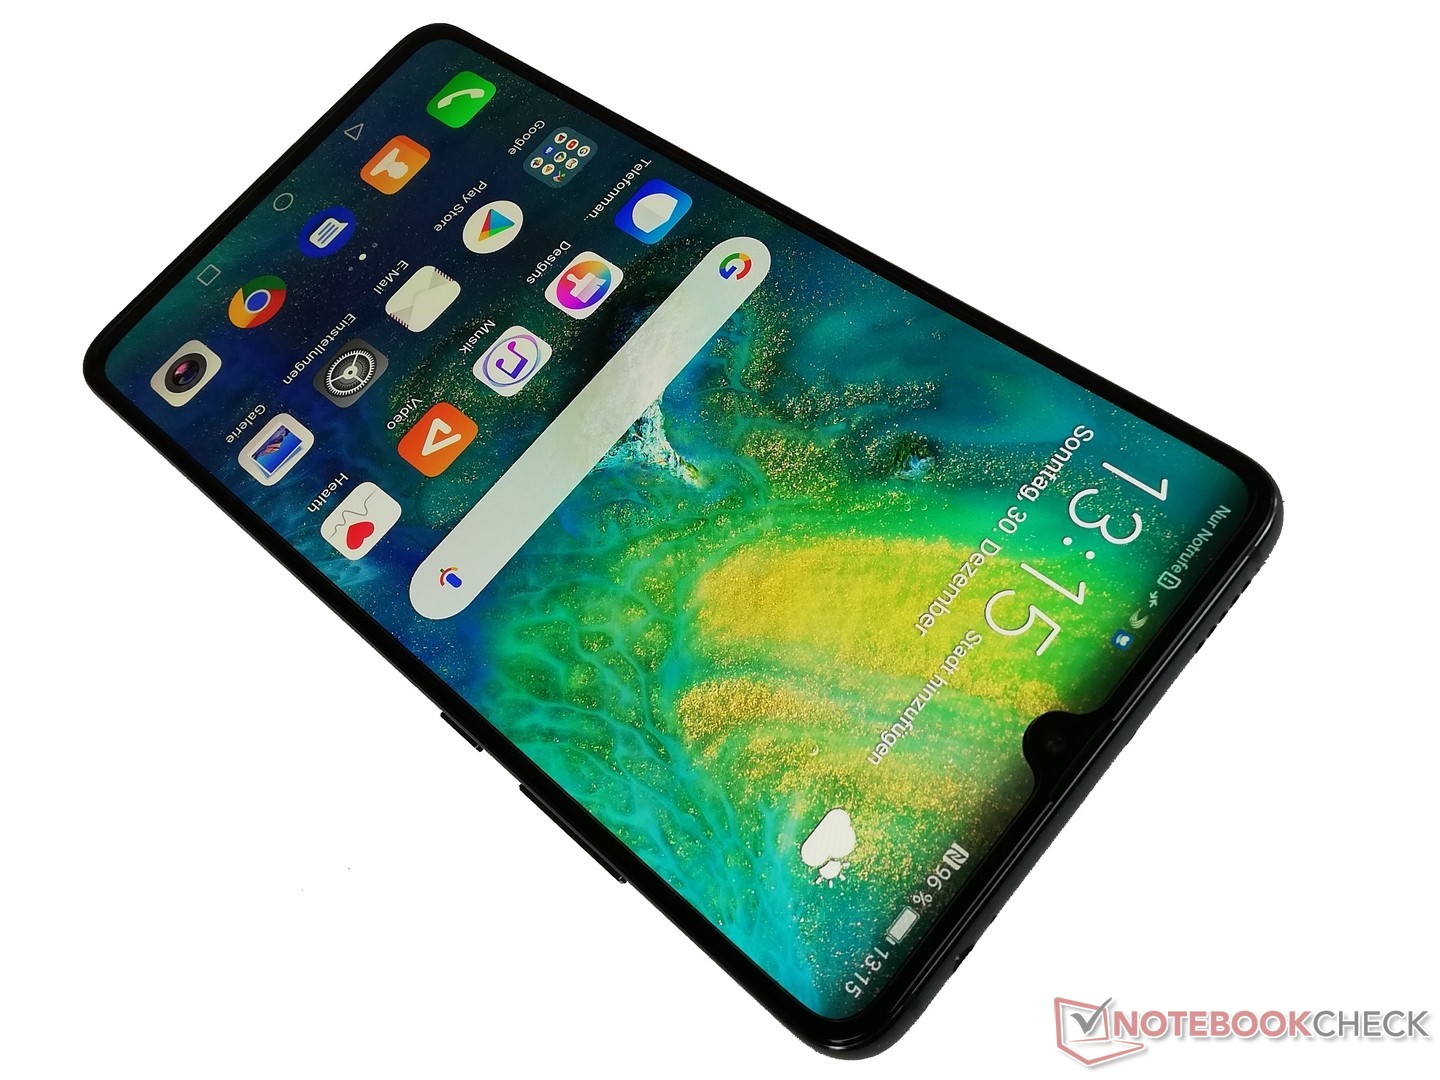
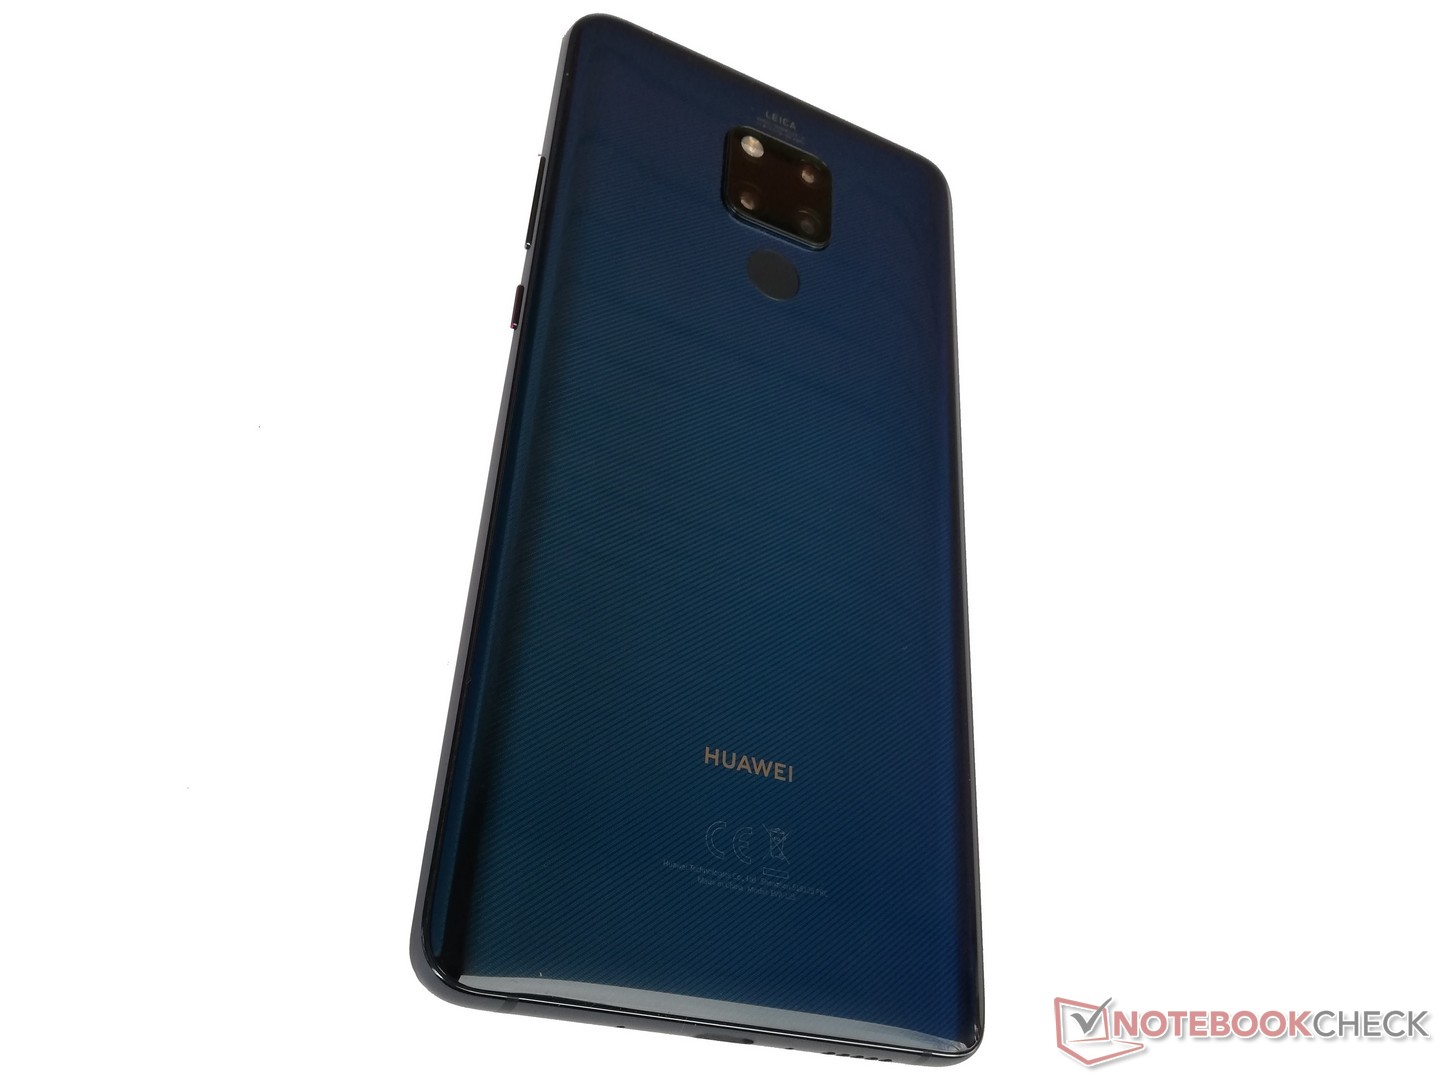
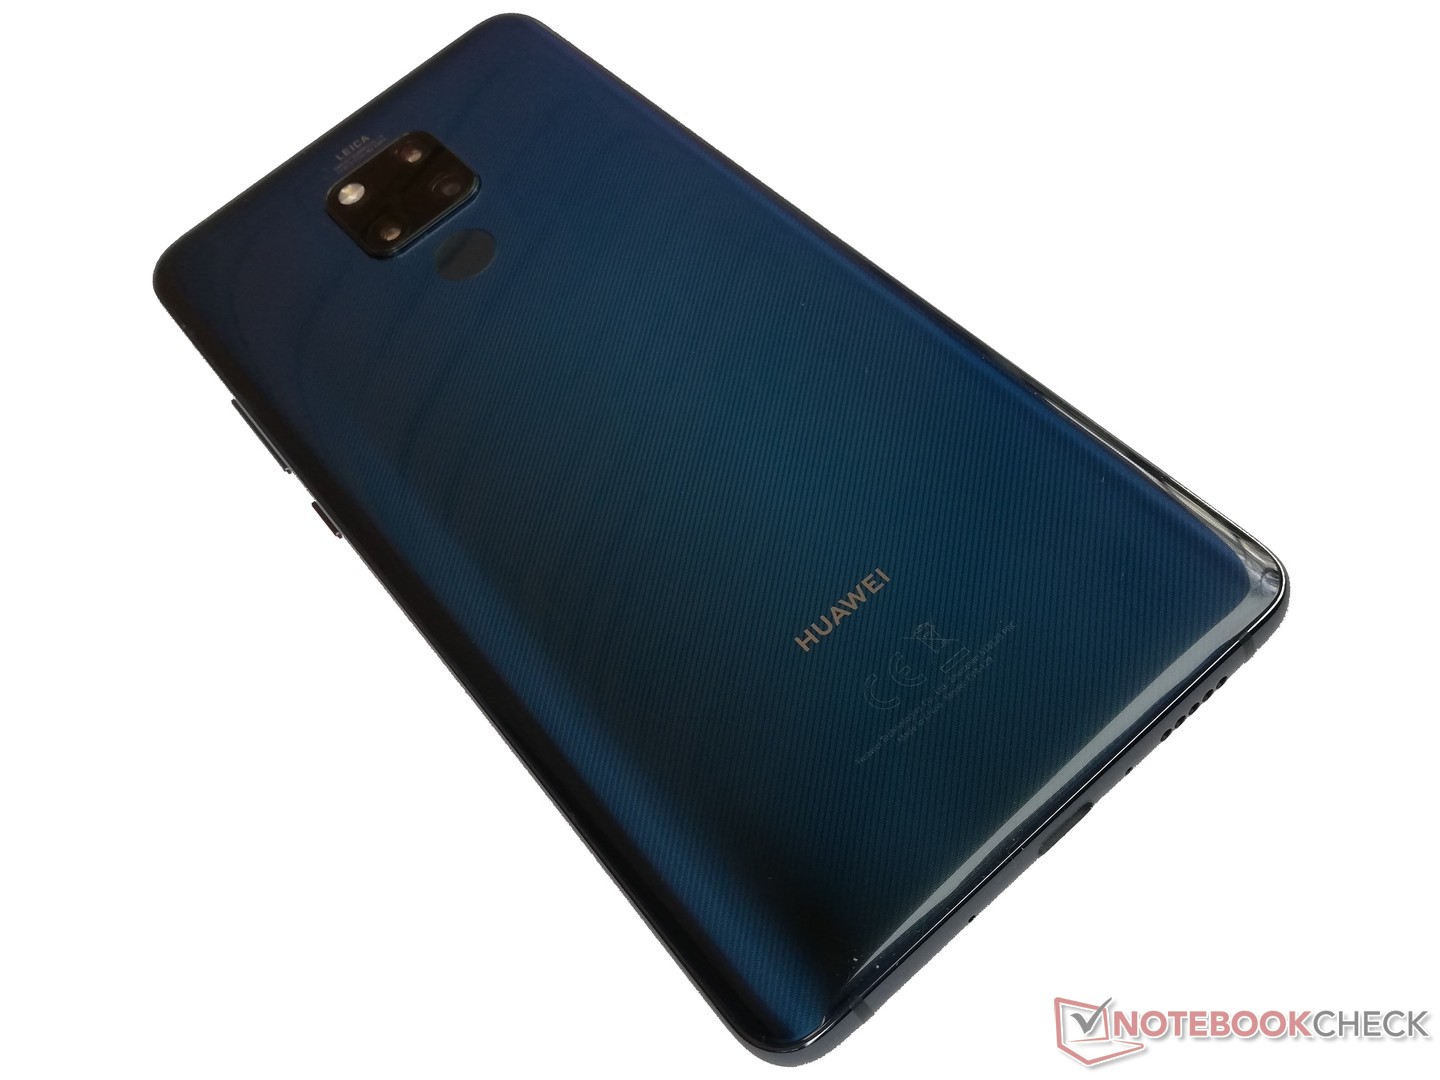
The Mate 20 X looks like the Mate 20. Hence, the case is rounded and has no curved display edges that the Mate 20 Pro does. The notch is also smaller and looks more like the waterdrop notch in the OnePlus 6T. Huawei has constructed the Mate 20 X from two pieces of glass that sandwich a metal frame. The company currently sells the device in blue and silver, which Huawei markets as Midnight Blue and Phantom Silver respectively.
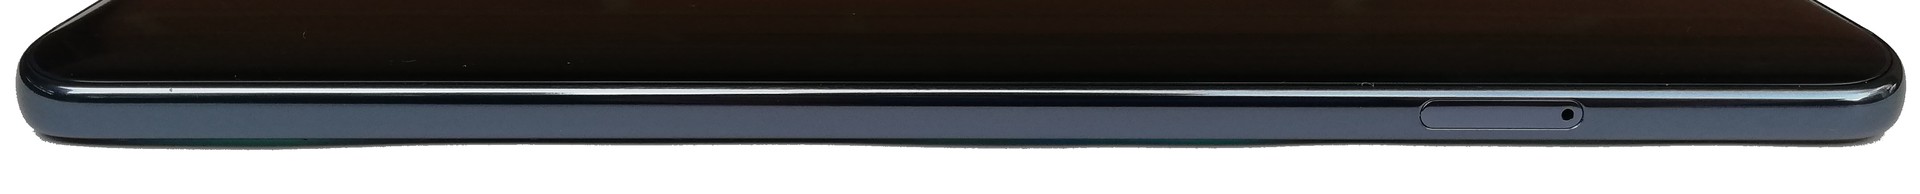
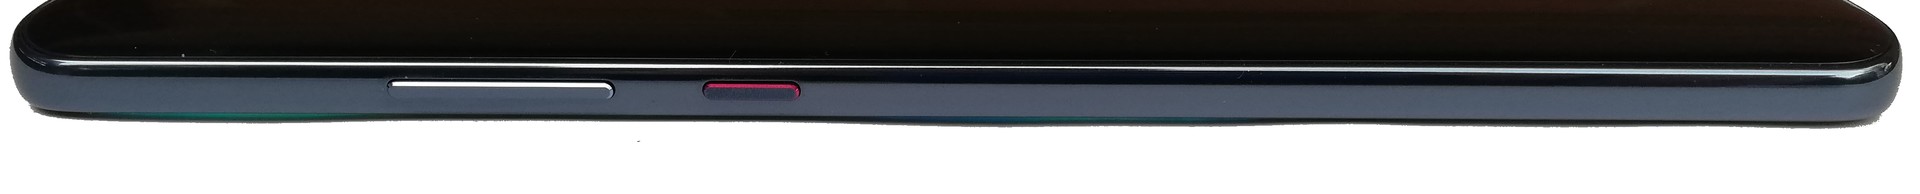
The only physical buttons are found on the right-hand side of the device. The power button and volume rocker sit firmly in their mounts and are flanked by a card slot on the opposite side, which sits flush with the frame. The Mate 20 X sits comfortably in our hands despite its large footprint, although the rear glass has a smooth finish that led to it occasionally slipping off slightly angled surfaces.
The Mate 20 X is much larger than most of our smartphone comparison devices. However, the device has a much larger display than the Note 9 or Pixel 3 XL and has a visibly higher screen-to-body ratio than the Xiaomi Mi Max 3. The Mate 20 X is also considerably more compact than the Amazon Fire 7 (2017) or the Google Nexus 7.


Connectivity
Huawei has equipped the Mate 20 X with its high-end Kirin 980 SoC and an ARM Mali-G76 MP10 GPU. These are complemented by 6 GB of RAM and 128 GB of UFS 2.1 flash storage, the latter of which can be expanded with up to 256 GB nano memory (NM) cards. The Mate 20 X is a dual-SIM device too, although it only has a hybrid SIM slot, which means that you can use two nano SIM cards or a single SIM card and an NM card. The device also supports VoLTE and Wi-Fi calling on either SIM card.
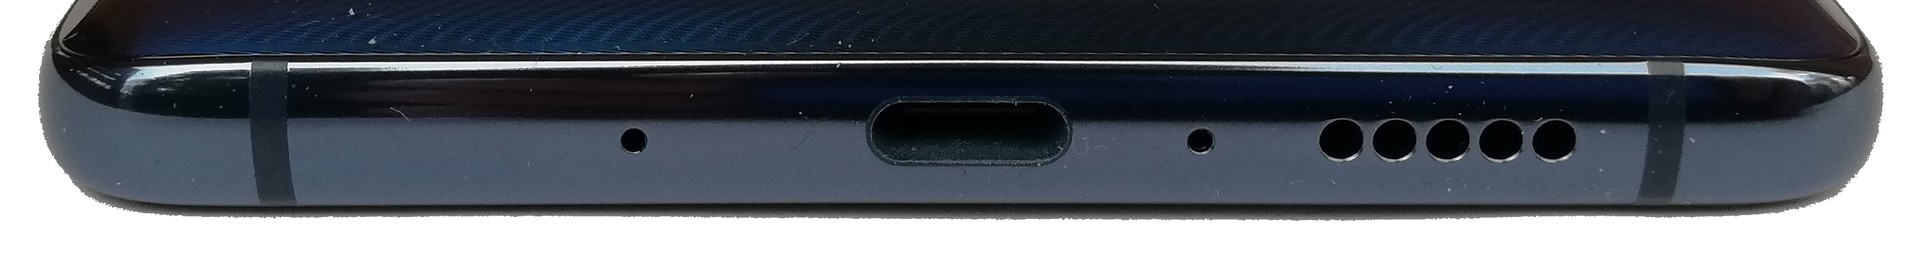
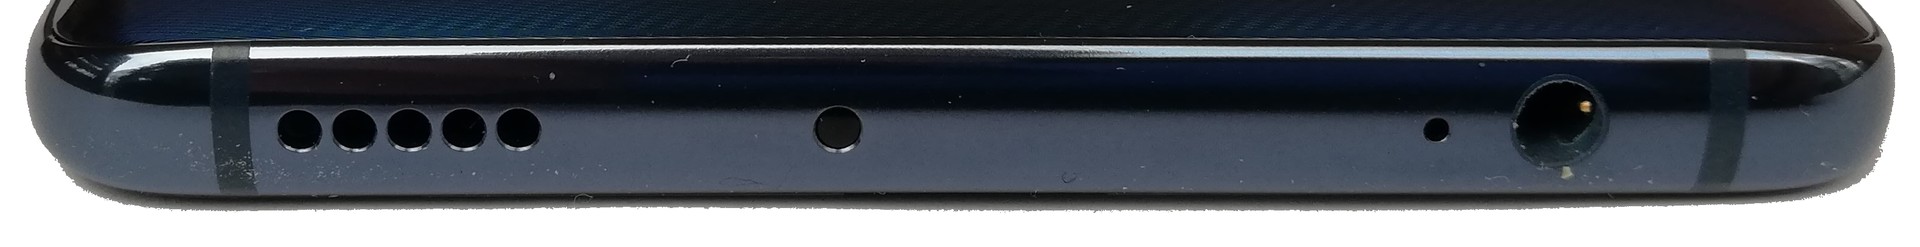
In addition to NFC, the Mate 20 X can also wirelessly connect to other devices via Bluetooth 5.0. Huawei has included AAC, aptX, aptX HD, BLE, HWA, LDAC and SBS codecs for support with almost any Bluetooth peripheral. There is also a USB 3.1 Gen1 Type-C port on the bottom of the device for wired connections. The port supports USB On The Go (OTG), but frustratingly Huawei only includes a USB 2.0 cable in the box. The Mate 20 X can connect to an external with an HDMI to USB Type-C adapter, which provides a desktop experience like Samsung DeX. The Mate 20 X has a headphone jack too, which is now a rarity for flagship smartphones.
Software
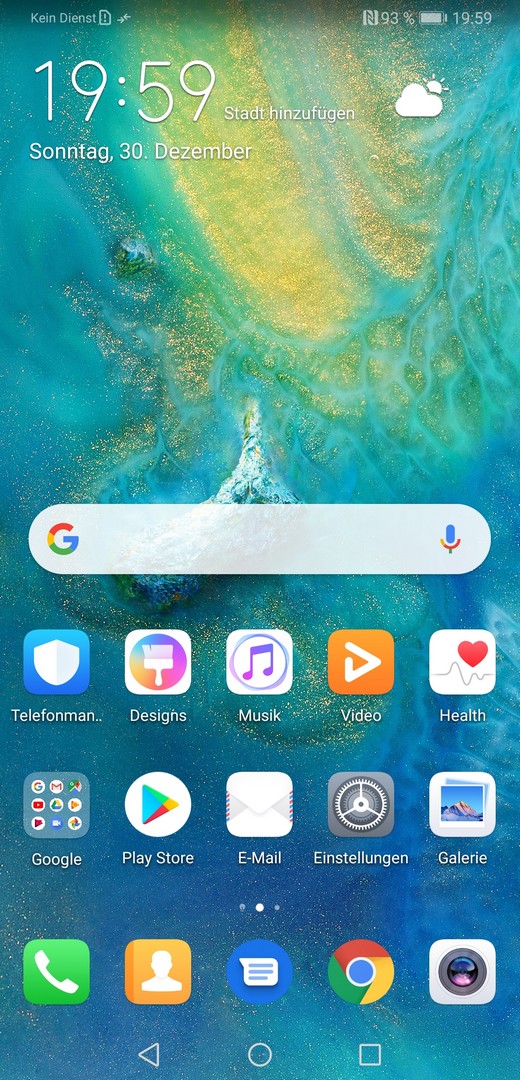
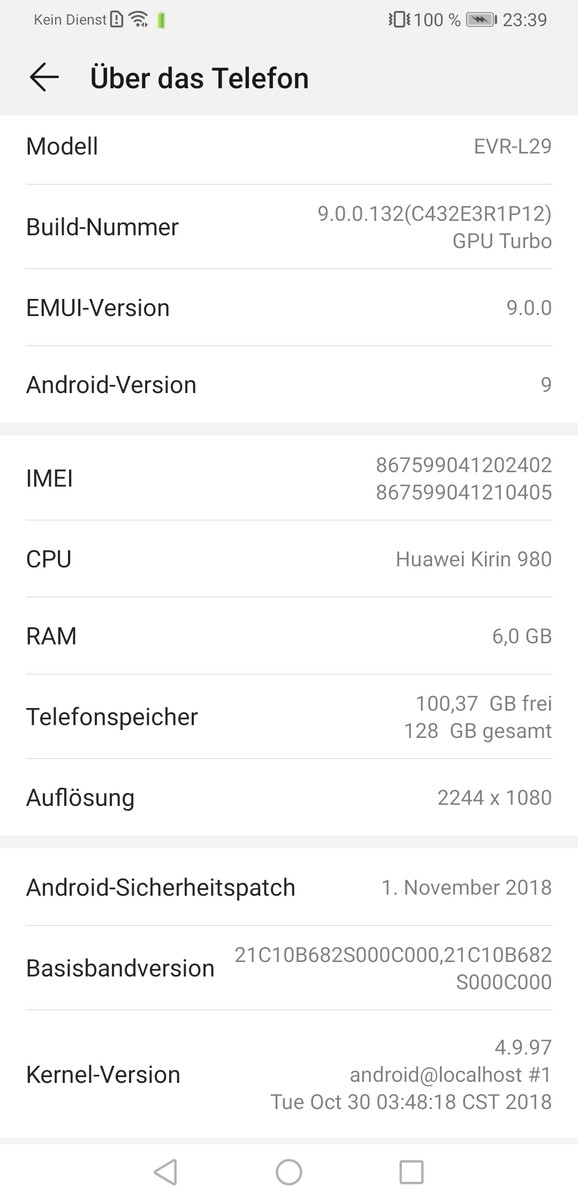
The Mate 20 X ships with Android 9.0 Pie, on top of which Huawei adds its EMUI 9.0 interface. Our test device arrived with Android security patches from November 1, 2018, which is relatively up to date. Huawei also released an update containing newer security patches during our tests, so we expect the company to continue keeping the Mate 20 X updated with the latest security and system updates.
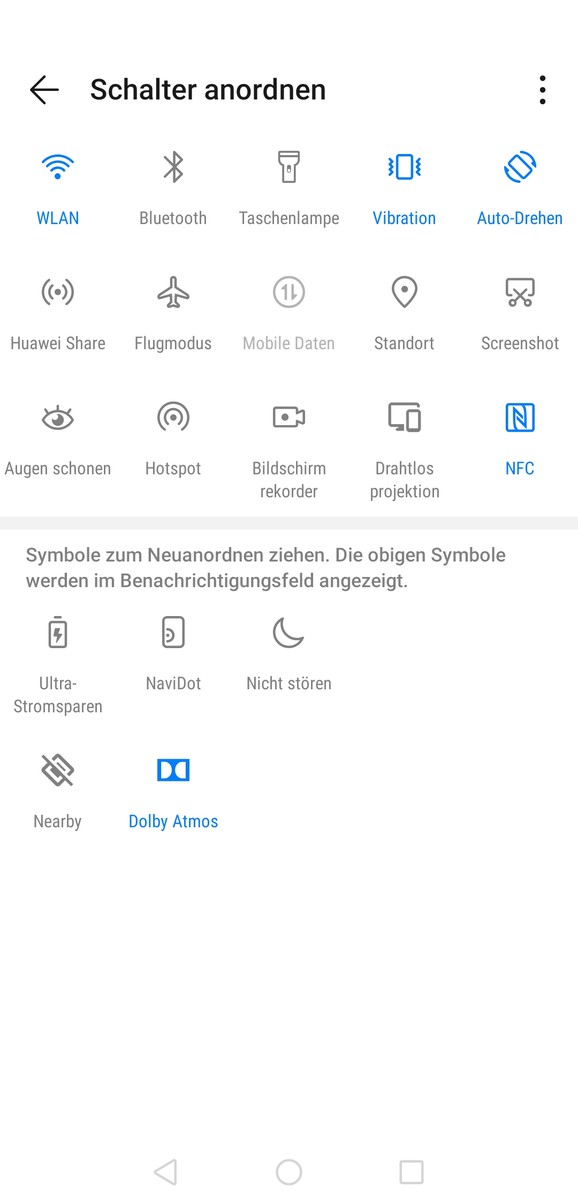
EMUI 9.0 functions like stock Android and should be easy to get used to for Android newcomers. Essentially, Huawei has restructured the settings menu and has pre-installed some of its apps instead of Google ones, so it should take little acclimatisation for Android veterans too.
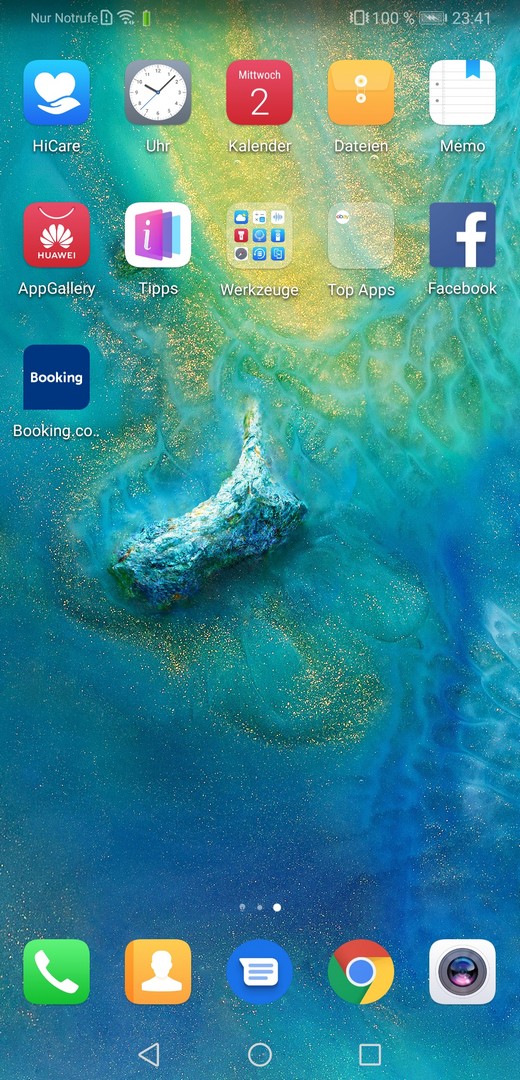
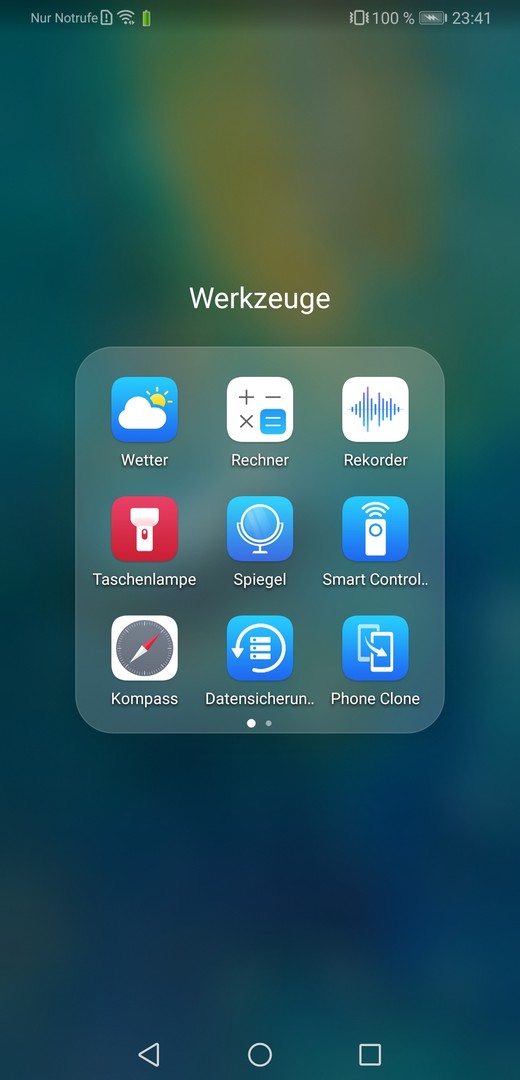
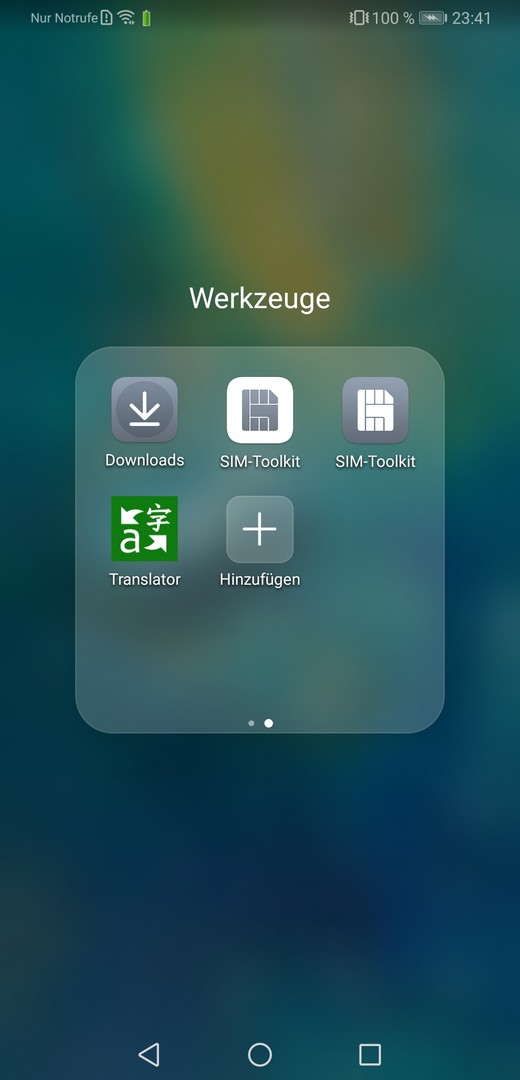
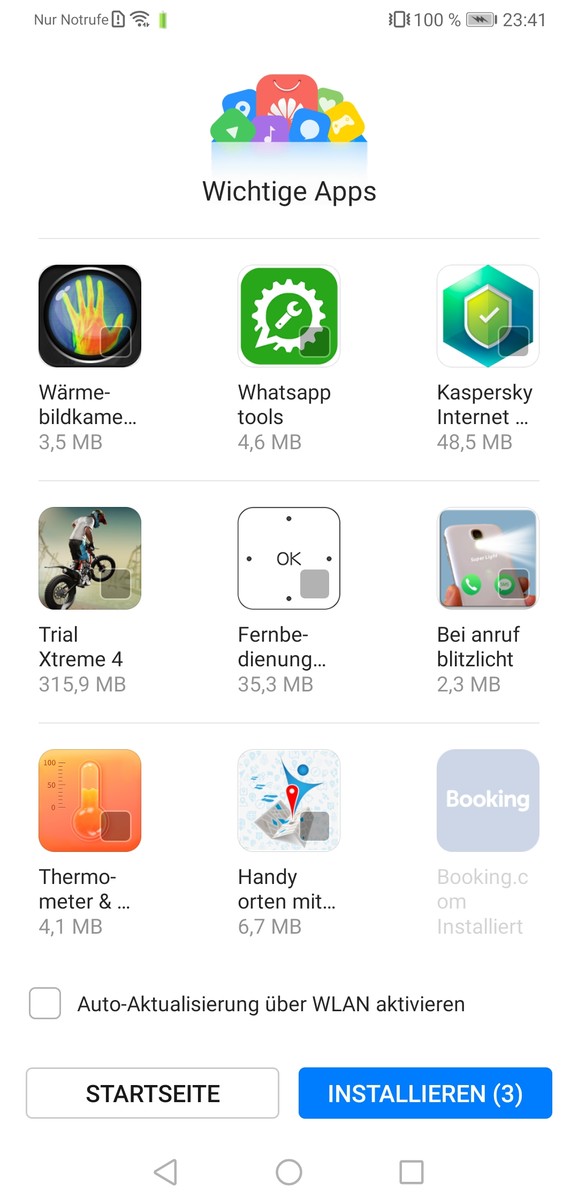
One of the pre-installed apps is the Huawei App Gallery, which supplements the Google Play Store. The inclusion of the former is designed to improve the user experience and includes not only games, but also various tools such as a radio app and a QR code scanner. Third-party apps such as Booking.com and Facebook are also pre-installed, but these can be uninstalled.
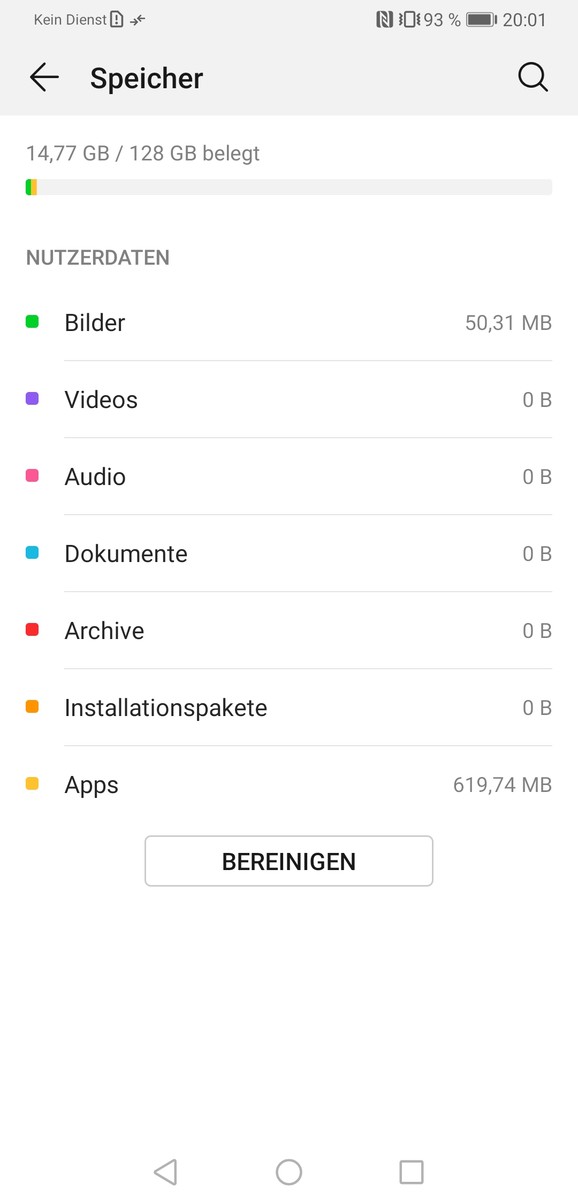
While the Mate 20 X supports NM cards, our test device can only format them as external storage, which limits apps and data to only being stored on the internal memory.
Communication & GPS
The Huawei Mate 20 X can be used worldwide on GSM, 3G and LTE networks. The latter utilises the Cat. 21 standard, which means that the device can achieve up to 1,400 Mbps download and 300 Mbps upload speeds. The Mate 20 X also supports all modern Wi-Fi standards up to IEEE 802.11 ac and can connect to either 2.4 or 5 GHz Wi-Fi networks.
Our test device performed well in our Wi-Fi tests and finished in the midfield of our comparison table. The Mate 20 X finished below the Mate 20 Pro in both iperf3 Client Wi-Fi tests.
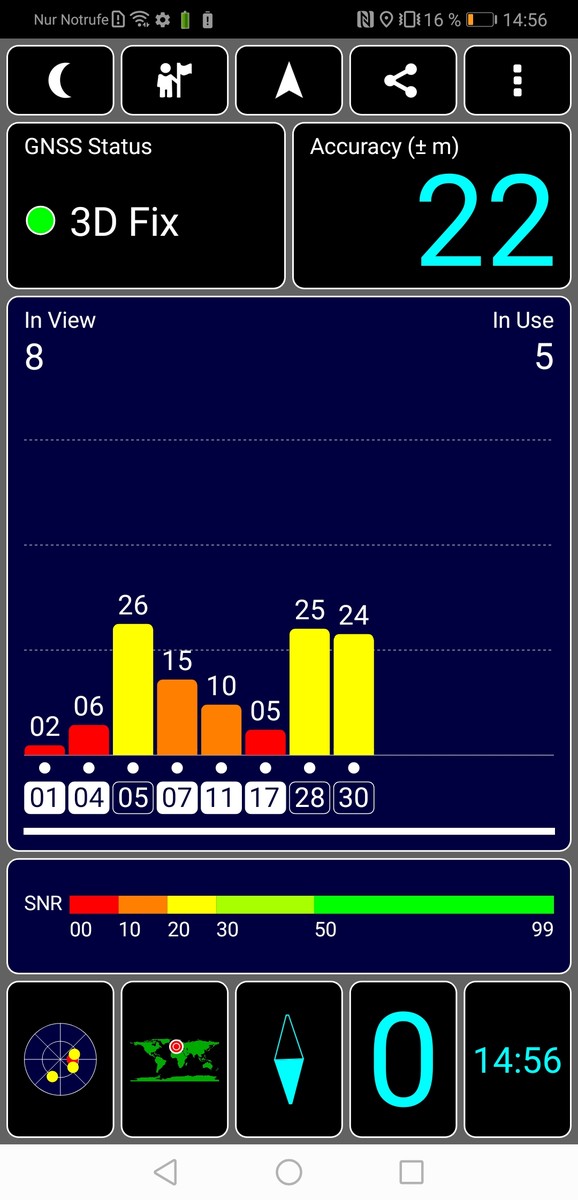
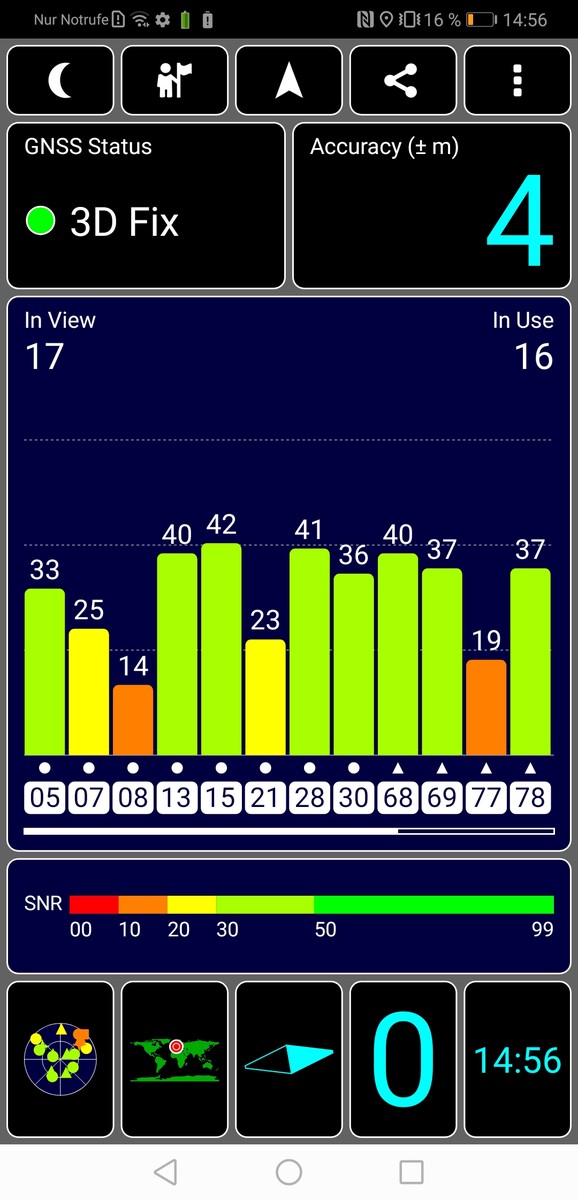
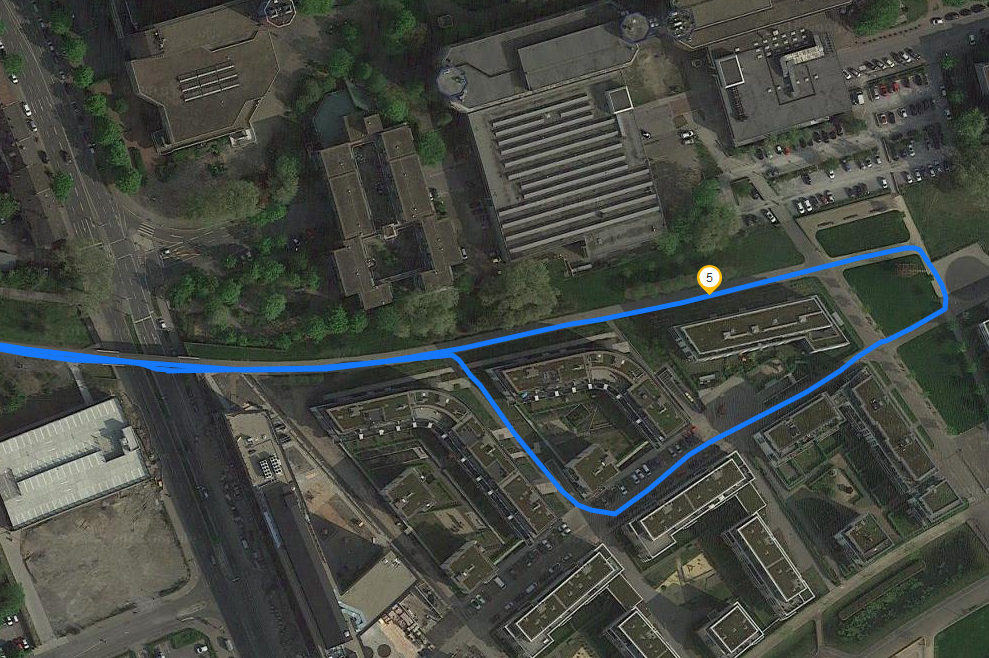
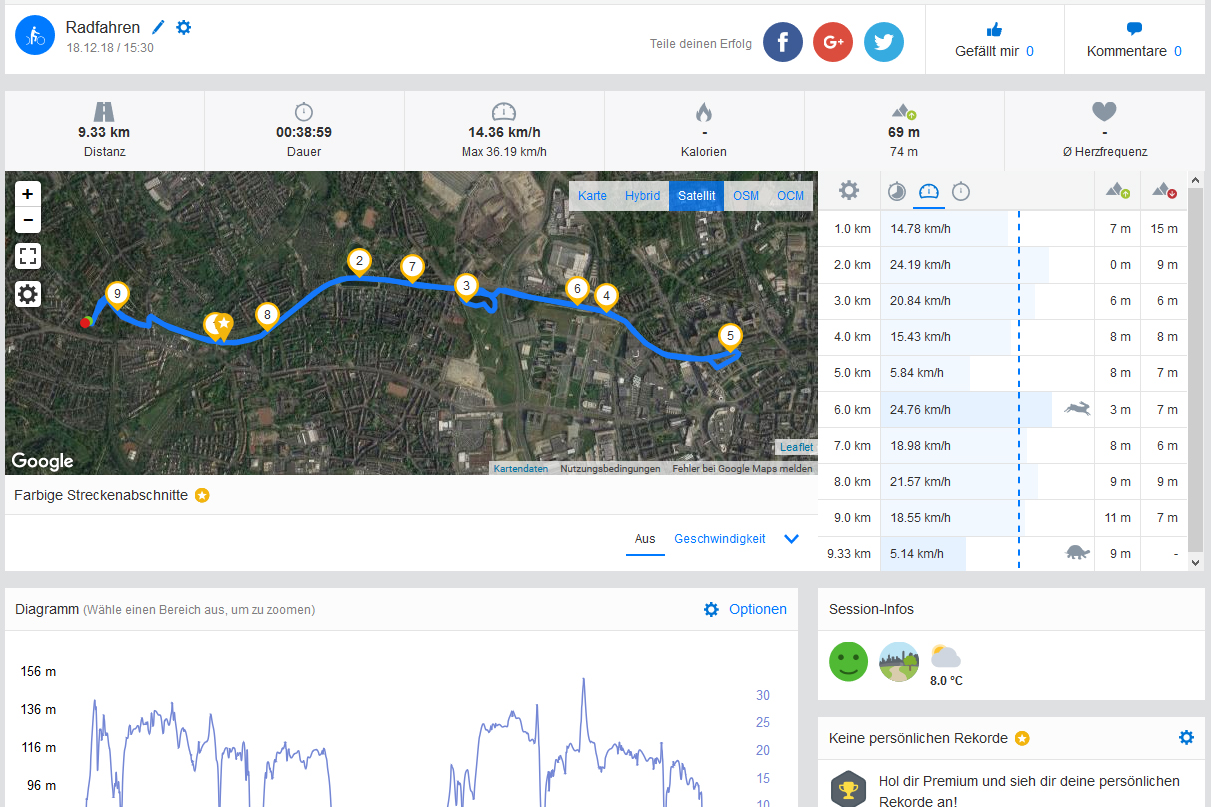
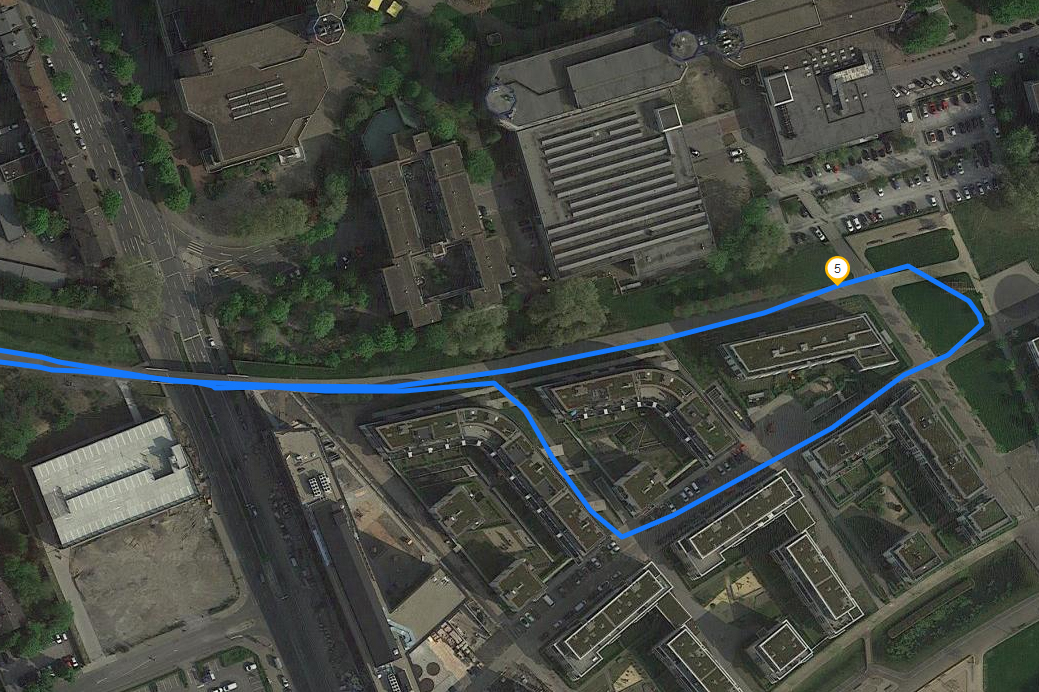
The Mate 20 X uses BeiDou, Galileo, GLONASS, GPS and QZSS for location services. Our test device achieves a satellite fix with up to four metres (~13 ft) accuracy, according to the GPS Test app. The location accuracy dropped to 22 metres (~72 ft) when we tested it indoors.
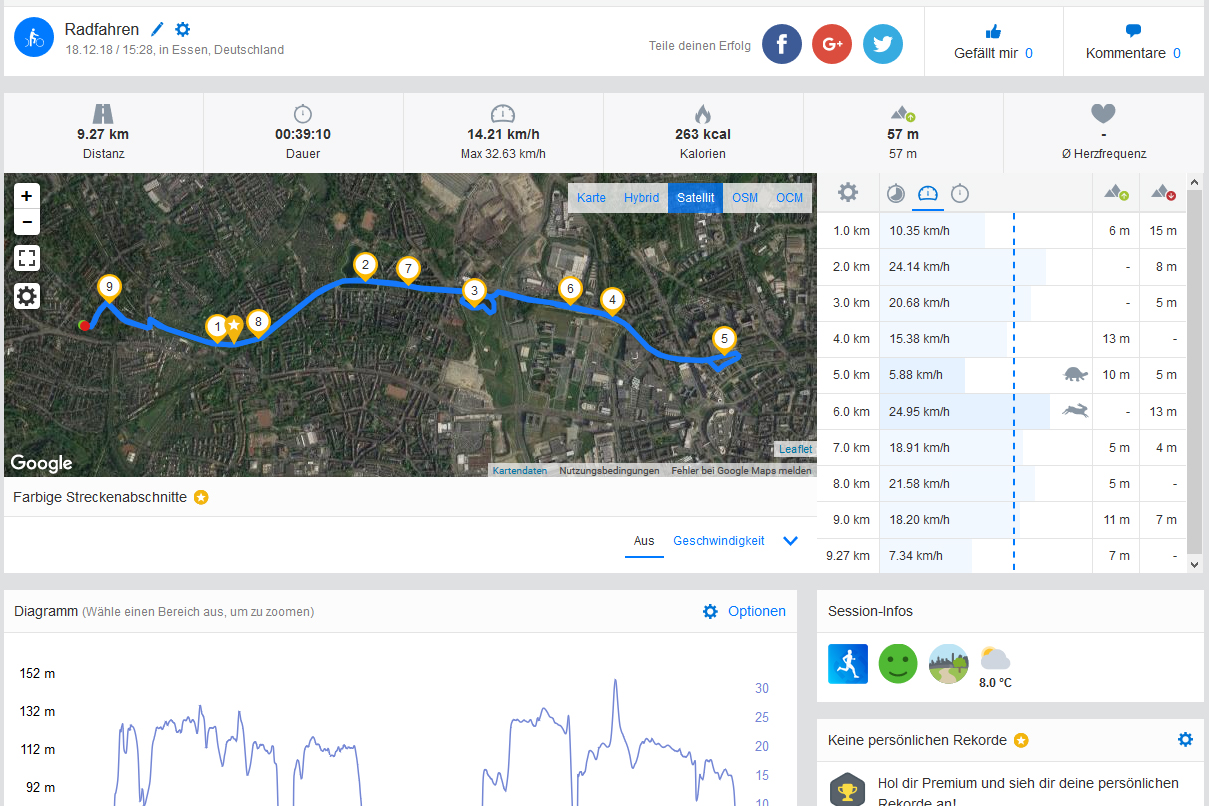
We also took the Mate 20 X on a bike ride to determine its location accuracy against a professional navigation device, the Garmin Edge 500. Our test device recorded a 60 metre (~197 ft) shorter route than the Garmin, but this represents a 99% location accuracy. The Garmin did a better job at plotting us through corners too, but in general, the Mate 20 X is accurate enough for most everyday navigation tasks.


Telephone Functions & Call Quality
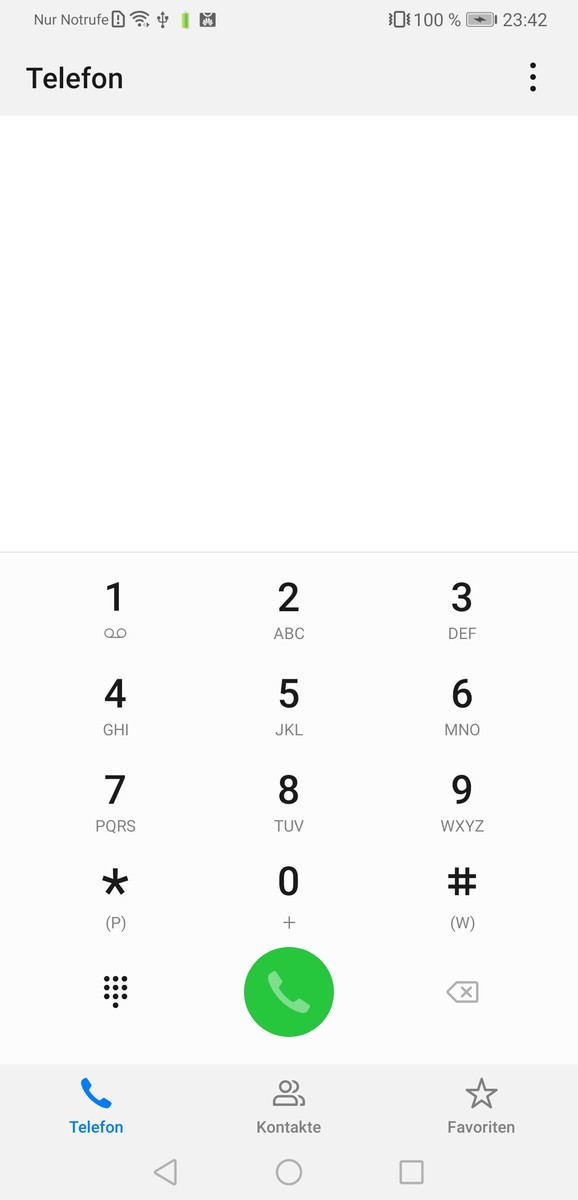
Huawei pre-installs its own telephony app suite for handling calls and messages. The phone app offers direct access to a number pad and has shortcuts for call history, contacts and favourites.
Our test device has a decent call quality and cancels background noise well. The earpiece gets sufficiently loud too, and both sides of the call are intelligible.
Alternatively, the included headphones also work well. They even isolate ambient noise better than the microphones do, which is impressive.
Cameras

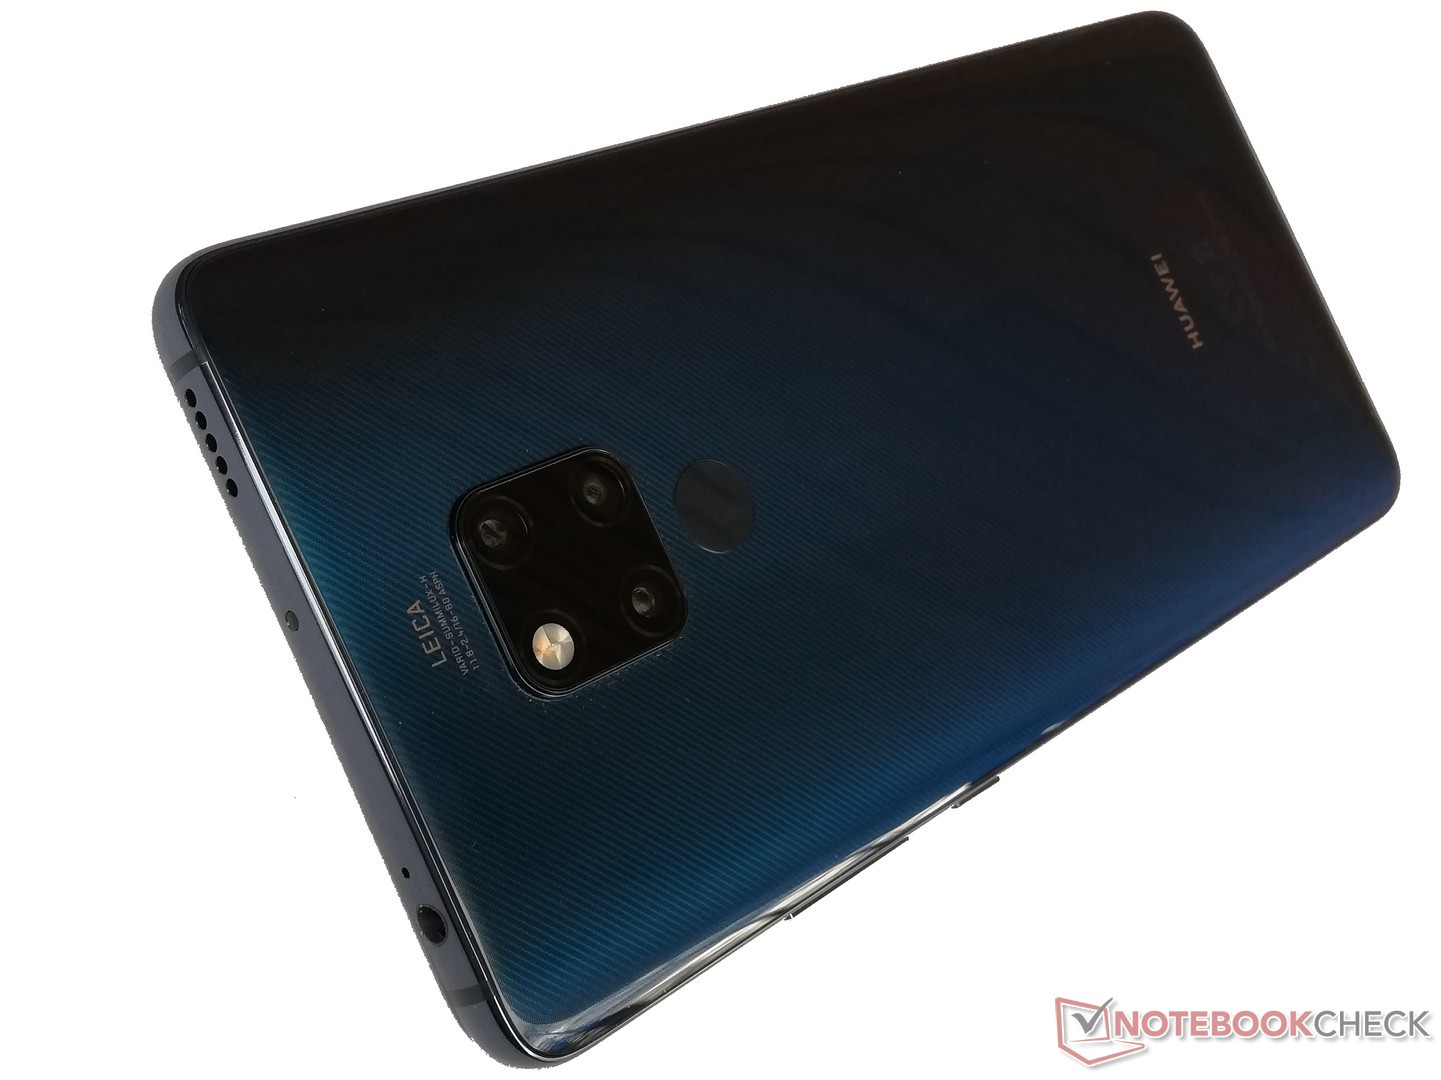
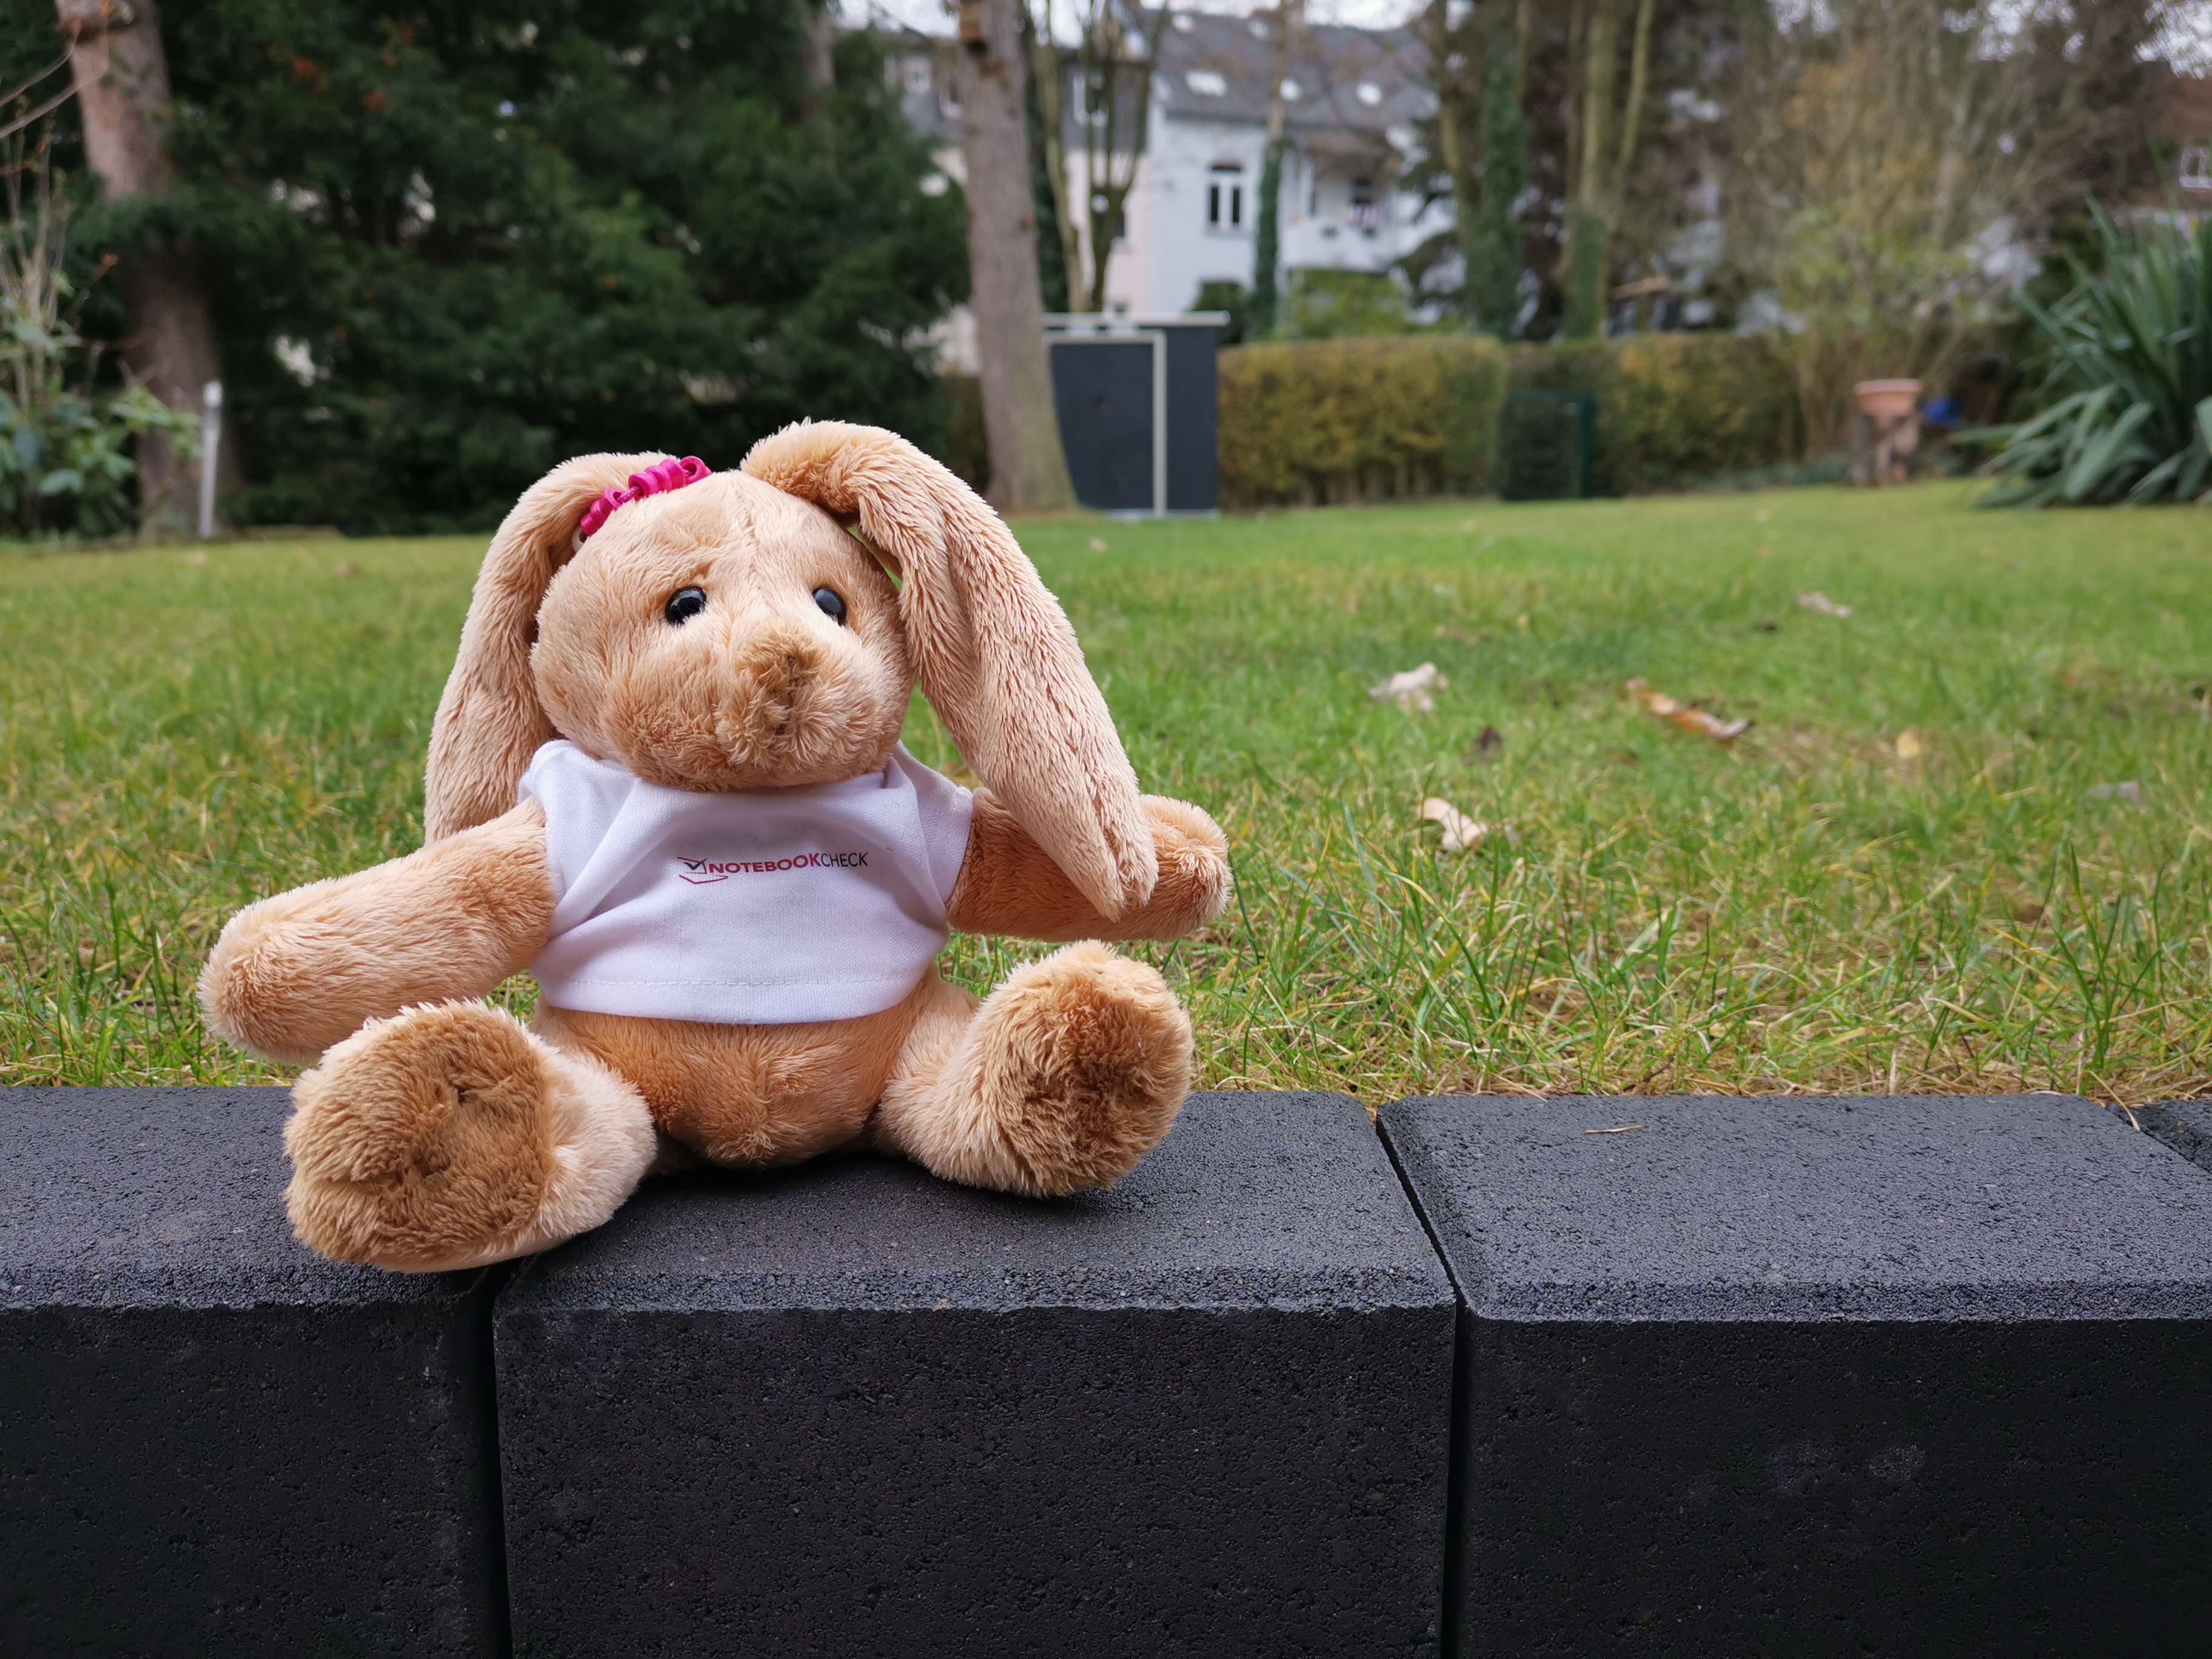
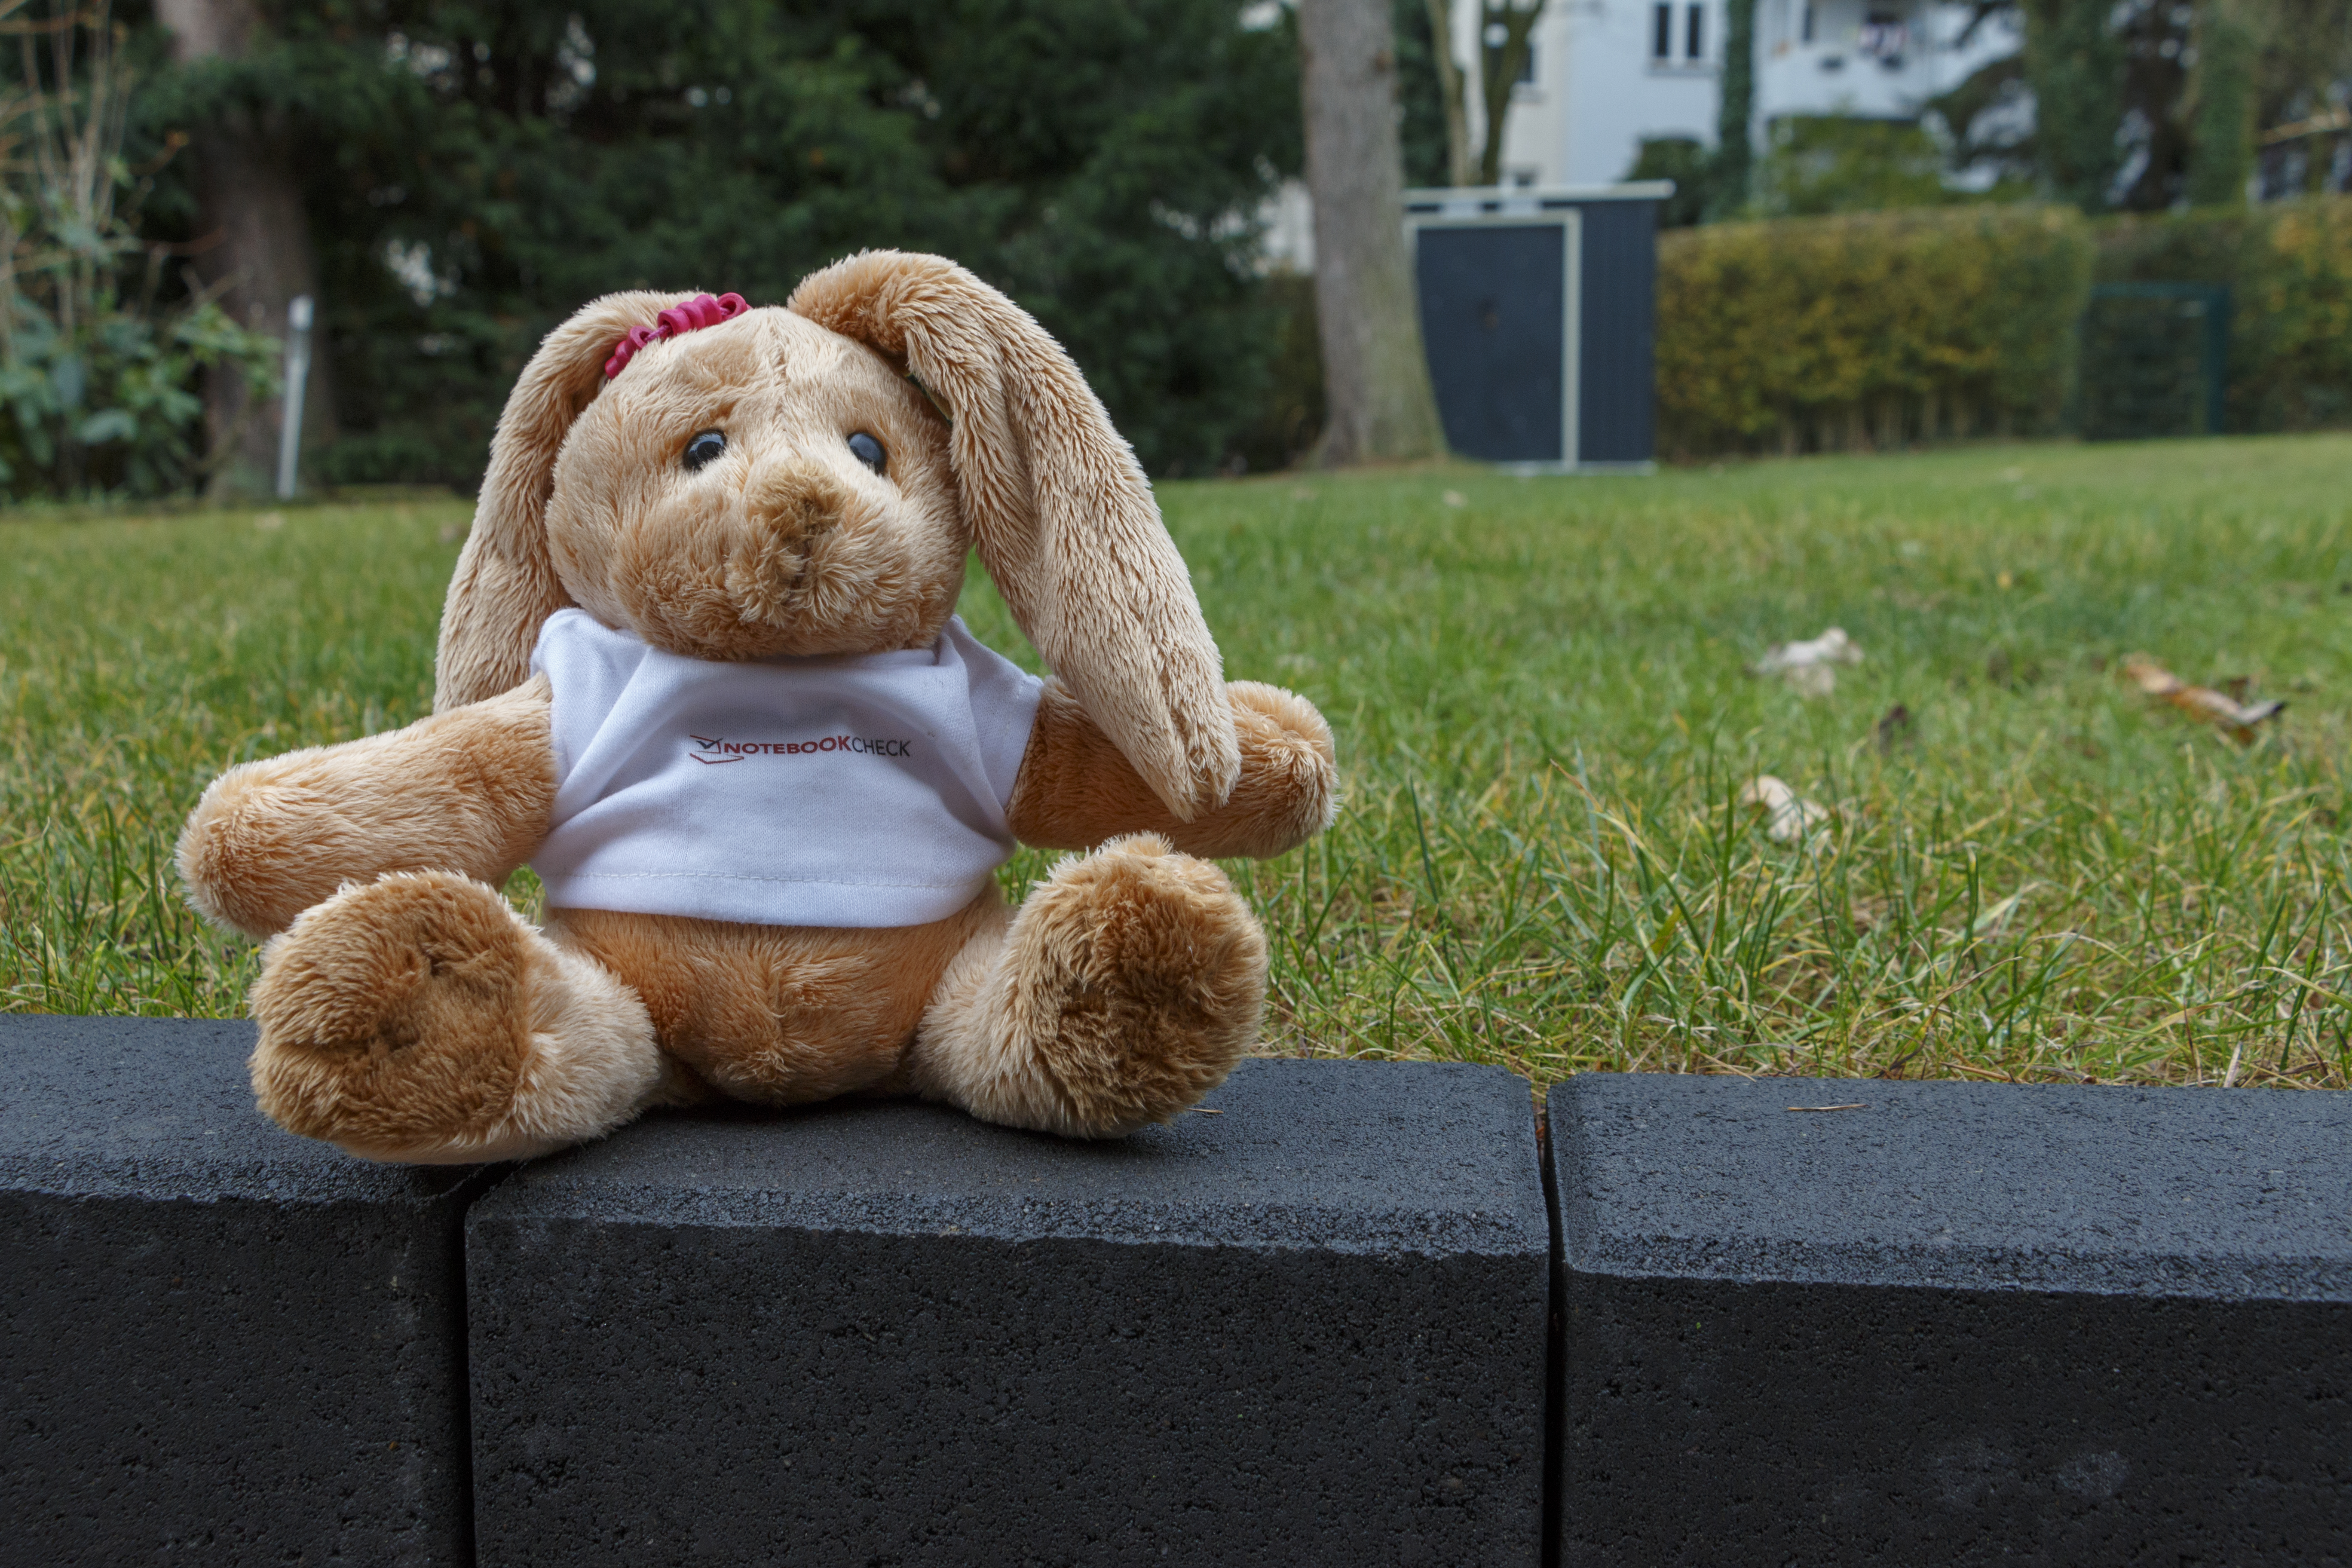
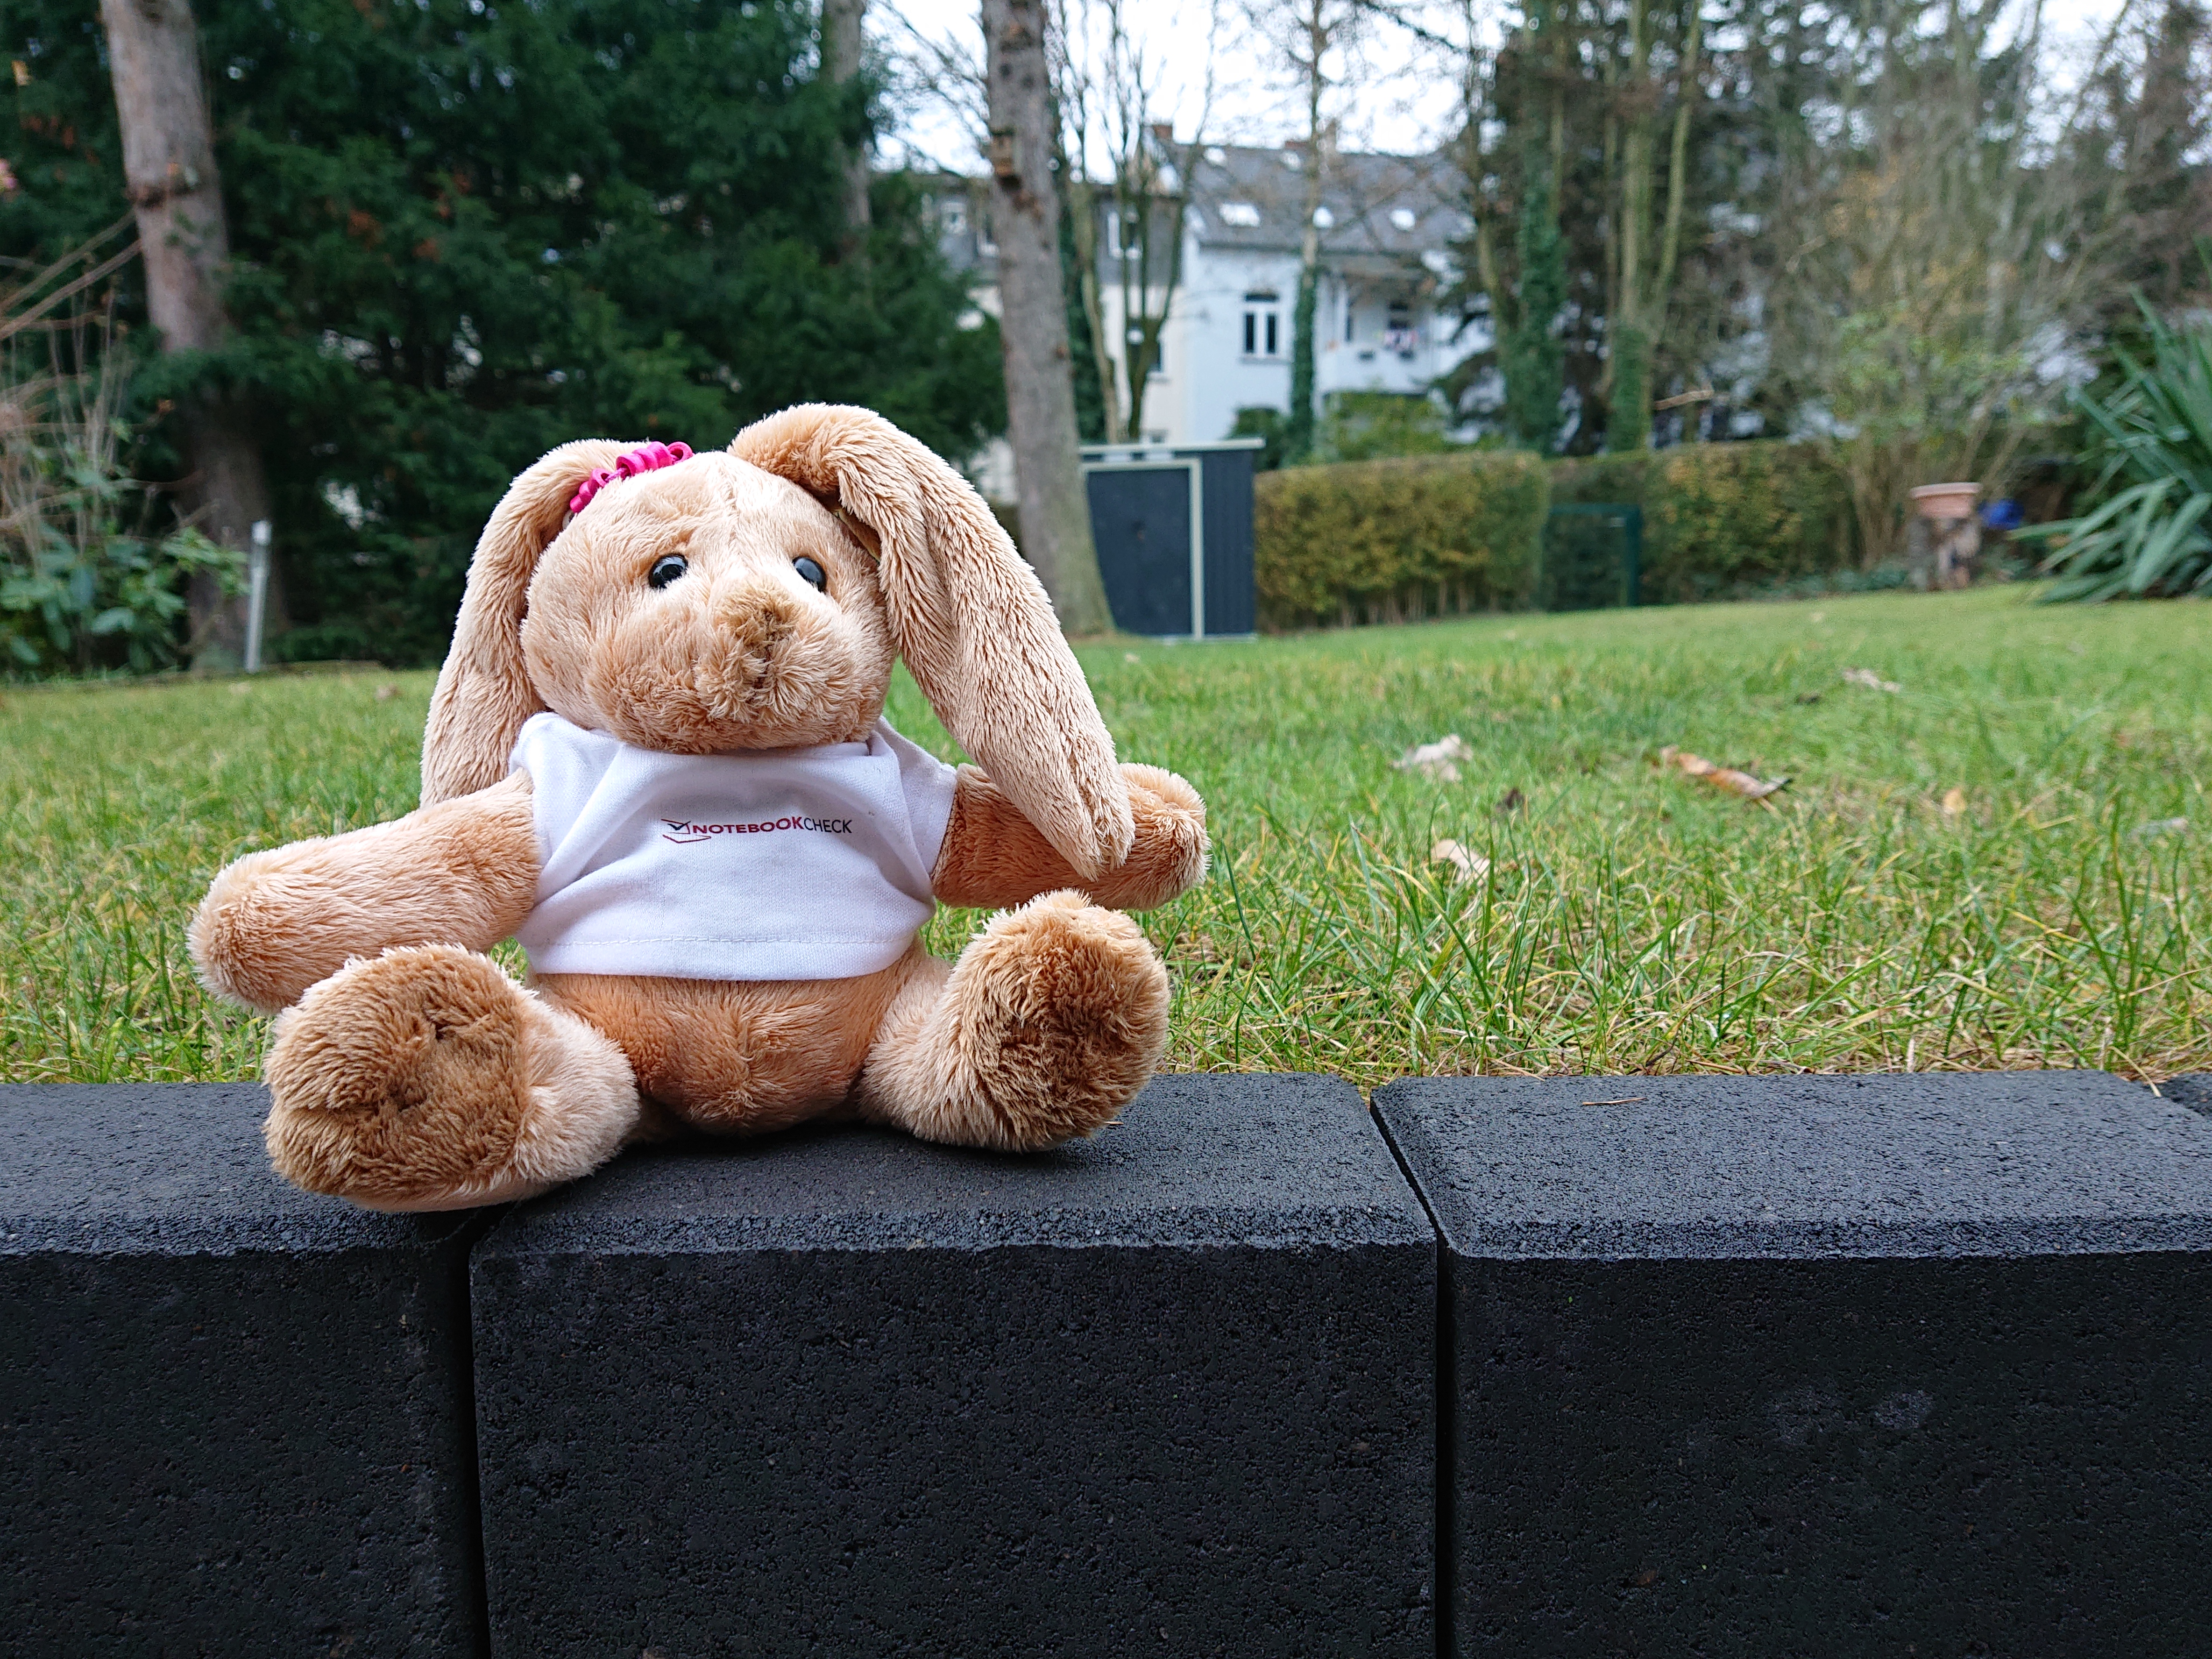
Huawei has equipped the Mate 20 X with the same cameras as the Mate 20 Pro. Hence, there is a Leica triple rear-facing camera array that combines a 40 MP wide-angle lens with a 20 MP ultra-wide-angle lens and an 8 MP telephoto lens. The sensors have f/1.8, f/2.2 and f/2.4 apertures respectively. There is also a 24 MP front-facing camera that has an f/2.0 aperture, which takes good quality photos. Details and fine structures remain visible even when looking closely, and colours are also well reproduced. The default camera app has several customisation options, which range from lighting effects to HDR and AI beautification.
The main 40 MP camera takes bright and detailed photos, although they look somewhat blurry upon closer inspection. Additionally, the colours are lacking, which is better represented in our reference picture. The Mate 20 X also takes decent macro photos that are detailed with vibrant colours. Fine textures also remain visible even at higher zoom. The triple rear-facing cameras show their strengths in low-light conditions. However, colours are reproduced too darkly for our liking, as demonstrated below in scene 3. The edges of objects do not look demarcated either, but fine details remain visible at the centre of the image. The default camera app has numerous settings, including colour options and a professional mode. The latter has options for manually setting the ISO, shutter speeds, brightness levels and white balance.
Videos look just as good as photos and have plenty of customisation options including beautification and colour filters that can be applied while recording. Colours can also be altered between standard, strong or soft. Moreover, there are slow-motion and time-lapse modes. Videos can be recorded in up to 4K. Additionally, the video format can be changed from H.264 to H.265 to save space. Videos can also be recorded at 60 FPS in 1080p.


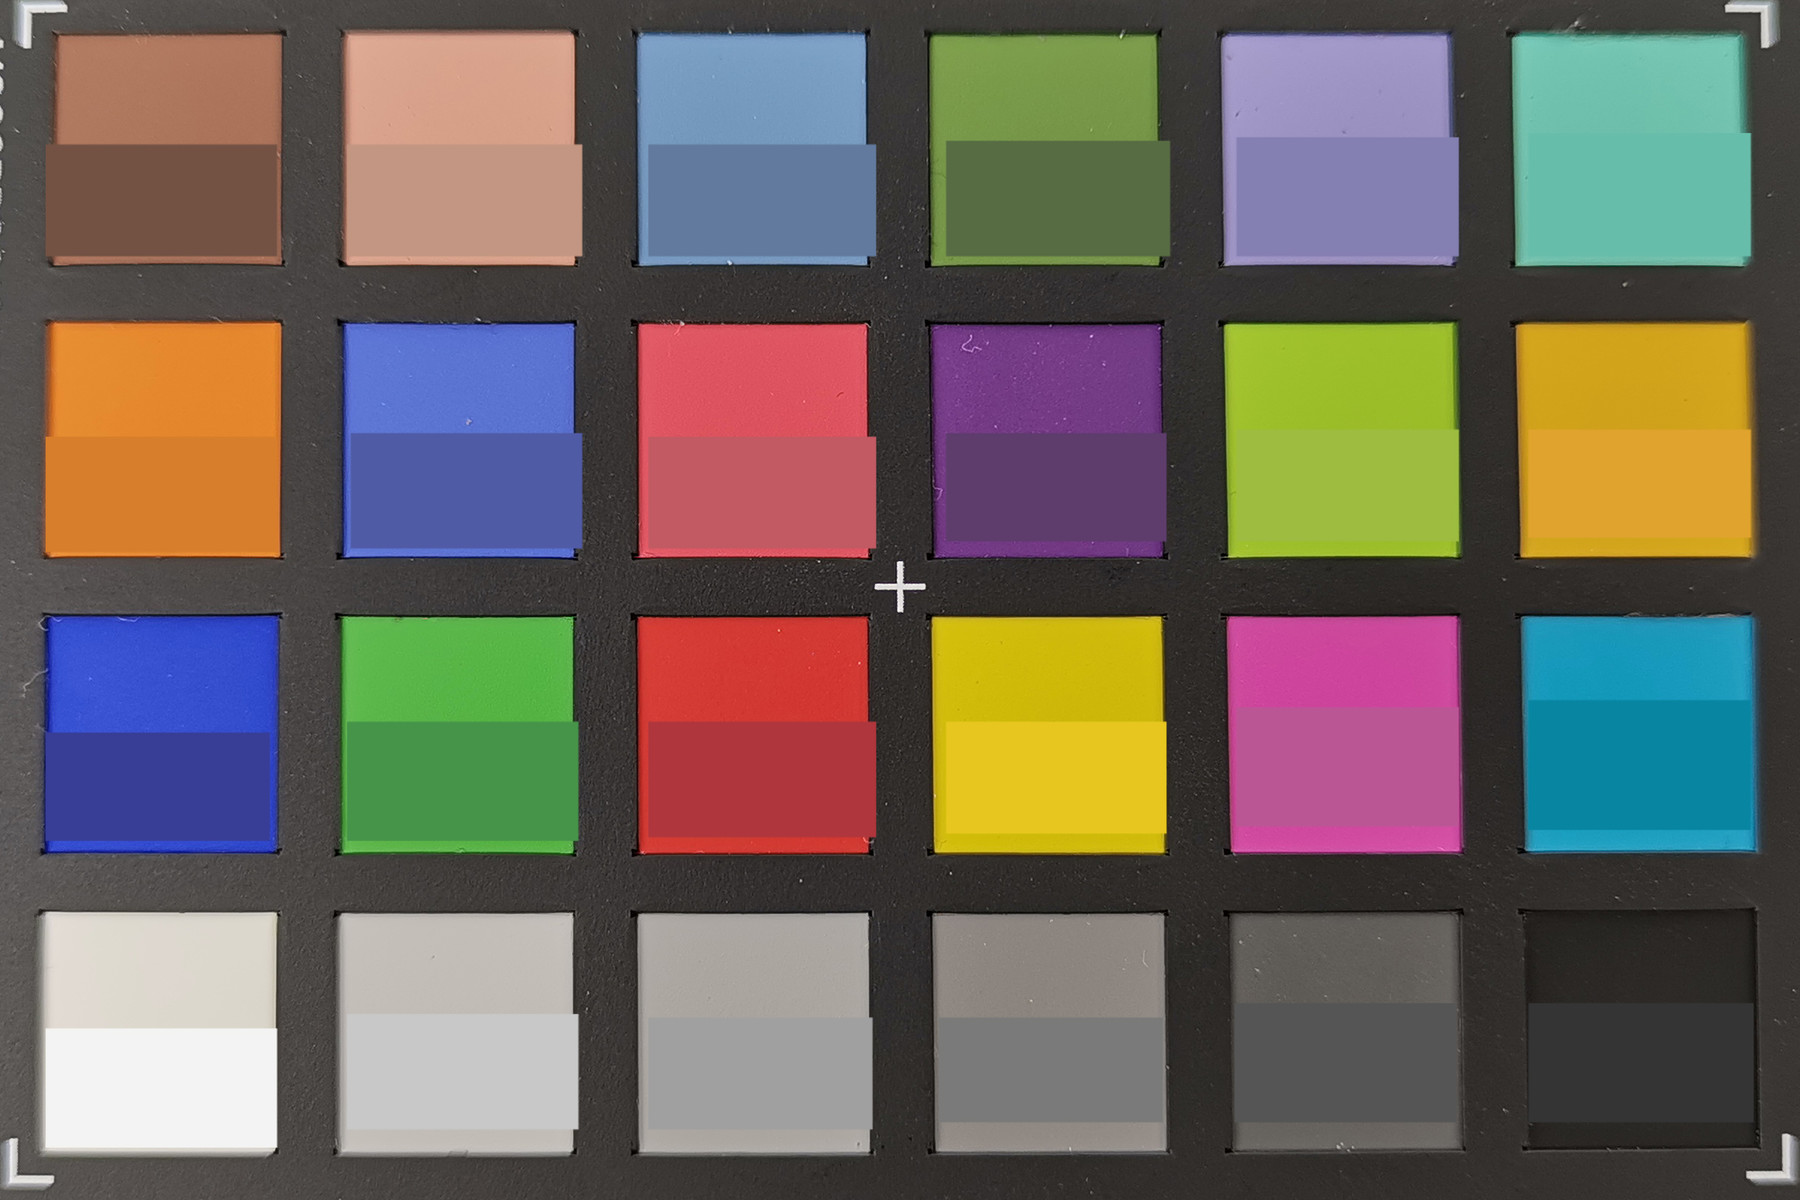
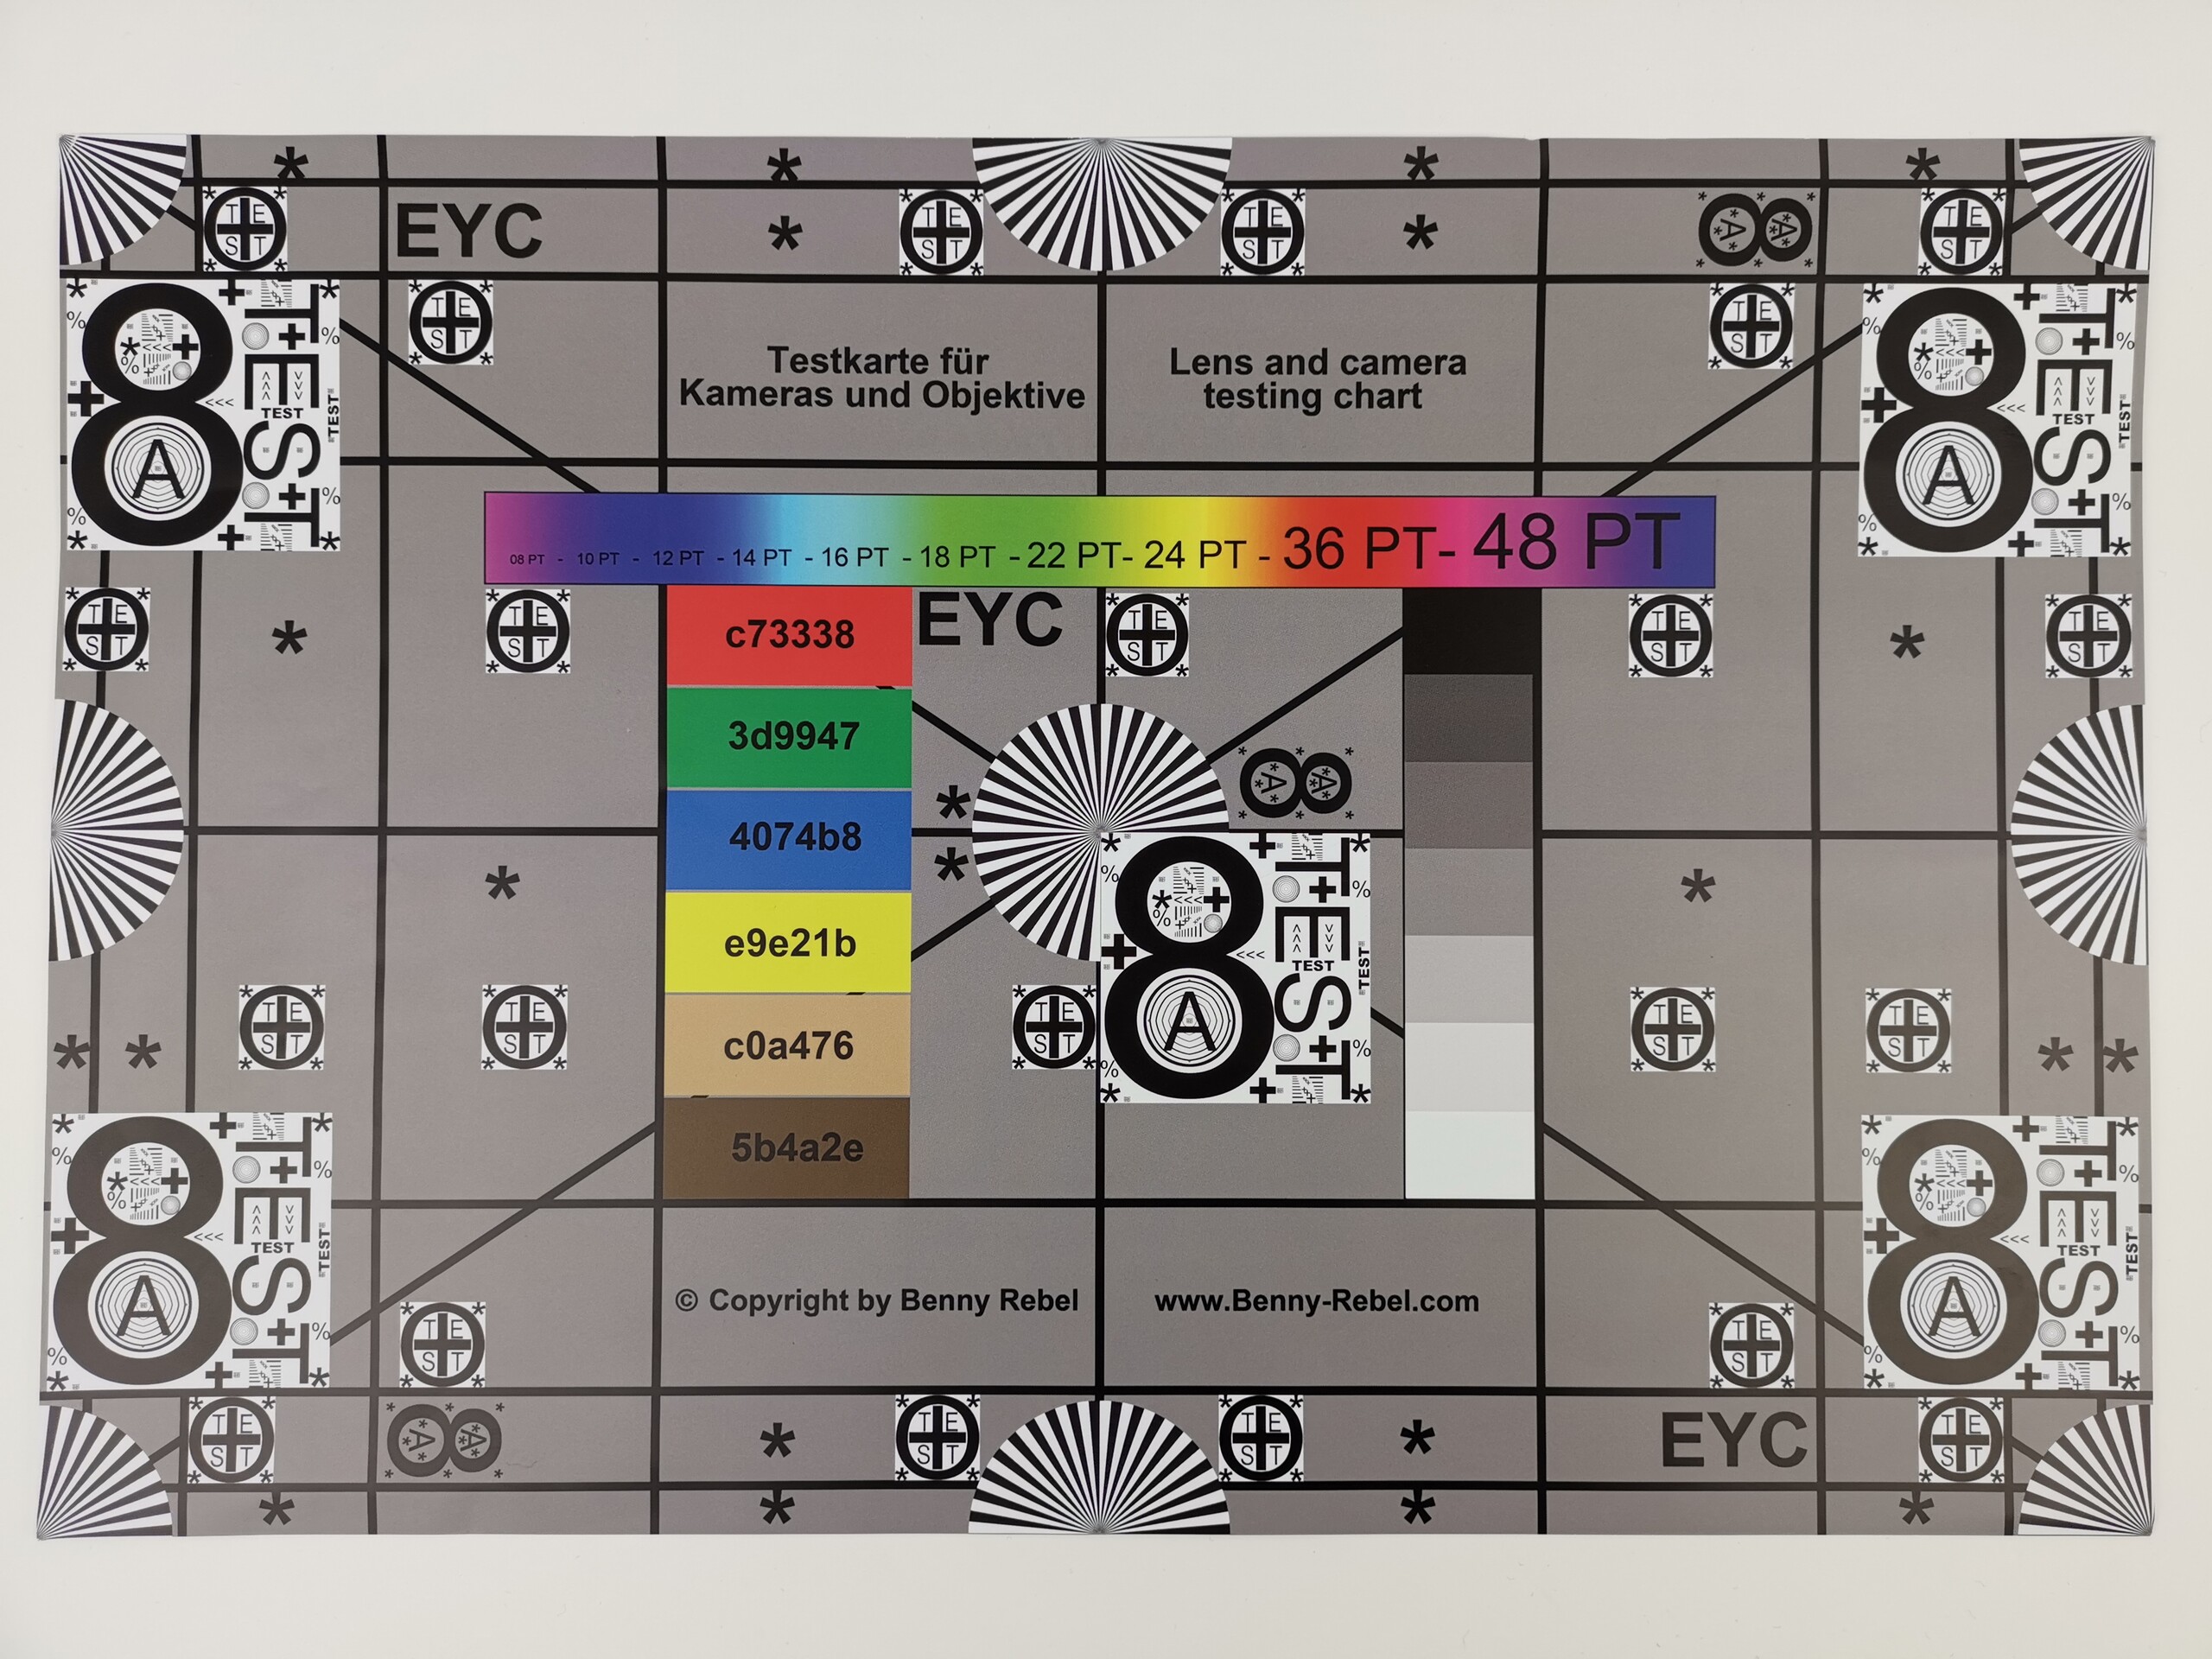
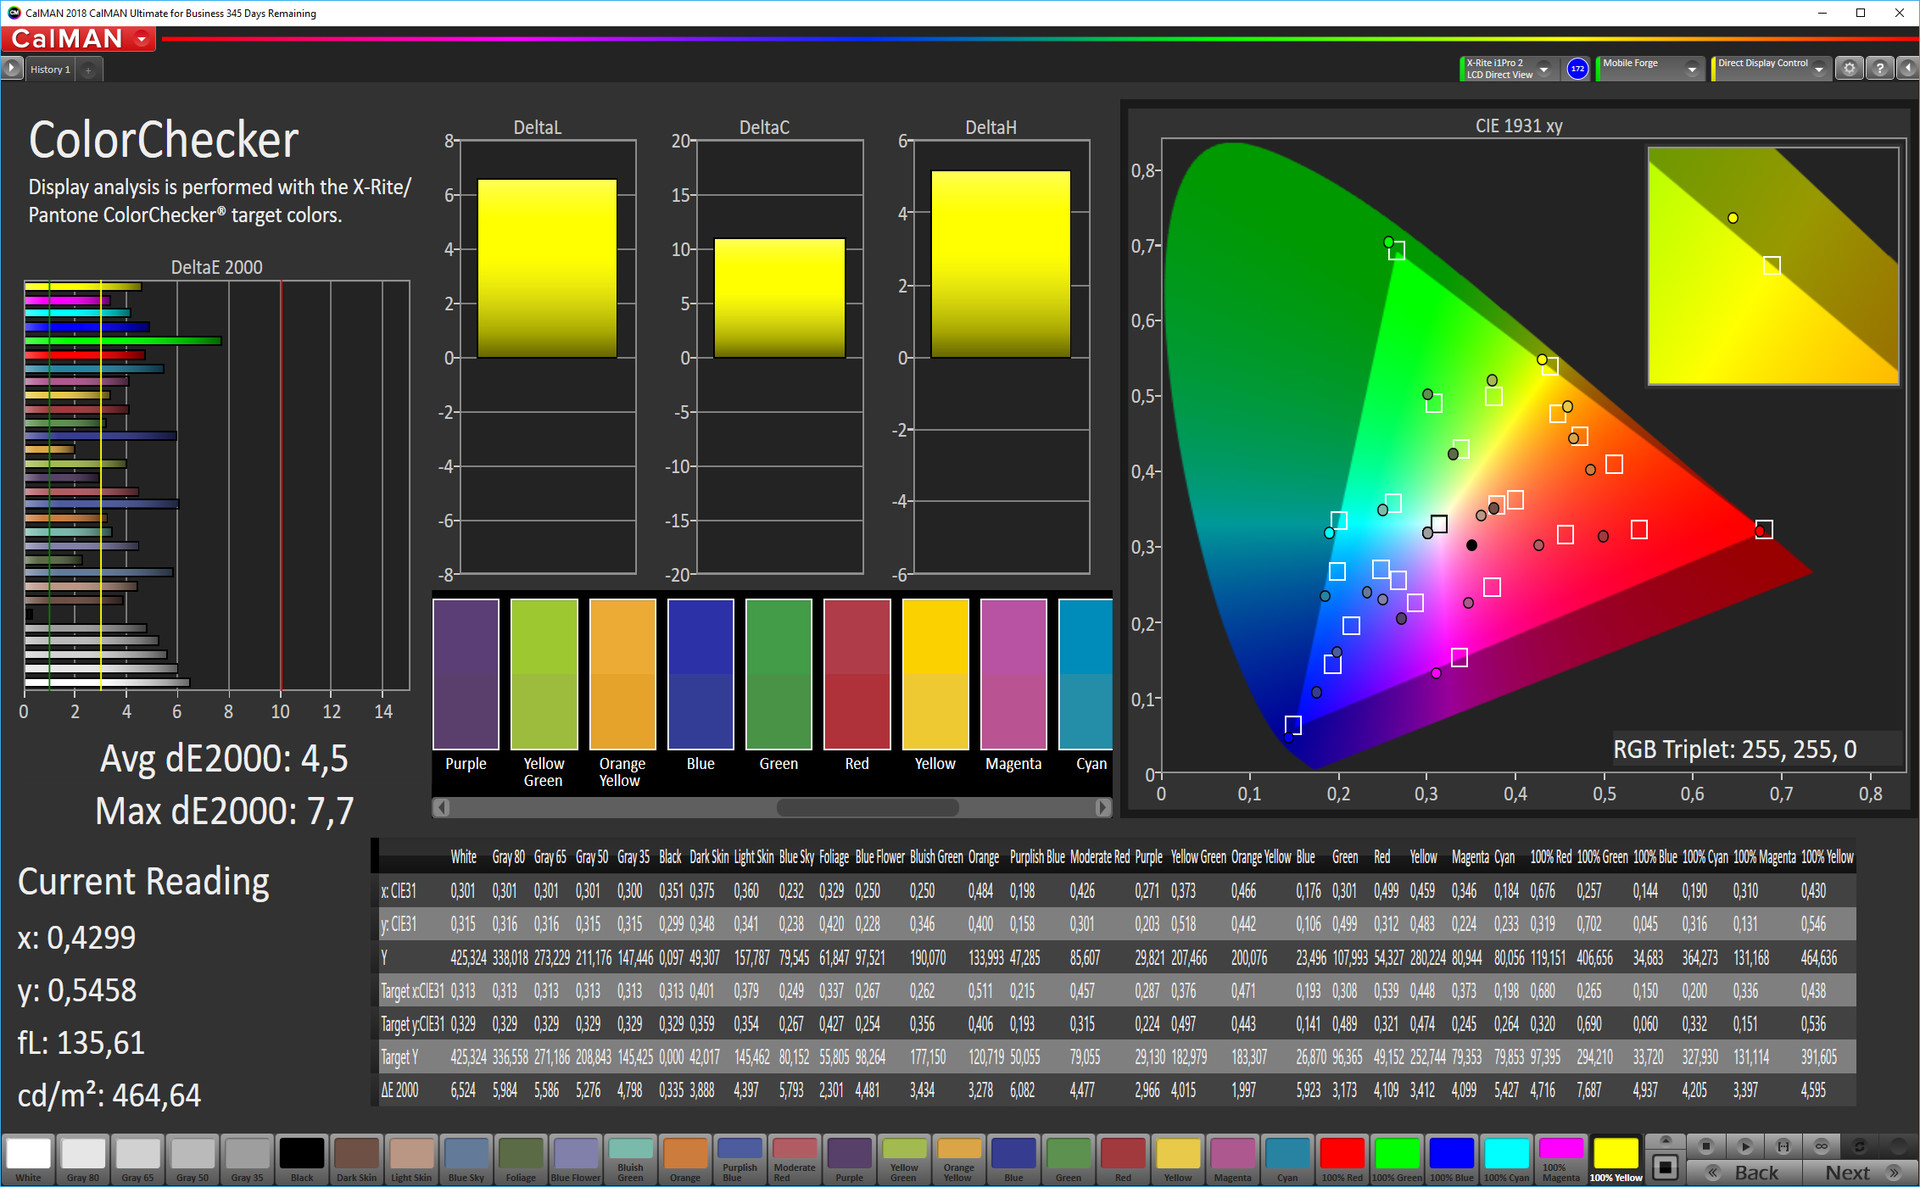
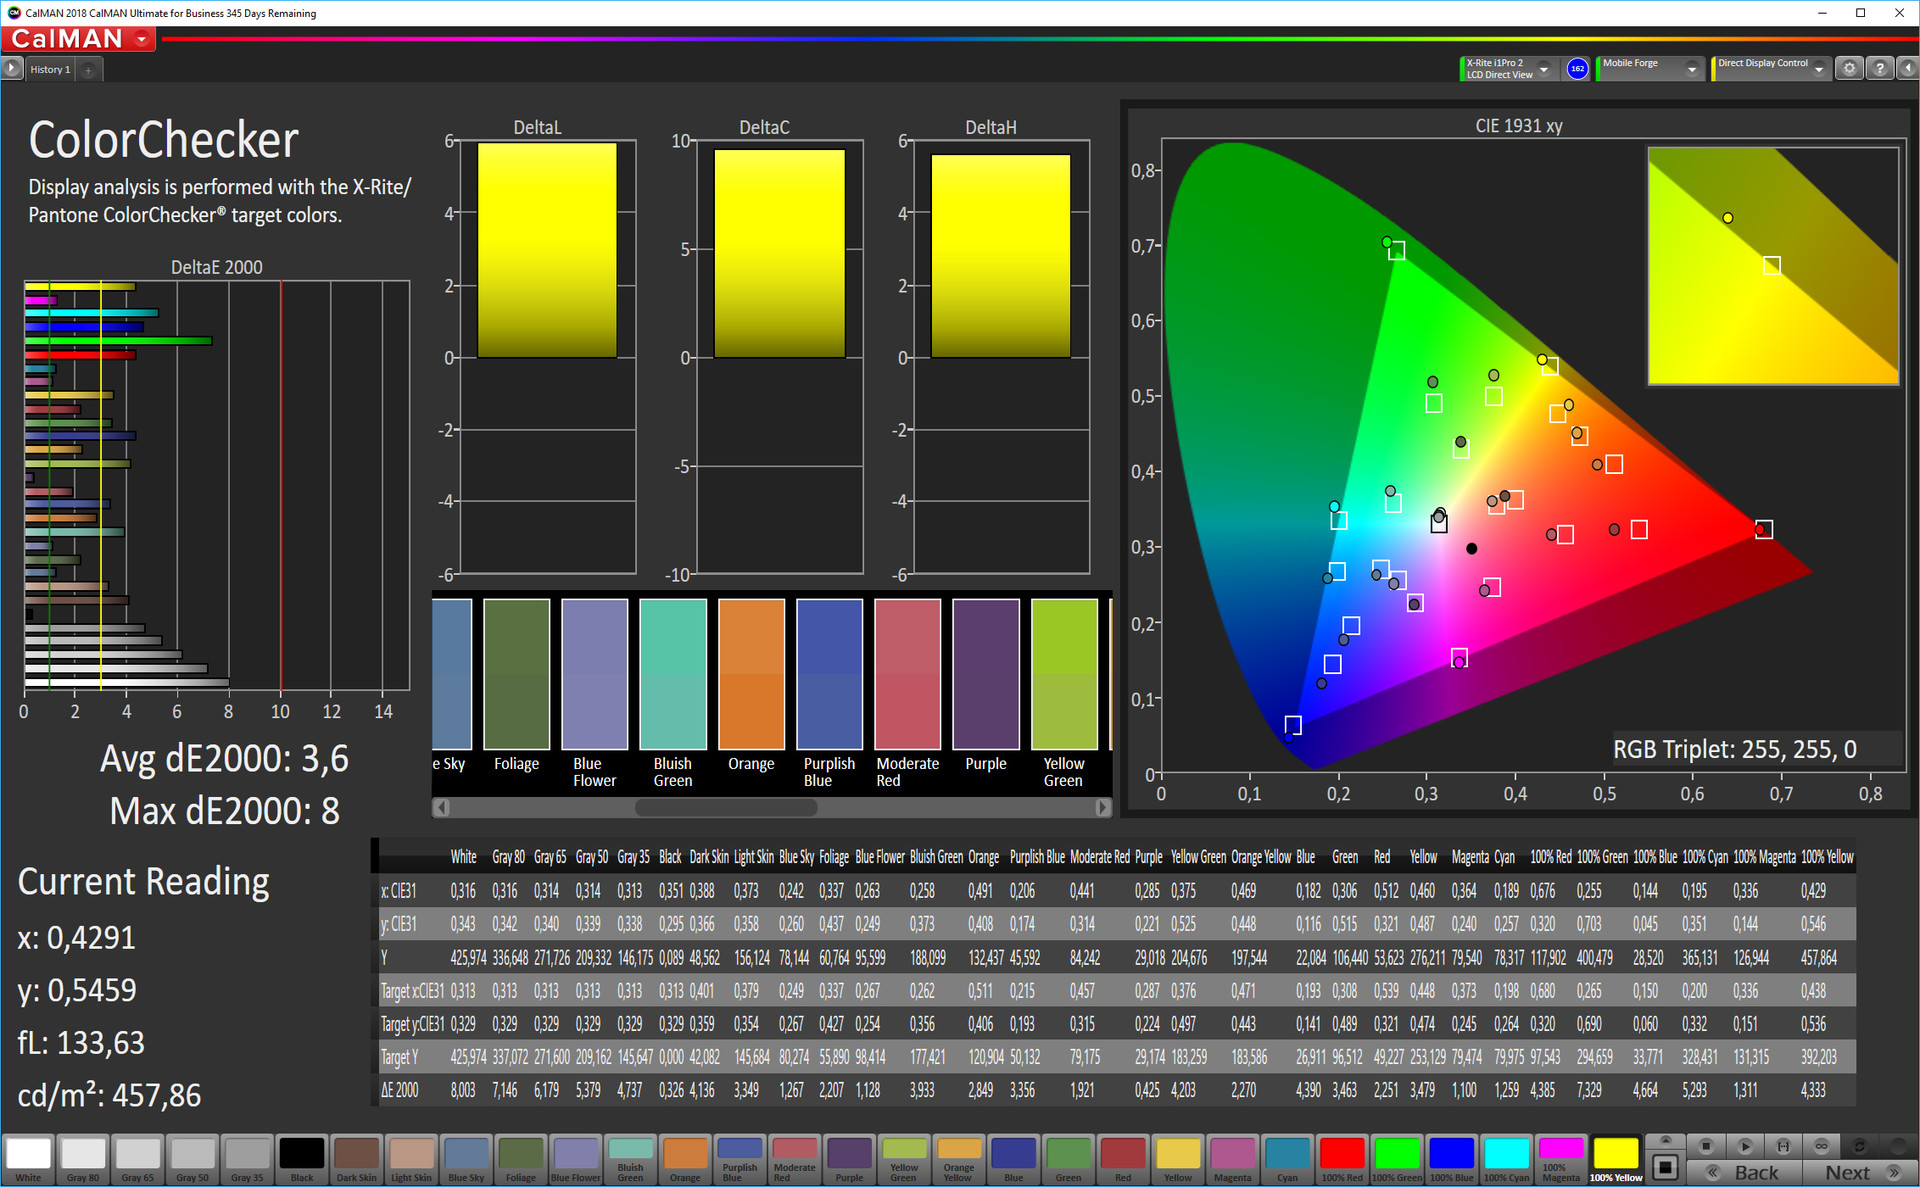
We also subjected the Mate 20 X to further camera tests under controlled lighting conditions, the results of which are mixed. Most colours are reproduced too brightly compared to the reference colour, although yellow and dark shades of grey are too dark.
Our test device did a good job at capturing our test chart. Details and fine textures are captured clearly even at higher zoom levels, while colours are reproduced well. The contrast drops visibly in the lower corners of the test chart, which happens with many smartphones.

Accessories & Warranty
The Mate 20 X comes with a USB charger, a matching USB Type-C cable, a set of headphones, a silicone case and a card slot tool. Huawei also sells Mate 20 X specific covers and other general smartphone accessories on its website. These include wireless chargers, headphones, power banks among others.
The Mate 20 X comes with 24 months manufacturer’s warranty. Please see our Guarantees, Return policies and Warranties article for country-specific information.
Input Devices & Operation
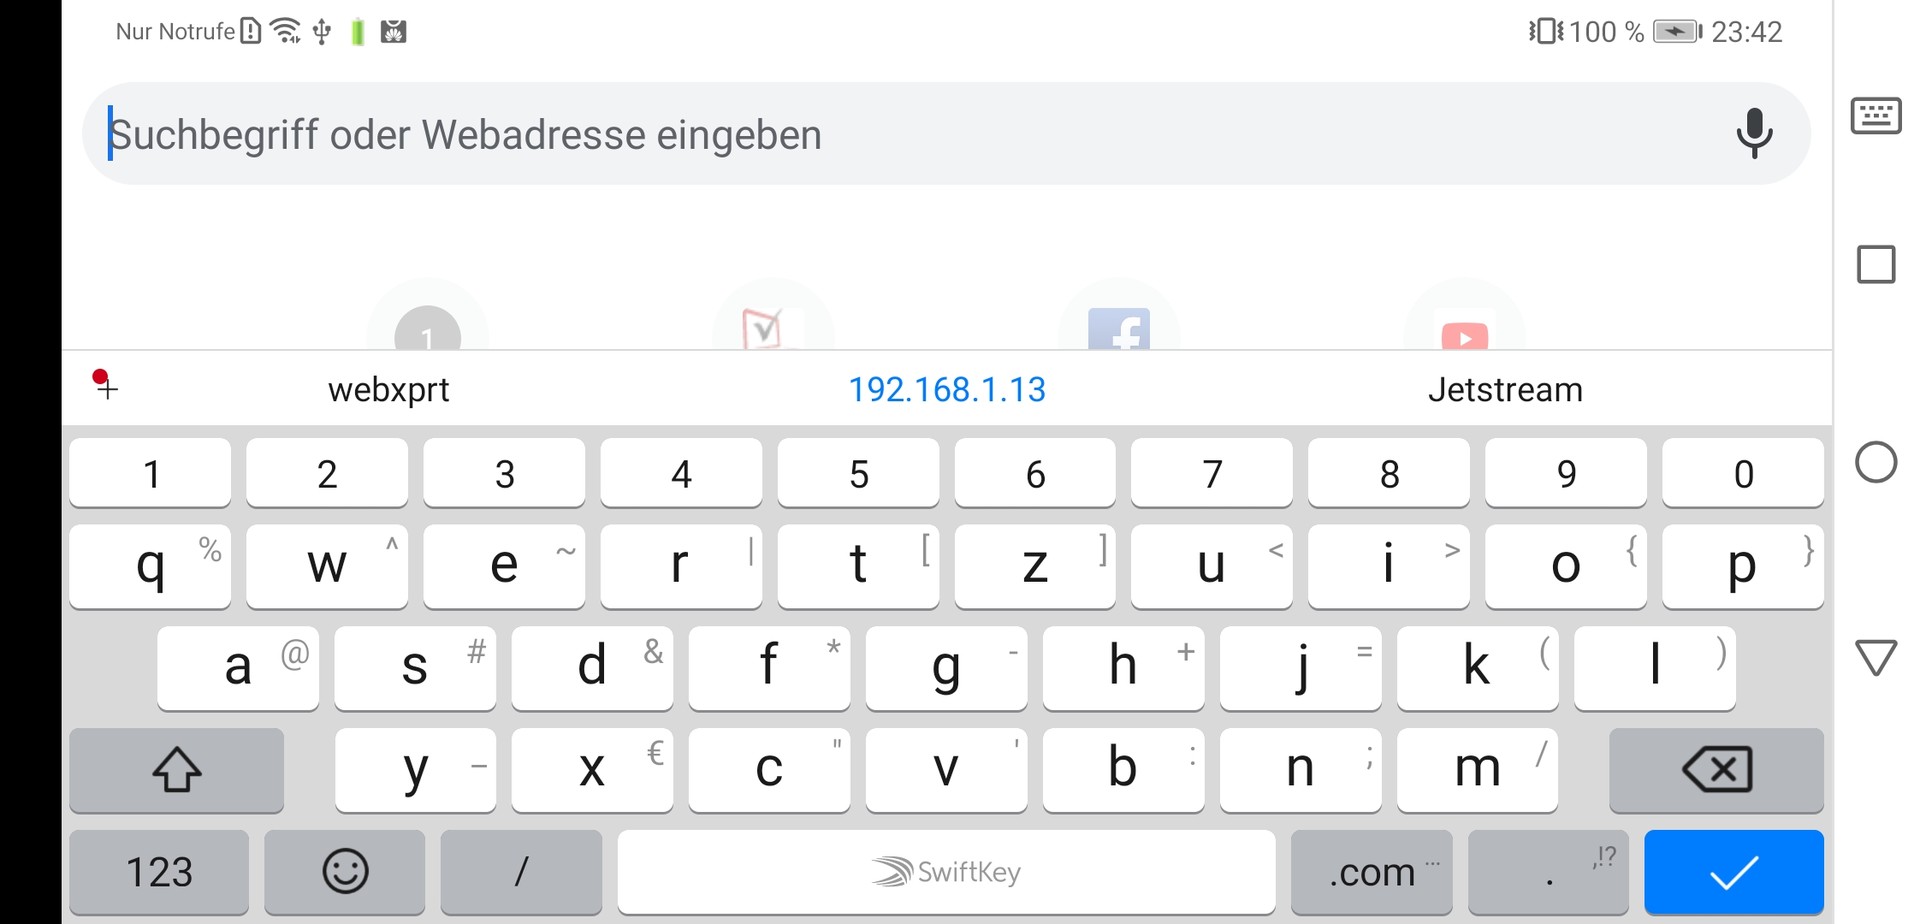
Huawei pre-installed our test device with SwiftKey as the default keyboard app. The app works just as well as it does on other devices. Moreover, the touchscreen responded quickly and accurately throughout testing, while the display’s smooth finish makes it easy to perform multi-finger gestures.
Huawei has placed the fingerprint sensor on the back of the device. The sensor is easy to reach despite the Mate 20 X’s large footprint and worked well throughout our tests.

Display
The Mate 20 X has a 7.2-inch OLED display that operates natively at 2,240x1,080. Our test device achieved an average maximum brightness of 418 cd/m², according to X-Rite i1Pro 2. This puts the Mate 20 X below all our comparison devices, except for the Pixel 3 XL, and is considerably darker than the maximum brightness that the Mate 20 Pro achieves. However, the APL50 test reports that the 20 X achieves an average maximum brightness of 425 cd/m² with the ambient light sensor switched on. Turning on the sensor increases the maximum average brightness to a more respectable 550 cd/m². Additionally, the display is 96% evenly lit, which is on par with our best comparison devices.
Unfortunately, the Mate 20 X uses pulse-width modulation (PWM) to regulate display brightness, which can cause eye strain and headaches for some people. The screen flickers at 243 Hz at 99% and below brightness. This value is relatively low too, which could make some people who are PWM sensitive feel exhausted.
| |||||||||||||||||||||||||
Brightness Distribution: 96 %
Center on Battery: 421 cd/m²
Contrast: ∞:1 (Black: 0 cd/m²)
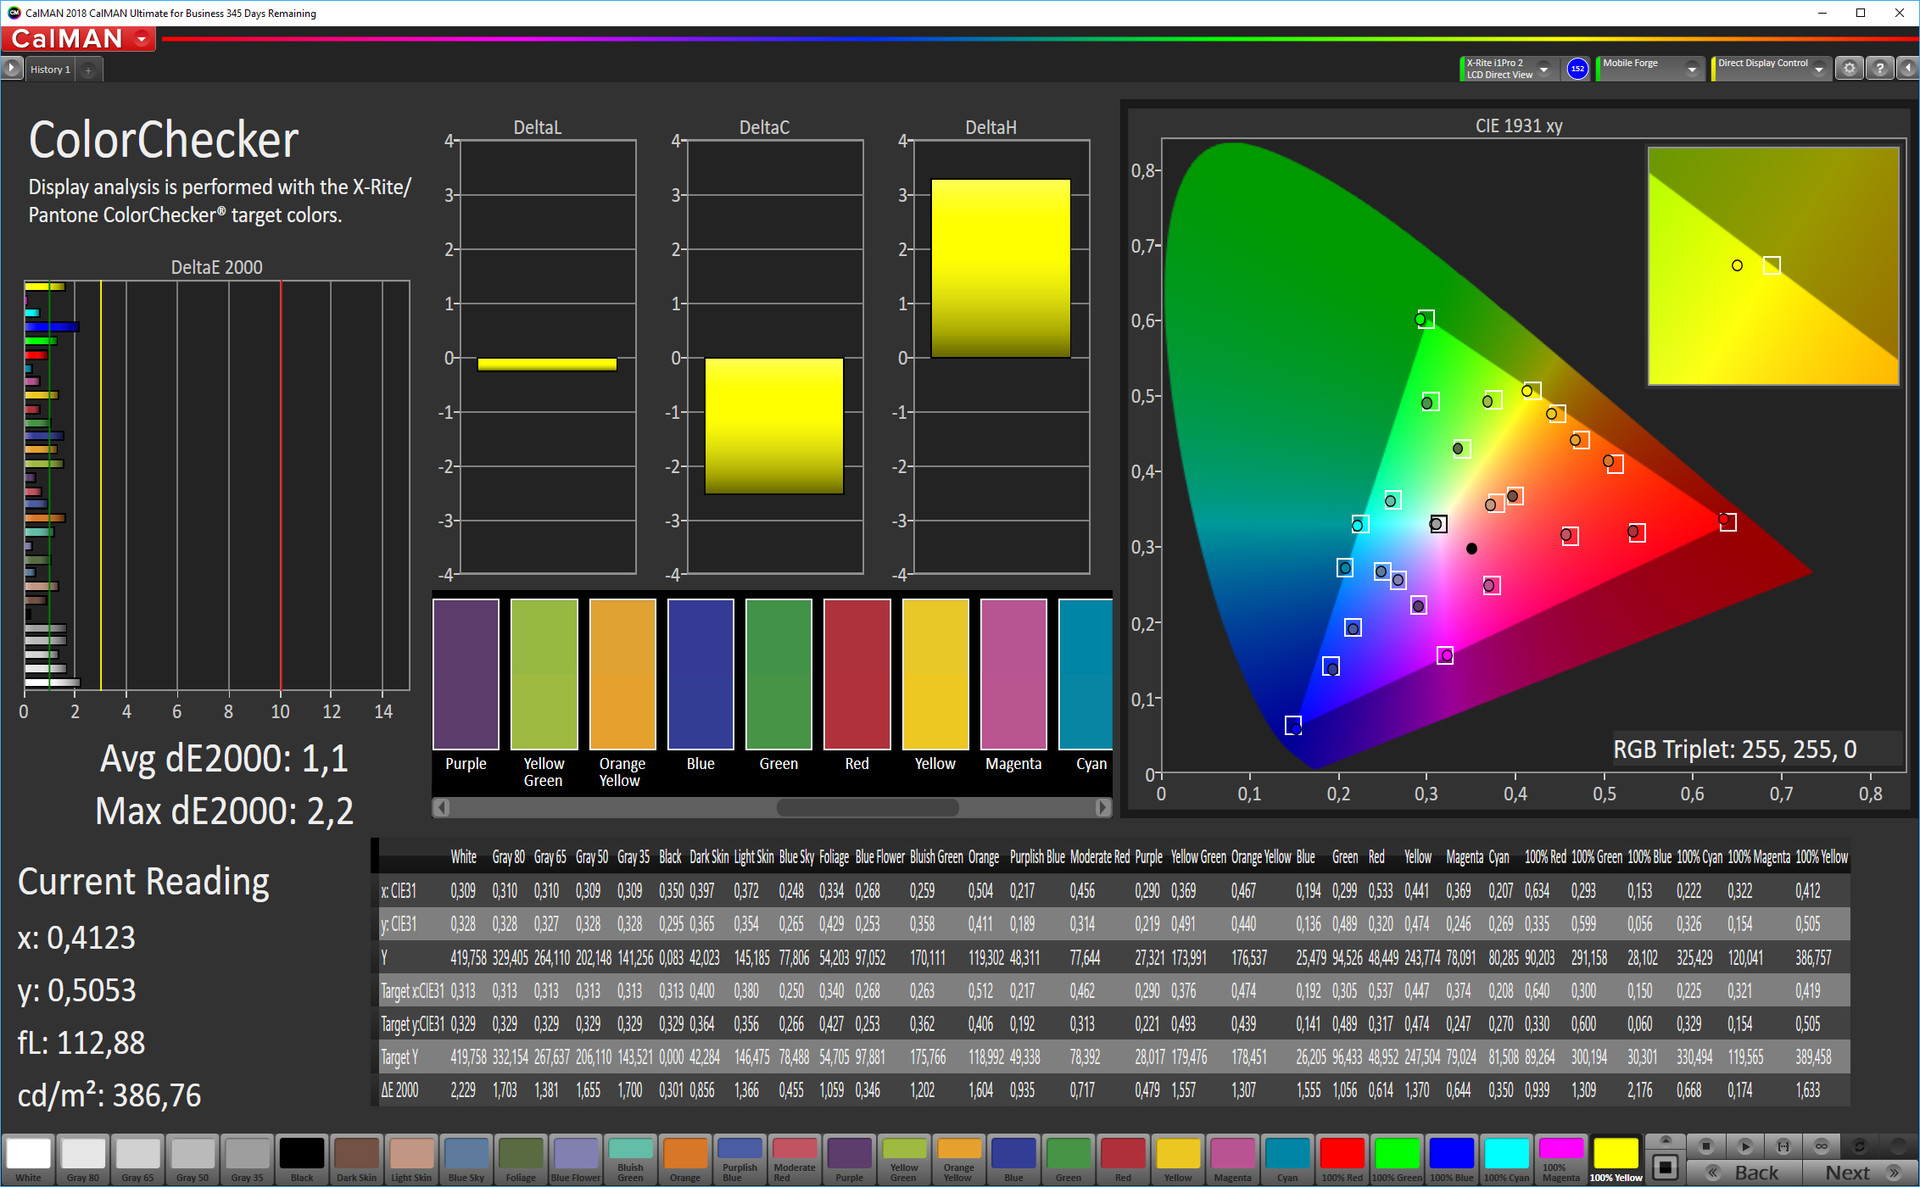
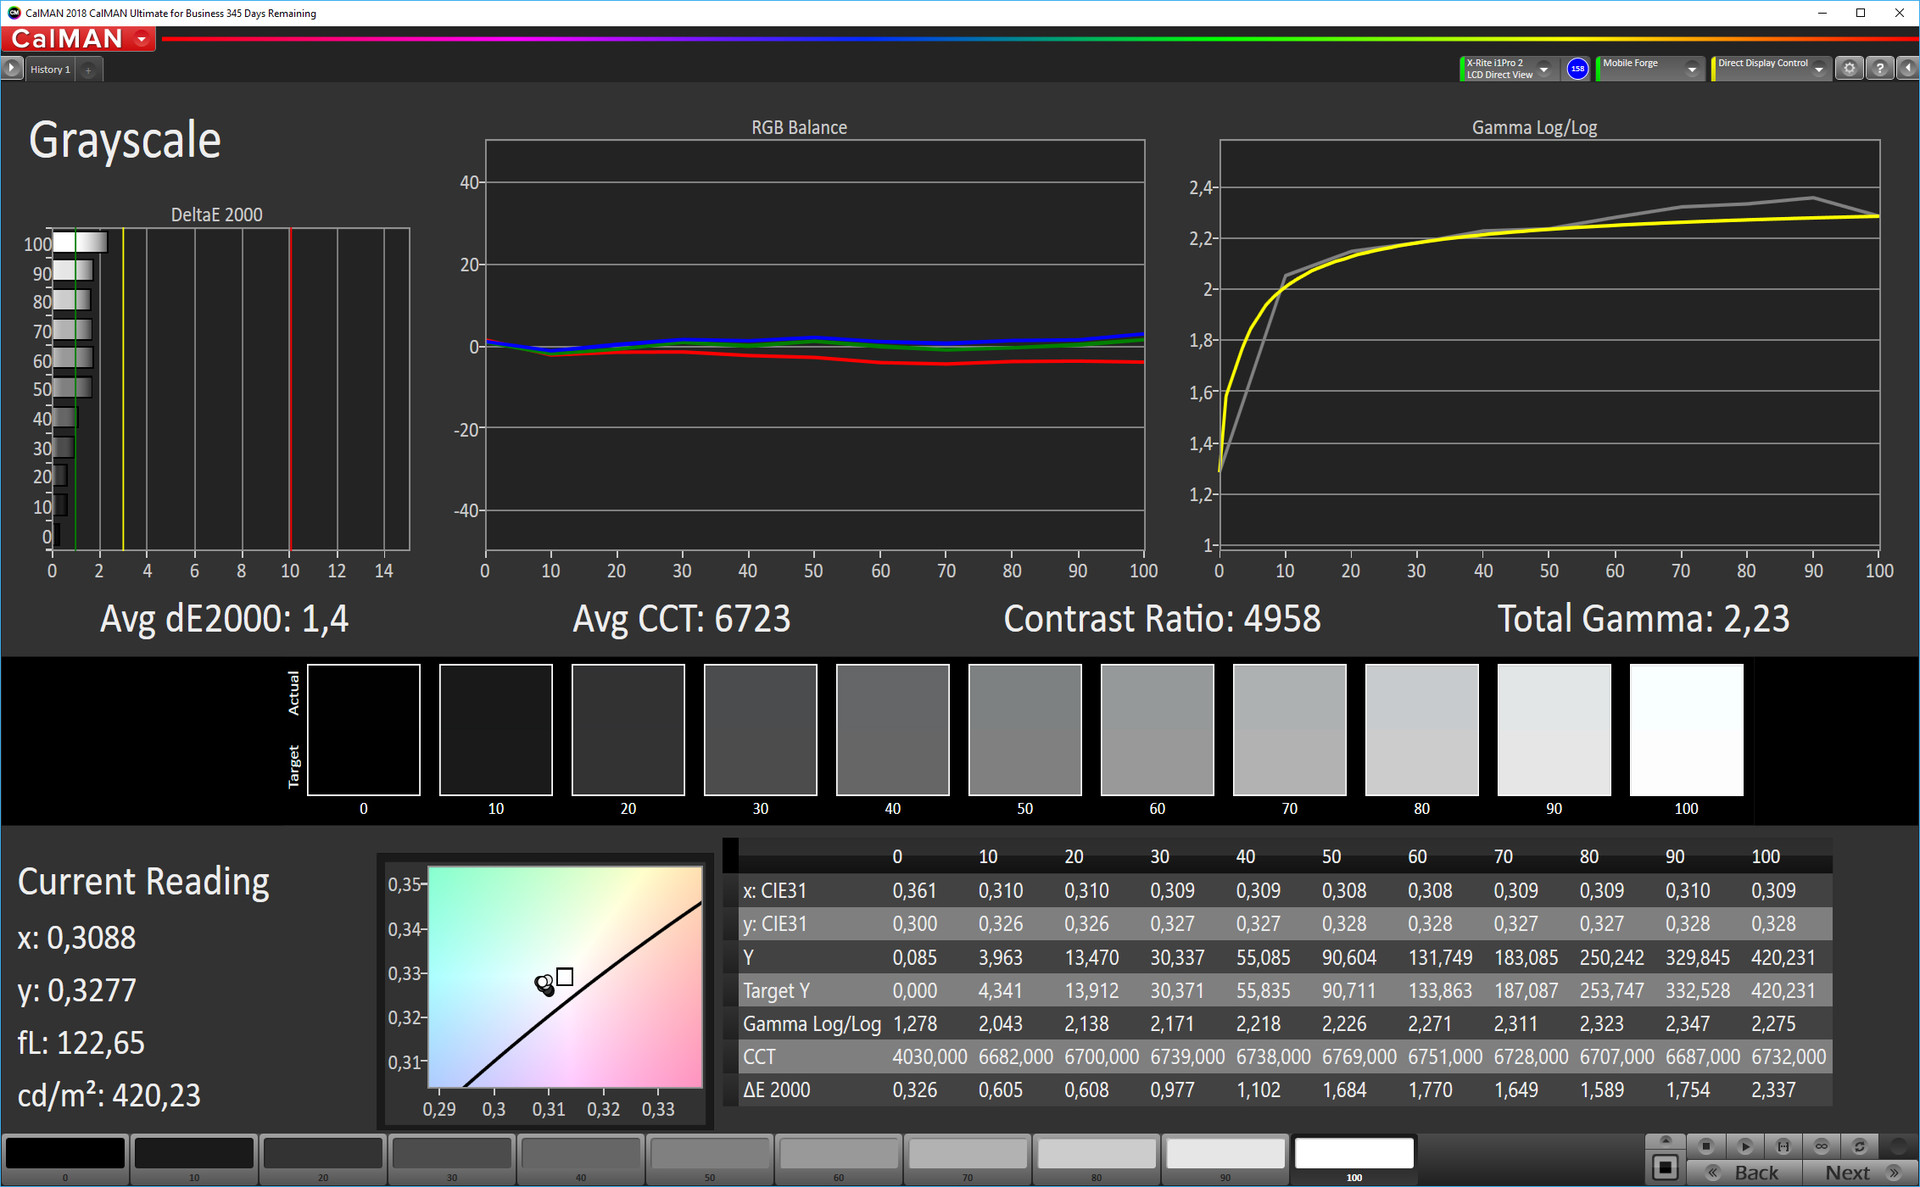
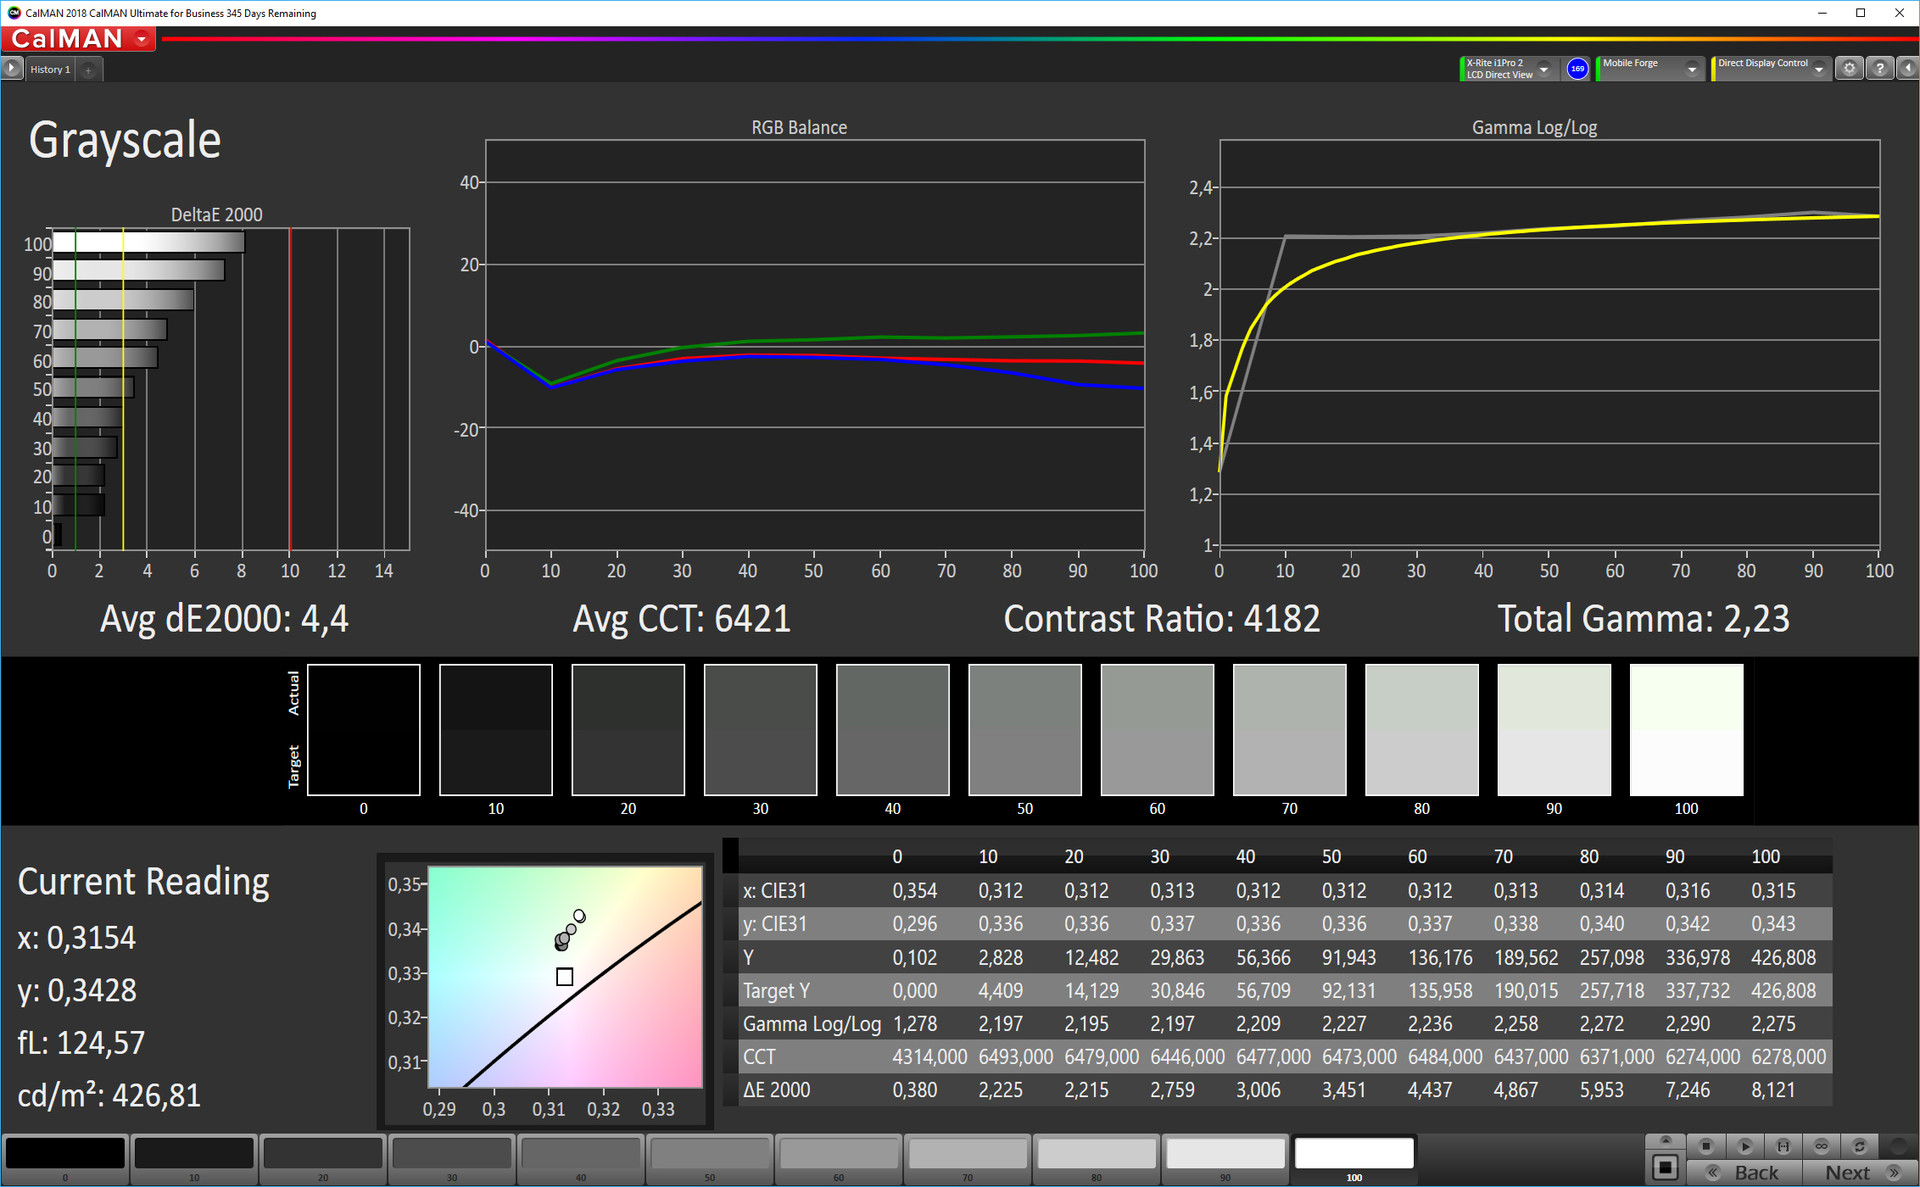
ΔE Color 1.1 | 0.5-29.43 Ø5
ΔE Greyscale 1.4 | 0.57-98 Ø5.3
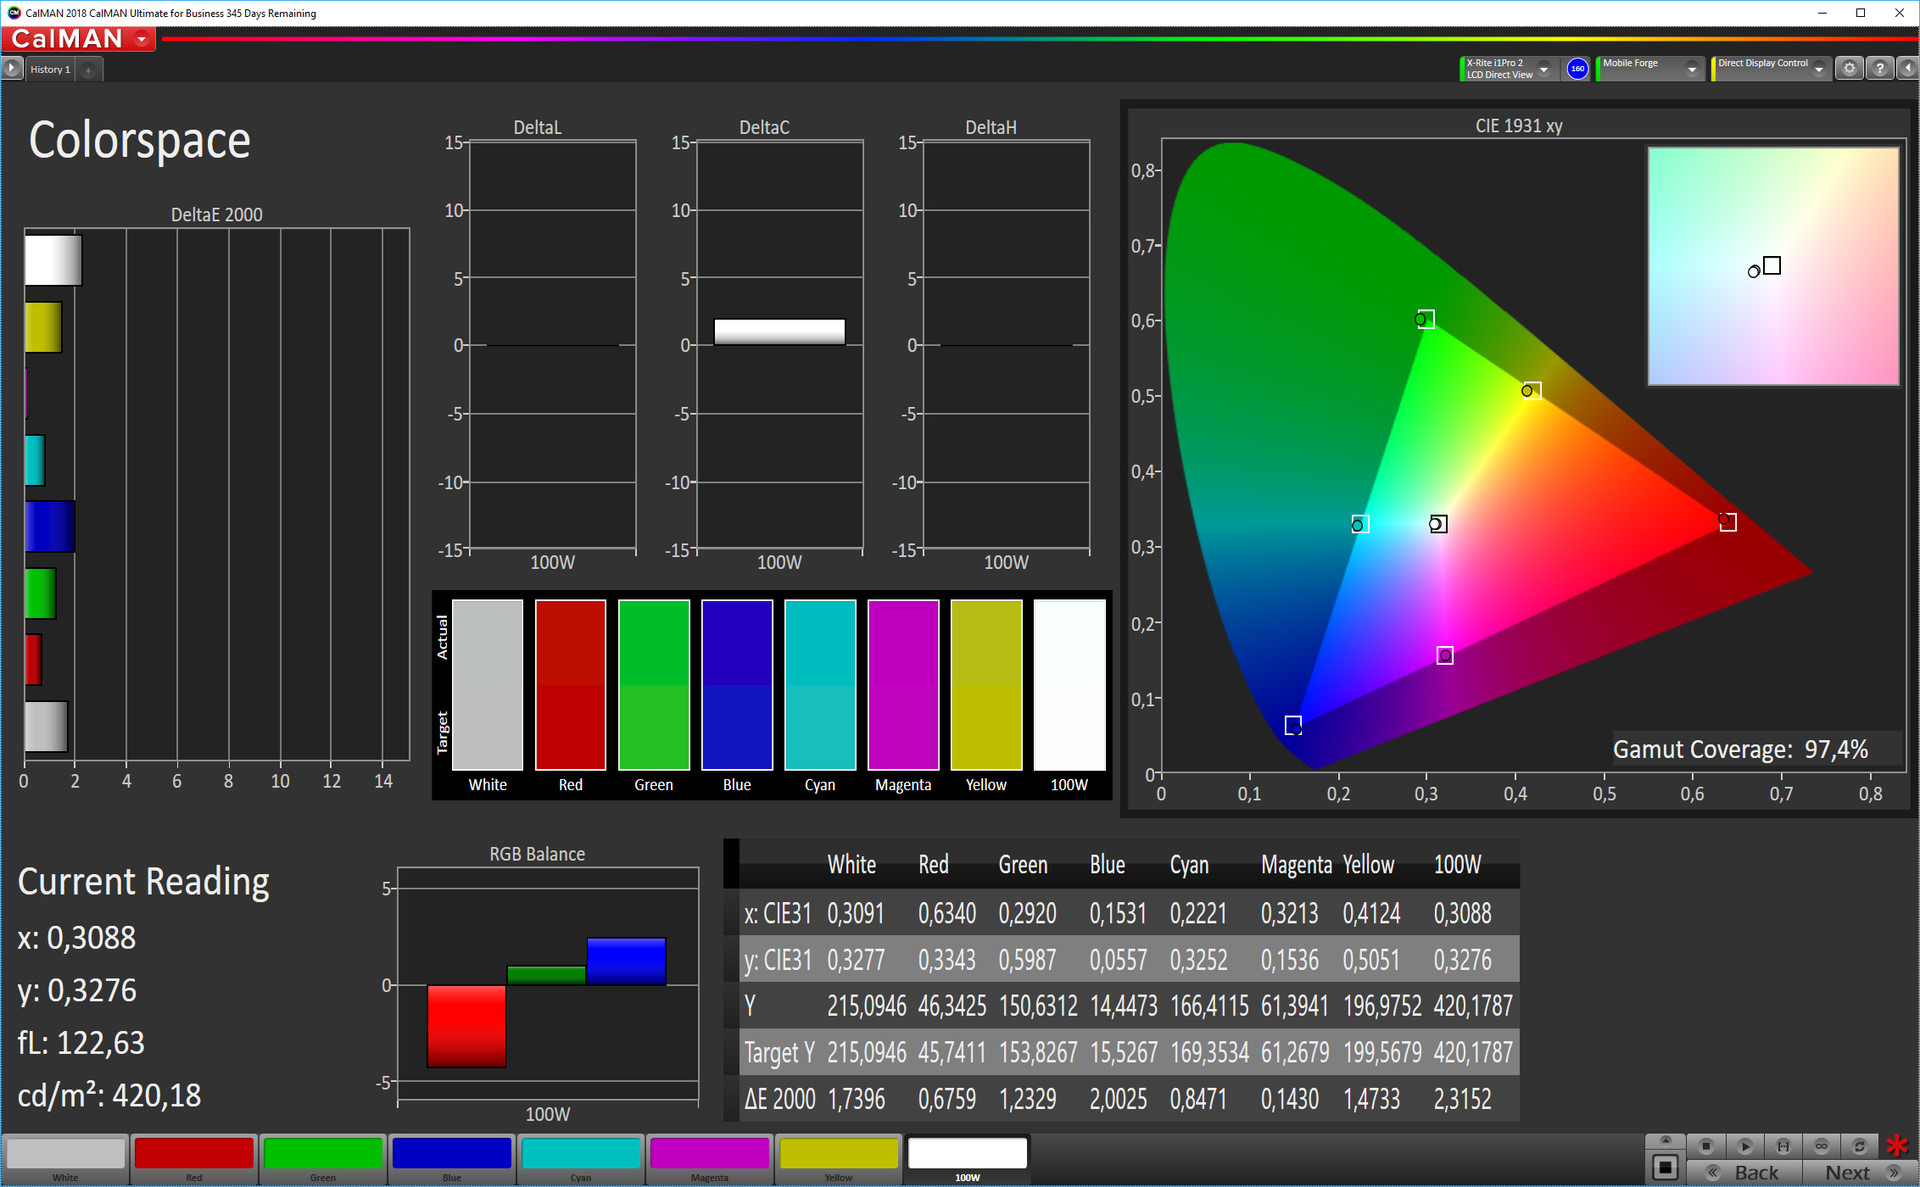
97.4% sRGB (Calman 2D)
Gamma: 2.23
| Huawei Mate 20 X OLED, 2244x1080, 7.20 | Xiaomi Mi Max 3 IPS, 2160x1080, 6.90 | Huawei Mate 20 Pro OLED, 3120x1440, 6.30 | Google Pixel 3 XL AMOLED, 2960x1440, 6.30 | Apple iPhone Xs Max OLED, 2688x1242, 6.50 | Samsung Galaxy Note 9 Super AMOLED, 2960x1440, 6.40 | |
|---|---|---|---|---|---|---|
| Screen | -54% | -4% | -60% | 1% | -122% | |
| Brightness middle | 421 | 508 21% | 576 37% | 410 -3% | 656 56% | 499 19% |
| Brightness | 418 | 505 21% | 582 39% | 413 -1% | 659 58% | 506 21% |
| Brightness Distribution | 96 | 91 -5% | 90 -6% | 97 1% | 88 -8% | 96 0% |
| Black Level * | 0.28 | |||||
| Colorchecker dE 2000 * | 1.1 | 2.85 -159% | 1.3 -18% | 3.16 -187% | 1.7 -55% | 4.62 -320% |
| Colorchecker dE 2000 max. * | 2.2 | 6.21 -182% | 3.5 -59% | 5.5 -150% | 2.8 -27% | 10.91 -396% |
| Greyscale dE 2000 * | 1.4 | 1.7 -21% | 1.6 -14% | 1.7 -21% | 1.7 -21% | 2.2 -57% |
| Gamma | 2.23 99% | 2.226 99% | 2.18 101% | 2.219 99% | 1.998 110% | 2.103 105% |
| CCT | 6723 97% | 6860 95% | 6561 99% | 6653 98% | 6487 100% | 6115 106% |
| Contrast | 1814 |
* ... smaller is better
Screen Flickering / PWM (Pulse-Width Modulation)
| Screen flickering / PWM detected | 242.7 Hz | ≤ 99 % brightness setting | 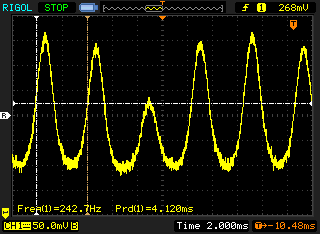 |
The display backlight flickers at 242.7 Hz (worst case, e.g., utilizing PWM) Flickering detected at a brightness setting of 99 % and below. There should be no flickering or PWM above this brightness setting. The frequency of 242.7 Hz is relatively low, so sensitive users will likely notice flickering and experience eyestrain at the stated brightness setting and below. In comparison: 53 % of all tested devices do not use PWM to dim the display. If PWM was detected, an average of 17900 (minimum: 5 - maximum: 3846000) Hz was measured. | |||
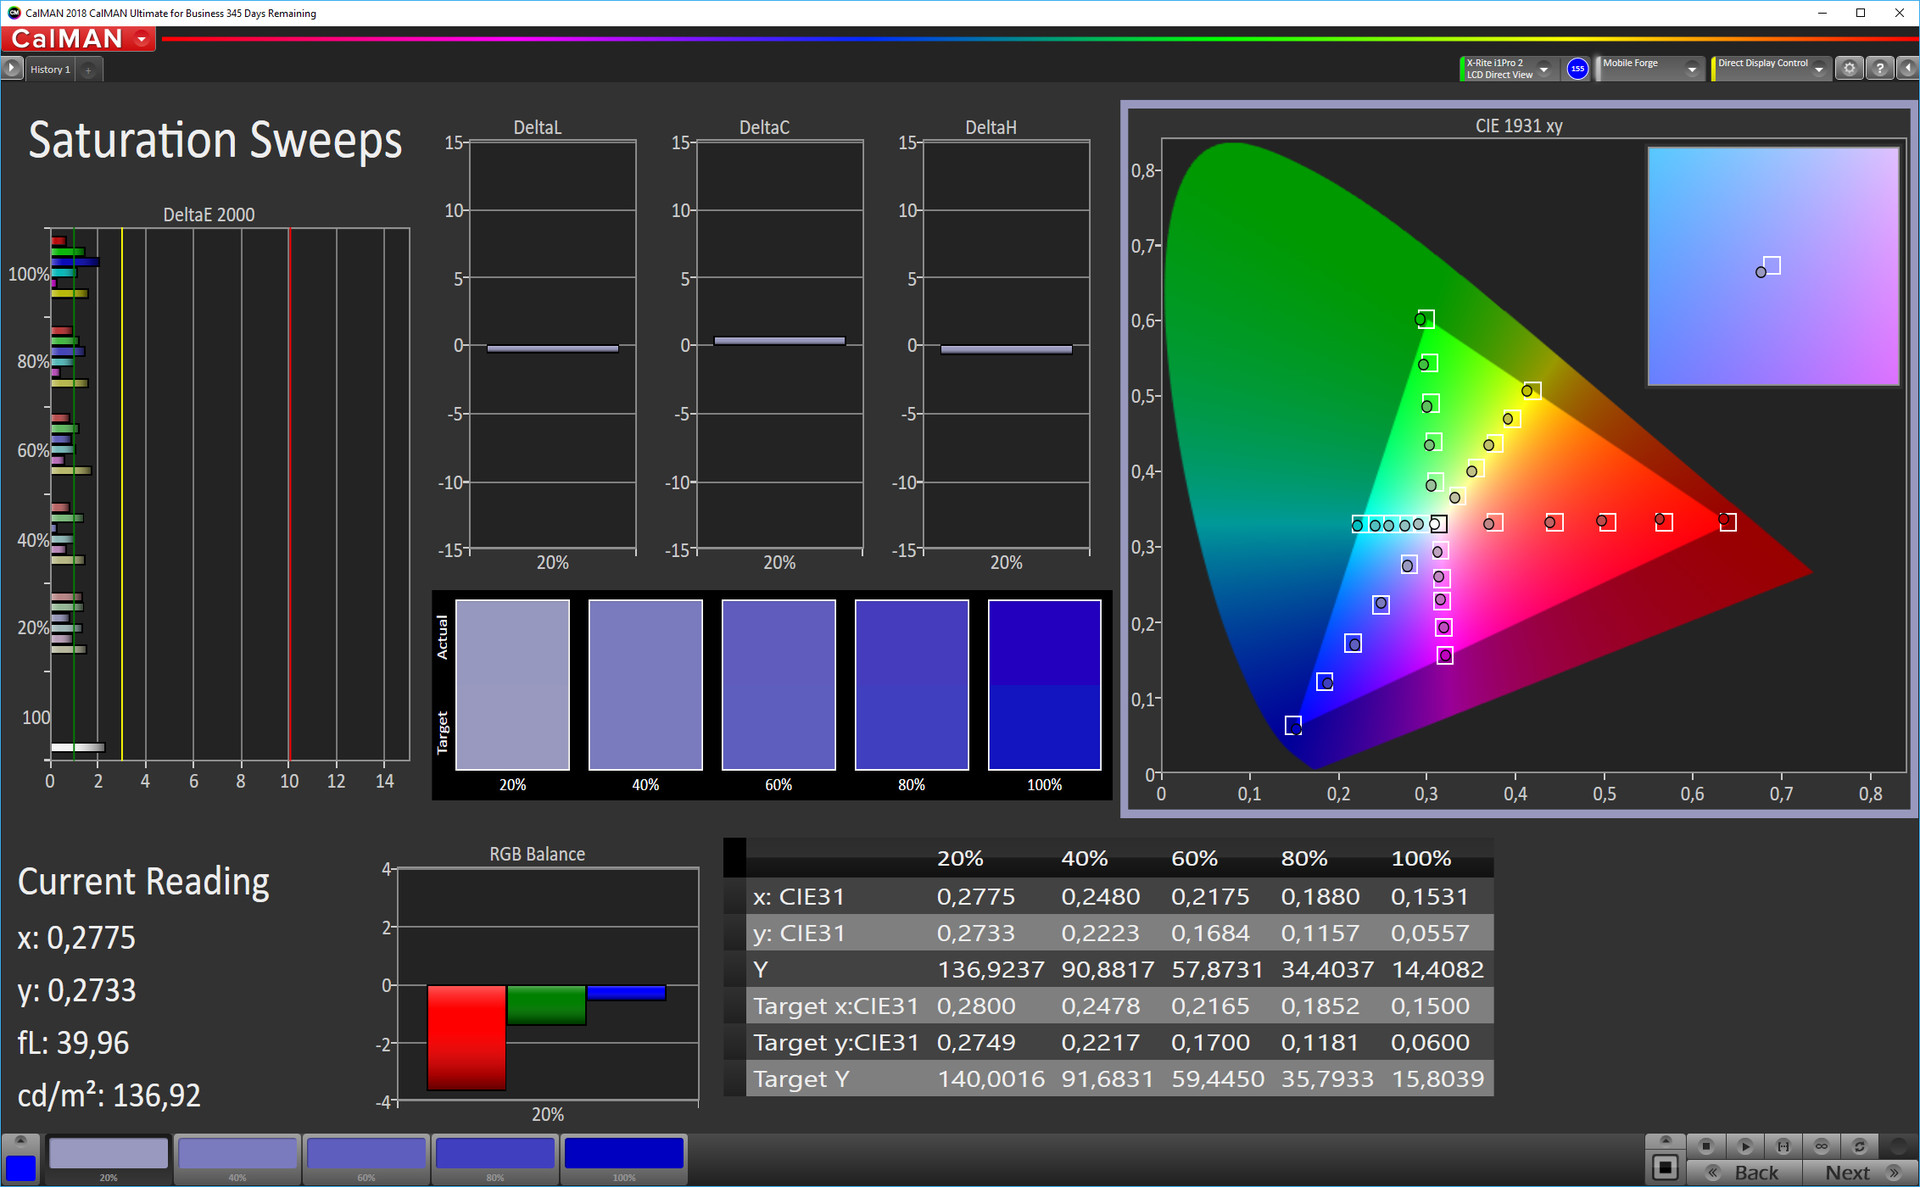
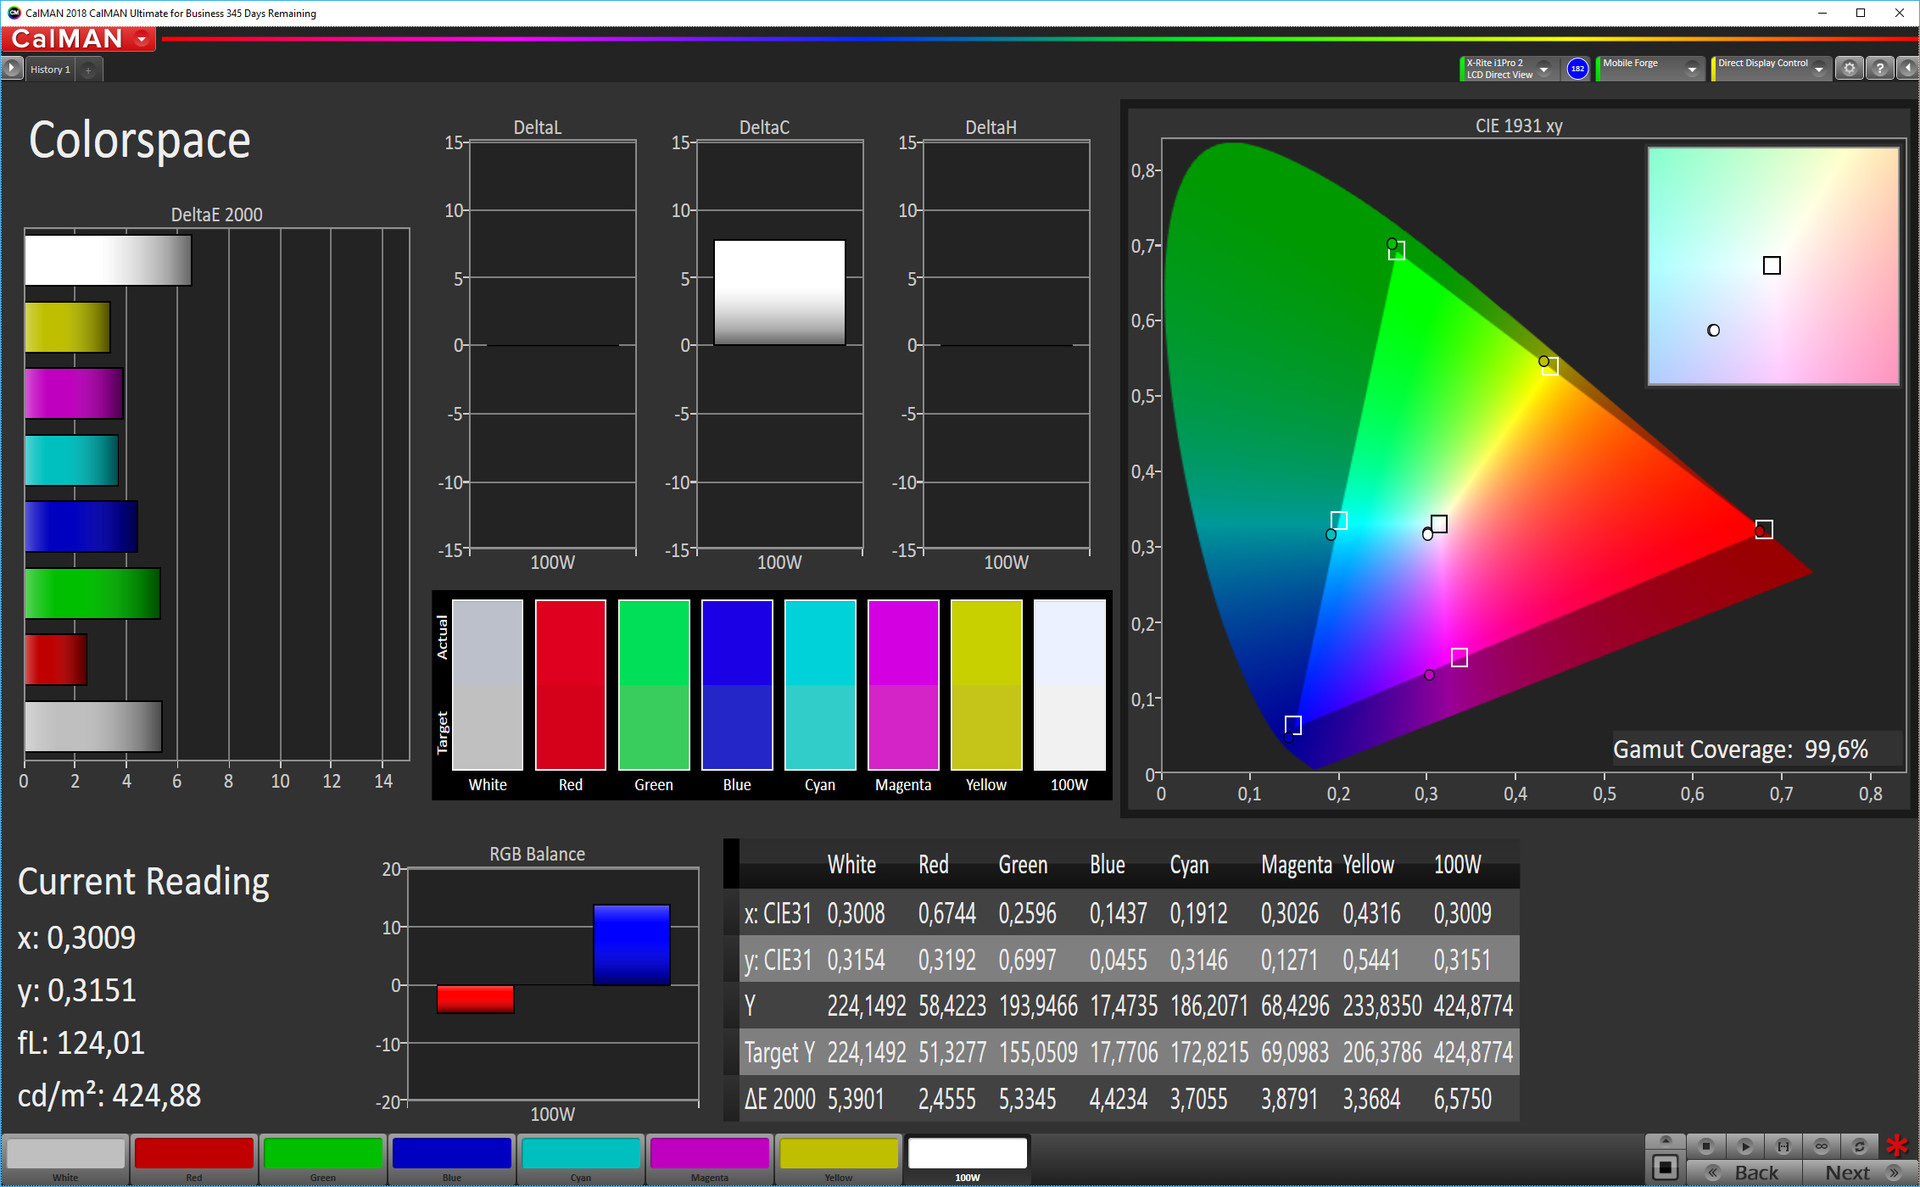
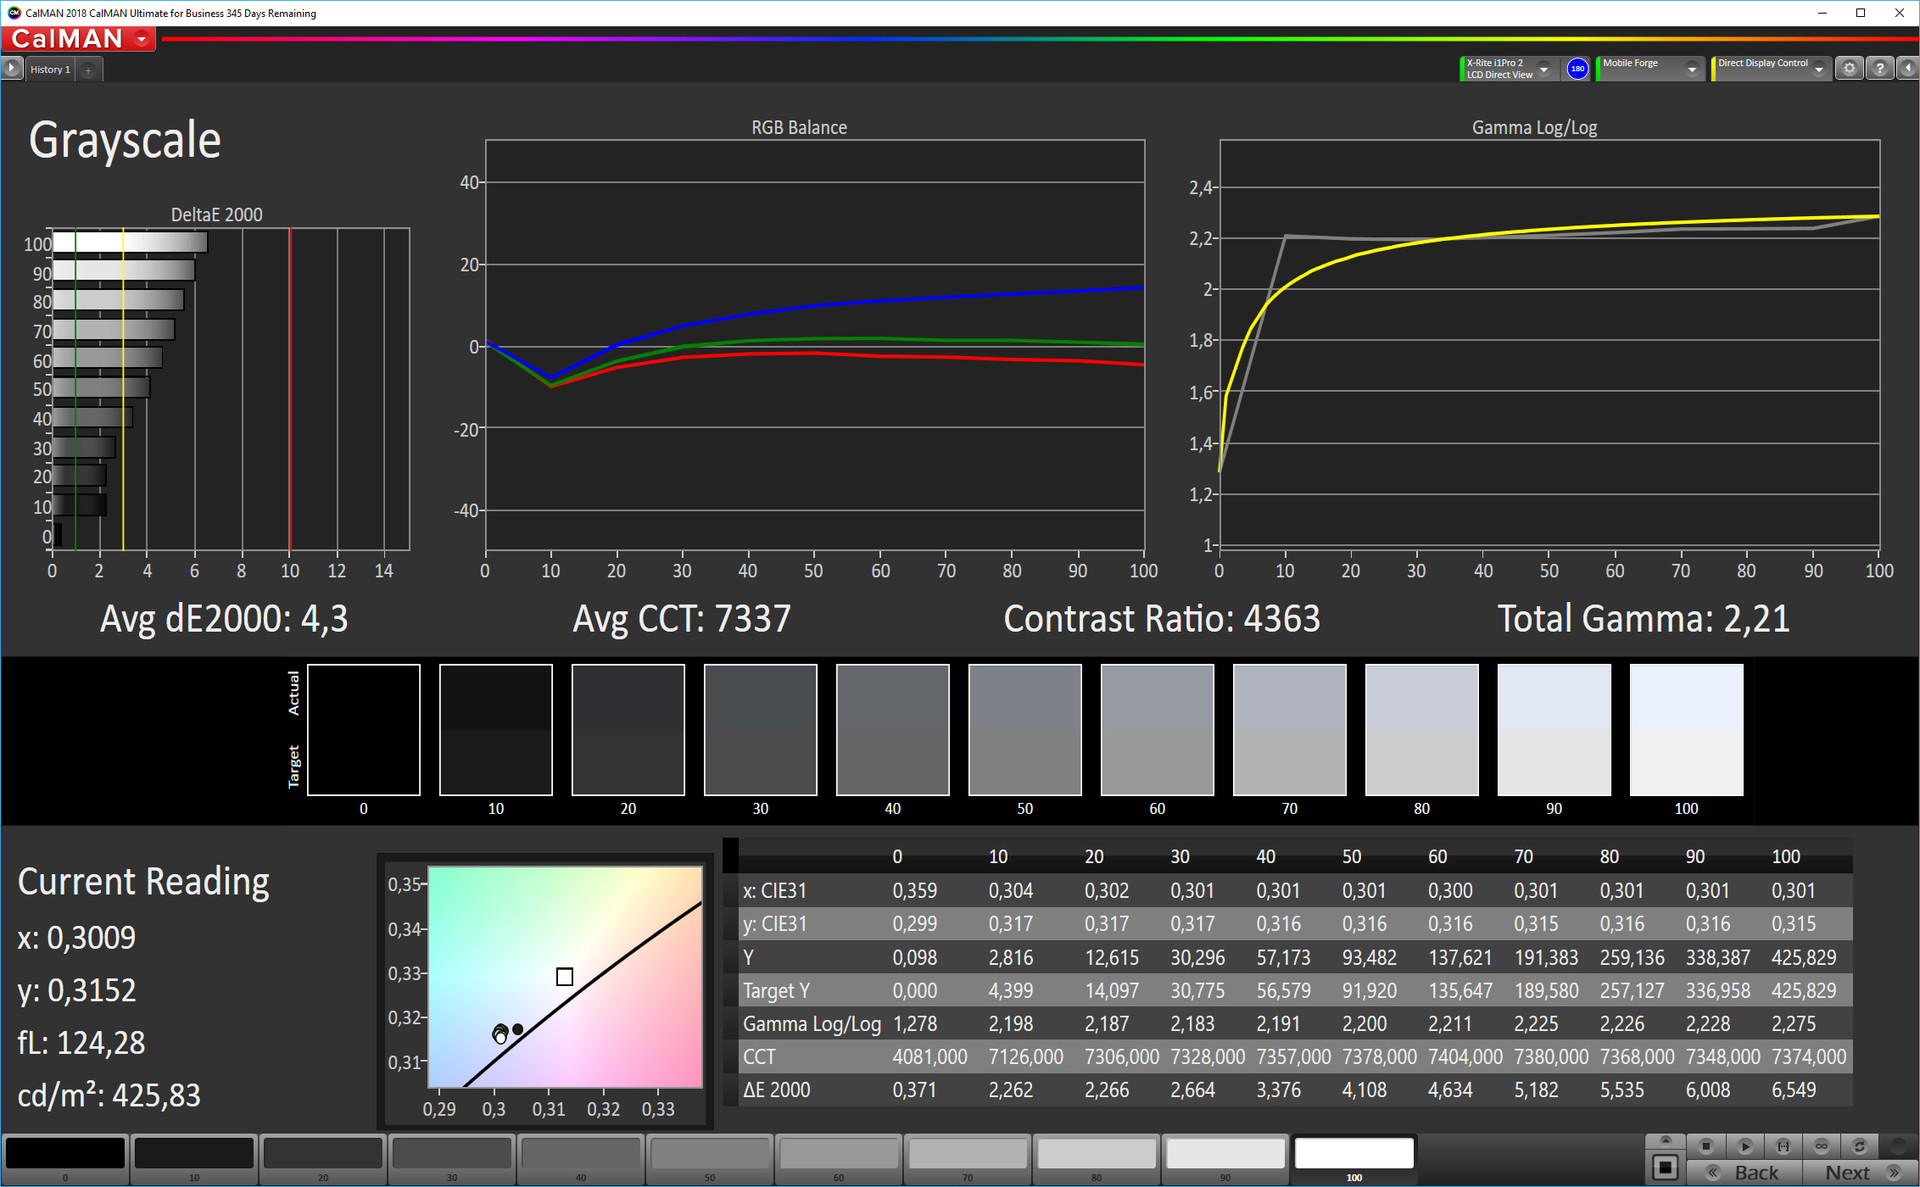
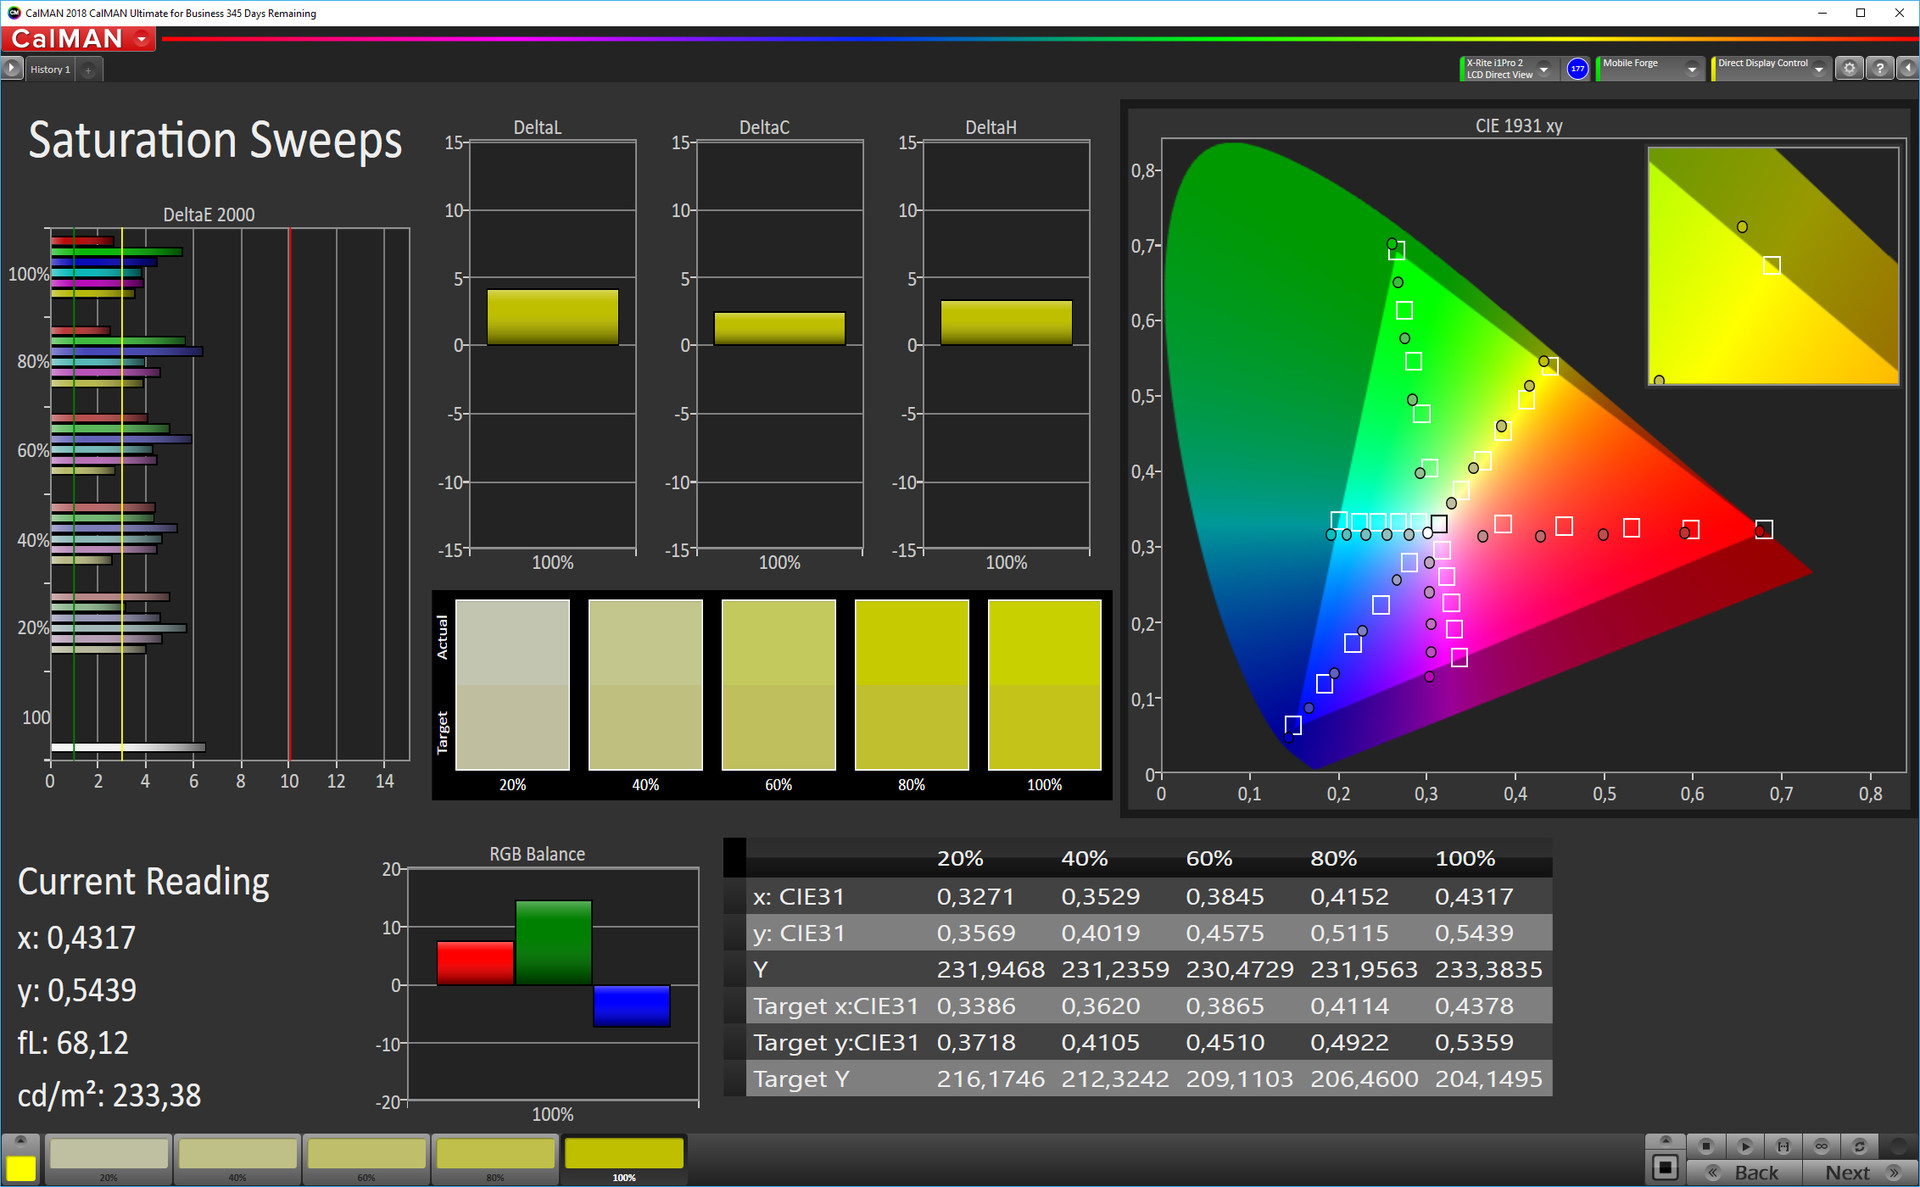
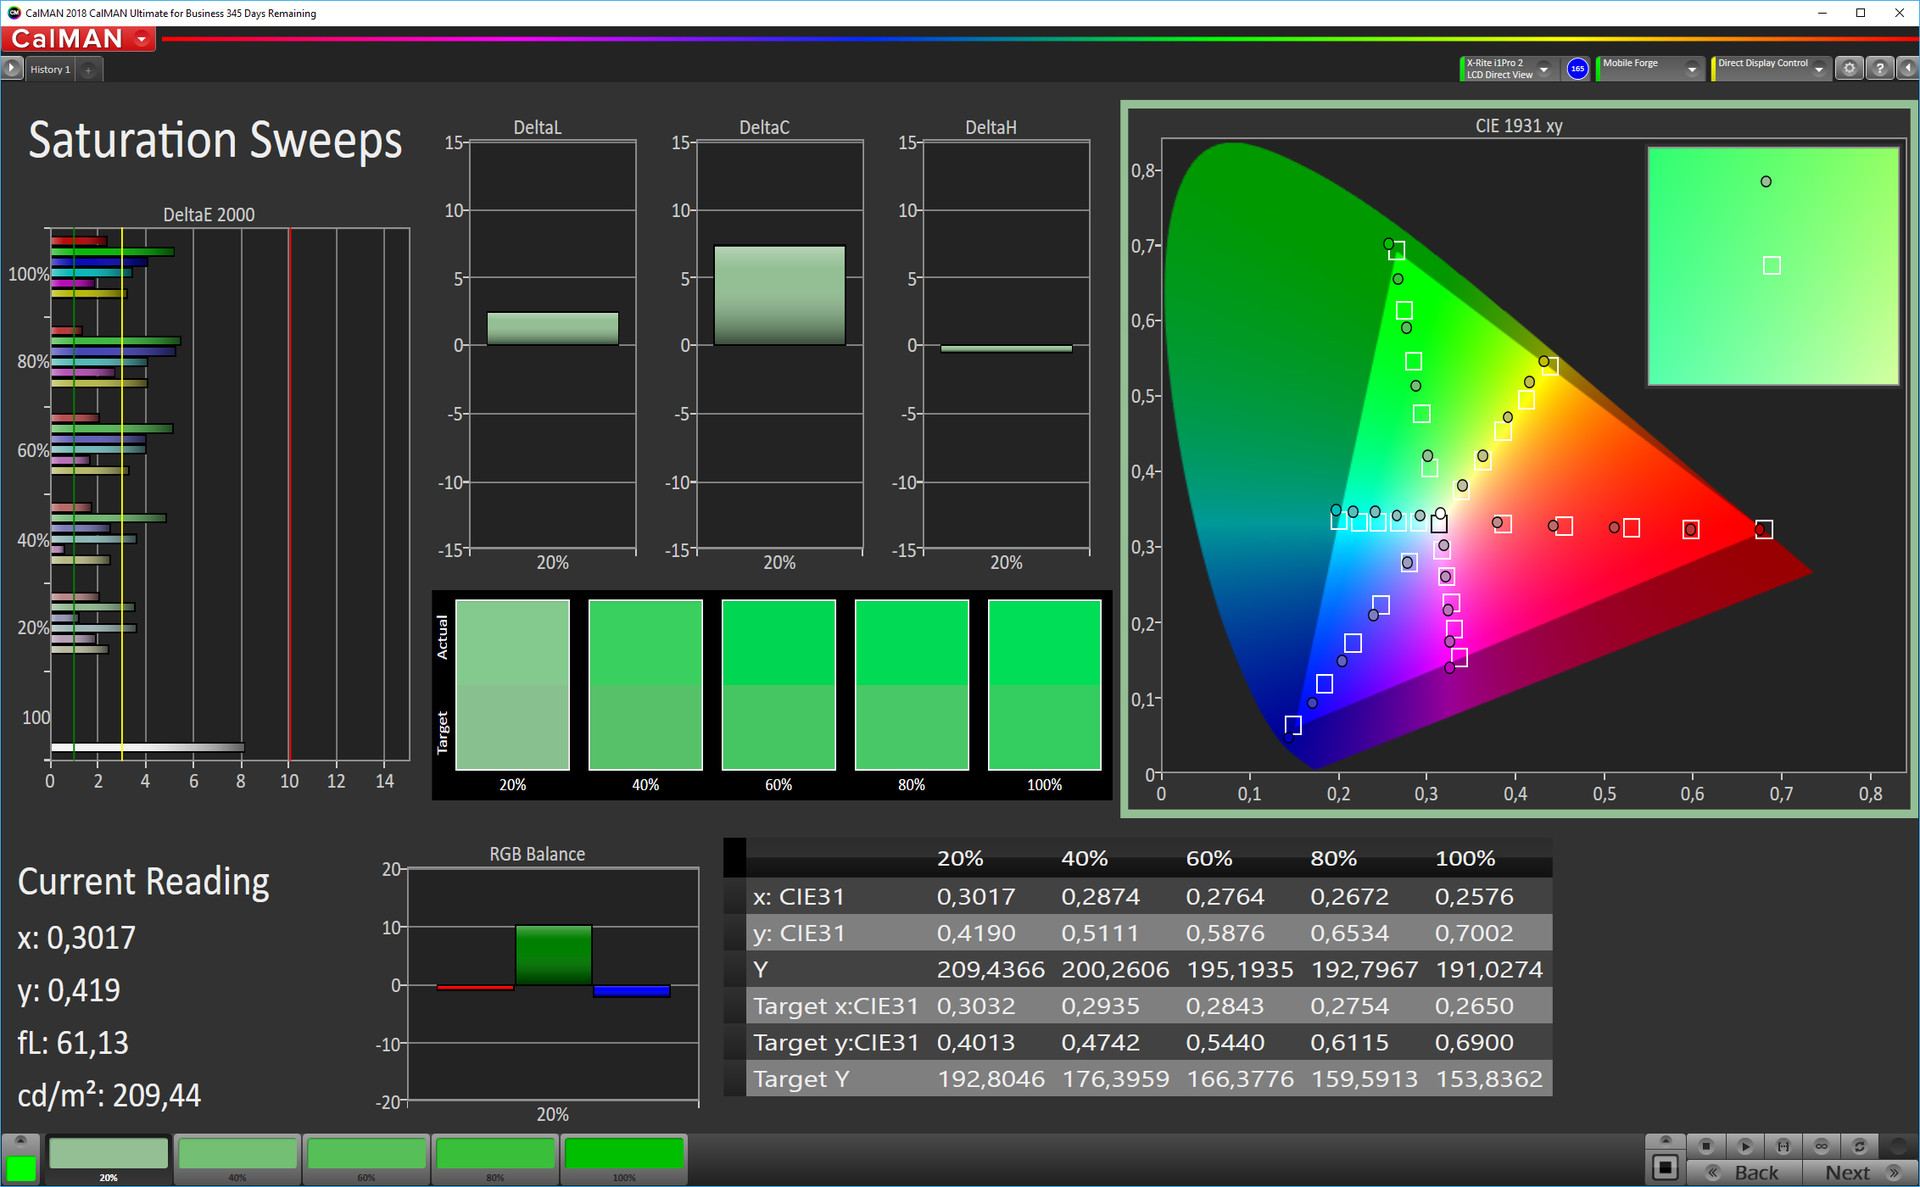
The Mate 20 X theoretically has an infinitely high contrast ratio and a 0 black value thanks to its OLED display technology. Huawei has included multiple colour profiles in the settings menu. There are Normal and Vivid colour modes, which are further delineated between Standard, Warm and Cold profiles. CalMAN analysis demonstrates that the Normal/Standard profile provides balanced colour reproduction. Conversely, the Standard/Vivid mode significantly increases blue tones, which results in a punchier and clearer image. The target colour space also changes from sRGB to P3 when the colour mode is switched to Vivid. Moreover, the Warm mode in the Vivid profile compensates for the increased amount of blue tones but retains the changed target colour space. Huawei has included a manual colour mode too should you wish to tinker with the colour reproduction of your Mate 20 X.
There is also an eye-safe mode that reduces the volume of blue light that the display emits. This can help reduce eye strain at night.

Display Response Times
| ↔ Response Time Black to White | ||
|---|---|---|
| 3.2 ms ... rise ↗ and fall ↘ combined | ↗ 1.2 ms rise | 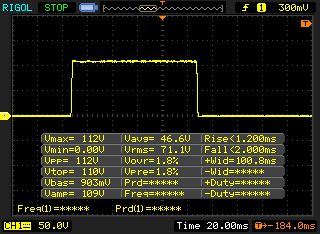 |
| ↘ 2 ms fall | ||
| The screen shows very fast response rates in our tests and should be very well suited for fast-paced gaming. In comparison, all tested devices range from 0.1 (minimum) to 240 (maximum) ms. » 9 % of all devices are better. This means that the measured response time is better than the average of all tested devices (21.5 ms). | ||
| ↔ Response Time 50% Grey to 80% Grey | ||
| 3.6 ms ... rise ↗ and fall ↘ combined | ↗ 2 ms rise | 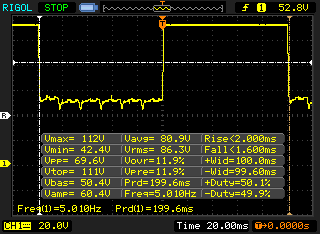 |
| ↘ 1.6 ms fall | ||
| The screen shows very fast response rates in our tests and should be very well suited for fast-paced gaming. In comparison, all tested devices range from 0.2 (minimum) to 636 (maximum) ms. » 9 % of all devices are better. This means that the measured response time is better than the average of all tested devices (33.7 ms). | ||
The Mate 20 X is easy to use outdoors. However, we would recommend avoiding direct sunlight where possible as the display does not get bright enough to overcome reflections. You should have no problems reading the screen in the shade or on a cloudy day.

The Mate 20 X has stable viewing angles thanks to its OLED display. The screen can be read from almost any angle without any brightness, colour or image distortions. We noticed a slight green tint at acute viewing angles, but we doubt that this would be an issue for most people in daily use.

Performance
Huawei has equipped the Mate 20 X with its high-end Kirin 980 SoC. The Kirin 980 integrates an ARM Mali-G76 MP10 GPU, which combine to create a powerful package that can handle all complex applications and games. Huawei complements the SoC with 6 GB of RAM and 128 GB of UFS 2.1 of flash storage, which should ensure smooth system performance and plenty of storage space for years to come.
Our test device generally finished in the midfield of benchmark comparison tables, but the Mate 20 X still scores well above average. Additionally, the Mate 20 Pro achieves better scores with the same hardware, despite having a higher resolution screen.
We disabled the performance mode for the purposes of our tests, but we will briefly outline the difference in benchmark scores below. Strikingly, the Geekbench 4.1/4.2 RenderScript score rises significantly to 10,006 points with performance mode activated compared to the 5,759 points that our test device scored initially, while the AnTuTu v7 score rose by over 30,000 points to 307,202. It is worth keeping in mind that the performance mode considerably worsens the battery life though, so we would advise against keeping this permanently switched on.
| AnTuTu v7 - Total Score (sort by value) | |
| Huawei Mate 20 X | |
| Xiaomi Mi Max 3 | |
| Huawei Mate 20 Pro | |
| Google Pixel 3 XL | |
| Apple iPhone Xs Max | |
| Samsung Galaxy Note 9 | |
| Average HiSilicon Kirin 980 (268359 - 322616, n=10) | |
| AnTuTu v6 - Total Score (sort by value) | |
| Huawei Mate 20 X | |
| Xiaomi Mi Max 3 | |
| Huawei Mate 20 Pro | |
| Google Pixel 3 XL | |
| Samsung Galaxy Note 9 | |
| Average HiSilicon Kirin 980 (245662 - 254229, n=9) | |
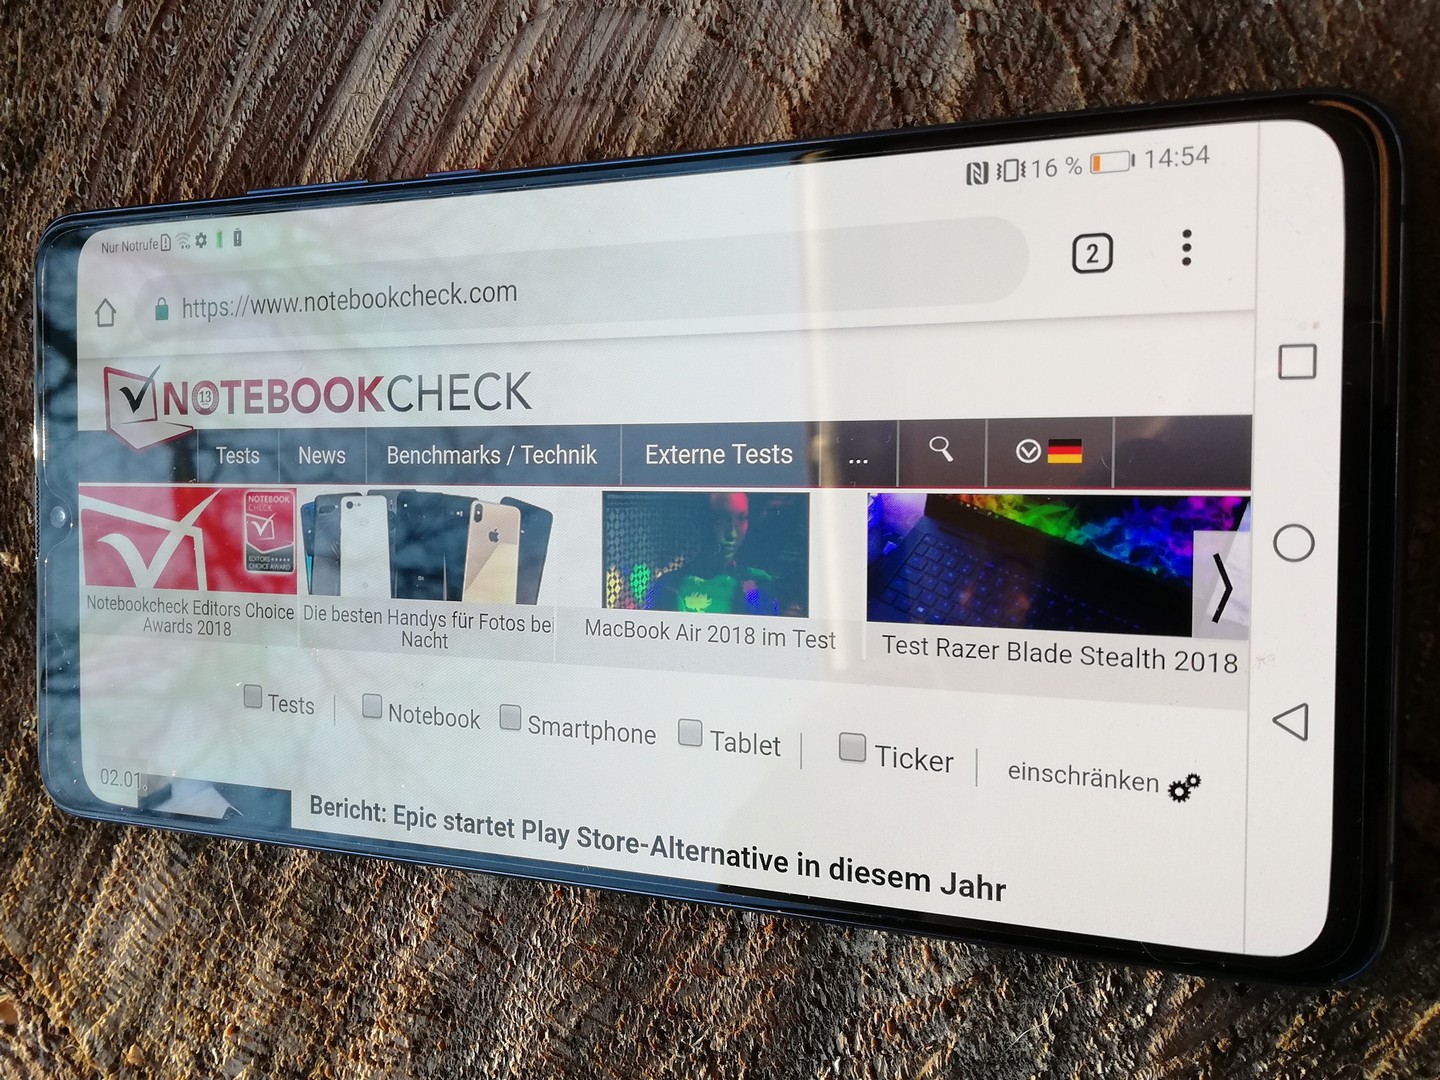
Browser benchmark results provide a similar picture to CPU and GPU benchmarks. Again, the Mate 20 X typically finished in the middle of our comparison table, but web browsing feels smooth in daily use. Even media content loads quickly, which is not always the case on other devices.
| JetStream 1.1 - Total Score | |
| Apple iPhone Xs Max (Safari 12) | |
| Huawei Mate 20 Pro (Chrome 69) | |
| Average of class Smartphone (last 2 years) | |
| Average HiSilicon Kirin 980 (93.2 - 109.9, n=9) | |
| Huawei Mate 20 X (hrome 71) | |
| Google Pixel 3 XL (Chrome 70) | |
| Samsung Galaxy Note 9 (Chrome 68) | |
| Xiaomi Mi Max 3 (Chrome 69) | |
| Octane V2 - Total Score | |
| Apple iPhone Xs Max (Safari 12) | |
| Average of class Smartphone (4633 - 89112, n=212, last 2 years) | |
| Huawei Mate 20 Pro (Chrome 69) | |
| Average HiSilicon Kirin 980 (20618 - 23285, n=10) | |
| Huawei Mate 20 X (hrome 71) | |
| Google Pixel 3 XL (Chrome 70) | |
| Samsung Galaxy Note 9 (Chrome 68) | |
| Xiaomi Mi Max 3 (Chrome 69) | |
| Mozilla Kraken 1.1 - Total | |
| Xiaomi Mi Max 3 (Chrome 69) | |
| Google Pixel 3 XL (Chrome 70) | |
| Samsung Galaxy Note 9 (Chrome 68) | |
| Average HiSilicon Kirin 980 (1948 - 3098, n=10) | |
| Huawei Mate 20 X (hrome 71) | |
| Huawei Mate 20 Pro (Chrome 69) | |
| Average of class Smartphone (388 - 9999, n=173, last 2 years) | |
| Apple iPhone Xs Max (Safari 12) | |
| WebXPRT 3 - Overall | |
| Apple iPhone Xs Max (Safari 12) | |
| Average of class Smartphone (39 - 304, n=122, last 2 years) | |
| Huawei Mate 20 Pro (Chrome 69) | |
| Average HiSilicon Kirin 980 (86 - 124, n=10) | |
| Google Pixel 3 XL (Chrome 70) | |
| Huawei Mate 20 X (hrome 71) | |
| Samsung Galaxy Note 9 (Chrome 68) | |
| WebXPRT 2015 - Overall | |
| Apple iPhone Xs Max (Safari 12) | |
| Huawei Mate 20 Pro (Chrome 69) | |
| Google Pixel 3 XL (Chrome 70) | |
| Average HiSilicon Kirin 980 (228 - 334, n=5) | |
| Huawei Mate 20 X (hrome 71) | |
| Samsung Galaxy Note 9 (Chrome 68) | |
| Xiaomi Mi Max 3 (Chrome 69) | |
* ... smaller is better
The Mate 20 X performed well in AndroBench 3-5 and outscored many of our comparison devices. The UFS 2.1 memory is faster than average and even beat the UFS 2.1 storage in the Mate 20 Pro in some tests. Please note that our test device had around 110 GB of its advertised 128 GB storage available upon delivery.
Huawei has also equipped the Mate 20 X with a fast memory card reader, which we tested with our reference 128 GB Huawei NM card. The card reader achieved better transfer rates than many of our microSD equipped comparison devices, but the speed difference is negligible at best. In short, NM cards are not currently worth the additional outlay compared to buying a microSD card.
| Huawei Mate 20 X | Xiaomi Mi Max 3 | Huawei Mate 20 Pro | Google Pixel 3 XL | Samsung Galaxy Note 9 | Average 128 GB UFS 2.1 Flash | Average of class Smartphone | |
|---|---|---|---|---|---|---|---|
| AndroBench 3-5 | -33% | -4% | -17% | -20% | -3% | 165% | |
| Sequential Read 256KB | 912 | 274.6 -70% | 853 -6% | 633 -31% | 805 -12% | 760 ? -17% | 1502 ? 65% |
| Sequential Write 256KB | 182.7 | 185.4 1% | 196.4 7% | 228.6 25% | 196 7% | 297 ? 63% | 1111 ? 508% |
| Random Read 4KB | 144.4 | 72.9 -50% | 157.4 9% | 120.8 -16% | 134 -7% | 152.9 ? 6% | 247 ? 71% |
| Random Write 4KB | 237.6 | 87.1 -63% | 157.8 -34% | 132.7 -44% | 21 -91% | 131.6 ? -45% | 271 ? 14% |
| Sequential Read 256KB SDCard | 83.1 ? | 83.8 ? 1% | 83.2 ? 0% | 77 ? -7% | 76 ? -9% | ||
| Sequential Write 256KB SDCard | 72 ? | 60.3 ? -16% | 72.4 ? 1% | 66.7 ? -7% | 59.6 ? -17% |
Games
The Mate 20 X is well suited for playing games with its large display and its powerful SoC. Moreover, the touchscreen and accelerometer react quickly and do not cause any issues when playing fast-paced games.
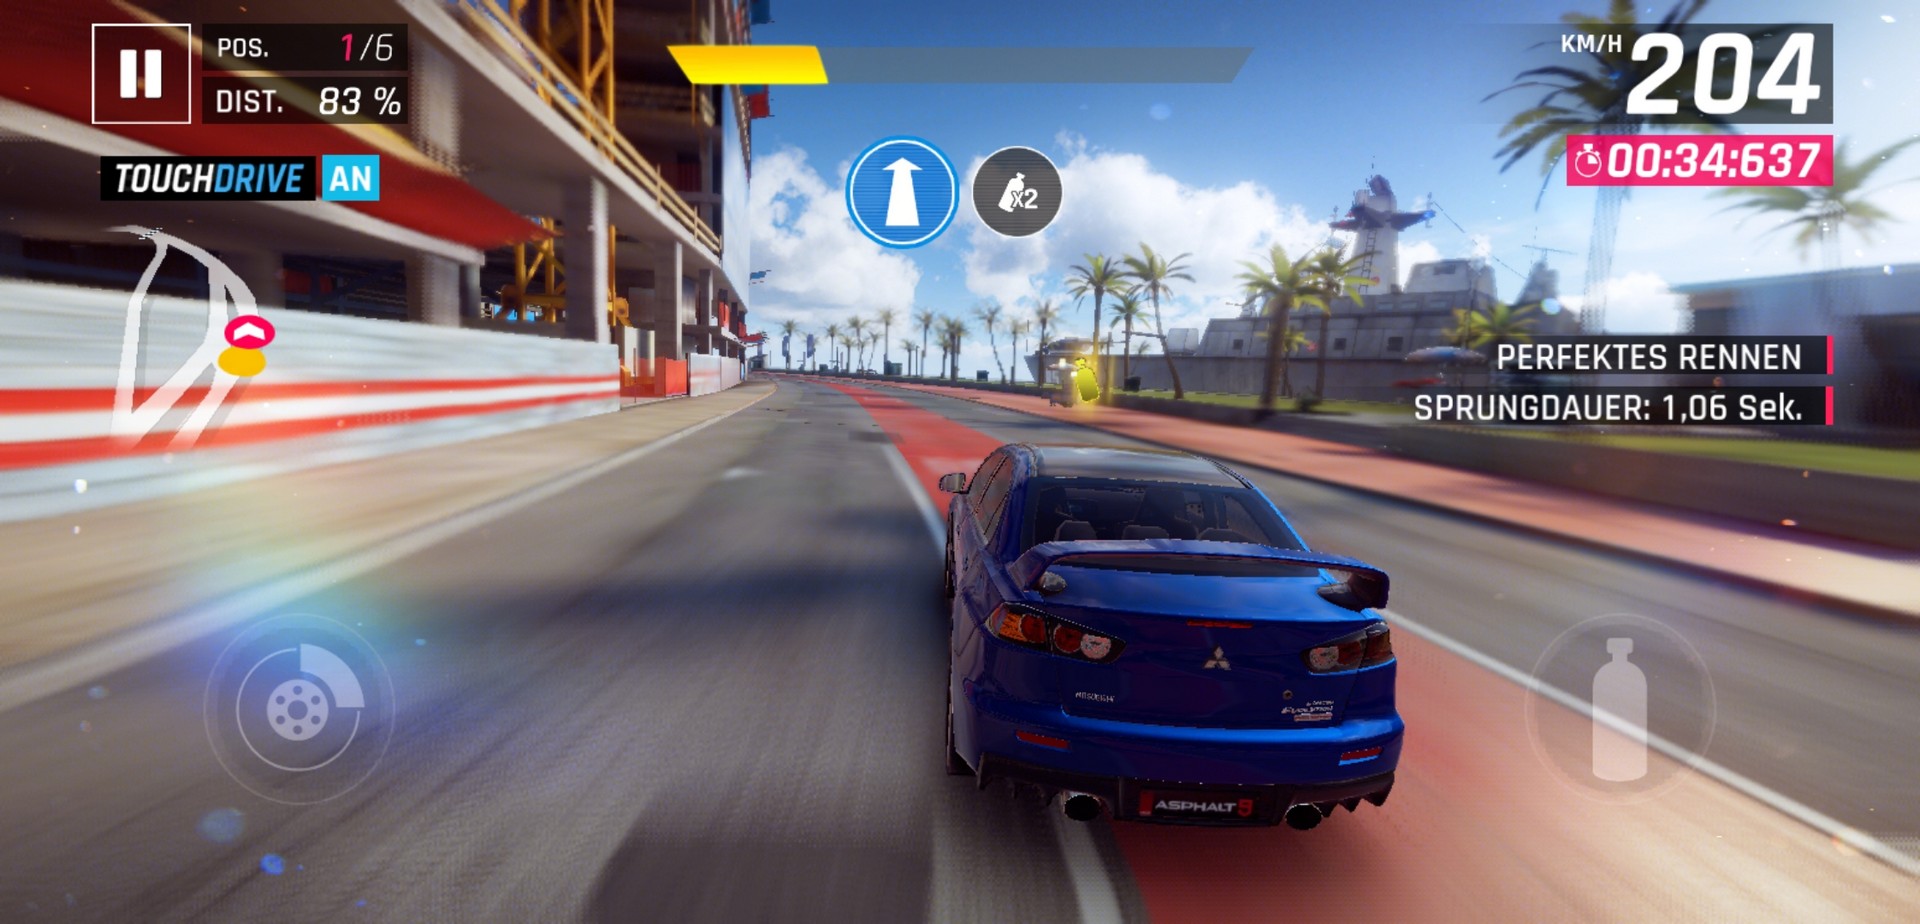
"Arena of Valor" and "Asphalt 9: Legends" both ran smoothly on our test device at high graphics. The latter averaged 29.9 FPS at both medium/low and High/HD presets, which indicates that the system has limited framerates for some reason. We did not notice any drop in framerates even over extended gaming sessions.
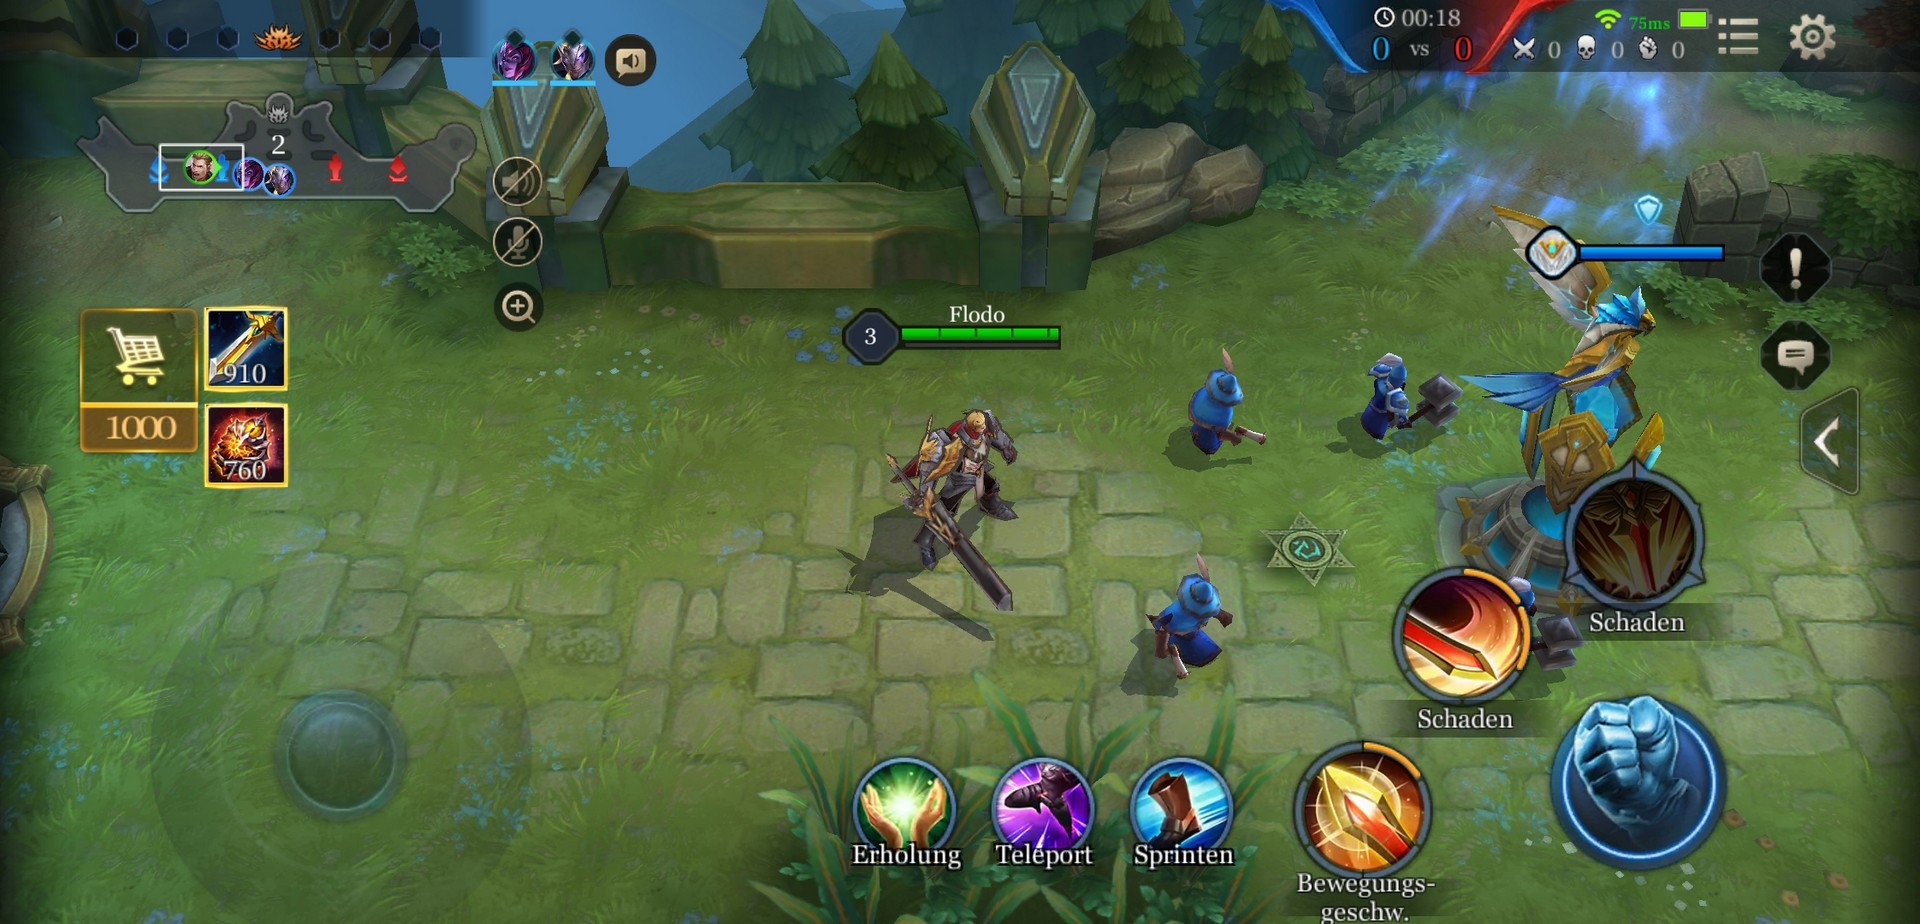
Arena of Valor
Asphalt 9: Legends
Emissions
Temperature
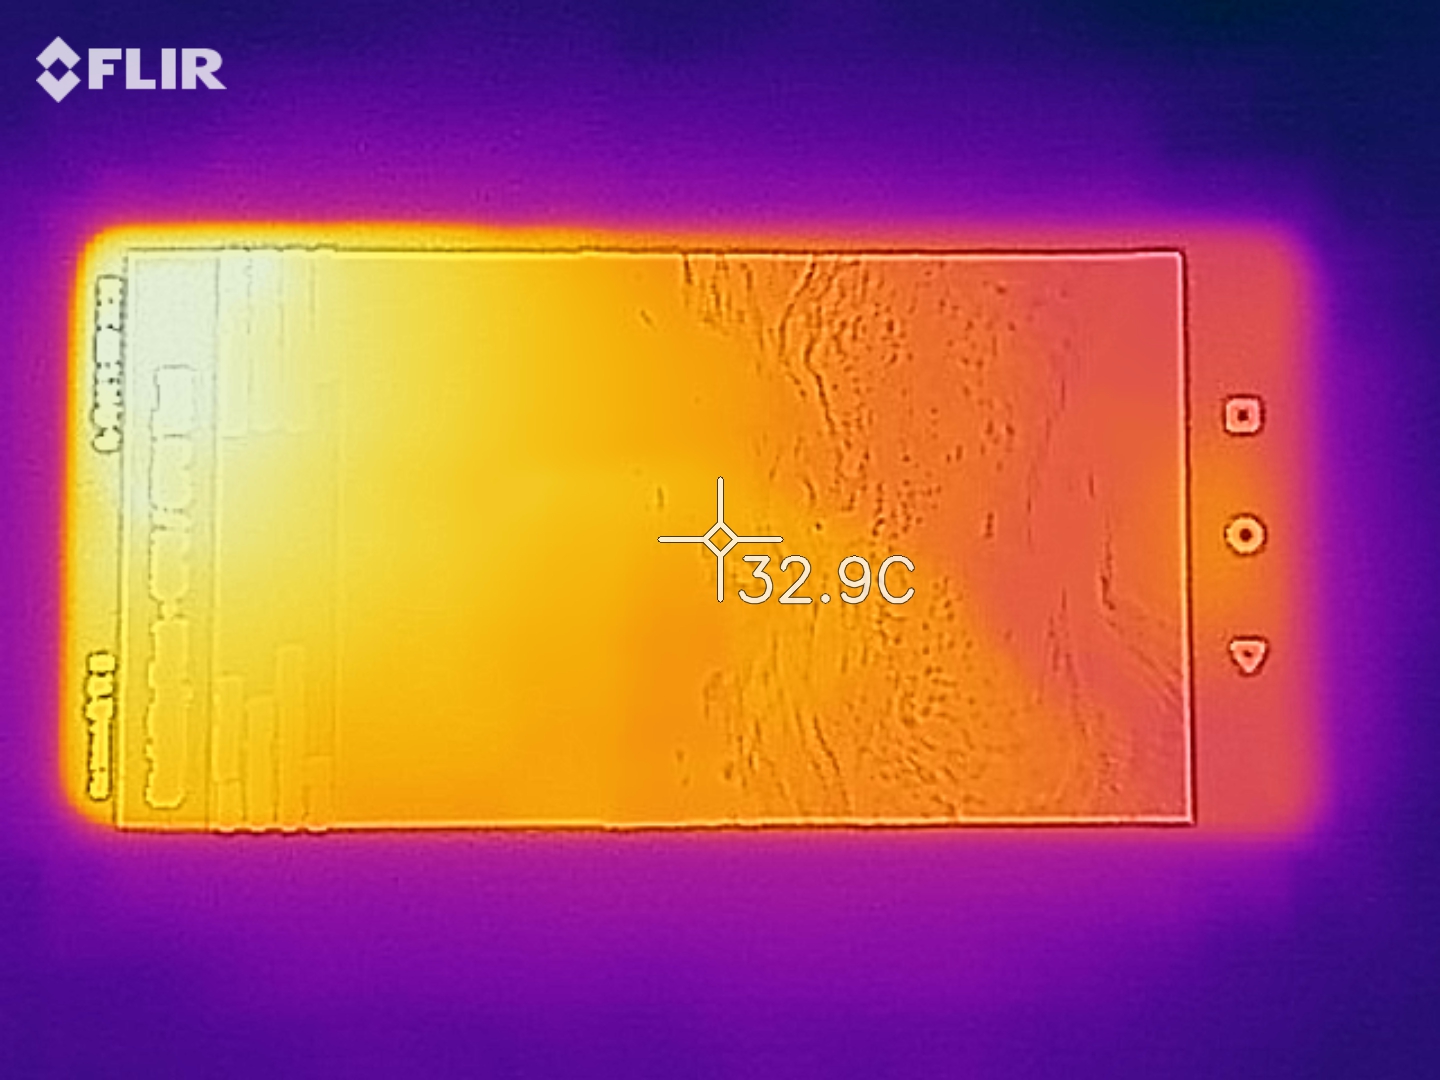
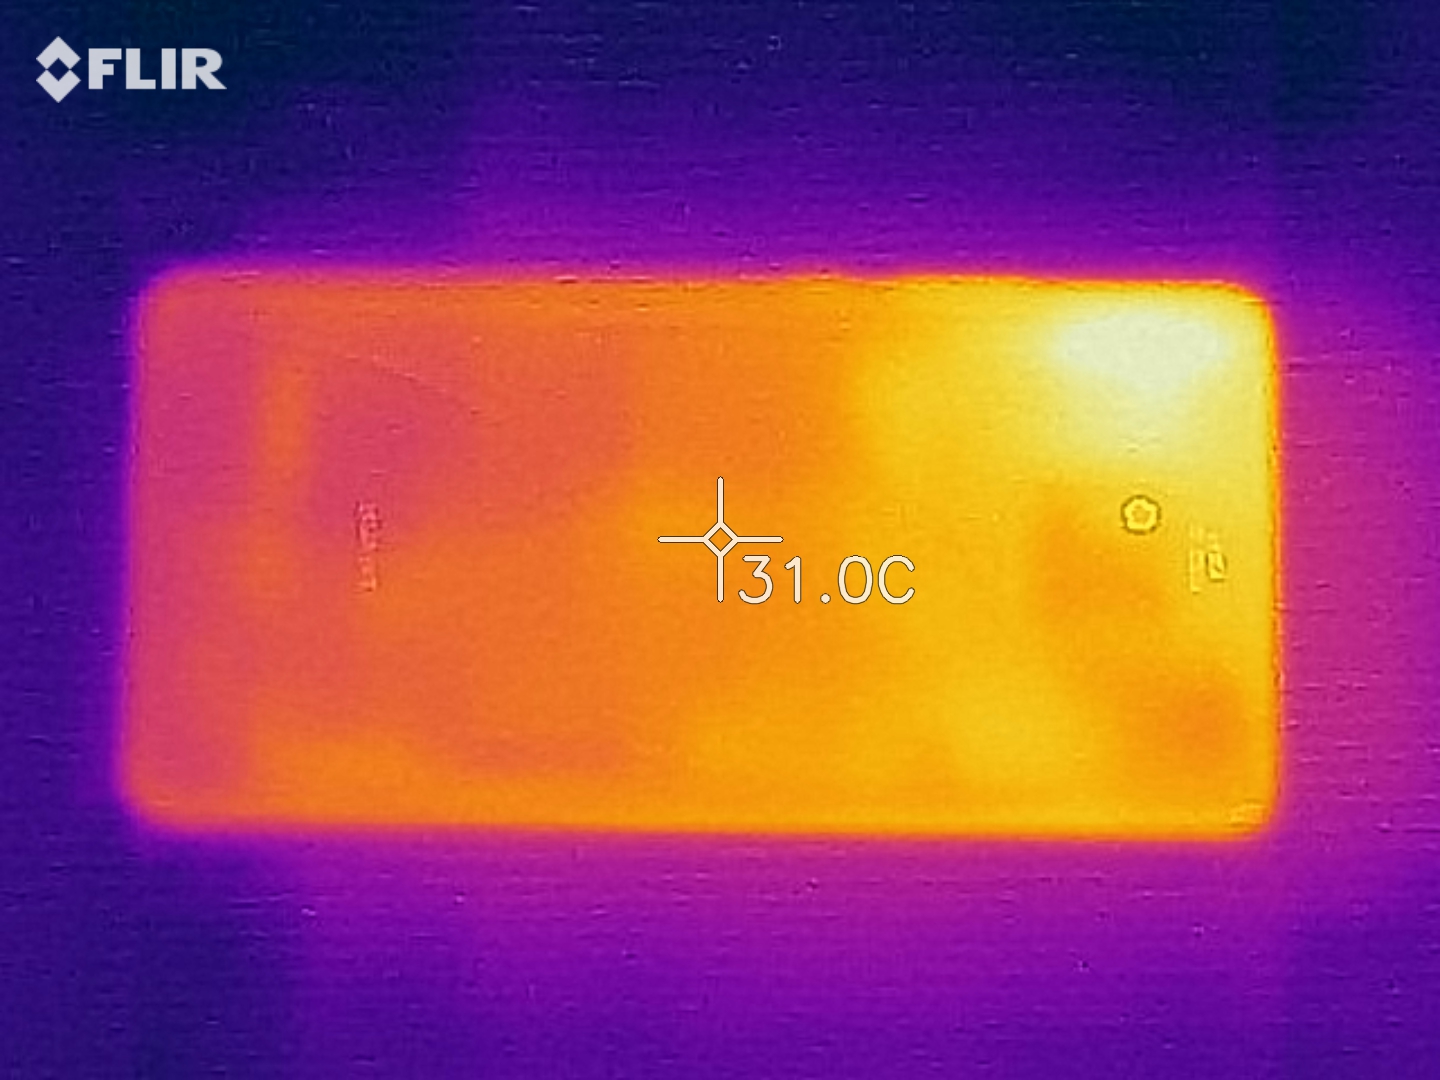
The Mate 20 X manages its surface temperatures well. Our test device reached a maximum of 28 °C (~82 °F) at idle, which then rose to a maximum of 35 °C (~95 °F) when we pushed the device hard. Hence, the Mate 20 X runs cool enough to hold in your hand comfortably during long gaming sessions.
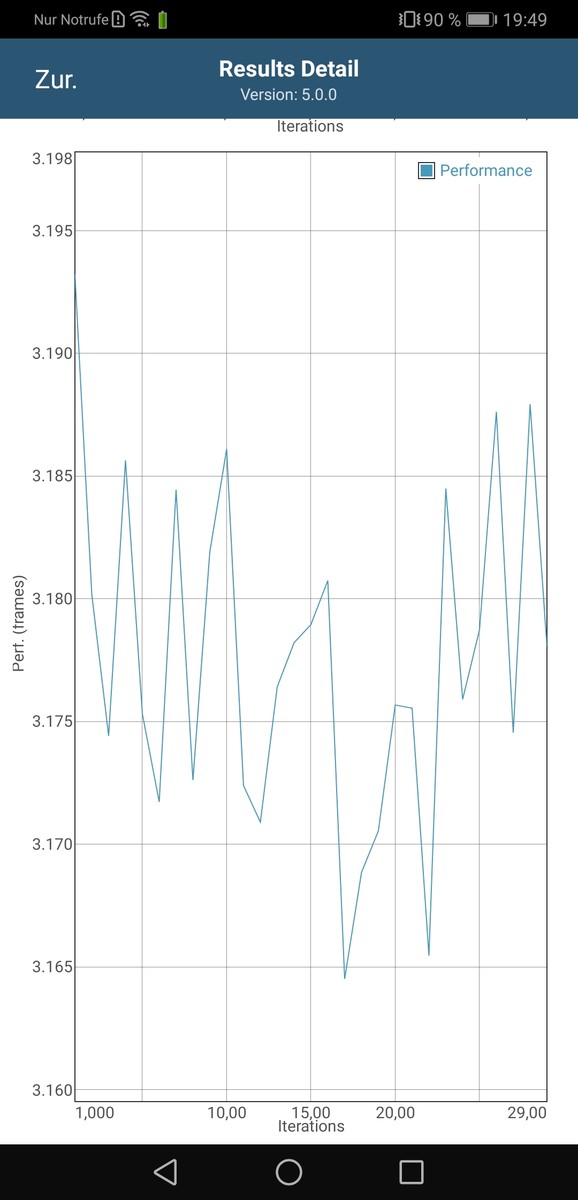
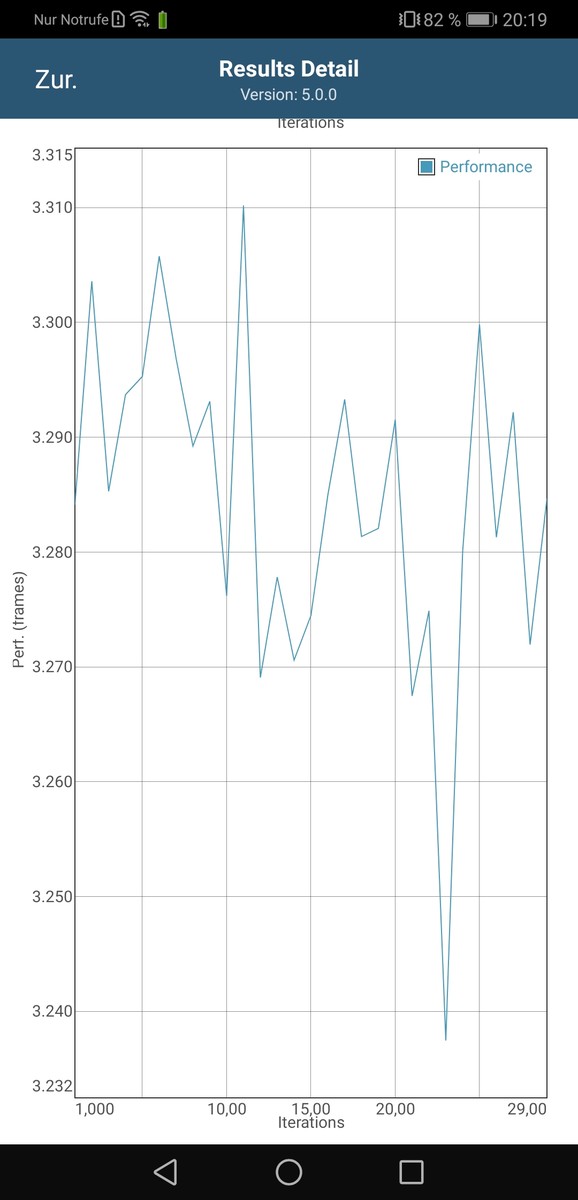
We also subjected the Mate 20 X to a looped GFXBench battery test to determine how well it manages its performance under sustained load. Our test device performed well overall, although there were some dips in framerates at certain points of the benchmark loop. The framerates returned to initial levels by the end of the benchmark loop though, so the Mate 20 X should not thermal throttle in daily use.
(+) The maximum temperature on the upper side is 33.6 °C / 92 F, compared to the average of 35 °C / 95 F, ranging from 21.9 to 56 °C for the class Smartphone.
(+) The bottom heats up to a maximum of 34.7 °C / 94 F, compared to the average of 33.8 °C / 93 F
(+) In idle usage, the average temperature for the upper side is 27.4 °C / 81 F, compared to the device average of 32.7 °C / 91 F.
Speakers
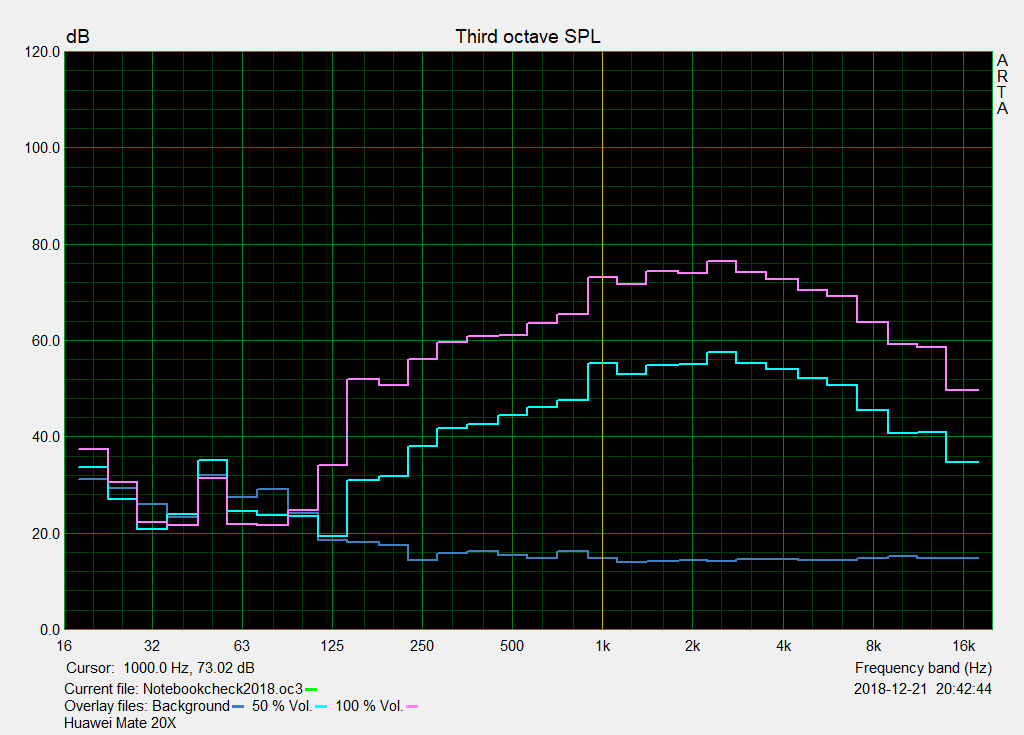
The Mate 20 X has stereo speakers that are on the top and underside of the device. The speakers get relatively loud and reproduce mid tones well. Music and media content generally sounds decent, so you will not need to rush for some headphones if you want to watch or listen to something.
The Mate 20 X also has a headphone jack, which is increasingly becoming a rarity among flagship smartphones. The device also supports Bluetooth 5.0 and can output using BLE, SBC, AAC, aptX, aptX HD, LDAC or HWA audio codecs.
Huawei Mate 20 X audio analysis
(+) | speakers can play relatively loud (84.1 dB)
Bass 100 - 315 Hz
(-) | nearly no bass - on average 17.3% lower than median
(±) | linearity of bass is average (13.8% delta to prev. frequency)
Mids 400 - 2000 Hz
(±) | higher mids - on average 5.7% higher than median
(+) | mids are linear (4.6% delta to prev. frequency)
Highs 2 - 16 kHz
(±) | higher highs - on average 7.1% higher than median
(+) | highs are linear (5.8% delta to prev. frequency)
Overall 100 - 16.000 Hz
(±) | linearity of overall sound is average (20.2% difference to median)
Compared to same class
» 27% of all tested devices in this class were better, 9% similar, 64% worse
» The best had a delta of 12%, average was 38%, worst was 134%
Compared to all devices tested
» 47% of all tested devices were better, 9% similar, 45% worse
» The best had a delta of 4%, average was 25%, worst was 134%
Samsung Galaxy Note 9 audio analysis
(-) | not very loud speakers (71.6 dB)
Bass 100 - 315 Hz
(-) | nearly no bass - on average 15.6% lower than median
(±) | linearity of bass is average (10.1% delta to prev. frequency)
Mids 400 - 2000 Hz
(+) | balanced mids - only 2.9% away from median
(+) | mids are linear (4.3% delta to prev. frequency)
Highs 2 - 16 kHz
(+) | balanced highs - only 1.6% away from median
(+) | highs are linear (5.7% delta to prev. frequency)
Overall 100 - 16.000 Hz
(±) | linearity of overall sound is average (16.2% difference to median)
Compared to same class
» 4% of all tested devices in this class were better, 4% similar, 93% worse
» The best had a delta of 12%, average was 38%, worst was 134%
Compared to all devices tested
» 21% of all tested devices were better, 5% similar, 74% worse
» The best had a delta of 4%, average was 25%, worst was 134%
Battery Life
Power Consumption
The Mate 20 X is an energy efficient device that consumed a minimum of 0.79 W at idle during our tests. Power consumption rose to a maximum of 9.85 W, which is considerably higher than what the Mate 20 Pro consumed during the same test. Overall, the Mate 20 X consumed slightly more than our comparison devices on average, but is not a power-hungry device.
The included quick charger is rated at up to 22.5 W, so it should always be able to charge the Mate 20 X even when it is operating under sustained load. We had no charging issues with our test device regardless of how hard we pushed it.
| Off / Standby | |
| Idle | |
| Load |
|
| Huawei Mate 20 X 5000 mAh | Xiaomi Mi Max 3 5500 mAh | Huawei Mate 20 Pro 4200 mAh | Google Pixel 3 XL 3430 mAh | Apple iPhone Xs Max 3174 mAh | Samsung Galaxy Note 9 4000 mAh | Average HiSilicon Kirin 980 | Average of class Smartphone | |
|---|---|---|---|---|---|---|---|---|
| Power Consumption | 14% | -2% | 8% | 10% | -20% | -3% | 6% | |
| Idle Minimum * | 0.79 | 0.7 11% | 0.95 -20% | 0.7 11% | 1 -27% | 0.9 -14% | 0.802 ? -2% | 0.897 ? -14% |
| Idle Average * | 1.72 | 1.5 13% | 2.17 -26% | 1.4 19% | 1.4 19% | 1.9 -10% | 2.07 ? -20% | 1.452 ? 16% |
| Idle Maximum * | 1.83 | 2.2 -20% | 2.25 -23% | 2 -9% | 1.7 7% | 3.7 -102% | 2.38 ? -30% | 1.629 ? 11% |
| Load Average * | 5.53 | 3.8 31% | 4.47 19% | 4.8 13% | 4.6 17% | 5.3 4% | 4.87 ? 12% | 5.55 ? -0% |
| Load Maximum * | 9.85 | 6.5 34% | 6.15 38% | 9.5 4% | 6.7 32% | 7.6 23% | 7.46 ? 24% | 8.31 ? 16% |
* ... smaller is better
Battery Life
The Mate 20 X has a 5,000 mAh battery, which is much larger than all but the 5,500 mAh battery in the Mi Max 3 of our comparison devices. Our test device lasted over 13 hours in our practical Wi-Fi test, which is respectable, but rather underwhelming. The Mate 20 X lasted longer than the Mate 20 Pro, the Pixel 3 XL and the iPhone XS Max in the same test, but the Galaxy Note 9 had a slightly better runtime with its 1,000 mAh smaller battery. Moreover, the Mi Max 3 lasted over 8 hours longer in the same test despite having just a 500 mAh larger battery capacity.
The included charger recharges our test device fully in under two hours.
| Huawei Mate 20 X 5000 mAh | Xiaomi Mi Max 3 5500 mAh | Huawei Mate 20 Pro 4200 mAh | Google Pixel 3 XL 3430 mAh | Apple iPhone Xs Max 3174 mAh | Samsung Galaxy Note 9 4000 mAh | |
|---|---|---|---|---|---|---|
| Battery Runtime | 66% | -8% | -13% | -21% | -1% | |
| Reader / Idle | 1984 | 1747 -12% | 1725 -13% | 1305 -34% | 1687 -15% | |
| H.264 | 986 | 854 -13% | 724 -27% | 801 -19% | 896 -9% | |
| WiFi v1.3 | 786 | 1305 66% | 767 -2% | 691 -12% | 742 -6% | 794 1% |
| Load | 300 | 282 -6% | 299 0% | 223 -26% | 354 18% |
Pros
Cons
Verdict
The Huawei Mate 20 X has the same qualities as the other Mate 20 models that we have already come to love. The giant smartphone has excellent system and storage performance, while its cameras are first-class. Moreover, the OLED screen is impressive, as are the LTE and Wi-Fi speeds.
The Mate 20 X lacks the standout features of the Mate 20 Pro such as its 3D face recognition, wireless charging and its 40 W fast charger, which is disappointing. The screen brightness is lower too, which is another drawback.
The Huawei Mate 20 X is an excellent flagship phablet whose performance is unique for a device of its size.
It is also worth keeping in mind that other devices achieved similar results in our tests and took almost as good pictures as the triple rear-facing camera array can. However, you will not find a better alternative to the Mate 20 X if you are in the market for a flagship phablet.
Huawei Mate 20 X
-
09/03/2022 v7
Mike Wobker


Pricecompare

