 Deutsch
 English
 Español
 Français
 Italiano
 Nederlands
 Polski
 Português
 Русский
 Türkçe
 Svenska
 Chinese
 Magyar
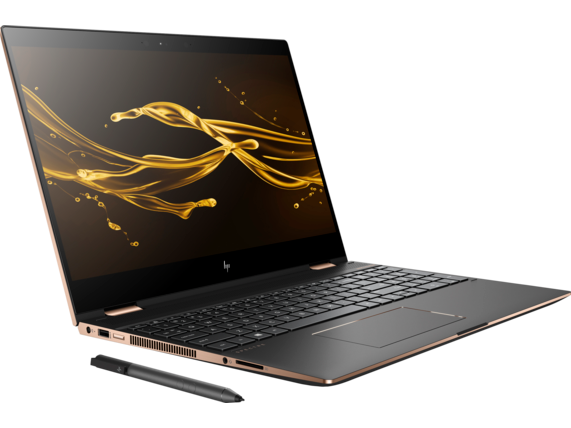
HP Spectre x360 15 2018 (i7-8550U, GeForce MX150) Convertible Review
HP introduced its third generation Spectre x360 15 at CES 2018 in two very distinct SKUs: One with Kaby Lake-R and Nvidia GeForce graphics and the other with the uncommon Kaby lake-G and Radeon RX Vega M GL graphics. Based on our experiences with both types of configurations, the performance delta between them is very wide especially for a convertible notebook where SKU options are usually narrow. Our preview of the 2018 Spectre x360 15 at CES includes more photos and comparisons with the 2017 model.
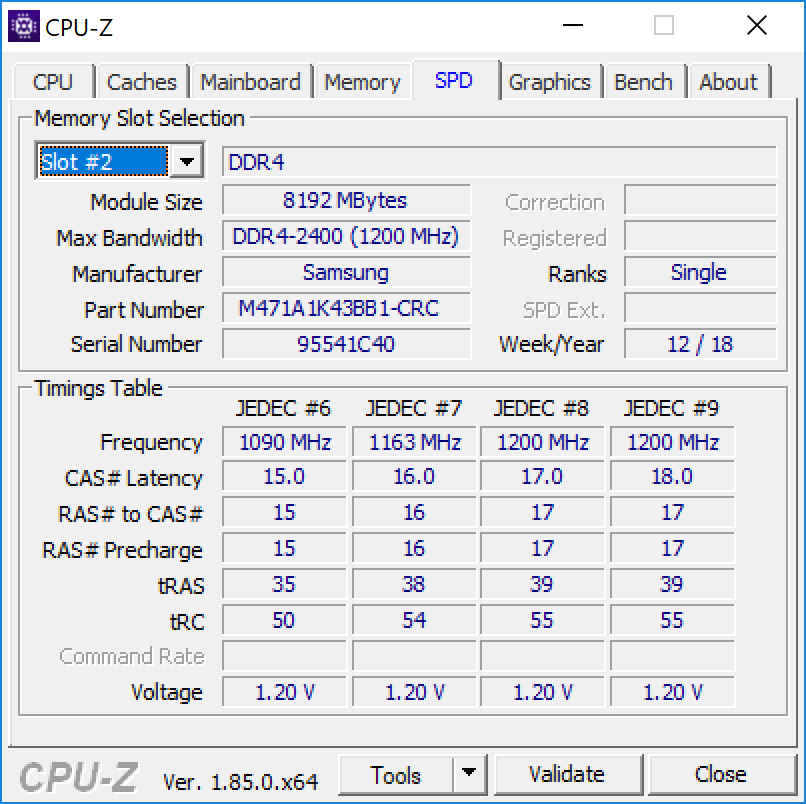
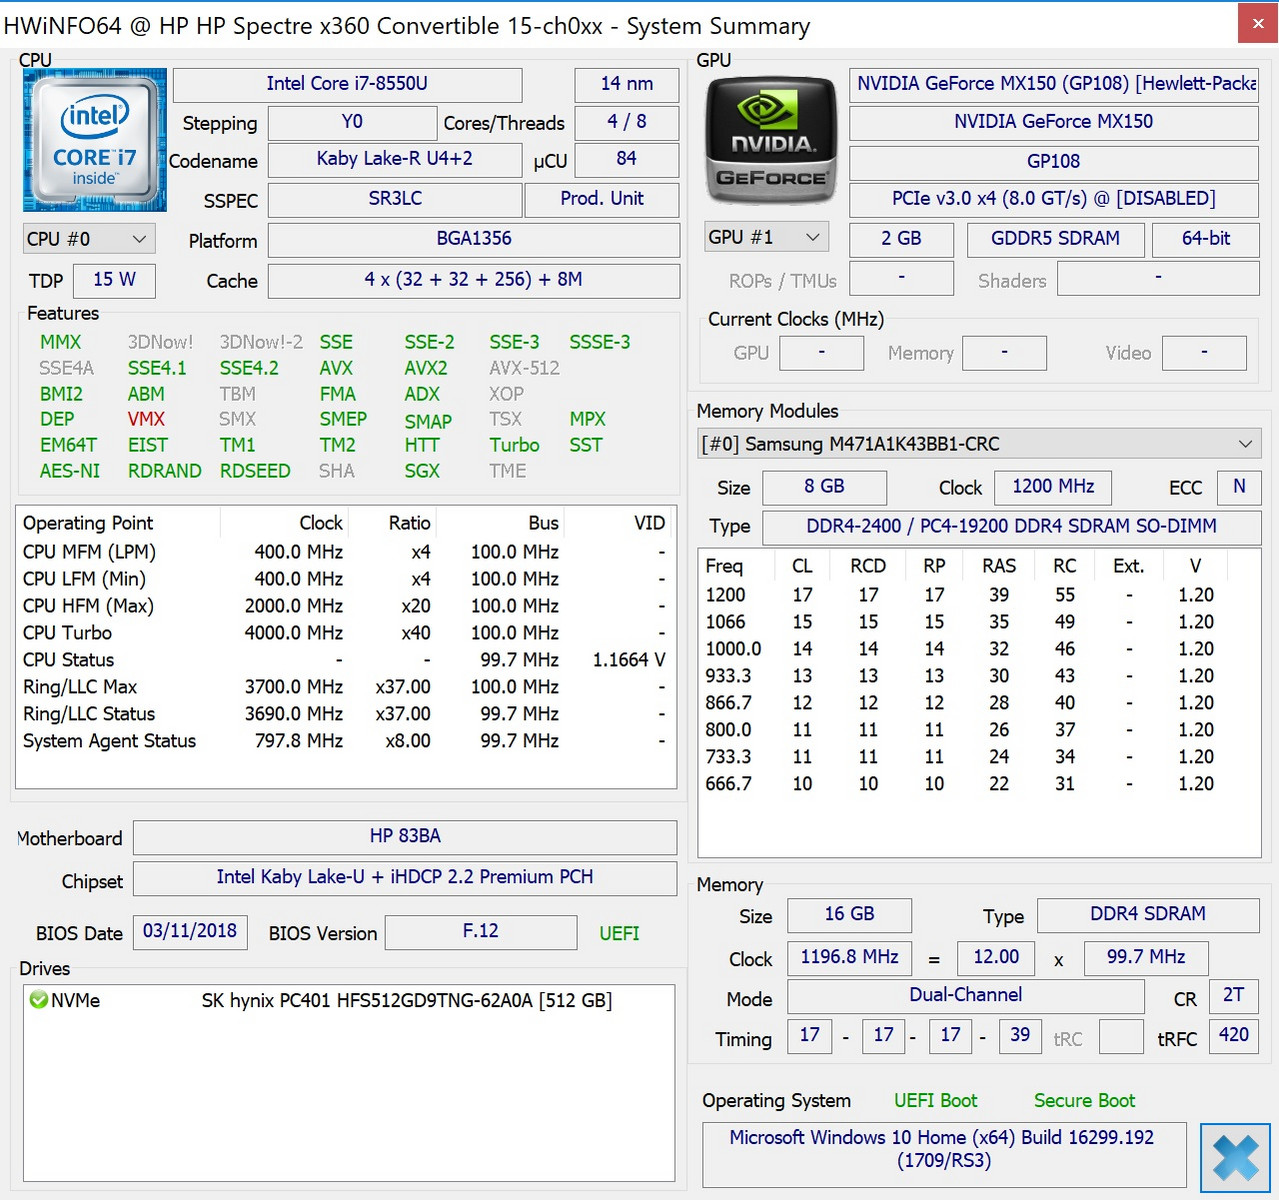
Our test unit today is the Kaby Lake-R configuration with the Kaby Lake-G system to come at a later date. This configuration comes with the same Core i7-8550U CPU and GeForce MX150 GPU as last year's model, but temperatures and fan noise are actually quite different since this latest revision has undergone some changes both internal and external. Aside from the usual storage (up to 2 TB NVMe SSD) and RAM (up to 16 GB DDR4-2400) options, the 4K UHD touchscreen and CPU/GPU combinations are fixed.
Direct competitors in the 15.6-inch convertible space include the Dell XPS 15 9575, Asus Zenbook Flip 15, and Acer Nitro 5 Spin. Nonetheless, comparisons will also inevitably be made between the Spectre and traditional flagship 15-inch laptops like the XPS 15, MacBook Pro 15, Lenovo ThinkPad T580, and Gigabyte Aero 15X.
We refer to our existing reviews on previous generation Spectre x360 15 SKUs for more information on the series.
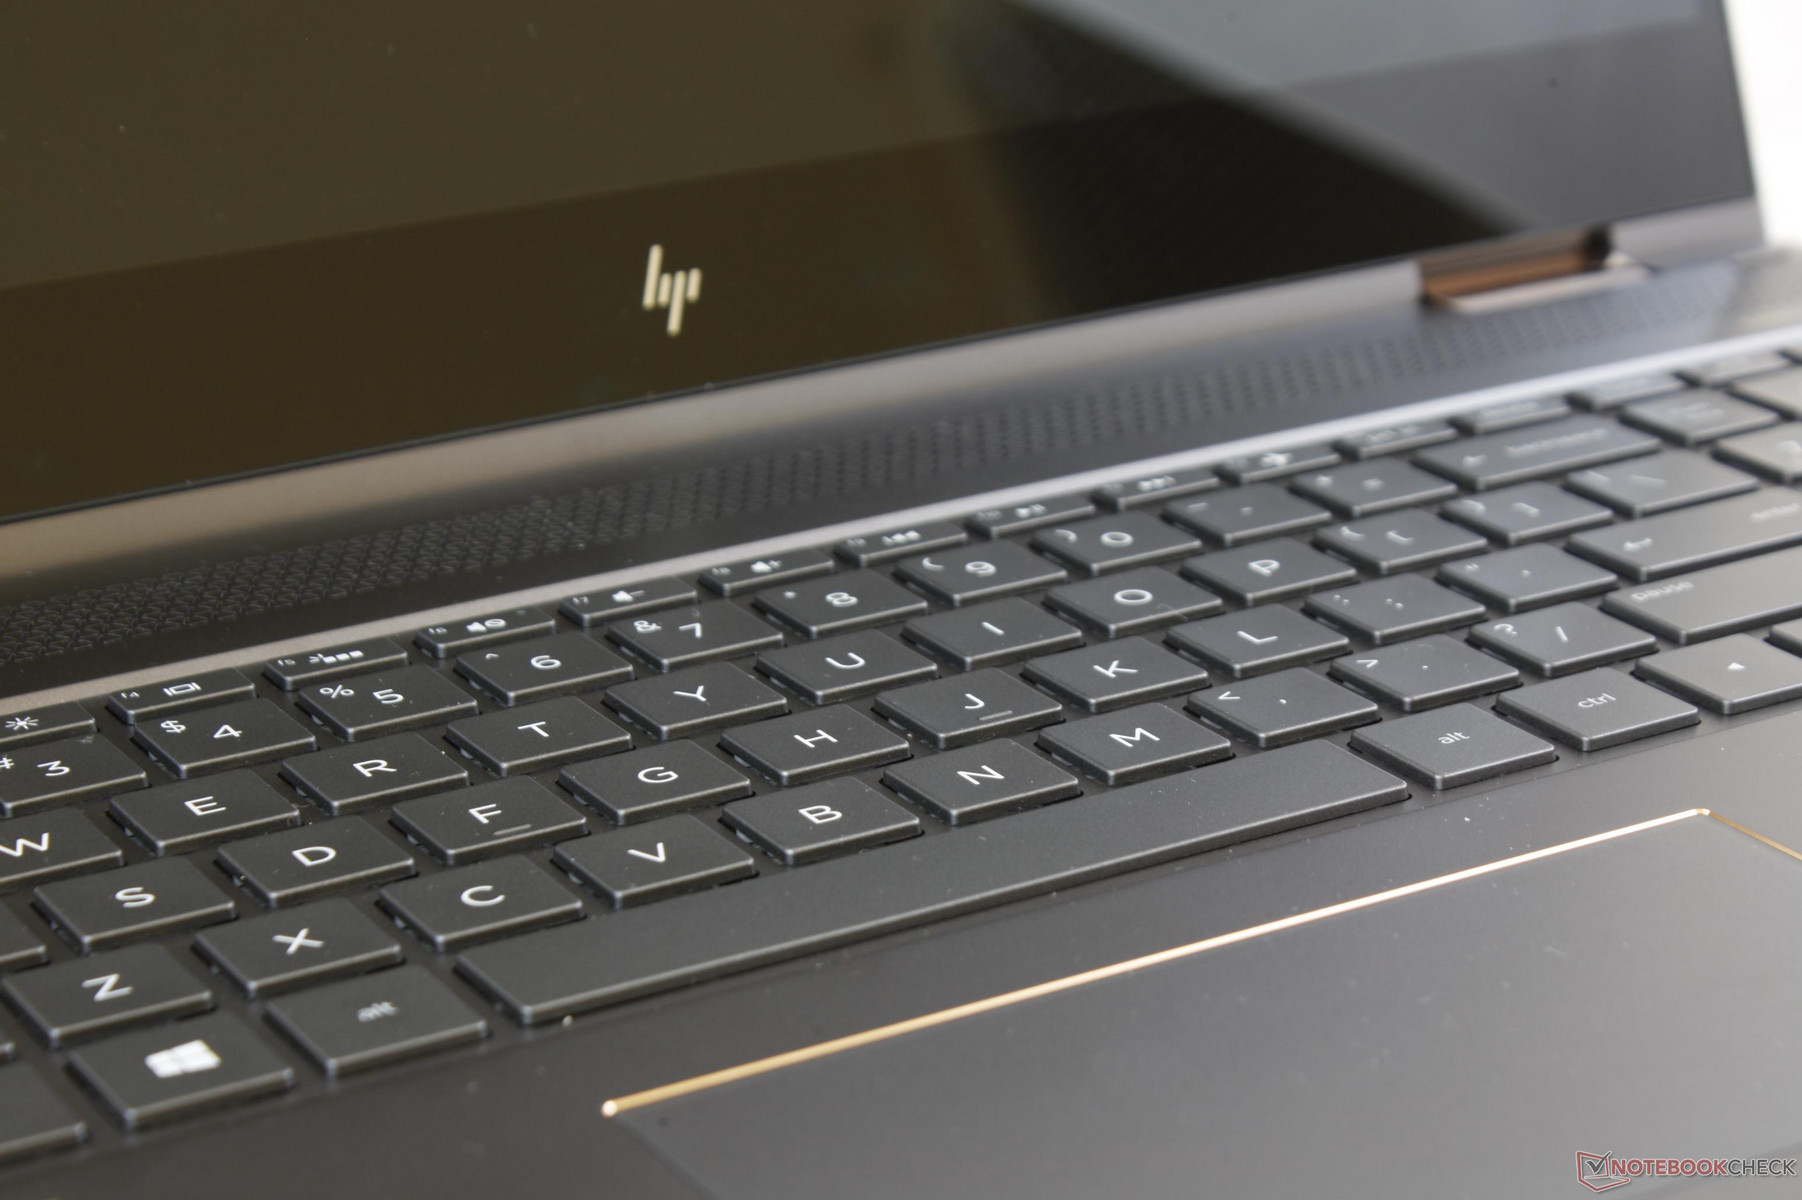
Case
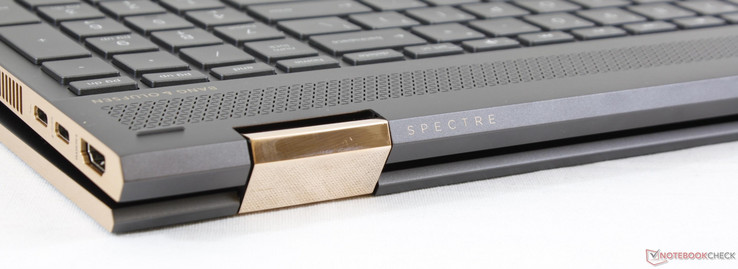
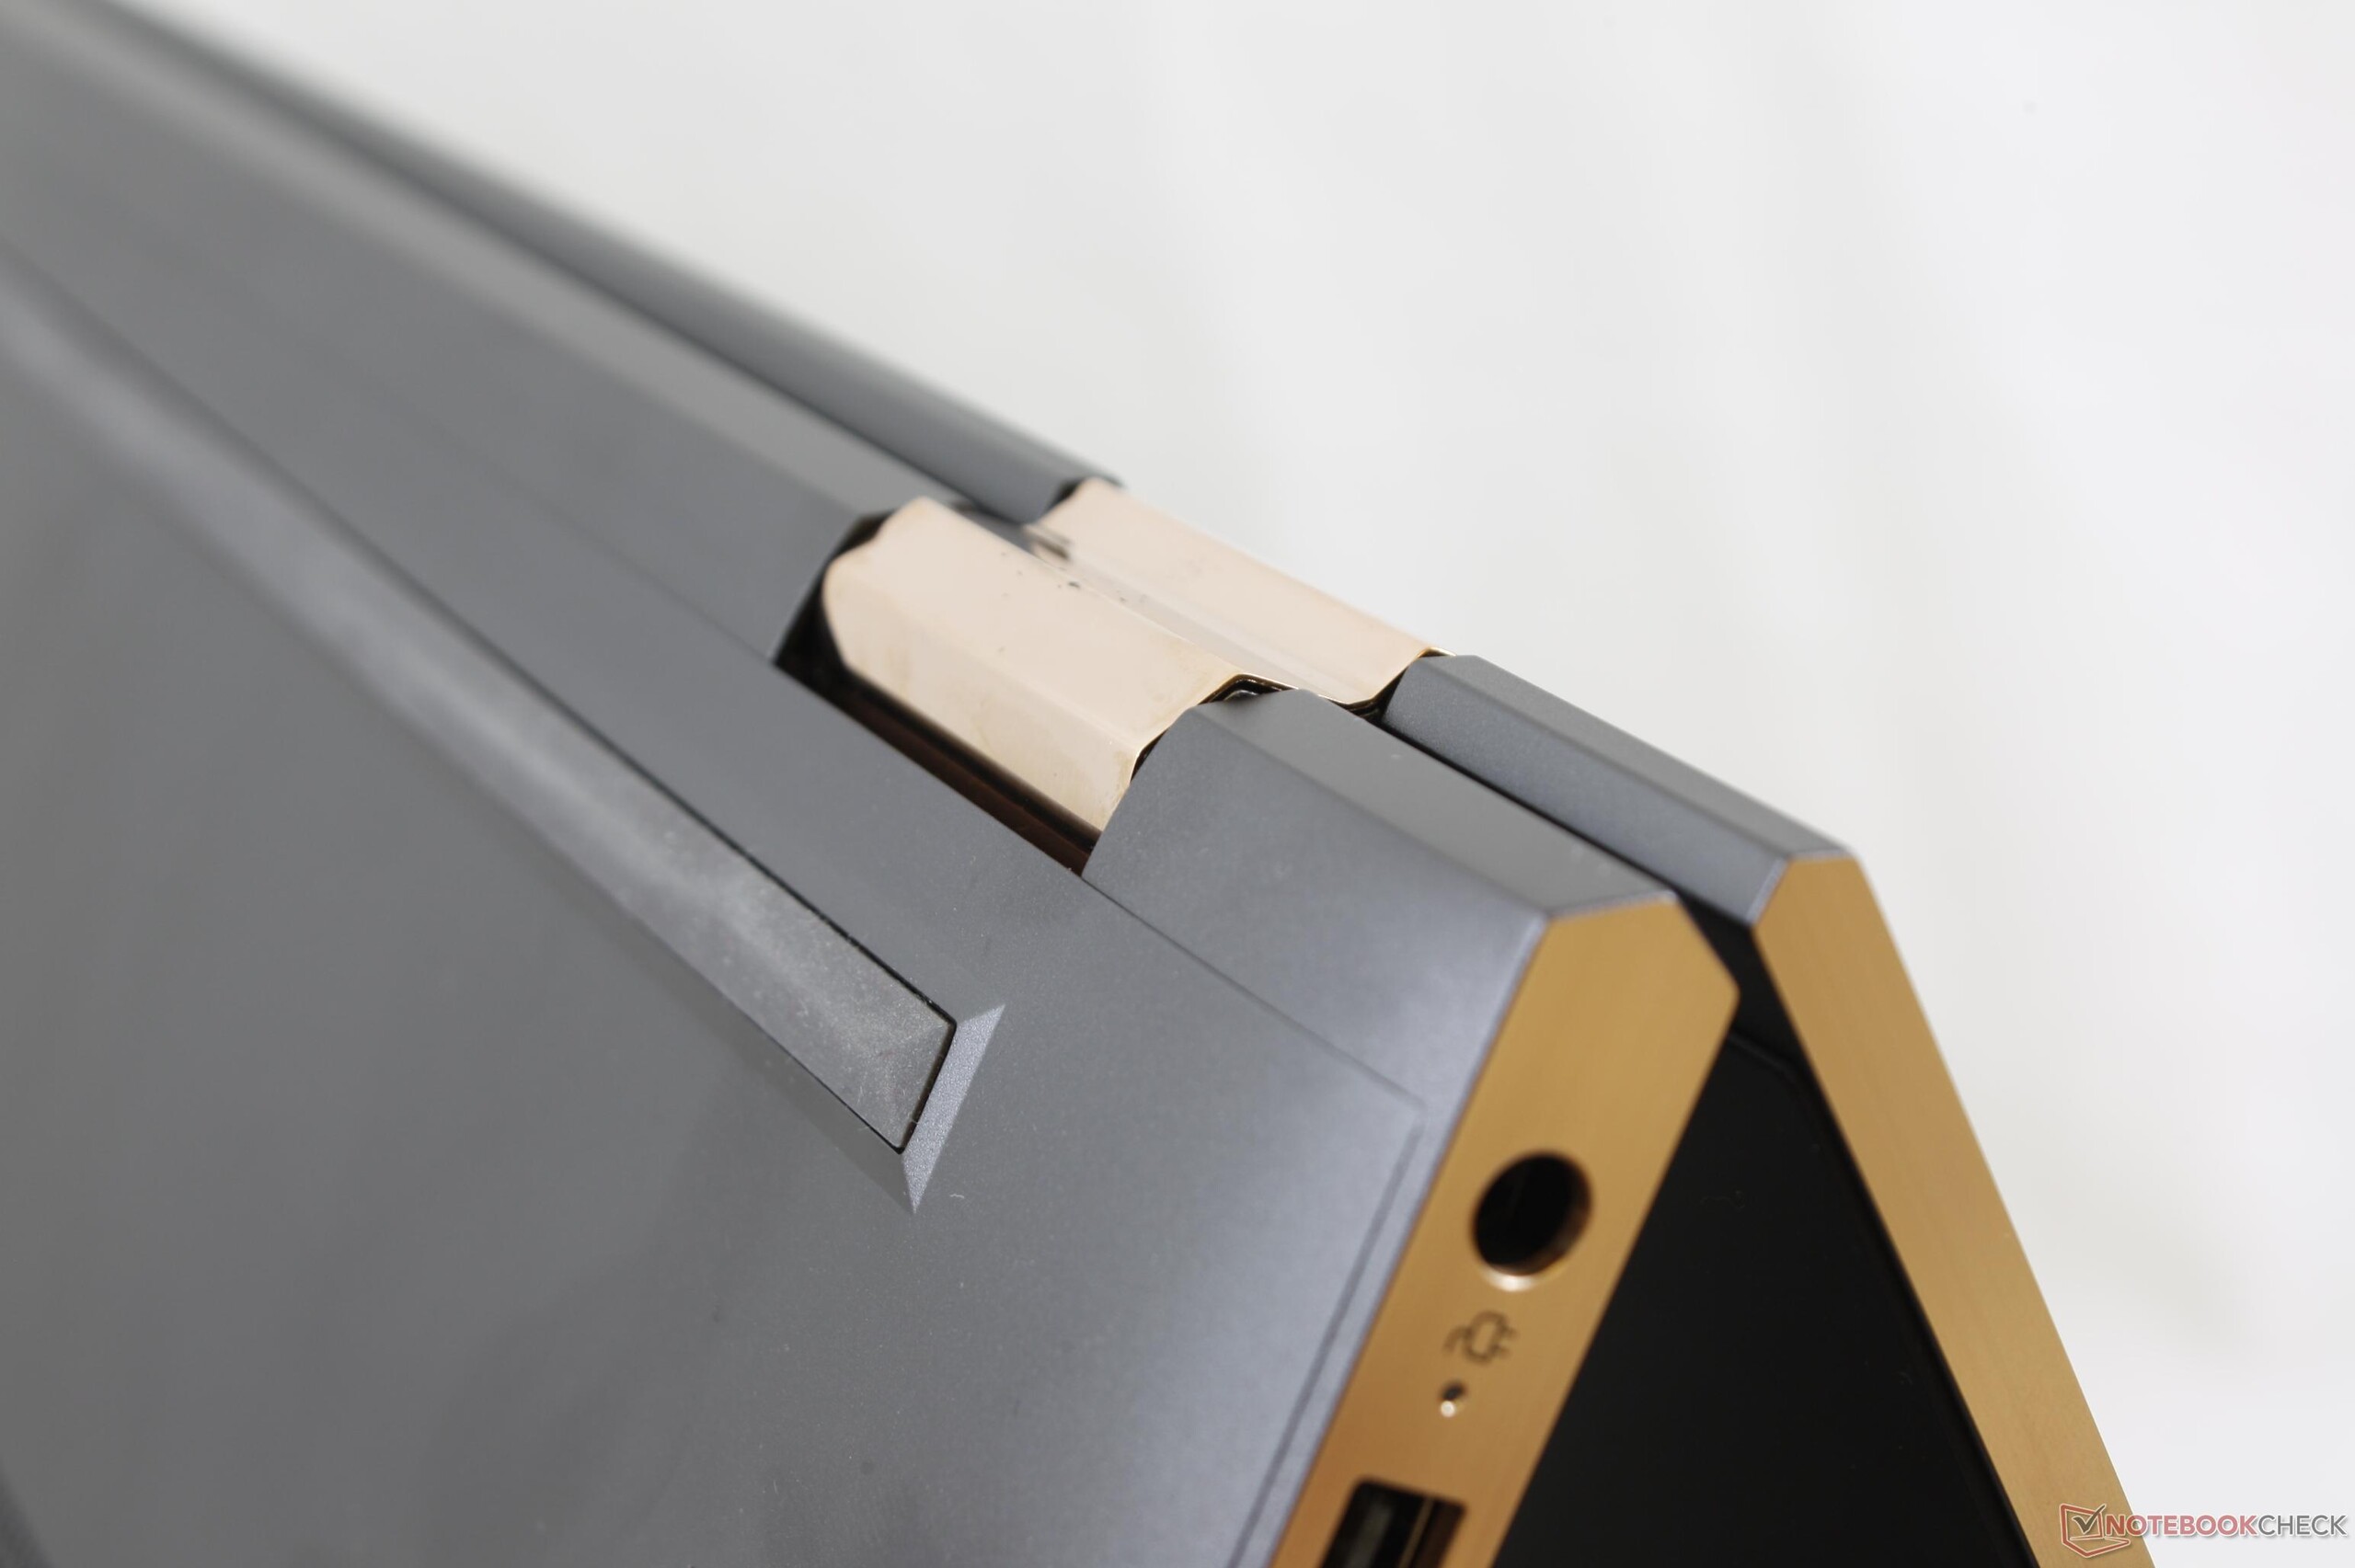
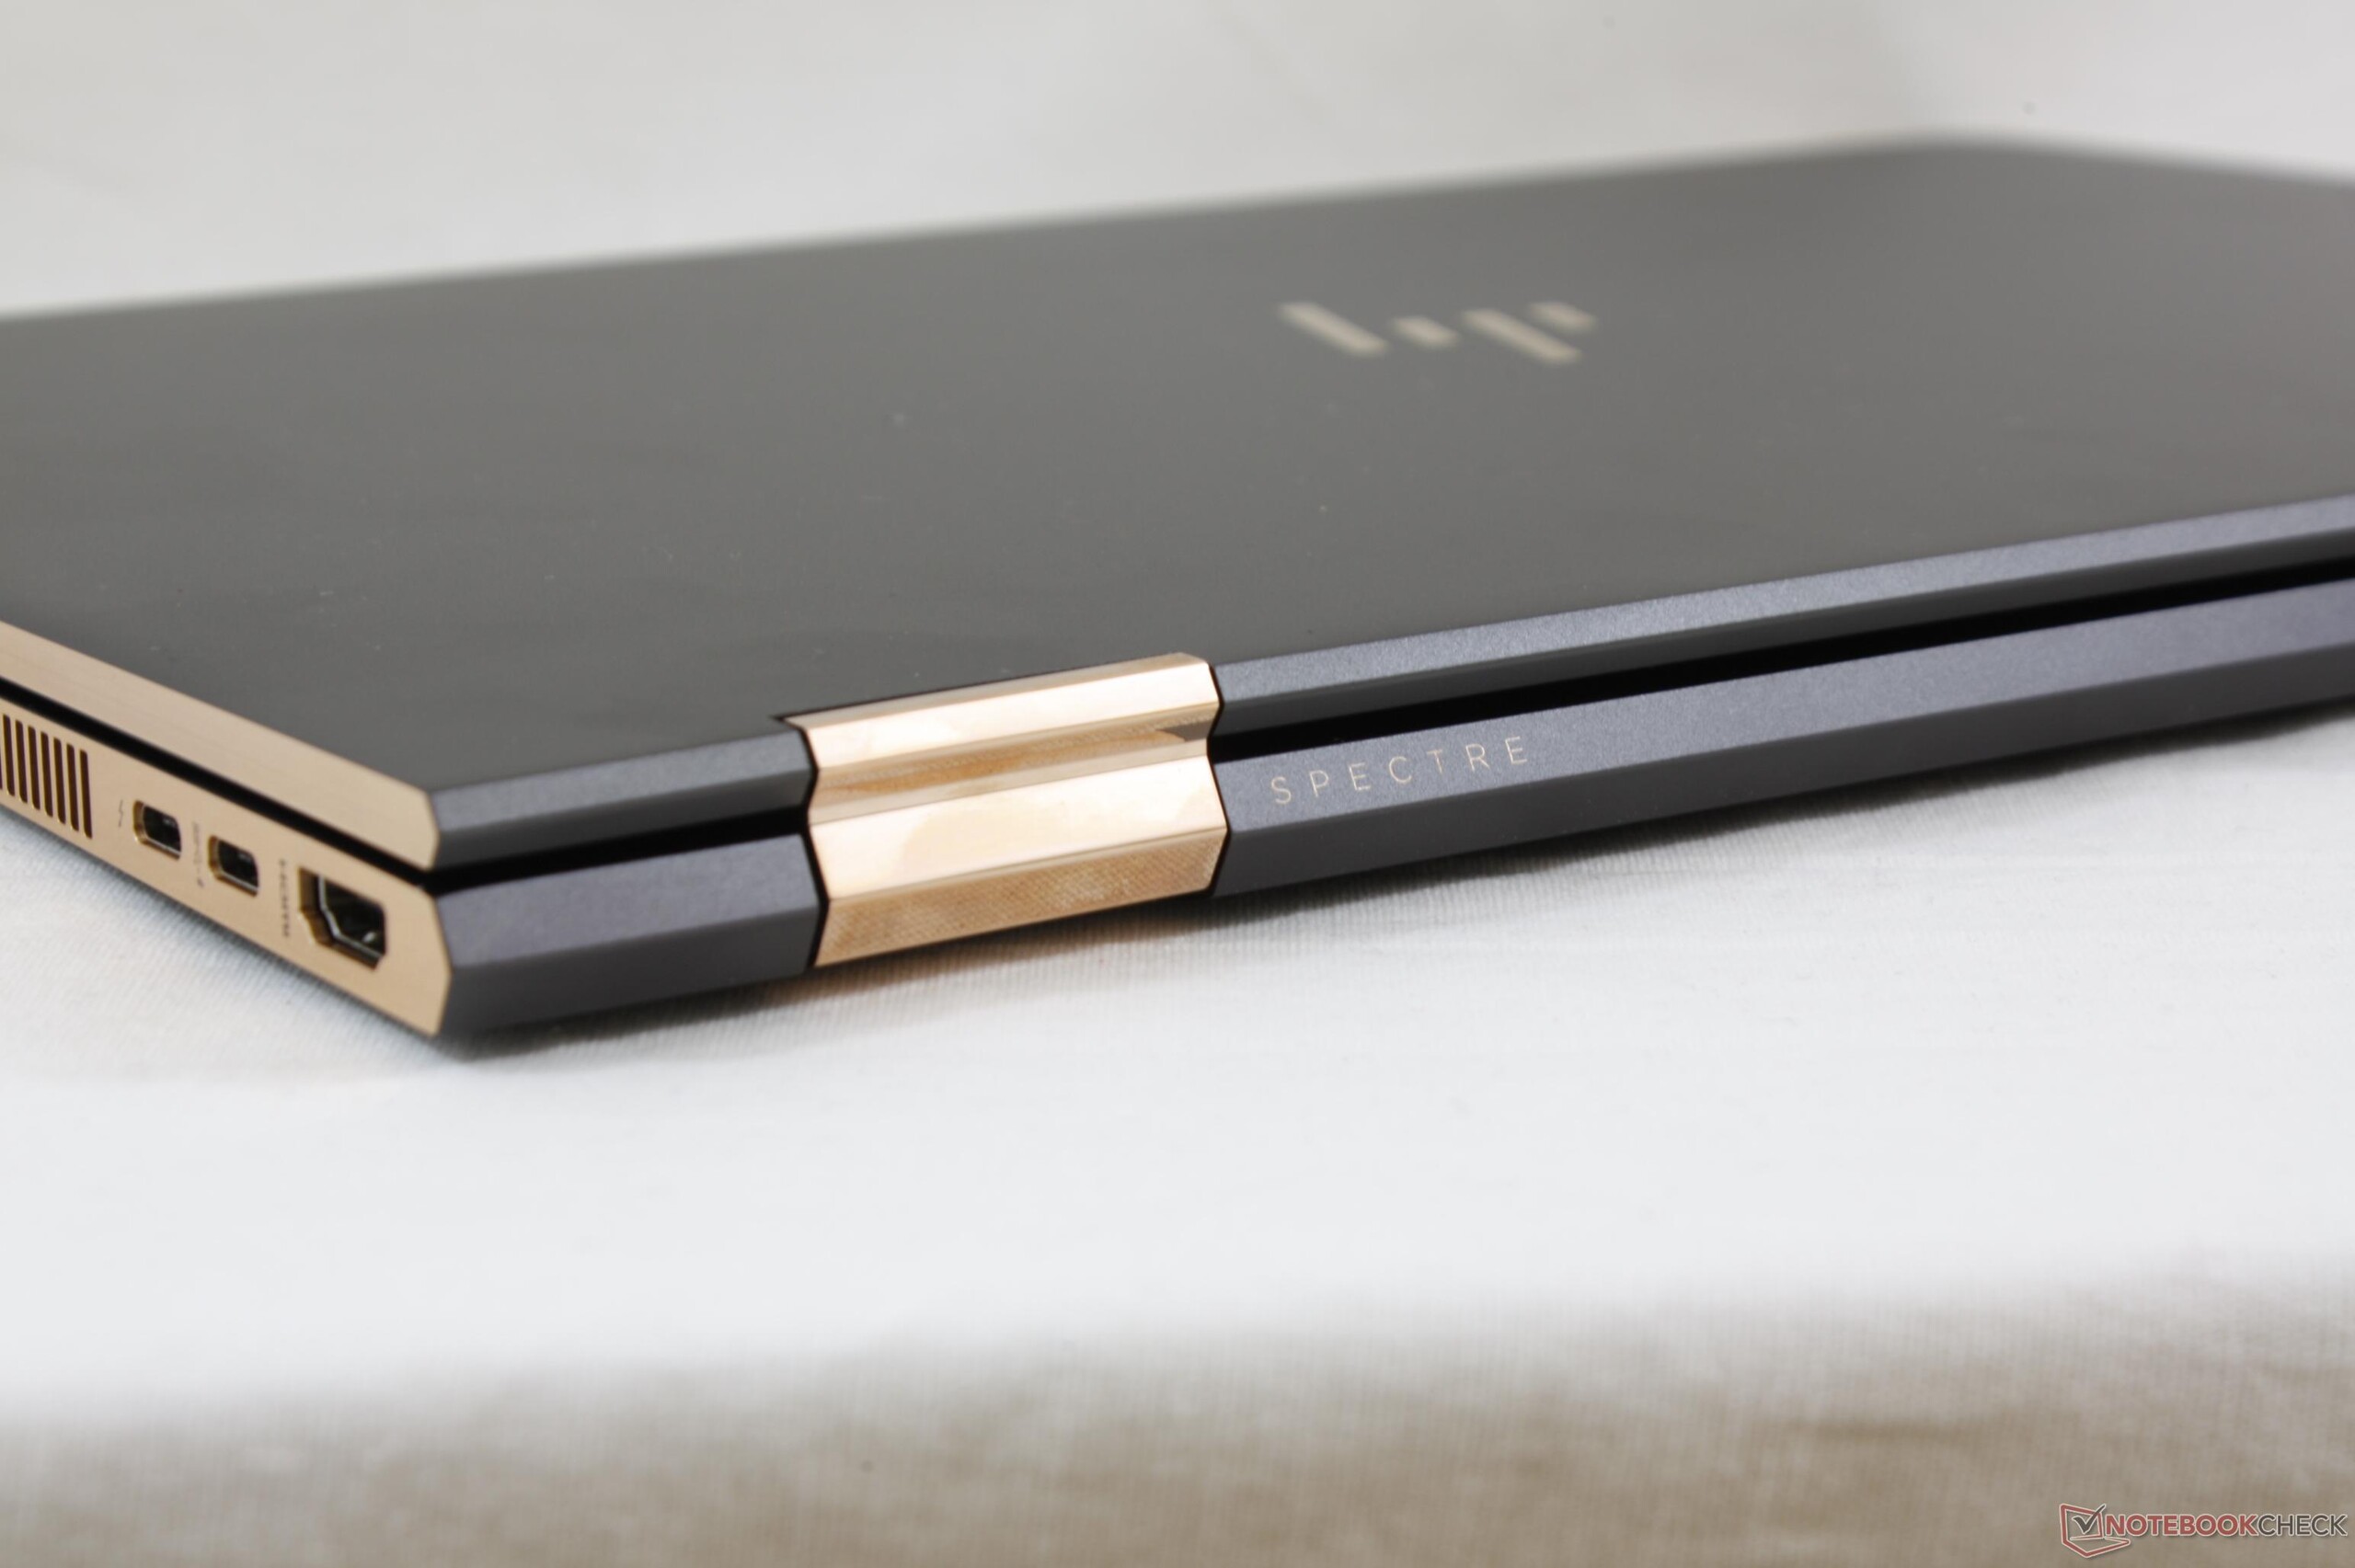
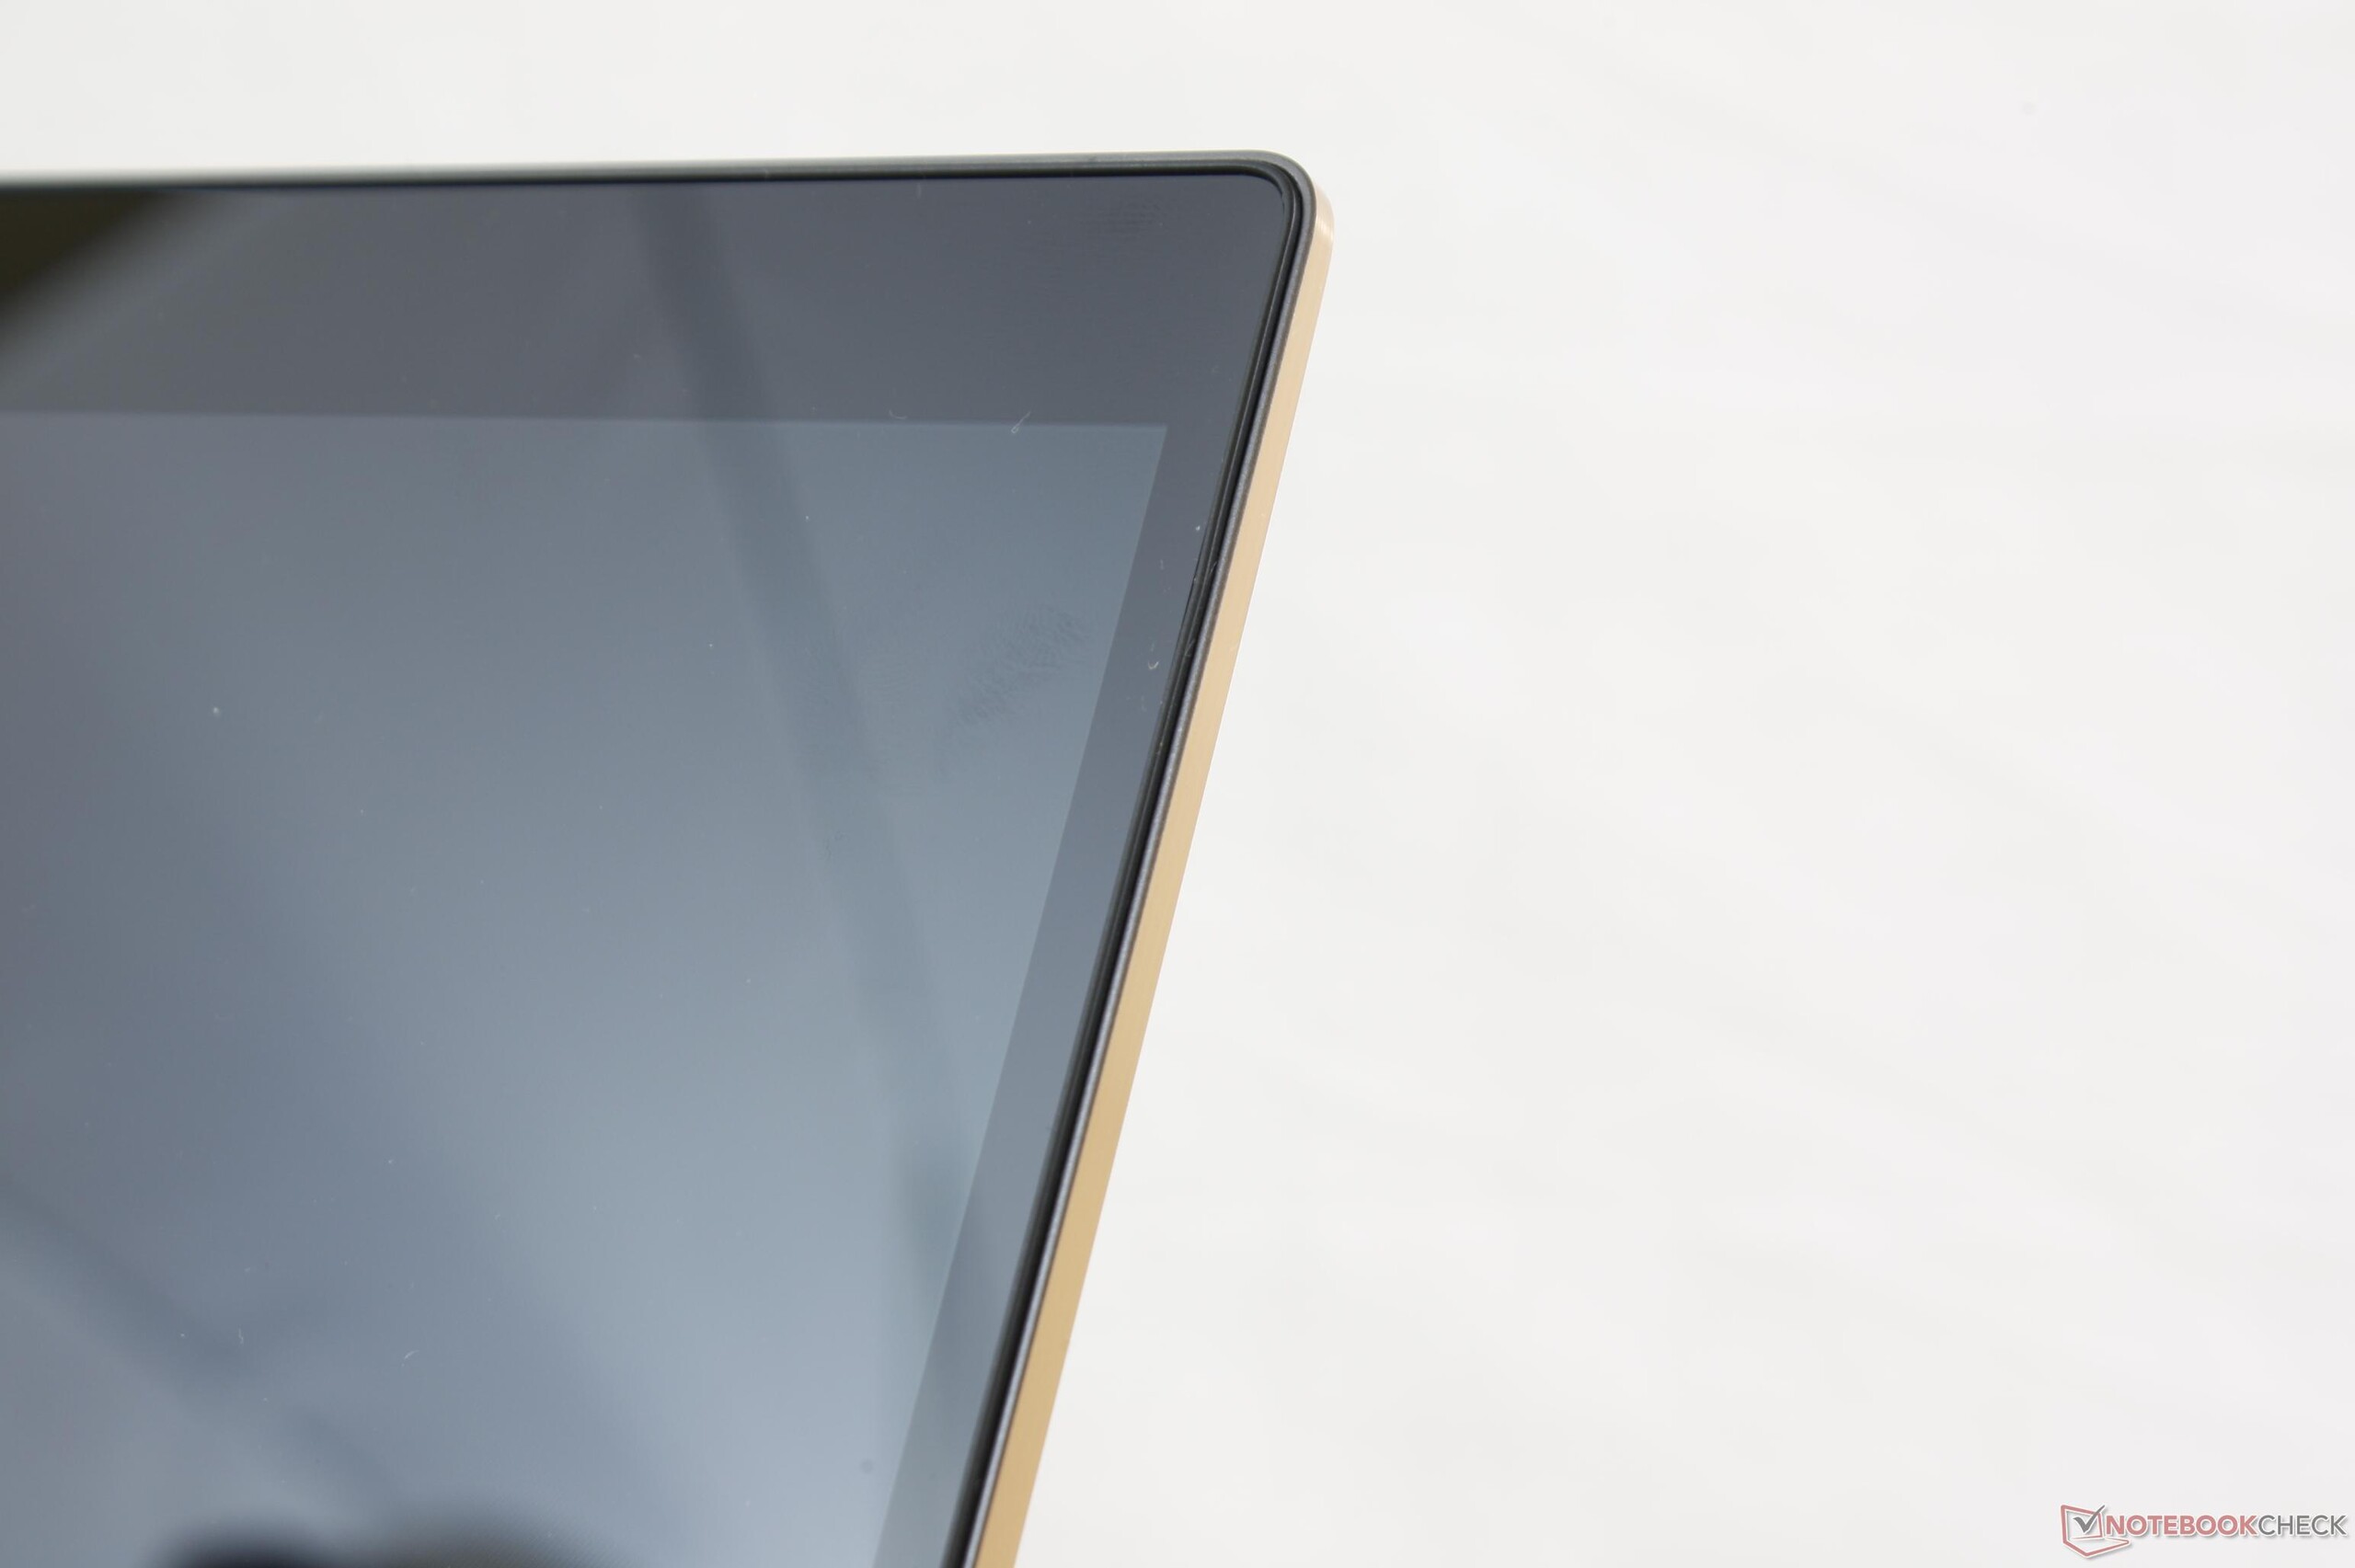
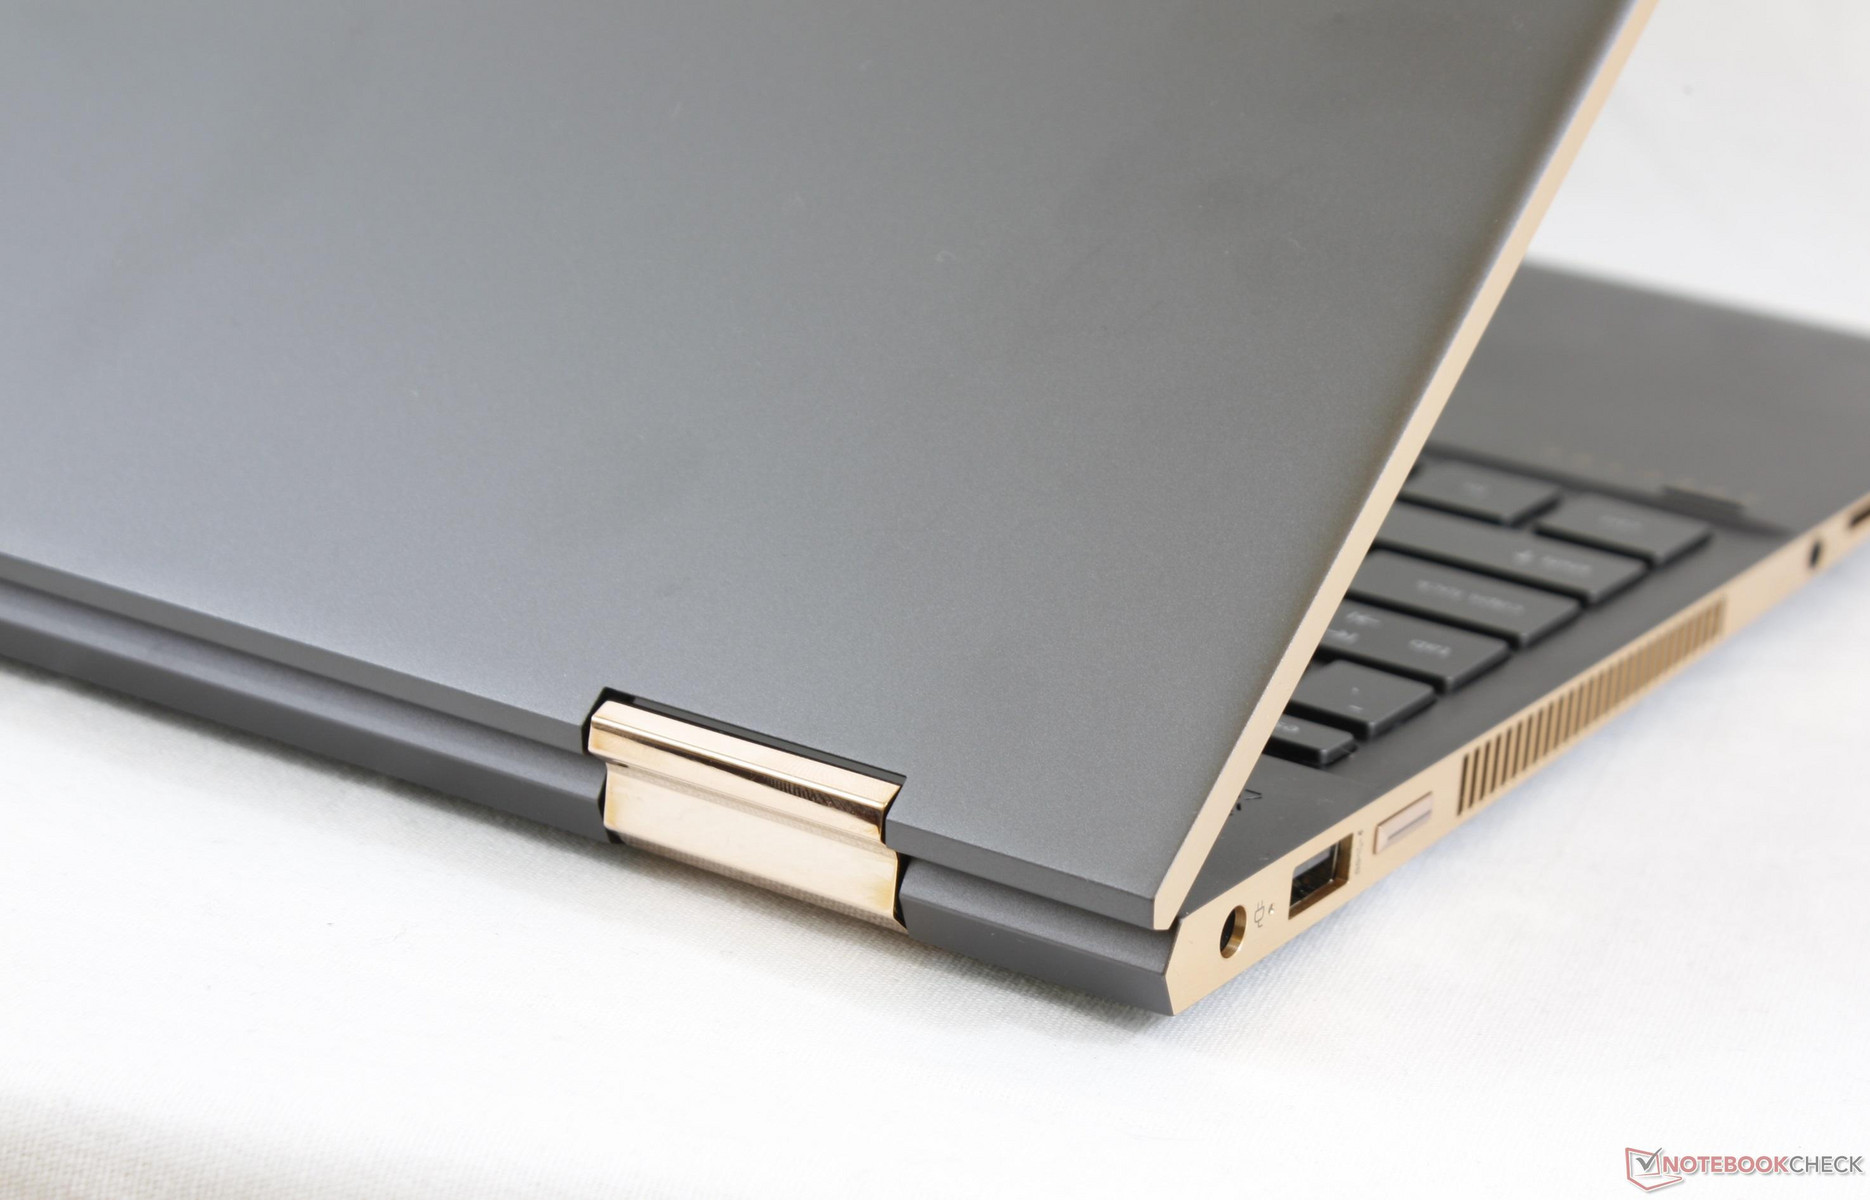
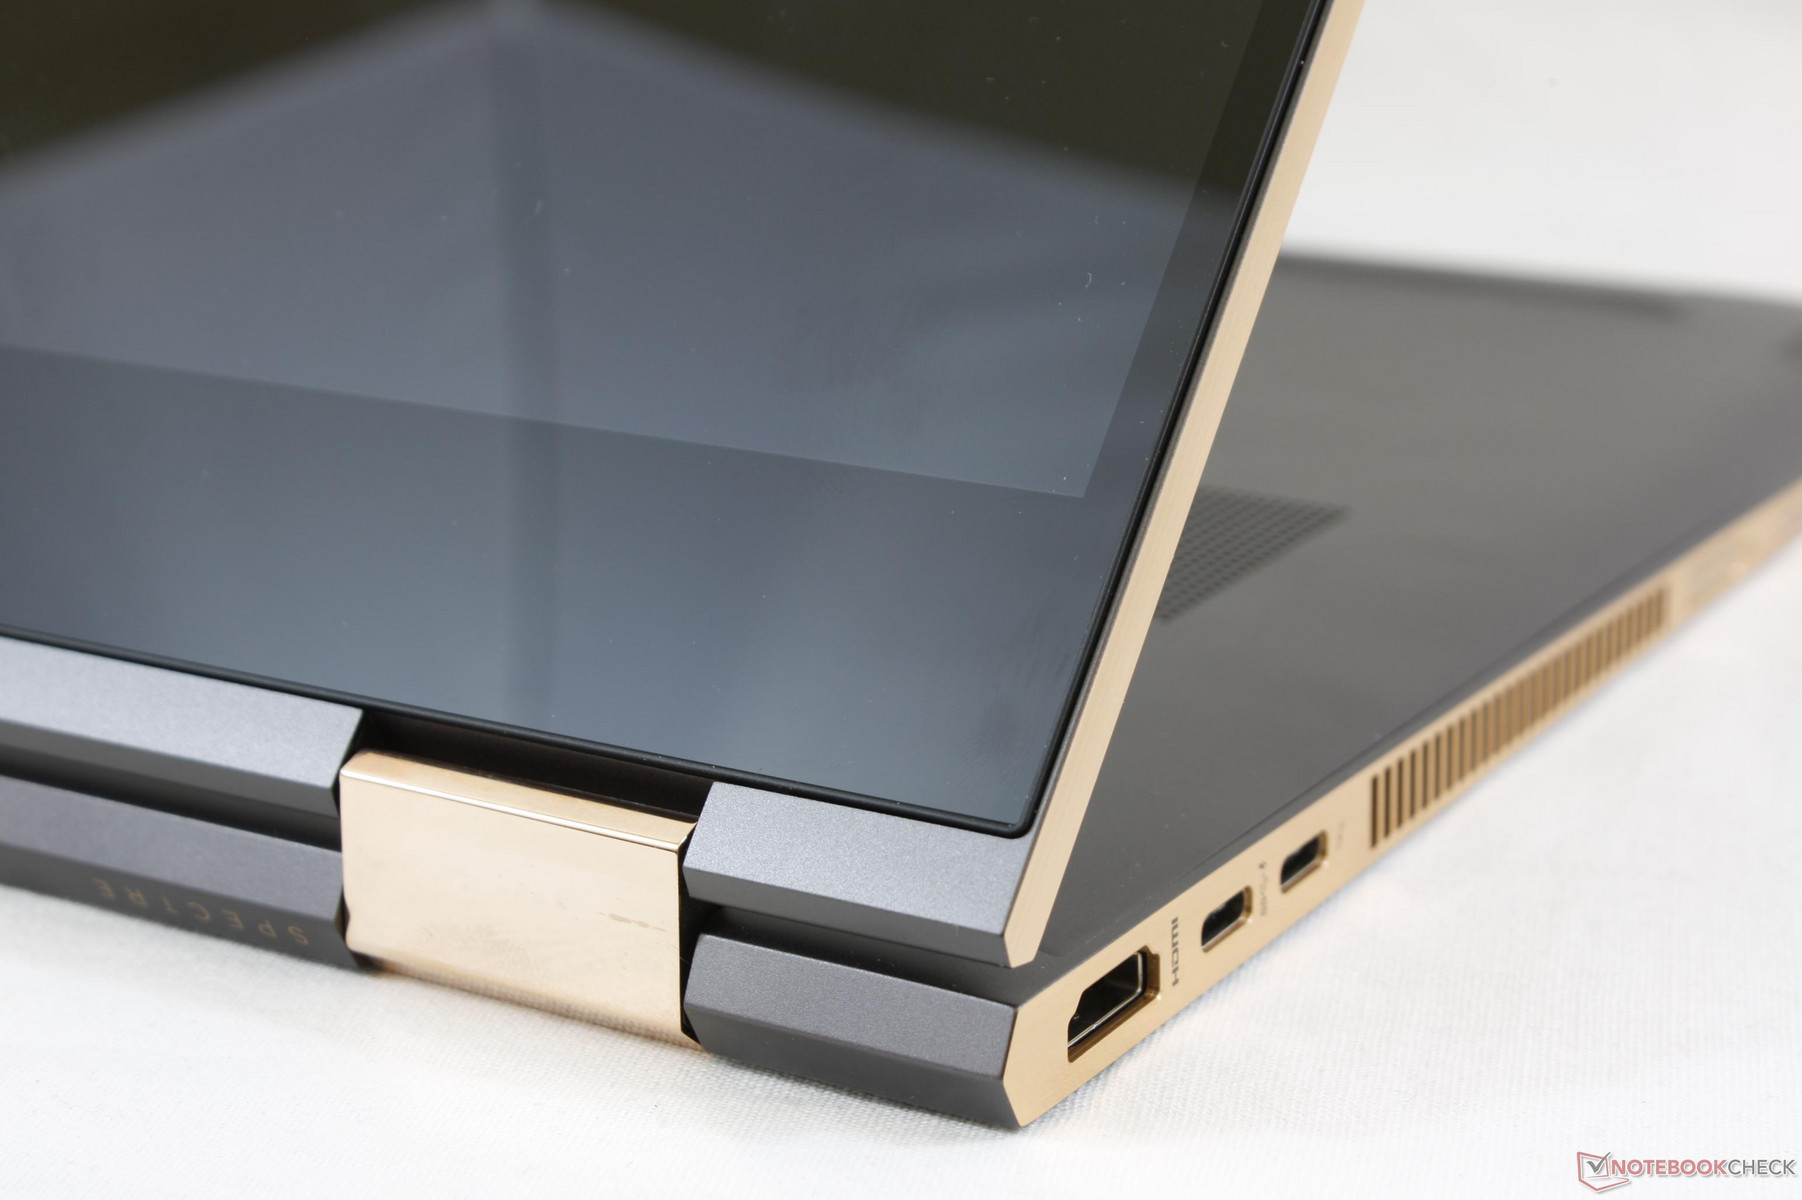
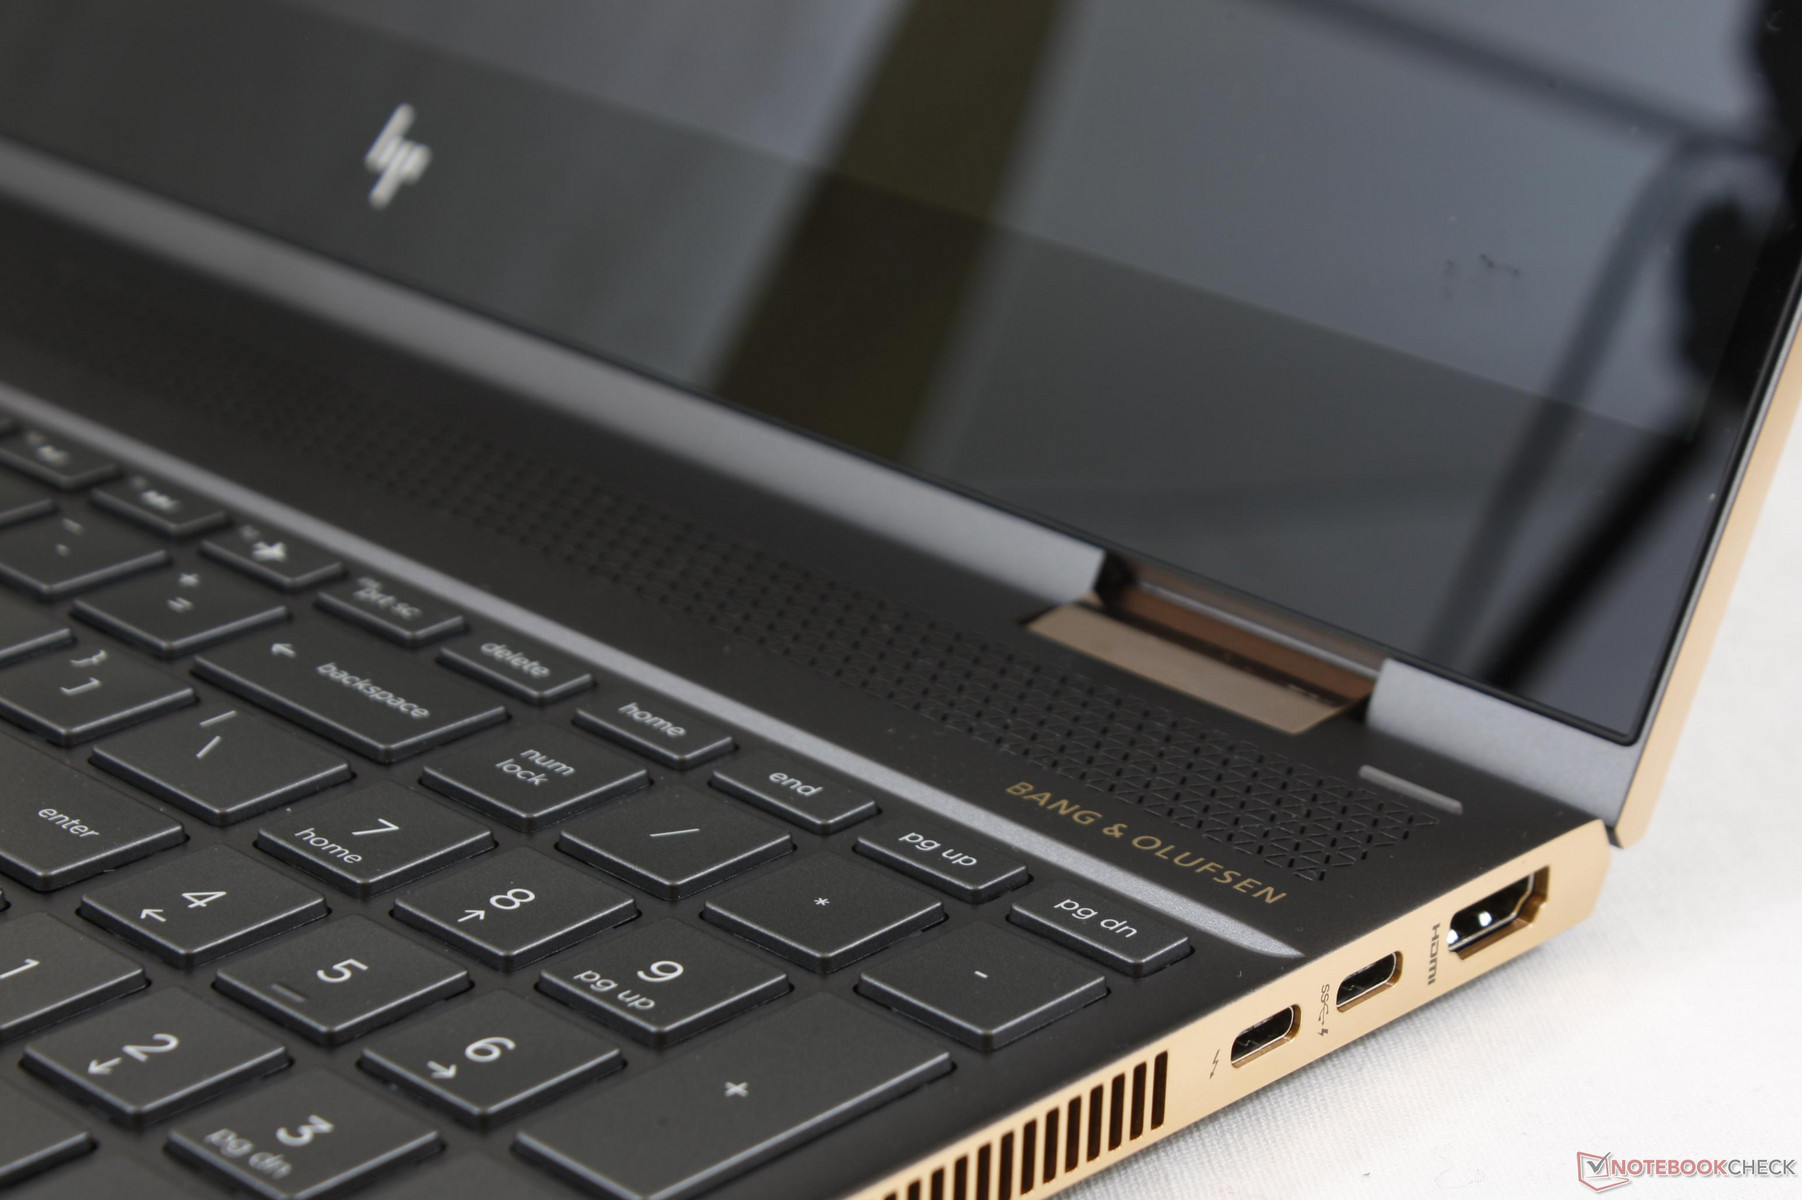
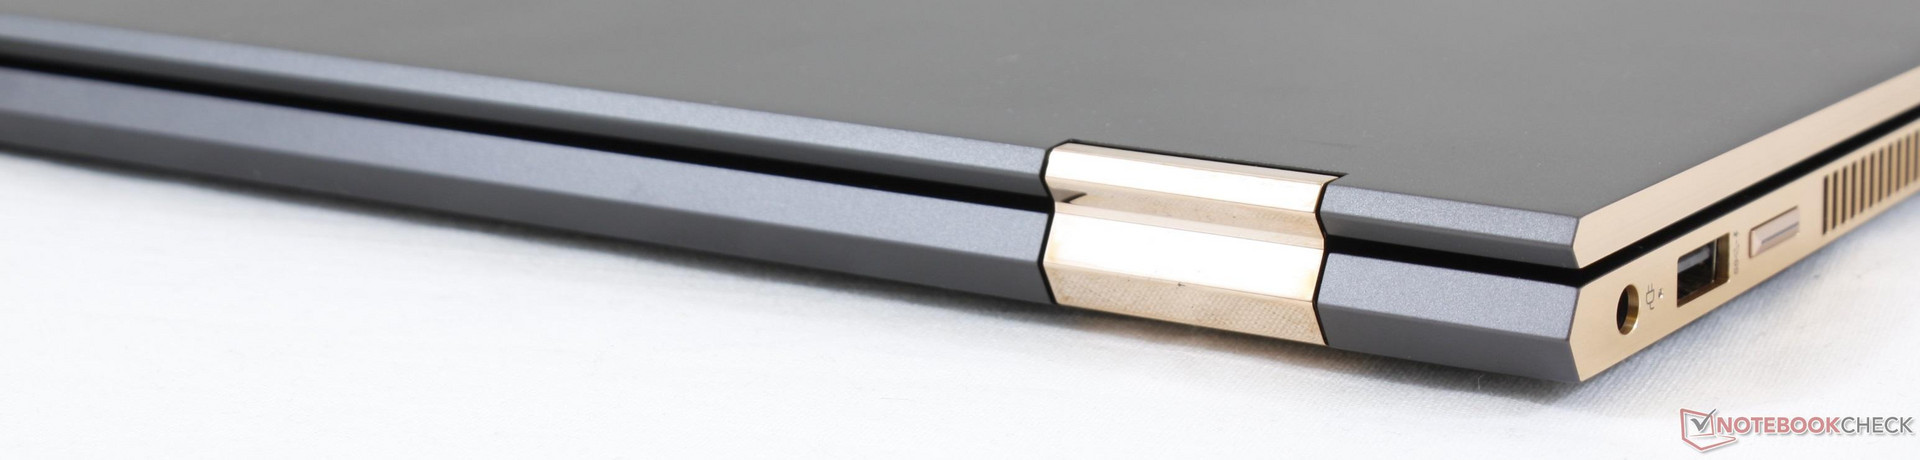
At first glance, the 2018 Spectre X360 15 may look identical to the 2017 Spectre x360 15 especially when the lid is closed. A closer inspection reveals plenty of differences including a new NumPad, relocated Bang & Olufsen speakers, sharper rear corners, new fingerprint reader, narrower bezels, and slightly altered dimensions.
The feel and construction of the chassis have always been high points of the Spectre series and we're glad to see that the same level of care has returned. Surfaces exhibit almost no flexing, the lid is almost as rigid as on the XPS 15 series, and we can notice no audible creaking when opening or closing the lid. This continues to be one of the most well-made 15-inch convertibles available.

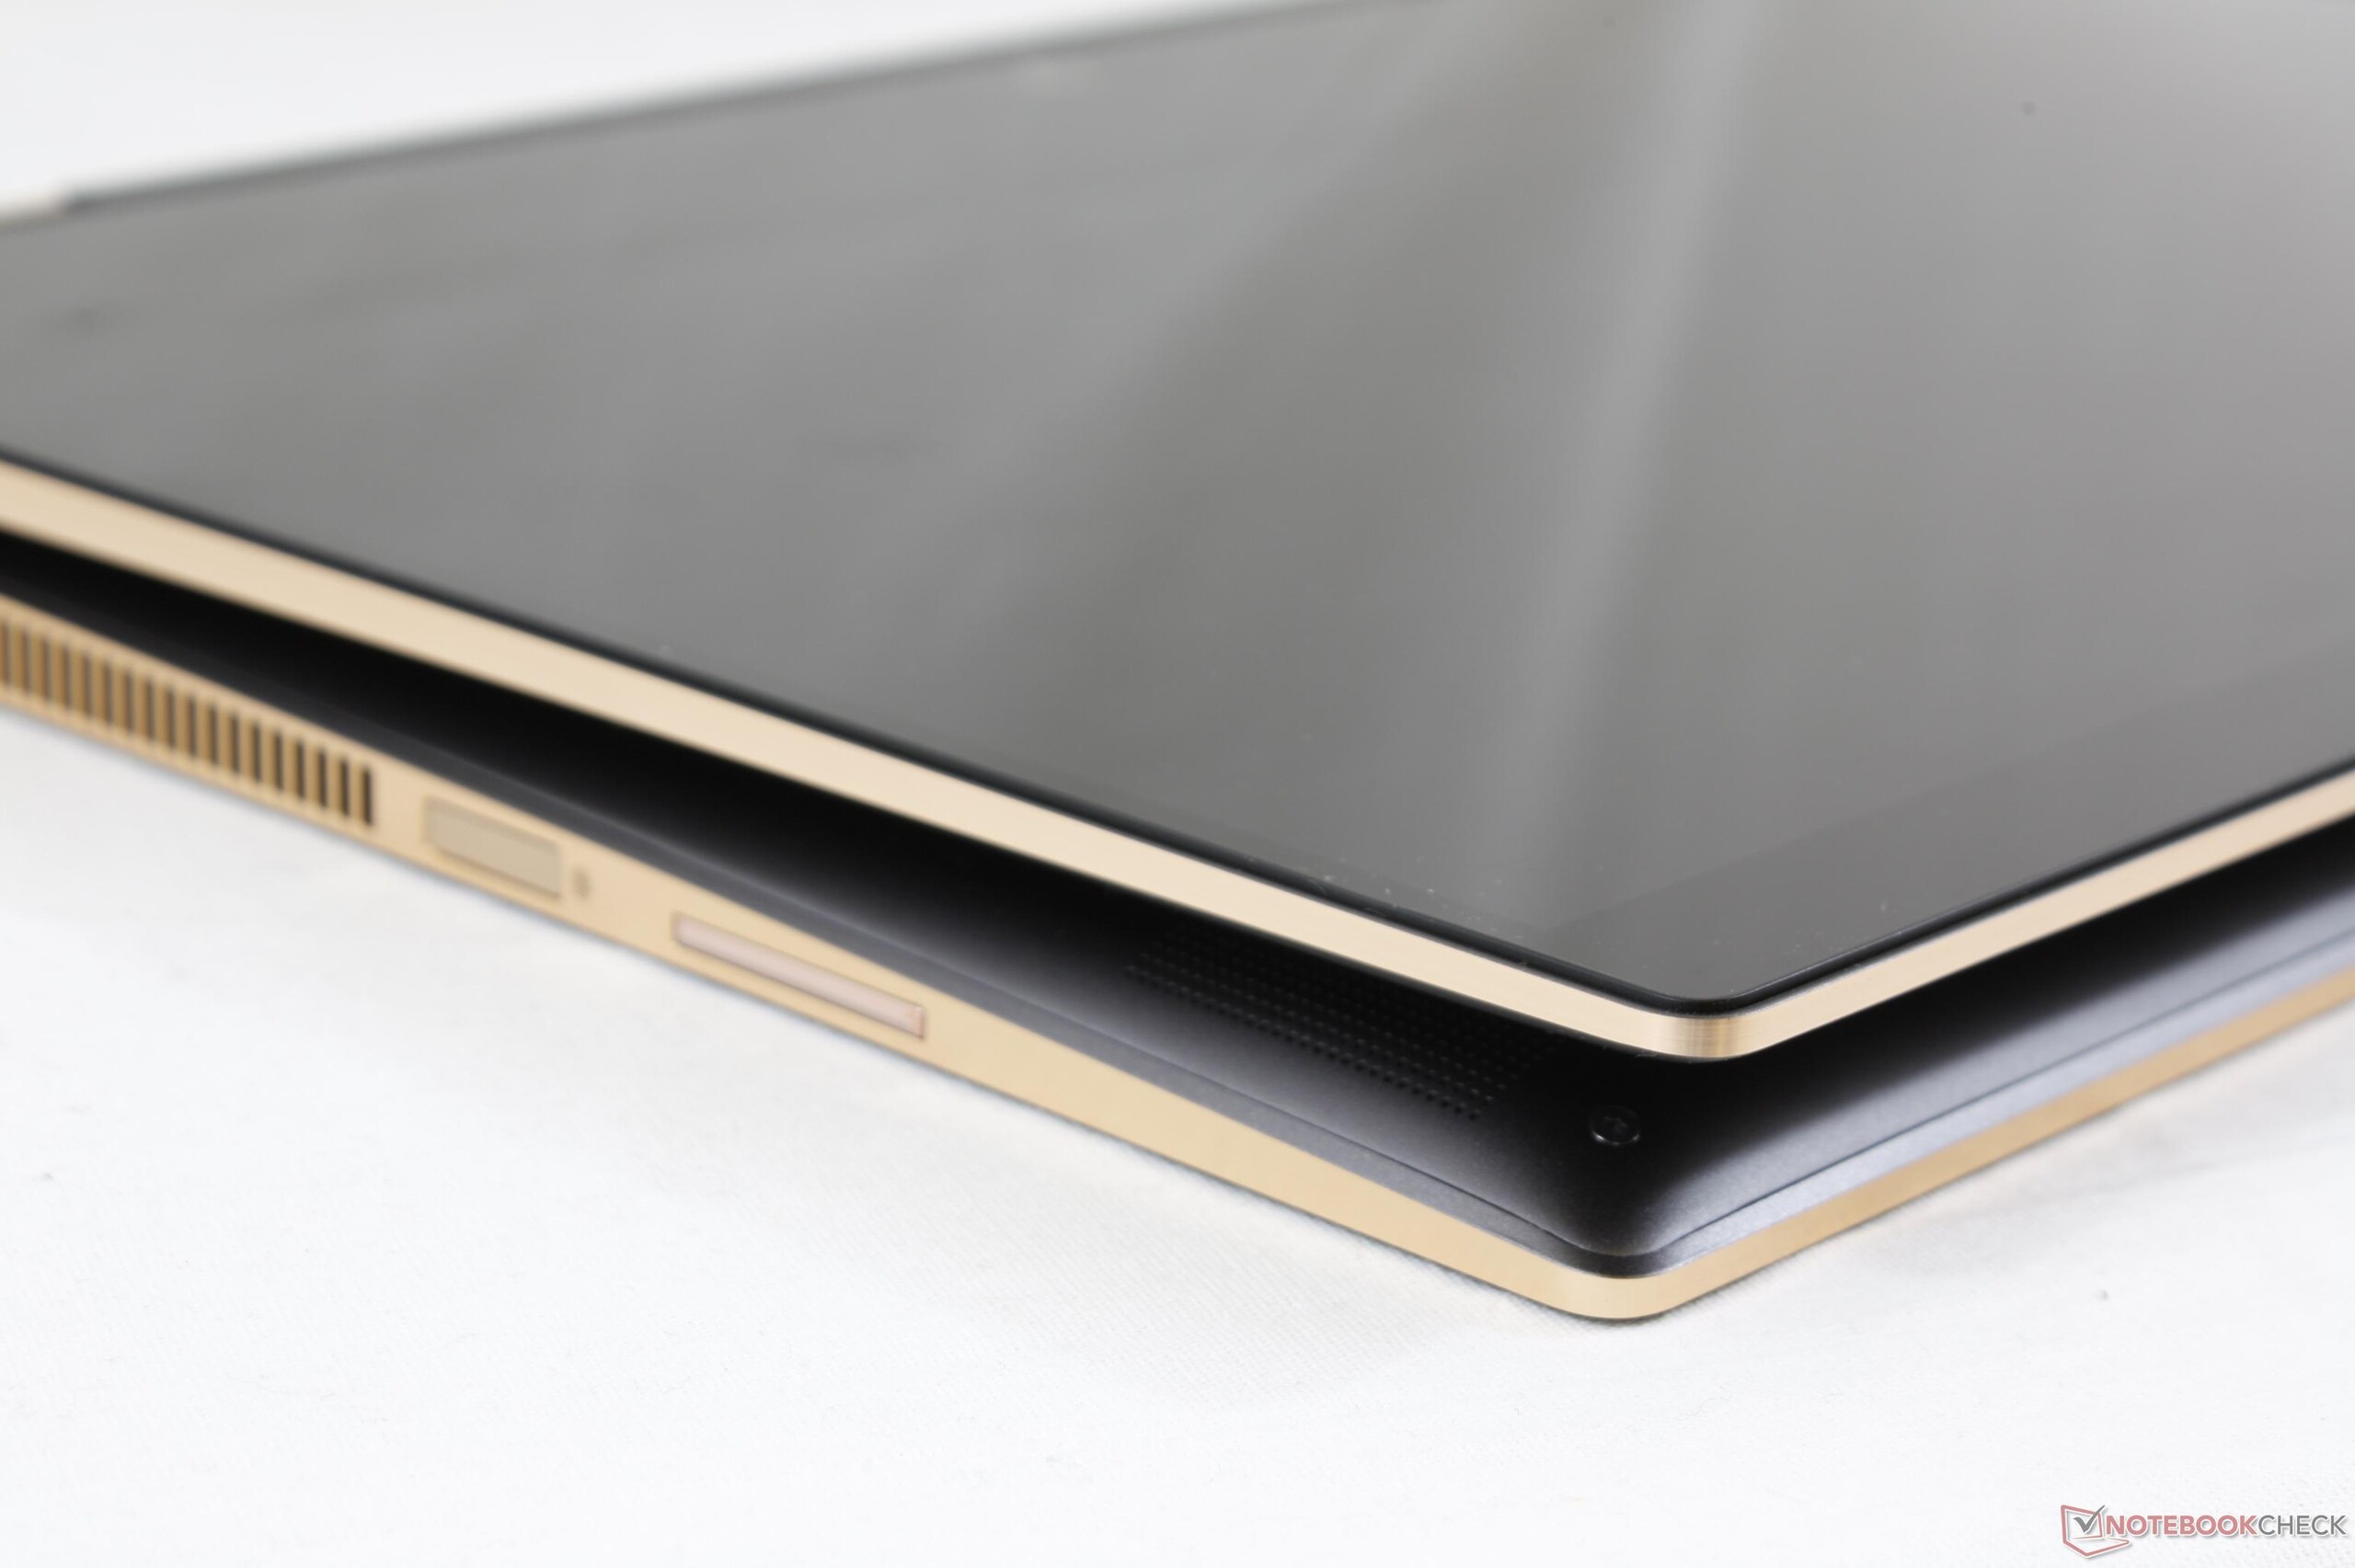
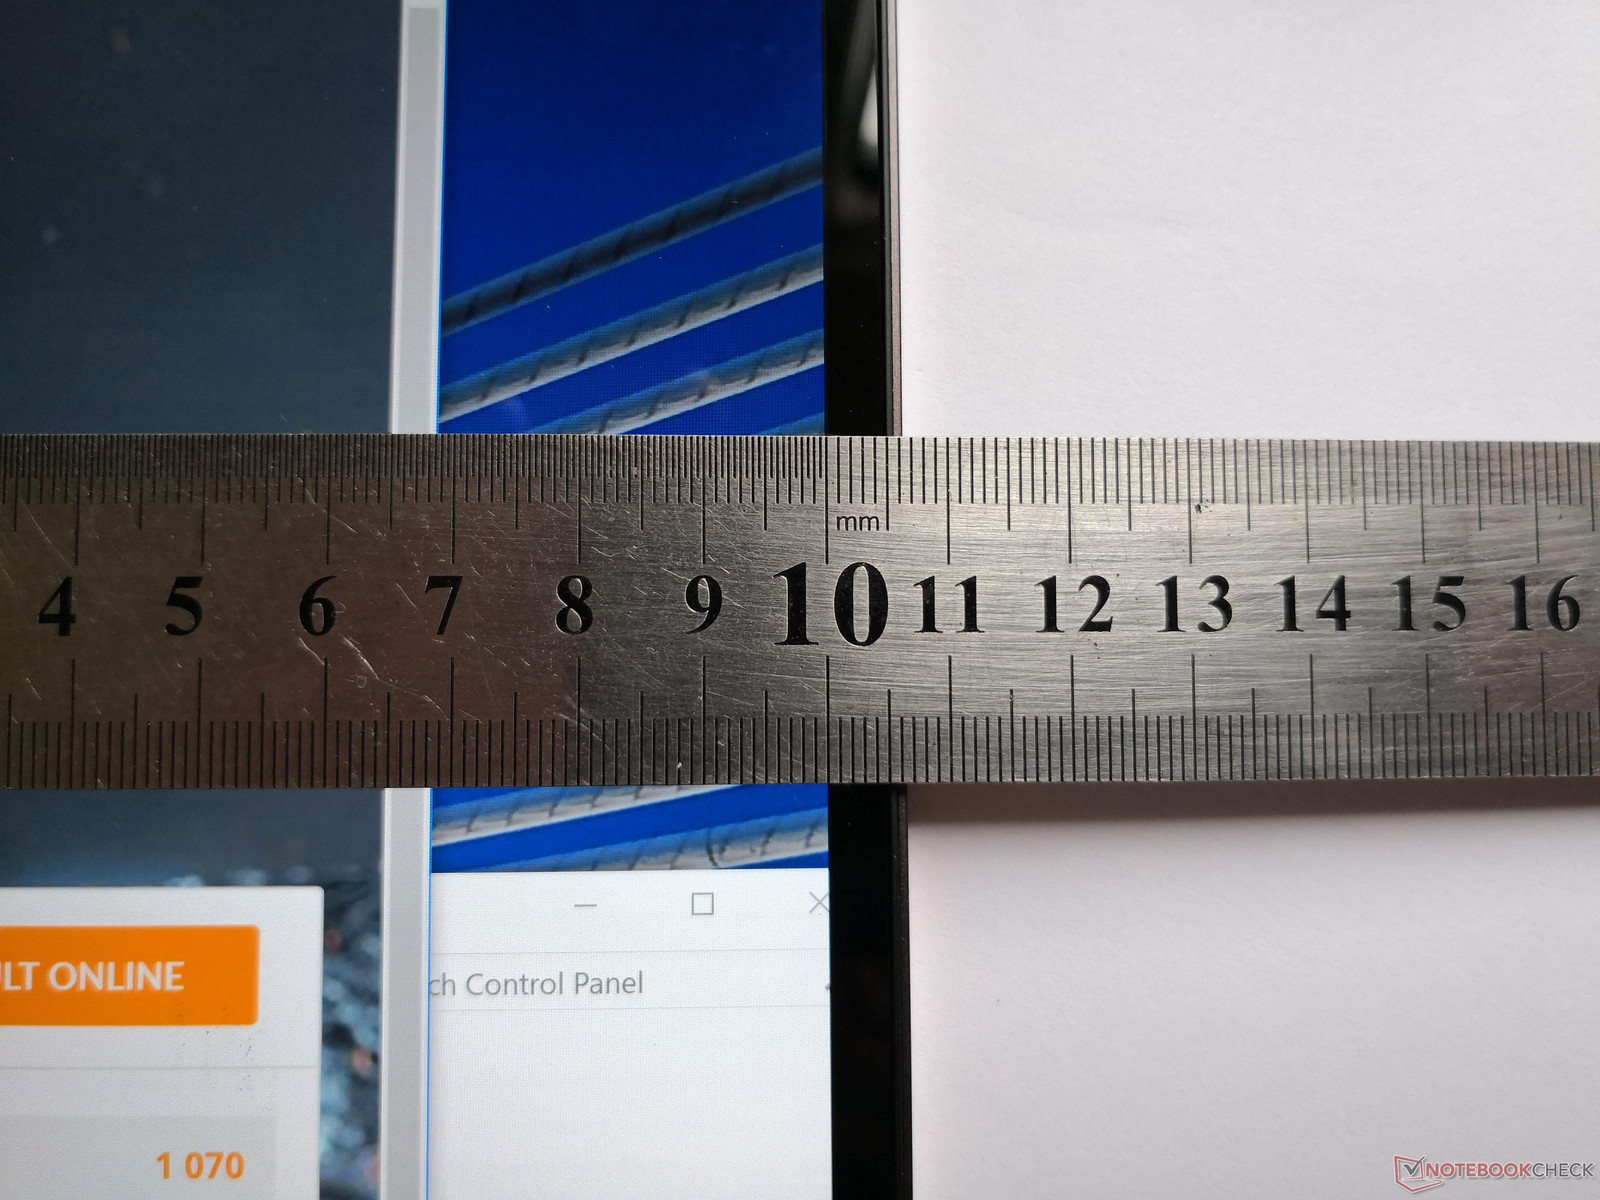
In terms of size and weight, the new Spectre x360 15 is slightly heavier (~2.1 kg vs. ~2.0 kg) and thicker (19.3 mm vs. 17.8 mm) than the outgoing model. HP says this was a very conscious effort in order to improve temperatures and integrate a full-fledged NumPad. Note that while the 2018 Spectre x360 15 may have narrower bezels than the 2017 model, it is actually slightly wider (359 mm vs 355.6 mm). During everyday use, however, it's almost impossible to notice these minute size differences.
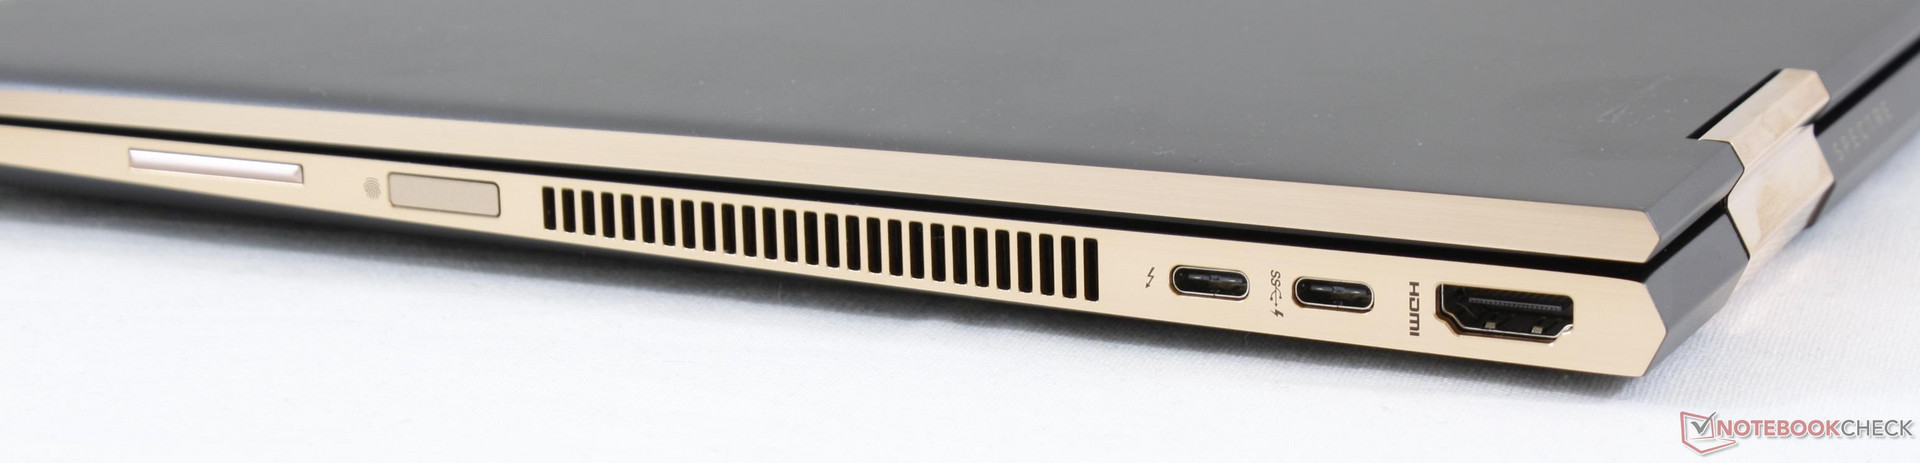
Connectivity
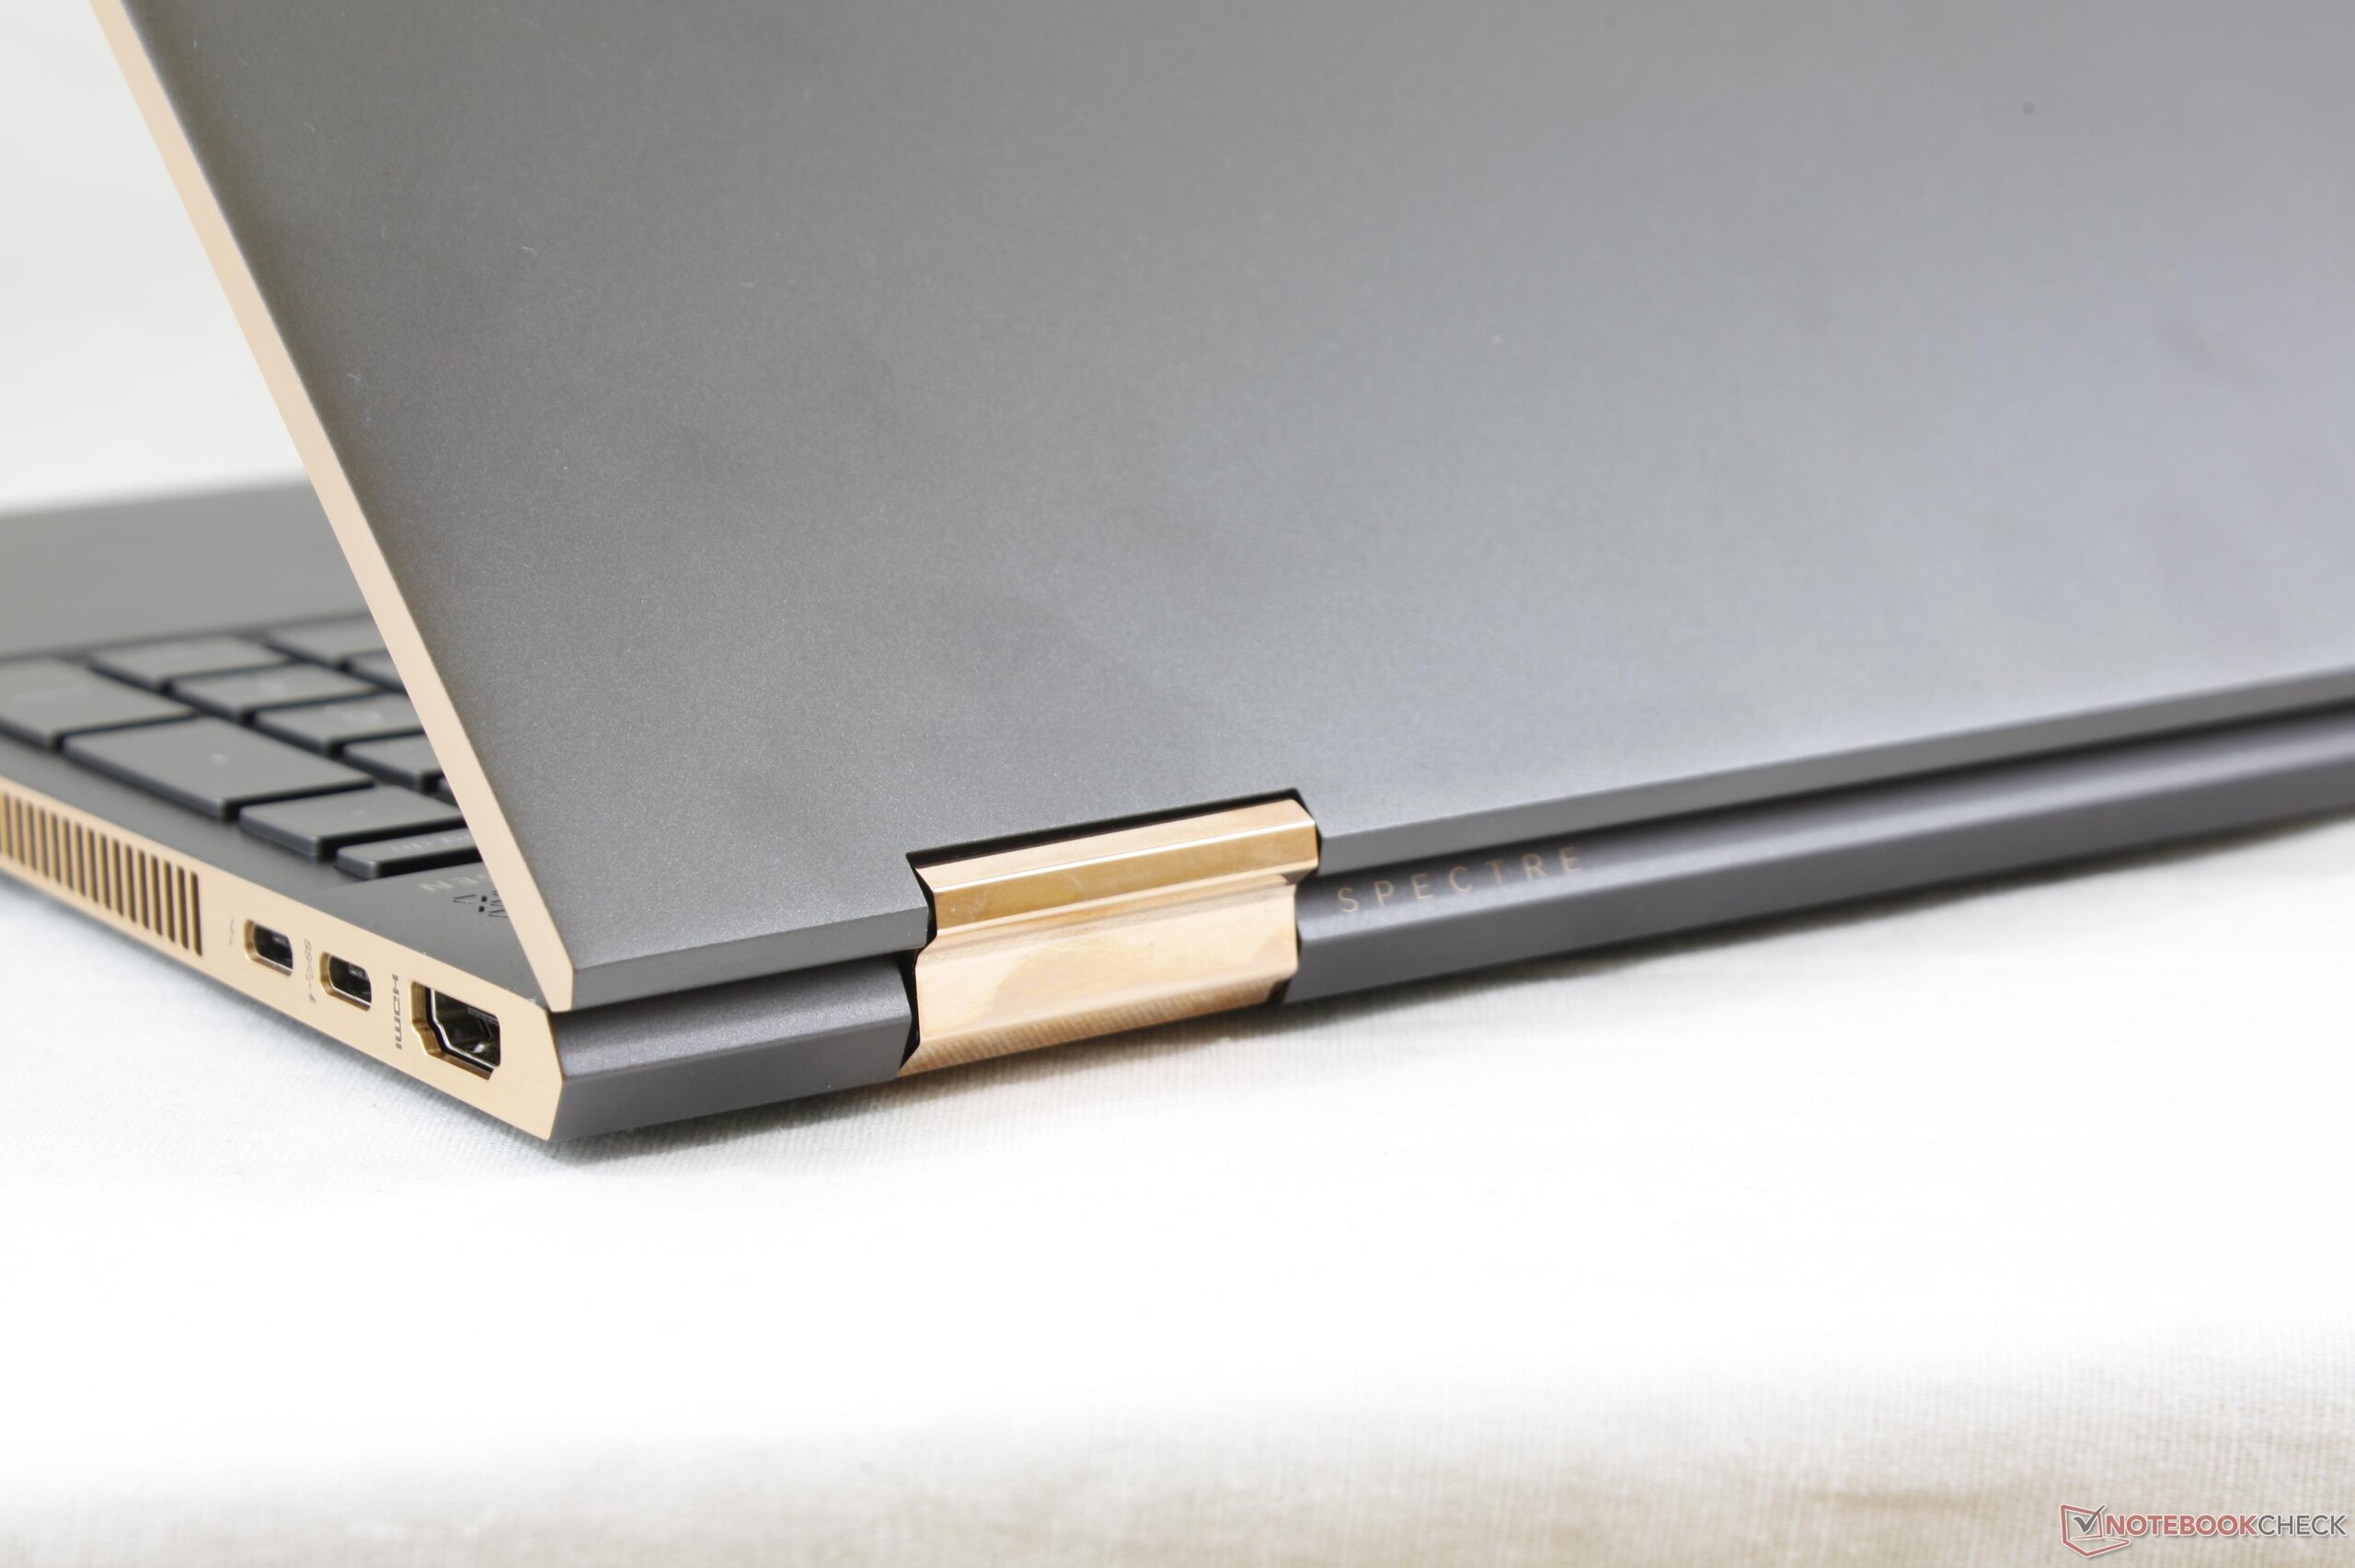
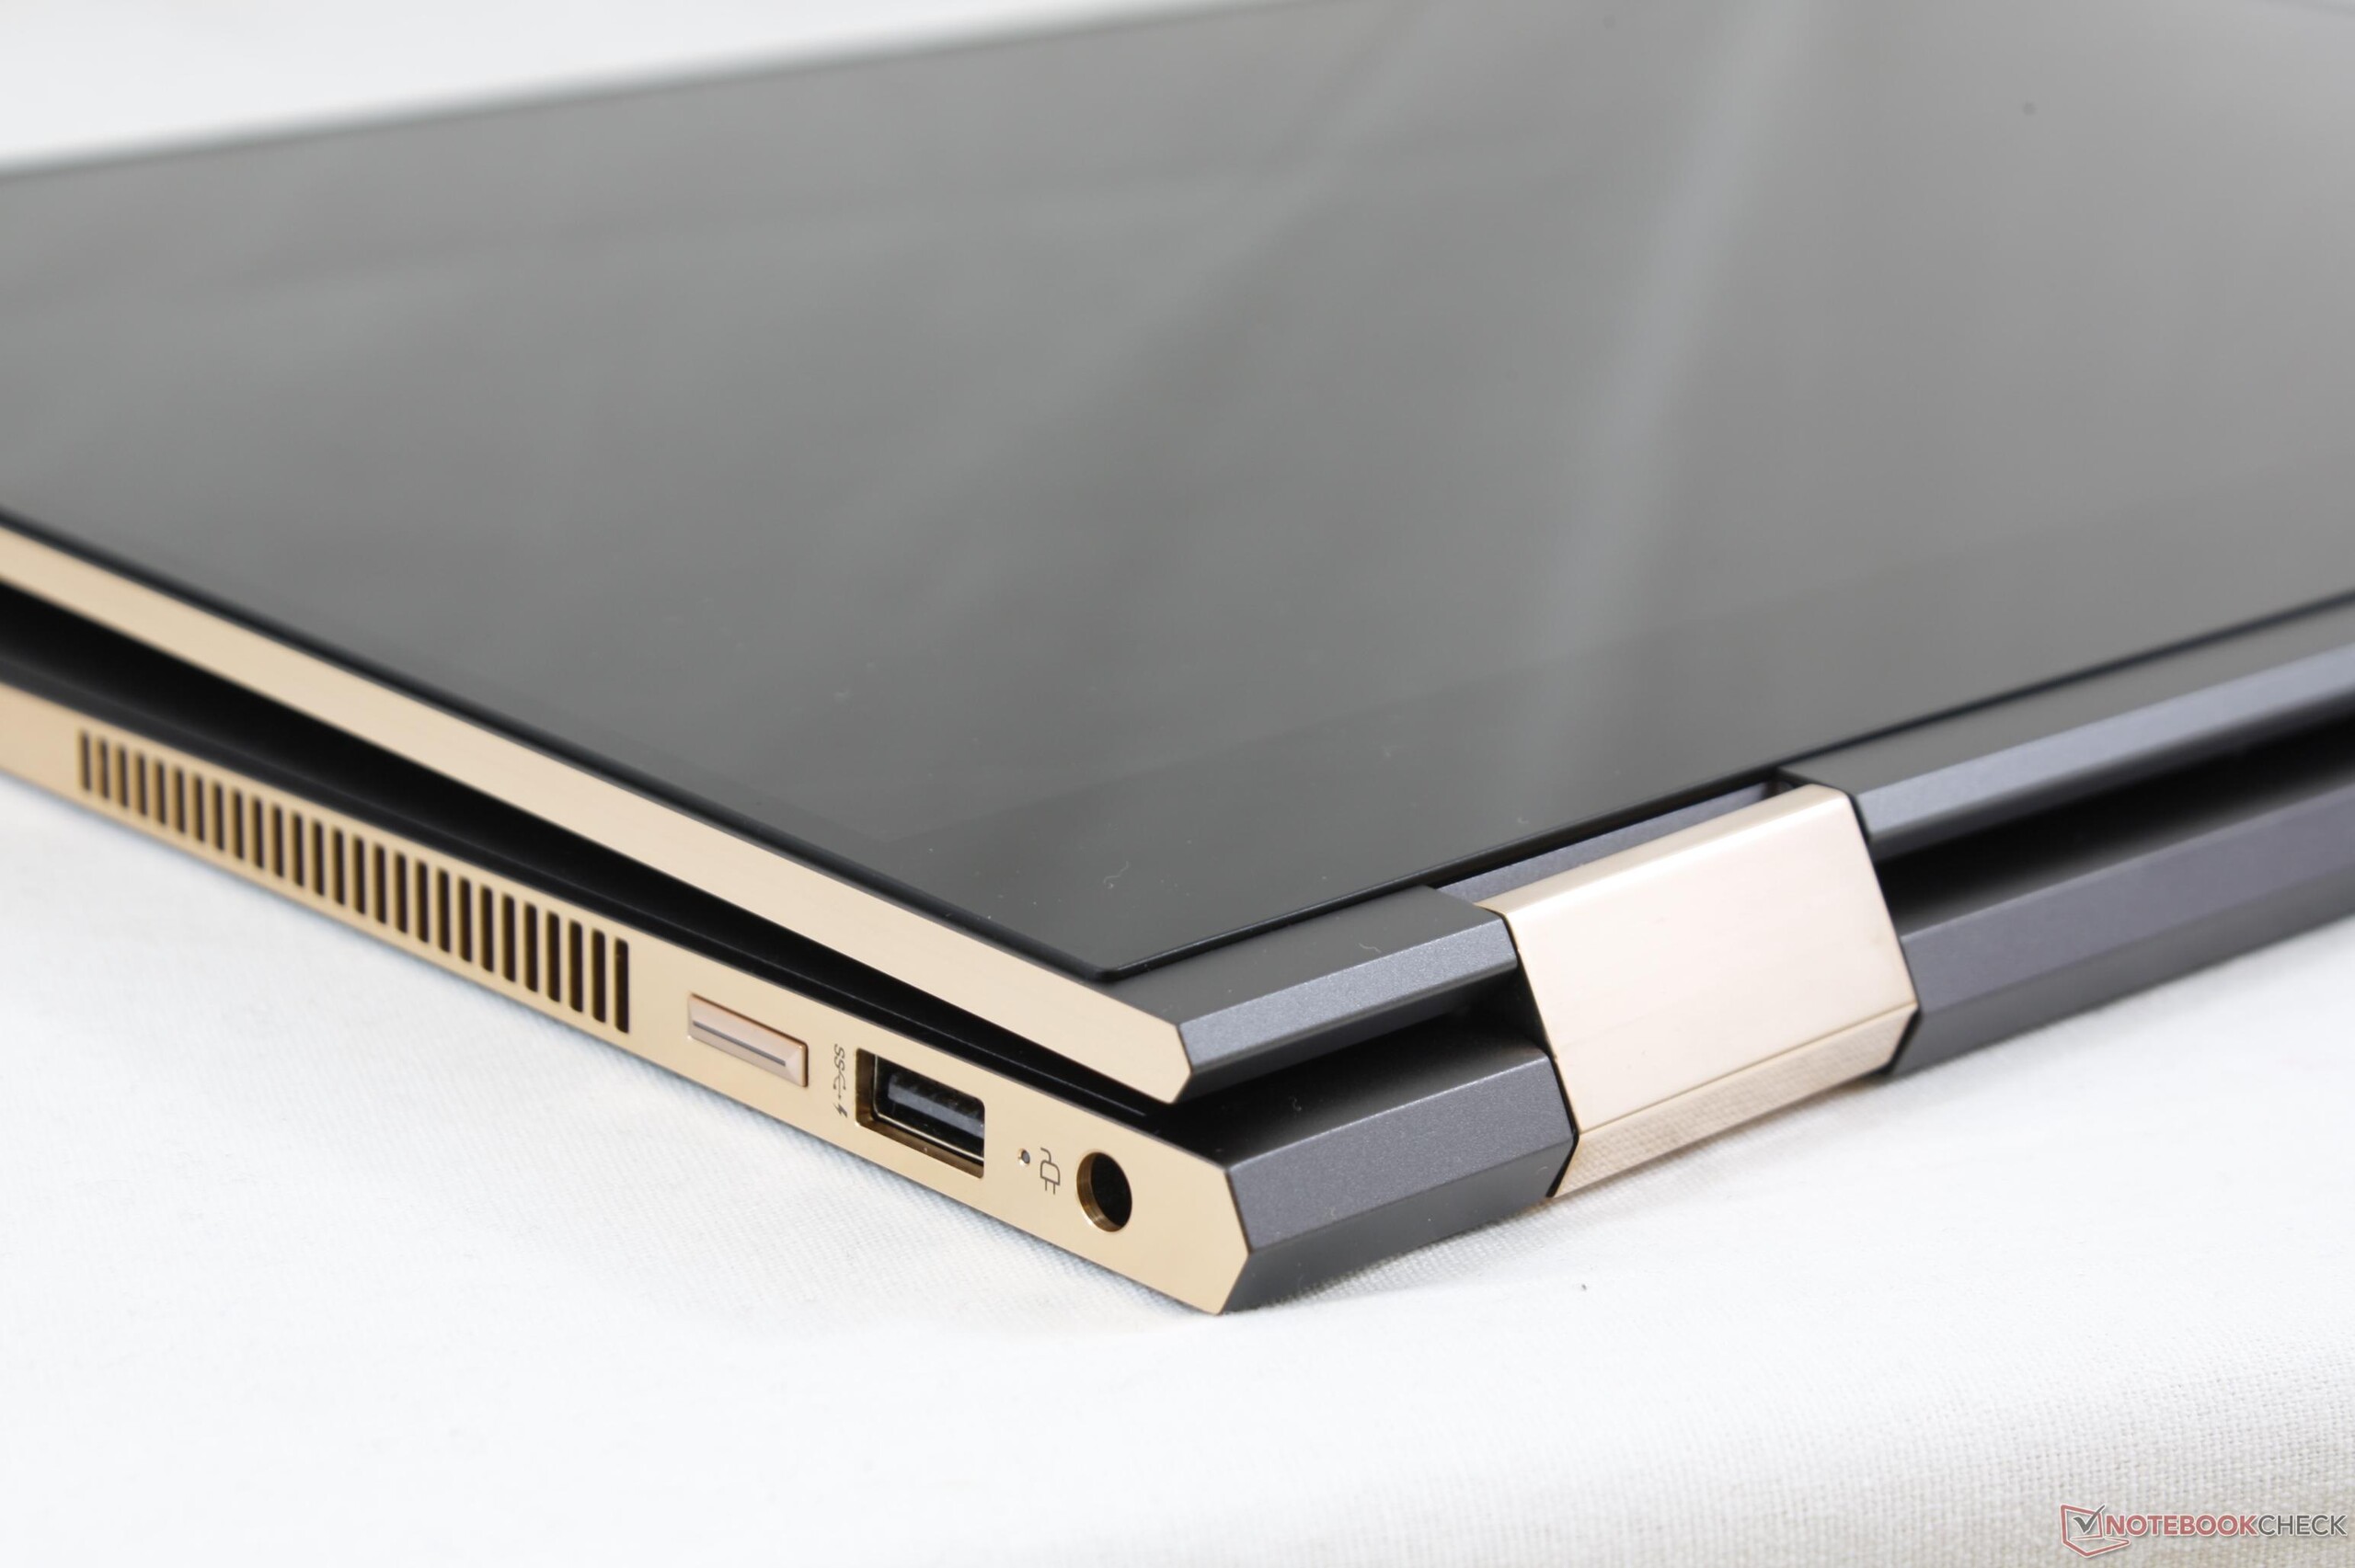
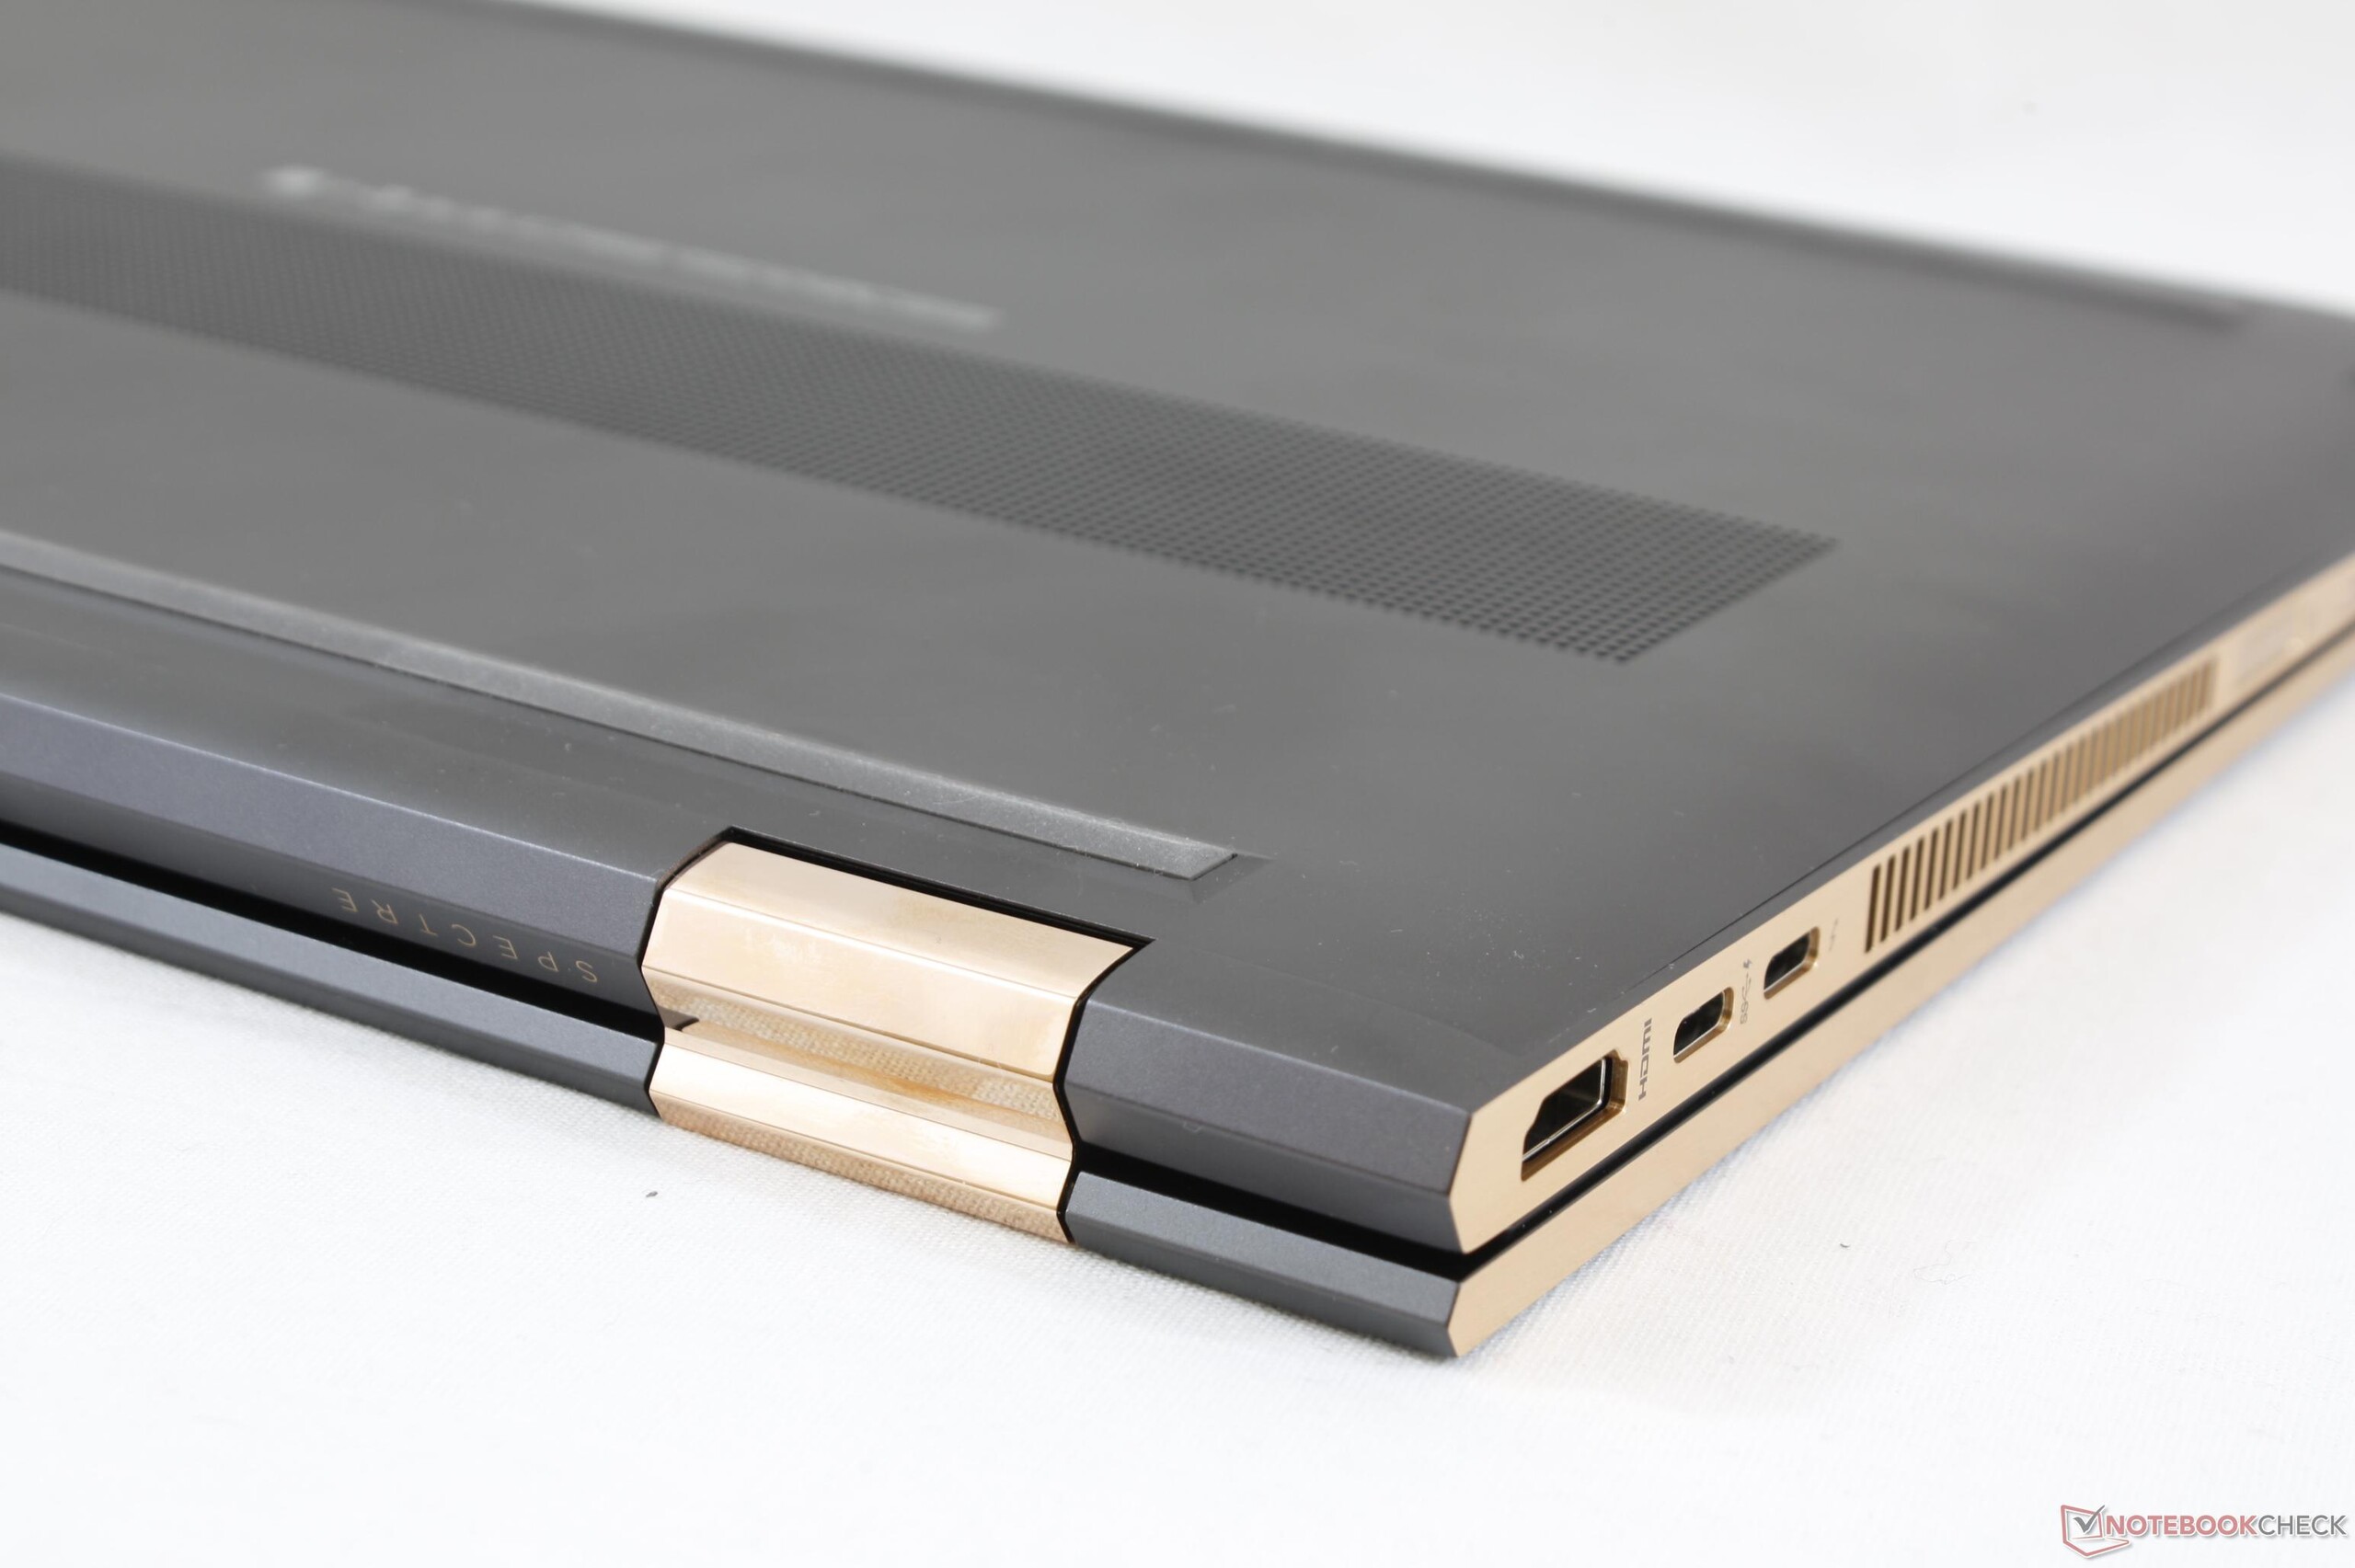
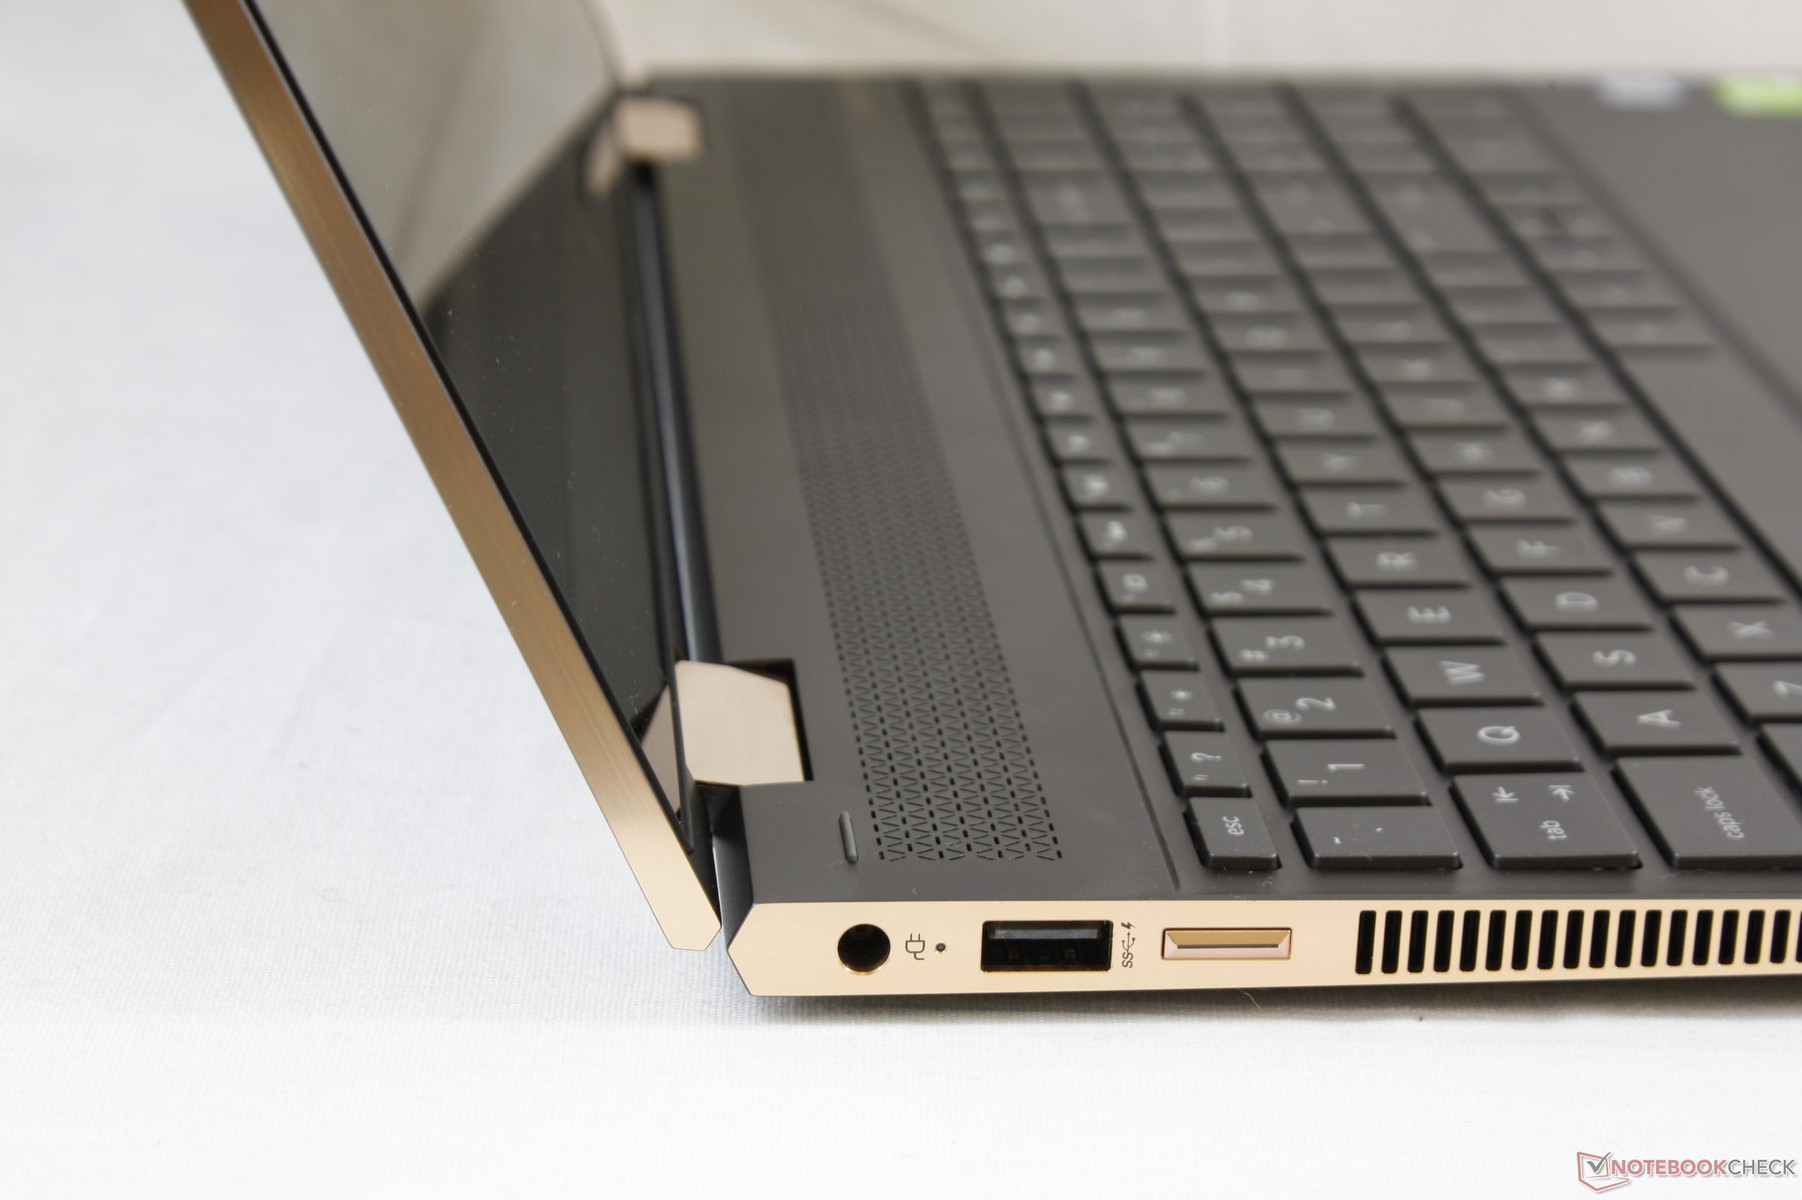
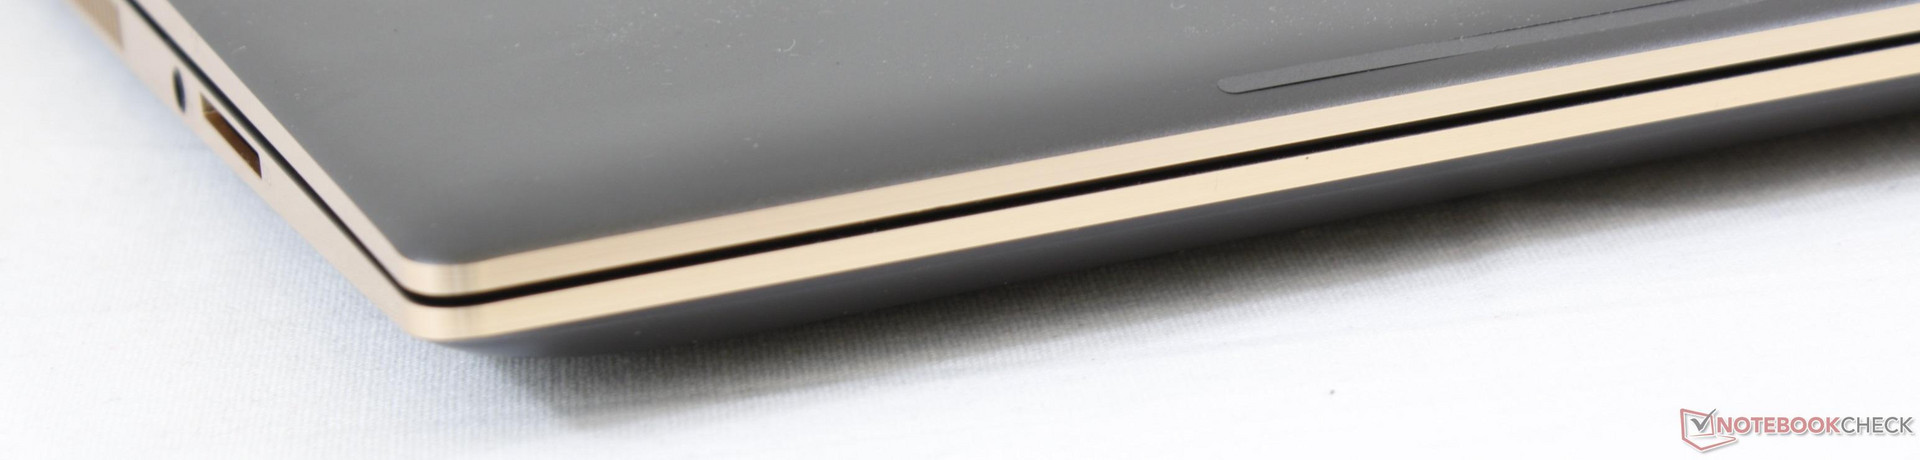
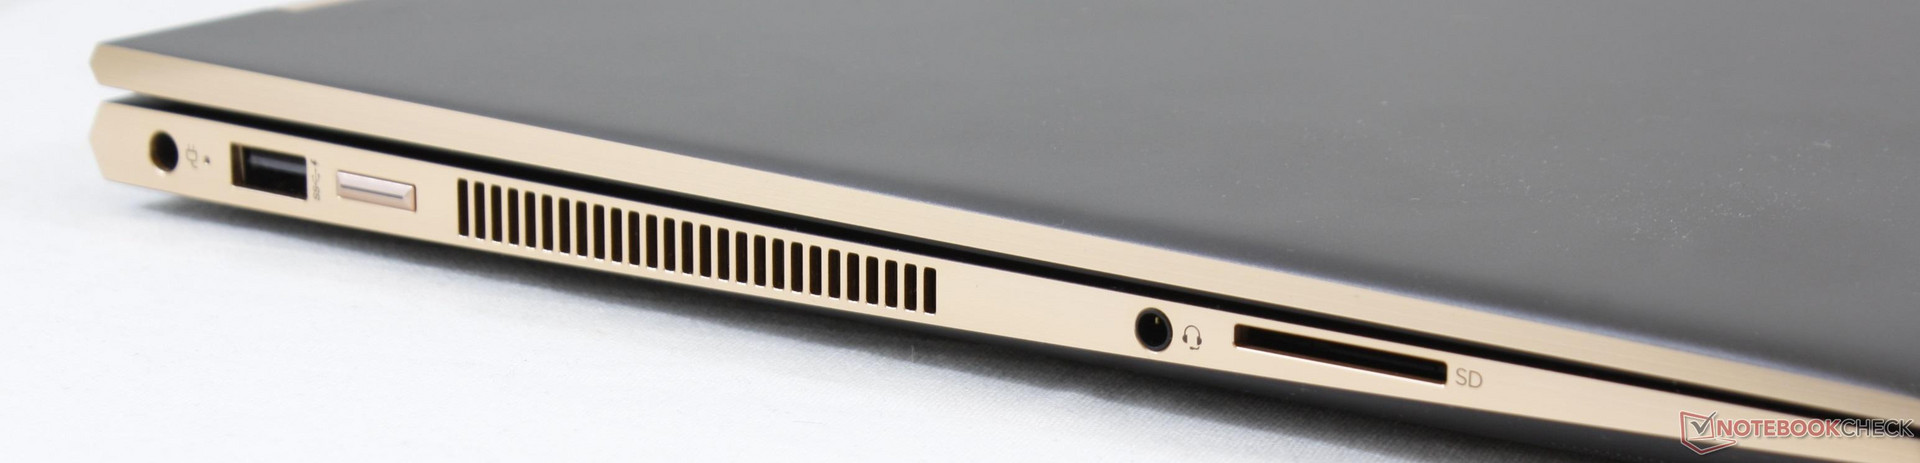
The 2018 Spectre x360 15 includes the same ports as the 2017 Spectre x360 15 albeit slightly rearranged. The audio port is now closer to the front edge, the HDMI and USB Type-C ports have been swapped, and a dedicated fingerprint reader is now in between the ventilation grilles and volume rocker. We're glad to see the USB Type-A port again since this is sorely missing from the competing XPS 15 9575.
The new fingerprint reader is a welcomed addition. Its placement, however, is strange because the reader is out of sight when sitting down and awkward to reach. Fingerprint readers on other laptops are typically squarer and on the palm rest for easier reach.
SD Card Reader
| SD Card Reader | |
| average JPG Copy Test (av. of 3 runs) | |
| HP Spectre x360 15-ch011nr (Toshiba Exceria Pro SDXC 64 GB UHS-II) | |
| HP Spectre x360 15t-bl100 (Toshiba Exceria Pro SDXC 64 GB UHS-II) | |
| Dell XPS 15 2018 i5 FHD 97Wh | |
| maximum AS SSD Seq Read Test (1GB) | |
| HP Spectre x360 15t-bl100 (Toshiba Exceria Pro SDXC 64 GB UHS-II) | |
| HP Spectre x360 15-ch011nr (Toshiba Exceria Pro SDXC 64 GB UHS-II) | |
| Dell XPS 15 2018 i5 FHD 97Wh | |
Communication
Unlike our last Spectre x360 15, this newer unit exhibits no wireless issues. HP has upgraded the WLAN module from the Intel 8265 to the Intel 9260 for Bluetooth 5.0 and theoretical transfer rates of up to 1.73 Gbps. Our current setup can test up to 1 Gbps only and so the results below are slower than what the Intel 9260 is capable of.
| Networking | |
| iperf3 transmit AX12 | |
| Dell XPS 15 2018 i5 FHD 97Wh | |
| HP Spectre x360 15-ch011nr | |
| Gigabyte Aero 15X v8 | |
| iperf3 receive AX12 | |
| Gigabyte Aero 15X v8 | |
| HP Spectre x360 15-ch011nr | |
| Dell XPS 15 2018 i5 FHD 97Wh | |
Accessories
Included extras are a faux leather case in addition to the HP Pen stylus and the usual usual Quick Start manuals. The carrying case is a nice freebie not included in lower-end HP models like the Pavilion or Envy.
Maintenance
The bottom panel is secured by both Torx screws and Philips screws. The main issue is that a number of screws are hidden underneath the rubber feet and they are subsequently covered in the same glue used to hold the rubber feet in place. Serviceability is thus more difficult than it ought to be and could have been more user-friendly.
Warranty
The standard one-year limited warranty applies with options to extend up to three years. Please see our Guarantees, Return policies and Warranties FAQ for country-specific information.
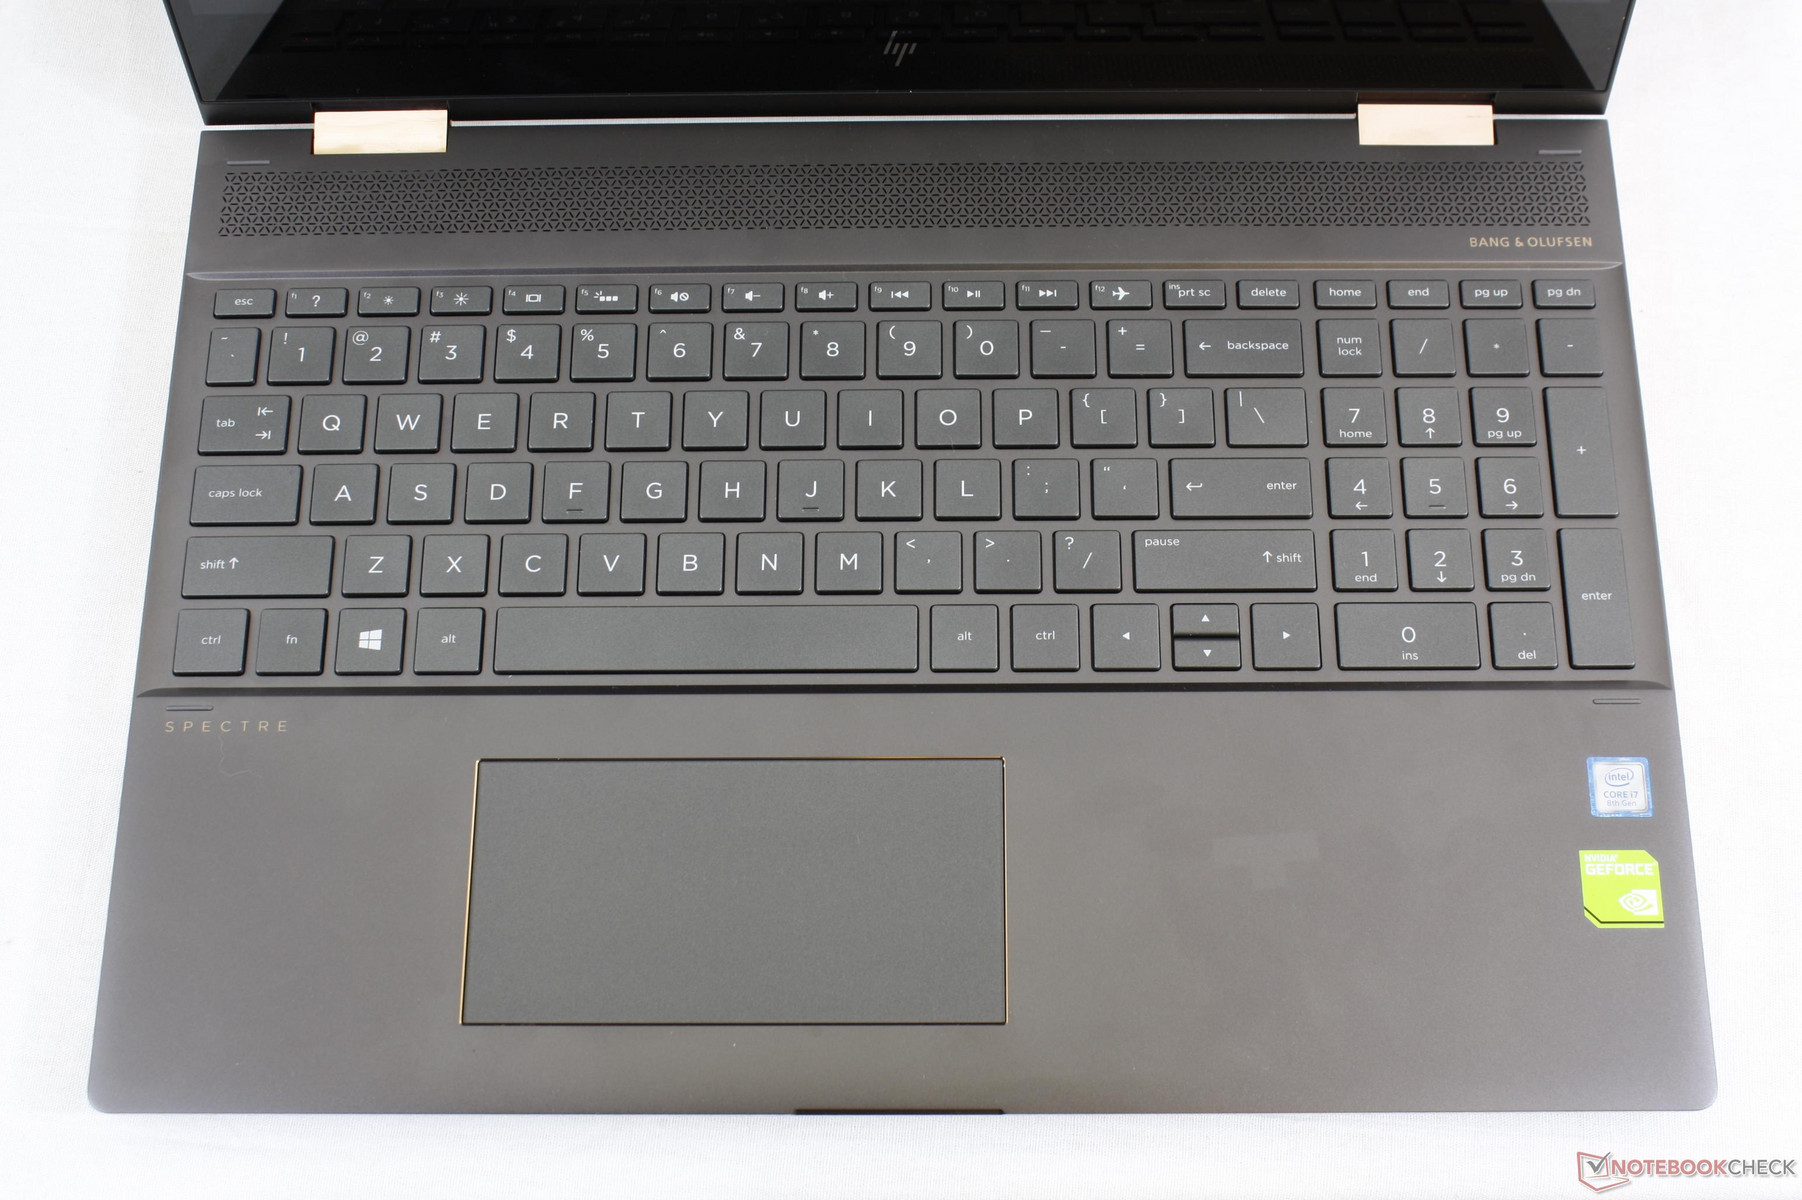
Input Devices
Keyboard
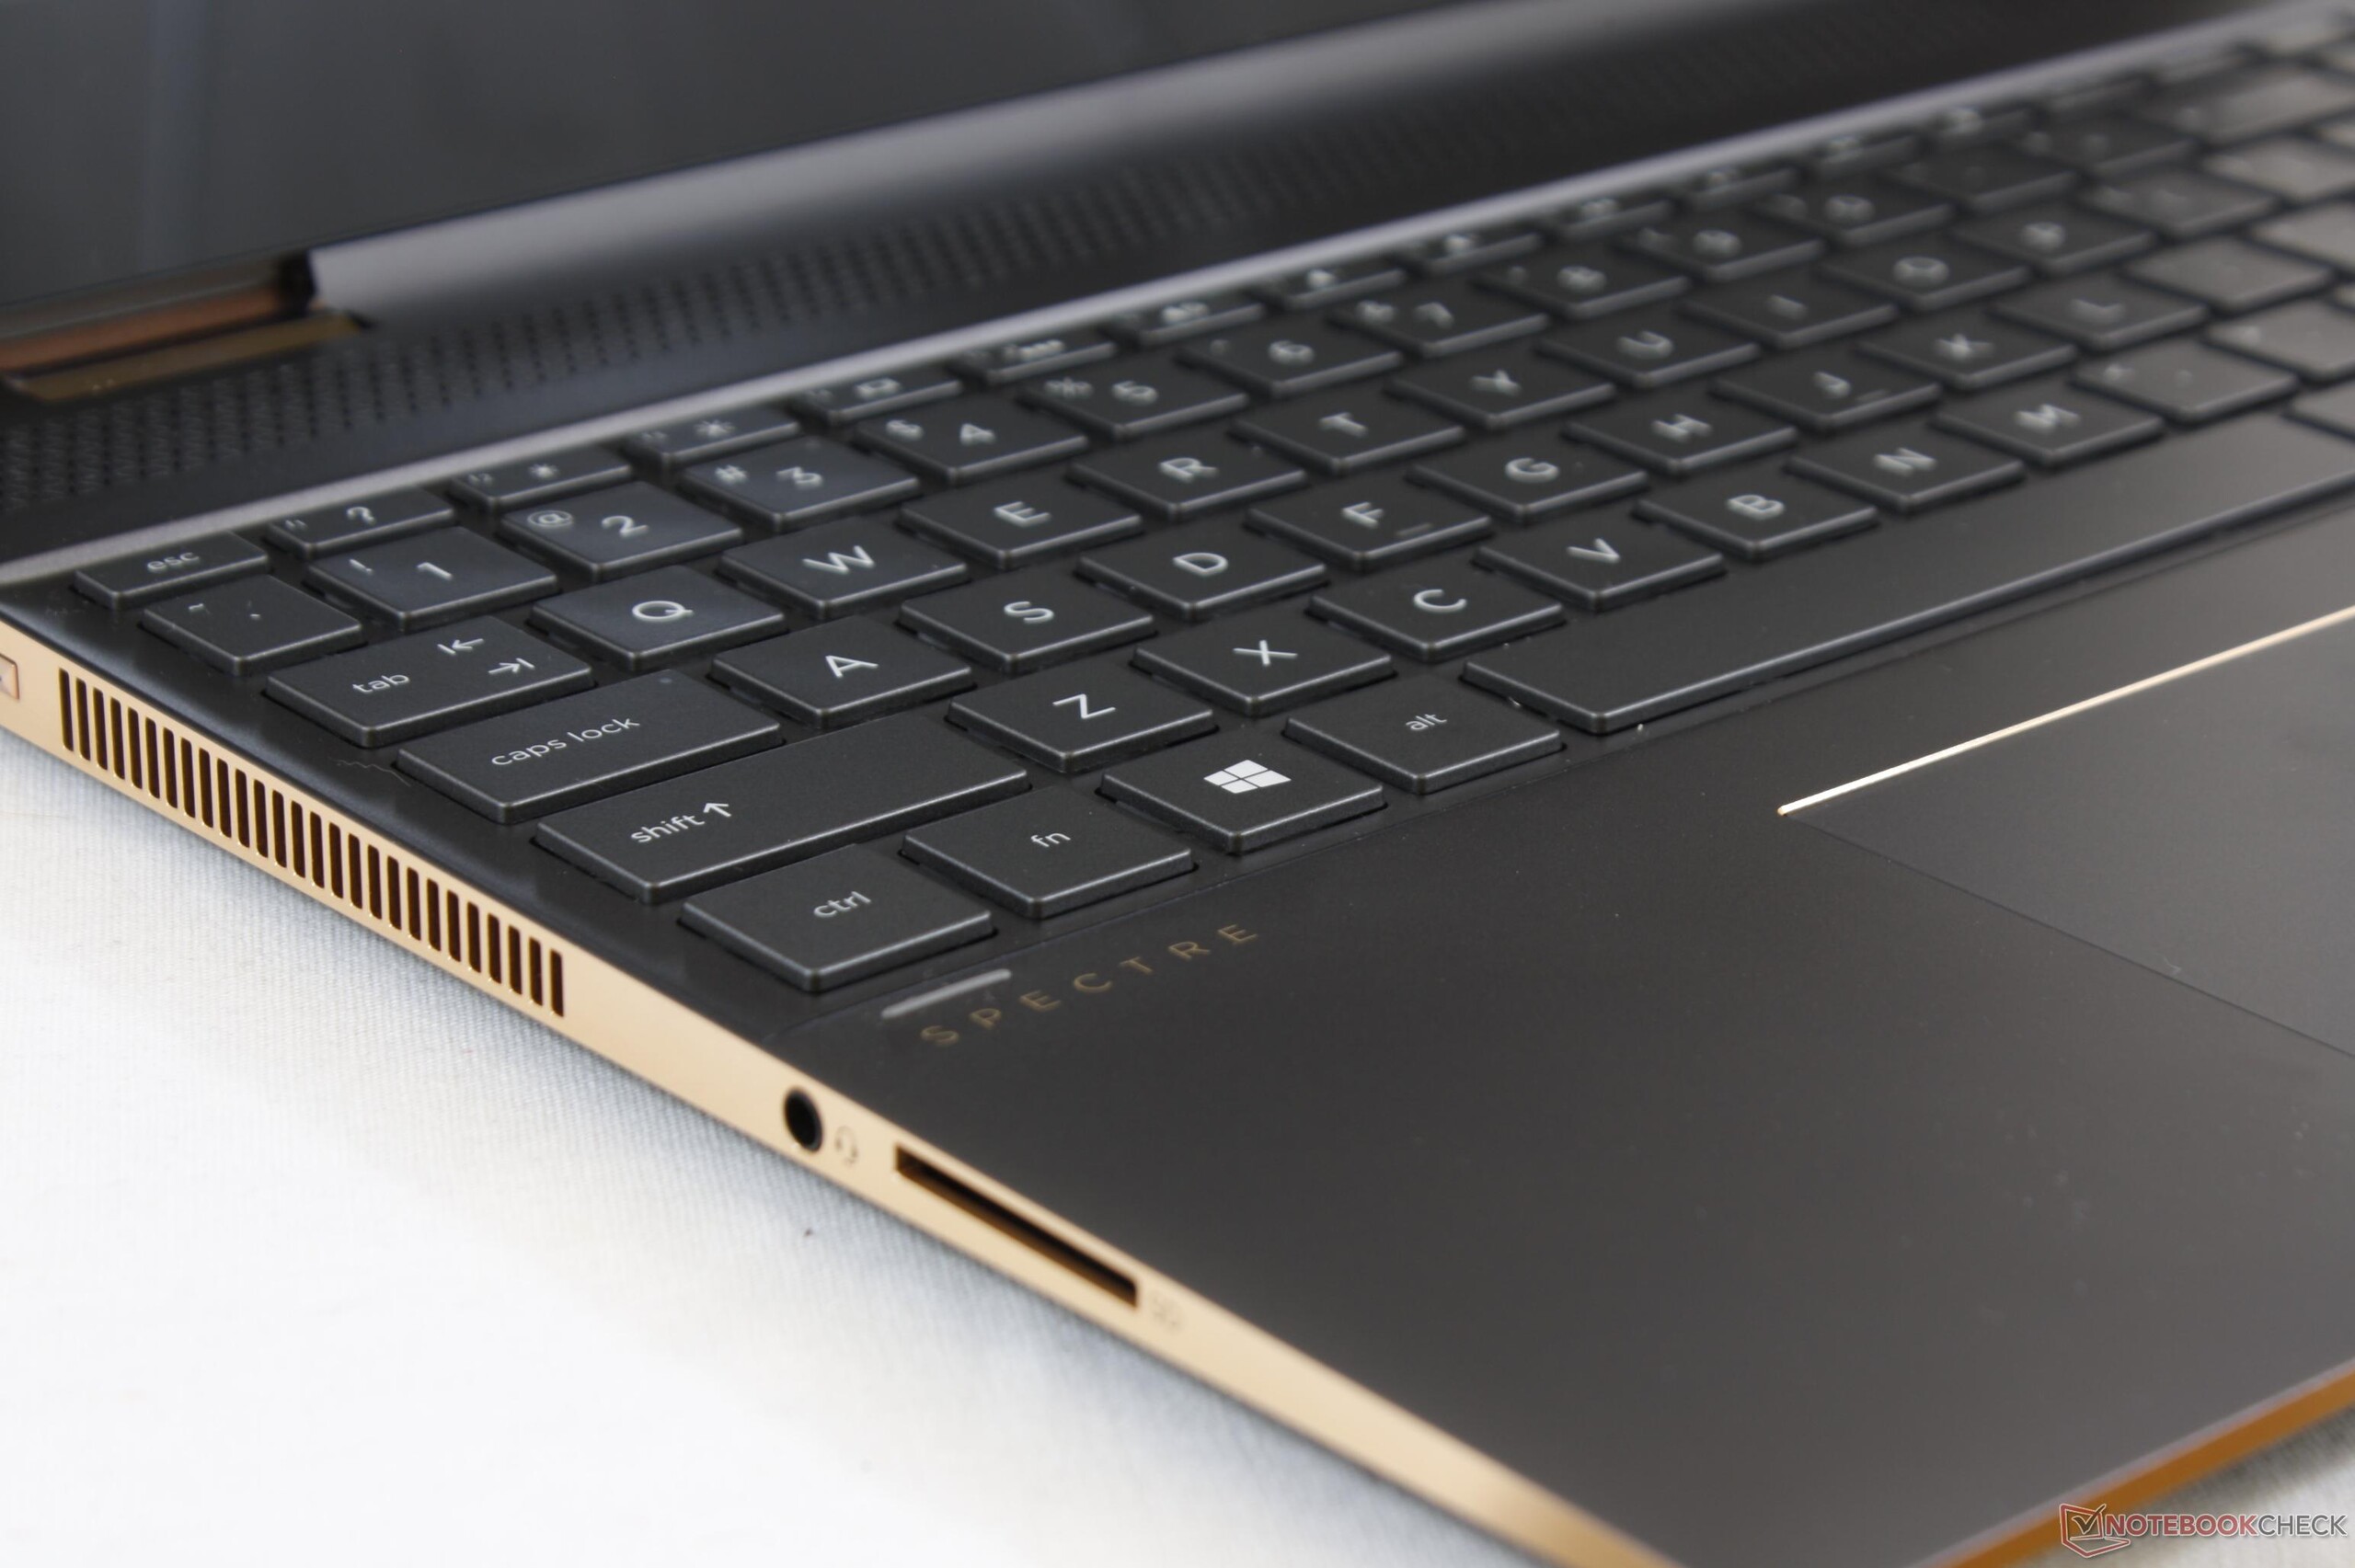
The Chiclet keyboard is much wider this time around (~34.1 x 10.0 cm) to accommodate the new NumPad without affecting the feedback or travel of the original QWERTY keys. Unlike the NumPad on most other notebooks, the NumPad keys on the Spectre are not reduced in size or made skinnier than the QWERTY keys. This is one of the most comfortable and roomy NumPads we've used on a notebook.
Because the keyboard is so wide, however, the speakers had to be moved to the bottom. It's a small sacrifice in our eyes from a productivity standpoint.
The white keyboard backlight can only be toggled on or off with no brightness levels to choose from. Adjusting the lid to about 190 degrees or beyond will automatically disable the keyboard keys and backlight.
Touchpad
The trackpad remains identical to last year's model in size (~12 x 6 cm) and feel. Feedback is shallow but with a firm and satisfying click. The 2:1 aspect ratio still feels strange because trackpads on most other notebooks are squarer in shape for better vertical cursor movement.
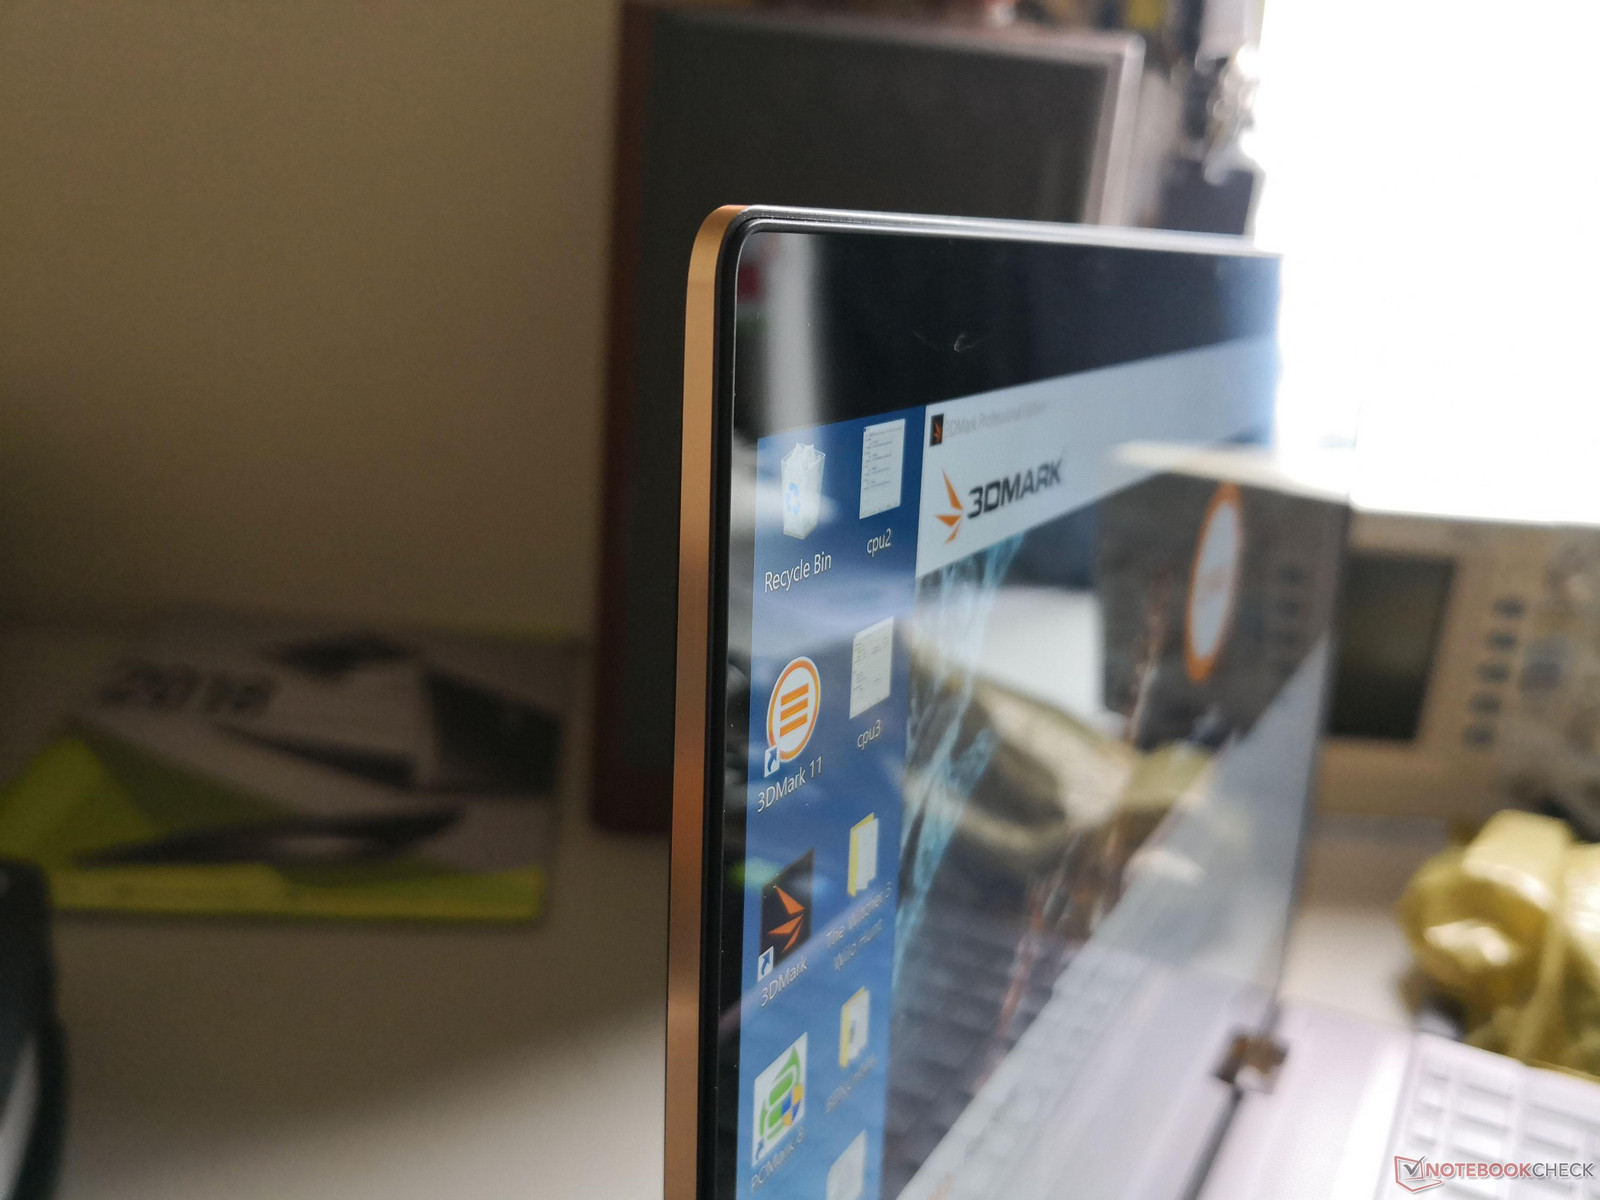
Display
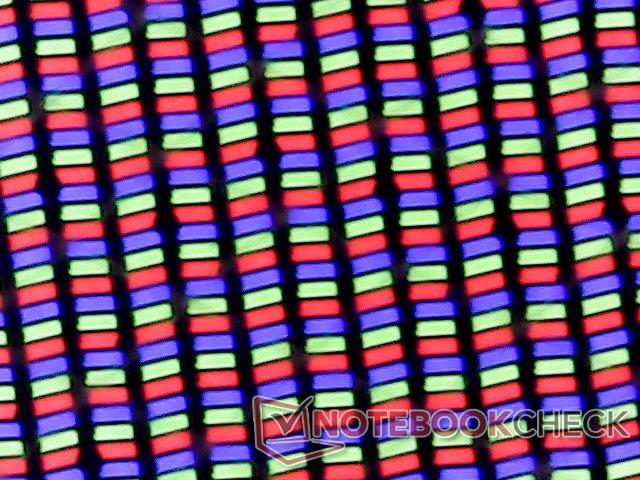
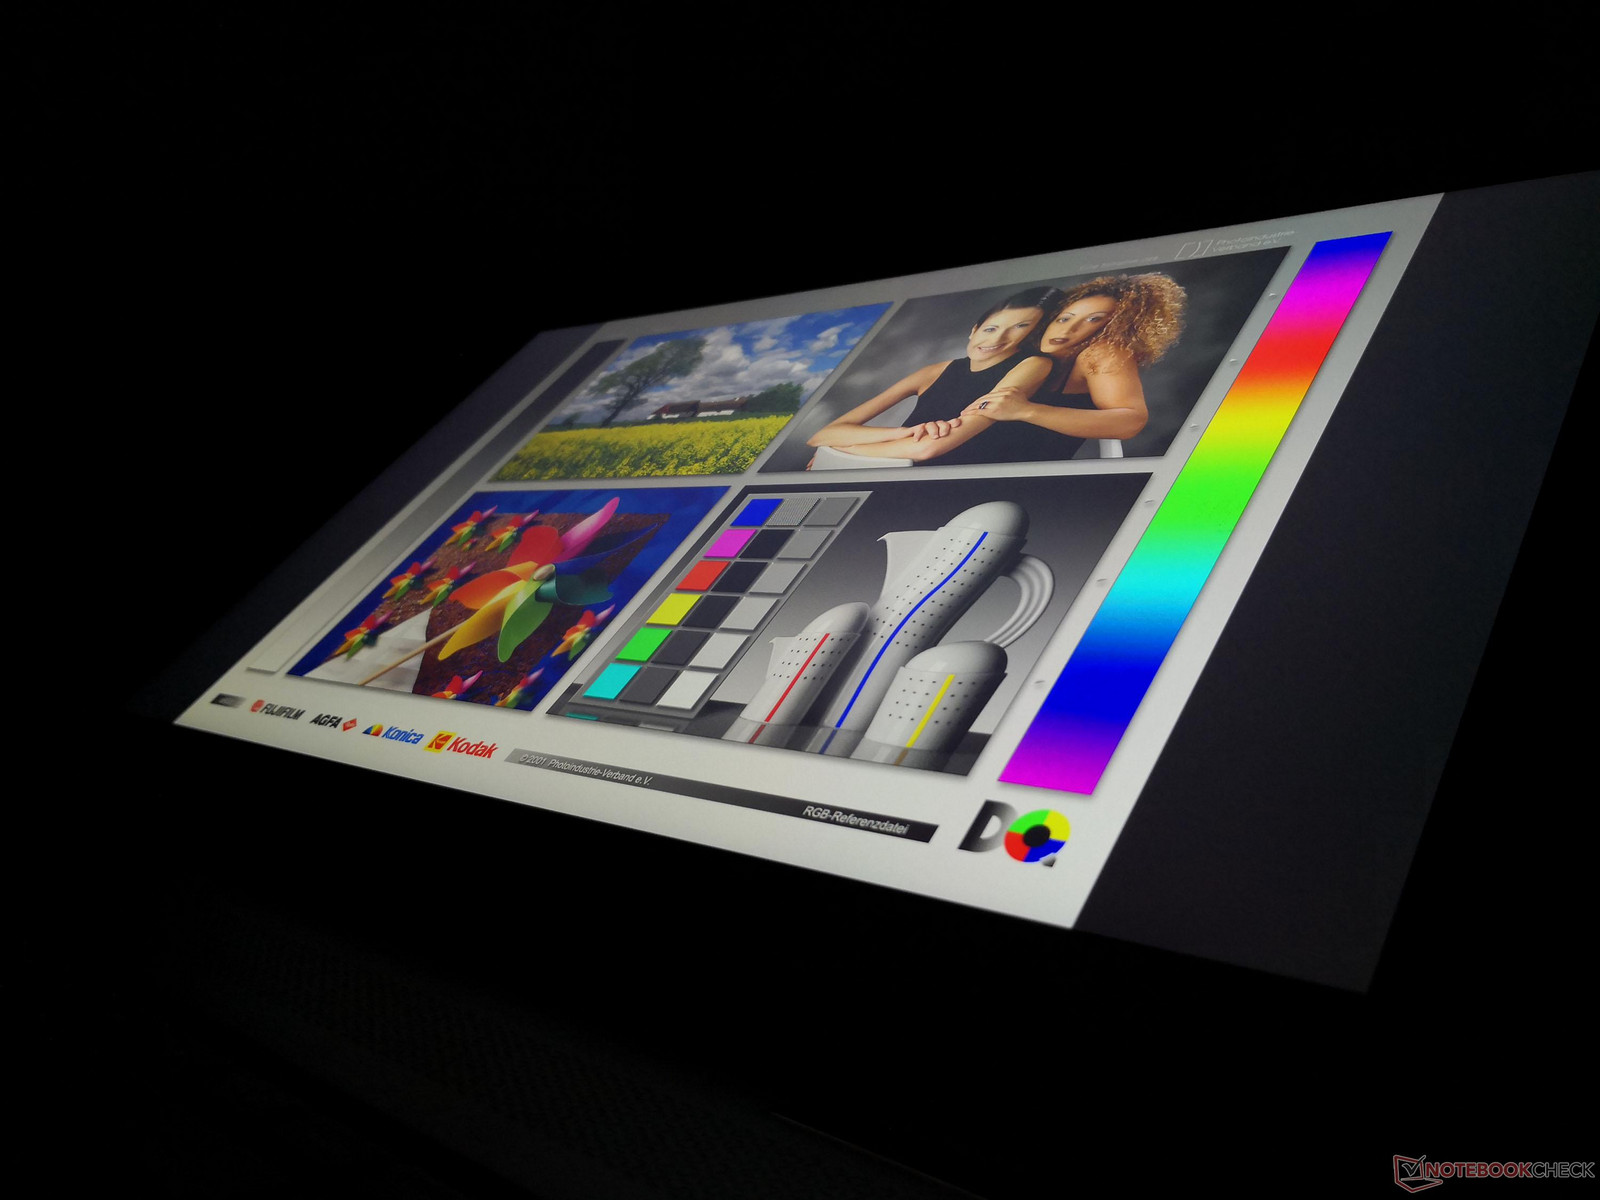
HP has again sourced BOE for its 4K UHD panel on the third generation Spectre x360 15. As a result, characteristics like contrast and color space are similar to last year's model. The backlight brightness is nearly the same as well which is a bit disappointing since the XPS 15 9570 and 9575 are each equipped with brighter panels for better outdoor visibility. Subjectively, however, text is crisp, colors pop, and the glossy panel is free of grains.
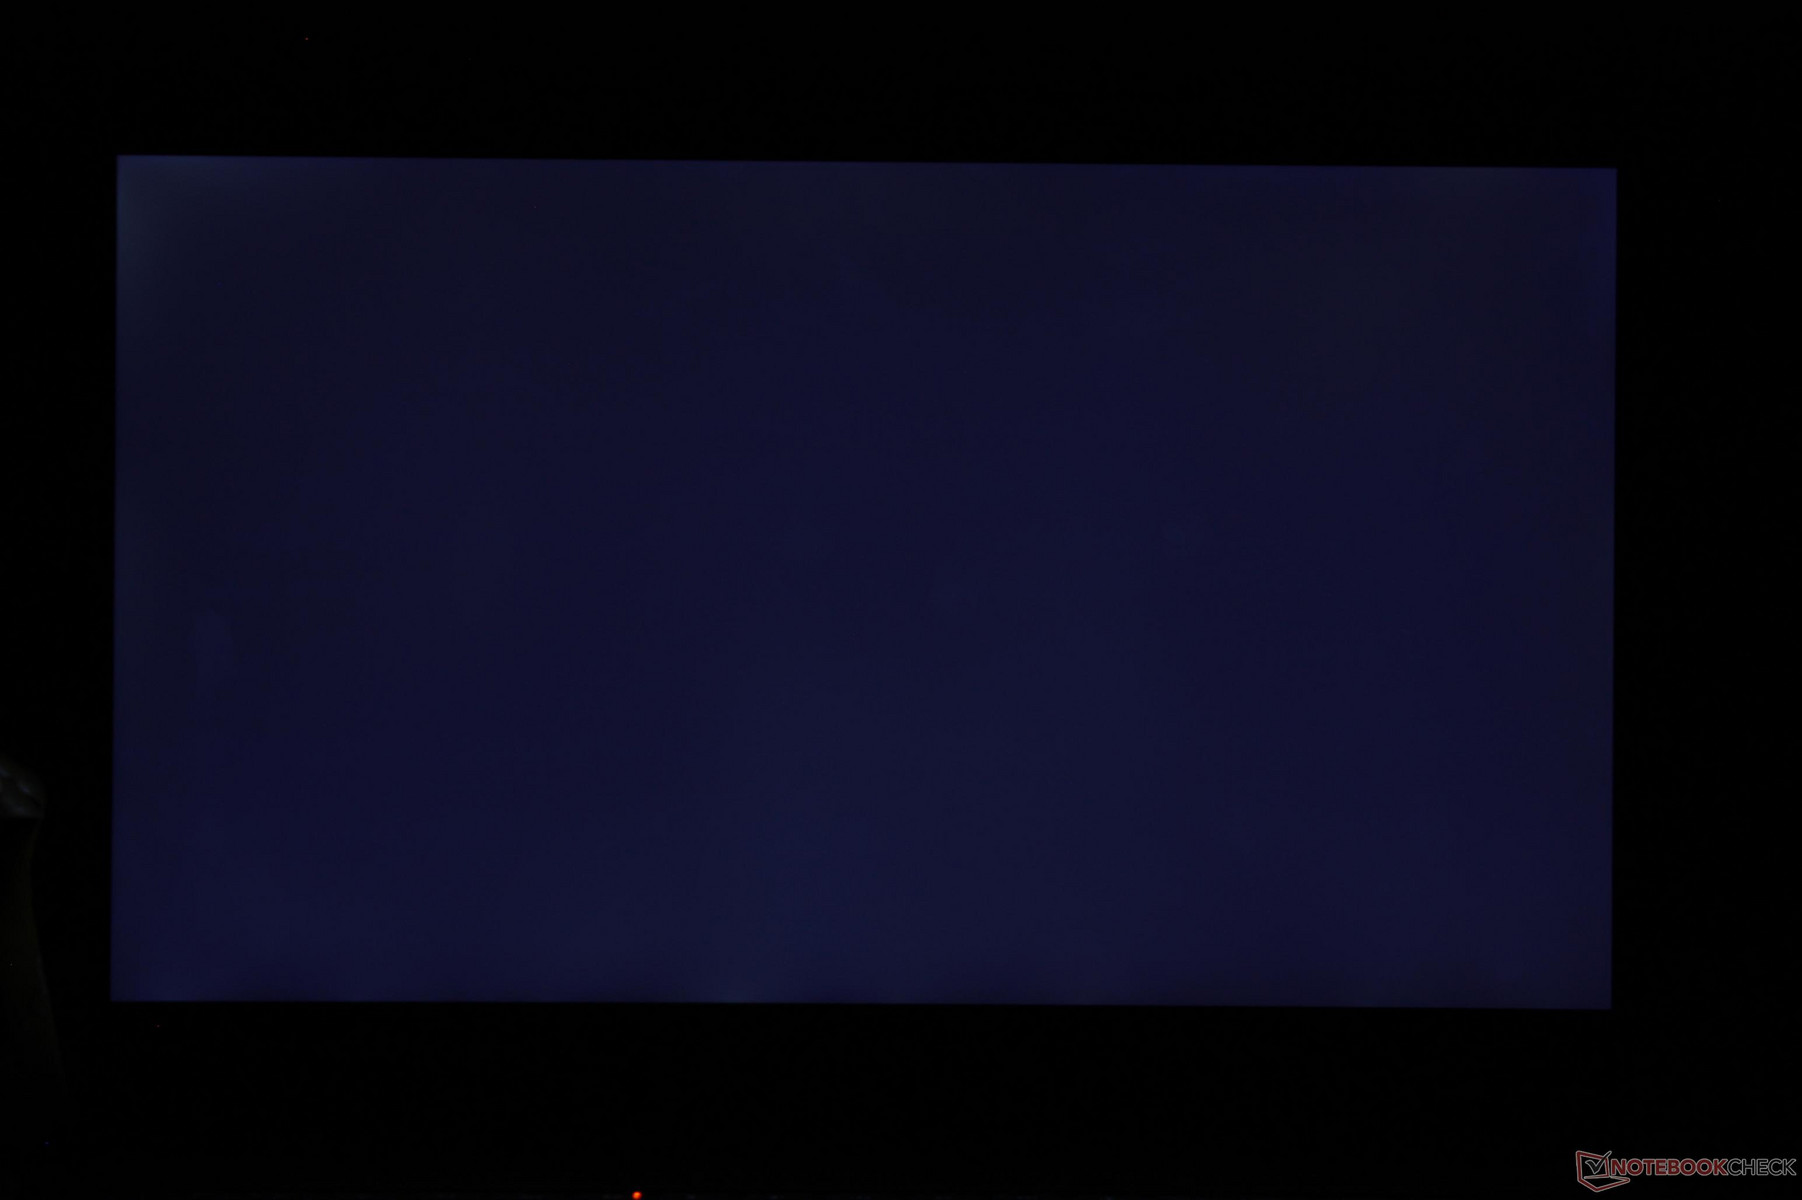
There is slight uneven backlight bleeding on the top left corner of our unit that is barely noticeable during video playback with black borders.
| |||||||||||||||||||||||||
Brightness Distribution: 84 %
Center on Battery: 329.3 cd/m²
Contrast: 1062:1 (Black: 0.31 cd/m²)
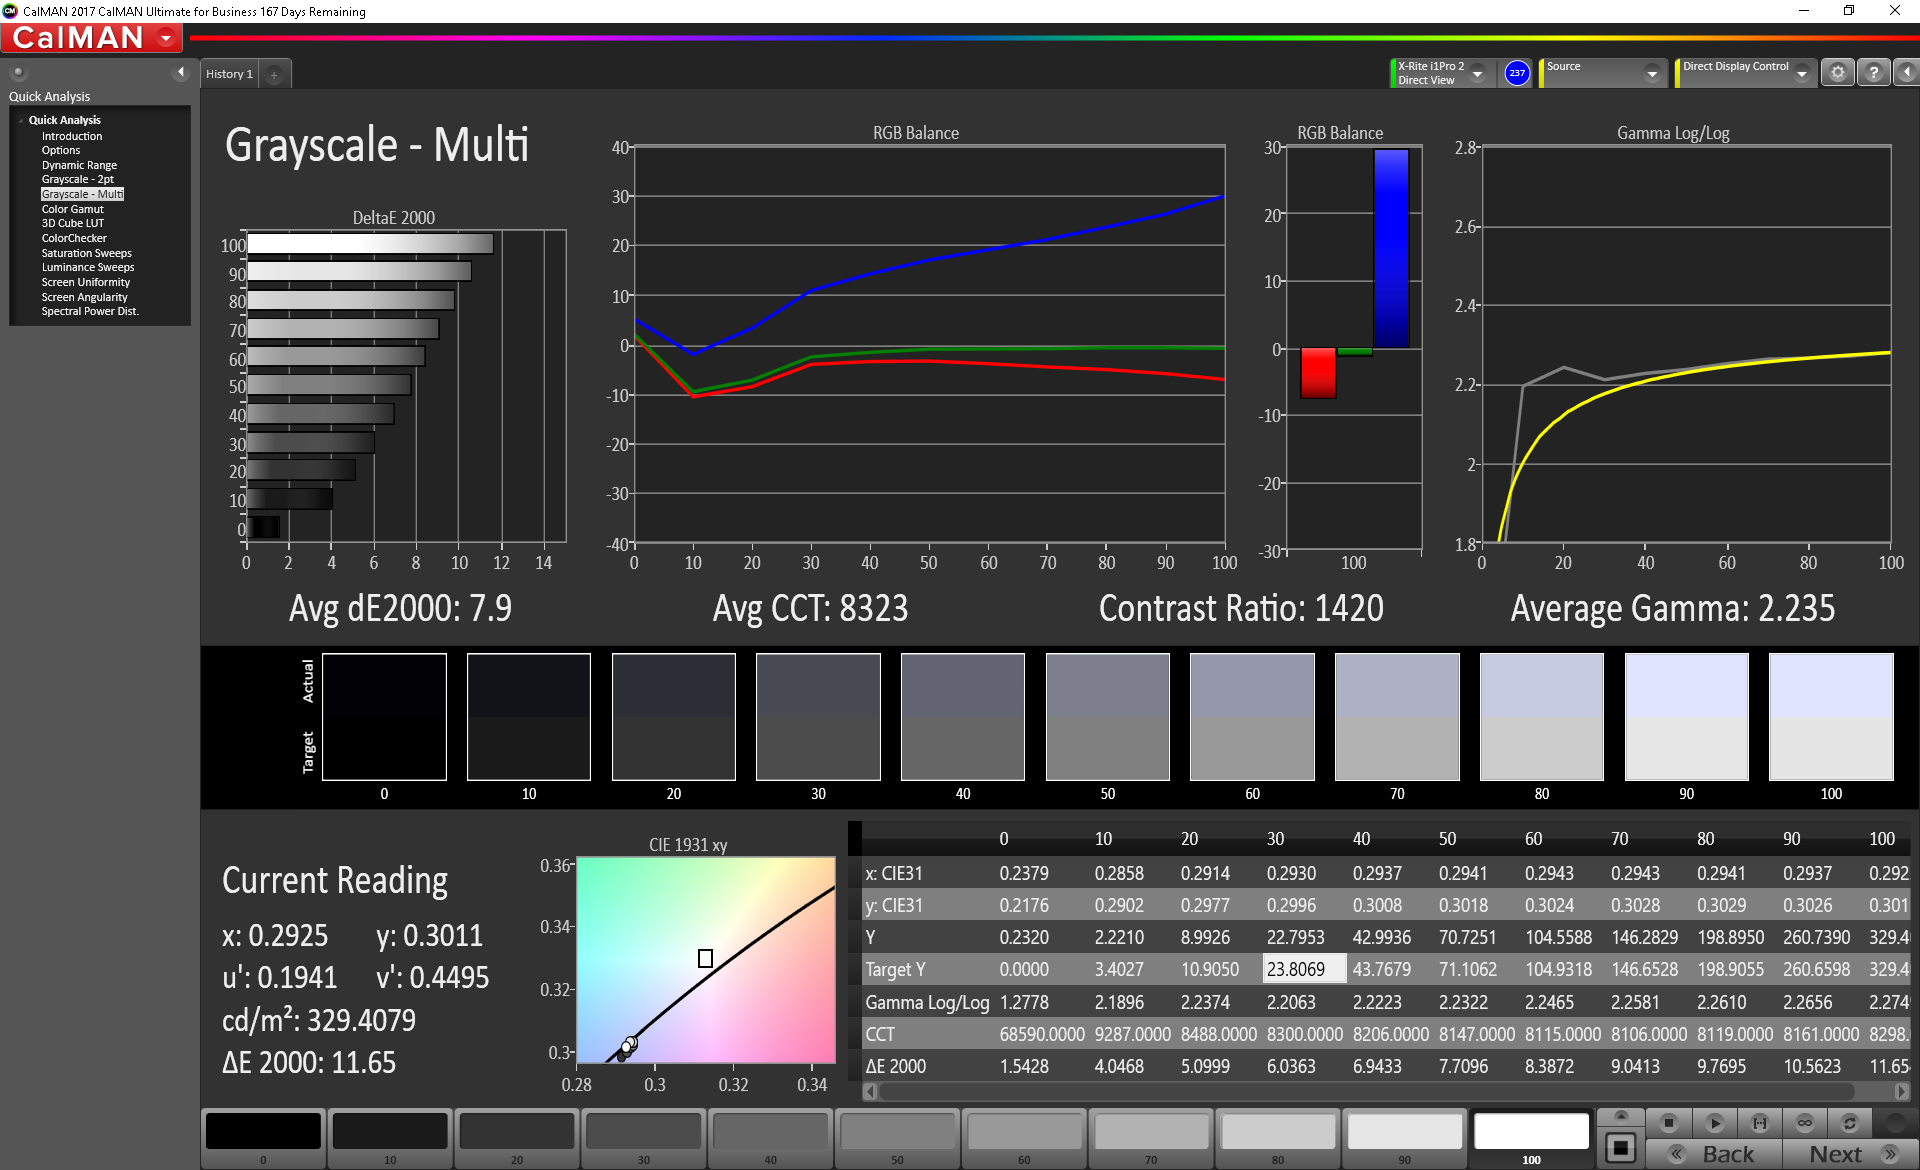
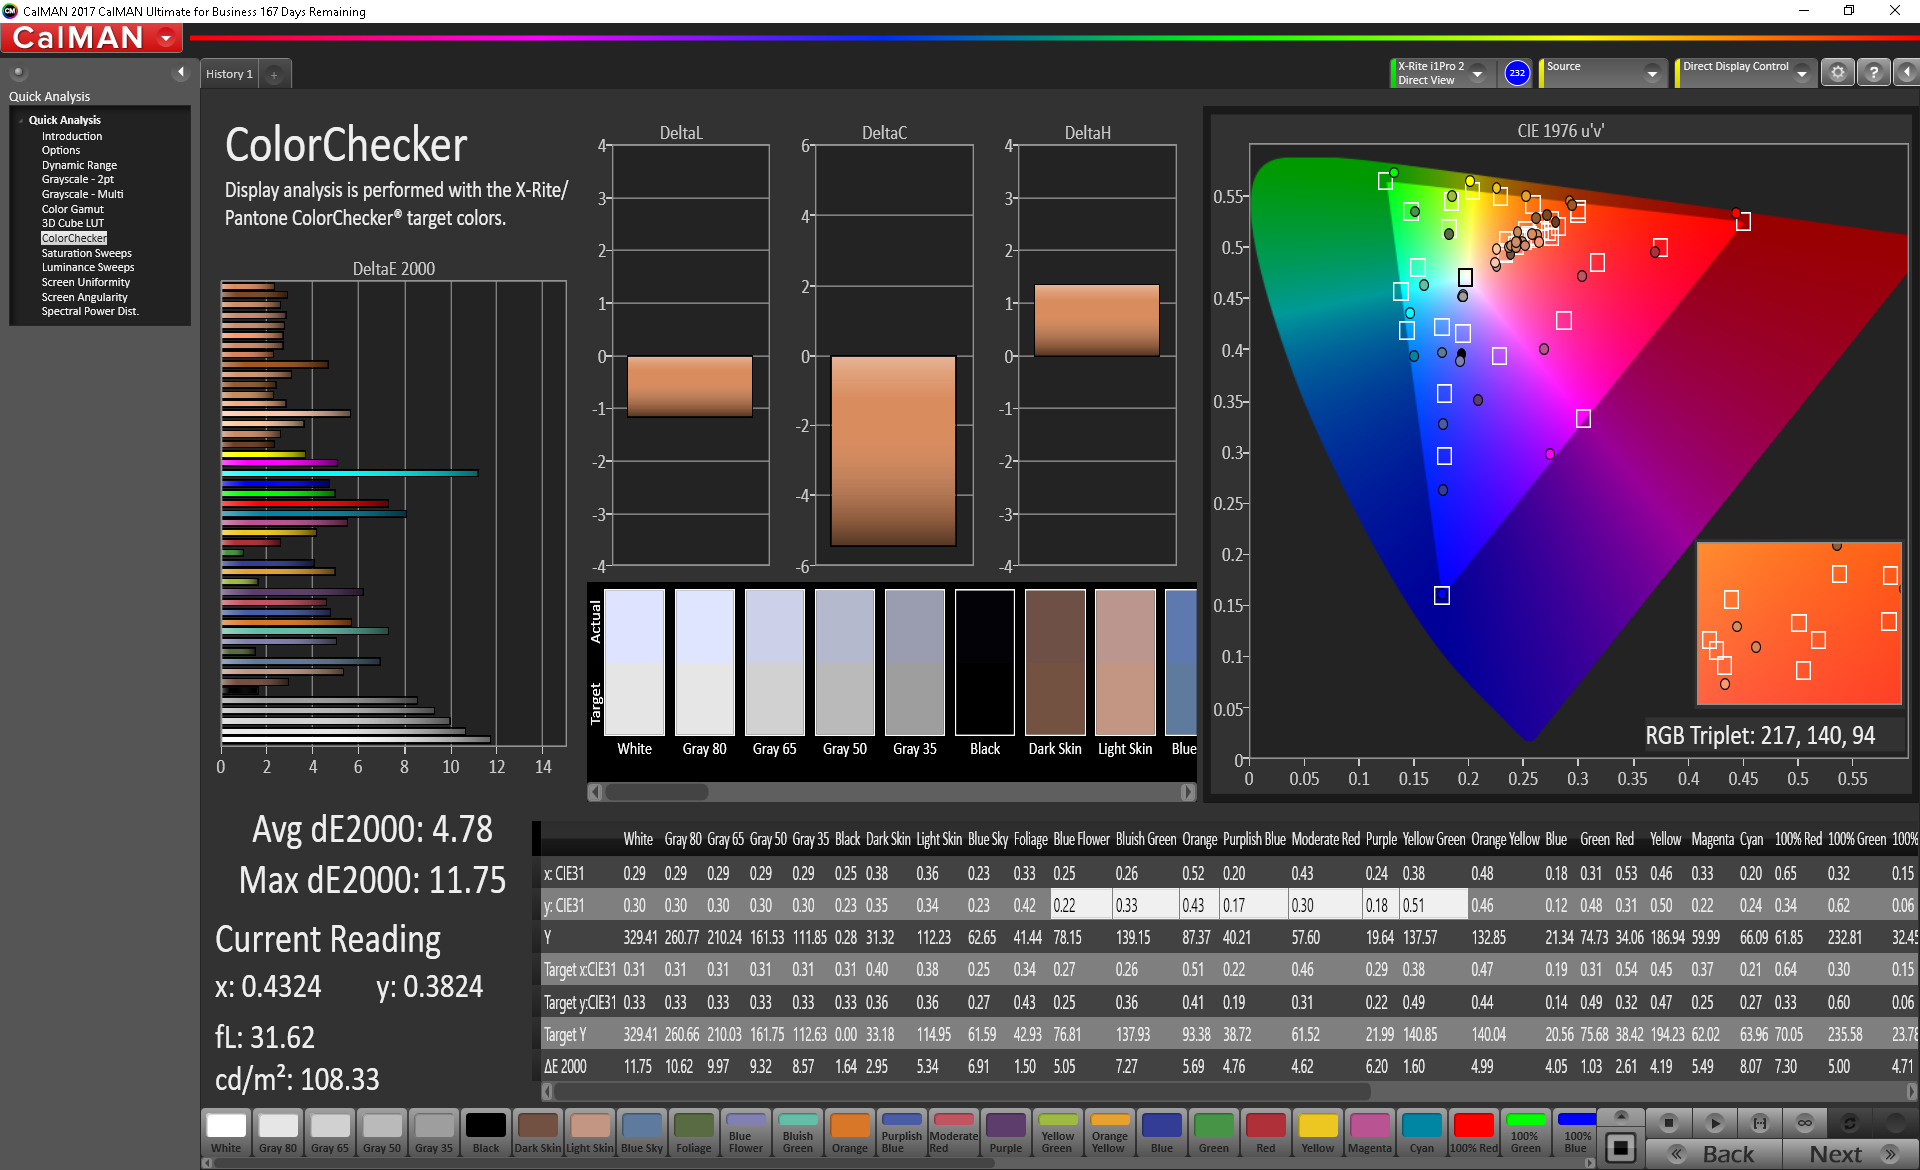
ΔE Color 4.78 | 0.5-29.43 Ø5, calibrated: 3.51
ΔE Greyscale 7.9 | 0.57-98 Ø5.3
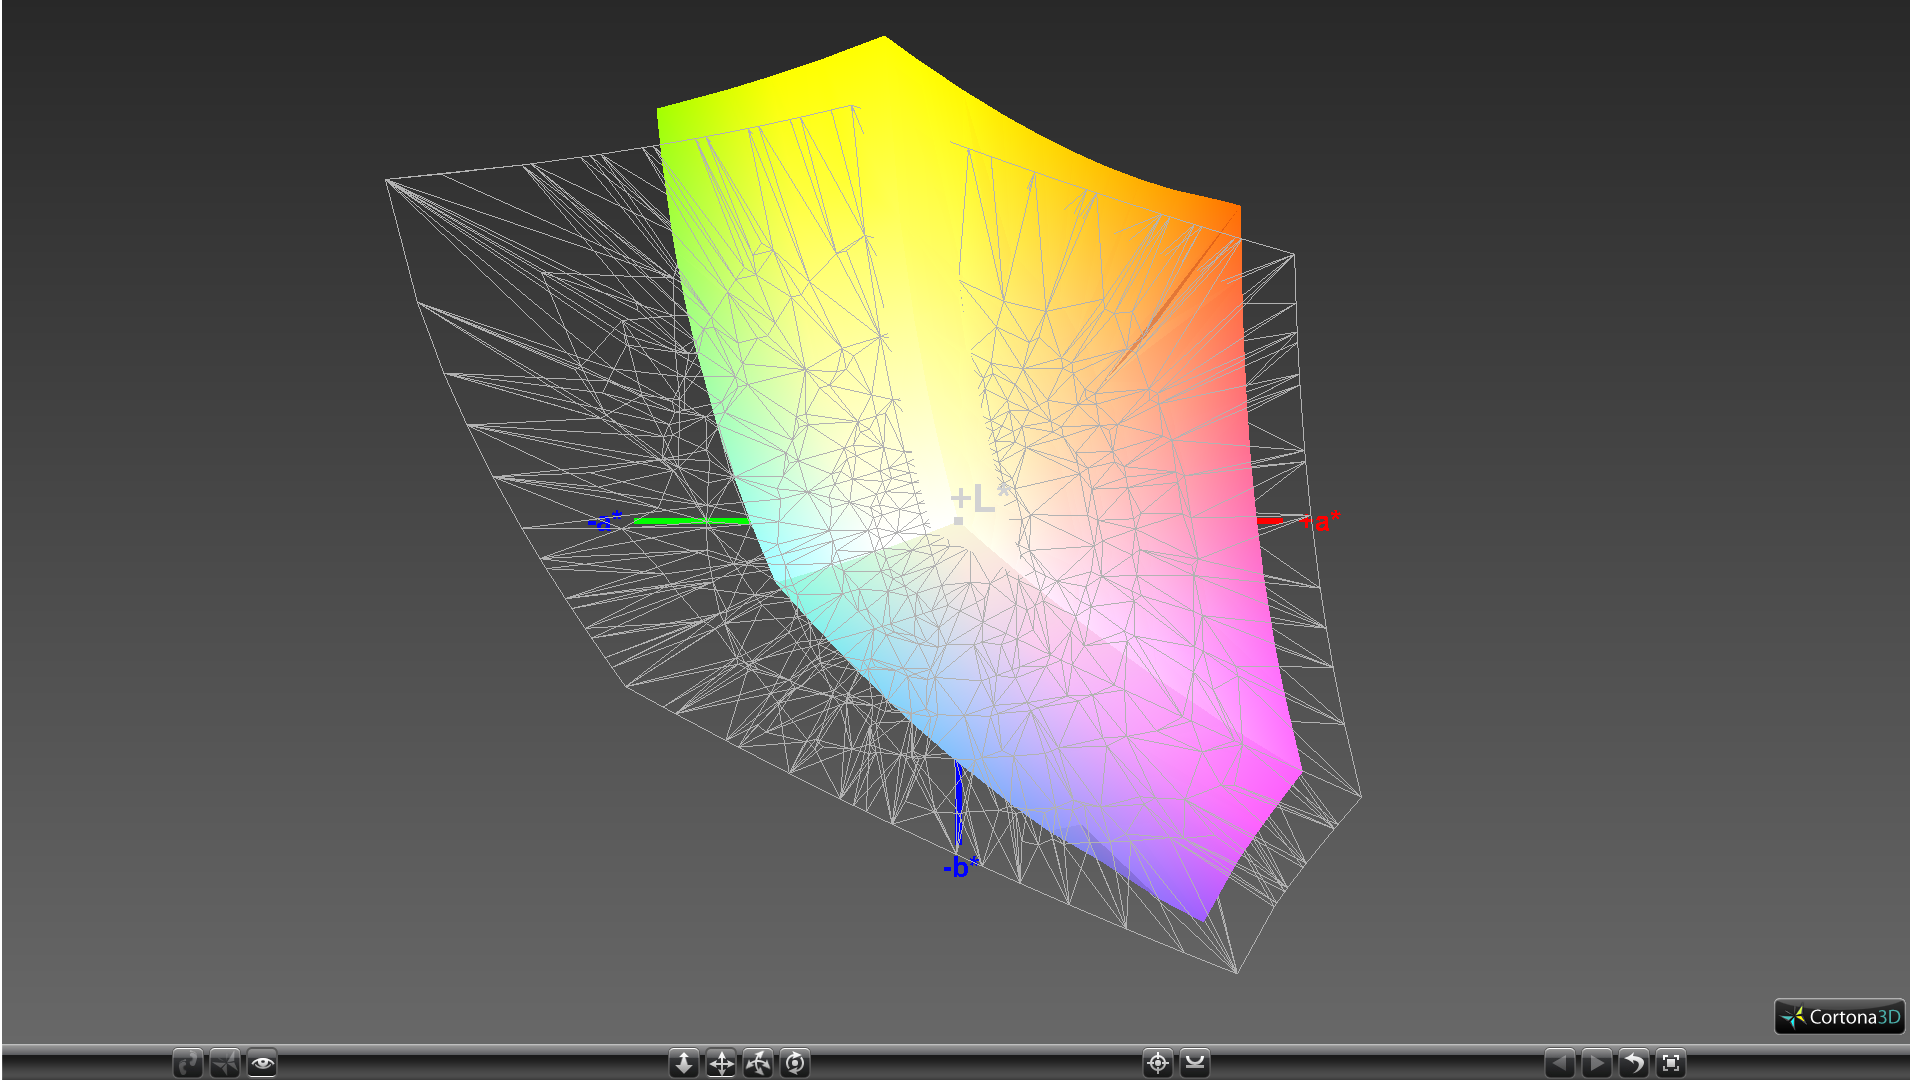
90.4% sRGB (Argyll 1.6.3 3D)
58.8% AdobeRGB 1998 (Argyll 1.6.3 3D)
66.3% AdobeRGB 1998 (Argyll 2.2.0 3D)
90.7% sRGB (Argyll 2.2.0 3D)
68.5% Display P3 (Argyll 2.2.0 3D)
Gamma: 2.24
| HP Spectre x360 15-ch011nr BOE0730, IPS, 15.60, 3840x2160 | HP Spectre x360 15t-bl100 BOE06C3, IPS, 15.60, 3840x2160 | Dell XPS 15 2018 i5 FHD 97Wh Sharp SHP149A LQ156M1, LED IGZO IPS InfinityEdge, 15.60, 1920x1080 | Dell XPS 15 9575 i7-8705G Sharp SHP148D, IPS, 15.60, 3840x2160 | Gigabyte Aero 15X v8 LGD05C0, IPS, 15.60, 1920x1080 | Asus ZenBook Pro 15 UX580GE AU Optronics B156ZAN03.1, IPS, 15.60, 3840x2160 | |
|---|---|---|---|---|---|---|
| Display | -4% | 1% | 14% | -2% | 28% | |
| Display P3 Coverage | 68.5 | 66.6 -3% | 66 -4% | 78.7 15% | 63.6 -7% | 85.9 25% |
| sRGB Coverage | 90.7 | 86.9 -4% | 96.5 6% | 97.9 8% | 93.8 3% | 100 10% |
| AdobeRGB 1998 Coverage | 66.3 | 63.5 -4% | 66.7 1% | 79.2 19% | 64.9 -2% | 99.1 49% |
| Response Times | -3% | -12% | -16% | 58% | 1% | |
| Response Time Grey 50% / Grey 80% * | 38 ? | 41.2 ? -8% | 49 ? -29% | 48.4 ? -27% | 16.8 ? 56% | 44 ? -16% |
| Response Time Black / White * | 27.6 ? | 29.6 ? -7% | 30 ? -9% | 34.8 ? -26% | 11.2 ? 59% | 22.8 ? 17% |
| PWM Frequency | 943 ? | 1000 6% | 961 ? 2% | 1000 ? 6% | ||
| Screen | 10% | 28% | 29% | 22% | 14% | |
| Brightness middle | 329.3 | 338.7 3% | 413 25% | 488 48% | 313 -5% | 357.6 9% |
| Brightness | 316 | 325 3% | 378 20% | 440 39% | 300 -5% | 350 11% |
| Brightness Distribution | 84 | 91 8% | 86 2% | 81 -4% | 78 -7% | 85 1% |
| Black Level * | 0.31 | 0.28 10% | 0.29 6% | 0.3 3% | 0.33 -6% | 0.35 -13% |
| Contrast | 1062 | 1210 14% | 1424 34% | 1627 53% | 948 -11% | 1022 -4% |
| Colorchecker dE 2000 * | 4.78 | 4.9 -3% | 2.44 49% | 3.16 34% | 1.29 73% | 4.12 14% |
| Colorchecker dE 2000 max. * | 11.75 | 8.7 26% | 4.46 62% | 8.8 25% | 2.04 83% | 9.91 16% |
| Colorchecker dE 2000 calibrated * | 3.51 | 2.48 29% | 4.23 -21% | |||
| Greyscale dE 2000 * | 7.9 | 5.5 30% | 2.48 69% | 3.3 58% | 0.69 91% | 1.8 77% |
| Gamma | 2.24 98% | 2.08 106% | 2.43 91% | 2.178 101% | 2.43 91% | 2.17 101% |
| CCT | 8323 78% | 7498 87% | 7006 93% | 6811 95% | 6550 99% | 6613 98% |
| Color Space (Percent of AdobeRGB 1998) | 58.8 | 63.5 8% | 62 5% | 71.7 22% | 60 2% | 87.5 49% |
| Color Space (Percent of sRGB) | 90.4 | 86.92 -4% | 96 6% | 97.9 8% | 94 4% | 100 11% |
| Total Average (Program / Settings) | 1% /
5% | 6% /
16% | 9% /
18% | 26% /
22% | 14% /
15% |
* ... smaller is better
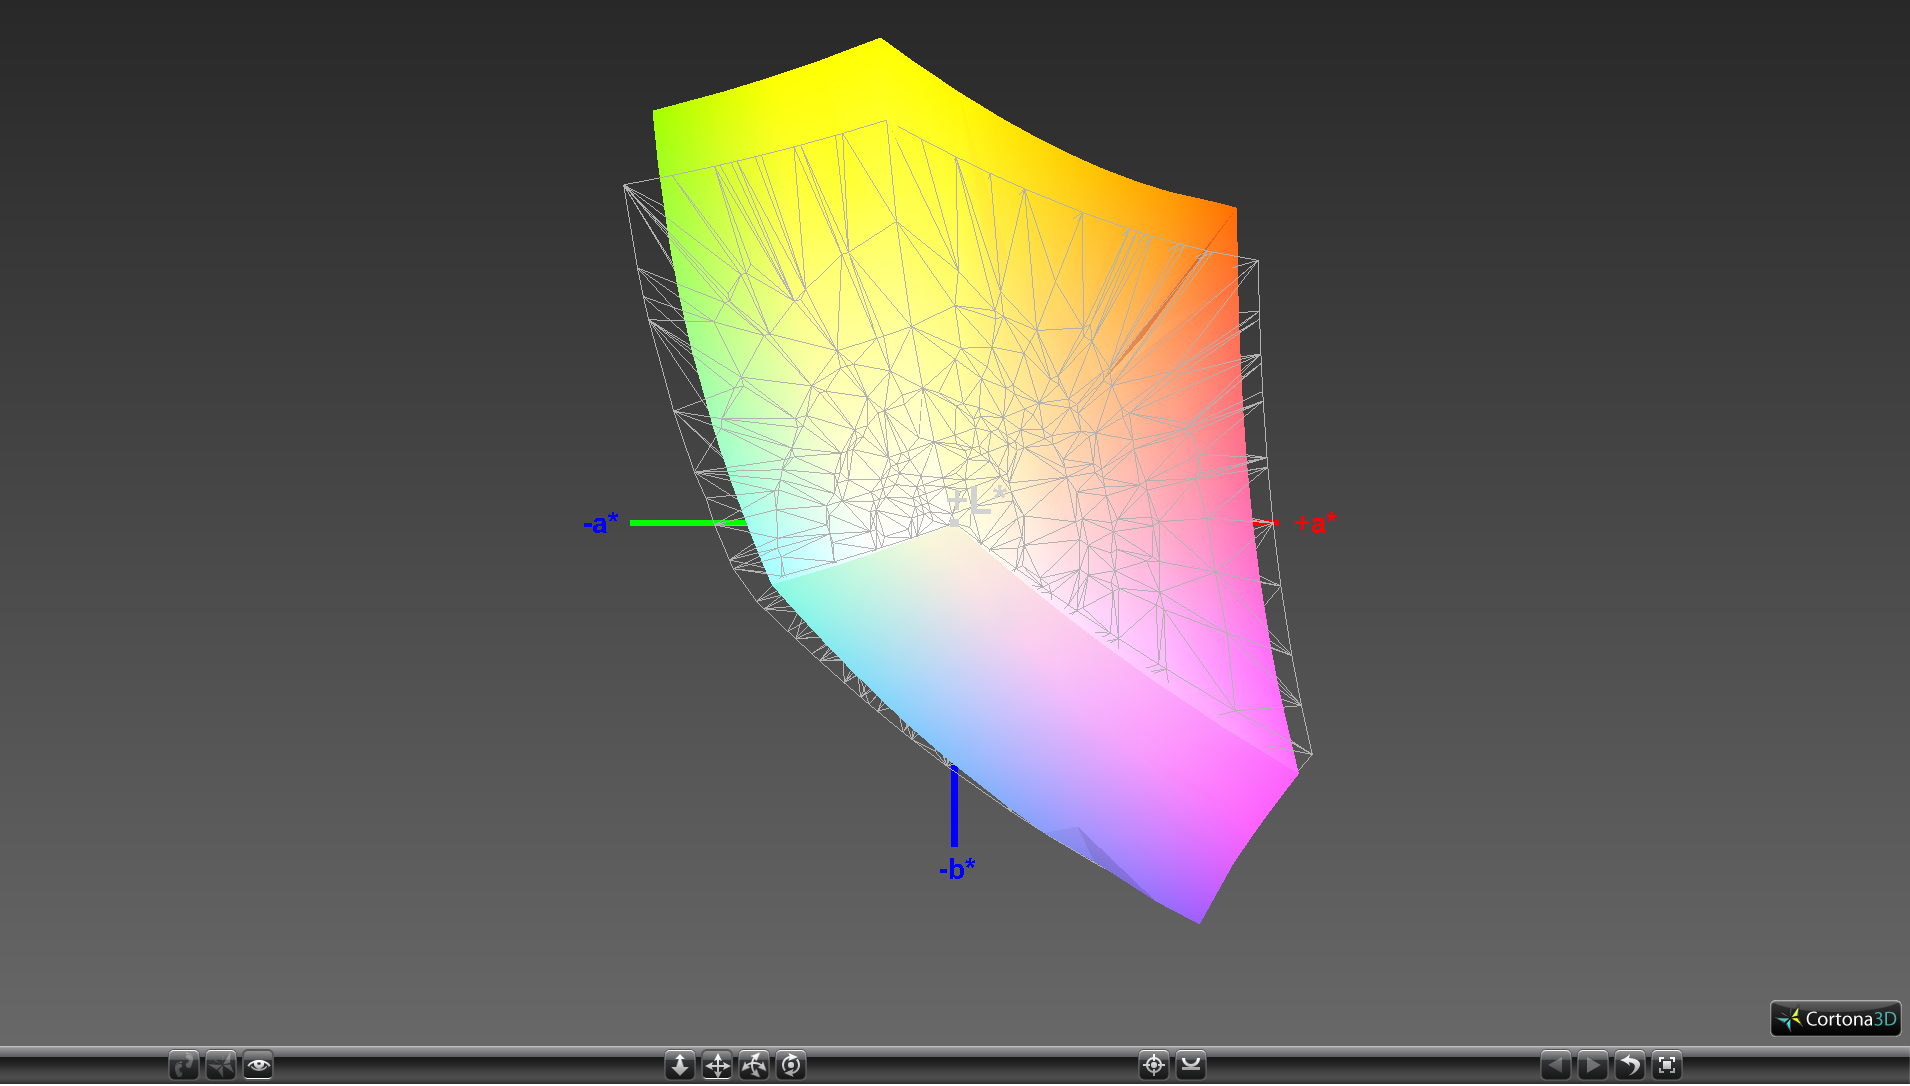
Color space is approximately 90 percent and 59 percent of the sRGB and AdobeRGB standards, respectively. In comparison, the competing Asus Zenbook Flip 15 promises 100 percent AdobeRGB coverage to better appeal to graphics artists.
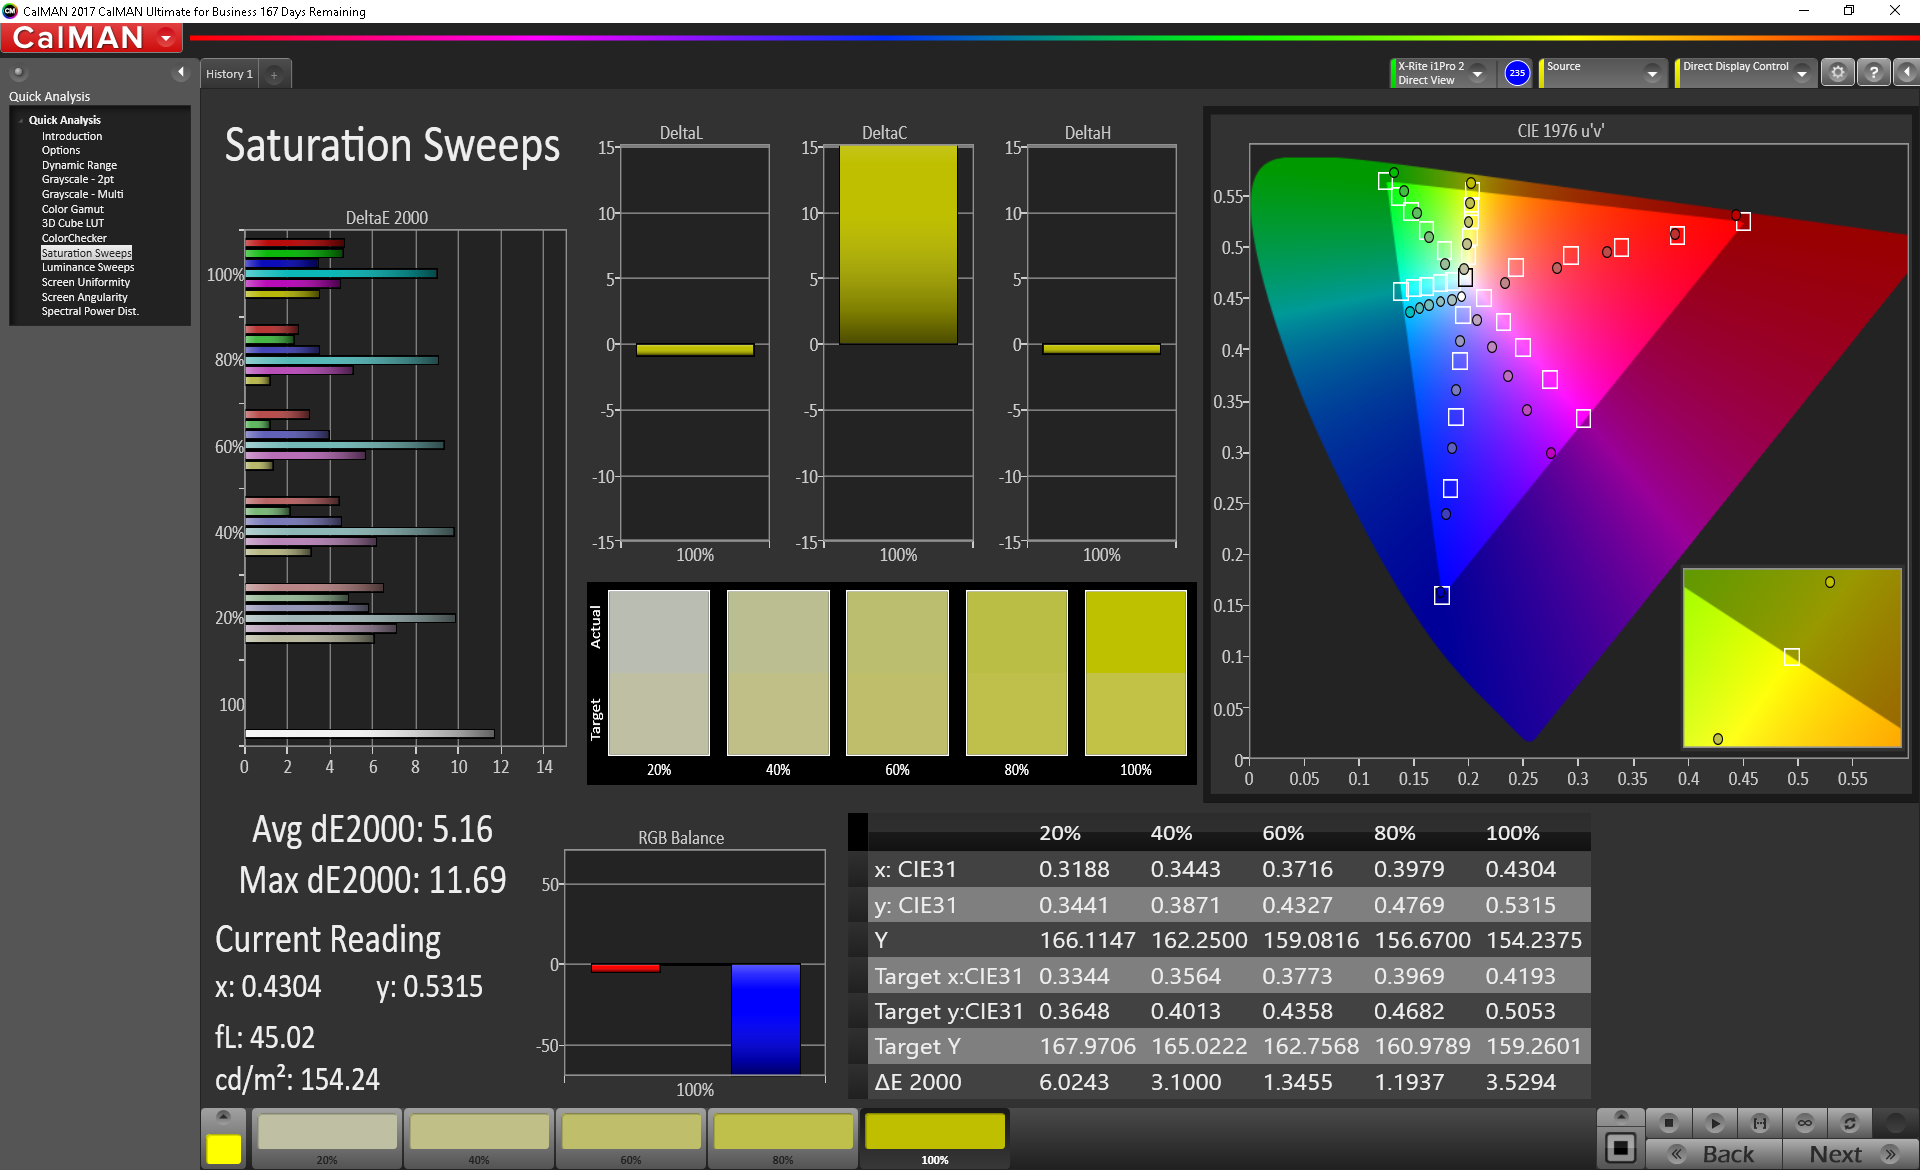
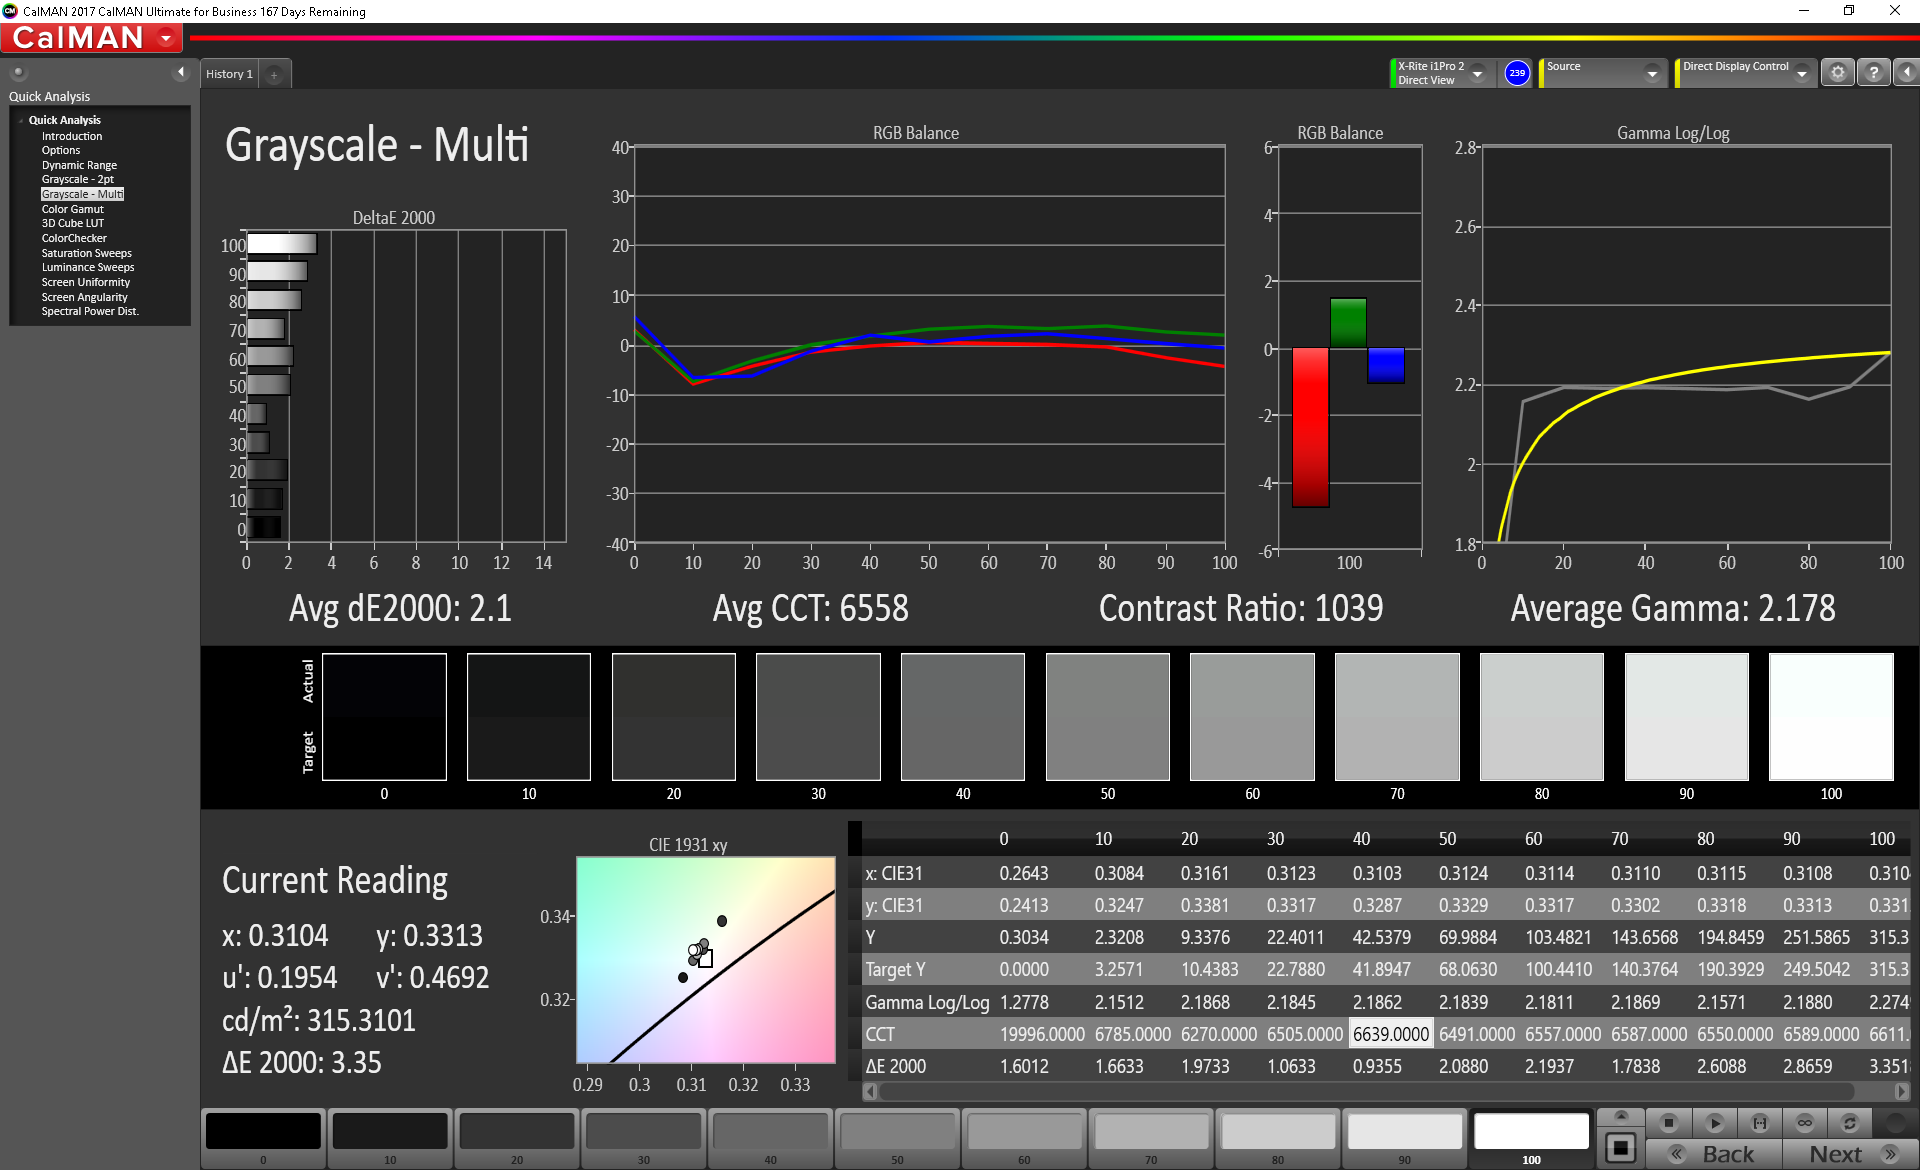
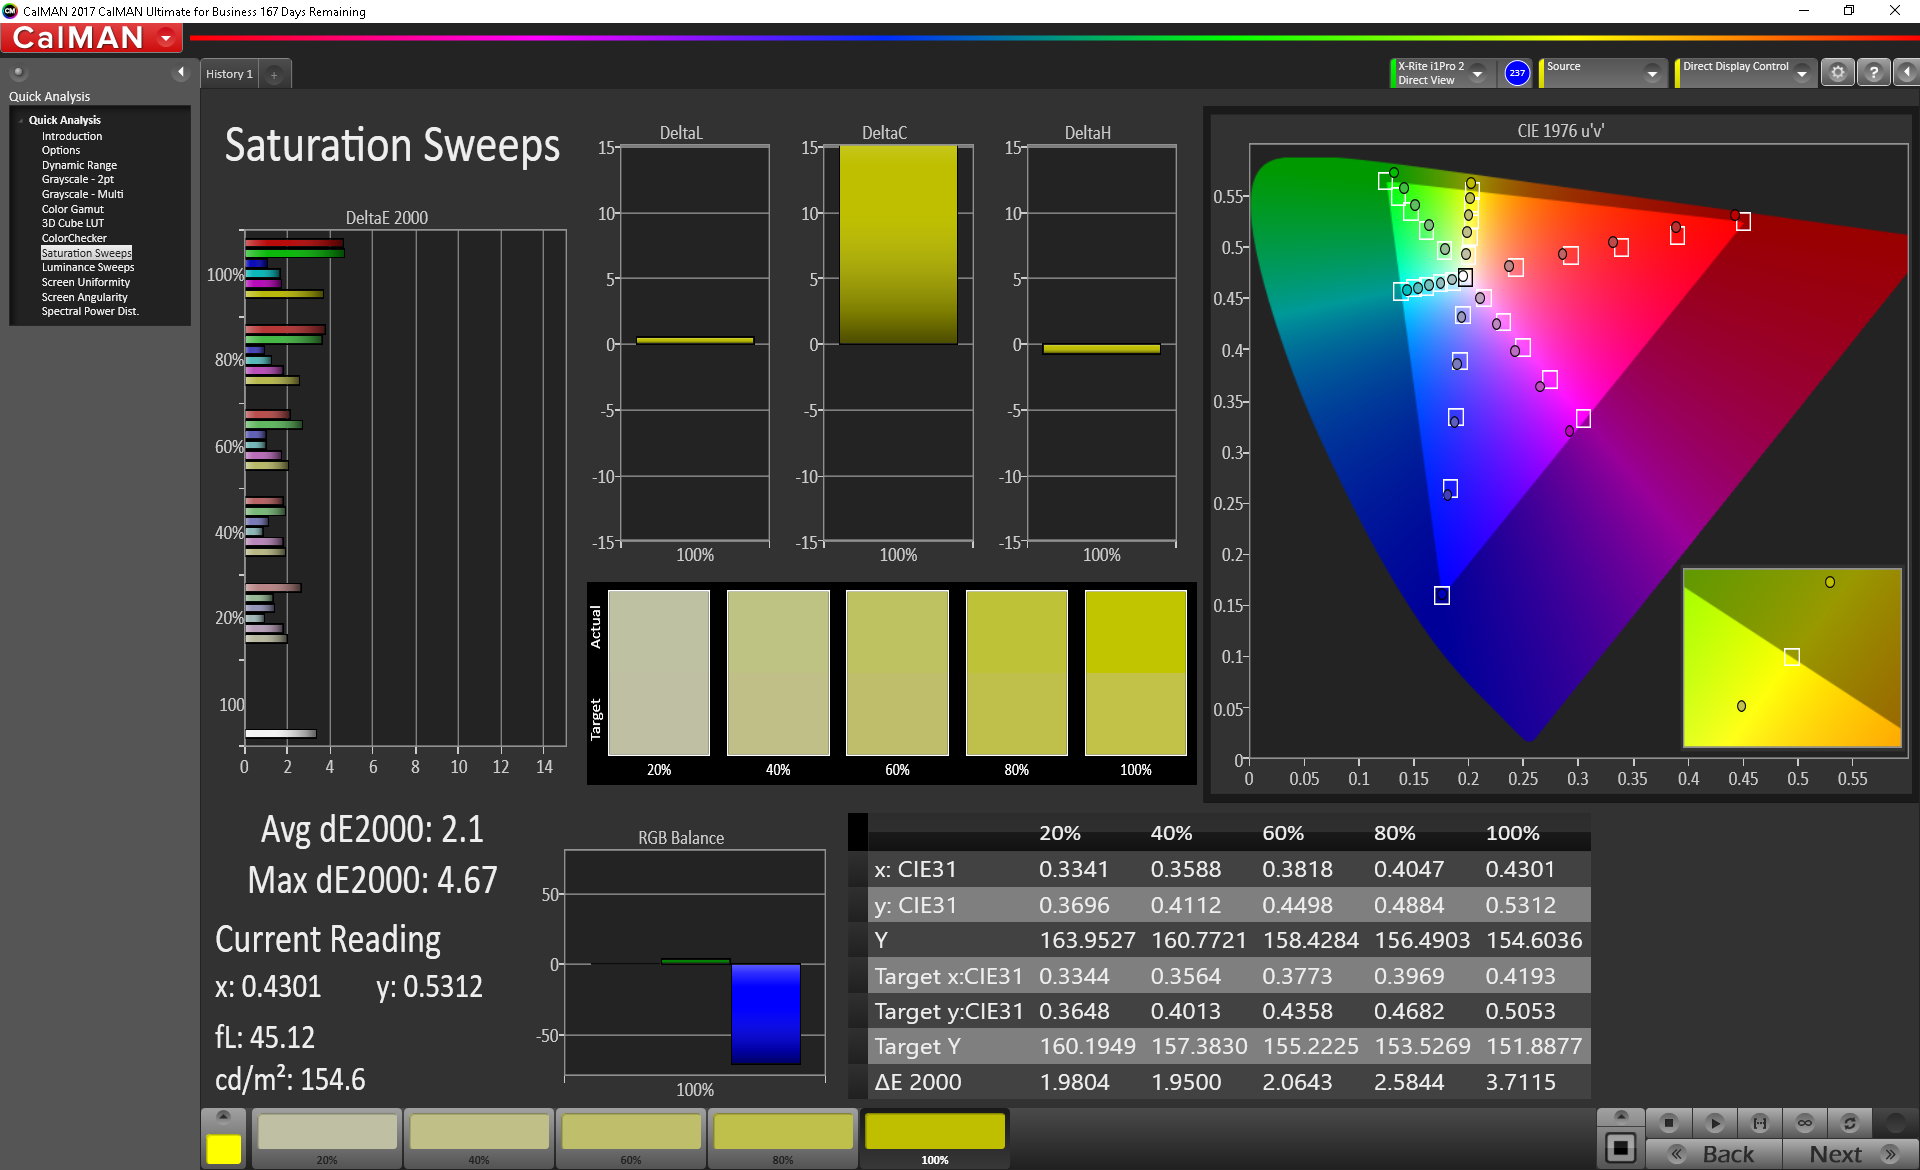
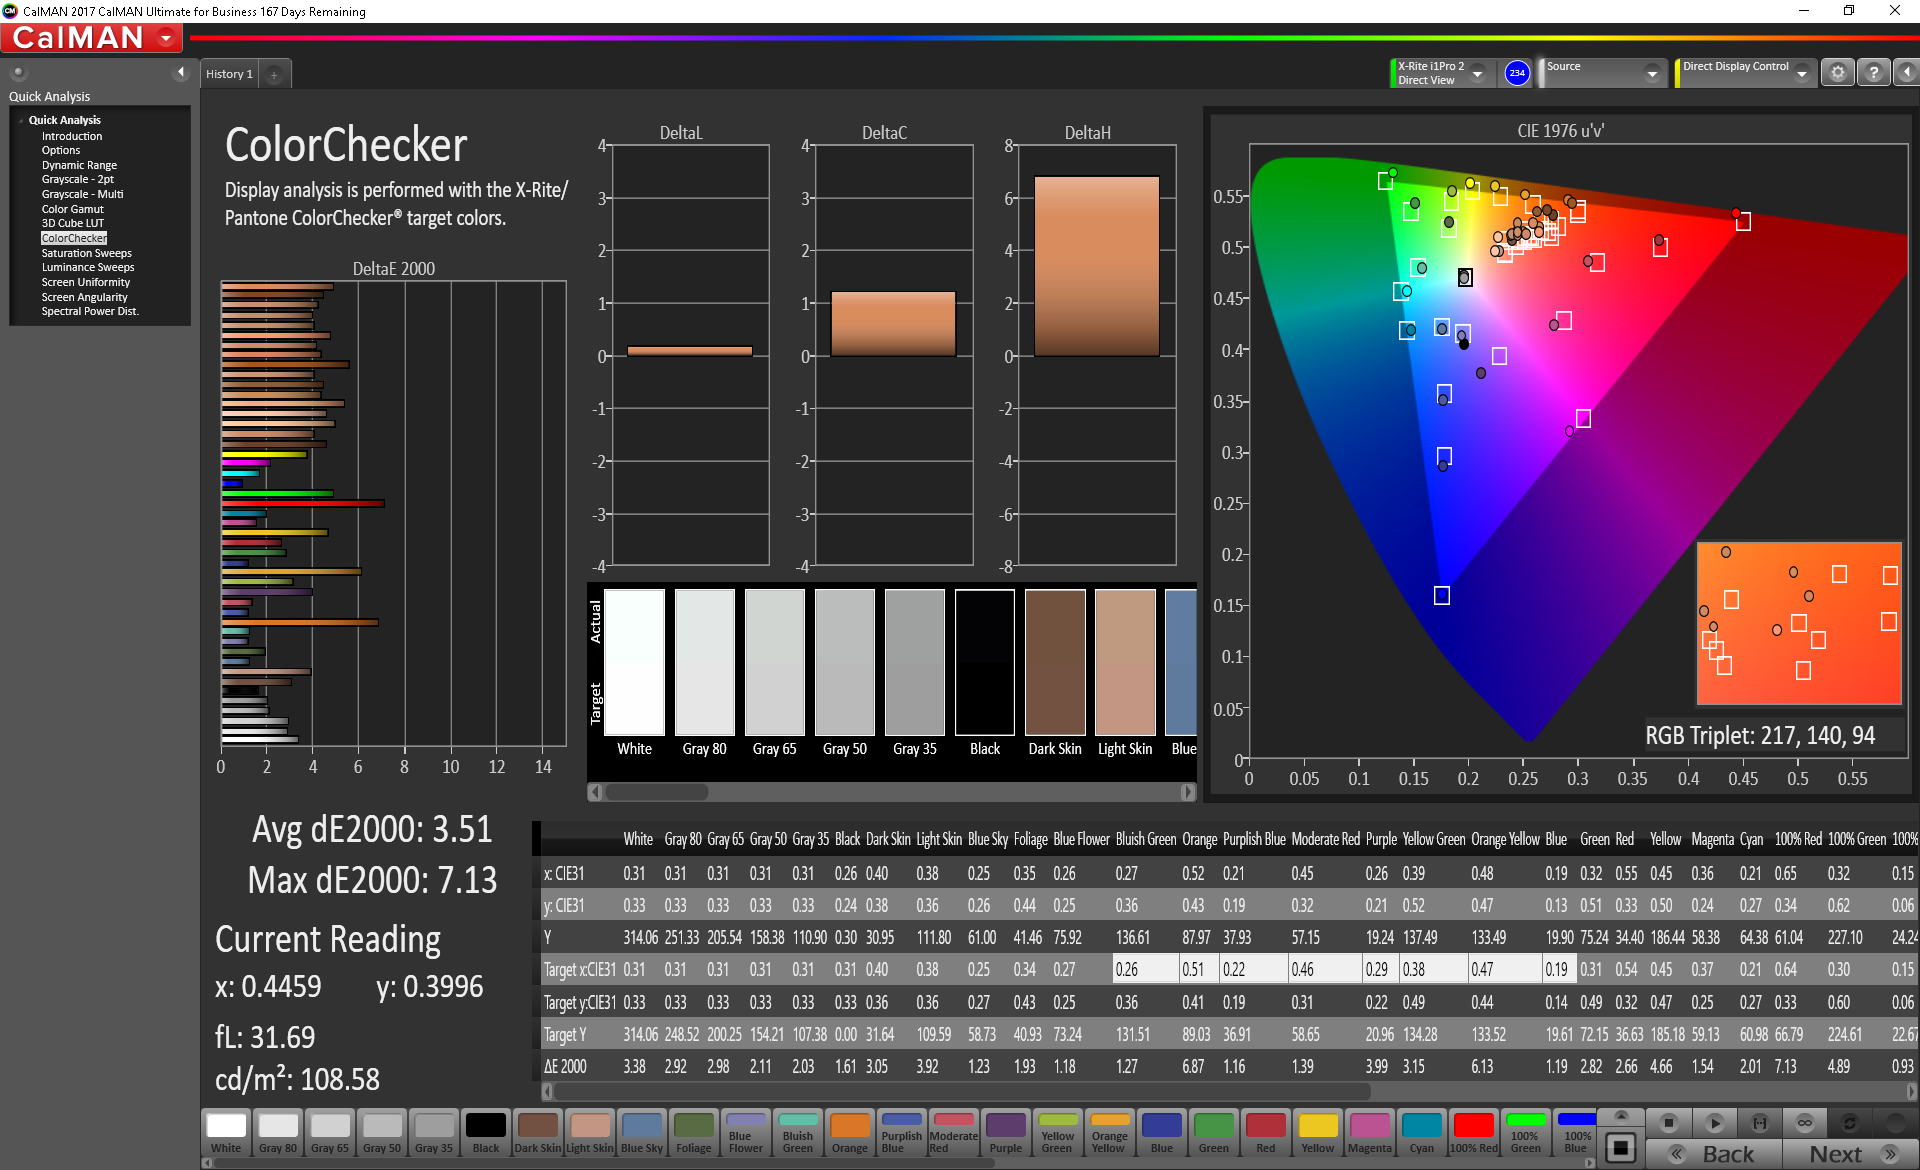
Further display measurements with a X-Rite spectrophotometer reveal generally inaccurate grayscale and colors with Teal in particular being most inaccurate. Color temperature is much too cool which is unexpected from flagship models like the Spectre. Fortunately, calibration addresses all of these concerns as shown by our CalMan results below. We recommend an end-user calibration for a much more accurate display or applying our calibrated ICC file above if calibration is not an option.
Display Response Times
| ↔ Response Time Black to White | ||
|---|---|---|
| 27.6 ms ... rise ↗ and fall ↘ combined | ↗ 15.6 ms rise | 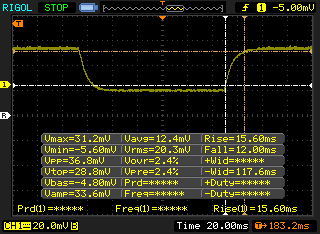 |
| ↘ 12 ms fall | ||
| The screen shows relatively slow response rates in our tests and may be too slow for gamers. In comparison, all tested devices range from 0.1 (minimum) to 240 (maximum) ms. » 66 % of all devices are better. This means that the measured response time is worse than the average of all tested devices (21.5 ms). | ||
| ↔ Response Time 50% Grey to 80% Grey | ||
| 38 ms ... rise ↗ and fall ↘ combined | ↗ 20.4 ms rise | 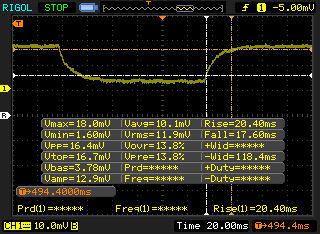 |
| ↘ 17.6 ms fall | ||
| The screen shows slow response rates in our tests and will be unsatisfactory for gamers. In comparison, all tested devices range from 0.2 (minimum) to 636 (maximum) ms. » 49 % of all devices are better. This means that the measured response time is worse than the average of all tested devices (33.7 ms). | ||
Screen Flickering / PWM (Pulse-Width Modulation)
| Screen flickering / PWM detected | 943 Hz | ≤ 99 % brightness setting | 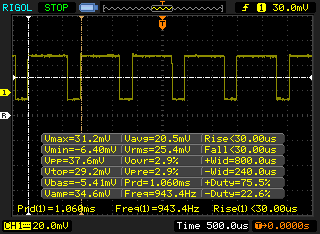 |
The display backlight flickers at 943 Hz (worst case, e.g., utilizing PWM) Flickering detected at a brightness setting of 99 % and below. There should be no flickering or PWM above this brightness setting. The frequency of 943 Hz is quite high, so most users sensitive to PWM should not notice any flickering. In comparison: 53 % of all tested devices do not use PWM to dim the display. If PWM was detected, an average of 17900 (minimum: 5 - maximum: 3846000) Hz was measured. | |||
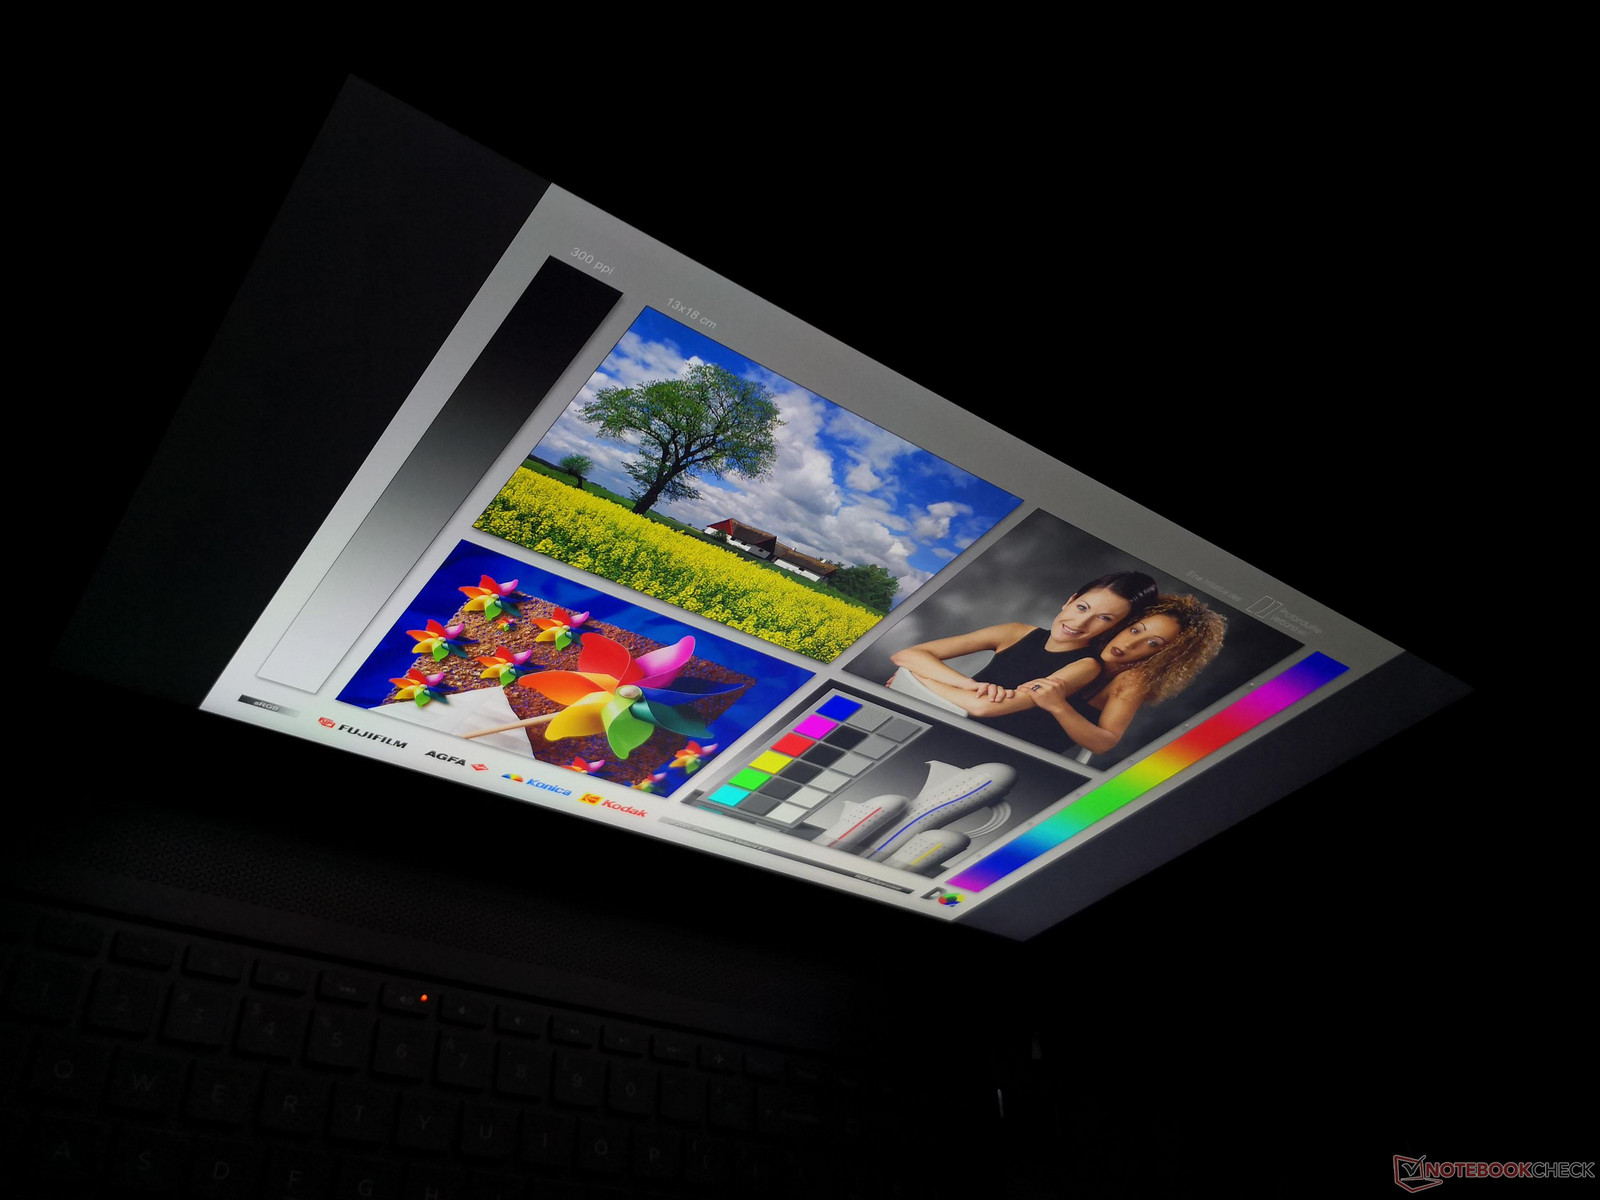
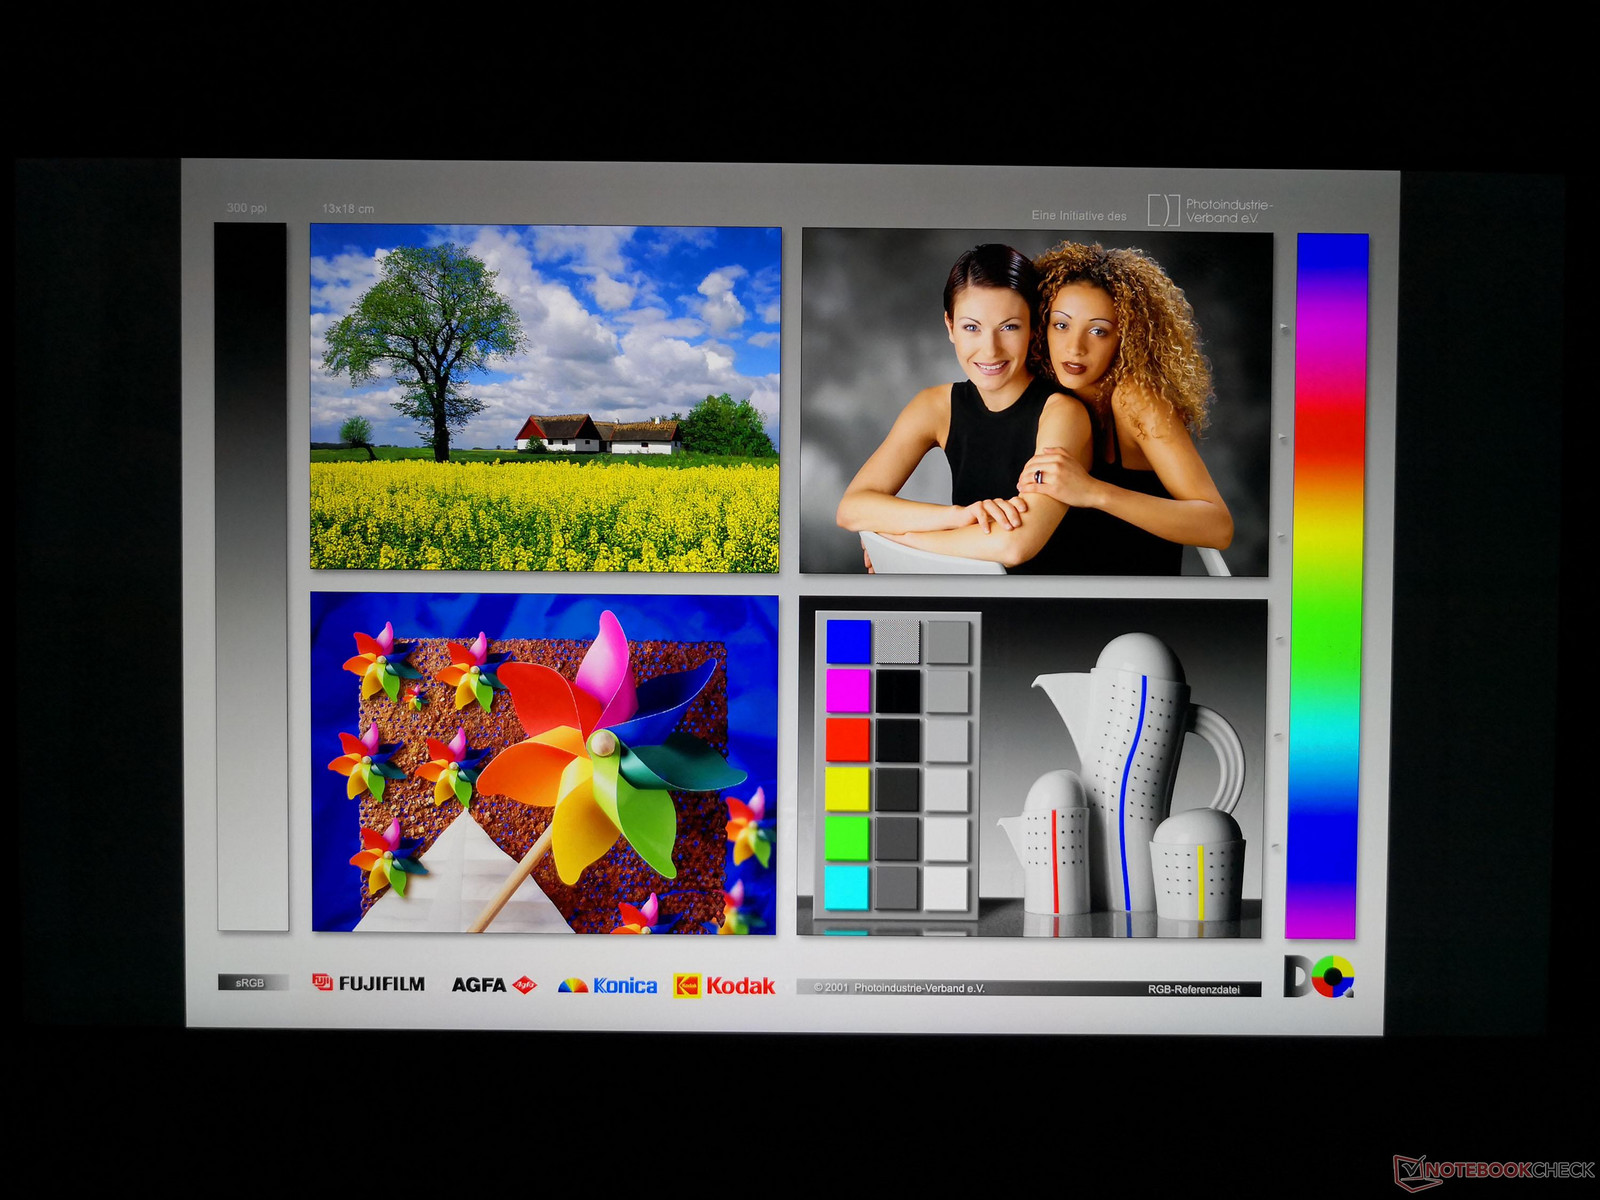
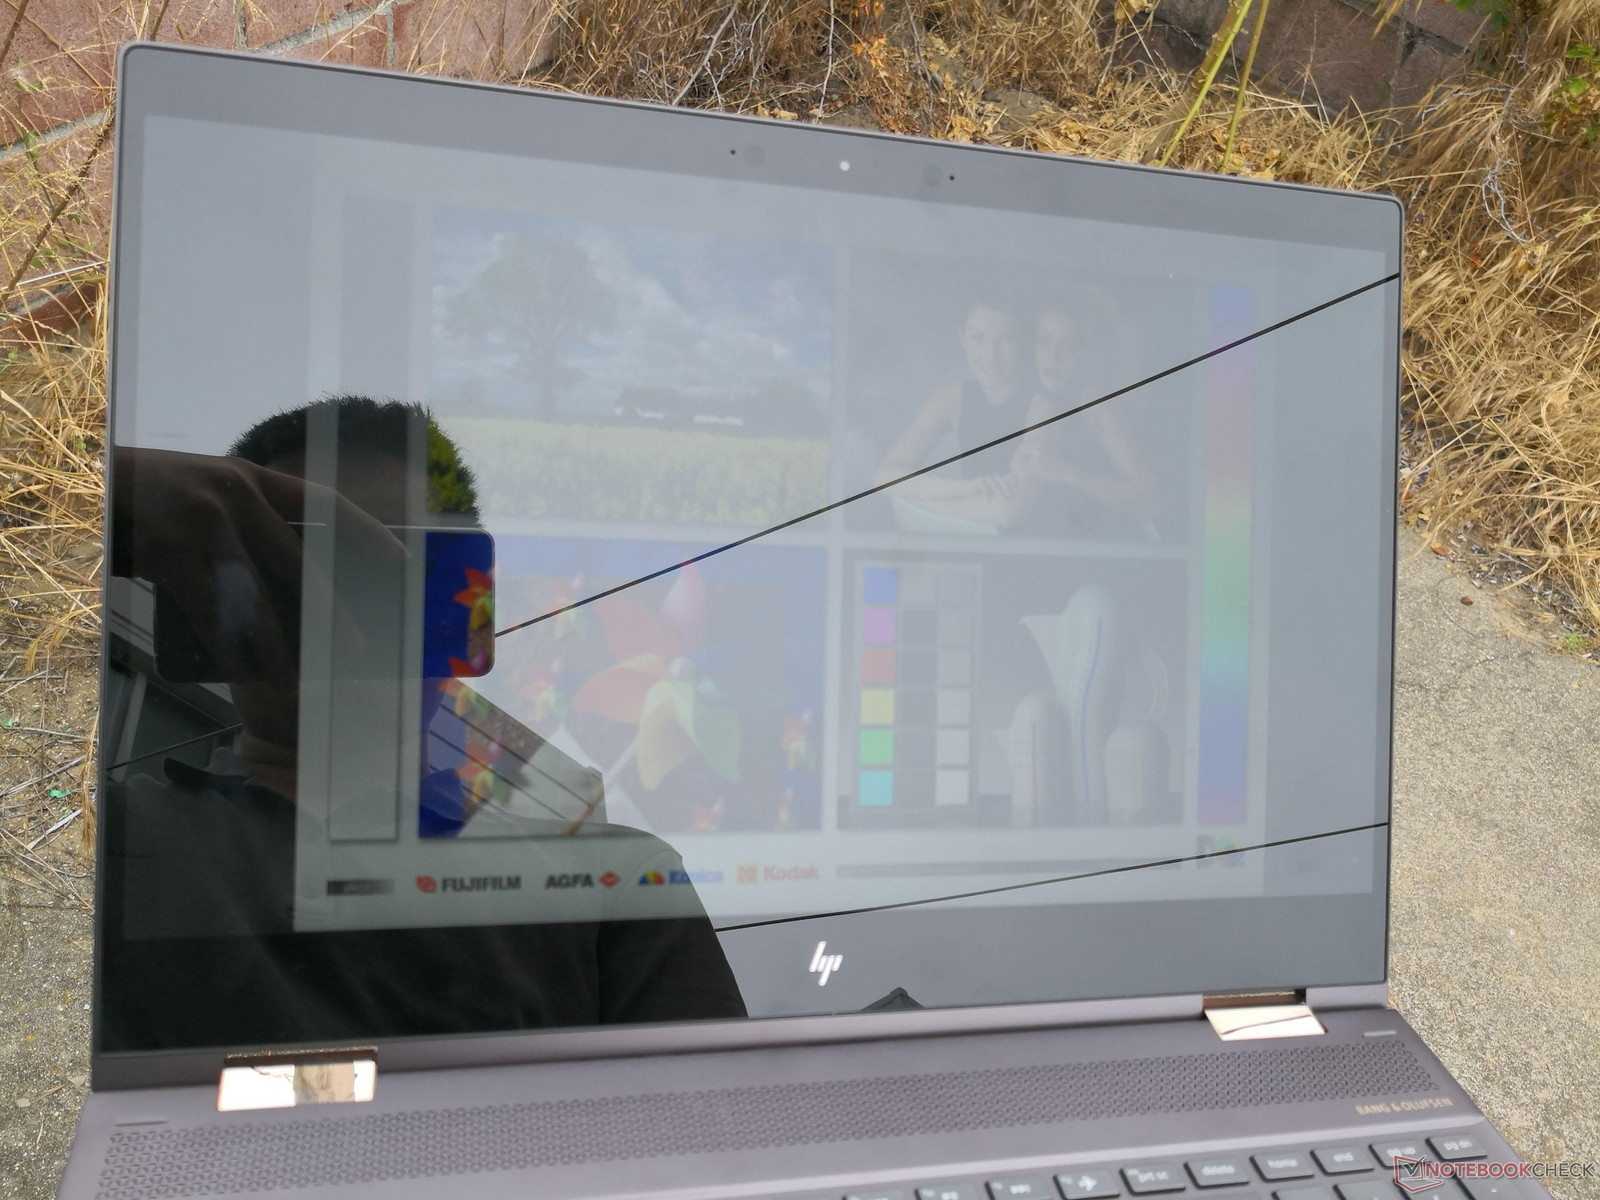
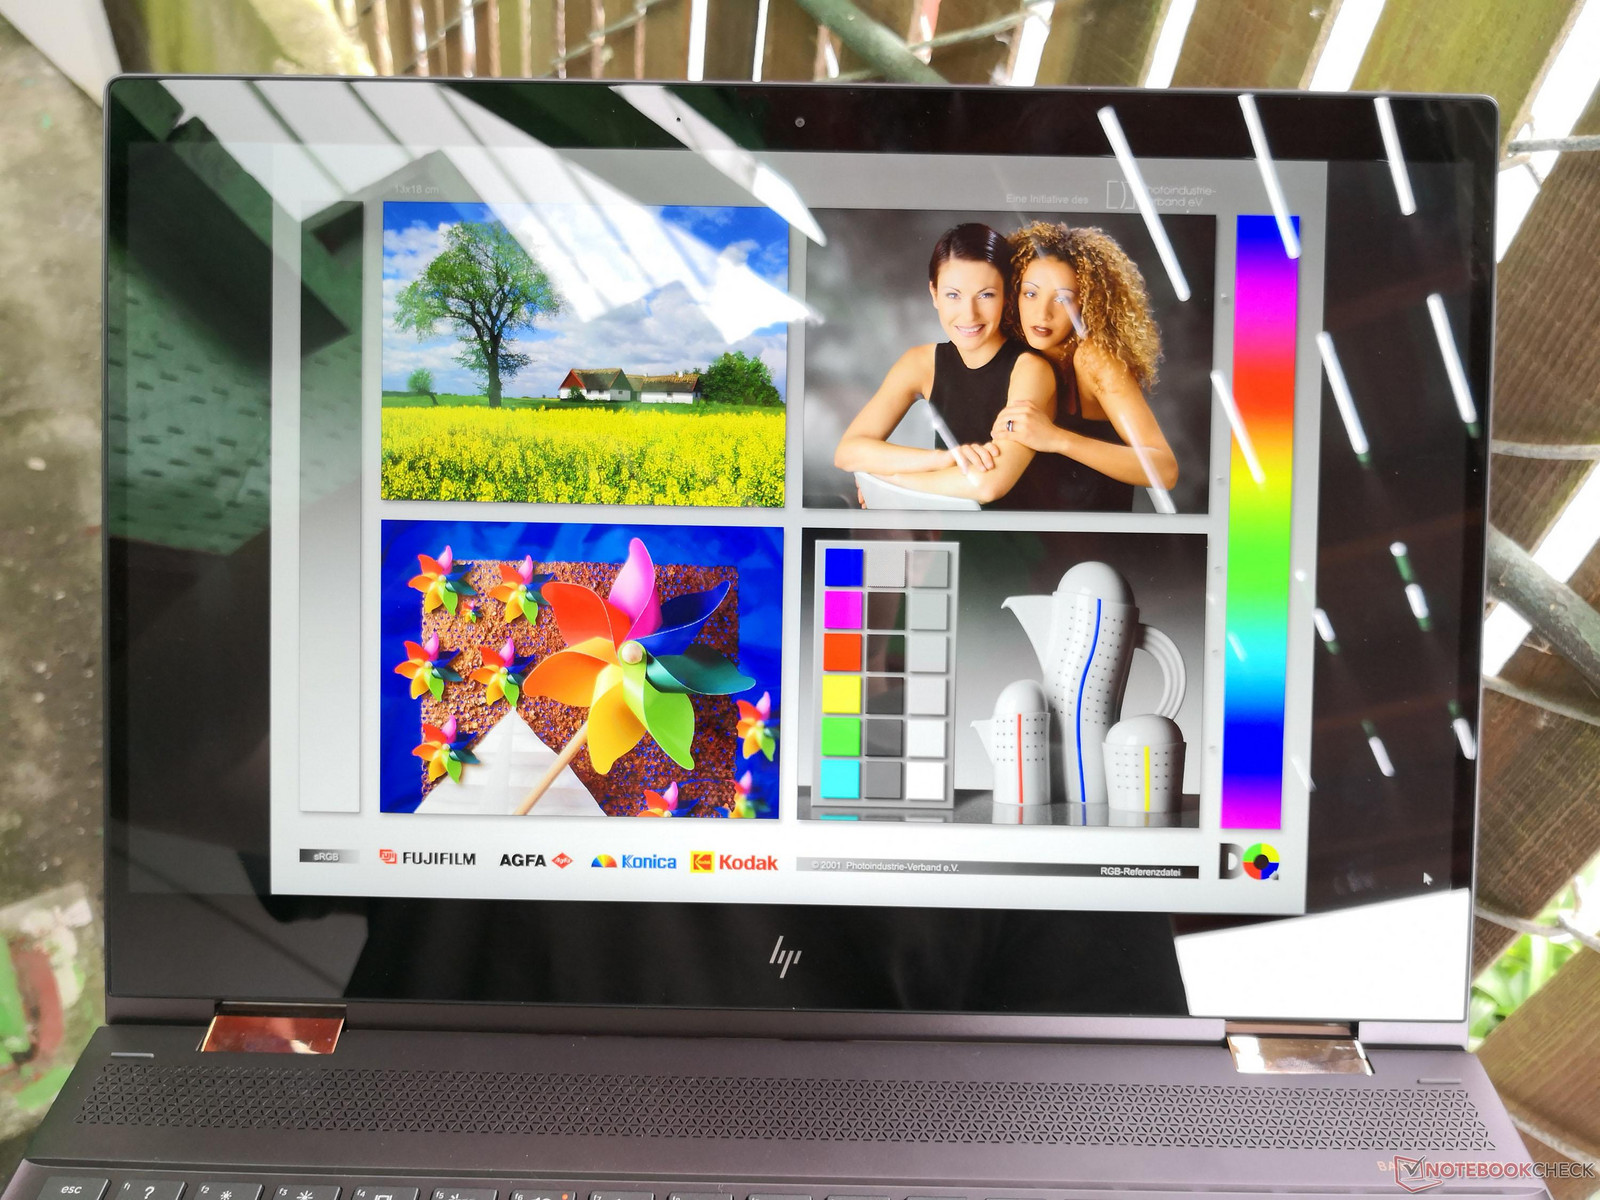
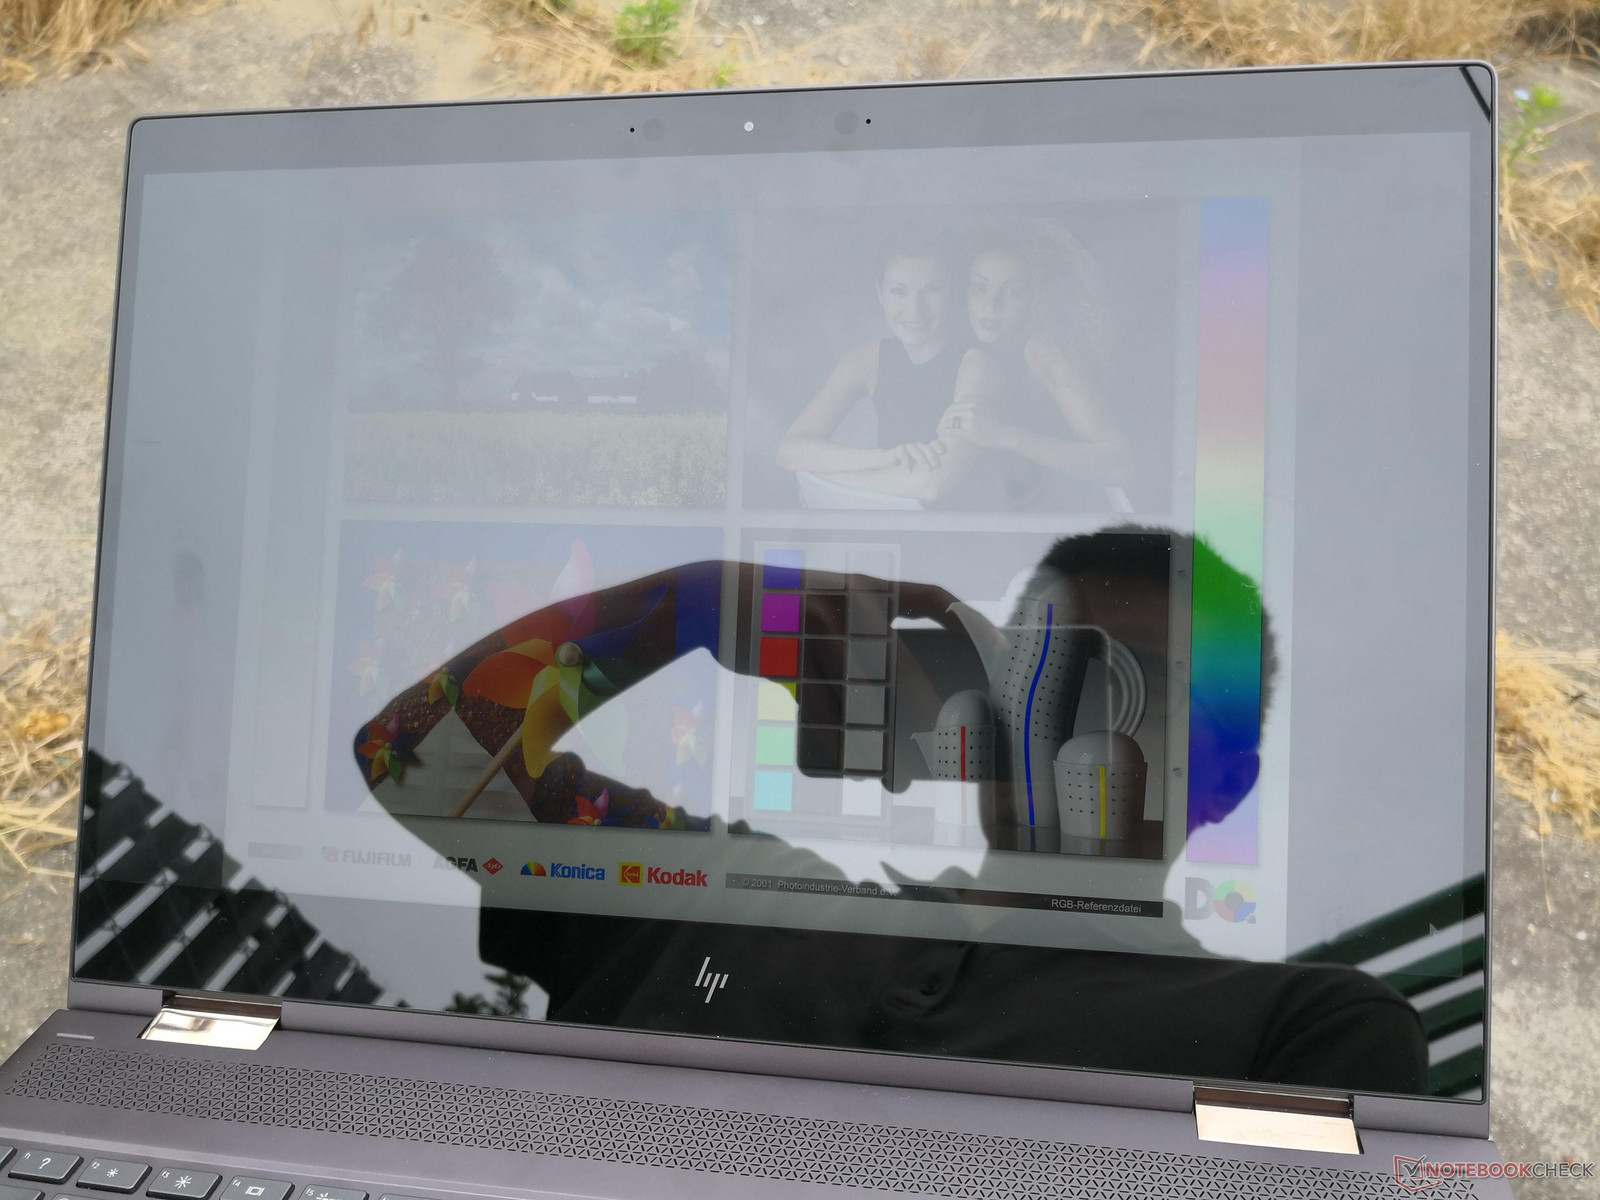
Viewing angles are identical to the last generation model since brightness, contrast, glossiness, and viewing angles are nearly the same. Glare is inevitable under most outdoor conditions.
Performance
There are only two CPU and GPU options at the moment: The Core i7-8550U plus GeForce MX150 and the Core i7-8705G plus Radeon RX Vega GL. The i7-8550U is very common on many Ultrabooks while the latter can also be found on the XPS 15 9575. Either option will cater well to multimedia users while the Kaby Lake-G SKU should satisfy more power-hungry editors and mainstream gamers.
Processor
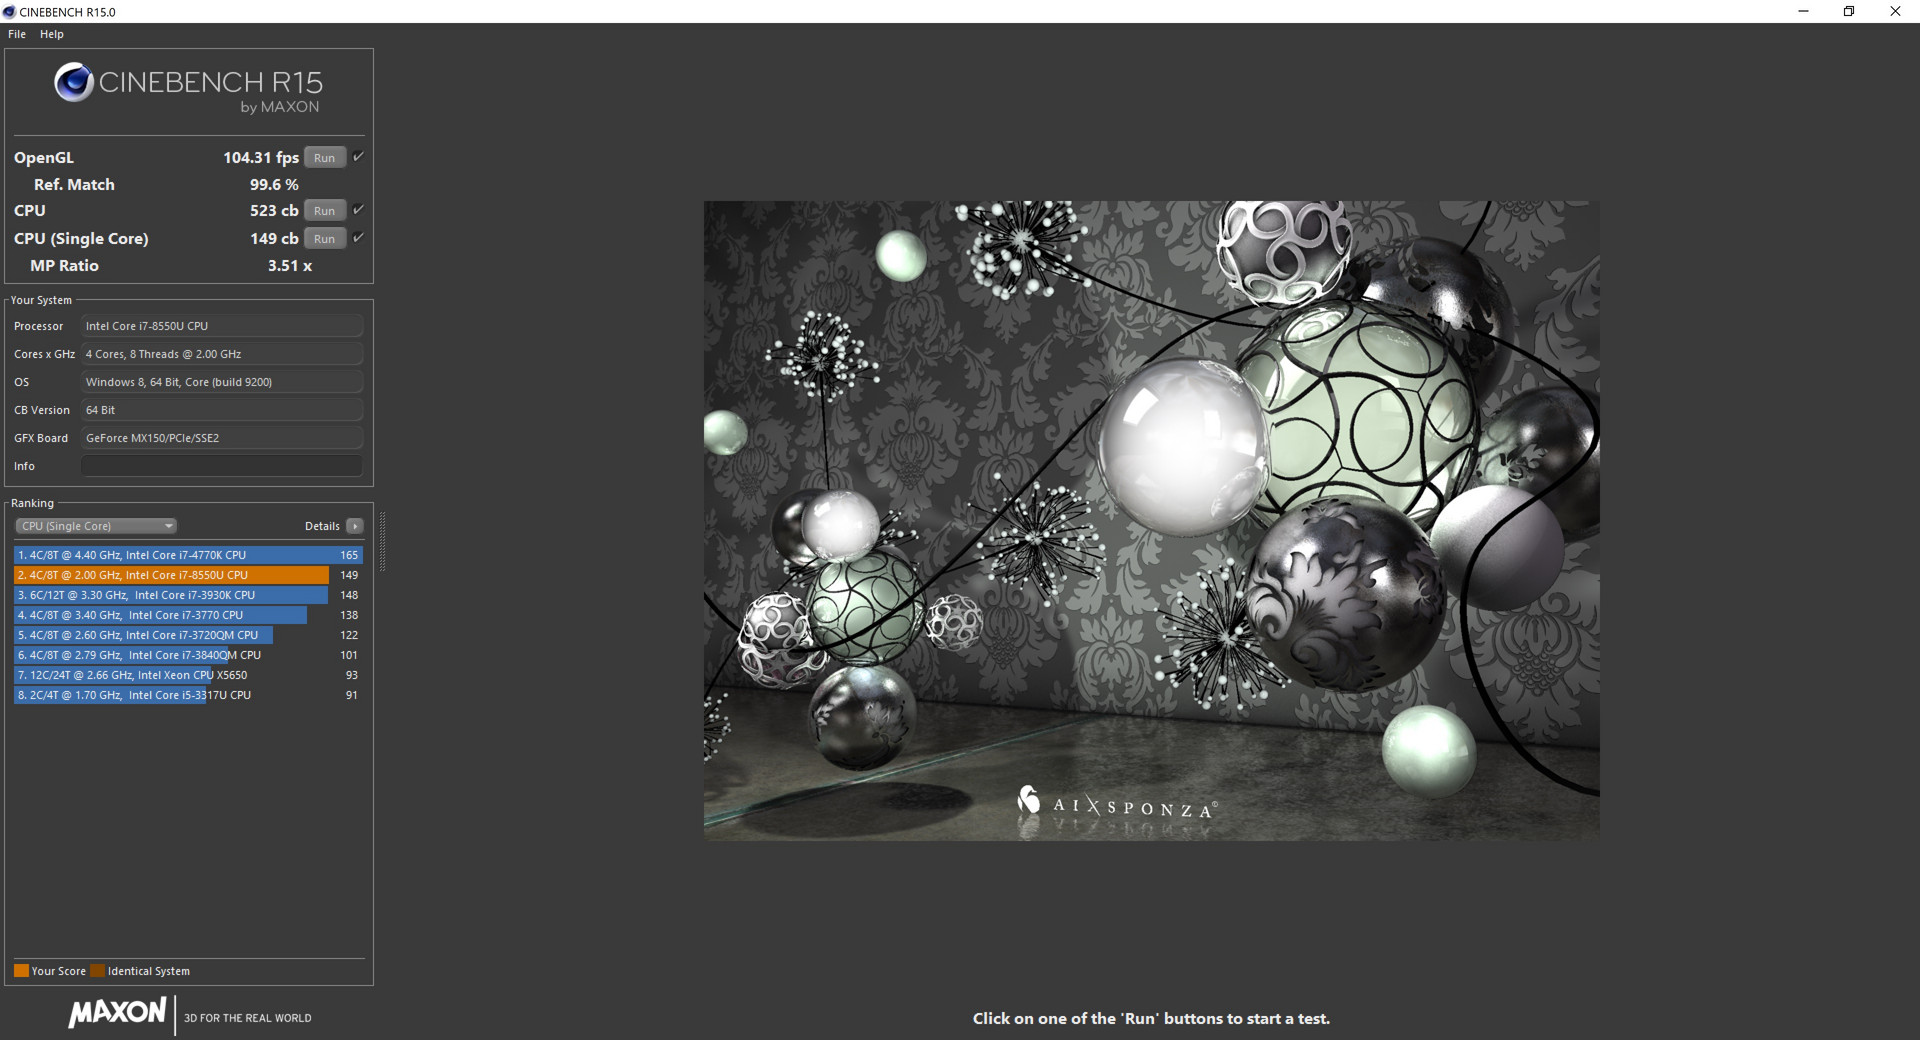
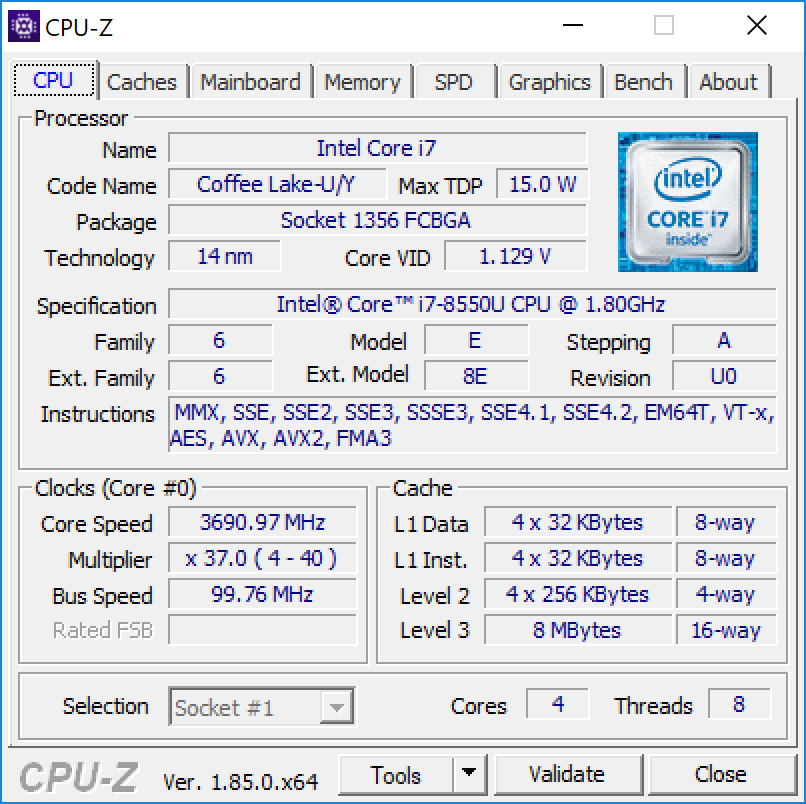
CPU performance is where we expect it to be for an i7-8550U if not slightly slower. When compared to the average i7-8550U in our database, the processor in our Spectre is about 7 to 9 percent slower in CineBench R15 to suggest that Turbo Boost clock rates are slightly below average. Scores are otherwise nearly identical to last year's Spectre x360 15.
It's important to note that the Kaby Lake-G Core i5-8305G in the competing XPS 15 9575 can outperform our i7-8550U by as much as 30 percent. Thus, users who want faster performance should consider the Kaby Lake-G Spectre x360 15 SKU.
Running CineBench R15 Multi-Thread in a loop results in relatively steady scores over time. Our initial score of 542 points drops by just 5 percent to a steady ~515 range after the first loop.
More technical information and benchmark comparisons on the Core i7-8550U can be found on our CPU page.
System Performance
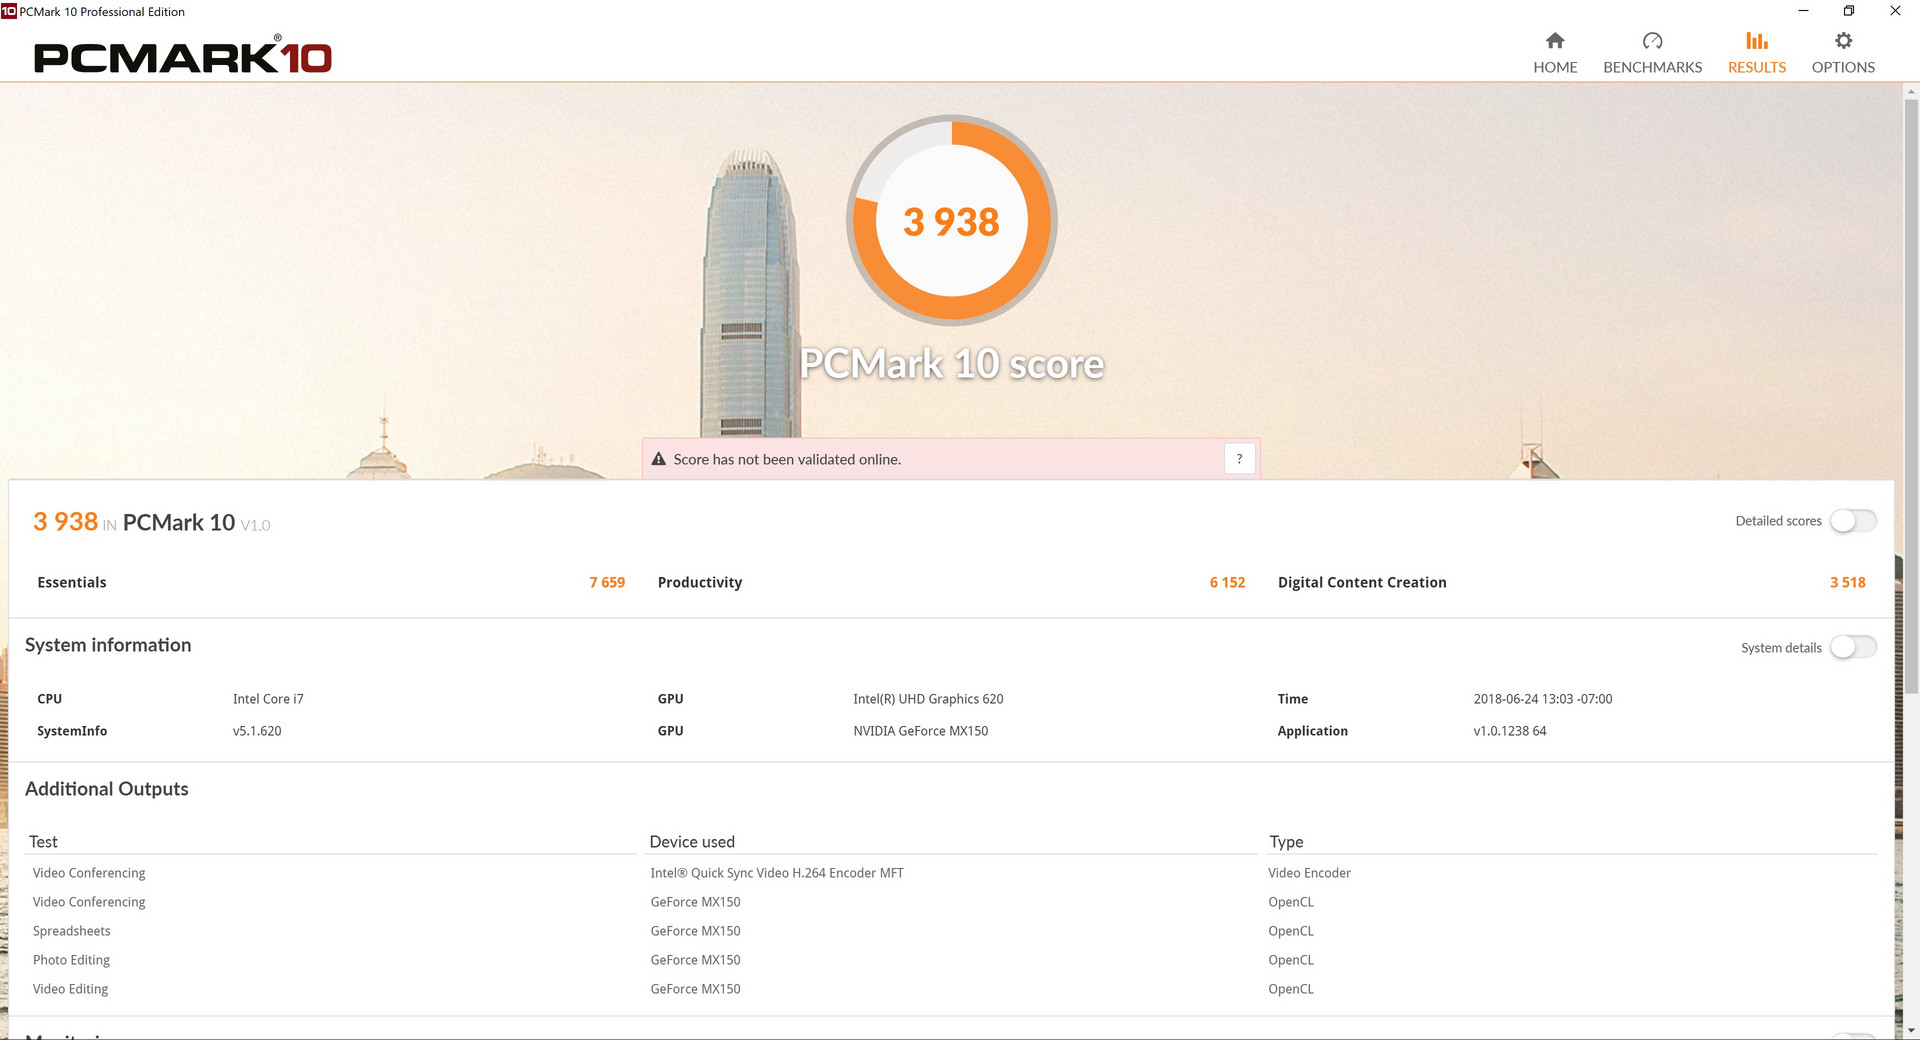
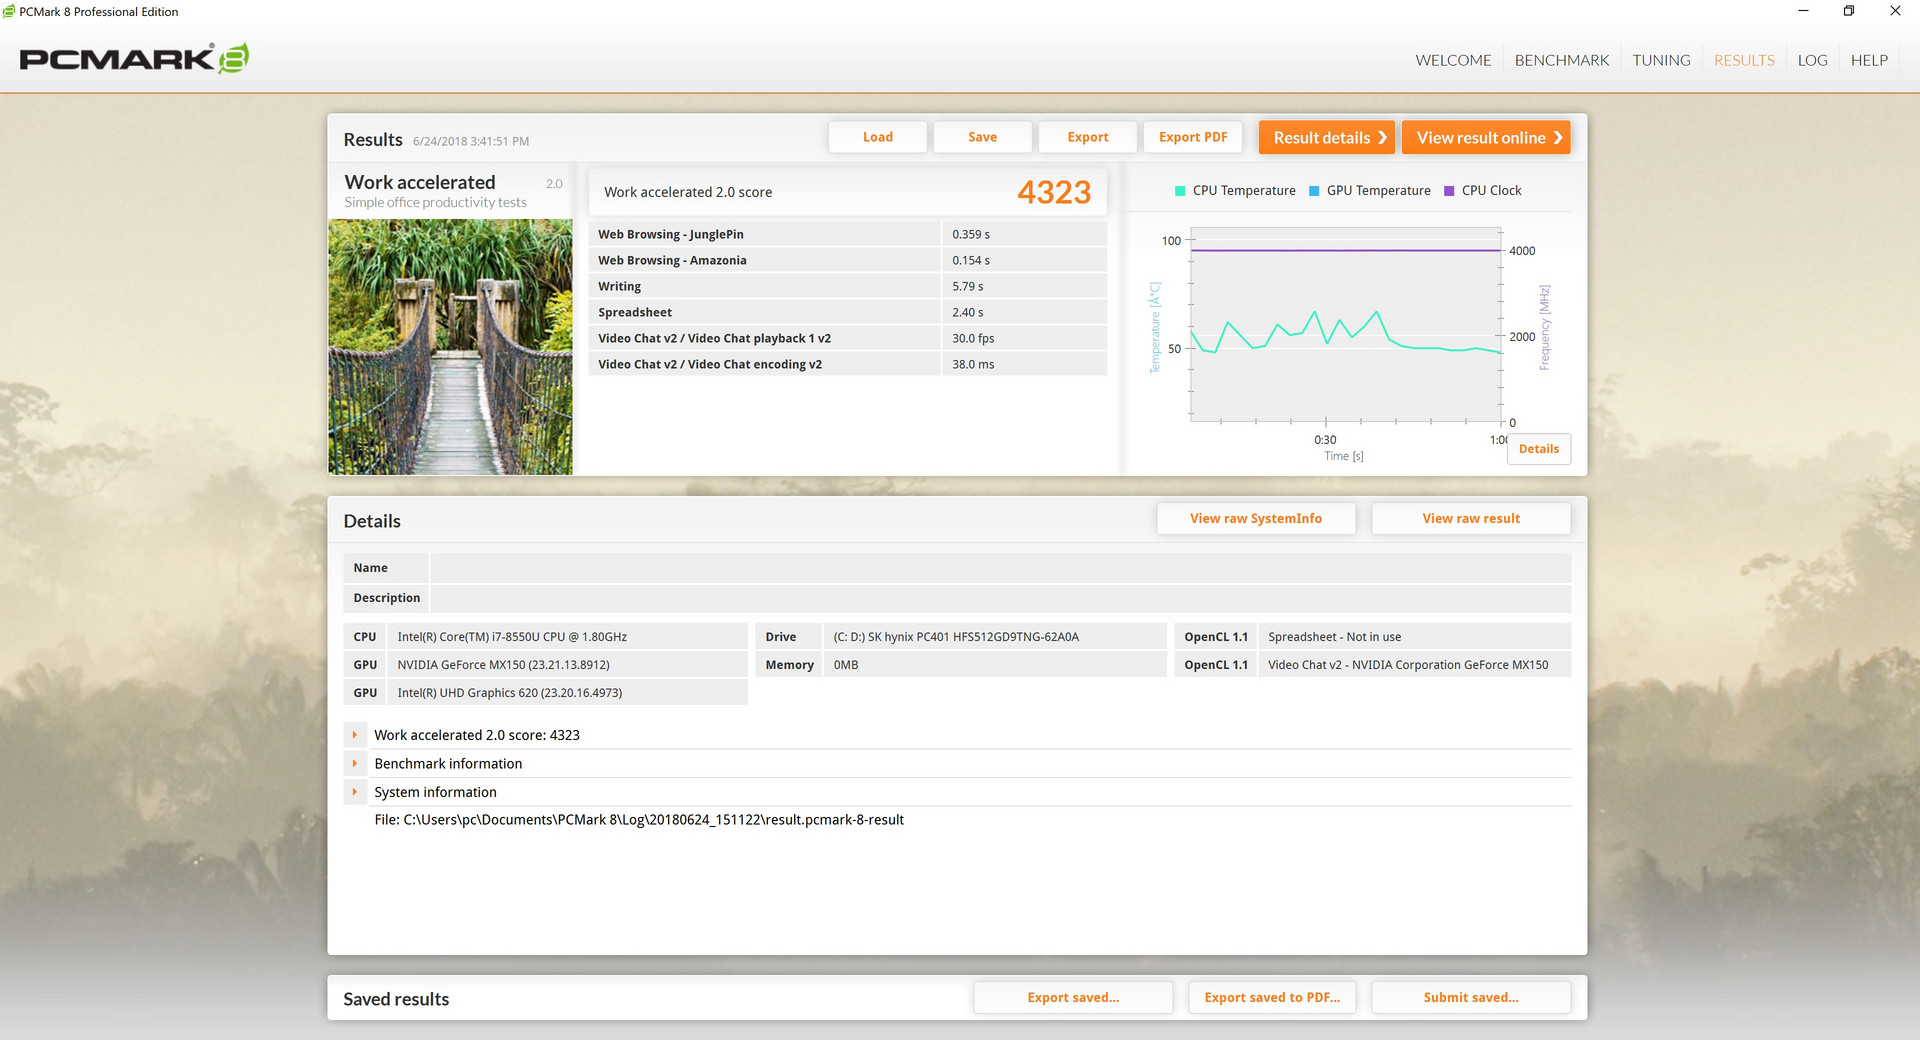
PCMark benchmarks rank our Spectre just a few percentage points higher than last year's model. In practice, however, this small of a difference is unnoticeable during regular browsing use. Notebooks with more powerful 45 W Intel Core H-series CPUs and GTX-class GPUs like the Asus ZenBook Pro 15 UX580GE can score about 30 percent higher than our Spectre.
We experienced no software or hardware issues during our time with the test unit.
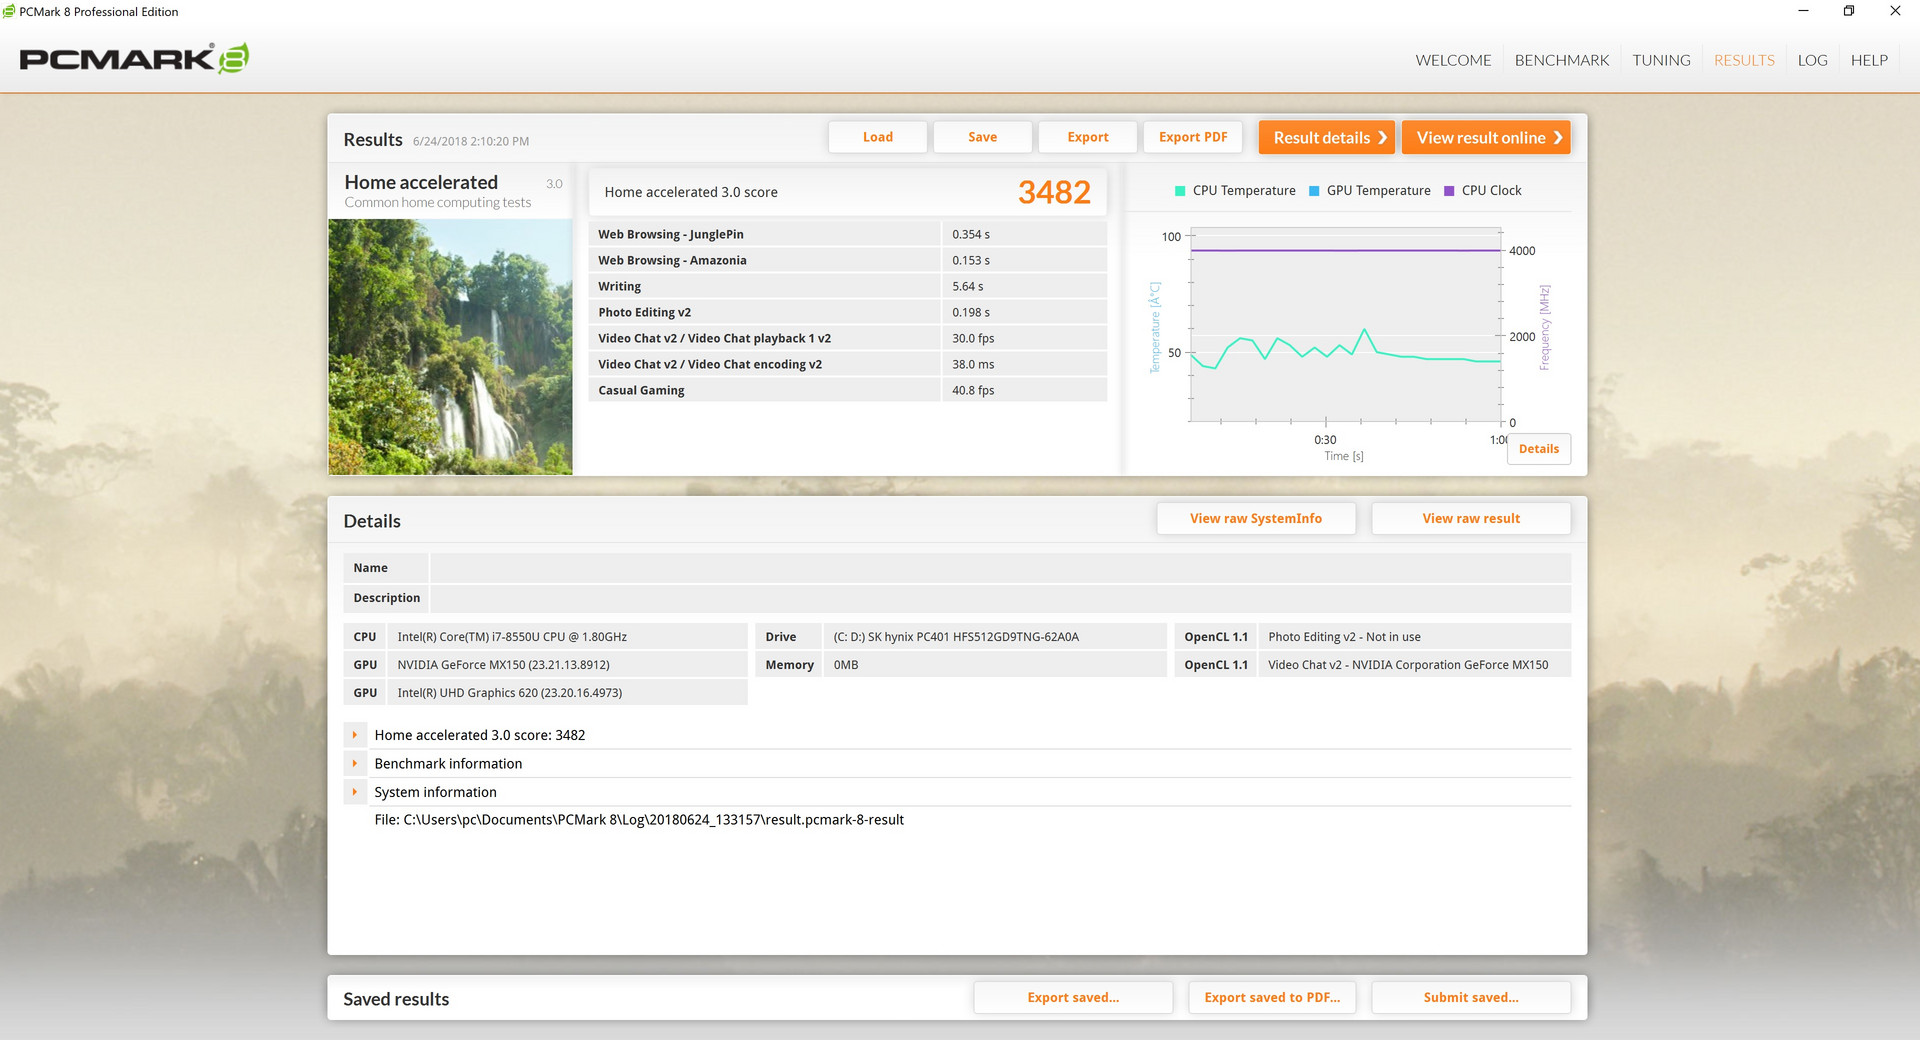
| PCMark 8 Home Score Accelerated v2 | 3482 points | |
| PCMark 8 Work Score Accelerated v2 | 4323 points | |
| PCMark 10 Score | 3938 points | |
Help | ||
Storage Devices
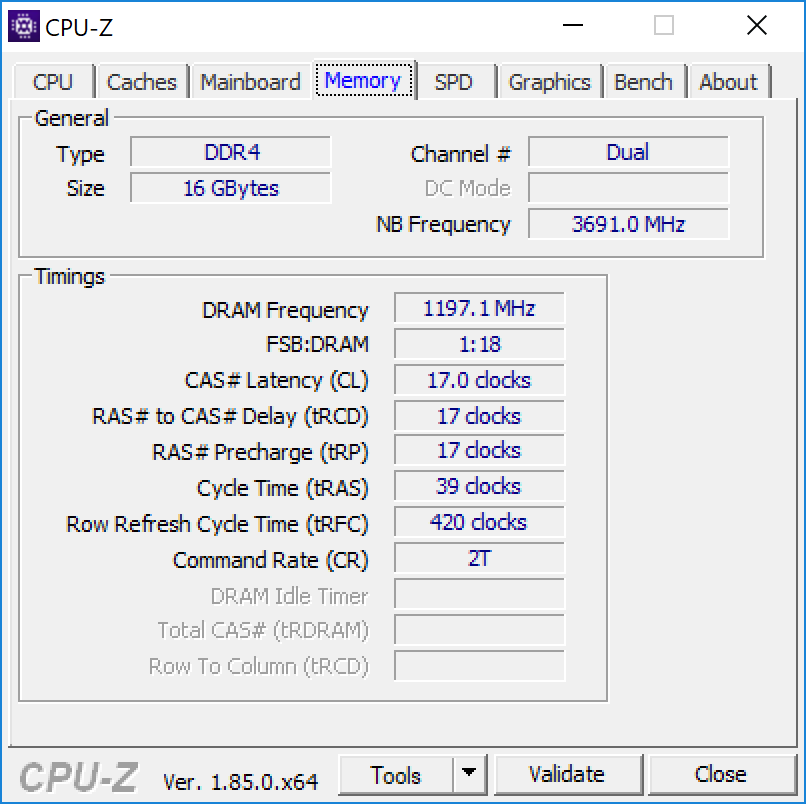
Perhaps by consequence, our Spectre x360 15 utilizes the same 512 GB PC401 NVMe SSD from SK Hynix as does the Dell XPS 15 9575. Average transfer rates are nearly the same between them. Nonetheless, Samsung SSDs like the PM961 can provide even faster speeds. It's strange to see the older 2017 Spectre x360 15 use the faster Samsung SSD compared to the slower SK Hynix SSD in the 2018 revision. Internal secondary storage options are not available.
See our table of SSDs and HDDs for more benchmark comparisons.
| HP Spectre x360 15-ch011nr SK hynix PC401 NVMe 500 GB | HP Spectre x360 15t-bl100 Samsung PM961 NVMe MZVLW512HMJP | Dell XPS 15 9575 i7-8705G SK hynix PC401 NVMe 500 GB | Gigabyte Aero 15X v8 Toshiba NVMe THNSN5512GPU7 | Dell XPS 15 2018 i5 FHD 97Wh Lite-On CA3-8D256-Q11 | |
|---|---|---|---|---|---|
| AS SSD | 53% | 3% | 0% | -174% | |
| Copy Game MB/s | 1042 | 1134 9% | 944 -9% | 465.9 -55% | |
| Copy Program MB/s | 486.8 | 534 10% | 487.9 0% | 117.2 -76% | |
| Copy ISO MB/s | 1668 | 1936 16% | 1523 -9% | 632 -62% | |
| Score Total | 2037 | 3781 86% | 2132 5% | 2536 24% | 750 -63% |
| Score Write | 757 | 1556 106% | 807 7% | 939 24% | 58 -92% |
| Score Read | 859 | 1493 74% | 921 7% | 1092 27% | 492 -43% |
| Access Time Write * | 0.051 | 0.026 49% | 0.051 -0% | 0.046 10% | 0.889 -1643% |
| Access Time Read * | 0.054 | 0.04 26% | 0.044 19% | 0.119 -120% | 0.086 -59% |
| 4K-64 Write | 545 | 1262 132% | 637 17% | 742 36% | 19.19 -96% |
| 4K-64 Read | 646 | 1206 87% | 649 0% | 847 31% | 301.8 -53% |
| 4K Write | 93.2 | 141.1 51% | 94.3 1% | 80.4 -14% | 5.12 -95% |
| 4K Read | 38.76 | 51.9 34% | 41.38 7% | 23.36 -40% | 32.5 -16% |
| Seq Write | 1189 | 1530 29% | 752 -37% | 1163 -2% | 340.3 -71% |
| Seq Read | 1739 | 2342 35% | 2302 32% | 2213 27% | 1574 -9% |
* ... smaller is better

GPU Performance
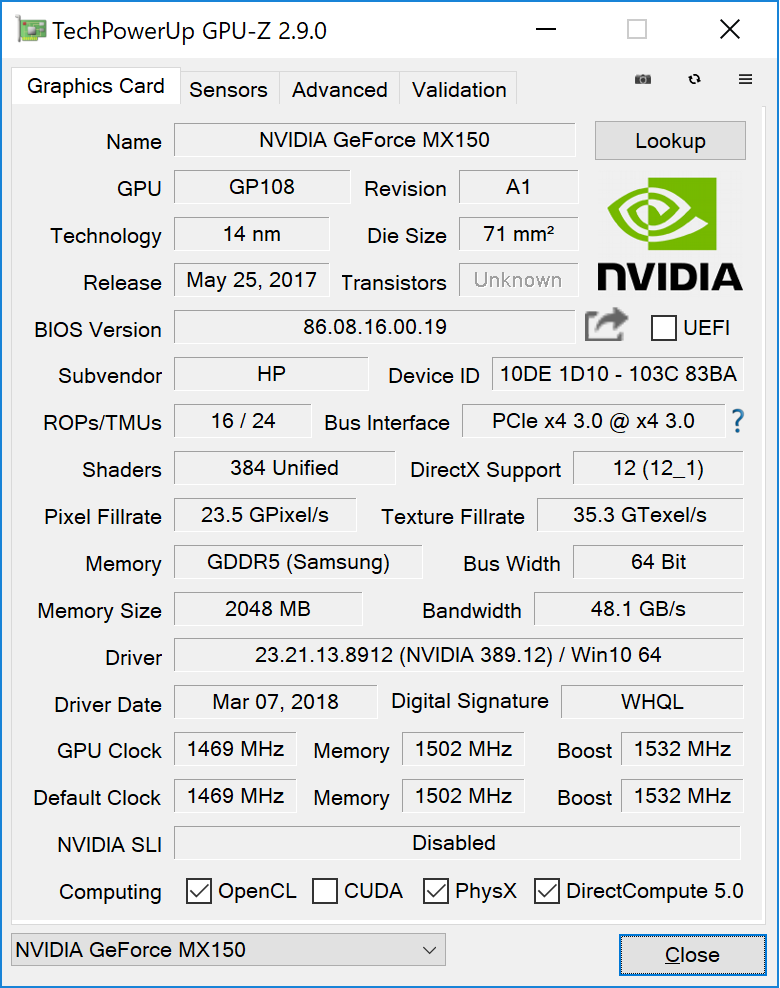
The GeForce MX150 in the Spectre is performing where we expect it to be. 3DMark results are just a hair higher than last year's model to offer a performance level similar to that of the GTX 950M. Opting for the Radeon RX Vega M GL GPU in the Kaby Lake-G SKU will net users twice the raw graphics performance of the MX150. Although the Spectre series is not advertised as a gaming solution, most titles will still run well in low to medium settings.
Thankfully, the 15.6-inch Spectre is not using the slower '1D12' MX150 variant commonly found on smaller 13-inch Ultrabooks. See our dedicated page on the GeForce MX150 GPU for more technical information and benchmark comparisons.
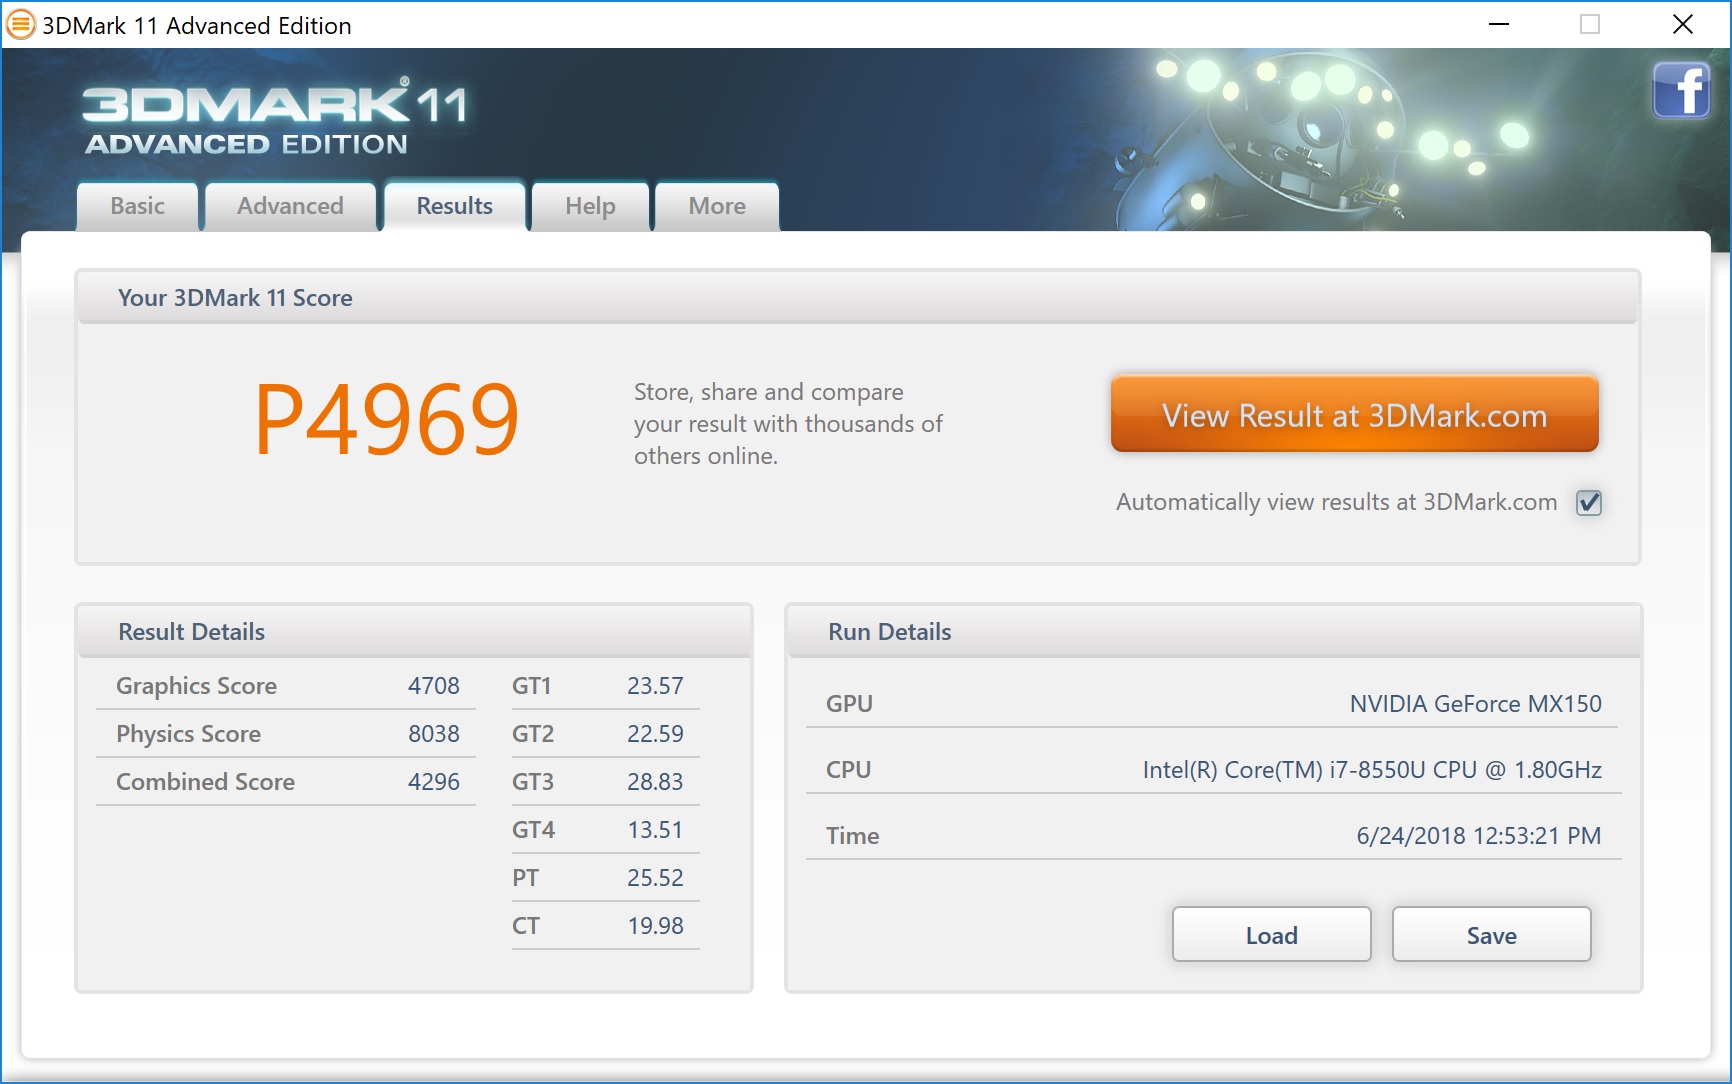
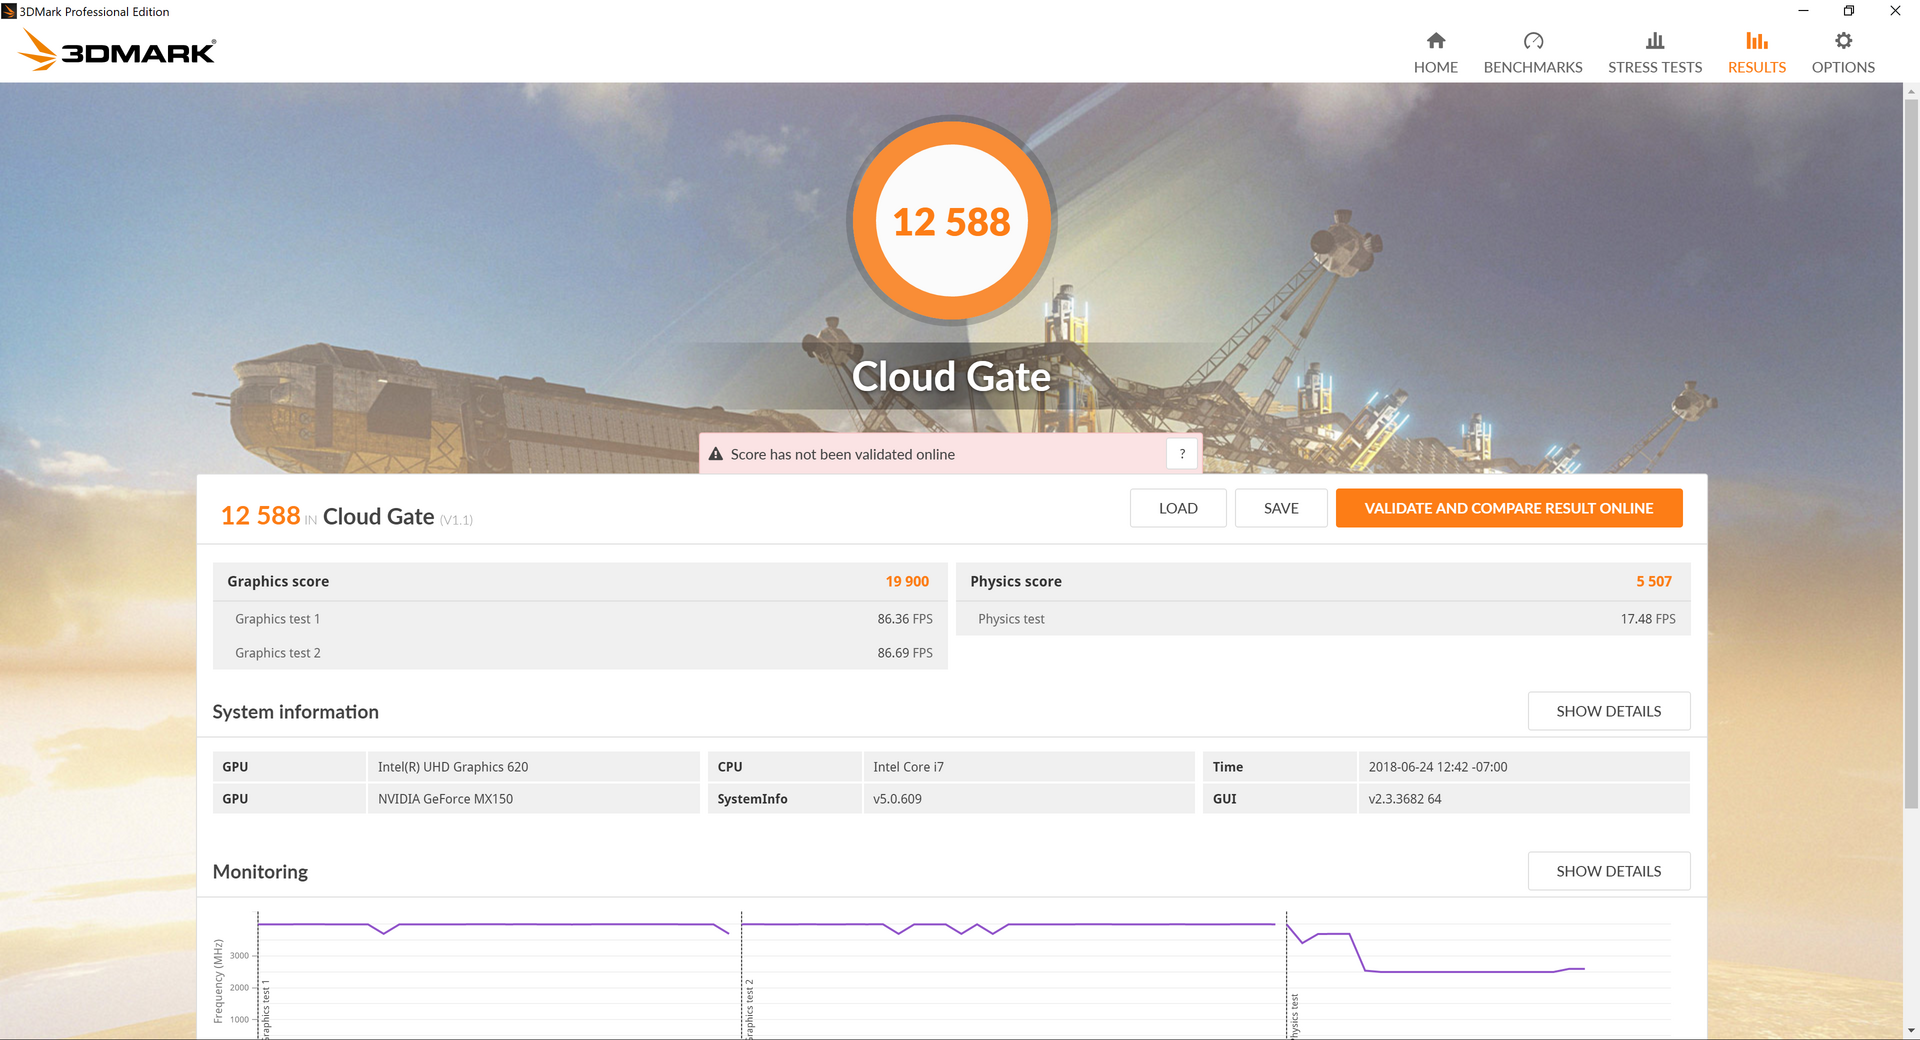
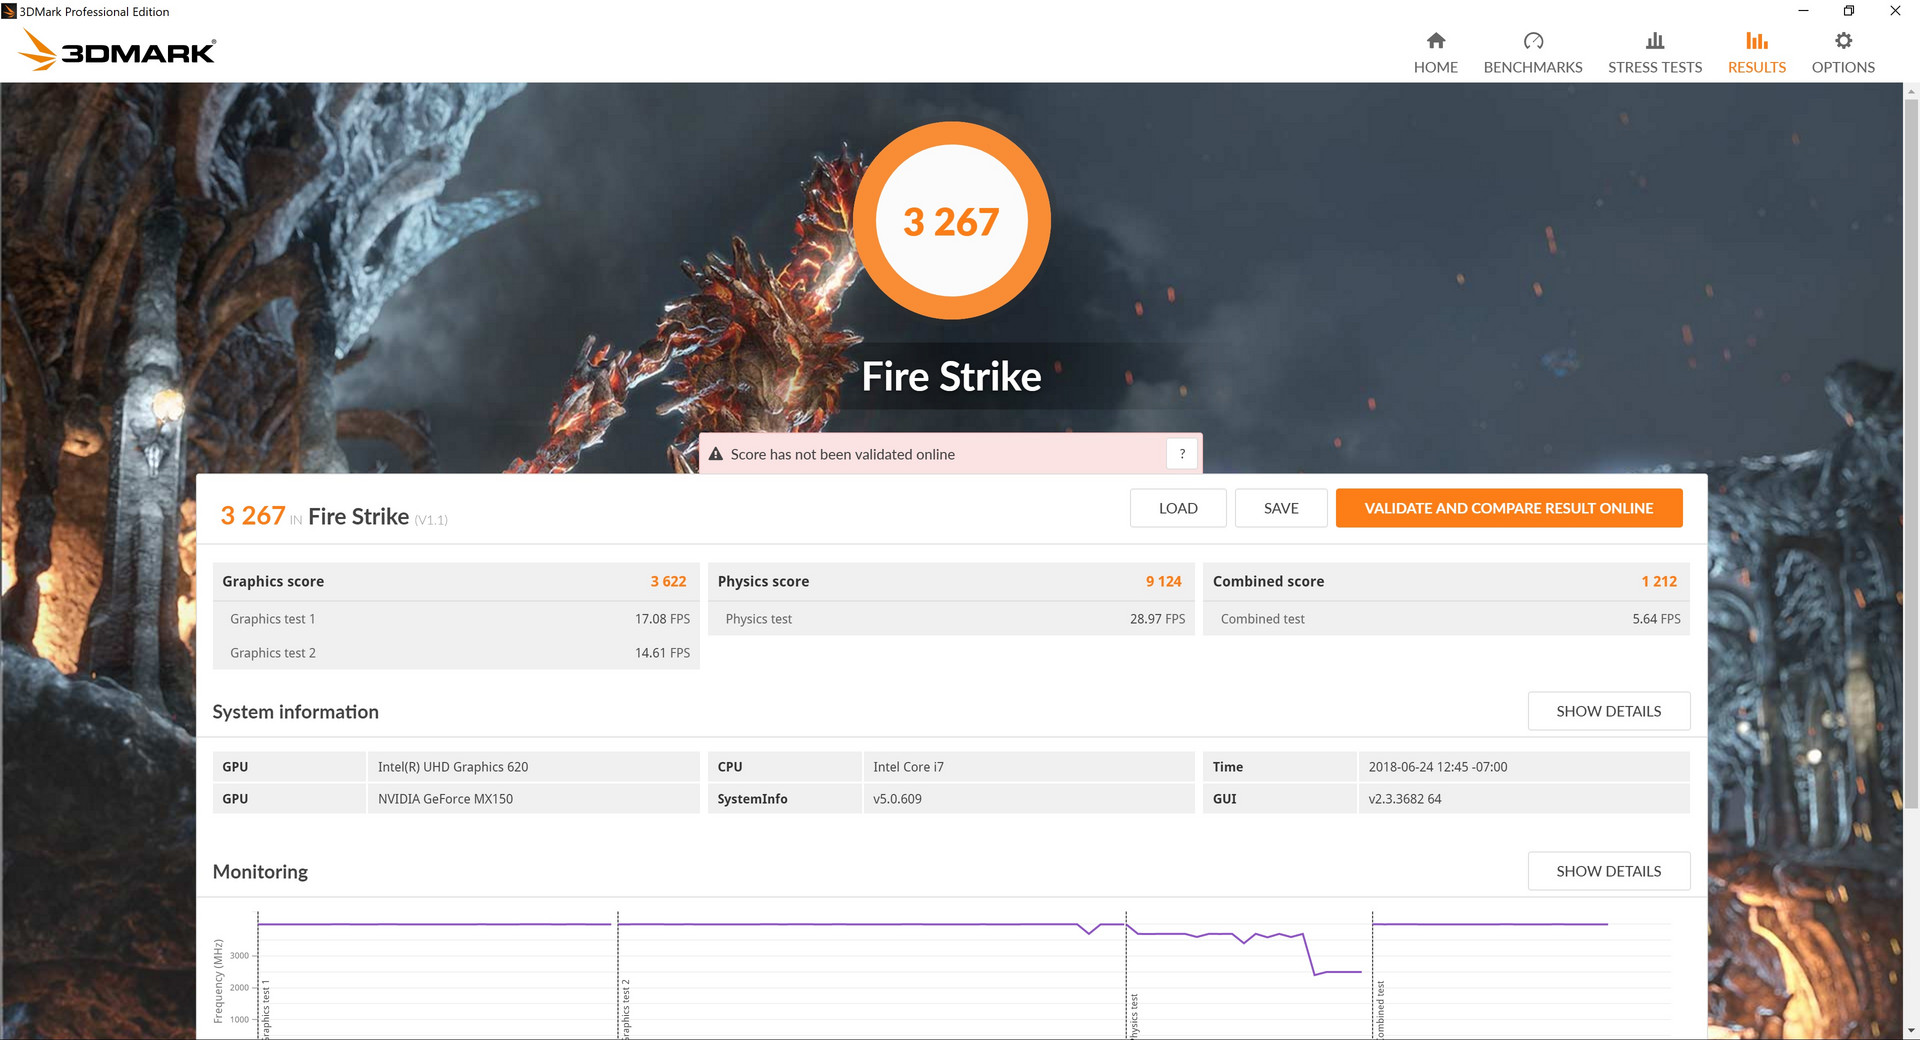
| 3DMark 11 Performance | 4969 points | |
| 3DMark Cloud Gate Standard Score | 12588 points | |
| 3DMark Fire Strike Score | 3267 points | |
Help | ||
| low | med. | high | ultra | |
| BioShock Infinite (2013) | 197.4 | 114.2 | 96 | 35.2 |
| Batman: Arkham Knight (2015) | 60 | 51 | 20 | |
| Rise of the Tomb Raider (2016) | 67.4 | 43.1 | 23 | 18.5 |
Stress Test
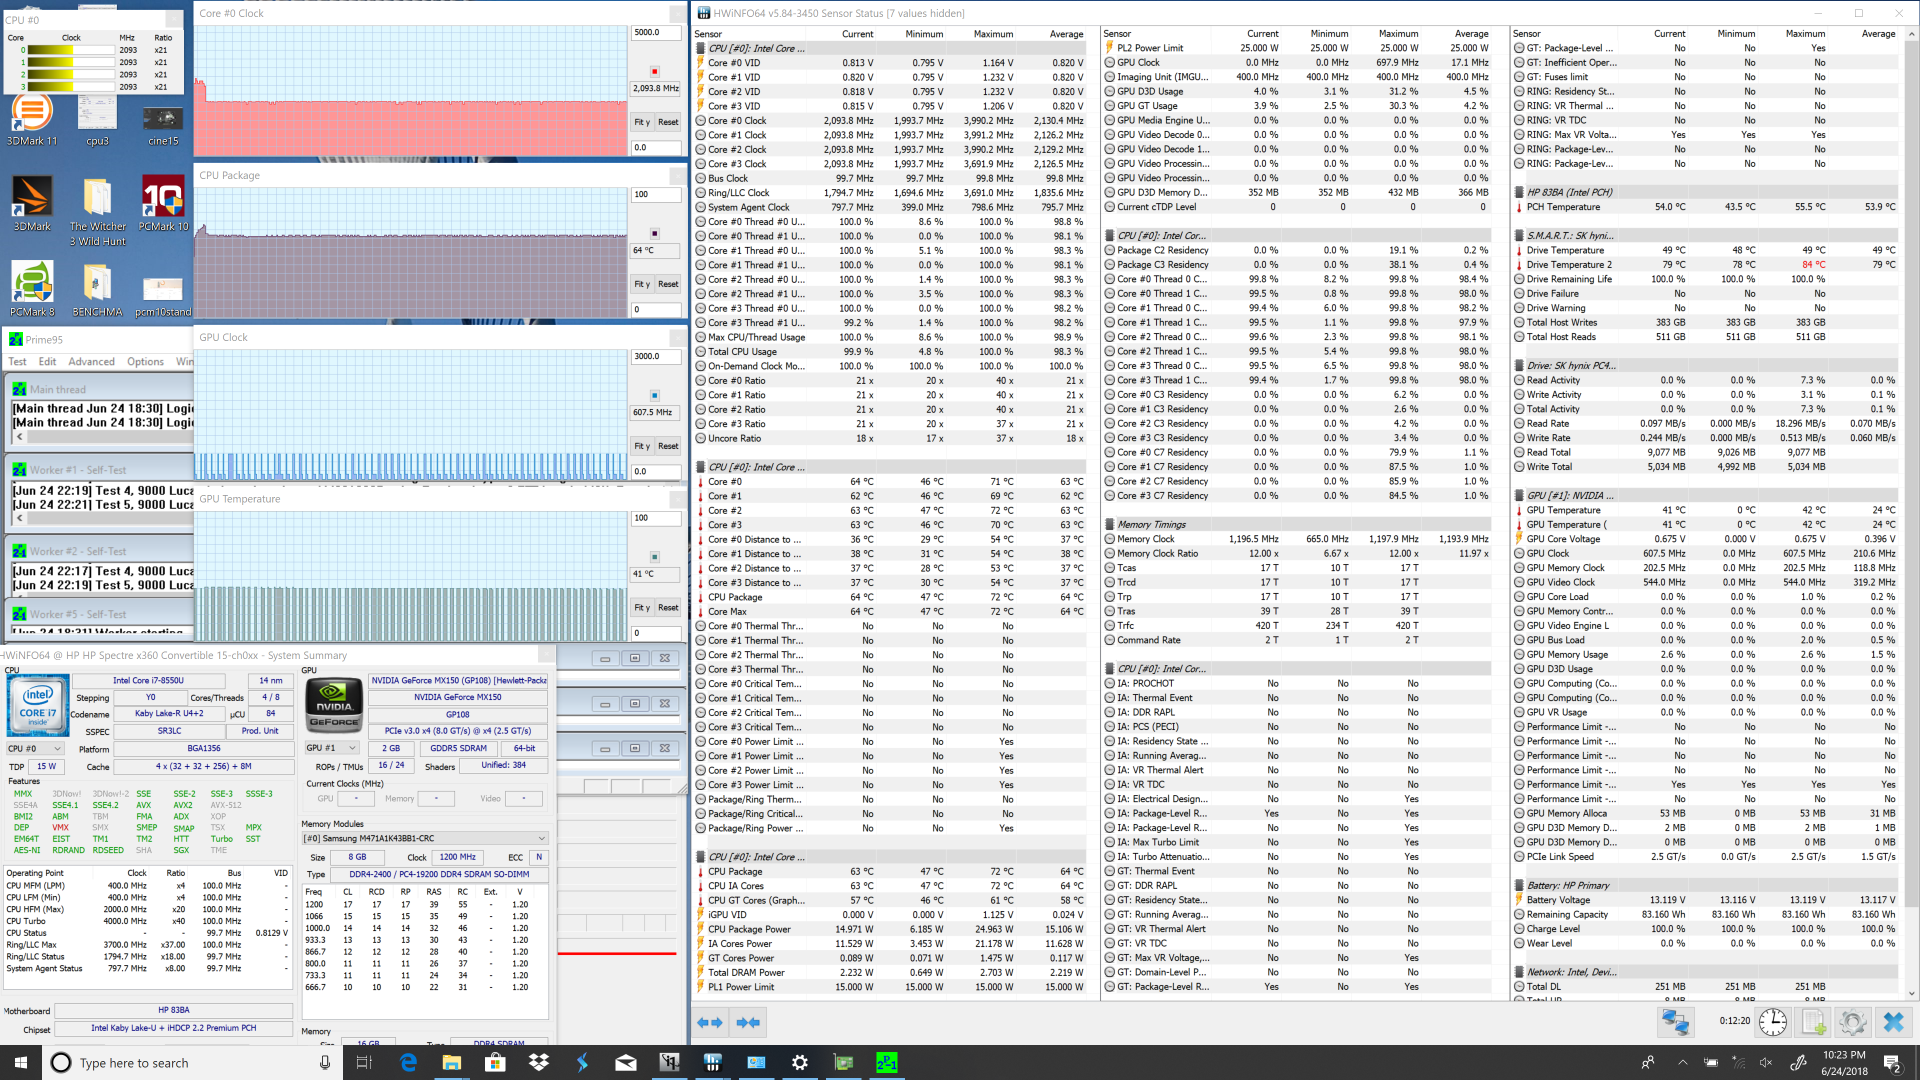
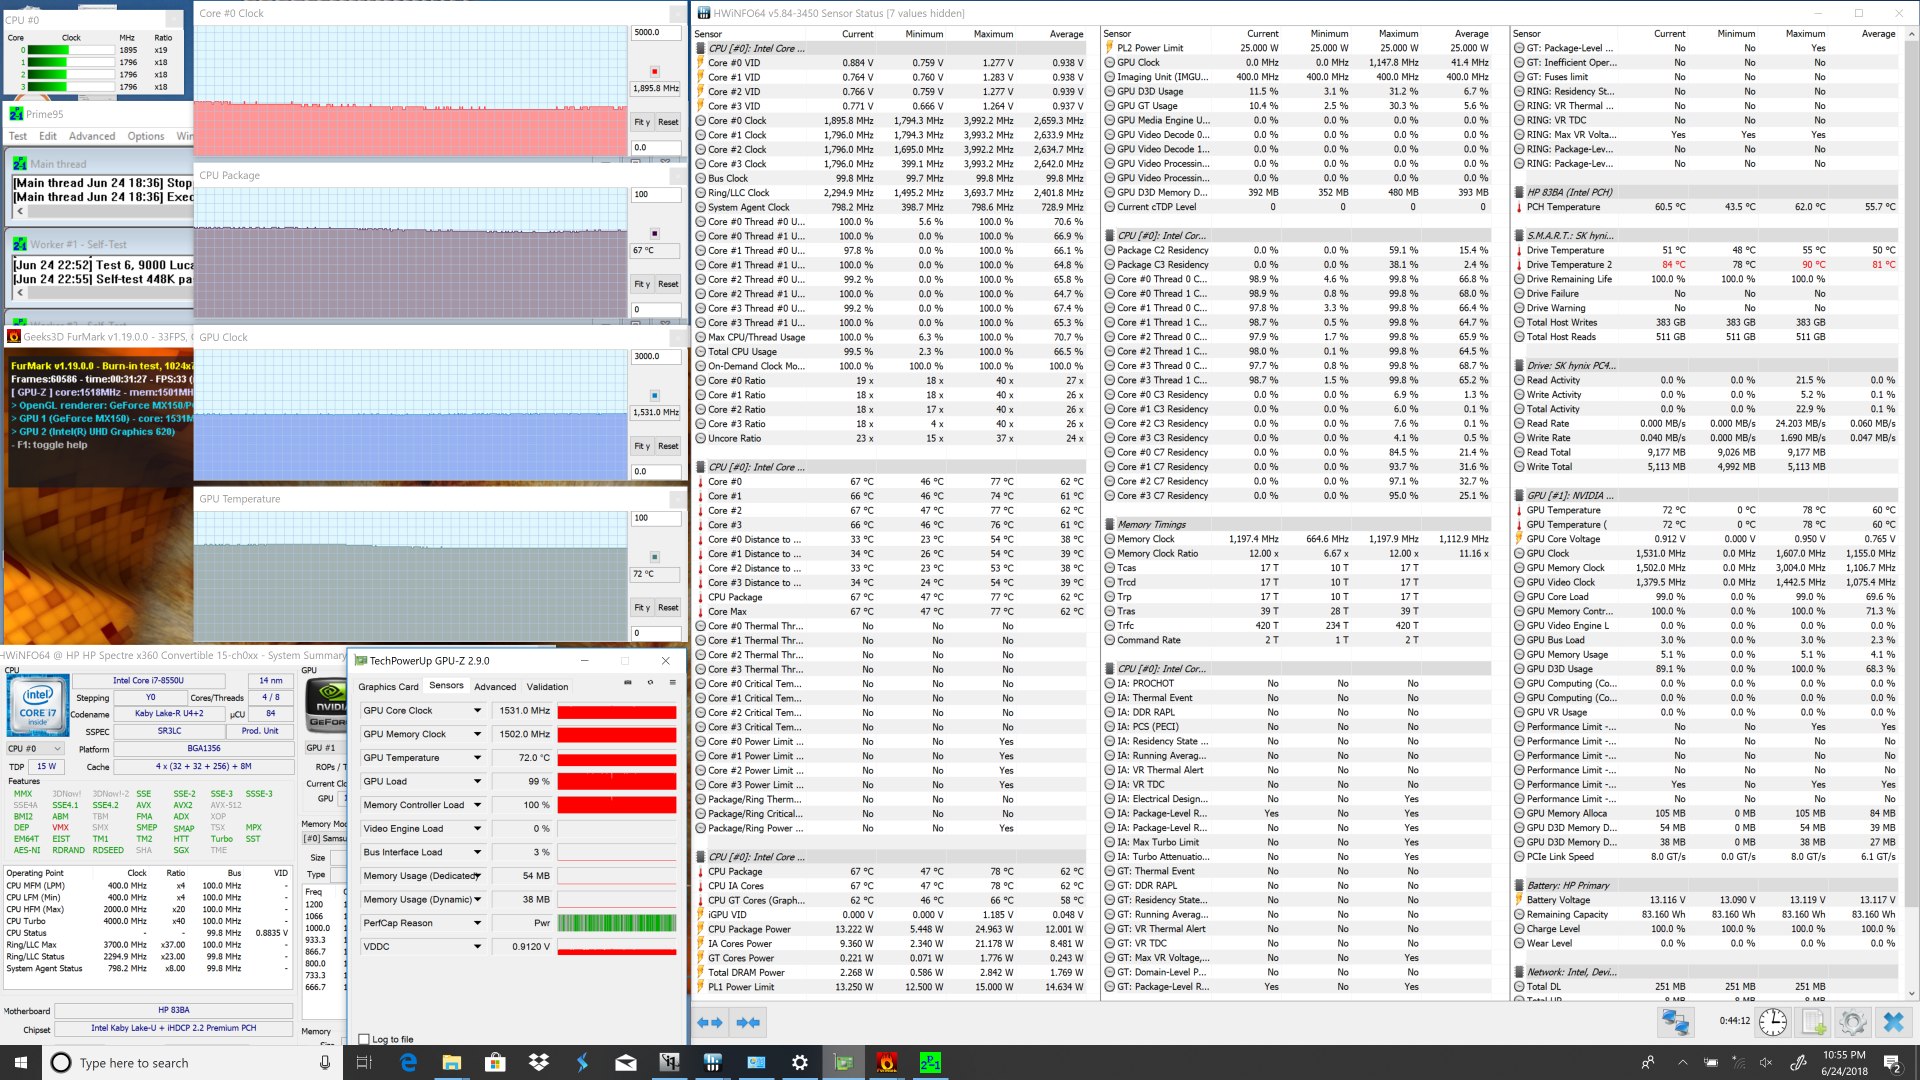
We stress the notebook with intensive benchmarks to identify for any potential hardware or software issues. When running Prime95, the CPU can be observed running as high as 2.9 GHz for the first few seconds before declining and plateauing at 2.1 GHz. Core temperature stabilizes at a relatively cool 64 C. When running both Prime95 and FurMark simultaneously, the CPU drops even further to 1.9 GHz or just 100 MHz above its base clock rate.
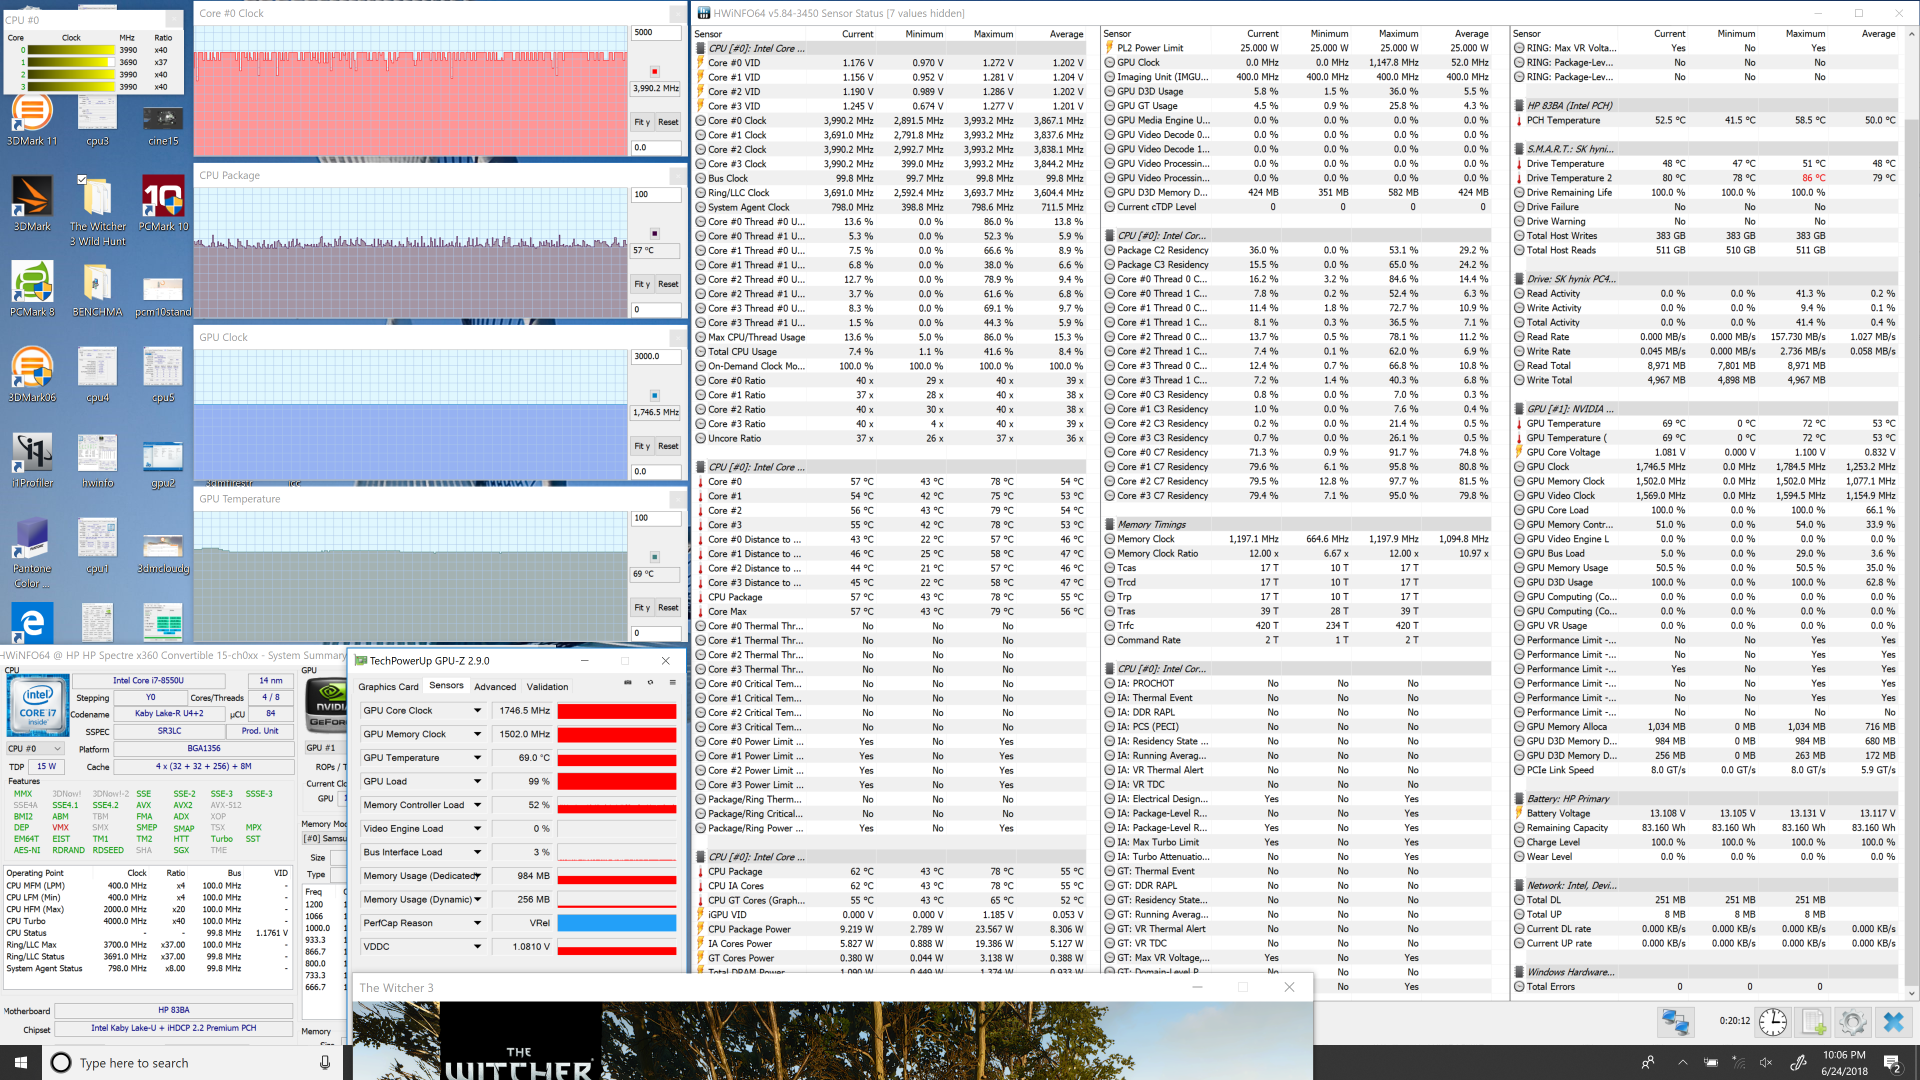
Running Witcher 3 is more representative of real-world gaming conditions. When under such a load, the CPU and GPU stabilizes in the 57 C and 69 C range, respectively. Temperatures are quite cool for a notebook especially when compared to the XPS 15 series where processors can be as warm as 90 C when under load.
Running on battery power will limit both CPU and GPU performance. Fire Strike on batteries returns Physics and Graphics scores of 7390 and 3265 points, respectively, compared to 9124 and 3622 points when on mains.
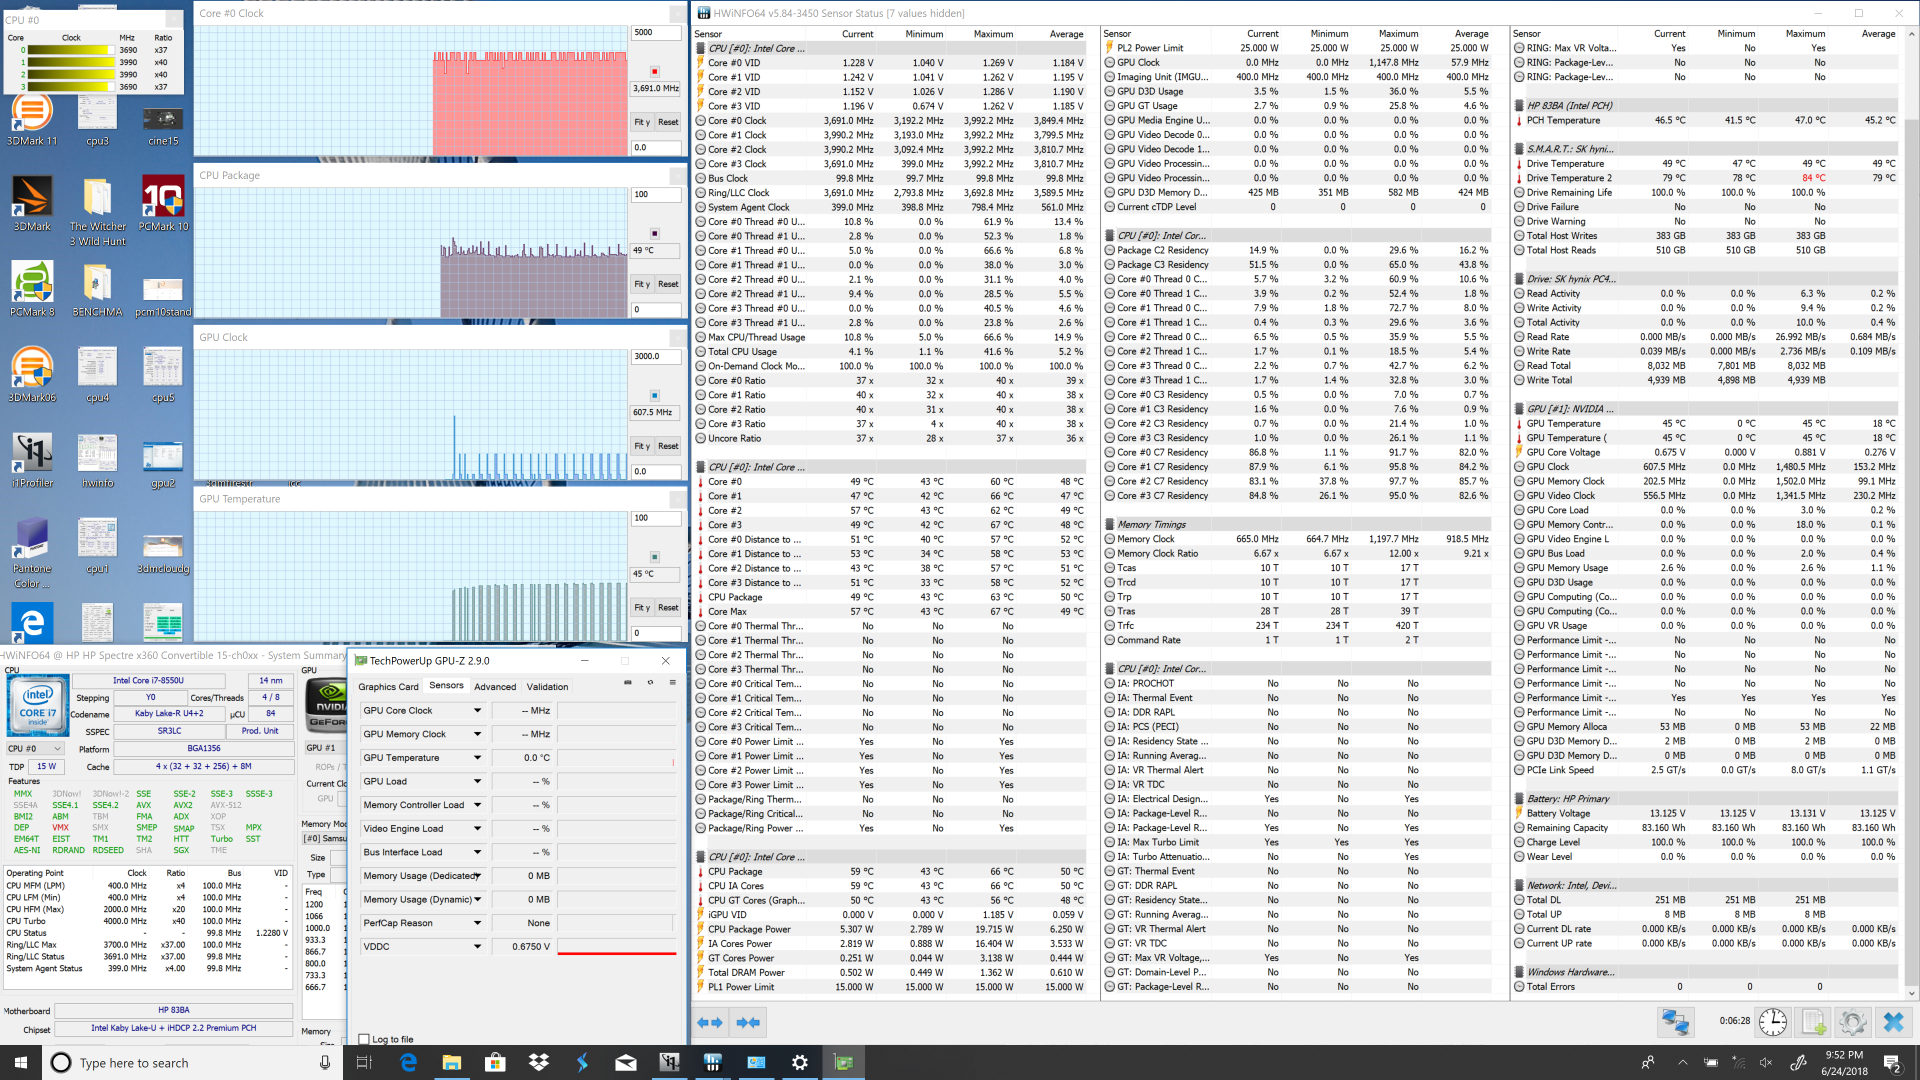
| CPU Clock (GHz) | GPU Clock (MHz) | Average CPU Temperature (°C) | Average GPU Temperature (°C) | |
| Prime95 Stress | 2.1 | -- | 64 | -- |
| FurMark Stress | -- | 1544 | -- | 75 |
| Prime95 + FurMark Stress | 1.9 | 1531 | 67 | 72 |
| Witcher 3 Stress | 3.7 - 4.0 | 1747 | 57 | 69 |
Emissions
System Noise
Fan noise has improved over the last generation during low-medium loads. The fans remain idle even through short bursts of medium loads. For example, the system remains silent after running the first benchmark scene of 3DMark 06 whereas the fans on most other laptops would begin pulsing. Users can browse and stream on the Power Saver profile almost silently.
Higher loads like gaming will induce a steady fan noise of almost 39 dB(A) to be quieter than competing notebooks with the more powerful GeForce GTX 1050 and also the XPS 15 9575. We fully expect the more powerful Kaby Lake-G SKU of the Spectre to run louder, warmer, or even both.
Our test unit exhibited no coil whine or electronic noise.
Noise Level
| Idle |
| 29.2 / 29.2 / 29.2 dB(A) |
| Load |
| 29.2 / 45.7 dB(A) |
 | ||
30 dB silent 40 dB(A) audible 50 dB(A) loud |
||
min: | ||
| HP Spectre x360 15-ch011nr GeForce MX150, i5-8550U, SK hynix PC401 NVMe 500 GB | HP Spectre x360 15t-bl100 GeForce MX150, i5-8550U, Samsung PM961 NVMe MZVLW512HMJP | Dell XPS 15 9575 i7-8705G Vega M GL / 870, i7-8705G, SK hynix PC401 NVMe 500 GB | Gigabyte Aero 15X v8 GeForce GTX 1070 Max-Q, i7-8750H, Toshiba NVMe THNSN5512GPU7 | Asus ZenBook Pro 15 UX580GE GeForce GTX 1050 Ti Mobile, i9-8950HK, Samsung SSD PM961 1TB M.2 PCIe 3.0 x4 NVMe (MZVLW1T0) | Dell XPS 15 2018 i5 FHD 97Wh GeForce GTX 1050 Mobile, i5-8300H, Lite-On CA3-8D256-Q11 | |
|---|---|---|---|---|---|---|
| Noise | -2% | -1% | -21% | -9% | -7% | |
| off / environment * | 28.6 | 28.4 1% | 28.2 1% | 29 -1% | 28 2% | 30.3 -6% |
| Idle Minimum * | 29.2 | 28.4 3% | 28.2 3% | 30 -3% | 28.6 2% | 30.3 -4% |
| Idle Average * | 29.2 | 28.4 3% | 28.2 3% | 31 -6% | 29.9 -2% | 30.3 -4% |
| Idle Maximum * | 29.2 | 28.4 3% | 28.2 3% | 35 -20% | 30.5 -4% | 30.3 -4% |
| Load Average * | 29.2 | 41.6 -42% | 29 1% | 49 -68% | 42.5 -46% | 37.1 -27% |
| Witcher 3 ultra * | 38.4 | 36.1 6% | 44.7 -16% | 51 -33% | 44.8 -17% | 43.3 -13% |
| Load Maximum * | 45.7 | 41.6 9% | 47.4 -4% | 54 -18% | 44.8 2% | 43 6% |
* ... smaller is better
Temperature
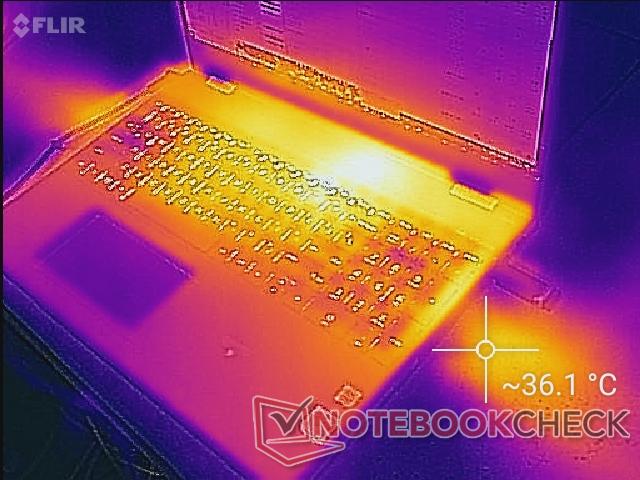
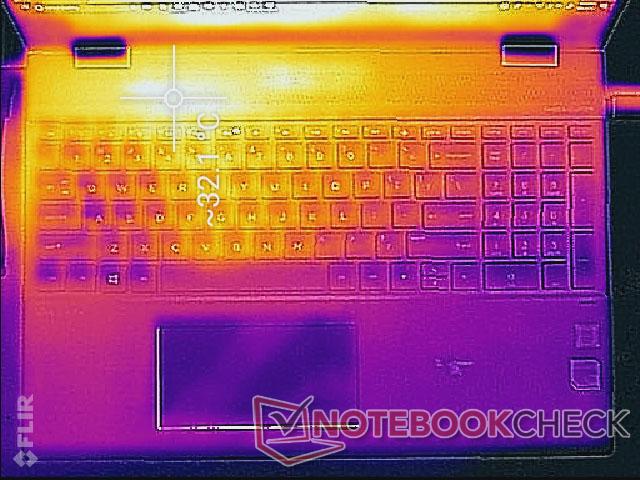
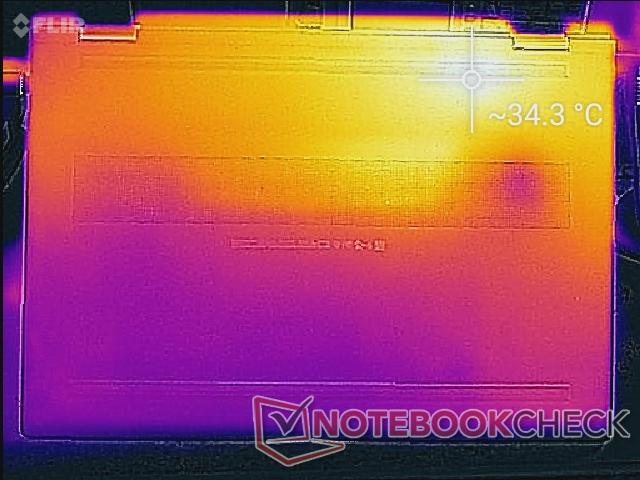
Surface temperatures when idling are slightly different compared to last year's model. The newer model is noticeably warmer around its rear quadrants than its front quadrants by almost 10 degrees. This wider delta is likely the result of the system's quieter fans during low-medium loads. Fortunately, the palm rests and keyboard areas remain comfortable for word processing.
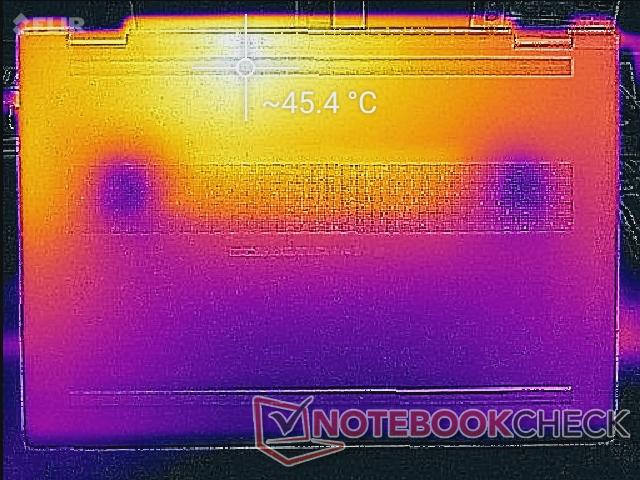
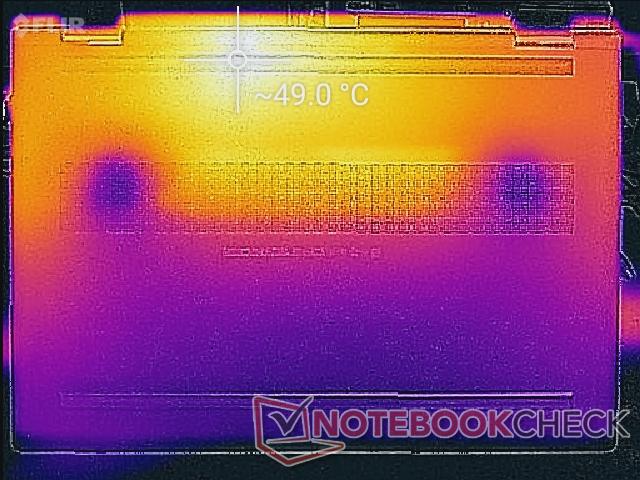
When under higher loads like gaming or sustained benchmarks, hot spots can be as warm as 49 C not unlike on the 2017 model. These spots are thankfully closer to the rear of the system and away from the commonly used WASD keys when gaming. In comparison, the WASD keys on the XPS 15 9575 can become much warmer at about 40 C when under similar loads.
It's worth noting that waste heat exits from both the left and right edges of the notebook. This is an uncommon setup on notebooks with dedicated graphics cards and it can lead to warm hands when using an external mouse.
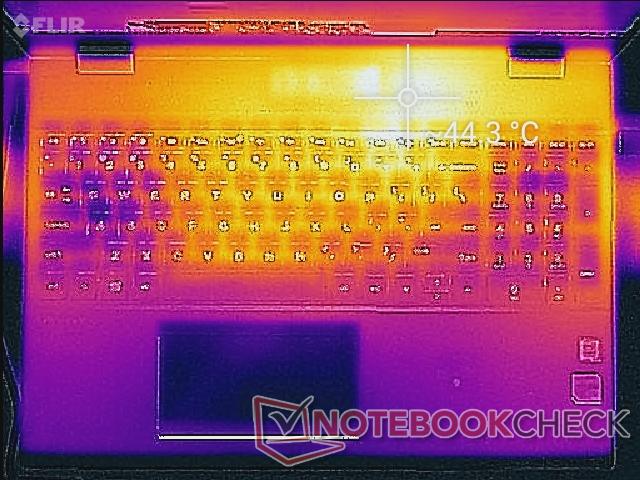
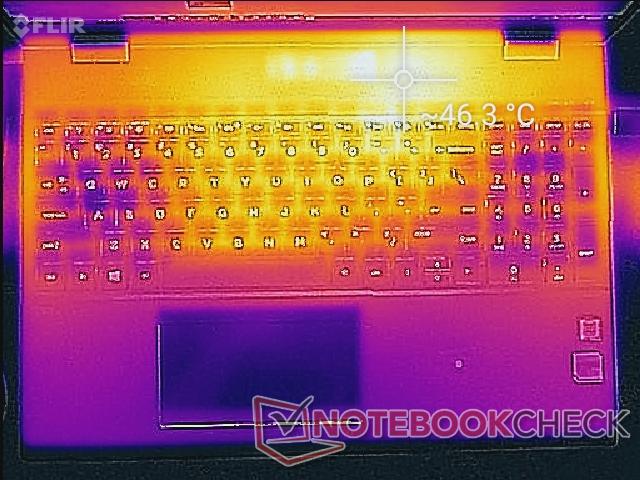
(-) The maximum temperature on the upper side is 46.4 °C / 116 F, compared to the average of 36.9 °C / 98 F, ranging from 21.1 to 71 °C for the class Multimedia.
(-) The bottom heats up to a maximum of 49 °C / 120 F, compared to the average of 39.1 °C / 102 F
(+) In idle usage, the average temperature for the upper side is 27.7 °C / 82 F, compared to the device average of 31.2 °C / 88 F.
(±) Playing The Witcher 3, the average temperature for the upper side is 36.3 °C / 97 F, compared to the device average of 31.2 °C / 88 F.
(+) The palmrests and touchpad are reaching skin temperature as a maximum (33 °C / 91.4 F) and are therefore not hot.
(-) The average temperature of the palmrest area of similar devices was 28.8 °C / 83.8 F (-4.2 °C / -7.6 F).
Speakers
HP advertises 60 percent louder B&O quad speakers YoY. Our pink noise readings do indeed reveal noticeably louder speakers for the new model when compared to the outgoing model. Sound quality is still decent for the size and probably much louder than most users will need even when at 50 percent volume. Chassis reverberation does not become noticeable until volume is past the 75 percent range. We would have preferred advancements in bass reproduction and balance for better sound quality instead of louder speakers.


HP Spectre x360 15-ch011nr audio analysis
(±) | speaker loudness is average but good (79.9 dB)
Bass 100 - 315 Hz
(-) | nearly no bass - on average 22.3% lower than median
(±) | linearity of bass is average (11.5% delta to prev. frequency)
Mids 400 - 2000 Hz
(+) | balanced mids - only 2.4% away from median
(±) | linearity of mids is average (7.5% delta to prev. frequency)
Highs 2 - 16 kHz
(+) | balanced highs - only 4% away from median
(+) | highs are linear (6.2% delta to prev. frequency)
Overall 100 - 16.000 Hz
(±) | linearity of overall sound is average (17.7% difference to median)
Compared to same class
» 45% of all tested devices in this class were better, 8% similar, 47% worse
» The best had a delta of 5%, average was 18%, worst was 45%
Compared to all devices tested
» 30% of all tested devices were better, 8% similar, 62% worse
» The best had a delta of 4%, average was 25%, worst was 134%
Apple MacBook 12 (Early 2016) 1.1 GHz audio analysis
(+) | speakers can play relatively loud (83.6 dB)
Bass 100 - 315 Hz
(±) | reduced bass - on average 11.3% lower than median
(±) | linearity of bass is average (14.2% delta to prev. frequency)
Mids 400 - 2000 Hz
(+) | balanced mids - only 2.4% away from median
(+) | mids are linear (5.5% delta to prev. frequency)
Highs 2 - 16 kHz
(+) | balanced highs - only 2% away from median
(+) | highs are linear (4.5% delta to prev. frequency)
Overall 100 - 16.000 Hz
(+) | overall sound is linear (10.2% difference to median)
Compared to same class
» 5% of all tested devices in this class were better, 2% similar, 93% worse
» The best had a delta of 5%, average was 19%, worst was 53%
Compared to all devices tested
» 3% of all tested devices were better, 1% similar, 96% worse
» The best had a delta of 4%, average was 25%, worst was 134%
Energy Management
Power Consumption
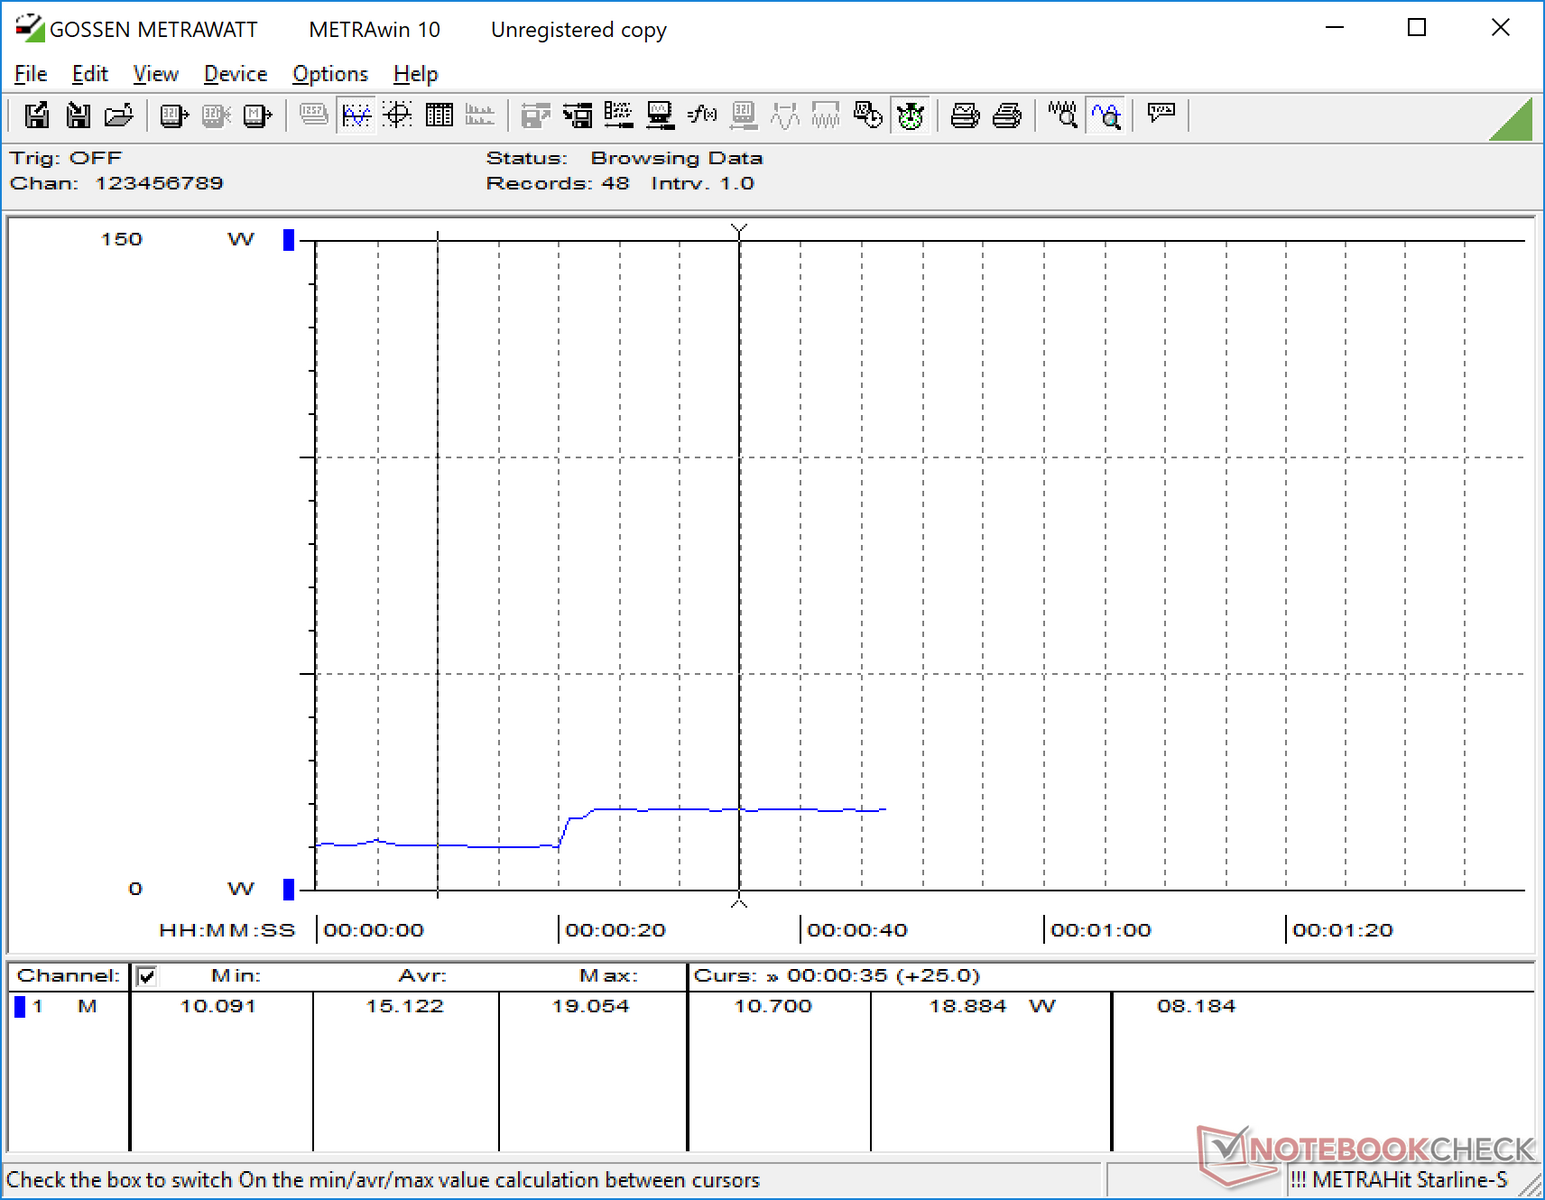
The system is less demanding than the last generation model when idling even though the CPU and GPU has remained the same. When under load, however, power consumption becomes very similar between them. The new XPS 15 9570 is more demanding when under load by as much as 16 W to 27 W since it utilizes more powerful CPU and GPU components.
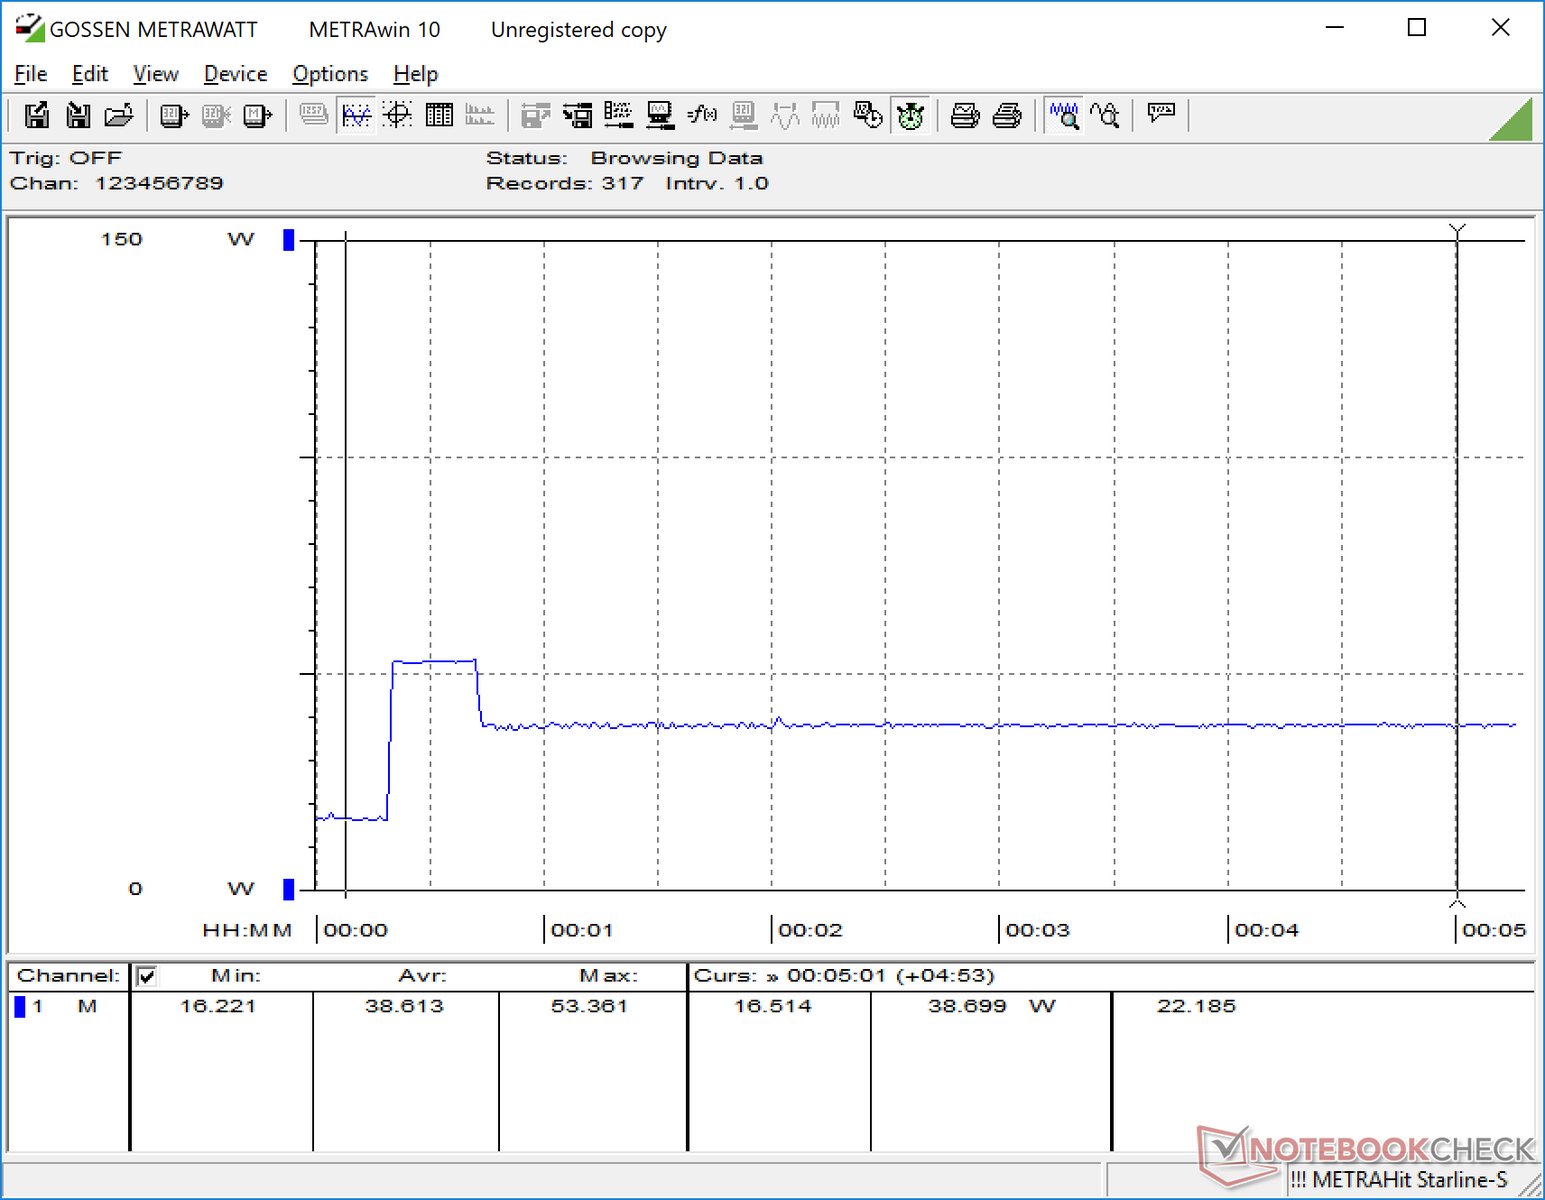
Maximum load will draw 80 W from a medium-sized (~13.8 x 6.5 x 2.3 cm) 90 W adapter. It is important to note that the Kaby Lake-G SKU comes with a larger 150 W AC adapter since its GPU is significantly more powerful and demanding than the Nvidia MX150. Consequently, its power consumption results will likely be very different than what is recorded here.
| Off / Standby | |
| Idle | |
| Load |
|
| HP Spectre x360 15-ch011nr i5-8550U, GeForce MX150, SK hynix PC401 NVMe 500 GB, IPS, 3840x2160, 15.60 | HP Spectre x360 15t-bl100 i5-8550U, GeForce MX150, Samsung PM961 NVMe MZVLW512HMJP, IPS, 3840x2160, 15.60 | Dell XPS 15 2018 i5 FHD 97Wh i5-8300H, GeForce GTX 1050 Mobile, Lite-On CA3-8D256-Q11, LED IGZO IPS InfinityEdge, 1920x1080, 15.60 | Dell XPS 15 9575 i7-8705G i7-8705G, Vega M GL / 870, SK hynix PC401 NVMe 500 GB, IPS, 3840x2160, 15.60 | Asus ZenBook Pro 15 UX580GE i9-8950HK, GeForce GTX 1050 Ti Mobile, Samsung SSD PM961 1TB M.2 PCIe 3.0 x4 NVMe (MZVLW1T0), IPS, 3840x2160, 15.60 | Acer Swift 3 SF315-41-R6J9 R7 2700U, Vega 10, Micron SSD 1100 SED 512GB, M.2 (MTFDDAV512TBN), IPS, 1920x1080, 15.60 | |
|---|---|---|---|---|---|---|
| Power Consumption | -25% | 10% | -18% | -69% | 30% | |
| Idle Minimum * | 5.3 | 11.6 -119% | 2.9 45% | 6.2 -17% | 11.7 -121% | 5.9 -11% |
| Idle Average * | 9.8 | 13.8 -41% | 5.8 41% | 12.9 -32% | 18.5 -89% | 8.6 12% |
| Idle Maximum * | 12.6 | 14.2 -13% | 7.5 40% | 13.6 -8% | 22.8 -81% | 8.7 31% |
| Load Average * | 73 | 67.9 7% | 77.5 -6% | 76.1 -4% | 97.5 -34% | 32.8 55% |
| Witcher 3 ultra * | 67.6 | 59 13% | 84 -24% | 84.3 -25% | 102.9 -52% | 38.2 43% |
| Load Maximum * | 80 | 76.9 4% | 107 -34% | 99.4 -24% | 111.1 -39% | 40.9 49% |
* ... smaller is better
Battery Life
The internal battery has been upped in capacity from 79 W in the outgoing model to 84 W on the 2018 model. Naturally, with core components being equal, our newer Spectre x360 15 can outlast the last model by a short amount when under similar loads. Continuous WLAN load in particular can be almost 2 hours longer for a total runtime of almost 10.5 hours.
Charging from near empty to full capacity takes between 1.5 to 2 hours as is normal for most notebooks.
| HP Spectre x360 15-ch011nr i5-8550U, GeForce MX150, 84 Wh | HP Spectre x360 15t-bl100 i5-8550U, GeForce MX150, 79.2 Wh | Dell XPS 15 2018 i5 FHD 97Wh i5-8300H, GeForce GTX 1050 Mobile, 97 Wh | Dell XPS 15 9575 i7-8705G i7-8705G, Vega M GL / 870, 75 Wh | Asus ZenBook Pro 15 UX580GE i9-8950HK, GeForce GTX 1050 Ti Mobile, 71 Wh | Acer Swift 3 SF315-41-R6J9 R7 2700U, Vega 10, 49 Wh | |
|---|---|---|---|---|---|---|
| Battery Runtime | -5% | 18% | -38% | -31% | -36% | |
| Reader / Idle | 927 | 934 1% | 673 -27% | 842 -9% | 795 -14% | |
| WiFi v1.3 | 625 | 511 -18% | 942 51% | 420 -33% | 375 -40% | 317 -49% |
| Load | 135 | 136 1% | 114 -16% | 63 -53% | 76 -44% | 75 -44% |
| Witcher 3 ultra | 62 |
Pros
Cons
Verdict
While most OEMs tend to go thinner, smaller, and lighter through each successive generation, HP had the guts to go slightly thicker and the gamble paid off. The third generation Spectre x360 15 runs quieter with cooler core temperatures than last year's model while offering more features to justify the marginal size increase. Perhaps best of all, HP didn't find the need to reposition the webcam or drop USB Type-A ports, full-size SD readers, or the traditional NumPad - all important attributes to have for productivity. We can't necessarily say the same for competing notebooks like the popular Dell XPS 15 9570 or MacBook Pro 15.
By being a bit larger than the 2017 Spectre x360 15, however, the 2018 model doesn't solve the main issue that's been plaguing the Spectre x360 series since 2016. Namely, this is still a heavy and almost cumbersome notebook to use in tablet mode. The top bezel is still quite thick compared to the competition and we wish HP had upped the display backlight for better outdoor usability. On the other hand, these are fair prices to pay for a well-built and unyielding machine worthy of standing toe-to-toe with both the XPS 15 9575 and 9570.
The cool and quiet temps of this 90 W Kaby Lake-R configuration have us excited to test out the more powerful 150 W Kaby Lake-G configuration. How this same chassis can cope with a more demanding processor should be interesting to see in a future review.
The 2017 Spectre x360 15 was one of the best 15-inch convertibles available and the 2018 refresh is no different. Our favorite 2-in-1 is now quieter, cooler, and more feature-packed than before. Users who were originally turned off by the weight and size of the Spectre x360 15 series, however, will not have a change of heart.
HP Spectre x360 15-ch011nr
-
06/29/2018 v6(old)
Allen Ngo
Pricecompare
