 Deutsch
 English
 Español
 Français
 Italiano
 Nederlands
 Polski
 Português
 Русский
 Türkçe
 Svenska
 Chinese
 Magyar
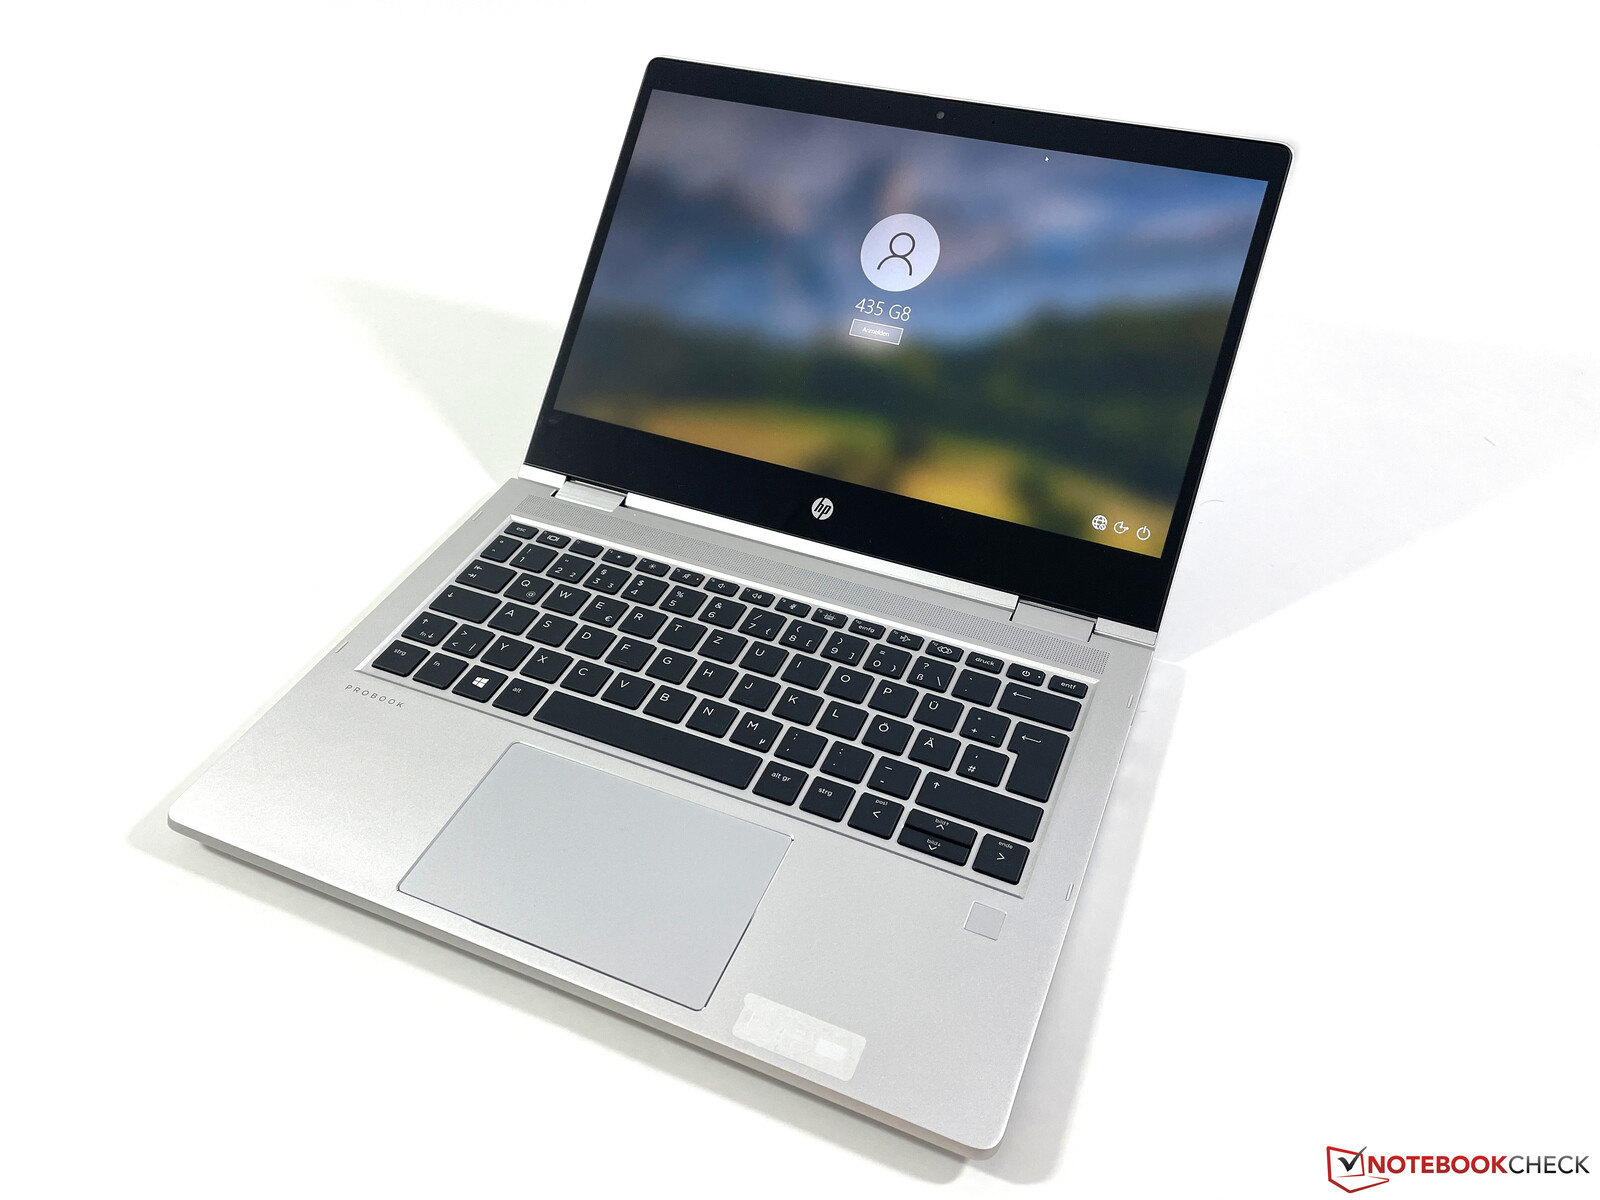
HP ProBook x360 435 G8 AMD in review - Entry-level business convertible with Zen 3 Ryzen CPU
The ProBook x360 435 is an entry-level business convertible from HP that relies on AMD processors (the Intel counterpart has the suffix 430). Now in its 8th generation, it is only a minor update because neither the casing nor the ports have changed. However, the new Ryzen 5000 mobile processors from AMD provide a significant performance boost that turns the compact convertible into a real powerhouse. We test the 32N18EA#ABD model for around 1,100 Euros (~$1305), which is equipped with the fast Ryzen 7 5800U, 16 GB of RAM, a 512 GB PCIe-SSD and the glossy 1080p touchscreen; cheaper versions are available starting at 880 Euros (~$1044).
Possible competitors in comparison
Rating | Date | Model | Weight | Height | Size | Resolution | Best Price |
|---|---|---|---|---|---|---|---|
| 85.7 % | 08/2021 | HP ProBook x360 435 G8 R7-5800U R7 5800U, Vega 8 | 1.5 kg | 18 mm | 13.30" | 1920x1080 | |
| 88.3 % | 04/2021 | Lenovo ThinkPad L13 Yoga Gen2-20VK000VGE i5-1135G7, Iris Xe G7 80EUs | 1.5 kg | 17.6 mm | 13.30" | 1920x1080 | |
| 86.2 % | 01/2021 | Fujitsu LifeBook U9310X i5-10210U, UHD Graphics 620 | 1 kg | 17 mm | 13.30" | 1920x1080 | |
| 85.7 % | 06/2021 | Acer Spin 3 SP313-51N-56YV i5-1135G7, Iris Xe G7 80EUs | 1.4 kg | 16 mm | 13.30" | 2560x1600 |
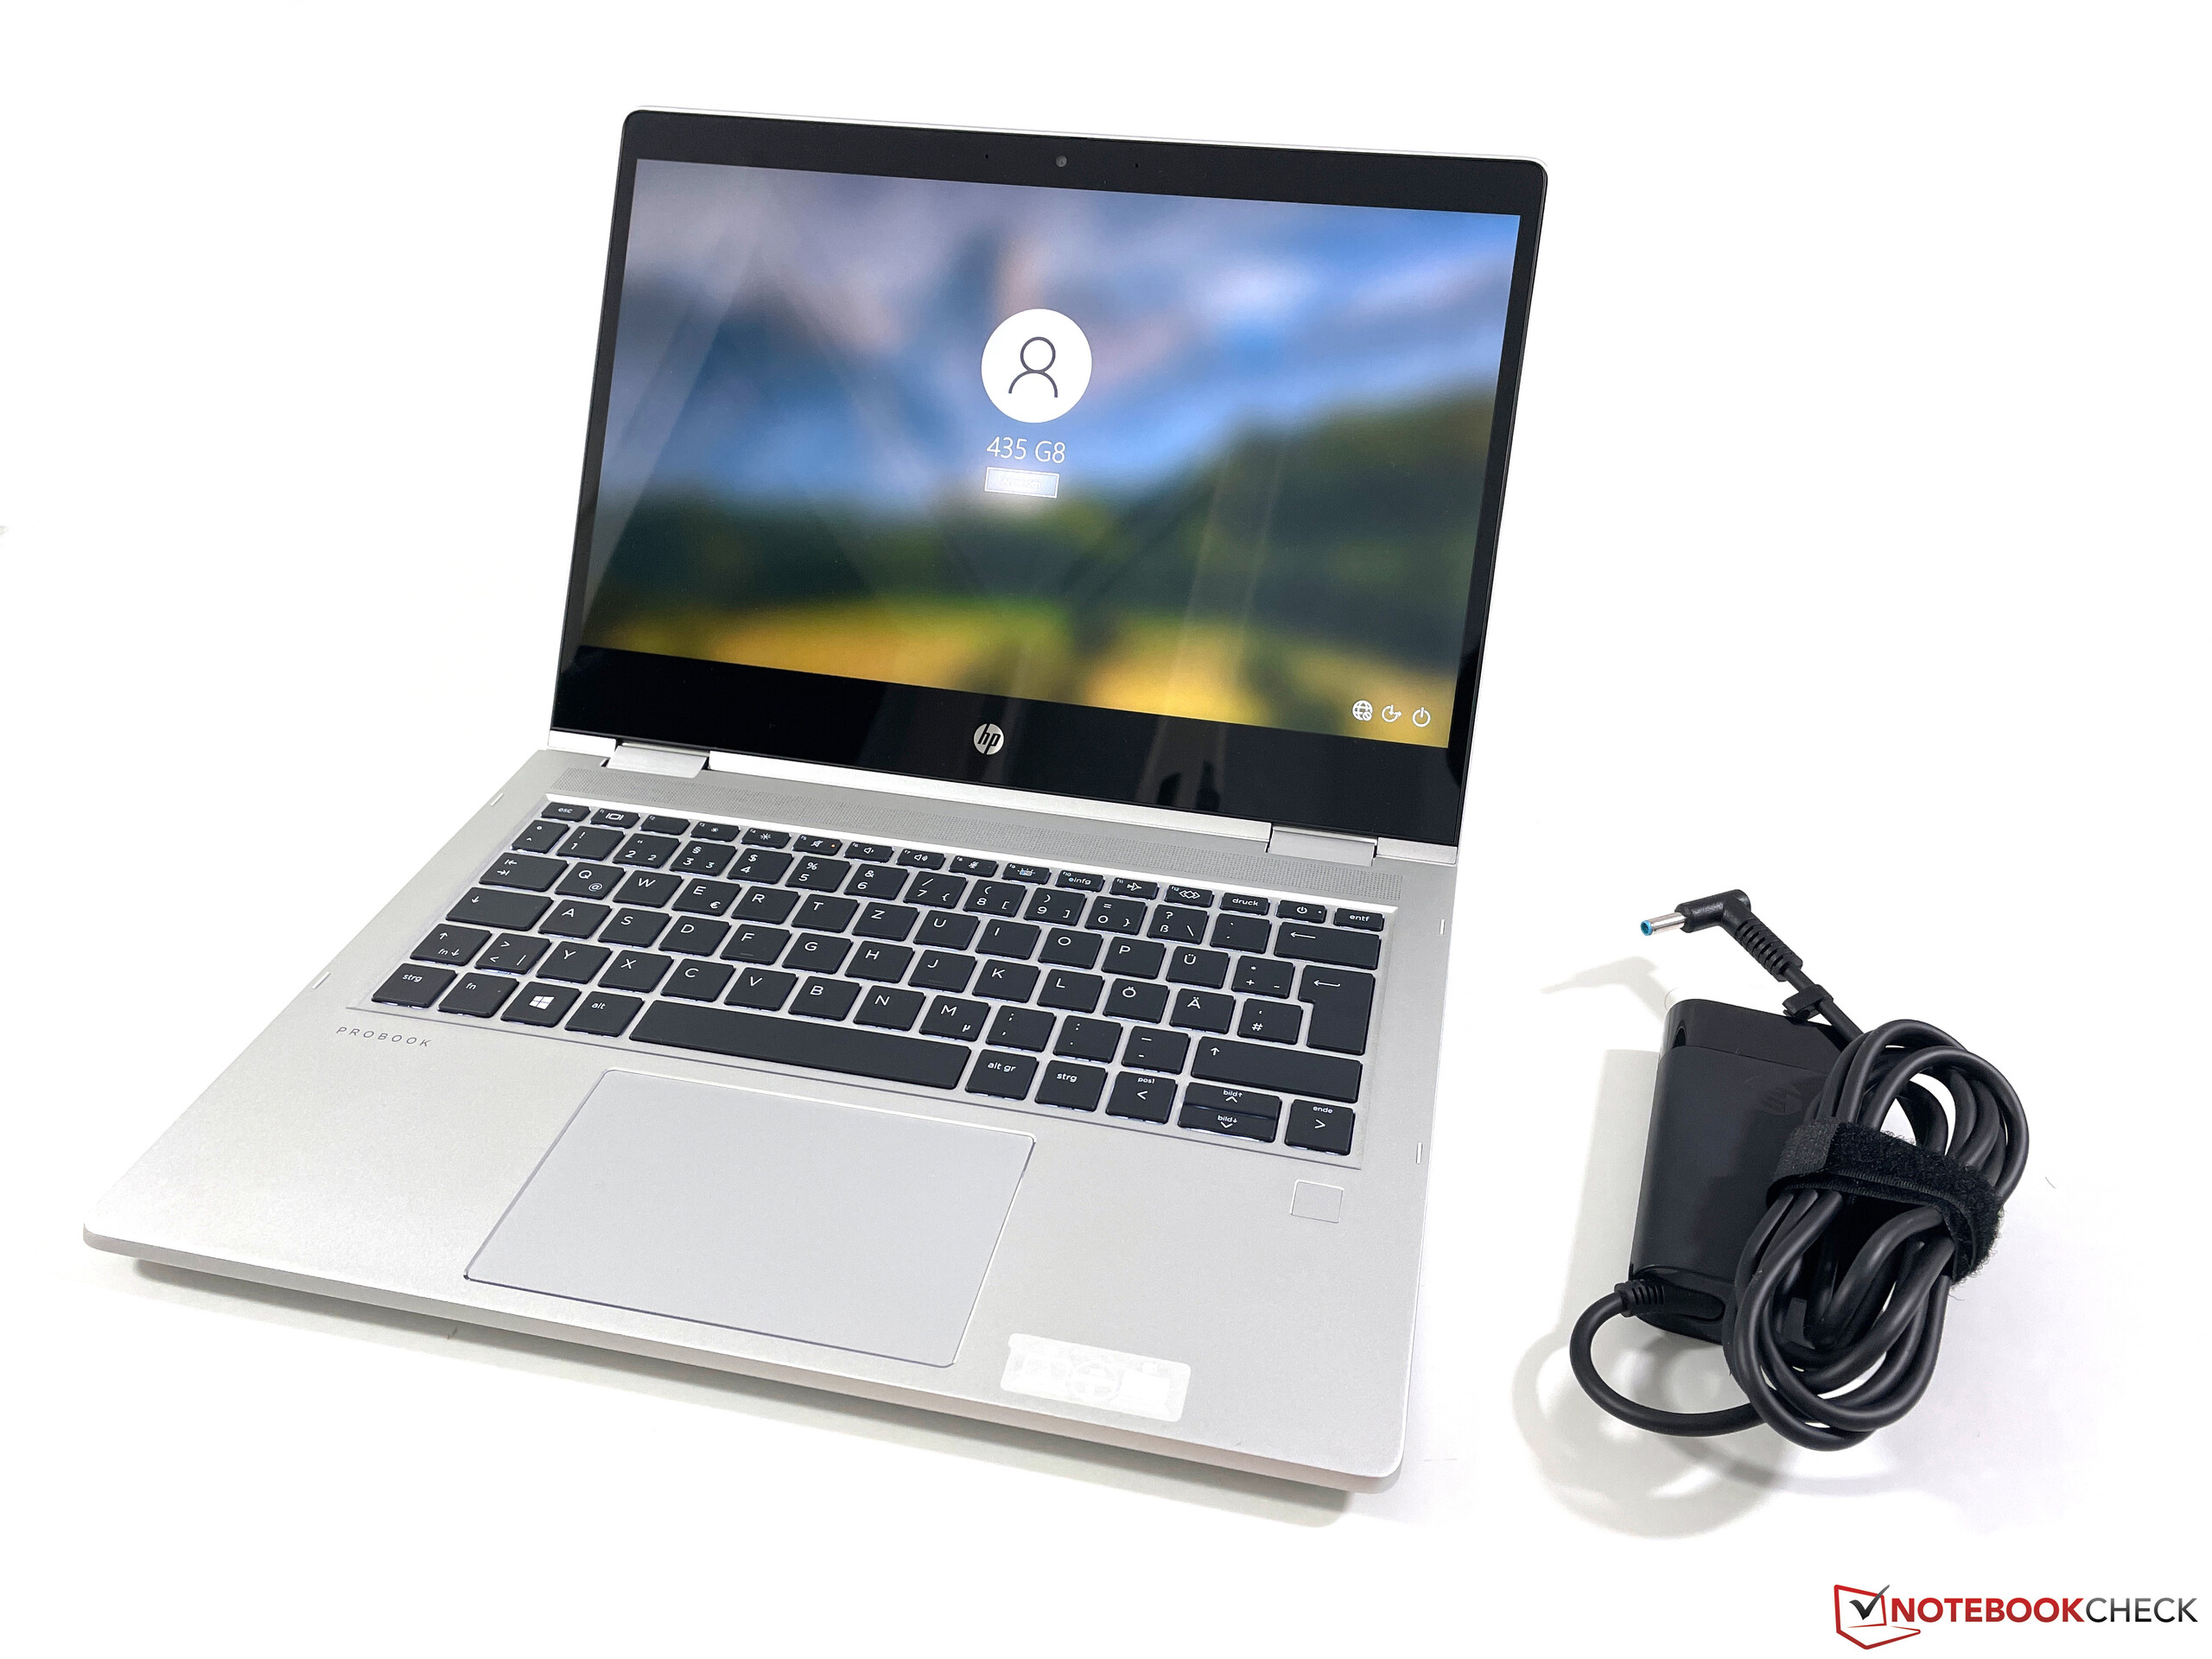
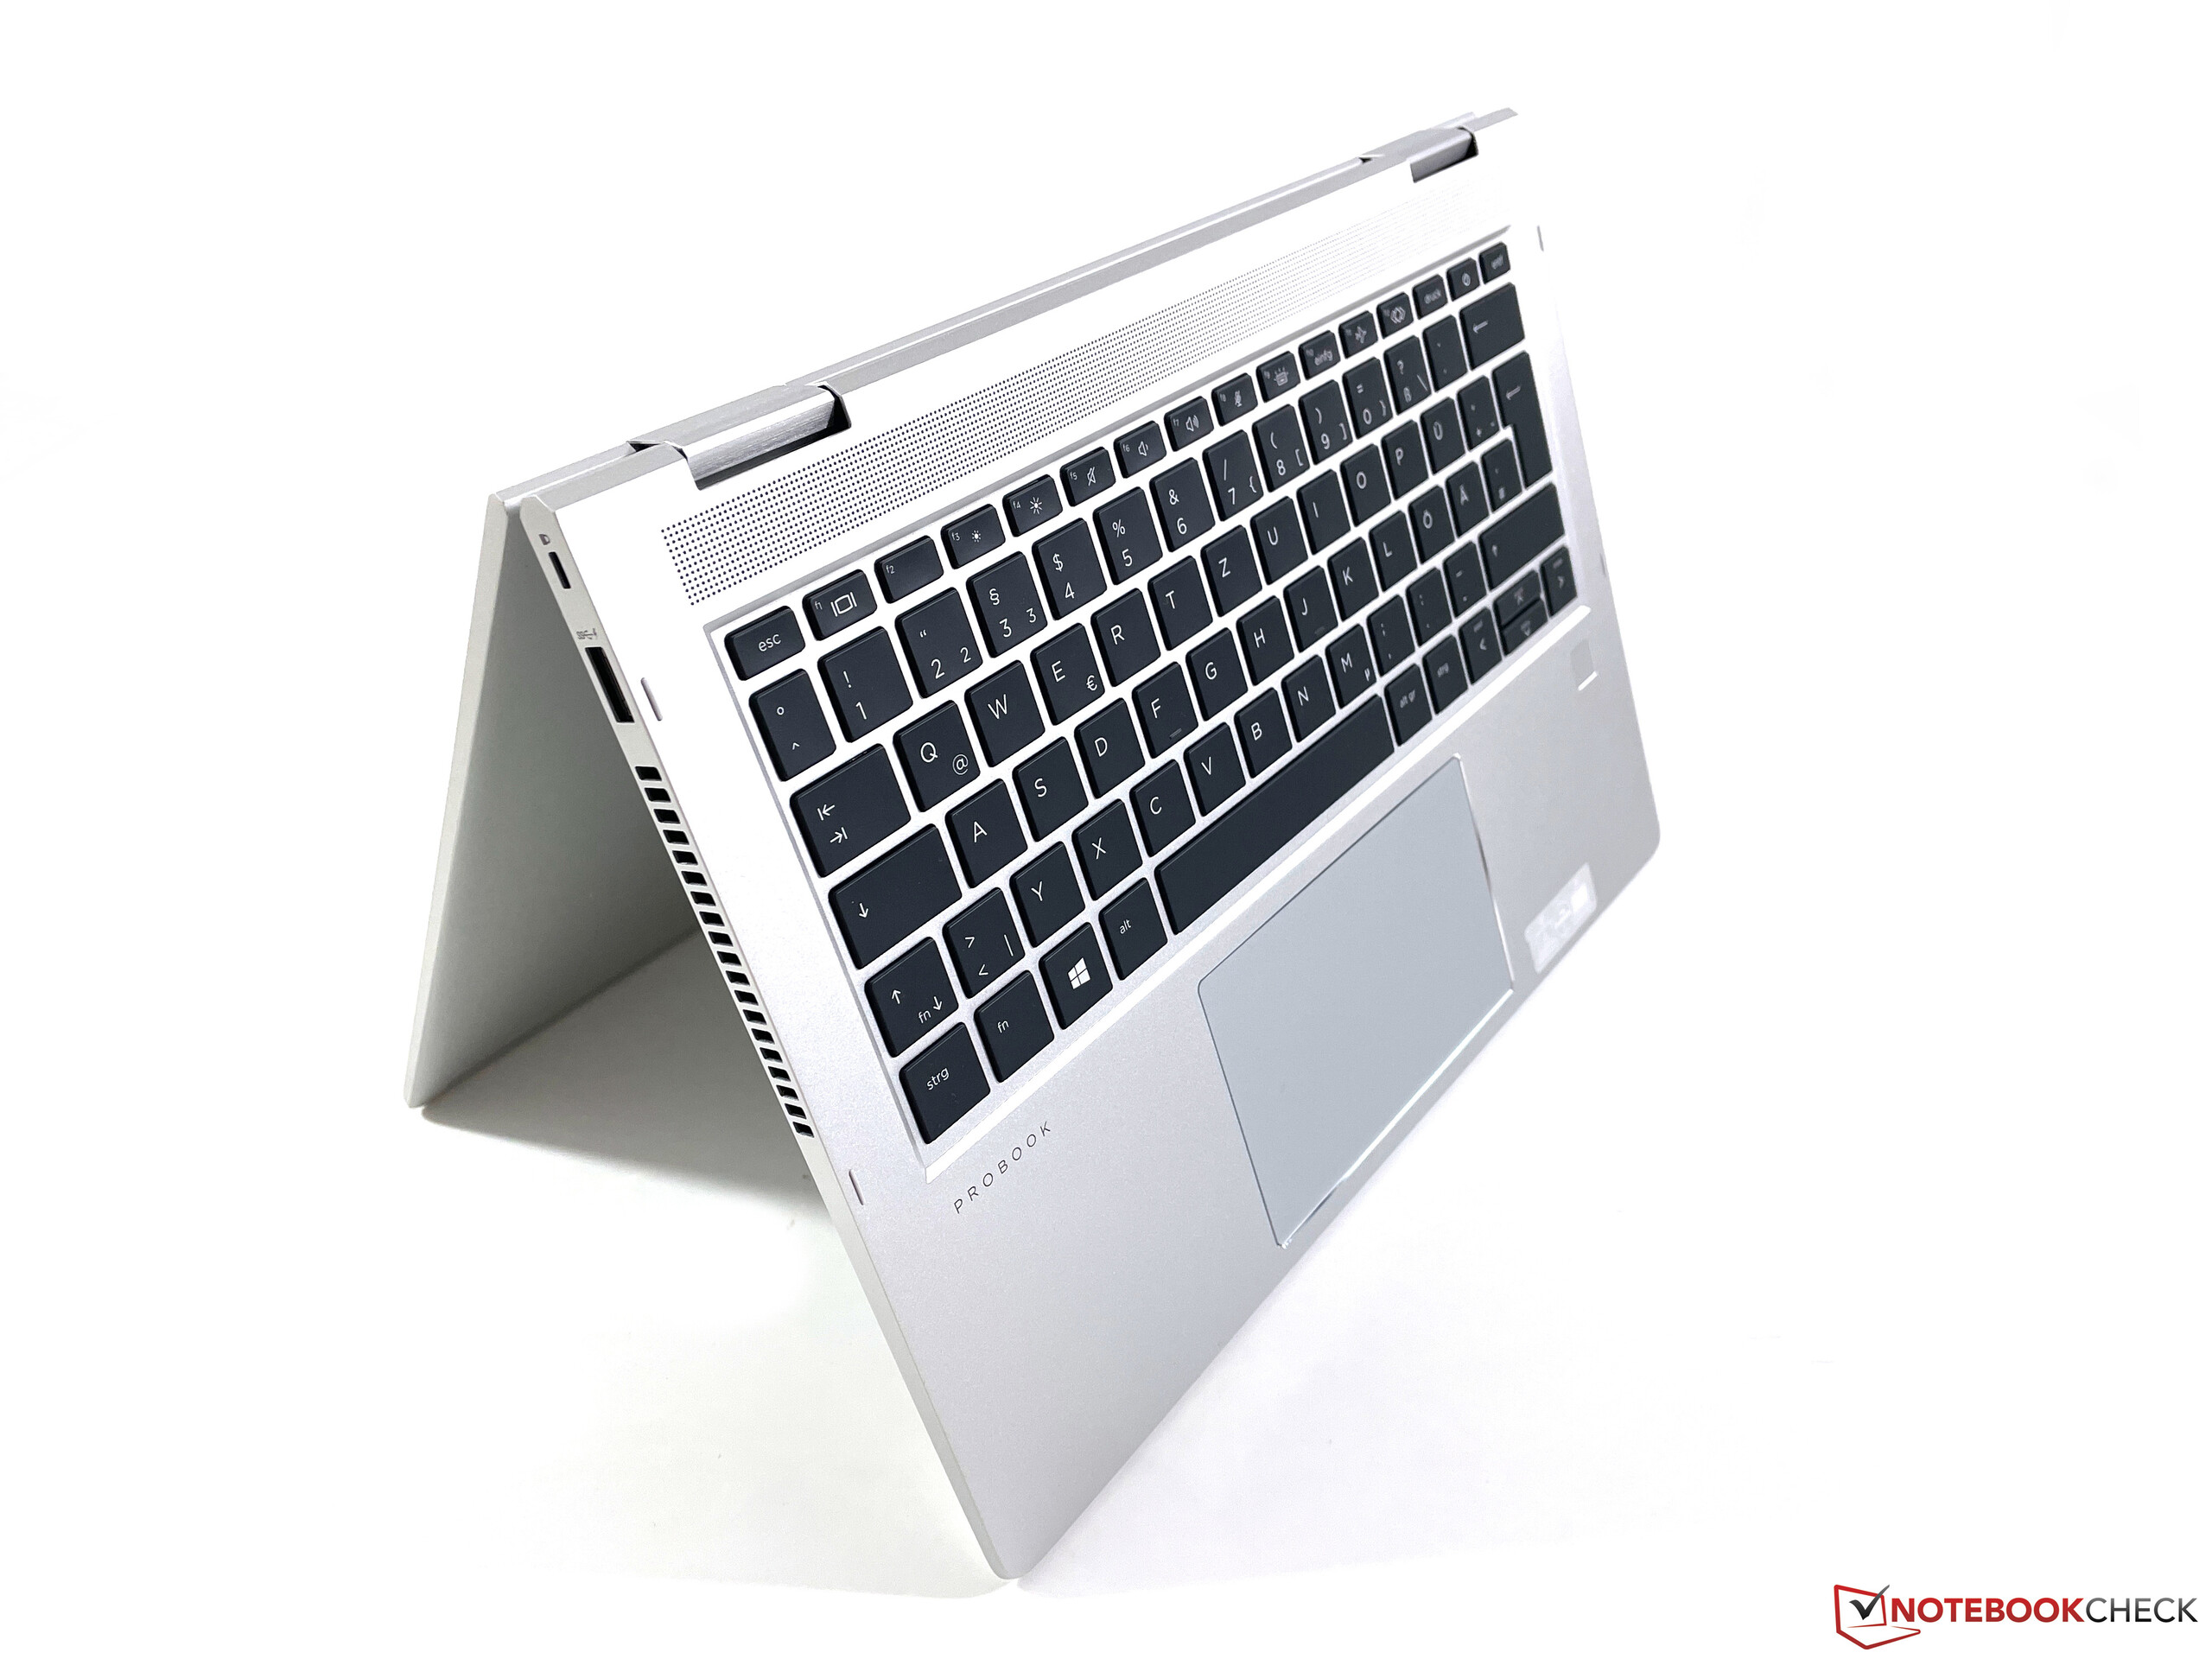
Case & Equipment
Nothing has changed in the aluminum case. From the outside, the device makes a high-quality impression and you cannot see any difference to HP's more expensive EliteBooks at first glance. This also applies to the stability and workmanship, which are both excellent. The base unit is not affected by pressure and the screen, which is protected by an additional glass pane, can hardly be warped. Only pressure from behind quickly becomes visible as ripples on the panel. In this category, the ProBook also has a clear advantage over its direct competitor from Lenovo, the ThinkPad L13 Yoga G2.
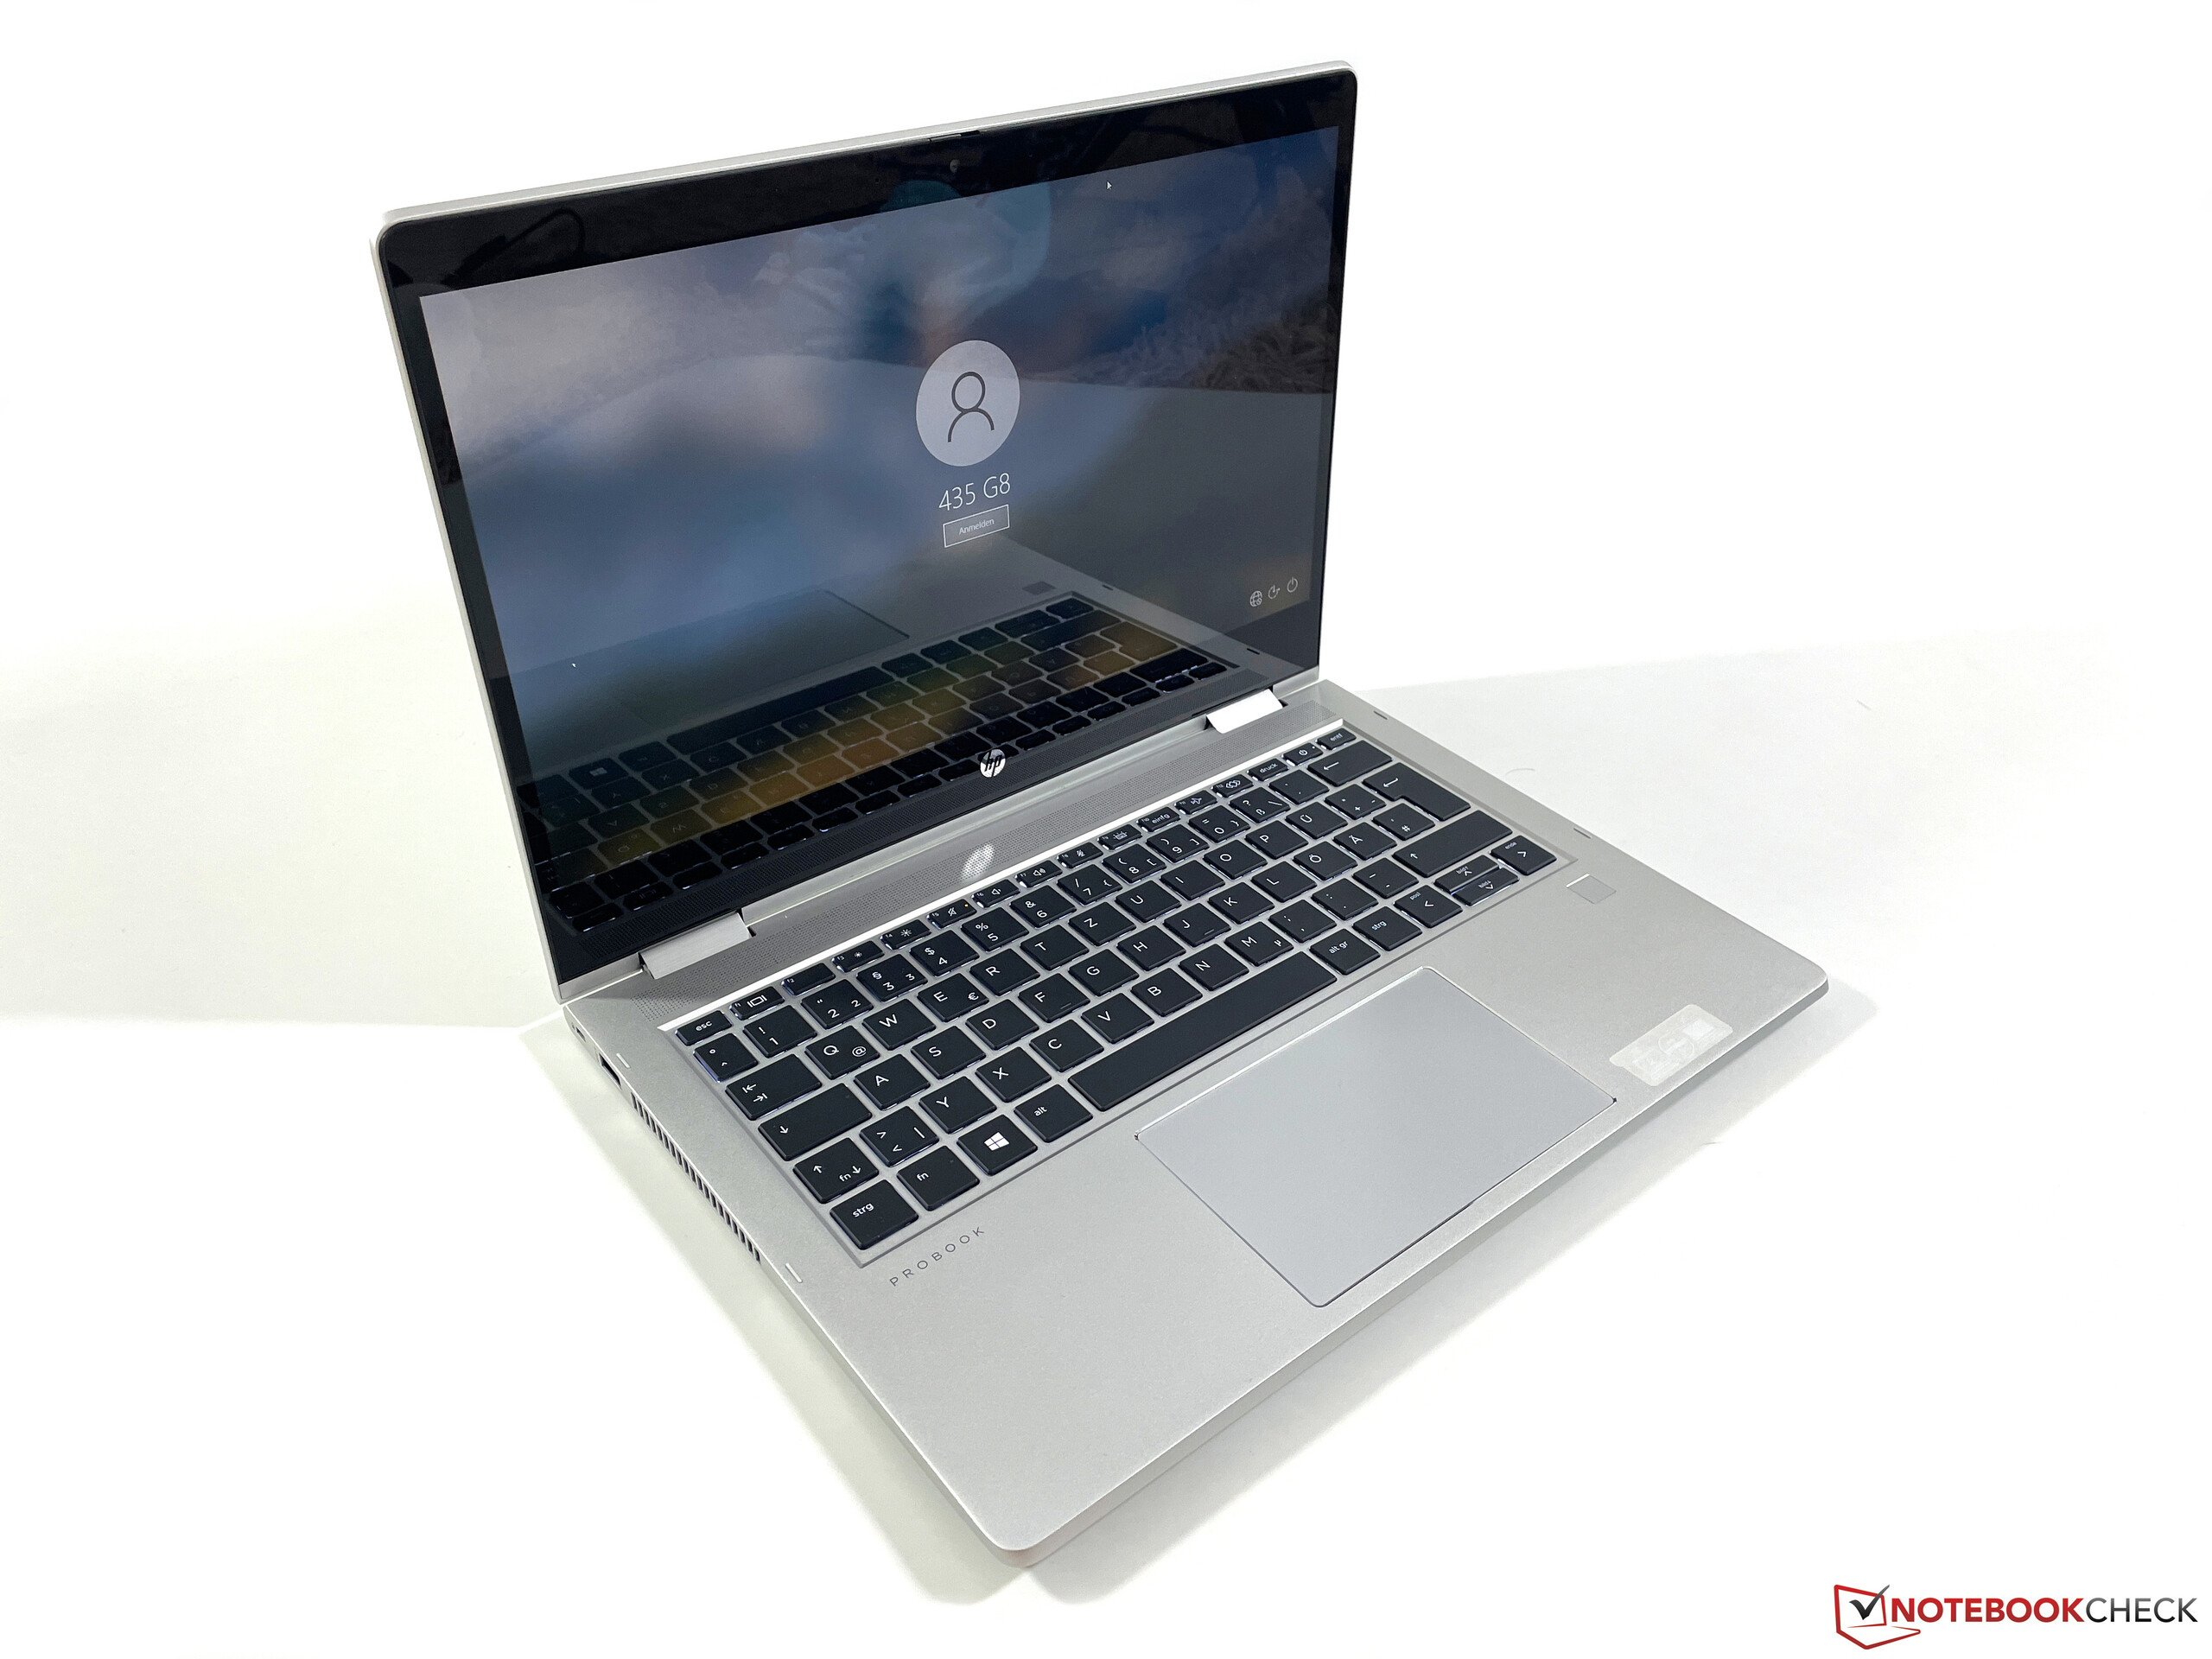
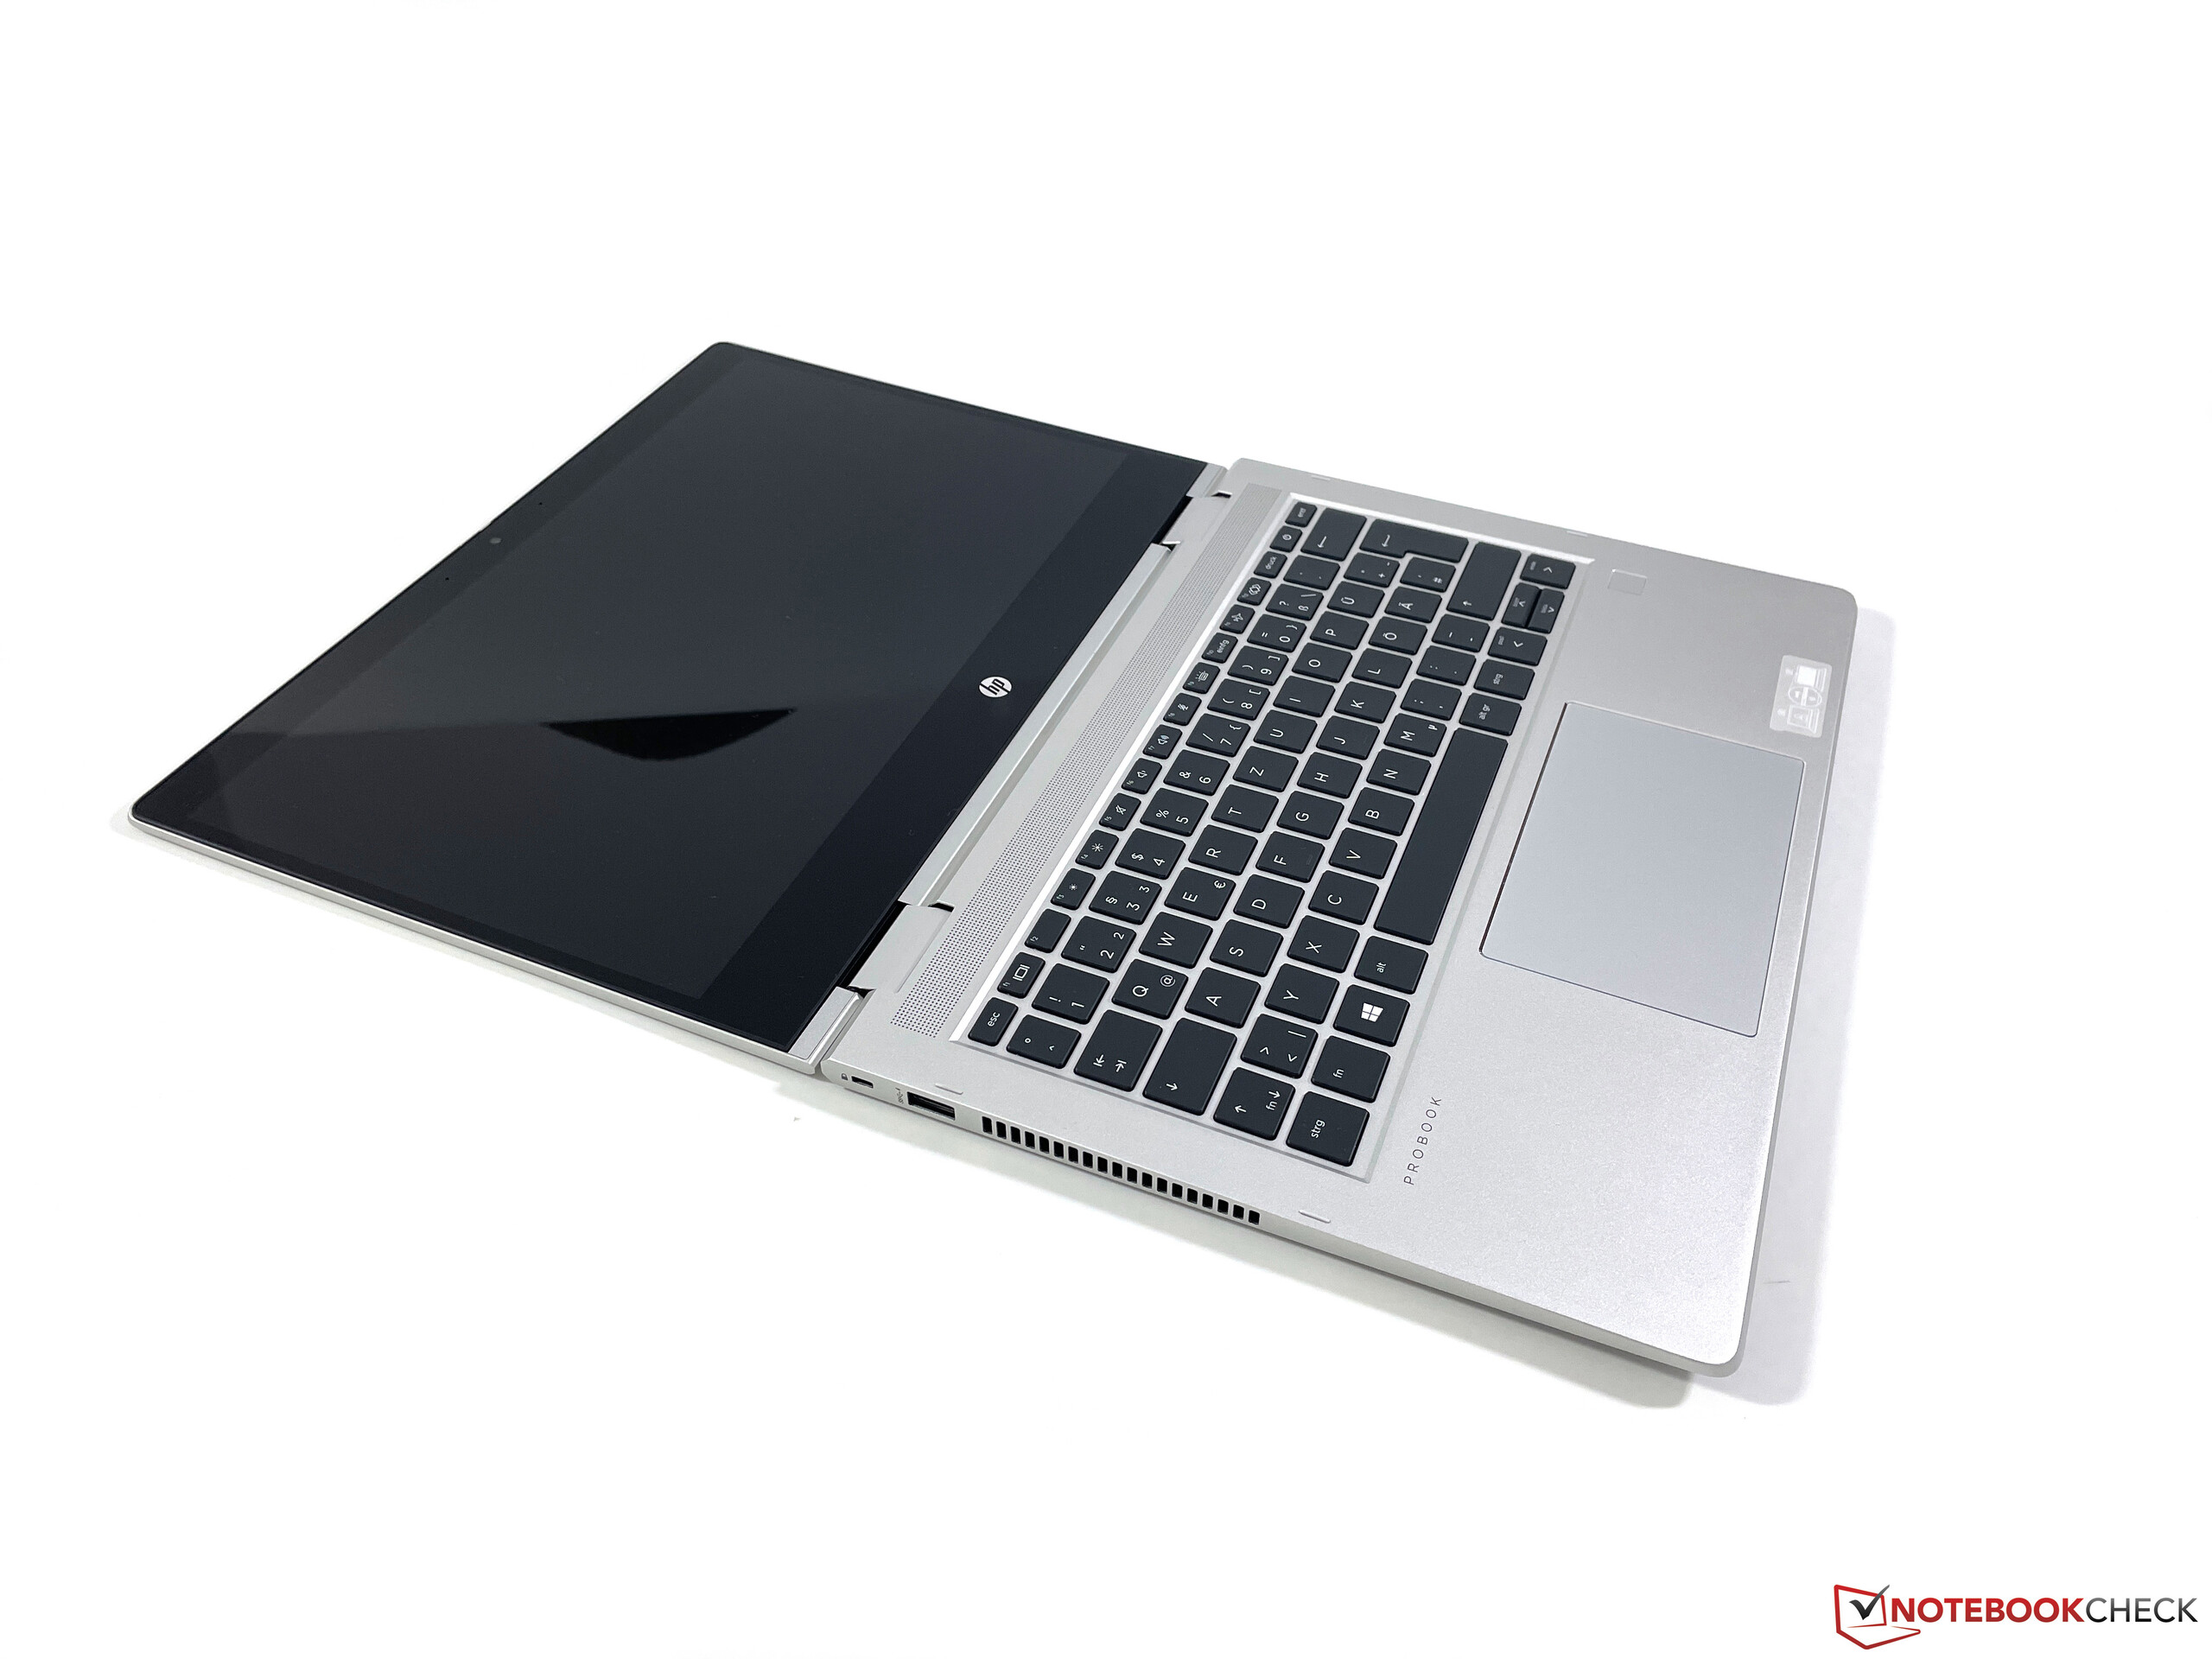
The hinges also do a good job, but you immediately see the very wide screen edges when you open the display, which is why the device does not look particularly modern. An update to the 16:10 form factor seems to be only a matter of time.
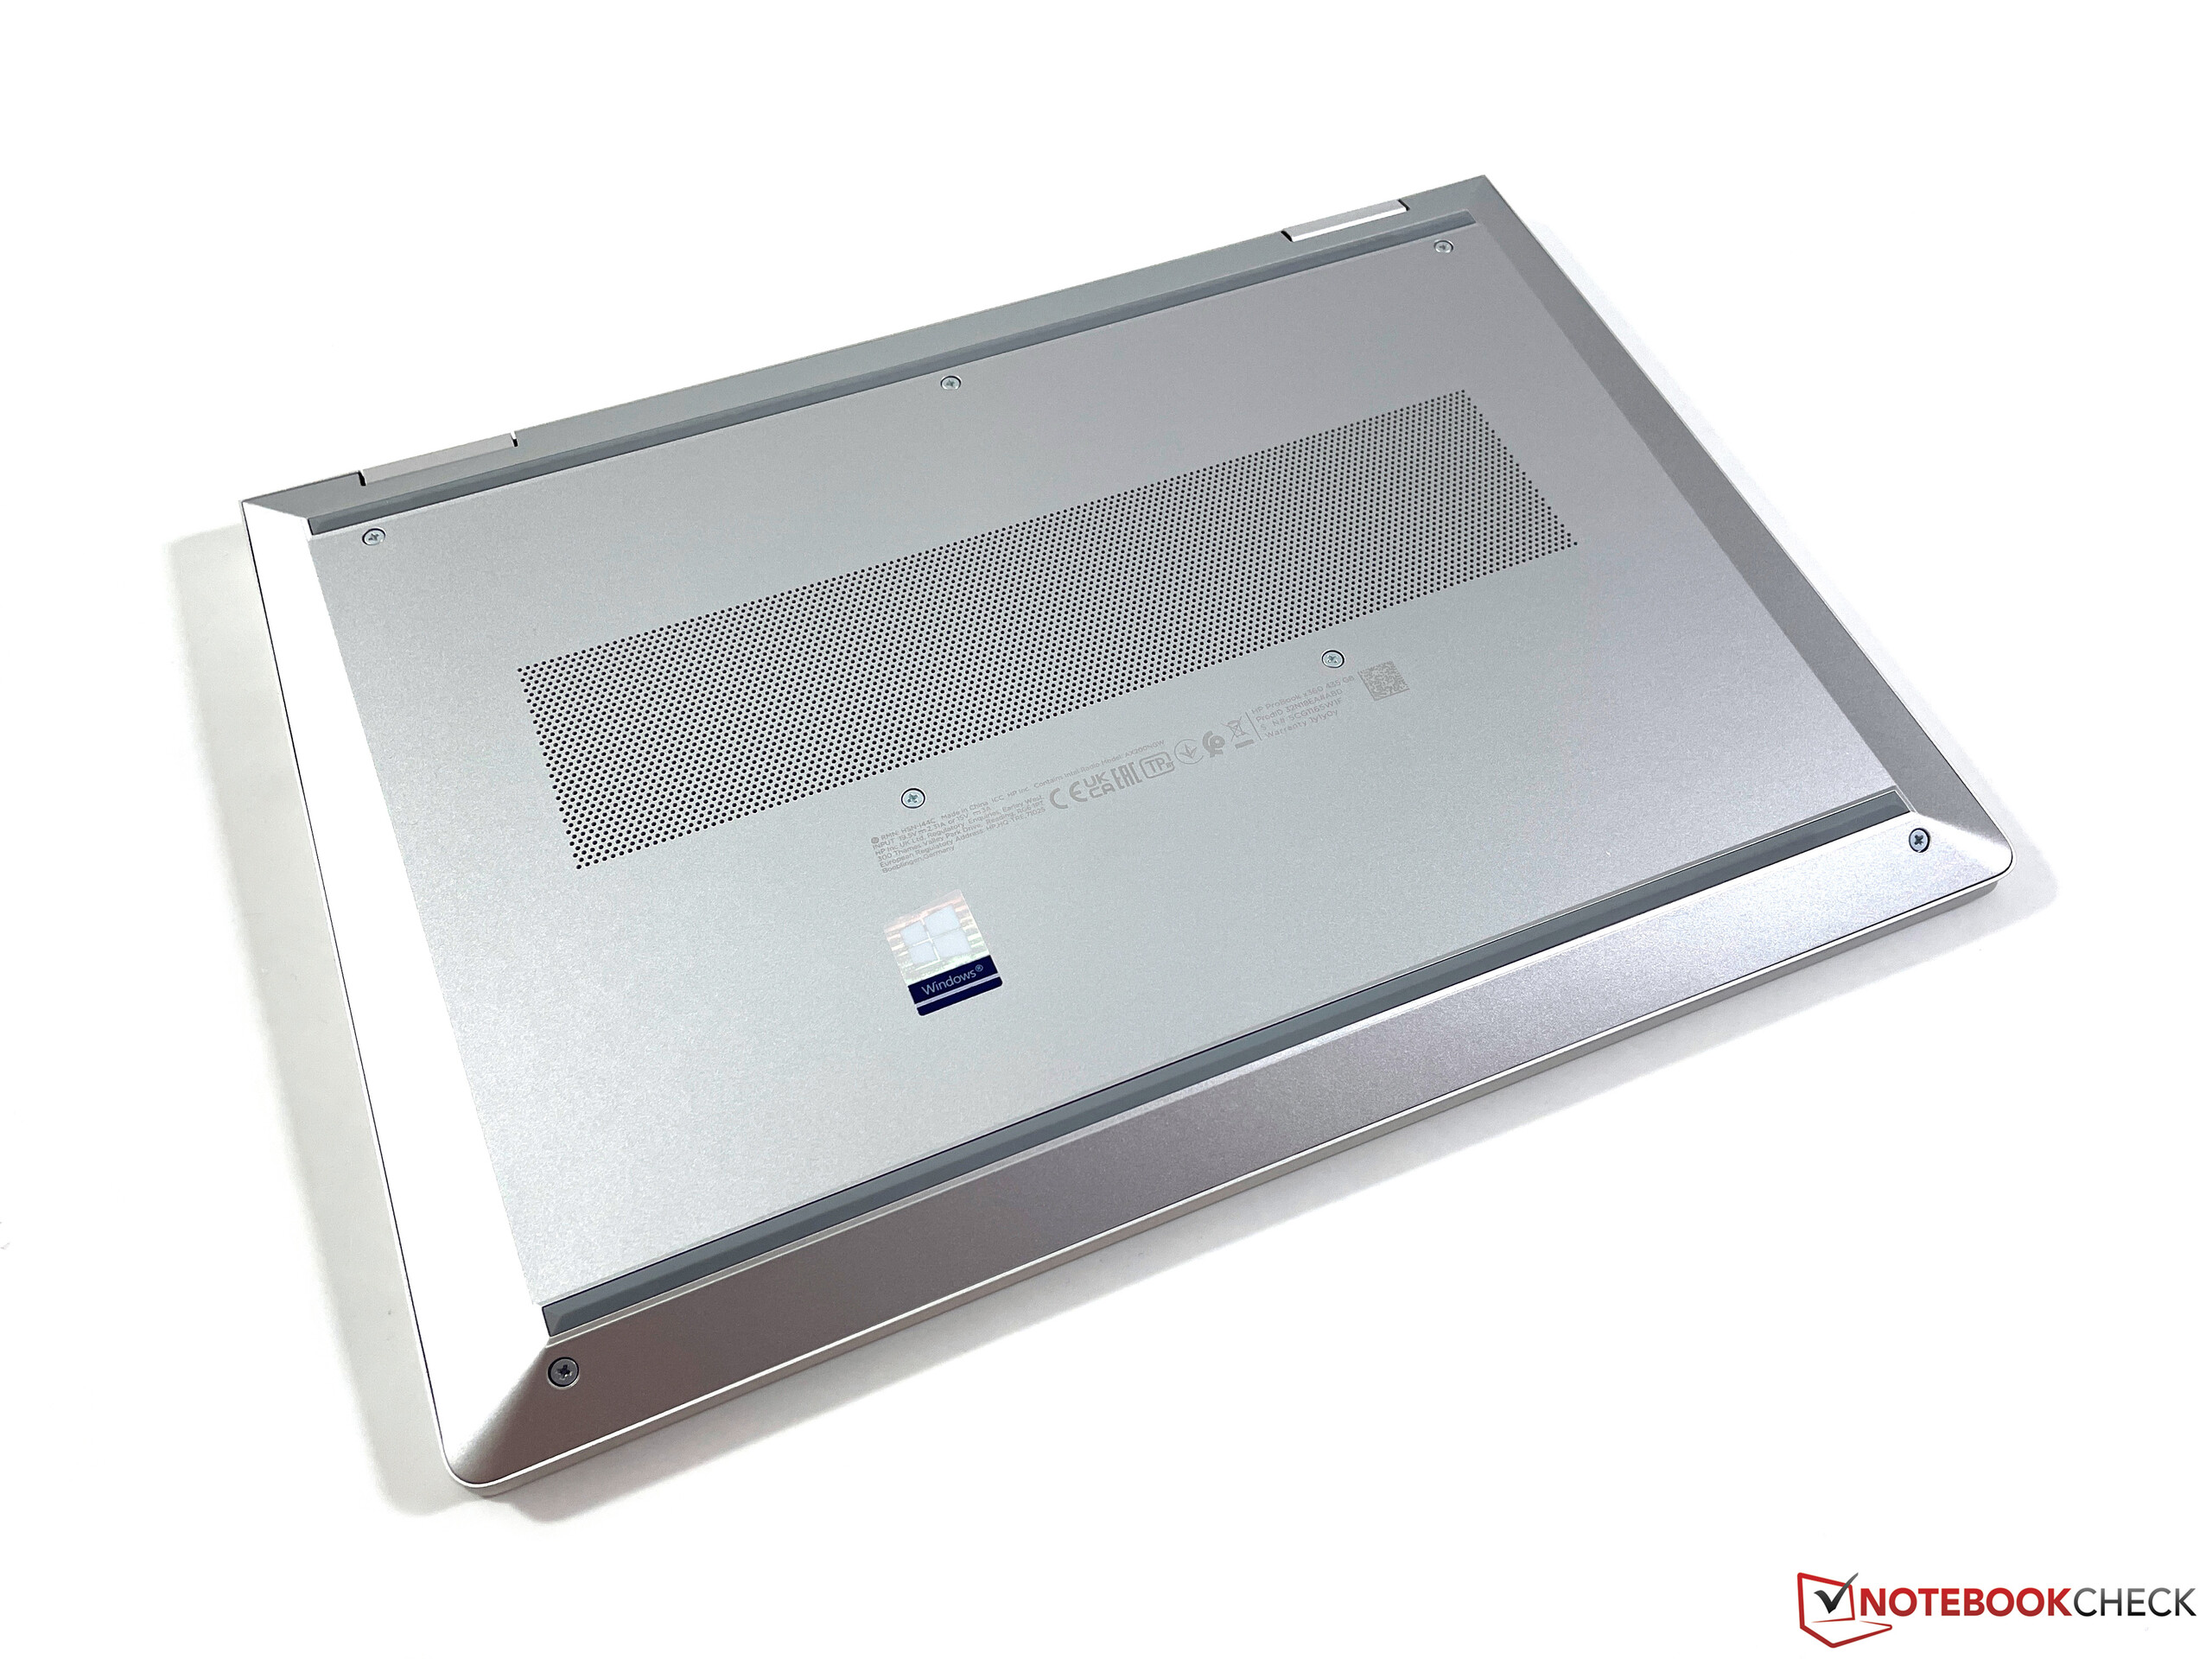
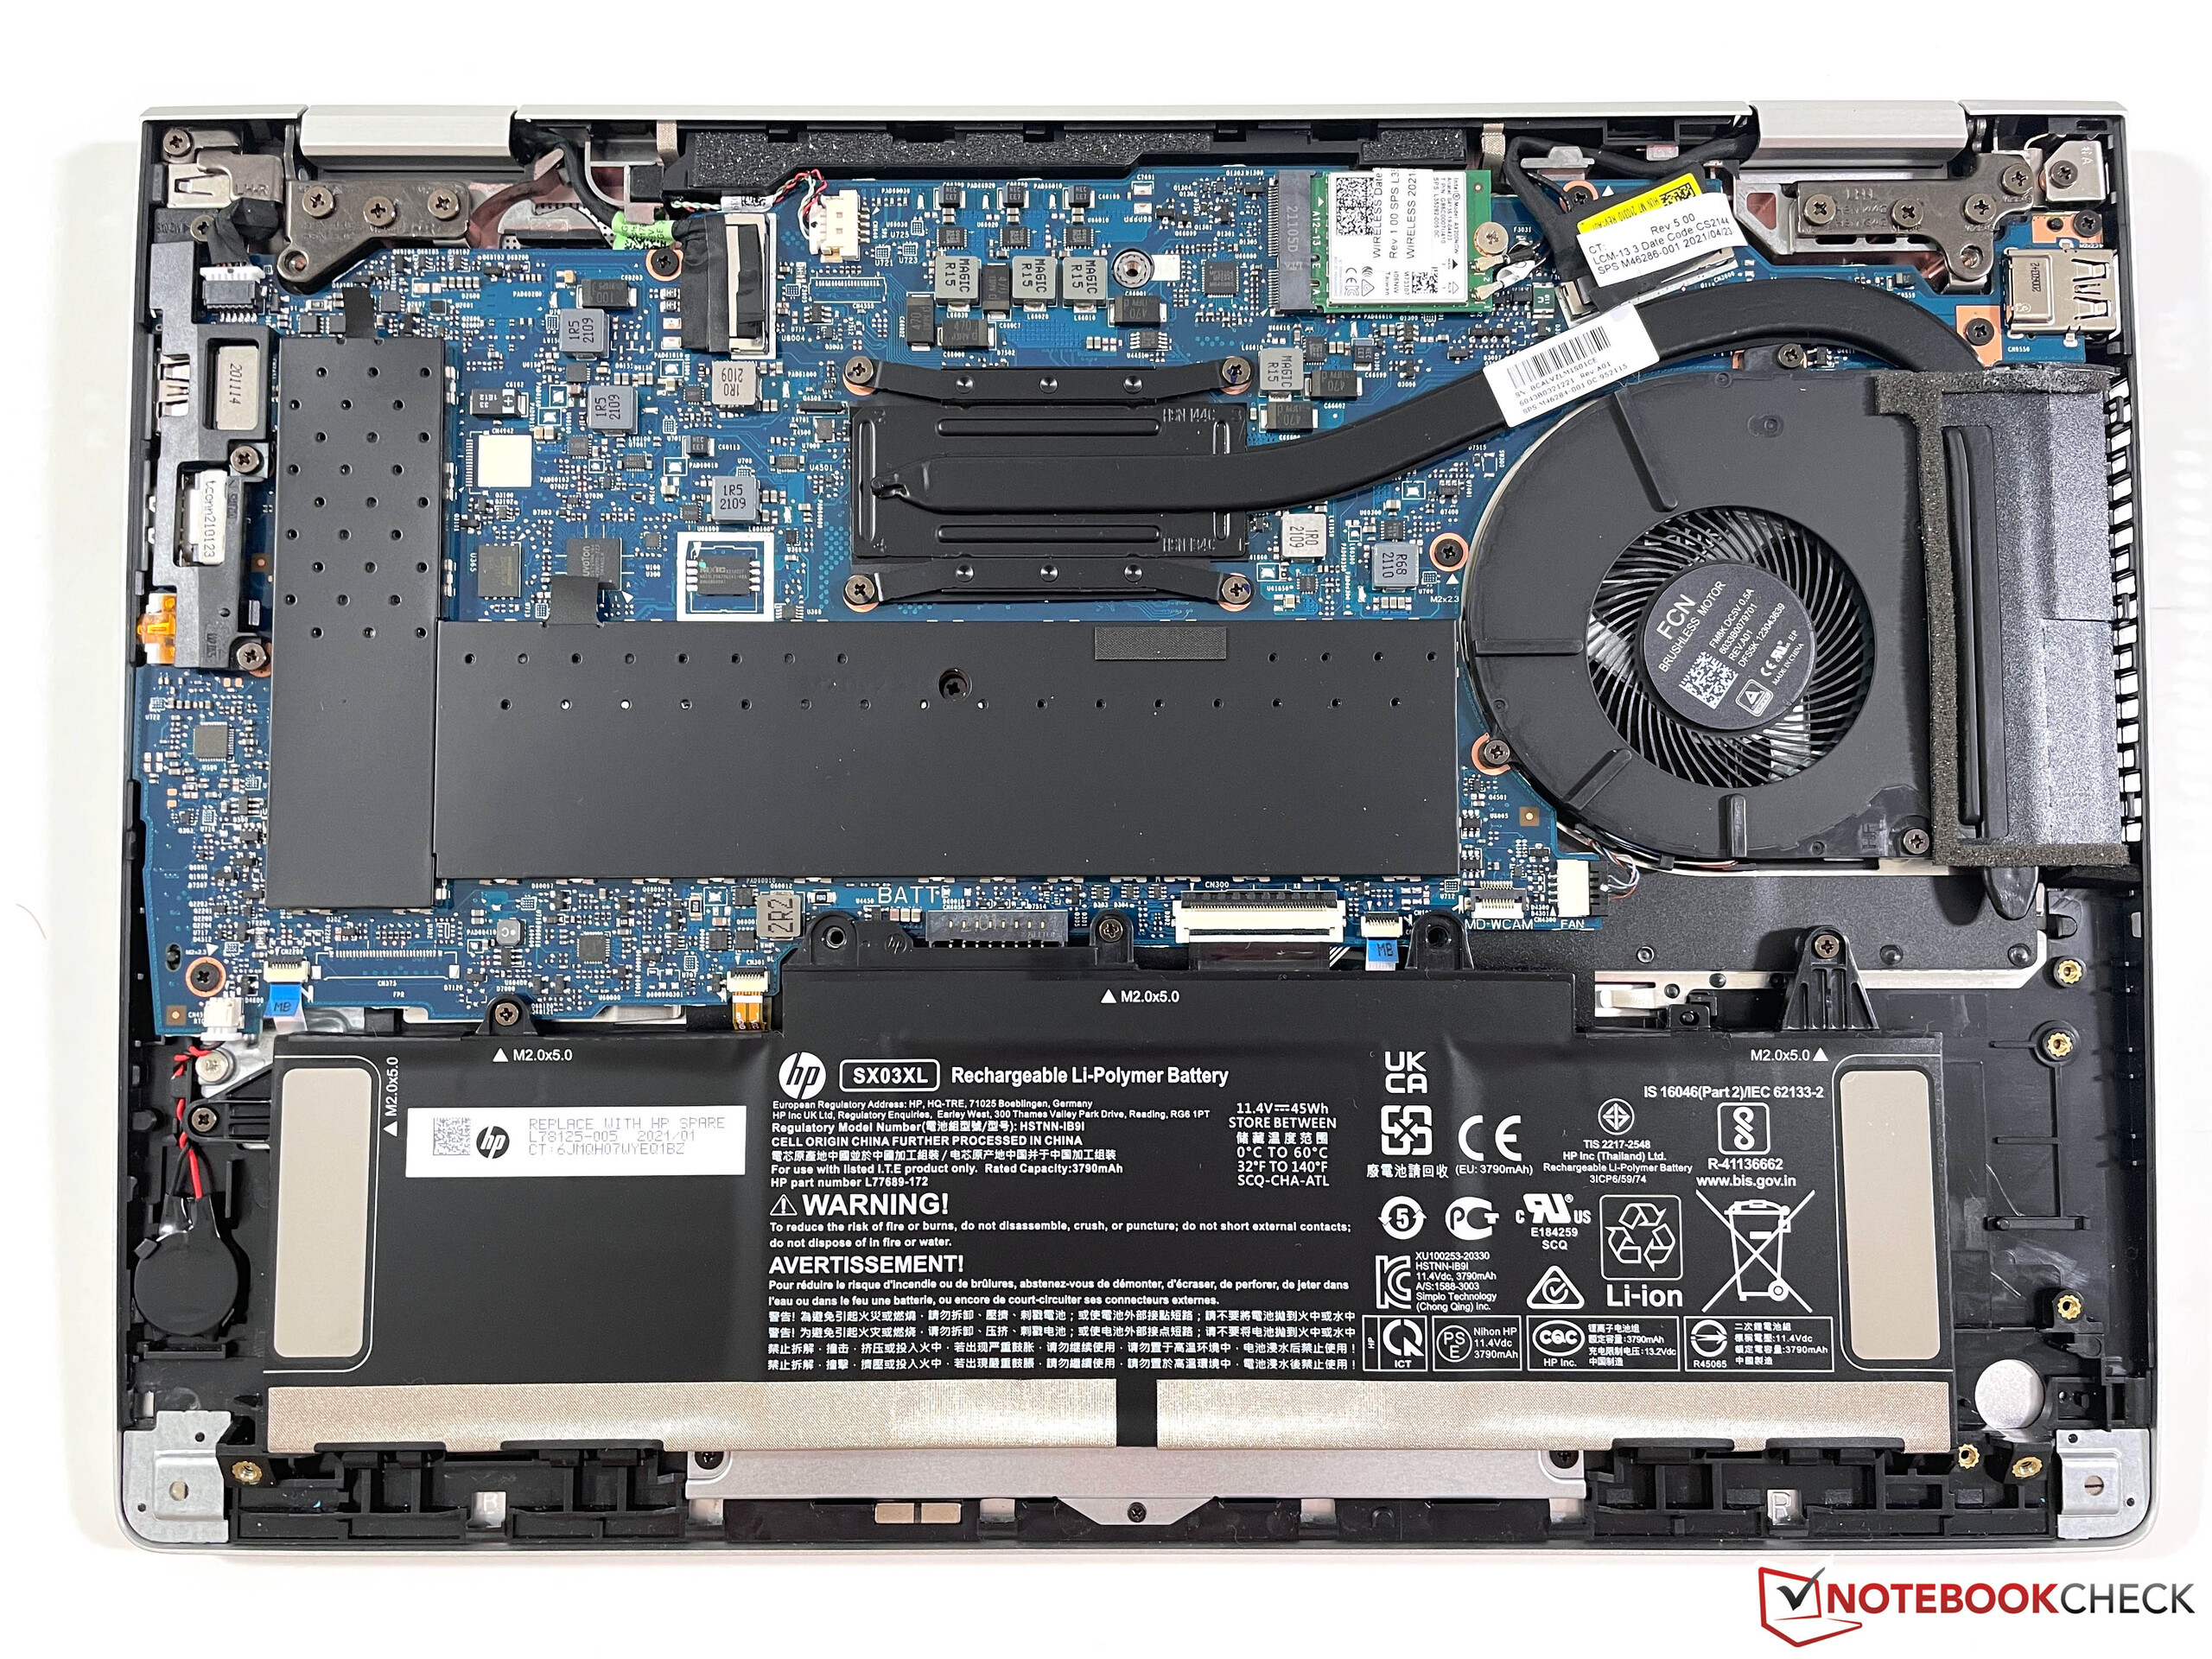
The bottom cover can be removed easily. The working memory and the M.2-2280 SSD are under an extra cover and the WLAN module can also be replaced.

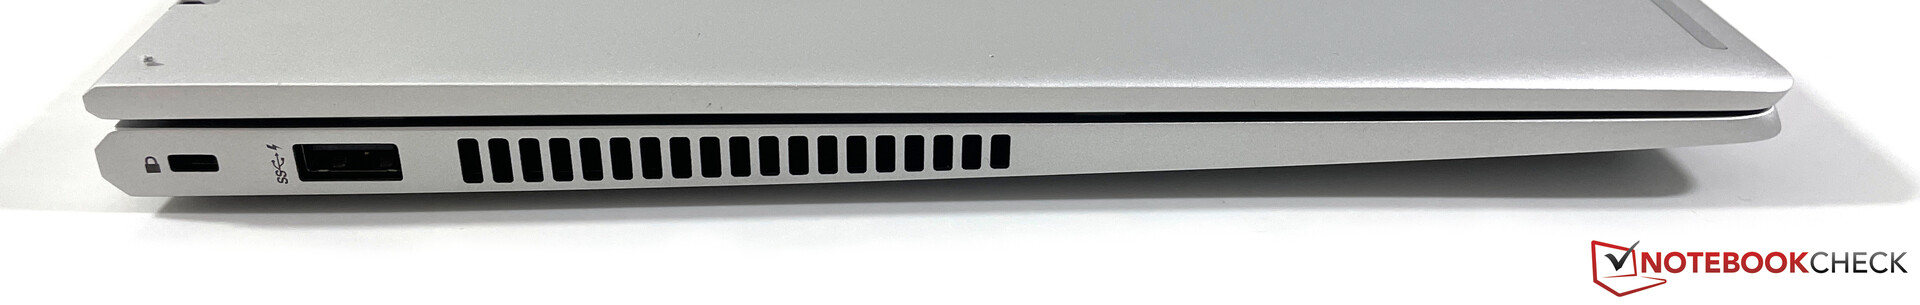
Connection equipment
All ports are available, including USB-C and normal USB-A connectors. However, you have to do without Thunderbolt or a SmartCard reader. The microSD reader achieves an average speed. Our review sample was still shipped with an old power adapter with a round plug, but the power supply is also possible via USB-C.
The Wi-Fi module is from Intel (AX200) and supports the fast Wi-Fi 6 standard. In our standardized test with the Netgear Nighthawk RAX120 router, the ProBook achieved very good transfer rates.
HP installs a normal 720p webcam including a mechanical shutter. The picture quality is very weak even in good lighting conditions. It serves its purpose, but you should not expect more.

| SD Card Reader | |
| average JPG Copy Test (av. of 3 runs) | |
| Fujitsu LifeBook U9310X (Toshiba Exceria Pro SDXC 64 GB UHS-II) | |
| Average of class Convertible (17.7 - 209, n=35, last 2 years) | |
| Lenovo ThinkPad L13 Yoga Gen2-20VK000VGE (AV PRO V60) | |
| HP ProBook x360 435 G7, Ryzen 5 4500U (Toshiba Exceria Pro M501 64 GB UHS-II) | |
| HP ProBook x360 435 G8 R7-5800U (AV Pro UHS-II V60) | |
| Acer Spin 3 SP313-51N-56YV (AV PRO microSD 128 GB V60) | |
| maximum AS SSD Seq Read Test (1GB) | |
| Average of class Convertible (22.6 - 263, n=34, last 2 years) | |
| Fujitsu LifeBook U9310X (Toshiba Exceria Pro SDXC 64 GB UHS-II) | |
| HP ProBook x360 435 G8 R7-5800U (AV Pro UHS-II V60) | |
| HP ProBook x360 435 G7, Ryzen 5 4500U (Toshiba Exceria Pro M501 64 GB UHS-II) | |
| Lenovo ThinkPad L13 Yoga Gen2-20VK000VGE (AV PRO V60) | |
| Acer Spin 3 SP313-51N-56YV (AV PRO microSD 128 GB V60) | |


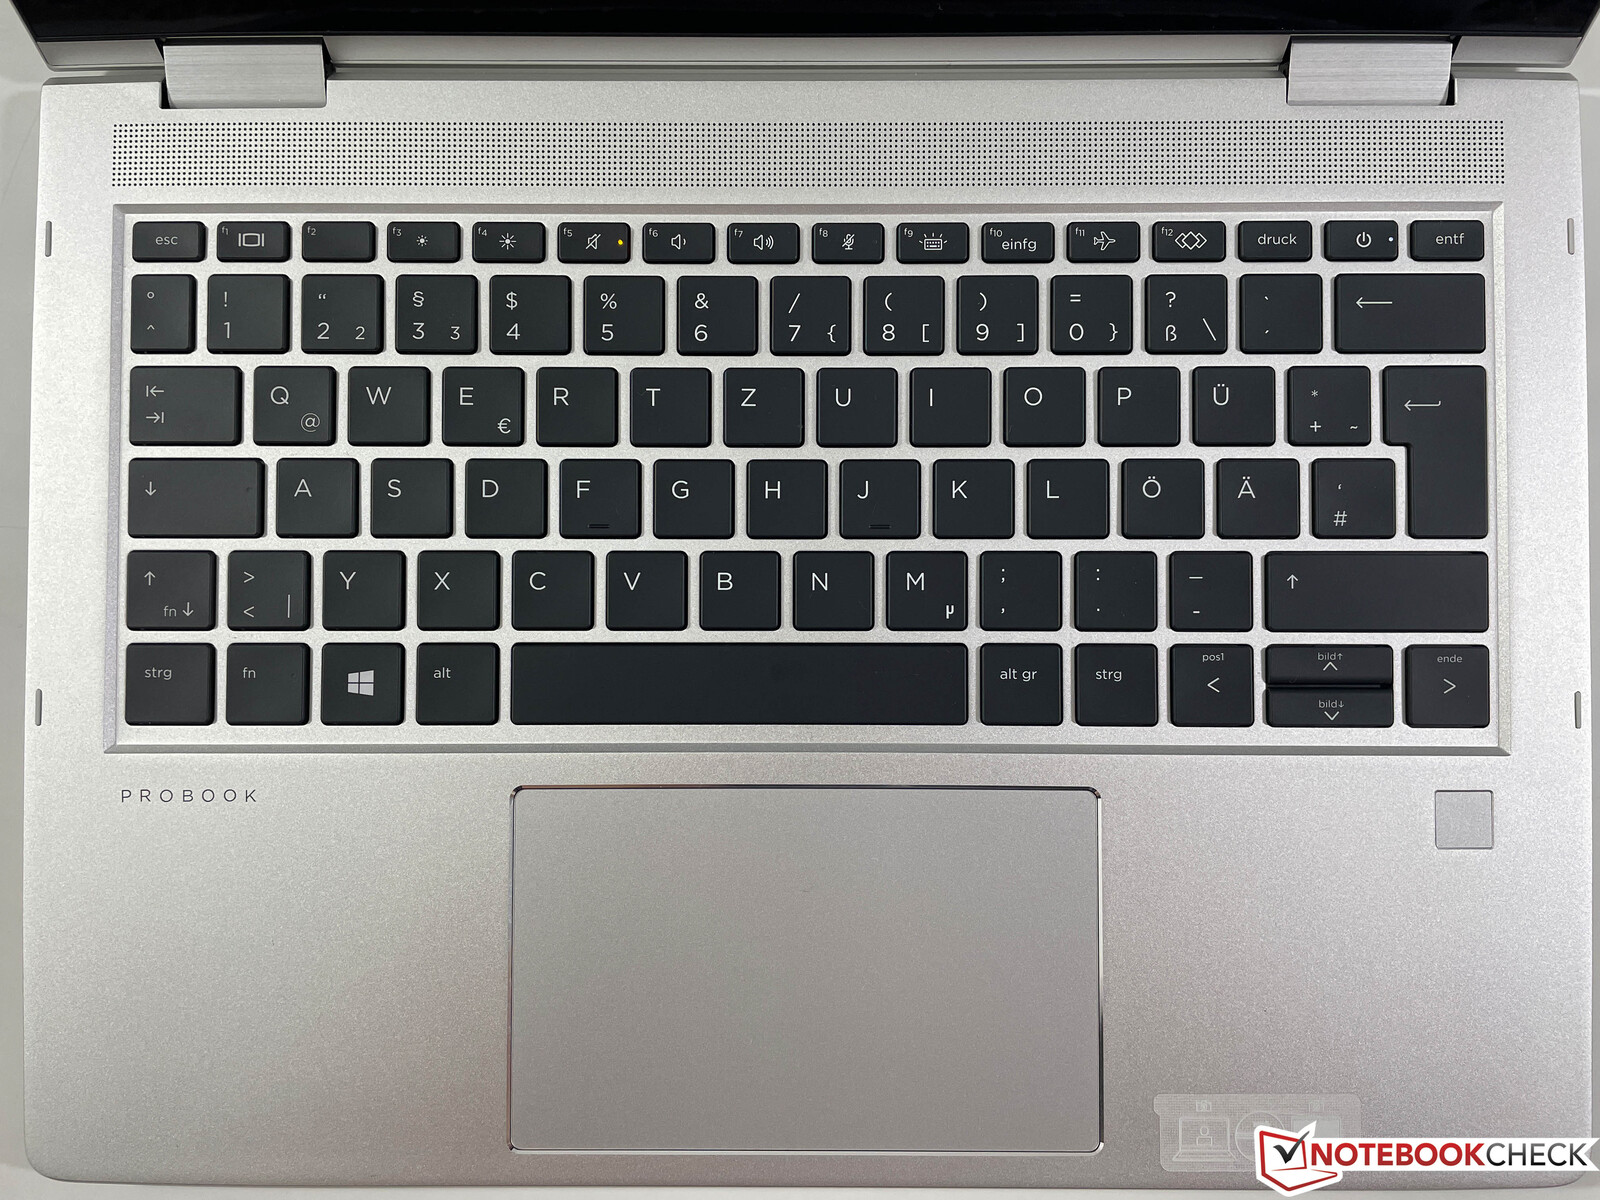
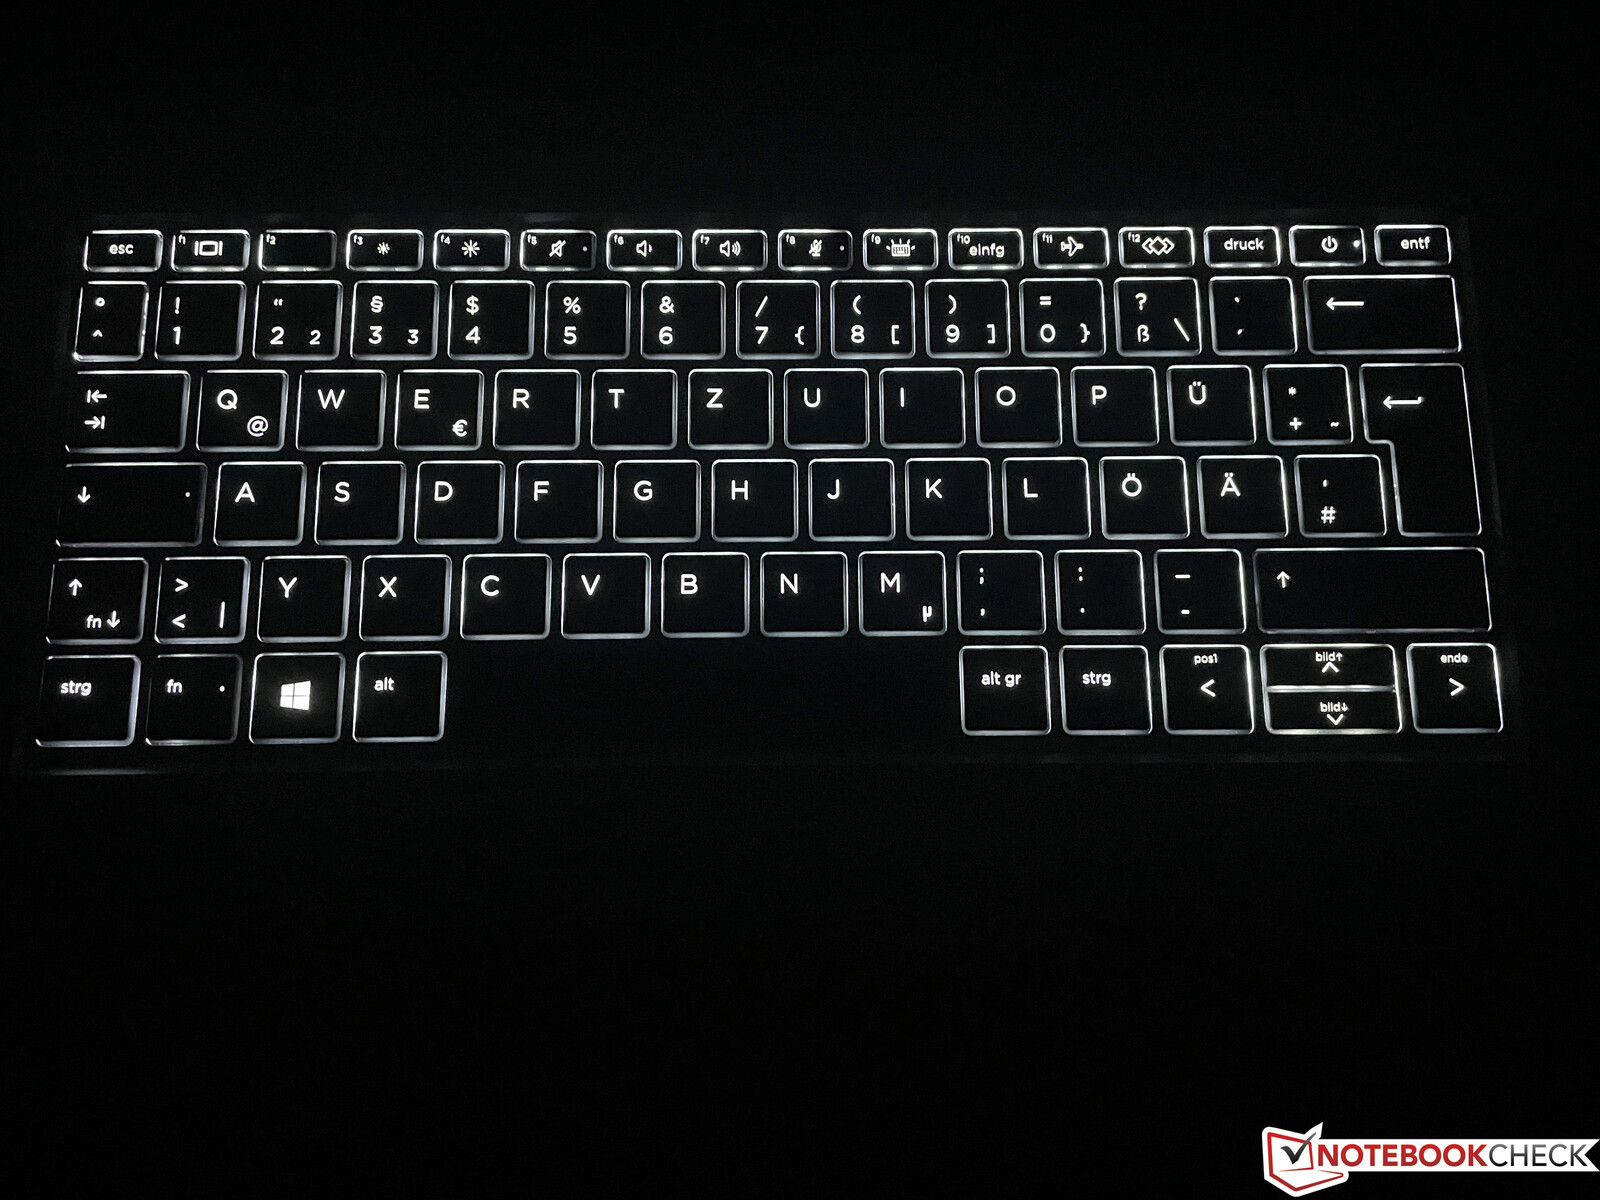
Input devices - Water-repellent keyboard
There are no changes in the input devices, which is not a problem at all. The keys offer sufficient travel and precise feedback. Even long texts can be typed comfortably on this keyboard. The two-stage white backlight is deactivated by default after a few seconds when you don't use the keyboard, but this setting can be adjusted in the BIOS.
The ClickPad supports the Microsoft Precision standard and the normal pointer control works perfectly. The pad can be pressed down in the lower area, which is acknowledged with a rather loud and muffled noise. Since it is a convertible, there is of course also the capacitive touchscreen. We cannot see any restrictions here either.
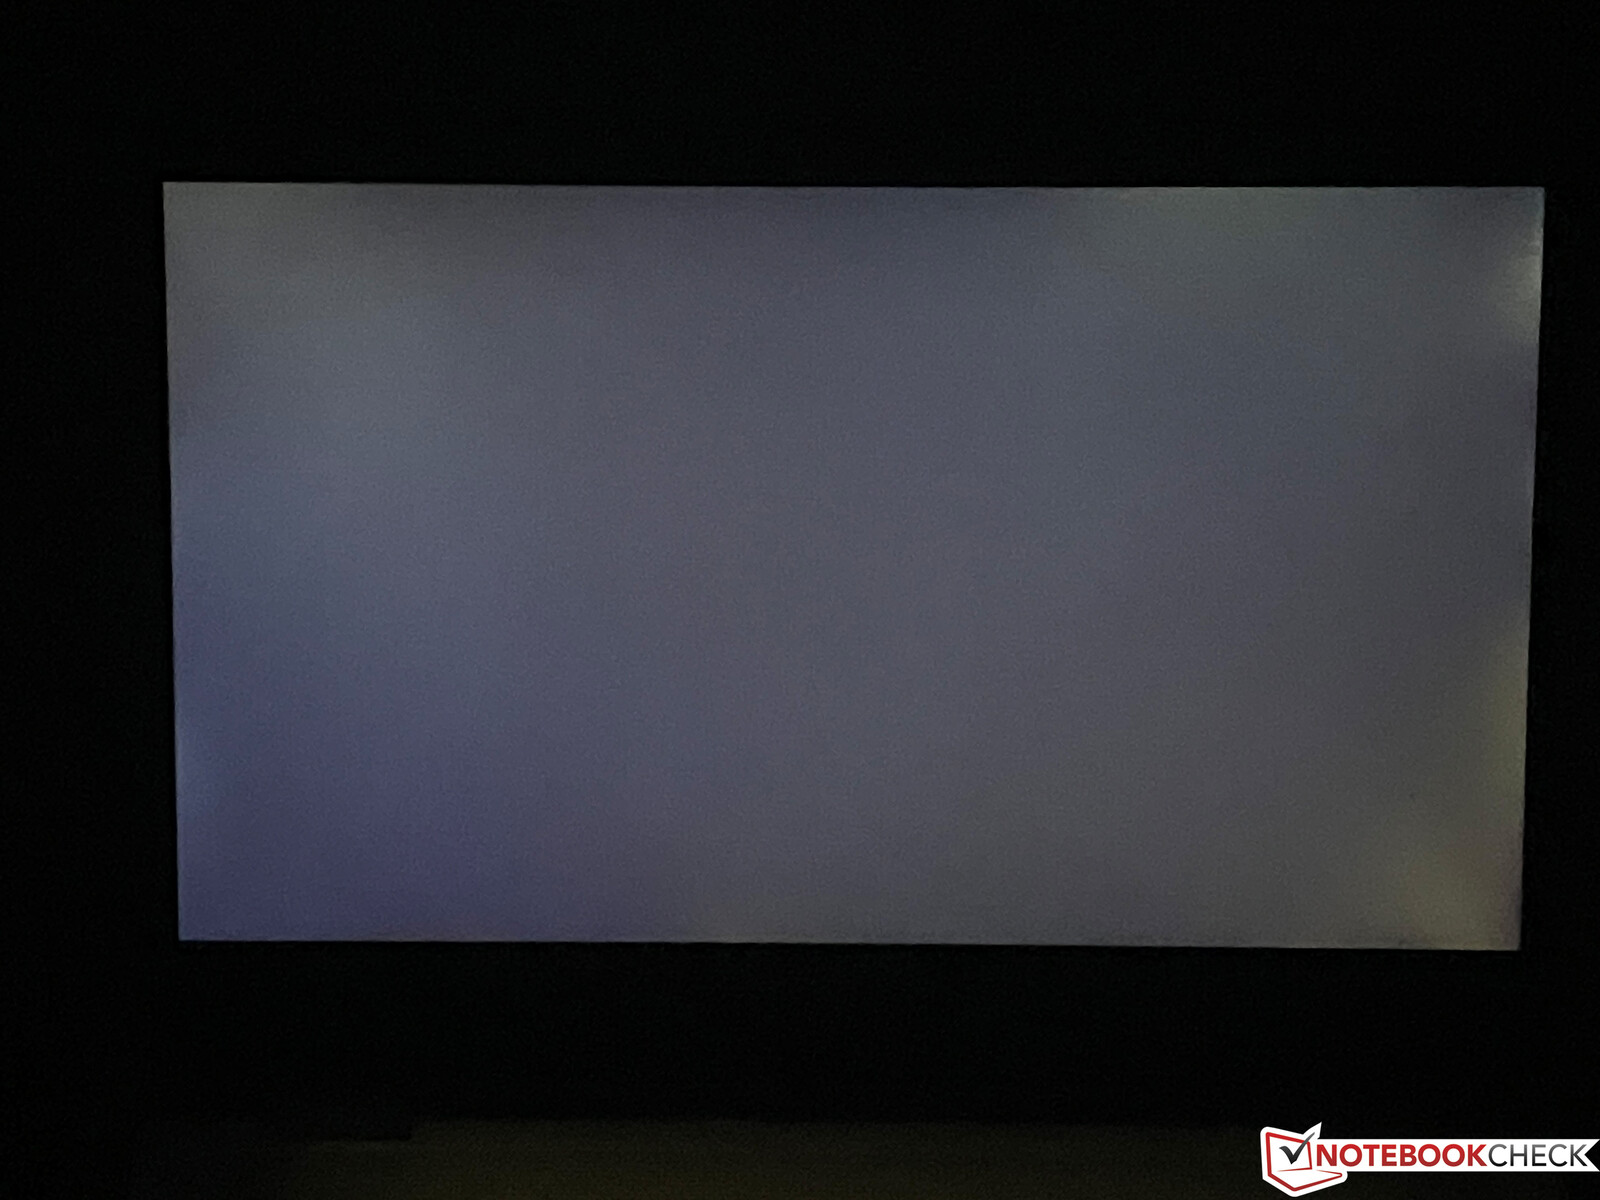
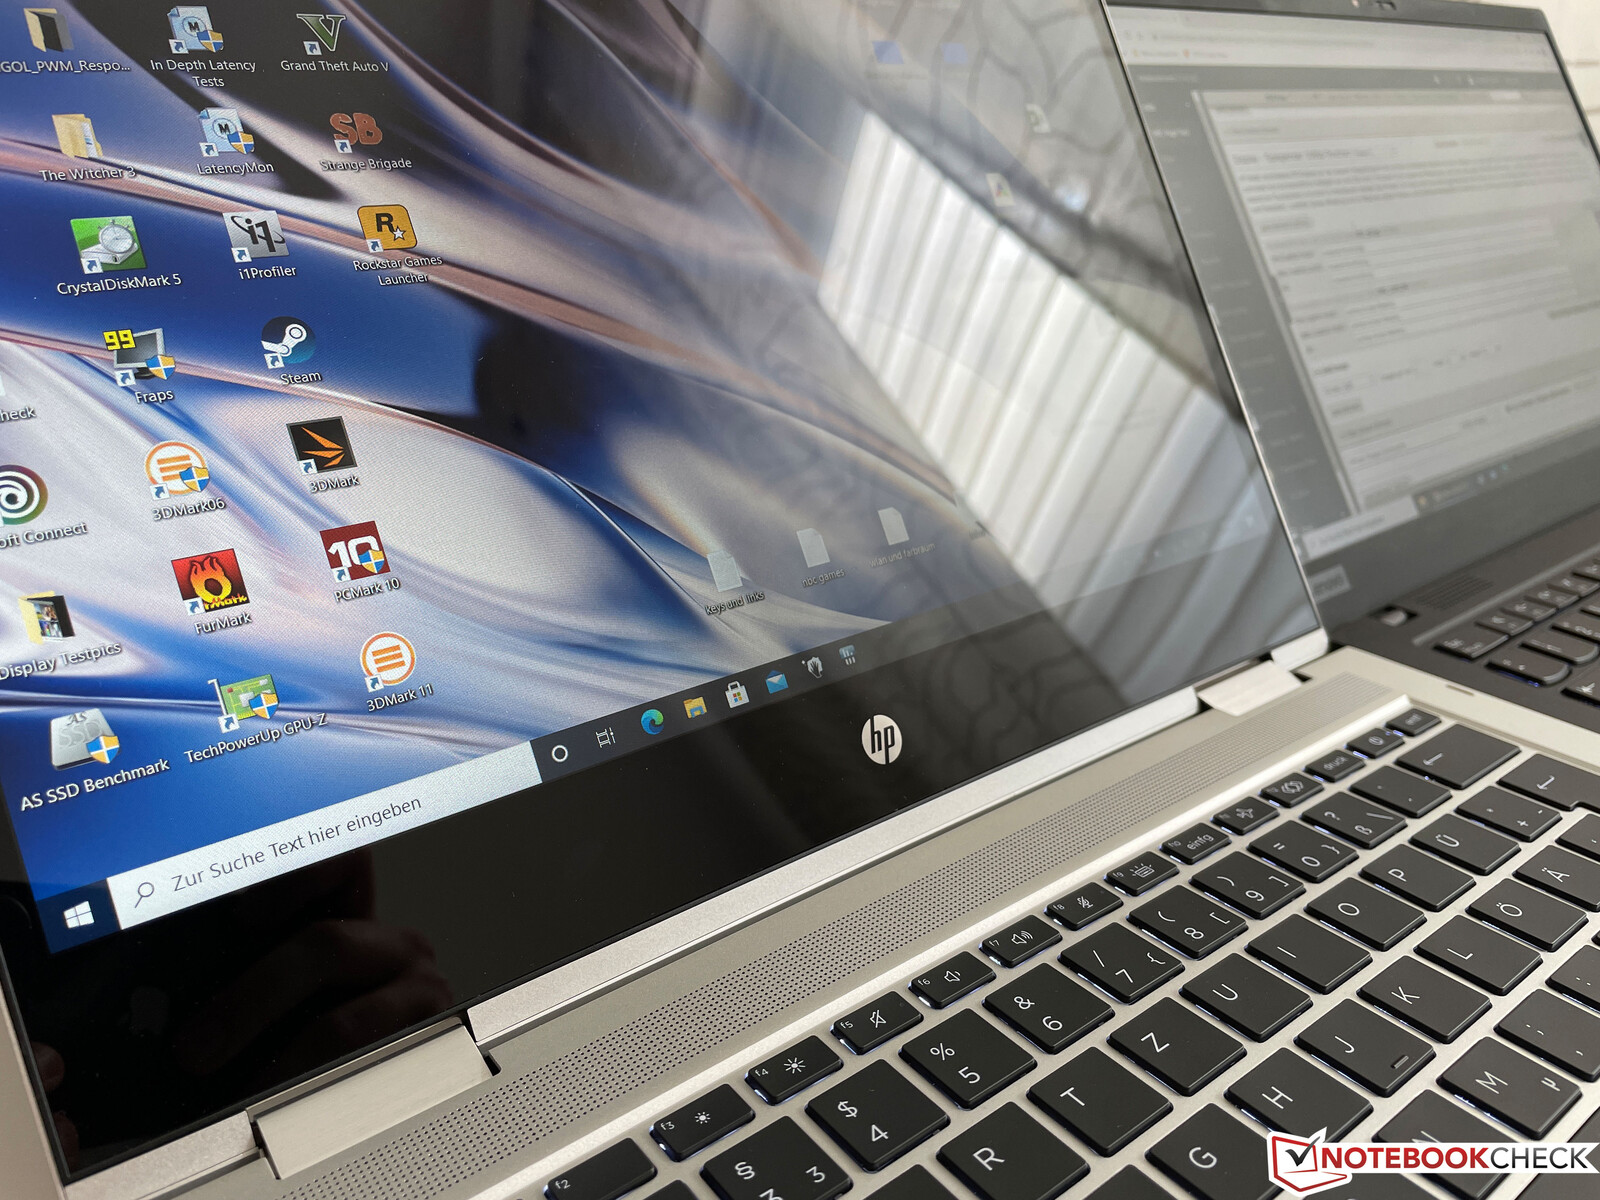
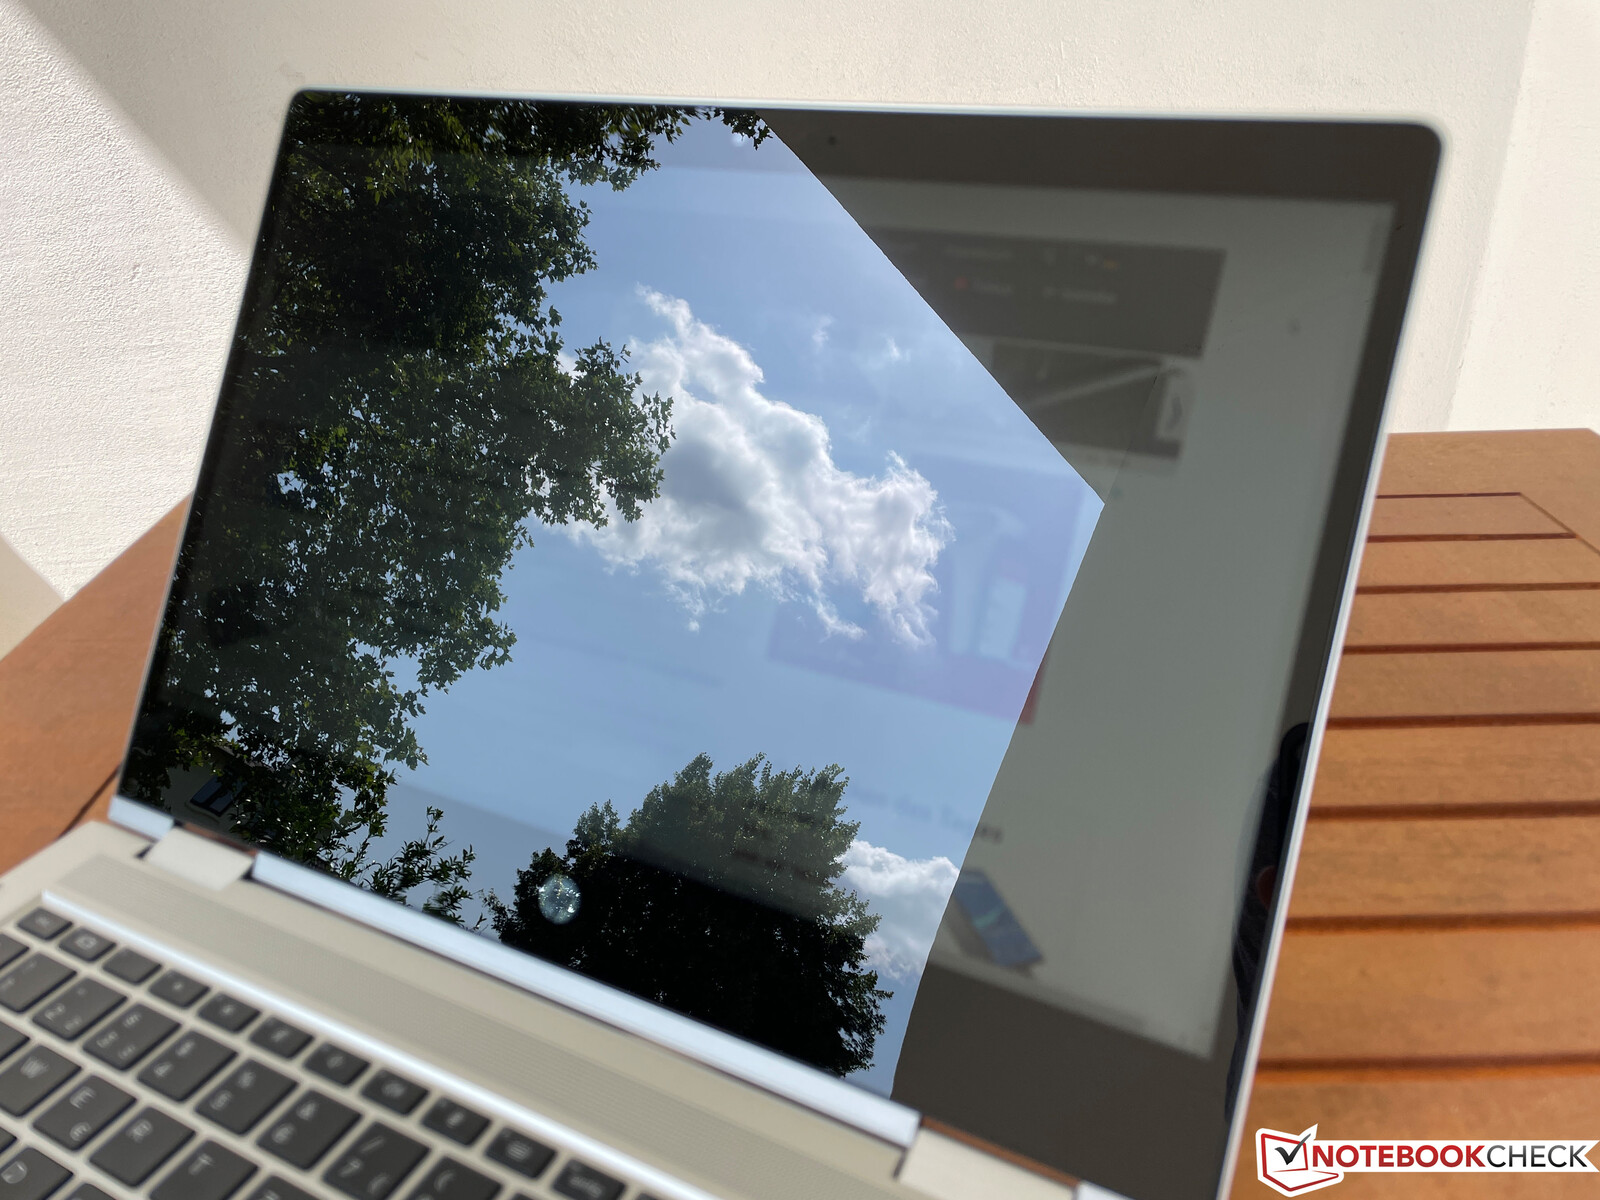
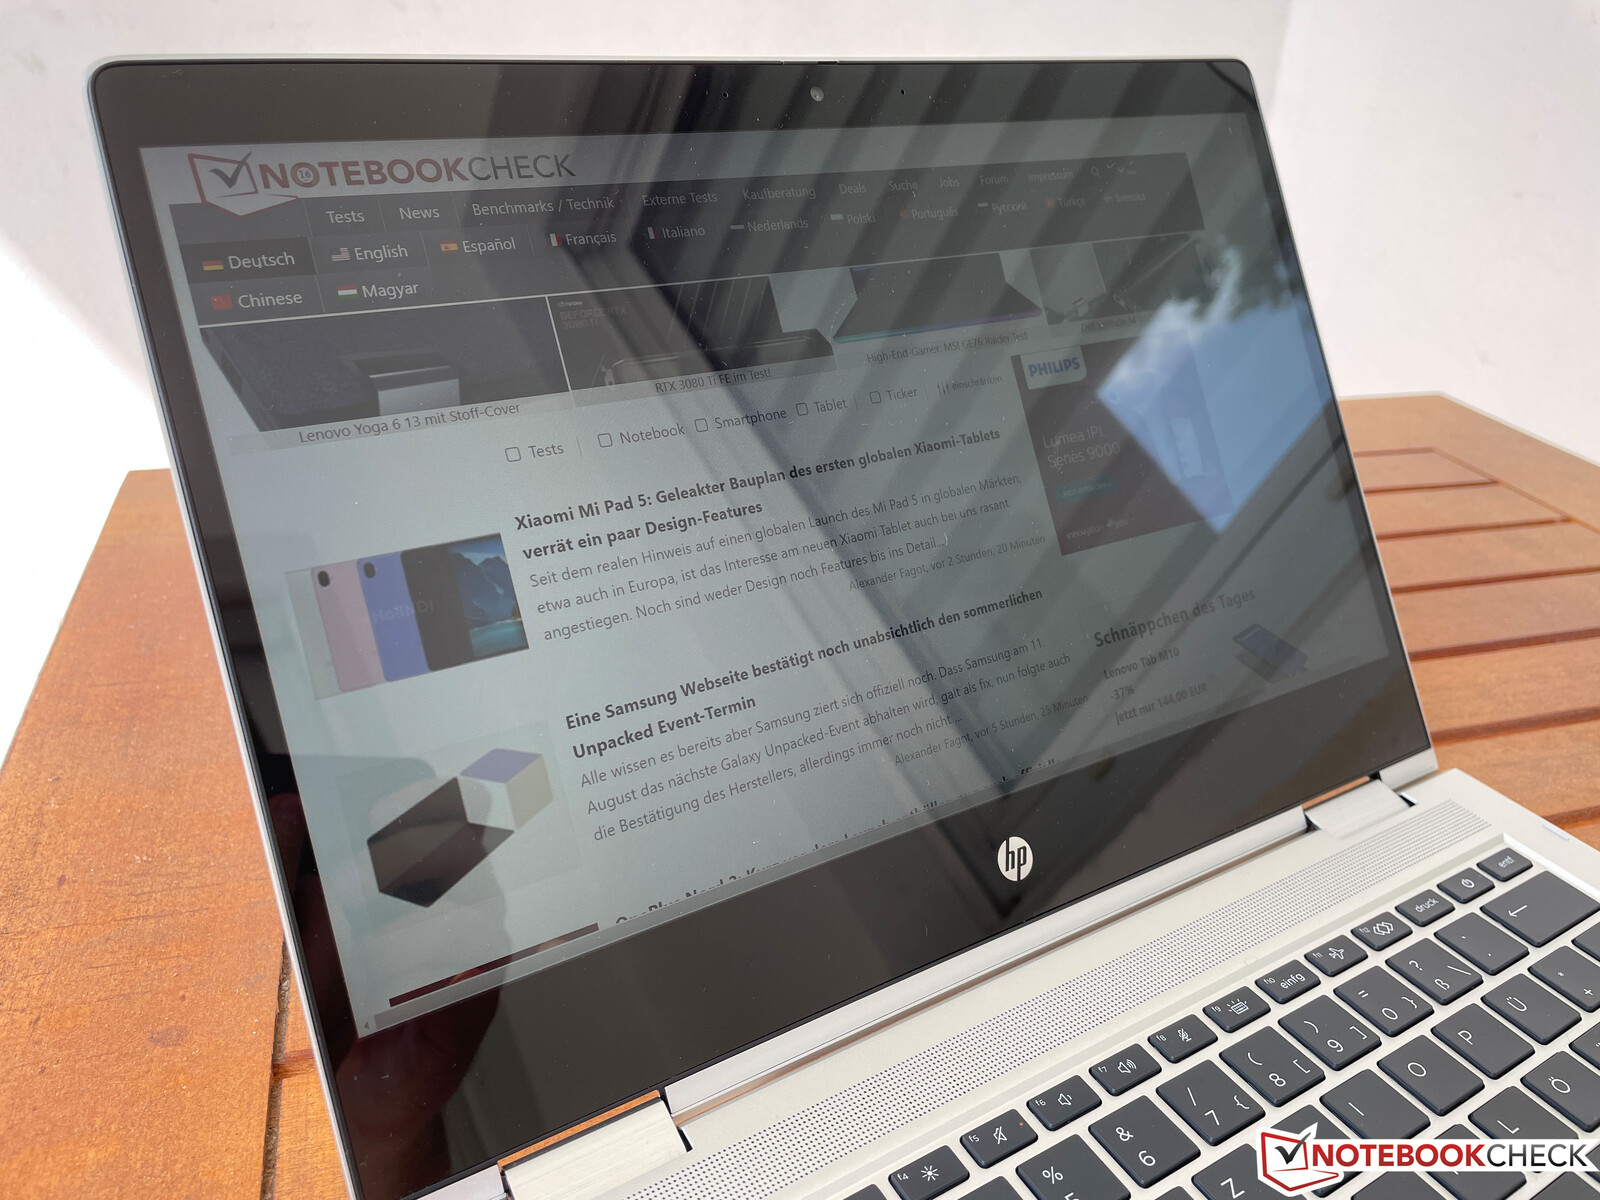
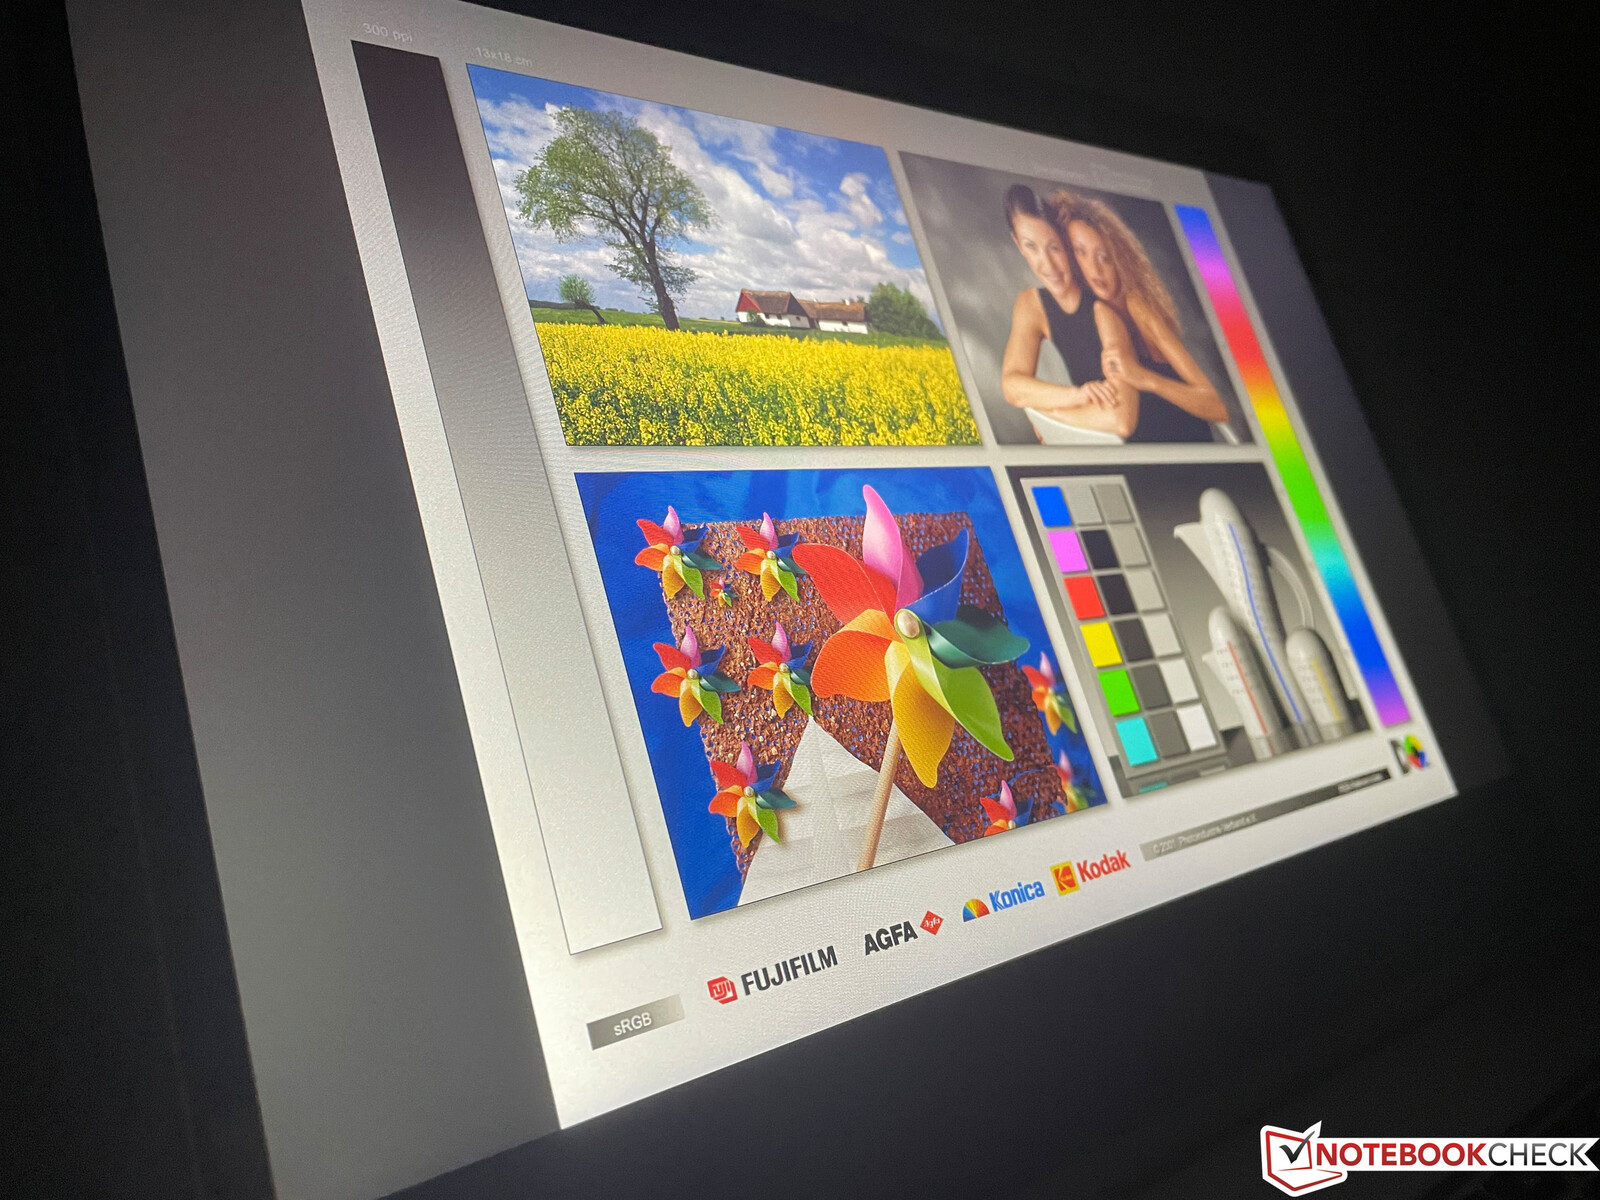
Display - Full HD 1080p mirrored touchscreen
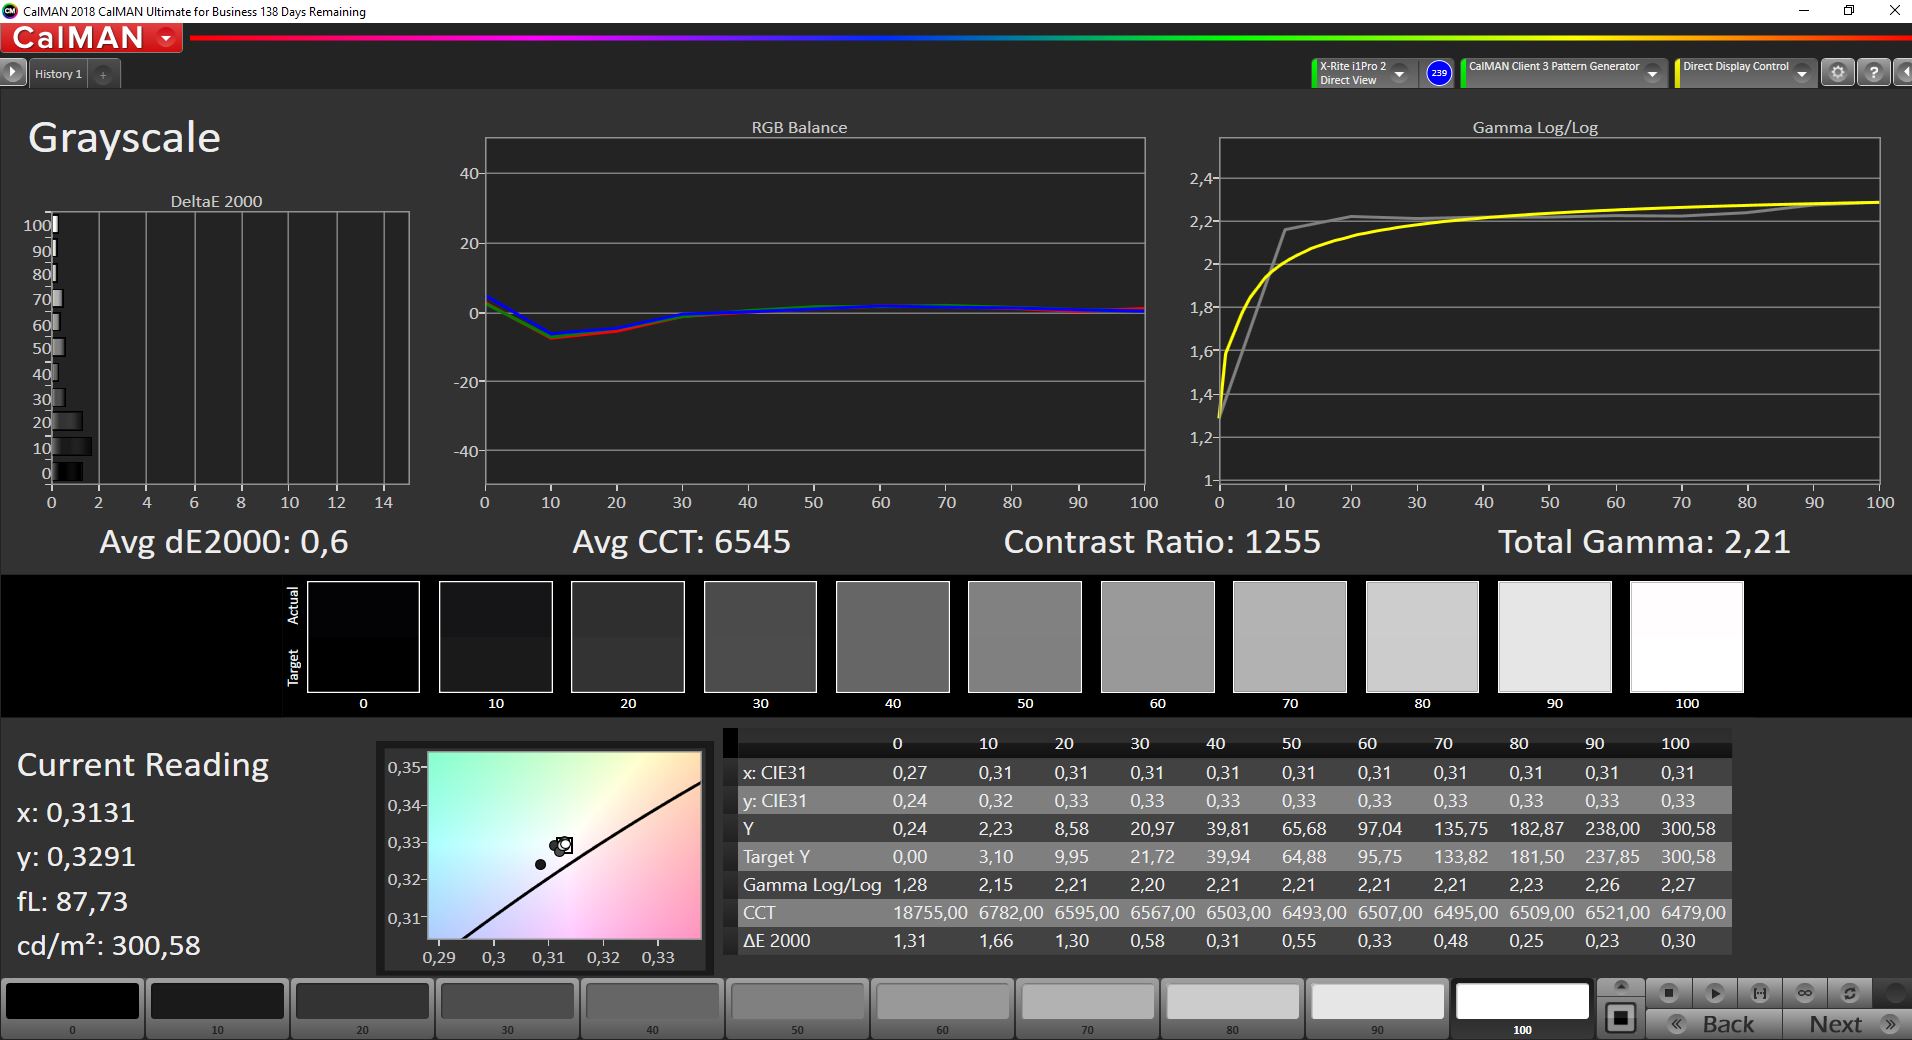
HP offers various IPS displays. Our test device uses the nominally worst variant with a brightness of 250 cd/m². Our panel comes from AU Optronics and at least achieves an average brightness of around 290 cd/m². In principle, the subjective picture impression is decent, also thanks to the good contrast ratio, but the extremely reflective glass surface of the capacitive touchscreen is already a problem indoors. Outdoors, you can hardly see anything and it is hardly possible to work properly. We could not determine PWM flickering, screen bleeding is not a big problem in everyday use and the viewing angle stability is also good, but reflections are often the bigger obstacle in practice.
| |||||||||||||||||||||||||
Brightness Distribution: 89 %
Center on Battery: 304 cd/m²
Contrast: 1322:1 (Black: 0.23 cd/m²)
ΔE Color 5 | 0.5-29.43 Ø5, calibrated: 4.2
ΔE Greyscale 2.1 | 0.57-98 Ø5.3
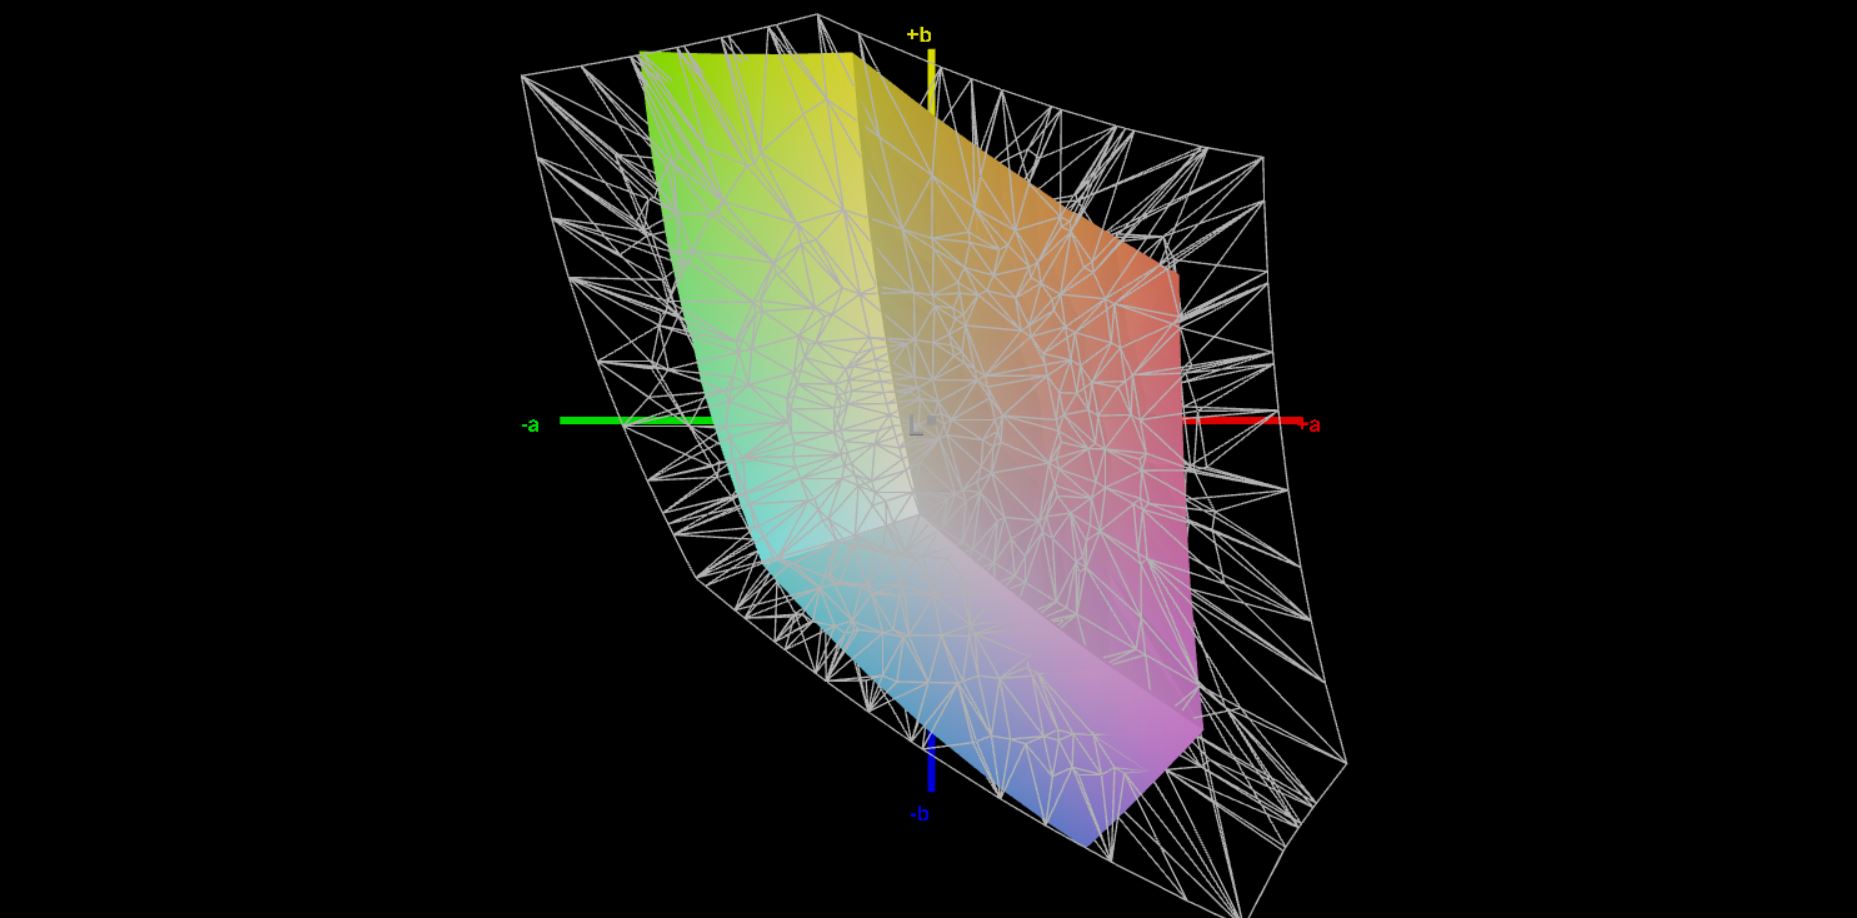
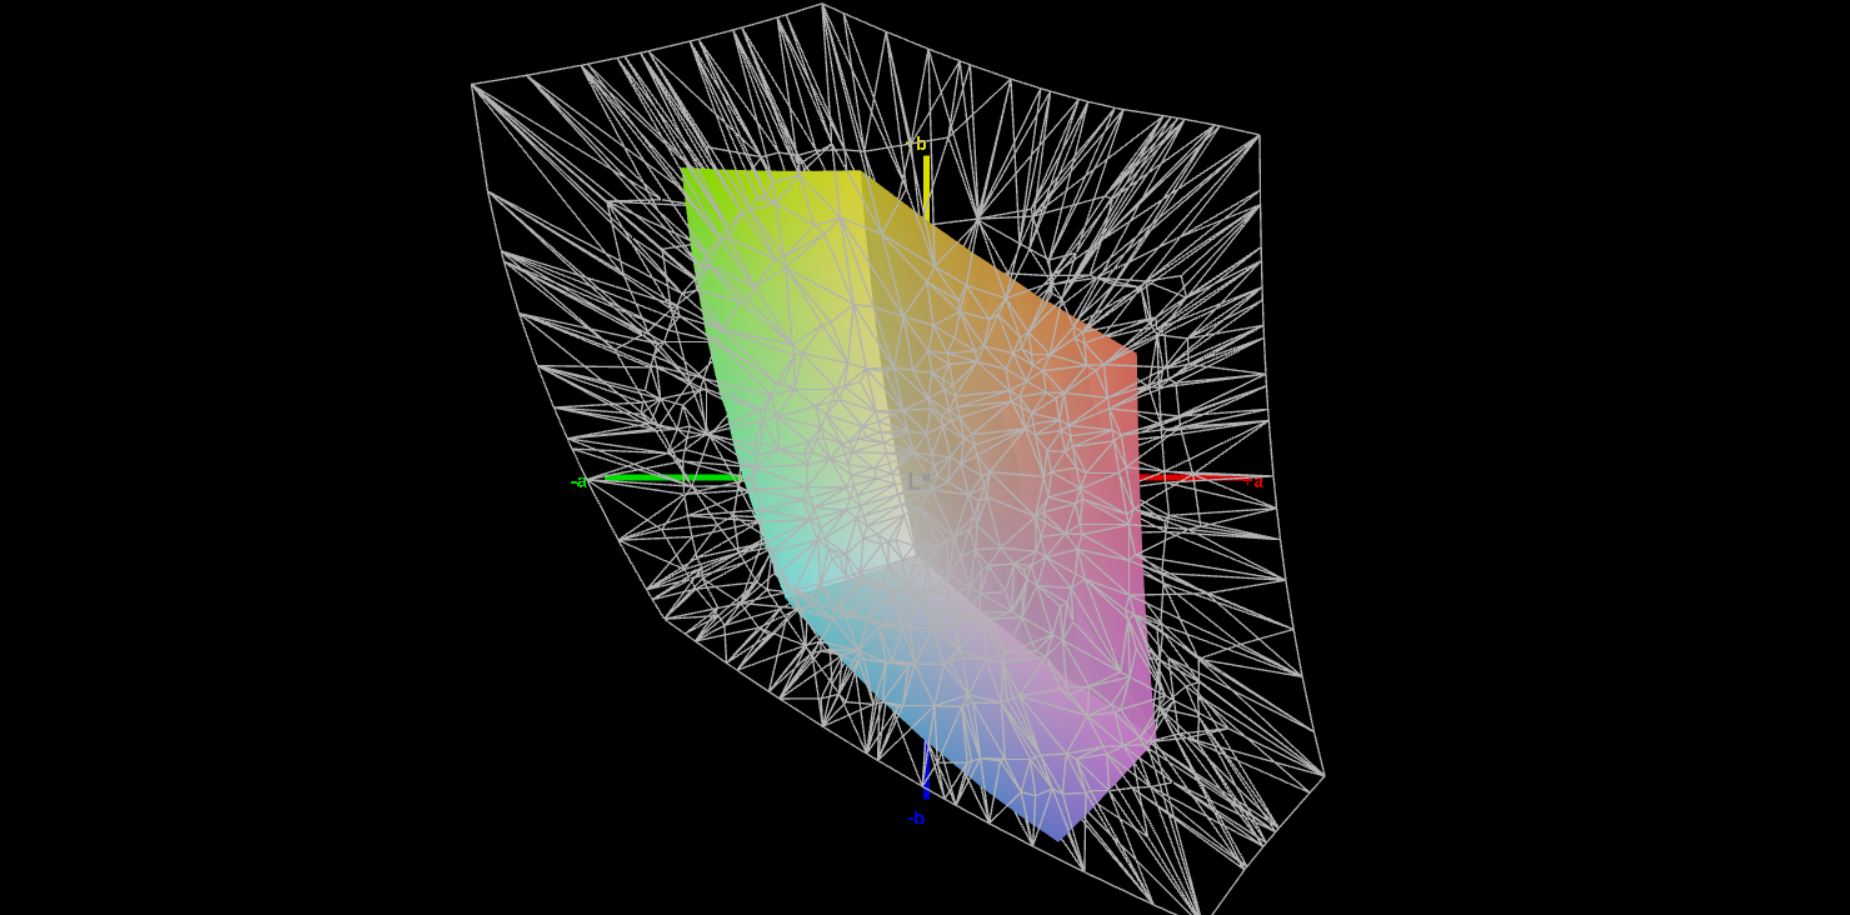
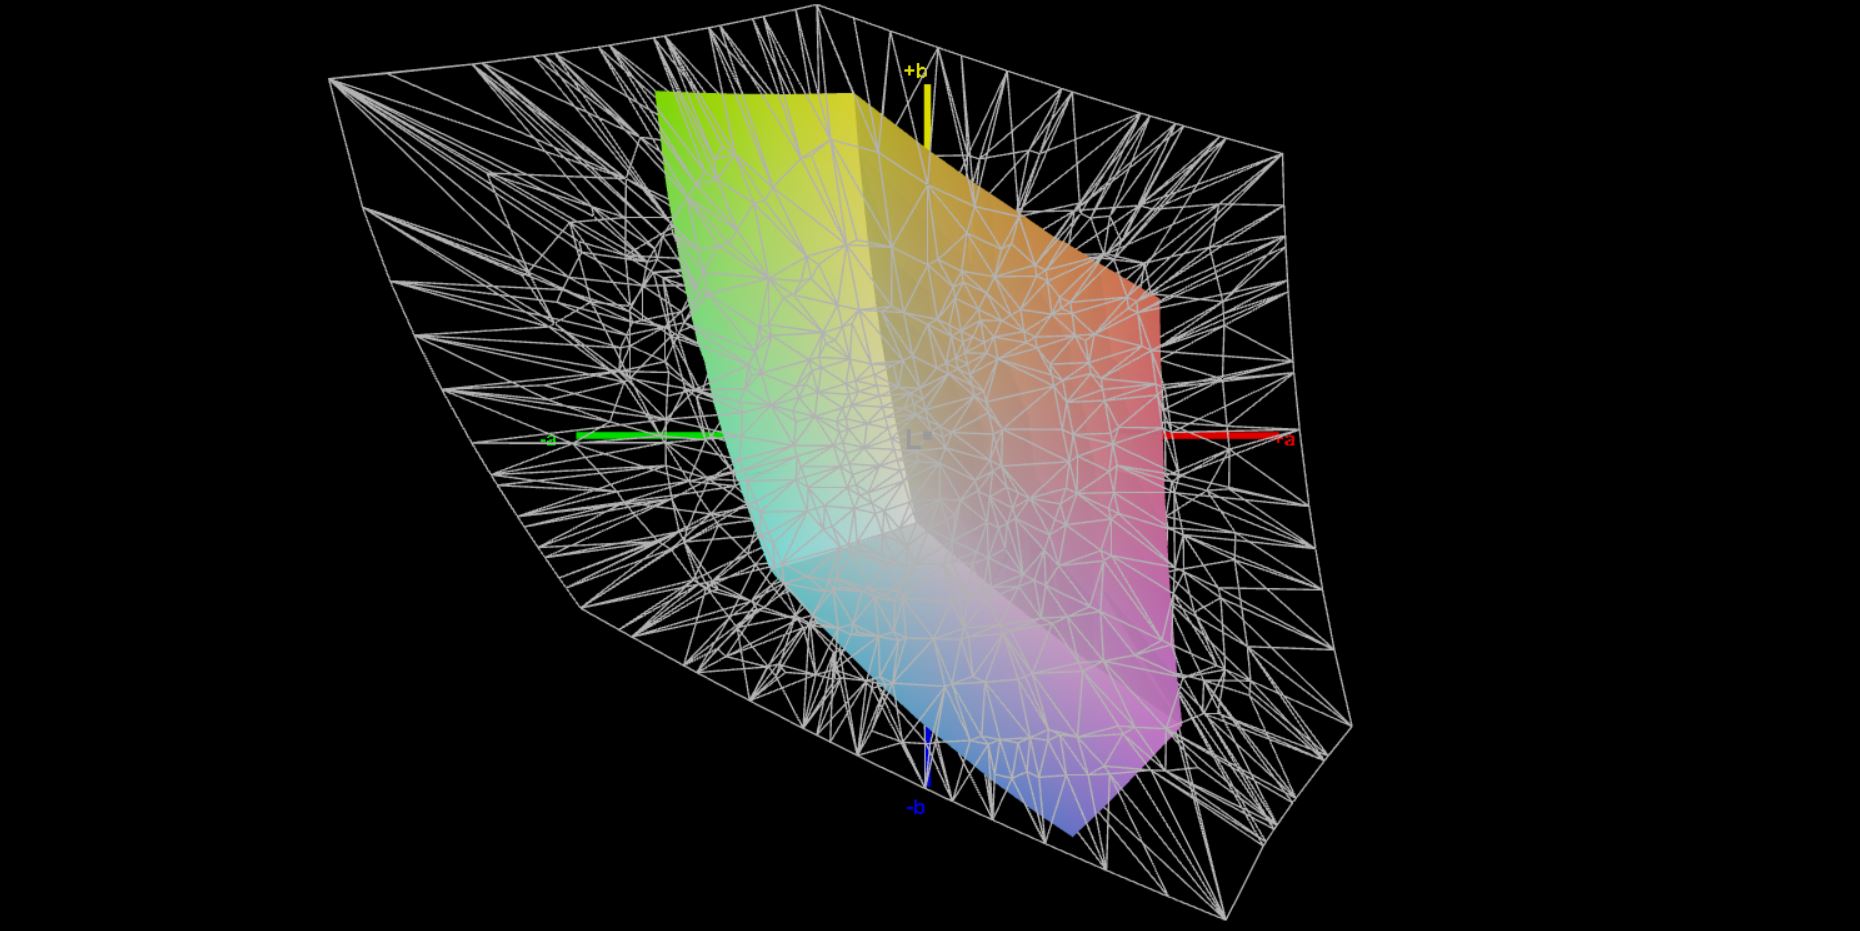
41.4% AdobeRGB 1998 (Argyll 2.2.0 3D)
59.9% sRGB (Argyll 2.2.0 3D)
40.1% Display P3 (Argyll 2.2.0 3D)
Gamma: 2.03
| HP ProBook x360 435 G8 R7-5800U AUO4B2D, IPS, 1920x1080, 13.30 | Lenovo ThinkPad L13 Yoga Gen2-20VK000VGE N133HCE-EP2, IPS, 1920x1080, 13.30 | Fujitsu LifeBook U9310X LQ133M1JW48, IPS, 1920x1080, 13.30 | Acer Spin 3 SP313-51N-56YV AU Optronics AUOB493, IPS, 2560x1600, 13.30 | HP ProBook x360 435 G7, Ryzen 5 4500U LGD0675, IPS LED, 1920x1080, 13.30 | |
|---|---|---|---|---|---|
| Display | 69% | 64% | 84% | 55% | |
| Display P3 Coverage | 40.1 | 68.5 71% | 66.4 66% | 78.8 97% | 63.1 57% |
| sRGB Coverage | 59.9 | 99.4 66% | 96.9 62% | 99.8 67% | 90.8 52% |
| AdobeRGB 1998 Coverage | 41.4 | 70.7 71% | 67.4 63% | 77.6 87% | 64.5 56% |
| Response Times | -1% | -27% | -17% | -2% | |
| Response Time Grey 50% / Grey 80% * | 42.8 ? | 44.4 ? -4% | 62.4 ? -46% | 52 ? -21% | 45.6 ? -7% |
| Response Time Black / White * | 32 ? | 31.2 ? 2% | 34.4 ? -8% | 36 ? -13% | 30.8 ? 4% |
| PWM Frequency | 25000 ? | 211.9 ? | |||
| Screen | 21% | 18% | -14% | 18% | |
| Brightness middle | 304 | 316 4% | 345 13% | 338 11% | 354 16% |
| Brightness | 292 | 299 2% | 317 9% | 307 5% | 344 18% |
| Brightness Distribution | 89 | 92 3% | 86 -3% | 83 -7% | 83 -7% |
| Black Level * | 0.23 | 0.25 -9% | 0.24 -4% | 0.27 -17% | 0.16 30% |
| Contrast | 1322 | 1264 -4% | 1438 9% | 1252 -5% | 2213 67% |
| Colorchecker dE 2000 * | 5 | 1.7 66% | 2.7 46% | 4.63 7% | 3.4 32% |
| Colorchecker dE 2000 max. * | 17.7 | 3.8 79% | 4.2 76% | 9.99 44% | 5.8 67% |
| Colorchecker dE 2000 calibrated * | 4.2 | 0.7 83% | 1 76% | 1.64 61% | 2 52% |
| Greyscale dE 2000 * | 2.1 | 2.8 -33% | 3.3 -57% | 6.76 -222% | 4.5 -114% |
| Gamma | 2.03 108% | 2.25 98% | 2.31 95% | 2.37 93% | 2.29 96% |
| CCT | 6443 101% | 6654 98% | 7188 90% | 5934 110% | 6046 108% |
| Color Space (Percent of AdobeRGB 1998) | 64.5 | 62.4 | 68 | 59 | |
| Color Space (Percent of sRGB) | 99.4 | 96.9 | 98 | 90.6 | |
| Total Average (Program / Settings) | 30% /
28% | 18% /
22% | 18% /
7% | 24% /
23% |
* ... smaller is better
Display Response Times
| ↔ Response Time Black to White | ||
|---|---|---|
| 32 ms ... rise ↗ and fall ↘ combined | ↗ 18 ms rise | 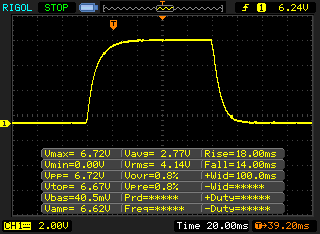 |
| ↘ 14 ms fall | ||
| The screen shows slow response rates in our tests and will be unsatisfactory for gamers. In comparison, all tested devices range from 0.1 (minimum) to 240 (maximum) ms. » 84 % of all devices are better. This means that the measured response time is worse than the average of all tested devices (21.5 ms). | ||
| ↔ Response Time 50% Grey to 80% Grey | ||
| 42.8 ms ... rise ↗ and fall ↘ combined | ↗ 20 ms rise | 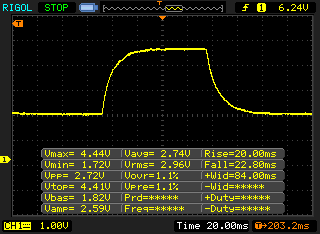 |
| ↘ 22.8 ms fall | ||
| The screen shows slow response rates in our tests and will be unsatisfactory for gamers. In comparison, all tested devices range from 0.2 (minimum) to 636 (maximum) ms. » 66 % of all devices are better. This means that the measured response time is worse than the average of all tested devices (33.7 ms). | ||
Screen Flickering / PWM (Pulse-Width Modulation)
| Screen flickering / PWM not detected |  | ||
In comparison: 53 % of all tested devices do not use PWM to dim the display. If PWM was detected, an average of 17915 (minimum: 5 - maximum: 3846000) Hz was measured. | |||
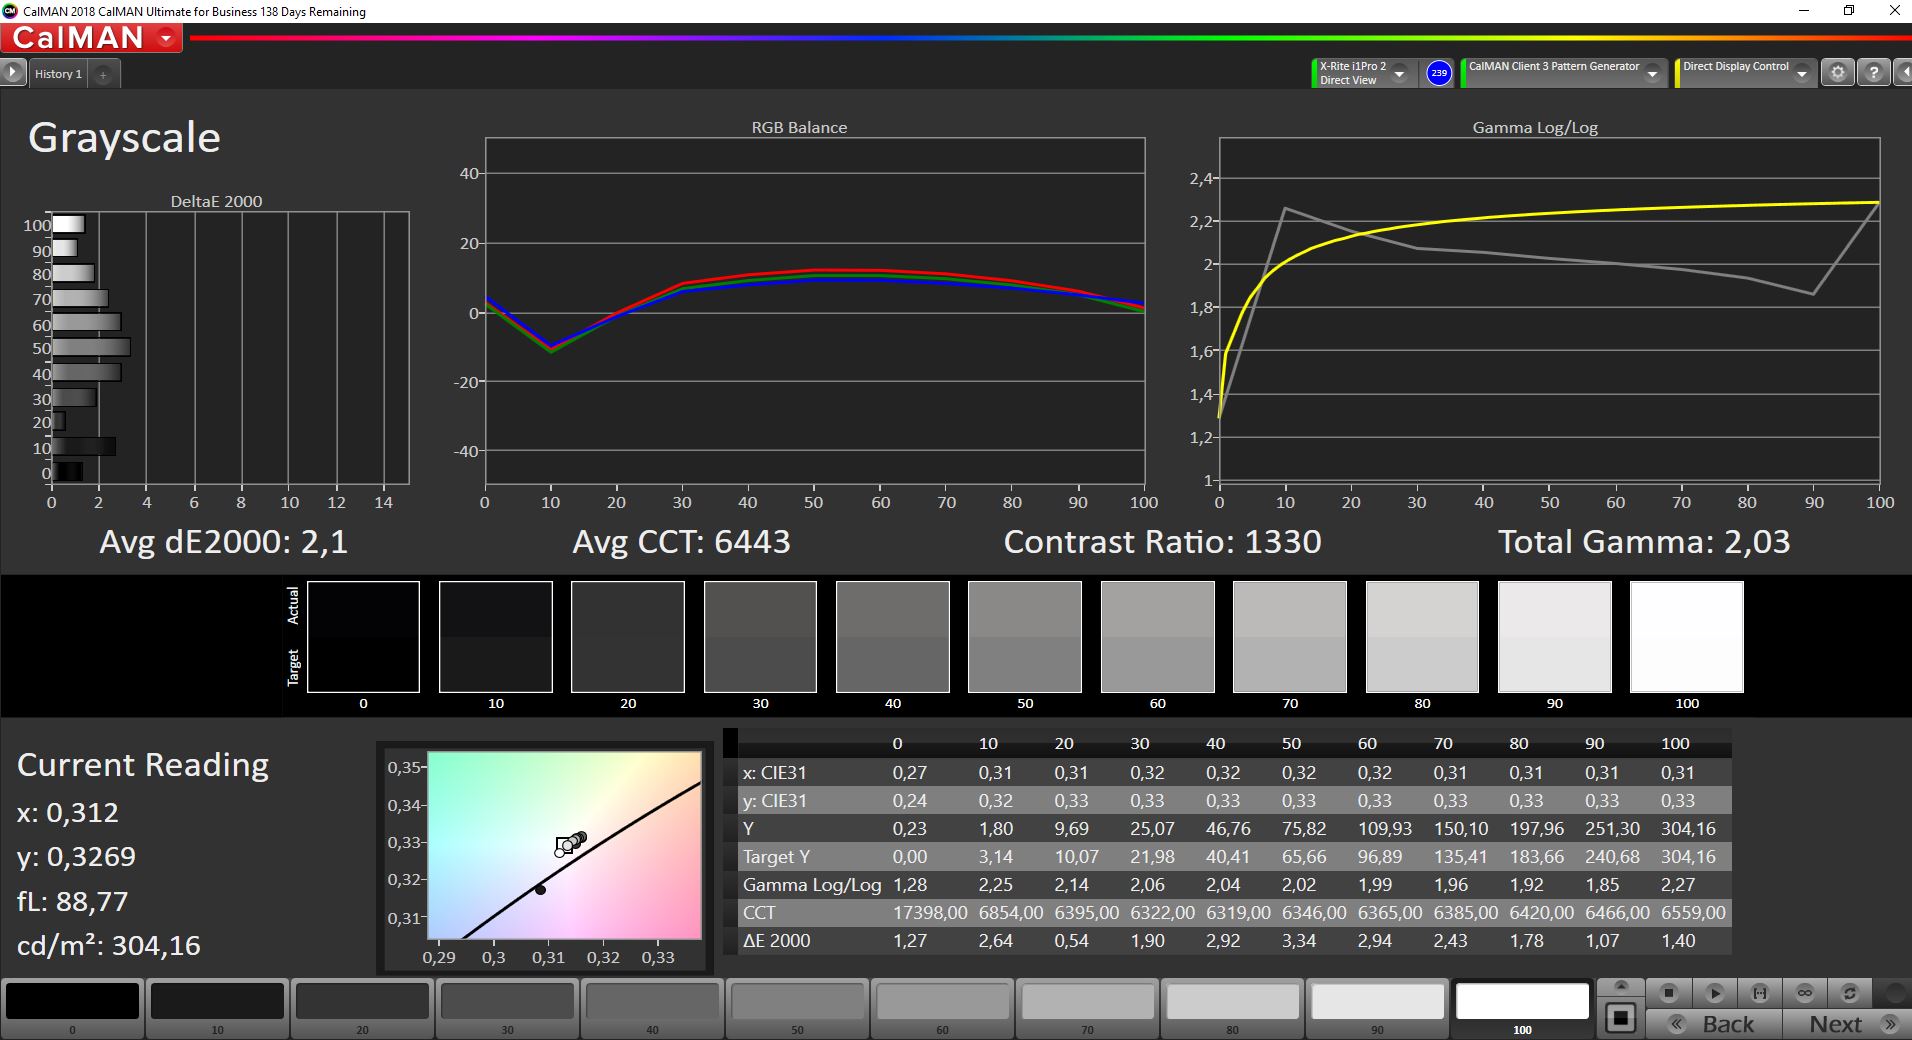
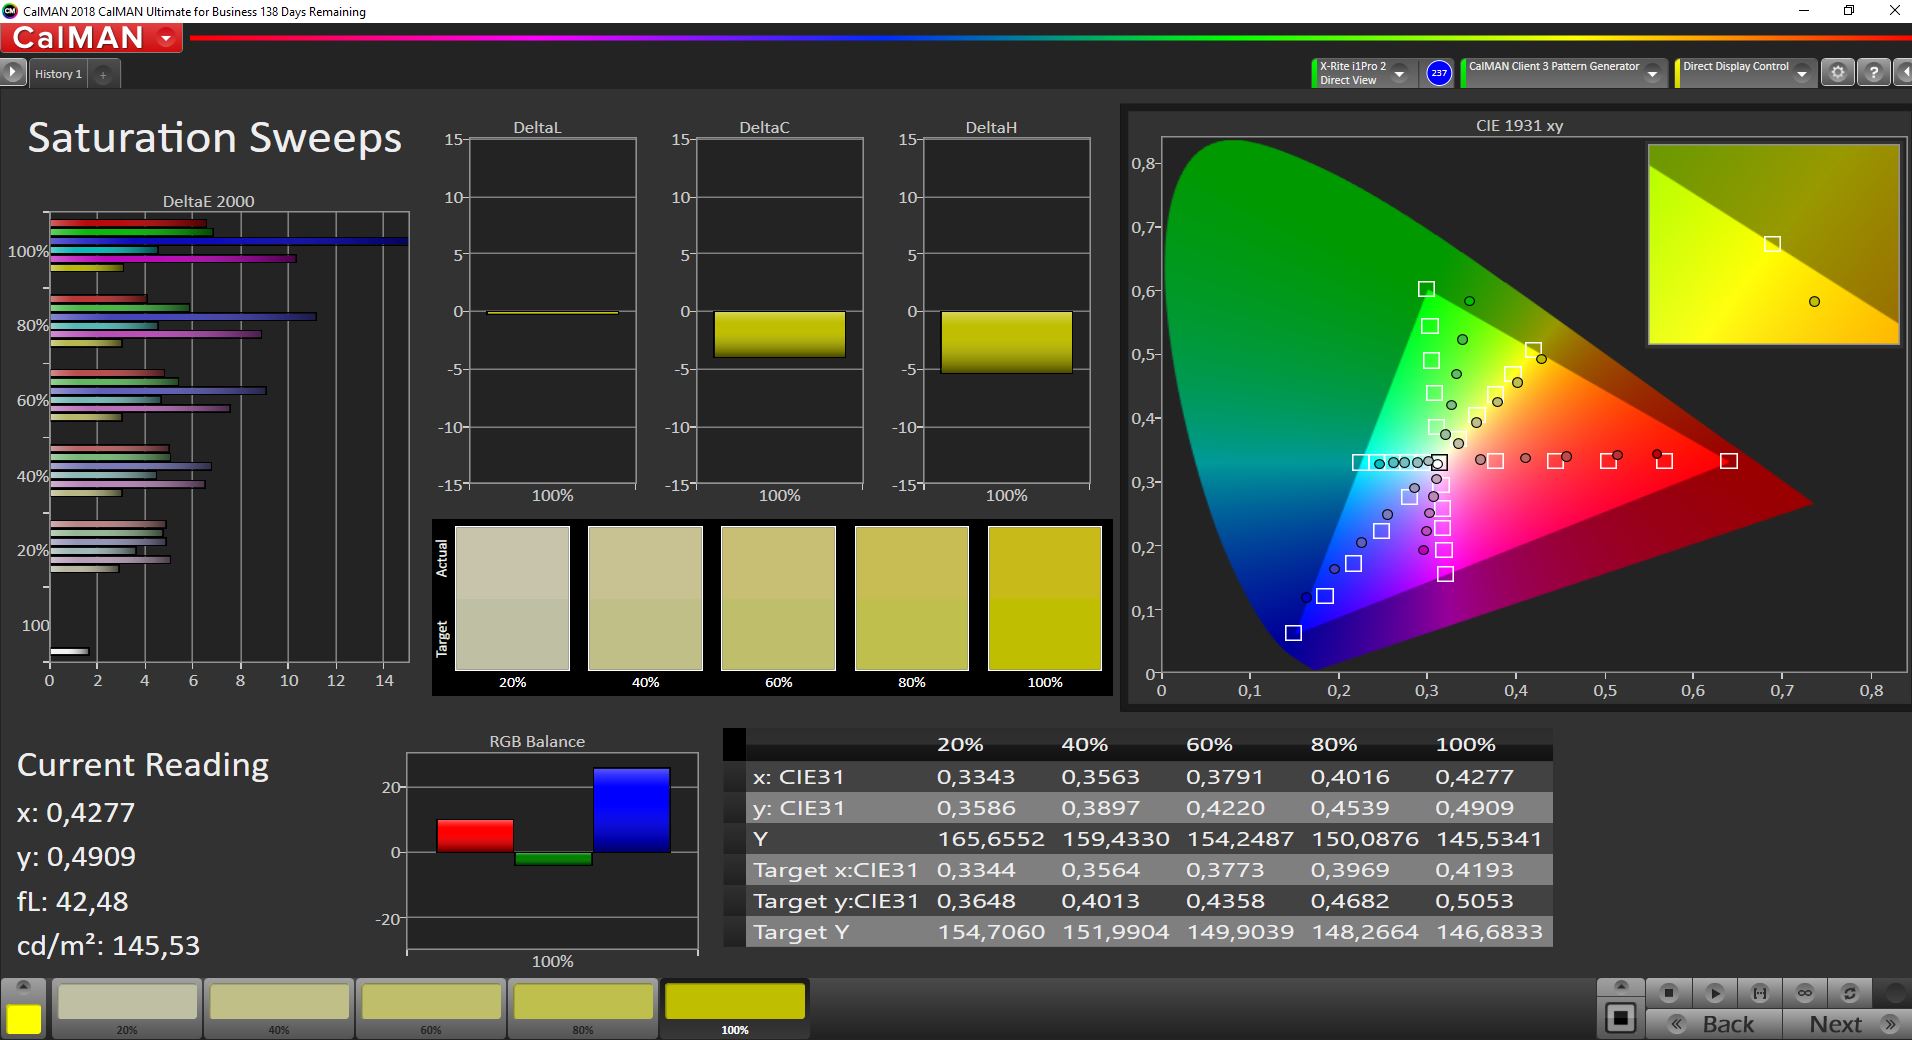
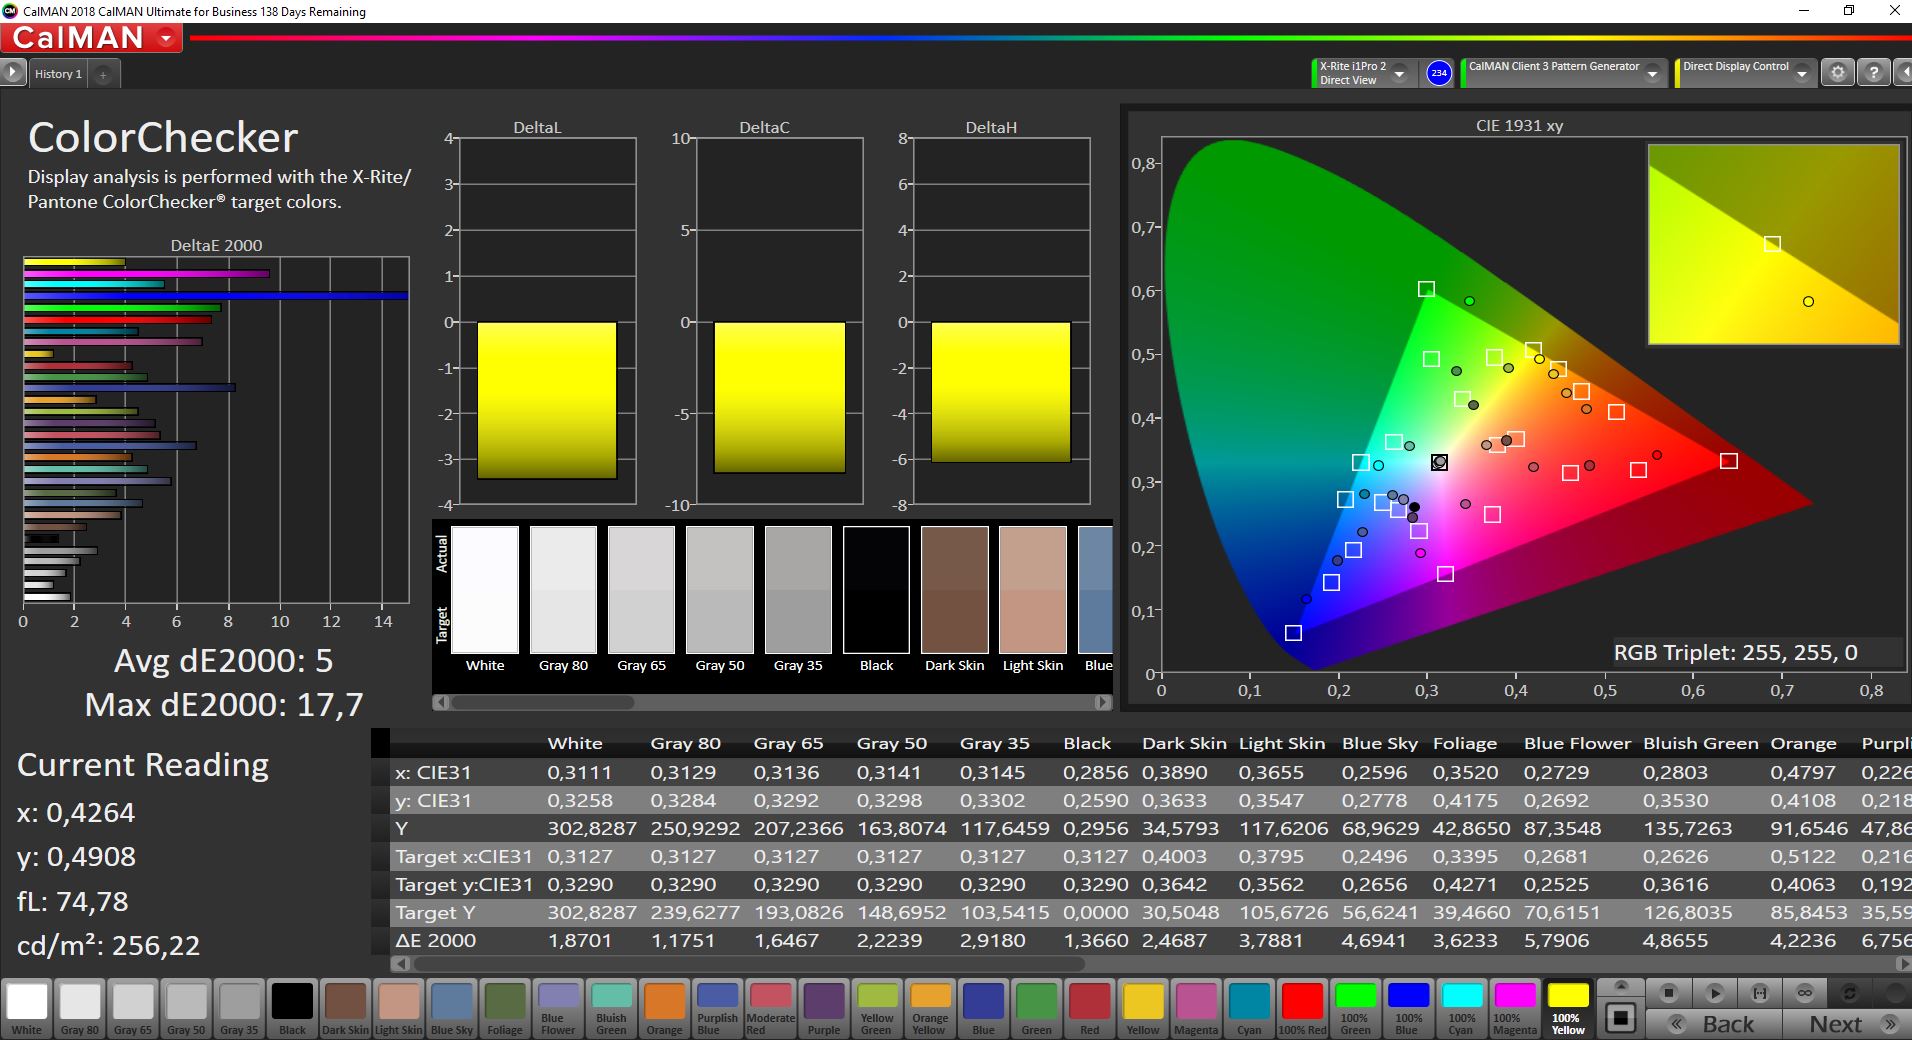
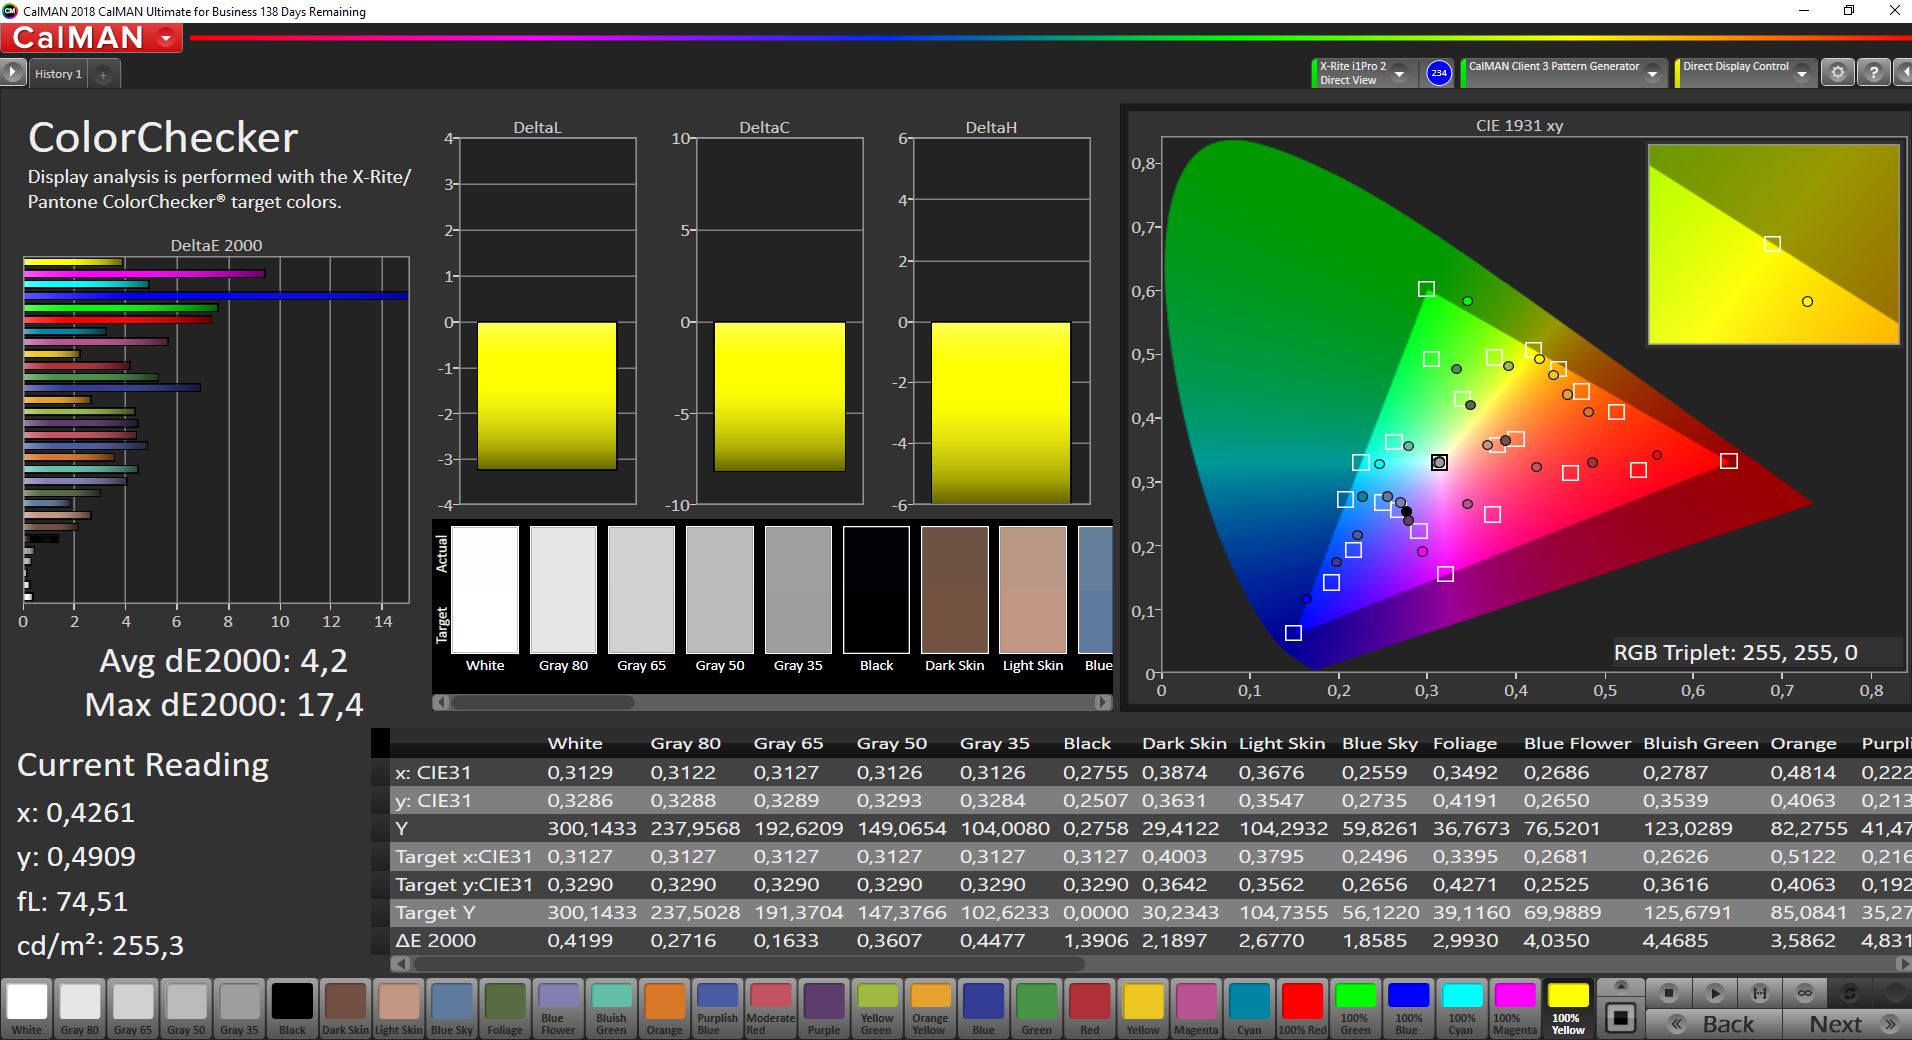
Not only in terms of brightness, but also in terms of color reproduction and the displayable color space, the panel in the test device is significantly weaker than our previous model of the ProBook x360 435 G7. Our analysis with the professional CalMAN software does not show any color cast and the grayscale in particular is already convincing ex-works. However, we cannot correct the high deviations in the colors even with our calibration (X-Rite i1 Pro 2); the panel simply cannot represent the colors more accurately. The sRGB color space is also only covered by just under 60%, so this panel is not suitable for editing pictures/videos. However, there are no restrictions for quite normal office applications.

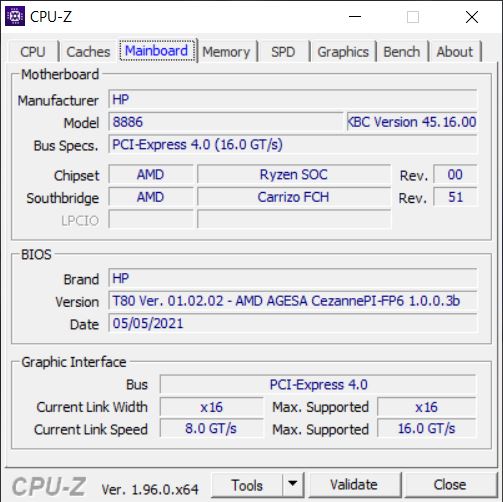
Performance - More power than many workstations
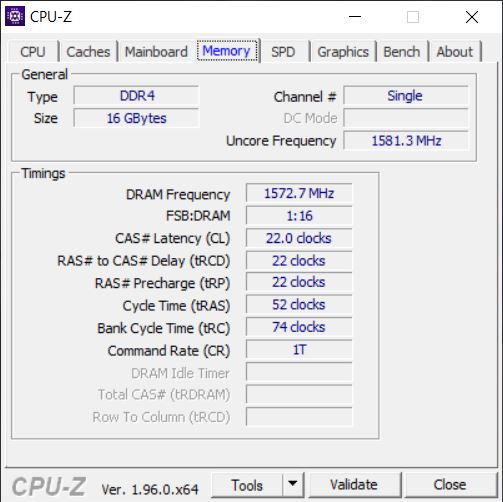
Besides the regular Ryzen 5000 chips (Ryzen 3, 5 & 7), HP also offers the ProBook x360 435 G8 with the Ryzen Pro CPUs, which offer more security features (comparable to Intel's vPro features). There are two slots for the working memory, but only a 16 GB bar is installed in our test device (single-channel). Thus, if you want to utilize the maximum graphics performance of the iGPU, you have to install another RAM module.
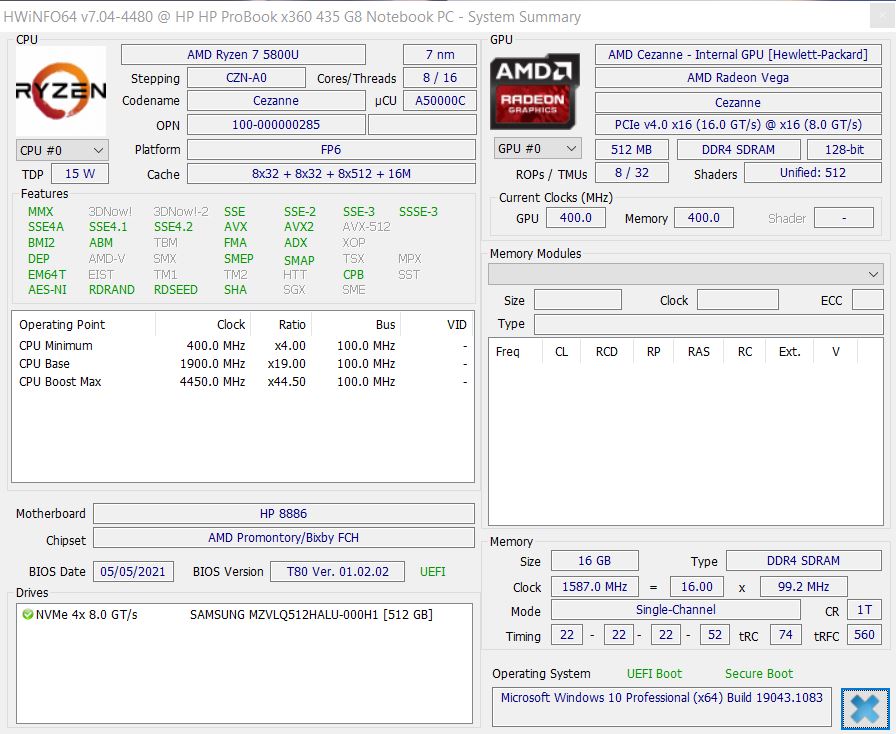
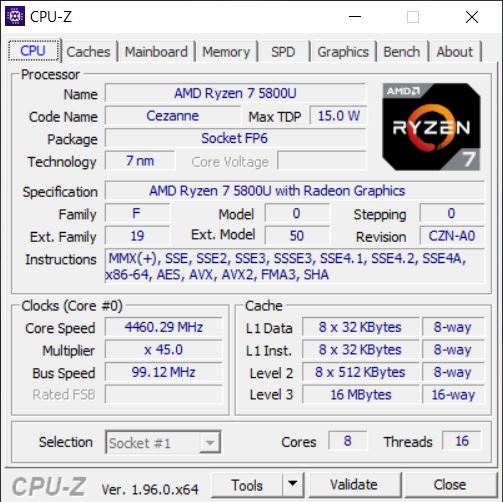
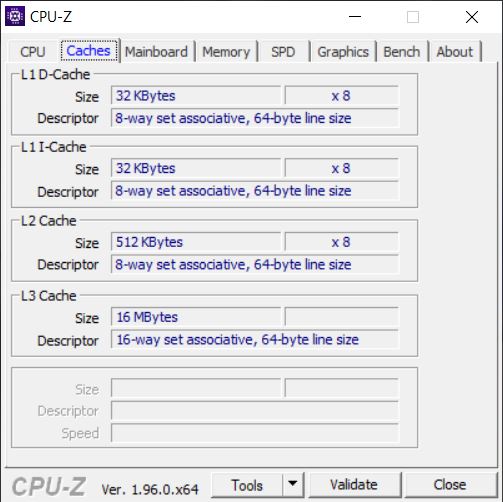
Processor - AMD Ryzen 7 5800U
With the Ryzen 7 5800U the compact convertible almost looks overpowered. With its eight cores, AMD's mobile processor even competes with full-grown workstations with Intel's 45-watt CPUs of the 10th generation. Only fast implementations of Intel's Tiger Lake CPUs have a slight advantage in single-core applications, but the difference is small and not noticeable in everyday use.
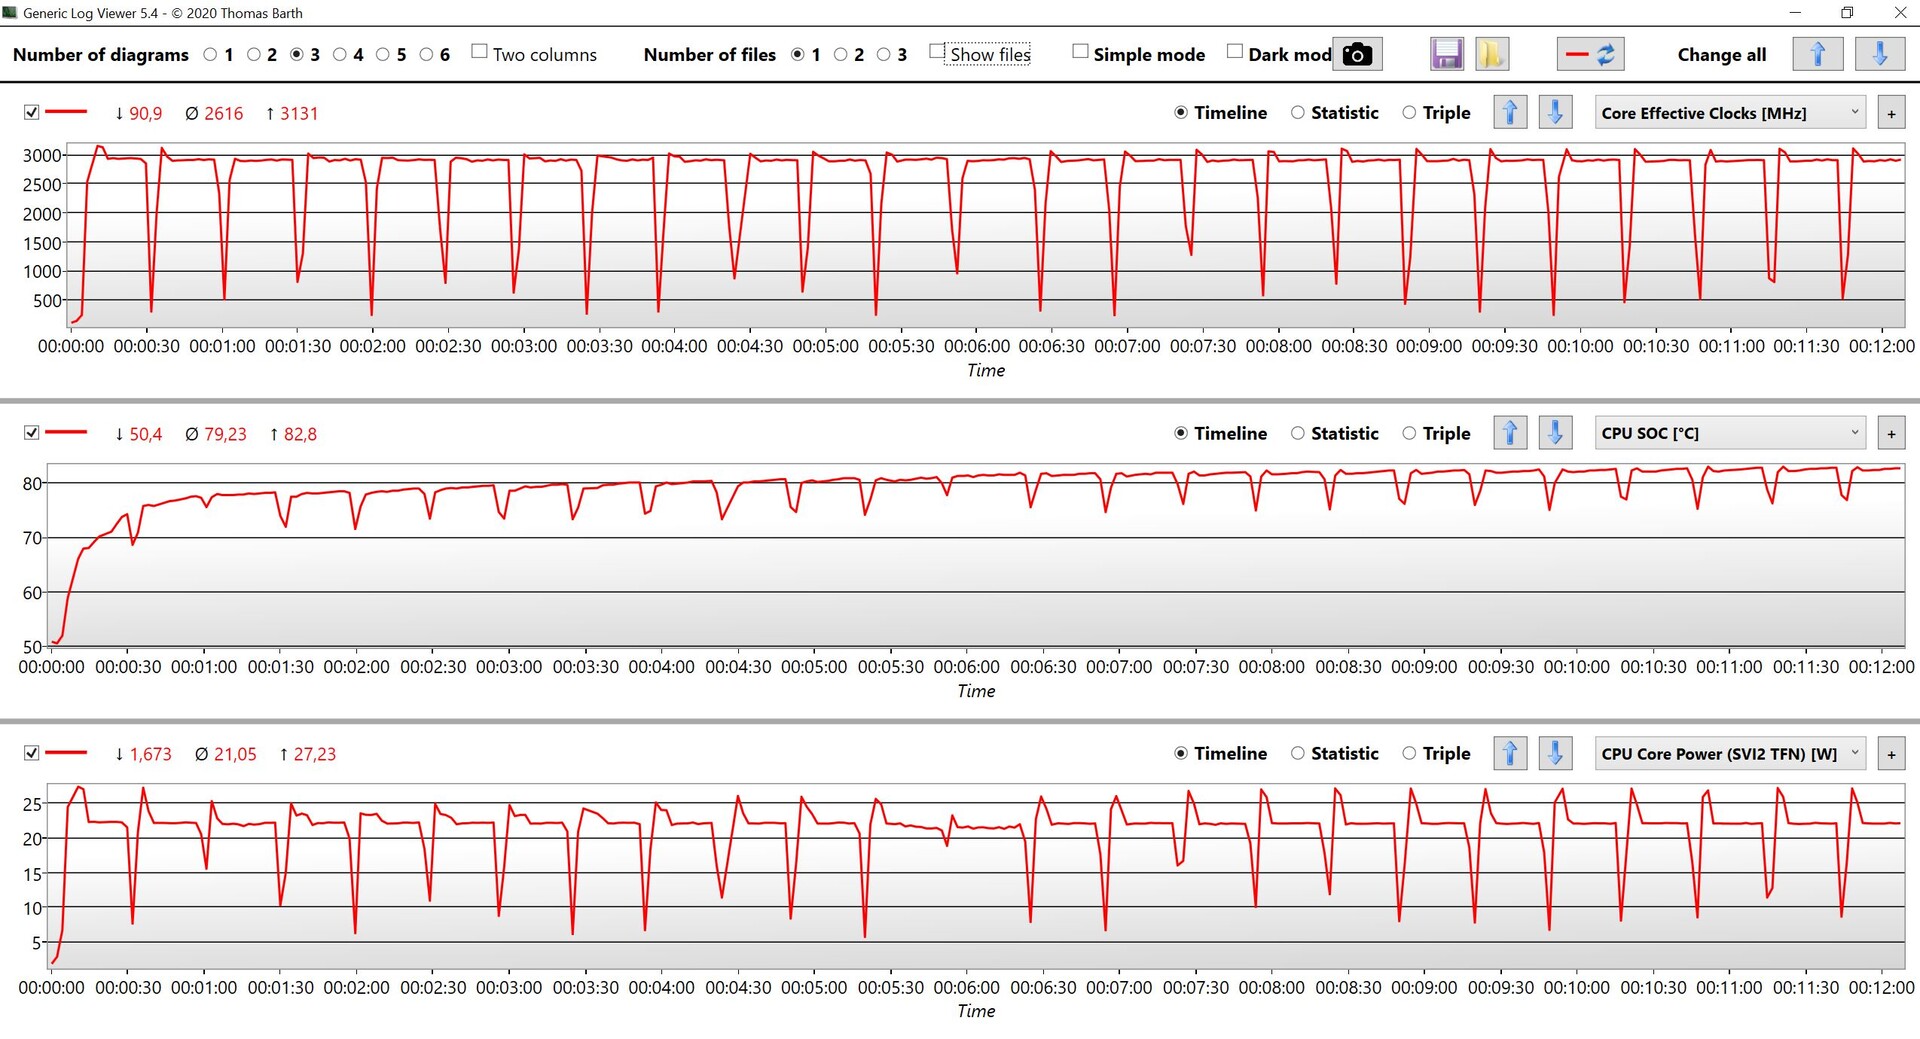
Cinebench R15 Multi Endurance test
The performance also remains quite stable and the strong drop after the first seconds, which is exhibited in Intel CPUs, does not exist here. However, it has to be said that HP's power limits are quite conservative (maximum 27 watts for a few seconds, then ~22 watts), which is why the Ryzen 7 5800U could theoretically be even faster. The performance is not reduced in battery mode.
Cinebench R20: CPU (Single Core) | CPU (Multi Core)
Cinebench R15: CPU Single 64Bit | CPU Multi 64Bit
Blender: v2.79 BMW27 CPU
7-Zip 18.03: 7z b 4 -mmt1 | 7z b 4
Geekbench 5.5: Single-Core | Multi-Core
HWBOT x265 Benchmark v2.2: 4k Preset
LibreOffice : 20 Documents To PDF
R Benchmark 2.5: Overall mean
| Cinebench R23 / Single Core | |
| Average of class Convertible (307 - 1970, n=66, last 2 years) | |
| Lenovo ThinkPad X13 G2 20WK0024GE | |
| Average AMD Ryzen 7 5800U (1415 - 1430, n=5) | |
| HP ProBook x360 435 G8 R7-5800U | |
| Acer Spin 3 SP313-51N-56YV | |
| Lenovo ThinkPad L13 Yoga Gen2-20VK000VGE | |
| Cinebench R23 / Multi Core | |
| HP ProBook x360 435 G8 R7-5800U | |
| Average of class Convertible (616 - 18070, n=66, last 2 years) | |
| Average AMD Ryzen 7 5800U (7872 - 10624, n=5) | |
| Lenovo ThinkPad X13 G2 20WK0024GE | |
| Acer Spin 3 SP313-51N-56YV | |
| Lenovo ThinkPad L13 Yoga Gen2-20VK000VGE | |
| Cinebench R20 / CPU (Single Core) | |
| Average of class Convertible (116.8 - 755, n=65, last 2 years) | |
| Lenovo ThinkPad X13 G2 20WK0024GE | |
| HP ProBook x360 435 G8 R7-5800U | |
| Average AMD Ryzen 7 5800U (551 - 560, n=5) | |
| Lenovo ThinkPad L13 Yoga Gen2-20VK000VGE | |
| Acer Spin 3 SP313-51N-56YV | |
| HP ProBook x360 435 G7, Ryzen 5 4500U | |
| Fujitsu LifeBook U9310X | |
| Cinebench R20 / CPU (Multi Core) | |
| HP ProBook x360 435 G8 R7-5800U | |
| Average of class Convertible (242 - 6954, n=66, last 2 years) | |
| Average AMD Ryzen 7 5800U (2995 - 3691, n=5) | |
| HP ProBook x360 435 G7, Ryzen 5 4500U | |
| Lenovo ThinkPad X13 G2 20WK0024GE | |
| Acer Spin 3 SP313-51N-56YV | |
| Lenovo ThinkPad L13 Yoga Gen2-20VK000VGE | |
| Fujitsu LifeBook U9310X | |
| Cinebench R15 / CPU Single 64Bit | |
| Average of class Convertible (68.6 - 287, n=65, last 2 years) | |
| HP ProBook x360 435 G8 R7-5800U | |
| Average AMD Ryzen 7 5800U (227 - 229, n=4) | |
| Lenovo ThinkPad X13 G2 20WK0024GE | |
| Acer Spin 3 SP313-51N-56YV | |
| Lenovo ThinkPad L13 Yoga Gen2-20VK000VGE | |
| HP ProBook x360 435 G7, Ryzen 5 4500U | |
| Fujitsu LifeBook U9310X | |
| Cinebench R15 / CPU Multi 64Bit | |
| Average AMD Ryzen 7 5800U (1390 - 1925, n=5) | |
| HP ProBook x360 435 G8 R7-5800U | |
| Average of class Convertible (110.1 - 2889, n=67, last 2 years) | |
| Lenovo ThinkPad X13 G2 20WK0024GE | |
| HP ProBook x360 435 G7, Ryzen 5 4500U | |
| Acer Spin 3 SP313-51N-56YV | |
| Lenovo ThinkPad L13 Yoga Gen2-20VK000VGE | |
| Fujitsu LifeBook U9310X | |
| Blender / v2.79 BMW27 CPU | |
| Fujitsu LifeBook U9310X | |
| Lenovo ThinkPad L13 Yoga Gen2-20VK000VGE | |
| Acer Spin 3 SP313-51N-56YV | |
| HP ProBook x360 435 G7, Ryzen 5 4500U | |
| Lenovo ThinkPad X13 G2 20WK0024GE | |
| Average of class Convertible (193 - 3620, n=61, last 2 years) | |
| Average AMD Ryzen 7 5800U (319 - 391, n=4) | |
| HP ProBook x360 435 G8 R7-5800U | |
| 7-Zip 18.03 / 7z b 4 -mmt1 | |
| HP ProBook x360 435 G8 R7-5800U | |
| Average AMD Ryzen 7 5800U (5285 - 5405, n=4) | |
| Lenovo ThinkPad X13 G2 20WK0024GE | |
| Average of class Convertible (2046 - 6417, n=63, last 2 years) | |
| Lenovo ThinkPad L13 Yoga Gen2-20VK000VGE | |
| Acer Spin 3 SP313-51N-56YV | |
| HP ProBook x360 435 G7, Ryzen 5 4500U | |
| Fujitsu LifeBook U9310X | |
| 7-Zip 18.03 / 7z b 4 | |
| HP ProBook x360 435 G8 R7-5800U | |
| Average AMD Ryzen 7 5800U (39618 - 45985, n=4) | |
| Average of class Convertible (7703 - 72400, n=63, last 2 years) | |
| Lenovo ThinkPad X13 G2 20WK0024GE | |
| HP ProBook x360 435 G7, Ryzen 5 4500U | |
| Acer Spin 3 SP313-51N-56YV | |
| Lenovo ThinkPad L13 Yoga Gen2-20VK000VGE | |
| Fujitsu LifeBook U9310X | |
| Geekbench 5.5 / Single-Core | |
| Average of class Convertible (319 - 1981, n=67, last 2 years) | |
| Lenovo ThinkPad X13 G2 20WK0024GE | |
| Average AMD Ryzen 7 5800U (1411 - 1450, n=4) | |
| HP ProBook x360 435 G8 R7-5800U | |
| Lenovo ThinkPad L13 Yoga Gen2-20VK000VGE | |
| Acer Spin 3 SP313-51N-56YV | |
| HP ProBook x360 435 G7, Ryzen 5 4500U | |
| Fujitsu LifeBook U9310X | |
| Geekbench 5.5 / Multi-Core | |
| Average of class Convertible (663 - 14016, n=67, last 2 years) | |
| Average AMD Ryzen 7 5800U (6093 - 7026, n=4) | |
| HP ProBook x360 435 G8 R7-5800U | |
| Lenovo ThinkPad X13 G2 20WK0024GE | |
| Acer Spin 3 SP313-51N-56YV | |
| Lenovo ThinkPad L13 Yoga Gen2-20VK000VGE | |
| HP ProBook x360 435 G7, Ryzen 5 4500U | |
| Fujitsu LifeBook U9310X | |
| HWBOT x265 Benchmark v2.2 / 4k Preset | |
| HP ProBook x360 435 G8 R7-5800U | |
| Average of class Convertible (0.61 - 20.1, n=65, last 2 years) | |
| Average AMD Ryzen 7 5800U (9.68 - 11, n=4) | |
| Lenovo ThinkPad X13 G2 20WK0024GE | |
| HP ProBook x360 435 G7, Ryzen 5 4500U | |
| Acer Spin 3 SP313-51N-56YV | |
| Lenovo ThinkPad L13 Yoga Gen2-20VK000VGE | |
| Fujitsu LifeBook U9310X | |
| LibreOffice / 20 Documents To PDF | |
| HP ProBook x360 435 G7, Ryzen 5 4500U | |
| HP ProBook x360 435 G8 R7-5800U | |
| Lenovo ThinkPad L13 Yoga Gen2-20VK000VGE | |
| Average AMD Ryzen 7 5800U (50.9 - 60.2, n=4) | |
| Fujitsu LifeBook U9310X | |
| Average of class Convertible (42 - 223, n=63, last 2 years) | |
| Acer Spin 3 SP313-51N-56YV | |
| Lenovo ThinkPad X13 G2 20WK0024GE | |
| R Benchmark 2.5 / Overall mean | |
| Fujitsu LifeBook U9310X | |
| HP ProBook x360 435 G7, Ryzen 5 4500U | |
| Acer Spin 3 SP313-51N-56YV | |
| Lenovo ThinkPad L13 Yoga Gen2-20VK000VGE | |
| Lenovo ThinkPad X13 G2 20WK0024GE | |
| Average AMD Ryzen 7 5800U (0.54 - 0.546, n=4) | |
| HP ProBook x360 435 G8 R7-5800U | |
| Average of class Convertible (0.4102 - 1.967, n=63, last 2 years) | |
* ... smaller is better
System performance
The system performance is very good and the benchmark results are also often ahead of the rivals. However, all modern laptops are very responsive in everyday use and you hardly notice a difference. Our test device had some problems with the standby mode (keyword: Modern Standby) and was often still active (and so was the fan) when we closed the lid, for example. Of course, this does not restrict use, but it should still be noted.
| PCMark 10 / Score | |
| Average AMD Ryzen 7 5800U, AMD Radeon RX Vega 8 (Ryzen 4000/5000) (5334 - 6090, n=4) | |
| Average of class Convertible (1486 - 7963, n=60, last 2 years) | |
| HP ProBook x360 435 G8 R7-5800U | |
| Acer Spin 3 SP313-51N-56YV | |
| Lenovo ThinkPad L13 Yoga Gen2-20VK000VGE | |
| HP ProBook x360 435 G7, Ryzen 5 4500U | |
| Fujitsu LifeBook U9310X | |
| PCMark 10 / Essentials | |
| Average of class Convertible (3975 - 12059, n=60, last 2 years) | |
| Average AMD Ryzen 7 5800U, AMD Radeon RX Vega 8 (Ryzen 4000/5000) (9476 - 10182, n=4) | |
| Lenovo ThinkPad L13 Yoga Gen2-20VK000VGE | |
| Acer Spin 3 SP313-51N-56YV | |
| HP ProBook x360 435 G8 R7-5800U | |
| Fujitsu LifeBook U9310X | |
| HP ProBook x360 435 G7, Ryzen 5 4500U | |
| PCMark 10 / Productivity | |
| Average AMD Ryzen 7 5800U, AMD Radeon RX Vega 8 (Ryzen 4000/5000) (8336 - 9657, n=4) | |
| HP ProBook x360 435 G8 R7-5800U | |
| Average of class Convertible (2764 - 10800, n=60, last 2 years) | |
| Fujitsu LifeBook U9310X | |
| HP ProBook x360 435 G7, Ryzen 5 4500U | |
| Acer Spin 3 SP313-51N-56YV | |
| Lenovo ThinkPad L13 Yoga Gen2-20VK000VGE | |
| PCMark 10 / Digital Content Creation | |
| Average of class Convertible (811 - 12360, n=60, last 2 years) | |
| Average AMD Ryzen 7 5800U, AMD Radeon RX Vega 8 (Ryzen 4000/5000) (5214 - 6235, n=4) | |
| HP ProBook x360 435 G8 R7-5800U | |
| Acer Spin 3 SP313-51N-56YV | |
| Lenovo ThinkPad L13 Yoga Gen2-20VK000VGE | |
| HP ProBook x360 435 G7, Ryzen 5 4500U | |
| Fujitsu LifeBook U9310X | |
| PCMark 10 Score | 5334 points | |
Help | ||
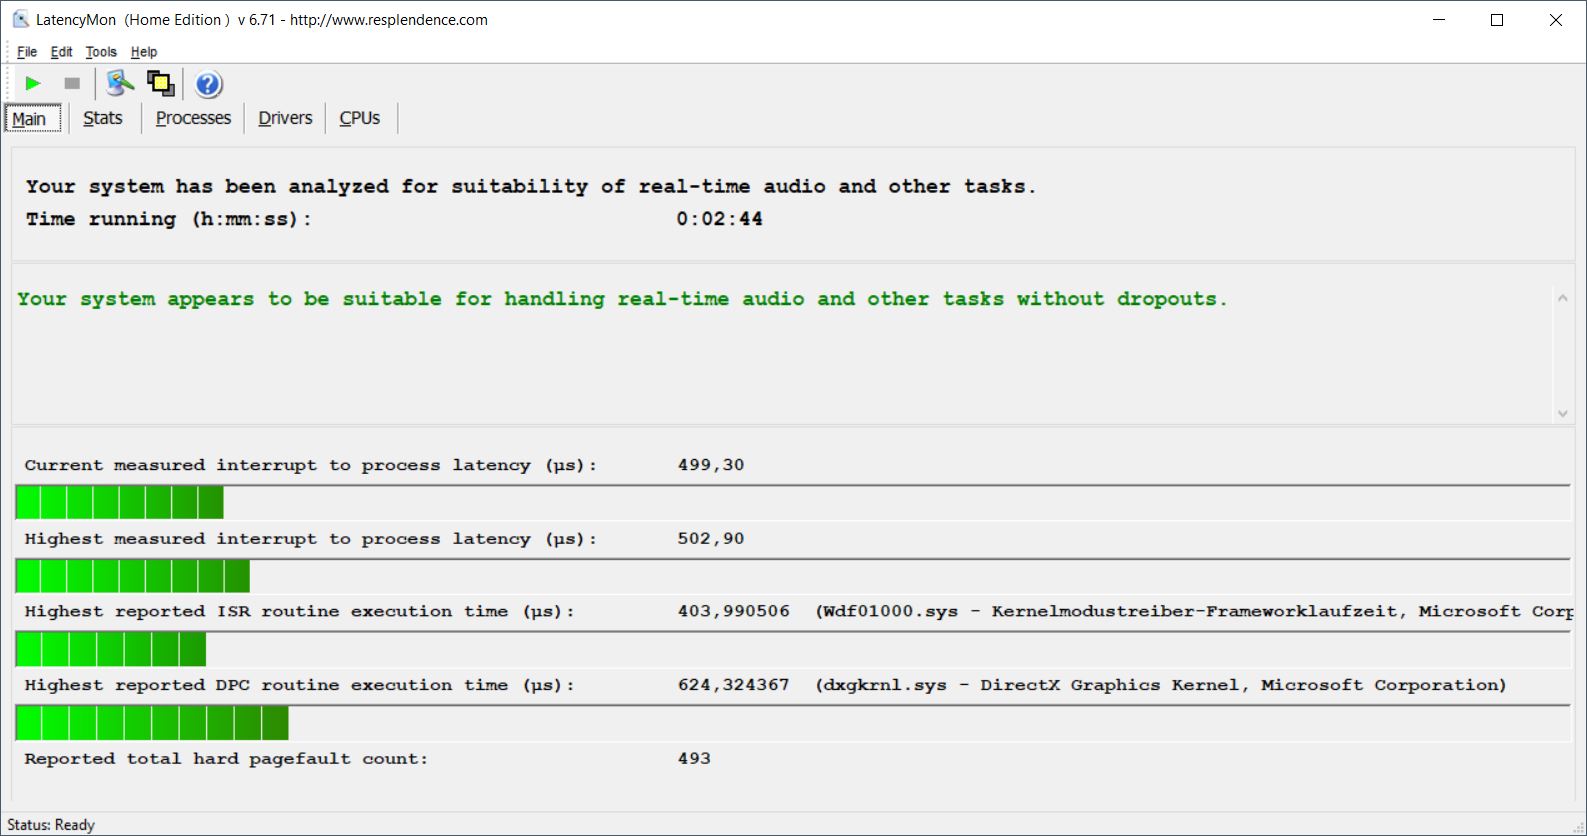
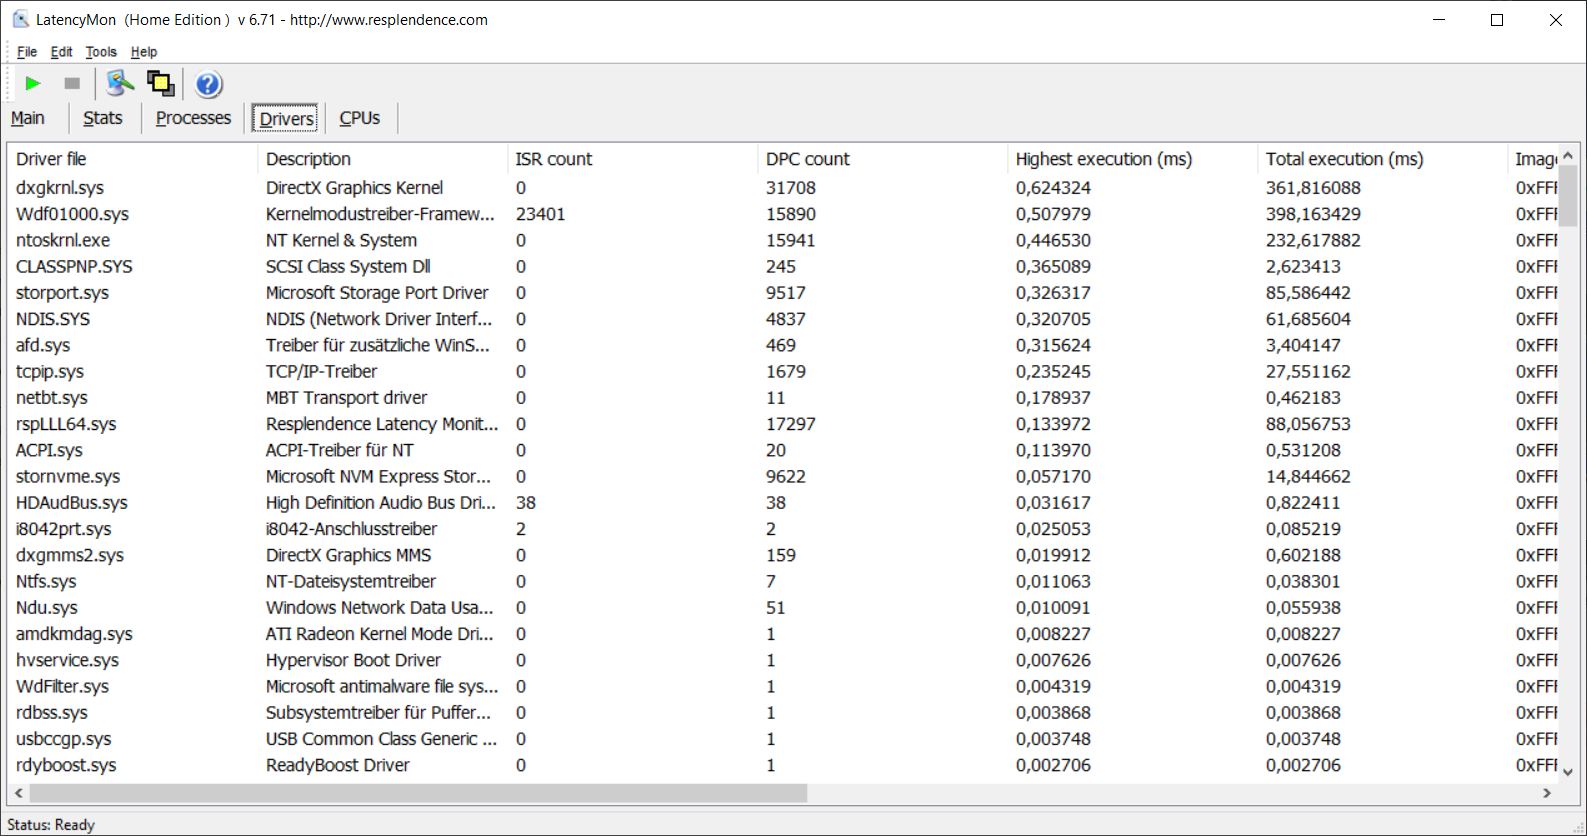
DPC latencies
There were no restrictions with the ProBook in our standardized latency test.
| DPC Latencies / LatencyMon - interrupt to process latency (max), Web, Youtube, Prime95 | |
| HP ProBook x360 435 G7, Ryzen 5 4500U | |
| Fujitsu LifeBook U9310X | |
| Acer Spin 3 SP313-51N-56YV | |
| Lenovo ThinkPad L13 Yoga Gen2-20VK000VGE | |
| HP ProBook x360 435 G8 R7-5800U | |
* ... smaller is better
Mass storage
The M.2-2280 SSD is connected via PCIe-3.0-x4 and a Samsung drive (PM991) with a storage capacity of 512 GB is used in our test device, of which 425 GB are still available for the user after the first start-up. The transfer rates are okay and there are no restrictions in everyday office use, but there are also faster drives on the market. More SSD benchmarks are available here.
| HP ProBook x360 435 G8 R7-5800U Samsung PM991 MZVLQ512HALU | Lenovo ThinkPad L13 Yoga Gen2-20VK000VGE WDC PC SN730 SDBPNTY-256G | Fujitsu LifeBook U9310X Toshiba KBG40ZNS512G NVMe | Acer Spin 3 SP313-51N-56YV Kingston OM8PCP3512F-AB | HP ProBook x360 435 G7, Ryzen 5 4500U WDC PC SN520 SDAPNUW-512G | Average Samsung PM991 MZVLQ512HALU | Average of class Convertible | |
|---|---|---|---|---|---|---|---|
| CrystalDiskMark 5.2 / 6 | 33% | 21% | 32% | 8% | 17% | 76% | |
| Write 4K | 86.7 | 119.7 38% | 134.2 55% | 286.1 230% | 94.1 9% | 131.8 ? 52% | 148.4 ? 71% |
| Read 4K | 32.45 | 38.54 19% | 53.4 65% | 48.89 51% | 41.01 26% | 44.9 ? 38% | 62.3 ? 92% |
| Write Seq | 1235 | 1754 42% | 1216 -2% | 982 -20% | 1465 19% | 1162 ? -6% | 2351 ? 90% |
| Read Seq | 1417 | 1709 21% | 1291 -9% | 1301 -8% | 1453 3% | 1473 ? 4% | 2650 ? 87% |
| Write 4K Q32T1 | 390.8 | 461.9 18% | 401.5 3% | 625 60% | 322.6 -17% | 399 ? 2% | 384 ? -2% |
| Read 4K Q32T1 | 291 | 390.5 34% | 491.4 69% | 301 3% | 421.8 45% | 426 ? 46% | 487 ? 67% |
| Write Seq Q32T1 | 1384 | 2185 58% | 1224 -12% | 981 -29% | 1463 6% | 1348 ? -3% | 3011 ? 118% |
| Read Seq Q32T1 | 2350 | 3118 33% | 2314 -2% | 1631 -31% | 1751 -25% | 2398 ? 2% | 4330 ? 84% |
| AS SSD | 86% | 10% | 30% | 43% | 58% | 104% | |
| Seq Read | 1936 | 2387 23% | 2030 5% | 1748 -10% | 1491 -23% | 1921 ? -1% | 3323 ? 72% |
| Seq Write | 1237 | 2000 62% | 1071 -13% | 941 -24% | 1306 6% | 1128 ? -9% | 1977 ? 60% |
| 4K Read | 40.35 | 41.18 2% | 49.16 22% | 44.06 9% | 41.2 2% | 47.6 ? 18% | 55.7 ? 38% |
| 4K Write | 99.5 | 169.6 70% | 117.3 18% | 77.7 -22% | 118.1 19% | 137.9 ? 39% | 163.2 ? 64% |
| 4K-64 Read | 645 | 681 6% | 1268 97% | 451.1 -30% | 1033 60% | 878 ? 36% | 916 ? 42% |
| 4K-64 Write | 365.8 | 571 56% | 699 91% | 926 153% | 1007 175% | 782 ? 114% | 1448 ? 296% |
| Access Time Read * | 0.104 | 0.051 51% | 0.067 36% | 0.188 -81% | 0.103 1% | 0.09367 ? 10% | 0.08413 ? 19% |
| Access Time Write * | 0.038 | 0.025 34% | 0.168 -342% | 0.043 -13% | 0.031 18% | 0.03708 ? 2% | 0.113 ? -197% |
| Score Read | 879 | 961 9% | 1520 73% | 670 -24% | 1223 39% | 1118 ? 27% | 1304 ? 48% |
| Score Write | 589 | 941 60% | 923 57% | 1098 86% | 1256 113% | 1033 ? 75% | 1809 ? 207% |
| Score Total | 1892 | 2384 26% | 3179 68% | 2084 10% | 3102 64% | 2694 ? 42% | 3725 ? 97% |
| Copy ISO MB/s | 708 | 1855 162% | 969 37% | 1347 ? 90% | 2018 ? 185% | ||
| Copy Program MB/s | 132.1 | 565 328% | 609 361% | 421 ? 219% | 496 ? 275% | ||
| Copy Game MB/s | 326.7 | 1360 316% | 232.4 -29% | 825 ? 153% | 1138 ? 248% | ||
| Total Average (Program / Settings) | 60% /
67% | 16% /
15% | 31% /
31% | 26% /
28% | 38% /
43% | 90% /
94% |
* ... smaller is better

Continuous load read: DiskSpd Read Loop, Queue Depth 8
Graphics card
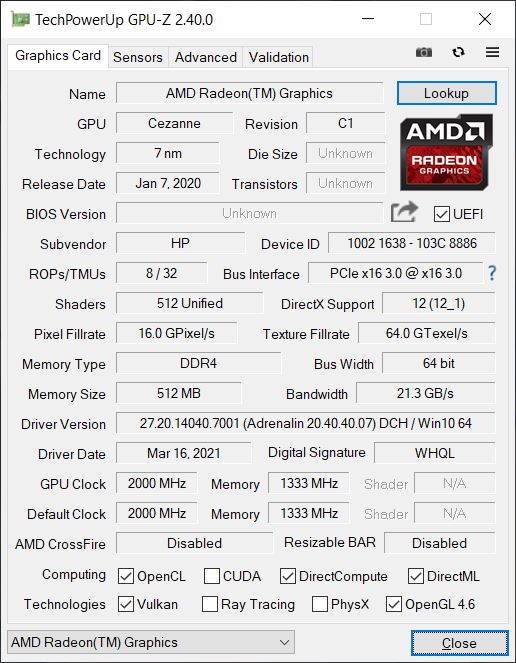
The Ryzen 7 5800U is equipped with the integrated Radeon RX Vega 8. Compared with the last generation, there are mainly improvements in detail. The performance is comparable overall, although our review sample cannot exploit the Vega 8's full potential with the single-channel RAM configuration. Intel's current Xe Graphics G7 (with 80 or 96 EUs) is slightly faster in the synthetic tests, but the ProBook could narrow the gap with another RAM module.
One advantage of the new iGPUs in the Ryzen 5000 chips is primarily the improved efficiency during video playback, which then also has a positive impact on the battery runtime. The GPU load during playback of a 4K YouTube video is only in the single-digit percentage range, whereas it was still ~60% in the predecessors (Iris Xe Graphics ~30%).
At least older or a few demanding titles can be played smoothly with the iGPU, although you are usually limited to low to medium details here.
In battery mode, the GPU performance is not reduced and the performance remains stable even under longer load. More GPU benchmarks are available in our technology section.
| 3DMark 11 Performance | 4663 points | |
| 3DMark Cloud Gate Standard Score | 18062 points | |
| 3DMark Fire Strike Score | 2356 points | |
| 3DMark Time Spy Score | 991 points | |
Help | ||
Witcher 3 FPS-Diagram
| GTA V | |
| 1920x1080 Highest Settings possible AA:4xMSAA + FX AF:16x | |
| Average of class Convertible (5.98 - 114.3, n=56, last 2 years) | |
| Average AMD Radeon RX Vega 8 (Ryzen 4000/5000) (6 - 18.2, n=41) | |
| HP ProBook x360 435 G8 R7-5800U | |
| Acer Spin 3 SP313-51N-56YV | |
| 1920x1080 High/On (Advanced Graphics Off) AA:2xMSAA + FX AF:8x | |
| Average of class Convertible (11.7 - 172.7, n=54, last 2 years) | |
| Average AMD Radeon RX Vega 8 (Ryzen 4000/5000) (13.8 - 40.6, n=44) | |
| Acer Spin 3 SP313-51N-56YV | |
| HP ProBook x360 435 G8 R7-5800U | |
| 1366x768 Normal/Off AF:4x | |
| Average of class Convertible (24.1 - 175.4, n=56, last 2 years) | |
| Average AMD Radeon RX Vega 8 (Ryzen 4000/5000) (34 - 148, n=42) | |
| Acer Spin 3 SP313-51N-56YV | |
| HP ProBook x360 435 G8 R7-5800U | |
| 1024x768 Lowest Settings possible | |
| Average of class Convertible (60.9 - 179.7, n=56, last 2 years) | |
| Average AMD Radeon RX Vega 8 (Ryzen 4000/5000) (53.6 - 160, n=47) | |
| Acer Spin 3 SP313-51N-56YV | |
| HP ProBook x360 435 G8 R7-5800U | |
| low | med. | high | ultra | |
| GTA V (2015) | 69.8 | 64.5 | 17.2 | 7.36 |
| The Witcher 3 (2015) | 42 | 14 | 9.33 | |
| Dota 2 Reborn (2015) | 108 | 79.2 | 38.6 | 36.4 |
| Final Fantasy XV Benchmark (2018) | 24.4 | 12 | 7.97 | |
| X-Plane 11.11 (2018) | 40 | 29.9 | 26.2 | |
| Strange Brigade (2018) | 48 | 18.7 | 15.8 | 13.9 |
Emissions & Energy
Noise emissions
The ProBook's single fan is not unpleasantly loud even under load, but the problem is the somewhat immature fan control. Especially in the high-performance profile of Windows, the fan starts every now and then even when idling without any apparent reason. Here, the problem with the standby mode occurs again, because we were sometimes surprised that the fan also started. In these cases, the laptop simply didn't go into standby mode correctly. We could not hear any other electronic noises.
Noise Level
| Idle |
| 23.7 / 27.5 / 34.4 dB(A) |
| Load |
| 36.2 / 38.7 dB(A) |
 | ||
30 dB silent 40 dB(A) audible 50 dB(A) loud |
||
min: | ||
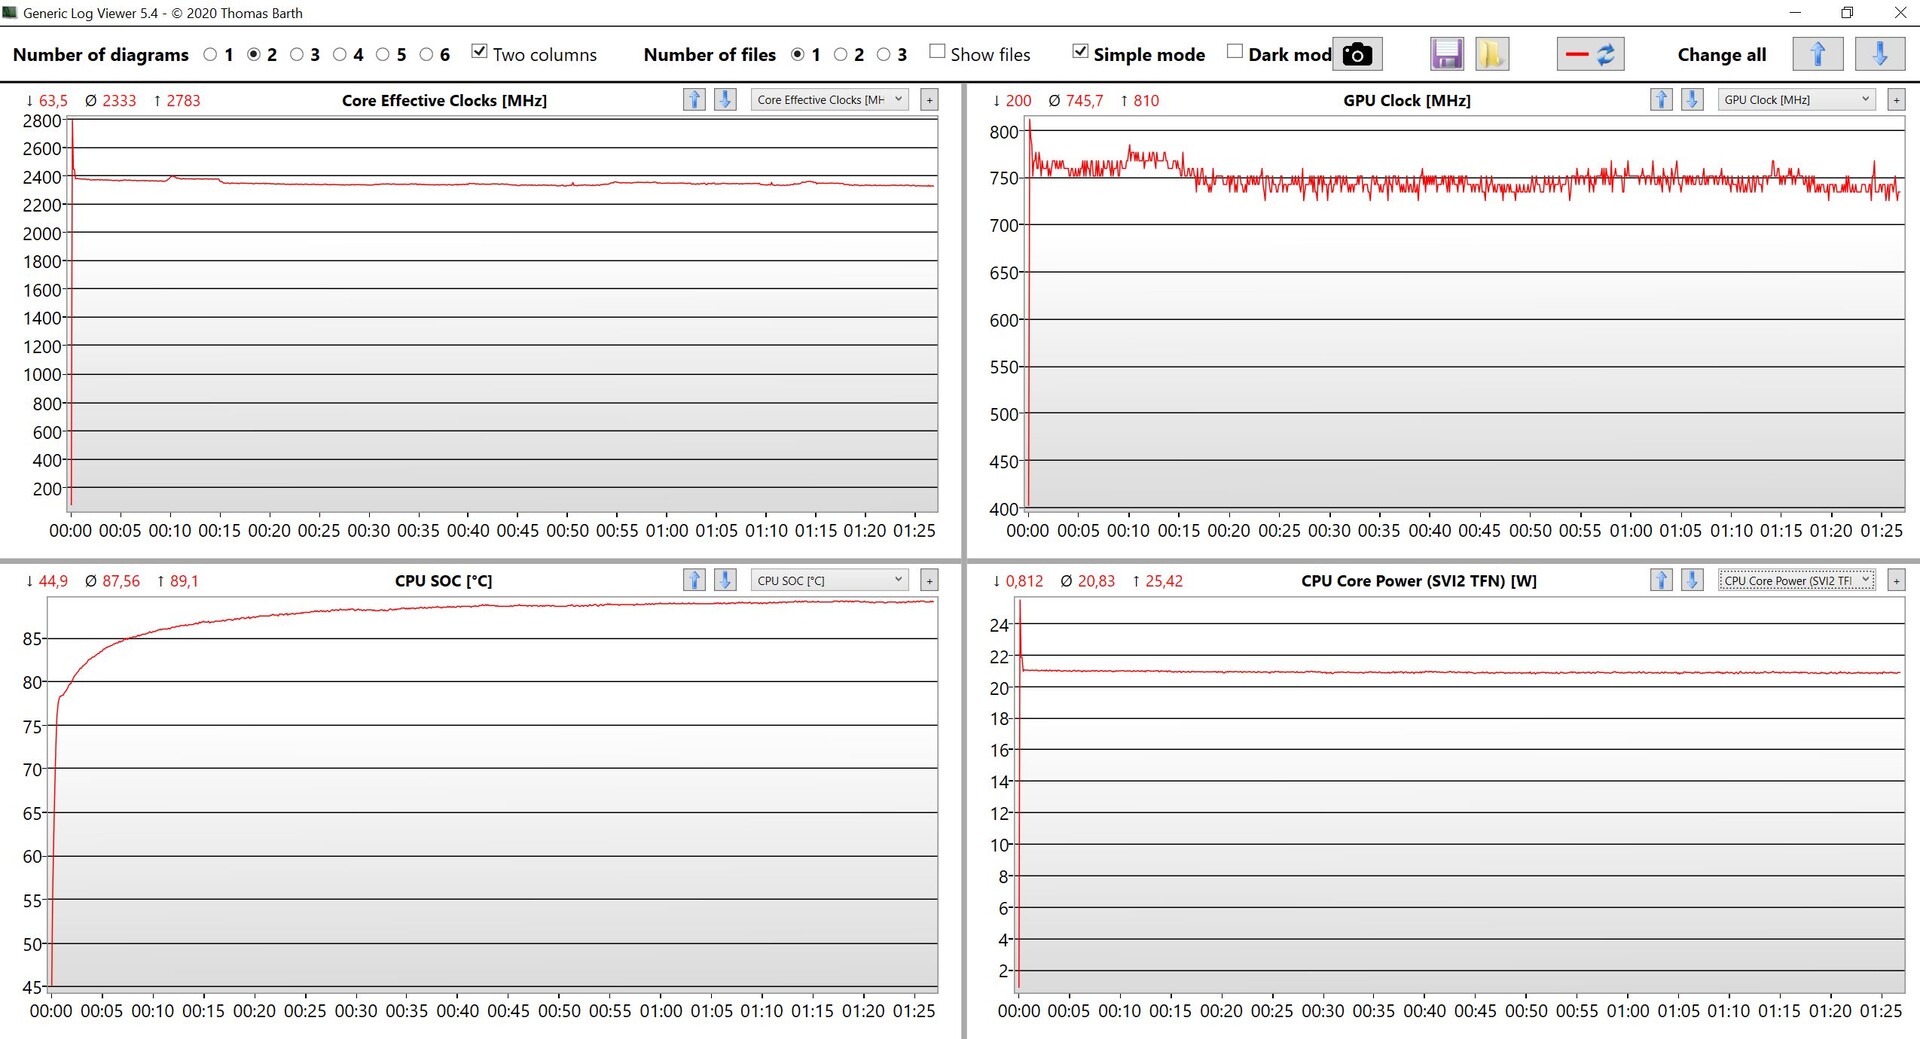
Temperature
Under load, the case does get noticeably warm in some places (<45 °C, 113 °F) and direct skin contact can be unpleasant, but it is by no means critical. There are no restrictions for normal office tasks anyway. As with the pure processor load, the SoC consumption quickly settles at ~21 watts, which is still sufficient for 8x 2.4 GHz (CPU) and ~750 MHz (iGPU). There are no performance losses directly after the stress test.
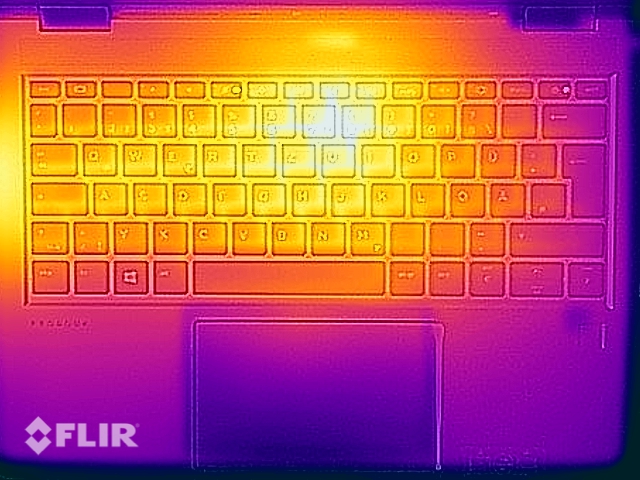
(±) The maximum temperature on the upper side is 43.8 °C / 111 F, compared to the average of 35.3 °C / 96 F, ranging from 19.6 to 55.7 °C for the class Convertible.
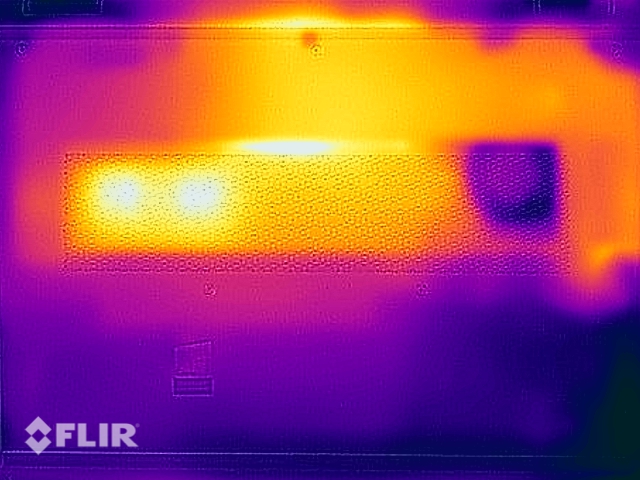
(-) The bottom heats up to a maximum of 47.4 °C / 117 F, compared to the average of 36.8 °C / 98 F
(+) In idle usage, the average temperature for the upper side is 24.2 °C / 76 F, compared to the device average of 30.2 °C / 86 F.
(±) Playing The Witcher 3, the average temperature for the upper side is 34.2 °C / 94 F, compared to the device average of 30.2 °C / 86 F.
(+) The palmrests and touchpad are cooler than skin temperature with a maximum of 31.9 °C / 89.4 F and are therefore cool to the touch.
(-) The average temperature of the palmrest area of similar devices was 28.1 °C / 82.6 F (-3.8 °C / -6.8 F).
Speaker
HP ProBook x360 435 G8 R7-5800U audio analysis
(±) | speaker loudness is average but good (76.5 dB)
Bass 100 - 315 Hz
(-) | nearly no bass - on average 25.4% lower than median
(-) | bass is not linear (15.6% delta to prev. frequency)
Mids 400 - 2000 Hz
(+) | balanced mids - only 1.1% away from median
(+) | mids are linear (3% delta to prev. frequency)
Highs 2 - 16 kHz
(+) | balanced highs - only 2.9% away from median
(+) | highs are linear (3.8% delta to prev. frequency)
Overall 100 - 16.000 Hz
(±) | linearity of overall sound is average (18% difference to median)
Compared to same class
» 33% of all tested devices in this class were better, 7% similar, 60% worse
» The best had a delta of 6%, average was 21%, worst was 57%
Compared to all devices tested
» 32% of all tested devices were better, 8% similar, 60% worse
» The best had a delta of 4%, average was 25%, worst was 134%
Lenovo ThinkPad L13 Yoga Gen2-20VK000VGE audio analysis
(±) | speaker loudness is average but good (81.4 dB)
Bass 100 - 315 Hz
(-) | nearly no bass - on average 19.4% lower than median
(±) | linearity of bass is average (10.4% delta to prev. frequency)
Mids 400 - 2000 Hz
(+) | balanced mids - only 3.9% away from median
(+) | mids are linear (3.7% delta to prev. frequency)
Highs 2 - 16 kHz
(±) | reduced highs - on average 6.9% lower than median
(+) | highs are linear (6.2% delta to prev. frequency)
Overall 100 - 16.000 Hz
(±) | linearity of overall sound is average (19.5% difference to median)
Compared to same class
» 42% of all tested devices in this class were better, 7% similar, 51% worse
» The best had a delta of 6%, average was 21%, worst was 57%
Compared to all devices tested
» 43% of all tested devices were better, 7% similar, 50% worse
» The best had a delta of 4%, average was 25%, worst was 134%
Fujitsu LifeBook U9310X audio analysis
(±) | speaker loudness is average but good (74.6 dB)
Bass 100 - 315 Hz
(-) | nearly no bass - on average 15.4% lower than median
(±) | linearity of bass is average (11.9% delta to prev. frequency)
Mids 400 - 2000 Hz
(±) | higher mids - on average 11.1% higher than median
(±) | linearity of mids is average (12.5% delta to prev. frequency)
Highs 2 - 16 kHz
(±) | higher highs - on average 8.7% higher than median
(±) | linearity of highs is average (10.1% delta to prev. frequency)
Overall 100 - 16.000 Hz
(-) | overall sound is not linear (39.7% difference to median)
Compared to same class
» 97% of all tested devices in this class were better, 1% similar, 3% worse
» The best had a delta of 6%, average was 21%, worst was 57%
Compared to all devices tested
» 94% of all tested devices were better, 0% similar, 6% worse
» The best had a delta of 4%, average was 25%, worst was 134%
Acer Spin 3 SP313-51N-56YV audio analysis
(±) | speaker loudness is average but good (76.3 dB)
Bass 100 - 315 Hz
(-) | nearly no bass - on average 30.2% lower than median
(±) | linearity of bass is average (10.3% delta to prev. frequency)
Mids 400 - 2000 Hz
(+) | balanced mids - only 4.1% away from median
(±) | linearity of mids is average (7.8% delta to prev. frequency)
Highs 2 - 16 kHz
(±) | higher highs - on average 7.7% higher than median
(+) | highs are linear (6.9% delta to prev. frequency)
Overall 100 - 16.000 Hz
(-) | overall sound is not linear (31.9% difference to median)
Compared to same class
» 90% of all tested devices in this class were better, 2% similar, 8% worse
» The best had a delta of 6%, average was 21%, worst was 57%
Compared to all devices tested
» 89% of all tested devices were better, 2% similar, 9% worse
» The best had a delta of 4%, average was 25%, worst was 134%
Energy consumption
Under light load, the ProBook is slightly more frugal than its direct Predecessor. Besides the more efficient processor, the somewhat darker display naturally plays a role here. We see a maximum of 47.5 watts under load, which quickly settles at ~40 watts. The included 65-watt power supply is therefore perfectly sufficient.
| HP ProBook x360 435 G8 R7-5800U Vega 8, R7 5800U, Samsung PM991 MZVLQ512HALU | Lenovo ThinkPad L13 Yoga Gen2-20VK000VGE Iris Xe G7 80EUs, i5-1135G7, WDC PC SN730 SDBPNTY-256G | Fujitsu LifeBook U9310X UHD Graphics 620, i5-10210U, Toshiba KBG40ZNS512G NVMe | Acer Spin 3 SP313-51N-56YV Iris Xe G7 80EUs, i5-1135G7, Kingston OM8PCP3512F-AB | HP ProBook x360 435 G7, Ryzen 5 4500U Vega 6, R5 4500U, WDC PC SN520 SDAPNUW-512G | |
|---|---|---|---|---|---|
| Power Consumption | -27% | -10% | -3% | -6% | |
| Idle Minimum * | 3.2 | 4.6 -44% | 2.9 9% | 3.5 -9% | 3.8 -19% |
| Idle Average * | 5.5 | 7.3 -33% | 5.8 -5% | 6.6 -20% | 5.7 -4% |
| Idle Maximum * | 6.4 | 10.2 -59% | 9.6 -50% | 8.5 -33% | 7.9 -23% |
| Load Average * | 35.5 | 32.3 9% | 34.6 3% | 32.2 9% | 29.3 17% |
| Witcher 3 ultra * | 36.4 | 35 4% | 32.5 11% | ||
| Load Maximum * | 47.5 | 65.3 -37% | 50.7 -7% | 34.5 27% | 48.6 -2% |
* ... smaller is better
| Off / Standby | |
| Idle | |
| Load |
|
Power consumption Witcher 3 / Stress test
Battery life
The battery runtimes with the 45 Wh battery are very good, as our WLAN test runs for around 9.5 hours (~8 hours at full brightness) and the video test even more than 10 hours.
Pros
Cons
Verdict - A lot of performance, but a weak display
With the new Ryzen 5000 processor, the eighth-generation ProBook x360 435 gets a massive performance update and the compact convertible can easily keep up with many full-fledged workstations in terms of multi-core performance. However, whether it really needs the top model, the Ryzen 7 5800U, we dare to doubt. Considering the classification as an entry-level model, a Ryzen 5 or at most the Ryzen 7 5700U would be perfectly sufficient.
In everyday use, the ProBook does many things right, because there are good input devices, all important ports and the battery runtimes are also good. In addition, the casing is very high-quality and hardly distinguishable from the more expensive EliteBooks. In this respect, the ProBook also has an advantage over its rivals, such as the Lenovo ThinkPad L13 Yoga G2.
Performance, case and input devices are top, but the standard display is too reflective and the fan control is annoying. Those interested in the ProBook x360 435 G8 should save the extra price for the high-end processor and rather put the money into one of the optional (and brighter) displays.
The two biggest problems are the screen and the fan behavior. The standard screen basically offers a good picture quality for office use, but the brightness is simply not enough to compensate for the reflections of the very reflective panel. In addition, the fan often starts up even when idling, which quickly becomes annoying. You would certainly be better off with a different configuration (Ryzen 5000 and a brighter display).
Price and availability
Our test device, the ProBook x360 435 G8, is currently available at Cyberport for just under 1,100 Euros (~$1305) available. A cheaper configuration with the Ryzen 5 5600U and less memory is available from 880 Euros (~$1044) at Notebooksbilliger.
HP ProBook x360 435 G8 R7-5800U
-
07/28/2021 v7
Andreas Osthoff
More articles related to this device
HP ProBook x360 435 G8 R7-5800U (ProBook X360 Series)Related Articles


Pricecompare

