 Deutsch
 English
 Español
 Français
 Italiano
 Nederlands
 Polski
 Português
 Русский
 Türkçe
 Svenska
 Chinese
 Magyar
HP ProBook 455 G3 T1B79UT Notebook Review
Aside from Intel-based business notebooks, HP also offers a number of AMD-based solutions that are typically more affordable and down-to-Earth in terms of features. The ProBook 455 series is visually identical to the ProBook 450 series save for the processor swap, so we recommend checking out our previous ProBook review pages for more information on the chassis and series as a whole.
Can the mainstream A10-8700P Carrizo APU compete against the more common Intel i5-6200U or i7-6500U CPUs found on most Ultrabooks or small business notebooks? Does this particular ProBook 455 AMD SKU run any warmer or longer than its ProBook 450 Intel counterparts? We compare this budget AMD configuration against popular inexpensive alternatives like the Dell Latitude 15 3570, Lenovo ThinkPad E560, and the Acer TravelMate P249-M.
Case
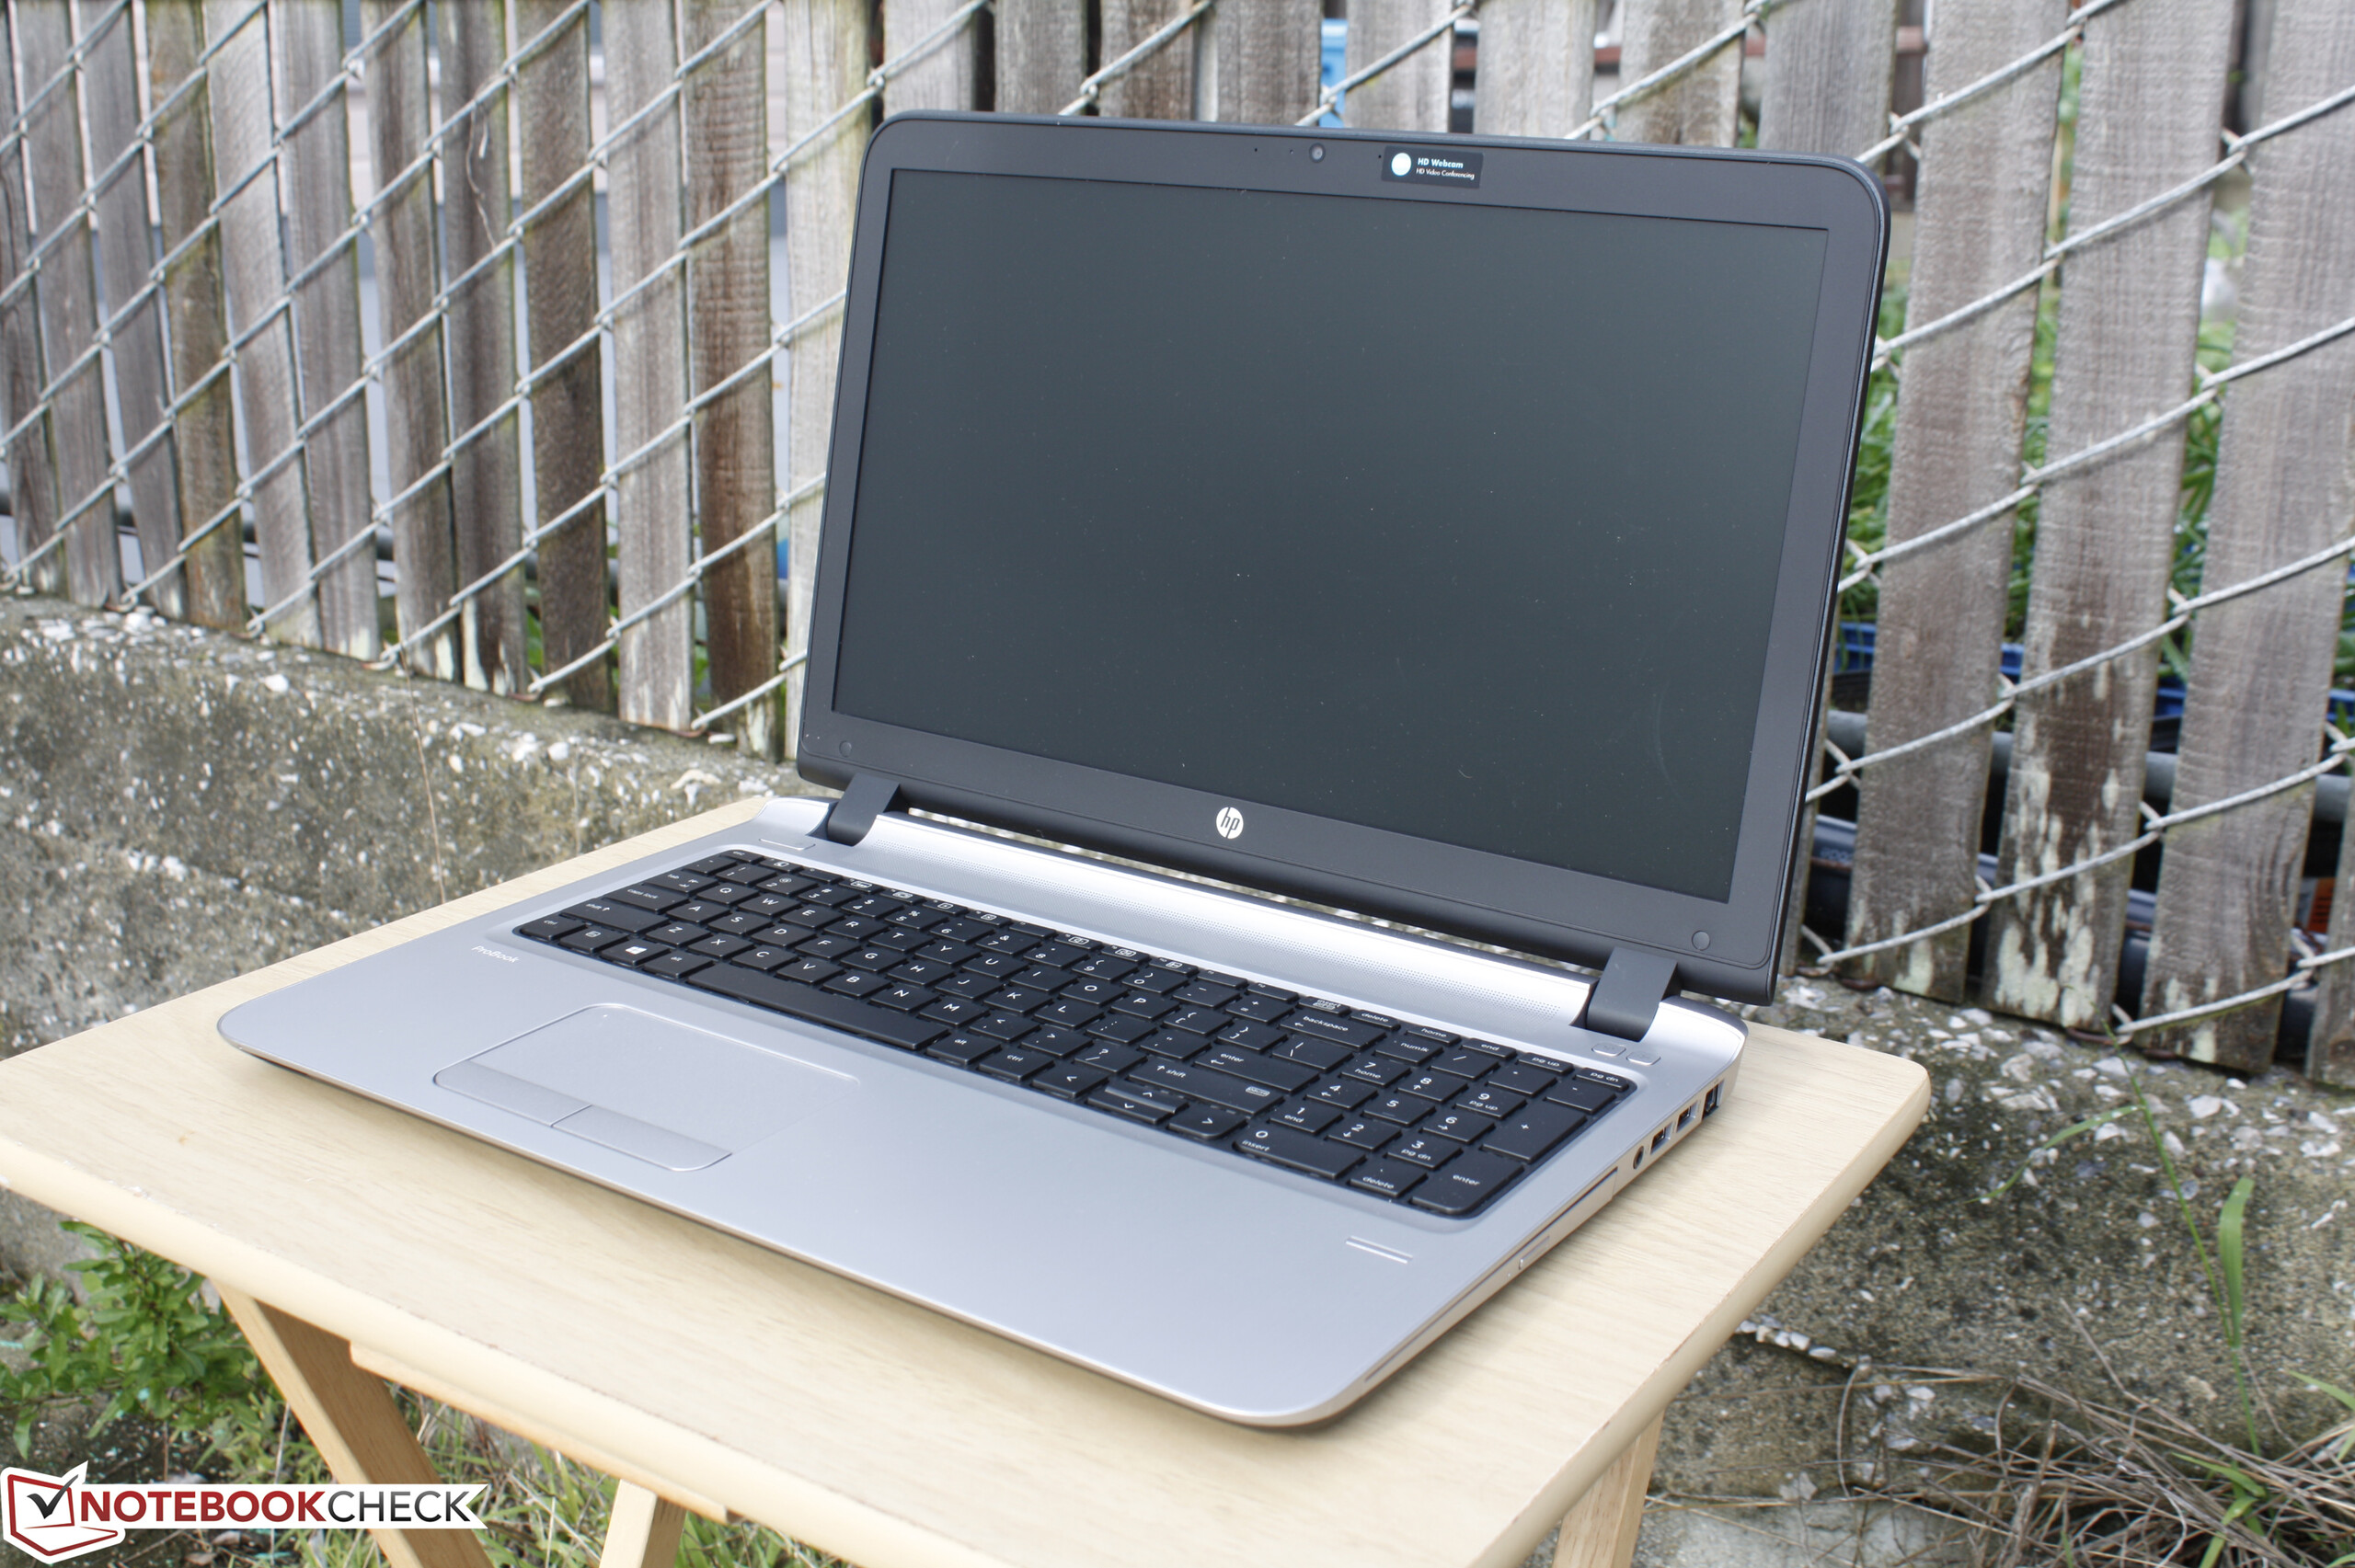
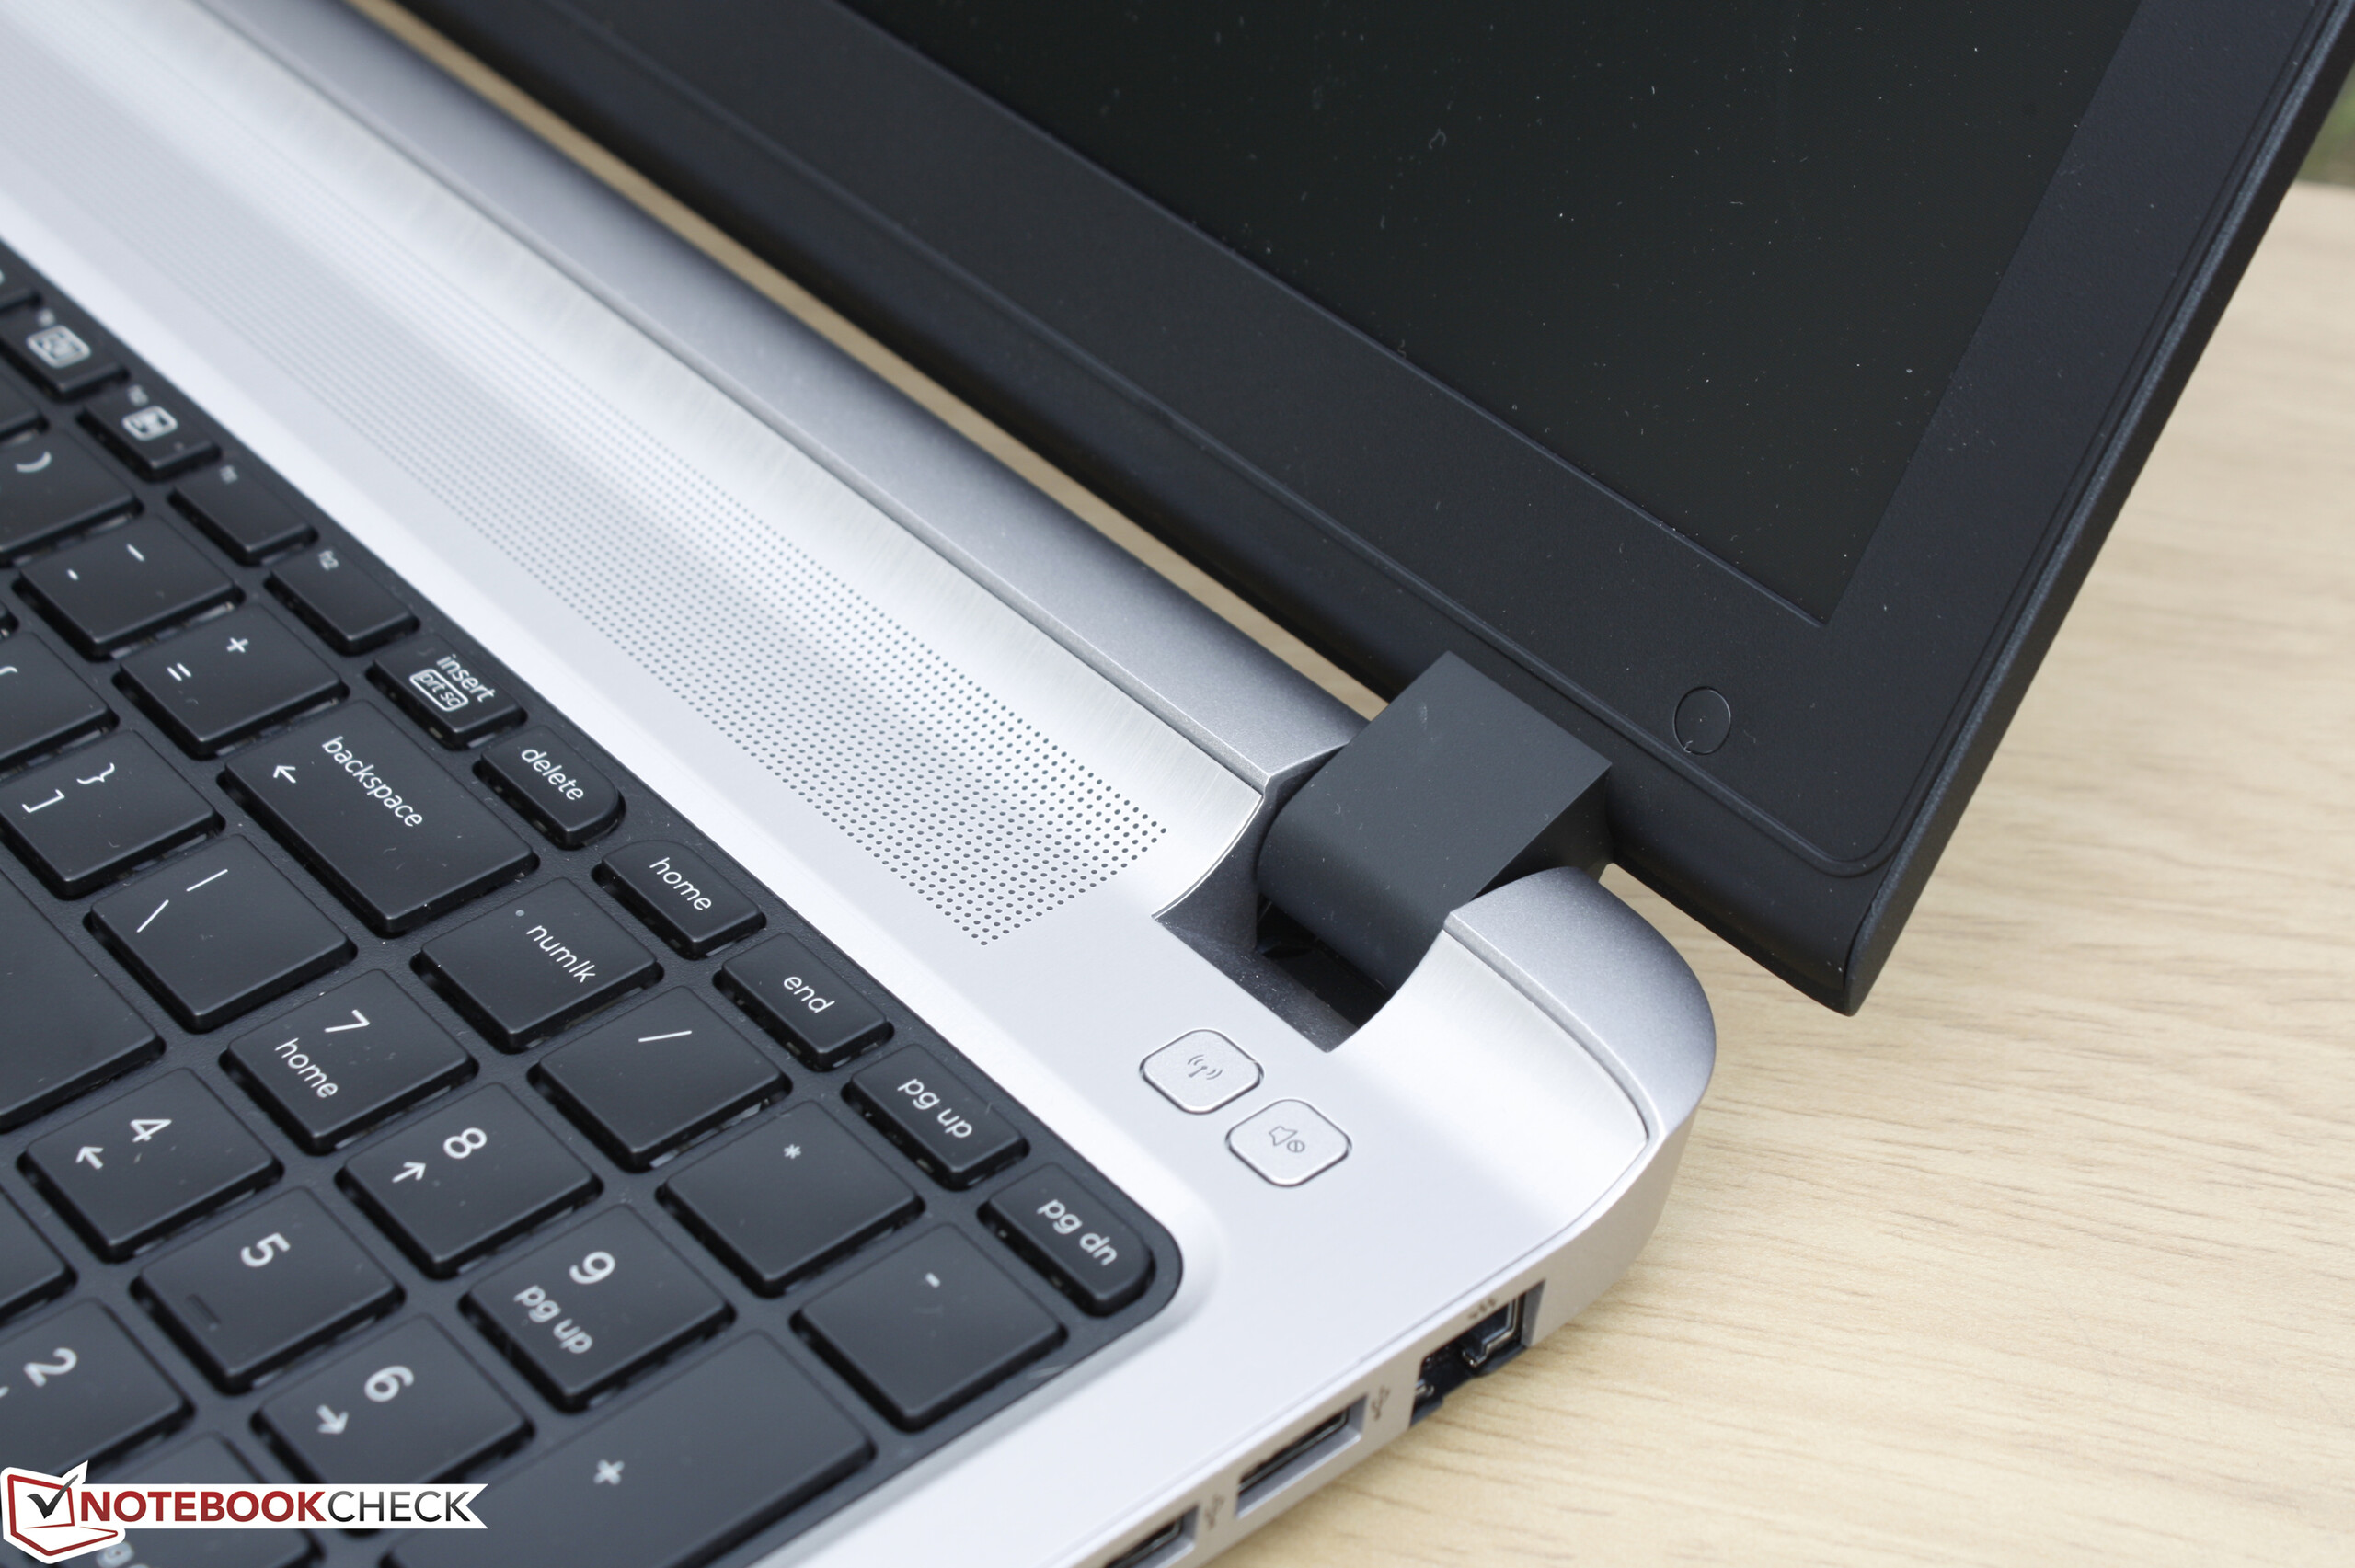
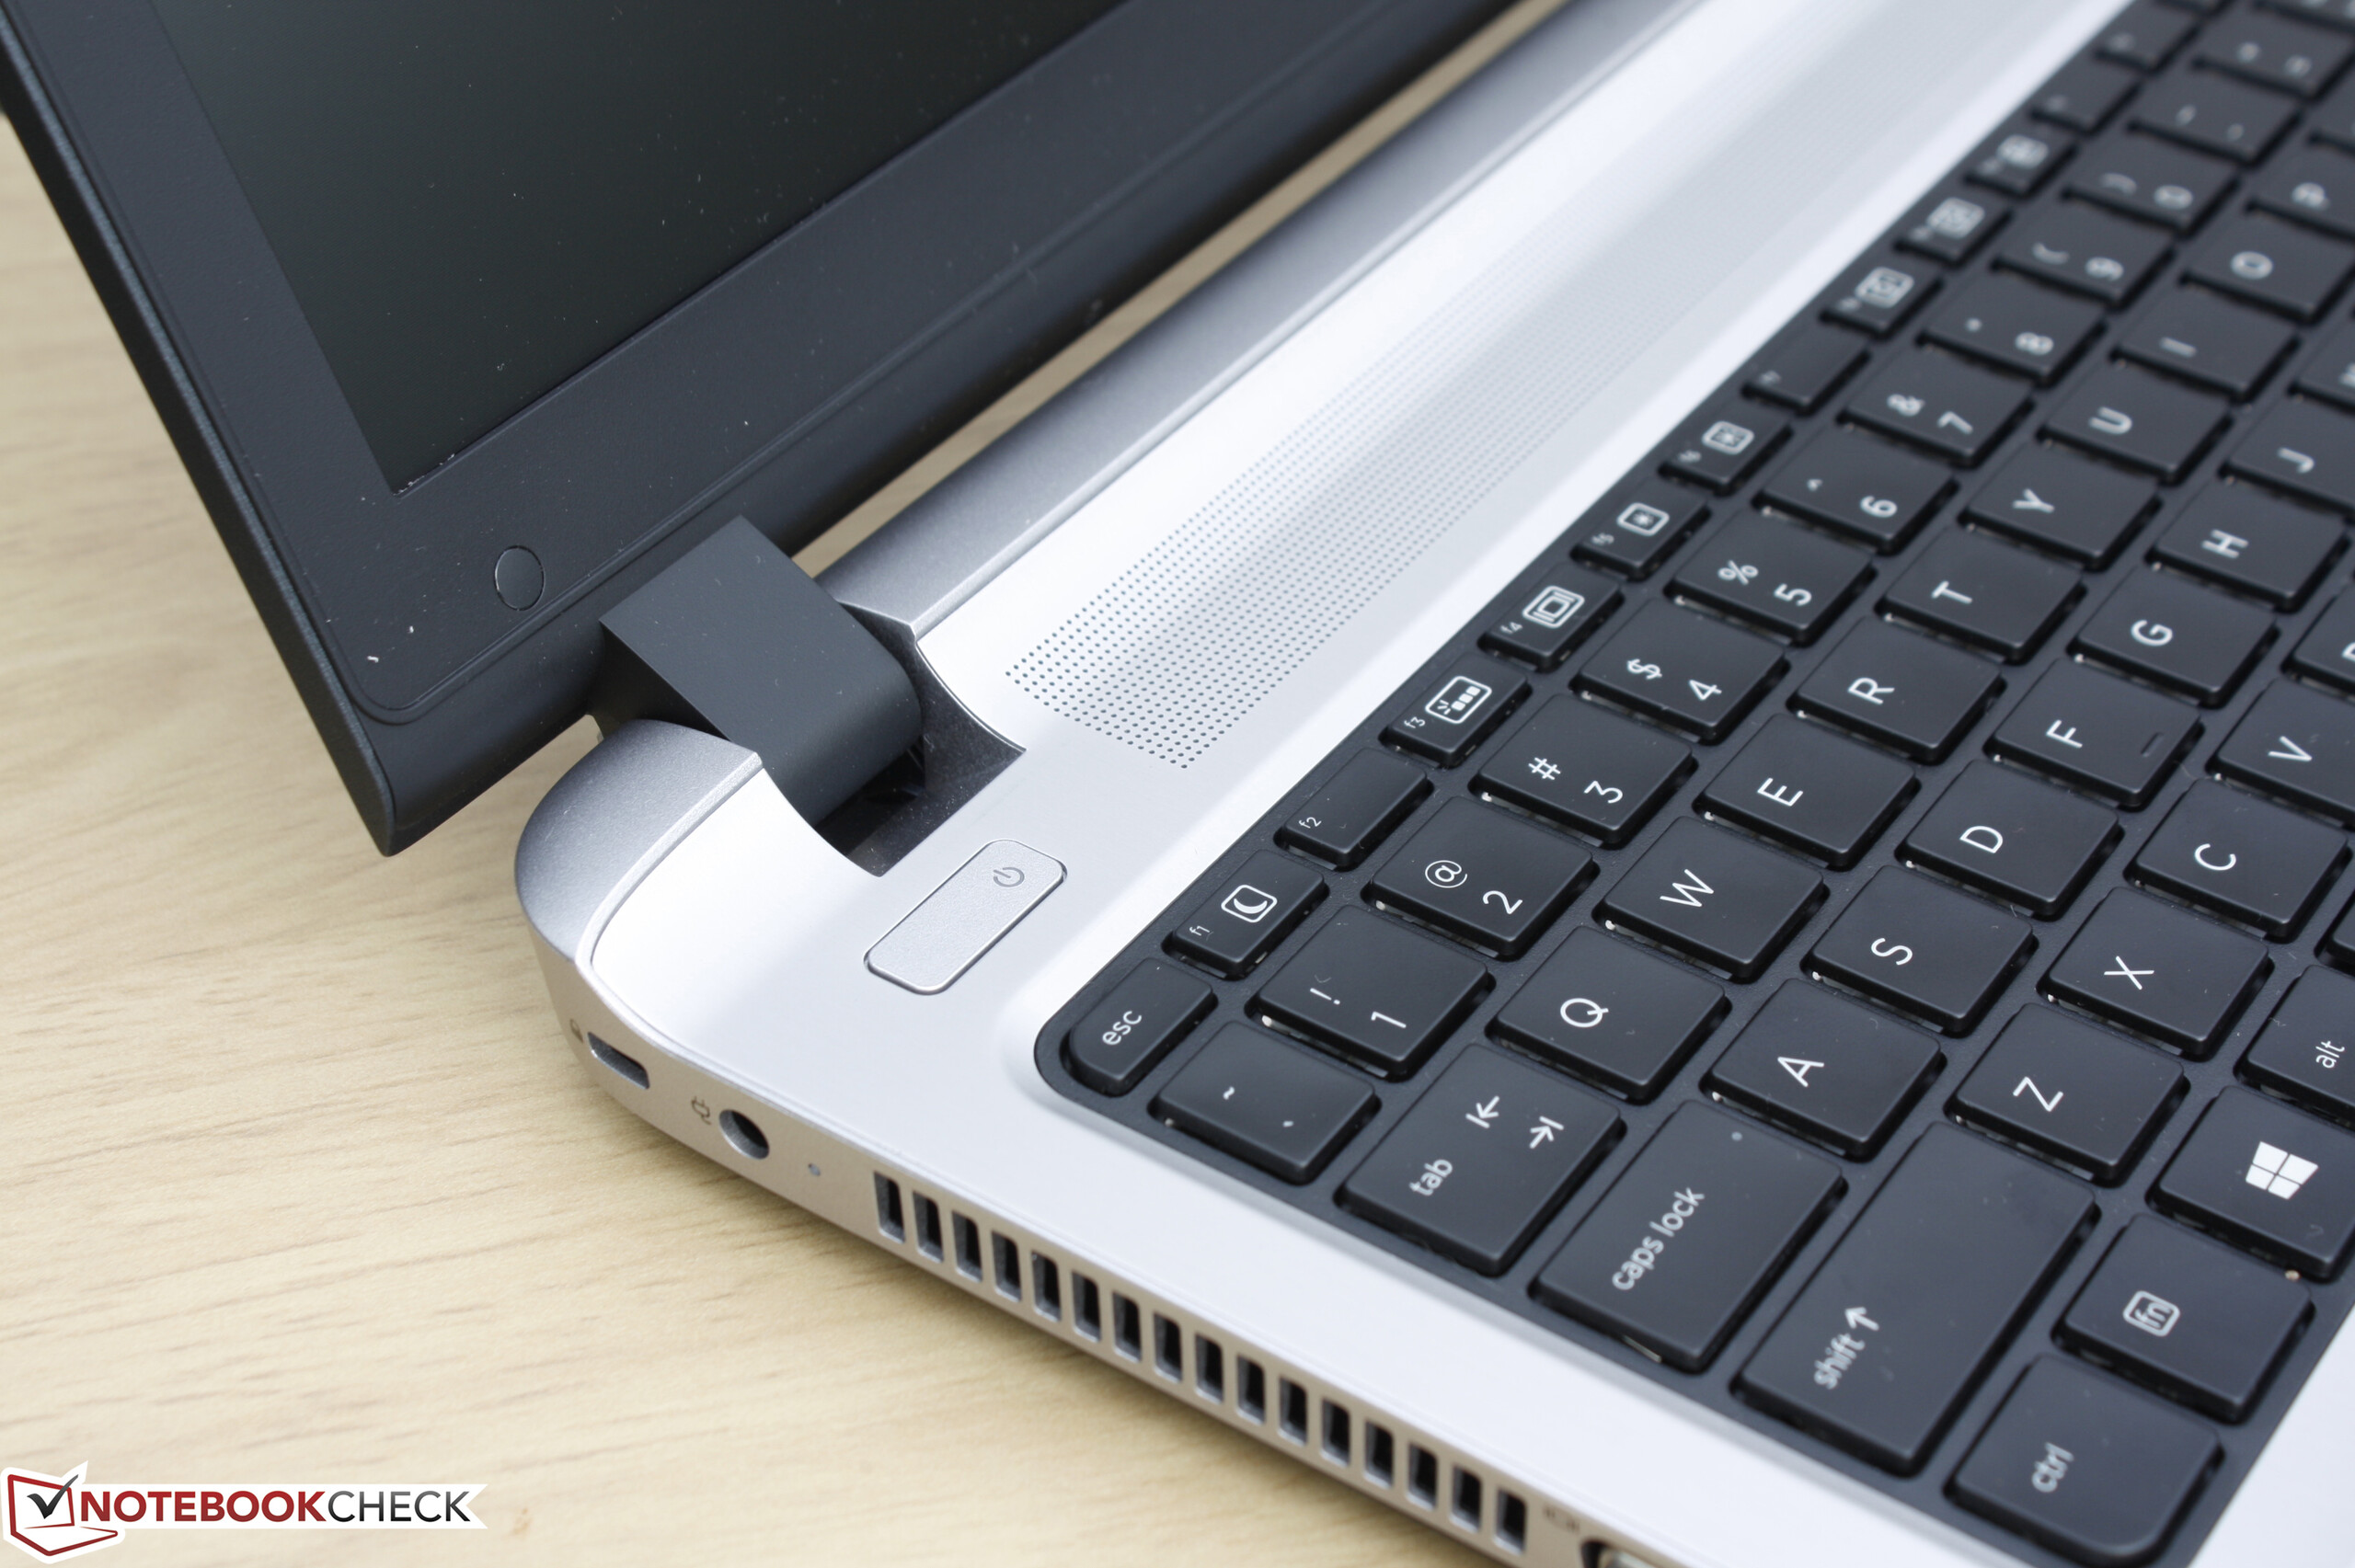
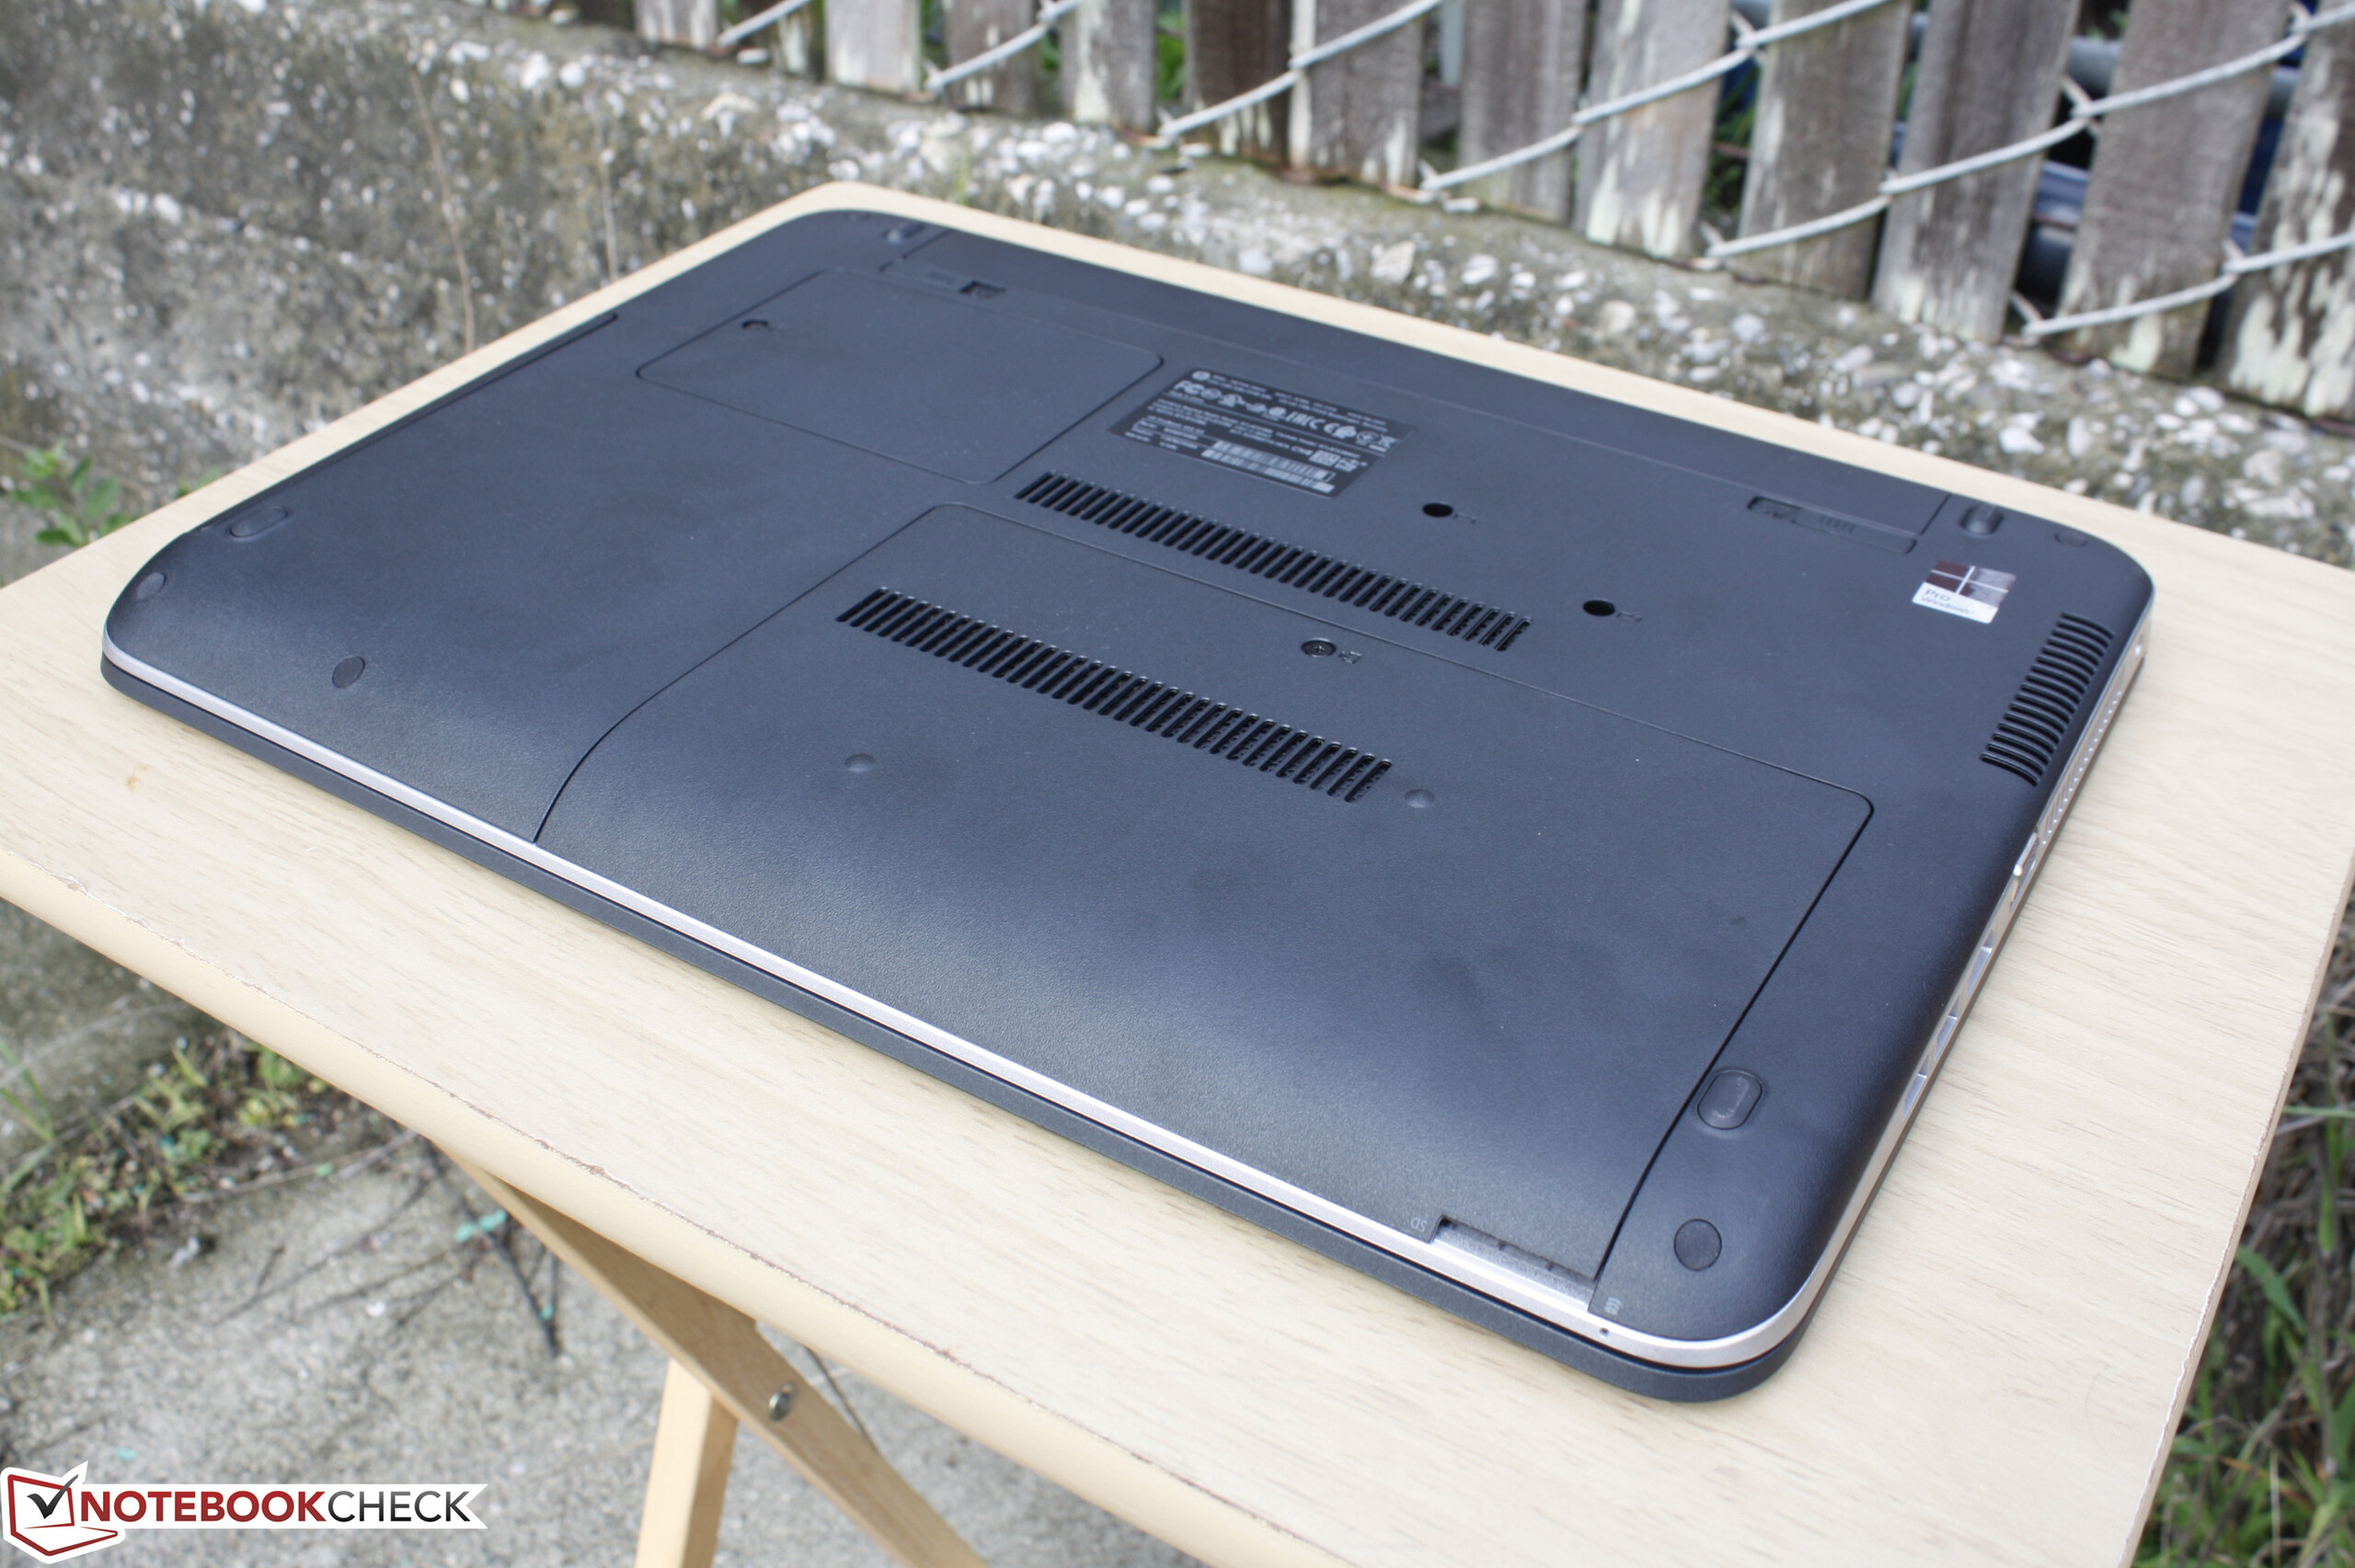
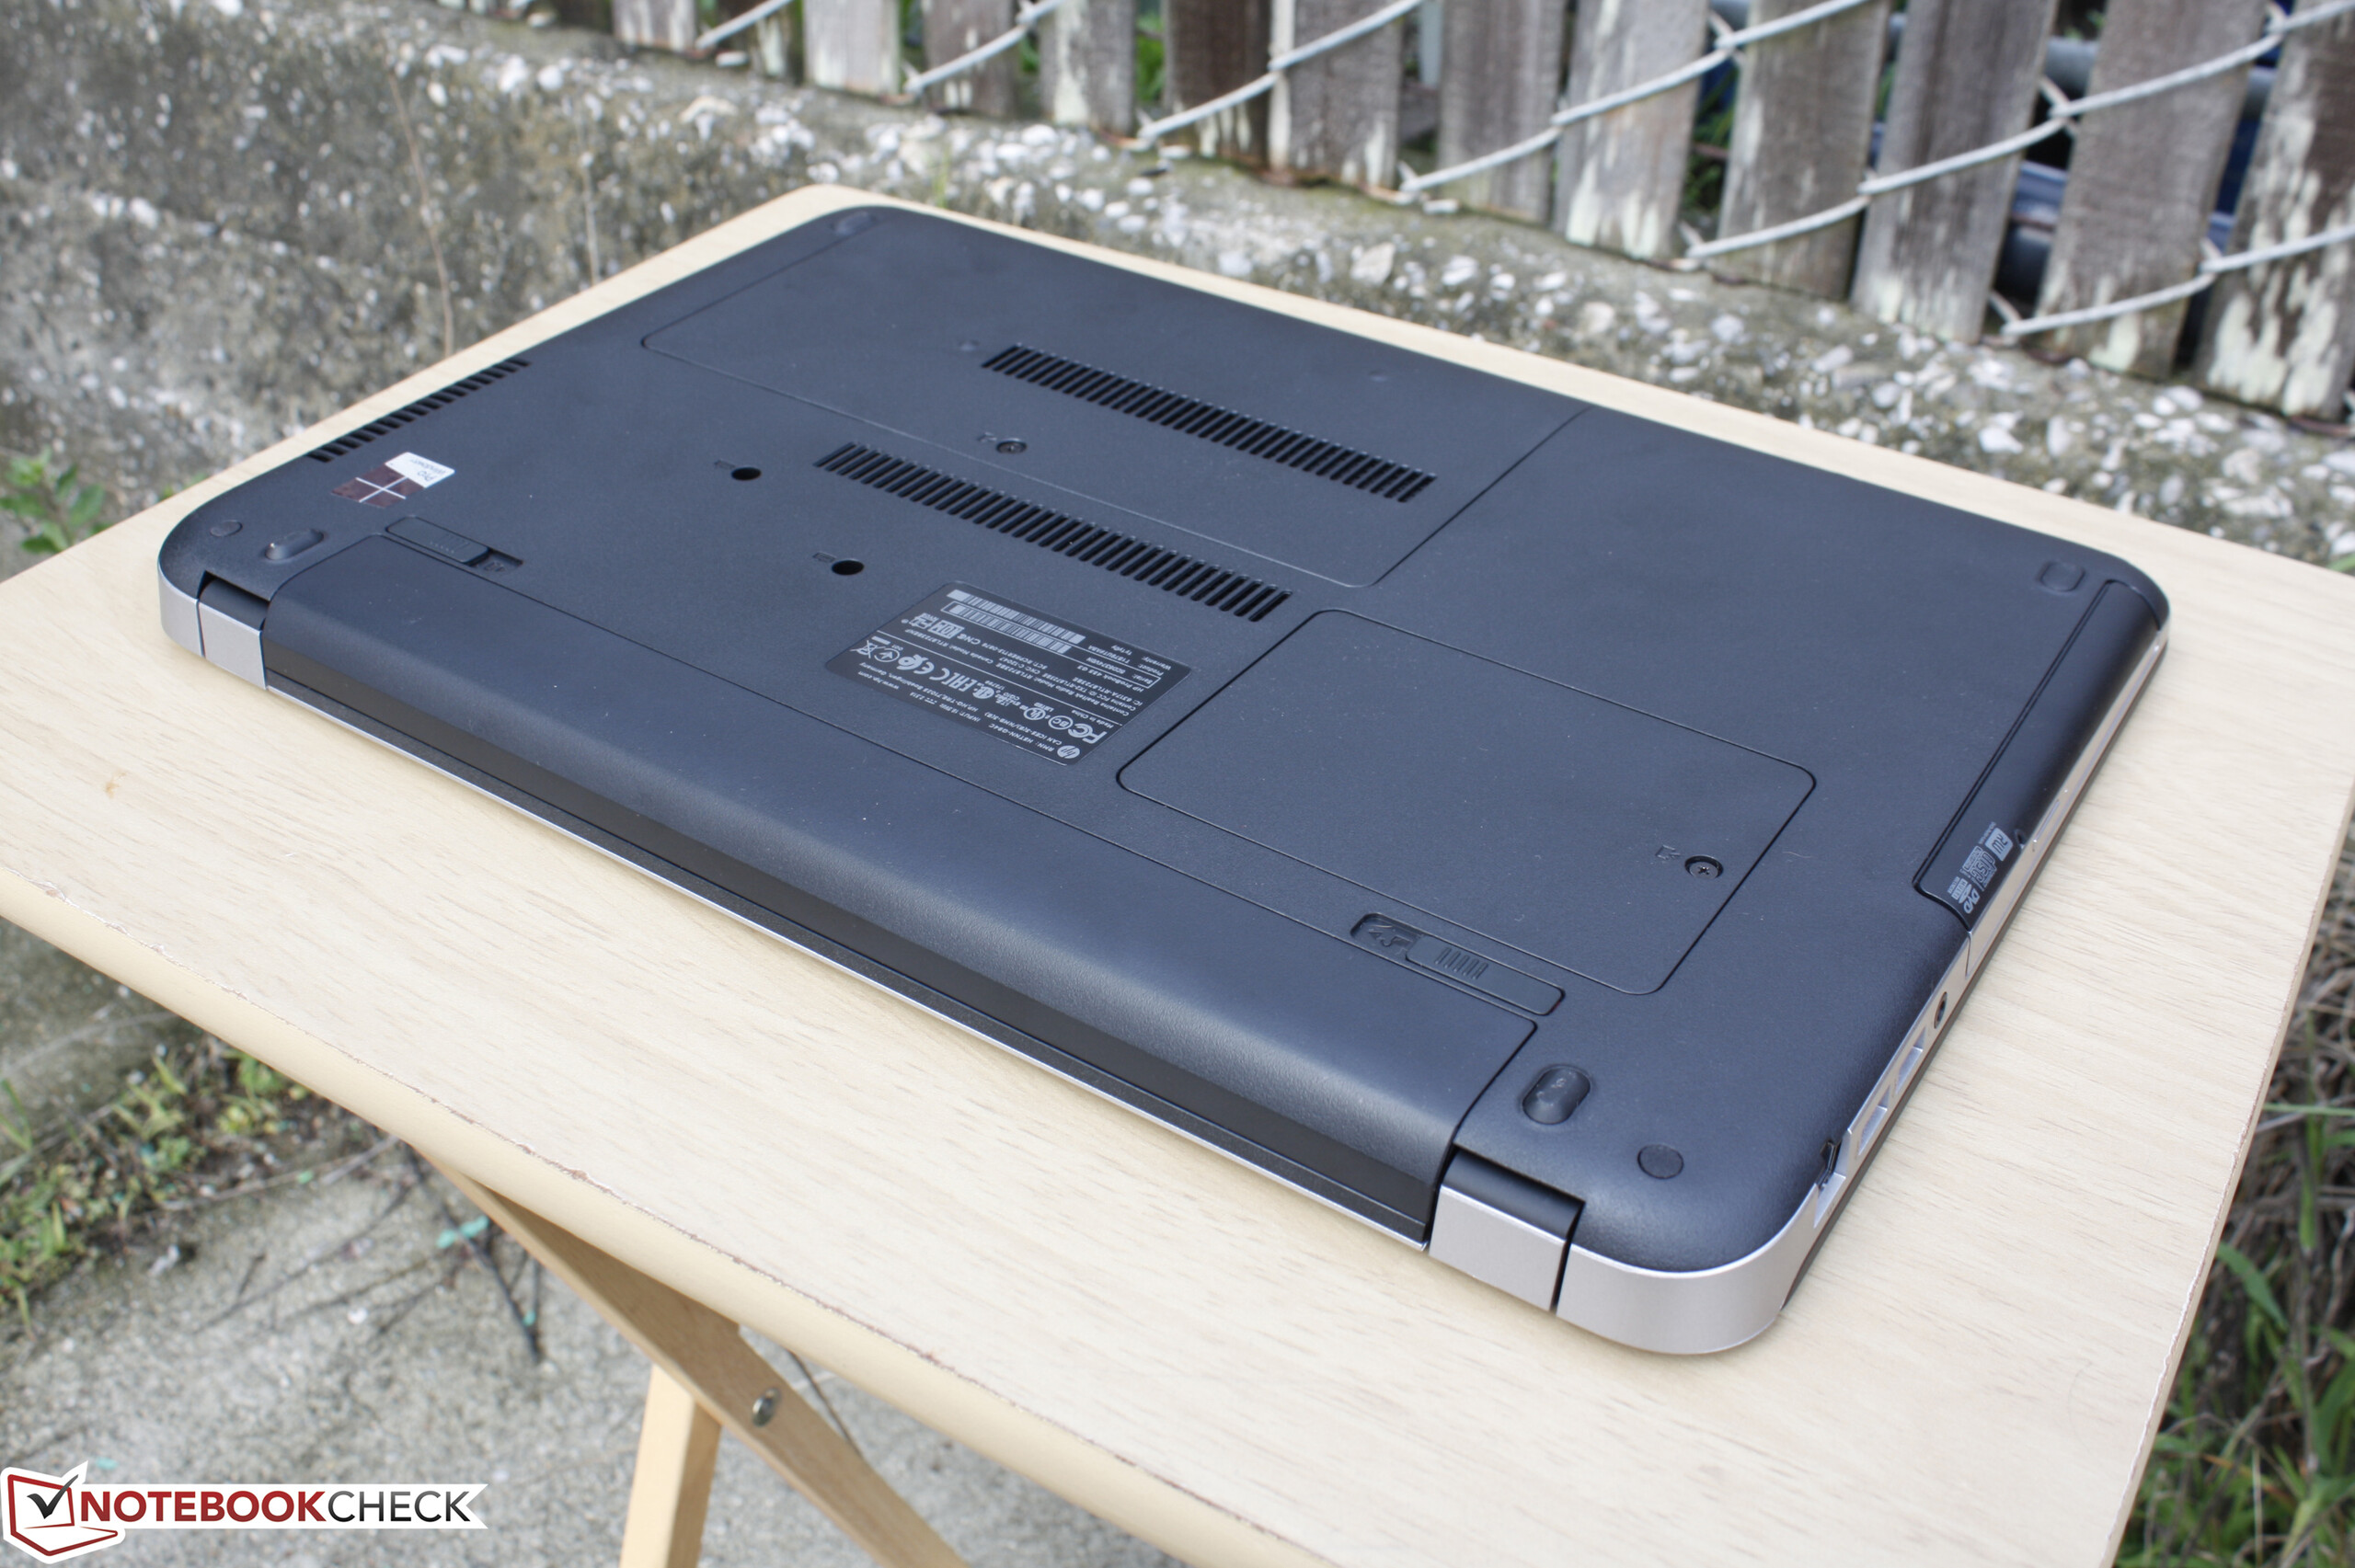
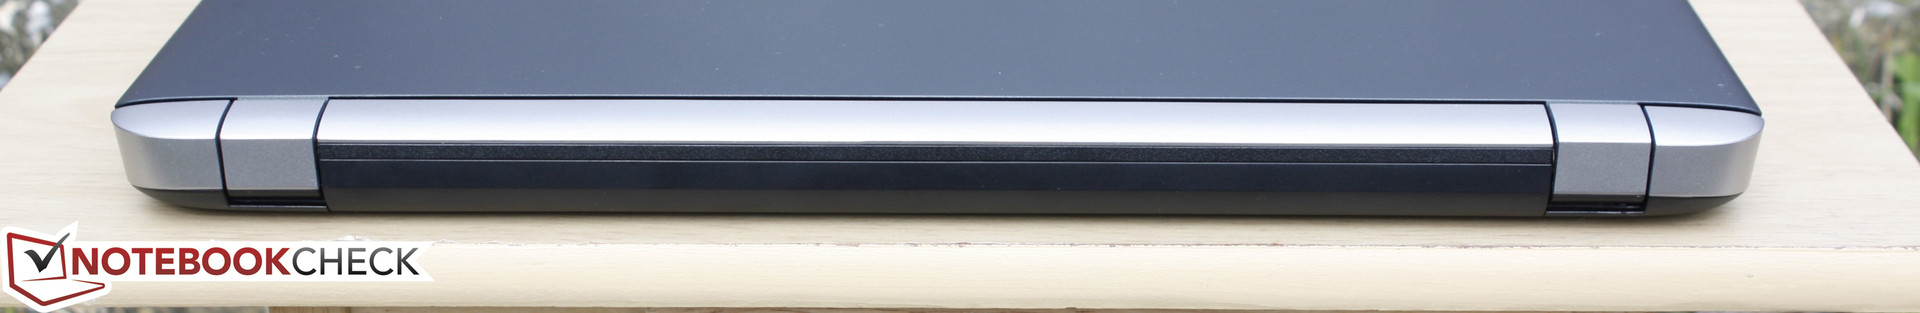
The design is unchanged from the existing ProBook 450 G3 as the 455 G3 is simply the AMD variant of the same chassis. Users still get the aluminum base and rubberized matte outer lid that promises to have passed MIL-STD 810G standards. Despite being a business-class notebook and design, the lid feels very weak and can be easily bent around its corners or depressed down the center. The base and keyboard can be depressed slightly with a bit of force, but the warping isn't major enough to be a cause for concern. Its dual hinges are sufficiently rigid up to its maximum 150-degree angle with no teetering of the display whilst typing.
Build quality is excellent with no unintended gaps between materials and only minimal creaking when attempting to twist the base. The inner display bezel sits flat against the edges of the screen unlike on some of our recent MSI gaming models. Like most notebooks with optical drives, the surface directly above the drive is weaker than the rest of the base in terms of rigidity. The system leaves a good impression, but the fragile lid feels as if it should have been on a cheap consumer notebook instead.
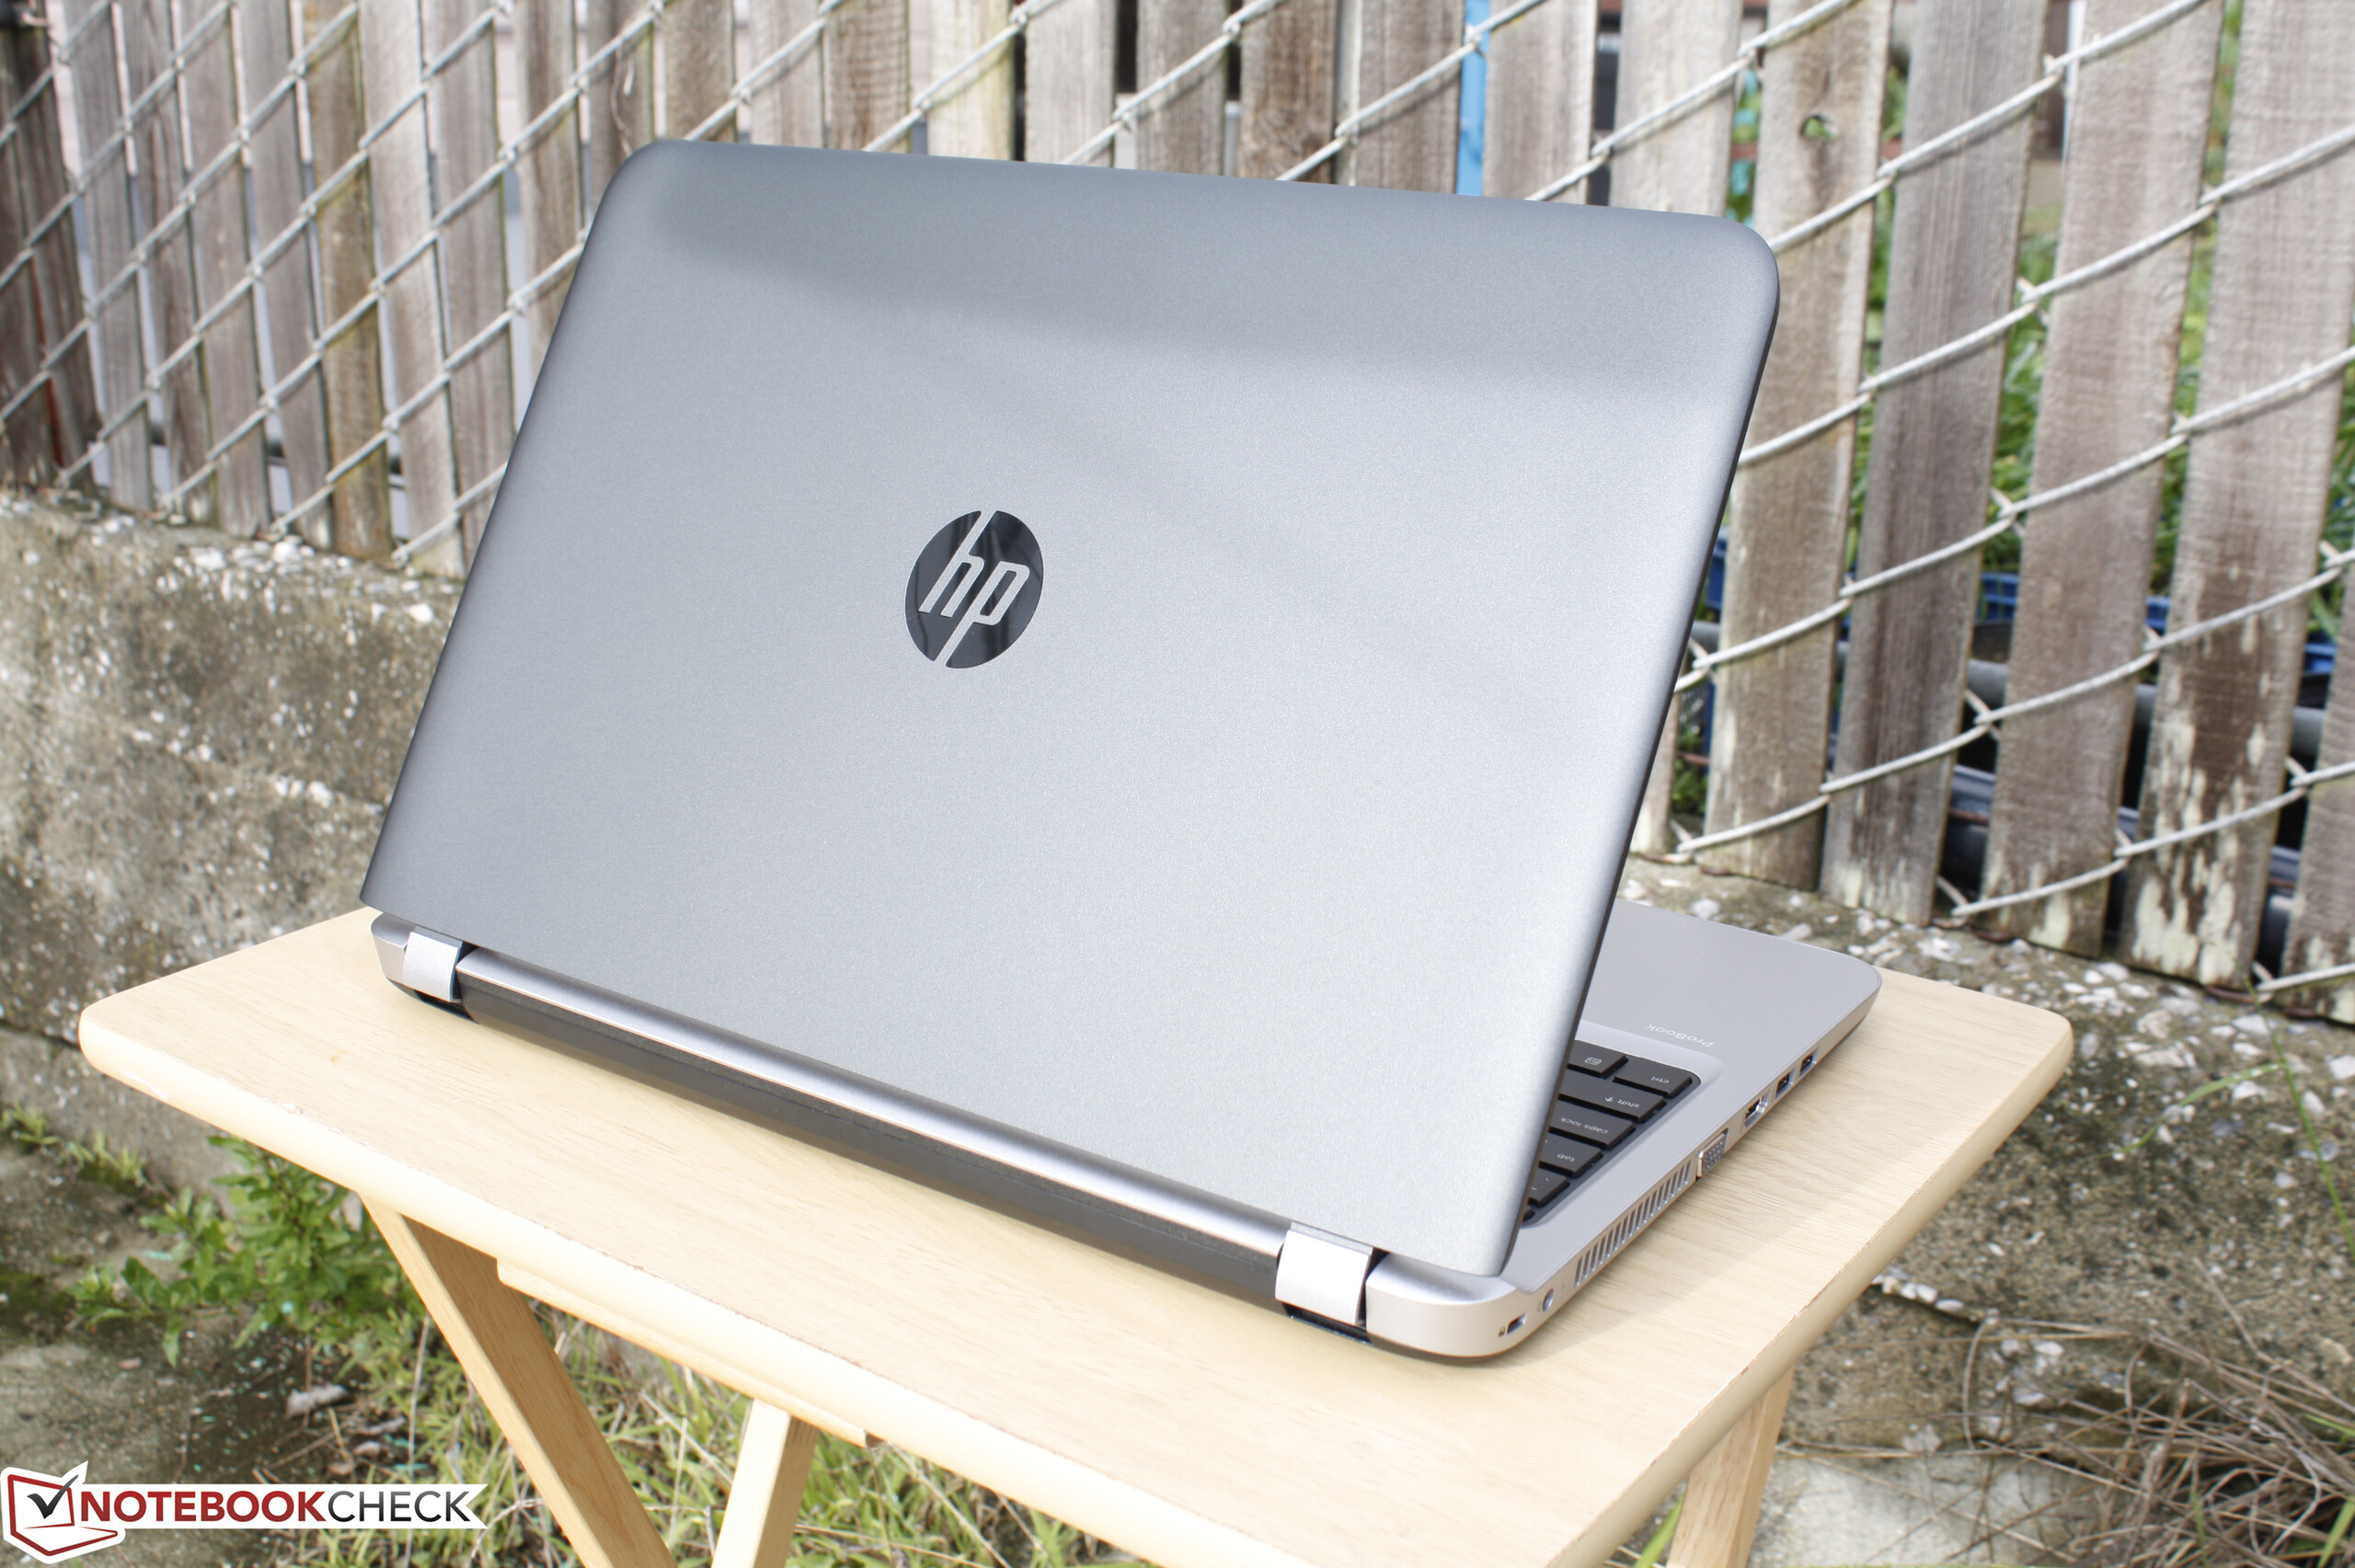
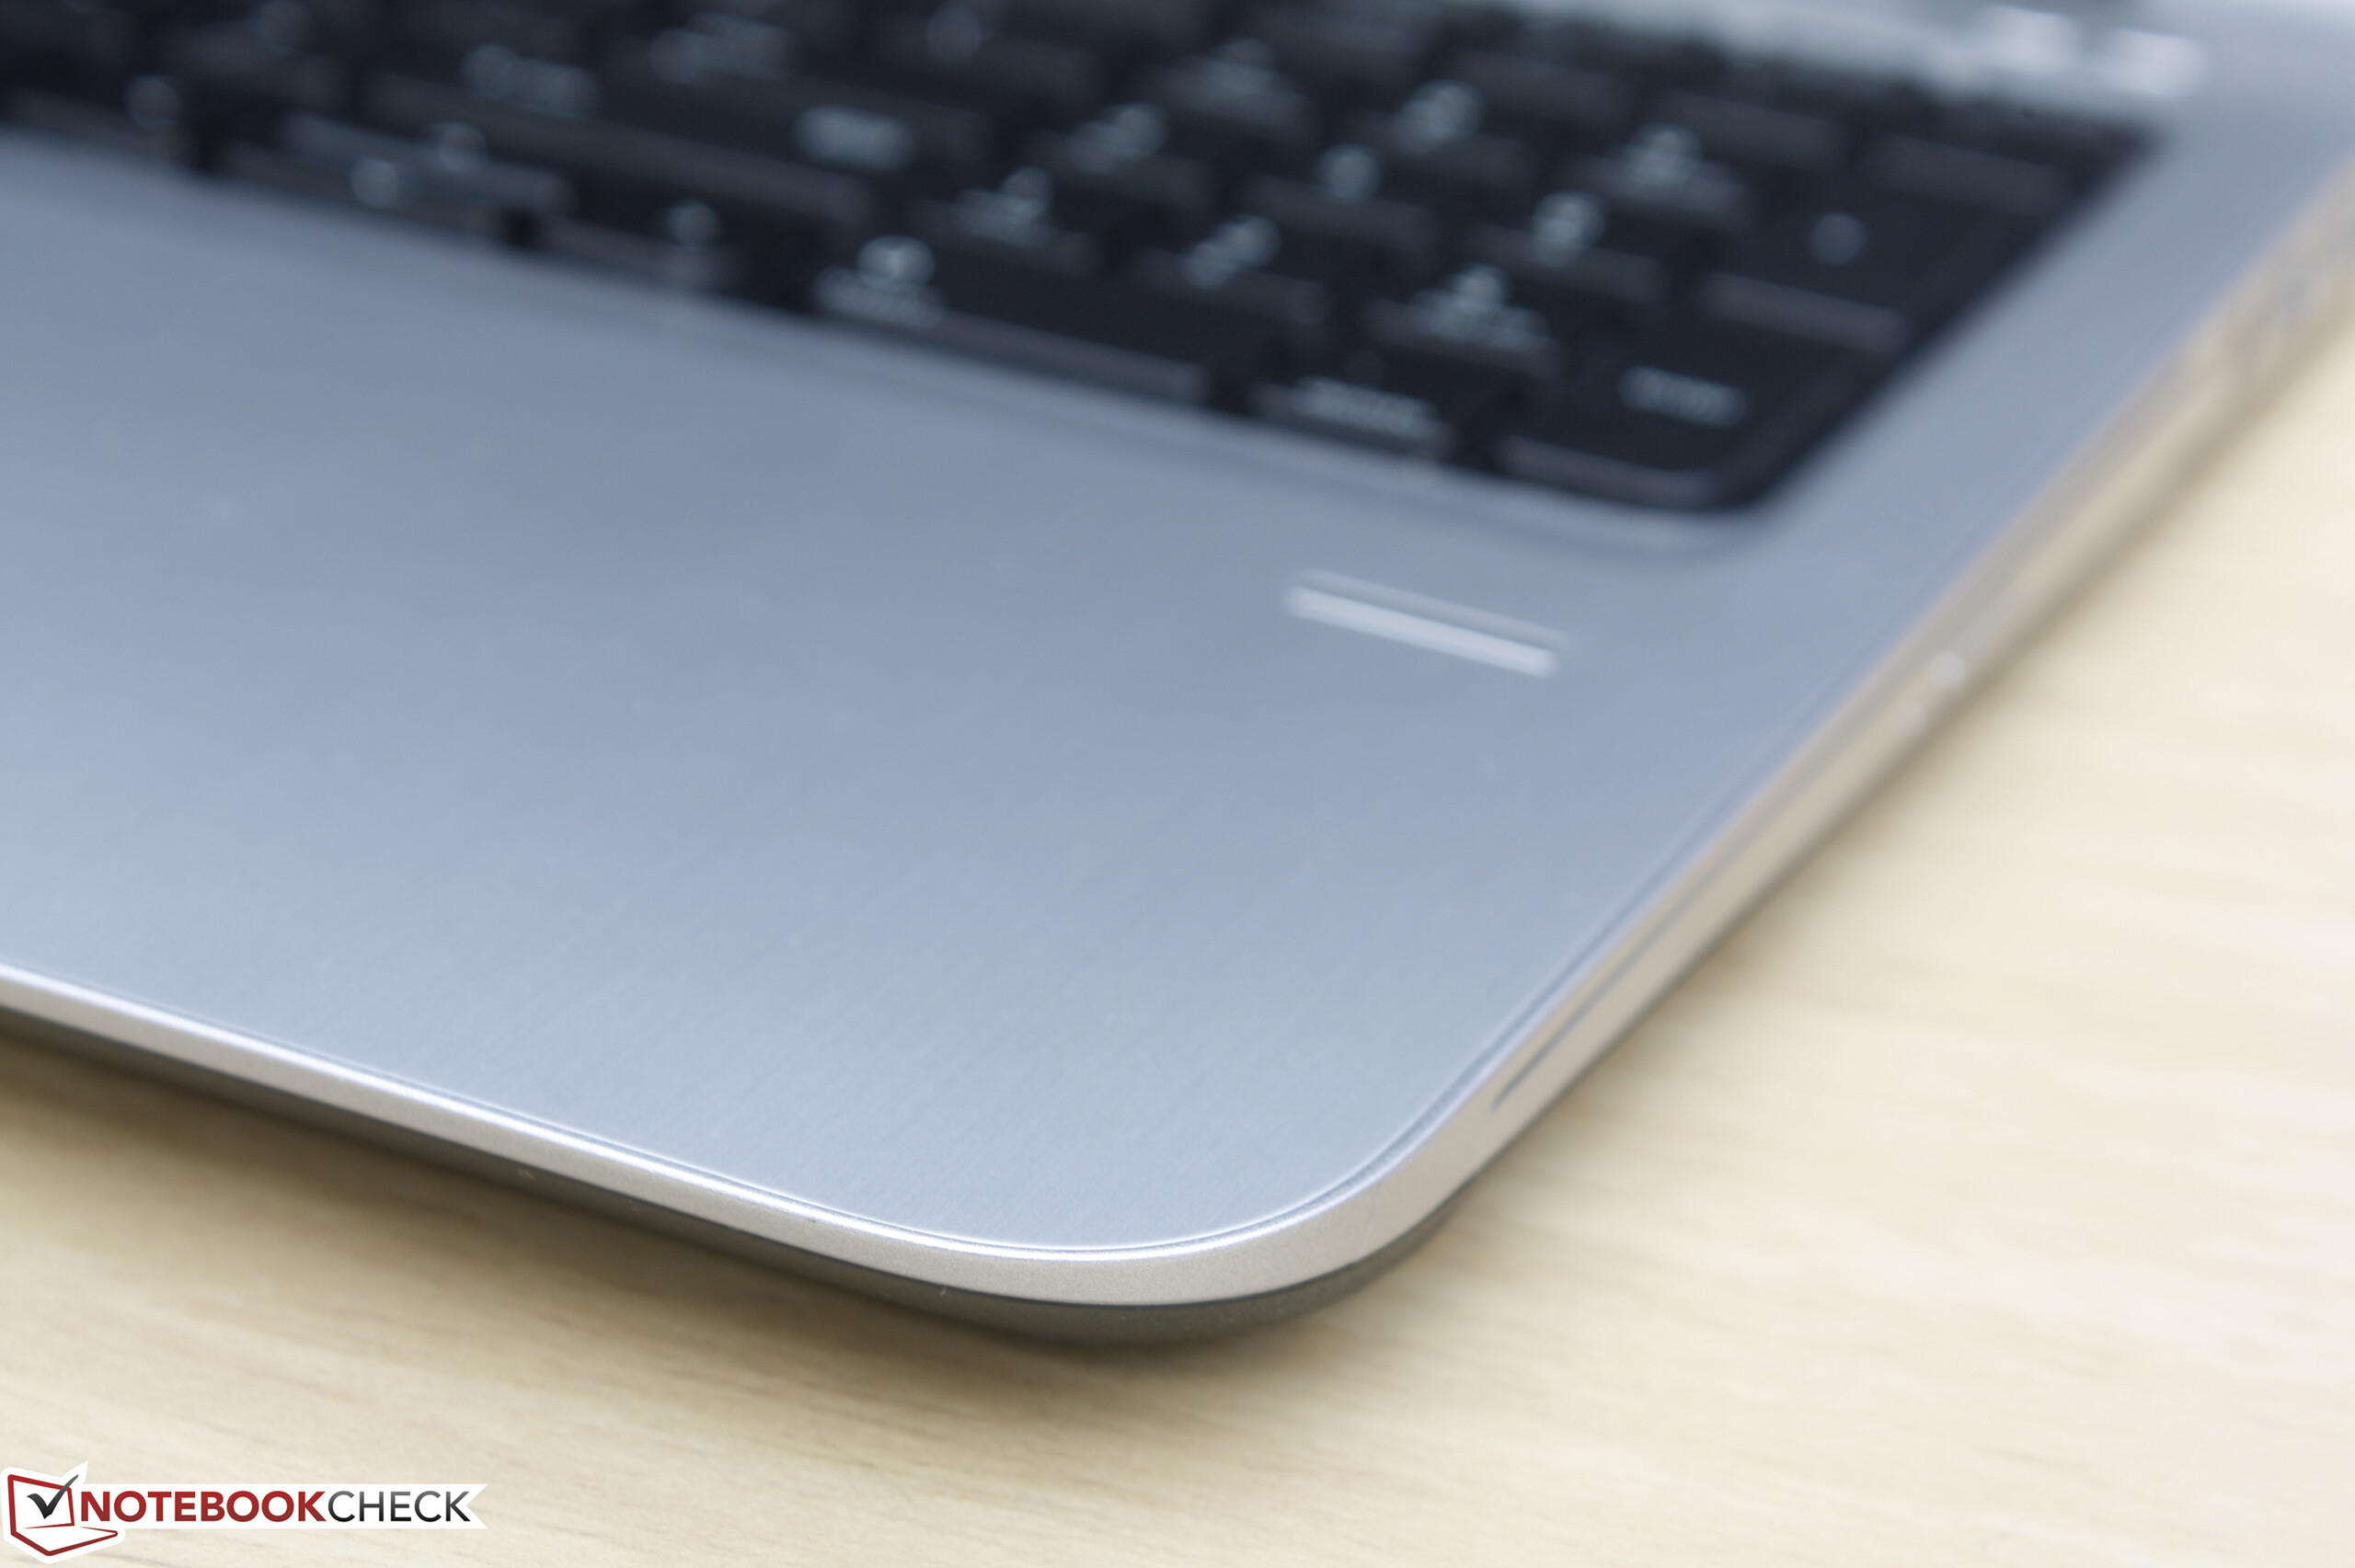
In terms of size and weight, the ProBook 455 G3 lies right around the middle for its size class and category. The ThinkPad E460 is about 200 g heavier and 2 mm thicker while the Dell Latitude 15 E3570 is about 100 g lighter and 2 mm thinner. In other words, the HP isn't breaking any ground with respect to its modest design.
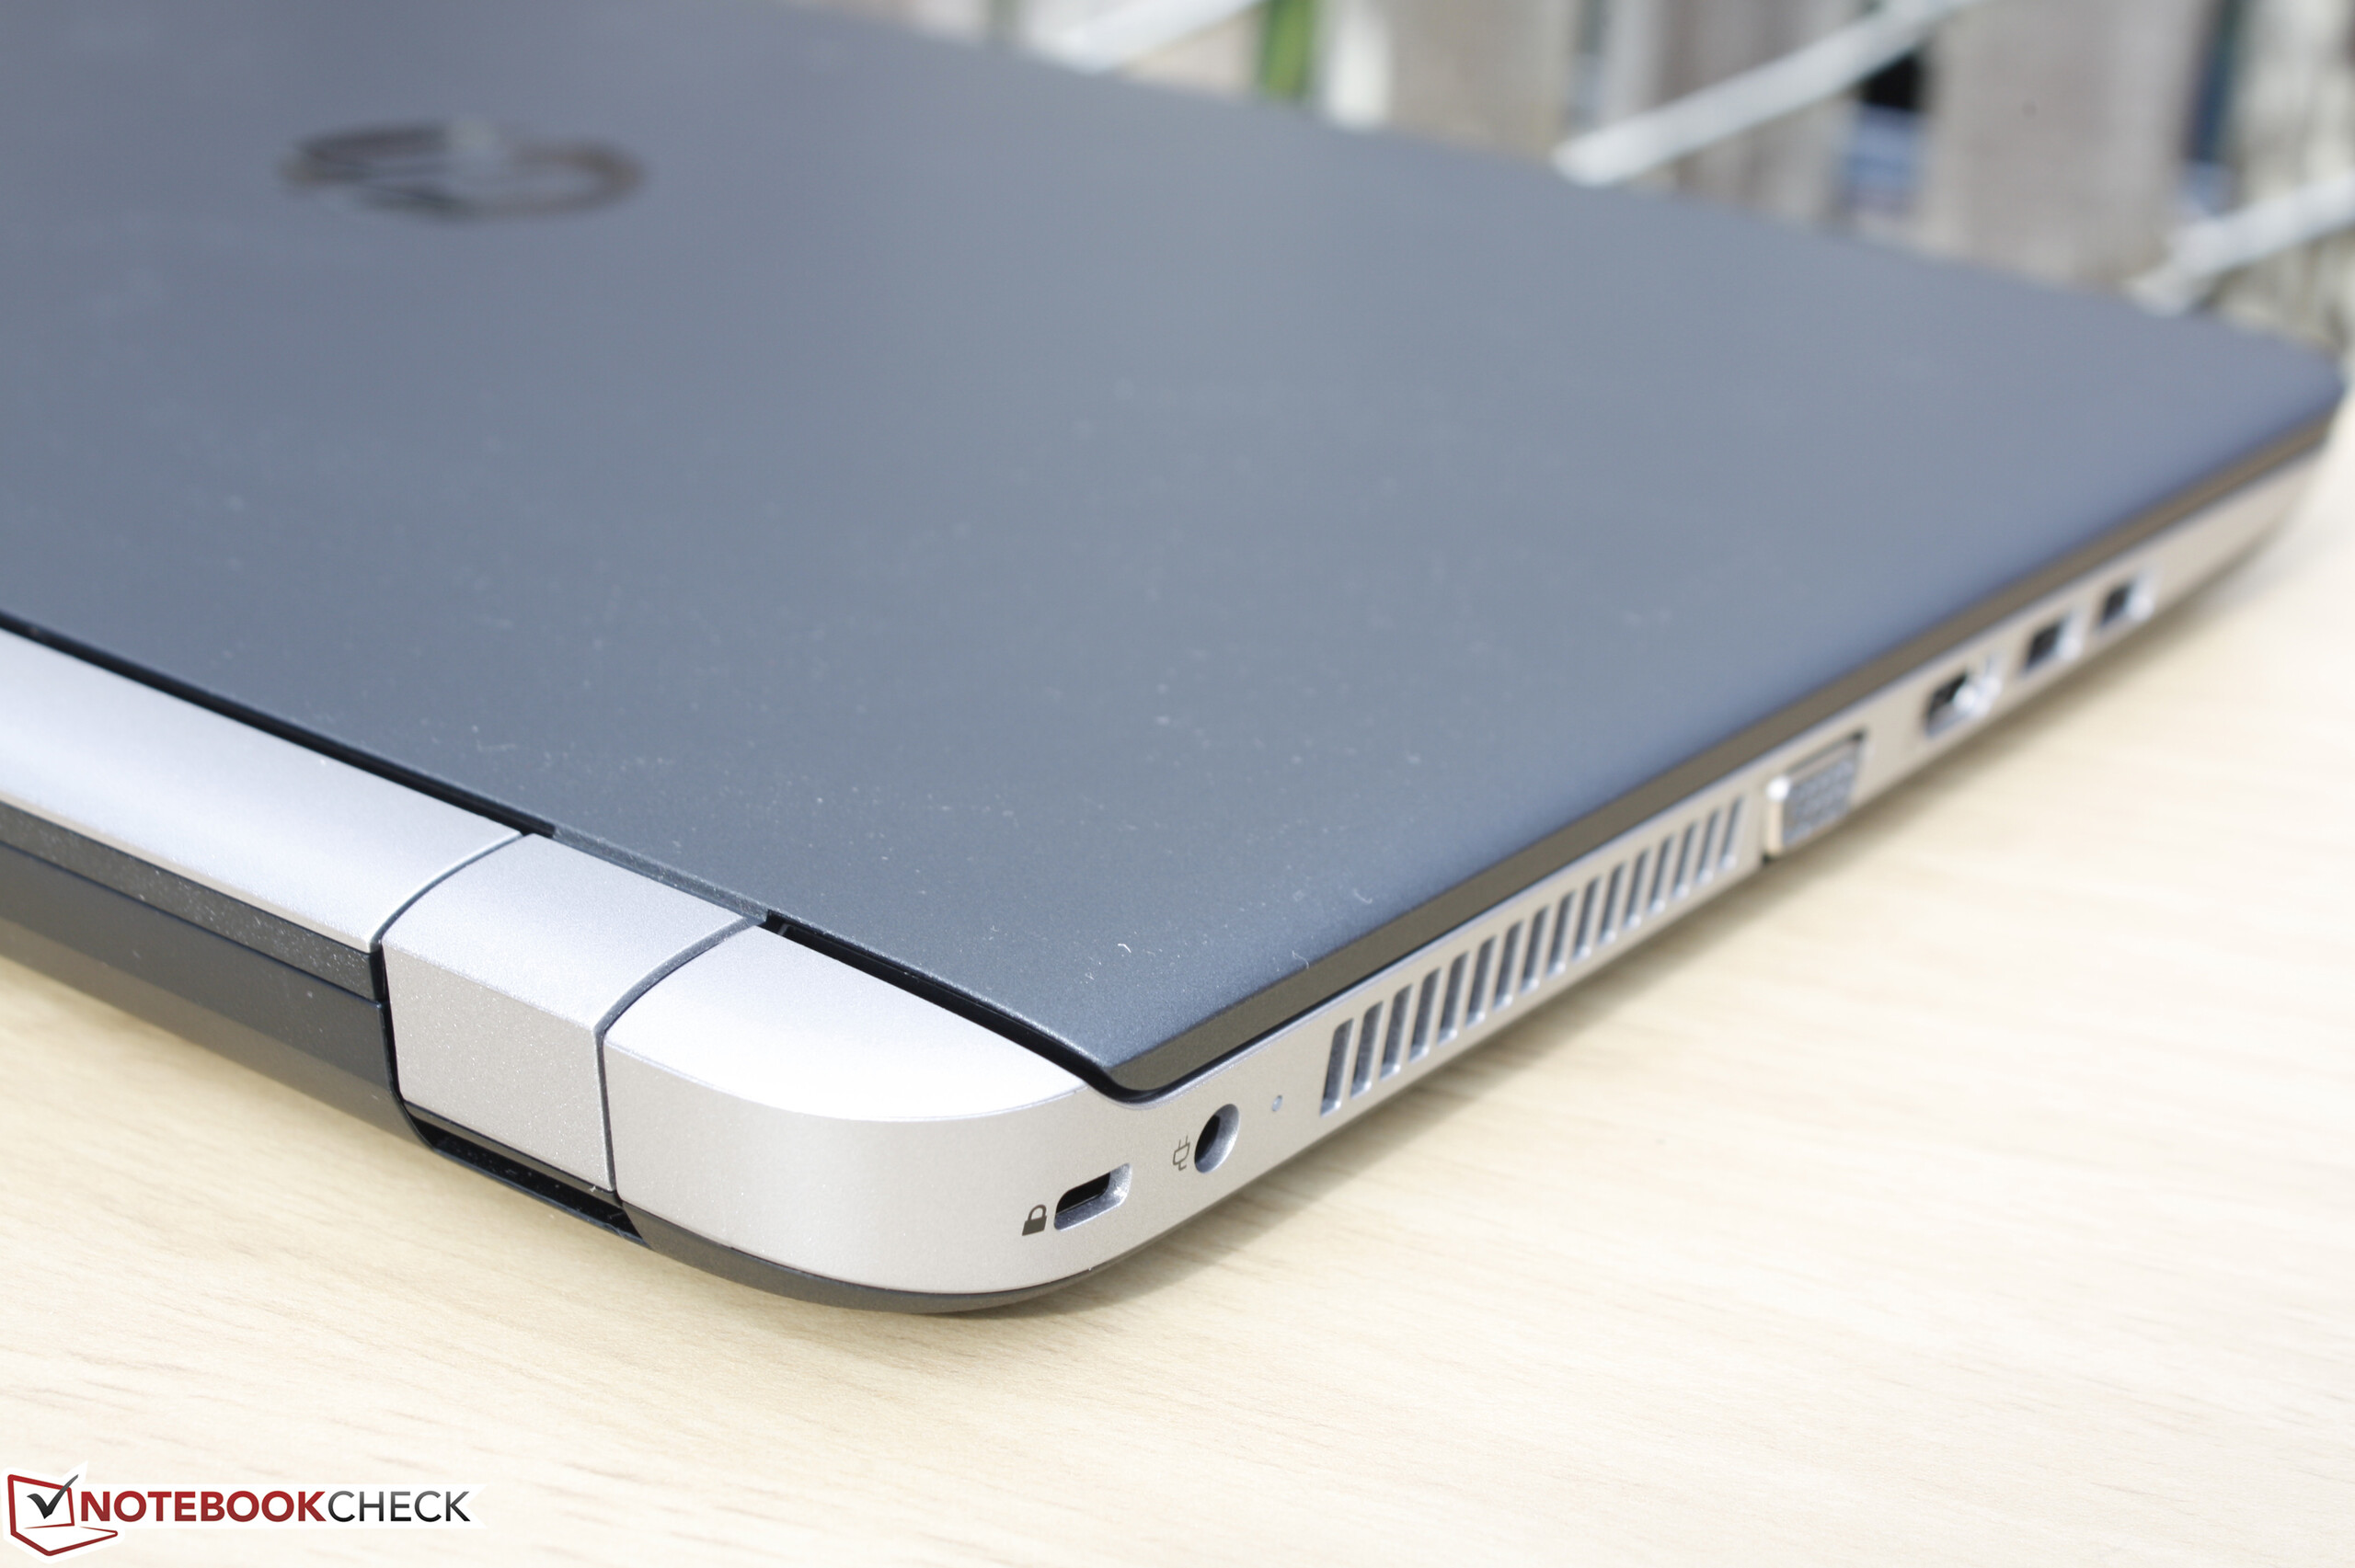
Connectivity
Owners will appreciate the fact that the system integrates 4x USB ports and 2x video-out options including legacy VGA. Unfortunately, there are no Smart Card, WWAN, or USB Type-C options to be found and the close placement of the video-out ports can take up valuable desk space to the left of the unit not unlike on the ThinkPad E560. We wouldn't mind dropping the optical drive for one or two of the above alternatives to improve the versatility of the ProBook.
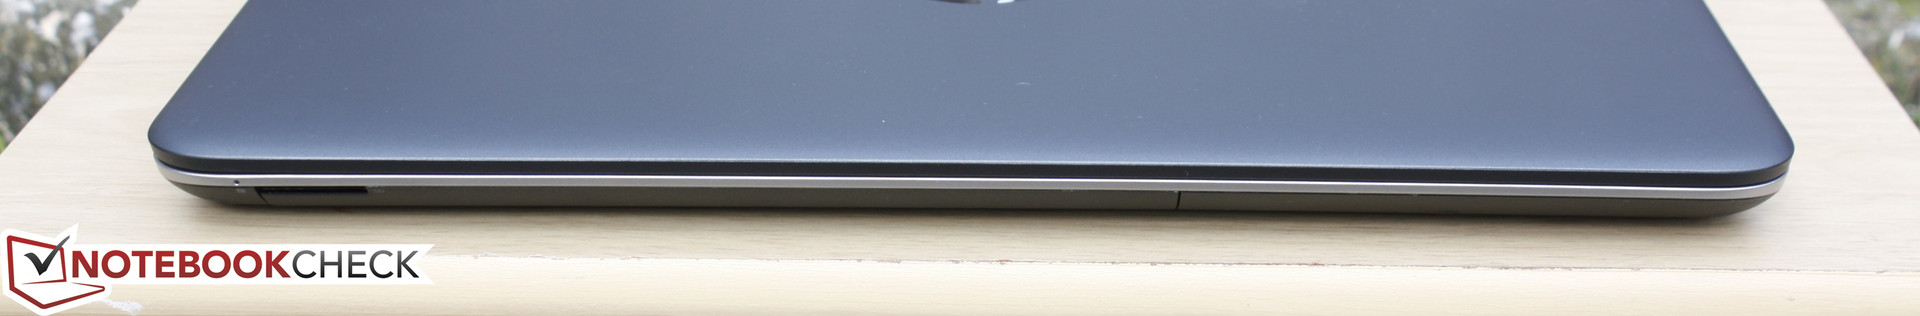


SD Card Reader
Transfer rates from the integrated card reader are relatively slow at just 80.6 MB/s read and 54.5 MB/s write according to AS SSD. Moving 1 GB worth of image files from our SDXC UHS-II test card takes just under 20 seconds.
| SD Card Reader | |
| average JPG Copy Test (av. of 3 runs) | |
| MSI GT73VR 6RF | |
| Dell XPS 13 9360 FHD i5 | |
| HP ProBook 455 T1B79UT | |
| maximum AS SSD Seq Read Test (1GB) | |
| Dell XPS 13 9360 FHD i5 | |
| MSI GT73VR 6RF | |
| HP ProBook 455 T1B79UT | |
Communication
WLAN and Bluetooth 4.0 are both provided by a Realtek RTL8723BE M.2 module. Network speeds are limited by the 802.11n standard and so we were only able to record a maximum transfer rate of about 89 Mbps in iPerf3 when standing one meter away from our Linksys EA8500 test router. We experienced no dropout issues during our time with the ProBook.
| Networking | |
| iperf3 receive AX12 | |
| Dell XPS 13 9360 FHD i5 | |
| HP Pavilion x360 15t X3W72AV | |
| HP ProBook 455 T1B79UT | |
| iperf3 transmit AX12 | |
| Dell XPS 13 9360 FHD i5 | |
| HP Pavilion x360 15t X3W72AV | |
| HP ProBook 455 T1B79UT | |
Accessories
Included extras are light at just a short setup guide, Warranty information, and recovery DVD. The notebook lacks a dedicated docking port for compatibility with specialized docking stations from HP.
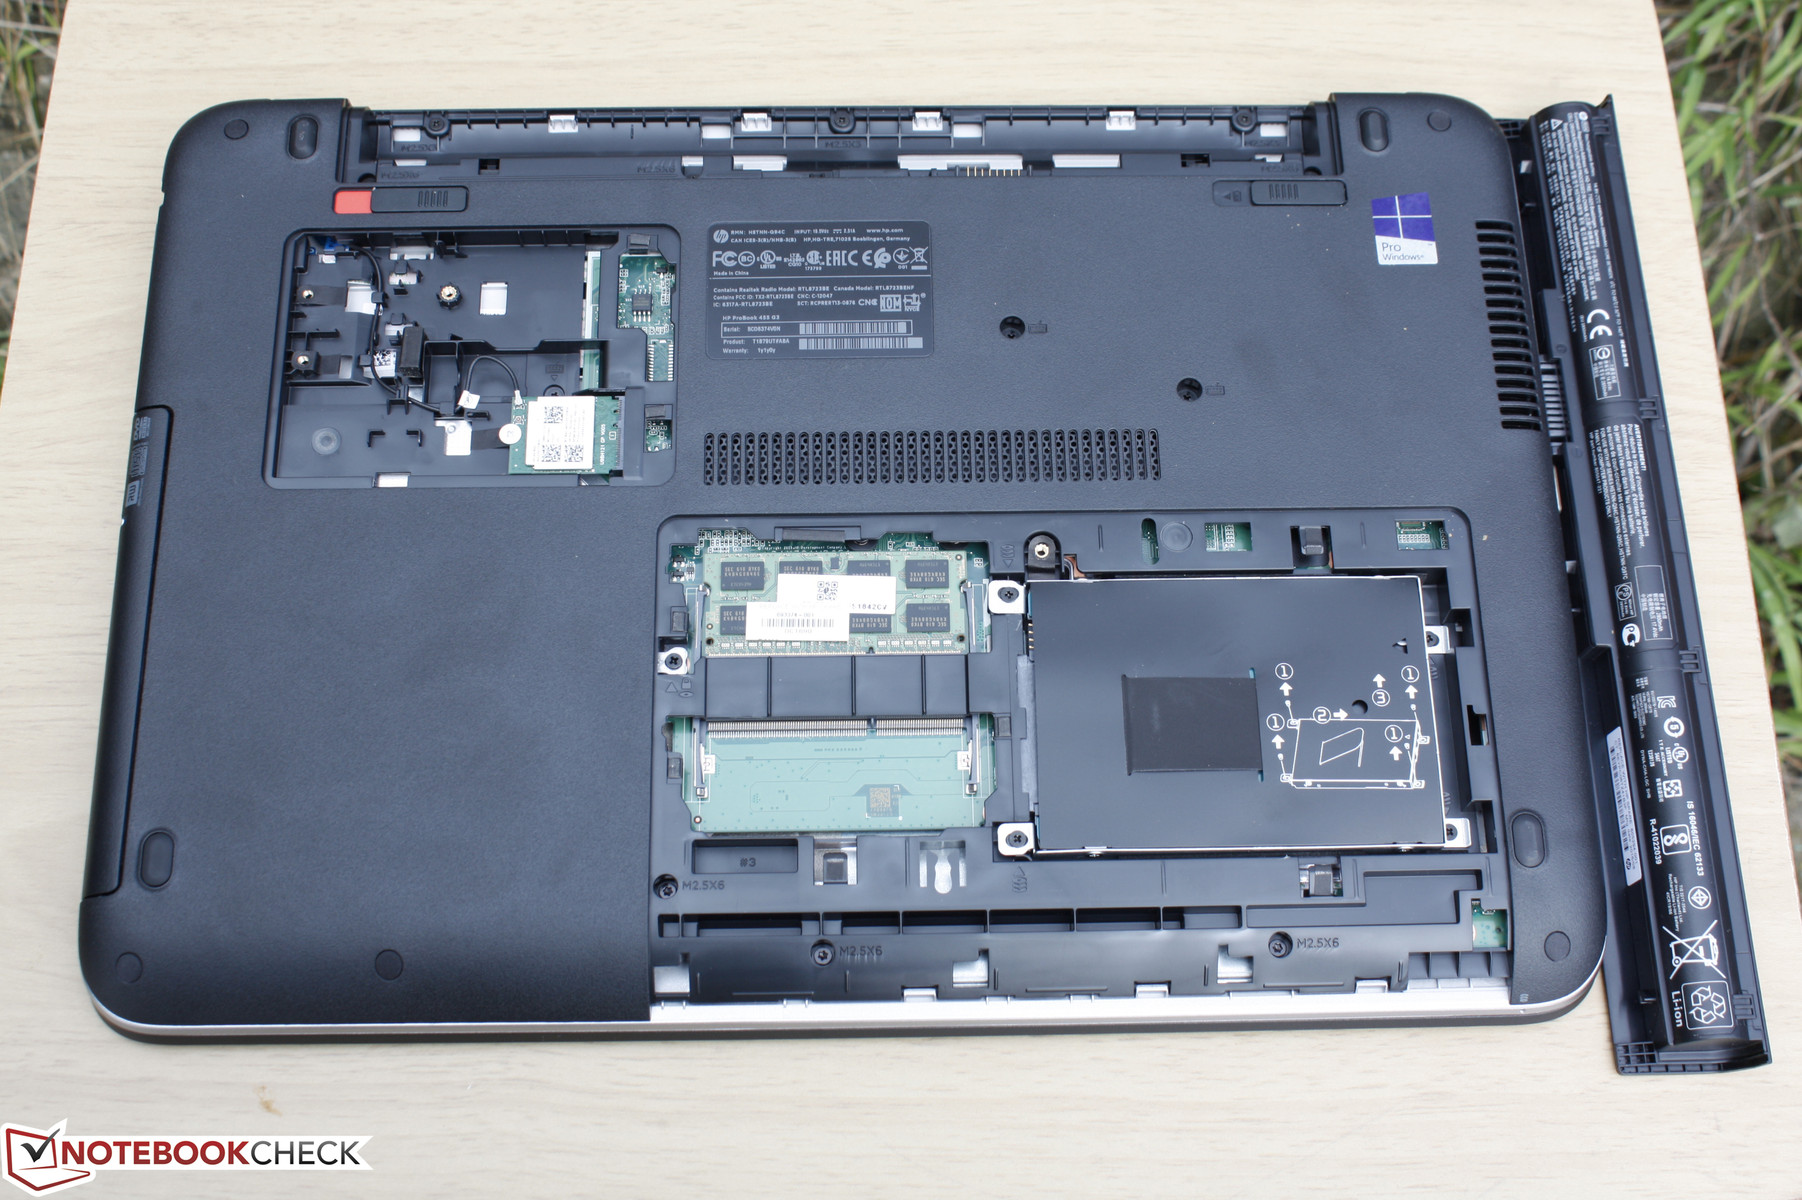
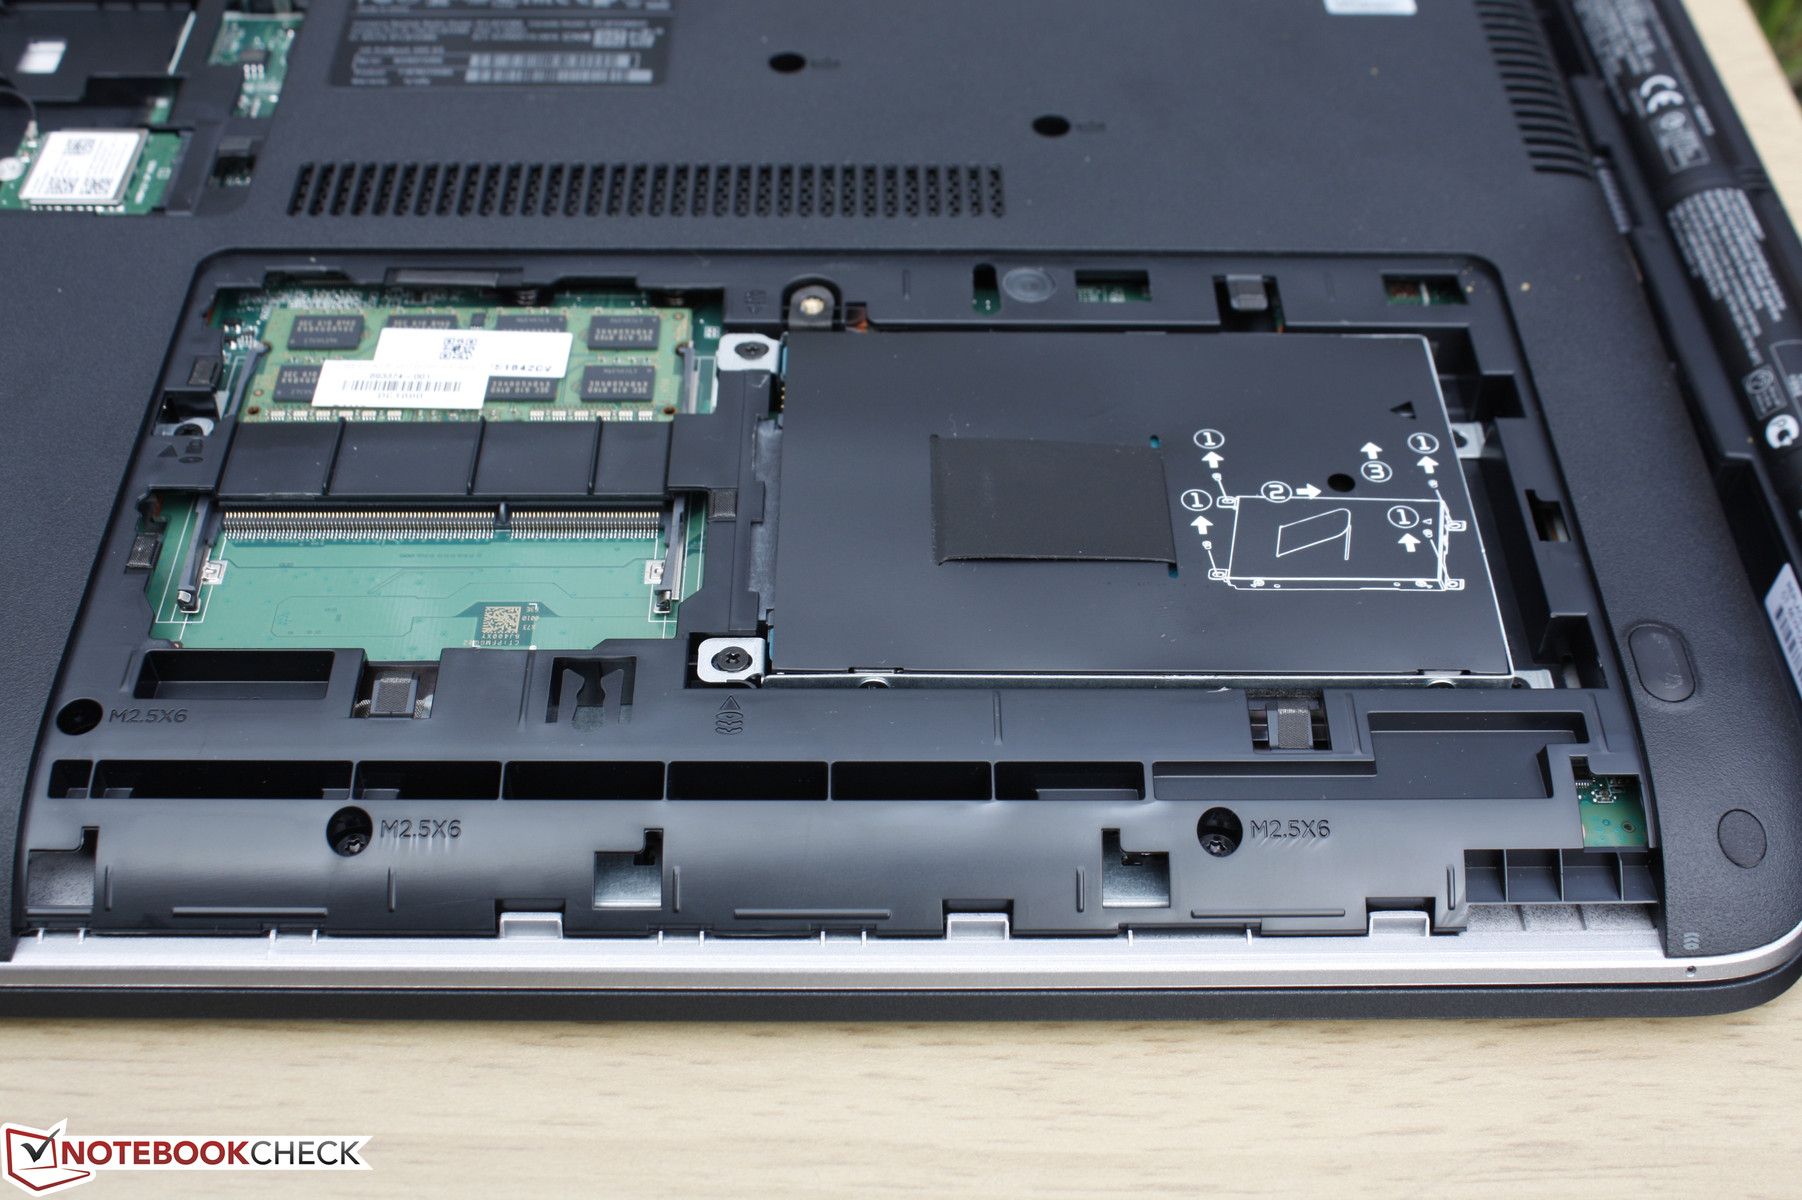
Maintenance
Access to the core upgradeable components (2x SODIMM, 2.5-inch SATA III, M.2 2230 WLAN) is straightforward via two separate hatches underneath the notebook. Additional servicing of the motherboard will require the removal of additional screws and latches around the edges and corners of the bottom panel.
Warranty
The usual one-year limited warranty period applies to new purchases made in the US.
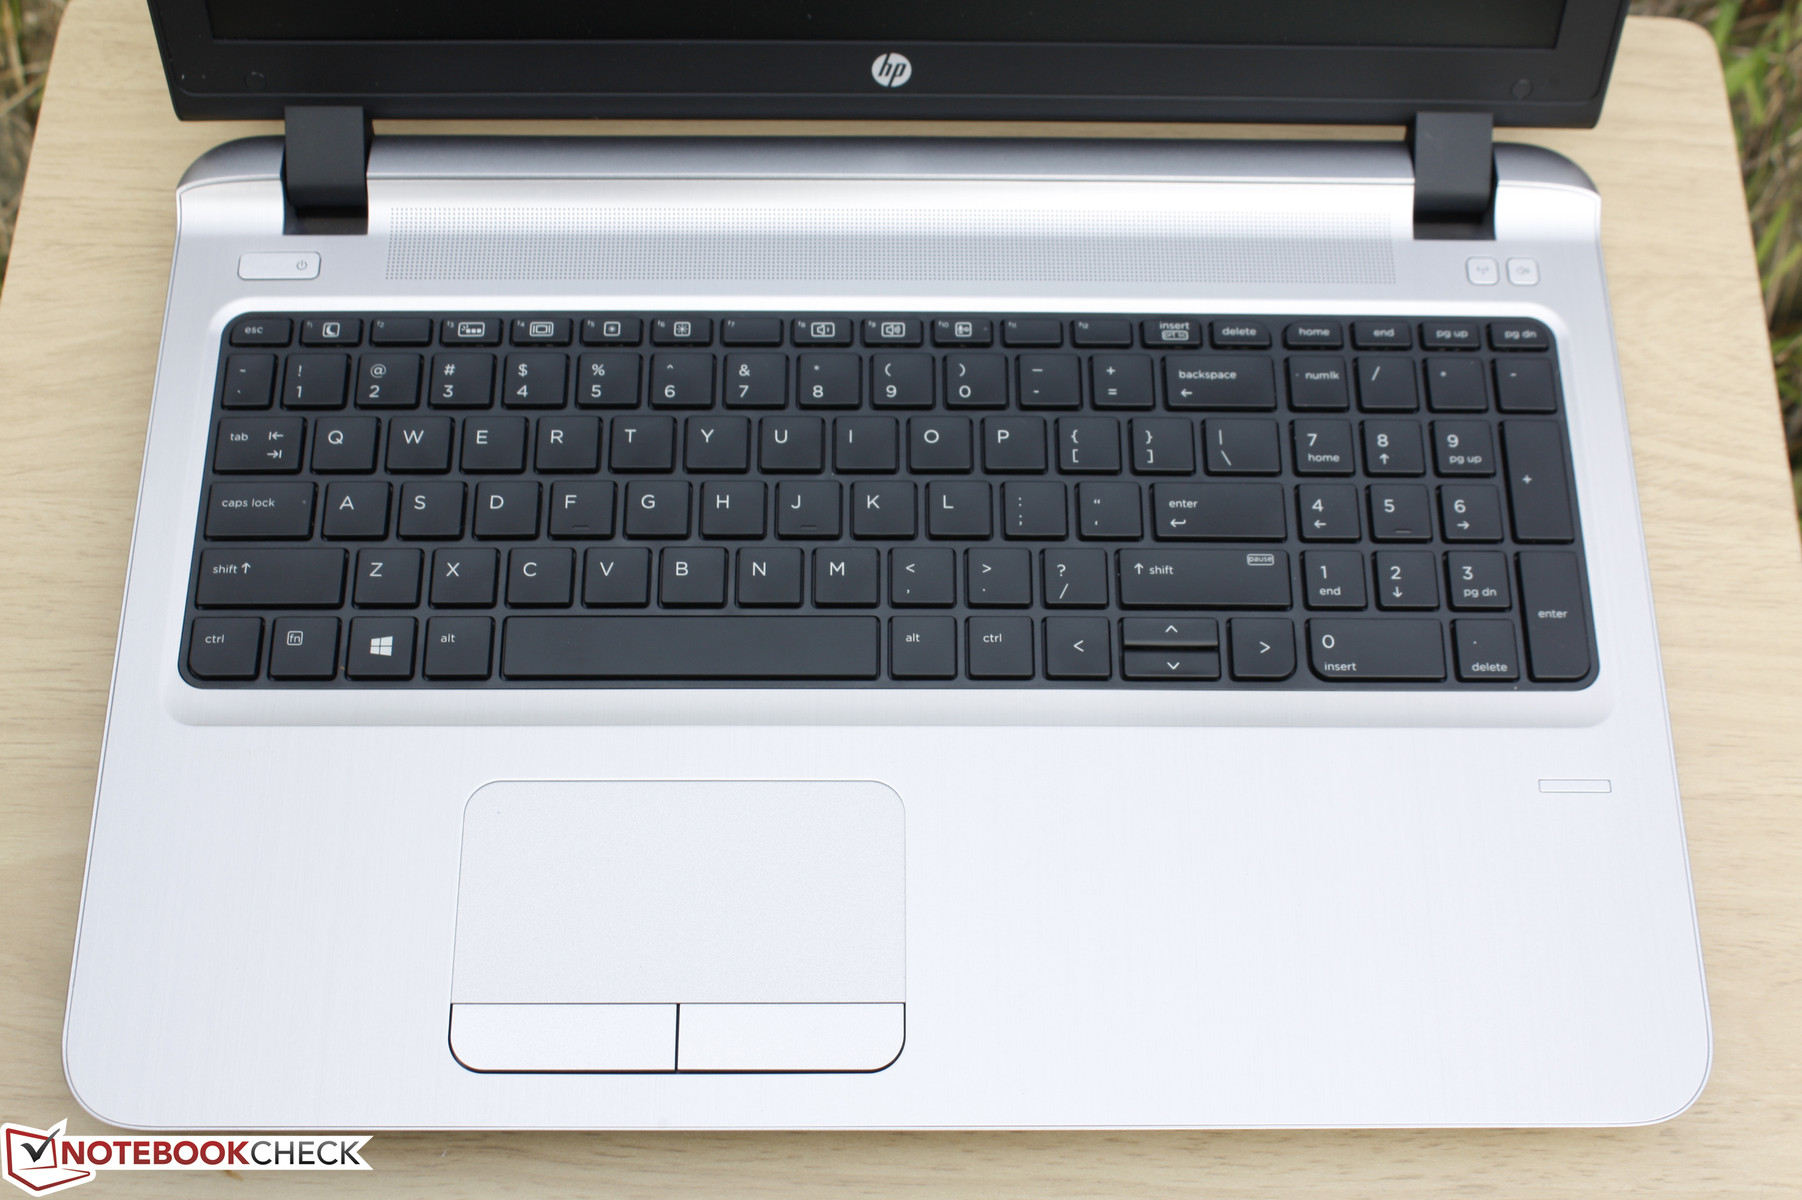
Input Devices
Keyboard
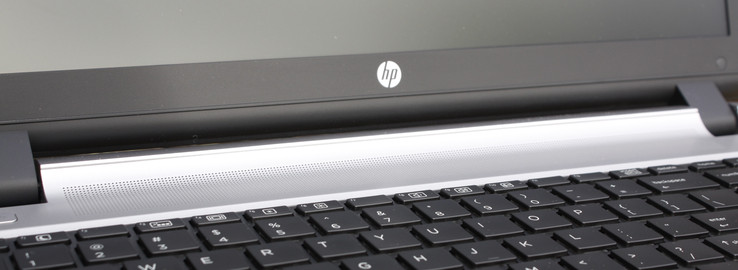
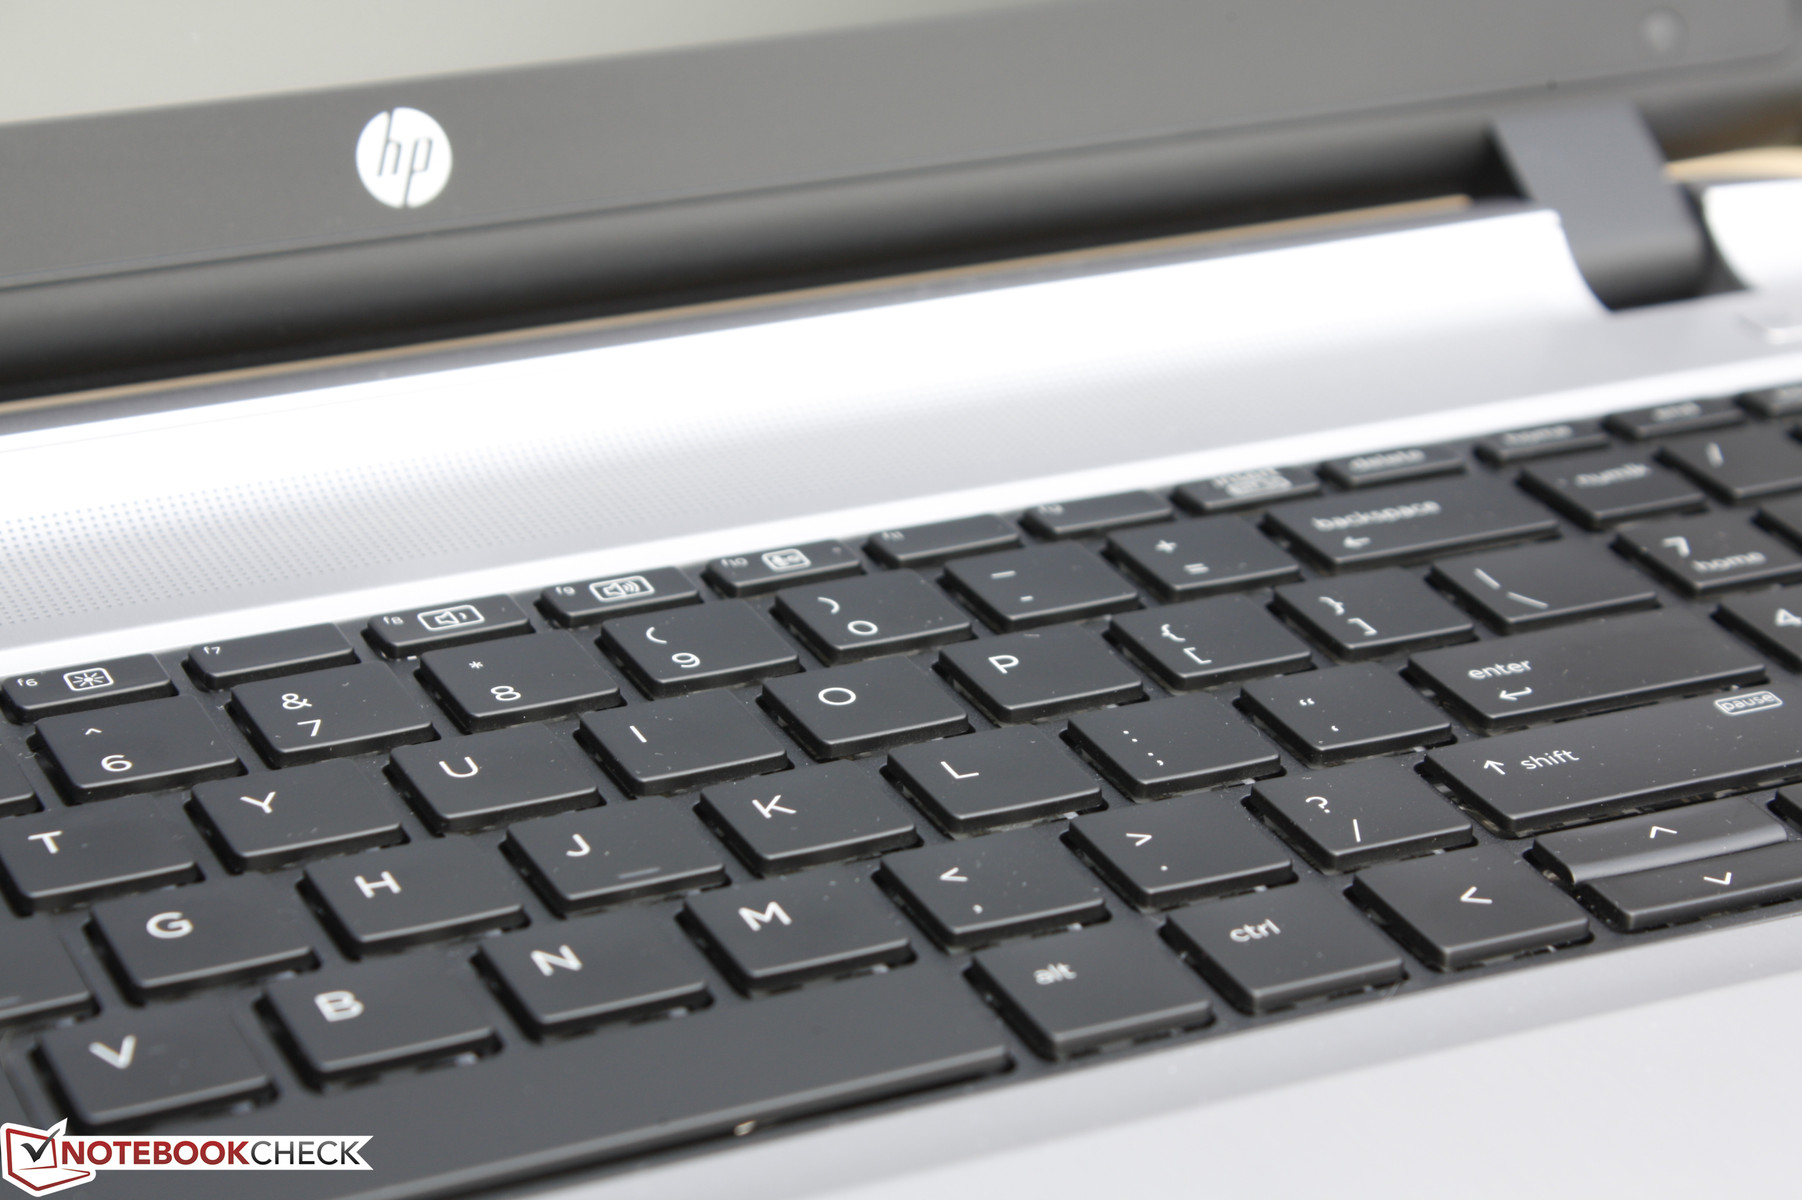
The plastic keys are slightly concave and offer crisp feedback with shallow travel. They clatter a bitt more than on the recent XPS 13 and the actuation point feels lighter as well, so mistakes may be more frequent for those with larger hands. Other than the softer half-size Up/Down Arrow keys, feedback appears even across each key.
The optional backlight comes in two brightness levels unlike the single-level backlight on the latest Spectre notebooks. The black keys contrast better against the white lettering here compared to the silver keys on HP's current consumer lineup, but grease and fingerprints will buildup more quickly as a result.
Touchpad
The small (~10.3 x 5.4 cm) touchpad is essentially identical to the touchpad of the last generation ProBook 450 G2. We experienced no issues related to simple cursor control and the gliding is equally smooth and responsive around the edges and corners of the surface. Unfortunately, the area is so small that multi-touch gesture controls can be somewhat unreliable. There is no TrackPoint for business users who may be accustomed to the feature.
The dedicated mouse keys are very quiet with its relatively soft feedback as the main drawback. Travel is reasonably deep, but it's still very easy to depress the key without inputting a click to make for a "squishy" clicking experience.
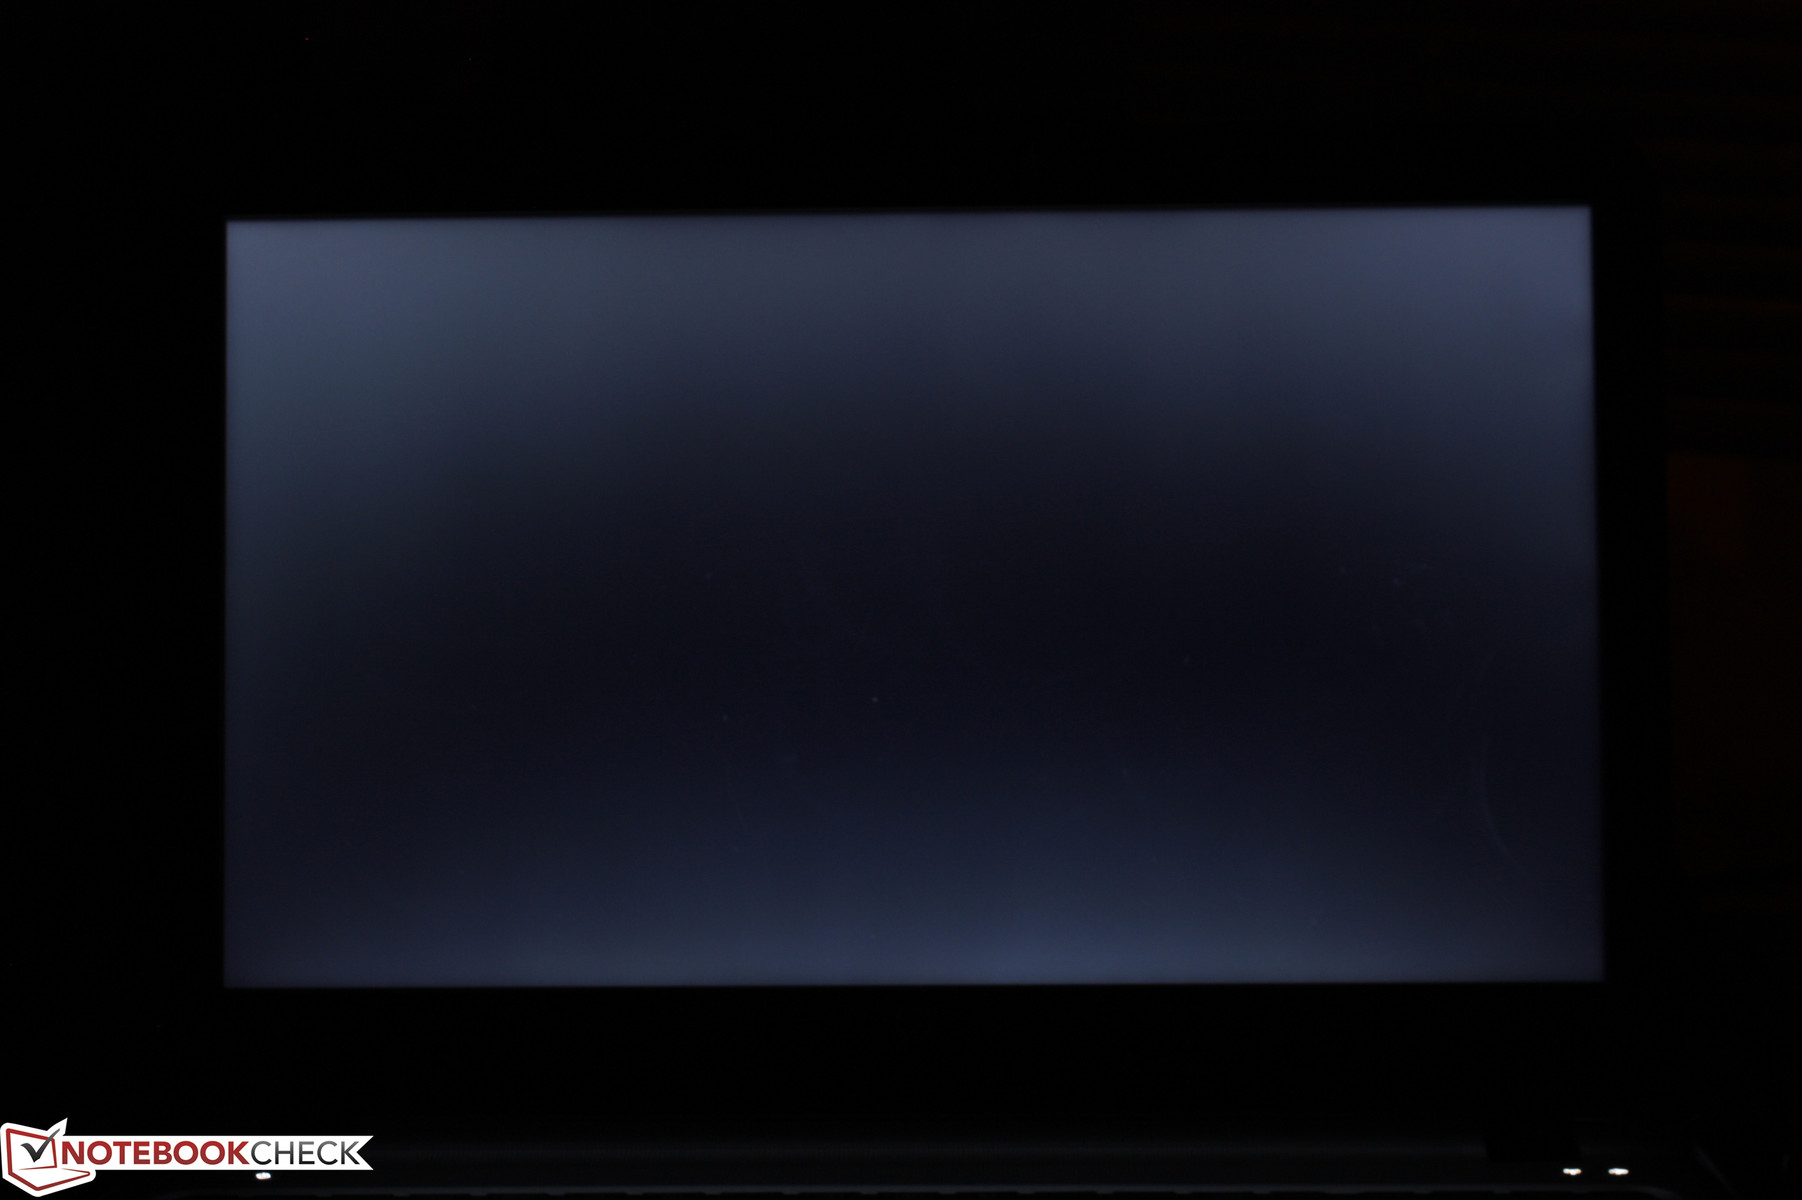
Display
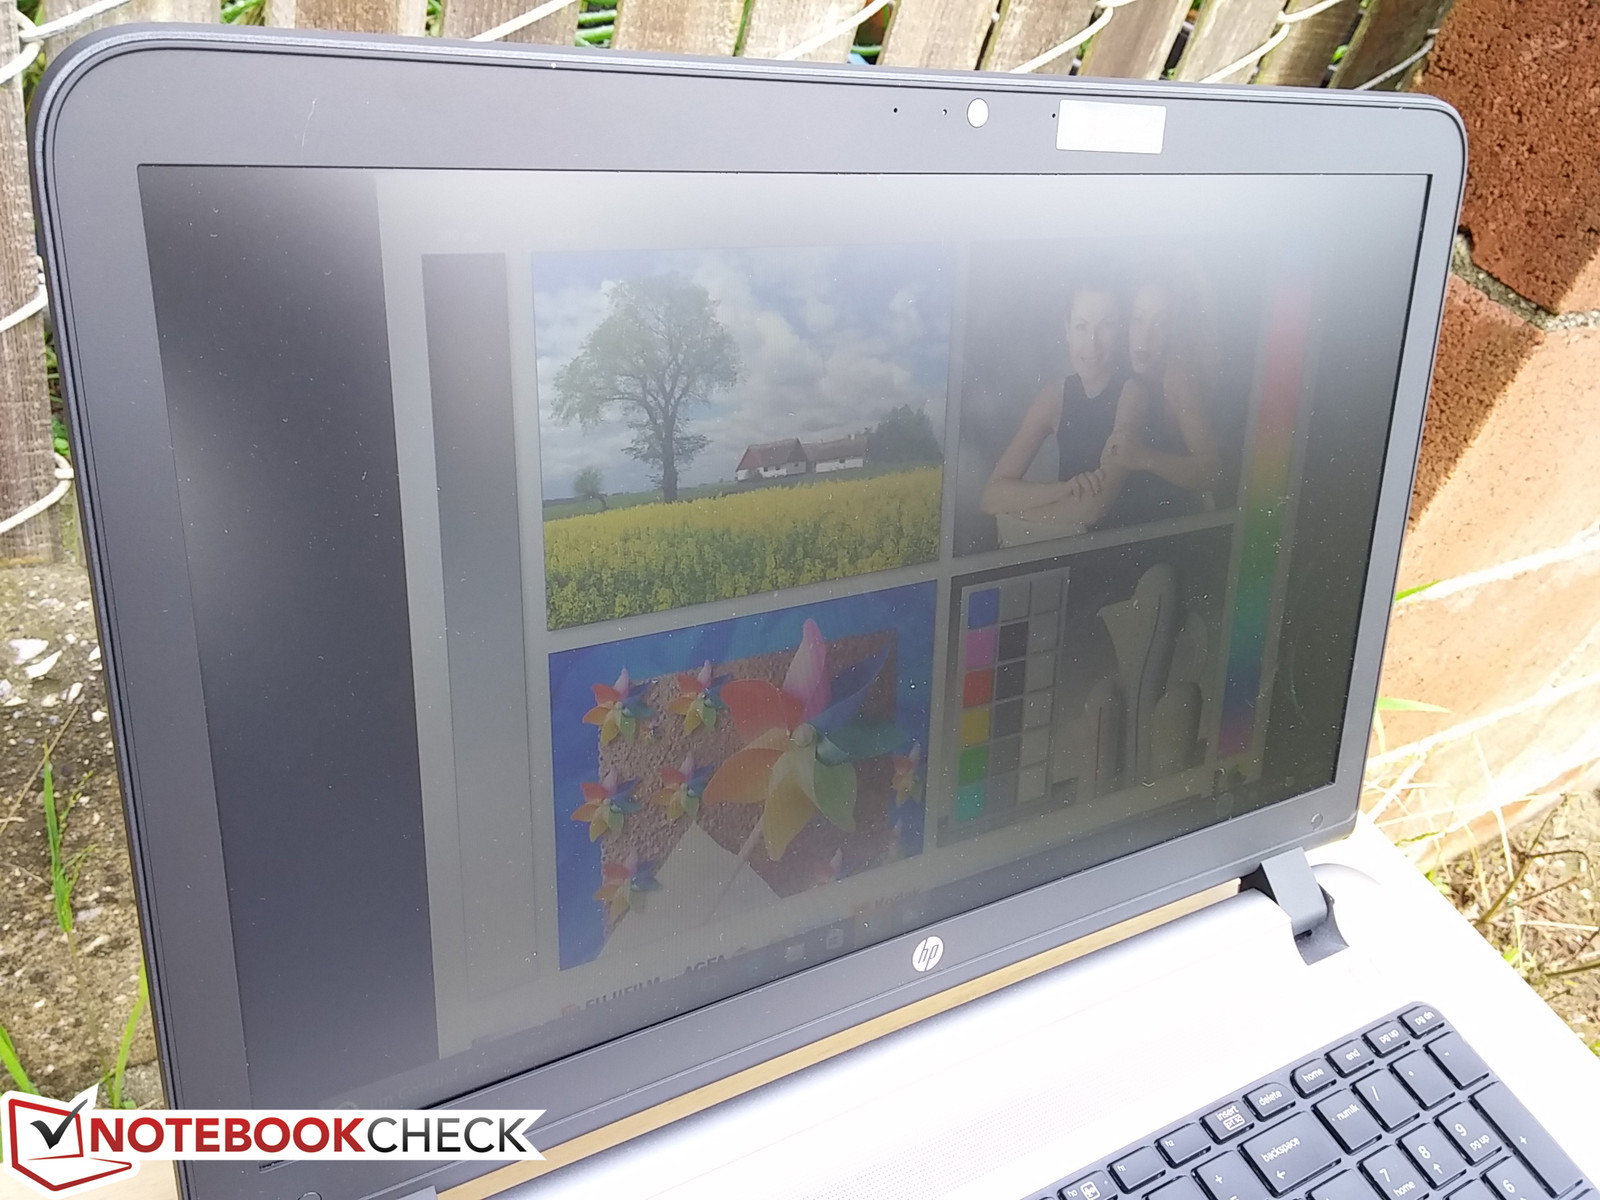
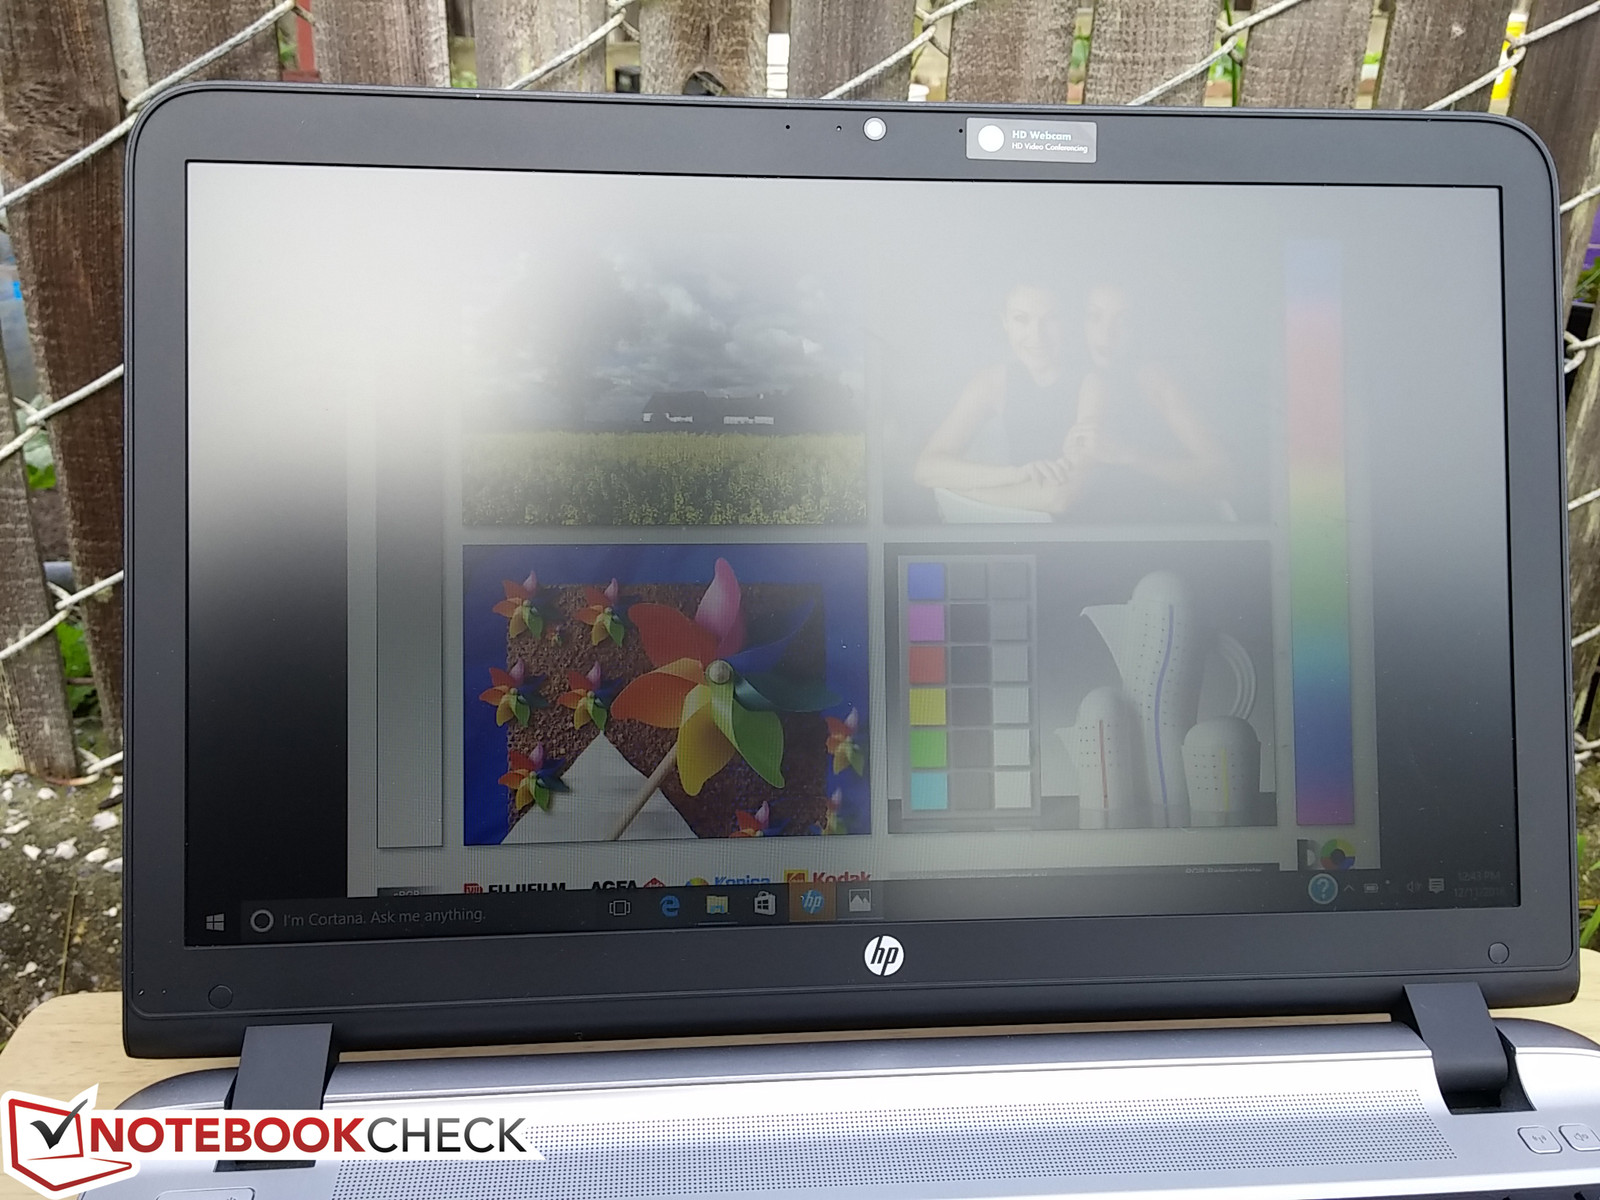
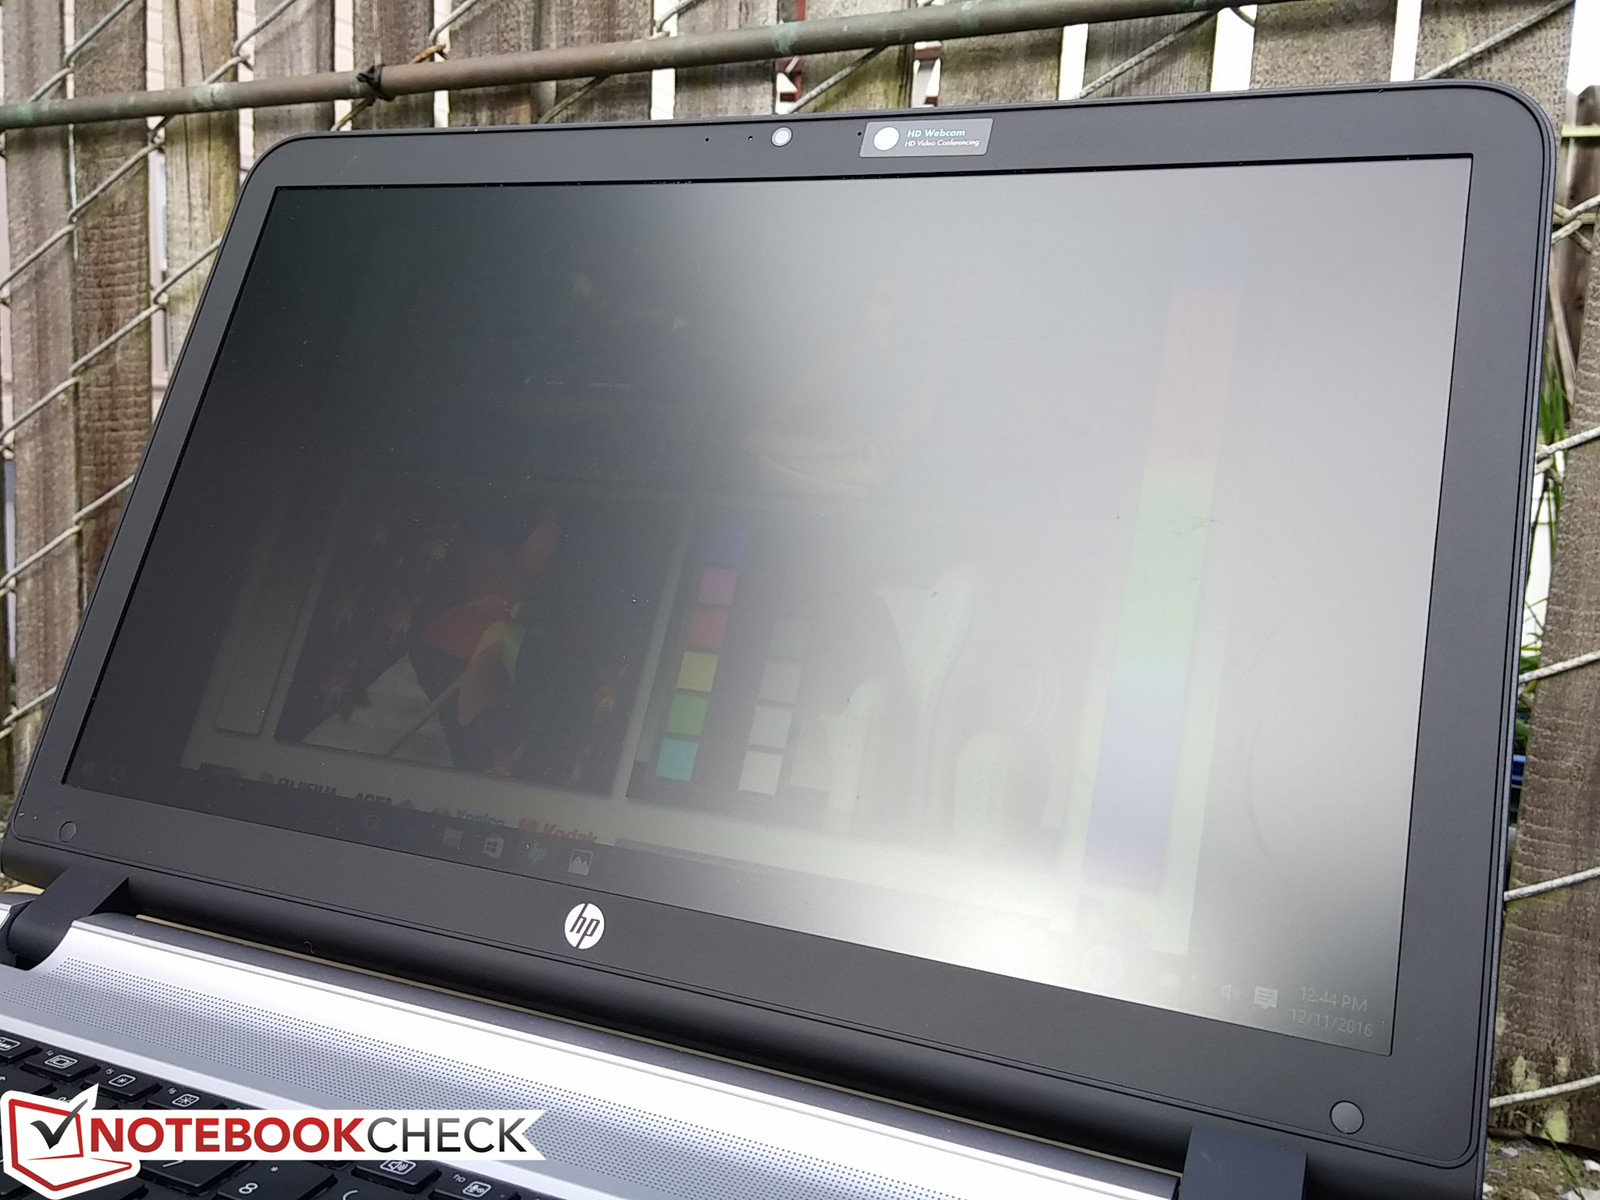
The display is perhaps the most disappointing aspect of the ProBook 455 G3. The configuration is limited to matte 768p with no other resolution options. Its Chi Mei CMN15BE panel can also be found on other budget notebooks including the ProBook 650 G2 and the two-year old Acer TravelMate P255-M. There is a slight graininess to the overall screen and its backlight brightness distribution is less even compared to other 15.6-inch budget business notebooks. Many of these disadvantages are common amongst notebooks with inexpensive 768p TN panels. To HP's credit, the panel here is not significantly better or worse than the competition in terms of contrast and response times.
Note that the maximum display brightness will drop if running on batteries unless if the "Vari-Bright" option is disabled in the AMD Catalyst utility. This is especially important for more comfortable outdoor viewing or when AC power is not available.
| |||||||||||||||||||||||||
Brightness Distribution: 72 %
Center on Battery: 245.3 cd/m²
Contrast: 598:1 (Black: 0.41 cd/m²)
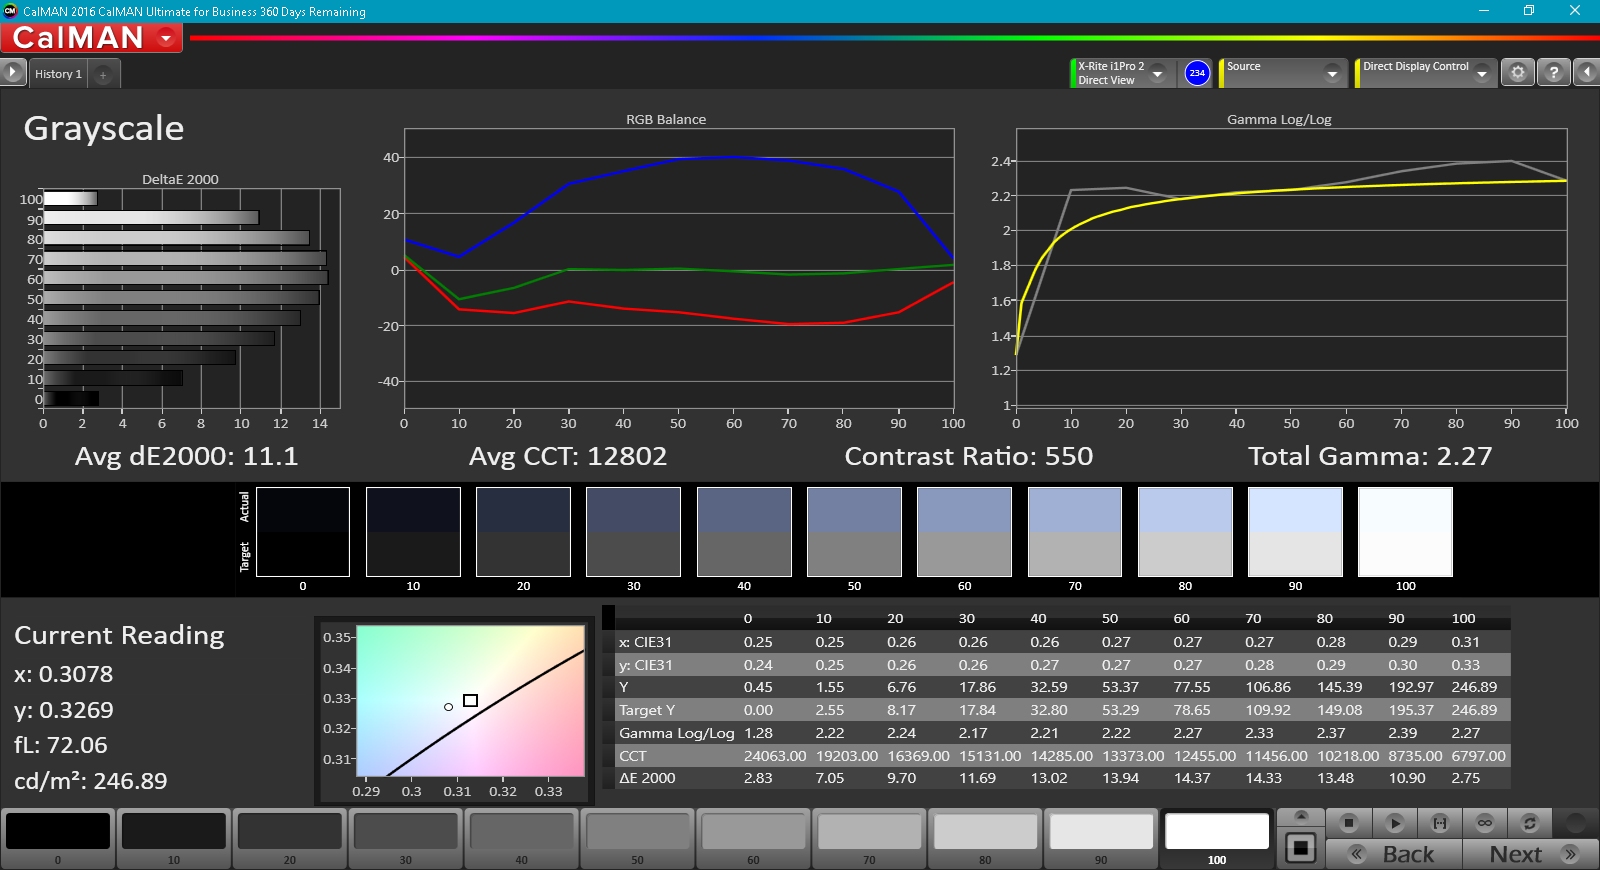
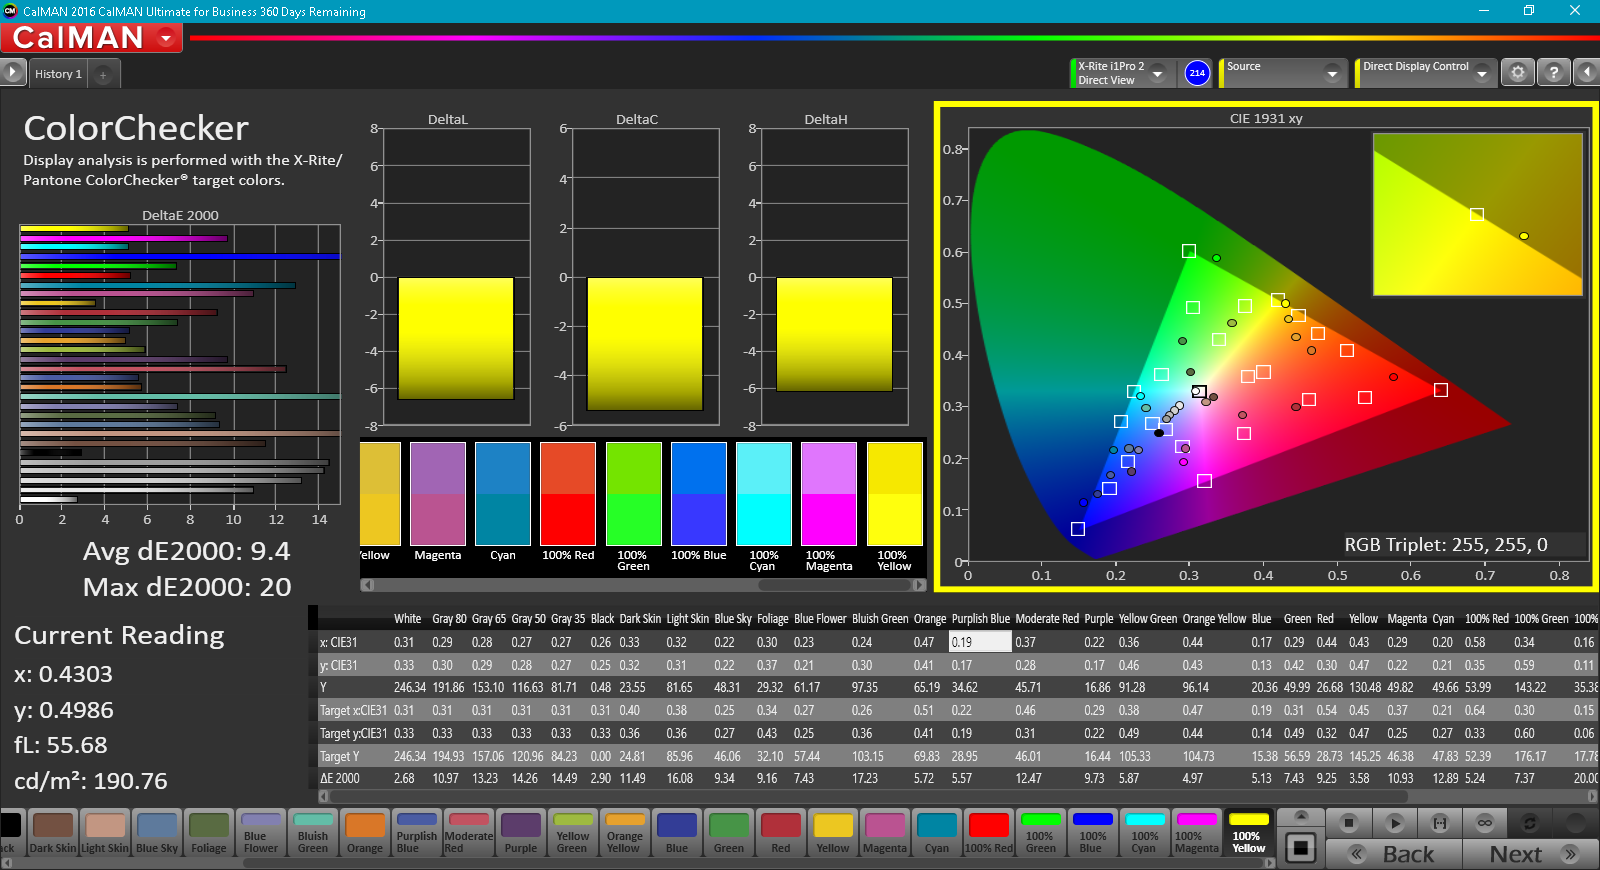
ΔE Color 9.4 | 0.5-29.43 Ø5
ΔE Greyscale 11.1 | 0.57-98 Ø5.3
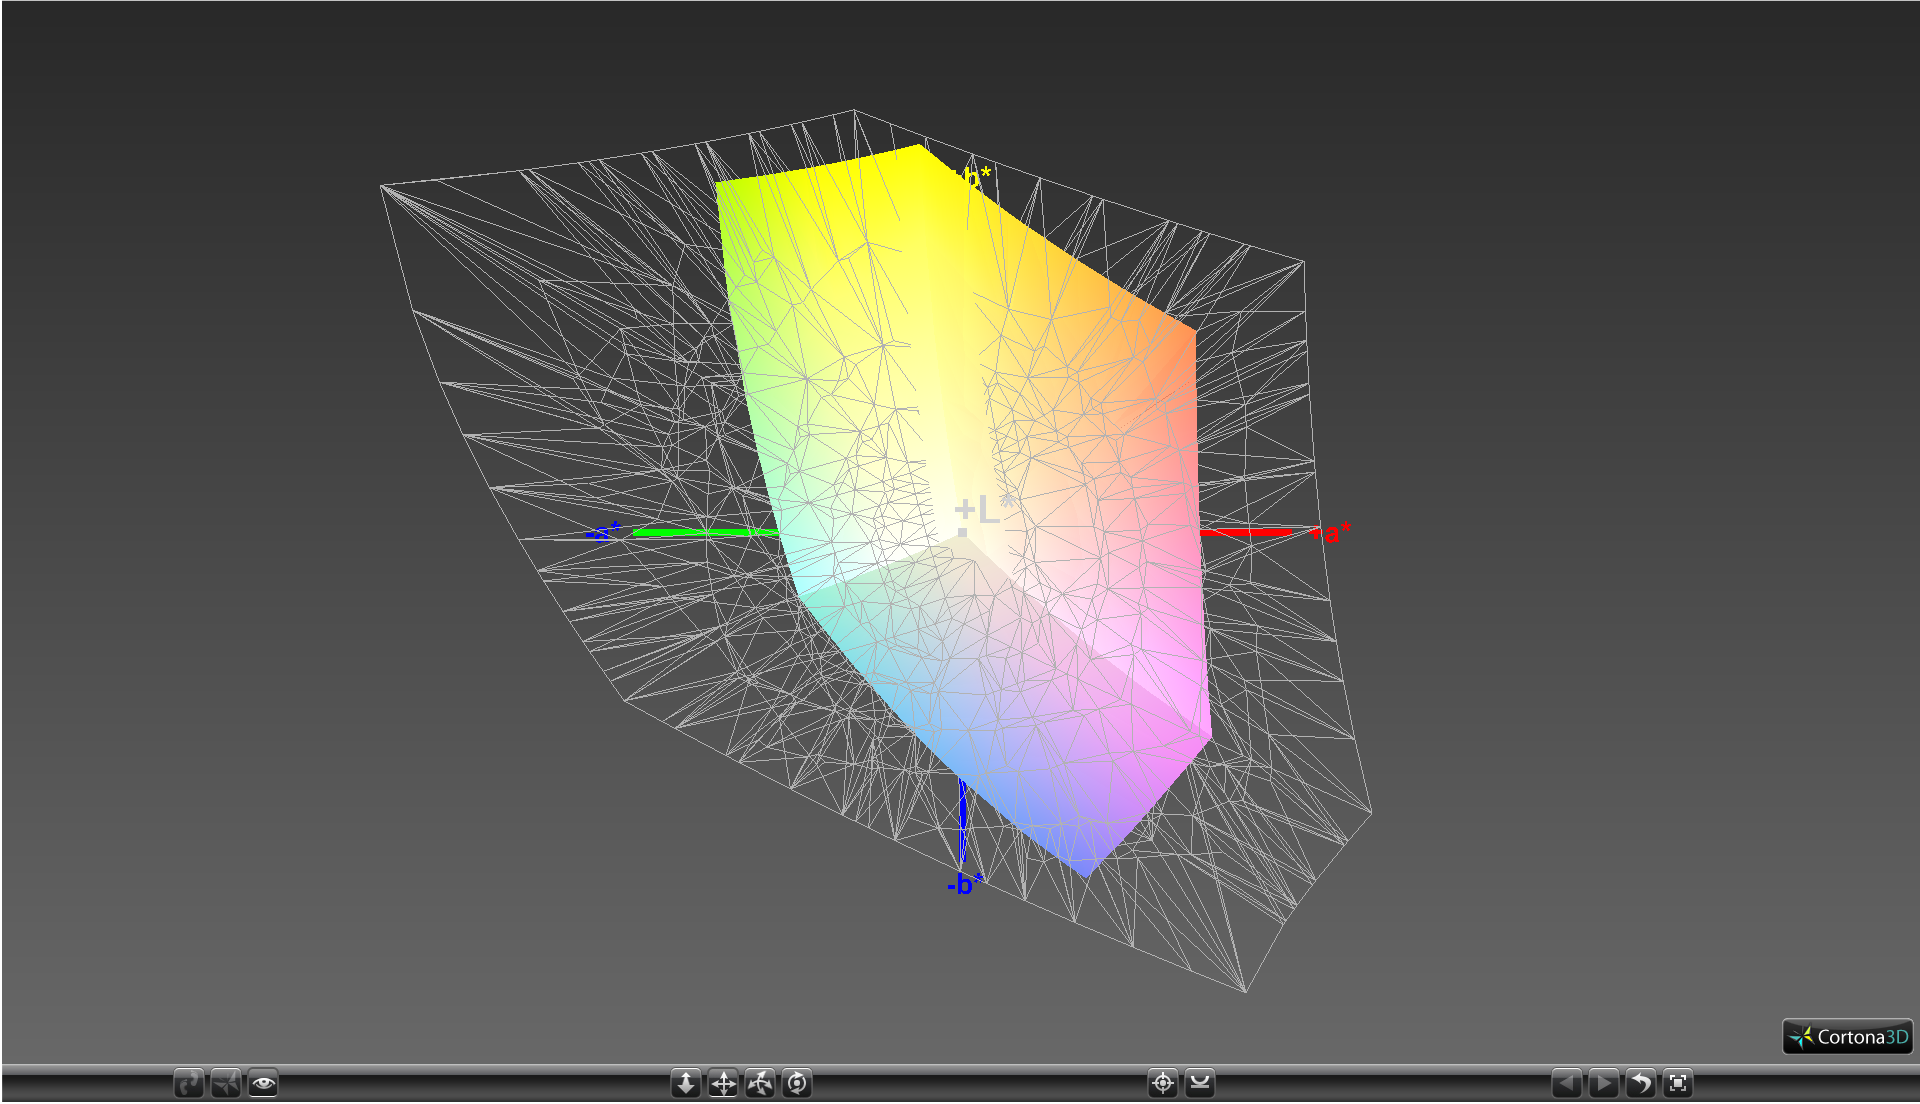
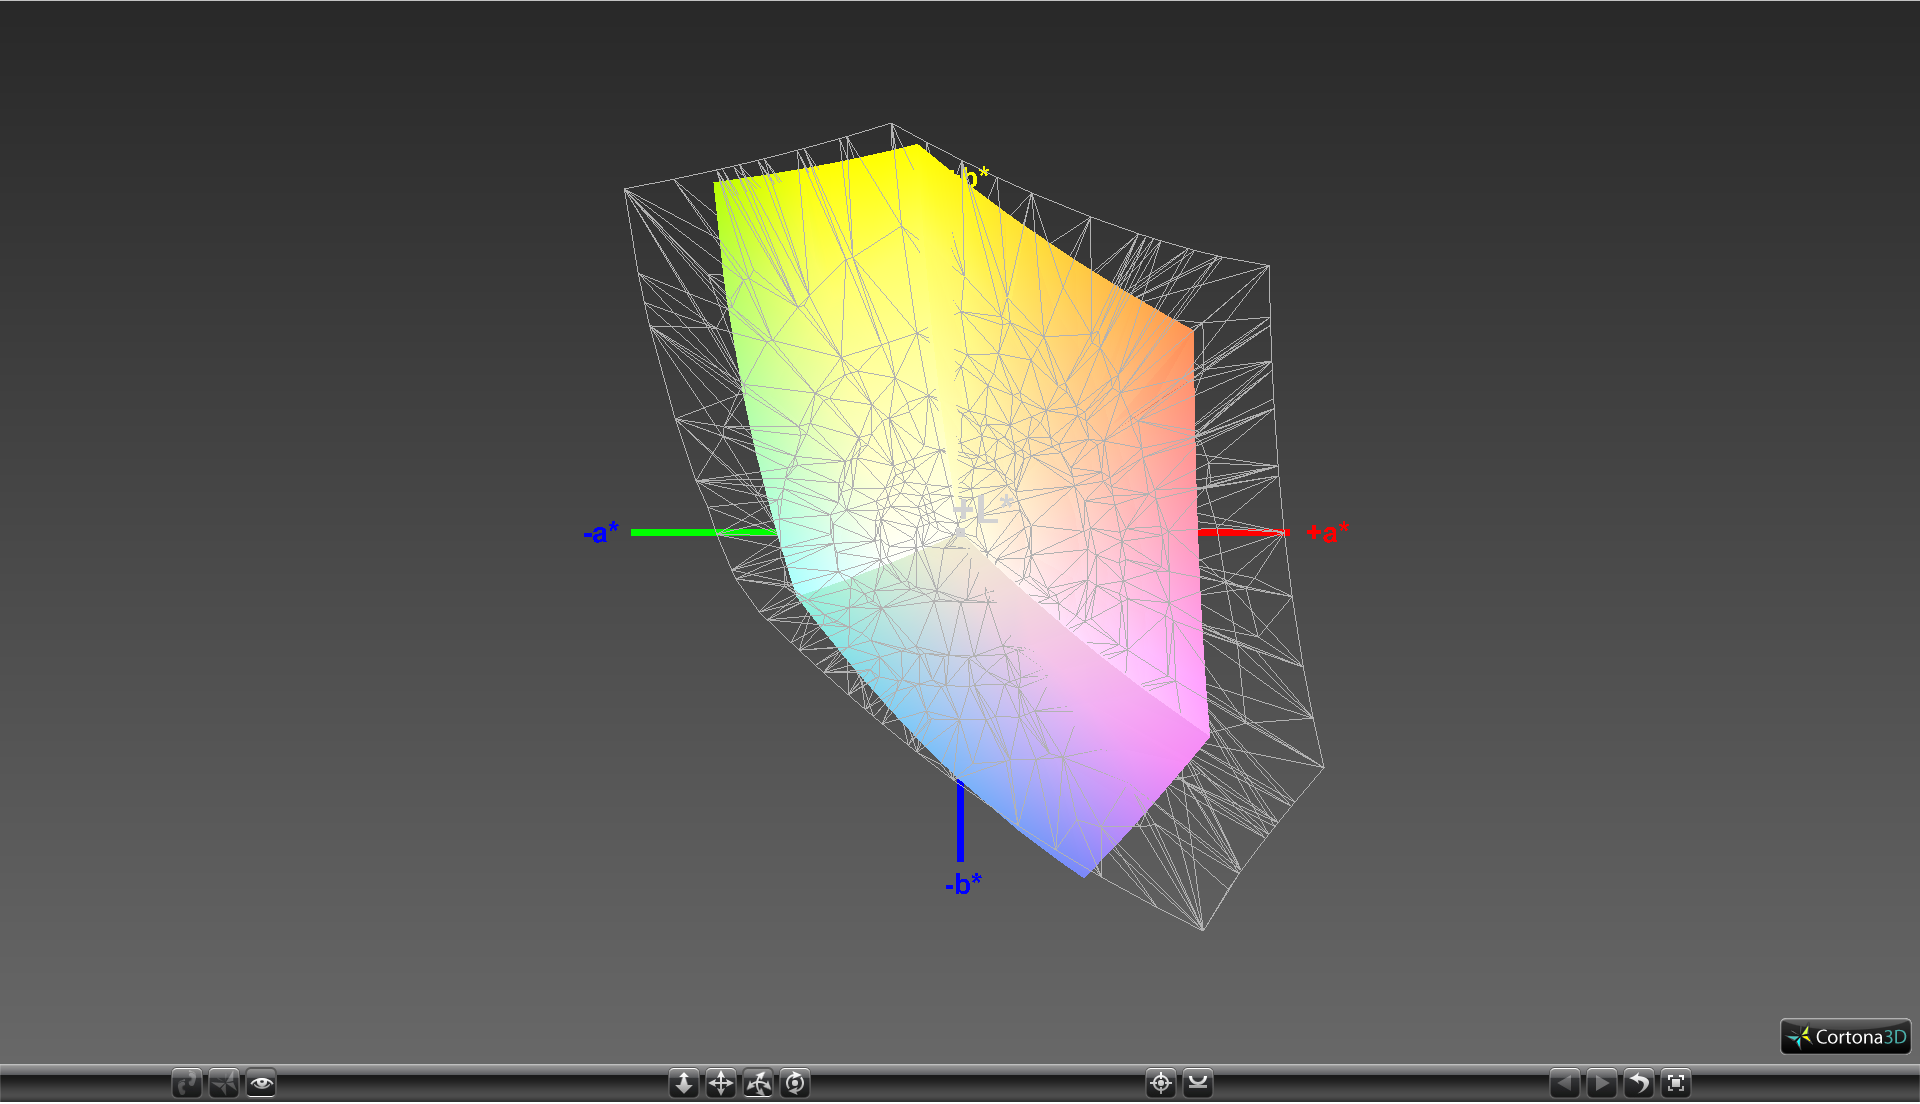
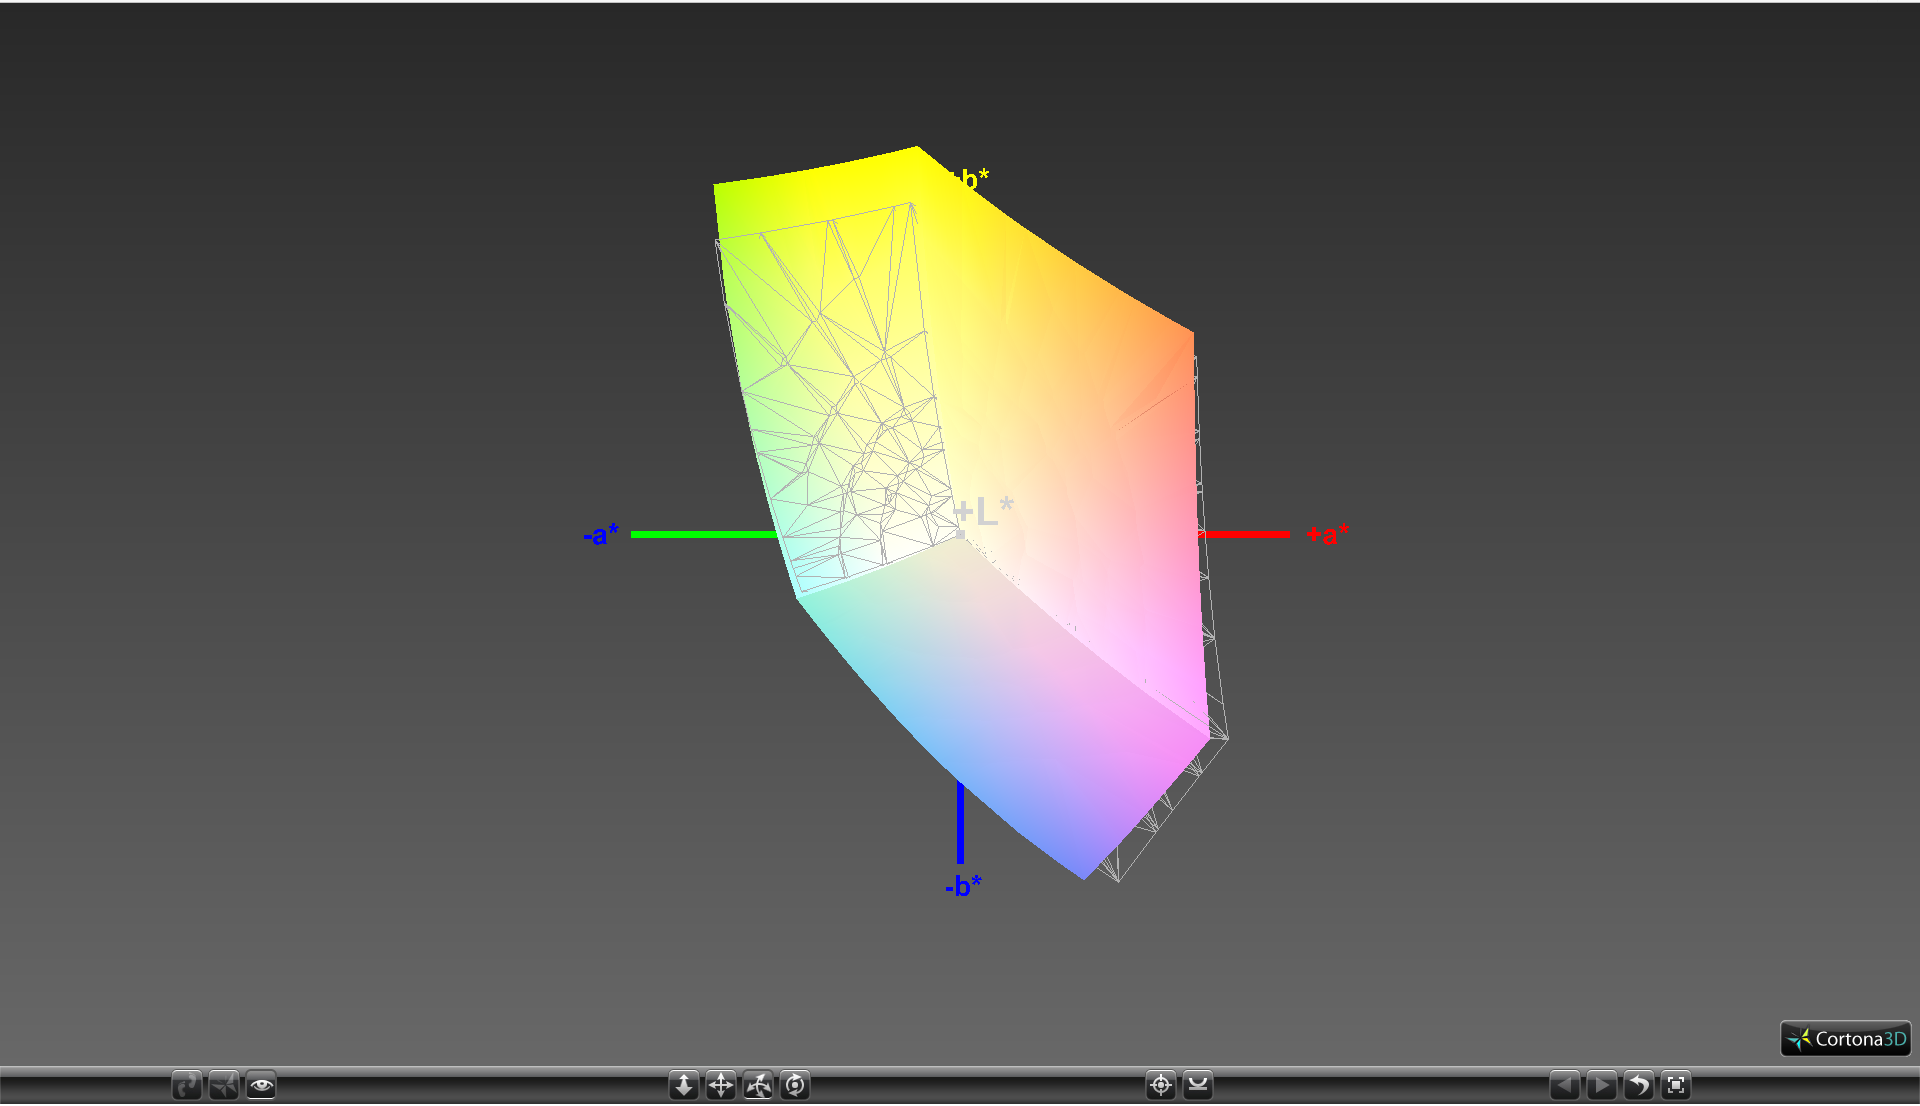
66.1% sRGB (Argyll 1.6.3 3D)
42.3% AdobeRGB 1998 (Argyll 1.6.3 3D)
45.98% AdobeRGB 1998 (Argyll 2.2.0 3D)
66.4% sRGB (Argyll 2.2.0 3D)
44.46% Display P3 (Argyll 2.2.0 3D)
Gamma: 2.27
| HP ProBook 455 T1B79UT TN, 15.60, 1366x768 | HP 15z-ba000 BOE06A4, TN, 15.60, 1366x768 | Dell Latitude 15-3570 LG Philips LGD04AF / 156WHU, TN LED, 15.60, 1366x768 | Lenovo ThinkPad E560 20EV000MGE Lenovo N156B6-L07, TN LED, 15.60, 1366x768 | Asus F555UB-XO043T AU Optronics B156XTN04.6, TN LED, 15.60, 1366x768 | |
|---|---|---|---|---|---|
| Display | -13% | -9% | -15% | -14% | |
| Display P3 Coverage | 44.46 | 38.58 -13% | 40.61 -9% | 37.63 -15% | 38.22 -14% |
| sRGB Coverage | 66.4 | 57.7 -13% | 61.1 -8% | 56.7 -15% | 57.5 -13% |
| AdobeRGB 1998 Coverage | 45.98 | 39.86 -13% | 41.96 -9% | 38.88 -15% | 39.49 -14% |
| Response Times | 67% | -1% | 7% | -22% | |
| Response Time Grey 50% / Grey 80% * | 45.2 ? | 41.2 ? 9% | 37 ? 18% | 50 ? -11% | 46 ? -2% |
| Response Time Black / White * | 30.8 ? | 33.6 ? -9% | 37 ? -20% | 23 ? 25% | 27 ? 12% |
| PWM Frequency | 198.4 ? | 595 ? 200% | 50 ? -75% | ||
| Screen | 4% | -17% | -10% | 5% | |
| Brightness middle | 245.3 | 244.5 0% | 202 -18% | 241 -2% | 214 -13% |
| Brightness | 231 | 232 0% | 211 -9% | 226 -2% | 205 -11% |
| Brightness Distribution | 72 | 80 11% | 88 22% | 89 24% | 82 14% |
| Black Level * | 0.41 | 0.385 6% | 0.62 -51% | 0.48 -17% | 0.46 -12% |
| Contrast | 598 | 635 6% | 326 -45% | 502 -16% | 465 -22% |
| Colorchecker dE 2000 * | 9.4 | 8.62 8% | 12.35 -31% | 12.43 -32% | 6.52 31% |
| Colorchecker dE 2000 max. * | 20 | 17.38 13% | 19.9 -0% | 21.03 -5% | 9.1 54% |
| Greyscale dE 2000 * | 11.1 | 9.8 12% | 13.46 -21% | 13.24 -19% | 7.05 36% |
| Gamma | 2.27 97% | 2.09 105% | 2.44 90% | 2.61 84% | 2.41 91% |
| CCT | 12802 51% | 11391 57% | 15217 43% | 15733 41% | 8623 75% |
| Color Space (Percent of AdobeRGB 1998) | 42.3 | 39.86 -6% | 39 -8% | 36 -15% | 36.6 -13% |
| Color Space (Percent of sRGB) | 66.1 | 57.71 -13% | 61 -8% | 57 -14% | 57.8 -13% |
| Total Average (Program / Settings) | 19% /
12% | -9% /
-13% | -6% /
-9% | -10% /
-3% |
* ... smaller is better
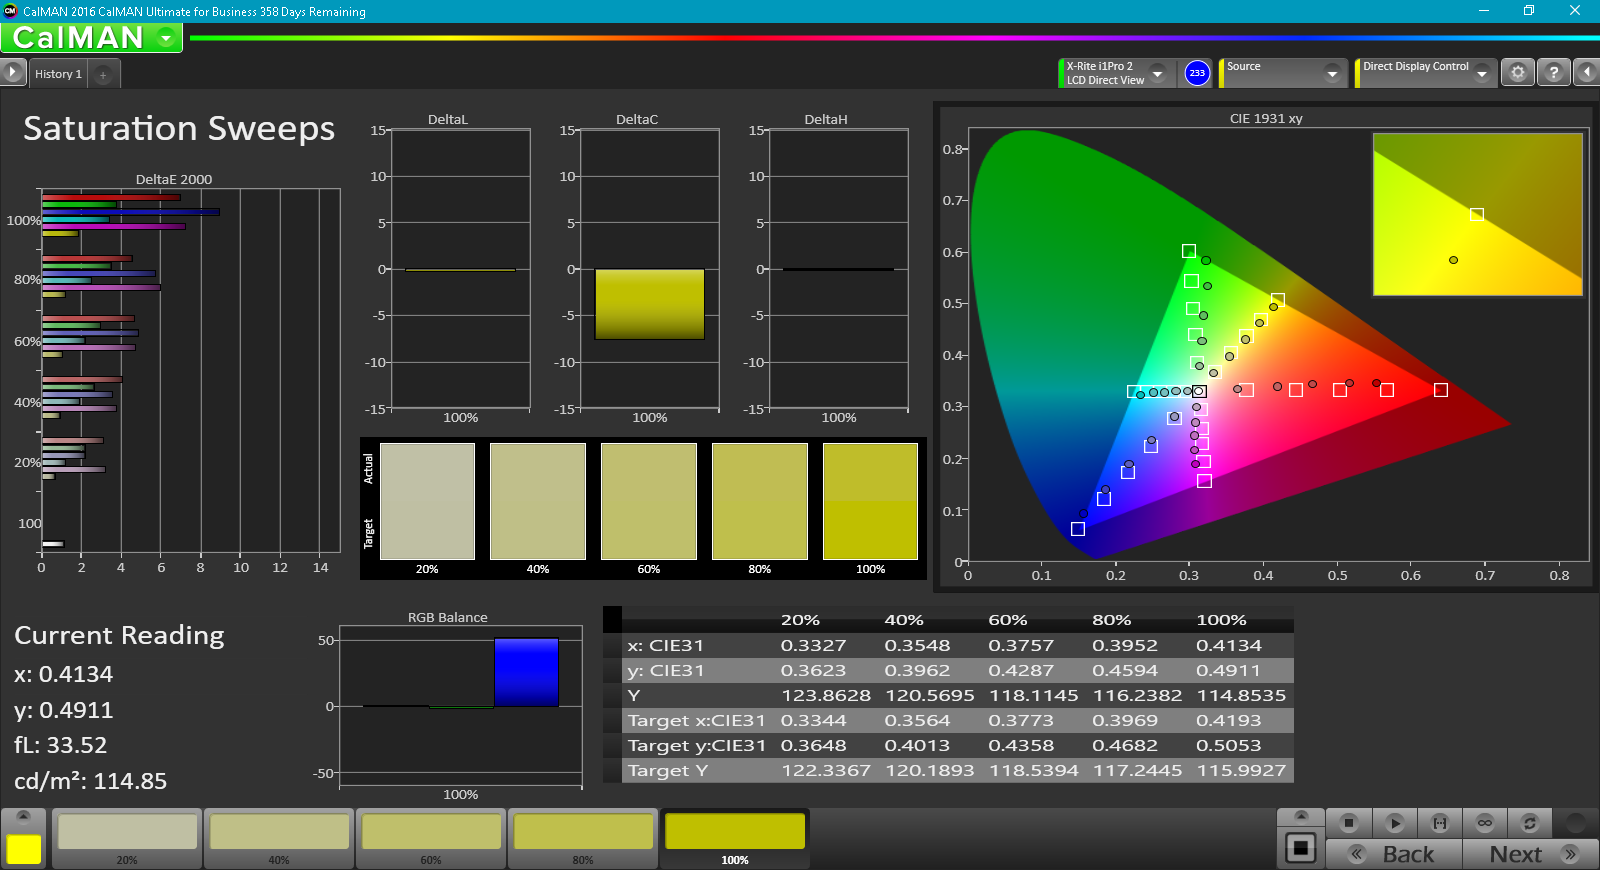
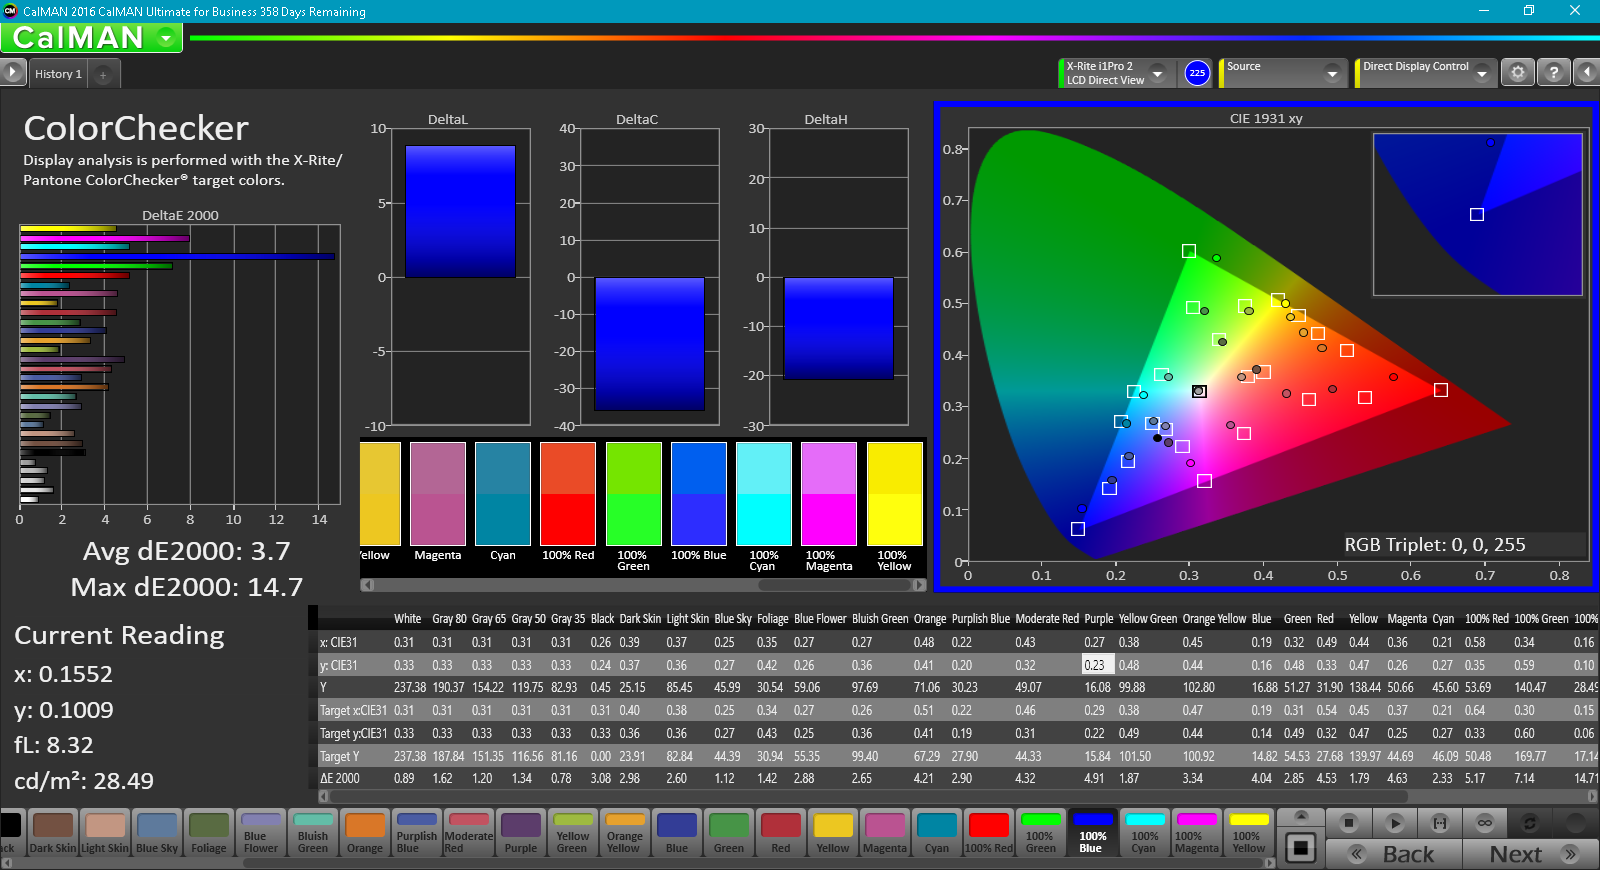
Color space is narrow at just 66 percent of the sRGB standard to be in line with most other budget panels on inexpensive notebooks. Even subjectively, onscreen colors do not appear as deep as on pricier IPS panels on modern Ultrabooks and convertibles. This should not be an issue for general word processing or browsing work.
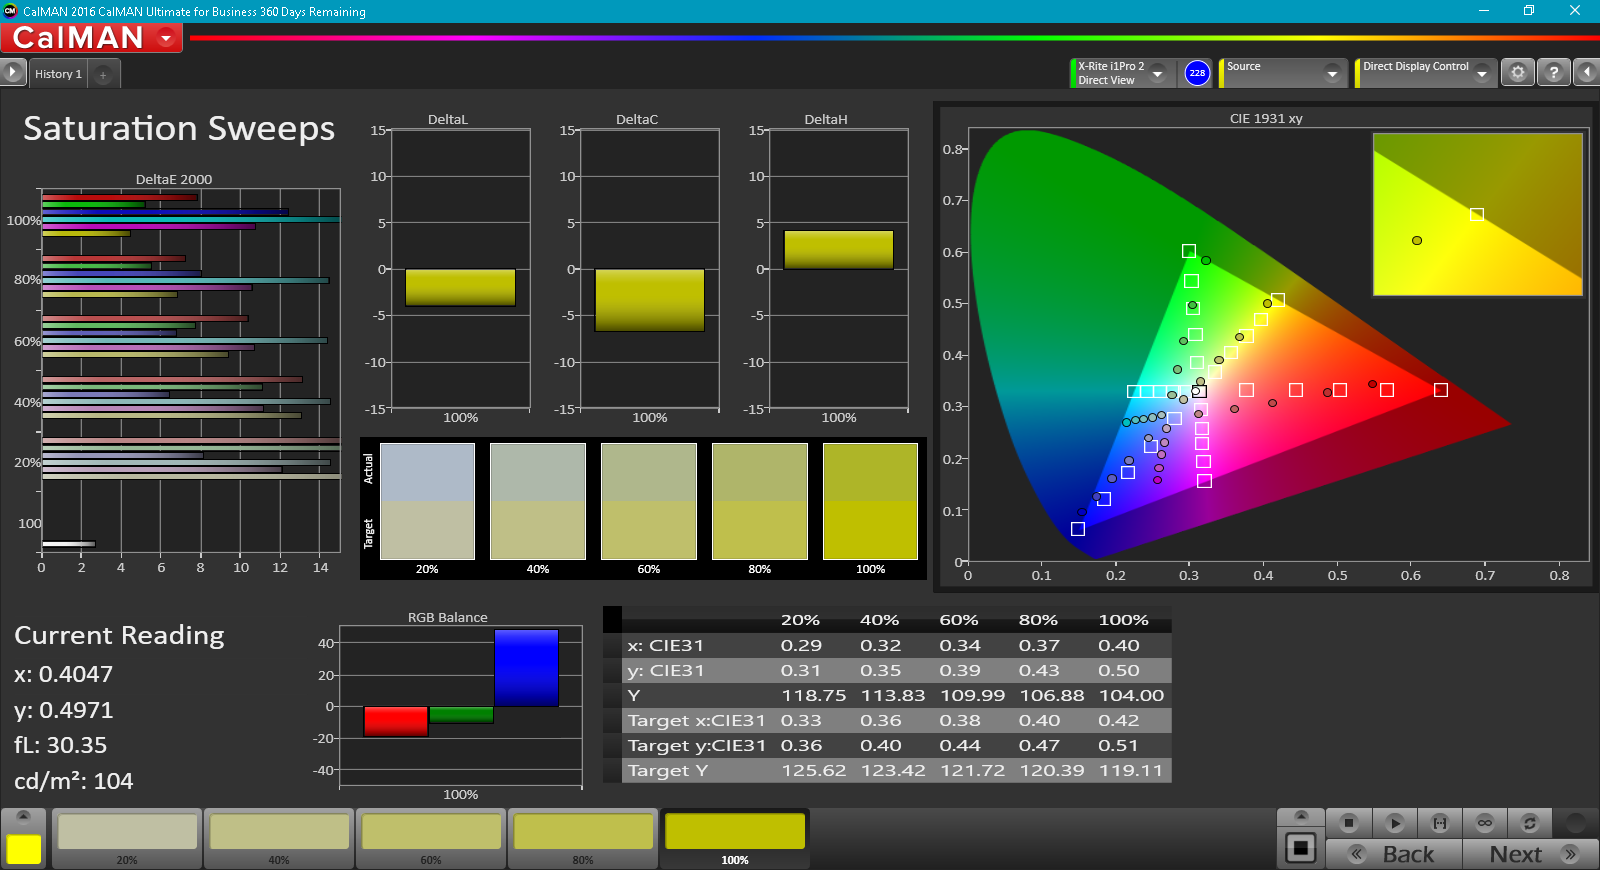
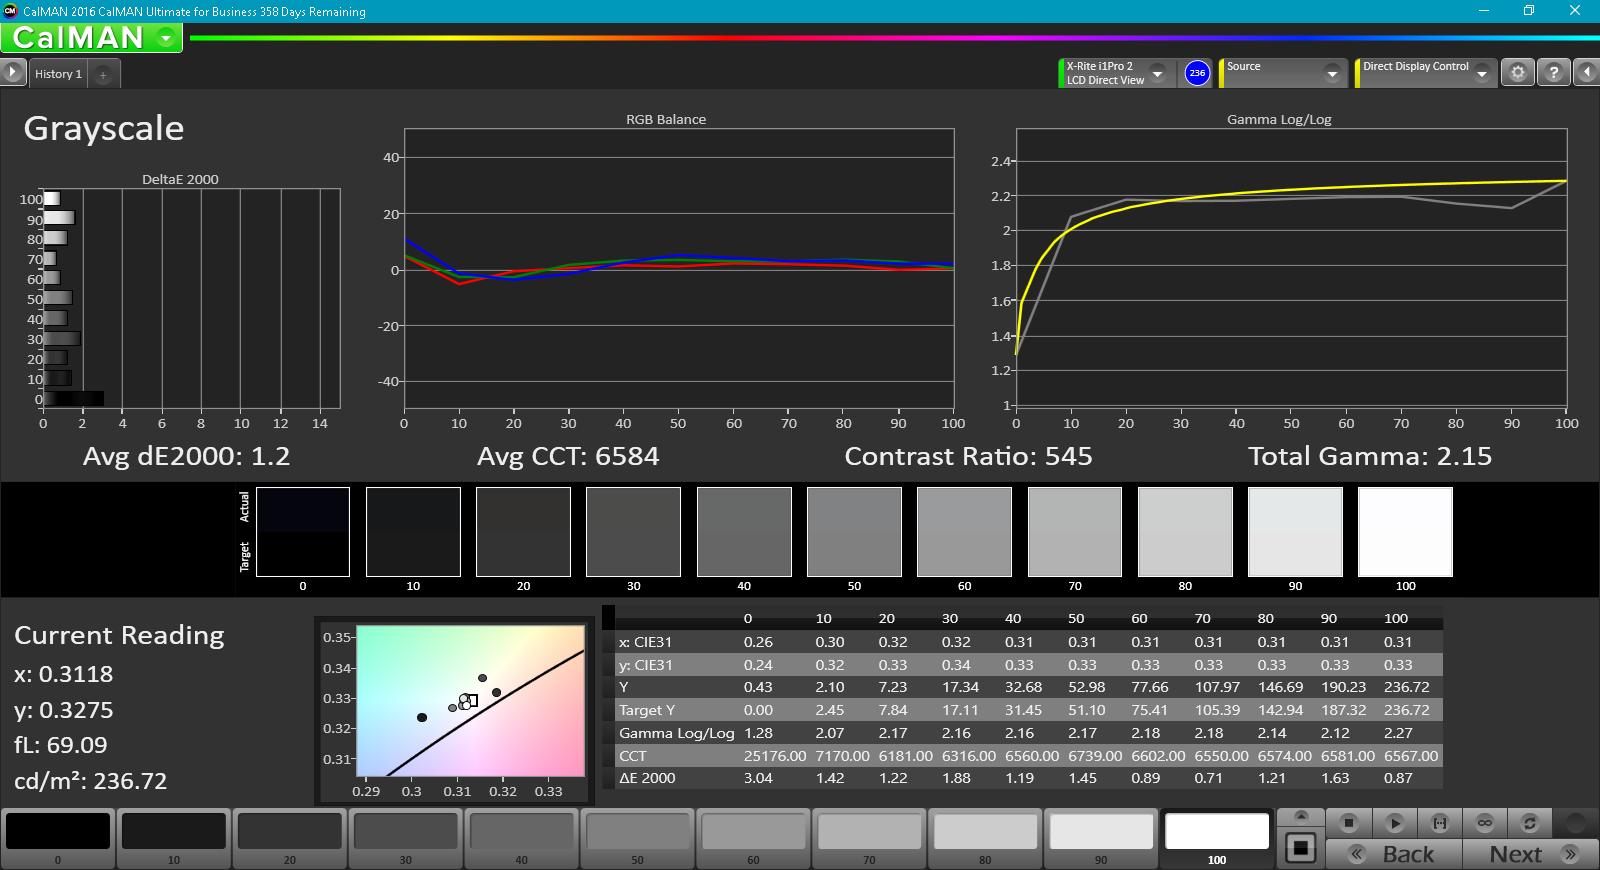
Grayscale and colors are extremely inaccurate out of the box as is common on cheap 768p panels. Color temperature is overly cool, colors are shallow, and the overall Blue tint is an unpleasant sight. Thankfully, a calibration with an X-Rite spectrophotometer fixes most of these issues for dramatically improved screen quality. Colors will still become more accurate the higher the saturation level due to the limited sRGB coverage.
Display Response Times
| ↔ Response Time Black to White | ||
|---|---|---|
| 30.8 ms ... rise ↗ and fall ↘ combined | ↗ 11.2 ms rise | 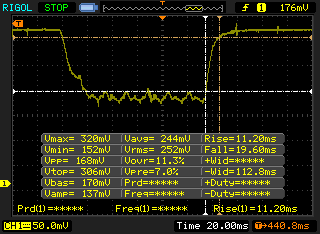 |
| ↘ 19.6 ms fall | ||
| The screen shows slow response rates in our tests and will be unsatisfactory for gamers. In comparison, all tested devices range from 0.1 (minimum) to 240 (maximum) ms. » 81 % of all devices are better. This means that the measured response time is worse than the average of all tested devices (21.5 ms). | ||
| ↔ Response Time 50% Grey to 80% Grey | ||
| 45.2 ms ... rise ↗ and fall ↘ combined | ↗ 23.2 ms rise | 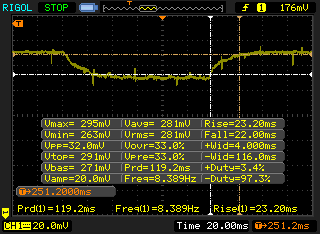 |
| ↘ 22 ms fall | ||
| The screen shows slow response rates in our tests and will be unsatisfactory for gamers. In comparison, all tested devices range from 0.2 (minimum) to 636 (maximum) ms. » 74 % of all devices are better. This means that the measured response time is worse than the average of all tested devices (33.7 ms). | ||
Screen Flickering / PWM (Pulse-Width Modulation)
| Screen flickering / PWM detected | 198.4 Hz | ≤ 99 % brightness setting | 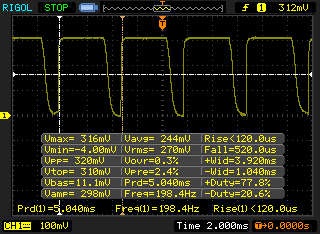 |
The display backlight flickers at 198.4 Hz (worst case, e.g., utilizing PWM) Flickering detected at a brightness setting of 99 % and below. There should be no flickering or PWM above this brightness setting. The frequency of 198.4 Hz is relatively low, so sensitive users will likely notice flickering and experience eyestrain at the stated brightness setting and below. In comparison: 53 % of all tested devices do not use PWM to dim the display. If PWM was detected, an average of 17924 (minimum: 5 - maximum: 3846000) Hz was measured. | |||
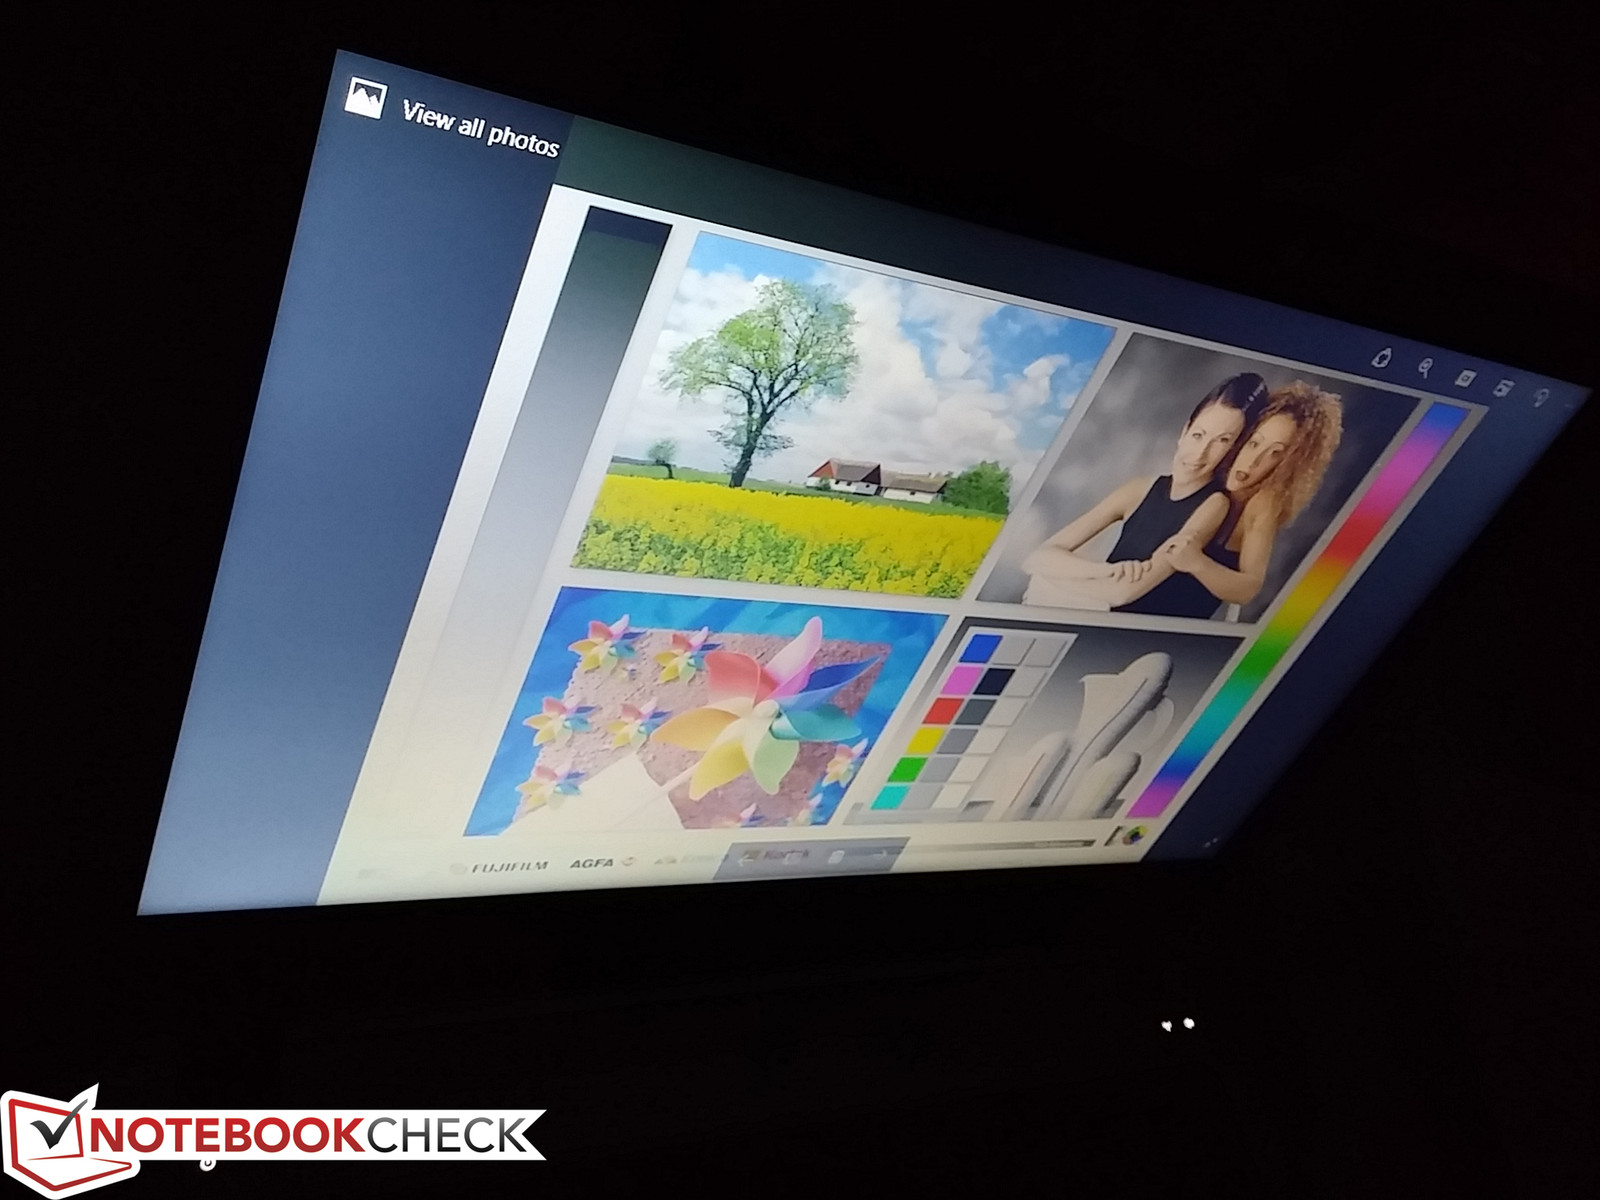
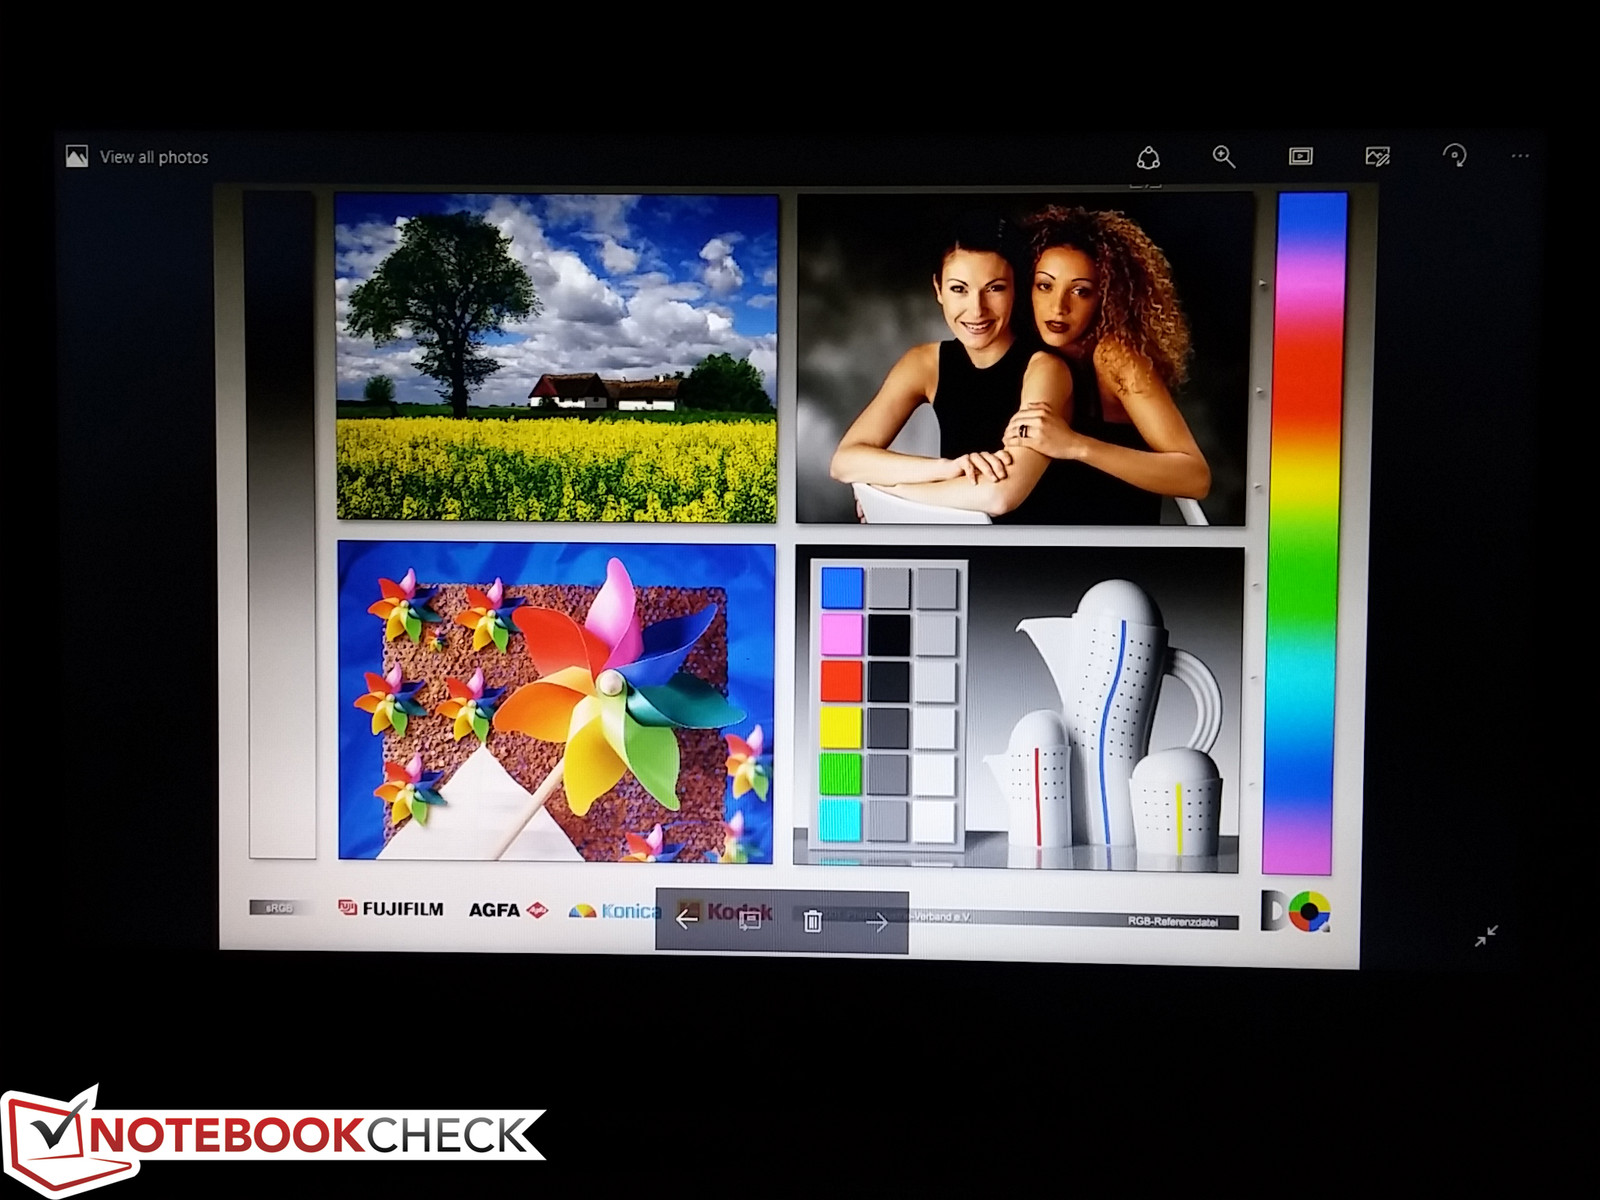
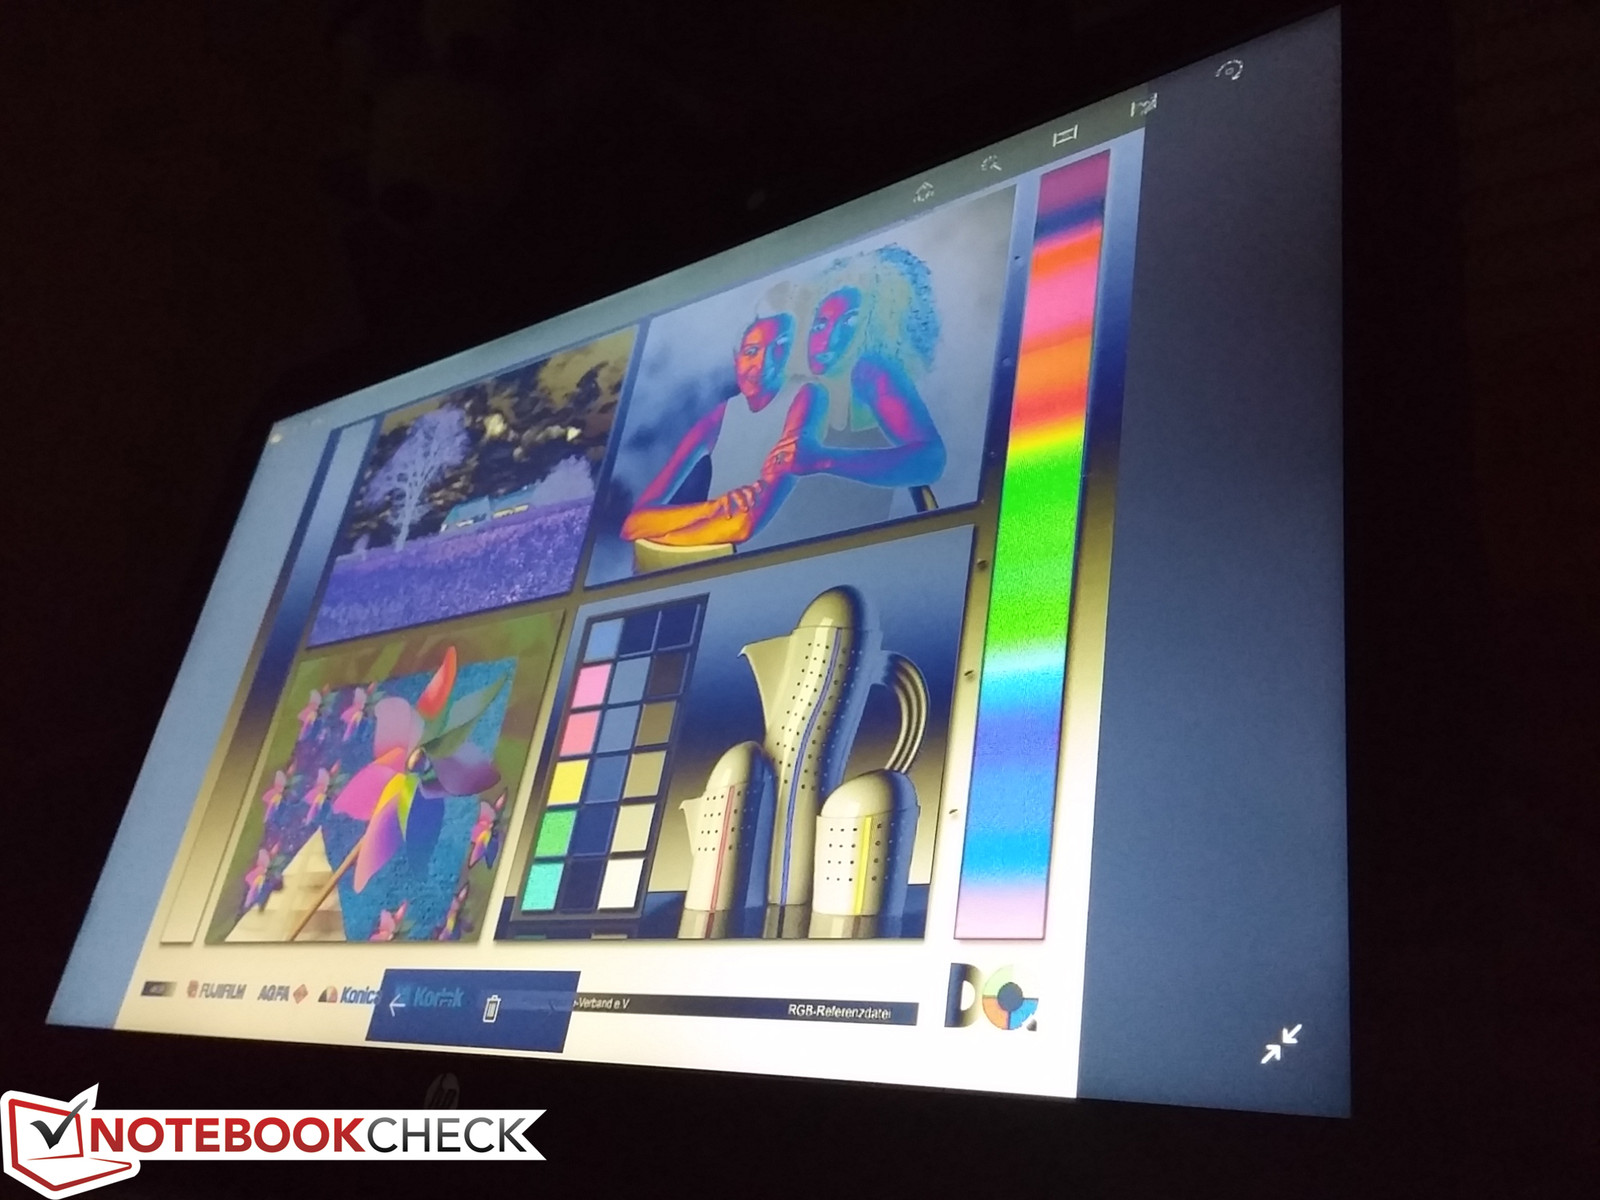
Viewing angles are narrow due to the underlying TN panel. This is advantageous in that business users will not want to unintentionally share onscreen content with passerbys, but can also be a disadvantage for when using the notebook for multimedia purposes. The limited viewing angles and generally dim backlight both contribute to the poor outdoor visibility of the screen even when on the maximum display brightness setting.
Performance
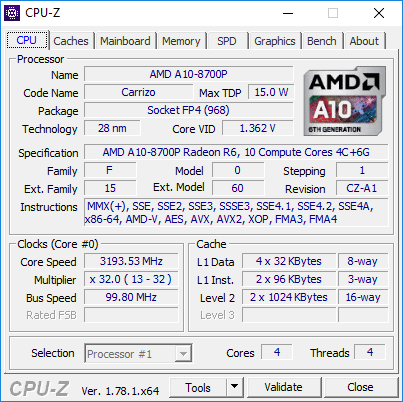
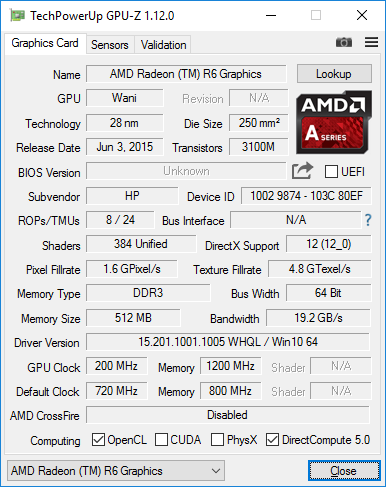
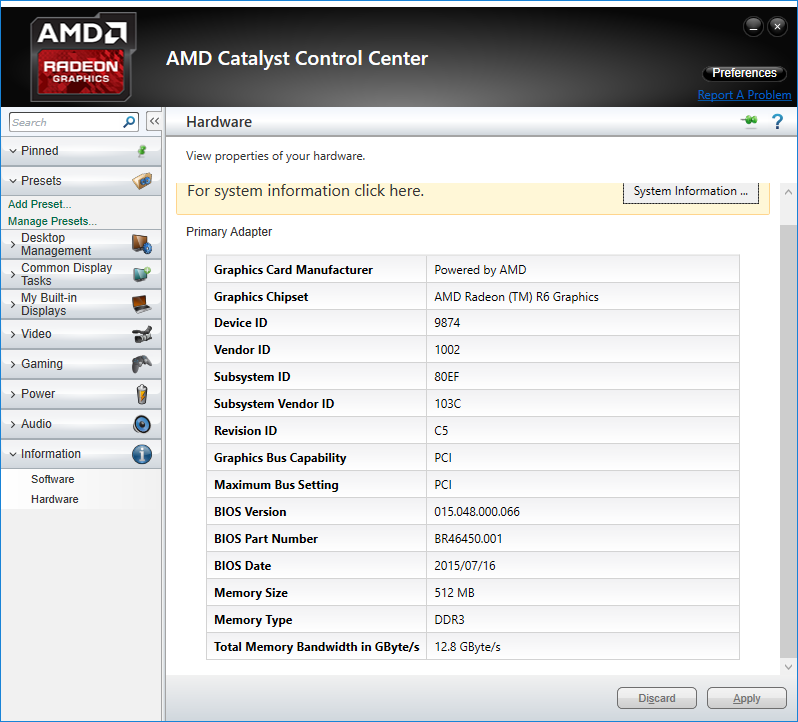
The ProBook 455 series includes a variety of AMD Carrizo options. The lower-end, mid-range, and high-end configurations are equipped with the A4-7210, A8-7410, and A10-8700P, respectively. Our test unit is the higher-end SKU with the quad-core A10-8700P and the corresponding integrated Radeon R6 GPU. Despite being the pricier SKU, the A10-8700P is still a budget offering designed for inexpensive systems.
See our dedicated review on the Carrizo series for more information and comparisons within the AMD family.
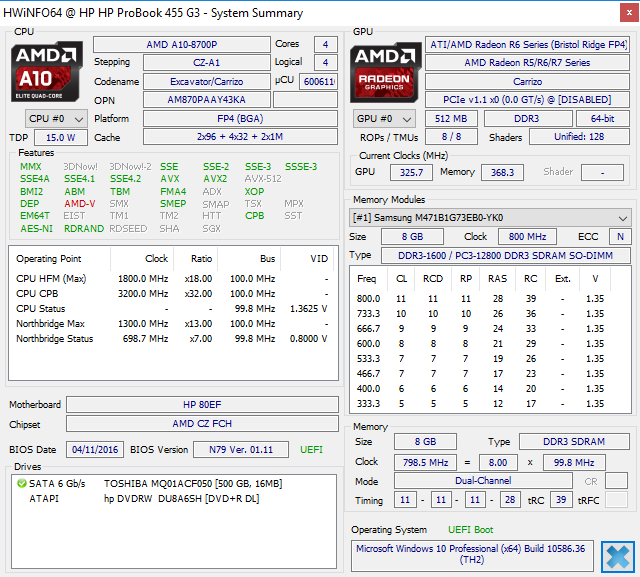
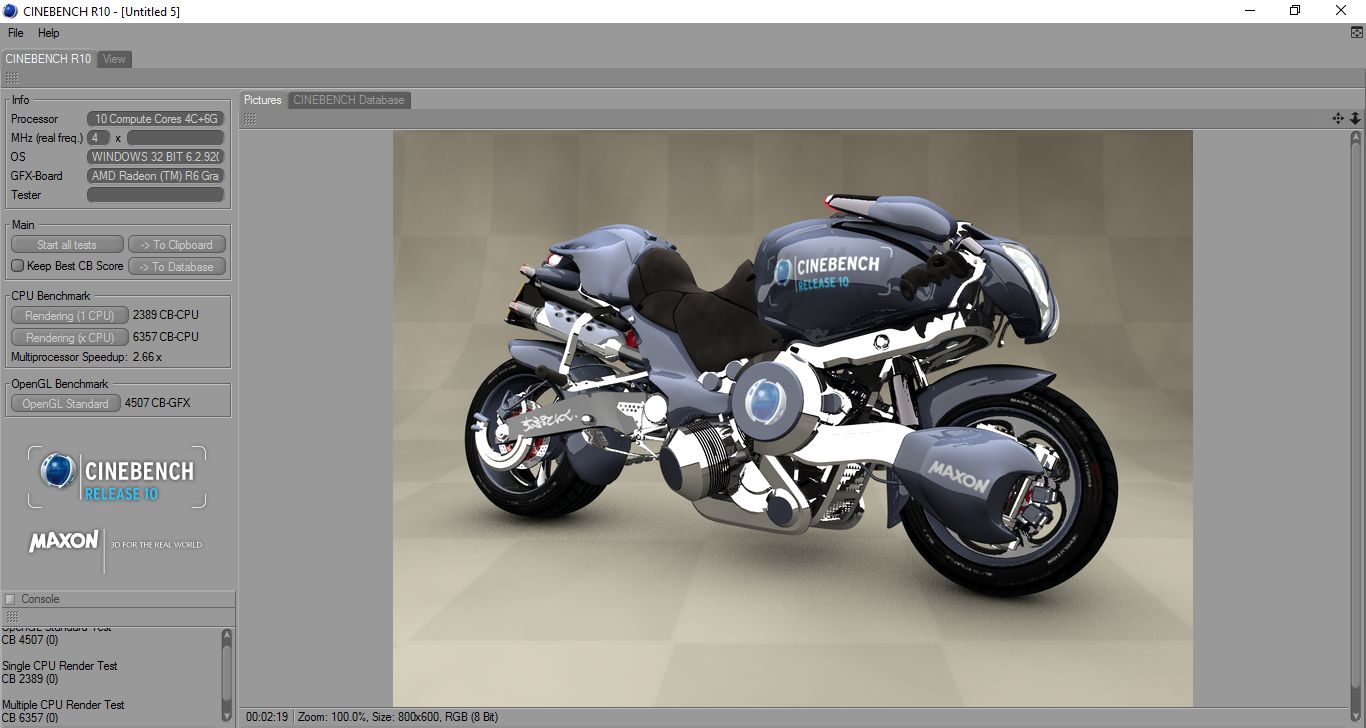
Processor
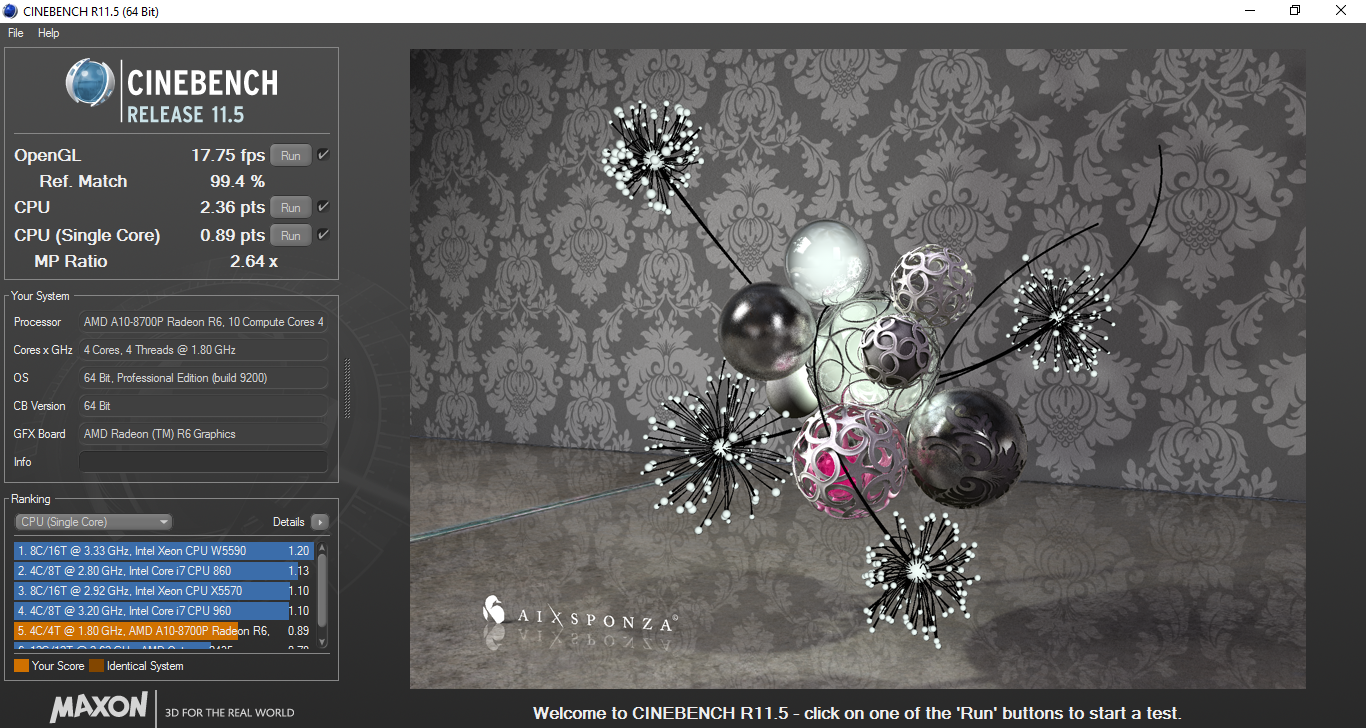
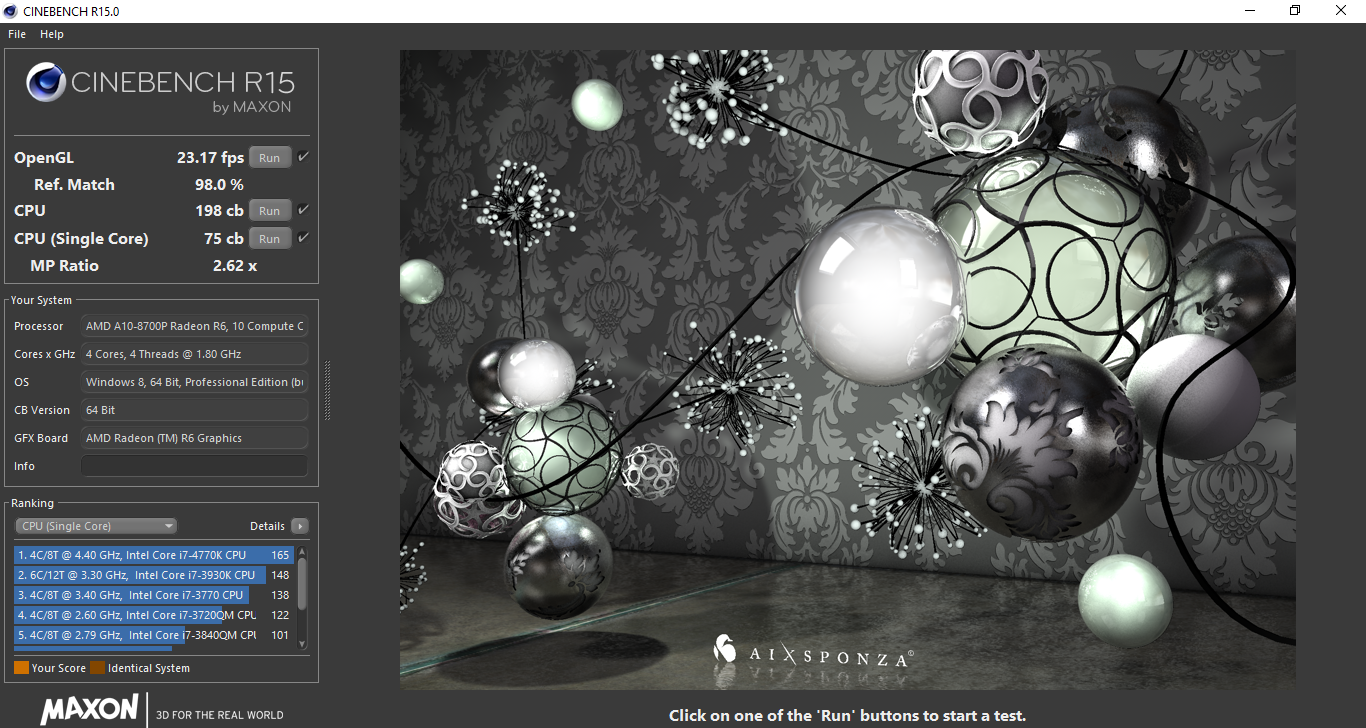
Raw CPU performance is a step below the generations old Core i5-4200U according to CineBench R15 in both single- and multi-threaded workloads. The latest Kaby Lake i5-7200U is about 60 percent faster than the A10-8700P without increasing the TDP envelope. Performance from the AMD APU is still well ahead of the cheaper Celeron and Atom CPUs as found on very low-end configurations.
See our dedicated page on the A10-8700P Carrizo for more technical details and benchmark comparisons.
| wPrime 2.10 - 1024m | |
| HP 250 G5 Y1V08UT | |
| Lenovo IdeaPad Z40-59422614 | |
| HP ProBook 455 T1B79UT | |
| Super Pi Mod 1.5 XS 32M - 32M | |
| HP 250 G5 Y1V08UT | |
| HP ProBook 455 T1B79UT | |
| Lenovo IdeaPad Z40-59422614 | |
| Dell XPS 13 9360 FHD i5 | |
* ... smaller is better
System Performance
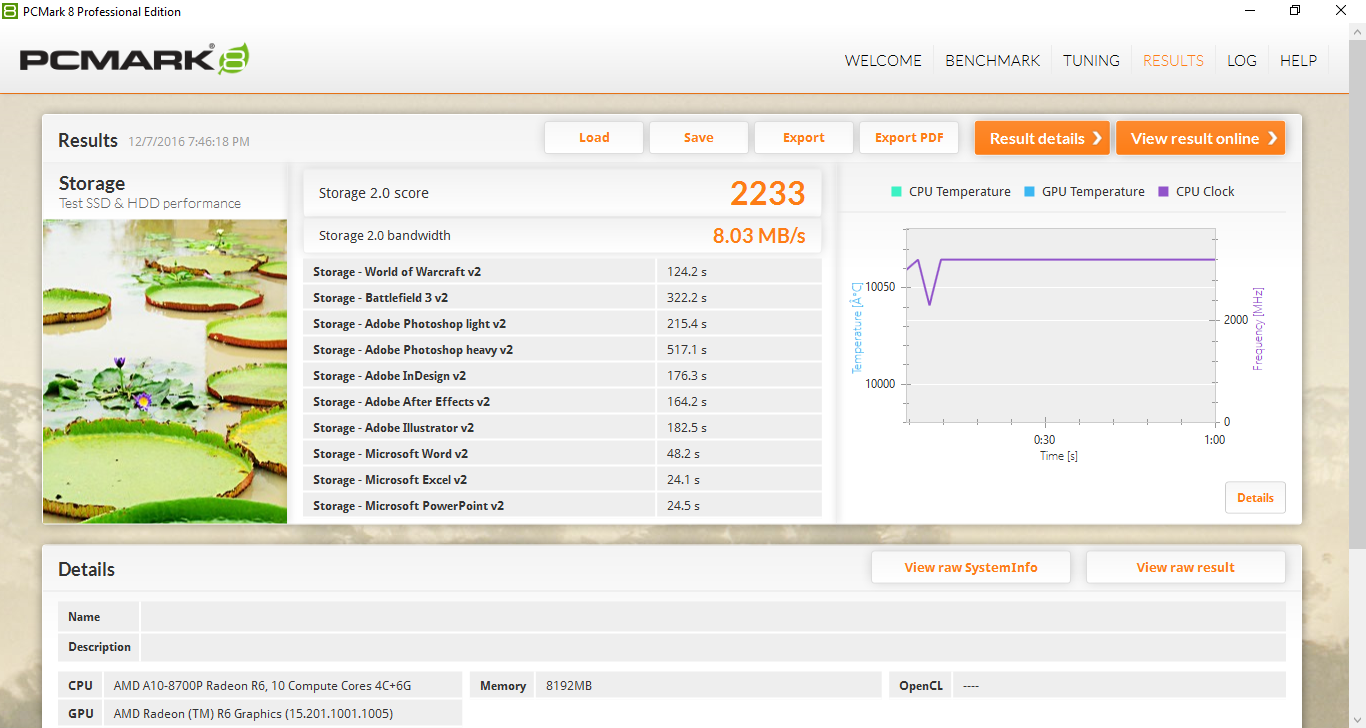
PCMark 8 ranks our AMD ProBook in the same ballpark as older Intel systems sporting ULV Haswell CPUs like the Lenovo IdeaPad Z40. More modern systems with Broadwell or newer processors and primary SSDs will handily outclass the HP.
Subjectively, overall system performance feels slow when launching or installing applications. There are very noticeably delays that would otherwise not be present on SSD-based alternatives.
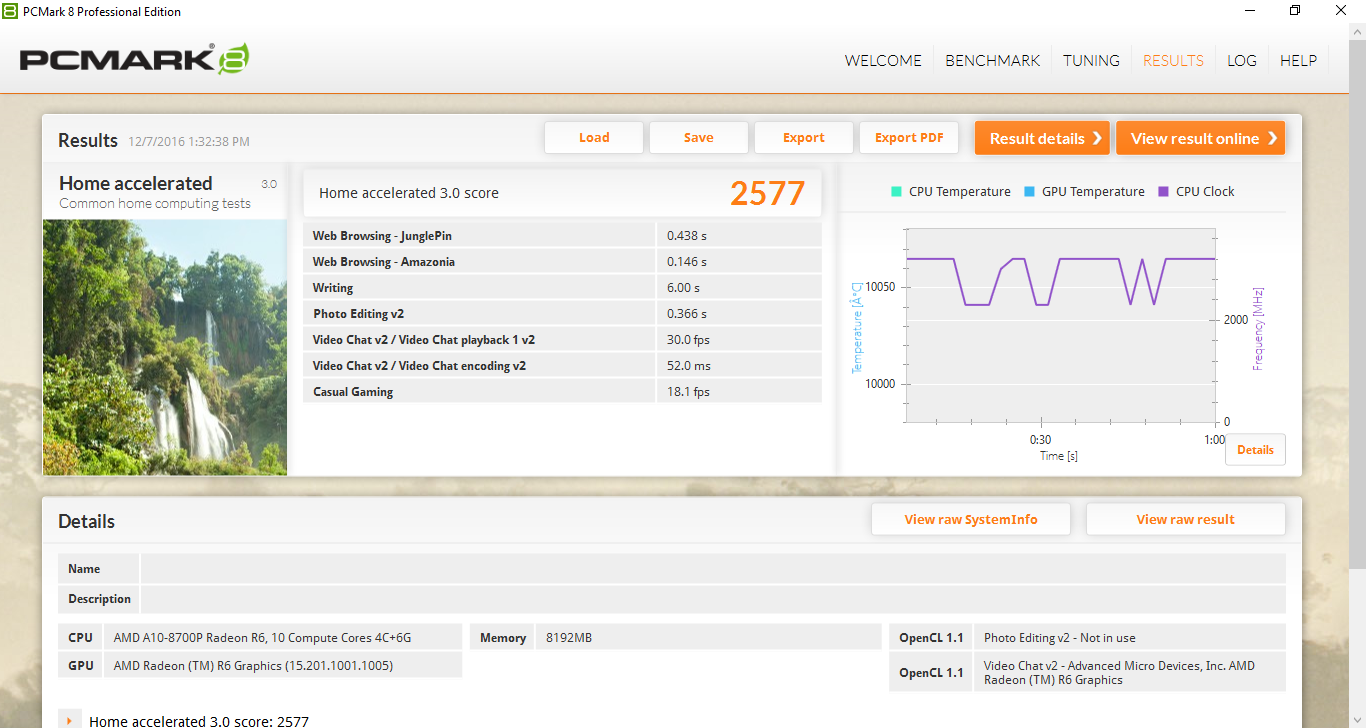
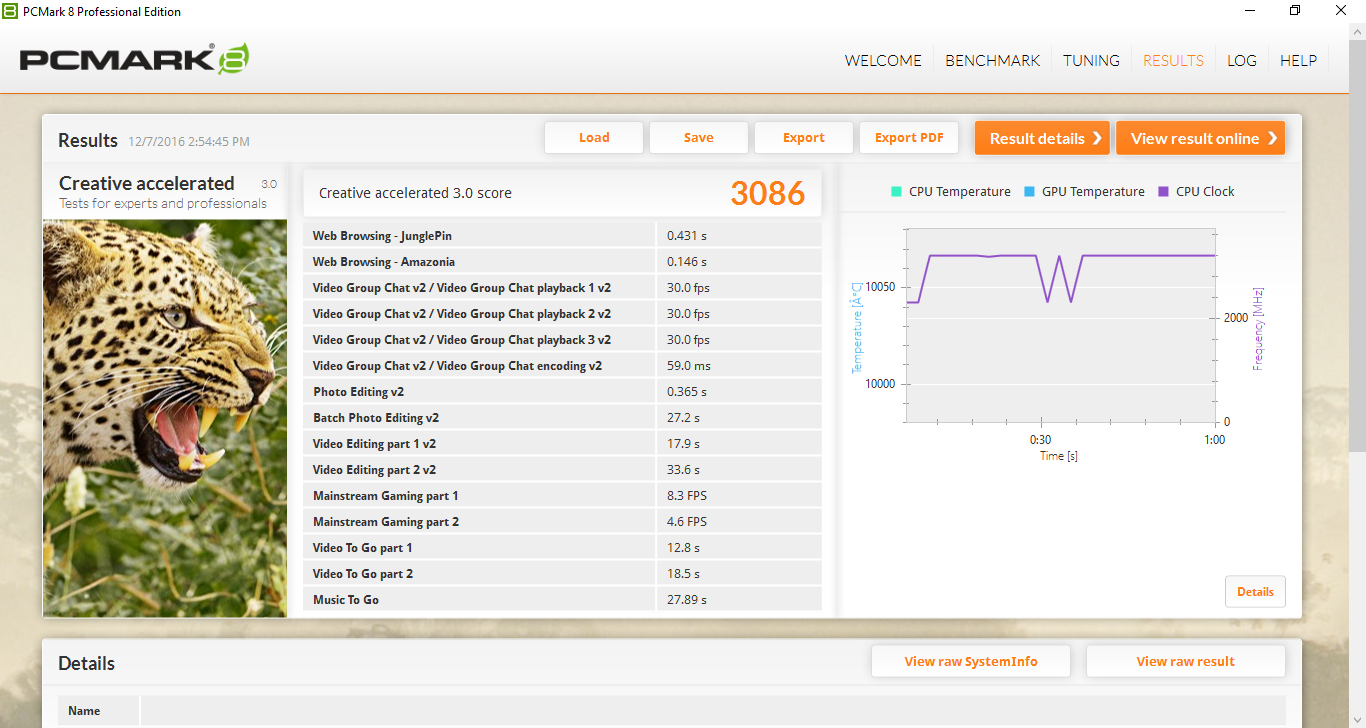
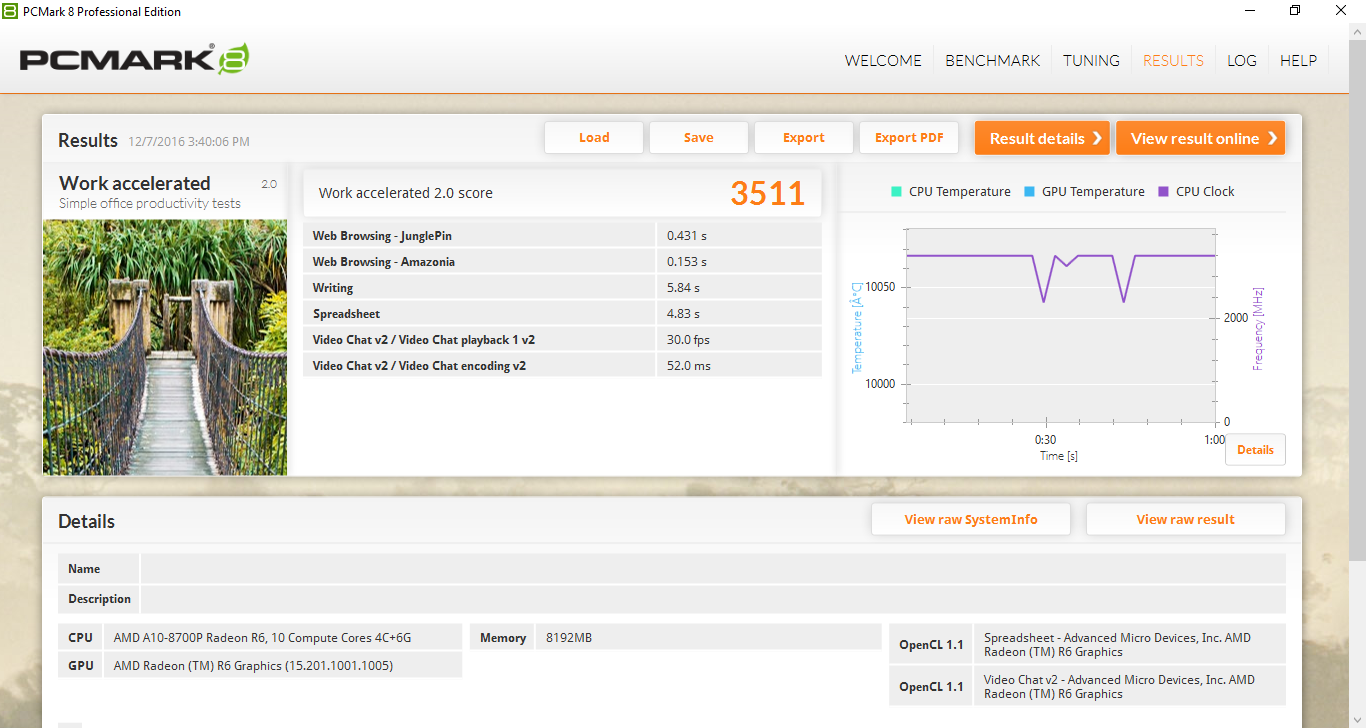
| PCMark 8 Home Score Accelerated v2 | 2577 points | |
| PCMark 8 Creative Score Accelerated v2 | 3086 points | |
| PCMark 8 Work Score Accelerated v2 | 3511 points | |
Help | ||
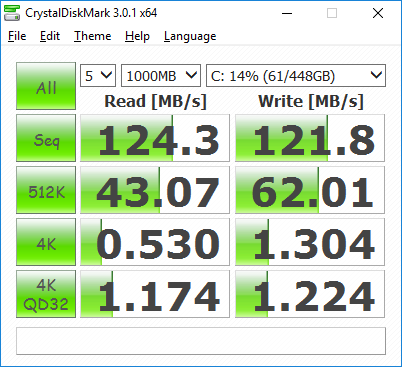
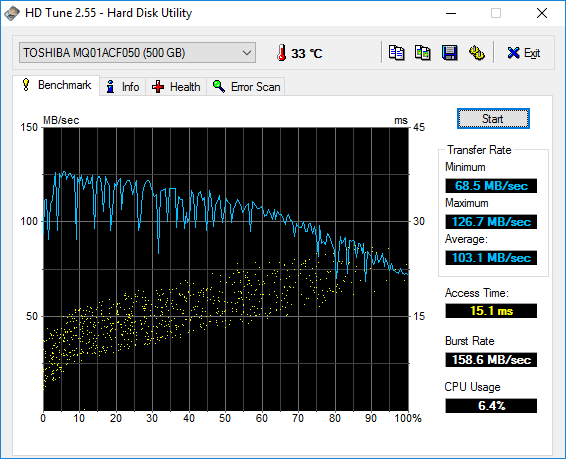
Storage Devices
Just a single internal storage bay is available. The included 7200 RPM Toshiba HDD is relatively fast with sequential transfer rates of just over 103 MB/s according to HD Tune. Nonetheless, it is leagues away from the performance benefits offered by systems with primary SSDs in both sequential and 4k read/write speeds.
See our table of SSDs and HDDs for more benchmark comparisons.
| HP ProBook 455 T1B79UT Toshiba MQ01ACF050 | HP 15z-ba000 Adata IM2S3138E-128GM-B | Dell Latitude 15-3570 Samsung CM871 MZNLF128HCHP | Lenovo ThinkPad E560 20EV000MGE Western Digital WD Black Mobile 500GB (WD5000LPLX) | Lenovo Yoga 510-15IKB 80VC000XGE Samsung MZYTY256HDHP | |
|---|---|---|---|---|---|
| CrystalDiskMark 3.0 | 4322% | 1964% | -7% | 8581% | |
| Read Seq | 124.3 | 397.9 220% | 453.2 265% | 120.4 -3% | 529 326% |
| Write Seq | 121.8 | 171.4 41% | 137.7 13% | 123.1 1% | 508 317% |
| Read 512 | 43.07 | 367.5 753% | 308.5 616% | 34.31 -20% | 409.8 851% |
| Write 512 | 62 | 172.3 178% | 134.1 116% | 66.8 8% | 316.5 410% |
| Read 4k | 0.53 | 26.11 4826% | 19.06 3496% | 0.373 -30% | 36.01 6694% |
| Write 4k | 1.304 | 52.3 3911% | 21.31 1534% | 1.29 -1% | 106.7 8083% |
| Read 4k QD32 | 1.174 | 164.3 13895% | 93.5 7864% | 0.976 -17% | 384.8 32677% |
| Write 4k QD32 | 1.224 | 132.8 10750% | 23.3 1804% | 1.285 5% | 237.3 19287% |

GPU Performance
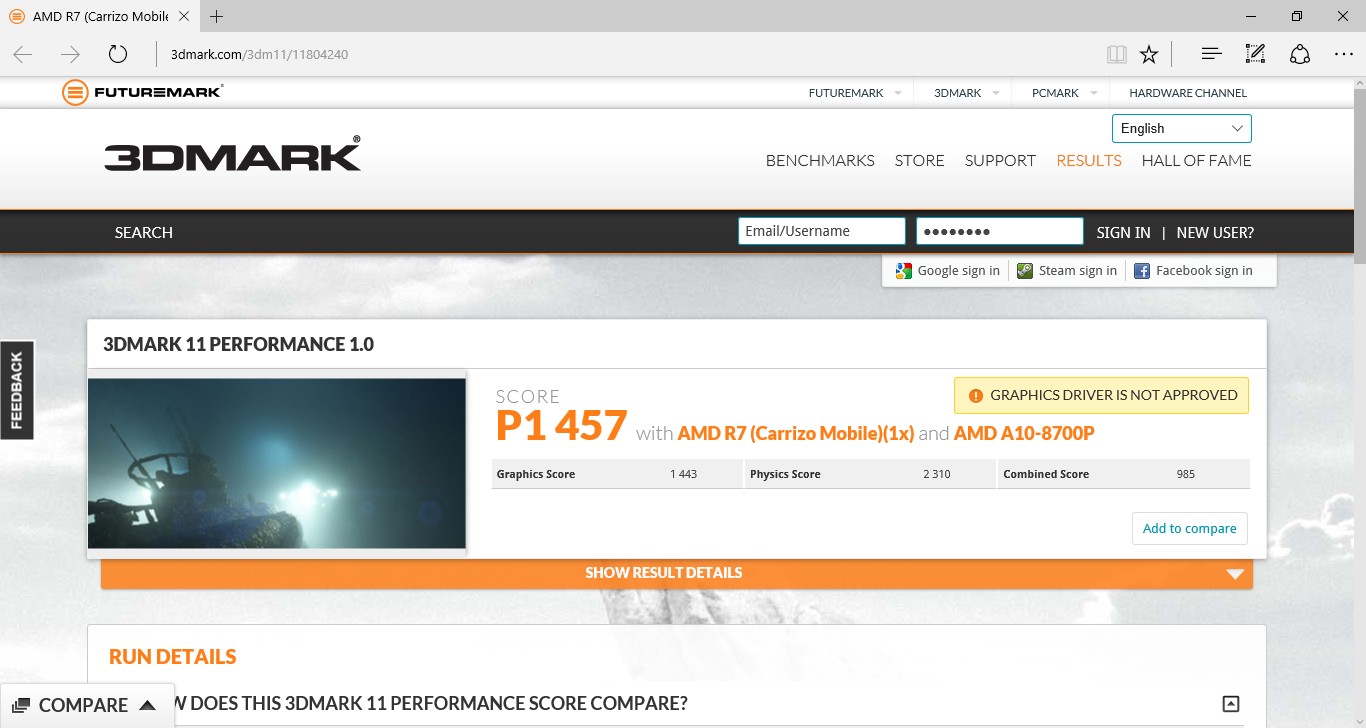
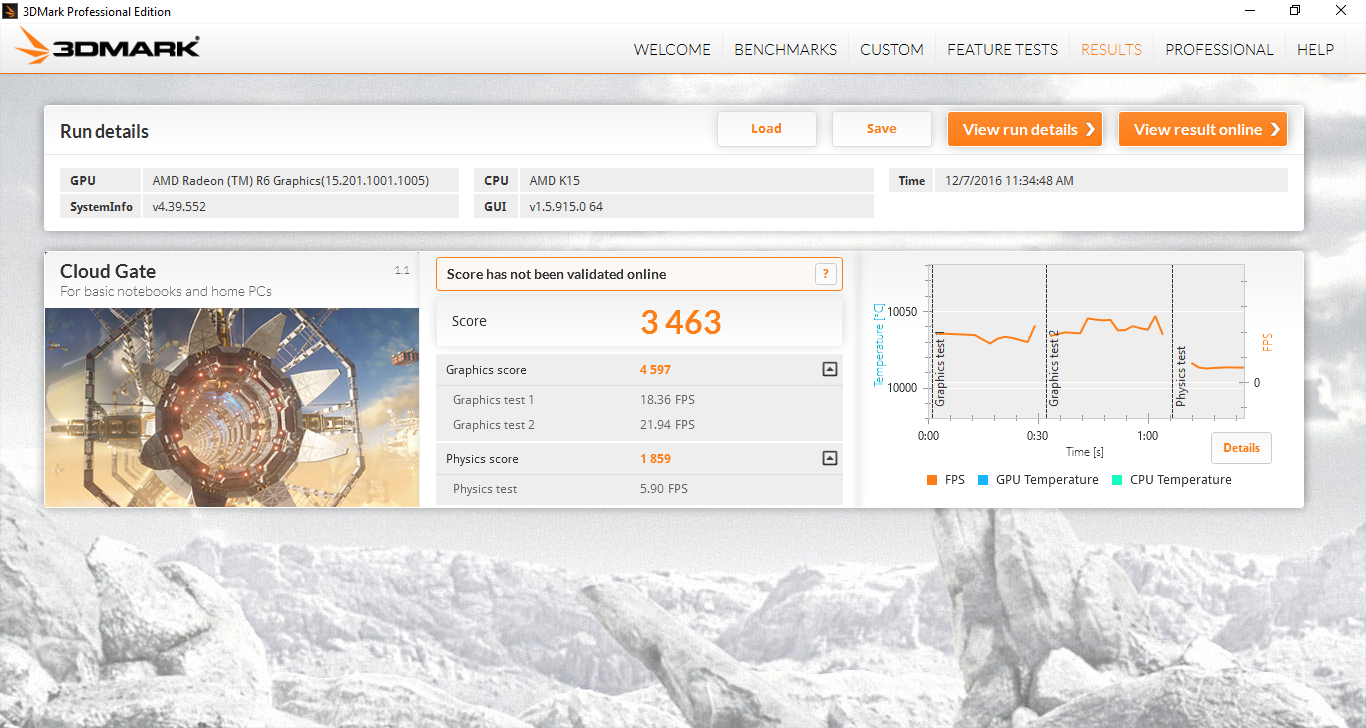
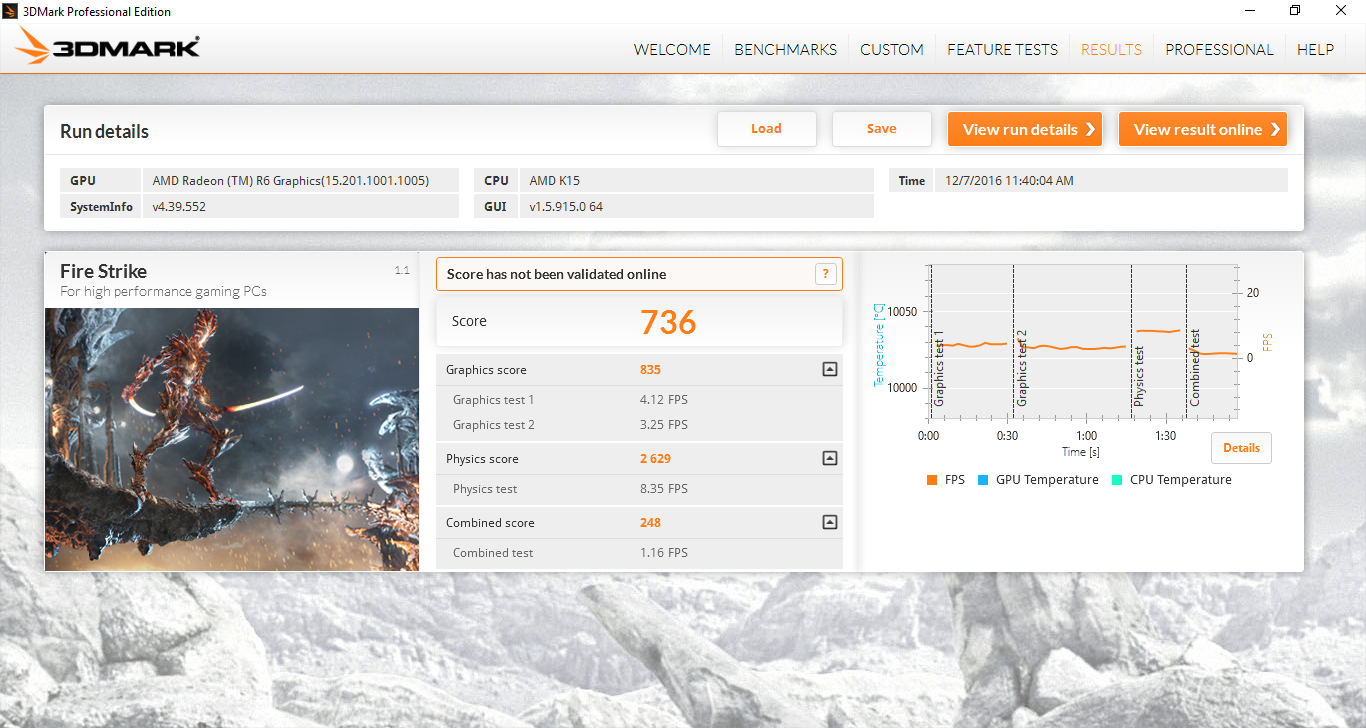
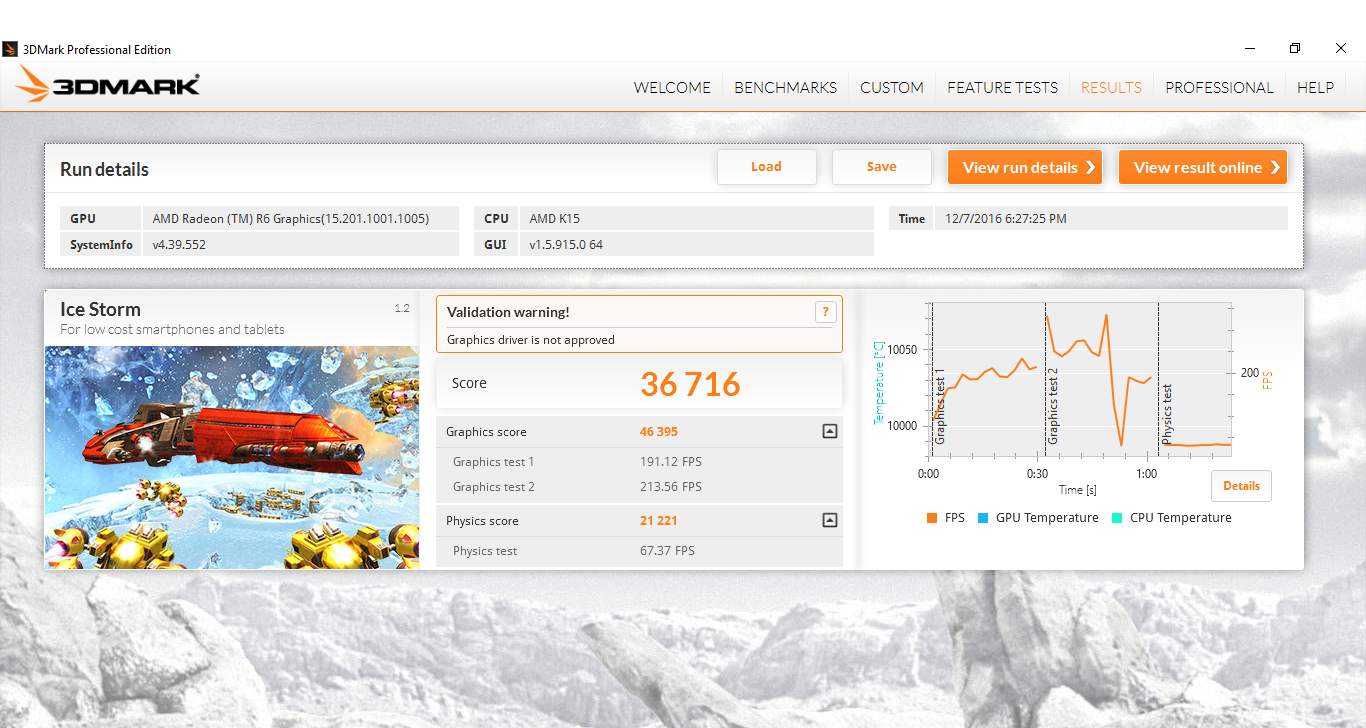
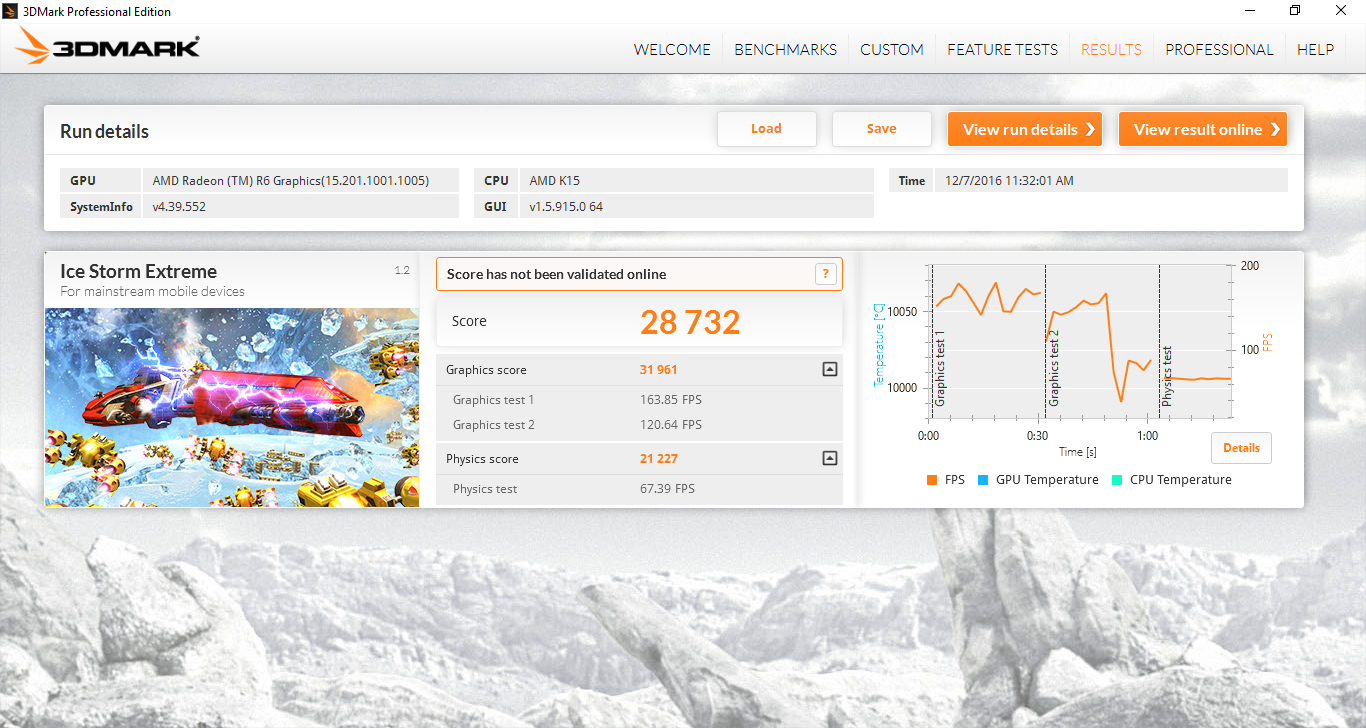
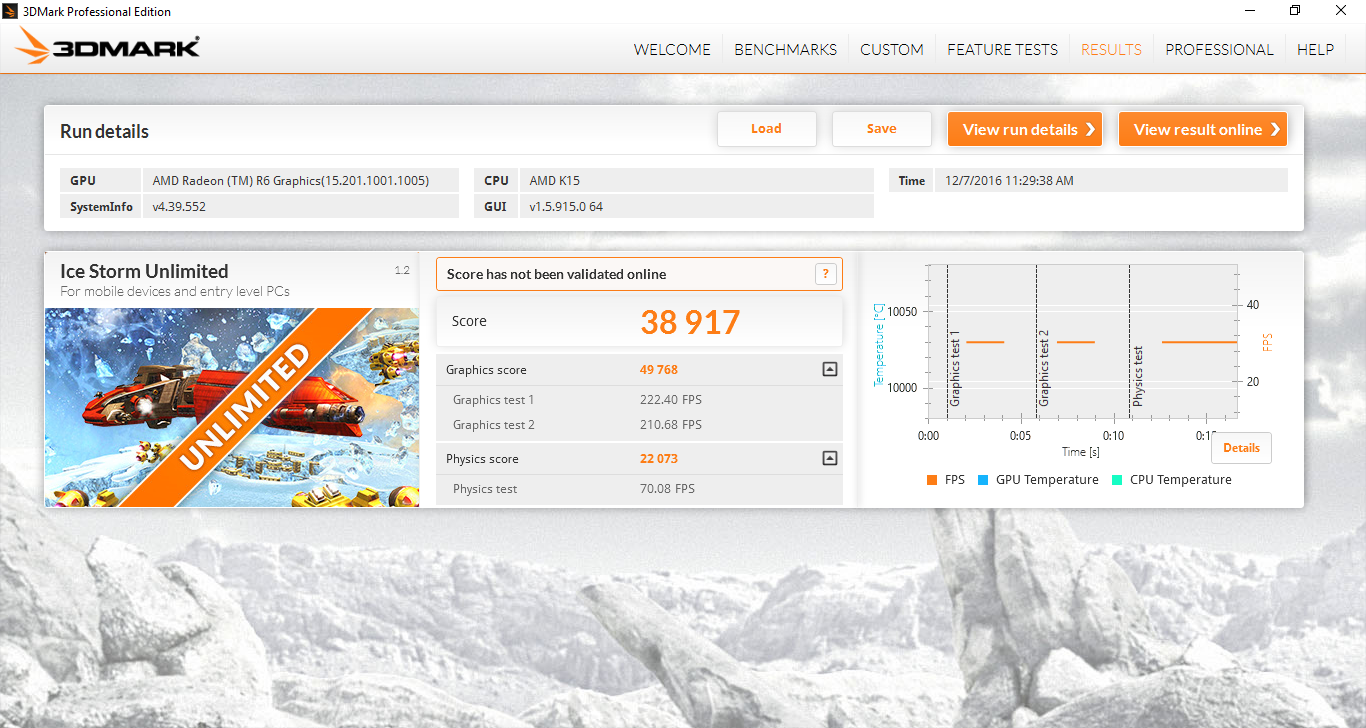
The Radeon R6 Carrizo GPU is not powerful even by integrated GPU standards. According to 3DMark Cloud Gate and Fire Strike benchmarks, the AMD GPU falls well behind the HD Graphics 520 as found on many Ultrabooks equipped with ULV Skylake processors. The performance deltas are smaller between the AMD and Intel GPUs in the older 3DMark 11 benchmark, however.
See our dedicated GPU page on the Radeon R6 Carrizo for more technical information and benchmark comparisons.
| 3DMark | |
| 1280x720 Cloud Gate Standard Graphics | |
| Dell XPS 13 9360 FHD i5 | |
| Acer TravelMate P249-M-5452 | |
| Lenovo IdeaPad Z40-59422614 | |
| HP 250 G4 T6P08ES | |
| HP ProBook 455 T1B79UT | |
| HP 250 G5 Y1V08UT | |
| 1920x1080 Fire Strike Graphics | |
| HP 250 G4 T6P08ES | |
| Dell XPS 13 9360 FHD i5 | |
| Lenovo IdeaPad Z40-59422614 | |
| HP ProBook 455 T1B79UT | |
| Acer TravelMate P249-M-5452 | |
| 1920x1080 Ice Storm Extreme Graphics | |
| Dell XPS 13 9360 FHD i5 | |
| Acer TravelMate P249-M-5452 | |
| HP ProBook 455 T1B79UT | |
| HP 250 G5 Y1V08UT | |
| 3DMark 11 Performance | 1457 points | |
| 3DMark Ice Storm Standard Score | 36716 points | |
| 3DMark Cloud Gate Standard Score | 3463 points | |
| 3DMark Fire Strike Score | 736 points | |
| 3DMark Fire Strike Extreme Score | 373 points | |
Help | ||
Gaming Performance
Real-world gaming performance is about on par with the HD Graphics 520 and the HD Graphics 620. This is somewhat disappointing considering that the A10-8700P is generally more power hungry than a Broadwell or Skylake ULV CPU without even providing any significant graphics performance benefits. Intensive 3D titles will barely run on the lowest graphical settings, so users will be limited to older or less demanding ones like DOTA 2 or Starcraft II.
| low | med. | high | ultra | |
| BioShock Infinite (2013) | 40.9 | 24.4 | 19.2 | |
| Metro: Last Light (2013) | 15.4 | |||
| Rise of the Tomb Raider (2016) | 16.8 | |||
| Overwatch (2016) | 26.1 |
Stress Test
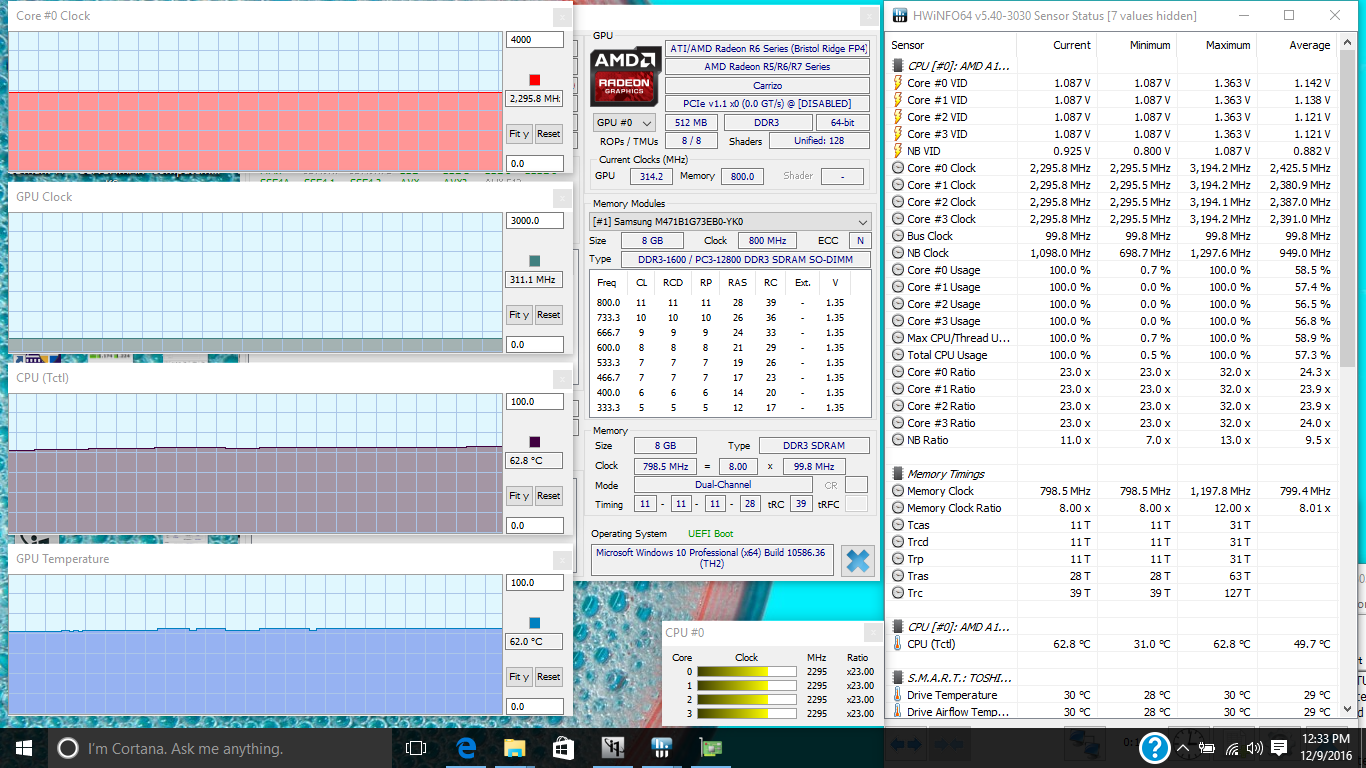
We stress the notebook with unrealistically high loads to identify for any potential throttling or stability issues. When under Prime95 stress, the CPU will be able to maintain a stable core clock rate of 2.3 GHz against a base clock of 1.8 GHz. This reflects our initial A10-8700P test where clock rates max out at 2.3 GHz when all four cores are stressed. Similarly when under FurMark stress, the integrated Radeon GPU will be able to maintain a stable clock of 720 MHz. Core temperature remains relatively cool in the low 60 C range no matter the workload.
Running both Prime95 and FurMark simultaneously will throttle both CPU and GPU performances while temperature remains in the low 60s. Interestingly, the GPU operates at a slower clock rate when under Unigine Valley stress compared to FurMark stress, which is opposite of most systems with Intel or Nvidia GPUs.
Running on battery power will not limit CPU or GPU power. A 3DMark 11 run on batteries returns Physics and Graphics scores of 2285 and 1446 points, respectively, compared to 2310 and 1443 points when connected to mains.
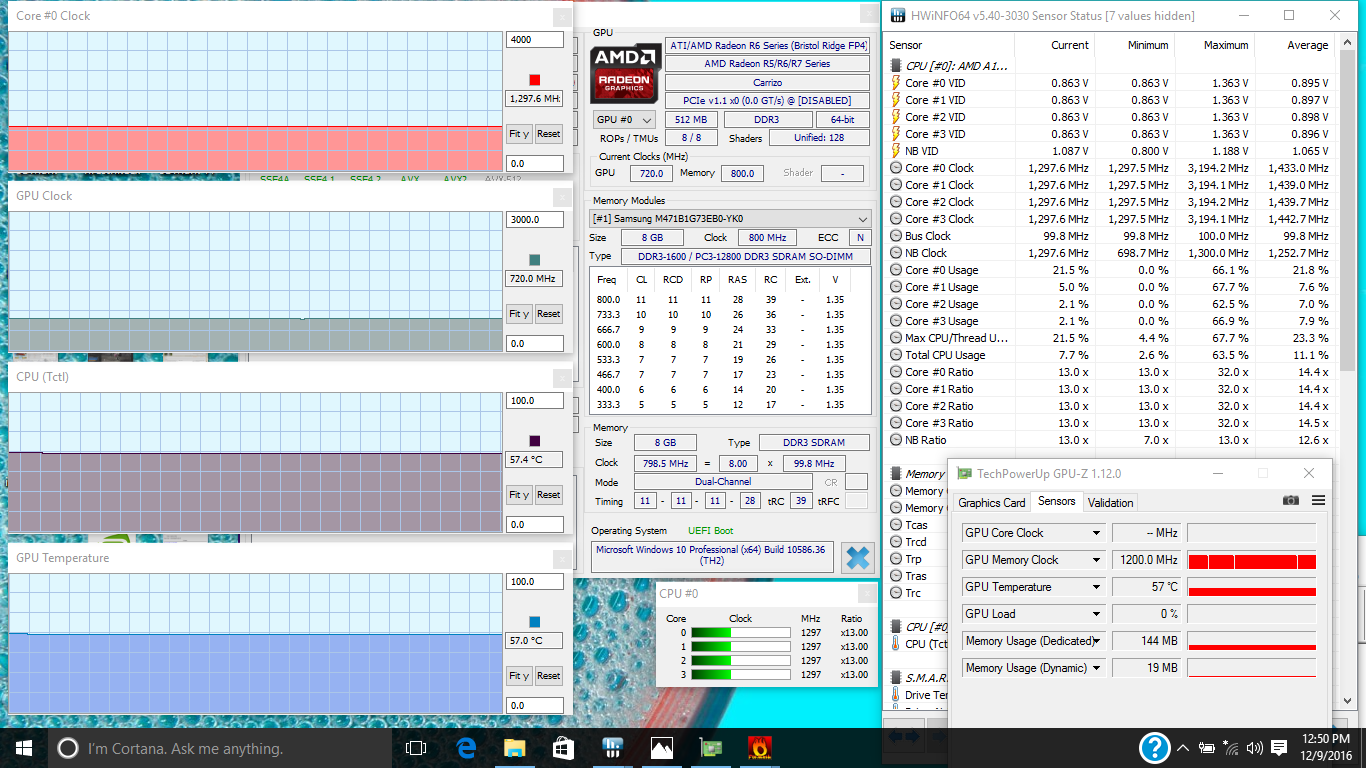
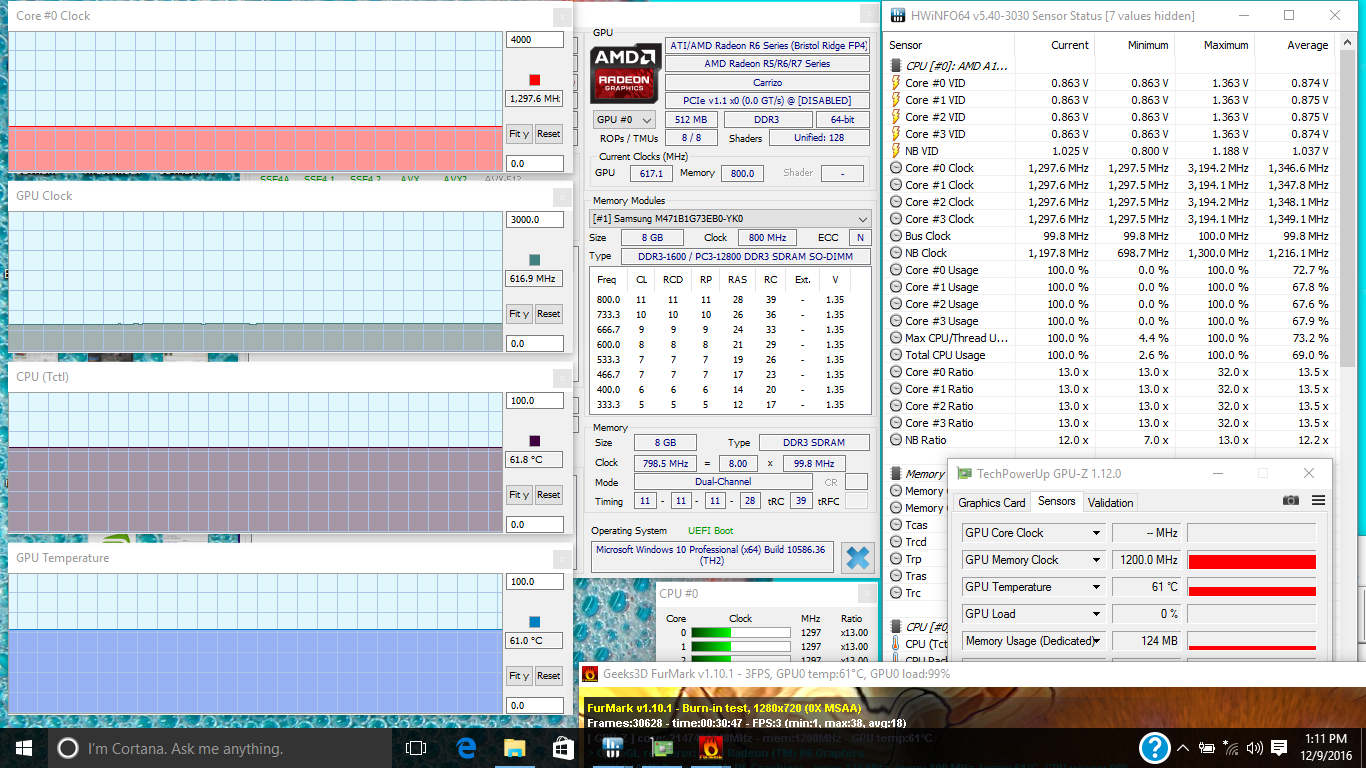
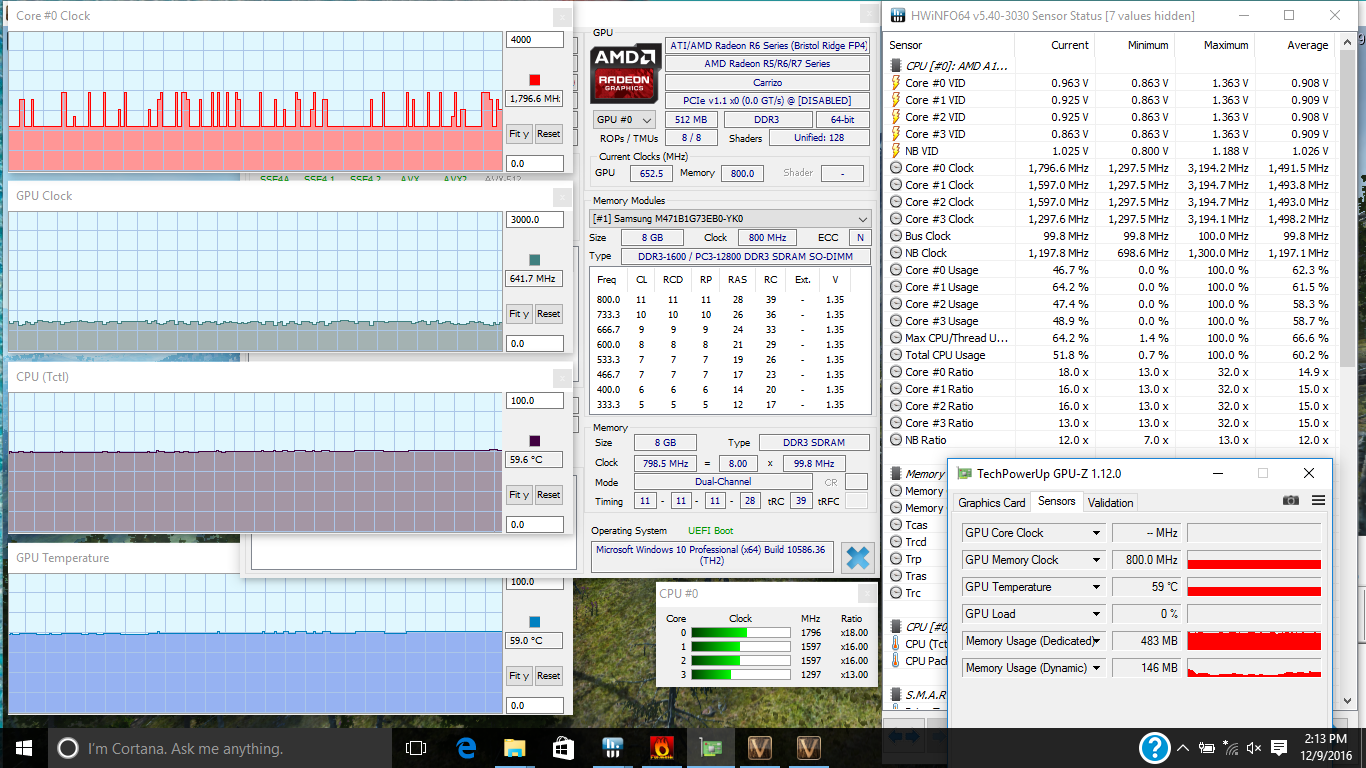
| CPU Clock (GHz) | GPU Clock (MHz) | Average CPU Temperature (°C) | |
| Prime95 Stress | 2.3 | -- | 63 |
| FurMark Stress | -- | 720 | 57 |
| Prime95 + FurMark Stress | 1.3 | 617 | 62 |
| Unigine Heaven Stress | 1.3 - 1.8 | 642 | 60 |
Emissions
System Noise
The system fan is always active no matter the onscreen workload. Fortunately, its audible range is narrow as expected from a low-power budget office notebook. We were able to record a fan noise of just over 36 dB(A) when under extreme processing loads to be slightly quieter than the HP 15z and ThinkPad E560 under similar conditions.
Noise Level
| Idle |
| 32.4 / 32.4 / 32.5 dB(A) |
| Load |
| 35.5 / 36.6 dB(A) |
 | ||
30 dB silent 40 dB(A) audible 50 dB(A) loud |
||
min: | ||
| HP ProBook 455 T1B79UT Radeon R6 (Carrizo), A10-8700P, Toshiba MQ01ACF050 | HP 15z-ba000 Radeon R4 (Beema), A6-7310, Adata IM2S3138E-128GM-B | Dell Latitude 15-3570 HD Graphics 520, 6200U, Samsung CM871 MZNLF128HCHP | Lenovo ThinkPad E560 20EV000MGE HD Graphics 520, 6100U, Western Digital WD Black Mobile 500GB (WD5000LPLX) | Lenovo Yoga 510-15IKB 80VC000XGE Radeon R7 M460, i5-7200U, Samsung MZYTY256HDHP | |
|---|---|---|---|---|---|
| Noise | -0% | 3% | -3% | 0% | |
| off / environment * | 28.8 | 28.6 1% | 31 -8% | 31.2 -8% | 30.15 -5% |
| Idle Minimum * | 32.4 | 31.6 2% | 31 4% | 32.3 -0% | 30.2 7% |
| Idle Average * | 32.4 | 31.6 2% | 31 4% | 32.3 -0% | 30.2 7% |
| Idle Maximum * | 32.5 | 31.6 3% | 31 5% | 32.5 -0% | 31 5% |
| Load Average * | 35.5 | 37.2 -5% | 34.2 4% | 36 -1% | 38 -7% |
| Load Maximum * | 36.6 | 38.2 -4% | 34.3 6% | 38.8 -6% | 38.6 -5% |
* ... smaller is better
Temperature
Surface temperatures are not as flat as we would like when the system is idling. The bottom center of the notebook, for example, can be as warm as 31 C simply from idling on desktop. Surfaces can be as warm as 44 C when under extreme processing loads both on the back and front sides of the notebook. The hot spot unfortunately sits right on the center of the keyboard surface where typists may find it to be disadvantageous. The palm rests remain cool in comparison and we weren't bothered by the warming surfaces during regular day-to-day load.
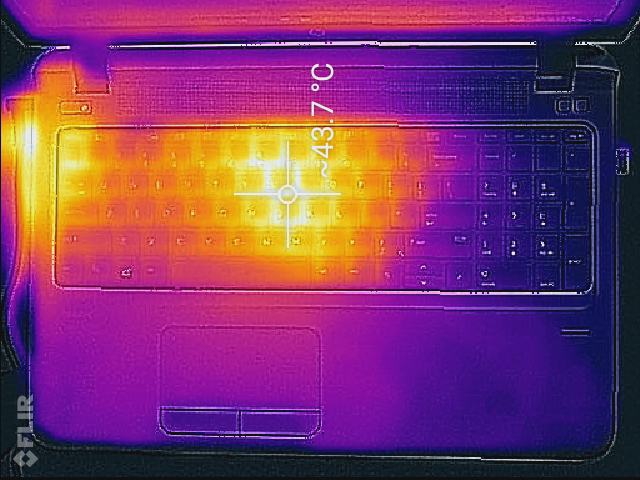
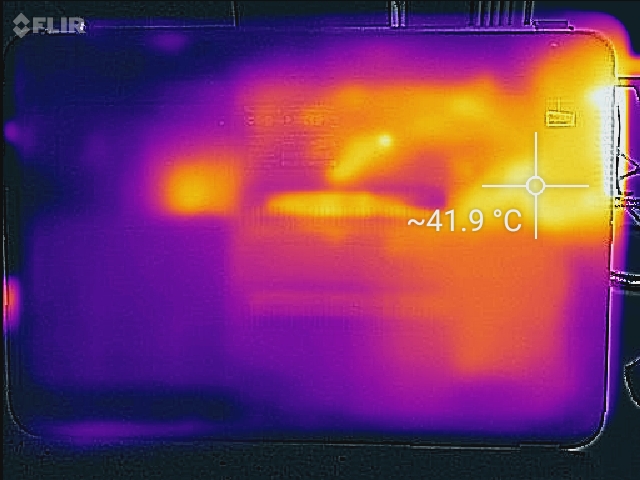
(±) The maximum temperature on the upper side is 44 °C / 111 F, compared to the average of 34.2 °C / 94 F, ranging from 21.2 to 62.5 °C for the class Office.
(±) The bottom heats up to a maximum of 42 °C / 108 F, compared to the average of 36.7 °C / 98 F
(+) In idle usage, the average temperature for the upper side is 24.8 °C / 77 F, compared to the device average of 29.5 °C / 85 F.
(+) The palmrests and touchpad are cooler than skin temperature with a maximum of 25.8 °C / 78.4 F and are therefore cool to the touch.
(±) The average temperature of the palmrest area of similar devices was 27.7 °C / 81.9 F (+1.9 °C / 3.5 F).
Speakers
Sound quality from the internal stereo speakers is acceptable for a business notebook. Bass is very poor as shown by our microphone measurements below where the sound curve drops off steeply and at a higher frequency compared to the Dell XPS 13 or the HP Spectre 13. Volume is louder than on the Dell, but overall quality feels unbalanced especially at higher volume settings. Fortunately, the speakers introduce no static or surface reverberations.


HP ProBook 455 T1B79UT audio analysis
(±) | speaker loudness is average but good (77.6 dB)
Bass 100 - 315 Hz
(-) | nearly no bass - on average 26.8% lower than median
(±) | linearity of bass is average (11.8% delta to prev. frequency)
Mids 400 - 2000 Hz
(+) | balanced mids - only 3.6% away from median
(±) | linearity of mids is average (9.7% delta to prev. frequency)
Highs 2 - 16 kHz
(+) | balanced highs - only 2.8% away from median
(+) | highs are linear (6.2% delta to prev. frequency)
Overall 100 - 16.000 Hz
(±) | linearity of overall sound is average (28.1% difference to median)
Compared to same class
» 87% of all tested devices in this class were better, 3% similar, 10% worse
» The best had a delta of 7%, average was 22%, worst was 53%
Compared to all devices tested
» 82% of all tested devices were better, 3% similar, 14% worse
» The best had a delta of 4%, average was 25%, worst was 134%
Apple MacBook 12 (Early 2016) 1.1 GHz audio analysis
(+) | speakers can play relatively loud (83.6 dB)
Bass 100 - 315 Hz
(±) | reduced bass - on average 11.3% lower than median
(±) | linearity of bass is average (14.2% delta to prev. frequency)
Mids 400 - 2000 Hz
(+) | balanced mids - only 2.4% away from median
(+) | mids are linear (5.5% delta to prev. frequency)
Highs 2 - 16 kHz
(+) | balanced highs - only 2% away from median
(+) | highs are linear (4.5% delta to prev. frequency)
Overall 100 - 16.000 Hz
(+) | overall sound is linear (10.2% difference to median)
Compared to same class
» 5% of all tested devices in this class were better, 2% similar, 93% worse
» The best had a delta of 5%, average was 19%, worst was 53%
Compared to all devices tested
» 3% of all tested devices were better, 1% similar, 96% worse
» The best had a delta of 4%, average was 25%, worst was 134%
Frequency Comparison (Checkbox selectable!)
Graph 1: Pink Noise 100% Vol.; Graph 2: Audio off
Energy Management
Power Consumption
The AMD ProBook is slightly less power efficient than many similarly sized competitors. Idling on desktop will demand about 6 W to 10 W depending on screen brightness and the Power Profile compared to 5 W to 8 W on the ThinkPad E560. Gaming loads will demand about 37 W to be notably higher than Intel's ULV Skylake solutions due in part to the higher TDP limit of the A10-8700P.
Maximum load will draw about 41 W from a small power adapter (~9.5 x 4.0 x 2.7 cm) rated for up to 45 W.
| Off / Standby | |
| Idle | |
| Load |
|
| HP ProBook 455 T1B79UT A10-8700P, Radeon R6 (Carrizo), Toshiba MQ01ACF050, TN, 1366x768, 15.60 | HP 15z-ba000 A6-7310, Radeon R4 (Beema), Adata IM2S3138E-128GM-B, TN, 1366x768, 15.60 | Dell Latitude 15-3570 6200U, HD Graphics 520, Samsung CM871 MZNLF128HCHP, TN LED, 1366x768, 15.60 | Lenovo ThinkPad E560 20EV000MGE 6100U, HD Graphics 520, Western Digital WD Black Mobile 500GB (WD5000LPLX), TN LED, 1366x768, 15.60 | Lenovo Yoga 510-15IKB 80VC000XGE i5-7200U, Radeon R7 M460, Samsung MZYTY256HDHP, IPS, 1920x1080, 15.60 | |
|---|---|---|---|---|---|
| Power Consumption | 29% | 23% | 23% | 9% | |
| Idle Minimum * | 5.9 | 5.22 12% | 4.9 17% | 5.2 12% | 3.9 34% |
| Idle Average * | 8.2 | 5.67 31% | 7.2 12% | 7.25 12% | 7.8 5% |
| Idle Maximum * | 9.9 | 7.82 21% | 7.5 24% | 7.9 20% | 8.4 15% |
| Load Average * | 37.5 | 19.67 48% | 25.4 32% | 25.1 33% | 37 1% |
| Load Maximum * | 41 | 26.72 35% | 28 32% | 25.1 39% | 46 -12% |
* ... smaller is better
Battery Life
Runtimes are unimpressive at just 4 hours of constant WLAN use at a backlight brightness of 150 nits (setting 8/10). Competing ULV Skylake models of the same screen size can last for over twice as long as our ProBook under similar conditions. For word processing, however, users will fortunately see longer runtimes between 4 to 9 hours. The GPU was set to "Optimize Battery" through the AMD Catalyst software during our WLAN test to better reflect real-world usage.
Charging from near empty to full capacity will take about 2 hours with the included adapter. Note that a larger internal 55 Wh upgrade is available for this particular configuration of the ProBook to improve overall battery life.
| HP ProBook 455 T1B79UT A10-8700P, Radeon R6 (Carrizo), 44 Wh | HP 15z-ba000 A6-7310, Radeon R4 (Beema), 31 Wh | Dell Latitude 15-3570 6200U, HD Graphics 520, 65 Wh | Lenovo ThinkPad E560 20EV000MGE 6100U, HD Graphics 520, 48 Wh | Lenovo Yoga 510-15IKB 80VC000XGE i5-7200U, Radeon R7 M460, 35 Wh | |
|---|---|---|---|---|---|
| Battery Runtime | 23% | 116% | 111% | 33% | |
| Reader / Idle | 572 | 511 -11% | 1024 79% | 885 55% | |
| WiFi v1.3 | 240 | 247 3% | 542 126% | 566 136% | 320 33% |
| Load | 65 | 115 77% | 157 142% | 157 142% |
Pros
Cons
Verdict
The AMD Carrizo platform for notebooks is supposed to be very versatile with its configurable thermal design power. Its performance here, however, is considerably slower than even the three-generation old Core i5-4200U. The integrated Radeon R6 GPU paints a similar story when compared to the common HD Graphics 520 or HD Graphics 5500 as found on older Intel hardware.
The performance disadvantages from AMD would have been acceptable if the ProBook 455 ran significantly quieter and longer as a result, but this is definitely not the case. Surface temperatures are not any cooler and battery life is even shorter than expected.
Outside of the processor, the ProBook 455 functions well as a barebones offering meant for undemanding workloads. It's unremarkable both in concept and design and we're hoping that future revisions will at least add some functionality to the hardware including USB Type-C and TrackPoint options.
It's difficult to recommend the Carrizo SKU when older Intel Core ix options can both outperform and outlast what AMD has to offer for its current generation.
HP ProBook 455 T1B79UT
-
12/15/2016 v6(old)
Allen Ngo
Pricecompare
