 Deutsch
 English
 Español
 Français
 Italiano
 Nederlands
 Polski
 Português
 Русский
 Türkçe
 Svenska
 Chinese
 Magyar
HP Pavilion Gaming 17 Review: Finally, a Quiet Gaming Laptop
The extensive HP Pavilion series has always included a few gaming laptops with GeForce and even Radeon graphics to appeal to gamers on tighter budgets. They would complement the flagship HP Omen series which consists of faster, more feature-heavy, and often pricier offerings. The problem with HP Pavilion gaming laptops in the past is that they can often feel like afterthoughts with no real care to the design, cooling, or overall experience. HP would simply slap on a dedicated GPU option for an existing Pavilion chassis design and then call it a day.
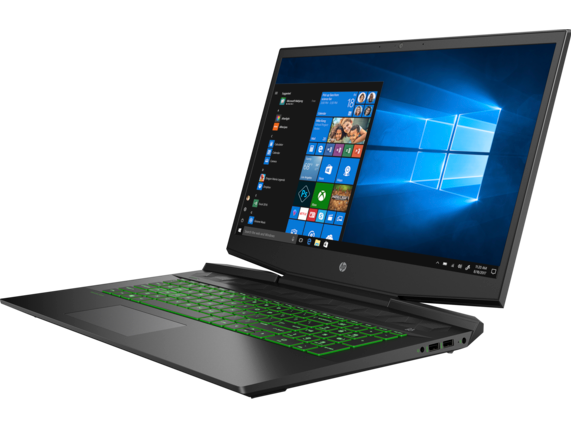
The latest Pavilion Gaming 17 is an update of last year's model and it throws us a curve ball with a brand new look not seen on any "ordinary" Pavilion configuration. HP offers a wide variety of SKUs ranging from Core i5-9300H to Core i7-9750H, 60 Hz or 144 Hz 1080p IPS, 8 GB to 32 GB of DDR4 RAM, and either GTX 1050, GTX 1650, or GTX 1660 Ti Max-Q graphics. It's worth noting that HP's official specifications list here omits mentioning "Max-Q" to the chagrin of enthusiasts who understand the importance of Max-Q versus non-Max-Q GPUs.
Our test unit today is the upper mid-range SKU with 9th gen Core i7, GTX 1660 Ti Max-Q graphics, and a 60 Hz display for a retail price of about $1300 USD. Direct competitors include other budget to mid-range 17.3-inch gaming laptops like the Lenovo Legion Y740 17, MSI GP75, Asus TUF FX705, Aorus 7, and the Acer Predator Triton.
More HP Pavilion reviews:
Case
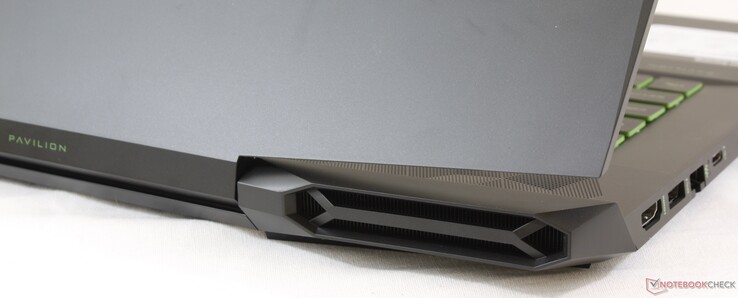
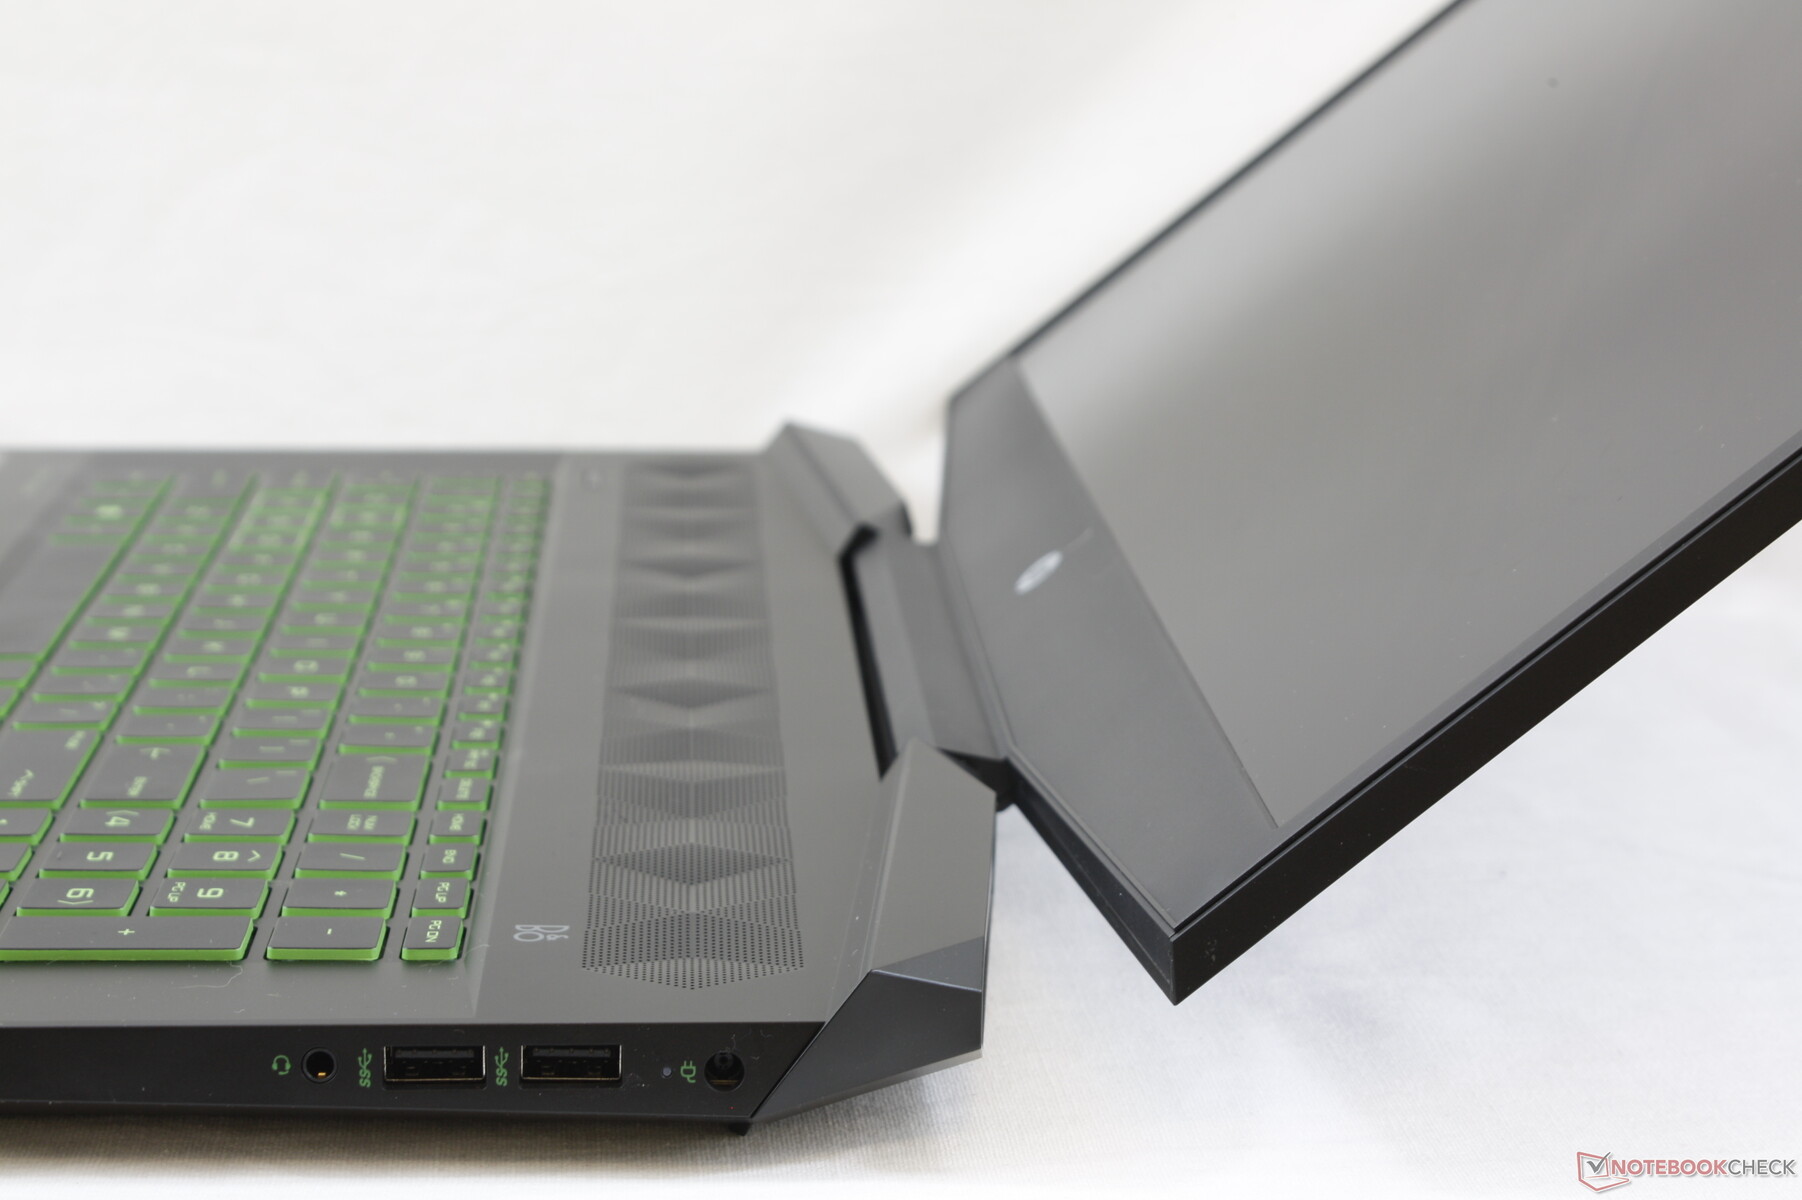
After handling so many Pavilion laptops over the years, we've learned to keep our expectations low for the series in terms of chassis quality. Flexible surfaces, flimsy lids, and cheap-feeling plastics have all become commonplace on the typical HP Pavilion. The Pavilion Gaming 17 bucks this trend with a new chassis that's actually sleeker and stronger than any Pavilion before it. The sharp and angular edges and corners contrast the normally rounder design of older Pavilion systems while the rear corners mimic the "diamond cut" look of the latest Spectre x360 15.
Chassis rigidity is excellent around the base with only minimal creaking and warping when attempting to twist the edges or when applying pressure on the palm rests or keyboard center. The smooth matte plastic and aluminum surfaces exhume a higher level of quality that raises the bar for other Pavilion systems to follow.
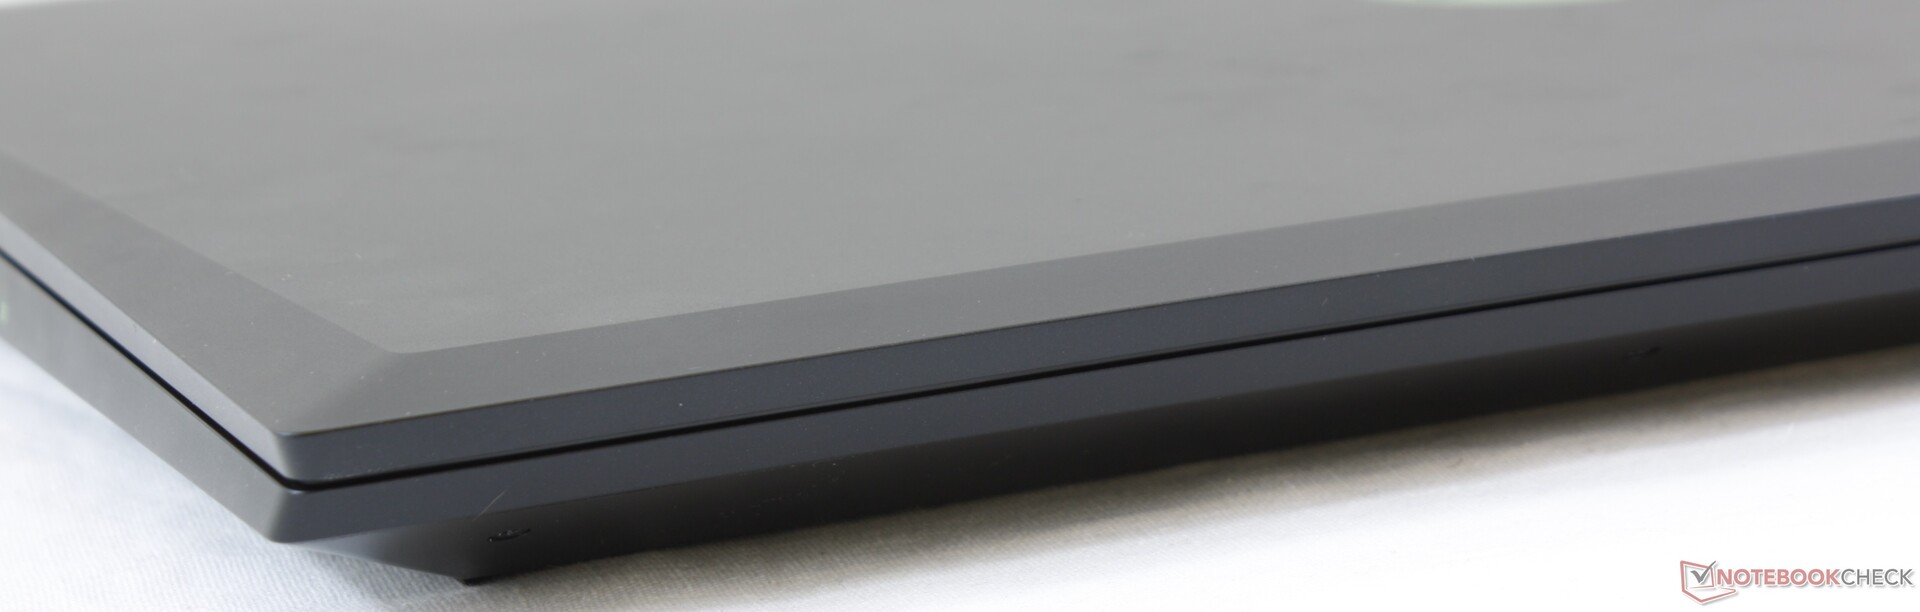
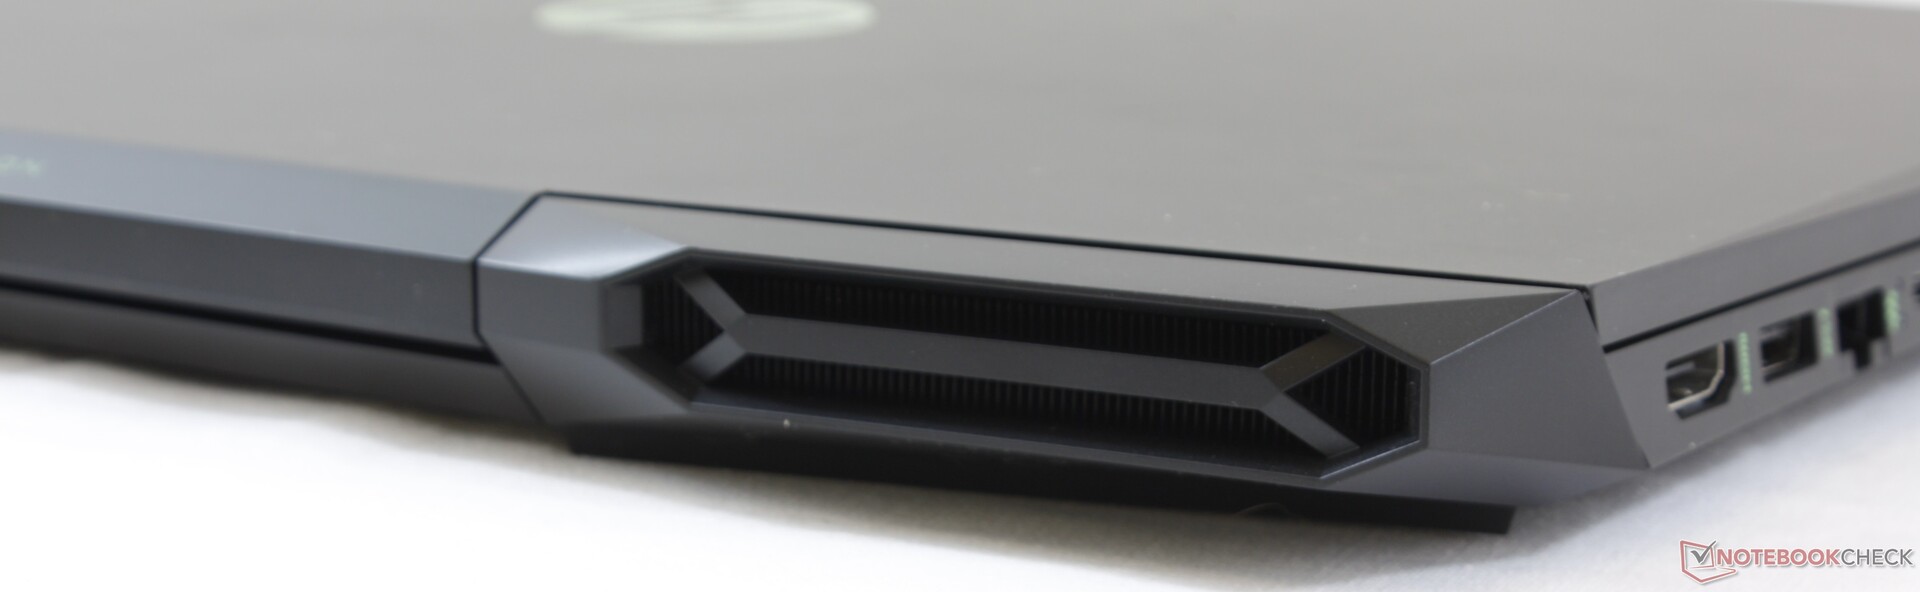
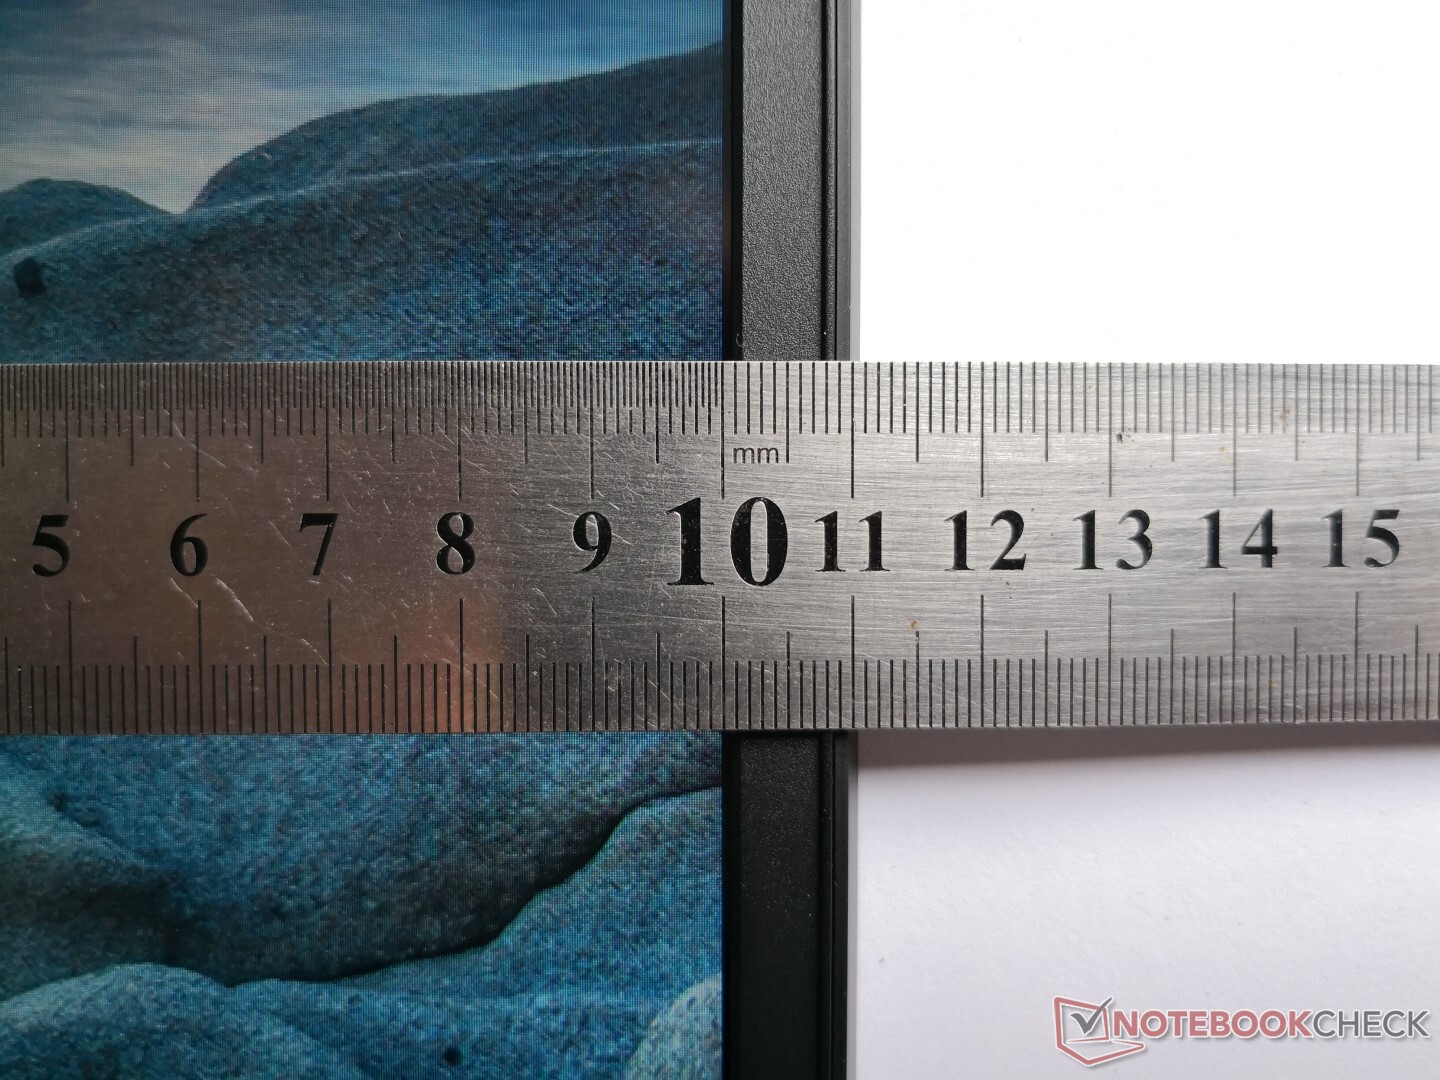
There are a couple of weak aspects to the chassis. While the base is strong, the lid is more susceptible to side-to-side twisting and warping down its center when compared to the lids of the Asus TUF FX705 or Razer Blade Pro 17. Secondly, the thin horizontal bars across the rear ventilation grilles (shown below) are very flexible and prone to damage. The hinges are satisfactory but could be firmer when fine-tuning the angle. Overall chassis quality is not as sound as the pricier Omen 17 or Asus ROG G703, albeit it's still stronger than other popular <$1000 alternatives like the Acer Nitro V17 Nitro or MSI GP75.
The Pavilion Gaming 17 is medium-sized machine in its narrow-bezel 17.3-inch category. Alternatives like the Asus TUF FX705 or MSI GP75 are slightly smaller in footprint while the Lenovo Legion Y740 is larger but thinner. It's significantly sleeker and lighter than HP's premier Omen 17.
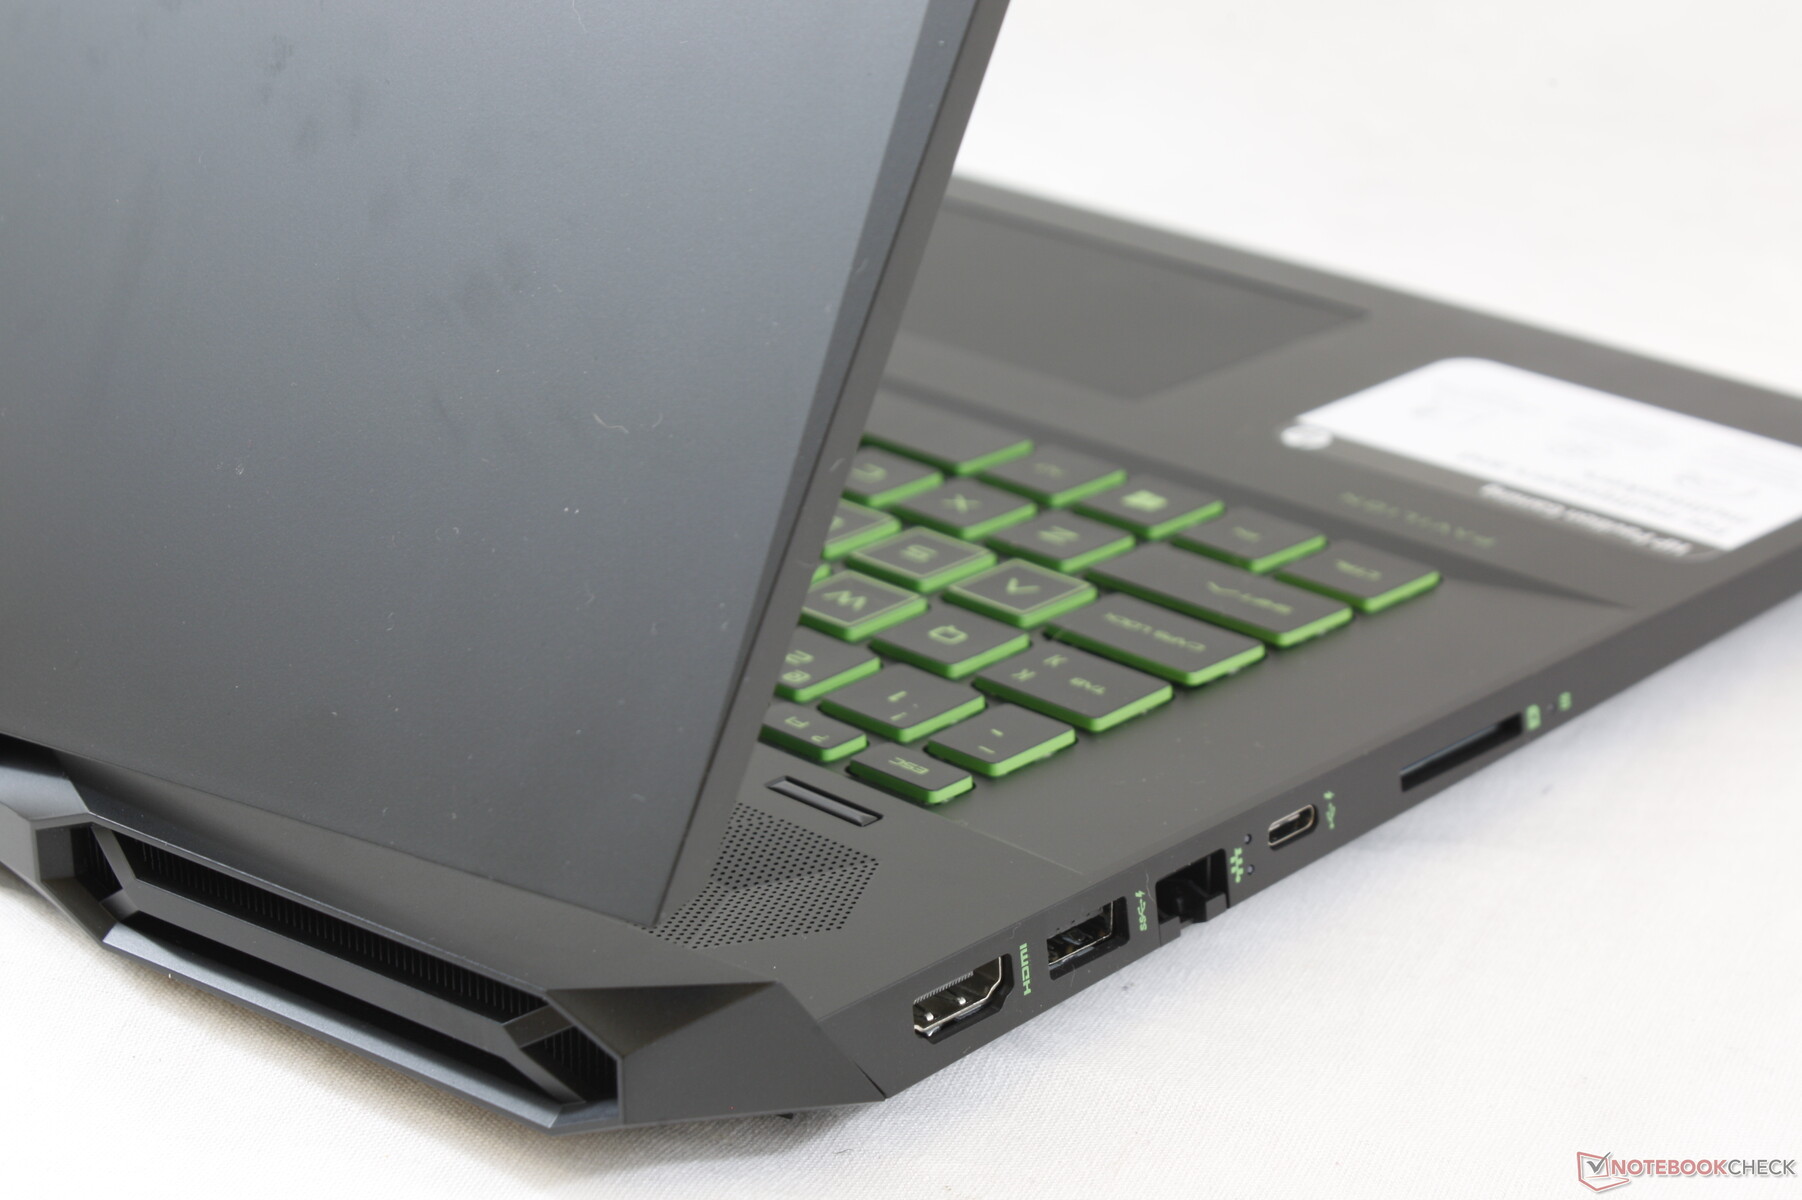
Connectivity
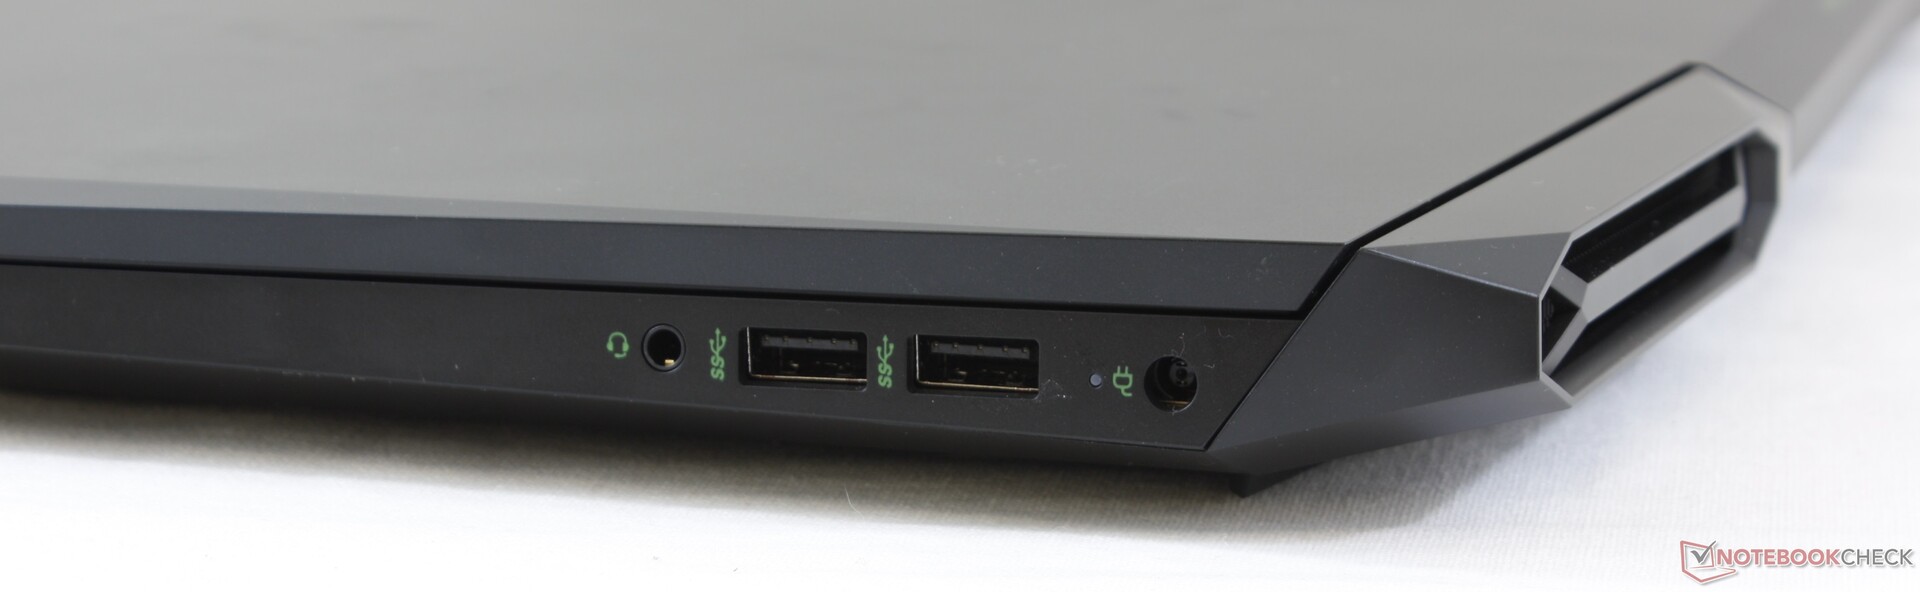
Port options are decent for a 17.3-inch gaming laptop. Gamers who want Thunderbolt 3 and a dedicated mini DisplayPort will have to opt for HP's pricier Omen 17 instead. While port positioning is excellent and more accessible than on the Legion Y740 or Asus Strix G GL731, the ports here are quite close to one another and could have been spaced out a bit wider to avoid clashing cables.
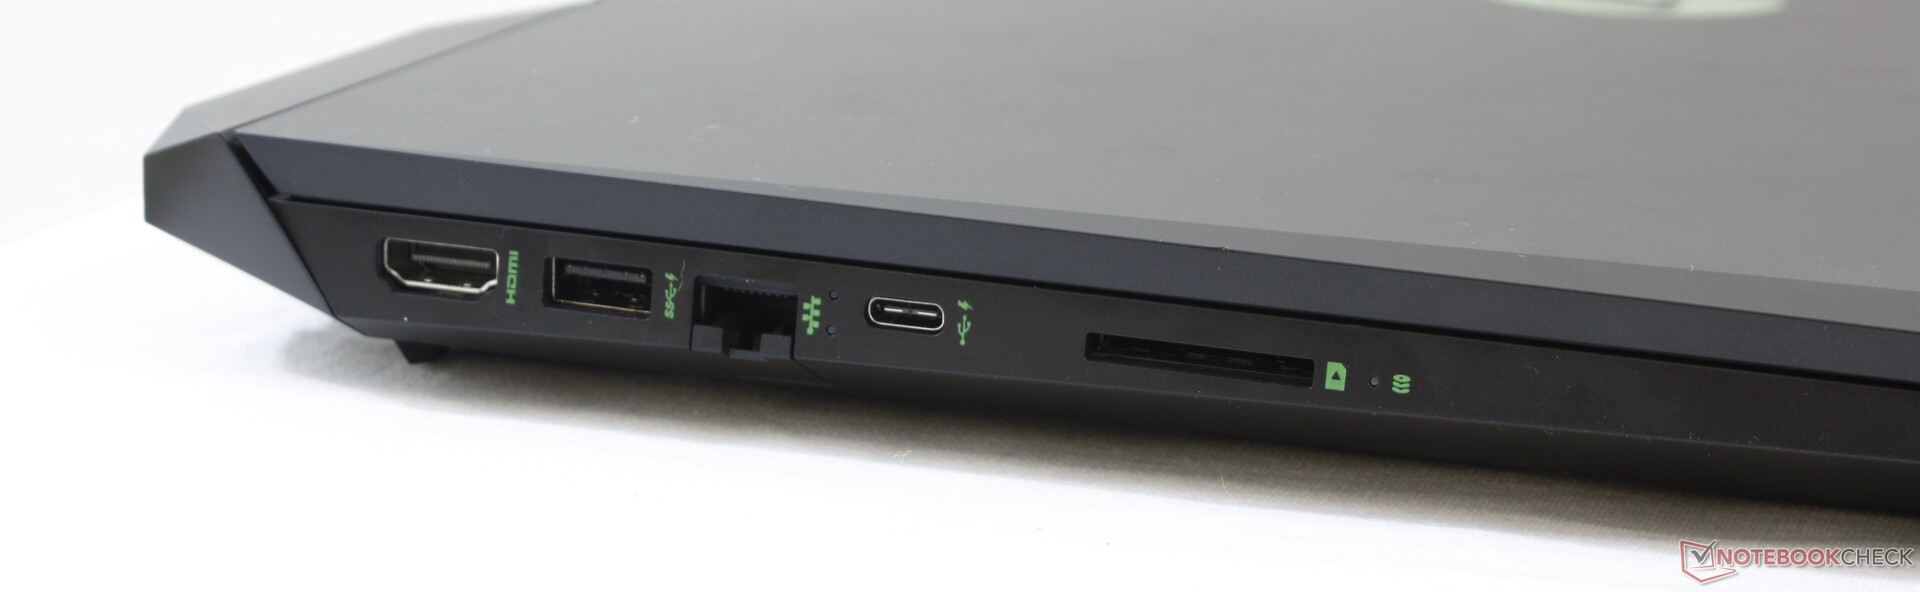
SD Card Reader
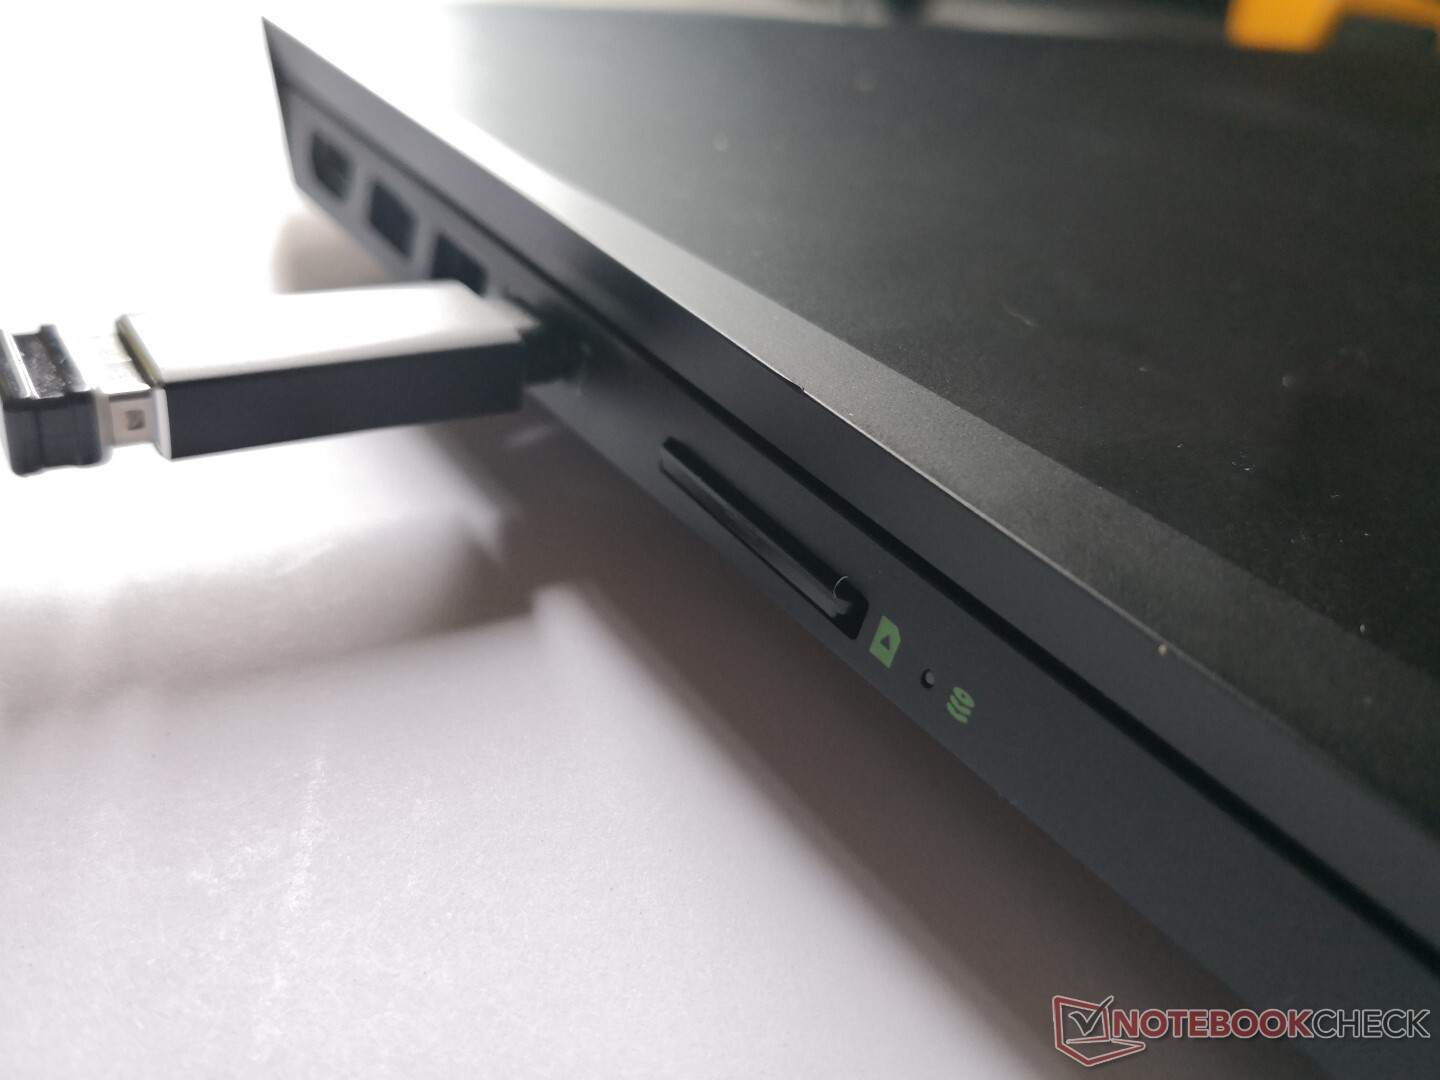
The spring-loaded SD reader offers average transfer rates. Transferring 1 GB of images from our UHS-II test card takes about 14 seconds compared to half that on the Dell XPS 15.
A fully inserted SD card sits almost flush against the edge for safe transporting.
| SD Card Reader | |
| average JPG Copy Test (av. of 3 runs) | |
| Dell XPS 15 9570 Core i9 UHD (Toshiba Exceria Pro SDXC 64 GB UHS-II) | |
| HP Omen 17t-3AW55AV_1 (Toshiba Exceria Pro SDXC 64 GB UHS-II) | |
| HP Pavilion Gaming 17-cd0085cl (Toshiba Exceria Pro SDXC 64 GB UHS-II) | |
| MSI GP75 Leopard 9SD (Toshiba Exceria Pro SDXC 64 GB UHS-II) | |
| maximum AS SSD Seq Read Test (1GB) | |
| Dell XPS 15 9570 Core i9 UHD (Toshiba Exceria Pro SDXC 64 GB UHS-II) | |
| HP Omen 17t-3AW55AV_1 (Toshiba Exceria Pro SDXC 64 GB UHS-II) | |
| HP Pavilion Gaming 17-cd0085cl (Toshiba Exceria Pro SDXC 64 GB UHS-II) | |
| MSI GP75 Leopard 9SD (Toshiba Exceria Pro SDXC 64 GB UHS-II) | |
Communication
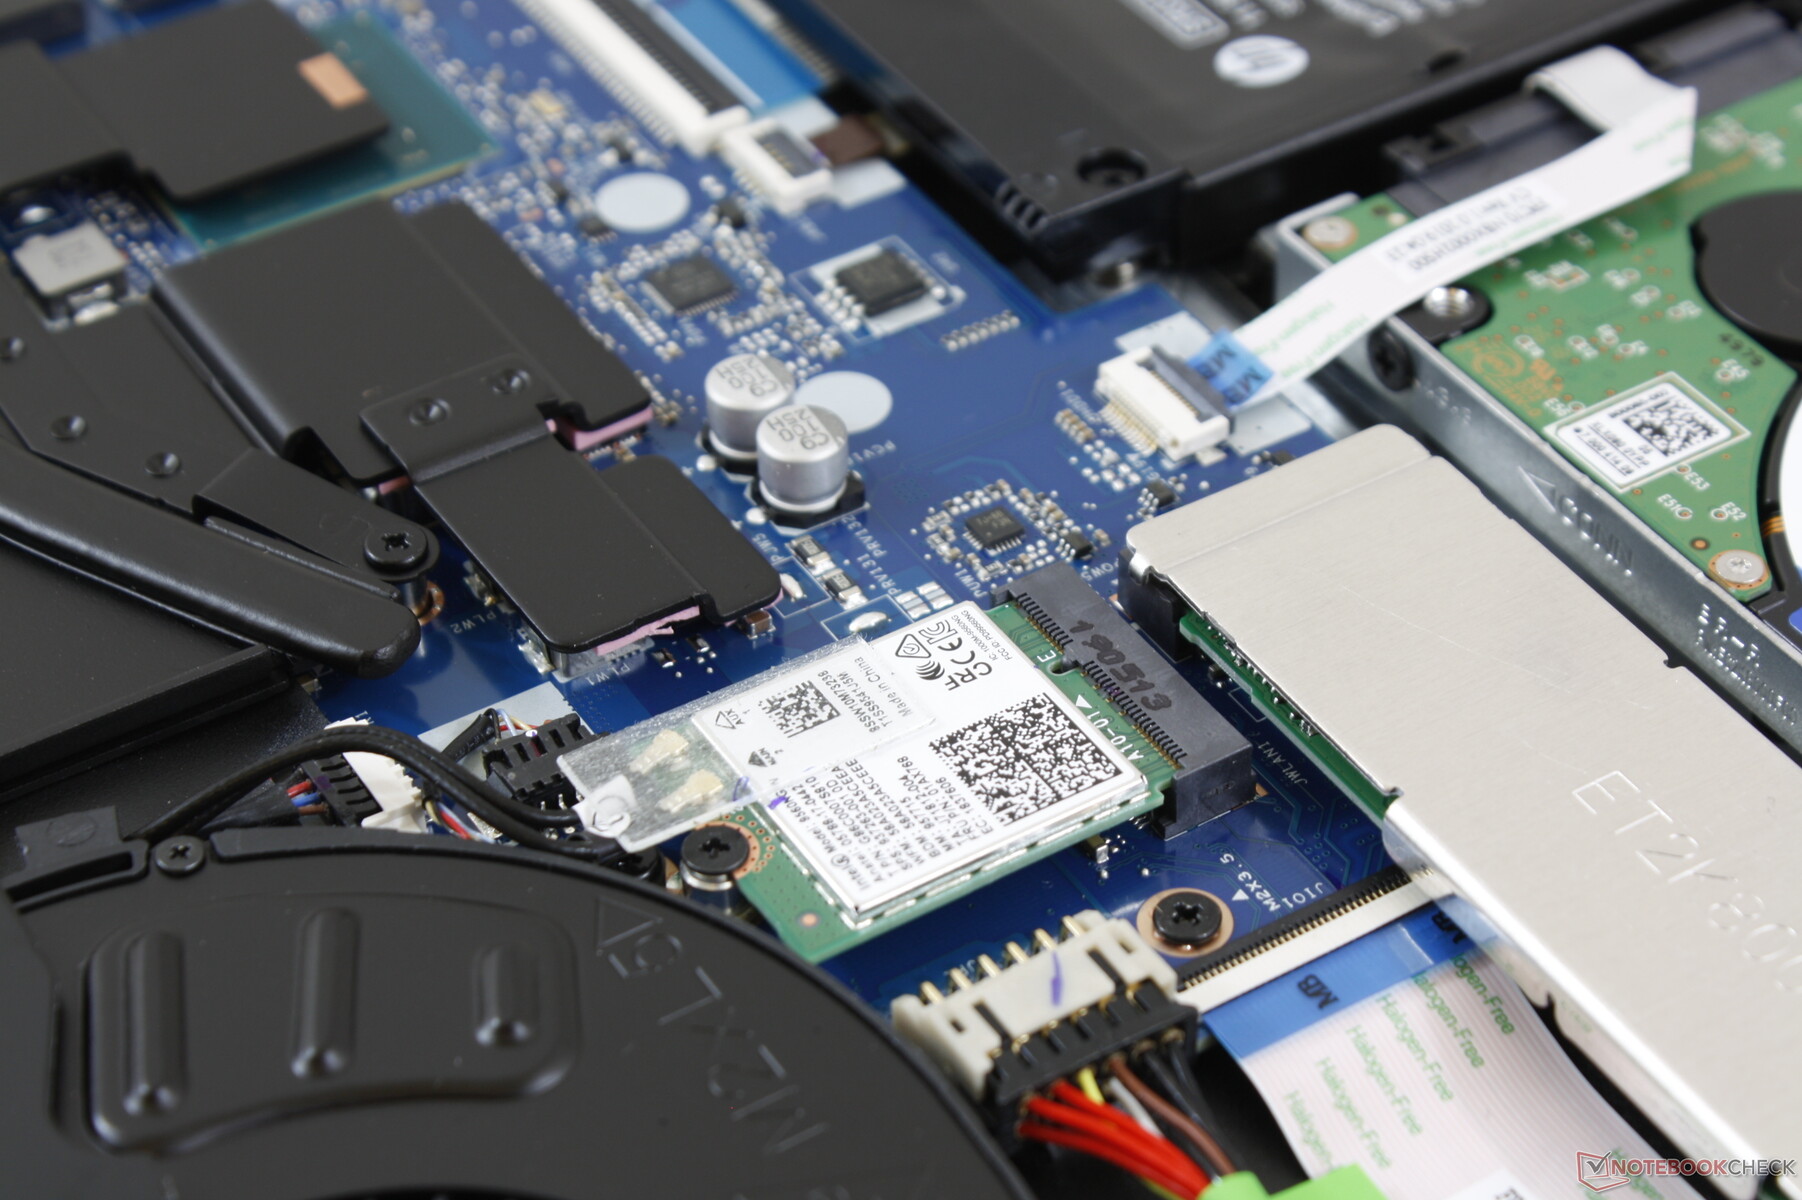
The Intel 9560 comes standard for Bluetooth 5 connectivity and 802.11ac transfer rates of up to 1.73 Gbps to be 2x faster than the last generation Intel 8265. Most home wireless networks do not yet support >1 Gbps speeds and so users shouldn't worry about the performance differences between newer and older WLAN modules. We experienced no connectivity issues during our time with the test unit.
Maintenance
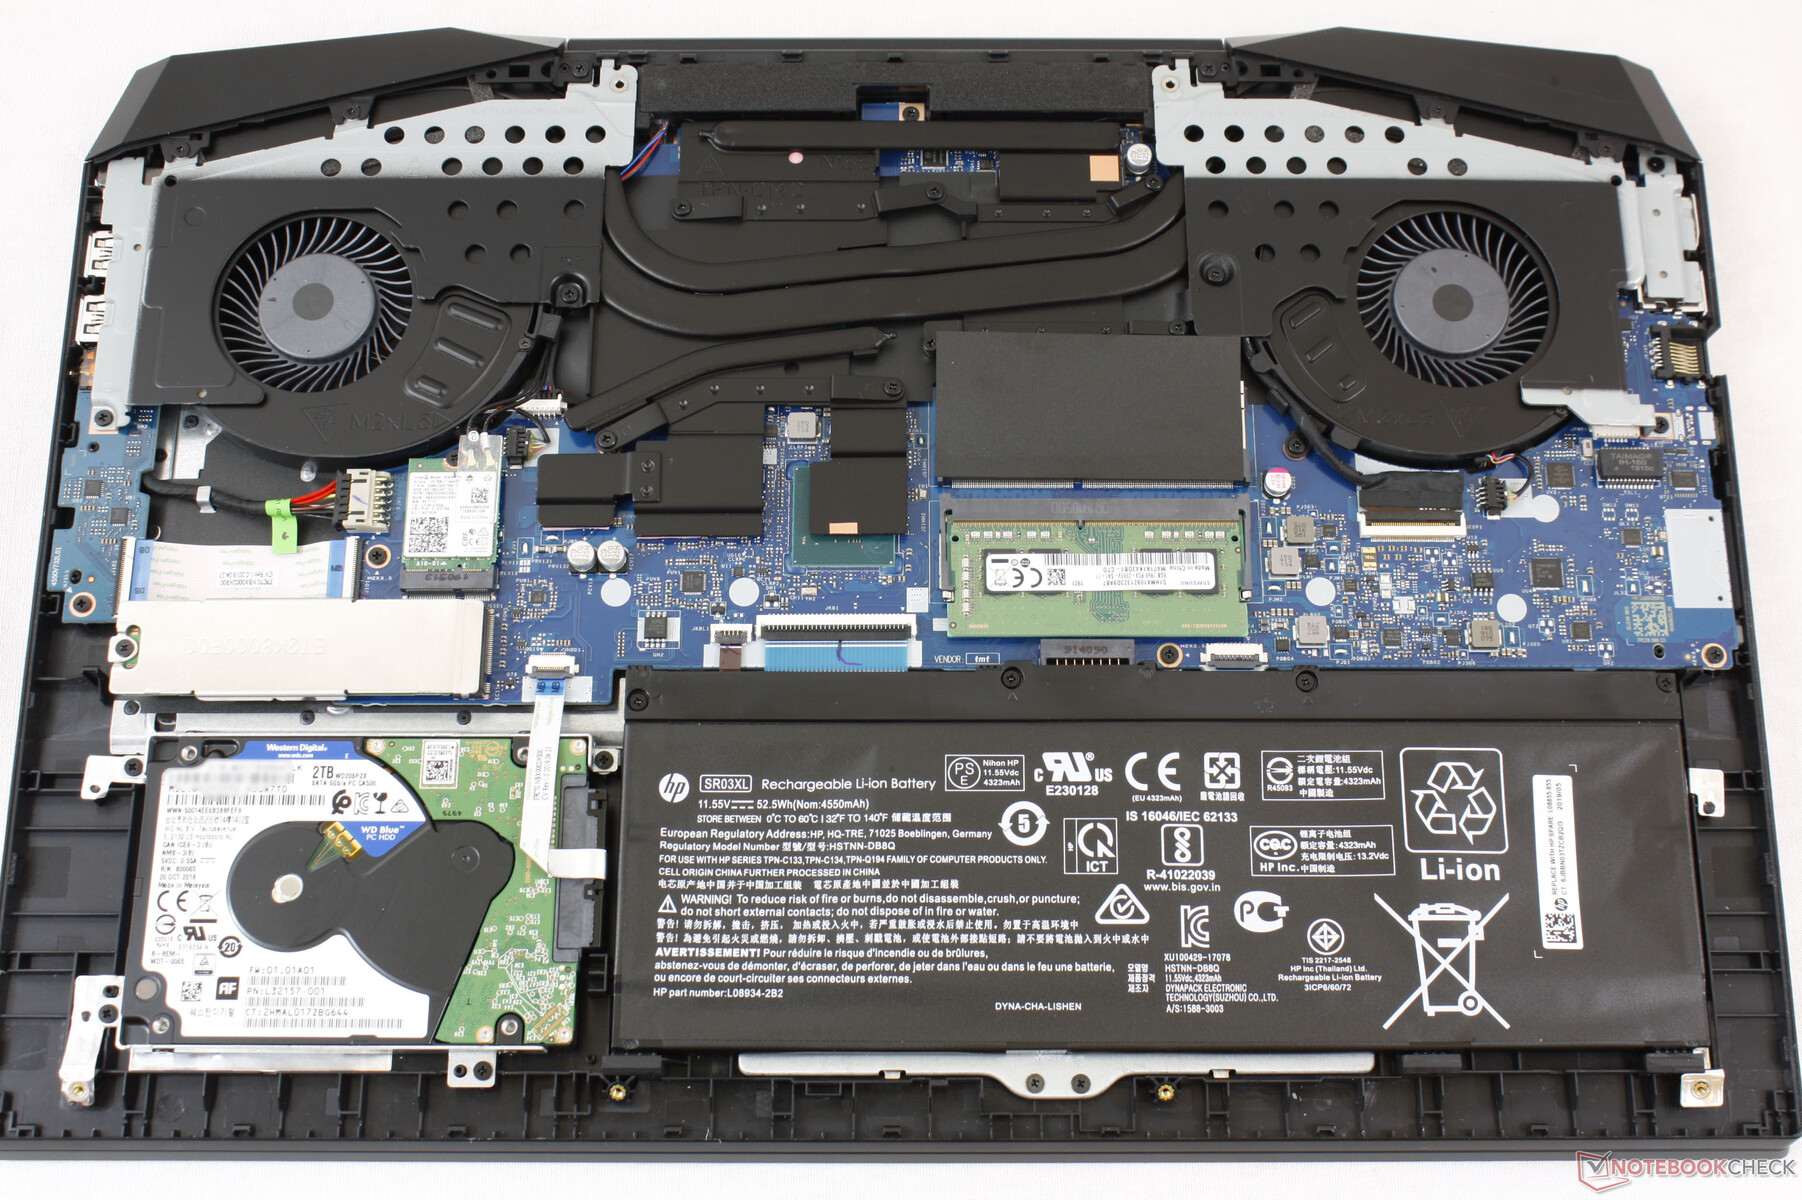
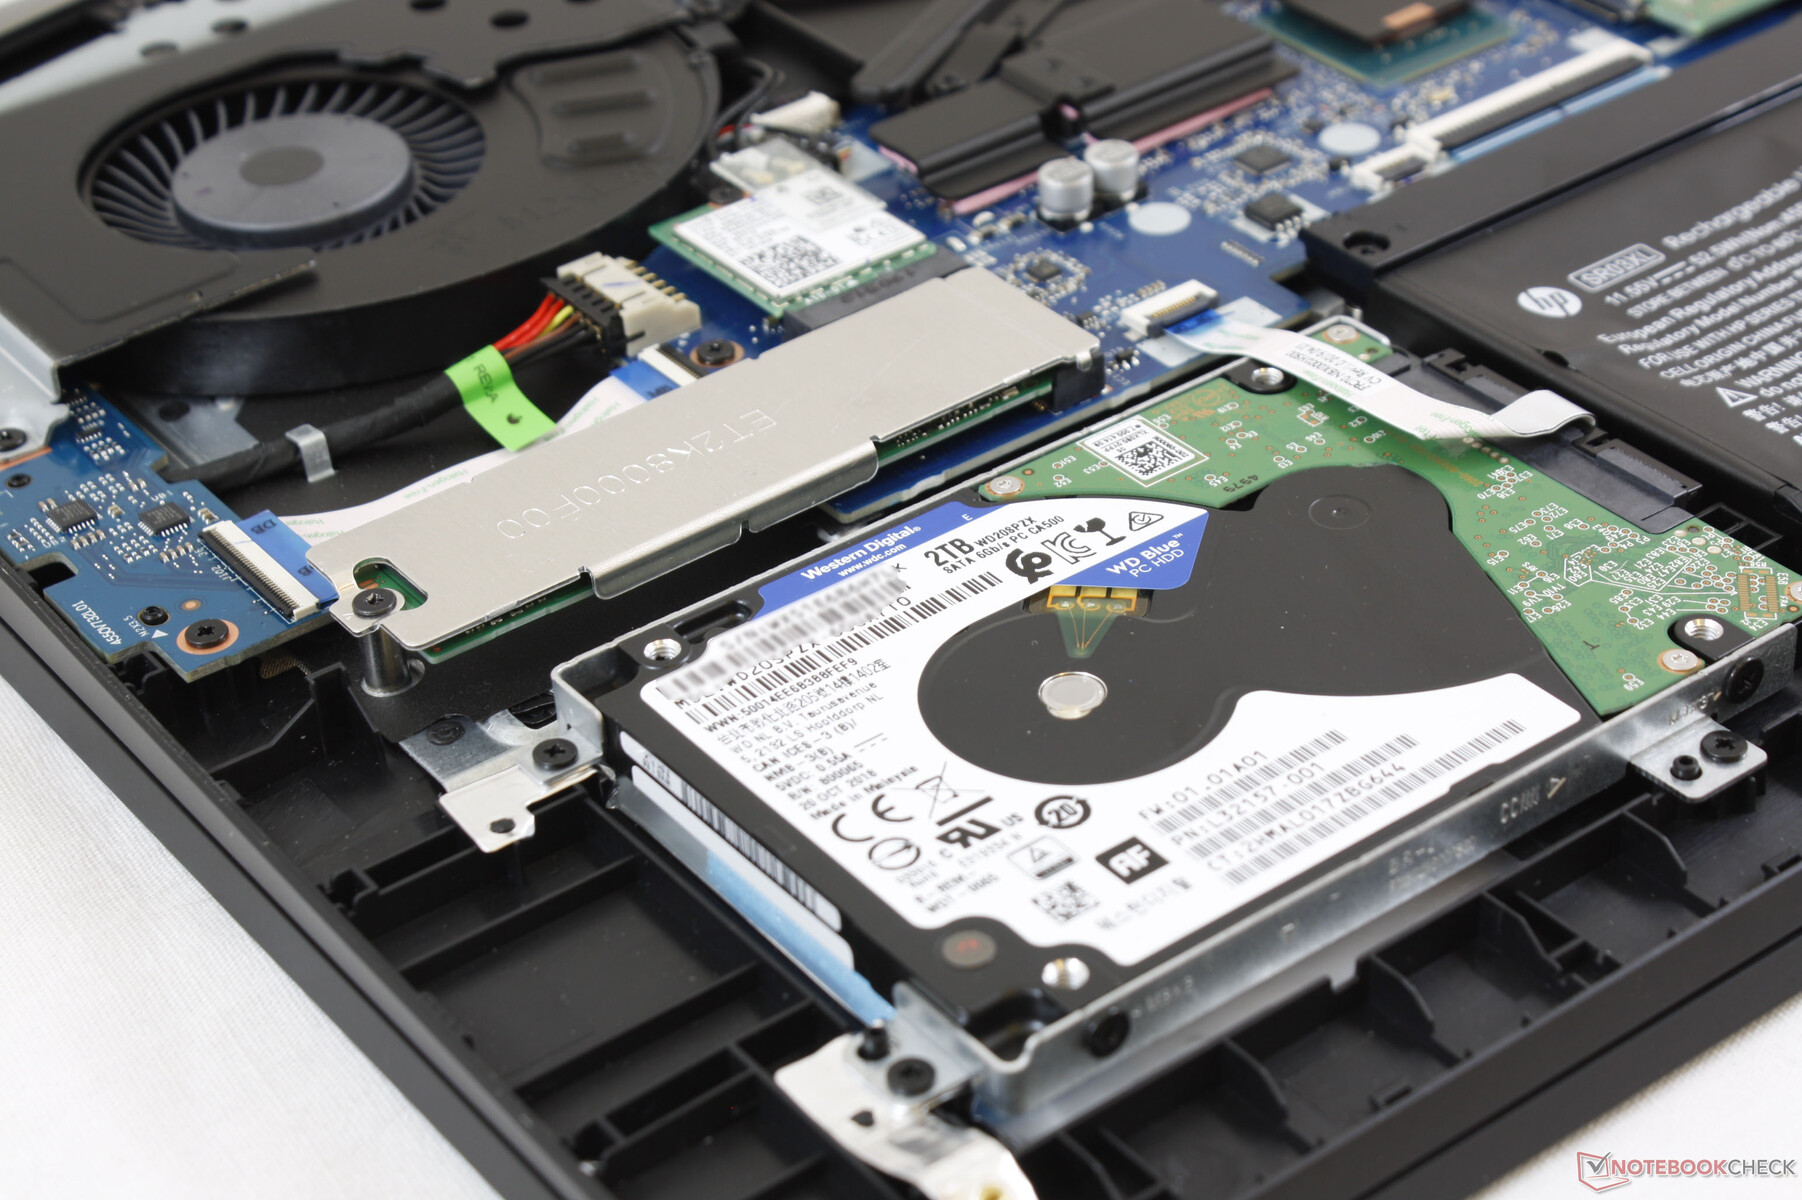
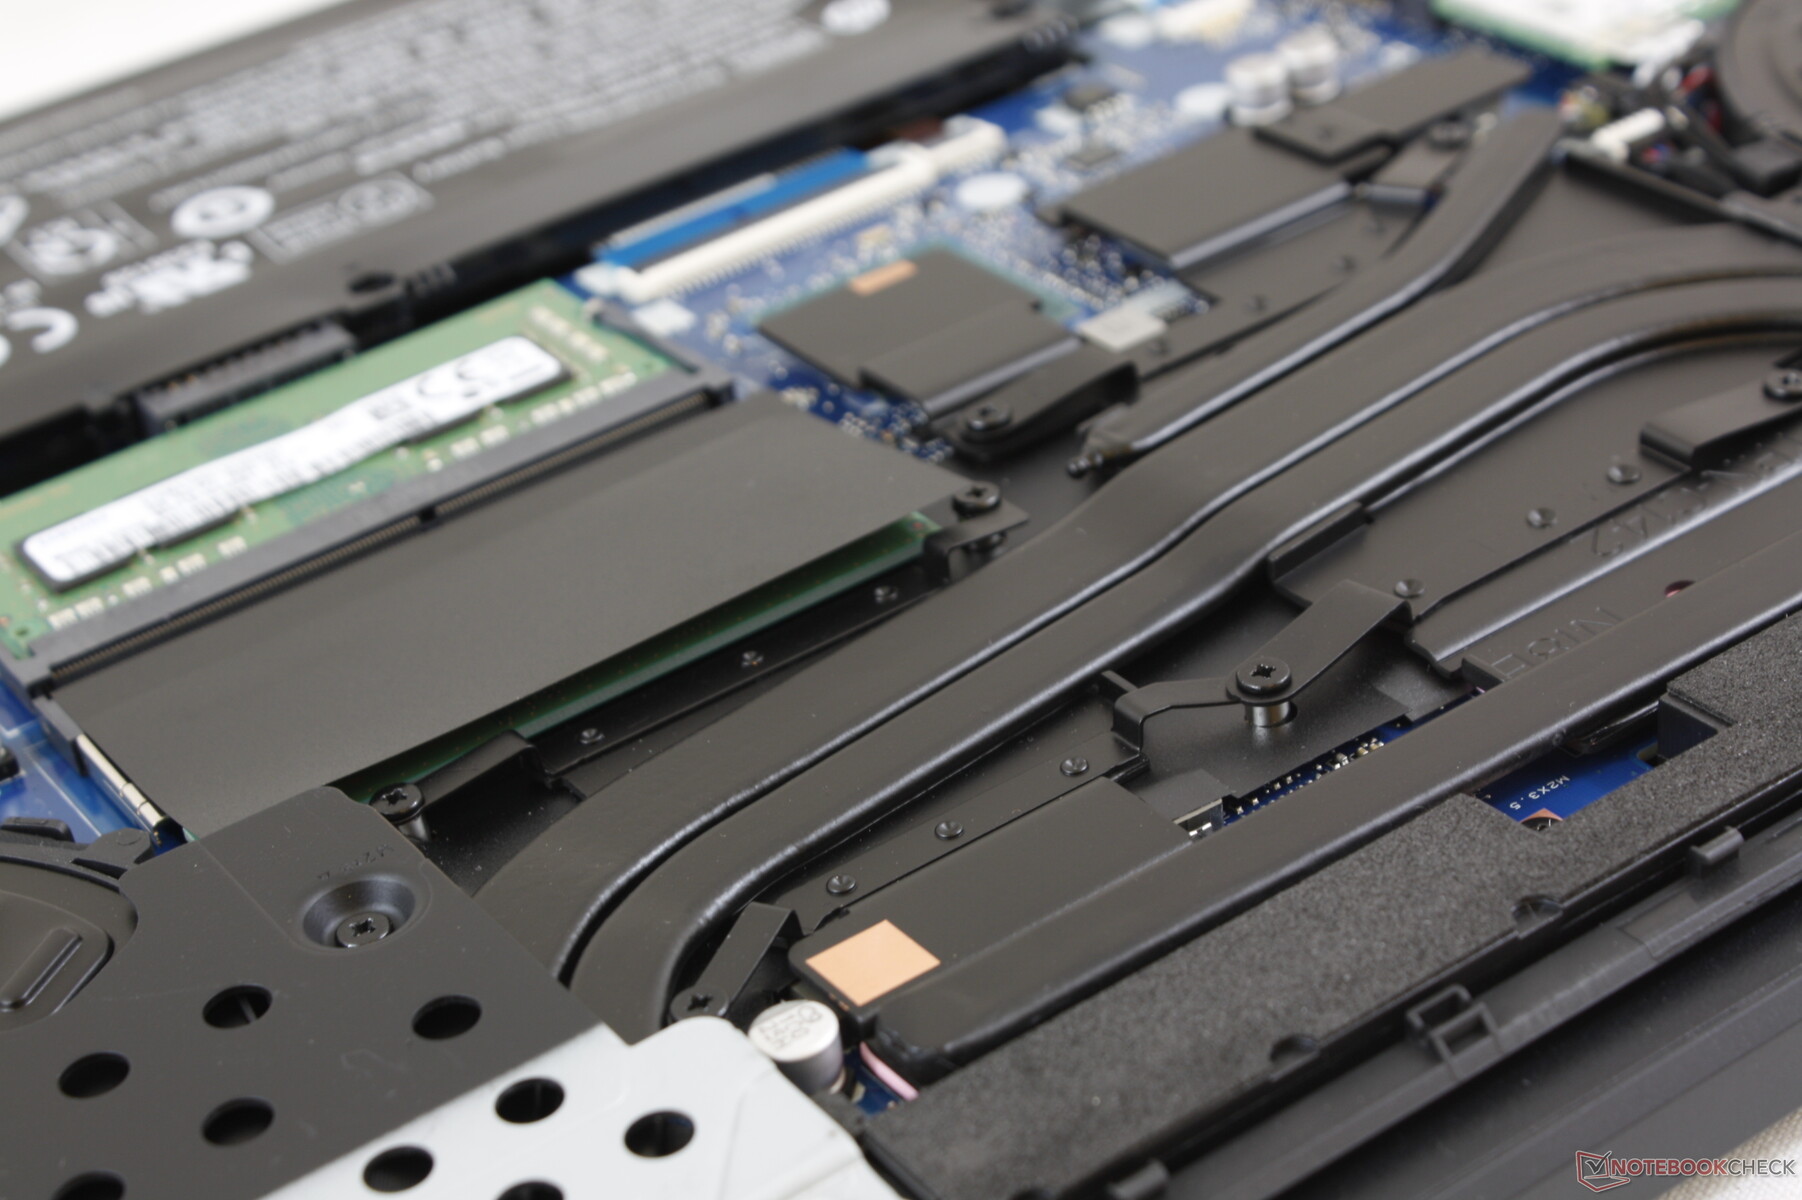
The bottom panel is secured by only 8 Phillips screws. Serviceability is still more difficult than expected because the edges and corners of the panel are latched very tightly to the chassis. Both patience and a sharp edge are required to service this system. Once inside, users have direct access to two SODIMM slots, two storage bays, and the WLAN module.
Accessories and Warranty
There are no included extras in the box other than the usual warranty card and Quick Start guide. Warranty is the standard one-year limited protection with plenty of extension options if purchased directly from HP.com.
Input Devices
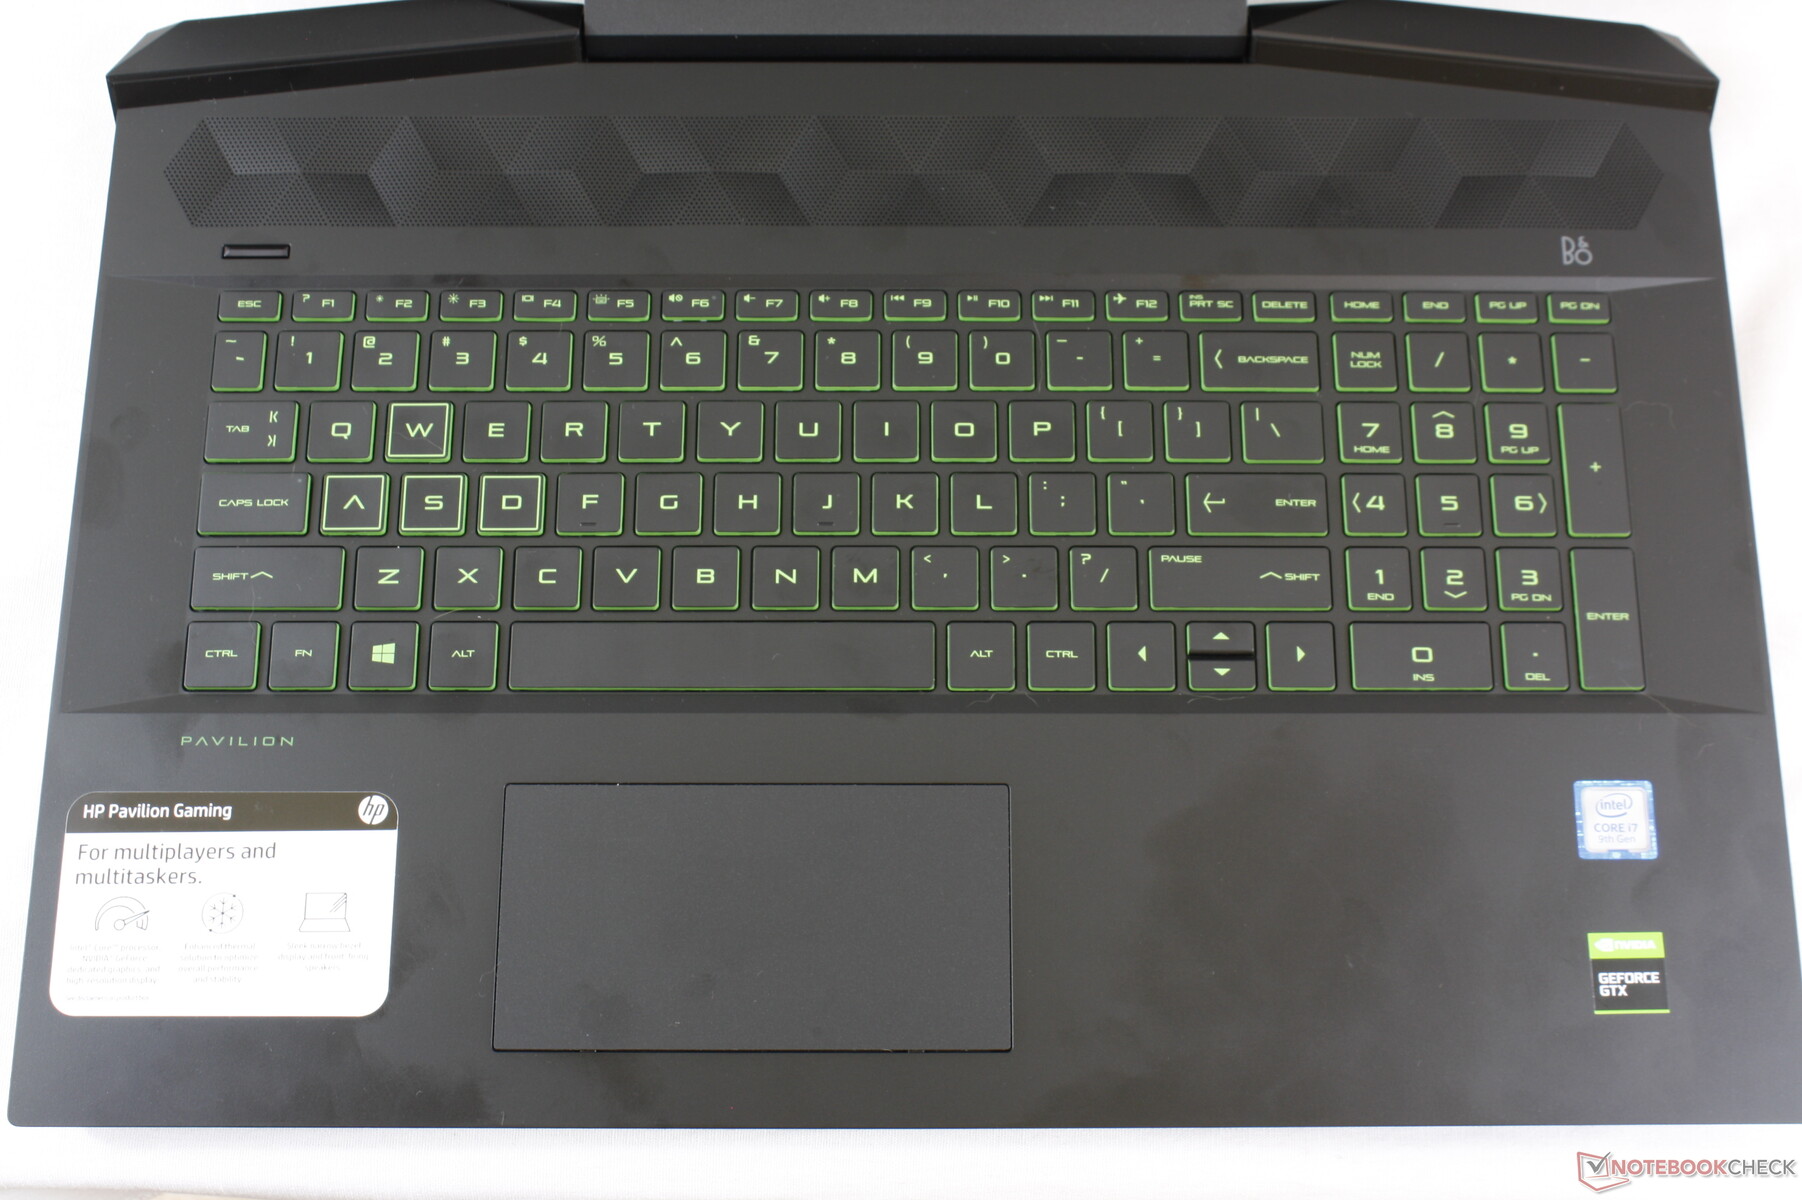
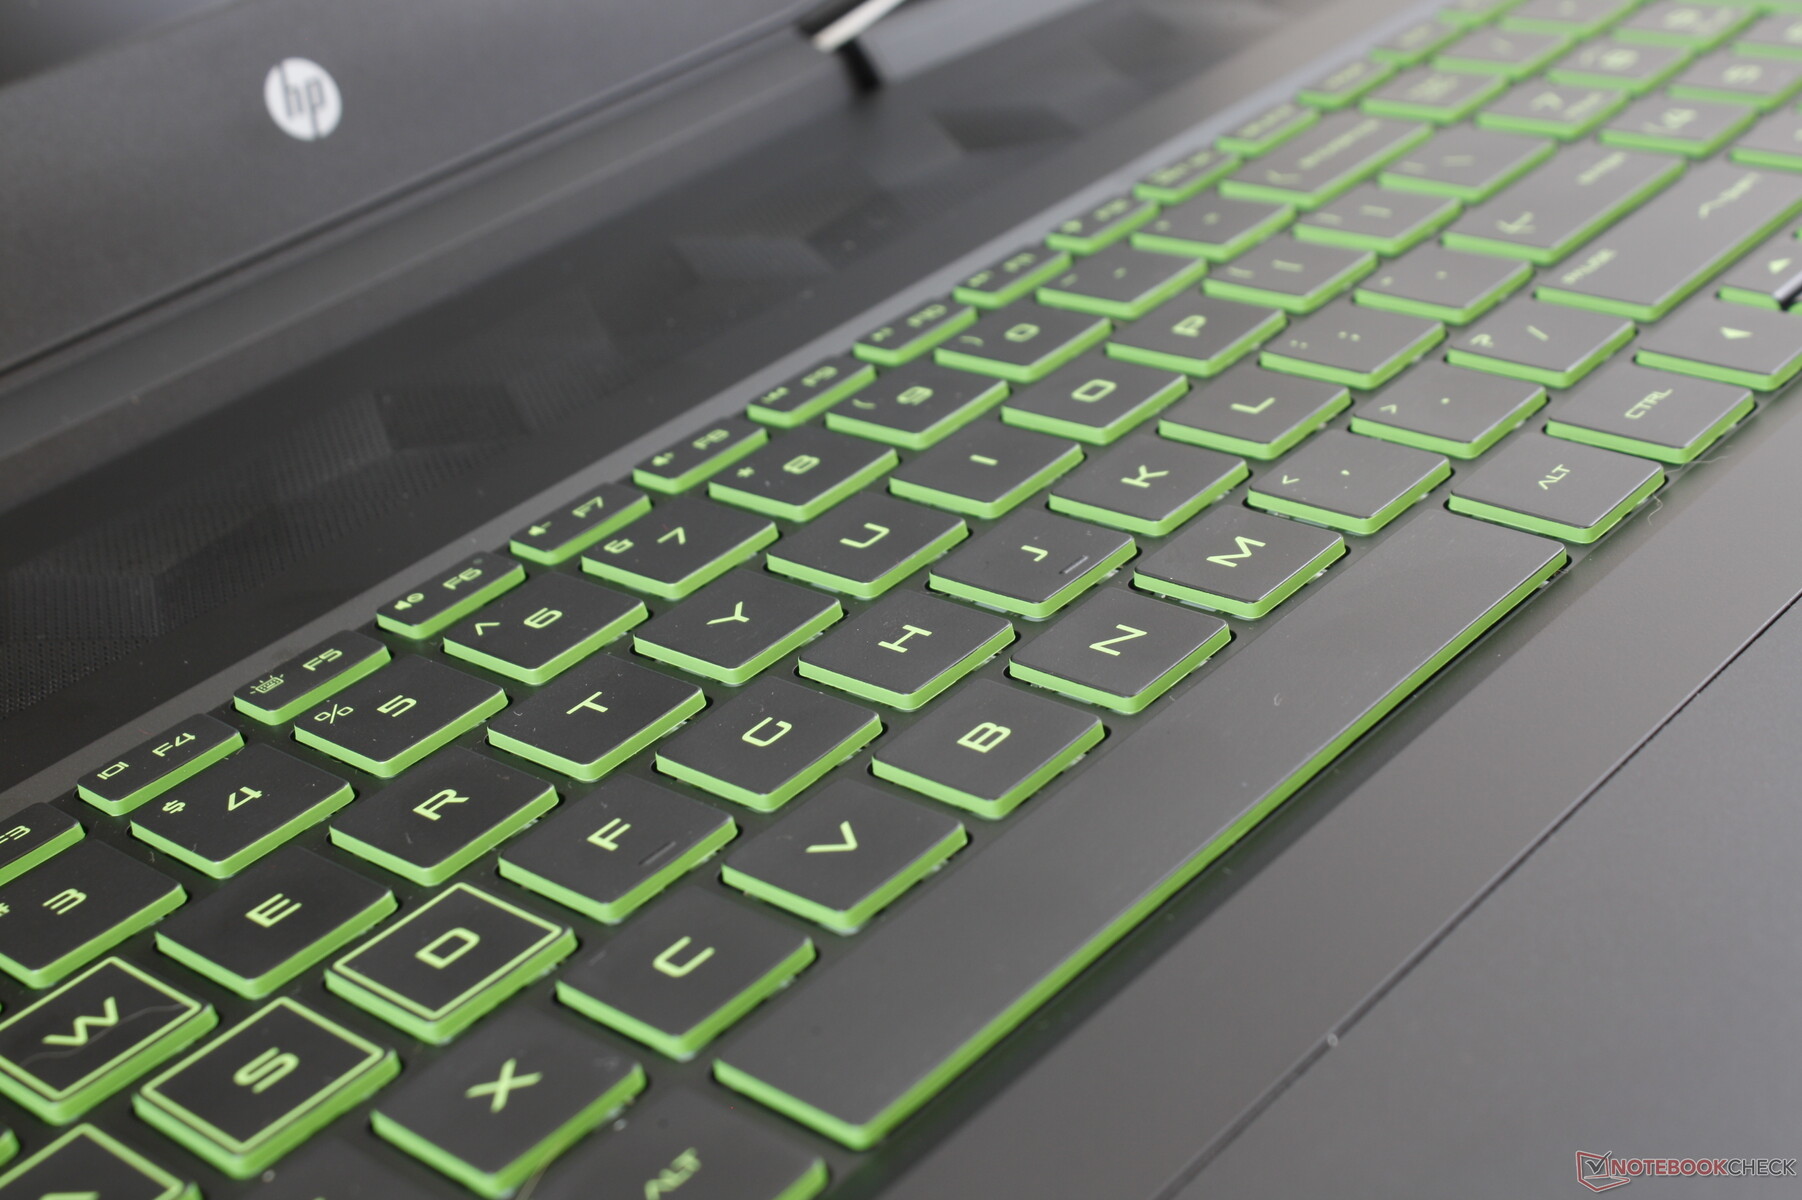
Keyboard
Higher-end HP laptops like the Spectre or EliteBook have some of the better keyboards considering their ultra-thin form factors. To our surprise, the Pavilion keyboard comes close as we find its keys to be firmer and "clickier" than the SteelSeries keyboards on most MSI laptops. On the flip side, key clatter is a bit louder and more noticeable as well.
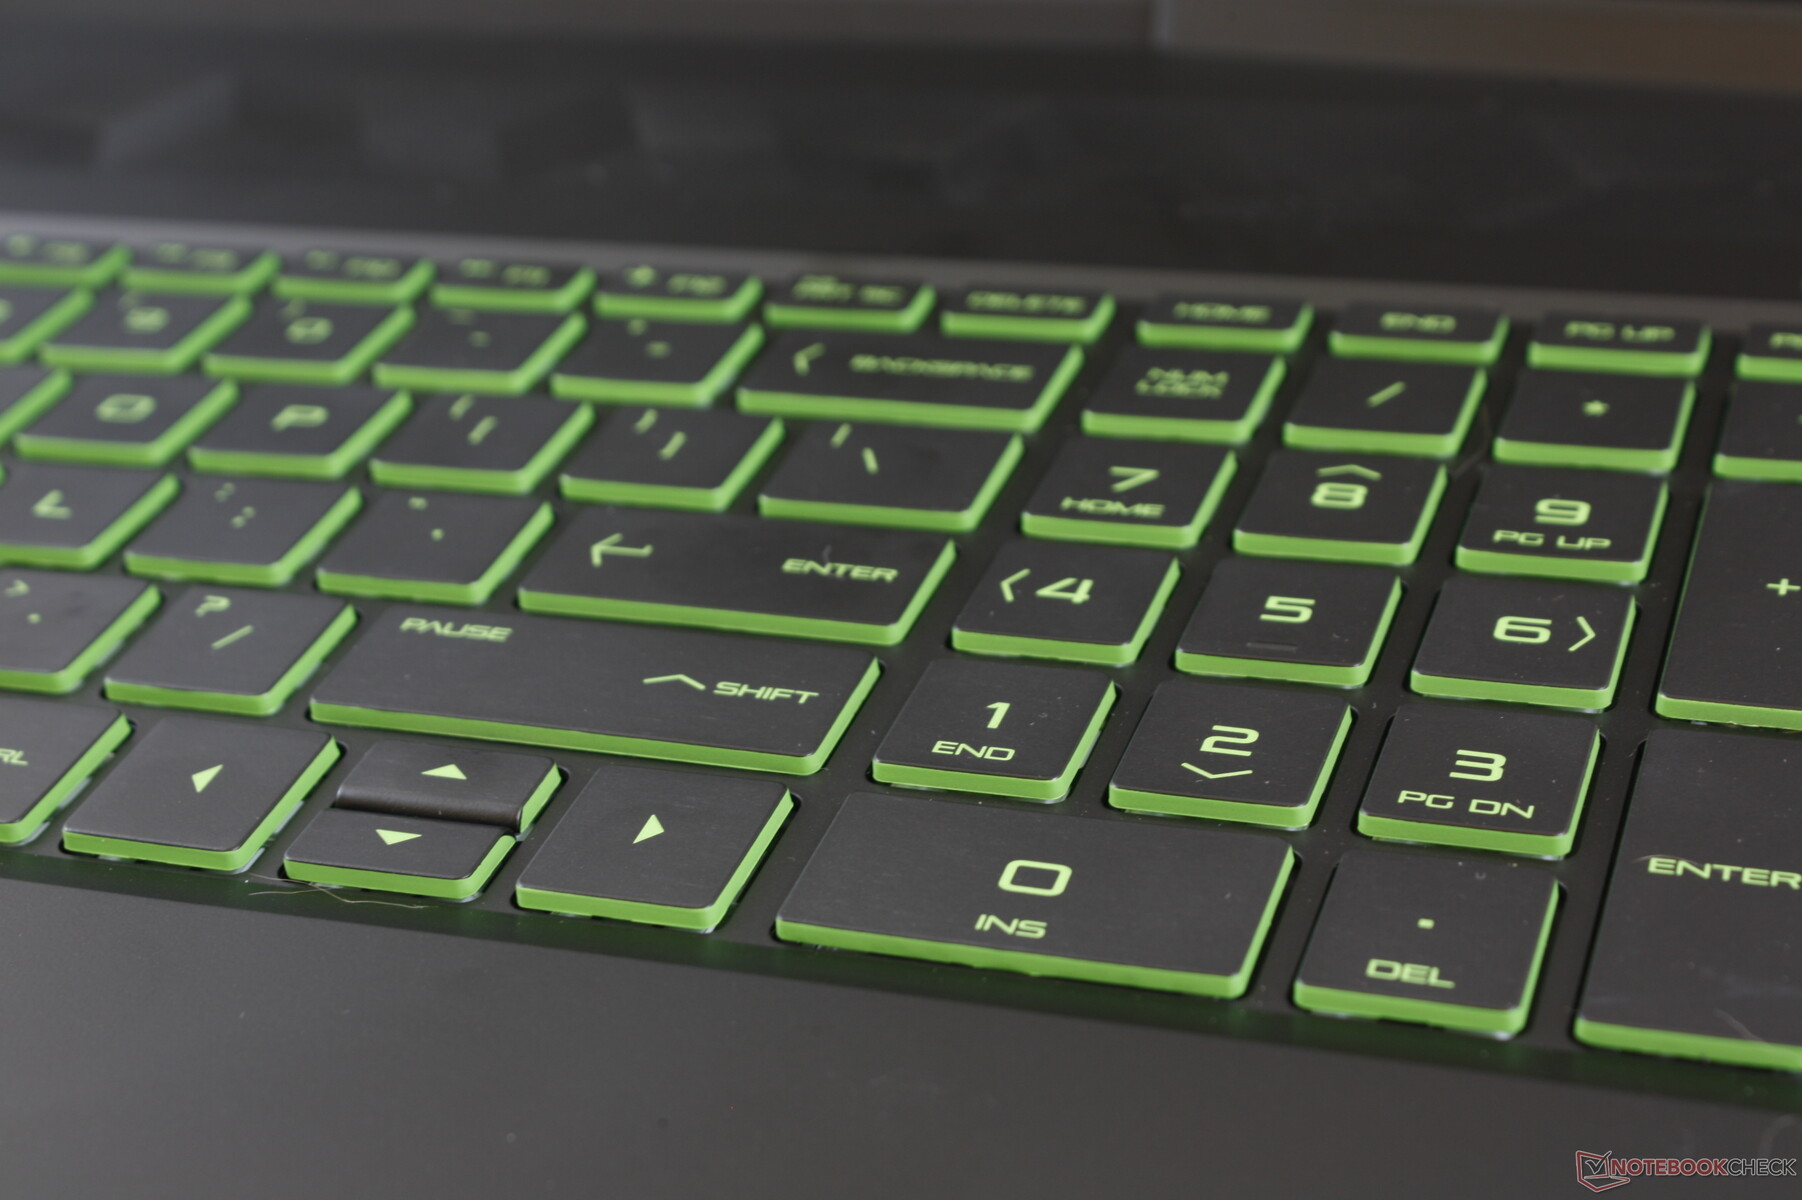
Users who rely on the NumPad and Arrow keys will discover that these keys are cramped and smaller than the main QWERTY keys. The Enter key could have also been firmer as it feels slightly spongy to press. Like most laptop keyboards, it can take a couple of days before becoming fully accustomed to the layout and feel.
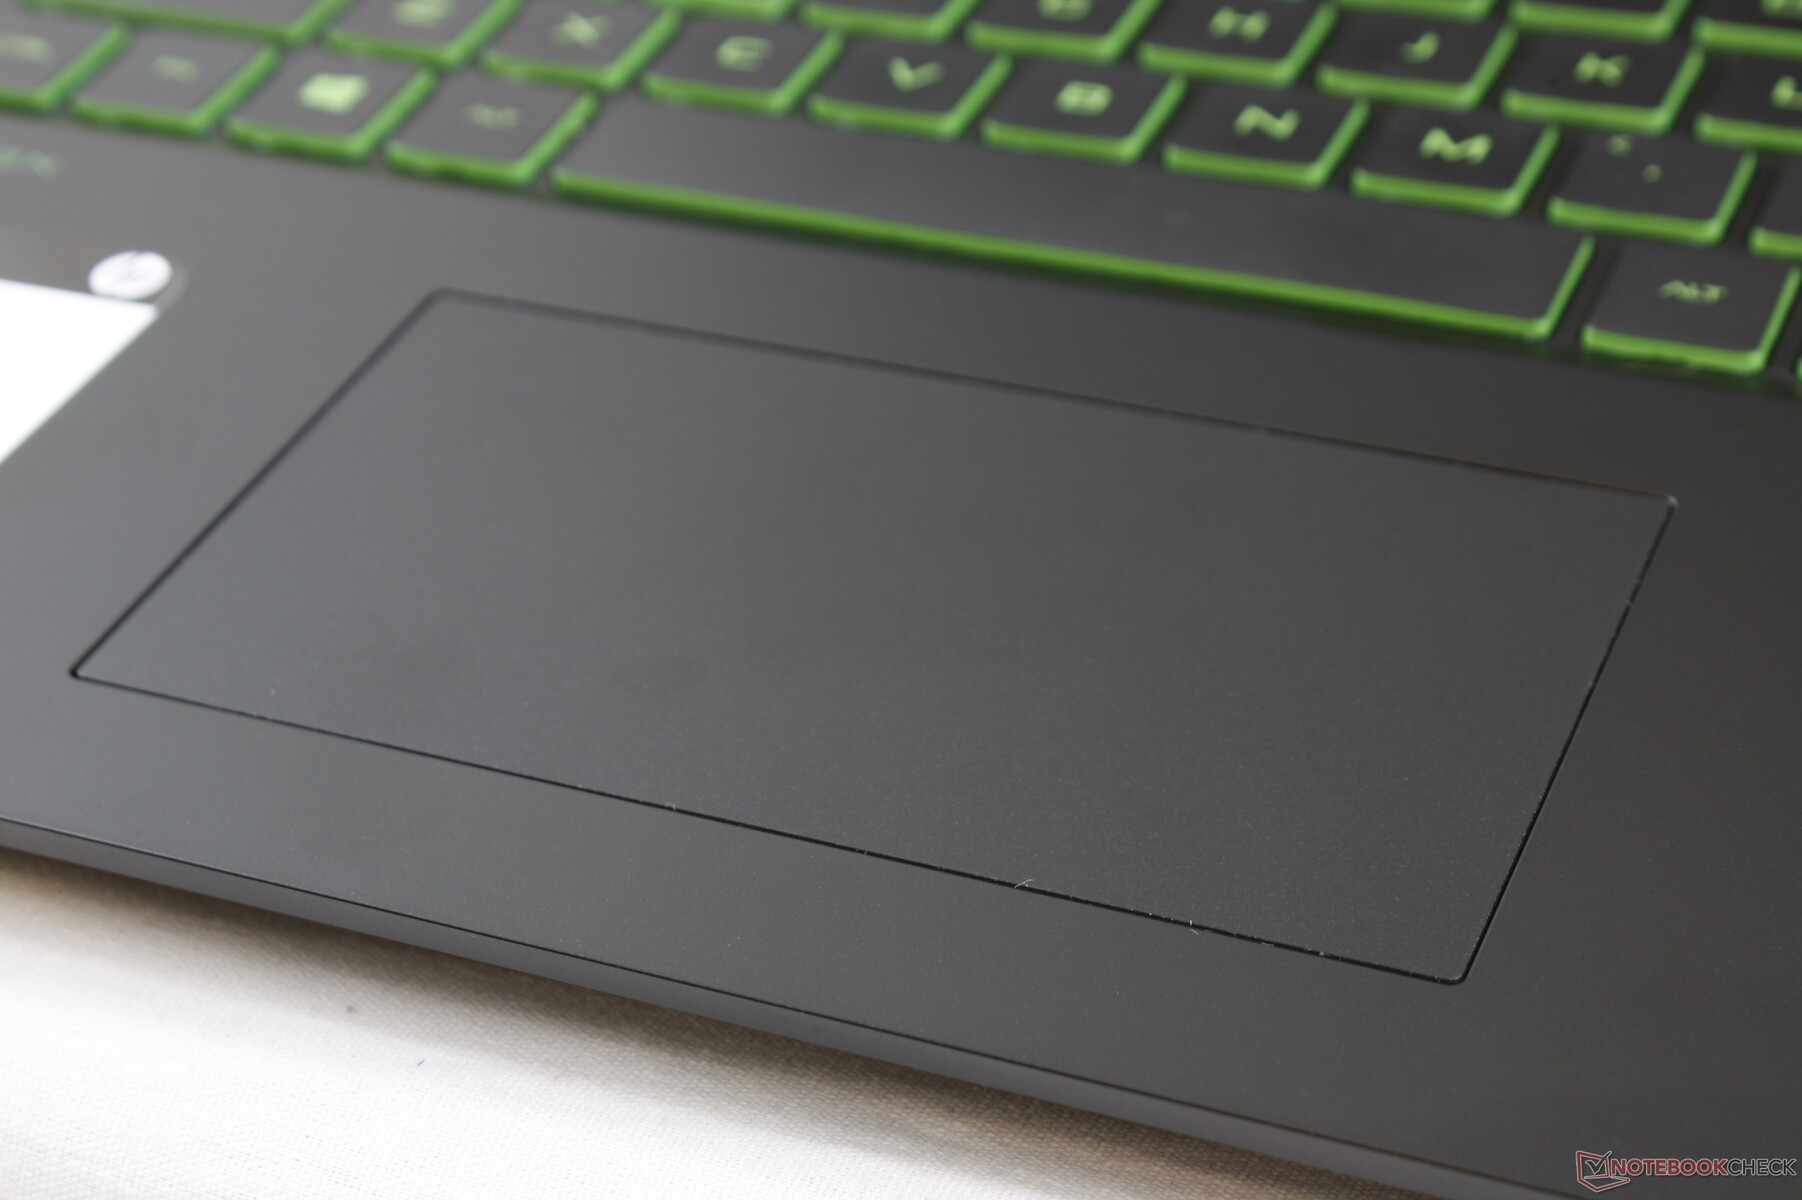
Touchpad
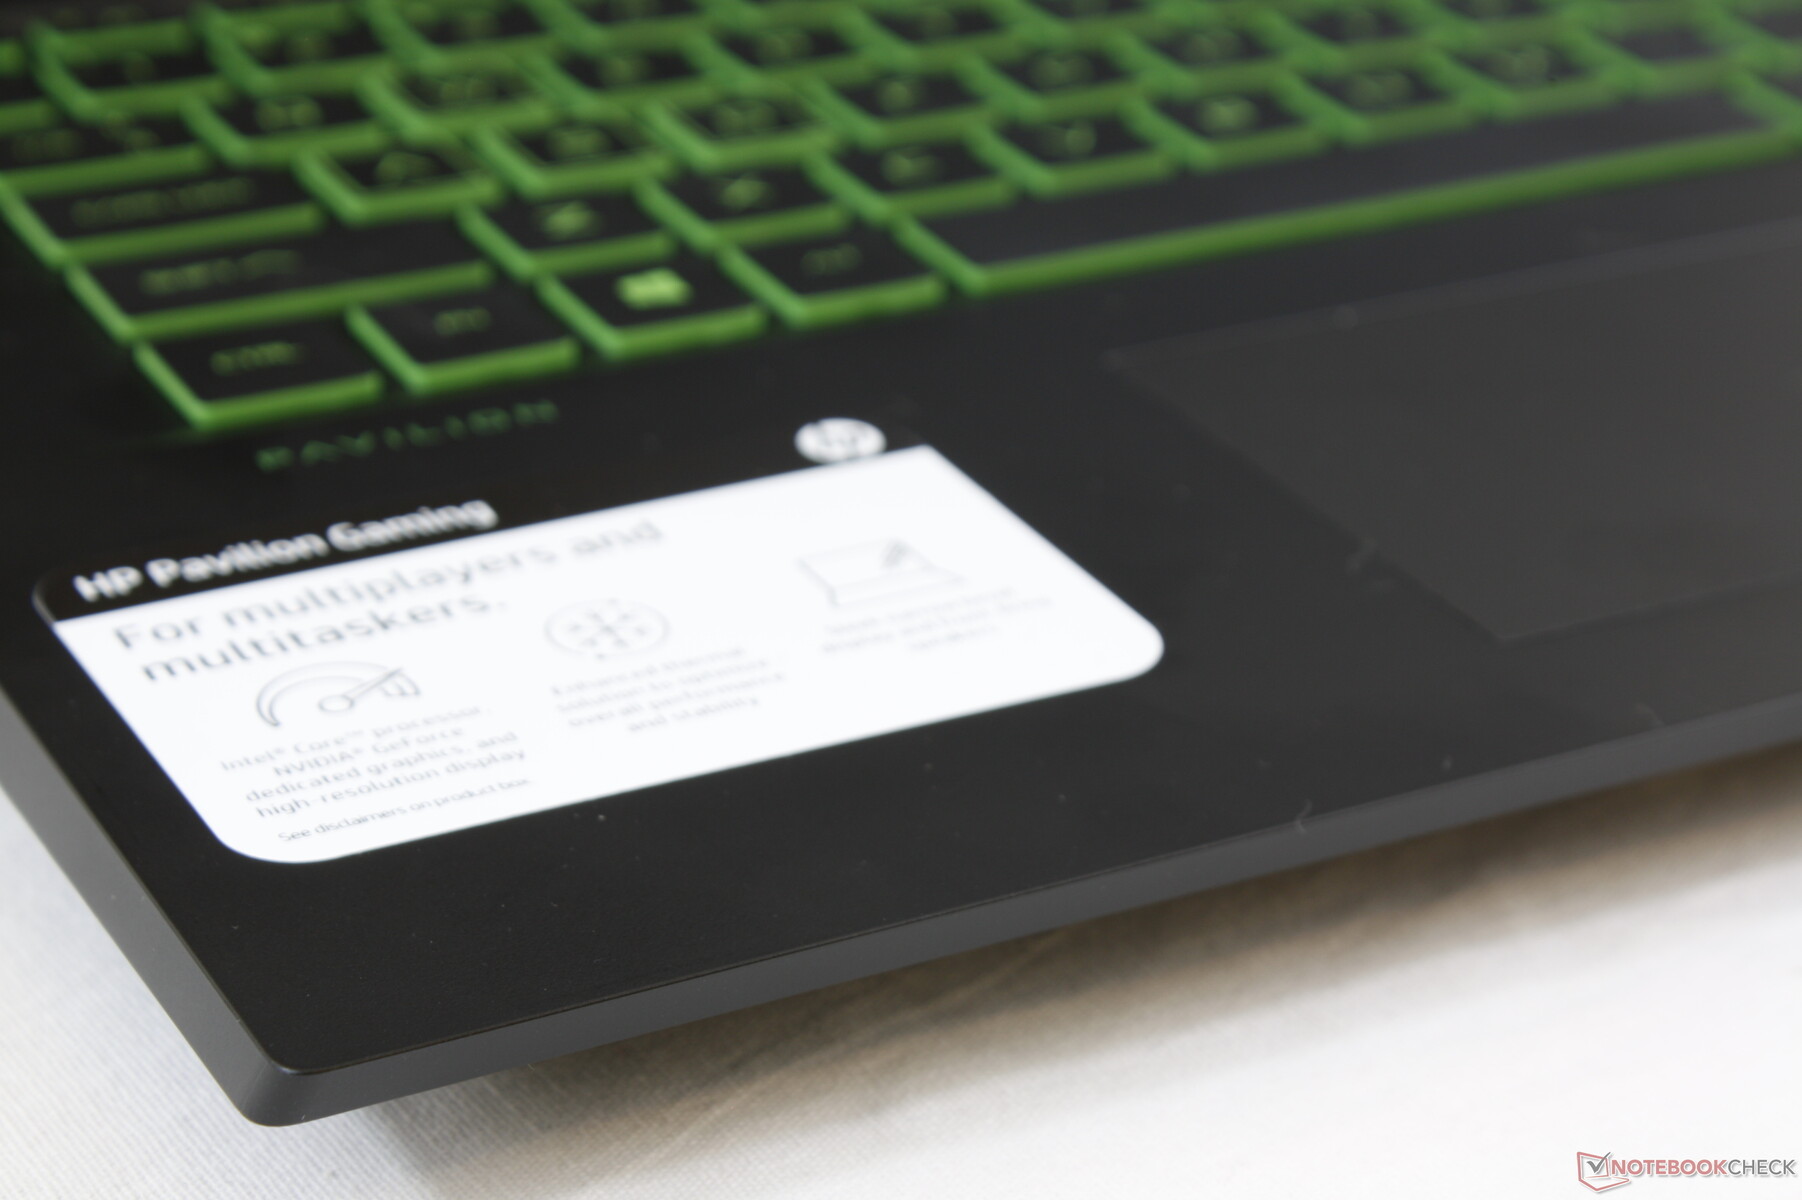
The clickpad (11.5 x 6 cm) is small when considering the large 17.3-inch form factor. Even the clickpads on the 15.6-inch Spectre x360 15 (12 x 6 cm) and Dell XPS 15 (10.5 x 8.5 cm) are larger in surface area. The extra-wide aspect ratio on the HP clickpad feels especially cramped when scrolling vertically. Fortunately, gliding at moderate-to-fast speeds on the surface is super smooth while slower speeds will stick slightly for better accuracy as one would expect.
The integrated mouse keys have a moderately loud audible click when pressed with shallow travel, slightly spongy feedback, and a hollow feel. We do believe that HP could have included dedicated mouse keys or at least a taller clickpad since there is so much unused space above and below the edges of the existing clickpad.
Display
Our base 1080p IPS panel is a no-frills offering as it doesn't have the fast response time or refresh rate features of the latest 3 ms or 144/240 Hz panels commonly found on higher-end laptops. Thus, there is more ghosting and movement doesn't feel as smooth on the Pavilion. This is supposed to be a budget gaming laptop, after all.
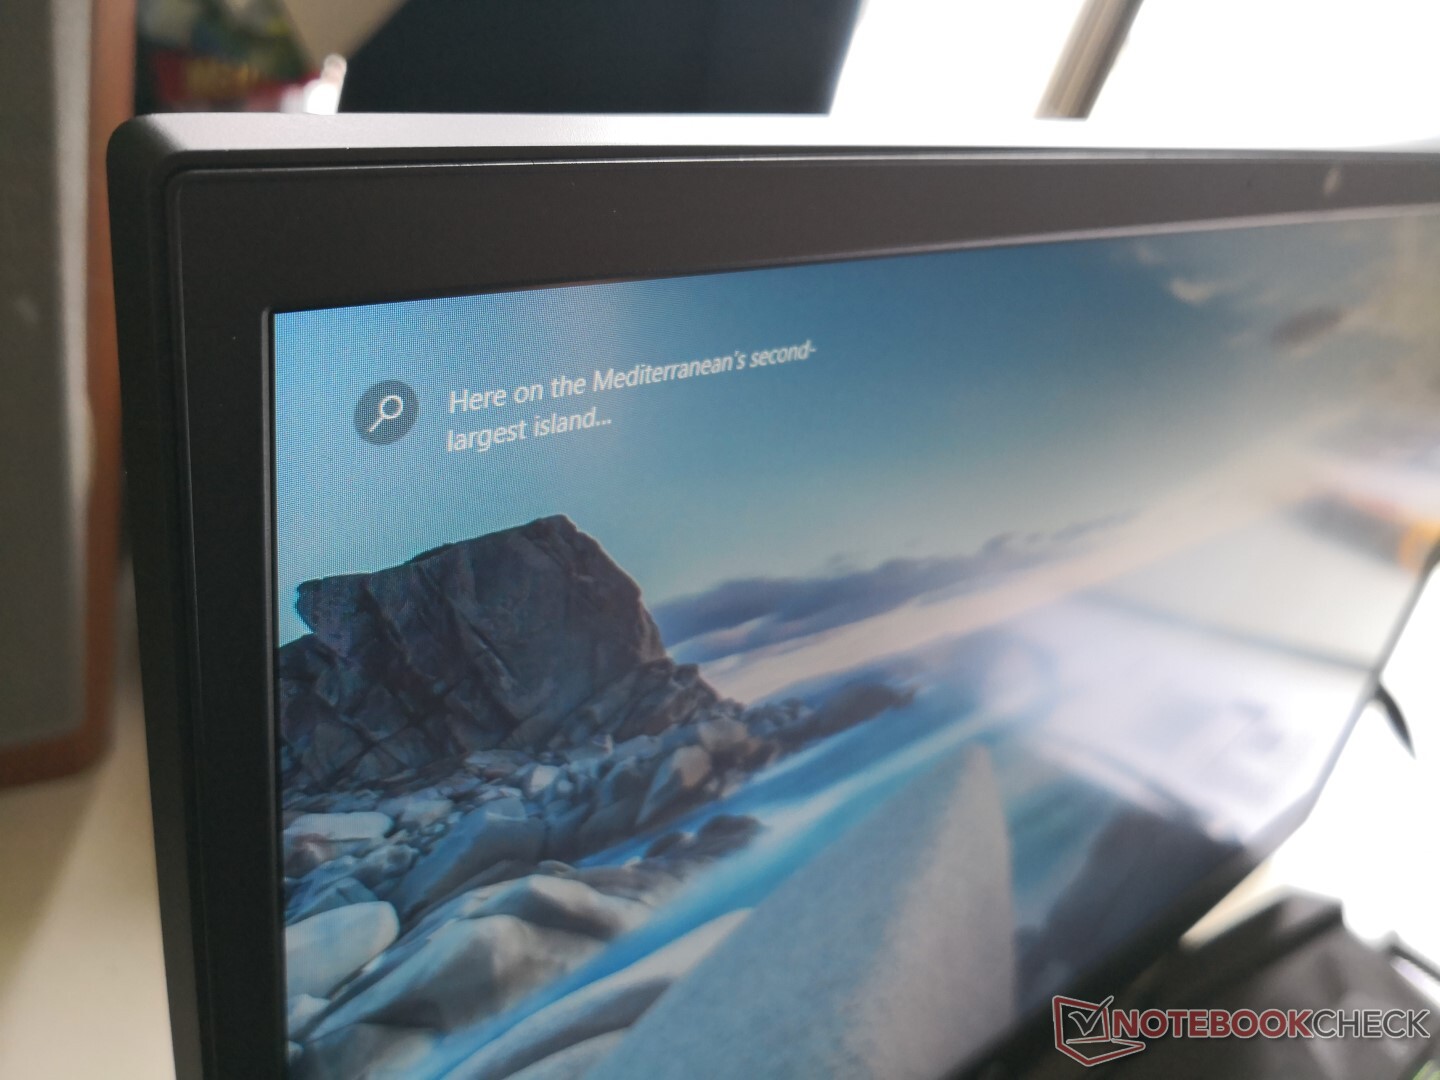
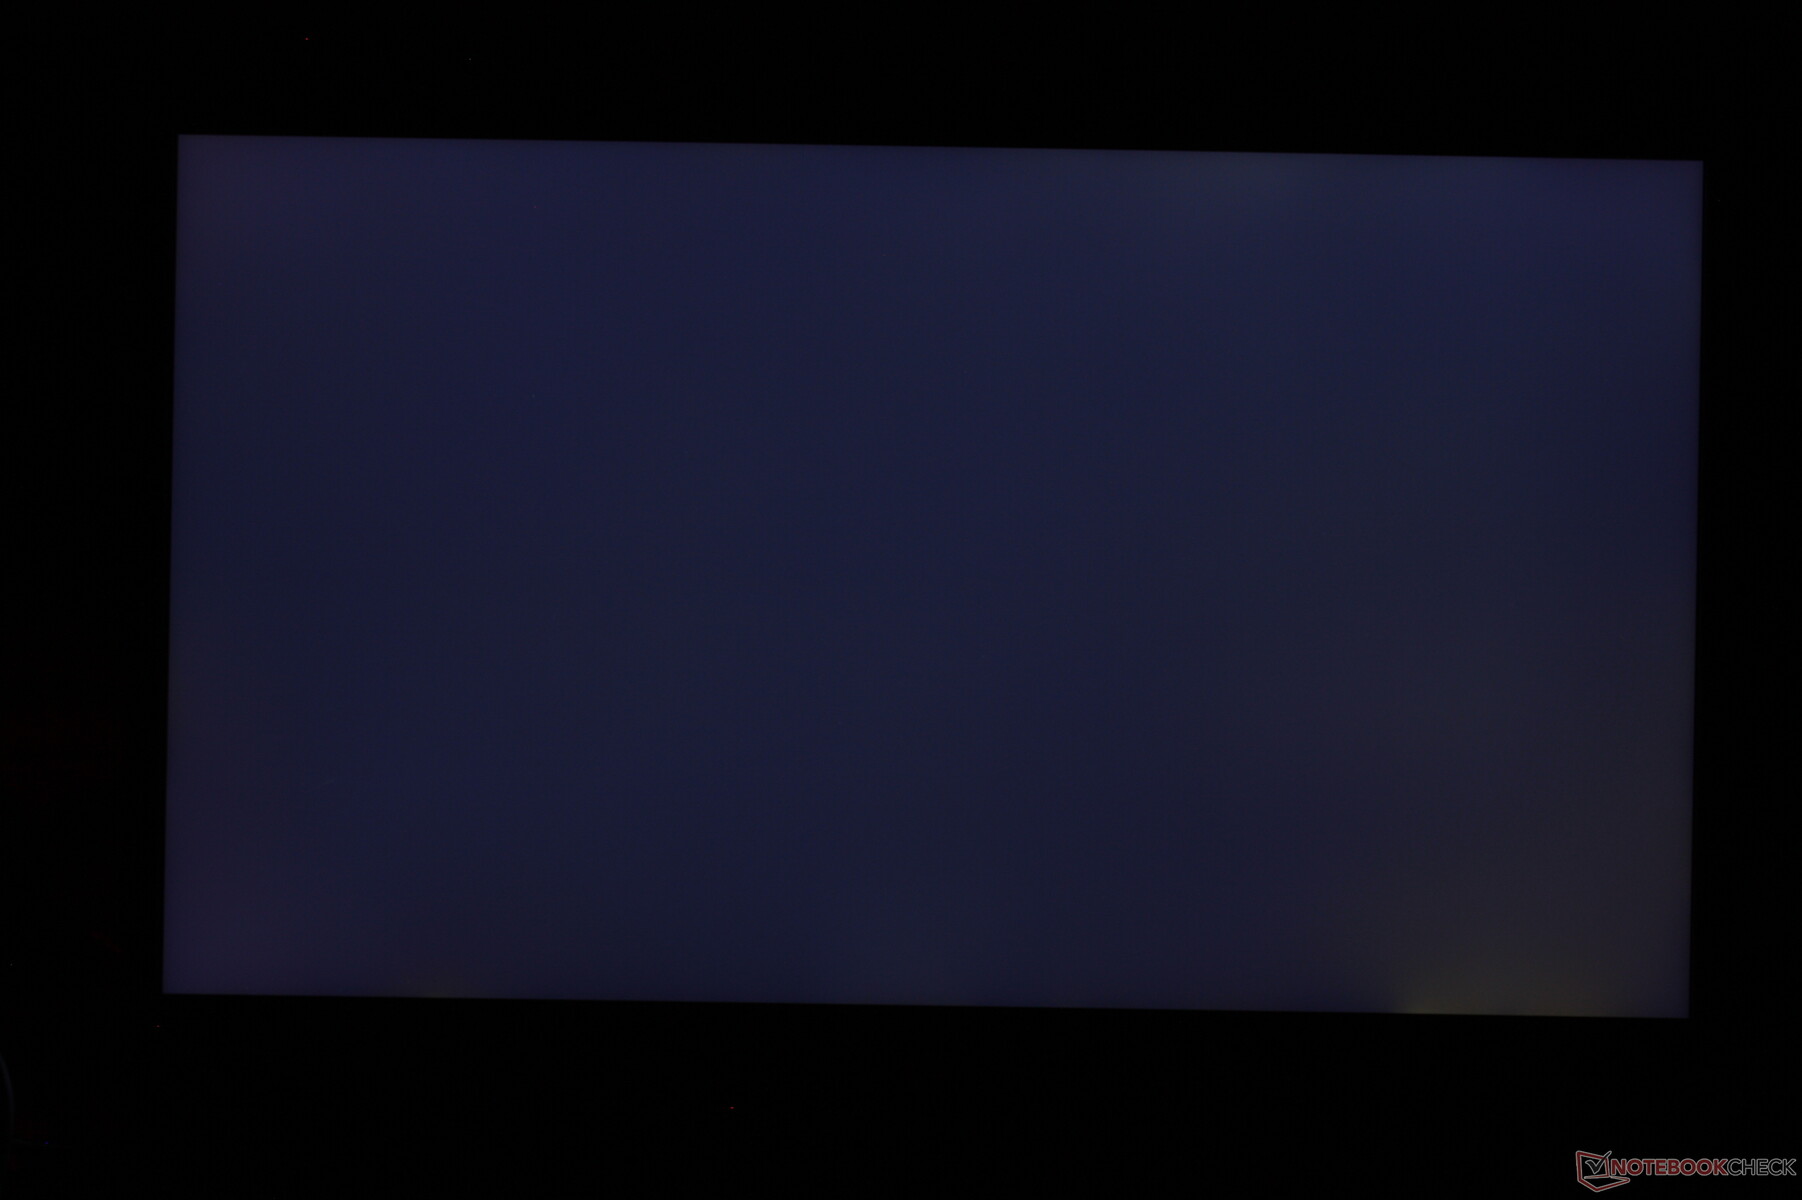
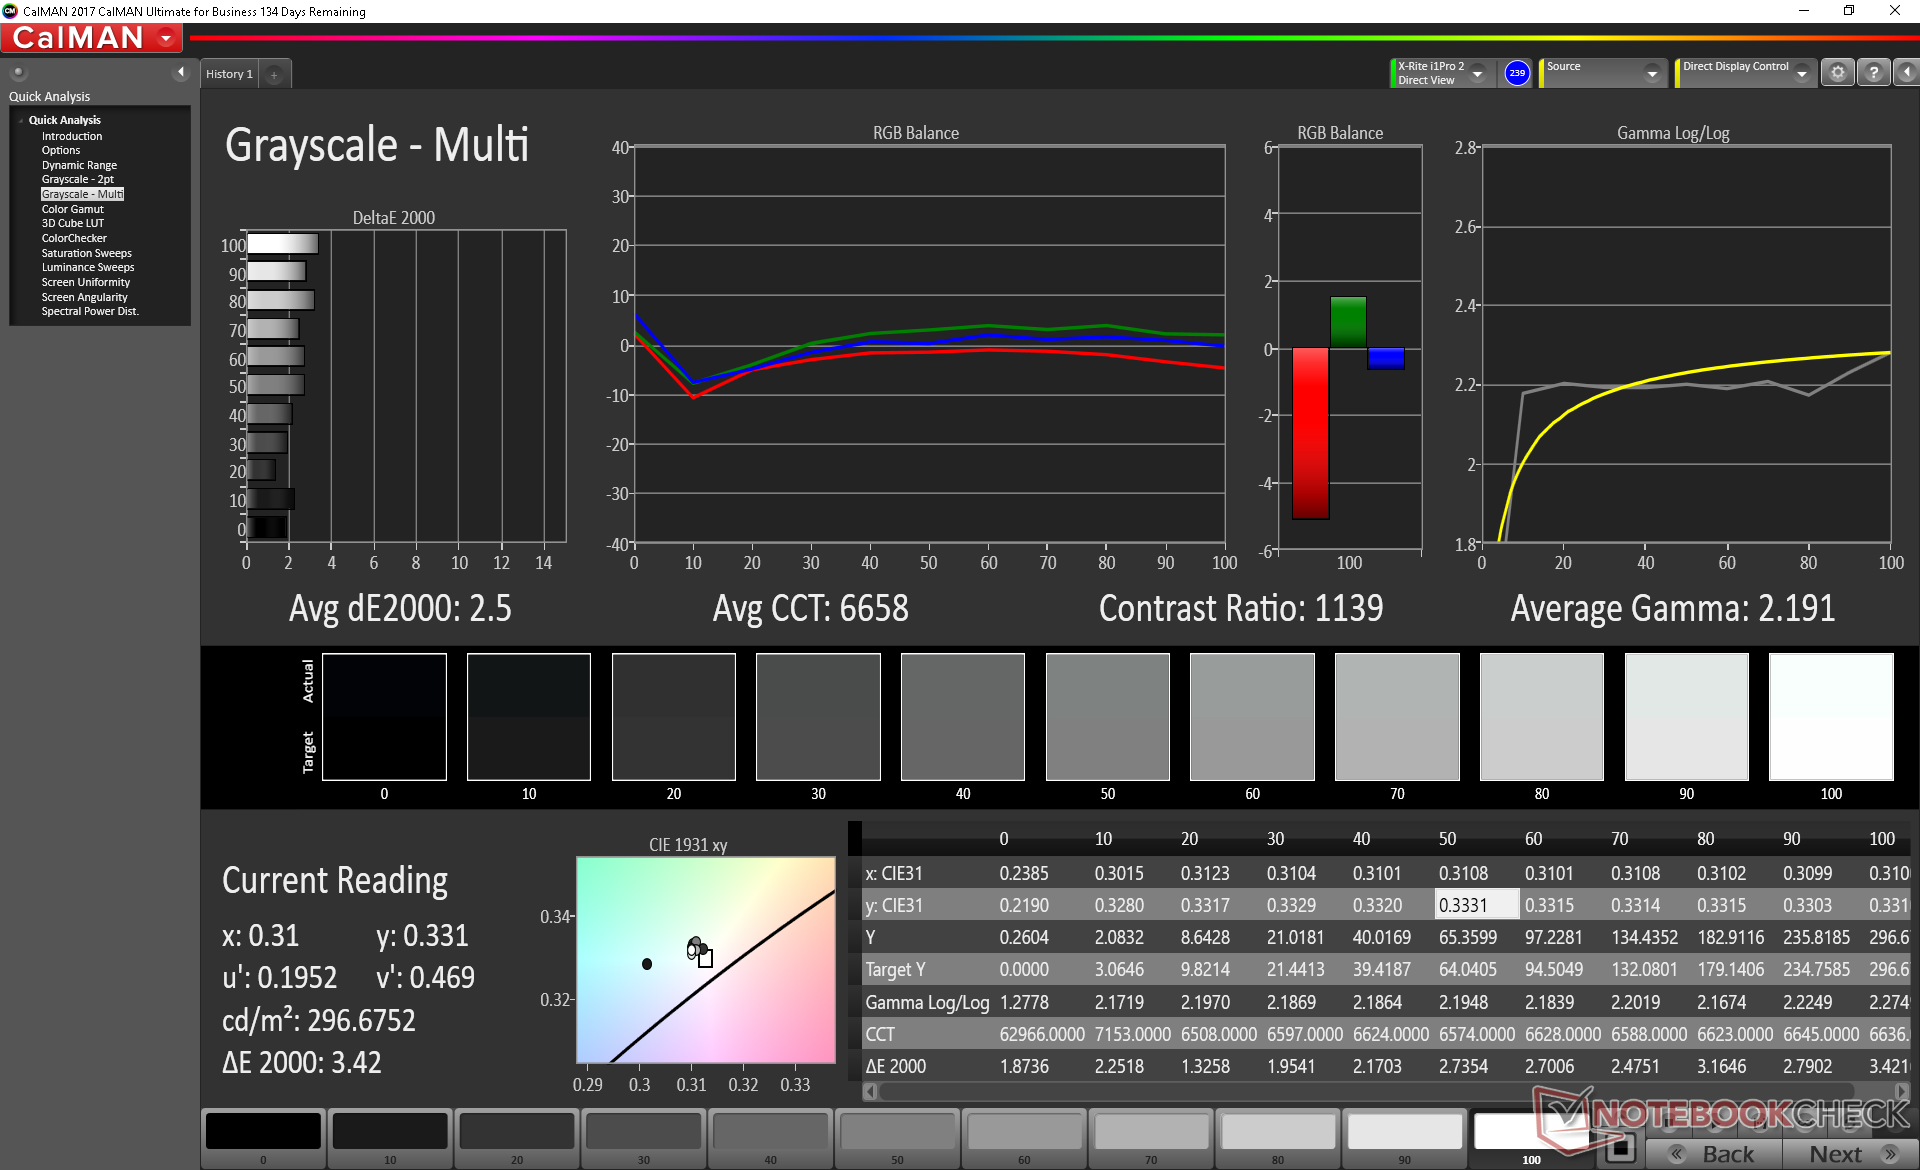
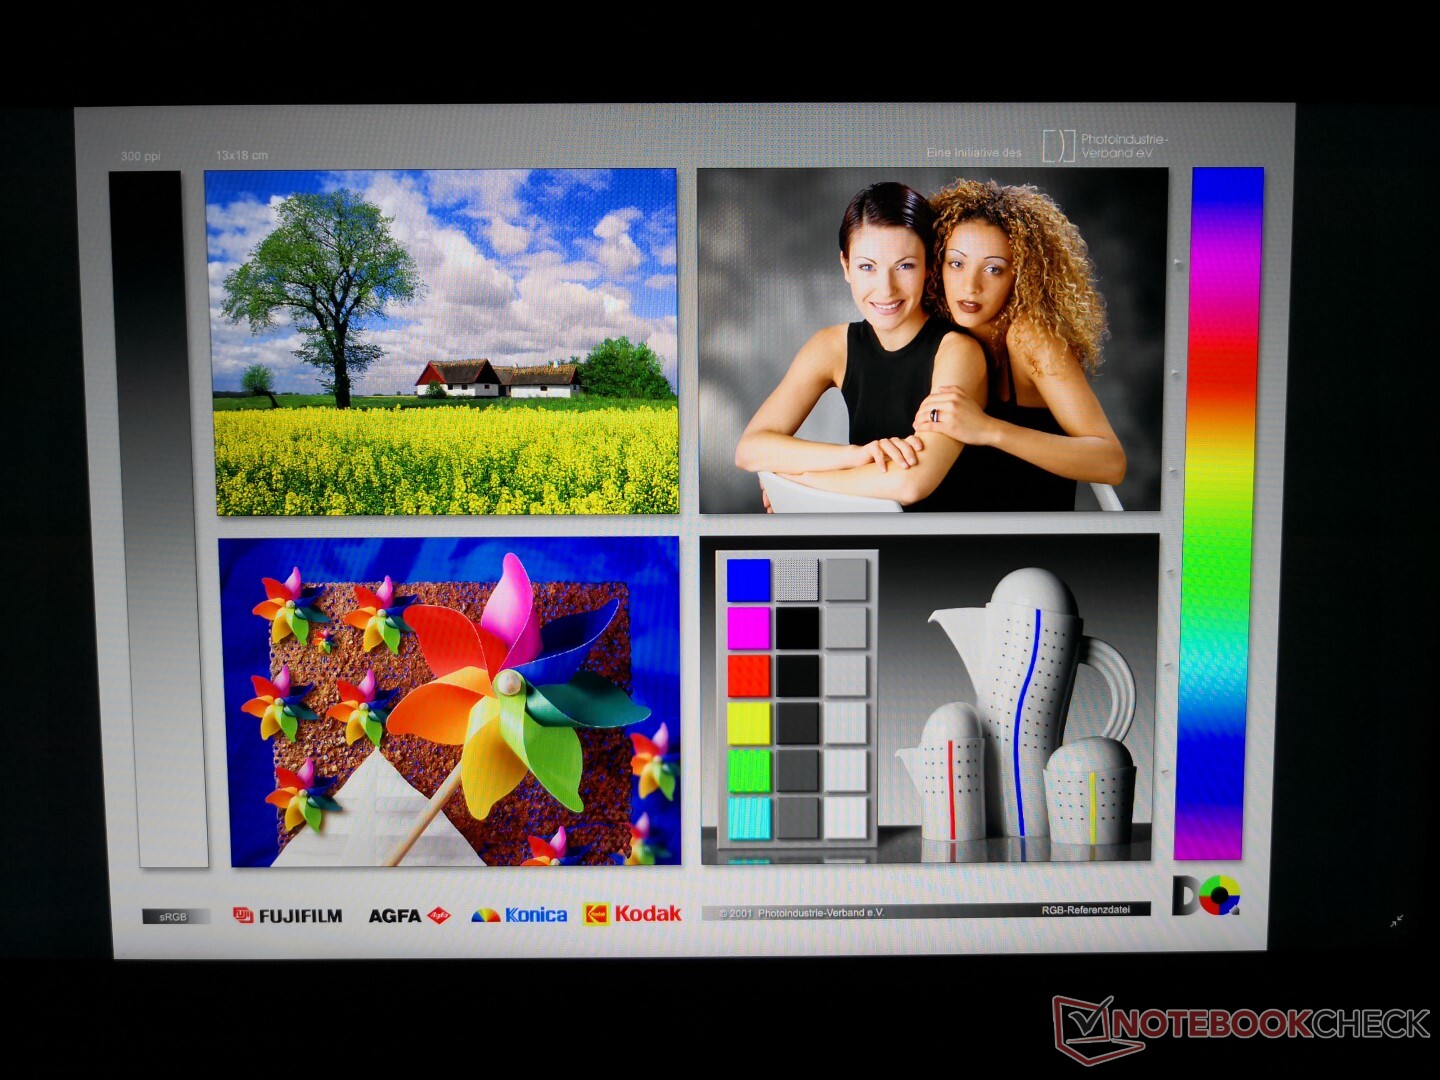
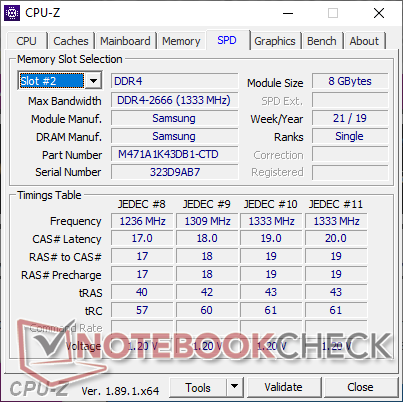
There are still a couple of excellent display qualities despite the above. Color coverage, contrast ratio, and color accuracy are as good as many of the aforementioned 3 ms or 144/240 Hz panels for a high quality appearance. Graininess and uneven backlight bleeding are both minimal for a great first impression. Interestingly, HWiNFO is unable to identify the exact panel name, but the BOE0825 controller definitely points to the NV173FHM-N4C as a potential candidate.

| |||||||||||||||||||||||||
Brightness Distribution: 86 %
Center on Battery: 299.6 cd/m²
Contrast: 908:1 (Black: 0.33 cd/m²)
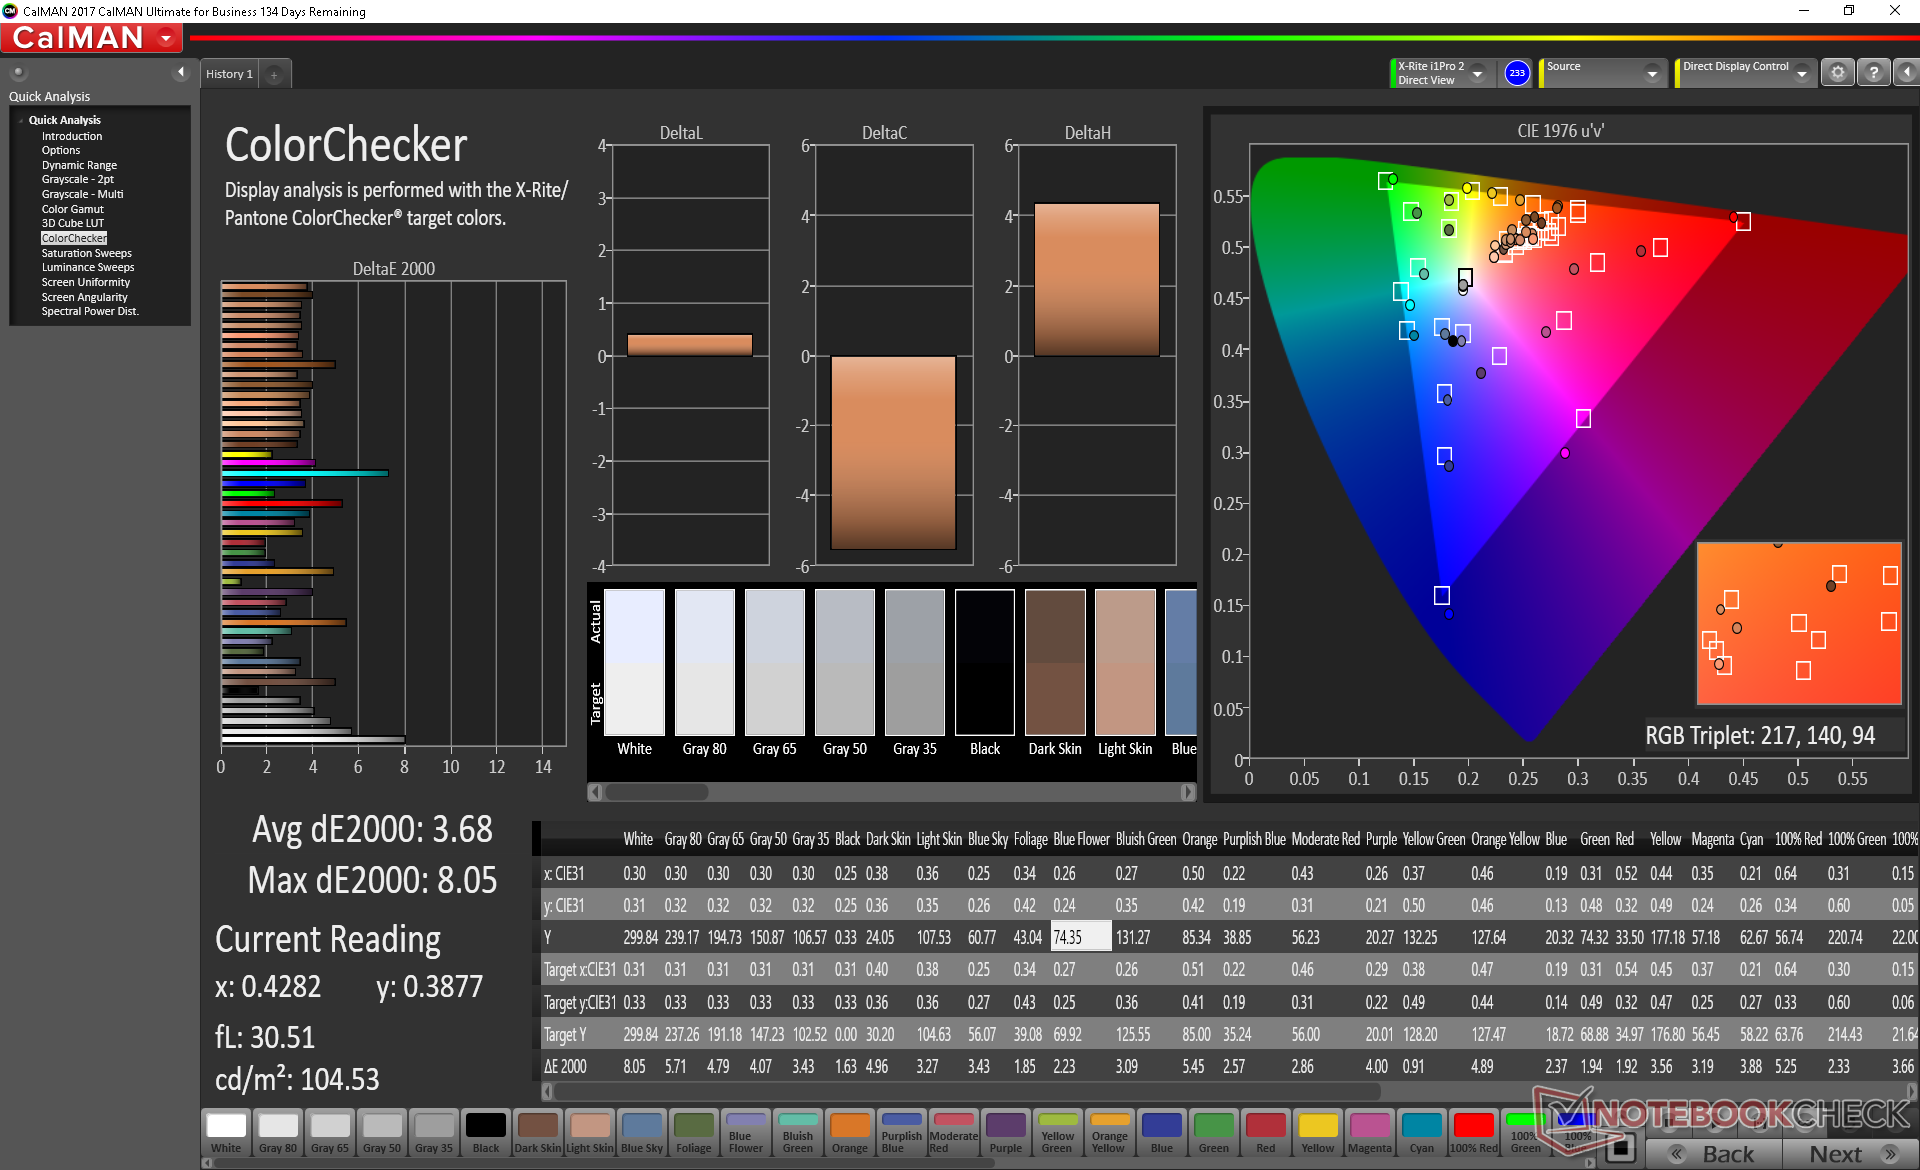
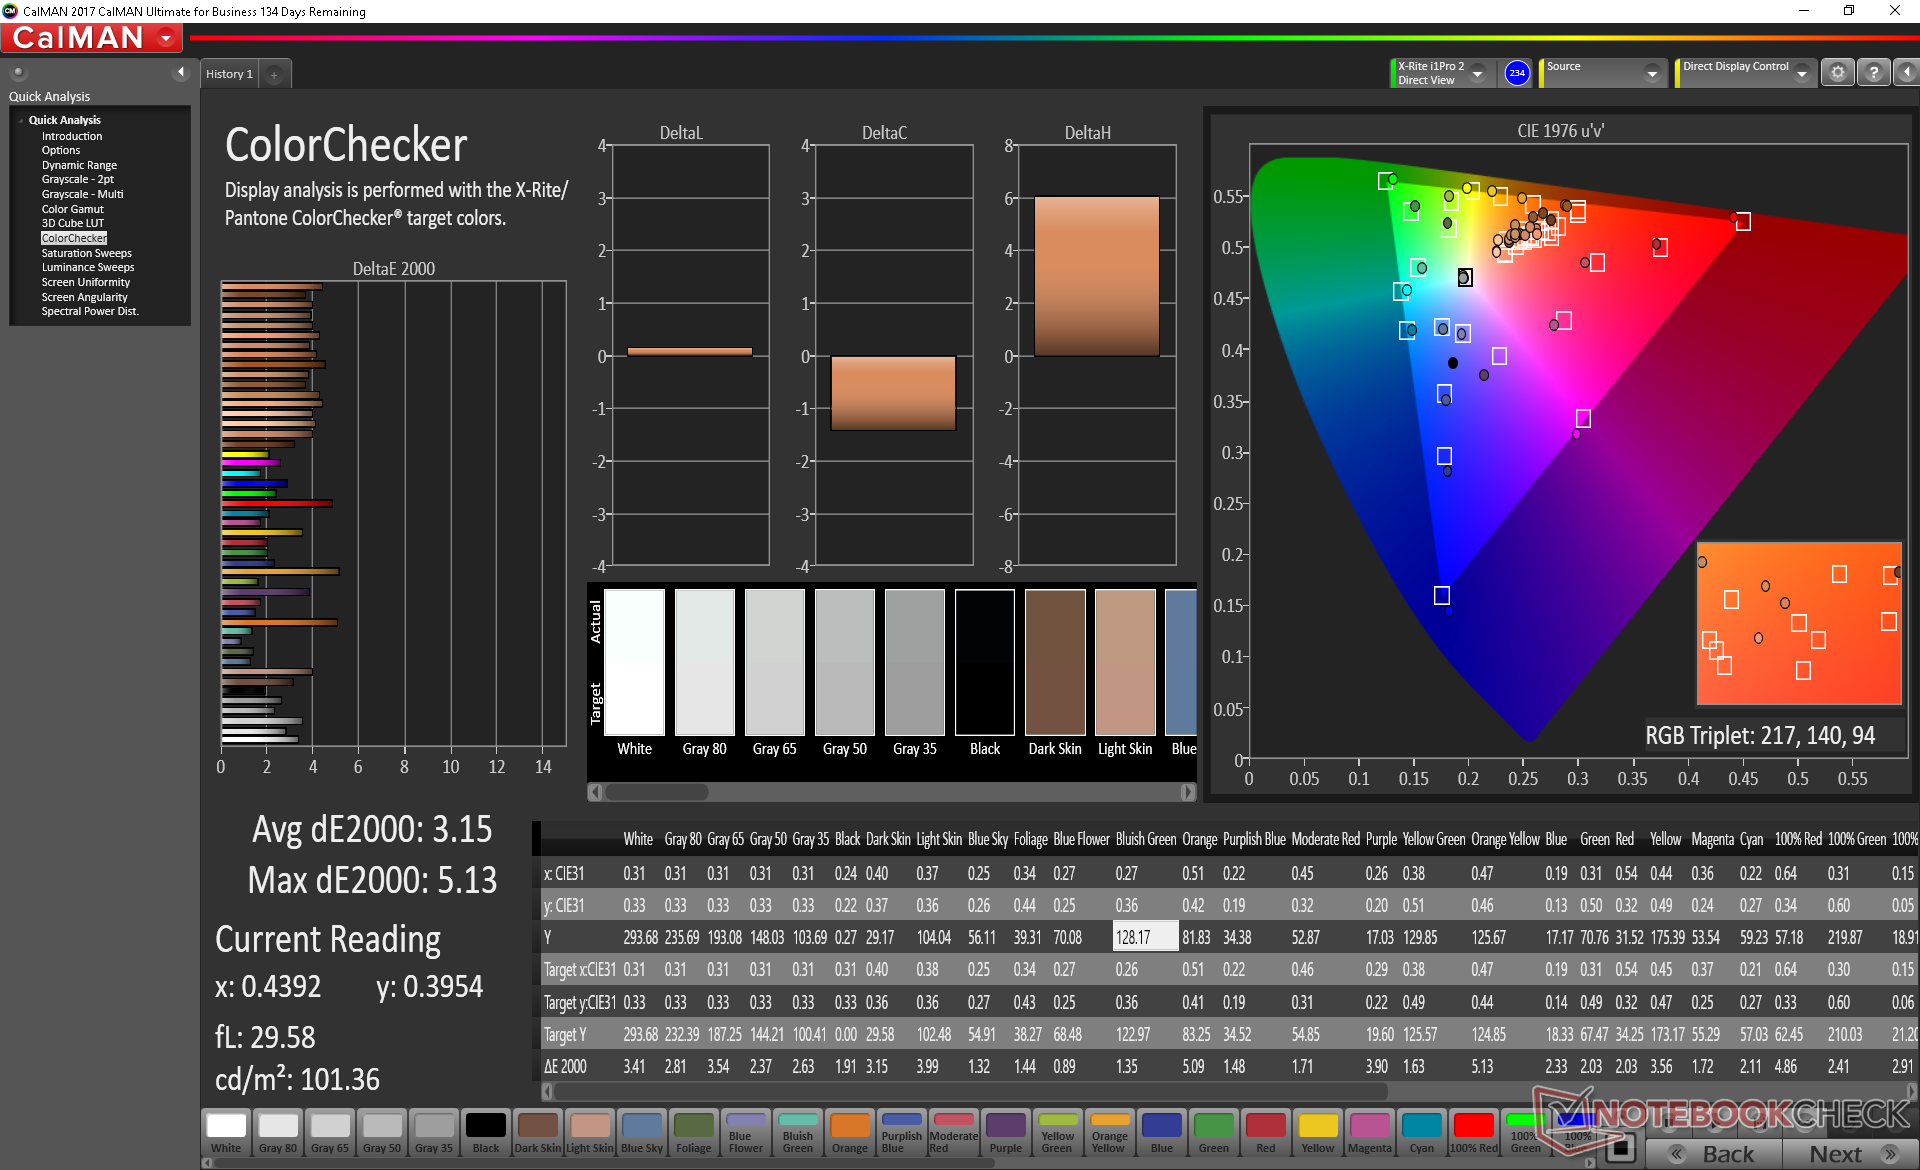
ΔE Color 3.68 | 0.5-29.43 Ø5, calibrated: 3.15
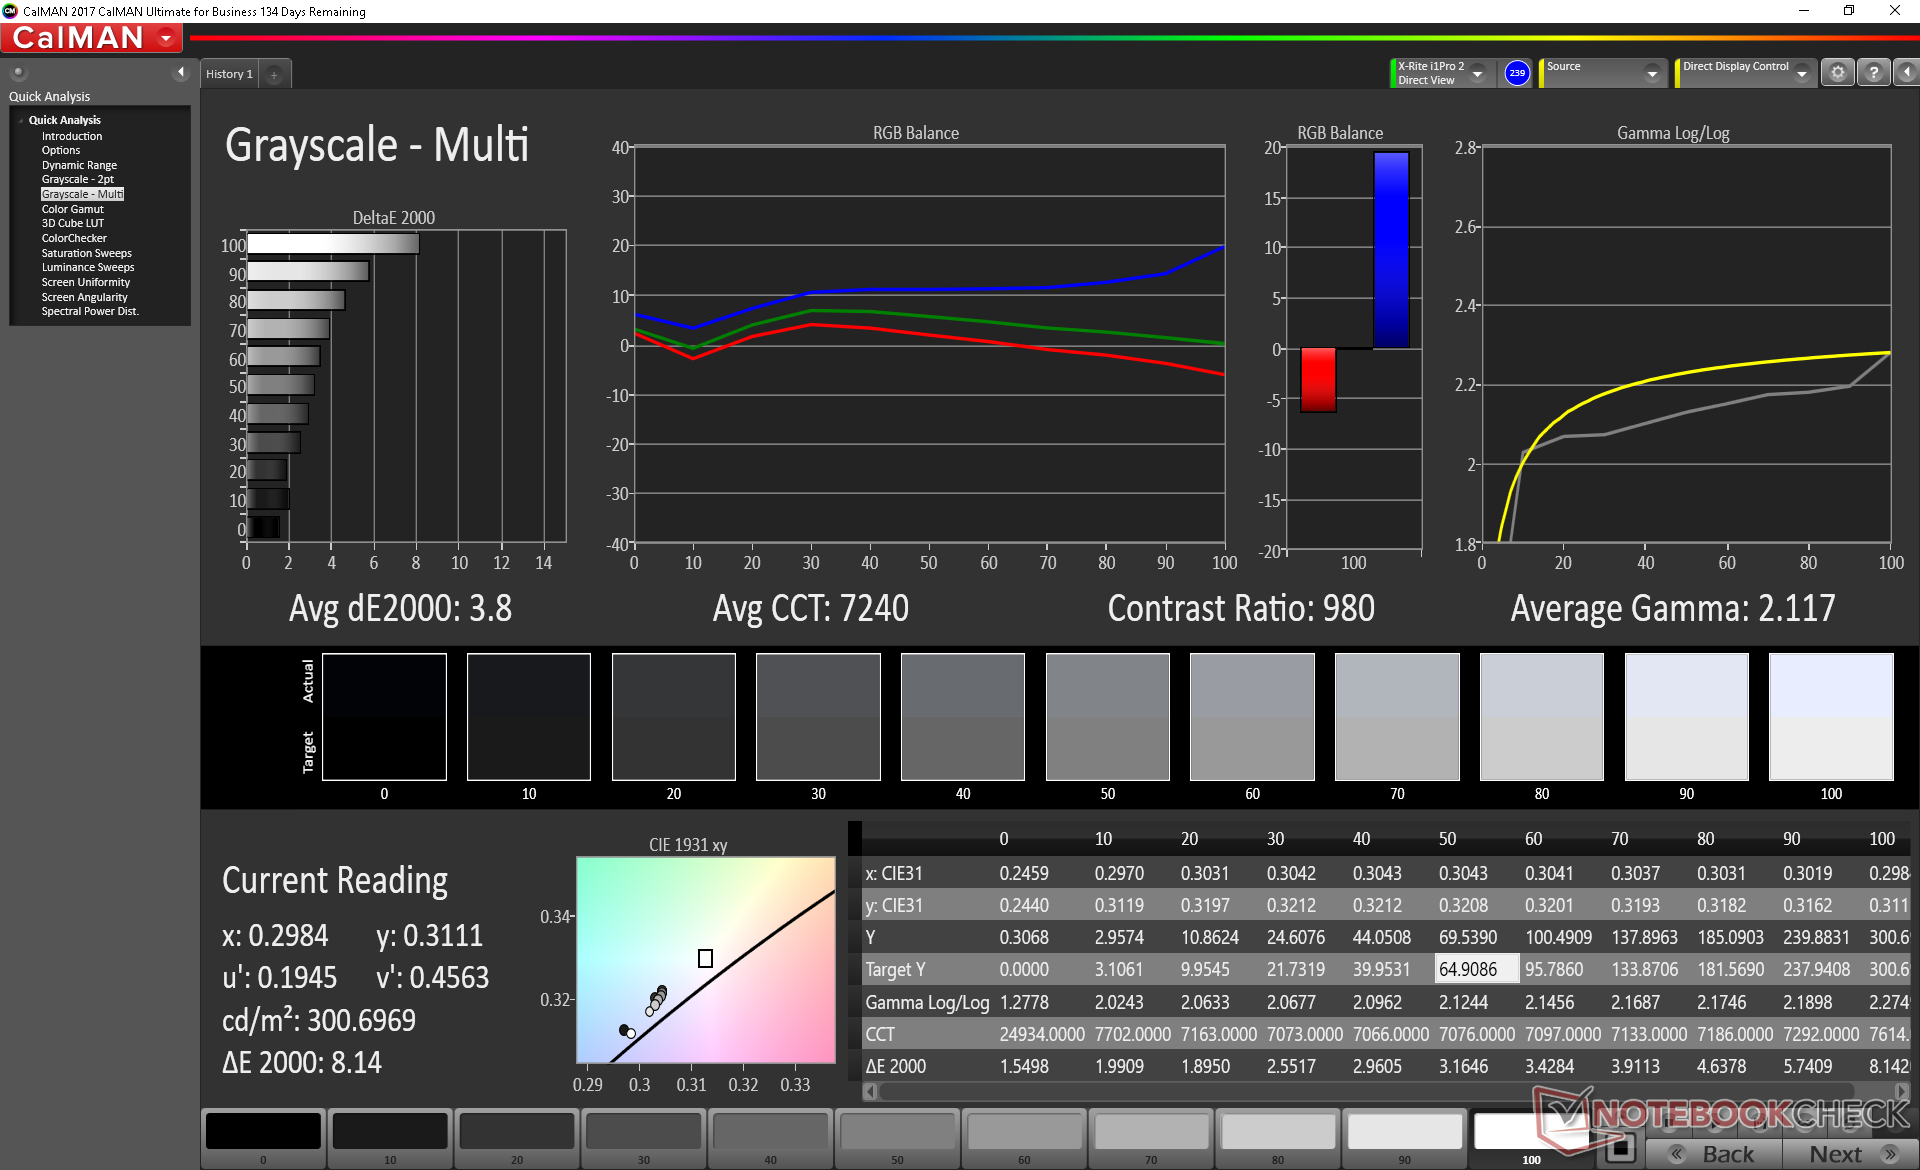
ΔE Greyscale 3.8 | 0.57-98 Ø5.3
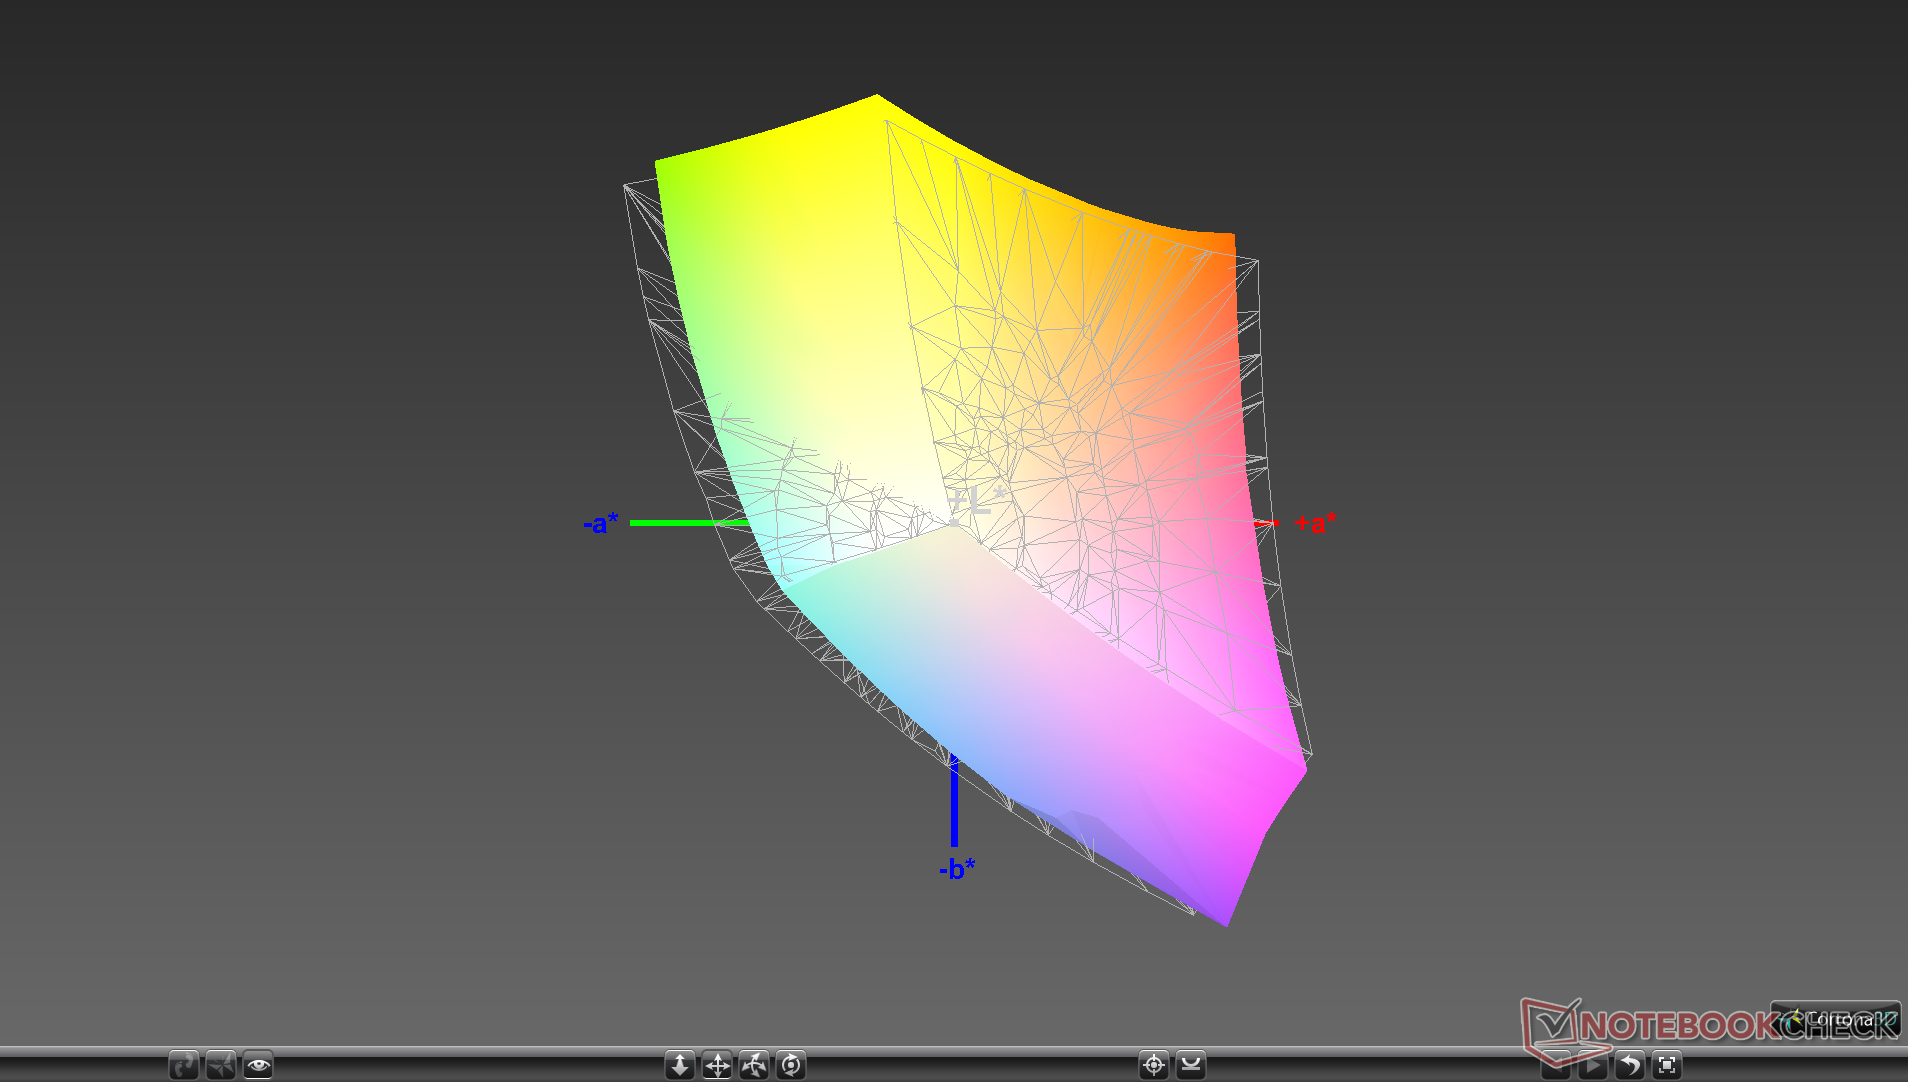
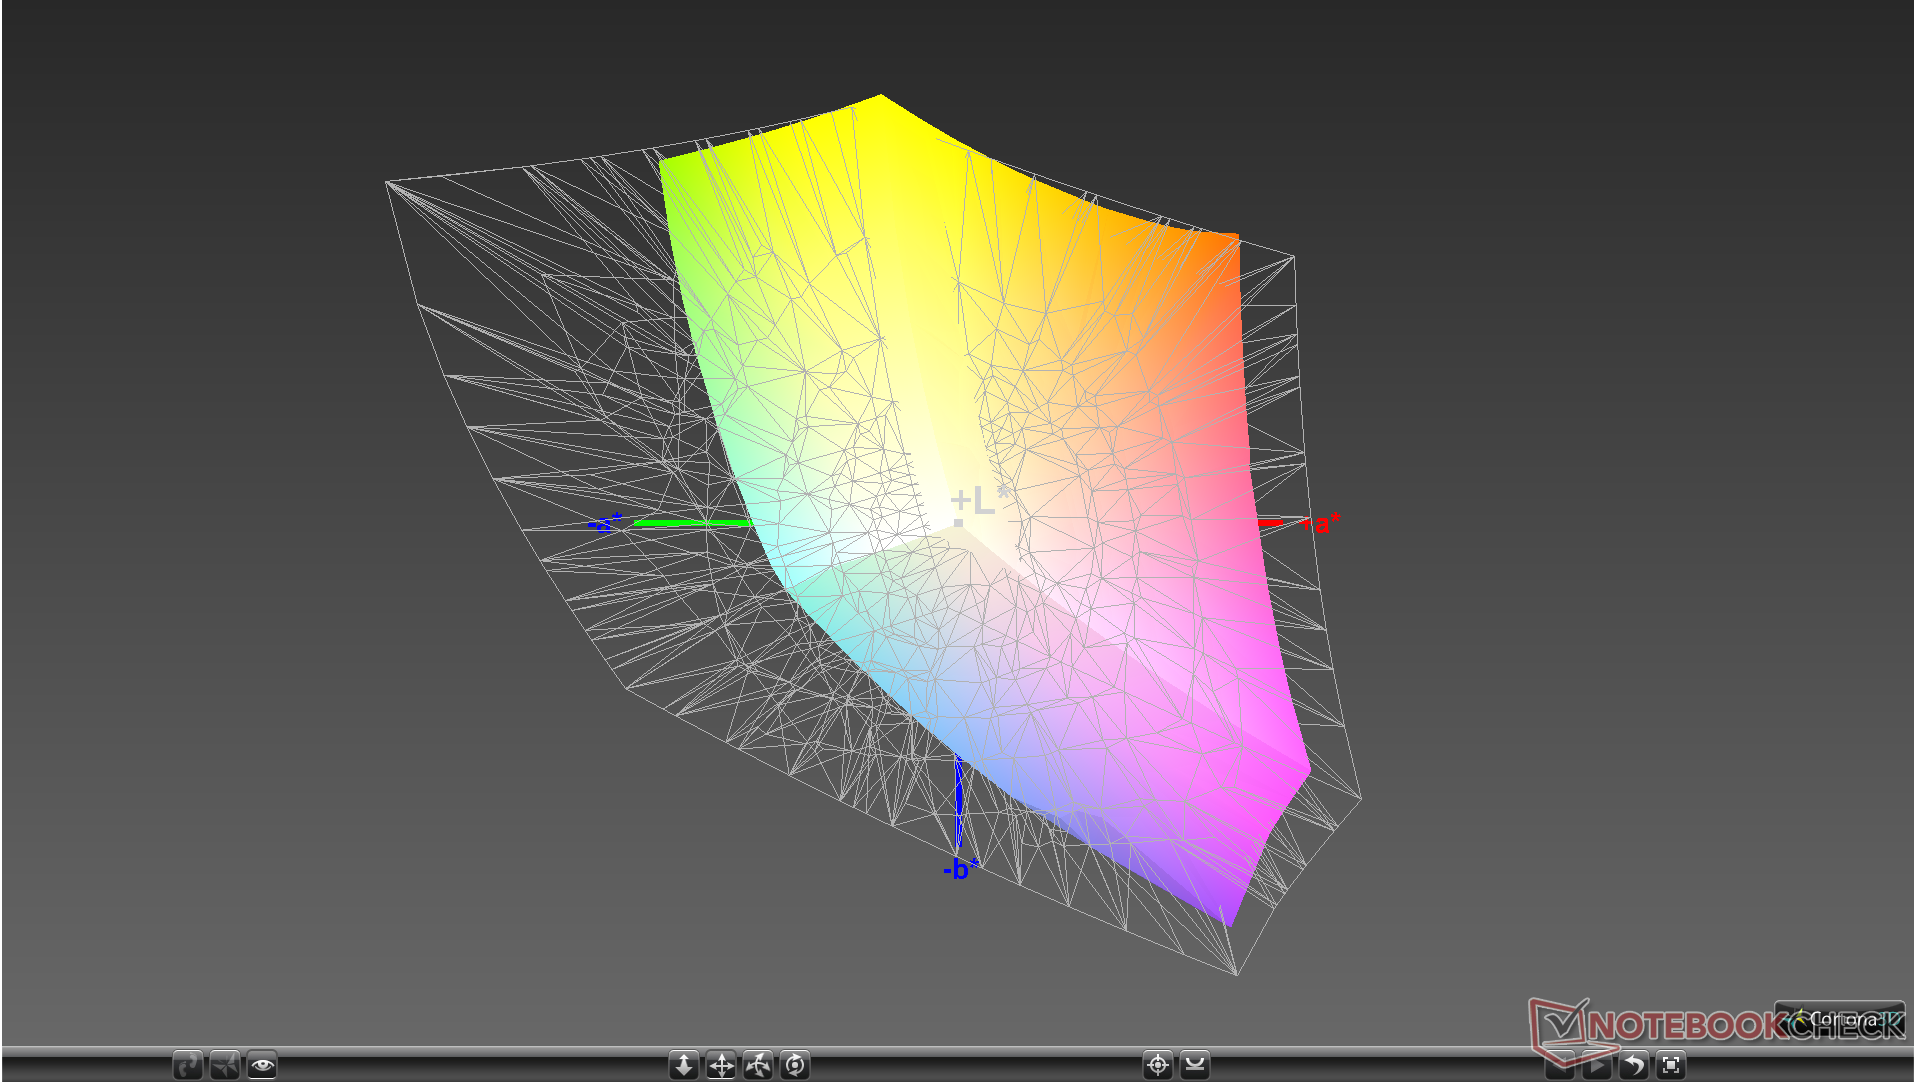
89.8% sRGB (Argyll 1.6.3 3D)
58.1% AdobeRGB 1998 (Argyll 1.6.3 3D)
64.3% AdobeRGB 1998 (Argyll 2.2.0 3D)
90.2% sRGB (Argyll 2.2.0 3D)
63.3% Display P3 (Argyll 2.2.0 3D)
Gamma: 2.12
| HP Pavilion Gaming 17-cd0085cl BOE0825, IPS, 17.30, 1920x1080 | Lenovo Legion Y740-17ICH AU Optronics B173HAN03.2, IPS, 17.30, 1920x1080 | HP Omen 17t-3AW55AV_1 AU Optronics AUO309D, IPS, 17.30, 1920x1080 | Asus TUF FX705DT-AU068T AU Optronics B173HAN04.2, IPS, 17.30, 1920x1080 | MSI GP75 Leopard 9SD Chi Mei N173HCE-G33 (CMN175C), IPS, 17.30, 1920x1080 | Razer Blade Pro 17 RTX 2080 Max-Q AU Optronics B173HAN04.0, IPS, 17.30, 1920x1080 | |
|---|---|---|---|---|---|---|
| Display | 1% | 2% | -1% | 2% | -3% | |
| Display P3 Coverage | 63.3 | 64 1% | 65.4 3% | 62.3 -2% | 63.4 0% | 60.6 -4% |
| sRGB Coverage | 90.2 | 90.4 0% | 90 0% | 89.1 -1% | 94.9 5% | 89 -1% |
| AdobeRGB 1998 Coverage | 64.3 | 64.8 1% | 65.8 2% | 63.7 -1% | 65.1 1% | 62.1 -3% |
| Response Times | 43% | 47% | -42% | 65% | 65% | |
| Response Time Grey 50% / Grey 80% * | 31.6 ? | 15.6 ? 51% | 17.6 ? 44% | 41 ? -30% | 8 ? 75% | 6.8 ? 78% |
| Response Time Black / White * | 19.6 ? | 12.8 ? 35% | 10 ? 49% | 30 ? -53% | 8.8 ? 55% | 9.6 ? 51% |
| PWM Frequency | 25510 ? | |||||
| Screen | -11% | 5% | 8% | 22% | 11% | |
| Brightness middle | 299.6 | 299.1 0% | 343.6 15% | 316 5% | 420 40% | 299.3 0% |
| Brightness | 285 | 273 -4% | 320 12% | 294 3% | 393 38% | 294 3% |
| Brightness Distribution | 86 | 81 -6% | 87 1% | 84 -2% | 91 6% | 94 9% |
| Black Level * | 0.33 | 0.27 18% | 0.34 -3% | 0.32 3% | 0.32 3% | 0.29 12% |
| Contrast | 908 | 1108 22% | 1011 11% | 988 9% | 1313 45% | 1032 14% |
| Colorchecker dE 2000 * | 3.68 | 5.07 -38% | 3.74 -2% | 3.39 8% | 3.04 17% | 2.55 31% |
| Colorchecker dE 2000 max. * | 8.05 | 10.55 -31% | 5.33 34% | 5.56 31% | 7.22 10% | 4.73 41% |
| Colorchecker dE 2000 calibrated * | 3.15 | 3.31 -5% | 3.49 -11% | 2.14 32% | 0.89 72% | 2.9 8% |
| Greyscale dE 2000 * | 3.8 | 6.8 -79% | 3.7 3% | 3.17 17% | 3.91 -3% | 3.5 8% |
| Gamma | 2.12 104% | 2.46 89% | 2.36 93% | 2.39 92% | 2.26 97% | 2.28 96% |
| CCT | 7240 90% | 7805 83% | 6388 102% | 7098 92% | 7138 91% | 7101 92% |
| Color Space (Percent of AdobeRGB 1998) | 58.1 | 58.5 1% | 58 0% | 51 -12% | 60 3% | 57 -2% |
| Color Space (Percent of sRGB) | 89.8 | 89.9 0% | 90 0% | 89 -1% | 95 6% | 88.7 -1% |
| Total Average (Program / Settings) | 11% /
-2% | 18% /
10% | -12% /
0% | 30% /
23% | 24% /
15% |
* ... smaller is better
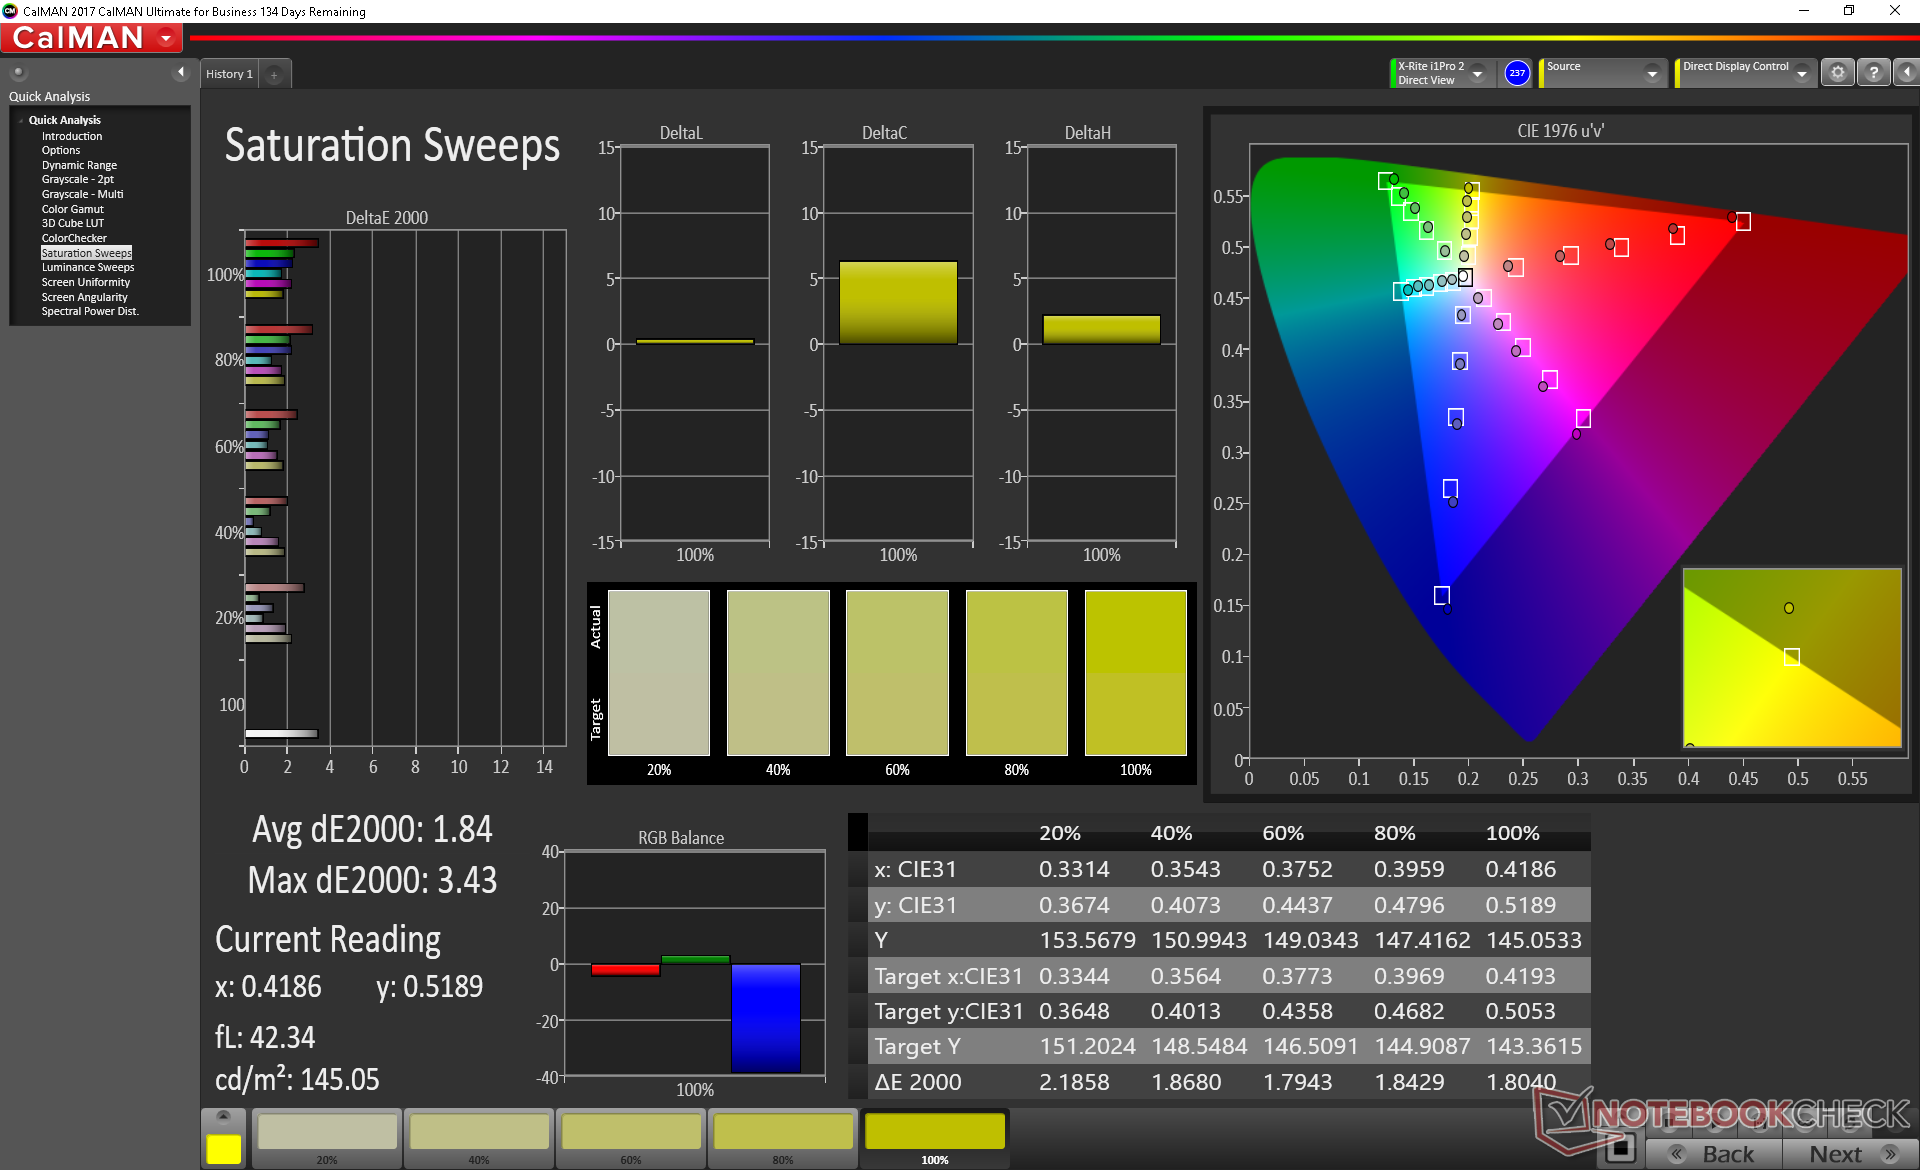
Color space is typical of most 17.3-inch IPS panels at about 90 percent of sRGB to be more than enough for gaming purposes. Some cheaper panels like the Panda LM156LF on the Asus ROG GA502DU cover only 60 percent of sRGB to offer noticeably shallower colors.
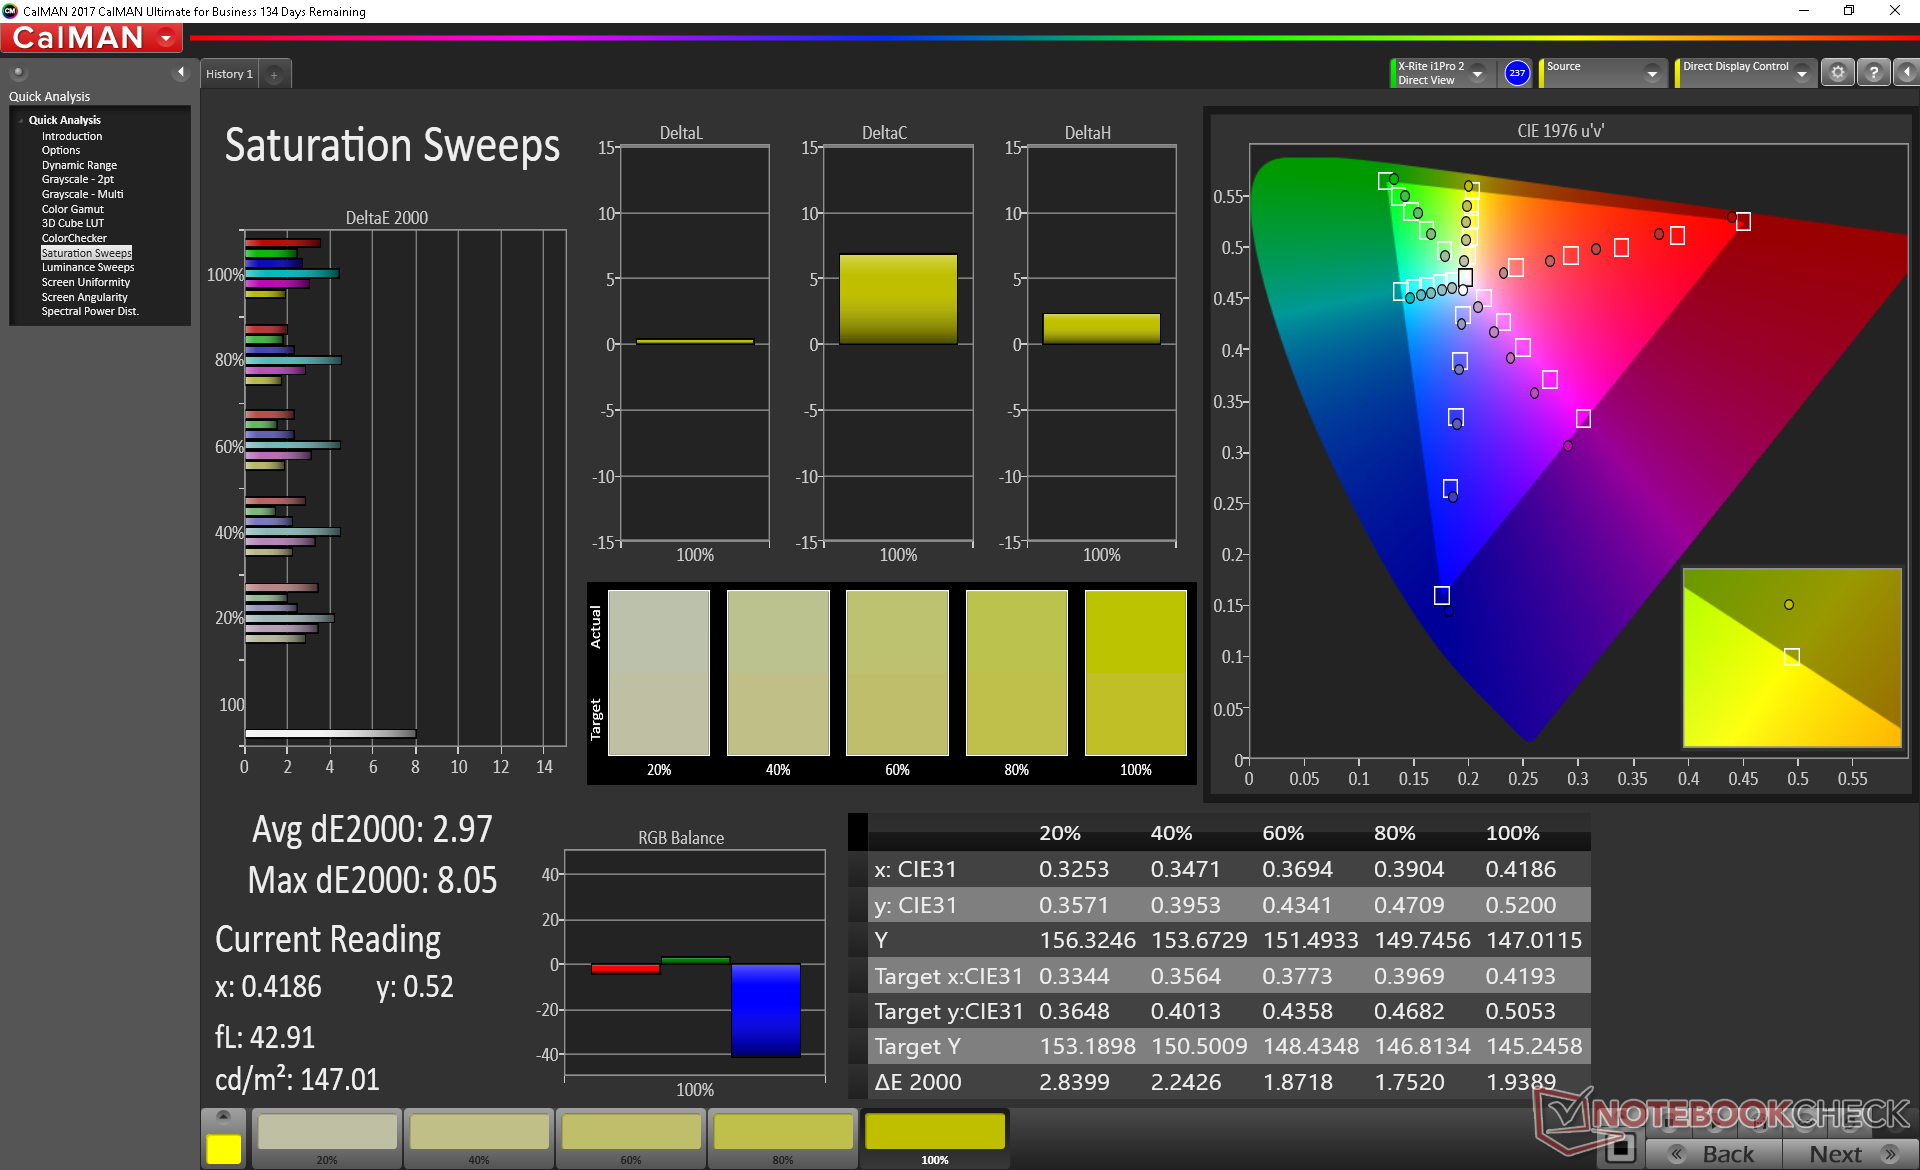
While colors are good out of the box with an average DeltaE value of under 3, grayscale is poorer because color temperature is slightly on the cool side. A calibration addresses this directly for more accurate grayscale and colors across the board.
Display Response Times
| ↔ Response Time Black to White | ||
|---|---|---|
| 19.6 ms ... rise ↗ and fall ↘ combined | ↗ 10.8 ms rise | 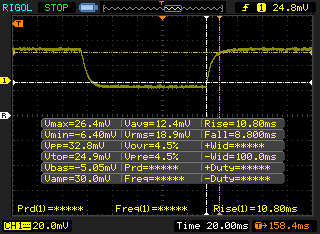 |
| ↘ 8.8 ms fall | ||
| The screen shows good response rates in our tests, but may be too slow for competitive gamers. In comparison, all tested devices range from 0.1 (minimum) to 240 (maximum) ms. » 37 % of all devices are better. This means that the measured response time is similar to the average of all tested devices (21.5 ms). | ||
| ↔ Response Time 50% Grey to 80% Grey | ||
| 31.6 ms ... rise ↗ and fall ↘ combined | ↗ 14 ms rise | 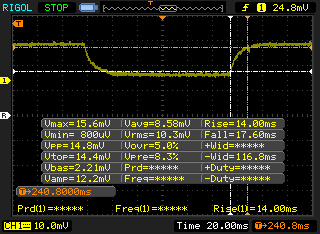 |
| ↘ 17.6 ms fall | ||
| The screen shows slow response rates in our tests and will be unsatisfactory for gamers. In comparison, all tested devices range from 0.2 (minimum) to 636 (maximum) ms. » 36 % of all devices are better. This means that the measured response time is similar to the average of all tested devices (33.7 ms). | ||
Screen Flickering / PWM (Pulse-Width Modulation)
| Screen flickering / PWM not detected | 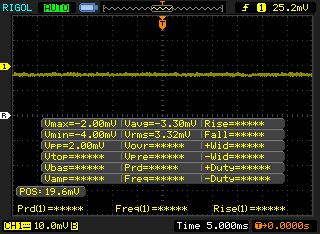 | ||
In comparison: 53 % of all tested devices do not use PWM to dim the display. If PWM was detected, an average of 17900 (minimum: 5 - maximum: 3846000) Hz was measured. | |||
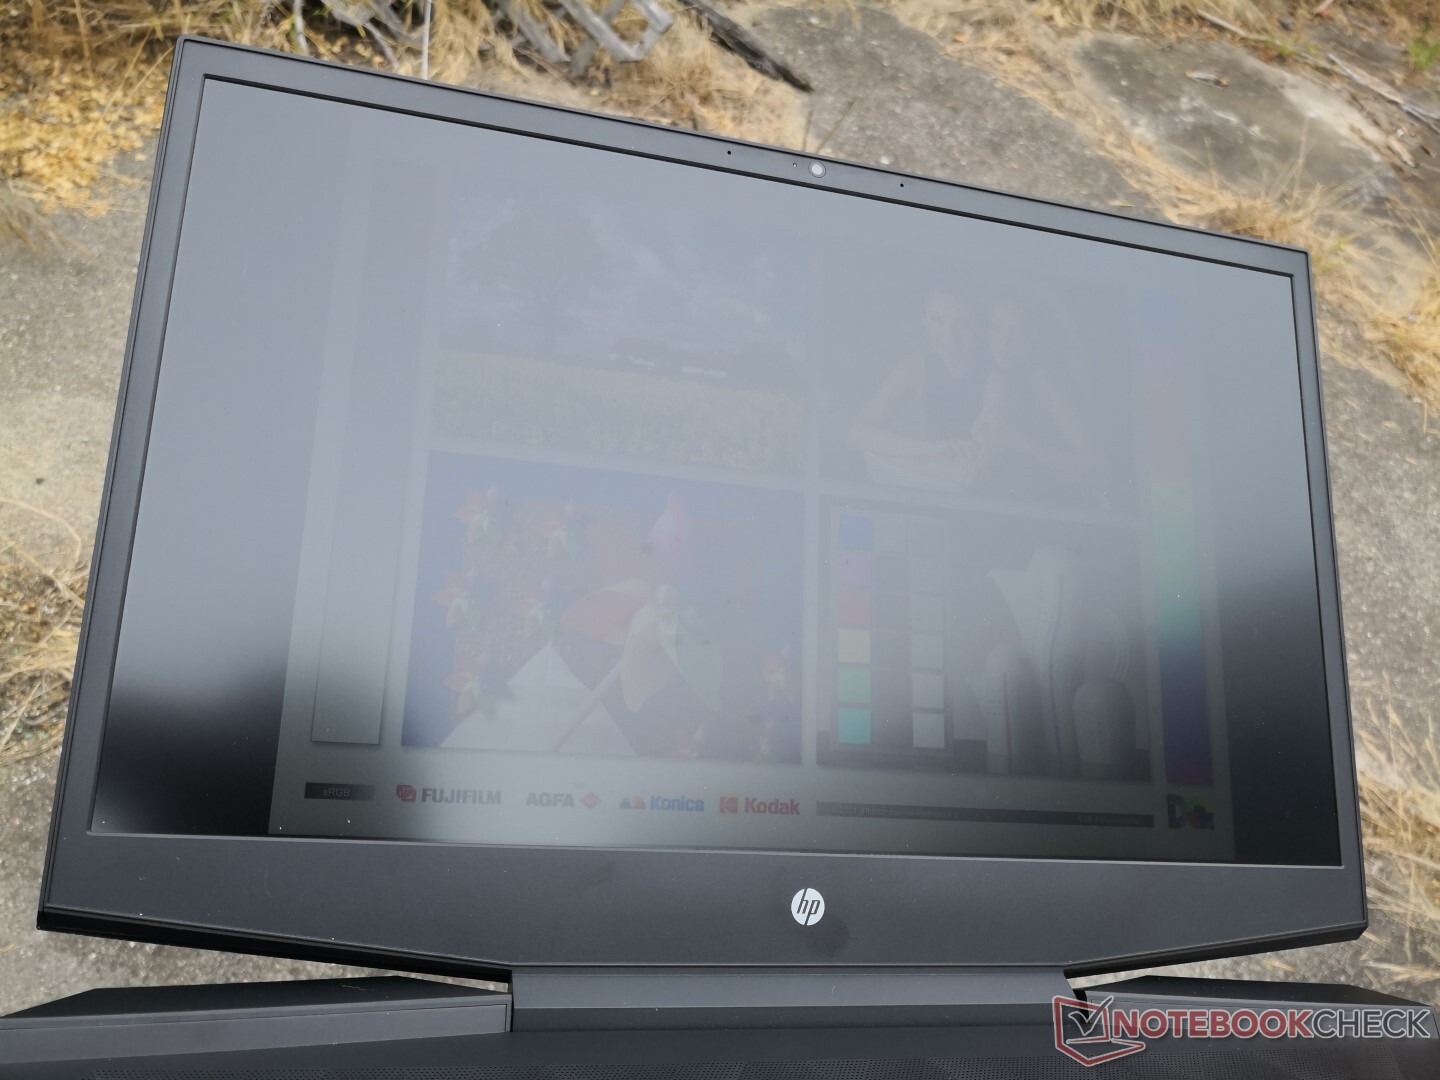
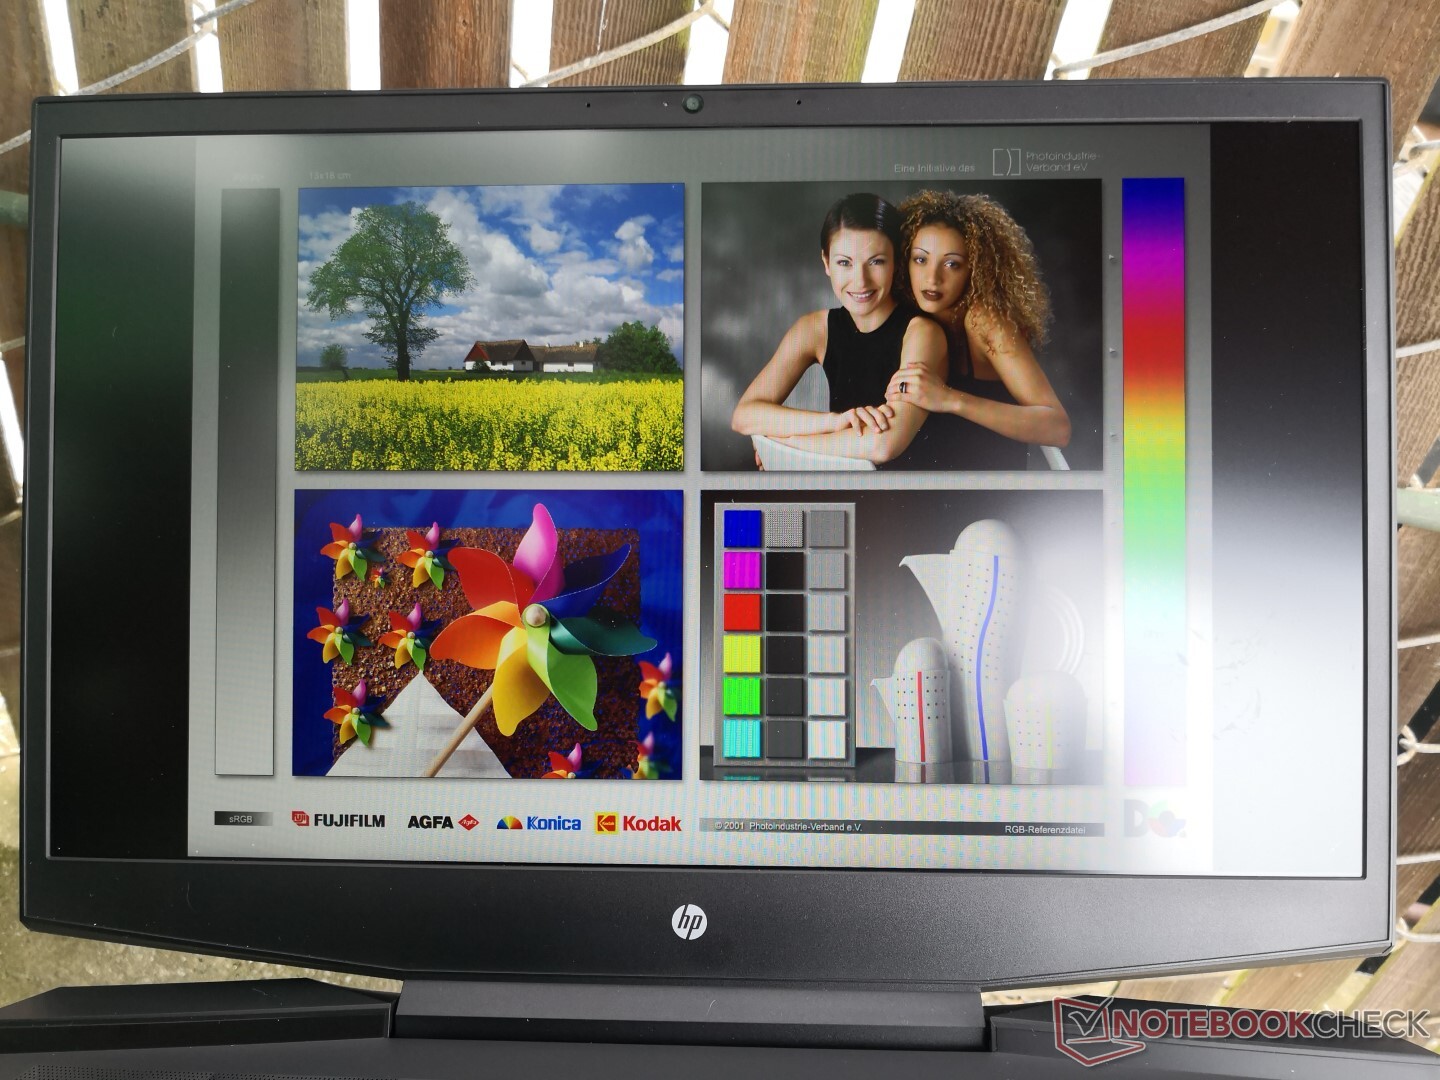
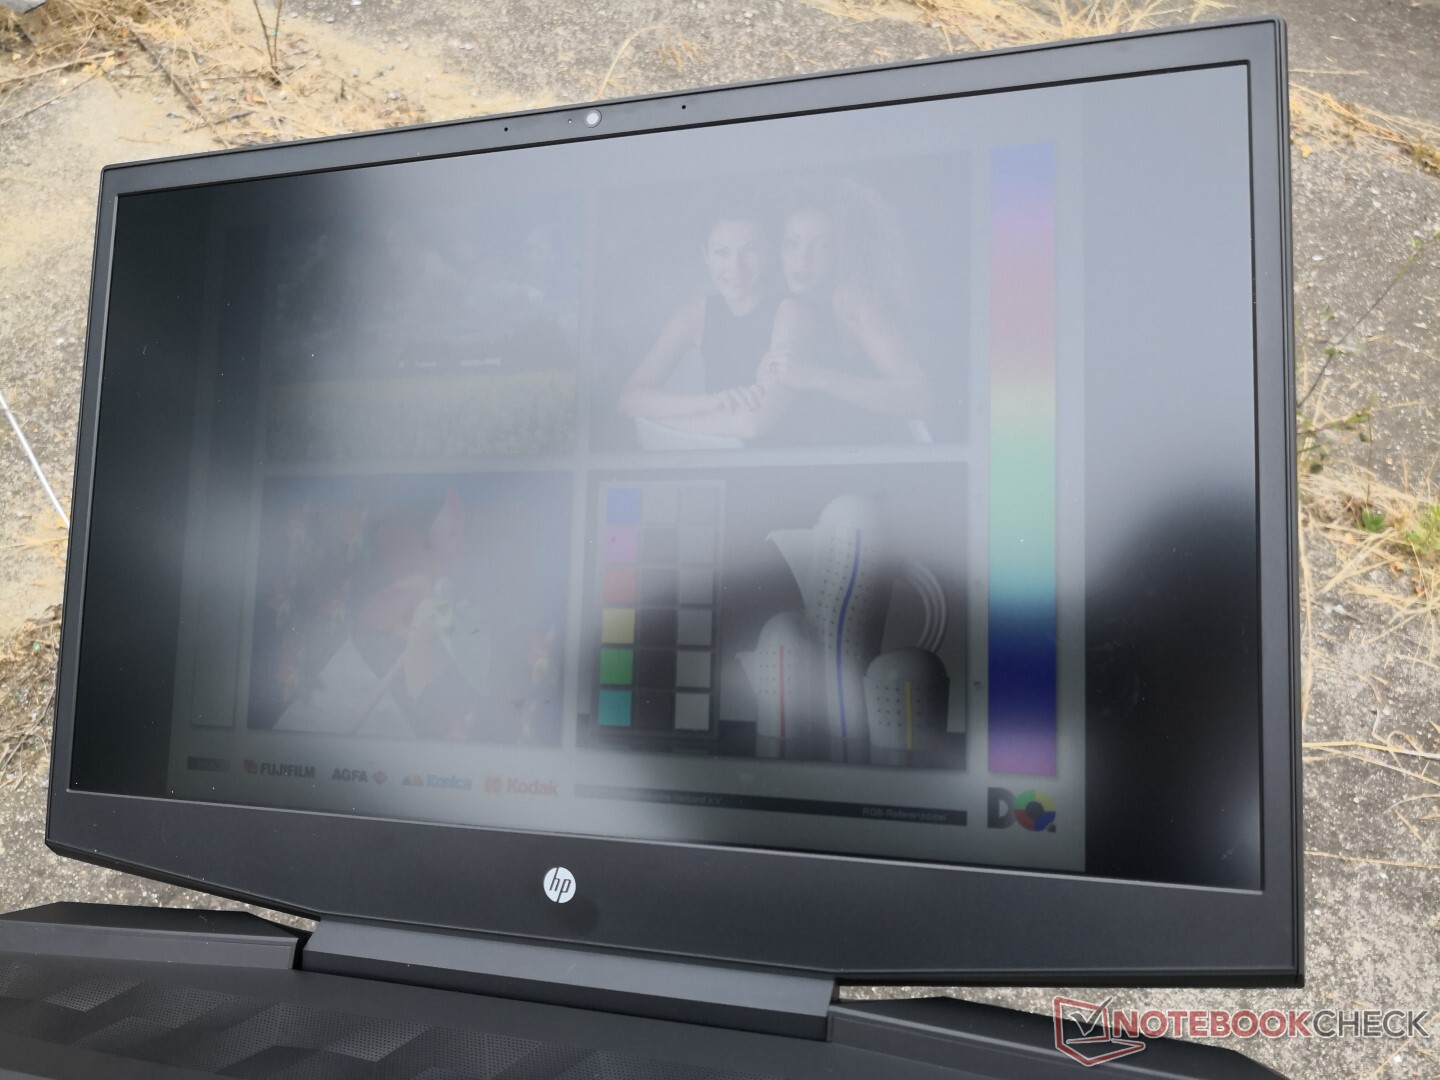
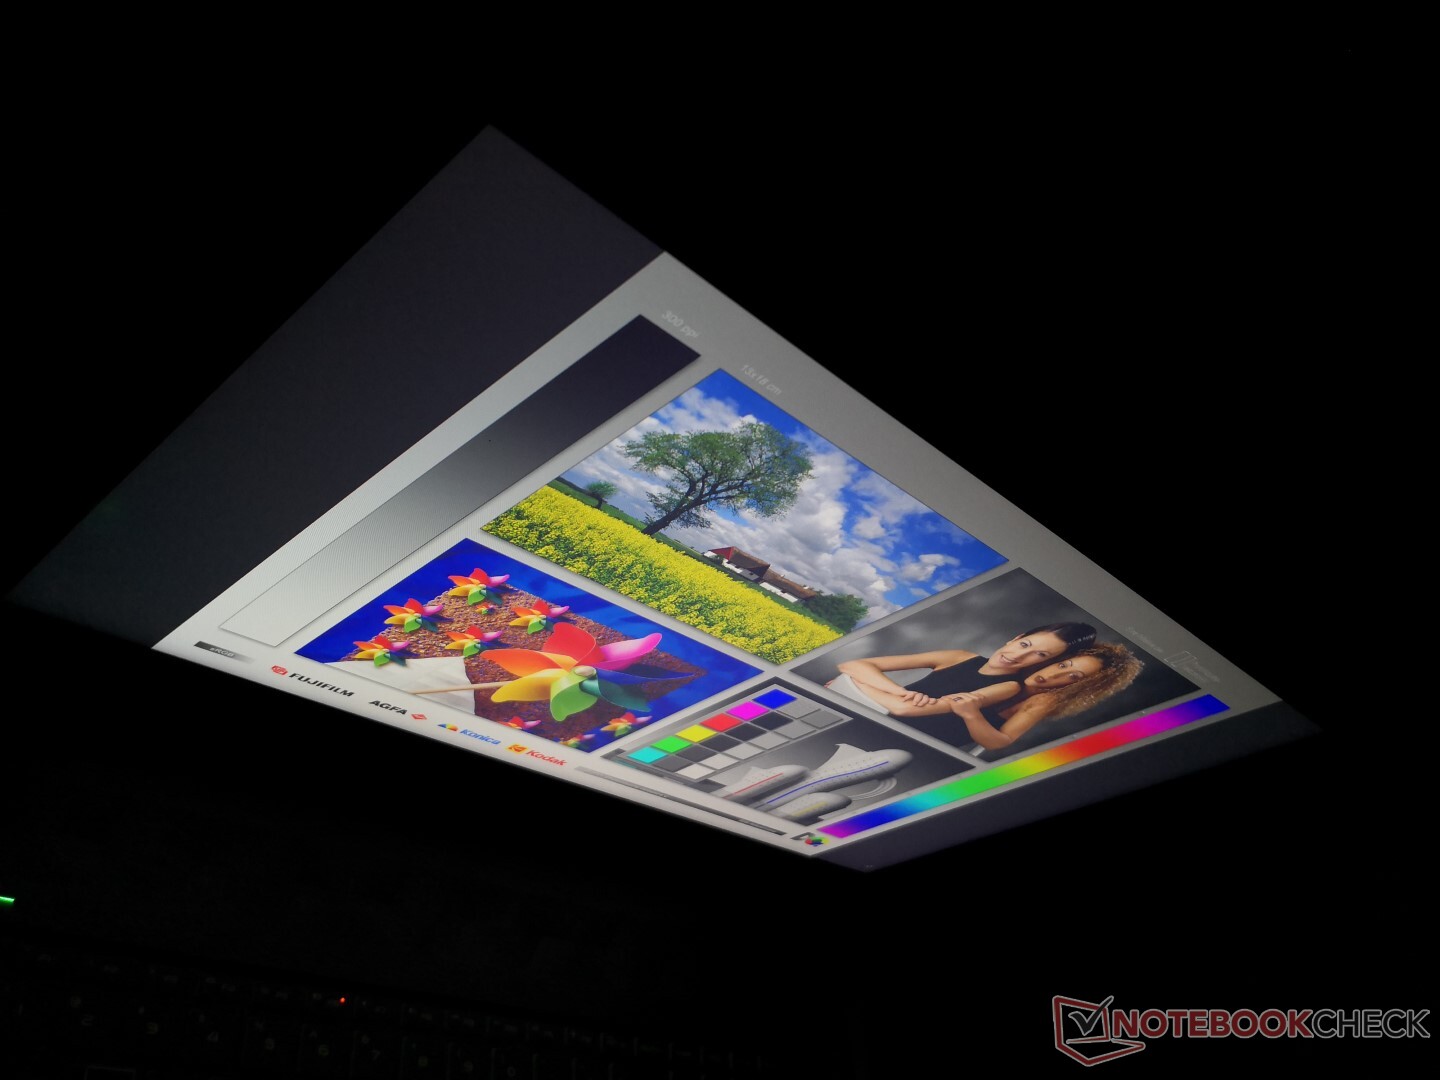
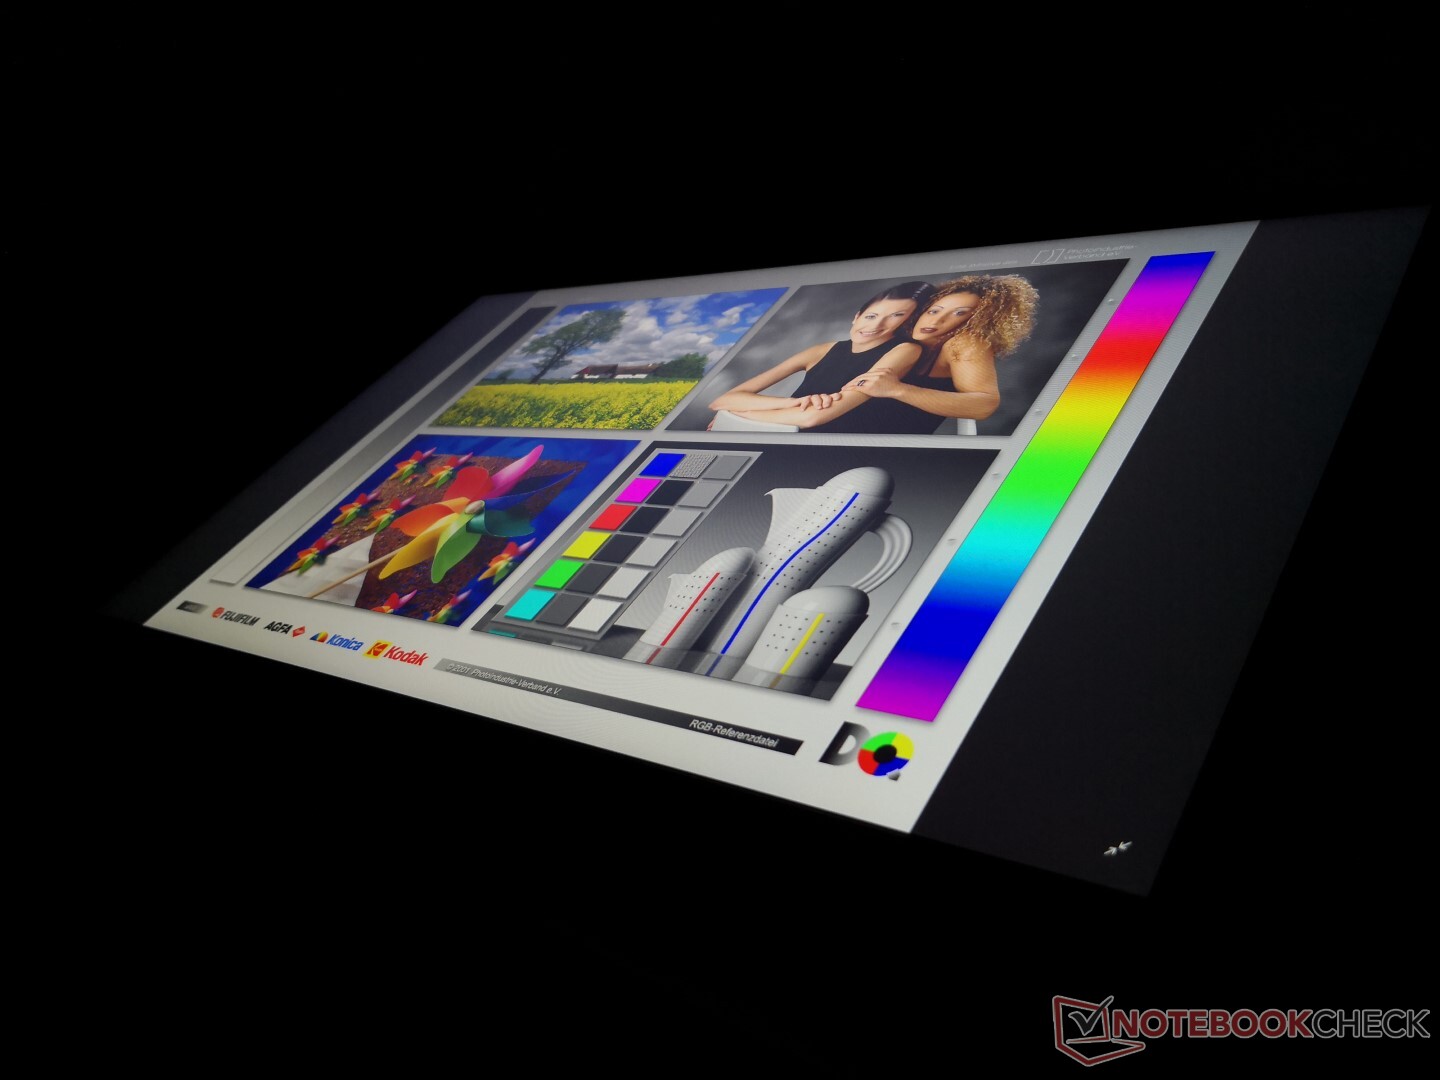
Outdoor visibility is average at best when under shade and not unlike most other 17.3-inch gaming laptops since a backlight of 300 nits is fairly common. Glare becomes difficult to ignore under most outdoor conditions. Viewing angles are otherwise very wide as one would expect from an IPS panel with no major color or contrast changes.
Performance
The Core i5-9300H to Core i7-9750H and GTX 1050 to GTX 1660 Ti Max-Q range puts the Pavilion in the budget to mid-range gaming category. Higher-end options like GeForce RTX graphics, 4K UHD, or additional LED lights are not available on the cost-conscious Pavilion series.
Nvidia Optimus is included by default and so G-Sync is not an option.
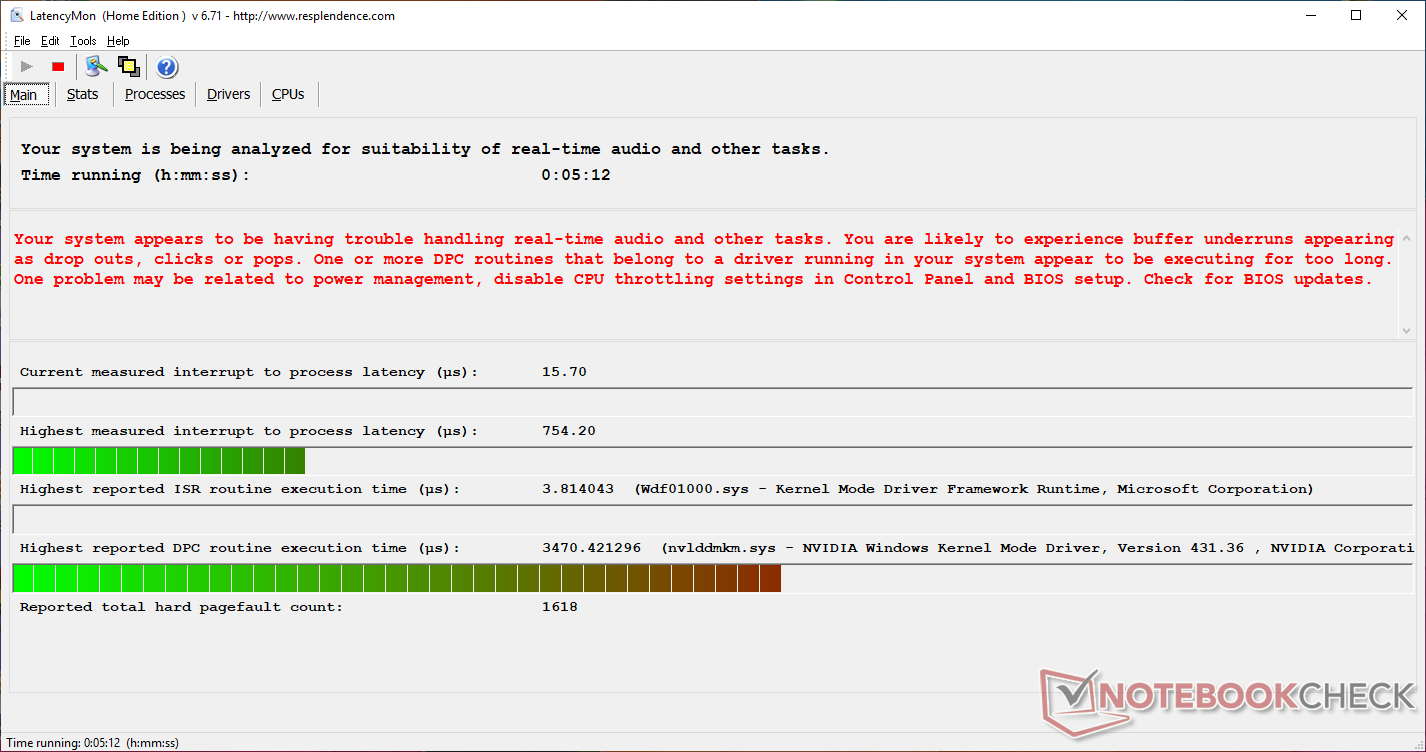
LatencyMon shows DPC issues even when the wireless is disabled.
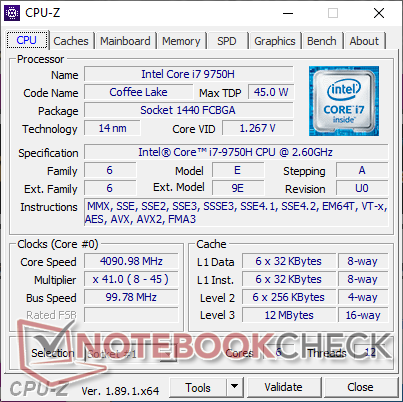
Processor
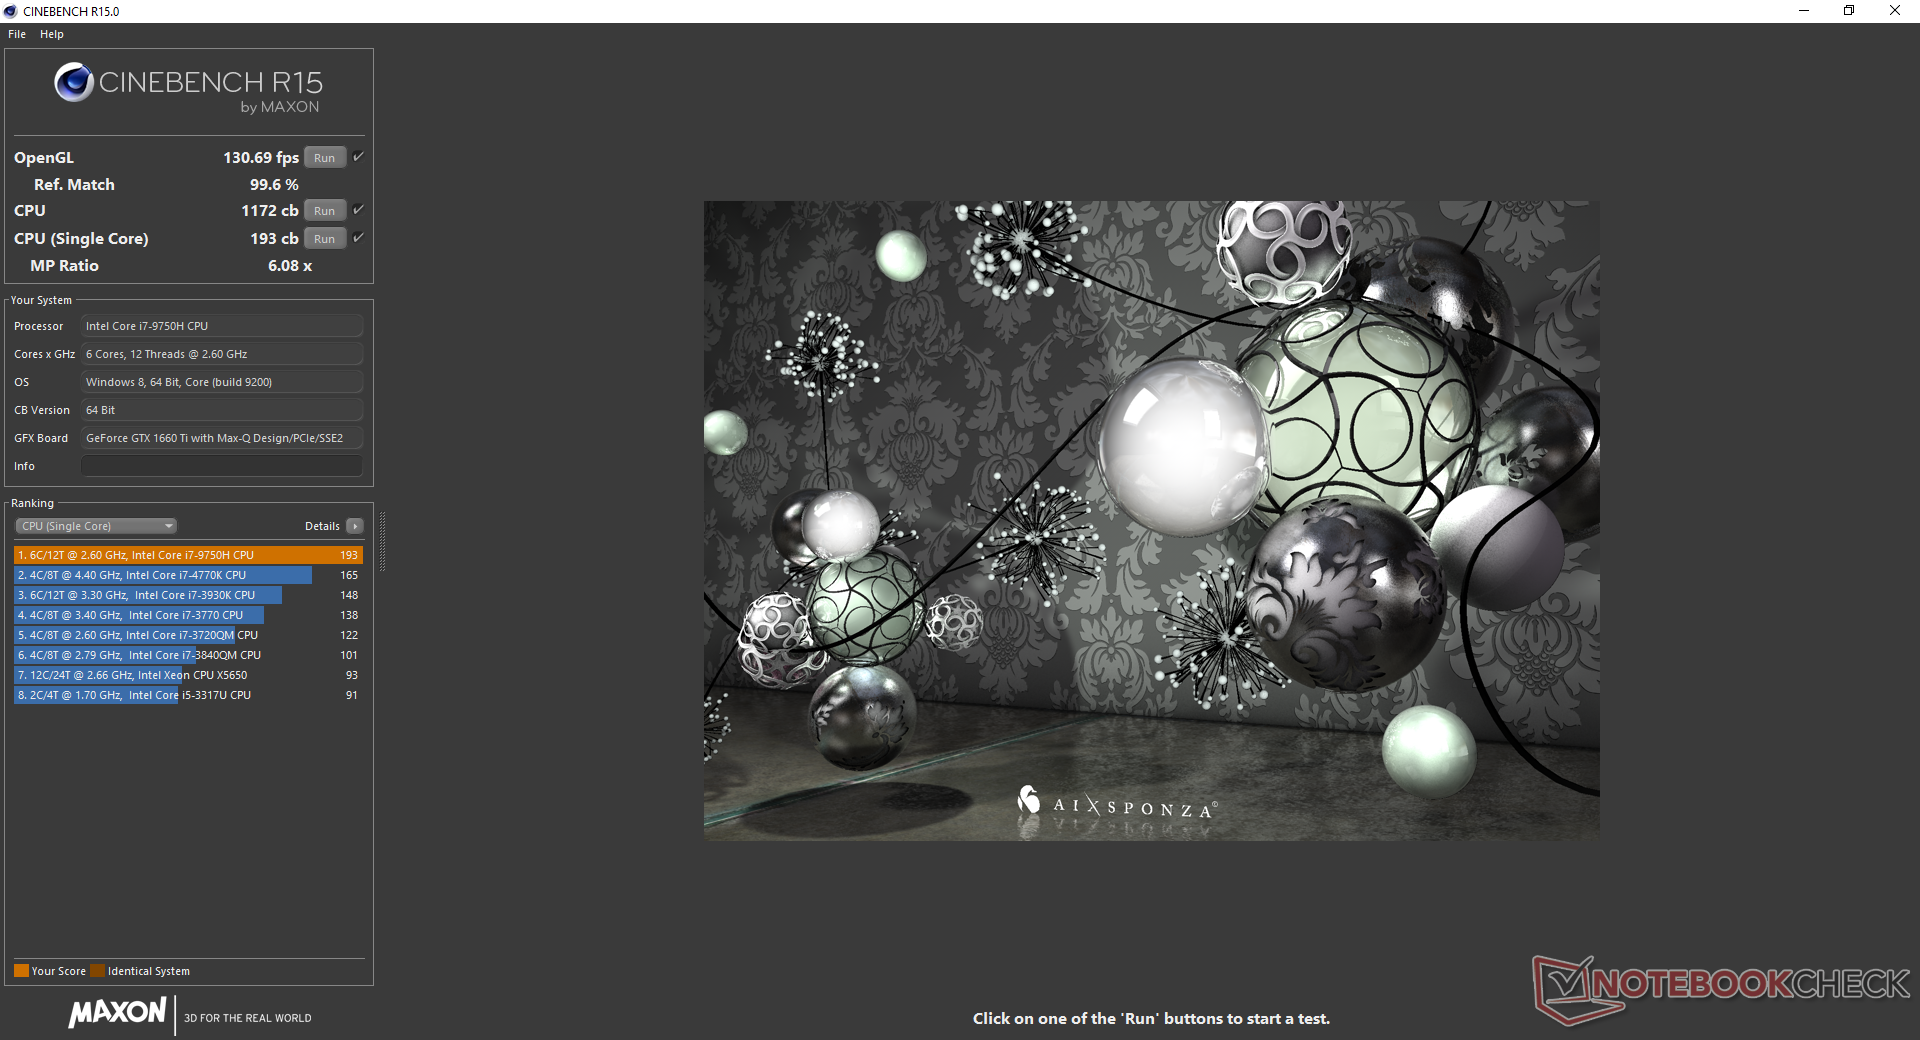
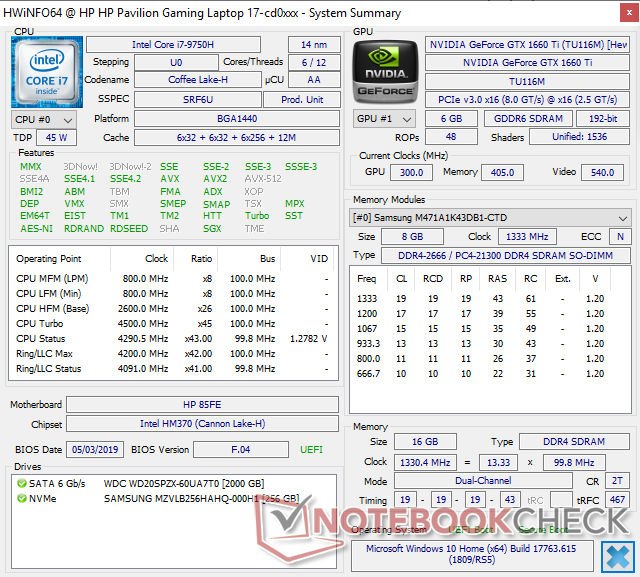
CPU performance is exactly where we expect it to be when compared to other laptops in our database sporting the same Core i7-9750H CPU. Users upgrading from Core i7-8750H laptops won't see much of a difference, but those with older i7-7700HQ or i5-8300H laptops will see a significant 40 to 60 percent boost in multi-thread performance since the i7-9750H offers two additional physical cores.
Running CineBench R15 Multi-Thread in a loop shows a 10 percent dip in performance over time to suggest that the CPU is unable to maintain maximum Turbo Boost clock rates indefinitely when under heavy stress. The Asus GL731GU and MSI GF75 with the same i7-9750H CPU are faster and slower, respectively, than our Pavilion after accounting for any throttling.
See our dedicated page on the Core i7-9750H for more technical information and benchmark comparisons.
| wPrime 2.10 - 1024m | |
| Asus FX503VM-EH73 | |
| Asus ROG Zephyrus G15 GA502DU | |
| Average Intel Core i7-9750H () | |
| HP Omen 17t-3AW55AV_1 | |
| MSI GE75 9SG | |
* ... smaller is better
System Performance
PCMark benchmarks are nearly identical to the MSI GP75 equipped with the GTX 1660 Ti and same i7-9750H CPU. We did not experience any software or hardware issues during our time with the unit.
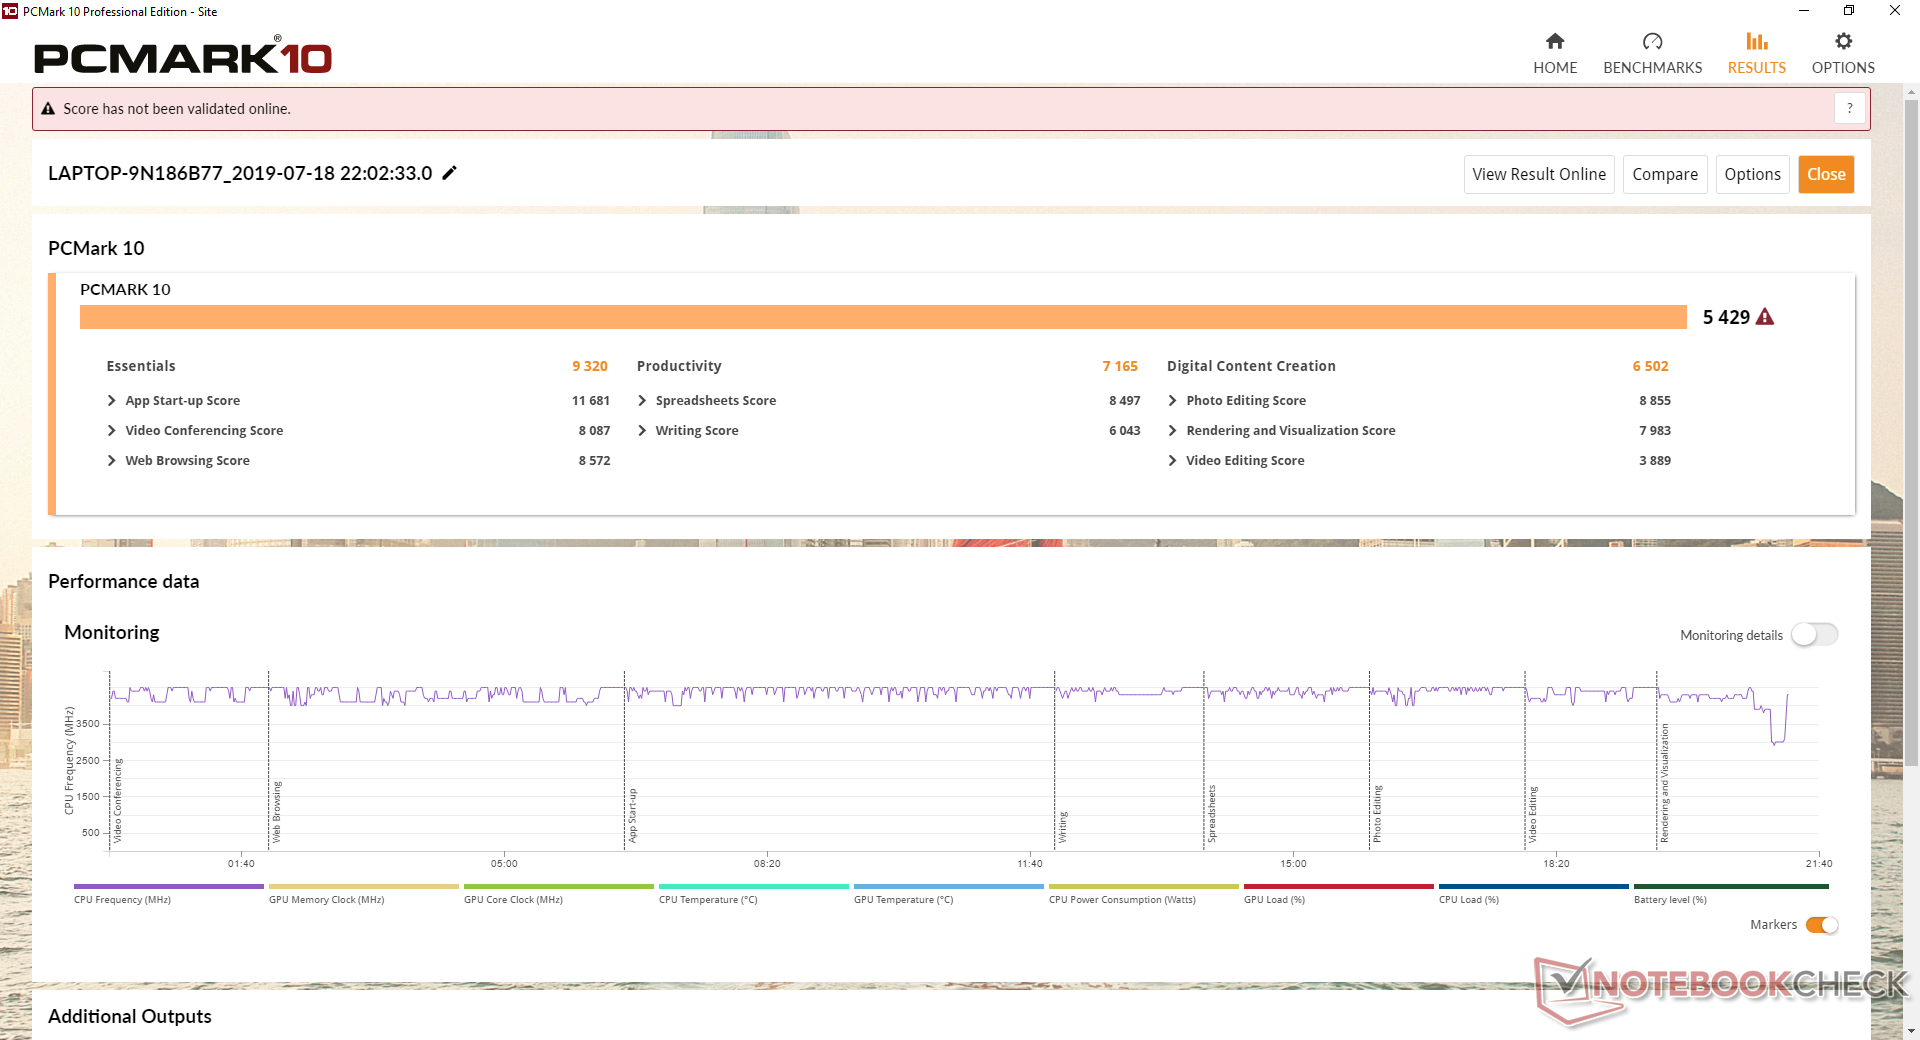
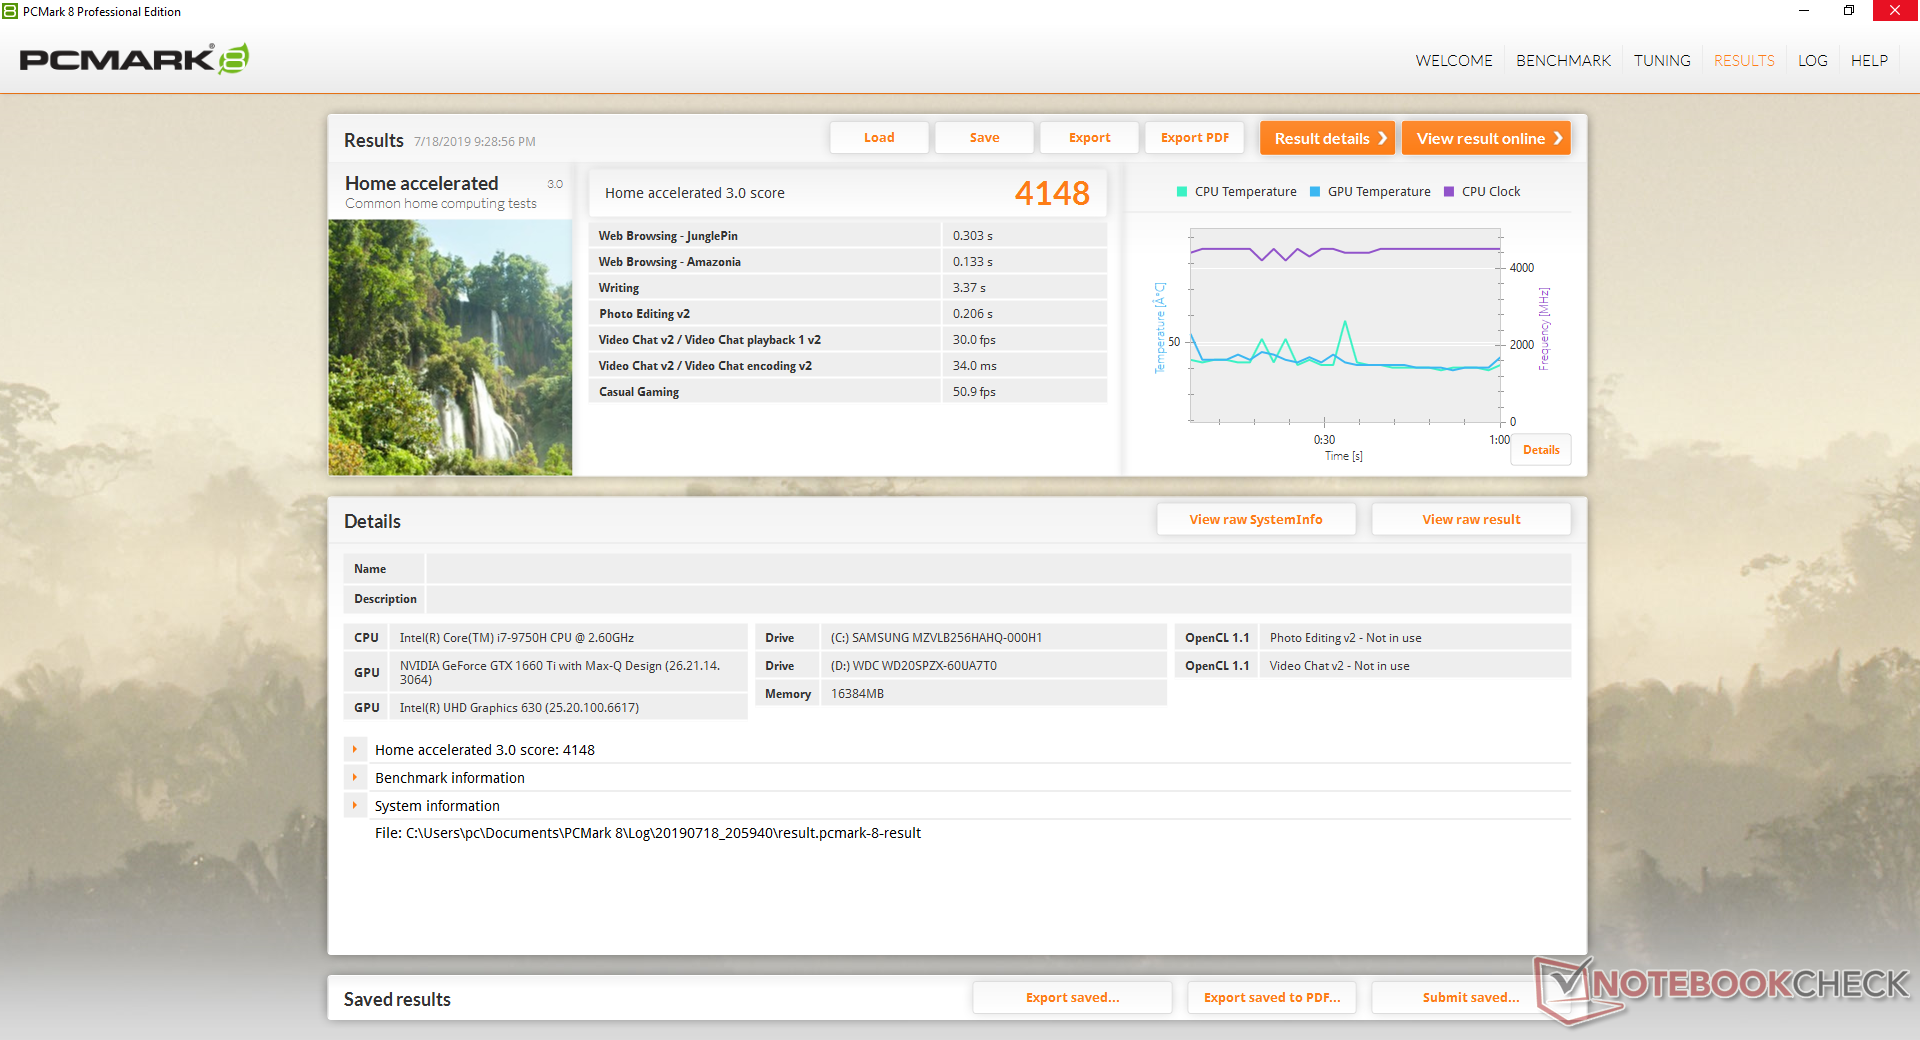
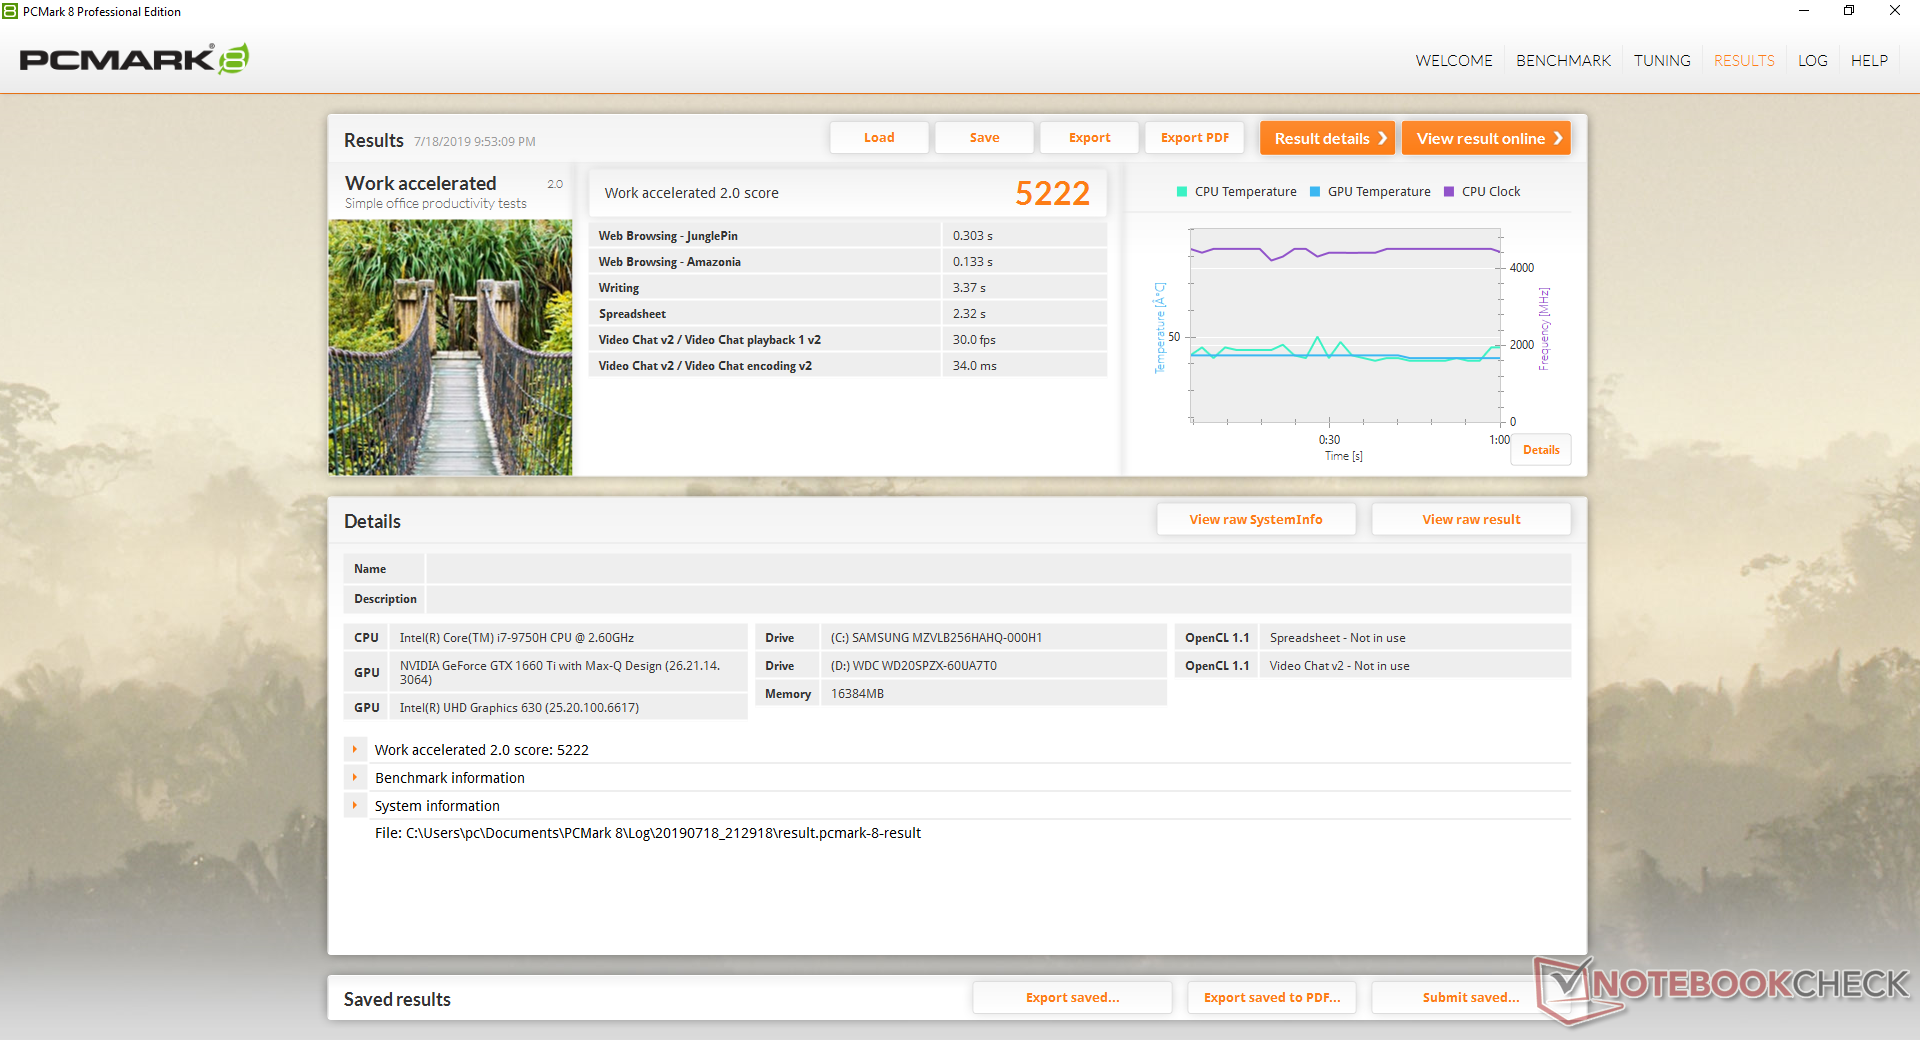
| PCMark 8 Home Score Accelerated v2 | 4148 points | |
| PCMark 8 Work Score Accelerated v2 | 5222 points | |
| PCMark 10 Score | 5429 points | |
Help | ||
Storage Devices
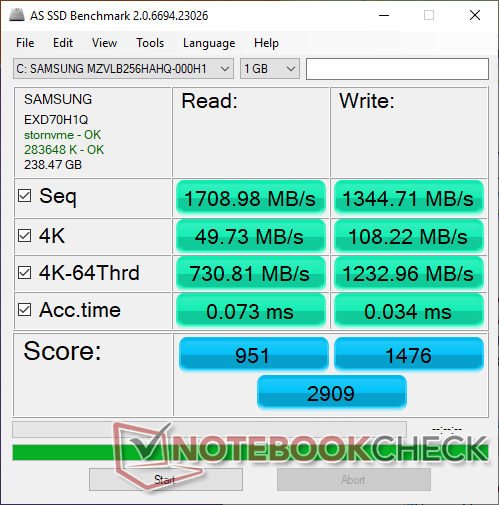
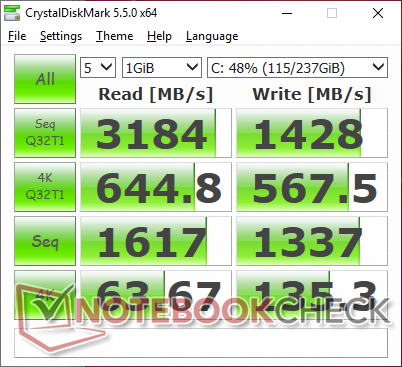
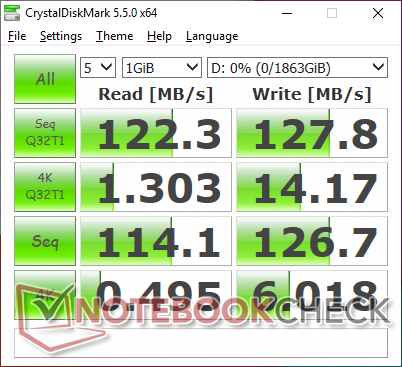
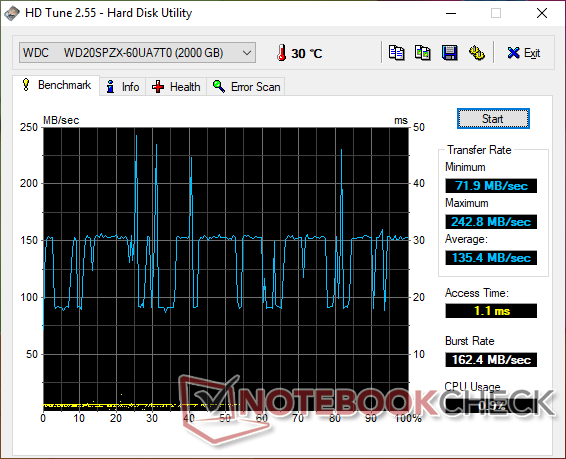
Users can configure a primary M.2 SSD with a secondary 2.5-inch SATA III drive. Our test unit comes equipped with a 256 GB Samsung PM981 NVMe SSD and secondary 2 TB WDC WD20SPZX HDD. Sequential read and write rates top out at about 1700 MB/s and 1350 MB/s, respectively, according to AS SSD to be faster than the less expensive Intel SSD 660p. It's likely that the laptop will ship with different brand drives than what we have here depending on the retailer and configuration.
See our table of HDDs and SSDs for more benchmark comparisons.
| HP Pavilion Gaming 17-cd0085cl Samsung SSD PM981 MZVLB256HAHQ | HP Omen 17t-3AW55AV_1 Samsung SSD PM981 MZVLB512HAJQ | Asus TUF FX705DT-AU068T WDC PC SN520 SDAPNUW-256G | Asus ROG Zephyrus G15 GA502DU Intel SSD 660p SSDPEKNW512G8 | SCHENKER XMG Ultra 15 Turing Samsung SSD 970 EVO Plus 1TB | |
|---|---|---|---|---|---|
| AS SSD | 8% | -35% | -30% | 51% | |
| Seq Read | 1709 | 1473 -14% | 1546 -10% | 907 -47% | 2739 60% |
| Seq Write | 1345 | 1962 46% | 1182 -12% | 926 -31% | 2650 97% |
| 4K Read | 49.73 | 31.66 -36% | 36.54 -27% | 47.26 -5% | 27.86 -44% |
| 4K Write | 108.2 | 84.4 -22% | 109.2 1% | 98.7 -9% | 134.7 24% |
| 4K-64 Read | 731 | 1125 54% | 612 -16% | 321.5 -56% | 1651 126% |
| 4K-64 Write | 1233 | 1866 51% | 436.6 -65% | 736 -40% | 2190 78% |
| Access Time Read * | 0.073 | 0.071 3% | 0.113 -55% | 0.064 12% | 0.031 58% |
| Access Time Write * | 0.034 | 0.047 -38% | 0.034 -0% | 0.045 -32% | 0.028 18% |
| Score Read | 951 | 1304 37% | 803 -16% | 459 -52% | 1953 105% |
| Score Write | 1476 | 2147 45% | 664 -55% | 927 -37% | 2590 75% |
| Score Total | 2909 | 4142 42% | 1869 -36% | 1641 -44% | 5529 90% |
| Copy ISO MB/s | 1284 | 1080 -16% | 698 -46% | 905 -30% | 2031 58% |
| Copy Program MB/s | 589 | 481.1 -18% | 114.1 -81% | 496.9 -16% | 452.1 -23% |
| Copy Game MB/s | 1107 | 875 -21% | 379.6 -66% | 819 -26% | 1043 -6% |
* ... smaller is better

GPU Performance
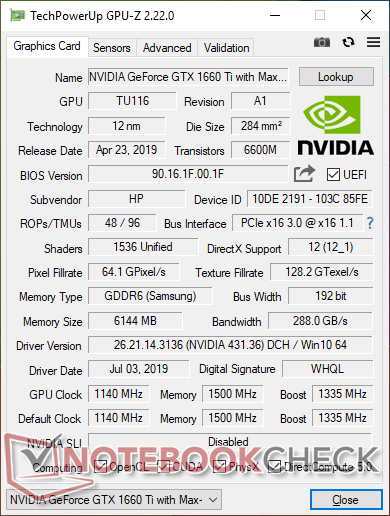
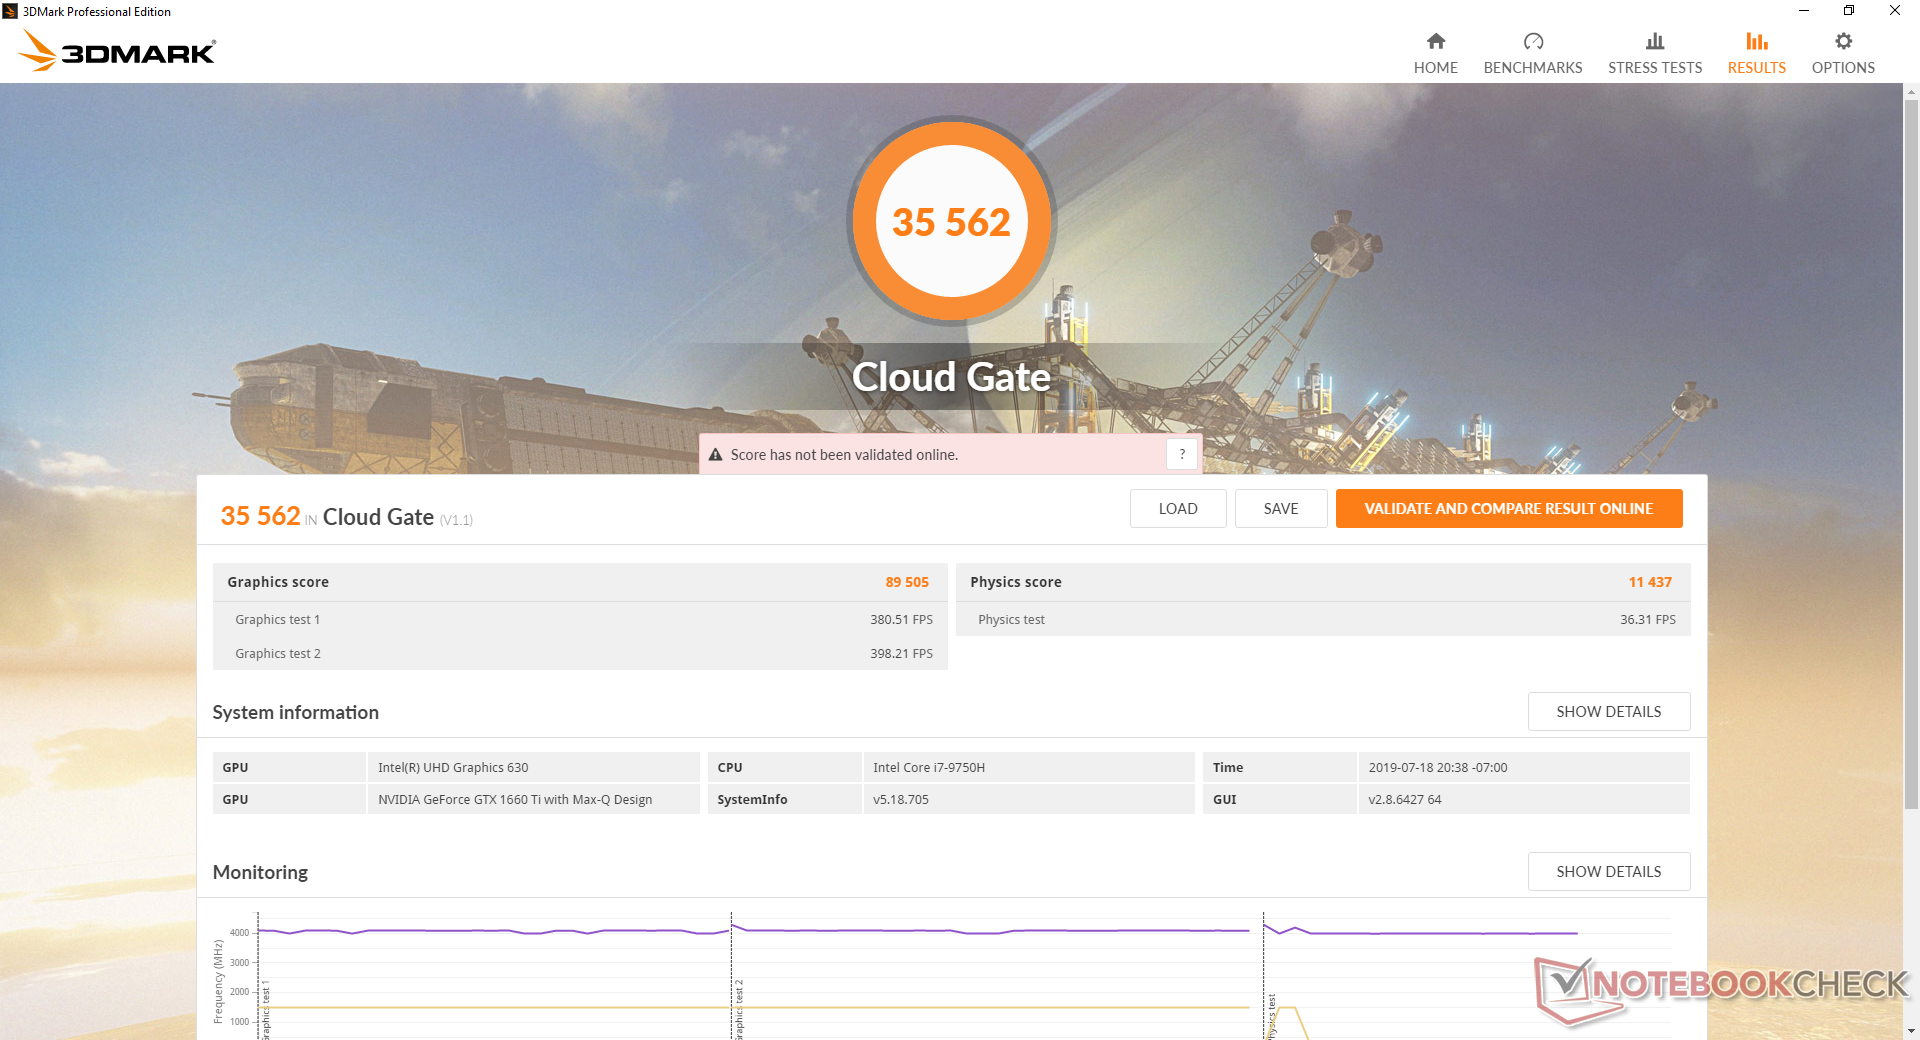
The GTX 1660 Ti Max-Q performs identically to the Asus GA502DU equipped with the exact same GPU according to 3DMark benchmarks. The notable exception is Cloud Gate because the quad-core Ryzen CPU in the Asus has issues maintaining very high frame rates beyond 60 FPS in contrast to our hexa-core Intel-powered HP. Overall GPU performance is about 18 percent slower than a desktop GTX 1660 Ti graphics card and about 45 to 55 percent faster than the mobile GTX 1650.
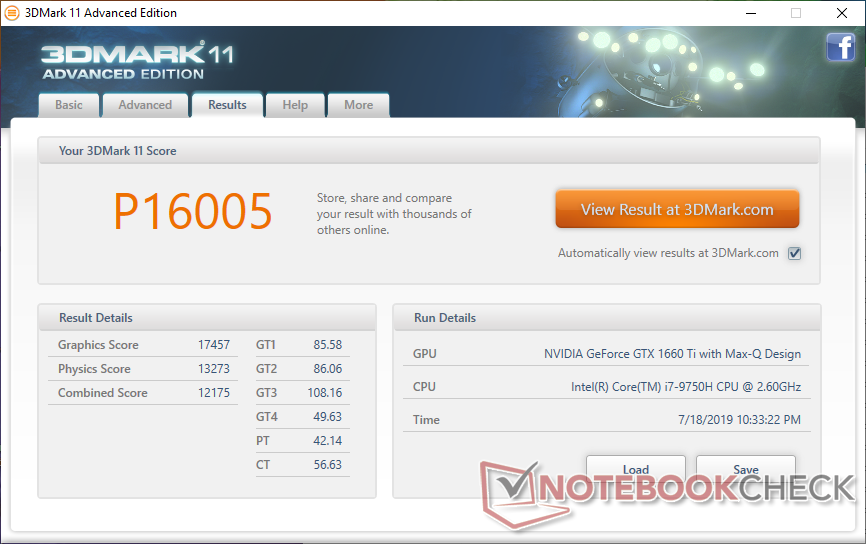
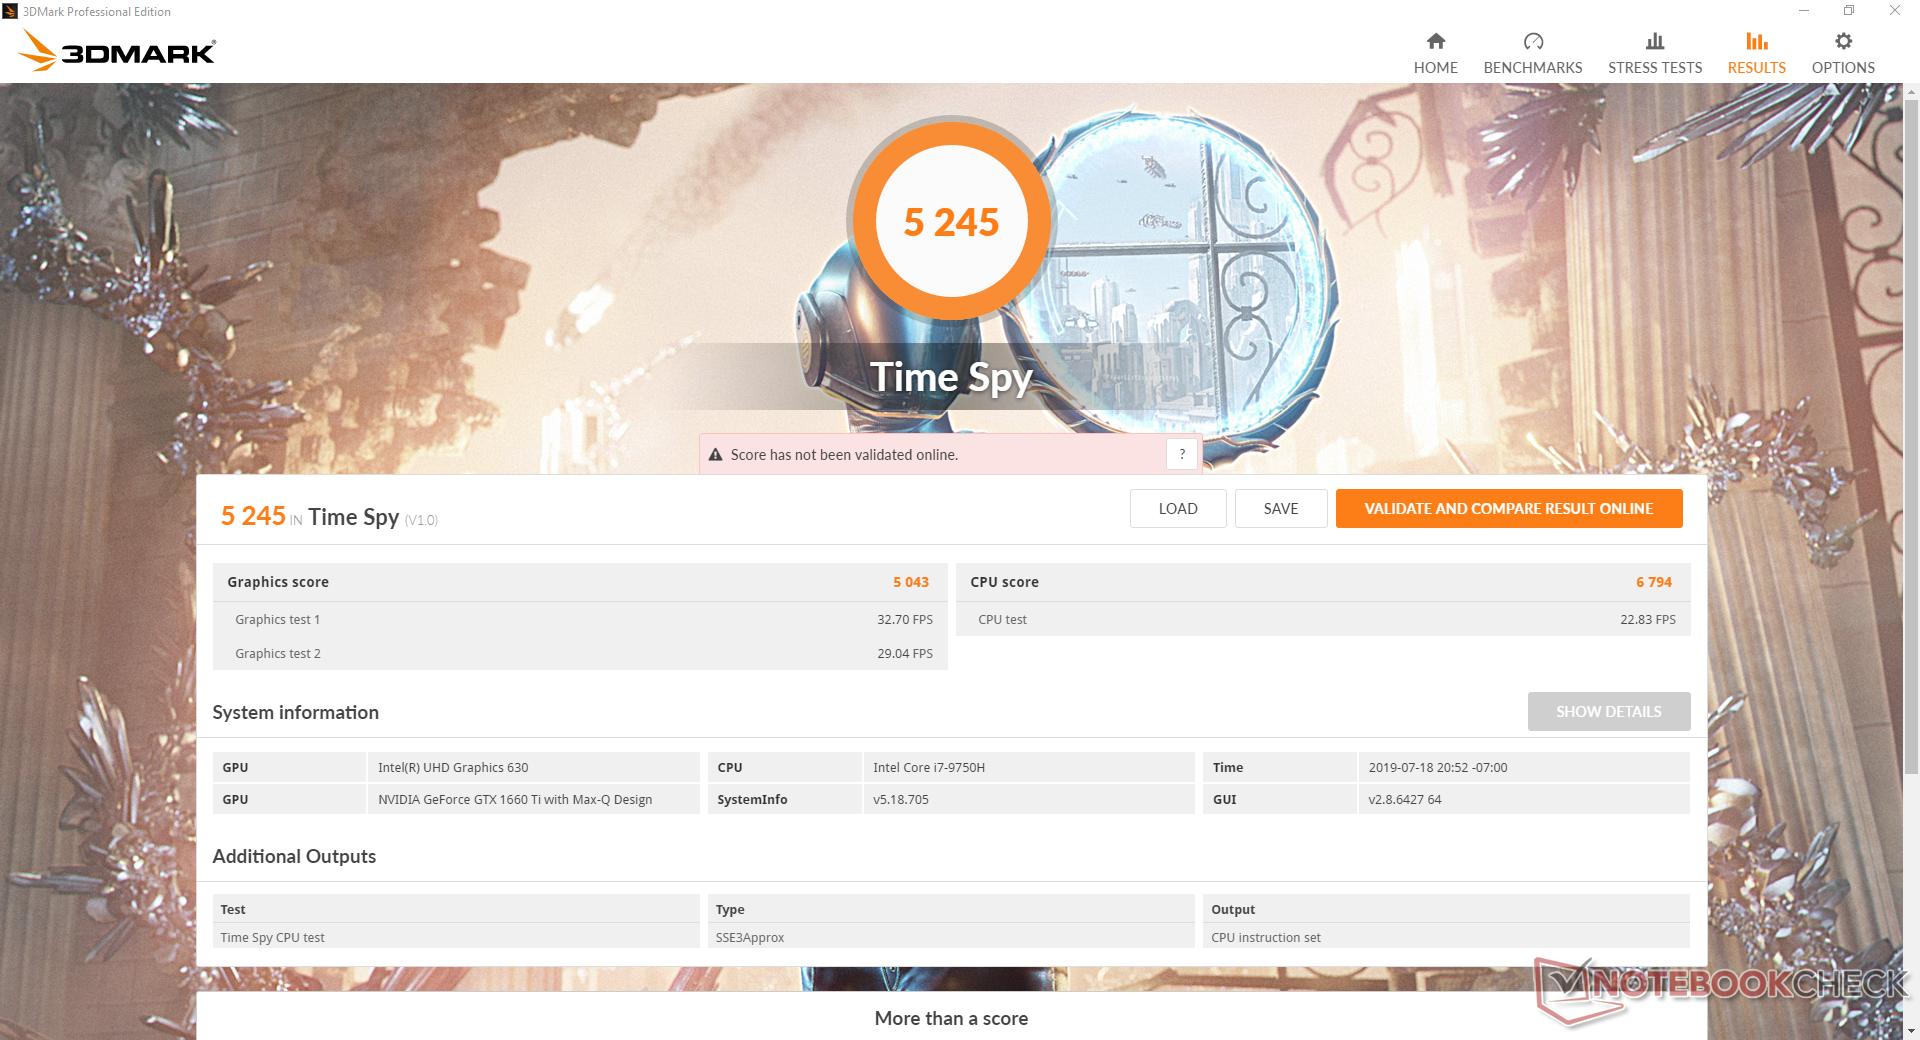
| 3DMark 11 Performance | 16005 points | |
| 3DMark Cloud Gate Standard Score | 35562 points | |
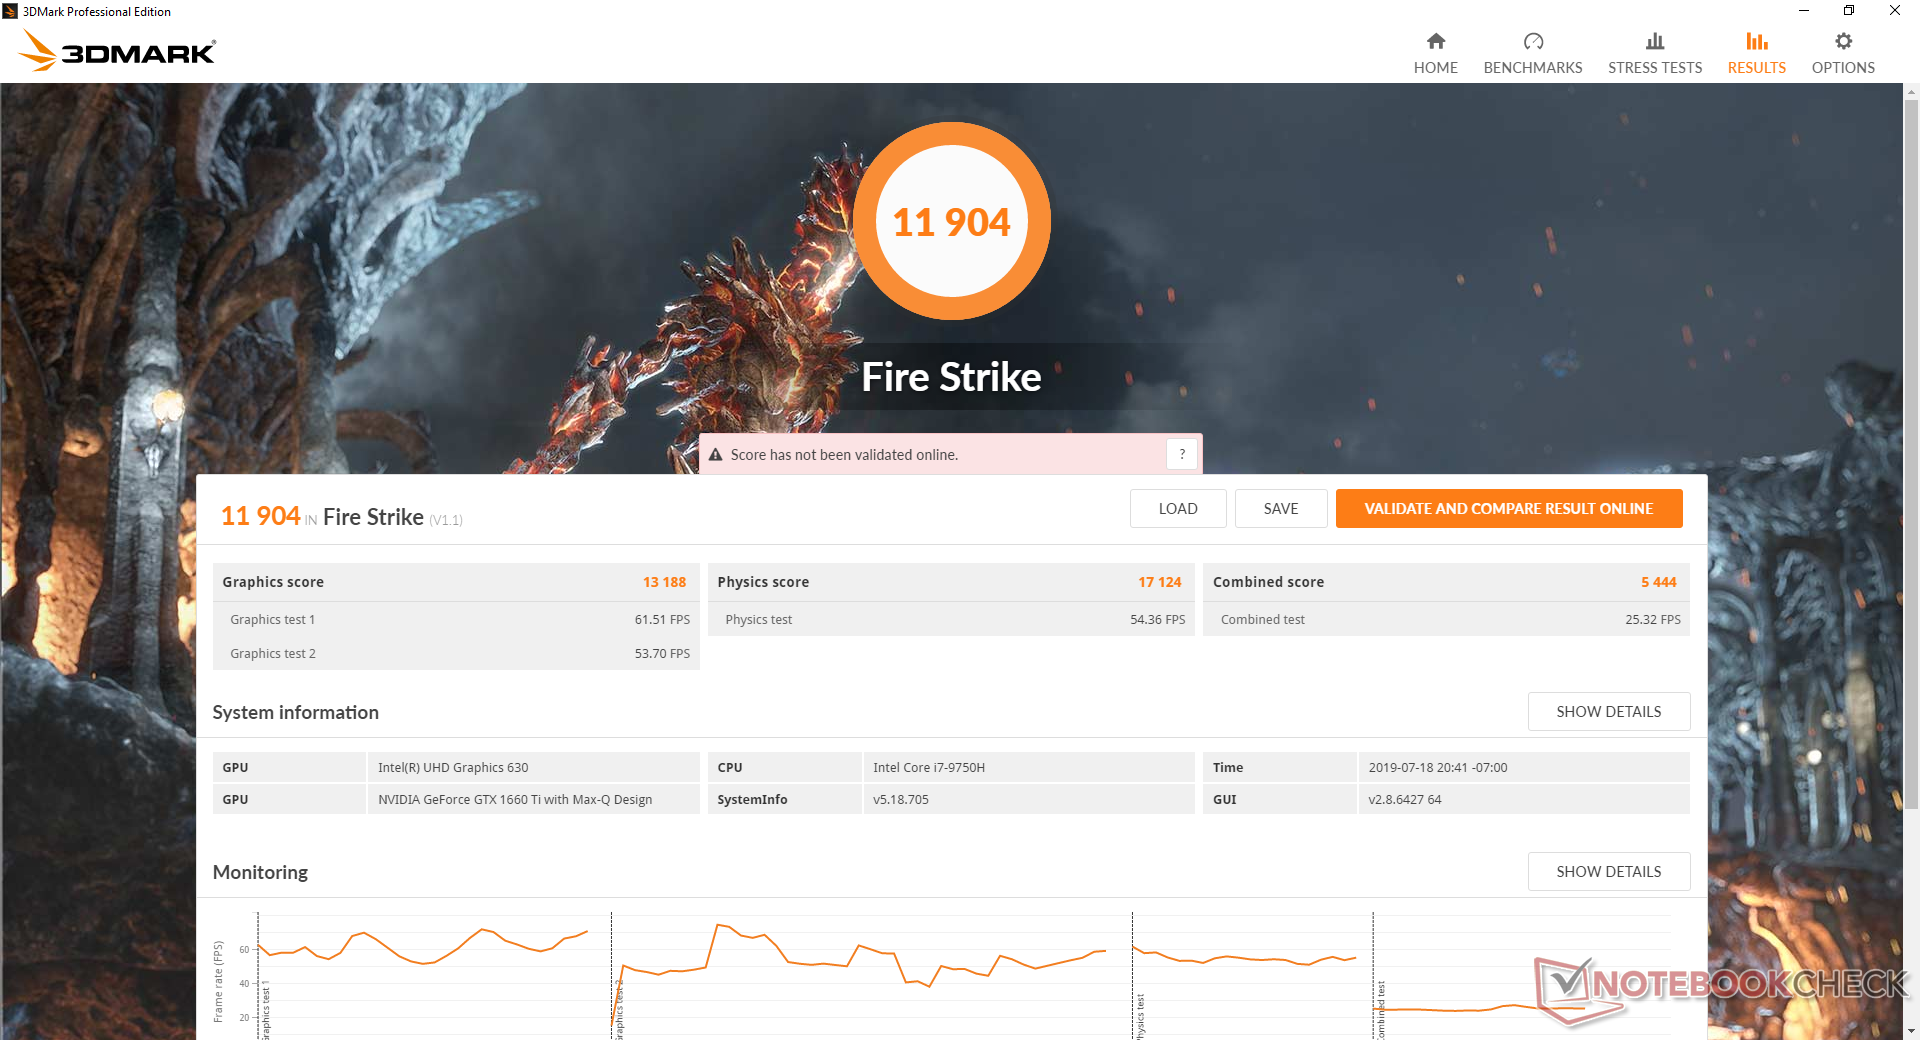
| 3DMark Fire Strike Score | 11904 points | |
| 3DMark Time Spy Score | 5245 points | |
Help | ||
Gaming Performance
Real-world performance in games is about 18 percent slower than a desktop GTX 1660 Ti as predicted by 3DMark above. Results are just shy of the last generation GTX 1070 Max-Q but still powerful enough to play the latest demanding titles on High settings at 1080p. G-Sync would have paired very well with the Pavilion since frame rates tend to teeter in the 40 to 60 FPS range on certain titles where the Nvidia technology excels.
It's interesting to note that Shadow of the Tomb Raider runs 30 percent to 100 percent faster than the Asus ROG GA502DU equipped with the same GPU but a Ryzen 7 3750H CPU instead. Titles optimized to use as many threads as available will run faster on the hexa-core i7-8750H or i7-9750H compared to the quad-core Ryzen 7 3750H, i5-8300H, or i5-9300H.
See our dedicated page on the GeForce GTX 1660 Ti Max-Q for more technical information and benchmark comparisons.
| low | med. | high | ultra | |
| BioShock Infinite (2013) | 331.3 | 282 | 259.9 | 130 |
| The Witcher 3 (2015) | 256.8 | 173.3 | 92.1 | 48.5 |
| Shadow of the Tomb Raider (2018) | 126 | 83 | 74 | 64 |
Emissions
System Noise
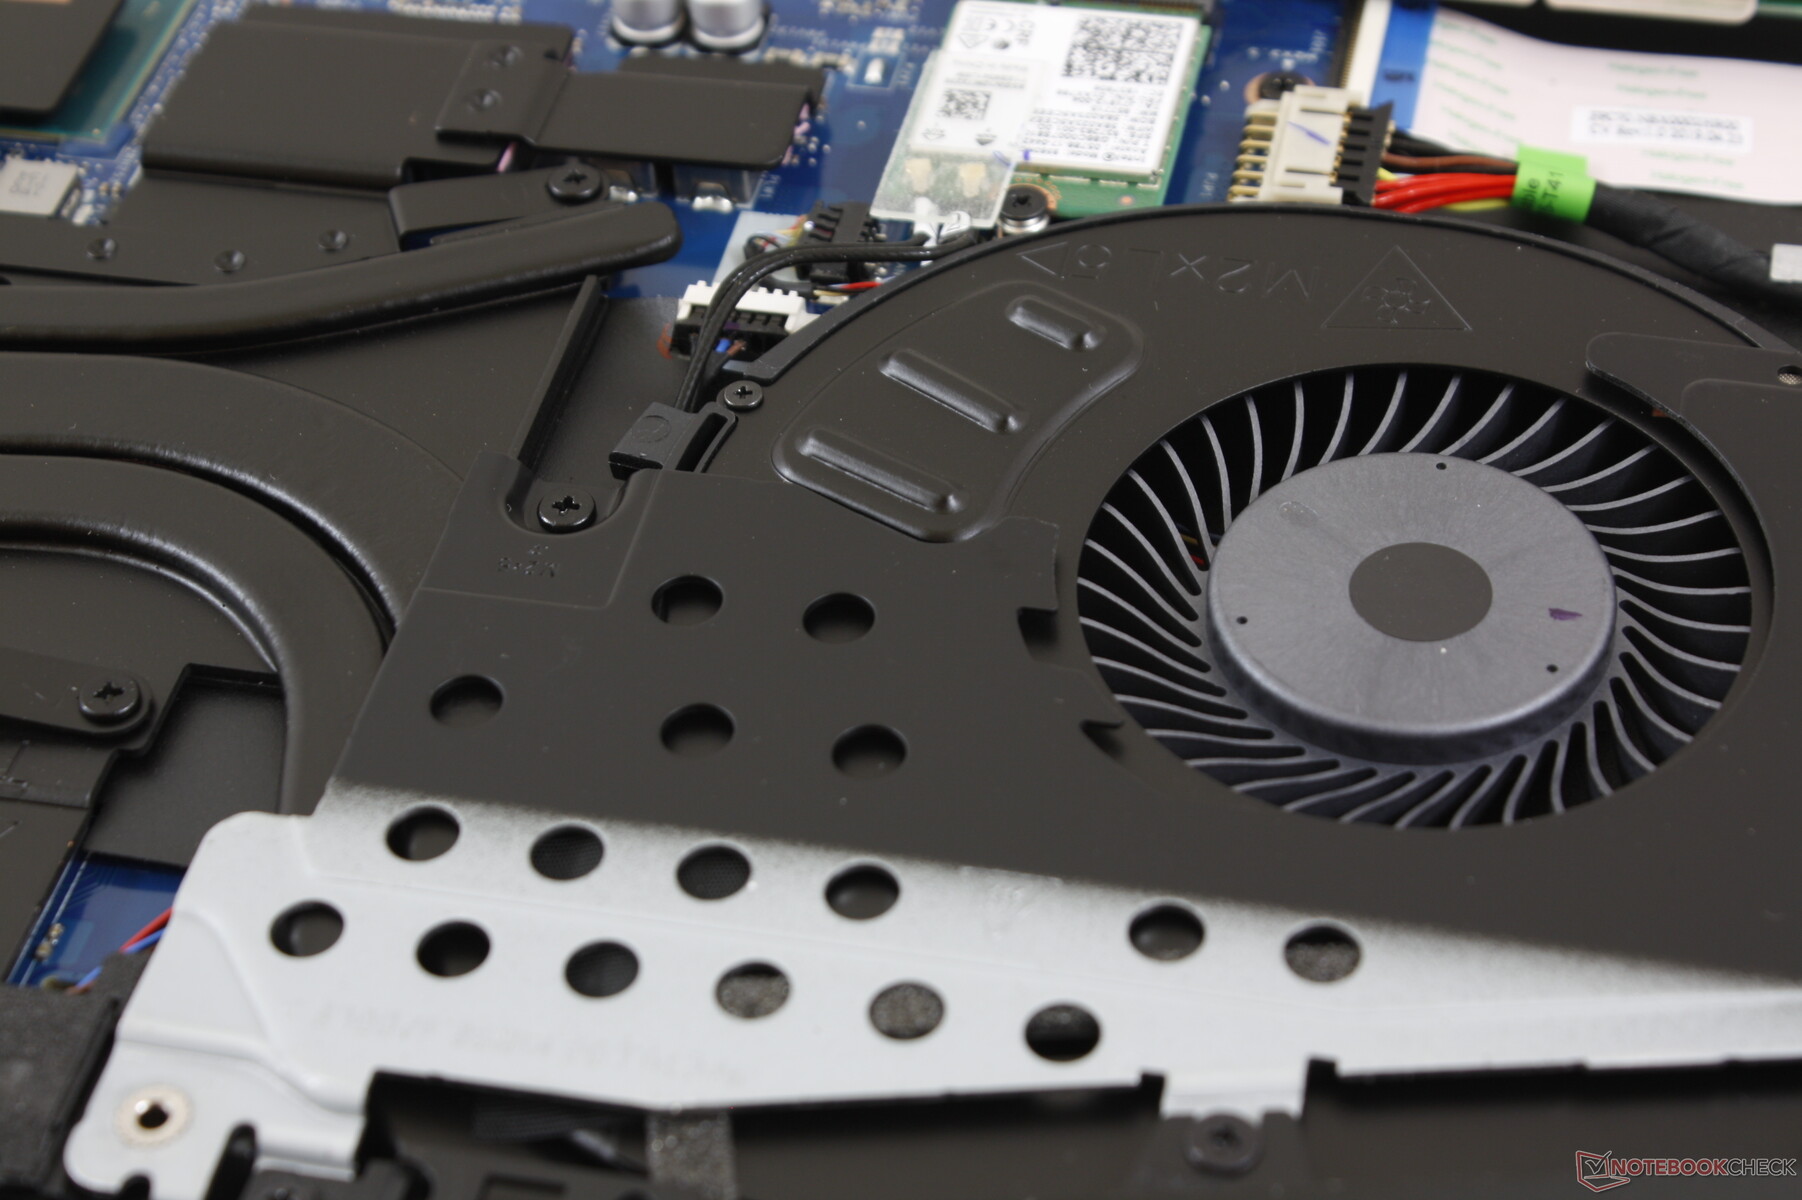
The cooling solution consists of two fans and four heat pipes in a mostly symmetrical arrangement. Fan noise is always present at about 30.1 dB(A) when the system is idling against a background of 28.2 dB(A). Thankfully, this is quiet enough to be easy to ignore in a typical home or classroom environment. At worst, fan noise can infrequently bump up to 33 dB(A) temporarily when launching applications or web browsing.
When running Witcher 3, fan noise is significantly quieter than other gaming laptops. We're able to record a fan noise of 34.2 to 36.7 dB(A) compared to 40+ dB(A) and even 50+ dB(A) on competing systems like the MSI GP75. We had to double-check that the system wasn't on Power Saver mode just because the fans can be so much quieter than what we are used to from a gaming laptop. Extreme loads will bump fan noise up to a steady 43.8 dB(A) to still be one of the quieter gaming laptops available.
We're not able to notice any coil whine or electronic noise from our test unit.
| HP Pavilion Gaming 17-cd0085cl GeForce GTX 1660 Ti Max-Q, i7-9750H, Samsung SSD PM981 MZVLB256HAHQ | Lenovo Legion Y740-17ICH GeForce RTX 2080 Max-Q, i7-8750H, Samsung SSD PM981 MZVLB256HAHQ | HP Omen 17t-3AW55AV_1 GeForce GTX 1070 Mobile, i7-8750H, Samsung SSD PM981 MZVLB512HAJQ | Asus TUF FX705DT-AU068T GeForce GTX 1650 Mobile, R5 3550H, WDC PC SN520 SDAPNUW-256G | MSI GP75 Leopard 9SD GeForce GTX 1660 Ti Mobile, i7-9750H, Kingston RBUSNS8154P3256GJ1 | Eurocom Nightsky RX17 GeForce RTX 2070 Mobile, i7-9750H, 2x Samsung SSD 970 Pro 512GB (RAID 0) | |
|---|---|---|---|---|---|---|
| Noise | -6% | -11% | -6% | -24% | -15% | |
| off / environment * | 28.2 | 28.3 -0% | 27.8 1% | 30.8 -9% | 29 -3% | 28 1% |
| Idle Minimum * | 30.1 | 31.5 -5% | 31.1 -3% | 30.8 -2% | 29 4% | 28 7% |
| Idle Average * | 30.1 | 31.6 -5% | 31.1 -3% | 30.8 -2% | 34 -13% | 28.4 6% |
| Idle Maximum * | 30.1 | 31.6 -5% | 35 -16% | 32.2 -7% | 37 -23% | 32.9 -9% |
| Load Average * | 34.2 | 32.3 6% | 42 -23% | 38.6 -13% | 53 -55% | 45 -32% |
| Witcher 3 ultra * | 34.2 | 43 -26% | 44.5 -30% | 51 -49% | 53.2 -56% | |
| Load Maximum * | 43.8 | 45.5 -4% | 46.5 -6% | 44.8 -2% | 55 -26% | 53.2 -21% |
* ... smaller is better
Noise Level
| Idle |
| 30.1 / 30.1 / 30.1 dB(A) |
| Load |
| 34.2 / 43.8 dB(A) |
 | ||
30 dB silent 40 dB(A) audible 50 dB(A) loud |
||
min: | ||
Temperature
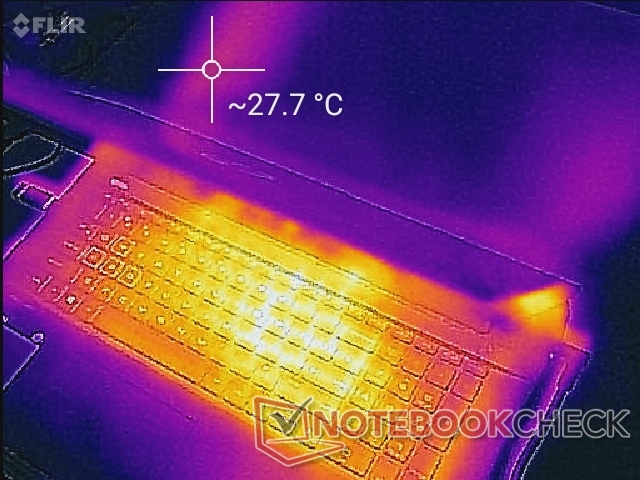
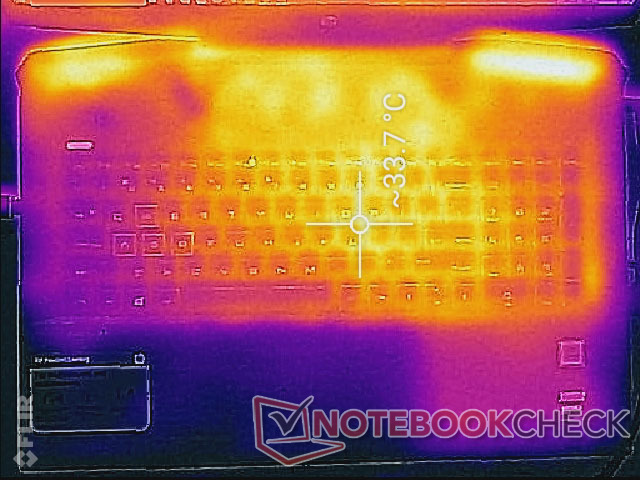
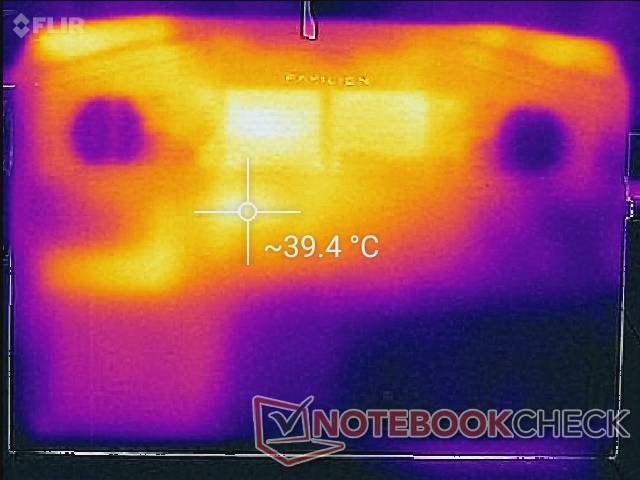
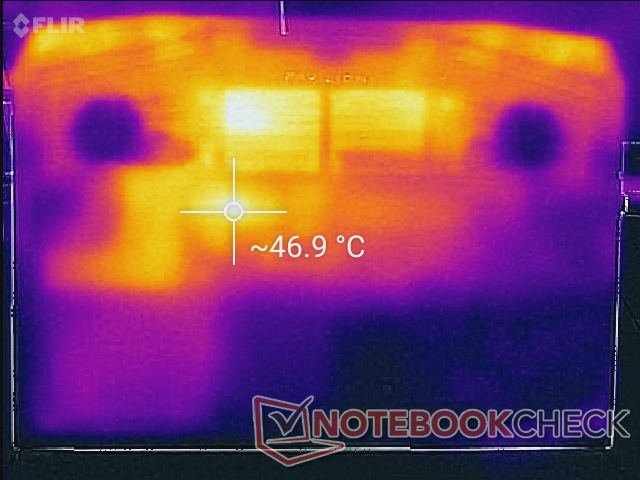
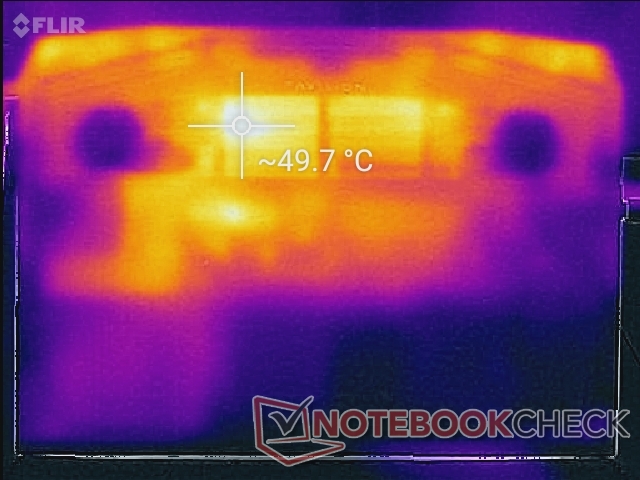
Surface temperatures are warmer than expected when idling on desktop. The keyboard center and bottom surface closest to the processors can be as warm as 34 C and 39 C, respectively, compared to just 26 C to 30 C on the Razer Blade Pro 17. When gaming, these same hot spots on the HP can reach up to 42 C to 49 C to be about standard for a gaming laptop. The WASD keys, NumPad, and palm rests remain comparatively cool for comfortable hands and fingers when gaming. Note that the right palm rest will always be a few degrees warmer than the left if a 2.5-inch drive is installed.
Waste heat from the rear is noticeably cool at just 28 C compared to over 40 C on the Asus ROG Strix G GL731GU.
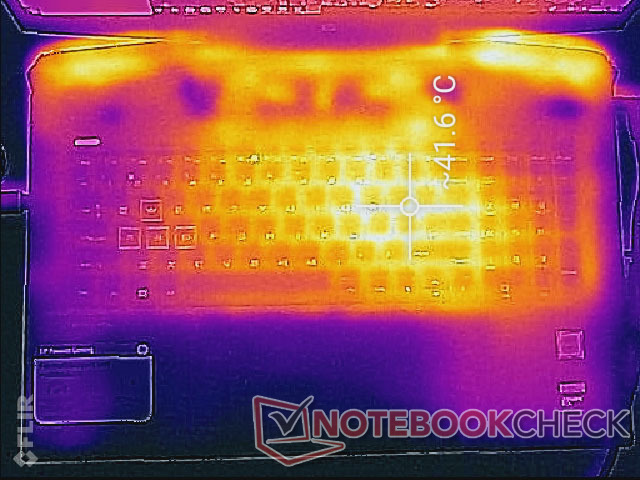
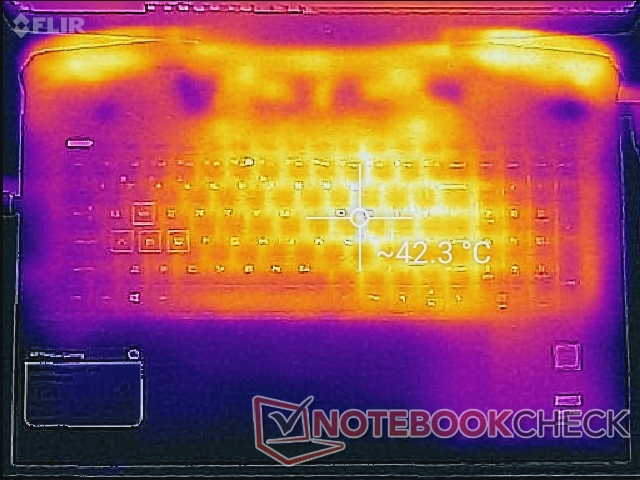
(±) The maximum temperature on the upper side is 42.6 °C / 109 F, compared to the average of 40.4 °C / 105 F, ranging from 21.2 to 68.8 °C for the class Gaming.
(-) The bottom heats up to a maximum of 49 °C / 120 F, compared to the average of 43.2 °C / 110 F
(+) In idle usage, the average temperature for the upper side is 29.8 °C / 86 F, compared to the device average of 33.8 °C / 93 F.
(±) Playing The Witcher 3, the average temperature for the upper side is 33.7 °C / 93 F, compared to the device average of 33.8 °C / 93 F.
(+) The palmrests and touchpad are cooler than skin temperature with a maximum of 29.2 °C / 84.6 F and are therefore cool to the touch.
(±) The average temperature of the palmrest area of similar devices was 28.9 °C / 84 F (-0.3 °C / -0.6 F).
Stress Test
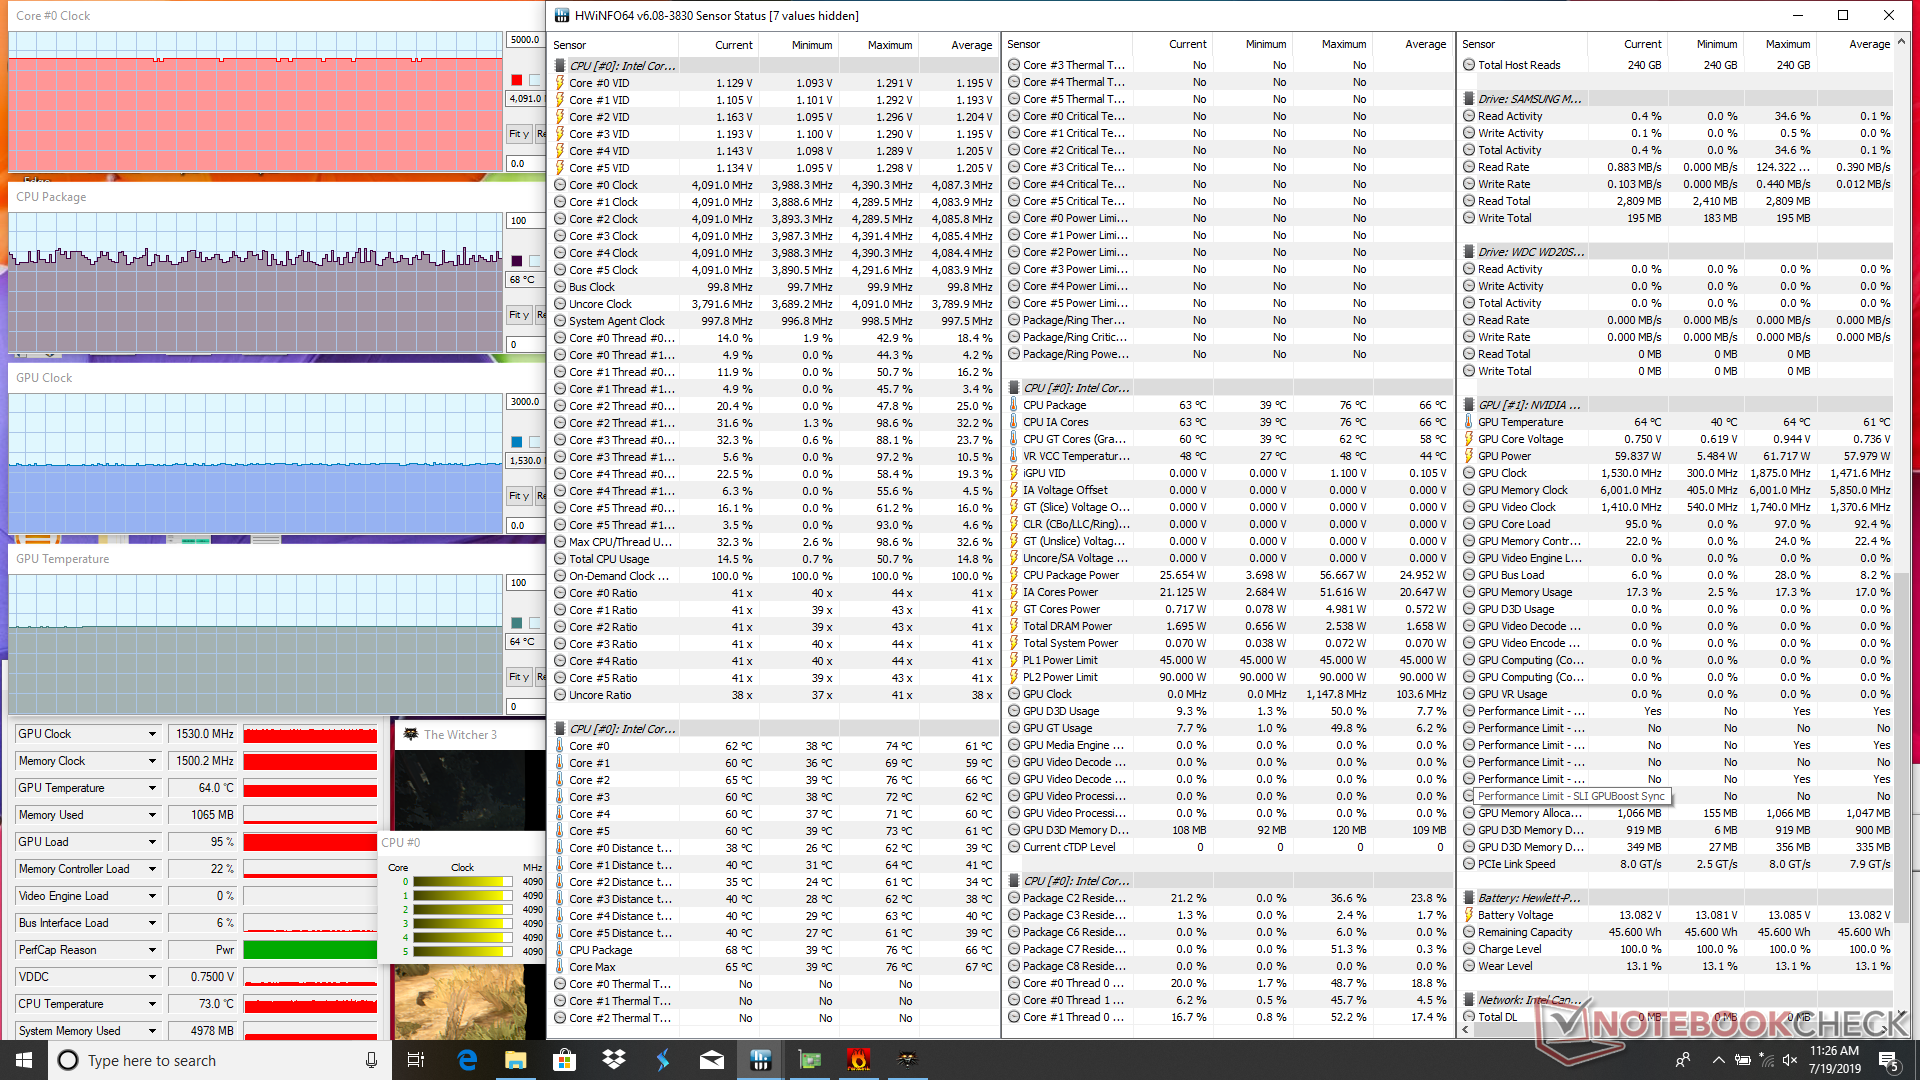
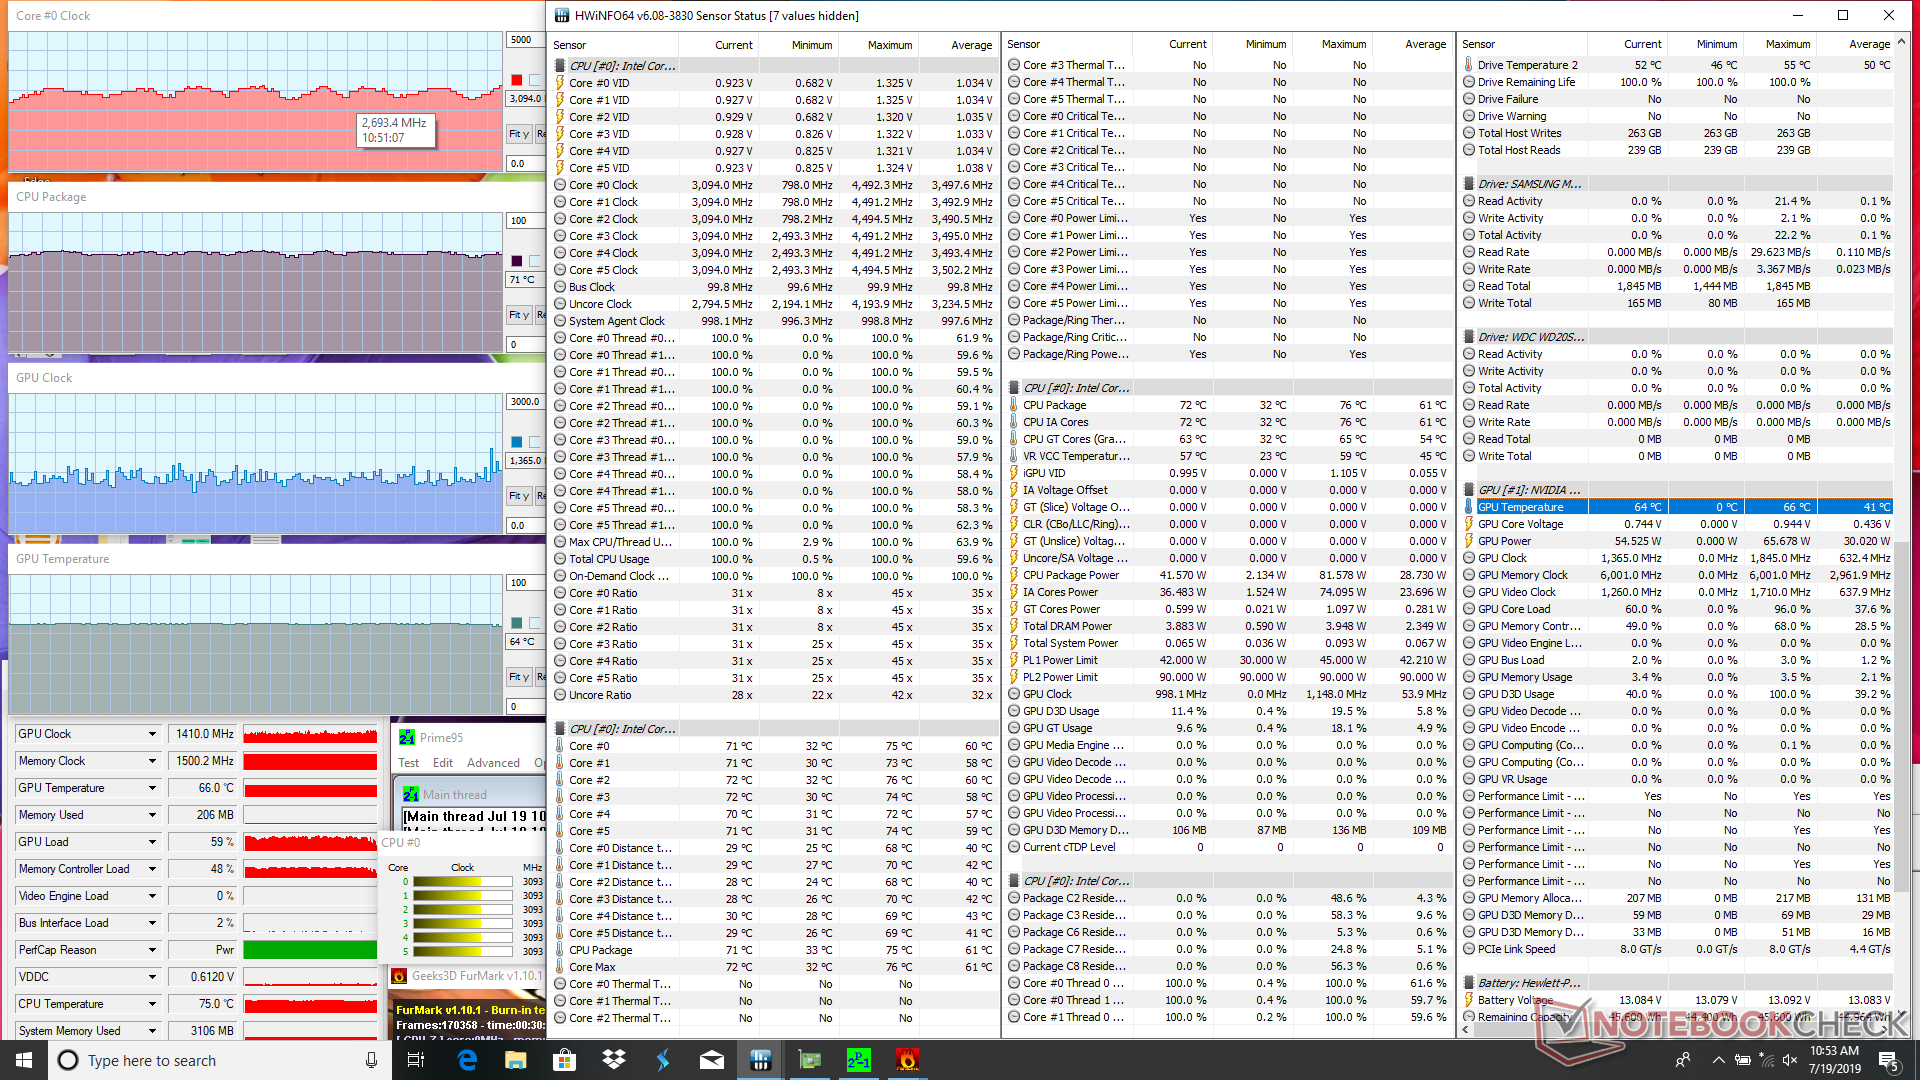
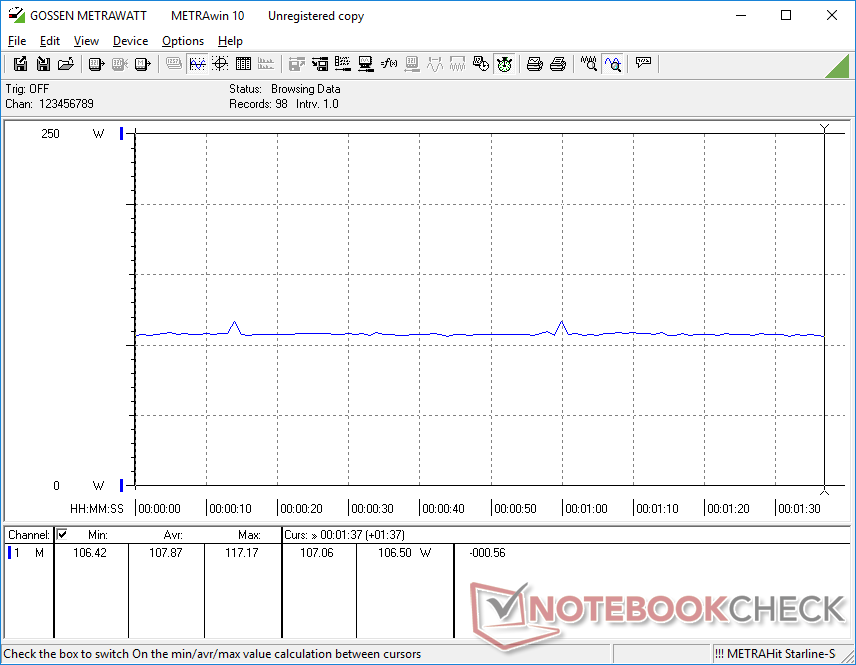
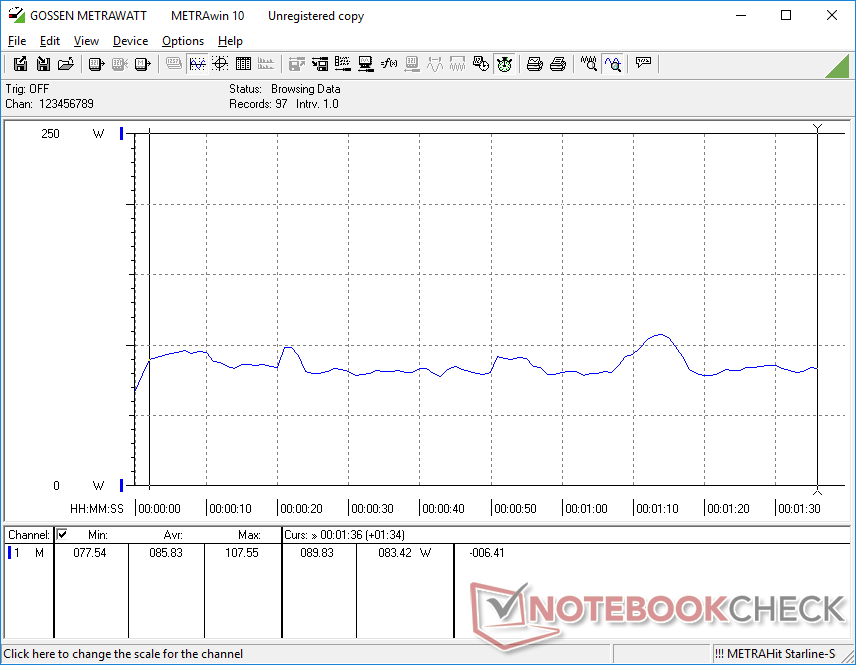
We stress the system with synthetic loads to identify for any potential throttling or stability issues. When running Prime95, the CPU can be observed boosting up to 4 GHz for the first few seconds before hitting a core temperature of 74 C. Clock rates will then drop to the 2.9 - 3.1 GHz range in order to maintain a cooler core temperature of 61 C. If running both Prime95 and FurMark simultaneously, CPU clock rates and temperature will cycle more heavily compared to other gaming laptops at 2.5 - 3.1 GHz and 69 C to 75 C, respectively, as shown by our screenshot below.
When running Witcher 3, the CPU and GPU remain steady at 68 C and 64 C, respectively, which are surprisingly cool for a gaming laptop. Results are a few degrees cooler than the MSI GP75 9SD and about 8 C to 13 C cooler than the Razer Blade Pro 17 with faster RTX 2080 Max-Q graphics when under similar gaming conditions.
Running on batteries will impact overall performance. A Fire Strike run on batteries returns Physics and Graphics scores of 12387 and 3849 points, respectively, compared to 17124 and 13188 points when on mains.
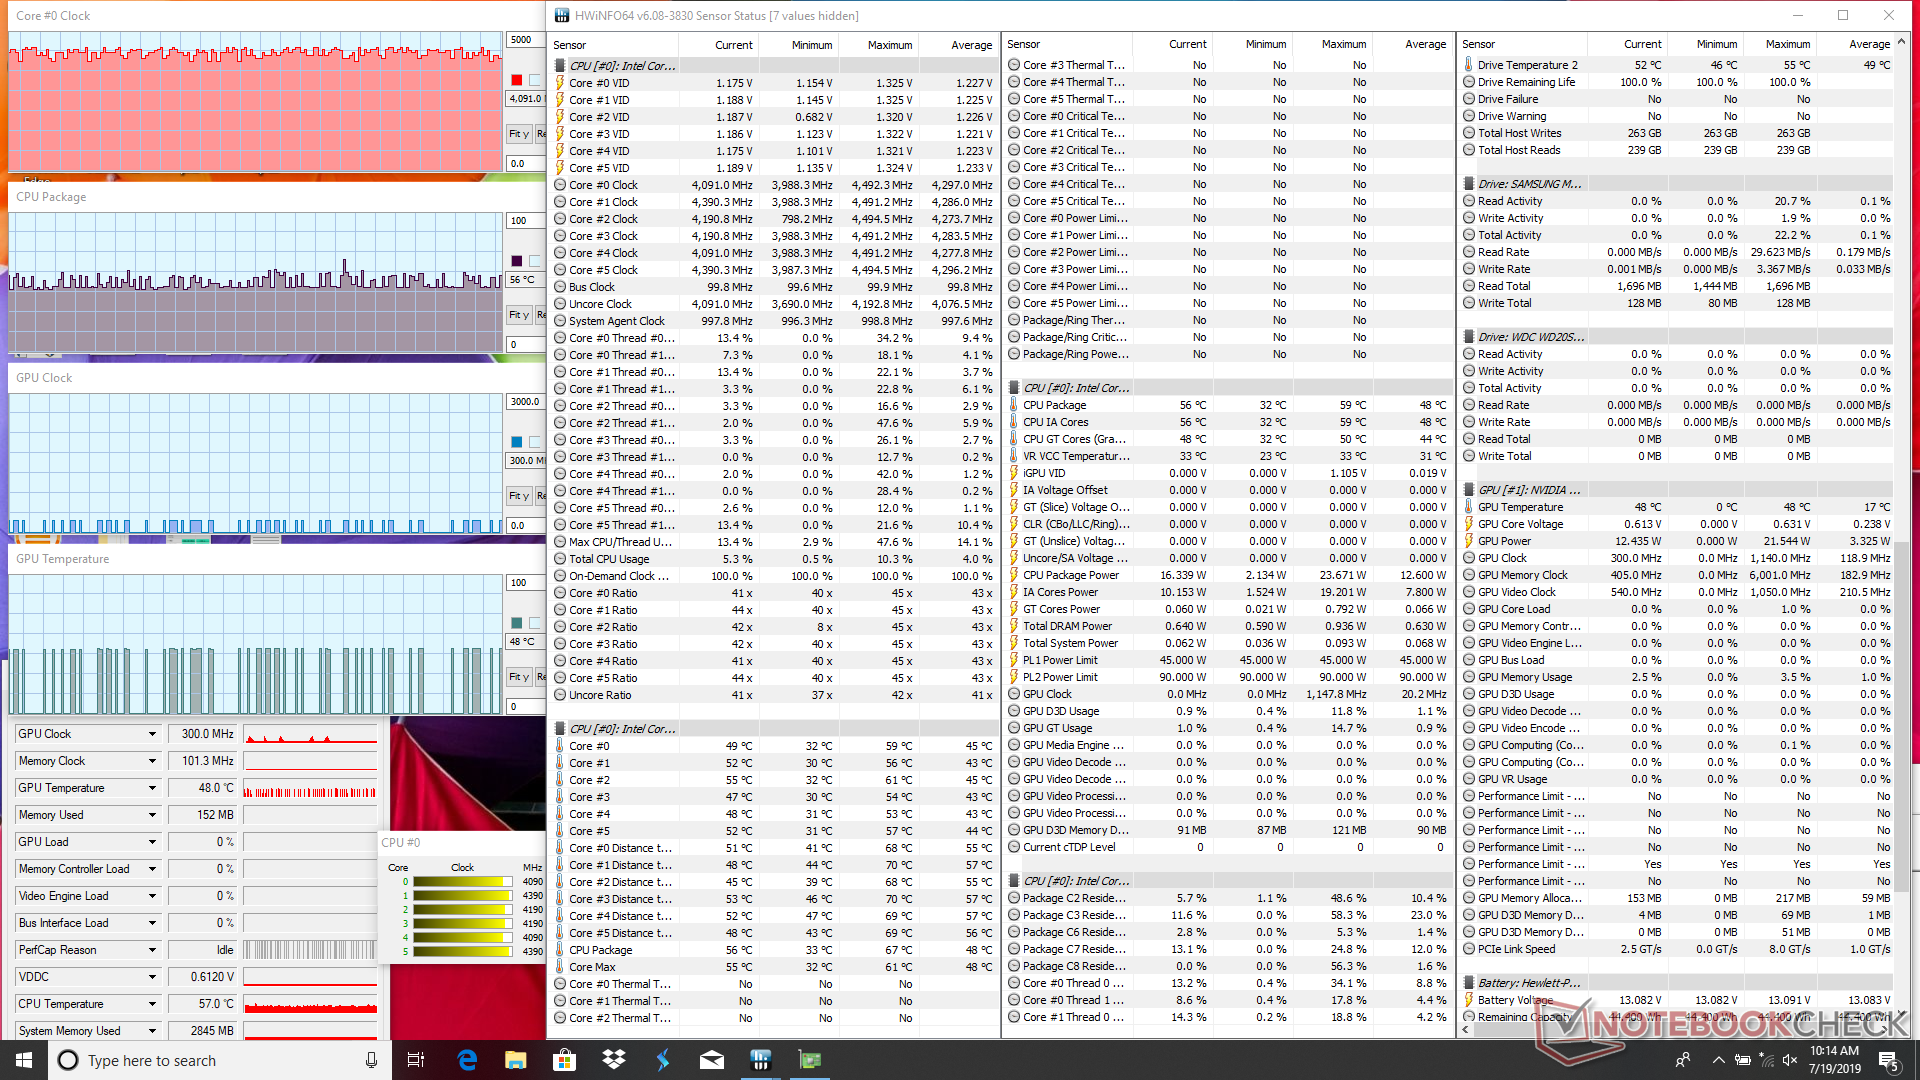
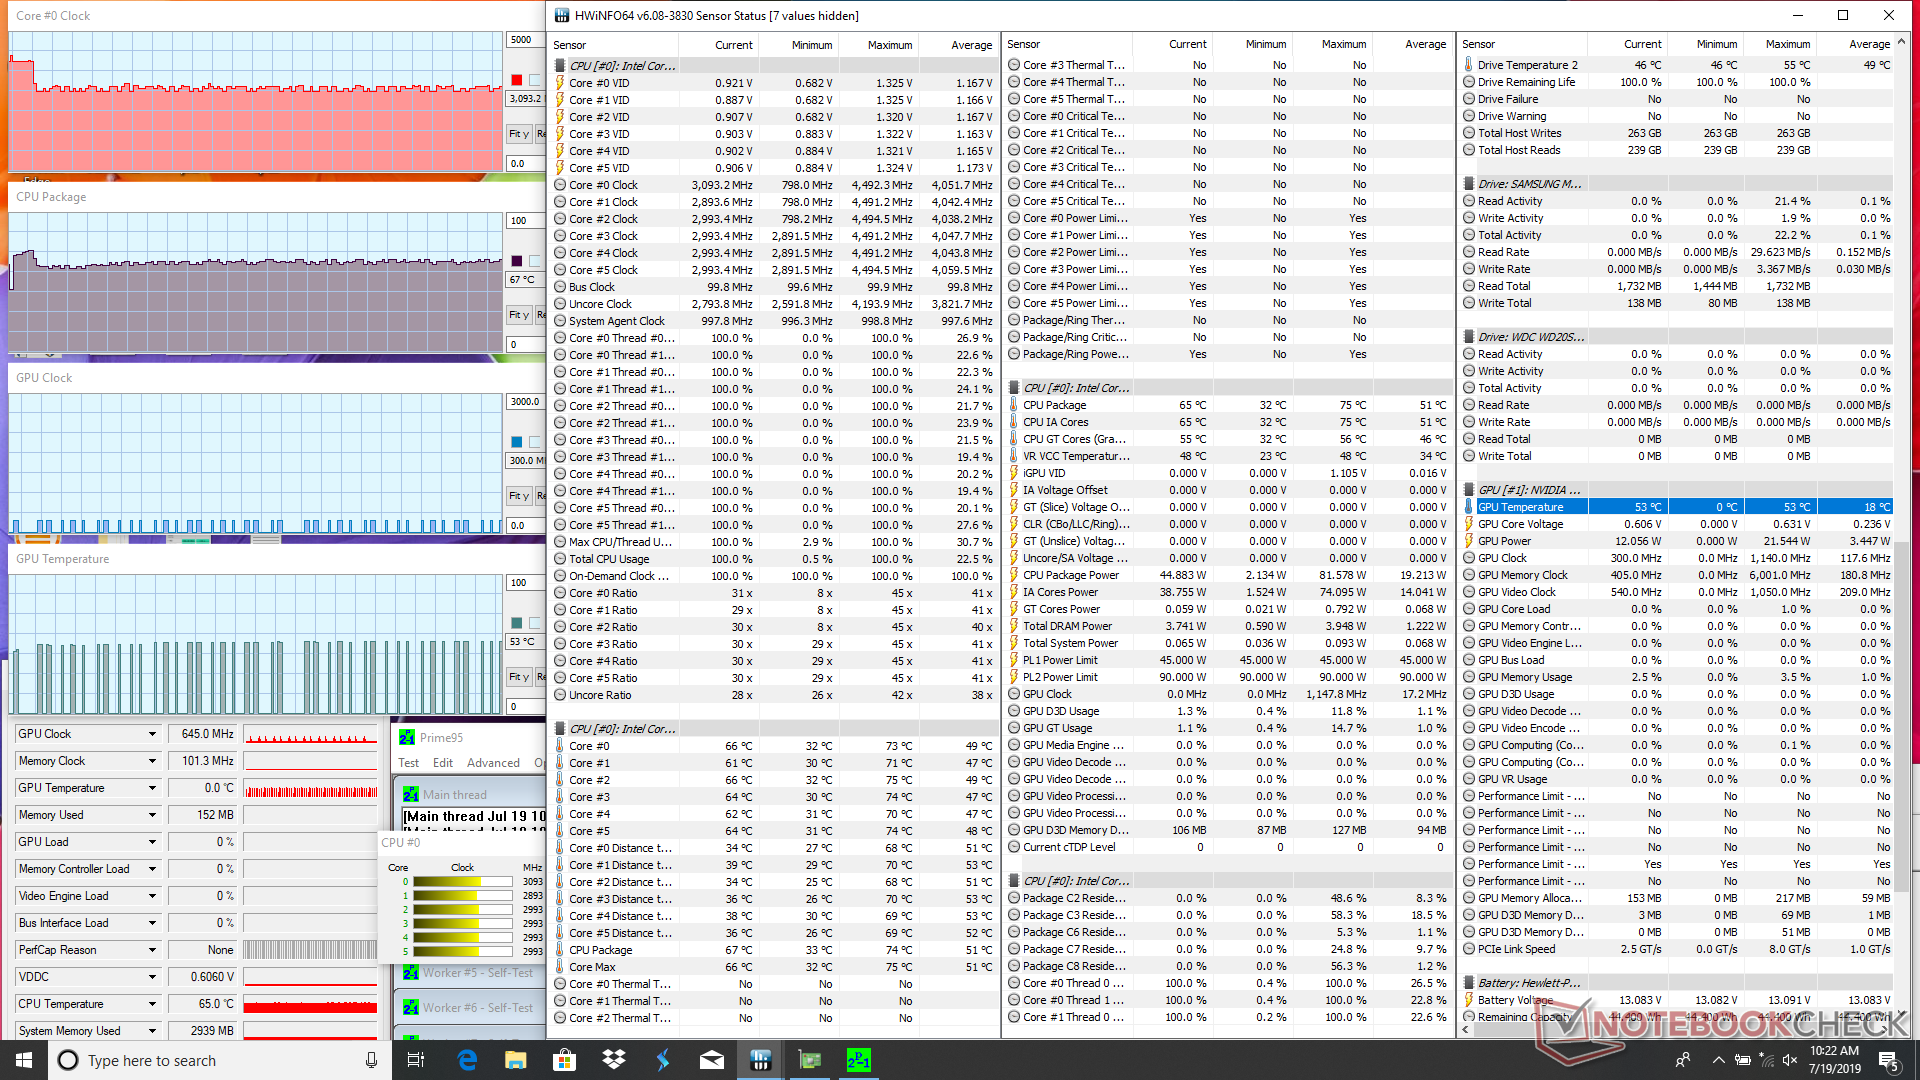
| CPU Clock (GHz) | GPU Clock (MHz) | Average CPU Temperature (°C) | Average GPU Temperature (°C) | |
| System Idle | -- | -- | 56 | 48 |
| Prime95 Stress | 2.9 - 3.1 | -- | 67 | 53 |
| Prime95 + FurMark Stress | 2.5 - 3.1 | 900 - 1350 | 69 - 75 | 66 |
| Witcher 3 Stress | 4.1 | 1530 | 68 | 64 |
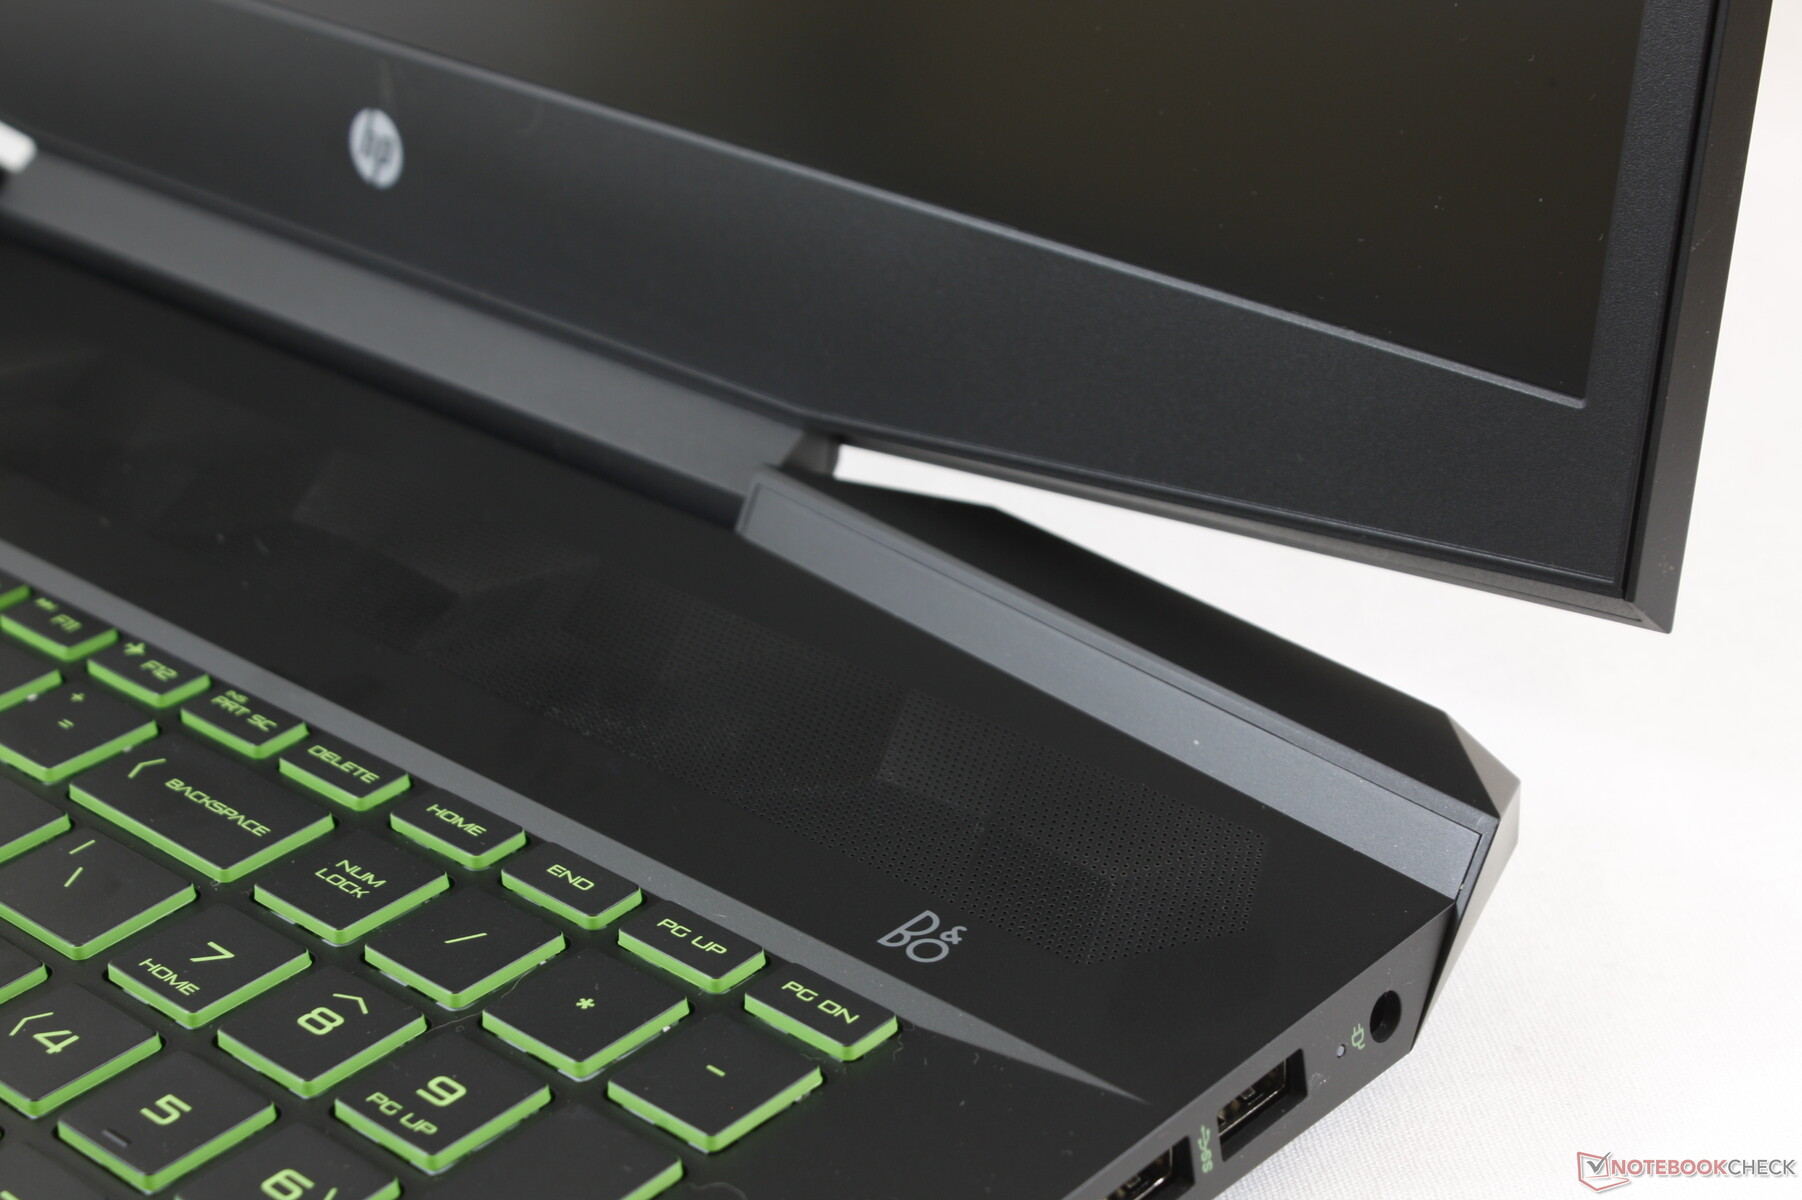
Speakers
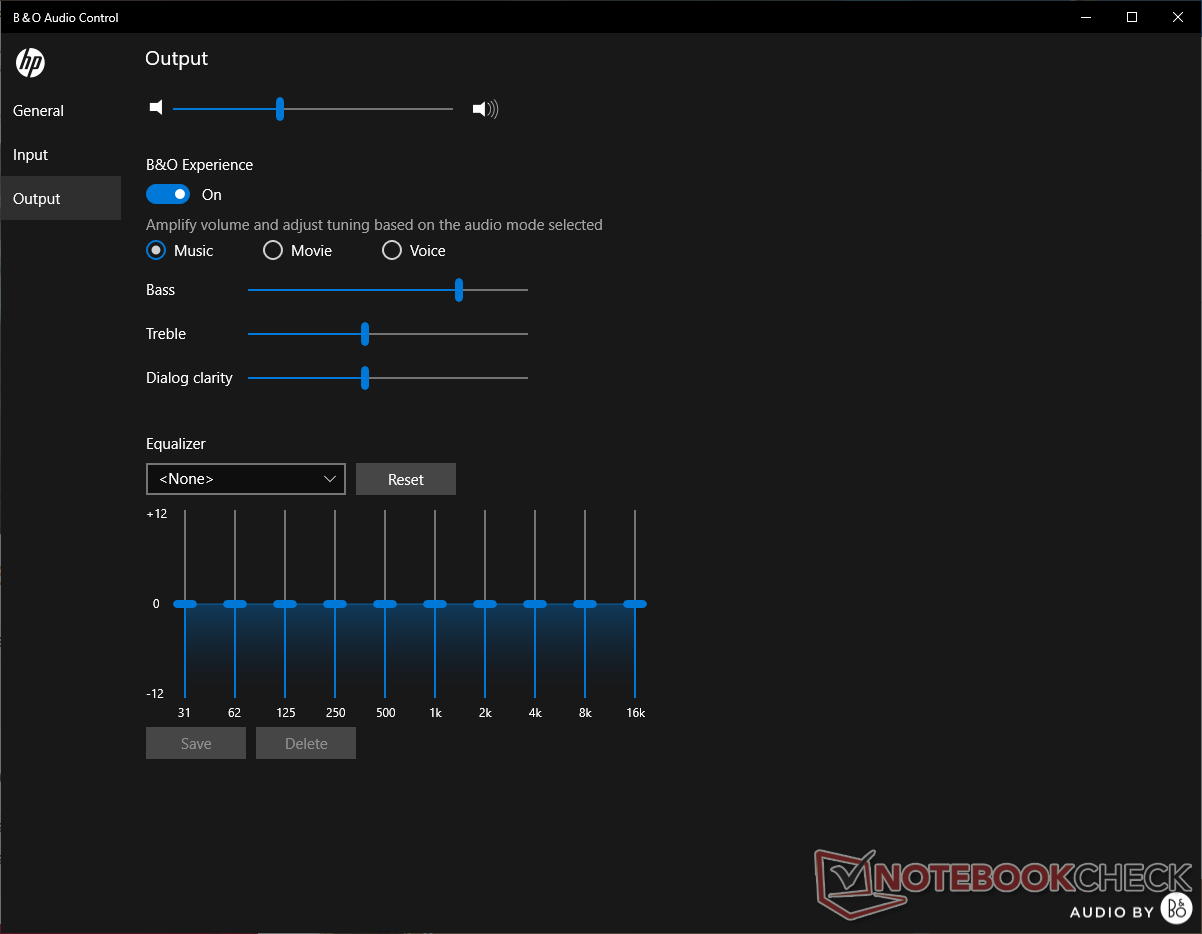
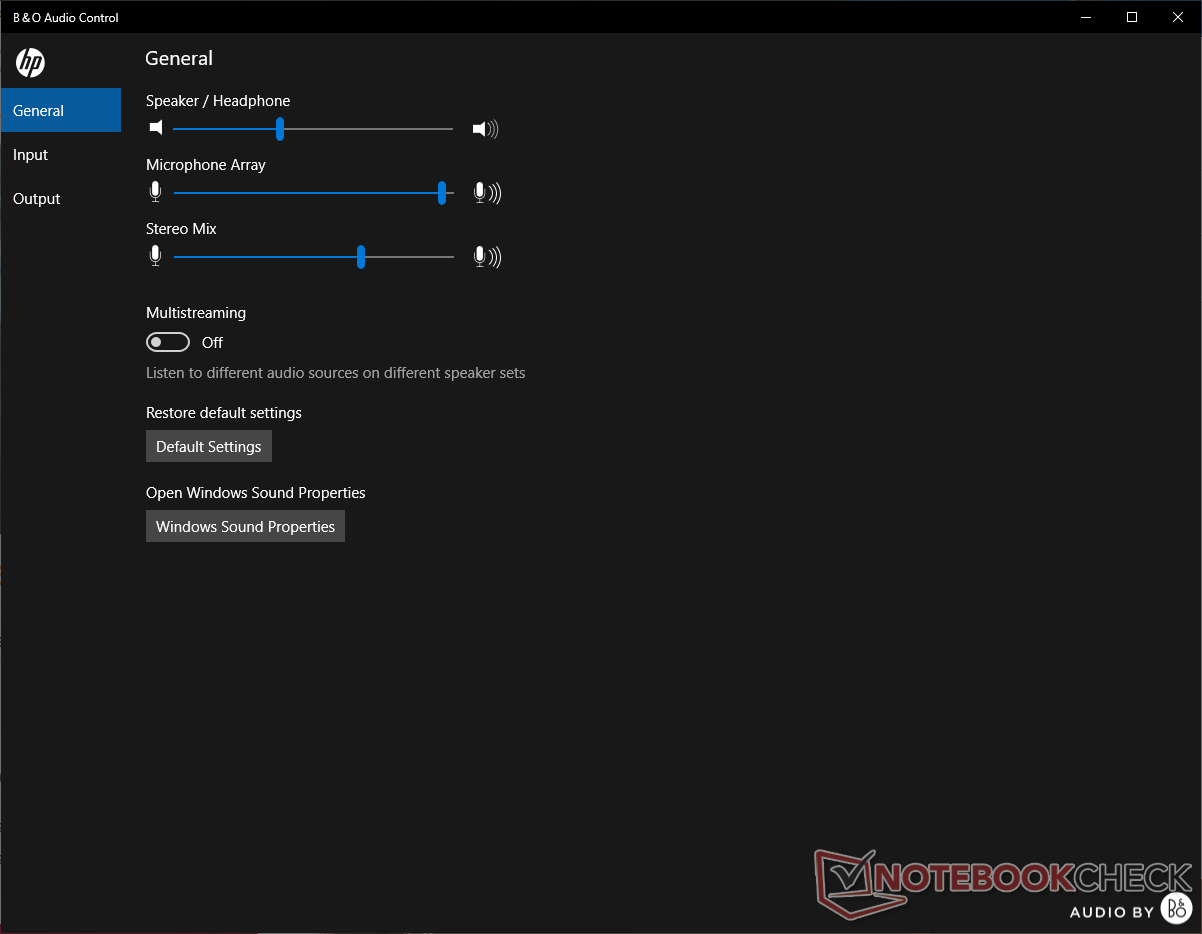
The stereo Bang & Olufsen speakers are positioned above the first row of keyboard keys instead of underneath the palm rests to avoid any vibration repercussions. Audio is loud enough for personal use or a small room, but bass is lacking. The B&O software can't make up for the fact that the speakers have narrow range.
Maximum volume introduces no static. Since fan noise is so low for a gaming laptop, the internal speakers are actually adequate and audible whilst playing games which is more than what we can say for systems like the MSI GT76,


HP Pavilion Gaming 17-cd0085cl audio analysis
(±) | speaker loudness is average but good (74.3 dB)
Analysis not possible as minimum curve is missing or too high
Apple MacBook 12 (Early 2016) 1.1 GHz audio analysis
(+) | speakers can play relatively loud (83.6 dB)
Bass 100 - 315 Hz
(±) | reduced bass - on average 11.3% lower than median
(±) | linearity of bass is average (14.2% delta to prev. frequency)
Mids 400 - 2000 Hz
(+) | balanced mids - only 2.4% away from median
(+) | mids are linear (5.5% delta to prev. frequency)
Highs 2 - 16 kHz
(+) | balanced highs - only 2% away from median
(+) | highs are linear (4.5% delta to prev. frequency)
Overall 100 - 16.000 Hz
(+) | overall sound is linear (10.2% difference to median)
Compared to same class
» 5% of all tested devices in this class were better, 2% similar, 93% worse
» The best had a delta of 5%, average was 19%, worst was 53%
Compared to all devices tested
» 3% of all tested devices were better, 1% similar, 96% worse
» The best had a delta of 4%, average was 25%, worst was 134%
Energy Management
Power Consumption
The Pavilion is very power efficient when idling on desktop at just 5 W to 13 W depending on the brightness profile and power setting compared to nearly 30 W on the Lenovo Legion Y740-17ICH or HP Omen 17. When gaming, power consumption jumps to 108 W to be nearly identical to the Asus Zephyrus G GA502DU with the same GTX 1660 Ti Max-Q GPU. The HP Omen 17 with GTX 1070 draws 168 W when subjected to the same conditions meaning that the Pavilion Gaming 17 offers 11 to 26 percent slower gaming performance for a significant 36 percent power savings.
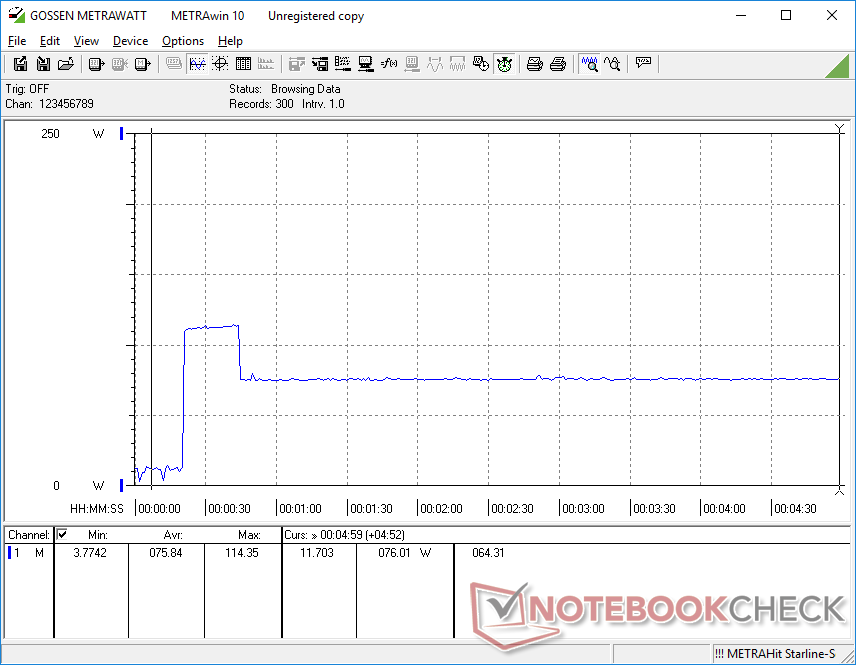
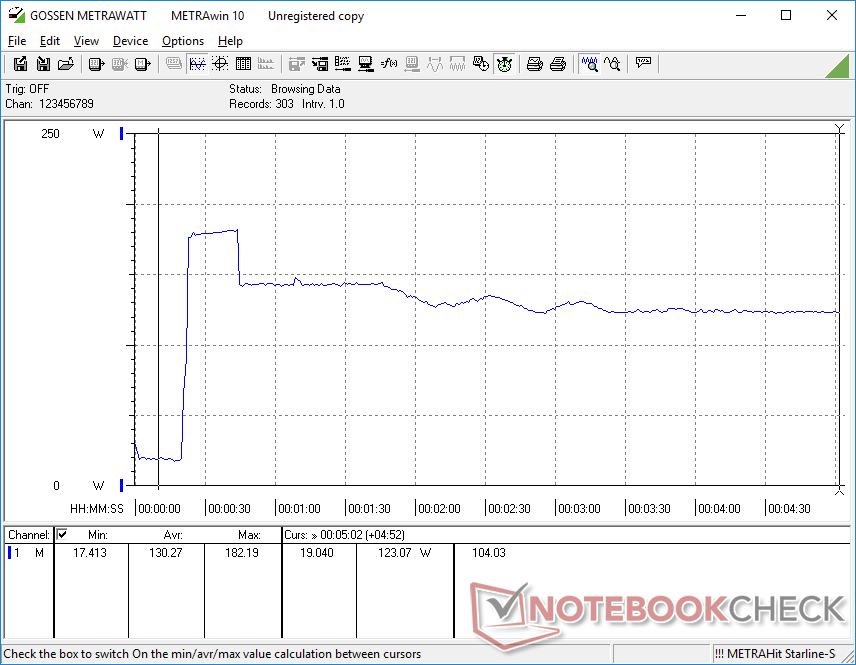
We're able to record a maximum draw of 182 W from the small-medium (~16.5 x 8 x 2.5 cm) 200 W AC adapter. Consumption will not stabilize at this high of a rate due to thermal constraints and so it will quickly drop to a more stable 123 W as shown by our graph below. CPU and GPU clock rates will also drop accordingly.
It's unlikely that HP will introduce a higher-end GPU option past the GTX 1660 Ti Max-Q anytime soon or else the OEM would have to begin offering higher 230+ W AC adapters in order to accommodate for the more demanding graphics card.
| Off / Standby | |
| Idle | |
| Load |
|
| HP Pavilion Gaming 17-cd0085cl i7-9750H, GeForce GTX 1660 Ti Max-Q, Samsung SSD PM981 MZVLB256HAHQ, IPS, 1920x1080, 17.30 | Lenovo Legion Y740-17ICH i7-8750H, GeForce RTX 2080 Max-Q, Samsung SSD PM981 MZVLB256HAHQ, IPS, 1920x1080, 17.30 | HP Omen 17t-3AW55AV_1 i7-8750H, GeForce GTX 1070 Mobile, Samsung SSD PM981 MZVLB512HAJQ, IPS, 1920x1080, 17.30 | MSI GP75 Leopard 9SD i7-9750H, GeForce GTX 1660 Ti Mobile, Kingston RBUSNS8154P3256GJ1, IPS, 1920x1080, 17.30 | Eurocom Nightsky RX17 i7-9750H, GeForce RTX 2070 Mobile, 2x Samsung SSD 970 Pro 512GB (RAID 0), IPS, 1920x1080, 17.30 | Asus ROG Zephyrus G15 GA502DU R7 3750H, GeForce GTX 1660 Ti Max-Q, Intel SSD 660p SSDPEKNW512G8, IPS, 1920x1080, 15.60 | |
|---|---|---|---|---|---|---|
| Power Consumption | -105% | -101% | -48% | -96% | -31% | |
| Idle Minimum * | 5.4 | 20.2 -274% | 17.8 -230% | 10 -85% | 18.6 -244% | 7.4 -37% |
| Idle Average * | 9.2 | 27.2 -196% | 24.7 -168% | 15 -63% | 22.6 -146% | 8.6 7% |
| Idle Maximum * | 13 | 28.7 -121% | 29.6 -128% | 22 -69% | 23 -77% | 39.1 -201% |
| Load Average * | 85.9 | 90.8 -6% | 110 -28% | 92 -7% | 93.4 -9% | 65.9 23% |
| Witcher 3 ultra * | 107.9 | 152.1 -41% | 167.8 -56% | 153 -42% | 186.4 -73% | 106.9 1% |
| Load Maximum * | 182.2 | 165.4 9% | 178.6 2% | 216 -19% | 233.6 -28% | 141.3 22% |
* ... smaller is better
Battery Life
The 53 Wh battery is somewhat on the small side for a 17.3-inch gaming laptop. Alternatives like the Lenovo Legion Y740 or Asus TUF FX705 are equipped with larger 76 Wh and 64 Wh modules, respectively. Battery life is still above average for its category at 5.5 hours of real-world WLAN use likely due to the system's higher power efficiency during low processing loads as mentioned above.
Charging from empty to full capacity takes the usual 1.5 hours.
| HP Pavilion Gaming 17-cd0085cl i7-9750H, GeForce GTX 1660 Ti Max-Q, 52.5 Wh | Lenovo Legion Y740-17ICH i7-8750H, GeForce RTX 2080 Max-Q, 76 Wh | HP Omen 17t-3AW55AV_1 i7-8750H, GeForce GTX 1070 Mobile, 86 Wh | Asus TUF FX705DT-AU068T R5 3550H, GeForce GTX 1650 Mobile, 64 Wh | MSI GP75 Leopard 9SD i7-9750H, GeForce GTX 1660 Ti Mobile, 51 Wh | Razer Blade Pro 17 RTX 2080 Max-Q i7-9750H, GeForce RTX 2080 Max-Q, 70 Wh | Eurocom Nightsky RX17 i7-9750H, GeForce RTX 2070 Mobile, 62 Wh | |
|---|---|---|---|---|---|---|---|
| Battery Runtime | -44% | -7% | 55% | -46% | -10% | -37% | |
| Reader / Idle | 695 | 268 -61% | 815 17% | 286 -59% | 295 -58% | 251 -64% | |
| WiFi v1.3 | 339 | 190 -44% | 253 -25% | 469 38% | 190 -44% | 280 -17% | 120 -65% |
| Load | 59 | 97 64% | 124 110% | 38 -36% | 86 46% | 69 17% |
Pros
Cons
Verdict
One word describes our overall experience with the Pavilion Gaming 17: surprised. The Pavilion series is HP's bottom-of-the-barrel offering designed for users on a budget and so we would always adjust our expectations accordingly. This particular model caught us off guard by being one of the quietest gaming laptops we've tested and also one of the sleeker and more strongly designed Pavilion PCs. HP is clearly beginning to put a lot more attention to its entry-level gaming laptops and it really shows with the Pavilion Gaming 17.
There are still some lingering "budget" characteristics that could use more work. The cramped clickpad, flexible lid, middling speakers, and flimsy rear grilles feel like they should belong on a much cheaper laptop instead.
The bigger asterisk here is that the Pavilion Gaming 17 with i9-9750H and GTX 1660 Ti Max-Q graphics is not all that much cheaper than a competing system with equivalent specifications. At $1300, this is only about $100 to $200 cheaper than the MSI GL73, MSI GP75, Asus TUF FX705, or Asus ROG GL731GU depending on the RAM, storage, and display configuration. Even so, we find the Pavilion to the better deal simply because of how much quieter the system is when gaming.
A Pavilion that punches above its budget category. Not only is it relatively quiet for a gaming laptop, but its strong design sets the bar for what future Pavilion laptops will be capable of.
HP Pavilion Gaming 17-cd0085cl
-
09/20/2019 v7
Allen Ngo


Pricecompare
