 Deutsch
 English
 Español
 Français
 Italiano
 Nederlands
 Polski
 Português
 Русский
 Türkçe
 Svenska
 Chinese
 Magyar
Gigabyte Aero 15 Classic-XA (i7-9750H, RTX 2070 Max-Q) Laptop Review

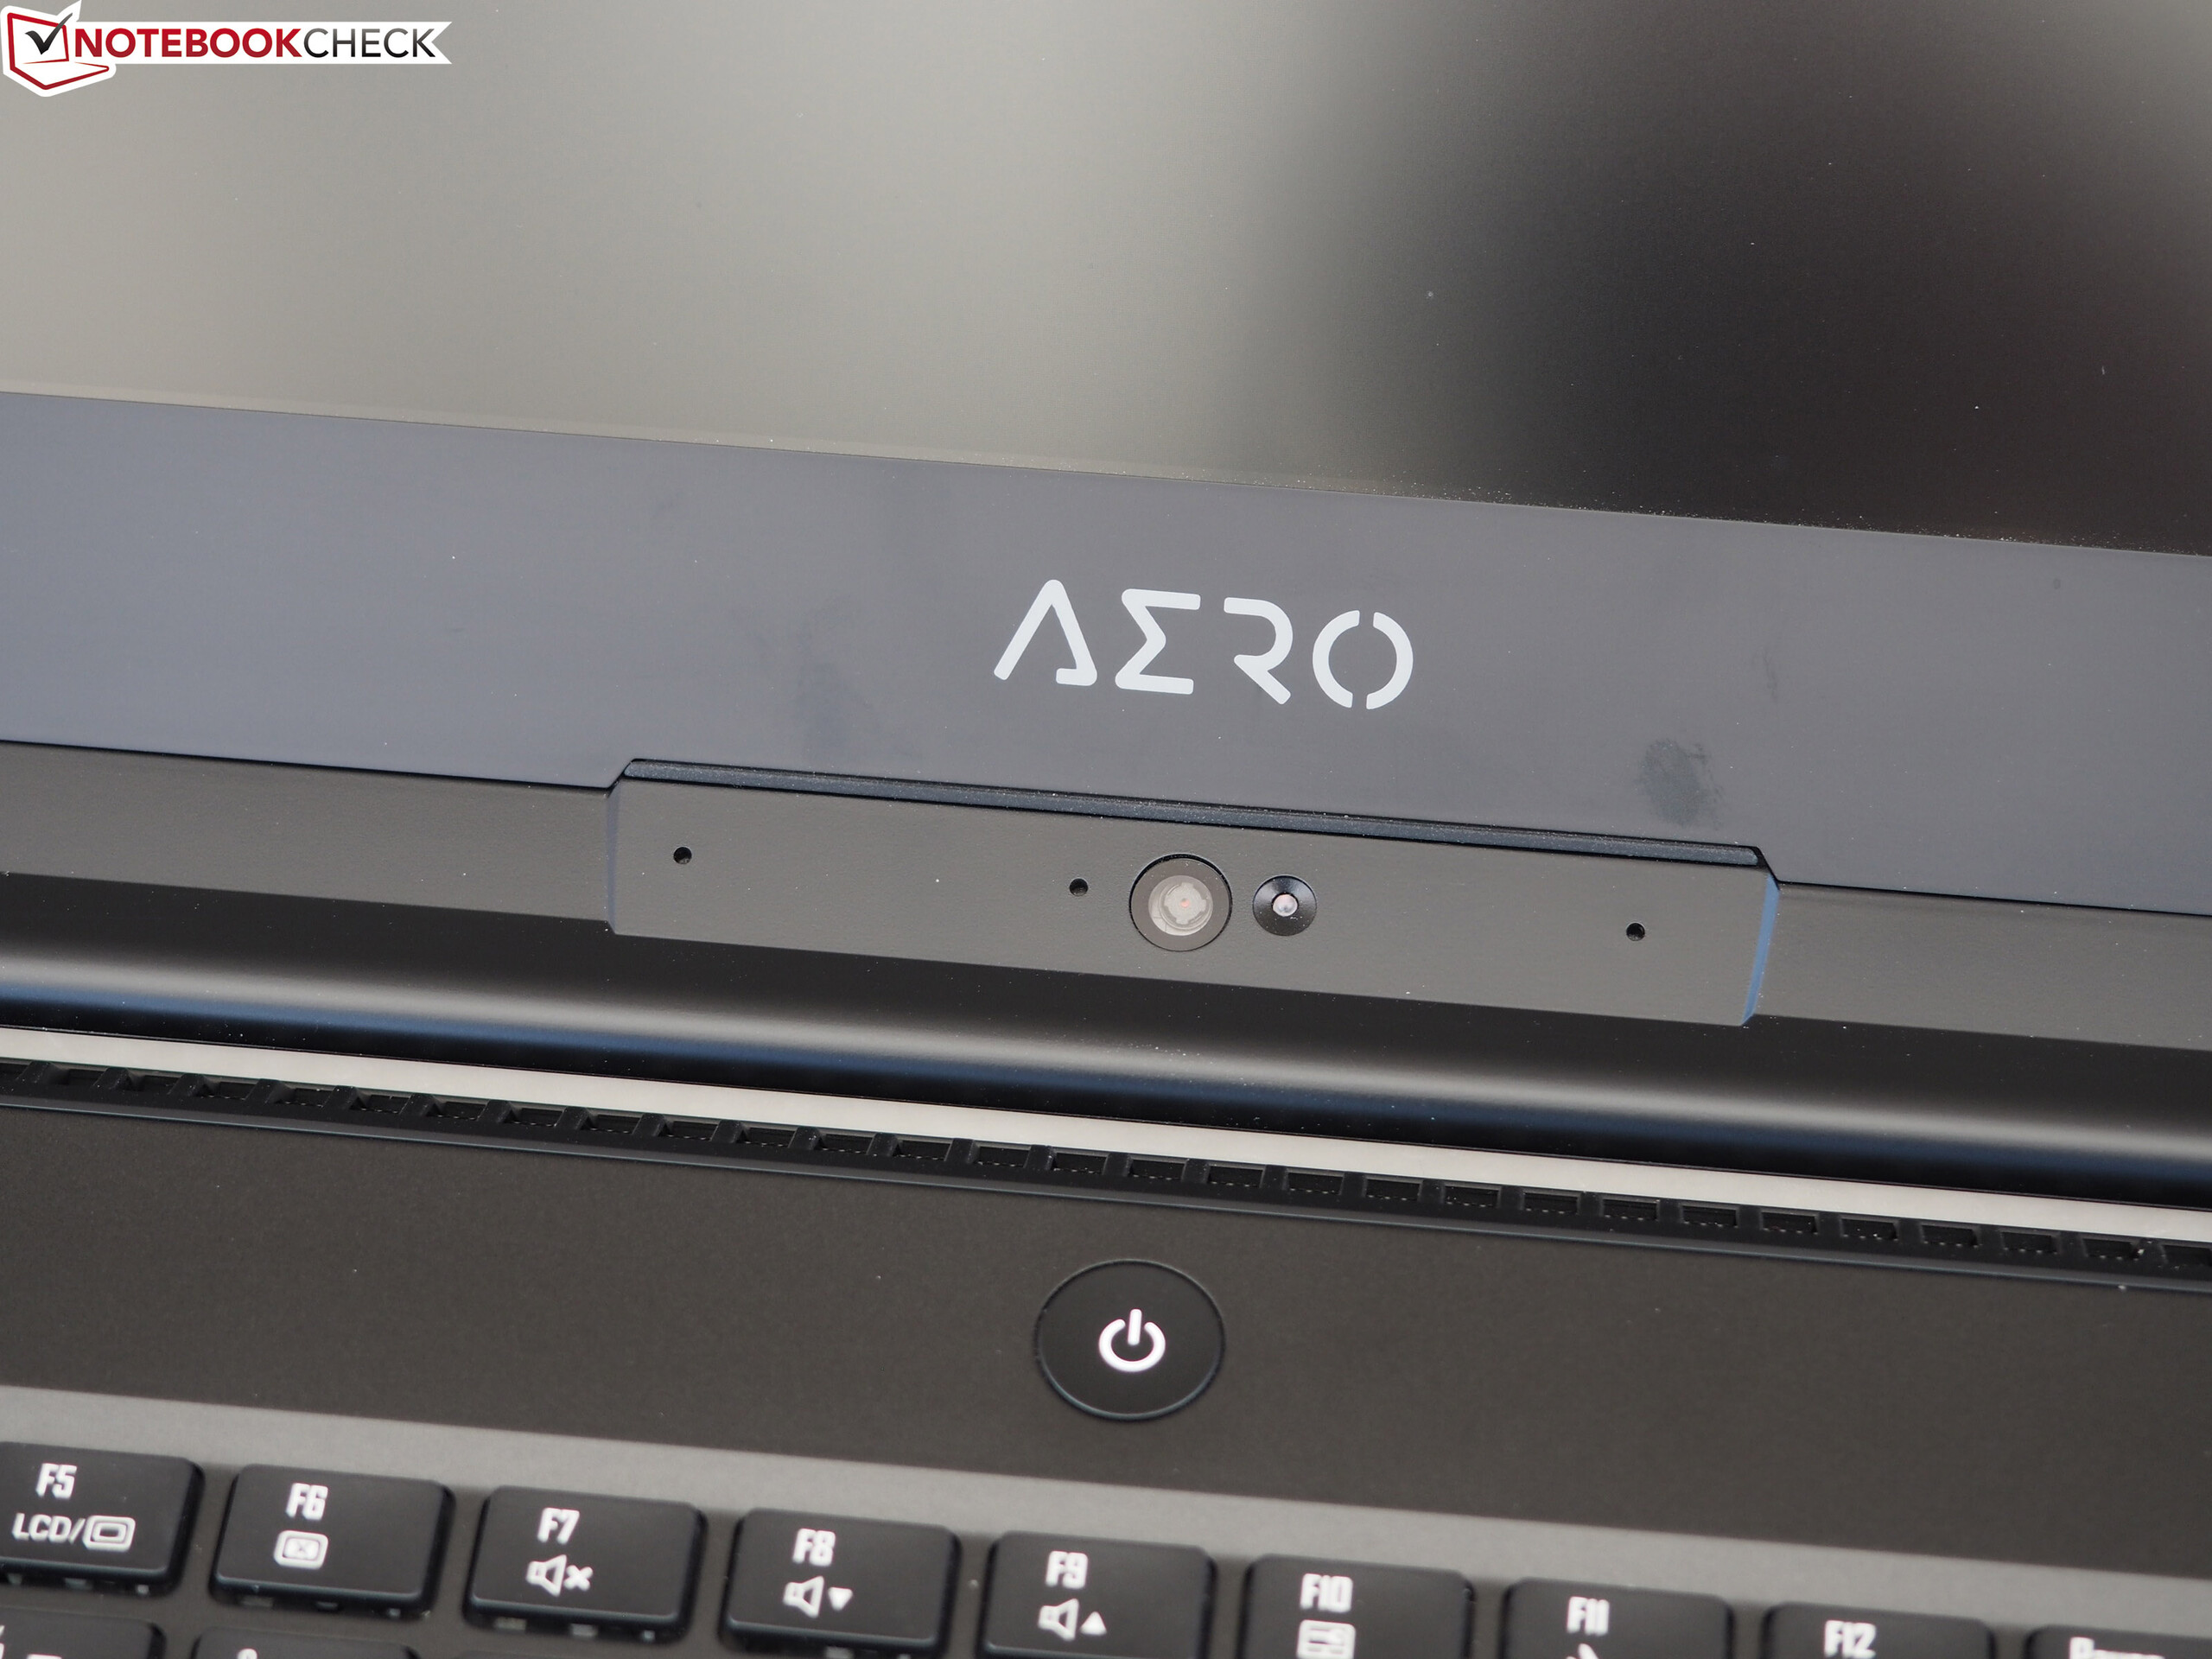
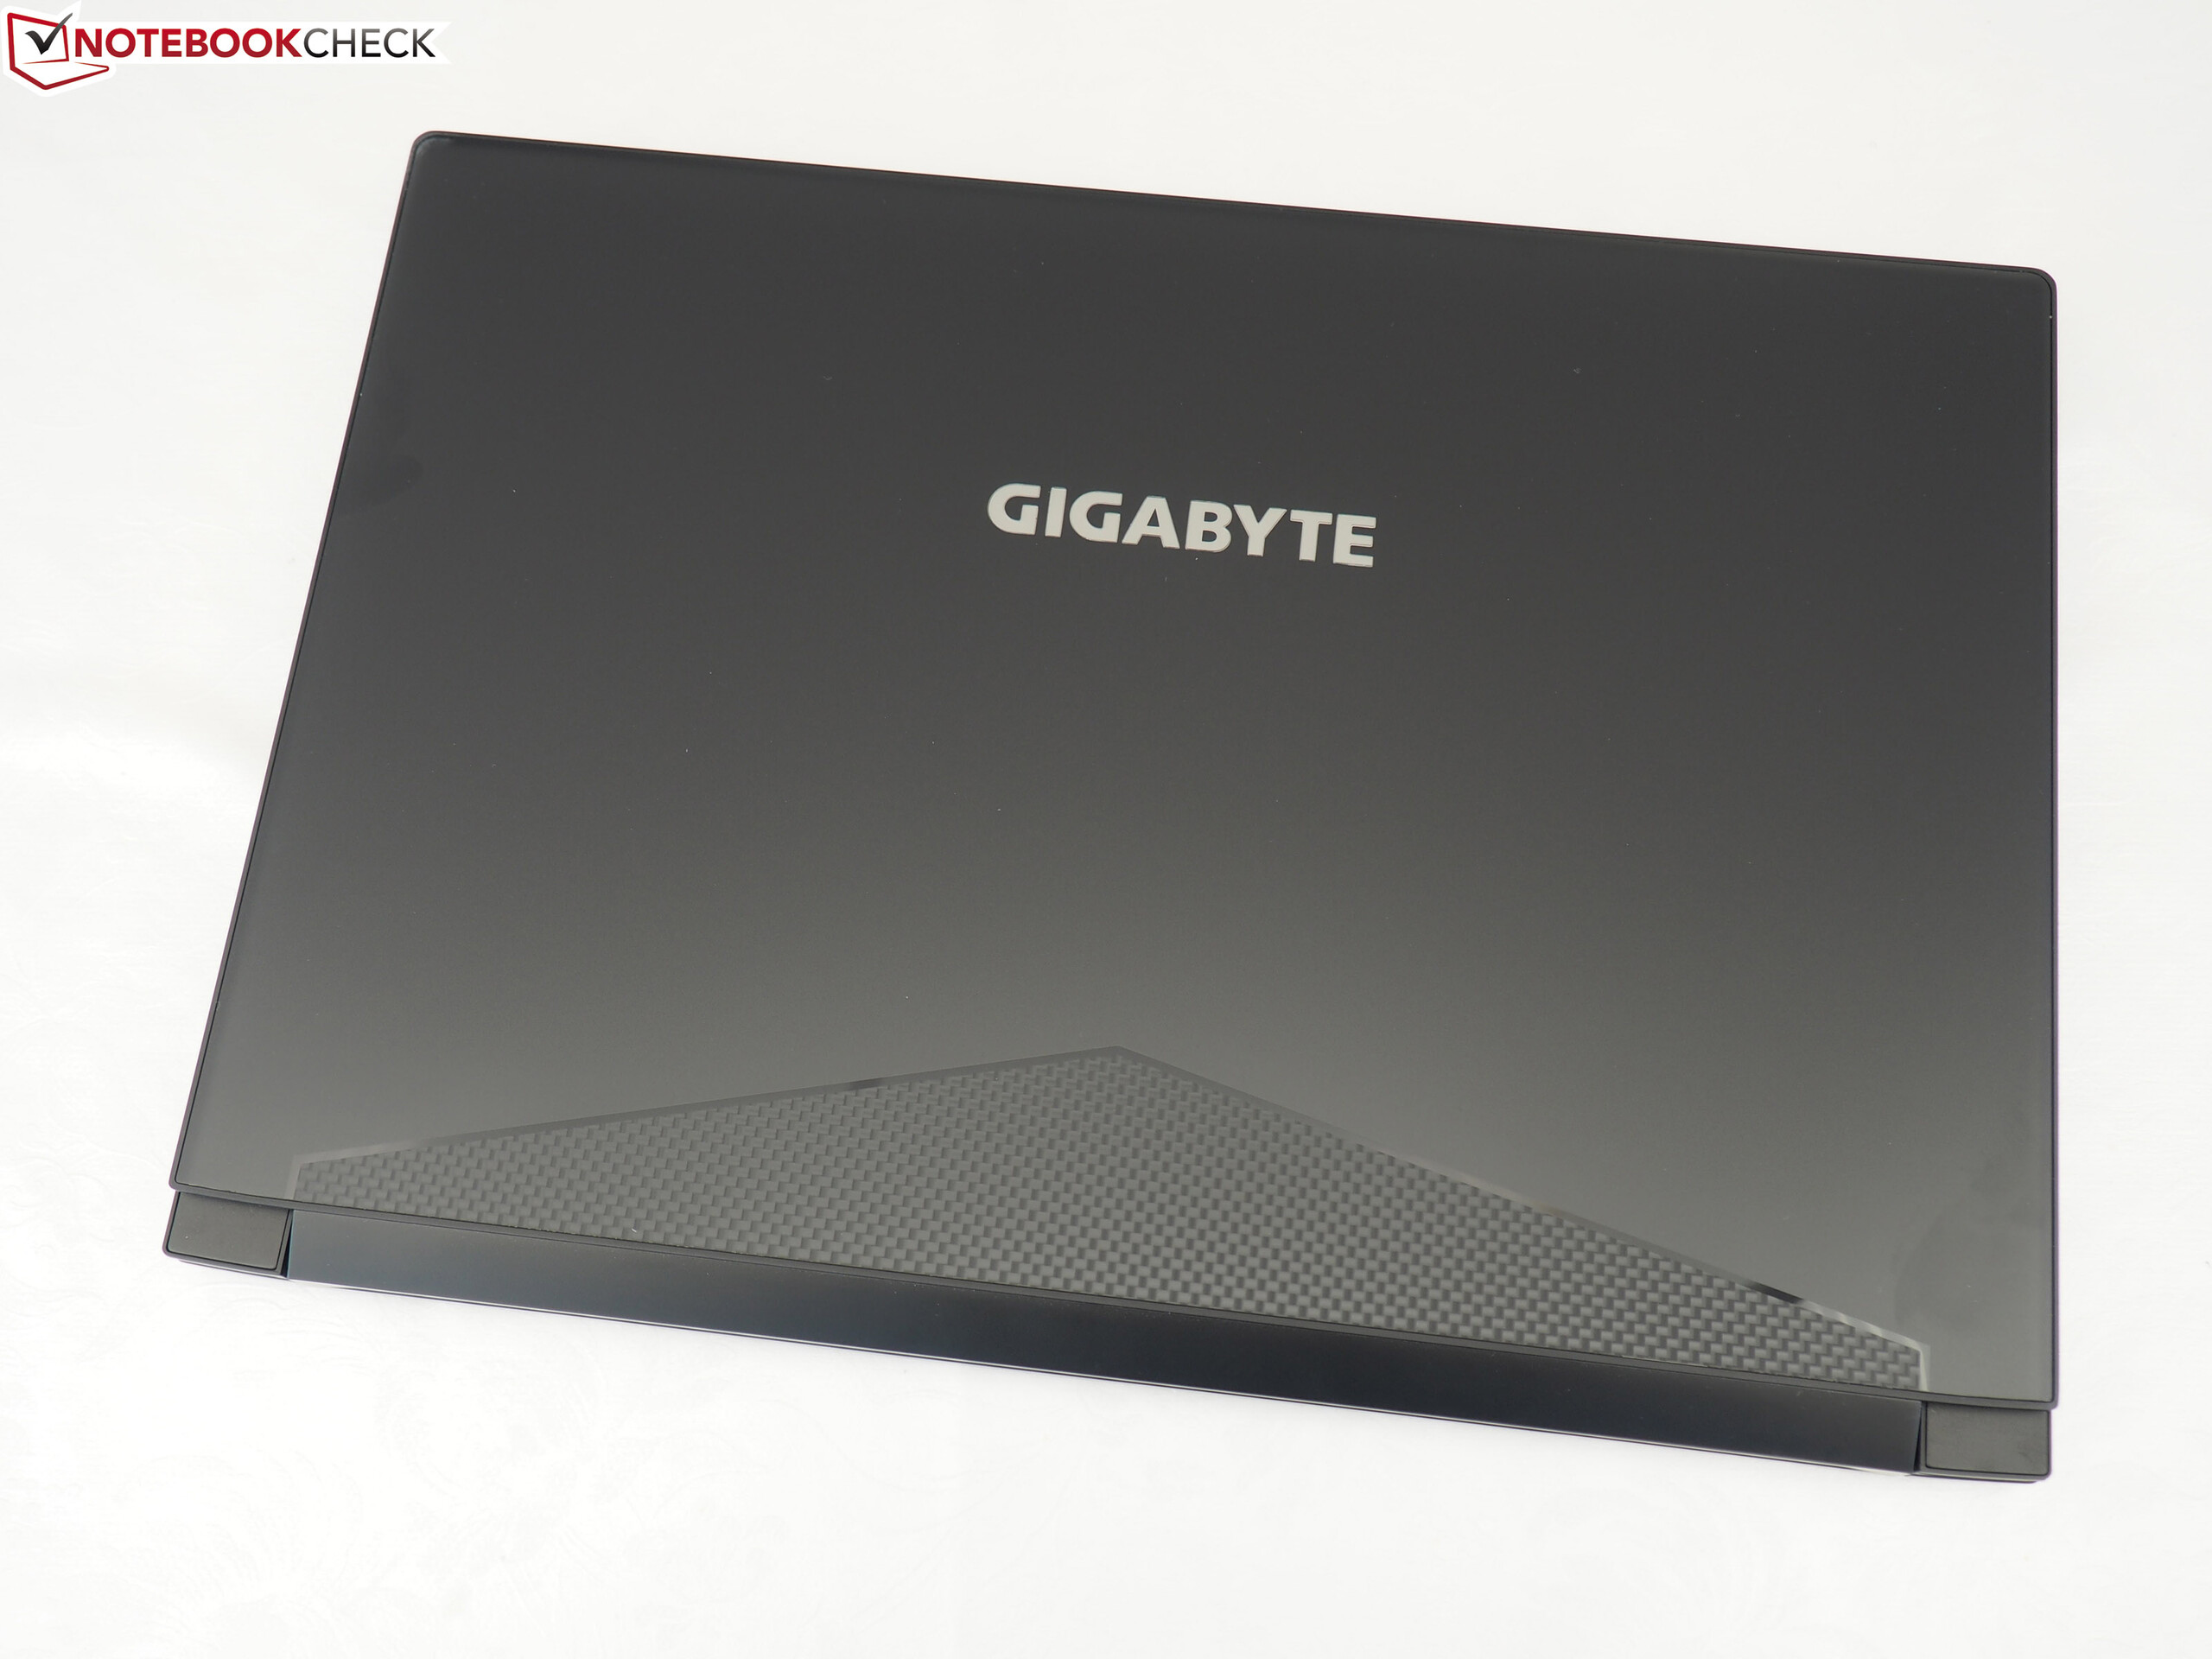
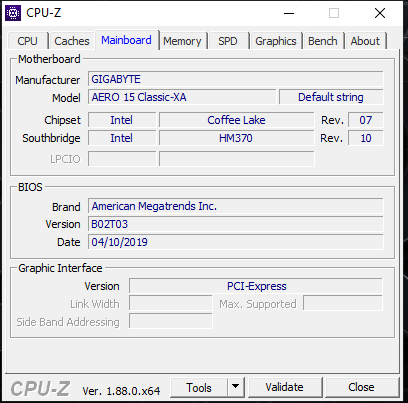
The Aero 15 Classic-XA is the newest model in Gigabyte's Aero 15 series. The Aero 15 Classic presents itself in the stylishly slim case that we already know from its predecessors. The changes are found on the inside. While the previous model was equipped with a Core i7-8750H, today's test unit features a Core i7-9750H. The 144-Hz IPS panel has also been replaced by a 240-Hz IGZO FHD display. We will be taking a look at whether these changes can be considered advantages or disadvantages in our review.
The competition includes devices such as the Razer Blade 15, the Acer Predator Triton 500, the Asus Zephyrus S GX531GX, the Schenker XMG Neo 15 and the Lenovo Legion Y740-15ICH.
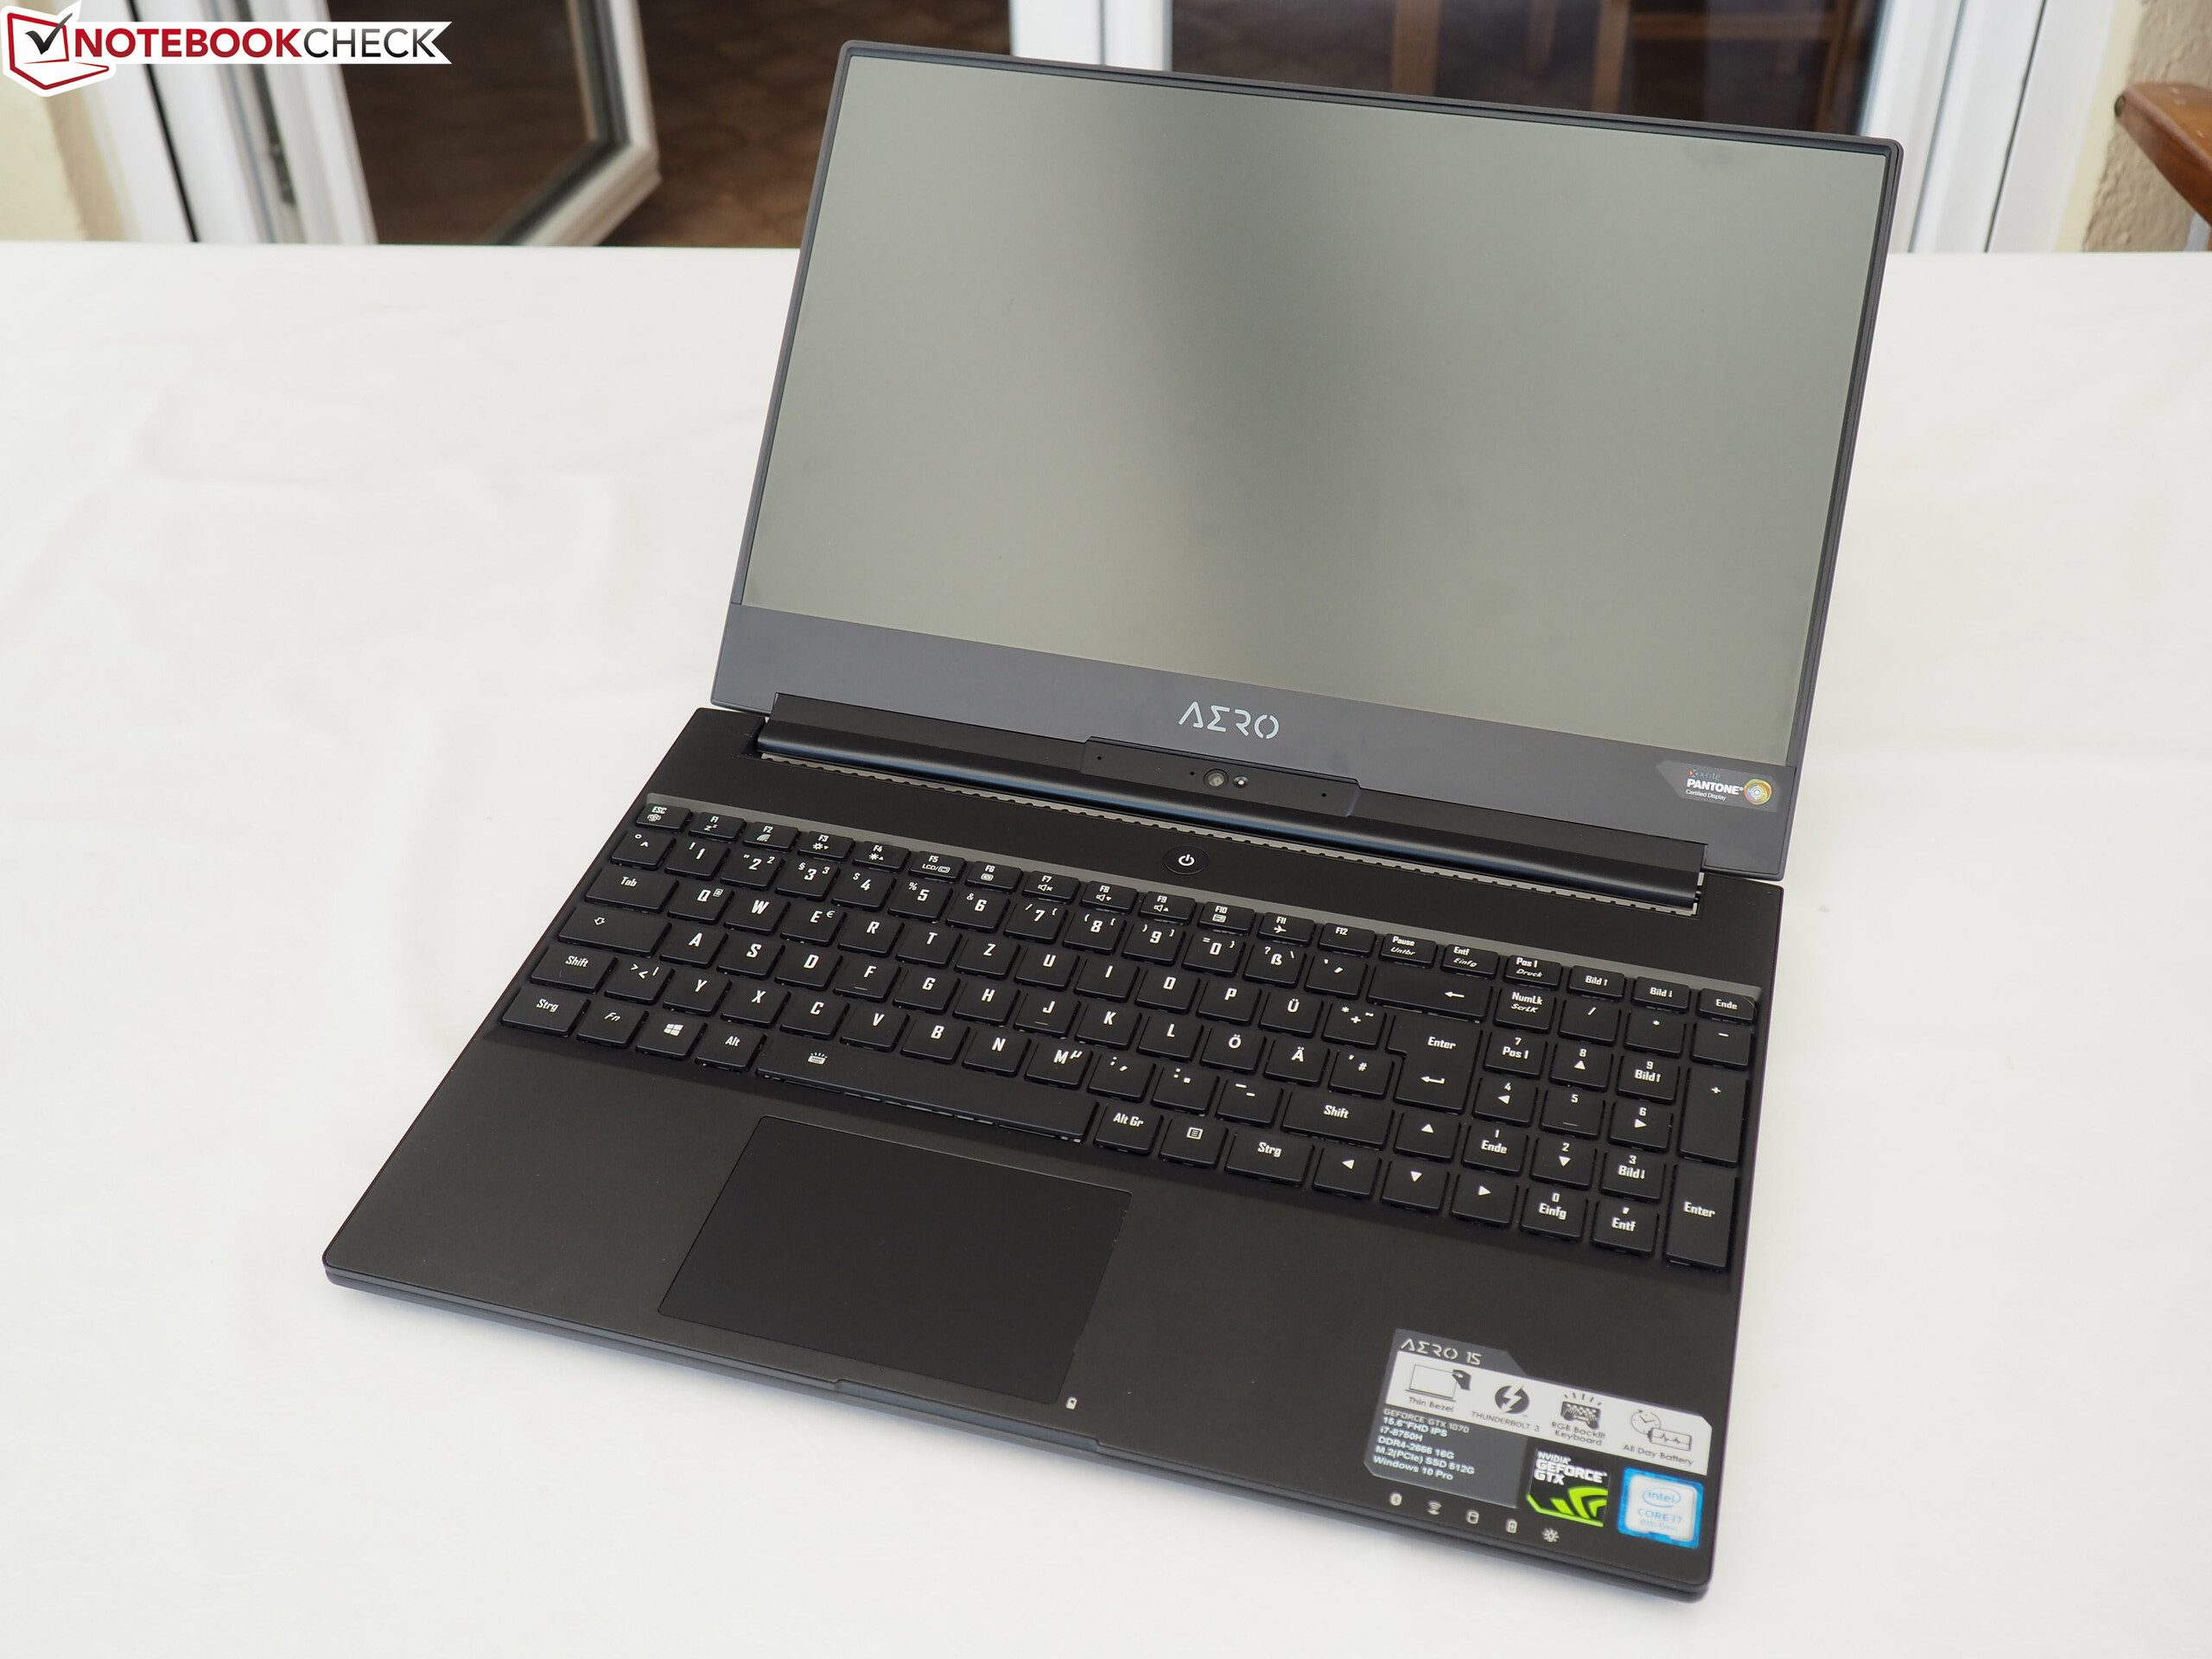
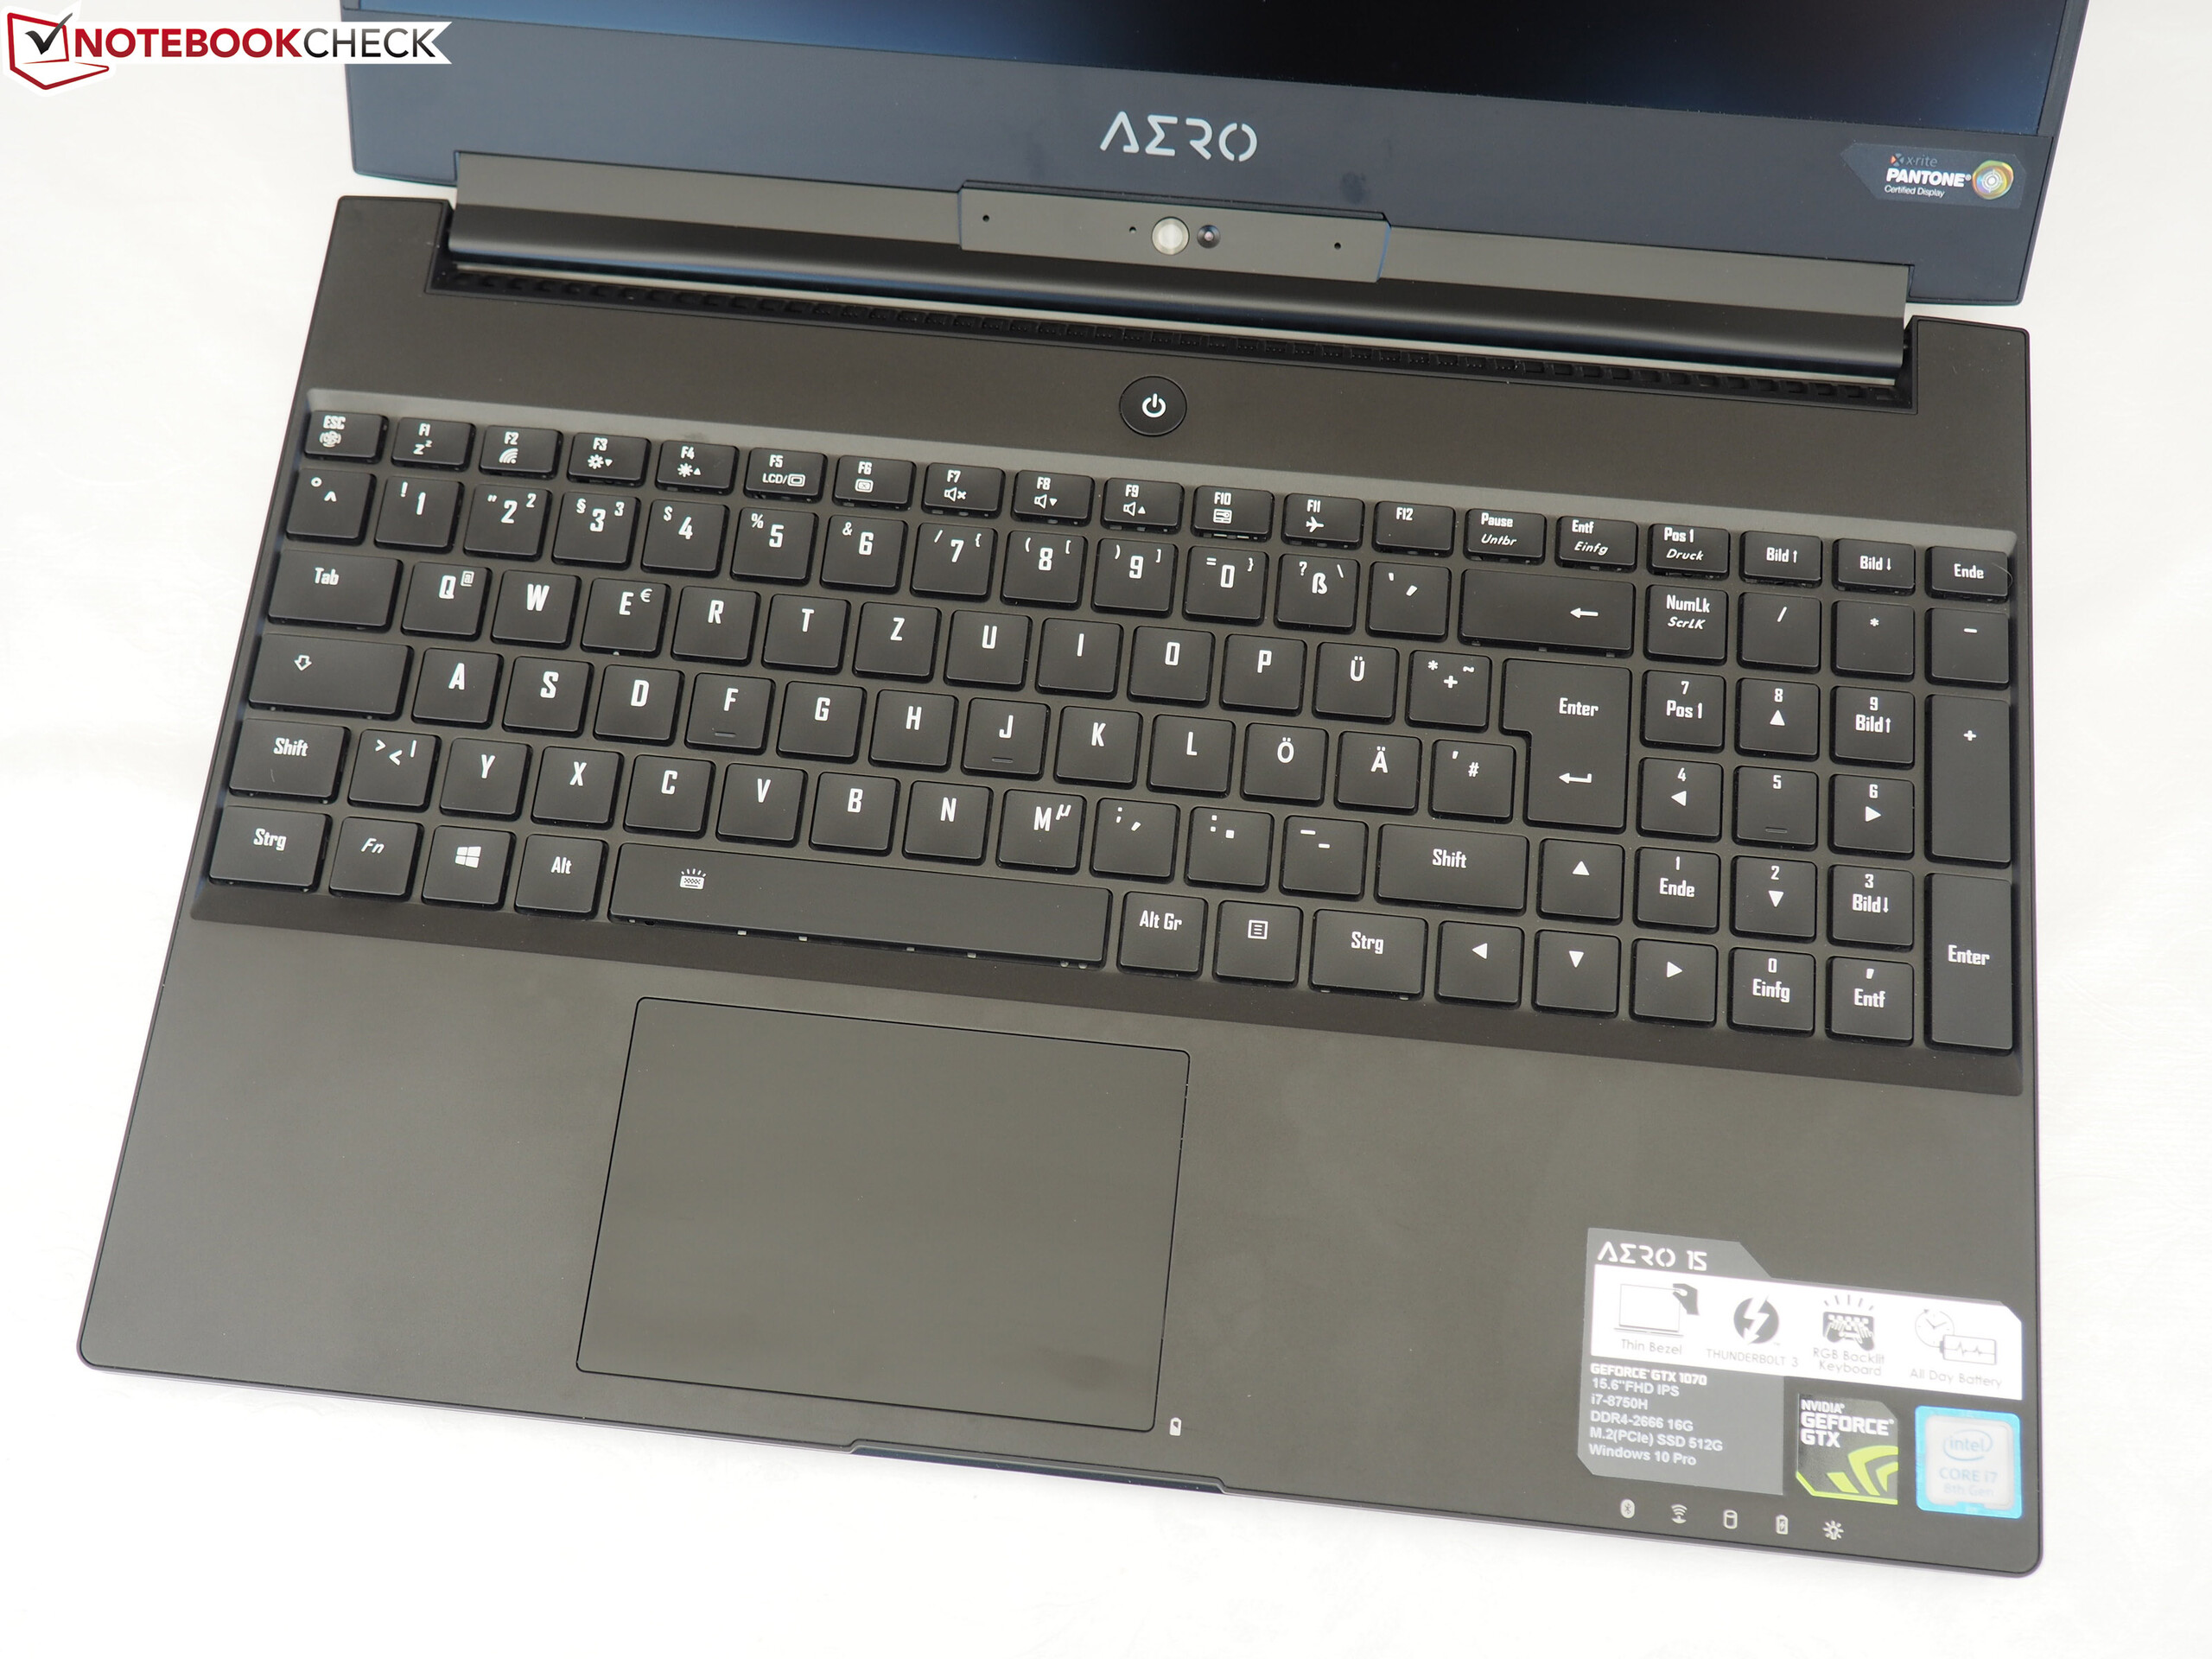
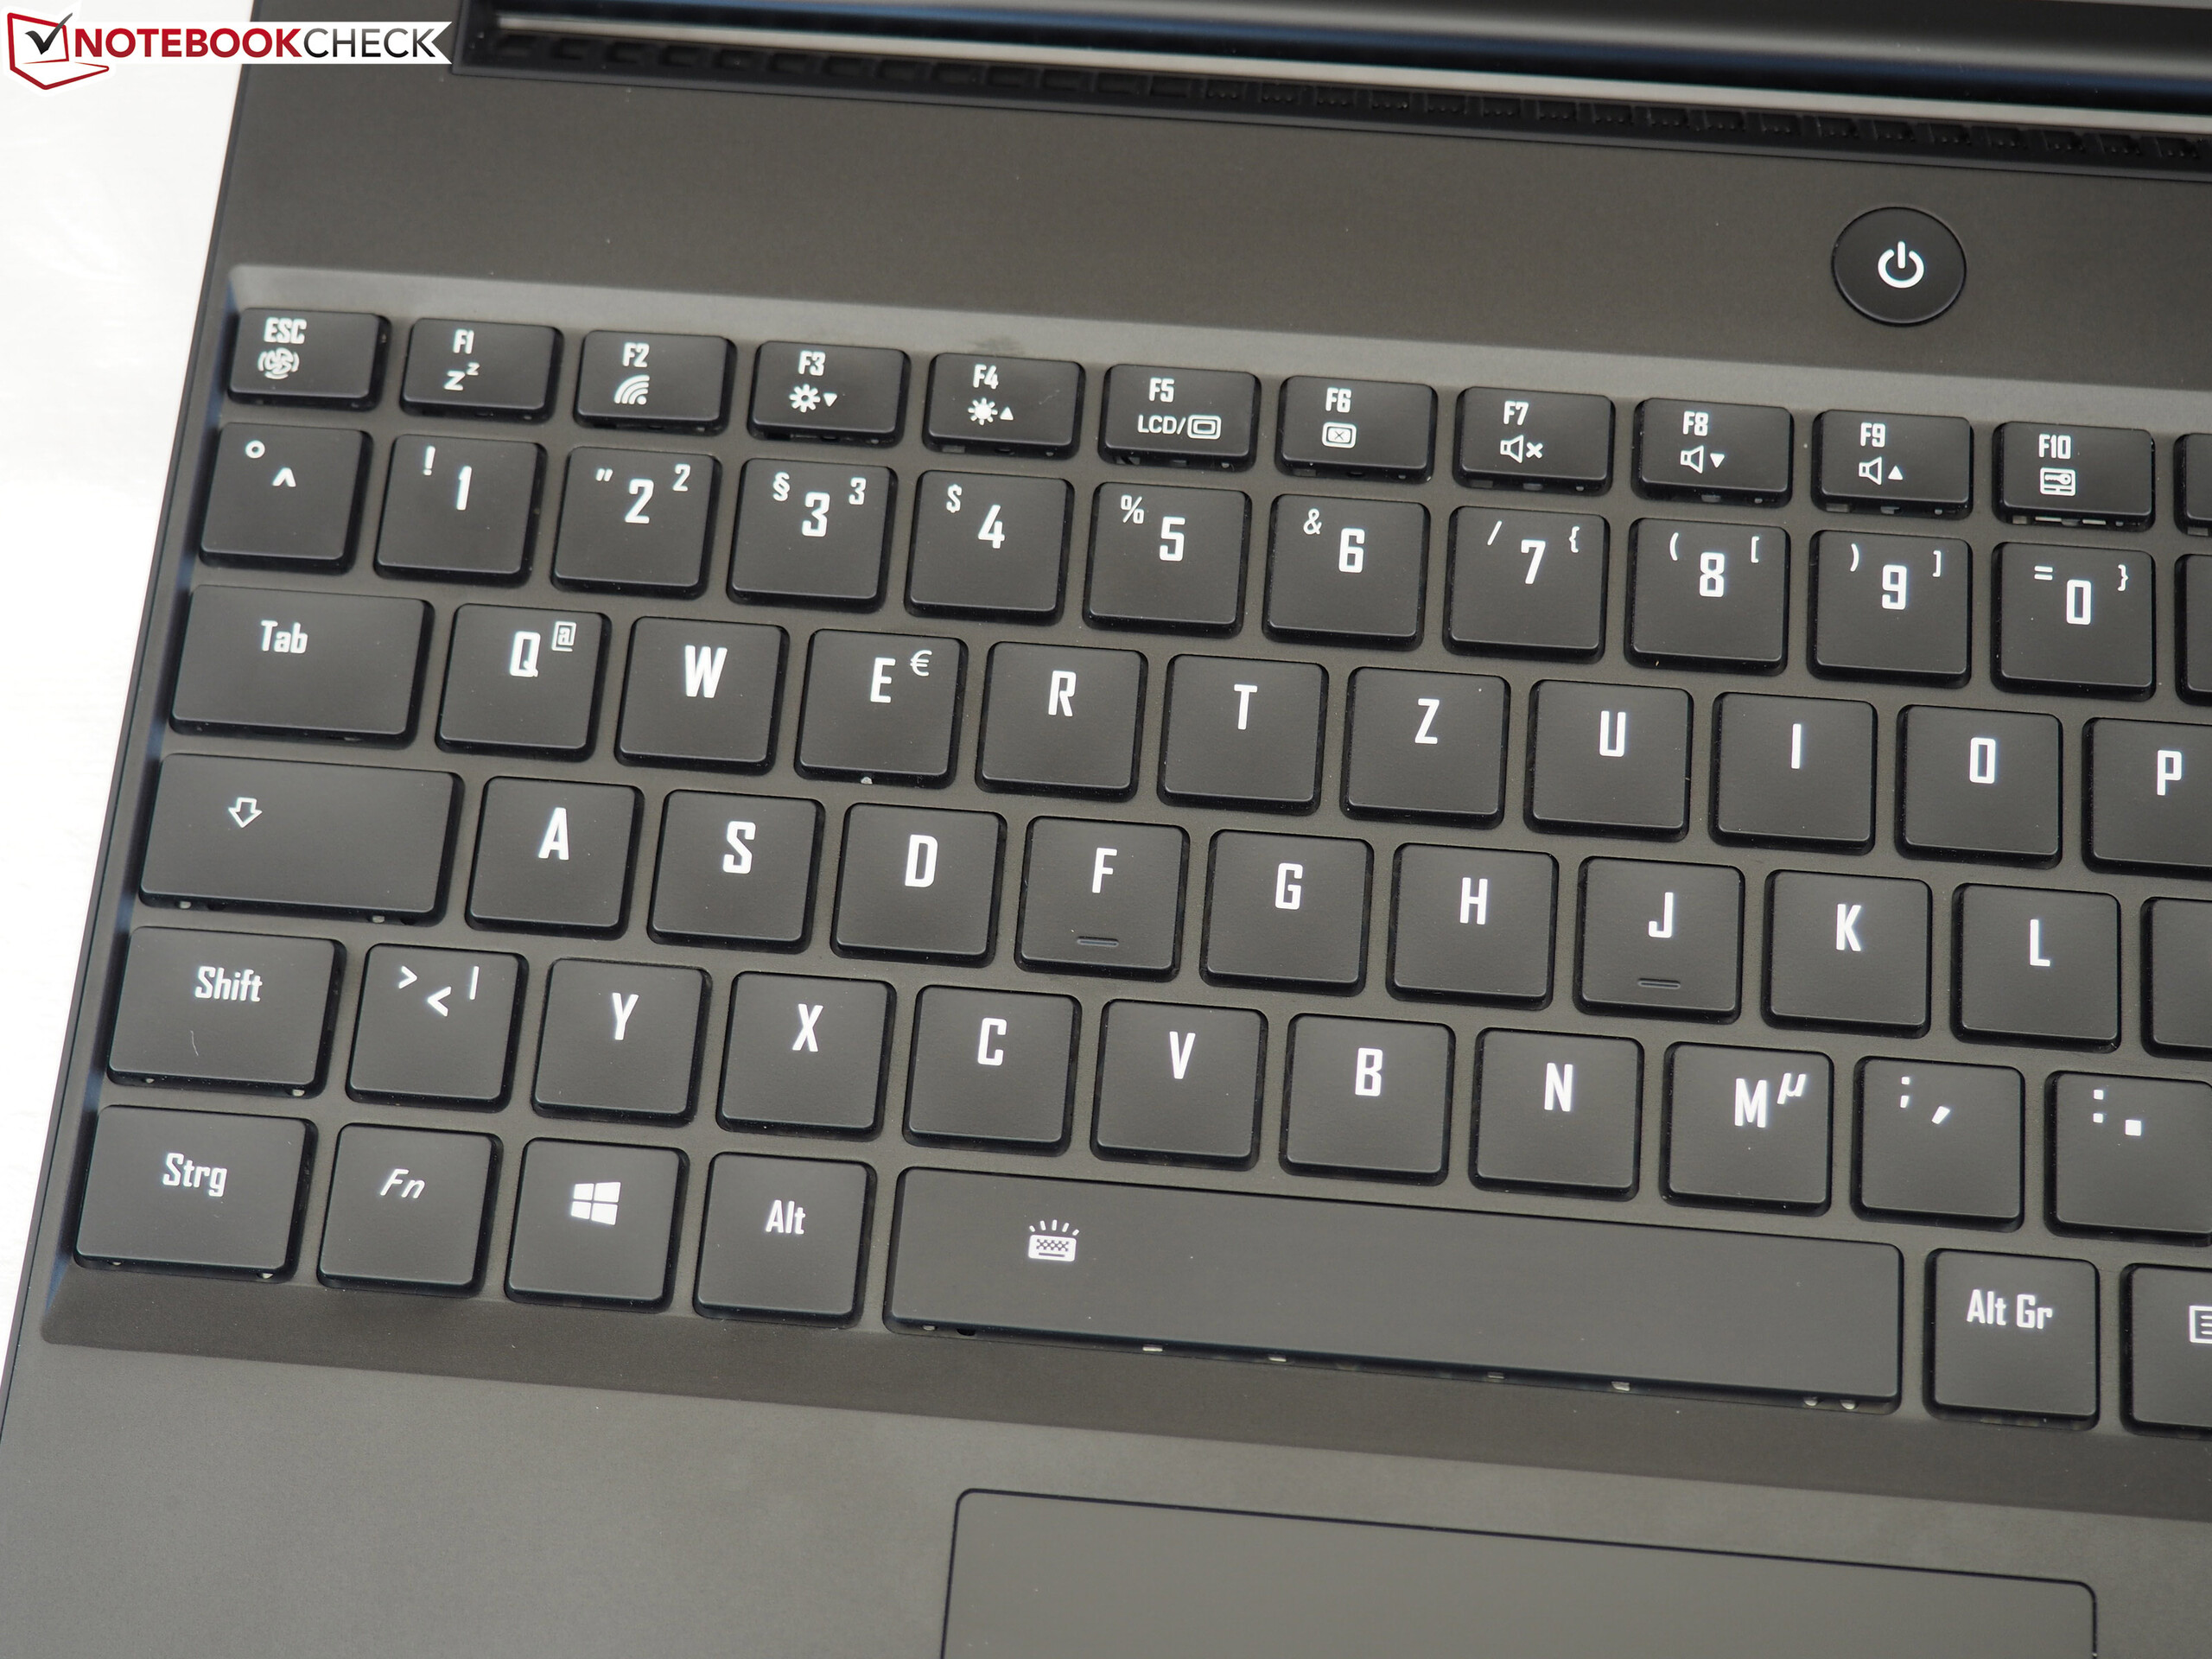
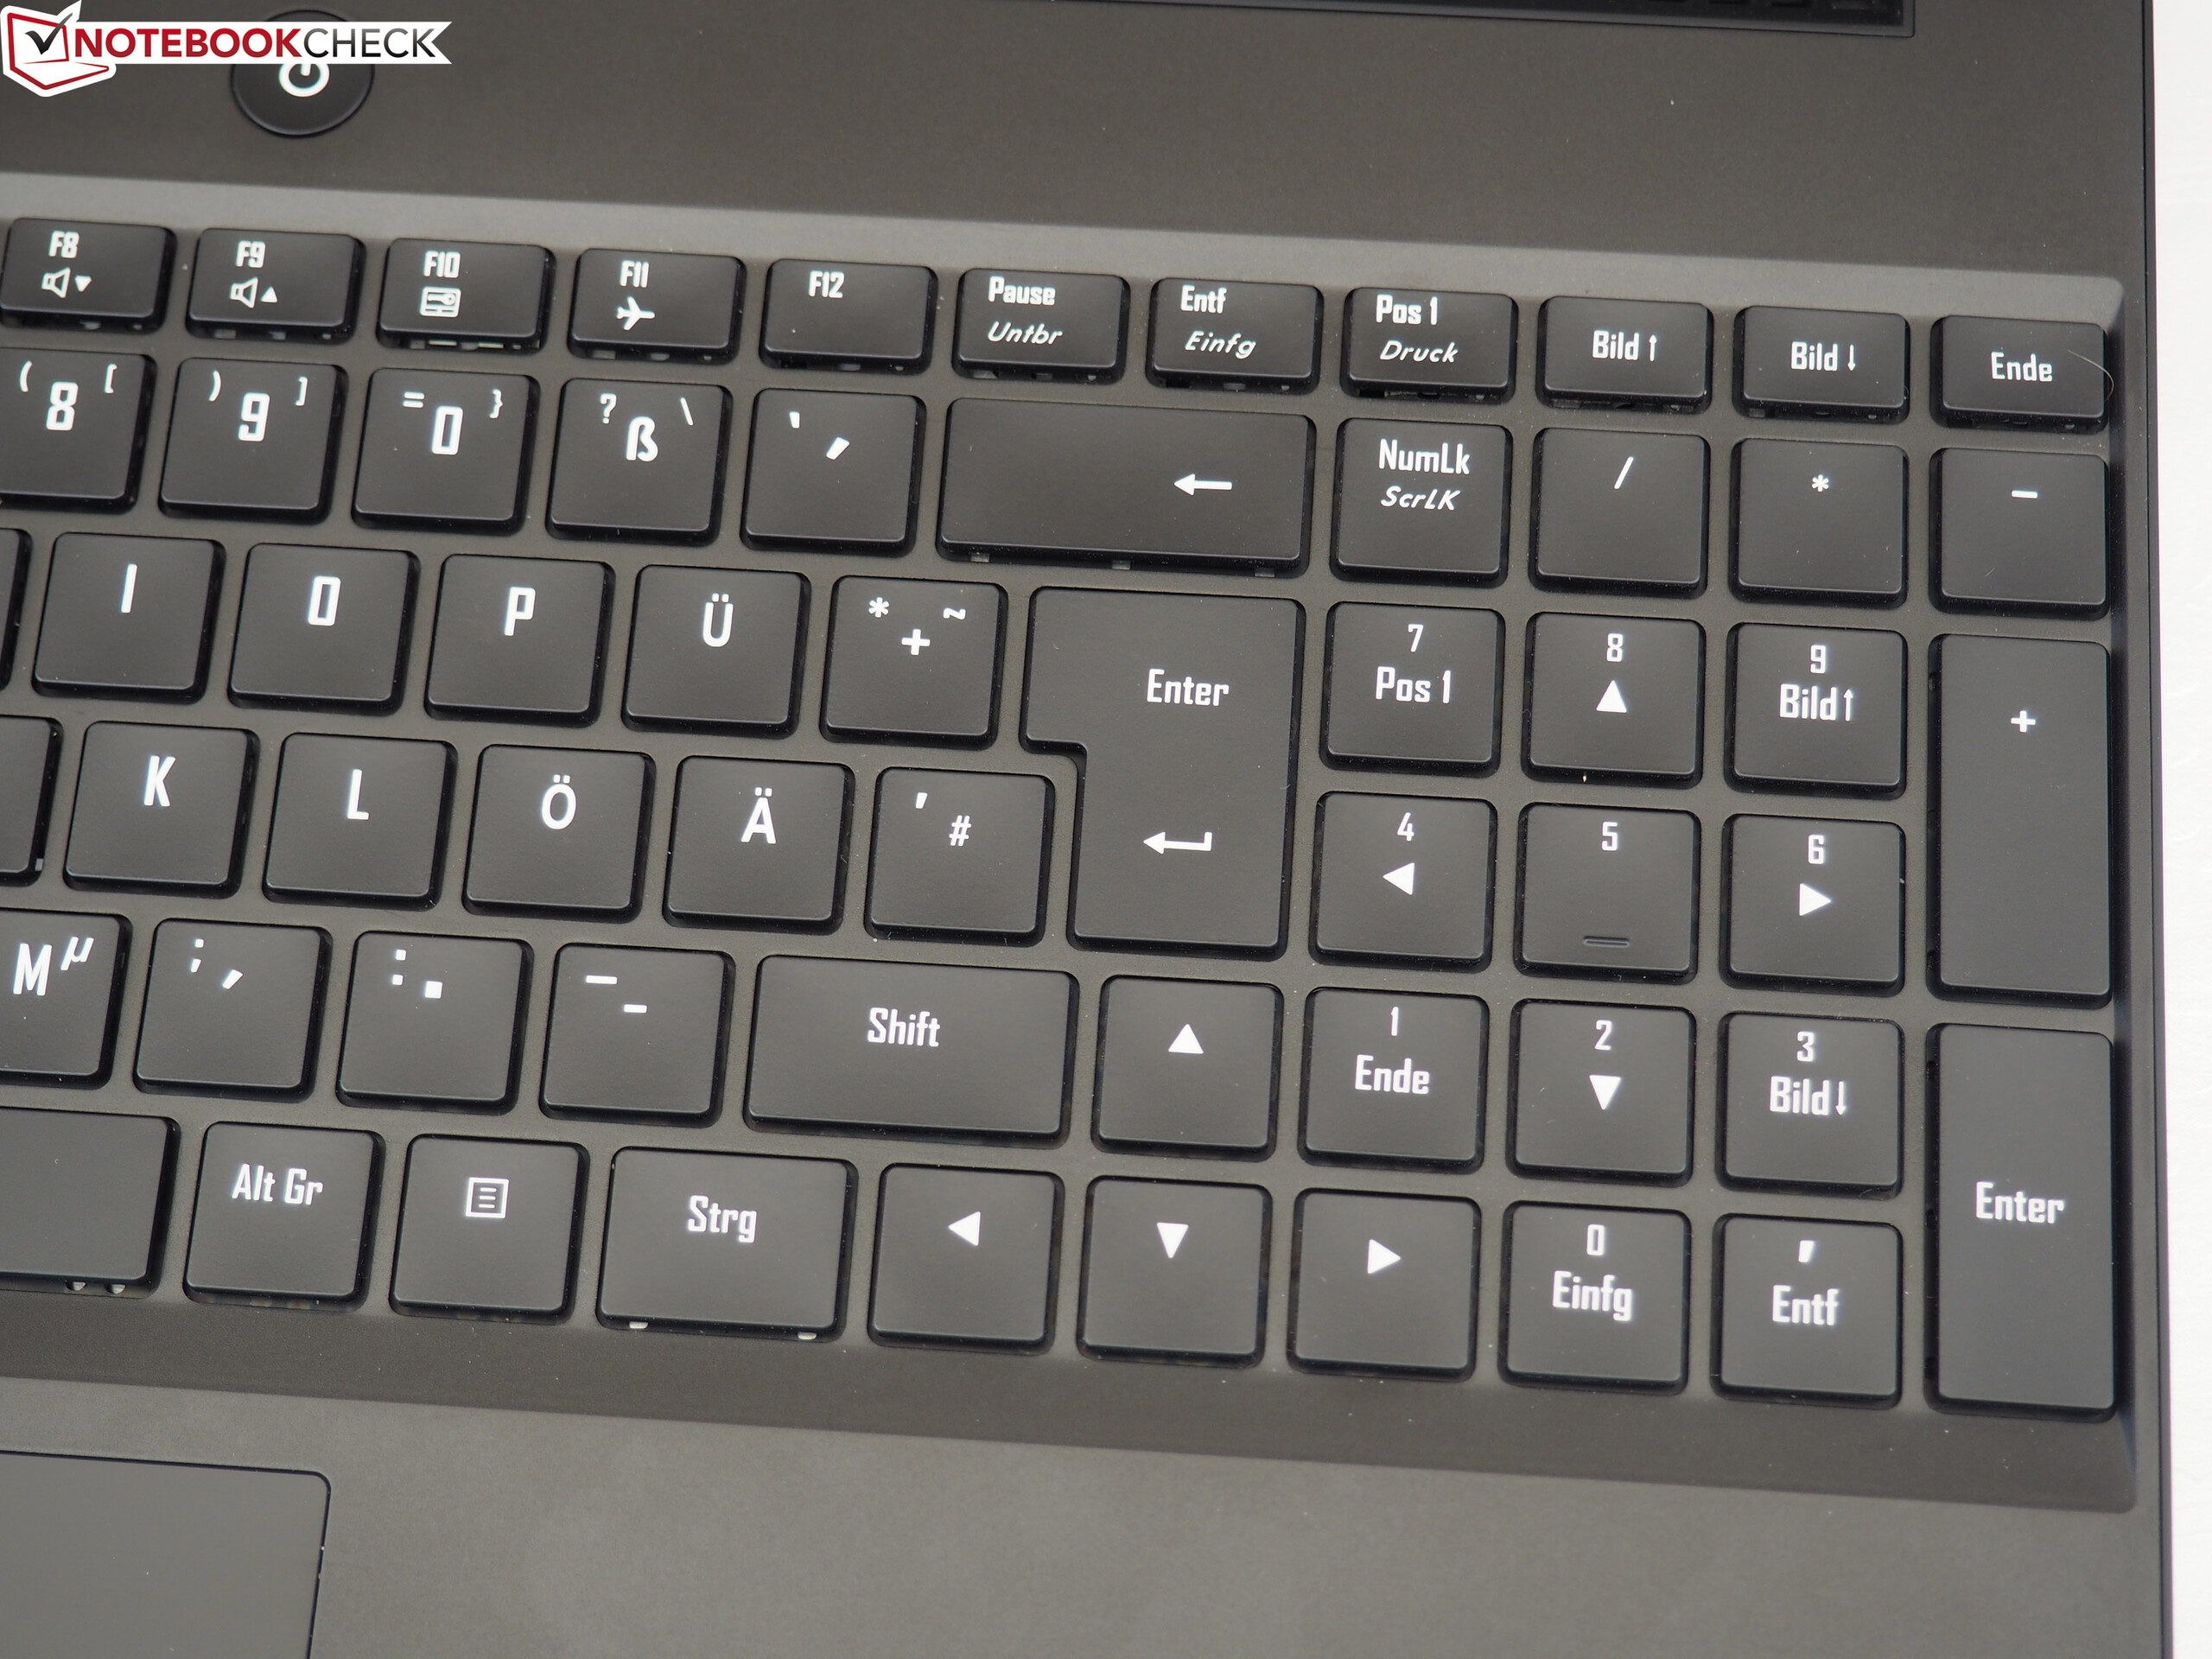
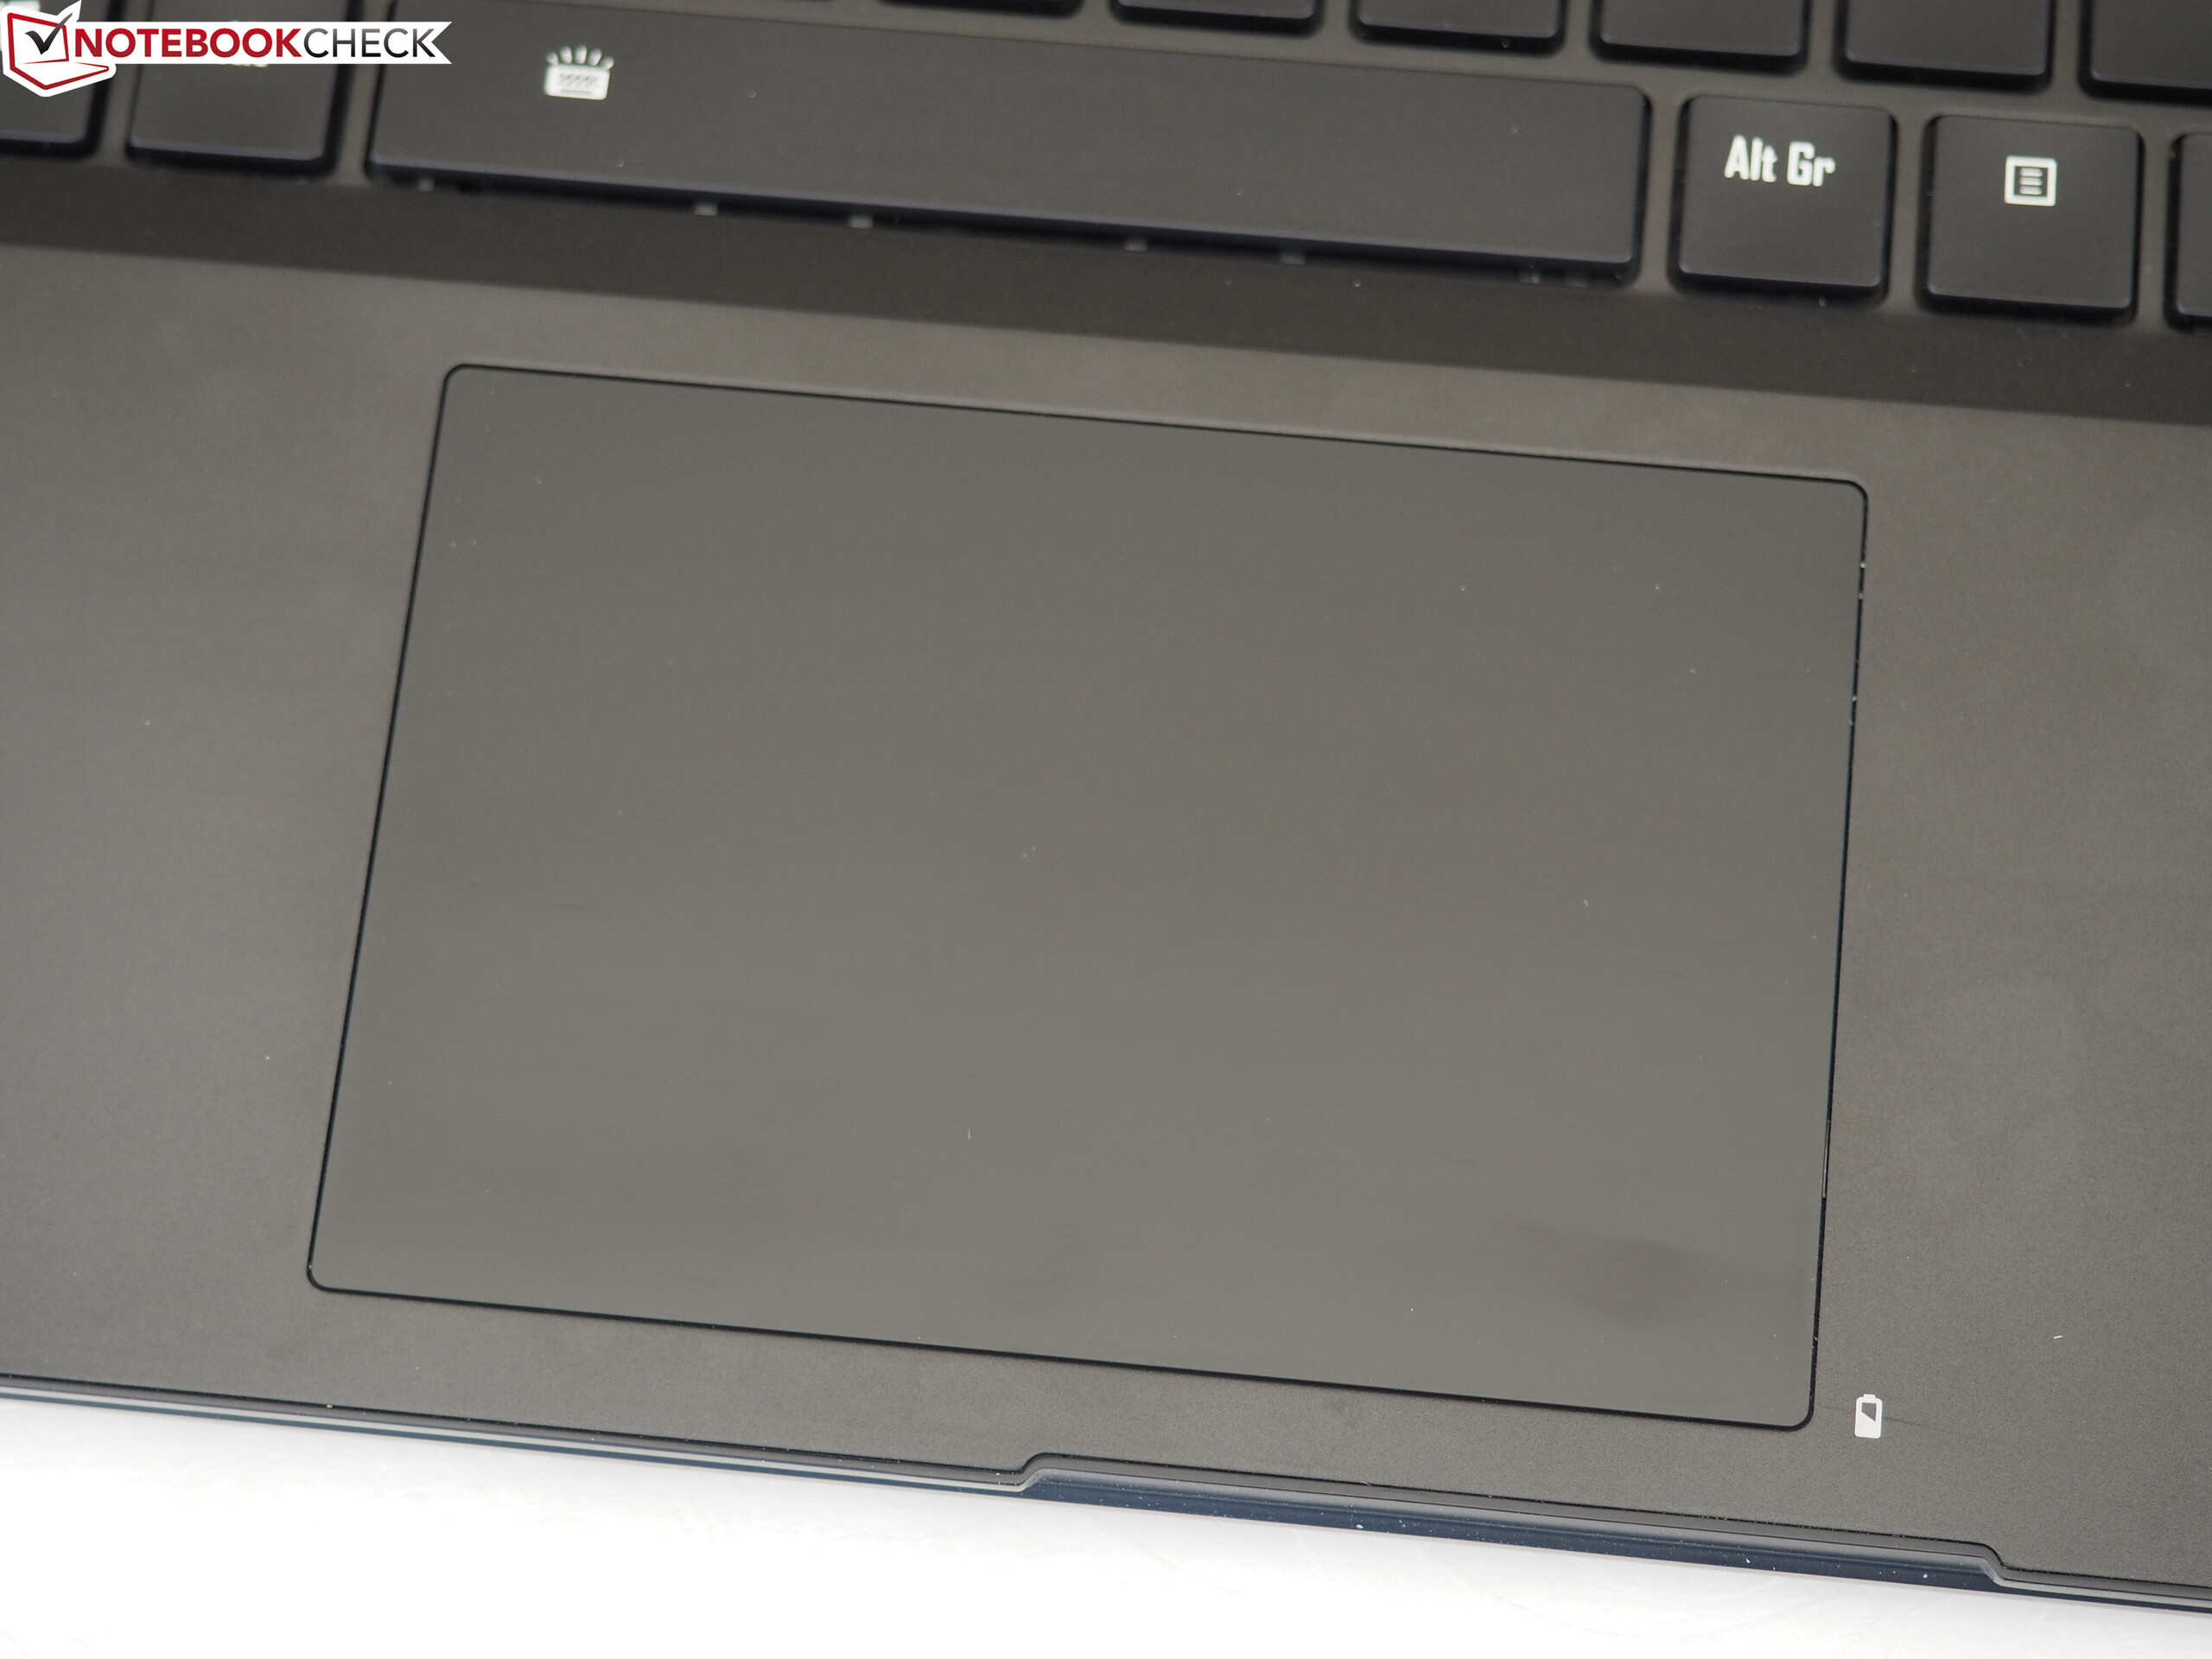
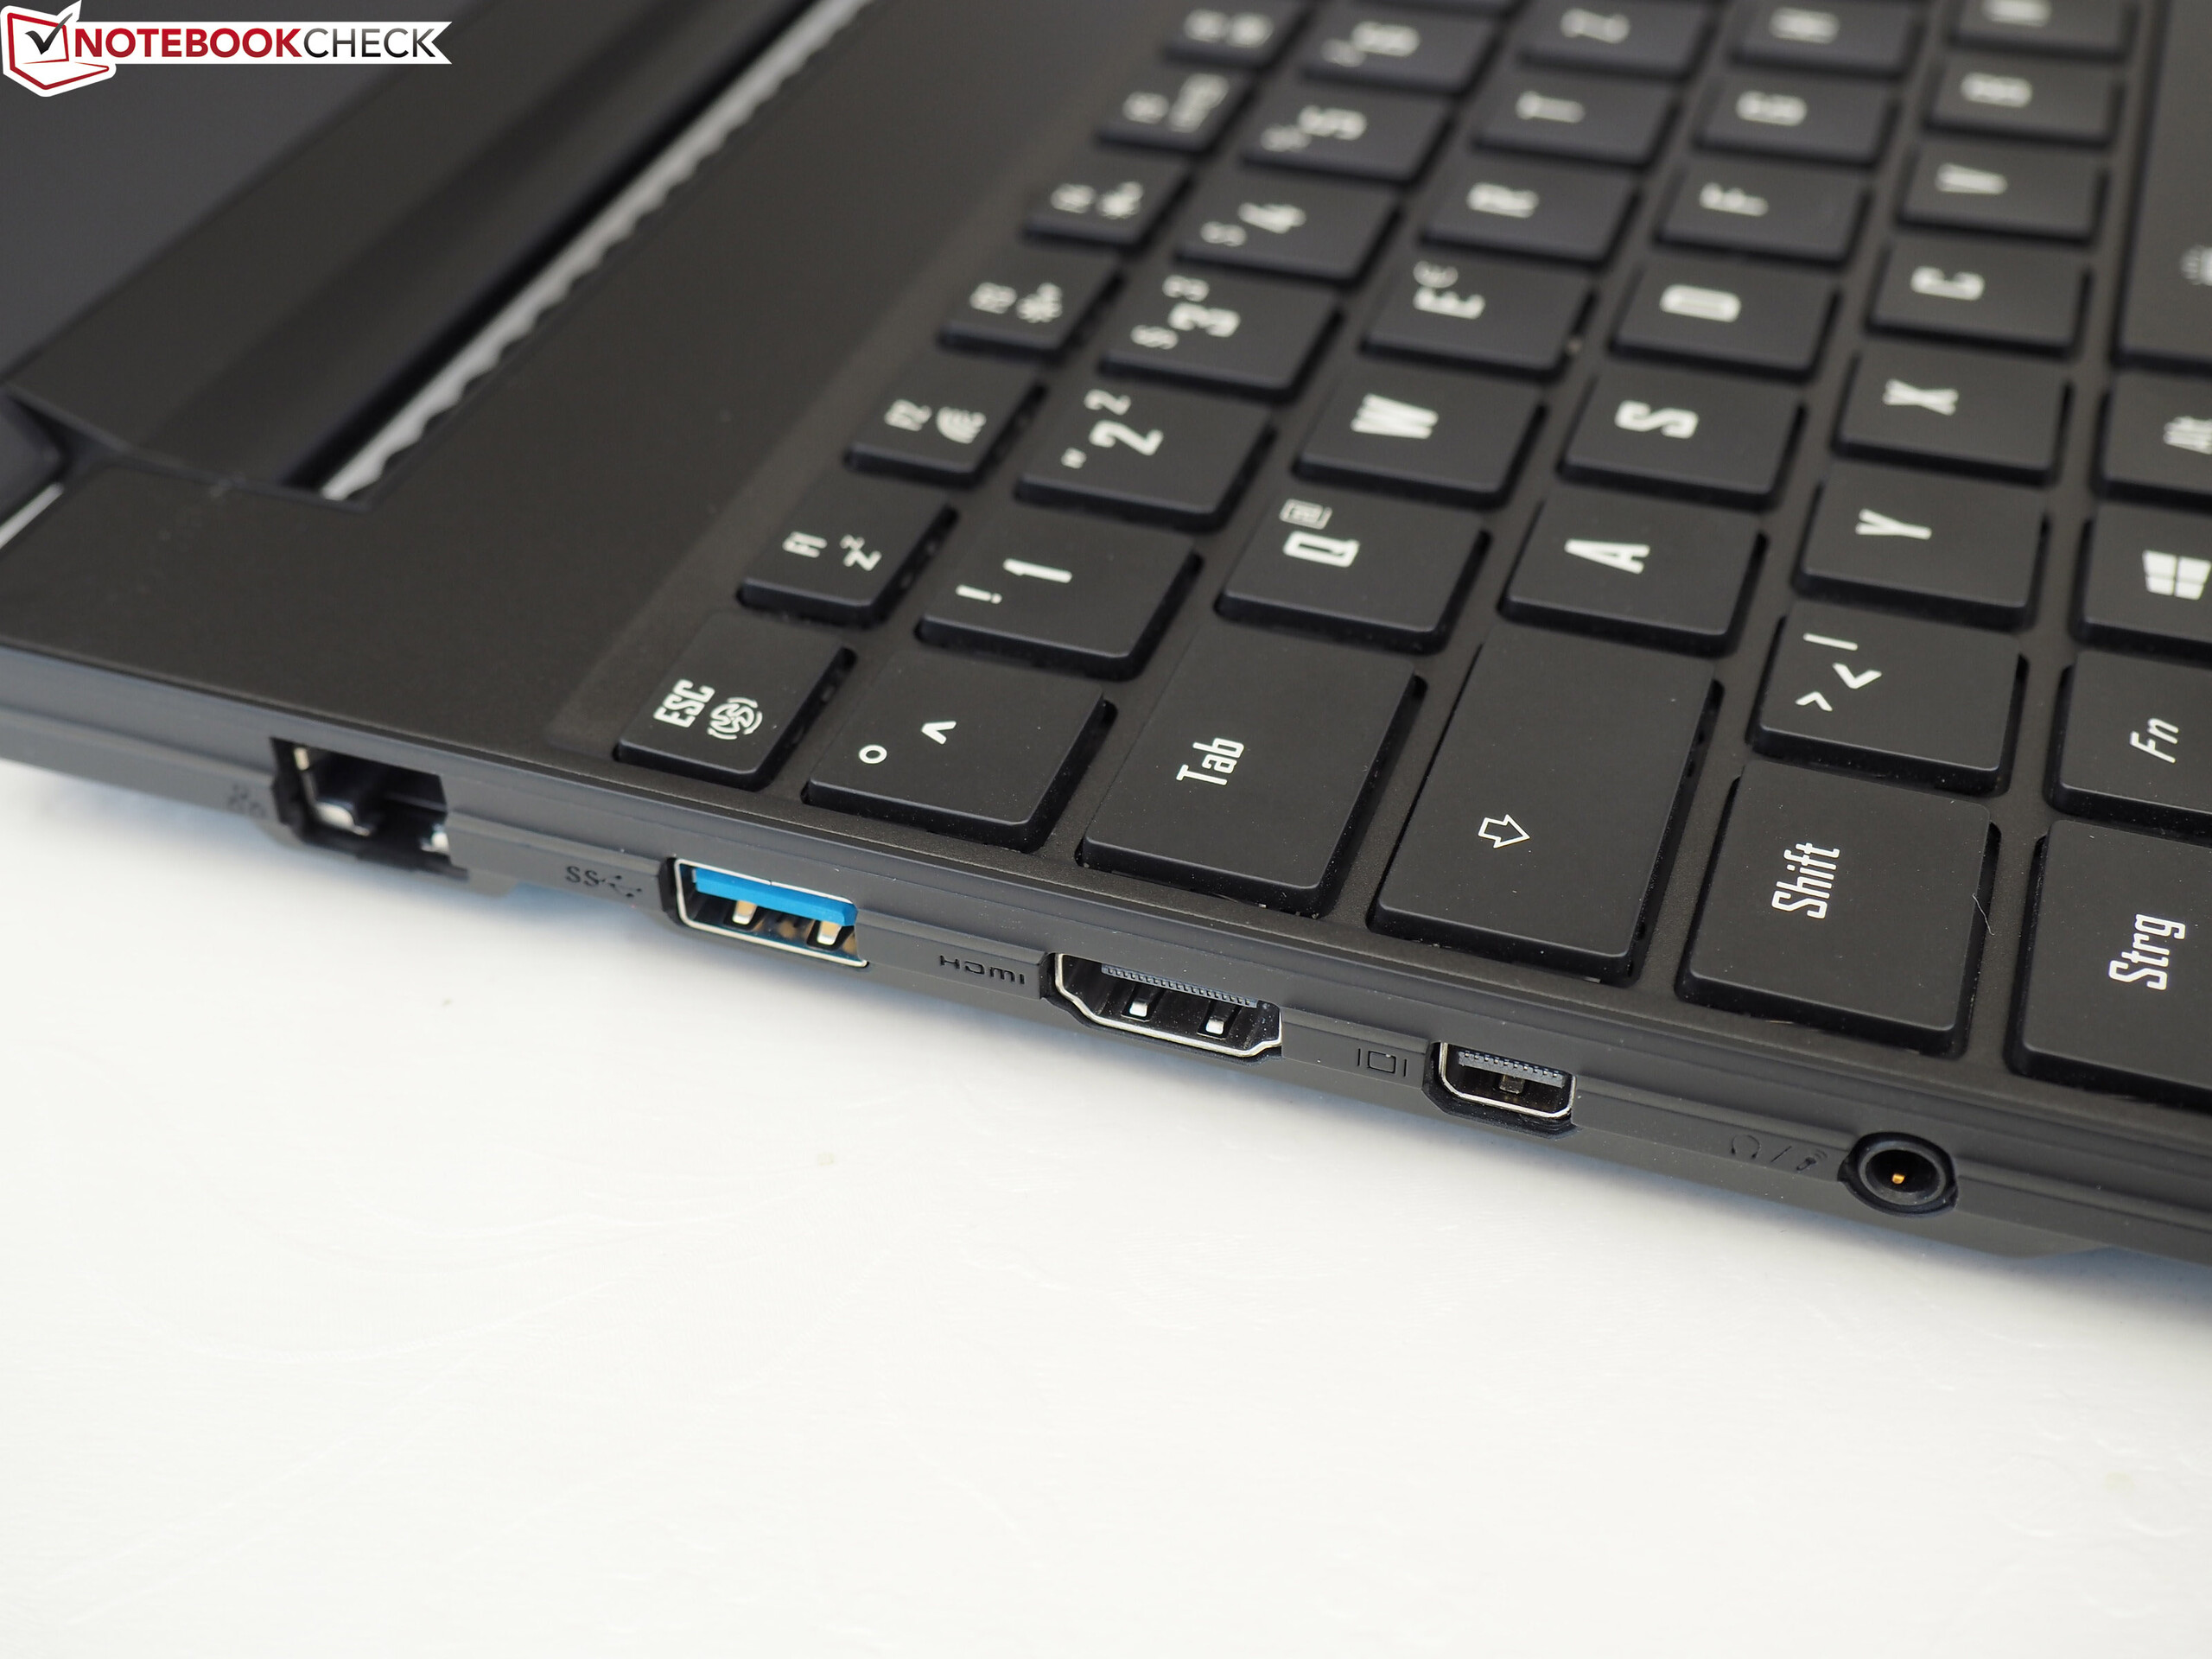
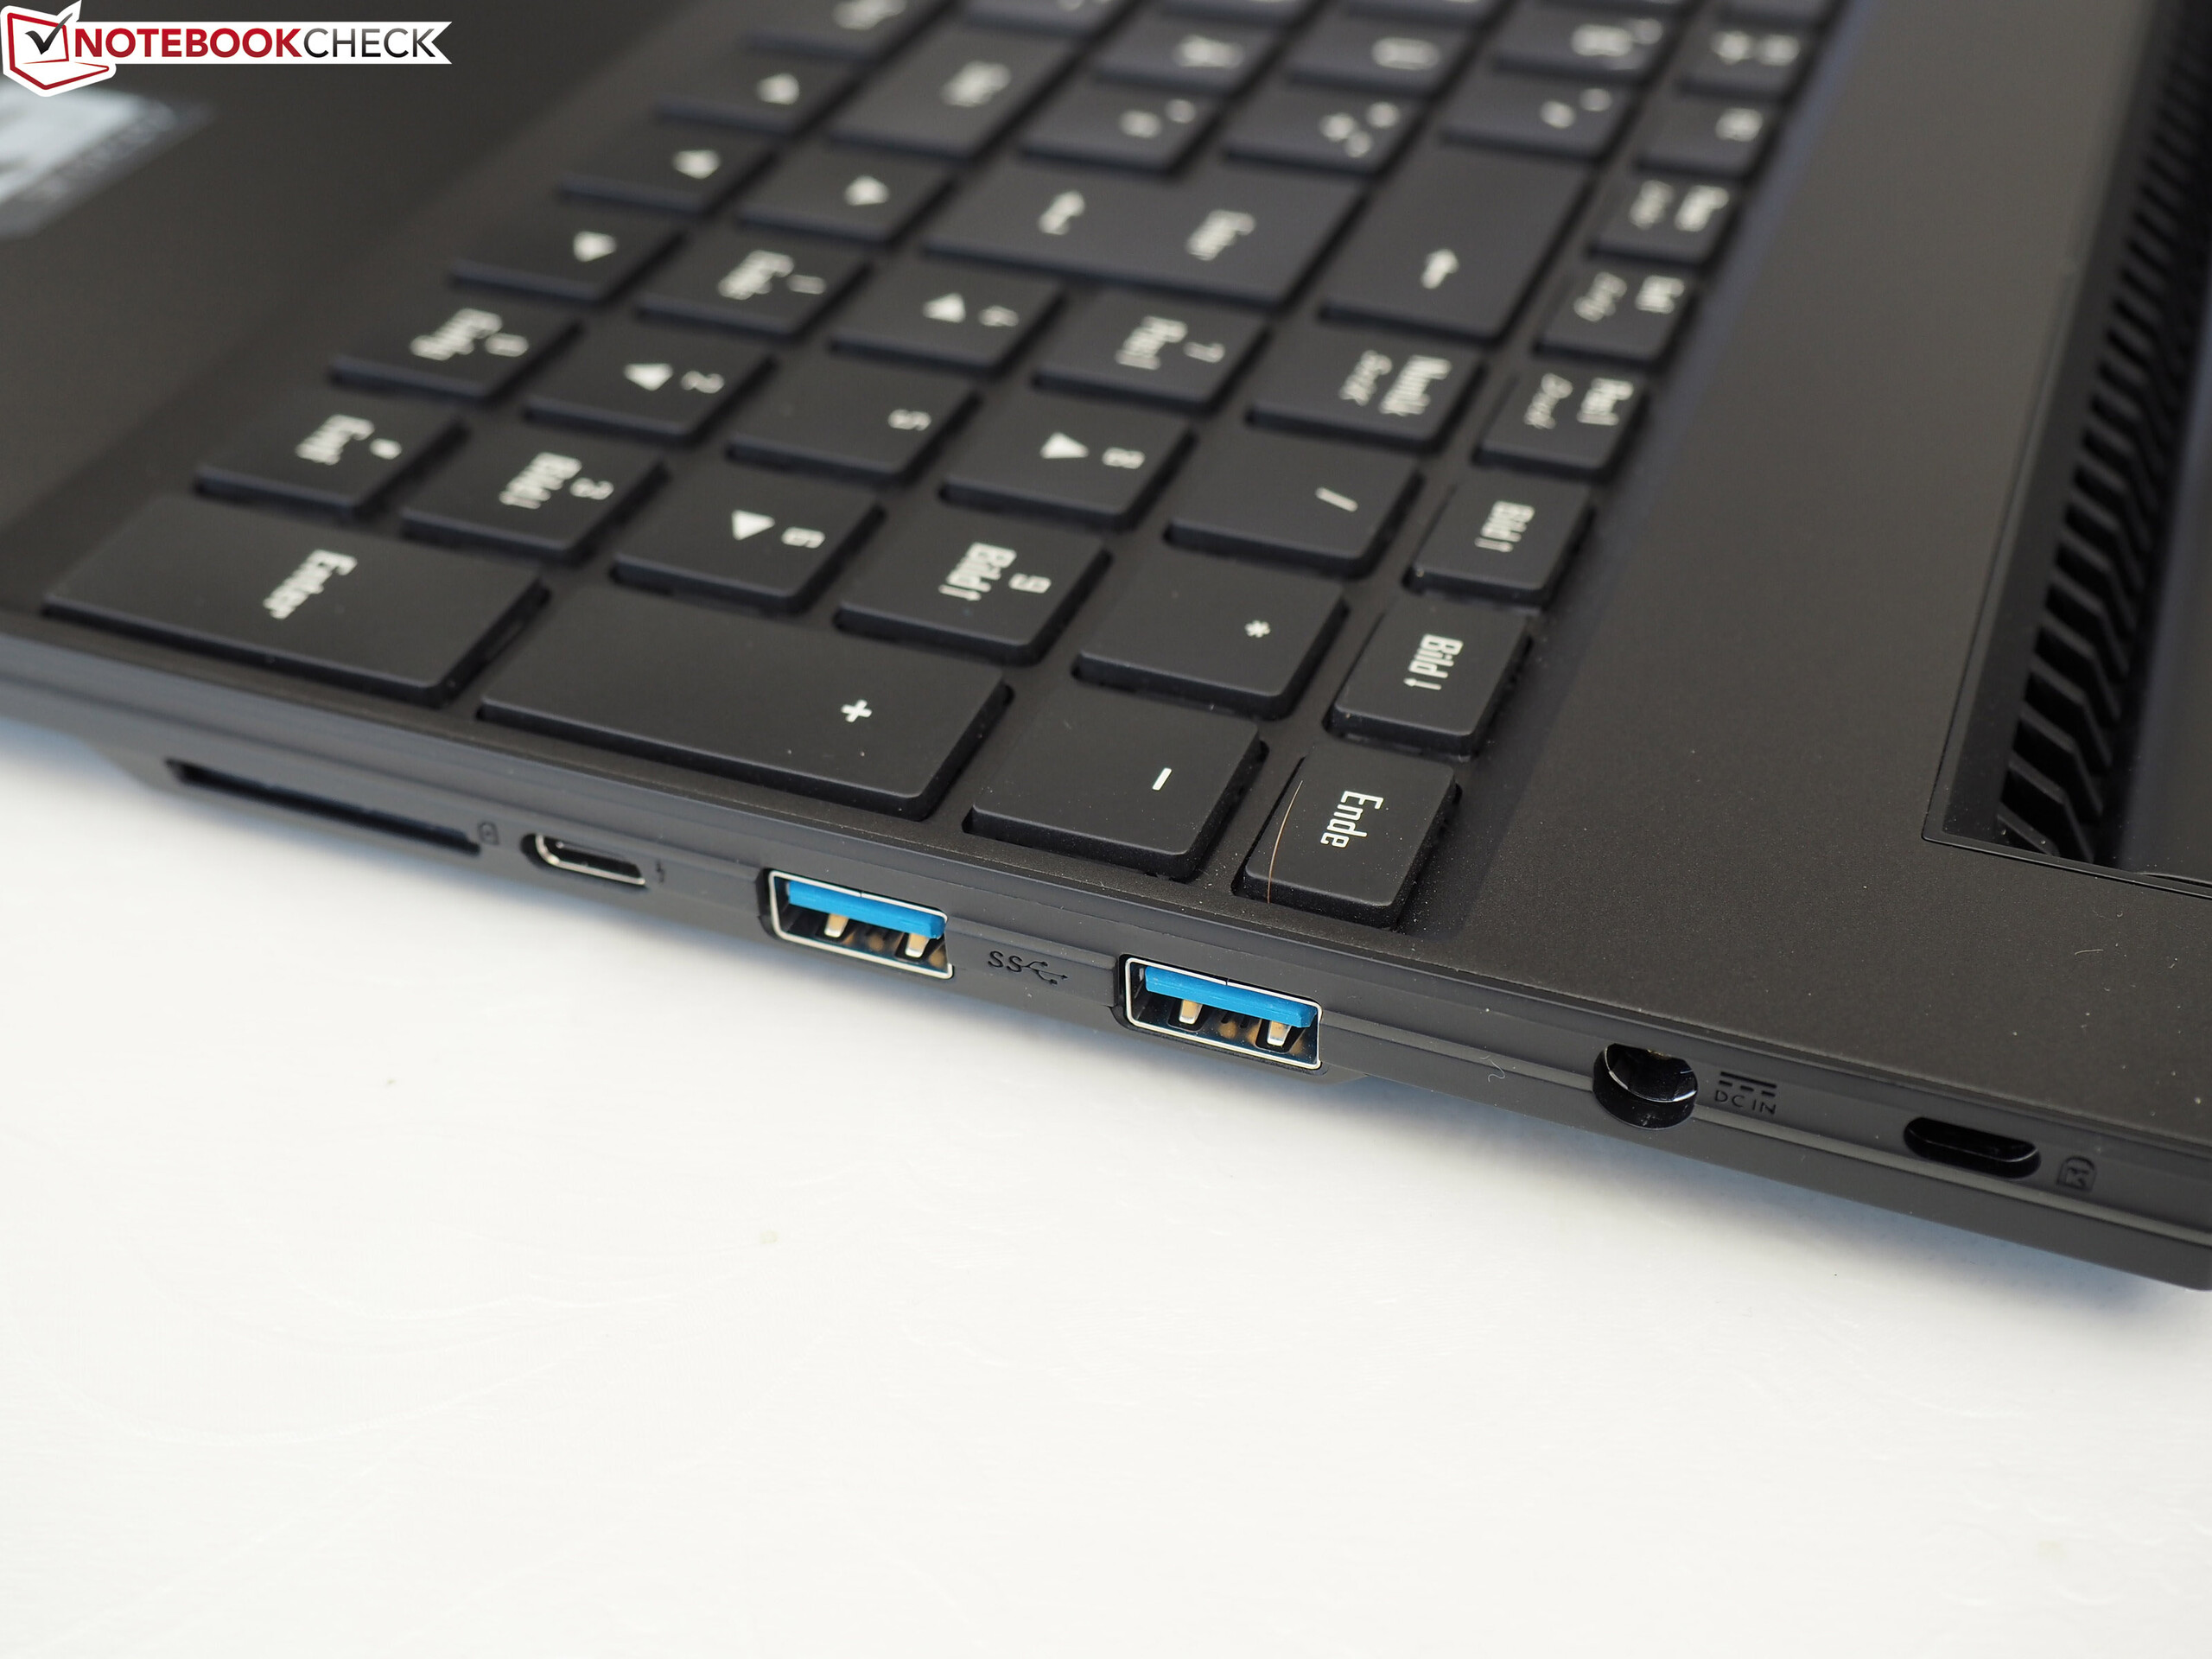
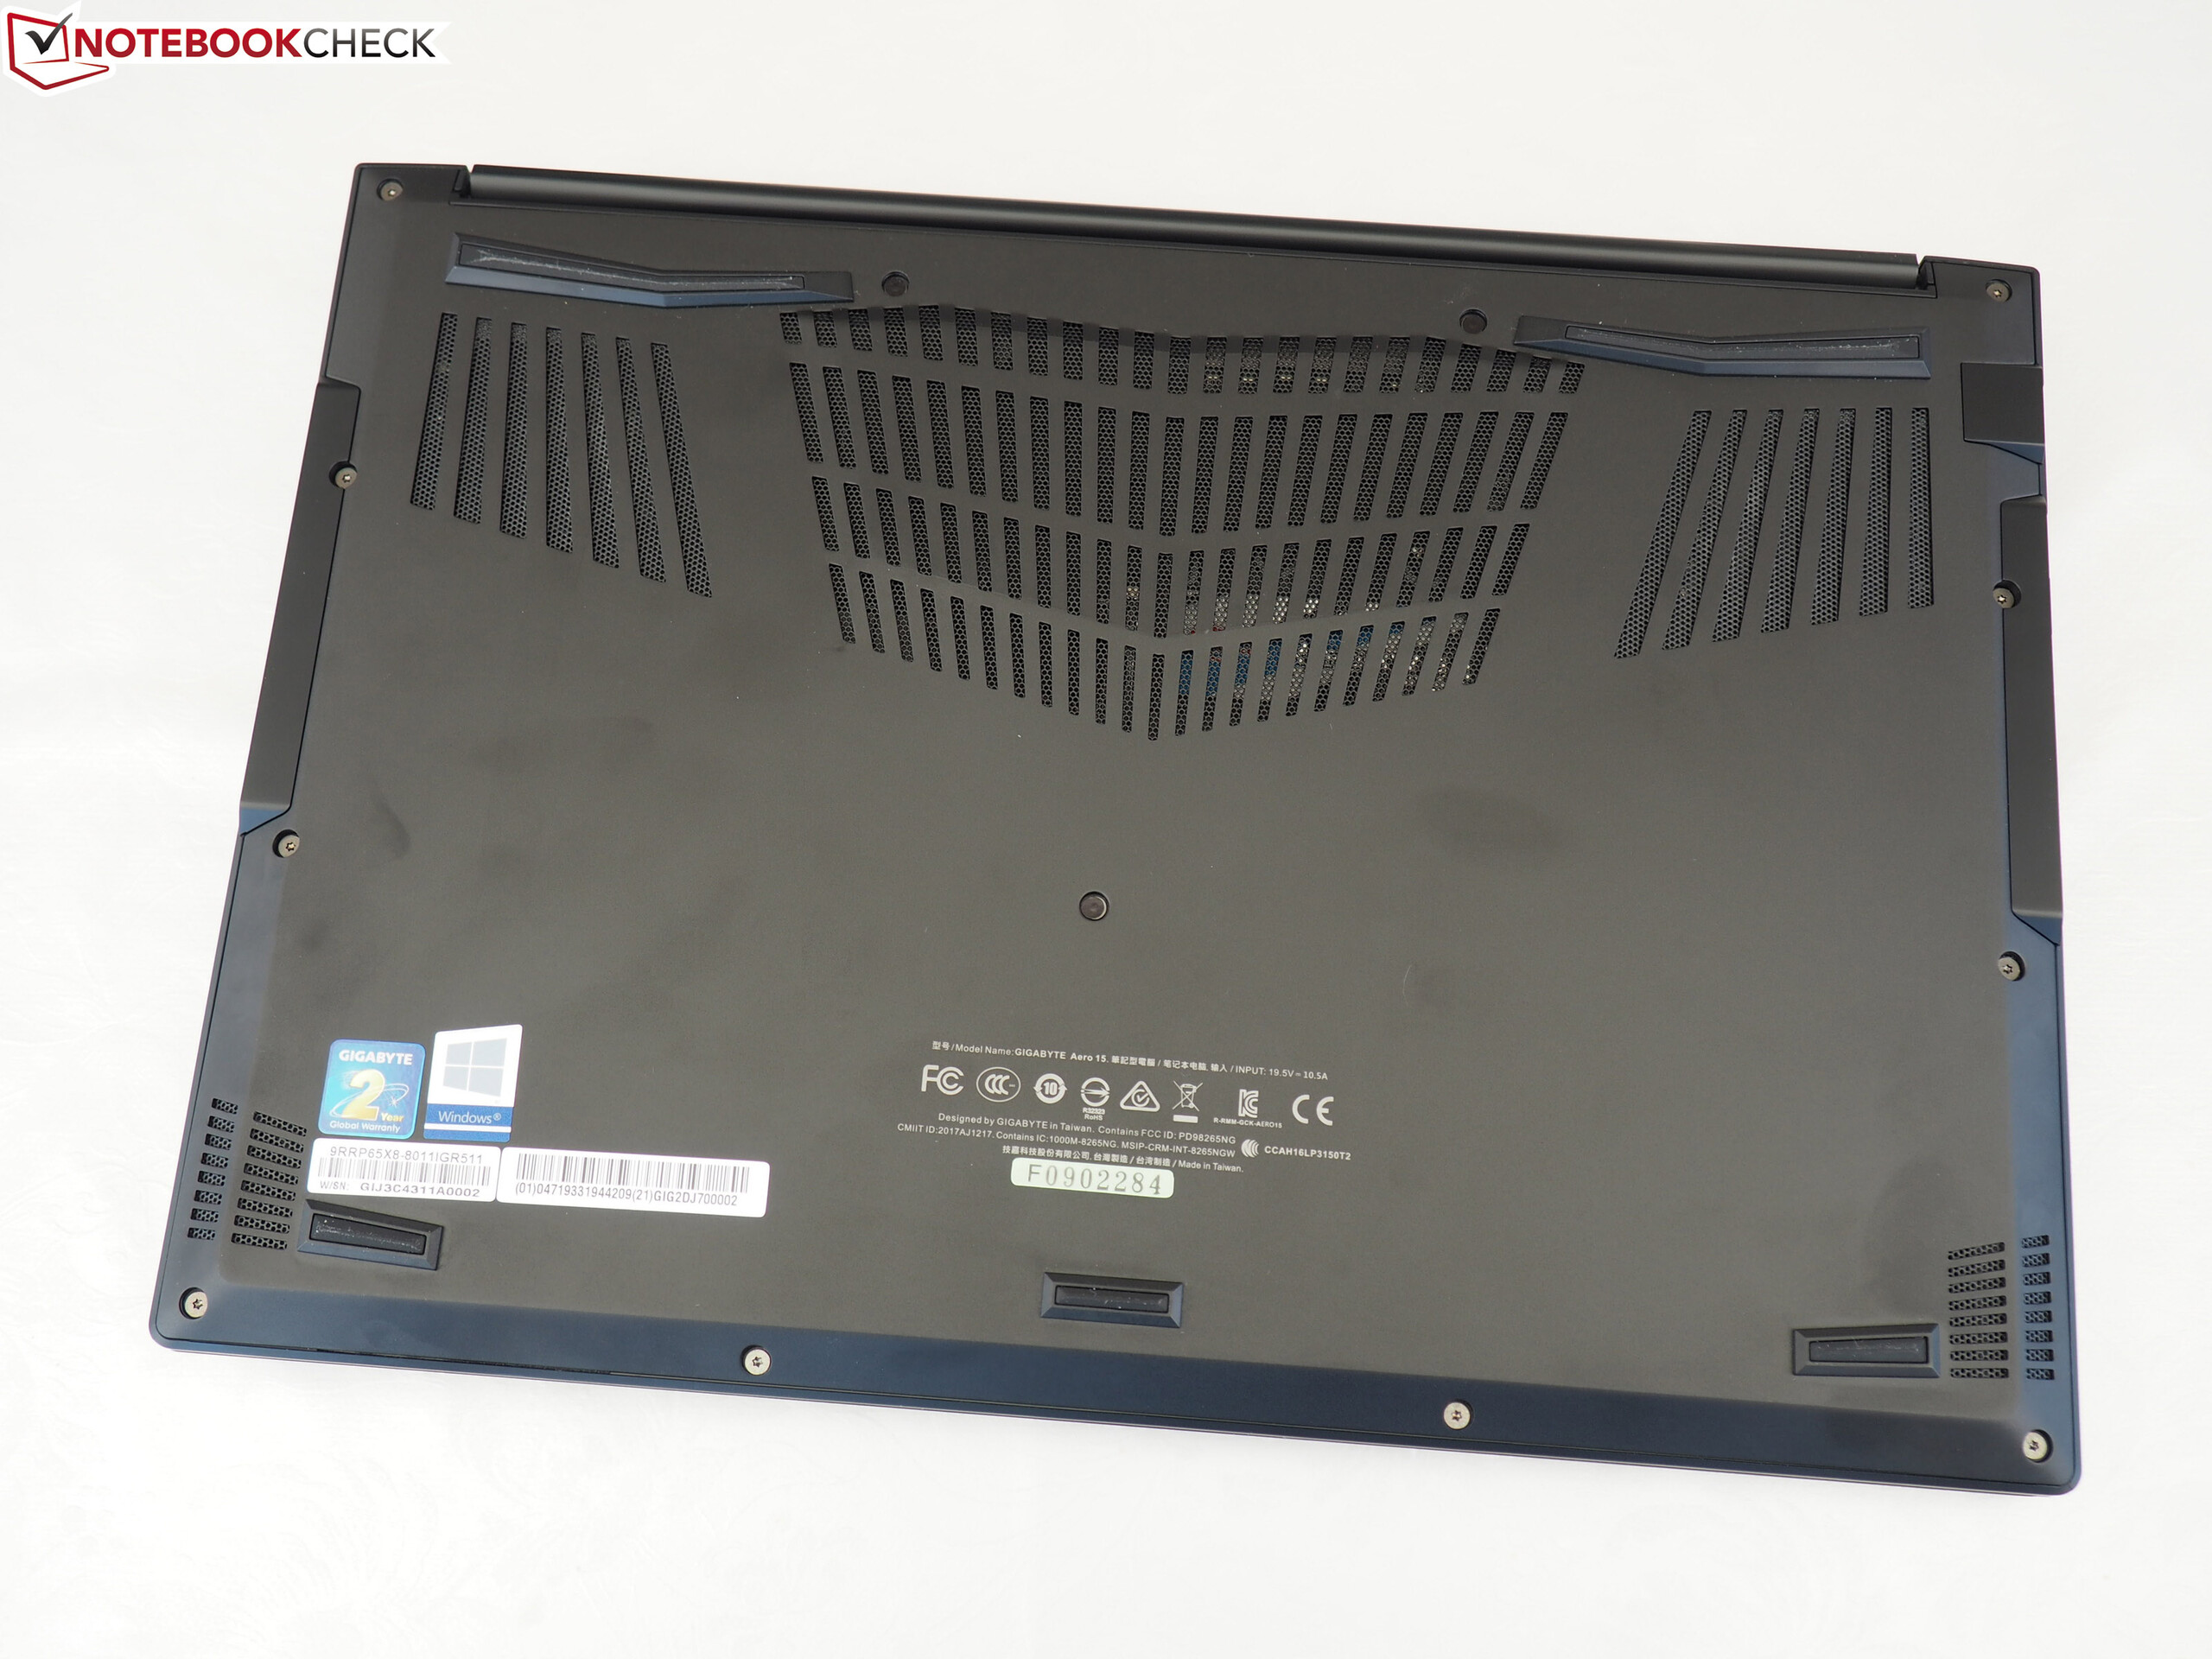
Because the Aero 15 Classic-XA has the same build as the Aero 15-X9 and Aero 15X v8, we will not go into details on the case, connectivity, input devices or speakers. Please refer to the predecessor's review for further information on these aspects.
| SD Card Reader | |
| average JPG Copy Test (av. of 3 runs) | |
| Gigabyte Aero 15-X9 (Toshiba Exceria Pro SDXC 64 GB UHS-II) | |
| Gigabyte Aero 15 Classic-XA (Toshiba Exceria Pro SDXC 64 GB UHS-II) | |
| Average of class Gaming (19 - 202, n=100, last 2 years) | |
| SCHENKER XMG Neo 15 Turing (Toshiba Exceria Pro SDXC 64 GB UHS-II) | |
| maximum AS SSD Seq Read Test (1GB) | |
| Gigabyte Aero 15-X9 (Toshiba Exceria Pro SDXC 64 GB UHS-II) | |
| Gigabyte Aero 15 Classic-XA (Toshiba Exceria Pro SDXC 64 GB UHS-II) | |
| Average of class Gaming (25.8 - 269, n=94, last 2 years) | |
| SCHENKER XMG Neo 15 Turing (Toshiba Exceria Pro SDXC 64 GB UHS-II) | |
Display - 240 Hz, IGZO
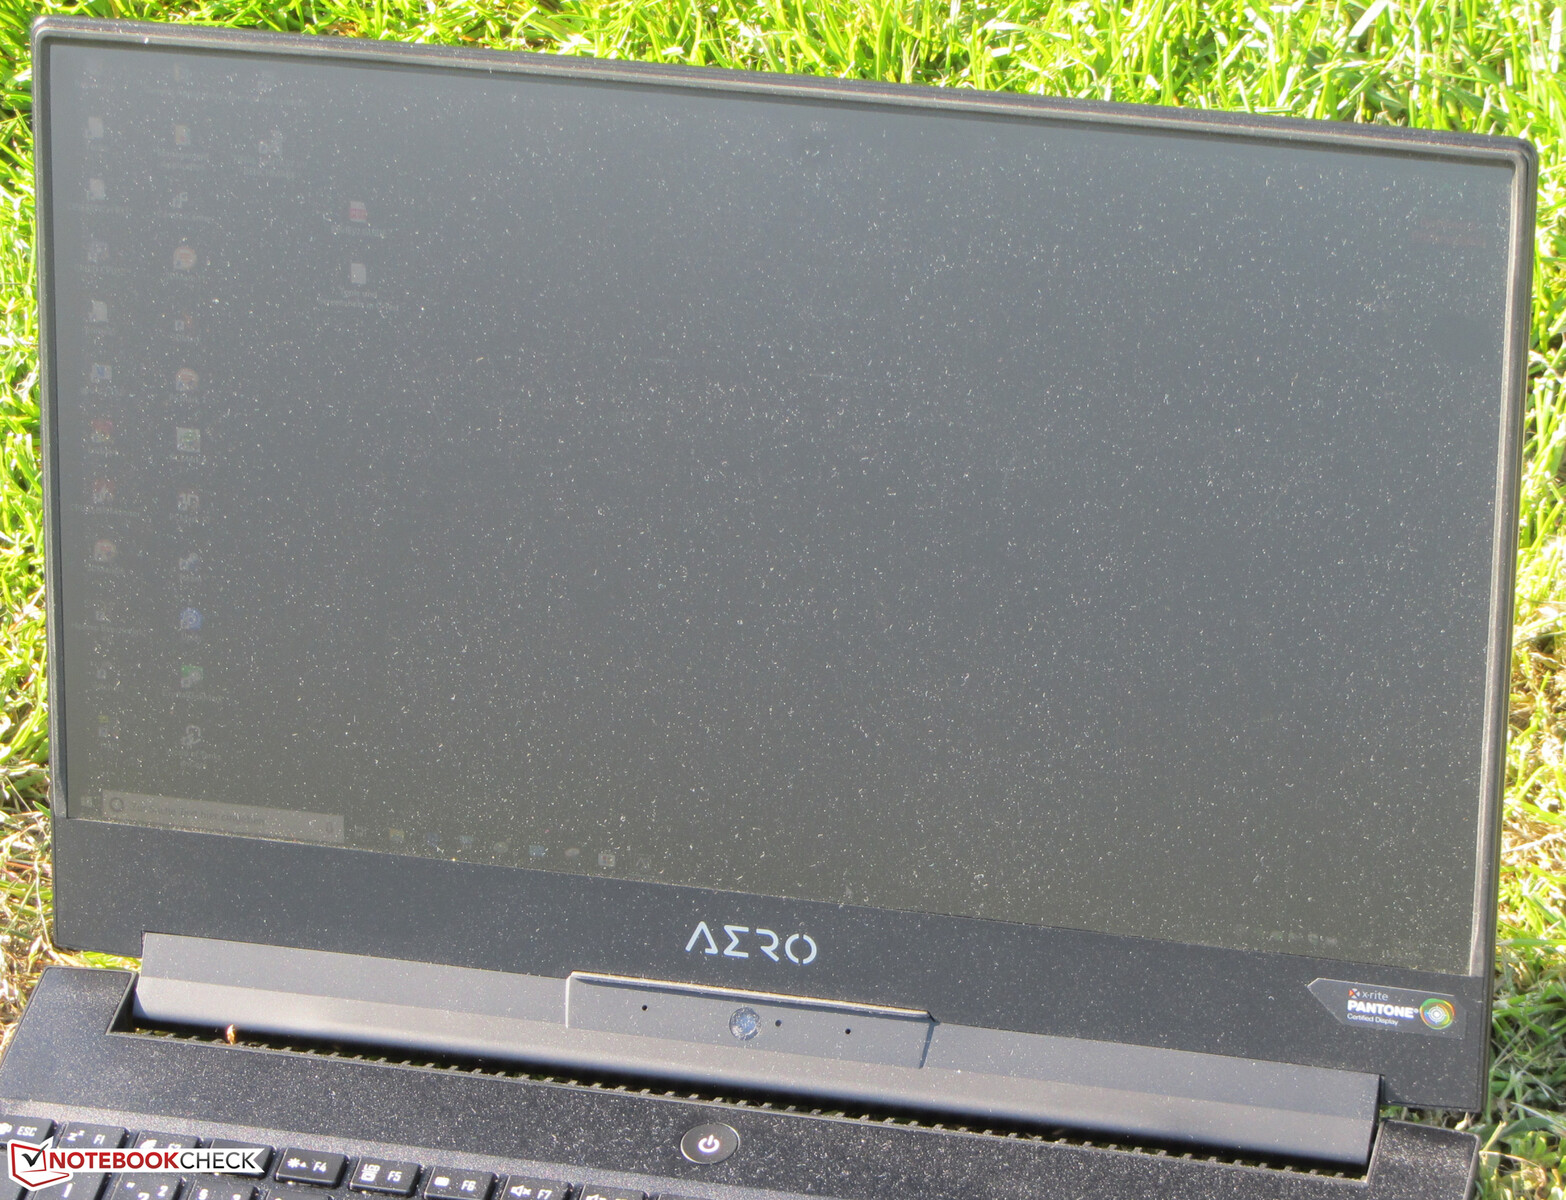
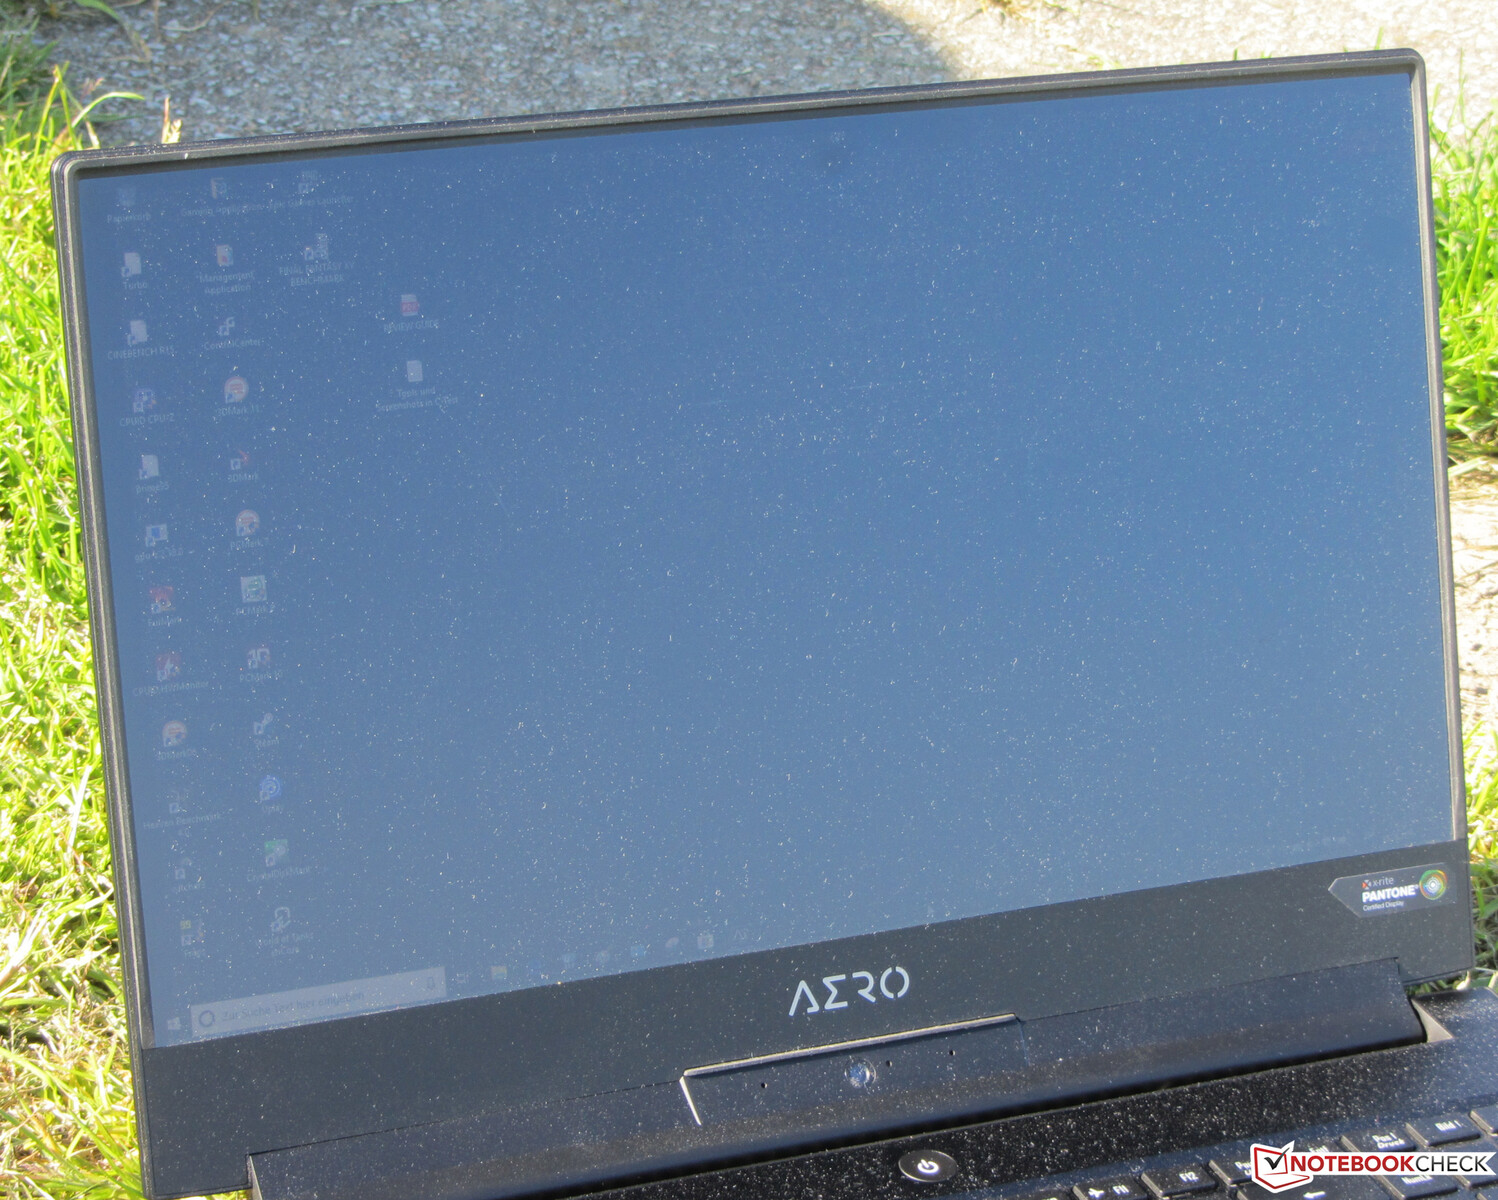
The matte 15.6-inch display of the Aero 15 Classic has a native resolution of 1920x1080 pixels. Its brightness (247 cd/m²) and contrast (858:1) are not particularly impressive and we would have expected more considering the device's price range. We basically consider values above 300 cd/m² and 1000:1 as acceptable. The Asus Zephyrus S GX531GX is actually the only device in our comparison field that fulfils these expectations.
The 240-Hz display in our Aero offers good response rates, although the Asus Zephyrus S GX531GX can top these as well.
Unfortunately, the display uses PWM at a frequency of 23580 Hz to regulate brightness levels below 24 percent. This frequency is quite high, however, so even sensitive users should not be affected by it.
| |||||||||||||||||||||||||
Brightness Distribution: 89 %
Center on Battery: 266 cd/m²
Contrast: 858:1 (Black: 0.31 cd/m²)
ΔE Color 2.78 | 0.5-29.43 Ø5, calibrated: 0.91
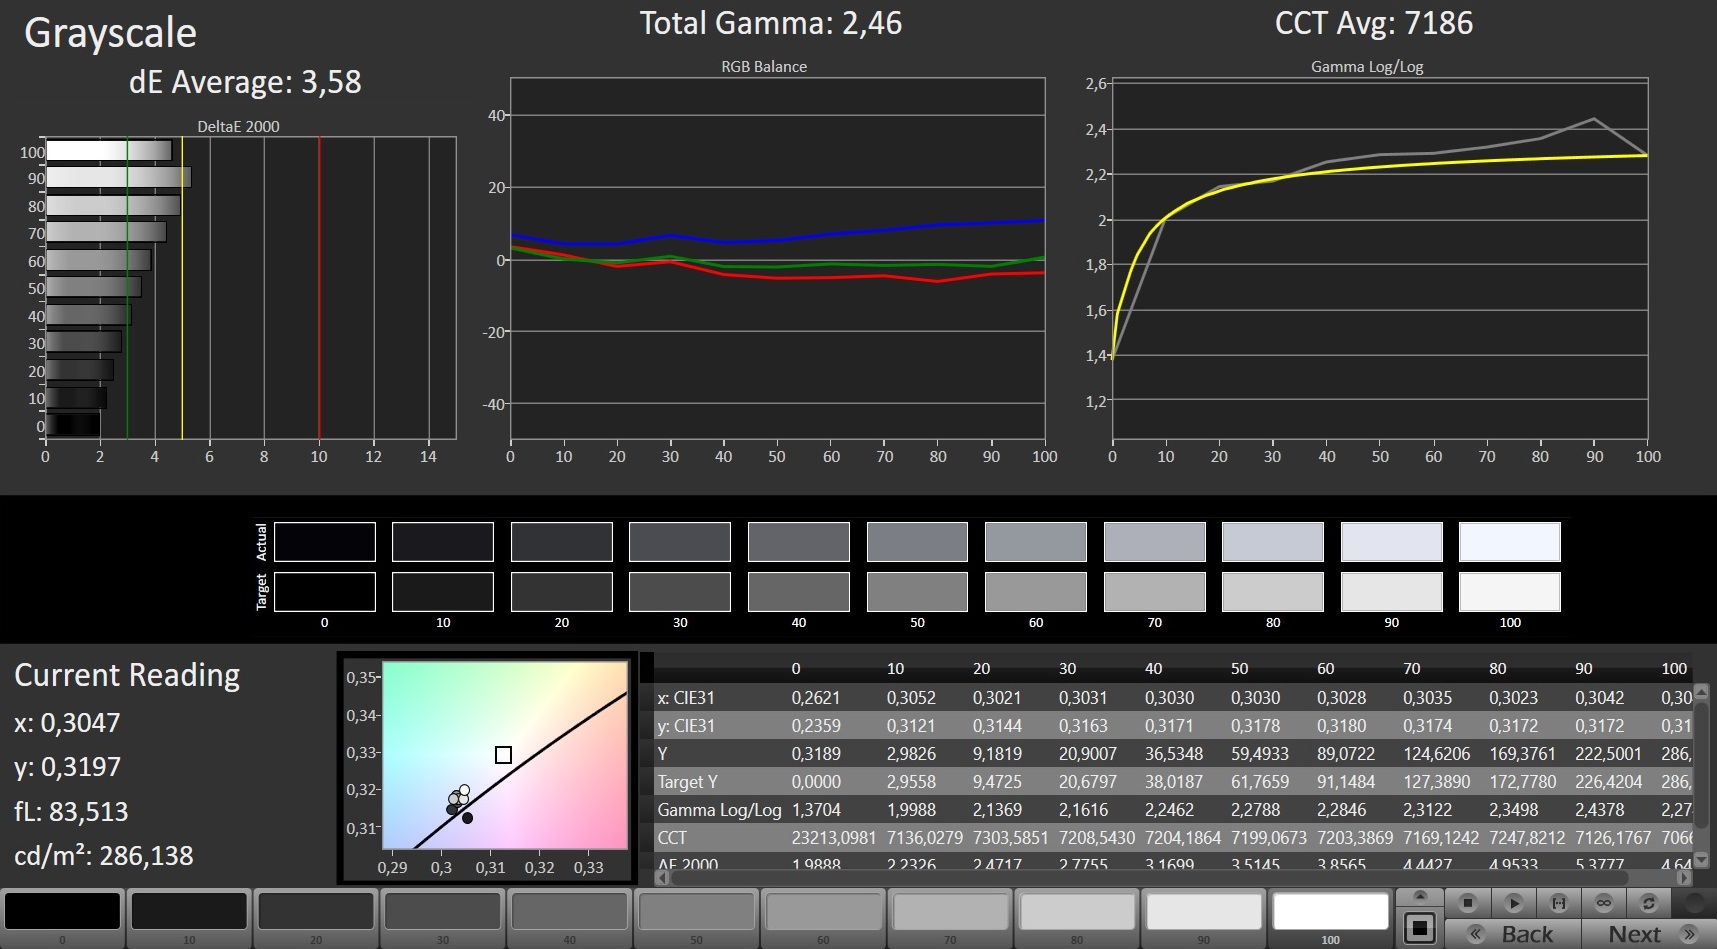
ΔE Greyscale 3.58 | 0.57-98 Ø5.3
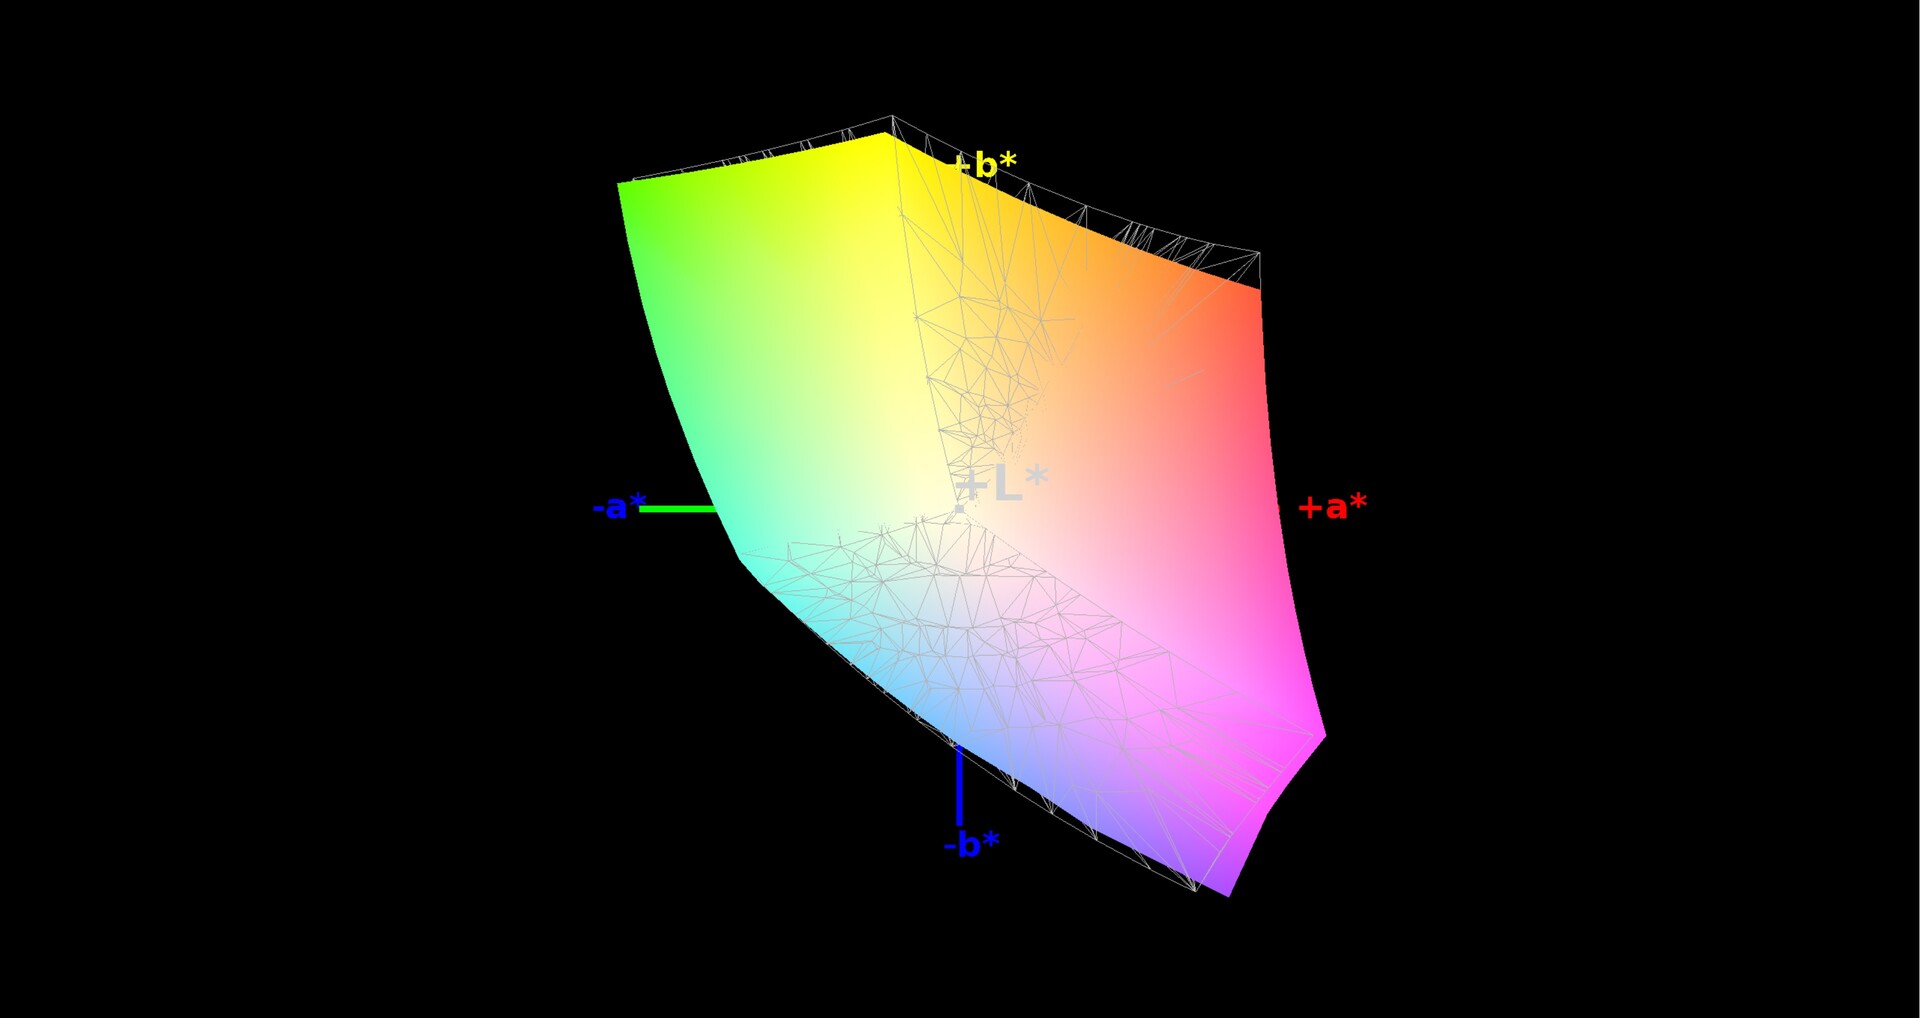
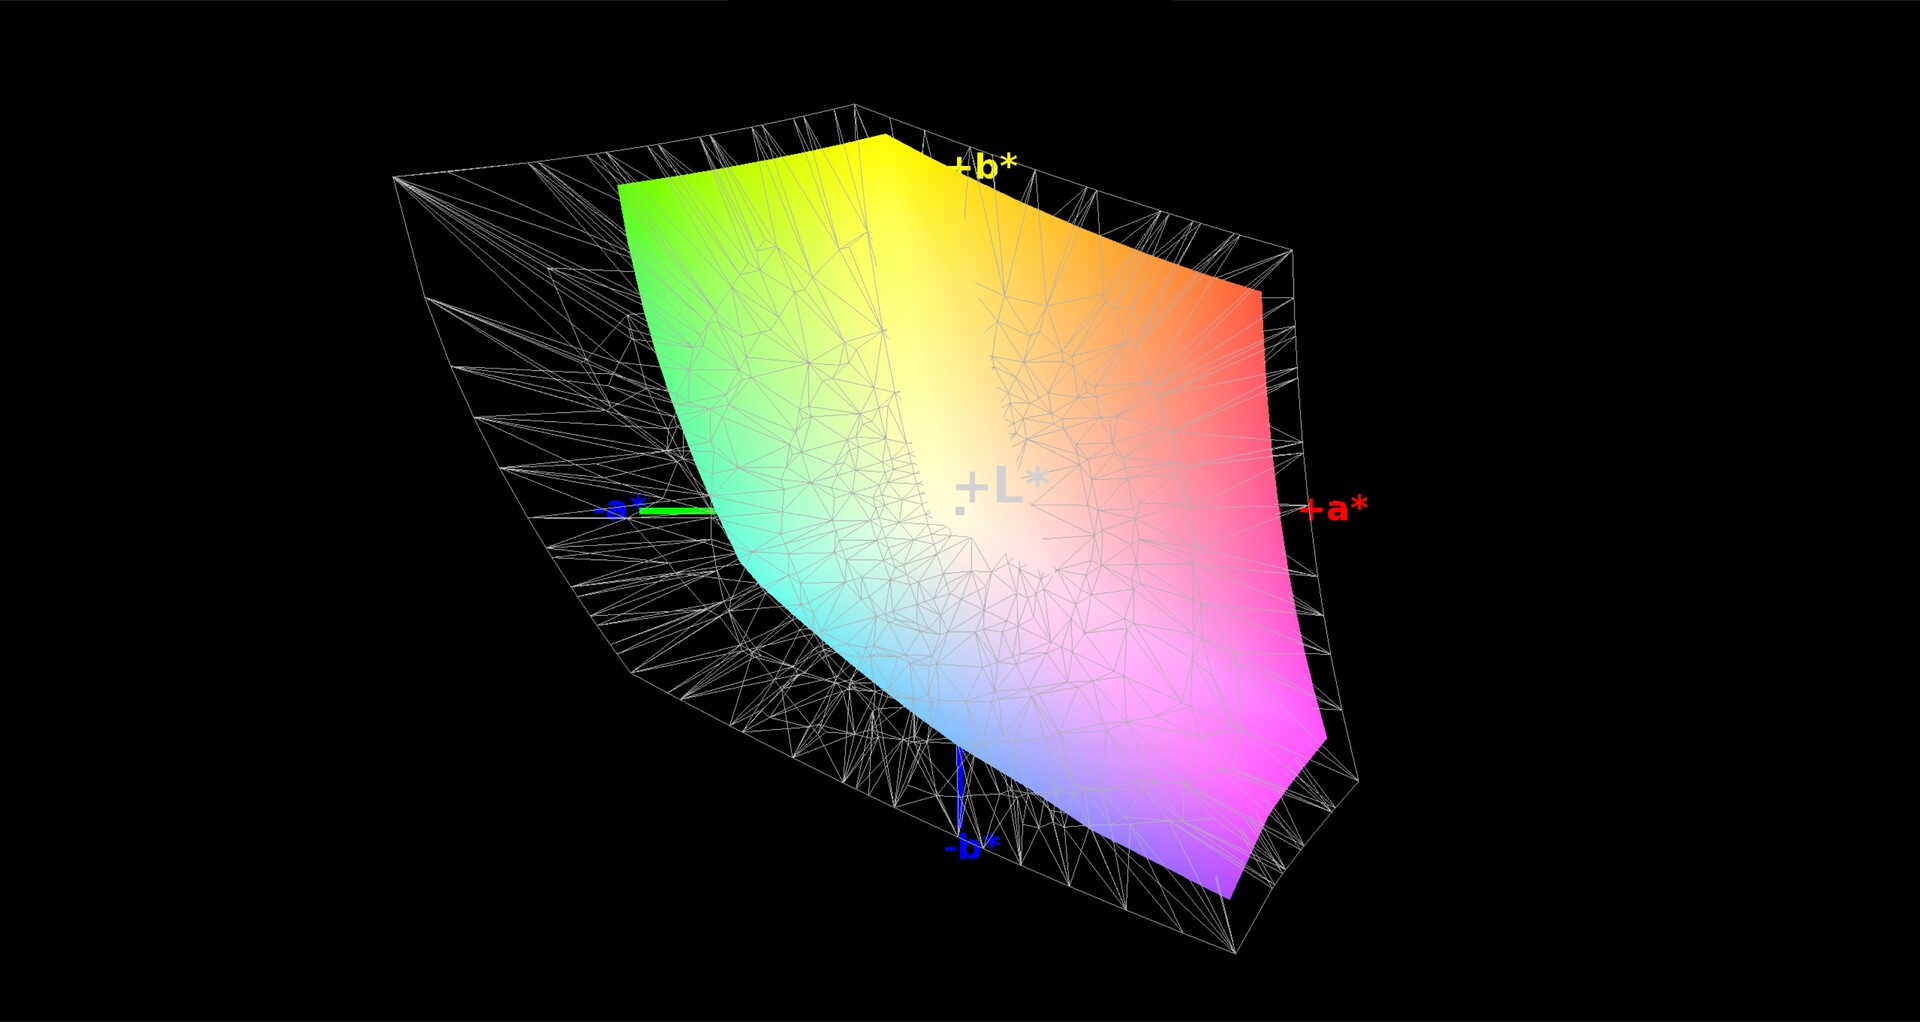
96% sRGB (Argyll 1.6.3 3D)
62% AdobeRGB 1998 (Argyll 1.6.3 3D)
66.5% AdobeRGB 1998 (Argyll 2.2.0 3D)
95.5% sRGB (Argyll 2.2.0 3D)
65.3% Display P3 (Argyll 2.2.0 3D)
Gamma: 2.46
| Gigabyte Aero 15 Classic-XA Sharp LQ156M1JW03 (SHP14C5), IGZO, 1920x1080, | Gigabyte Aero 15-X9 LGD05C0, IPS, 1920x1080, | Razer Blade 15 RTX 2070 Max-Q LG Philips LGD05C0, IPS, 1920x1080, | Asus Zephyrus S GX531GX AU Optronics B156HAN08.2, IPS, 1920x1080, | SCHENKER XMG Neo 15 Turing BOEhydis NV156FHM-N4G (BOE07AF), IPS, 1920x1080, | Acer Predator Triton 500 AU Optronics B156HAN08.2 (AUO82ED), IPS, 1920x1080, | Lenovo Legion Y740-15ICHg LP156WFG-SPB2, IPS, 1920x1080, | |
|---|---|---|---|---|---|---|---|
| Display | -3% | -0% | -1% | -3% | -2% | -3% | |
| Display P3 Coverage | 65.3 | 63.5 -3% | 65.3 0% | 65.6 0% | 63.5 -3% | 64.2 -2% | 63.5 -3% |
| sRGB Coverage | 95.5 | 93.1 -3% | 94.9 -1% | 92.2 -3% | 92.3 -3% | 92.6 -3% | 92.4 -3% |
| AdobeRGB 1998 Coverage | 66.5 | 64.5 -3% | 66.3 0% | 66.9 1% | 65 -2% | 65.7 -1% | 64.7 -3% |
| Response Times | -15% | -8% | 34% | -14% | 24% | -21% | |
| Response Time Grey 50% / Grey 80% * | 15.2 ? | 16.4 ? -8% | 16.8 ? -11% | 7 ? 54% | 8.8 ? 42% | 8 ? 47% | 18.8 ? -24% |
| Response Time Black / White * | 11.2 ? | 13.6 ? -21% | 11.6 ? -4% | 9.6 ? 14% | 10 ? 11% | 11.2 ? -0% | 13.2 ? -18% |
| PWM Frequency | 23580 ? | 1000 ? -96% | |||||
| Screen | 16% | -4% | -11% | -18% | -18% | -17% | |
| Brightness middle | 266 | 250 -6% | 314.7 18% | 323.6 22% | 268 1% | 304 14% | 320.4 20% |
| Brightness | 248 | 235 -5% | 312 26% | 315 27% | 270 9% | 299 21% | 298 20% |
| Brightness Distribution | 89 | 85 -4% | 90 1% | 91 2% | 84 -6% | 89 0% | 85 -4% |
| Black Level * | 0.31 | 0.29 6% | 0.38 -23% | 0.29 6% | 0.24 23% | 0.27 13% | 0.42 -35% |
| Contrast | 858 | 862 0% | 828 -3% | 1116 30% | 1117 30% | 1126 31% | 763 -11% |
| Colorchecker dE 2000 * | 2.78 | 1.46 47% | 2.56 8% | 3.31 -19% | 4.51 -62% | 4.66 -68% | 3.21 -15% |
| Colorchecker dE 2000 max. * | 5.96 | 2.47 59% | 4.89 18% | 5.74 4% | 9.58 -61% | 9.65 -62% | 5.54 7% |
| Colorchecker dE 2000 calibrated * | 0.91 | 1.71 -88% | 2.73 -200% | 1.57 -73% | 1.72 -89% | 2.36 -159% | |
| Greyscale dE 2000 * | 3.58 | 1.27 65% | 3.4 5% | 2.9 19% | 5.36 -50% | 5.53 -54% | 3.6 -1% |
| Gamma | 2.46 89% | 2.4 92% | 2.3 96% | 2.29 96% | 2.51 88% | 2.5 88% | 2.27 97% |
| CCT | 7186 90% | 6749 96% | 6435 101% | 6765 96% | 7826 83% | 8028 81% | 6503 100% |
| Color Space (Percent of AdobeRGB 1998) | 62 | 60 -3% | 60.7 -2% | 59.7 -4% | 59 -5% | 60 -3% | 59 -5% |
| Color Space (Percent of sRGB) | 96 | 93 -3% | 94.6 -1% | 91.8 -4% | 92 -4% | 93 -3% | 92 -4% |
| Total Average (Program / Settings) | -1% /
8% | -4% /
-4% | 7% /
-3% | -12% /
-15% | 1% /
-10% | -14% /
-15% |
* ... smaller is better
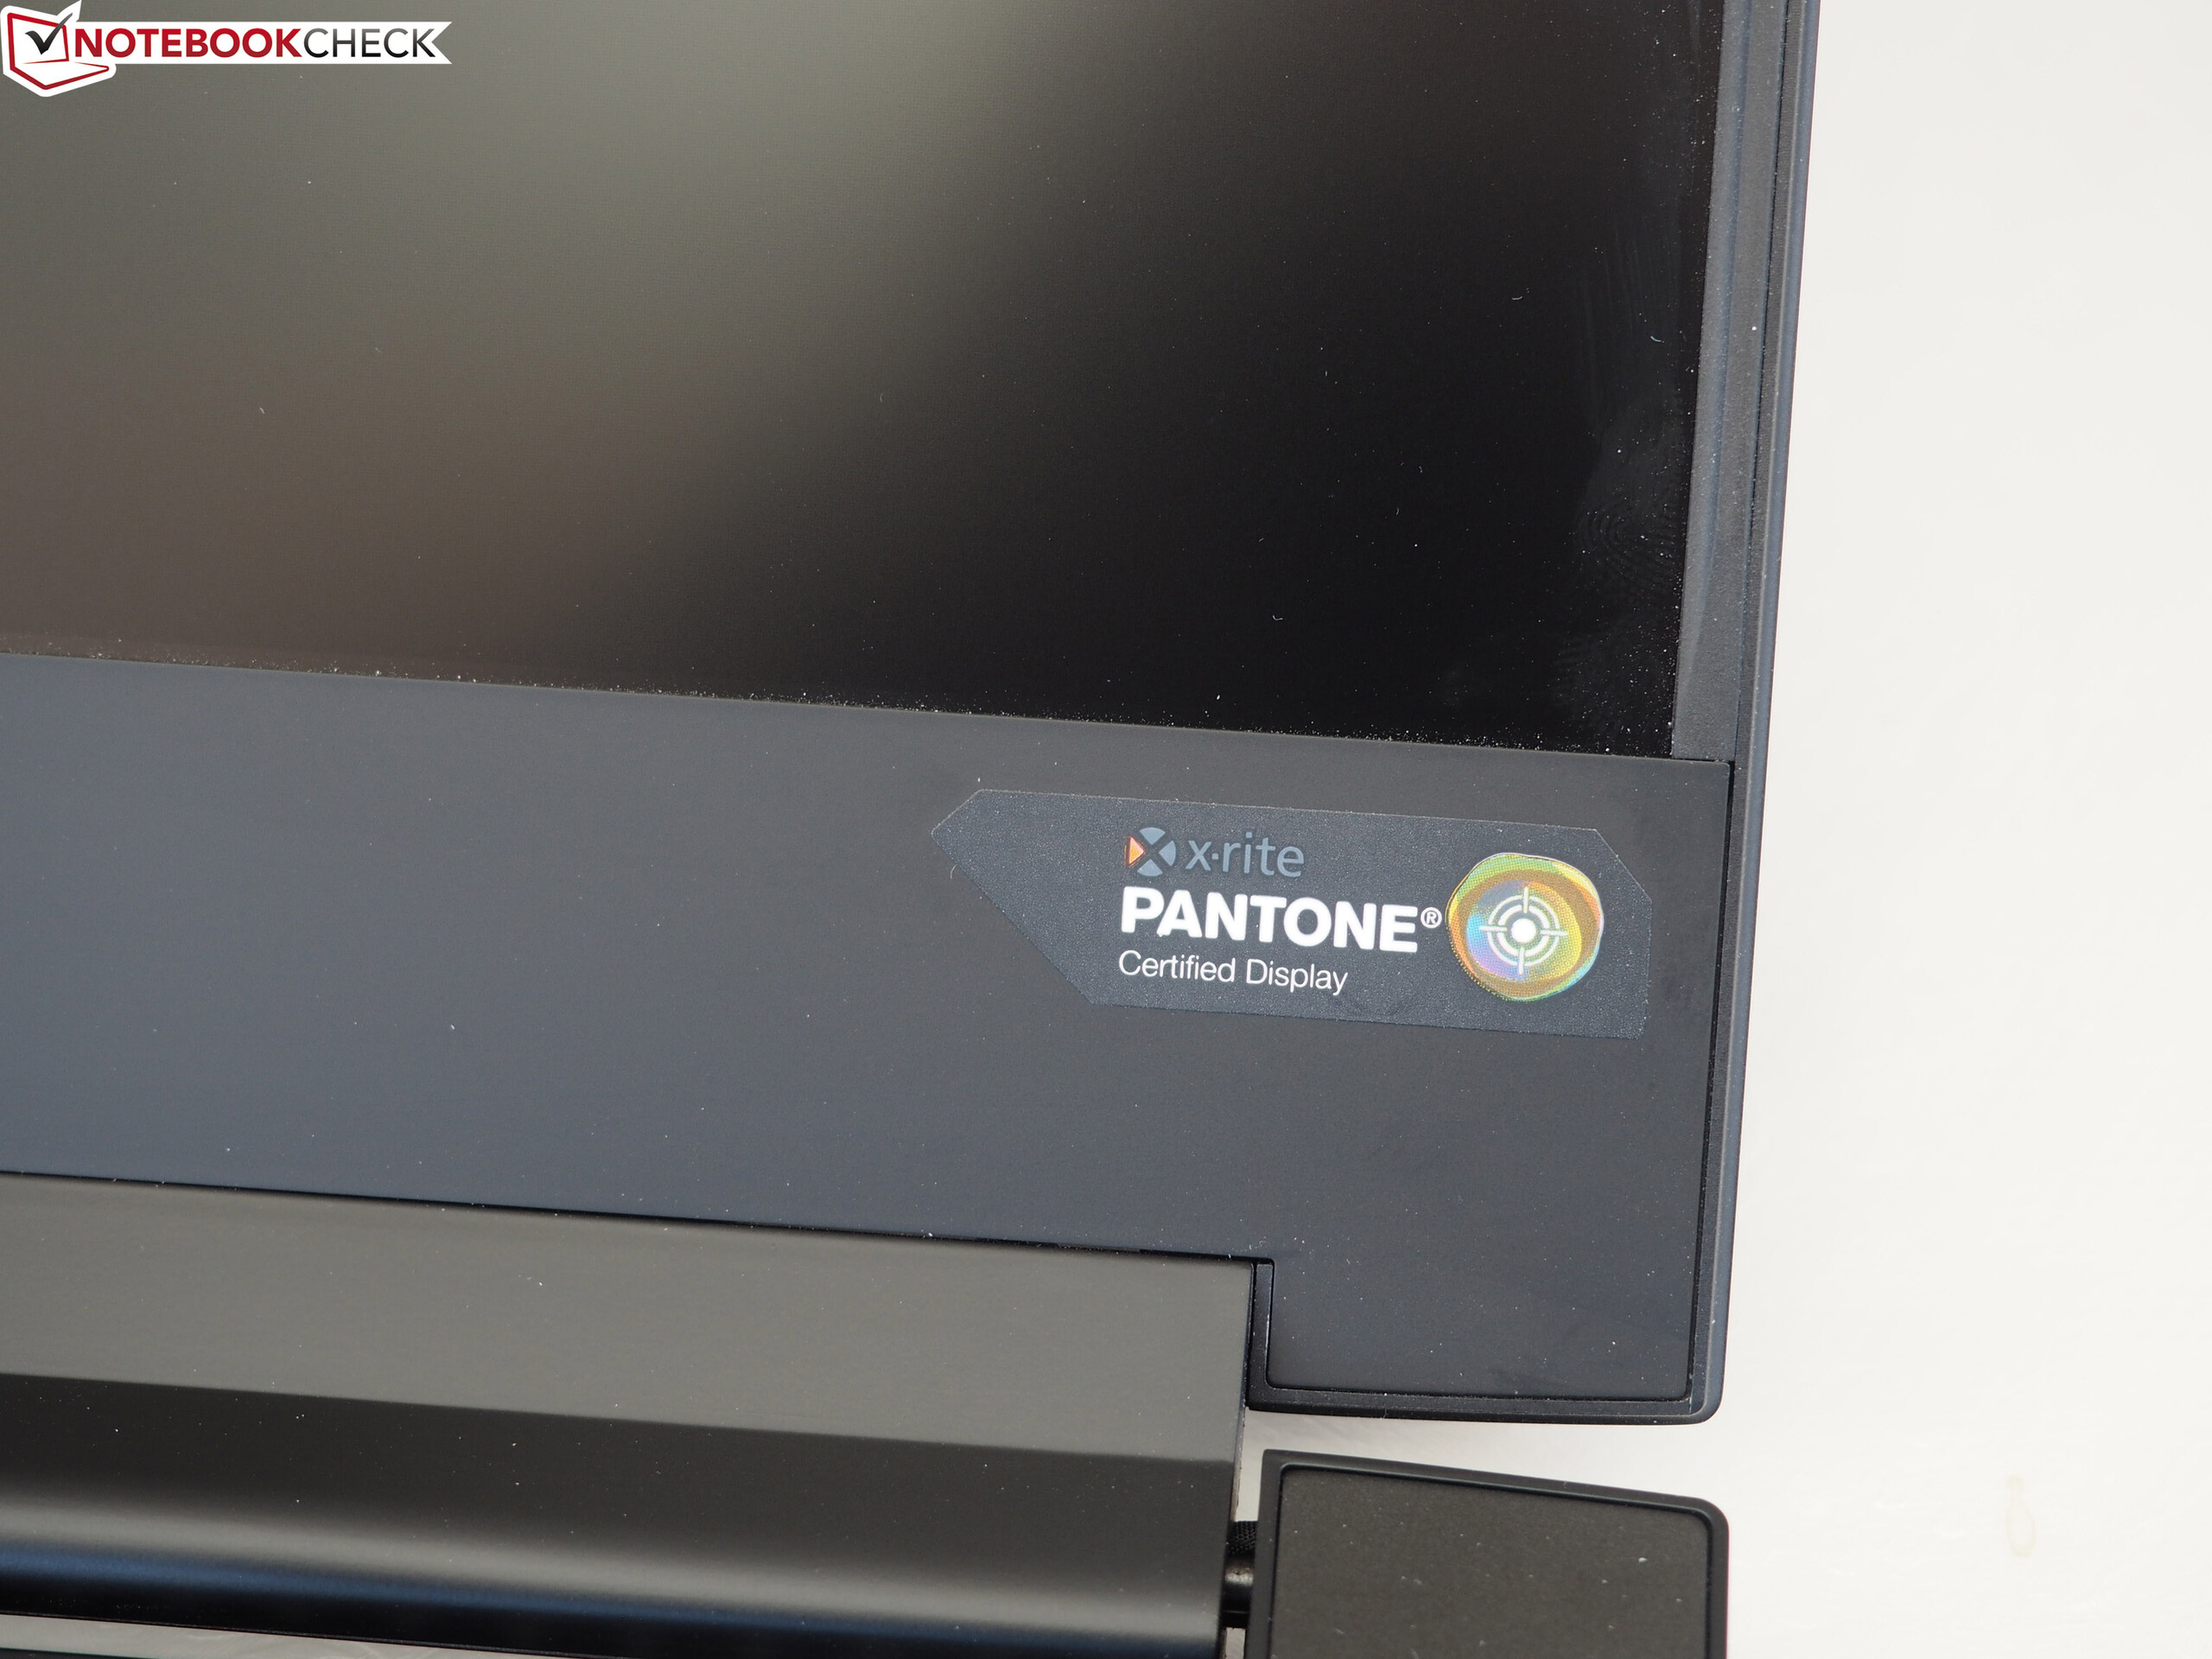
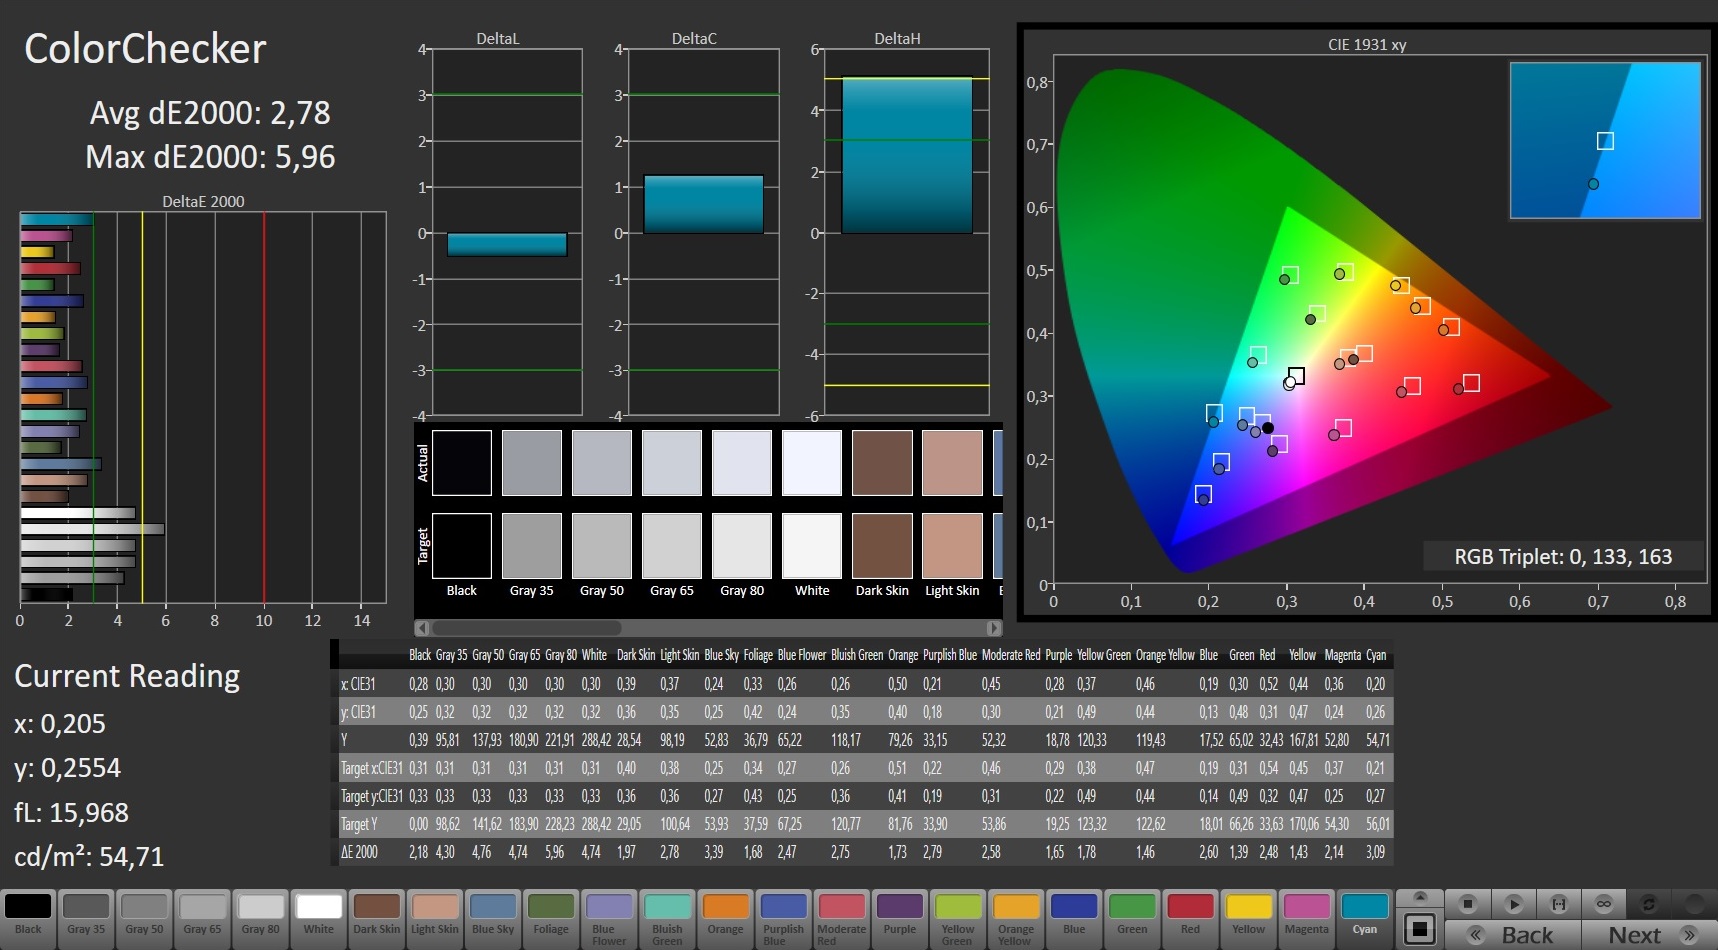
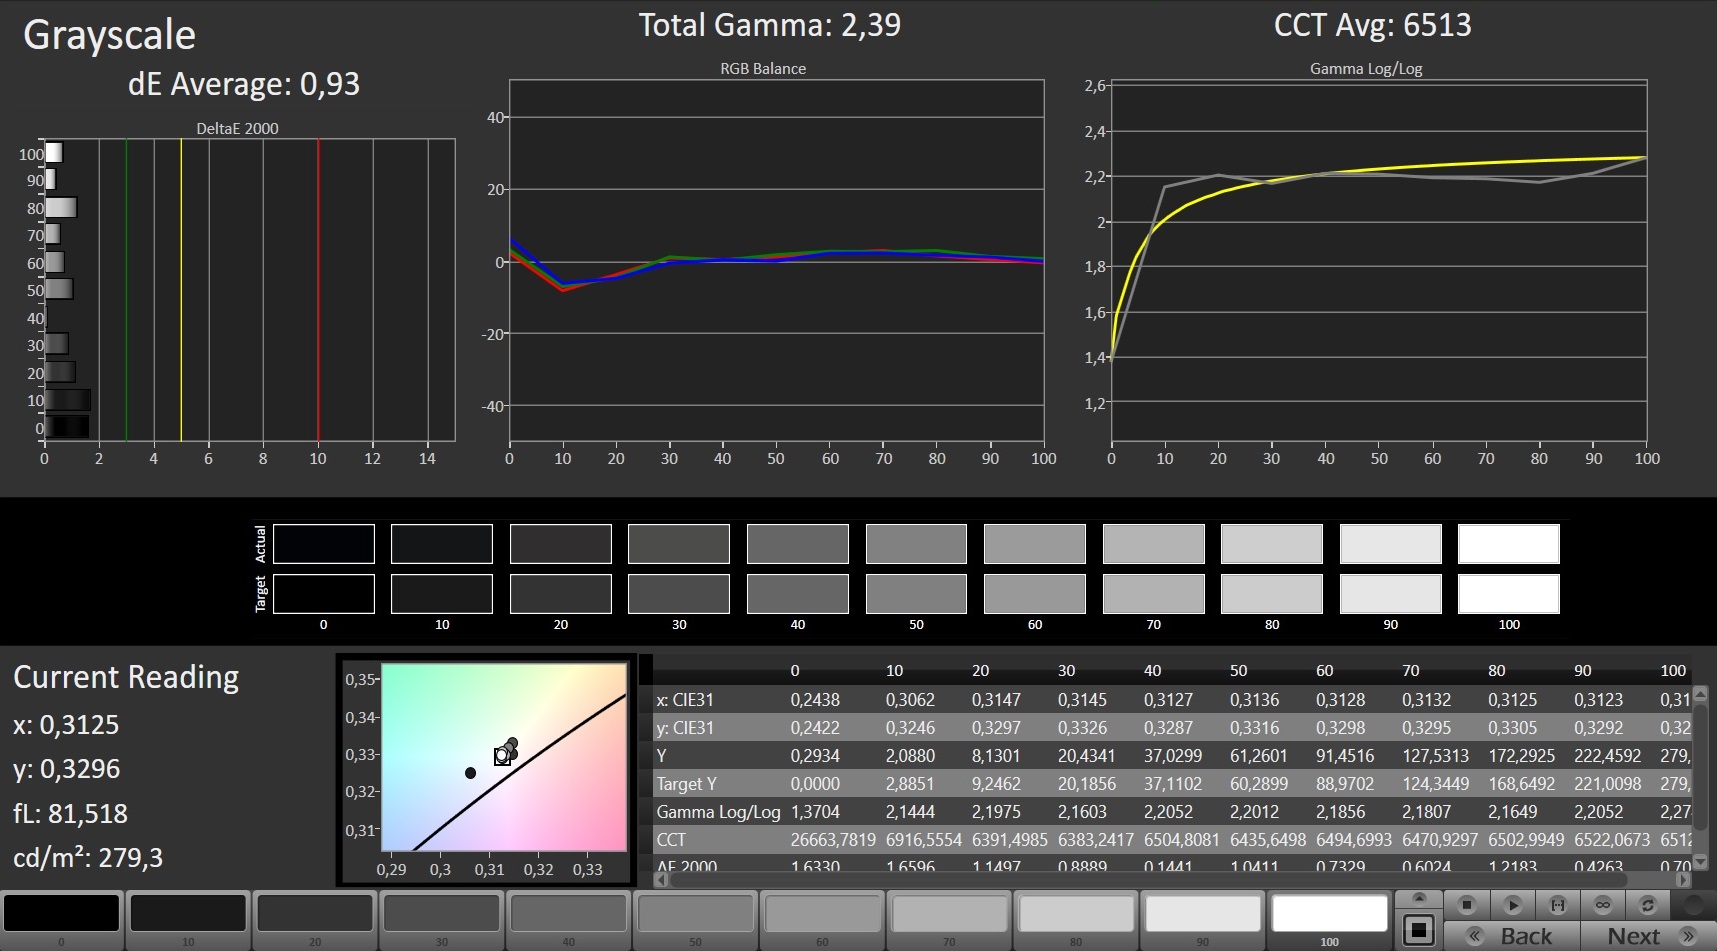
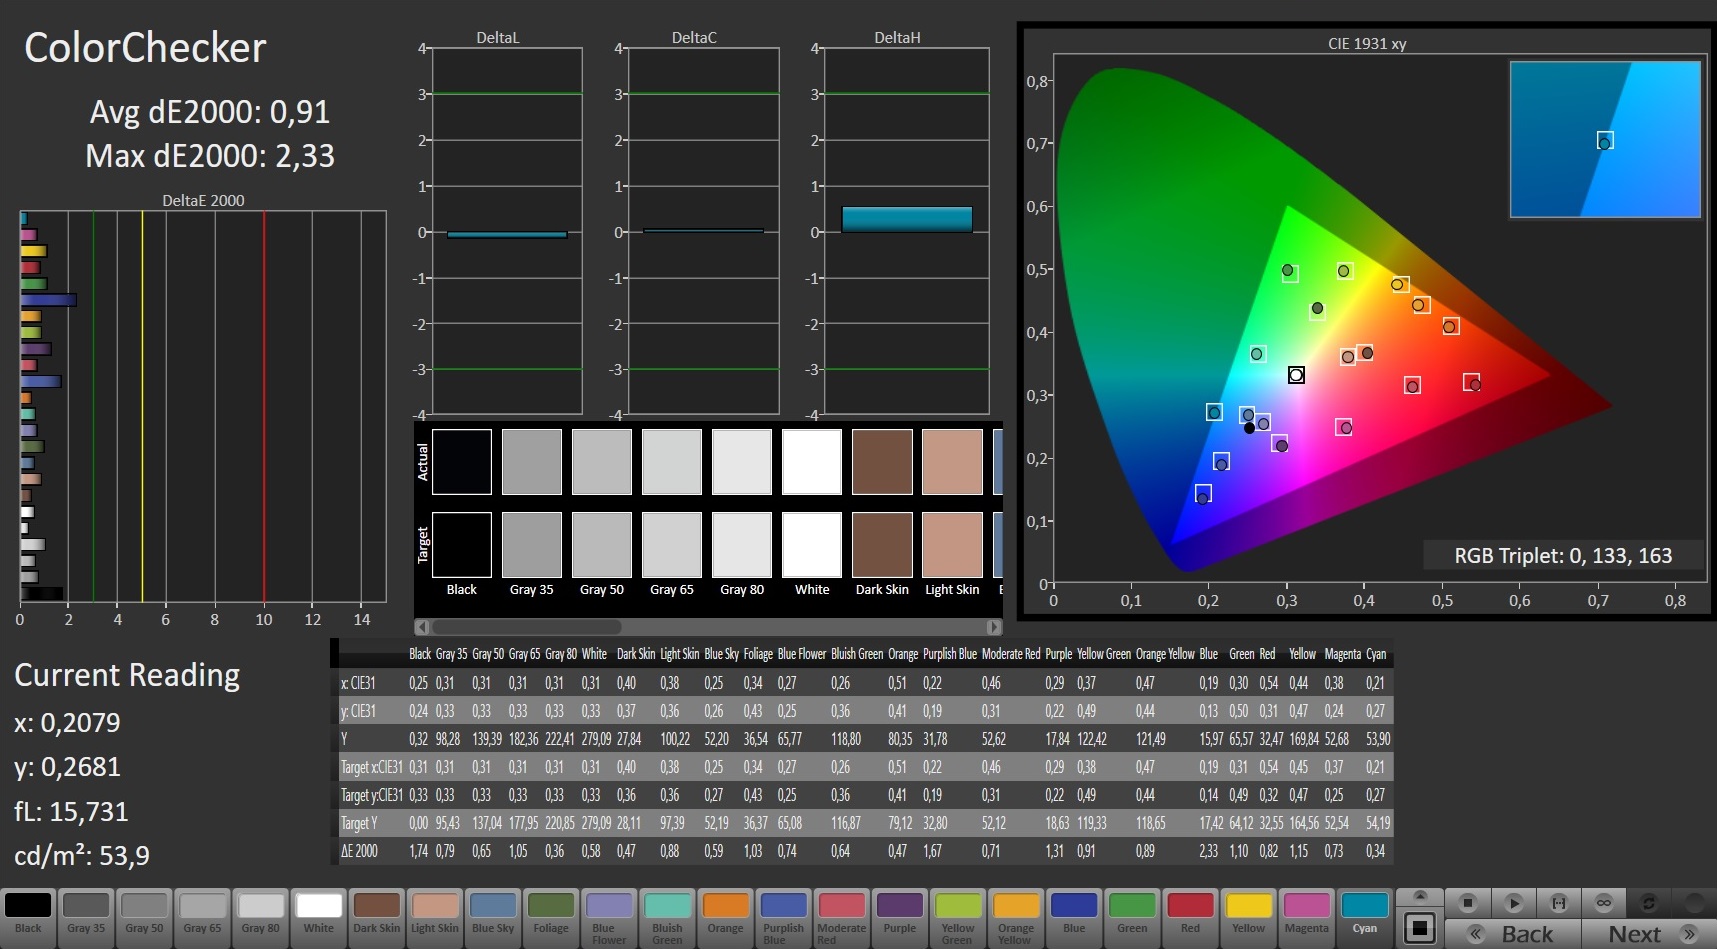
The color display is already good at factory settings (active X-Rite Pantone). We measured a DeltaE-2000 color deviation of 2.78, which is within the ideal range of DeltaE below 3. The display does not have a blue cast. Our own calibration improved the colors even more with the deviation dropping to 0.91. Grayscales are also displayed more evenly. Users can download our color profile above and adjust the colors of their screen according to our calibration.
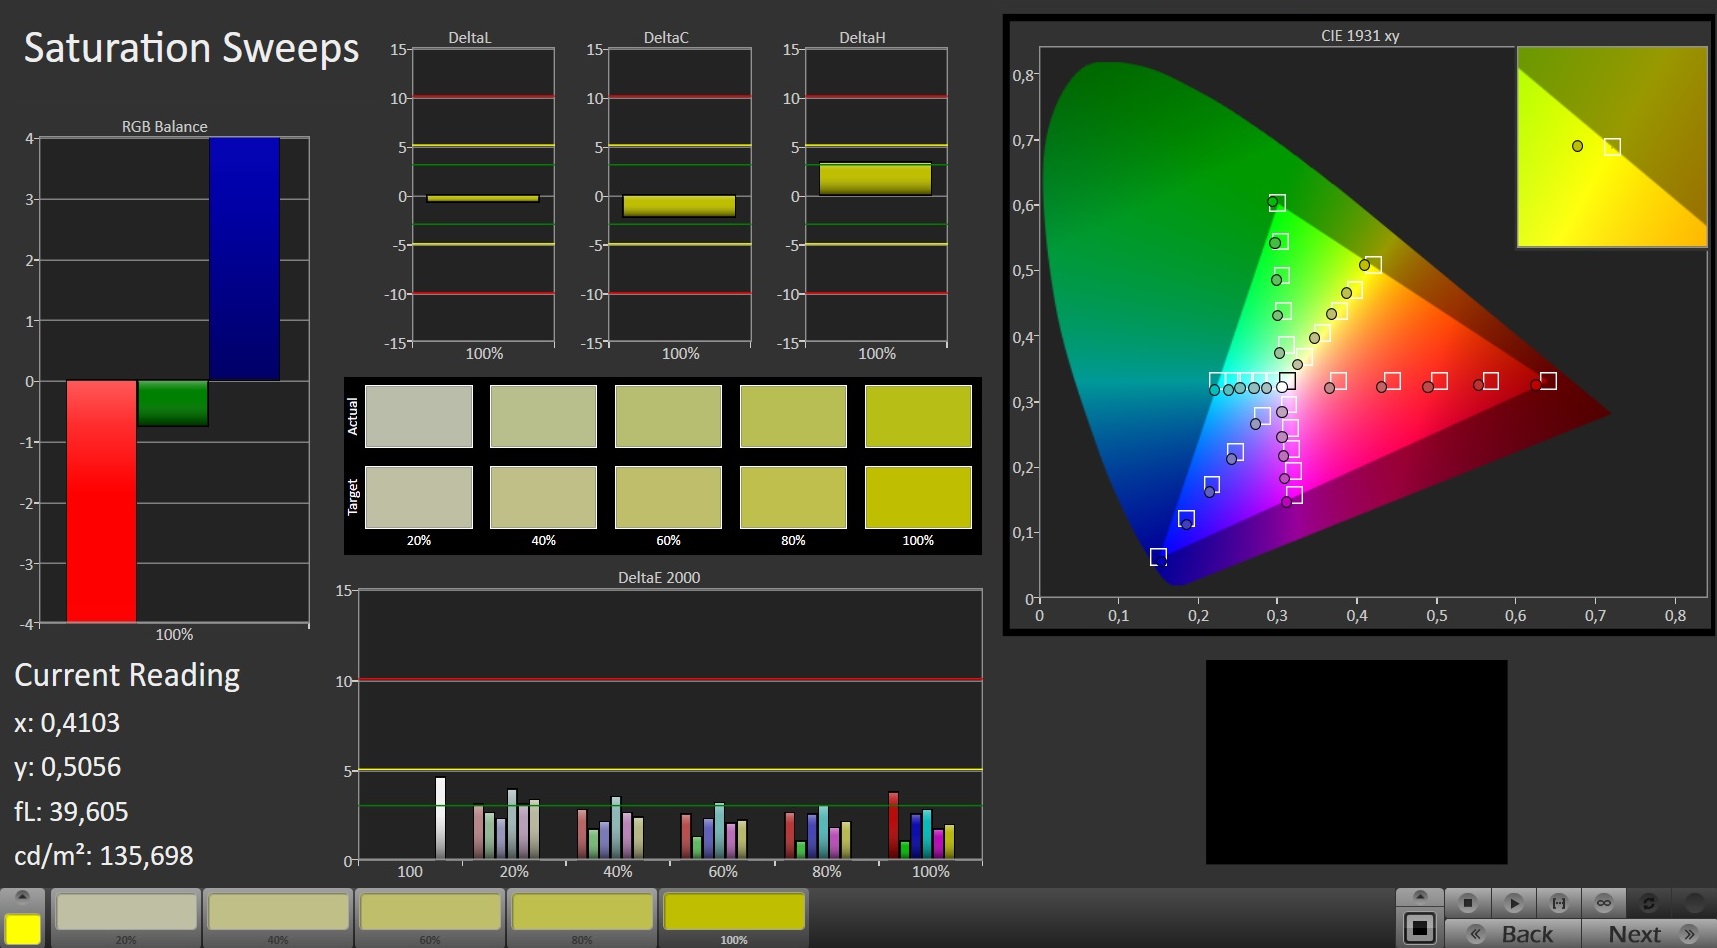
The color spaces AdobeRGB and sRGB are not covered entirely at 62 percent and 96 percent, respectively. The Aero 15 Classic models that are equipped with a 4K screen should offer better color space coverage. Gigabyte actually claims 100 percent AdobeRGB coverage for those panels.
Display Response Times
| ↔ Response Time Black to White | ||
|---|---|---|
| 11.2 ms ... rise ↗ and fall ↘ combined | ↗ 6.8 ms rise | 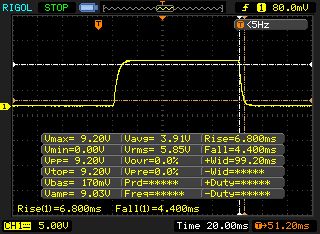 |
| ↘ 4.4 ms fall | ||
| The screen shows good response rates in our tests, but may be too slow for competitive gamers. In comparison, all tested devices range from 0.1 (minimum) to 240 (maximum) ms. » 25 % of all devices are better. This means that the measured response time is better than the average of all tested devices (21.5 ms). | ||
| ↔ Response Time 50% Grey to 80% Grey | ||
| 15.2 ms ... rise ↗ and fall ↘ combined | ↗ 7.6 ms rise | 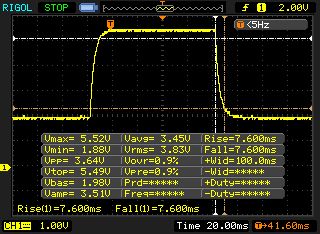 |
| ↘ 7.6 ms fall | ||
| The screen shows good response rates in our tests, but may be too slow for competitive gamers. In comparison, all tested devices range from 0.2 (minimum) to 636 (maximum) ms. » 24 % of all devices are better. This means that the measured response time is better than the average of all tested devices (33.7 ms). | ||
Screen Flickering / PWM (Pulse-Width Modulation)
| Screen flickering / PWM detected | 23580 Hz | ≤ 24 % brightness setting | 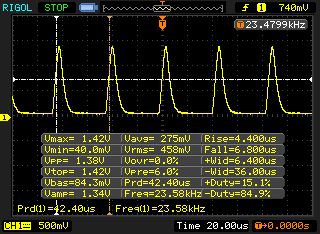 |
The display backlight flickers at 23580 Hz (worst case, e.g., utilizing PWM) Flickering detected at a brightness setting of 24 % and below. There should be no flickering or PWM above this brightness setting. The frequency of 23580 Hz is quite high, so most users sensitive to PWM should not notice any flickering. In comparison: 53 % of all tested devices do not use PWM to dim the display. If PWM was detected, an average of 17900 (minimum: 5 - maximum: 3846000) Hz was measured. | |||
Gigabyte has equipped the Aero with an IGZO panel with stable viewing angles. This means that screen content can be read from every angle. The low luminosity makes it rather difficult to read the screen outdoors.

Performance - room for improvement
Gigabyte has created the Aero 15 Classic as a compact mobile 15.6-inch gaming notebook. It can display all current games smoothly and also does a good job in other areas. Our test unit is currently available for around $2,700.
Testing Conditions
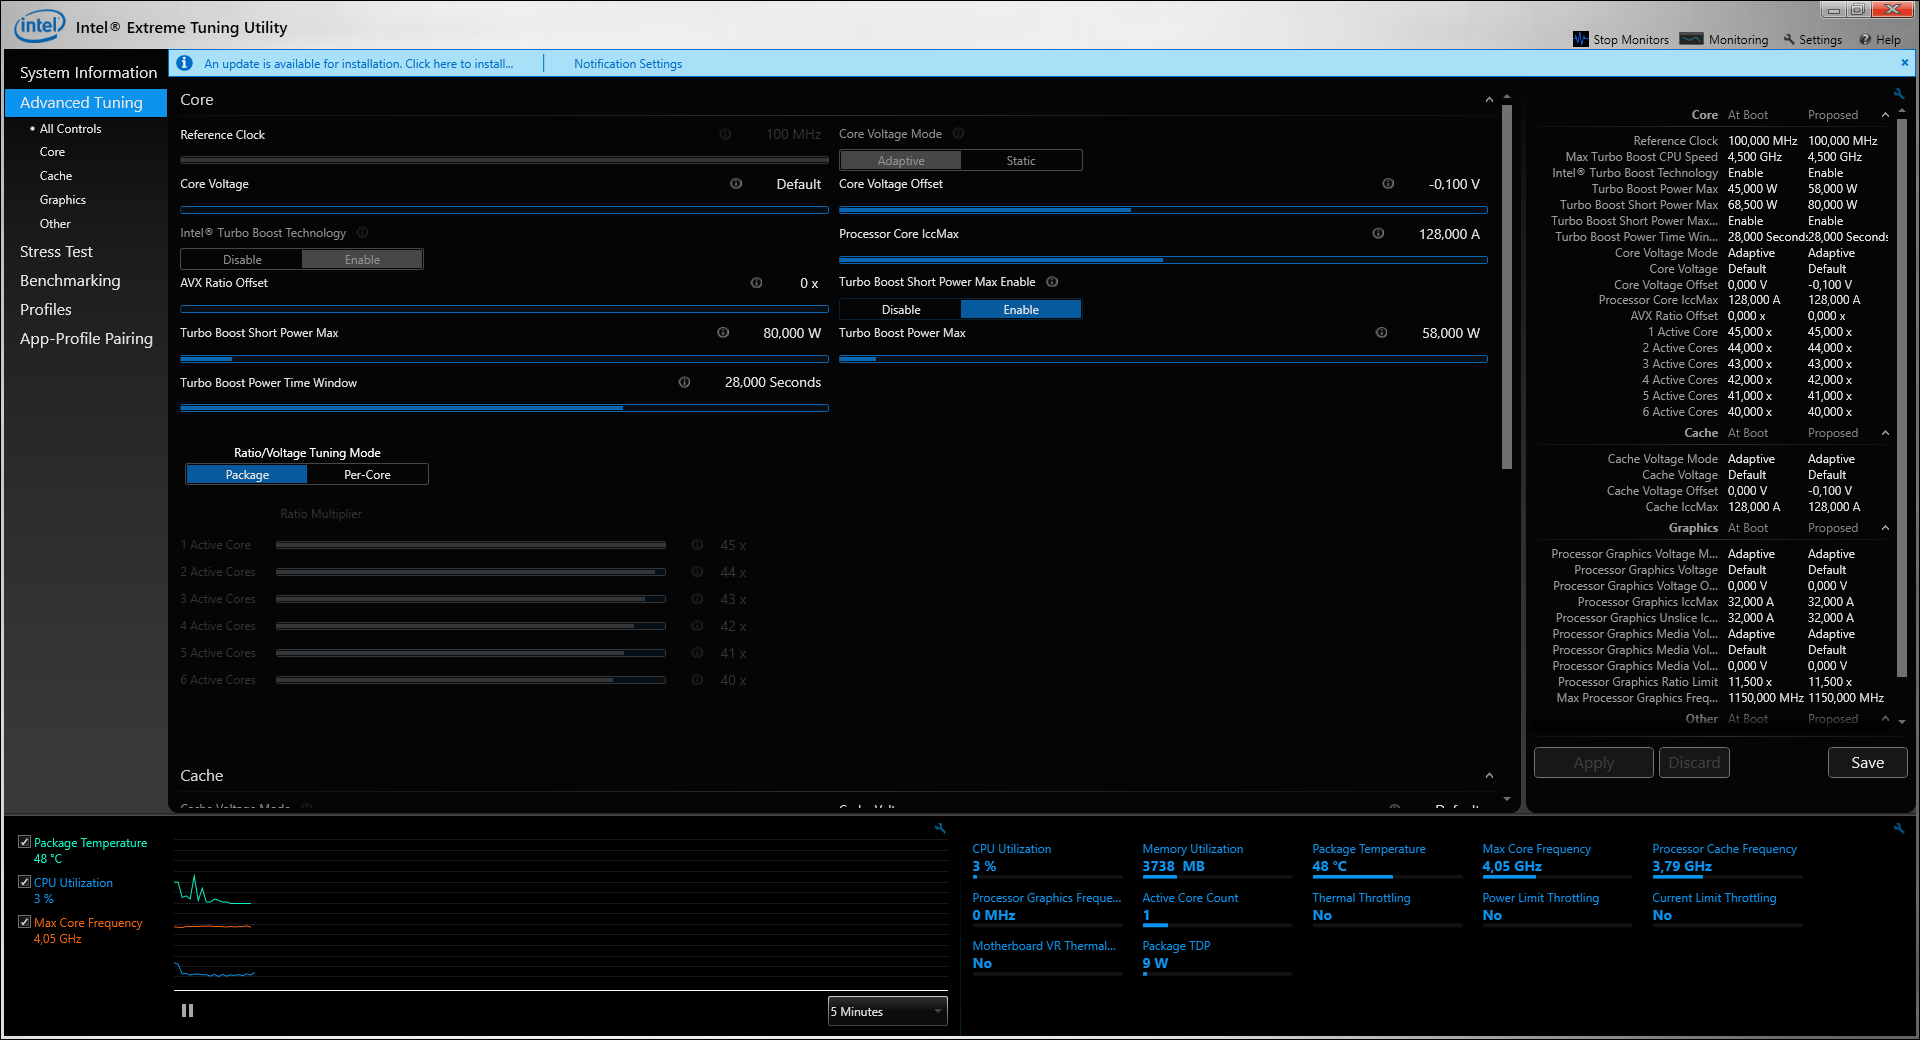
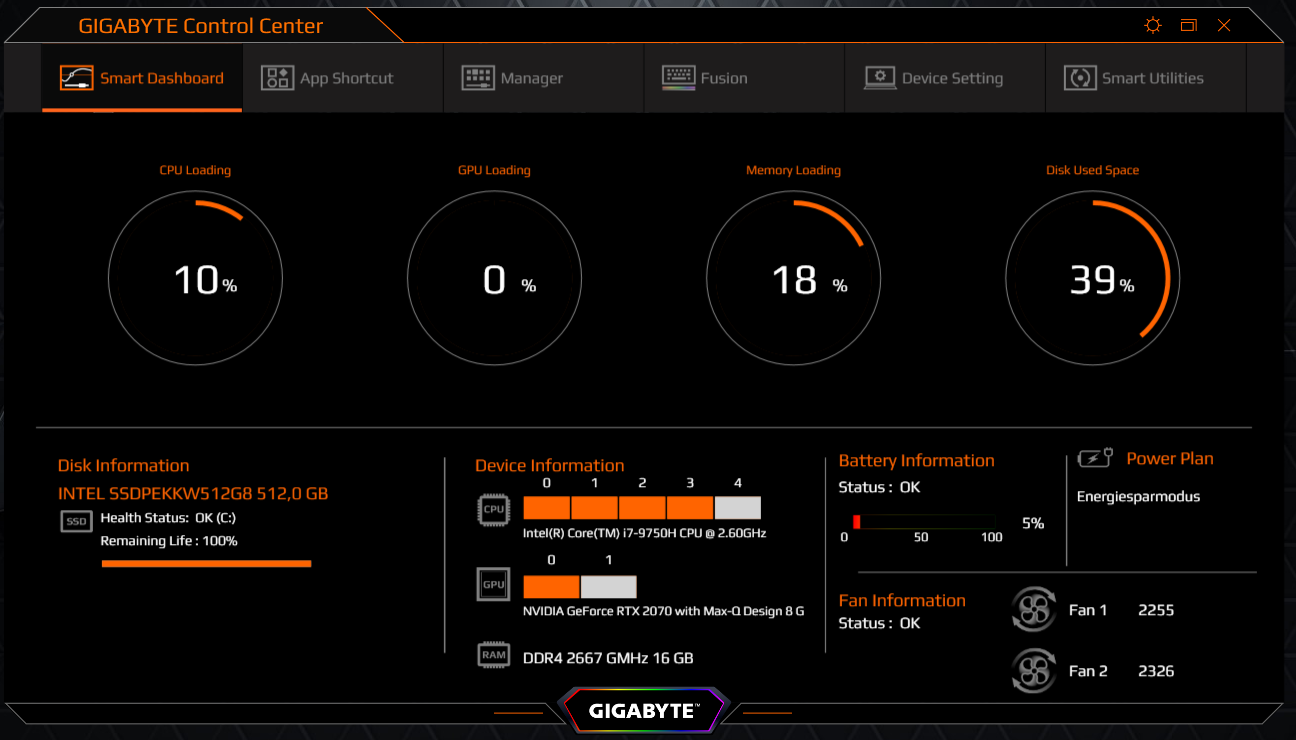
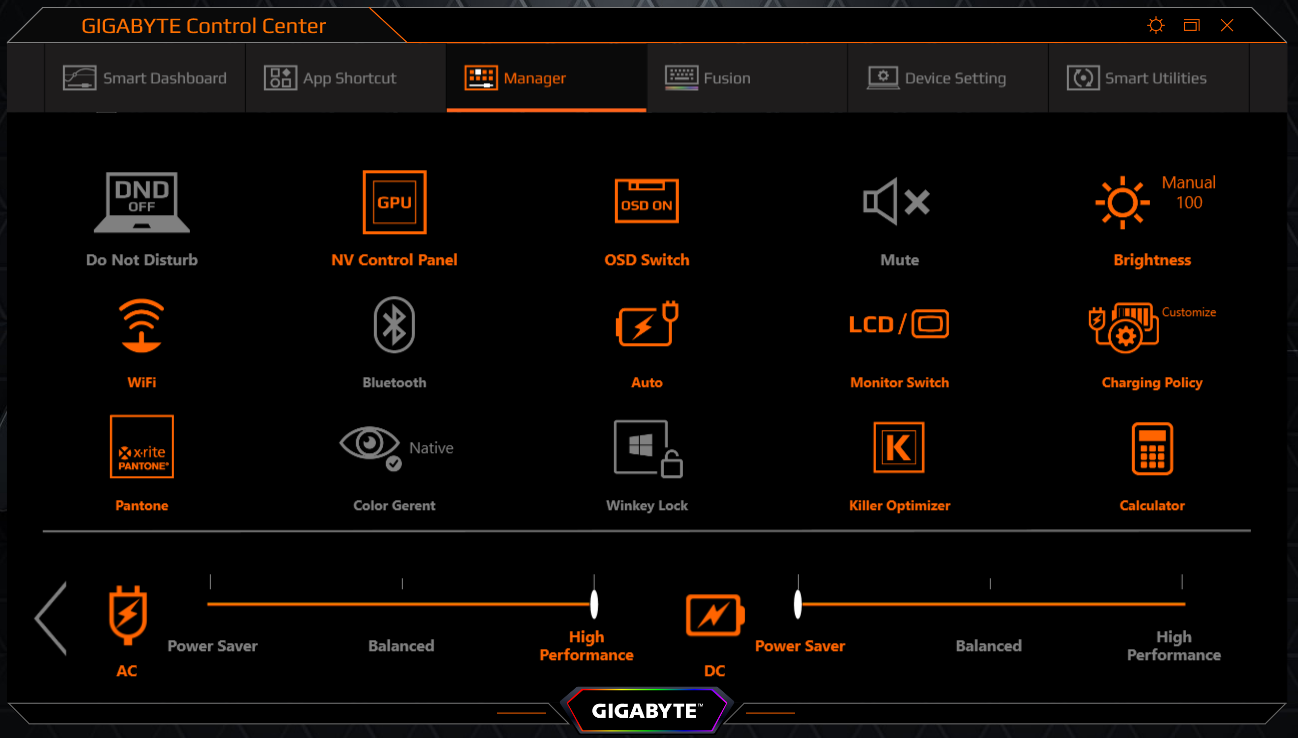
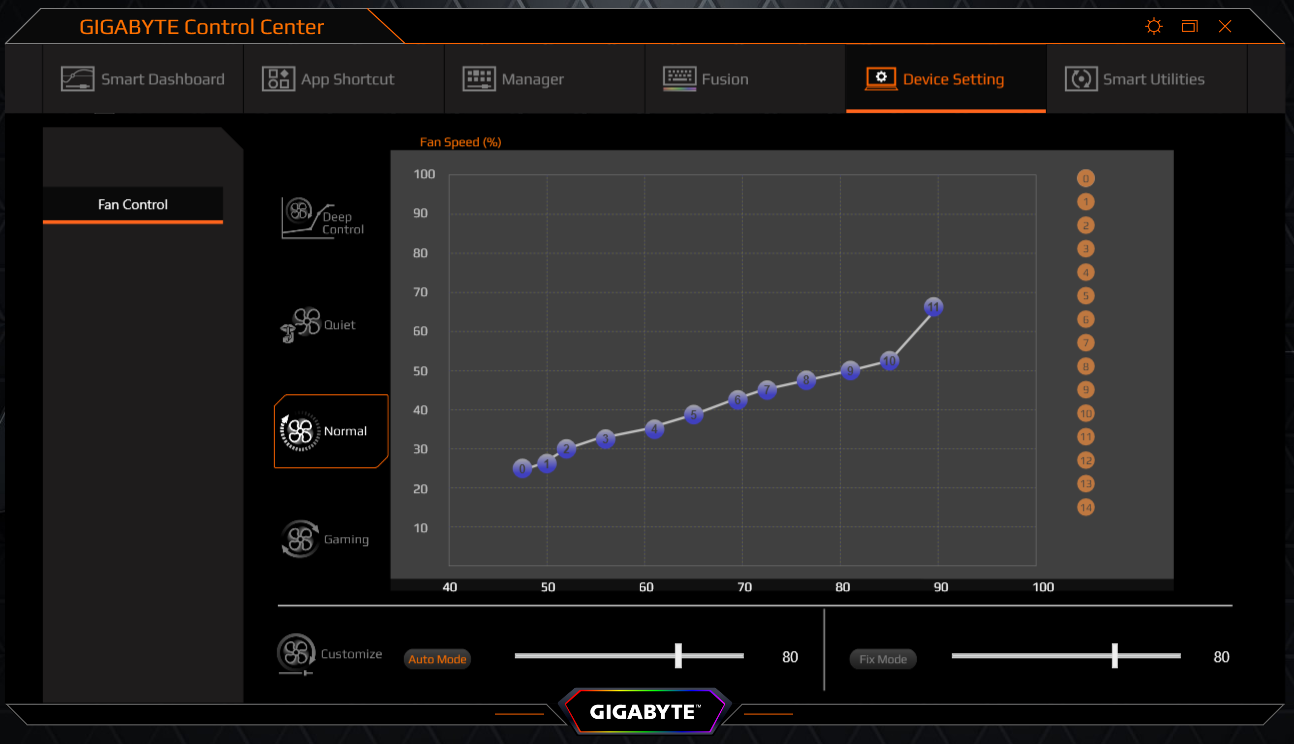
The preinstalled Gigabyte Control Center lets users set an energy profile. We used the "auto" setting (with the AI function activated), which enables the Control Center to choose the suitable settings itself. We used the Windows energy profiles for our battery runtime tests.
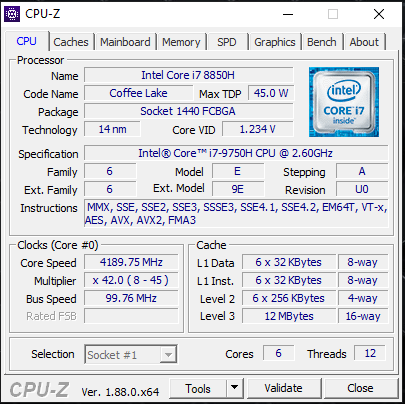
Processor
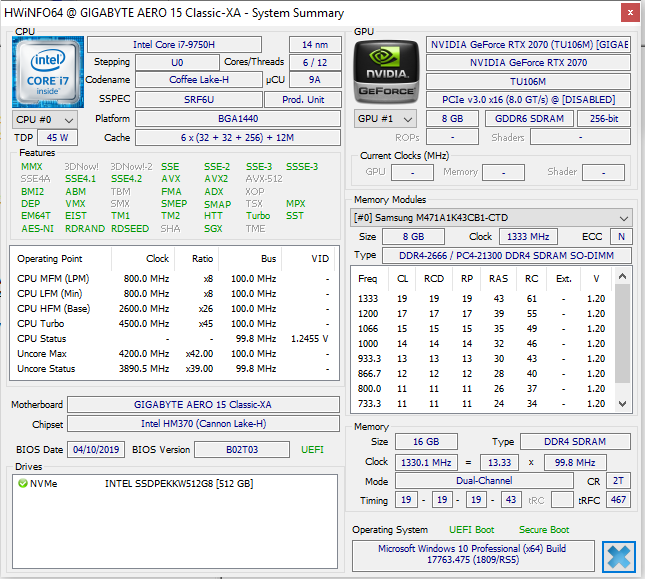
The Aero 15 is equipped with a six-core Intel Core i7-9750H processor (Coffee Lake Refresh), which is the successor of the Core i7-8750H. This CPU has a TDP of 45 watts and 9750H clocks at a base rate of 2.6 GHz. It can reach a turbo of 4 GHz (six cores), 4.1 GHz (five cores), 4.2 GHz (four cores), 4.3 GHz (three cores), 4.4 GHz (two cores) and 4.5 GHz (one core).
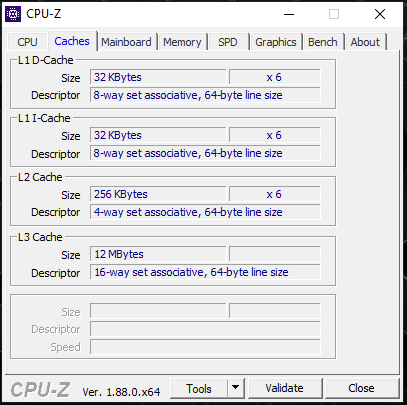
Technically speaking, the difference between the i7-8750H and the i7-9750H is not particularly big. Both chips are based on Coffee Lake. However, the 9750H has a larger L3 cache (12 MB instead of 9 MB). Both CPUs offer the same performance-per-MHz.
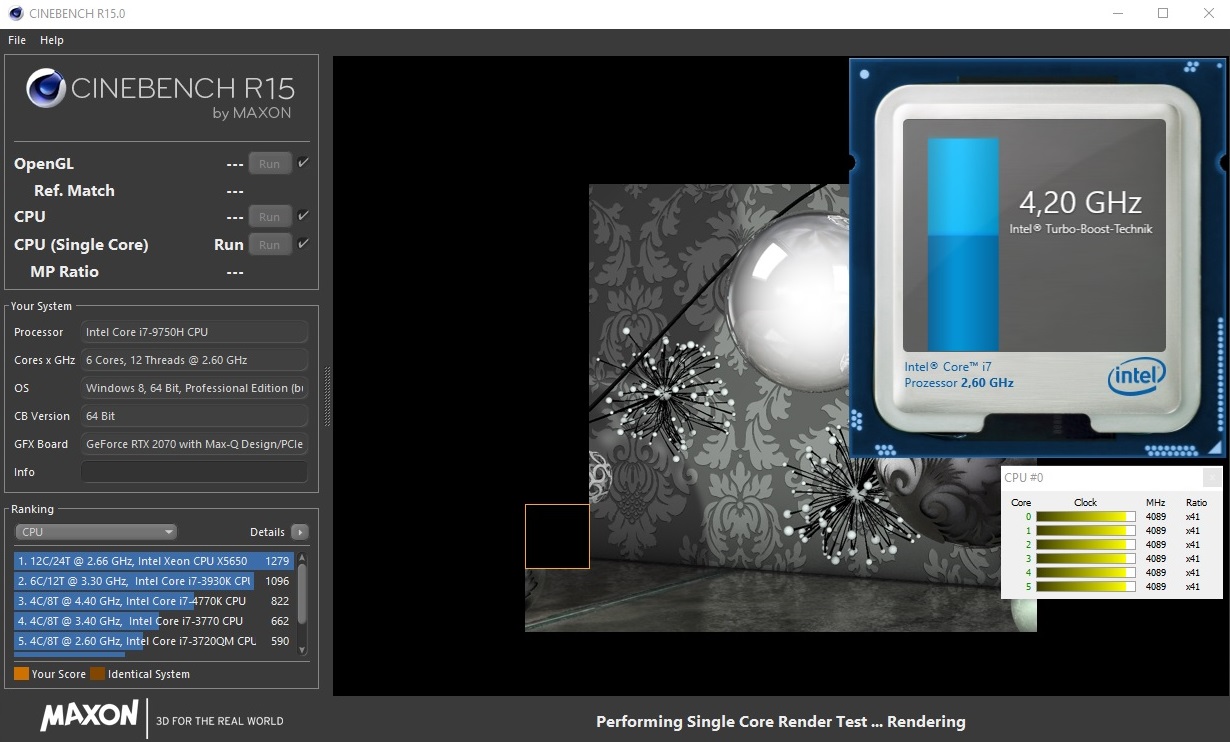
The i7-9750H should offer slightly more processing power than the i7-8750H due to its higher clock rates. However, this is only true for the benchmarks that do not max out the processor for a prolonged period - for example the GeekBench benchmarks. The CPU cannot reach its full potential during our CineBench benchmarks.
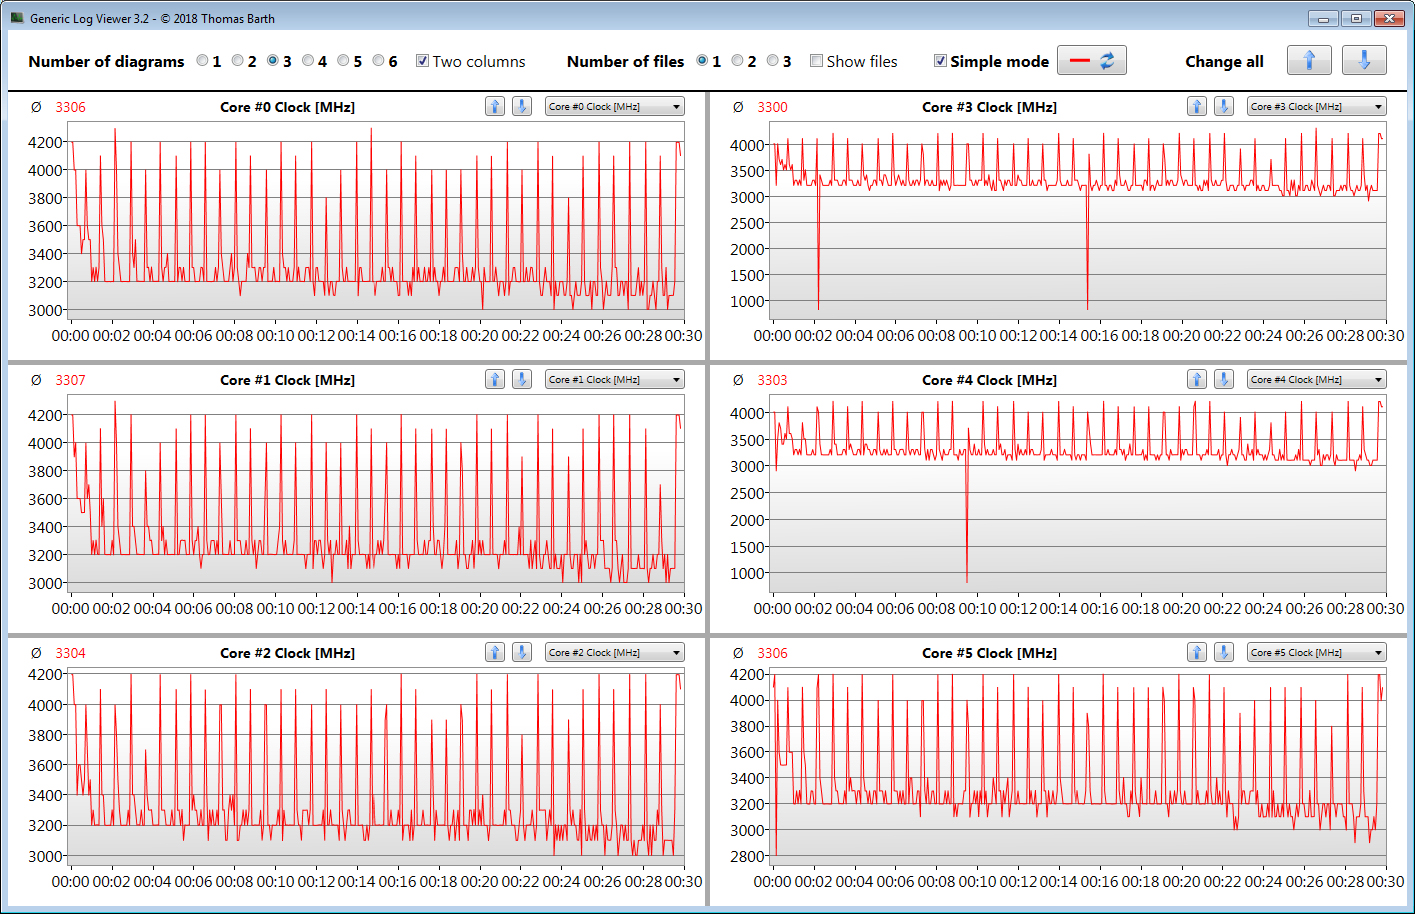
The processor clocks at between 2.6 and 4.0 GHz (average 3.5 GHz) during our Cinebench R15 Multi Thread benchmark and between 4.0 and 4.2 GHz during the single-thread test. This is when the device runs on power supply. The clock rates drop slightly on battery with a maximum of 3.4 GHz (multi thread) and 4.1 GHz (single thread).
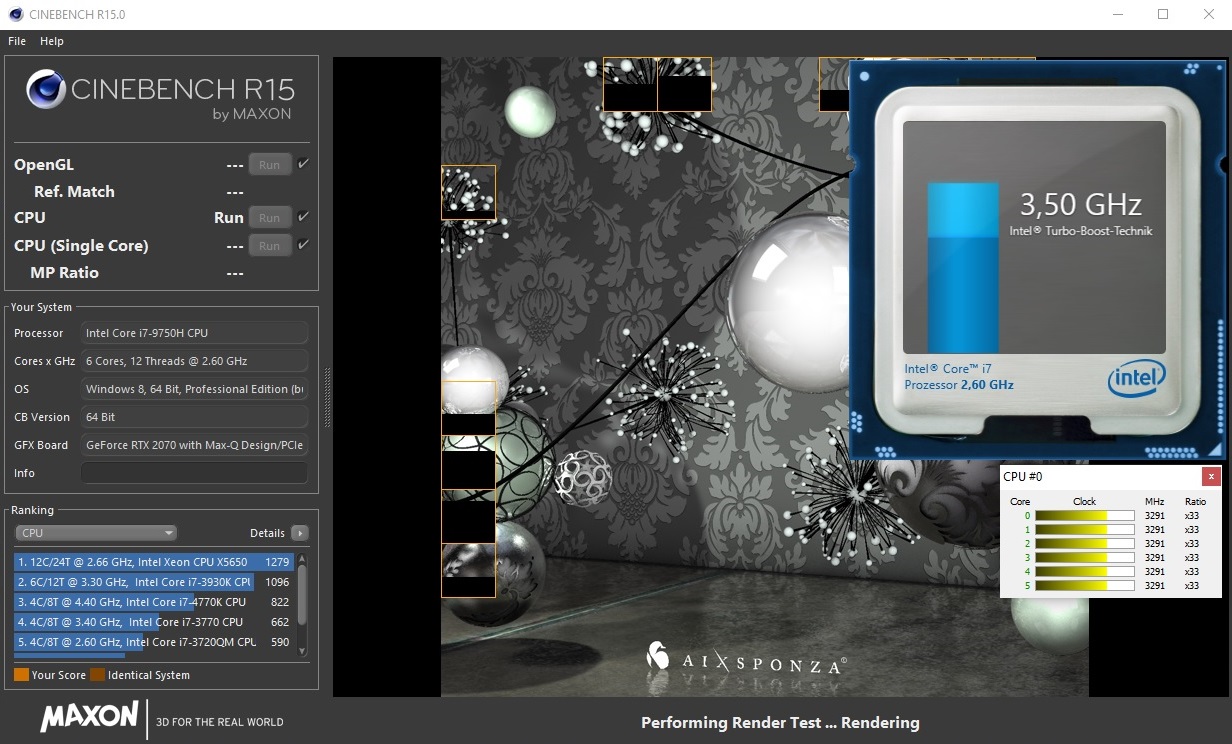
We ran the Cinebench R15 Multi Thread in a loop for 30 minutes to find out how the CPU turbo fares under prolonged load. The results drop significantly between the first and second run and then continue to drop slowly but steadily throughout the remainder of the test.
Surprisingly, the results are significantly below those of the Aero 15-X9 equipped with a Core i7-750H. The latter's average speed was around 10 percent higher than that of our test unit.
| Cinebench R10 | |
| Rendering Single 32Bit | |
| Average of class Gaming (5719 - 15819, n=24, last 2 years) | |
| Gigabyte Aero 15 Classic-XA | |
| SCHENKER XMG Neo 15 Turing | |
| Gigabyte Aero 15-X9 | |
| Rendering Multiple CPUs 32Bit | |
| Average of class Gaming (32456 - 112749, n=24, last 2 years) | |
| Gigabyte Aero 15-X9 | |
| Gigabyte Aero 15 Classic-XA | |
| SCHENKER XMG Neo 15 Turing | |
| Cinebench R20 | |
| CPU (Single Core) | |
| Average of class Gaming (169 - 855, n=228, last 2 years) | |
| Gigabyte Aero 15 Classic-XA | |
| SCHENKER XMG Neo 15 Turing | |
| CPU (Multi Core) | |
| Average of class Gaming (930 - 13769, n=228, last 2 years) | |
| Gigabyte Aero 15 Classic-XA | |
| SCHENKER XMG Neo 15 Turing | |
| Geekbench 3 | |
| 32 Bit Multi-Core Score | |
| Gigabyte Aero 15 Classic-XA | |
| SCHENKER XMG Neo 15 Turing | |
| Gigabyte Aero 15-X9 | |
| 32 Bit Single-Core Score | |
| Gigabyte Aero 15 Classic-XA | |
| SCHENKER XMG Neo 15 Turing | |
| Gigabyte Aero 15-X9 | |
| Geekbench 4.4 | |
| 64 Bit Multi-Core Score | |
| Average of class Gaming (31241 - 71700, n=26, last 2 years) | |
| Gigabyte Aero 15 Classic-XA | |
| SCHENKER XMG Neo 15 Turing | |
| Gigabyte Aero 15-X9 | |
| 64 Bit Single-Core Score | |
| Average of class Gaming (5986 - 8936, n=26, last 2 years) | |
| Gigabyte Aero 15 Classic-XA | |
| SCHENKER XMG Neo 15 Turing | |
| Gigabyte Aero 15-X9 | |
| Mozilla Kraken 1.1 - Total | |
| Gigabyte Aero 15-X9 (Edge 44) | |
| Razer Blade 15 RTX 2070 Max-Q (Edge 44.17763.1.0) | |
| SCHENKER XMG Neo 15 Turing (Edge 44) | |
| Lenovo Legion Y740-15ICHg (Microsoft Edge 44.17763.1.0) | |
| Asus Zephyrus S GX531GX (Edge 42.17134.1.0) | |
| Gigabyte Aero 15 Classic-XA (Edge 44) | |
| Average of class Gaming (421 - 824, n=210, last 2 years) | |
| Octane V2 - Total Score | |
| Average of class Gaming (69893 - 111243, n=52, last 2 years) | |
| Gigabyte Aero 15 Classic-XA (Edge 44) | |
| SCHENKER XMG Neo 15 Turing (Edge 44) | |
| Lenovo Legion Y740-15ICHg (Microsoft Edge 44.17763.1.0) | |
| Gigabyte Aero 15-X9 (Edge 44) | |
| Asus Zephyrus S GX531GX (Edge 42.17134.1.0) | |
| Razer Blade 15 RTX 2070 Max-Q (Edge 44.17763.1.0) | |
| WebXPRT 3 - Overall | |
| Average of class Gaming (215 - 480, n=194, last 2 years) | |
| Gigabyte Aero 15 Classic-XA (Edge 44) | |
| JetStream 1.1 - Total Score | |
| Average of class Gaming (357 - 650, n=27, last 2 years) | |
| Razer Blade 15 RTX 2070 Max-Q (Edge 44.17763.1.0) | |
| SCHENKER XMG Neo 15 Turing (Edge 44) | |
| Asus Zephyrus S GX531GX (Edge 42.17134.1.0) | |
| Lenovo Legion Y740-15ICHg (Microsoft Edge 44.17763.1.0) | |
| Gigabyte Aero 15 Classic-XA (Edge 44) | |
| Gigabyte Aero 15-X9 (Edge 44) | |
* ... smaller is better
System Performance
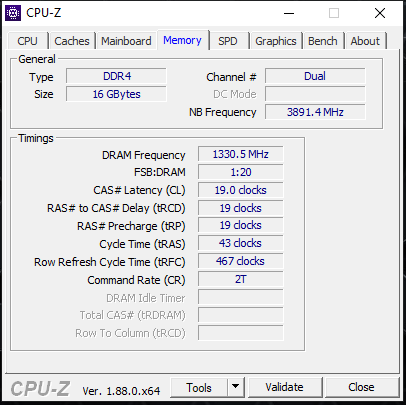
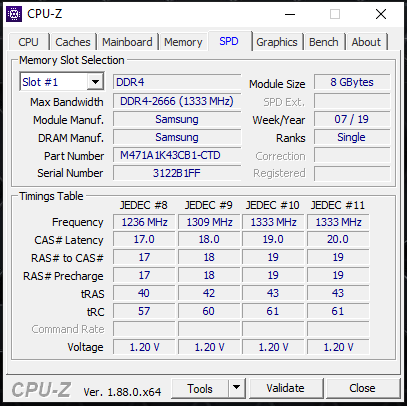
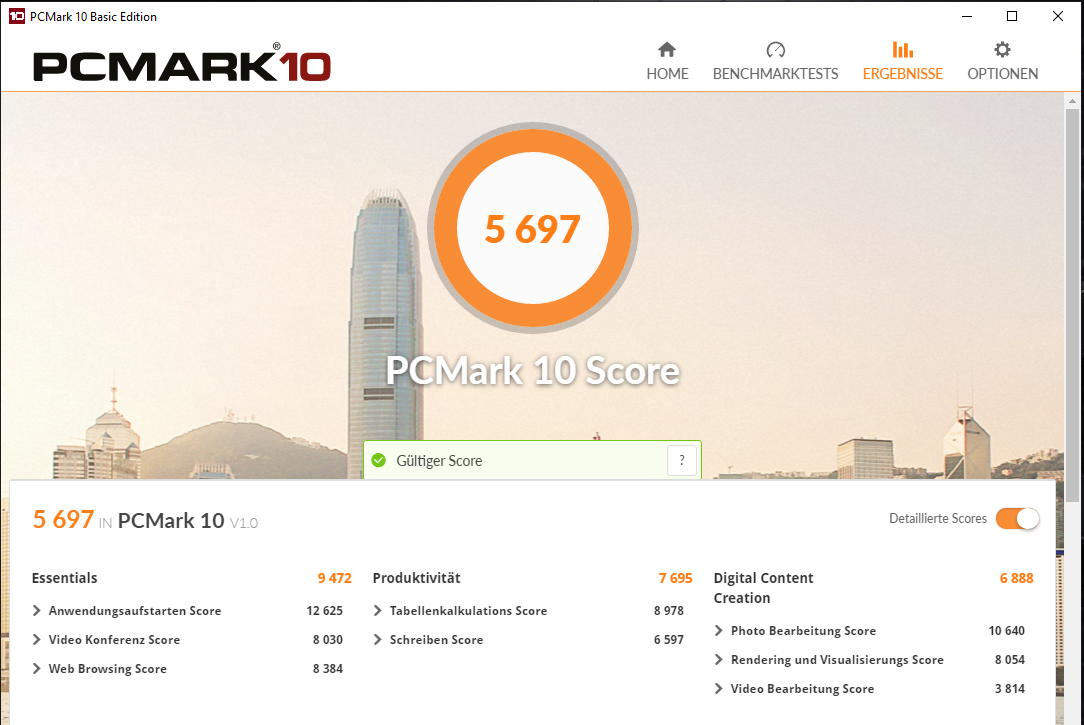
The PCMark results are very good and confirm that our test unit offers sufficient processing power for all usual areas of use. The device can easily handle gaming, video editing and image processing. Thanks to the combination of a six-core processor, an NVMe SSD and dual-channel RAM the Aero 15 Classic can offer a fast and smooth system.
| PCMark 7 Score | 6854 points | |
| PCMark 8 Home Score Accelerated v2 | 4851 points | |
| PCMark 8 Creative Score Accelerated v2 | 5574 points | |
| PCMark 8 Work Score Accelerated v2 | 6035 points | |
| PCMark 10 Score | 5697 points | |
Help | ||
Storage Devices
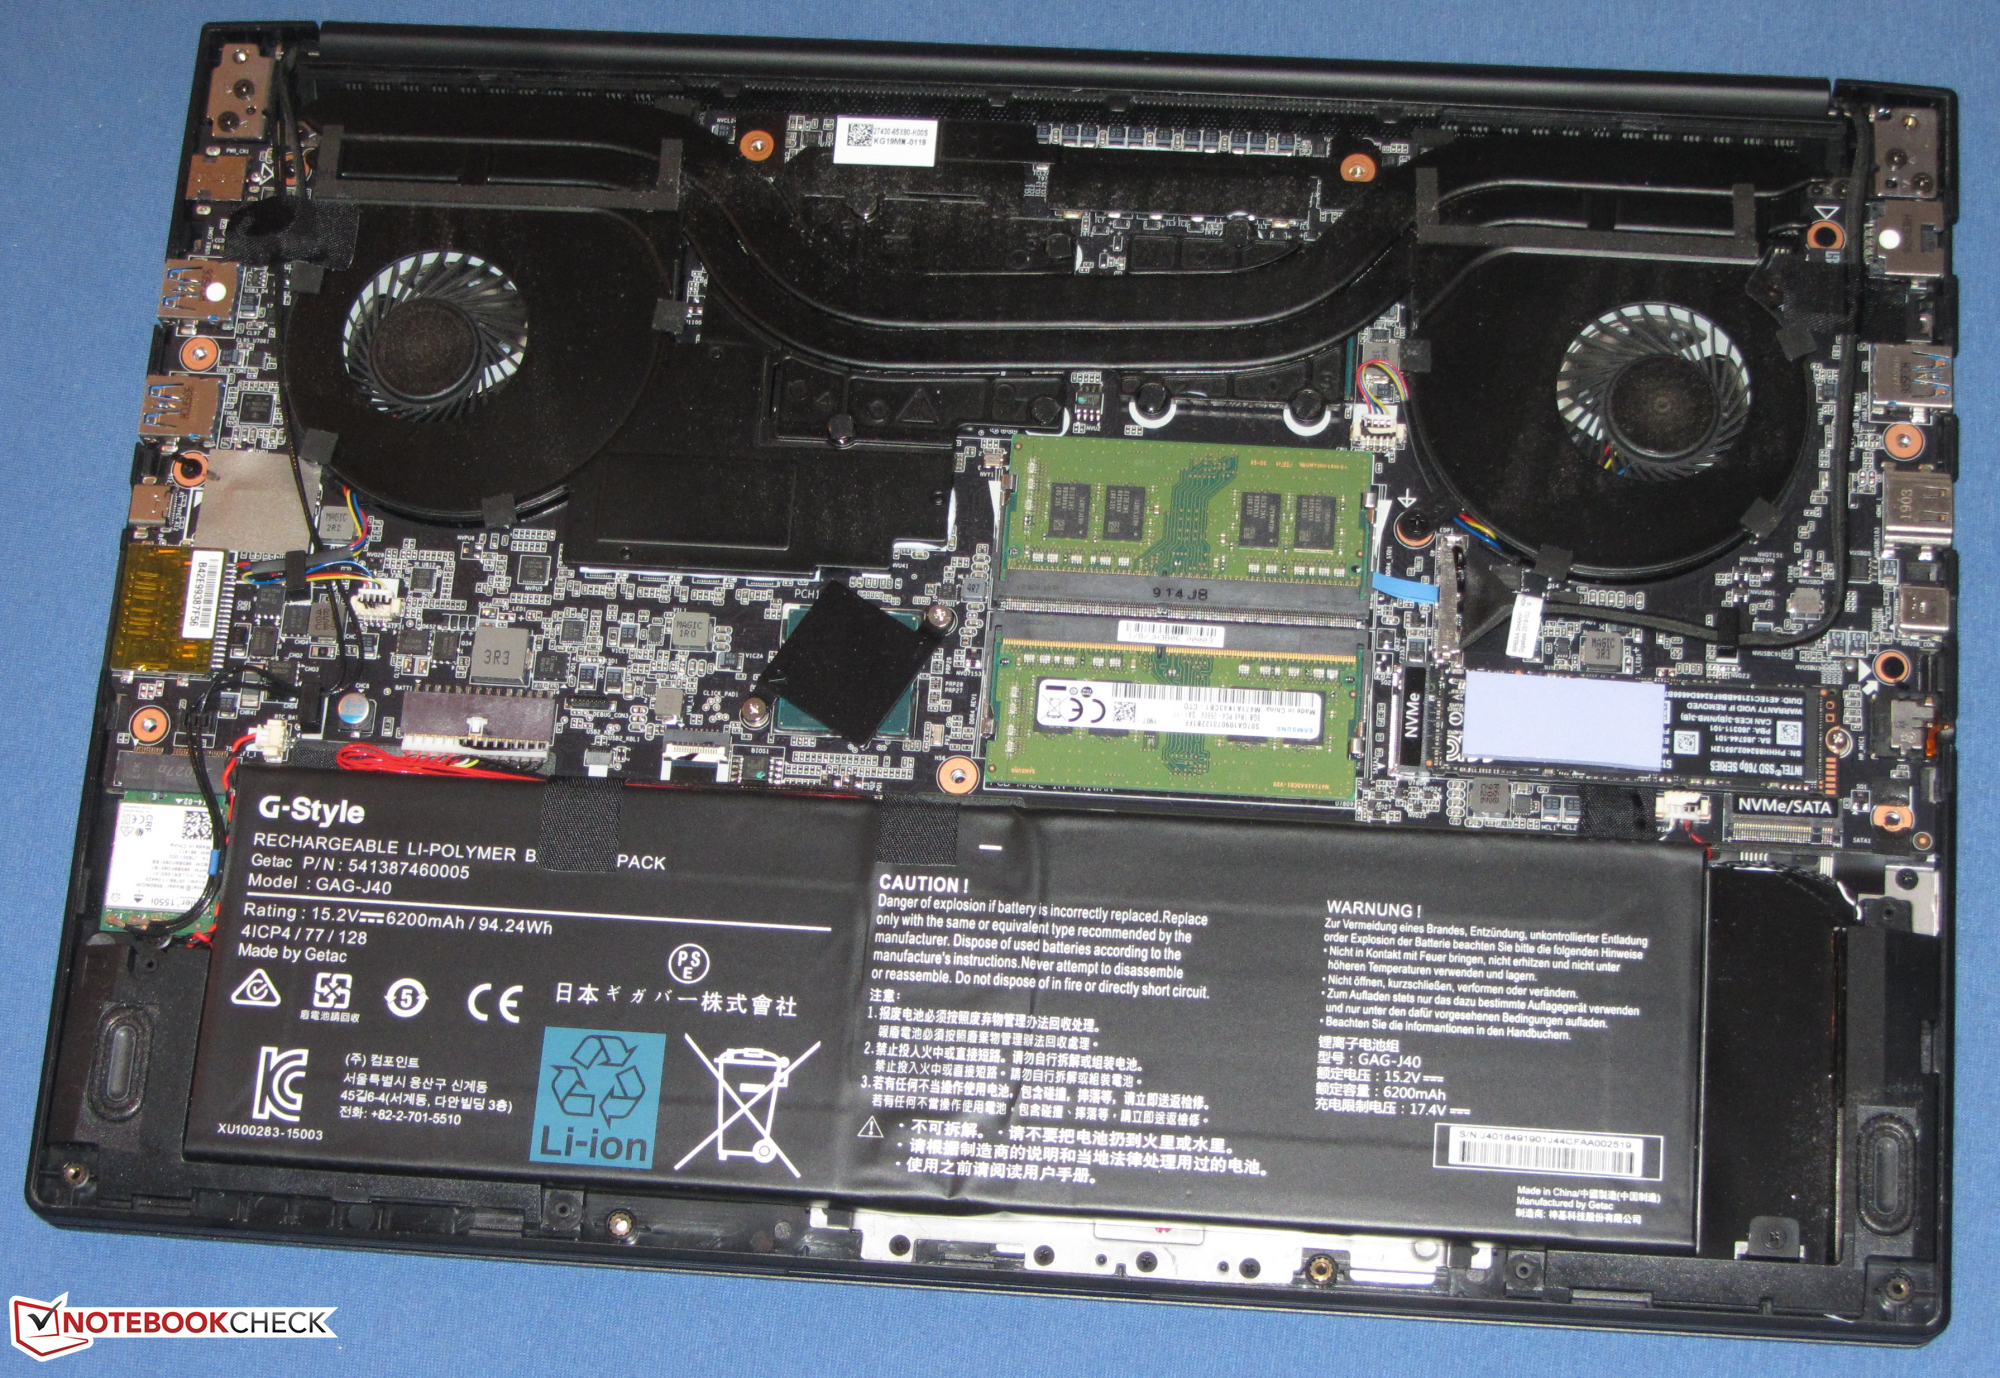
The M.2 2280 NVMe SSD comes from Intel and has a capacity of 512 GB. Users have 427 GB available after the initial set-up. The remaining space is taken up by the Windows OS and Recovery partition. Thanks to its PCIe interface, the SSD has very good transfer rates. NVMe drives are usually significantly faster than SATA III storage devices (maximum of 600 MB/s). Users who are interested in expanding storage capacity will be happy to find a free M.2 2280 storage bay inside the device. This can be connected to a SATA III or an NVMe SSD.

| Gigabyte Aero 15 Classic-XA Intel SSD 760p SSDPEKKW512G8 | Gigabyte Aero 15-X9 Intel SSD 760p SSDPEKKW010T8 | Razer Blade 15 RTX 2070 Max-Q Samsung SSD PM981 MZVLB512HAJQ | Asus Zephyrus S GX531GX Intel SSD 660p SSDPEKNW512G8 | SCHENKER XMG Neo 15 Turing Samsung SSD 970 EVO Plus 1TB | Acer Predator Triton 500 2x WDC PC SN720 SDAPNTW-256G-1014 (RAID 0) | Lenovo Legion Y740-15ICHg Samsung SSD PM981 MZVLB256HAHQ | |
|---|---|---|---|---|---|---|---|
| CrystalDiskMark 5.2 / 6 | -15% | -13% | -33% | -6% | 7% | -20% | |
| Write 4K | 115.5 | 97.1 -16% | 93.9 -19% | 93.9 -19% | 92.5 -20% | 93.6 -19% | 81 -30% |
| Read 4K | 58 | 53.7 -7% | 40.56 -30% | 46.29 -20% | 40.45 -30% | 38.82 -33% | 36.03 -38% |
| Write Seq | 1555 | 1526 -2% | 1468 -6% | 974 -37% | 1197 -23% | 2455 58% | 1687 8% |
| Read Seq | 2590 | 2020 -22% | 1540 -41% | 1425 -45% | 1018 -61% | 2107 -19% | 1835 -29% |
| Write 4K Q32T1 | 369.3 | 285.6 -23% | 293.5 -21% | 259.4 -30% | 288.6 -22% | 298.7 -19% | 205.3 -44% |
| Read 4K Q32T1 | 441.7 | 321.8 -27% | 346 -22% | 296.5 -33% | 332 -25% | 338.7 -23% | 229 -48% |
| Write Seq Q32T1 | 1547 | 1533 -1% | 1941 25% | 977 -37% | 3317 114% | 2902 88% | 1683 9% |
| Read Seq Q32T1 | 2969 | 2351 -21% | 3266 10% | 1666 -44% | 3515 18% | 3536 19% | 3363 13% |
Graphics Performance
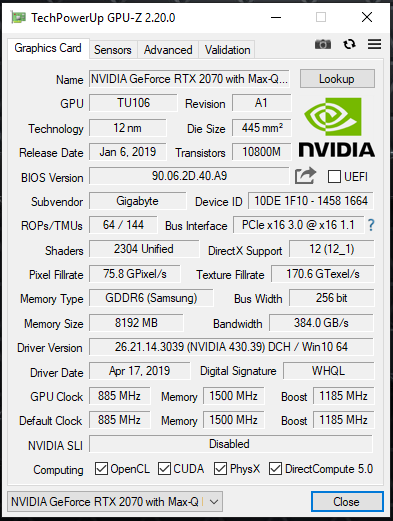
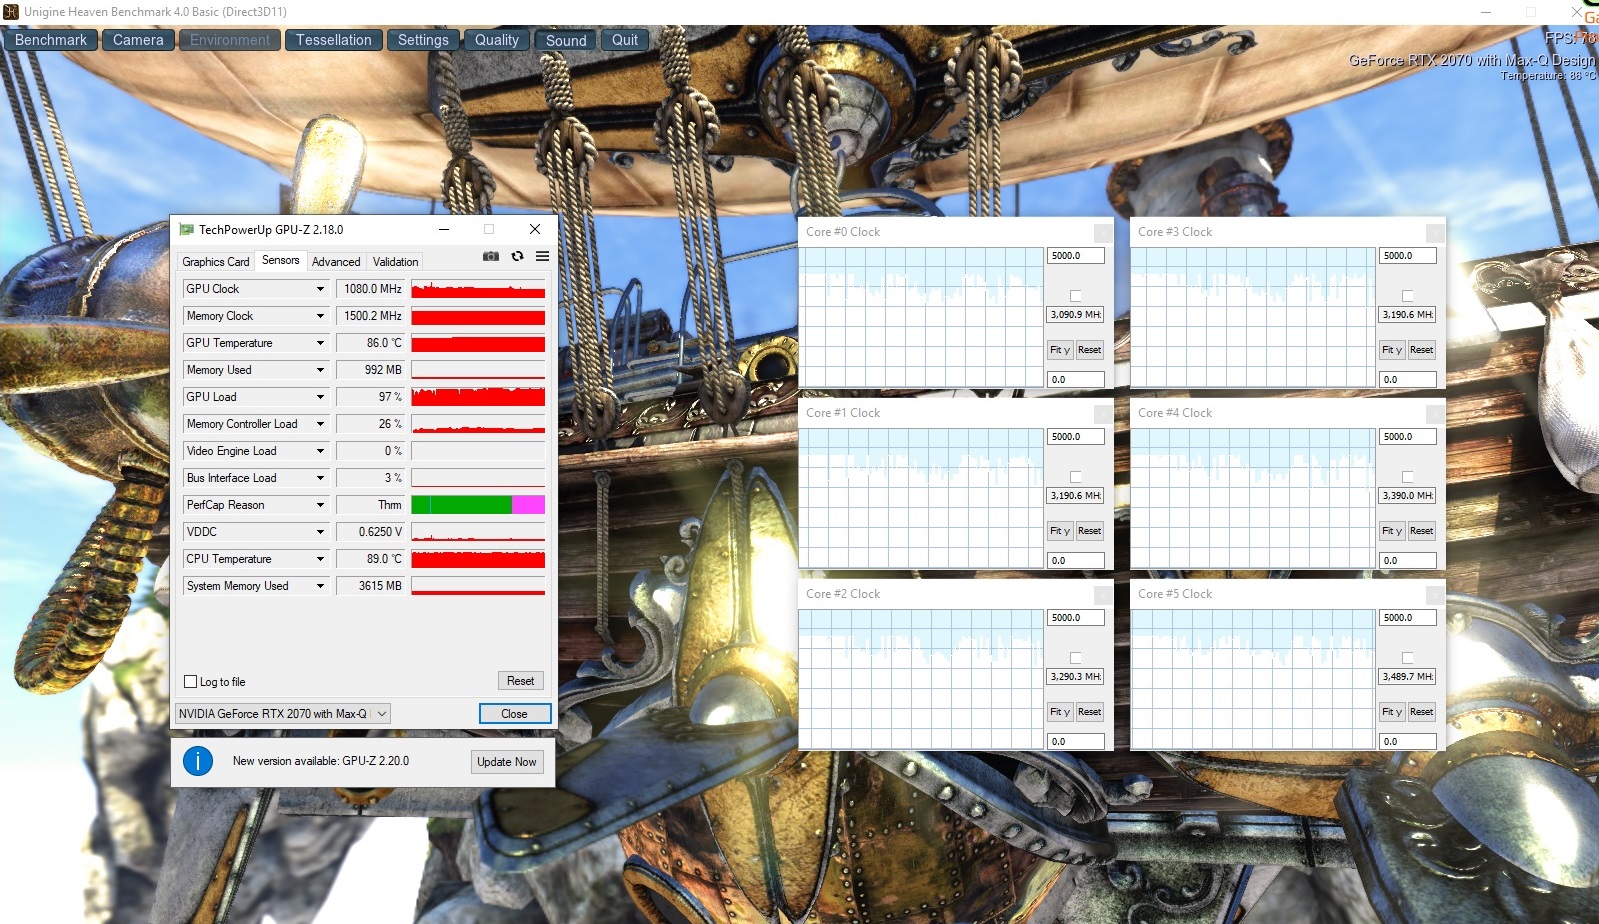
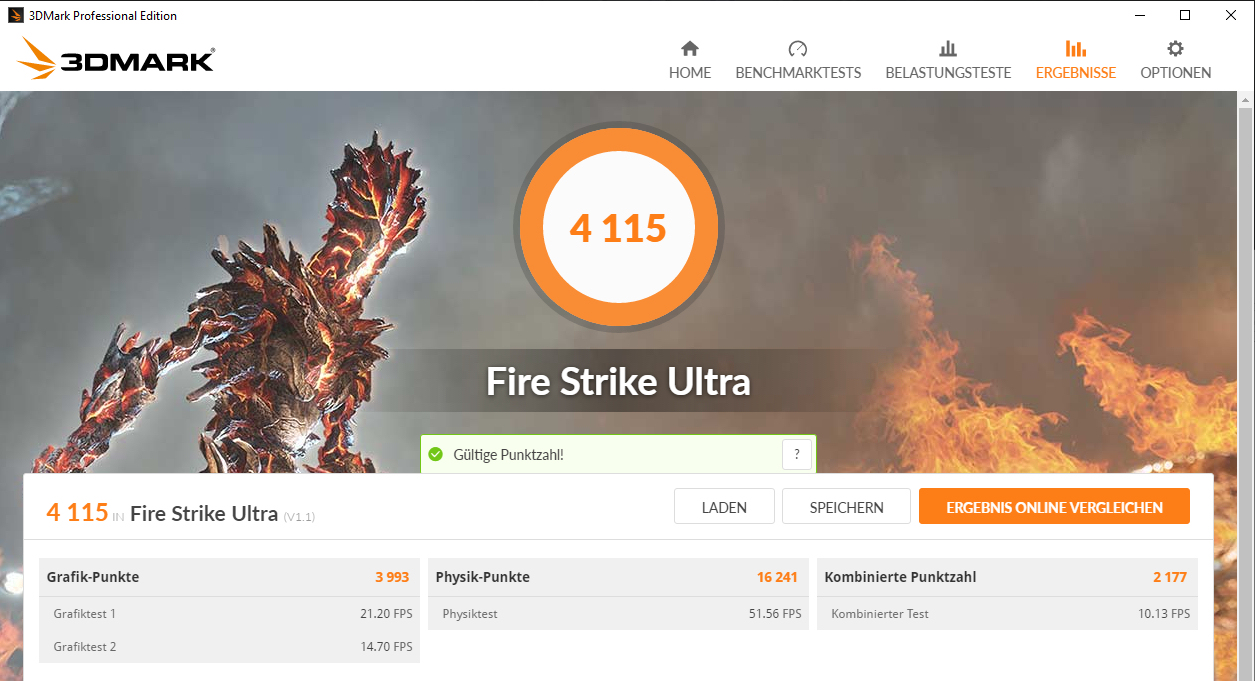
The Aero 15 is equipped with a dedicated GeForce RTX 2070 Max-Q from Nvidia. This is the more efficient version of the regular RTX 2070 that is made with thin-and-light notebooks in mind. The chip in our test unit reached a maximum speed of 1785 MHz. However, the GPU did not manage to keep this speed up for long. We measured an average rate of 1080 MHz during our benchmarks. The GPU has an 8192-MB GDDR6 VRAM available.
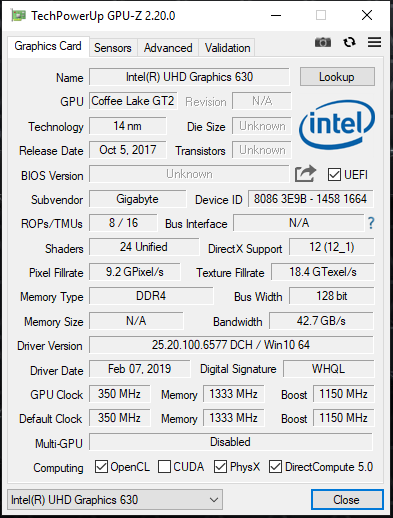
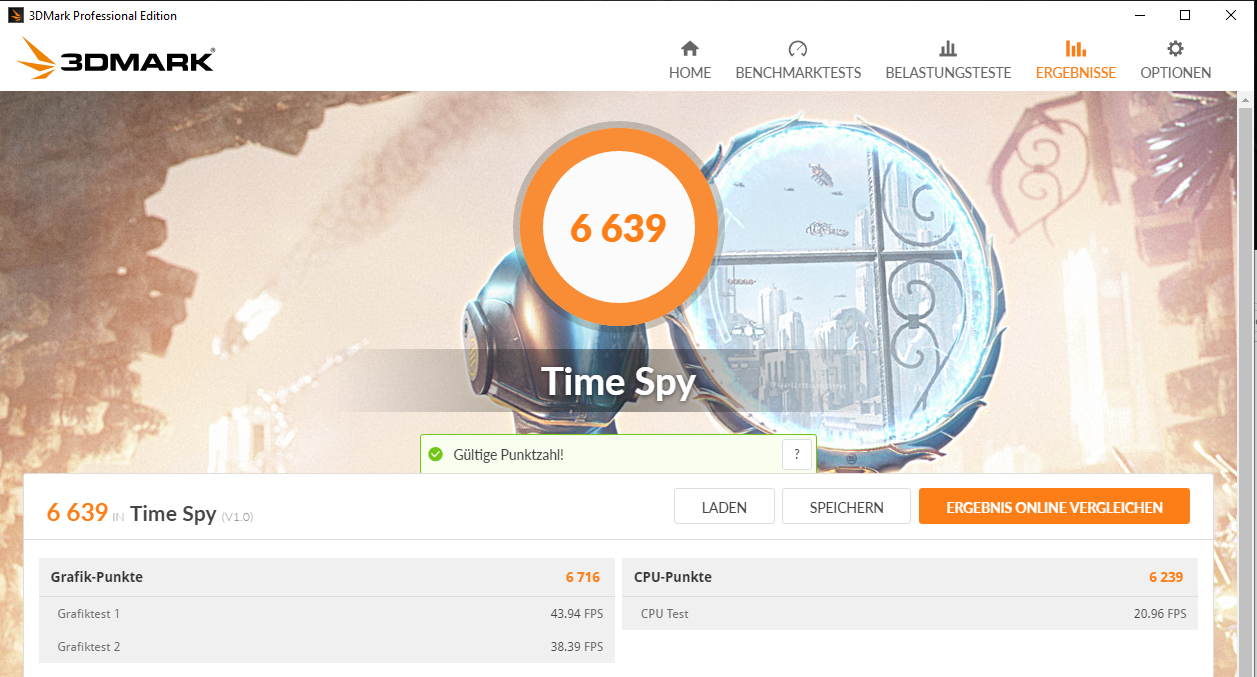
The results of the various 3DMark benchmarks are normal for this GPU. The device uses Nvidia's graphics switching solution Optimus, which means that the integrated Intel UHD Graphics 630 is also used for certain applications.
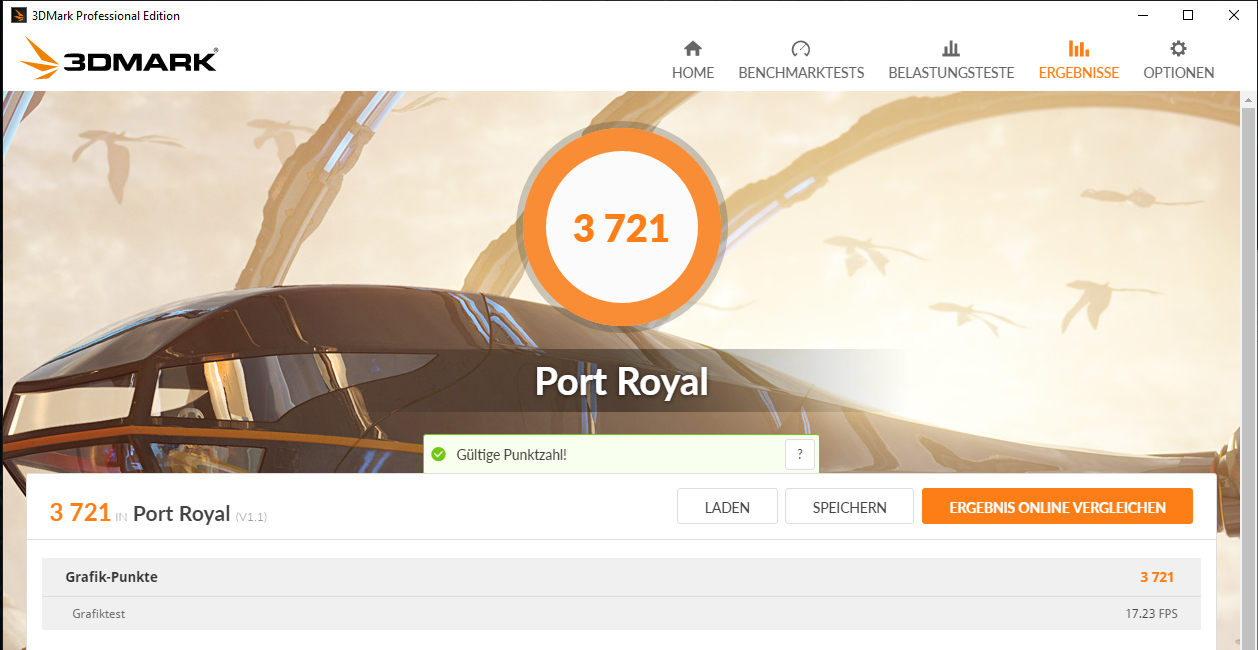
| 3DMark 06 Standard Score | 35193 points | |
| 3DMark 11 Performance | 18171 points | |
| 3DMark Ice Storm Standard Score | 113186 points | |
| 3DMark Cloud Gate Standard Score | 35891 points | |
| 3DMark Fire Strike Score | 15494 points | |
| 3DMark Time Spy Score | 6639 points | |
Help | ||
Gaming Performance
The Aero 15's hardware can display all current games in our database smoothly at Full-HD resolution and high or even maximum details. The GPU can also display resolutions above Full HD if you connect a suitable external monitor, although this requires the quality settings to be tuned down - particularly if we are talking about 4K resolution.
The Aero 15 Classic offers higher refresh rates than the Aero 15-X9, which is equipped with the same GPU. This is because the RAM in our Aero 15 X9 test unit was limited to single-channel mode. Had we inserted a second RAM module in the Aero 15 X9 the refresh rate would probably be the same.
| The Witcher 3 - 1920x1080 Ultra Graphics & Postprocessing (HBAO+) | |
| Average of class Gaming (8.61 - 216, n=226, last 2 years) | |
| Asus Zephyrus S GX531GX | |
| Acer Predator Triton 500 | |
| Razer Blade 15 RTX 2070 Max-Q | |
| Gigabyte Aero 15 Classic-XA | |
| SCHENKER XMG Neo 15 Turing | |
| Gigabyte Aero 15-X9 | |
| Lenovo Legion Y740-15ICHg | |
| BioShock Infinite - 1920x1080 Ultra Preset, DX11 (DDOF) | |
| Lenovo Legion Y740-15ICHg | |
| Asus Zephyrus S GX531GX | |
| Razer Blade 15 RTX 2070 Max-Q | |
| Gigabyte Aero 15 Classic-XA | |
| SCHENKER XMG Neo 15 Turing | |
| Gigabyte Aero 15-X9 | |
| Far Cry 5 - 1920x1080 Ultra Preset AA:T | |
| Average of class Gaming (14 - 218, n=125, last 2 years) | |
| Gigabyte Aero 15 Classic-XA | |
| Gigabyte Aero 15-X9 | |
We ran the game "The Witcher 3" at Full HD resolution and maximum settings for around an hour to find out whether the refresh rates remain stable over a prolonged period. We did not move the character at all during this period. The frame rate never fell to an unacceptable level, but we did note two short drops in the frame rate during our test.
| low | med. | high | ultra | |
| BioShock Infinite (2013) | 321.3 | 279.3 | 238 | 150.3 |
| The Witcher 3 (2015) | 273.1 | 189.2 | 113.2 | 64.1 |
| Final Fantasy XV Benchmark (2018) | 117.6 | 87.9 | 62.9 | |
| World of Tanks enCore (2018) | 490.3 | 218.9 | 129.1 | |
| Far Cry 5 (2018) | 127 | 100 | 95 | 89 |
| Forza Horizon 4 (2018) | 150 | 121 | 118 | 98 |
| Far Cry New Dawn (2019) | 113 | 93 | 87 | 79 |
| Metro Exodus (2019) | 128.8 | 79.8 | 56.3 | 47.7 |
| The Division 2 (2019) | 147 | 108 | 87 | 70 |
| Anno 1800 (2019) | 92 | 82.1 | 68.1 | 34 |
Emissions - loud and hot under load
System Noise
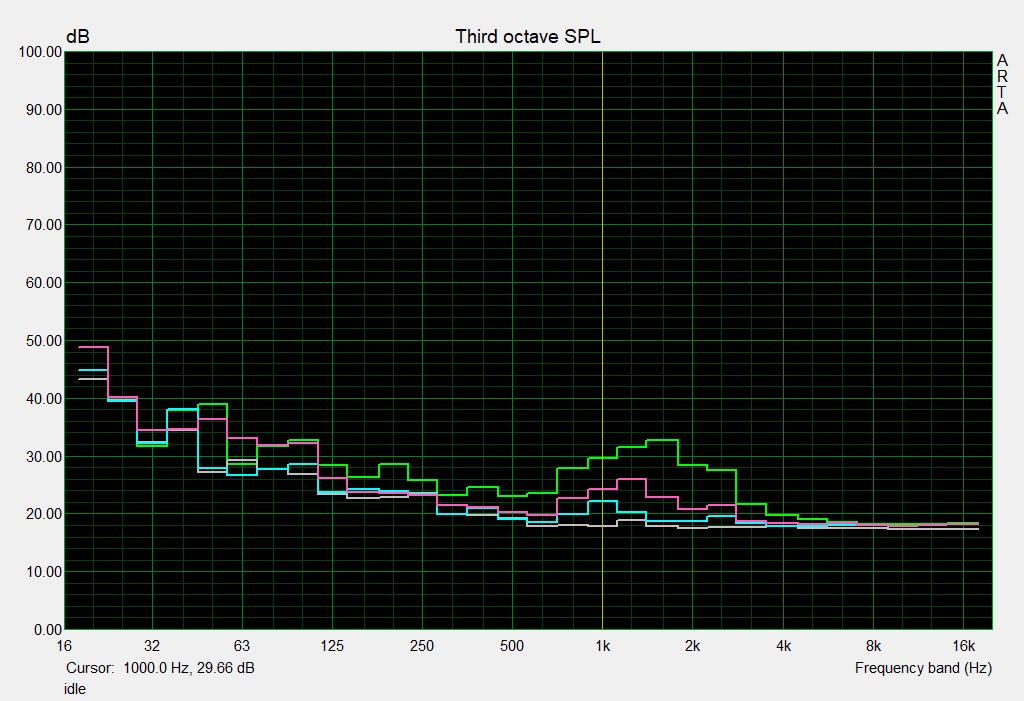
The fan of the Aero runs slowly but continuously while idling with regular changes in the RPM. Nonetheless, the noise it produces is acceptable. It would be possible to run the system silently while idling by choosing the "Quiet" setting in the Gigabyte Control Center. However, this would also have an impact on the available processing power. Therefore, this is mainly suitable when doing office jobs.
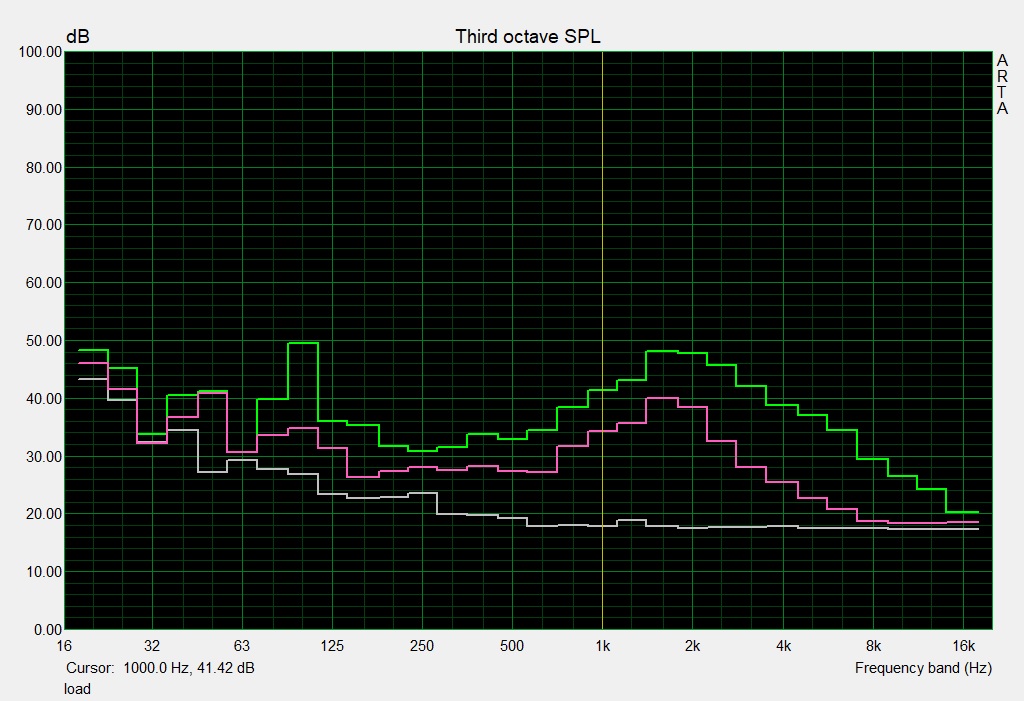
The fan noise is very audible under load. We measured 55 dB(A) during our stress test and 53 dB(A) during our "Witcher 3" test, which makes it almost impossible to play games without headphones. The fan turns up high under load but often calms down again after a while. Overall, the Aero 15 Classic is louder than its sibling Aero 15-X9 with the same build.
Noise Level
| Idle |
| 31 / 34 / 39 dB(A) |
| Load |
| 46 / 55 dB(A) |
 | ||
30 dB silent 40 dB(A) audible 50 dB(A) loud |
||
min: | ||
| Gigabyte Aero 15 Classic-XA i7-9750H, GeForce RTX 2070 Max-Q | Gigabyte Aero 15-X9 i7-8750H, GeForce RTX 2070 Max-Q | Razer Blade 15 RTX 2070 Max-Q i7-8750H, GeForce RTX 2070 Max-Q | Asus Zephyrus S GX531GX i7-8750H, GeForce RTX 2080 Max-Q | SCHENKER XMG Neo 15 Turing i7-8750H, GeForce RTX 2070 Max-Q | Acer Predator Triton 500 i7-8750H, GeForce RTX 2080 Max-Q | Lenovo Legion Y740-15ICHg i7-8750H, GeForce RTX 2070 Max-Q | |
|---|---|---|---|---|---|---|---|
| Noise | 6% | 16% | 3% | 2% | 8% | 13% | |
| off / environment * | 30 | 30 -0% | 28.8 4% | 28.7 4% | 30 -0% | 29 3% | 28 7% |
| Idle Minimum * | 31 | 32 -3% | 28.8 7% | 29.8 4% | 30 3% | 30 3% | 32.6 -5% |
| Idle Average * | 34 | 34 -0% | 28.8 15% | 32.4 5% | 32 6% | 32 6% | 32.7 4% |
| Idle Maximum * | 39 | 36 8% | 29.4 25% | 38 3% | 35 10% | 34 13% | 32.7 16% |
| Load Average * | 46 | 42 9% | 35.7 22% | 38.2 17% | 47 -2% | 44 4% | 33.3 28% |
| Witcher 3 ultra * | 53 | 44 17% | 42.5 20% | 56.6 -7% | 53 -0% | 46 13% | 41.6 22% |
| Load Maximum * | 55 | 48 13% | 45 18% | 56.6 -3% | 55 -0% | 47 15% | 45.2 18% |
* ... smaller is better
Temperature
Our stress test (Prime95 and FurMark running for at least an hour) has slightly different results depending on whether the Aero 15 is running on power supply or in battery mode. When connected to the grid, the processor clocks at 2.4 GHz for the first 36-37 minutes while the GPU works at 885 MHz. The clock rates then throttle to 1.8 GHz (CPU) and 555 MHz (GPU). The processor behaves similarly on battery while the GPU continuously jumps between 300 MHz and 1365 MHz. The stress test is an extreme scenario which will not occur during everyday use. We use the test to find out whether the system remains stable under maximum load.
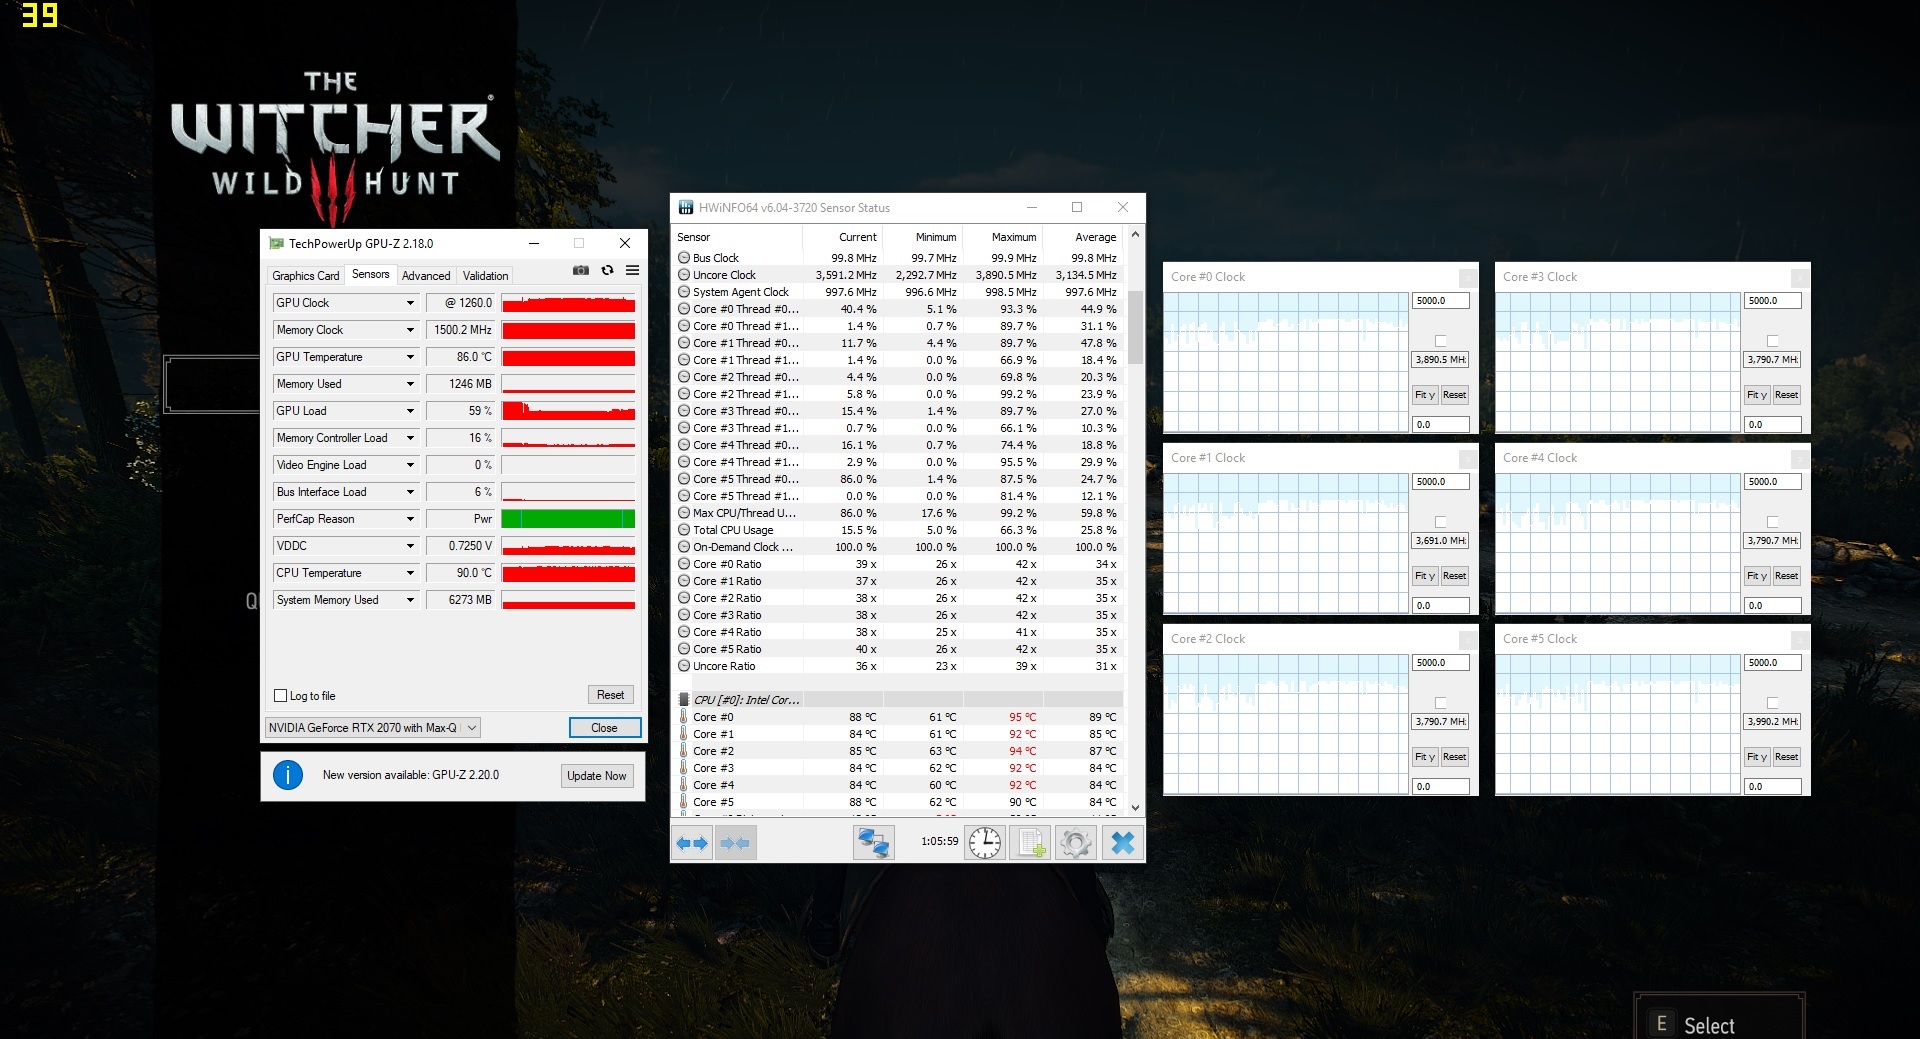
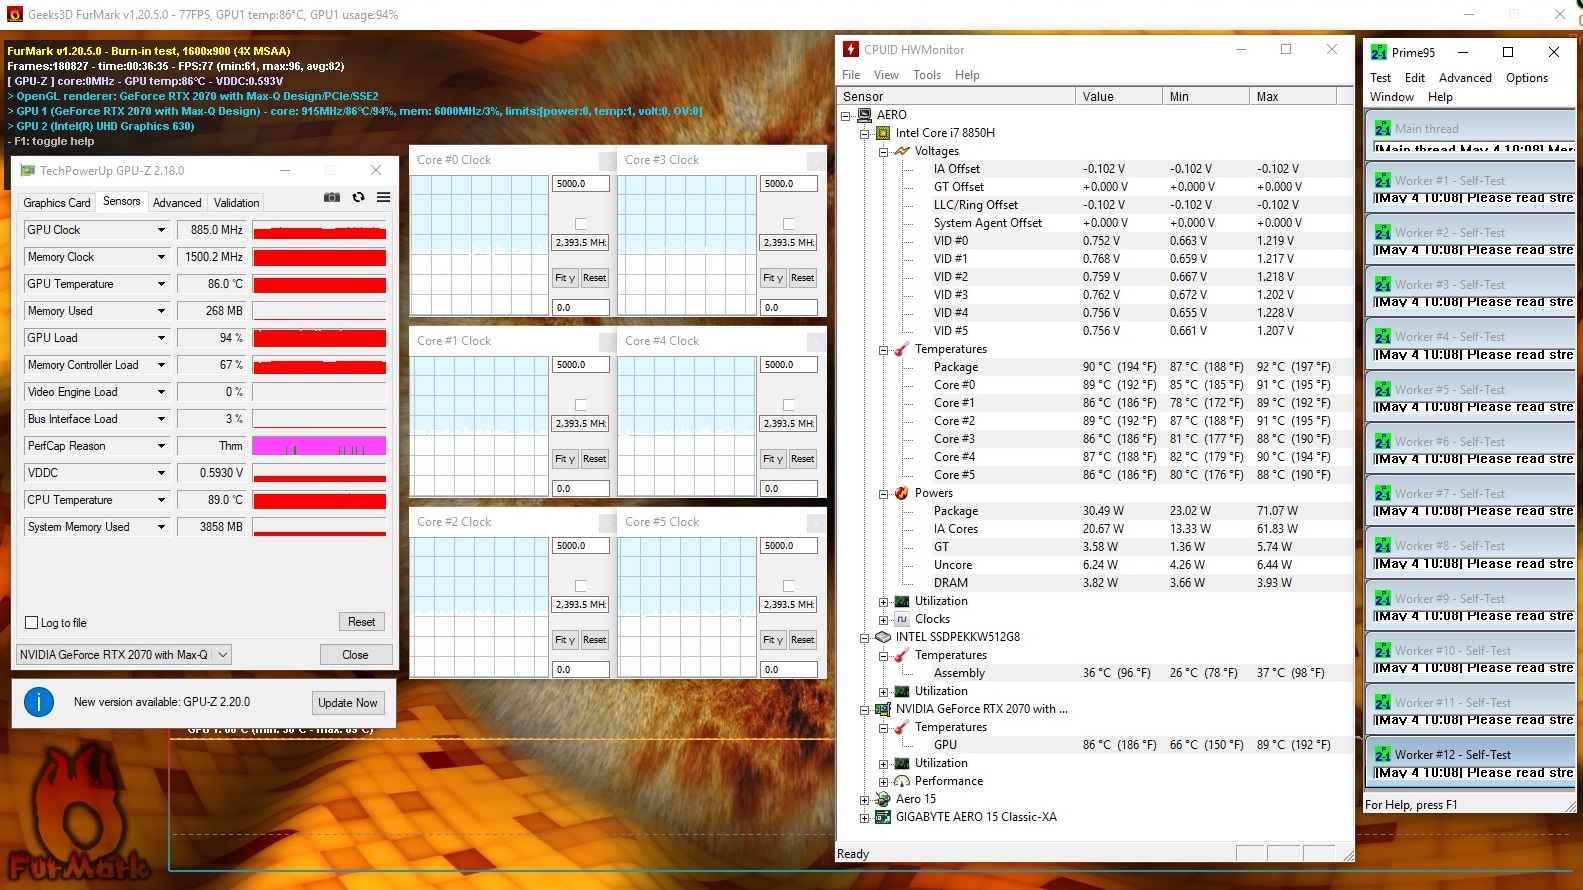
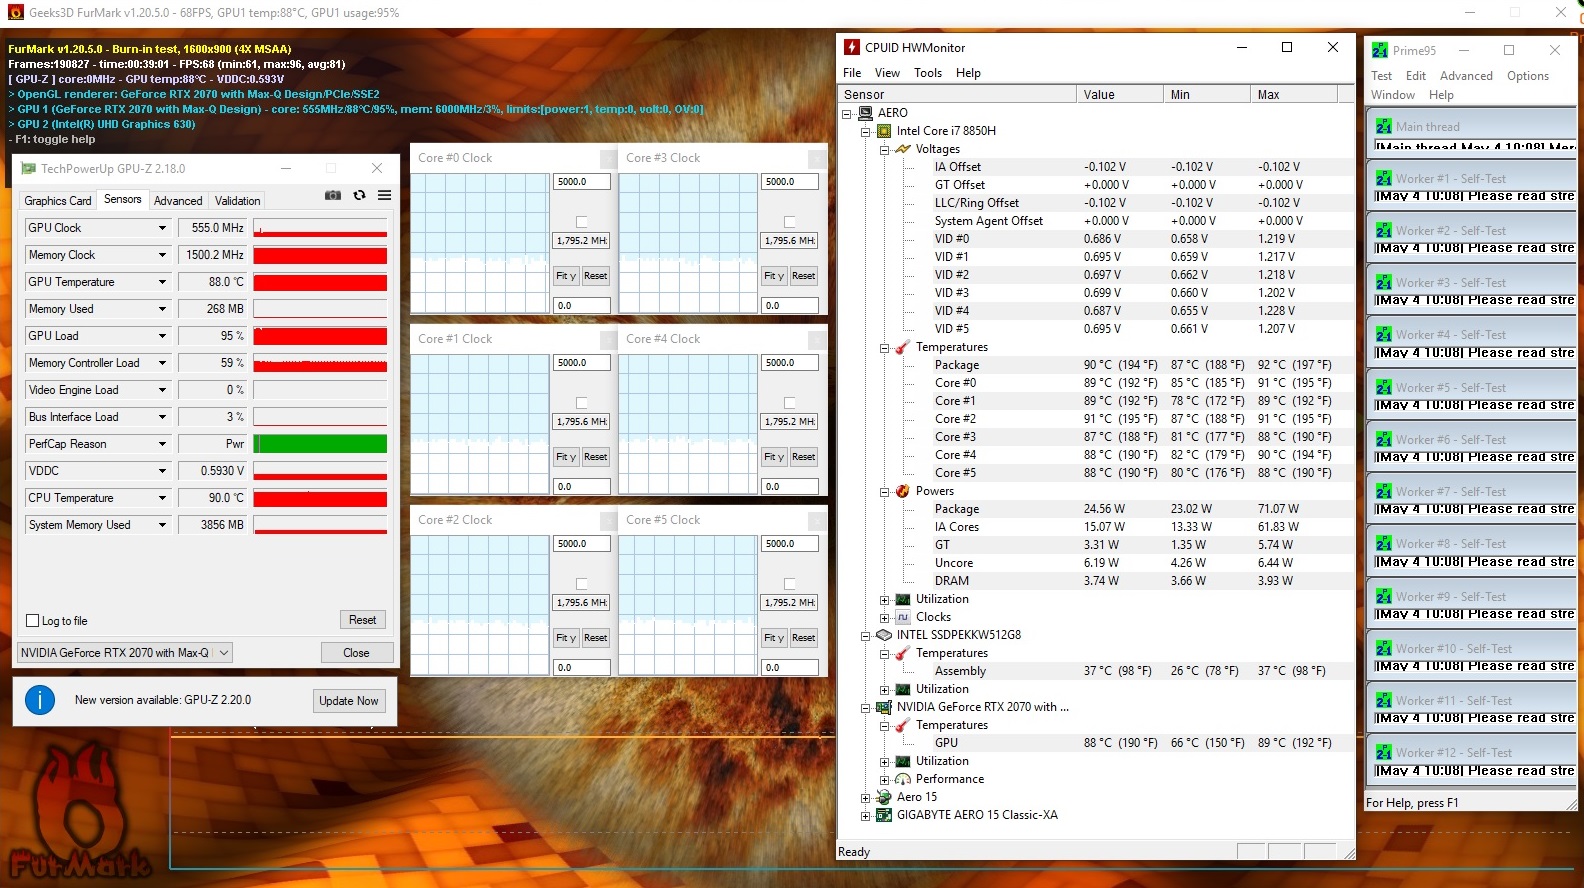
The device heats up significantly under load. We measured temperatures above 50 °C and sometimes 60 °C (~140 °F) during the stress test and the results are similar during our "Witcher 3" test (with the game running in Full HD resolution and maximum settings for one hour). The temperature is fine during everyday use.
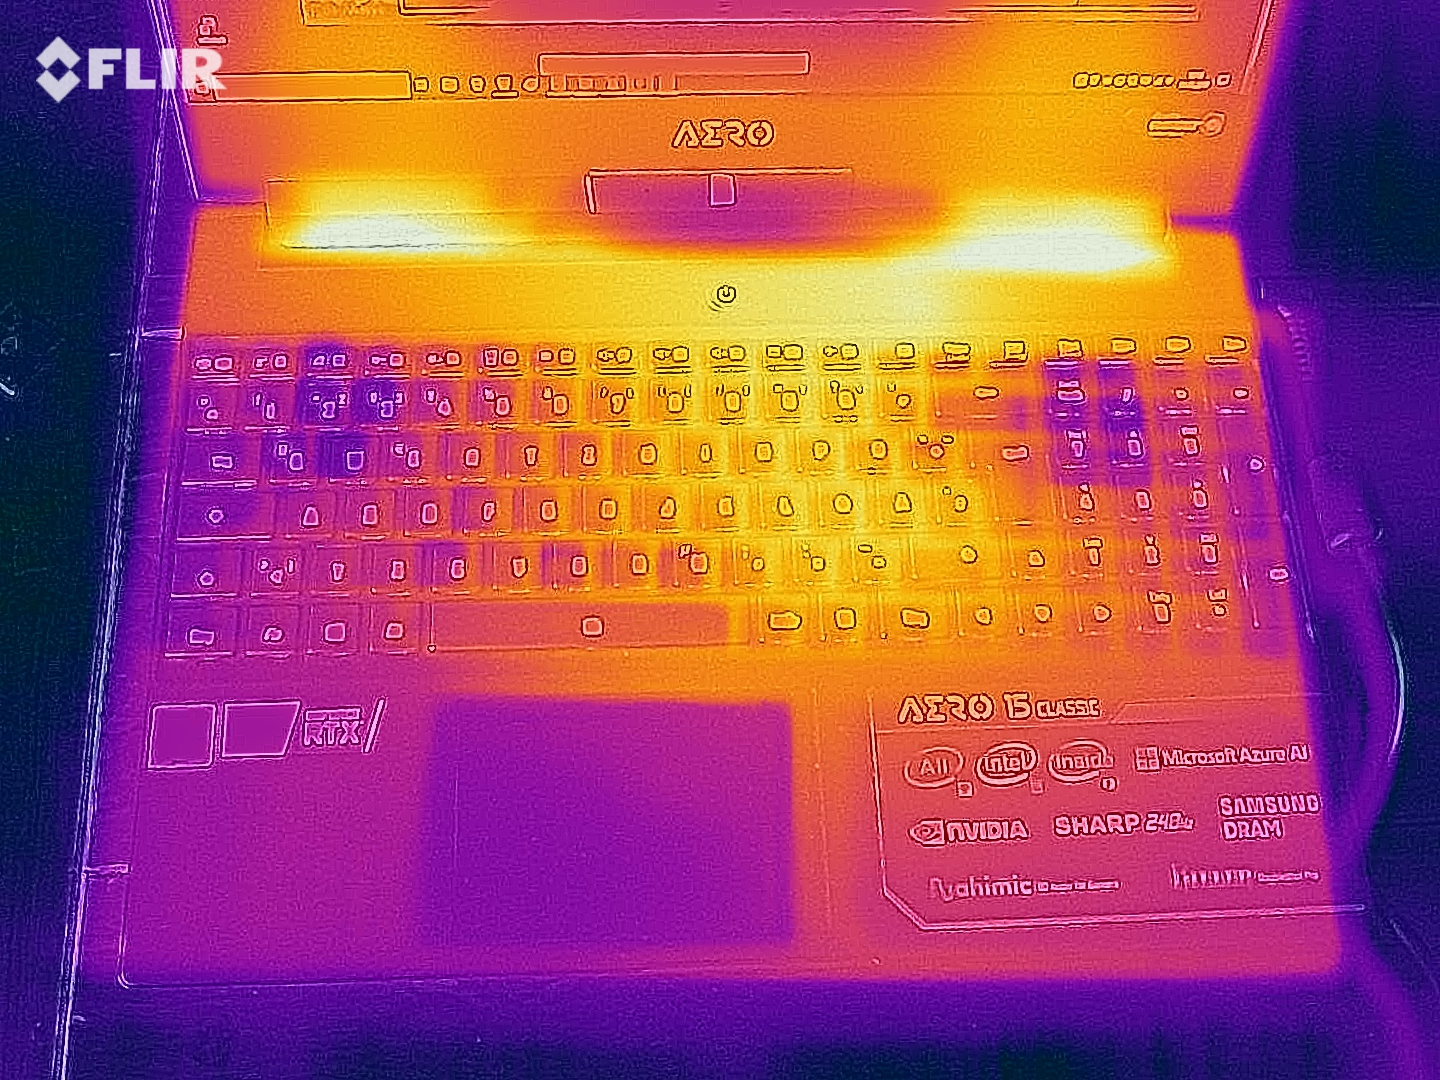
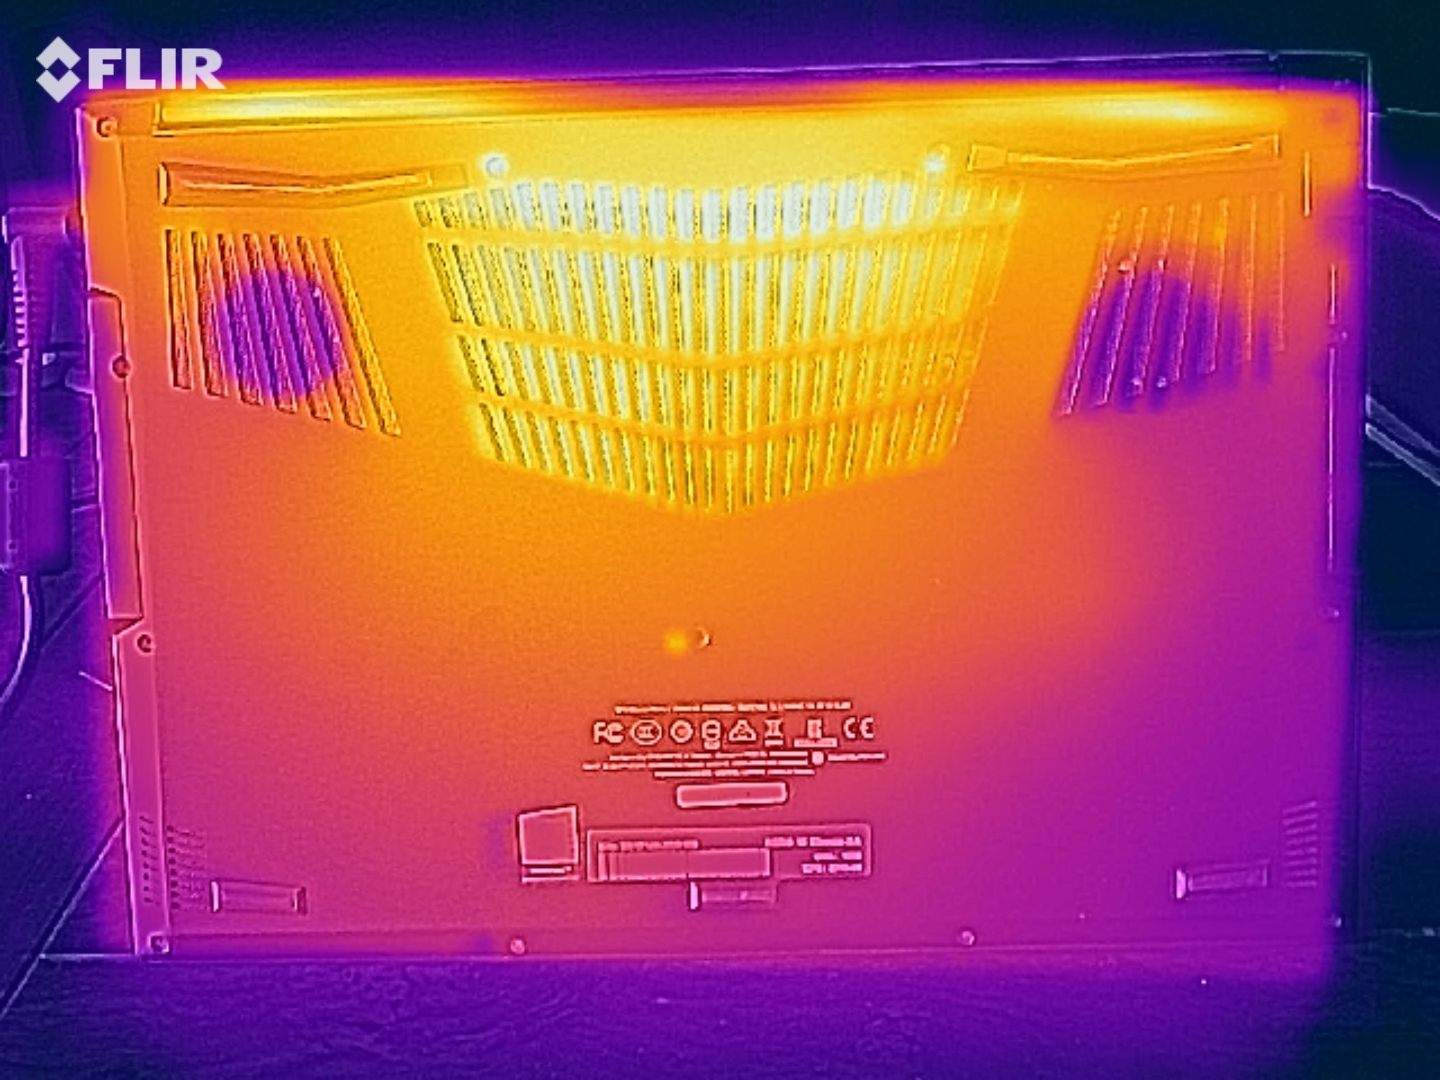
(-) The maximum temperature on the upper side is 58 °C / 136 F, compared to the average of 40.4 °C / 105 F, ranging from 21.2 to 68.8 °C for the class Gaming.
(-) The bottom heats up to a maximum of 64 °C / 147 F, compared to the average of 43.2 °C / 110 F
(+) In idle usage, the average temperature for the upper side is 28.1 °C / 83 F, compared to the device average of 33.8 °C / 93 F.
(-) Playing The Witcher 3, the average temperature for the upper side is 45.4 °C / 114 F, compared to the device average of 33.8 °C / 93 F.
(-) The palmrests and touchpad can get very hot to the touch with a maximum of 40 °C / 104 F.
(-) The average temperature of the palmrest area of similar devices was 28.9 °C / 84 F (-11.1 °C / -20 F).
| Gigabyte Aero 15 Classic-XA i7-9750H, GeForce RTX 2070 Max-Q | Gigabyte Aero 15-X9 i7-8750H, GeForce RTX 2070 Max-Q | Razer Blade 15 RTX 2070 Max-Q i7-8750H, GeForce RTX 2070 Max-Q | Asus Zephyrus S GX531GX i7-8750H, GeForce RTX 2080 Max-Q | SCHENKER XMG Neo 15 Turing i7-8750H, GeForce RTX 2070 Max-Q | Acer Predator Triton 500 i7-8750H, GeForce RTX 2080 Max-Q | Lenovo Legion Y740-15ICHg i7-8750H, GeForce RTX 2070 Max-Q | |
|---|---|---|---|---|---|---|---|
| Heat | 6% | 17% | 10% | -2% | 2% | 9% | |
| Maximum Upper Side * | 58 | 56 3% | 49 16% | 47 19% | 58 -0% | 49 16% | 37.6 35% |
| Maximum Bottom * | 64 | 66 -3% | 49 23% | 48.6 24% | 68 -6% | 58 9% | 45.2 29% |
| Idle Upper Side * | 30 | 27 10% | 25.4 15% | 28.8 4% | 30 -0% | 33 -10% | 32.2 -7% |
| Idle Bottom * | 31 | 27 13% | 27.2 12% | 33.2 -7% | 31 -0% | 33 -6% | 37.2 -20% |
* ... smaller is better
Speakers
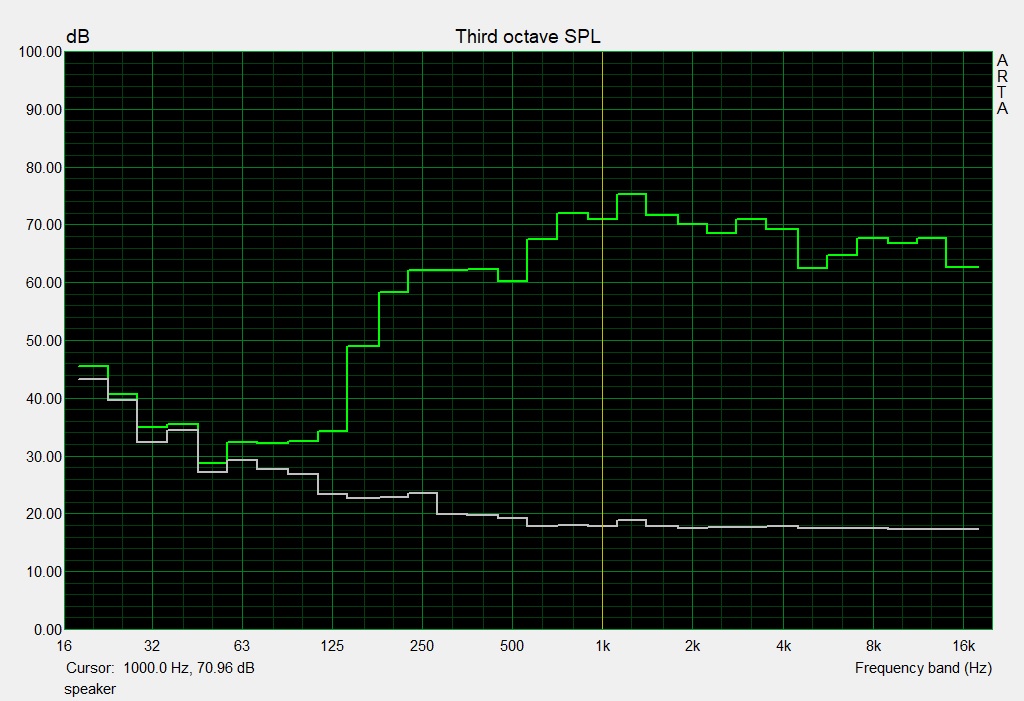
Gigabyte Aero 15 Classic-XA audio analysis
(+) | speakers can play relatively loud (82 dB)
Bass 100 - 315 Hz
(-) | nearly no bass - on average 17% lower than median
(±) | linearity of bass is average (10.2% delta to prev. frequency)
Mids 400 - 2000 Hz
(+) | balanced mids - only 4.7% away from median
(+) | mids are linear (6.2% delta to prev. frequency)
Highs 2 - 16 kHz
(+) | balanced highs - only 2.3% away from median
(+) | highs are linear (5.5% delta to prev. frequency)
Overall 100 - 16.000 Hz
(±) | linearity of overall sound is average (15.5% difference to median)
Compared to same class
» 32% of all tested devices in this class were better, 6% similar, 61% worse
» The best had a delta of 6%, average was 18%, worst was 132%
Compared to all devices tested
» 19% of all tested devices were better, 4% similar, 78% worse
» The best had a delta of 4%, average was 25%, worst was 134%
Razer Blade 15 RTX 2070 Max-Q audio analysis
(-) | not very loud speakers (71.6 dB)
Bass 100 - 315 Hz
(±) | reduced bass - on average 7.7% lower than median
(±) | linearity of bass is average (11.1% delta to prev. frequency)
Mids 400 - 2000 Hz
(±) | higher mids - on average 7.8% higher than median
(±) | linearity of mids is average (9.5% delta to prev. frequency)
Highs 2 - 16 kHz
(+) | balanced highs - only 3% away from median
(±) | linearity of highs is average (7.2% delta to prev. frequency)
Overall 100 - 16.000 Hz
(±) | linearity of overall sound is average (23.9% difference to median)
Compared to same class
» 84% of all tested devices in this class were better, 5% similar, 11% worse
» The best had a delta of 6%, average was 18%, worst was 132%
Compared to all devices tested
» 67% of all tested devices were better, 7% similar, 26% worse
» The best had a delta of 4%, average was 25%, worst was 134%
Energy Management - slightly improved runtimes
Power Consumption
The Aero 15 Classic consumes significantly more power than the Aero 15-X9 over the entire load range. We measured a maximum consumption of 32 watts while idling. Consumption increased to 213 watts during the stress test. Gaming does not require the same amount of power and we measured a consumption of 148 watts during our "Witcher 3" test. The rated output of the device's AC adapter is 230 watts.
| Off / Standby | |
| Idle | |
| Load |
|
| Gigabyte Aero 15 Classic-XA i7-9750H, GeForce RTX 2070 Max-Q | Gigabyte Aero 15-X9 i7-8750H, GeForce RTX 2070 Max-Q | Razer Blade 15 RTX 2070 Max-Q i7-8750H, GeForce RTX 2070 Max-Q | Asus Zephyrus S GX531GX i7-8750H, GeForce RTX 2080 Max-Q | SCHENKER XMG Neo 15 Turing i7-8750H, GeForce RTX 2070 Max-Q | Acer Predator Triton 500 i7-8750H, GeForce RTX 2080 Max-Q | Lenovo Legion Y740-15ICHg i7-8750H, GeForce RTX 2070 Max-Q | |
|---|---|---|---|---|---|---|---|
| Power Consumption | 21% | 26% | 6% | 23% | 9% | 5% | |
| Idle Minimum * | 21 | 16 24% | 10.4 50% | 16.1 23% | 13 38% | 16 24% | 22.9 -9% |
| Idle Average * | 23 | 18 22% | 14.6 37% | 20.9 9% | 16 30% | 22 4% | 27.2 -18% |
| Idle Maximum * | 32 | 23 28% | 16.3 49% | 27 16% | 21 34% | 32 -0% | 27.5 14% |
| Load Average * | 97 | 88 9% | 88.5 9% | 93.4 4% | 84 13% | 89 8% | 83.4 14% |
| Witcher 3 ultra * | 148 | 120 19% | 155.4 -5% | 168.2 -14% | 135 9% | 147 1% | 143.6 3% |
| Load Maximum * | 213 | 167 22% | 182.4 14% | 215.3 -1% | 183 14% | 173 19% | 160.5 25% |
* ... smaller is better
Battery Runtimes
The Aero 15 Classic reaches a runtime of 7:01 h during our realistic Wi-Fi test in which we simulate browsing the web with the help of a script. The Windows energy profile is set to balanced and the display brightness to around 150 cd/m². Our video test lasts 6:48 h on this 15.6-inch device. This test includes running the short film Big Buck Bunny (encoded to H.264 at 1920 x 1080 pixels) in a loop with the wireless module deactivated and display brightness set to 150 cd/m².
Although we measured a higher power consumption than on the Aero 15-X9, the battery runtimes are slightly better in our realistic tests. This could be due to the IGZO display from Sharp. These screens require less power than comparable panels. However, our test unit cannot get close to the brilliant runtimes offered by the Aero 15X v8.
| Gigabyte Aero 15 Classic-XA i7-9750H, GeForce RTX 2070 Max-Q, 94.24 Wh | Gigabyte Aero 15-X9 i7-8750H, GeForce RTX 2070 Max-Q, 94.24 Wh | Gigabyte Aero 15X v8 i7-8750H, GeForce GTX 1070 Max-Q, 94.24 Wh | Razer Blade 15 RTX 2070 Max-Q i7-8750H, GeForce RTX 2070 Max-Q, 80 Wh | Asus Zephyrus S GX531GX i7-8750H, GeForce RTX 2080 Max-Q, 50 Wh | SCHENKER XMG Neo 15 Turing i7-8750H, GeForce RTX 2070 Max-Q, 62.3 Wh | Acer Predator Triton 500 i7-8750H, GeForce RTX 2080 Max-Q, 82 Wh | Lenovo Legion Y740-15ICHg i7-8750H, GeForce RTX 2070 Max-Q, 57 Wh | |
|---|---|---|---|---|---|---|---|---|
| Battery Runtime | -6% | 18% | -11% | -57% | -32% | -50% | -64% | |
| Reader / Idle | 545 | 549 1% | 762 40% | 682 25% | 412 -24% | 335 -39% | 235 -57% | |
| H.264 | 408 | 364 -11% | 504 24% | 292 -28% | ||||
| WiFi v1.3 | 421 | 382 -9% | 513 22% | 387 -8% | 181 -57% | 304 -28% | 190 -55% | 166 -61% |
| Load | 181 | 174 -4% | 156 -14% | 88 -51% | 93 -49% | 81 -55% | 46 -75% |
Pros
Cons
Verdict
Judging by the exterior, the Aero 15 Classic has not really changed compared to its predecessor Aero 15-X9. The real changes are on the inside: The notebook is equipped with a brand-new six-core Core i7-9750H, the successor of the Core i7-8750H.
The new Core i7-9750H cannot offer any real improvements.
It cannot make real use of its slightly higher working memory and the results are often on par with those of the i7-8750H. On top of that, performance drops continuously under high load, which we measured with our CineBench R15 loop. We assume that the cooling system and processor were not very well aligned.
Nonetheless, the combination of a Core i7-9750H and a GeForce RTX 2070 Max-Q manages to display all current games smoothly on the matte Full HD screen. Games can be played at high to maximum settings. The fast NVMe SSD enables smooth system performance and the device also has a free slot for a second M.2 2280 SSD.
The other thing that has been changed is the screen of the Aero 15 Classic. While the Aero 15-X9 was equipped with a 144-Hz IPS display, Gigabyte has given the Aero 15 Classic a 240-Hz IGZO panel, made by Sharp. This new panel offers stable viewing angles, short response times and of course, great colors. We were disappointed by the brightness and contrast ratio, however. These were very low considering the device's price range. The battery runtimes are great for a gaming notebook.
Gigabyte Aero 15 Classic-XA
-
05/14/2020 v7
Sascha Mölck
More articles related to this device
Gigabyte Aero 15 Classic-XA (Aero 15 Series)Related Articles


Pricecompare

