 Deutsch
 English
 Español
 Français
 Italiano
 Nederlands
 Polski
 Português
 Русский
 Türkçe
 Svenska
 Chinese
 Magyar
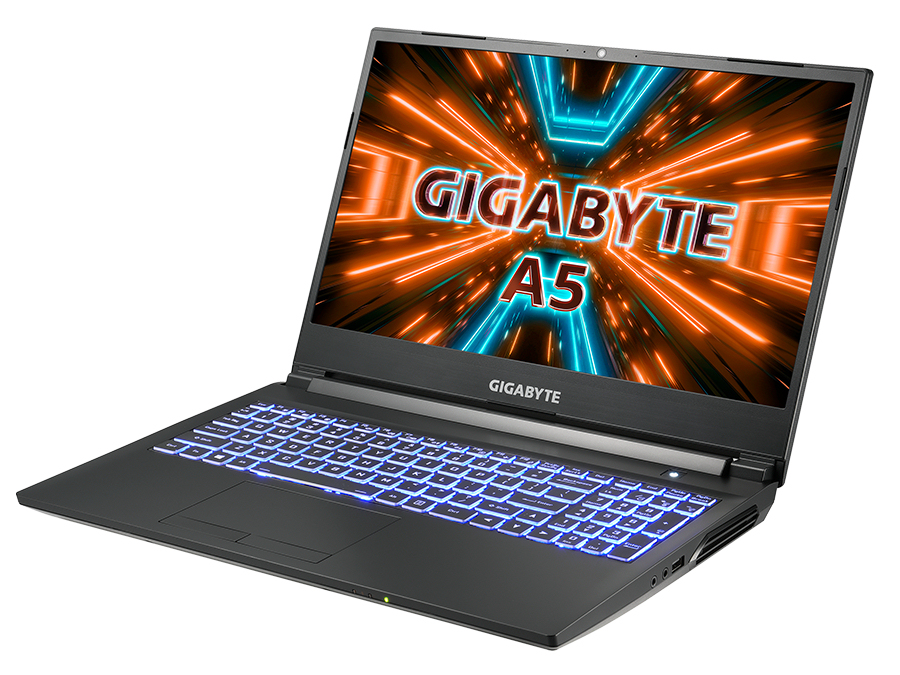
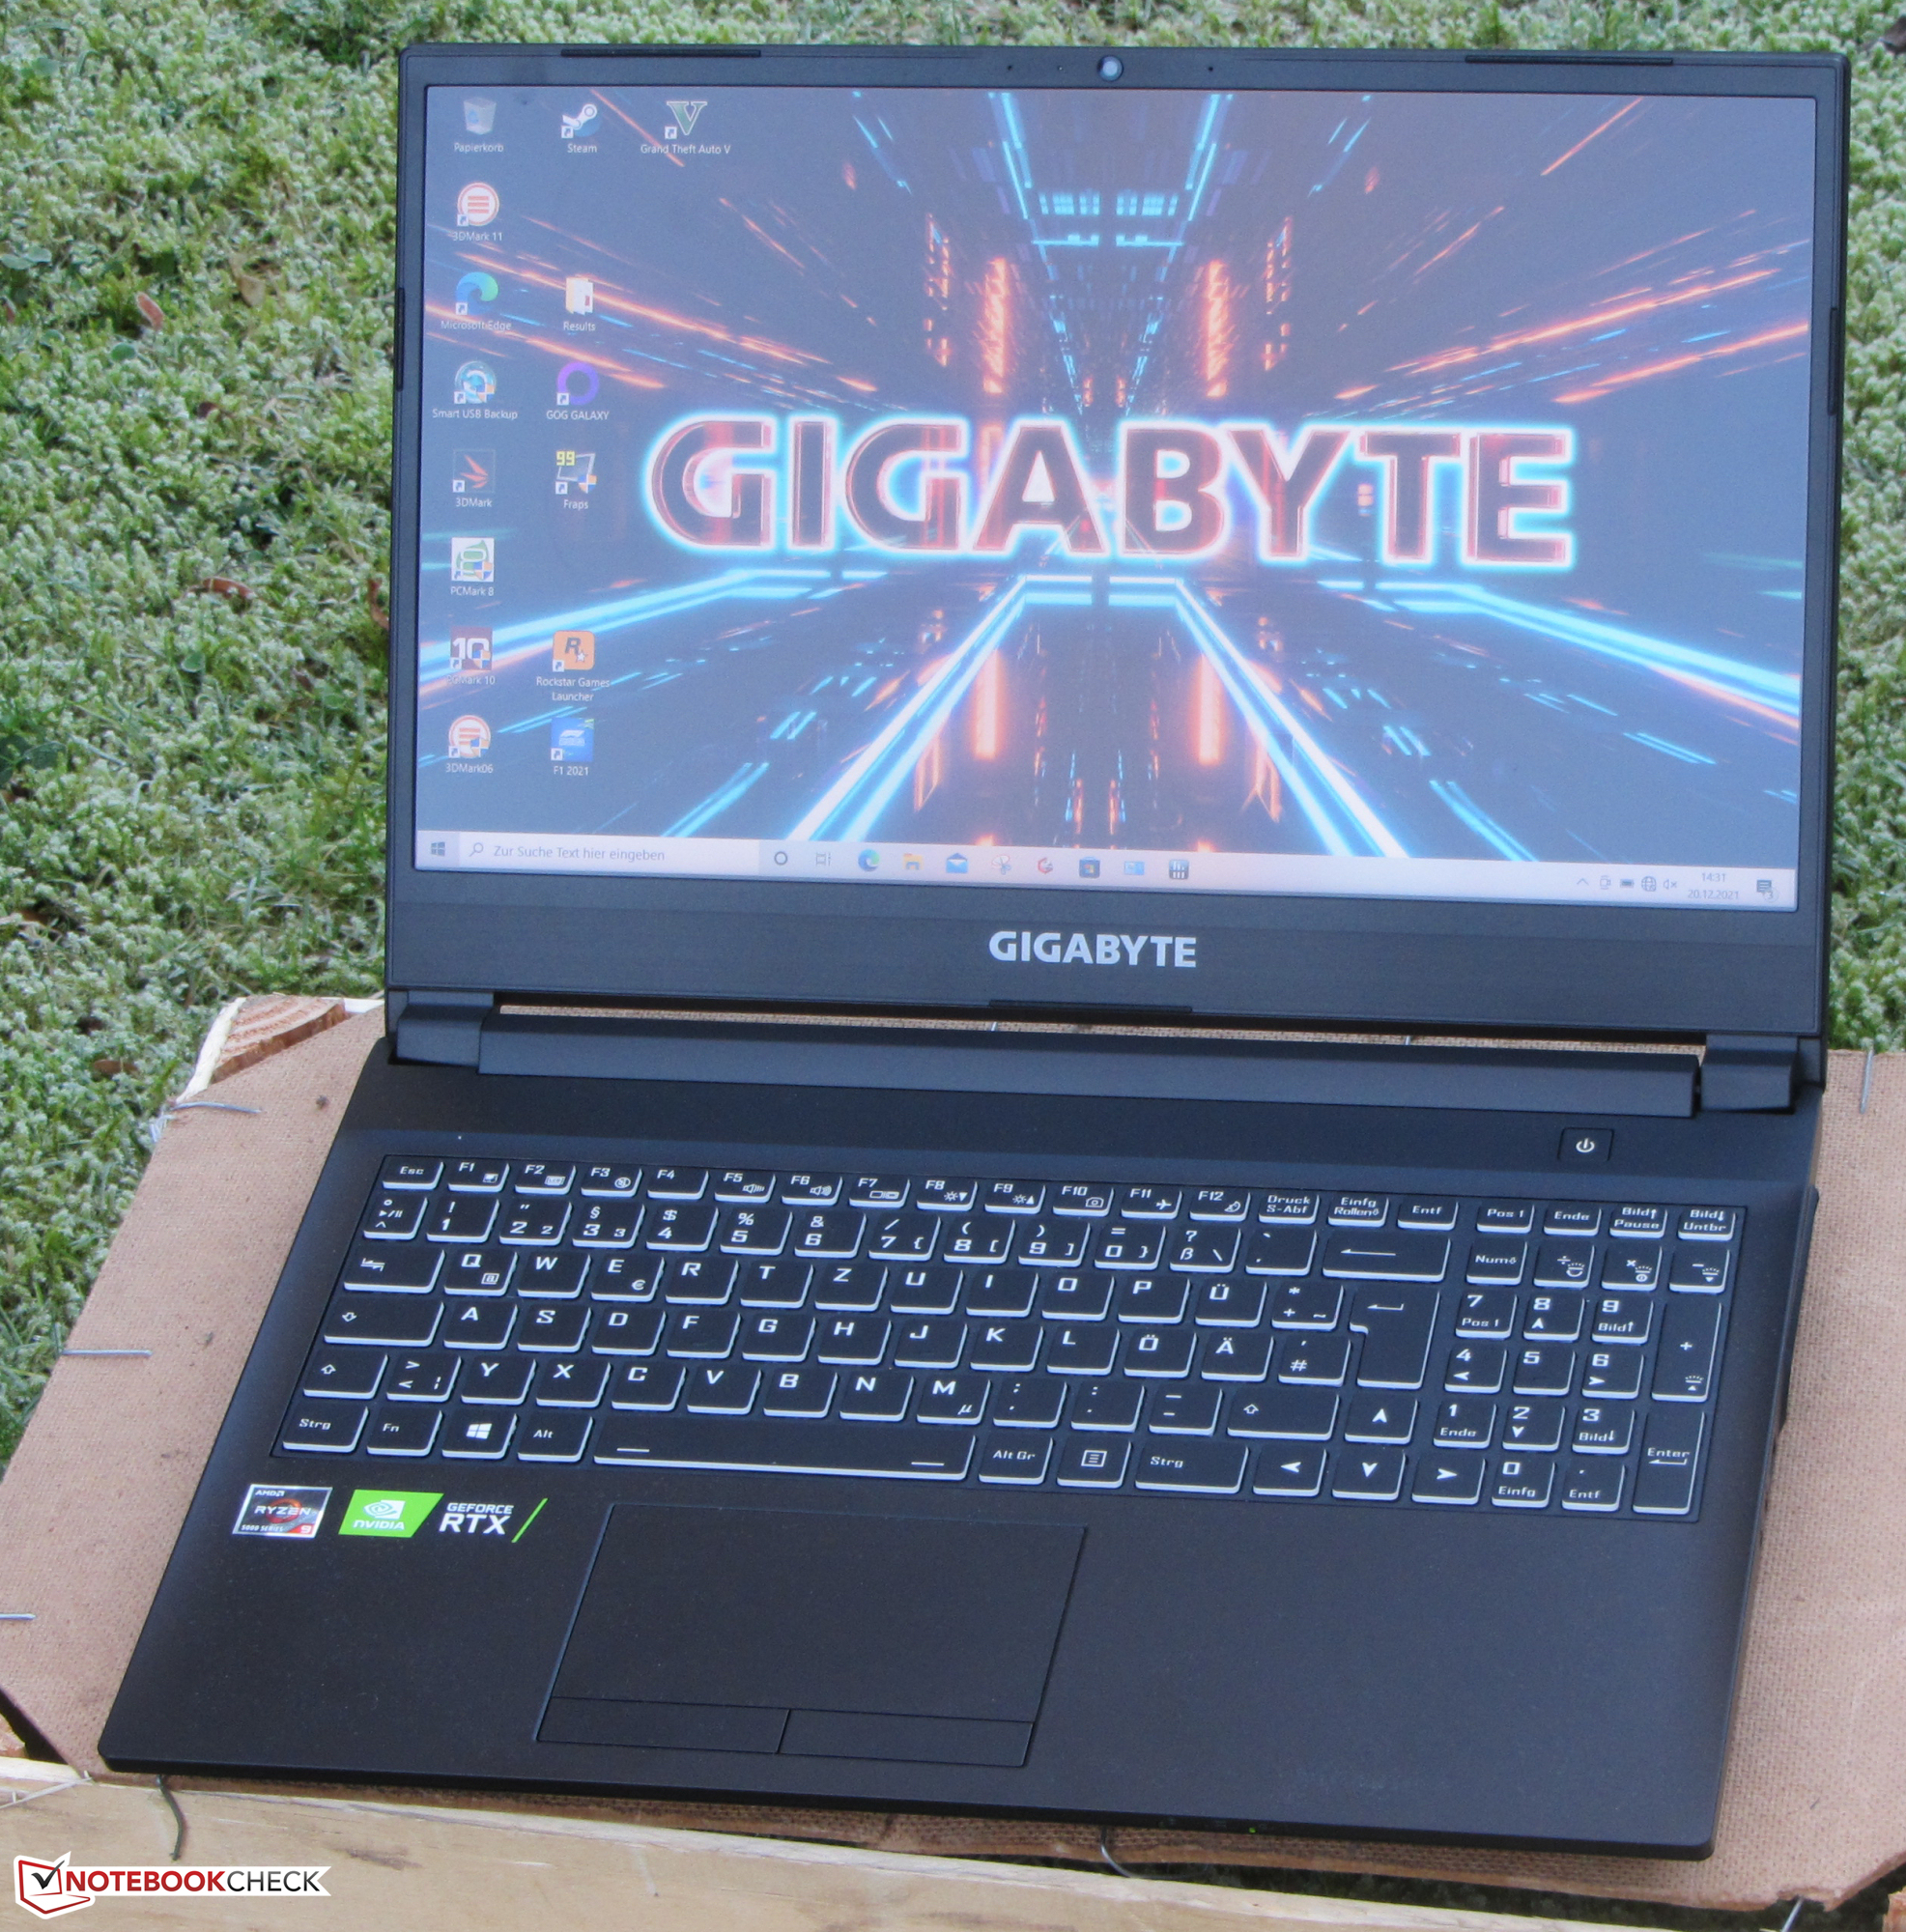
Gigabyte A5 X1 in review: Powerful gaming laptop

Gigabyte's 15.6-inch gaming laptop is powered by a Ryzen 9 5900HX-APU and a GeForce RTX 3070 laptop GPU. Our model can be purchased for just under 1,800 Euros (~$2,032). Competitors include devices like the MSI Katana GF66 11UG, the Acer Nitro 5 AN515-45, the Schenker XMG Apex 15, and the HP Omen 16.
Possible contenders in comparison
Rating | Date | Model | Weight | Height | Size | Resolution | Best Price |
|---|---|---|---|---|---|---|---|
| 84.1 % | 01/2022 | Gigabyte A5 X1 R9 5900HX, GeForce RTX 3070 Laptop GPU | 2.2 kg | 25.3 mm | 15.60" | 1920x1080 | |
| 86.6 % | 10/2021 | HP Omen 16-b0085ng i7-11800H, GeForce RTX 3070 Laptop GPU | 2.4 kg | 23 mm | 16.10" | 1920x1080 | |
| 79.2 % | 09/2021 | MSI Katana GF66 11UG-220 i7-11800H, GeForce RTX 3070 Laptop GPU | 2.3 kg | 25 mm | 15.60" | 1920x1080 | |
| 82.2 % | 08/2021 | Acer Nitro 5 AN515-45-R1JH R7 5800H, GeForce RTX 3070 Laptop GPU | 2.3 kg | 23.9 mm | 15.60" | 2560x1440 | |
| 84.4 % | 11/2021 | SCHENKER XMG Apex 15 NH57E PS R7 5800H, GeForce RTX 3060 Laptop GPU | 2.1 kg | 29 mm | 15.60" | 1920x1080 |
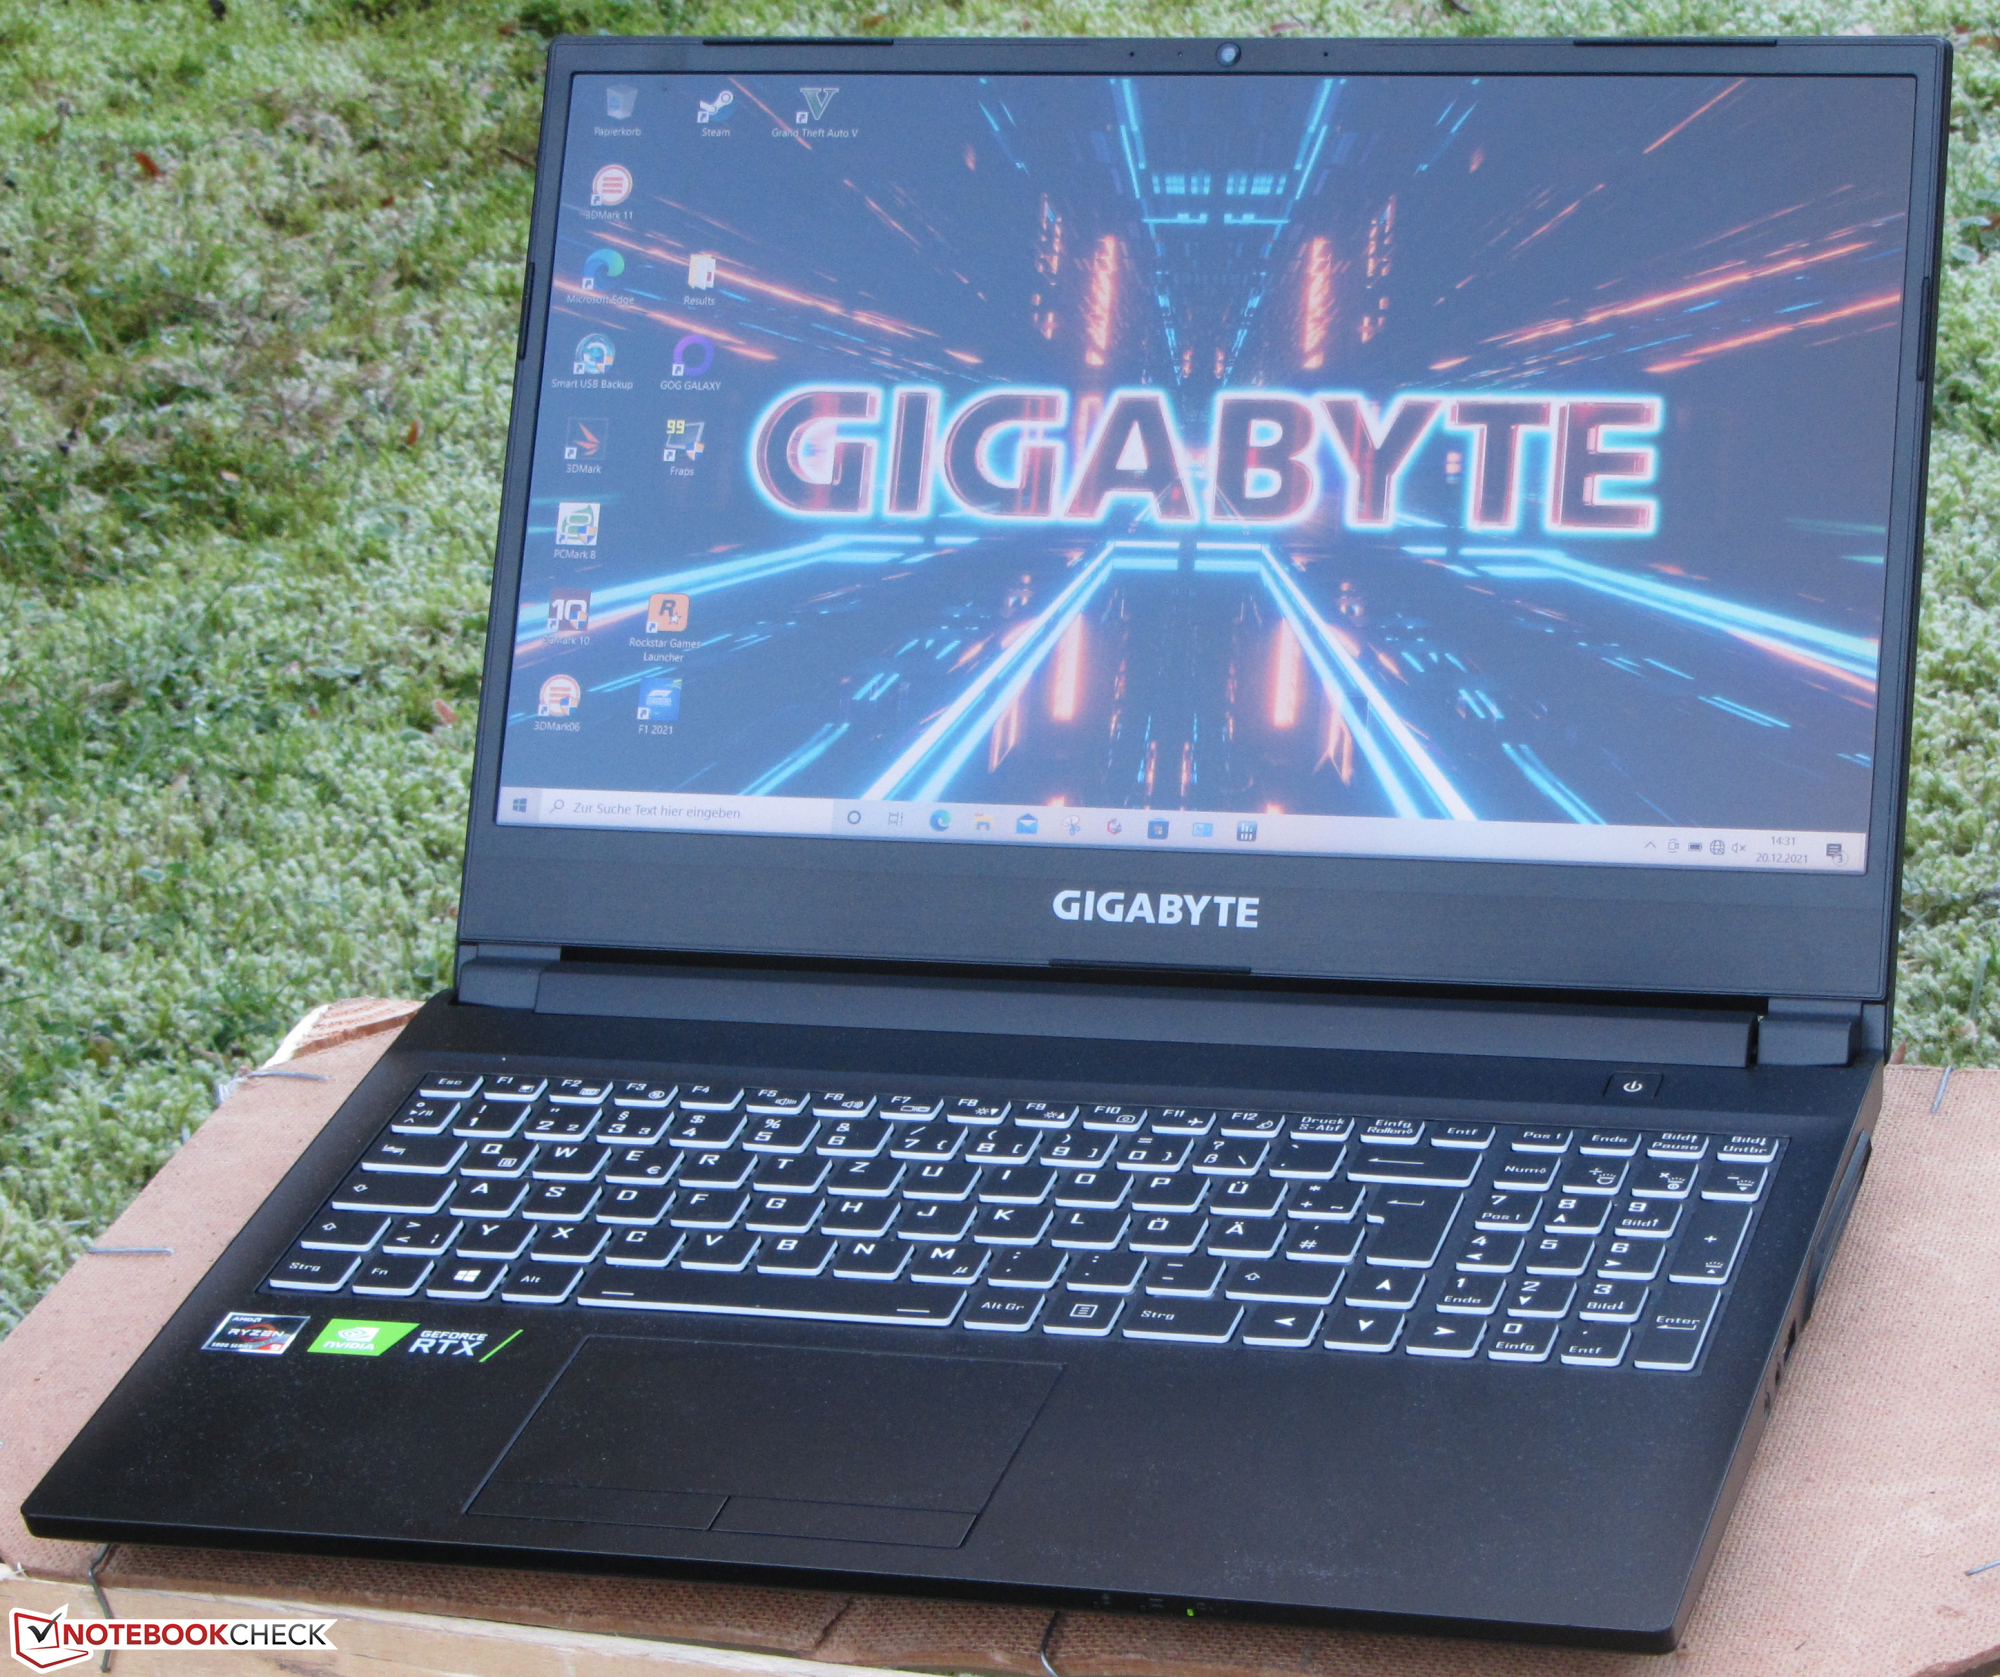
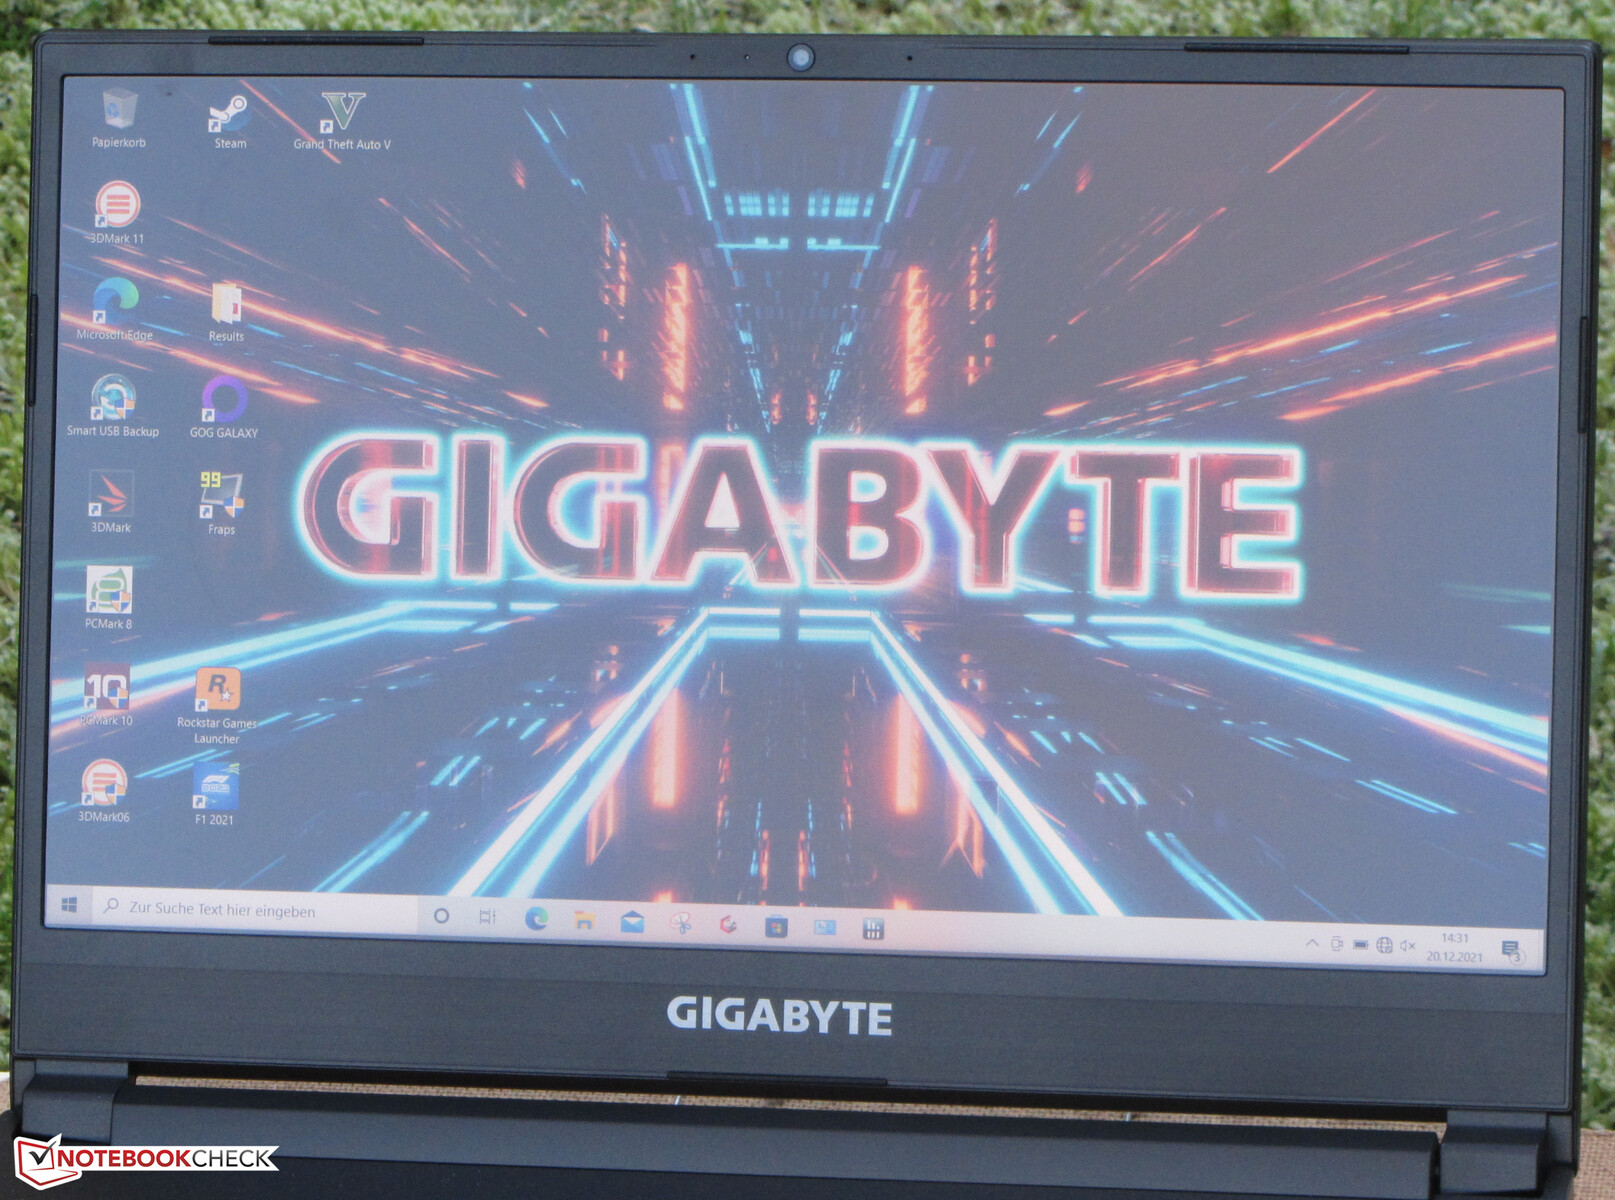
Case - The A5 comes in a plastic chassis
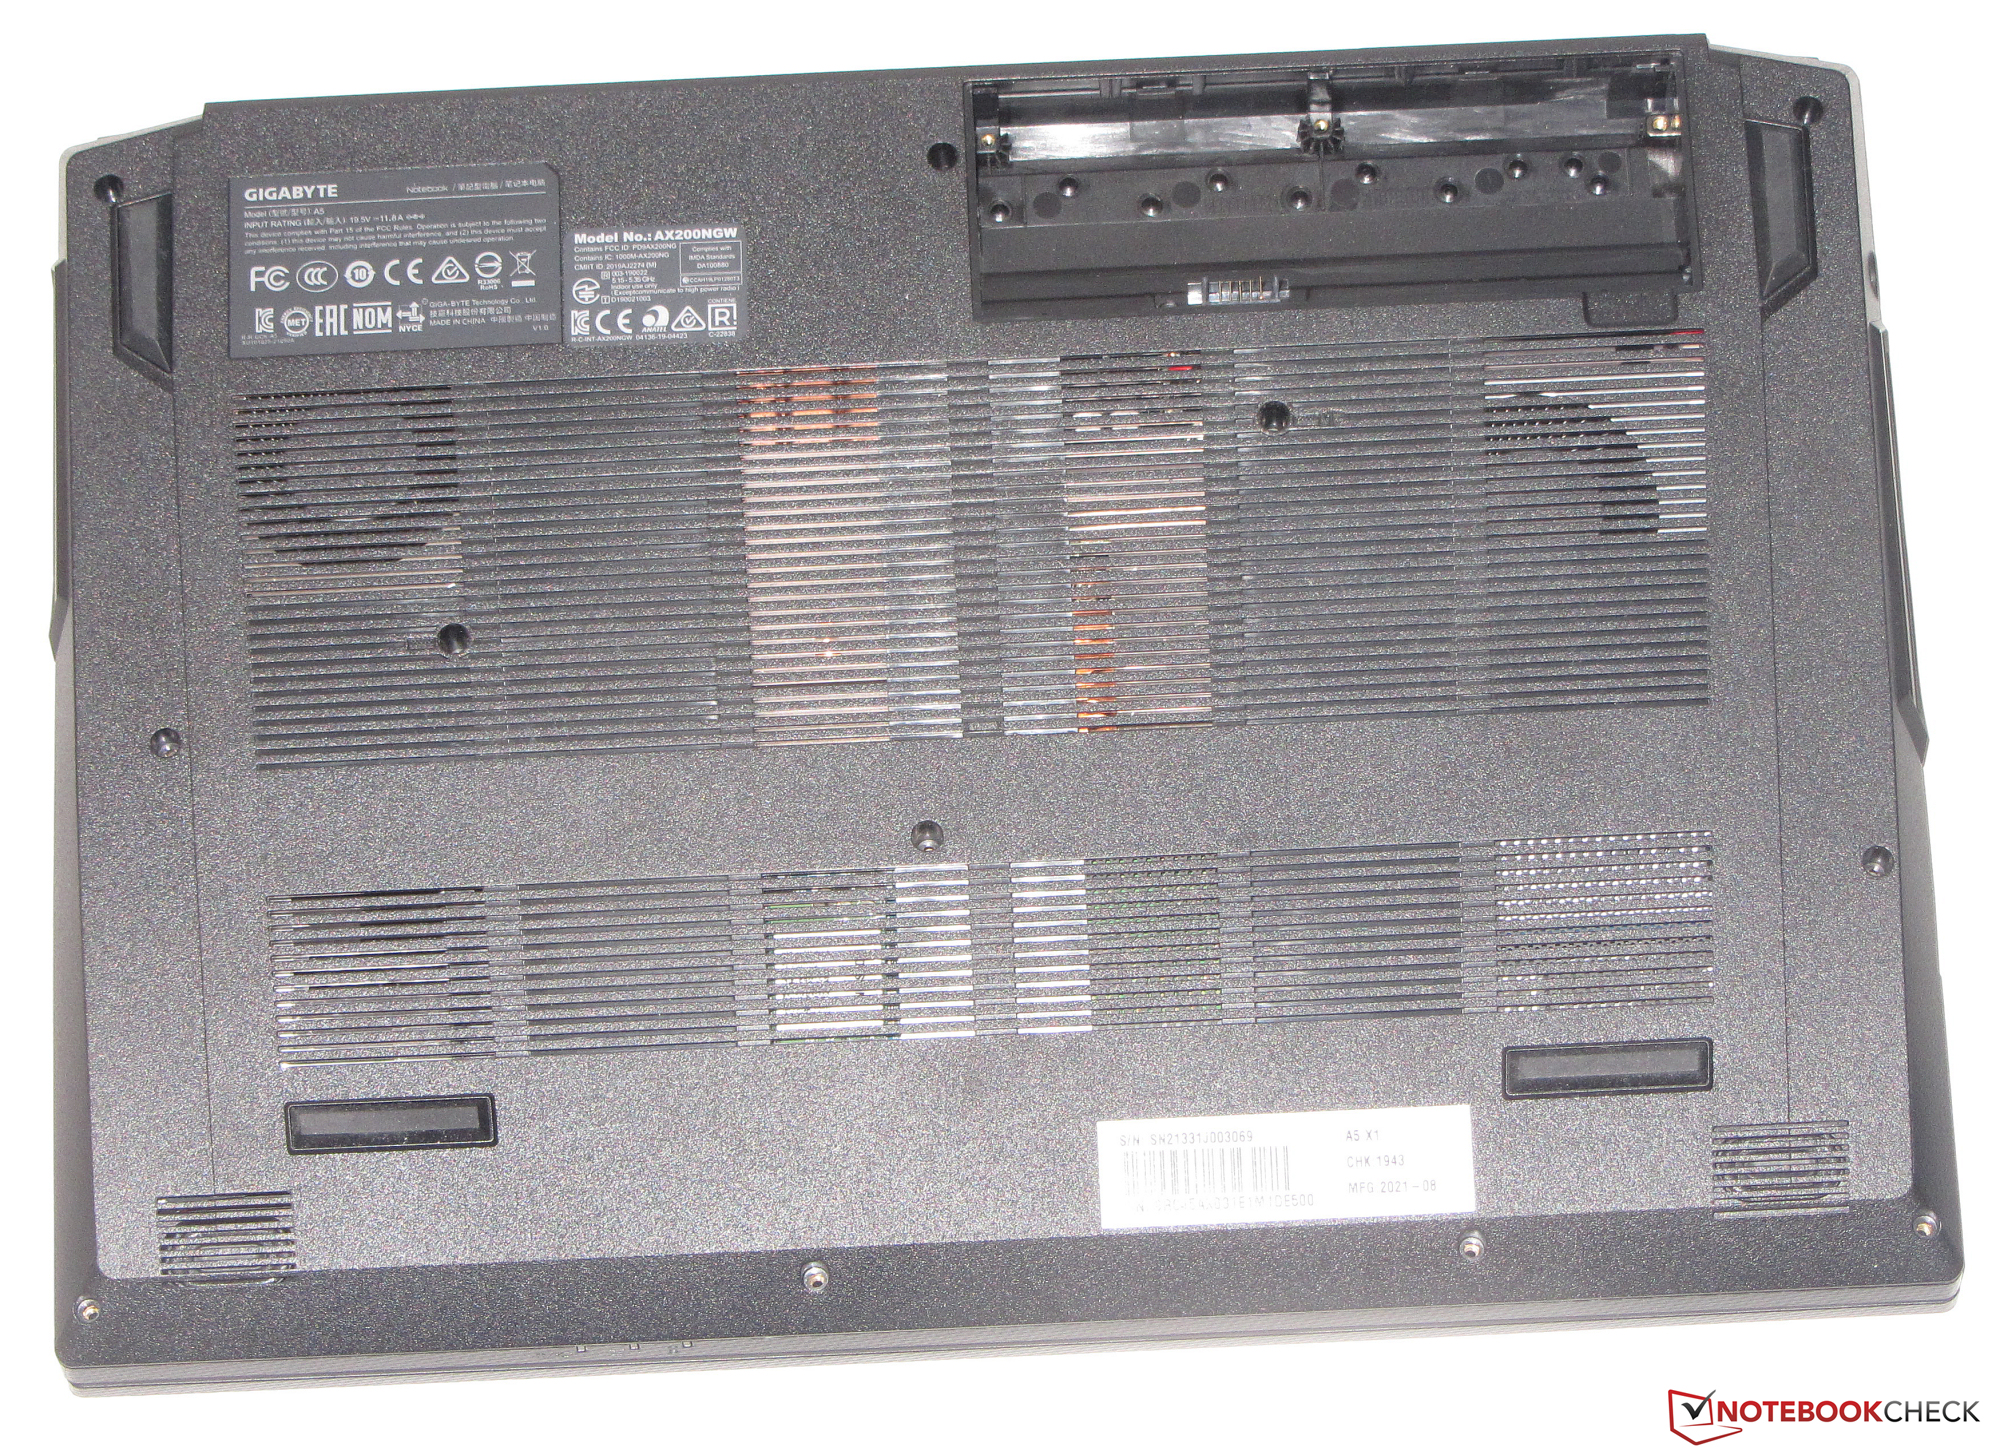
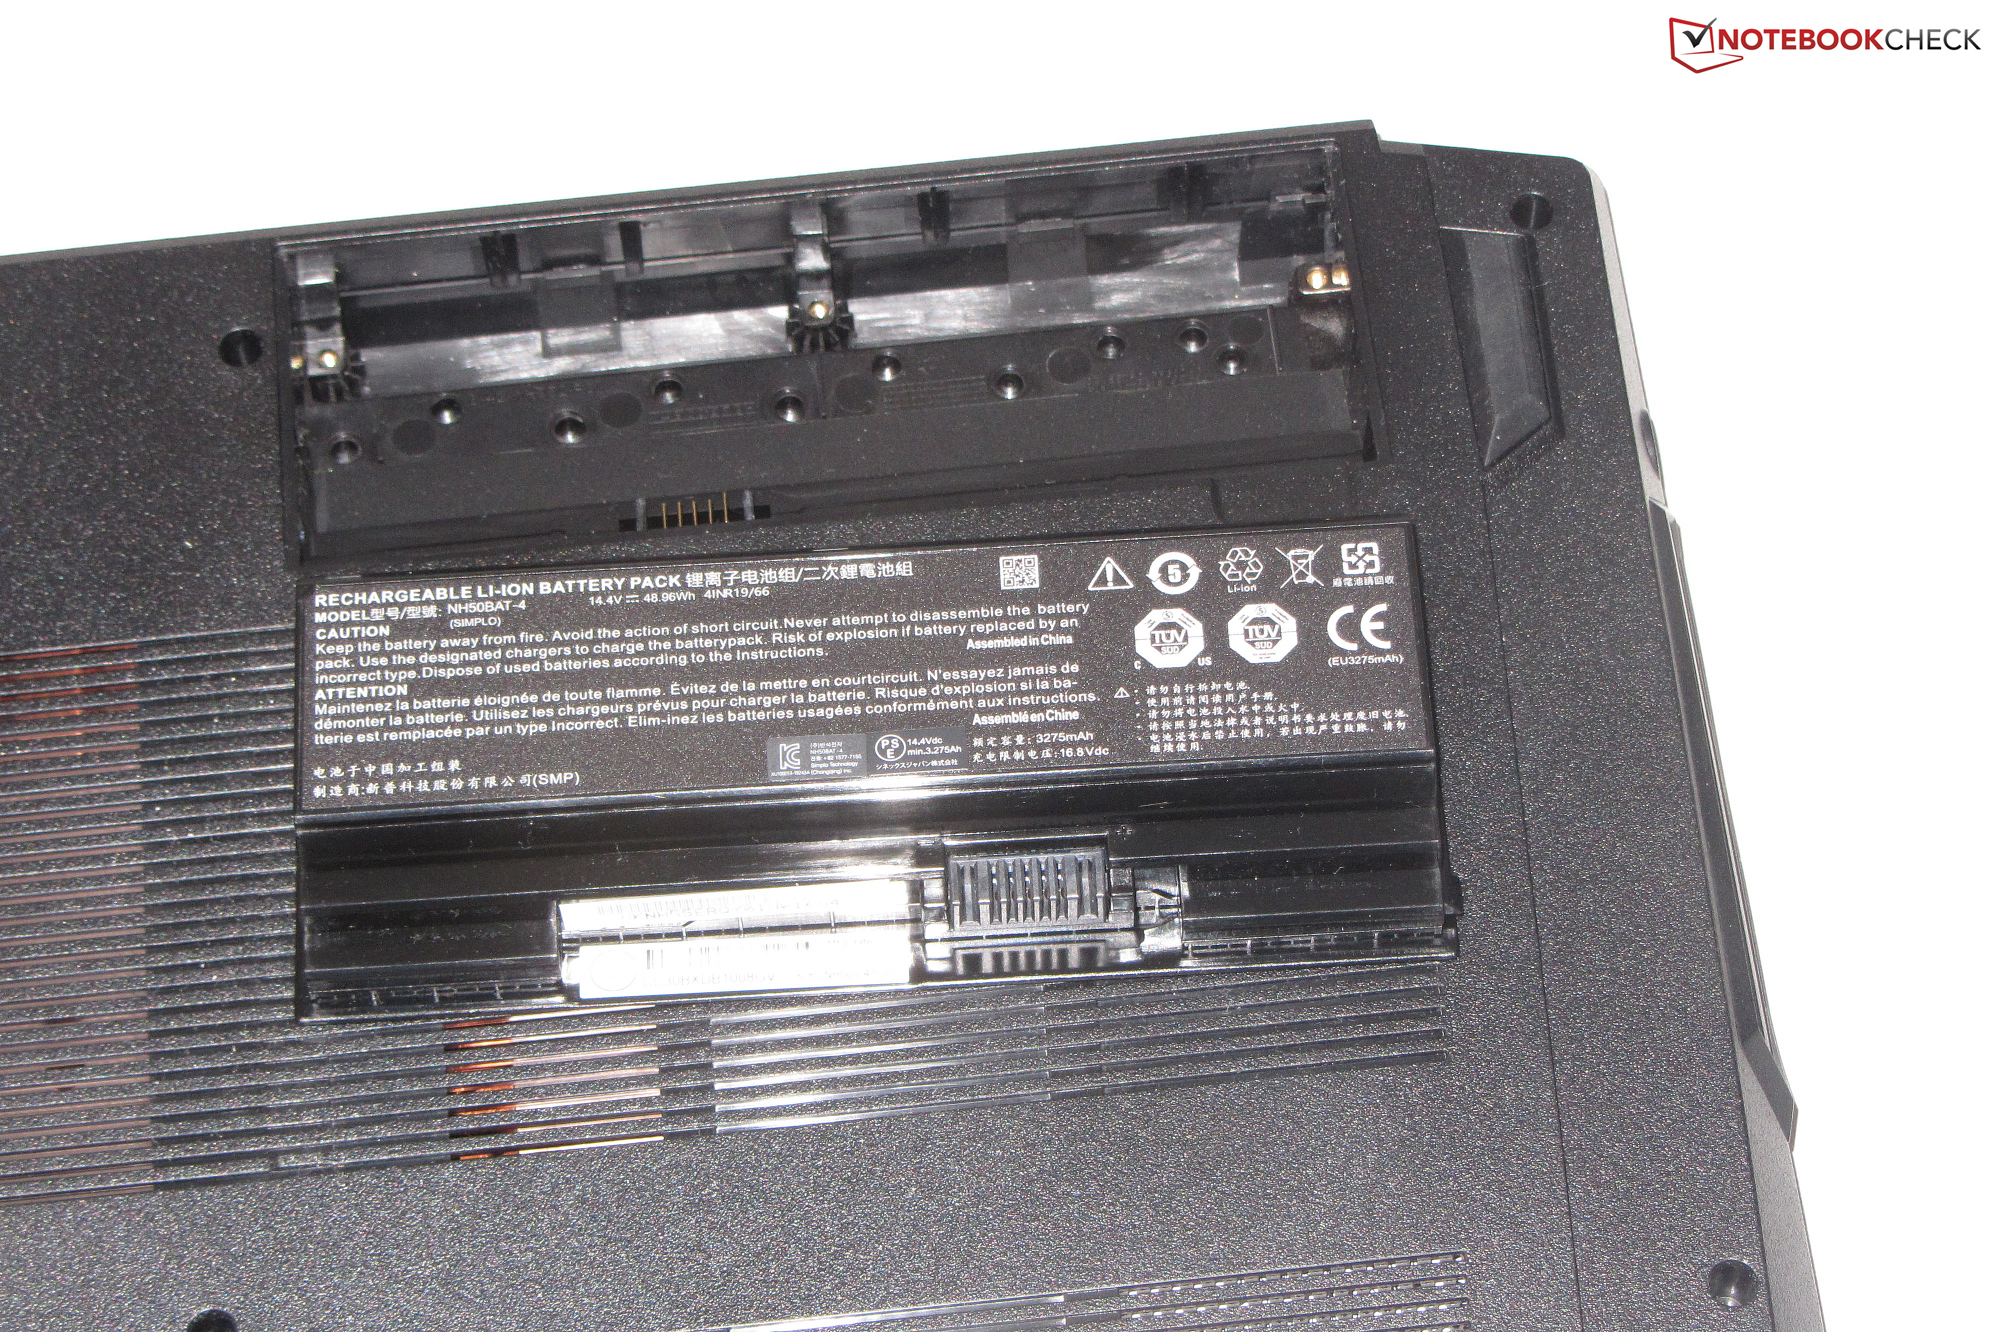
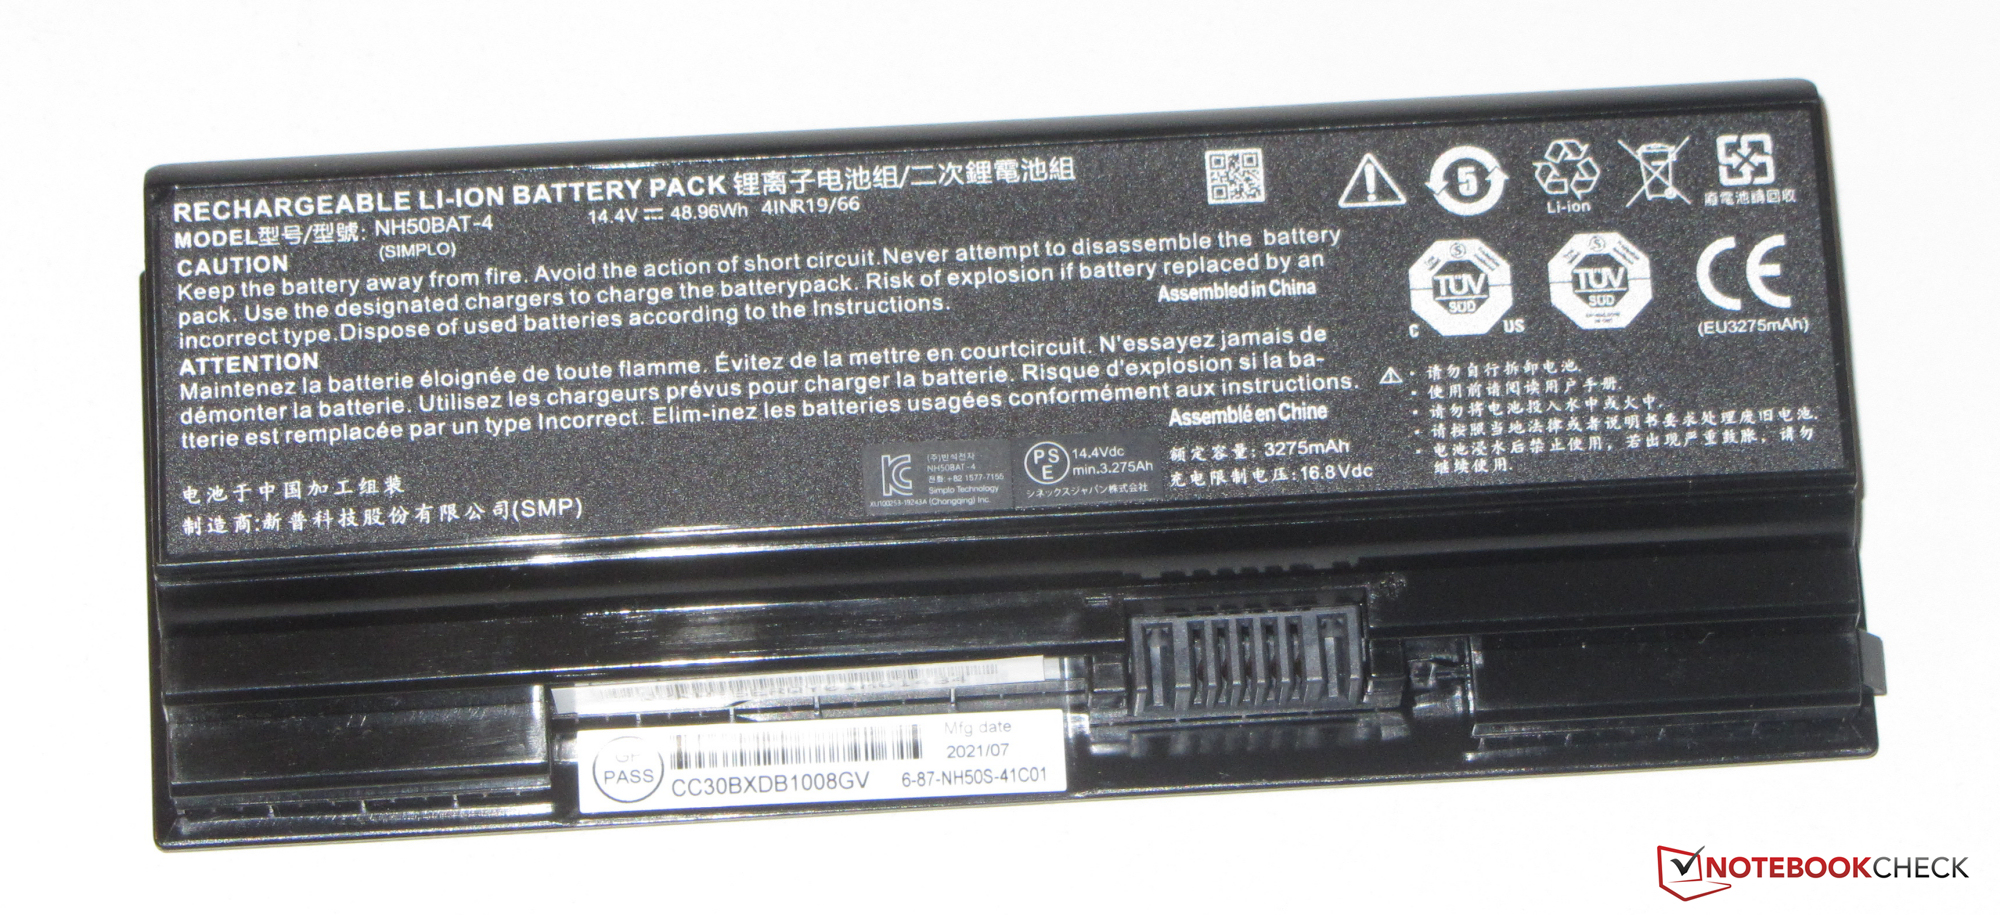
The case of the A5 doesn't offer high-quality materials. Gigabyte opts for a black plastic case with a design that can be described as sober and functional - the laptop doesn't attract attention. The back of the lid and the top of the base unit have matte, smooth surfaces, while the surfaces of the bottom cover and the narrow lid edges are roughened. The laptop doesn't come with a maintenance hatch. The battery can be removed from the outside.
The chassis doesn't reveal any manufacturing flaws. The gap dimensions are accurate, and there are no material protrusions. Although the base unit can be twisted a bit, the whole situation remains within limits. On the other hand, the lid lacks rigidity. The hinges hold the lid firmly in position and only allow it to wobble slightly. The maximum opening angle is about 120 degrees. Opening the lid with one hand is possible.

In terms of weight and size, the laptops in our comparison field don't differ much. The A5 is one of the lighter devices.
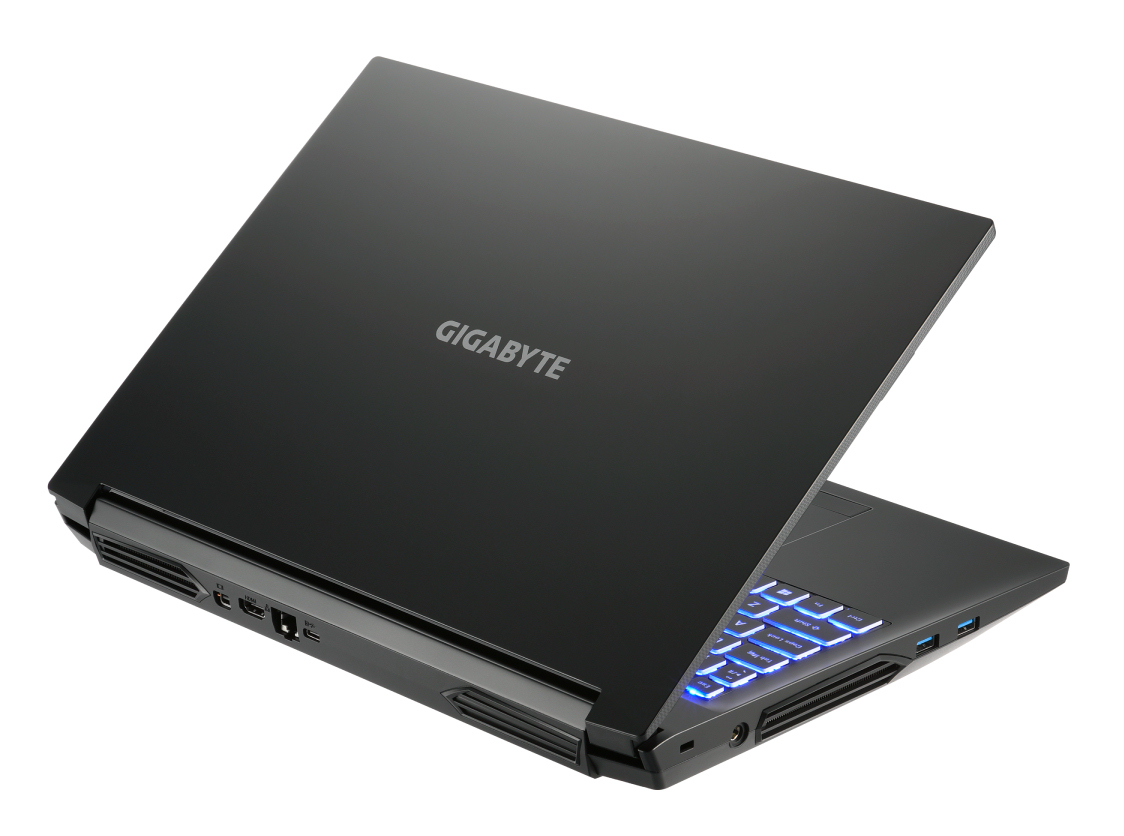
Connectivity - Gigabyte laptop without Thunderbolt
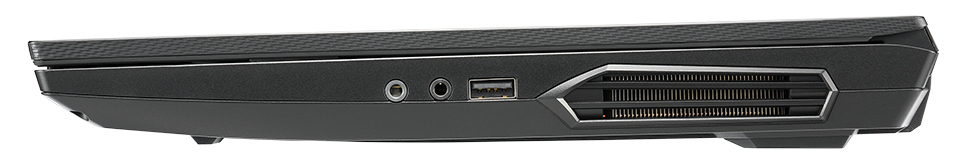
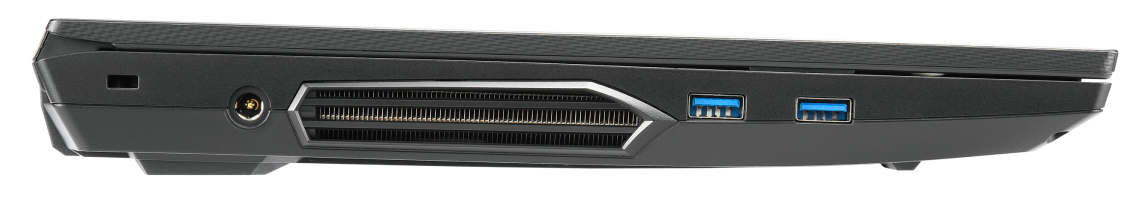
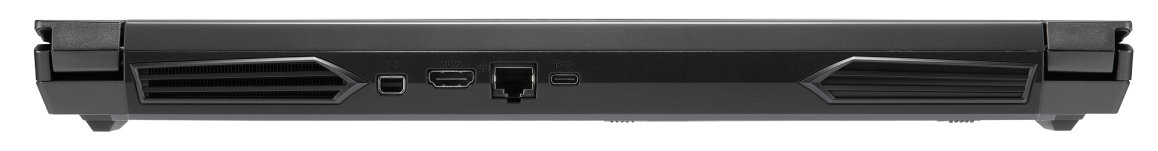
The A5 comes with three USB-A ports (1x USB 2.0, 1x USB 3.2 Gen 1, 1x USB 3.2 Gen 2) and one USB-C port (USB 3.2 Gen 2). The latter supports DisplayPort via USB-C. This means that there are three video outputs together with the HDMI port and the dedicated Mini DisplayPort. Gigabyte has not provided the gaming laptop with a memory card reader.
The ports are distributed along three of the laptop's sides. All three video outputs as well as the Ethernet port are located on the back of the device. Consequently, the corresponding cables run towards the back without getting in the way.
Communication
The WLAN module is equipped with a chip (AX200) from Intel that supports the 802.11a/b/g/n/ac/ax standards. The transmission speeds determined under optimal conditions (no other WLAN devices nearby, short distance between laptop and server PC) are excellent. The Realtek RTL8125 Gigabit Ethernet controller handles wired network connections. It performs its tasks without any problems.
Webcam
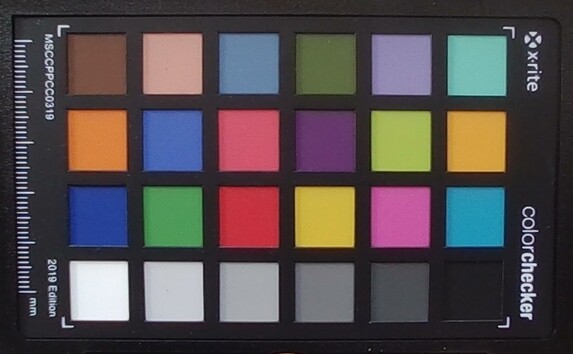
The built-in webcam (0.9 MP) is a positive surprise: The colors of the pictures taken only deviate from the target to a small extent - we rarely see this. Otherwise, the camera delivers the standard quality.
")
")
Accessories
Besides the usual documents (Quick Start guide and warranty information), the laptop comes with screws (for connecting a 2.5-inch storage drive to the mounting frame), and a thermal pad (for a second SSD).
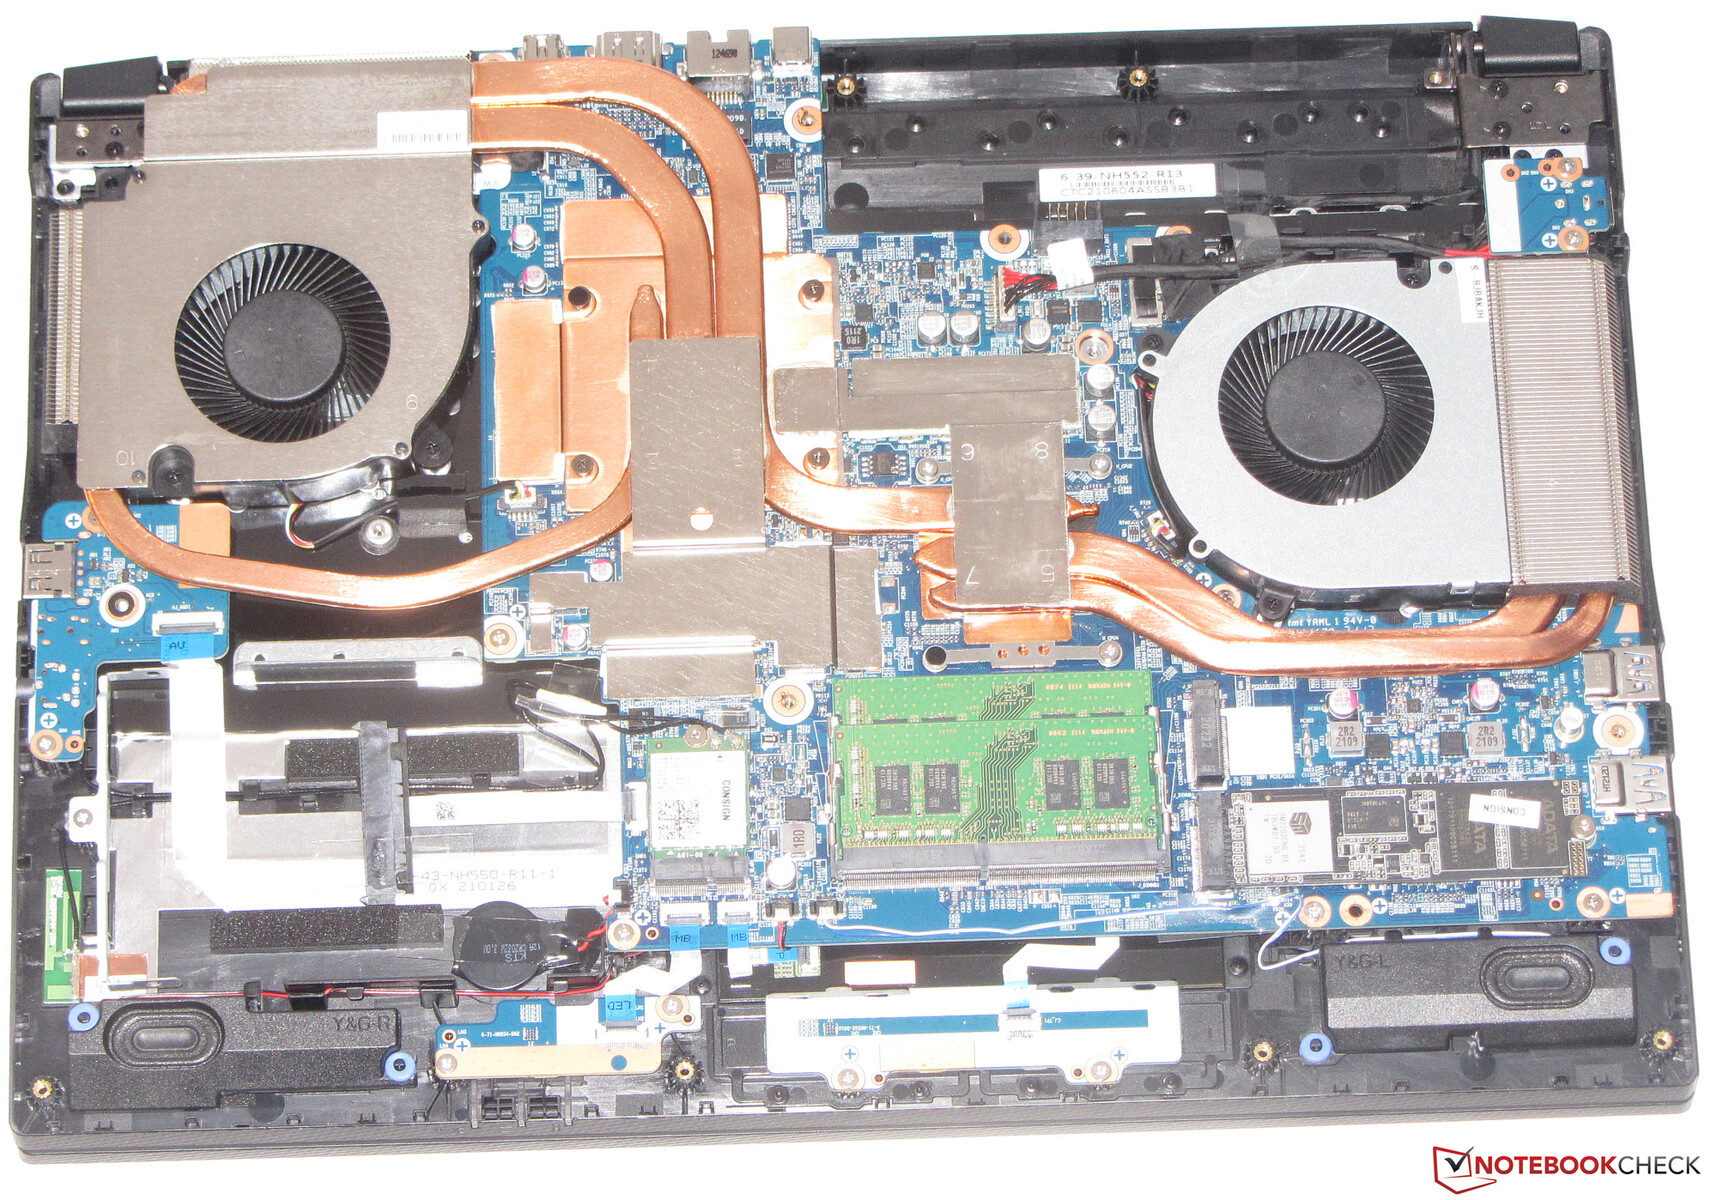
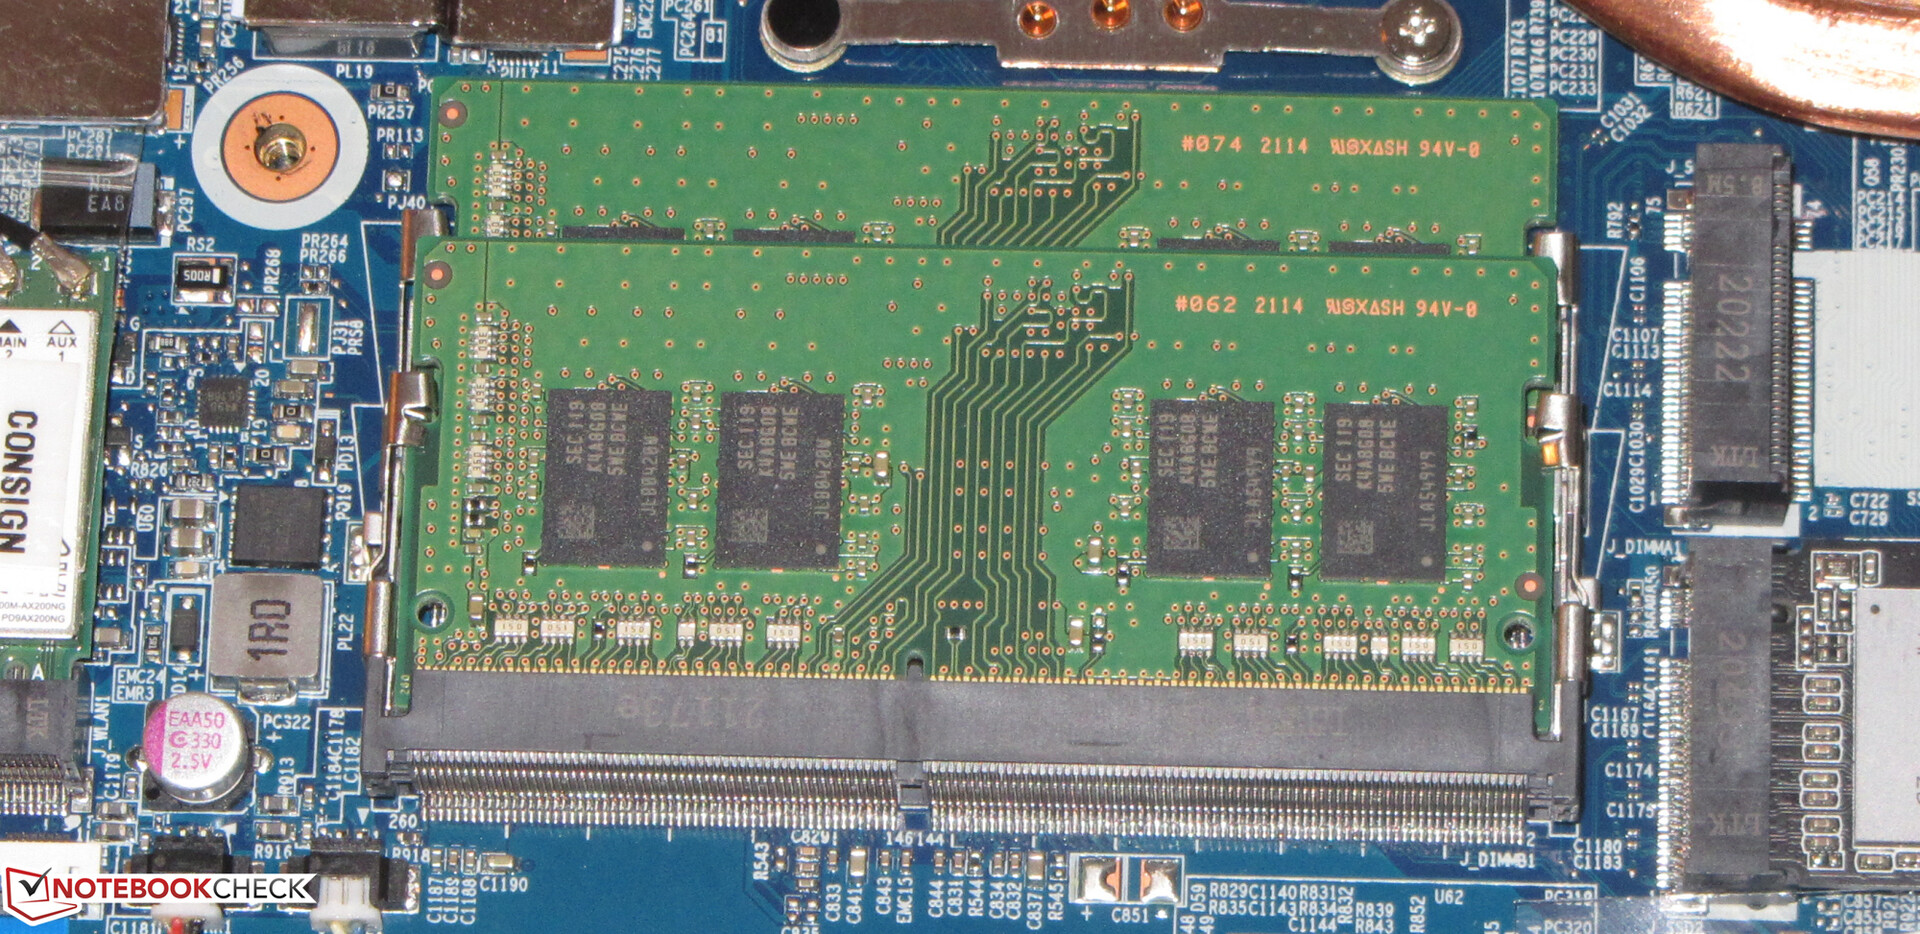
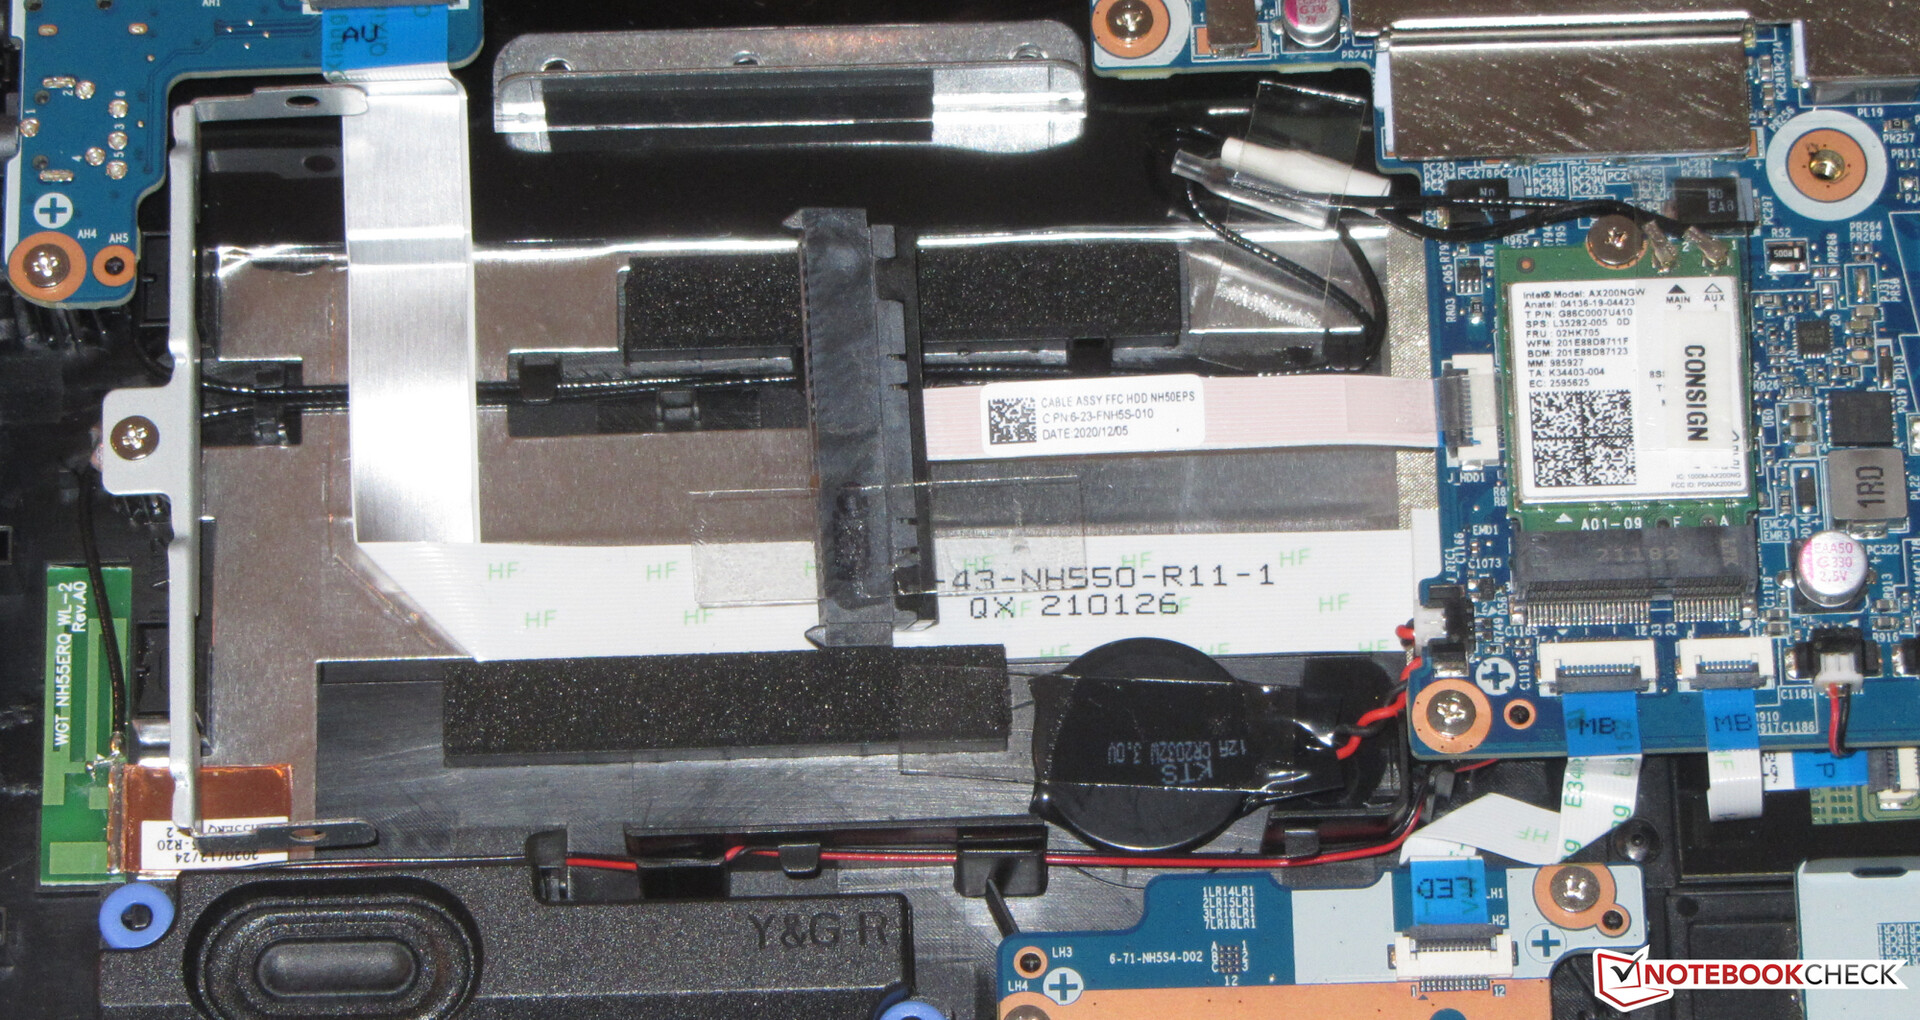
Maintenance
After all screws on the bottom of the device (there are also screws in the battery compartment) have been loosened, the bottom cover can be removed with the help of a flat spatula or a joint finishing tool - the bottom cover sits quite tightly in some places. After that, you can access the SSD, the second M.2 slot, the SATA port, the WLAN module, the RAM, the BIOS battery, and the fans.
Warranty
Gigabyte grants the 15.6-incher a two-year warranty. Warranty extensions are not available.
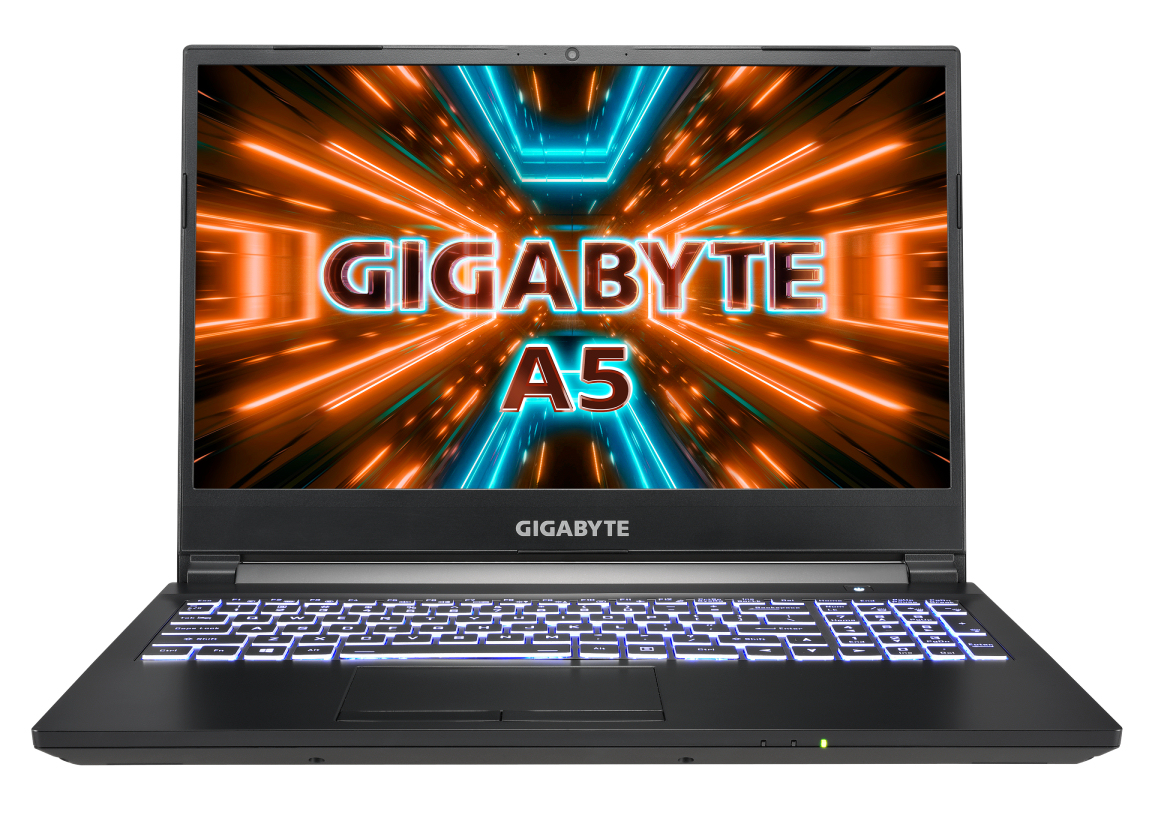
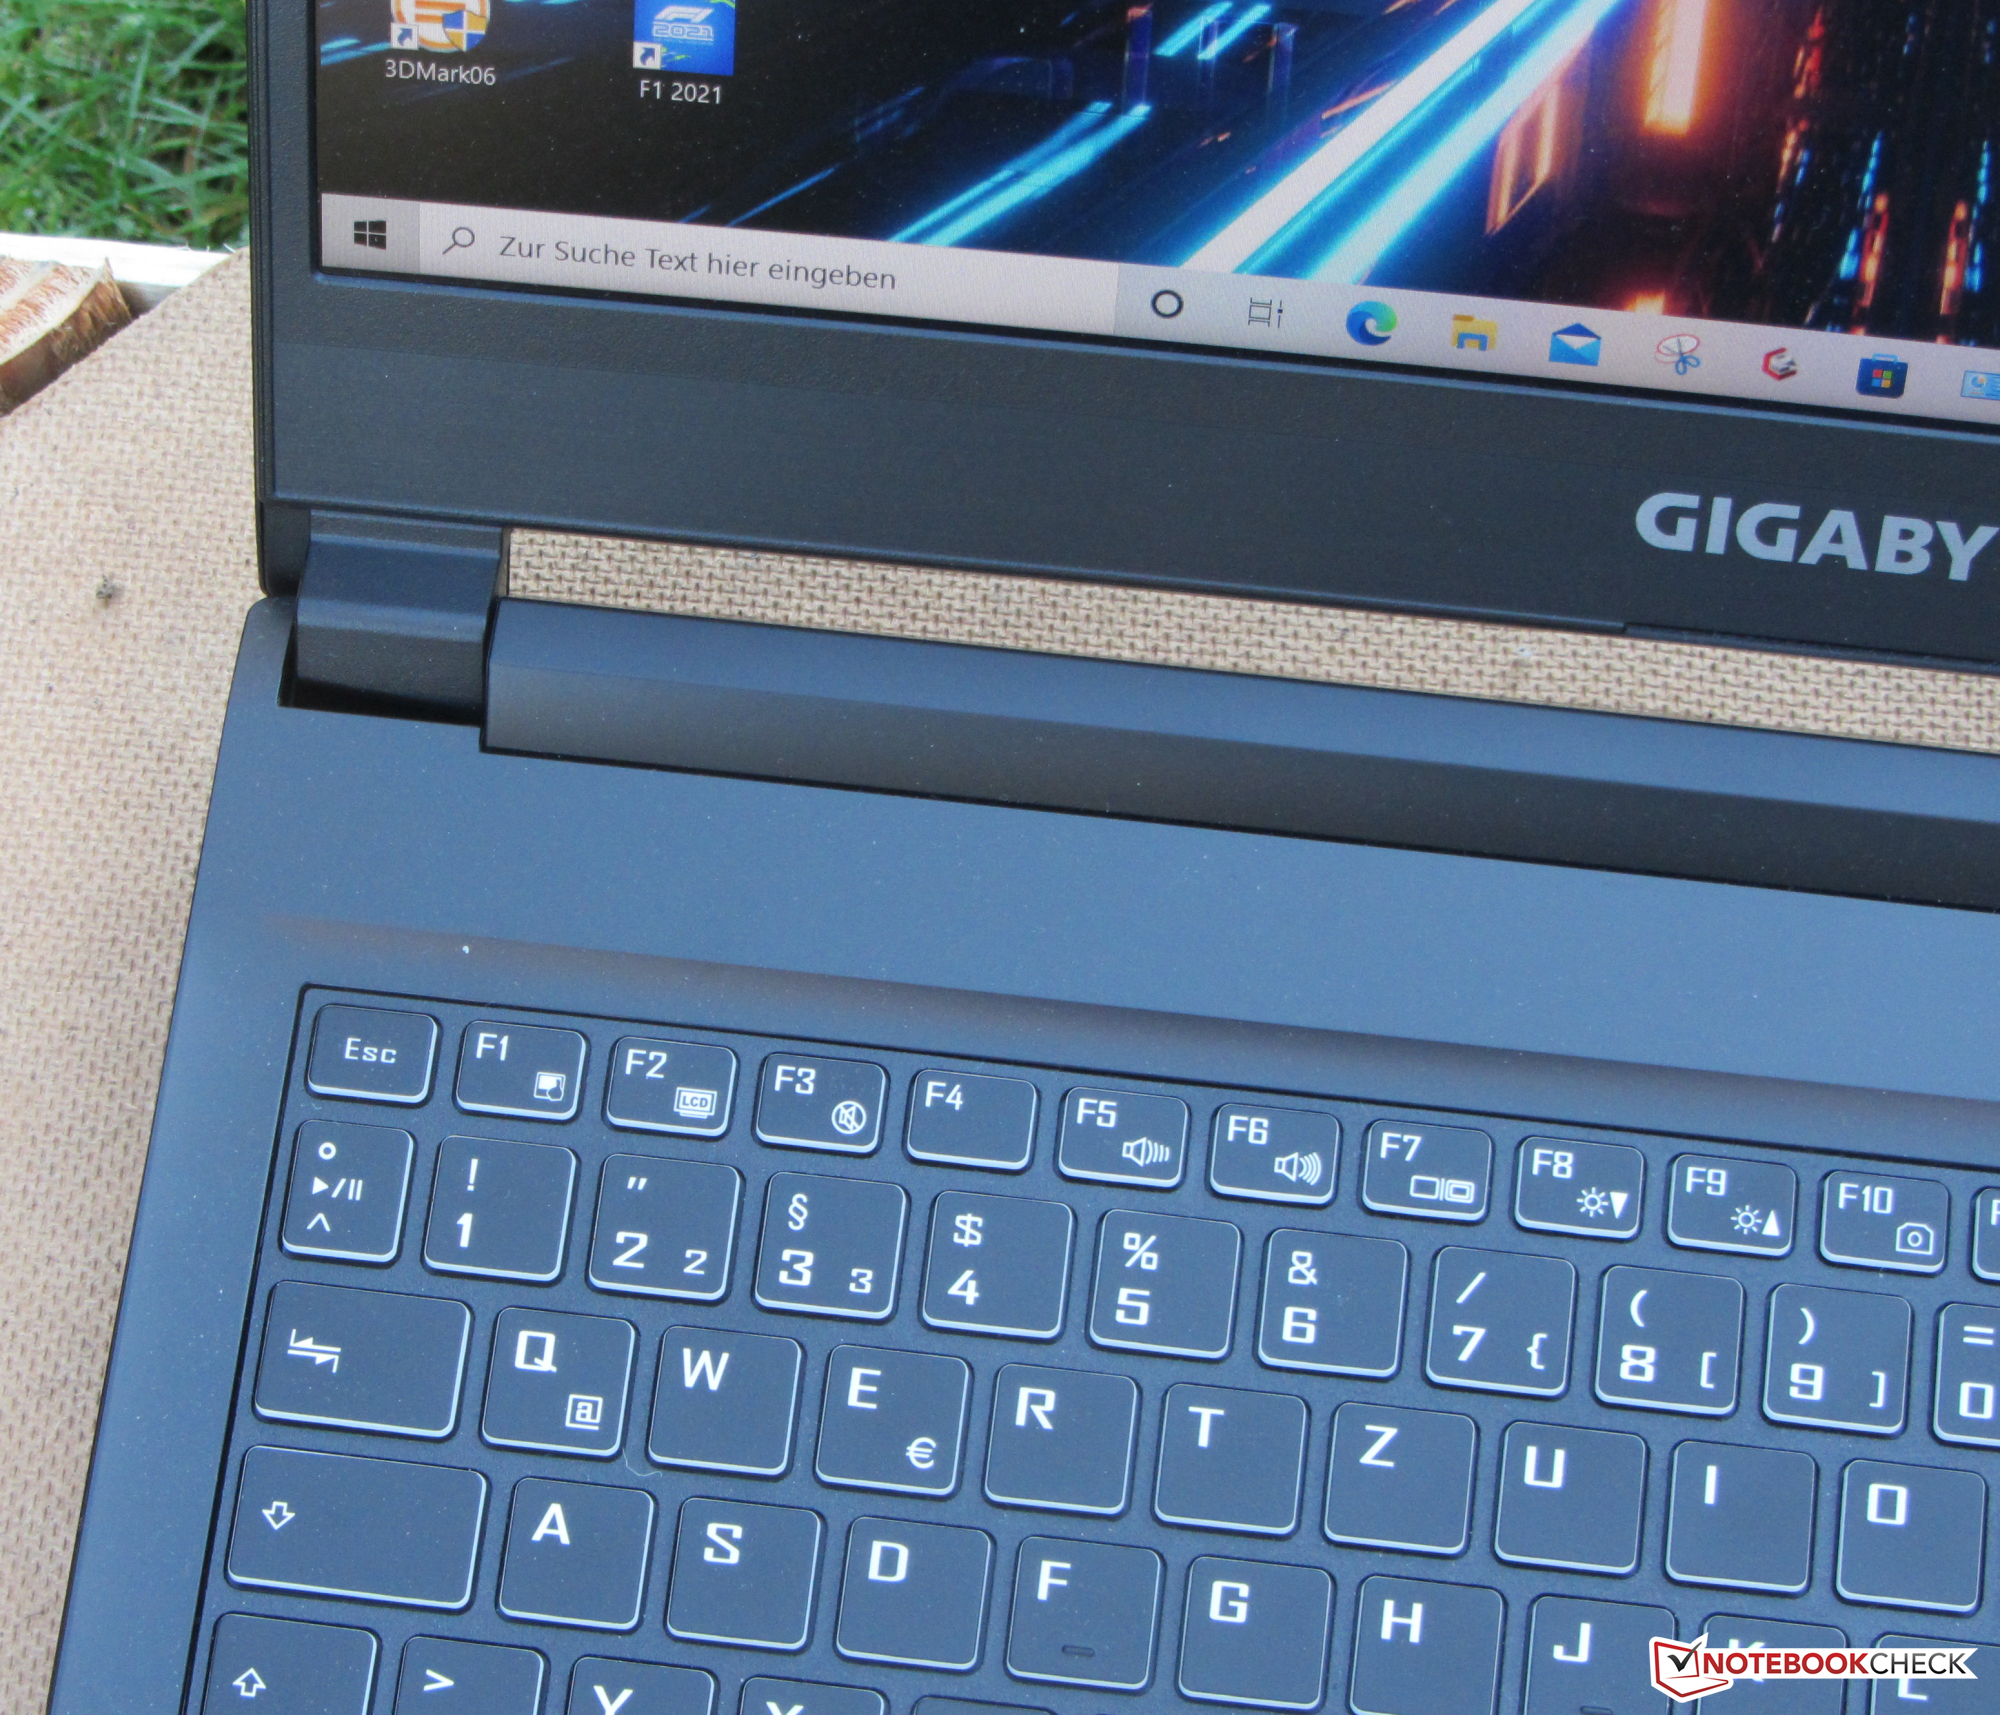
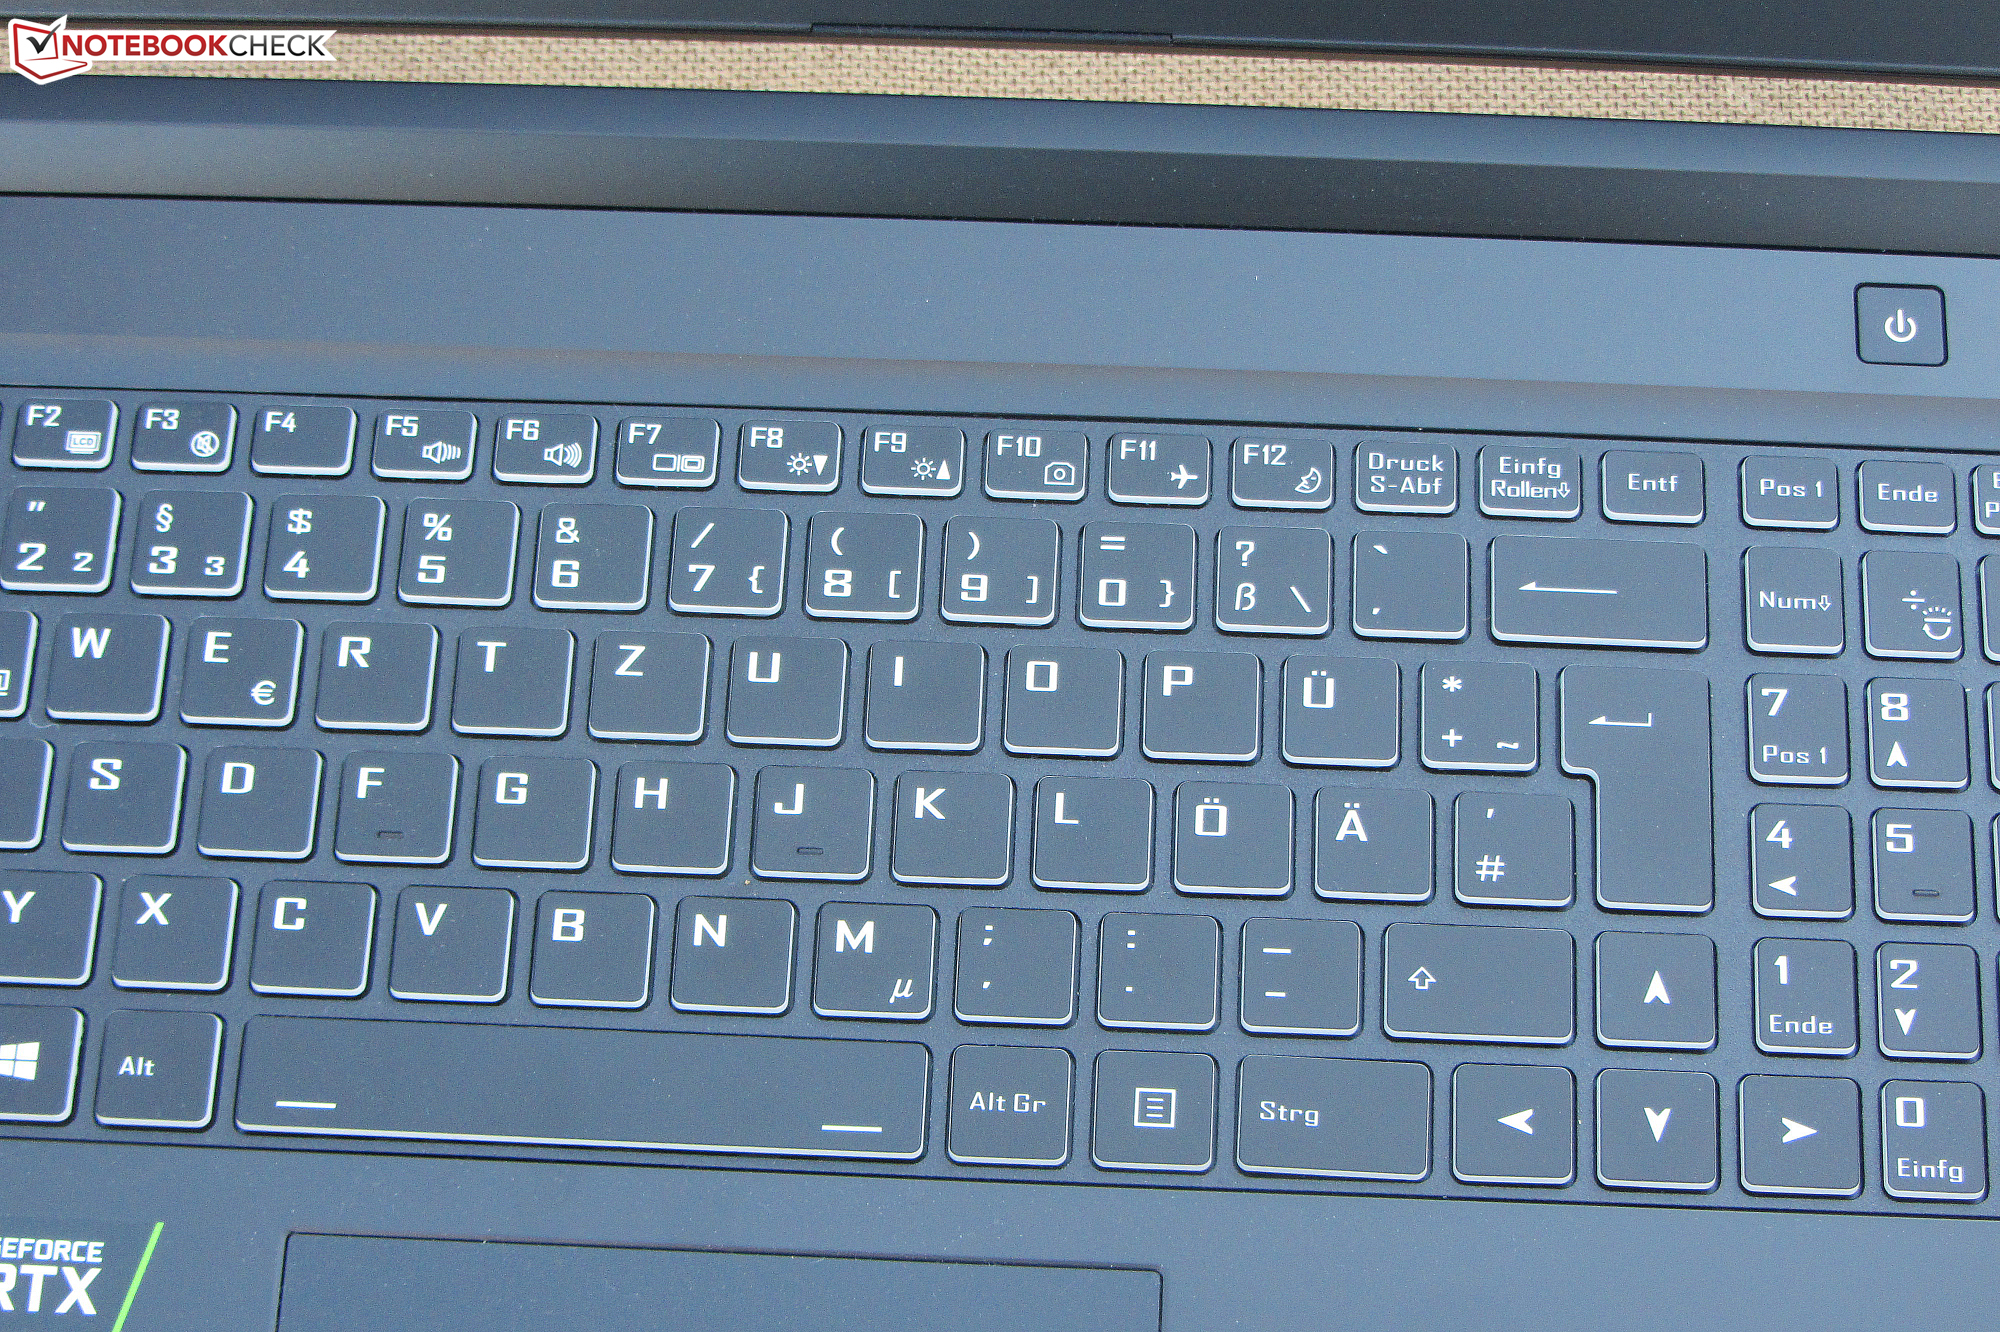
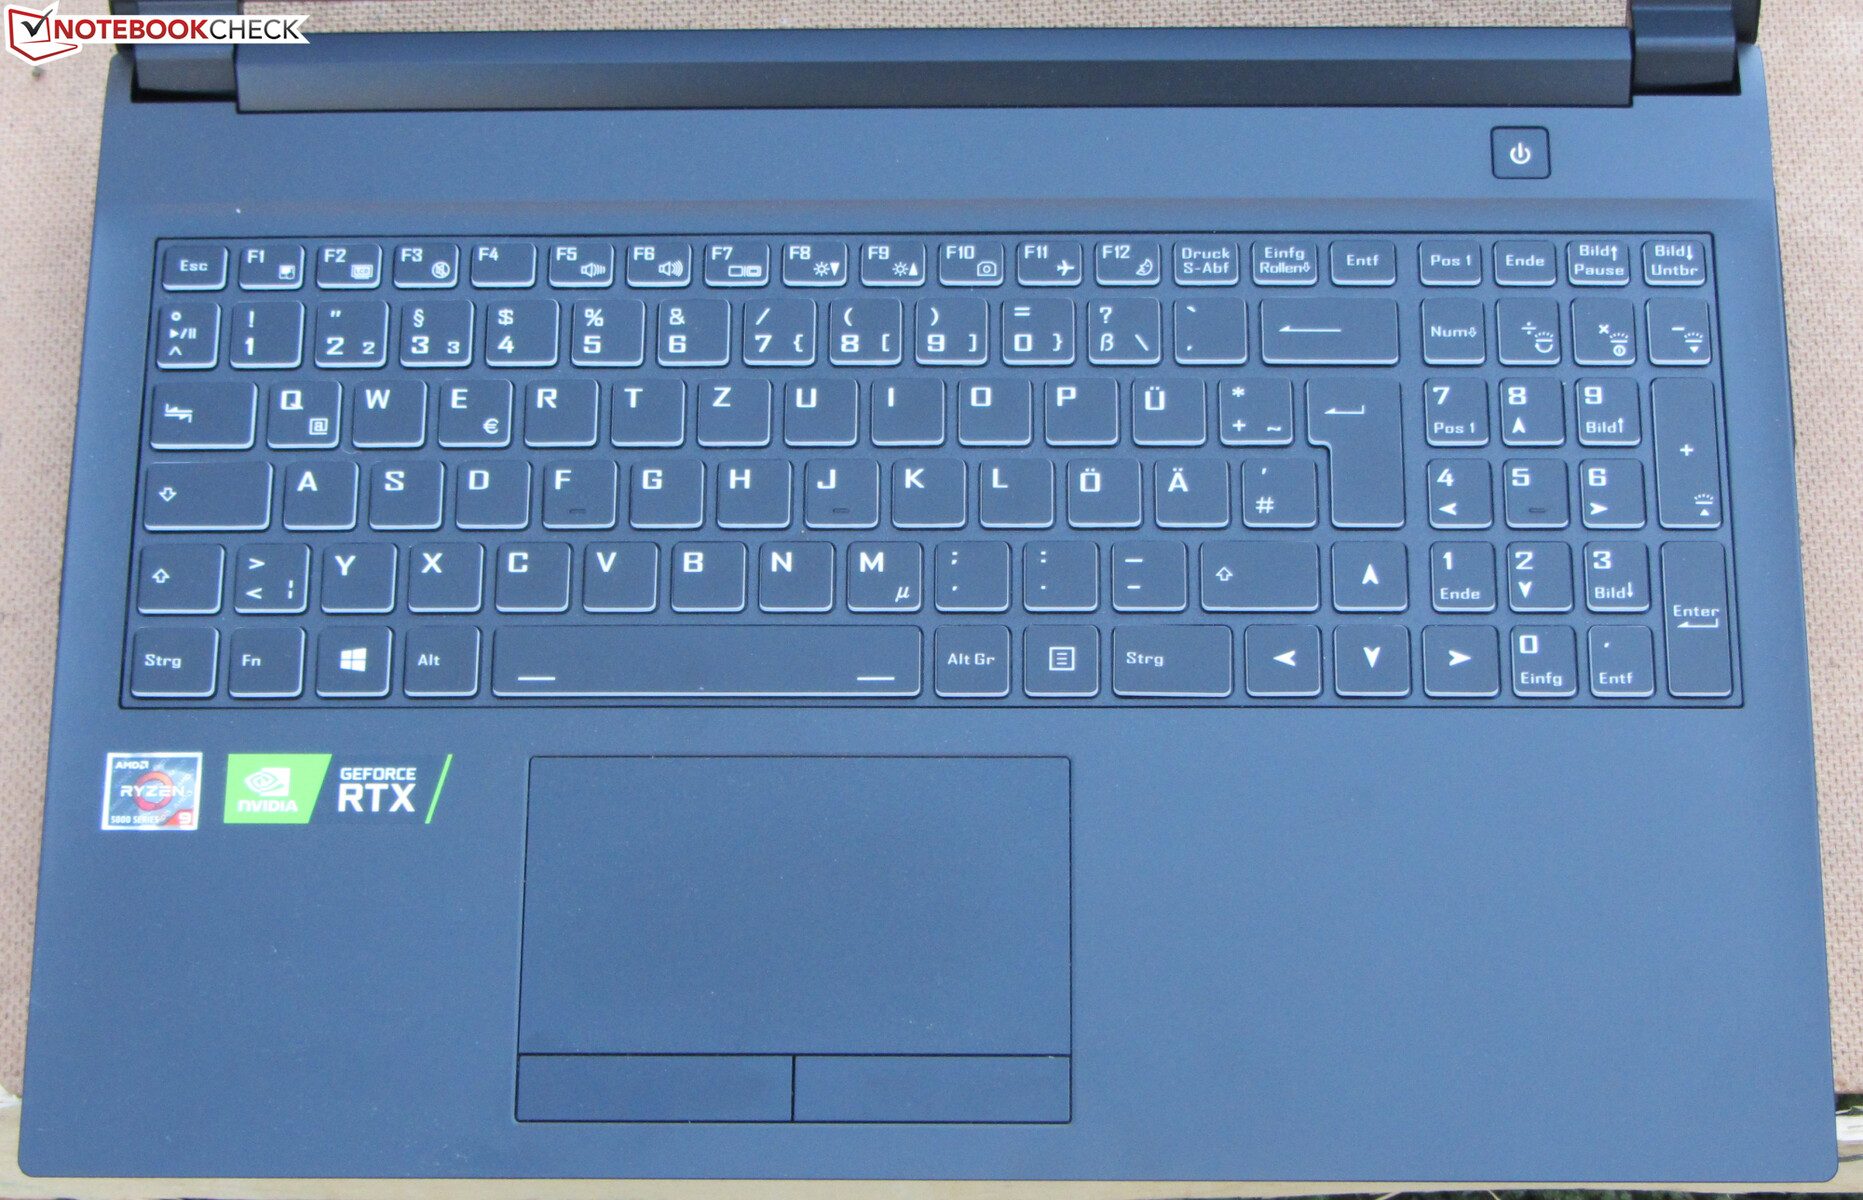
Input devices - The keyboard comes with backlighting
Keyboard
The A5 comes with a backlit chiclet keyboard including a number pad. The flat, smooth keys offer a medium travel and a clear pressure point. The resistance provided by the keys could be crisper, though. The keyboard yields slightly during typing. It didn't prove to be overly annoying, however. Overall, Gigabyte provides a keyboard that is suitable for everyday use here.
Touchpad
A multitouch-capable touchpad (approx. 11 x 6.3 cm) serves as a mouse replacement. Its smooth surface makes it easy for fingers to glide on it. It also responds to inputs in the corners. The two mouse buttons offer a short travel, but a very clear pressure point.
Display - 240 Hz IPS
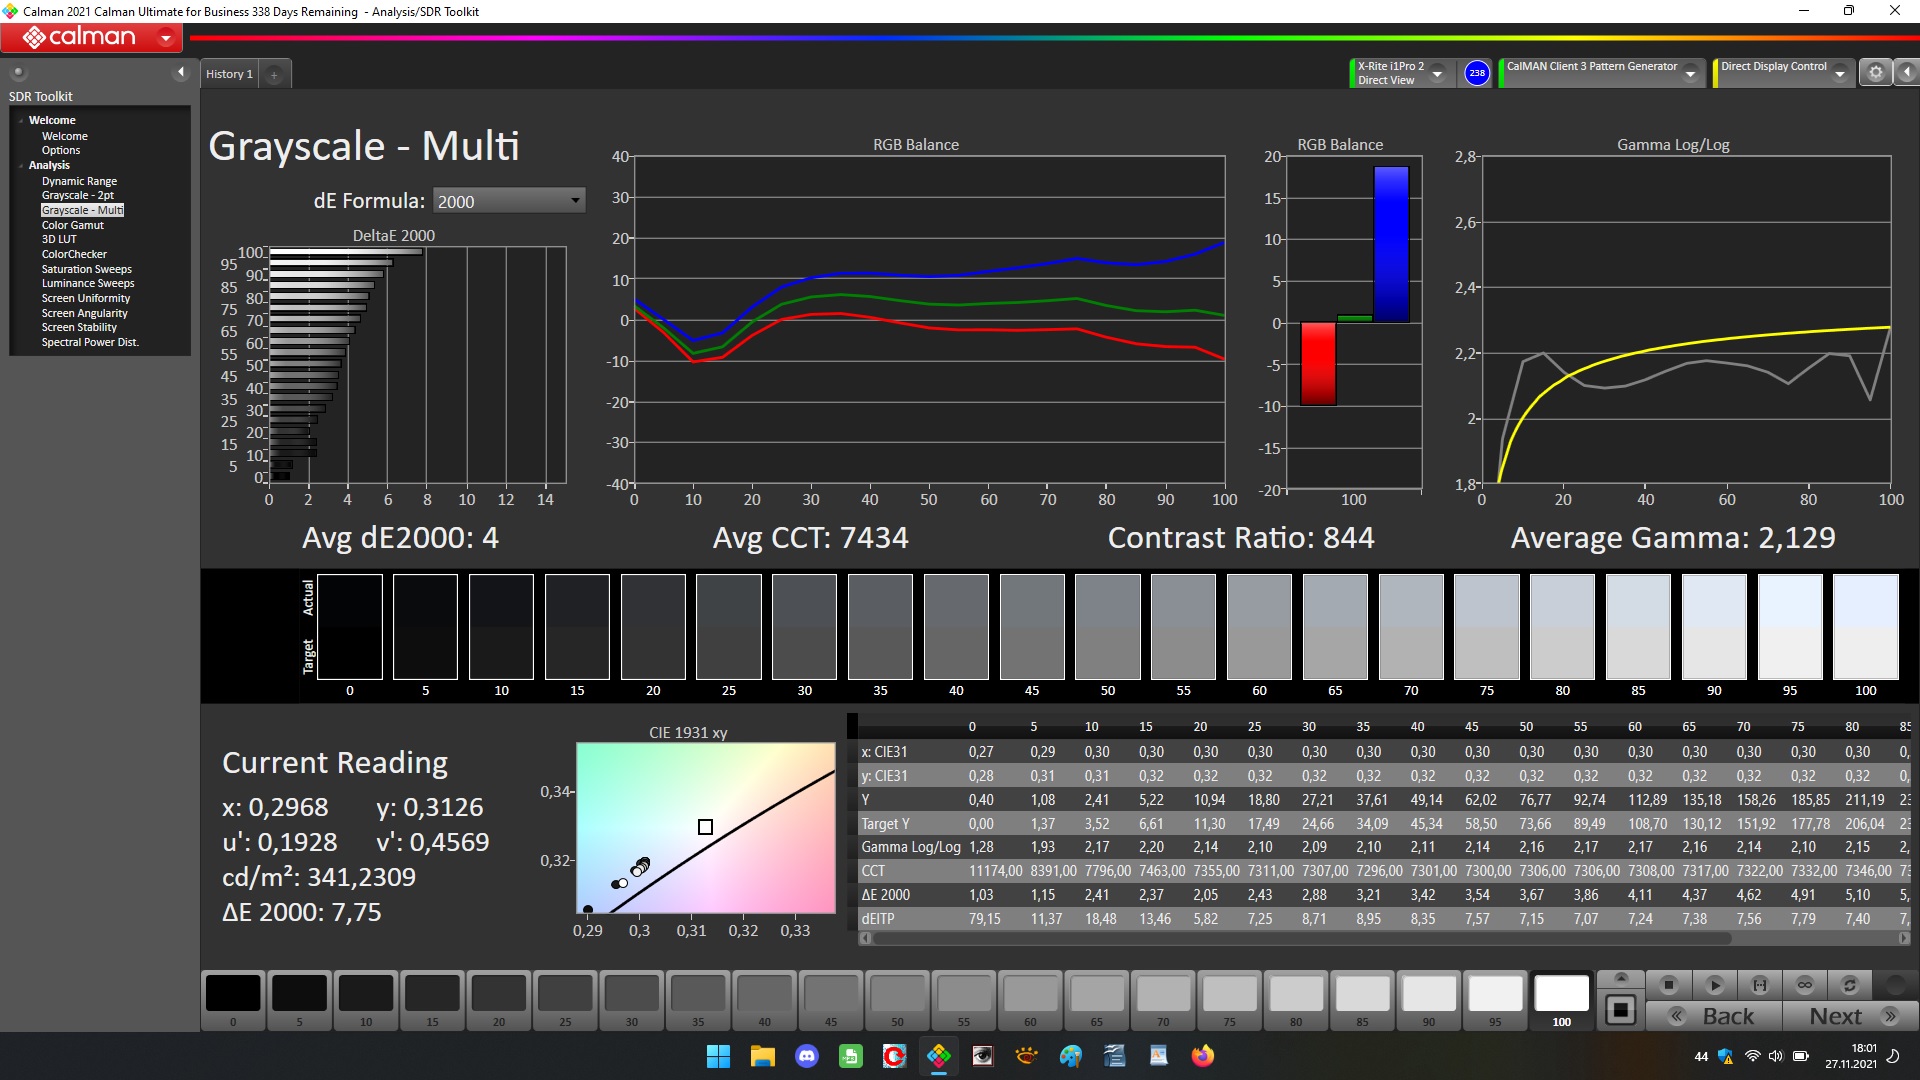
While the brightness (324.7 cd/m²) of the matte 15.6-inch display (1920x1080 pixels) meets the target (> 300 cd/m²), the contrast (838:1) is too low. We consider values beyond 1,000:1 to be good. The 240 Hz panel provides fast response times. PWM flickering was not detected.
| |||||||||||||||||||||||||
Brightness Distribution: 90 %
Center on Battery: 335 cd/m²
Contrast: 838:1 (Black: 0.4 cd/m²)
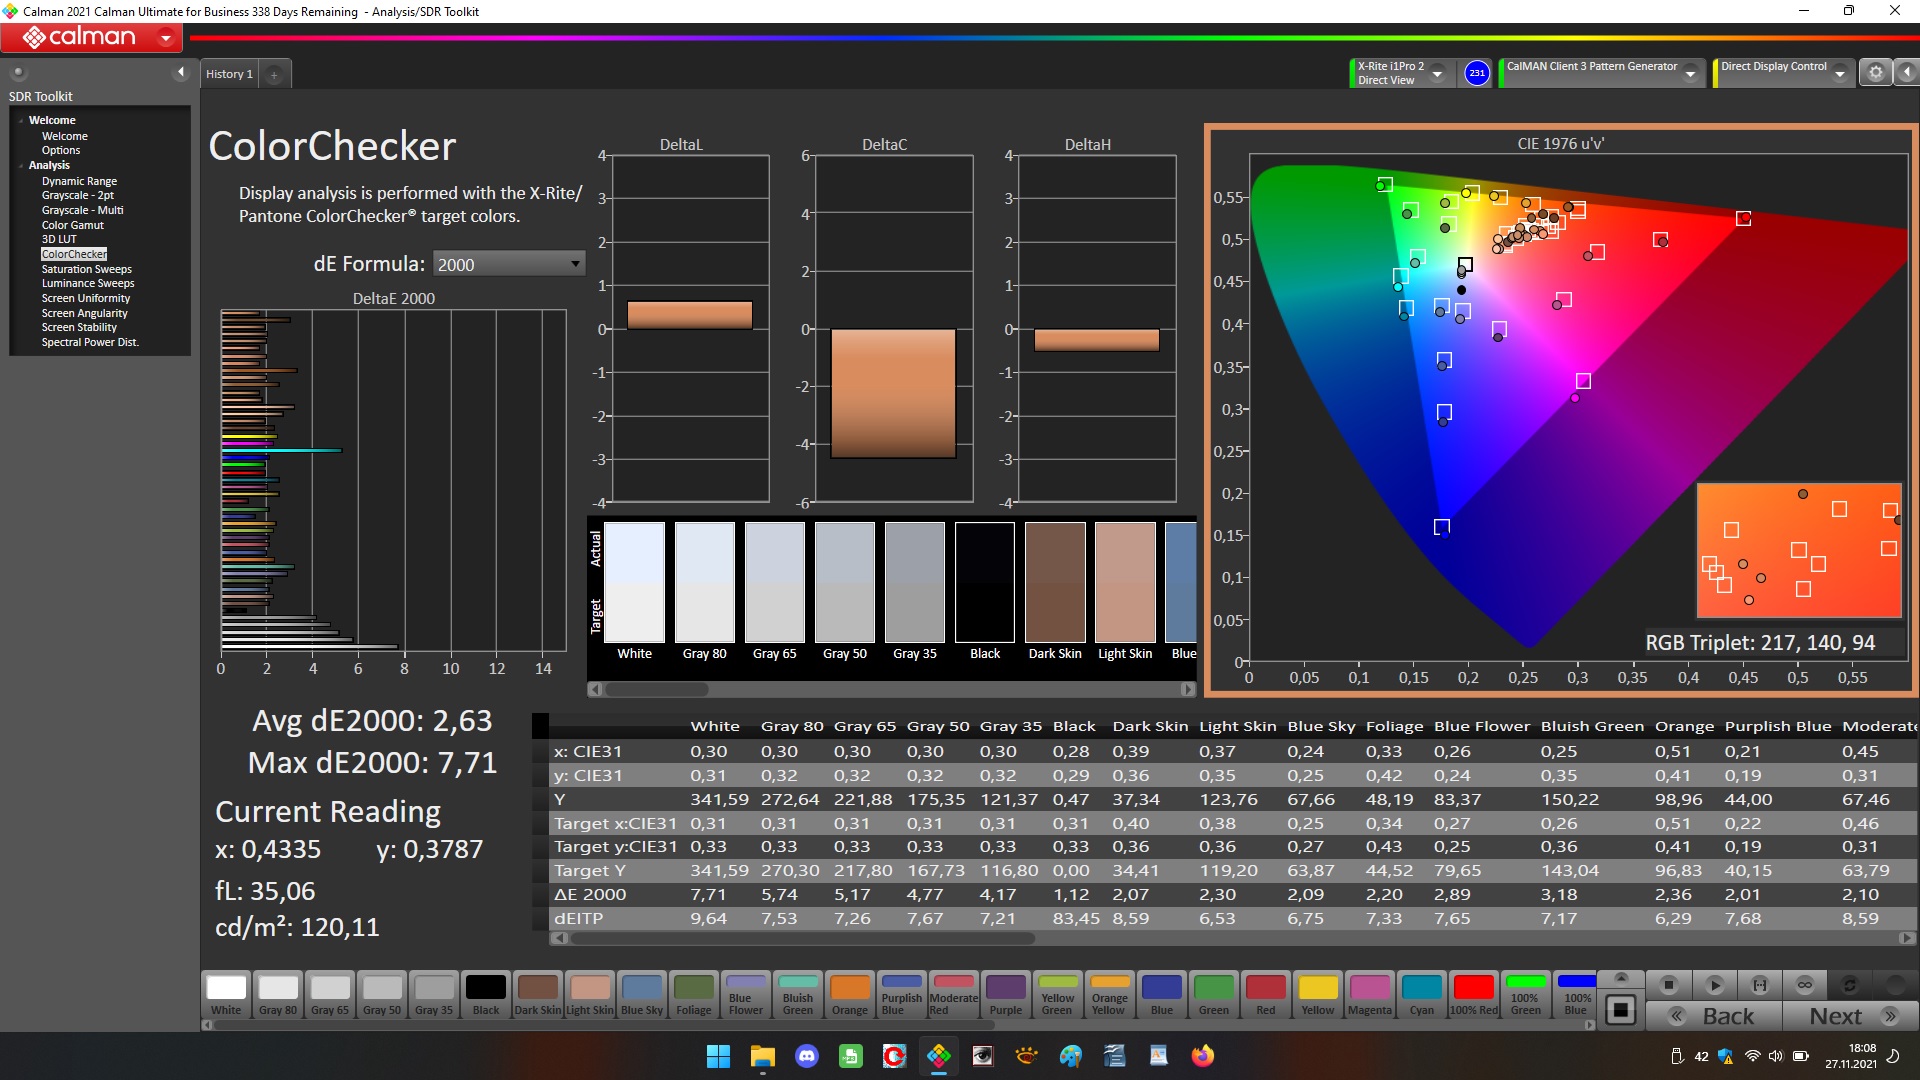
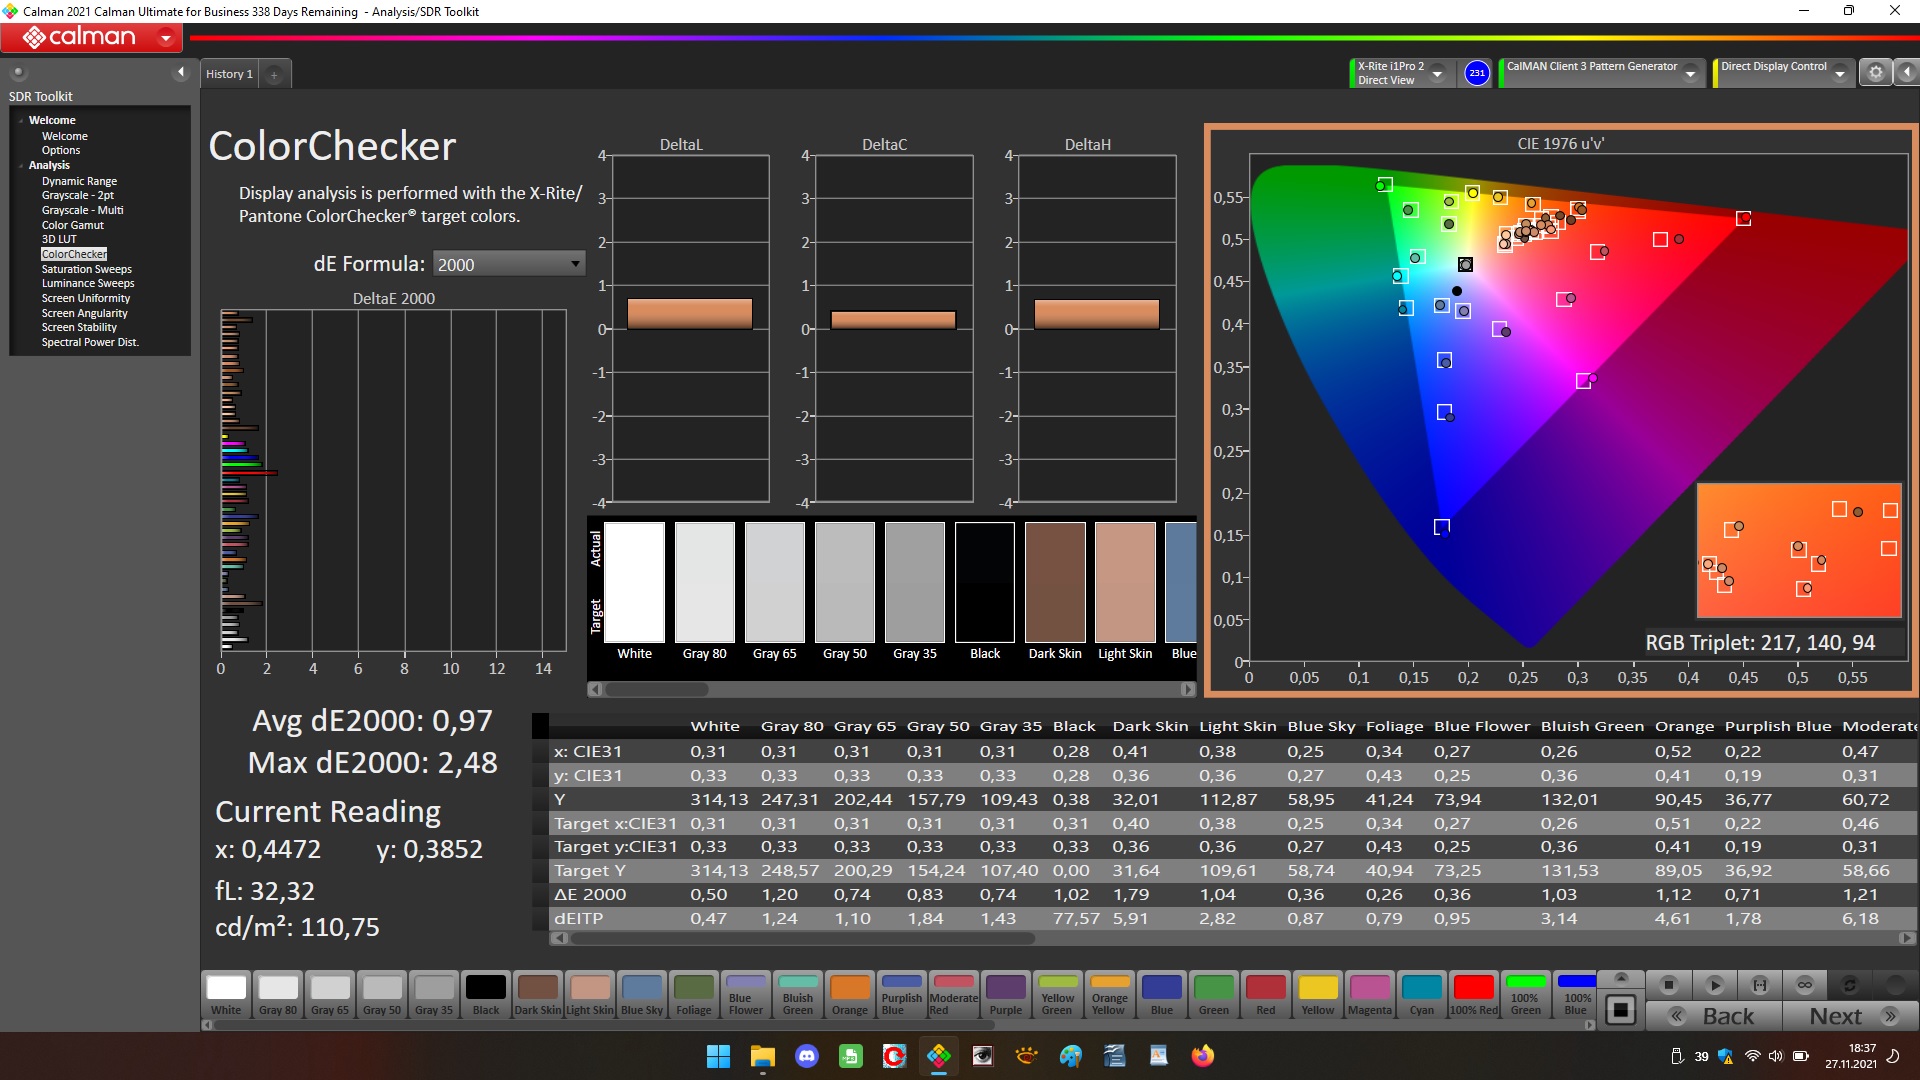
ΔE Color 2.63 | 0.5-29.43 Ø5, calibrated: 0.97
ΔE Greyscale 4 | 0.57-98 Ø5.3
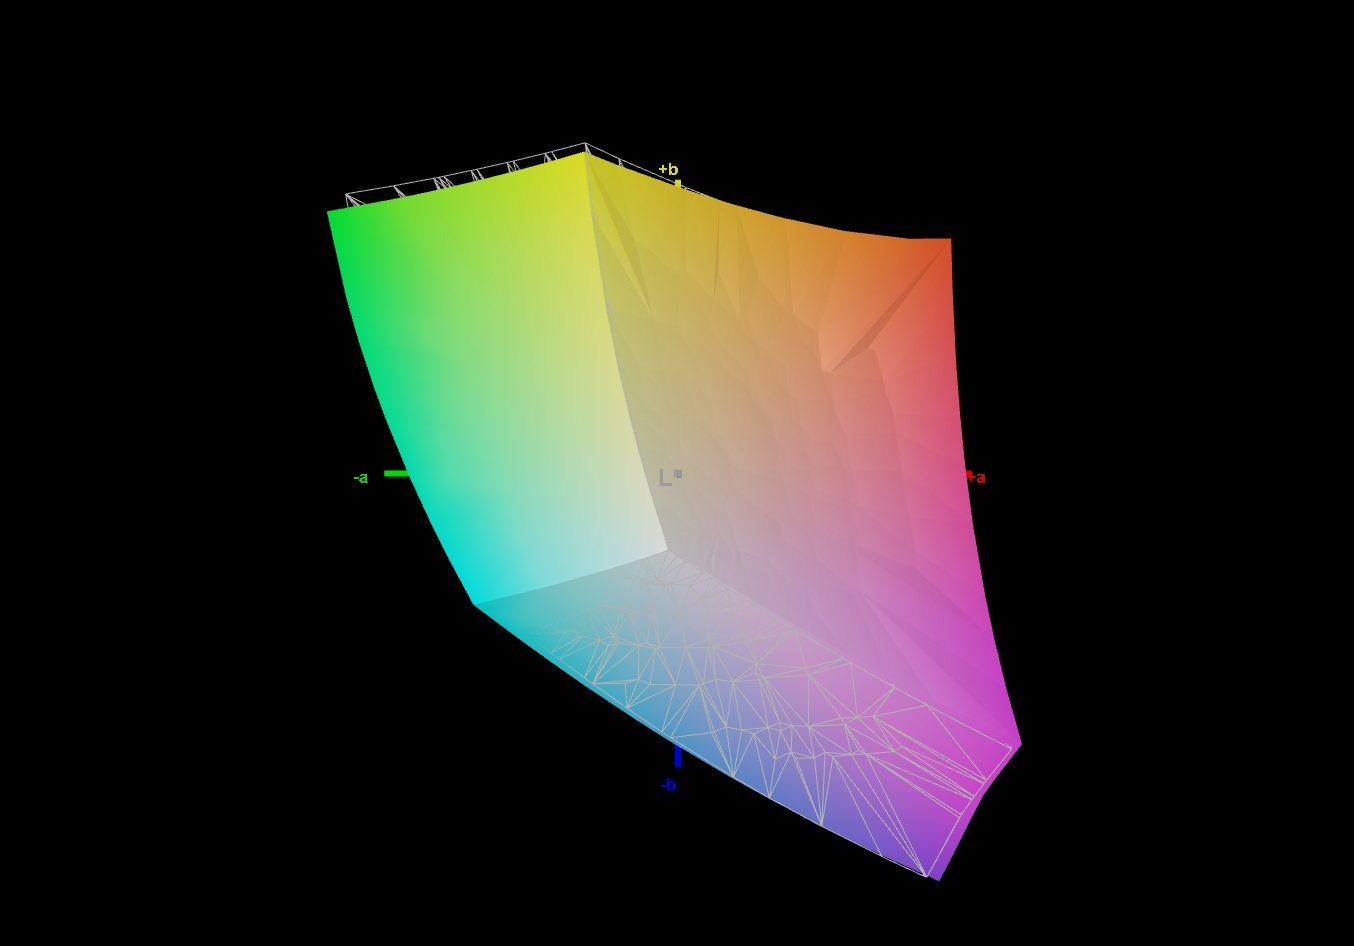
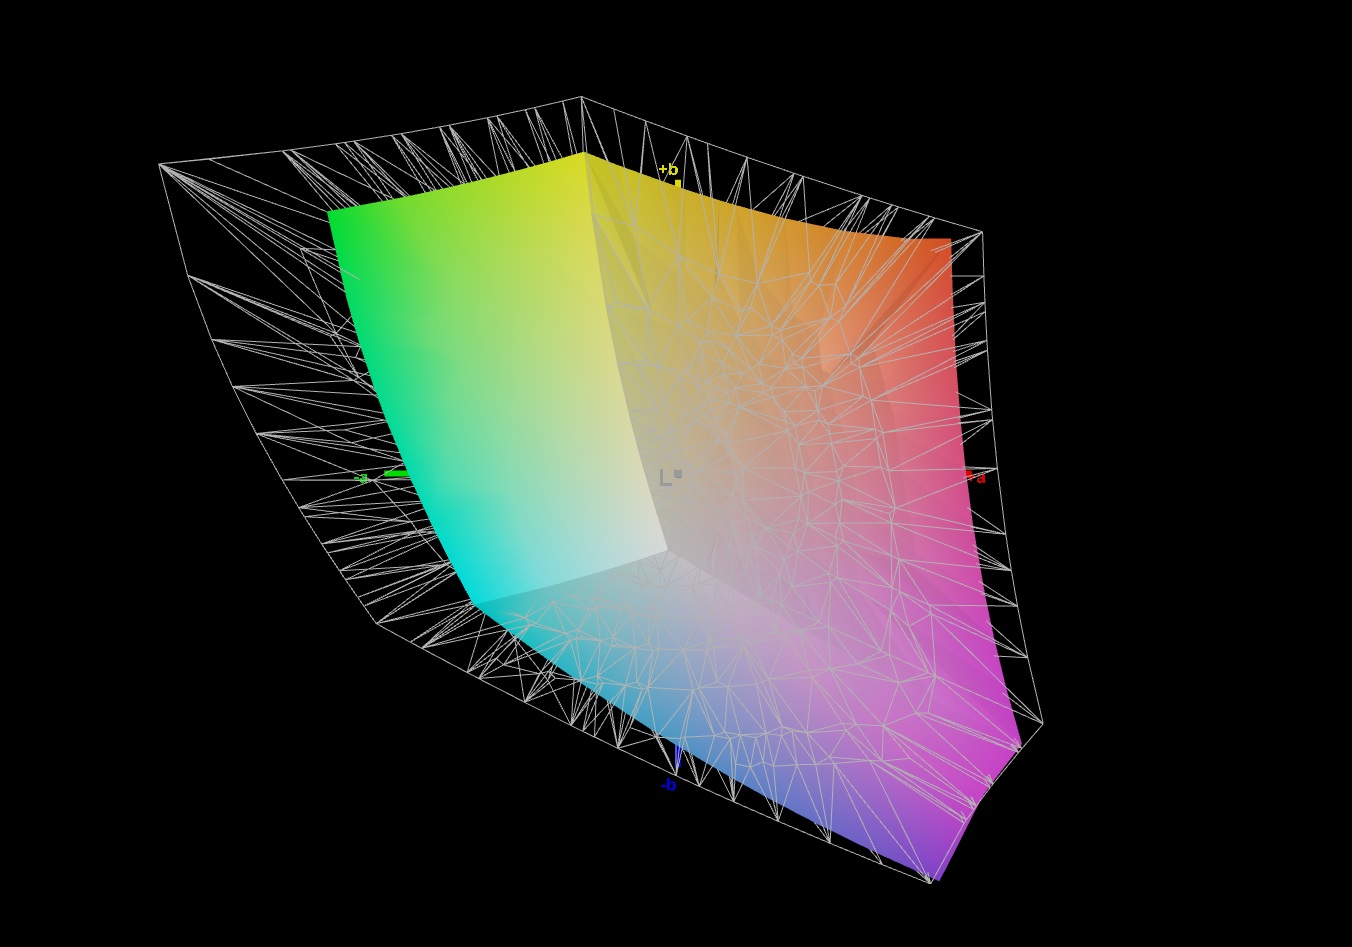
70.8% AdobeRGB 1998 (Argyll 2.2.0 3D)
98.6% sRGB (Argyll 2.2.0 3D)
69.6% Display P3 (Argyll 2.2.0 3D)
Gamma: 2.129
| Gigabyte A5 X1 AU Optronics B156HAN12.0, IPS, 1920x1080, 15.60 | HP Omen 16-b0085ng BOE09BE, IPS, 1920x1080, 16.10 | MSI Katana GF66 11UG-220 AU Optronics B156HAN08.0, IPS, 1920x1080, 15.60 | Acer Nitro 5 AN515-45-R1JH BOE BOE09B8, IPS, 2560x1440, 15.60 | SCHENKER XMG Apex 15 NH57E PS LG Philips LGD0625 (LP156WFG-SPB3), IPS, 1920x1080, 15.60 | |
|---|---|---|---|---|---|
| Display | 3% | -6% | -4% | -6% | |
| Display P3 Coverage | 69.6 | 72.3 4% | 65.4 -6% | 66.2 -5% | 64.5 -7% |
| sRGB Coverage | 98.6 | 99.5 1% | 91.3 -7% | 96.3 -2% | 95.9 -3% |
| AdobeRGB 1998 Coverage | 70.8 | 73.8 4% | 66.7 -6% | 67.1 -5% | 65.8 -7% |
| Response Times | -39% | -27% | -82% | -109% | |
| Response Time Grey 50% / Grey 80% * | 4.8 ? | 8 ? -67% | 7.4 ? -54% | 14 ? -192% | 15 -213% |
| Response Time Black / White * | 11.2 ? | 12.4 ? -11% | 11.2 ? -0% | 8 ? 29% | 11.6 -4% |
| PWM Frequency | |||||
| Screen | -29% | -21% | -17% | 4% | |
| Brightness middle | 335 | 405 21% | 307 -8% | 349 4% | 393 17% |
| Brightness | 325 | 378 16% | 321 -1% | 304 -6% | 353 9% |
| Brightness Distribution | 90 | 87 -3% | 83 -8% | 79 -12% | 83 -8% |
| Black Level * | 0.4 | 0.34 15% | 0.27 32% | 0.535 -34% | 0.47 -18% |
| Contrast | 838 | 1191 42% | 1137 36% | 652 -22% | 836 0% |
| Colorchecker dE 2000 * | 2.63 | 3.7 -41% | 4.67 -78% | 3.11 -18% | 2.84 -8% |
| Colorchecker dE 2000 max. * | 7.71 | 7.77 -1% | 7.53 2% | 9.57 -24% | 7.15 7% |
| Colorchecker dE 2000 calibrated * | 0.97 | 3.49 -260% | 2.41 -148% | 0.67 31% | |
| Greyscale dE 2000 * | 4 | 5.88 -47% | 4.5 -13% | 5 -25% | 3.73 7% |
| Gamma | 2.129 103% | 2.57 86% | 2.276 97% | 2.36 93% | 2.53 87% |
| CCT | 7434 87% | 6342 102% | 6824 95% | 6976 93% | 7312 89% |
| Color Space (Percent of AdobeRGB 1998) | 73.76 | ||||
| Color Space (Percent of sRGB) | 99.47 | ||||
| Total Average (Program / Settings) | -22% /
-23% | -18% /
-19% | -34% /
-24% | -37% /
-14% |
* ... smaller is better
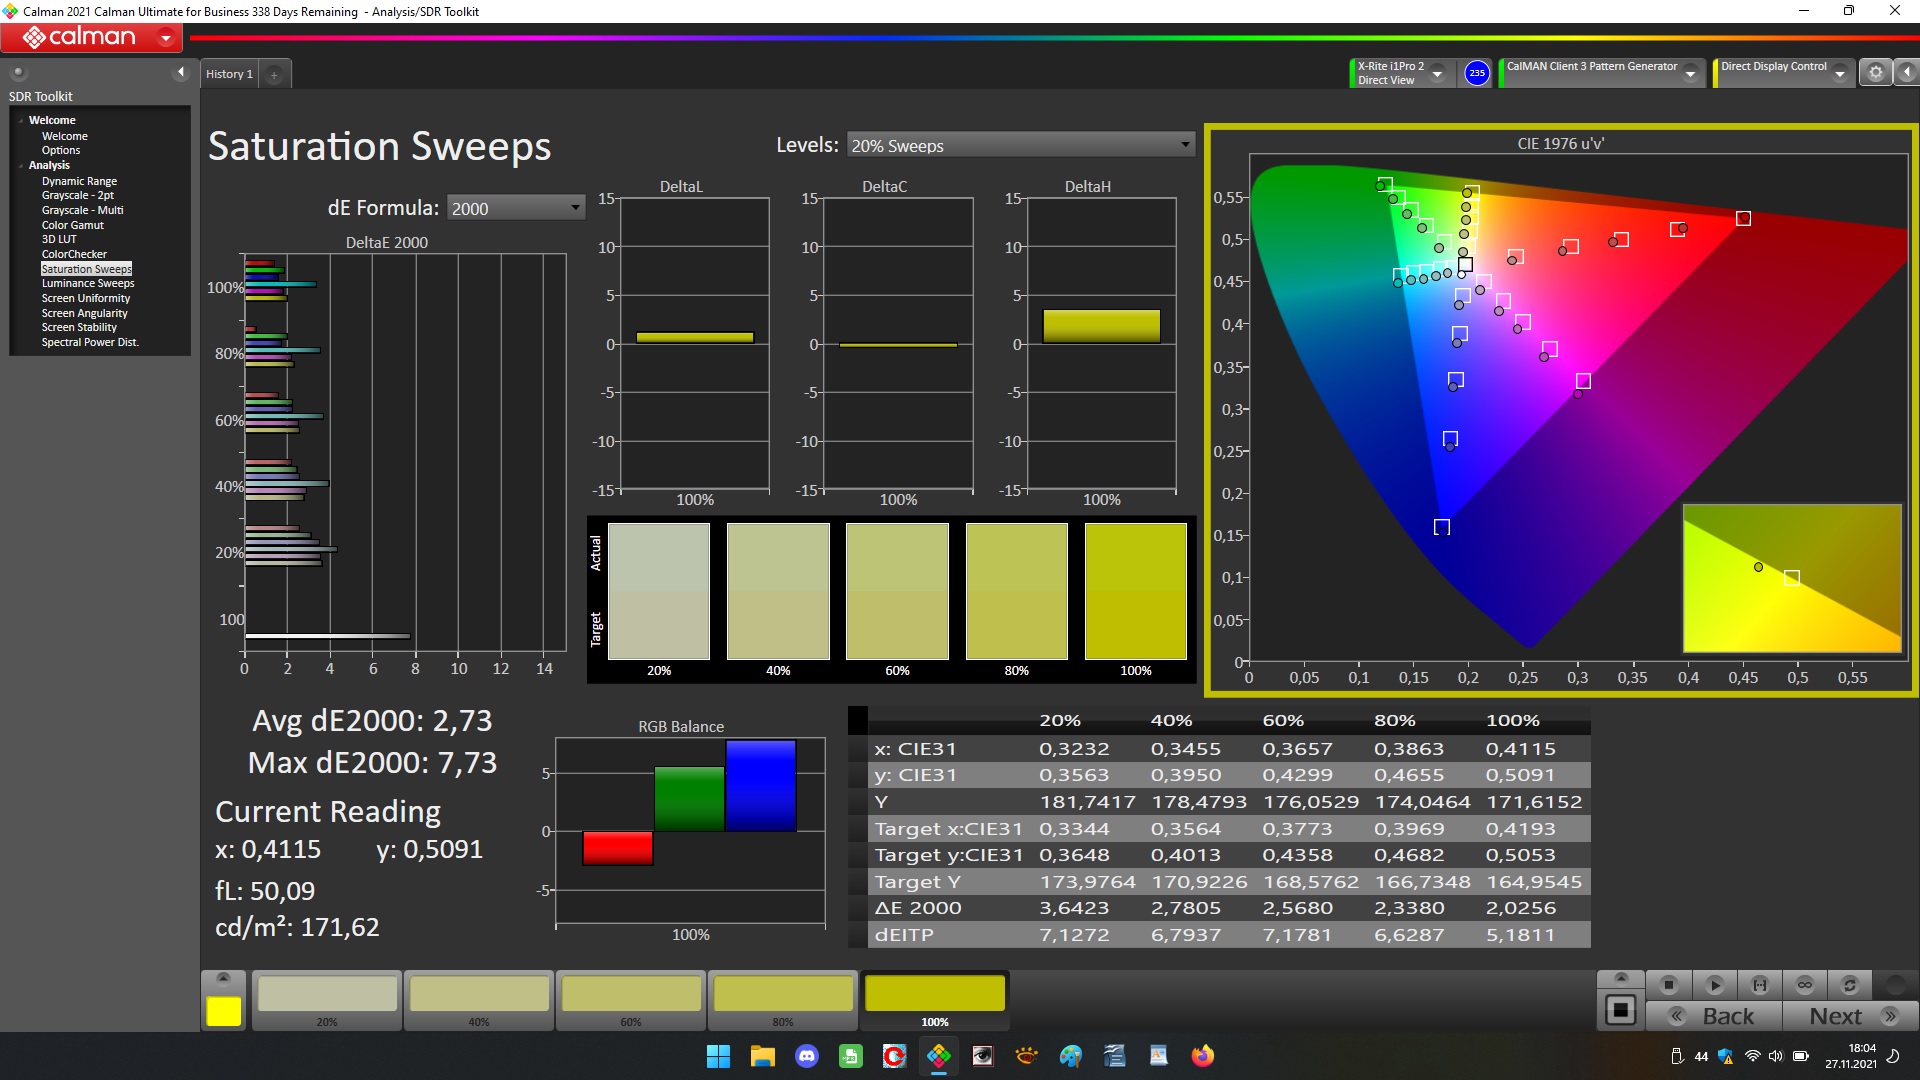
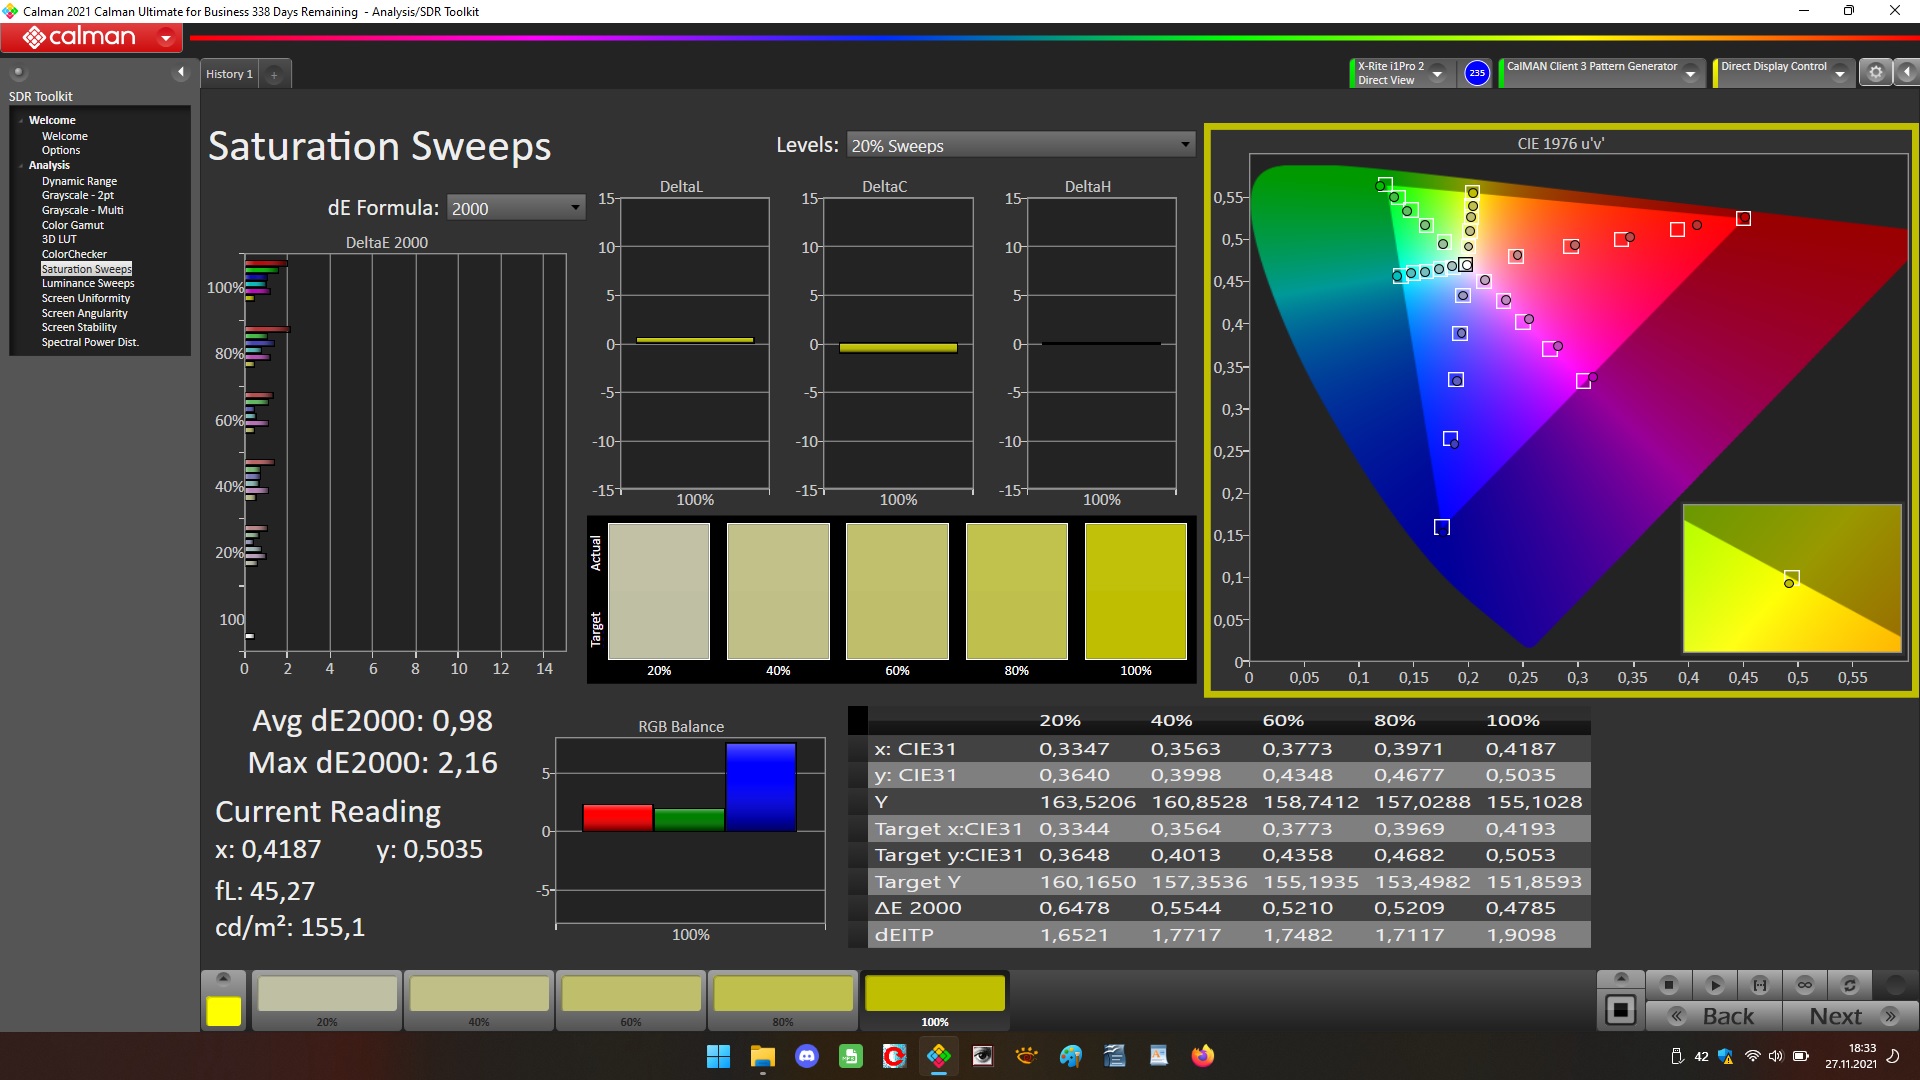
The display already shows a good color reproduction out of the box, and the color deviation is within the target. However, calibrating the display still provides significant improvements. The display is unable to fully reproduce the AdobeRGB (71%) and DCI-P3 (70%) color spaces, the sRGB color space is reproduced to 99%.

Display Response Times
| ↔ Response Time Black to White | ||
|---|---|---|
| 11.2 ms ... rise ↗ and fall ↘ combined | ↗ 5.2 ms rise | 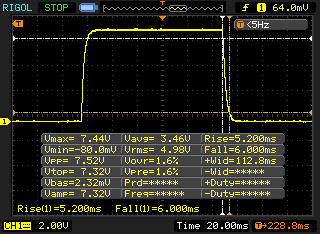 |
| ↘ 6 ms fall | ||
| The screen shows good response rates in our tests, but may be too slow for competitive gamers. In comparison, all tested devices range from 0.1 (minimum) to 240 (maximum) ms. » 25 % of all devices are better. This means that the measured response time is better than the average of all tested devices (21.5 ms). | ||
| ↔ Response Time 50% Grey to 80% Grey | ||
| 4.8 ms ... rise ↗ and fall ↘ combined | ↗ 1.4 ms rise | 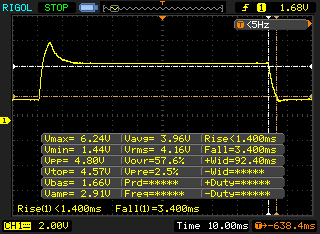 |
| ↘ 3.4 ms fall | ||
| The screen shows very fast response rates in our tests and should be very well suited for fast-paced gaming. In comparison, all tested devices range from 0.2 (minimum) to 636 (maximum) ms. » 11 % of all devices are better. This means that the measured response time is better than the average of all tested devices (33.7 ms). | ||
Screen Flickering / PWM (Pulse-Width Modulation)
| Screen flickering / PWM not detected | 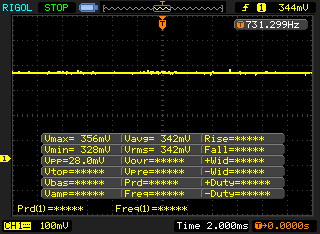 | ||
In comparison: 53 % of all tested devices do not use PWM to dim the display. If PWM was detected, an average of 17924 (minimum: 5 - maximum: 3846000) Hz was measured. | |||
The viewing-angle stable IPS panel can be read from any position. Reading the display outdoors is possible when the sun isn't shining too brightly.

Performance - The Gigabyte A5 is a powerhouse
With the A5 X1, Gigabyte has a 15.6-inch gaming laptop in its lineup that brings every modern game smoothly onto the screen.
Test conditions
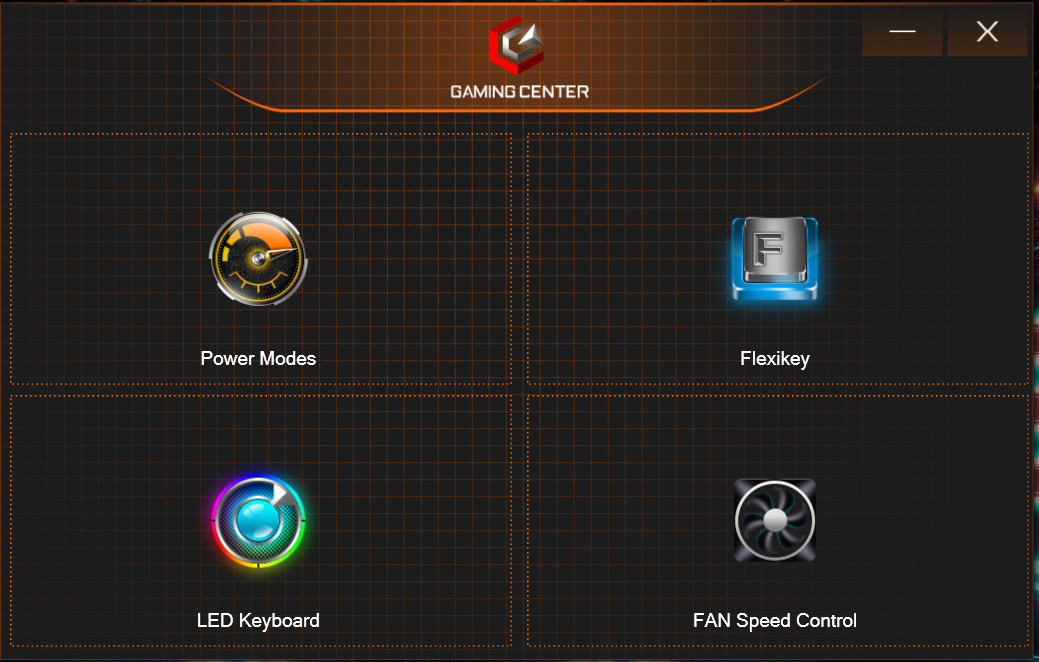
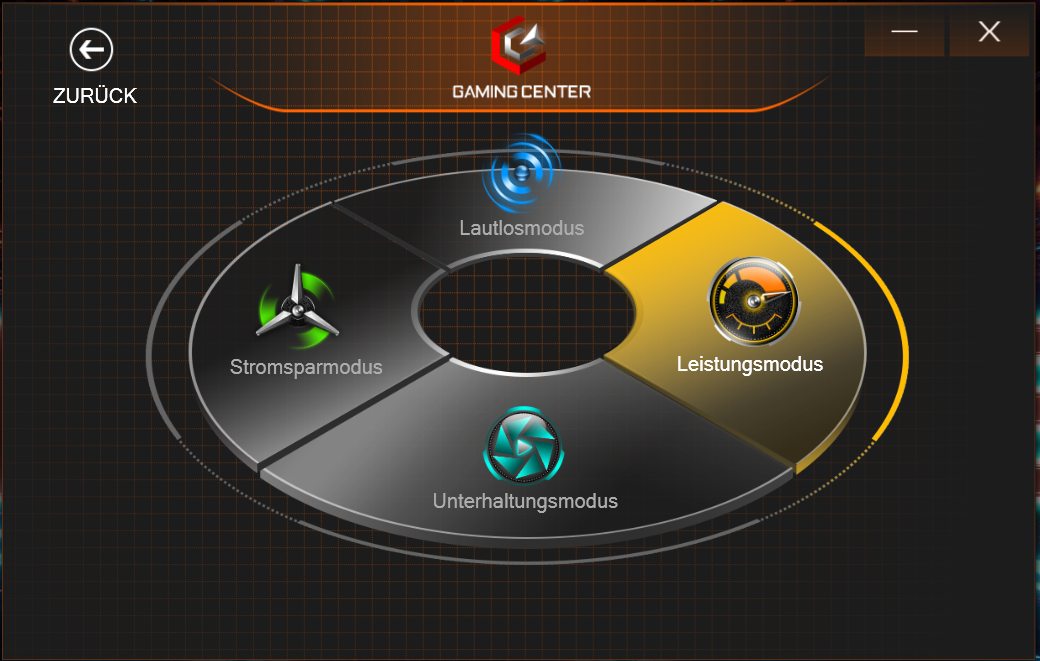
The preinstalled Control Center allows choosing a performance profile (see table), among other things. The benchmarks were executed using the "Performance Mode" profile including automatic fan control. Some benchmarks were additionally run under the remaining three profiles. The results can be found in the comparison tables. The "Entertainment Mode" profile was used for the battery tests.
| Performance Mode | Entertainment Mode | Power-Saving Mode | Silent Mode | |
|---|---|---|---|---|
| Power Limit 1 | 54 watts | 52 watts | 25 watts | 42 watts |
| Power Limit 2 | 65 watts | 63 watts | 30 watts | 60 watts |
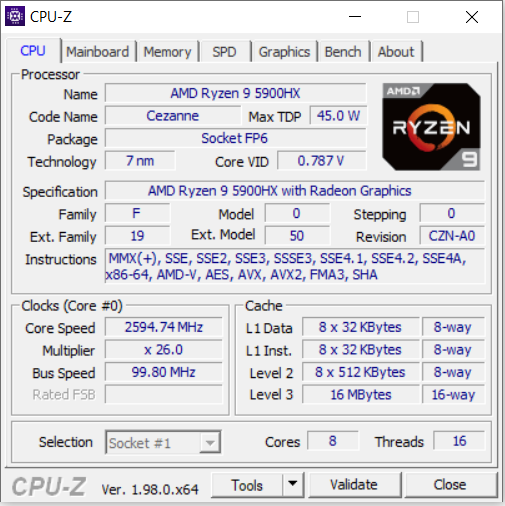
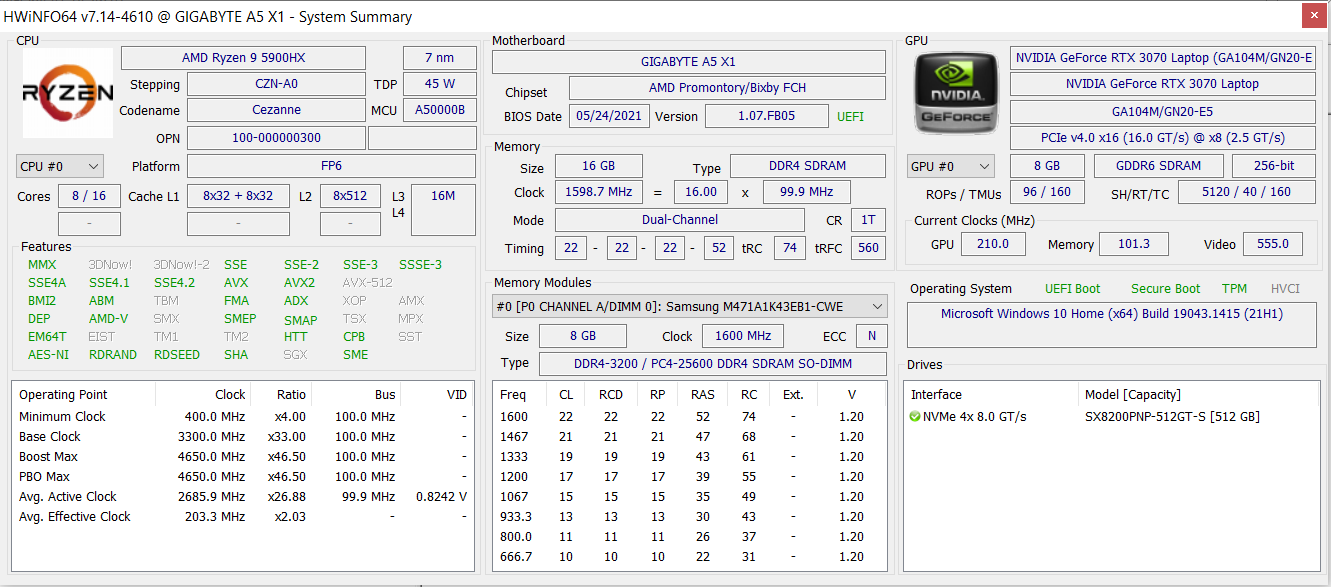
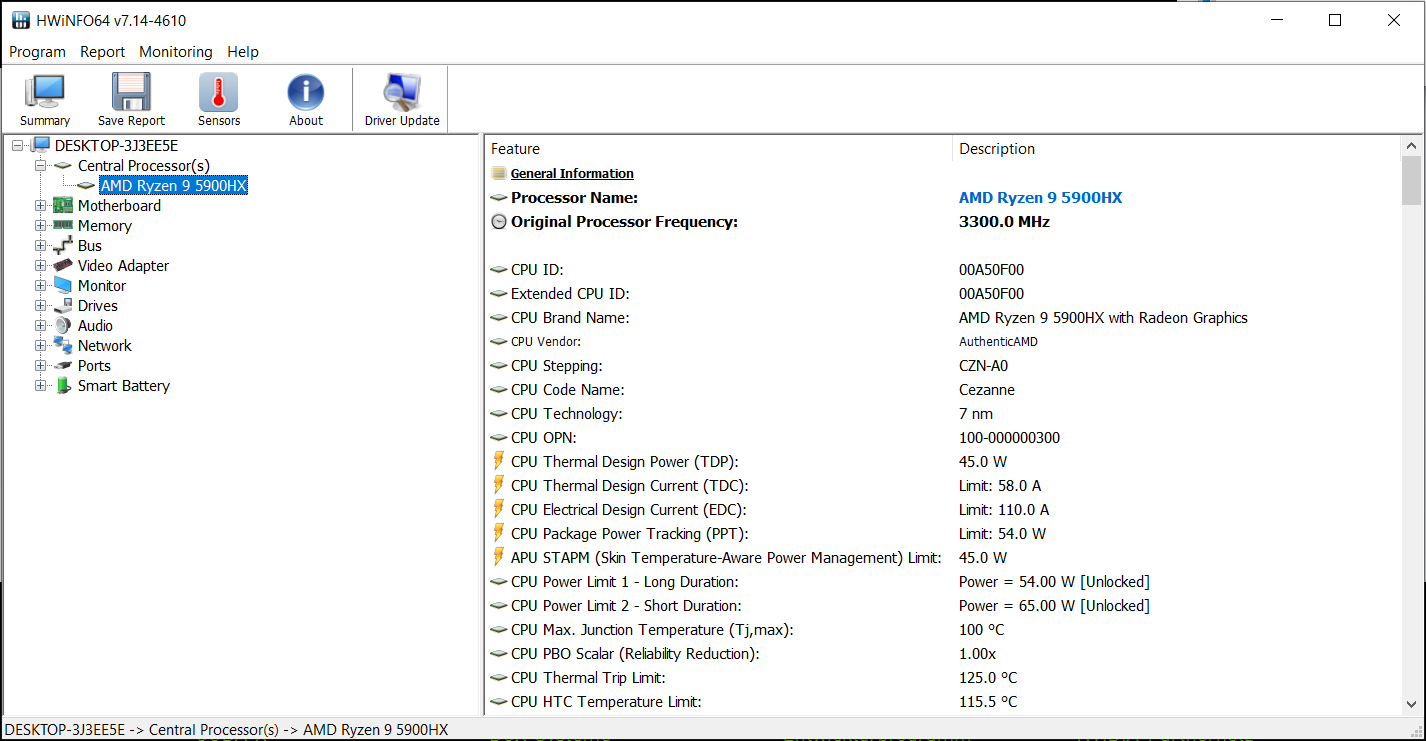
Processor
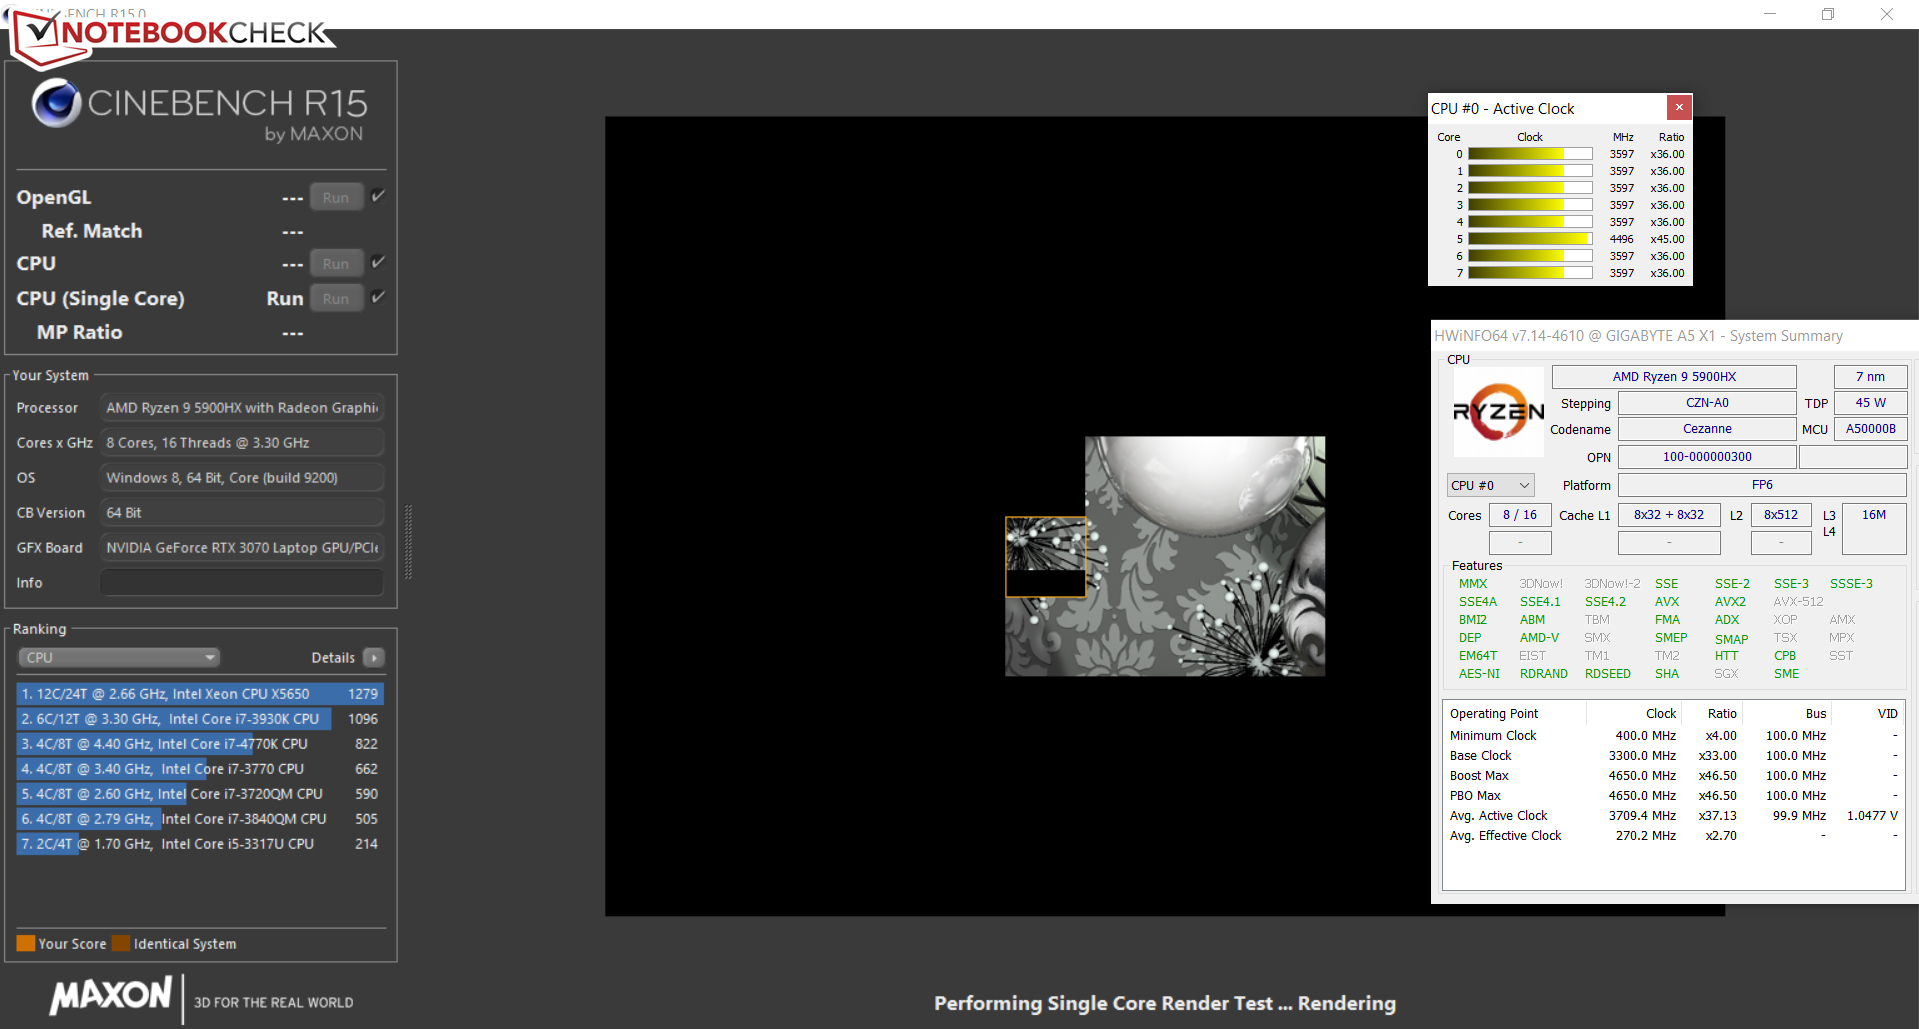
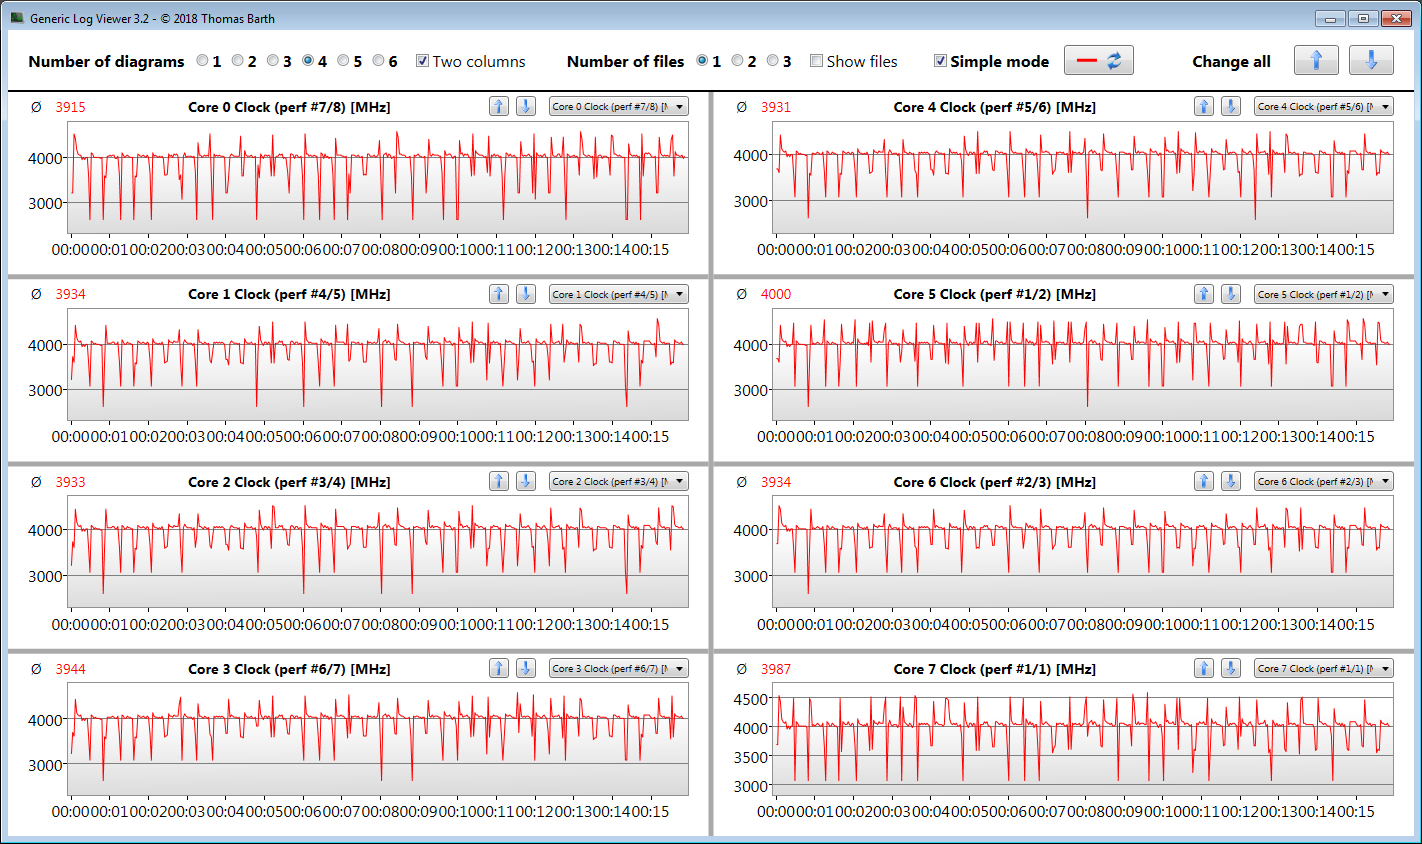
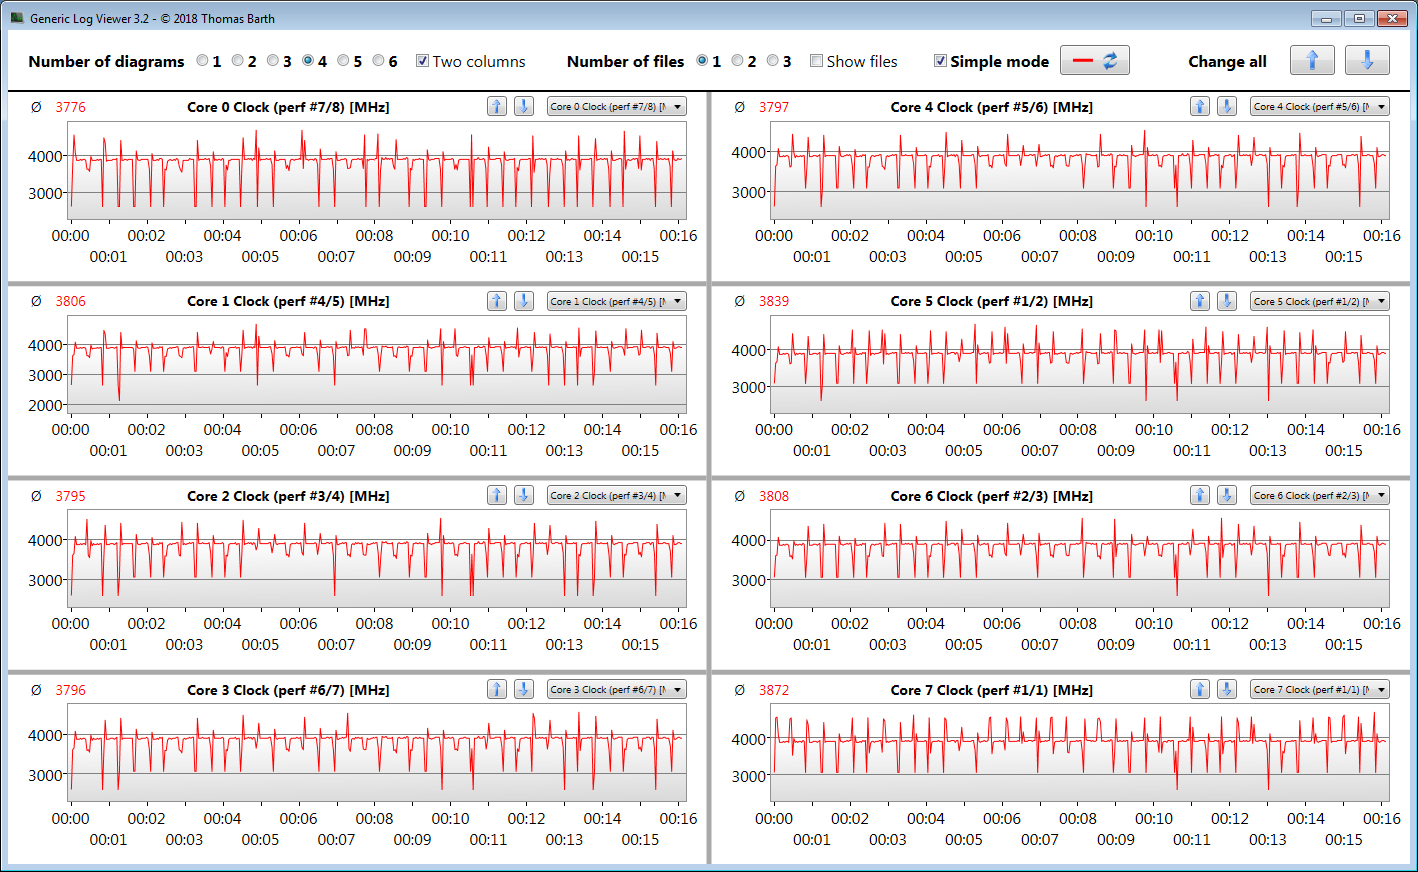
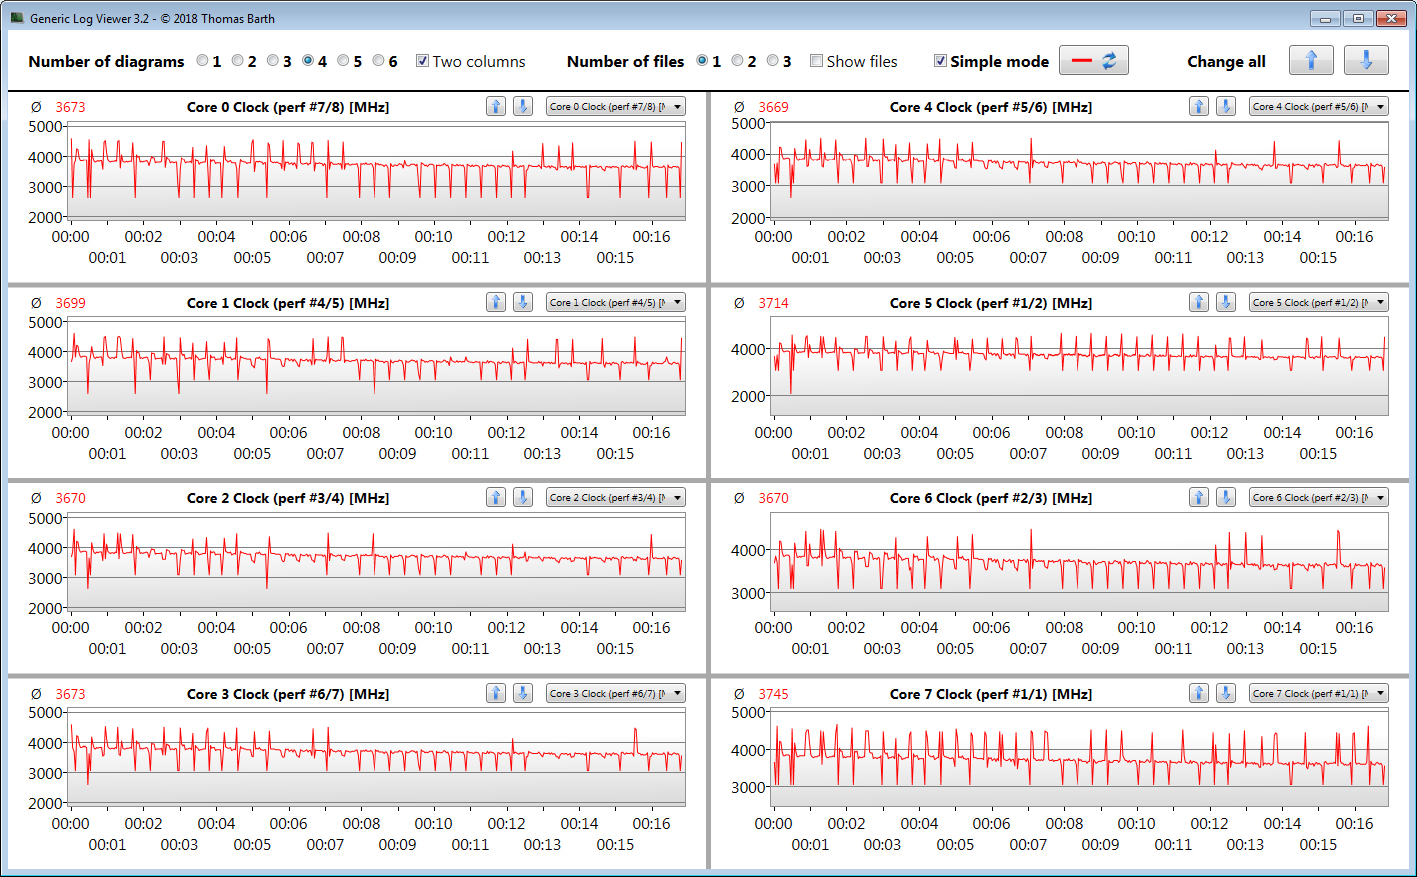
The CPU part of the Ryzen 9 5900HX APU (Cezanne) consists of an octa-core processor that runs at a base clock speed of 3.3 GHz. An increase up to 4.65 GHz is possible via Turbo. Simultaneous multithreading (two threads per core) is supported.
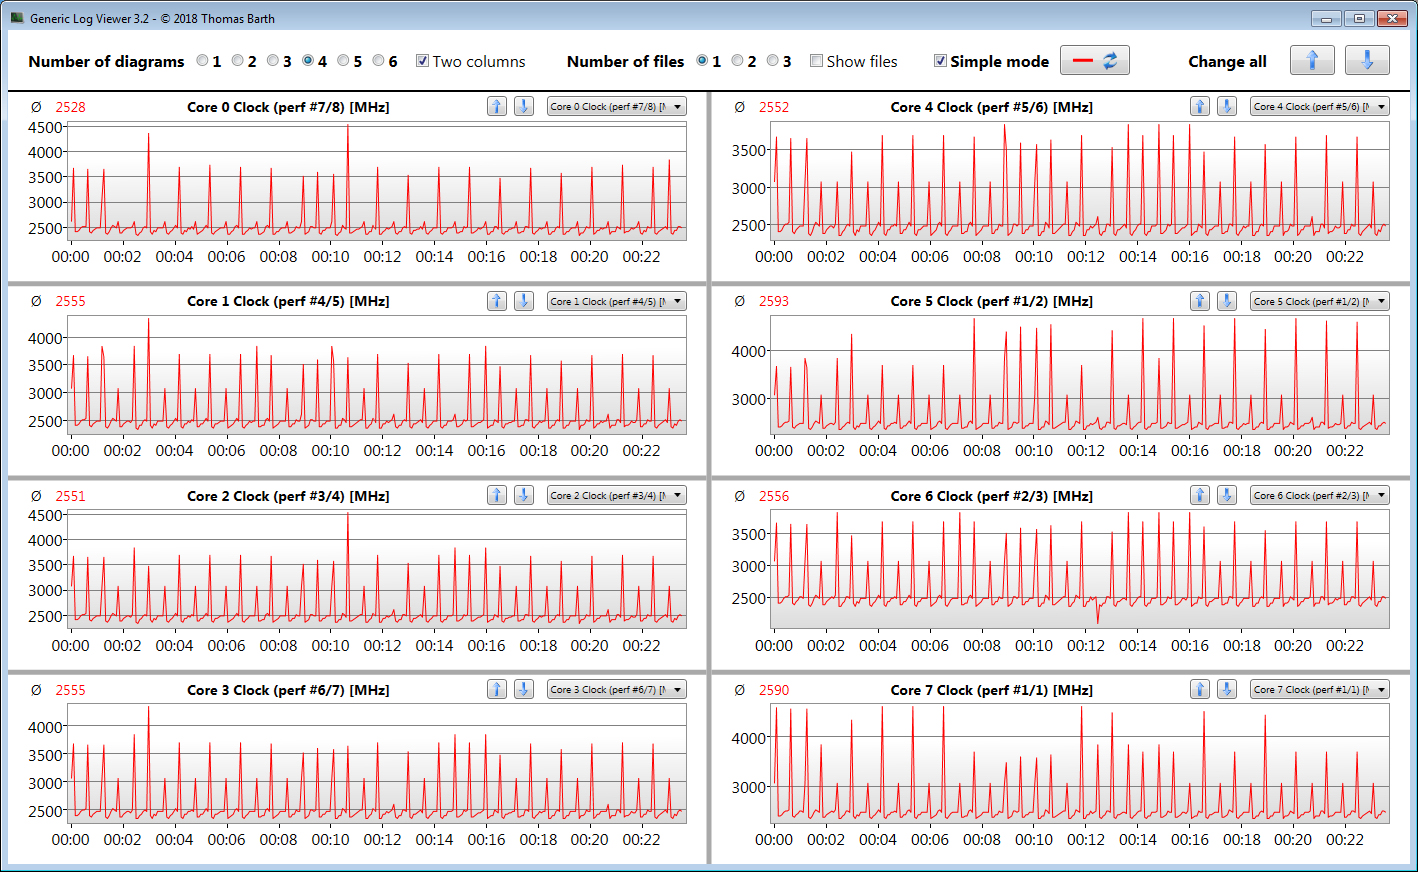
The Cinebench R15 benchmark's multi-thread test is processed at 4.2 GHz for a short time, after which the clock rate drops to between 4 and 4.1 GHz. The single-thread test is run at 3.6 to 4.65 GHz. On battery power, the CPU runs at 2.4 to 2.5 GHz (multithread) and 2.2 to 3.5 GHz (single-thread), respectively.
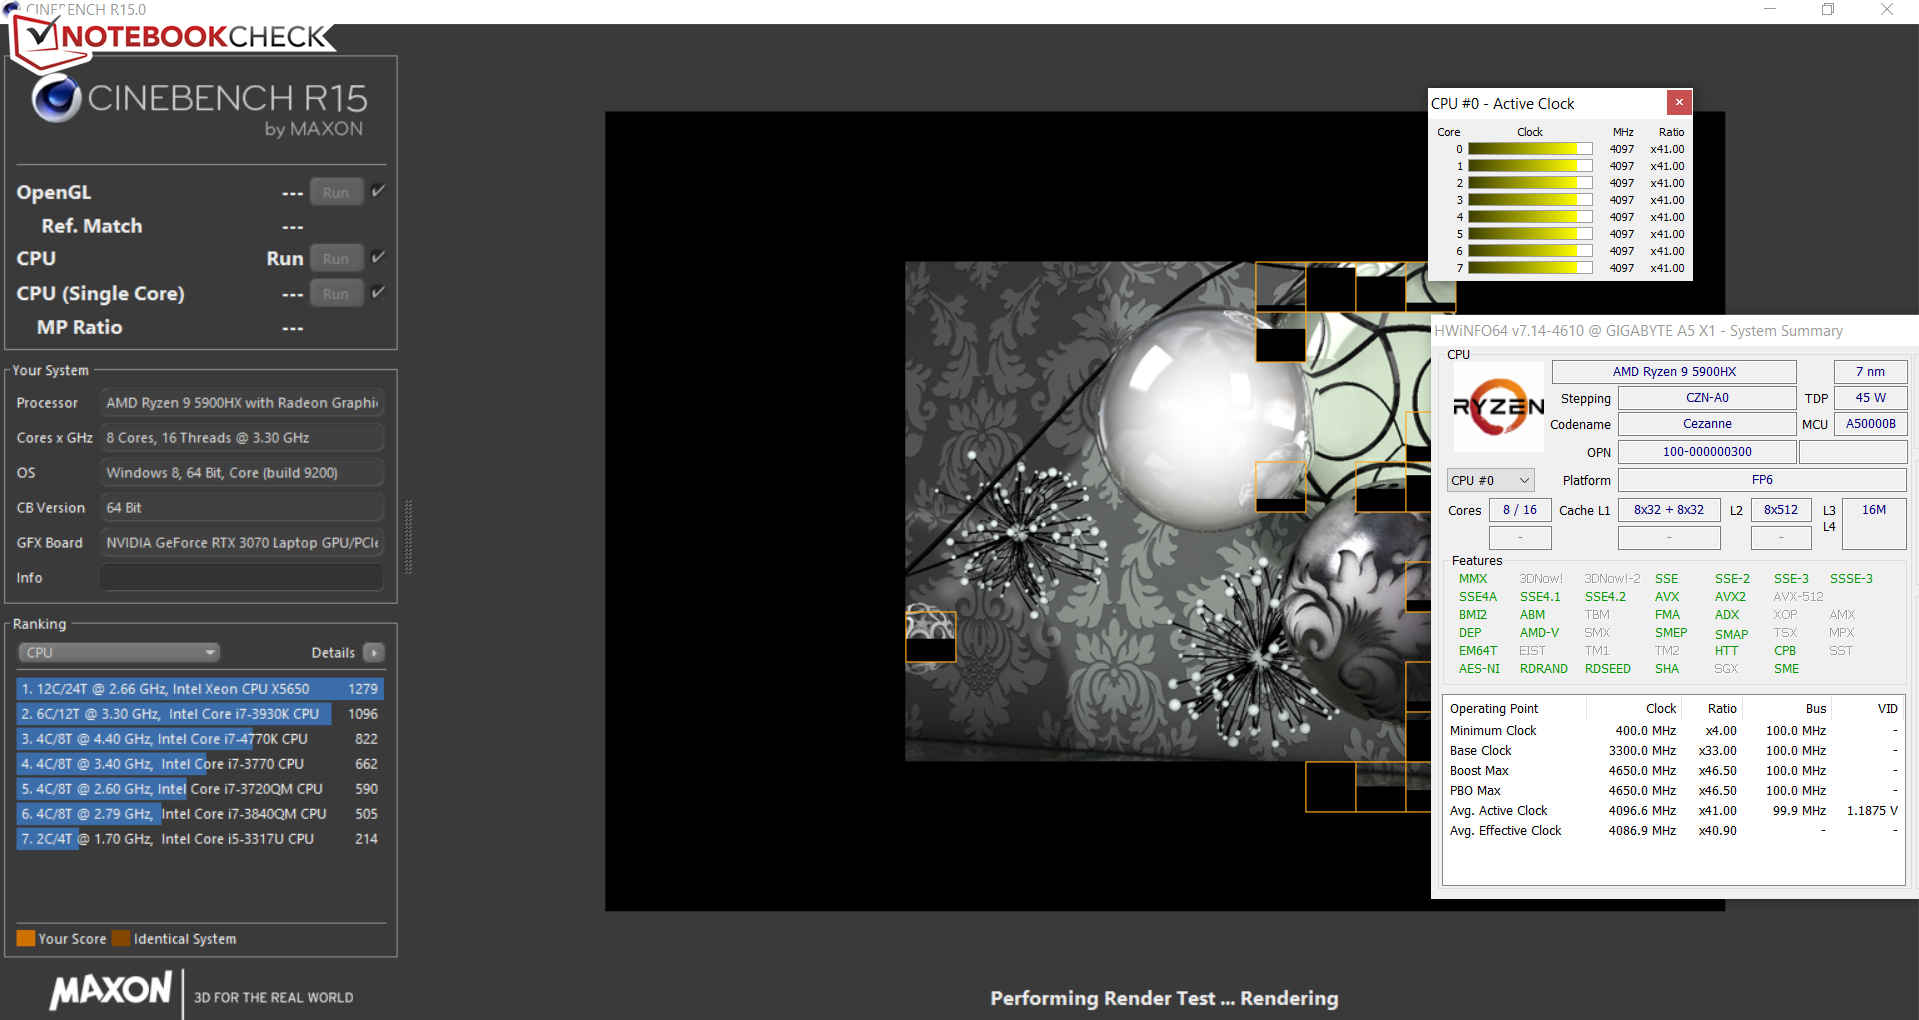
We verify if the CPU Turbo is consistently used when plugged in by running the Cinebench R15 benchmark's multithread test in a continuous loop for at least 30 minutes. Turbo is used to a great extent.
Cinebench R15 Multi endurance test
| CPU Performance Rating - Percent | |
| Average of class Gaming | |
| Gigabyte A5 X1 | |
| HP Omen 16-b0085ng | |
| Gigabyte A5 X1 | |
| Average AMD Ryzen 9 5900HX | |
| Gigabyte A5 X1 | |
| SCHENKER XMG Apex 15 NH57E PS | |
| Gigabyte A5 X1 | |
| Acer Nitro 5 AN515-45-R1JH | |
| MSI Katana GF66 11UG-220 | |
| Cinebench R23 | |
| Multi Core | |
| Average of class Gaming (2435 - 34613, n=229, last 2 years) | |
| Gigabyte A5 X1 | |
| Gigabyte A5 X1 (Unterhaltungsmodus) | |
| Gigabyte A5 X1 (Lautlosmodus) | |
| SCHENKER XMG Apex 15 NH57E PS | |
| Average AMD Ryzen 9 5900HX (6622 - 14363, n=30) | |
| HP Omen 16-b0085ng | |
| Acer Nitro 5 AN515-45-R1JH | |
| Gigabyte A5 X1 (Stromsparmodus) | |
| MSI Katana GF66 11UG-220 | |
| Single Core | |
| Average of class Gaming (527 - 2235, n=227, last 2 years) | |
| MSI Katana GF66 11UG-220 | |
| HP Omen 16-b0085ng | |
| Gigabyte A5 X1 | |
| Gigabyte A5 X1 (Stromsparmodus) | |
| Gigabyte A5 X1 (Unterhaltungsmodus) | |
| Average AMD Ryzen 9 5900HX (1218 - 1499, n=29) | |
| Gigabyte A5 X1 (Lautlosmodus) | |
| Acer Nitro 5 AN515-45-R1JH | |
| SCHENKER XMG Apex 15 NH57E PS | |
| Cinebench R20 | |
| CPU (Multi Core) | |
| Average of class Gaming (930 - 13769, n=227, last 2 years) | |
| Gigabyte A5 X1 | |
| Gigabyte A5 X1 (Unterhaltungsmodus) | |
| SCHENKER XMG Apex 15 NH57E PS | |
| Average AMD Ryzen 9 5900HX (2242 - 5476, n=30) | |
| HP Omen 16-b0085ng | |
| Gigabyte A5 X1 (Lautlosmodus) | |
| Acer Nitro 5 AN515-45-R1JH | |
| Gigabyte A5 X1 (Stromsparmodus) | |
| MSI Katana GF66 11UG-220 | |
| CPU (Single Core) | |
| Average of class Gaming (169 - 855, n=227, last 2 years) | |
| HP Omen 16-b0085ng | |
| MSI Katana GF66 11UG-220 | |
| Gigabyte A5 X1 | |
| Gigabyte A5 X1 (Stromsparmodus) | |
| Gigabyte A5 X1 (Unterhaltungsmodus) | |
| Average AMD Ryzen 9 5900HX (471 - 584, n=29) | |
| Gigabyte A5 X1 (Lautlosmodus) | |
| Acer Nitro 5 AN515-45-R1JH | |
| SCHENKER XMG Apex 15 NH57E PS | |
| Cinebench R15 | |
| CPU Multi 64Bit | |
| Average of class Gaming (400 - 5663, n=231, last 2 years) | |
| Gigabyte A5 X1 | |
| HP Omen 16-b0085ng | |
| MSI Katana GF66 11UG-220 (fan in full speed) | |
| MSI Katana GF66 11UG-220 (Factory settings) | |
| Gigabyte A5 X1 (Unterhaltungsmodus) | |
| SCHENKER XMG Apex 15 NH57E PS | |
| Gigabyte A5 X1 (Lautlosmodus) | |
| Average AMD Ryzen 9 5900HX (1076 - 2267, n=29) | |
| Acer Nitro 5 AN515-45-R1JH | |
| Gigabyte A5 X1 (Stromsparmodus) | |
| CPU Single 64Bit | |
| Average of class Gaming (79.2 - 318, n=230, last 2 years) | |
| Gigabyte A5 X1 (Stromsparmodus) | |
| Gigabyte A5 X1 (Unterhaltungsmodus) | |
| Gigabyte A5 X1 (Lautlosmodus) | |
| Average AMD Ryzen 9 5900HX (197 - 243, n=25) | |
| Gigabyte A5 X1 | |
| Acer Nitro 5 AN515-45-R1JH | |
| SCHENKER XMG Apex 15 NH57E PS | |
| MSI Katana GF66 11UG-220 | |
| MSI Katana GF66 11UG-220 | |
| HP Omen 16-b0085ng | |
| Blender - v2.79 BMW27 CPU | |
| MSI Katana GF66 11UG-220 | |
| Gigabyte A5 X1 (Stromsparmodus) | |
| Acer Nitro 5 AN515-45-R1JH | |
| Average AMD Ryzen 9 5900HX (219 - 442, n=29) | |
| Gigabyte A5 X1 (Lautlosmodus) | |
| SCHENKER XMG Apex 15 NH57E PS | |
| Gigabyte A5 X1 (Unterhaltungsmodus) | |
| Gigabyte A5 X1 | |
| HP Omen 16-b0085ng | |
| Average of class Gaming (87 - 1259, n=225, last 2 years) | |
| 7-Zip 18.03 | |
| 7z b 4 | |
| Average of class Gaming (11386 - 140932, n=226, last 2 years) | |
| Gigabyte A5 X1 | |
| Gigabyte A5 X1 (Unterhaltungsmodus) | |
| Gigabyte A5 X1 (Lautlosmodus) | |
| SCHENKER XMG Apex 15 NH57E PS | |
| Average AMD Ryzen 9 5900HX (36011 - 62503, n=29) | |
| HP Omen 16-b0085ng | |
| Acer Nitro 5 AN515-45-R1JH | |
| Gigabyte A5 X1 (Stromsparmodus) | |
| MSI Katana GF66 11UG-220 | |
| 7z b 4 -mmt1 | |
| Average of class Gaming (2685 - 7581, n=226, last 2 years) | |
| Gigabyte A5 X1 (Stromsparmodus) | |
| Gigabyte A5 X1 (Unterhaltungsmodus) | |
| Gigabyte A5 X1 (Lautlosmodus) | |
| Gigabyte A5 X1 | |
| Average AMD Ryzen 9 5900HX (4791 - 5905, n=29) | |
| HP Omen 16-b0085ng | |
| SCHENKER XMG Apex 15 NH57E PS | |
| MSI Katana GF66 11UG-220 | |
| Acer Nitro 5 AN515-45-R1JH | |
| Geekbench 5.5 | |
| Multi-Core | |
| Average of class Gaming (1946 - 22200, n=231, last 2 years) | |
| HP Omen 16-b0085ng | |
| Gigabyte A5 X1 | |
| Gigabyte A5 X1 (Unterhaltungsmodus) | |
| SCHENKER XMG Apex 15 NH57E PS | |
| Average AMD Ryzen 9 5900HX (5057 - 9294, n=27) | |
| Gigabyte A5 X1 (Lautlosmodus) | |
| Gigabyte A5 X1 (Stromsparmodus) | |
| Acer Nitro 5 AN515-45-R1JH | |
| MSI Katana GF66 11UG-220 | |
| Single-Core | |
| Average of class Gaming (158 - 2193, n=231, last 2 years) | |
| HP Omen 16-b0085ng | |
| MSI Katana GF66 11UG-220 | |
| Gigabyte A5 X1 (Stromsparmodus) | |
| Gigabyte A5 X1 | |
| Average AMD Ryzen 9 5900HX (1271 - 1574, n=27) | |
| Gigabyte A5 X1 (Unterhaltungsmodus) | |
| SCHENKER XMG Apex 15 NH57E PS | |
| Acer Nitro 5 AN515-45-R1JH | |
| Gigabyte A5 X1 (Lautlosmodus) | |
| HWBOT x265 Benchmark v2.2 - 4k Preset | |
| Average of class Gaming (3 - 37.6, n=229, last 2 years) | |
| HP Omen 16-b0085ng | |
| Gigabyte A5 X1 | |
| Gigabyte A5 X1 (Unterhaltungsmodus) | |
| SCHENKER XMG Apex 15 NH57E PS | |
| Average AMD Ryzen 9 5900HX (8.26 - 17.1, n=29) | |
| Gigabyte A5 X1 (Lautlosmodus) | |
| Acer Nitro 5 AN515-45-R1JH | |
| Gigabyte A5 X1 (Stromsparmodus) | |
| MSI Katana GF66 11UG-220 | |
| LibreOffice - 20 Documents To PDF | |
| Gigabyte A5 X1 | |
| Acer Nitro 5 AN515-45-R1JH | |
| SCHENKER XMG Apex 15 NH57E PS | |
| Average AMD Ryzen 9 5900HX (44.1 - 87.4, n=29) | |
| Gigabyte A5 X1 (Stromsparmodus) | |
| Gigabyte A5 X1 (Lautlosmodus) | |
| Gigabyte A5 X1 (Unterhaltungsmodus) | |
| MSI Katana GF66 11UG-220 | |
| Average of class Gaming (32.8 - 332, n=223, last 2 years) | |
| HP Omen 16-b0085ng | |
| R Benchmark 2.5 - Overall mean | |
| HP Omen 16-b0085ng | |
| MSI Katana GF66 11UG-220 | |
| Acer Nitro 5 AN515-45-R1JH | |
| SCHENKER XMG Apex 15 NH57E PS | |
| Gigabyte A5 X1 (Unterhaltungsmodus) | |
| Average AMD Ryzen 9 5900HX (0.48 - 0.599, n=29) | |
| Gigabyte A5 X1 (Lautlosmodus) | |
| Gigabyte A5 X1 | |
| Gigabyte A5 X1 (Stromsparmodus) | |
| Average of class Gaming (0.3609 - 4.47, n=226, last 2 years) | |
* ... smaller is better
AIDA64: FP32 Ray-Trace | FPU Julia | CPU SHA3 | CPU Queen | FPU SinJulia | FPU Mandel | CPU AES | CPU ZLib | FP64 Ray-Trace | CPU PhotoWorxx
| Performance Rating | |
| Average of class Gaming | |
| Gigabyte A5 X1 | |
| Gigabyte A5 X1 | |
| Gigabyte A5 X1 | |
| Average AMD Ryzen 9 5900HX | |
| SCHENKER XMG Apex 15 NH57E PS | |
| Acer Nitro 5 AN515-45-R1JH | |
| Gigabyte A5 X1 | |
| HP Omen 16-b0085ng -9! | |
| MSI Katana GF66 11UG-220 -9! | |
| AIDA64 / FP32 Ray-Trace | |
| Average of class Gaming (3069 - 60169, n=222, last 2 years) | |
| Gigabyte A5 X1 (v6.50.5800) | |
| Gigabyte A5 X1 (v6.50.5800, Unterhaltungsmodus) | |
| Gigabyte A5 X1 (v6.50.5800, Lautlosmodus) | |
| Average AMD Ryzen 9 5900HX (12470 - 16014, n=26) | |
| SCHENKER XMG Apex 15 NH57E PS (v6.50.5800) | |
| Acer Nitro 5 AN515-45-R1JH (v6.33.5700) | |
| Gigabyte A5 X1 (v6.50.5800, Stromsparmodus) | |
| AIDA64 / FPU Julia | |
| Gigabyte A5 X1 (v6.50.5800) | |
| Gigabyte A5 X1 (v6.50.5800, Unterhaltungsmodus) | |
| SCHENKER XMG Apex 15 NH57E PS (v6.50.5800) | |
| Average AMD Ryzen 9 5900HX (79554 - 101008, n=26) | |
| Gigabyte A5 X1 (v6.50.5800, Lautlosmodus) | |
| Average of class Gaming (18567 - 252486, n=222, last 2 years) | |
| Acer Nitro 5 AN515-45-R1JH (v6.33.5700) | |
| Gigabyte A5 X1 (v6.50.5800, Stromsparmodus) | |
| AIDA64 / CPU SHA3 | |
| Average of class Gaming (629 - 10389, n=222, last 2 years) | |
| Gigabyte A5 X1 (v6.50.5800) | |
| Gigabyte A5 X1 (v6.50.5800, Unterhaltungsmodus) | |
| Average AMD Ryzen 9 5900HX (2754 - 3444, n=26) | |
| SCHENKER XMG Apex 15 NH57E PS (v6.50.5800) | |
| Gigabyte A5 X1 (v6.50.5800, Lautlosmodus) | |
| Acer Nitro 5 AN515-45-R1JH (v6.33.5700) | |
| Gigabyte A5 X1 (v6.50.5800, Stromsparmodus) | |
| AIDA64 / CPU Queen | |
| Average of class Gaming (15371 - 200651, n=222, last 2 years) | |
| Gigabyte A5 X1 (v6.50.5800, Unterhaltungsmodus) | |
| Gigabyte A5 X1 (v6.50.5800) | |
| Gigabyte A5 X1 (v6.50.5800, Lautlosmodus) | |
| Average AMD Ryzen 9 5900HX (87865 - 105123, n=26) | |
| SCHENKER XMG Apex 15 NH57E PS (v6.50.5800) | |
| Acer Nitro 5 AN515-45-R1JH (v6.33.5700) | |
| Gigabyte A5 X1 (v6.50.5800, Stromsparmodus) | |
| AIDA64 / FPU SinJulia | |
| Gigabyte A5 X1 (v6.50.5800, Unterhaltungsmodus) | |
| Gigabyte A5 X1 (v6.50.5800) | |
| Average AMD Ryzen 9 5900HX (10899 - 12806, n=26) | |
| Gigabyte A5 X1 (v6.50.5800, Lautlosmodus) | |
| Average of class Gaming (2137 - 32988, n=222, last 2 years) | |
| SCHENKER XMG Apex 15 NH57E PS (v6.50.5800) | |
| Acer Nitro 5 AN515-45-R1JH (v6.33.5700) | |
| Gigabyte A5 X1 (v6.50.5800, Stromsparmodus) | |
| AIDA64 / FPU Mandel | |
| Gigabyte A5 X1 (v6.50.5800) | |
| Gigabyte A5 X1 (v6.50.5800, Unterhaltungsmodus) | |
| SCHENKER XMG Apex 15 NH57E PS (v6.50.5800) | |
| Average AMD Ryzen 9 5900HX (43685 - 55702, n=26) | |
| Gigabyte A5 X1 (v6.50.5800, Lautlosmodus) | |
| Acer Nitro 5 AN515-45-R1JH (v6.33.5700) | |
| Average of class Gaming (10291 - 134044, n=222, last 2 years) | |
| Gigabyte A5 X1 (v6.50.5800, Stromsparmodus) | |
| AIDA64 / CPU AES | |
| Gigabyte A5 X1 (v6.50.5800) | |
| Gigabyte A5 X1 (v6.50.5800, Unterhaltungsmodus) | |
| Average AMD Ryzen 9 5900HX (109927 - 137901, n=26) | |
| Gigabyte A5 X1 (v6.50.5800, Lautlosmodus) | |
| SCHENKER XMG Apex 15 NH57E PS (v6.50.5800) | |
| Acer Nitro 5 AN515-45-R1JH (v6.33.5700) | |
| Gigabyte A5 X1 (v6.50.5800, Stromsparmodus) | |
| Average of class Gaming (19065 - 328679, n=222, last 2 years) | |
| AIDA64 / CPU ZLib | |
| Average of class Gaming (150.9 - 2409, n=222, last 2 years) | |
| Gigabyte A5 X1 (v6.50.5800) | |
| Gigabyte A5 X1 (v6.50.5800, Unterhaltungsmodus) | |
| Average AMD Ryzen 9 5900HX (706 - 878, n=26) | |
| Gigabyte A5 X1 (v6.50.5800, Lautlosmodus) | |
| SCHENKER XMG Apex 15 NH57E PS (v6.50.5800) | |
| Acer Nitro 5 AN515-45-R1JH (v6.33.5700) | |
| Gigabyte A5 X1 (v6.50.5800, Stromsparmodus) | |
| MSI Katana GF66 11UG-220 (v6.33.5700) | |
| HP Omen 16-b0085ng (v6.33.5700) | |
| AIDA64 / FP64 Ray-Trace | |
| Average of class Gaming (1518 - 31796, n=222, last 2 years) | |
| Gigabyte A5 X1 (v6.50.5800) | |
| Gigabyte A5 X1 (v6.50.5800, Unterhaltungsmodus) | |
| Gigabyte A5 X1 (v6.50.5800, Lautlosmodus) | |
| Average AMD Ryzen 9 5900HX (6664 - 8644, n=26) | |
| SCHENKER XMG Apex 15 NH57E PS (v6.50.5800) | |
| Acer Nitro 5 AN515-45-R1JH (v6.33.5700) | |
| Gigabyte A5 X1 (v6.50.5800, Stromsparmodus) | |
| AIDA64 / CPU PhotoWorxx | |
| Average of class Gaming (10805 - 60161, n=223, last 2 years) | |
| Gigabyte A5 X1 (v6.50.5800, Lautlosmodus) | |
| Gigabyte A5 X1 (v6.50.5800, Unterhaltungsmodus) | |
| Gigabyte A5 X1 (v6.50.5800, Stromsparmodus) | |
| SCHENKER XMG Apex 15 NH57E PS (v6.50.5800) | |
| Gigabyte A5 X1 (v6.50.5800) | |
| Average AMD Ryzen 9 5900HX (14344 - 25533, n=26) | |
| Acer Nitro 5 AN515-45-R1JH (v6.33.5700) | |
System performance
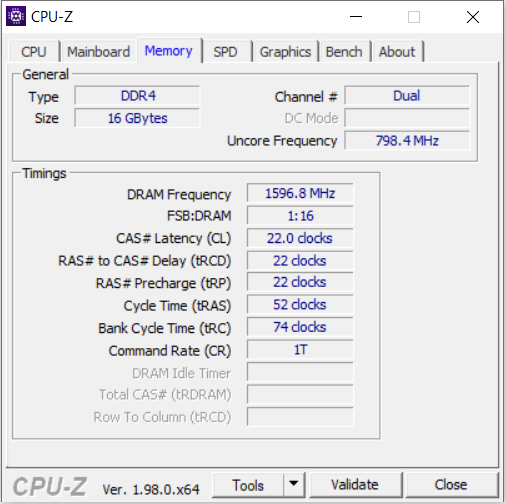
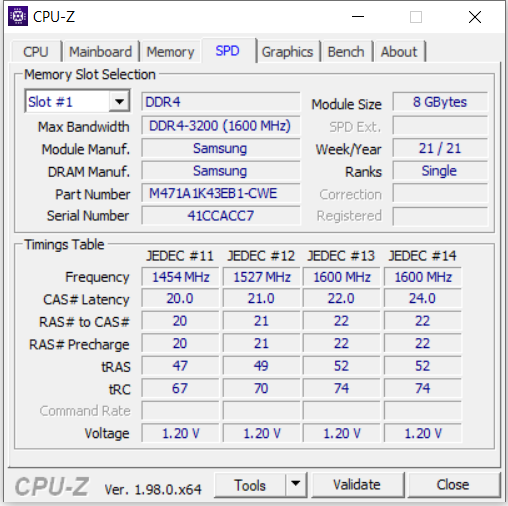
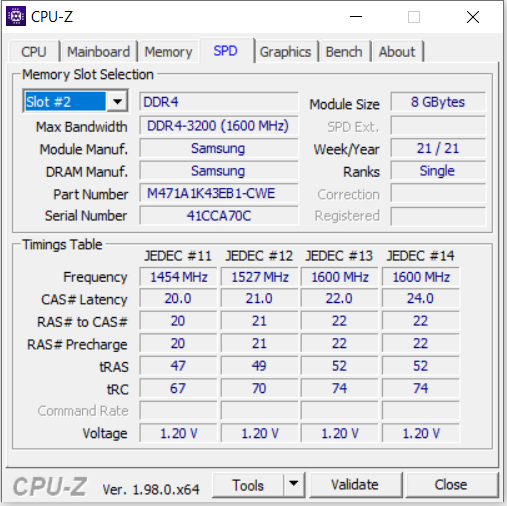
The fast and smooth system offers enough computing power for gaming, video editing, and image processing for years to come. The transfer rates of the built-in RAM are at a normal level for DDR4-3200 memory. This is complemented by very good PCMark results.
| PCMark 8 Home Score Accelerated v2 | 5419 points | |
| PCMark 8 Creative Score Accelerated v2 | 6593 points | |
| PCMark 8 Work Score Accelerated v2 | 6263 points | |
| PCMark 10 Score | 6875 points | |
Help | ||
| PCMark 10 / Score | |
| Average of class Gaming (5235 - 9852, n=197, last 2 years) | |
| HP Omen 16-b0085ng | |
| Average AMD Ryzen 9 5900HX, NVIDIA GeForce RTX 3070 Laptop GPU (6875 - 6967, n=4) | |
| Gigabyte A5 X1 | |
| Acer Nitro 5 AN515-45-R1JH | |
| SCHENKER XMG Apex 15 NH57E PS | |
| MSI Katana GF66 11UG-220 | |
| PCMark 10 / Essentials | |
| HP Omen 16-b0085ng | |
| Average of class Gaming (8300 - 12334, n=196, last 2 years) | |
| Average AMD Ryzen 9 5900HX, NVIDIA GeForce RTX 3070 Laptop GPU (9991 - 10413, n=3) | |
| Gigabyte A5 X1 | |
| Acer Nitro 5 AN515-45-R1JH | |
| SCHENKER XMG Apex 15 NH57E PS | |
| MSI Katana GF66 11UG-220 | |
| PCMark 10 / Productivity | |
| Average of class Gaming (7244 - 11833, n=196, last 2 years) | |
| Average AMD Ryzen 9 5900HX, NVIDIA GeForce RTX 3070 Laptop GPU (9301 - 9381, n=3) | |
| Gigabyte A5 X1 | |
| Acer Nitro 5 AN515-45-R1JH | |
| MSI Katana GF66 11UG-220 | |
| HP Omen 16-b0085ng | |
| SCHENKER XMG Apex 15 NH57E PS | |
| PCMark 10 / Digital Content Creation | |
| Average of class Gaming (6462 - 18475, n=196, last 2 years) | |
| HP Omen 16-b0085ng | |
| Average AMD Ryzen 9 5900HX, NVIDIA GeForce RTX 3070 Laptop GPU (9383 - 9561, n=3) | |
| MSI Katana GF66 11UG-220 | |
| Gigabyte A5 X1 | |
| SCHENKER XMG Apex 15 NH57E PS | |
| Acer Nitro 5 AN515-45-R1JH | |
| AIDA64 / Memory Copy | |
| Average of class Gaming (21842 - 92565, n=222, last 2 years) | |
| SCHENKER XMG Apex 15 NH57E PS (v6.50.5800) | |
| Gigabyte A5 X1 (v6.50.5800) | |
| Average AMD Ryzen 9 5900HX (36725 - 43318, n=26) | |
| Acer Nitro 5 AN515-45-R1JH (v6.33.5700) | |
| AIDA64 / Memory Read | |
| Average of class Gaming (24879 - 90647, n=222, last 2 years) | |
| SCHENKER XMG Apex 15 NH57E PS (v6.50.5800) | |
| Gigabyte A5 X1 (v6.50.5800) | |
| Average AMD Ryzen 9 5900HX (41378 - 47593, n=26) | |
| Acer Nitro 5 AN515-45-R1JH (v6.33.5700) | |
| AIDA64 / Memory Write | |
| Average of class Gaming (21619 - 103259, n=222, last 2 years) | |
| SCHENKER XMG Apex 15 NH57E PS (v6.50.5800) | |
| Gigabyte A5 X1 (v6.50.5800) | |
| Average AMD Ryzen 9 5900HX (32536 - 46718, n=26) | |
| Acer Nitro 5 AN515-45-R1JH (v6.33.5700) | |
| AIDA64 / Memory Latency | |
| Average of class Gaming (59.5 - 152.5, n=219, last 2 years) | |
| Average AMD Ryzen 9 5900HX (73.5 - 97.1, n=26) | |
| SCHENKER XMG Apex 15 NH57E PS (v6.50.5800) | |
| Gigabyte A5 X1 (v6.50.5800) | |
| Acer Nitro 5 AN515-45-R1JH (v6.33.5700) | |
| MSI Katana GF66 11UG-220 (v6.33.5700) | |
| MSI Katana GF66 11UG-220 (v6.33.5700) | |
| HP Omen 16-b0085ng (v6.33.5700) | |
* ... smaller is better
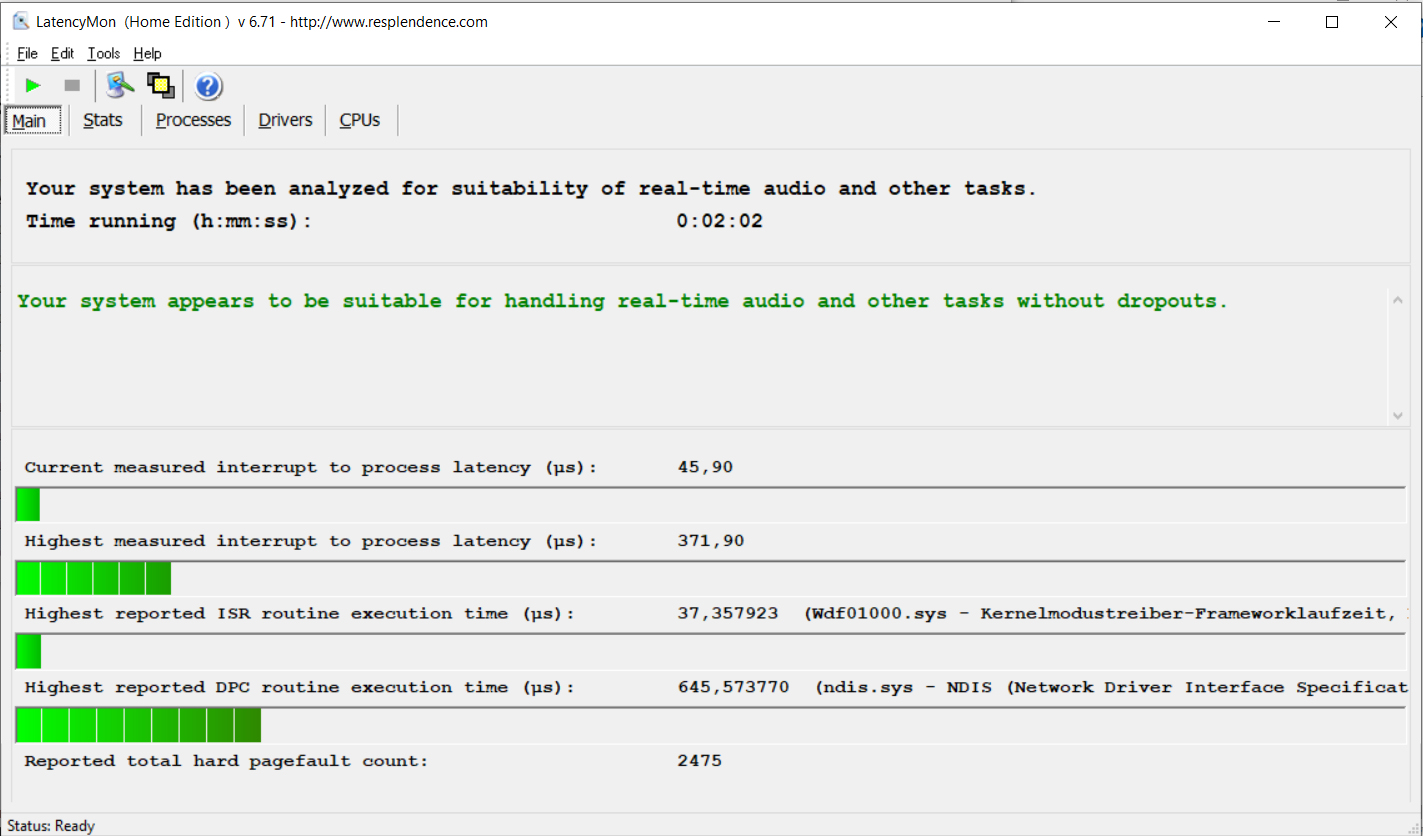
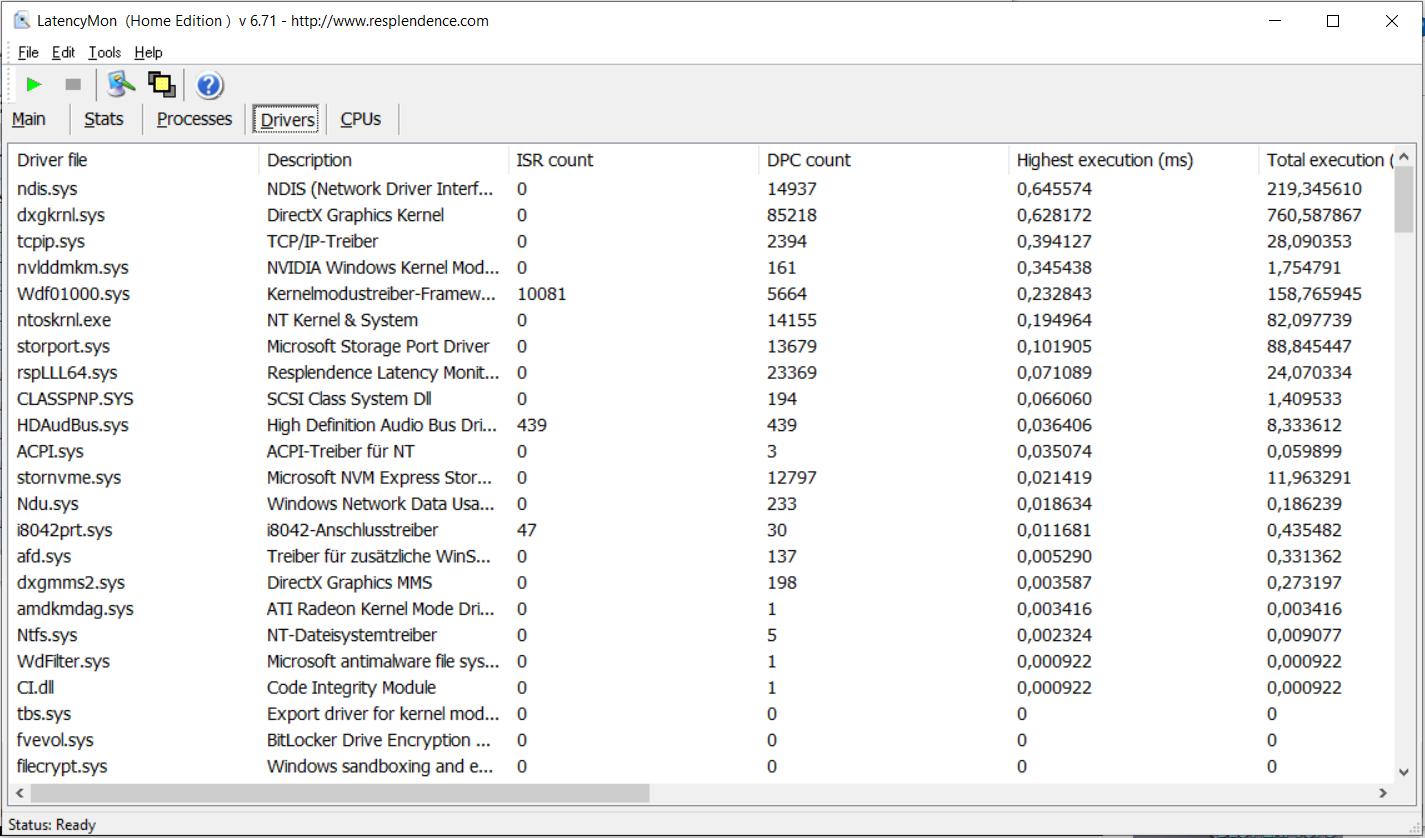
DPC latencies
Our standardized latency monitor test (web browsing, 4K video playback, high-load Prime95) didn't reveal any issues with DPC latencies. The system seems to be suitable for real-time video and audio editing. Future software updates could lead to improvements or even to worse performance.
| DPC Latencies / LatencyMon - interrupt to process latency (max), Web, Youtube, Prime95 | |
| SCHENKER XMG Apex 15 NH57E PS | |
| MSI Katana GF66 11UG-220 | |
| HP Omen 16-b0085ng | |
| Acer Nitro 5 AN515-45-R1JH | |
| Gigabyte A5 X1 | |
* ... smaller is better
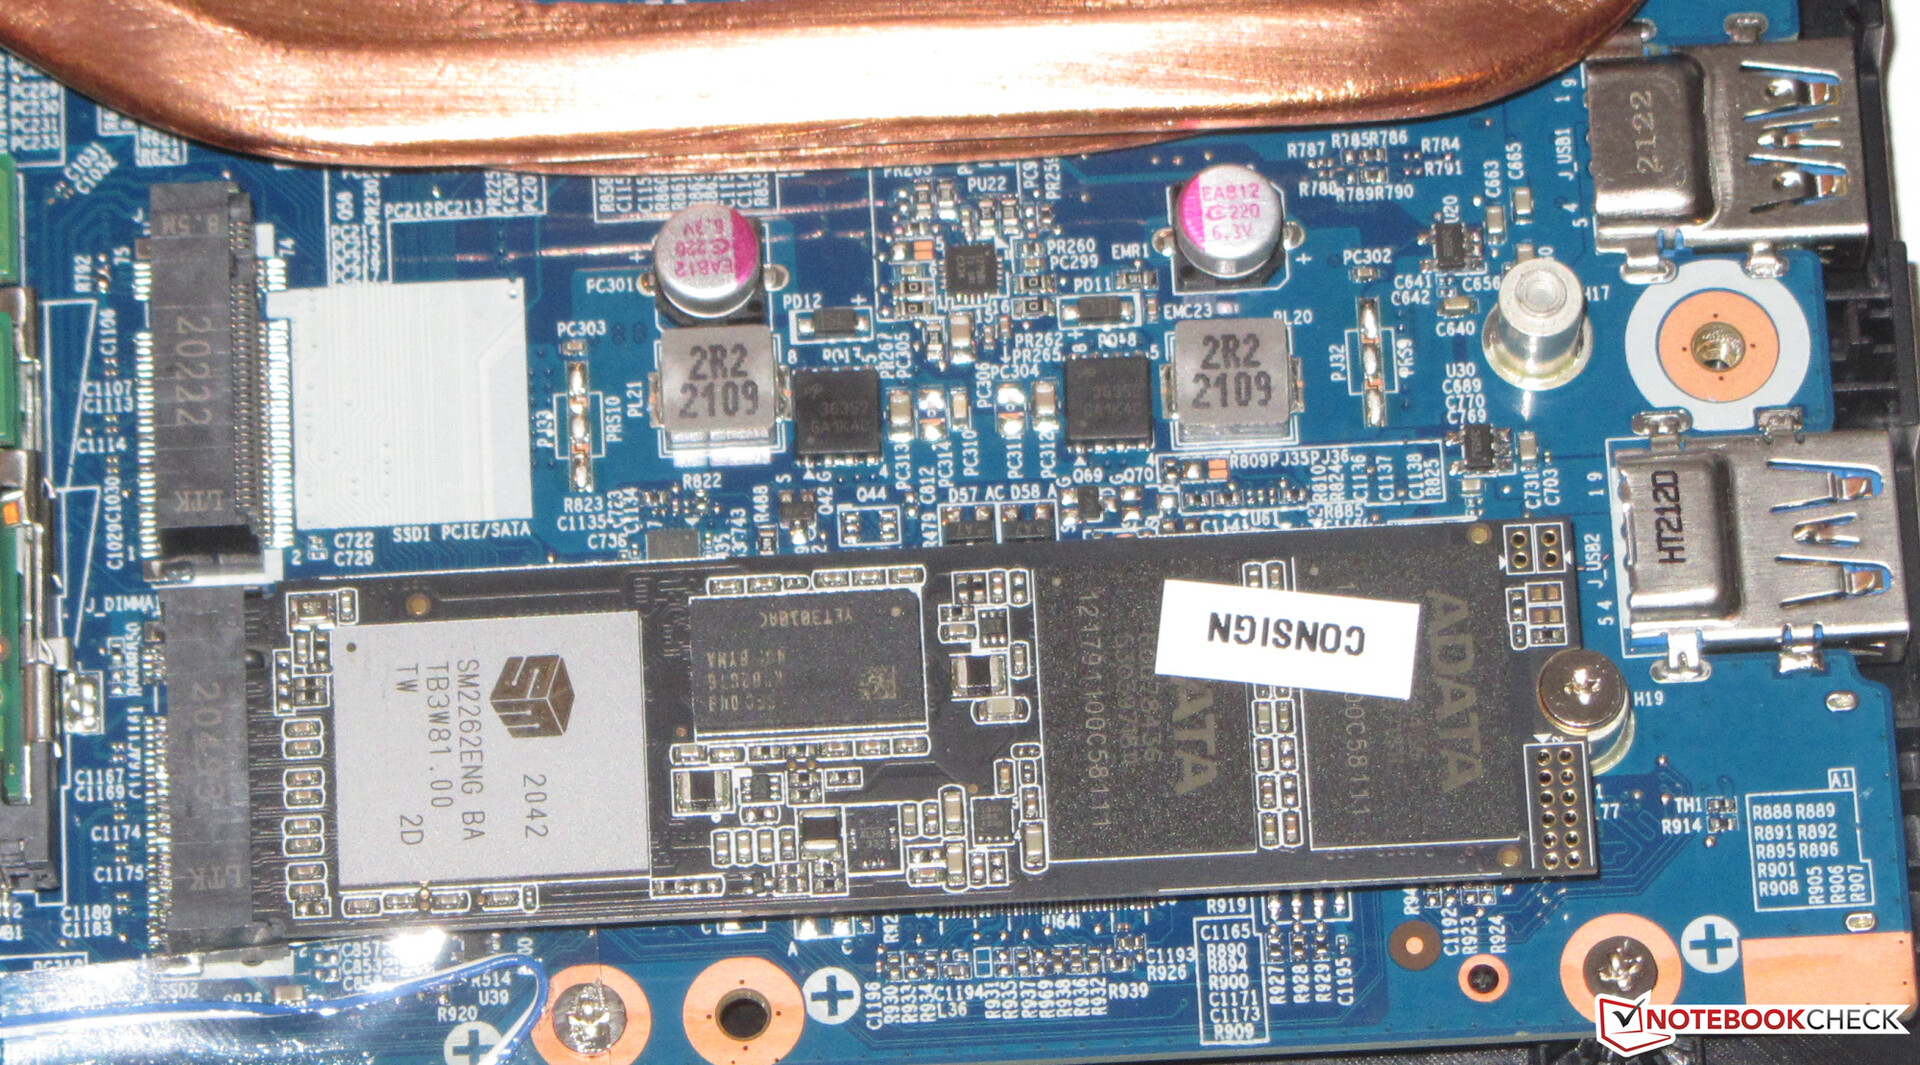
Storage
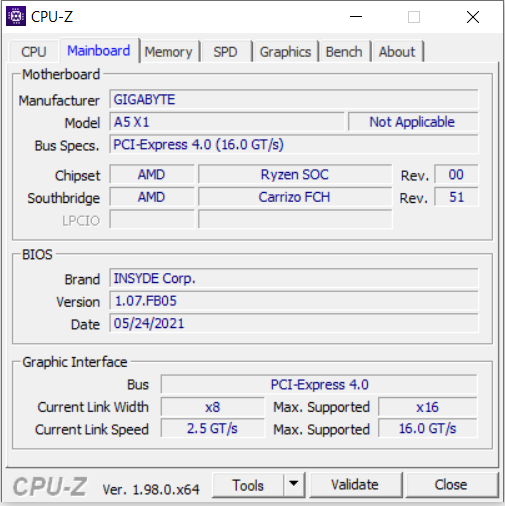
An NVMe SSD (M.2-2280) from Adata serves as the system drive. It offers 512 GB of storage space and delivers good transfer rates - however, it's not among the top SSD models. The laptop can accommodate a second NVMe SSD (M.2-2280). Both M.2 slots support PCIe Gen 4. In addition, there's also space for a 2.5-inch storage drive (the SATA slot and mounting frame are found inside the laptop, the screws are in the box).

* ... smaller is better
Continuous load read: DiskSpd Read Loop, Queue Depth 8
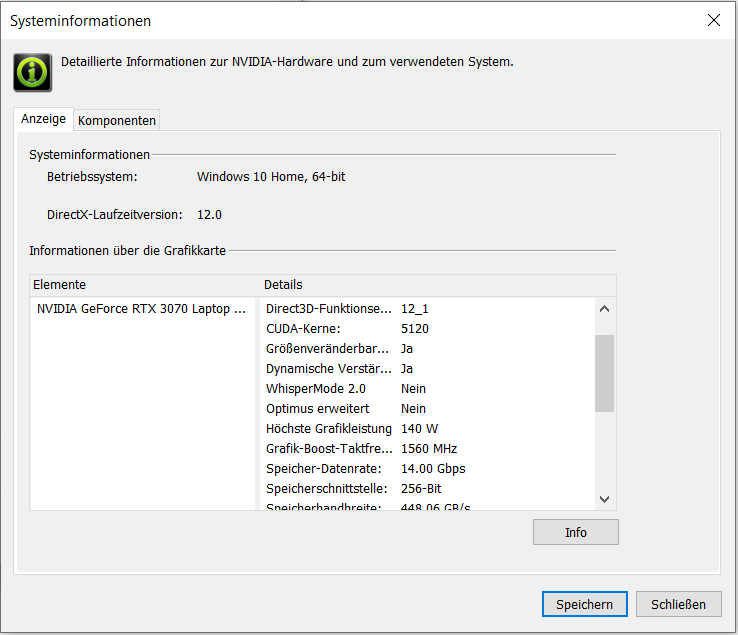
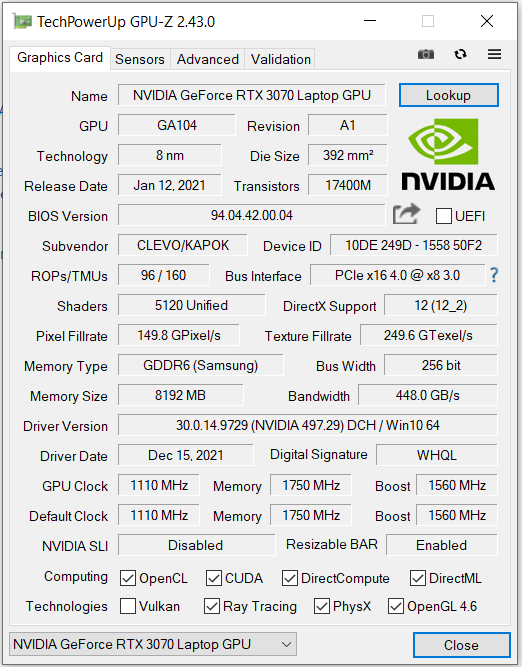
Graphics card
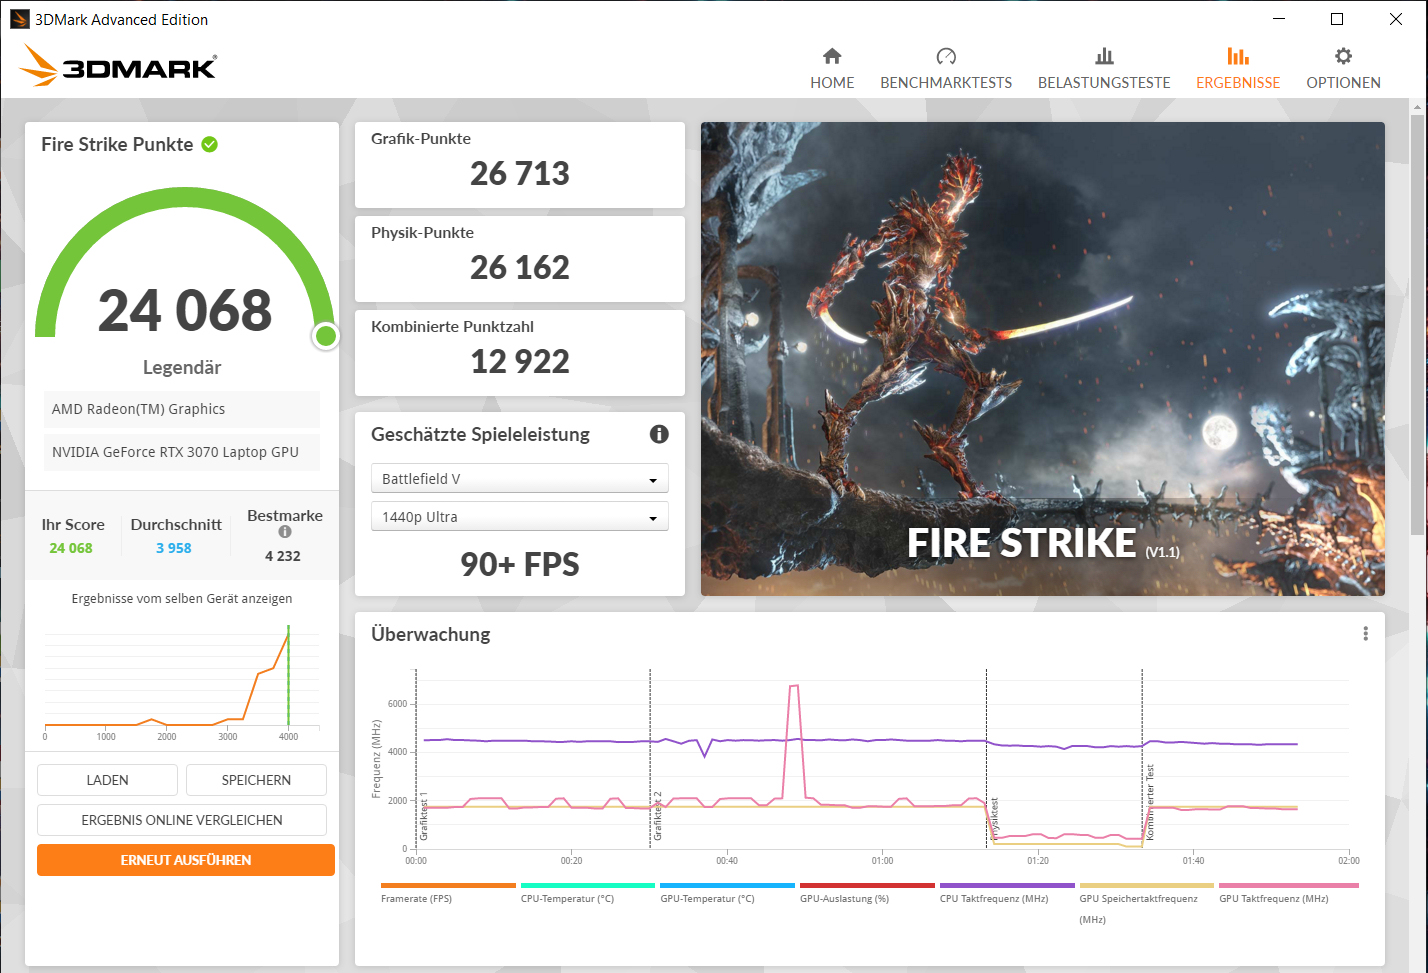
The actual performance of an RTX 3000 GPU depends on a few factors: Cooling, memory configuration, and the maximum TGP that a laptop manufacturer chooses within the limits defined by Nvidia. Gigabyte grants the GeForce RTX 3070 (overview of all RTX 3070 laptops including their TGPs) a maximum TGP of 140 watts (125 watts + 15 watts Dynamic Boost).
The 3DMark results exceed the RTX 3070 average that has been determined so far. The rates of the HP Omen 16 immediate competitor are often on par - despite its lower TGP. This might be an indication that the A5 isn't always able to exploit its maximum TGP. However, our The Witcher 3 test proves its fundamental potential.
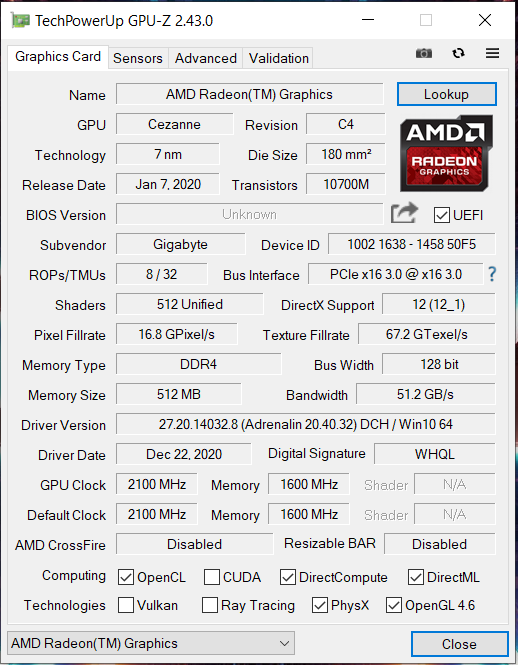
The GPU can access fast GDDR6 graphics memory (8,192 MB). The Vega 8 graphics core that's integrated into the processor is active, and the laptop works with Nvidia's Optimus graphics-switching solution.


| 3DMark 06 Standard Score | 45160 points | |
| 3DMark 11 Performance | 27915 points | |
| 3DMark Cloud Gate Standard Score | 50228 points | |
| 3DMark Fire Strike Score | 24068 points | |
| 3DMark Time Spy Score | 10535 points | |
Help | ||
| 3DMark Performance Rating - Percent | |
| Average of class Gaming | |
| Gigabyte A5 X1 | |
| Gigabyte A5 X1 | |
| Gigabyte A5 X1 | |
| HP Omen 16-b0085ng | |
| Average NVIDIA GeForce RTX 3070 Laptop GPU | |
| SCHENKER XMG Apex 15 NH57E PS | |
| MSI Katana GF66 11UG-220 -1! | |
| Acer Nitro 5 AN515-45-R1JH | |
| Gigabyte A5 X1 | |
| 3DMark 11 - 1280x720 Performance GPU | |
| Average of class Gaming (1029 - 72070, n=229, last 2 years) | |
| Gigabyte A5 X1 | |
| HP Omen 16-b0085ng | |
| Gigabyte A5 X1 (Unterhaltungsmodus) | |
| Gigabyte A5 X1 (Lautlosmodus) | |
| Average NVIDIA GeForce RTX 3070 Laptop GPU (12535 - 38275, n=54) | |
| MSI Katana GF66 11UG-220 | |
| SCHENKER XMG Apex 15 NH57E PS | |
| Acer Nitro 5 AN515-45-R1JH | |
| Gigabyte A5 X1 (Stromsparmodus) | |
| 3DMark | |
| 1920x1080 Fire Strike Graphics | |
| Average of class Gaming (781 - 53059, n=233, last 2 years) | |
| Gigabyte A5 X1 | |
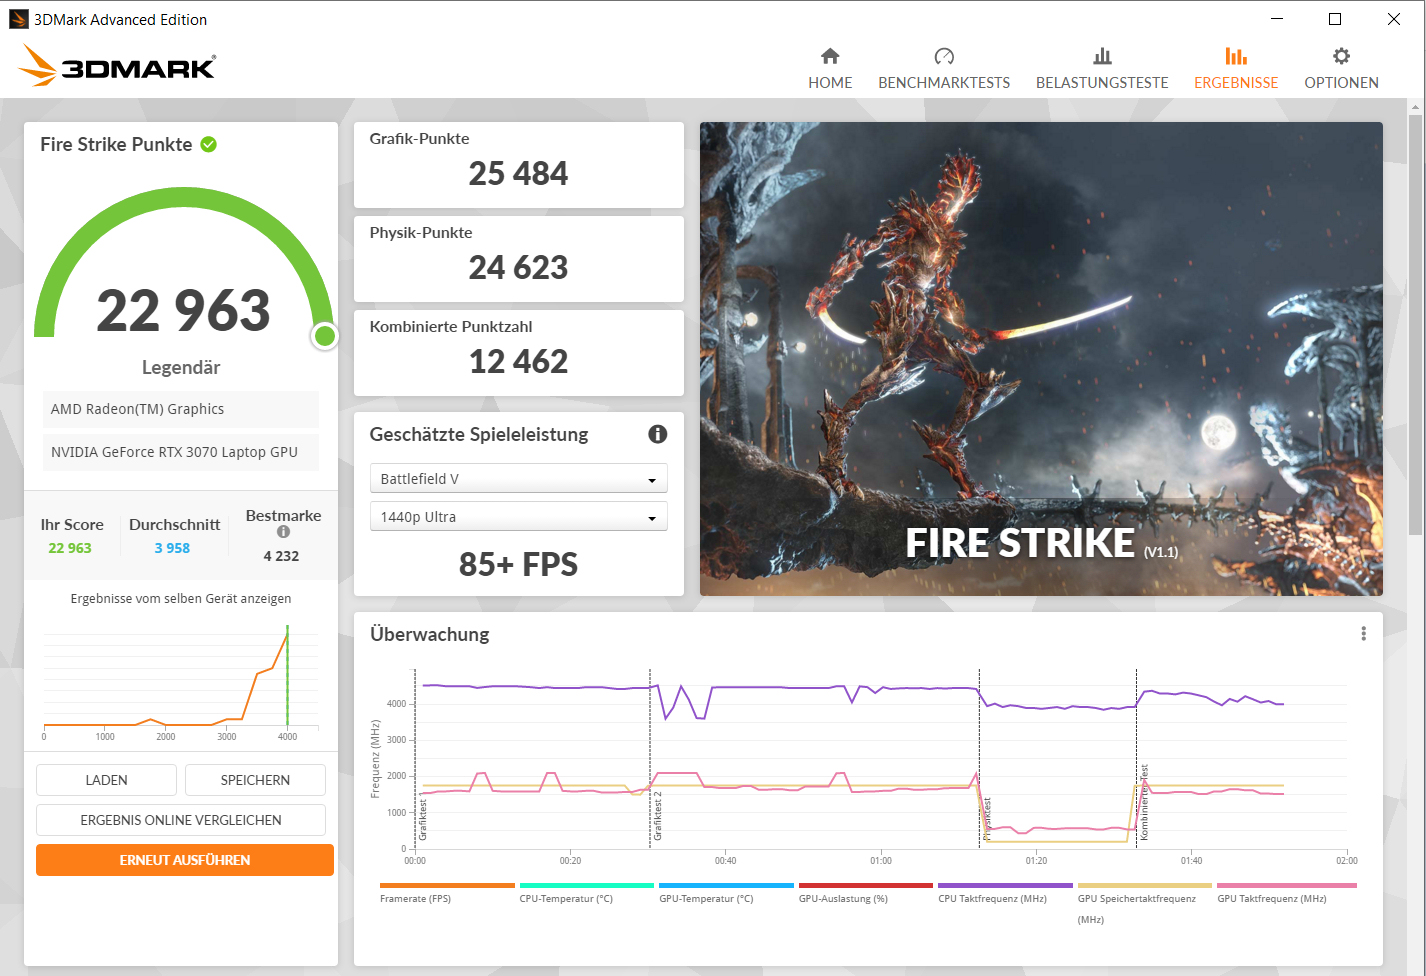
| Gigabyte A5 X1 (Unterhaltungsmodus) | |
| Gigabyte A5 X1 (Lautlosmodus) | |
| HP Omen 16-b0085ng | |
| Average NVIDIA GeForce RTX 3070 Laptop GPU (7178 - 29128, n=52) | |
| SCHENKER XMG Apex 15 NH57E PS | |
| Acer Nitro 5 AN515-45-R1JH | |
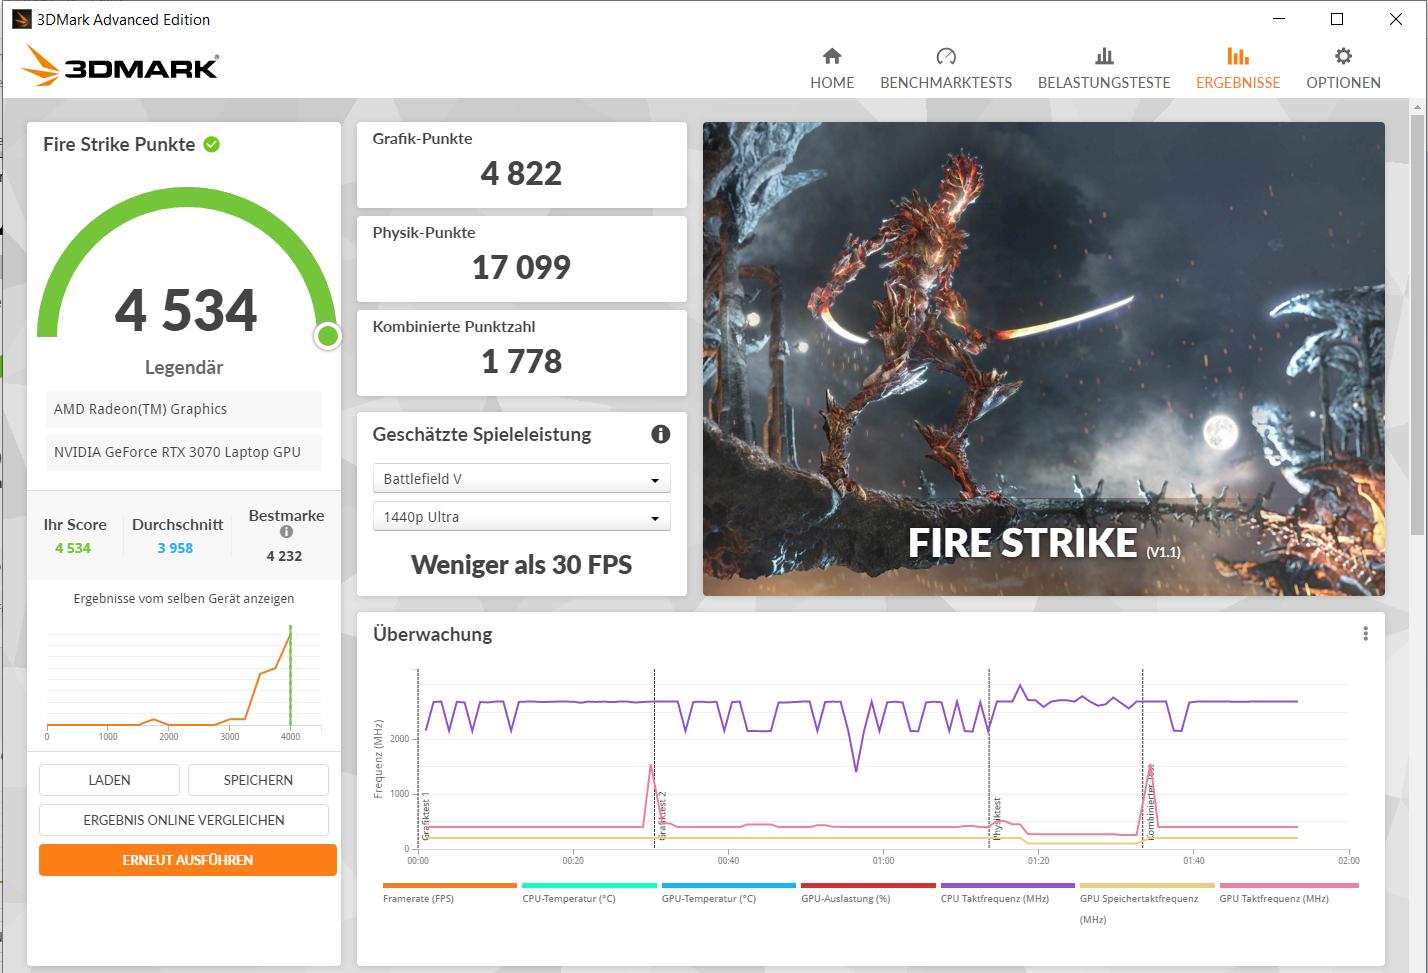
| Gigabyte A5 X1 (Stromsparmodus) | |
| 2560x1440 Time Spy Graphics | |
| Average of class Gaming (224 - 22547, n=231, last 2 years) | |
| Gigabyte A5 X1 | |
| HP Omen 16-b0085ng | |
| Gigabyte A5 X1 (Unterhaltungsmodus) | |
| Gigabyte A5 X1 (Lautlosmodus) | |
| Average NVIDIA GeForce RTX 3070 Laptop GPU (2644 - 11019, n=53) | |
| SCHENKER XMG Apex 15 NH57E PS | |
| MSI Katana GF66 11UG-220 | |
| Acer Nitro 5 AN515-45-R1JH | |
| Gigabyte A5 X1 (Stromsparmodus) | |
Gaming performance
The laptop displays all the latest games smoothly at Full HD resolution (1920x1080 pixels) and maximum quality settings. It would also be possible to use higher resolutions by connecting a suitable monitor. The frame rates are above the average in the RTX 3070 comparison.
| The Witcher 3 - 1920x1080 Ultra Graphics & Postprocessing (HBAO+) | |
| Average of class Gaming (8.61 - 216, n=225, last 2 years) | |
| Gigabyte A5 X1 | |
| Gigabyte A5 X1 (Lautlosmodus) | |
| HP Omen 16-b0085ng | |
| Average NVIDIA GeForce RTX 3070 Laptop GPU (34.9 - 109, n=52) | |
| SCHENKER XMG Apex 15 NH57E PS | |
| Acer Nitro 5 AN515-45-R1JH | |
| MSI Katana GF66 11UG-220 | |
| Gigabyte A5 X1 (Stromsparmodus) | |
| Dota 2 Reborn - 1920x1080 ultra (3/3) best looking | |
| Average of class Gaming (26.9 - 220, n=235, last 2 years) | |
| HP Omen 16-b0085ng | |
| Gigabyte A5 X1 | |
| MSI Katana GF66 11UG-220 | |
| Average NVIDIA GeForce RTX 3070 Laptop GPU (26.9 - 163.9, n=58) | |
| SCHENKER XMG Apex 15 NH57E PS | |
| Gigabyte A5 X1 (Lautlosmodus) | |
| Gigabyte A5 X1 (Unterhaltungsmodus) | |
| Gigabyte A5 X1 (Stromsparmodus) | |
| Acer Nitro 5 AN515-45-R1JH | |
| X-Plane 11.11 - 1920x1080 high (fps_test=3) | |
| Average of class Gaming (12.4 - 166.2, n=240, last 2 years) | |
| HP Omen 16-b0085ng | |
| Average NVIDIA GeForce RTX 3070 Laptop GPU (12.4 - 118.8, n=61) | |
| MSI Katana GF66 11UG-220 | |
| MSI Katana GF66 11UG-220 | |
| SCHENKER XMG Apex 15 NH57E PS | |
| Gigabyte A5 X1 | |
| Gigabyte A5 X1 (Unterhaltungsmodus) | |
| Gigabyte A5 X1 (Lautlosmodus) | |
| Gigabyte A5 X1 (Stromsparmodus) | |
| Acer Nitro 5 AN515-45-R1JH | |
| Final Fantasy XV Benchmark - 1920x1080 High Quality | |
| Average of class Gaming (9.13 - 194.9, n=225, last 2 years) | |
| Gigabyte A5 X1 (1.3) | |
| Gigabyte A5 X1 (1.3, Unterhaltungsmodus) | |
| Average NVIDIA GeForce RTX 3070 Laptop GPU (27.9 - 107, n=49) | |
| Acer Nitro 5 AN515-45-R1JH (1.3) | |
| Gigabyte A5 X1 (1.3, Lautlosmodus) | |
| MSI Katana GF66 11UG-220 (1.3) | |
| Gigabyte A5 X1 (1.3, Stromsparmodus) | |
| GTA V - 1920x1080 Highest Settings possible AA:4xMSAA + FX AF:16x | |
| Average of class Gaming (6.38 - 167.7, n=215, last 2 years) | |
| HP Omen 16-b0085ng | |
| Gigabyte A5 X1 | |
| MSI Katana GF66 11UG-220 | |
| Gigabyte A5 X1 (Unterhaltungsmodus) | |
| Gigabyte A5 X1 (Lautlosmodus) | |
| Average NVIDIA GeForce RTX 3070 Laptop GPU (21.7 - 125.8, n=50) | |
| Gigabyte A5 X1 (Stromsparmodus) | |
| SCHENKER XMG Apex 15 NH57E PS | |
| Acer Nitro 5 AN515-45-R1JH | |
| Strange Brigade - 1920x1080 ultra AA:ultra AF:16 | |
| Average of class Gaming (14.6 - 421, n=223, last 2 years) | |
| HP Omen 16-b0085ng (1.47.22.14 D3D12) | |
| Gigabyte A5 X1 (1.47.22.14 D3D12, Lautlosmodus) | |
| Gigabyte A5 X1 (1.47.22.14 D3D12) | |
| Average NVIDIA GeForce RTX 3070 Laptop GPU (36.2 - 194, n=46) | |
| SCHENKER XMG Apex 15 NH57E PS (1.47.22.14 D3D12) | |
| MSI Katana GF66 11UG-220 (1.47.22.14 D3D12) | |
| Acer Nitro 5 AN515-45-R1JH (1.47.22.14 D3D12) | |
| F1 2021 - 1920x1080 Ultra High Preset + Raytracing AA:T AF:16x | |
| Average of class Gaming (13.5 - 271, n=63, last 2 years) | |
| Gigabyte A5 X1 (831795) | |
| Gigabyte A5 X1 (831795, Unterhaltungsmodus) | |
| Gigabyte A5 X1 (831795, Lautlosmodus) | |
| Average NVIDIA GeForce RTX 3070 Laptop GPU (33.1 - 123.1, n=23) | |
| MSI Katana GF66 11UG-220 (800360) | |
| Gigabyte A5 X1 (831795, Stromsparmodus) | |
| Far Cry 6 | |
| 1920x1080 Ultra Graphics Quality + HD Textures AA:T | |
| Average of class Gaming (14.7 - 167, n=35, last 2 years) | |
| Average NVIDIA GeForce RTX 3070 Laptop GPU (74 - 99.8, n=4) | |
| Gigabyte A5 X1 | |
| 1920x1080 Ultra Graphics Quality + HD Textures + DXR AA:T | |
| Average of class Gaming (53 - 119, n=11, last 2 years) | |
| Gigabyte A5 X1 | |
| Average NVIDIA GeForce RTX 3070 Laptop GPU (19.1 - 69, n=3) | |
| Riders Republic - 1920x1080 Ultra Preset | |
| Average NVIDIA GeForce RTX 3070 Laptop GPU (98 - 111, n=4) | |
| Gigabyte A5 X1 | |
| Average of class Gaming (13 - 179, n=10, last 2 years) | |
| Forza Horizon 5 - 1920x1080 Extreme Preset | |
| Average NVIDIA GeForce RTX 3070 Laptop GPU (75 - 86, n=5) | |
| Average of class Gaming (19 - 124, n=11, last 2 years) | |
| Gigabyte A5 X1 | |
| Battlefield 2042 | |
| 1920x1080 Ultra Preset | |
| Average of class Gaming (106.1 - 172.6, n=2, last 2 years) | |
| Average NVIDIA GeForce RTX 3070 Laptop GPU (86.6 - 102, n=2) | |
| Gigabyte A5 X1 | |
| 1920x1080 Ultra Preset + Ray Tracing | |
| Average of class Gaming (last 2 years) | |
| Average NVIDIA GeForce RTX 3070 Laptop GPU (69.3 - 81.7, n=2) | |
| Gigabyte A5 X1 | |
| Halo Infinite - 1920x1080 Ultra Preset | |
| Average of class Gaming (44.6 - 197.5, n=10, last 2 years) | |
| Average NVIDIA GeForce RTX 3070 Laptop GPU (90.1 - 102, n=2) | |
| Gigabyte A5 X1 | |
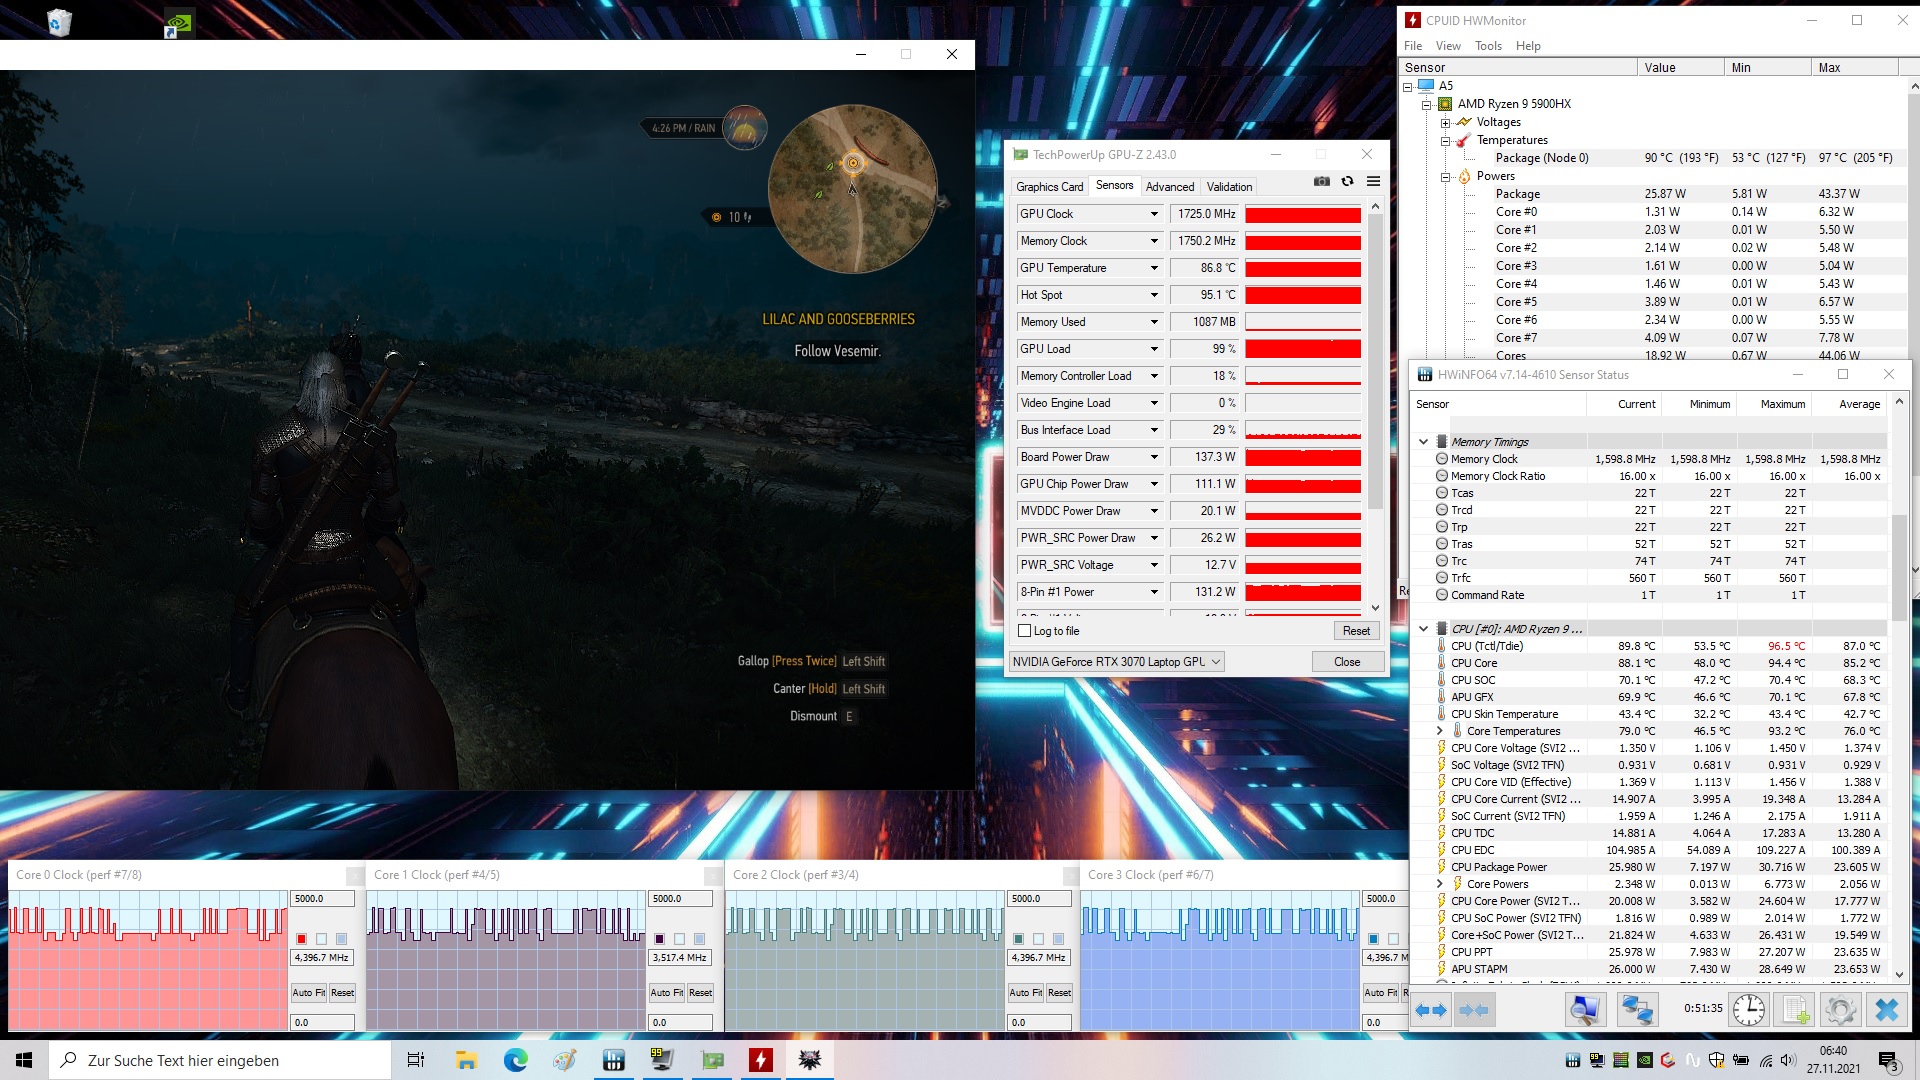
In order to verify whether the frame rates remain largely constant over a prolonged period of time, we let the game The Witcher 3 run for about 60 minutes at Full HD resolution and maximum quality settings. The character is not moved. A drop in frame rates wasn't found.
The Witcher 3 FPS diagram
| low | med. | high | ultra | |
| GTA V (2015) | 179 | 172 | 155 | 94.7 |
| The Witcher 3 (2015) | 309 | 261 | 171 | 101 |
| Dota 2 Reborn (2015) | 152 | 146 | 131 | 124 |
| Final Fantasy XV Benchmark (2018) | 170 | 127 | 95.4 | |
| X-Plane 11.11 (2018) | 103 | 90 | 75.7 | |
| Far Cry 5 (2018) | 137 | 118 | 114 | 107 |
| Strange Brigade (2018) | 334 | 195 | 179 | 169 |
| F1 2021 (2021) | 291 | 199 | 171 | 114 |
| Far Cry 6 (2021) | 119 | 101 | 91 | 84 |
| Riders Republic (2021) | 163 | 122 | 106 | 98 |
| Forza Horizon 5 (2021) | 191 | 120 | 109 | 75 |
| Battlefield 2042 (2021) | 134 | 107 | 95.5 | 86.6 |
| Halo Infinite (2021) | 106 | 93.9 | 90.1 |
Emissions - The X1 produces a lot of noise under load
Noise emissions
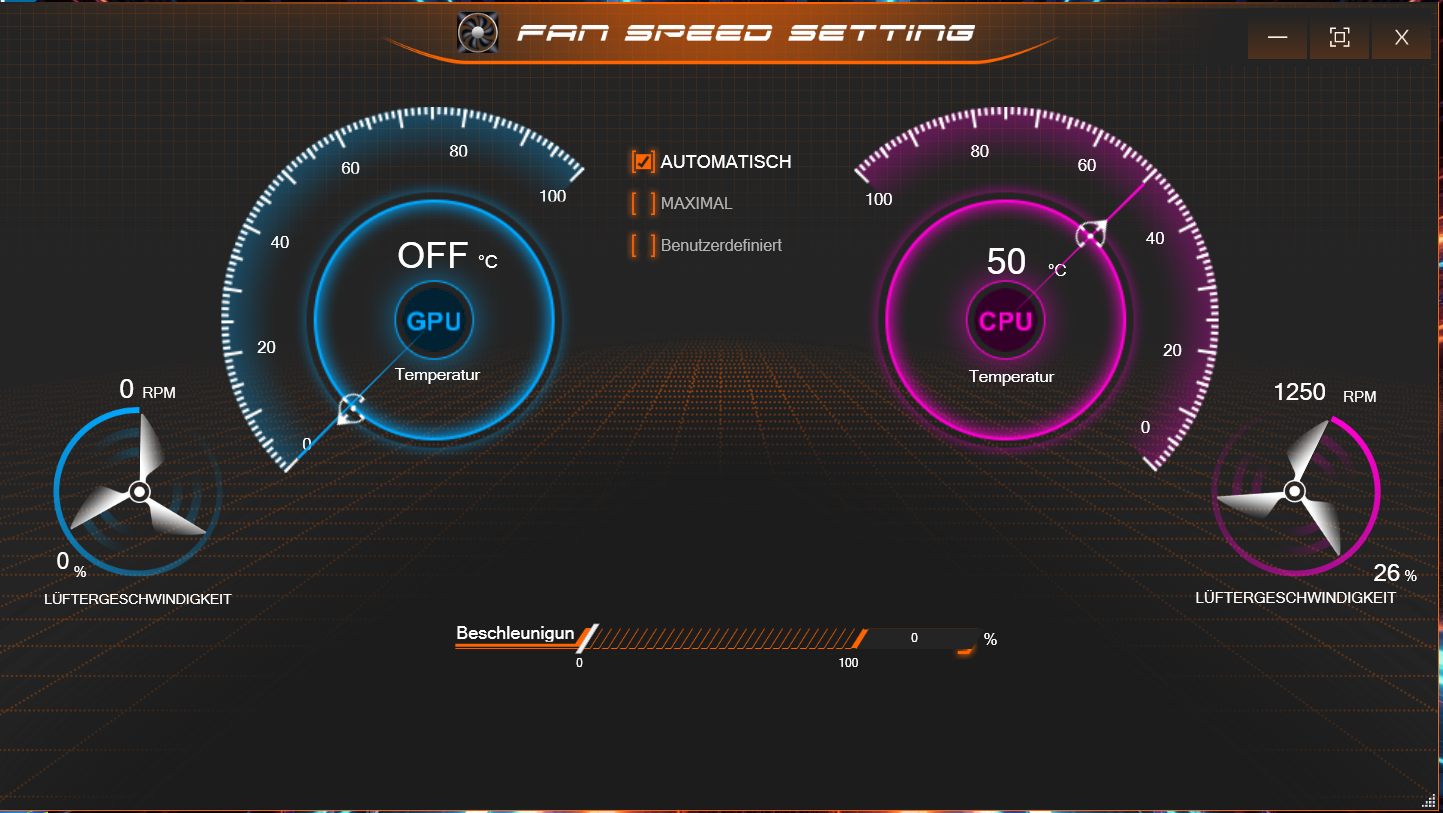
The two fans normally only generate little noise in everyday use (office, Internet). However, they occasionally turn up unnecessarily - the sound pressure level can rise to values above 40 dB(A). Gigabyte should make further adjustments in this regard. With a maximum of 58 dB(A) (stress test) and 56 dB(A) (our The Witcher 3 test), things get quite loud under load. The Omen 16 only scores slightly better than the A5. The MSI Katana GF66 is considerably quieter.
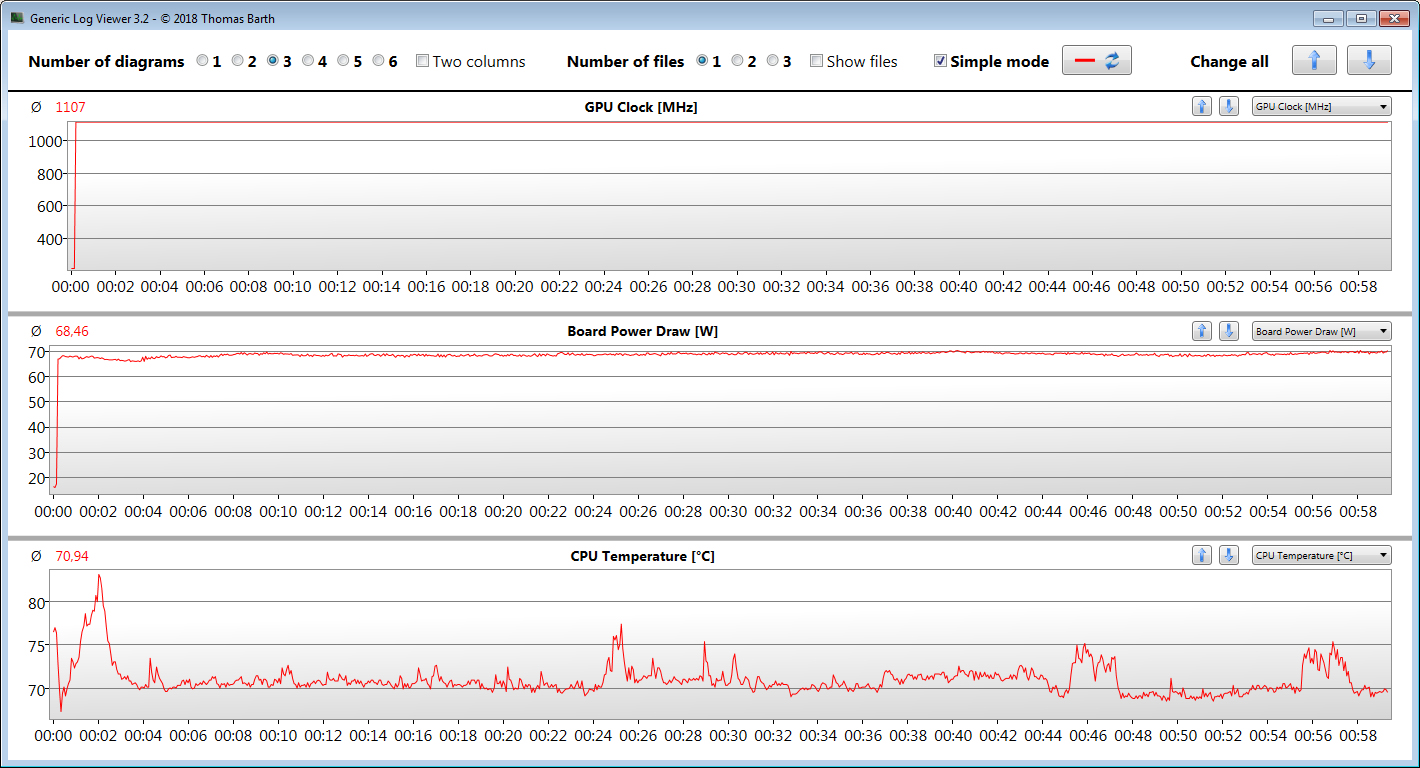
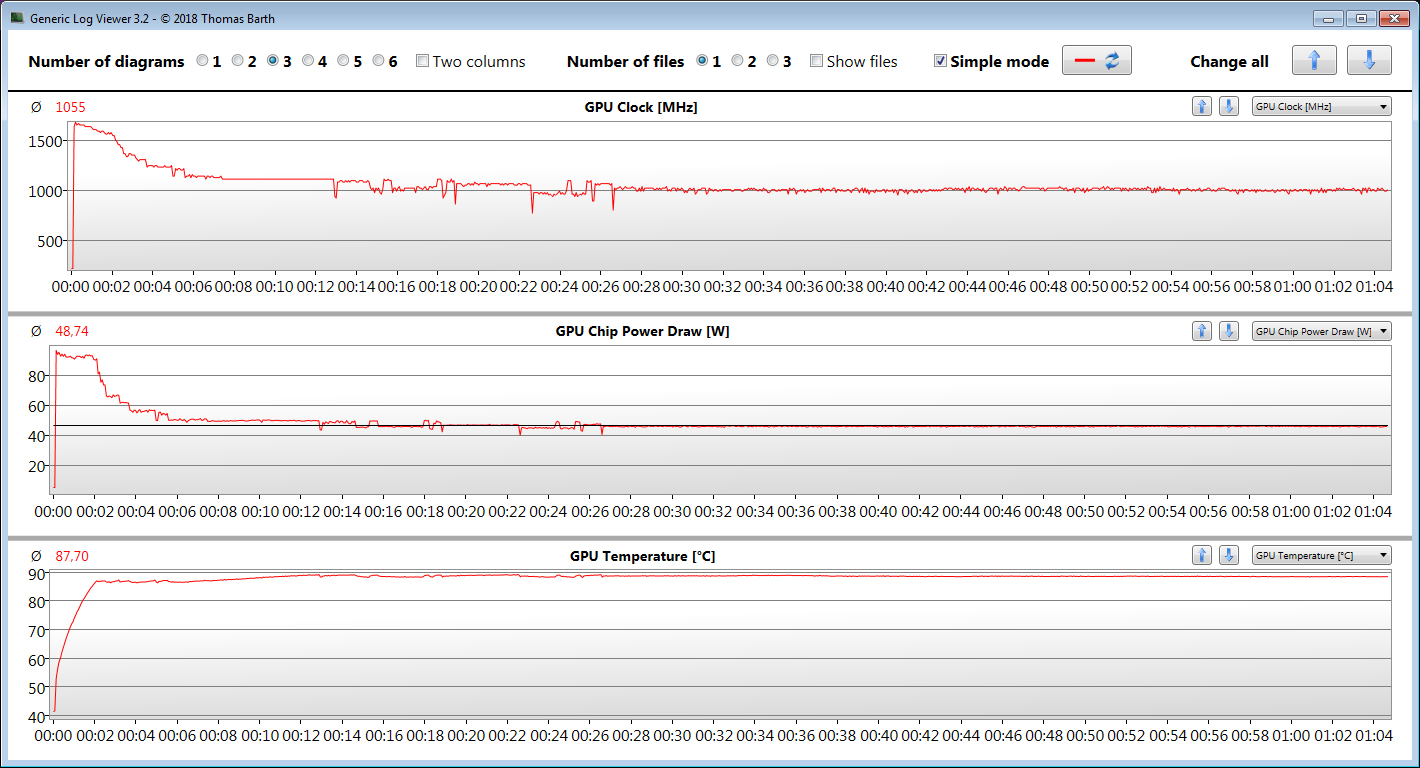
The noise level under load can be reduced significantly by using the "Silent Mode" performance profile. In this case, the fans run at very low speeds and only emit a quiet hiss here. While the CPU can still run at high clock rates continuously in this scenario, the GPU clock speed is reduced quite quickly for thermal reasons. This is illustrated by our The Witcher 3 test. Nevertheless, gaming would still be possible - albeit at reduced settings.
Noise Level
| Idle |
| 27 / 29 / 32 dB(A) |
| Load |
| 57 / 58 dB(A) |
 | ||
30 dB silent 40 dB(A) audible 50 dB(A) loud |
||
min: | ||
| Gigabyte A5 X1 GeForce RTX 3070 Laptop GPU, R9 5900HX | HP Omen 16-b0085ng GeForce RTX 3070 Laptop GPU, i7-11800H | MSI Katana GF66 11UG-220 GeForce RTX 3070 Laptop GPU, i7-11800H | Acer Nitro 5 AN515-45-R1JH GeForce RTX 3070 Laptop GPU, R7 5800H | SCHENKER XMG Apex 15 NH57E PS GeForce RTX 3060 Laptop GPU, R7 5800H | |
|---|---|---|---|---|---|
| Noise | 12% | -1% | 9% | 14% | |
| off / environment * | 25 | 23 8% | 25 -0% | 25 -0% | 23 8% |
| Idle Minimum * | 27 | 23 15% | 34 -26% | 25 7% | 23 15% |
| Idle Average * | 29 | 23 21% | 35 -21% | 25 14% | 23 21% |
| Idle Maximum * | 32 | 34.81 -9% | 36 -13% | 32.2 -1% | 26.4 17% |
| Load Average * | 57 | 35.02 39% | 48 16% | 45.8 20% | 34.25 40% |
| Witcher 3 ultra * | 56 | 52 7% | 46 18% | 58.4 -4% | |
| Load Maximum * | 58 | 56 3% | 49 16% | 49.1 15% | 58.42 -1% |
* ... smaller is better
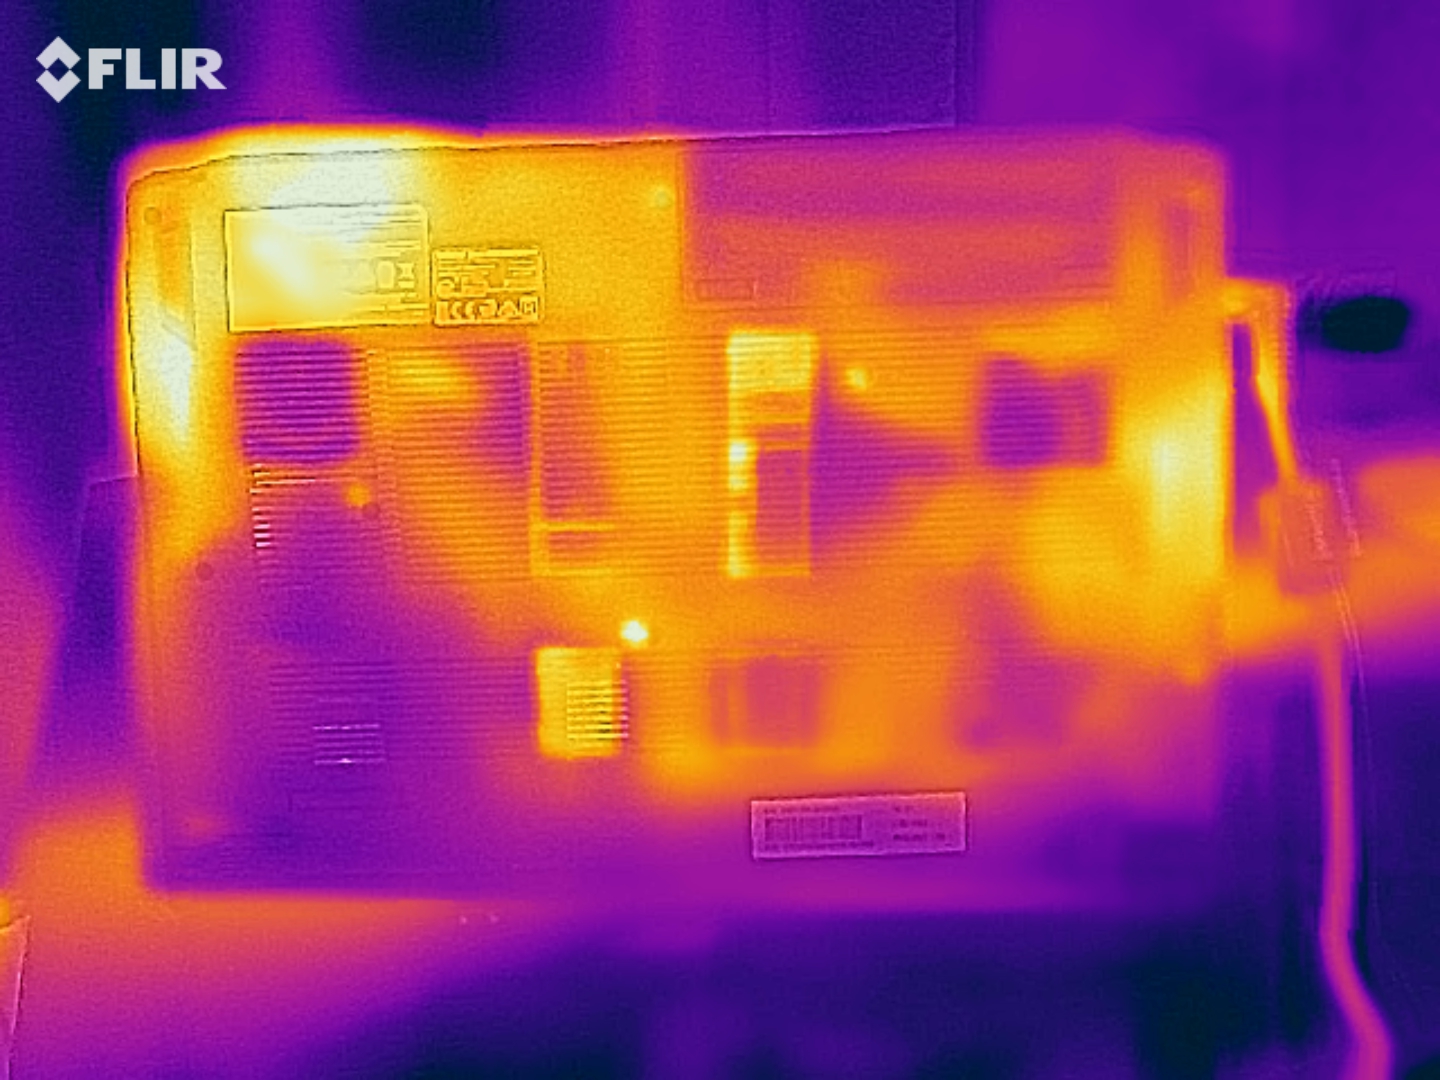
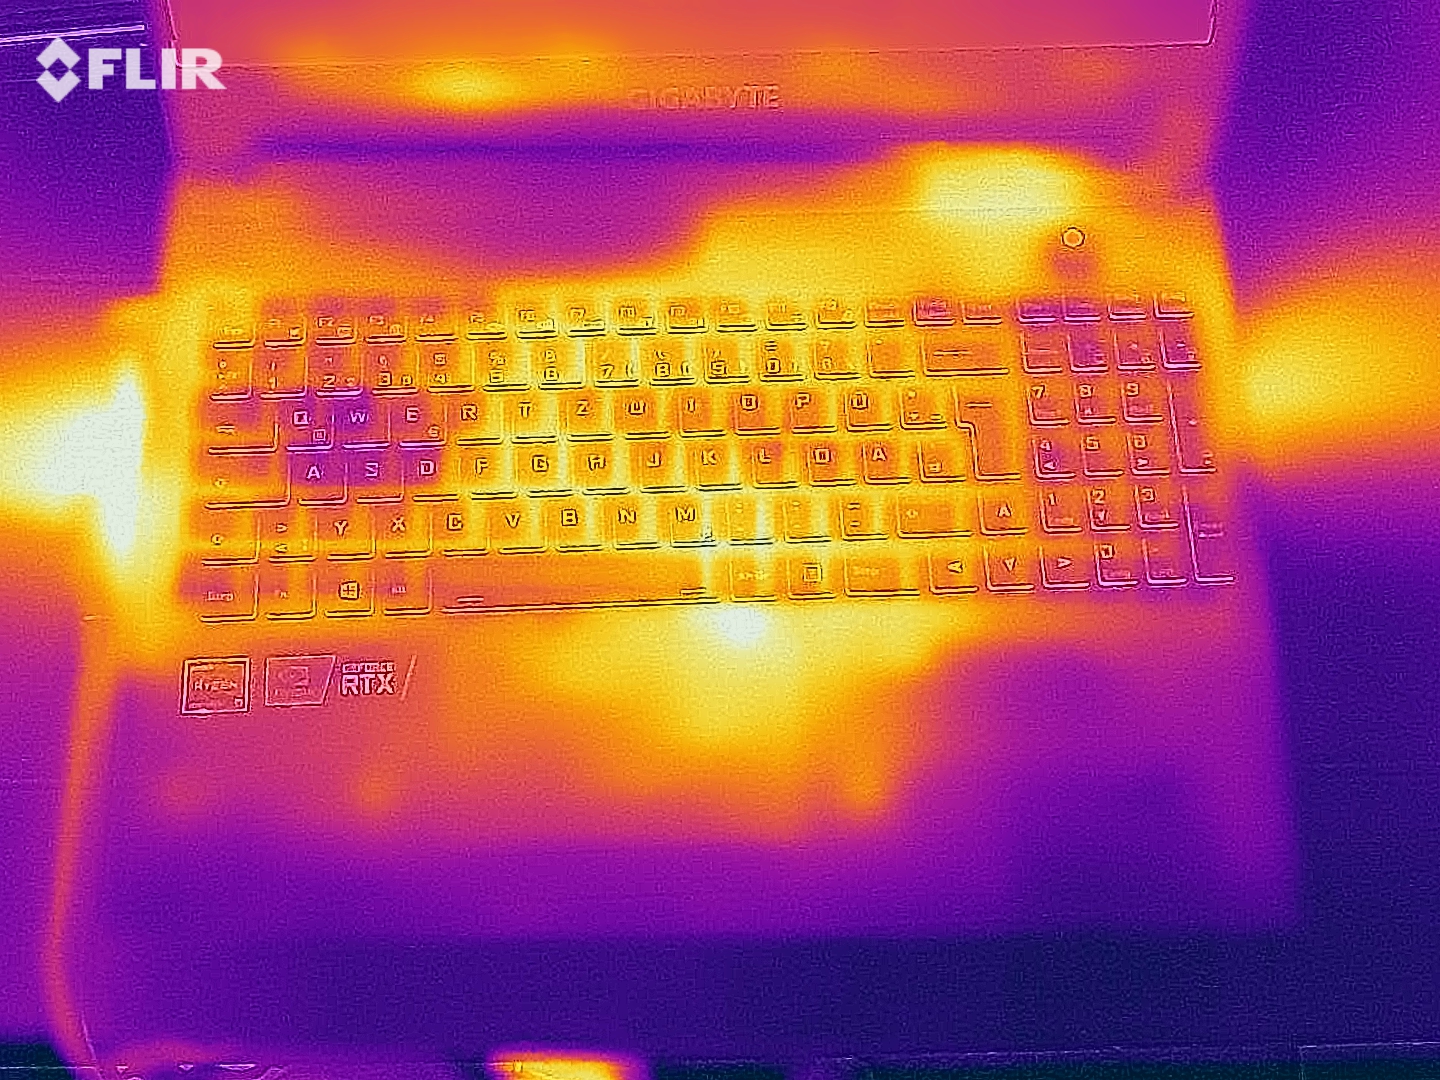
Temperature
The case temperatures remain within the green zone in everyday use (office, Internet). Under load (stress test, our The Witcher 3 test), the laptop heats up noticeably, but not excessively. In extreme cases, the CPU heats up to over 90 °C (~194 °F).
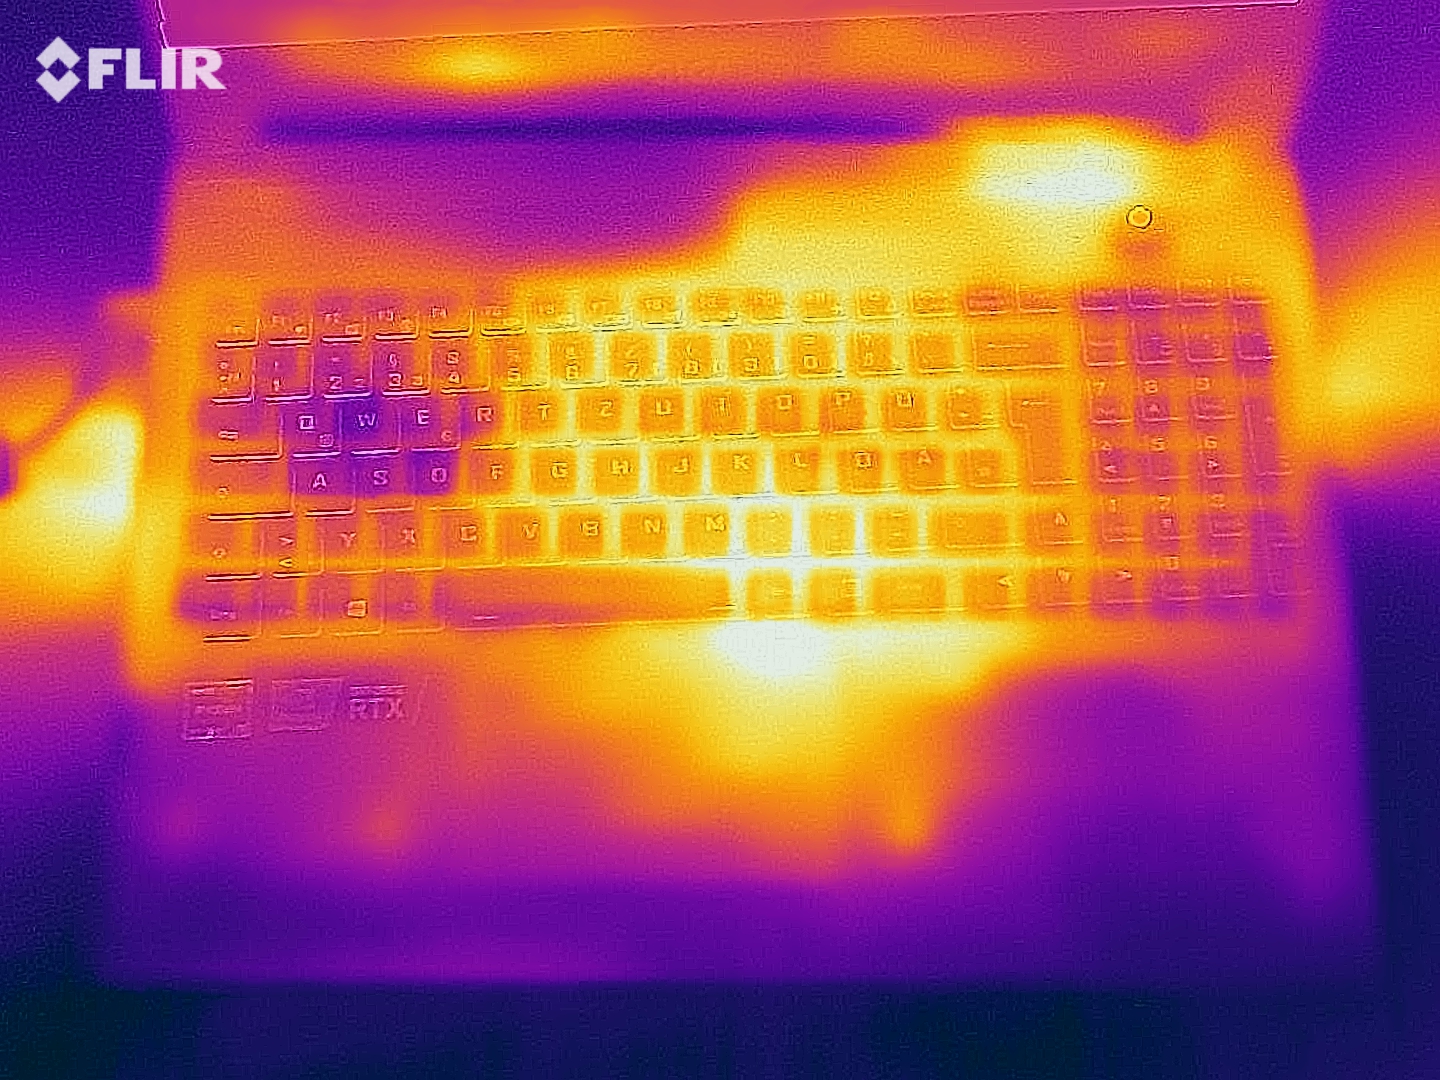
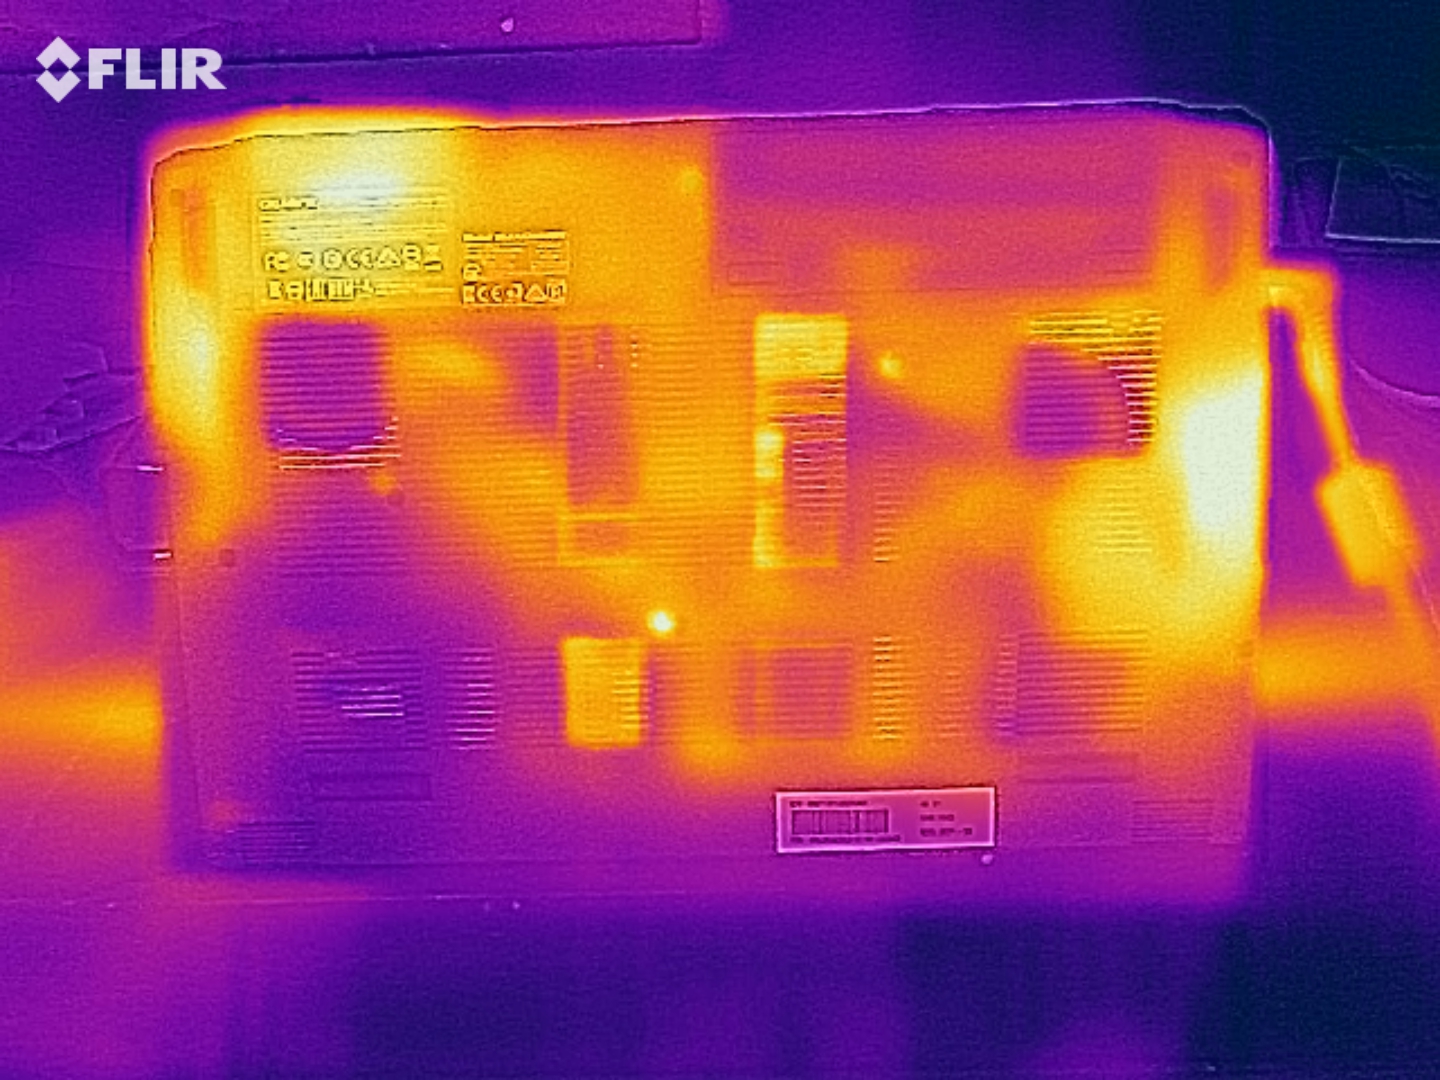
(-) The maximum temperature on the upper side is 47 °C / 117 F, compared to the average of 40.4 °C / 105 F, ranging from 21.2 to 68.8 °C for the class Gaming.
(-) The bottom heats up to a maximum of 51 °C / 124 F, compared to the average of 43.2 °C / 110 F
(+) In idle usage, the average temperature for the upper side is 25.9 °C / 79 F, compared to the device average of 33.8 °C / 93 F.
(-) Playing The Witcher 3, the average temperature for the upper side is 44.4 °C / 112 F, compared to the device average of 33.8 °C / 93 F.
(-) The palmrests and touchpad can get very hot to the touch with a maximum of 47 °C / 116.6 F.
(-) The average temperature of the palmrest area of similar devices was 28.9 °C / 84 F (-18.1 °C / -32.6 F).
| Gigabyte A5 X1 AMD Ryzen 9 5900HX, NVIDIA GeForce RTX 3070 Laptop GPU | HP Omen 16-b0085ng Intel Core i7-11800H, NVIDIA GeForce RTX 3070 Laptop GPU | MSI Katana GF66 11UG-220 Intel Core i7-11800H, NVIDIA GeForce RTX 3070 Laptop GPU | Acer Nitro 5 AN515-45-R1JH AMD Ryzen 7 5800H, NVIDIA GeForce RTX 3070 Laptop GPU | SCHENKER XMG Apex 15 NH57E PS AMD Ryzen 7 5800H, NVIDIA GeForce RTX 3060 Laptop GPU | |
|---|---|---|---|---|---|
| Heat | -16% | -10% | -10% | 6% | |
| Maximum Upper Side * | 47 | 48 -2% | 56 -19% | 53.2 -13% | 36 23% |
| Maximum Bottom * | 51 | 55 -8% | 49 4% | 58.2 -14% | 38 25% |
| Idle Upper Side * | 27 | 33 -22% | 36 -33% | 29.5 -9% | 31 -15% |
| Idle Bottom * | 30 | 39 -30% | 28 7% | 31.2 -4% | 33 -10% |
* ... smaller is better
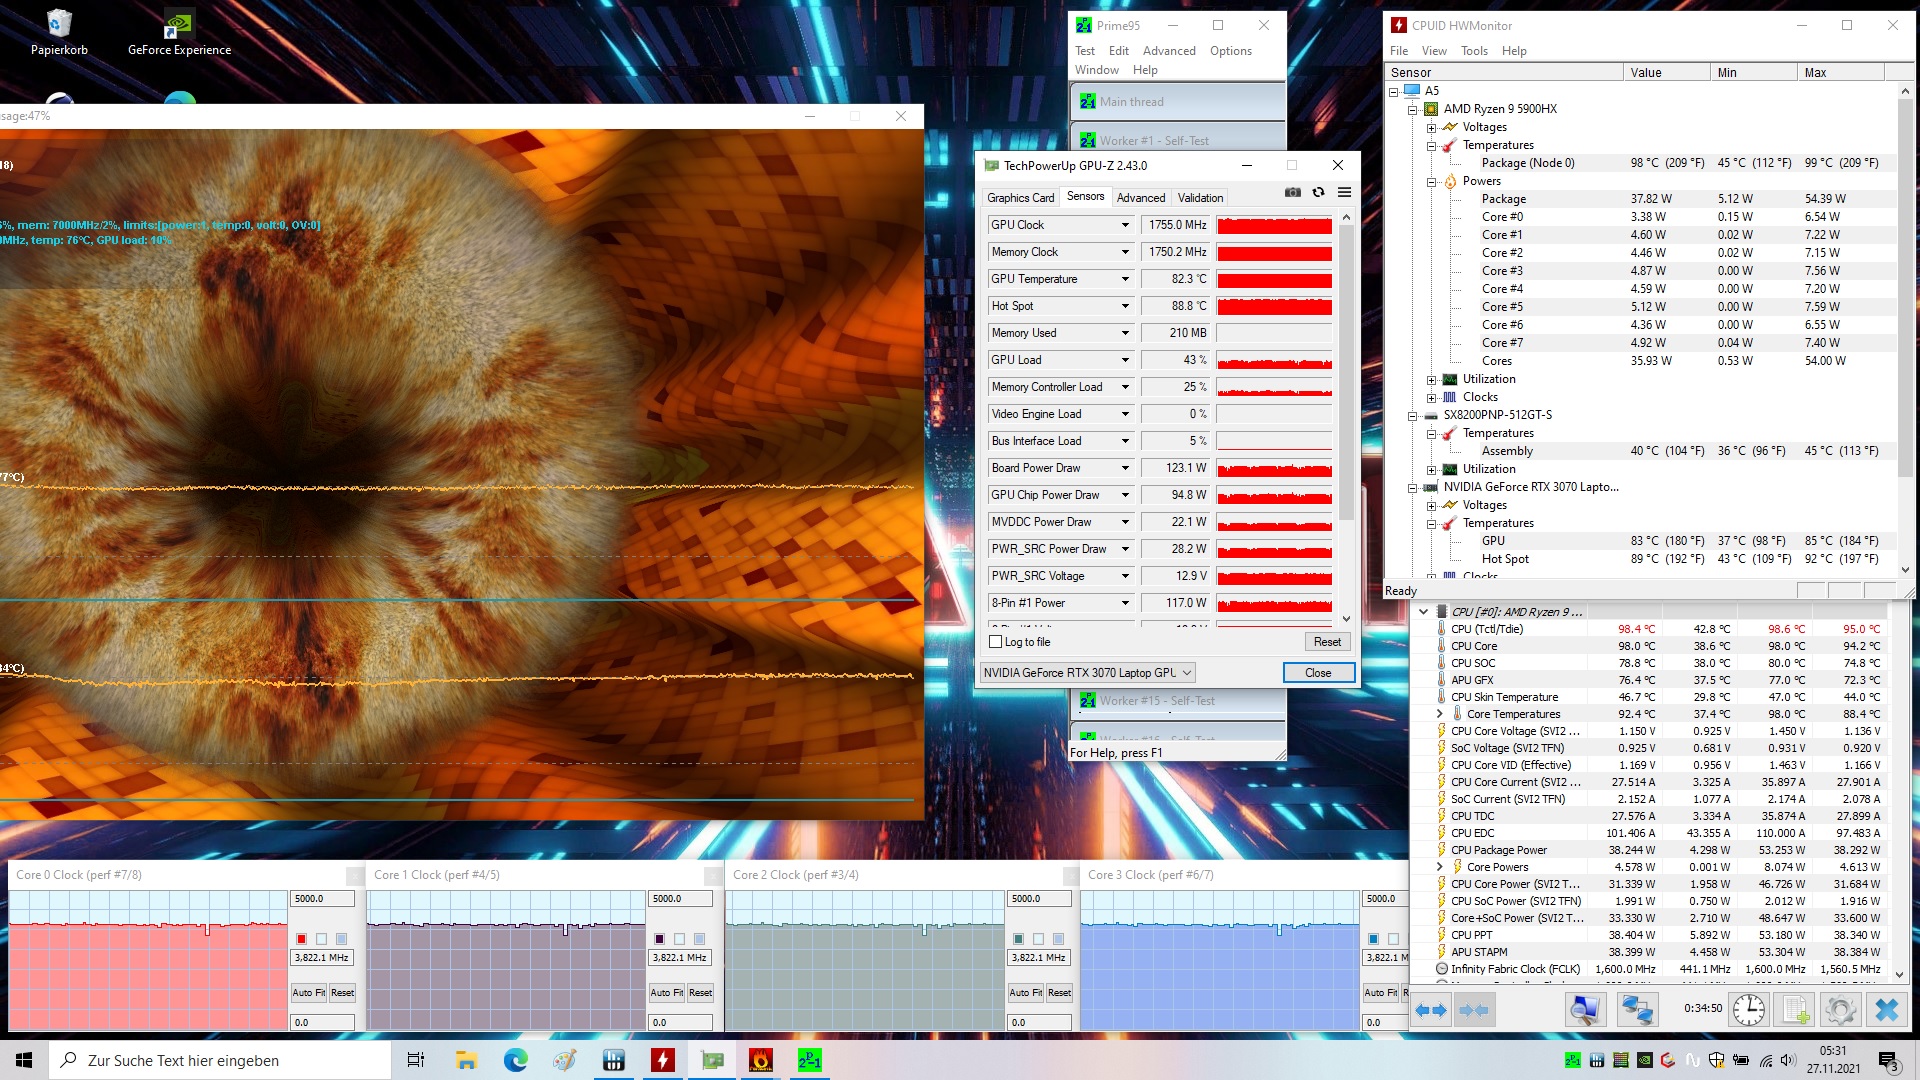
Stress test
The CPU and GPU complete the stress test (Prime95 and FurMark run for at least an hour) at 3.8 GHz and about 1,755 MHz, respectively. The stress test represents an extreme scenario. With this test, we check whether the system remains stable under full load.
Speakers
The stereo speakers produce a decent sound that lacks bass. The maximum volume should be higher, though. Headphones or external speakers are recommended for a better sound experience.
Gigabyte A5 X1 audio analysis
(±) | speaker loudness is average but good (80 dB)
Bass 100 - 315 Hz
(-) | nearly no bass - on average 22% lower than median
(±) | linearity of bass is average (12.5% delta to prev. frequency)
Mids 400 - 2000 Hz
(+) | balanced mids - only 1.9% away from median
(+) | mids are linear (6% delta to prev. frequency)
Highs 2 - 16 kHz
(+) | balanced highs - only 4.2% away from median
(+) | highs are linear (6% delta to prev. frequency)
Overall 100 - 16.000 Hz
(±) | linearity of overall sound is average (17% difference to median)
Compared to same class
» 42% of all tested devices in this class were better, 12% similar, 46% worse
» The best had a delta of 6%, average was 18%, worst was 132%
Compared to all devices tested
» 25% of all tested devices were better, 7% similar, 67% worse
» The best had a delta of 4%, average was 25%, worst was 134%
Energy management - The Gigabyte laptop offers decent battery life
Energy consumption
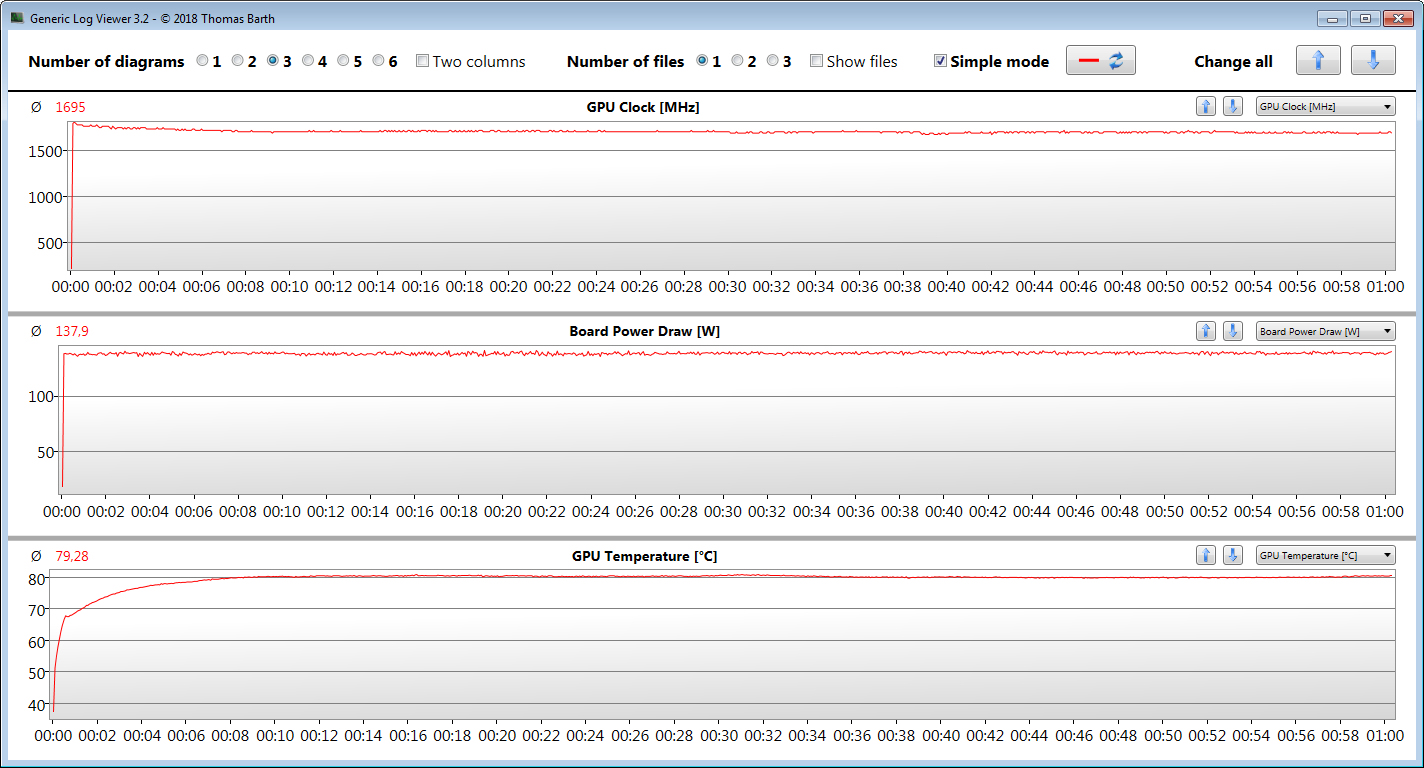
In idle usage or under low load, the A5's energy consumption is normal for the hardware installed here - the Intel-based competition requires a bit more energy in some cases. The stress test and our The Witcher 3 test increase the power consumption of the Gigabyte laptop to up to 272 watts and an average of 204 watts, respectively. This makes it the most energy-hungry device within our comparison field. Since the battery didn't drain, the included power adapter (rated output: 230 watts) seems to be of enough capacity. The following graphs illustrate the laptop's fairly constant power consumption during the stress test and our The Witcher 3 test.
| Off / Standby | |
| Idle | |
| Load |
|
| Gigabyte A5 X1 R9 5900HX, GeForce RTX 3070 Laptop GPU | HP Omen 16-b0085ng i7-11800H, GeForce RTX 3070 Laptop GPU | MSI Katana GF66 11UG-220 i7-11800H, GeForce RTX 3070 Laptop GPU | Acer Nitro 5 AN515-45-R1JH R7 5800H, GeForce RTX 3070 Laptop GPU | SCHENKER XMG Apex 15 NH57E PS R7 5800H, GeForce RTX 3060 Laptop GPU | Average NVIDIA GeForce RTX 3070 Laptop GPU | Average of class Gaming | |
|---|---|---|---|---|---|---|---|
| Power Consumption | -4% | 11% | 13% | 3% | -35% | -29% | |
| Idle Minimum * | 10 | 12 -20% | 8 20% | 8.8 12% | 10.5 -5% | 15.6 ? -56% | 13.8 ? -38% |
| Idle Average * | 12 | 18 -50% | 12 -0% | 13 -8% | 15 -25% | 20.1 ? -68% | 19.1 ? -59% |
| Idle Maximum * | 16 | 21 -31% | 22 -38% | 14.6 9% | 17 -6% | 29.4 ? -84% | 26.8 ? -68% |
| Load Average * | 124 | 94 24% | 98 21% | 133 -7% | 109 12% | 110.8 ? 11% | 110.9 ? 11% |
| Witcher 3 ultra * | 204 | 147 28% | 152 25% | 134 34% | 186 9% | ||
| Load Maximum * | 272 | 199 27% | 162 40% | 164 40% | 186 32% | 214 ? 21% | 250 ? 8% |
* ... smaller is better
The Witcher 3 energy consumption
Energy consumption with an external monitor
Battery life
The 15.6-incher achieves runtimes of 6:21 hours and 7:15 hours in the Wi-Fi test (accessing websites via a script) and video test (short film Big Buck Bunny (H.264 encoding, Full HD) running in a loop), respectively. The laptop's energy-saving features are disabled during both tests, and the display brightness is set to about 150 cd/m². In addition, the wireless modules are disabled for the video test.
| Gigabyte A5 X1 R9 5900HX, GeForce RTX 3070 Laptop GPU, 48.96 Wh | HP Omen 16-b0085ng i7-11800H, GeForce RTX 3070 Laptop GPU, 83 Wh | MSI Katana GF66 11UG-220 i7-11800H, GeForce RTX 3070 Laptop GPU, 90 Wh | Acer Nitro 5 AN515-45-R1JH R7 5800H, GeForce RTX 3070 Laptop GPU, 57.5 Wh | SCHENKER XMG Apex 15 NH57E PS R7 5800H, GeForce RTX 3060 Laptop GPU, 49 Wh | Average of class Gaming | |
|---|---|---|---|---|---|---|
| Battery Runtime | 2% | -12% | -11% | -10% | -3% | |
| Reader / Idle | 604 | 547 -9% | 552 -9% | 544 ? -10% | ||
| H.264 | 435 | 325 -25% | 413 -5% | 277 -36% | 399 ? -8% | |
| WiFi v1.3 | 381 | 457 20% | 317 -17% | 340 -11% | 389 2% | 368 ? -3% |
| Load | 77 | 85 10% | 70 -9% | 62 -19% | 81 5% | 84.2 ? 9% |
Pros
Cons
Verdict - The A5 X1 does what it's meant to do
The Ryzen 9 5900HX APU and the GeForce RTX 3070 laptop GPU (max. TGP: 140 watts) bring all the latest games smoothly onto the Full HD screen in full detail. Resolutions beyond Full HD are also possible if a suitable monitor is connected. The CPU and GPU run at consistently high clock rates.
Gigabyte delivers a solid gaming laptop with the A5 X1.
The laptop heats up noticeably under load, but not excessively. Noise development is in line with the class: The laptop gets loud under load. The "Silent Mode" energy profile leads to a significant noise decrease. The resulting reduced computing power is still sufficient for gaming - with some compromises.
The sparse storage capacity (512 GB) can be expanded with a second M.2 SSD and/or a 2.5-inch storage drive. The matte, viewing-angle stable display (Full HD, IPS, 240 Hz) scores points in terms of brightness, color reproduction, and color-space coverage. However, its contrast is too low. Battery life is perfectly fine. It's a pity that the battery can't be charged via USB-C.
An alternative to the A5 X1 would be the HP Omen 16. It offers a slightly larger display and Thunderbolt 4, but the HP laptop can barely take advantage of the much larger battery (83 Wh).
Price and availability
At the time of writing, the Gigabyte A5 X1 can be found on Amazon in the configuration that we tested (Ryzen 9 5900HX, GeForce RTX 3070, 16 GB RAM, 512 GB SSD) at a currently discounted price of $1,699.
Gigabyte A5 X1
-
01/03/2022 v7
Sascha Mölck

Pricecompare

