 Deutsch
 English
 Español
 Français
 Italiano
 Nederlands
 Polski
 Português
 Русский
 Türkçe
 Svenska
 Chinese
 Magyar
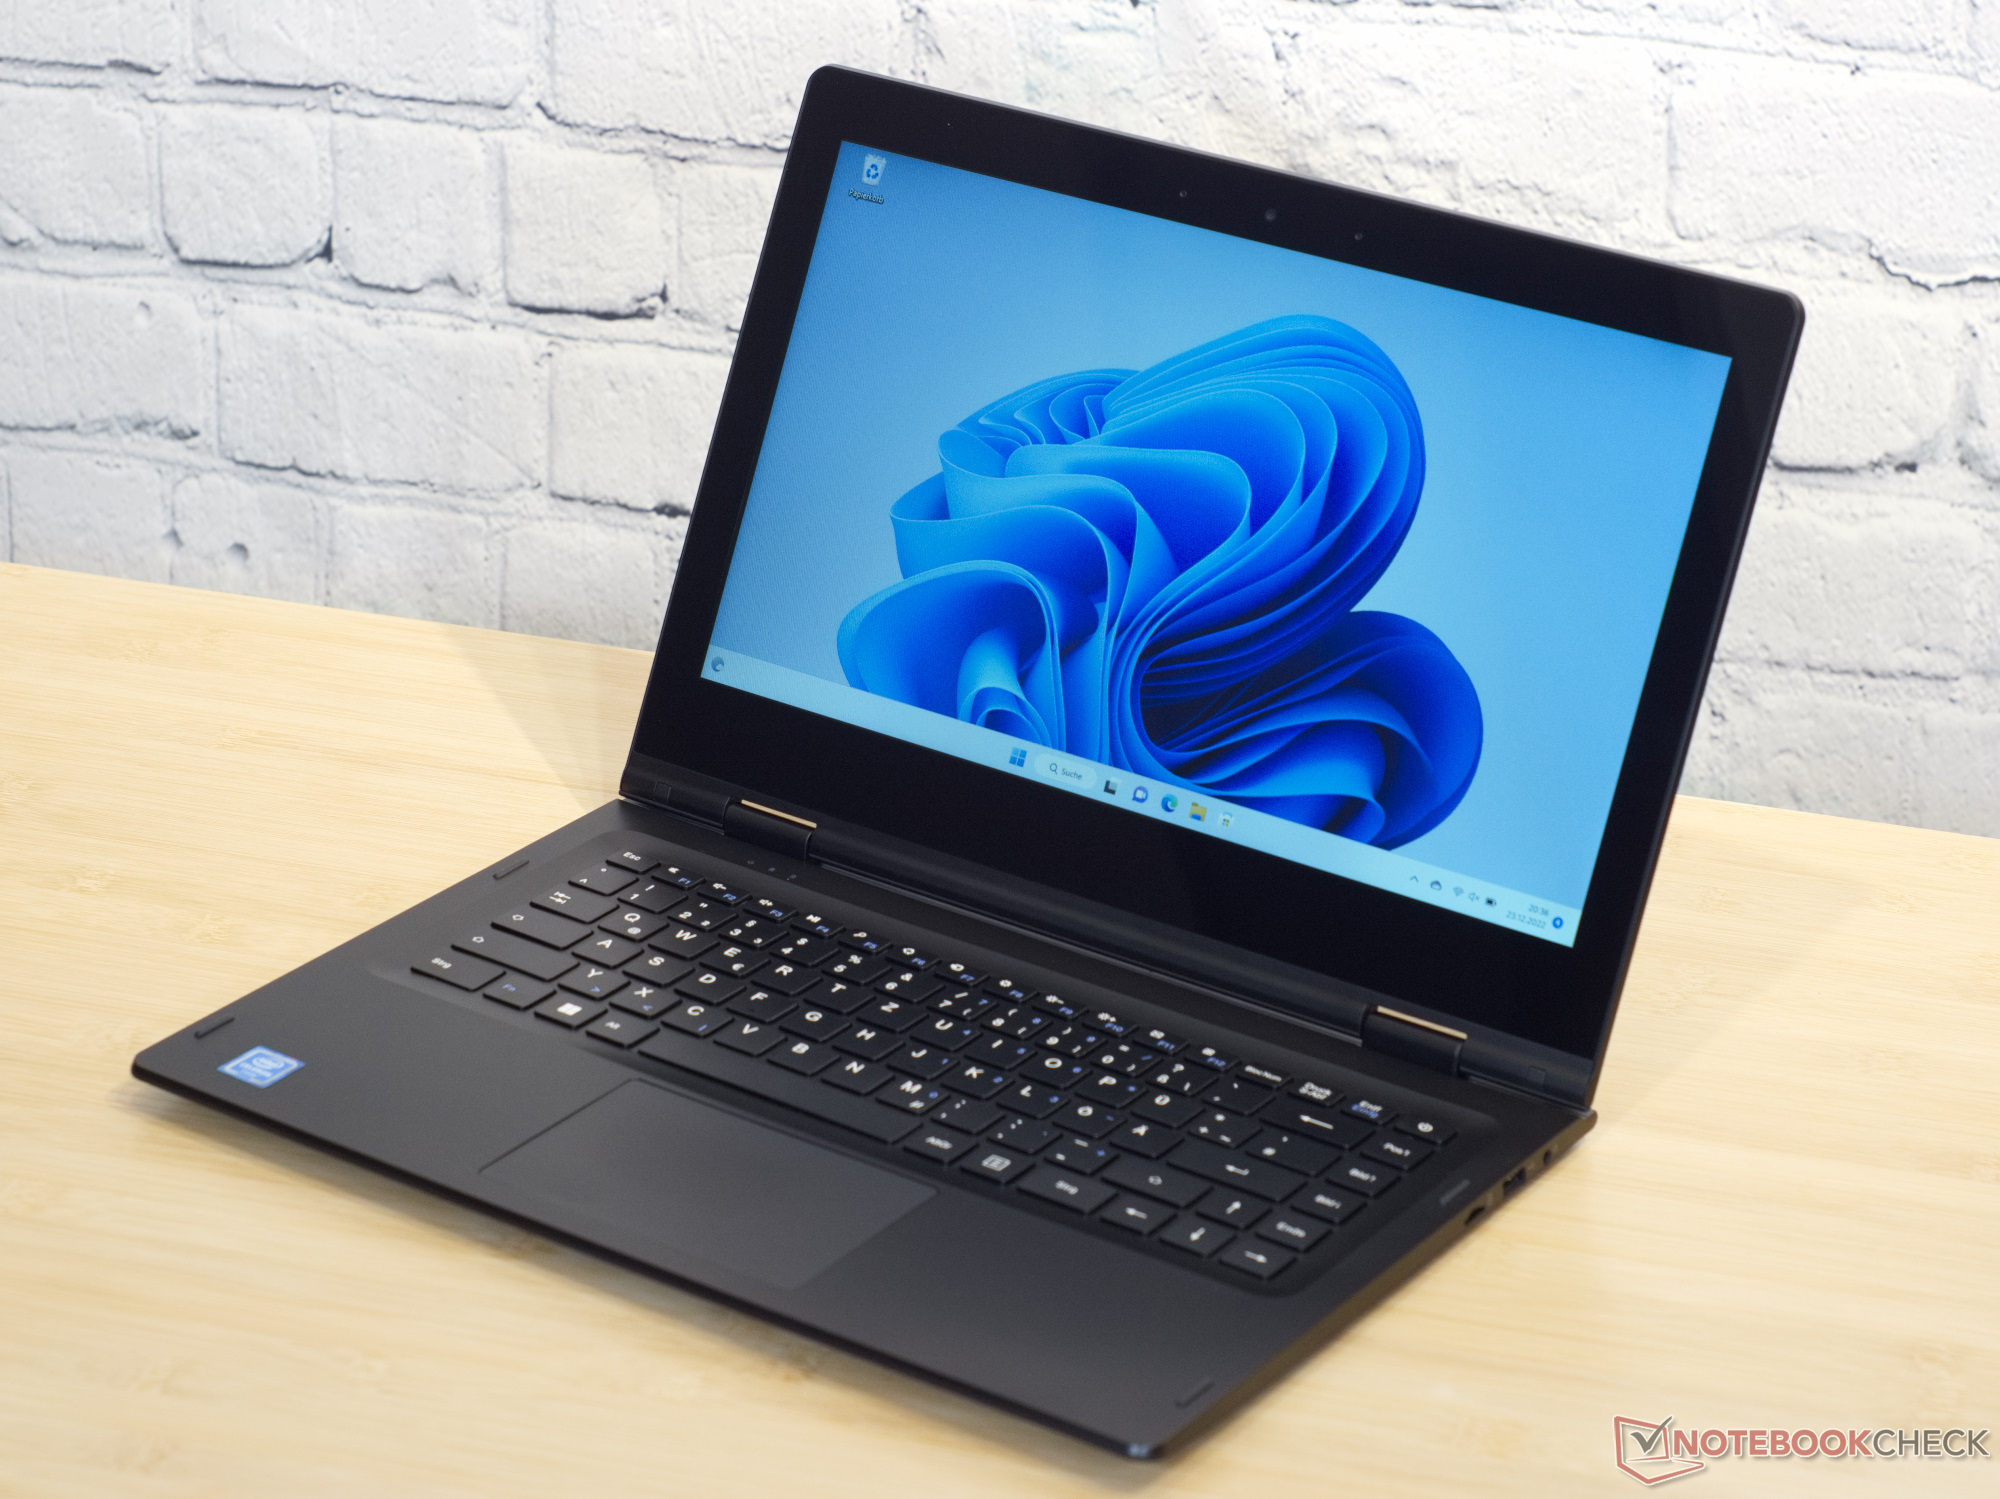
Geo Computers GeoFlex 140 2-in-1 laptop in test: A convertible for about $160

Geo Computers belongs to the English Tactus Group just like the brands Chillblast, Nazare and Horizon. In gamer circles, these three are known for extreme desktop computers with water cooling and strong laptops. Geo is more aimed at end customers with low requirements for PCs, but could also convince Microsoft in the Partner of the Year OEM Device Award in 2021.
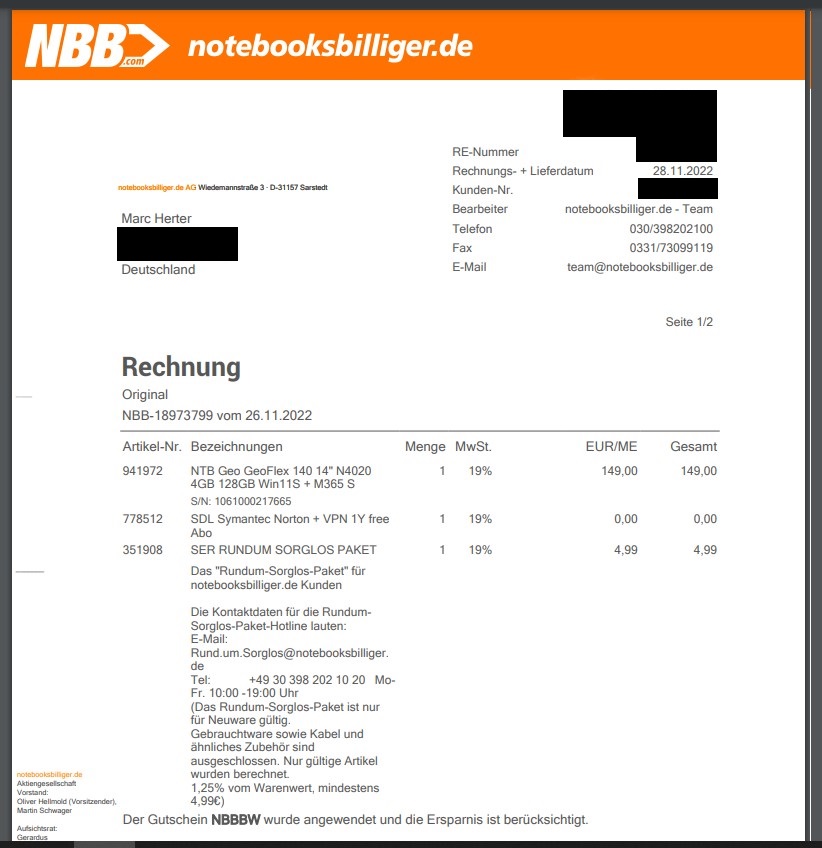
The GeoFlex 140 is an unusual laptop, not because it is particularly powerful, but because it is extremely cheap. On Prime Day, Cyber-Monday and other occasions, retailers like Notebooksbilliger sometimes offer the device for only 150 Euros (~$163). We bought the review sample from Notebooksbilliger for this price during Blackweek. The Windows and Microsoft 365 licenses alone, which you get with the laptop, are higher than the laptop's price at Microsoft at 216 Euros (~$235). This makes us wonder, "How can you offer a laptop so cheaply?"
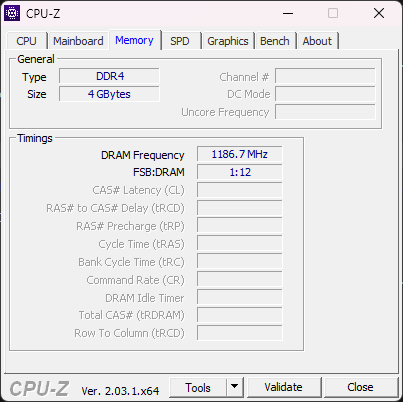
Unsurprisingly, the answer is that the GeoFlex 140 relies on inexpensive hardware. Thus, an inexpensive Intel Celeron N4020, 4 GB RAM and an M.2 SATA SSD with only 128 GB are in the device. With the undemanding processor, Geo Computers can even rely on a purely passive solution for heat dissipation. The manufacturer has also chosen the most favorable options for the screen and other peripherals. Nevertheless, you get a convertible that can handle most everyday applications (office, streaming, browsing) without problems. However, you should do without multitasking.
When selecting possible competitors, we limit ourselves to the cheapest possible devices and still can't find a laptop in our database that can currently undercut 200 Euros (~$218) as a new device. In our top list of the best laptops under 600 Euros (~$652) there are, however, some laptops that at least undercut 300 Euros (~$326).
Possible competitors in comparison
Rating | Date | Model | Weight | Height | Size | Resolution | Best Price |
|---|---|---|---|---|---|---|---|
| 76.1 % | 01/2023 | Geo Computers GeoFlex 140 Celeron N4020, UHD Graphics 600 | 2 kg | 21 mm | 14.10" | 1366x768 | |
| 74.9 % | 07/2021 | Asus BR1100FKA-BP0109RA Celeron N4500, UHD Graphics (Jasper Lake 16 EU) | 1.4 kg | 19.9 mm | 11.60" | 1366x768 | |
| 78.1 % | 07/2020 | Lenovo IdeaPad Flex 3 11IGL05 Celeron N4020, UHD Graphics 600 | 1.1 kg | 17.5 mm | 11.60" | 1366x768 | |
| 69.1 % | 05/2020 | Chuwi Hi10 X Celeron N4100, UHD Graphics 600 | 600 g | 8.8 mm | 10.10" | 1920x1200 | |
| 74.9 % | 03/2020 | BMAX MaxBook Y11 H1M6 Celeron N4100, UHD Graphics 600 | 1 kg | 14.4 mm | 11.60" | 1920x1080 | |
| 74.2 % | 09/2019 | XIDU PhilBook Max Celeron J3355, HD Graphics 500 | 1.5 kg | 17.8 mm | 14.10" | 1920x1080 | |
| 73.1 % | 04/2020 | Asus Vivobook 15 F512DA-SH31 R3 3200U, Vega 3 | 1.8 kg | 19.9 mm | 15.60" | 1920x1080 |
Case - Sturdy laptop with a lot of plastic
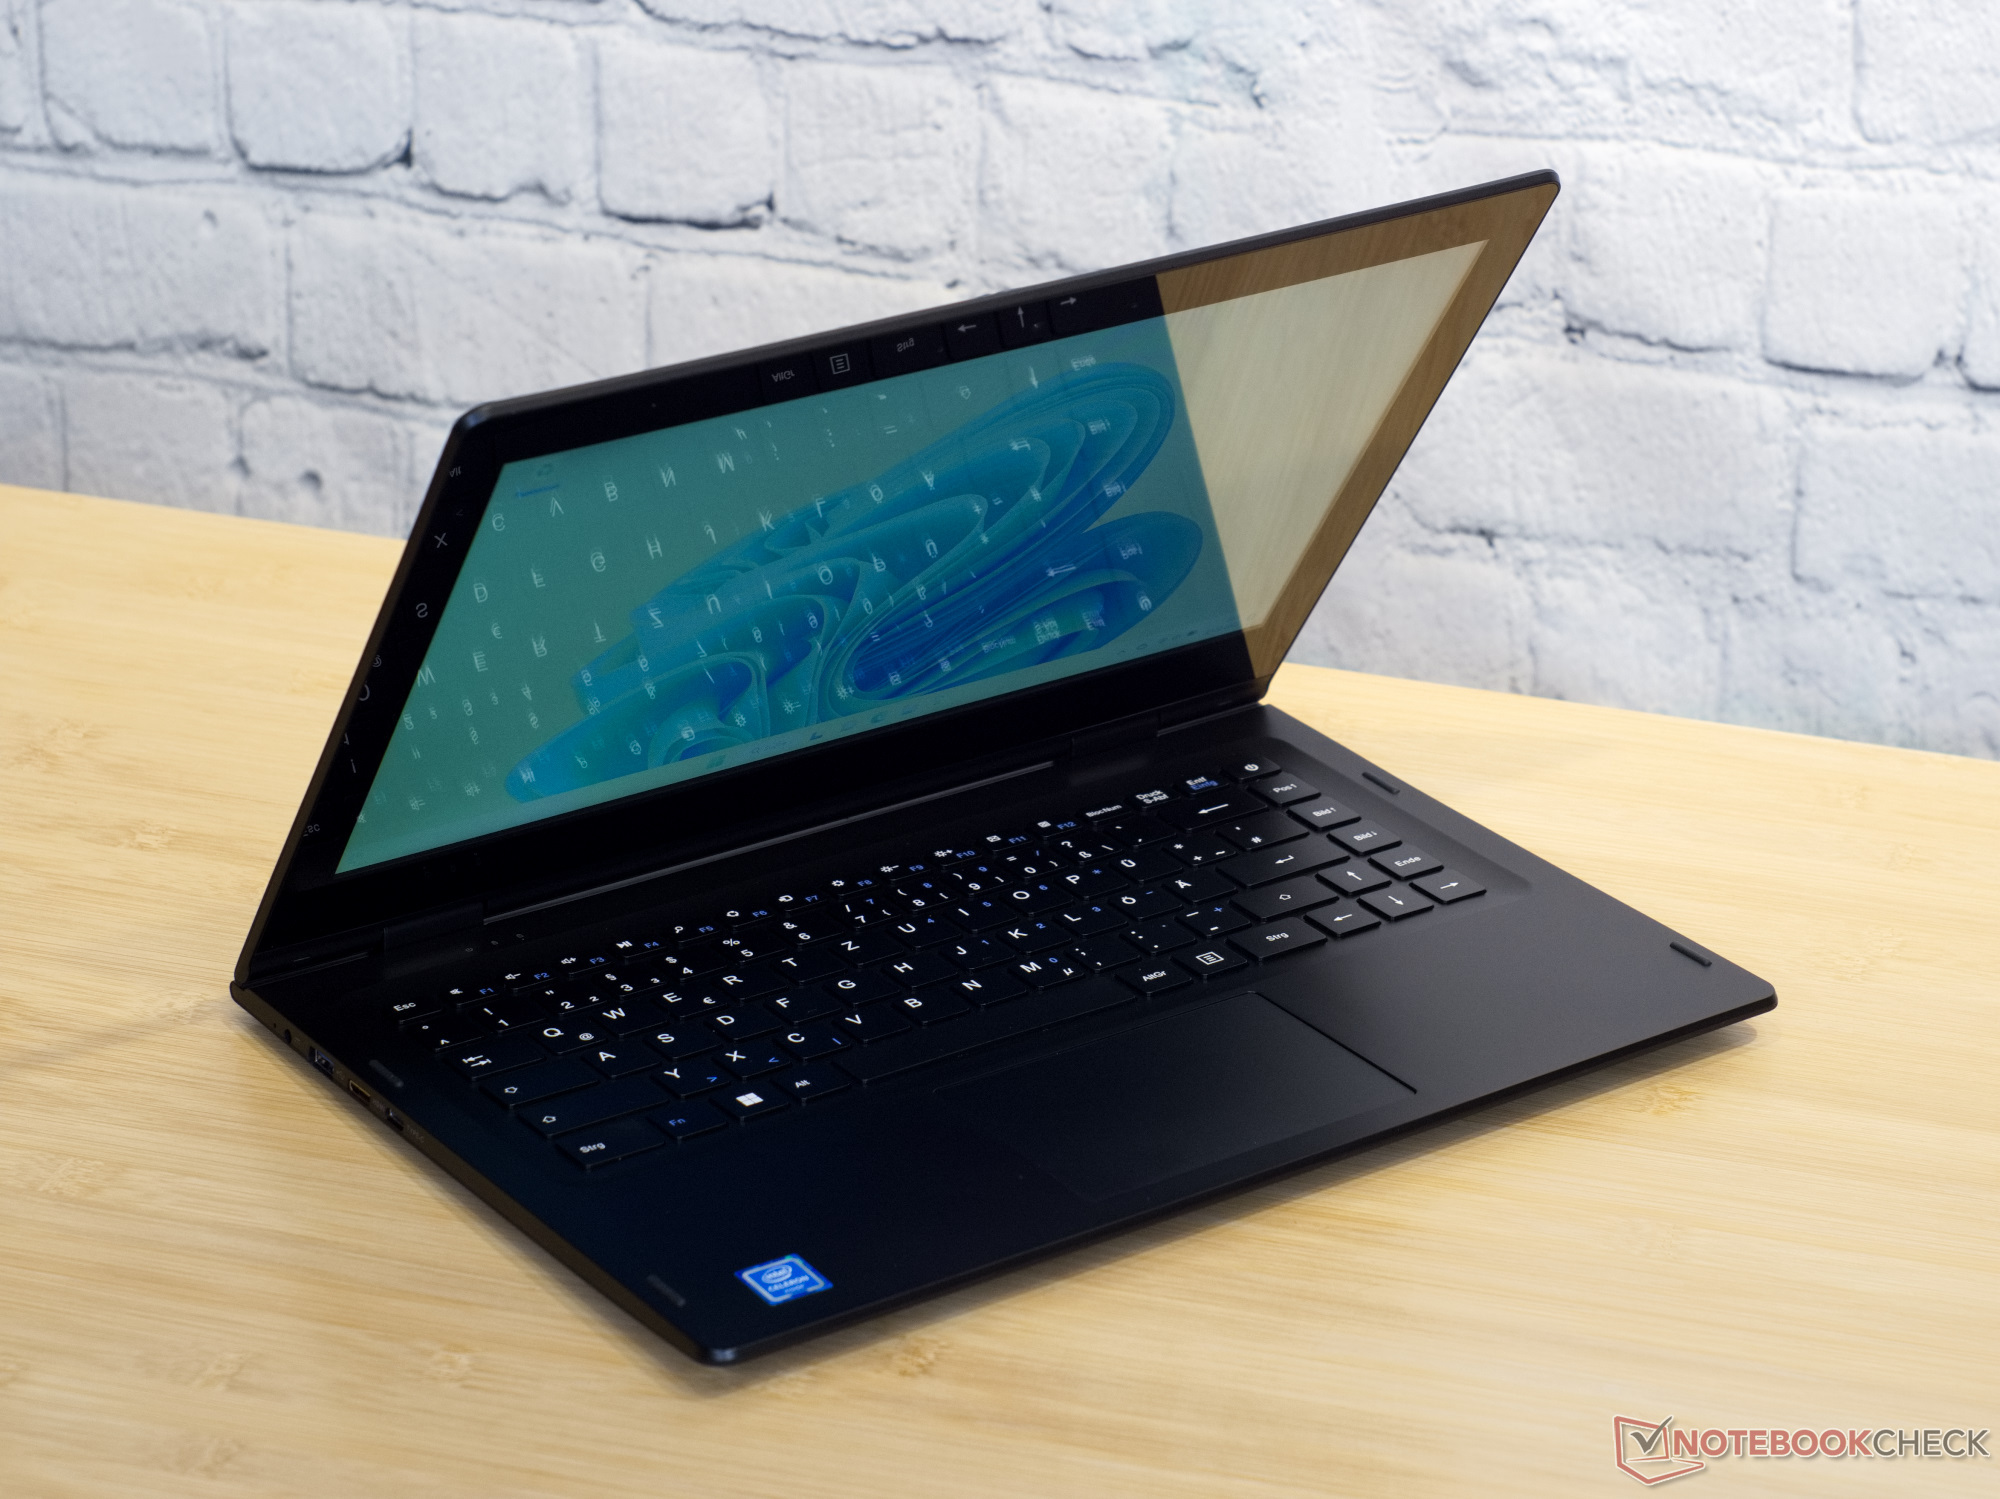
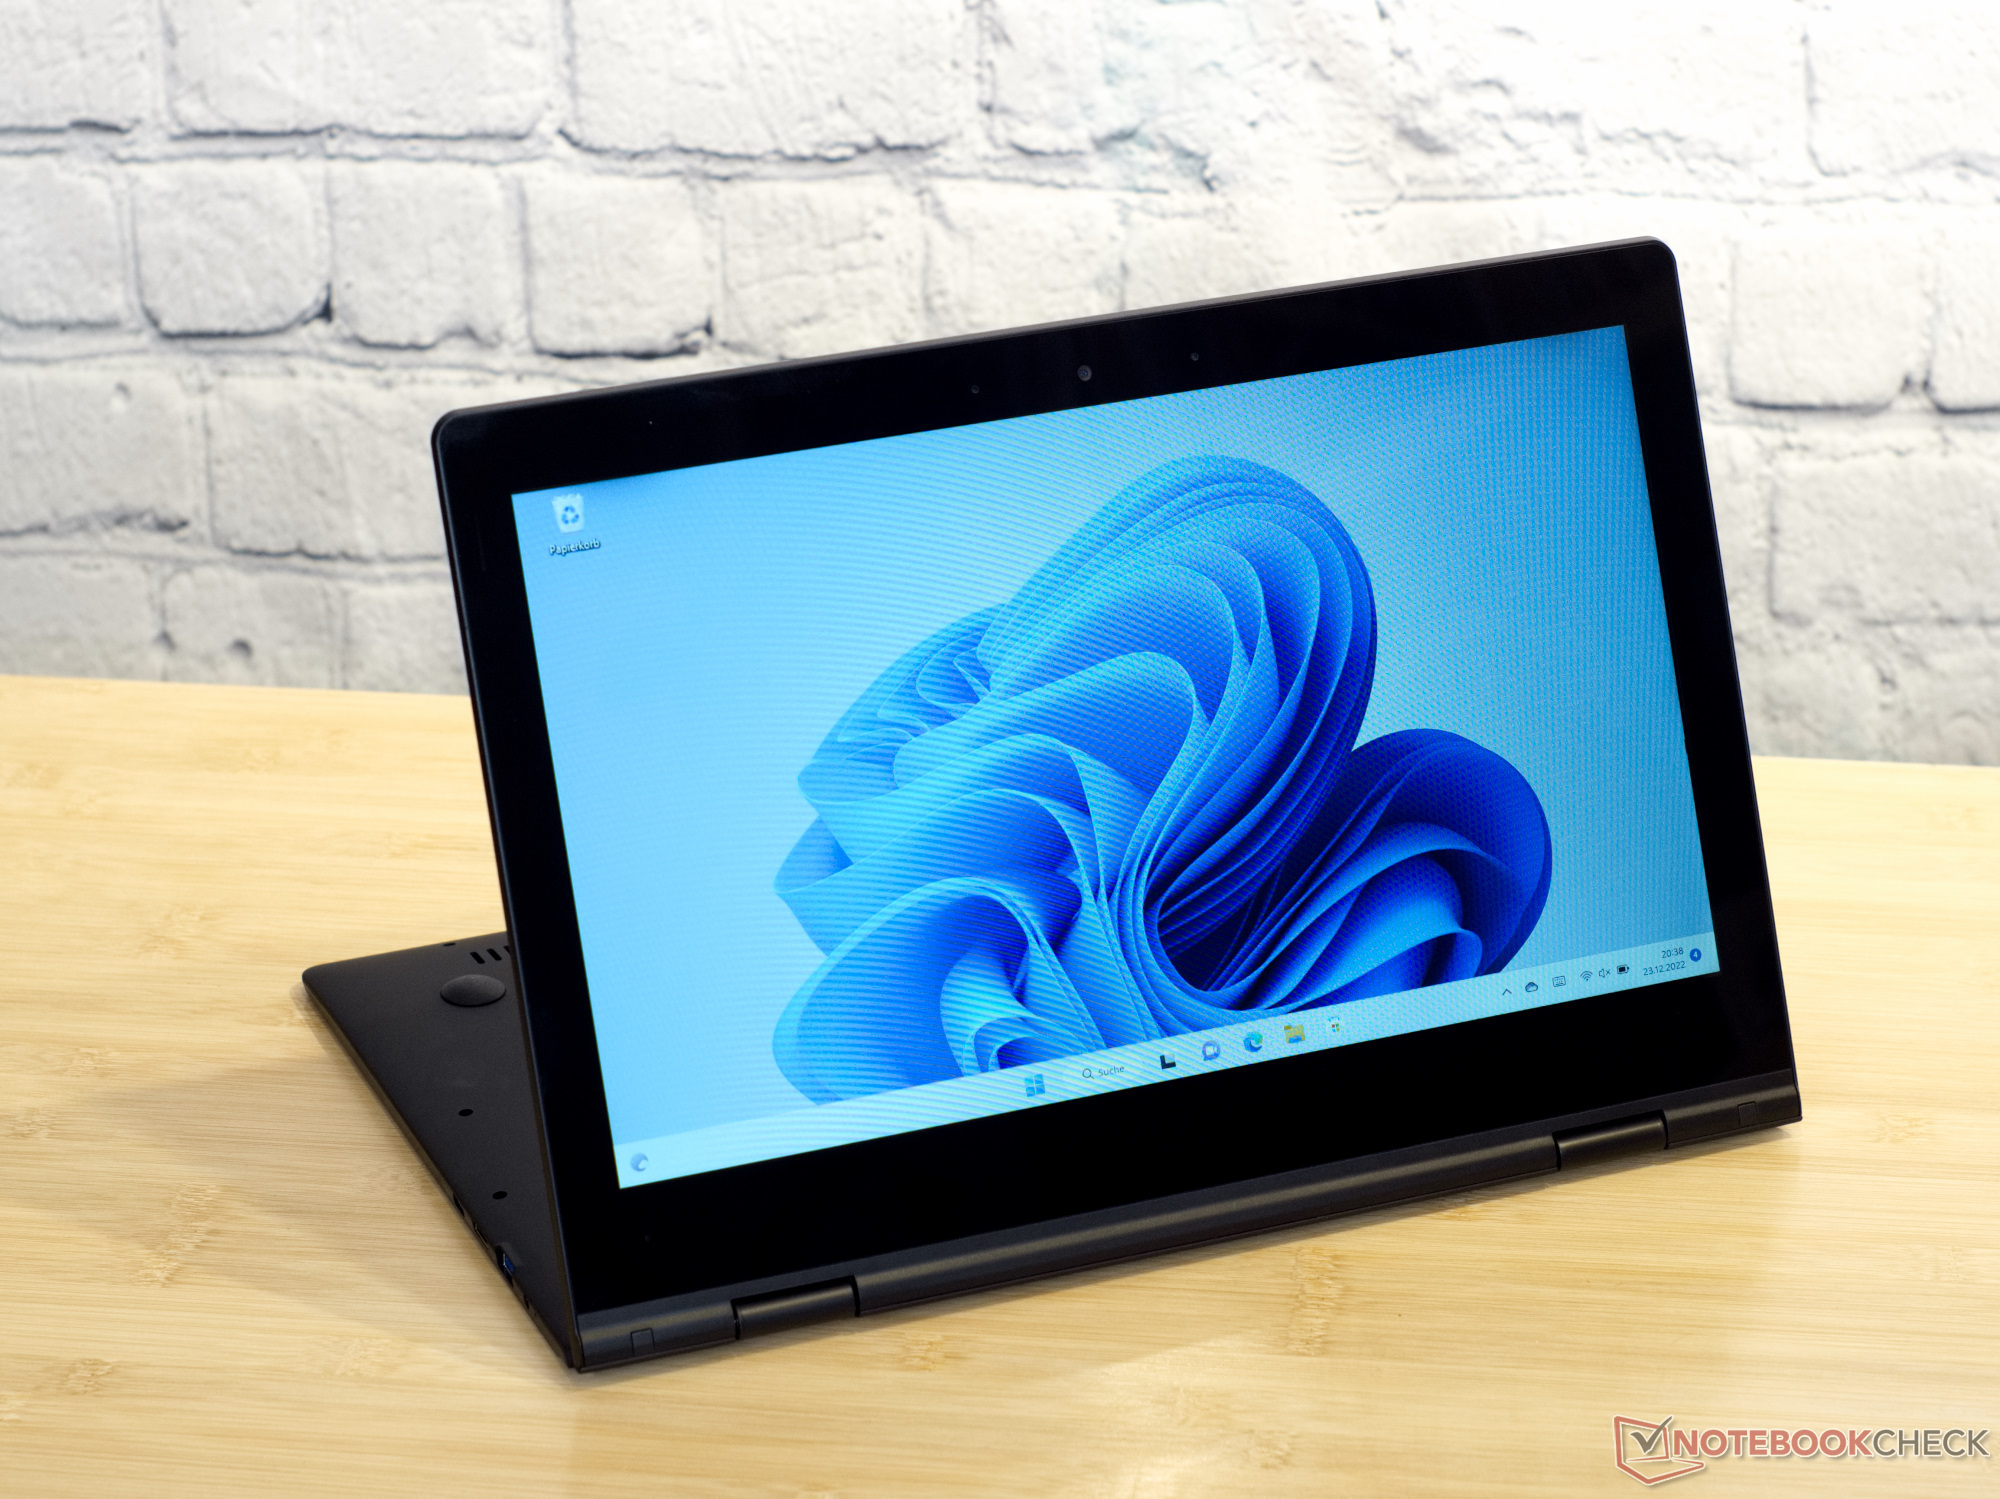
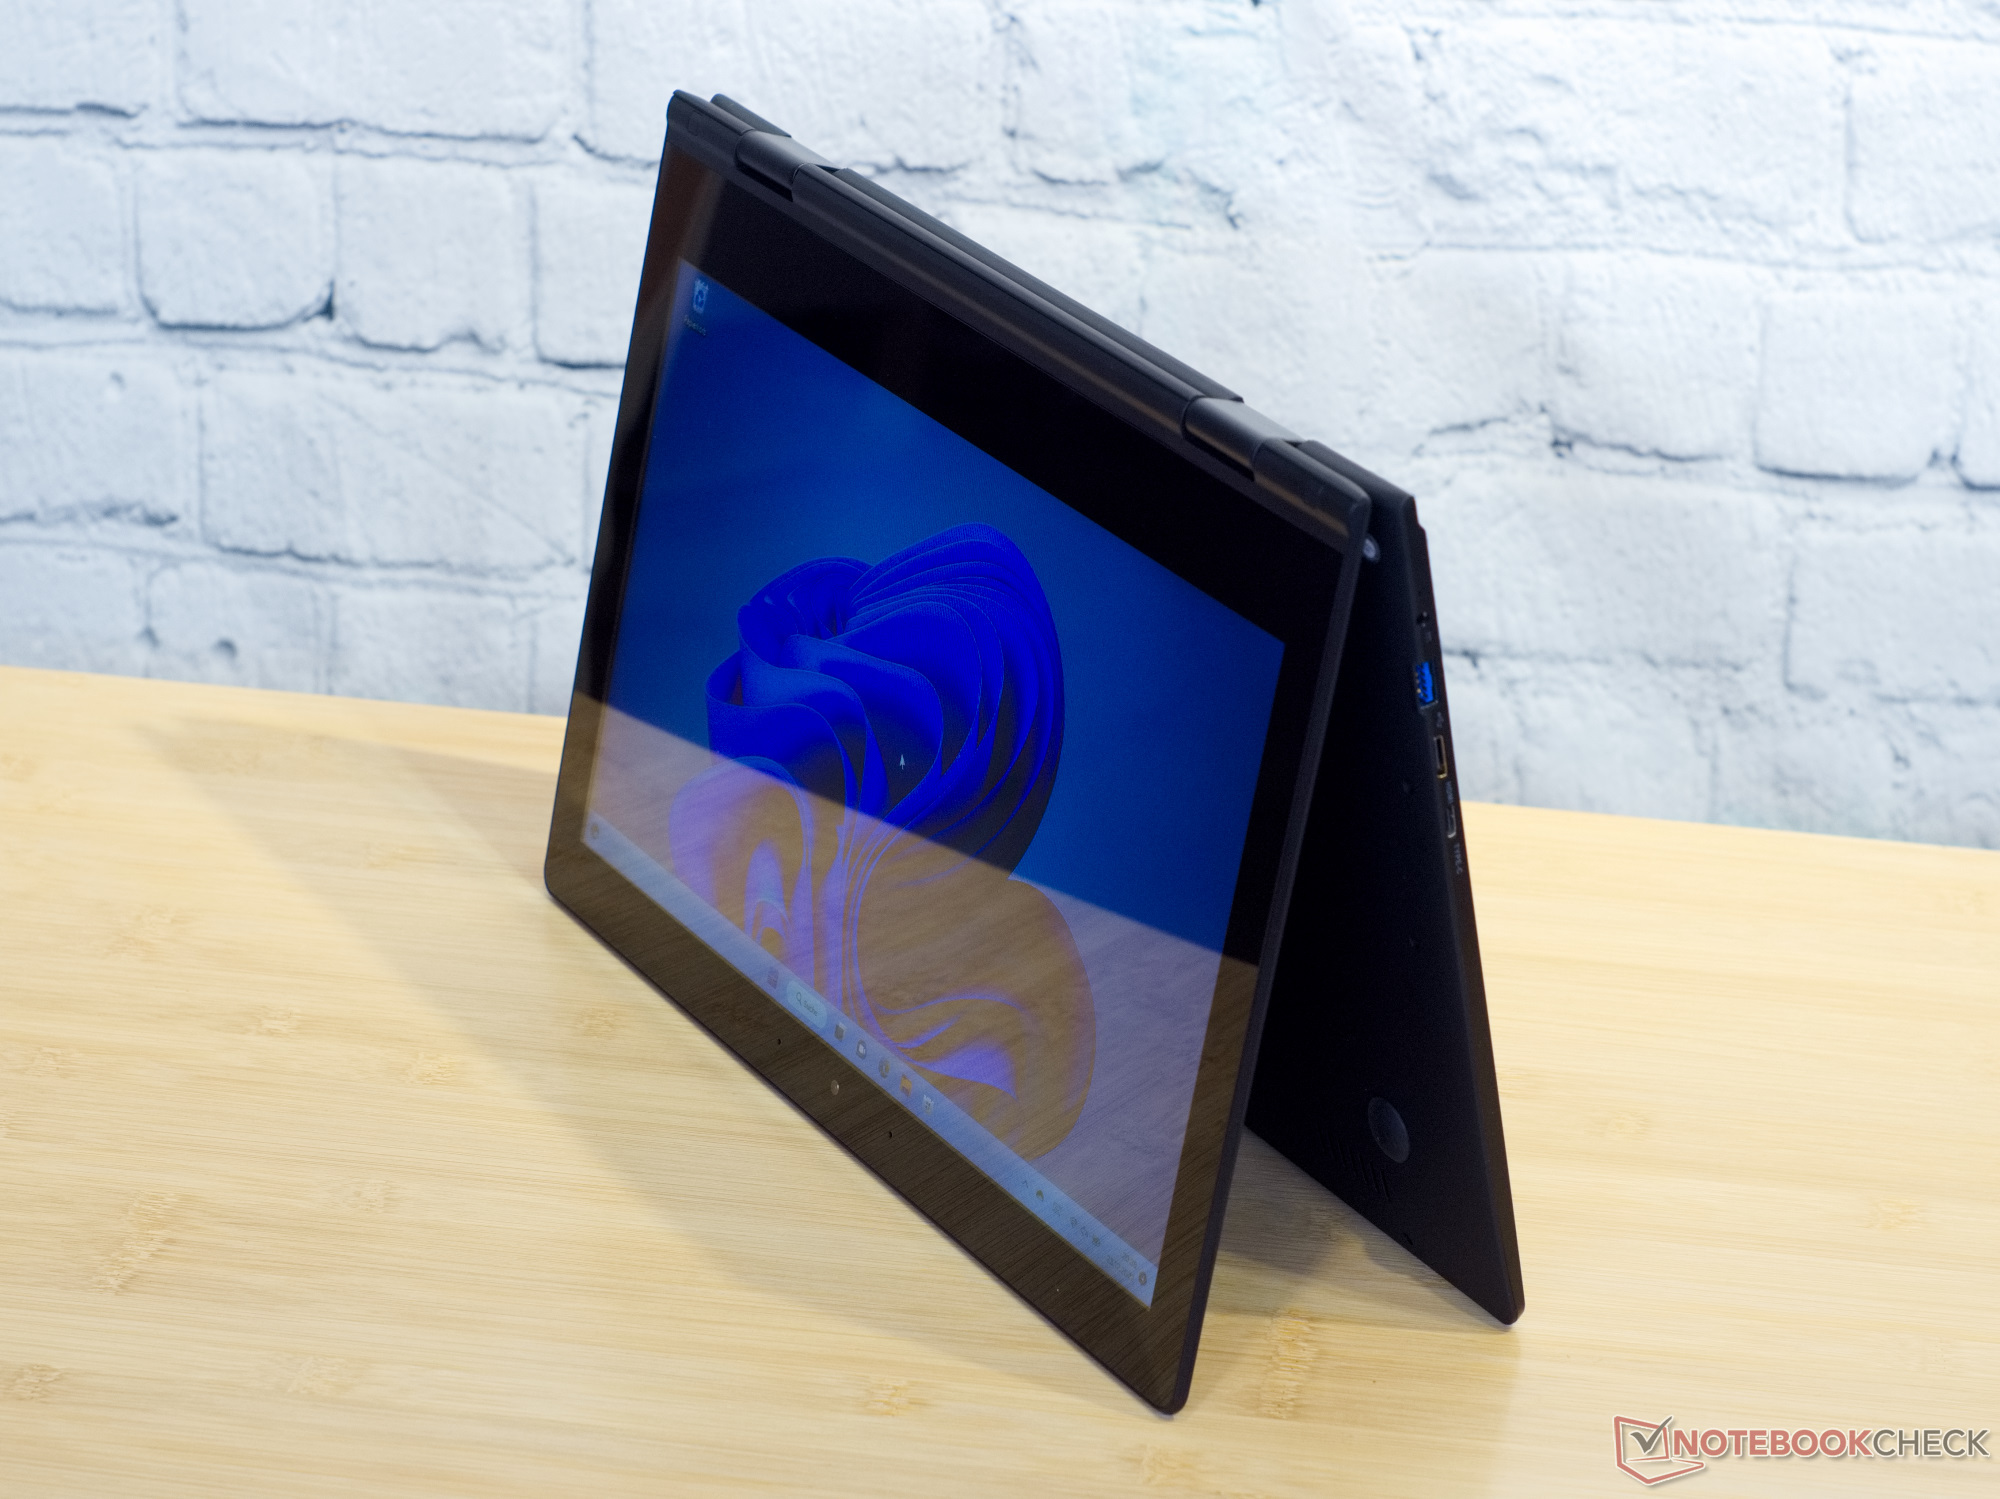
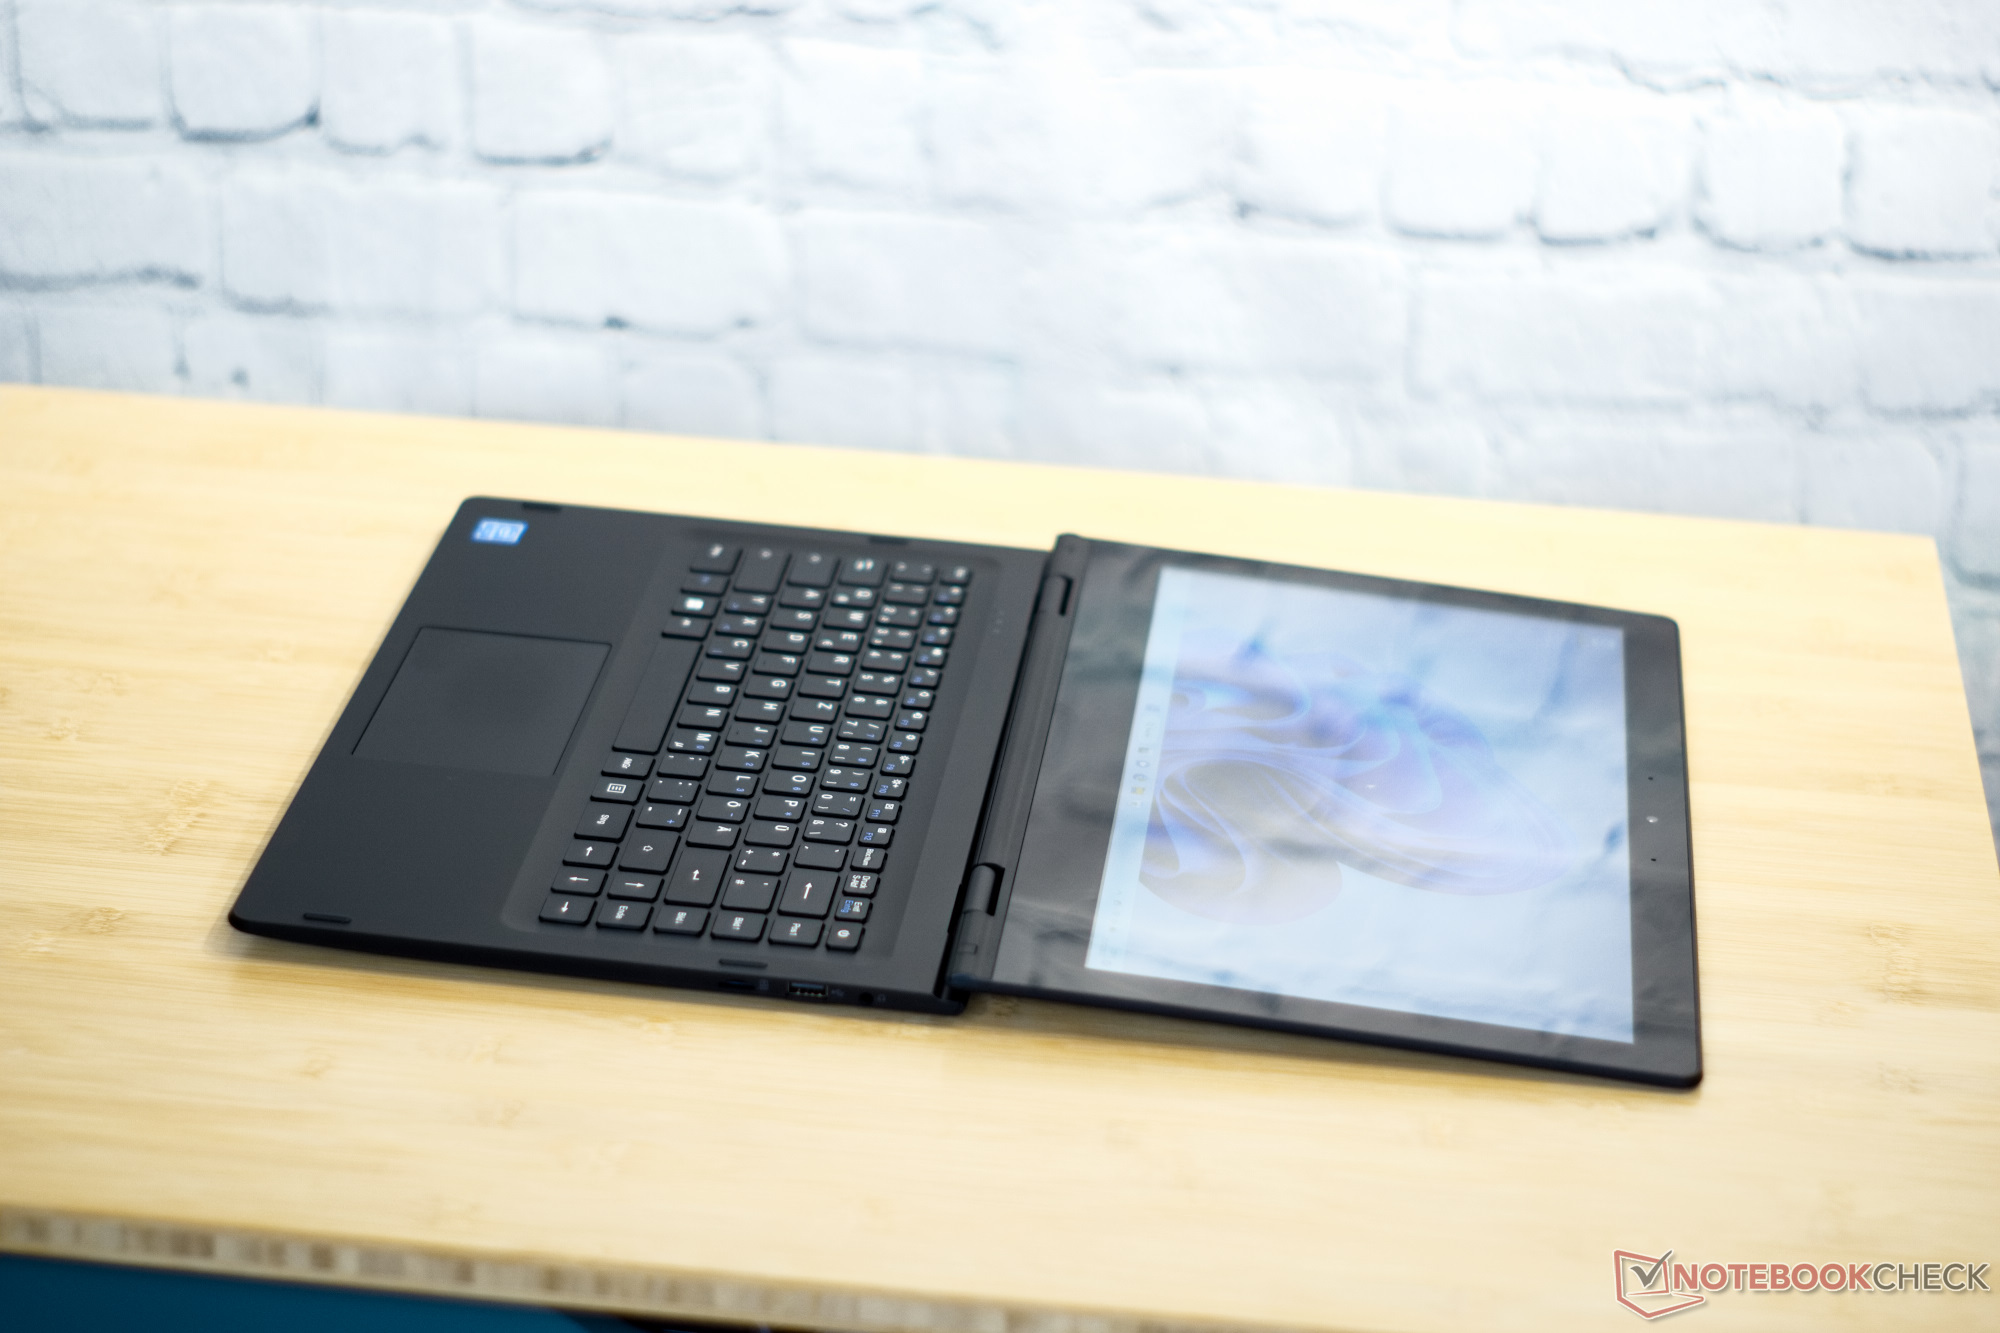
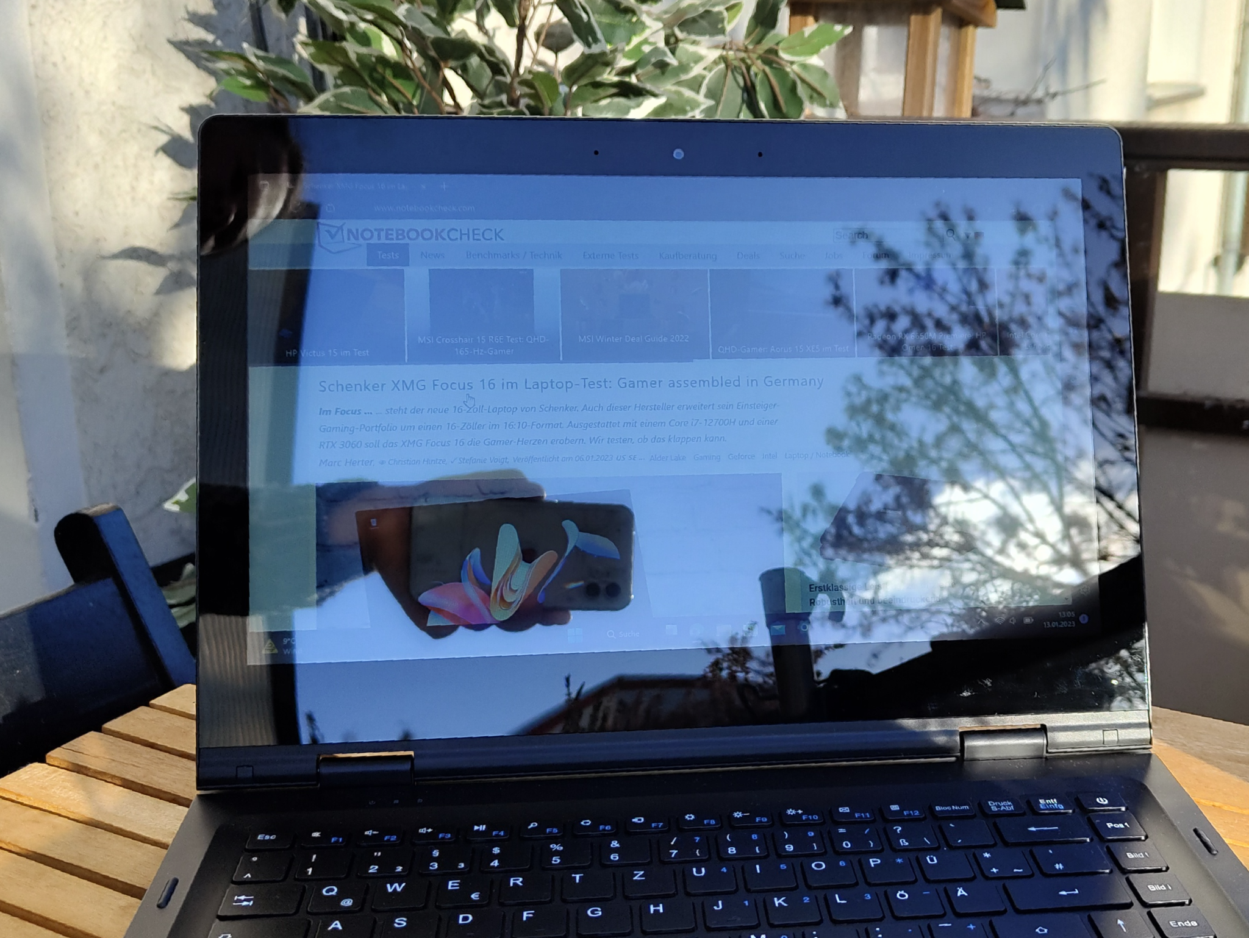
The laptop's casing was a pleasant surprise when we unpack it, because the GeoFlex 140 feels anything but cheap. The case of the black laptop is stable and can hardly be twisted. The display hinges hold their position and yet the screen can be opened with one hand. Even gaps and a slim design even make the GeoFlex 140 look relatively high-end. Large rubber feet on the bottom ensure a secure stand. On the upper side, there are more rubbers as spacers to the screen and as feet for the presentation mode. Only the rubberized surfaces, consisting of the display lid and the base underside, suggest bad things. We know from experience that this kind of coating is not very resistant in the long run. In fact, we find the first scratches after a short period of use. If the 14.1-inch device is too big for you, you could also consider the GeoFlex 110 with almost identical features and an 11-inch screen.
Equipment - Meets the basics
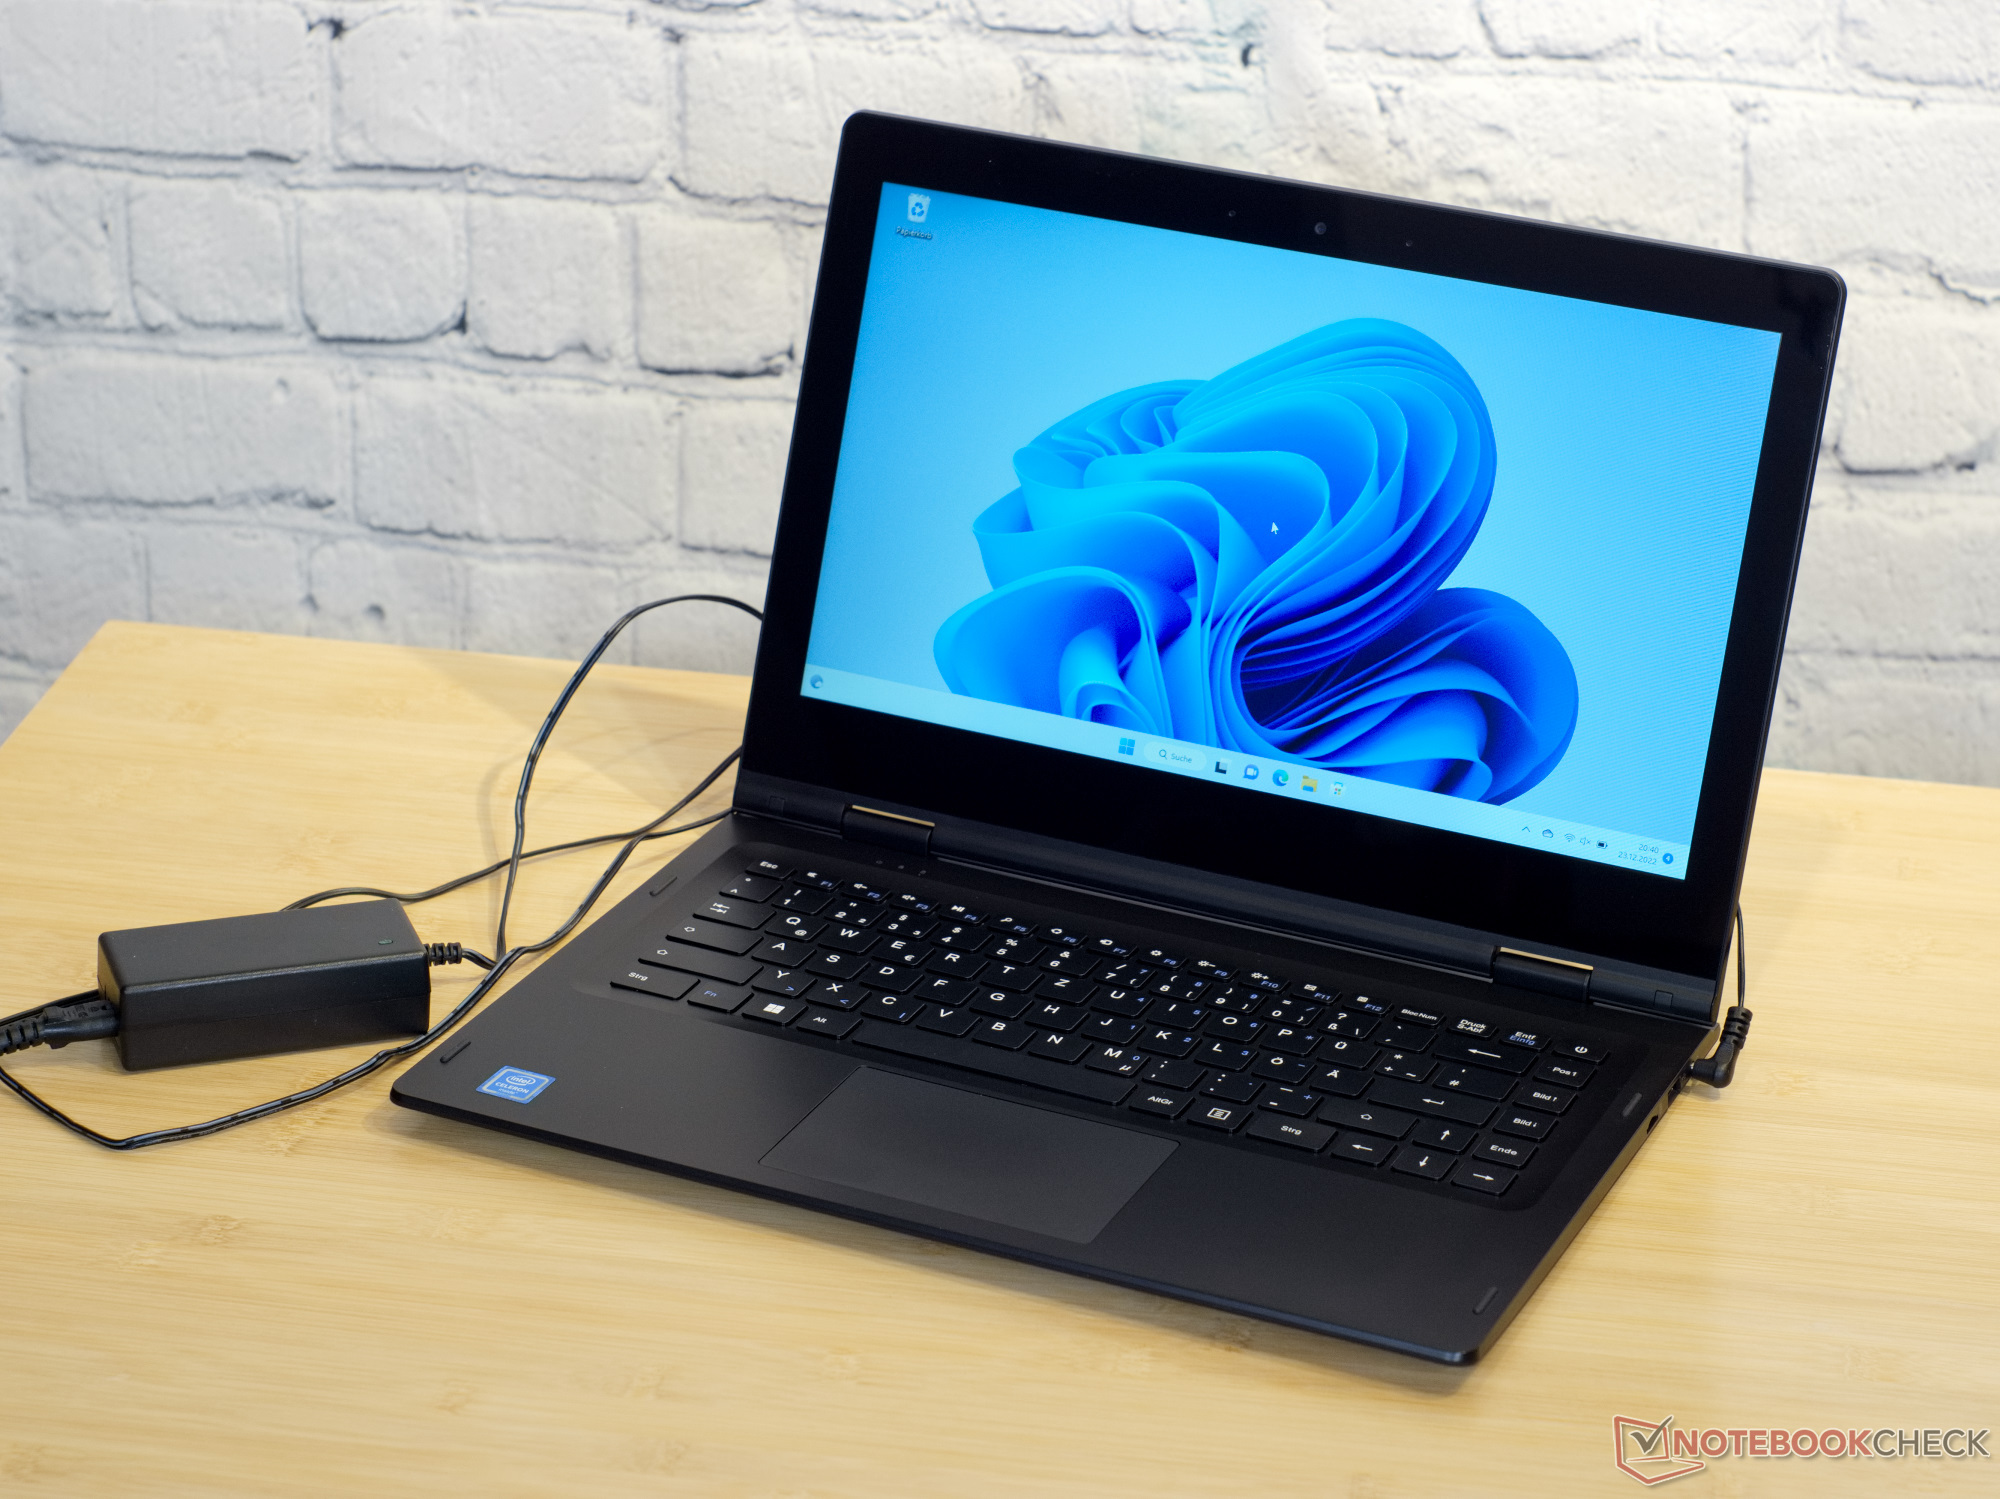
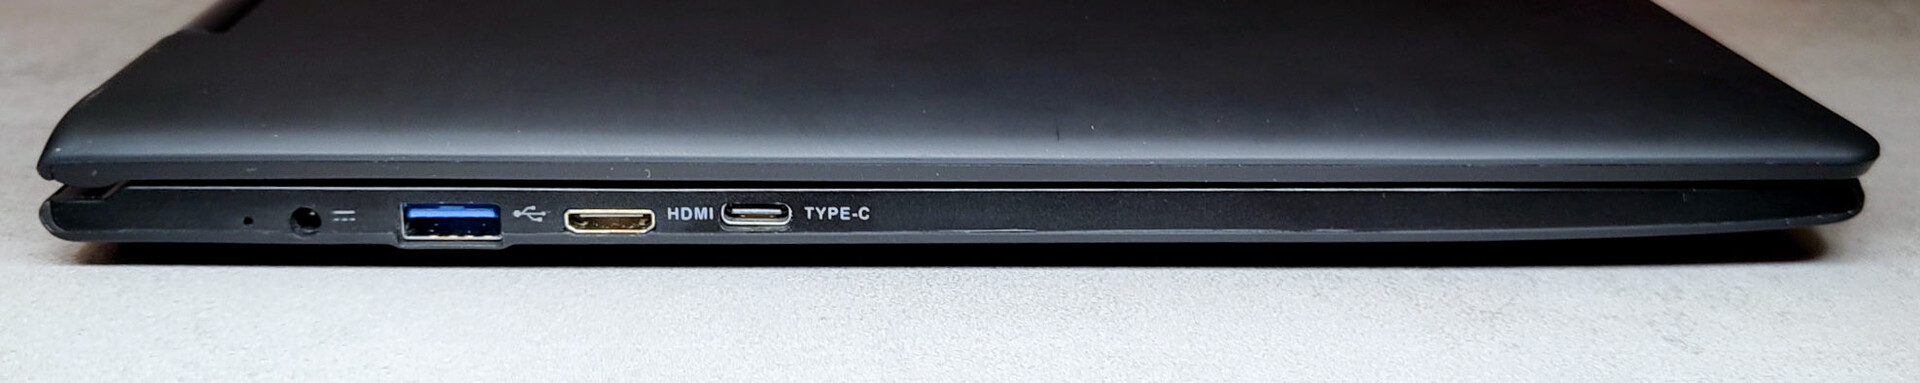
At first glance, the GeoFlex 140 has all the connectivity standards of modern laptops. Two USB Type-A ports, a 3.5 mm jack, HDMI and an SD card reader are on board. A USB Type-C port is also found on the left side of the laptop. However, it does not have any additional functions beyond the pure USB 3.0 connection. The port does not support PowerDelivery, DisplayPort or Thunderbolt. Thus, you have to rely on the included 24-watt power adapter to charge the laptop. An external monitor via HDMI only worked in our test after Windows had loaded updates for all possible drivers.
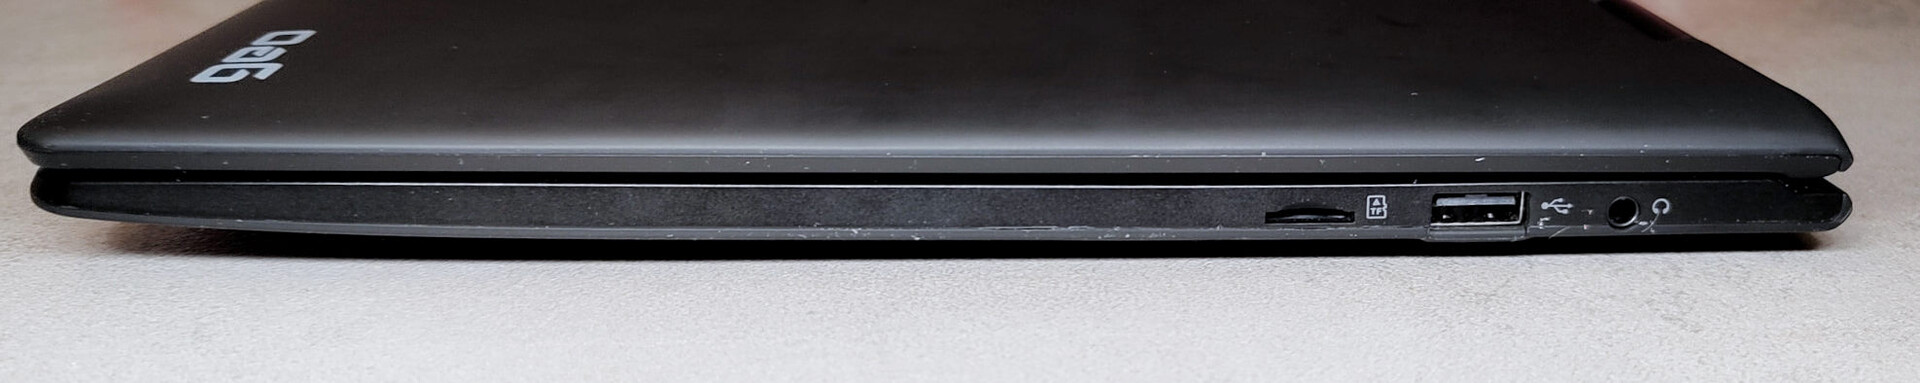
SD Card Reader
The SD card reader on the GeoFlex 140 is connected via USB 2.0. Accordingly, the transfer speeds with our AV Pro microSD are low. However, these clearly fit into the picture for inexpensive laptops.
| SD Card Reader | |
| average JPG Copy Test (av. of 3 runs) | |
| Average of class Convertible (17.7 - 209, n=36, last 2 years) | |
| Lenovo IdeaPad Flex 3 11IGL05 (Toshiba Exceria Pro SDXC 64 GB UHS-II) | |
| Asus Vivobook 15 F512DA-SH31 (Toshiba Exceria Pro M501 64 GB UHS-II) | |
| BMAX MaxBook Y11 H1M6 (Toshiba Exceria Pro M501 64 GB UHS-II) | |
| Chuwi Hi10 X (Toshiba Exceria Pro M501 64 GB UHS-II) | |
| XIDU PhilBook Max (Toshiba Exceria Pro M501 64 GB UHS-II) | |
| Geo Computers GeoFlex 140 (AV PRO microSD (128GB) V60) | |
| maximum AS SSD Seq Read Test (1GB) | |
| Average of class Convertible (22.6 - 263, n=35, last 2 years) | |
| Lenovo IdeaPad Flex 3 11IGL05 (Toshiba Exceria Pro SDXC 64 GB UHS-II) | |
| Asus Vivobook 15 F512DA-SH31 (Toshiba Exceria Pro M501 64 GB UHS-II) | |
| BMAX MaxBook Y11 H1M6 (Toshiba Exceria Pro M501 64 GB UHS-II) | |
| XIDU PhilBook Max (Toshiba Exceria Pro M501 64 GB UHS-II) | |
| Chuwi Hi10 X (Toshiba Exceria Pro M501 64 GB UHS-II) | |
| Geo Computers GeoFlex 140 (AV PRO microSD (128GB) V60) | |
Communication
Geo installs an Intel Dual Band Wireless-AC 7265 for WLAN and Bluetooth 4.2. The module was already introduced at the end of 2014 and does not yet offer Wi-Fi 6. Wi-Fi 5 (802.11ac) is the highest standard that the module supports. The transmission speeds in the WLAN also correspond to the module's capabilities here. However, it is fair to mention that the GeoFlex 140 is even quite fast in the network compared with the rivals.
Webcam
The webcam of the GeoFlex 140 is surprisingly good. Geo installs a rather unusual module with 1.9 megapixels in a 4:3 format in the device. The resolution of 1600 × 1200 pixels is thus above HD, but still below Full HD. Although the color reproduction can probably be described as poor, the sharpness and contrast of the camera's pictures are respectable.


Security
The 2-in-1 laptop at least has a TPM 2.0 module and all other security requirements for Windows 11. Apart from that, you will not find any other security features on the GeoFlex 140.
Accessories
In the box of the GeoFlex 140, we only find the obligatory paper documentation besides the power supply. The Microsoft 365 annual license is linked to the computer and can be activated up to six months after it has been put into operation.
Maintenance
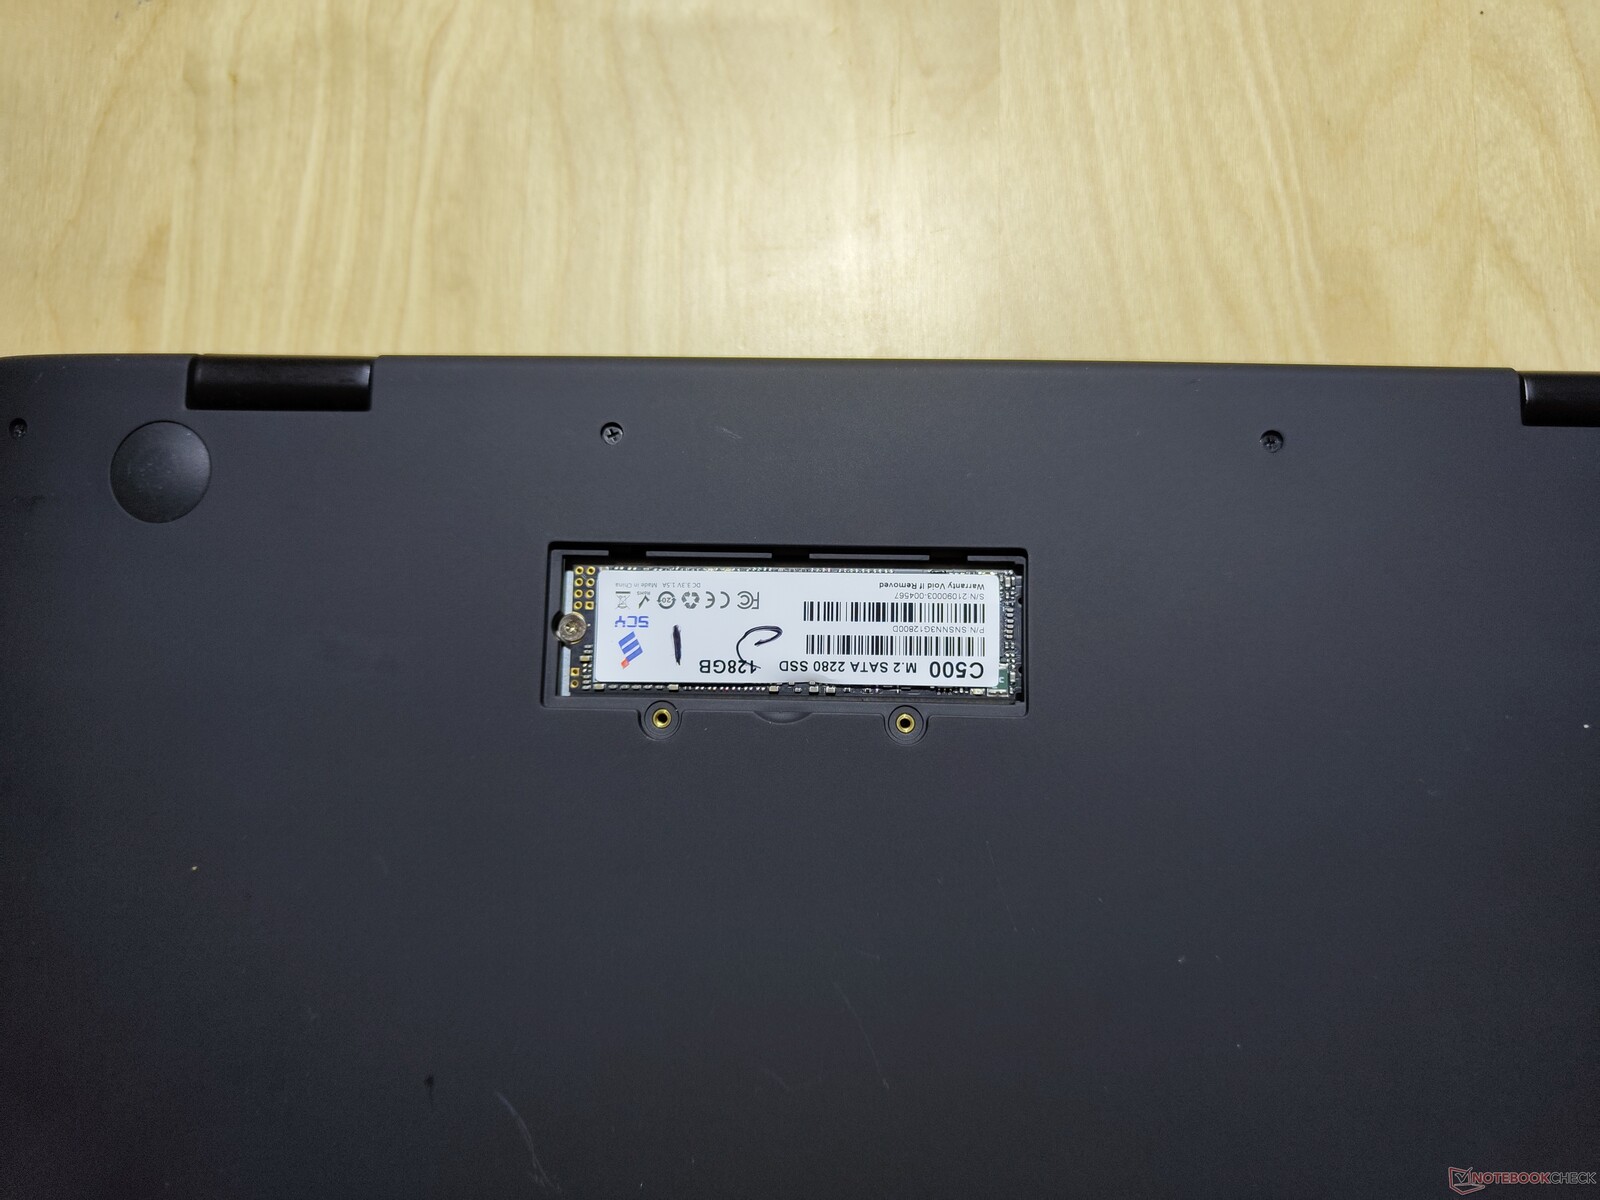
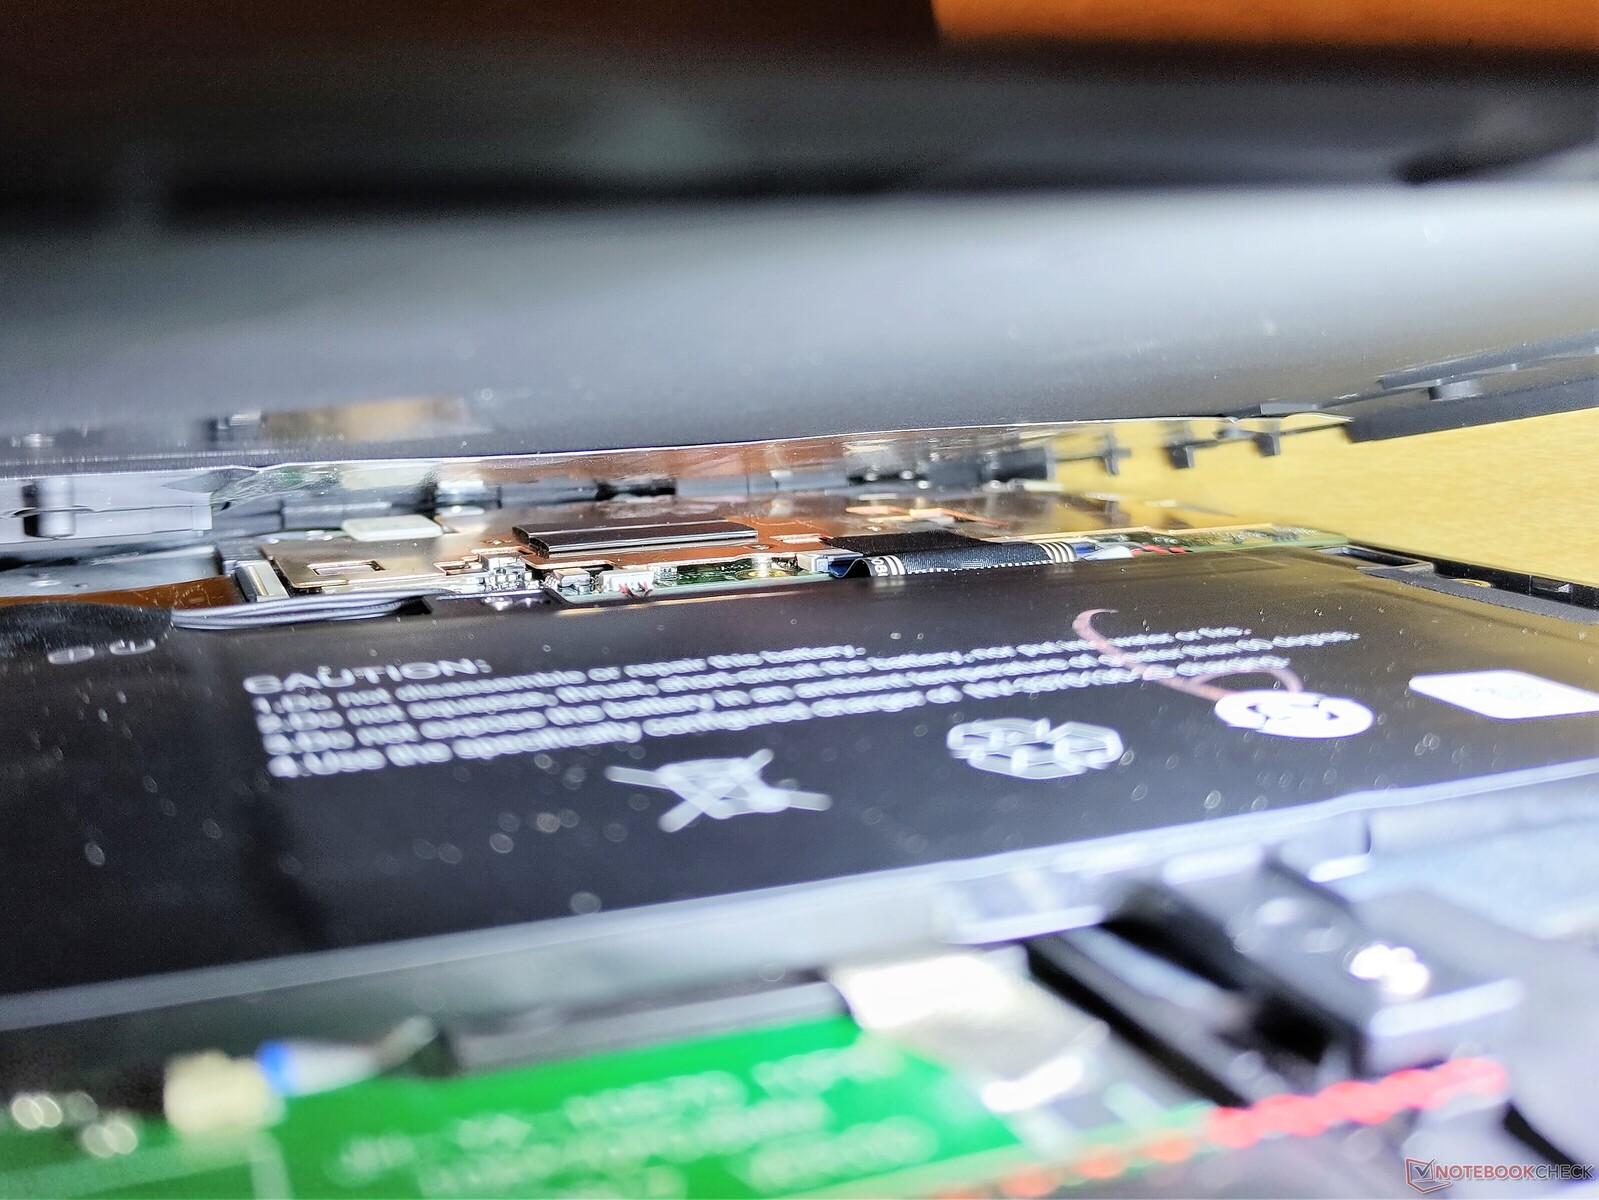
On the laptop's underside, we first find a small maintenance access for the M.2 SATA SSD. Thus, you do not have to disassemble the entire laptop right away to replace the hard drive. However, before you disassemble the rest of the base cover, you should also remove the SSD. After that, 14 more screws separate us from the convertible's interior. Unfortunately, the base cover is almost impossible to remove. Countless plastic clips keep it in position. However, a look inside the partially opened notebook also shows that the effort would probably be in vain. All other components are soldered to the mainboard. Only battery and the daughter board on the right side as well as the loudspeakers could be replaced. Furthermore, there is a risk of causing damage when opening the notebook. For example, the strong magnets, which are supposed to close the notebook, are not glued in, but only inserted. In an emergency, they could cause short circuits in the device.
Warranty
Geo Computers does not provide any information about a warranty. Thus, you probably have to rely on the legal warranty of 24 months in Germany.
Input devices - No stylus support
The touchscreen and touchpad of the GeoFlex 140 are precise and offer ten and five touch points, respectively. Both respond quickly without noticeable latency. The keyboard of the convertible does not offer a high key drop, but at least it has a pleasant feeling when typing. A kind of NumBlock can be placed over the letters on the right side as an overlay. Two clear criticisms of the keyboard are the lack of a backlight and the unusual ANSI layout of the keyboard. All European keyboards are normally based on the ISO layout with corresponding character arrangements for the different national languages. Since Geo Computers is a company that mainly operates in Europe, the choice of the ANSI layout doesn't make sense to us. Unlike many other convertibles, the GeoFlex 140 does not support digital pen input.
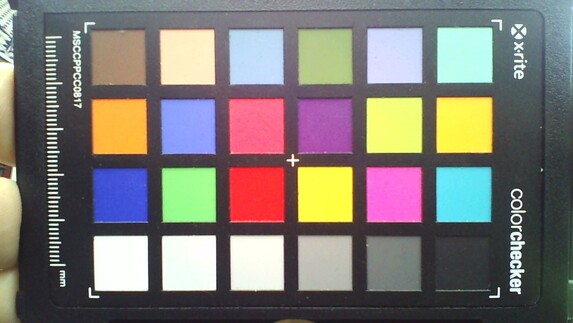
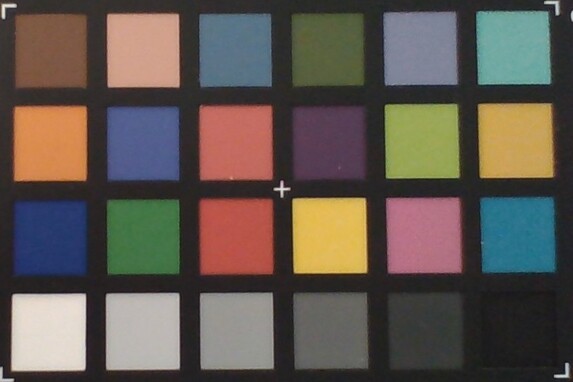
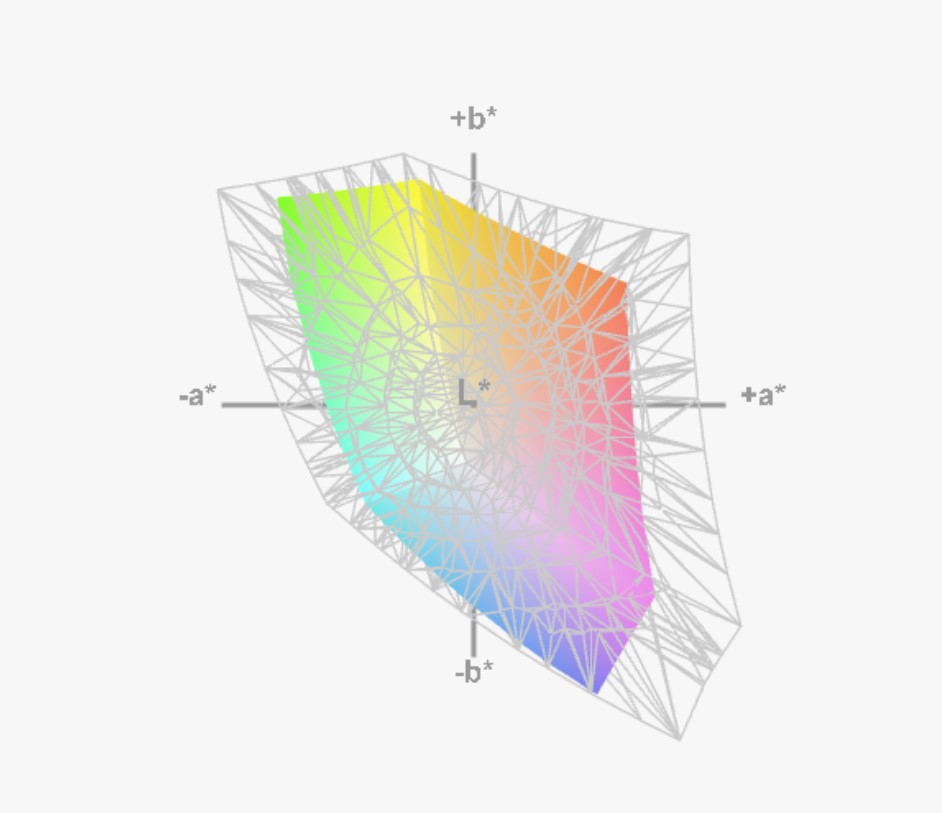
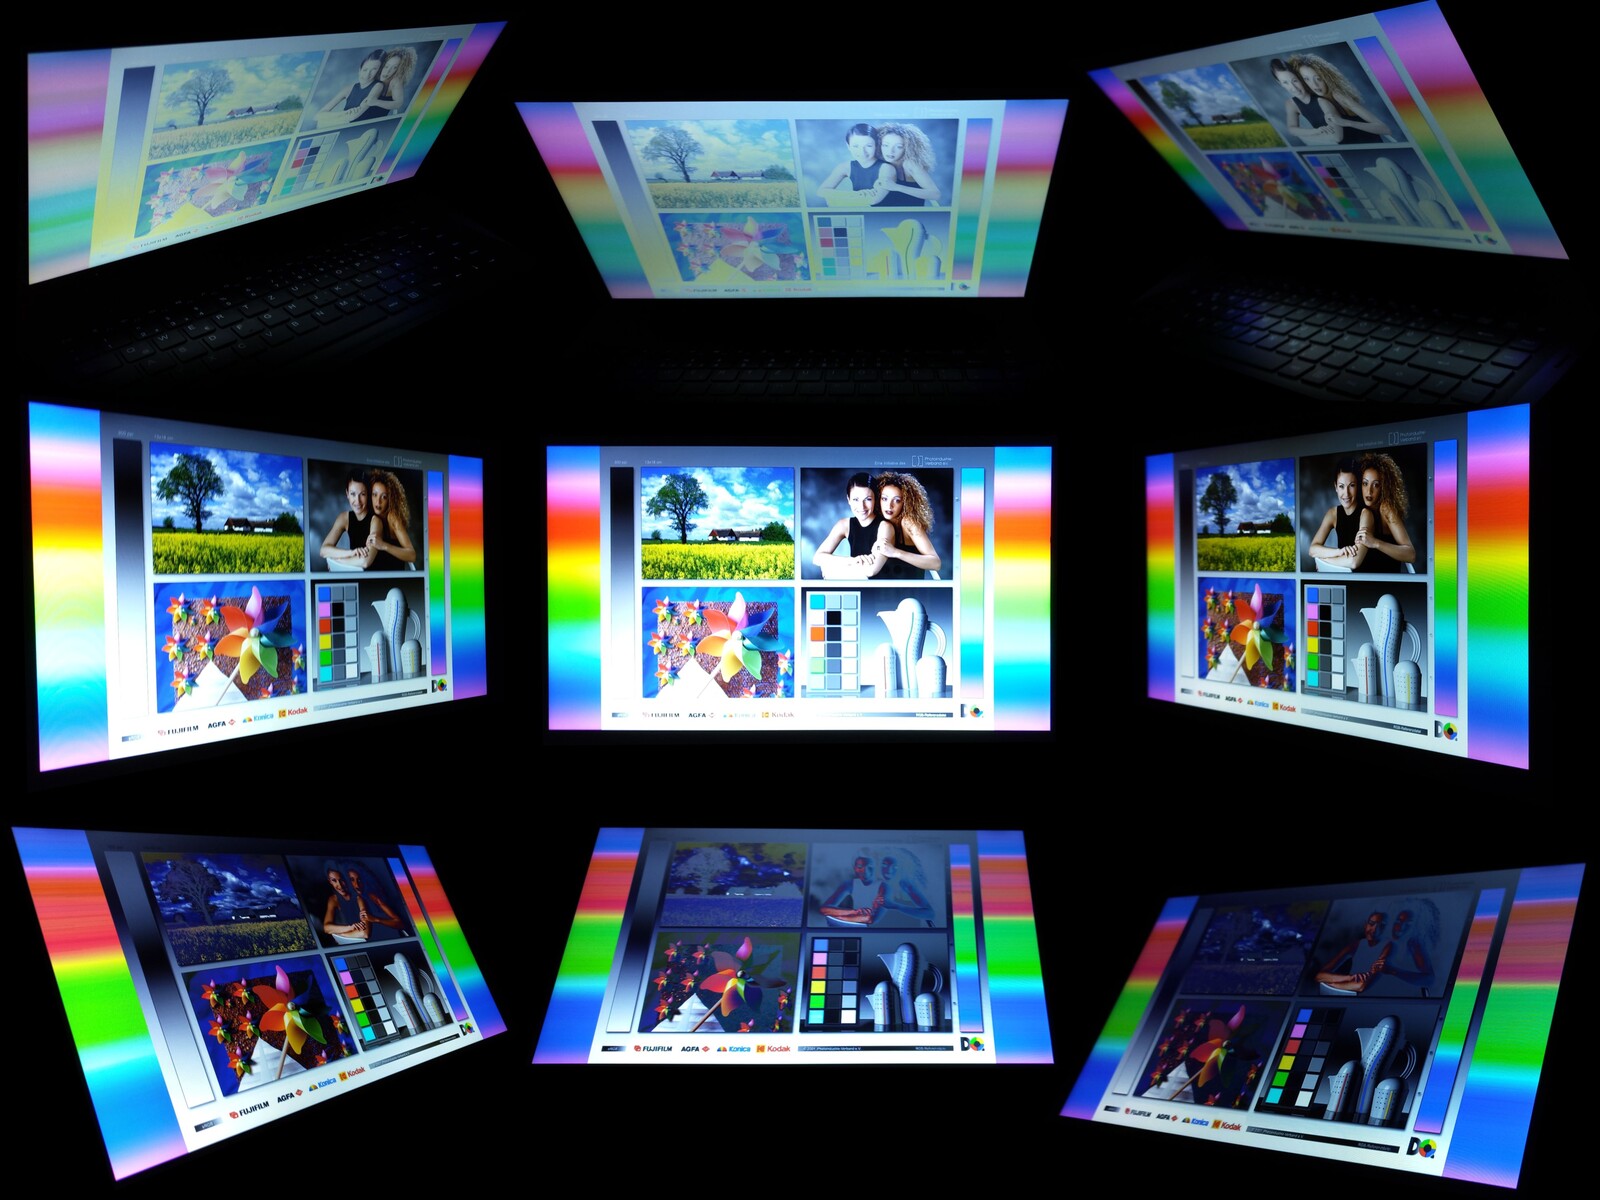
Display - Poorly calibrated TN panel

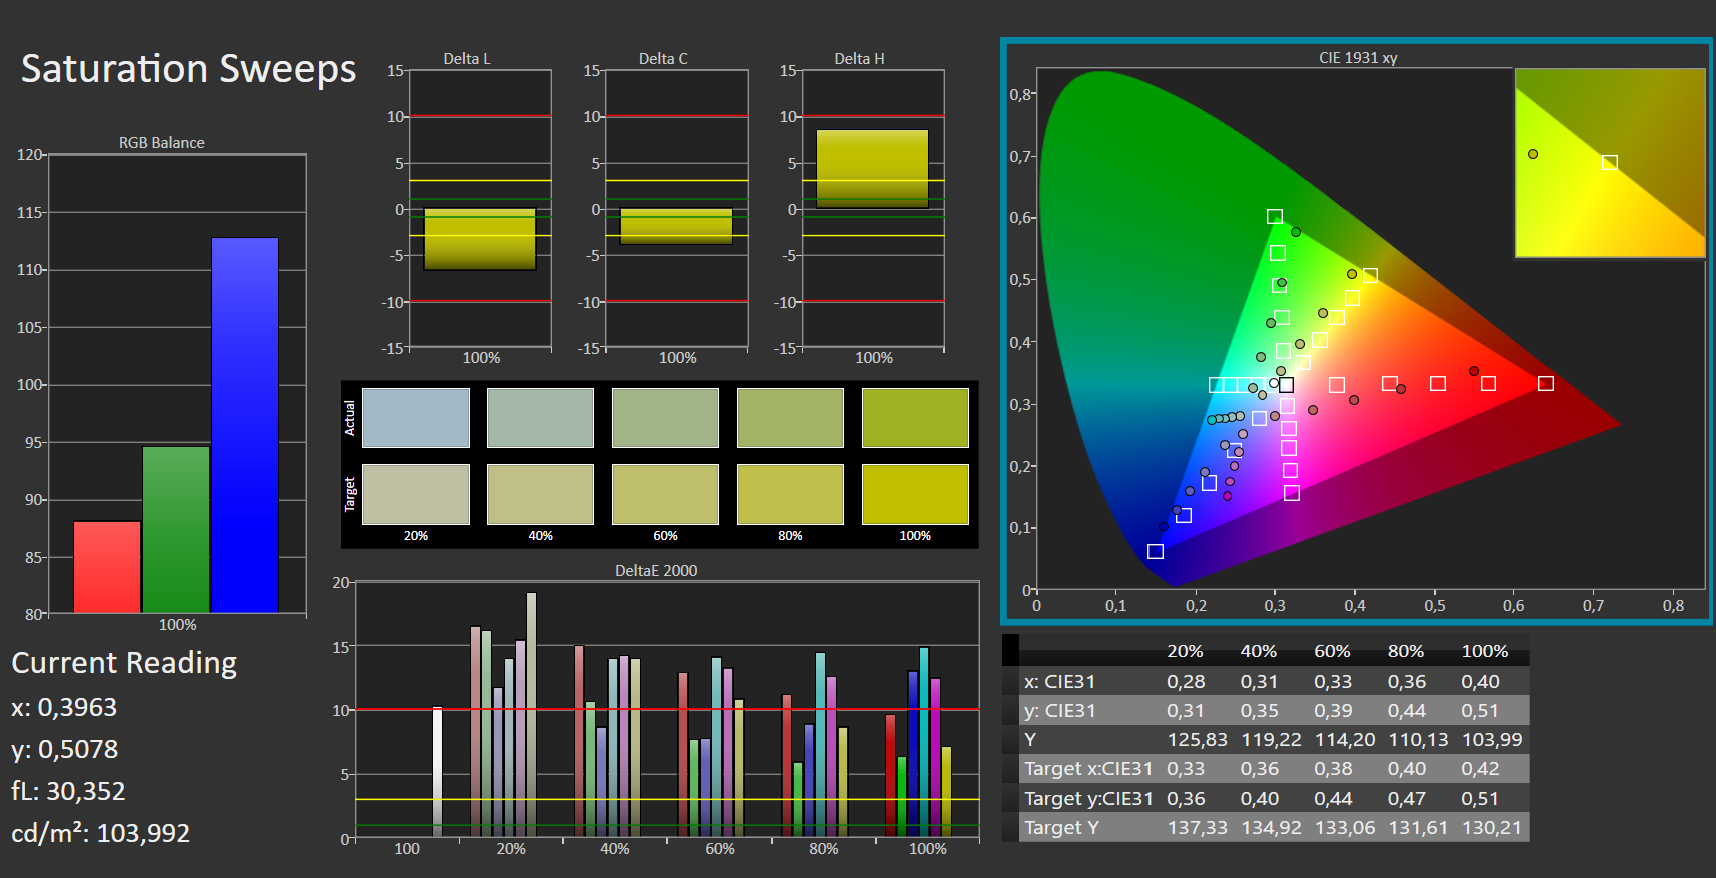
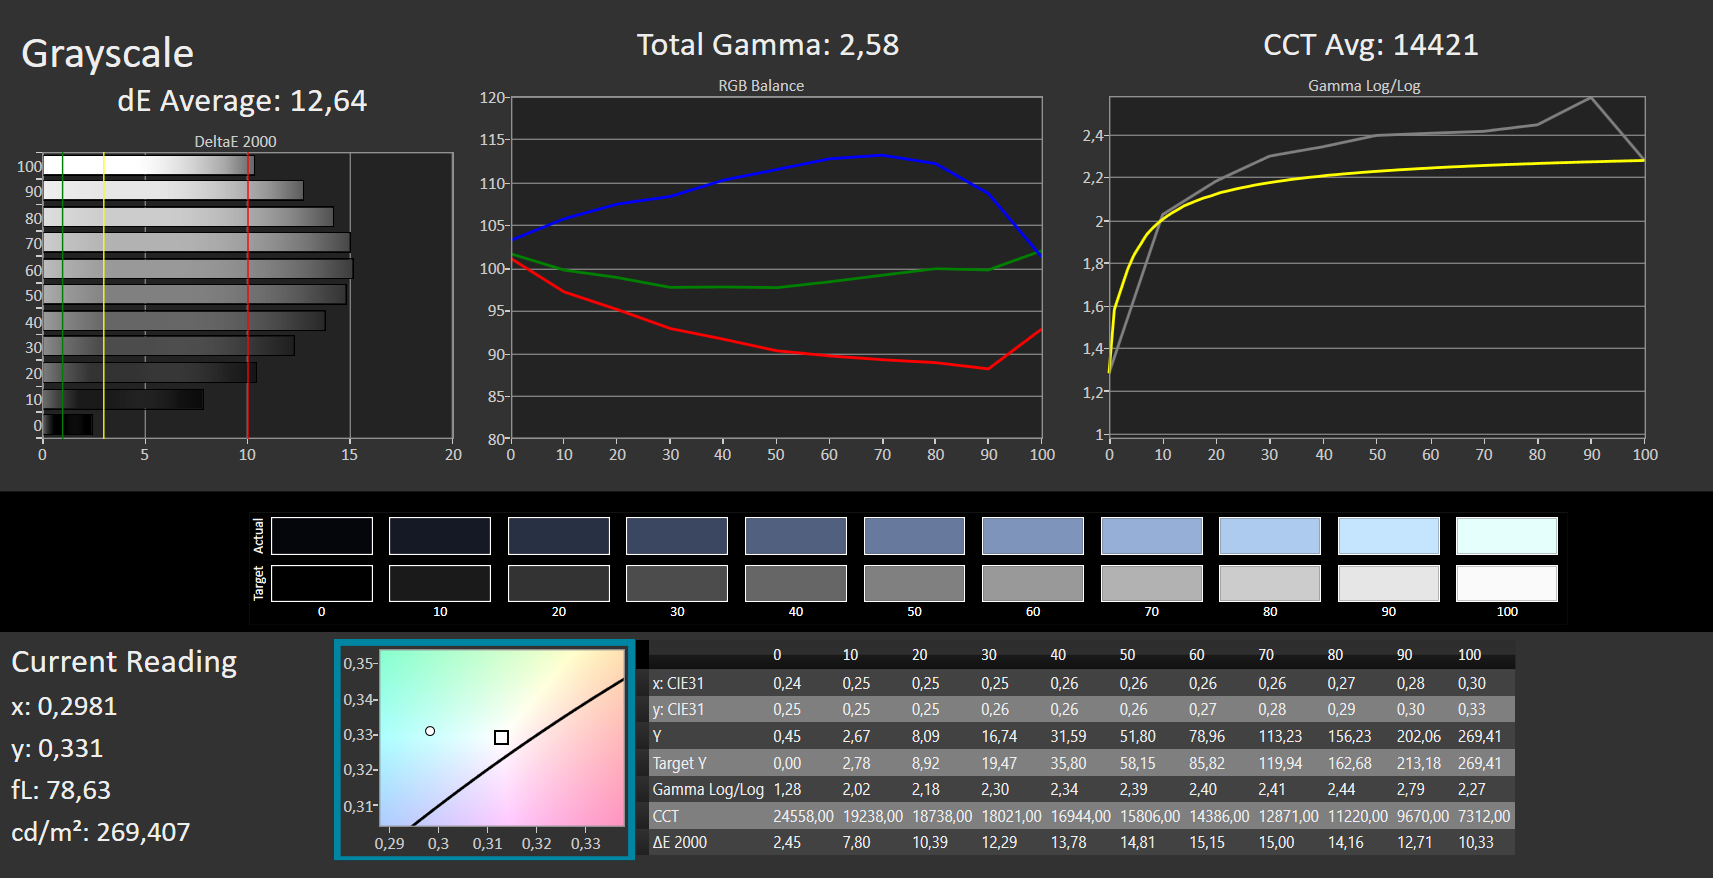
The first point in the GeoFlex 140 where you find the necessary savings for a low-priced computer is the screen. The TN panel with 1,366 × 768 pixels is hardly up to date and 247.8 cd/m² does not offer high brightness. Its contrast ratio of 598:1 is also low. At least no noticeable illumination errors can be found. Ultimately, there is no other way to put it: The screen in the convertible is from the lowest drawer.
| |||||||||||||||||||||||||
Brightness Distribution: 80 %
Center on Battery: 269 cd/m²
Contrast: 598:1 (Black: 0.45 cd/m²)
ΔE Color 11.34 | 0.5-29.43 Ø5, calibrated: 4.25
ΔE Greyscale 12.64 | 0.57-98 Ø5.3
42.76% AdobeRGB 1998 (Argyll 2.2.0 3D)
62.35% sRGB (Argyll 2.2.0 3D)
41.39% Display P3 (Argyll 2.2.0 3D)
Gamma: 2.58
| Geo Computers GeoFlex 140 GJX08BD, TN, 1366x768, 14.10 | Asus BR1100FKA-BP0109RA IPS, 1366x768, 11.60 | Lenovo IdeaPad Flex 3 11IGL05 N116BCA-EA1, IPS LED, 1366x768, 11.60 | Chuwi Hi10 X AU Optronics AUO17D8, IPS, 1920x1200, 10.10 | BMAX MaxBook Y11 H1M6 LC116LF3L01, IPS, 1920x1080, 11.60 | XIDU PhilBook Max CMN N140HCA-EAC, IPS, 1920x1080, 14.10 | Asus Vivobook 15 F512DA-SH31 AU Optronics B156HAN02.1, IPS, 1920x1080, 15.60 | |
|---|---|---|---|---|---|---|---|
| Display | 10% | 10% | 60% | 50% | 2% | -6% | |
| Display P3 Coverage | 41.39 | 46 11% | 45.35 10% | 67.9 64% | 62.4 51% | 42.16 2% | 38.71 -6% |
| sRGB Coverage | 62.35 | 68 9% | 67.7 9% | 96.8 55% | 93.4 50% | 63 1% | 58.2 -7% |
| AdobeRGB 1998 Coverage | 42.76 | 47 10% | 46.93 10% | 68.9 61% | 64.2 50% | 43.6 2% | 40 -6% |
| Response Times | -26% | -33% | 11% | -12% | -5% | -7% | |
| Response Time Grey 50% / Grey 80% * | 38 ? | 34 ? 11% | 38 ? -0% | 30.4 ? 20% | 36.1 ? 5% | 38.4 ? -1% | 36 ? 5% |
| Response Time Black / White * | 25 ? | 25 ? -0% | 25 ? -0% | 24.4 ? 2% | 30.4 ? -22% | 28.8 ? -15% | 29.6 ? -18% |
| PWM Frequency | 25000 | 2500 -90% | 250 ? -99% | 20000 ? -20% | 25000 ? 0% | ||
| Screen | 40% | 43% | 12% | 30% | 22% | -0% | |
| Brightness middle | 269 | 242 -10% | 270 0% | 256.3 -5% | 258 -4% | 179 -33% | 252.8 -6% |
| Brightness | 248 | 230 -7% | 259 4% | 255 3% | 248 0% | 175 -29% | 237 -4% |
| Brightness Distribution | 80 | 87 9% | 76 -5% | 93 16% | 94 18% | 78 -2% | 89 11% |
| Black Level * | 0.45 | 0.195 57% | 0.195 57% | 0.41 9% | 0.26 42% | 0.15 67% | 0.86 -91% |
| Contrast | 598 | 1241 108% | 1385 132% | 625 5% | 992 66% | 1193 99% | 294 -51% |
| Colorchecker dE 2000 * | 11.34 | 5.35 53% | 3.98 65% | 10.04 11% | 7.1 37% | 6 47% | 4.83 57% |
| Colorchecker dE 2000 max. * | 17.68 | 8.74 51% | 8.46 52% | 17.49 1% | 14.8 16% | 20.2 -14% | 16.38 7% |
| Colorchecker dE 2000 calibrated * | 4.25 | 4 6% | 2.17 49% | 1.3 69% | 4.3 -1% | 3.78 11% | |
| Greyscale dE 2000 * | 12.64 | 4.79 62% | 2.57 80% | 10.4 18% | 9.6 24% | 5 60% | 4.6 64% |
| Gamma | 2.58 85% | 2.22 99% | 2.3 96% | 2.23 99% | 2.148 102% | 2 110% | 2.34 94% |
| CCT | 14421 45% | 6148 106% | 6332 103% | 10211 64% | 10313 63% | 6197 105% | 6841 95% |
| Color Space (Percent of AdobeRGB 1998) | 43 | 43 | 63 | 39.4 | 36.9 | ||
| Color Space (Percent of sRGB) | 68 | 67 | 96.7 | 61.6 | 58.1 | ||
| Total Average (Program / Settings) | 8% /
20% | 7% /
21% | 28% /
22% | 23% /
25% | 6% /
12% | -4% /
-2% |
* ... smaller is better
With an sRGB color space coverage of only 62%, the screen also offers quite little here. A clear blue cast is perceptible ex-factory, and the screen's color deviations are very high. But the GeoFlex 140 can be calibrated surprisingly well. With the ICC profile from the info box, the average ΔΕ2000 drops to an acceptable value of 4.25. With this, the colors become much more natural and the screen quite respectable. Even though the GeoFlex 140 only costs 200 Euros (~$218), a display that is at least halfway well calibrated at delivery would still be desirable.
Display Response Times
| ↔ Response Time Black to White | ||
|---|---|---|
| 25 ms ... rise ↗ and fall ↘ combined | ↗ 19 ms rise |  |
| ↘ 6 ms fall | ||
| The screen shows relatively slow response rates in our tests and may be too slow for gamers. In comparison, all tested devices range from 0.1 (minimum) to 240 (maximum) ms. » 53 % of all devices are better. This means that the measured response time is worse than the average of all tested devices (21.5 ms). | ||
| ↔ Response Time 50% Grey to 80% Grey | ||
| 38 ms ... rise ↗ and fall ↘ combined | ↗ 20 ms rise |  |
| ↘ 18 ms fall | ||
| The screen shows slow response rates in our tests and will be unsatisfactory for gamers. In comparison, all tested devices range from 0.2 (minimum) to 636 (maximum) ms. » 49 % of all devices are better. This means that the measured response time is worse than the average of all tested devices (33.7 ms). | ||
Screen Flickering / PWM (Pulse-Width Modulation)
| Screen flickering / PWM detected | 25000 Hz |  | |
The display backlight flickers at 25000 Hz (worst case, e.g., utilizing PWM) . The frequency of 25000 Hz is quite high, so most users sensitive to PWM should not notice any flickering. In comparison: 53 % of all tested devices do not use PWM to dim the display. If PWM was detected, an average of 17900 (minimum: 5 - maximum: 3846000) Hz was measured. | |||


The TN panel's low brightness hardly allows good readability outdoors. The viewing angle stability here is at typical values for the technology. This means that the screen only really displays the right colors from a very limited viewing angle range.
Performance - multitasking is hardly possible
With the Intel Celeron N4020 and 4 GB of working memory, one can at least expect a decent performance from the GeoFlex 140 for Internet browsers, web applications, Office and many apps from the Microsoft Store. Accordingly, the GeoFlex 140 ships with Windows in S mode. In everyday use, at least streaming, browsing and Office also work without problems. However, it should be clear that the installed dual-core processor can only perform multitasking to a very limited extent and many applications need more time than you are used to from stronger laptops.
Test conditions
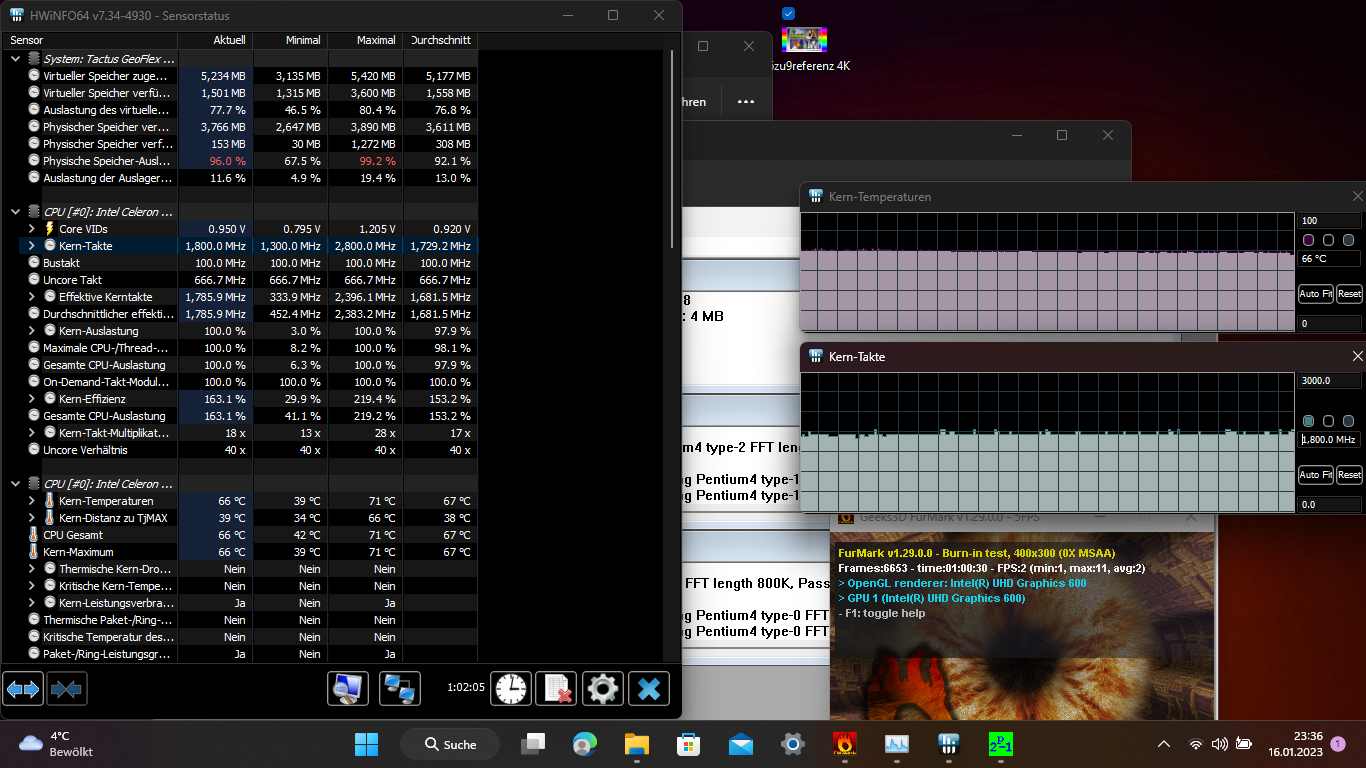
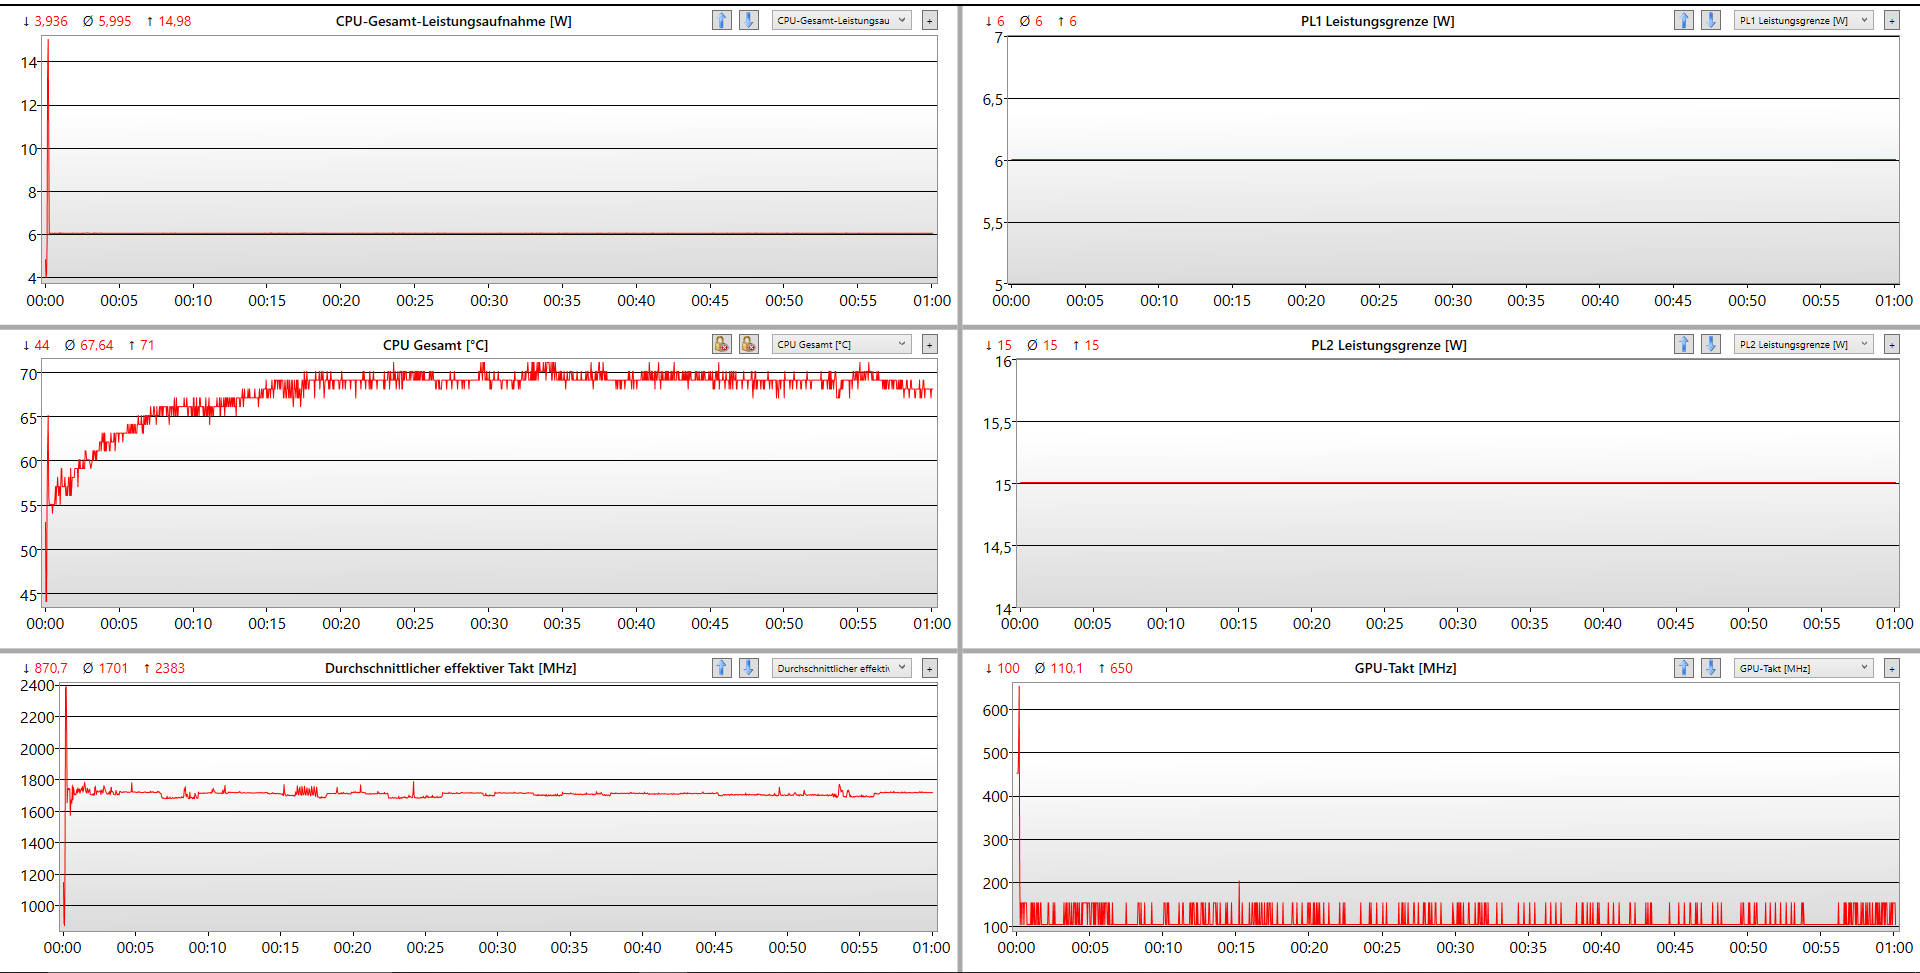
Due to the passive cooling, there are hardly any points where a performance control could be applied in the GeoFlex 140. Thus, it is not surprising that the laptop's performance can at most be manipulated via the Windows energy settings. Here we find that nothing changes in the set performance limits. The processor's boost power (PL2) is always 15 watts, the permanent power is 6 watts. Thus, it would not be crucial, in principle, in which setting the benchmarks are executed. Nevertheless, we opted for the energy status "Best performance".
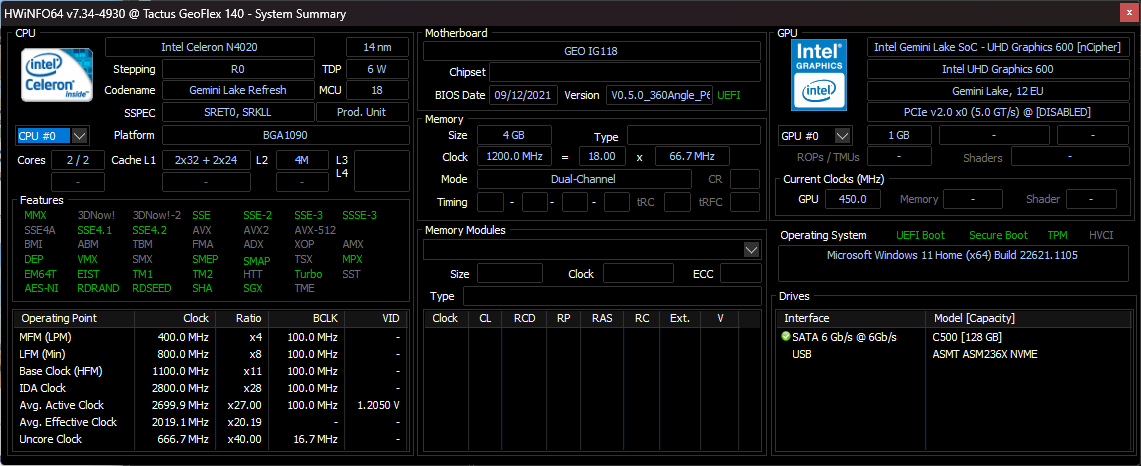
Processor
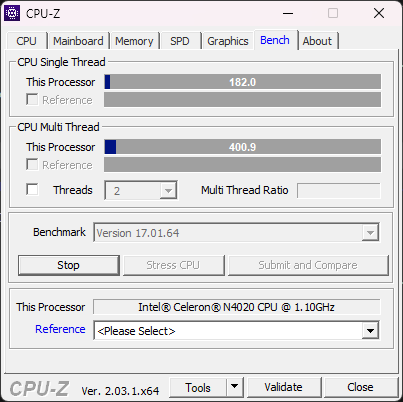
The Intel Celeron N4020 has been on the market for three years now and is manufactured in a 14 nanometer process. The processor comes with two cores and without hyperthreading. Thus, it is not a multitasking talent. Too many applications open at the same time can quickly overload it. Accordingly, the scores and results in all possible processor benchmarks are low. The purely passively cooled Intel Celeron processor cannot achieve particularly good scores here. It only manages all tasks given to it with patience.
Cinebench R15 Multi Endurance test
Cinebench R23: Multi Core | Single Core
Cinebench R20: CPU (Multi Core) | CPU (Single Core)
Cinebench R15: CPU Multi 64Bit | CPU Single 64Bit
Blender: v2.79 BMW27 CPU
7-Zip 18.03: 7z b 4 | 7z b 4 -mmt1
Geekbench 5.5: Multi-Core | Single-Core
HWBOT x265 Benchmark v2.2: 4k Preset
LibreOffice : 20 Documents To PDF
R Benchmark 2.5: Overall mean
| CPU Performance Rating | |
| Average of class Convertible | |
| Asus Vivobook 15 F512DA-SH31 -2! | |
| Lenovo IdeaPad Flex 3 11IGL05 -2! | |
| Chuwi Hi10 X -2! | |
| BMAX MaxBook Y11 H1M6 | |
| Average Intel Celeron N4020 | |
| Asus BR1100FKA-BP0109RA | |
| Geo Computers GeoFlex 140 -5! | |
| XIDU PhilBook Max -6! | |
| Cinebench R23 / Multi Core | |
| Average of class Convertible (616 - 18070, n=67, last 2 years) | |
| BMAX MaxBook Y11 H1M6 | |
| Asus BR1100FKA-BP0109RA | |
| Geo Computers GeoFlex 140 | |
| Average Intel Celeron N4020 () | |
| Cinebench R23 / Single Core | |
| Average of class Convertible (307 - 1970, n=67, last 2 years) | |
| Asus BR1100FKA-BP0109RA | |
| BMAX MaxBook Y11 H1M6 | |
| Geo Computers GeoFlex 140 | |
| Average Intel Celeron N4020 () | |
| Cinebench R20 / CPU (Multi Core) | |
| Average of class Convertible (242 - 6954, n=67, last 2 years) | |
| Asus Vivobook 15 F512DA-SH31 | |
| BMAX MaxBook Y11 H1M6 | |
| Chuwi Hi10 X | |
| Asus BR1100FKA-BP0109RA | |
| Lenovo IdeaPad Flex 3 11IGL05 | |
| Average Intel Celeron N4020 (242 - 316, n=2) | |
| Geo Computers GeoFlex 140 | |
| XIDU PhilBook Max | |
| Cinebench R20 / CPU (Single Core) | |
| Average of class Convertible (116.8 - 755, n=66, last 2 years) | |
| Asus Vivobook 15 F512DA-SH31 | |
| Asus BR1100FKA-BP0109RA | |
| Lenovo IdeaPad Flex 3 11IGL05 | |
| Average Intel Celeron N4020 (149.8 - 175, n=2) | |
| Chuwi Hi10 X | |
| BMAX MaxBook Y11 H1M6 | |
| Geo Computers GeoFlex 140 | |
| XIDU PhilBook Max | |
| Cinebench R15 / CPU Multi 64Bit | |
| Average of class Convertible (110.1 - 2889, n=68, last 2 years) | |
| Asus Vivobook 15 F512DA-SH31 | |
| BMAX MaxBook Y11 H1M6 | |
| Chuwi Hi10 X | |
| Asus BR1100FKA-BP0109RA | |
| Lenovo IdeaPad Flex 3 11IGL05 | |
| Average Intel Celeron N4020 (110.1 - 144.1, n=2) | |
| Geo Computers GeoFlex 140 | |
| XIDU PhilBook Max | |
| Cinebench R15 / CPU Single 64Bit | |
| Average of class Convertible (68.6 - 287, n=66, last 2 years) | |
| Asus Vivobook 15 F512DA-SH31 | |
| Asus BR1100FKA-BP0109RA | |
| Lenovo IdeaPad Flex 3 11IGL05 | |
| Average Intel Celeron N4020 (68.6 - 78.9, n=2) | |
| Chuwi Hi10 X | |
| Geo Computers GeoFlex 140 | |
| BMAX MaxBook Y11 H1M6 | |
| XIDU PhilBook Max | |
| Blender / v2.79 BMW27 CPU | |
| XIDU PhilBook Max | |
| Asus BR1100FKA-BP0109RA | |
| Lenovo IdeaPad Flex 3 11IGL05 | |
| Average Intel Celeron N4020 () | |
| Chuwi Hi10 X | |
| BMAX MaxBook Y11 H1M6 | |
| Asus Vivobook 15 F512DA-SH31 | |
| Average of class Convertible (193 - 3620, n=62, last 2 years) | |
| 7-Zip 18.03 / 7z b 4 | |
| Average of class Convertible (7703 - 72400, n=64, last 2 years) | |
| Asus Vivobook 15 F512DA-SH31 | |
| BMAX MaxBook Y11 H1M6 | |
| Chuwi Hi10 X | |
| Asus BR1100FKA-BP0109RA | |
| Lenovo IdeaPad Flex 3 11IGL05 | |
| Average Intel Celeron N4020 () | |
| XIDU PhilBook Max | |
| 7-Zip 18.03 / 7z b 4 -mmt1 | |
| Average of class Convertible (2046 - 6417, n=64, last 2 years) | |
| Asus Vivobook 15 F512DA-SH31 | |
| Asus BR1100FKA-BP0109RA | |
| Lenovo IdeaPad Flex 3 11IGL05 | |
| Average Intel Celeron N4020 () | |
| Chuwi Hi10 X | |
| BMAX MaxBook Y11 H1M6 | |
| XIDU PhilBook Max | |
| Geekbench 5.5 / Multi-Core | |
| Average of class Convertible (663 - 14016, n=68, last 2 years) | |
| Asus Vivobook 15 F512DA-SH31 | |
| BMAX MaxBook Y11 H1M6 | |
| Chuwi Hi10 X | |
| Lenovo IdeaPad Flex 3 11IGL05 | |
| Geo Computers GeoFlex 140 | |
| Geo Computers GeoFlex 140 | |
| Average Intel Celeron N4020 (663 - 858, n=3) | |
| Asus BR1100FKA-BP0109RA | |
| Geekbench 5.5 / Single-Core | |
| Average of class Convertible (319 - 1981, n=68, last 2 years) | |
| Asus Vivobook 15 F512DA-SH31 | |
| Lenovo IdeaPad Flex 3 11IGL05 | |
| Geo Computers GeoFlex 140 | |
| Geo Computers GeoFlex 140 | |
| Average Intel Celeron N4020 (319 - 475, n=3) | |
| Chuwi Hi10 X | |
| Asus BR1100FKA-BP0109RA | |
| BMAX MaxBook Y11 H1M6 | |
| HWBOT x265 Benchmark v2.2 / 4k Preset | |
| Average of class Convertible (0.61 - 20.1, n=66, last 2 years) | |
| Asus Vivobook 15 F512DA-SH31 | |
| BMAX MaxBook Y11 H1M6 | |
| Chuwi Hi10 X | |
| Lenovo IdeaPad Flex 3 11IGL05 | |
| Average Intel Celeron N4020 (0.73 - 0.92, n=2) | |
| Asus BR1100FKA-BP0109RA | |
| Geo Computers GeoFlex 140 | |
| XIDU PhilBook Max | |
| LibreOffice / 20 Documents To PDF | |
| Asus BR1100FKA-BP0109RA | |
| BMAX MaxBook Y11 H1M6 | |
| Chuwi Hi10 X | |
| Lenovo IdeaPad Flex 3 11IGL05 | |
| Average Intel Celeron N4020 () | |
| Asus Vivobook 15 F512DA-SH31 | |
| Average of class Convertible (42 - 223, n=64, last 2 years) | |
| R Benchmark 2.5 / Overall mean | |
| Asus BR1100FKA-BP0109RA | |
| BMAX MaxBook Y11 H1M6 | |
| Chuwi Hi10 X | |
| Lenovo IdeaPad Flex 3 11IGL05 | |
| Average Intel Celeron N4020 () | |
| Asus Vivobook 15 F512DA-SH31 | |
| Average of class Convertible (0.4102 - 1.967, n=64, last 2 years) | |
* ... smaller is better
AIDA64: FP32 Ray-Trace | FPU Julia | CPU SHA3 | CPU Queen | FPU SinJulia | FPU Mandel | CPU AES | CPU ZLib | FP64 Ray-Trace | CPU PhotoWorxx
| Performance Rating | |
| Average of class Convertible | |
| Asus Vivobook 15 F512DA-SH31 | |
| BMAX MaxBook Y11 H1M6 | |
| Chuwi Hi10 X | |
| Geo Computers GeoFlex 140 | |
| Average Intel Celeron N4020 | |
| XIDU PhilBook Max -1! | |
| Asus BR1100FKA-BP0109RA | |
| AIDA64 / FP32 Ray-Trace | |
| Average of class Convertible (109 - 25226, n=67, last 2 years) | |
| Asus Vivobook 15 F512DA-SH31 | |
| BMAX MaxBook Y11 H1M6 | |
| Chuwi Hi10 X | |
| Geo Computers GeoFlex 140 | |
| Average Intel Celeron N4020 () | |
| XIDU PhilBook Max | |
| Asus BR1100FKA-BP0109RA | |
| AIDA64 / FPU Julia | |
| Average of class Convertible (2644 - 106512, n=66, last 2 years) | |
| Asus Vivobook 15 F512DA-SH31 | |
| BMAX MaxBook Y11 H1M6 | |
| Chuwi Hi10 X | |
| XIDU PhilBook Max | |
| Geo Computers GeoFlex 140 | |
| Average Intel Celeron N4020 () | |
| Asus BR1100FKA-BP0109RA | |
| AIDA64 / CPU SHA3 | |
| Average of class Convertible (121 - 4764, n=66, last 2 years) | |
| Asus Vivobook 15 F512DA-SH31 | |
| BMAX MaxBook Y11 H1M6 | |
| Chuwi Hi10 X | |
| Geo Computers GeoFlex 140 | |
| Average Intel Celeron N4020 () | |
| Asus BR1100FKA-BP0109RA | |
| AIDA64 / CPU Queen | |
| Average of class Convertible (3256 - 120368, n=66, last 2 years) | |
| Asus Vivobook 15 F512DA-SH31 | |
| BMAX MaxBook Y11 H1M6 | |
| Chuwi Hi10 X | |
| Geo Computers GeoFlex 140 | |
| Average Intel Celeron N4020 () | |
| XIDU PhilBook Max | |
| Asus BR1100FKA-BP0109RA | |
| AIDA64 / FPU SinJulia | |
| Average of class Convertible (549 - 14835, n=66, last 2 years) | |
| Asus Vivobook 15 F512DA-SH31 | |
| BMAX MaxBook Y11 H1M6 | |
| Chuwi Hi10 X | |
| Geo Computers GeoFlex 140 | |
| Average Intel Celeron N4020 () | |
| XIDU PhilBook Max | |
| Asus BR1100FKA-BP0109RA | |
| AIDA64 / FPU Mandel | |
| Average of class Convertible (1420 - 56839, n=66, last 2 years) | |
| Asus Vivobook 15 F512DA-SH31 | |
| BMAX MaxBook Y11 H1M6 | |
| Chuwi Hi10 X | |
| XIDU PhilBook Max | |
| Geo Computers GeoFlex 140 | |
| Average Intel Celeron N4020 () | |
| Asus BR1100FKA-BP0109RA | |
| AIDA64 / CPU AES | |
| Average of class Convertible (191 - 169089, n=66, last 2 years) | |
| Asus Vivobook 15 F512DA-SH31 | |
| BMAX MaxBook Y11 H1M6 | |
| Chuwi Hi10 X | |
| Geo Computers GeoFlex 140 | |
| Average Intel Celeron N4020 () | |
| XIDU PhilBook Max | |
| Asus BR1100FKA-BP0109RA | |
| AIDA64 / CPU ZLib | |
| Average of class Convertible (61.4 - 1088, n=66, last 2 years) | |
| Asus Vivobook 15 F512DA-SH31 | |
| BMAX MaxBook Y11 H1M6 | |
| Chuwi Hi10 X | |
| Geo Computers GeoFlex 140 | |
| Average Intel Celeron N4020 () | |
| XIDU PhilBook Max | |
| Asus BR1100FKA-BP0109RA | |
| AIDA64 / FP64 Ray-Trace | |
| Average of class Convertible (59 - 13175, n=66, last 2 years) | |
| Asus Vivobook 15 F512DA-SH31 | |
| BMAX MaxBook Y11 H1M6 | |
| Chuwi Hi10 X | |
| Geo Computers GeoFlex 140 | |
| Average Intel Celeron N4020 () | |
| XIDU PhilBook Max | |
| Asus BR1100FKA-BP0109RA | |
| AIDA64 / CPU PhotoWorxx | |
| Average of class Convertible (2185 - 52599, n=66, last 2 years) | |
| Asus Vivobook 15 F512DA-SH31 | |
| BMAX MaxBook Y11 H1M6 | |
| Chuwi Hi10 X | |
| Geo Computers GeoFlex 140 | |
| Average Intel Celeron N4020 () | |
| XIDU PhilBook Max | |
| Asus BR1100FKA-BP0109RA | |
System performance
In PCMark10 and CrossMark, the results are on the expected low level for a dual-core processor. With the Intel Celeron N4020 it is possible to do quite a bit with the Intel Celeron N4020 in everyday use, but as soon as it comes to heavier tasks, as in the benchmarks, the laptop clearly reveals its weaknesses. In practice, it turns out that many open programs slow down the GeoFlex 140 noticeably. However, the low performance of the convertible is hardly noticed when you restrict it to browser and office applications.
CrossMark: Overall | Productivity | Creativity | Responsiveness
| PCMark 10 / Score | |
| Average of class Convertible (1486 - 7963, n=61, last 2 years) | |
| Asus Vivobook 15 F512DA-SH31 | |
| BMAX MaxBook Y11 H1M6 | |
| Chuwi Hi10 X | |
| Lenovo IdeaPad Flex 3 11IGL05 | |
| Average Intel Celeron N4020, Intel UHD Graphics 600 (1486 - 1521, n=2) | |
| Geo Computers GeoFlex 140 | |
| Asus BR1100FKA-BP0109RA | |
| XIDU PhilBook Max | |
| PCMark 10 / Essentials | |
| Average of class Convertible (3975 - 12059, n=61, last 2 years) | |
| Asus Vivobook 15 F512DA-SH31 | |
| BMAX MaxBook Y11 H1M6 | |
| Chuwi Hi10 X | |
| Geo Computers GeoFlex 140 | |
| Average Intel Celeron N4020, Intel UHD Graphics 600 (3833 - 3975, n=2) | |
| Lenovo IdeaPad Flex 3 11IGL05 | |
| Asus BR1100FKA-BP0109RA | |
| XIDU PhilBook Max | |
| PCMark 10 / Productivity | |
| Average of class Convertible (2764 - 10800, n=61, last 2 years) | |
| Asus Vivobook 15 F512DA-SH31 | |
| Geo Computers GeoFlex 140 | |
| Average Intel Celeron N4020, Intel UHD Graphics 600 (2638 - 2764, n=2) | |
| Lenovo IdeaPad Flex 3 11IGL05 | |
| BMAX MaxBook Y11 H1M6 | |
| Chuwi Hi10 X | |
| Asus BR1100FKA-BP0109RA | |
| XIDU PhilBook Max | |
| PCMark 10 / Digital Content Creation | |
| Average of class Convertible (811 - 12360, n=61, last 2 years) | |
| Asus Vivobook 15 F512DA-SH31 | |
| Lenovo IdeaPad Flex 3 11IGL05 | |
| BMAX MaxBook Y11 H1M6 | |
| Asus BR1100FKA-BP0109RA | |
| Chuwi Hi10 X | |
| Average Intel Celeron N4020, Intel UHD Graphics 600 (811 - 946, n=2) | |
| Geo Computers GeoFlex 140 | |
| XIDU PhilBook Max | |
| CrossMark / Overall | |
| Average of class Convertible (285 - 1912, n=61, last 2 years) | |
| Geo Computers GeoFlex 140 | |
| Average Intel Celeron N4020, Intel UHD Graphics 600 () | |
| CrossMark / Productivity | |
| Average of class Convertible (310 - 1790, n=61, last 2 years) | |
| Geo Computers GeoFlex 140 | |
| Average Intel Celeron N4020, Intel UHD Graphics 600 () | |
| CrossMark / Creativity | |
| Average of class Convertible (252 - 2183, n=61, last 2 years) | |
| Geo Computers GeoFlex 140 | |
| Average Intel Celeron N4020, Intel UHD Graphics 600 () | |
| CrossMark / Responsiveness | |
| Average of class Convertible (204 - 1868, n=61, last 2 years) | |
| Geo Computers GeoFlex 140 | |
| Average Intel Celeron N4020, Intel UHD Graphics 600 () | |
| PCMark 10 Score | 1486 points | |
Help | ||
| AIDA64 / Memory Copy | |
| Average of class Convertible (14439 - 95631, n=66, last 2 years) | |
| Geo Computers GeoFlex 140 | |
| Average Intel Celeron N4020 () | |
| Asus Vivobook 15 F512DA-SH31 | |
| XIDU PhilBook Max | |
| BMAX MaxBook Y11 H1M6 | |
| Chuwi Hi10 X | |
| Asus BR1100FKA-BP0109RA | |
| AIDA64 / Memory Read | |
| Average of class Convertible (12706 - 87812, n=66, last 2 years) | |
| Asus Vivobook 15 F512DA-SH31 | |
| Geo Computers GeoFlex 140 | |
| Average Intel Celeron N4020 () | |
| BMAX MaxBook Y11 H1M6 | |
| XIDU PhilBook Max | |
| Chuwi Hi10 X | |
| Asus BR1100FKA-BP0109RA | |
| AIDA64 / Memory Write | |
| Average of class Convertible (10177 - 93451, n=66, last 2 years) | |
| Asus Vivobook 15 F512DA-SH31 | |
| BMAX MaxBook Y11 H1M6 | |
| Chuwi Hi10 X | |
| Geo Computers GeoFlex 140 | |
| Average Intel Celeron N4020 () | |
| XIDU PhilBook Max | |
| Asus BR1100FKA-BP0109RA | |
| AIDA64 / Memory Latency | |
| Asus BR1100FKA-BP0109RA | |
| XIDU PhilBook Max | |
| Asus Vivobook 15 F512DA-SH31 | |
| Average of class Convertible (10.2 - 260, n=63, last 2 years) | |
| BMAX MaxBook Y11 H1M6 | |
| Chuwi Hi10 X | |
| Geo Computers GeoFlex 140 | |
| Average Intel Celeron N4020 () | |
* ... smaller is better
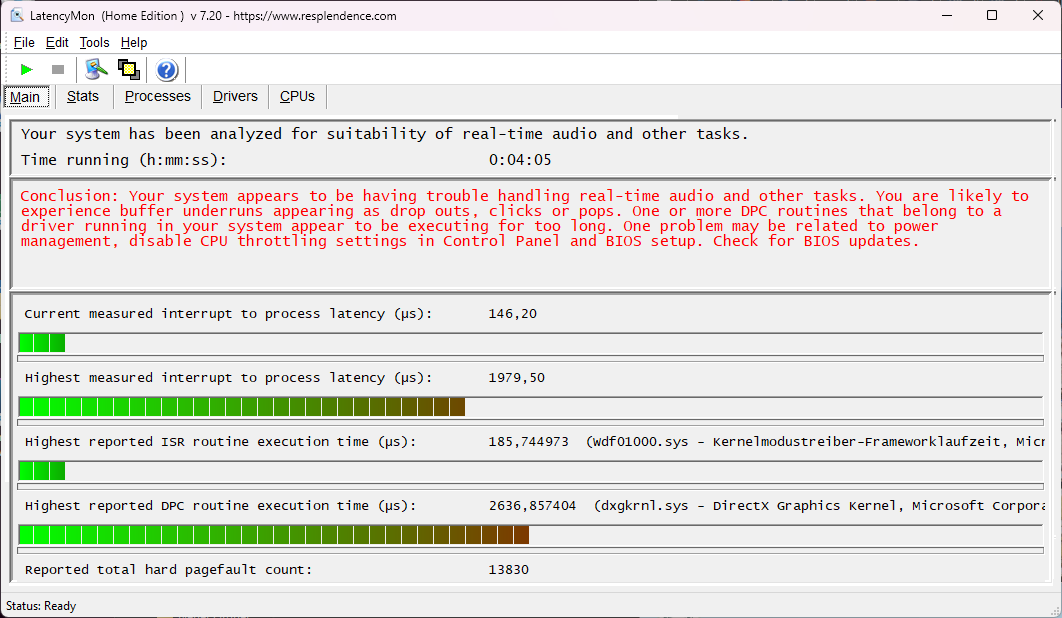
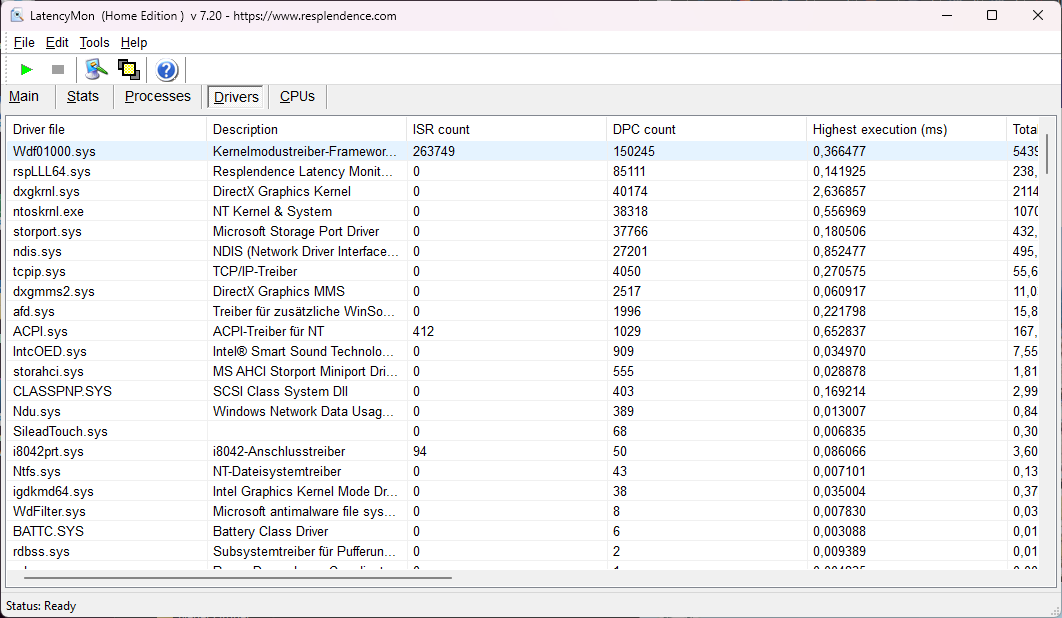
DPC latencies
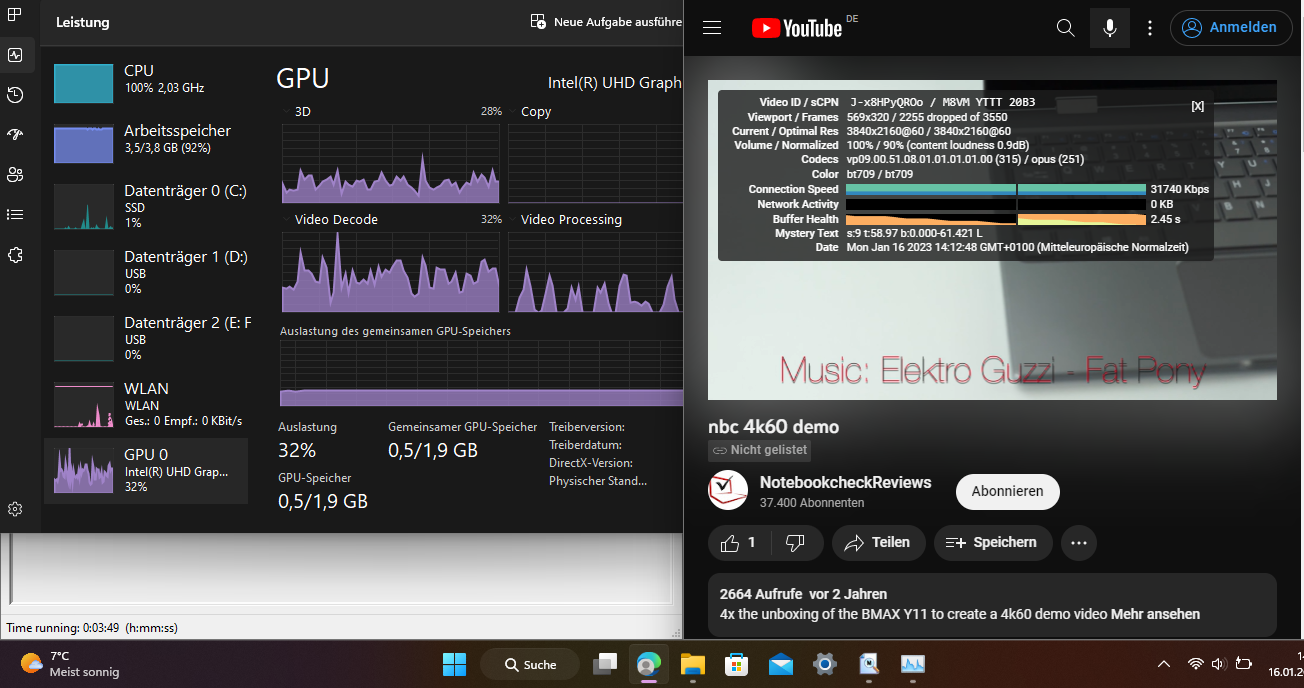
With only two cores, Windows has a hard time executing all tasks at the right time. This results in high DPC latencies. The laptop omits two thirds of the frames in the YouTube 4K60 Hz video. The Intel Celeron N4020 with its iGPU does not offer enough performance to render the video smoothly in this high resolution. The GeoFlex 140 does not have any problems when playing HD or Full HD videos.
| DPC Latencies / LatencyMon - interrupt to process latency (max), Web, Youtube, Prime95 | |
| Asus BR1100FKA-BP0109RA | |
| Lenovo IdeaPad Flex 3 11IGL05 | |
| BMAX MaxBook Y11 H1M6 | |
| Chuwi Hi10 X | |
| Asus Vivobook 15 F512DA-SH31 | |
* ... smaller is better
Mass storage
When it comes to the storage technology used, the GeoFlex 140 is a bit ahead of many of its competitors. While some other inexpensive laptops rely on soldered eMMC storage, the GeoFlex 140 at least has an M.2 SATA SSD. This could also be exchanged. In practice, however, the SCY C500 SNS1N3G12800D M.2 SATA does not mean a clear speed advantage for the laptop compared to the rivals with eMMC storage.

* ... smaller is better
Continuous power: DiskSpd Read Loop, Queue Depth 8
Graphics card
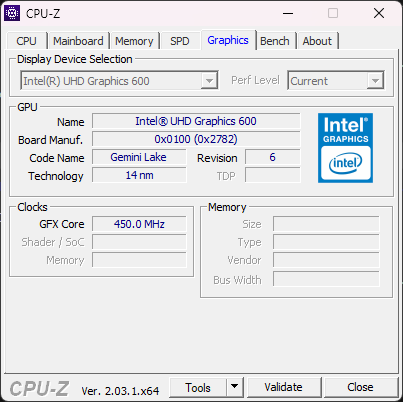
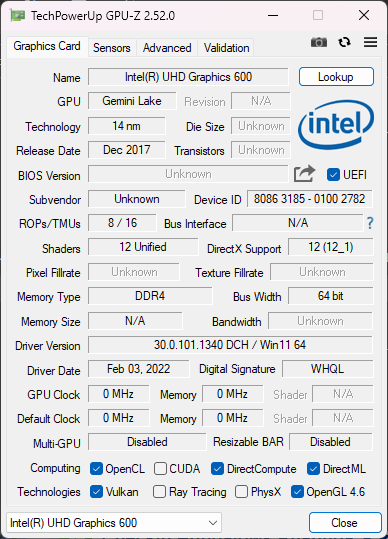
The Intel Celeron N4020 is equipped with the Intel UHD Graphics 600 is integrated. This is not powerful enough to meet the requirements of modern 3D games. We also ascertained this quite clearly in the test. At most, the laptop could achieve playable frame rates in games from the penultimate decade. The benchmarks with Blender, V-Ray and GPUScore completely bring the laptop to its knees. For example, we stopped GPUScore: Sacred Path after half an hour. Since the CPU and iGPU have to share six watts, the graphics performance collapses when the games demand a lot from the processor at the same time.
| 3DMark 11 Performance | 530 points | |
| 3DMark Cloud Gate Standard Score | 2298 points | |
| 3DMark Fire Strike Score | 352 points | |
| 3DMark Time Spy Score | 106 points | |
Help | ||
| low | med. | high | ultra | |
| Counter-Strike: GO (2012) | 15 | |||
| Dota 2 Reborn (2015) | 15.5 | 6.9 | 5.5 | 5.4 |
| Final Fantasy XV Benchmark (2018) | 3.56 | |||
| X-Plane 11.11 (2018) | 4.16 | 3.91 |
Emissions - Silent 2-in-1 laptop
Noise emissions
Like almost all competing devices, the GeoFlex 140 comes without a fan or other moving parts. Even a coil whine or similar is not perceptible from the laptop. Thus, the convertible can be operated silently.
Temperature
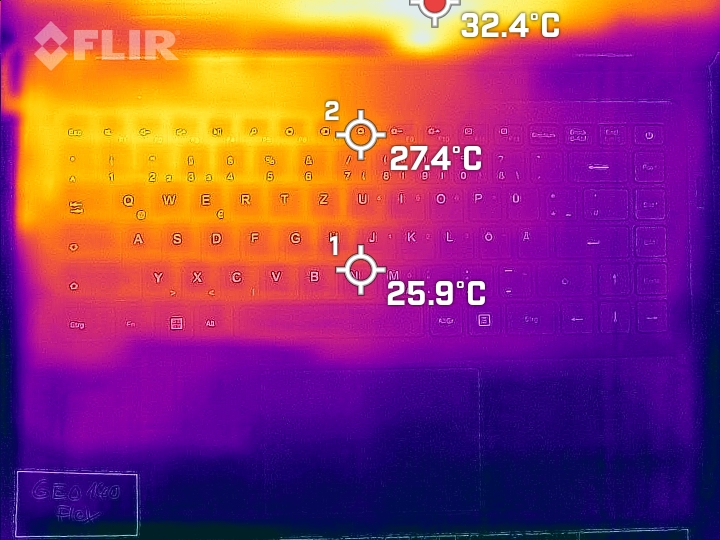
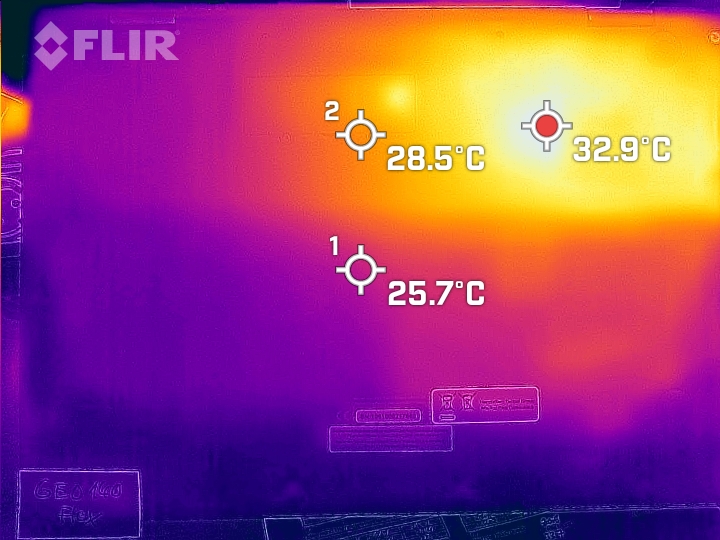
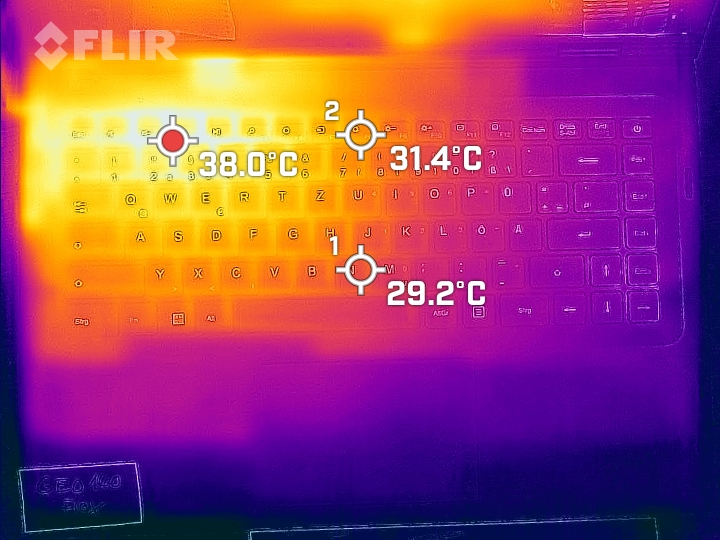
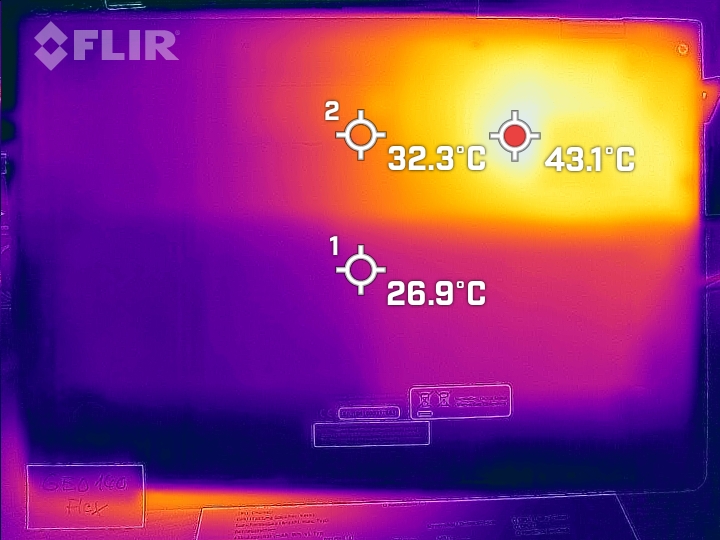
The convertible can convert a maximum of 24 watts of power. This low power nevertheless causes the laptop's surfaces to heat up considerably. We measured up to 48 °C (118.4 °F) on the underside. Since a relatively large copper plate dissipates the heat from the processor, the case is not only warm at certain points, almost a quarter of the underside of the GeoFlex 140 can develop an uncomfortably high temperature.
(+) The maximum temperature on the upper side is 39.7 °C / 103 F, compared to the average of 35.3 °C / 96 F, ranging from 19.6 to 55.7 °C for the class Convertible.
(-) The bottom heats up to a maximum of 47.4 °C / 117 F, compared to the average of 36.7 °C / 98 F
(+) In idle usage, the average temperature for the upper side is 25.4 °C / 78 F, compared to the device average of 30.2 °C / 86 F.
(+) The palmrests and touchpad are cooler than skin temperature with a maximum of 26.2 °C / 79.2 F and are therefore cool to the touch.
(±) The average temperature of the palmrest area of similar devices was 28.1 °C / 82.6 F (+1.9 °C / 3.4 F).
| Geo Computers GeoFlex 140 Intel Celeron N4020, Intel UHD Graphics 600 | Asus BR1100FKA-BP0109RA Intel Celeron N4500, Intel UHD Graphics (Jasper Lake 16 EU) | Lenovo IdeaPad Flex 3 11IGL05 Intel Celeron N4020, Intel UHD Graphics 600 | Chuwi Hi10 X Intel Celeron N4100, Intel UHD Graphics 600 | BMAX MaxBook Y11 H1M6 Intel Celeron N4100, Intel UHD Graphics 600 | XIDU PhilBook Max Intel Celeron J3355, Intel HD Graphics 500 | Asus Vivobook 15 F512DA-SH31 AMD Ryzen 3 3200U, AMD Radeon RX Vega 3 | |
|---|---|---|---|---|---|---|---|
| Heat | 8% | 13% | 2% | 15% | 9% | 10% | |
| Maximum Upper Side * | 39.7 | 39.3 1% | 37.4 6% | 41.8 -5% | 37 7% | 44.3 -12% | 33 17% |
| Maximum Bottom * | 47.4 | 42 11% | 41.4 13% | 42.8 10% | 38 20% | 42.8 10% | 41.4 13% |
| Idle Upper Side * | 30.9 | 28.4 8% | 27.2 12% | 33 -7% | 27 13% | 26.4 15% | 29 6% |
| Idle Bottom * | 34.1 | 30.4 11% | 27 21% | 31 9% | 27 21% | 26.4 23% | 32.4 5% |
* ... smaller is better
Stress test
The 2-in-1 laptop can maintain its performance throughout the stress test. Although this is low, it does not cause overheating. With its power of six watts, the processor heats up to around 70 °C (158 °F).
Speaker
The speakers in the GeoFlex 140 are acceptable and sound relatively balanced beyond the basses. The lows are simply too weak here, as in many laptops. At 80 dB(A), the speakers in the convertible do not get too loud, but do not sound tinny at all.
Geo Computers GeoFlex 140 audio analysis
(±) | speaker loudness is average but good (79.9 dB)
Bass 100 - 315 Hz
(-) | nearly no bass - on average 22.3% lower than median
(±) | linearity of bass is average (7.8% delta to prev. frequency)
Mids 400 - 2000 Hz
(±) | higher mids - on average 5.5% higher than median
(±) | linearity of mids is average (8.8% delta to prev. frequency)
Highs 2 - 16 kHz
(±) | higher highs - on average 5.8% higher than median
(±) | linearity of highs is average (9.5% delta to prev. frequency)
Overall 100 - 16.000 Hz
(±) | linearity of overall sound is average (21.7% difference to median)
Compared to same class
» 55% of all tested devices in this class were better, 10% similar, 35% worse
» The best had a delta of 6%, average was 21%, worst was 57%
Compared to all devices tested
» 56% of all tested devices were better, 7% similar, 36% worse
» The best had a delta of 4%, average was 25%, worst was 134%
Lenovo IdeaPad Flex 3 11IGL05 audio analysis
(-) | not very loud speakers (71.1 dB)
Bass 100 - 315 Hz
(-) | nearly no bass - on average 18.6% lower than median
(±) | linearity of bass is average (9.7% delta to prev. frequency)
Mids 400 - 2000 Hz
(+) | balanced mids - only 4.7% away from median
(±) | linearity of mids is average (10.2% delta to prev. frequency)
Highs 2 - 16 kHz
(+) | balanced highs - only 0.9% away from median
(+) | highs are linear (3.8% delta to prev. frequency)
Overall 100 - 16.000 Hz
(±) | linearity of overall sound is average (20.1% difference to median)
Compared to same class
» 46% of all tested devices in this class were better, 6% similar, 48% worse
» The best had a delta of 6%, average was 21%, worst was 57%
Compared to all devices tested
» 46% of all tested devices were better, 8% similar, 45% worse
» The best had a delta of 4%, average was 25%, worst was 134%
Power management - energy saving laptop
Power consumption
The laptop does not need much power. The included 24-watt power supply only has to exceed its specified power limit for a short time. Under load, the power consumption is around 15 watts after the short boost time. When idle, the GeoFlex 140 needs six watts. Compared to most convertibles, these are very low power consumptions, but laptops and convertibles with Intel Celeron processors can be even more energy-efficient. All comparison devices with Celeron processors require significantly less energy.
| Off / Standby | |
| Idle | |
| Load |
|
| Geo Computers GeoFlex 140 Celeron N4020, UHD Graphics 600, SCY C500 SNS1N3G12800D M.2 SATA, TN, 1366x768, 14.10 | Asus BR1100FKA-BP0109RA Celeron N4500, UHD Graphics (Jasper Lake 16 EU), 64 GB eMMC Flash, IPS, 1366x768, 11.60 | Lenovo IdeaPad Flex 3 11IGL05 Celeron N4020, UHD Graphics 600, SanDisk DA4064, IPS LED, 1366x768, 11.60 | Chuwi Hi10 X Celeron N4100, UHD Graphics 600, SanDisk DF4128, IPS, 1920x1200, 10.10 | BMAX MaxBook Y11 H1M6 Celeron N4100, UHD Graphics 600, FORESEE 256GB, IPS, 1920x1080, 11.60 | XIDU PhilBook Max Celeron J3355, HD Graphics 500, FORESEE 128GB O1229B, IPS, 1920x1080, 14.10 | Asus Vivobook 15 F512DA-SH31 R3 3200U, Vega 3, SanDisk X600 SD9SN8W-128G, IPS, 1920x1080, 15.60 | Average Intel UHD Graphics 600 | Average of class Convertible | |
|---|---|---|---|---|---|---|---|---|---|
| Power Consumption | 48% | 42% | 27% | 12% | 10% | -33% | 26% | -78% | |
| Idle Minimum * | 5.2 | 2.5 52% | 2.4 54% | 3.7 29% | 4.1 21% | 4.6 12% | 3.2 38% | 3.47 ? 33% | 5.44 ? -5% |
| Idle Average * | 8.8 | 4.6 48% | 4.5 49% | 6.3 28% | 7.7 12% | 6.4 27% | 6.8 23% | 5.61 ? 36% | 8.27 ? 6% |
| Idle Maximum * | 9.8 | 5.3 46% | 4.6 53% | 6.7 32% | 9 8% | 8.7 11% | 7.7 21% | 6.6 ? 33% | 10.8 ? -10% |
| Load Average * | 14.6 | 12.8 12% | 14 4% | 14.5 1% | 16.2 -11% | 30.3 -108% | 13.6 ? 7% | 46.7 ? -220% | |
| Witcher 3 ultra * | 14.7 | 28.2 -92% | |||||||
| Load Maximum * | 24.9 | 13.4 46% | 14.3 43% | 14.5 42% | 21 16% | 22 12% | 44.4 -78% | 20.2 ? 19% | 65.4 ? -163% |
* ... smaller is better
Energy consumption Witcher 3 / Stress test
Battery life
With 41.8 Wh, the battery in the GeoFlex 140 is significantly larger than the batteries of the competing devices, with the exception of the Asus BR1100FKA. However, the more generous battery does not seem to provide for a longer battery life. The inexpensive laptop can stay active for five to six hours in the Wi-Fi web surfing test.
| Geo Computers GeoFlex 140 Celeron N4020, UHD Graphics 600, 41.8 Wh | Asus BR1100FKA-BP0109RA Celeron N4500, UHD Graphics (Jasper Lake 16 EU), 42 Wh | Lenovo IdeaPad Flex 3 11IGL05 Celeron N4020, UHD Graphics 600, 37.5 Wh | Chuwi Hi10 X Celeron N4100, UHD Graphics 600, 24 Wh | BMAX MaxBook Y11 H1M6 Celeron N4100, UHD Graphics 600, 26.6 Wh | XIDU PhilBook Max Celeron J3355, HD Graphics 500, 36.1 Wh | Asus Vivobook 15 F512DA-SH31 R3 3200U, Vega 3, 37 Wh | Average of class Convertible | |
|---|---|---|---|---|---|---|---|---|
| Battery Runtime | 35% | 62% | -2% | -22% | 0% | 4% | 19% | |
| WiFi v1.3 | 342 | 462 35% | 555 62% | 336 -2% | 248 -27% | 342 0% | 357 4% | 567 ? 66% |
| Load | 168 | 140 -17% | 121.7 ? -28% | |||||
| H.264 | 269 | 769 ? |
Pros
Cons
Verdict - Usable minimum PC

Ultimately, the question is how much performance you really need. If we wanted to make it simple, we could probably draw a devastating conclusion here. The screen, processor and graphics performance are simply low-end. But the GeoFlex 140 is actually better than expected for its low price. If you are only looking for a laptop for surfing, streaming or office applications, you won't need more performance than the convertible can deliver. Those who expect more from a laptop, and are still looking for a low price, should probably better look for a laptop with Intel Core i3 or AMD Ryzen 3. Alternatively, the second-hand market also offers some laptops with stronger processors for around 200 Euros (~$218). However, they usually do not meet the requirements of Windows 11.
The GeoFlex 140 has one advantage over many more powerful laptops: It has a very low power consumption. The GeoFlex 140 can be used without problems in everyday use and it sometimes consumes only half of what a laptop with Core i5 or Ryzen 5 needs. So does a powerful laptop make sense for every user?
The GeoFlex 140 is slim and offers a modern exterior, but only shows low performance in all technical aspects.
It should be clear, photo or video editing, 3D programs and much more can't be done by the Intel Celeron, or only to a limited extent under considerable time expenditure. But the Chromebook method, where many applications are moved to the cloud, also works with Windows computers. Many things can now be done conveniently via cloud applications.
Unfortunately, we also have to note that there would be a few places where the manufacturer could improve the device a lot with little effort. PowerDelivery in the existing USB-C port, a halfway calibrated screen, and an HDMI port instead of mini-HDMI would greatly improve the usability of the GeoFlex 140. Especially the missing USB-PD unnecessarily limits the convertible to the included power adapter, since most modern smartphone power adapters manage to output 12 volts and 2 amps. We would even gladly do without the included power adapter for this.
In the end, there would probably not be a good hair left on any of the comparison devices if they were compared with laptops and convertibles in the price range of 400 to 800 Euros (~$435 to 870). In many benchmarks, it becomes too clear that the laptops with Celeron processors can only manage half of the performance that even the weakest Ryzen or Core processors deliver. With the exception of the memory, the Lenovo IdeaPad Flex 3 performs better than the GeoFlex 140 in most benchmarks, but it also costs at least 120 Euros (~$131) more to purchase. The BMAX MaxBook Y11, which is now also in the 300 Euros (~$326) range, has a much better screen than our test device, but quality problems and no warranty in case of emergency. The convertible is only available in Germany via Chinese mail-order companies.
Ultimately, the GeoFlex 140 is almost the only alternative for laptops under 200 Euros (~$218). The GeoBook 140 is another option and costs 50 Euros (~$54) less than the convertible and also offers Microsoft 365 and an Intel Celeron N4020.
Price and availability
At the time of research, Notebooksbilliger.de charges around 200 Euros (~$218) for the GeoFlex 140. You can often find promotions here, where another 50 Euros (~$54) are deducted from the purchase price. Apart from that, there are also some other cheap Geo computers at Notebooksbilliger. The GeoFlex 110, GeoBook 140 and GeoBook 110 are even cheaper than the GeoFlex 140, but use the same hardware.
Geo Computers GeoFlex 140
-
01/17/2023 v7
Marc Herter
Pricecompare

