 Deutsch
 English
 Español
 Français
 Italiano
 Nederlands
 Polski
 Português
 Русский
 Türkçe
 Svenska
 Chinese
 Magyar
Eurocom Raptor X17 laptop review: The MSI and Asus ROG alternative

(May 22, 2023 update: Eurocom has responded to many of our comments about the Raptor X17 in this review. Responses and changes to the Raptor X17 include the following:
- An upcoming BIOS update to "eliminate fan pulse on lower power profiles".
- Updates to the Control Center application
- Smaller and lighter 330 W AC adapter in the next few weeks
- A promise of no backlight bleeding for the UHD 144 Hz panel option
- Calibrated ICC profile now comes free of charge
The original review is below.)
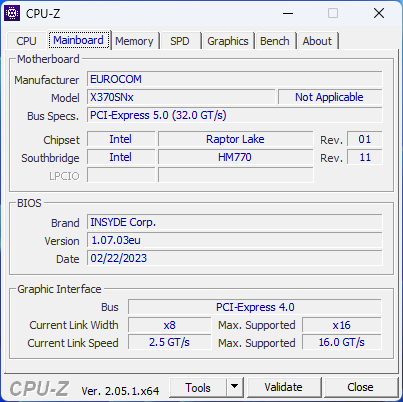
After having recently checked out the 15.6-inch Raptor X15, we're now ready to tackle its bigger brother the 17.3-inch Raptor X17. Its chassis is a new design (X370) that we have not yet seen from other brands at the time of review. Nonetheless, we fully expect other resellers like Schenker to eventually offer this same chassis under different branding for markets overseas.
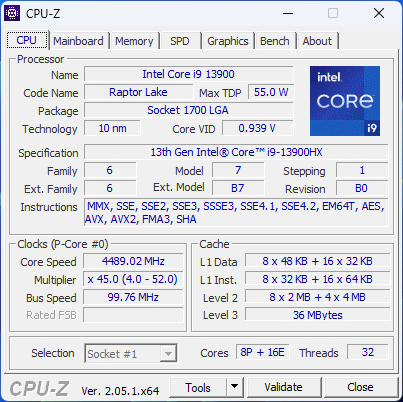
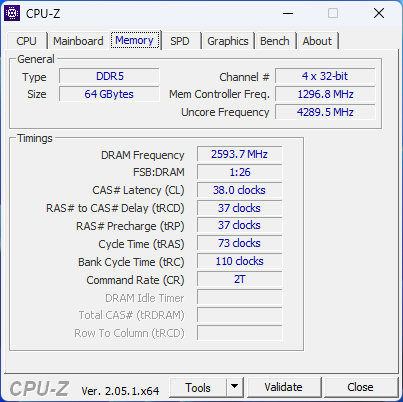
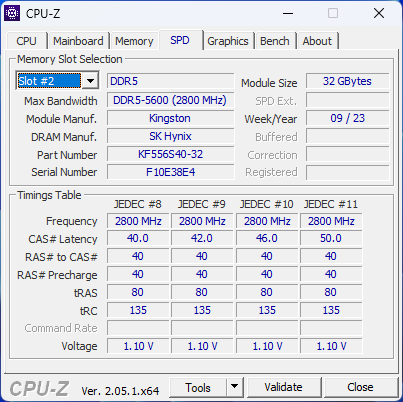
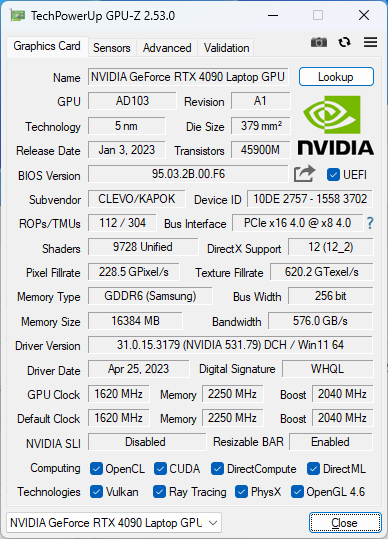
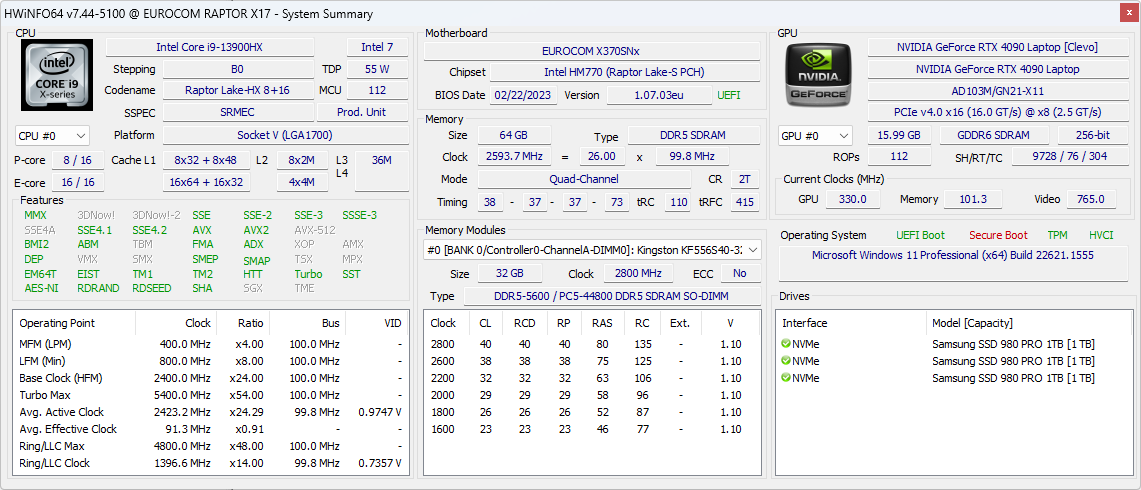
Our configuration in review is a high-end SKU with the 13th gen Raptor Lake Core i9-13900HX CPU, 175 W GeForce RTX 4090 GPU, 64 GB DDR5 RAM, 3x 1 TB SSDs, and 1440p 240 Hz display for approximately $6600 USD. Of course, users can configure with less RAM and storage and an i7-13700HX or an RTX 4080 for lower starting prices.
Competitors to the Raptor X17 include other thin to midsize 17-inch gaming laptops like the Razer Blade 17, Asus ROG Strix Scar 17, Gigabyte Aorus 17X, or the MSI GS77.
More Eurocom reviews:
Potential Competitors in Comparison
Rating | Date | Model | Weight | Height | Size | Resolution | Best Price |
|---|---|---|---|---|---|---|---|
| 82.8 % | 05/2023 | Eurocom Raptor X17 i9-13900HX, NVIDIA GeForce RTX 4090 Laptop GPU | 3.5 kg | 24.9 mm | 17.30" | 2560x1440 | |
| 88.3 % | 04/2023 | Asus ROG Strix Scar 17 G733PY-XS96 R9 7945HX, NVIDIA GeForce RTX 4090 Laptop GPU | 2.9 kg | 28.3 mm | 17.30" | 2560x1440 | |
| 86 % | 04/2023 | Aorus 17X AZF i9-13900HX, NVIDIA GeForce RTX 4090 Laptop GPU | 2.9 kg | 21.8 mm | 17.30" | 2560x1440 | |
| 88.3 % | 03/2023 | MSI GE78HX 13VH-070US i9-13950HX, NVIDIA GeForce RTX 4080 Laptop GPU | 3 kg | 23 mm | 17.00" | 2560x1600 | |
| 89.9 % | 03/2023 | Eluktronics Mech-17 GP2 i9-13900HX, NVIDIA GeForce RTX 4090 Laptop GPU | 2.9 kg | 27 mm | 17.00" | 2560x1600 | |
| 86.1 % | 01/2023 | Alienware m17 R5 (R9 6900HX, RX 6850M XT) R9 6900HX, Radeon RX 6850M XT | 3.4 kg | 26.7 mm | 17.00" | 3840x2160 |
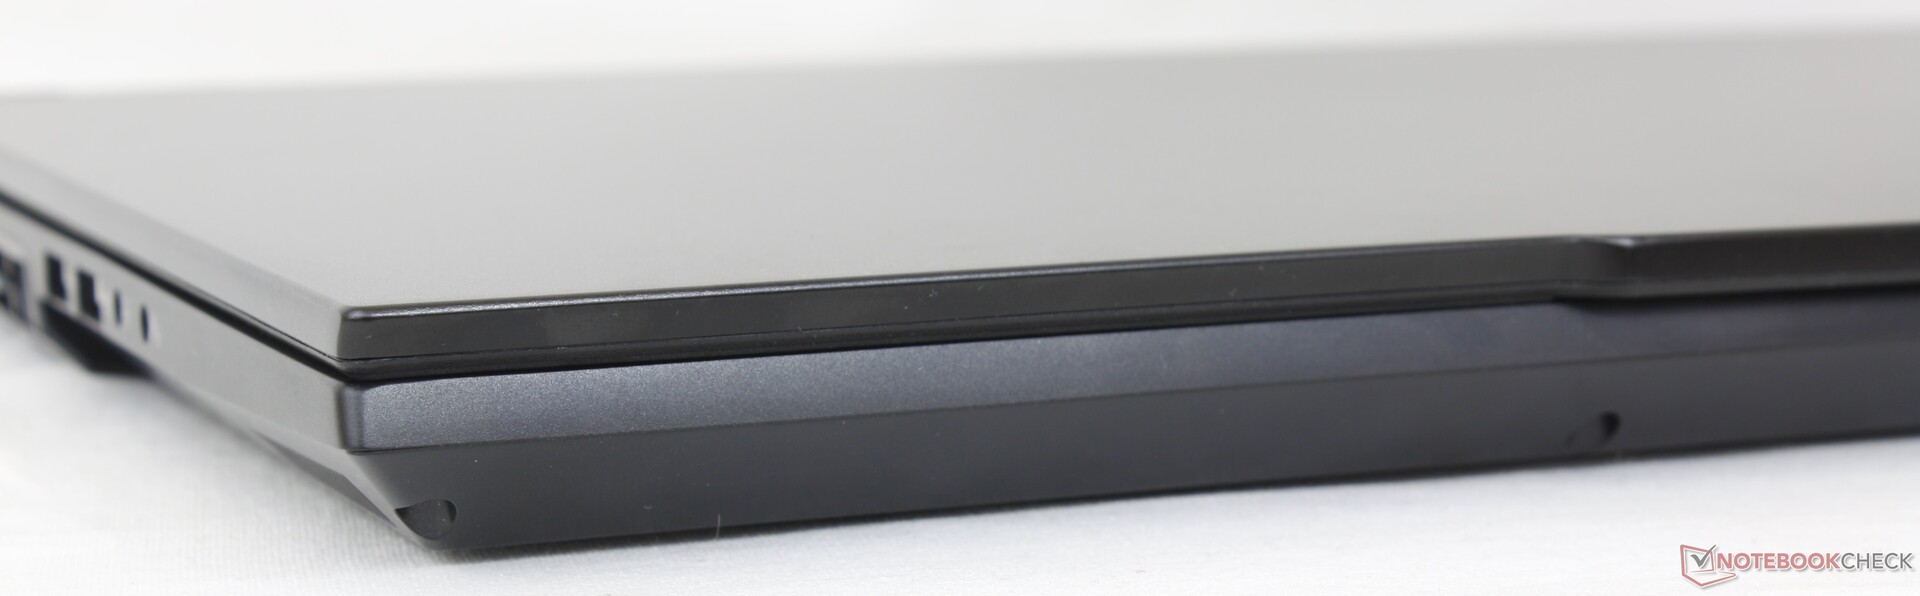
Case — A Fresh Restart
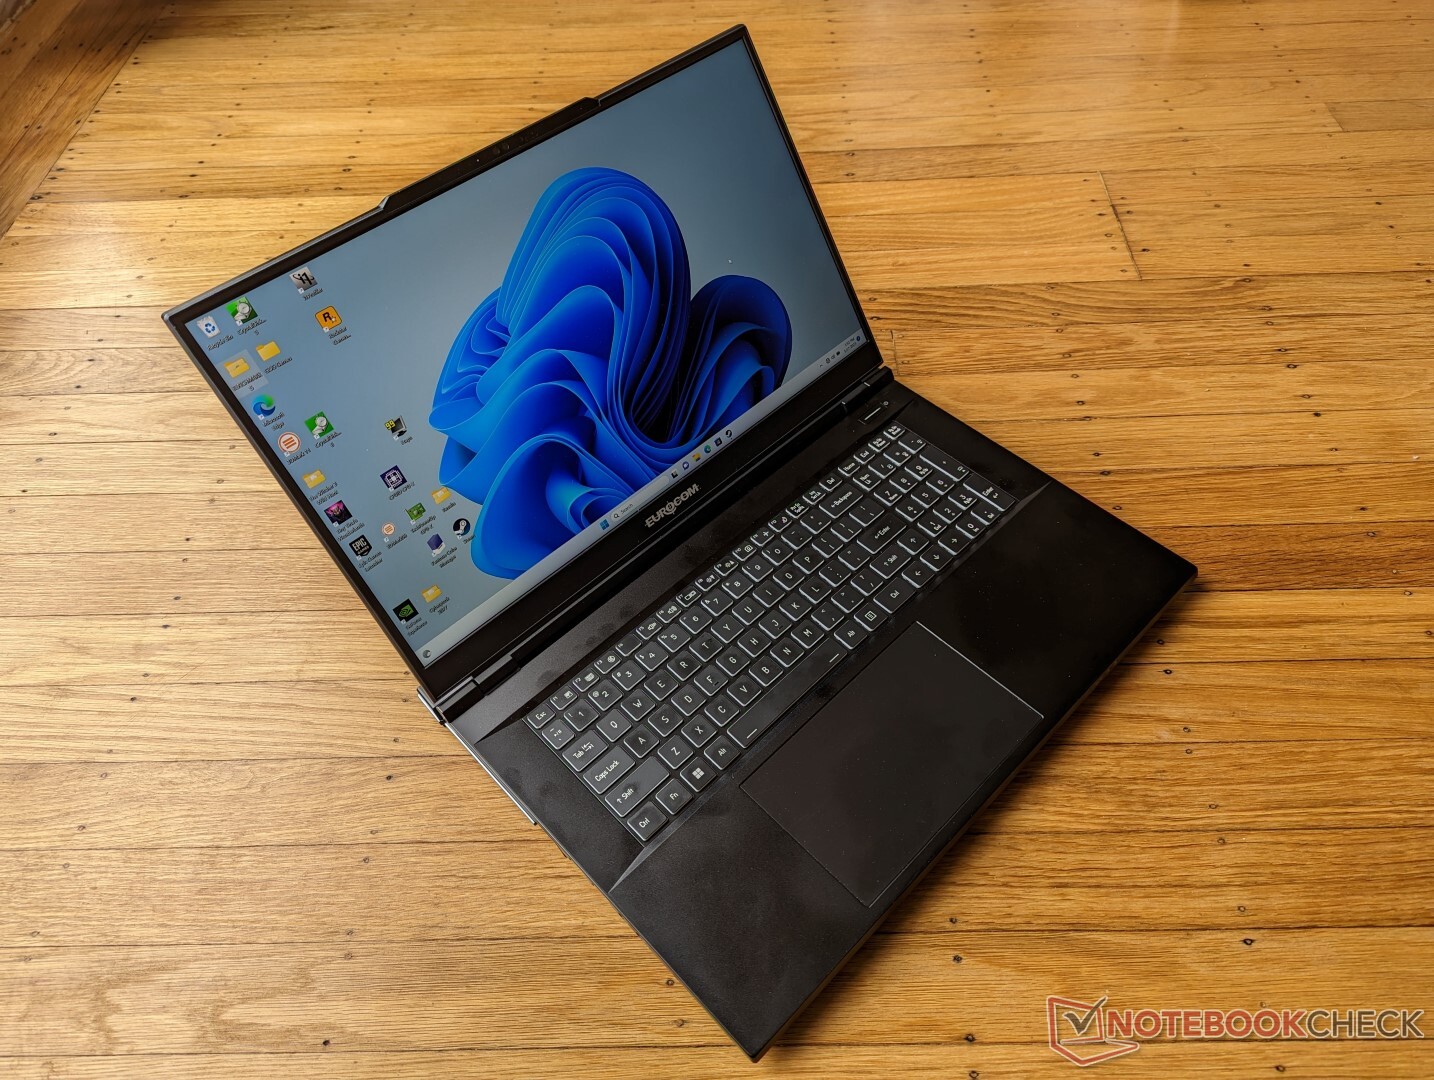
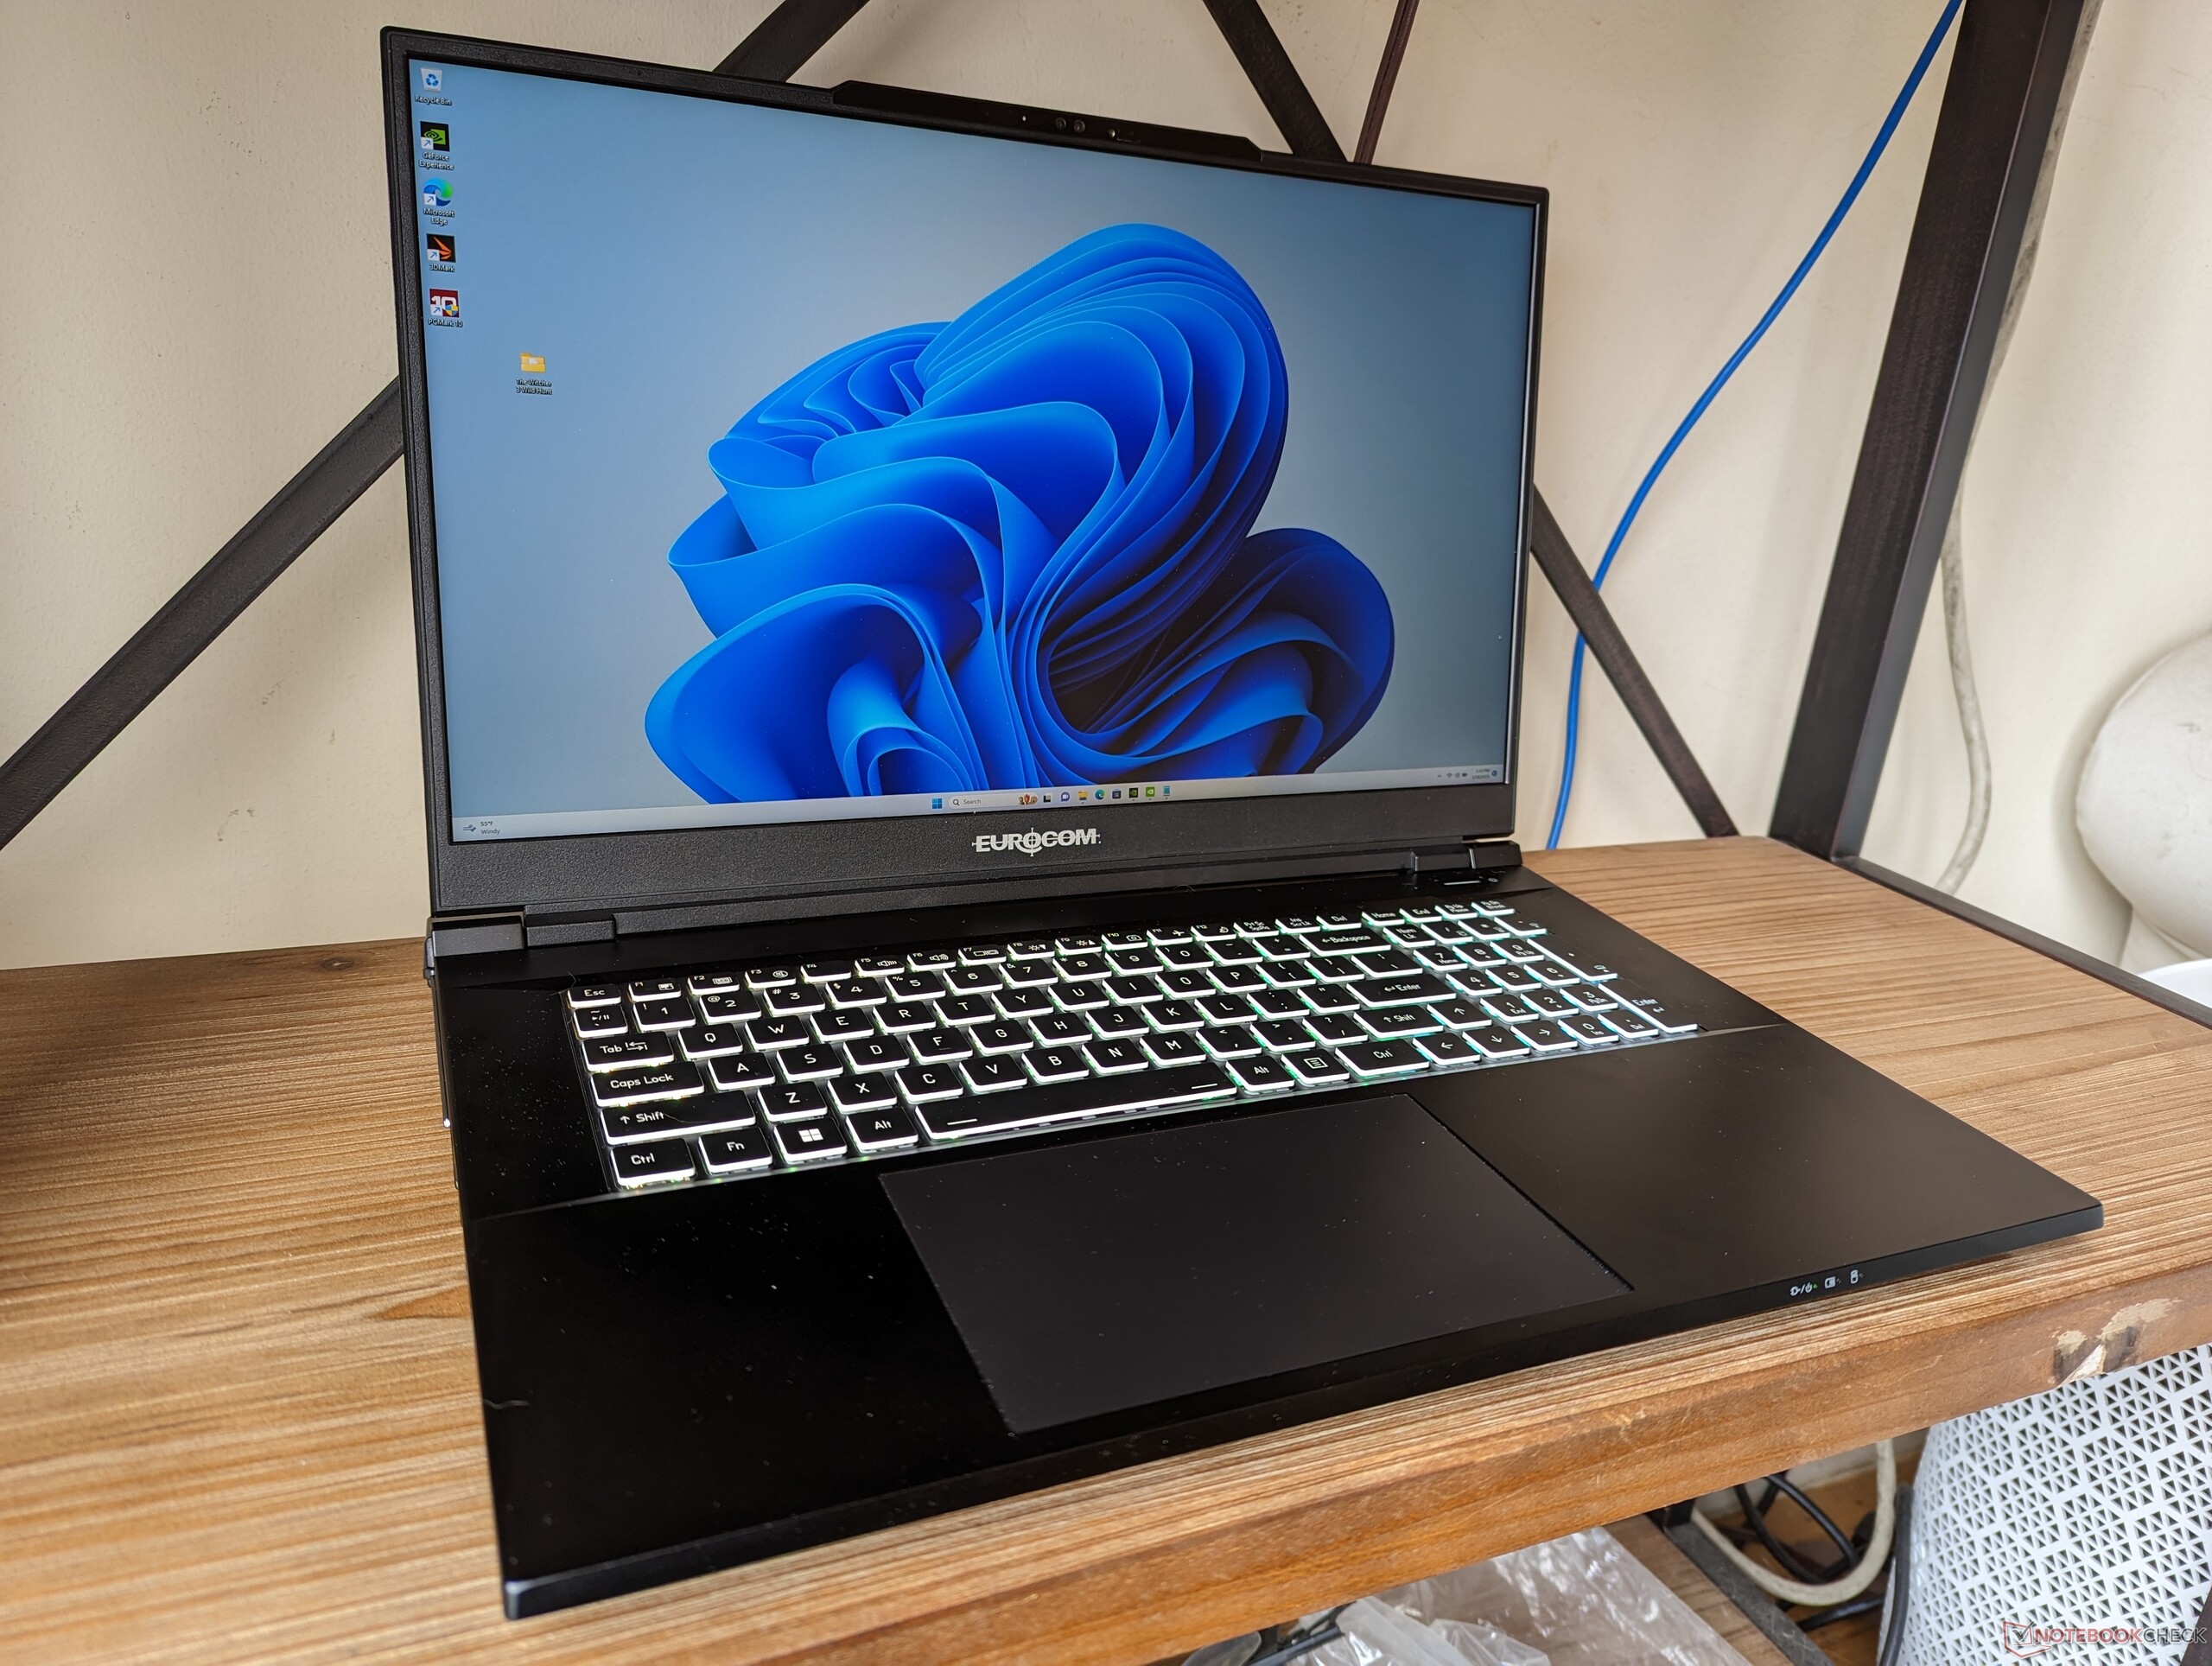
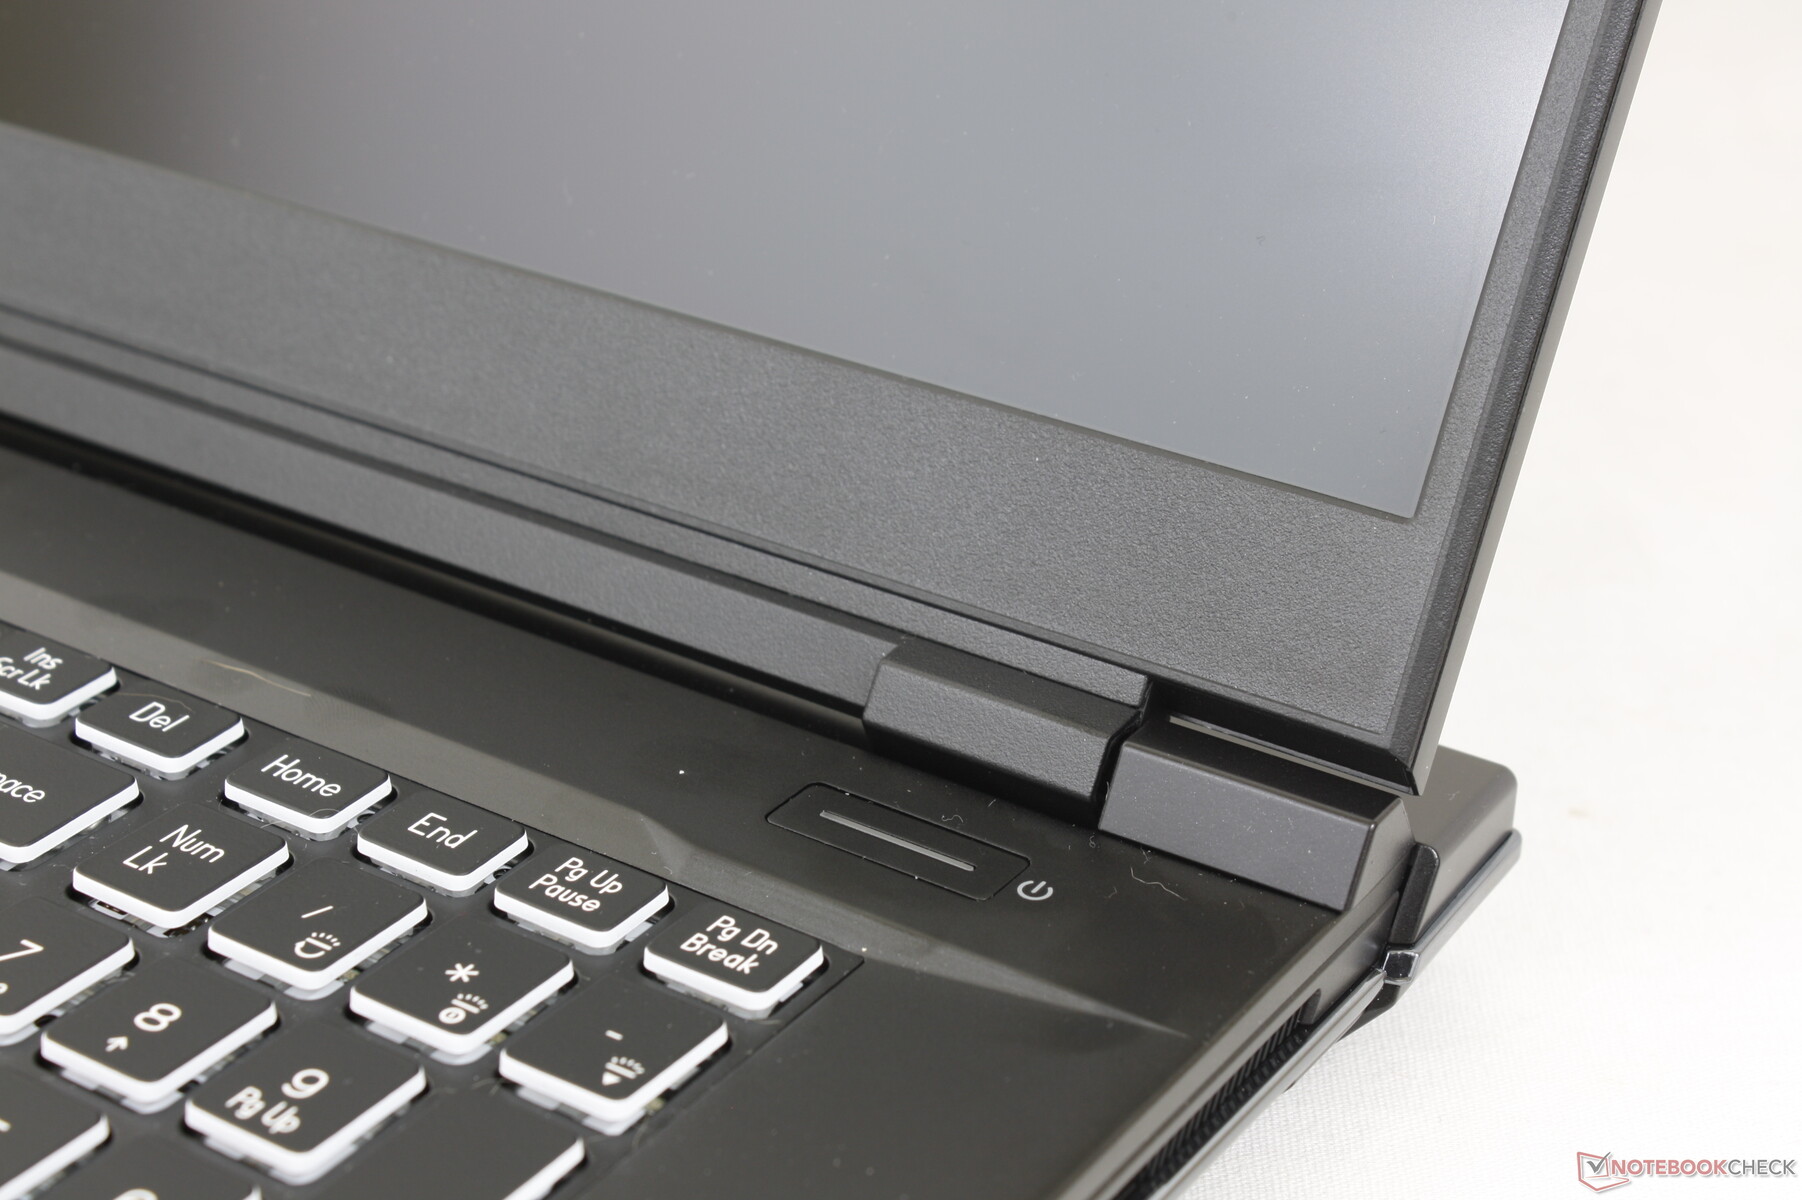
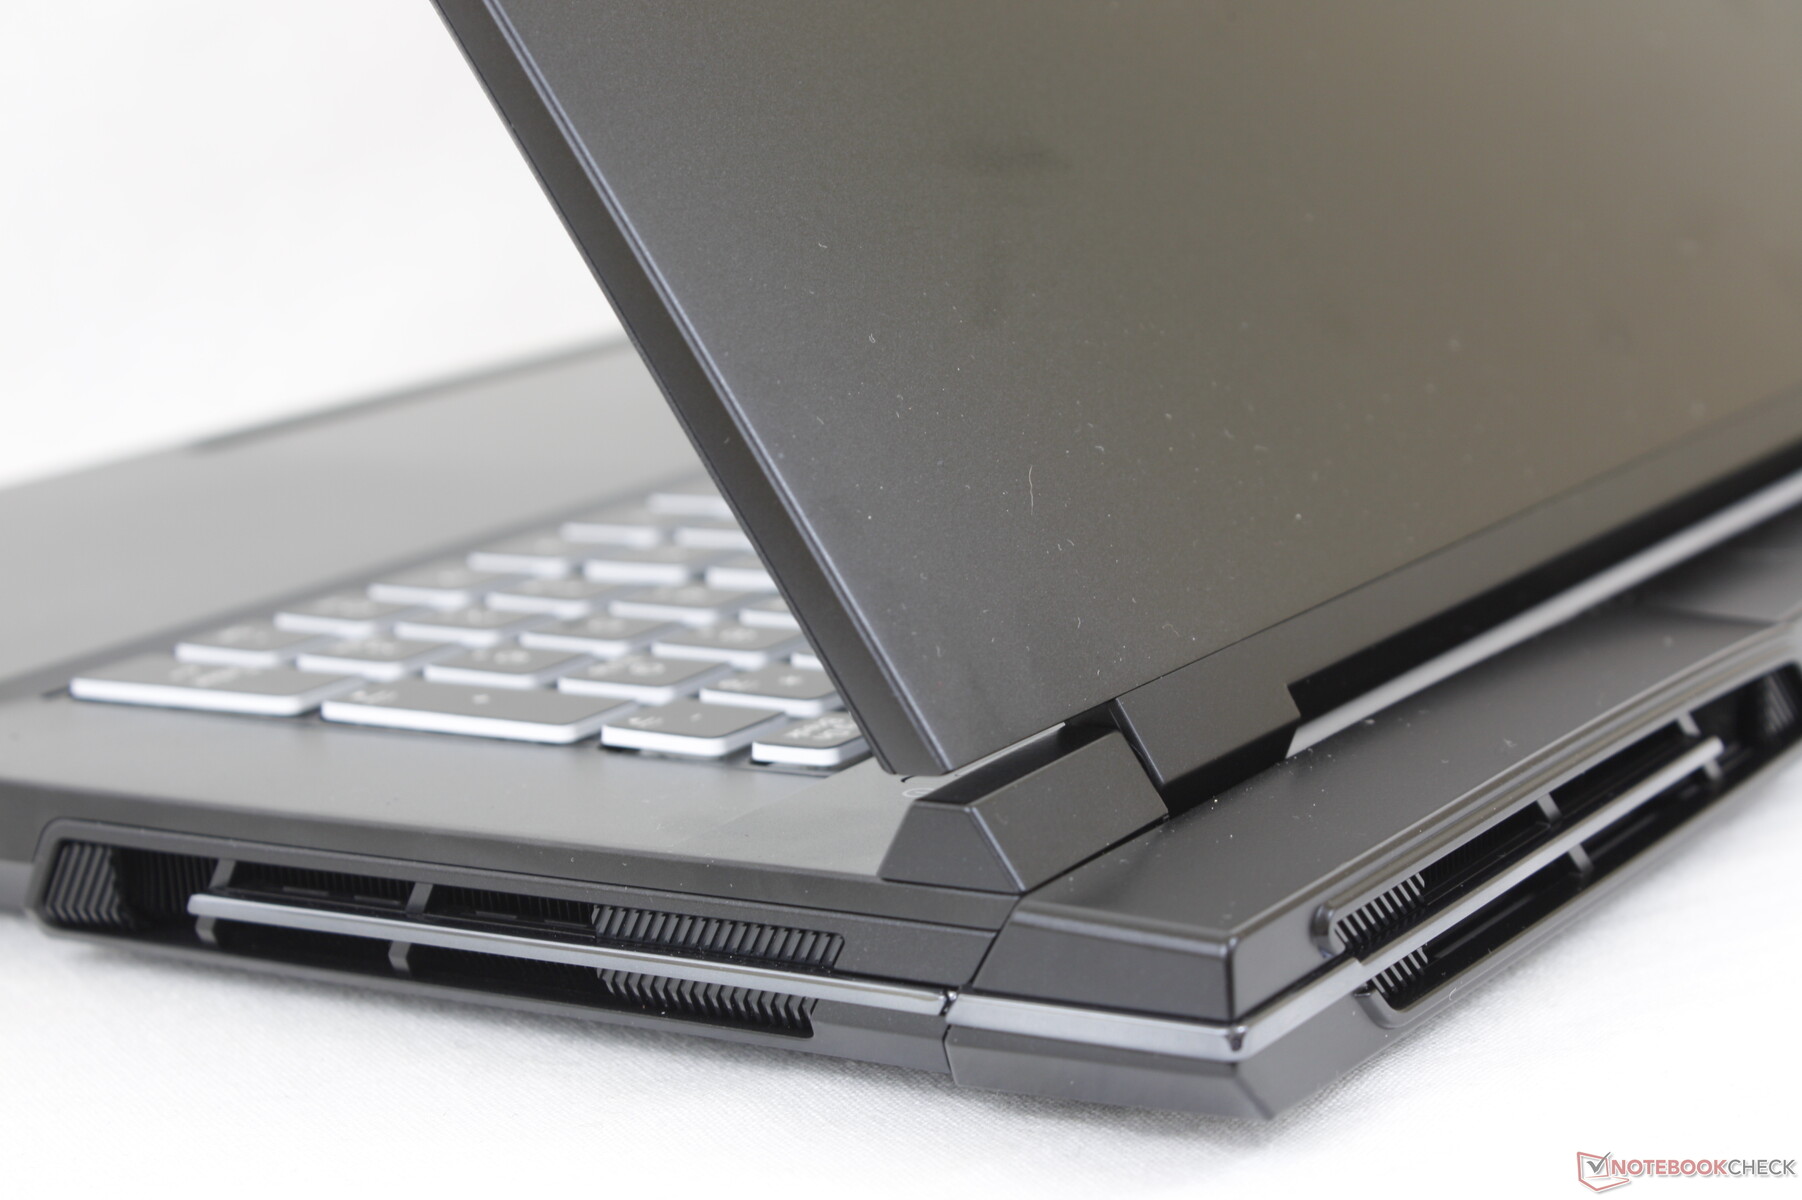
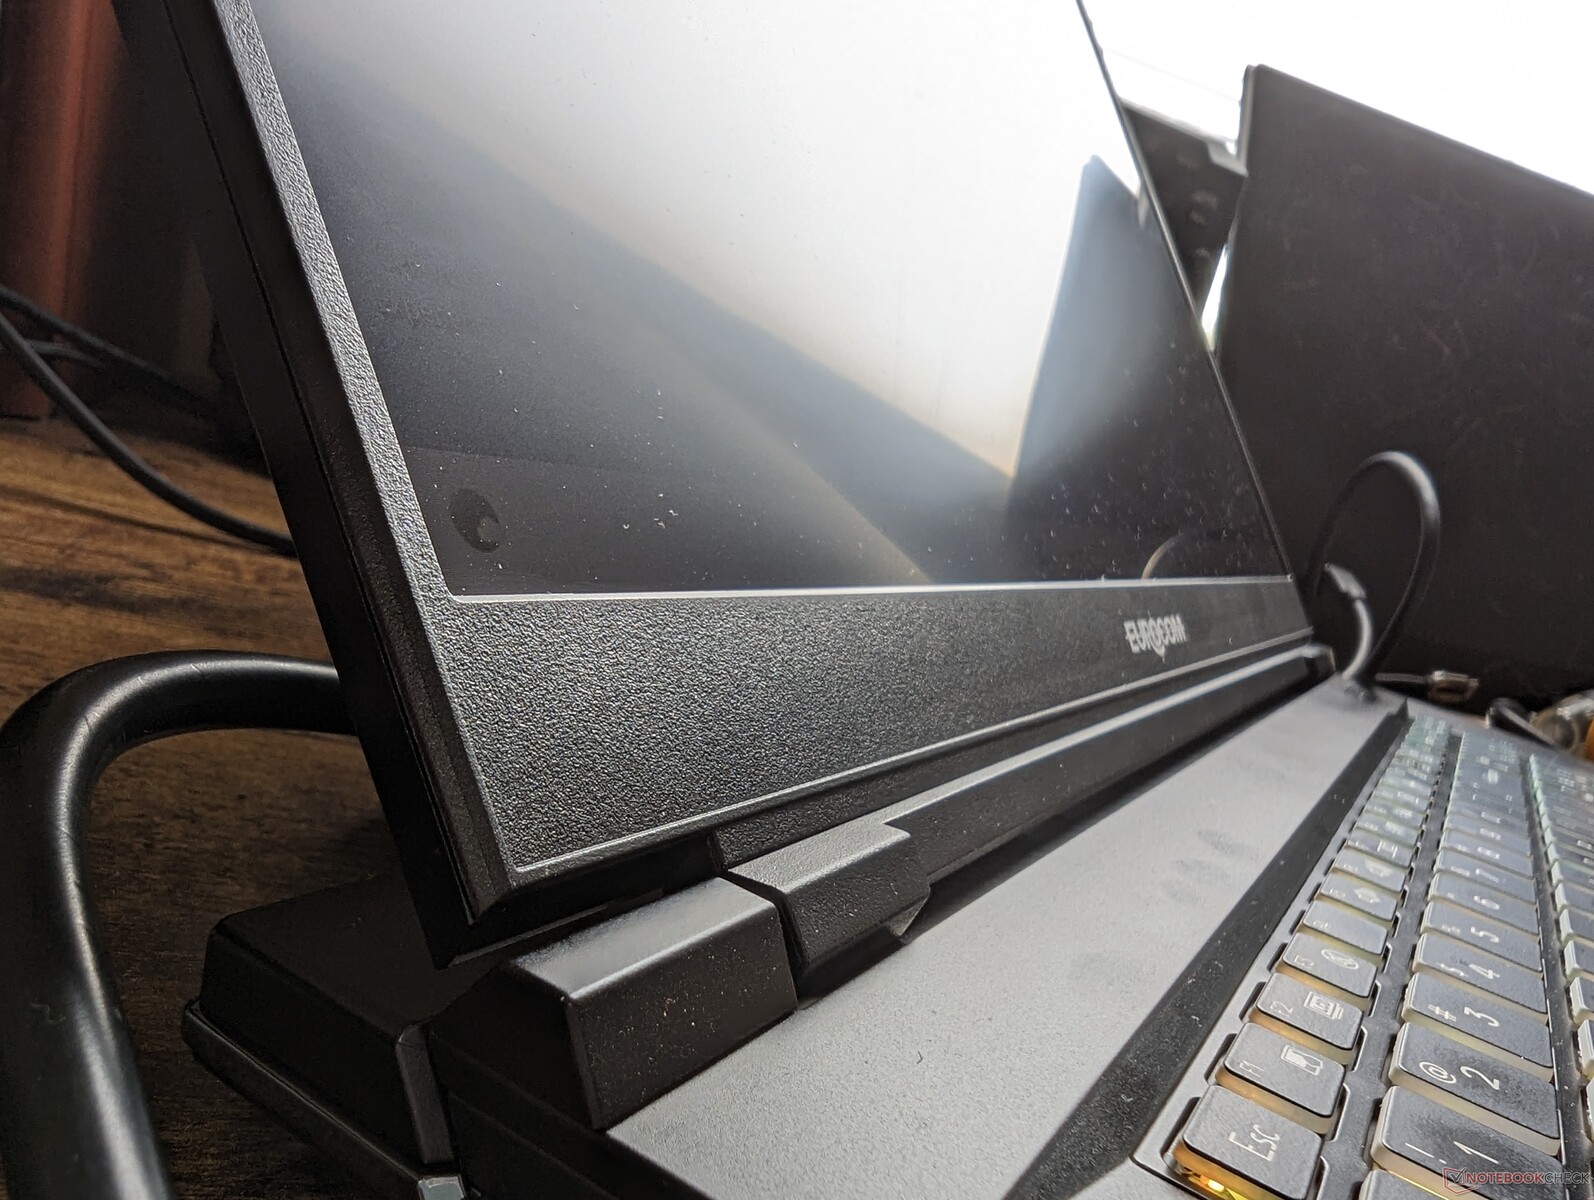
The Raptor X17 is probably the sleekest laptop we've seen from Eurocom. The super-smooth and mostly metal skeleton contrasts heavily with the older and thicker ABS designs from the same company. Chassis rigidity is excellent as well with minimal flexing along the base and outer lid for solid first impressions.
Perhaps the weakest aspect of the chassis is the hinge as the display teeters a bit more aggressively when adjusting angles compared to the stiffer and larger hinges of an Asus ROG laptop. The keyboard center would also flex slightly when applying pressure with a finger which negatively impacts key feedback whilst typing. Hopefully any future redesigns can address these concerns.
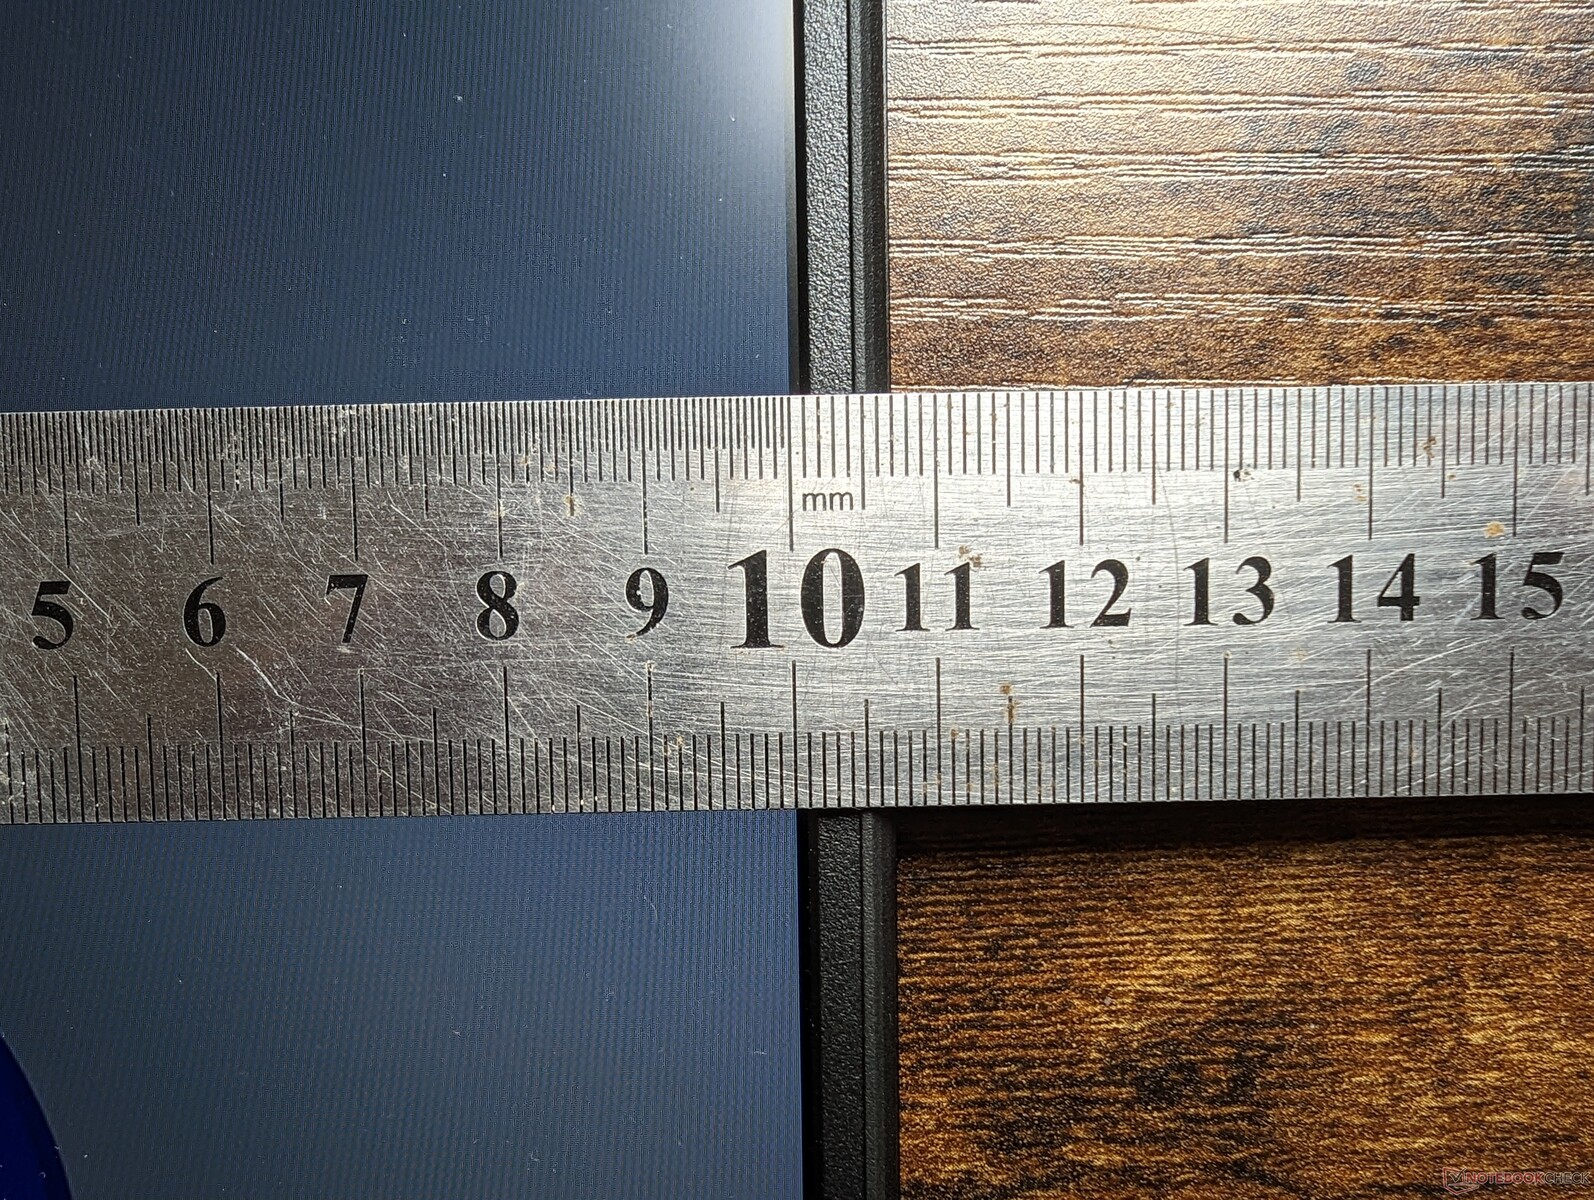
At 3.5 kg, the Raptor X17 is one of the heavier gaming laptops in its size class edging out even the 3.4 kg Alienware m17 R5. Most notably, the system is slightly smaller than the ROG Strix Scar 17 G733 and yet it is 20 percent heavier for a very dense feel. For something significantly lighter and smaller, users may want to consider the Razer Blade 17 instead.
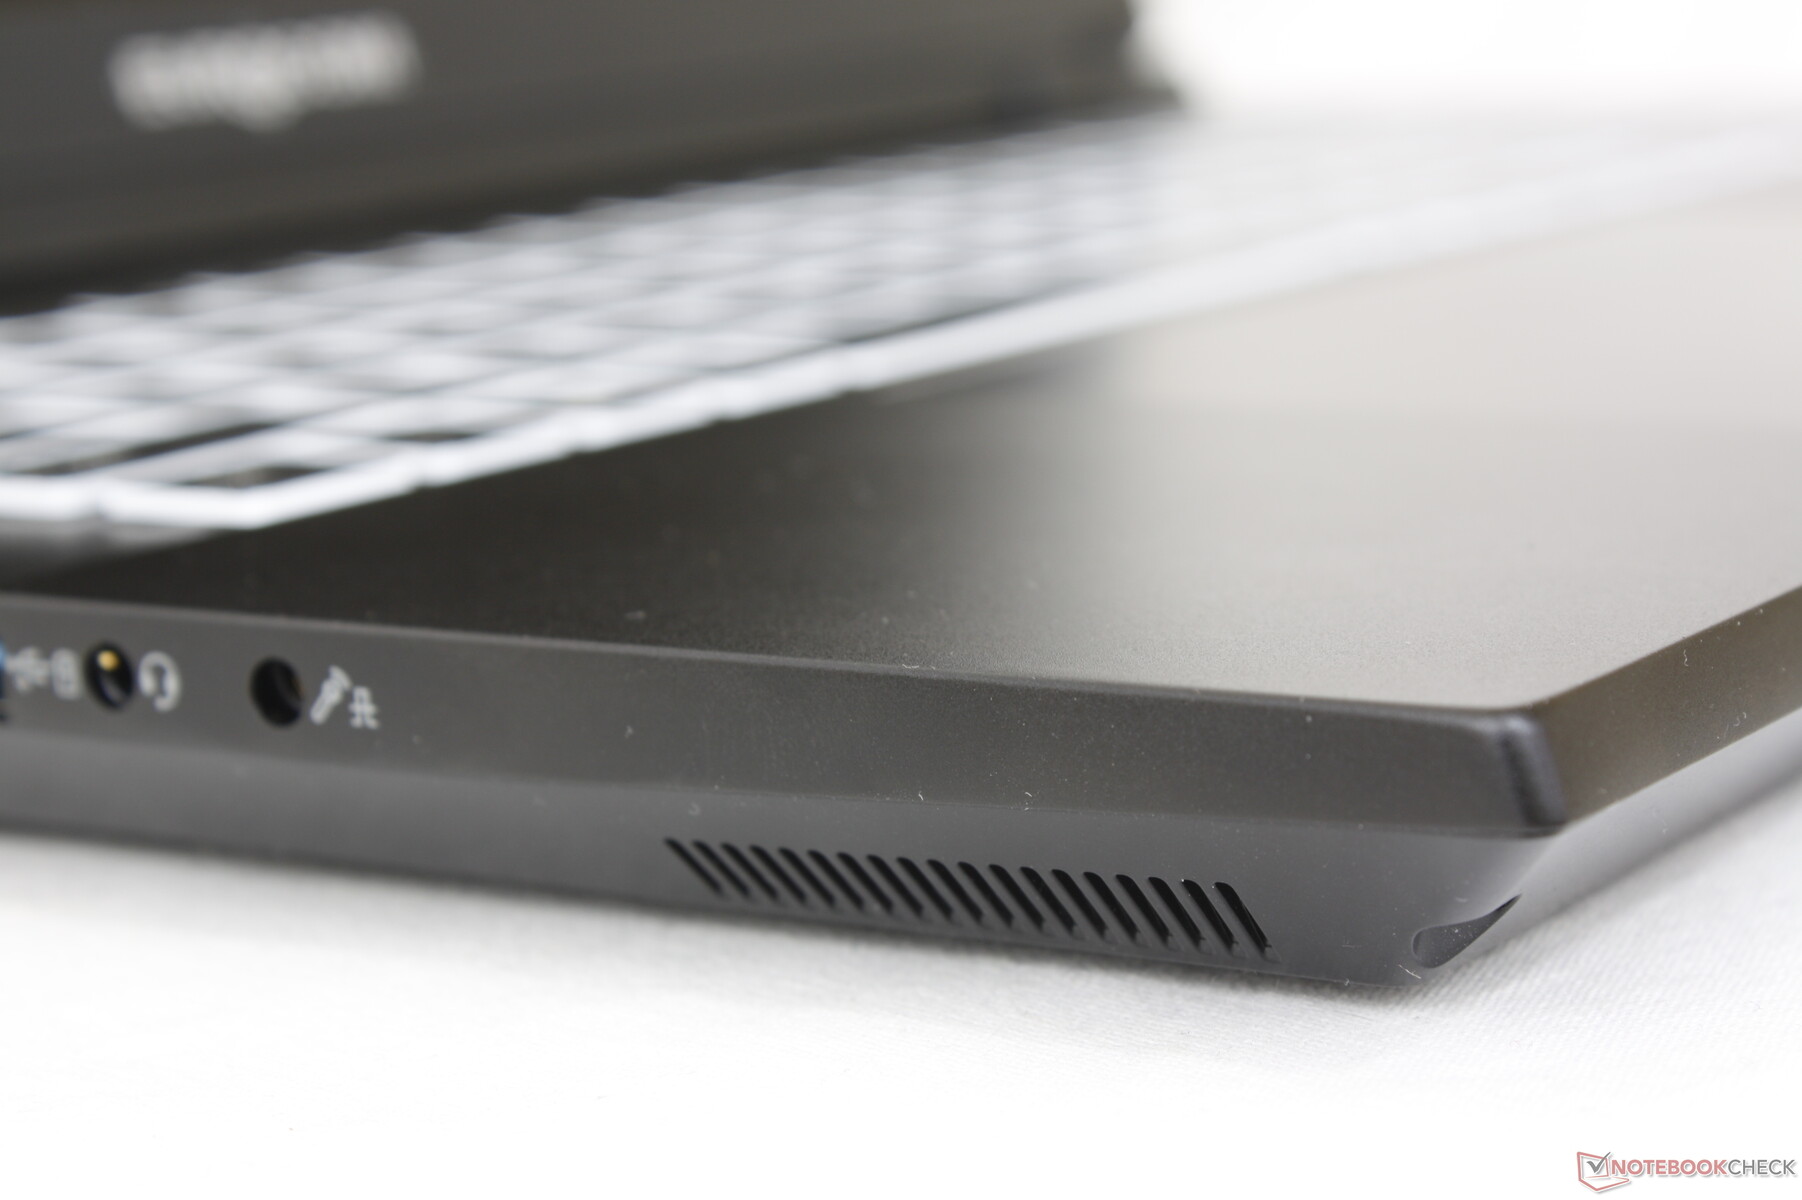
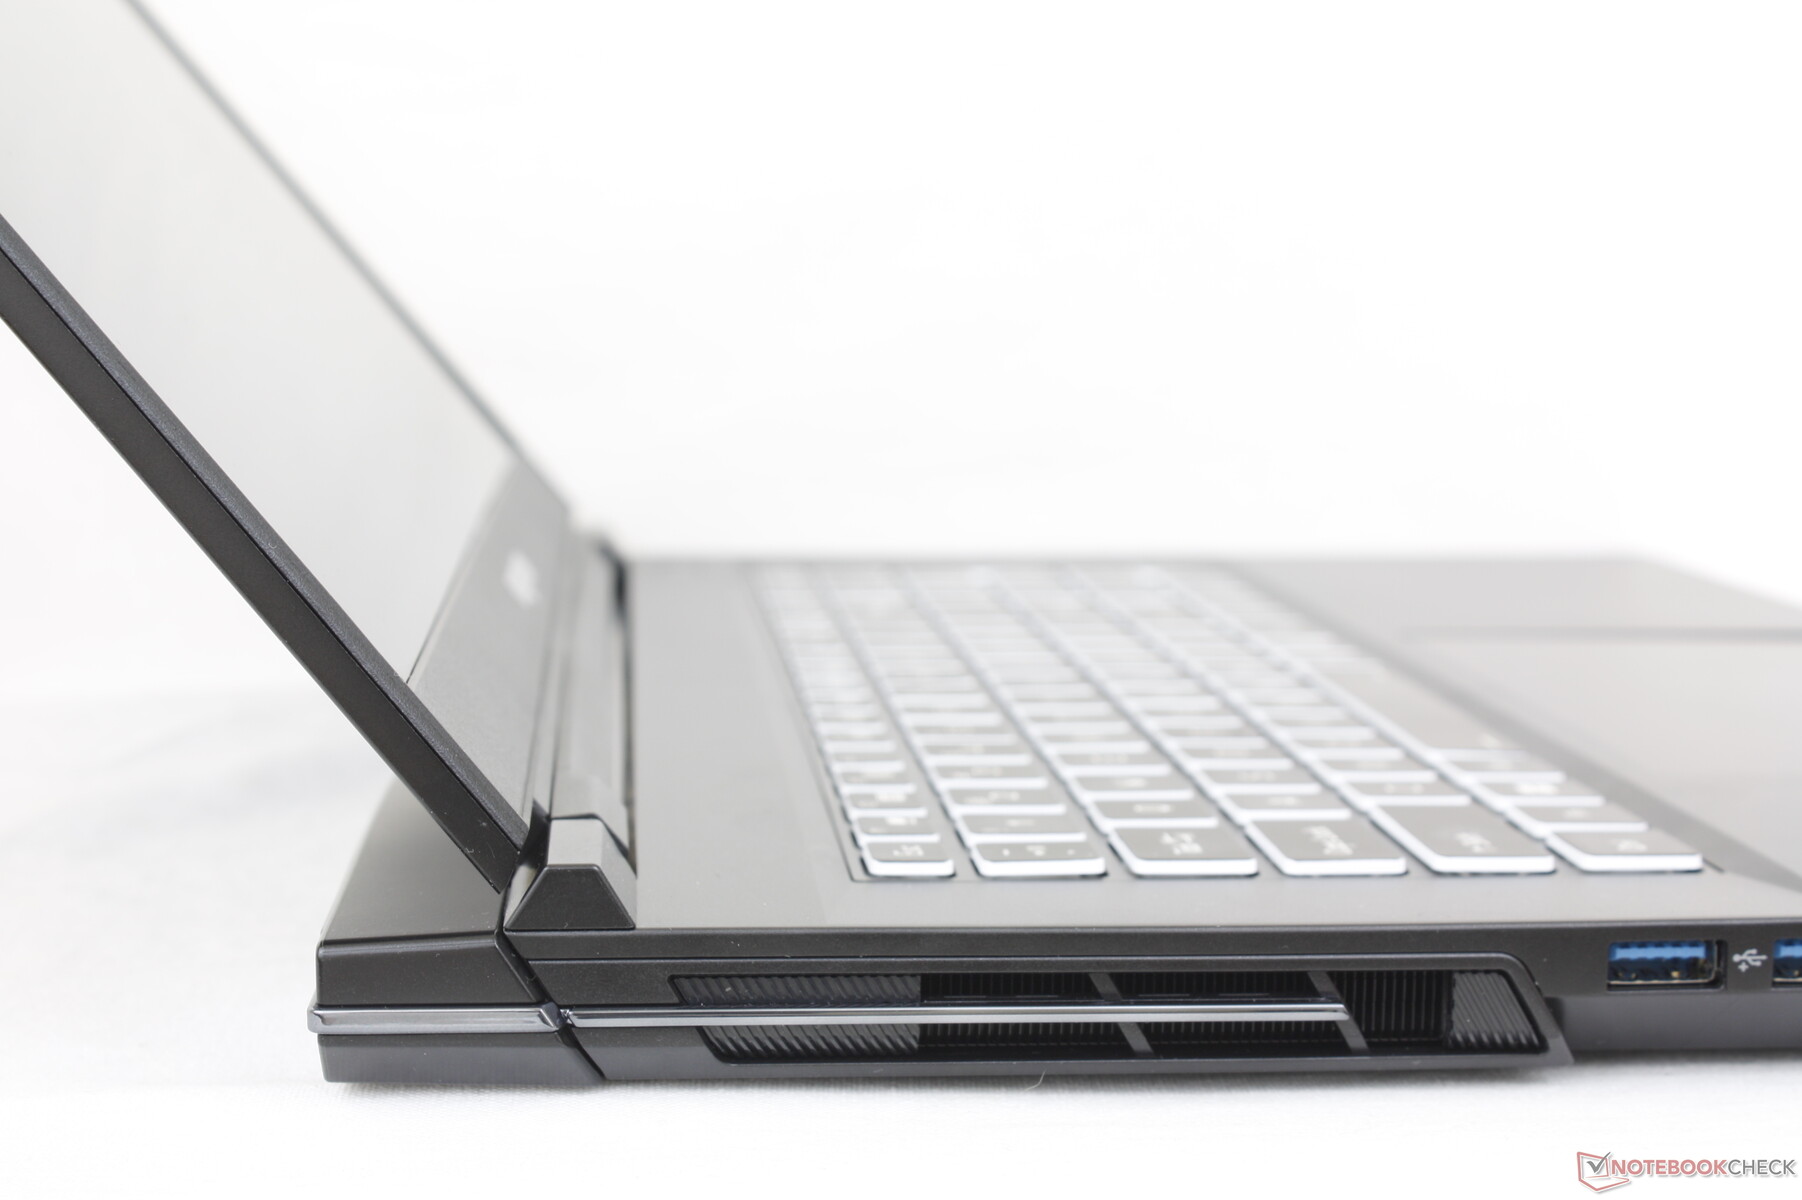
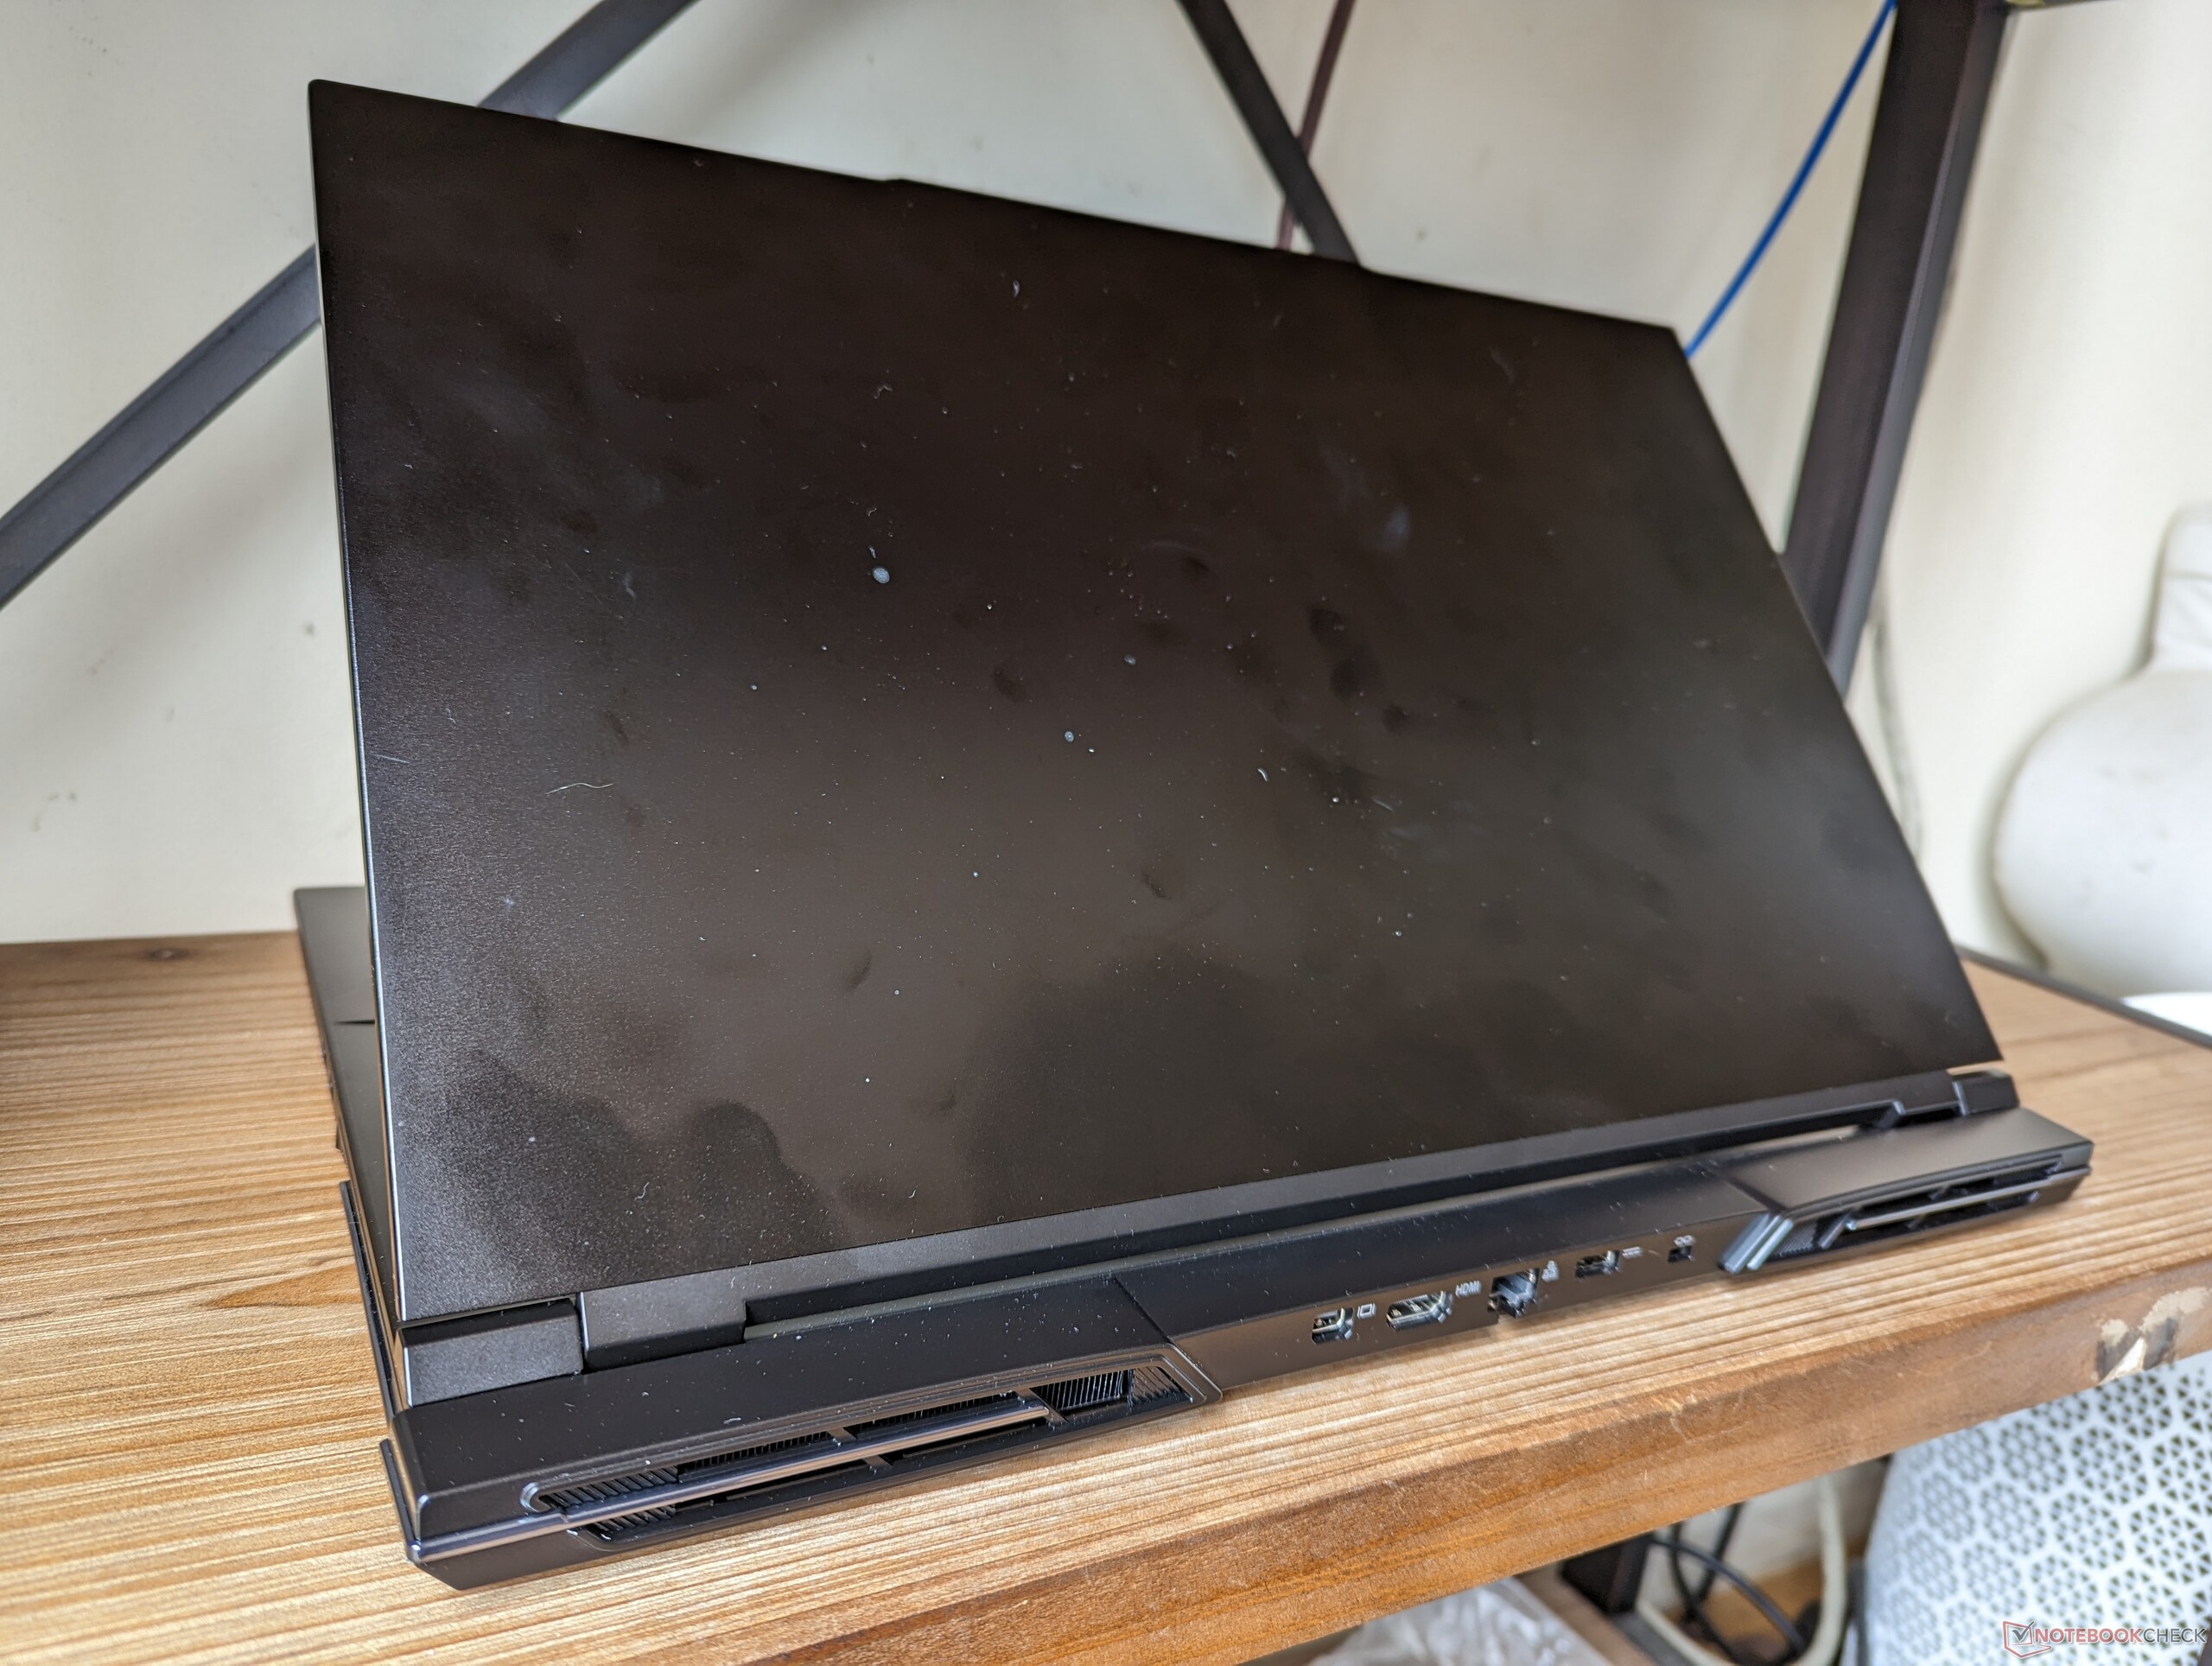
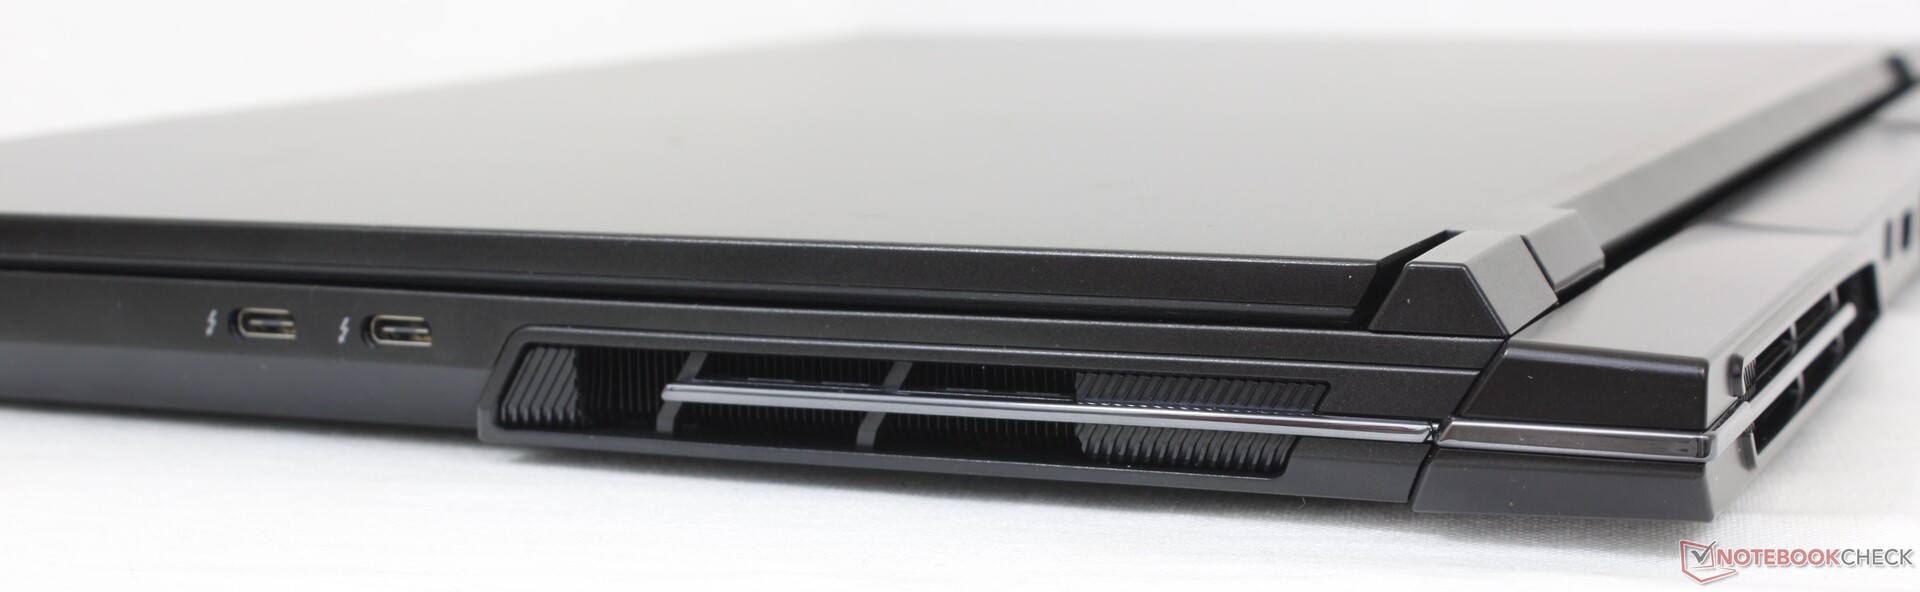
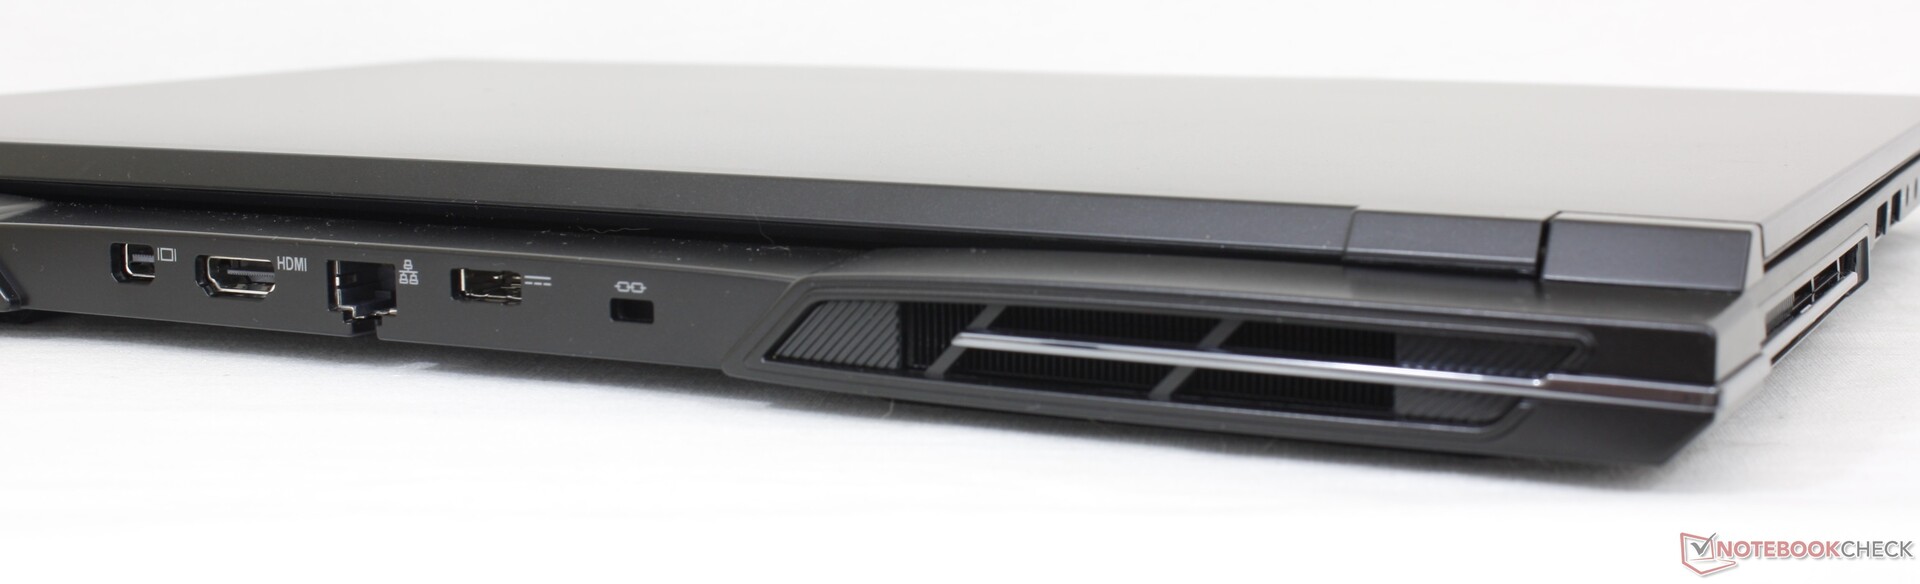
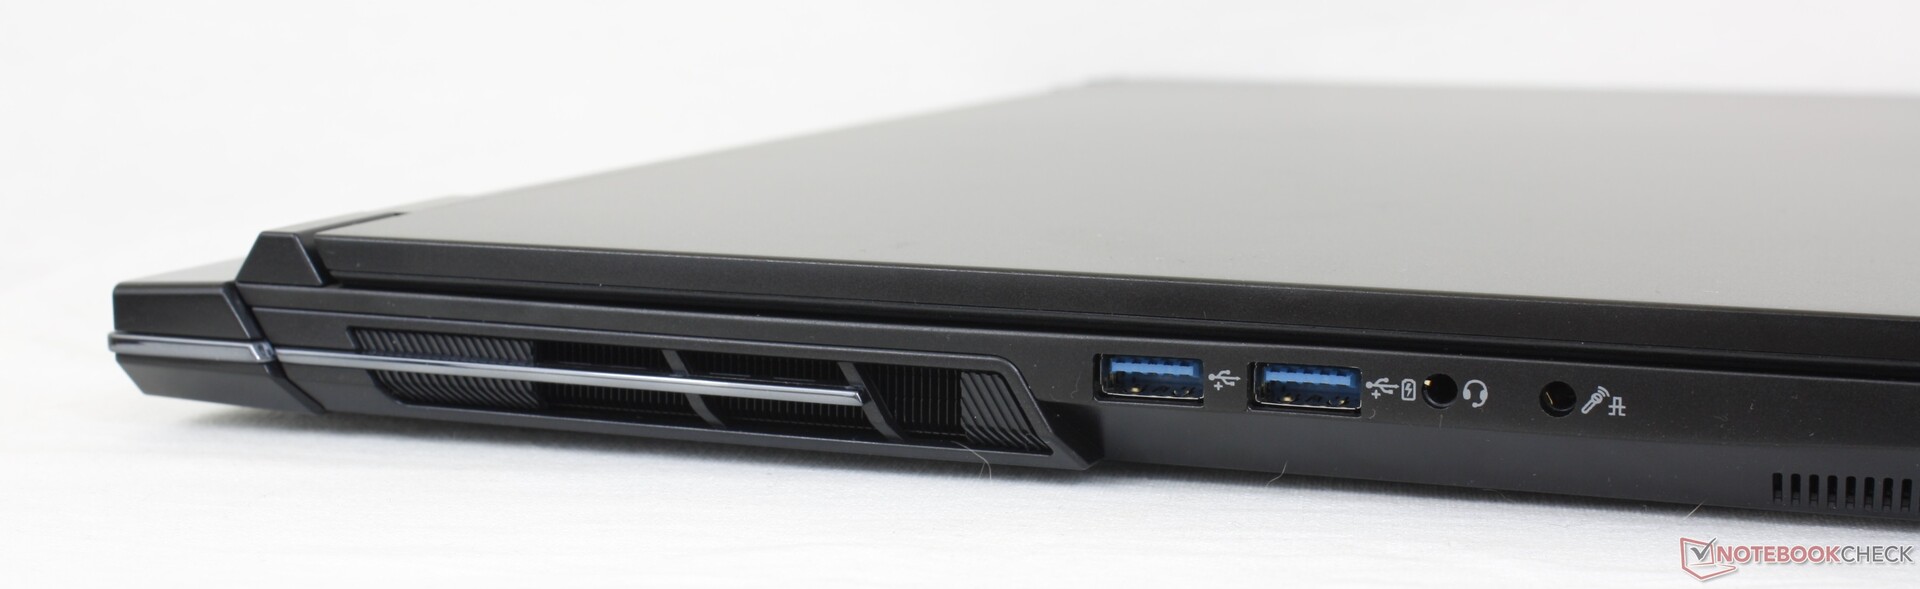
Connectivity — A Little Bit Of Everything
Port options are more varied than on most other 17-inch gaming laptops. For example, it's uncommon to find a model that integrates both mini DisplayPort and RJ-45. All USB ports are along the sides of the chassis while the rear houses almost everything else.
Communication
| Networking | |
| iperf3 transmit AXE11000 | |
| Aorus 17X AZF | |
| Eluktronics Mech-17 GP2 | |
| MSI GE78HX 13VH-070US | |
| Eurocom Raptor X17 | |
| Alienware m17 R5 (R9 6900HX, RX 6850M XT) | |
| Asus ROG Strix Scar 17 G733PY-XS96 | |
| iperf3 receive AXE11000 | |
| Aorus 17X AZF | |
| Eluktronics Mech-17 GP2 | |
| Asus ROG Strix Scar 17 G733PY-XS96 | |
| MSI GE78HX 13VH-070US | |
| Eurocom Raptor X17 | |
| Alienware m17 R5 (R9 6900HX, RX 6850M XT) | |
| iperf3 transmit AXE11000 6GHz | |
| Asus ROG Strix Scar 17 G733PY-XS96 | |
| MSI GE78HX 13VH-070US | |
| Eurocom Raptor X17 | |
| iperf3 receive AXE11000 6GHz | |
| MSI GE78HX 13VH-070US | |
| Asus ROG Strix Scar 17 G733PY-XS96 | |
| Eurocom Raptor X17 | |
Webcam
The 2 MP webcam is typical of most other laptops regardless of price. At least IR is built-in for Hello support and there is an electronic shutter for privacy. Hopefully next generation models will integrate 5 MP webcams much like on the latest Razer Blade 18.
Eurocom offers an Anti Spying Security Package where the internal webcams, wireless, and microphones are removed for privacy purposes.
")
")
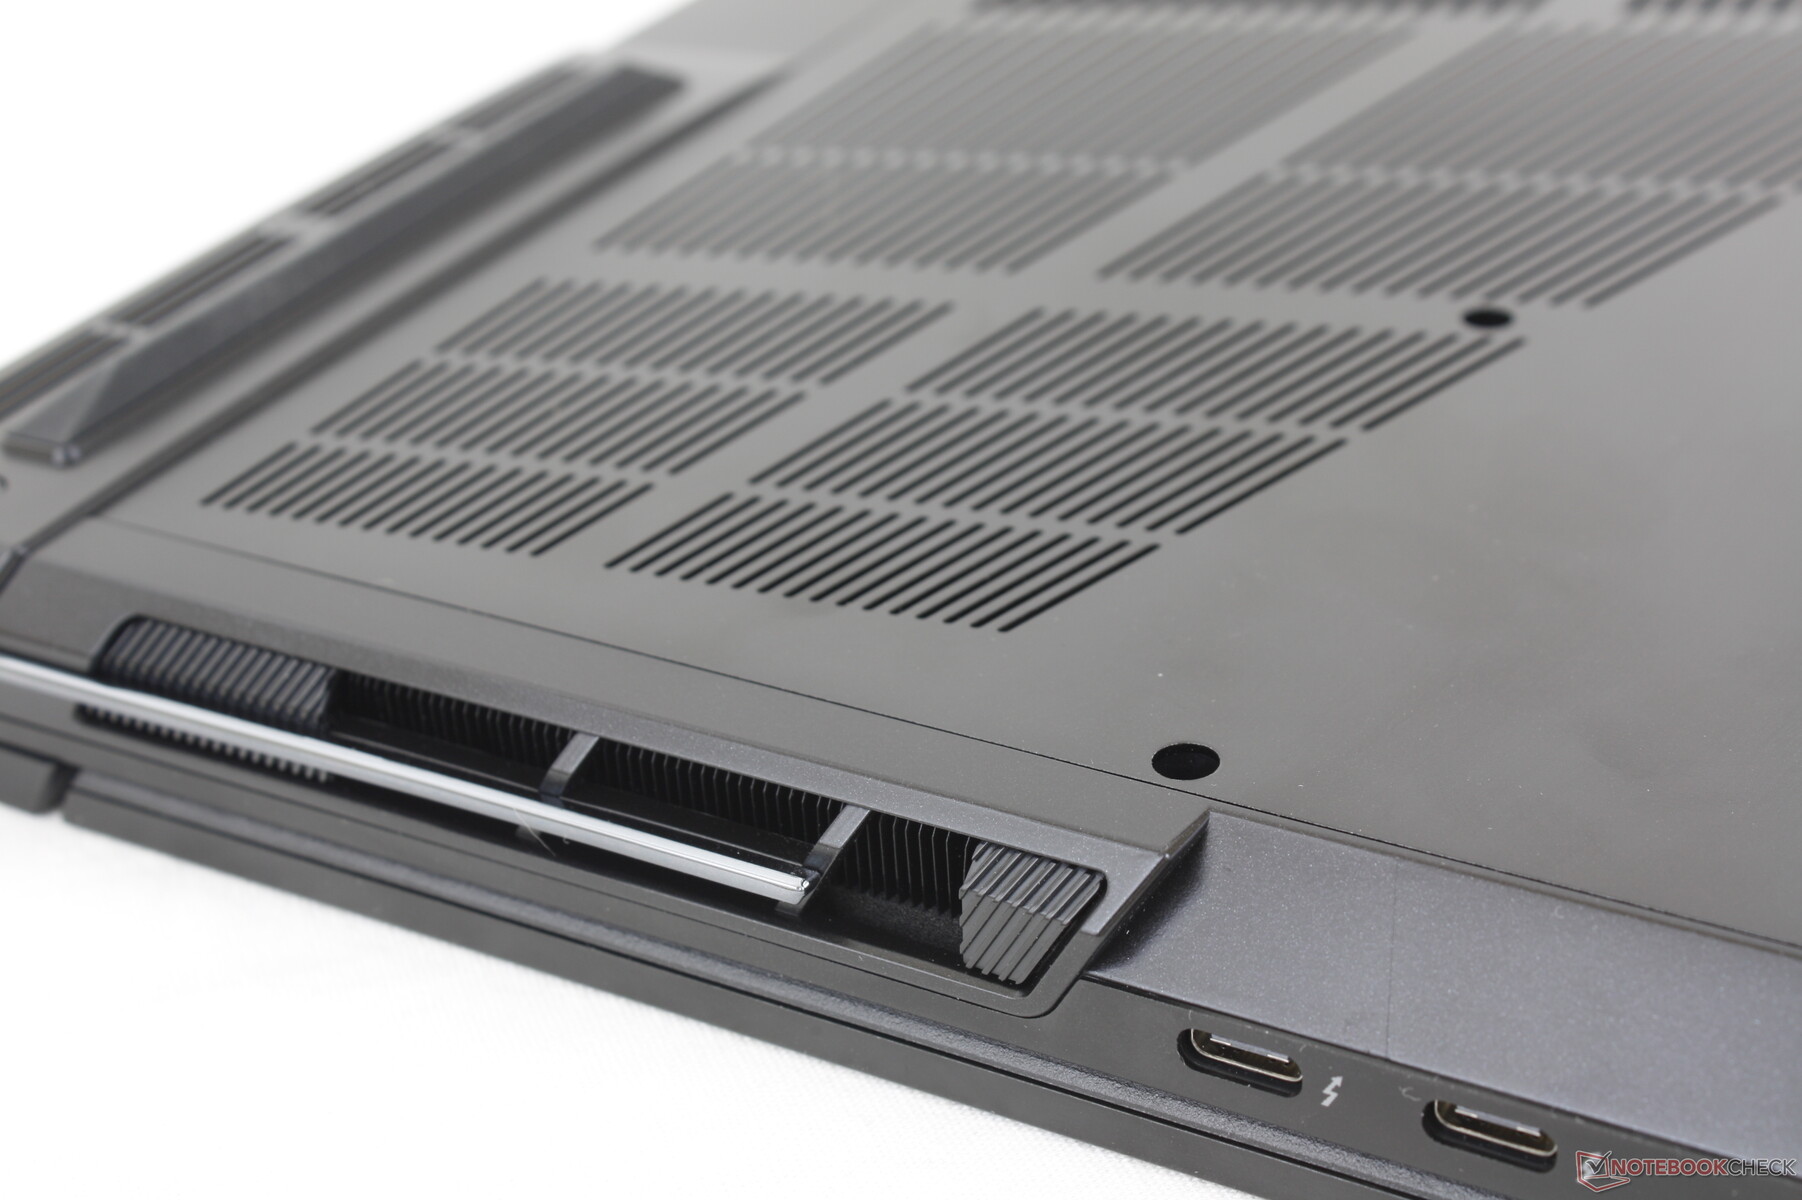
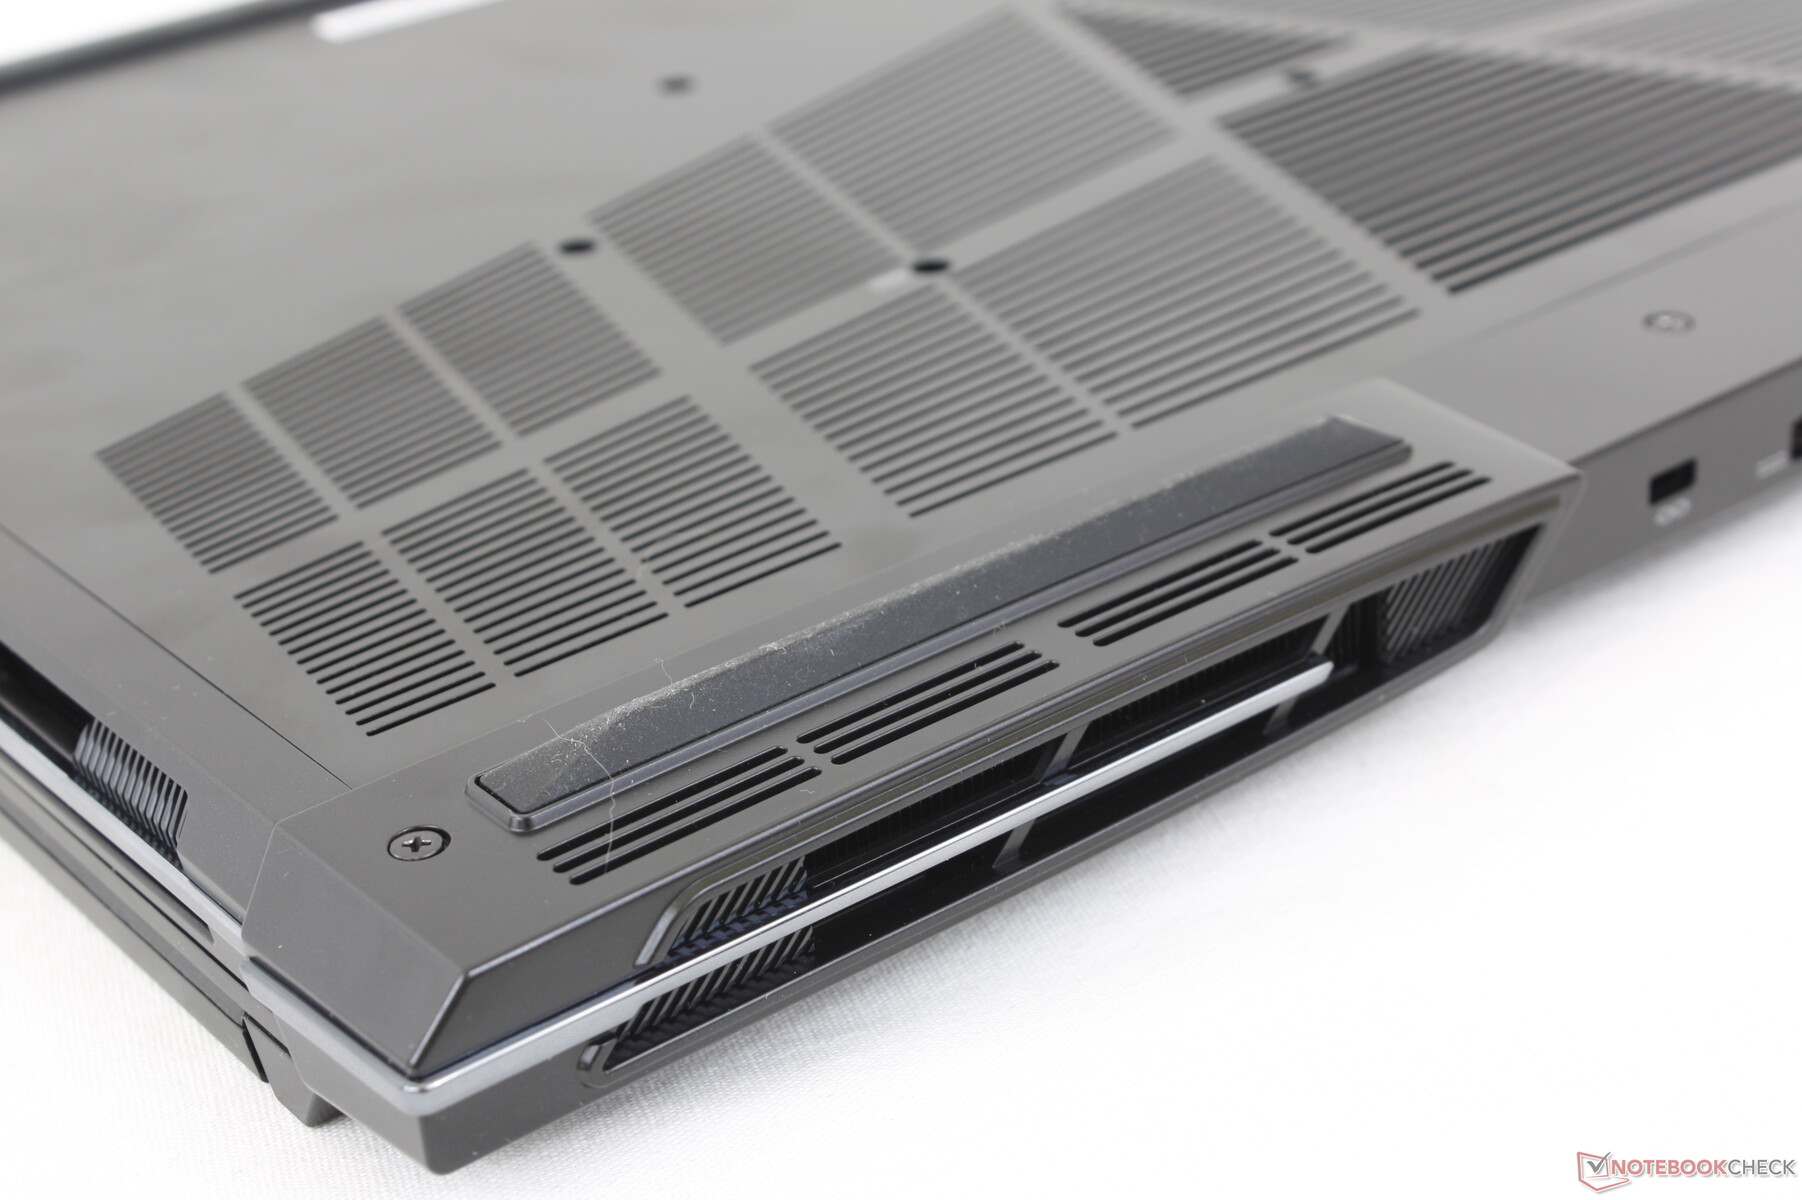
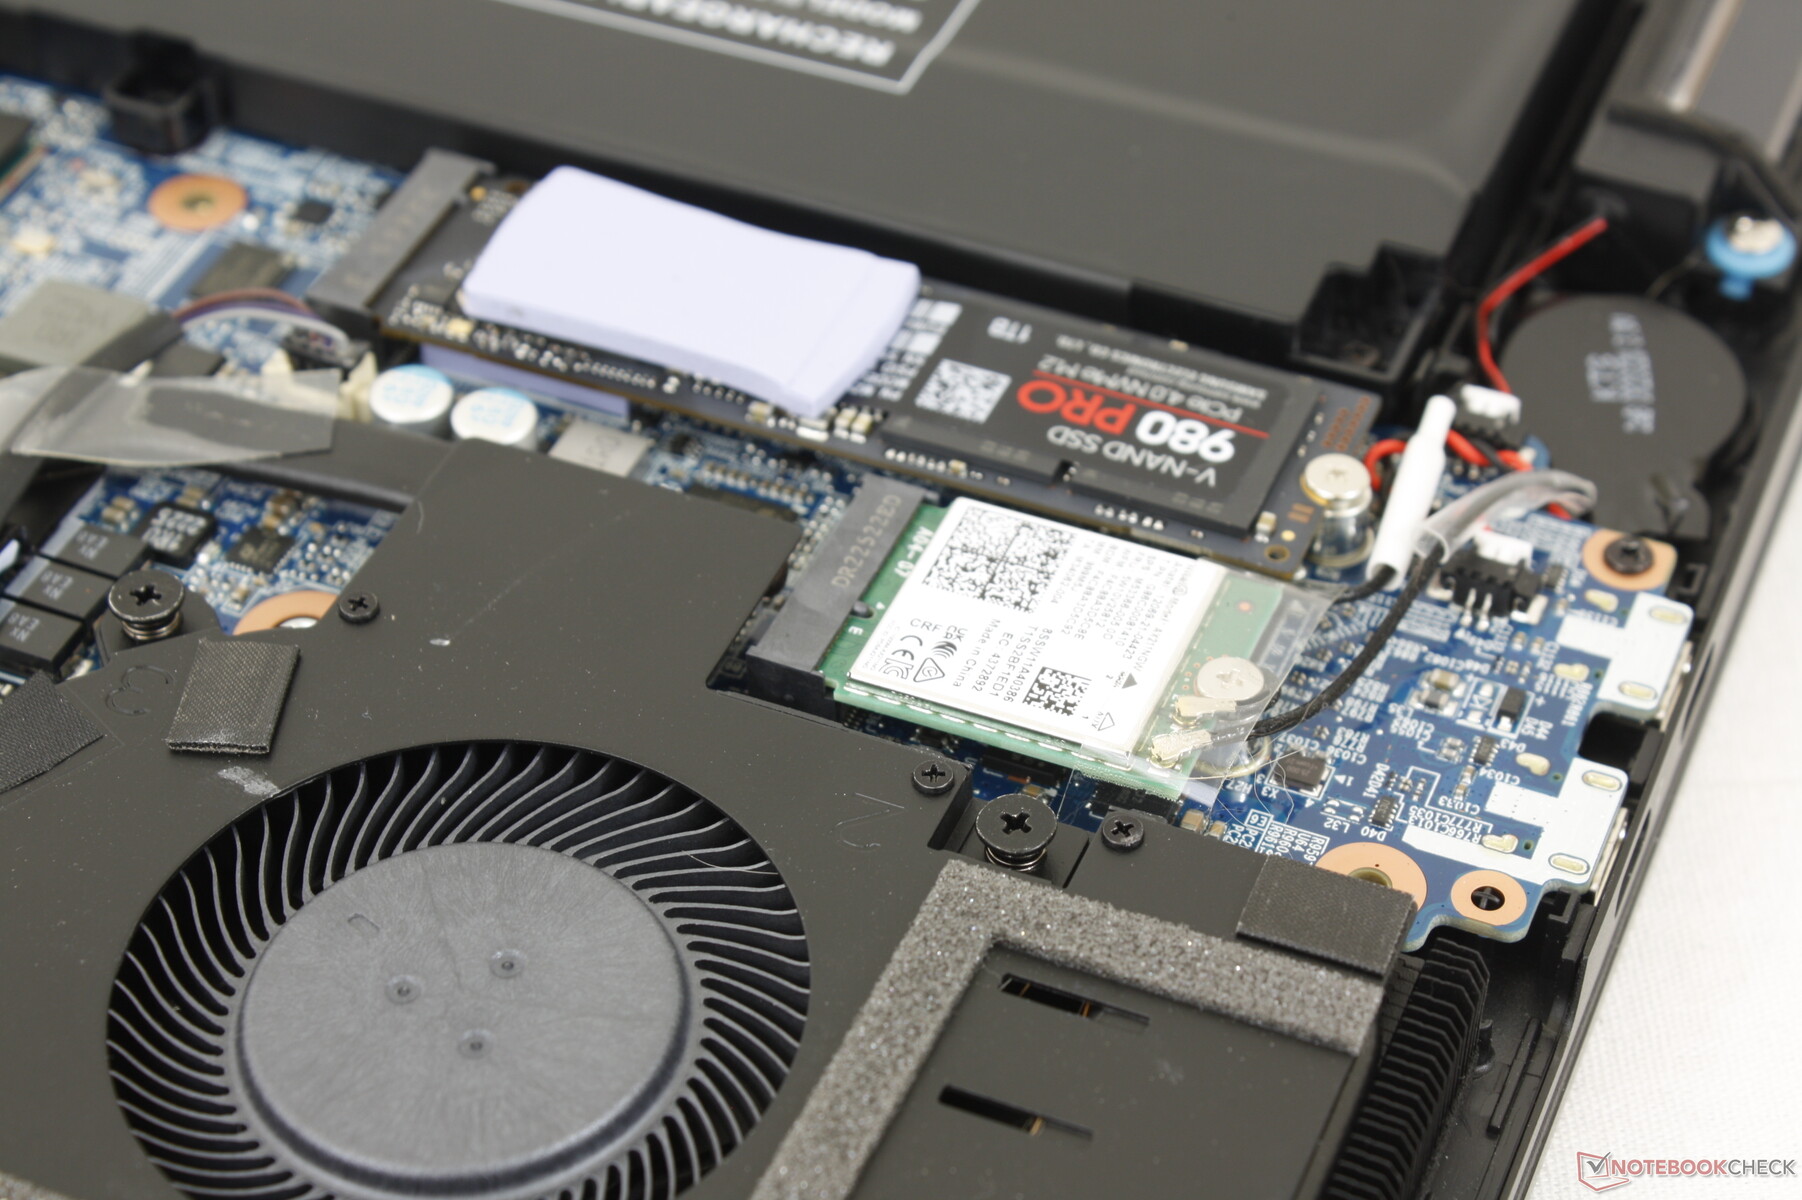
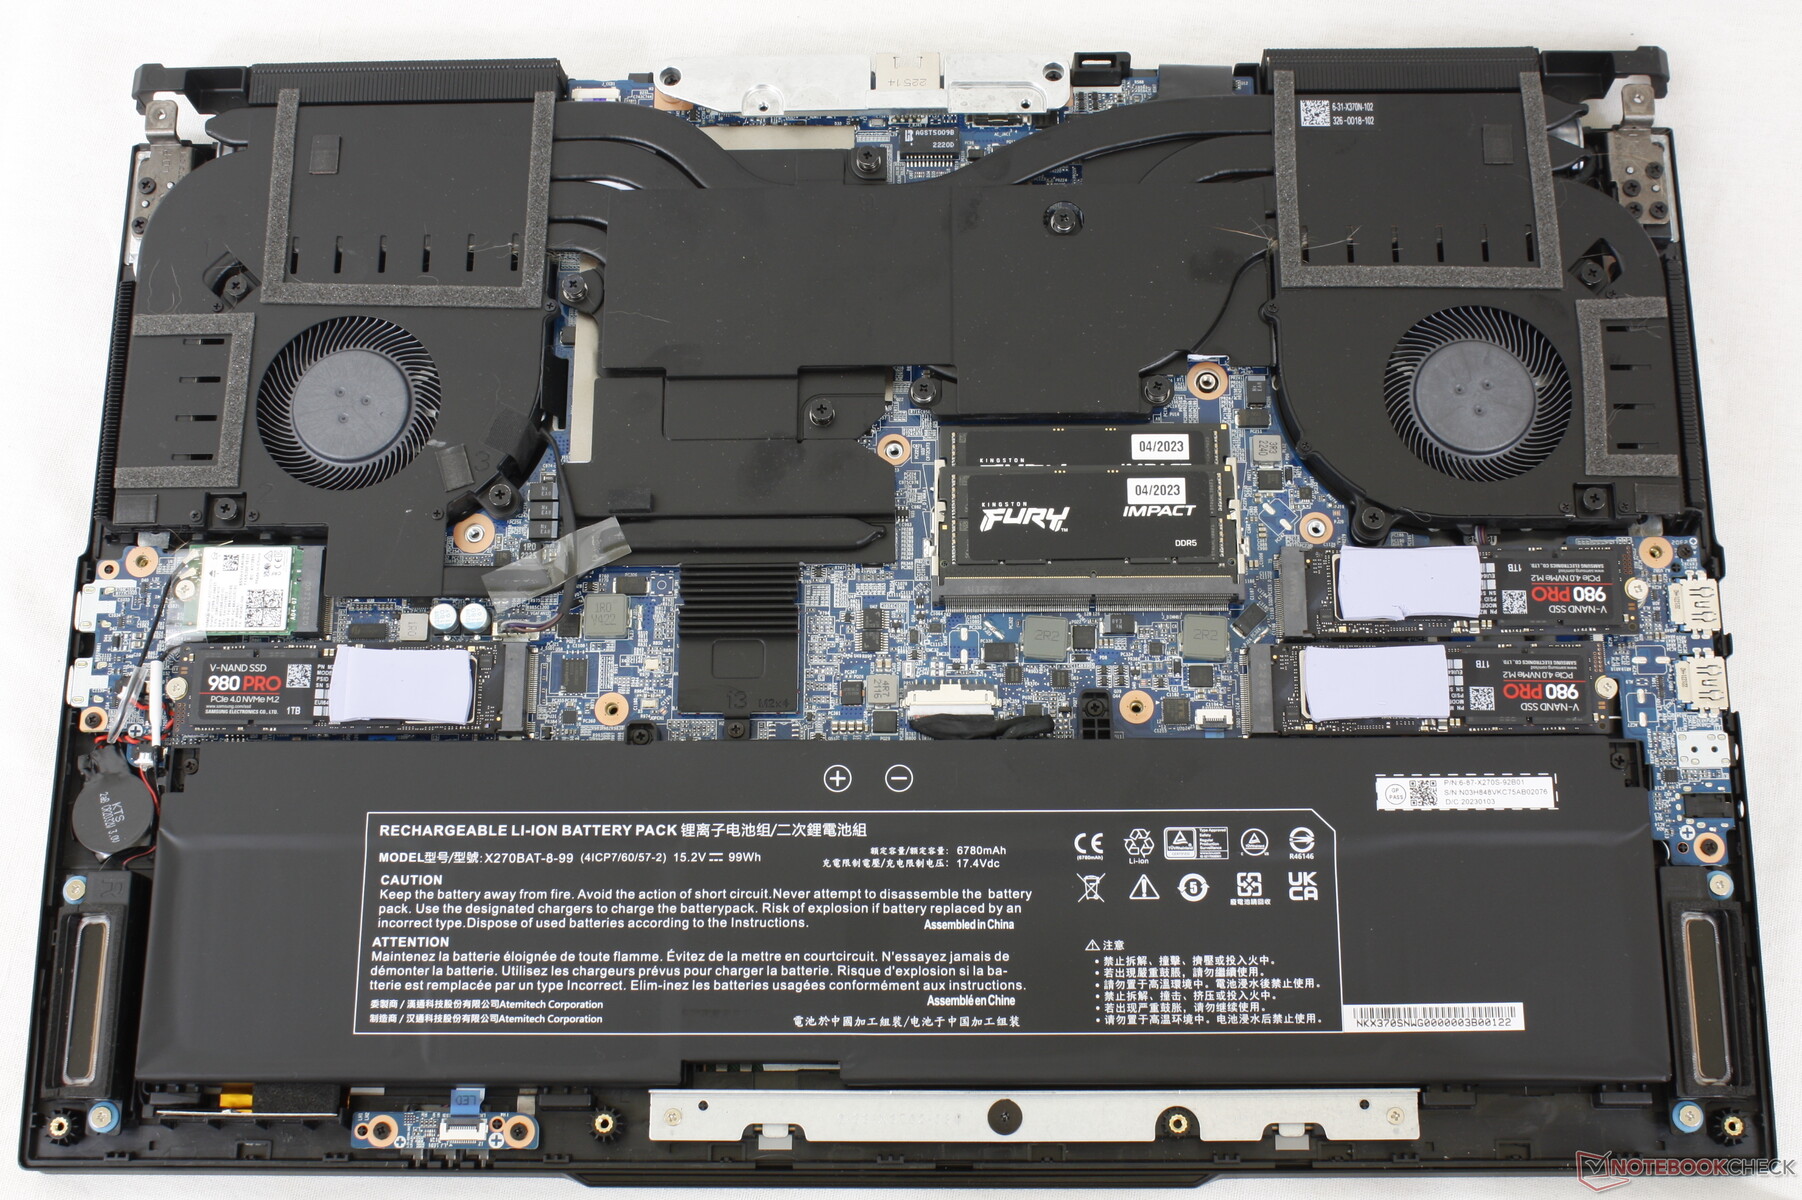
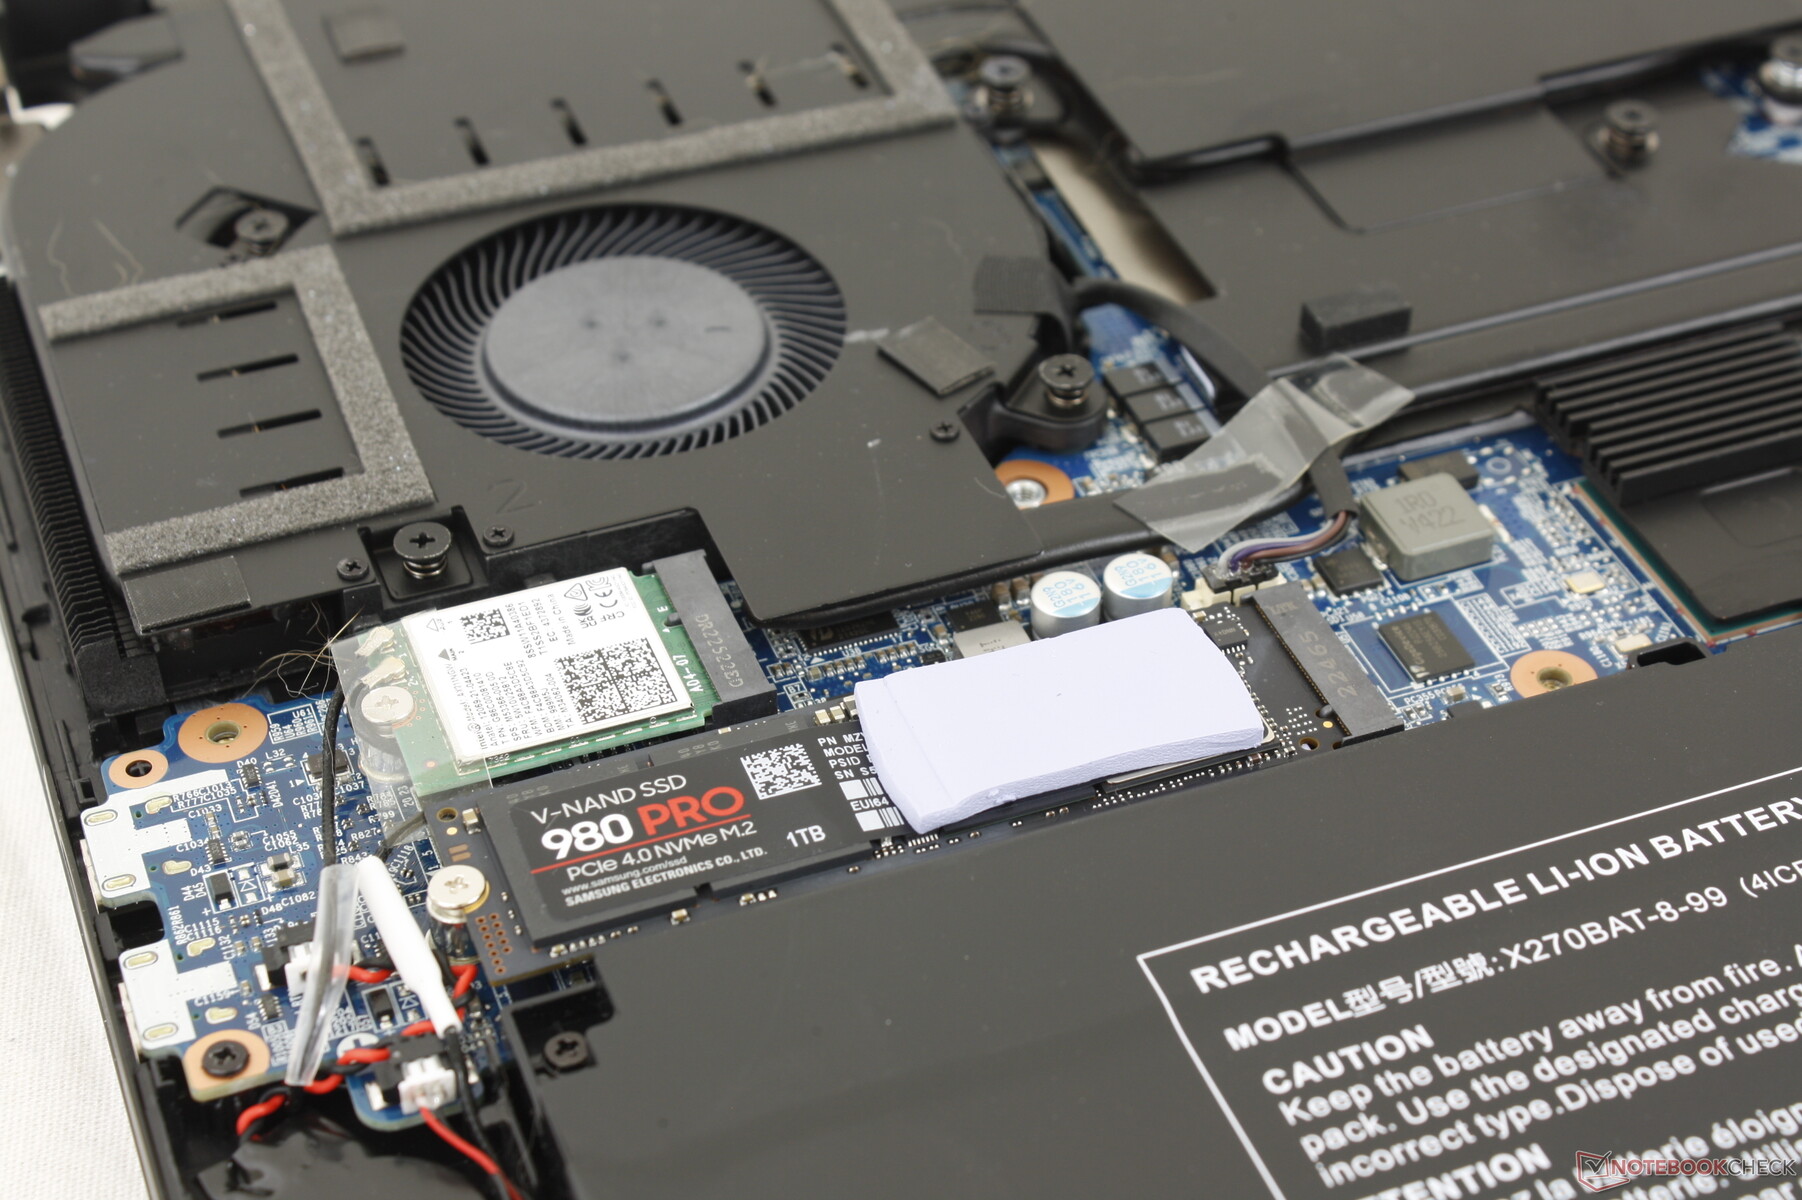
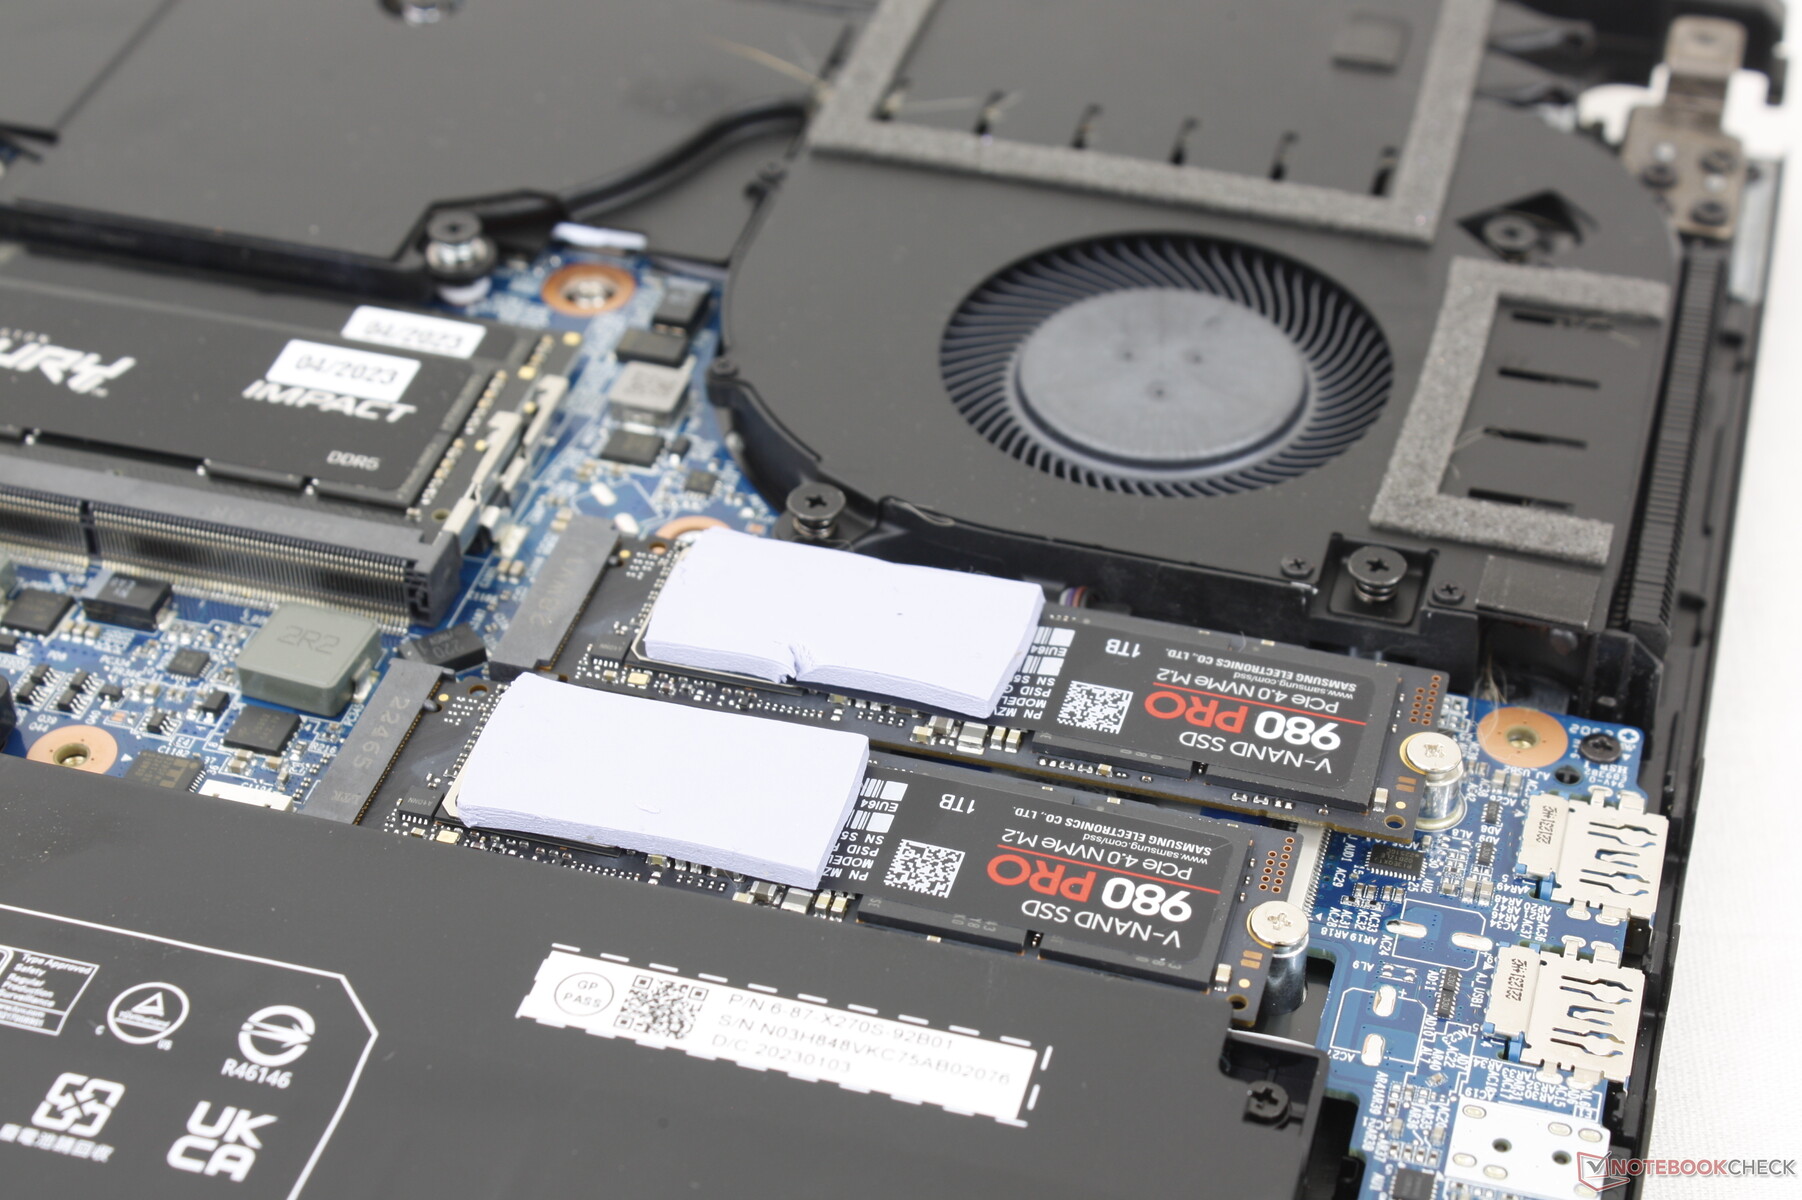
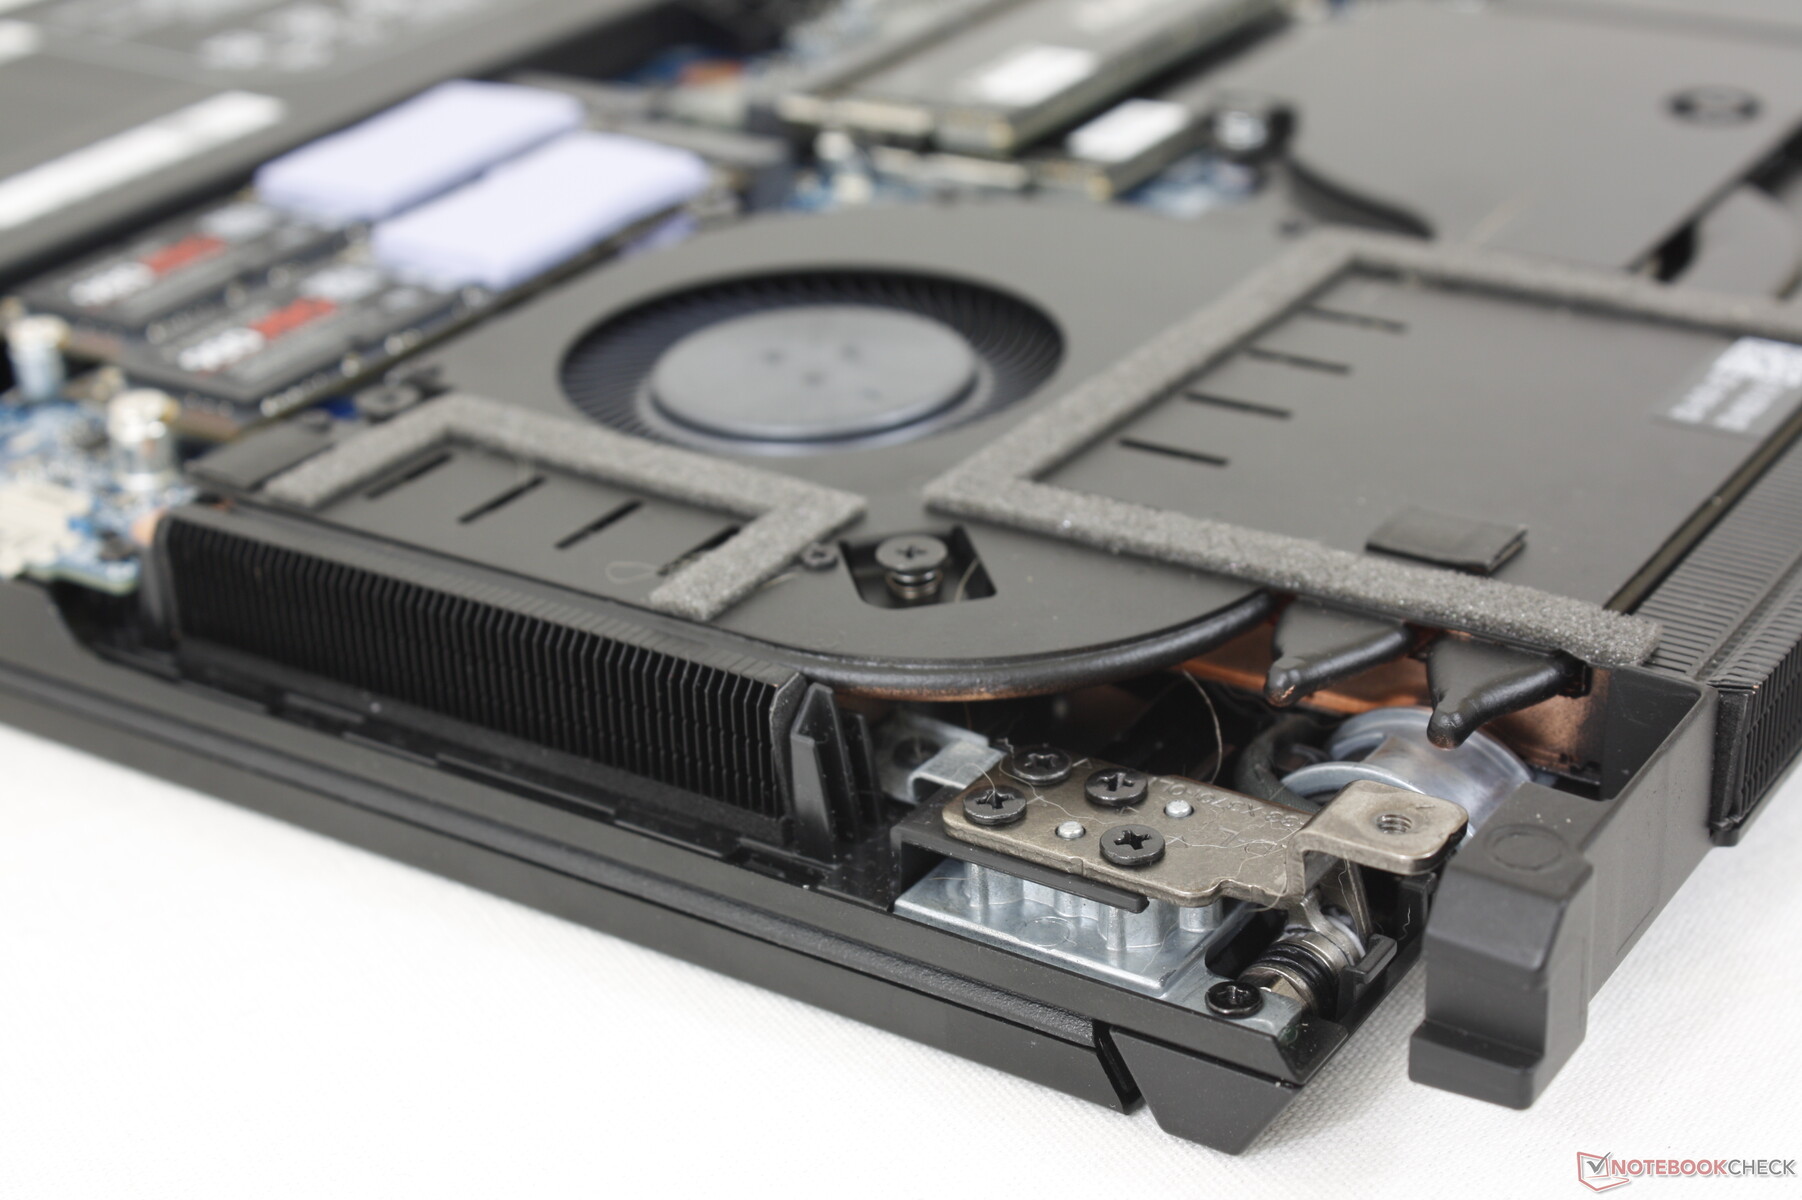
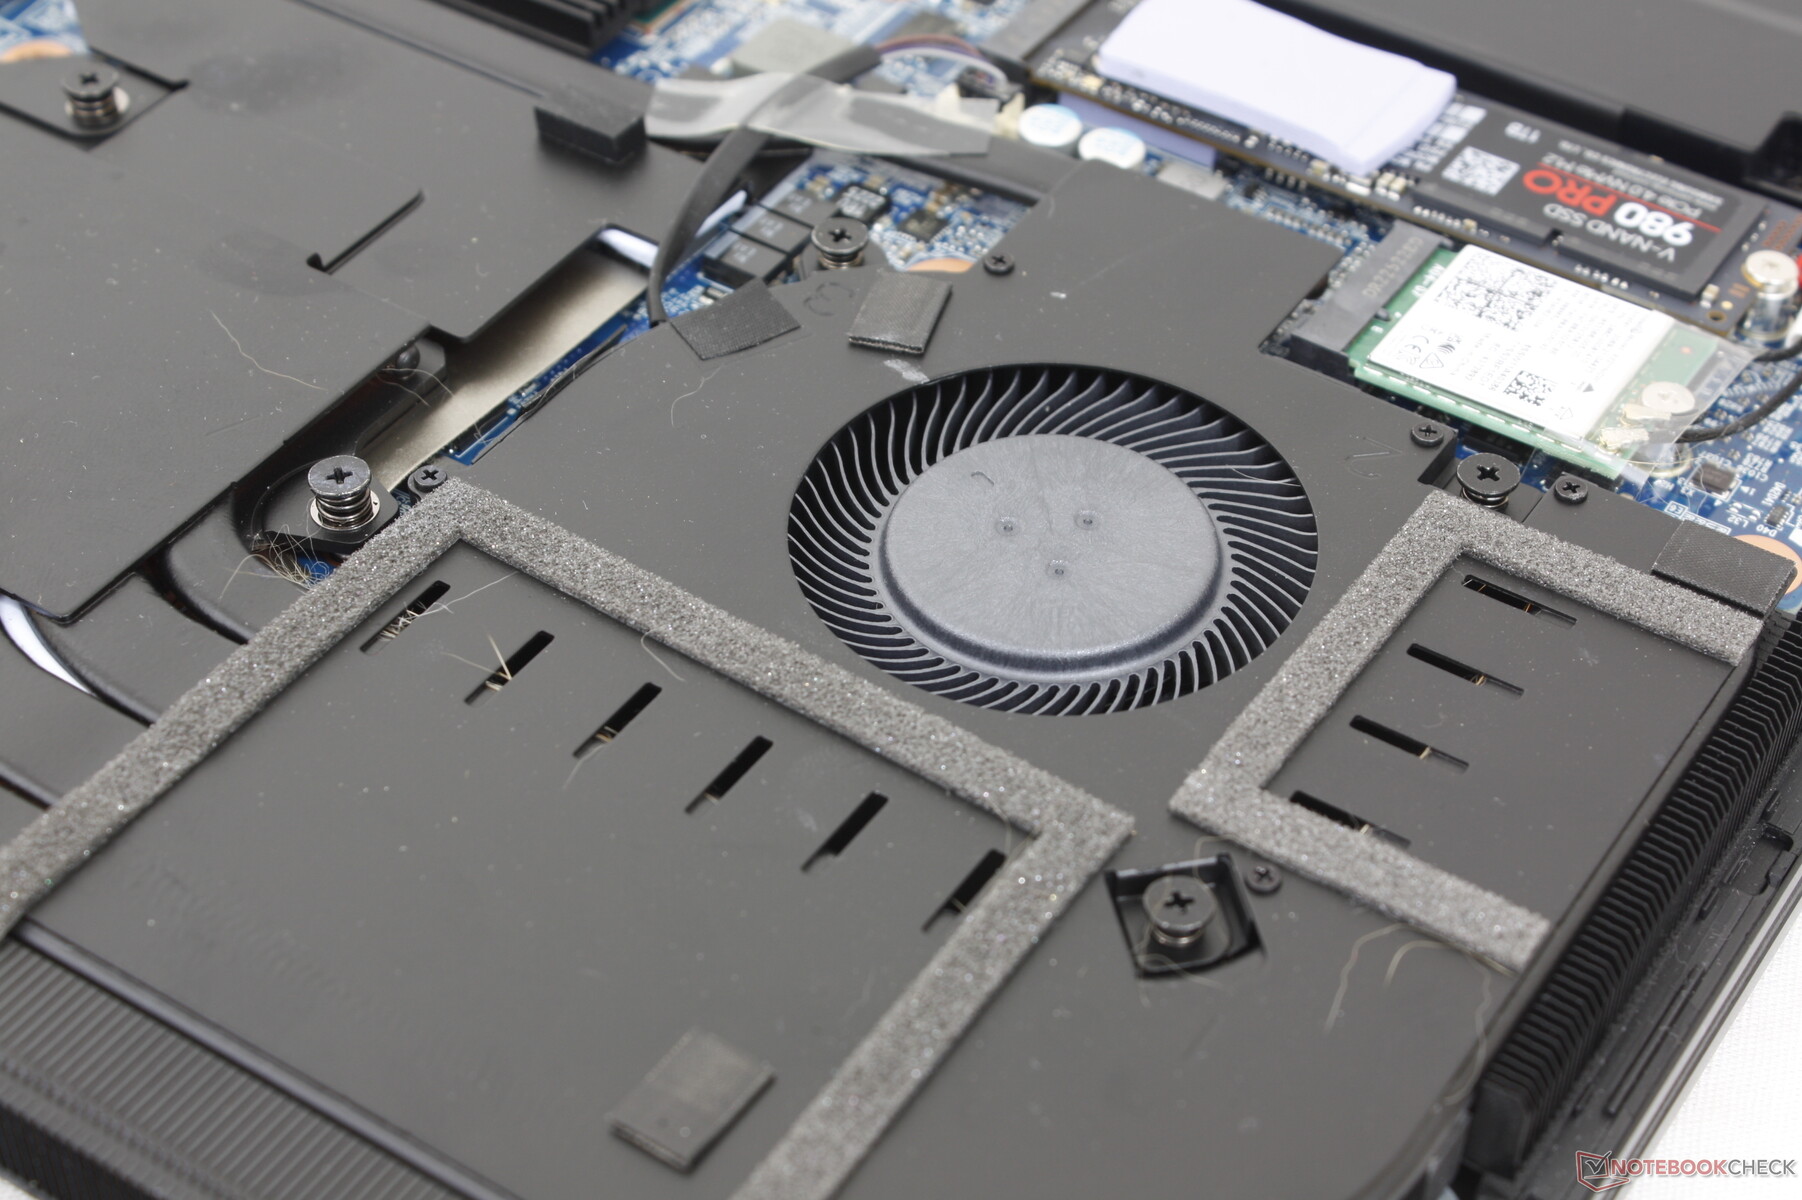
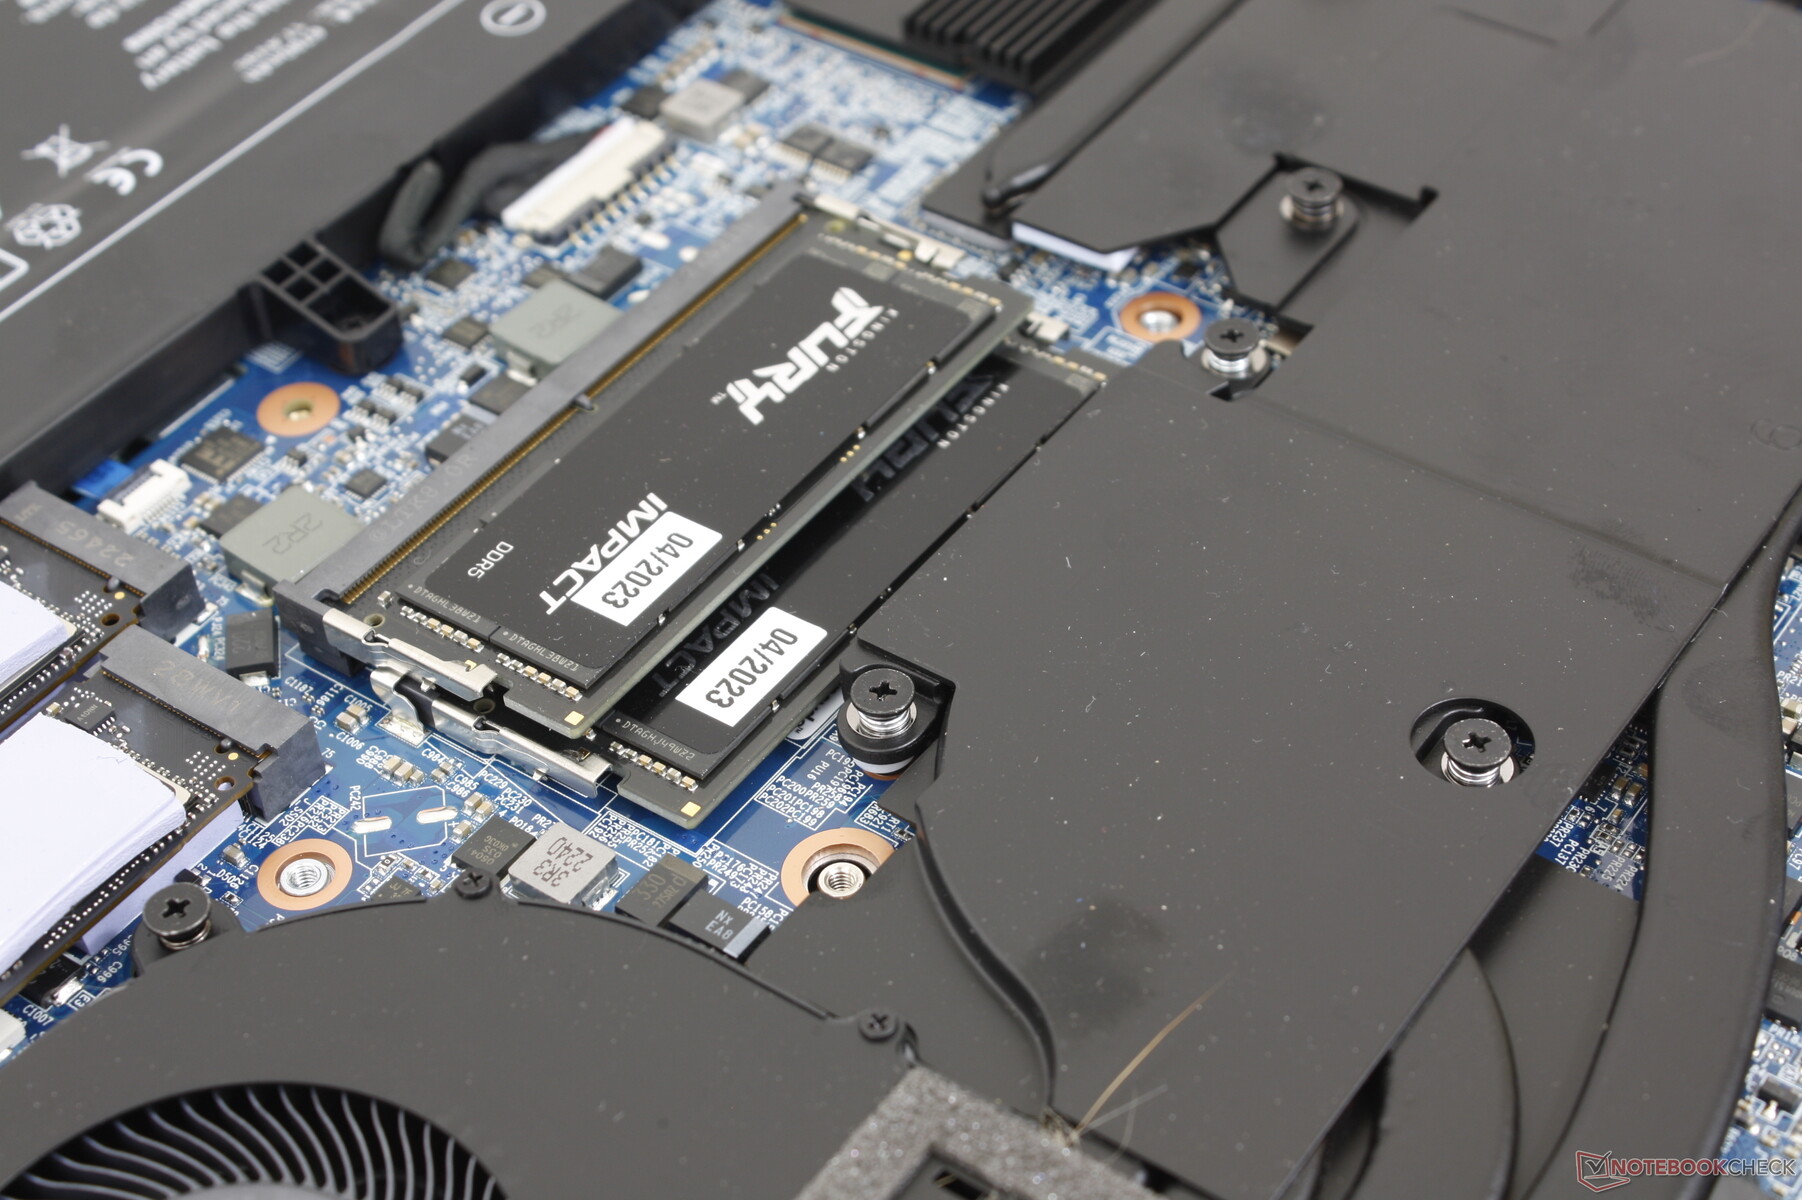
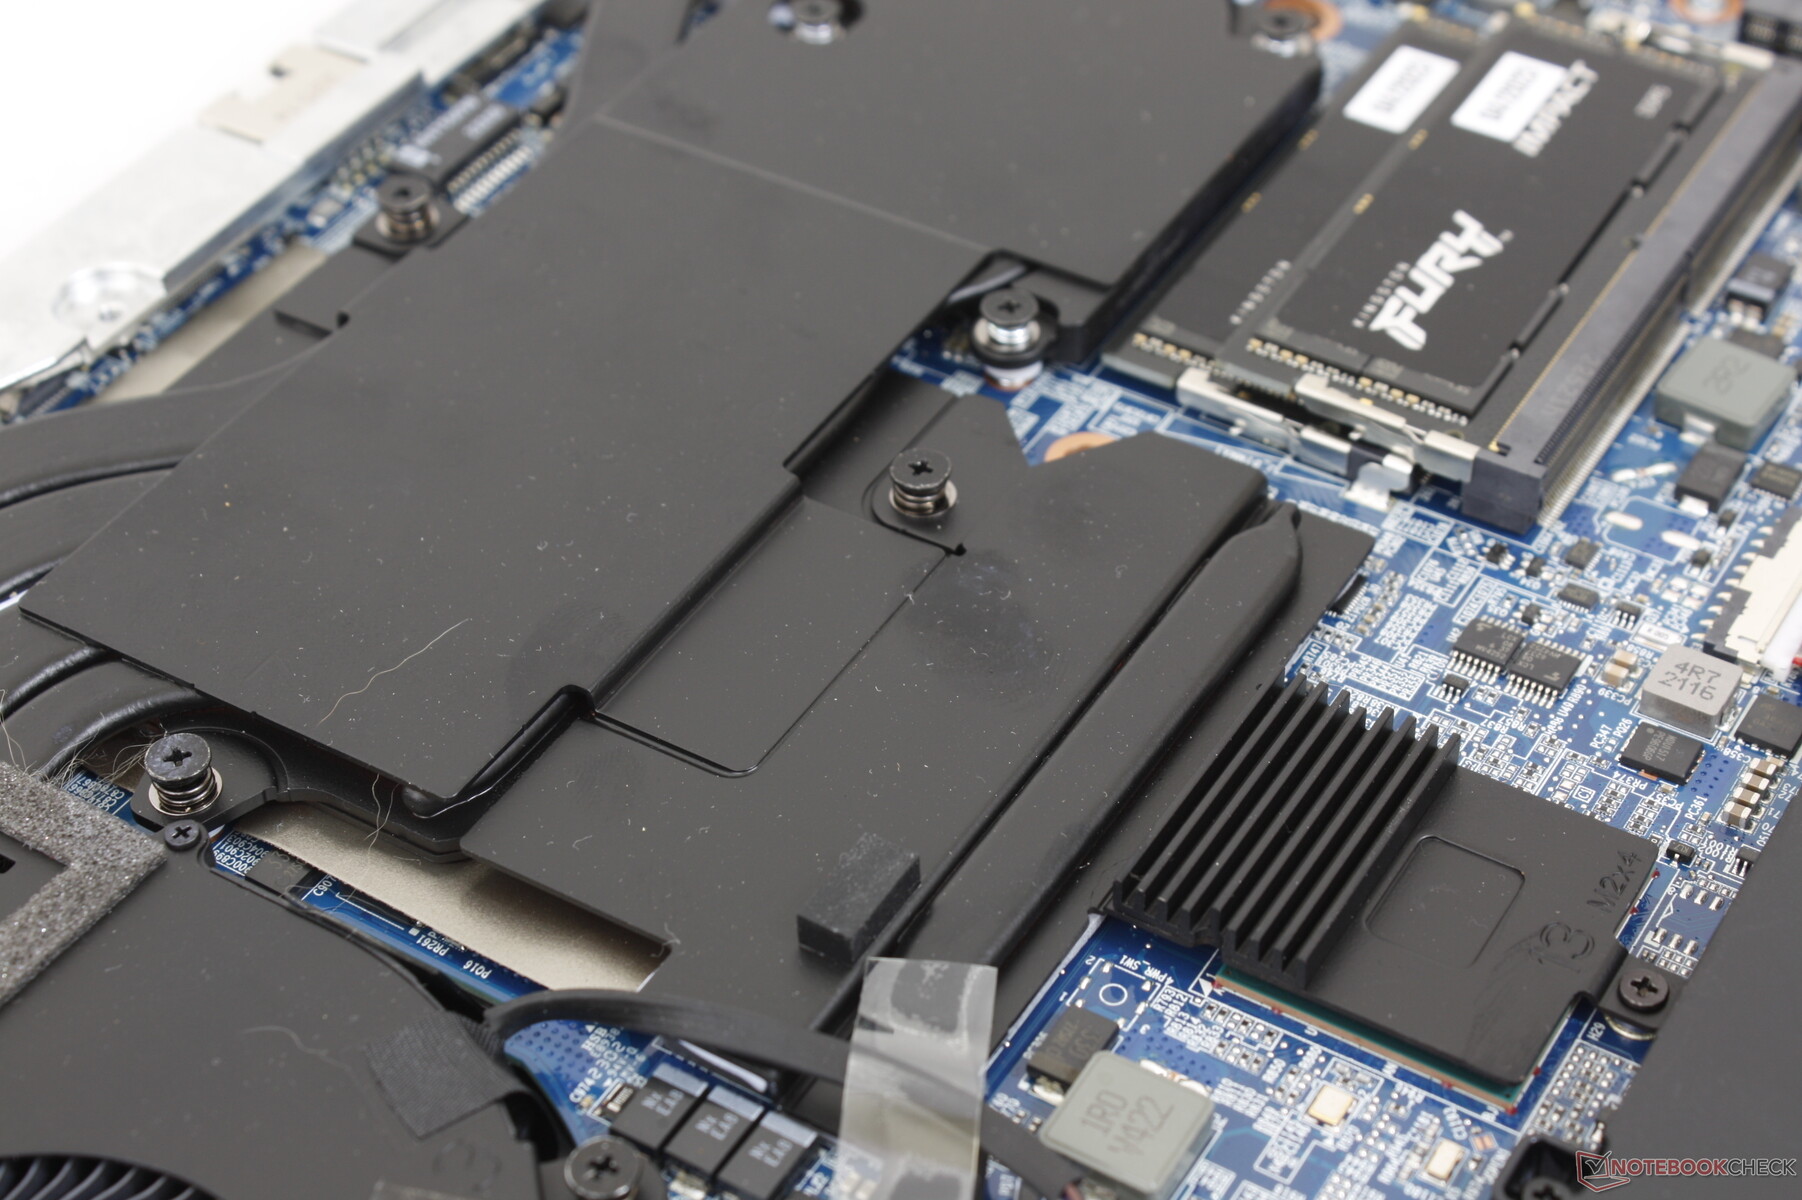
Maintenance
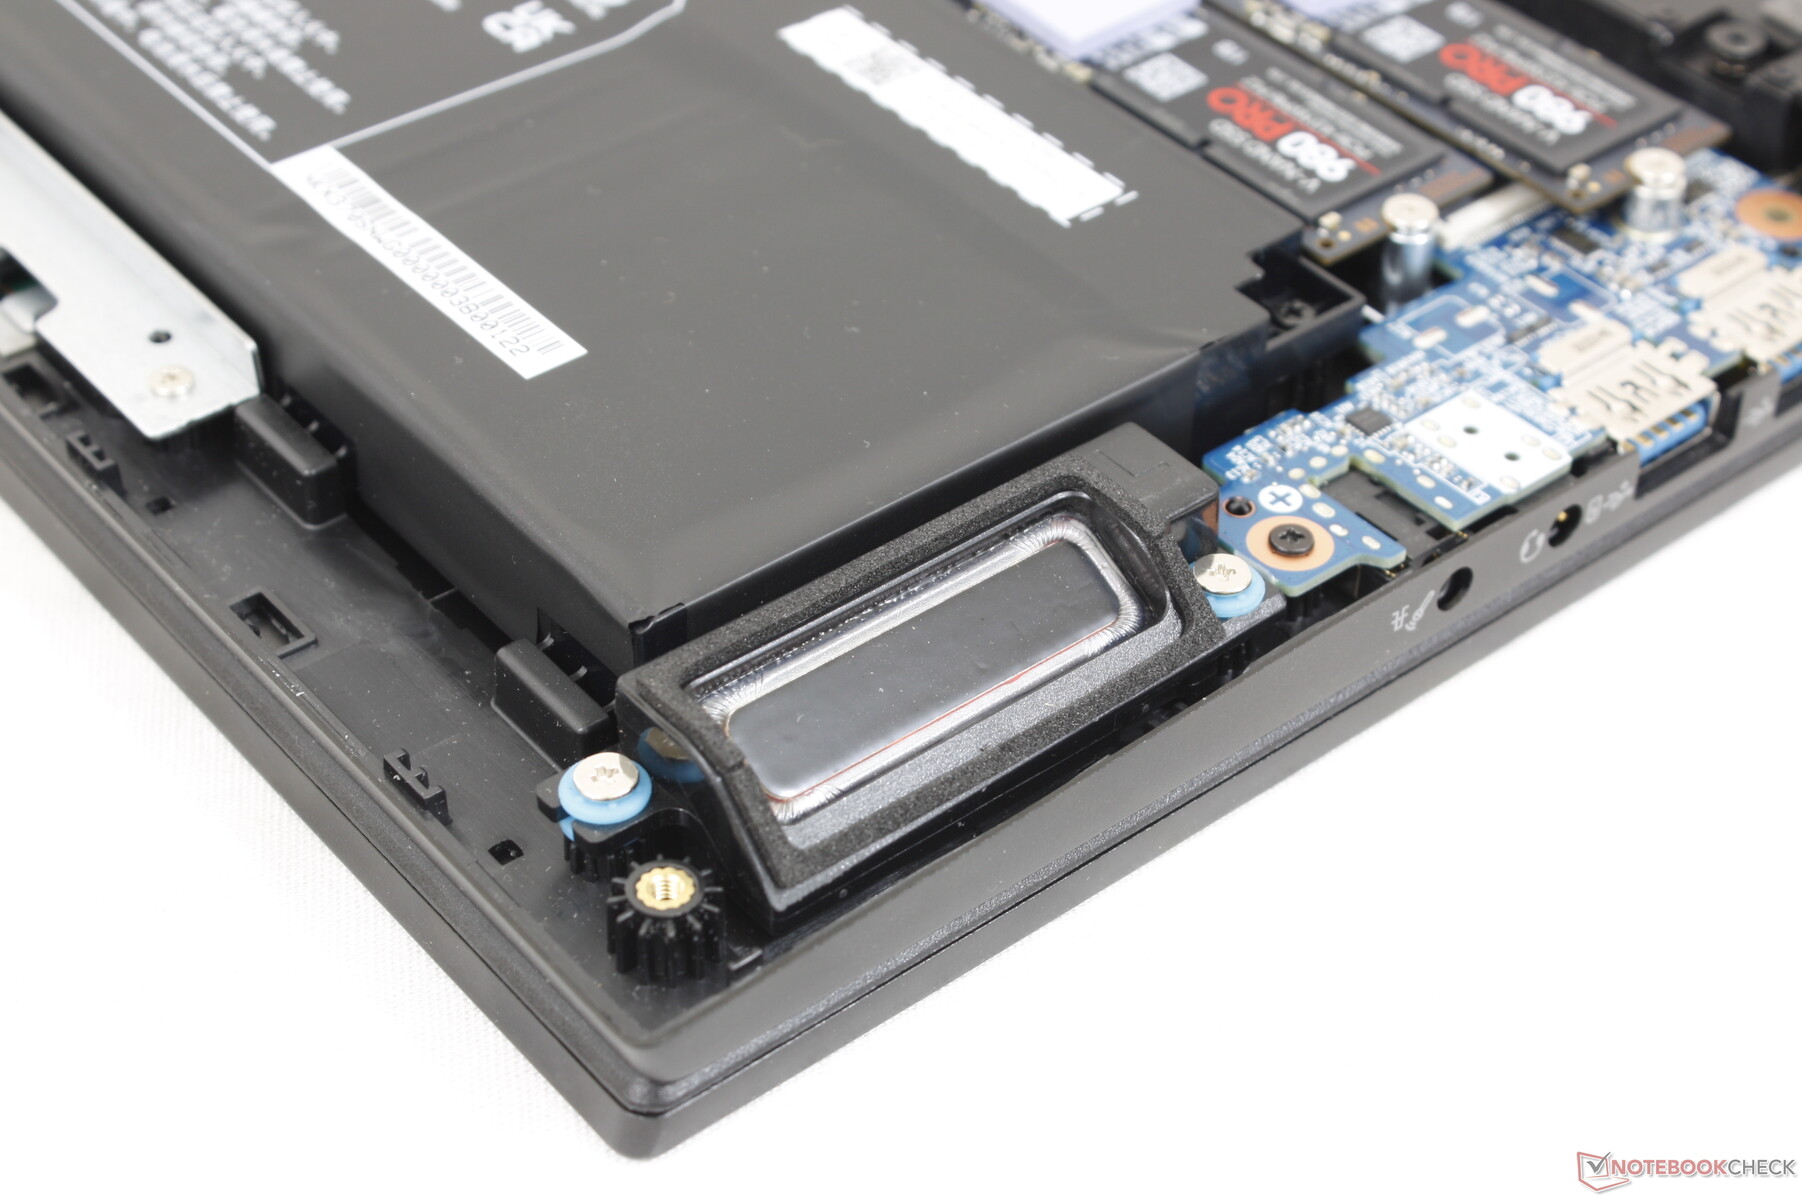
The bottom panel is secured by 16 Philips screws for relatively easy removal. Once inside, users have access to the removable WLAN module, 2x SODIMM slots, and 3x PCIe4 x4 M.2 2280 slots. The system does not support PCIe5 speeds unlike on the recent MSI GE and GT refresh.
Accessories and Warranty
The retail box includes a device drivers CD, Windows 11 drivers USB stick, and a velvet wipe in addition to the usual paperwork and AC adapter. The standard one-year limited warranty applies with options to extend up to three years.
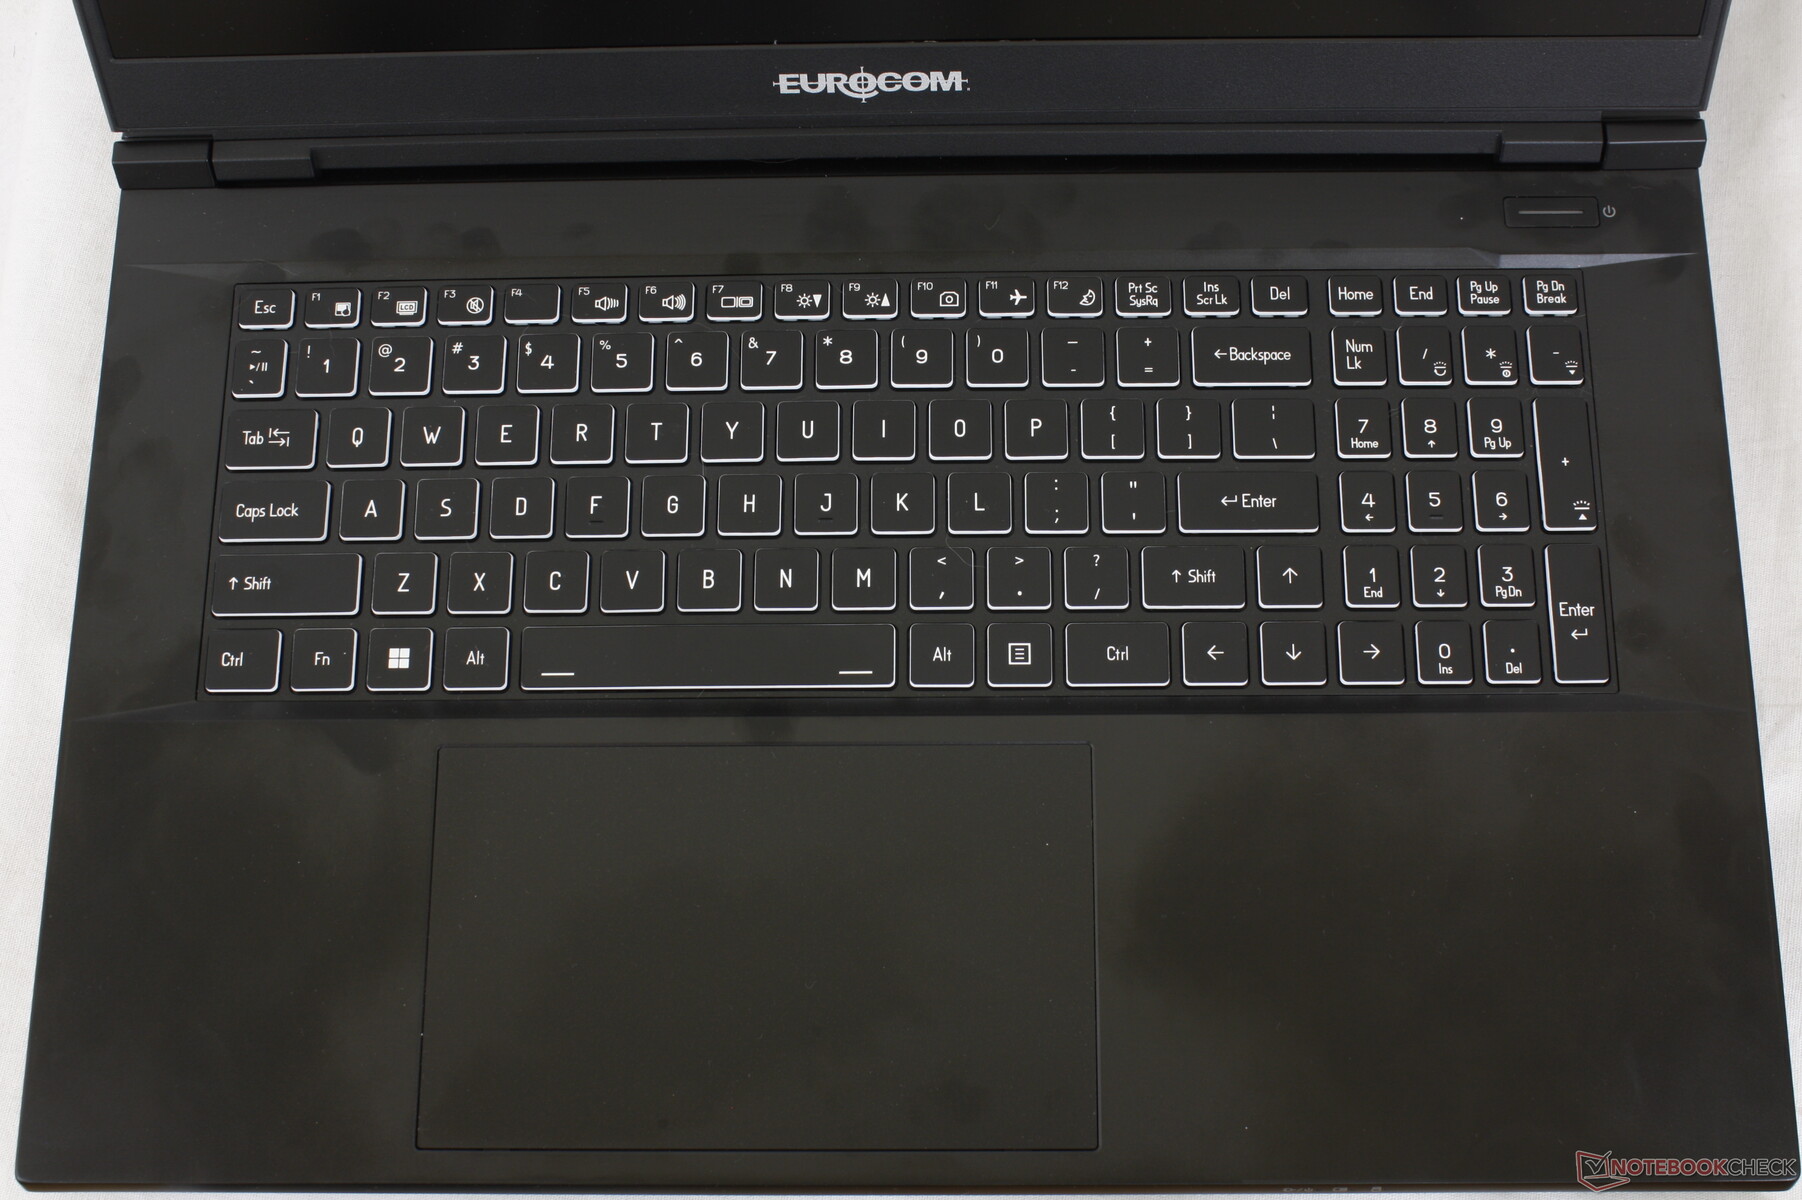
Input Devices — Traditional Eurocom
Keyboard
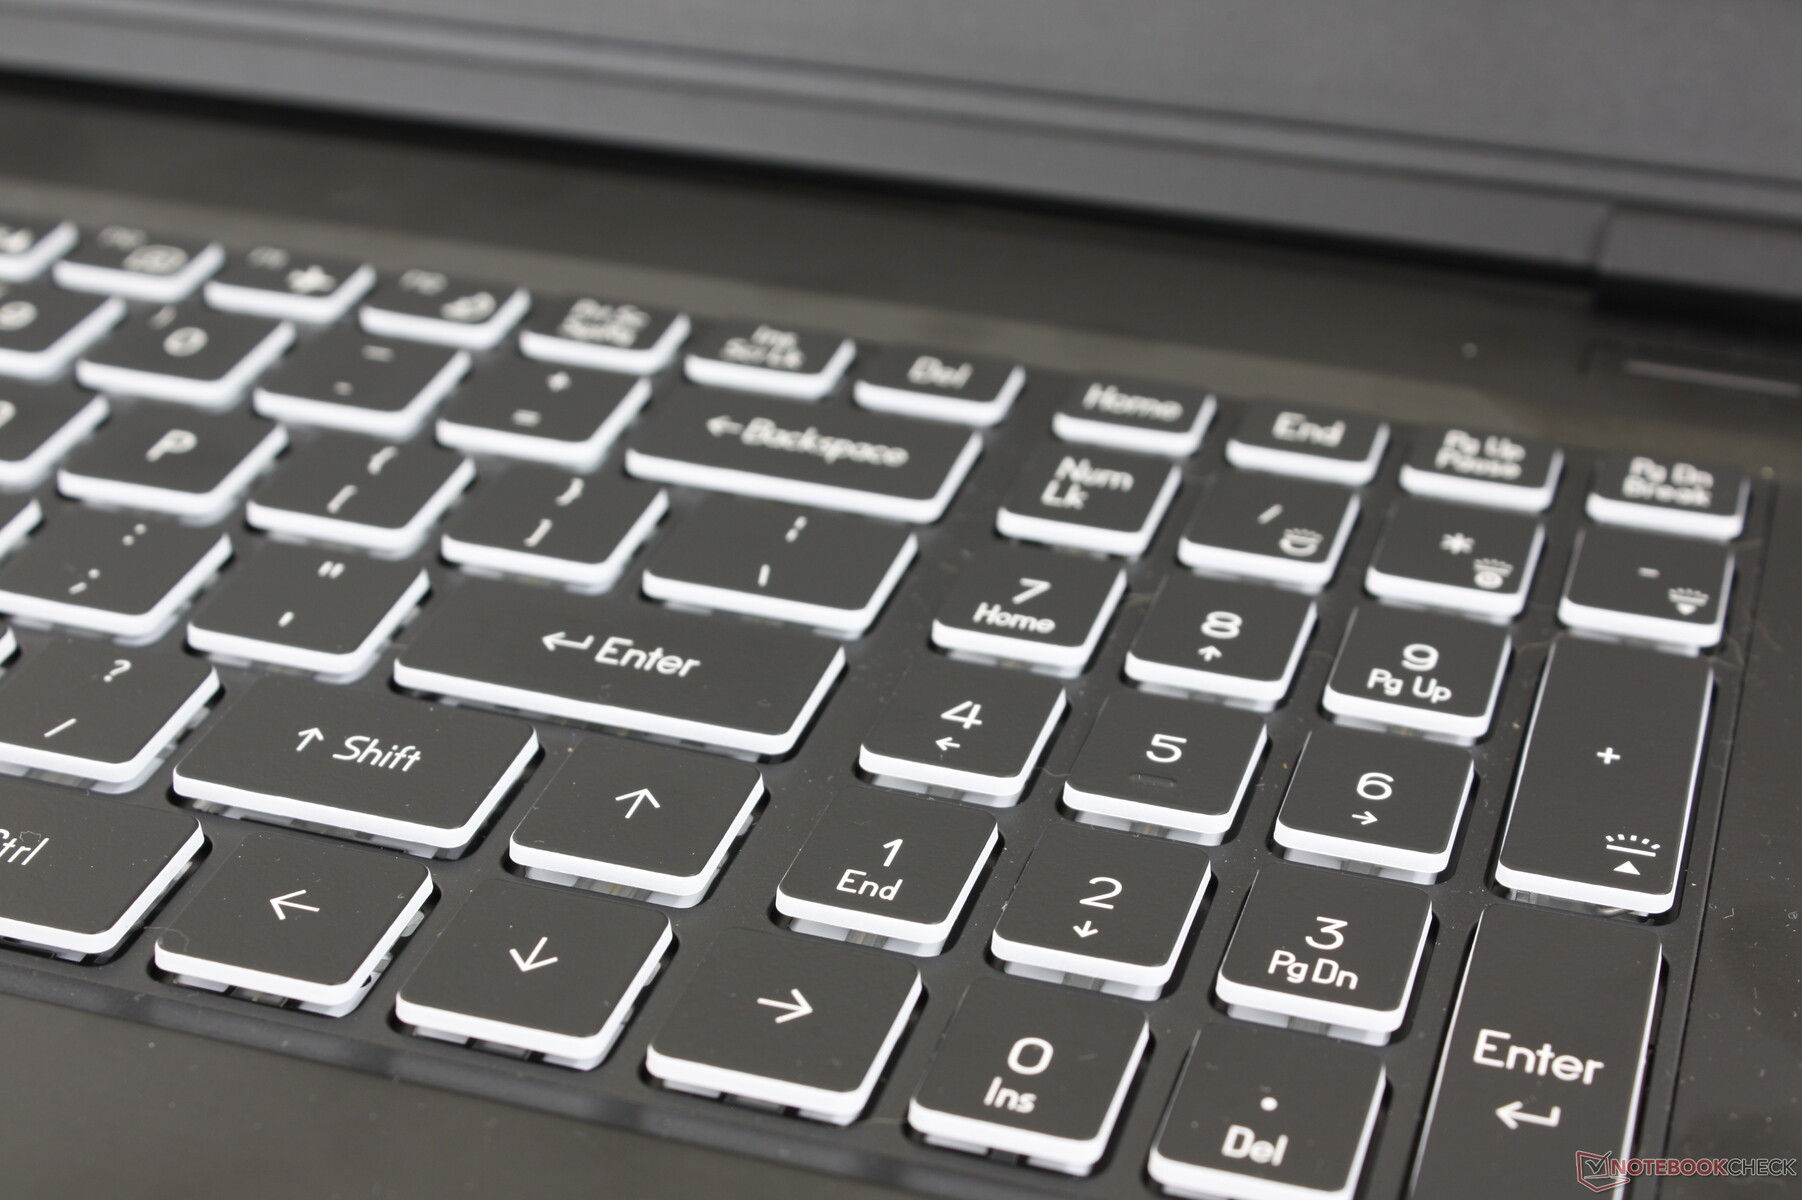
The typing experience is consistent across most Eurocom models since the underlying ODM remains the same. The Raptor X17 has the same membrane-based keyboard as on the Raptor X15 despite the screen size differences which is a shame because the numpad keys continue to be narrower and more cramped than the main QWERTY keys.
Key feedback is softer than the keys on the MSI GE78 or Asus ROG Strix Scar 17. Clatter is relatively quiet as a result which some typists might prefer, but hardcore gamers may be disappointed by the lack of "clickiness".
Touchpad
The clickpad is large at 15 x 9 cm compared to the smaller 13 x 8.2 cm clickpad on the MSI GE78 HX. Gliding is smooth at medium to higher speeds while there is a bit of sticking at slower speeds to aid in accuracy.
Feedback when clicking on the clickpad is on the soft side with shallow travel not unlike on the Razer Blade 17. Drag and drop actions are therefore a bit cumbersome to perform despite the large surface area. A dedicated USB mouse is still the way to go whenever possible.


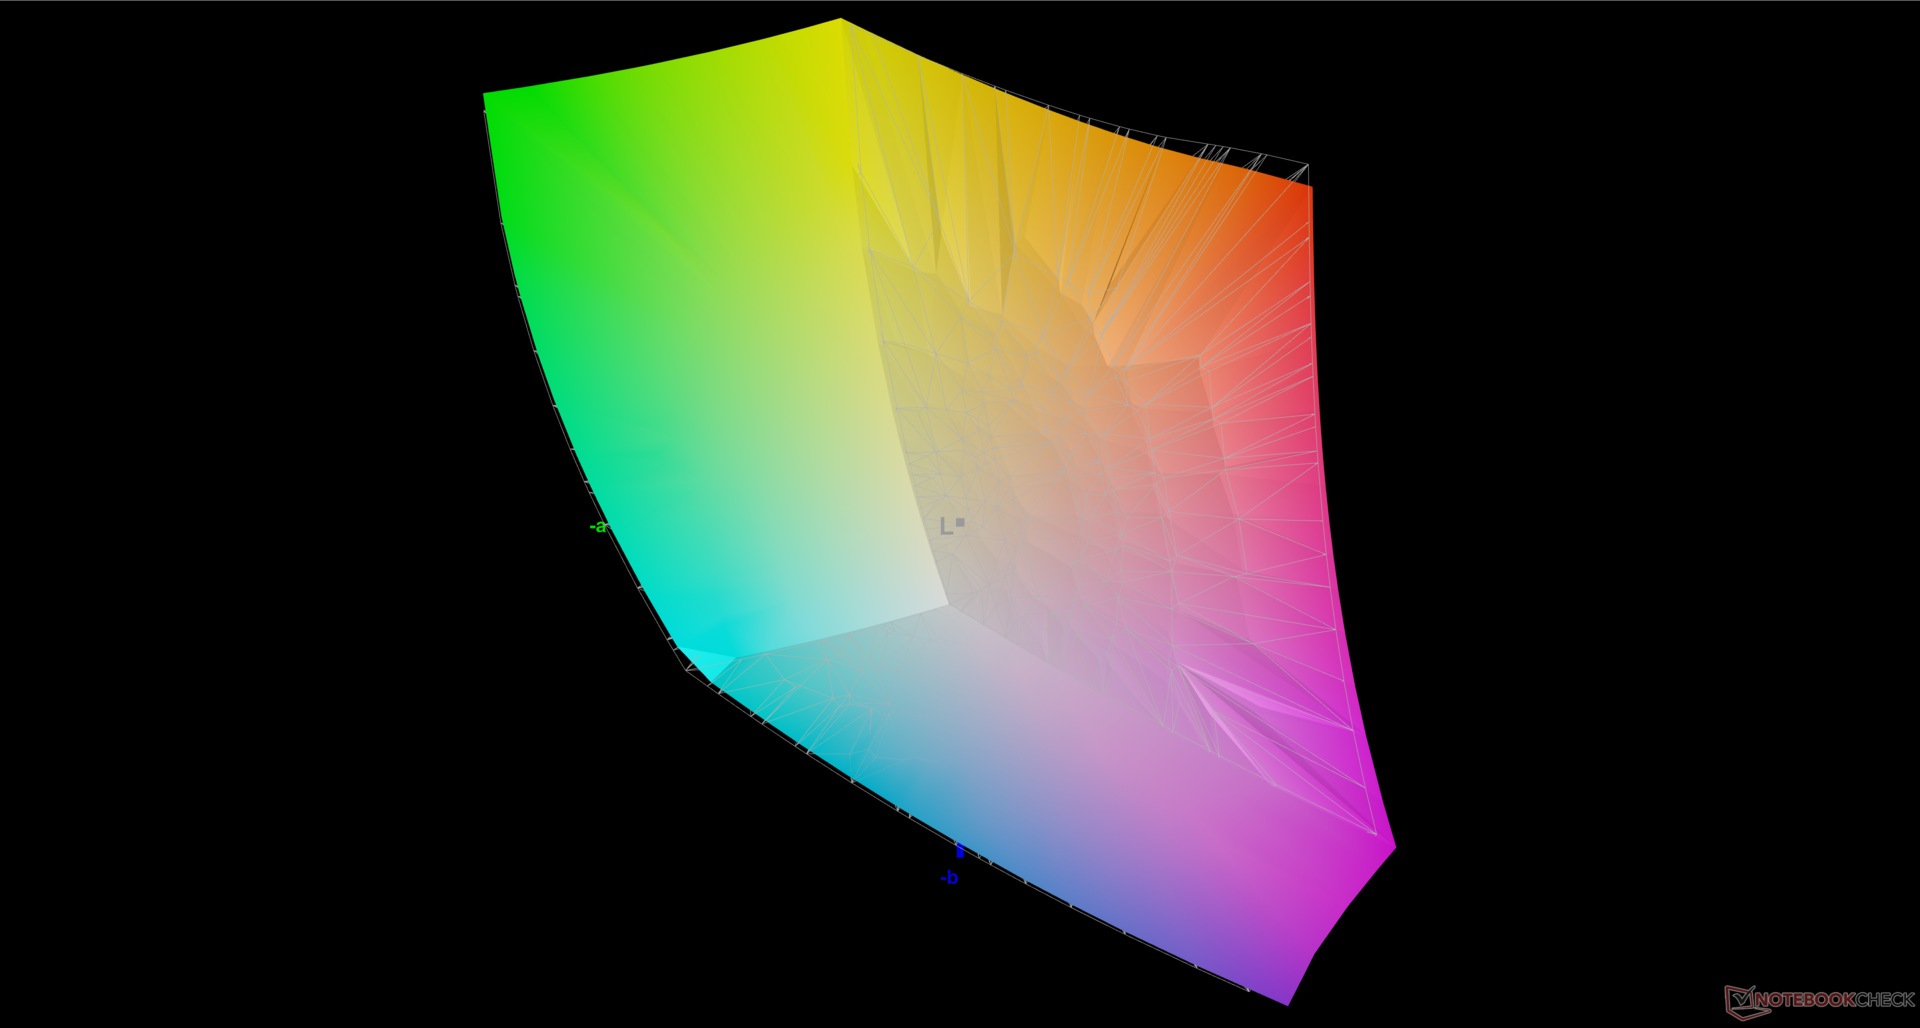
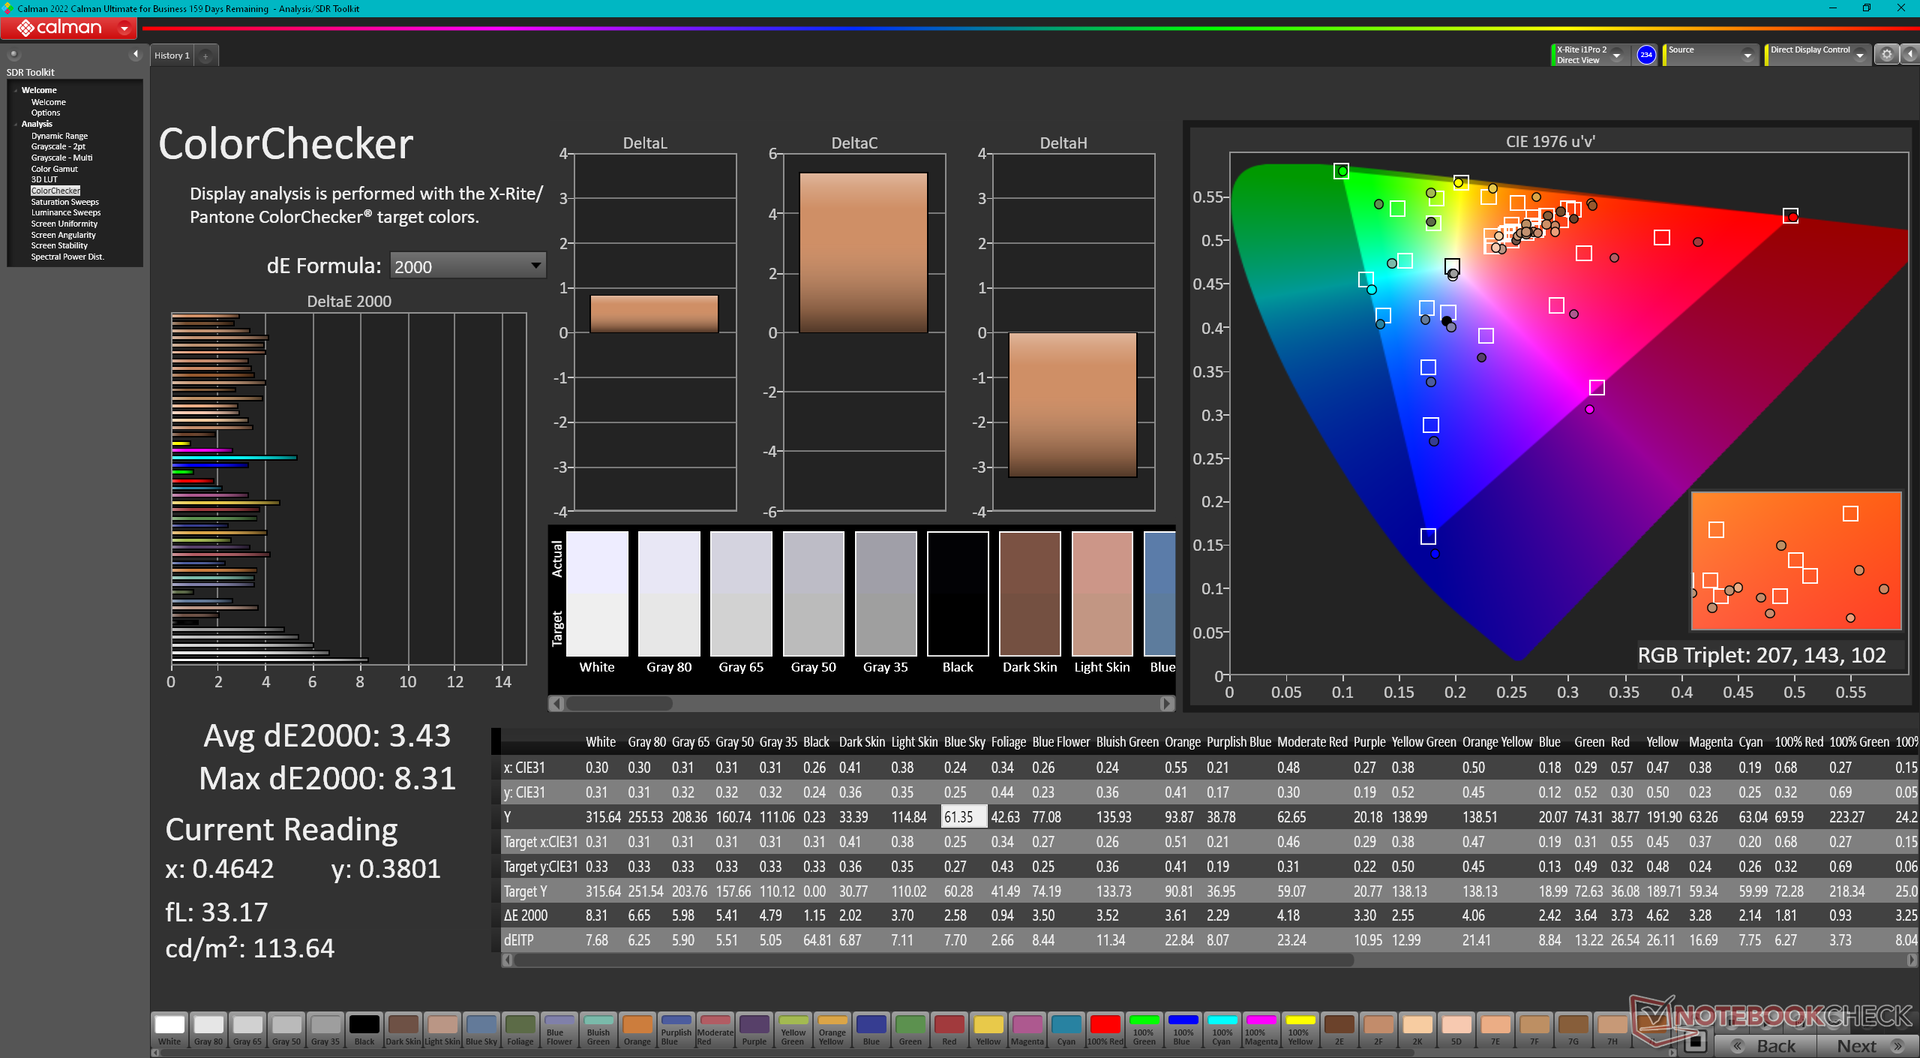
Display — 240 Hz, QHD, G-Sync, Full DCI-P3 Colors
Two display options are available: QHD at 240 Hz or 4K UHD at 144 Hz each with 100% DCI-P3 colors and G-Sync support. Our specific test unit ships with the former.
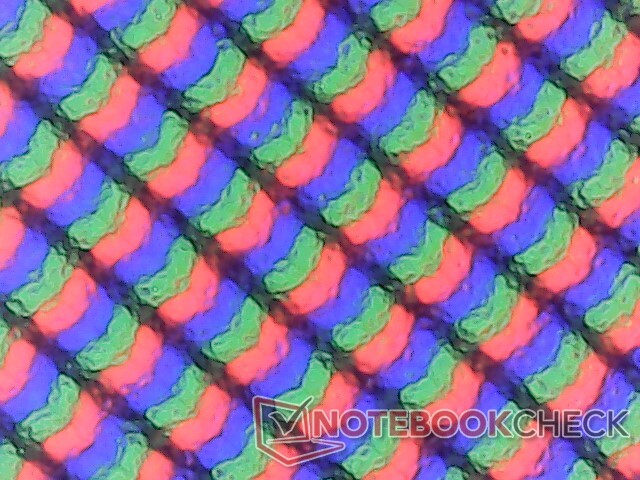
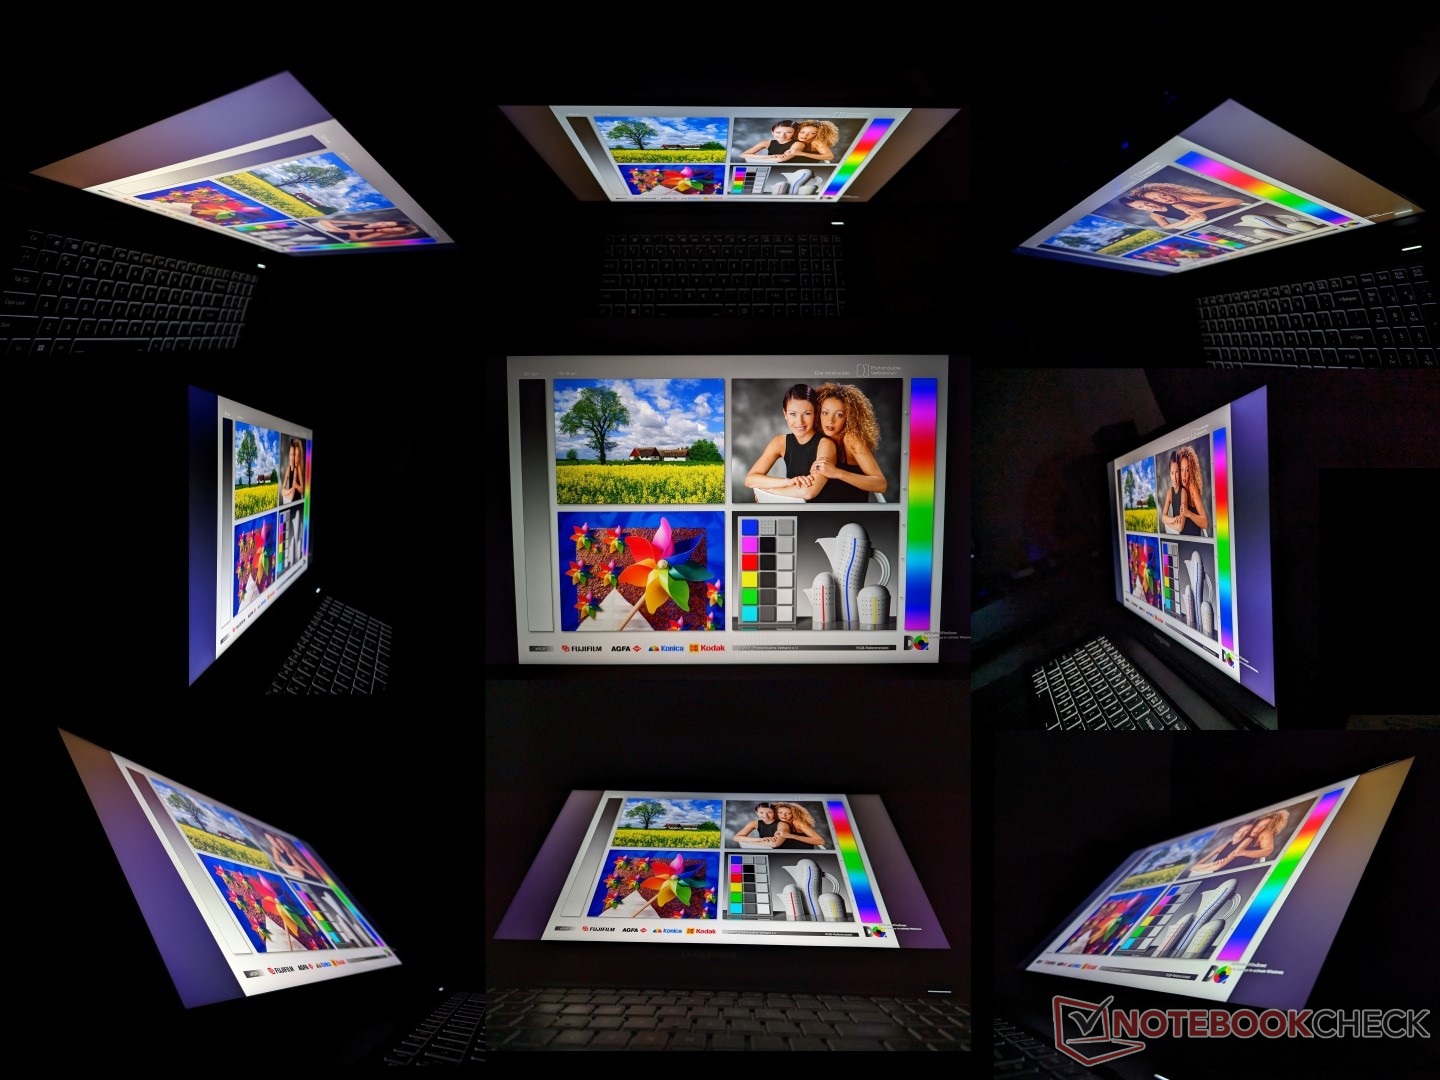
Our system employs a very similar IPS panel from BOE as the one found on the ROG Strix Scar 17 (NE173QHM-NZ1 vs. NE173QHM-NZ2). We can notice no major differences between the two panels down to their fast refresh rates, fast response times, wide color coverages, brightness targets, and decent contrast ratios. It's a high-end panel fit for both gaming and content editing purposes.
One complaint we have relates to the noticeable backlight bleeding on our test unit. Though some bleeding is to be expected from most IPS panels, it's more severe here than on other laptops we've tested that are under half the price.

| |||||||||||||||||||||||||
Brightness Distribution: 75 %
Center on Battery: 312.6 cd/m²
Contrast: 1202:1 (Black: 0.26 cd/m²)
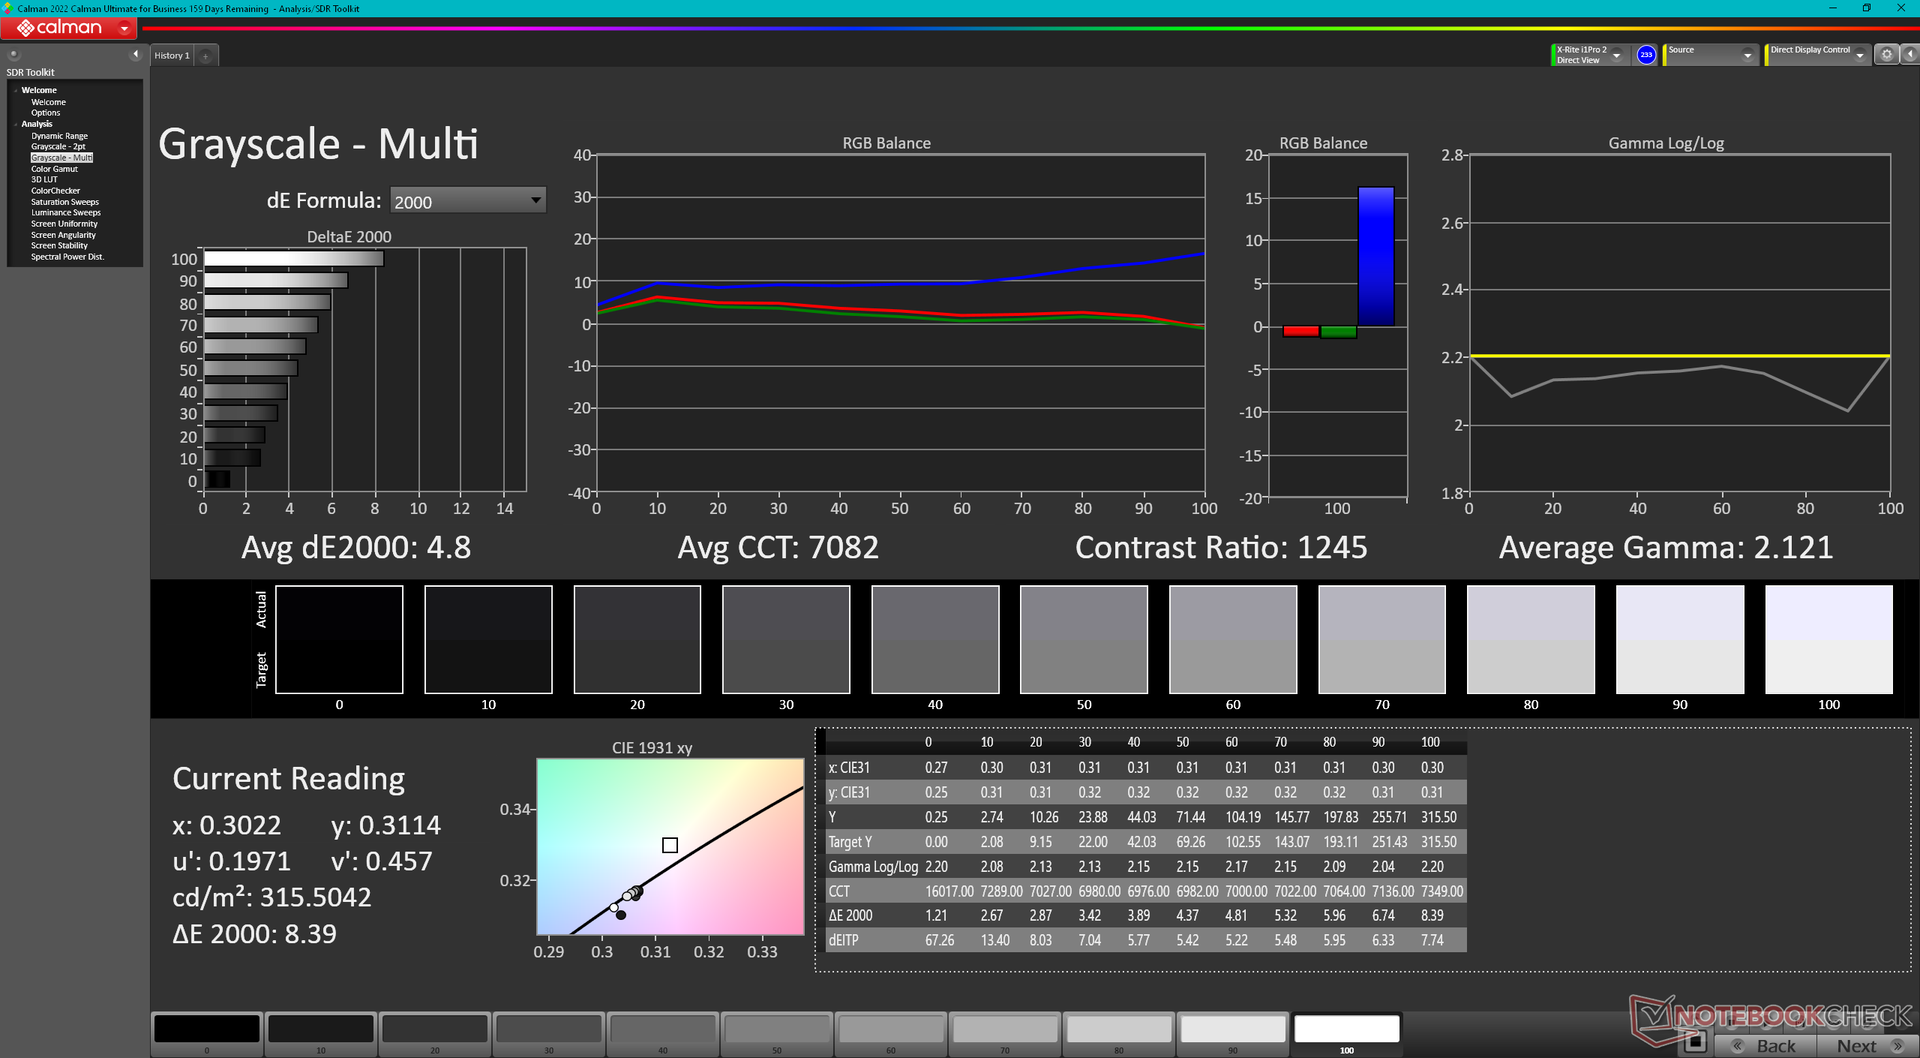
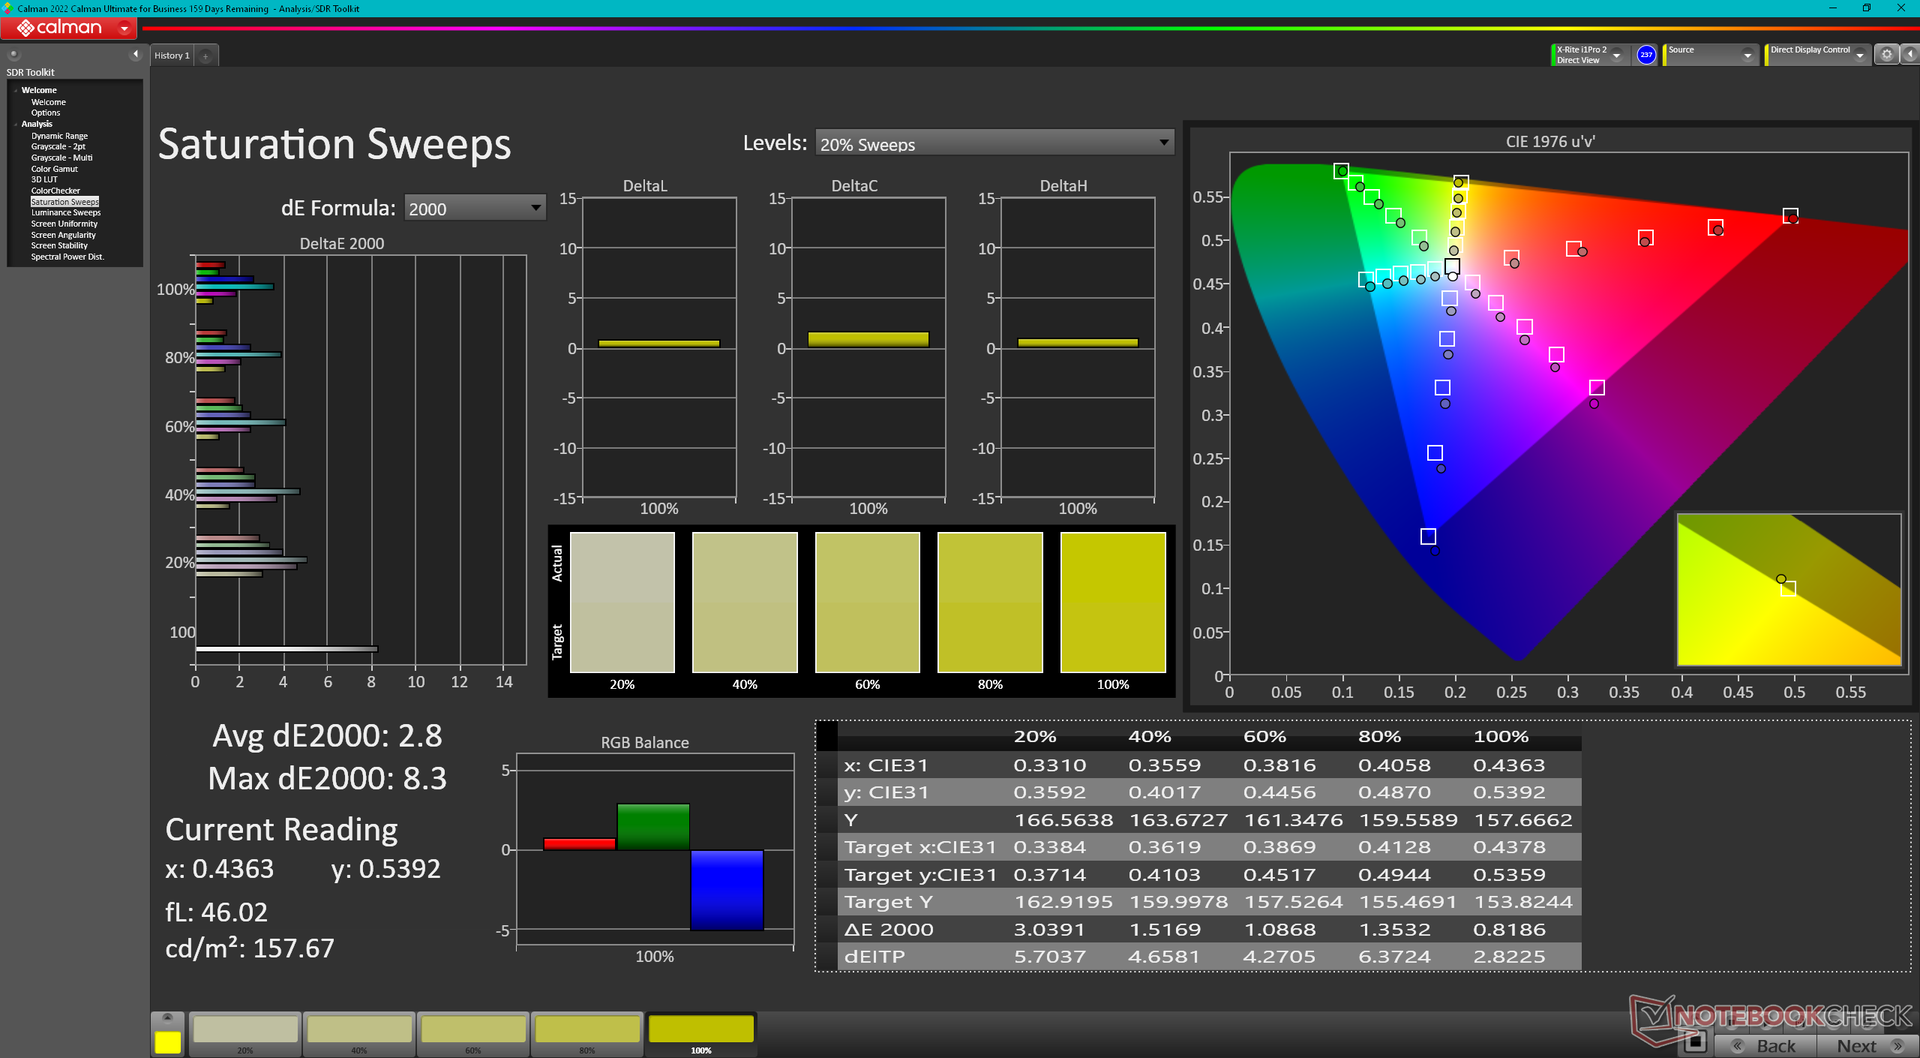
ΔE Color 3.43 | 0.5-29.43 Ø5, calibrated: 0.74
ΔE Greyscale 4.8 | 0.57-98 Ø5.3
85.4% AdobeRGB 1998 (Argyll 2.2.0 3D)
99.9% sRGB (Argyll 2.2.0 3D)
97.8% Display P3 (Argyll 2.2.0 3D)
Gamma: 2.12
| Eurocom Raptor X17 BOE NE173QHM-NZ1, IPS, 2560x1440, 17.30 | Asus ROG Strix Scar 17 G733PY-XS96 NE173QHM-NZ2, IPS, 2560x1440, 17.30 | Aorus 17X AZF BOE09F9, IPS, 2560x1440, 17.30 | MSI GE78HX 13VH-070US AU Optronics B170QAN01.2, IPS, 2560x1600, 17.00 | Eluktronics Mech-17 GP2 BOE NE170QDM-NZ1, IPS, 2560x1600, 17.00 | Alienware m17 R5 (R9 6900HX, RX 6850M XT) AU Optronics AUODBA3, IPS, 3840x2160, 17.00 | |
|---|---|---|---|---|---|---|
| Display | 0% | -1% | 0% | -16% | 1% | |
| Display P3 Coverage | 97.8 | 98 0% | 96.7 -1% | 97.6 0% | 69.1 -29% | 97.2 -1% |
| sRGB Coverage | 99.9 | 100 0% | 99.9 0% | 99.9 0% | 99.7 0% | 99.6 0% |
| AdobeRGB 1998 Coverage | 85.4 | 85.6 0% | 84.5 -1% | 86.5 1% | 69.8 -18% | 88.4 4% |
| Response Times | 20% | -3% | 52% | 8% | -20% | |
| Response Time Grey 50% / Grey 80% * | 13.3 ? | 6.2 ? 53% | 14 ? -5% | 4.2 ? 68% | 12 ? 10% | 16.4 ? -23% |
| Response Time Black / White * | 10 ? | 11.4 ? -14% | 10.1 ? -1% | 6.4 ? 36% | 9.4 ? 6% | 11.6 ? -16% |
| PWM Frequency | ||||||
| Screen | 25% | 6% | -13% | 19% | -67% | |
| Brightness middle | 312.6 | 322.5 3% | 294 -6% | 398.6 28% | 417.3 33% | 484 55% |
| Brightness | 292 | 317 9% | 276 -5% | 384 32% | 387 33% | 449 54% |
| Brightness Distribution | 75 | 86 15% | 90 20% | 89 19% | 87 16% | 87 16% |
| Black Level * | 0.26 | 0.29 -12% | 0.28 -8% | 0.46 -77% | 0.42 -62% | 0.55 -112% |
| Contrast | 1202 | 1112 -7% | 1050 -13% | 867 -28% | 994 -17% | 880 -27% |
| Colorchecker dE 2000 * | 3.43 | 1.15 66% | 2.81 18% | 4.05 -18% | 2.14 38% | 4.8 -40% |
| Colorchecker dE 2000 max. * | 8.31 | 3.03 64% | 5.7 31% | 8.68 -4% | 4.09 51% | 7.48 10% |
| Colorchecker dE 2000 calibrated * | 0.74 | 0.56 24% | 0.86 -16% | 1.02 -38% | 0.42 43% | 4.74 -541% |
| Greyscale dE 2000 * | 4.8 | 1.7 65% | 3.4 29% | 6.5 -35% | 3.1 35% | 5.5 -15% |
| Gamma | 2.12 104% | 2.27 97% | 2.301 96% | 2.11 104% | 2.19 100% | 2.42 91% |
| CCT | 7082 92% | 6299 103% | 7389 88% | 7518 86% | 6040 108% | 6148 106% |
| Total Average (Program / Settings) | 15% /
19% | 1% /
3% | 13% /
-1% | 4% /
10% | -29% /
-45% |
* ... smaller is better

The display does not come pre-calibrated out of the box. Instead, Eurocom charges extra for factory calibration which we find to be absurd given the already high price. Other makers like MSI, Asus, Dell, and others offer pre-calibration as standard for many of their respective models.
Display Response Times
| ↔ Response Time Black to White | ||
|---|---|---|
| 10 ms ... rise ↗ and fall ↘ combined | ↗ 5 ms rise | 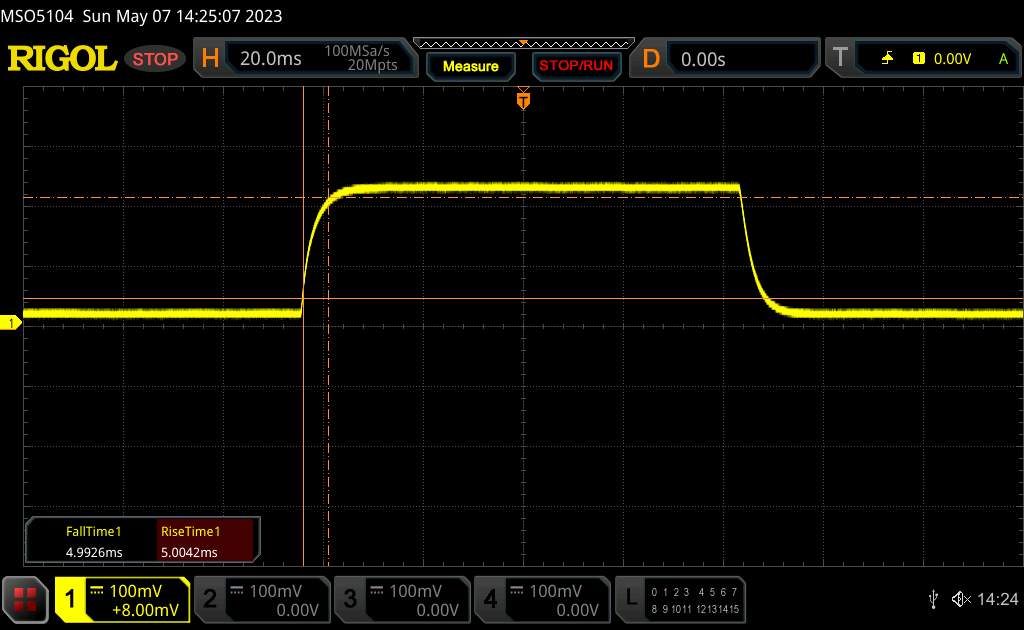 |
| ↘ 5 ms fall | ||
| The screen shows good response rates in our tests, but may be too slow for competitive gamers. In comparison, all tested devices range from 0.1 (minimum) to 240 (maximum) ms. » 22 % of all devices are better. This means that the measured response time is better than the average of all tested devices (21.5 ms). | ||
| ↔ Response Time 50% Grey to 80% Grey | ||
| 13.3 ms ... rise ↗ and fall ↘ combined | ↗ 6 ms rise | 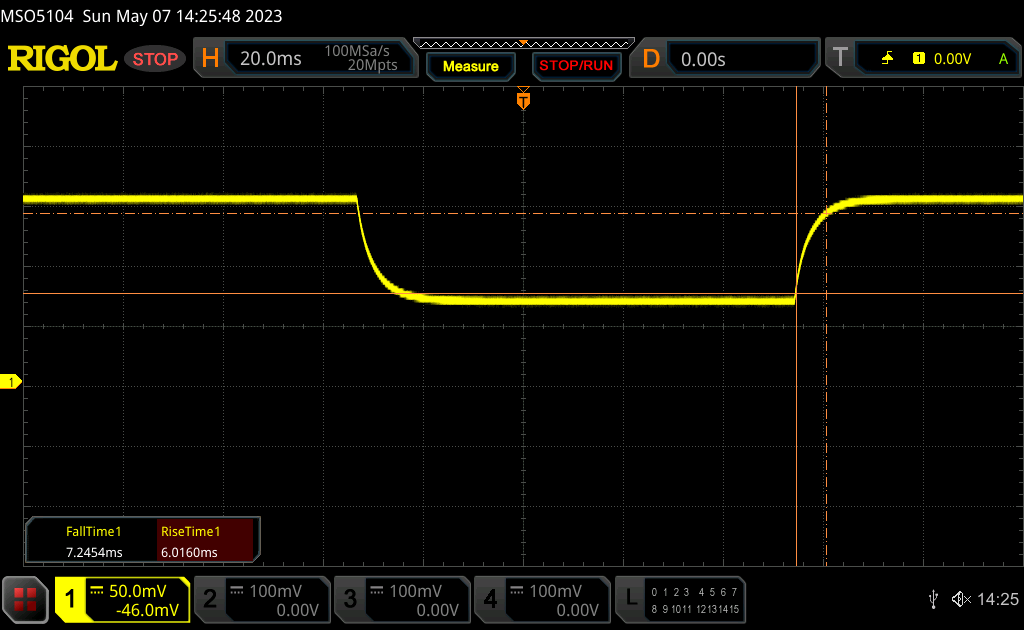 |
| ↘ 7.3 ms fall | ||
| The screen shows good response rates in our tests, but may be too slow for competitive gamers. In comparison, all tested devices range from 0.2 (minimum) to 636 (maximum) ms. » 22 % of all devices are better. This means that the measured response time is better than the average of all tested devices (33.7 ms). | ||
Screen Flickering / PWM (Pulse-Width Modulation)
| Screen flickering / PWM not detected | 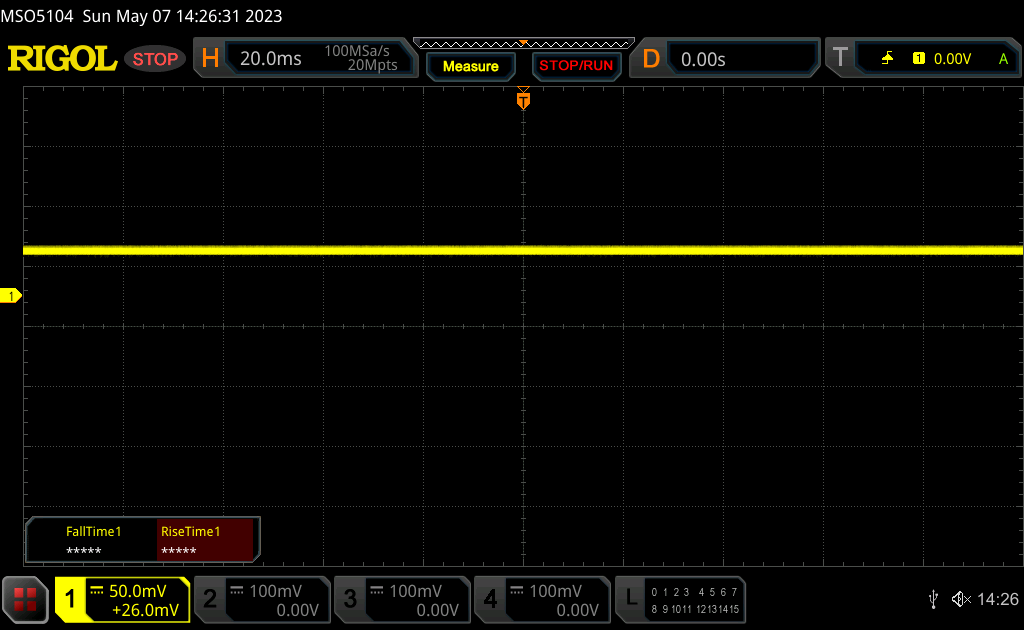 | ||
In comparison: 53 % of all tested devices do not use PWM to dim the display. If PWM was detected, an average of 17915 (minimum: 5 - maximum: 3846000) Hz was measured. | |||
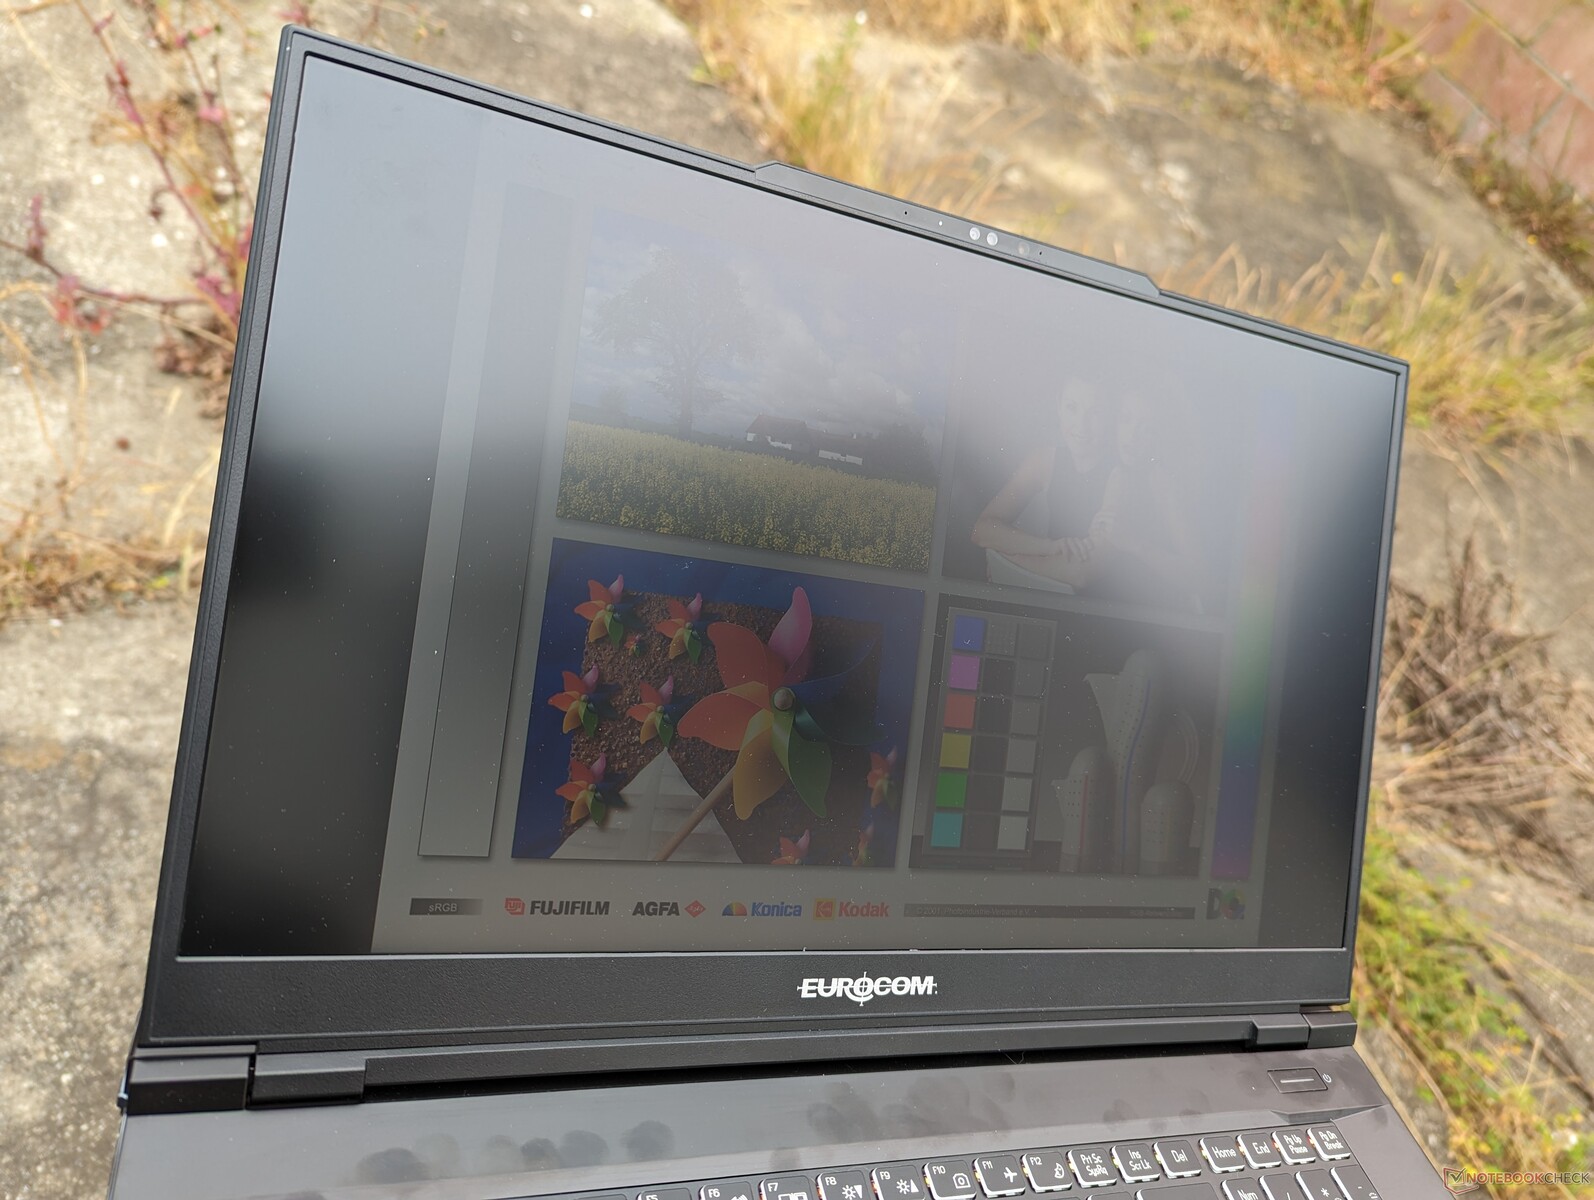
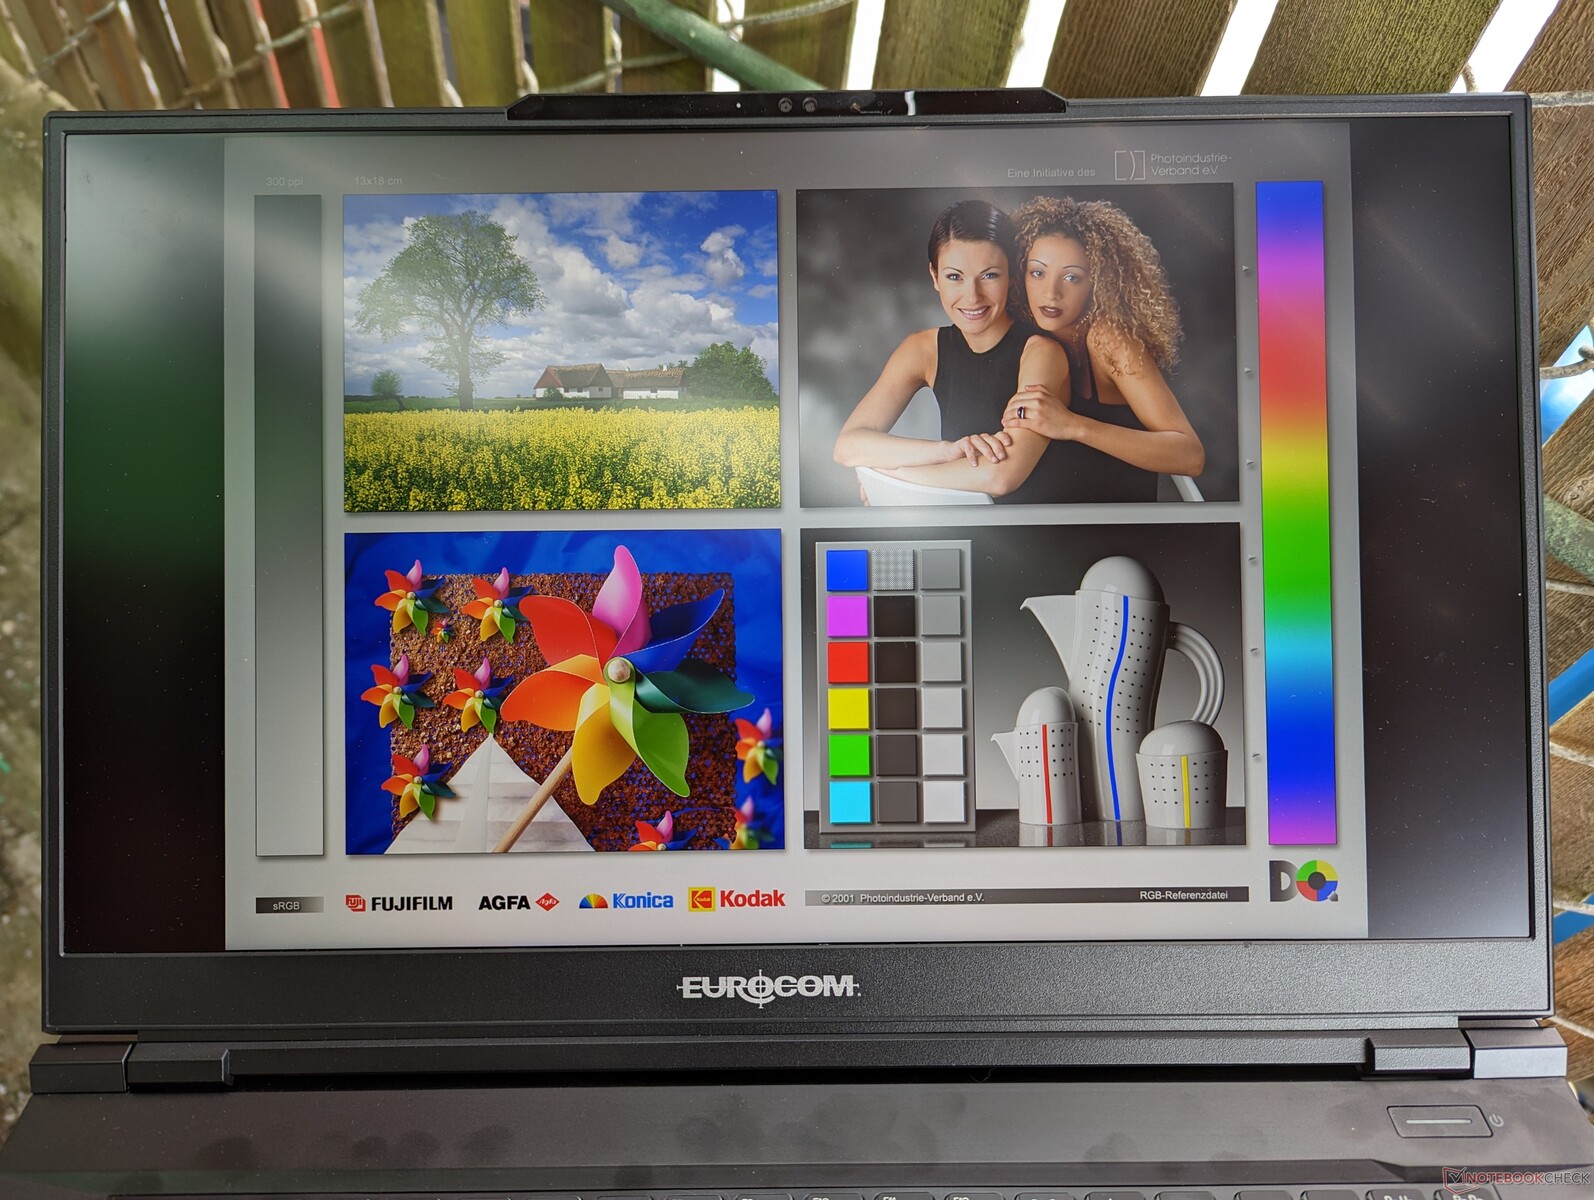
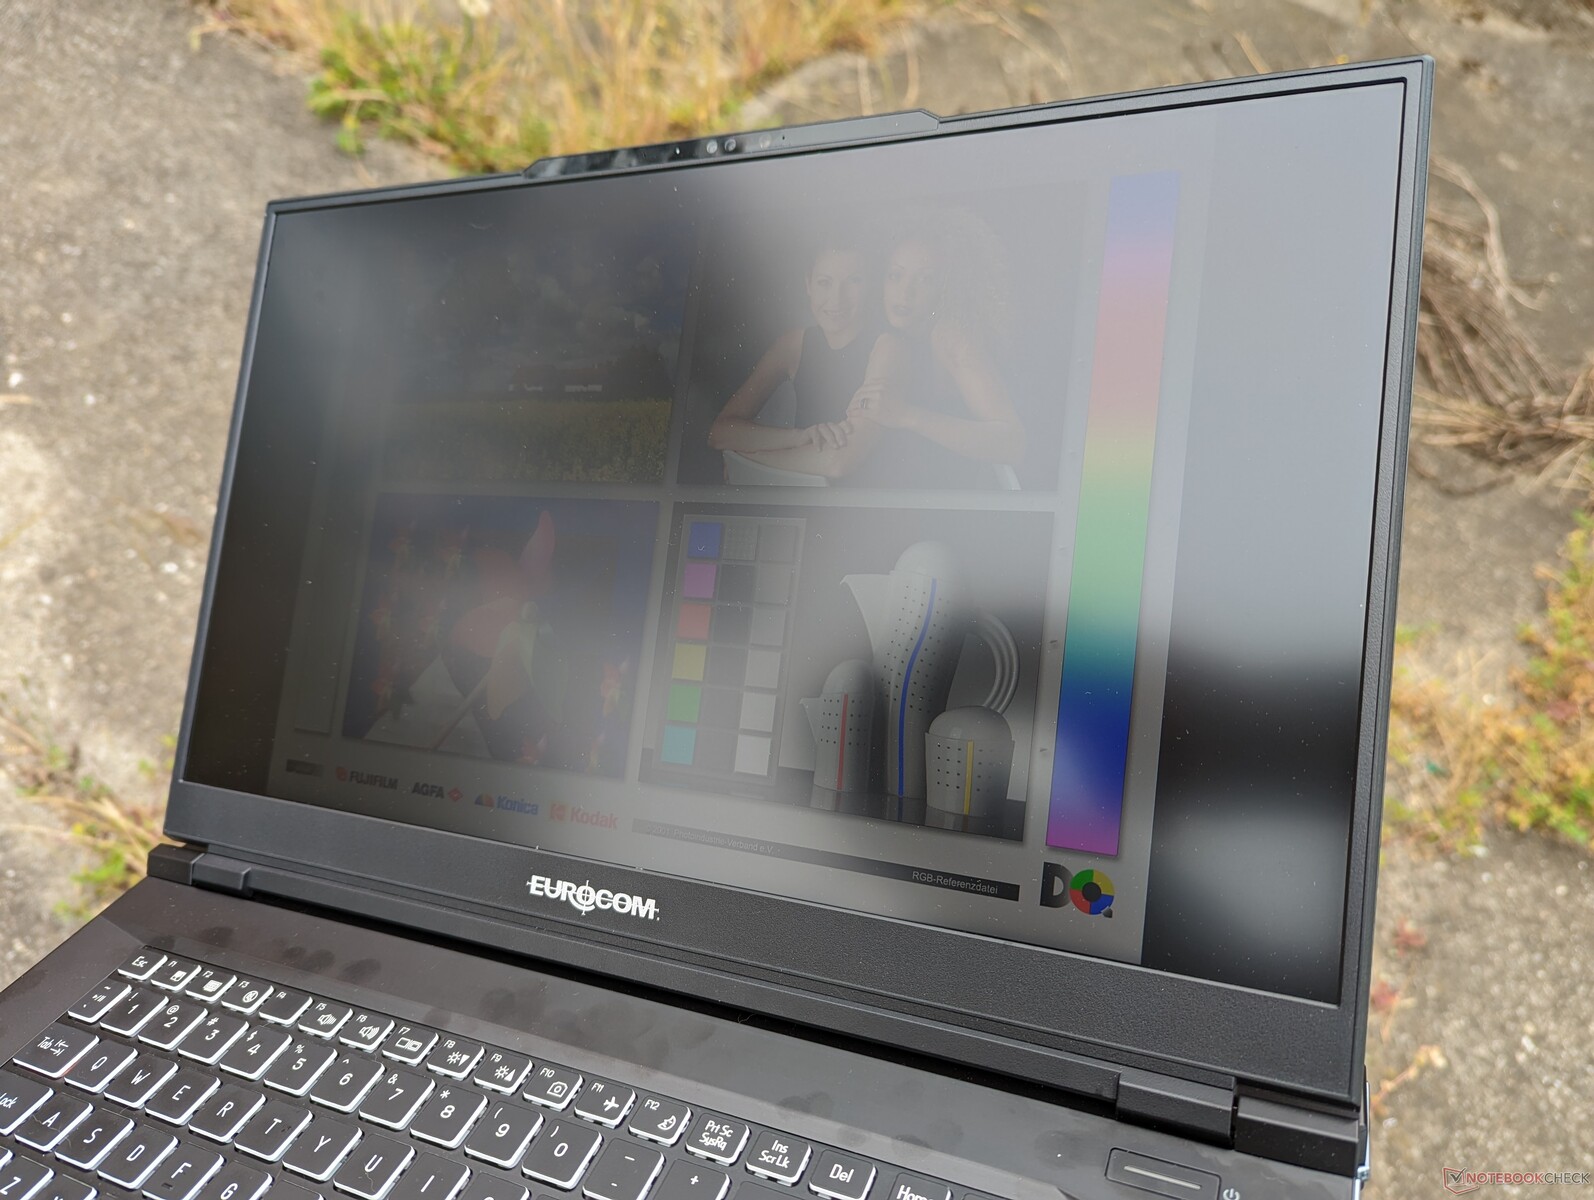
Outdoor visibility is typical of most gaming laptops since 300 nits is average for the category. The panels on some competing models can reach up to 500 nits such as with the Alienware m17 R5 or Razer Blade 17 for an easier time viewing outdoors, but we don't see this as a huge advantage over the Eurocom considering the size and weight of 17-inch gaming laptops.
Performance — Raptor Lake For The Raptor X17
Testing Conditions
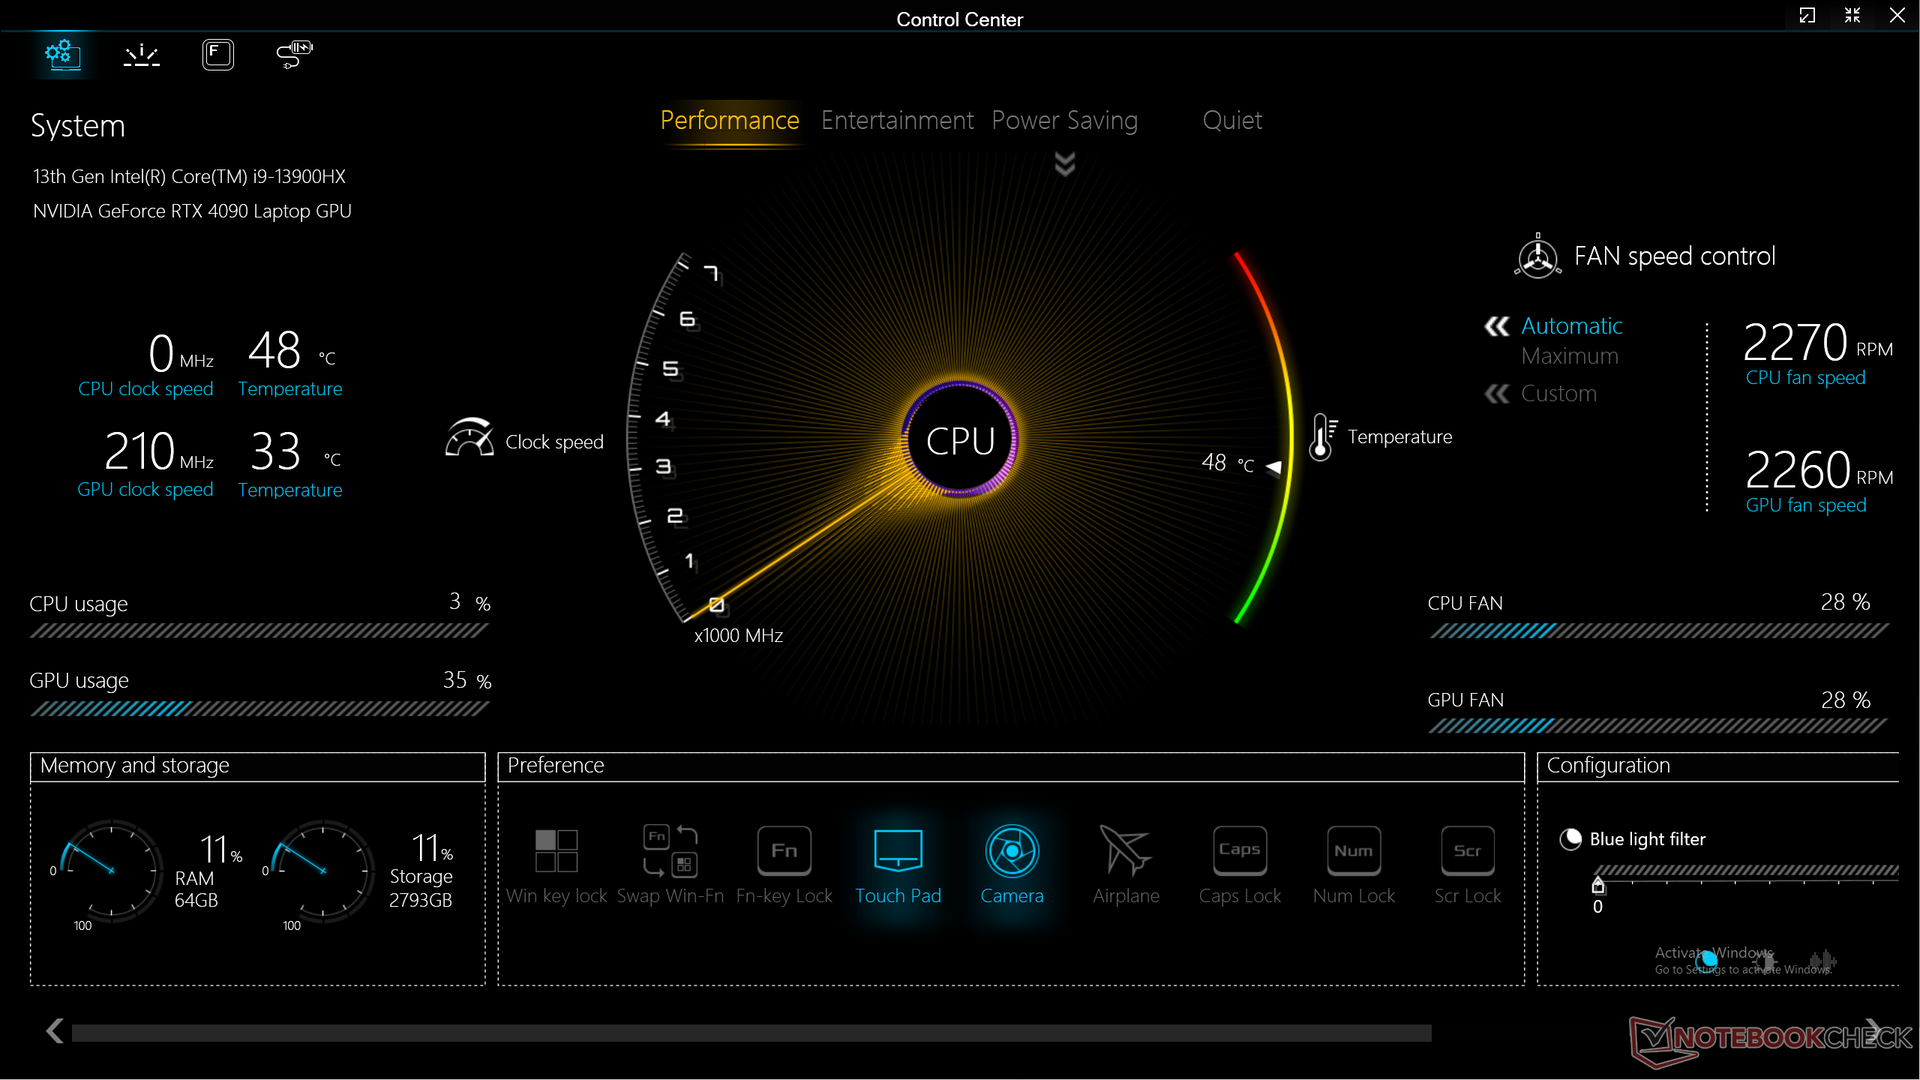
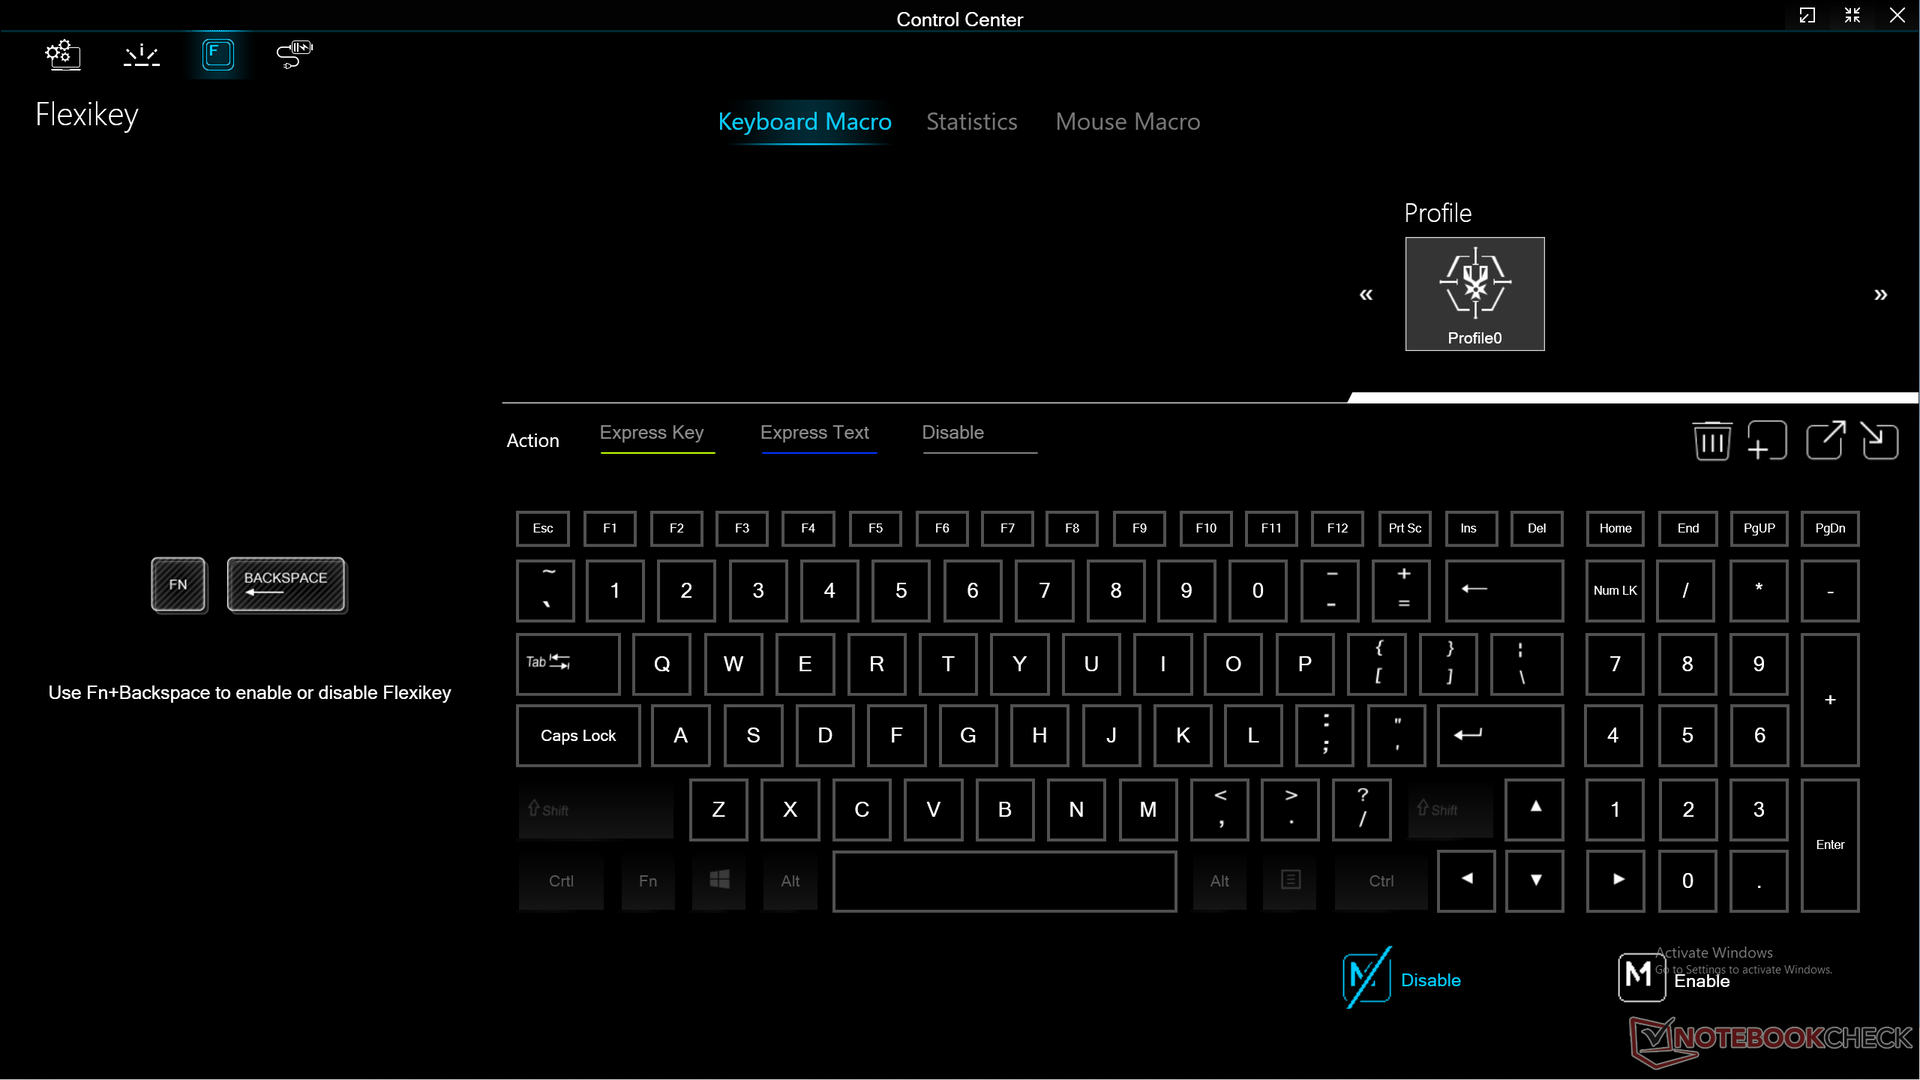
We set our unit to Performance mode via both Control Center and Windows prior to running the benchmarks below. Annoyingly, the Control Center power settings are not tied to the Windows power settings meaning there could be some conflict if both settings are not identical. For example, it is possible to set Windows to Power Saver mode and Control Center set to Performance mode simultaneously. OEMs like Dell have already addressed this issue on their Alienware series.
We also set our unit to dGPU mode prior to benchmarking. The Raptor X17 supports hybrid graphics mode (Optimus), dGPU mode, and Dynamic (aka Advanced Optimus) mode. Though we appreciate the options, the settings are buried deep within several layers of submenus in the BIOS. In comparison, competitors like MSI and Asus have similar settings in their respective Control Center applications for easier access.
Processor
The Core i9-13900HX in our unit is performing slightly slower relative to other laptops with the same processor by about 5 percent. Regardless, it is still one of the fastest H-series CPUs in the market rivaling the competing Ryzen 9 7945HX. Upgrading from last year's Core i9-12900HX will boost multi-thread performance by about 20 percent.
Performance sustainability is excellent especially when compared to the Aorus 17X which ships with the same Core i9-13900HX. CineBench R15 xT loop scores would be steadier on our unit throughout the stress test as shown by the comparison graph below.
Downgrading to the Core i7-13700HX configuration from our Core i9-13900HX is expected to reduce multi-thread performance by about 20 to 25 percent.
Cinebench R15 Multi Loop
Cinebench R23: Multi Core | Single Core
Cinebench R20: CPU (Multi Core) | CPU (Single Core)
Cinebench R15: CPU Multi 64Bit | CPU Single 64Bit
Blender: v2.79 BMW27 CPU
7-Zip 18.03: 7z b 4 | 7z b 4 -mmt1
Geekbench 5.5: Multi-Core | Single-Core
HWBOT x265 Benchmark v2.2: 4k Preset
LibreOffice : 20 Documents To PDF
R Benchmark 2.5: Overall mean
* ... smaller is better
AIDA64: FP32 Ray-Trace | FPU Julia | CPU SHA3 | CPU Queen | FPU SinJulia | FPU Mandel | CPU AES | CPU ZLib | FP64 Ray-Trace | CPU PhotoWorxx
| Performance Rating | |
| Asus ROG Strix Scar 17 G733PY-XS96 | |
| Eluktronics Mech-17 GP2 | |
| MSI GE78HX 13VH-070US | |
| Average Intel Core i9-13900HX | |
| Eurocom Raptor X17 | |
| Aorus 17X AZF | |
| Alienware m17 R5 (R9 6900HX, RX 6850M XT) | |
| AIDA64 / FP32 Ray-Trace | |
| Asus ROG Strix Scar 17 G733PY-XS96 | |
| MSI GE78HX 13VH-070US | |
| Eluktronics Mech-17 GP2 | |
| Average Intel Core i9-13900HX (17589 - 27615, n=21) | |
| Eurocom Raptor X17 | |
| Aorus 17X AZF | |
| Alienware m17 R5 (R9 6900HX, RX 6850M XT) | |
| AIDA64 / FPU Julia | |
| Asus ROG Strix Scar 17 G733PY-XS96 | |
| MSI GE78HX 13VH-070US | |
| Eluktronics Mech-17 GP2 | |
| Eurocom Raptor X17 | |
| Average Intel Core i9-13900HX (88686 - 137015, n=21) | |
| Alienware m17 R5 (R9 6900HX, RX 6850M XT) | |
| Aorus 17X AZF | |
| AIDA64 / CPU SHA3 | |
| Asus ROG Strix Scar 17 G733PY-XS96 | |
| Eluktronics Mech-17 GP2 | |
| MSI GE78HX 13VH-070US | |
| Eurocom Raptor X17 | |
| Average Intel Core i9-13900HX (4362 - 7029, n=21) | |
| Aorus 17X AZF | |
| Alienware m17 R5 (R9 6900HX, RX 6850M XT) | |
| AIDA64 / CPU Queen | |
| Asus ROG Strix Scar 17 G733PY-XS96 | |
| Eluktronics Mech-17 GP2 | |
| MSI GE78HX 13VH-070US | |
| Eurocom Raptor X17 | |
| Average Intel Core i9-13900HX (125644 - 141385, n=21) | |
| Aorus 17X AZF | |
| Alienware m17 R5 (R9 6900HX, RX 6850M XT) | |
| AIDA64 / FPU SinJulia | |
| Asus ROG Strix Scar 17 G733PY-XS96 | |
| Eluktronics Mech-17 GP2 | |
| MSI GE78HX 13VH-070US | |
| Average Intel Core i9-13900HX (12334 - 17179, n=21) | |
| Eurocom Raptor X17 | |
| Aorus 17X AZF | |
| Alienware m17 R5 (R9 6900HX, RX 6850M XT) | |
| AIDA64 / FPU Mandel | |
| Asus ROG Strix Scar 17 G733PY-XS96 | |
| MSI GE78HX 13VH-070US | |
| Eluktronics Mech-17 GP2 | |
| Average Intel Core i9-13900HX (43850 - 69202, n=21) | |
| Eurocom Raptor X17 | |
| Alienware m17 R5 (R9 6900HX, RX 6850M XT) | |
| Aorus 17X AZF | |
| AIDA64 / CPU AES | |
| Eluktronics Mech-17 GP2 | |
| Asus ROG Strix Scar 17 G733PY-XS96 | |
| Aorus 17X AZF | |
| Average Intel Core i9-13900HX (89413 - 237881, n=21) | |
| MSI GE78HX 13VH-070US | |
| Eurocom Raptor X17 | |
| Alienware m17 R5 (R9 6900HX, RX 6850M XT) | |
| AIDA64 / CPU ZLib | |
| Asus ROG Strix Scar 17 G733PY-XS96 | |
| MSI GE78HX 13VH-070US | |
| Eluktronics Mech-17 GP2 | |
| Eurocom Raptor X17 | |
| Average Intel Core i9-13900HX (1284 - 1958, n=21) | |
| Aorus 17X AZF | |
| Alienware m17 R5 (R9 6900HX, RX 6850M XT) | |
| AIDA64 / FP64 Ray-Trace | |
| Asus ROG Strix Scar 17 G733PY-XS96 | |
| MSI GE78HX 13VH-070US | |
| Eluktronics Mech-17 GP2 | |
| Average Intel Core i9-13900HX (9481 - 15279, n=21) | |
| Eurocom Raptor X17 | |
| Aorus 17X AZF | |
| Alienware m17 R5 (R9 6900HX, RX 6850M XT) | |
| AIDA64 / CPU PhotoWorxx | |
| Eurocom Raptor X17 | |
| Aorus 17X AZF | |
| MSI GE78HX 13VH-070US | |
| Average Intel Core i9-13900HX (42994 - 51994, n=21) | |
| Eluktronics Mech-17 GP2 | |
| Asus ROG Strix Scar 17 G733PY-XS96 | |
| Alienware m17 R5 (R9 6900HX, RX 6850M XT) | |
System Performance
CrossMark: Overall | Productivity | Creativity | Responsiveness
| PCMark 10 / Score | |
| Eluktronics Mech-17 GP2 | |
| MSI GE78HX 13VH-070US | |
| Asus ROG Strix Scar 17 G733PY-XS96 | |
| Average Intel Core i9-13900HX, NVIDIA GeForce RTX 4090 Laptop GPU (7690 - 9331, n=8) | |
| Eurocom Raptor X17 | |
| Aorus 17X AZF | |
| Alienware m17 R5 (R9 6900HX, RX 6850M XT) | |
| PCMark 10 / Essentials | |
| Eluktronics Mech-17 GP2 | |
| Eurocom Raptor X17 | |
| MSI GE78HX 13VH-070US | |
| Average Intel Core i9-13900HX, NVIDIA GeForce RTX 4090 Laptop GPU (10972 - 11983, n=8) | |
| Aorus 17X AZF | |
| Asus ROG Strix Scar 17 G733PY-XS96 | |
| Alienware m17 R5 (R9 6900HX, RX 6850M XT) | |
| PCMark 10 / Productivity | |
| Eluktronics Mech-17 GP2 | |
| MSI GE78HX 13VH-070US | |
| Average Intel Core i9-13900HX, NVIDIA GeForce RTX 4090 Laptop GPU (9038 - 11680, n=8) | |
| Aorus 17X AZF | |
| Asus ROG Strix Scar 17 G733PY-XS96 | |
| Alienware m17 R5 (R9 6900HX, RX 6850M XT) | |
| Eurocom Raptor X17 | |
| PCMark 10 / Digital Content Creation | |
| Asus ROG Strix Scar 17 G733PY-XS96 | |
| Eluktronics Mech-17 GP2 | |
| MSI GE78HX 13VH-070US | |
| Eurocom Raptor X17 | |
| Average Intel Core i9-13900HX, NVIDIA GeForce RTX 4090 Laptop GPU (10605 - 16395, n=8) | |
| Alienware m17 R5 (R9 6900HX, RX 6850M XT) | |
| Aorus 17X AZF | |
| CrossMark / Overall | |
| Eluktronics Mech-17 GP2 | |
| Aorus 17X AZF | |
| Average Intel Core i9-13900HX, NVIDIA GeForce RTX 4090 Laptop GPU (1825 - 2295, n=8) | |
| Asus ROG Strix Scar 17 G733PY-XS96 | |
| MSI GE78HX 13VH-070US | |
| Eurocom Raptor X17 | |
| Alienware m17 R5 (R9 6900HX, RX 6850M XT) | |
| CrossMark / Productivity | |
| Aorus 17X AZF | |
| Eluktronics Mech-17 GP2 | |
| Average Intel Core i9-13900HX, NVIDIA GeForce RTX 4090 Laptop GPU (1666 - 2166, n=8) | |
| MSI GE78HX 13VH-070US | |
| Asus ROG Strix Scar 17 G733PY-XS96 | |
| Eurocom Raptor X17 | |
| Alienware m17 R5 (R9 6900HX, RX 6850M XT) | |
| CrossMark / Creativity | |
| Eluktronics Mech-17 GP2 | |
| Average Intel Core i9-13900HX, NVIDIA GeForce RTX 4090 Laptop GPU (2162 - 2514, n=8) | |
| Asus ROG Strix Scar 17 G733PY-XS96 | |
| Aorus 17X AZF | |
| Eurocom Raptor X17 | |
| MSI GE78HX 13VH-070US | |
| Alienware m17 R5 (R9 6900HX, RX 6850M XT) | |
| CrossMark / Responsiveness | |
| Aorus 17X AZF | |
| Eluktronics Mech-17 GP2 | |
| Average Intel Core i9-13900HX, NVIDIA GeForce RTX 4090 Laptop GPU (1441 - 2275, n=8) | |
| MSI GE78HX 13VH-070US | |
| Asus ROG Strix Scar 17 G733PY-XS96 | |
| Eurocom Raptor X17 | |
| Alienware m17 R5 (R9 6900HX, RX 6850M XT) | |
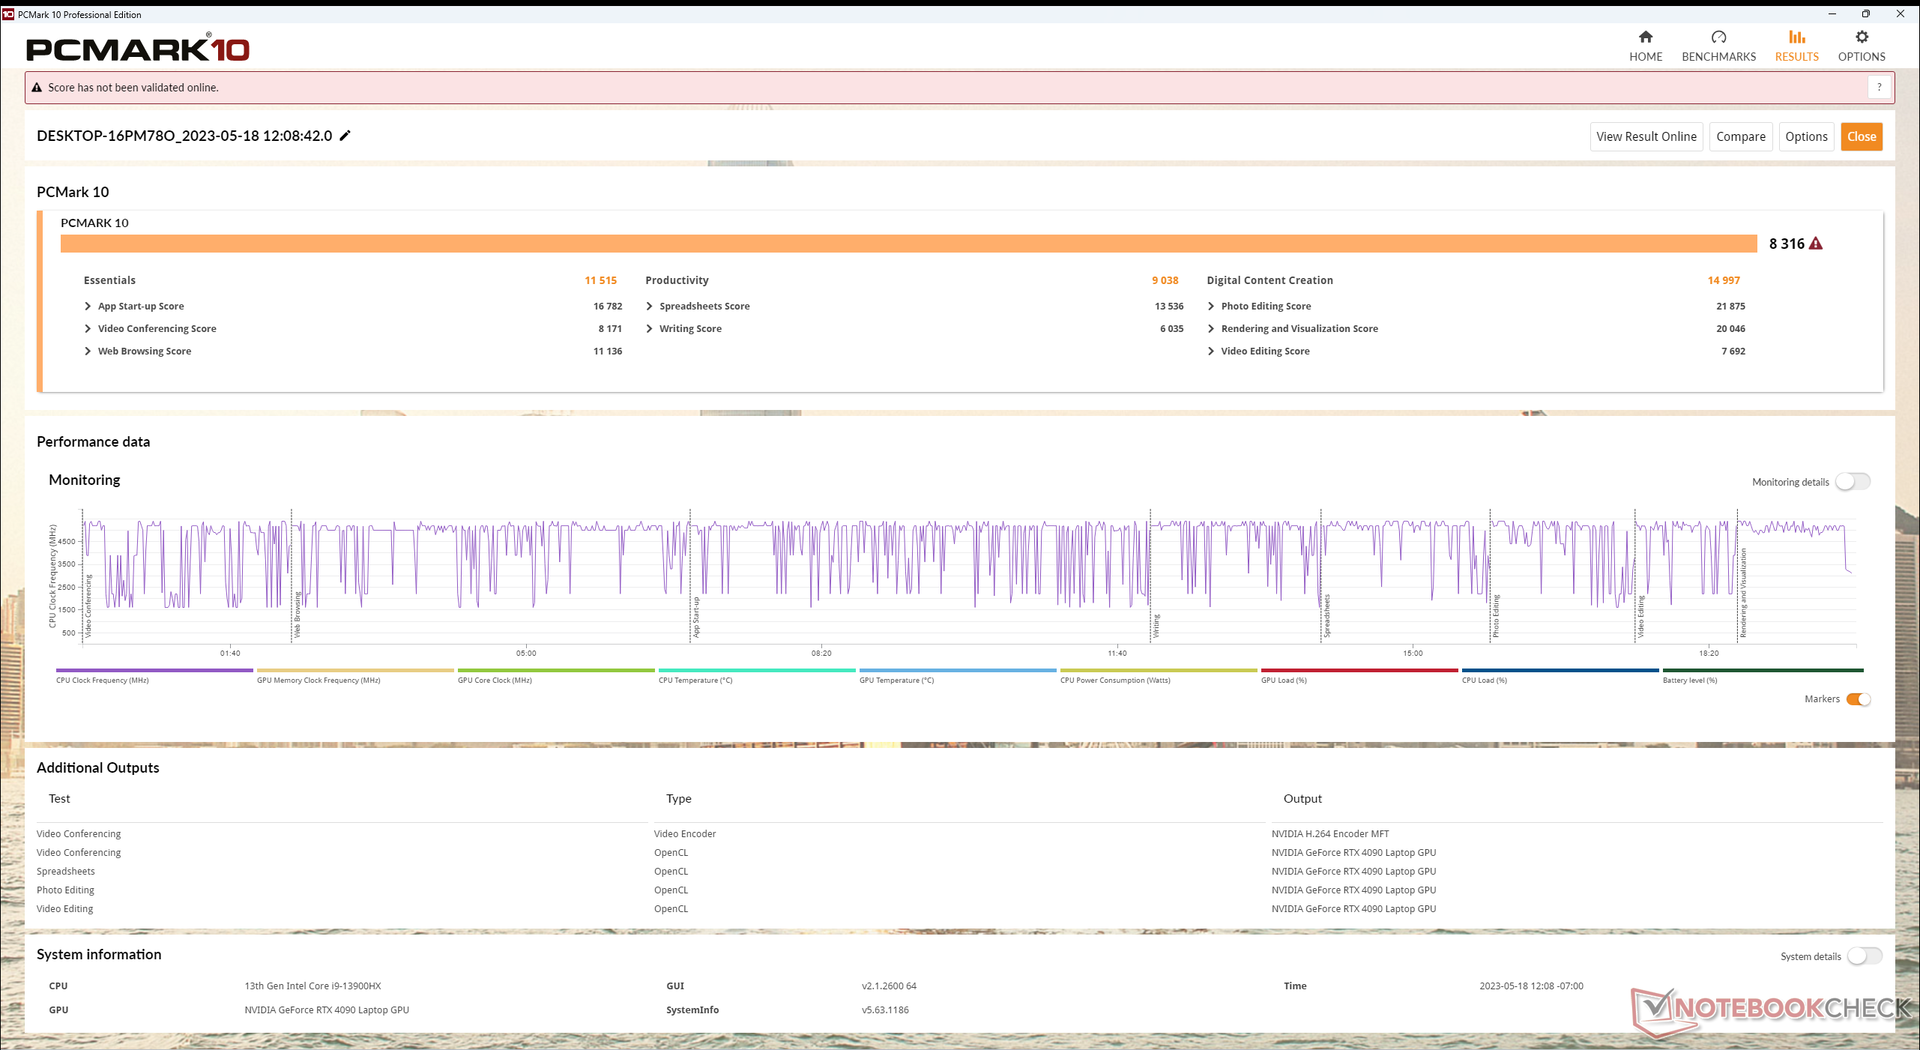
| PCMark 10 Score | 8316 points | |
Help | ||
| AIDA64 / Memory Copy | |
| Aorus 17X AZF | |
| MSI GE78HX 13VH-070US | |
| Eurocom Raptor X17 | |
| Average Intel Core i9-13900HX (67716 - 78835, n=21) | |
| Eluktronics Mech-17 GP2 | |
| Alienware m17 R5 (R9 6900HX, RX 6850M XT) | |
| Asus ROG Strix Scar 17 G733PY-XS96 | |
| AIDA64 / Memory Read | |
| Aorus 17X AZF | |
| MSI GE78HX 13VH-070US | |
| Average Intel Core i9-13900HX (73998 - 88462, n=21) | |
| Eurocom Raptor X17 | |
| Eluktronics Mech-17 GP2 | |
| Asus ROG Strix Scar 17 G733PY-XS96 | |
| Alienware m17 R5 (R9 6900HX, RX 6850M XT) | |
| AIDA64 / Memory Write | |
| Aorus 17X AZF | |
| MSI GE78HX 13VH-070US | |
| Eurocom Raptor X17 | |
| Average Intel Core i9-13900HX (65472 - 77045, n=21) | |
| Eluktronics Mech-17 GP2 | |
| Asus ROG Strix Scar 17 G733PY-XS96 | |
| Alienware m17 R5 (R9 6900HX, RX 6850M XT) | |
| AIDA64 / Memory Latency | |
| Alienware m17 R5 (R9 6900HX, RX 6850M XT) | |
| Eluktronics Mech-17 GP2 | |
| Average Intel Core i9-13900HX (80.4 - 91.1, n=21) | |
| MSI GE78HX 13VH-070US | |
| Eurocom Raptor X17 | |
| Asus ROG Strix Scar 17 G733PY-XS96 | |
| Aorus 17X AZF | |
* ... smaller is better
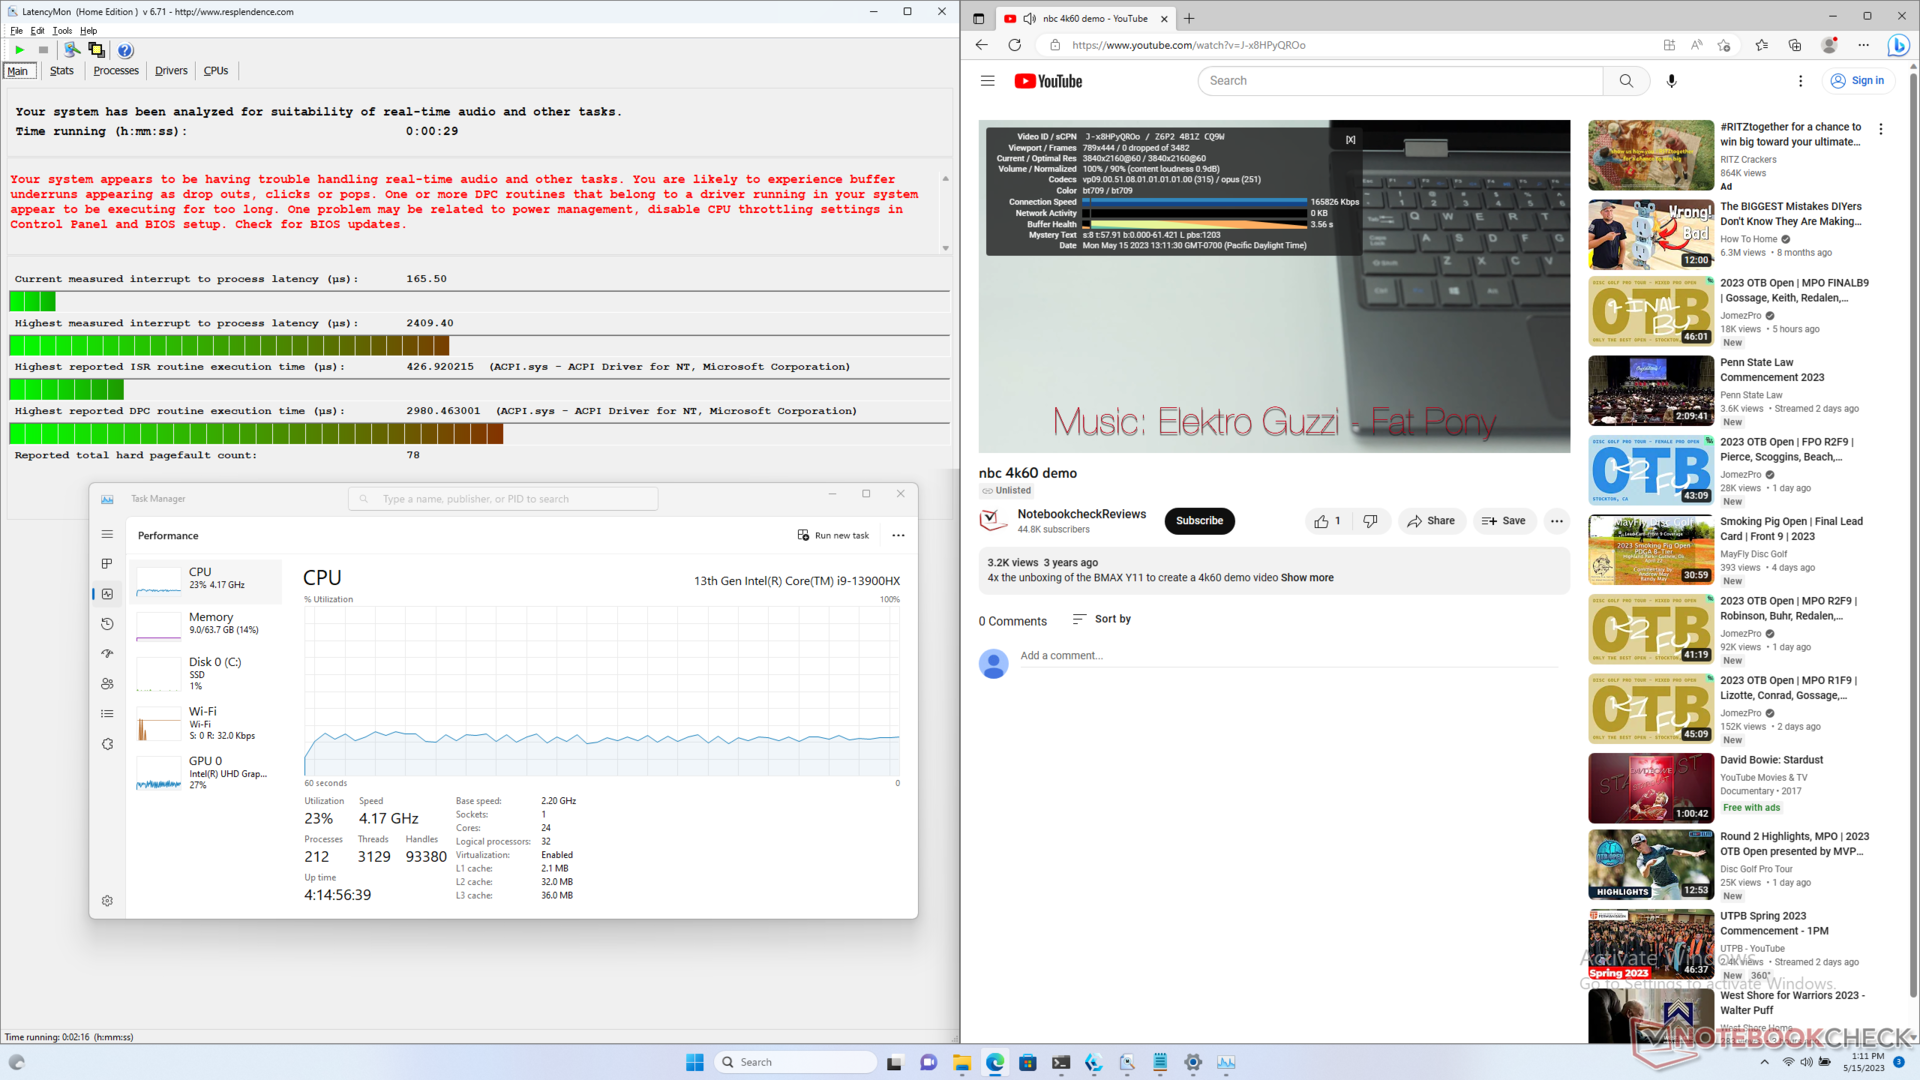
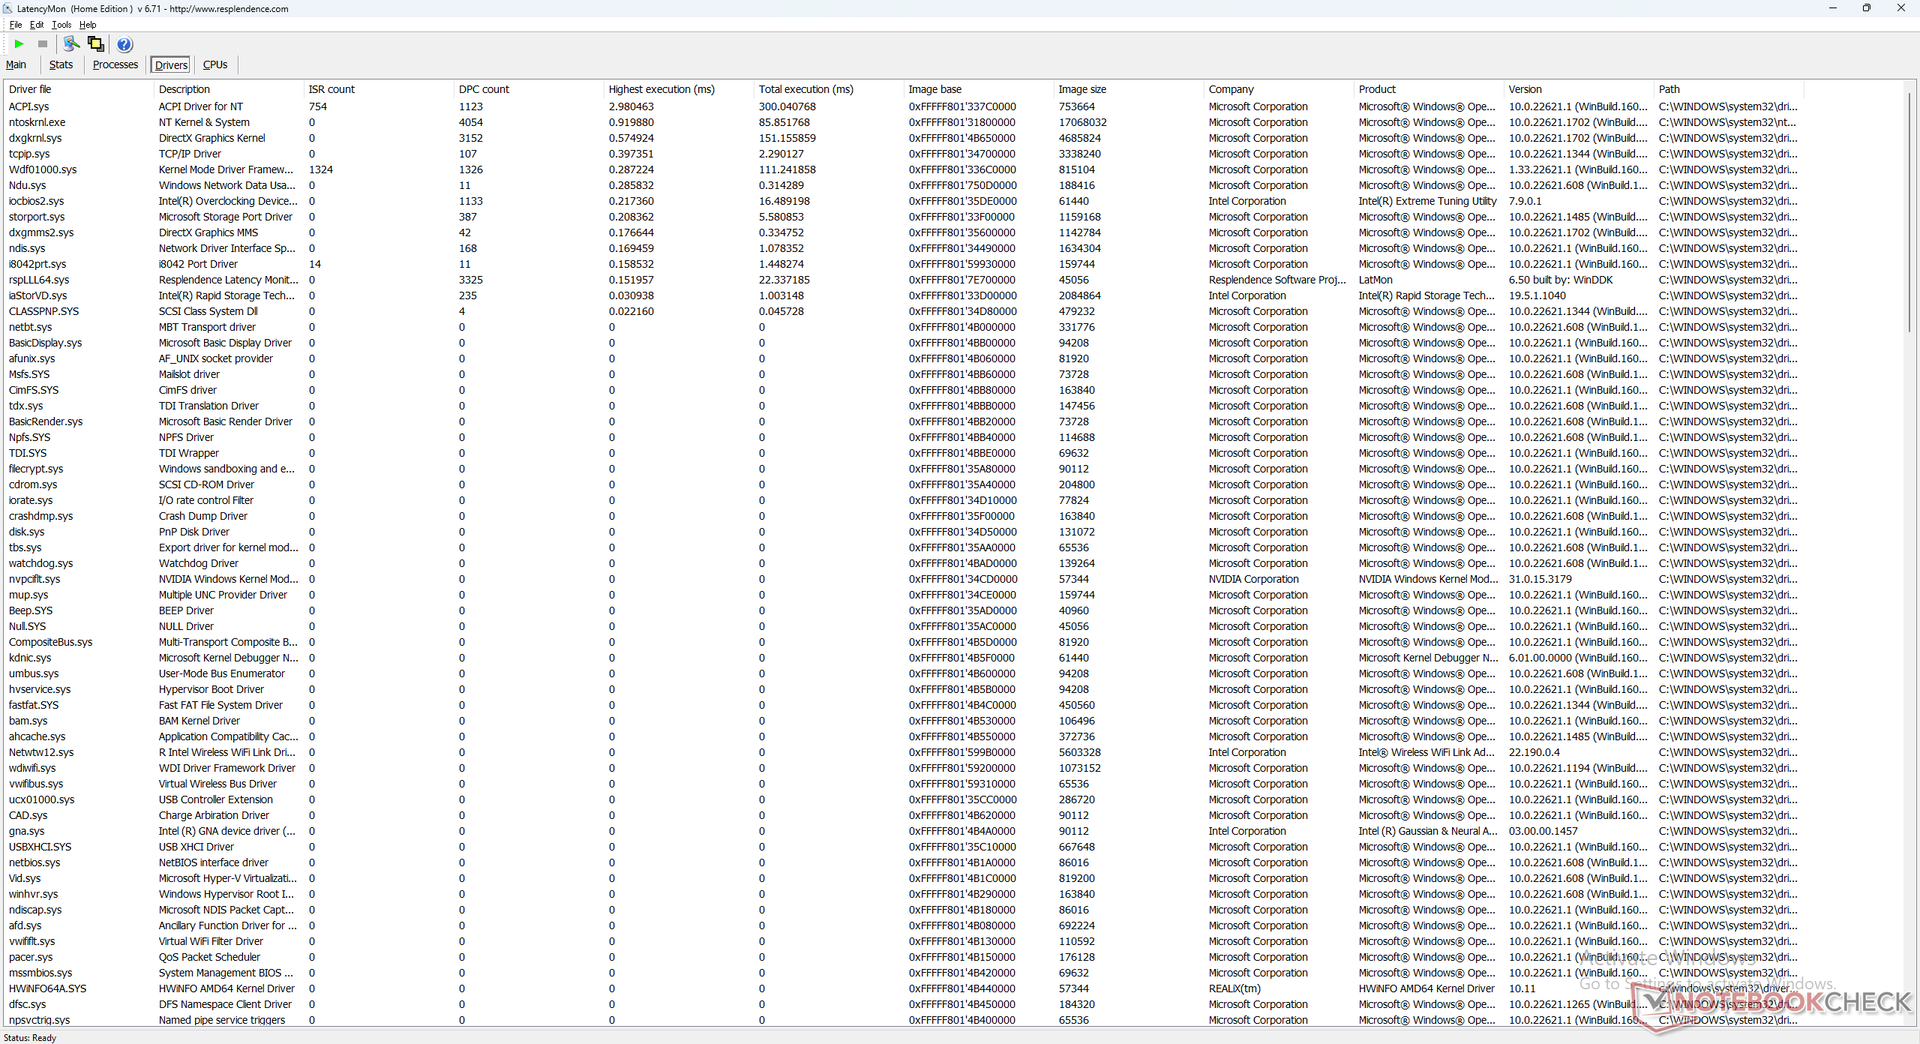
DPC Latency
LatencyMon reveals DPC issues when opening multiple browser tabs of our homepage. 4K video playback at 60 FPS is otherwise perfect with low CPU utilization and no dropped frames.
| DPC Latencies / LatencyMon - interrupt to process latency (max), Web, Youtube, Prime95 | |
| Aorus 17X AZF | |
| MSI GE78HX 13VH-070US | |
| Eurocom Raptor X17 | |
| Asus ROG Strix Scar 17 G733PY-XS96 | |
| Alienware m17 R5 (R9 6900HX, RX 6850M XT) | |
| Eluktronics Mech-17 GP2 | |
* ... smaller is better
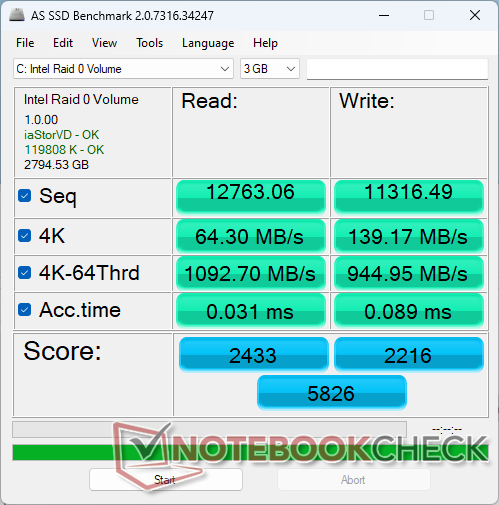
Storage Devices — 3x PCIe4 x4 NVMe SSDs
Our unit comes configured with three Samsung 980 Pro PCIe4 x4 NVMe SSDs in RAID 0 to maximize performance. In fact, this is one of the few gaming laptops to even support this many drives in RAID configuration. Maximum transfer rates top out at about 19000 MB/s, but expect performance to hover between 15000 to 18000 MB/s when under stress which is still impressive. We can notice no major throttling issues in this regard.


| Drive Performance Rating - Percent | |
| Aorus 17X AZF | |
| MSI GE78HX 13VH-070US | |
| Eurocom Raptor X17 | |
| Asus ROG Strix Scar 17 G733PY-XS96 | |
| Eluktronics Mech-17 GP2 | |
| Alienware m17 R5 (R9 6900HX, RX 6850M XT) | |
* ... smaller is better
Disk Throttling: DiskSpd Read Loop, Queue Depth 8
GPU Performance — 175 W TGP Graphics
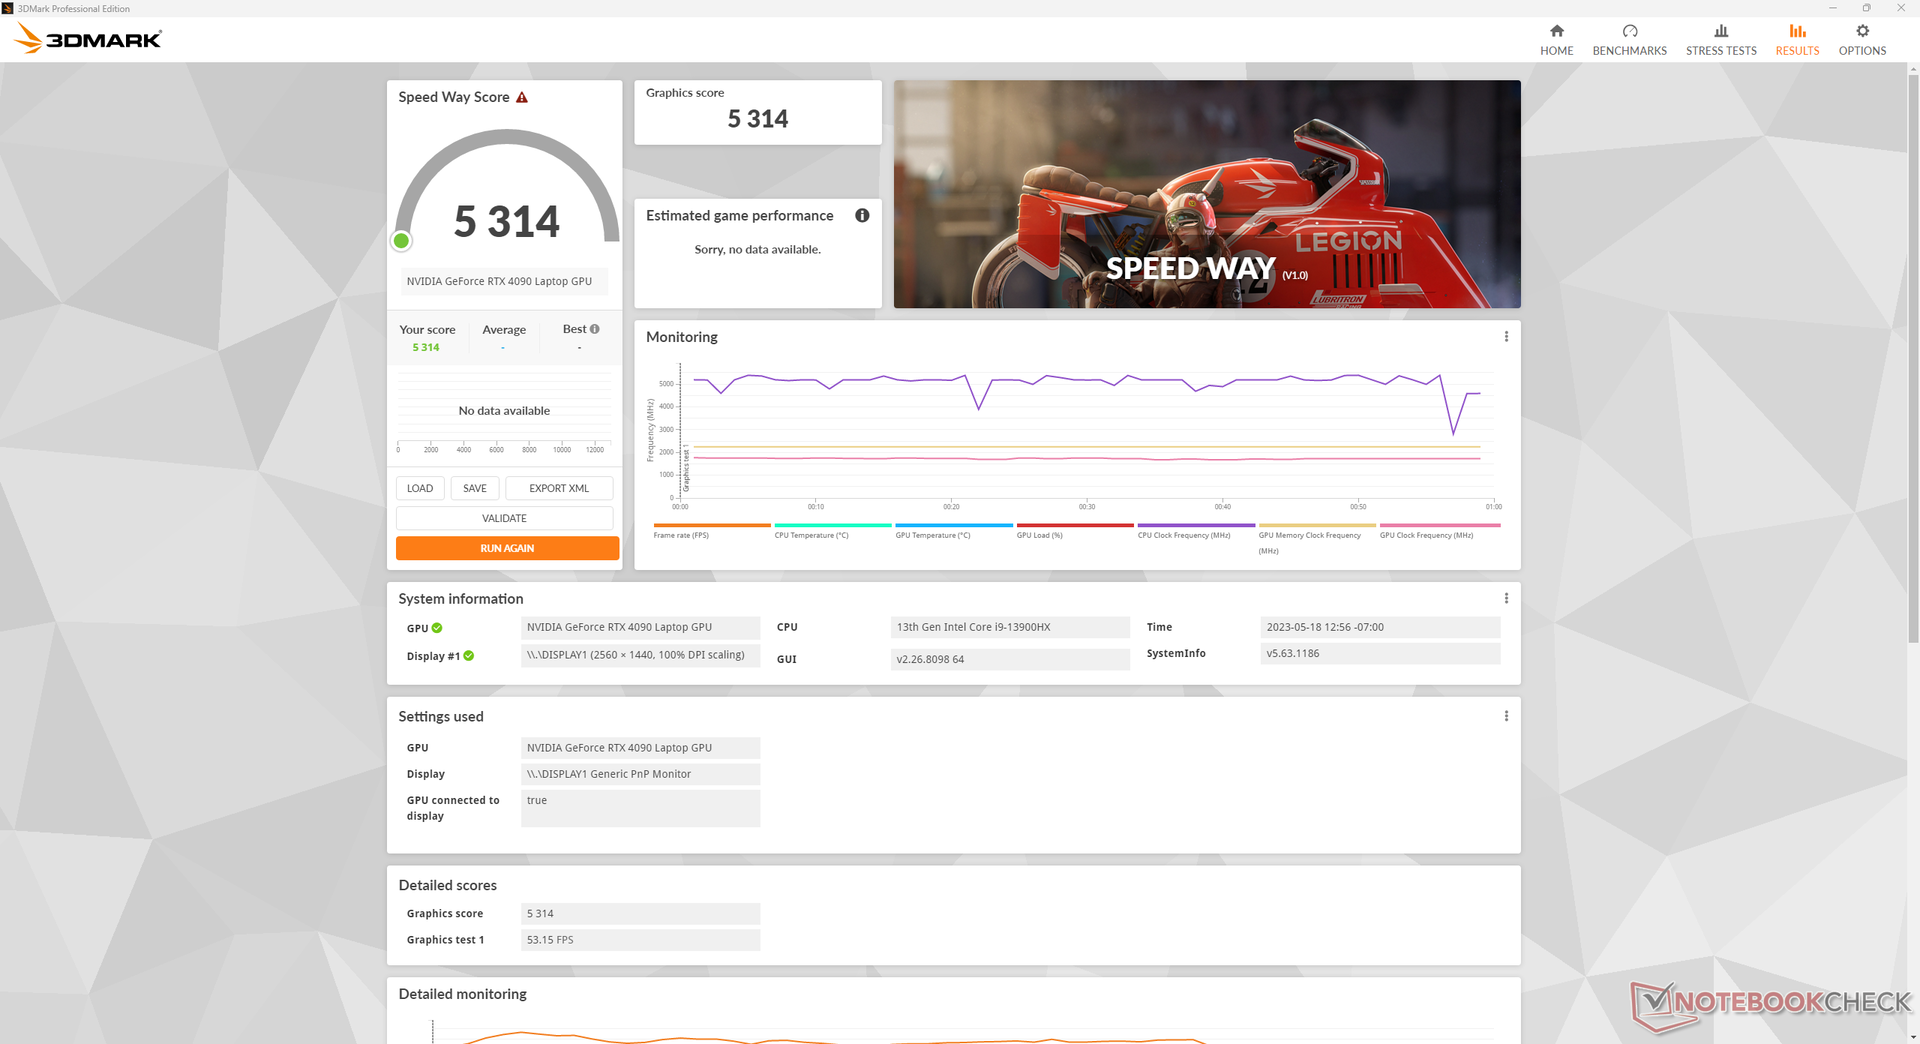
Graphics performance is within a few percentage points of the average laptop in our database with the same GeForce RTX 4090 GPU. Running on Entertainment mode instead of Performance mode would decrease graphics performance by about 4 to 5 percent. A "proper" desktop GeForce RTX 4090 is still significantly faster than our mobile RTX 4090 by about 60 to 80 percent due to the heavy thermal limitations of mobile GPUs.
Note that downgrading to the mobile GeForce RTX 4080 configuration would only decrease graphics performance by about 5 to 10 percent. Thus, the mobile RTX 4080 may be worth considering since performance is so similar between the two GPUs.
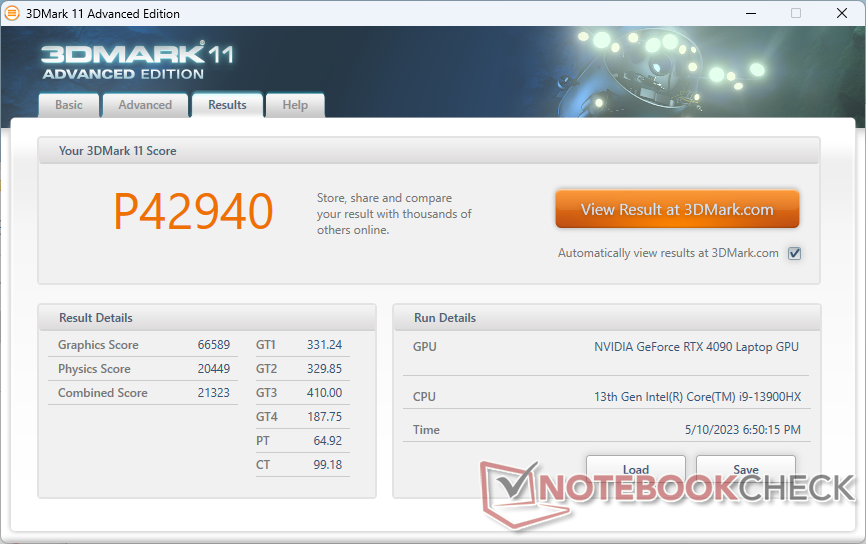
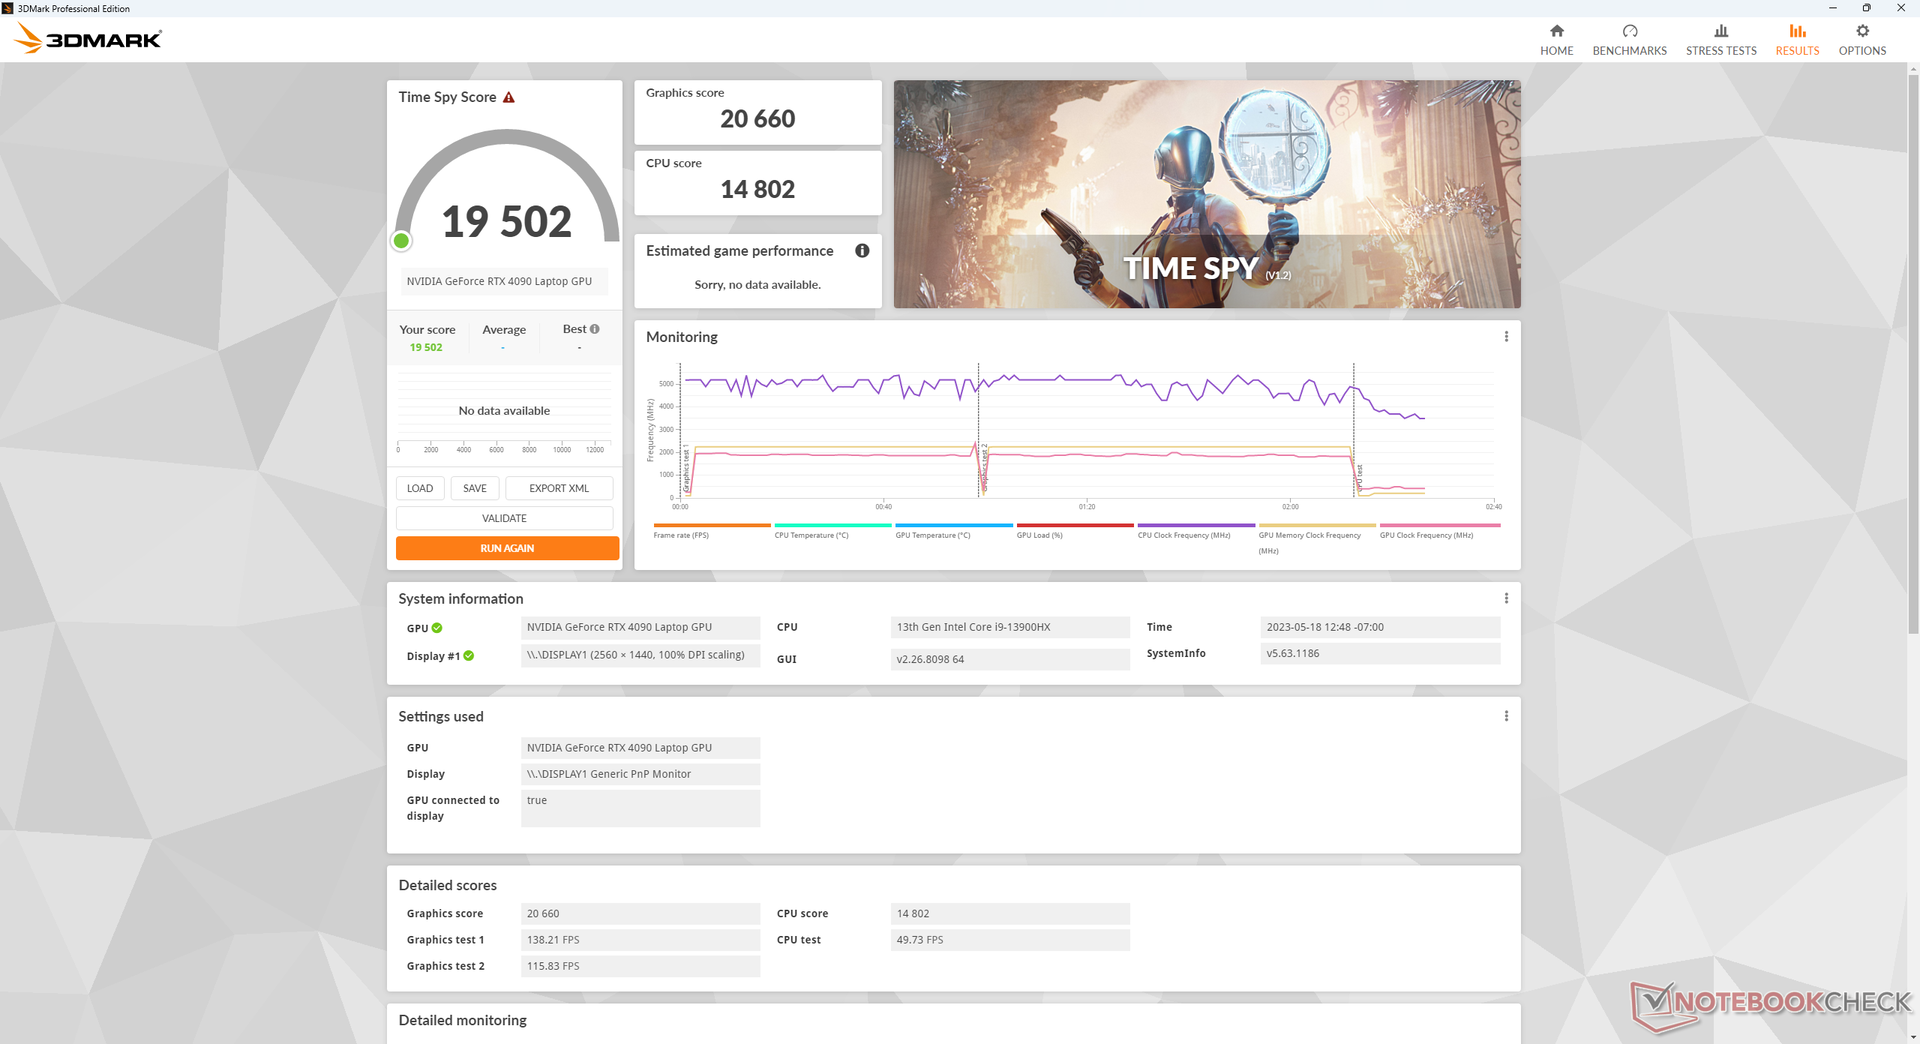
| 3DMark 11 Performance | 42940 points | |
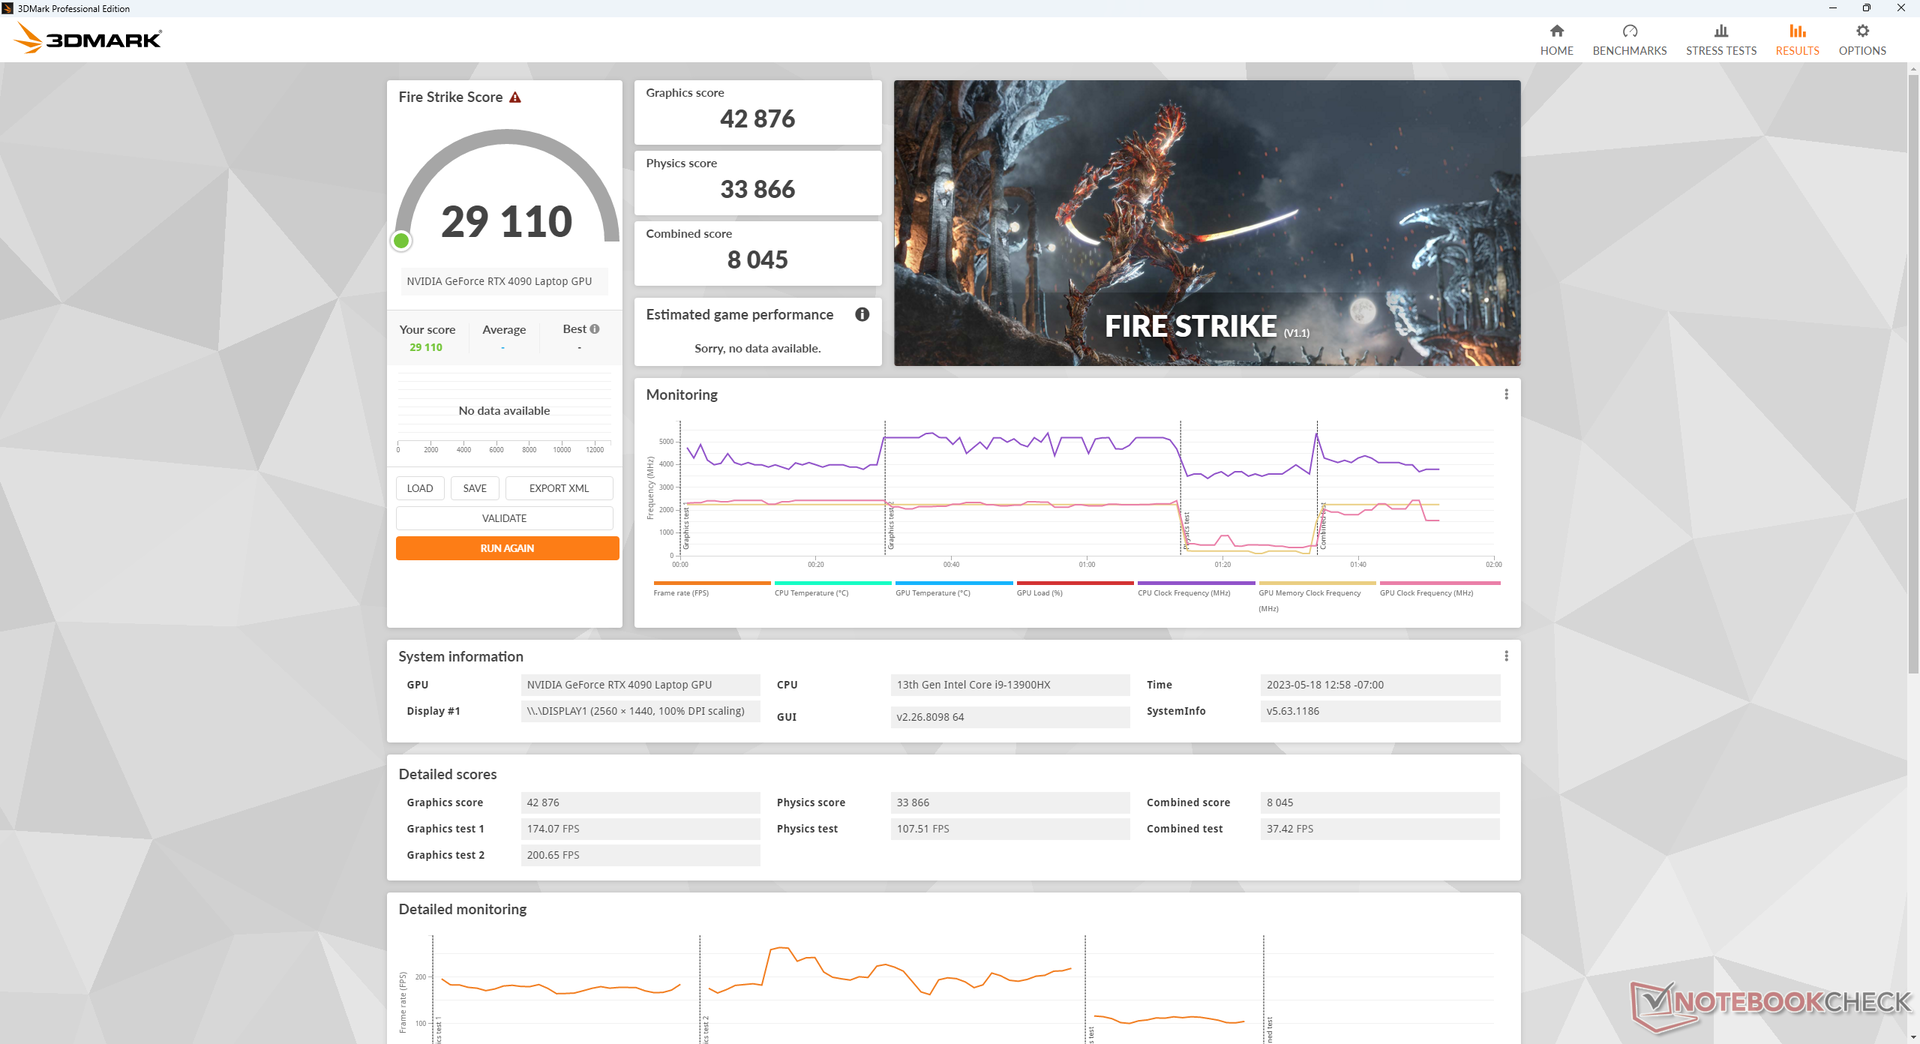
| 3DMark Fire Strike Score | 33425 points | |
| 3DMark Time Spy Score | 19502 points | |
Help | ||
* ... smaller is better
Gaming Performance
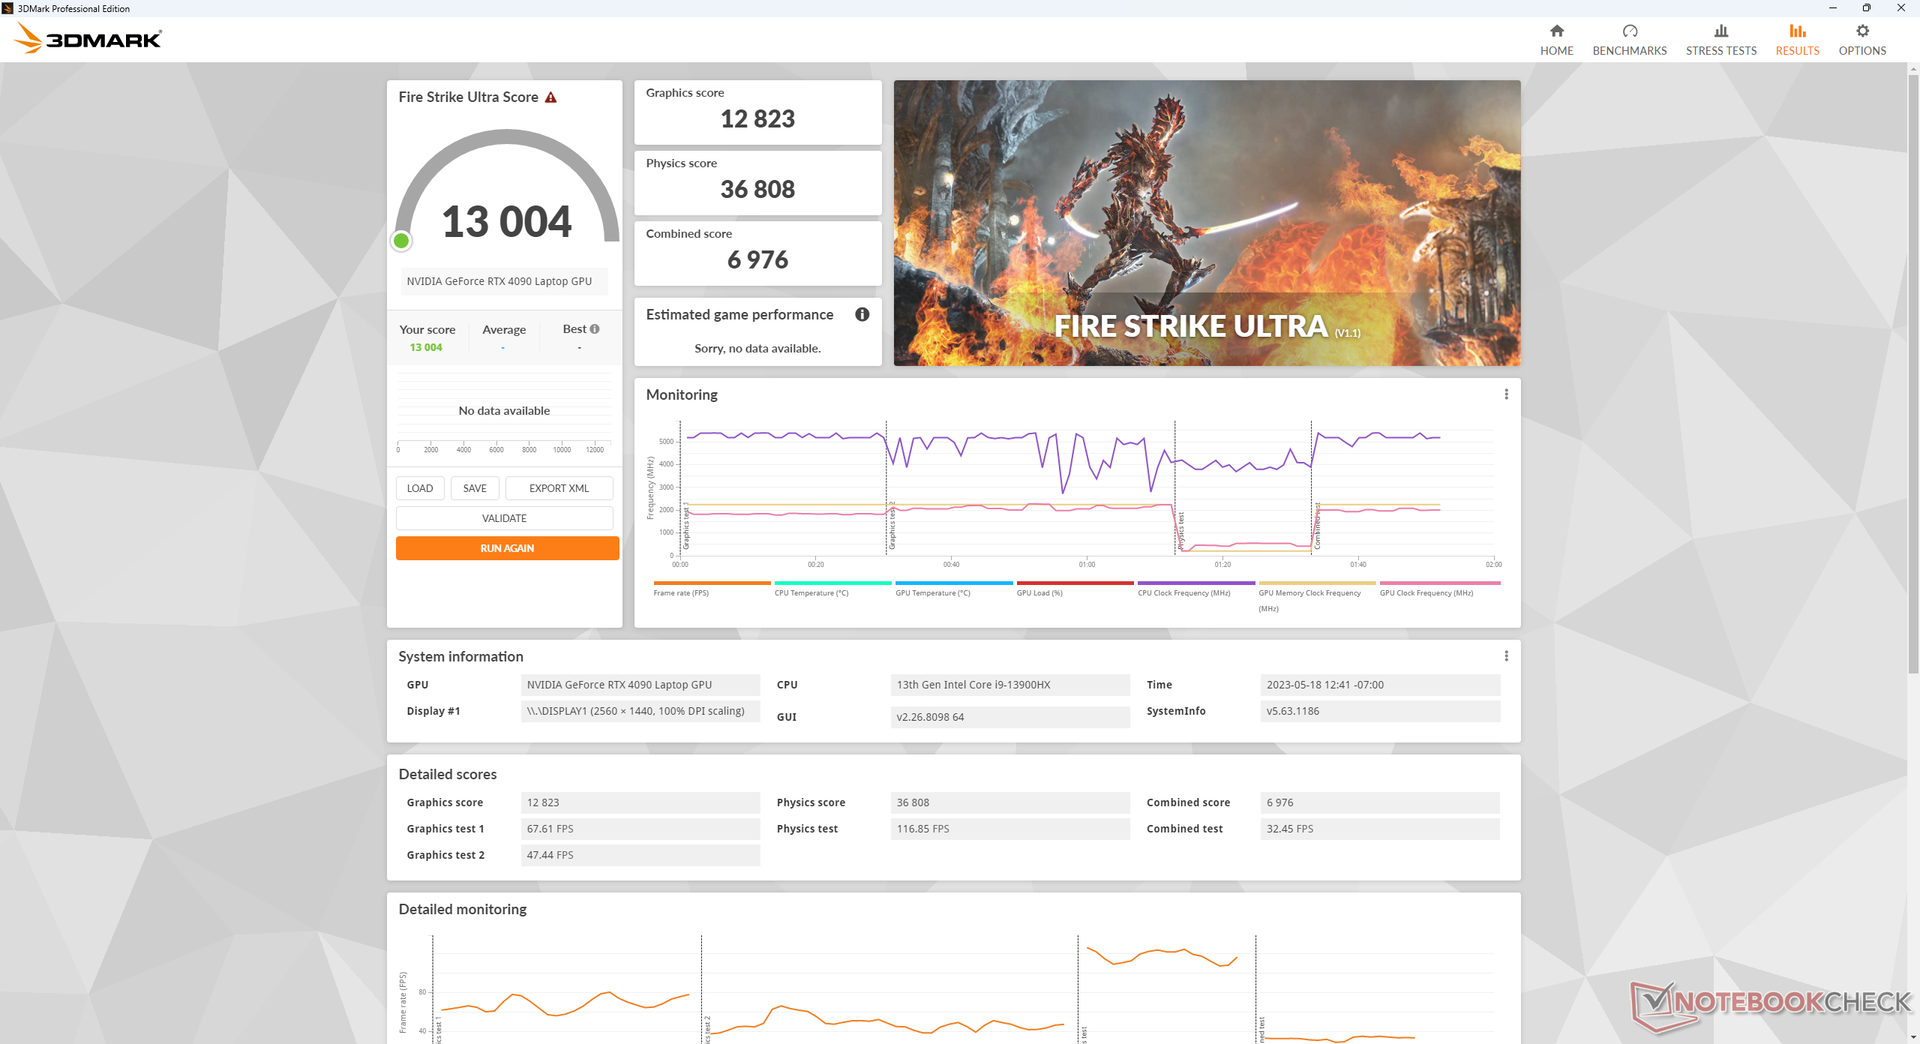
While the mobile RTX 4090 is nowhere near as fast as a desktop RTX 4090, it's still potent for even the most demanding of titles like F1 22, Returnal, or Cyberpunk 2077. More specifically, the mobile RTX 4090 appears to be ideal for targeting 1440p at 120 FPS or 4K at 60 FPS at high to ultra settings. You'll want to run in dGPU mode or Advanced Optimus mode whenever possible especially since G-Sync is not available on hybrid graphics mode.
Witcher 3 FPS Chart
| low | med. | high | ultra | QHD | 4K | |
| GTA V (2015) | 187.2 | 186.4 | 183.7 | 139.5 | 134.3 | 173.6 |
| The Witcher 3 (2015) | 512.8 | 448.8 | 388.1 | 207.2 | 163.8 | |
| Dota 2 Reborn (2015) | 234 | 207 | 199.4 | 184.9 | 178.5 | |
| Final Fantasy XV Benchmark (2018) | 219 | 204 | 172.2 | 149 | 88.8 | |
| X-Plane 11.11 (2018) | 192.9 | 172.1 | 136.2 | 117.3 | ||
| Strange Brigade (2018) | 439 | 351 | 341 | 328 | 300 | 155.2 |
| Cyberpunk 2077 1.6 (2022) | 114 | 109.4 | 103.7 | 91 | 87.3 | 47.3 |
| Tiny Tina's Wonderlands (2022) | 271.8 | 238.8 | 203.3 | 183.1 | 130.7 | 68.7 |
| F1 22 (2022) | 210 | 209 | 199 | 120.8 | 90.2 | 44.3 |
| Returnal (2023) | 145 | 153 | 159 | 141 | 115 | 69 |
Emissions
System Noise — Very Loud When Gaming
(June 29, 2023 update: Eurocom has released a new BIOS version that addresses our fan noise concerns by lowering the fan noise ceiling to be more in line with other gaming laptops. Our original text is below.)
The fans are always active no matter the power setting or onscreen load. Even when set to Quiet mode, for example, there would still be a minimum fan noise of 33 dB(A) against a silent background of 23 dB(A). This level is louder than on most other gaming laptops and it is audible under office environments. If set to Performance mode or Entertainment mode, the fans would pulse regularly even if simply browsing or video streaming. You'll definitely want to be on a lower power setting whenever possible when the extra horsepower isn't needed.
Gaming on Performance mode would induce a fan noise of almost 61 dB(A) to be significantly louder than competing gaming laptops like the Alienware m17 R5 or MSI GE78HX. The 50+ dB(A) range is loud but tolerable with a good pair of headphones, but 60+ dB(A) makes it extremely difficult to play noise-sensitive games like Fortnite or Overwatch where footsteps and other audio queues are vital to gameplay.
Changing the power setting from Performance mode to Entertainment mode would drop fan noise just slightly from 60.7 dB(A) to 59.7 dB(A). The difference is so small that you may as well run on Performance mode when gaming and skip Entertainment mode altogether.
Noise Level
| Idle |
| 33.1 / 33.1 / 40.7 dB(A) |
| Load |
| 59.9 / 61 dB(A) |
 | ||
30 dB silent 40 dB(A) audible 50 dB(A) loud |
||
min: | ||
| Eurocom Raptor X17 NVIDIA GeForce RTX 4090 Laptop GPU, i9-13900HX, 3x Samsung SSD 980 Pro 1TB (RAID 0) | Asus ROG Strix Scar 17 G733PY-XS96 NVIDIA GeForce RTX 4090 Laptop GPU, R9 7945HX, SK hynix PC801 HFS001TEJ9X101N | Aorus 17X AZF NVIDIA GeForce RTX 4090 Laptop GPU, i9-13900HX, Gigabyte AG470S1TB-SI B10 | MSI GE78HX 13VH-070US NVIDIA GeForce RTX 4080 Laptop GPU, i9-13950HX, Samsung PM9A1 MZVL22T0HBLB | Eluktronics Mech-17 GP2 NVIDIA GeForce RTX 4090 Laptop GPU, i9-13900HX, Samsung PM9A1 MZVL21T0HCLR | Alienware m17 R5 (R9 6900HX, RX 6850M XT) Radeon RX 6850M XT, R9 6900HX, SSSTC CA6-8D1024 | |
|---|---|---|---|---|---|---|
| Noise | 22% | 10% | 16% | 16% | 23% | |
| off / environment * | 23.3 | 22.7 3% | 25 -7% | 23.4 -0% | 25.2 -8% | 23 1% |
| Idle Minimum * | 33.1 | 23.5 29% | 28 15% | 24.2 27% | 28 15% | 23 31% |
| Idle Average * | 33.1 | 27.7 16% | 29 12% | 25.6 23% | 28 15% | 28.11 15% |
| Idle Maximum * | 40.7 | 27.7 32% | 34 16% | 31 24% | 30.4 25% | 28.11 31% |
| Load Average * | 59.9 | 30.5 49% | 51 15% | 43.3 28% | 41 32% | 30.62 49% |
| Witcher 3 ultra * | 60.8 | 51.4 15% | 57 6% | 56.3 7% | 50.7 17% | 49.75 18% |
| Load Maximum * | 61 | 54.1 11% | 54 11% | 59.1 3% | 52.6 14% | 50.17 18% |
* ... smaller is better
Temperature
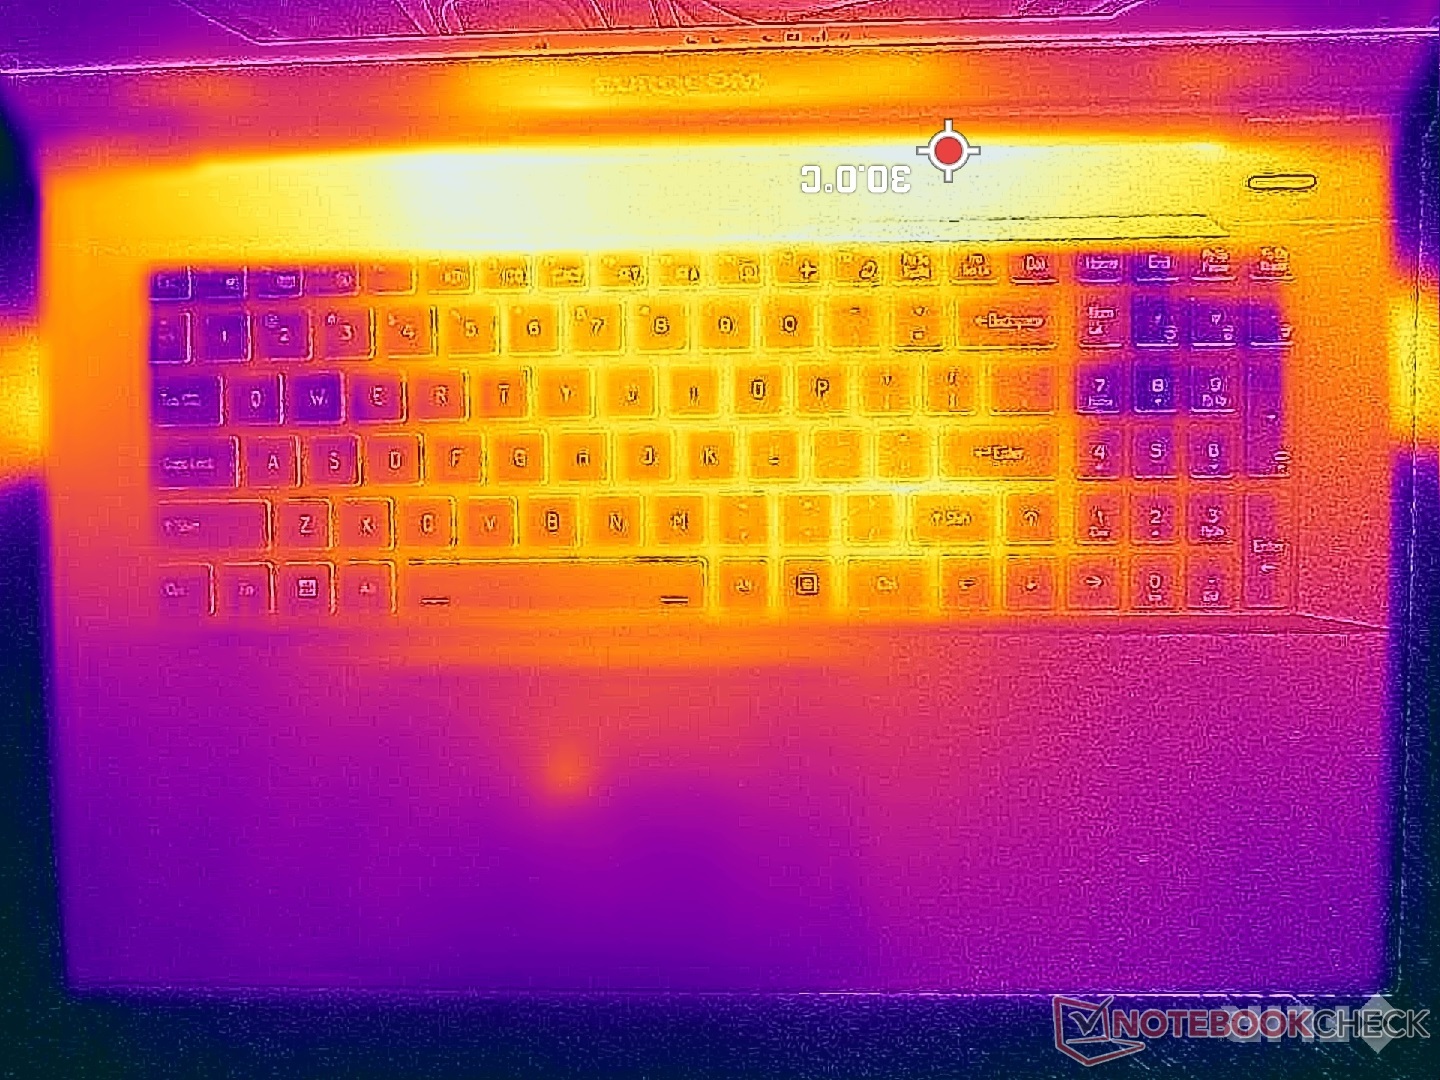
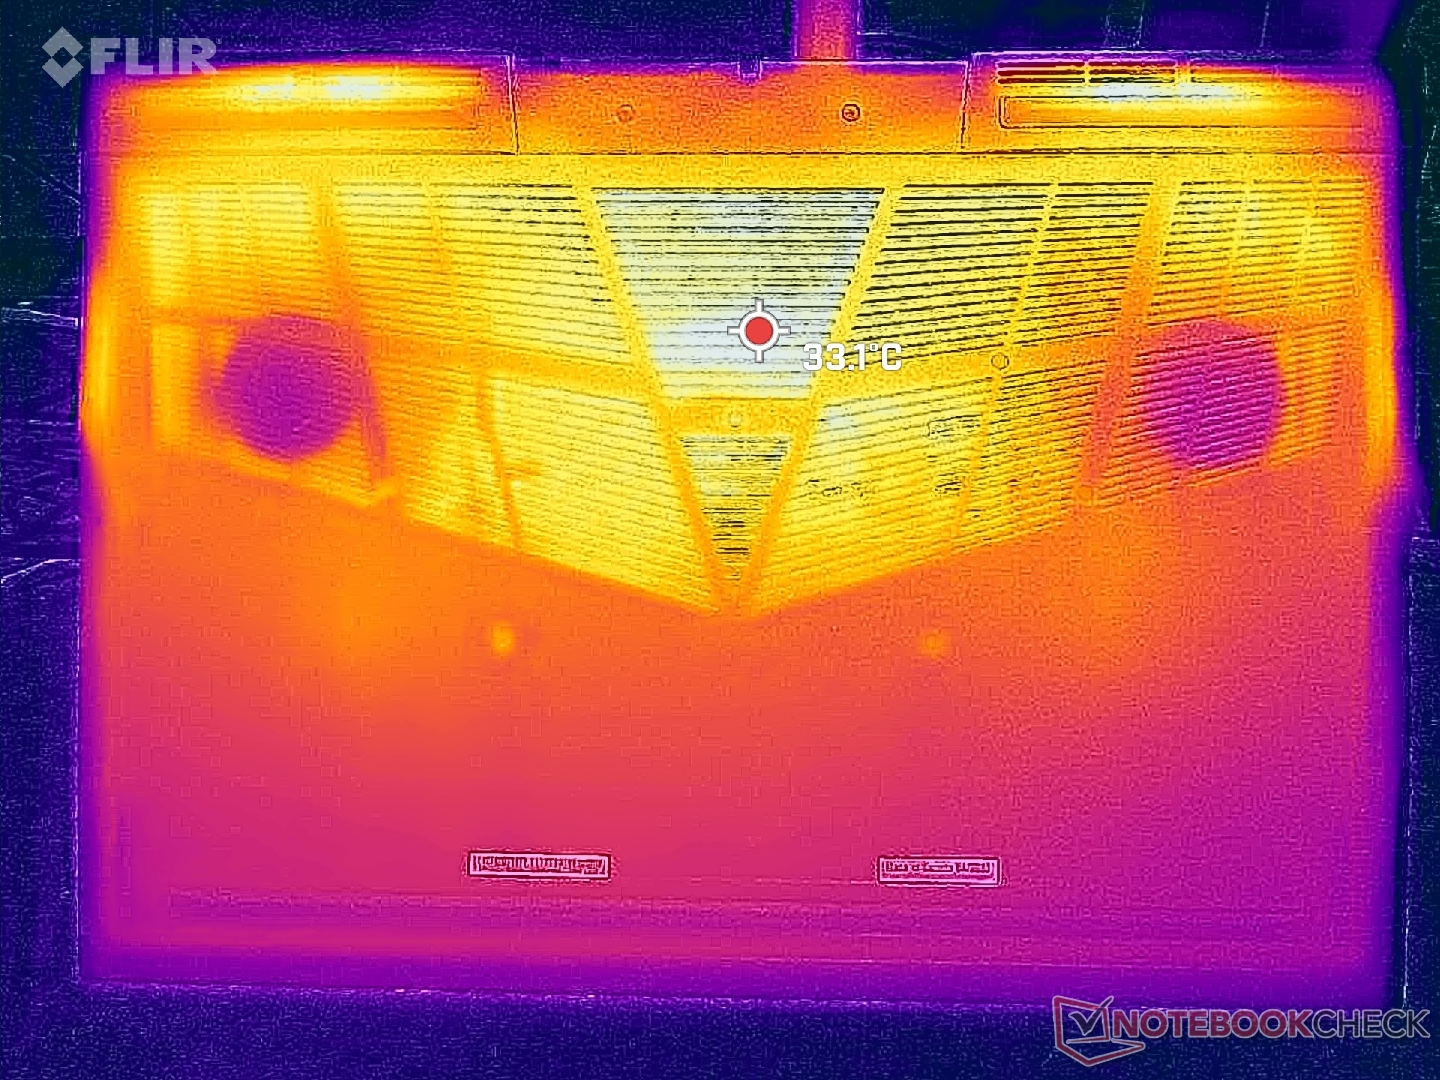
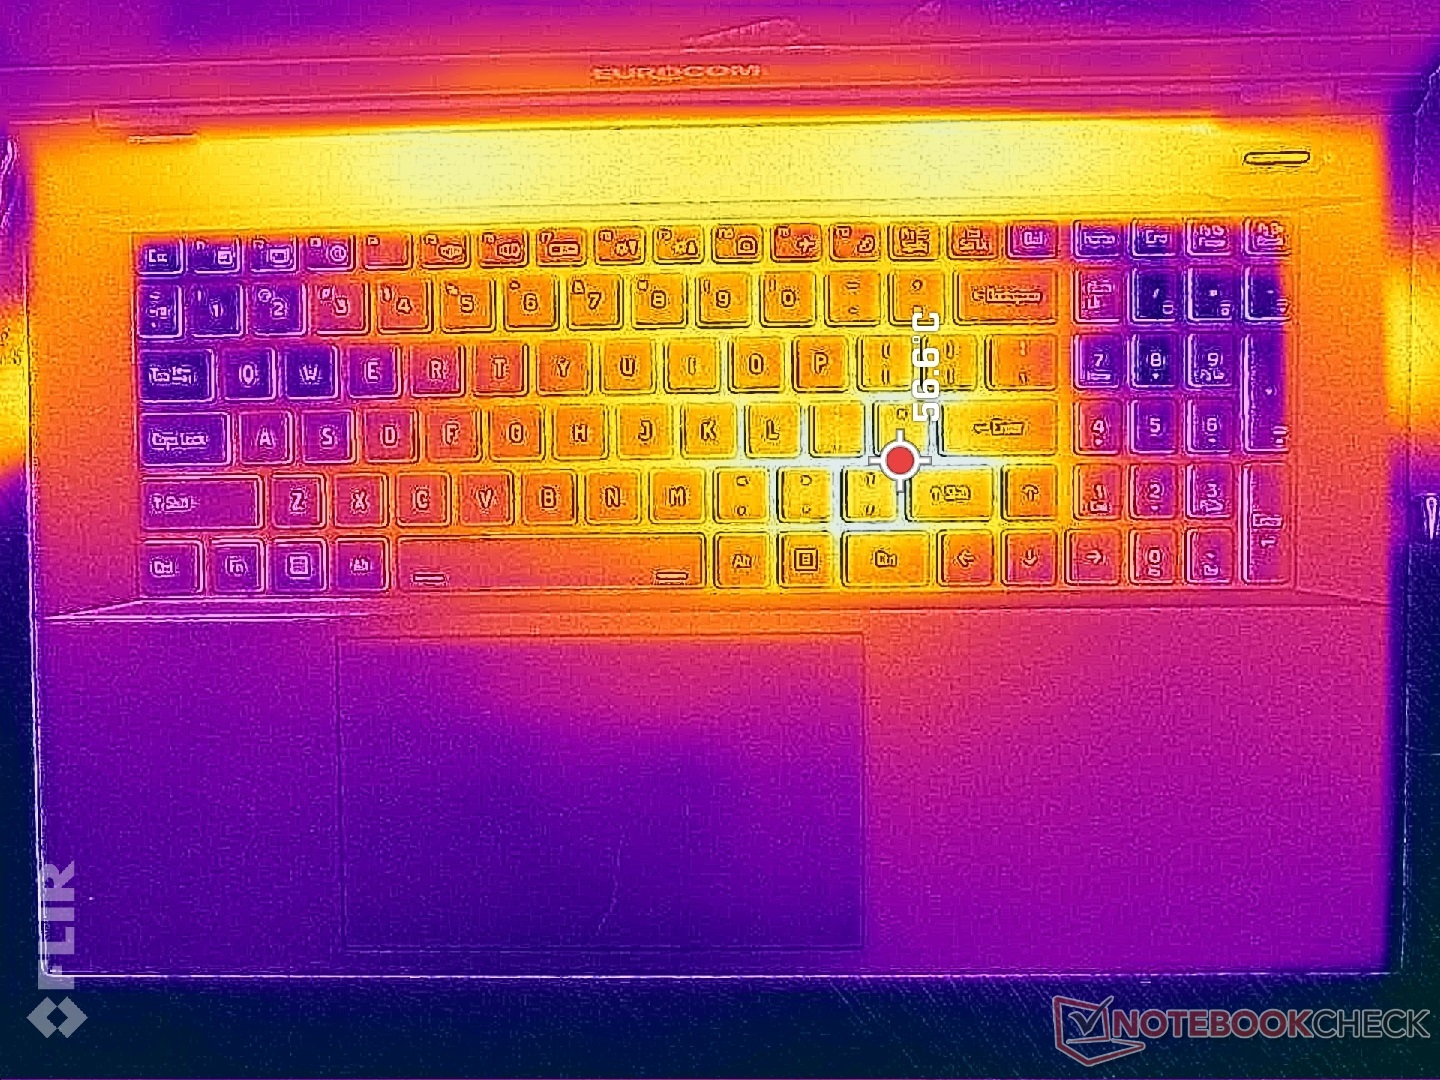
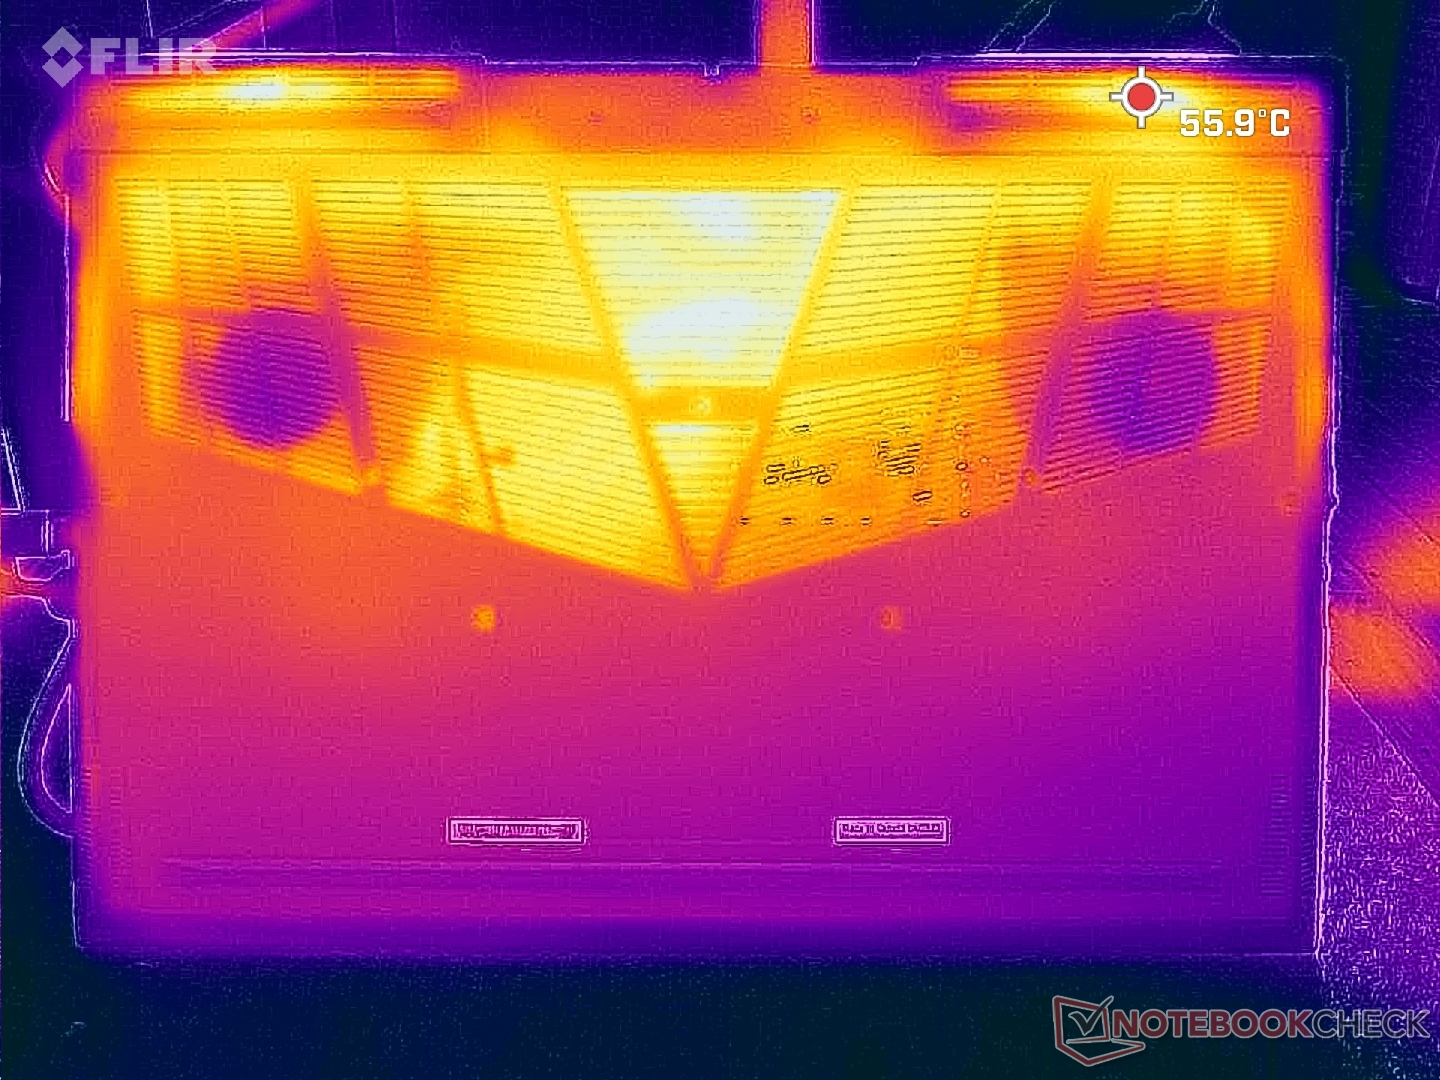
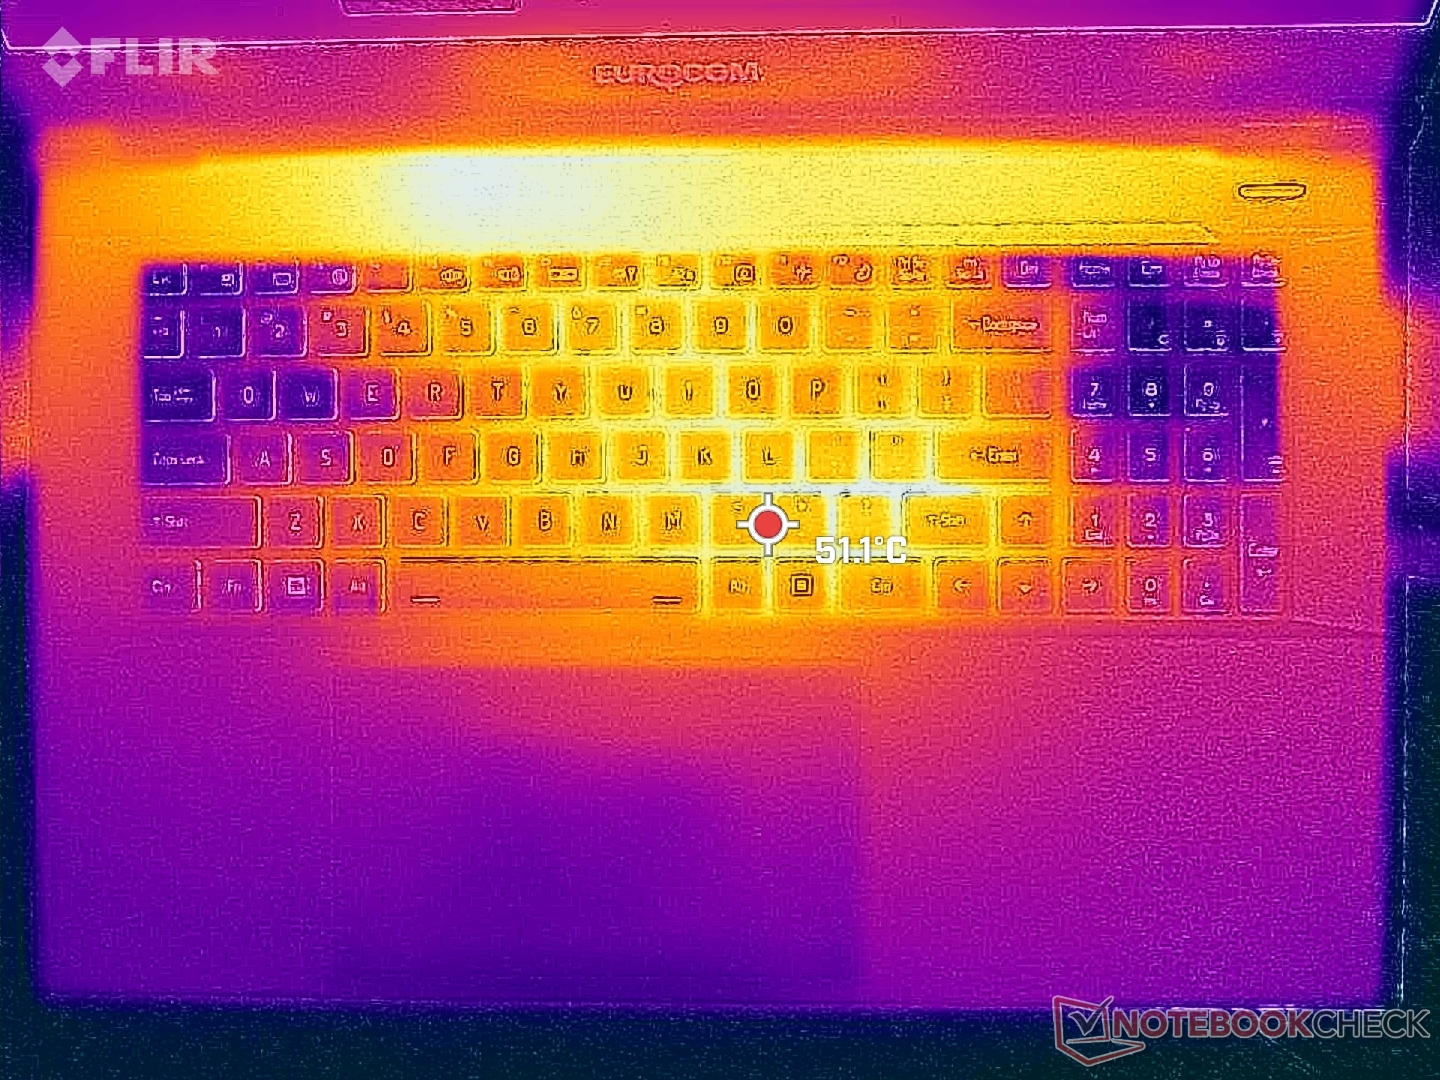
Surface temperatures are warmest toward the keyboard center as both the CPU and GPU are directly underneath. Hot spots can reach over 56 C in this region compared to 46 C and 35 C on the Aorus 17X and MSI Raider GE78 HX, respectively. Thankfully, the palm rests, WASD keys, and numpad areas are not nearly as warm to keep hands comfortable when gaming.
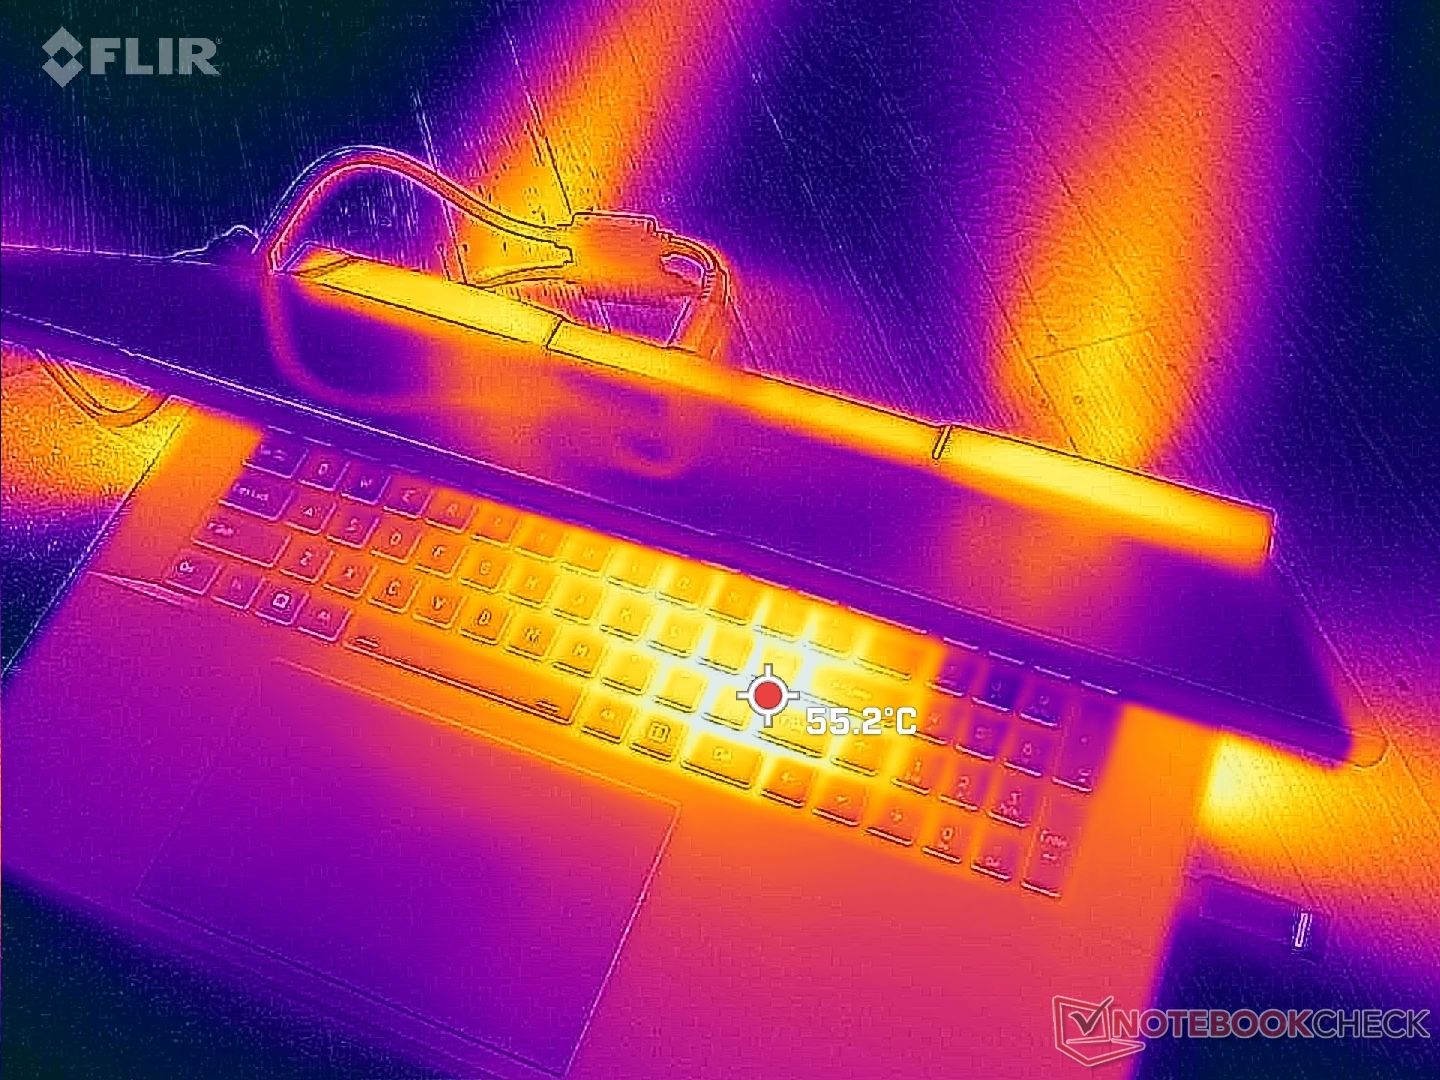
(-) The maximum temperature on the upper side is 49.4 °C / 121 F, compared to the average of 40.4 °C / 105 F, ranging from 21.2 to 68.8 °C for the class Gaming.
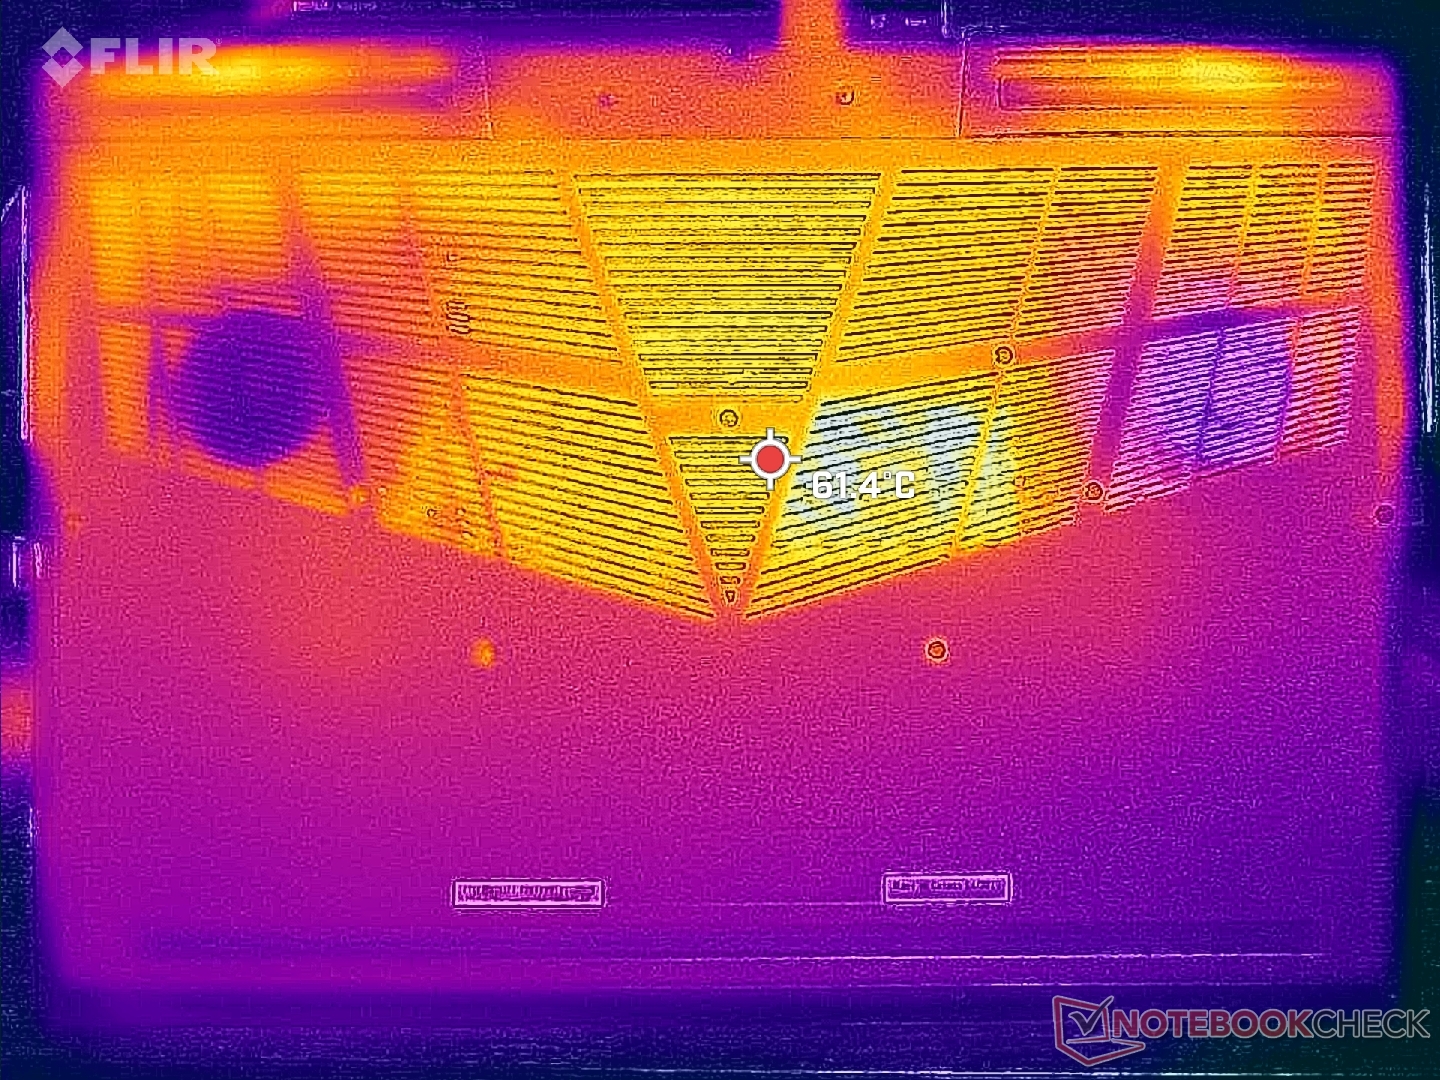
(-) The bottom heats up to a maximum of 55.2 °C / 131 F, compared to the average of 43.2 °C / 110 F
(+) In idle usage, the average temperature for the upper side is 28.8 °C / 84 F, compared to the device average of 33.8 °C / 93 F.
(-) Playing The Witcher 3, the average temperature for the upper side is 40.4 °C / 105 F, compared to the device average of 33.8 °C / 93 F.
(+) The palmrests and touchpad are cooler than skin temperature with a maximum of 31.2 °C / 88.2 F and are therefore cool to the touch.
(-) The average temperature of the palmrest area of similar devices was 28.9 °C / 84 F (-2.3 °C / -4.2 F).
| Eurocom Raptor X17 Intel Core i9-13900HX, NVIDIA GeForce RTX 4090 Laptop GPU | Asus ROG Strix Scar 17 G733PY-XS96 AMD Ryzen 9 7945HX, NVIDIA GeForce RTX 4090 Laptop GPU | Aorus 17X AZF Intel Core i9-13900HX, NVIDIA GeForce RTX 4090 Laptop GPU | MSI GE78HX 13VH-070US Intel Core i9-13950HX, NVIDIA GeForce RTX 4080 Laptop GPU | Eluktronics Mech-17 GP2 Intel Core i9-13900HX, NVIDIA GeForce RTX 4090 Laptop GPU | Alienware m17 R5 (R9 6900HX, RX 6850M XT) AMD Ryzen 9 6900HX, AMD Radeon RX 6850M XT | |
|---|---|---|---|---|---|---|
| Heat | 24% | 8% | 14% | 15% | 4% | |
| Maximum Upper Side * | 49.4 | 34.6 30% | 47 5% | 37.4 24% | 39 21% | 53 -7% |
| Maximum Bottom * | 55.2 | 35.6 36% | 51 8% | 45 18% | 44 20% | 56 -1% |
| Idle Upper Side * | 33.4 | 27.2 19% | 30 10% | 29.8 11% | 31 7% | 30 10% |
| Idle Bottom * | 33.4 | 30 10% | 31 7% | 32.4 3% | 29.8 11% | 29 13% |
* ... smaller is better
Stress Test
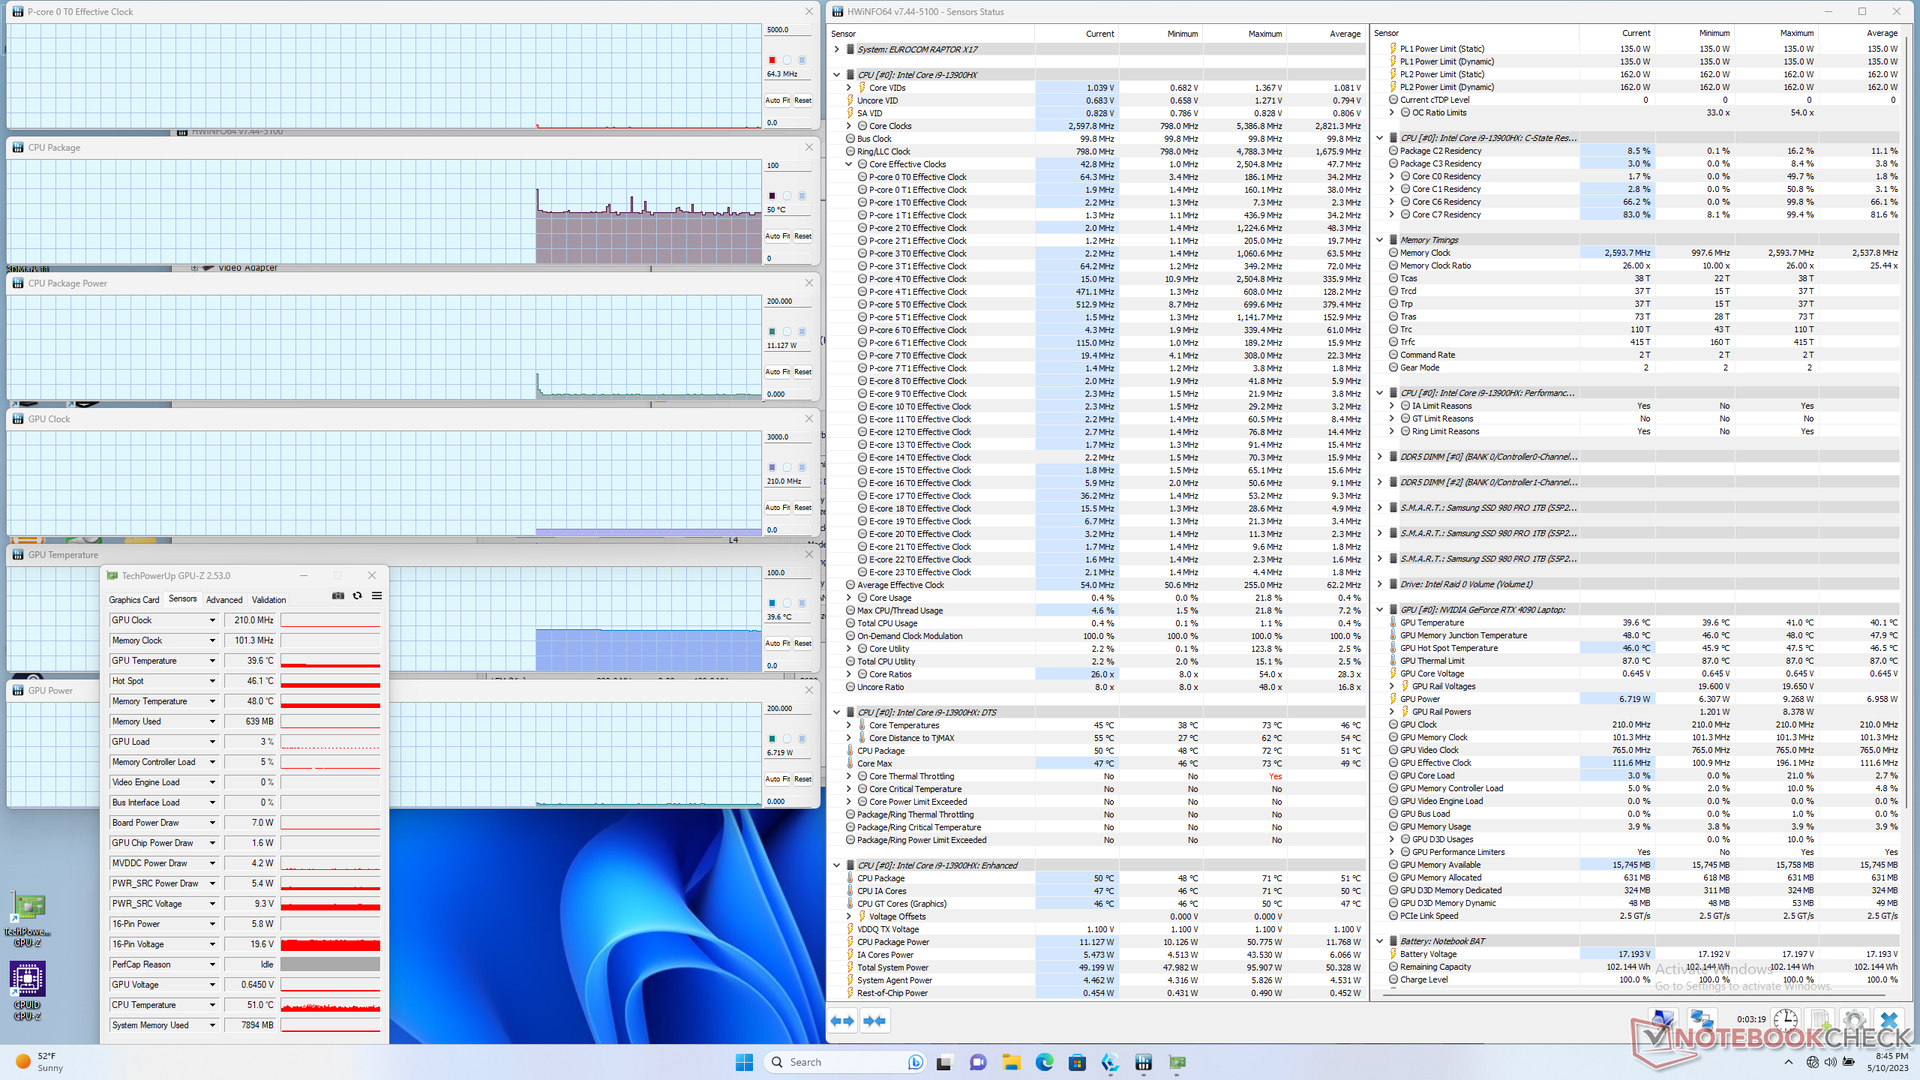
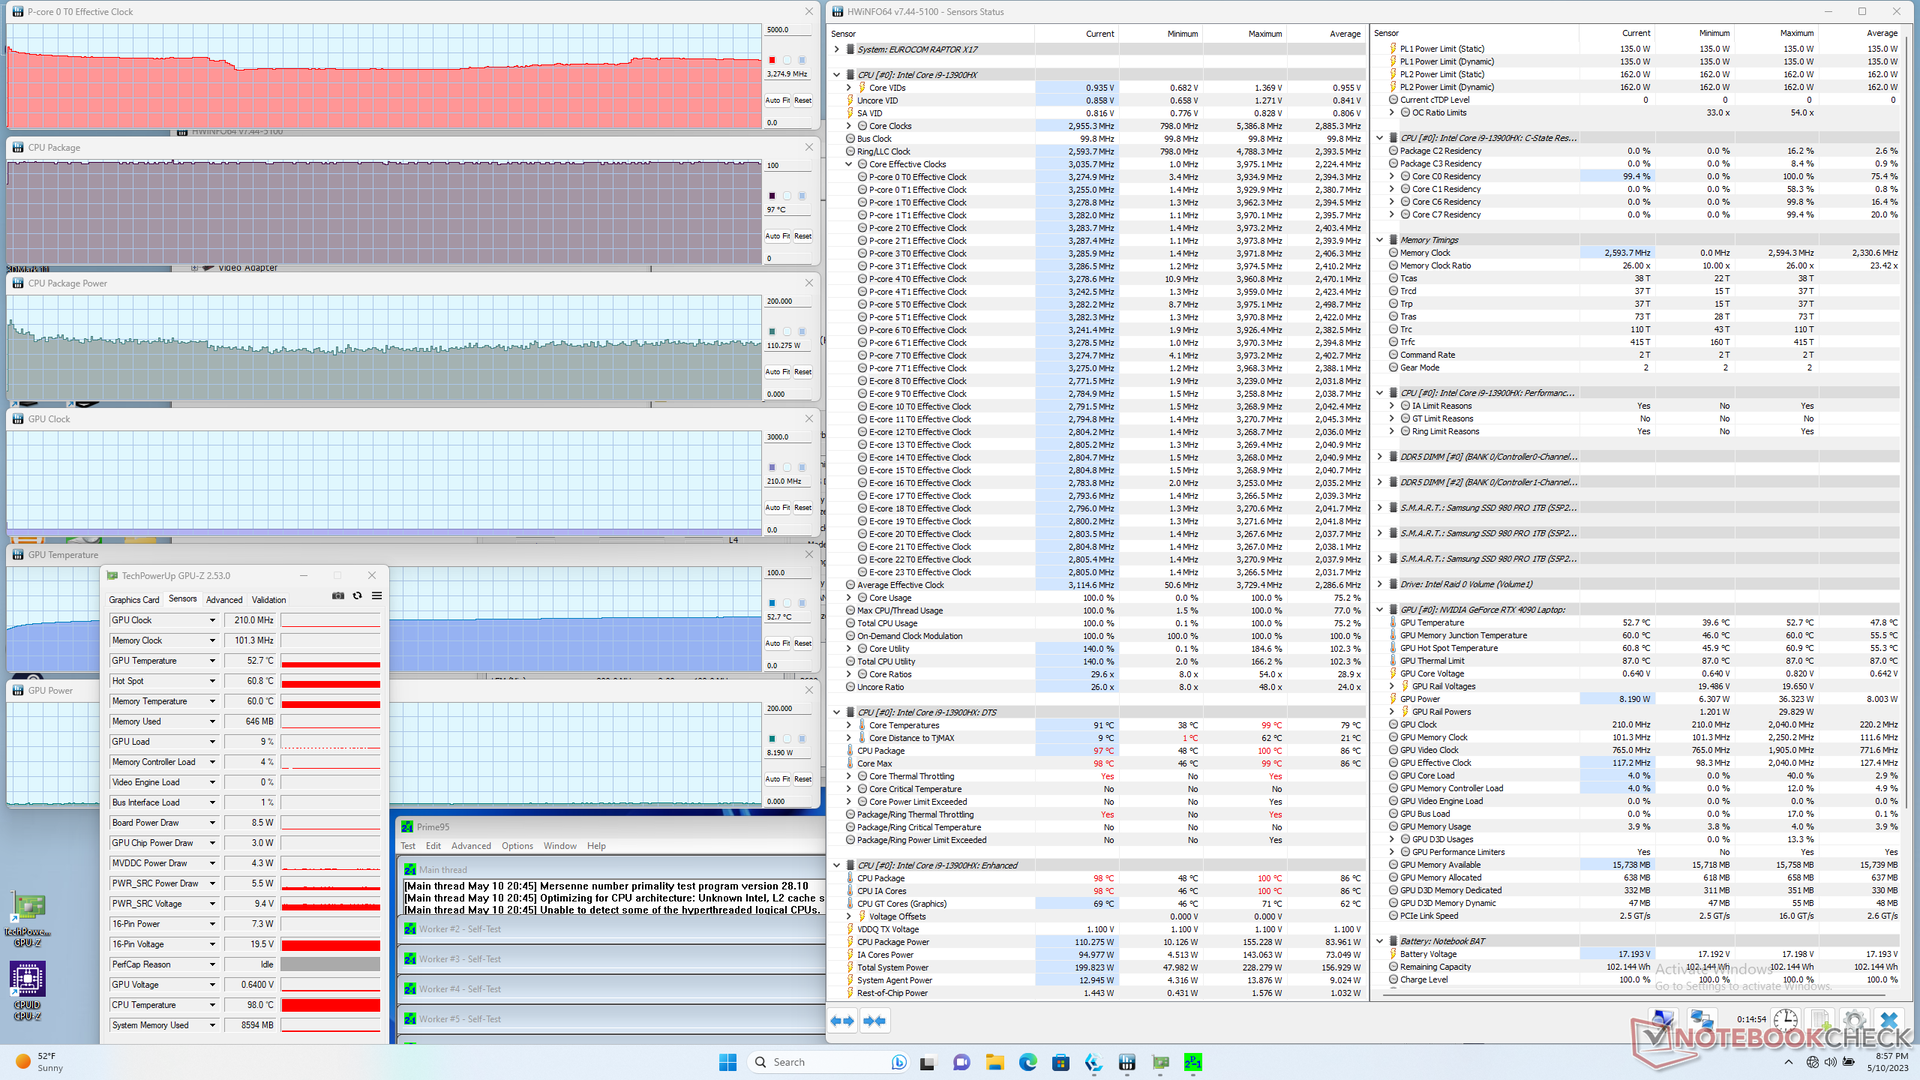
When running Prime95 to stress the CPU, clock rates and board power draw would boost to 4 GHz and 155 W, respectively, for just a moment before quickly falling to the 3.3 GHz and 110 W range. Core temperature would remain very warm at 97 C which is the likely reason for the very short-lived maximum Turbo Boost. Repeating this test on the MSI GE78HX or Eluktronics Mech-17 GP2 would result in similar core temperatures of over 90 C to suggest that most 13th gen H-series CPUs are generally warmer than average when under load.
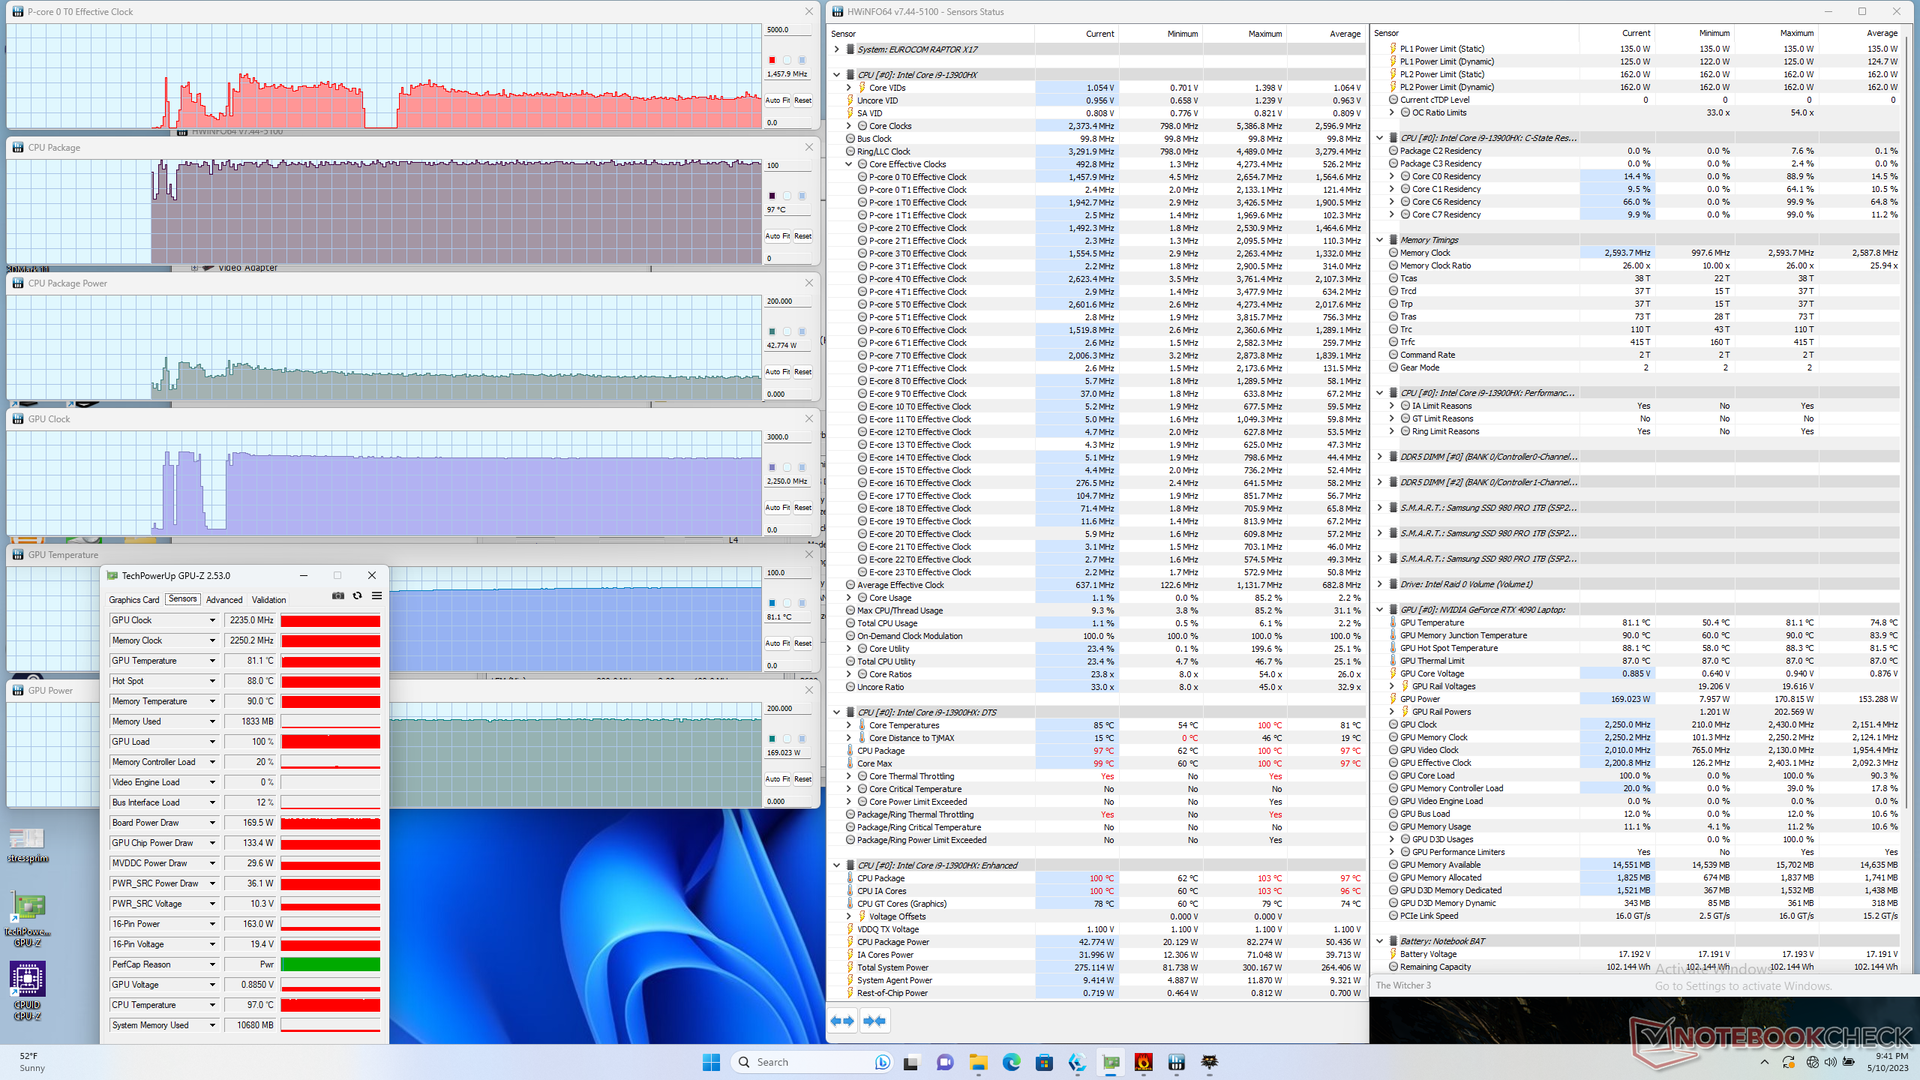
When running Witcher 3 on Performance mode to represent typical gaming loads, the GPU would stabilize at 2235 MHz core clock, 81 C, and 170 W board power draw against a TGP target of 175 W. Tuning the system down to Balanced mode (or Entertainment mode) would lower the GPU to 2055 MHz clock, 76 C, and just 146 W. Thus, you'll need to enable Performance mode and endure its louder fan noise if you wish to get the most out of the GPU.
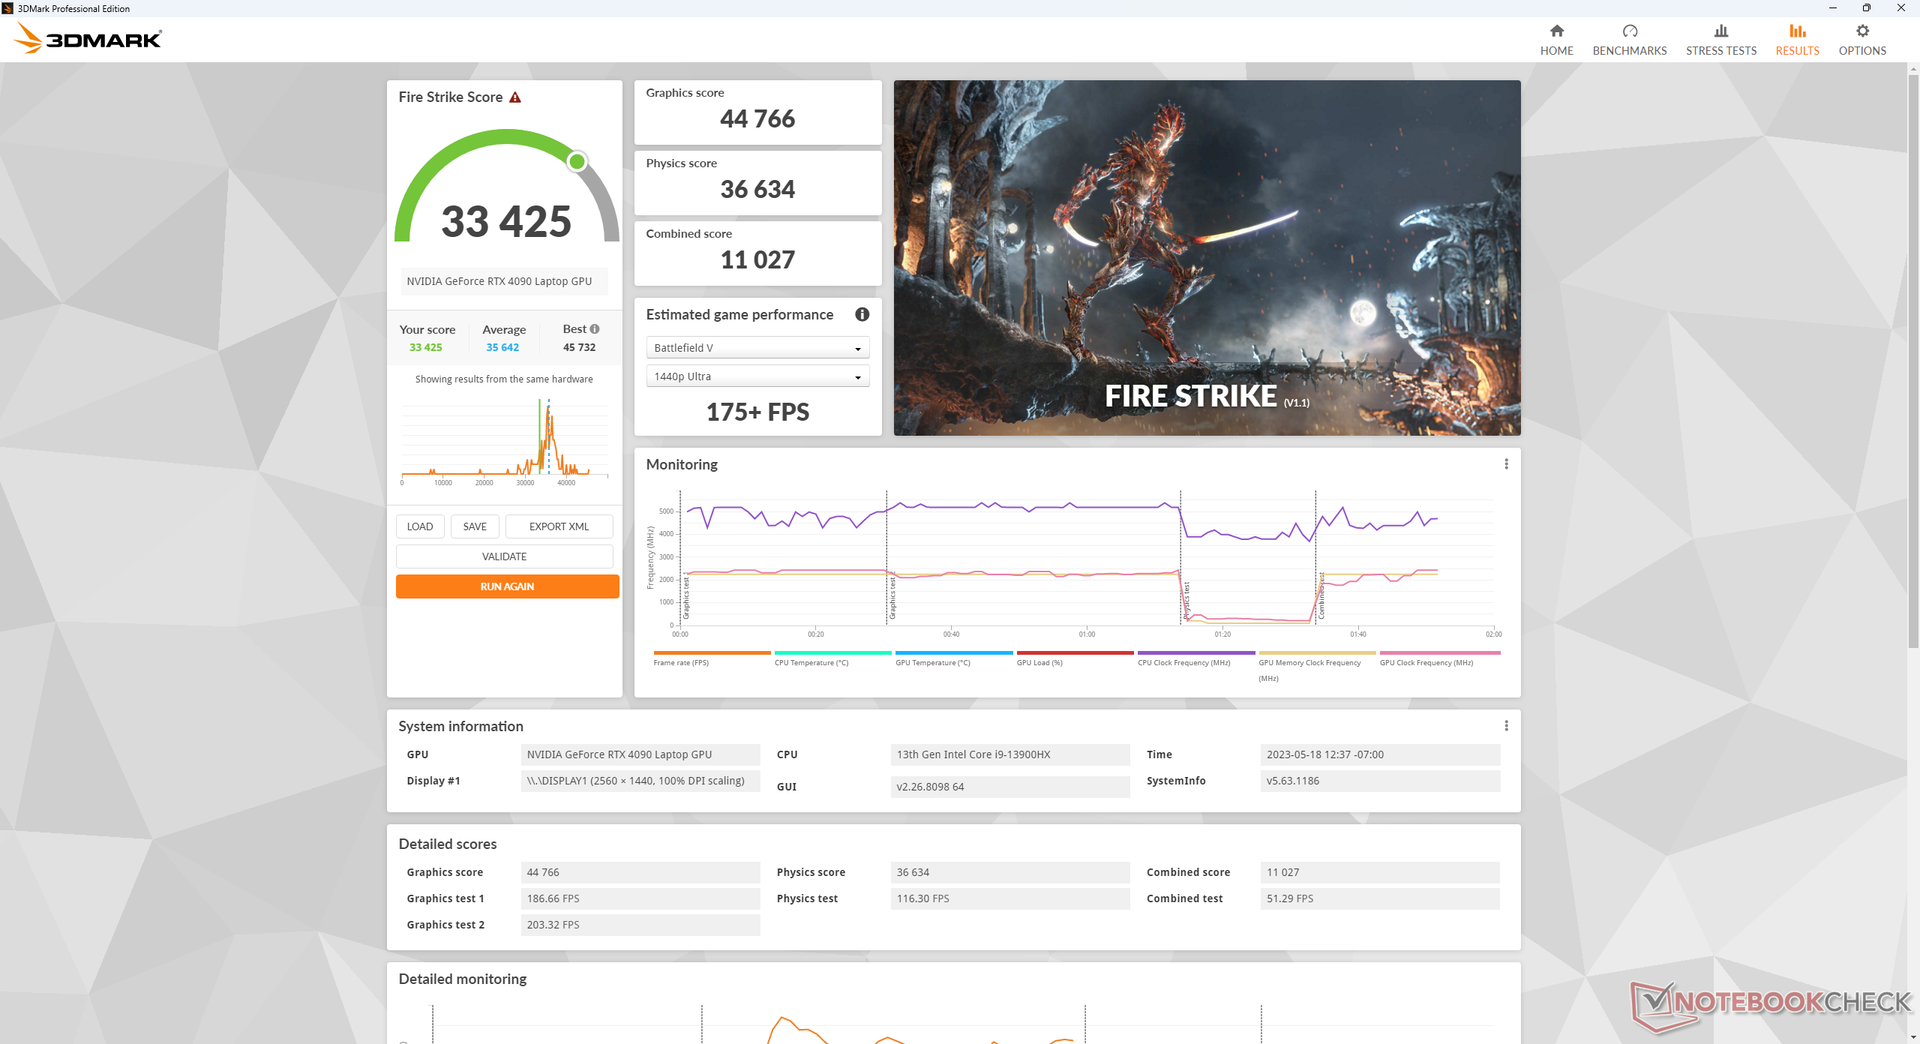
Running on battery power limits performance. A Fire Strike test on batteries would return Physics and Graphics scores of 12863 and 10075 points, respectively, versus 36634 and 44766 points when on mains.

| CPU Clock (GHz) | GPU Clock (MHz) | Average CPU Temperature (°C) | Average GPU Temperature (°C) | |
| System Idle | -- | -- | 50 | 40 |
| Prime95 Stress | 3.3 | -- | 97 | 53 |
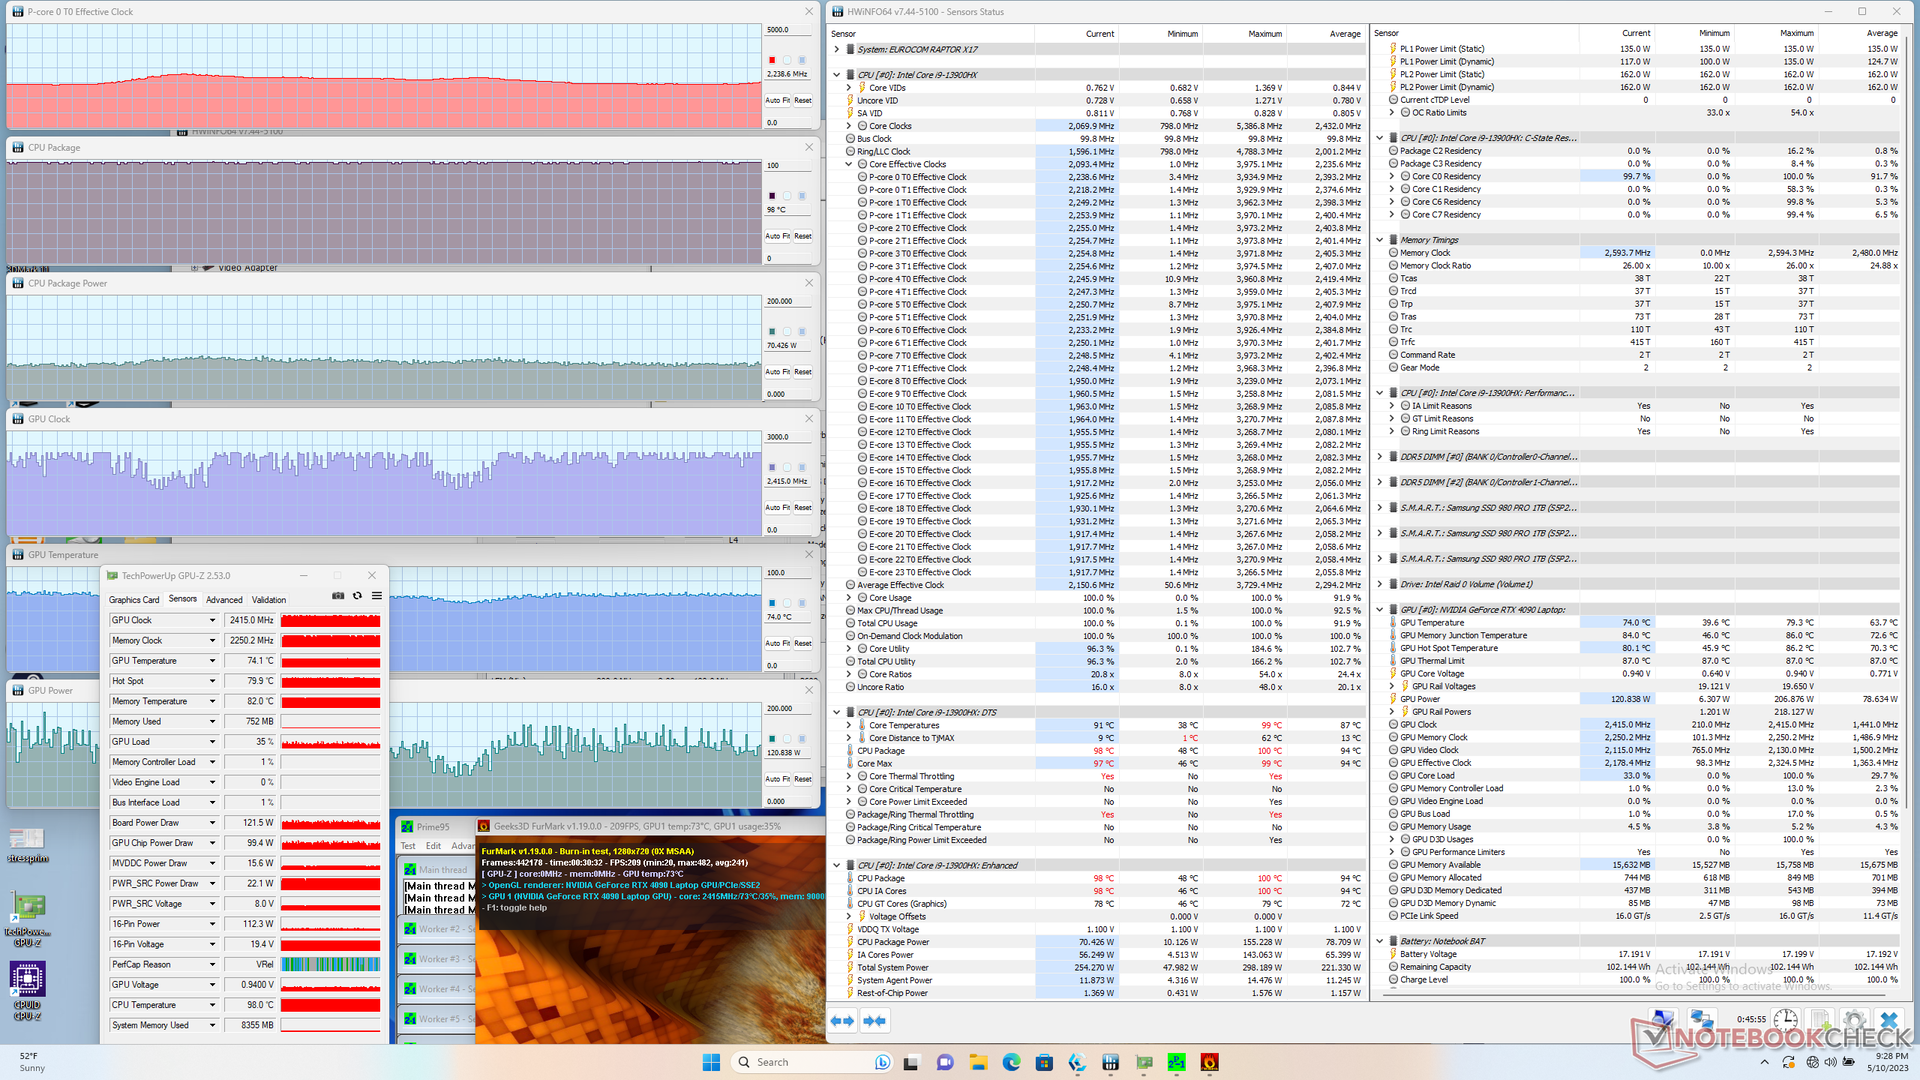
| Prime95 + FurMark Stress | 2.2 | 840 - 2400 | 98 | 74 |
| Witcher 3 Stress (Balanced mode) | 1.4 | 2055 | 92 | 76 |
| Witcher 3 Stress (Performance mode) | 1.5 | 2250 | 97 | 81 |
Speakers
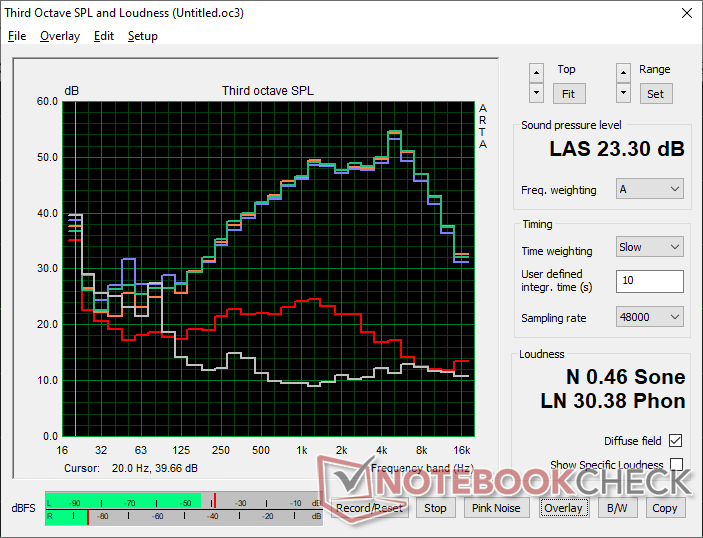
The integrated speakers are disappointing. Not only is bass reproduction poor, but the maximum volume of 71 dB(A) is noticeably quieter than most other gaming laptops where 80 dB(A) or louder is common. This definitely feels like a cut corner for this new chassis design.
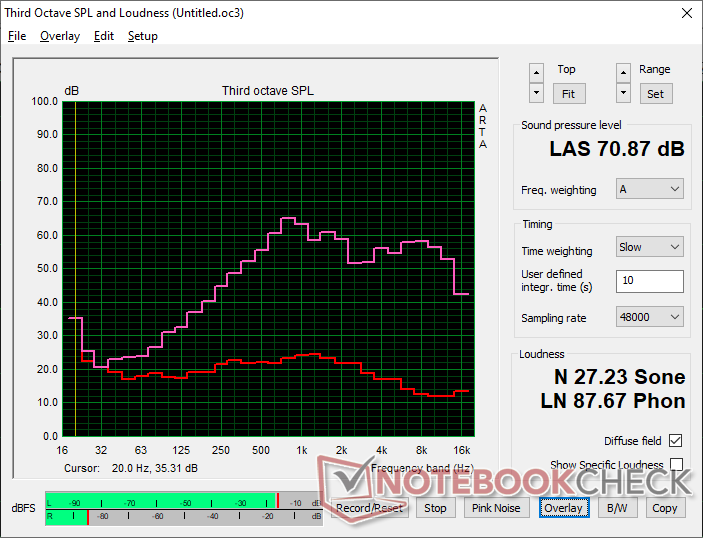
Eurocom Raptor X17 audio analysis
(-) | not very loud speakers (70.9 dB)
Bass 100 - 315 Hz
(-) | nearly no bass - on average 15.5% lower than median
(±) | linearity of bass is average (10.3% delta to prev. frequency)
Mids 400 - 2000 Hz
(±) | higher mids - on average 5.4% higher than median
(±) | linearity of mids is average (9.6% delta to prev. frequency)
Highs 2 - 16 kHz
(+) | balanced highs - only 2.3% away from median
(±) | linearity of highs is average (7.5% delta to prev. frequency)
Overall 100 - 16.000 Hz
(±) | linearity of overall sound is average (23.7% difference to median)
Compared to same class
» 83% of all tested devices in this class were better, 5% similar, 11% worse
» The best had a delta of 6%, average was 18%, worst was 132%
Compared to all devices tested
» 66% of all tested devices were better, 7% similar, 27% worse
» The best had a delta of 4%, average was 25%, worst was 134%
Apple MacBook Pro 16 2021 M1 Pro audio analysis
(+) | speakers can play relatively loud (84.7 dB)
Bass 100 - 315 Hz
(+) | good bass - only 3.8% away from median
(+) | bass is linear (5.2% delta to prev. frequency)
Mids 400 - 2000 Hz
(+) | balanced mids - only 1.3% away from median
(+) | mids are linear (2.1% delta to prev. frequency)
Highs 2 - 16 kHz
(+) | balanced highs - only 1.9% away from median
(+) | highs are linear (2.7% delta to prev. frequency)
Overall 100 - 16.000 Hz
(+) | overall sound is linear (4.6% difference to median)
Compared to same class
» 0% of all tested devices in this class were better, 0% similar, 100% worse
» The best had a delta of 5%, average was 18%, worst was 45%
Compared to all devices tested
» 0% of all tested devices were better, 0% similar, 100% worse
» The best had a delta of 4%, average was 25%, worst was 134%
Energy Management
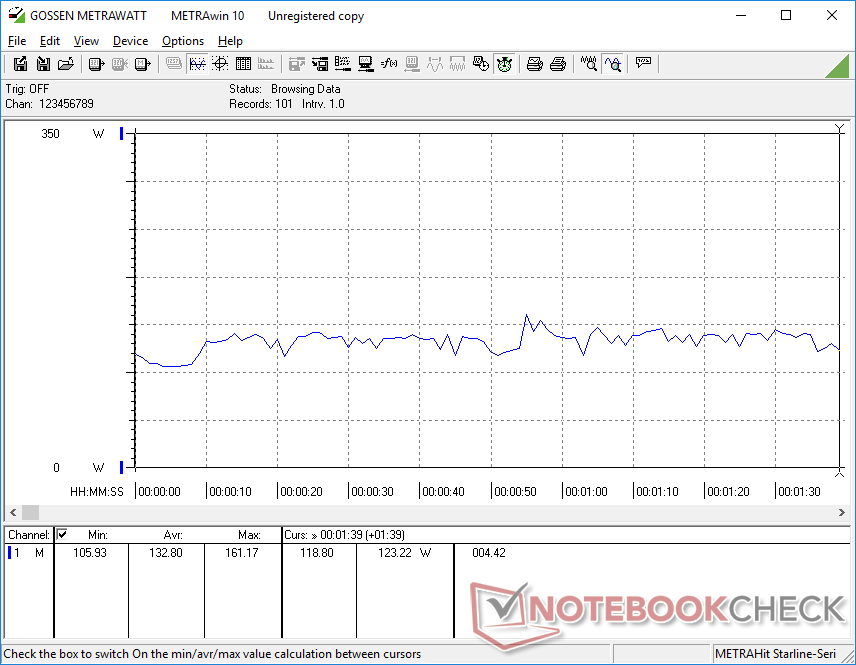
Power Consumption — Over 300 W When Gaming
Idling on desktop consumes between 13 W and 43 W depending on the power profile, GPU setting, and display brightness. In fact, 43 W is about the same as a Core U-powered Ultrabook like the Samsung Galaxy Book3 15 on maximum load. Simply switching from iGPU mode to dGPU mode would increase power draw by about 9 W on the Eurocom. Power consumption is therefore very sensitive to the active power profile.
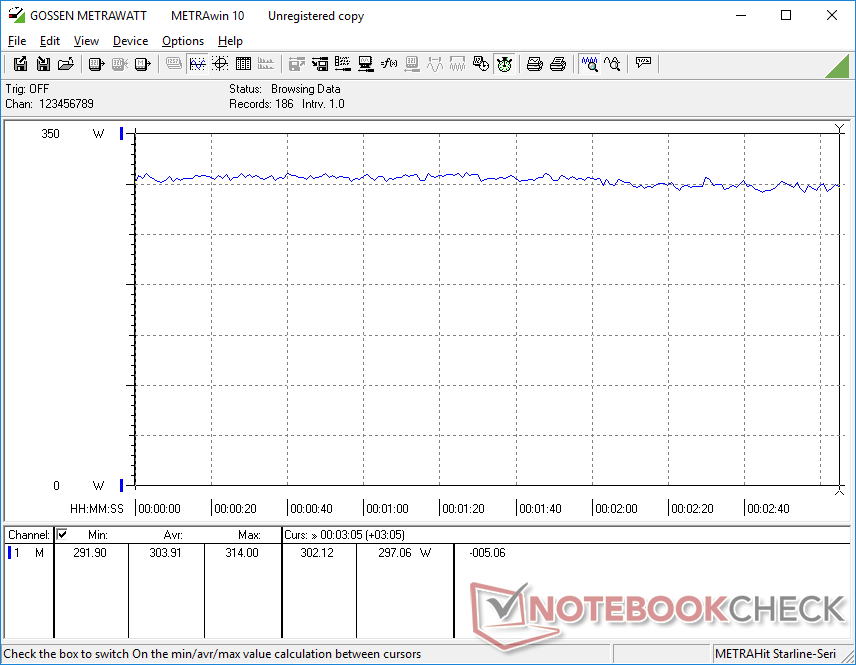
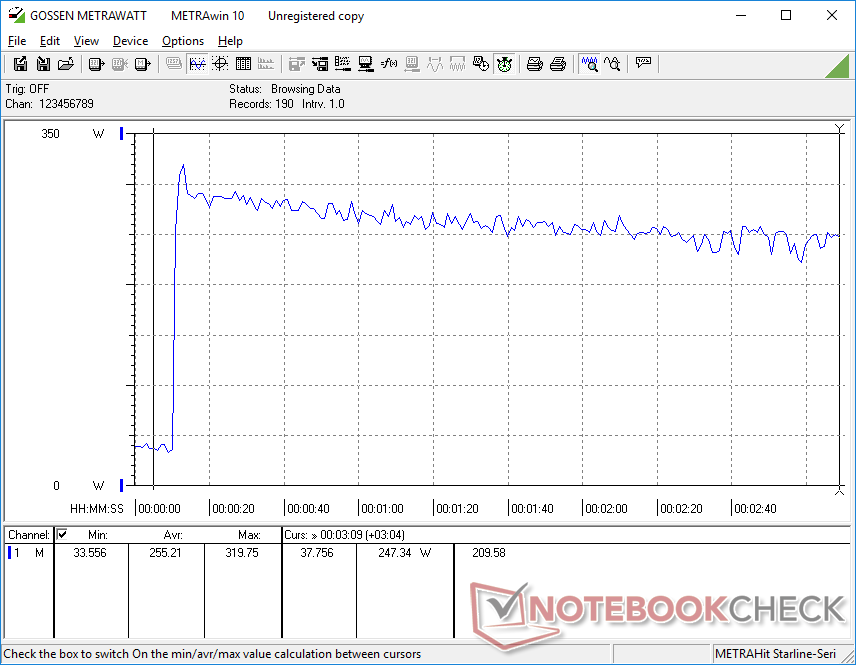
Average power consumption when gaming is very high at 304 W compared to 278 W each on the competing Asus ROG Strix Scar 17 or Aorus 17X with the same GeForce RTX 4090 GPU. The triple SSDs, fast 240 Hz refresh rate, high RAM capacity, and slightly higher GPU power draw all contribute to the higher consumption on the Eurocom.
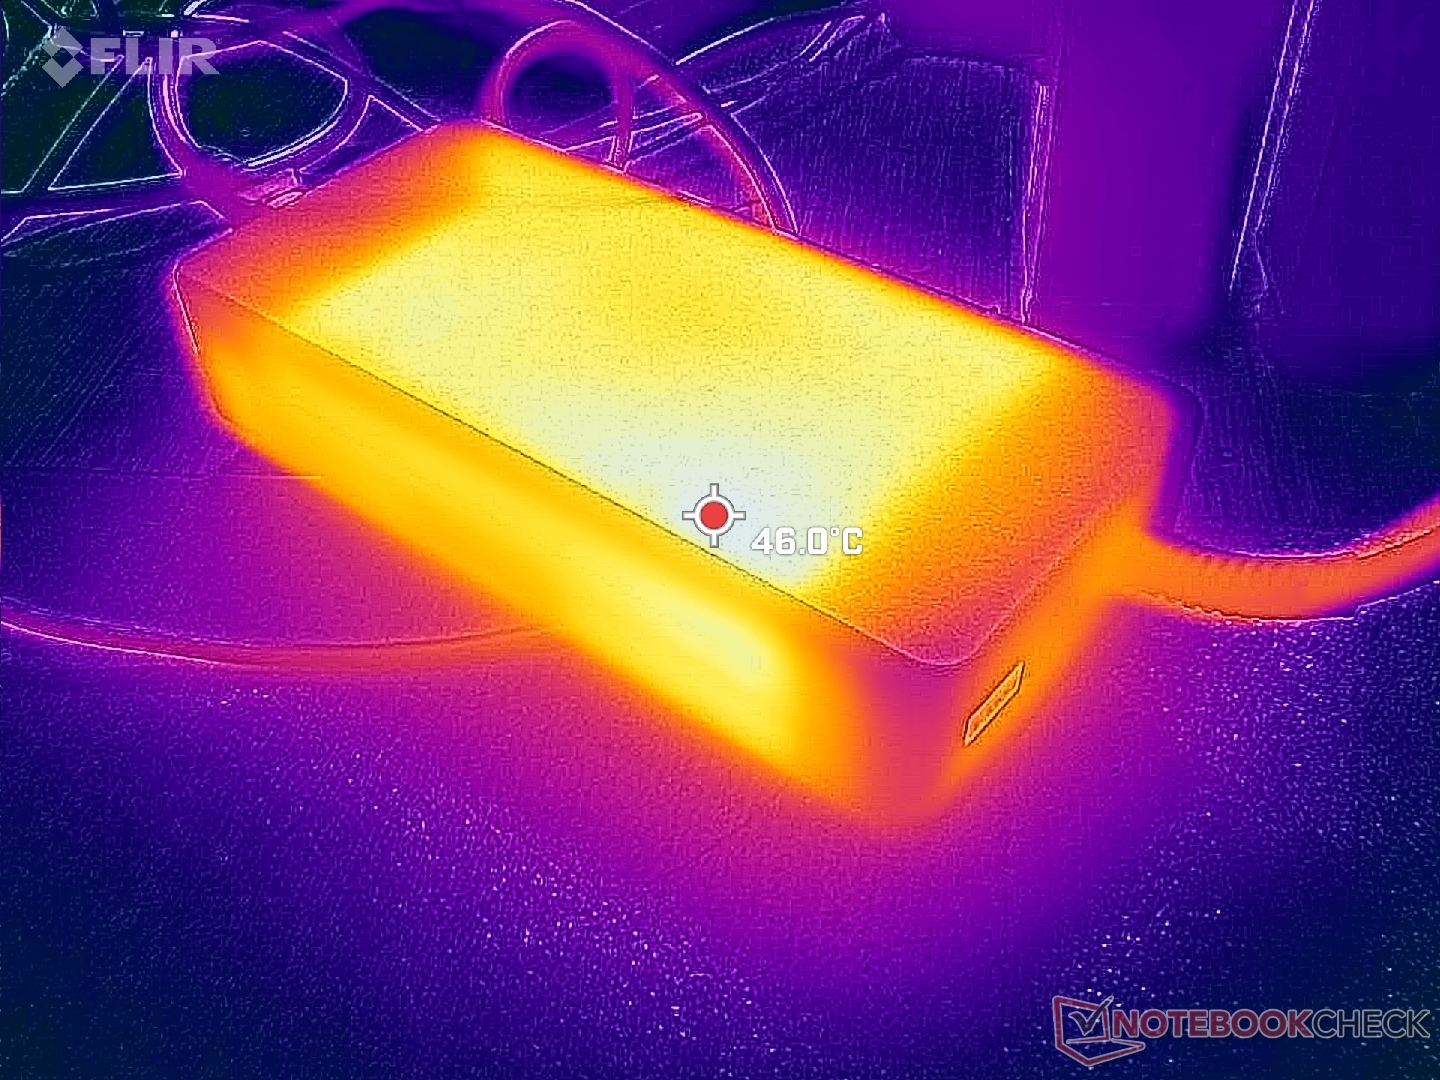
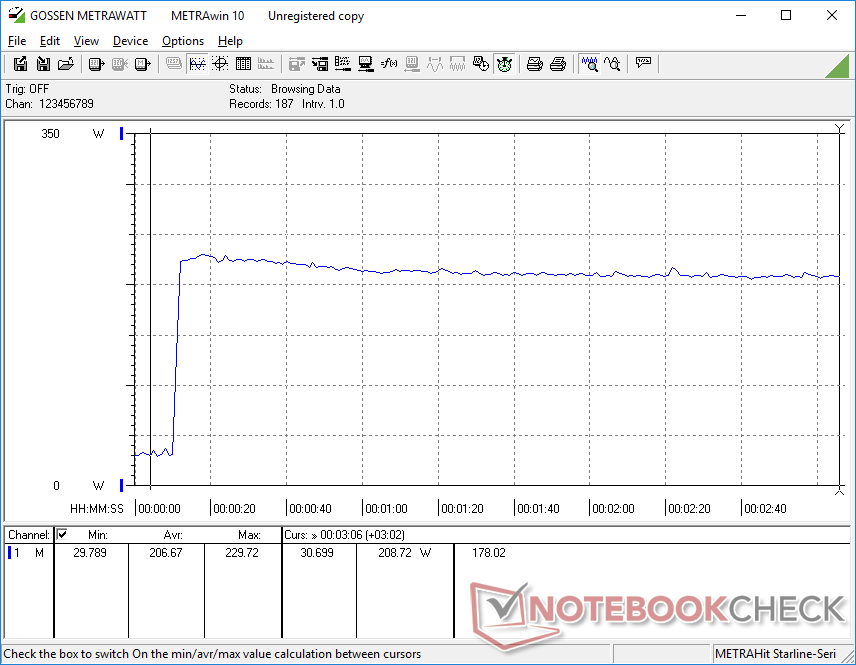
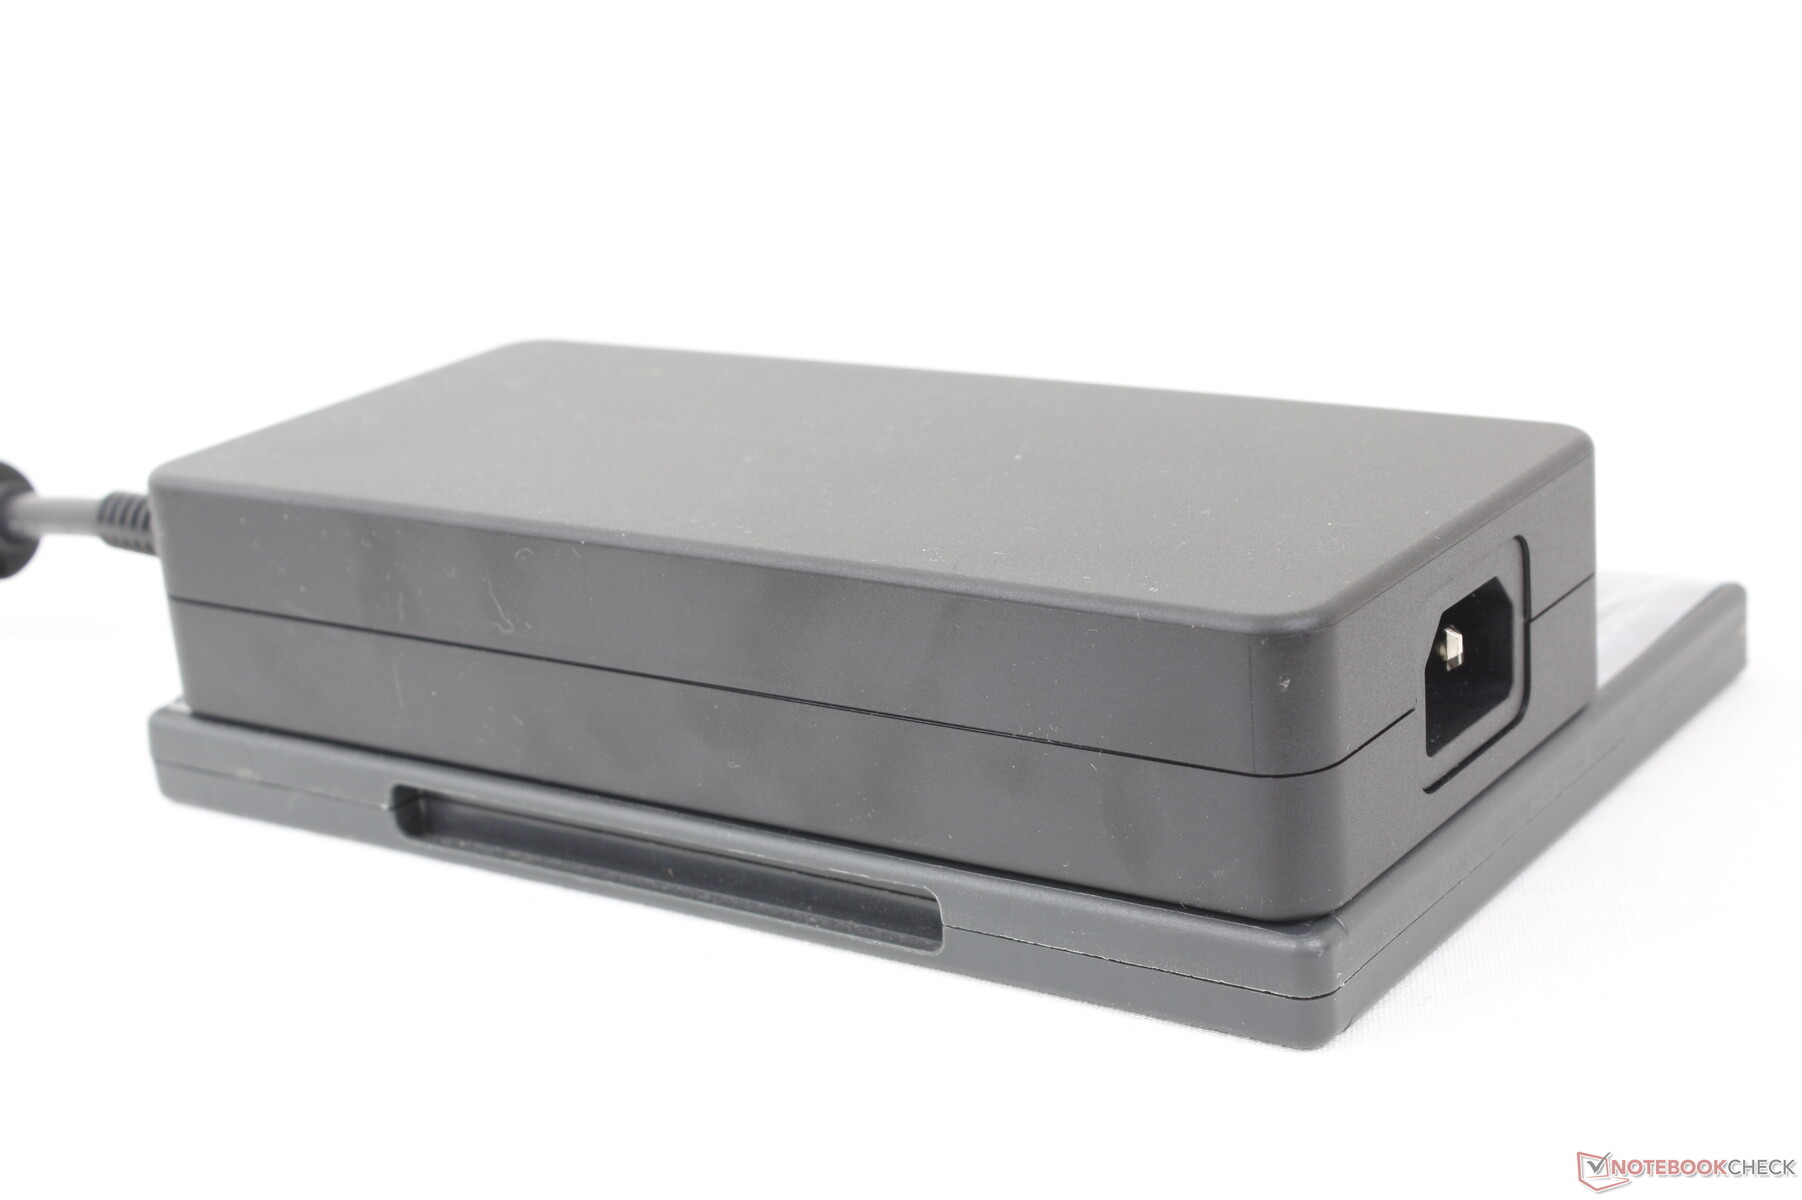
We're able to record a maximum draw of 320 W from the large (~18.5 x 8.5 x 3.5 cm) 330 W AC adapter when both the CPU and GPU are at 100 percent utilization. This rate would fall over time as shown by the graph below due to thermal limitations.
| Off / Standby | |
| Idle | |
| Load |
|
| Eurocom Raptor X17 i9-13900HX, NVIDIA GeForce RTX 4090 Laptop GPU, 3x Samsung SSD 980 Pro 1TB (RAID 0), IPS, 2560x1440, 17.30 | Asus ROG Strix Scar 17 G733PY-XS96 R9 7945HX, NVIDIA GeForce RTX 4090 Laptop GPU, SK hynix PC801 HFS001TEJ9X101N, IPS, 2560x1440, 17.30 | Aorus 17X AZF i9-13900HX, NVIDIA GeForce RTX 4090 Laptop GPU, Gigabyte AG470S1TB-SI B10, IPS, 2560x1440, 17.30 | MSI GE78HX 13VH-070US i9-13950HX, NVIDIA GeForce RTX 4080 Laptop GPU, Samsung PM9A1 MZVL22T0HBLB, IPS, 2560x1600, 17.00 | Eluktronics Mech-17 GP2 i9-13900HX, NVIDIA GeForce RTX 4090 Laptop GPU, Samsung PM9A1 MZVL21T0HCLR, IPS, 2560x1600, 17.00 | Alienware m17 R5 (R9 6900HX, RX 6850M XT) R9 6900HX, Radeon RX 6850M XT, SSSTC CA6-8D1024, IPS, 3840x2160, 17.00 | |
|---|---|---|---|---|---|---|
| Power Consumption | 5% | 13% | 3% | 5% | 27% | |
| Idle Minimum * | 13.4 | 14.5 -8% | 11 18% | 16.1 -20% | 14 -4% | 13 3% |
| Idle Average * | 22.2 | 21.1 5% | 17 23% | 24 -8% | 19.3 13% | 16.5 26% |
| Idle Maximum * | 42.4 | 42.8 -1% | 29 32% | 34 20% | 36.8 13% | 17 60% |
| Load Average * | 132.8 | 116.7 12% | 134 -1% | 123.6 7% | 117.2 12% | 93 30% |
| Witcher 3 ultra * | 304 | 278 9% | 278 9% | 286 6% | 304 -0% | 239 21% |
| Load Maximum * | 319.8 | 279.6 13% | 334 -4% | 285.7 11% | 342.5 -7% | 251 22% |
* ... smaller is better
Power Consumption Witcher 3 / Stresstest
Power Consumption external Monitor
Battery Life
Runtimes are pretty good considering how powerful the internals are. We're able to record just under 5 hours of real-world WLAN browsing when on the Balanced power profile with the iGPU active. Even so, competing models like the Aorus 17X or MSI GE78HX are each able to last over an hour longer than our Eurocom.
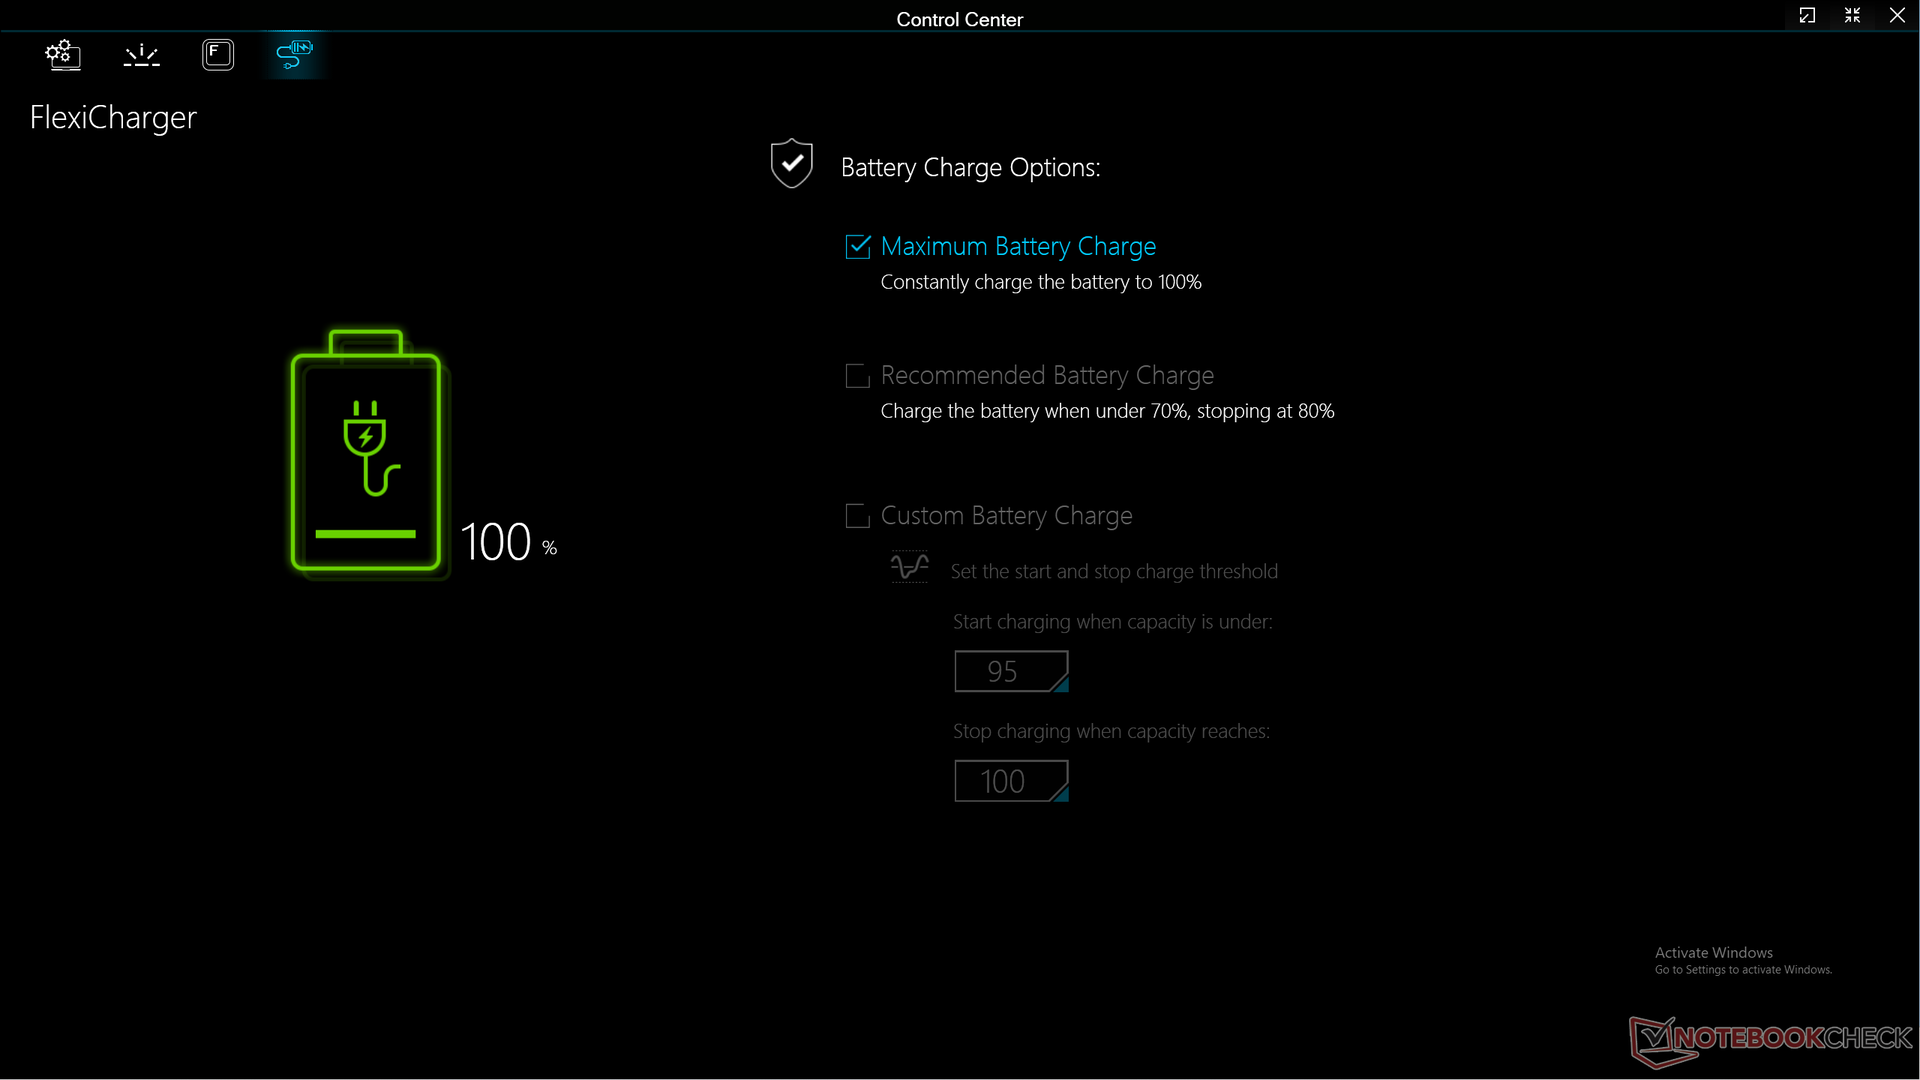
Charging from empty to full capacity with the included 330 W AC adapter is relatively slow at 2 to 2.5 hours. Charging via third-party USB-C AC adapters is supported, but note that it only works on just one of the two USB-C ports (the port closest to the rear).
| Eurocom Raptor X17 i9-13900HX, NVIDIA GeForce RTX 4090 Laptop GPU, 99 Wh | Asus ROG Strix Scar 17 G733PY-XS96 R9 7945HX, NVIDIA GeForce RTX 4090 Laptop GPU, 90 Wh | Aorus 17X AZF i9-13900HX, NVIDIA GeForce RTX 4090 Laptop GPU, 99 Wh | MSI GE78HX 13VH-070US i9-13950HX, NVIDIA GeForce RTX 4080 Laptop GPU, 99 Wh | Eluktronics Mech-17 GP2 i9-13900HX, NVIDIA GeForce RTX 4090 Laptop GPU, 99 Wh | Alienware m17 R5 (R9 6900HX, RX 6850M XT) R9 6900HX, Radeon RX 6850M XT, 97 Wh | |
|---|---|---|---|---|---|---|
| Battery Runtime | -17% | 20% | -3% | 2% | 8% | |
| Reader / Idle | 612 | 541 -12% | 439 -28% | |||
| WiFi v1.3 | 299 | 248 -17% | 389 30% | 363 21% | 305 2% | 290 -3% |
| Load | 91 | 128 41% | 89 -2% | 107 18% | ||
| H.264 | 403 | 294 |
Pros
Cons
Verdict — Nails Performance, But Could Use More TLC

The best aspect of the Raptor X17 is its very fast performance relative to the thin profile. It will unabashedly run very warm and very loud in order to squeeze as much performance out of the CPU and GPU as possible. Performance hunters in particular are likely to appreciate this approach as well as the support for up to three PCIe4 x4 NVMe SSDs.
Unfortunately, there are a handful of drawbacks to keep in mind. At over 60 dB(A) when gaming, the system is noticeably louder than most other gaming laptops in the market. When competing models like the MSI GE78HX or Asus ROG Strix Scar 17 can offer similar processor options while running 10 dB(A) quieter when gaming, it becomes a tougher sell to prefer the Raptor X17 over many alternatives in the market. The much heavier weight does it no favors, either.
The hardware and performance are solid, but other aspects like the weak speakers, very loud fans, and unrefined Control Center software do not properly reflect the high asking price.
There are a few more details we think could have been better as well. The confusing power profiles, pulsing fan behavior, concealed GPU modes, moderate uneven backlight bleeding, and optional calibrated display are all unfortunate to see on a high-end laptop starting at well over $3000 USD. Eurocom says it is currently in the process of redesigning the BIOS menu and Control Center software which should hopefully address some of our main points.
Price and Availability
Eurocom is now shipping the Raptor X17 in North America starting at $3499 USD for the base configuration up to over $6000 as configured with our test unit.
Eurocom Raptor X17
-
05/18/2023 v7
Allen Ngo
More articles related to this device
Eurocom Raptor X17 (Raptor Series)Related Articles


Transparency
The present review sample was made available to the author as a loan by the manufacturer or a shop for the purposes of review. The lender had no influence on this review, nor did the manufacturer receive a copy of this review before publication. There was no obligation to publish this review.
Pricecompare
