 Deutsch
 English
 Español
 Français
 Italiano
 Nederlands
 Polski
 Português
 Русский
 Türkçe
 Svenska
 Chinese
 Magyar
Eurocom Raptor X15 review: LGA1700 Core i7-12700K in a laptop
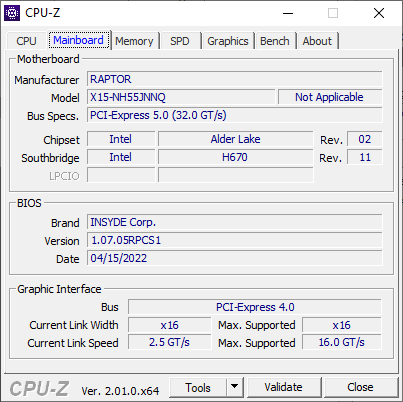
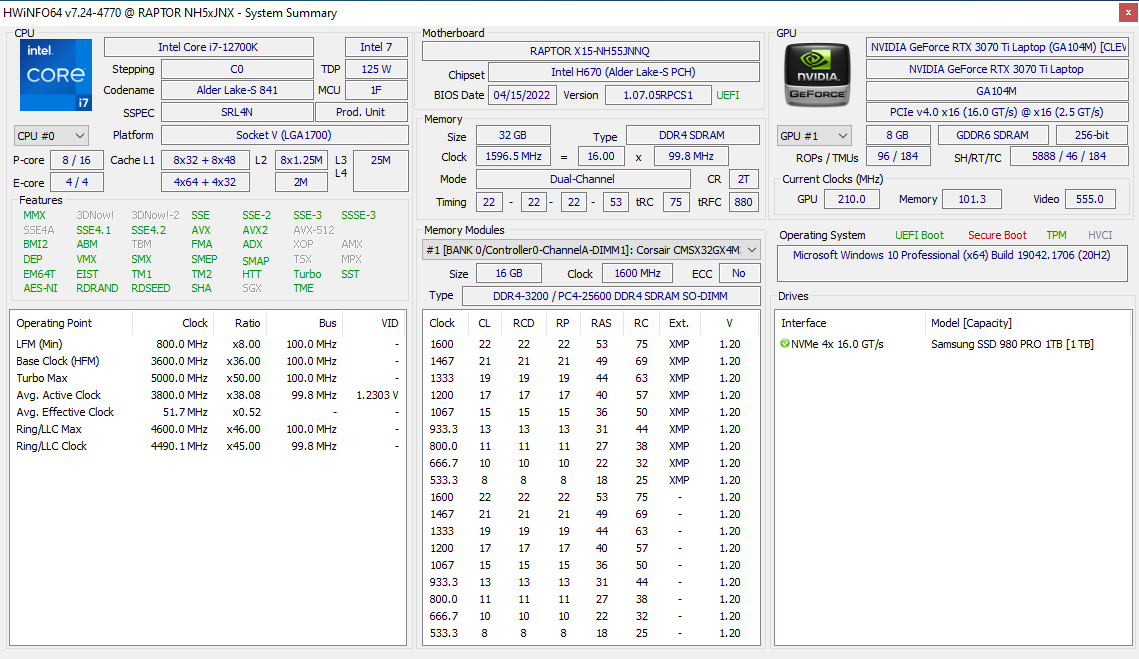
The chassis of the Raptor X15 is similar to the Clevo NH57AF1 which Schenker also uses for its XMG Apex 15 laptop. Thus, we recommend checking out our Schenker review page as our comments on the ports and overall design of the model all apply here for the Raptor X15. This page will instead focus on the performance of the Raptor X15 and what users can expect from the 12th gen Core i7-12700K CPU when applied to a laptop form factor.
The Raptor X15 competes against other non-ultrathin enthusiast 15.6-inch gaming laptops like the MSI GE66, Gigabyte A5 X1, Asus TUF Gaming A15, or Razer Blade 15. However, a key differentiating factor is its use of a LGA1700 socket desktop CPU instead of a typical mobile H-series processor.
(June 14, 2022 update: The manufacturer has clarified to us that the Raptor X15 is not based on the Clevo NH57AF1 model despite the chassis similarities. The Sckenker model is based on AMD while the Raptor X15 is based on Intel. Schenker has no relationship to the Raptor X15.)
More Eurocom reviews:
Potential Competitors in Comparison
Rating | Date | Model | Weight | Height | Size | Resolution | Best Price |
|---|---|---|---|---|---|---|---|
| 86.1 % | 06/2022 | Eurocom Raptor X15 i7-12700K, GeForce RTX 3070 Ti Laptop GPU | 2.7 kg | 32.5 mm | 15.60" | 1920x1080 | |
| 87.4 % | 06/2022 | MSI Raider GE66 12UHS i9-12900HK, GeForce RTX 3080 Ti Laptop GPU | 2.4 kg | 23.4 mm | 15.60" | 3840x2160 | |
| 88.3 % | 05/2022 | Razer Blade 15 Advanced Model Early 2022 i7-12800H, GeForce RTX 3080 Ti Laptop GPU | 2.1 kg | 16.99 mm | 15.60" | 1920x1080 | |
| 85.2 % | 03/2022 | Eurocom RX315 NH57AF1 i7-11800H, GeForce RTX 3070 Laptop GPU | 2 kg | 20 mm | 15.60" | 1920x1080 | |
| 84.1 % | 01/2022 | Gigabyte A5 X1 R9 5900HX, GeForce RTX 3070 Laptop GPU | 2.2 kg | 25.3 mm | 15.60" | 1920x1080 | |
| 85 % | 07/2021 | Asus TUF Gaming A15 FA506QR-AZ061T R7 5800H, GeForce RTX 3070 Laptop GPU | 2.3 kg | 24 mm | 15.60" | 1920x1080 |
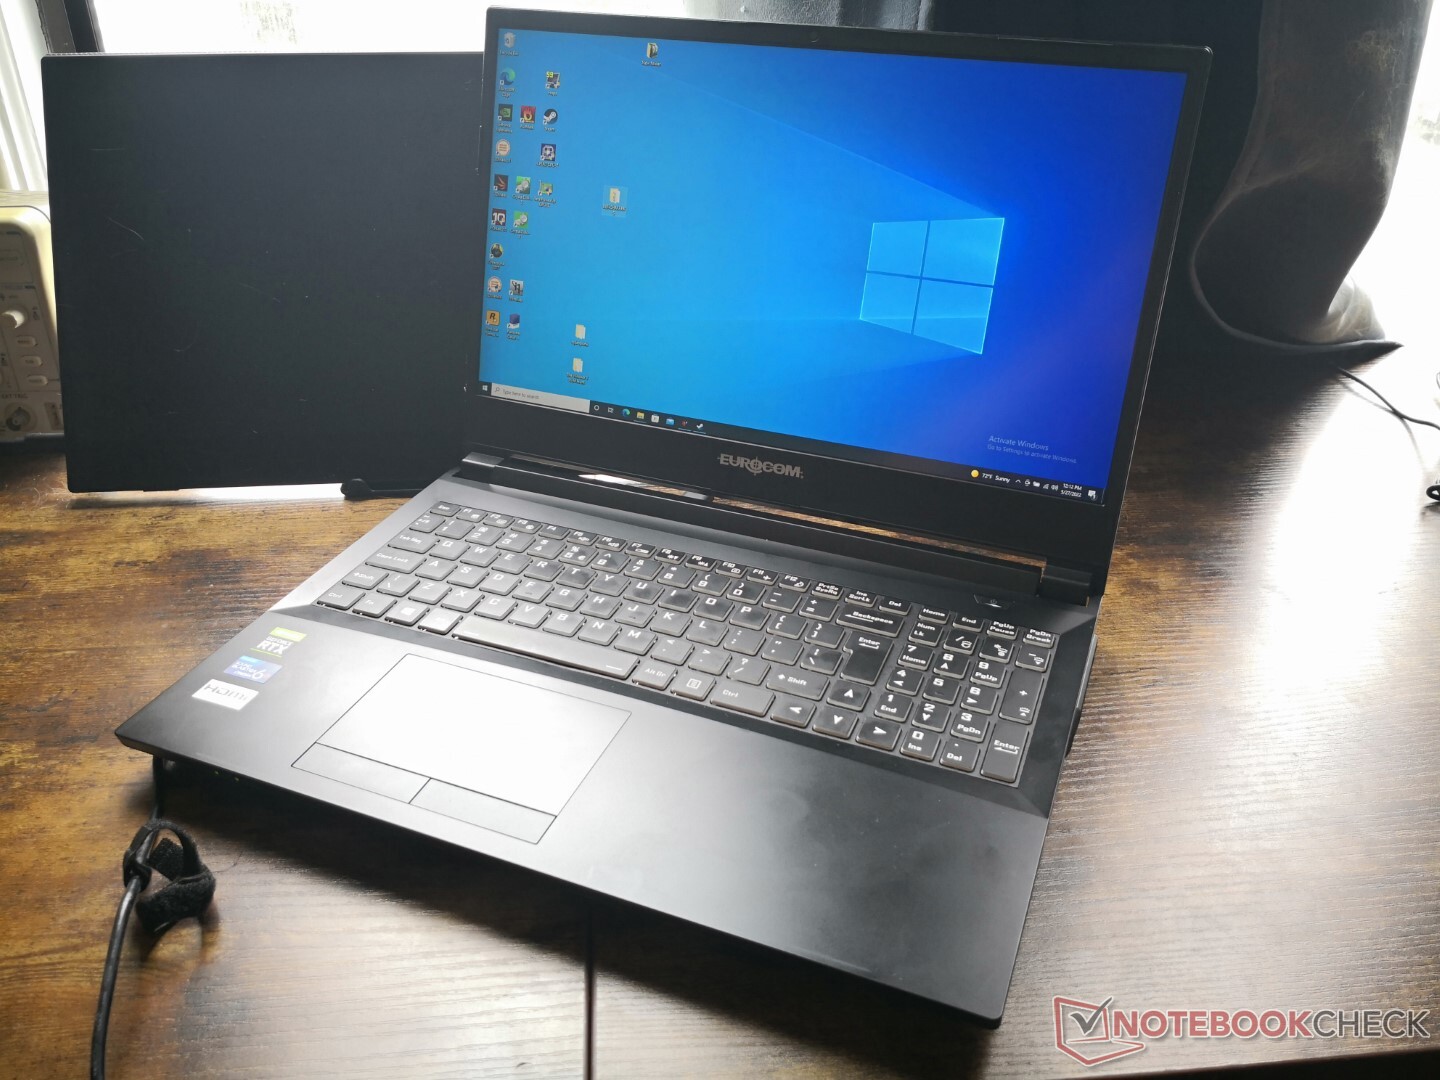
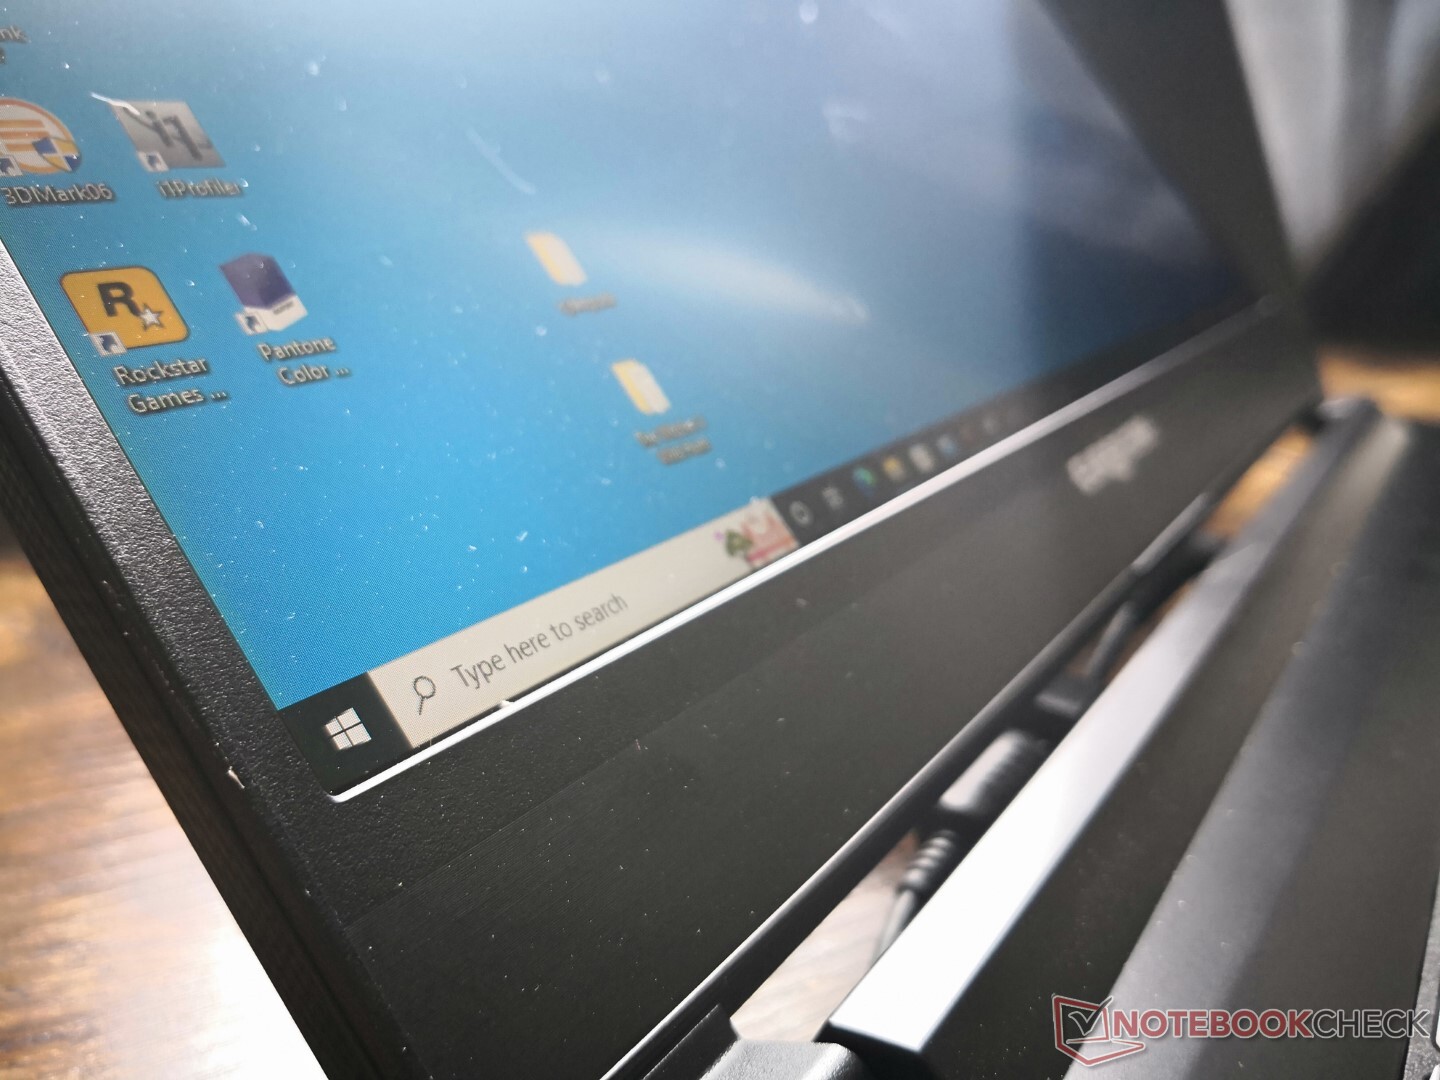
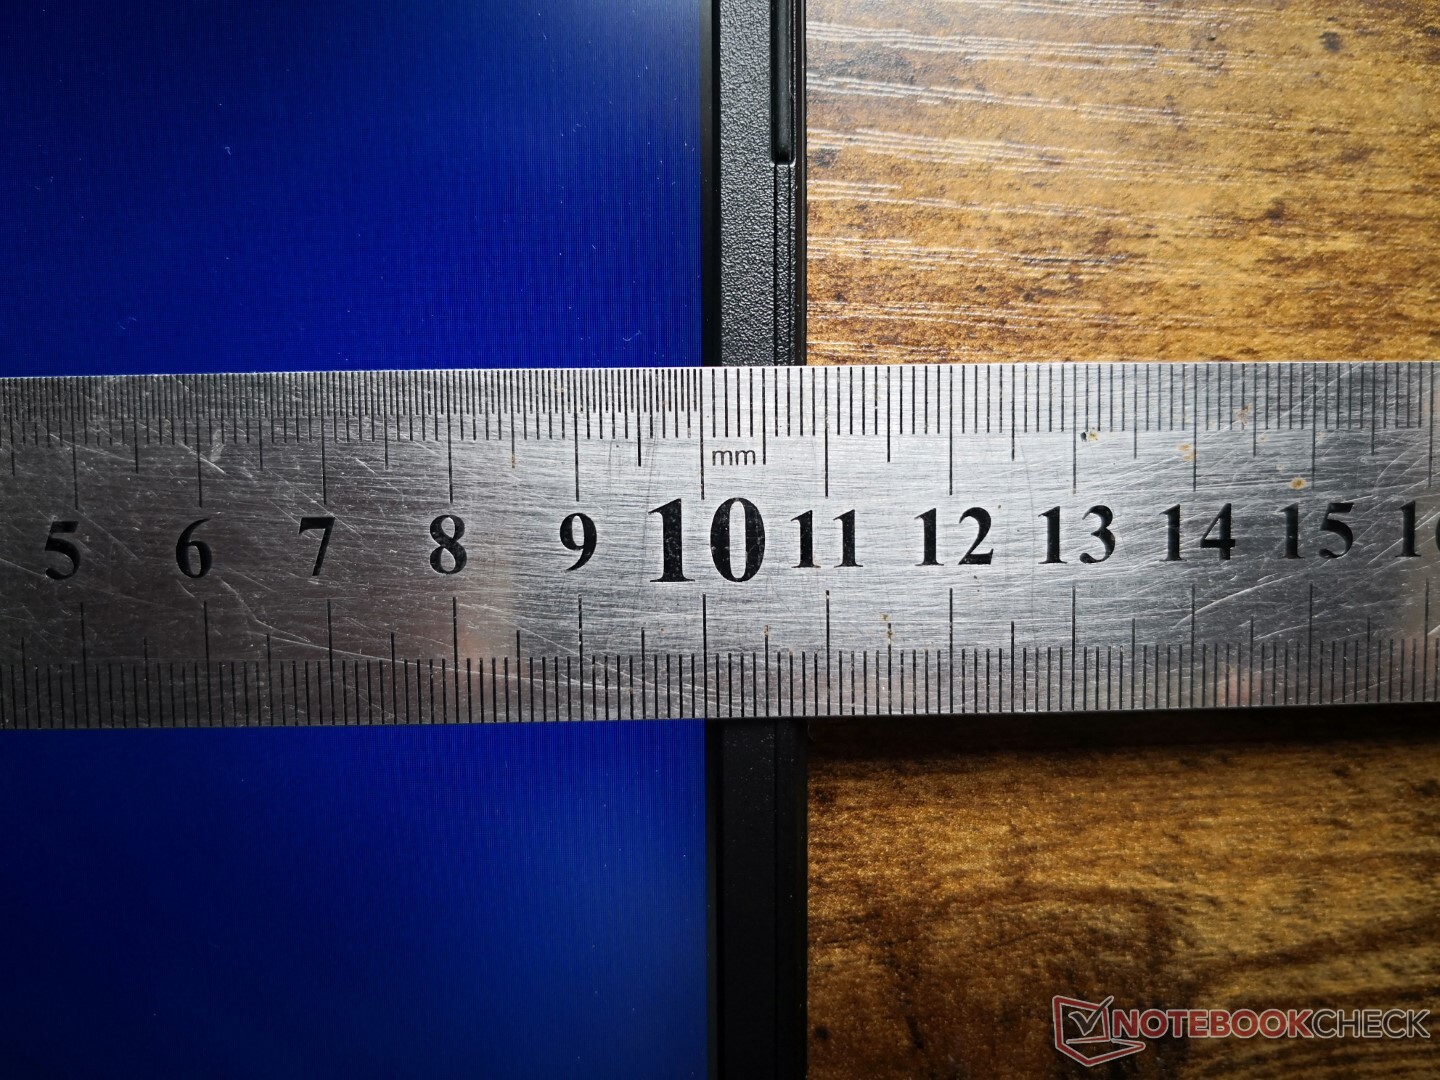
Case
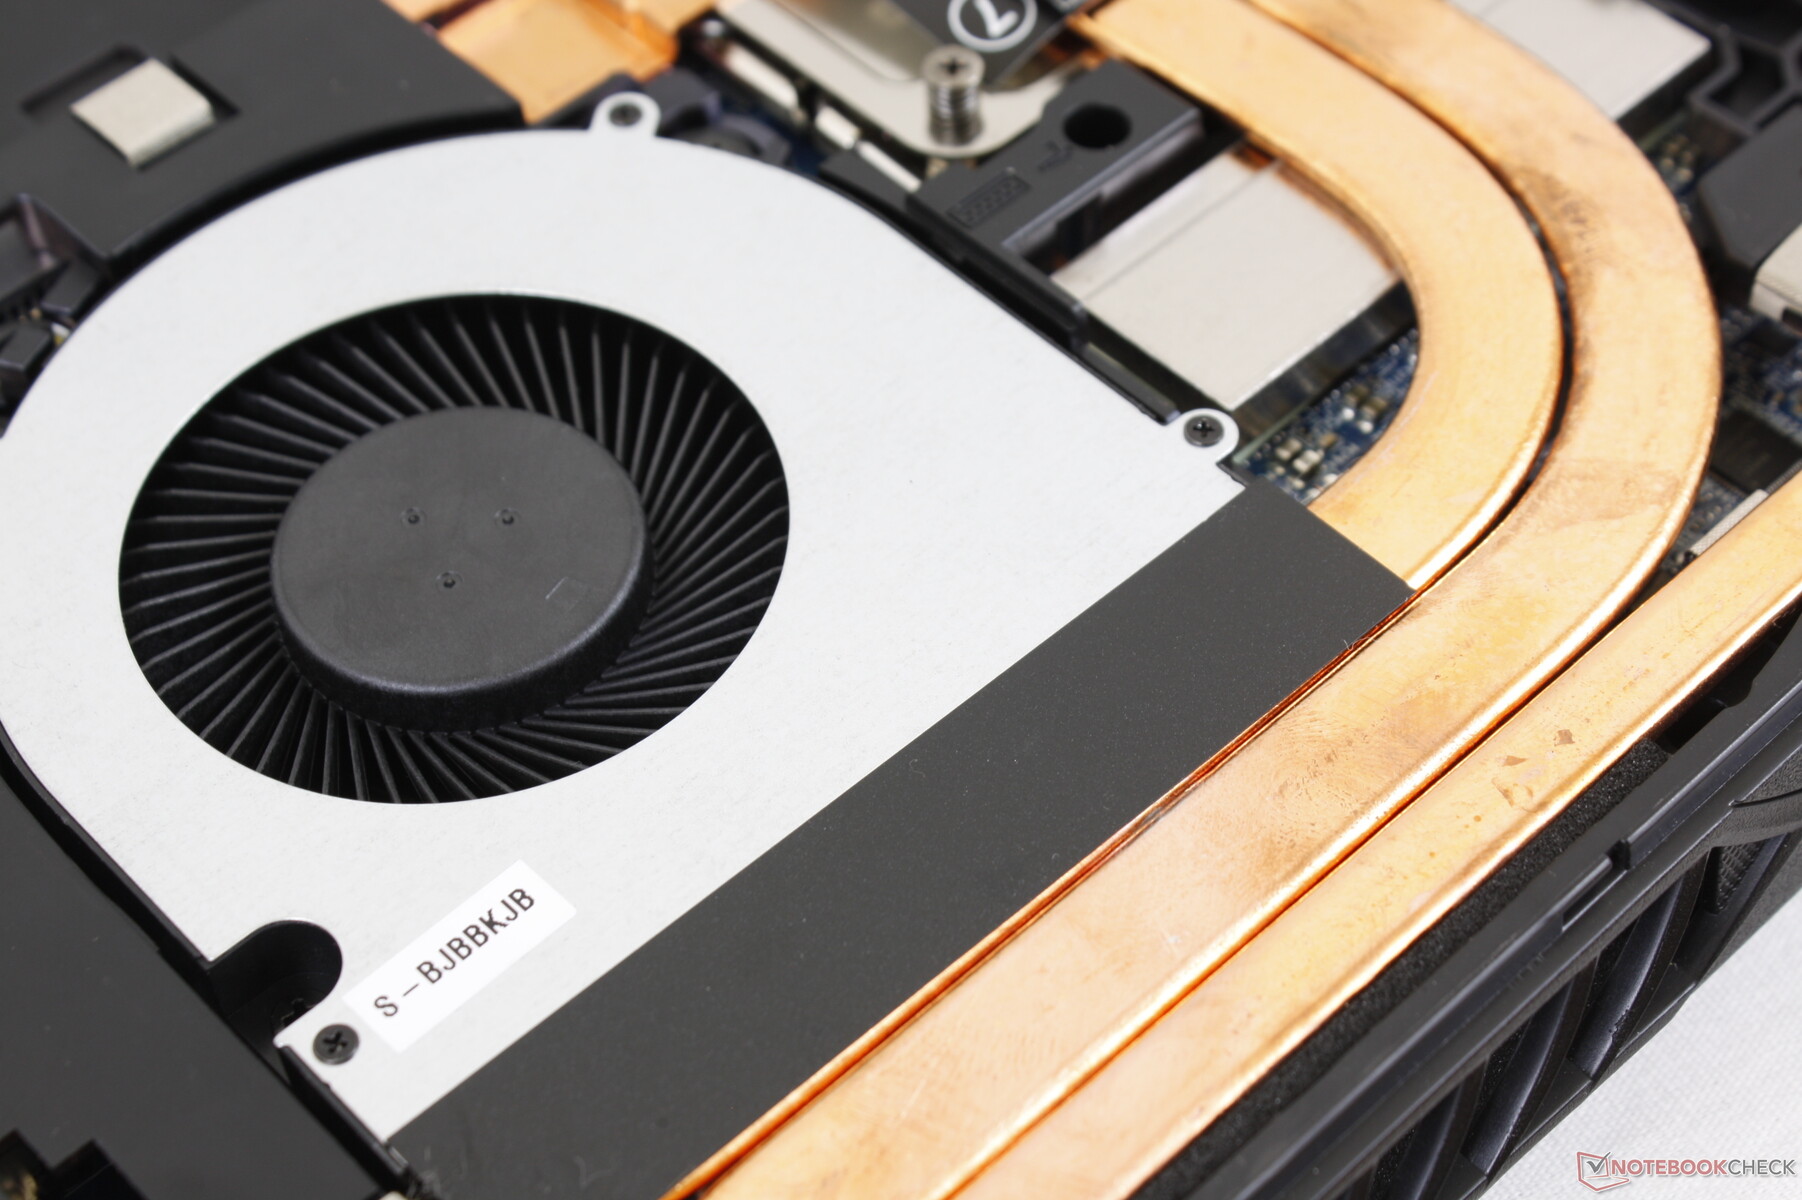
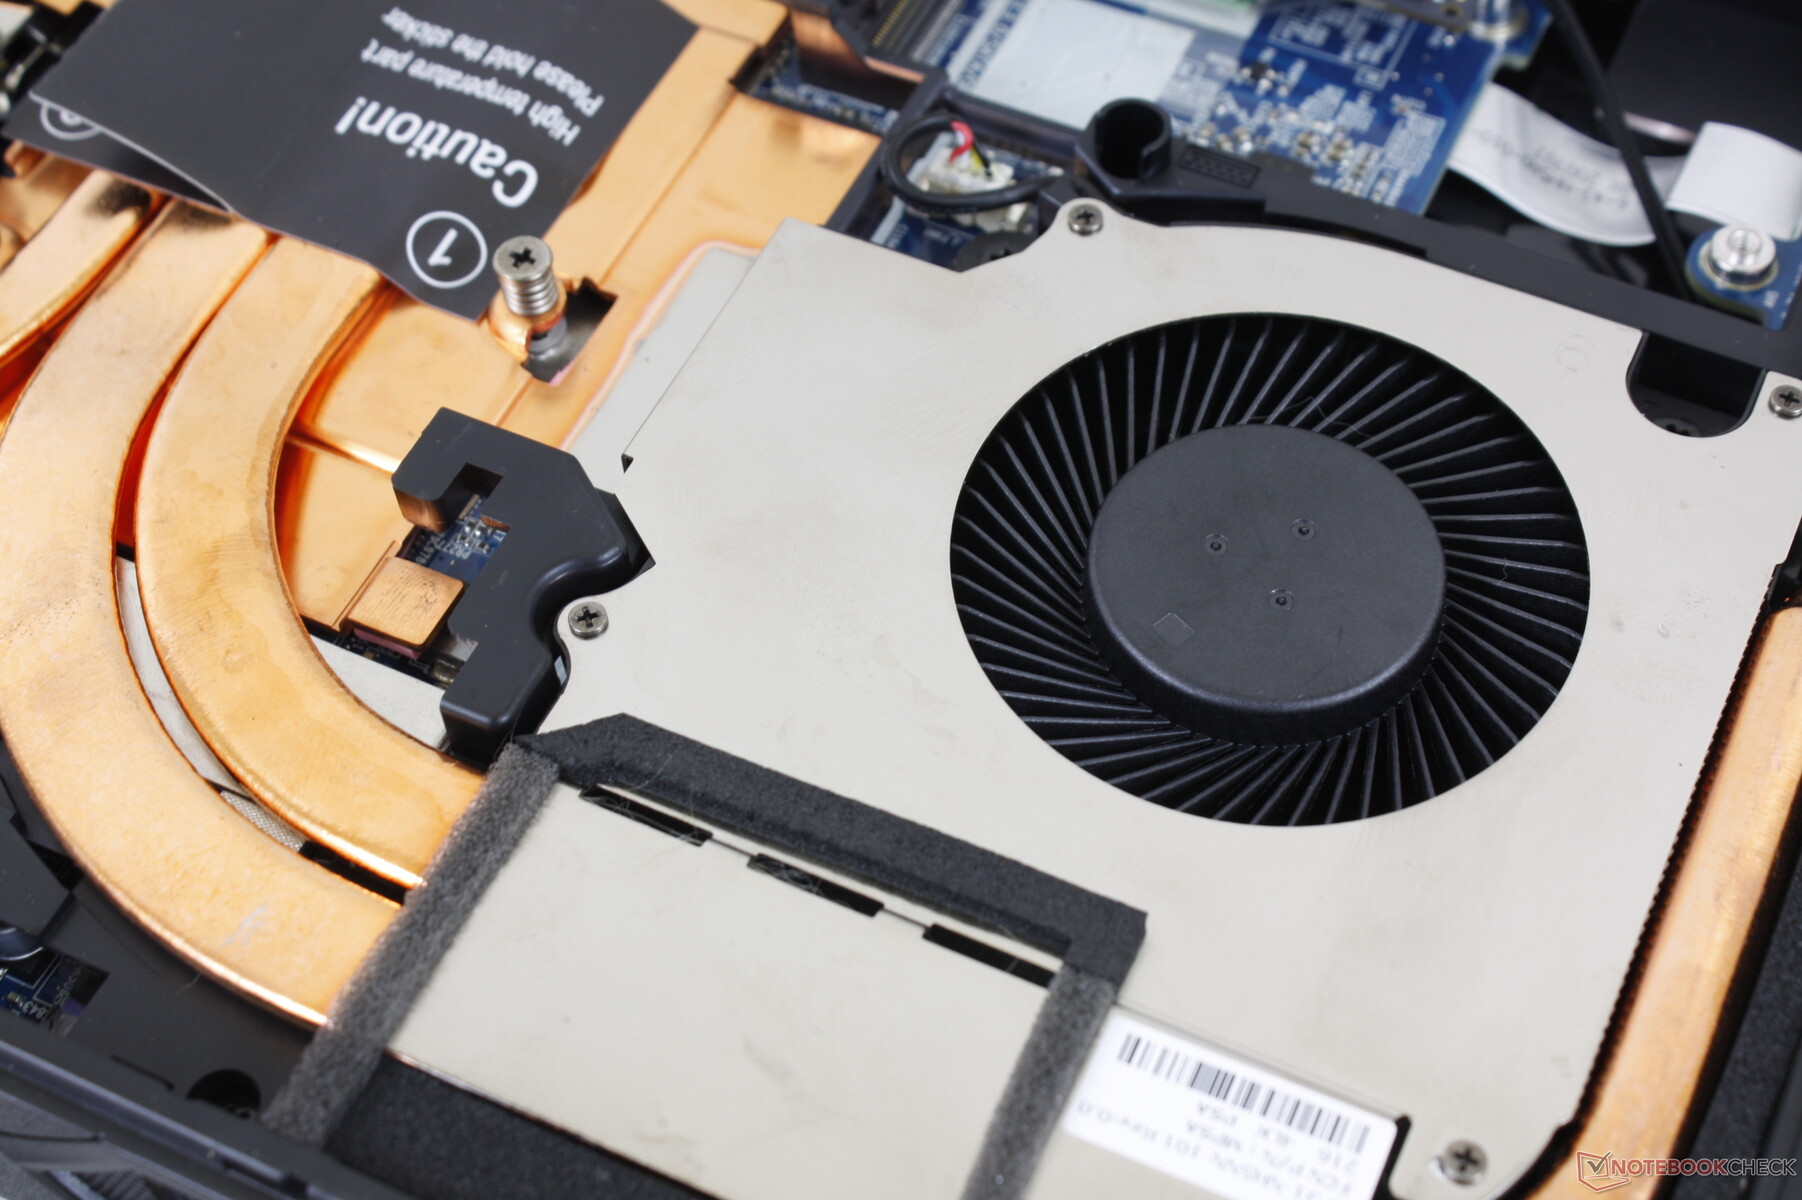
At 2.7 kg and 32.5 mm thick, the Raptor X15 is heavier and thicker than most other 15.6-inch gaming laptops including the MSI GE66 or Asus TUF Gaming A15. The extra weight can be partly attributed to the bulkier cooling solution required to adequately house and cool the LGA1700 socket and processor.
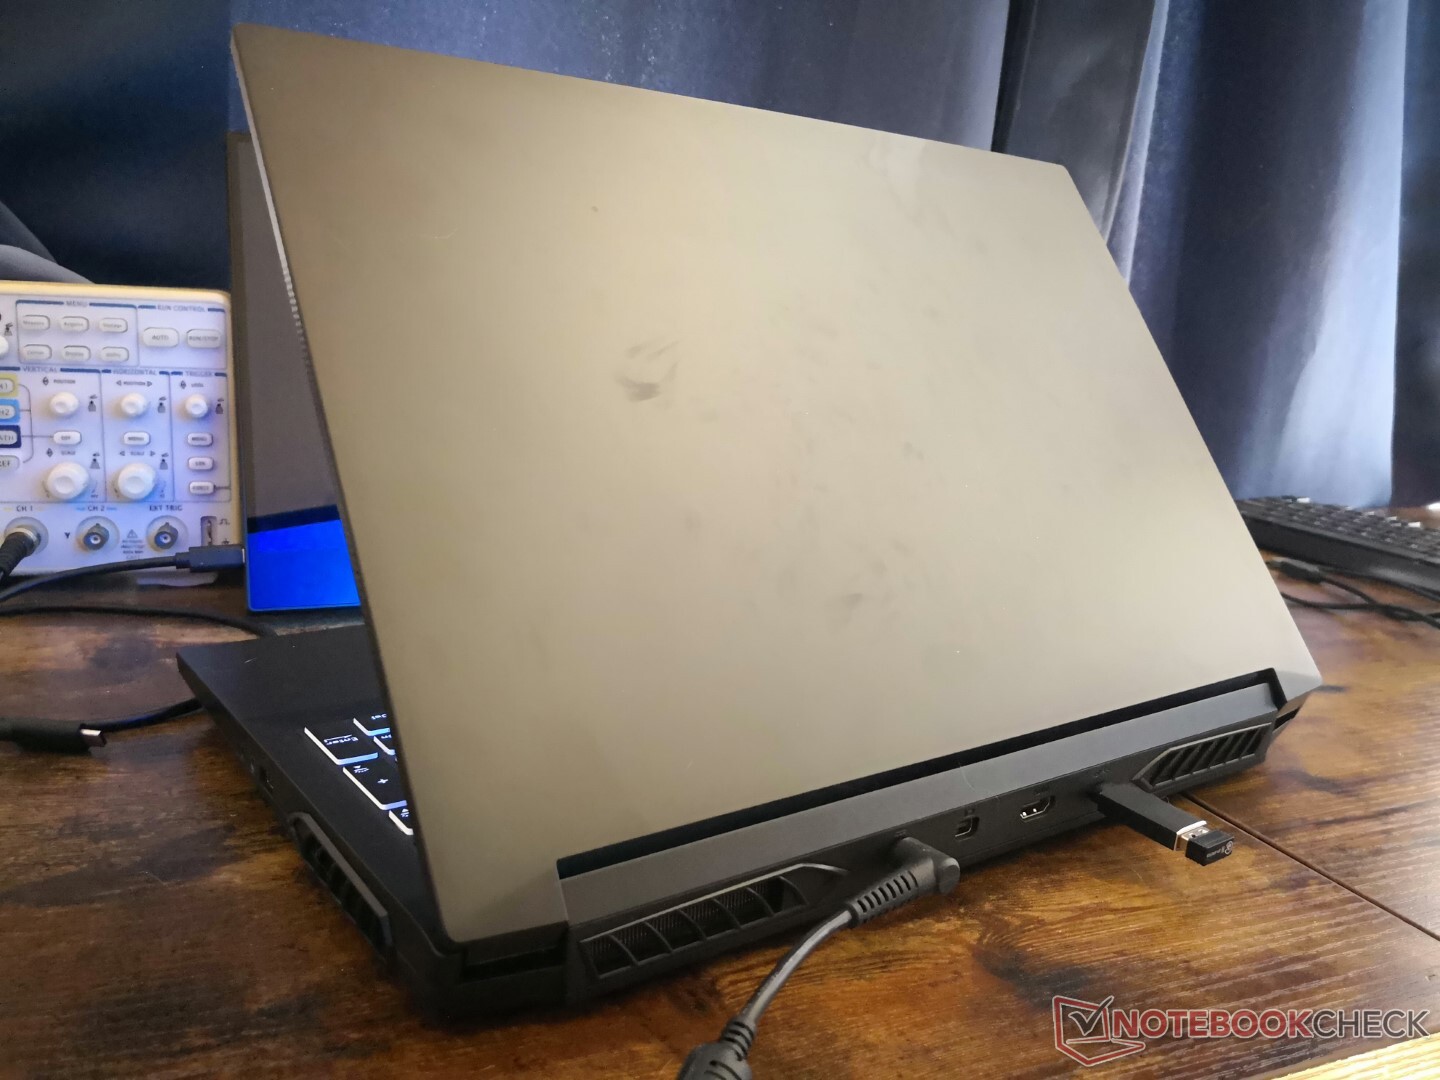
Connectivity
Ports options are varied and identical to the Schenker XMG Apex 15. Note that there is only one USB-C port with support for DisplayPort but not Thunderbolt or Power Delivery unlike on many other Intel-powered gaming laptops like the Razer Blade series or the MSI GS series.
SD Card Reader
Strangely, the model integrates a microSD card reader instead of a full-size one despite the large and relatively thick form factor. Transfer rates are only average at less than half the speed of the card reader on the Dell XPS 15.
| SD Card Reader | |
| average JPG Copy Test (av. of 3 runs) | |
| Dell XPS 15 9510 i5 11400H FHD (AV Pro V60) | |
| Asus ZenBook Flip 14 UN5401QA-KN085W (AV Pro SD microSD 128 GB V60) | |
| Asus Zenbook Pro 15 OLED UM535Q (Toshiba Exceria Pro SDXC 64 GB UHS-II) | |
| Eurocom Raptor X15 (AV Pro V60) | |
| Asus ZenBook 14X OLED UX5400EA-L7154W | |
| maximum AS SSD Seq Read Test (1GB) | |
| Dell XPS 15 9510 i5 11400H FHD (AV Pro V60) | |
| Eurocom Raptor X15 (AV Pro V60) | |
| Asus ZenBook Flip 14 UN5401QA-KN085W (AV Pro SD microSD 128 GB V60) | |
| Asus Zenbook Pro 15 OLED UM535Q (Toshiba Exceria Pro SDXC 64 GB UHS-II) | |
| Asus ZenBook 14X OLED UX5400EA-L7154W | |
Communication
The Intel AX200/201 is available as the highest-end option for Wi-Fi 6 and Bluetooth 5.2 connectivity. We experienced no issues when paired to our Asus GT-AXE11000 test router.
Wi-Fi 6E is unfortunately not compatible.
| Networking | |
| iperf3 transmit AX12 | |
| Gigabyte A5 X1 | |
| Asus TUF Gaming A15 FA506QR-AZ061T | |
| Eurocom RX315 NH57AF1 | |
| iperf3 receive AX12 | |
| Asus TUF Gaming A15 FA506QR-AZ061T | |
| Gigabyte A5 X1 | |
| Eurocom RX315 NH57AF1 | |
| iperf3 receive AXE11000 | |
| Razer Blade 15 Advanced Model Early 2022 | |
| MSI Raider GE66 12UHS | |
| Eurocom Raptor X15 | |
| iperf3 transmit AXE11000 | |
| Razer Blade 15 Advanced Model Early 2022 | |
| MSI Raider GE66 12UHS | |
| Eurocom Raptor X15 | |
Webcam
The webcam is poor at just 720p compared to 1080p on some other gaming laptops like the Razer Blade 15. There is no support for Windows Hello, either. The camera can be disabled electronically via the F10 key in place of a physical shutter.


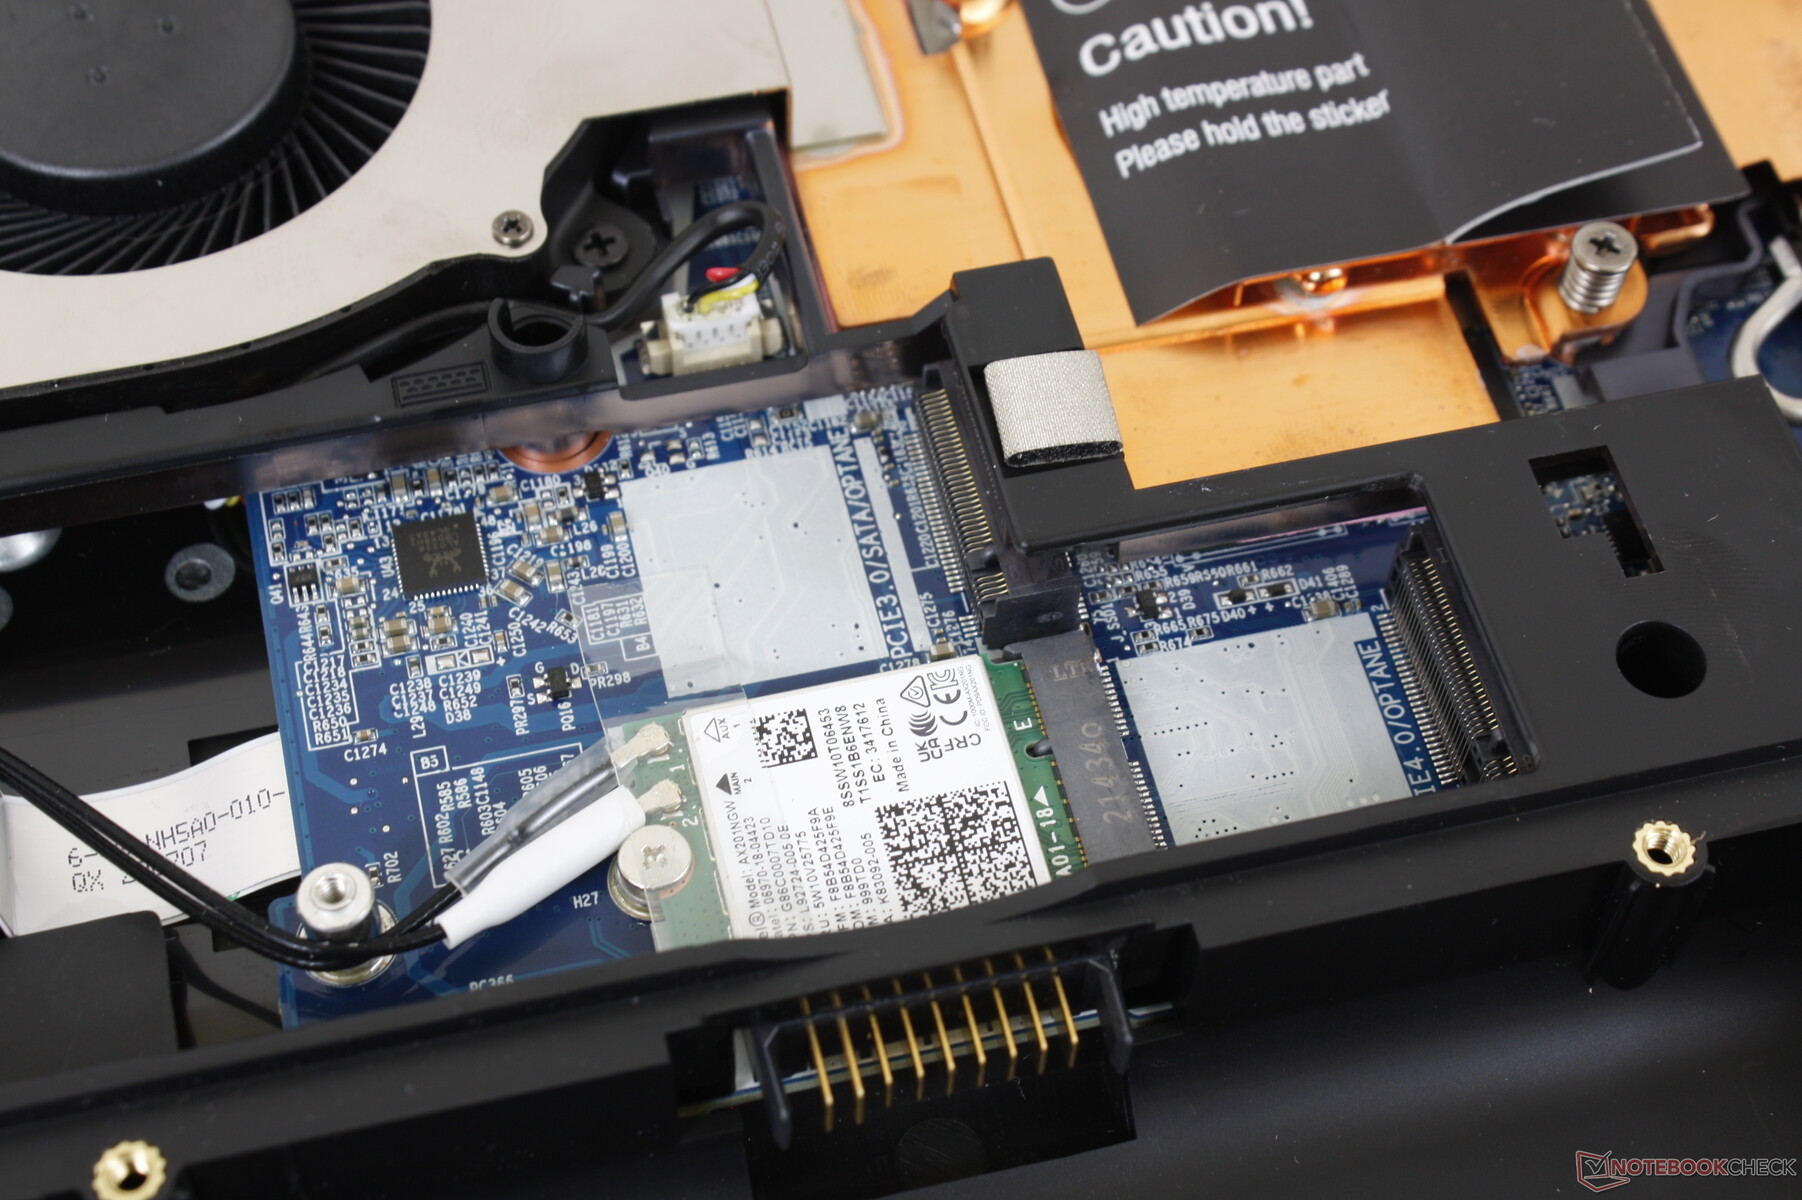
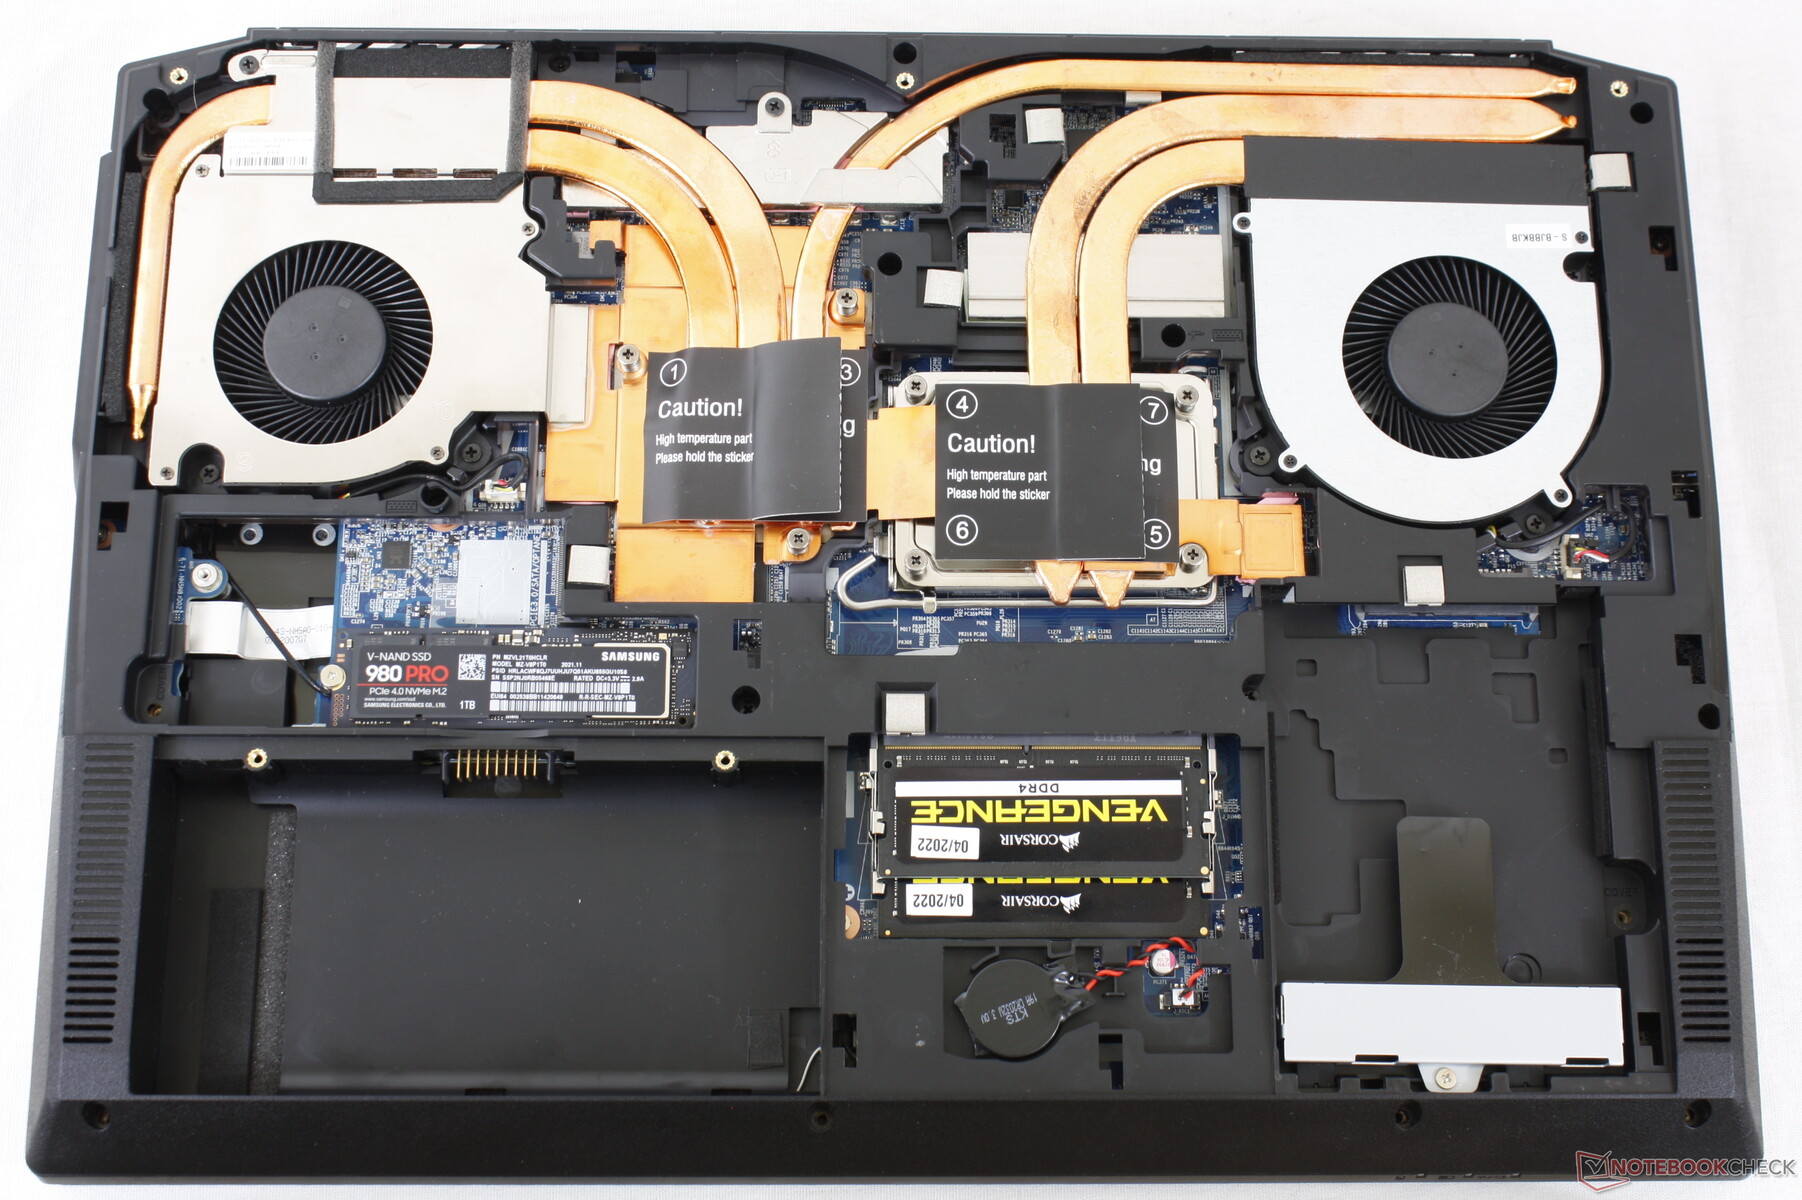
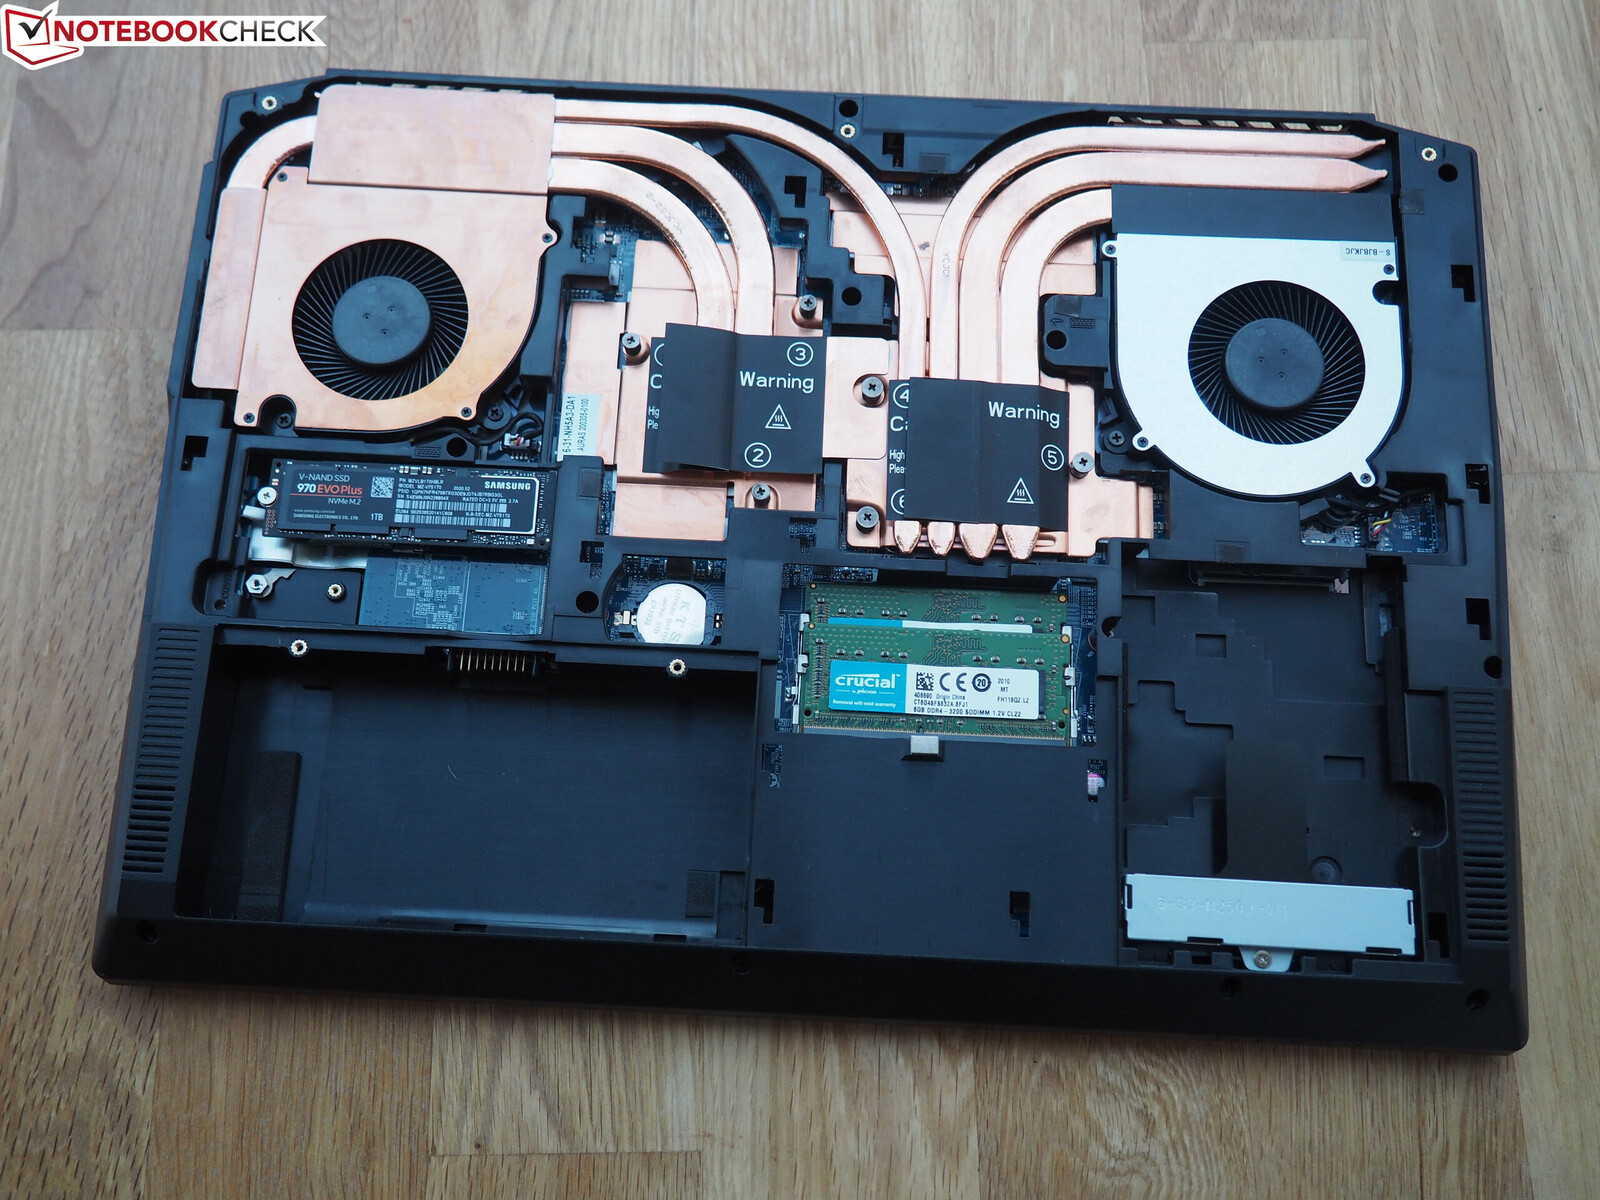
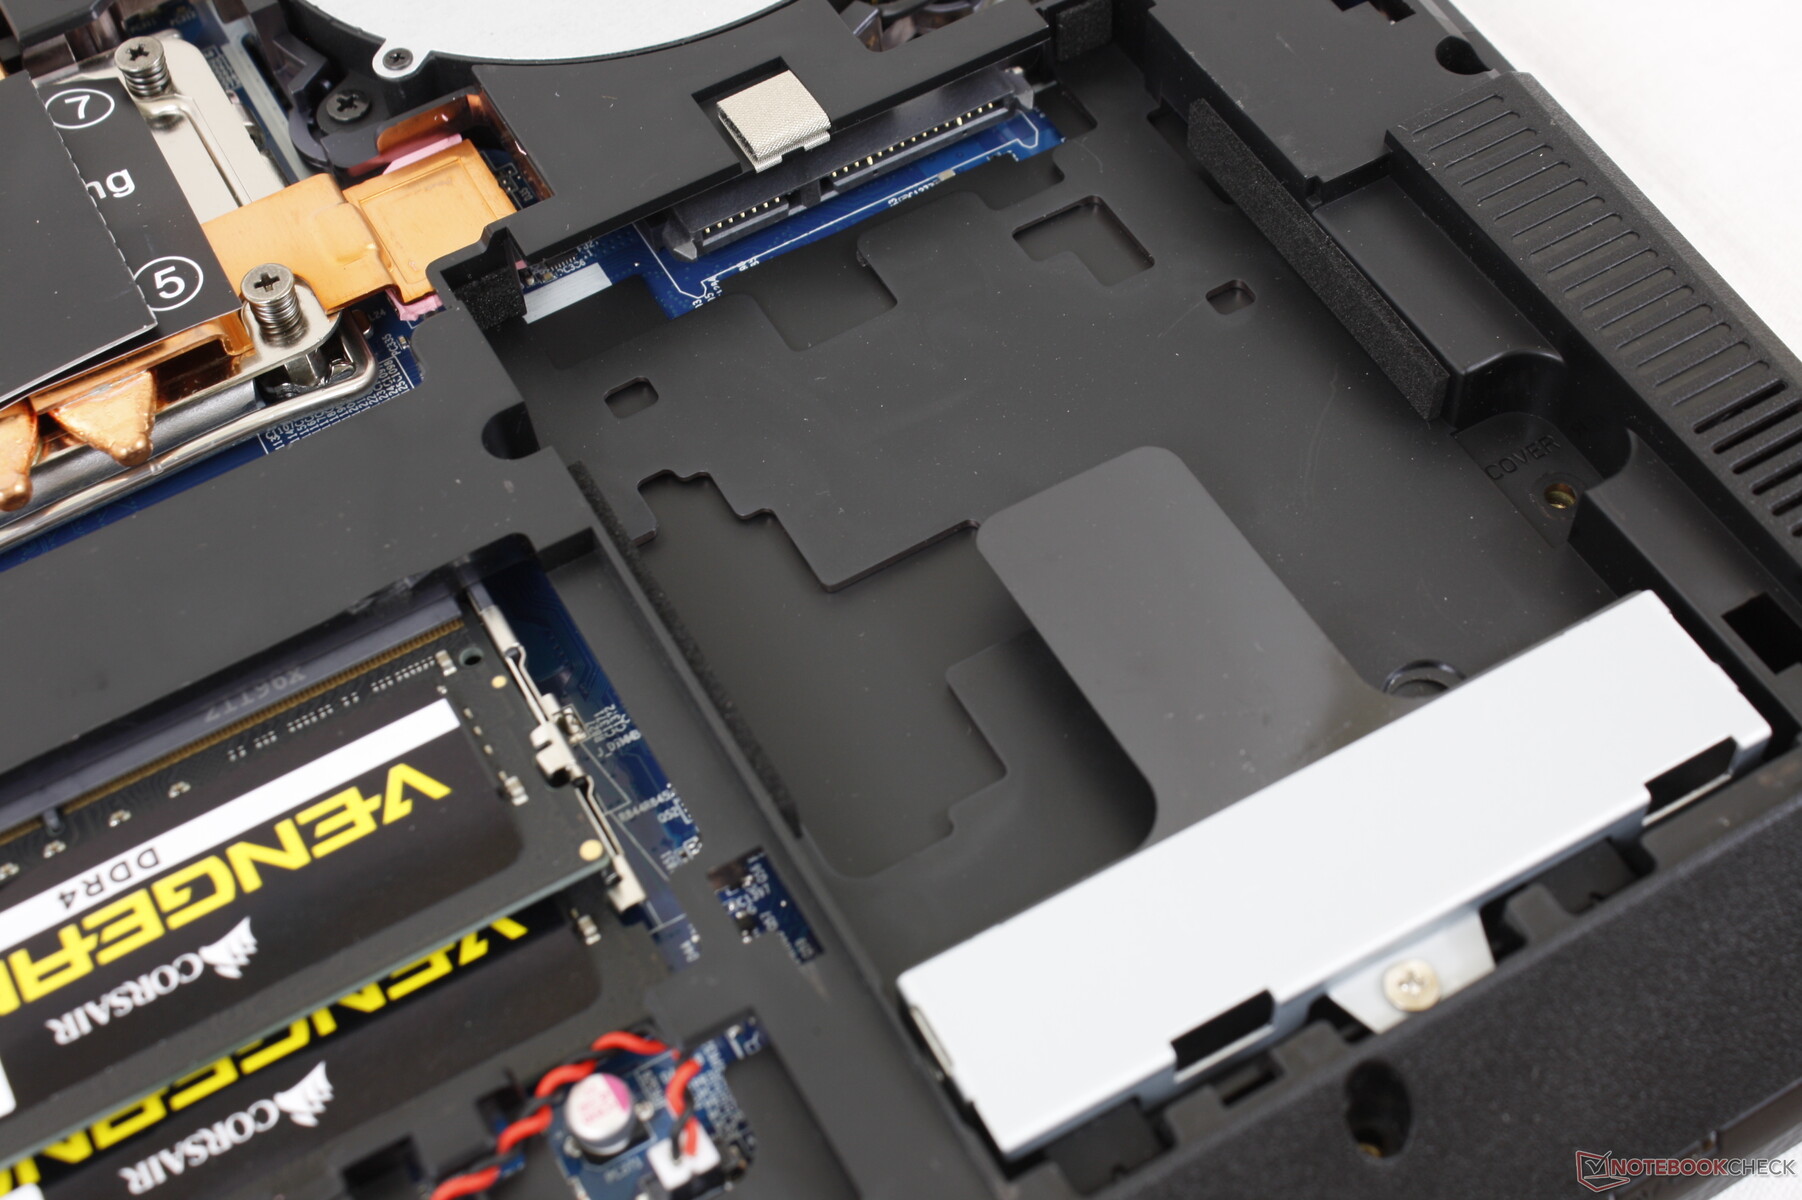
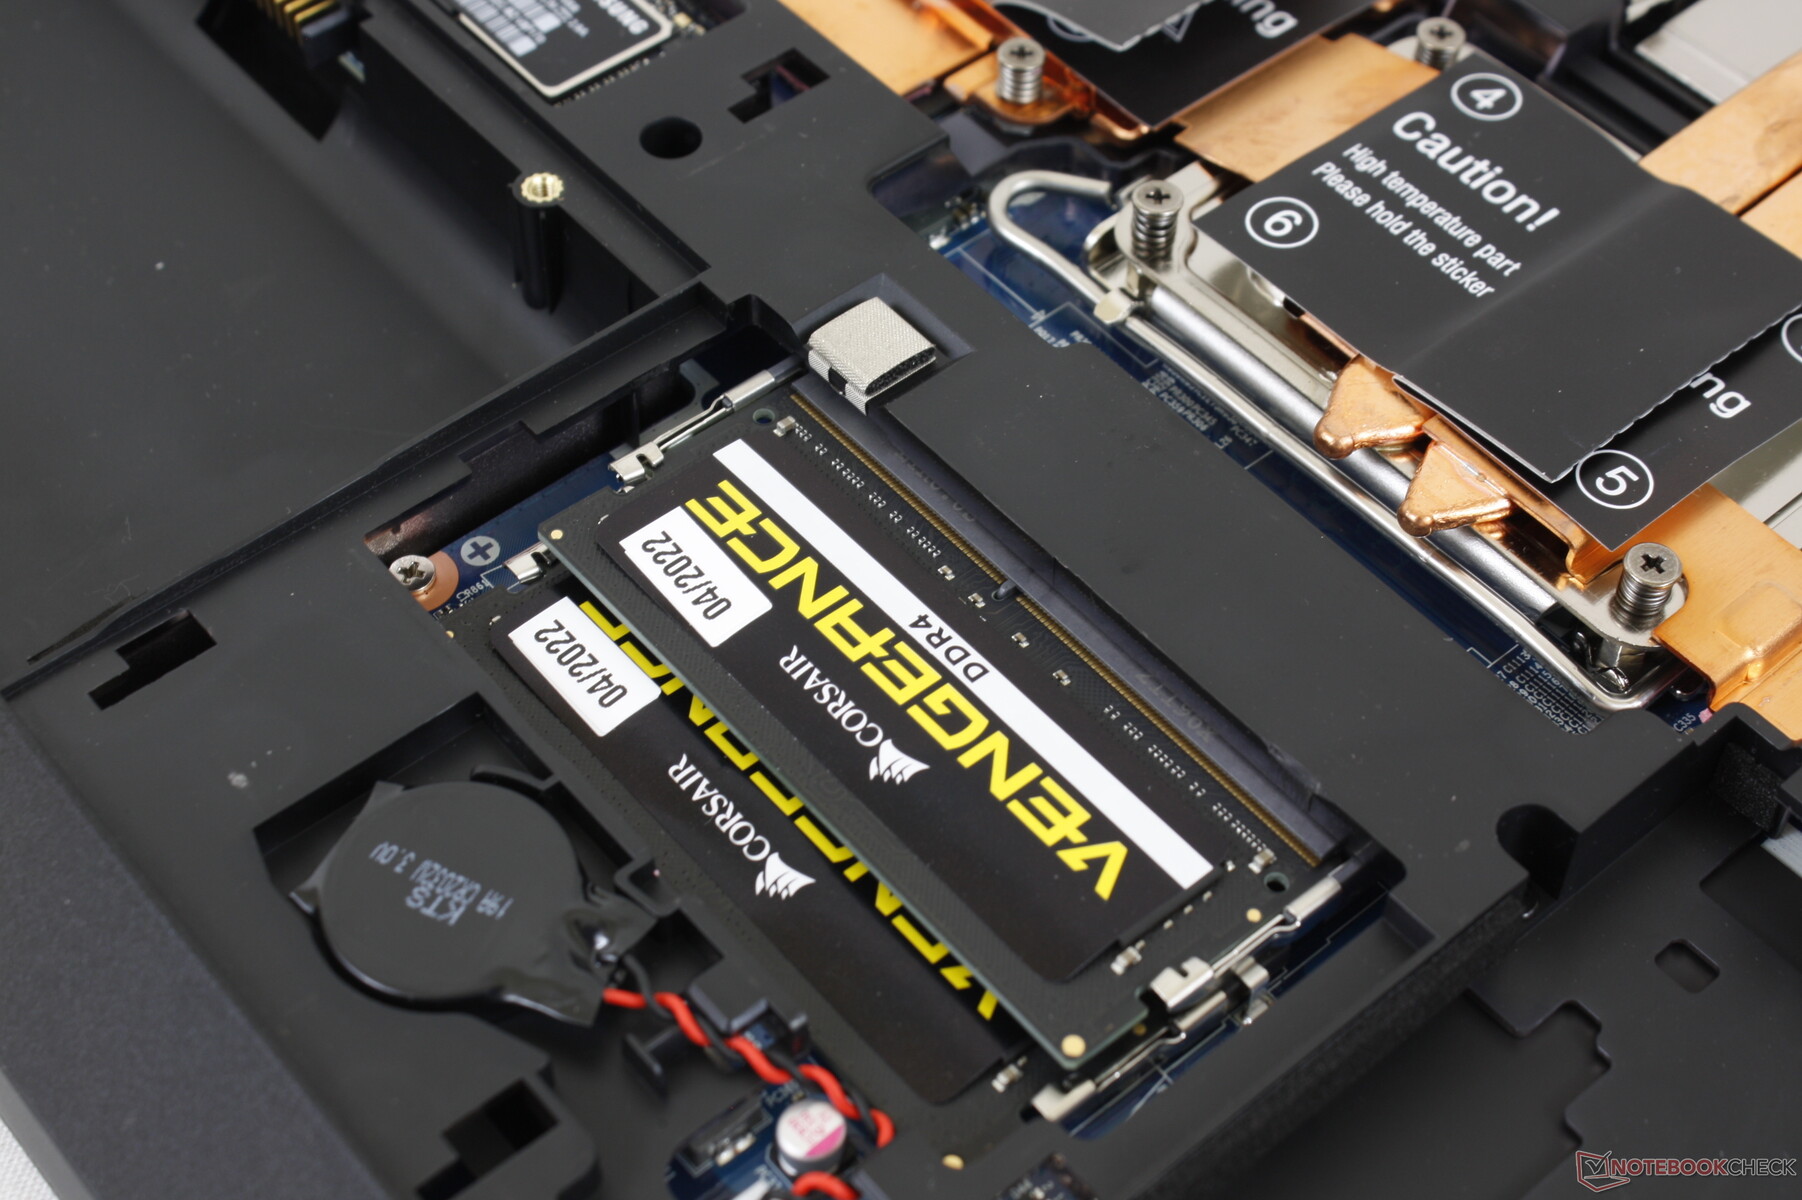
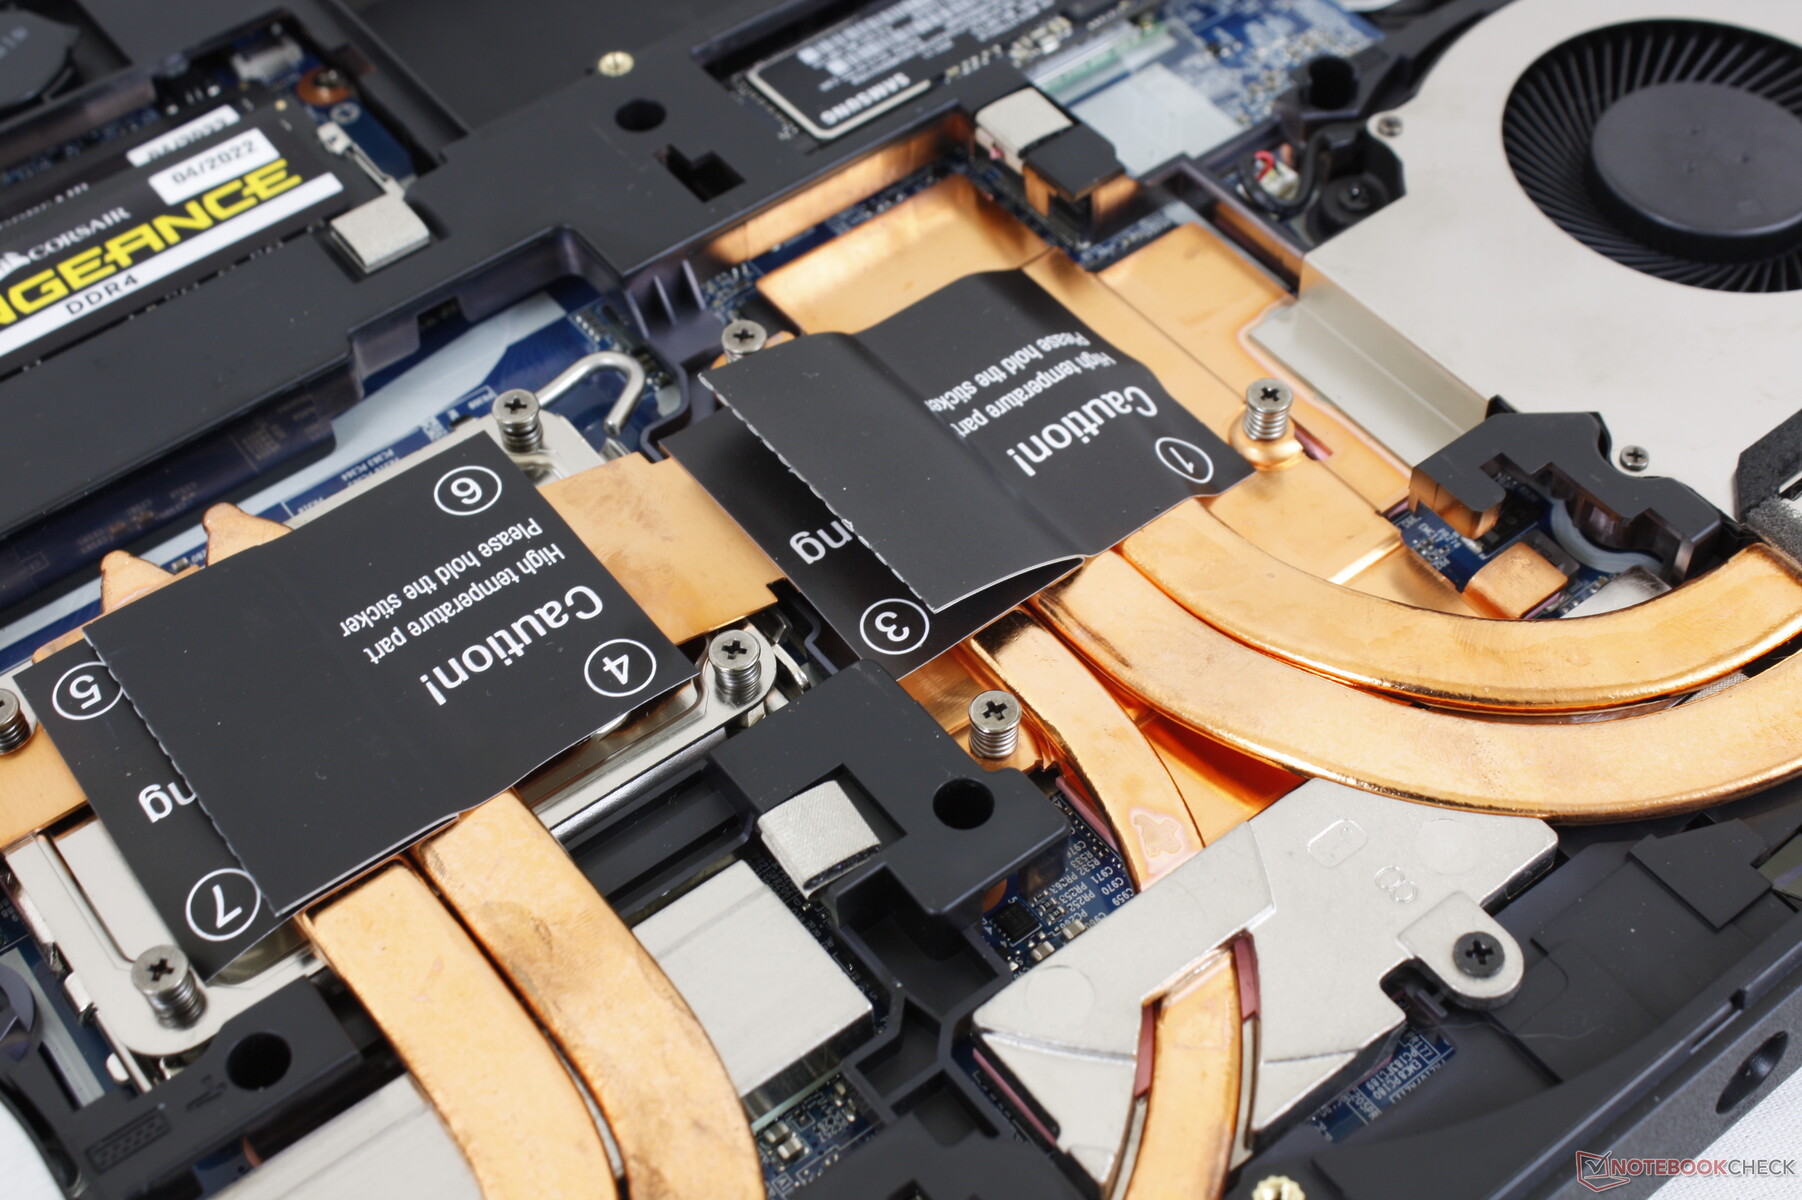
Maintenance
Accessories and Warranty
The retail box includes screws and pads for installing additional SSDs and a drivers disc. CPU thermal paste is not included.
The standard one-year limited warranty applies when purchased in the US with optional two-year and three-year extensions.
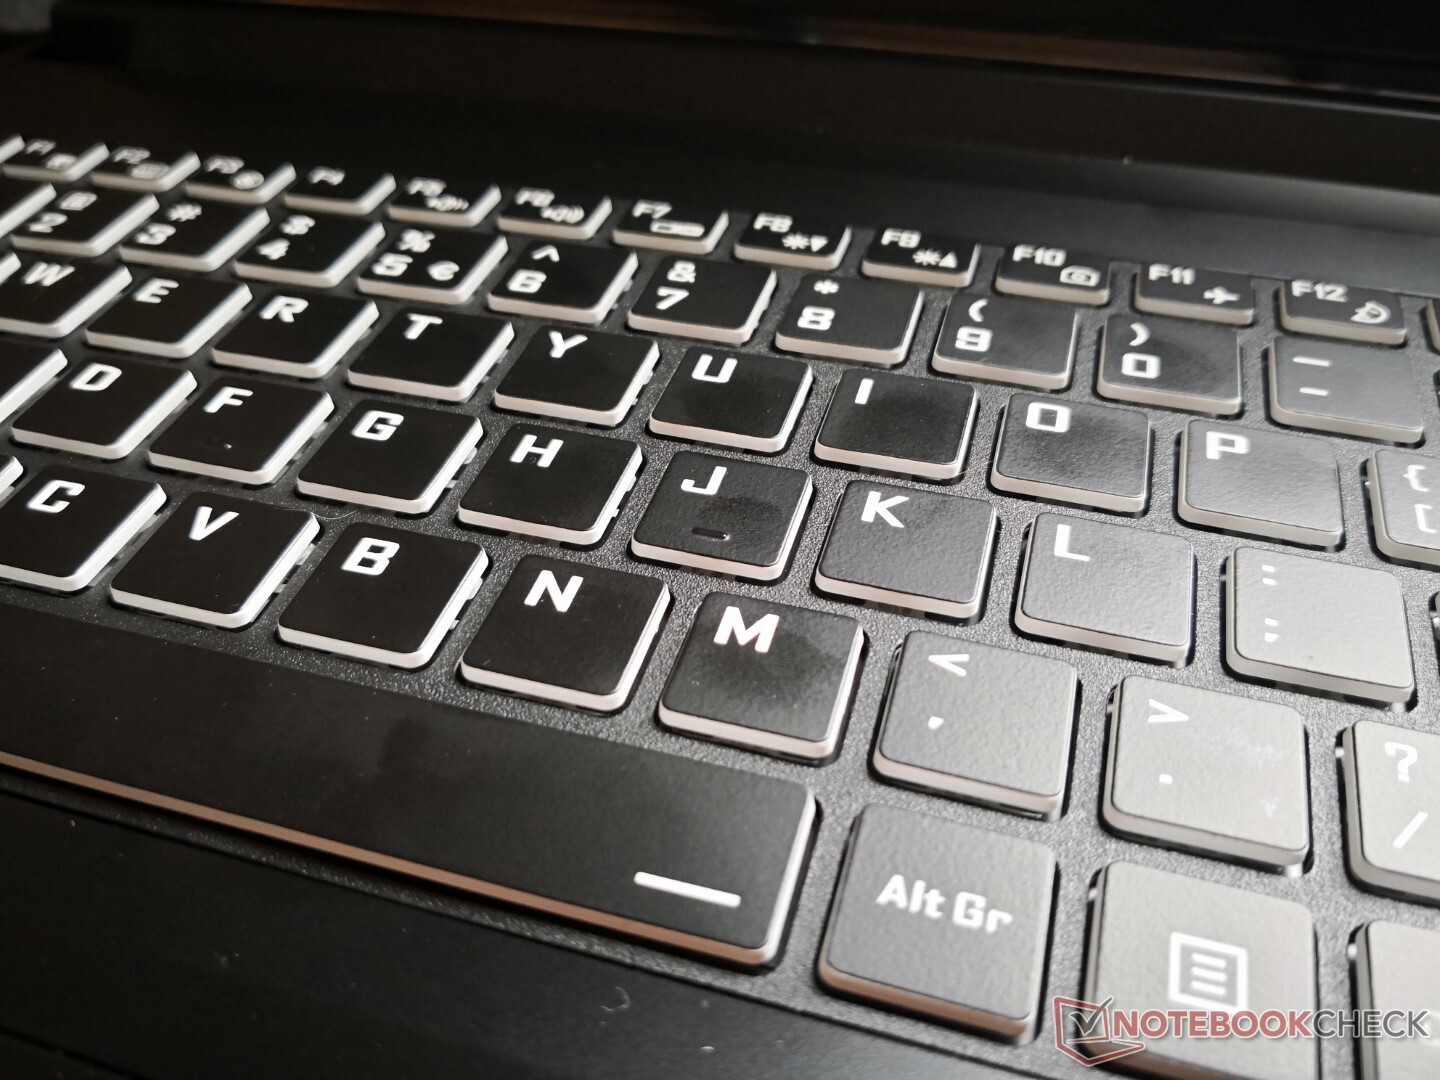
Input Devices
The typing experience is comfortable with firmer feedback but louder clatter than what we're used to on other gaming laptops.
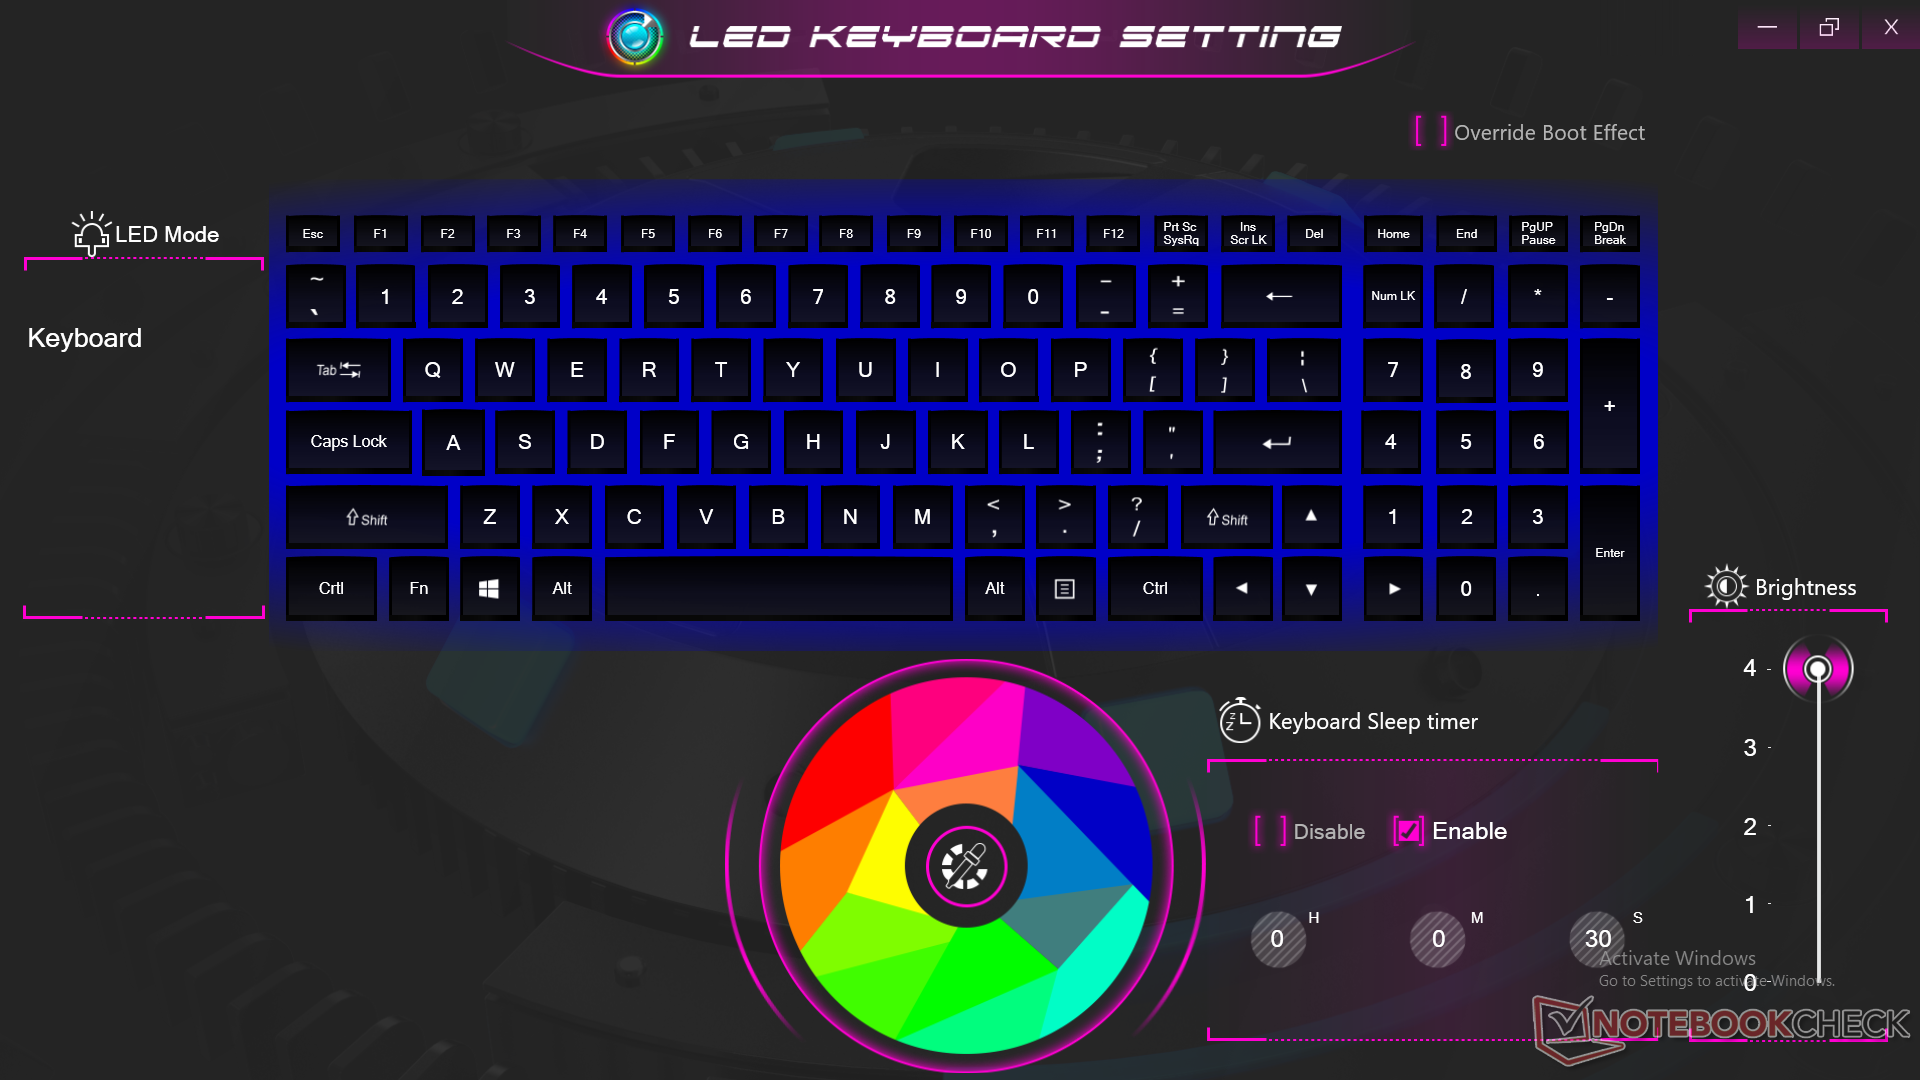
Keyboard lighting is unfortunately single-zone only compared to quad-zone or per-key RGB lighting on most other performance laptops. We do, however, appreciate the dedicated mouse buttons for easier multi-touch inputs.
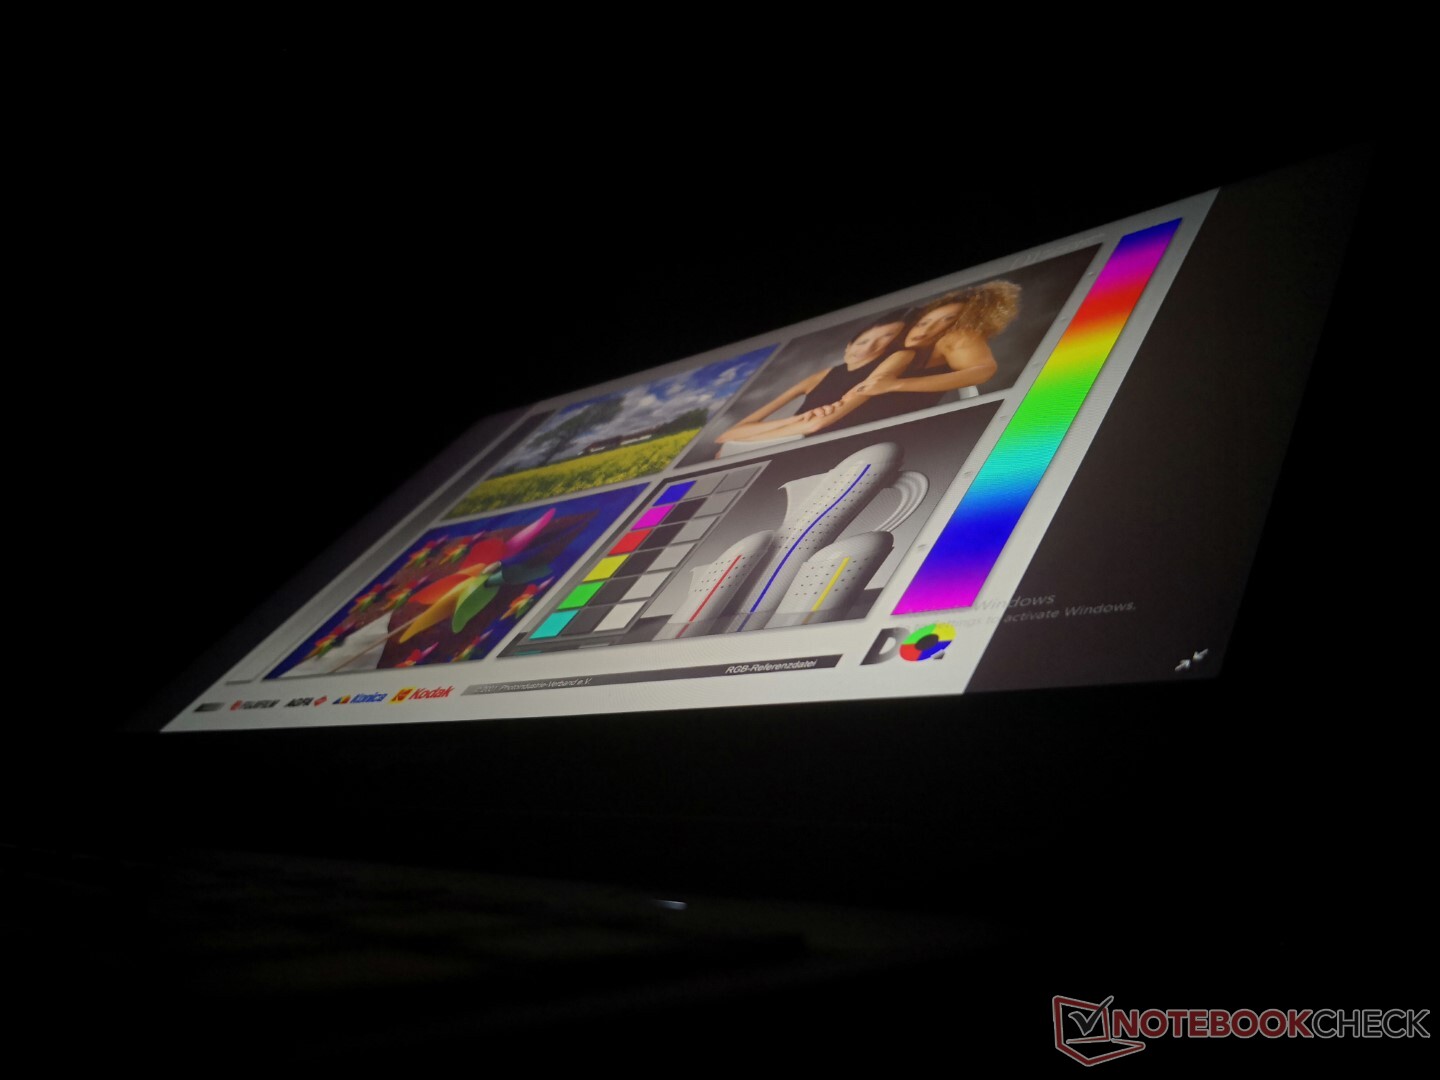
Display
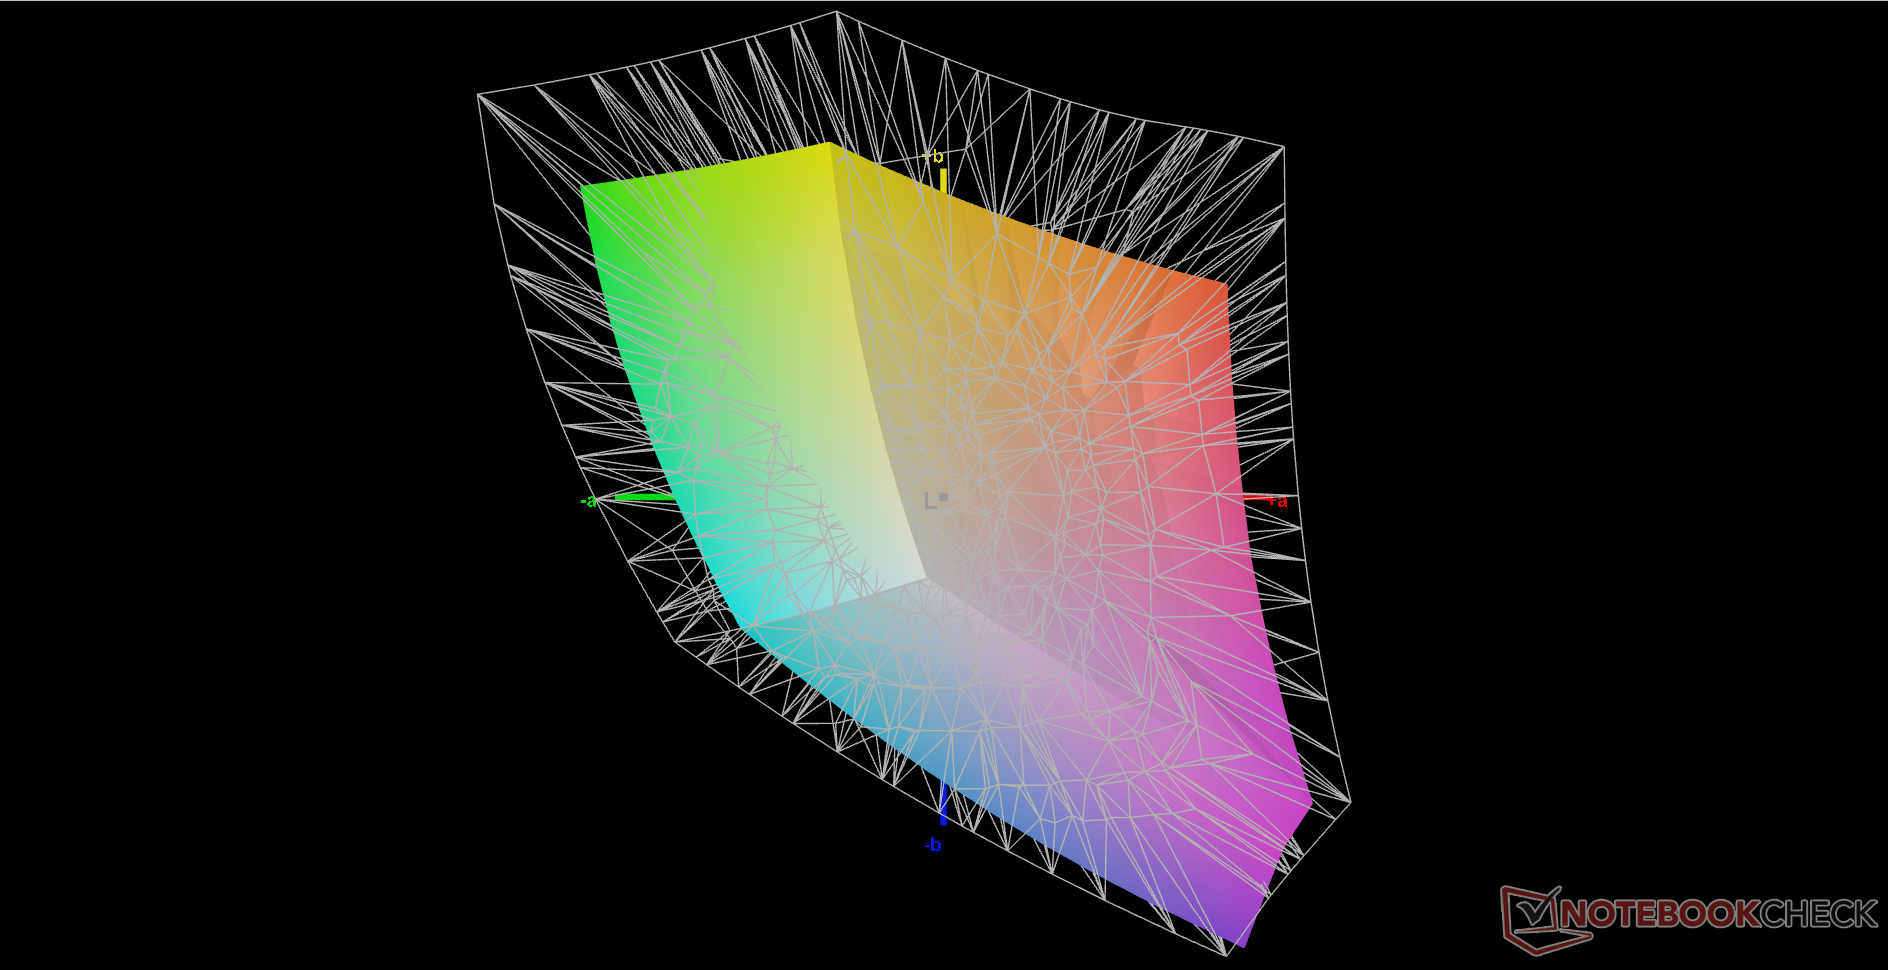
Our unit comes configured with the same Sharp LQ156M1JW03 IPS panel as found on the Eurocom RX315. This panel is notable for its very fast 240 Hz refresh rate, fast response times, and full sRGB coverage to be fit for both gaming and most graphics editing. A higher resolution QHD panel is also available promising full DCI-P3 coverage albeit at a slower 165 Hz refresh rate.

| |||||||||||||||||||||||||
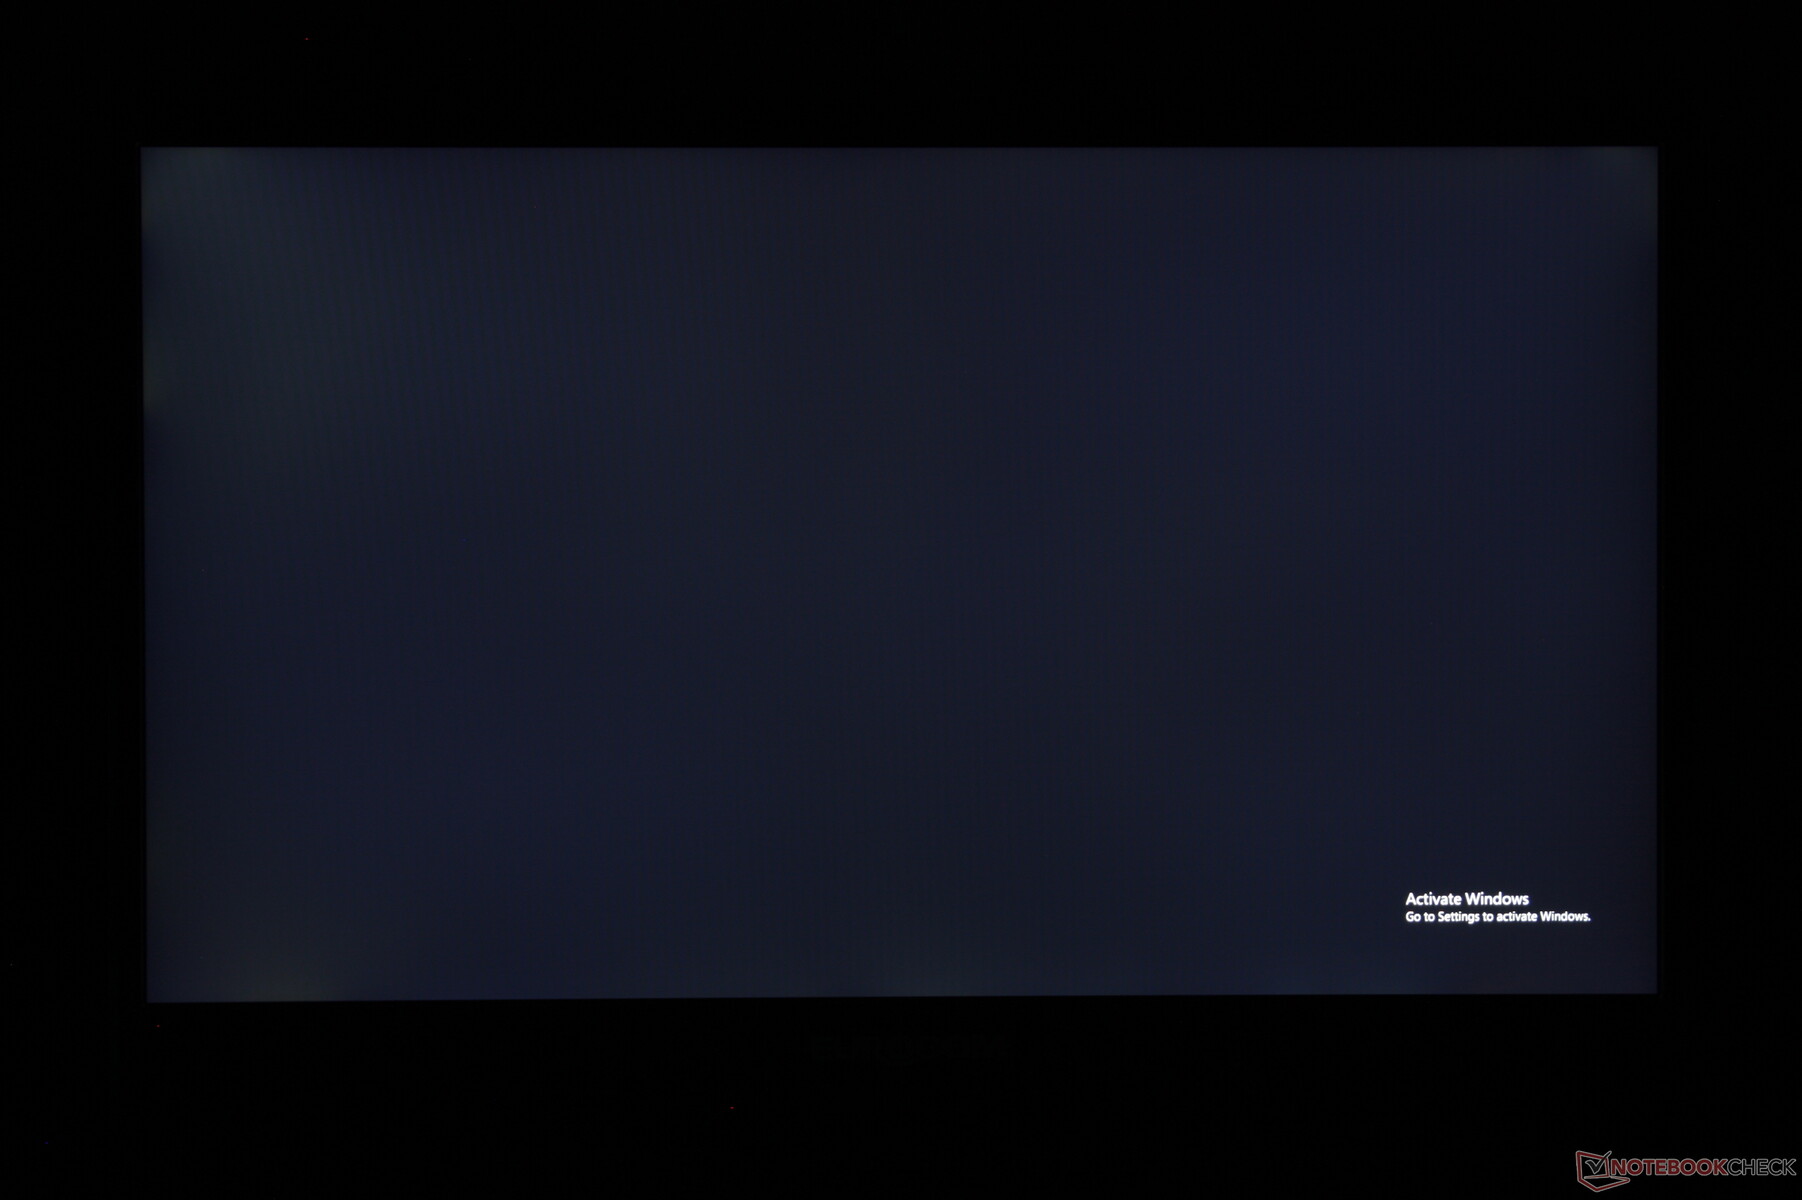
Brightness Distribution: 91 %
Center on Battery: 299.2 cd/m²
Contrast: 997:1 (Black: 0.3 cd/m²)
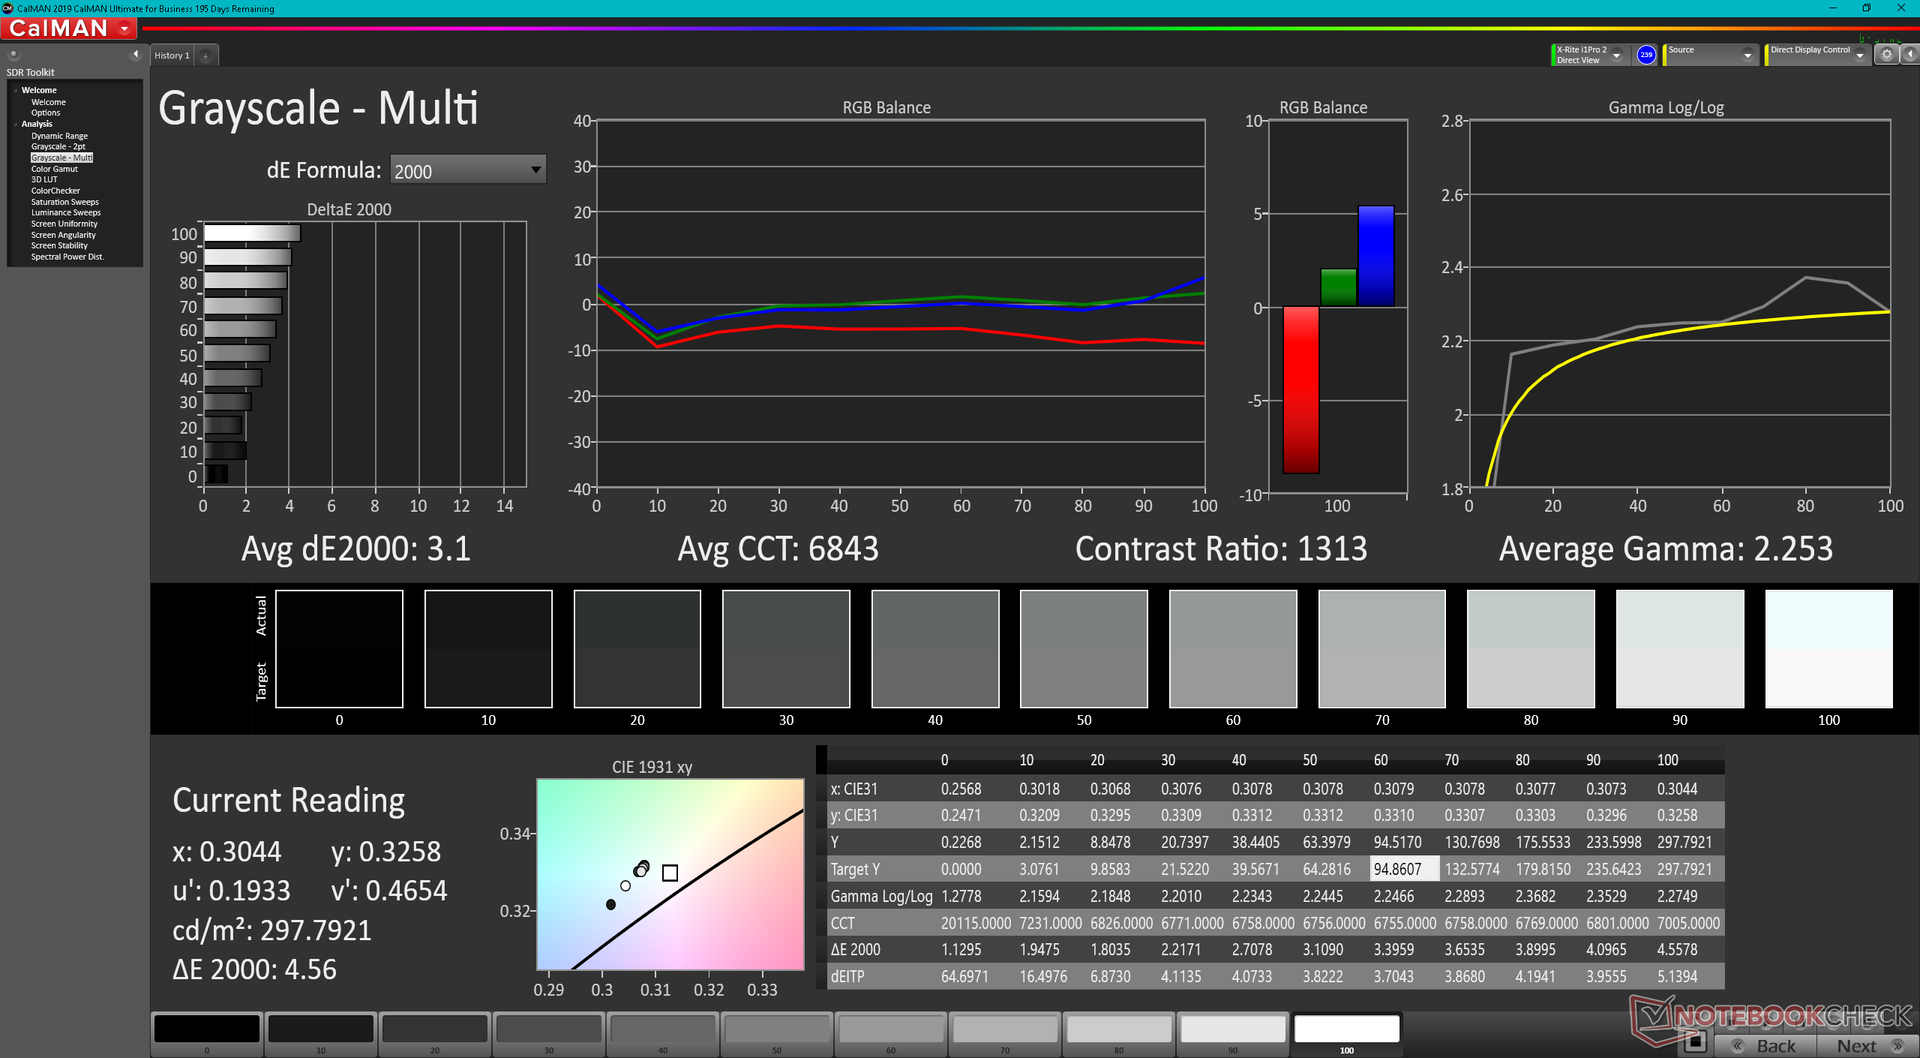
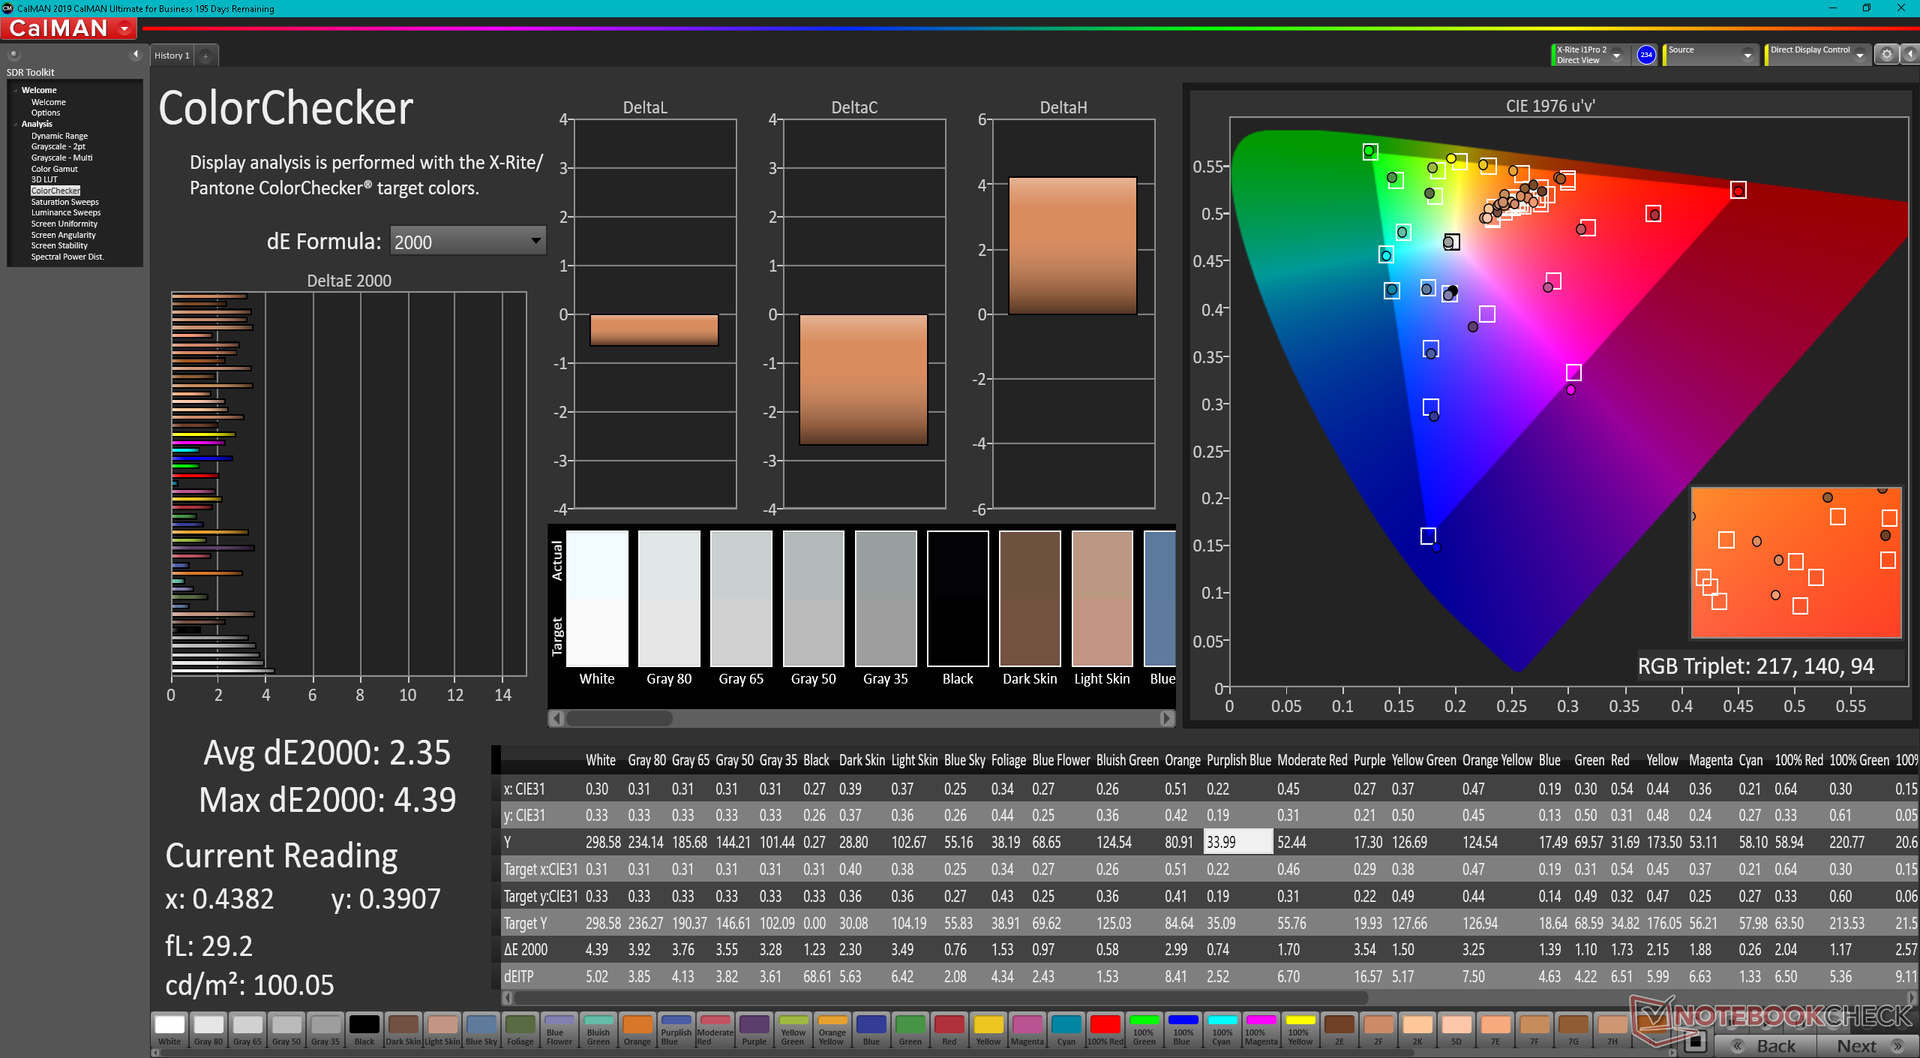
ΔE Color 2.35 | 0.5-29.43 Ø5, calibrated: 1.21
ΔE Greyscale 3.1 | 0.57-98 Ø5.3
67.7% AdobeRGB 1998 (Argyll 2.2.0 3D)
97.3% sRGB (Argyll 2.2.0 3D)
66.5% Display P3 (Argyll 2.2.0 3D)
Gamma: 2.25
| Eurocom Raptor X15 Sharp LQ156M1JW03, IPS, 1920x1080, 15.60 | MSI Raider GE66 12UHS AUO51EB, IPS, 3840x2160, 15.60 | Razer Blade 15 Advanced Model Early 2022 TL156VDXP02-0, IPS, 1920x1080, 15.60 | Eurocom RX315 NH57AF1 Sharp LQ156M1JW03, IPS, 1920x1080, 15.60 | Gigabyte A5 X1 AU Optronics B156HAN12.0, IPS, 1920x1080, 15.60 | Asus TUF Gaming A15 FA506QR-AZ061T Sharp SHP1532, IPS, 1920x1080, 15.60 | |
|---|---|---|---|---|---|---|
| Display | 21% | -5% | 1% | 4% | ||
| Display P3 Coverage | 66.5 | 80.4 21% | 65.3 -2% | 67.5 2% | 69.6 5% | |
| sRGB Coverage | 97.3 | 98.4 1% | 85.1 -13% | 98 1% | 98.6 1% | |
| AdobeRGB 1998 Coverage | 67.7 | 94.7 40% | 67.4 0% | 68.5 1% | 70.8 5% | |
| Response Times | -35% | 33% | 1% | 27% | -22% | |
| Response Time Grey 50% / Grey 80% * | 12.8 ? | 18.8 ? -47% | 4.3 ? 66% | 10.4 ? 19% | 4.8 ? 62% | 12 ? 6% |
| Response Time Black / White * | 10.4 ? | 12.8 ? -23% | 10.5 ? -1% | 11.6 ? -12% | 11.2 ? -8% | 8 ? 23% |
| PWM Frequency | 23810 ? | 22730 ? -5% | 1250 ? -95% | |||
| Screen | -7% | 27% | -23% | -13% | 18% | |
| Brightness middle | 299.2 | 351 17% | 330 10% | 291.3 -3% | 335 12% | 297 -1% |
| Brightness | 282 | 347 23% | 315 12% | 273 -3% | 325 15% | 268 -5% |
| Brightness Distribution | 91 | 90 -1% | 89 -2% | 91 0% | 90 -1% | 84 -8% |
| Black Level * | 0.3 | 0.35 -17% | 0.24 20% | 0.35 -17% | 0.4 -33% | 0.22 27% |
| Contrast | 997 | 1003 1% | 1375 38% | 832 -17% | 838 -16% | 1350 35% |
| Colorchecker dE 2000 * | 2.35 | 2.54 -8% | 1.47 37% | 2.39 -2% | 2.63 -12% | 1.36 42% |
| Colorchecker dE 2000 max. * | 4.39 | 8.36 -90% | 2.73 38% | 8.05 -83% | 7.71 -76% | 3.82 13% |
| Colorchecker dE 2000 calibrated * | 1.21 | 0.67 45% | 0.63 48% | 1.49 -23% | 0.97 20% | |
| Greyscale dE 2000 * | 3.1 | 4.1 -32% | 1.8 42% | 4.8 -55% | 4 -29% | 1.88 39% |
| Gamma | 2.25 98% | 2.089 105% | 2.282 96% | 2.25 98% | 2.129 103% | 2.48 89% |
| CCT | 6843 95% | 7036 92% | 6499 100% | 7124 91% | 7434 87% | 6768 96% |
| Color Space (Percent of AdobeRGB 1998) | 63 | |||||
| Color Space (Percent of sRGB) | 99 | |||||
| Total Average (Program / Settings) | -7% /
-5% | 18% /
21% | -7% /
-13% | 6% /
-4% | -2% /
7% |
* ... smaller is better
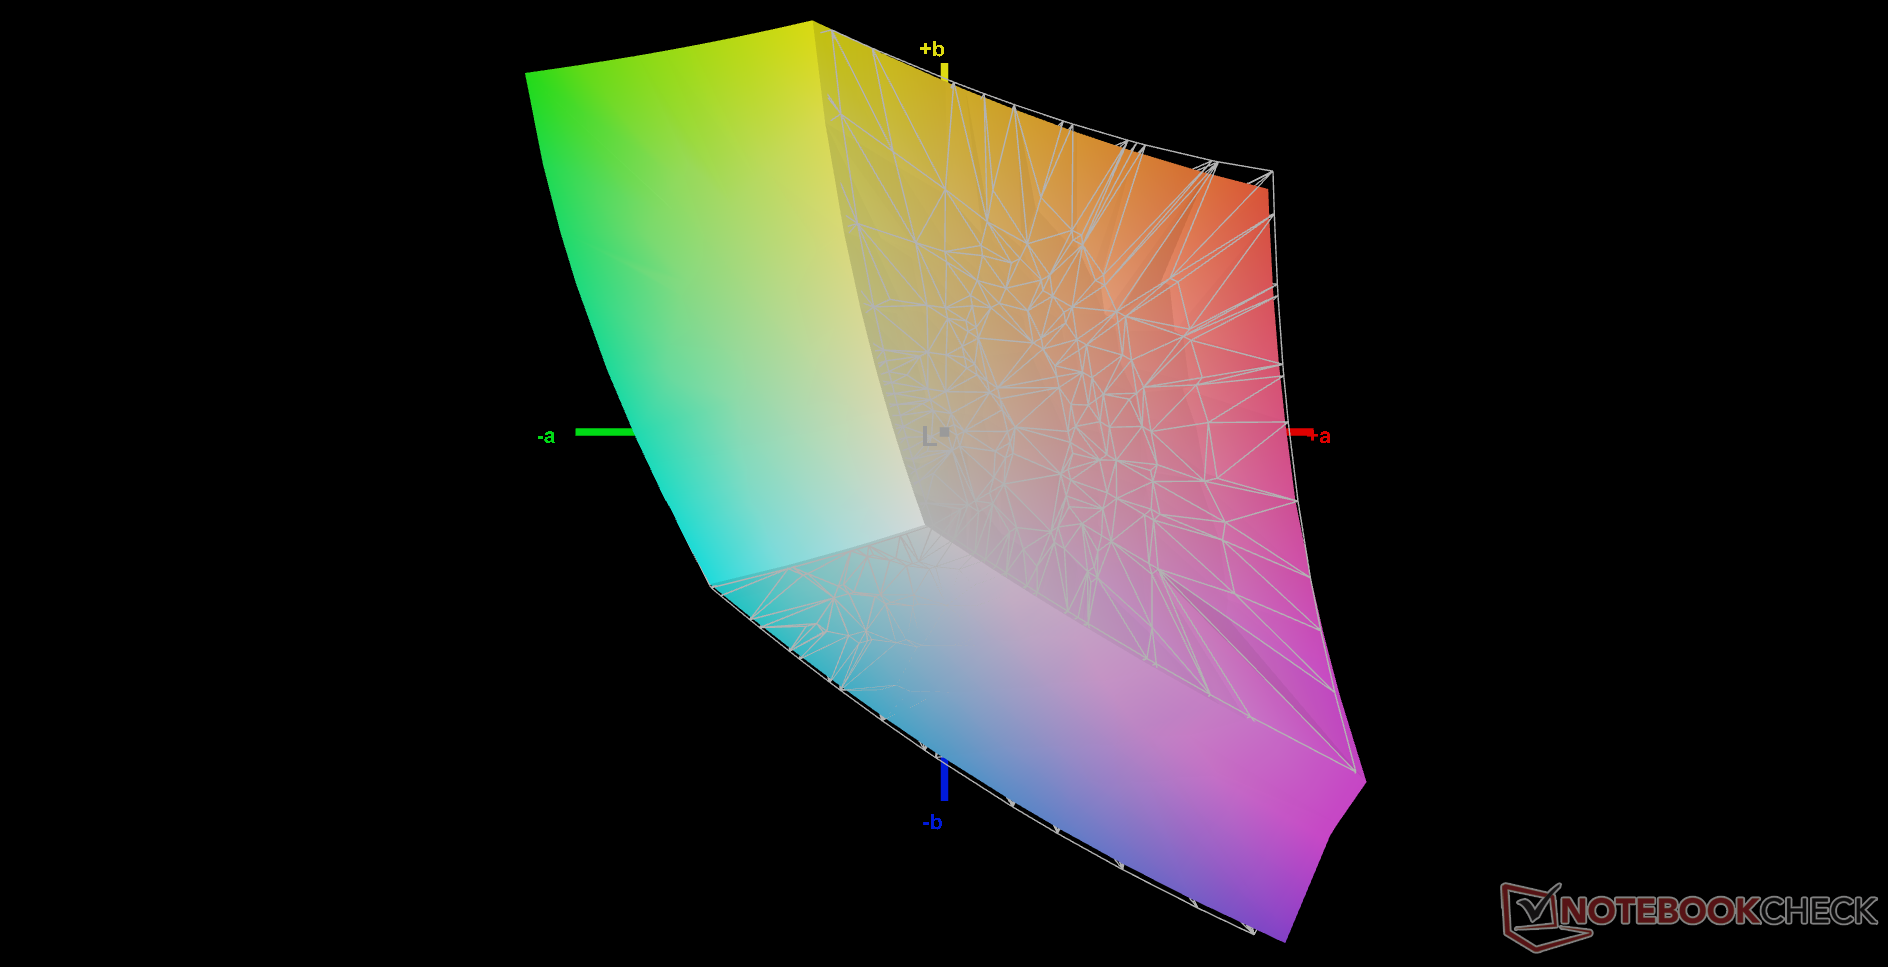
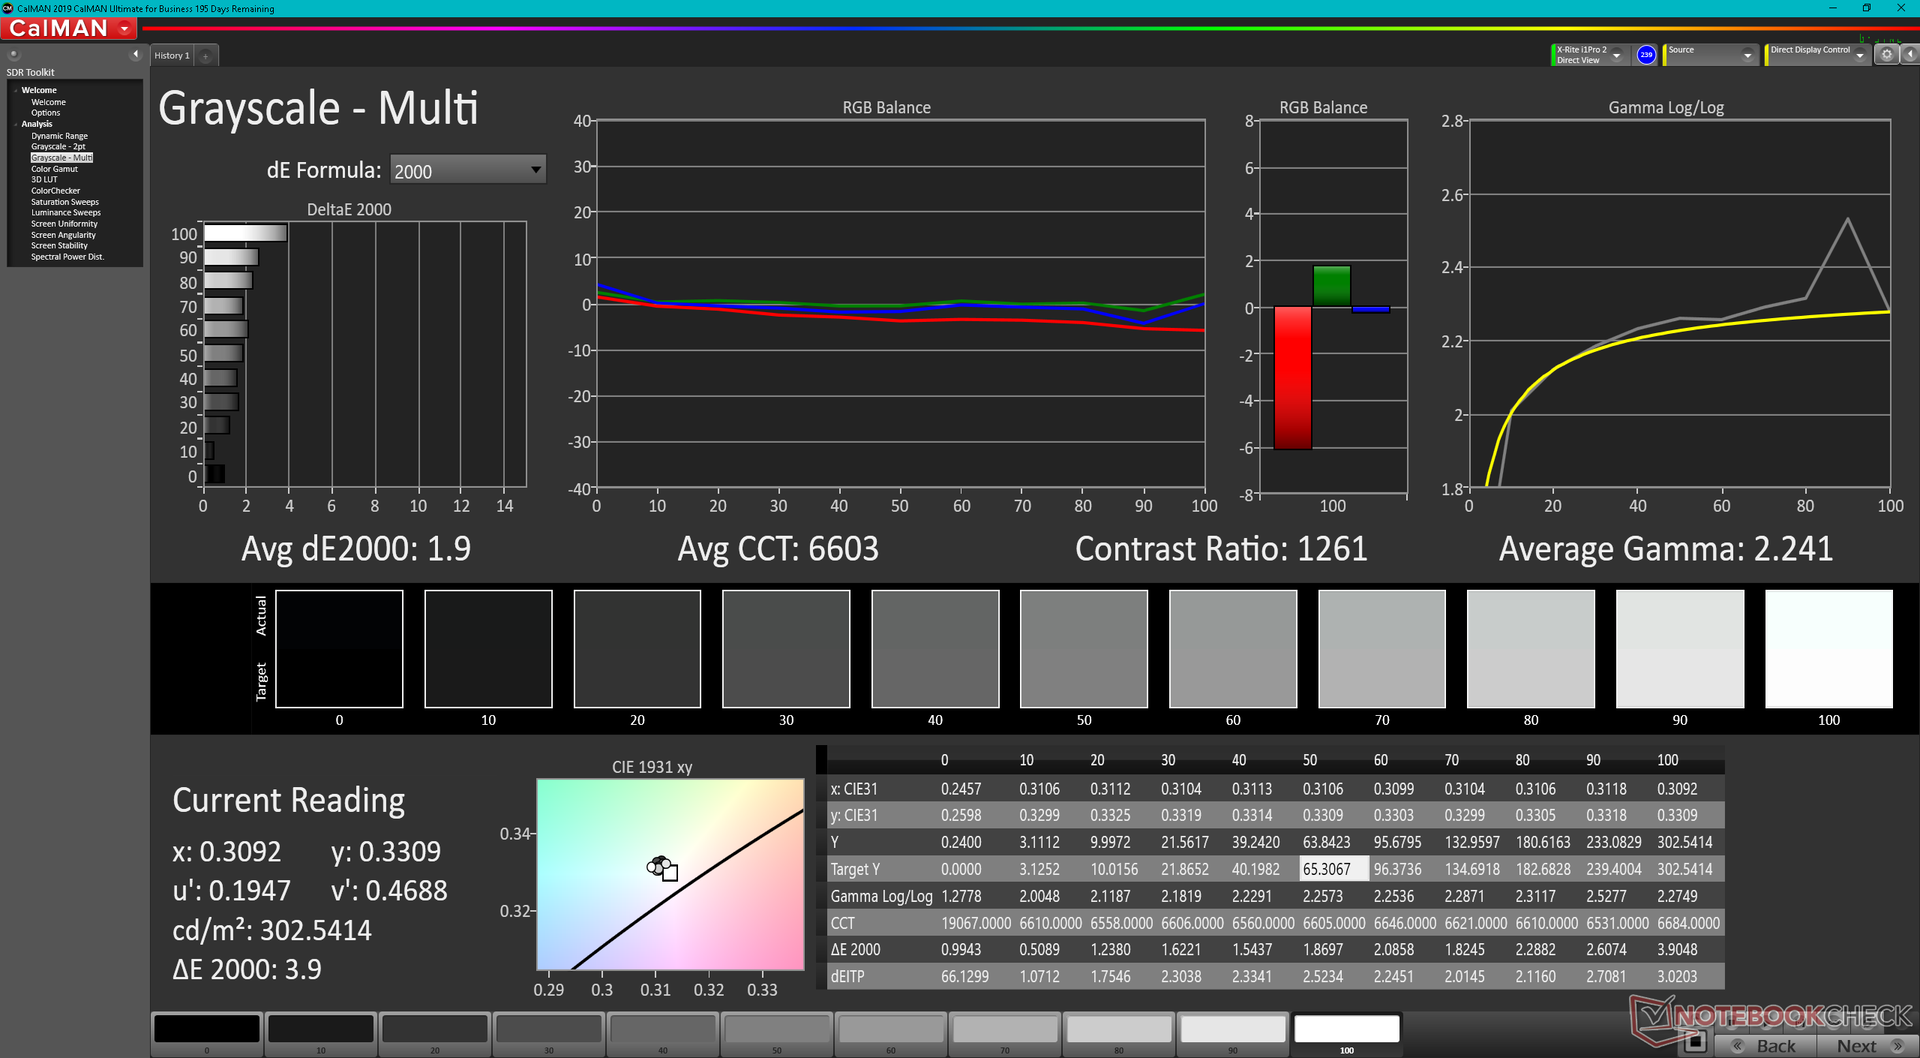
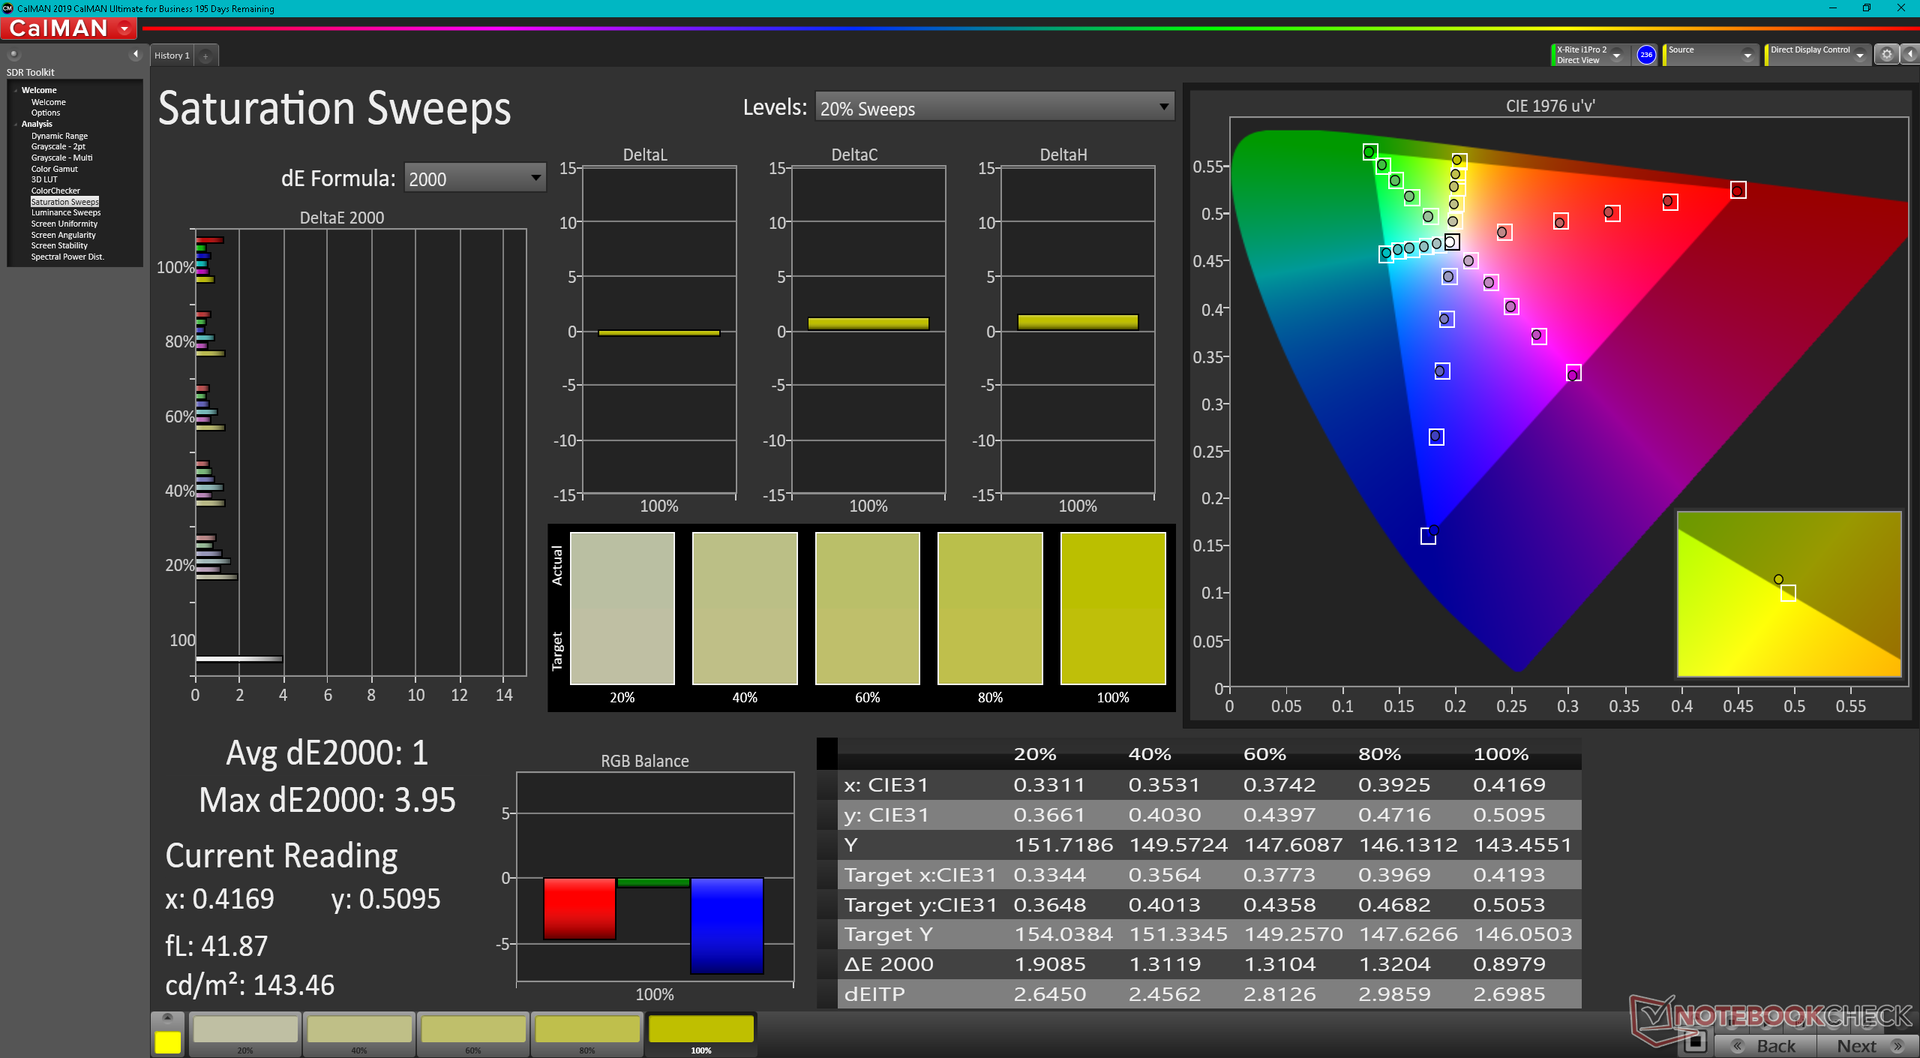
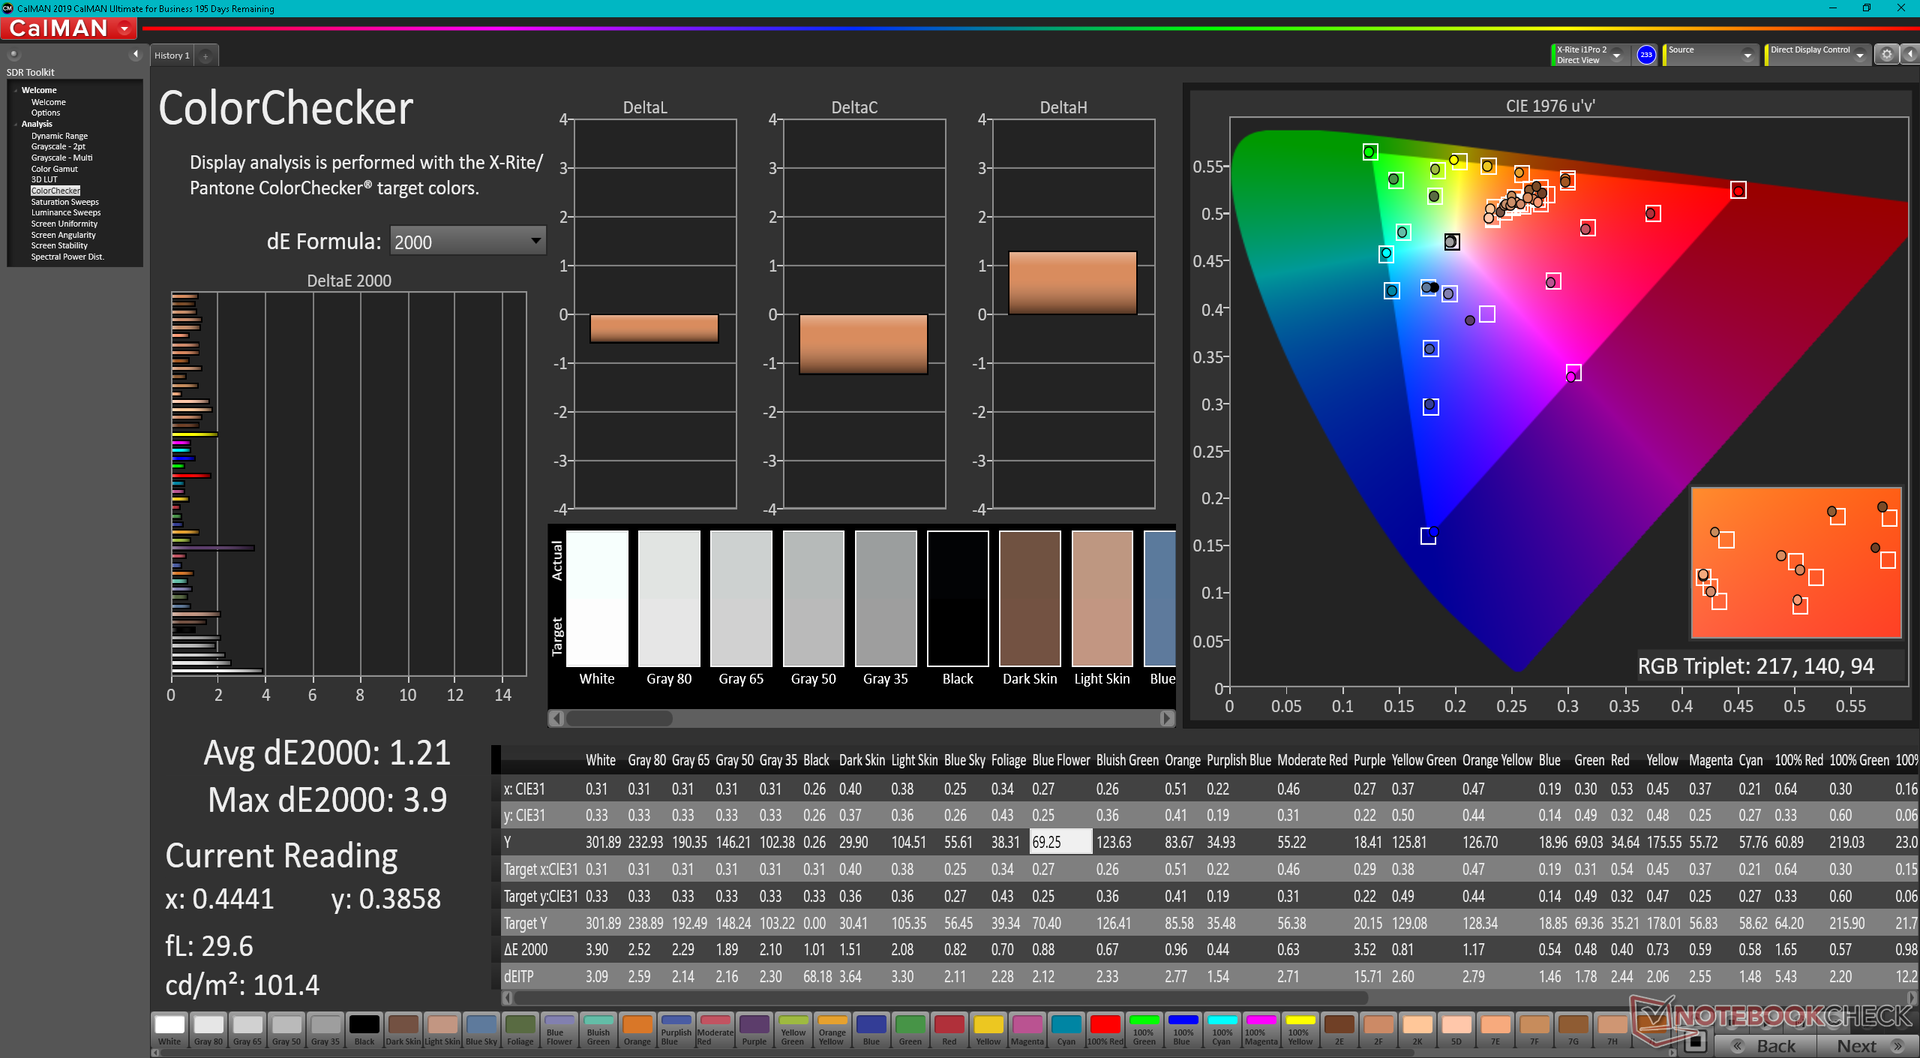
The display is decently calibrated out of the box with average grayscale and ColorChecker DeltaE values of just 3.1 and 2.35, respectively. We're able to improve DeltaE even further with our X-Rite colorimeter as shown by our screenshots below.

Display Response Times
| ↔ Response Time Black to White | ||
|---|---|---|
| 10.4 ms ... rise ↗ and fall ↘ combined | ↗ 5.2 ms rise | 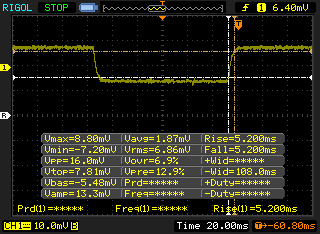 |
| ↘ 5.2 ms fall | ||
| The screen shows good response rates in our tests, but may be too slow for competitive gamers. In comparison, all tested devices range from 0.1 (minimum) to 240 (maximum) ms. » 23 % of all devices are better. This means that the measured response time is better than the average of all tested devices (21.5 ms). | ||
| ↔ Response Time 50% Grey to 80% Grey | ||
| 12.8 ms ... rise ↗ and fall ↘ combined | ↗ 4.8 ms rise | 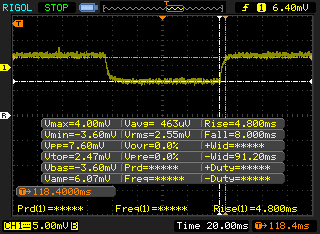 |
| ↘ 8 ms fall | ||
| The screen shows good response rates in our tests, but may be too slow for competitive gamers. In comparison, all tested devices range from 0.2 (minimum) to 636 (maximum) ms. » 21 % of all devices are better. This means that the measured response time is better than the average of all tested devices (33.7 ms). | ||
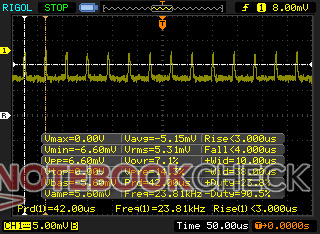
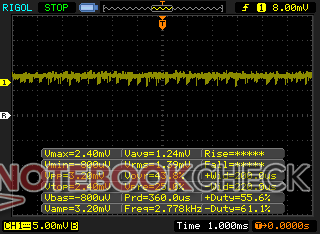
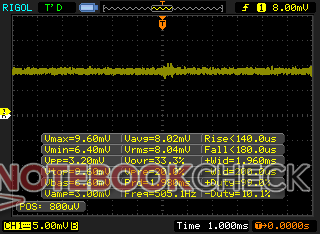
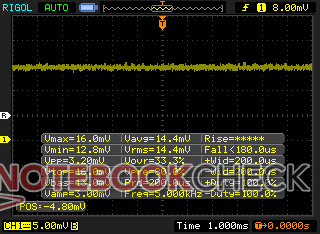
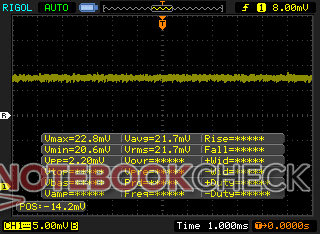
Screen Flickering / PWM (Pulse-Width Modulation)
| Screen flickering / PWM detected | 23810 Hz | ≤ 25 % brightness setting | 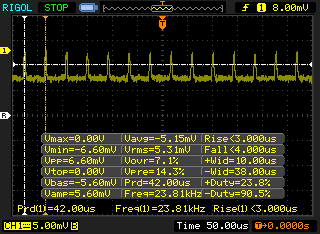 |
The display backlight flickers at 23810 Hz (worst case, e.g., utilizing PWM) Flickering detected at a brightness setting of 25 % and below. There should be no flickering or PWM above this brightness setting. The frequency of 23810 Hz is quite high, so most users sensitive to PWM should not notice any flickering. In comparison: 53 % of all tested devices do not use PWM to dim the display. If PWM was detected, an average of 17900 (minimum: 5 - maximum: 3846000) Hz was measured. | |||


Performance
Testing Conditions
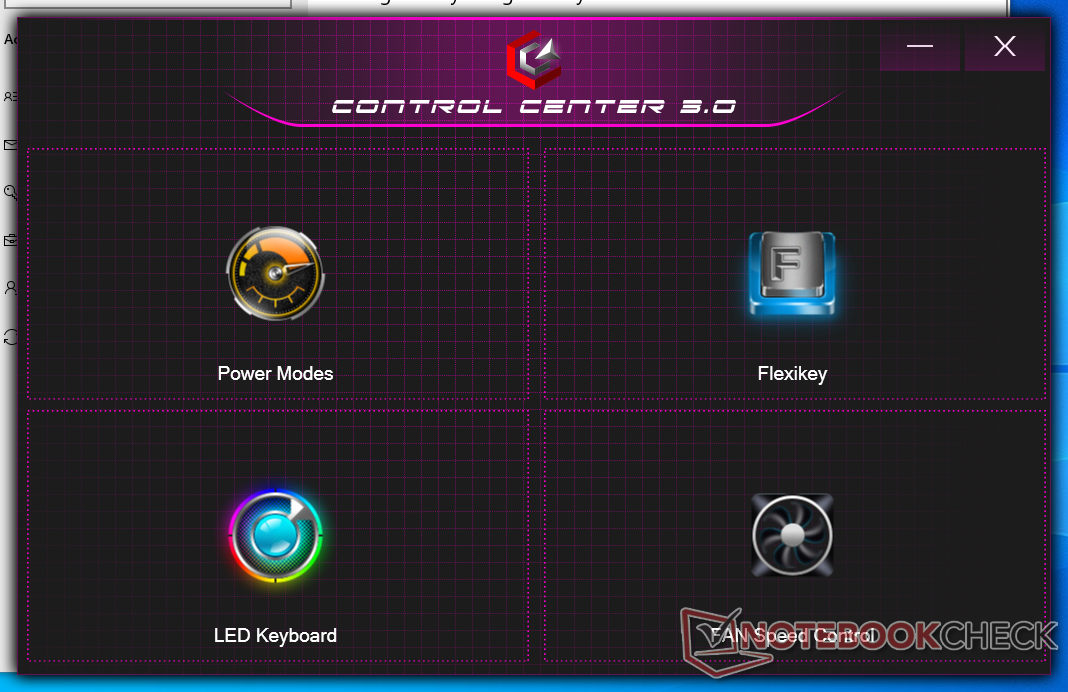
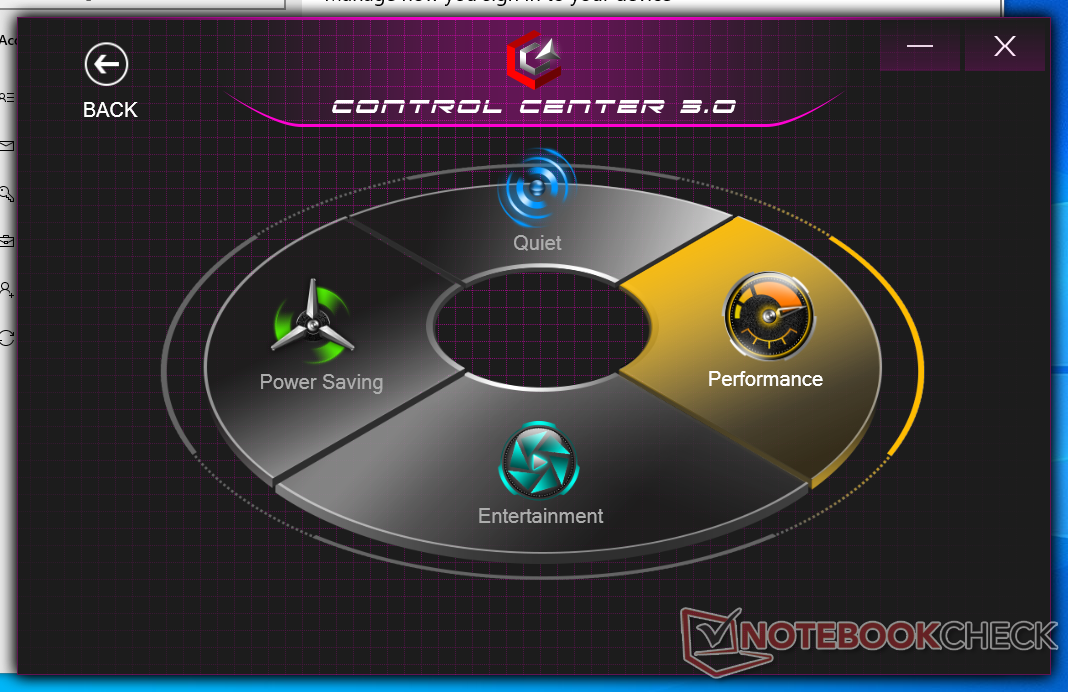
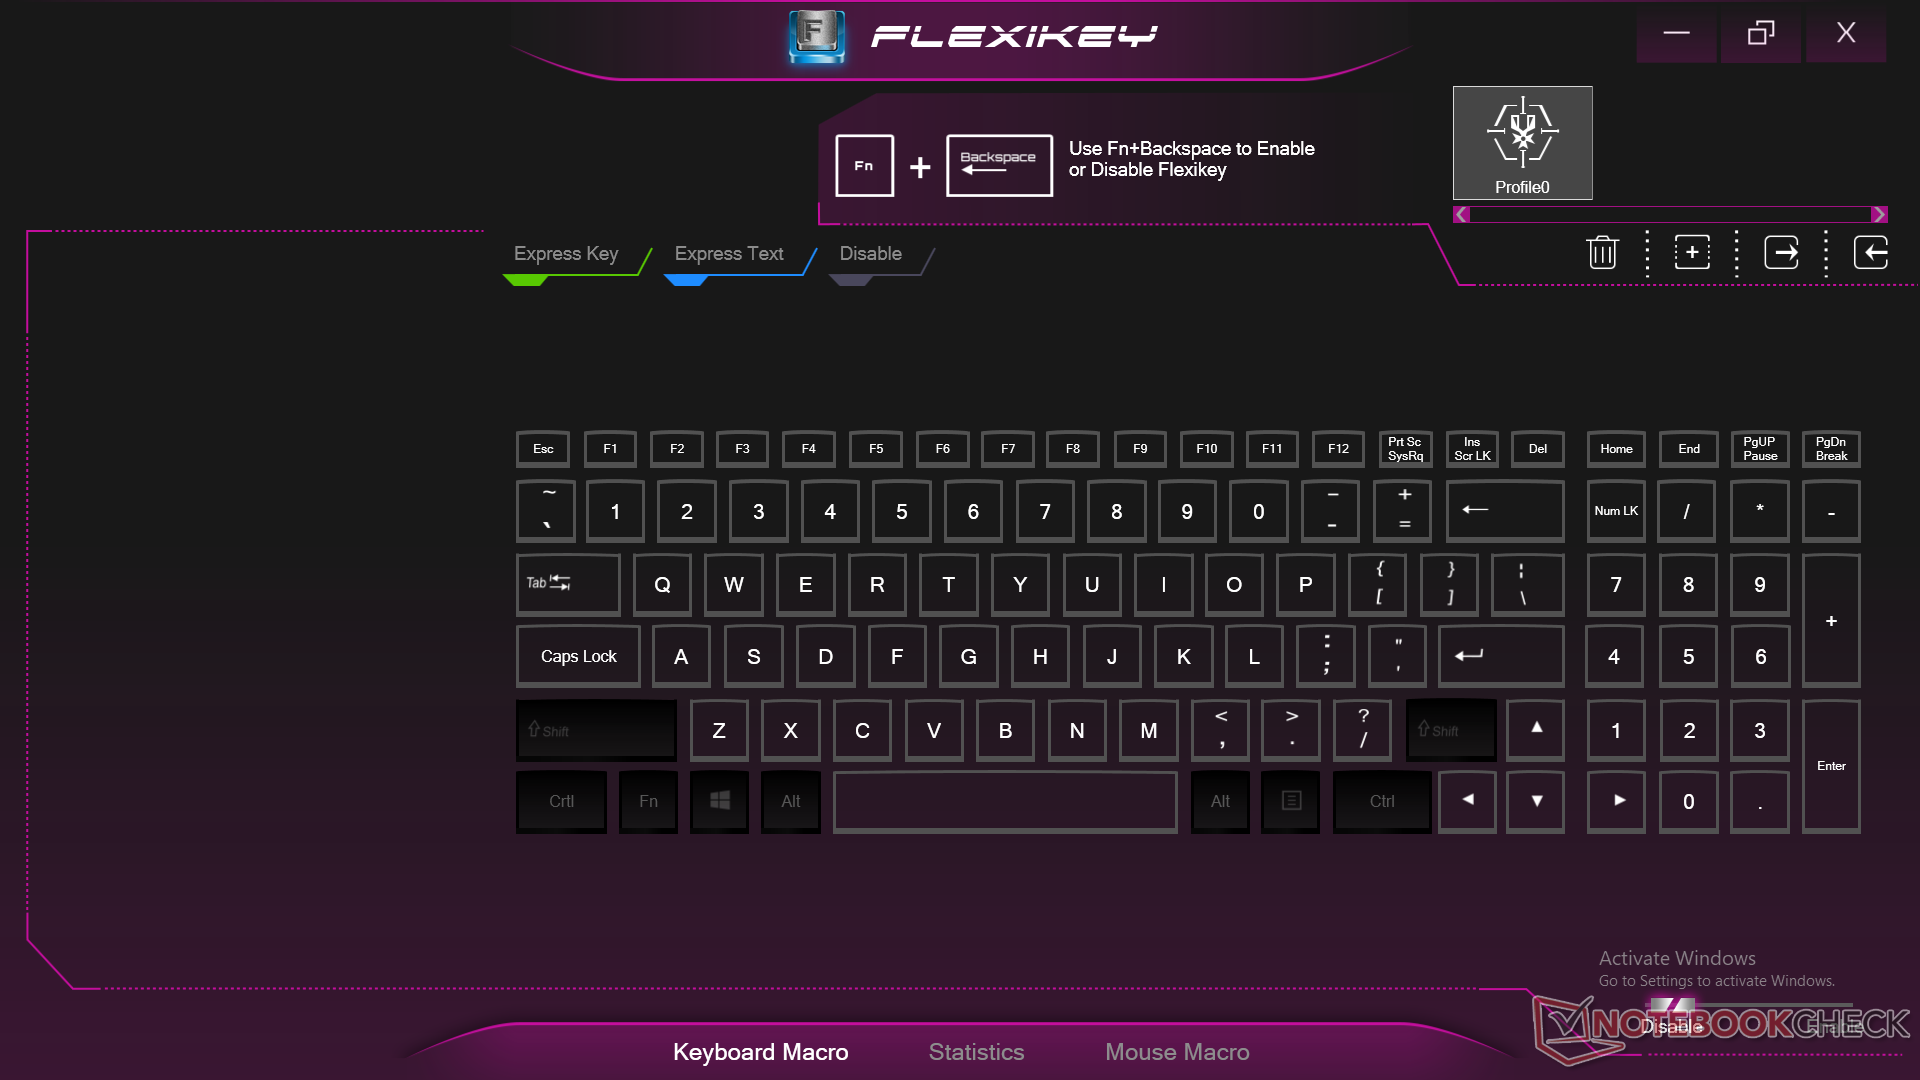
Our unit was set to Performance mode via both Windows and the Control Center 3.0 software prior to running any performance benchmarks below for the highest possible scores without end-user overclocking. It's recommend that owners become familiar with Control Center 3.0 as fan controls, power modes, and LED/macro features are all toggled here.
There is no MUX switch and so there is only Optimus 1.0 support. Eurocom says the Raptor X15 was not designed with a MUX switch in mind.
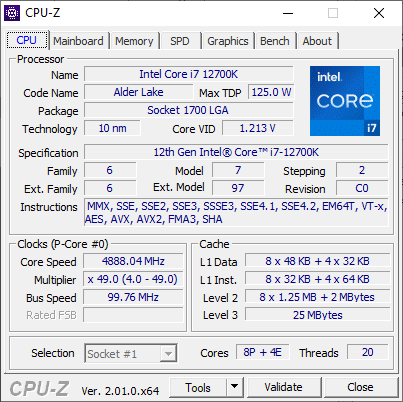
Processor
Unfortunately, our unit would exhibit performance bugs when running CineBench R15 which would prevent us from recording proper scores with the benchmark. Eurocom has confirmed with us that the bug is reproducible on multiple Raptor X15 units. Fortunately, all other benchmarks would run without any issues. When compared to our reference desktop with the same Core i7-12700K CPU, the i7-12700K in our Eurocom would be 20 to 25 percent slower in multi-threaded workloads for an overall performance level that is most similar to the mobile Core i7-12700H.
Readers can catch up on all the details of the Alder Lake-S platform by checking out our overview page here.
Cinebench R15 Multi Loop
Cinebench R23: Multi Core | Single Core
Cinebench R15: CPU Multi 64Bit | CPU Single 64Bit
Blender: v2.79 BMW27 CPU
7-Zip 18.03: 7z b 4 | 7z b 4 -mmt1
Geekbench 5.5: Multi-Core | Single-Core
HWBOT x265 Benchmark v2.2: 4k Preset
LibreOffice : 20 Documents To PDF
R Benchmark 2.5: Overall mean
| Cinebench R20 / CPU (Multi Core) | |
| Intel Core i7-12700K | |
| Average Intel Core i7-12700K (6953 - 8648, n=2) | |
| Eurocom Raptor X15 | |
| MSI Vector GP76 12UGS-434 | |
| SCHENKER XMG Apex 15 NH57AF1 | |
| MSI Raider GE66 12UHS | |
| Razer Blade 15 2022 | |
| Razer Blade 14 Ryzen 9 6900HX | |
| Gigabyte A5 X1 | |
| Eurocom Nightsky ARX315 | |
| SCHENKER XMG Apex 15 NH57E PS | |
| Eurocom RX315 NH57AF1 | |
| Aorus 15P XC | |
| Lenovo Legion C7 15IMH05 82EH0030GE | |
| Cinebench R20 / CPU (Single Core) | |
| Eurocom Raptor X15 | |
| Average Intel Core i7-12700K (731 - 740, n=2) | |
| Intel Core i7-12700K | |
| MSI Raider GE66 12UHS | |
| Razer Blade 15 2022 | |
| MSI Vector GP76 12UGS-434 | |
| Razer Blade 14 Ryzen 9 6900HX | |
| Eurocom Nightsky ARX315 | |
| Gigabyte A5 X1 | |
| Eurocom RX315 NH57AF1 | |
| SCHENKER XMG Apex 15 NH57E PS | |
| SCHENKER XMG Apex 15 NH57AF1 | |
| Lenovo Legion C7 15IMH05 82EH0030GE | |
| Aorus 15P XC | |
| Cinebench R23 / Multi Core | |
| Intel Core i7-12700K | |
| Average Intel Core i7-12700K (17003 - 22565, n=2) | |
| MSI Vector GP76 12UGS-434 | |
| Eurocom Raptor X15 | |
| MSI Raider GE66 12UHS | |
| Razer Blade 15 2022 | |
| Razer Blade 14 Ryzen 9 6900HX | |
| Gigabyte A5 X1 | |
| Eurocom Nightsky ARX315 | |
| SCHENKER XMG Apex 15 NH57E PS | |
| Eurocom RX315 NH57AF1 | |
| Aorus 15P XC | |
| Lenovo Legion C7 15IMH05 82EH0030GE | |
| Cinebench R23 / Single Core | |
| Intel Core i7-12700K | |
| MSI Raider GE66 12UHS | |
| Average Intel Core i7-12700K (1806 - 1895, n=2) | |
| Eurocom Raptor X15 | |
| Razer Blade 15 2022 | |
| MSI Vector GP76 12UGS-434 | |
| Eurocom Nightsky ARX315 | |
| Razer Blade 14 Ryzen 9 6900HX | |
| Eurocom RX315 NH57AF1 | |
| Gigabyte A5 X1 | |
| SCHENKER XMG Apex 15 NH57E PS | |
| Lenovo Legion C7 15IMH05 82EH0030GE | |
| Aorus 15P XC | |
| Cinebench R15 / CPU Multi 64Bit | |
| Intel Core i7-12700K | |
| Average Intel Core i7-12700K () | |
| MSI Vector GP76 12UGS-434 | |
| SCHENKER XMG Apex 15 NH57AF1 | |
| MSI Raider GE66 12UHS | |
| Razer Blade 14 Ryzen 9 6900HX | |
| Eurocom Nightsky ARX315 | |
| Razer Blade 15 2022 | |
| Gigabyte A5 X1 | |
| SCHENKER XMG Apex 15 NH57E PS | |
| Eurocom RX315 NH57AF1 | |
| Aorus 15P XC | |
| Lenovo Legion C7 15IMH05 82EH0030GE | |
| Cinebench R15 / CPU Single 64Bit | |
| Intel Core i7-12700K | |
| Average Intel Core i7-12700K () | |
| MSI Raider GE66 12UHS | |
| Razer Blade 15 2022 | |
| MSI Vector GP76 12UGS-434 | |
| Eurocom Nightsky ARX315 | |
| Razer Blade 14 Ryzen 9 6900HX | |
| Gigabyte A5 X1 | |
| SCHENKER XMG Apex 15 NH57E PS | |
| Eurocom RX315 NH57AF1 | |
| Lenovo Legion C7 15IMH05 82EH0030GE | |
| Aorus 15P XC | |
| SCHENKER XMG Apex 15 NH57AF1 | |
| Blender / v2.79 BMW27 CPU | |
| Lenovo Legion C7 15IMH05 82EH0030GE | |
| Aorus 15P XC | |
| Eurocom RX315 NH57AF1 | |
| SCHENKER XMG Apex 15 NH57E PS | |
| Gigabyte A5 X1 | |
| Razer Blade 15 2022 | |
| Razer Blade 14 Ryzen 9 6900HX | |
| Eurocom Nightsky ARX315 | |
| MSI Vector GP76 12UGS-434 | |
| MSI Raider GE66 12UHS | |
| Eurocom Raptor X15 | |
| SCHENKER XMG Apex 15 NH57AF1 | |
| Average Intel Core i7-12700K (152.3 - 193.9, n=2) | |
| Intel Core i7-12700K | |
| 7-Zip 18.03 / 7z b 4 -mmt1 | |
| Eurocom Nightsky ARX315 | |
| Eurocom Raptor X15 | |
| Average Intel Core i7-12700K (6117 - 6422, n=2) | |
| Intel Core i7-12700K | |
| MSI Raider GE66 12UHS | |
| Razer Blade 14 Ryzen 9 6900HX | |
| Razer Blade 15 2022 | |
| Gigabyte A5 X1 | |
| SCHENKER XMG Apex 15 NH57E PS | |
| MSI Vector GP76 12UGS-434 | |
| Lenovo Legion C7 15IMH05 82EH0030GE | |
| Eurocom RX315 NH57AF1 | |
| Aorus 15P XC | |
| SCHENKER XMG Apex 15 NH57AF1 | |
| Geekbench 5.5 / Multi-Core | |
| Intel Core i7-12700K | |
| Average Intel Core i7-12700K (12475 - 15557, n=2) | |
| MSI Raider GE66 12UHS | |
| Eurocom Raptor X15 | |
| Razer Blade 15 2022 | |
| MSI Vector GP76 12UGS-434 | |
| SCHENKER XMG Apex 15 NH57AF1 | |
| Eurocom Nightsky ARX315 | |
| Razer Blade 14 Ryzen 9 6900HX | |
| Eurocom RX315 NH57AF1 | |
| Gigabyte A5 X1 | |
| SCHENKER XMG Apex 15 NH57E PS | |
| Lenovo Legion C7 15IMH05 82EH0030GE | |
| Aorus 15P XC | |
| Geekbench 5.5 / Single-Core | |
| Eurocom Raptor X15 | |
| Average Intel Core i7-12700K (1890 - 1933, n=2) | |
| Intel Core i7-12700K | |
| MSI Raider GE66 12UHS | |
| MSI Vector GP76 12UGS-434 | |
| Razer Blade 15 2022 | |
| Eurocom Nightsky ARX315 | |
| Razer Blade 14 Ryzen 9 6900HX | |
| Eurocom RX315 NH57AF1 | |
| Gigabyte A5 X1 | |
| SCHENKER XMG Apex 15 NH57E PS | |
| Lenovo Legion C7 15IMH05 82EH0030GE | |
| Aorus 15P XC | |
| SCHENKER XMG Apex 15 NH57AF1 | |
| HWBOT x265 Benchmark v2.2 / 4k Preset | |
| Intel Core i7-12700K | |
| Average Intel Core i7-12700K (14.9 - 26.1, n=2) | |
| MSI Vector GP76 12UGS-434 | |
| SCHENKER XMG Apex 15 NH57AF1 | |
| MSI Raider GE66 12UHS | |
| Razer Blade 14 Ryzen 9 6900HX | |
| Eurocom Nightsky ARX315 | |
| Razer Blade 15 2022 | |
| Gigabyte A5 X1 | |
| SCHENKER XMG Apex 15 NH57E PS | |
| Eurocom RX315 NH57AF1 | |
| Eurocom Raptor X15 | |
| Aorus 15P XC | |
| Lenovo Legion C7 15IMH05 82EH0030GE | |
| LibreOffice / 20 Documents To PDF | |
| Gigabyte A5 X1 | |
| SCHENKER XMG Apex 15 NH57AF1 | |
| Lenovo Legion C7 15IMH05 82EH0030GE | |
| SCHENKER XMG Apex 15 NH57E PS | |
| Aorus 15P XC | |
| Razer Blade 15 2022 | |
| Razer Blade 14 Ryzen 9 6900HX | |
| Eurocom RX315 NH57AF1 | |
| Eurocom Nightsky ARX315 | |
| MSI Vector GP76 12UGS-434 | |
| Intel Core i7-12700K | |
| Average Intel Core i7-12700K (37.8 - 39.8, n=2) | |
| Eurocom Raptor X15 | |
| MSI Raider GE66 12UHS | |
| R Benchmark 2.5 / Overall mean | |
| Aorus 15P XC | |
| Lenovo Legion C7 15IMH05 82EH0030GE | |
| Eurocom RX315 NH57AF1 | |
| SCHENKER XMG Apex 15 NH57AF1 | |
| SCHENKER XMG Apex 15 NH57E PS | |
| Gigabyte A5 X1 | |
| Eurocom Nightsky ARX315 | |
| Razer Blade 14 Ryzen 9 6900HX | |
| Razer Blade 15 2022 | |
| MSI Vector GP76 12UGS-434 | |
| MSI Raider GE66 12UHS | |
| Intel Core i7-12700K | |
| Average Intel Core i7-12700K (0.412 - 0.423, n=2) | |
| Eurocom Raptor X15 | |
Cinebench R23: Multi Core | Single Core
Cinebench R15: CPU Multi 64Bit | CPU Single 64Bit
Blender: v2.79 BMW27 CPU
7-Zip 18.03: 7z b 4 | 7z b 4 -mmt1
Geekbench 5.5: Multi-Core | Single-Core
HWBOT x265 Benchmark v2.2: 4k Preset
LibreOffice : 20 Documents To PDF
R Benchmark 2.5: Overall mean
* ... smaller is better
AIDA64: FP32 Ray-Trace | FPU Julia | CPU SHA3 | CPU Queen | FPU SinJulia | FPU Mandel | CPU AES | CPU ZLib | FP64 Ray-Trace | CPU PhotoWorxx
| Performance Rating | |
| Gigabyte A5 X1 | |
| Eurocom RX315 NH57AF1 | |
| Asus TUF Gaming A15 FA506QR-AZ061T | |
| MSI Raider GE66 12UHS | |
| Eurocom Raptor X15 | |
| Average Intel Core i7-12700K | |
| Razer Blade 15 Advanced Model Early 2022 | |
| AIDA64 / FP32 Ray-Trace | |
| Gigabyte A5 X1 | |
| Eurocom RX315 NH57AF1 | |
| Asus TUF Gaming A15 FA506QR-AZ061T | |
| MSI Raider GE66 12UHS | |
| Eurocom Raptor X15 | |
| Average Intel Core i7-12700K () | |
| Razer Blade 15 Advanced Model Early 2022 | |
| AIDA64 / FPU Julia | |
| Gigabyte A5 X1 | |
| Asus TUF Gaming A15 FA506QR-AZ061T | |
| Eurocom RX315 NH57AF1 | |
| Eurocom Raptor X15 | |
| Average Intel Core i7-12700K () | |
| MSI Raider GE66 12UHS | |
| Razer Blade 15 Advanced Model Early 2022 | |
| AIDA64 / CPU SHA3 | |
| Eurocom RX315 NH57AF1 | |
| Gigabyte A5 X1 | |
| Eurocom Raptor X15 | |
| Average Intel Core i7-12700K () | |
| MSI Raider GE66 12UHS | |
| Asus TUF Gaming A15 FA506QR-AZ061T | |
| Razer Blade 15 Advanced Model Early 2022 | |
| AIDA64 / CPU Queen | |
| MSI Raider GE66 12UHS | |
| Gigabyte A5 X1 | |
| Eurocom Raptor X15 | |
| Average Intel Core i7-12700K () | |
| Asus TUF Gaming A15 FA506QR-AZ061T | |
| Eurocom RX315 NH57AF1 | |
| Razer Blade 15 Advanced Model Early 2022 | |
| AIDA64 / FPU SinJulia | |
| Gigabyte A5 X1 | |
| Asus TUF Gaming A15 FA506QR-AZ061T | |
| Eurocom Raptor X15 | |
| Average Intel Core i7-12700K () | |
| Eurocom RX315 NH57AF1 | |
| MSI Raider GE66 12UHS | |
| Razer Blade 15 Advanced Model Early 2022 | |
| AIDA64 / FPU Mandel | |
| Gigabyte A5 X1 | |
| Eurocom RX315 NH57AF1 | |
| Asus TUF Gaming A15 FA506QR-AZ061T | |
| MSI Raider GE66 12UHS | |
| Eurocom Raptor X15 | |
| Average Intel Core i7-12700K () | |
| Razer Blade 15 Advanced Model Early 2022 | |
| AIDA64 / CPU AES | |
| Eurocom RX315 NH57AF1 | |
| Gigabyte A5 X1 | |
| MSI Raider GE66 12UHS | |
| Eurocom Raptor X15 | |
| Average Intel Core i7-12700K () | |
| Asus TUF Gaming A15 FA506QR-AZ061T | |
| Razer Blade 15 Advanced Model Early 2022 | |
| AIDA64 / CPU ZLib | |
| Eurocom Raptor X15 | |
| Average Intel Core i7-12700K () | |
| MSI Raider GE66 12UHS | |
| Gigabyte A5 X1 | |
| Eurocom RX315 NH57AF1 | |
| Asus TUF Gaming A15 FA506QR-AZ061T | |
| Razer Blade 15 Advanced Model Early 2022 | |
| AIDA64 / FP64 Ray-Trace | |
| Eurocom RX315 NH57AF1 | |
| Gigabyte A5 X1 | |
| Asus TUF Gaming A15 FA506QR-AZ061T | |
| MSI Raider GE66 12UHS | |
| Eurocom Raptor X15 | |
| Average Intel Core i7-12700K () | |
| Razer Blade 15 Advanced Model Early 2022 | |
| AIDA64 / CPU PhotoWorxx | |
| MSI Raider GE66 12UHS | |
| Razer Blade 15 Advanced Model Early 2022 | |
| Eurocom Raptor X15 | |
| Average Intel Core i7-12700K () | |
| Eurocom RX315 NH57AF1 | |
| Gigabyte A5 X1 | |
| Asus TUF Gaming A15 FA506QR-AZ061T | |
System Performance
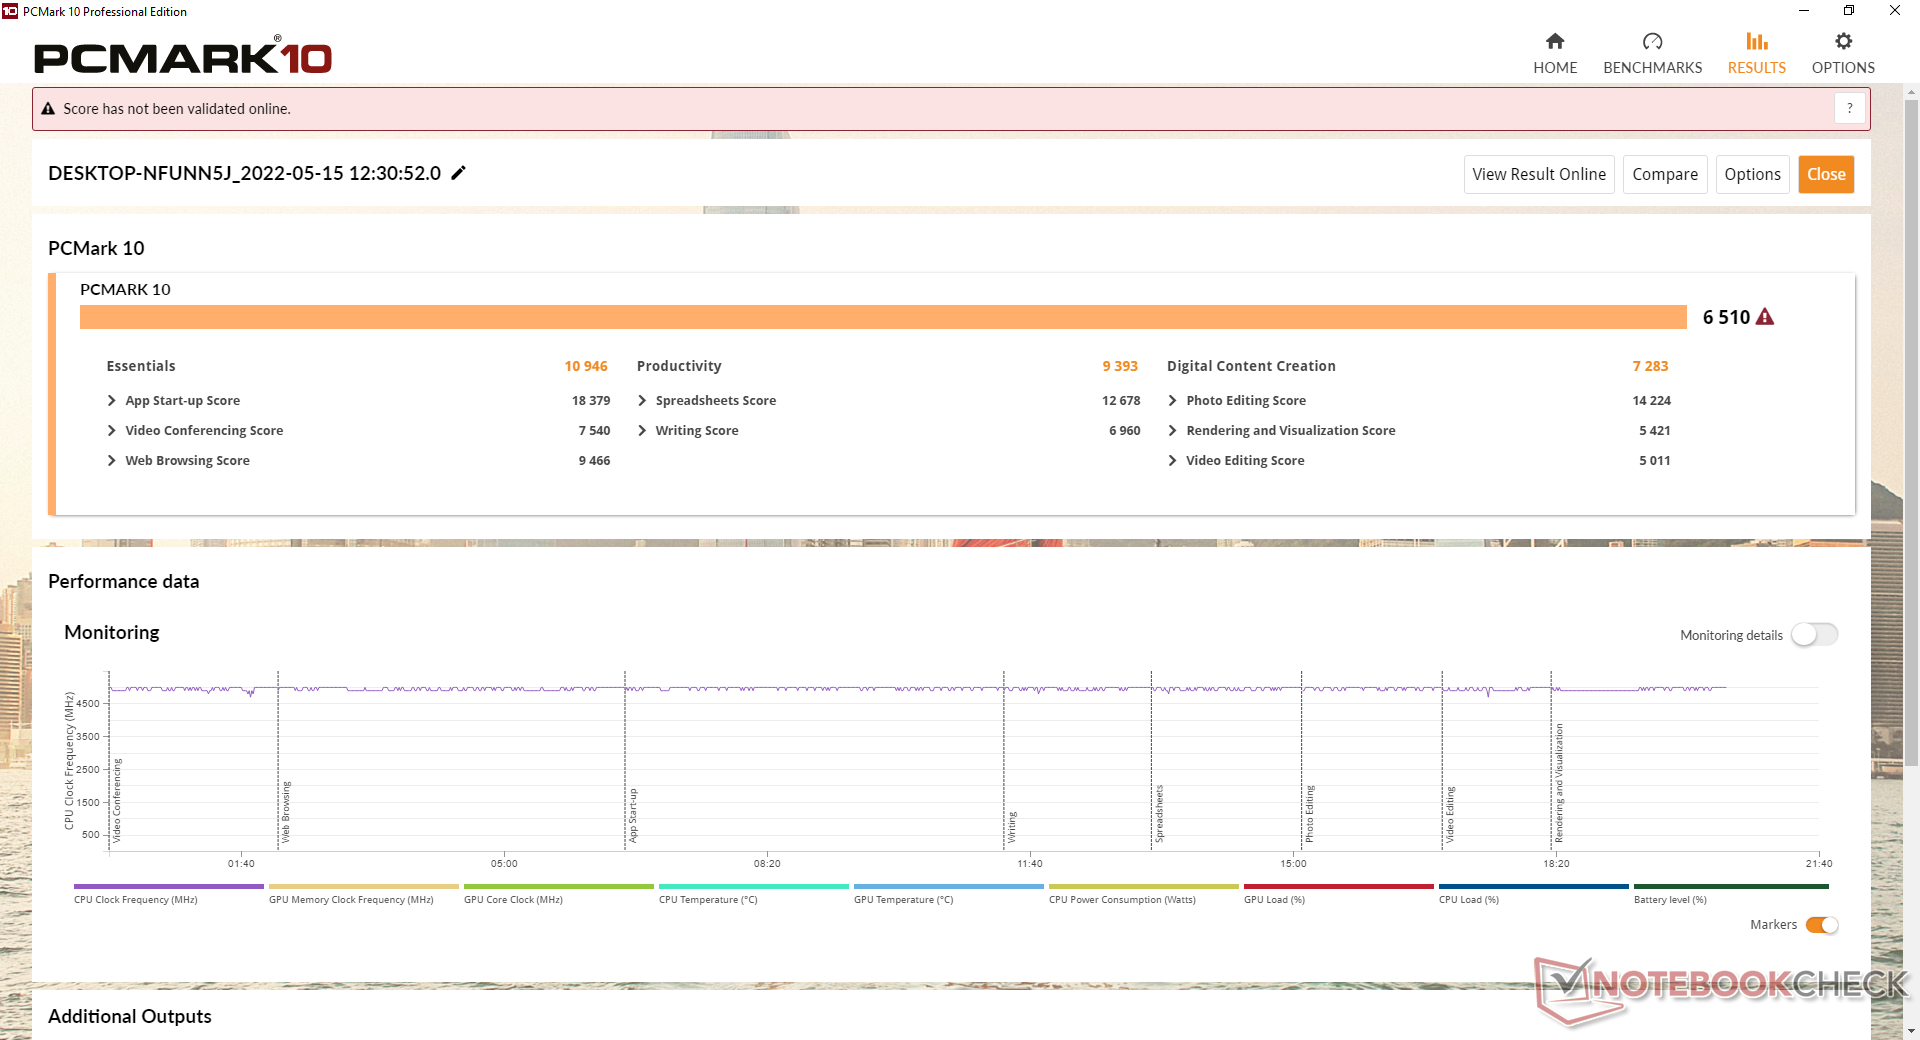
PCMark 10 scores are comparable to high-end gaming laptops equipped with "regular" mobile CPUs like the MSI GE66 i9-12900HK or Razer Blade 15 i7-12800H. The Digital Content Creation subtest score, however, is lower than expected.
CrossMark: Overall | Productivity | Creativity | Responsiveness
| PCMark 10 / Score | |
| MSI Raider GE66 12UHS | |
| Razer Blade 15 Advanced Model Early 2022 | |
| Eurocom RX315 NH57AF1 | |
| Asus TUF Gaming A15 FA506QR-AZ061T | |
| Gigabyte A5 X1 | |
| Eurocom Raptor X15 | |
| Average Intel Core i7-12700K, NVIDIA GeForce RTX 3070 Ti Laptop GPU () | |
| PCMark 10 / Essentials | |
| MSI Raider GE66 12UHS | |
| Eurocom Raptor X15 | |
| Average Intel Core i7-12700K, NVIDIA GeForce RTX 3070 Ti Laptop GPU () | |
| Razer Blade 15 Advanced Model Early 2022 | |
| Eurocom RX315 NH57AF1 | |
| Asus TUF Gaming A15 FA506QR-AZ061T | |
| Gigabyte A5 X1 | |
| PCMark 10 / Productivity | |
| MSI Raider GE66 12UHS | |
| Razer Blade 15 Advanced Model Early 2022 | |
| Asus TUF Gaming A15 FA506QR-AZ061T | |
| Eurocom Raptor X15 | |
| Average Intel Core i7-12700K, NVIDIA GeForce RTX 3070 Ti Laptop GPU () | |
| Gigabyte A5 X1 | |
| Eurocom RX315 NH57AF1 | |
| PCMark 10 / Digital Content Creation | |
| MSI Raider GE66 12UHS | |
| Razer Blade 15 Advanced Model Early 2022 | |
| Eurocom RX315 NH57AF1 | |
| Gigabyte A5 X1 | |
| Asus TUF Gaming A15 FA506QR-AZ061T | |
| Eurocom Raptor X15 | |
| Average Intel Core i7-12700K, NVIDIA GeForce RTX 3070 Ti Laptop GPU () | |
| CrossMark / Overall | |
| Eurocom Raptor X15 | |
| Average Intel Core i7-12700K, NVIDIA GeForce RTX 3070 Ti Laptop GPU () | |
| Razer Blade 15 Advanced Model Early 2022 | |
| CrossMark / Productivity | |
| Eurocom Raptor X15 | |
| Average Intel Core i7-12700K, NVIDIA GeForce RTX 3070 Ti Laptop GPU () | |
| Razer Blade 15 Advanced Model Early 2022 | |
| CrossMark / Creativity | |
| Eurocom Raptor X15 | |
| Average Intel Core i7-12700K, NVIDIA GeForce RTX 3070 Ti Laptop GPU () | |
| Razer Blade 15 Advanced Model Early 2022 | |
| CrossMark / Responsiveness | |
| Eurocom Raptor X15 | |
| Average Intel Core i7-12700K, NVIDIA GeForce RTX 3070 Ti Laptop GPU () | |
| Razer Blade 15 Advanced Model Early 2022 | |
| PCMark 10 Score | 6510 points | |
Help | ||
| AIDA64 / Memory Copy | |
| MSI Raider GE66 12UHS | |
| Razer Blade 15 Advanced Model Early 2022 | |
| Eurocom Raptor X15 | |
| Average Intel Core i7-12700K () | |
| Eurocom RX315 NH57AF1 | |
| Gigabyte A5 X1 | |
| Asus TUF Gaming A15 FA506QR-AZ061T | |
| AIDA64 / Memory Read | |
| MSI Raider GE66 12UHS | |
| Razer Blade 15 Advanced Model Early 2022 | |
| Eurocom Raptor X15 | |
| Average Intel Core i7-12700K () | |
| Eurocom RX315 NH57AF1 | |
| Gigabyte A5 X1 | |
| Asus TUF Gaming A15 FA506QR-AZ061T | |
| AIDA64 / Memory Write | |
| Razer Blade 15 Advanced Model Early 2022 | |
| MSI Raider GE66 12UHS | |
| Eurocom Raptor X15 | |
| Average Intel Core i7-12700K () | |
| Eurocom RX315 NH57AF1 | |
| Gigabyte A5 X1 | |
| Asus TUF Gaming A15 FA506QR-AZ061T | |
| AIDA64 / Memory Latency | |
| Razer Blade 15 Advanced Model Early 2022 | |
| MSI Raider GE66 12UHS | |
| Eurocom RX315 NH57AF1 | |
| Asus TUF Gaming A15 FA506QR-AZ061T | |
| Gigabyte A5 X1 | |
| Eurocom Raptor X15 | |
| Average Intel Core i7-12700K () | |
* ... smaller is better
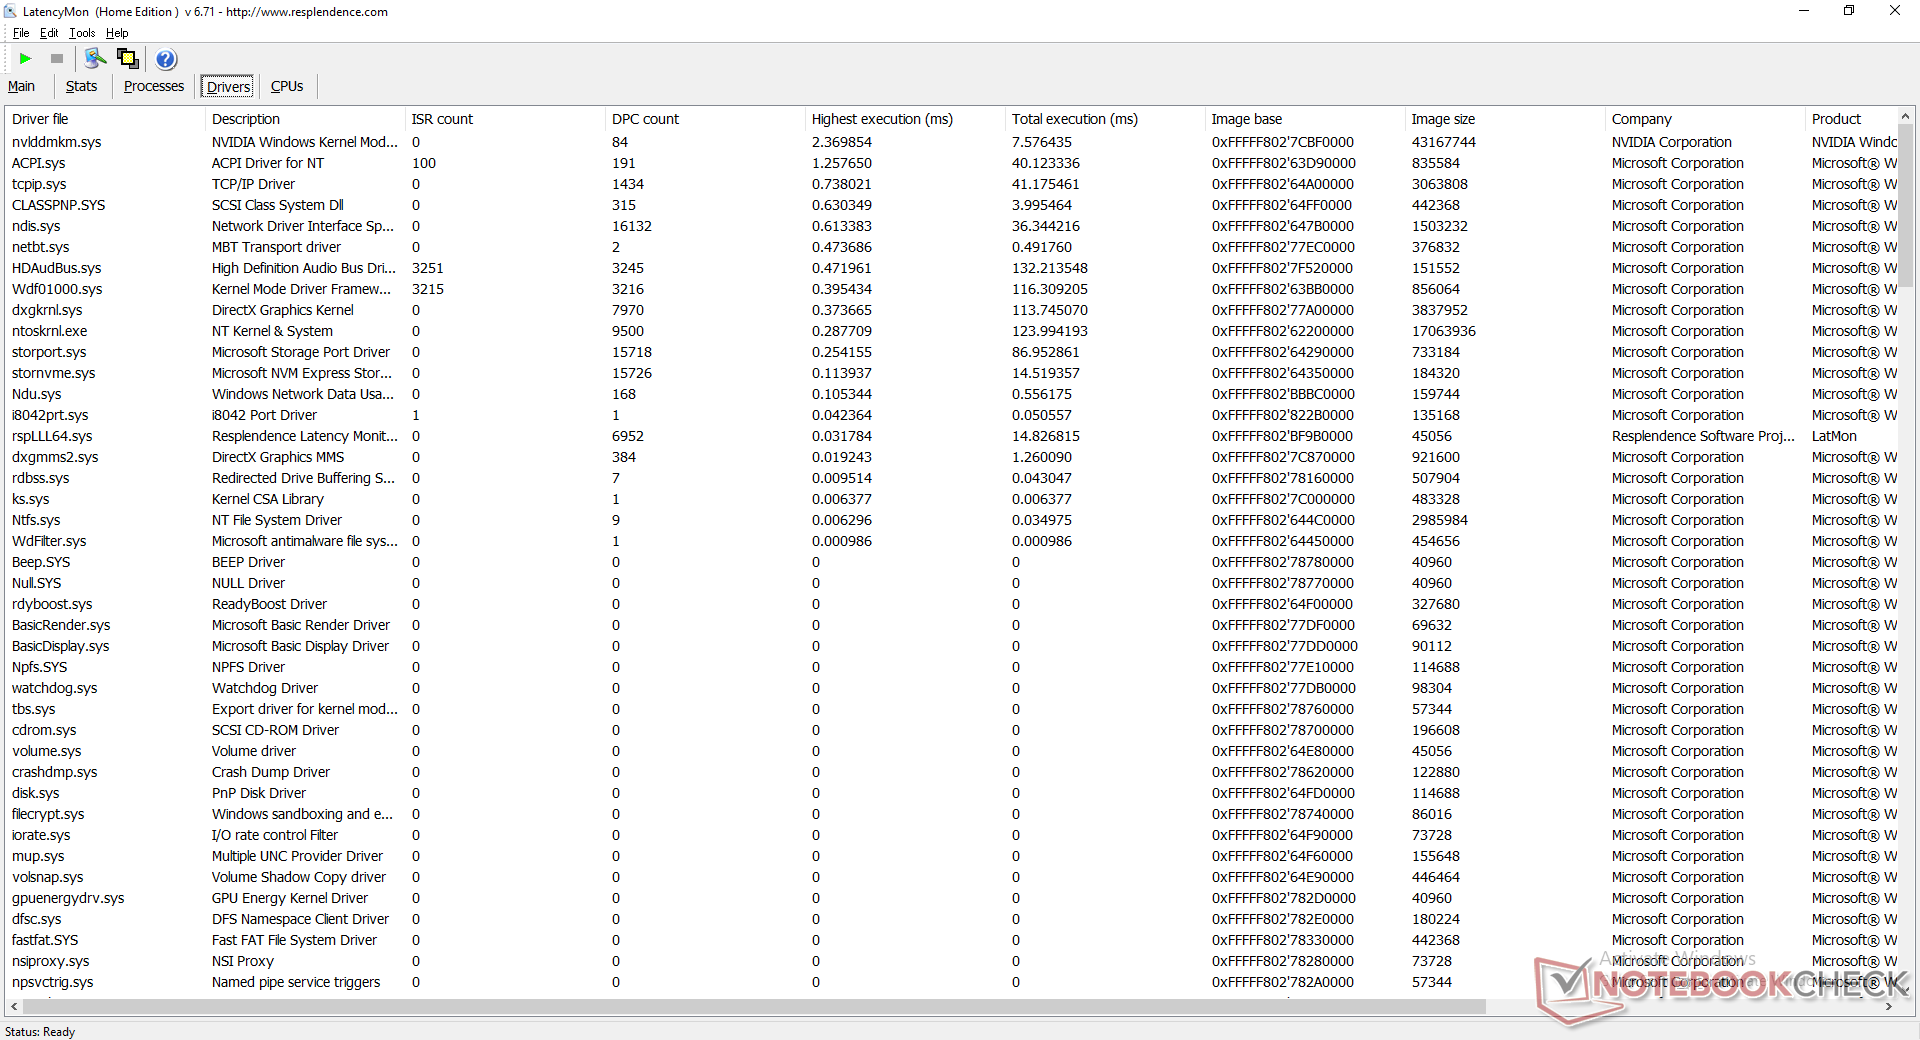
DPC Latency
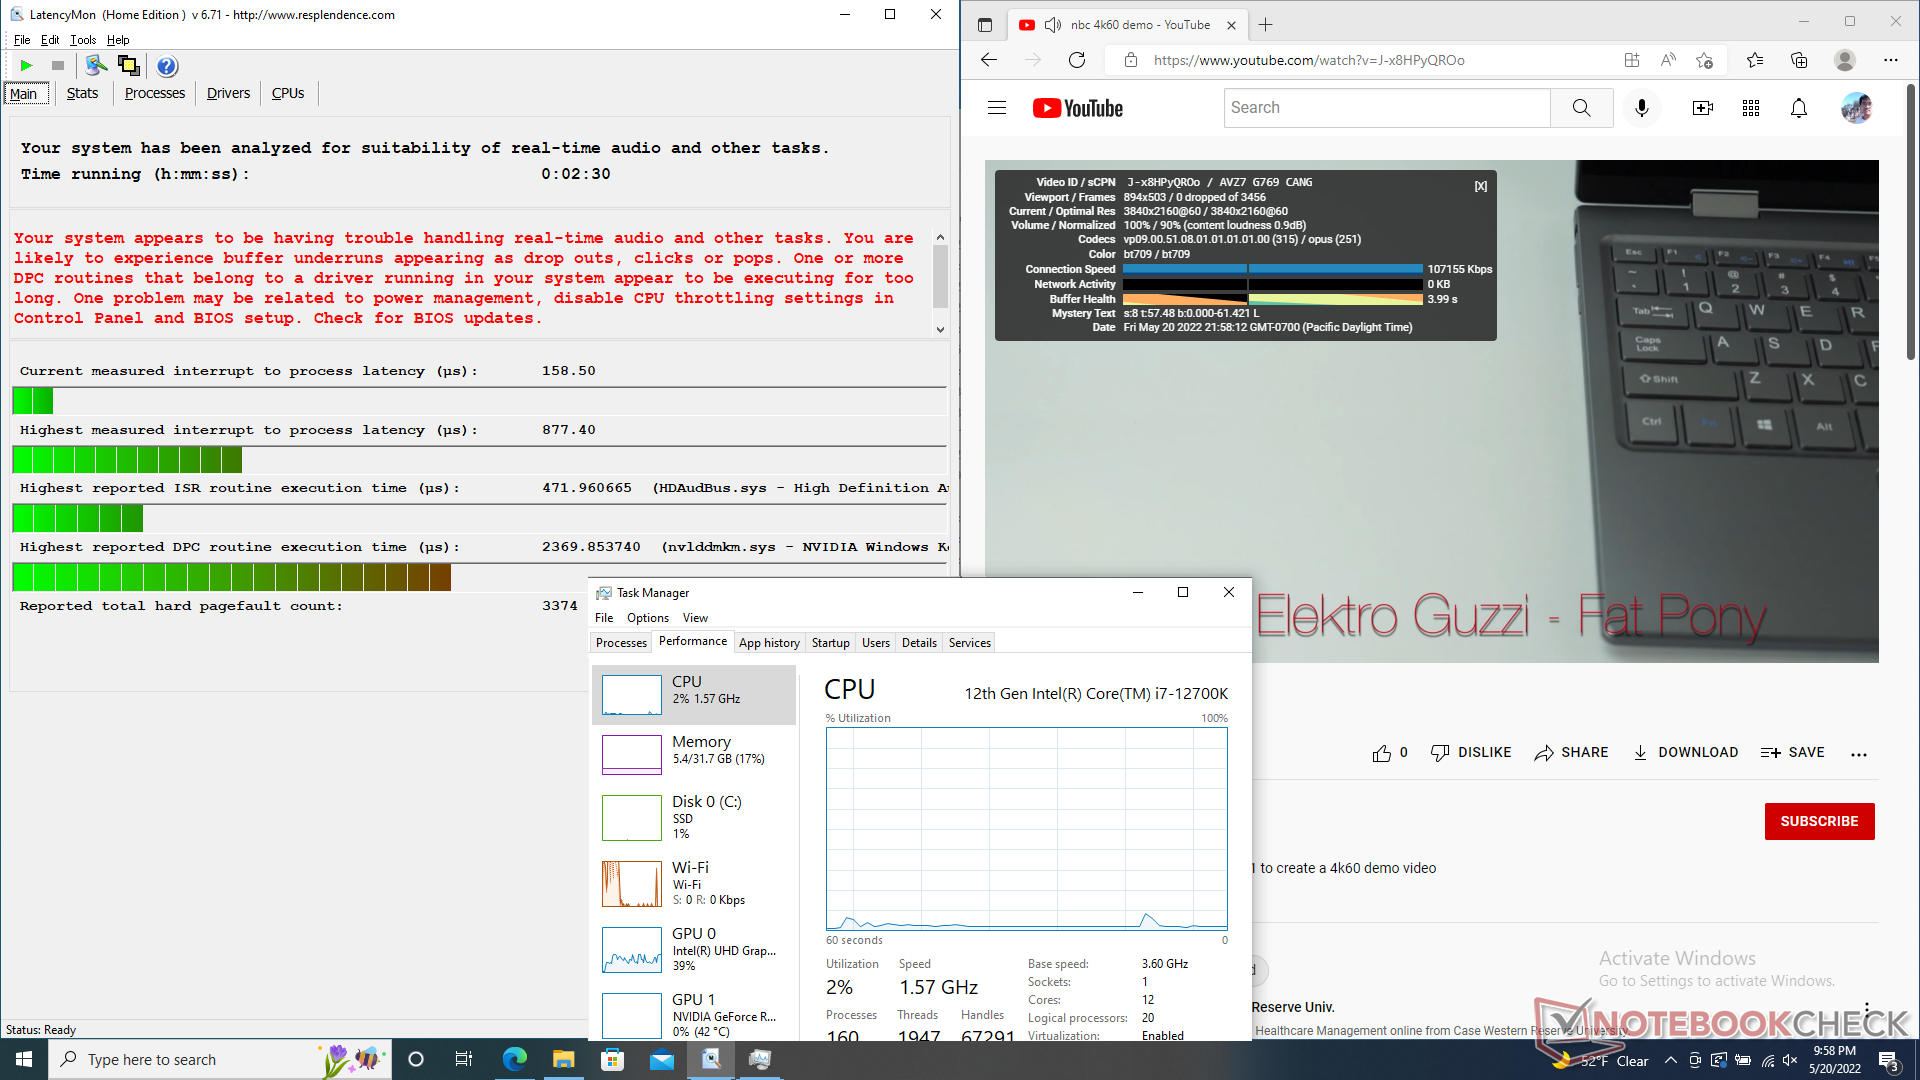
LatencyMon reveals DPC issues when opening multiple browser tabs of our homepage. 4K video playback at 60 FPS is otherwise perfect and with no dropped frames when set to the integrated GPU.
| DPC Latencies / LatencyMon - interrupt to process latency (max), Web, Youtube, Prime95 | |
| MSI Raider GE66 12UHS | |
| Razer Blade 15 Advanced Model Early 2022 | |
| Eurocom RX315 NH57AF1 | |
| Asus TUF Gaming A15 FA506QR-AZ061T | |
| Eurocom Raptor X15 | |
| Gigabyte A5 X1 | |
* ... smaller is better
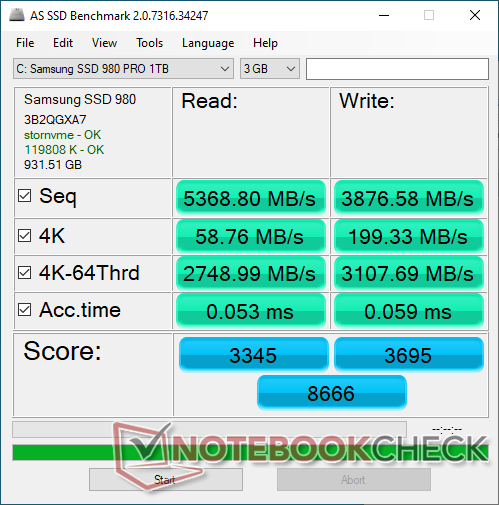
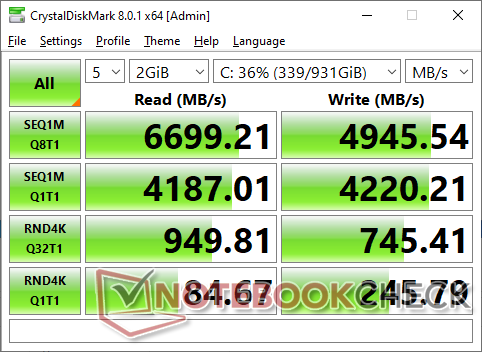
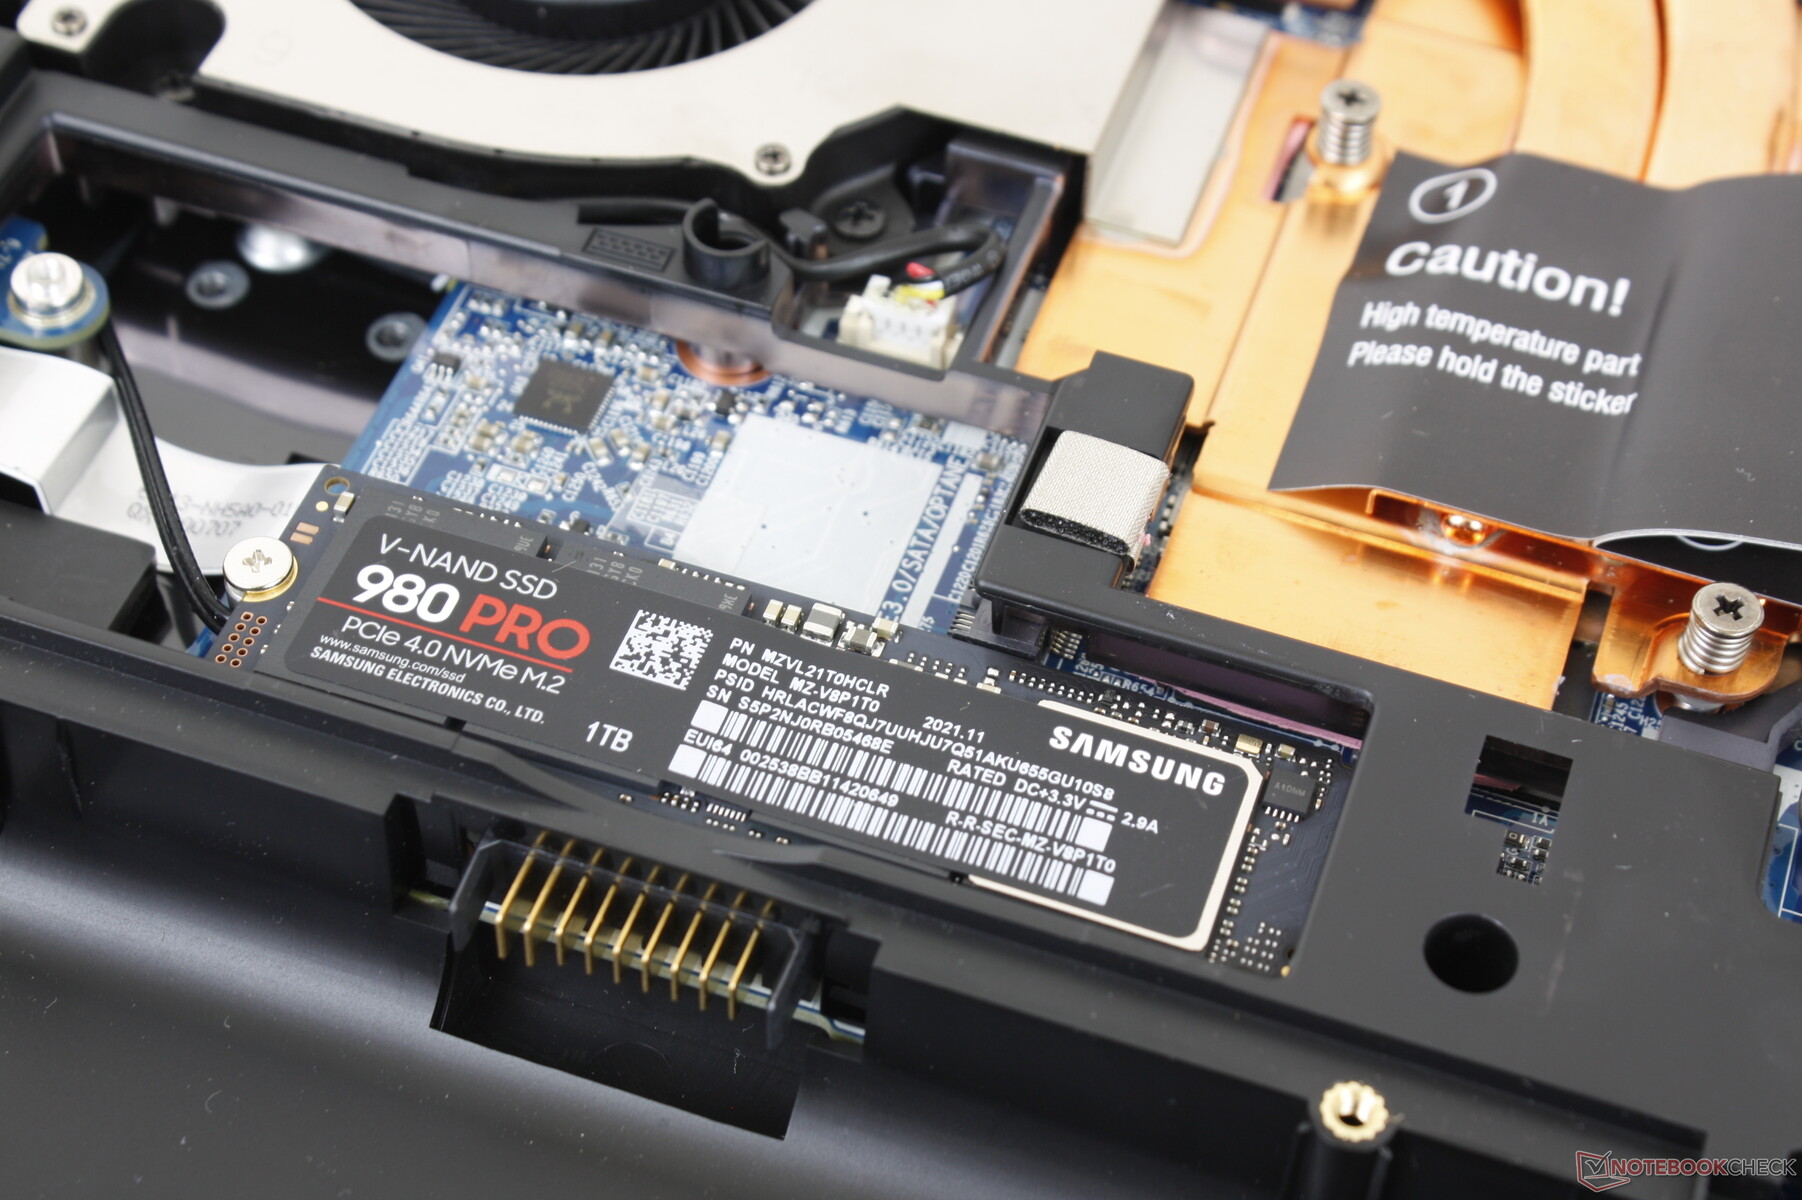
Storage Devices
Performance sustainability is poor when a PCIe4 drive is installed. As shown by our graph below, the Samsung SSD 980 Pro has issues maintaining its maximum transfer rate for even short periods. Performance throttling kicks in early due to thermal limitations stemming from the lack of an included heat spreader.

| Drive Performance Rating - Percent | |
| MSI Raider GE66 12UHS | |
| Razer Blade 15 Advanced Model Early 2022 | |
| Eurocom Raptor X15 | |
| Eurocom RX315 NH57AF1 | |
| Asus TUF Gaming A15 FA506QR-AZ061T | |
| Gigabyte A5 X1 | |
* ... smaller is better
Disk Throttling: DiskSpd Read Loop, Queue Depth 8
GPU Performance
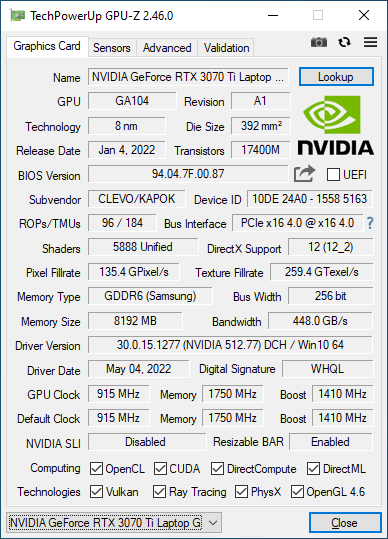
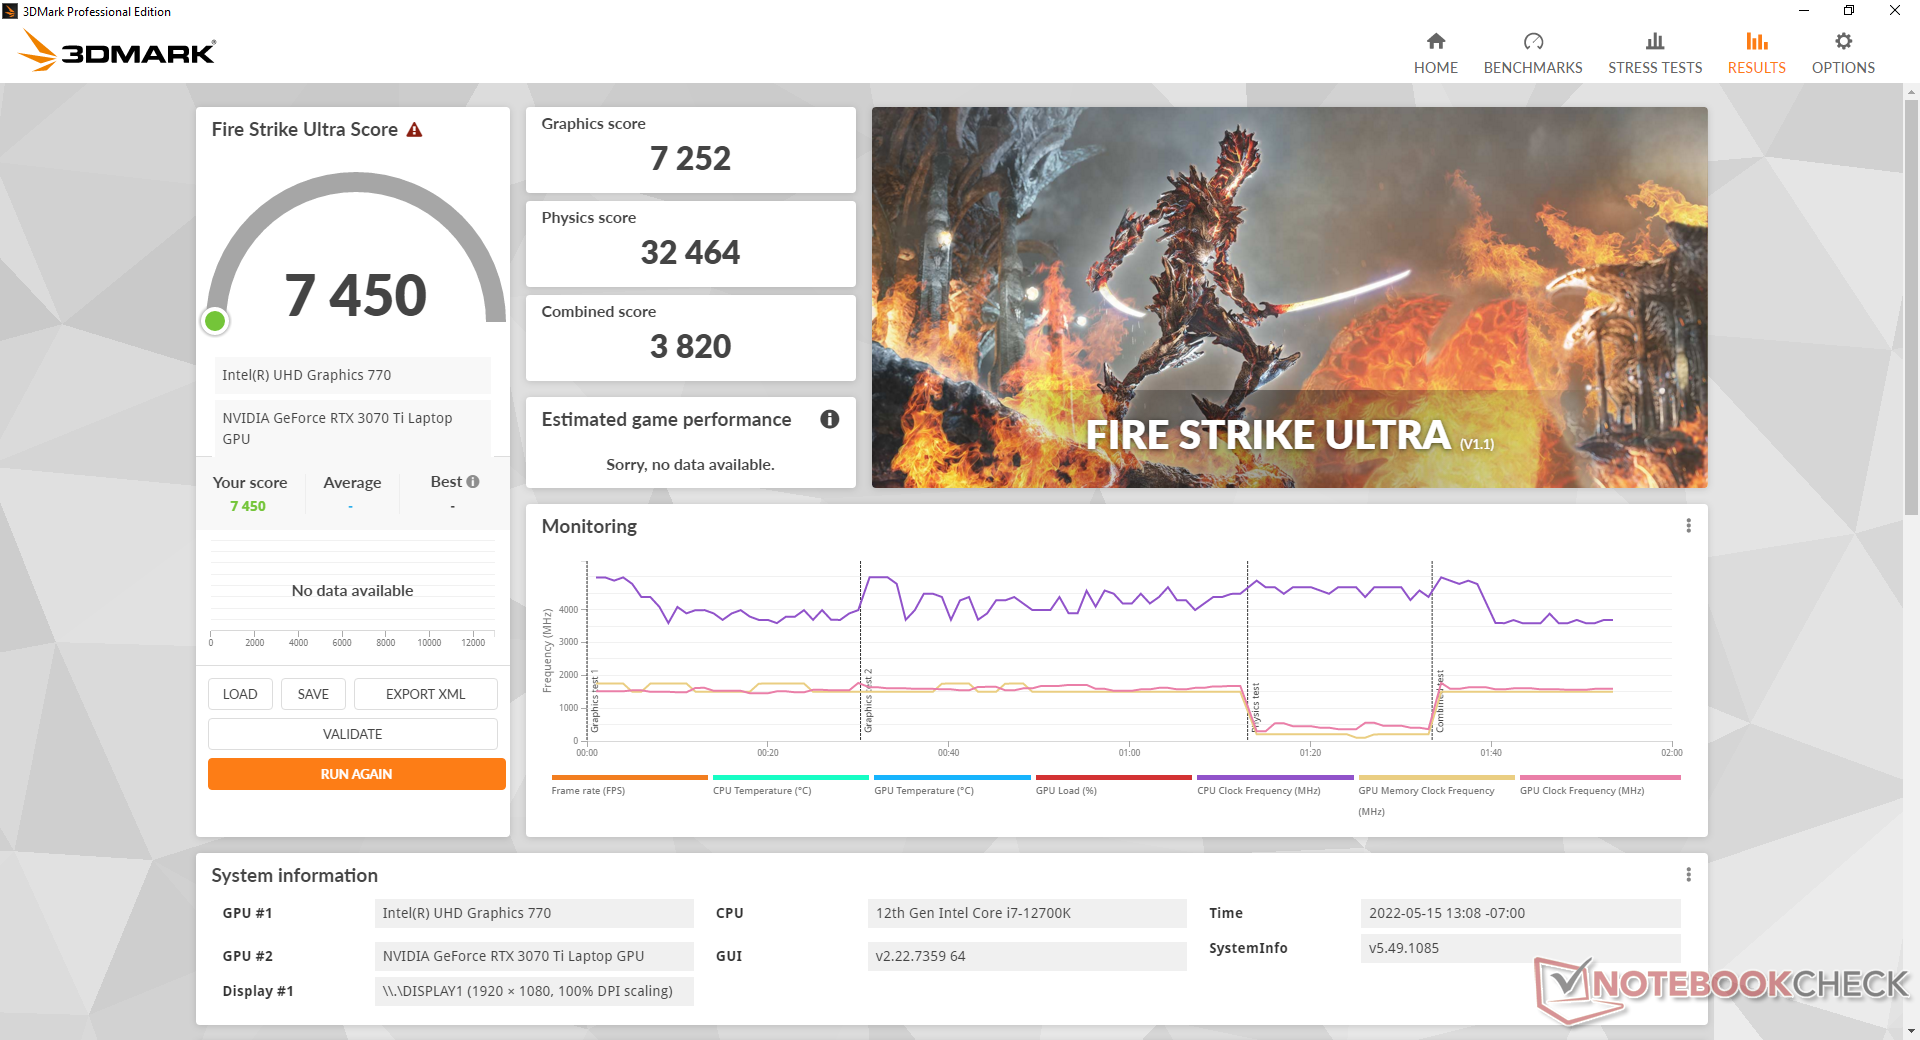
Graphics performance is excellent at up to 10 percent faster than the average laptop in our database equipped with the same GeForce RTX 3070 Ti GPU. The relatively thick chassis has allowed for a higher-than-average 140 W TGP target compared to just 105 W or less such as on the MSI GS66. Performance is just shy of the GeForce RTX 3070 for desktops.
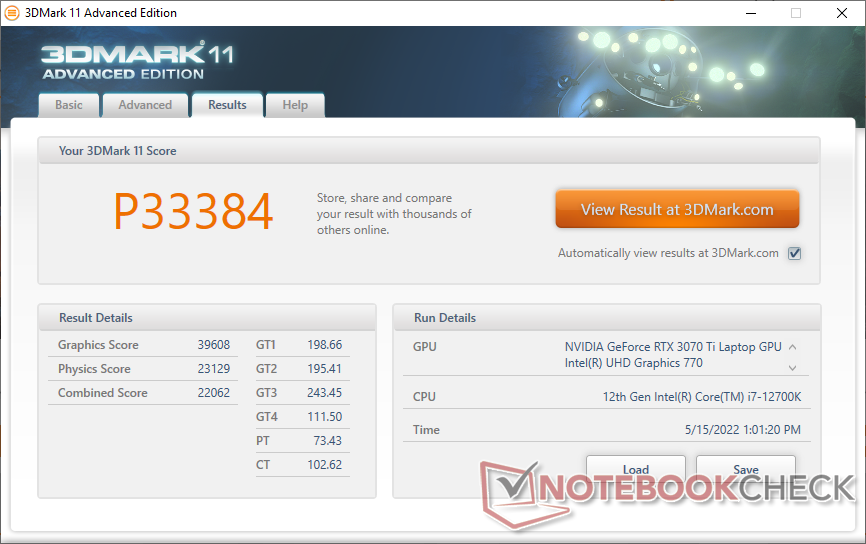
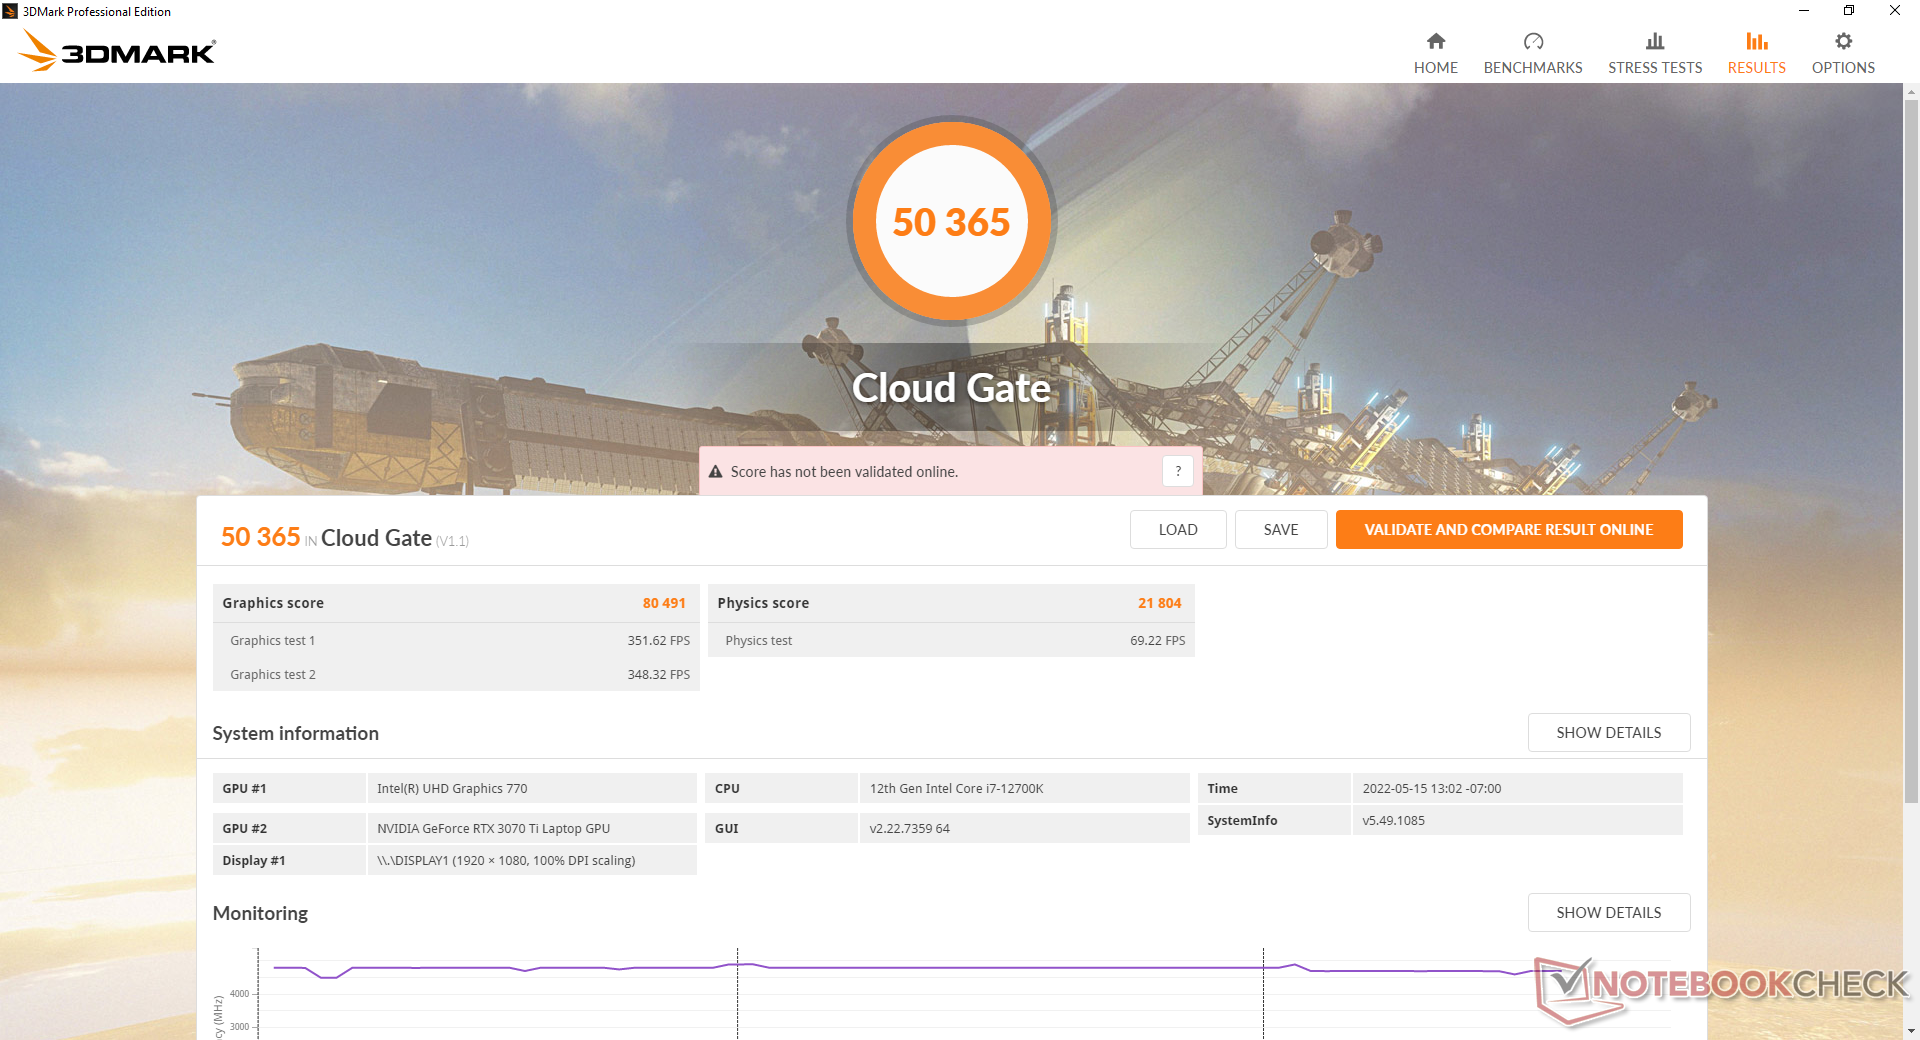
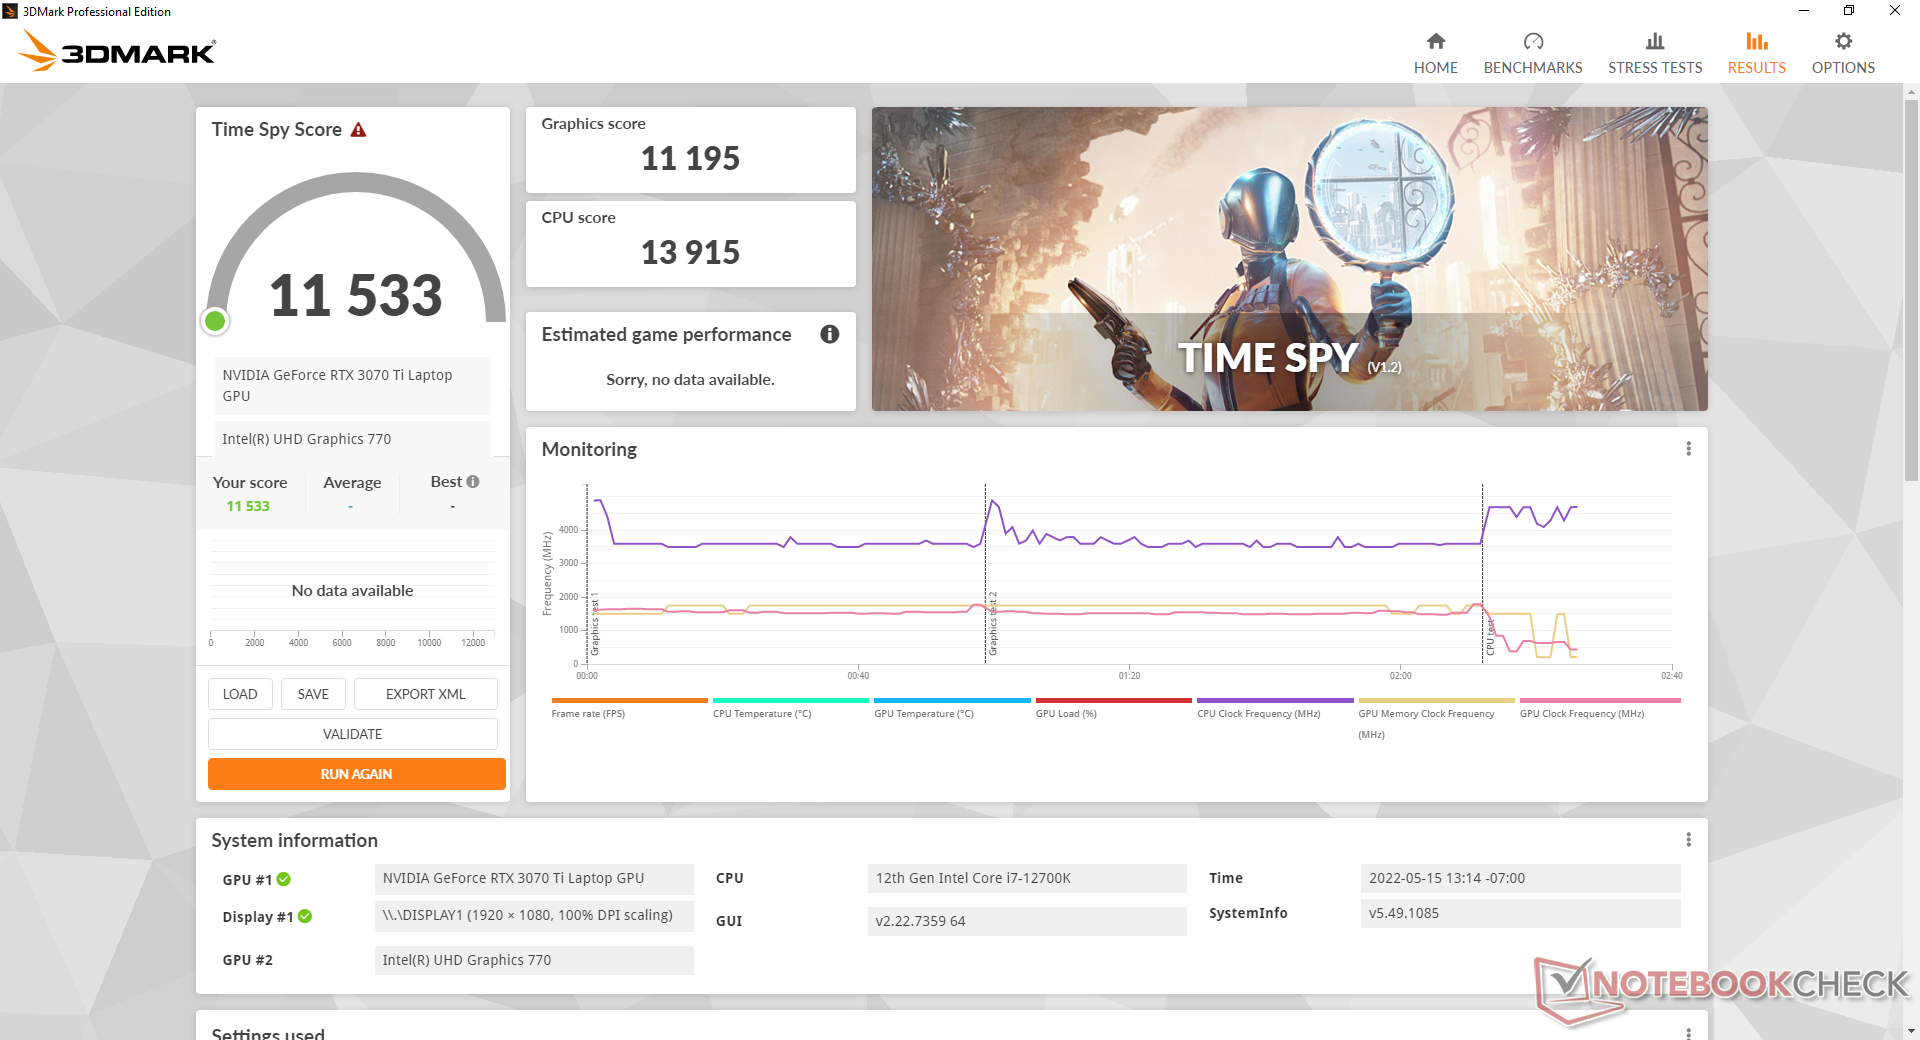
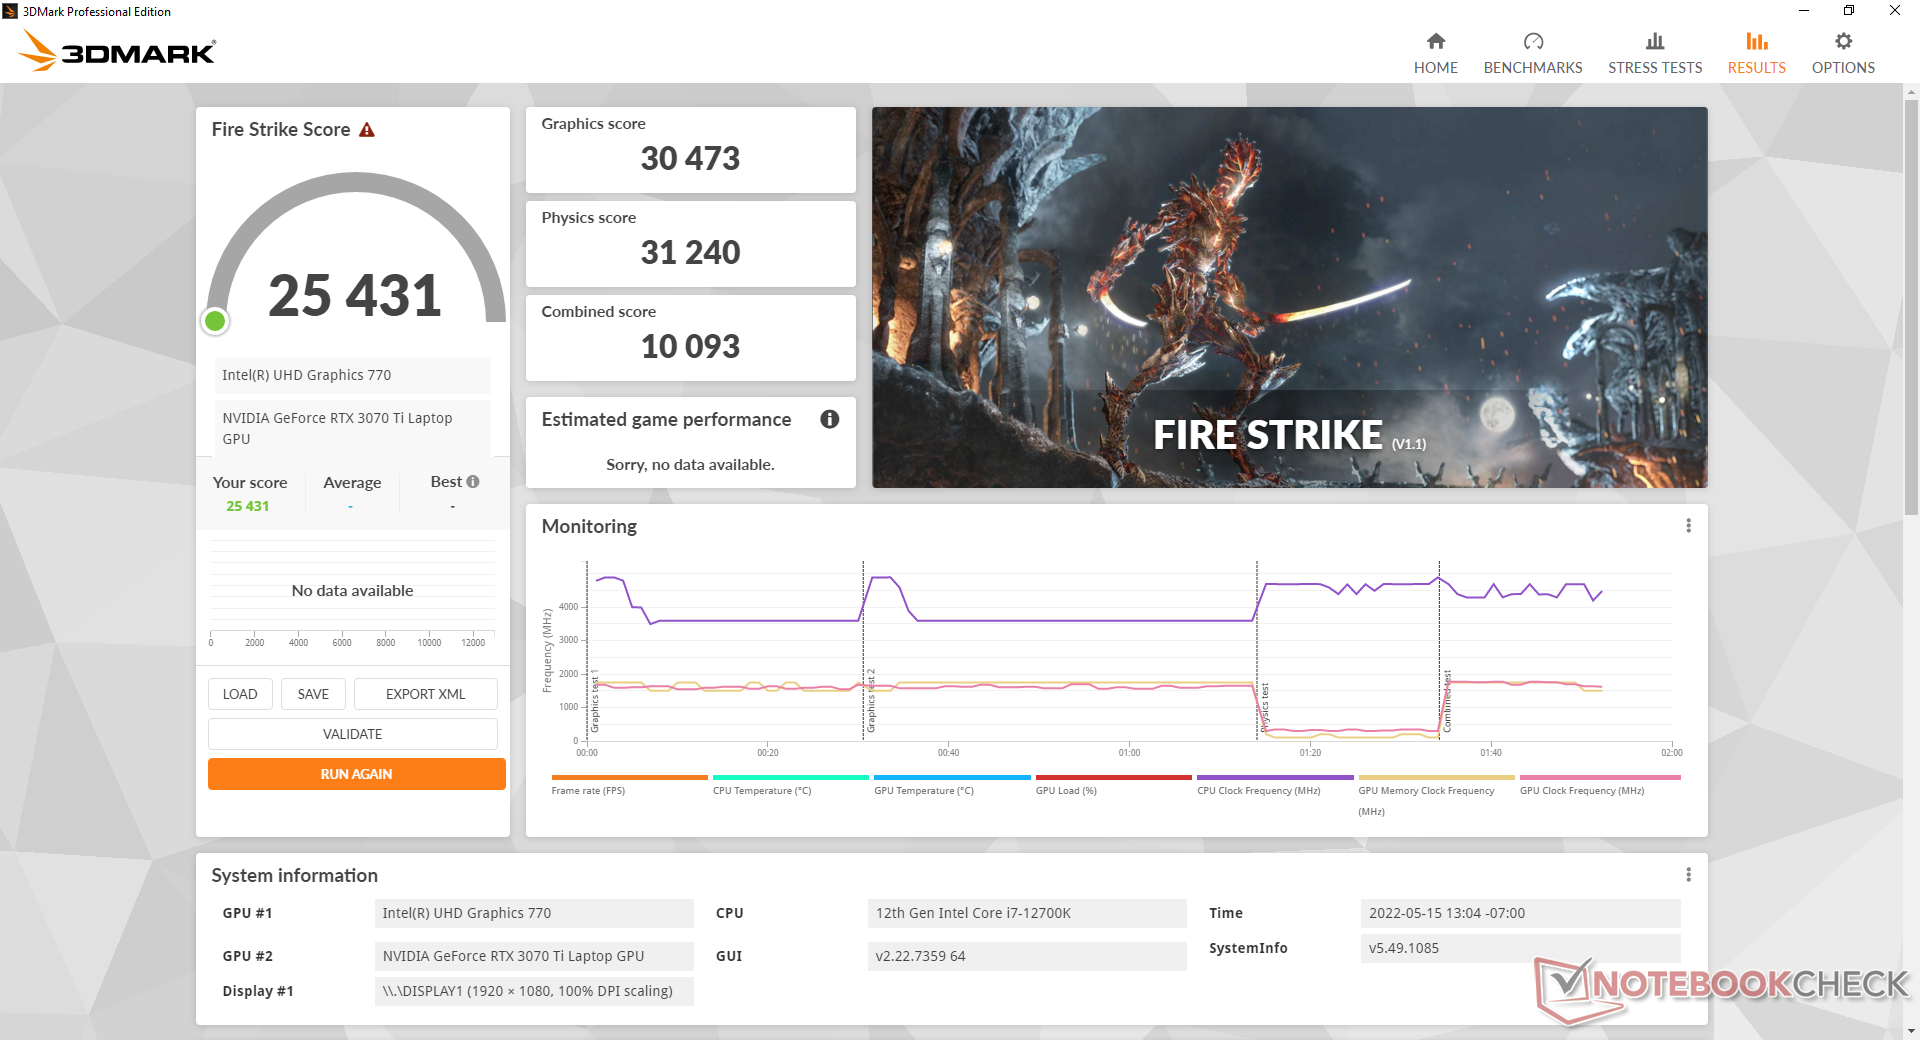
| 3DMark 11 Performance | 33384 points | |
| 3DMark Cloud Gate Standard Score | 50365 points | |
| 3DMark Fire Strike Score | 25431 points | |
| 3DMark Time Spy Score | 11533 points | |
Help | ||
Witcher 3 FPS Chart
| low | med. | high | ultra | |
| GTA V (2015) | 186.6 | 182.8 | 174.6 | 116.5 |
| The Witcher 3 (2015) | 429 | 329.2 | 213.9 | 111.4 |
| Dota 2 Reborn (2015) | 199 | 178.4 | 166.3 | 155.6 |
| Final Fantasy XV Benchmark (2018) | 202 | 145.8 | 109.5 | |
| X-Plane 11.11 (2018) | 160.9 | 137.6 | 109.9 | |
| Strange Brigade (2018) | 490 | 271 | 223 | 194 |
| Cyberpunk 2077 1.6 (2022) | 140.4 | 124.6 | 132.3 | 81.8 |
Emissions
System Noise
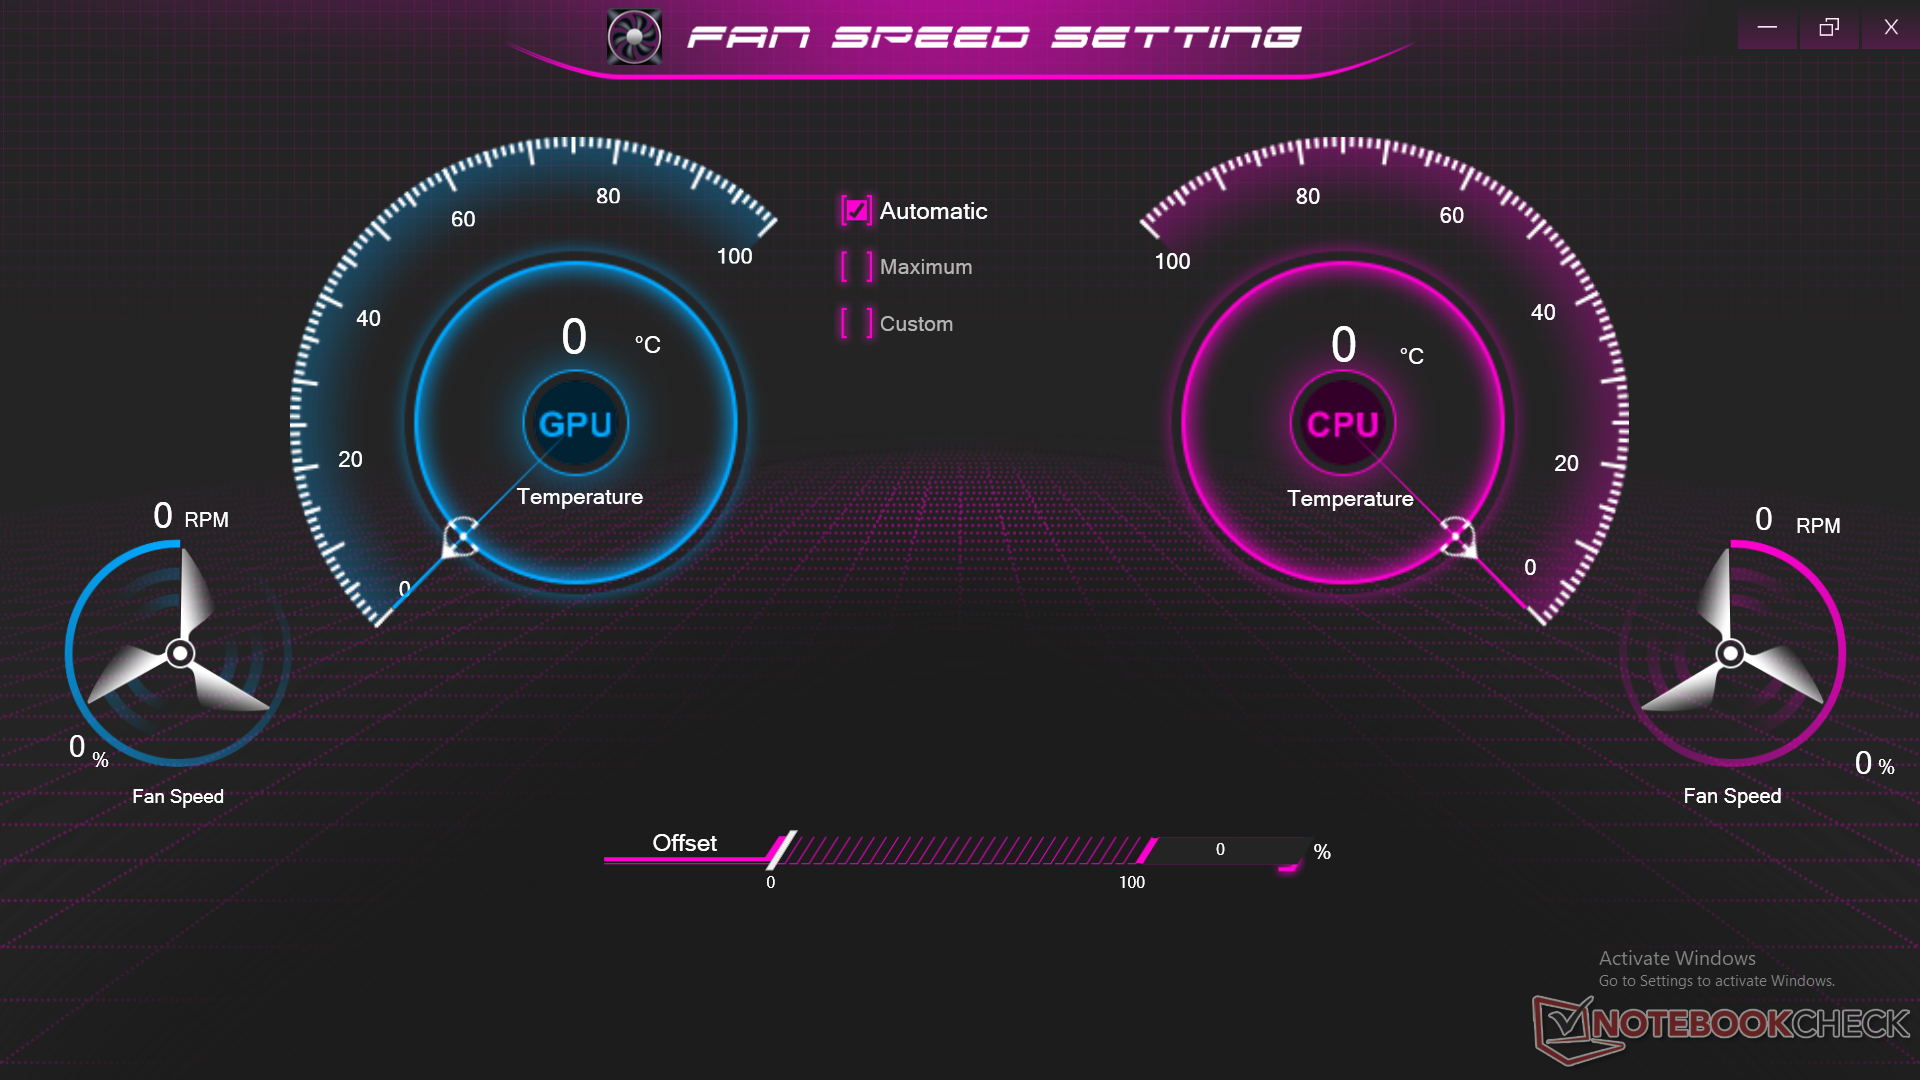
Fan noise is dependent on the five Control Center power mode settings: Power Saving, Quiet, Entertainment, Performance, and Maximum Fan mode. Quiet or Power Saving are recommended when simply browsing or video streaming to keep fan noise at a minimum. Otherwise, the fans will pulse more frequently when running undemanding applications on Entertainment or Performance modes.
Expect fan noise to be in the low to mid 50 dB(A) range when gaming to be louder than many other gaming laptops under similar conditions. If both Performance mode with Maximum Fan mode are active, then fan noise can be as high as 55 dB(A).
Noise Level
| Idle |
| 23.8 / 23.8 / 30.1 dB(A) |
| Load |
| 31.1 / 55.1 dB(A) |
 | ||
30 dB silent 40 dB(A) audible 50 dB(A) loud |
||
min: | ||
| Eurocom Raptor X15 GeForce RTX 3070 Ti Laptop GPU, i7-12700K, Samsung SSD 980 Pro 1TB MZ-V8P1T0BW | MSI Raider GE66 12UHS GeForce RTX 3080 Ti Laptop GPU, i9-12900HK, Samsung PM9A1 MZVL22T0HBLB | Razer Blade 15 Advanced Model Early 2022 GeForce RTX 3080 Ti Laptop GPU, i7-12800H, Samsung PM9A1 MZVL21T0HCLR | Eurocom RX315 NH57AF1 GeForce RTX 3070 Laptop GPU, i7-11800H, Samsung SSD 980 Pro 1TB MZ-V8P1T0BW | Gigabyte A5 X1 GeForce RTX 3070 Laptop GPU, R9 5900HX, ADATA XPG SX8200 Pro (ASX8200PNP-512GT) | Asus TUF Gaming A15 FA506QR-AZ061T GeForce RTX 3070 Laptop GPU, R7 5800H, SK Hynix HFM001TD3JX013N | |
|---|---|---|---|---|---|---|
| Noise | -14% | -2% | -18% | -21% | -10% | |
| off / environment * | 23.3 | 26 -12% | 26 -12% | 26.3 -13% | 25 -7% | 26 -12% |
| Idle Minimum * | 23.8 | 27 -13% | 26 -9% | 26.4 -11% | 27 -13% | 26 -9% |
| Idle Average * | 23.8 | 30 -26% | 27 -13% | 31 -30% | 29 -22% | 26 -9% |
| Idle Maximum * | 30.1 | 39 -30% | 29 4% | 34 -13% | 32 -6% | 27.4 9% |
| Load Average * | 31.1 | 45 -45% | 37 -19% | 47.8 -54% | 57 -83% | 46.6 -50% |
| Witcher 3 ultra * | 51.3 | 45 12% | 44 14% | 51.7 -1% | 56 -9% | |
| Load Maximum * | 55.1 | 47 15% | 45 18% | 57.1 -4% | 58 -5% | 49.3 11% |
* ... smaller is better
Temperature
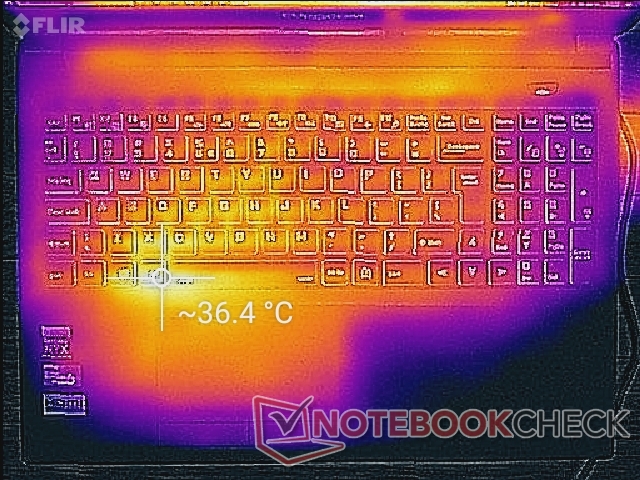
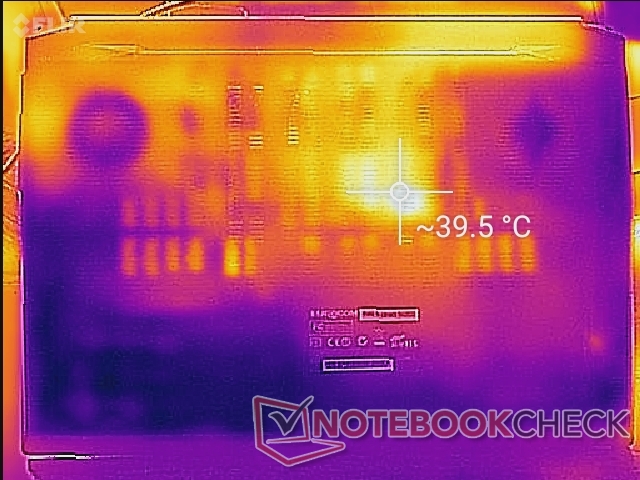
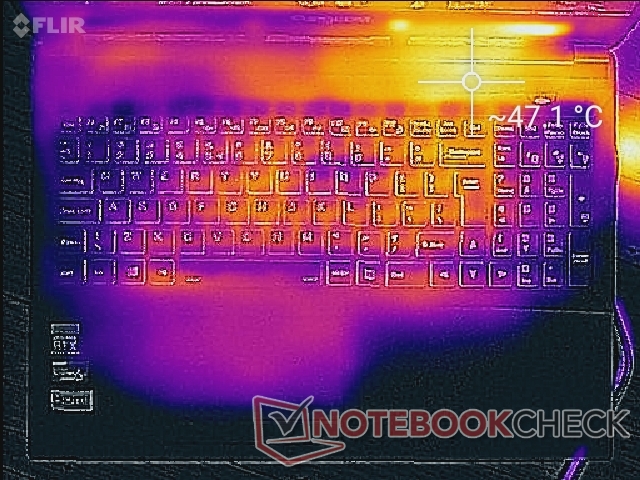
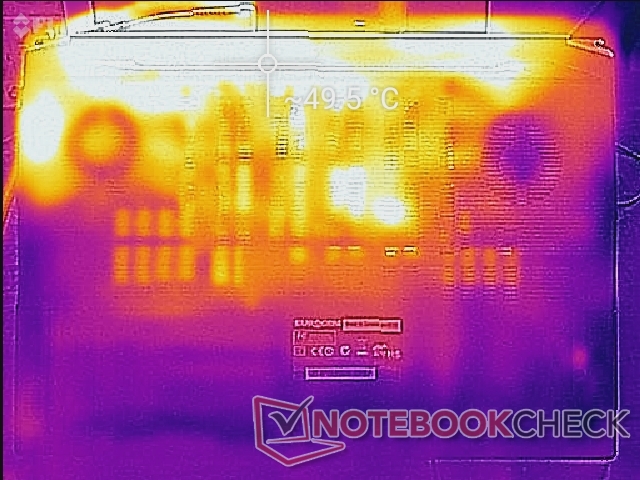
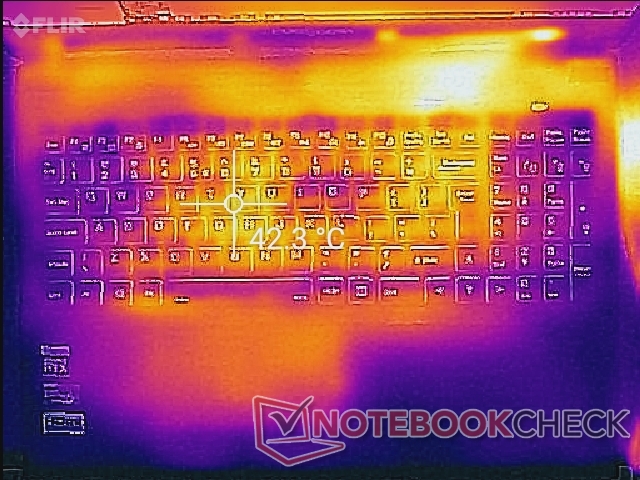
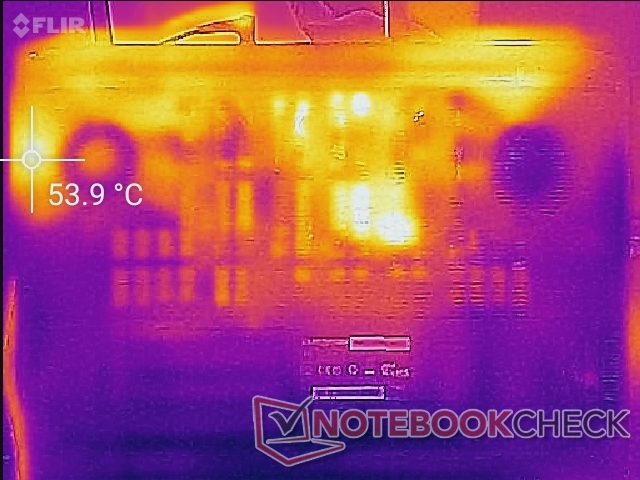
Surface temperature hot spots are nearest the left palm rest and keyboard center when running demanding applications. The left palm rest is usually warmer than the right since the PCIe4 NVMe SSD is positioned underneath. Hot spots can reach about 50 C on the top and bottom areas as shown by the temperature maps below.
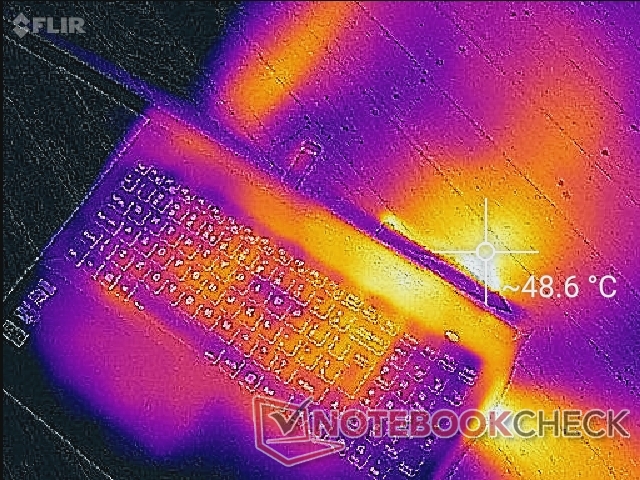
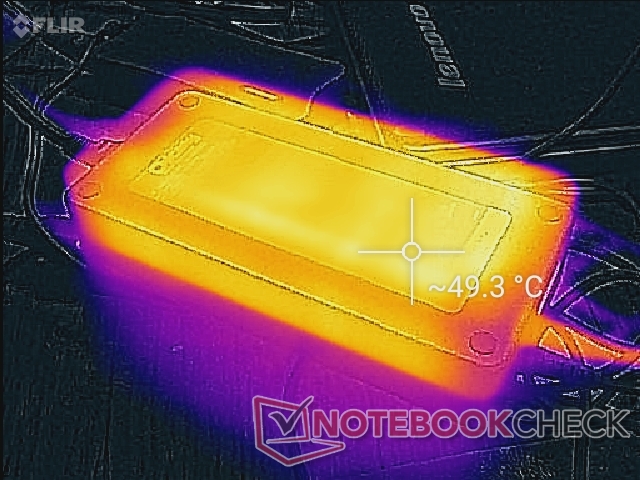
(-) The maximum temperature on the upper side is 48.8 °C / 120 F, compared to the average of 40.4 °C / 105 F, ranging from 21.2 to 68.8 °C for the class Gaming.
(-) The bottom heats up to a maximum of 57.8 °C / 136 F, compared to the average of 43.2 °C / 110 F
(+) In idle usage, the average temperature for the upper side is 30.2 °C / 86 F, compared to the device average of 33.8 °C / 93 F.
(±) Playing The Witcher 3, the average temperature for the upper side is 34.3 °C / 94 F, compared to the device average of 33.8 °C / 93 F.
(±) The palmrests and touchpad can get very hot to the touch with a maximum of 37.2 °C / 99 F.
(-) The average temperature of the palmrest area of similar devices was 28.9 °C / 84 F (-8.3 °C / -15 F).
| Eurocom Raptor X15 Intel Core i7-12700K, NVIDIA GeForce RTX 3070 Ti Laptop GPU | MSI Raider GE66 12UHS Intel Core i9-12900HK, NVIDIA GeForce RTX 3080 Ti Laptop GPU | Razer Blade 15 Advanced Model Early 2022 Intel Core i7-12800H, NVIDIA GeForce RTX 3080 Ti Laptop GPU | Eurocom RX315 NH57AF1 Intel Core i7-11800H, NVIDIA GeForce RTX 3070 Laptop GPU | Gigabyte A5 X1 AMD Ryzen 9 5900HX, NVIDIA GeForce RTX 3070 Laptop GPU | Asus TUF Gaming A15 FA506QR-AZ061T AMD Ryzen 7 5800H, NVIDIA GeForce RTX 3070 Laptop GPU | |
|---|---|---|---|---|---|---|
| Heat | 2% | 2% | 14% | 17% | 3% | |
| Maximum Upper Side * | 48.8 | 54 -11% | 53 -9% | 36 26% | 47 4% | 46.7 4% |
| Maximum Bottom * | 57.8 | 65 -12% | 53 8% | 46 20% | 51 12% | 55.9 3% |
| Idle Upper Side * | 36.6 | 30 18% | 36 2% | 35.6 3% | 27 26% | 37.1 -1% |
| Idle Bottom * | 40.2 | 35 13% | 38 5% | 36.8 8% | 30 25% | 38.1 5% |
* ... smaller is better
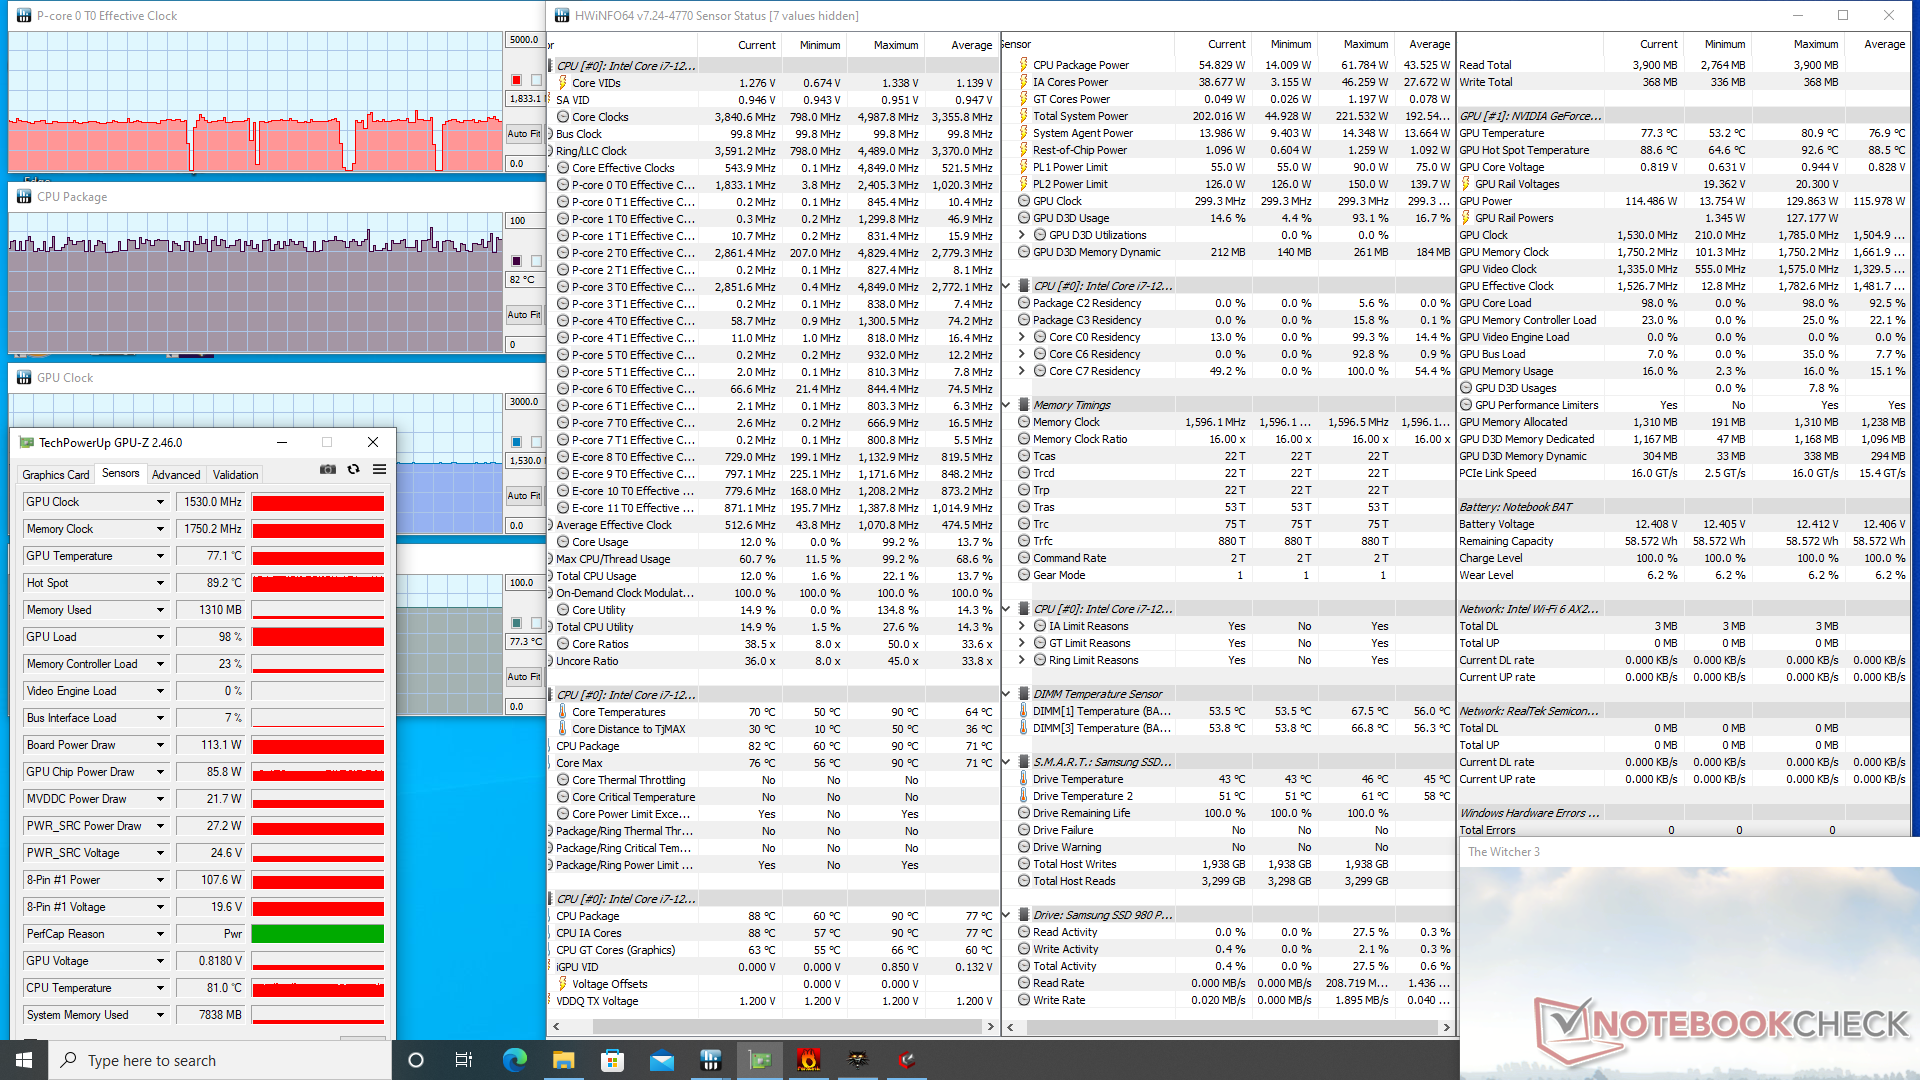
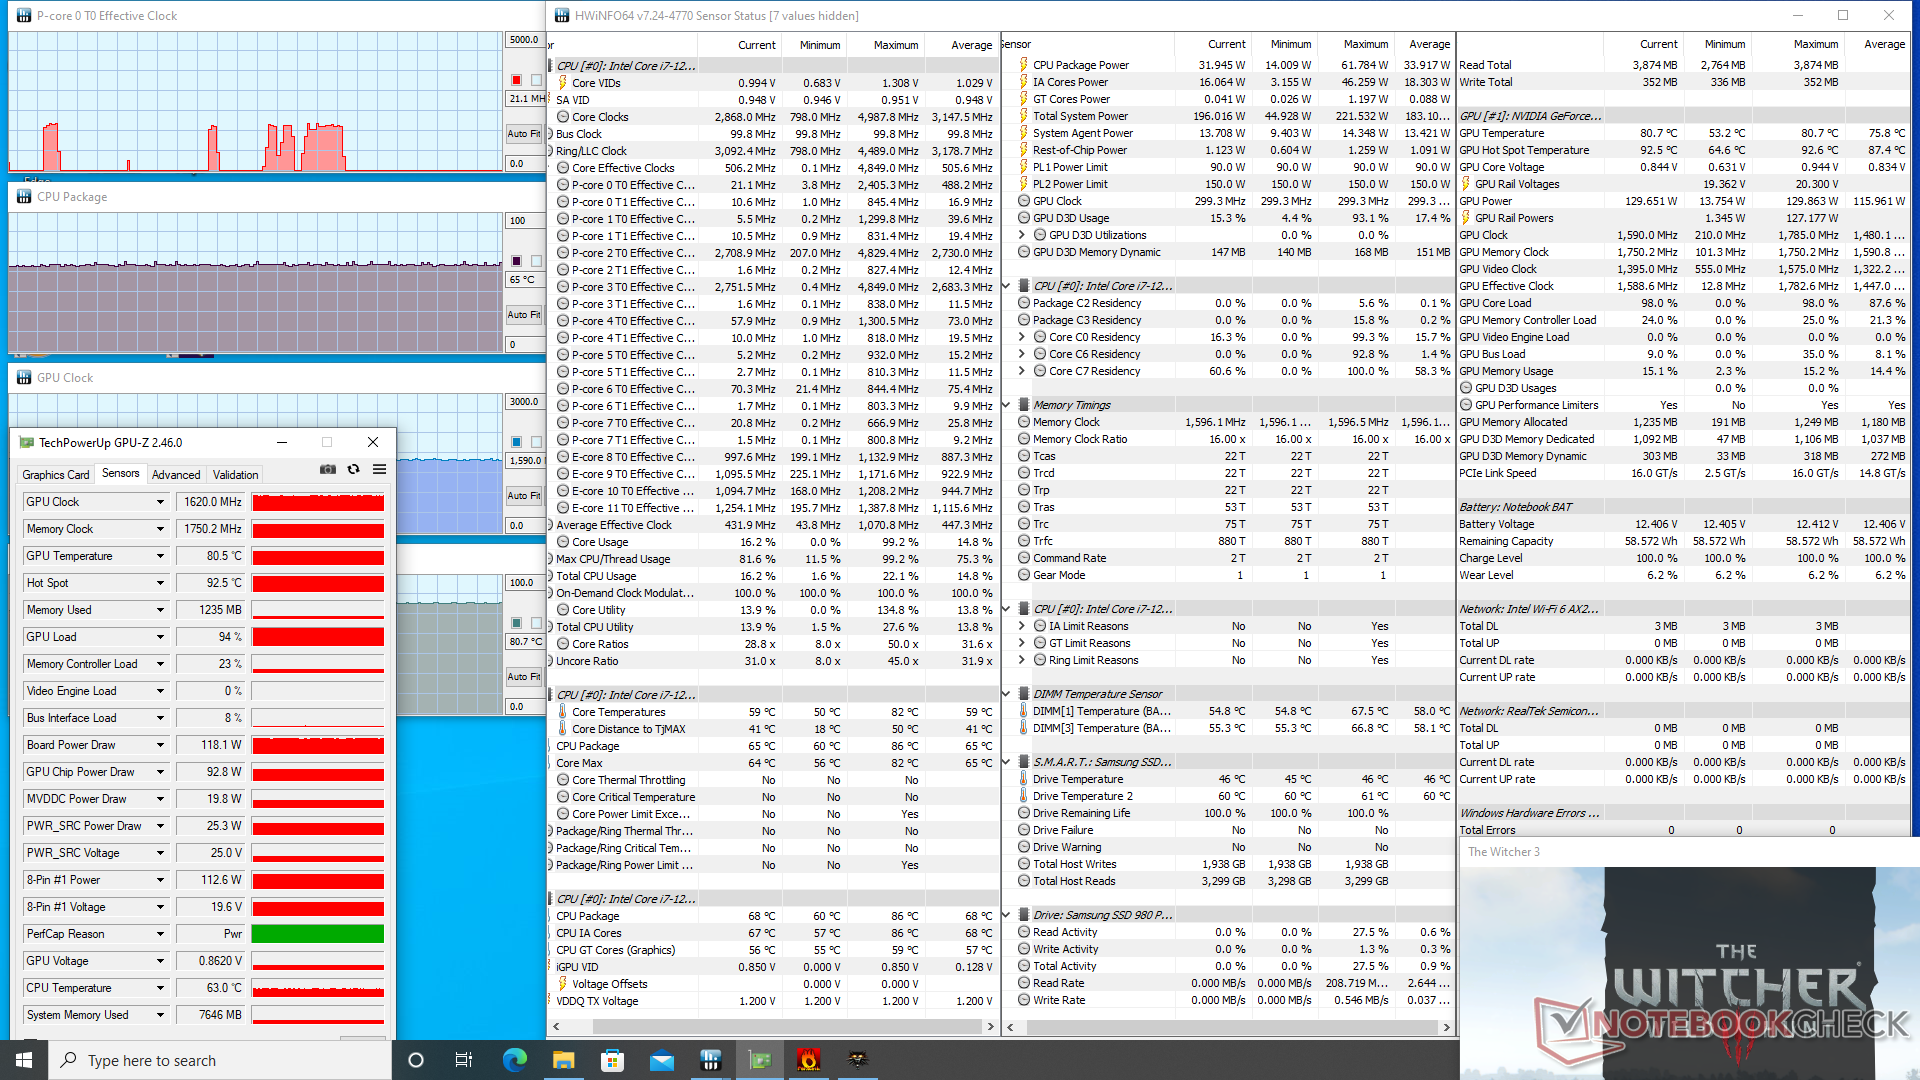
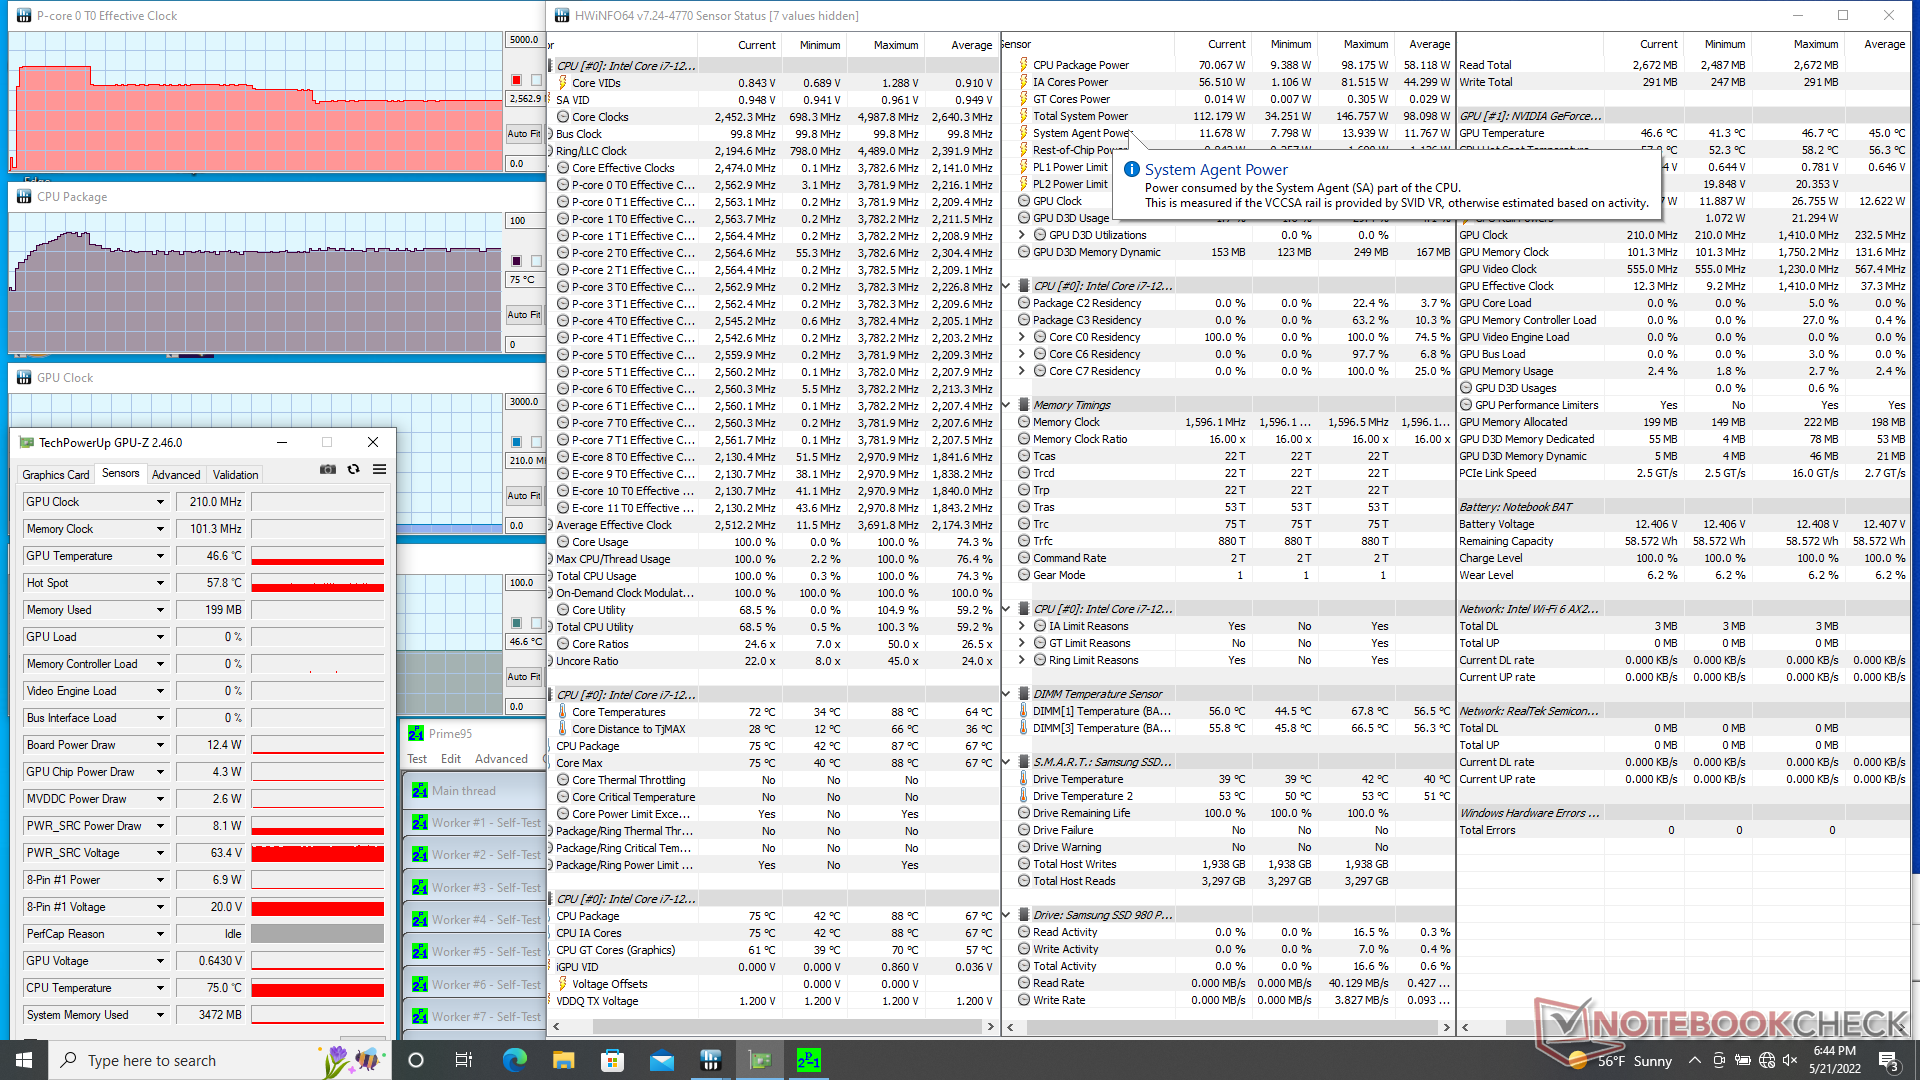
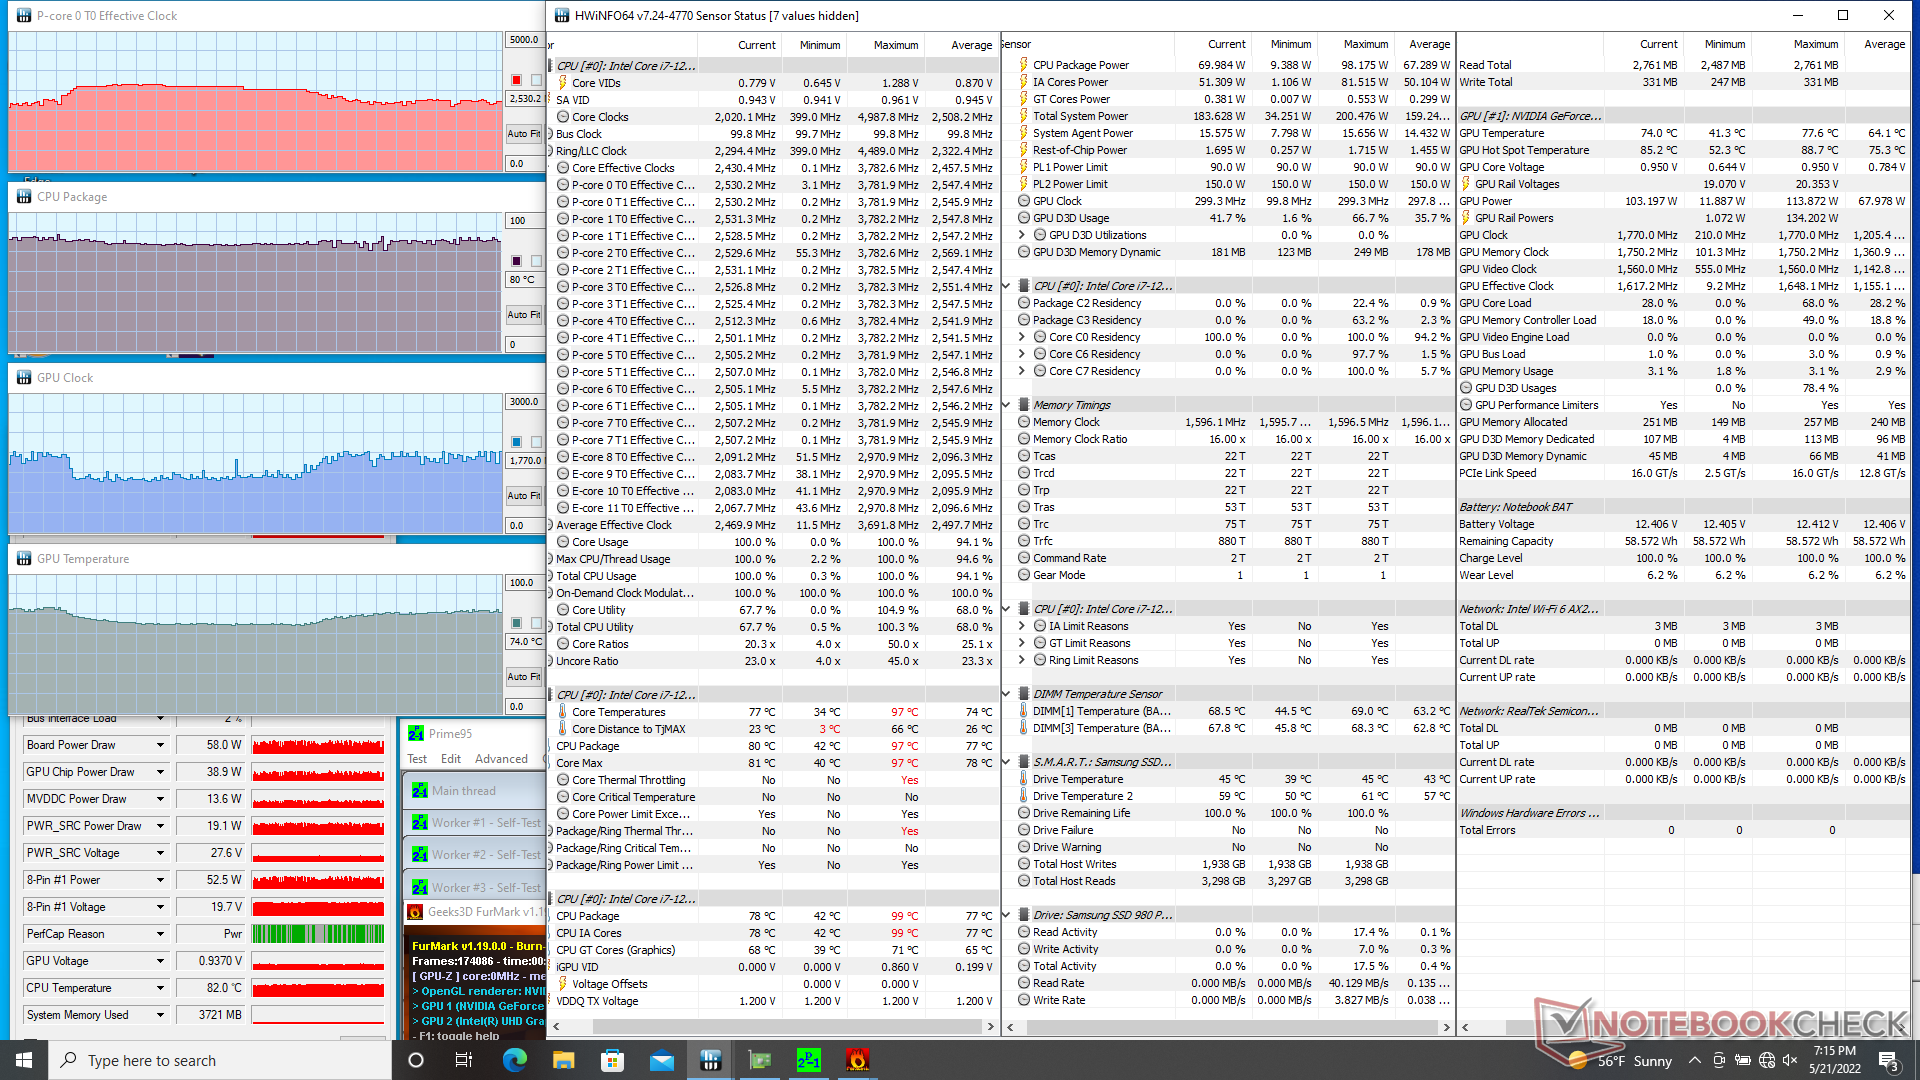
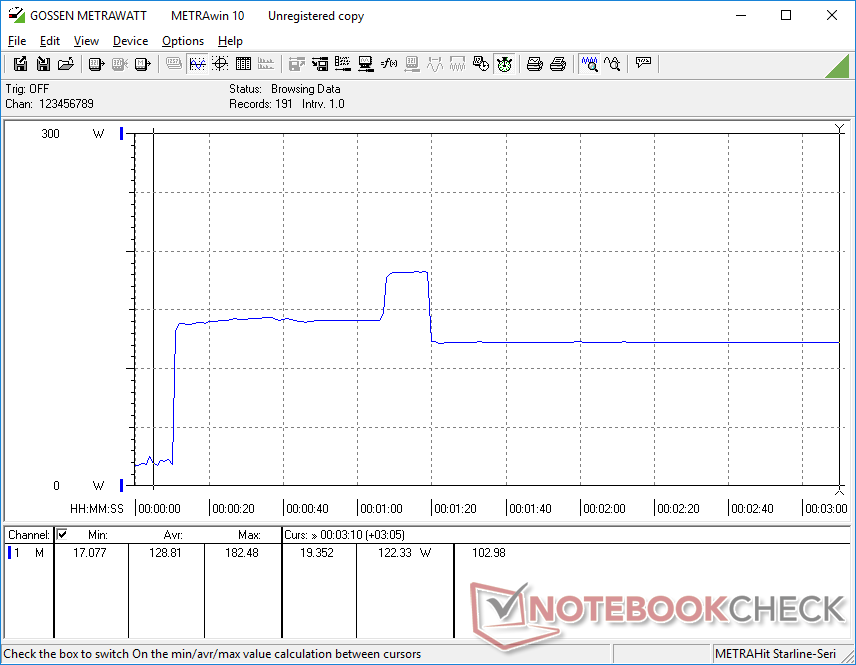
Stress Test
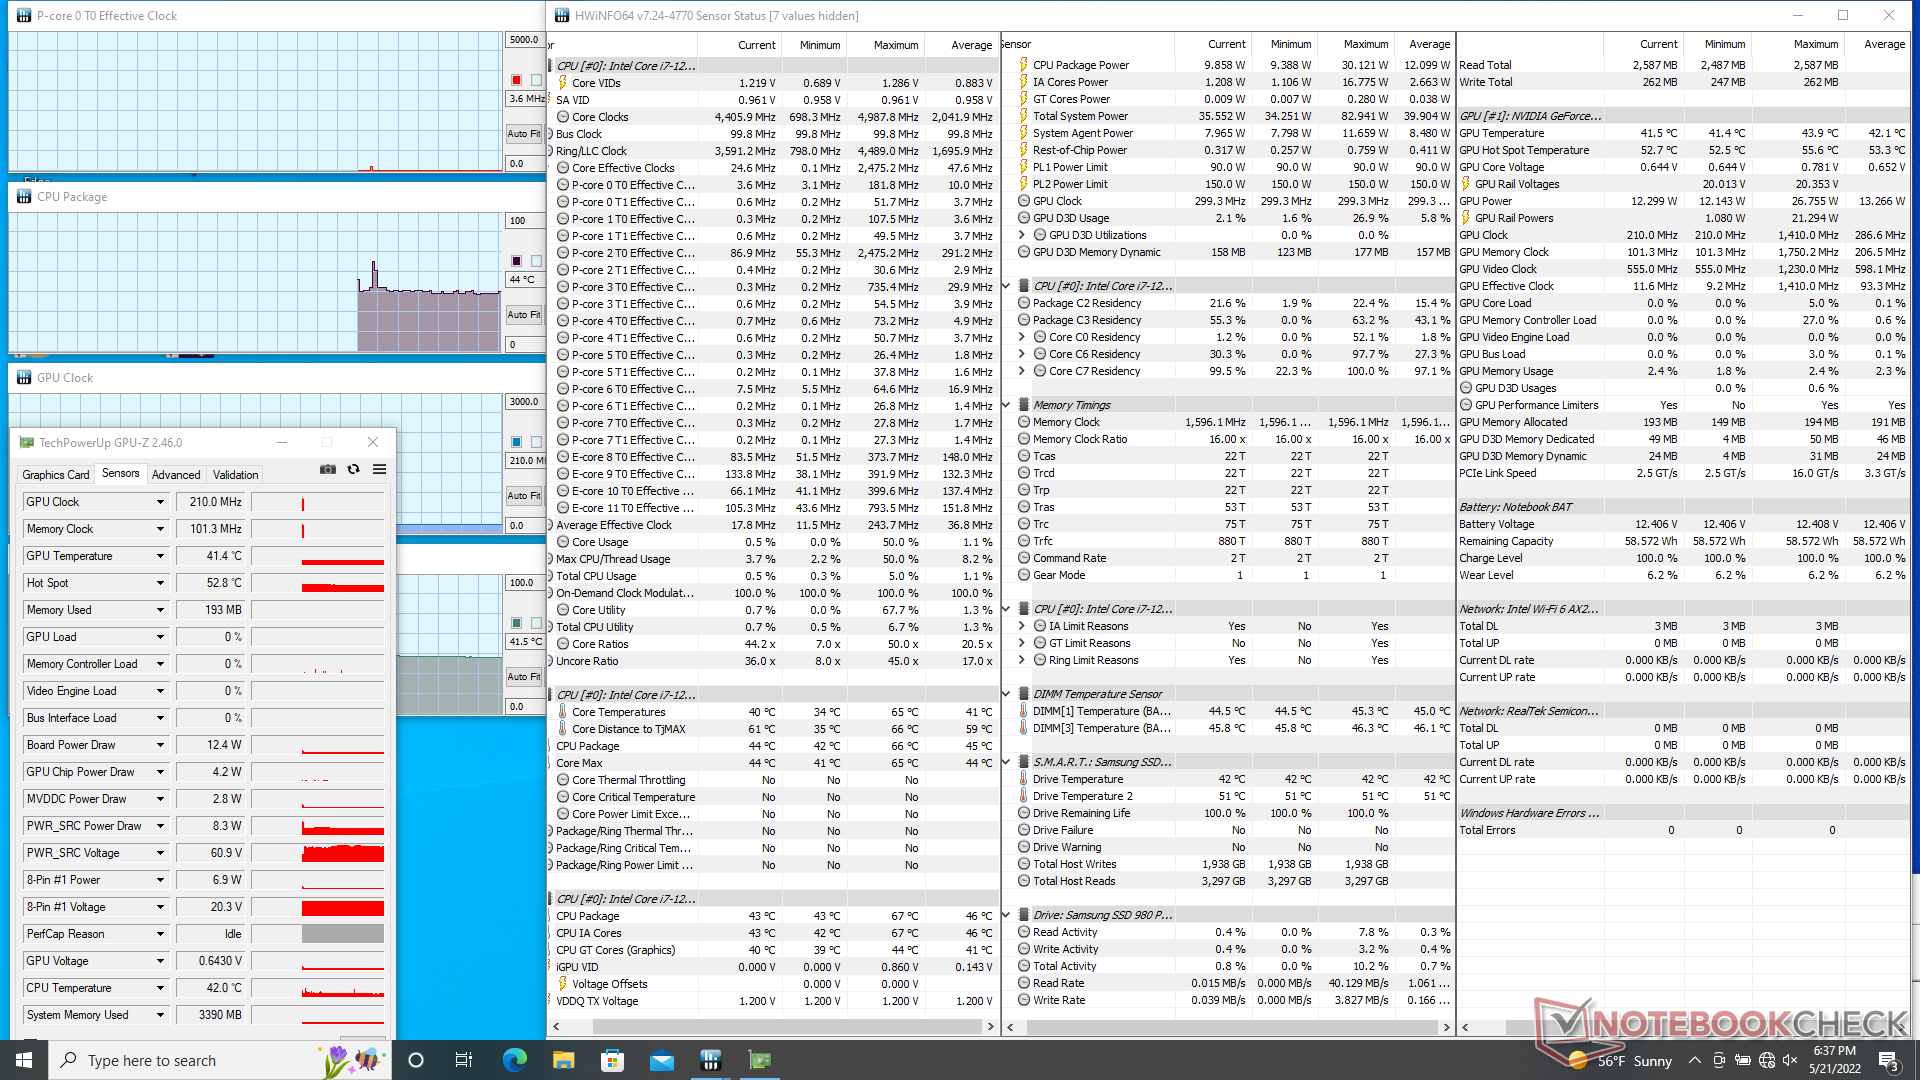
When stressed under Prime95, the CPU would boost to 3.8 GHz and 100 W for almost a full minute before hitting a core temperature of 86 C. Thereafter, clock rates would steadily fall before stabilizing at just 2.6 GHz and 70 W in order to reach a more stable core temperature of 75 C. In other words, the CPU is unable to maintain the full 100 W power draw for extended periods due to thermal limitations.
There is a slight boost to graphics performance when switching to Performance mode from Entertainment mode. GPU board power draw and clock rate would stabilize at 118 W and 1620 MHz, respectively, when running Witcher 3 on Performance mode versus 113 W and 1530 MHz when running the same game on Entertainment mode. If Maximum Fan mode is activated, GPU clock rate and board power draw would stabilize at even higher values of 1725 MHz and 130 W, respectively. It's disappointing that the GPU cannot reach closer to the 140 W target as claimed on the Nvidia Control Panel and that users must turn on Maximum Fan mode in order to squeeze the expected performance level out of the GPU.
Running on battery power limits performance. A Fire Strike test on batteries would return Physics and Graphics scores of 12708 and 3419 points, respectively, compared to 31240 and 30473 points when on mains.
| CPU Clock (GHz) | GPU Clock (MHz) | Average CPU Temperature (°C) | Average GPU Temperature (°C) | |
| System Idle | -- | -- | 44 | 41 |
| Prime95 Stress | 2.6 | -- | 75 | 47 |
| Prime95 + FurMark Stress | ~2.5 | ~1770 | 80 | 74 |
| Witcher 3 Stress (Entertainment mode) | -- | 1530 | ~82 | 77 |
| Witcher 3 Stress (Performance mode) | -- | 1620 | 65 | 81 |
Speakers
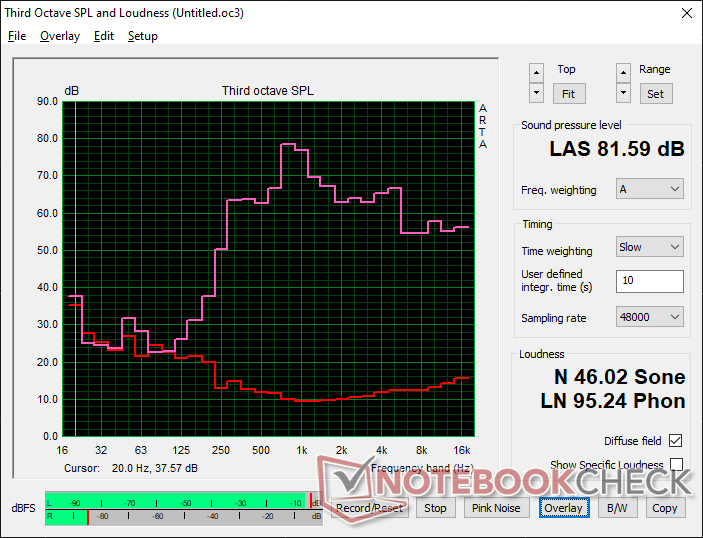
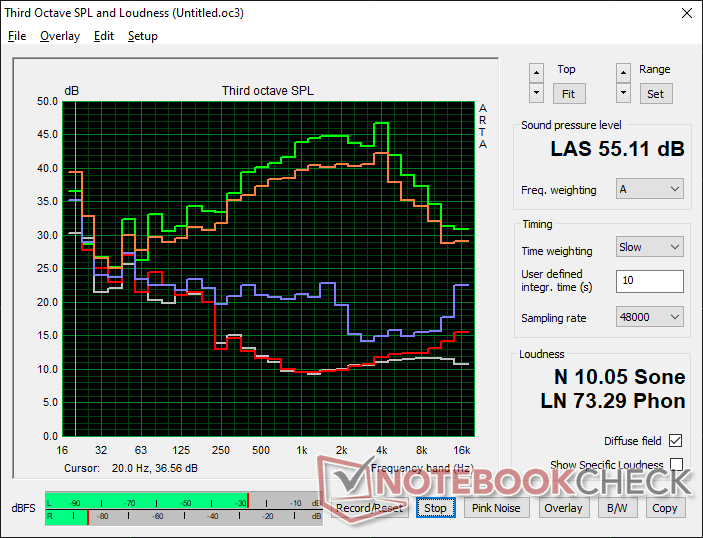
Eurocom Raptor X15 audio analysis
(±) | speaker loudness is average but good (81.6 dB)
Bass 100 - 315 Hz
(-) | nearly no bass - on average 24.6% lower than median
(±) | linearity of bass is average (13.4% delta to prev. frequency)
Mids 400 - 2000 Hz
(±) | higher mids - on average 5.6% higher than median
(±) | linearity of mids is average (8.1% delta to prev. frequency)
Highs 2 - 16 kHz
(+) | balanced highs - only 4.2% away from median
(+) | highs are linear (6% delta to prev. frequency)
Overall 100 - 16.000 Hz
(±) | linearity of overall sound is average (21.5% difference to median)
Compared to same class
» 75% of all tested devices in this class were better, 5% similar, 21% worse
» The best had a delta of 6%, average was 18%, worst was 132%
Compared to all devices tested
» 55% of all tested devices were better, 7% similar, 37% worse
» The best had a delta of 4%, average was 25%, worst was 134%
Apple MacBook Pro 16 2021 M1 Pro audio analysis
(+) | speakers can play relatively loud (84.7 dB)
Bass 100 - 315 Hz
(+) | good bass - only 3.8% away from median
(+) | bass is linear (5.2% delta to prev. frequency)
Mids 400 - 2000 Hz
(+) | balanced mids - only 1.3% away from median
(+) | mids are linear (2.1% delta to prev. frequency)
Highs 2 - 16 kHz
(+) | balanced highs - only 1.9% away from median
(+) | highs are linear (2.7% delta to prev. frequency)
Overall 100 - 16.000 Hz
(+) | overall sound is linear (4.6% difference to median)
Compared to same class
» 0% of all tested devices in this class were better, 0% similar, 100% worse
» The best had a delta of 5%, average was 18%, worst was 45%
Compared to all devices tested
» 0% of all tested devices were better, 0% similar, 100% worse
» The best had a delta of 4%, average was 25%, worst was 134%
Energy Management
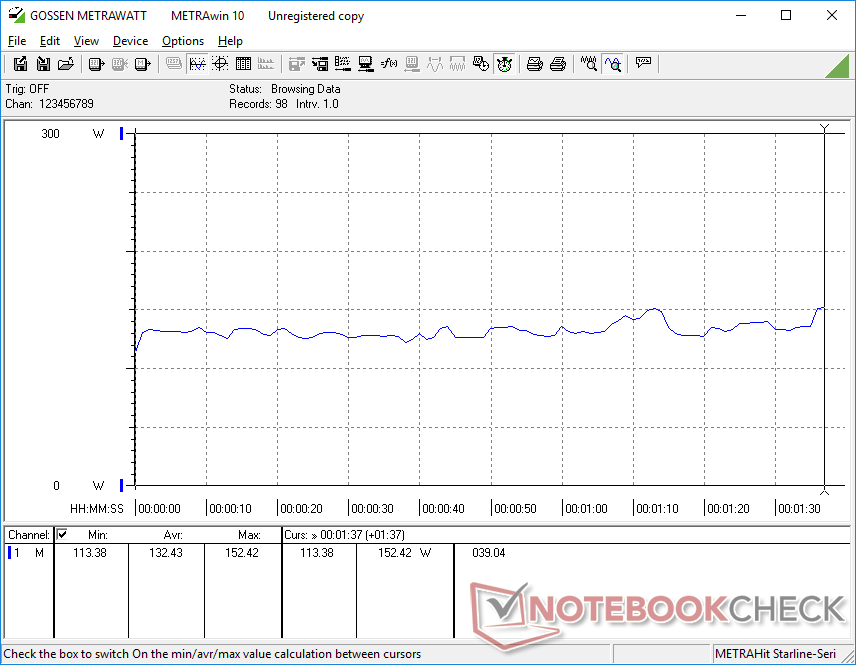
Power Consumption
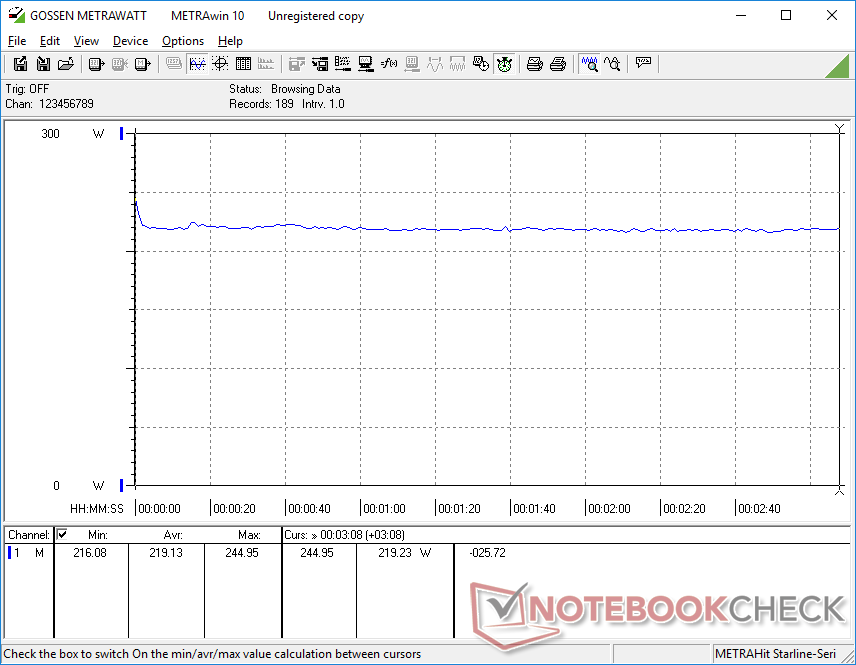
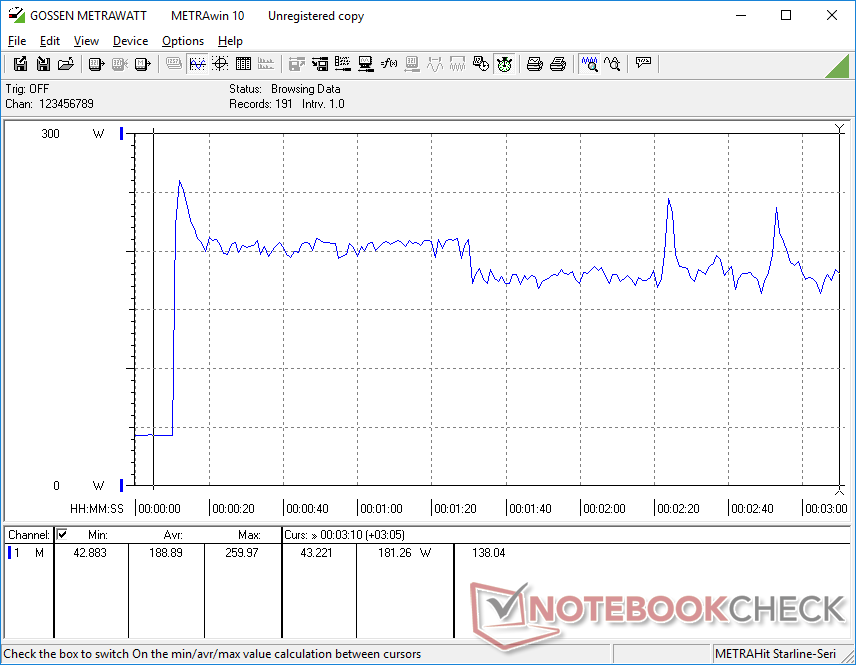
Power consumption is reasonably low when idling on desktop. Our unit would consume between 12 W and 22 W when idling on desktop compared to 33 W to 44 W on the much older Eurocom Sky X4C with an Intel 9th gen desktop CPU. Nonetheless, consumption is still very high when running more demanding applications. Running Witcher 3, for example, demands more power than most any laptop with an Intel or AMD H-series CPU and similar GeForce RTX 3070-class GPU.
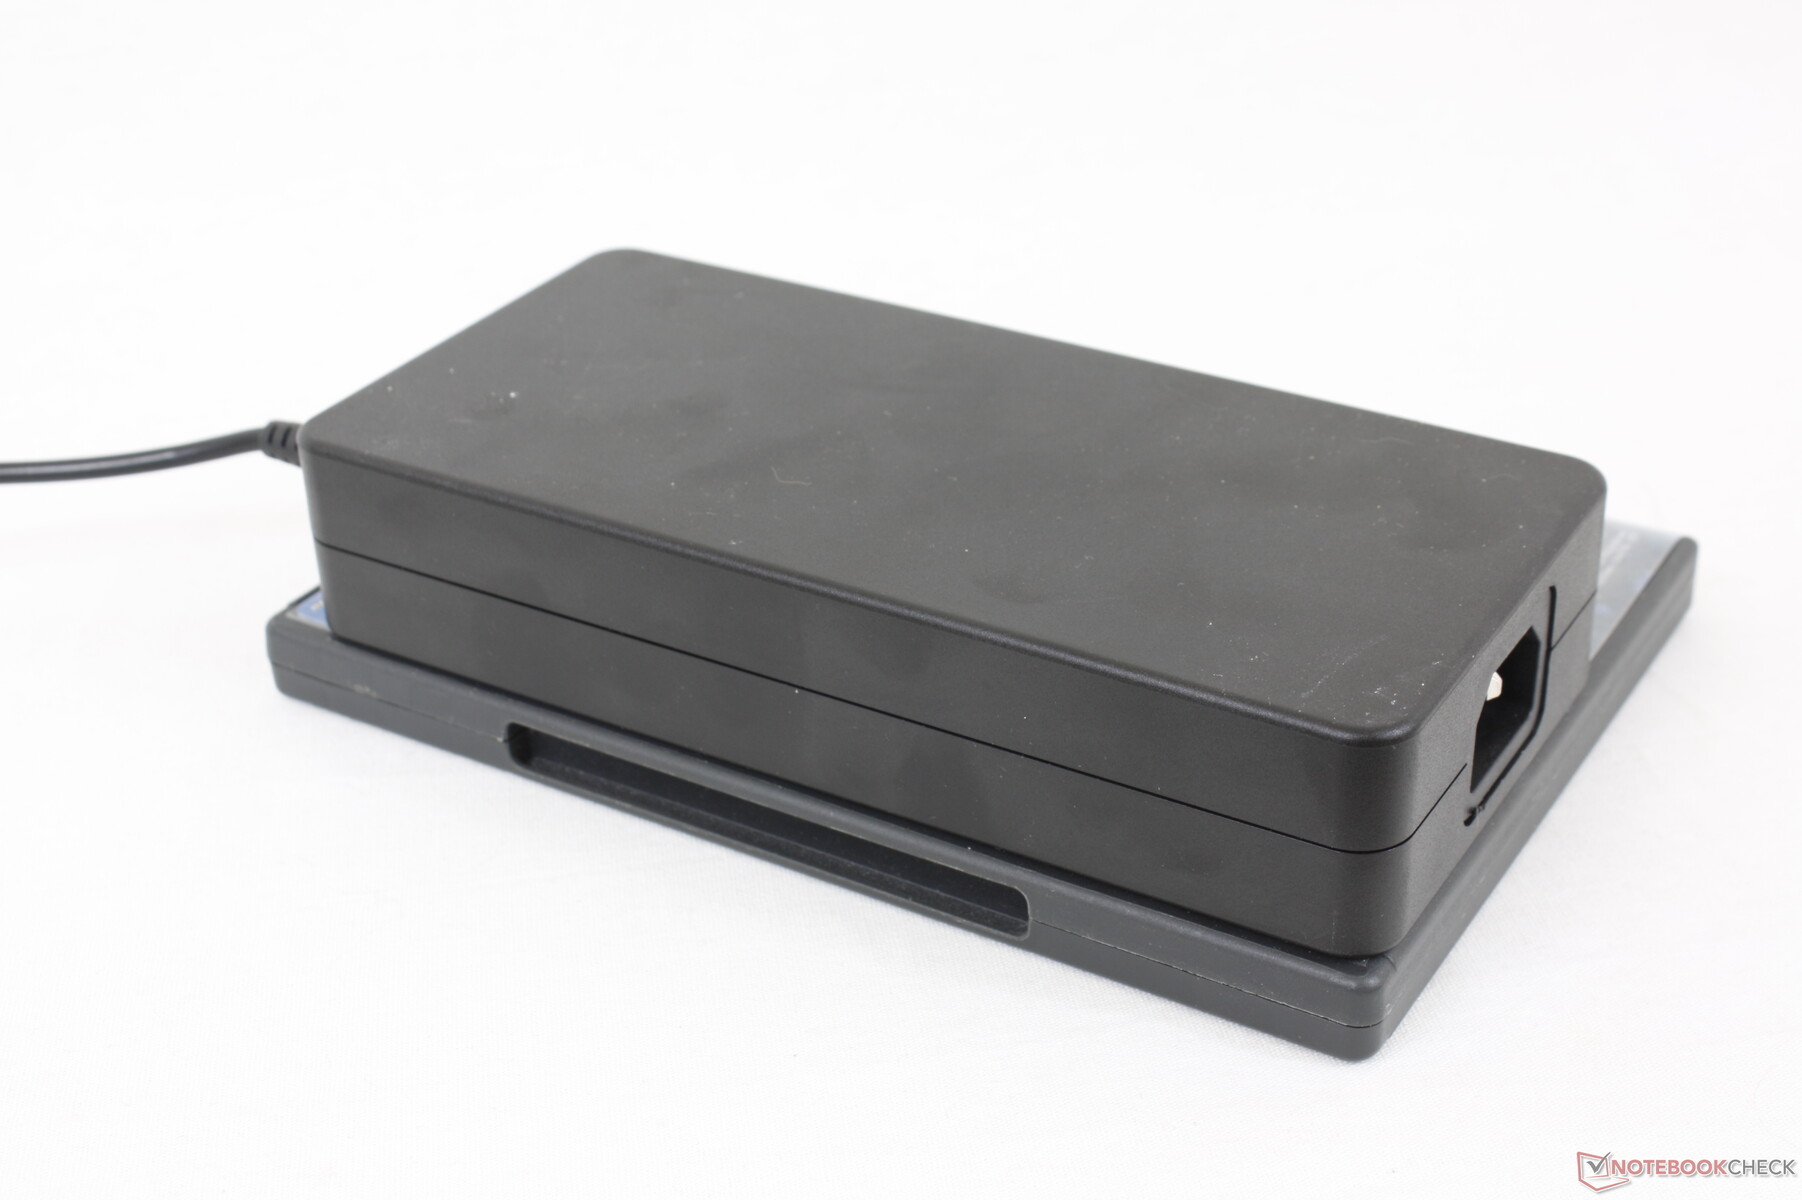
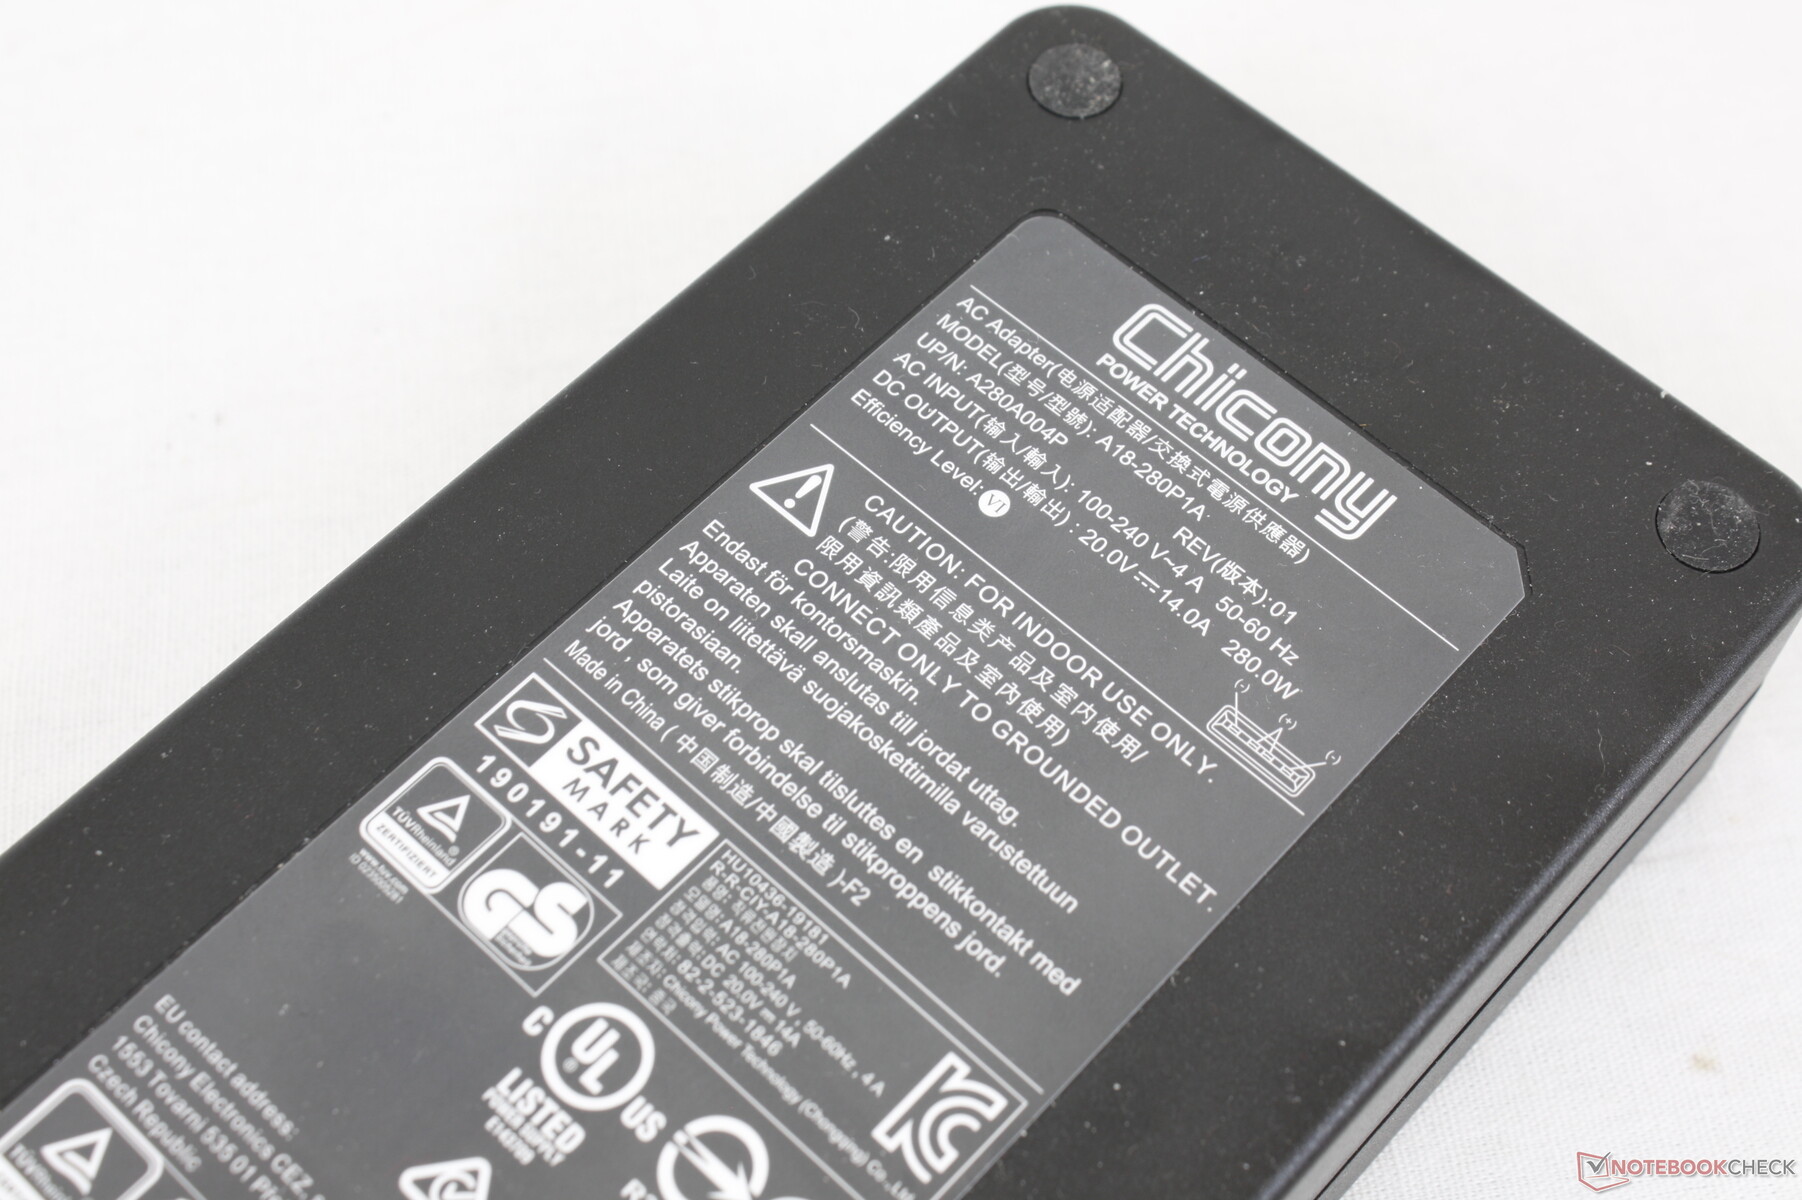
The 280 W AC adapter may be large, but it is necessary for running the system at full power. We're able to reach a draw of 260 W when both the CPU and GPU are at maximum utilization.
| Off / Standby | |
| Idle | |
| Load |
|
| Eurocom Raptor X15 i7-12700K, GeForce RTX 3070 Ti Laptop GPU, Samsung SSD 980 Pro 1TB MZ-V8P1T0BW, IPS, 1920x1080, 15.60 | MSI Raider GE66 12UHS i9-12900HK, GeForce RTX 3080 Ti Laptop GPU, Samsung PM9A1 MZVL22T0HBLB, IPS, 3840x2160, 15.60 | Razer Blade 15 Advanced Model Early 2022 i7-12800H, GeForce RTX 3080 Ti Laptop GPU, Samsung PM9A1 MZVL21T0HCLR, IPS, 1920x1080, 15.60 | Eurocom RX315 NH57AF1 i7-11800H, GeForce RTX 3070 Laptop GPU, Samsung SSD 980 Pro 1TB MZ-V8P1T0BW, IPS, 1920x1080, 15.60 | Gigabyte A5 X1 R9 5900HX, GeForce RTX 3070 Laptop GPU, ADATA XPG SX8200 Pro (ASX8200PNP-512GT), IPS, 1920x1080, 15.60 | Asus TUF Gaming A15 FA506QR-AZ061T R7 5800H, GeForce RTX 3070 Laptop GPU, SK Hynix HFM001TD3JX013N, IPS, 1920x1080, 15.60 | |
|---|---|---|---|---|---|---|
| Power Consumption | 0% | 8% | 3% | 17% | 27% | |
| Idle Minimum * | 12.8 | 16 -25% | 17 -33% | 12.7 1% | 10 22% | 10.2 20% |
| Idle Average * | 21.7 | 19 12% | 19 12% | 16.4 24% | 12 45% | 12.8 41% |
| Idle Maximum * | 21.8 | 26 -19% | 25 -15% | 36.1 -66% | 16 27% | 15 31% |
| Load Average * | 132.4 | 110 17% | 108 18% | 101.5 23% | 124 6% | 130 2% |
| Witcher 3 ultra * | 219 | 202 8% | 150 32% | 197 10% | 204 7% | 137 37% |
| Load Maximum * | 260 | 242 7% | 179 31% | 196.1 25% | 272 -5% | 184 29% |
* ... smaller is better
Power Consumption Witcher 3 / Stresstest
Power Consumption external Monitor
Battery Life
Runtimes are short at just under 4 hours of real-world WLAN use on the Balanced power profile and with the integrated GPU active. The charging rate is decent at 2 to 2.5 hours from empty to a full capacity. We do appreciate that the battery is easily removable, however, unlike on most other laptops.
| Eurocom Raptor X15 i7-12700K, GeForce RTX 3070 Ti Laptop GPU, 62 Wh | MSI Raider GE66 12UHS i9-12900HK, GeForce RTX 3080 Ti Laptop GPU, 99 Wh | Razer Blade 15 Advanced Model Early 2022 i7-12800H, GeForce RTX 3080 Ti Laptop GPU, 80 Wh | Eurocom RX315 NH57AF1 i7-11800H, GeForce RTX 3070 Laptop GPU, 71 Wh | Gigabyte A5 X1 R9 5900HX, GeForce RTX 3070 Laptop GPU, 48.96 Wh | Asus TUF Gaming A15 FA506QR-AZ061T R7 5800H, GeForce RTX 3070 Laptop GPU, 90 Wh | |
|---|---|---|---|---|---|---|
| Battery Runtime | 43% | 24% | 21% | 61% | 189% | |
| WiFi v1.3 | 237 | 340 43% | 293 24% | 287 21% | 381 61% | 685 189% |
| H.264 | 426 | 356 | 435 | |||
| Load | 102 | 122 | 77 | 145 | ||
| Reader / Idle | 484 | 604 | 1043 |
Pros
Cons
Verdict
The Raptor X15 uses the latest Intel CPUs and Nvidia GPUs trapped in an aging chassis. The model is missing features commonly found on other high-end 15.6-inch gaming laptops such as per-key RGB lighting, DisplayPort-over-USB, Thunderbolt, Wi-Fi 6E support, and better NVMe SSD cooling. When competing models like the MSI GE66 or Gigabyte A5 X1 can each be thinner and lighter while offering similar TGP targets than the Raptor, it can be difficult to recommend the Eurocom over such alternatives.
Keep in mind that maximum performance is tied to Maximum Fan mode. Thus, users must manually set the system profile to Maximum Fan mode and endure loud fans in order to get the most performance out of the system.
The Raptor X15 has a removable LGA1700 CPU with lots of storage options, but its overall chassis design could use a facelift.
There are still some notable features worth praising. The model supports 2.5-inch SATA III drives and an easily removable battery pack, for example, which are now rarities on modern gaming laptops. If you don't think you'll exploit its LGA1700 socket, however, then the biggest selling point of the Raptor X15 becomes moot.
Price and Availability
Eurocom is now shipping the Raptor X15 starting at $2000 USD for the base configuration or approximately $3500 as configured in our review.
Eurocom Raptor X15
-
06/09/2022 v7
Allen Ngo
More articles related to this device
Eurocom Raptor X15 (Raptor Series)Related Articles


Pricecompare
