 Deutsch
 English
 Español
 Français
 Italiano
 Nederlands
 Polski
 Português
 Русский
 Türkçe
 Svenska
 Chinese
 Magyar
Dynabook Tecra X50 Laptop Review: A light Ultrabook with light endurance
The Toshiba Tecra is back, though it is under new management. Sporting the new Dynabook branding, the Tecra X50 is a competent thin-and-light Ultrabook targeted at office employees in need of a highly portable machine. While the main draw of the Tecra X50 is its thin profile, the machine has a few tricks up its sleeve. We will see how our configuration of the Tecra X50 (Core i7-8665U, 16 GB RAM, 512 GB SSD, ~US $2400) compares to other thin-and-light business notebooks like the Lenovo ThinkPad T490s, Lenovo ThinkPad X1 Carbon, Acer Swift 5, and the Microsoft Surface Laptop 3.
A quick note before we begin: we are currently upgrading our WiFi testing hardware and thus cannot provide pinpoint wireless transfer speeds at the moment. However, speaking from personal use, the Tecra X50's wireless performance is perfectly satisfactory for general office and home use. We experienced no dropped connections or odd behavior during our time with the device.
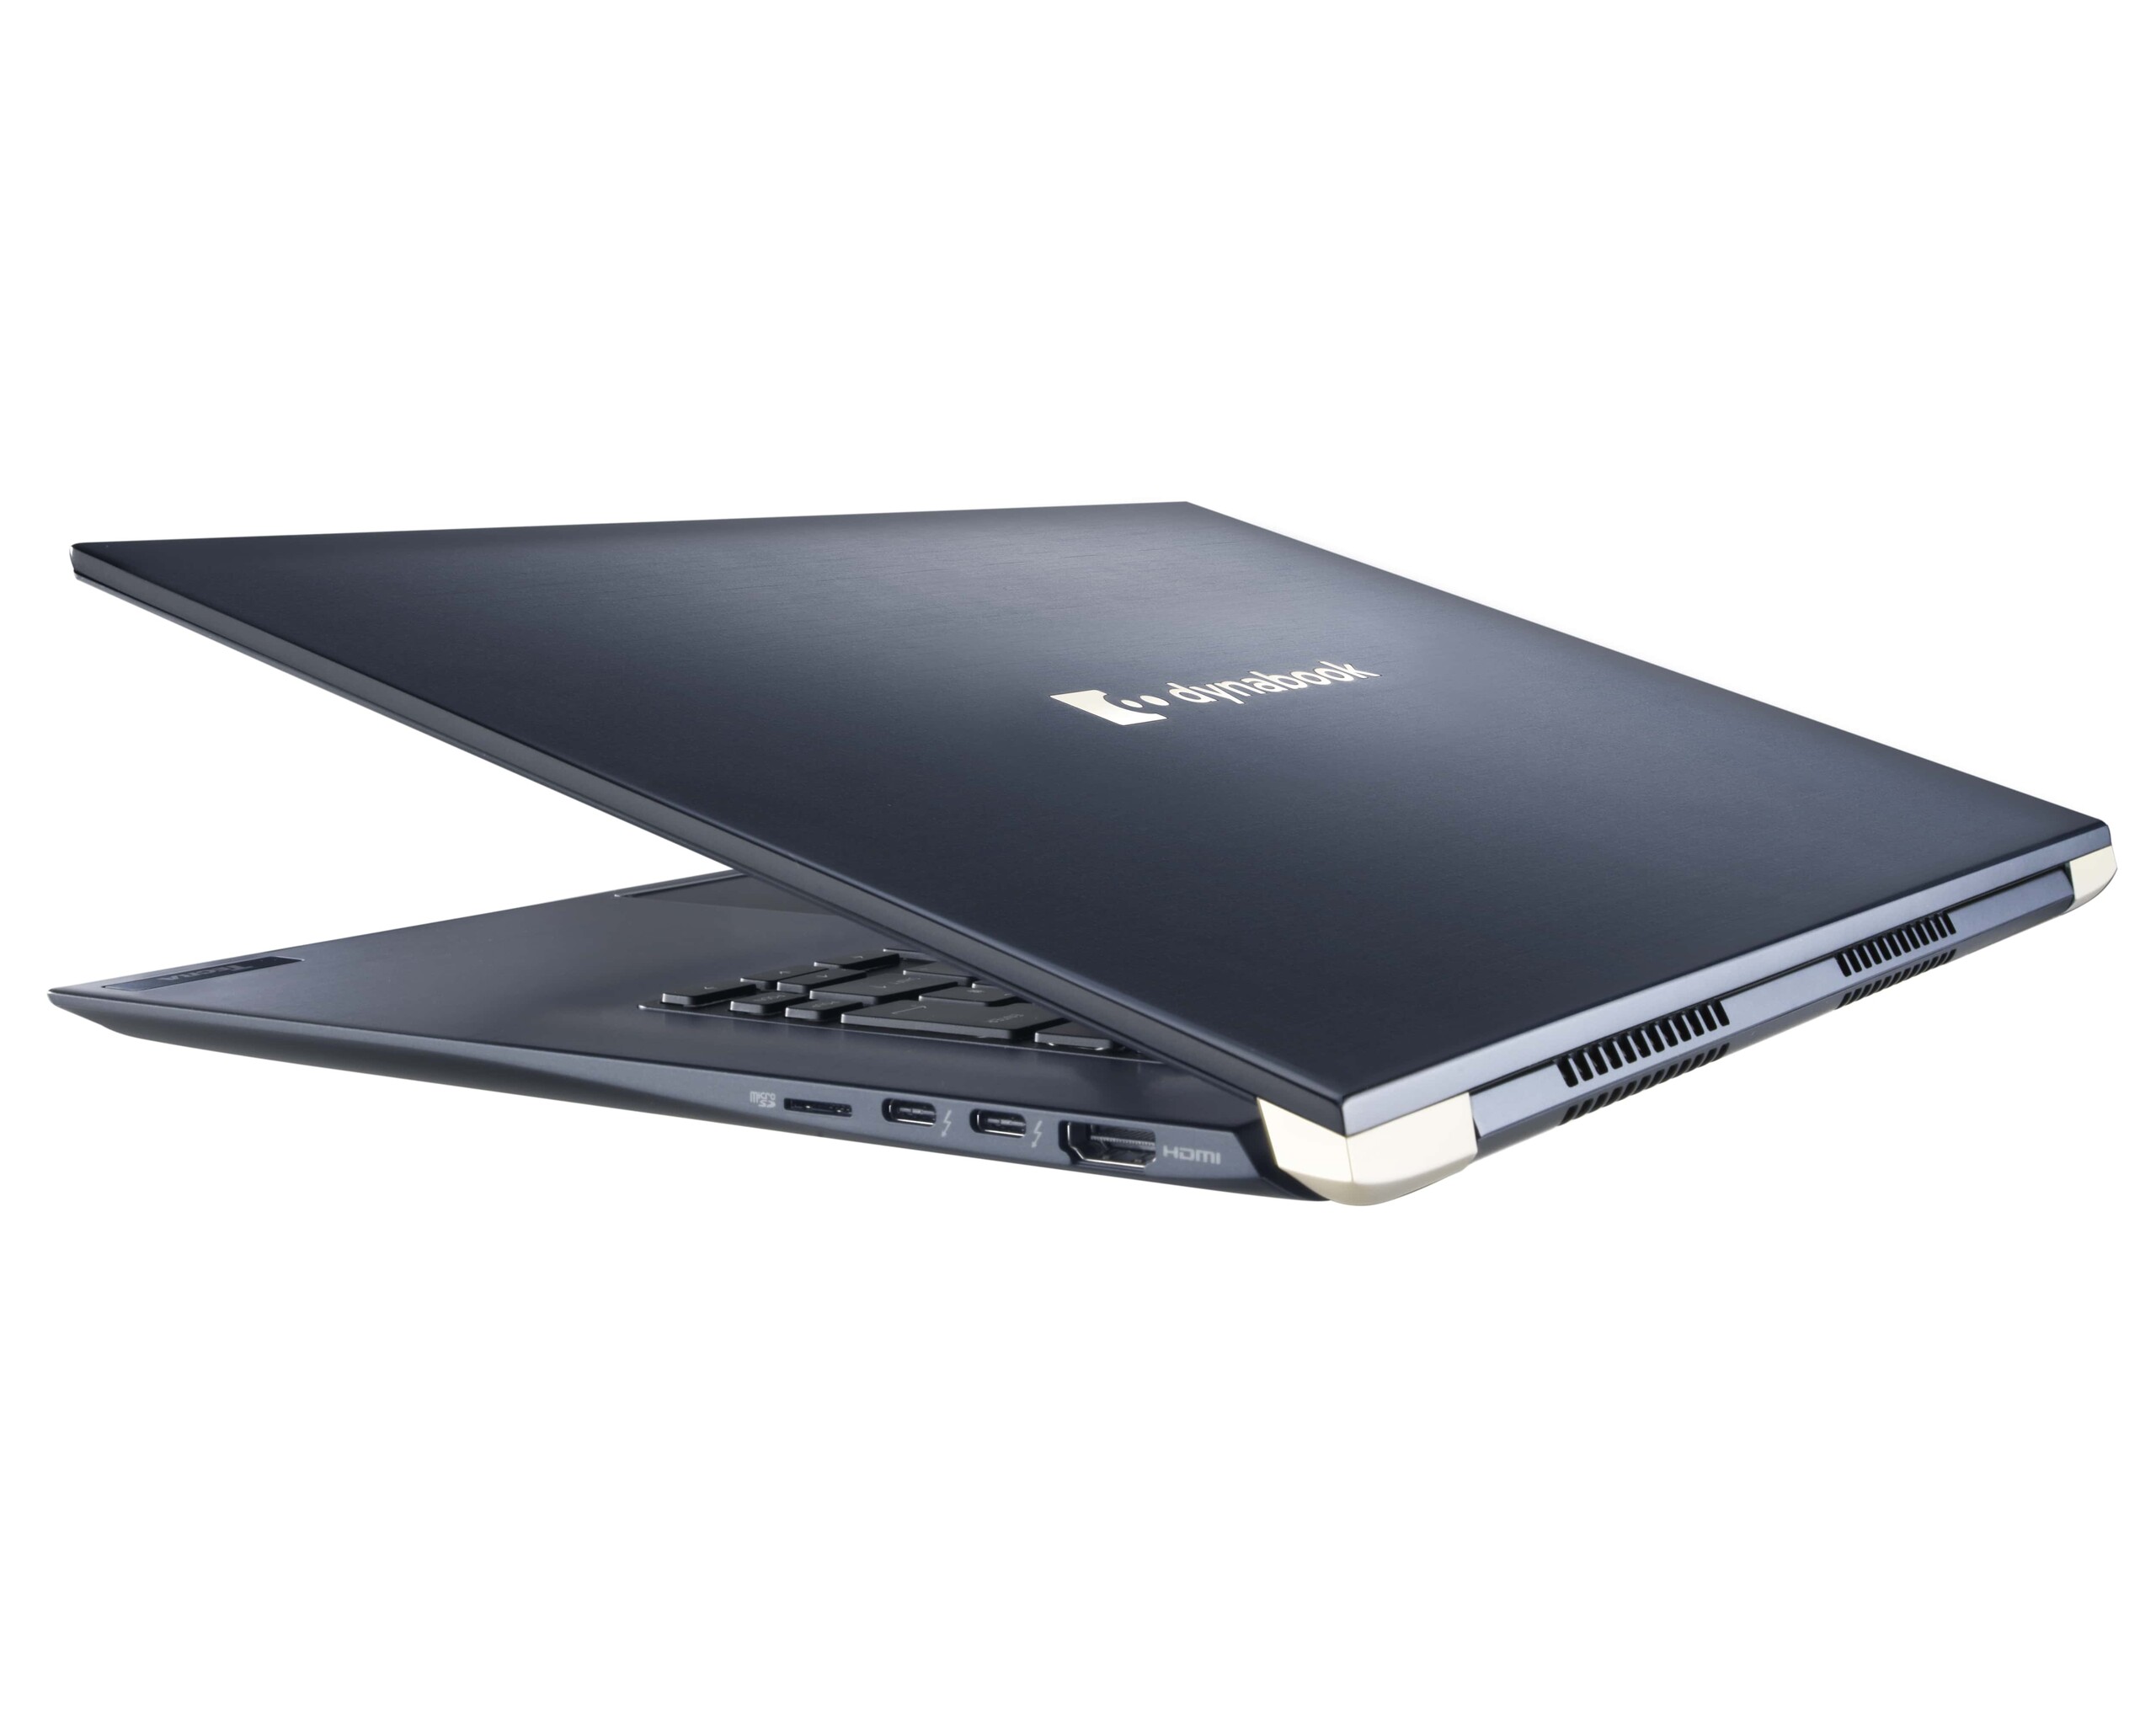
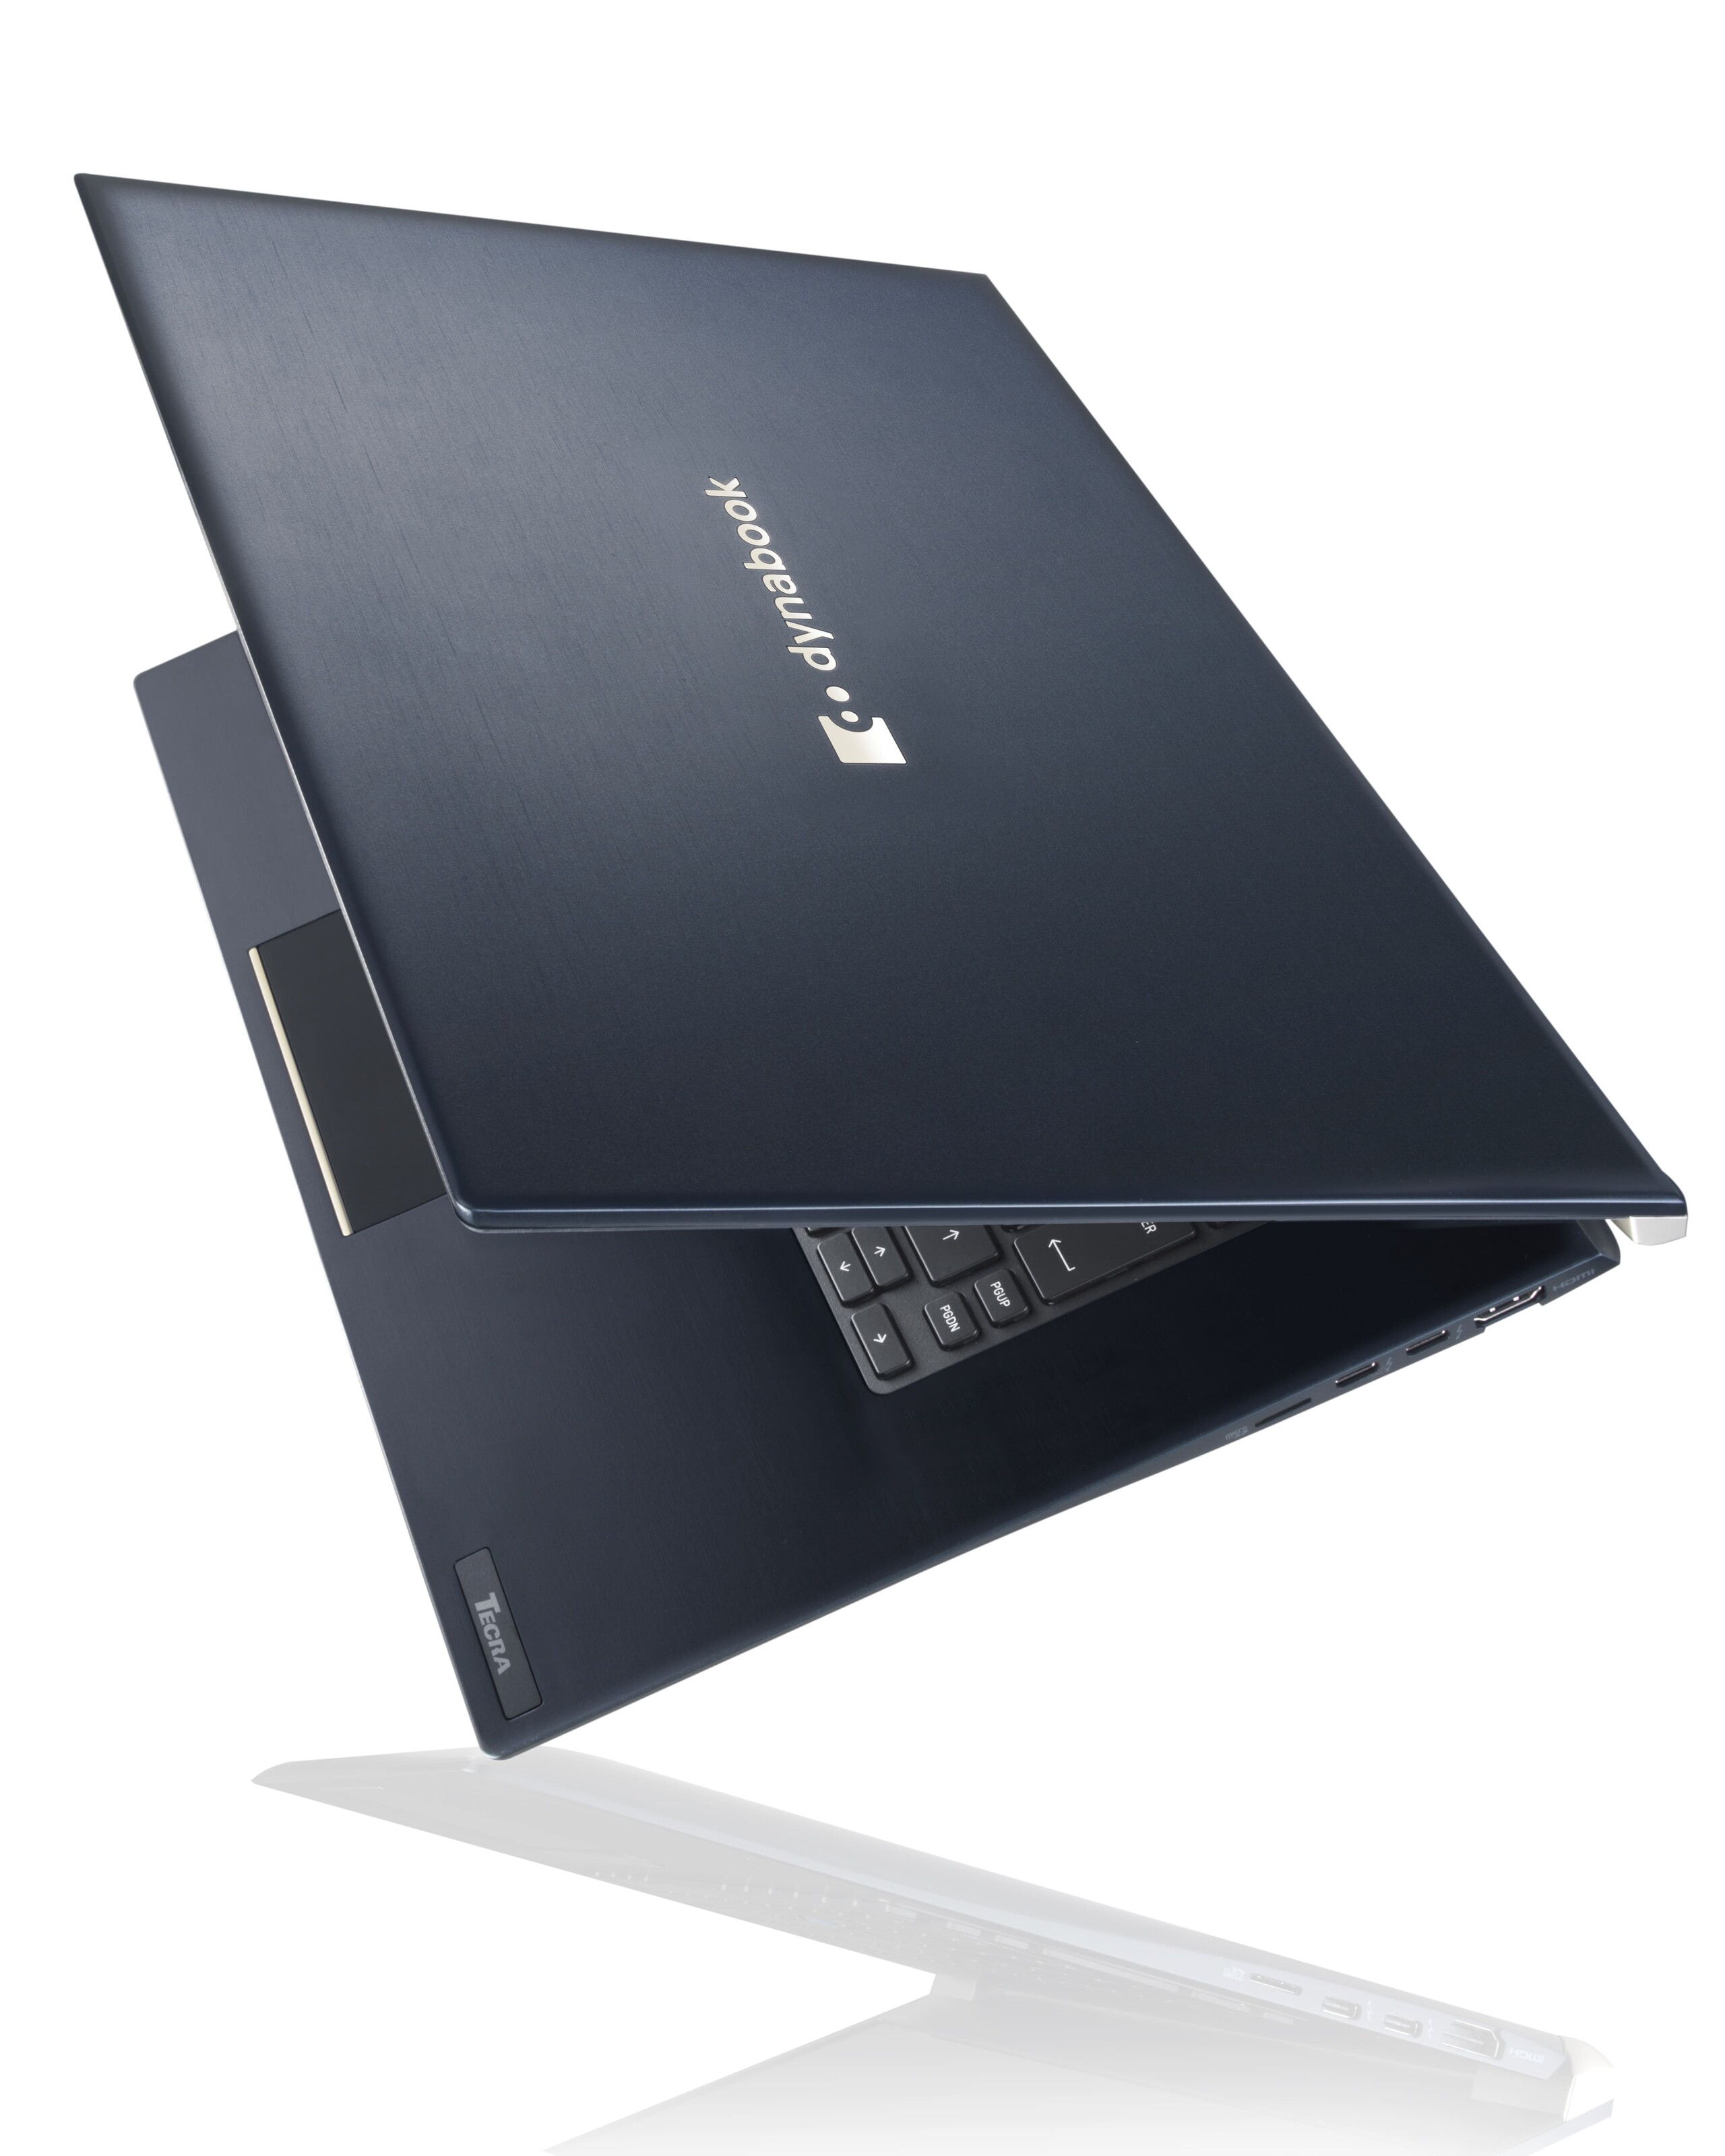
Case and Connectivity
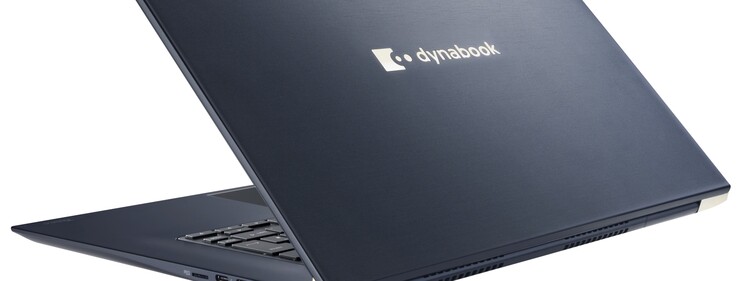
The Dynabook Tecra X50 is a beautiful machine. It's dark brushed metal chassis looks gorgeous. It will remain so, as the case is resistant to fingerprints and smudges. The bright metal accents complement the dark blue color well. The only plastic on the machine is the display bezel (which is reasonably thin for a 15.6-inch screen), the keycaps, and the dedicated buttons for the pointing stick.
The case is well-built, although there is some flex. In particular, the keyboard deck bends slightly under normal use. The display can also be twisted under direct pressure. The hinges of the machine are firm and hold the screen in place during normal use. The display bobbles a bit when touch input is used. The hinges are too stiff for one-handed opening. Lastly, there are no unsightly gaps around the chassis, and the case does not creak when squeezed.
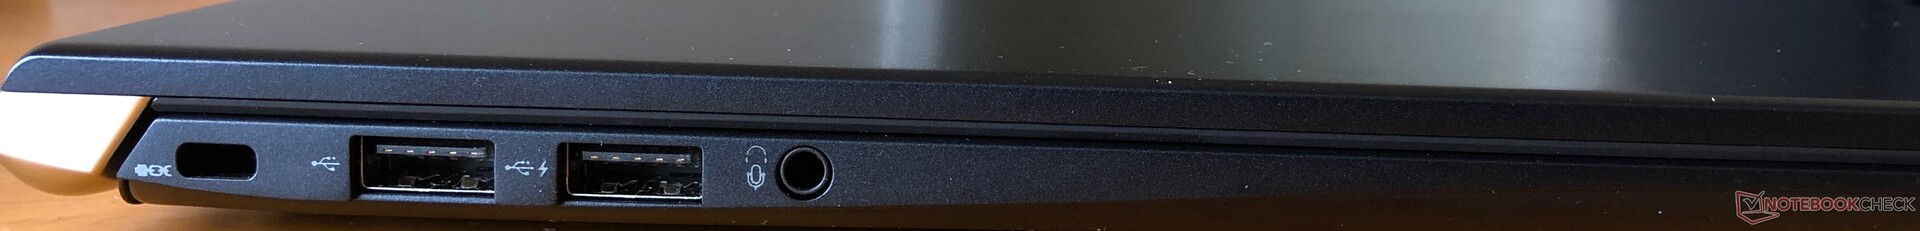
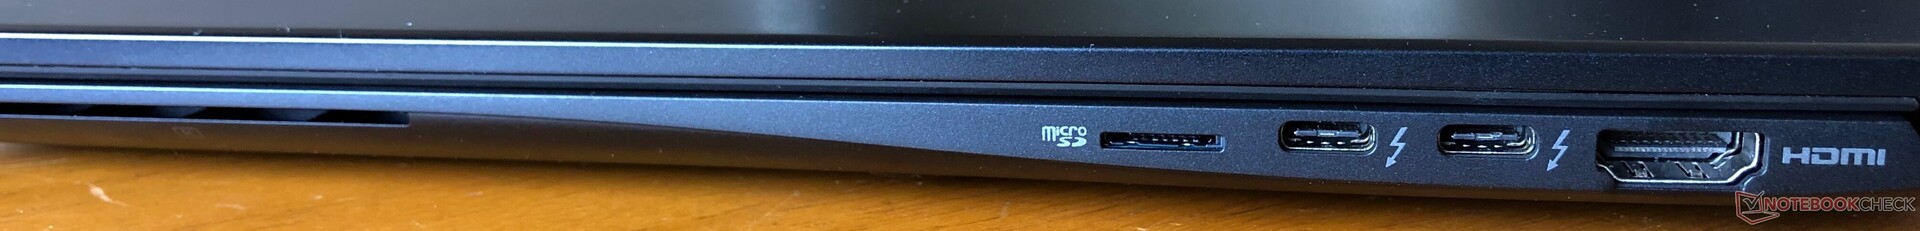
Perhaps the defining feature of the Tecra X50 (like the Tecra X40 before it) is how thin the machine is. The X50 is highly portable and could be carried in a hand all day without trouble. Port selection is good for such a thin machine, although we would prefer a full-sized SD card reader to the microSD card reader. The inclusion of two Thunderbolt 3 ports is very nice and opens several possibilities for docking and display hookups.
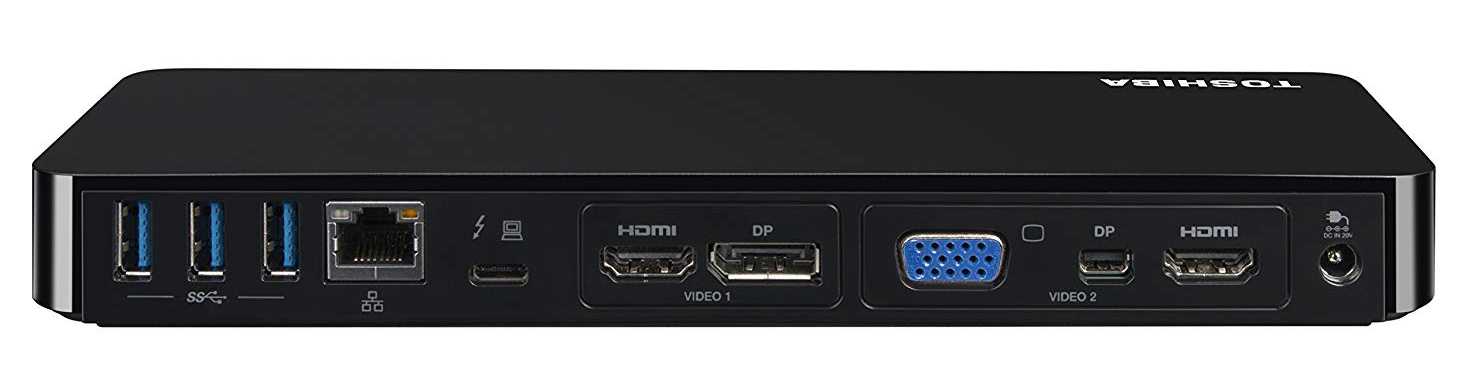
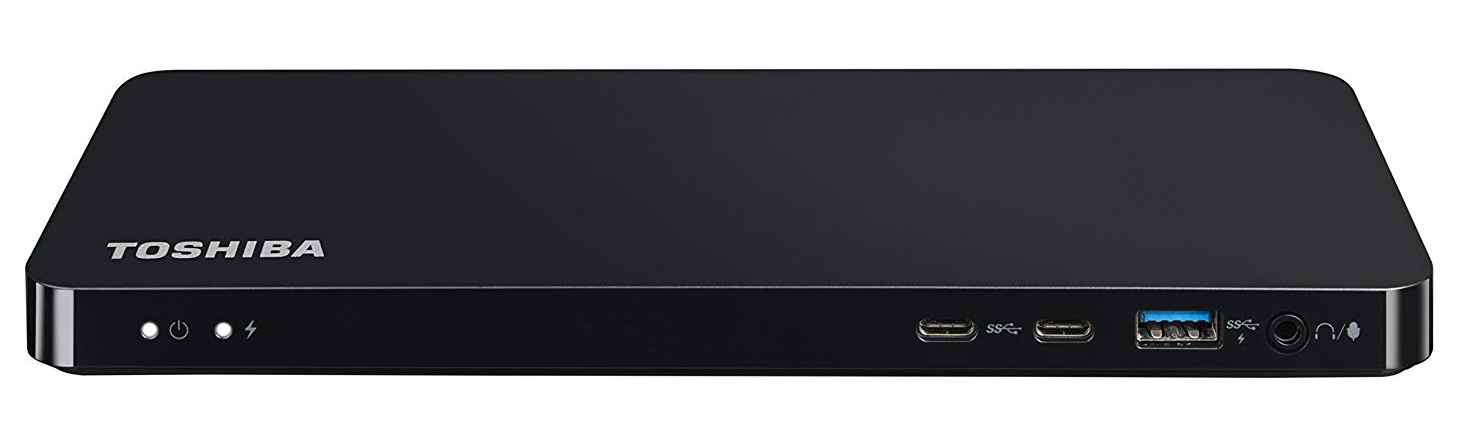
Dynabook included a Toshiba Thunderbolt 3 dock with the Tecra X50. The dock greatly expands connectivity options, adding 4 more USB 3.1 Gen 1 Type-A ports, two more USB 3.1 Gen 1 Type-C ports, a full-size Ethernet jack, and hookups for two monitors (one via HDMI or DisplayPort, the other via HDMI, mini DisplayPort, or VGA.) The dock also charges the Tecra X50 at the same rate as the included 45 Watt USB-C power adapter. The Toshiba Thunderbolt 3 dock is available from Dynabook for US $299.99.
Connectivity
| SD Card Reader | |
| average JPG Copy Test (av. of 3 runs) | |
| Dynabook Tecra X50-F | |
| Lenovo ThinkPad T490s-20NYS02A00 (Toshiba Exceria Pro M501) | |
| Toshiba Tecra X40-E-10W (Toshiba Exceria Pro M501 microSDXC 64GB) | |
| Average of class Office (8 - 82.7, n=48, last 2 years) | |
| maximum AS SSD Seq Read Test (1GB) | |
| Lenovo ThinkPad T490s-20NYS02A00 (Toshiba Exceria Pro M501) | |
| Toshiba Tecra X40-E-10W (Toshiba Exceria Pro M501 microSDXC 64GB) | |
| Dynabook Tecra X50-F | |
| Average of class Office (25 - 90.5, n=42, last 2 years) | |
Input Devices and Security
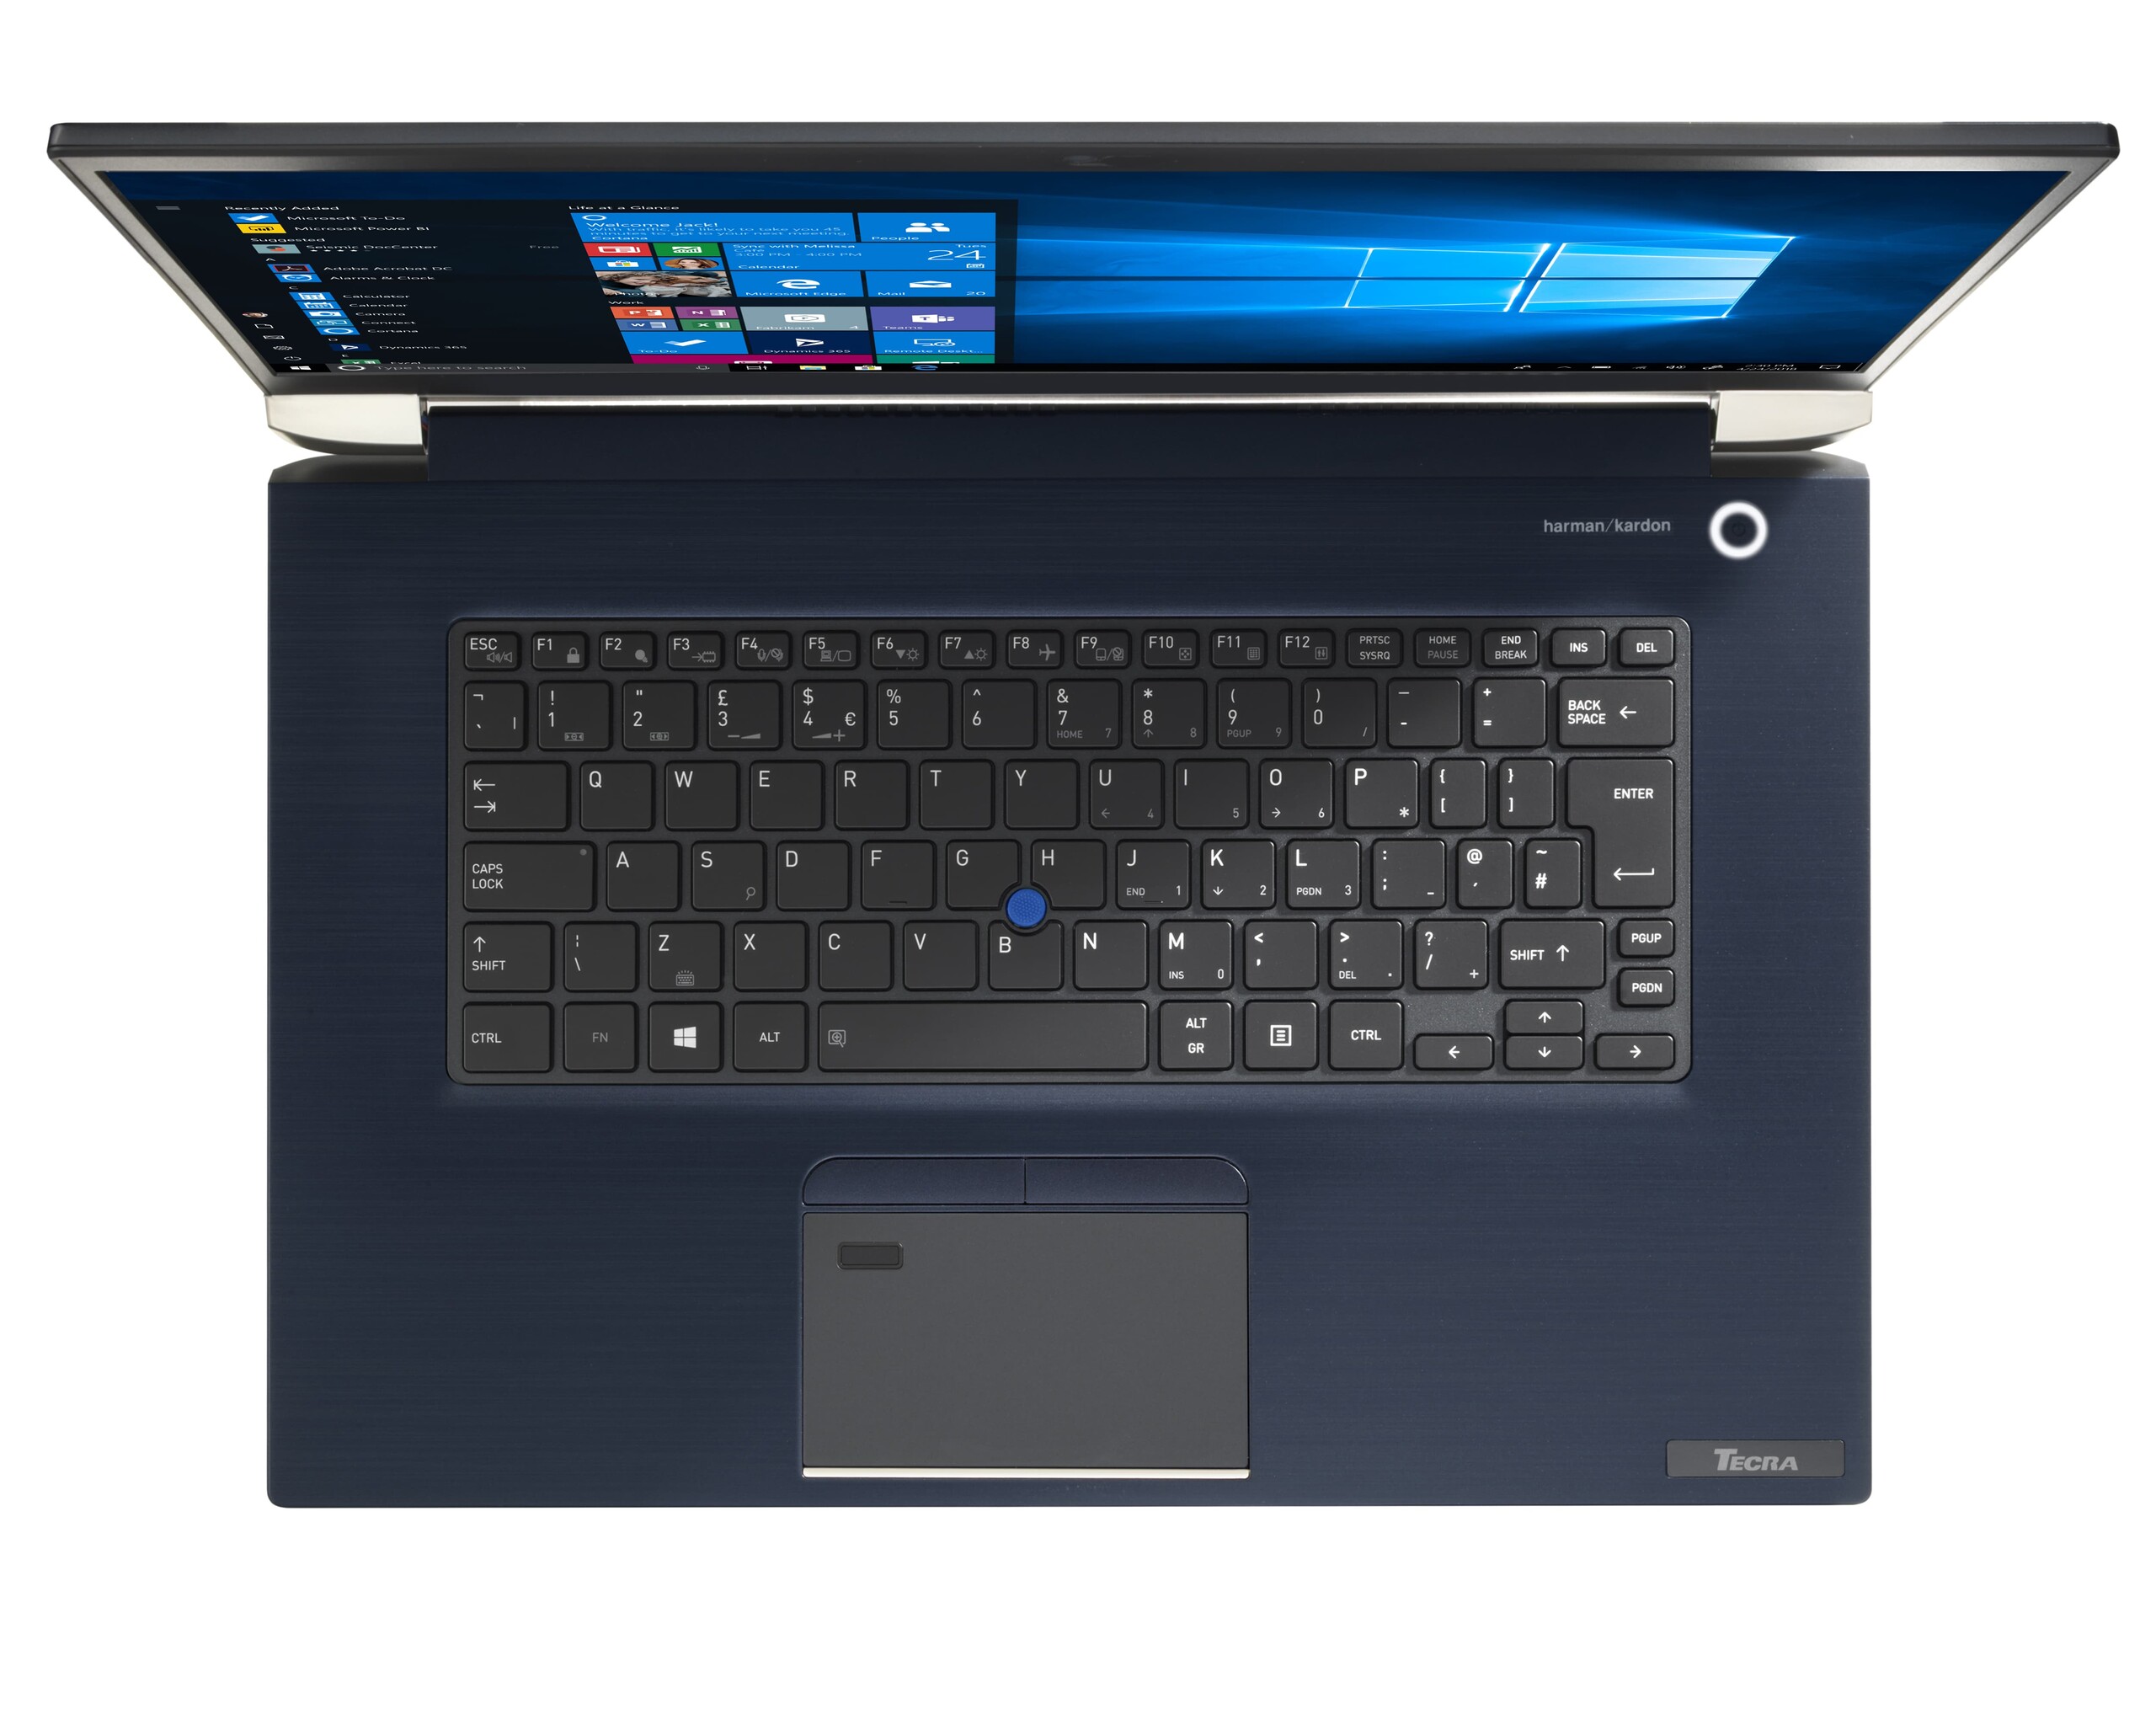
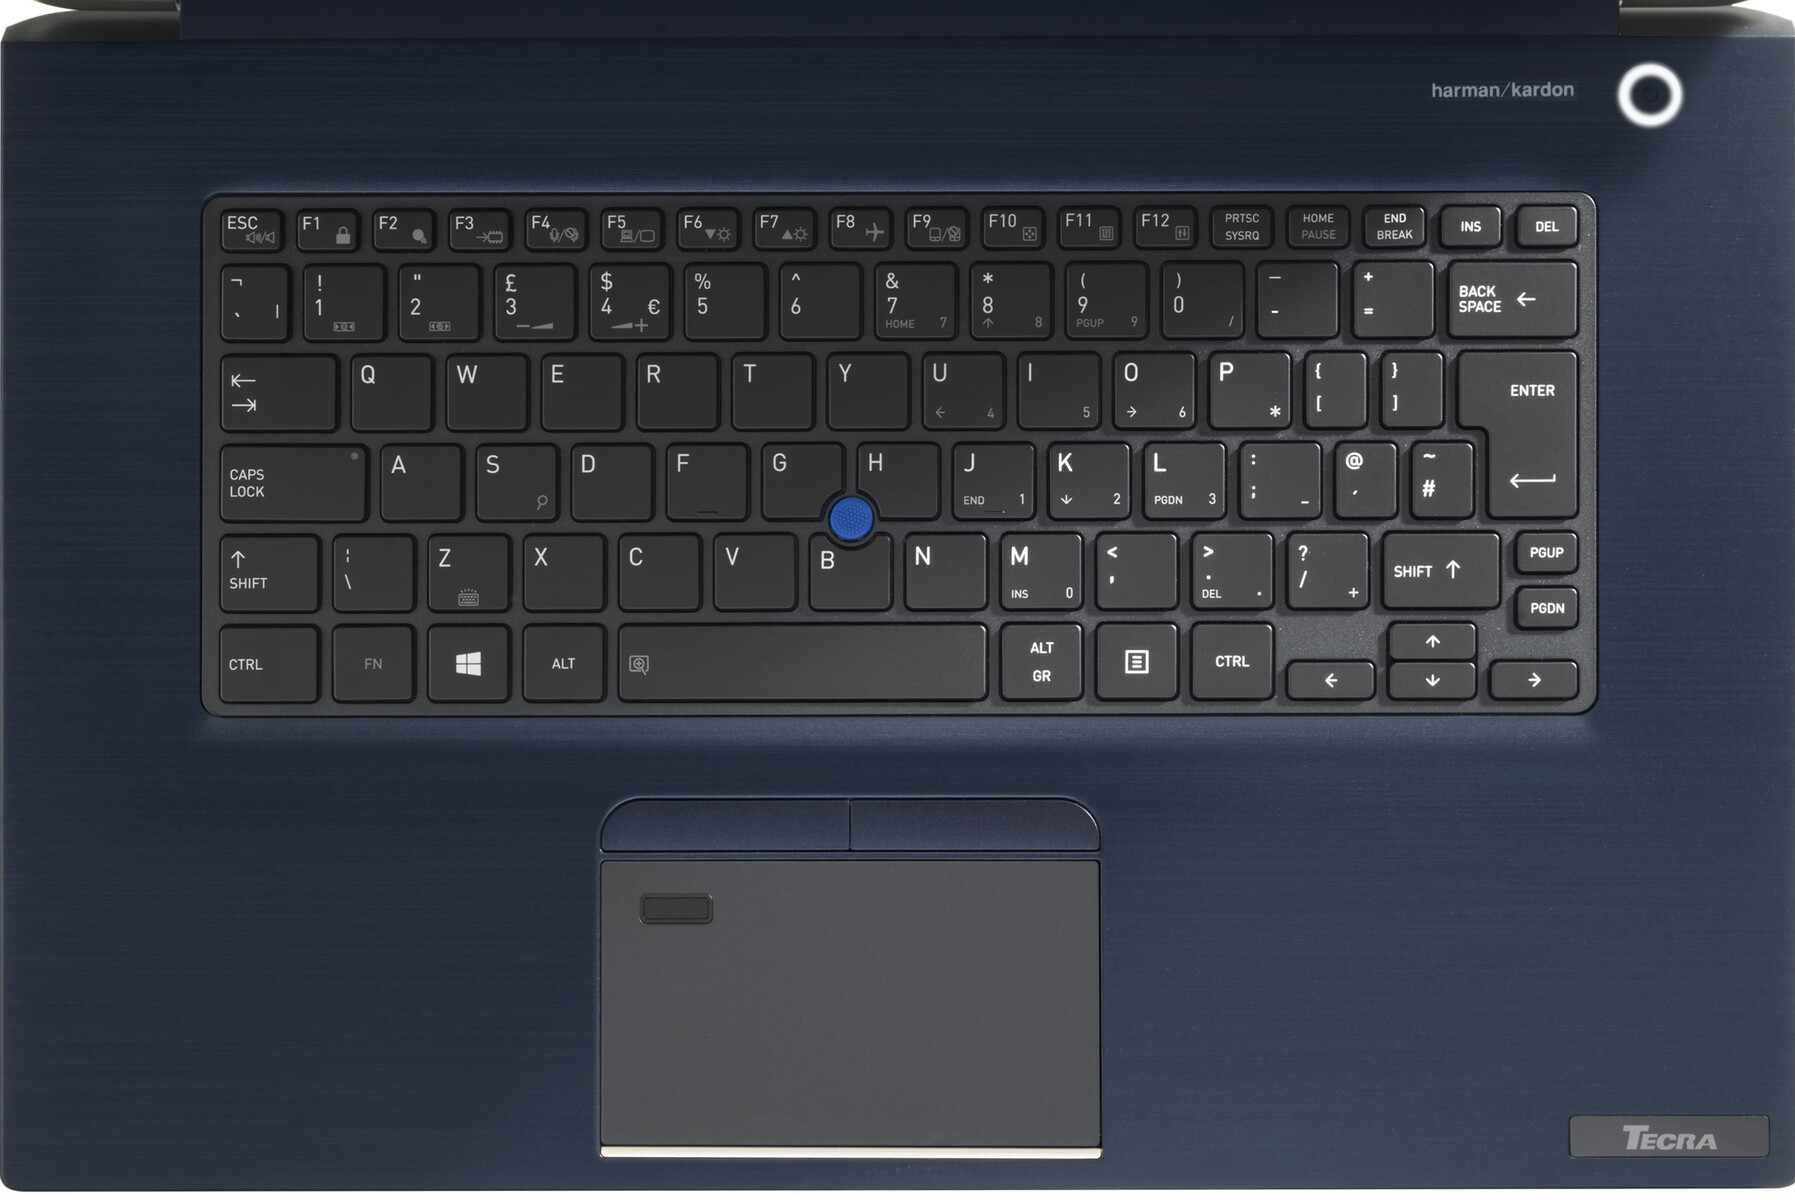
The plastic keyboard feels crisp underhand. The plastic keycaps have a firm body and springy feedback, and travel is adequate. The keys are well-sized and well-spaced. Clatter is noticeable but not offensive. Our primary complaints lie with the small arrow keys and the odd placement of special functions (e.g., screen brightness controls, volume controls). The single-stage white backlight is a bit dim but usable. However, the special function markers are not lit by the backlight, making them difficult to find in dark environments. This can be frustrating.
The trackpad feels smooth but is small. Additionally, the integrated fingerprint reader that occupies the upper-left corner of the trackpad often gets in the way, further reducing usable space. The clicking mechanism feels solid, and its click is quiet. The pointing stick in the middle of the keyboard is a fair bit worse than Lenovo's TrackPoint. Dynabook's implementation is usable but feels slippery and isn't as responsive as the TrackPoint on Lenovo's business laptops. Hence, most users will opt for the compact trackpad. The pointing stick's buttons (located above the trackpad) are excellent, offering firm feedback, good travel, and a quiet yet strong click.
Dynabook offers a touchscreen option, which our unit has. Touch input is reliable, although there is a slight delay before the laptop registers an actual input.
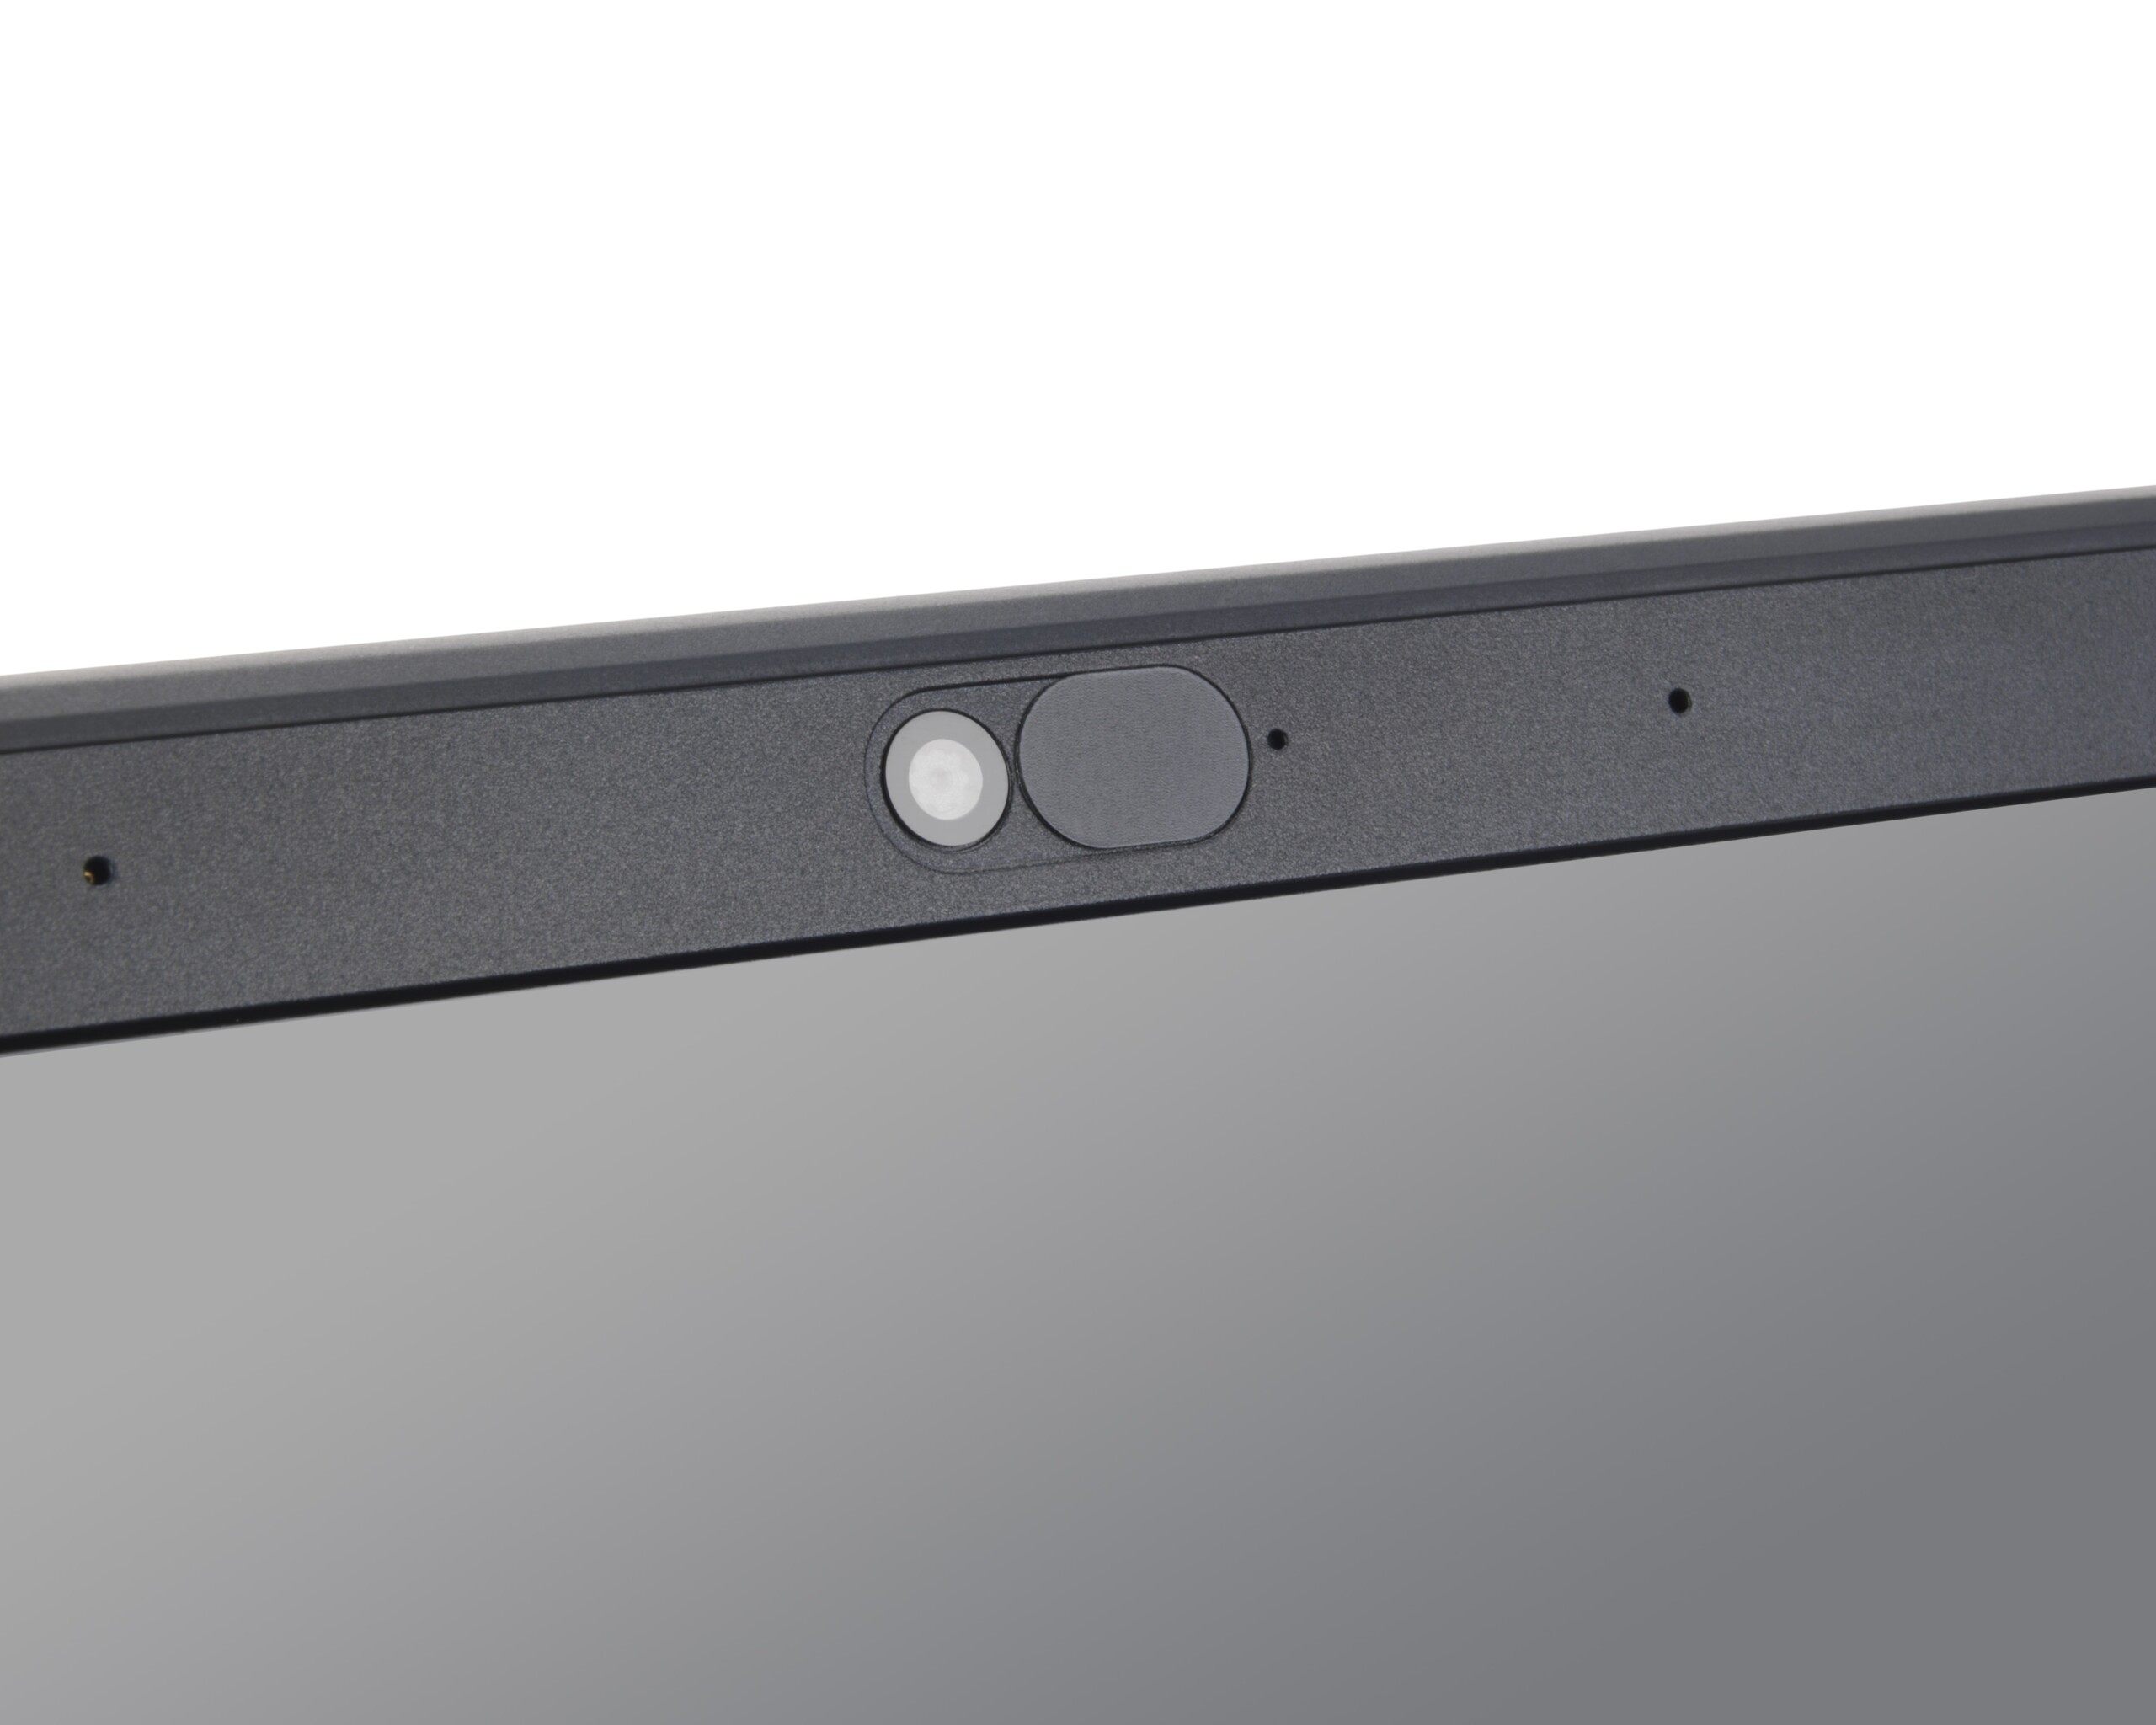
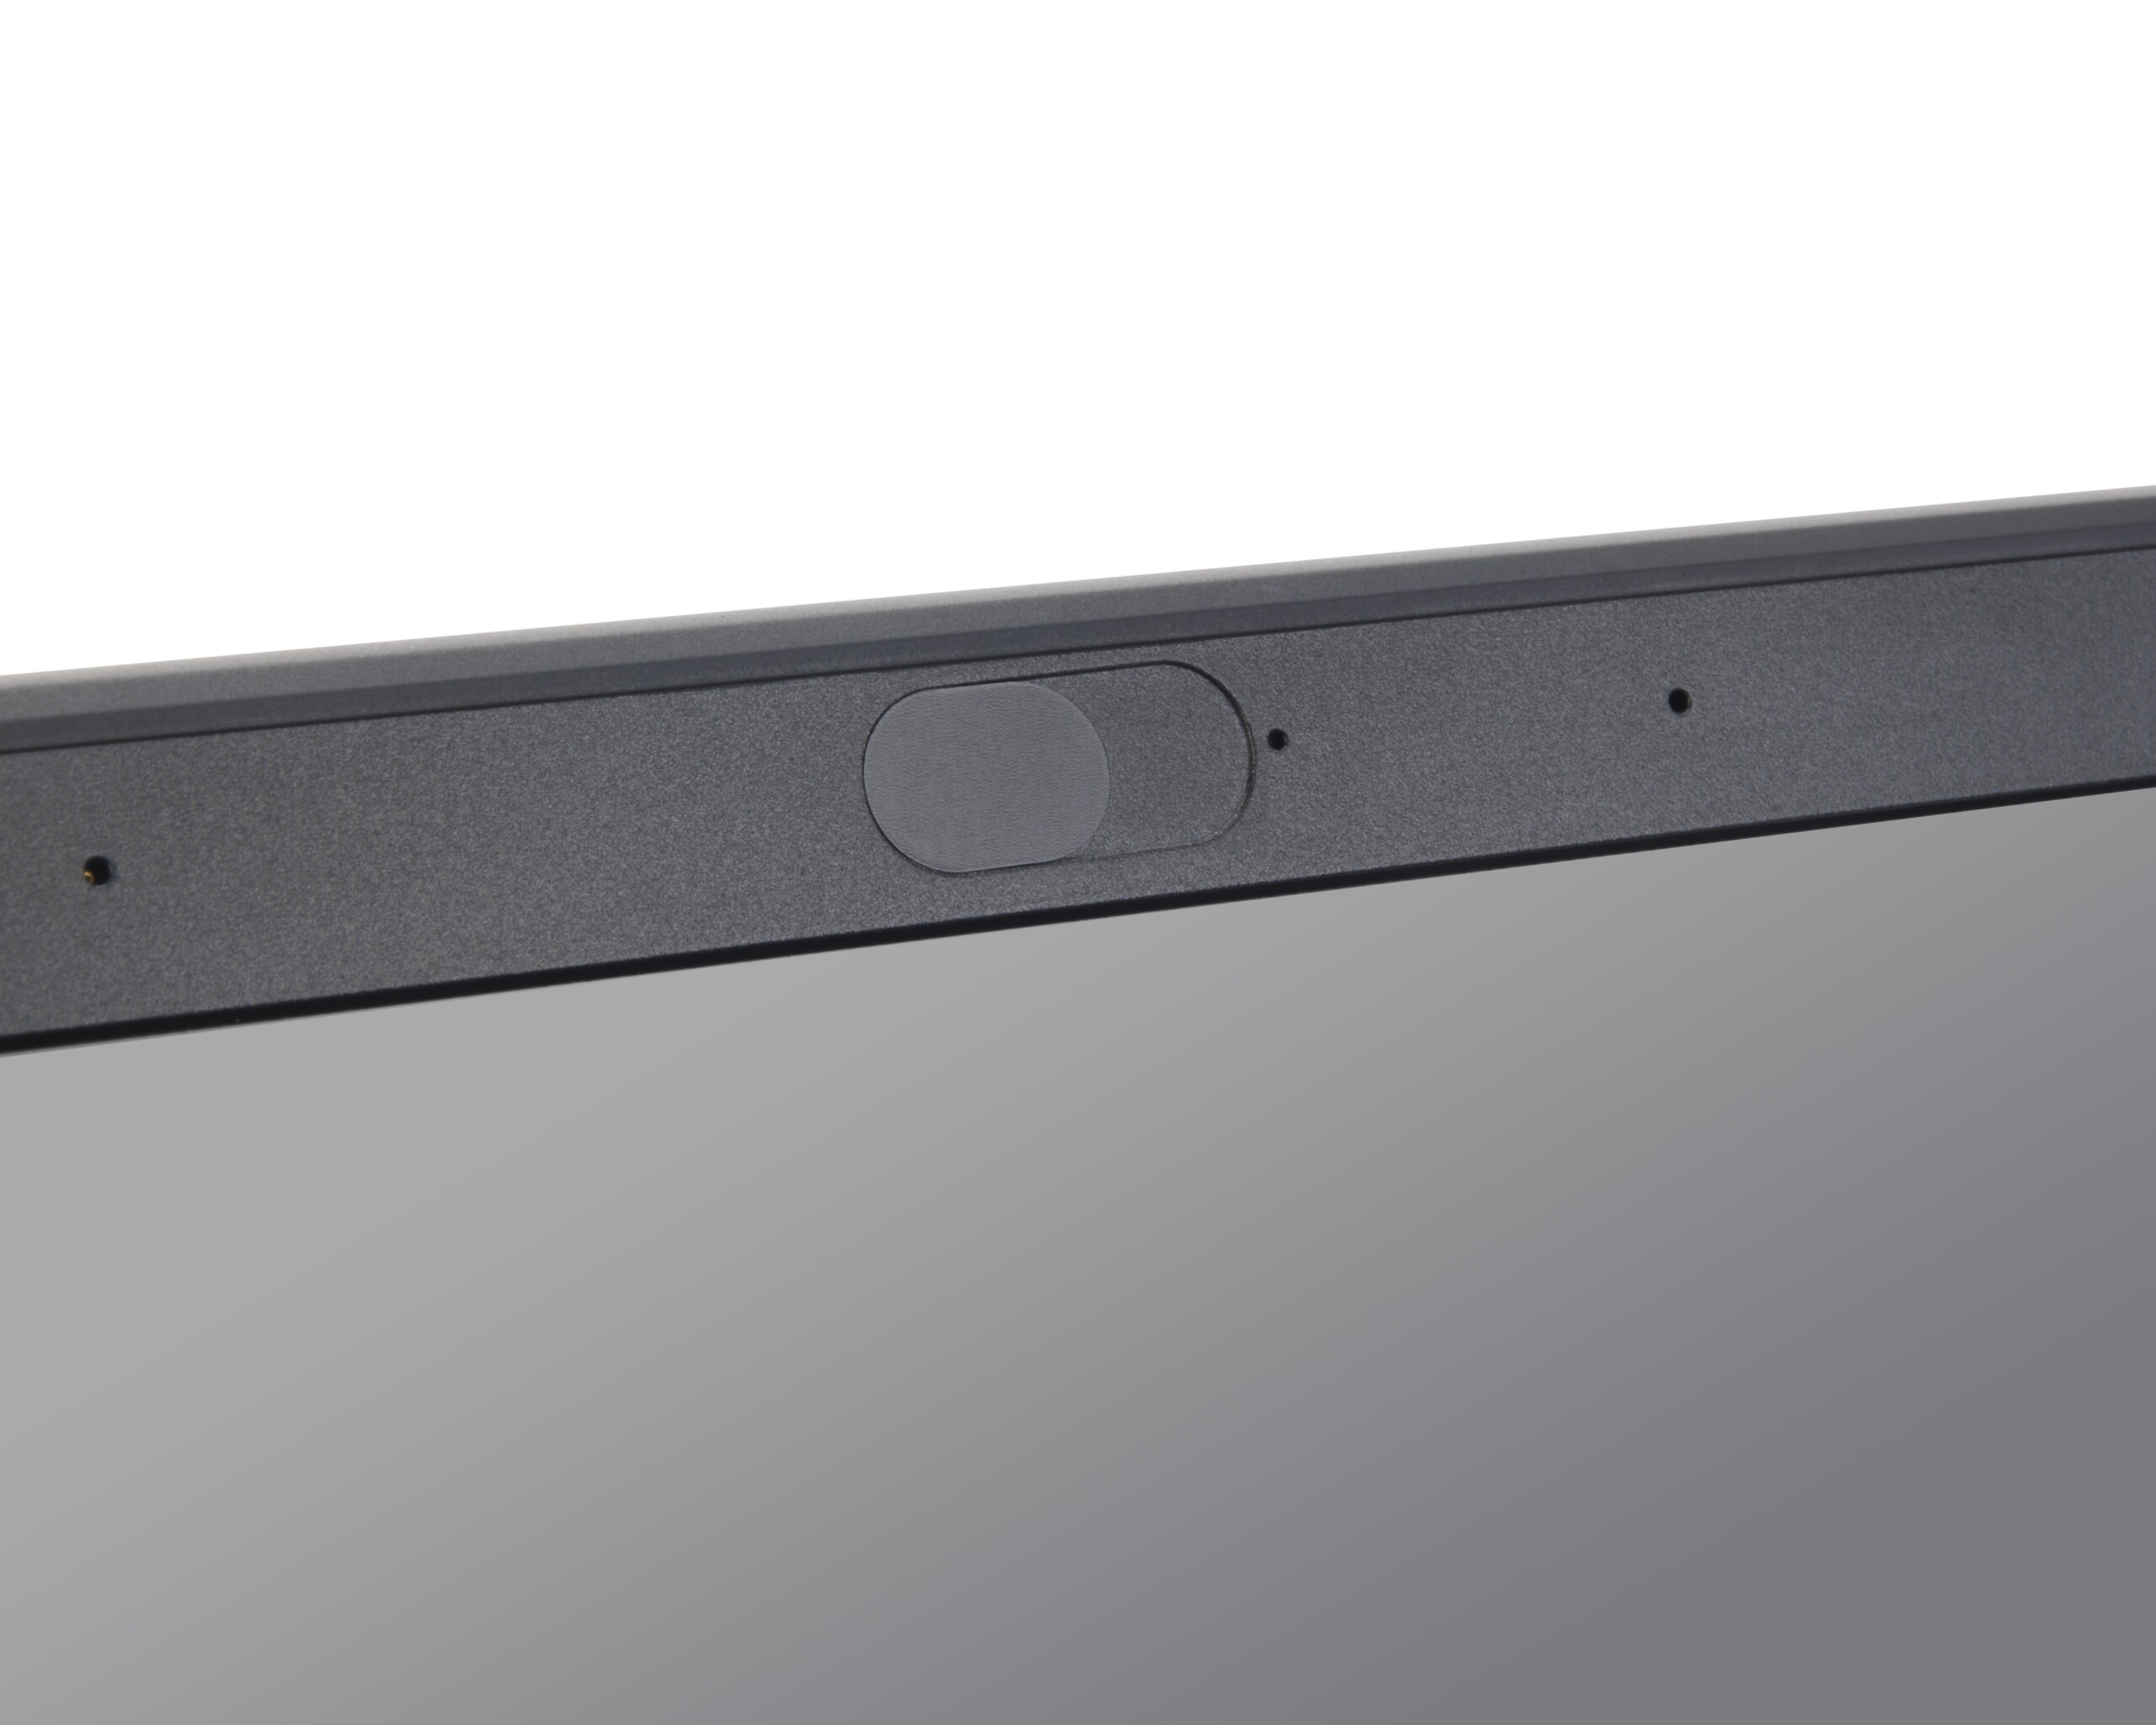
The Tecra X50 includes a fingerprint scanner that registers about 75% of the time. The camera can be configured with a Windows Hello-capable IR sensor. This sensor is reliable and allows for immediate logins, even in dark environments.
Display
The FullHD touch display is a bit below average. The Tecra X50 uses the same Toshiba panel as the older Tecra X40, albeit at 15.6 inches rather than 14. The impression is largely the same as that left by its older brother. Contrast is decent (986:1), but the backlight is too dim for our tastes. Average brightness across the panel is 270 nits. Competitors in this price range routinely shoot past 300 nits and are better options. The Tecra X50's display is fine for office use but can be difficult to read next to a window. Outdoor is almost impossible.
On the plus side, response times for the IGZO panel are excellent, and PWM is not a problem. At this price point, we would expect that to be the case, so the Tecra X50 earns full marks here. Additionally, there is minimal backlight bleed. The matte finish across the touchscreen helps to kill glare indoors.
| |||||||||||||||||||||||||
Brightness Distribution: 86 %
Center on Battery: 295.9 cd/m²
Contrast: 986:1 (Black: 0.3 cd/m²)
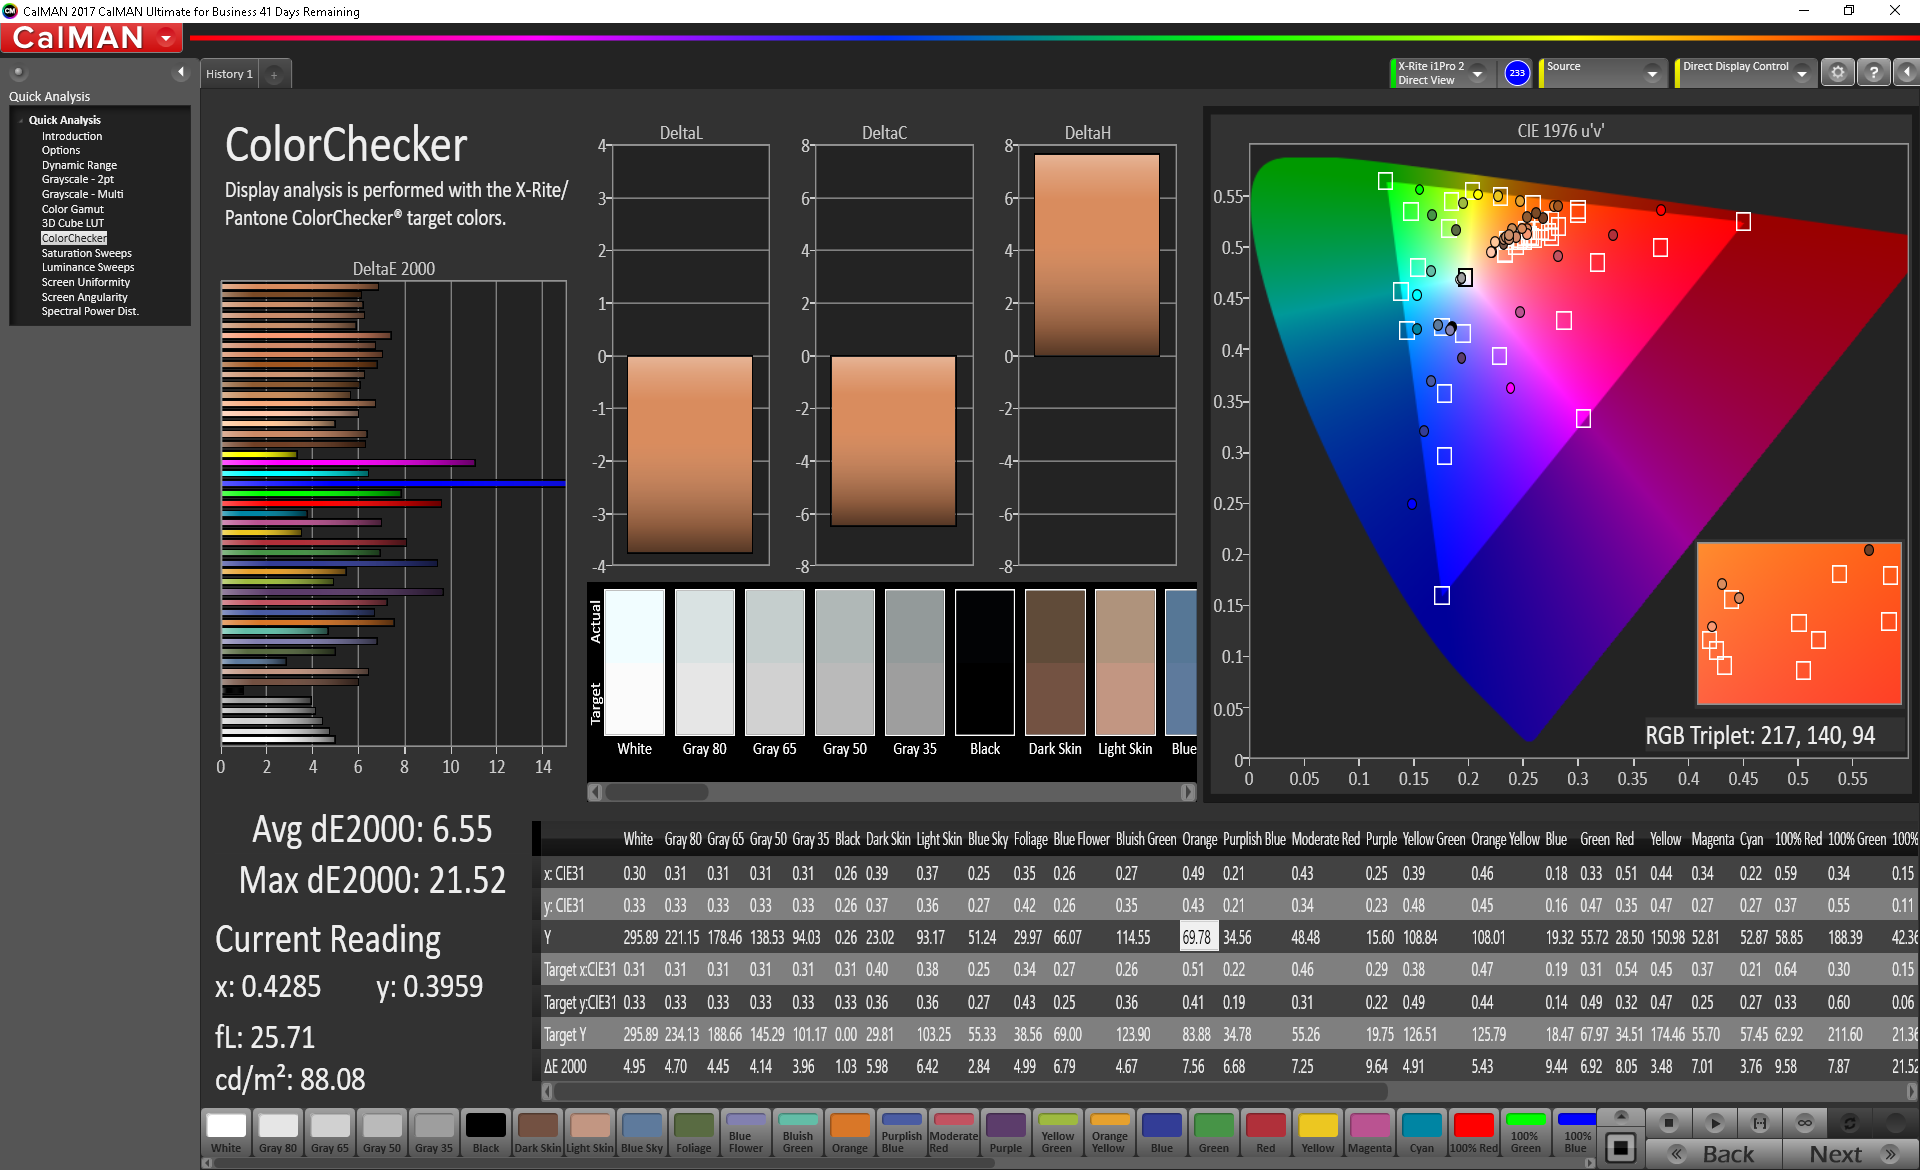
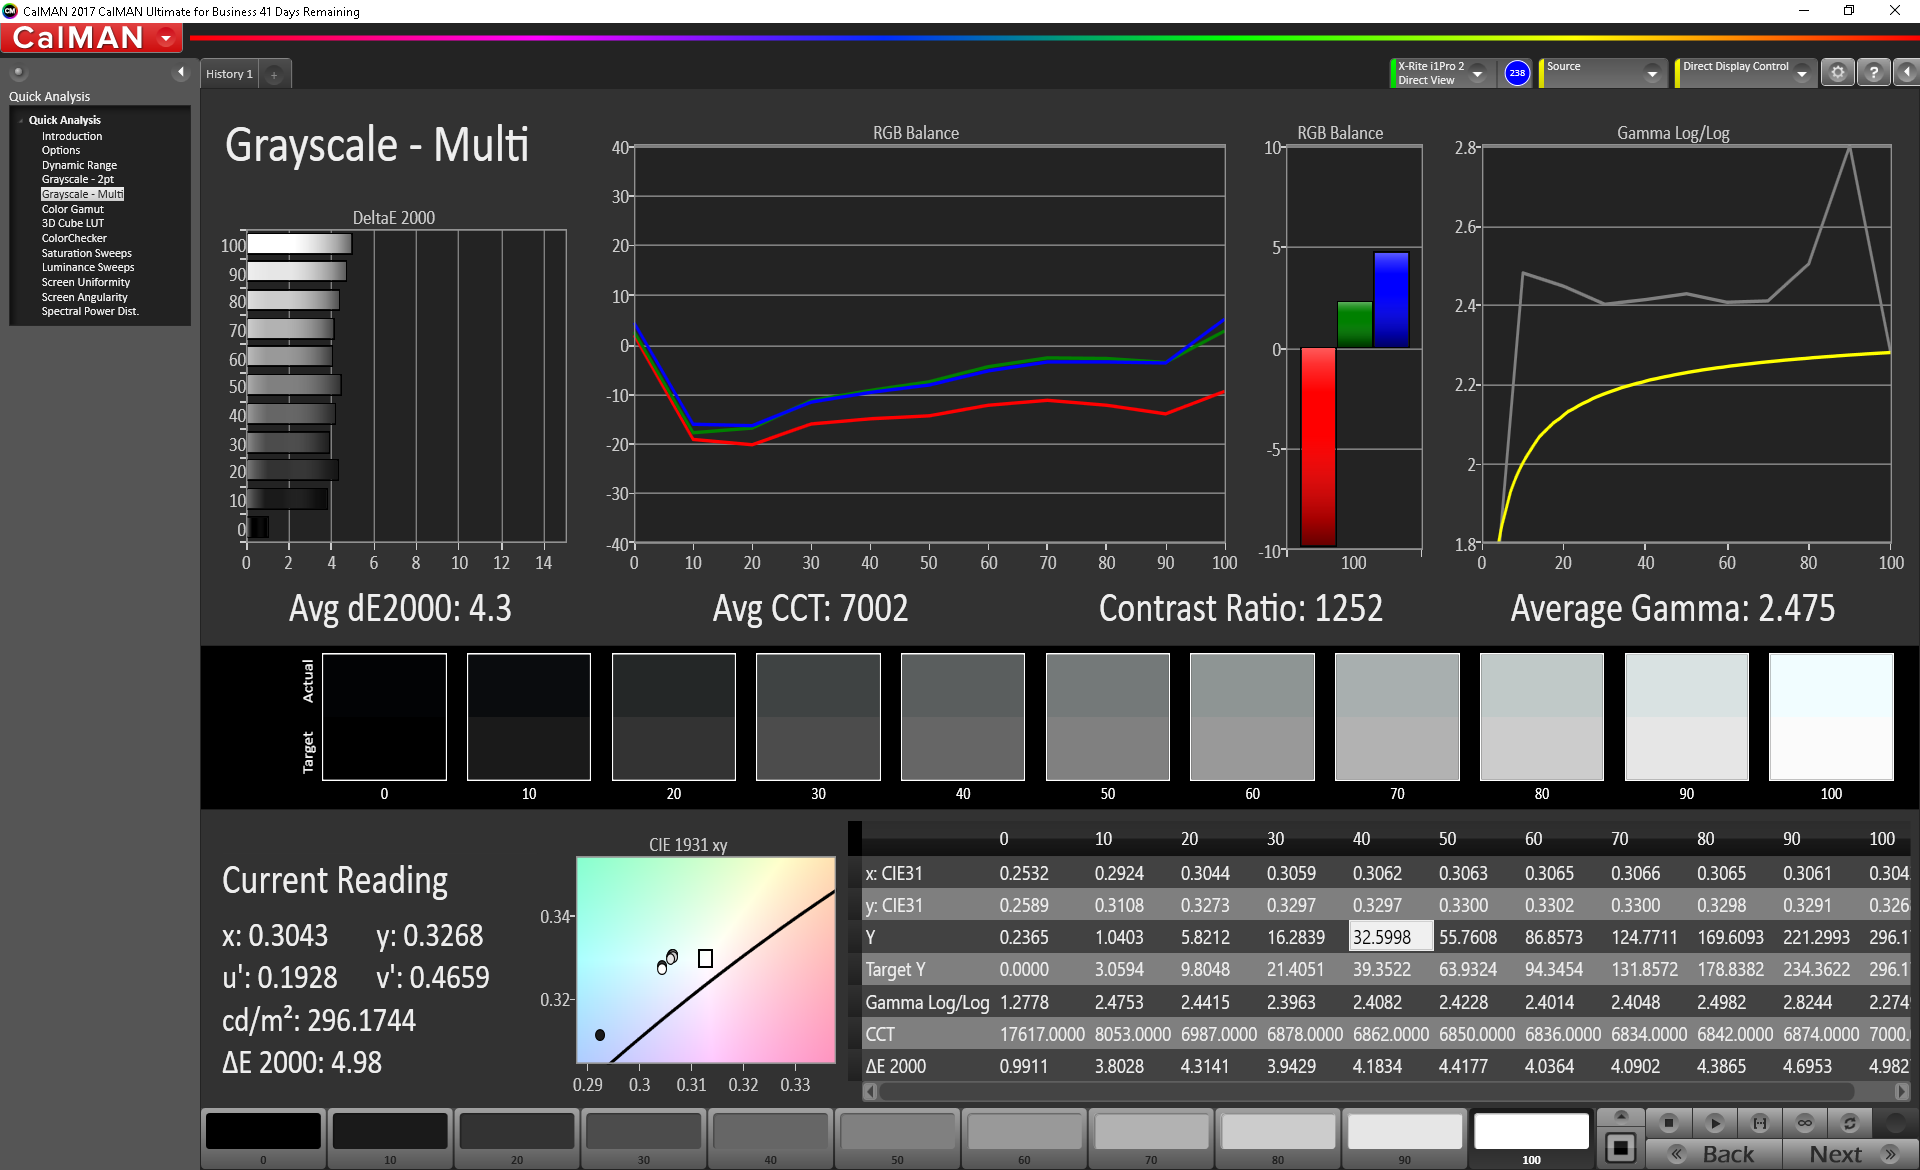
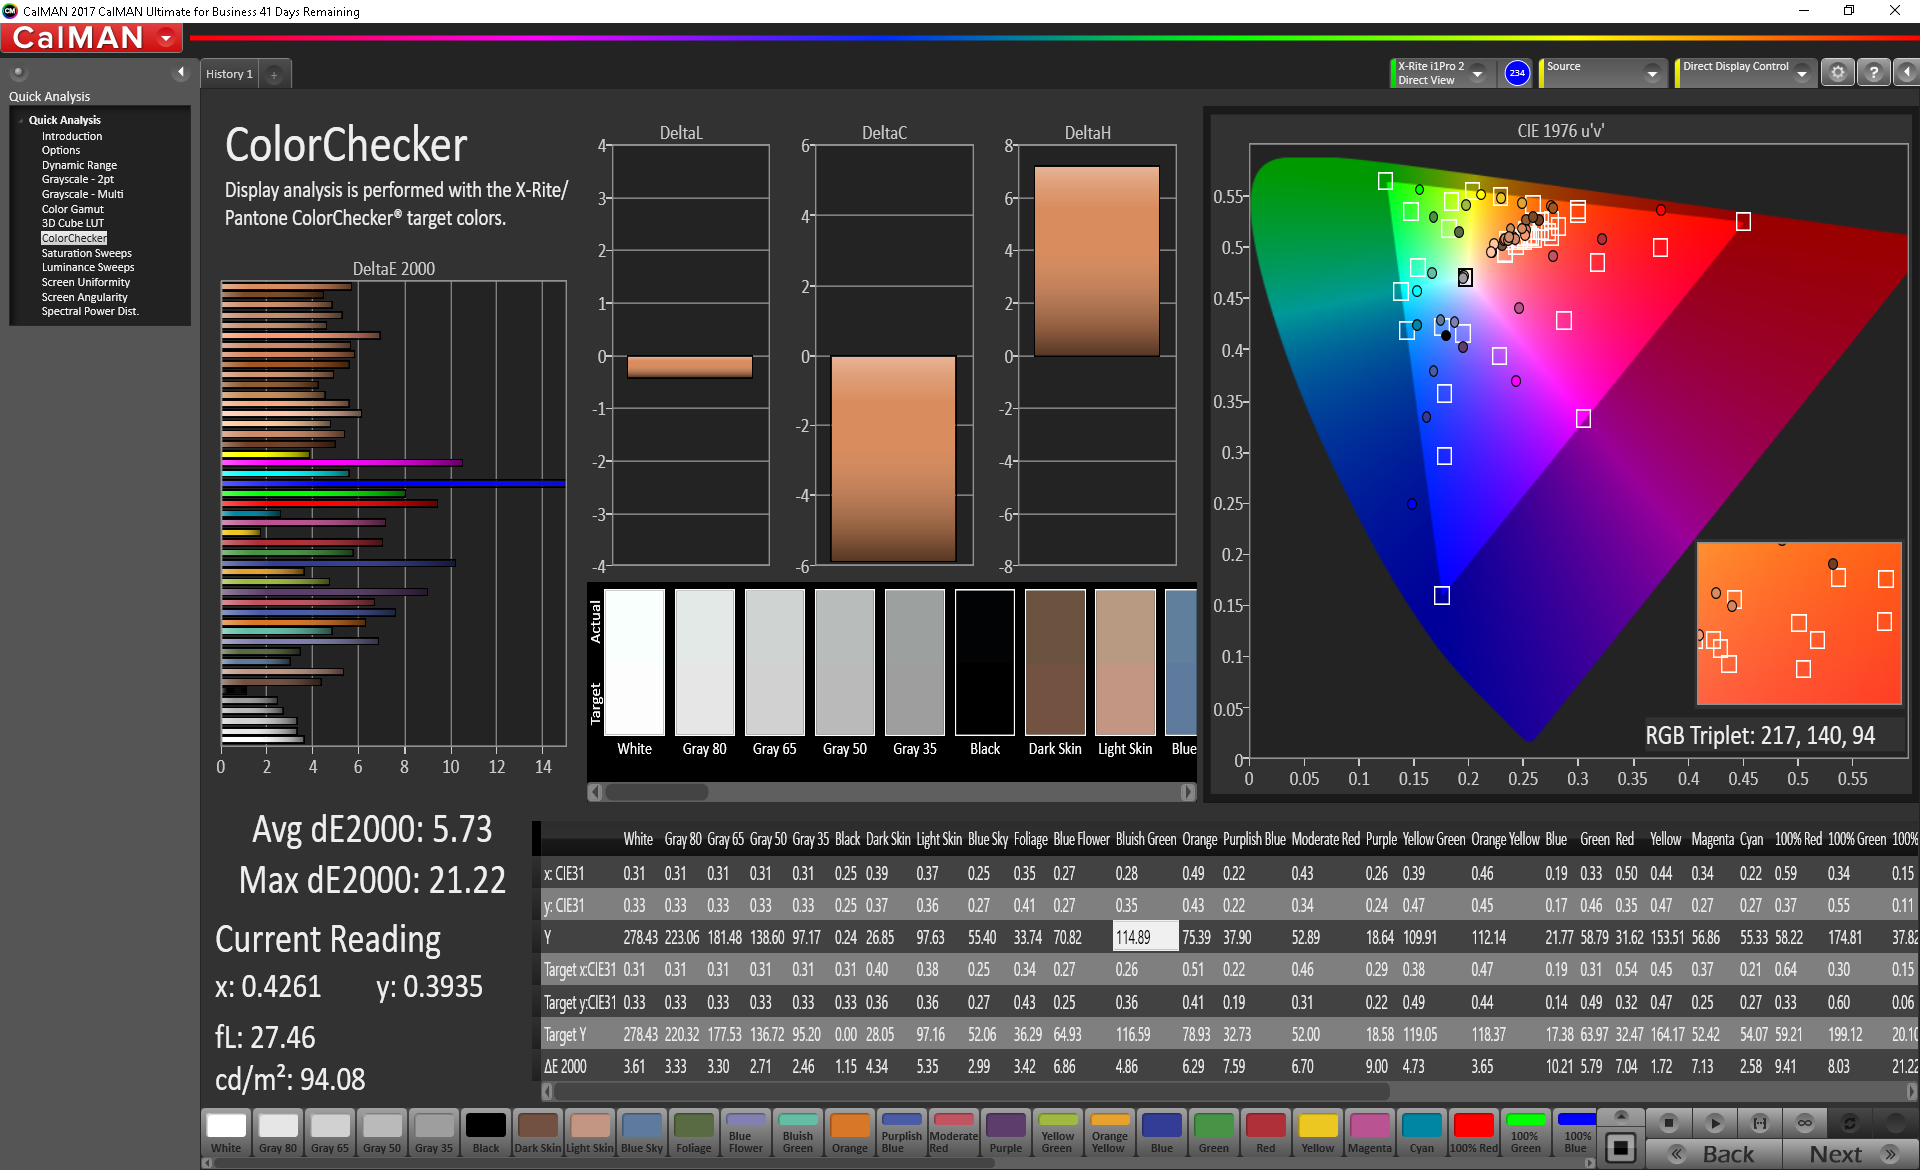
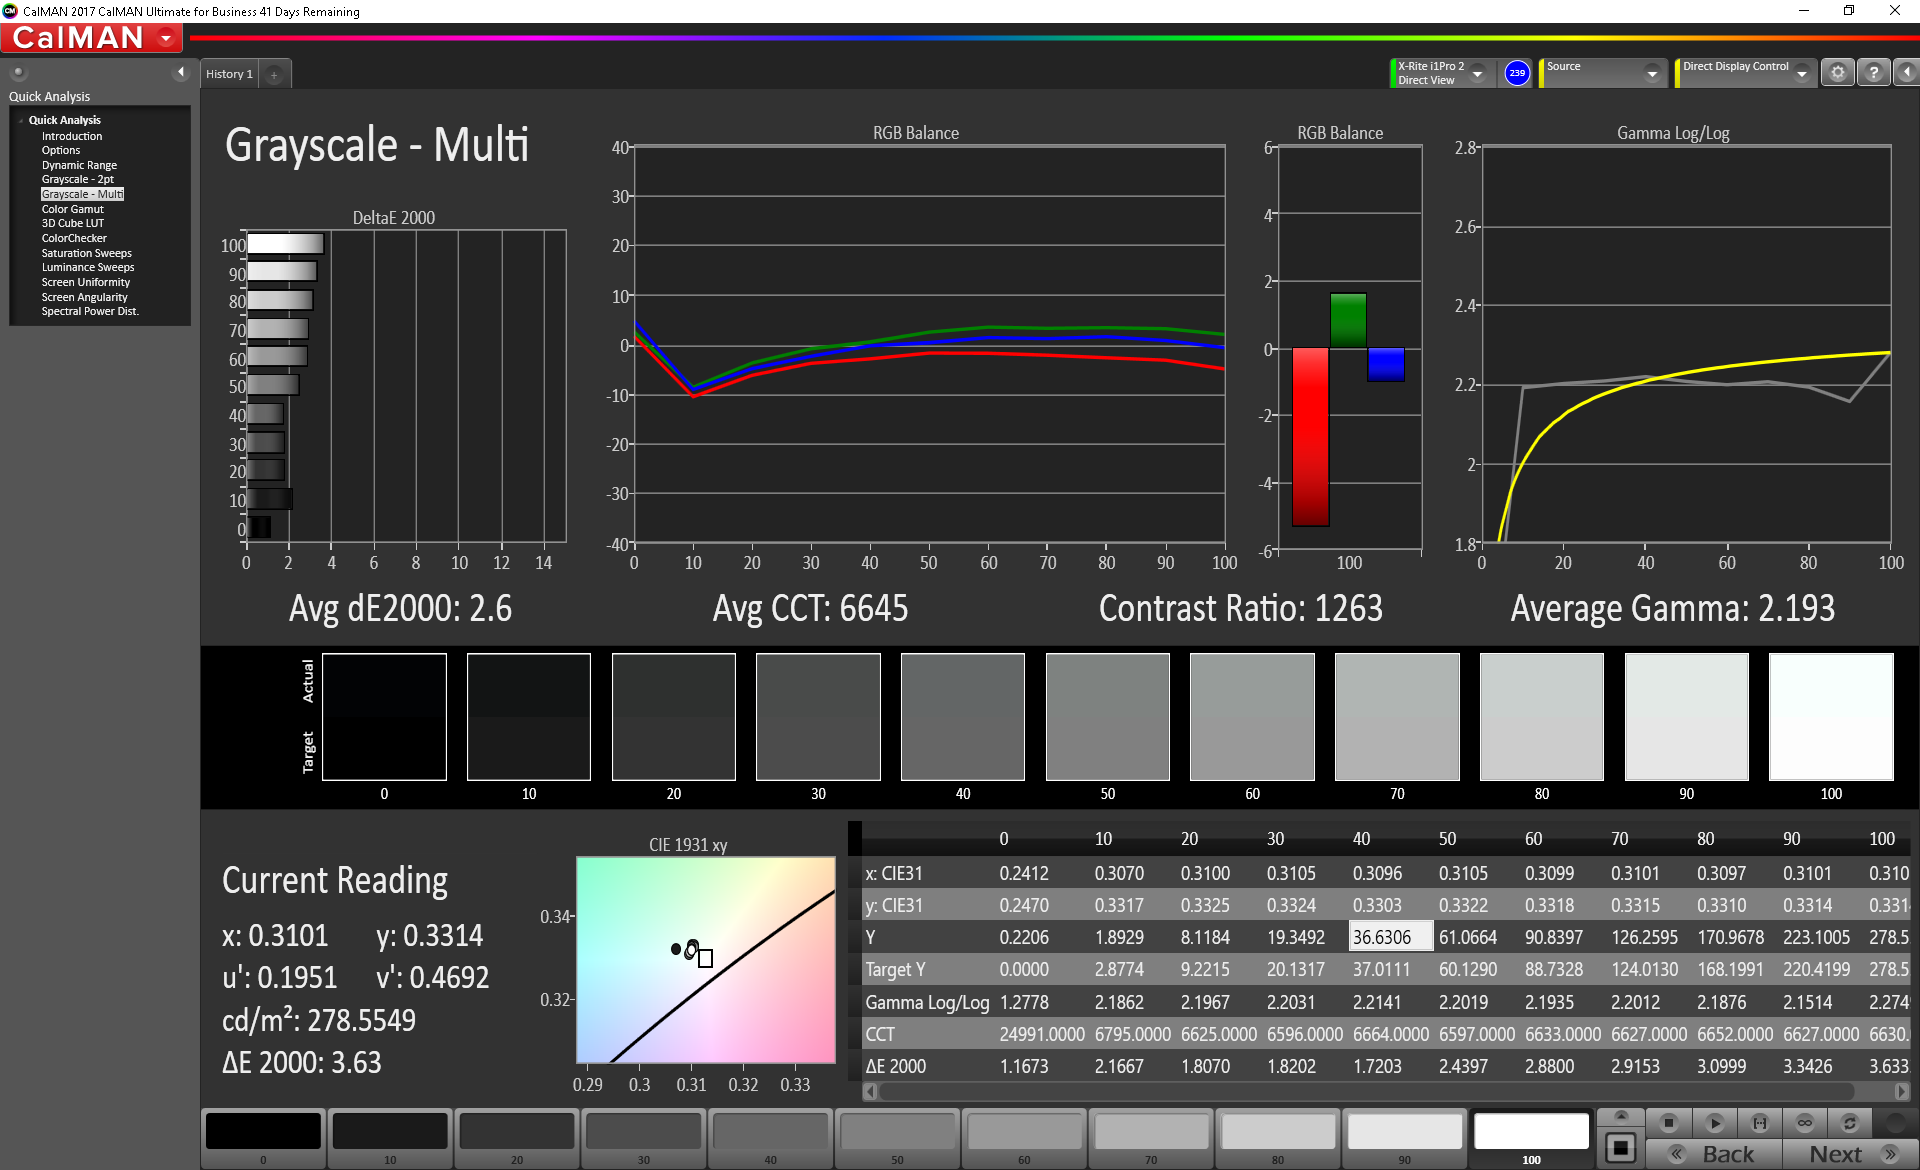
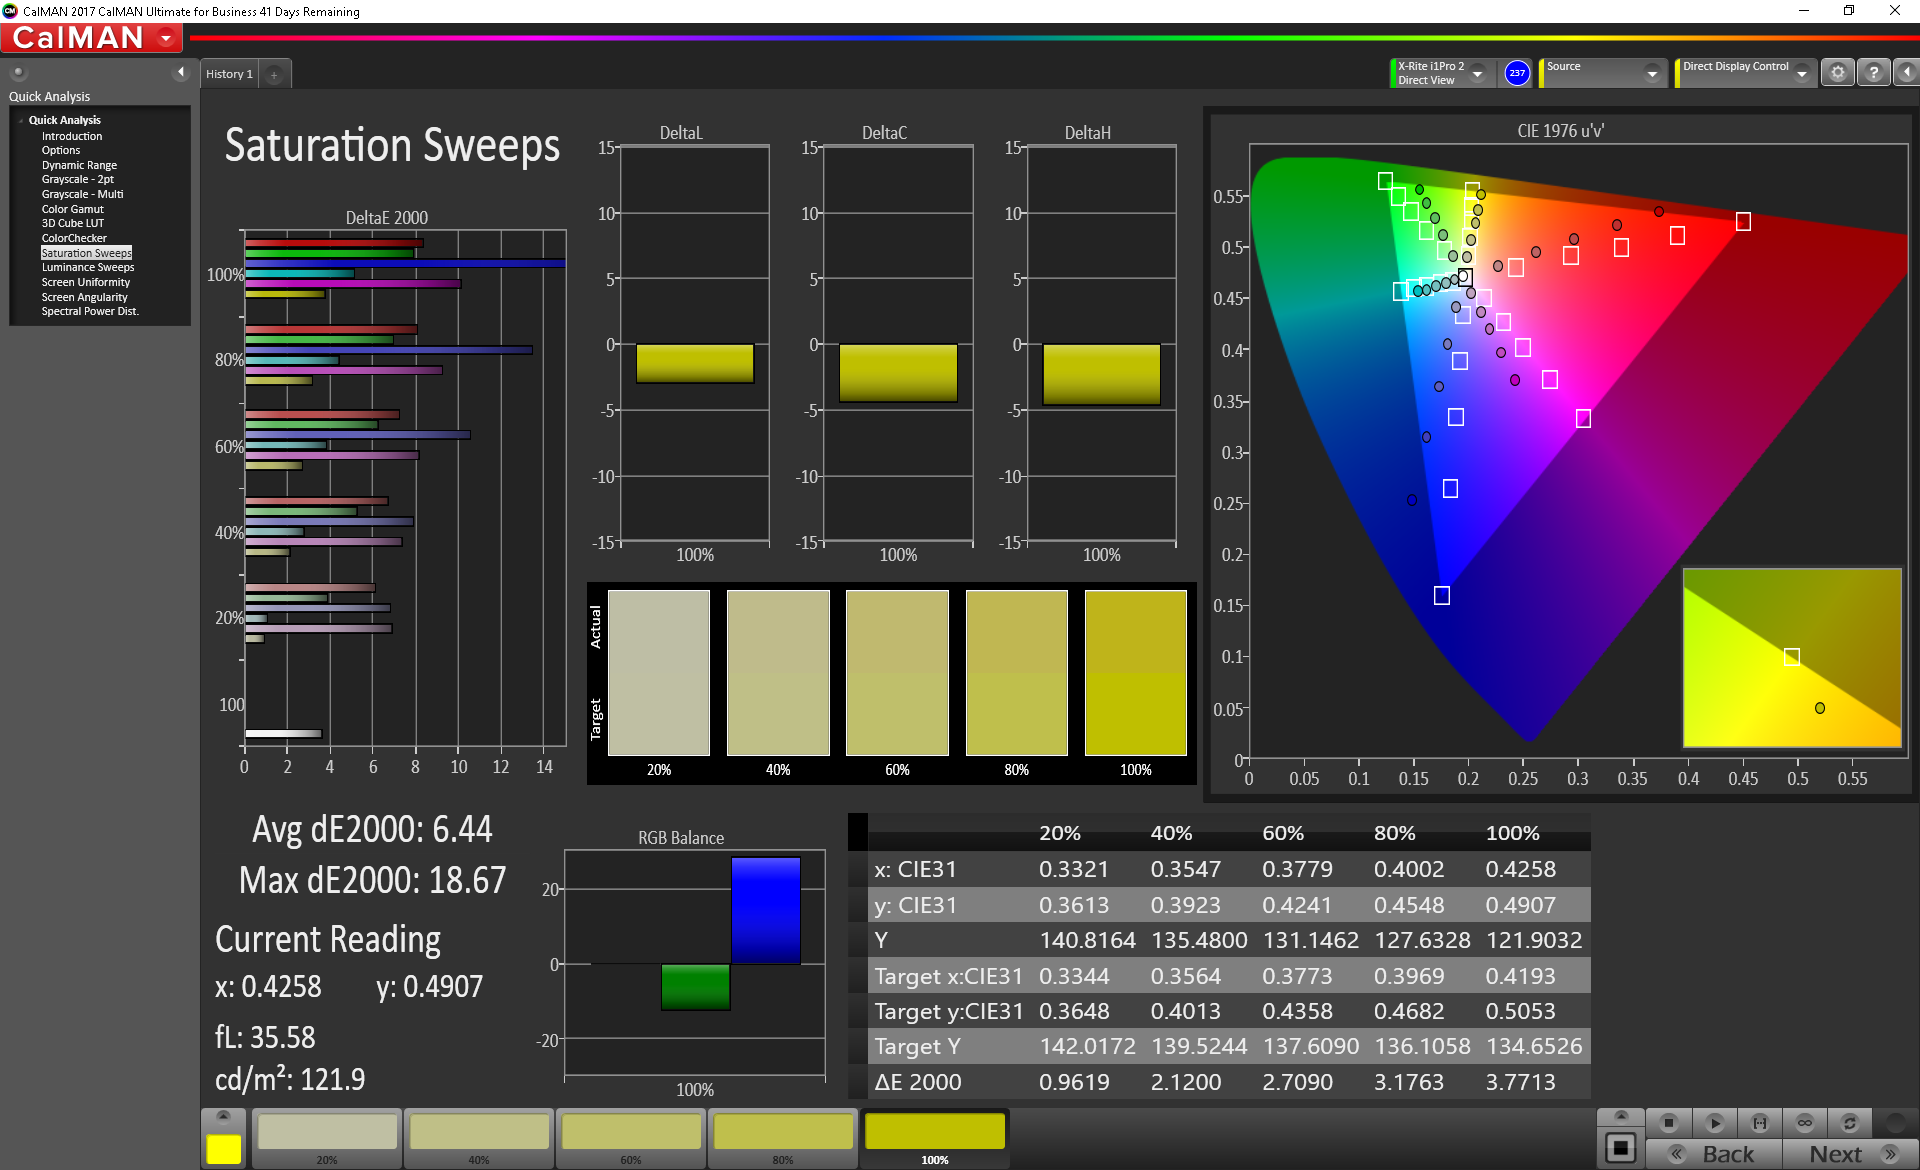
ΔE Color 6.55 | 0.5-29.43 Ø5, calibrated: 5.73
ΔE Greyscale 4.3 | 0.57-98 Ø5.3
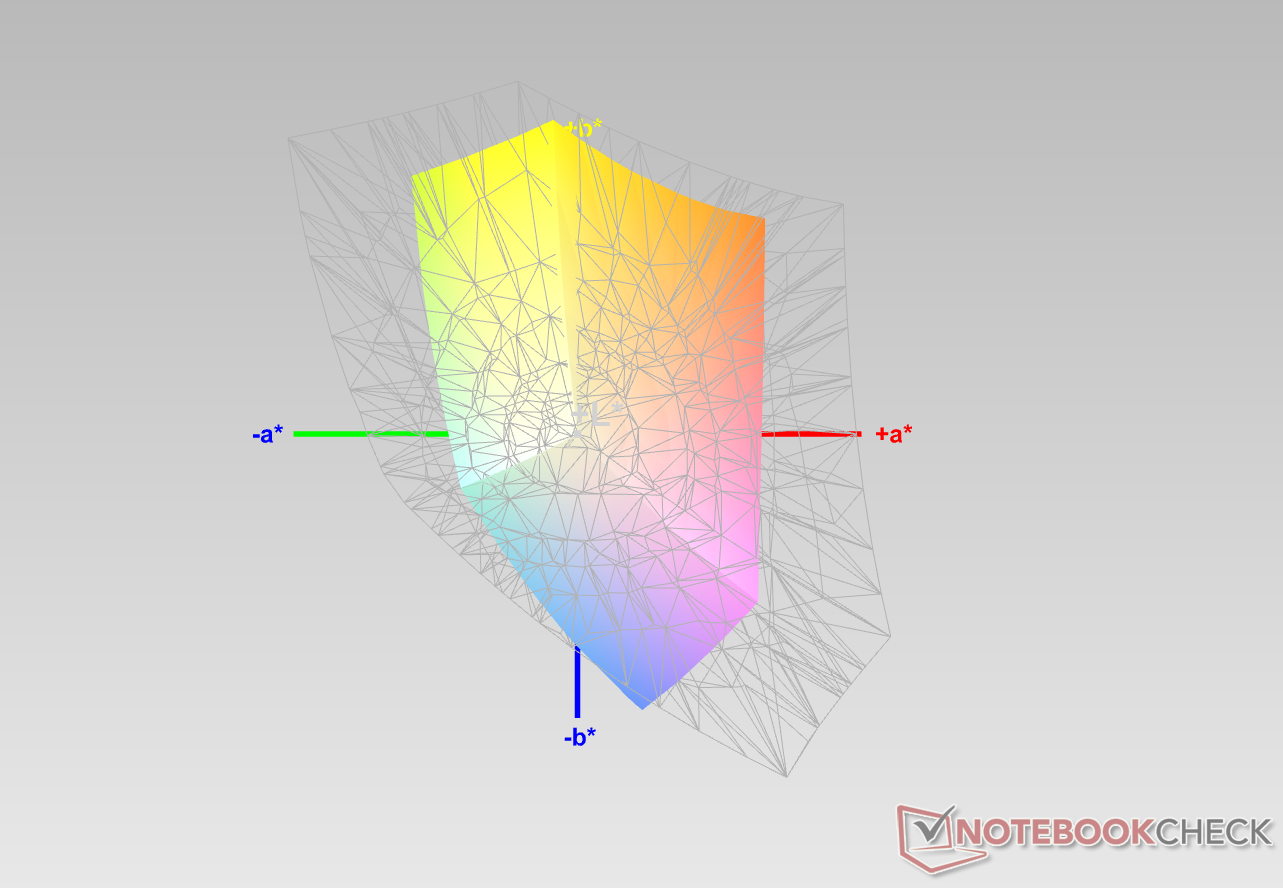
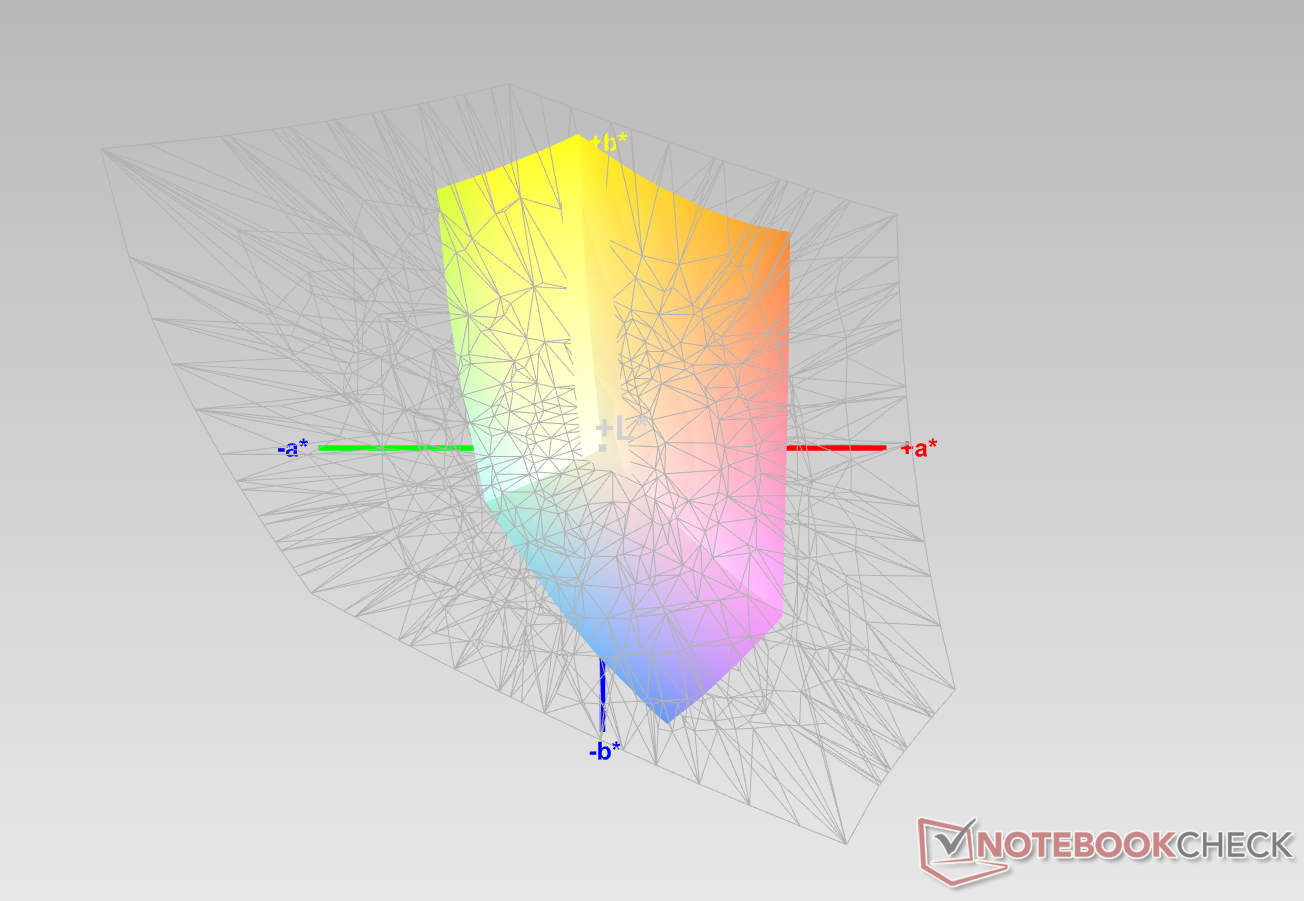
54% sRGB (Argyll 1.6.3 3D)
35% AdobeRGB 1998 (Argyll 1.6.3 3D)
37.92% AdobeRGB 1998 (Argyll 2.2.0 3D)
55% sRGB (Argyll 2.2.0 3D)
36.68% Display P3 (Argyll 2.2.0 3D)
Gamma: 2.475
| Dynabook Tecra X50-F Toshiba TOS508F, , 1920x1080, 15.60 | Toshiba Tecra X40-E-10W Toshiba TOS508F, , 1920x1080, 14.00 | Lenovo ThinkPad T490s-20NYS02A00 B140HAN05.7, , 1920x1080, 14.00 | Lenovo ThinkPad X1 Carbon 2019-20QE000VGE LP140QH2-SPD1, , 2560x1440, 14.00 | Acer Swift 5 SF515-51T-76B6 LG Philips LP156WFA-SPG2, , 1920x1080, 15.60 | Microsoft Surface Laptop 3 15 Ryzen 5 3580U Sharp LQ150P1JX51, , 2496x1664, 15.00 | |
|---|---|---|---|---|---|---|
| Display | 11% | 80% | 90% | 80% | 77% | |
| Display P3 Coverage | 36.68 | 40.55 11% | 67.1 83% | 72.5 98% | 66.8 82% | 66.9 82% |
| sRGB Coverage | 55 | 61 11% | 97.6 77% | 97.8 78% | 98 78% | 99.3 81% |
| AdobeRGB 1998 Coverage | 37.92 | 41.9 10% | 68.5 81% | 73.8 95% | 67.8 79% | 63.7 68% |
| Response Times | 28% | -57% | 9% | 1% | -34% | |
| Response Time Grey 50% / Grey 80% * | 38 ? | 22 ? 42% | 61.6 ? -62% | 33.6 ? 12% | 38 ? -0% | 47.2 ? -24% |
| Response Time Black / White * | 25.6 ? | 22 ? 14% | 38.8 ? -52% | 24 ? 6% | 25 ? 2% | 36.8 ? -44% |
| PWM Frequency | 21000 ? | 21370 ? | ||||
| Screen | 17% | 49% | 25% | 44% | 45% | |
| Brightness middle | 295.9 | 266 -10% | 391 32% | 338 14% | 341 15% | 416.9 41% |
| Brightness | 270 | 244 -10% | 389 44% | 315 17% | 319 18% | 389 44% |
| Brightness Distribution | 86 | 86 0% | 87 1% | 88 2% | 87 1% | 86 0% |
| Black Level * | 0.3 | 0.2 33% | 0.23 23% | 0.43 -43% | 0.31 -3% | 0.4 -33% |
| Contrast | 986 | 1330 35% | 1700 72% | 786 -20% | 1100 12% | 1042 6% |
| Colorchecker dE 2000 * | 6.55 | 4.61 30% | 3.4 48% | 4 39% | 2.01 69% | 2.75 58% |
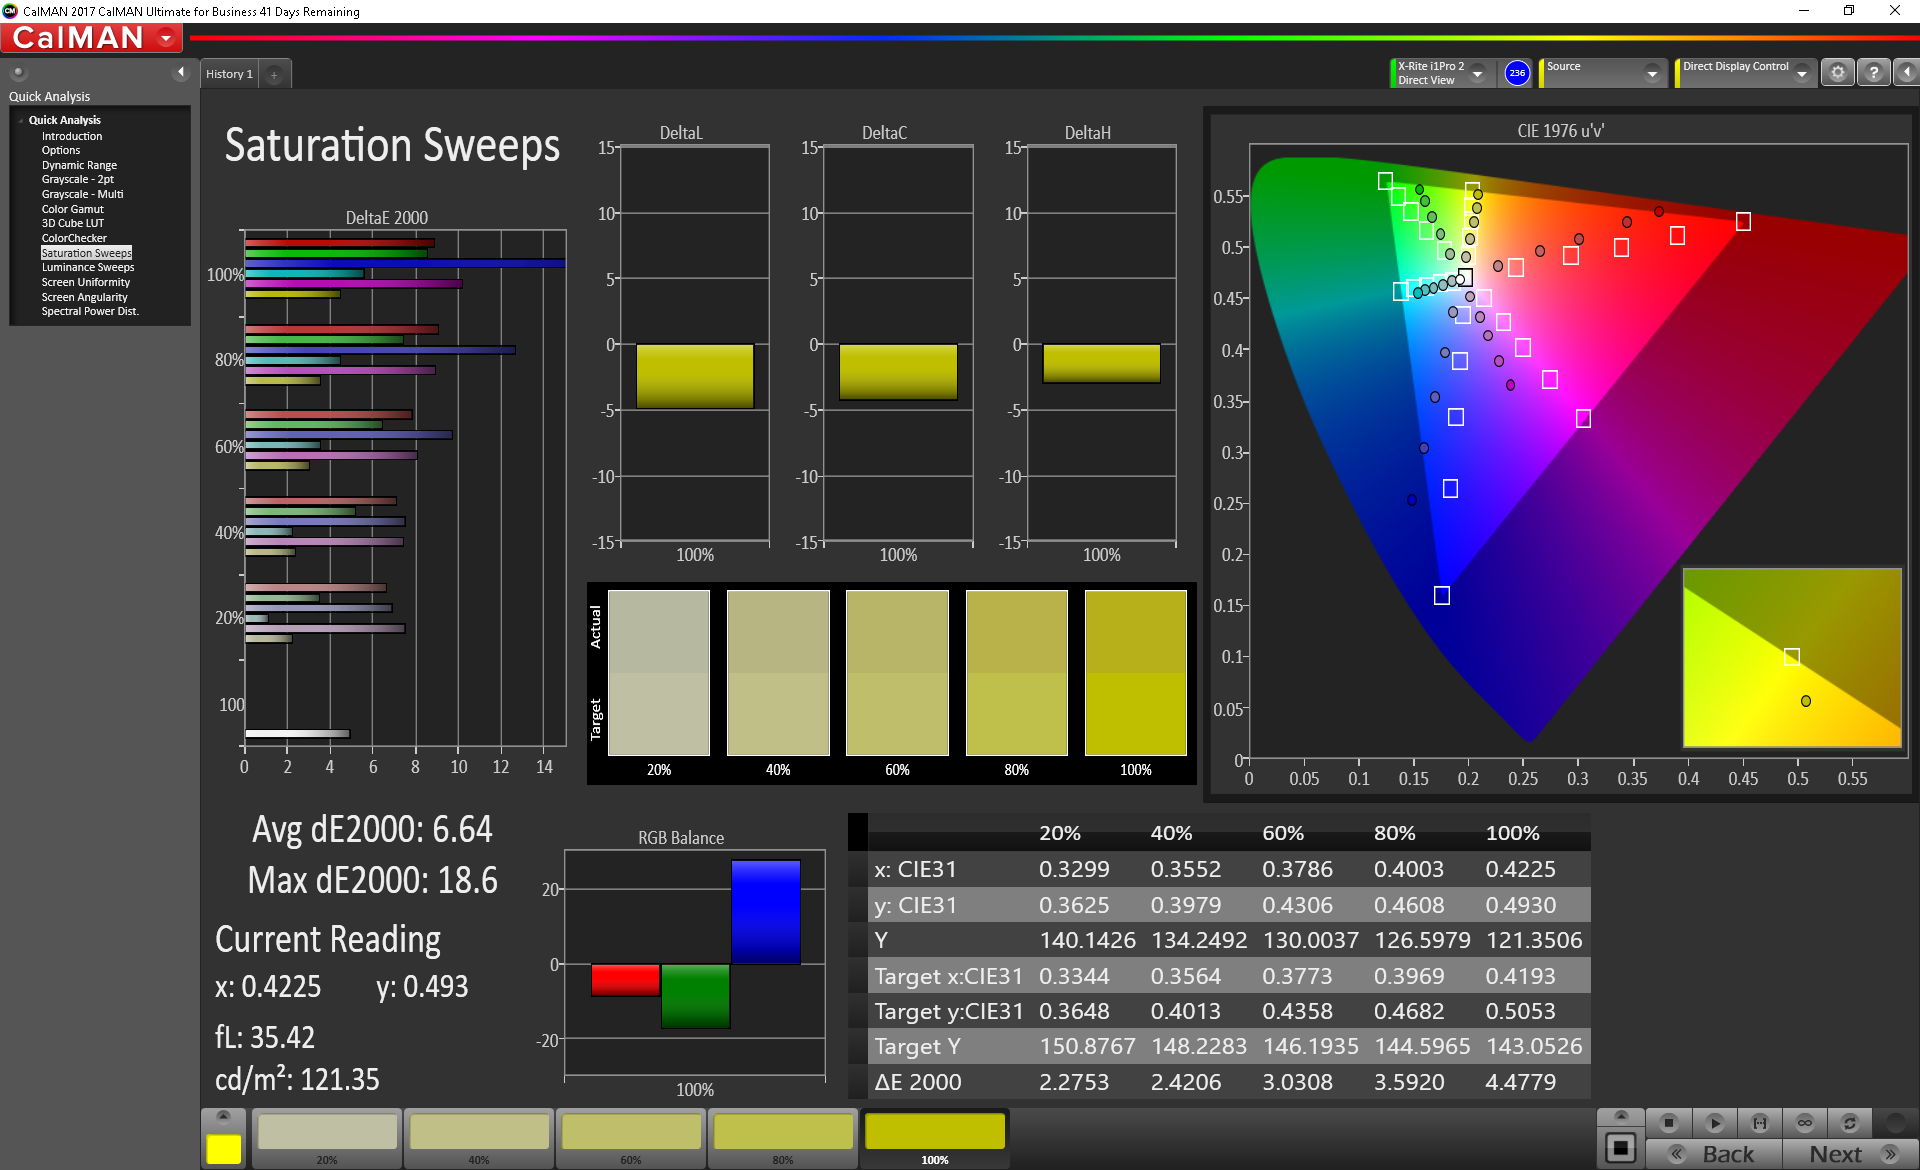
| Colorchecker dE 2000 max. * | 21.52 | 7.46 65% | 4.7 78% | 7.9 63% | 4.74 78% | 6.64 69% |
| Colorchecker dE 2000 calibrated * | 5.73 | 1.1 81% | 1.7 70% | 1.11 81% | 0.71 88% | |
| Greyscale dE 2000 * | 4.3 | 4.31 -0% | 4 7% | 6.2 -44% | 2.01 53% | 1.8 58% |
| Gamma | 2.475 89% | 2.54 87% | 2.49 88% | 2.13 103% | 2.52 87% | 2.09 105% |
| CCT | 7002 93% | 6848 95% | 6809 95% | 6787 96% | 6704 97% | 6646 98% |
| Color Space (Percent of AdobeRGB 1998) | 35 | 39 11% | 62.4 78% | 68.1 95% | 63 80% | 63.4 81% |
| Color Space (Percent of sRGB) | 54 | 61 13% | 97.4 80% | 97.8 81% | 98 81% | 99.4 84% |
| Total Average (Program / Settings) | 19% /
17% | 24% /
42% | 41% /
35% | 42% /
45% | 29% /
41% |
* ... smaller is better
Display Response Times
| ↔ Response Time Black to White | ||
|---|---|---|
| 25.6 ms ... rise ↗ and fall ↘ combined | ↗ 15.6 ms rise | 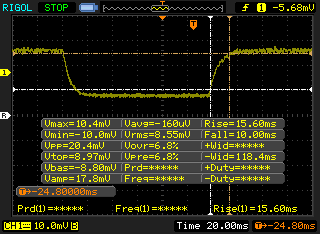 |
| ↘ 10 ms fall | ||
| The screen shows relatively slow response rates in our tests and may be too slow for gamers. In comparison, all tested devices range from 0.1 (minimum) to 240 (maximum) ms. » 56 % of all devices are better. This means that the measured response time is worse than the average of all tested devices (21.5 ms). | ||
| ↔ Response Time 50% Grey to 80% Grey | ||
| 38 ms ... rise ↗ and fall ↘ combined | ↗ 21.6 ms rise | 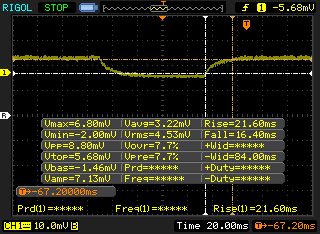 |
| ↘ 16.4 ms fall | ||
| The screen shows slow response rates in our tests and will be unsatisfactory for gamers. In comparison, all tested devices range from 0.2 (minimum) to 636 (maximum) ms. » 49 % of all devices are better. This means that the measured response time is worse than the average of all tested devices (33.8 ms). | ||
Screen Flickering / PWM (Pulse-Width Modulation)
| Screen flickering / PWM not detected | 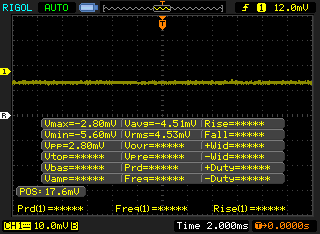 | ||
In comparison: 53 % of all tested devices do not use PWM to dim the display. If PWM was detected, an average of 17933 (minimum: 5 - maximum: 3846000) Hz was measured. | |||
Color reproduction is well below expectations for a $2000+ laptop. The panel's DeltaE2000 score for colors averaged 6.55 with a spike up to 21.52 in blue wavelengths. Considering competitors like the Lenovo ThinkPad T490s feature much more color accurate displays, this is disappointing. Even the older Tecra X40 has more accurate colors. Grays and color temperature are similarly off-kilter and trail behind other business Ultrabooks. Calibration helps a bit, but the Tecra X50's screen isn't great out of the box. Your mileage may vary.
Performance
The Tecra X50 is meant for "road warriors" and professionals on the go. To that end, performance needs to balance productivity against battery life. On the performance end of the scale, the Tecra X50 is adequate for office tasks. However, the machine falls far behind competitors with regard to battery life.
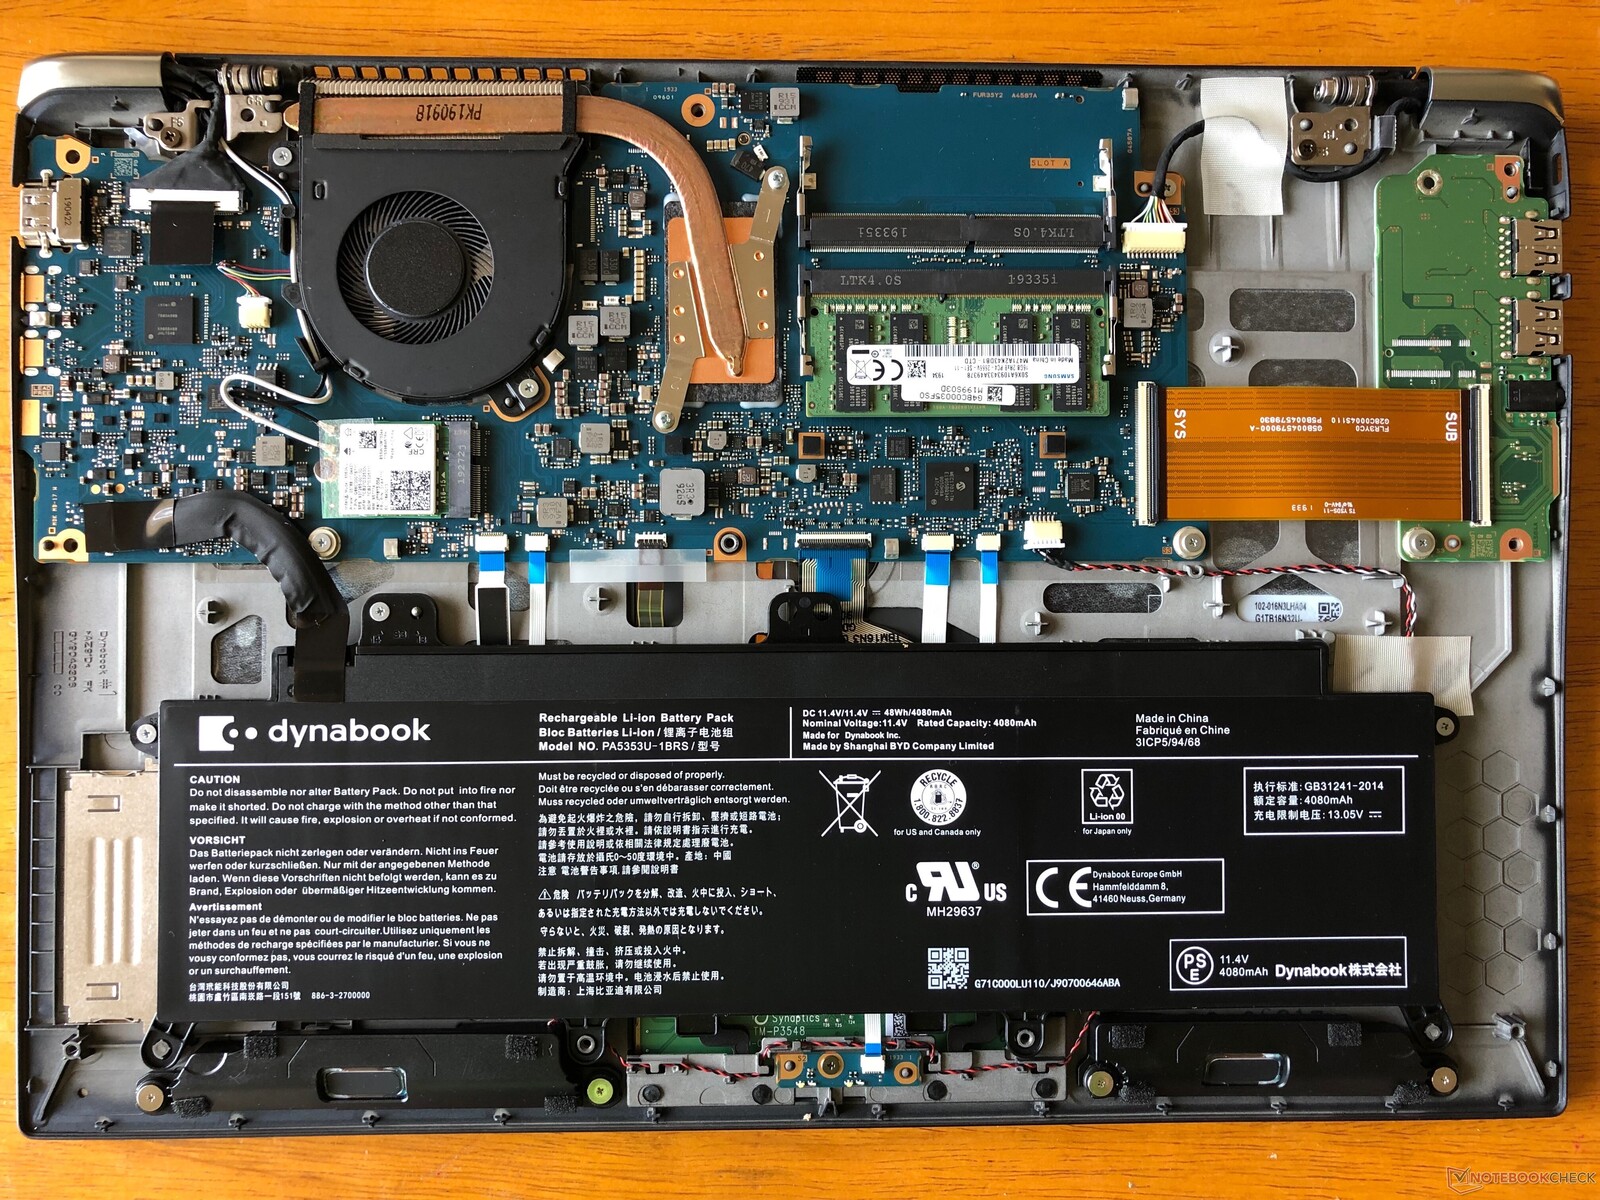
Despite its thin profile, the Tecra X50 allows for some user maintenance. The bottom panel easily lifts off, and end users have access to the wireless card, both RAM slots, and the cooling system. The storage drive is located on the other side of the mainboard, requiring further disassembly.
Processor
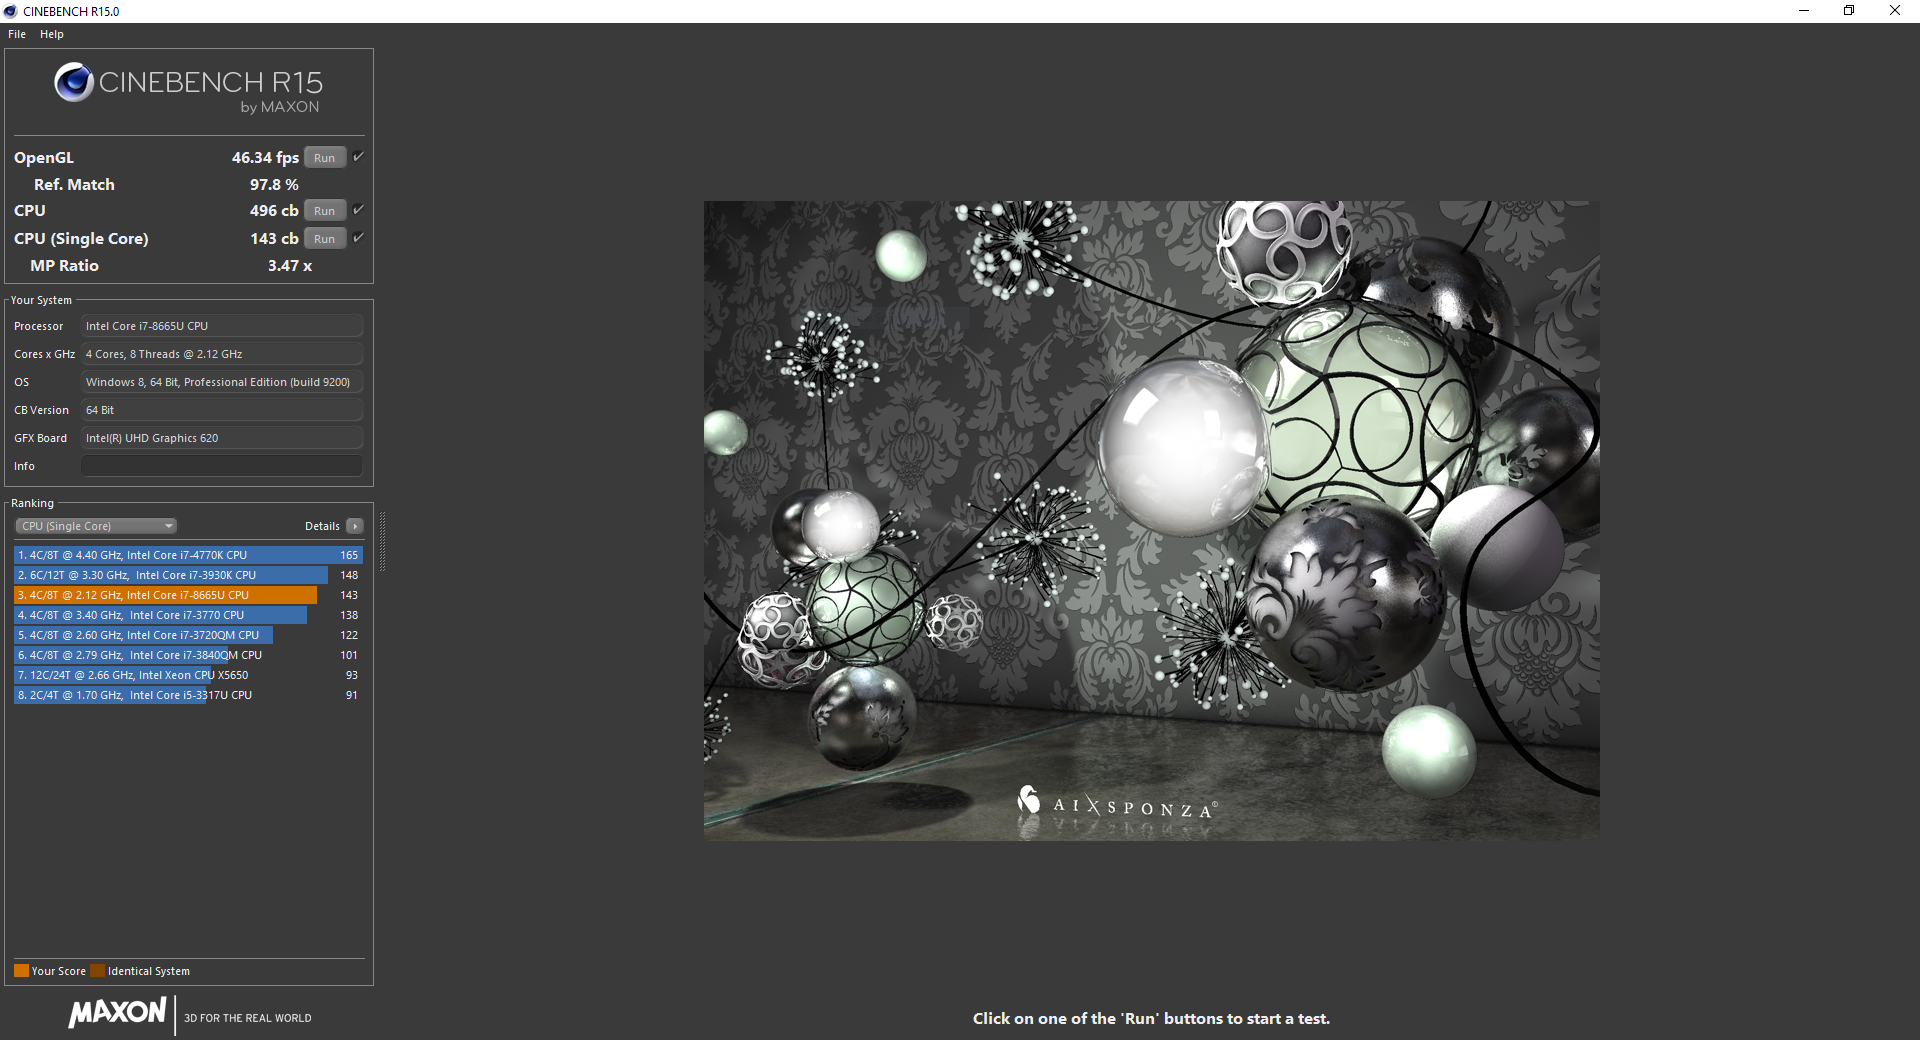
The Intel Core i7-8665U is getting a bit long in the tooth but is still a capable ULV processor. Based on Intel's Whiskey Lake architecture, we've seen the CPU in many other laptops, and it typically shows itself to be up to most office tasks. The quad-core Hyperthreaded chip should make short work of most workplace workloads and be perfectly adequate for on-the-go professionals. As an added bonus, the Core i7-8665U shouldn't suck too much juice, which helps with battery life.
Compared to similarly-priced competitors, the Dynabook X50 performs adequately. Interestingly, the X50 isn't too much of an improvement over the Core i5-equipped Tecra X40 we reviewed last year. In fact, the Tecra X50 performs about 20% worse than the average Core i7-8665U laptop.
Long-term performance, as measured by 30 consecutive runs of Cinebench R15, is stable. For this price range, the scores we observe are disappointing.
Dynabook also offers SKUs with either the Core i5-8265U, Core i5-8365U with vPro, or Core i7-8565U.
System Performance
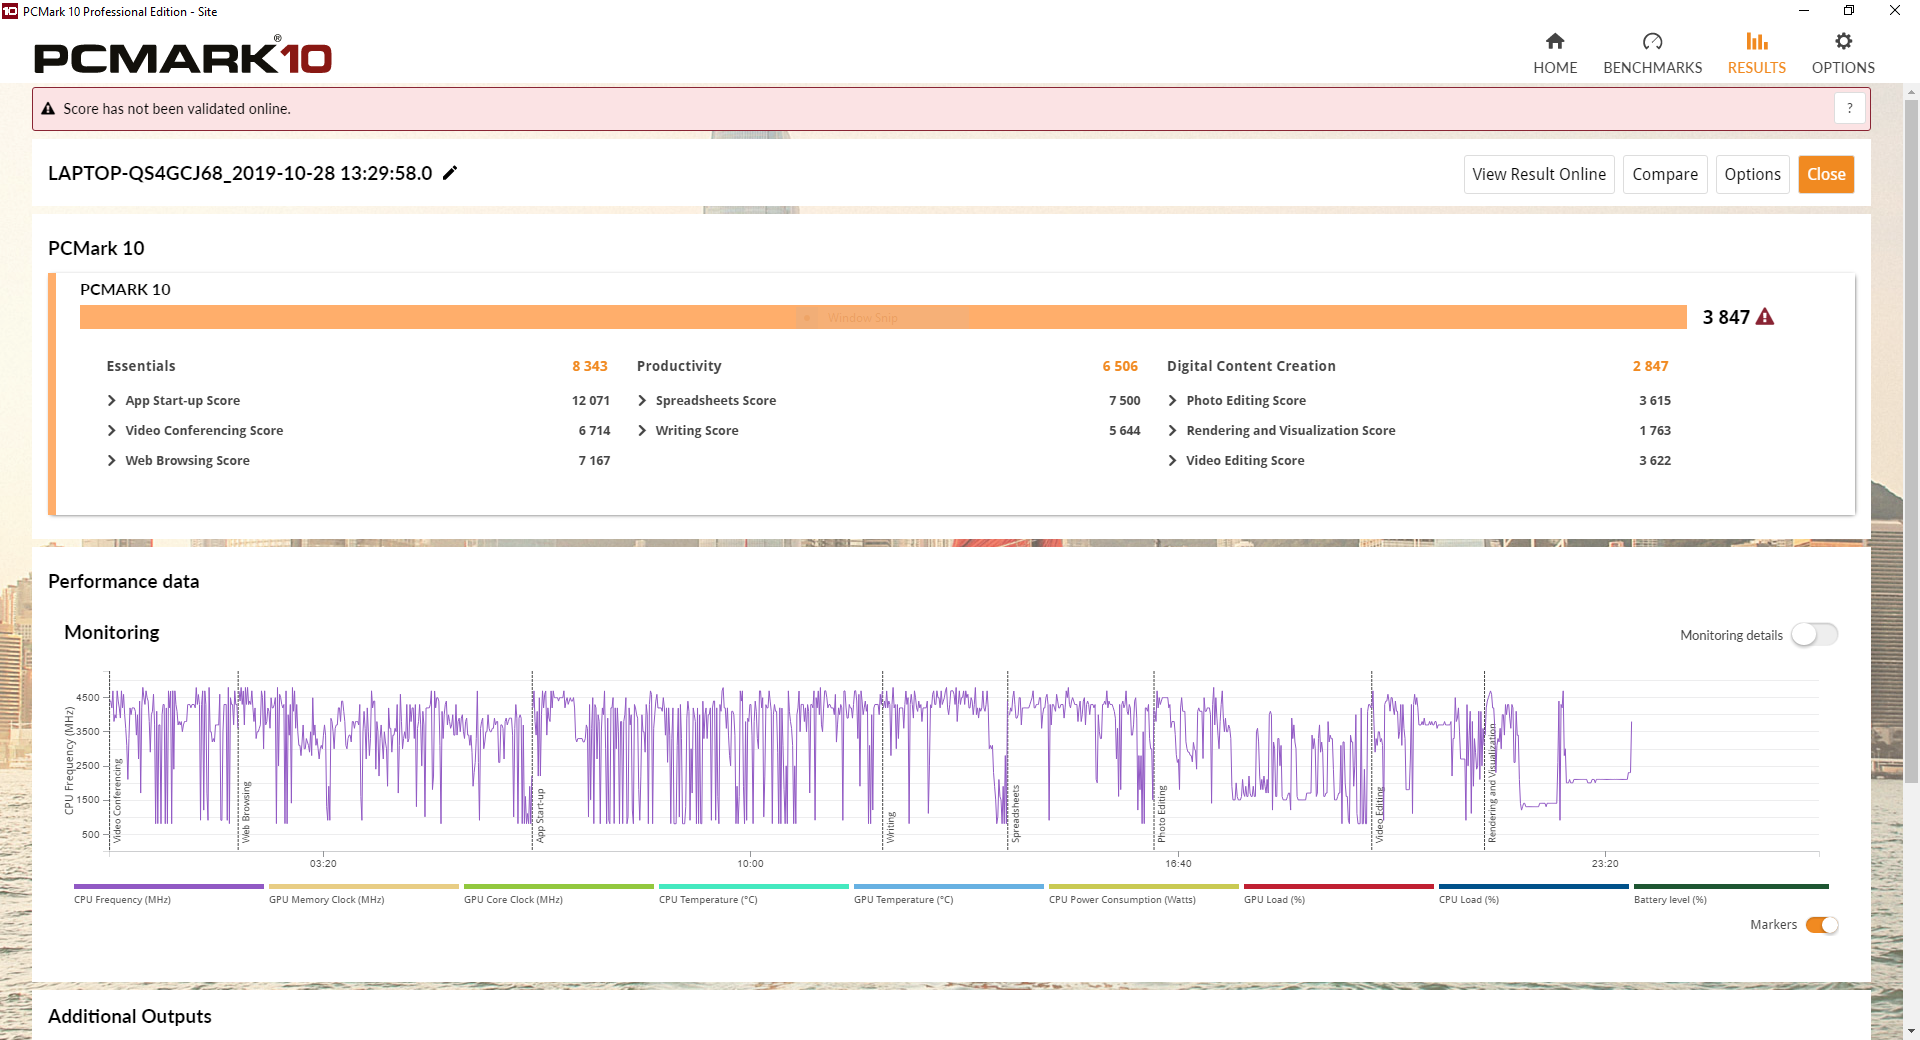
Overall system performance is good, if a bit below average. The Tecra X50 comes in about 6-8% the average Core i7-8665U laptop. While there are better options, the Tecra X50 offers adequate all-around performance.
Storage Devices
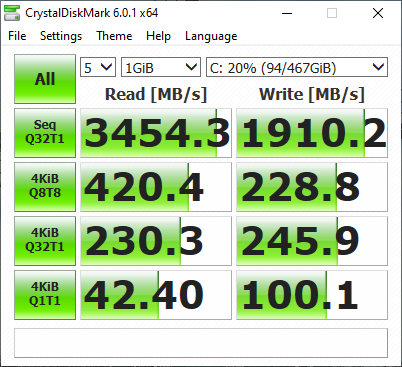
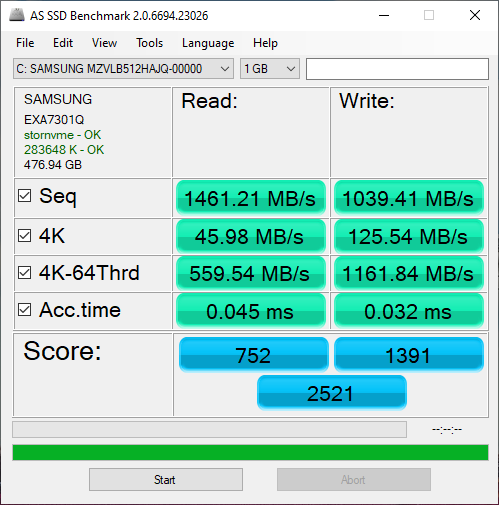
The 512 GB Samsung PM981 PCIe NVMe SSD used in the Tecra X50 is snappy and responsive. The PM981 is common for high-end laptops, and with good reason; it offers fast read speeds and quick access times. The storage is not readily available to end users, so drive swaps are tricky.
| Dynabook Tecra X50-F Samsung SSD PM981 MZVLB512HAJQ | Toshiba Tecra X40-E-10W Samsung PM961 MZVLW256HEHP | Lenovo ThinkPad T490s-20NYS02A00 Intel SSD Pro 7600p SSDPEKKF512G8L | Lenovo ThinkPad X1 Carbon 2019-20QE000VGE WDC PC SN720 SDAQNTW-512G | Acer Swift 5 SF515-51T-76B6 SK Hynix BC501 HFM512GDJTNG | Microsoft Surface Laptop 3 15 Ryzen 5 3580U SK hynix BC501 HFM256GDGTNG | Dell XPS 13 7390 Core i7-10710U SK Hynix PC601 NVMe 512 GB | Average Samsung SSD PM981 MZVLB512HAJQ | Average of class Office | |
|---|---|---|---|---|---|---|---|---|---|
| CrystalDiskMark 5.2 / 6 | -3% | 6% | 60% | -3% | -11% | 30% | 30% | 63% | |
| Write 4K | 100.1 | 100.1 0% | 122 22% | 196.9 97% | 109.6 9% | 99 -1% | 134 34% | 126.7 ? 27% | 159 ? 59% |
| Read 4K | 42.4 | 40.03 -6% | 45.56 7% | 51.3 21% | 41.15 -3% | 35.63 -16% | 42.91 1% | 44 ? 4% | 61.6 ? 45% |
| Write Seq | 1259 | 1497 | 1715 | 747 | 706 | 1841 | 1617 ? | 2427 ? | |
| Read Seq | 1296 | 2385 | 2464 | 1134 | 1044 | 1707 | 1716 ? | 2611 ? | |
| Write 4K Q32T1 | 245.9 | 228.1 -7% | 240.9 -2% | 429.1 75% | 321.5 31% | 326.6 33% | 394.7 61% | 413 ? 68% | 401 ? 63% |
| Read 4K Q32T1 | 230.3 | 292.9 27% | 338 47% | 542 135% | 354 54% | 270 17% | 398.5 73% | 420 ? 82% | 517 ? 124% |
| Write Seq Q32T1 | 1910 | 1286 -33% | 1528 -20% | 2521 32% | 872 -54% | 820 -57% | 2250 18% | 2076 ? 9% | 3070 ? 61% |
| Read Seq Q32T1 | 3454 | 3411 -1% | 2915 -16% | 3481 1% | 1639 -53% | 2028 -41% | 3265 -5% | 3130 ? -9% | 4269 ? 24% |
| AS SSD | 1% | 23% | 58% | -5% | -54% | -13% | 22% | 35% | |
| Seq Read | 1461 | 2390 64% | 2654 82% | 2978 104% | 1446 -1% | 1122 -23% | 1804 23% | 1976 ? 35% | 3167 ? 117% |
| Seq Write | 1039 | 1241 19% | 1341 29% | 2287 120% | 708 -32% | 514 -51% | 1000 -4% | 1637 ? 58% | 2083 ? 100% |
| 4K Read | 45.98 | 47.68 4% | 65.6 43% | 47.39 3% | 44.27 -4% | 34.98 -24% | 45.1 -2% | 50.5 ? 10% | 56.3 ? 22% |
| 4K Write | 125.5 | 98.4 -22% | 164.4 31% | 175.6 40% | 124.8 -1% | 96.8 -23% | 115 -8% | 112 ? -11% | 158.8 ? 27% |
| 4K-64 Read | 560 | 1005 79% | 761 36% | 1209 116% | 788 41% | 492 -12% | 893 59% | 1203 ? 115% | 1064 ? 90% |
| 4K-64 Write | 1162 | 277.7 -76% | 927 -20% | 1148 -1% | 737 -37% | 339.9 -71% | 732 -37% | 1504 ? 29% | 1481 ? 27% |
| Access Time Read * | 0.045 | 0.062 -38% | 0.033 27% | 0.056 -24% | 0.044 2% | 0.05092 ? -13% | 0.08054 ? -79% | ||
| Access Time Write * | 0.032 | 0.038 -19% | 0.039 -22% | 0.023 28% | 0.033 -3% | 0.11 -244% | 0.095 -197% | 0.08337 ? -161% | 0.06475 ? -102% |
| Score Read | 752 | 1292 72% | 1092 45% | 1554 107% | 977 30% | 639 -15% | 1119 49% | 1451 ? 93% | 1437 ? 91% |
| Score Write | 1391 | 500 -64% | 1226 -12% | 1553 12% | 932 -33% | 488 -65% | 947 -32% | 1780 ? 28% | 1848 ? 33% |
| Score Total | 2521 | 2404 -5% | 2831 12% | 3874 54% | 2384 -5% | 1434 -43% | 2608 3% | 3966 ? 57% | 3977 ? 58% |
| Copy ISO MB/s | 739 | 955 | 828 | 1515 | 1755 ? | 1673 ? | |||
| Copy Program MB/s | 281.9 | 327.1 | 200.5 | 535 | 454 ? | 518 ? | |||
| Copy Game MB/s | 460 | 700 | 387.4 | 1211 | 1057 ? | 1191 ? | |||
| Total Average (Program / Settings) | -1% /
-0% | 15% /
17% | 59% /
59% | -4% /
-4% | -33% /
-39% | 9% /
2% | 26% /
25% | 49% /
45% |
* ... smaller is better

GPU Performance
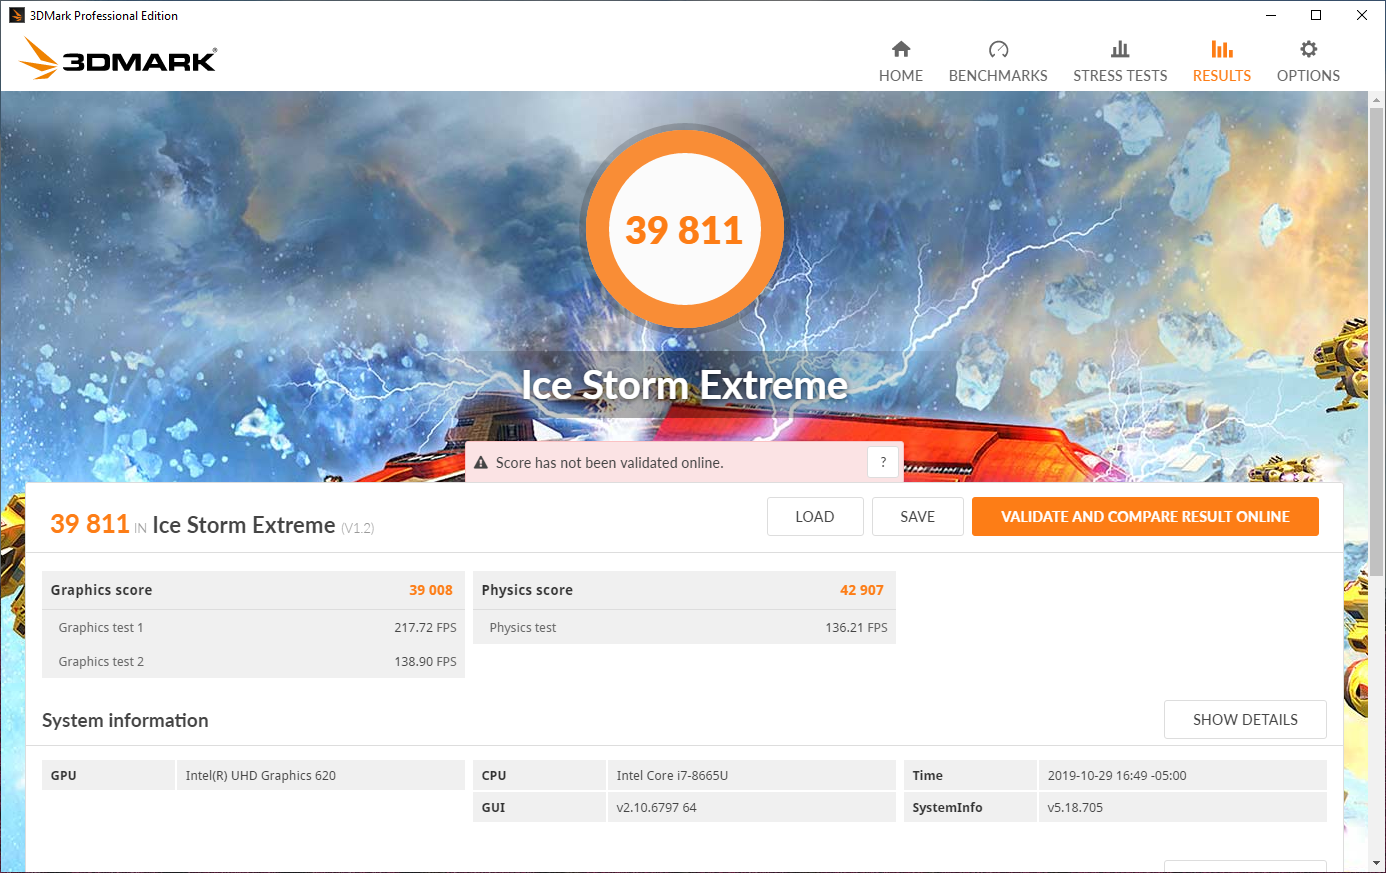
The integrated Intel UHD Graphics 620 GPU offers little graphical power, but the chip performs within expectations for an iGPU. The Tecra X50 scores in line with similarly-specced laptops and should be adequate for simple photo and video editing. Those that need more power in a thin chassis should look at the Microsoft Surface Laptop 3 15; its Vega 9 GPU hits about 1.5 times the graphical performance.
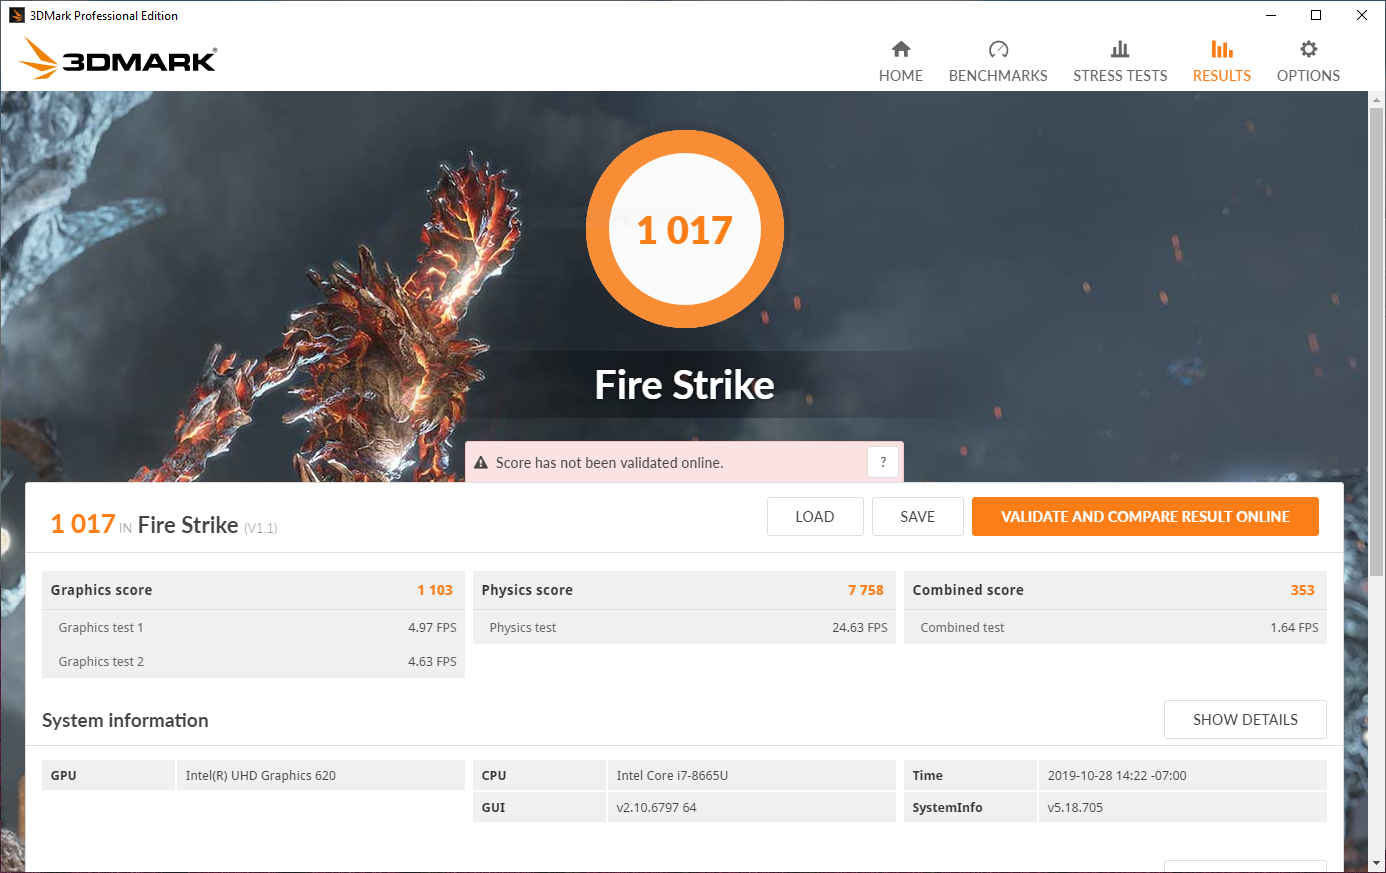
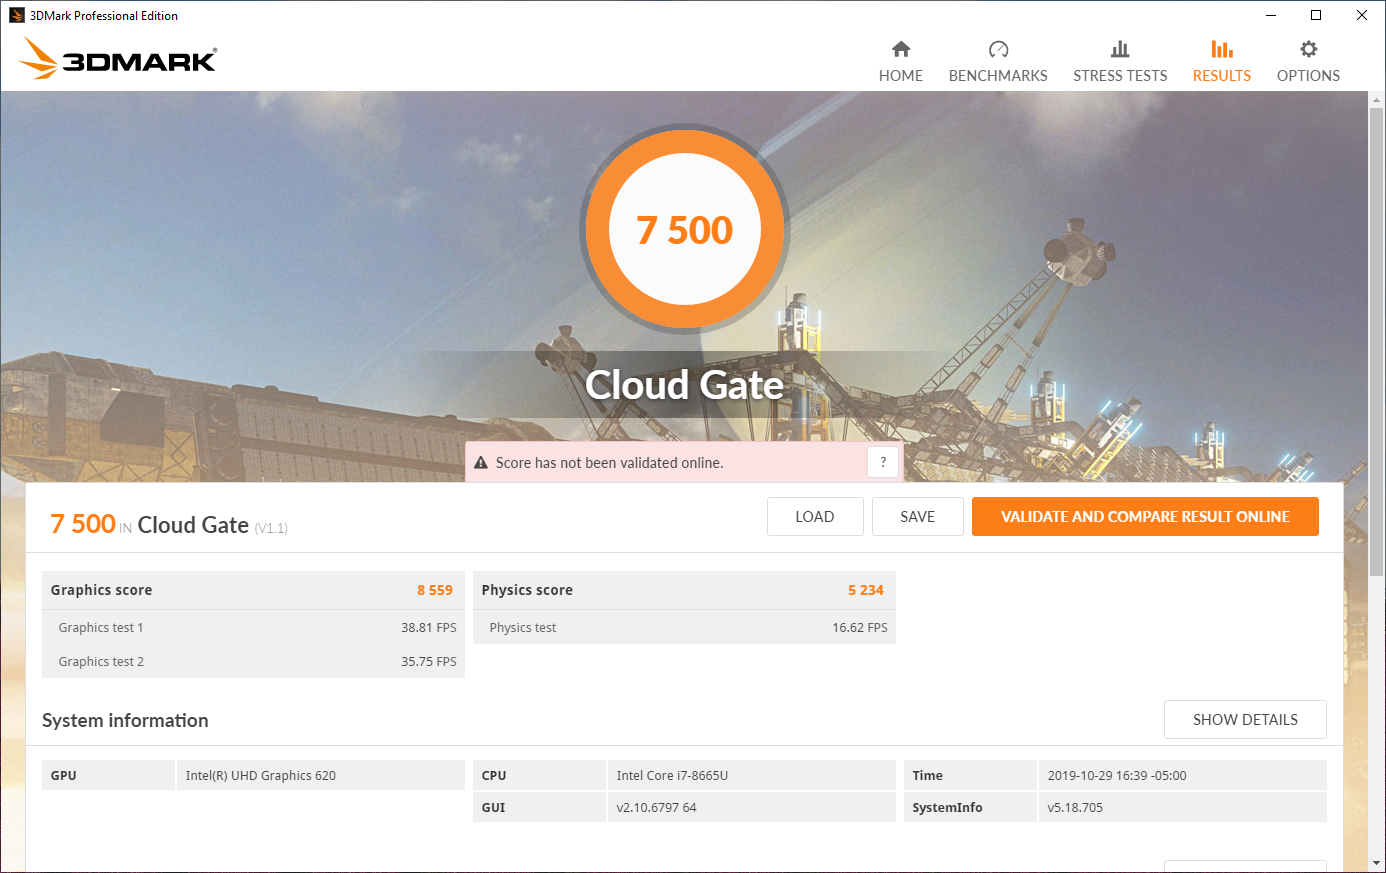
| 3DMark Cloud Gate Standard Score | 7500 points | |
| 3DMark Fire Strike Score | 1017 points | |
Help | ||
Gaming Performance
Because of its integrated GPU, the Tecra X50 is not well-suited to AAA games. Older or lighter titles can be played, albeit at 720p with Low/Medium settings. Games like Stardew Valley run flawlessly on the Tecra X50, but heavier titles may be out of reach.
| low | med. | high | ultra | |
| BioShock Infinite (2013) | 58 | 36 | 28 | 11 |
| Rocket League (2017) | 95 | 43 | 21 |
Emissions & Energy Management
System Noise
Fan noise is well-controlled. The single fan remains off under lighter loads (e.g., web browsing). Heavier work causes the fan to steadily ramp up. At full tilt, the fan stays under 40 dB(A), and its lower pitch makes it blend into normal office noise. The Tecra X50 remains innocuous under most workloads. There is minimal coil whine that can only be heard directly next to the chassis.
Noise Level
| Idle |
| 30.2 / 30.2 / 30.2 dB(A) |
| Load |
| 33.4 / 39 dB(A) |
 | ||
30 dB silent 40 dB(A) audible 50 dB(A) loud |
||
min: | ||
Temperature
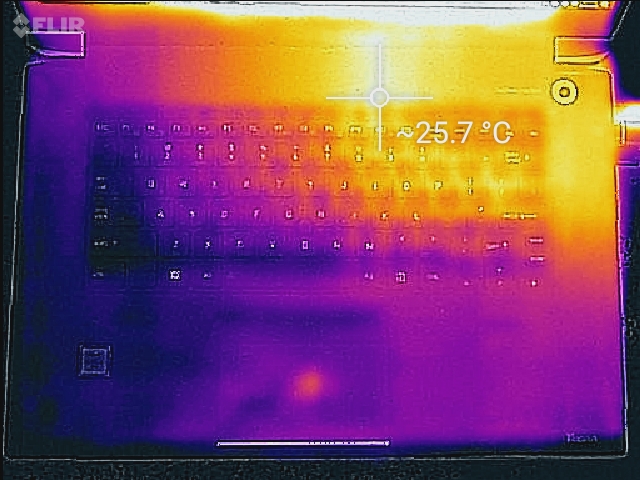
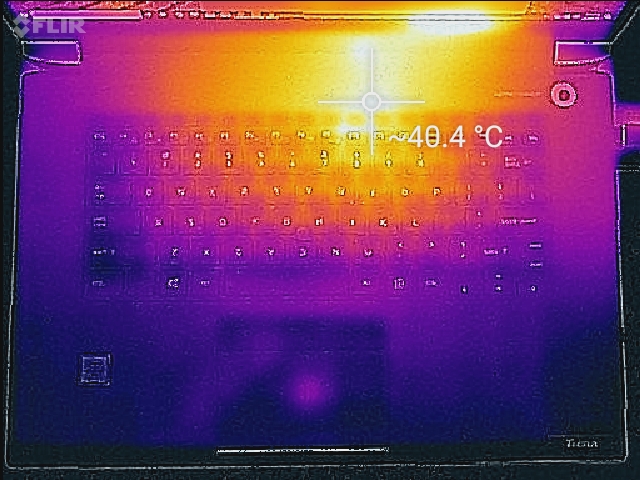
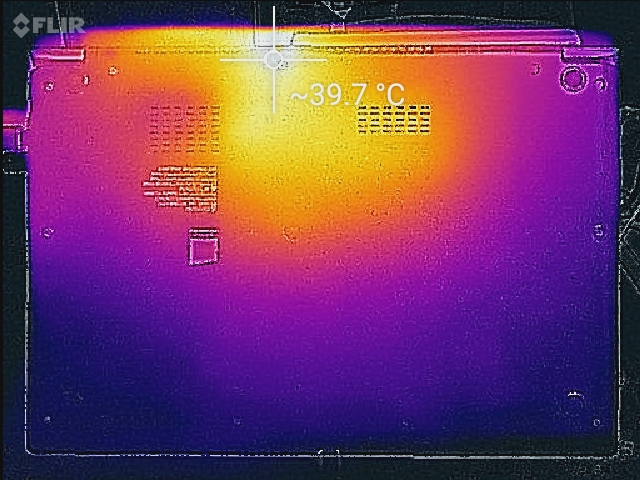
External temperature causes no complaint. Under load, there is a hot spot directly above the CPU, but even this does not grow uncomfortably hot. The rest of the chassis remains fairly cool to the touch. The Tecra X50 can be comfortably used in a lap during most workloads.
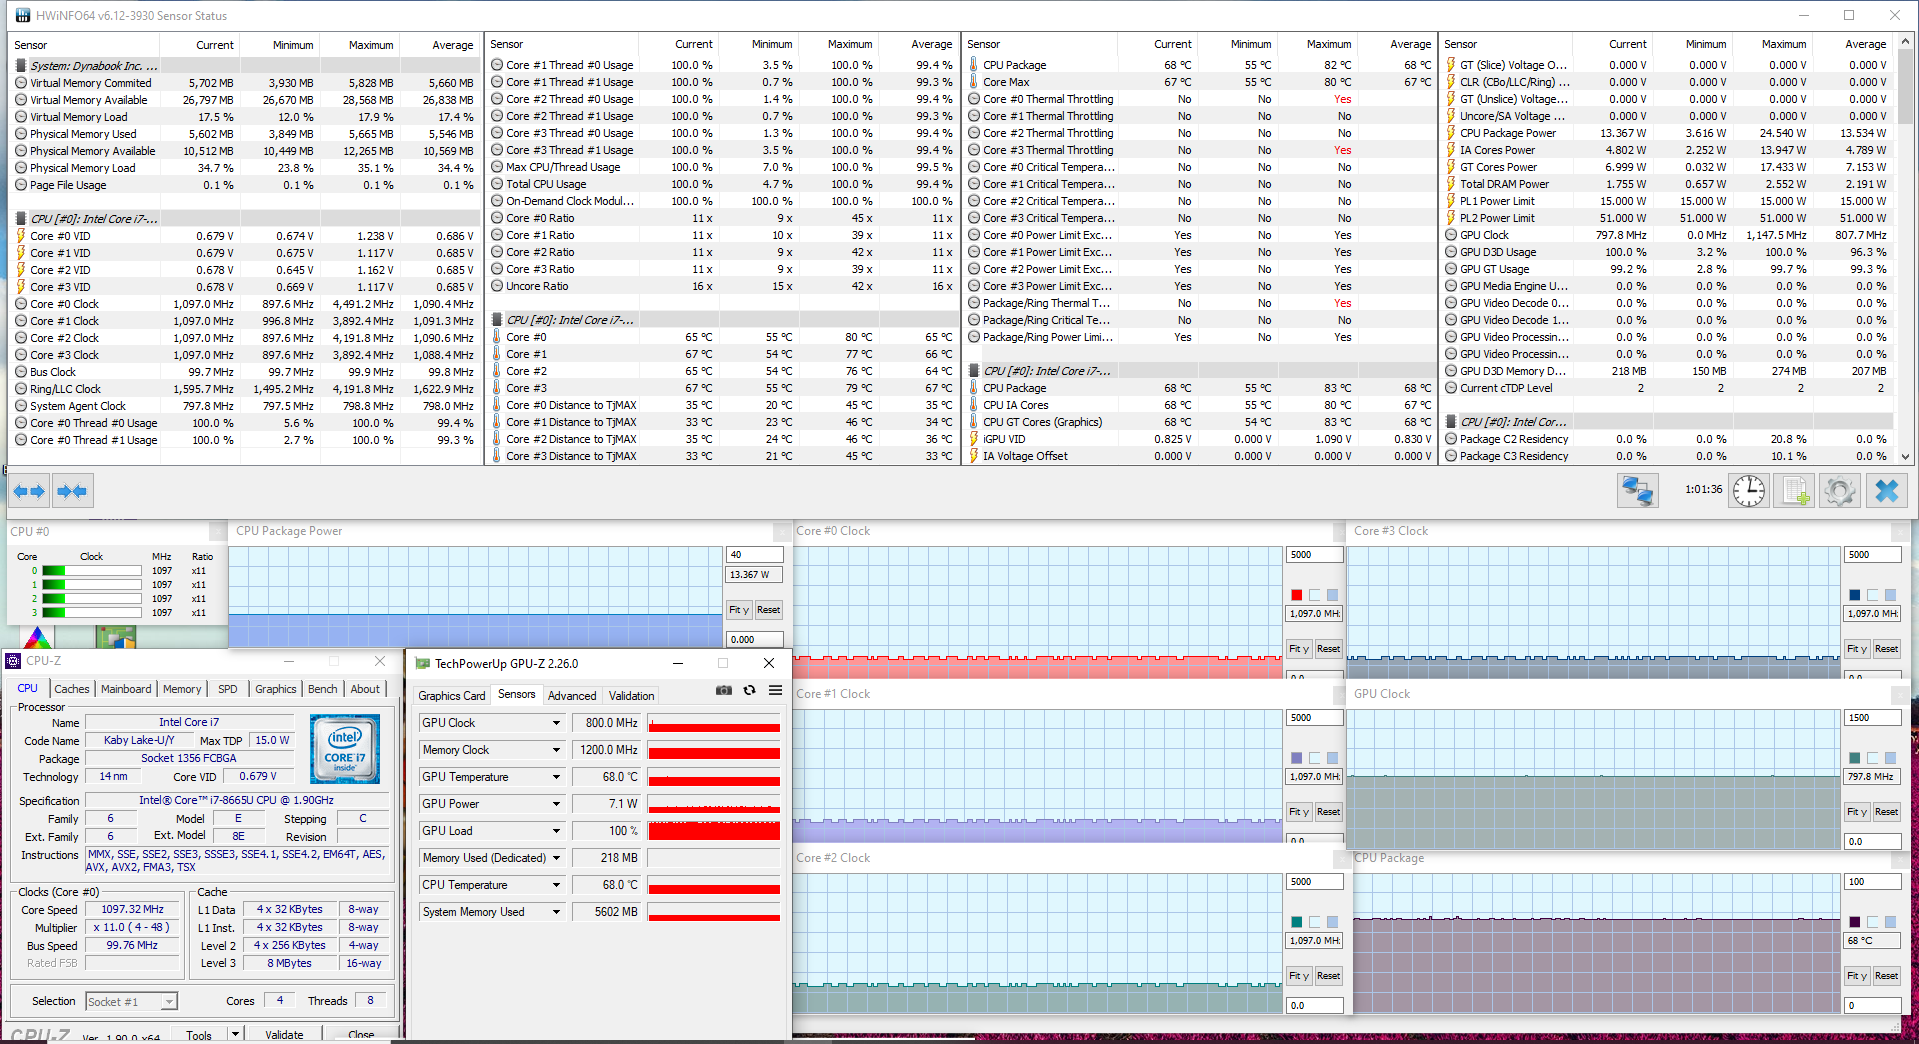
Stressing the machine with Prime 95 and FurMark causes the CPU to heavily throttle down to about 1.1 GHz. This throttling is aggressive, as CPU temperatures remain around 68° C throughout the test.
(±) The maximum temperature on the upper side is 40.2 °C / 104 F, compared to the average of 34.2 °C / 94 F, ranging from 21.2 to 62.5 °C for the class Office.
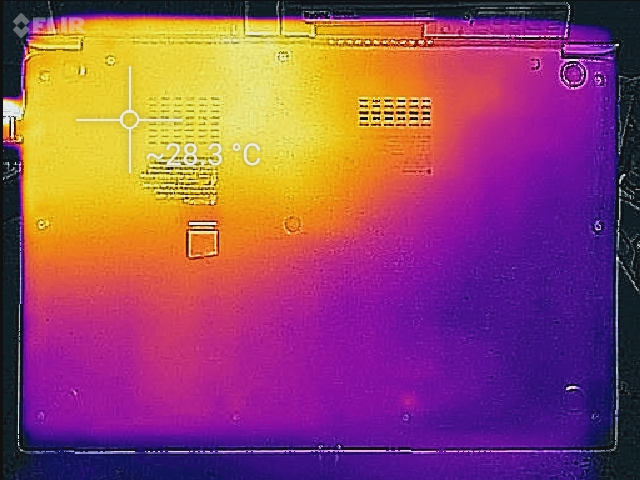
(±) The bottom heats up to a maximum of 40 °C / 104 F, compared to the average of 36.7 °C / 98 F
(+) The palmrests and touchpad are cooler than skin temperature with a maximum of 24.4 °C / 75.9 F and are therefore cool to the touch.
(+) The average temperature of the palmrest area of similar devices was 27.7 °C / 81.9 F (+3.3 °C / 6 F).
Speakers and Camera
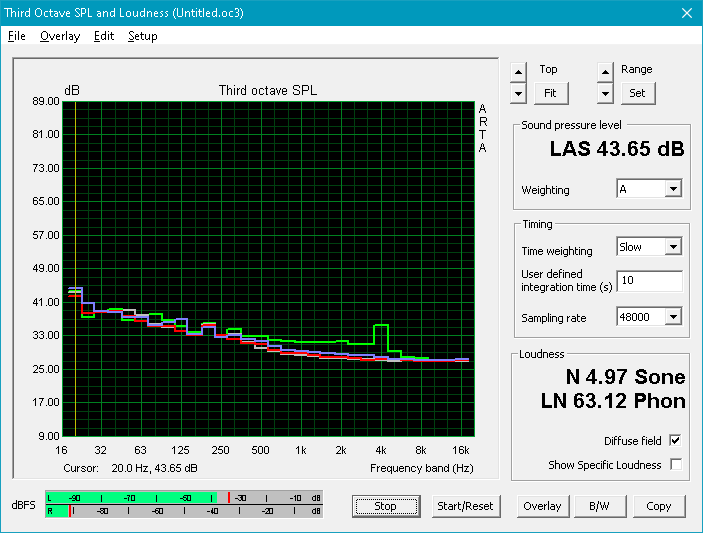
The dual front-facing speakers are loud and clear. Bass is too low to be heard, making thumps sound more like slaps, but mids and highs are loud and level. There is no rattle at full volume, and the speakers remain clear and crisp.
The HD camera looks awful. Even in well-lit conditions, visual noise spoils the picture. The dual microphones are excellent and capture high-quality voice recordings.
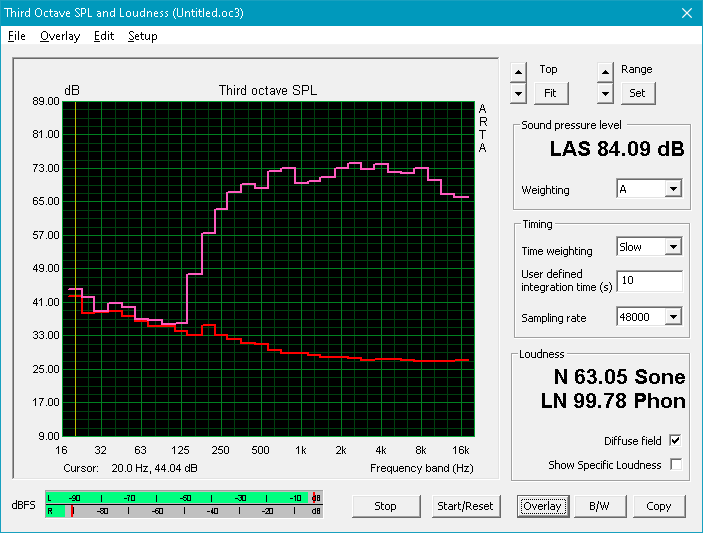

Dynabook Tecra X50-F audio analysis
(±) | speaker loudness is average but good (74.3 dB)
Bass 100 - 315 Hz
(-) | nearly no bass - on average 18.8% lower than median
(±) | linearity of bass is average (13.1% delta to prev. frequency)
Mids 400 - 2000 Hz
(+) | balanced mids - only 1.5% away from median
(+) | mids are linear (4.4% delta to prev. frequency)
Highs 2 - 16 kHz
(+) | balanced highs - only 2.5% away from median
(+) | highs are linear (3.5% delta to prev. frequency)
Overall 100 - 16.000 Hz
(±) | linearity of overall sound is average (16.4% difference to median)
Compared to same class
» 15% of all tested devices in this class were better, 5% similar, 79% worse
» The best had a delta of 7%, average was 22%, worst was 53%
Compared to all devices tested
» 22% of all tested devices were better, 5% similar, 72% worse
» The best had a delta of 4%, average was 25%, worst was 134%
Apple MacBook 12 (Early 2016) 1.1 GHz audio analysis
(+) | speakers can play relatively loud (83.6 dB)
Bass 100 - 315 Hz
(±) | reduced bass - on average 11.3% lower than median
(±) | linearity of bass is average (14.2% delta to prev. frequency)
Mids 400 - 2000 Hz
(+) | balanced mids - only 2.4% away from median
(+) | mids are linear (5.5% delta to prev. frequency)
Highs 2 - 16 kHz
(+) | balanced highs - only 2% away from median
(+) | highs are linear (4.5% delta to prev. frequency)
Overall 100 - 16.000 Hz
(+) | overall sound is linear (10.2% difference to median)
Compared to same class
» 5% of all tested devices in this class were better, 2% similar, 93% worse
» The best had a delta of 5%, average was 19%, worst was 53%
Compared to all devices tested
» 3% of all tested devices were better, 1% similar, 96% worse
» The best had a delta of 4%, average was 25%, worst was 134%
Power Consumption
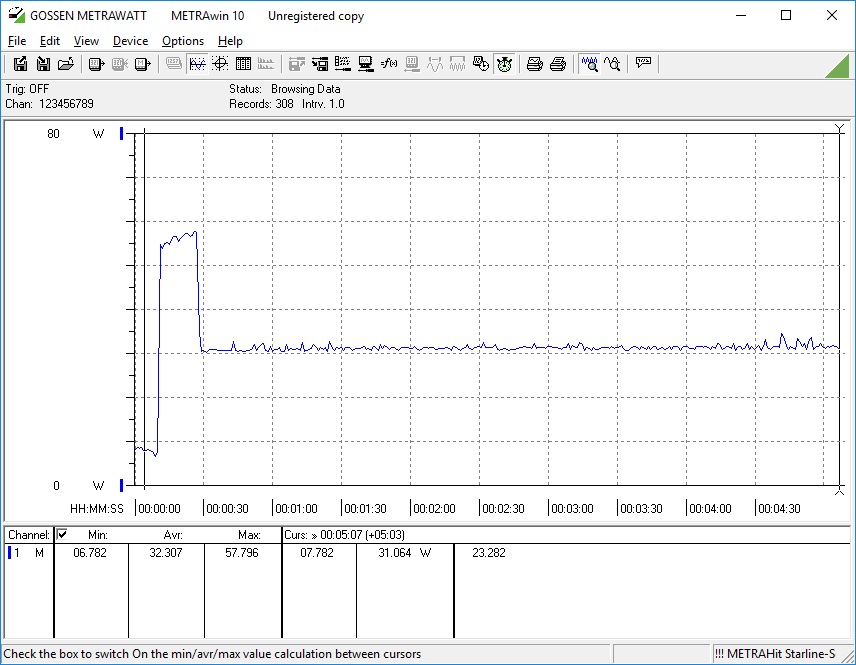
Power draw is within expectation. Under load, the Tecra X50 spikes to 55 Watts briefly before falling back to about 30 Watts. The included power adapter is rated for 45 Watts, which is more than enough for even heavy workloads.
| Off / Standby | |
| Idle | |
| Load |
|
Battery Life
Dynabook proudly proclaims the i7 variant of the Tecra X50 can last over 10 hours on a full charge. In real-world use, the machine gets nowhere near this estimate. Even under very light loads (e.g., Battery Eater's Reader test), the Tecra X50 dies in less than 6 hours. Users should expect about 4-5 hours of regular use (web browsing, word processing, etc.). The X50 should survive a morning meeting but will need to be plugged in soon after. Third-party USB Type-C chargers can be used to recharge the laptop, though we recommend one with a 45 Watt rating.
Pros
Cons
Verdict
The Dynabook Tecra X50 continues Toshiba's ethos of laptop design. There's quite a bit to like about the device. For one, it is one of the thinnest and lightest 15.6-inch business laptops we have seen. Portability is its defining feature, though there are some high points.
The Tecra X50 has a crisp, responsive keyboard and excellent speakers. It looks and feels premium. It has some room for upgradeability despite the thin profile. Other than these factors, the Tecra X50 does little to stand out.
The machine uses the same Whiskey Lake Core i7-8665U as many other business laptops, but its performance is noticeably below that of rival machines. Additionally, the battery dies far too soon given its target audience. Those that value the portability of the machine will find fault in its lackluster endurance.
Overall performance is perfectly fine for general office work, but there are much better laptops for less money. In particular, Lenovo's ThinkPad T490s and X1 Carbon (2019) are cheaper, lighter, and more powerful. These options also last significantly longer on a charge.
Ultimately, the Dynabook Tecra X50 is all looks with little substance. If you're in the market for a beautiful thin-and-light, the Dynabook certainly checks that box. Otherwise, it is difficult to justify the high price.
Dynabook Tecra X50-F
-
11/04/2019 v7
Sam Medley


Pricecompare
