 Deutsch
 English
 Español
 Français
 Italiano
 Nederlands
 Polski
 Português
 Русский
 Türkçe
 Svenska
 Chinese
 Magyar
Dell Precision 7710 Workstation Review
For the original German review, see here.
If you consider buying a mobile workstation, Dell certainly belongs to the first sites to look for a suitable product. You'll get almost every possible workstation variant from cheaper entry-level models like the Dell Precision 3510, to the especially slim and stylish Precision 5510 up to the powerful Precision 7510 and 7710 there.
While the still available predecessor models increase the number of options, they can hardly be recommended in view of the plethora of innovations. In particular, the Dell Precision M6800's case has grown old, since it is still based on the Dell Precision M6500 from 2009.
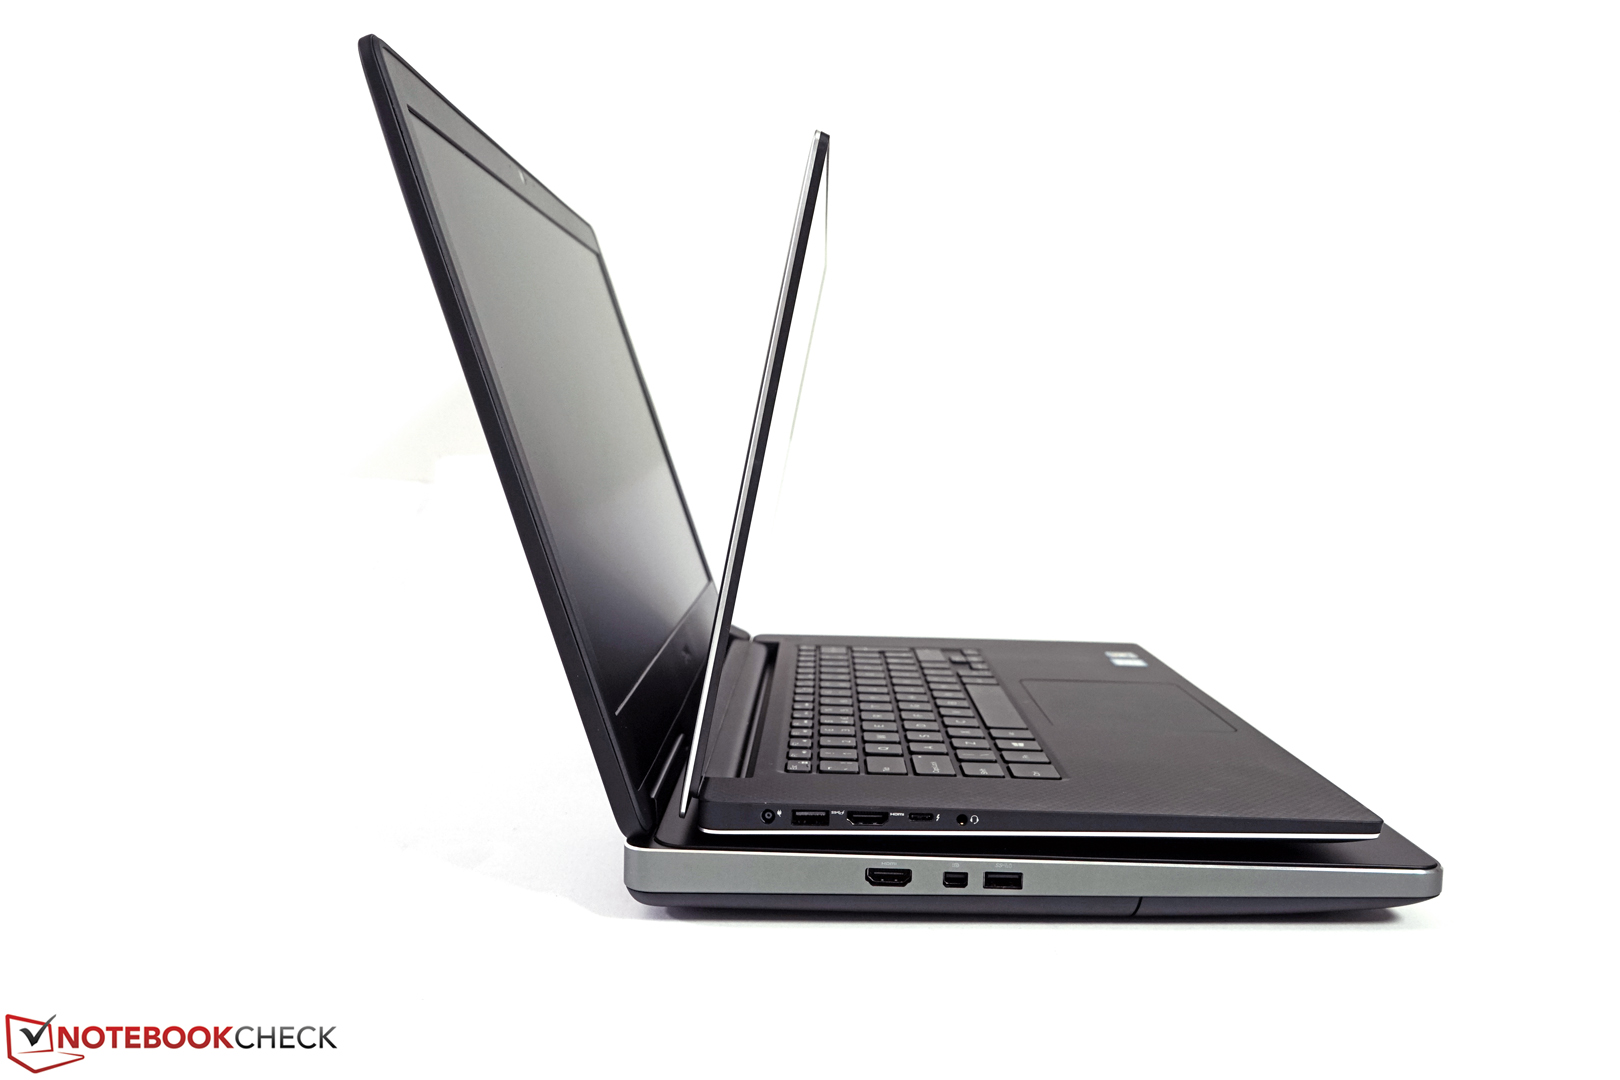
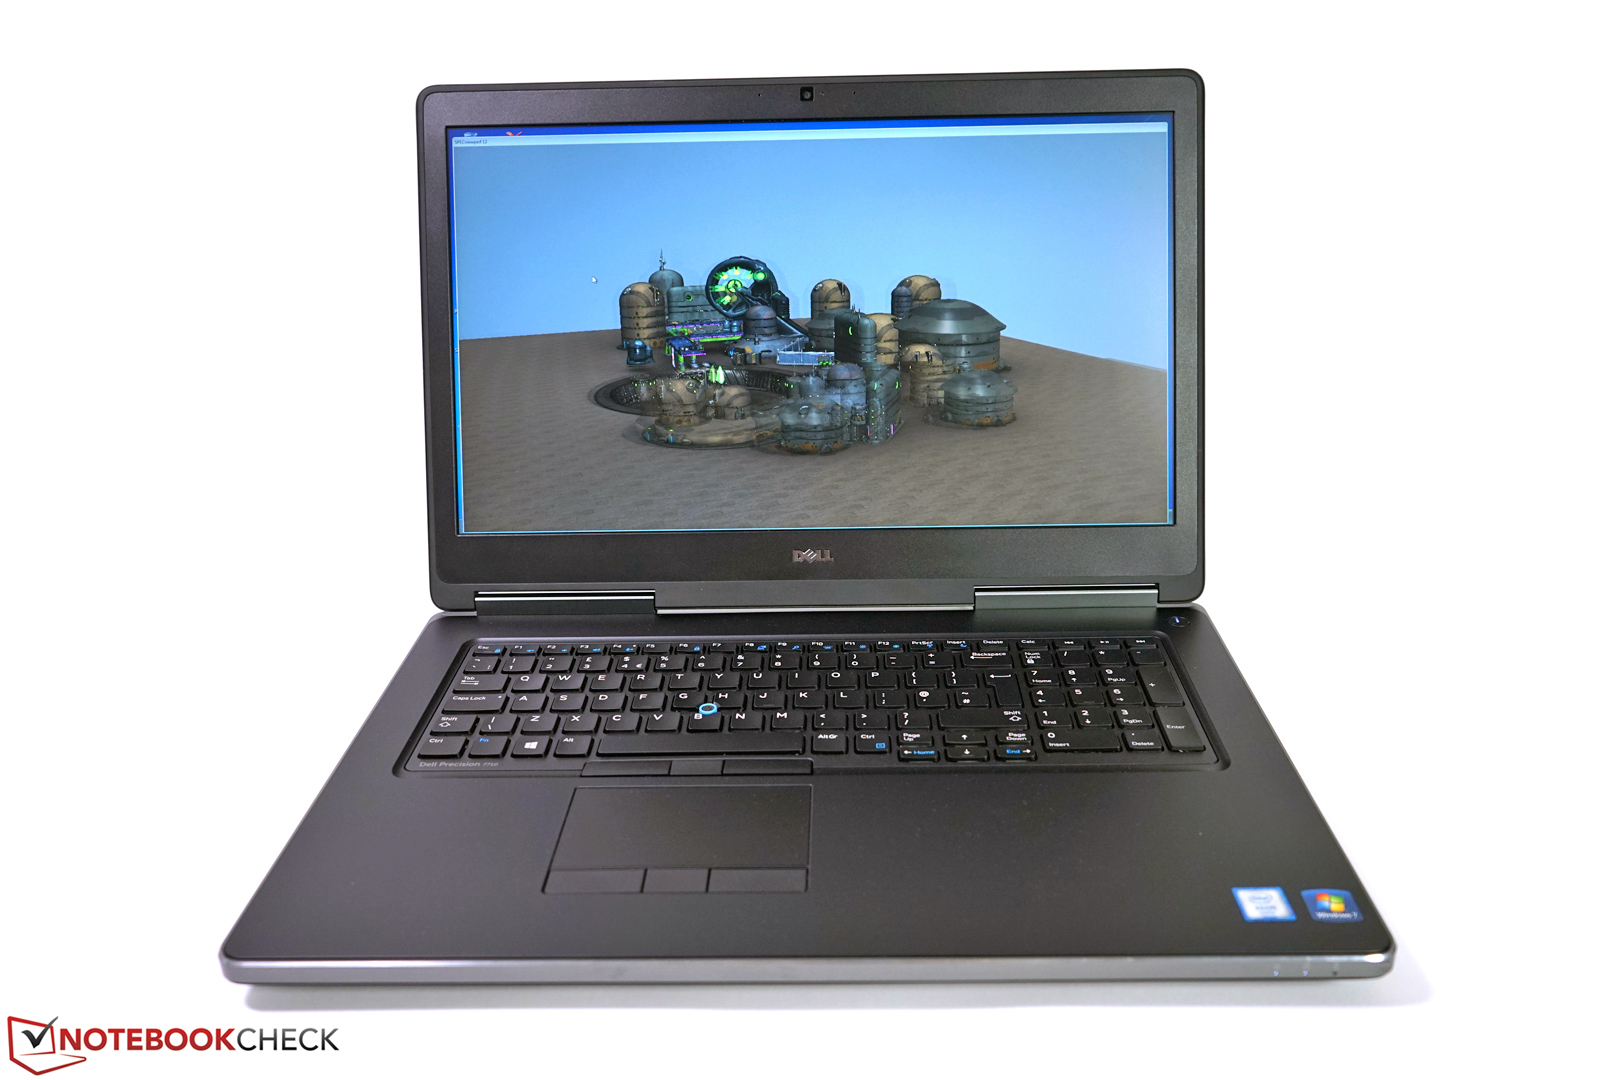
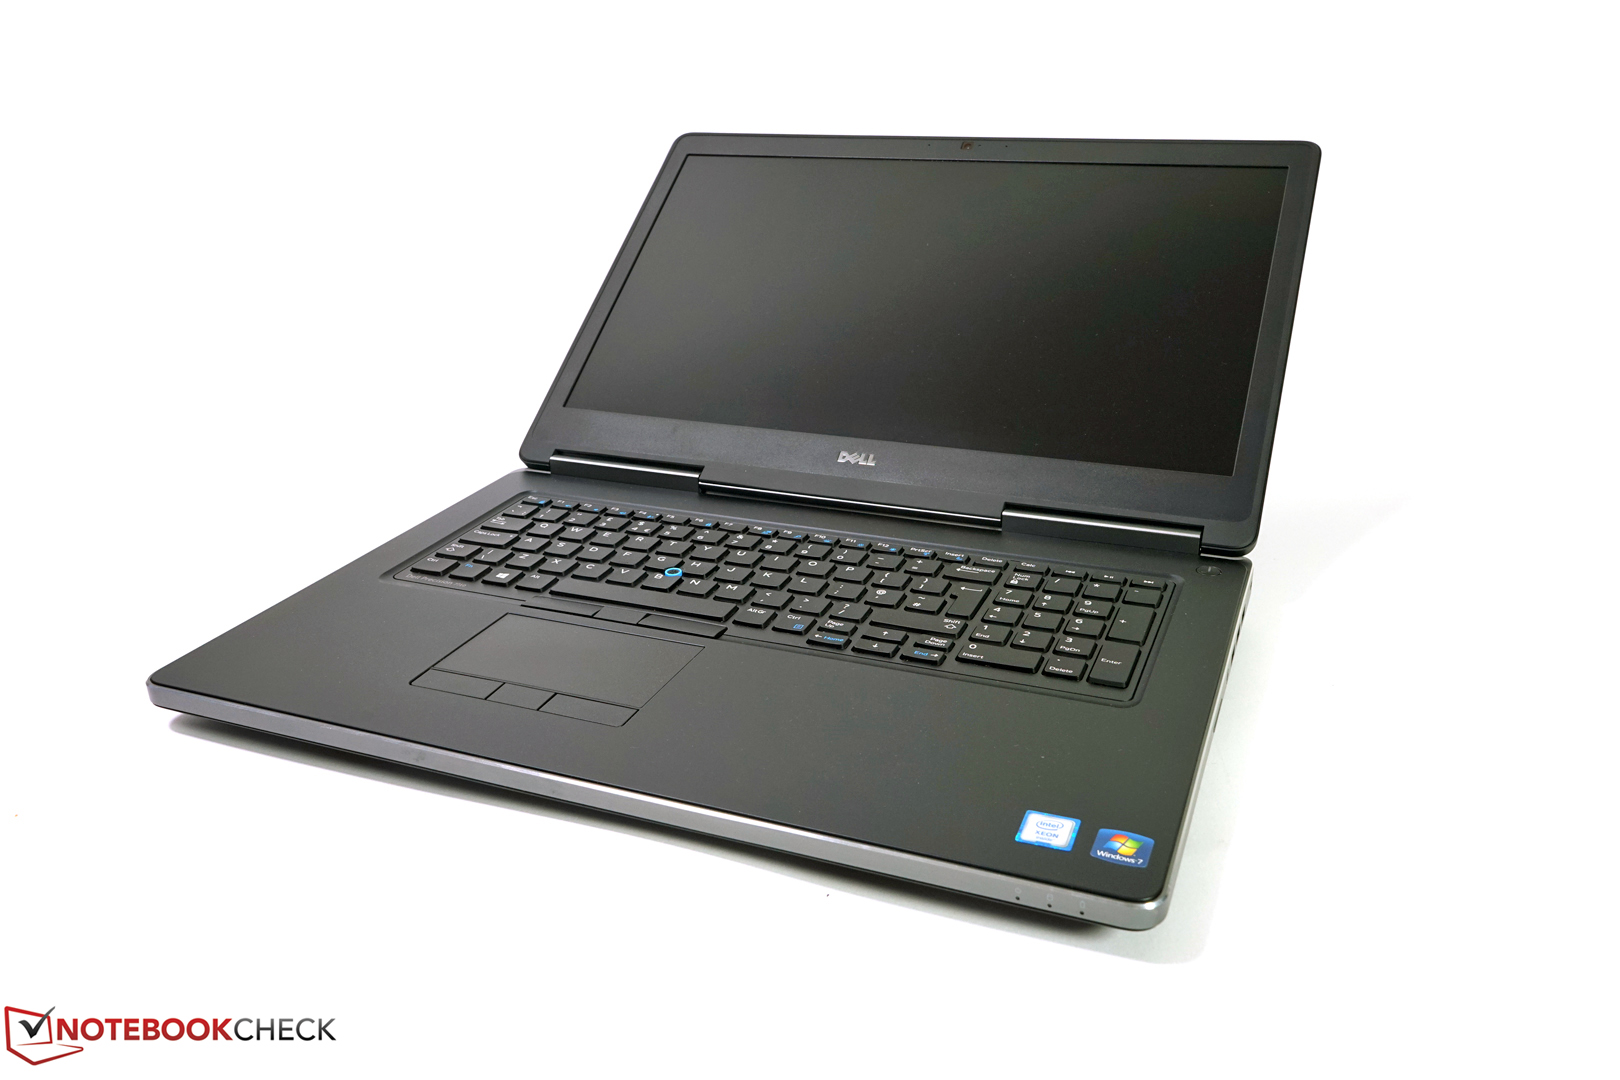
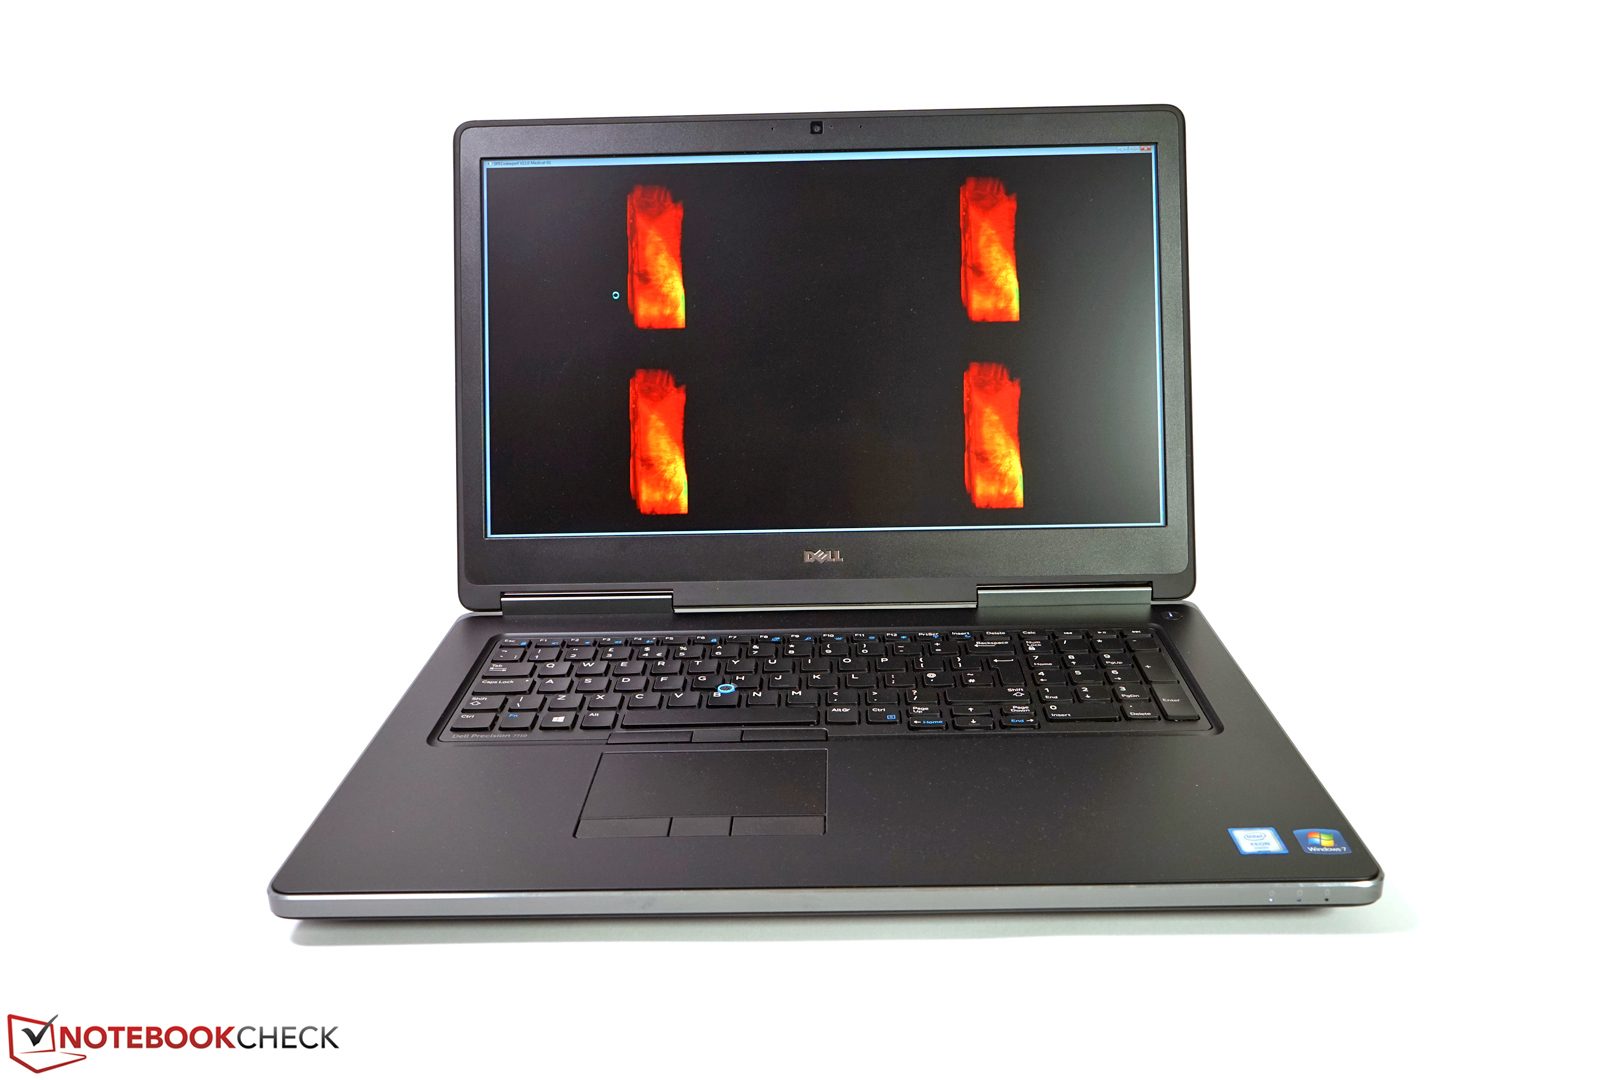
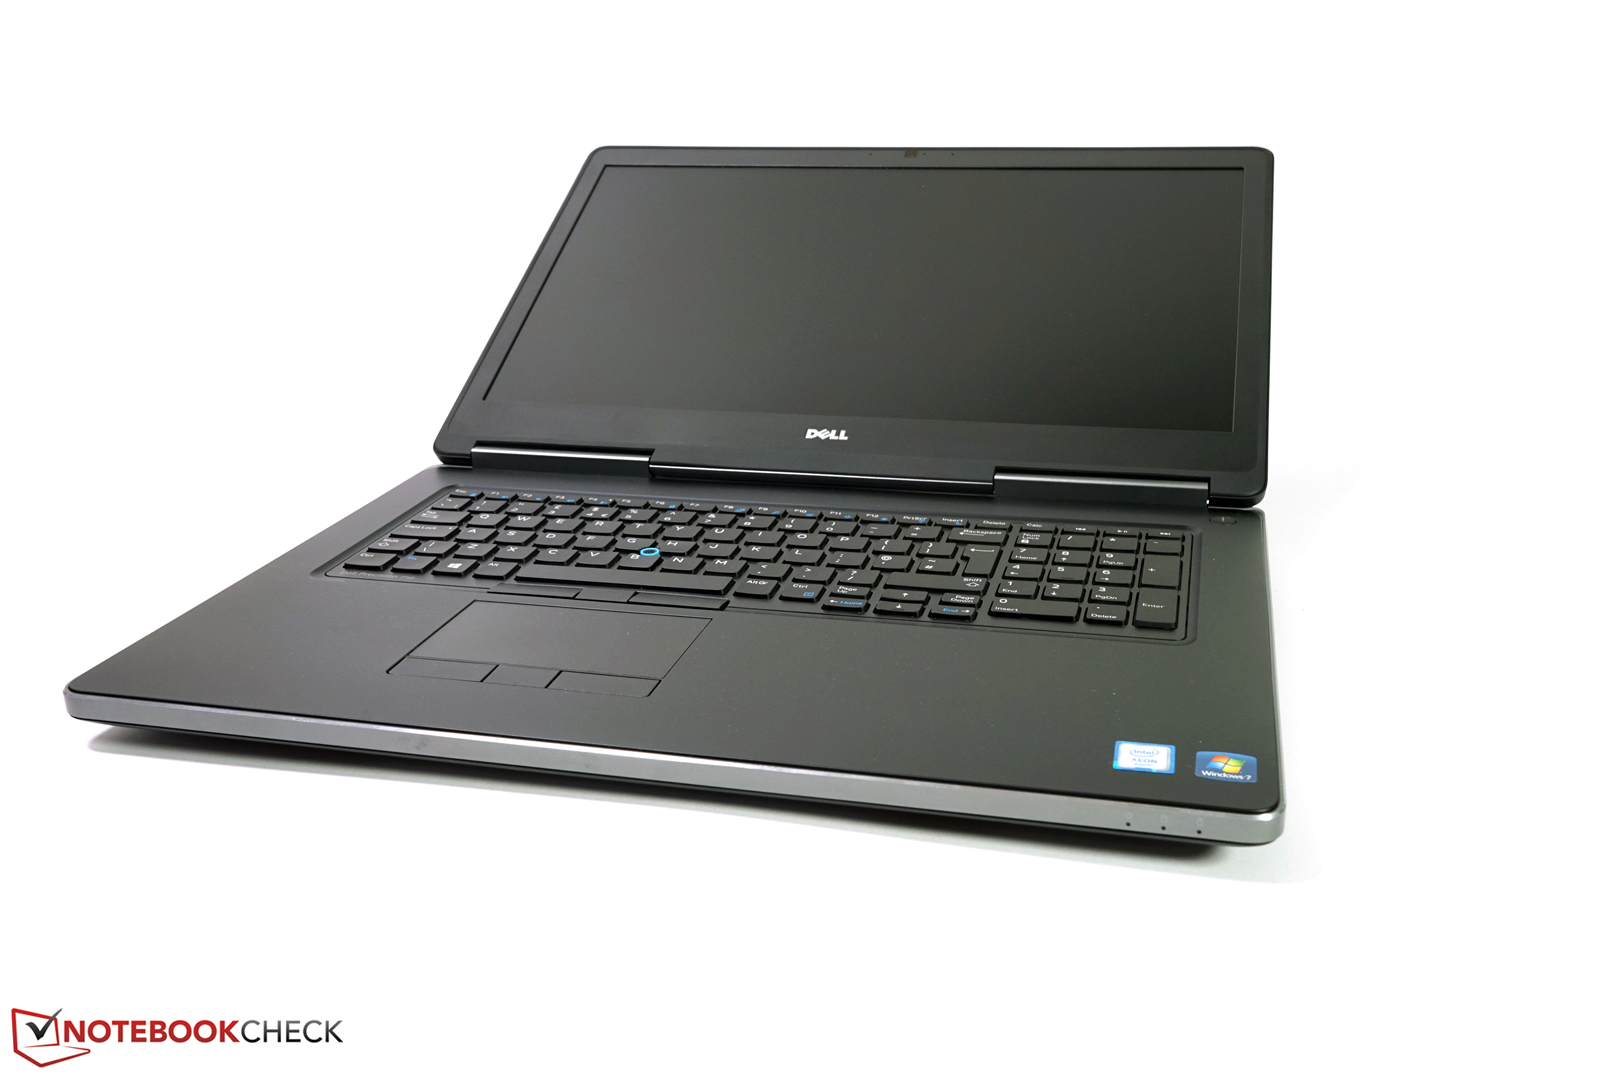
The successor of the big 17-inch workstation got a completely new case and certainly comes with up-to-date interfaces and the latest processors, displays and graphics chips. Traditionally, the mobile 17-inch workstations can be very freely configured with very powerful components. Our test model is a cheaper variant with mobile Intel Xeon E3-1535M-CPU, 16 GB of DDR4 RAM, an HDD SSD combination, AMD's professional FirePro W7170M graphics and Full HD IPS display.
When configured in Dell's online configurator our test model's net price is just under 3100 Euros (~$3381). This gives a gross retail price of about 3730 Euros (~$4068), including VAT in Germany. However, the top variant with Nvidia Quadro M5000M, three 1 TB SSDs, UHD IGZO display and 64 GB of RAM for just under 7400 Euros (~$8072, gross price) proves that Precision models can be much more expensive. Various service and accessory options are not yet considered here and can boost the price even further.
Case
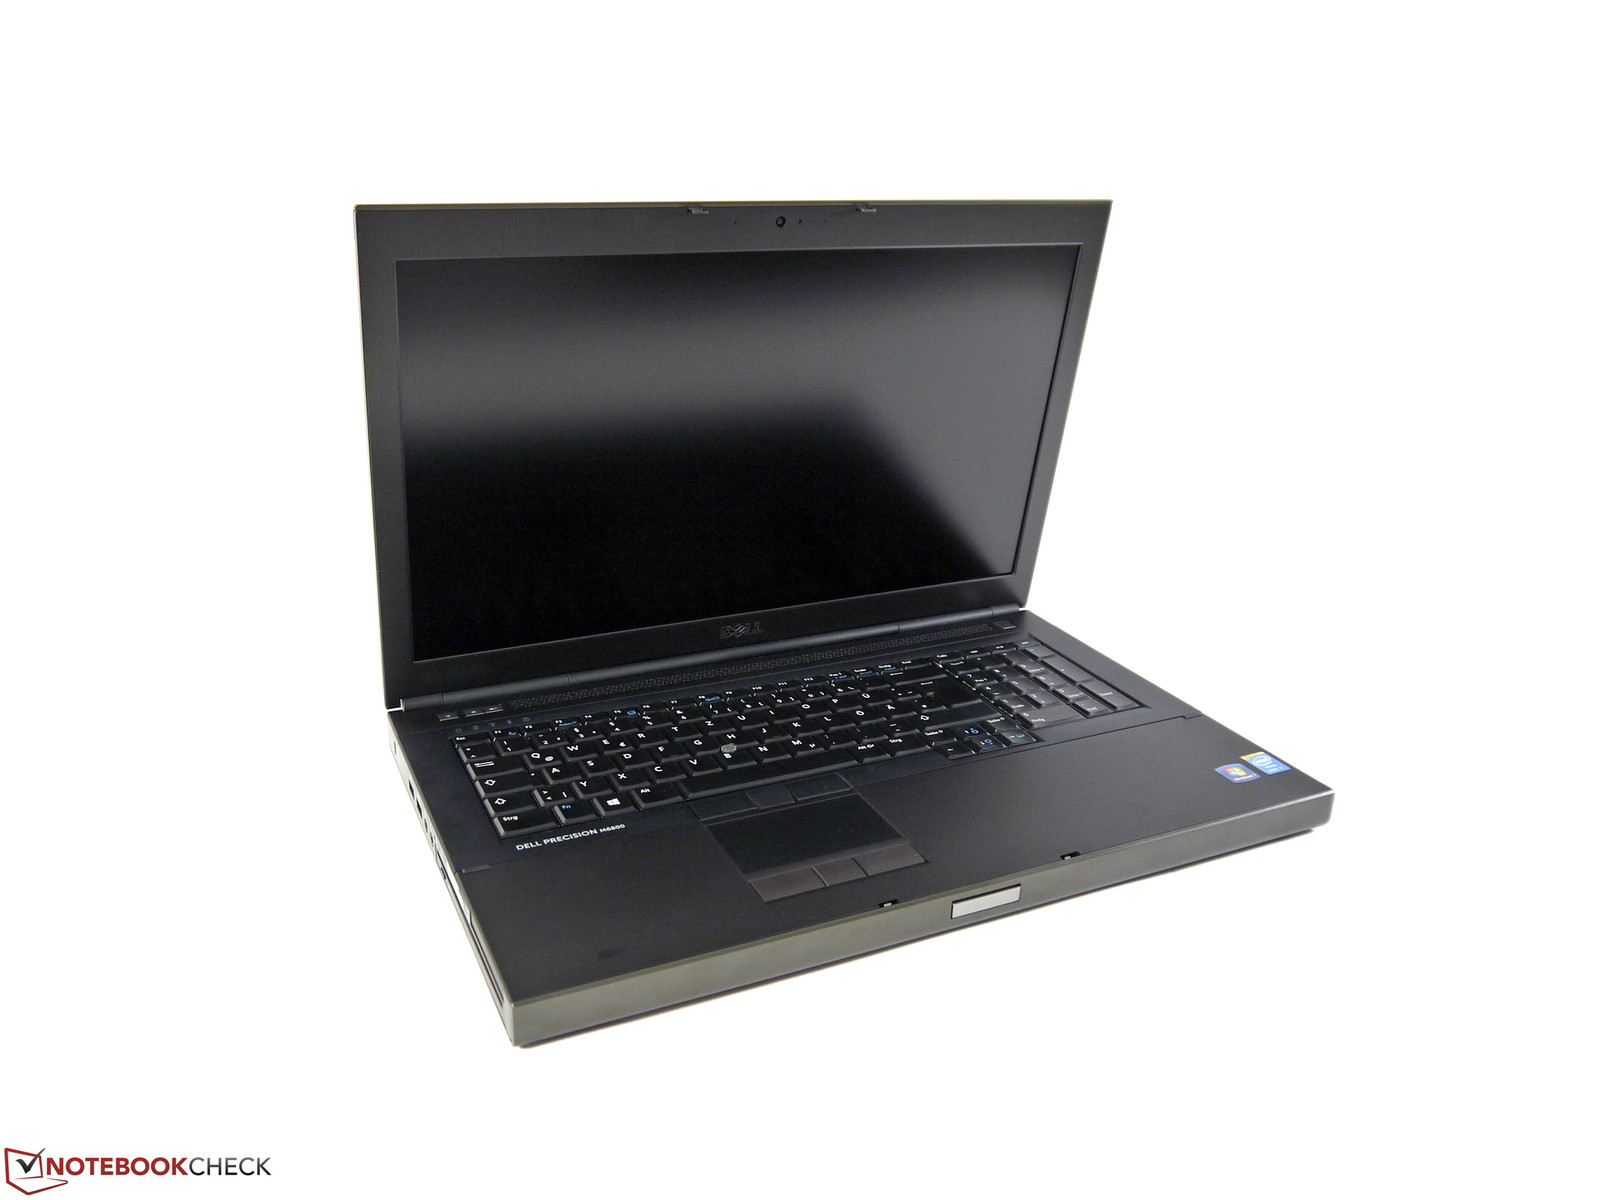
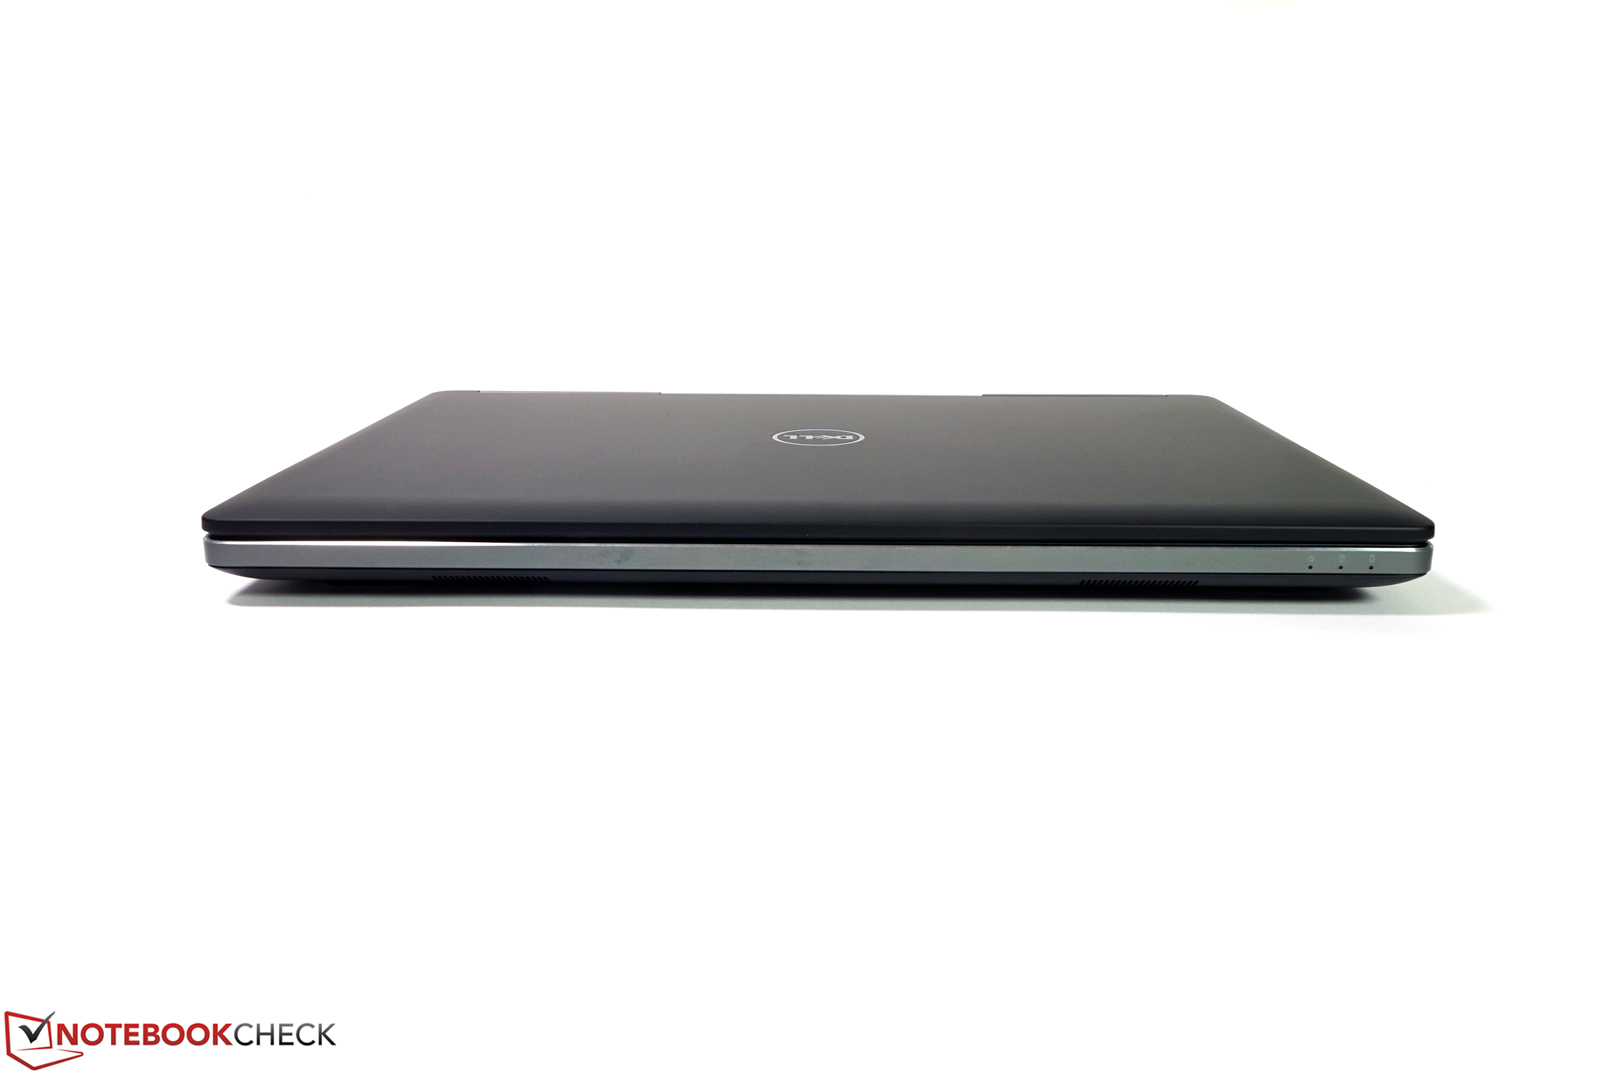
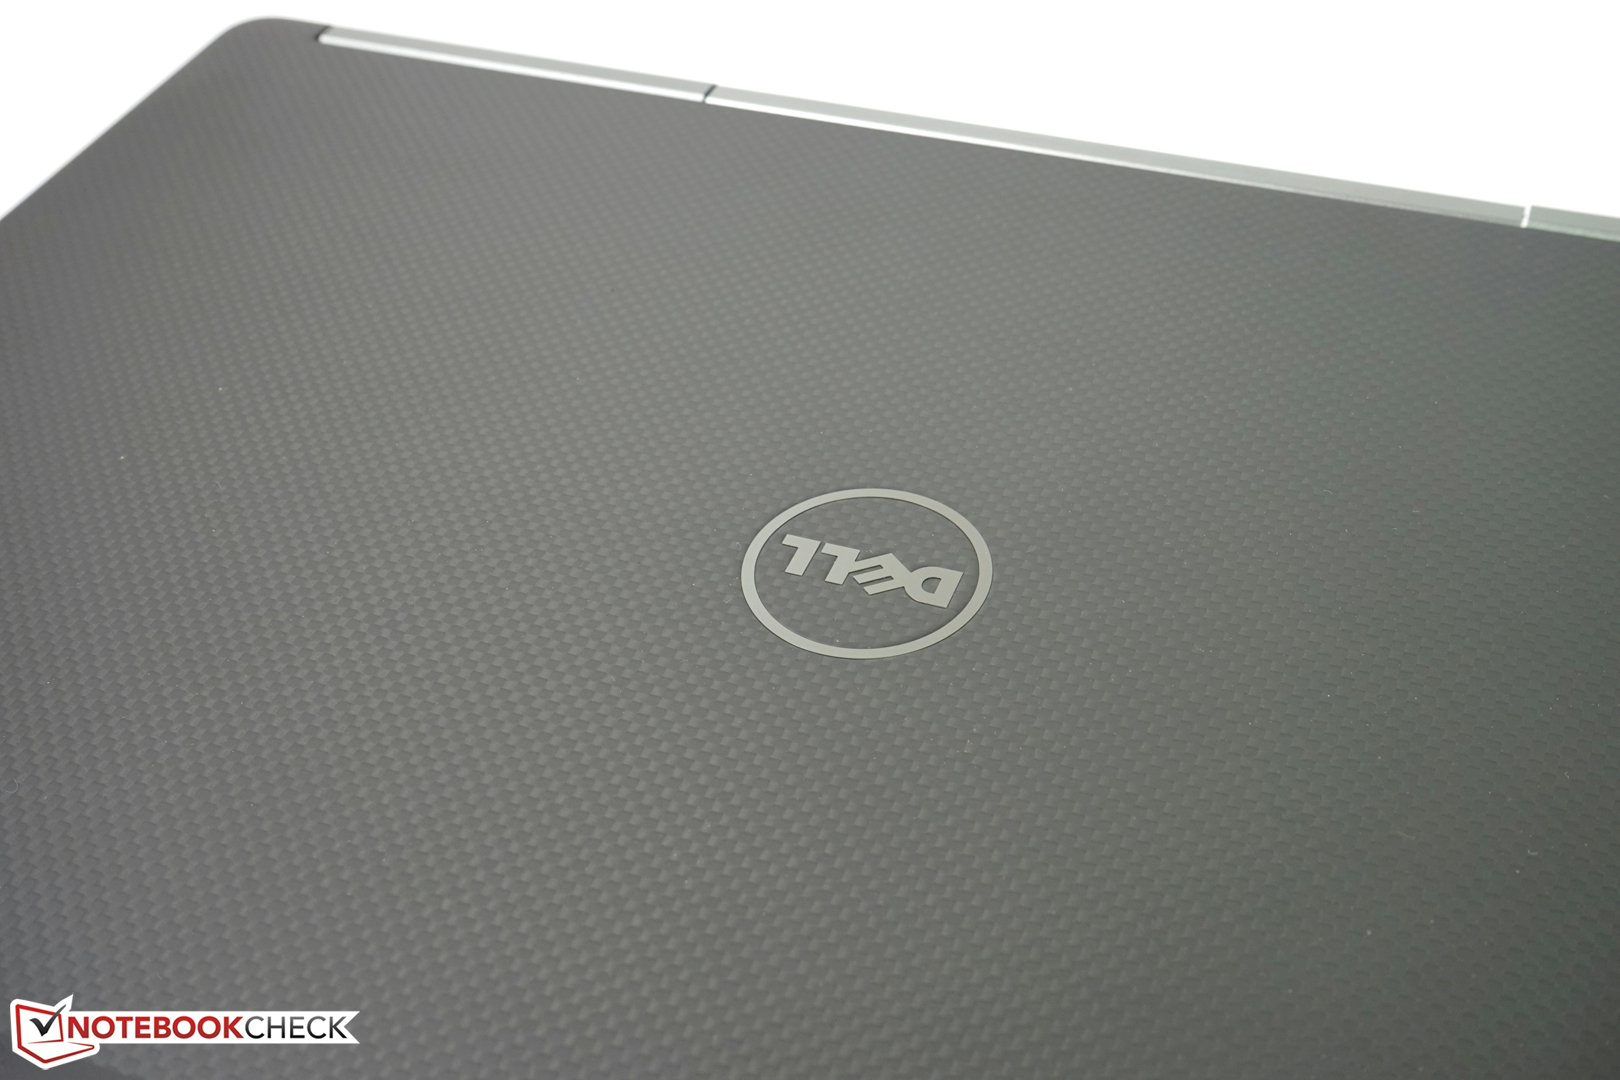
The Dell Precision M6800 predecessor's case featured many good properties. Of course, we expect to see these in the successor, too. Apart from high stability, especially the good upgrade and maintenance options were convincing here. However, ill-fitting components and a significantly too small touchpad were not perfect. Moreover, the slightly unusual metallic brown of the case might not have met everybody's taste.
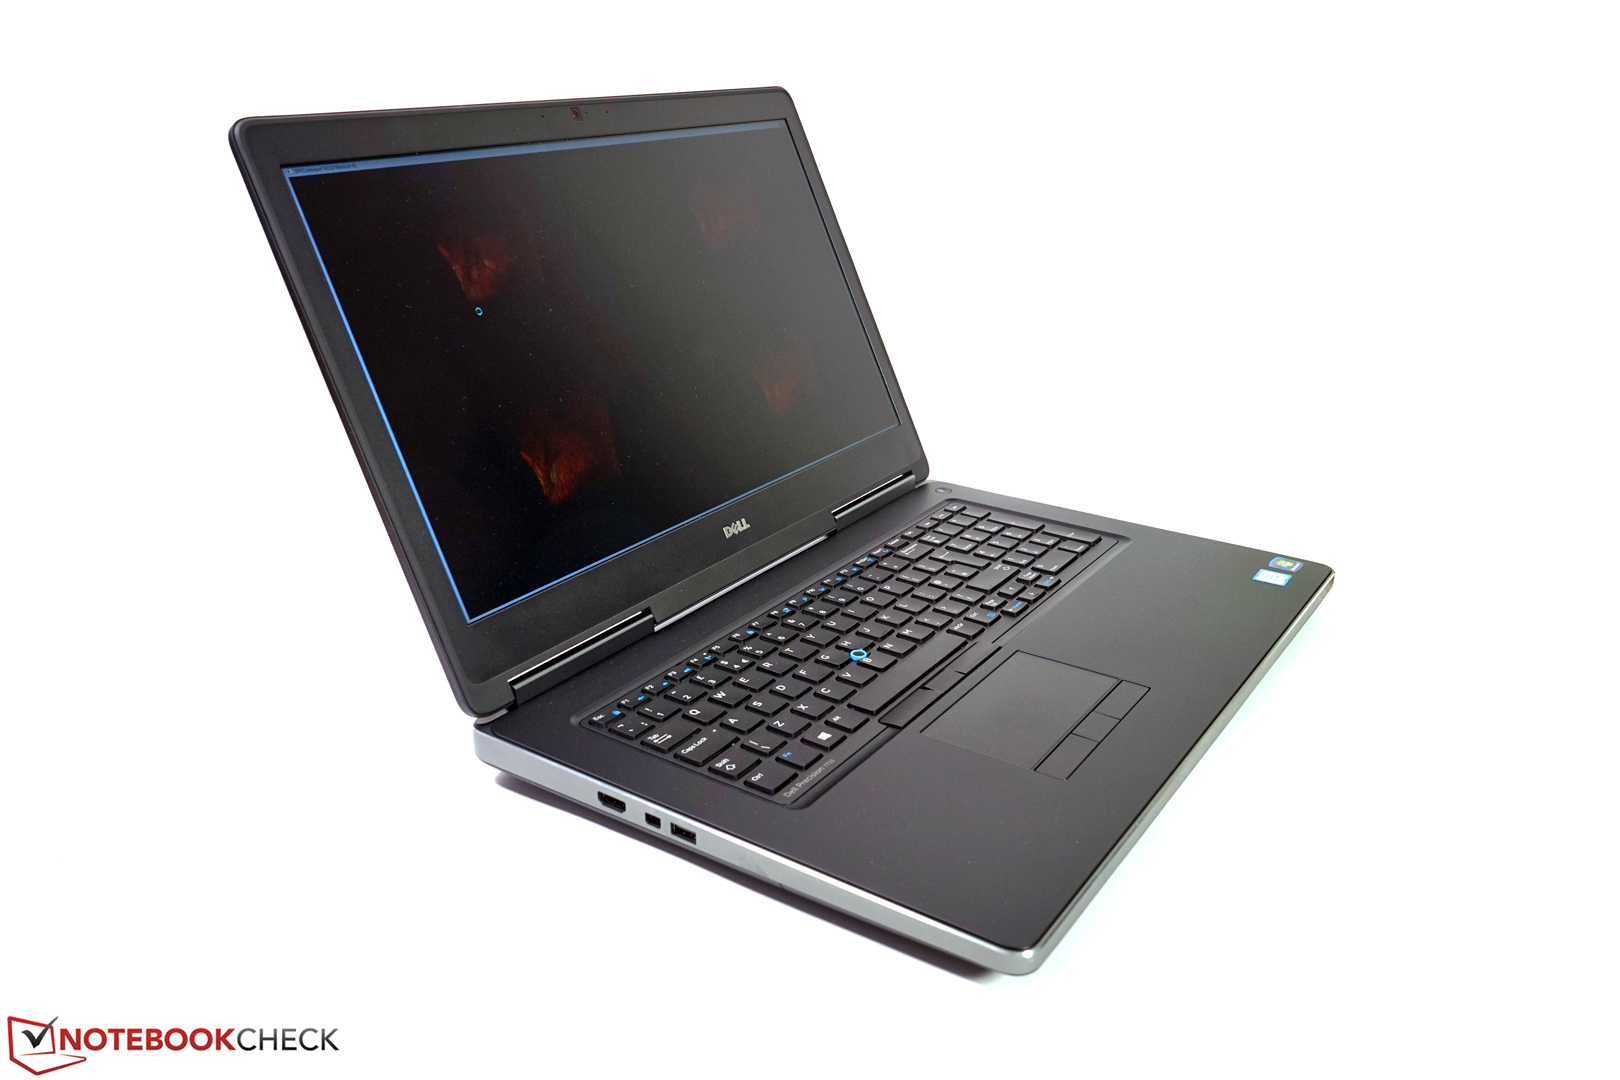
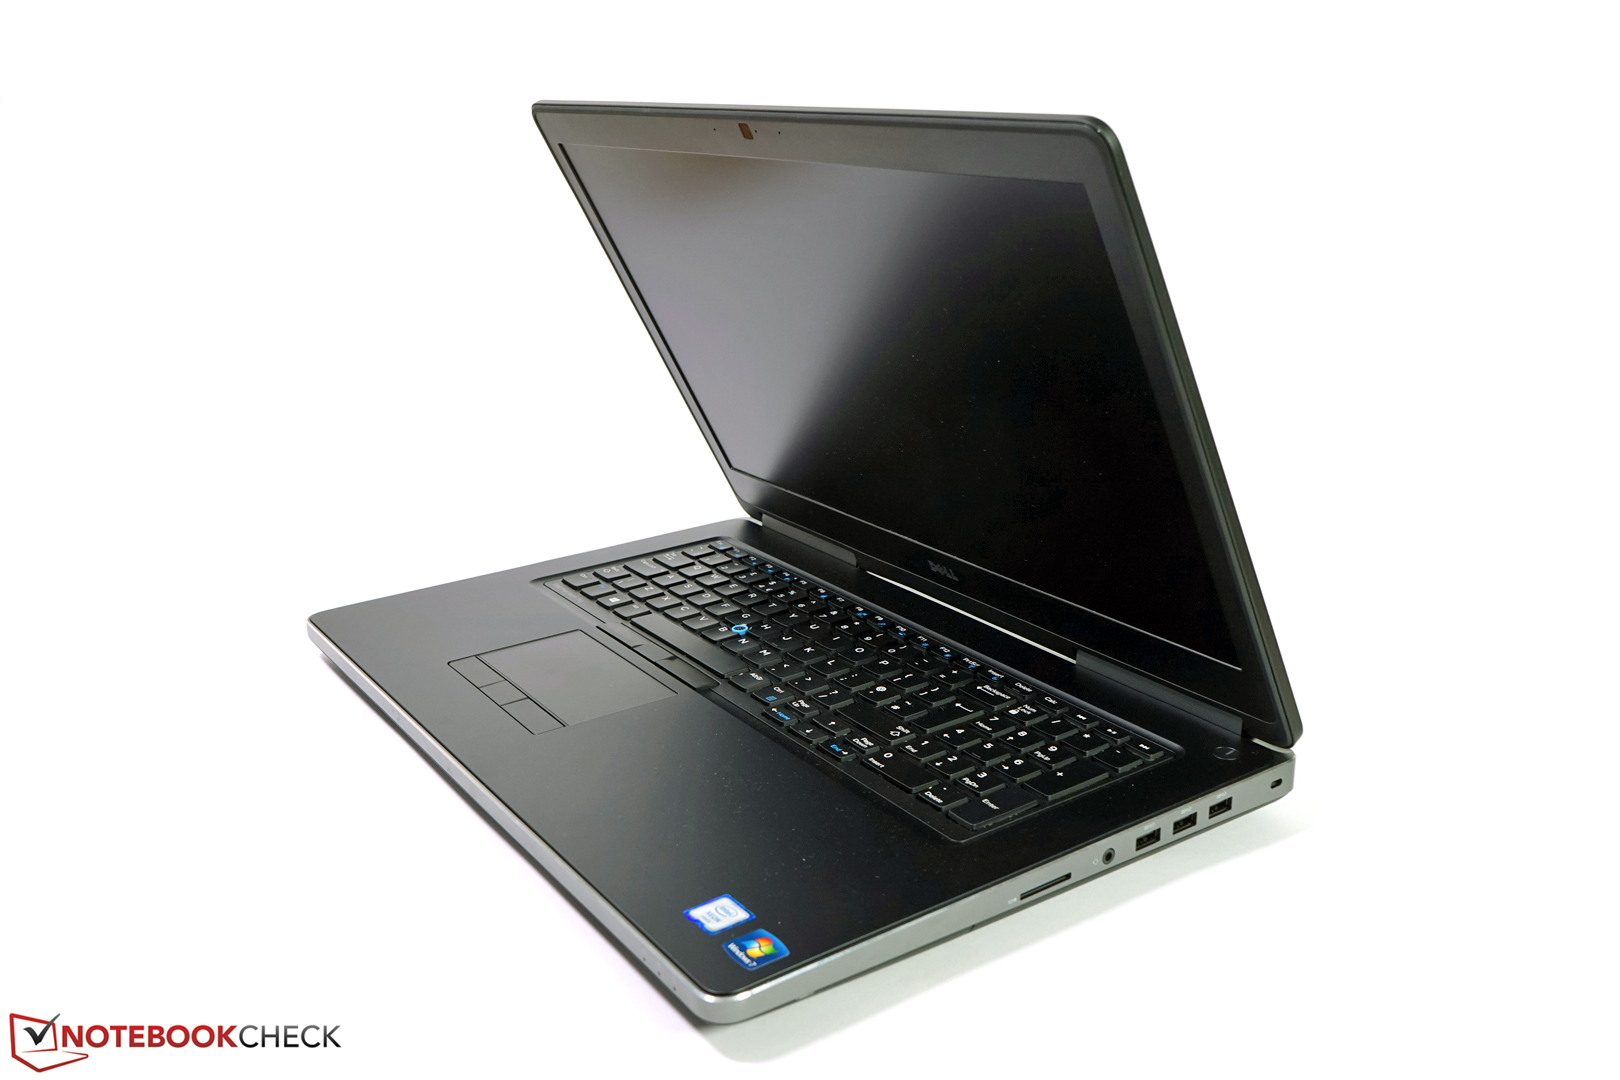
The new case of the Precision 7710 appears slimmer and its gray aluminum combination might be appealing to the masses. Moreover, it features the same positive traits as its predecessor. The palm rests are stiff, the keyboard bed does not yield anywhere, and the hinges keep the display firmly in position. The base unit is very torsionally stiff and does not creak at all. Even the lid is very rigid overall and we could not find sharp edges. However, we found two spots where the finish is chipped off in our test model. Such flaws should not exist in retail-ready models; we put this down to the model being a test sample. Although the Dell Precision 7710 is not lightweight with a weight of 3580 g, it is in line with its category. Our Lenovo ThinkPad P70 test model weighed in at 3600 g and Schenker's W706 weighed in at 3810 g.
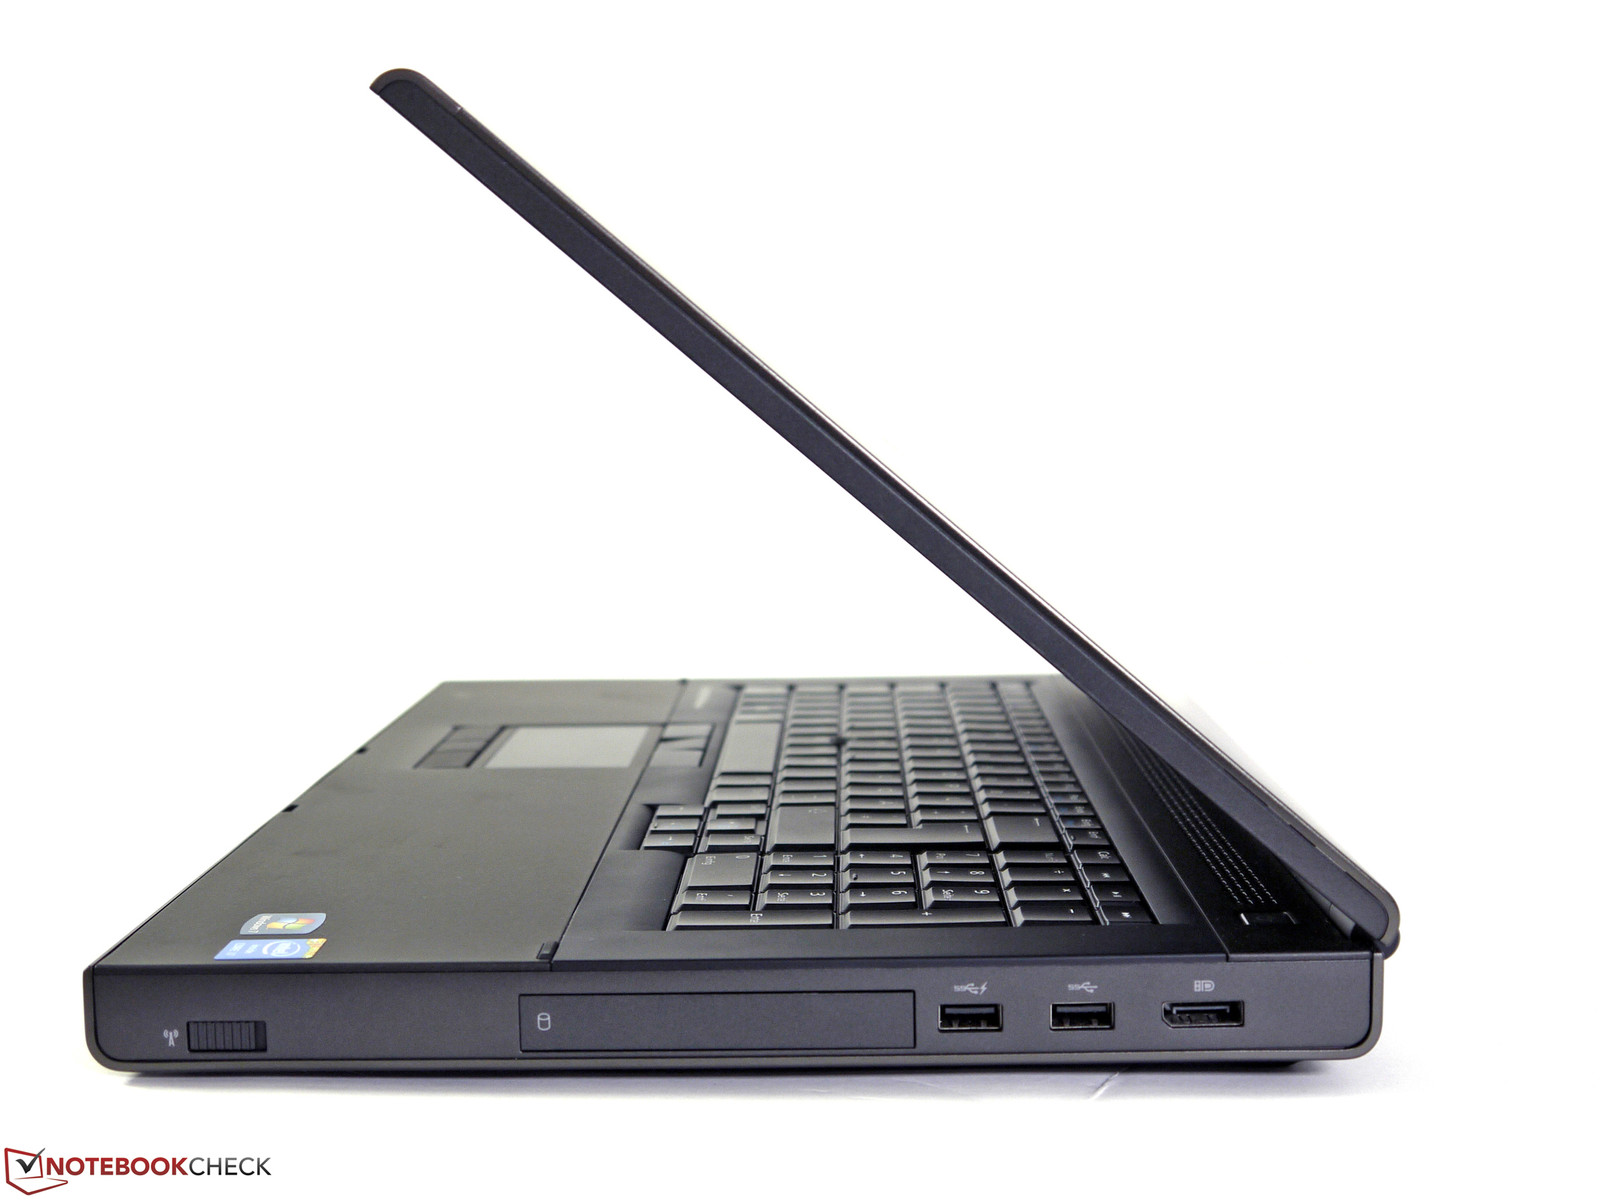
Connectivity
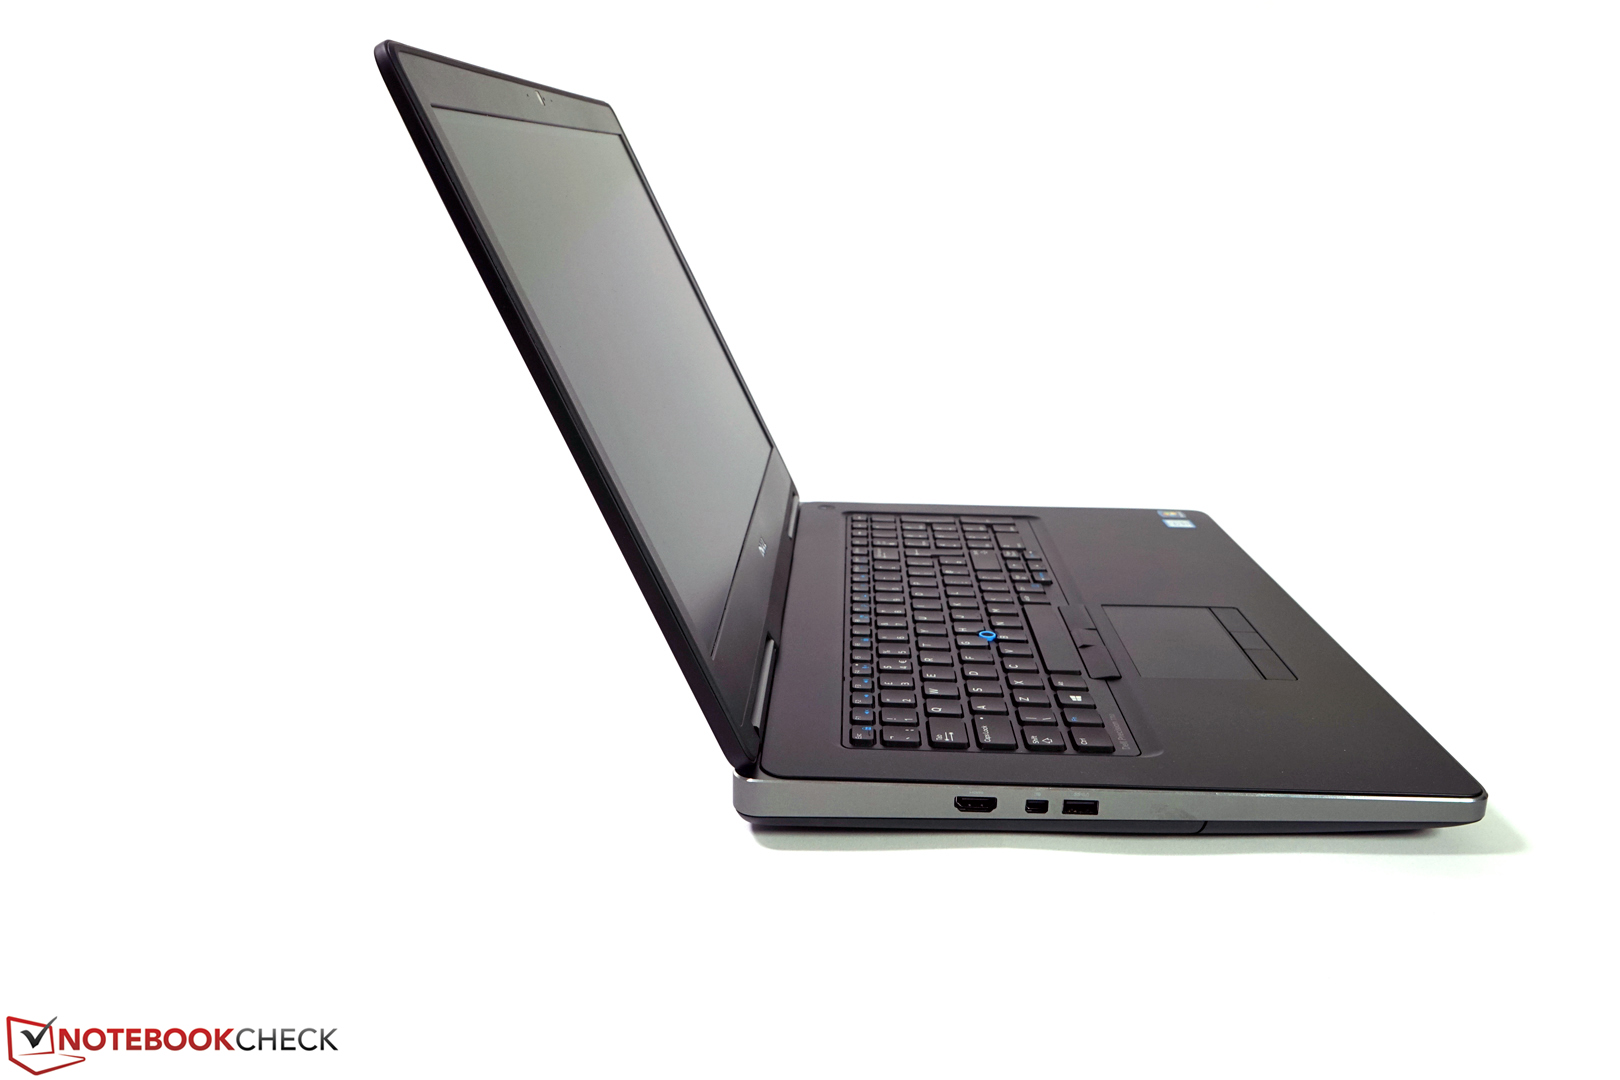
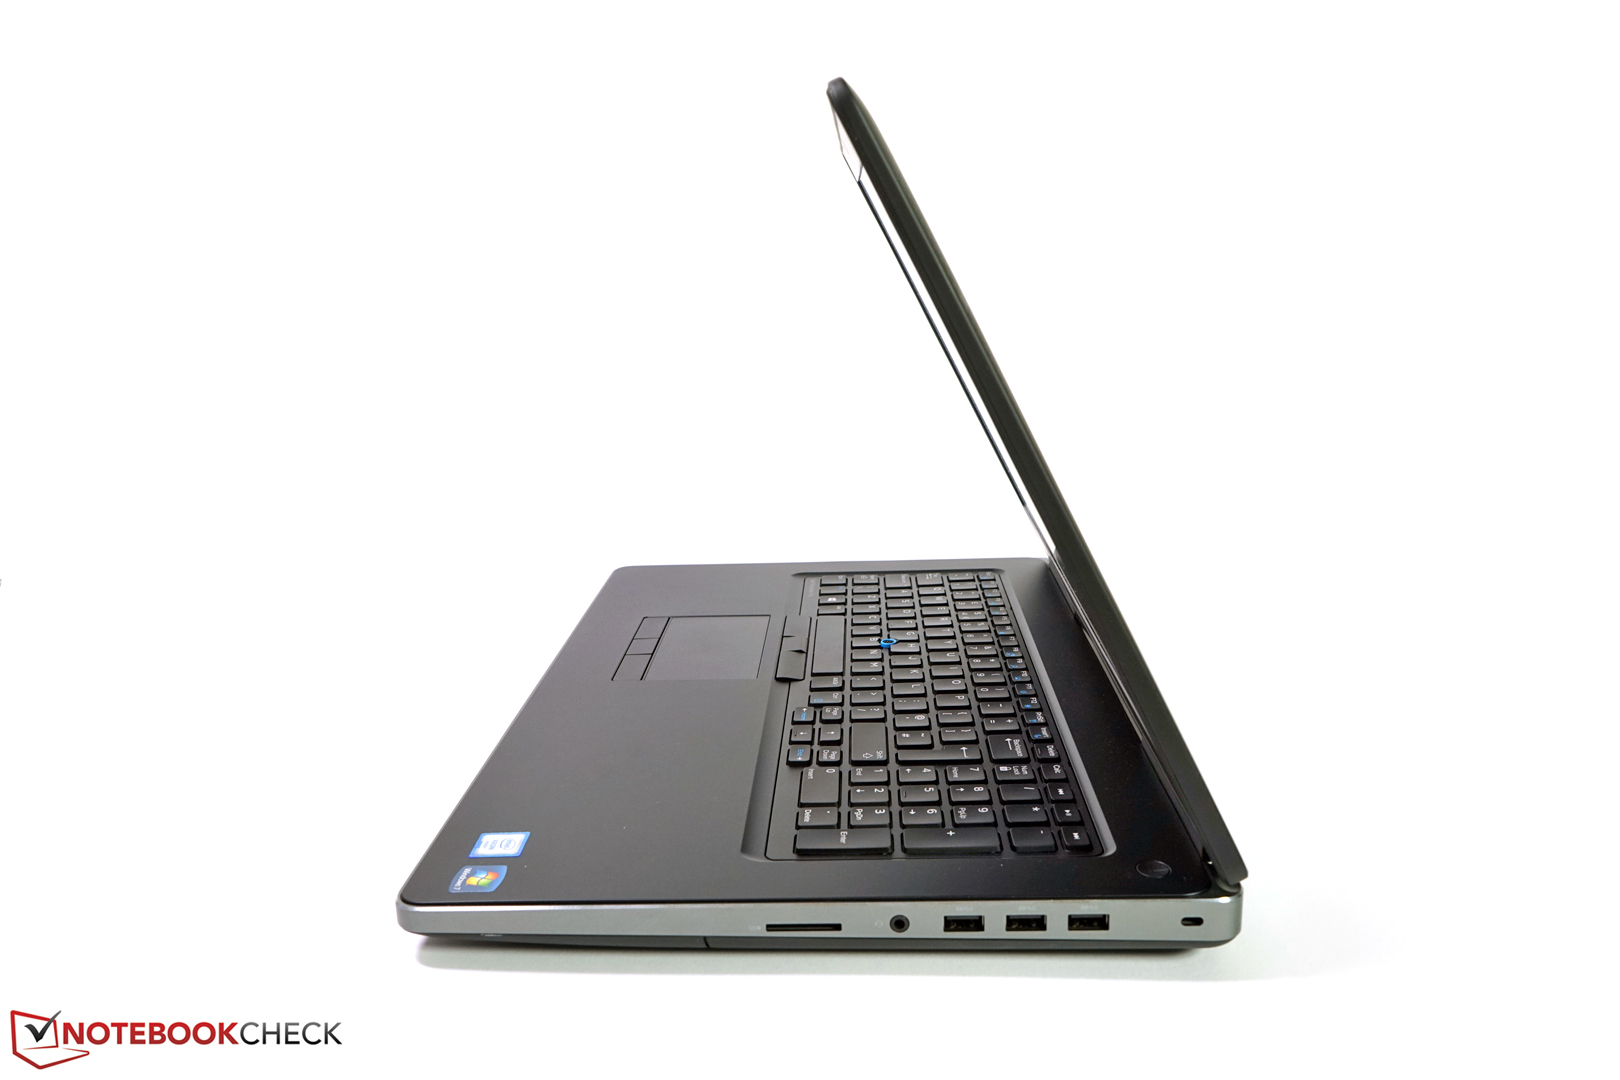
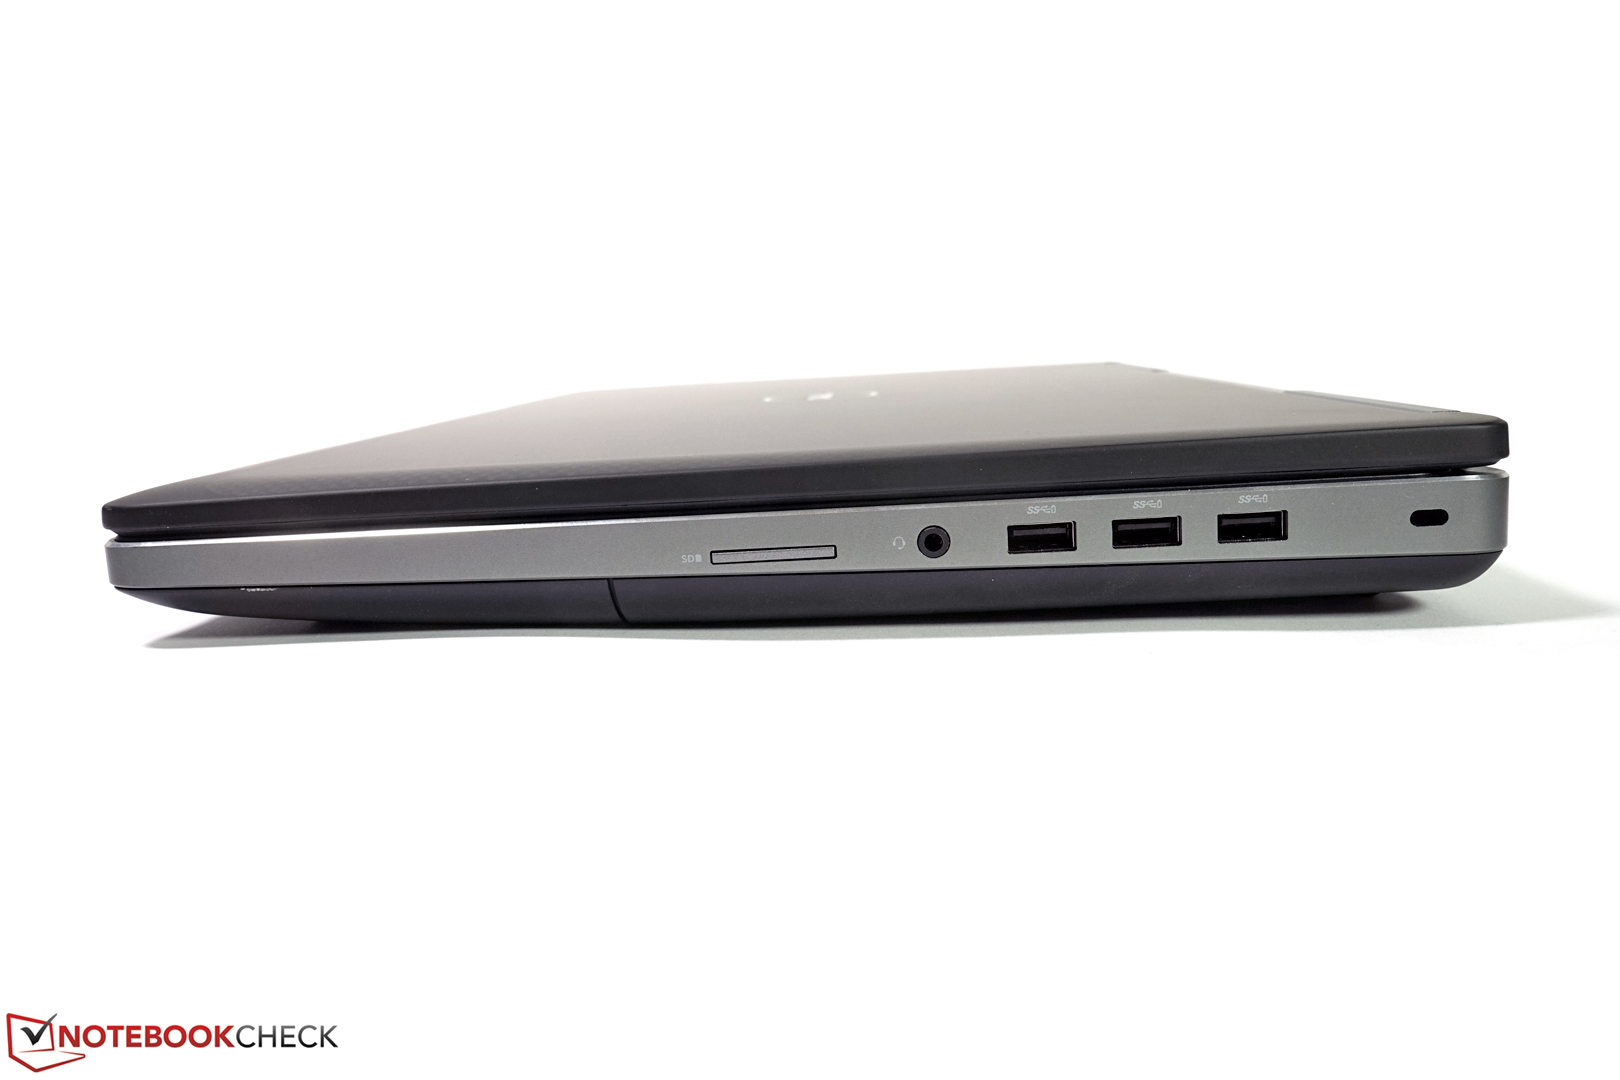
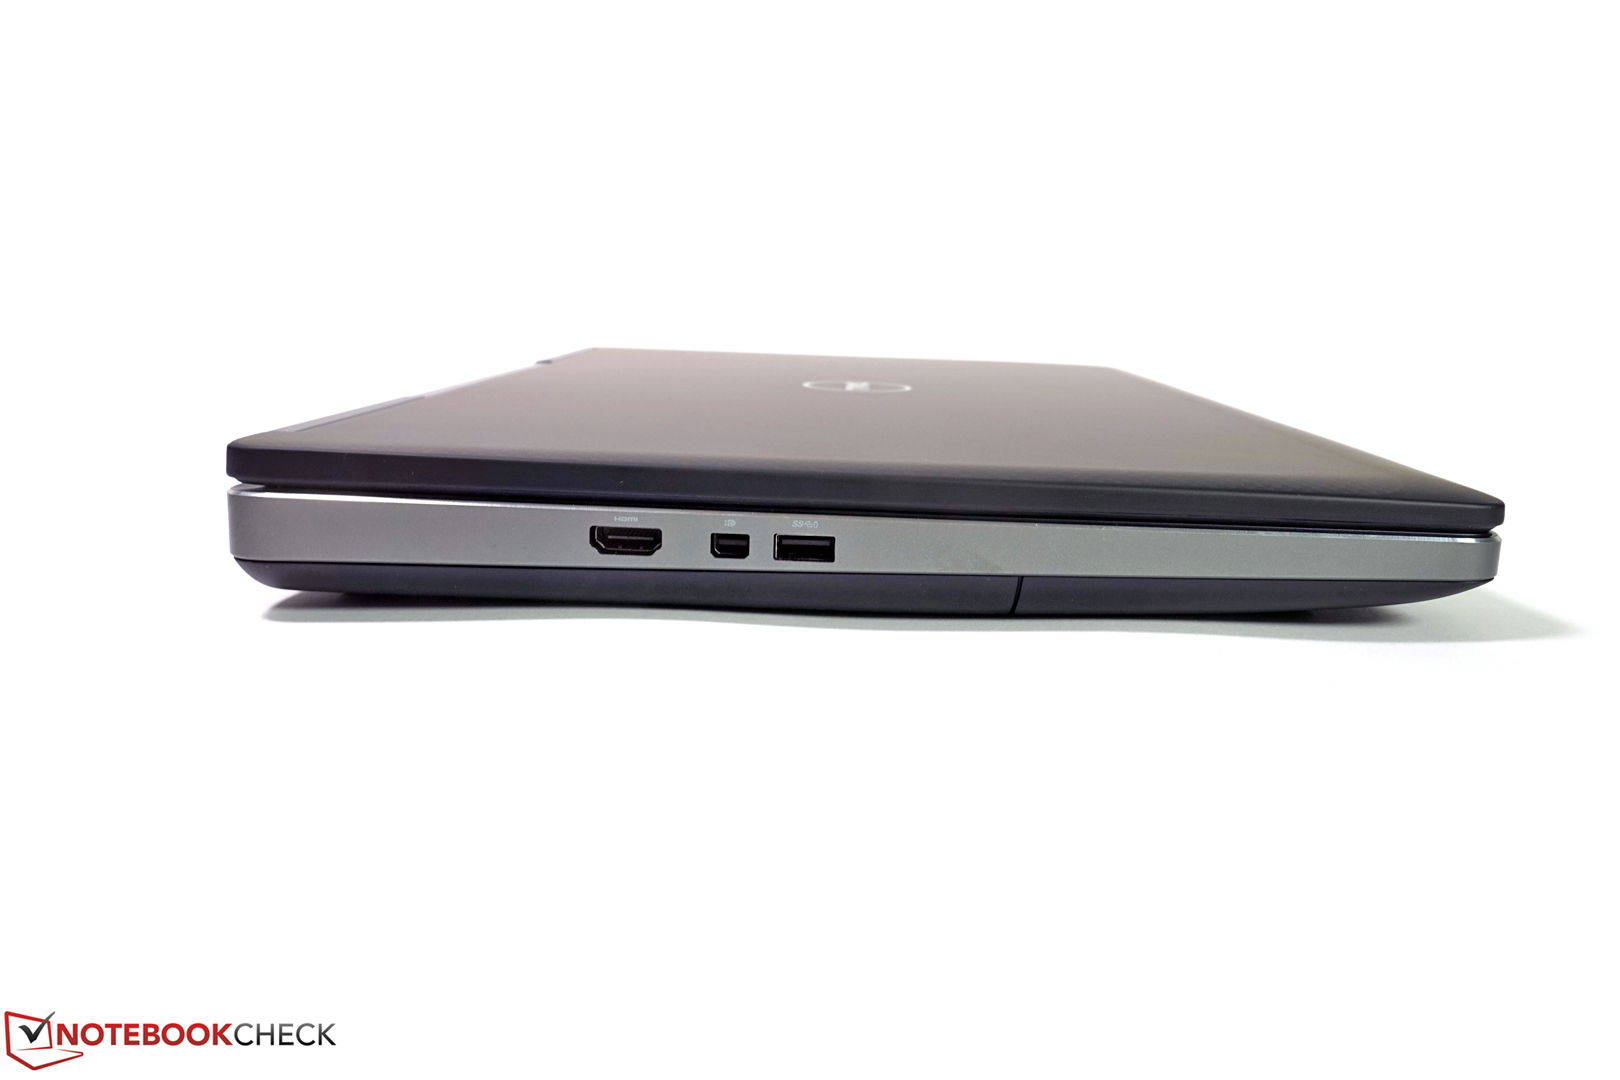
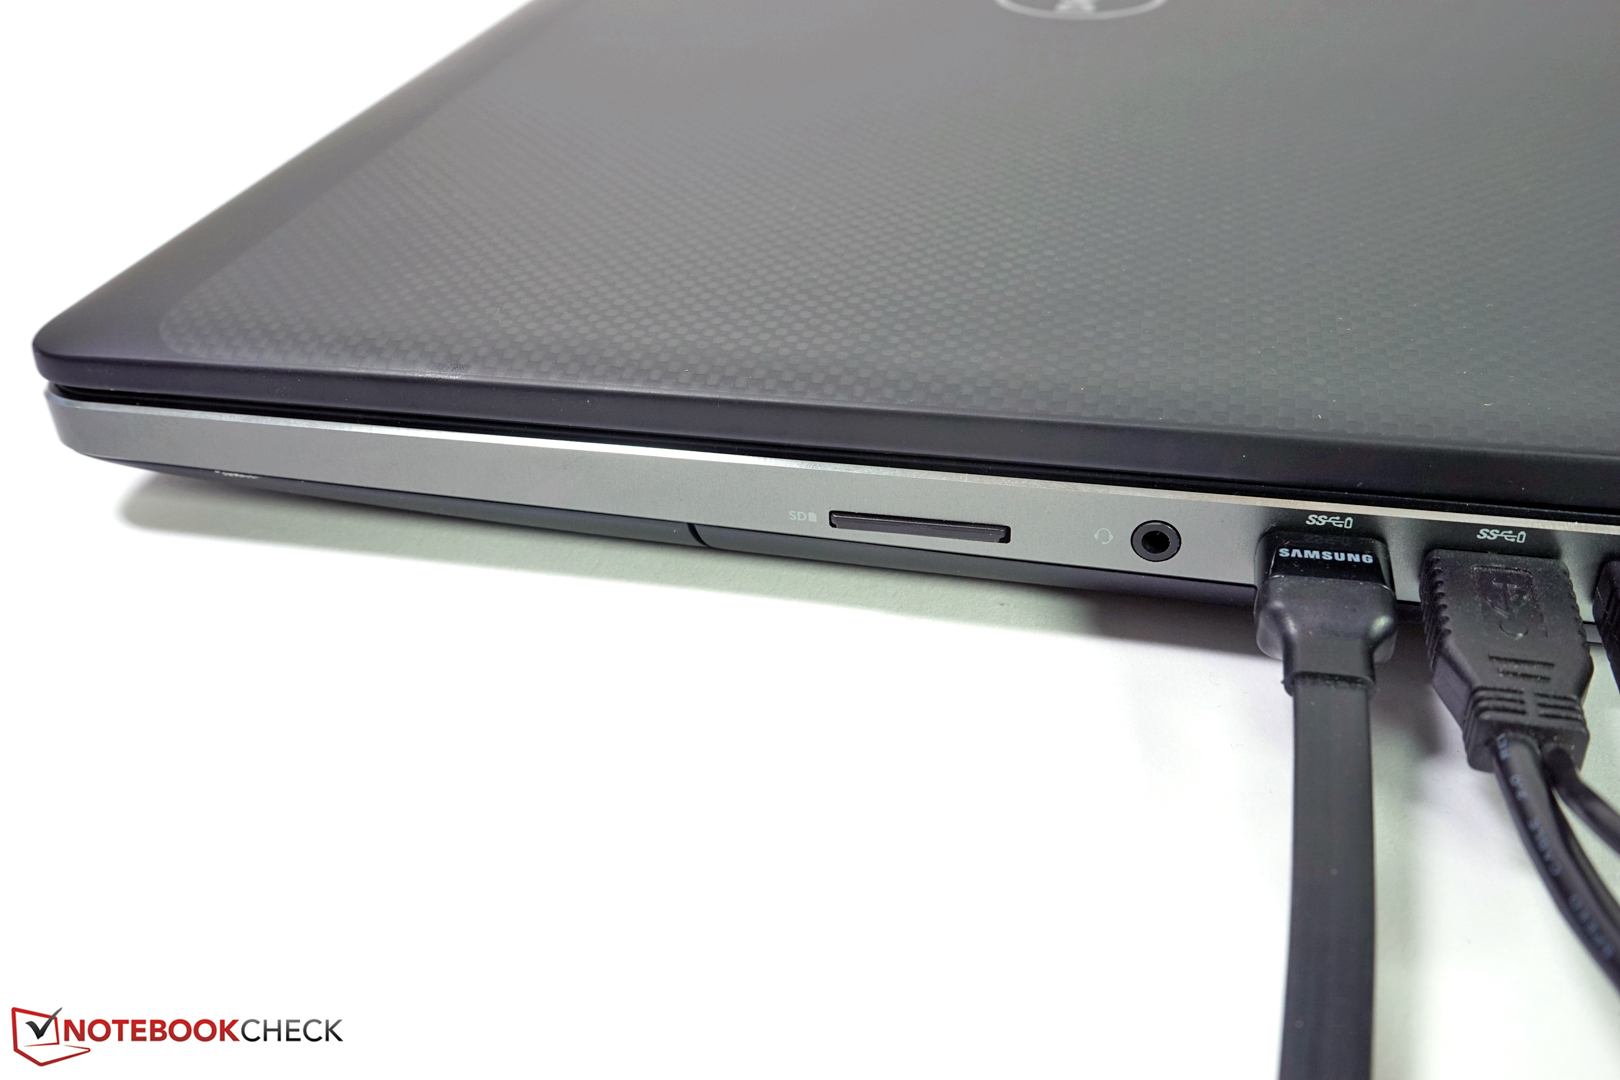
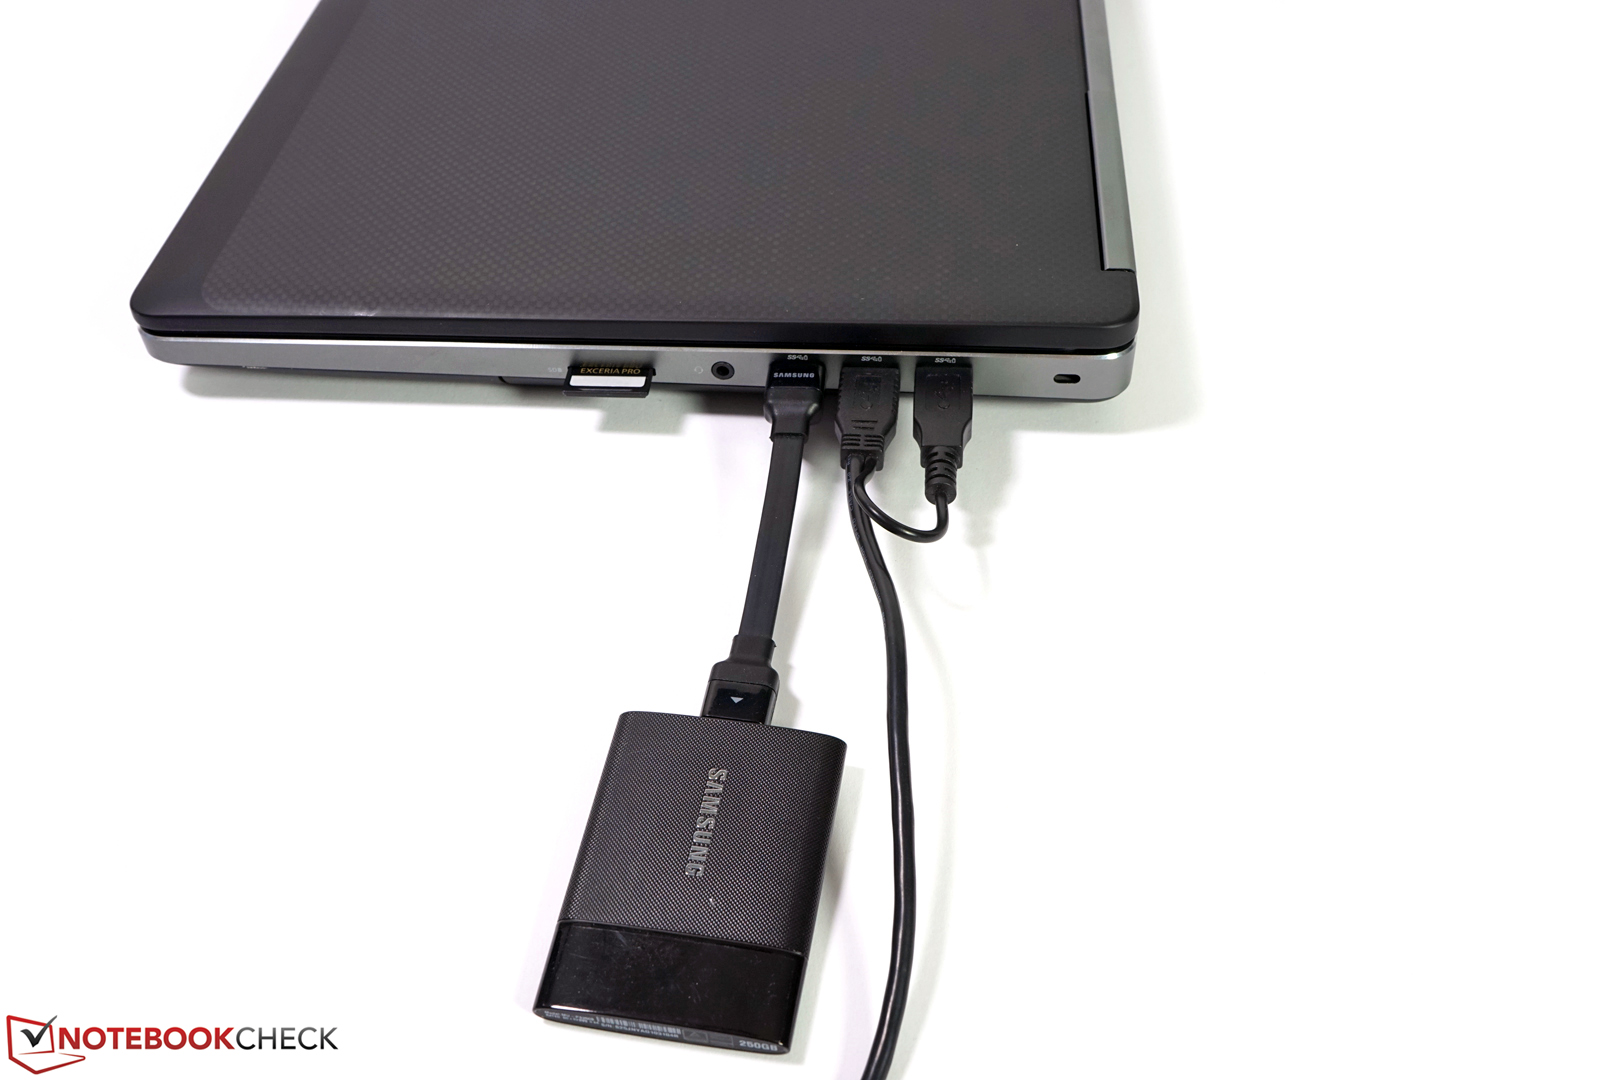
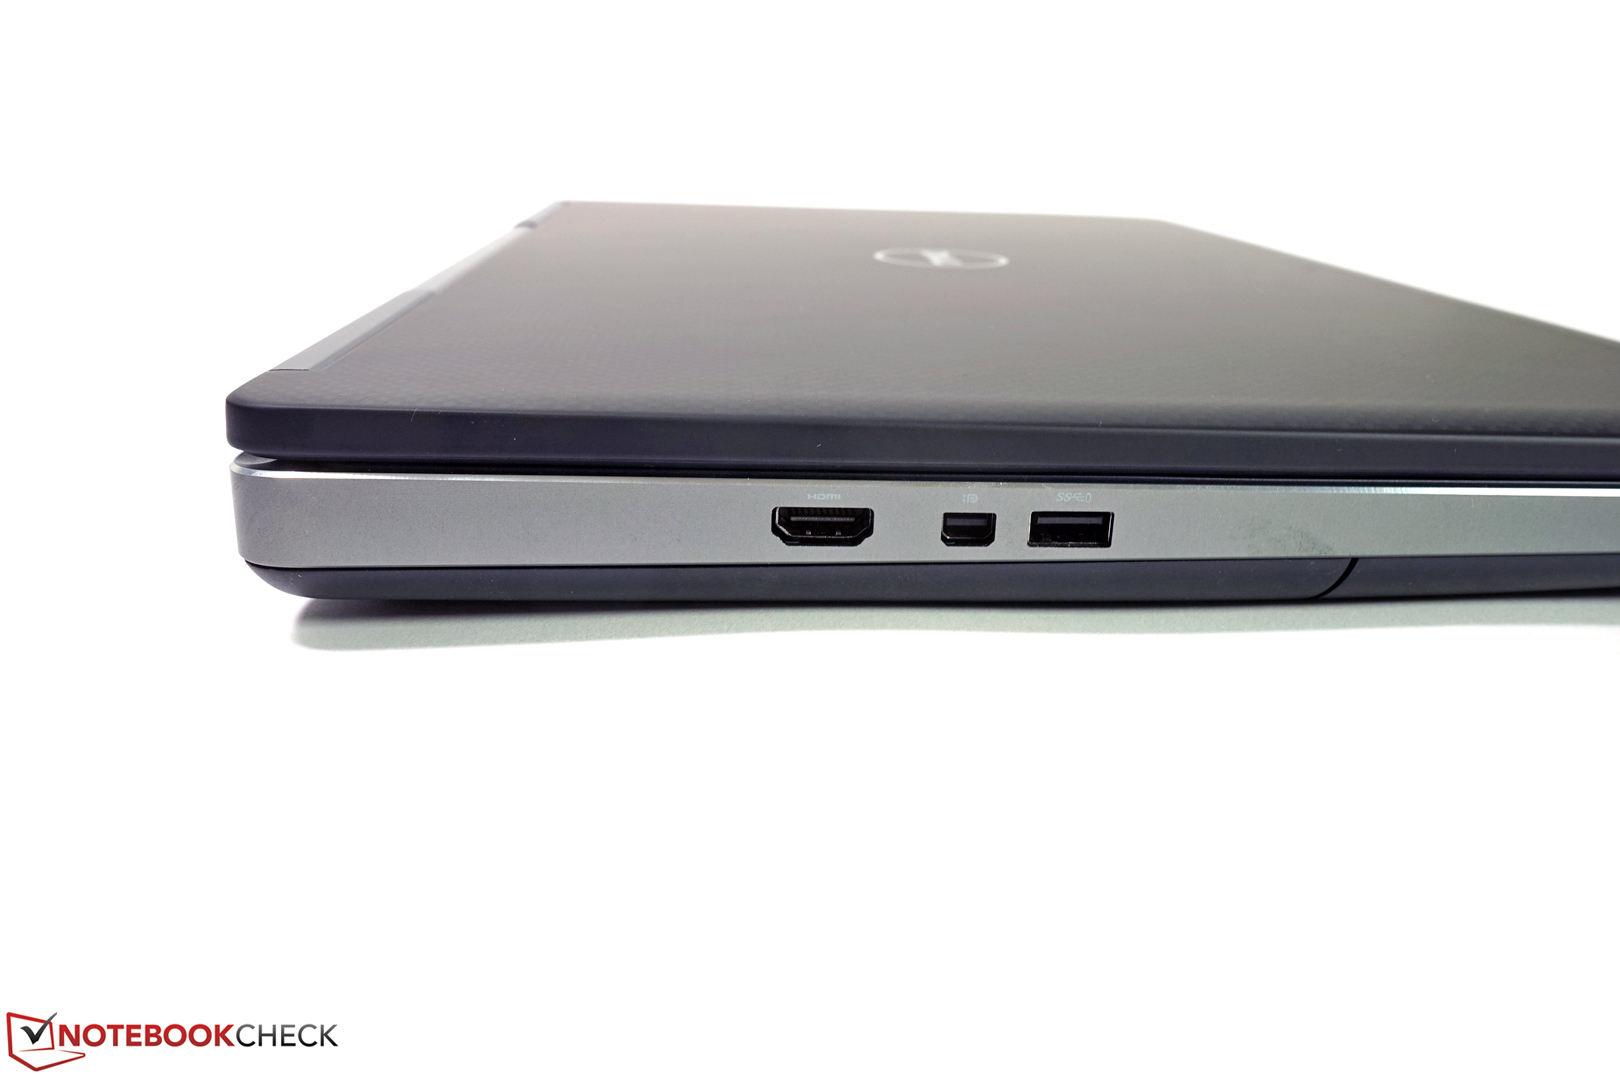
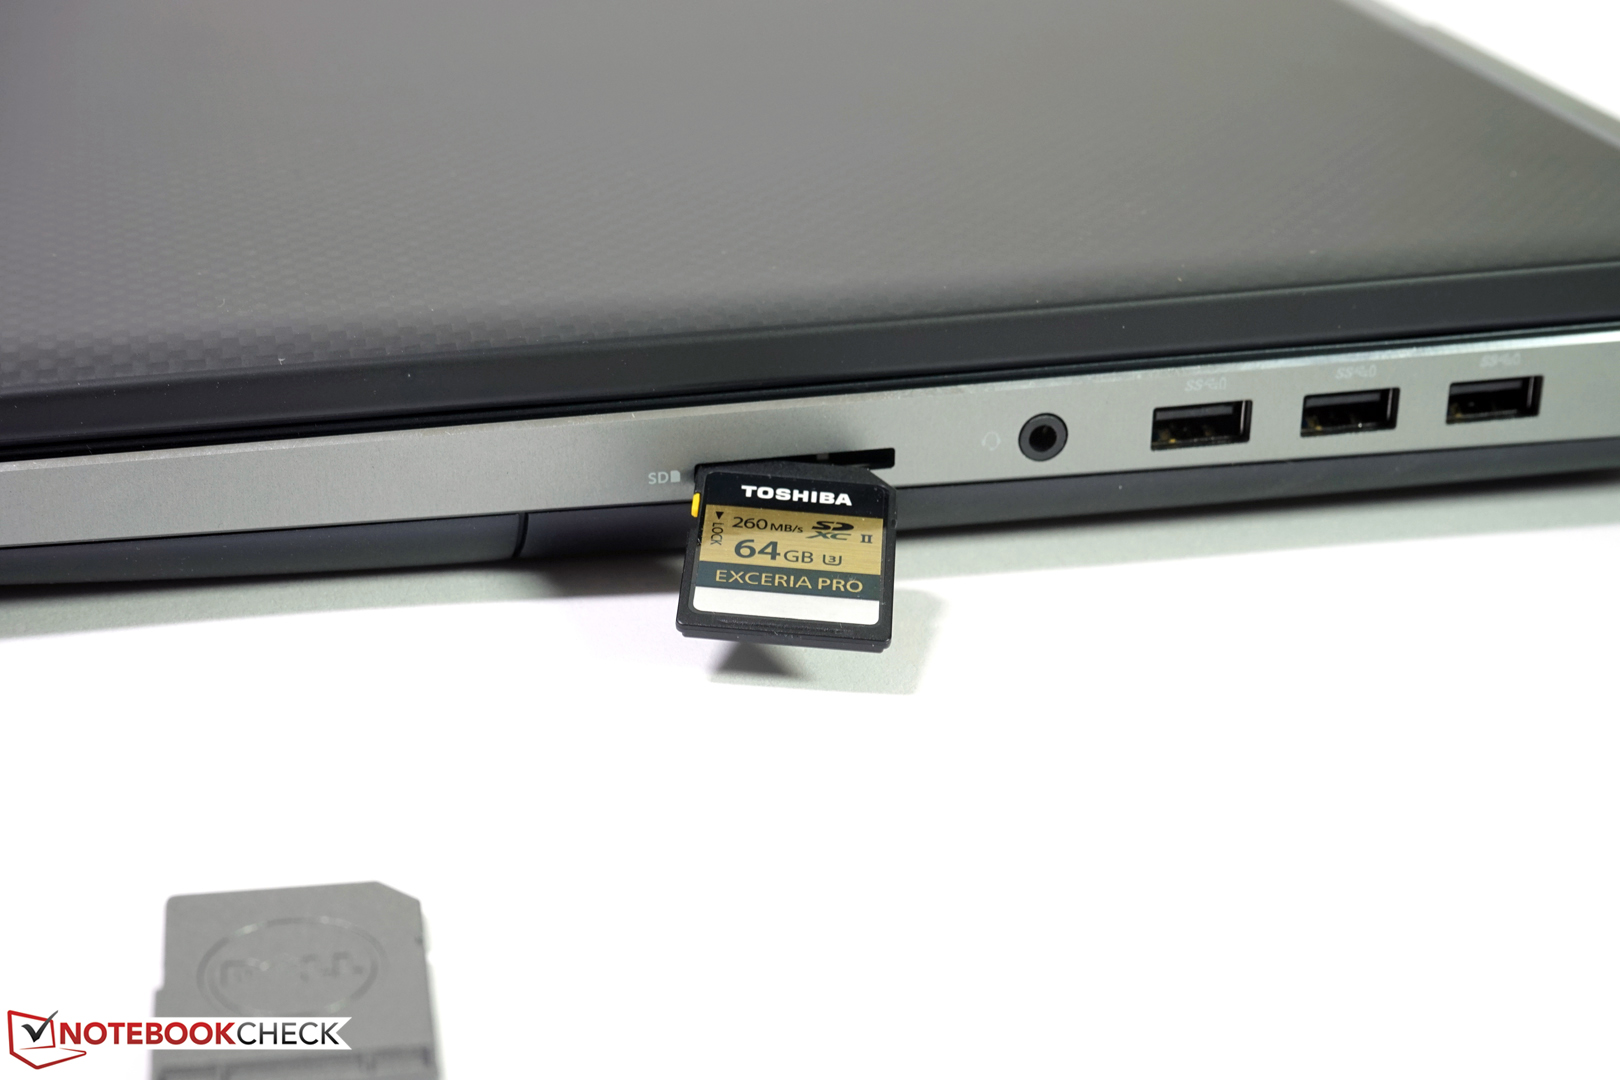
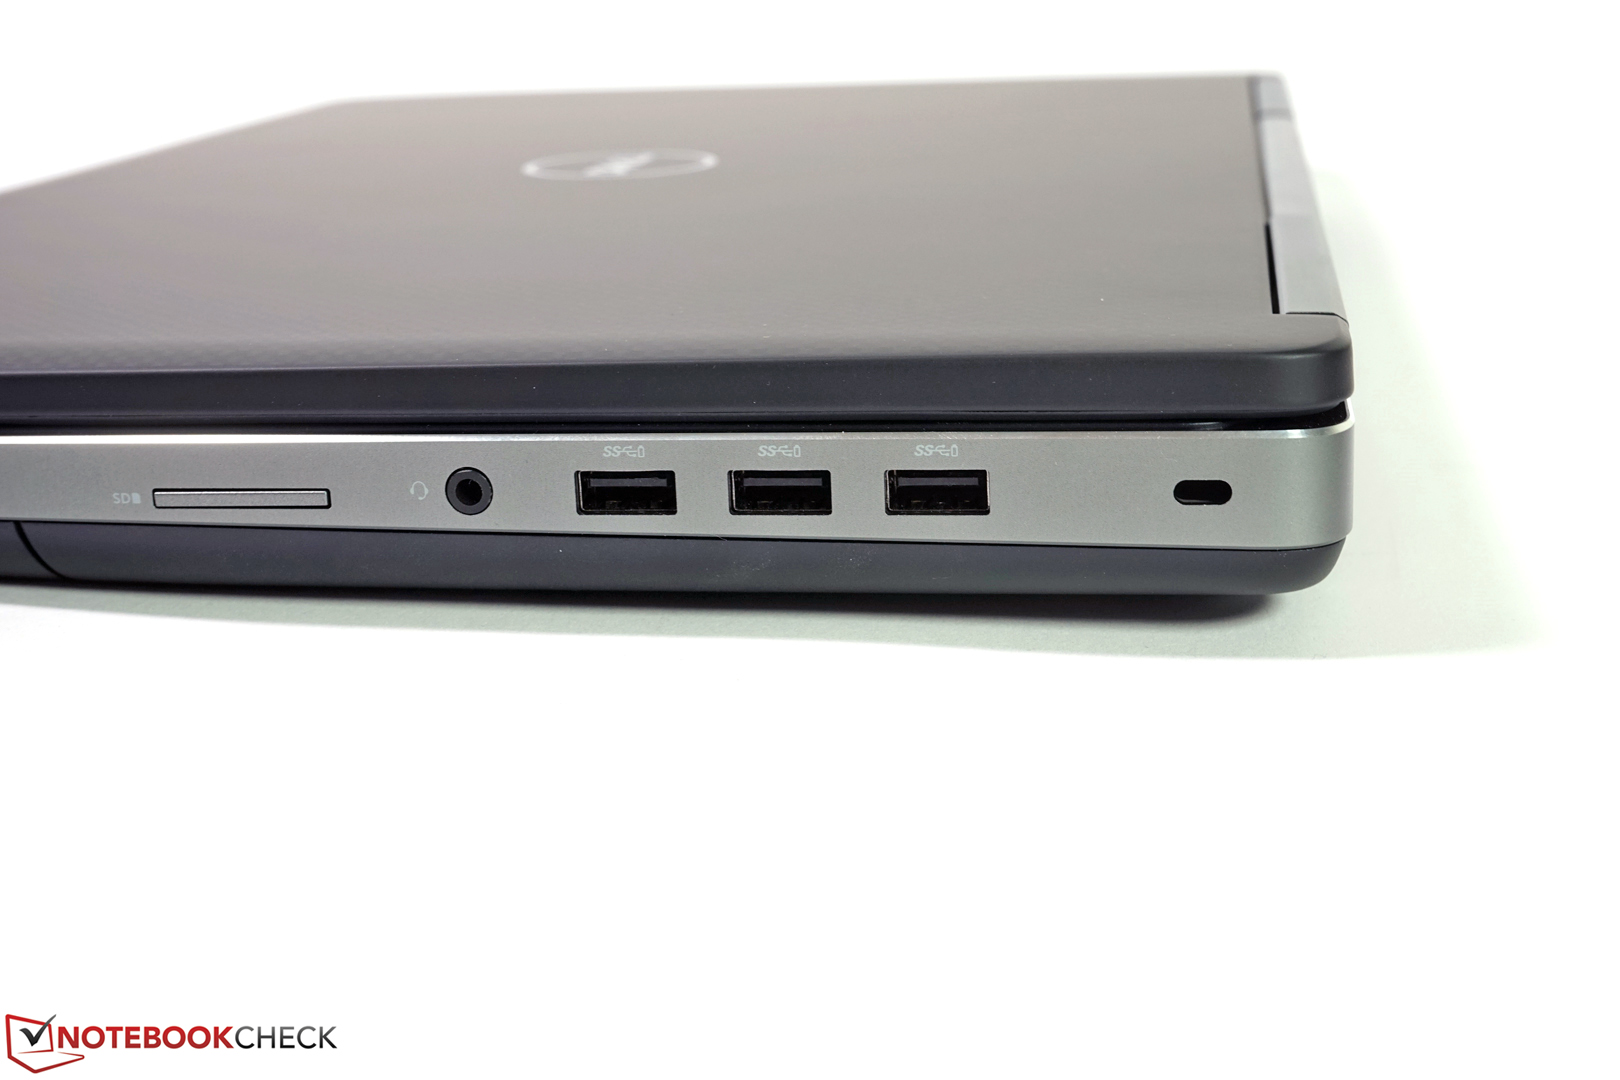
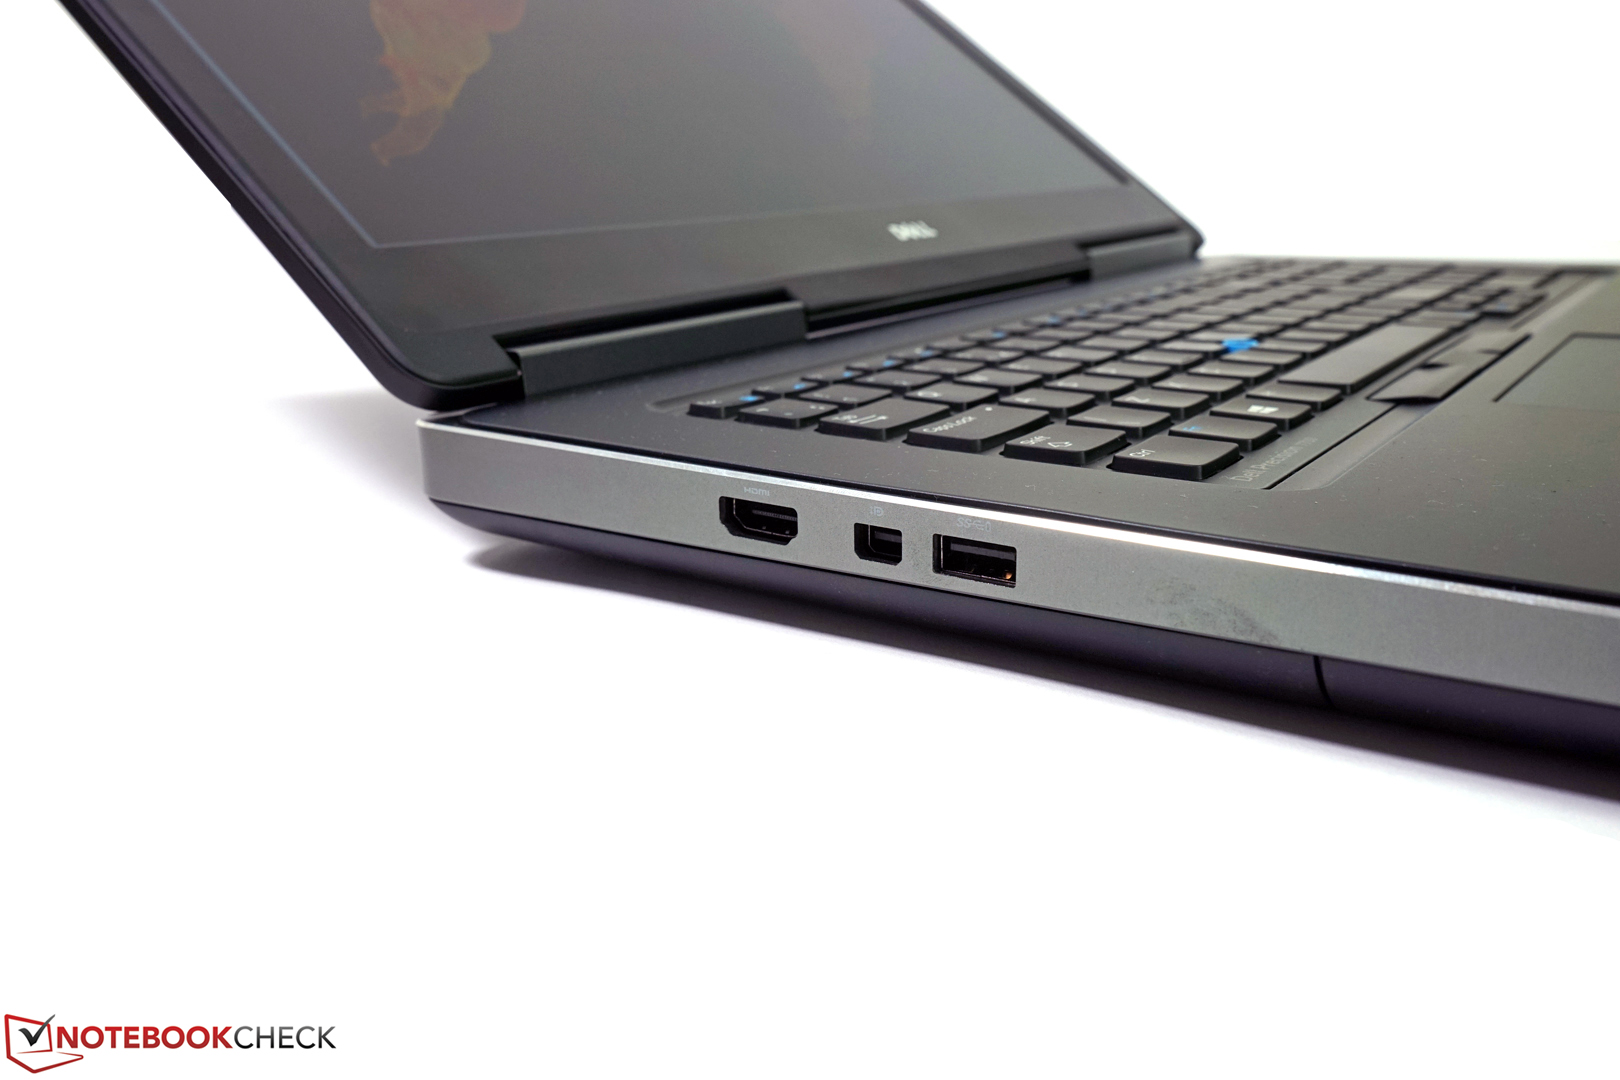
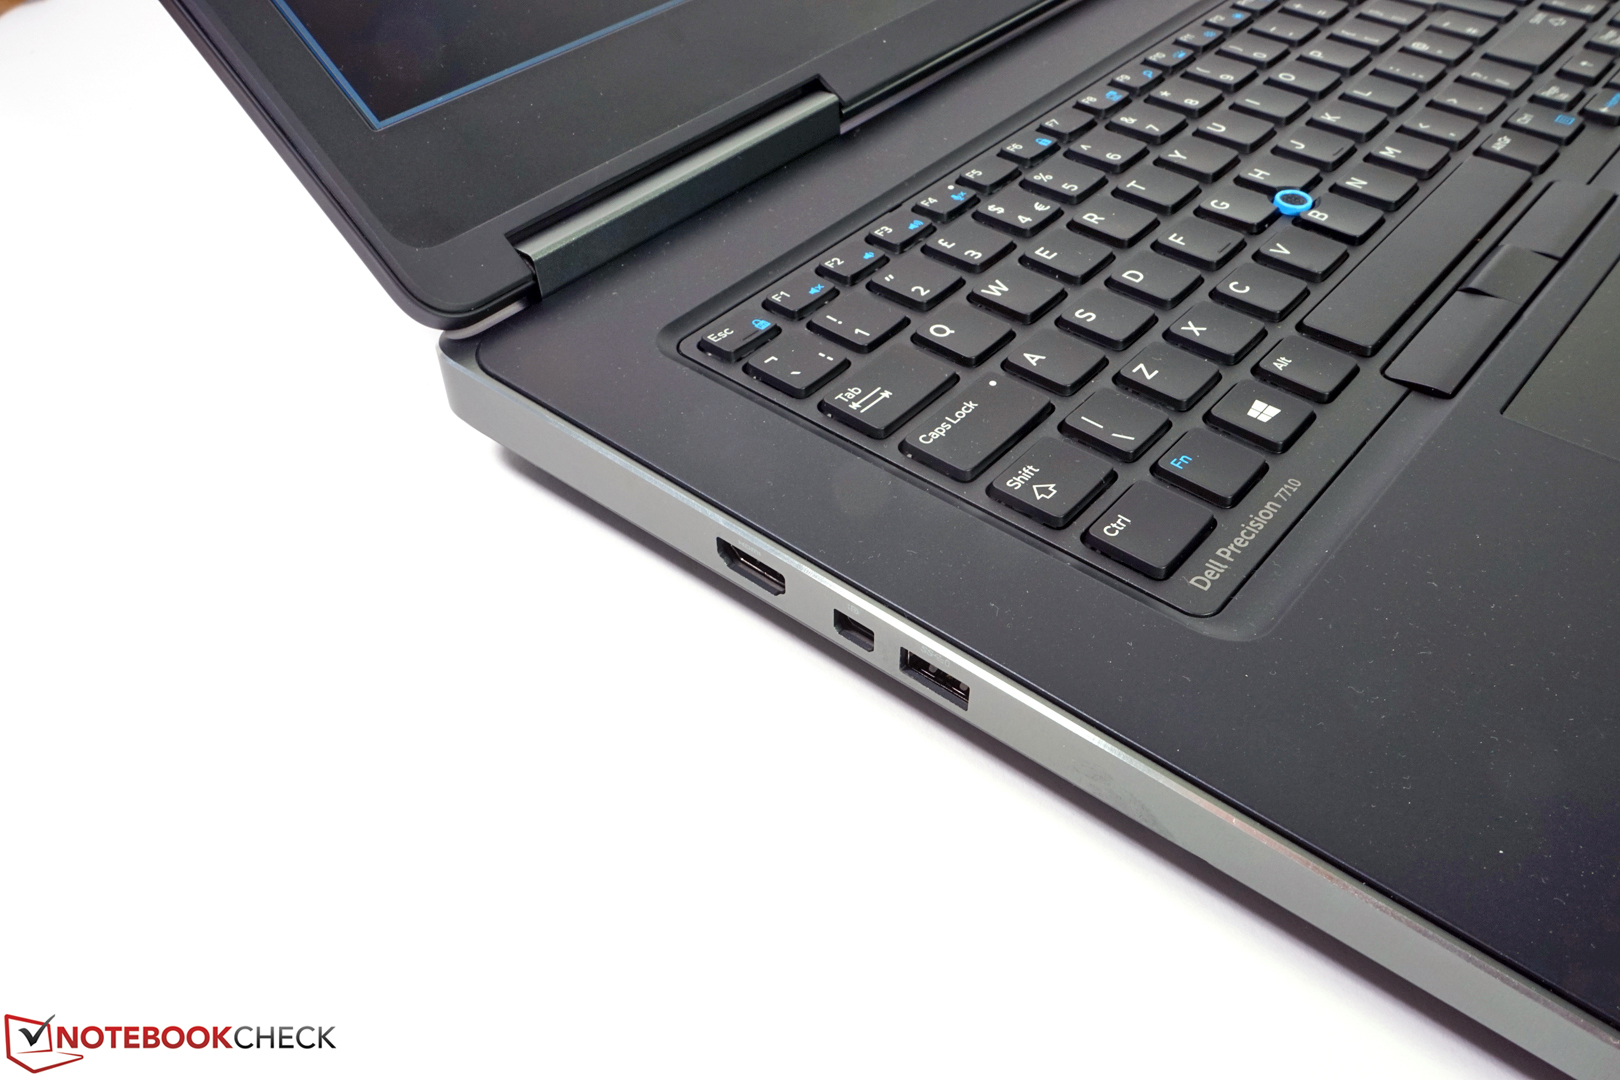
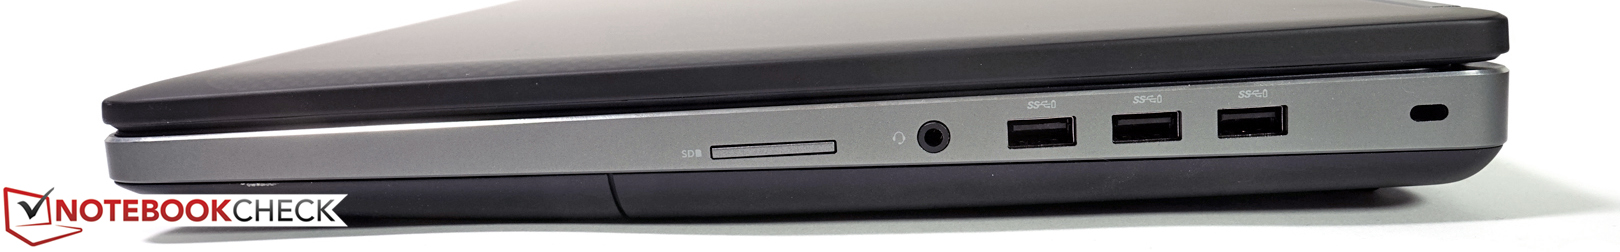
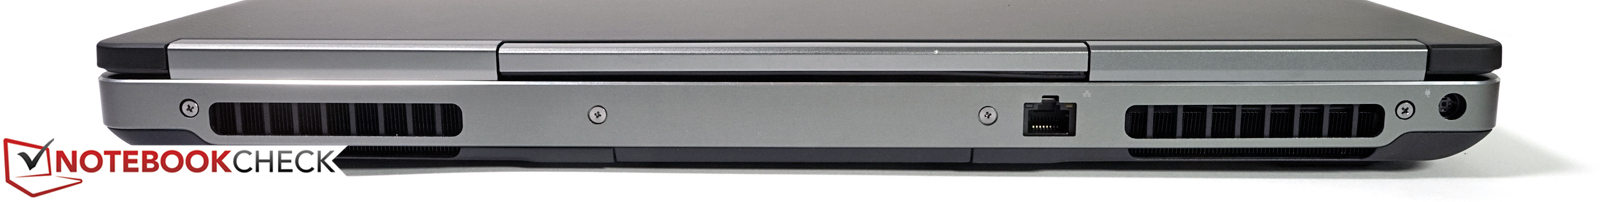
While the Dell Precision 7710's connectivity covers the most important fields of application, it could still be better for a 17-inch workstation. While older interfaces like ExpressCard slots, VGA, eSATA, or Firewire have no longer been provided by new models for a while now, you also have to do without an optical drive. On the other hand, Dell neither incorporates a Thunderbolt 3.0 port nor USB 3.1 Gen. 2 in Precision 7710 models by default. At least, Thunderbolt 3.0 is supposed to be optionally configurable from this month onwards (January 2016), which makes the device much more future-proof. Otherwise, there are an HDMI port, a mini DisplayPort, four USB 3.0 ports and a 3.5 mm combo-audio jack. We could not find further details about the HDMI port in the included information, but it appears to be HDMI 1.4, since our Viewsonic VP2780-4k cannot be driven at 60 Hz via HDMI 2.0 in its native resolution (3840x2160 pixels). However, the display works flawlessly when connected via DisplayPort.
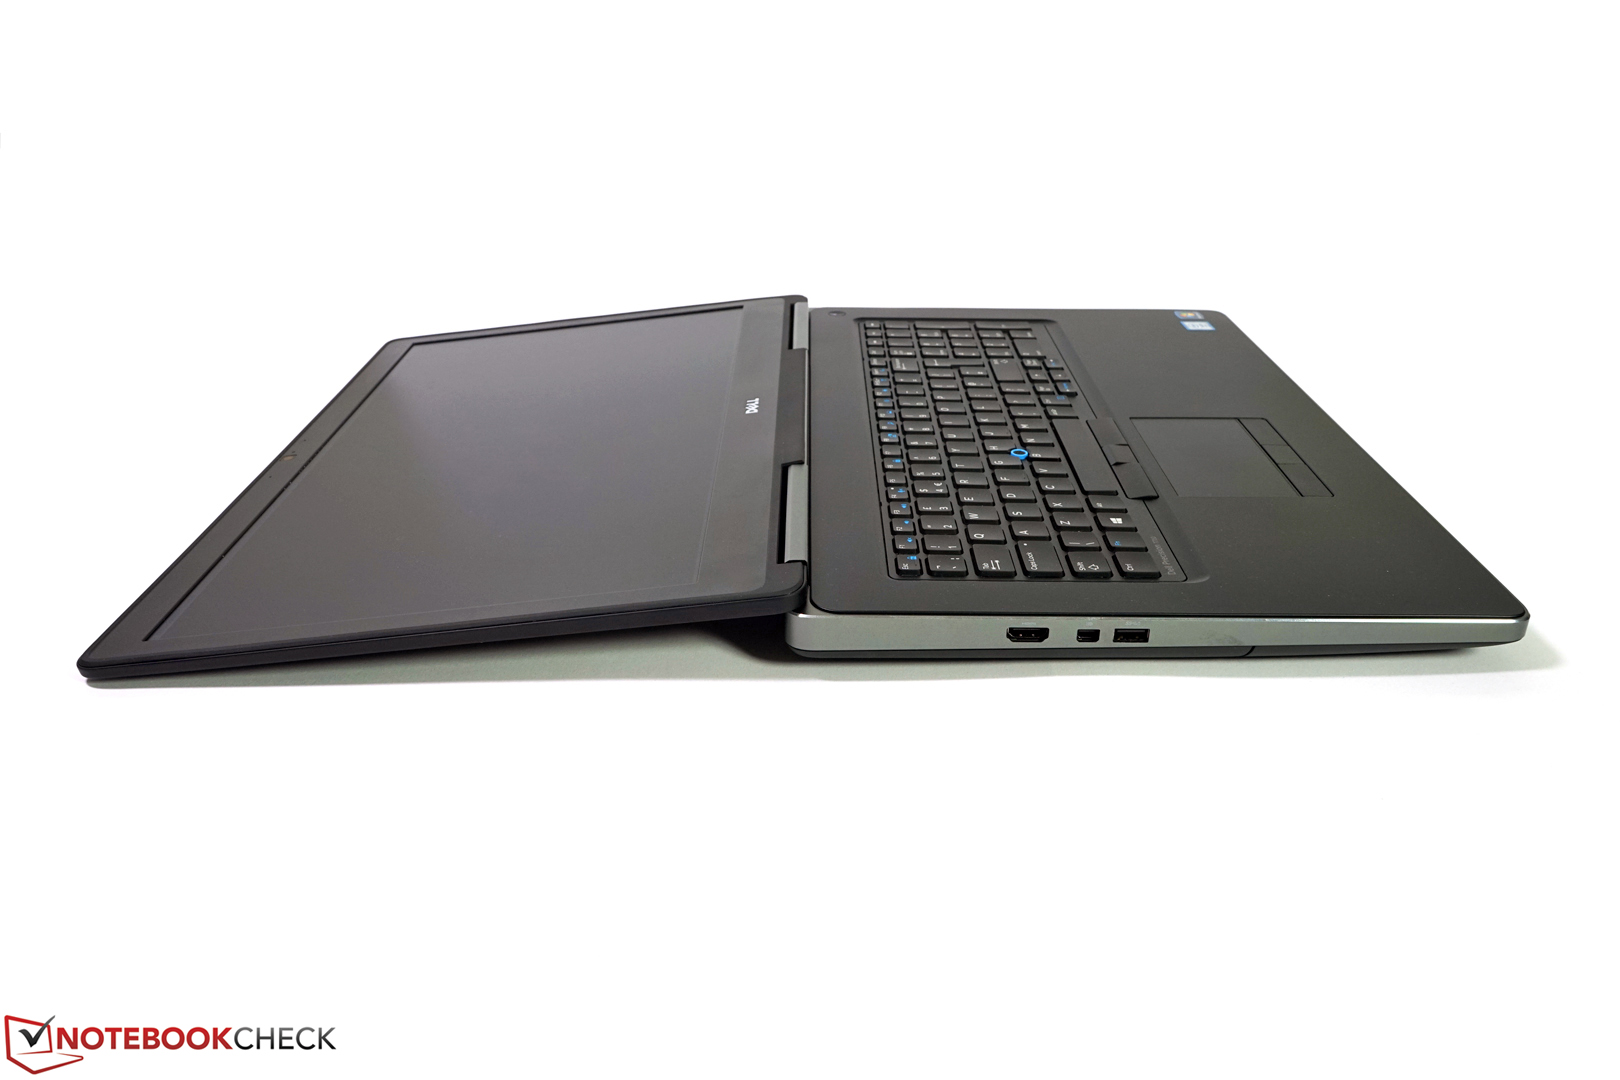
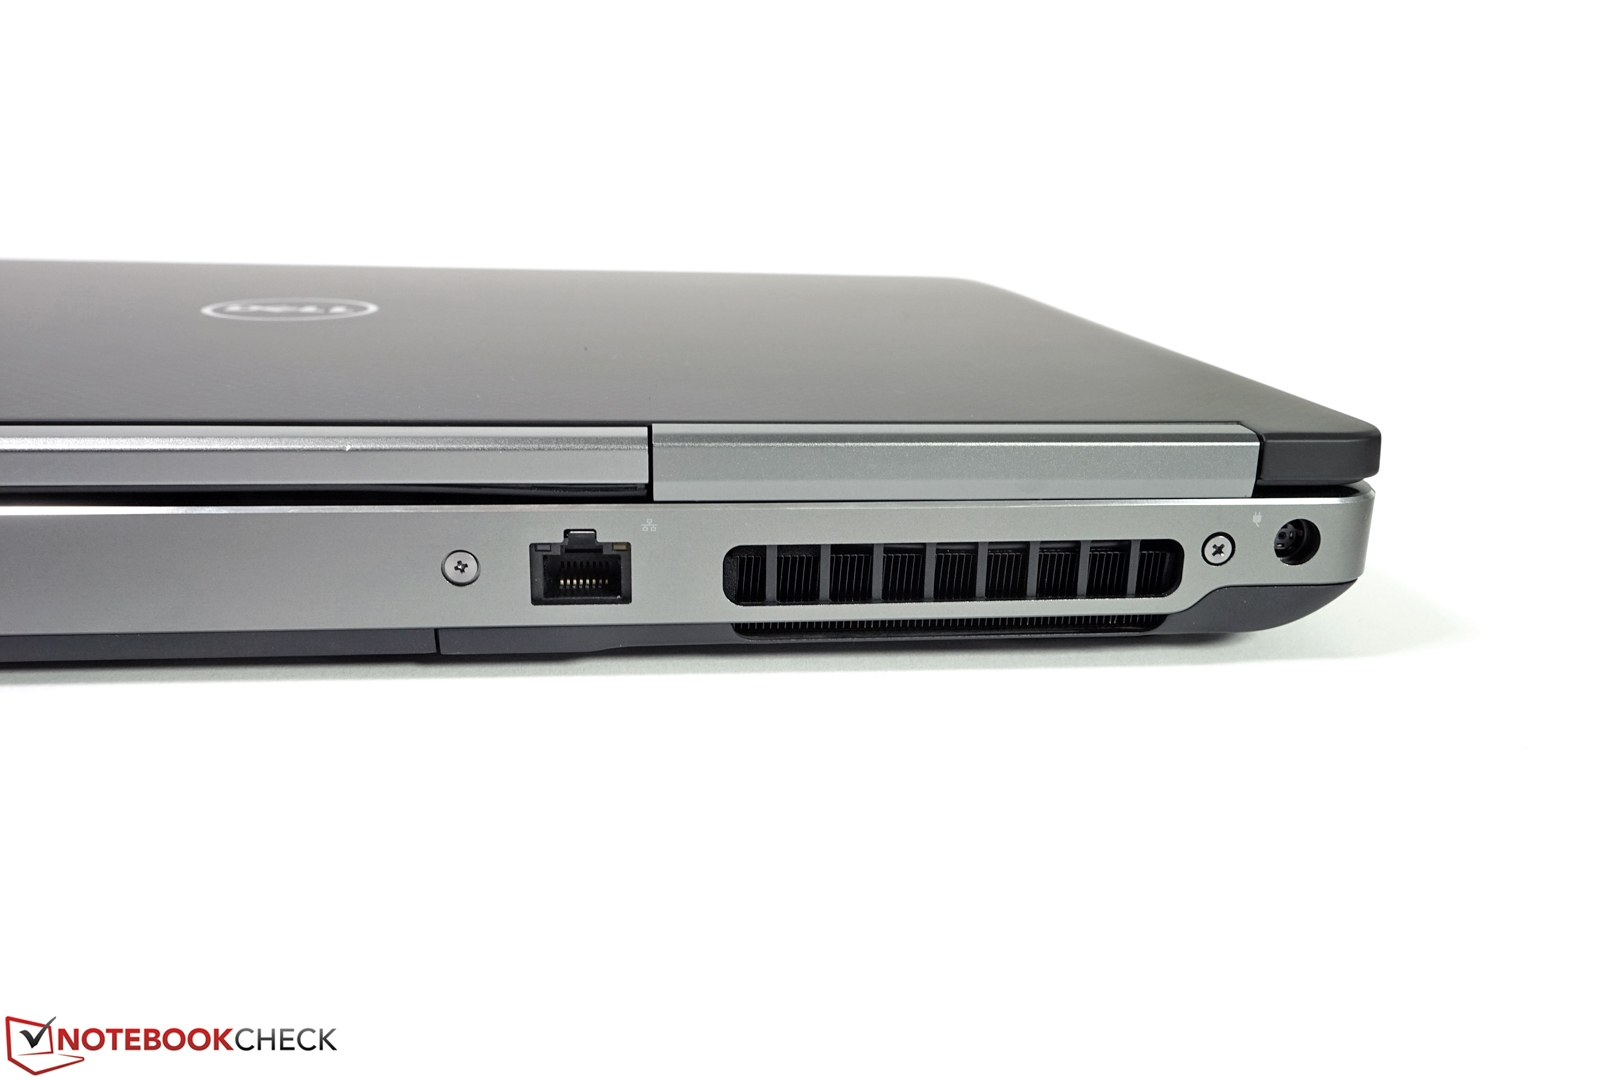
The interface layout is quite convenient overall. The USB ports on the right side are not too close to each other, the card reader is easily reachable and the rear-faced Ethernet port is convenient for stationary use. Some users might also wish for display ports or at least a USB port on the rear side in order to connect peripherals in an undisturbed way without requiring a docking station. On the other hand, those who often connect their laptop to different displays might find it convenient that the display ports are easily reachable on the left side.


Communication
Intel's Dual Band Wireless 8260 AC-WLAN, Gigabit-LAN, and an HD webcam cover the usual communication features. The WLAN signal is 2-3 bars with a distance of about 15 meters from a FritzBox 7490 and through several walls. In practice, the connection quality was always good without noticeable interruptions or disconnections.
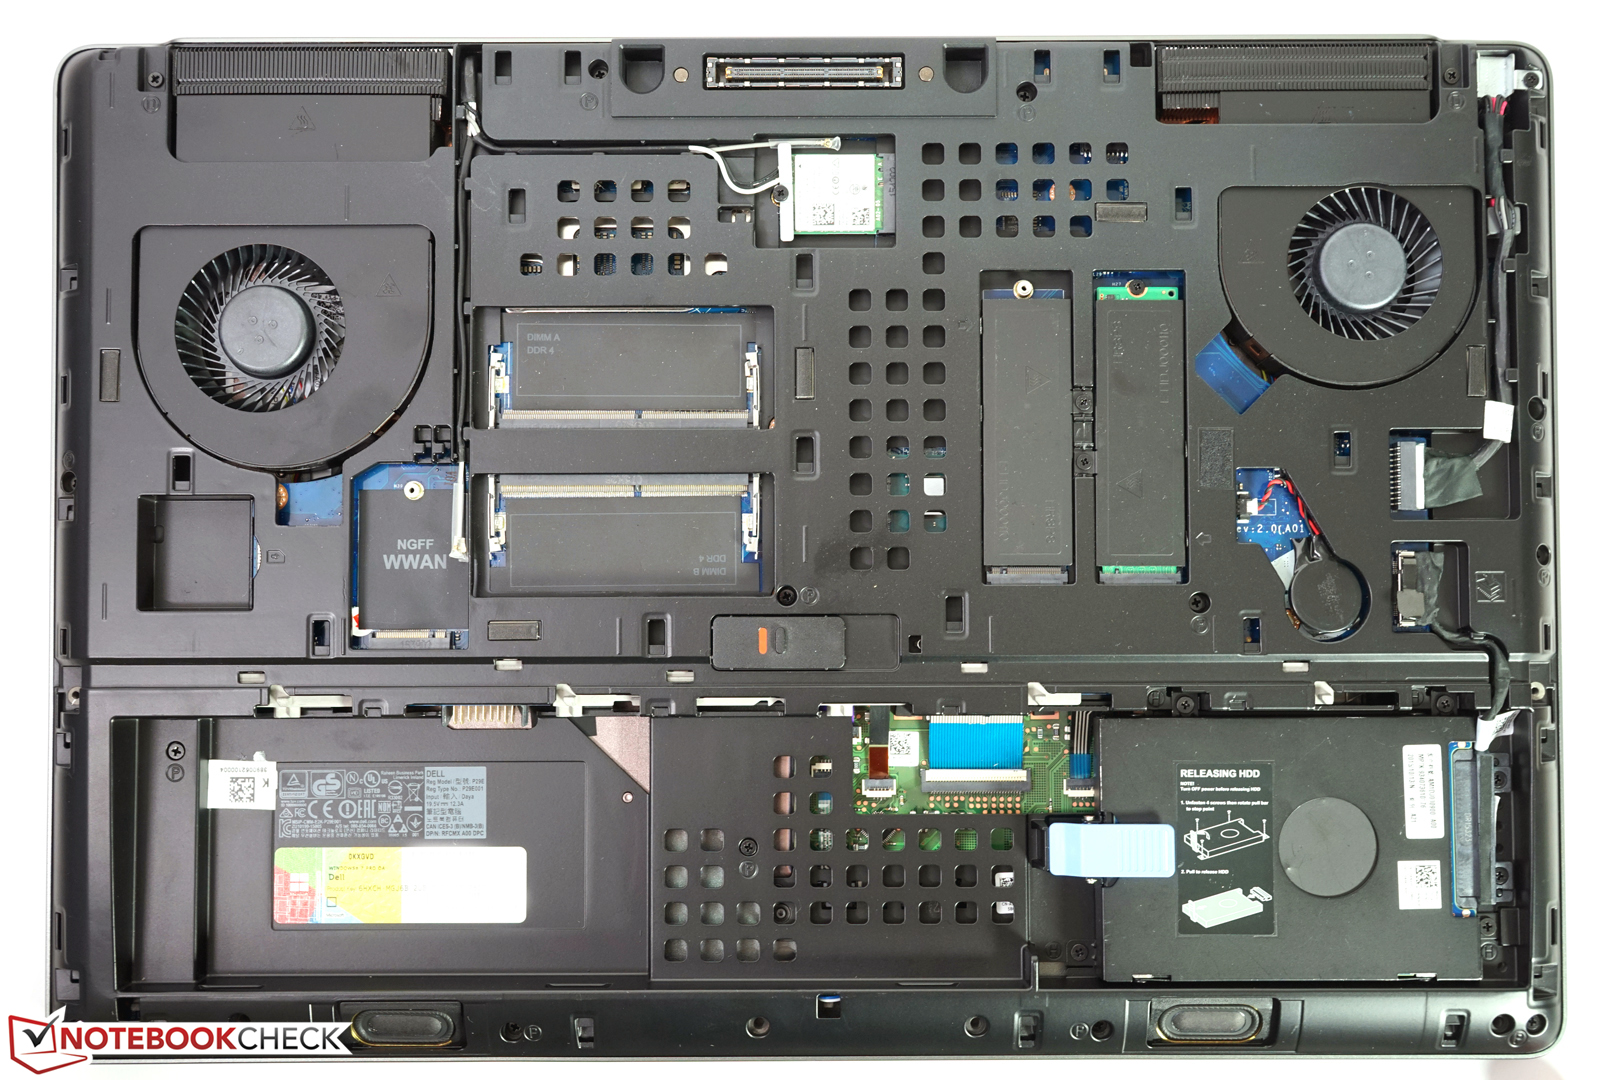
In addition, it is possible to add a mobile broadband module for fast network connections on the move. The necessary cables are available. At the time of testing, the Dell Wireless DW5811e card for mobile broadband, LTE/HSPA+ (gross price of about 110 Euros, ~$120) is available in the online shop. However, the SIM slot is unfavorably placed immediately beside the WWAN slot. Those who often swap cards will have to remove the screwed part of the underside all the time.
The web cam features a resolution of 1280x720 pixels and is a standard model, which delivers a passable video quality for chats and conferences in well-lit places. In poor light, artifacts, noise, and color shifts build up and the quality diminishes notably.
Security
In general, there are many security features available for the Precision 7710. However, our test model does not come with the optional smartcard reader or fingerprint reader. Thus, apart from the Trusted Platform Module (TPM) 1.2, users have only basic security features available with a Kensington lock slot and the usual password options on BIOS or system level. As usual, Computrace service or self-encrypting drives have to be bought separately.
Accessories
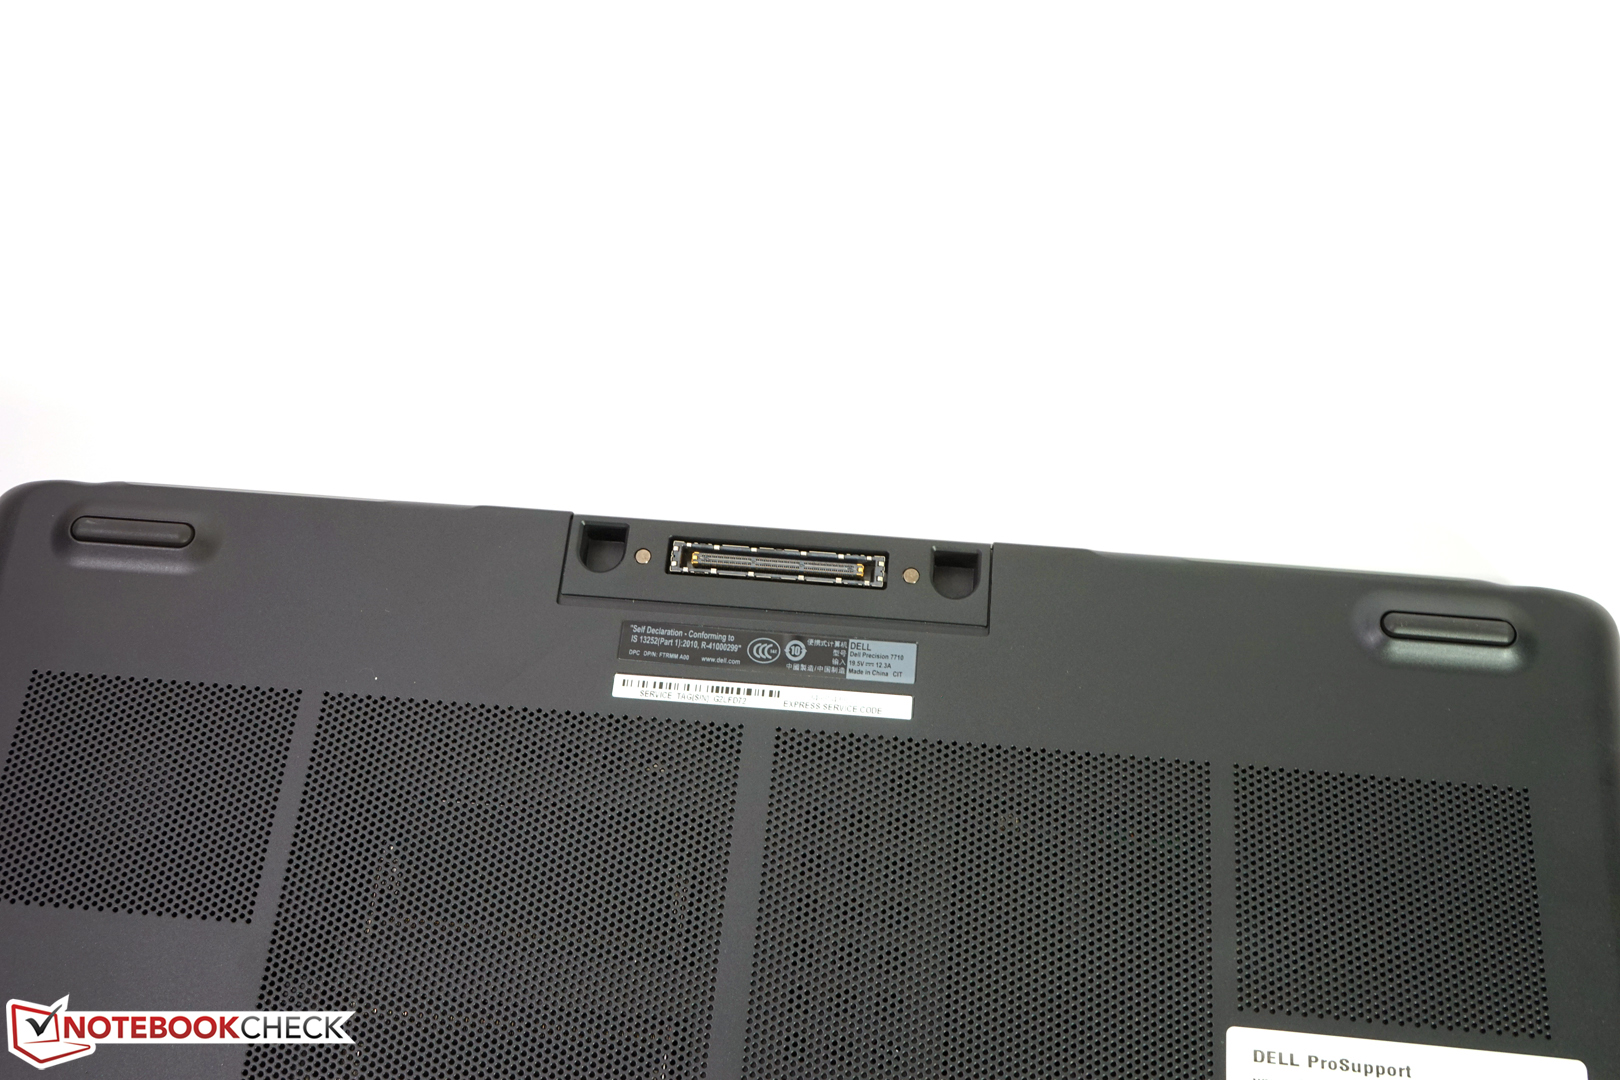
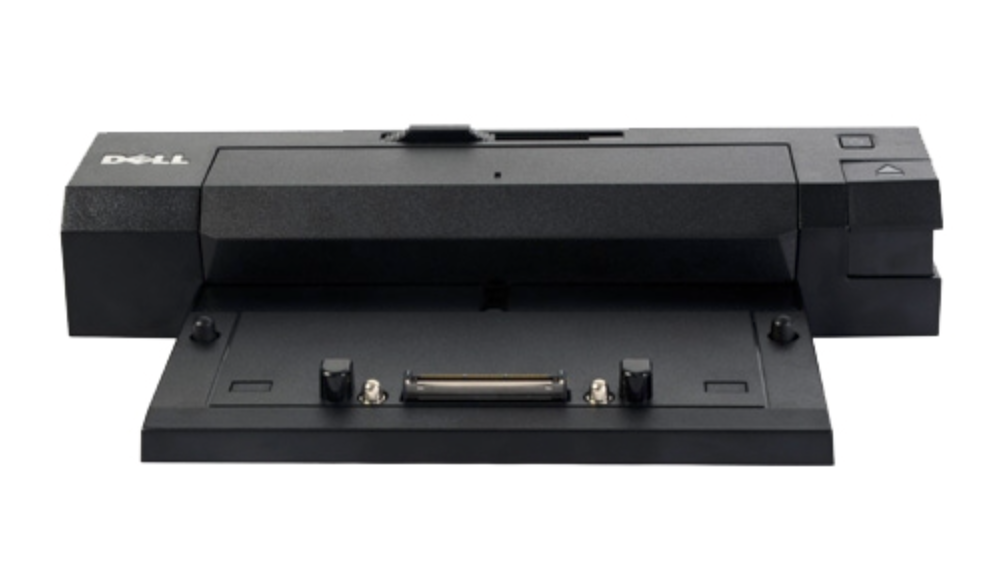
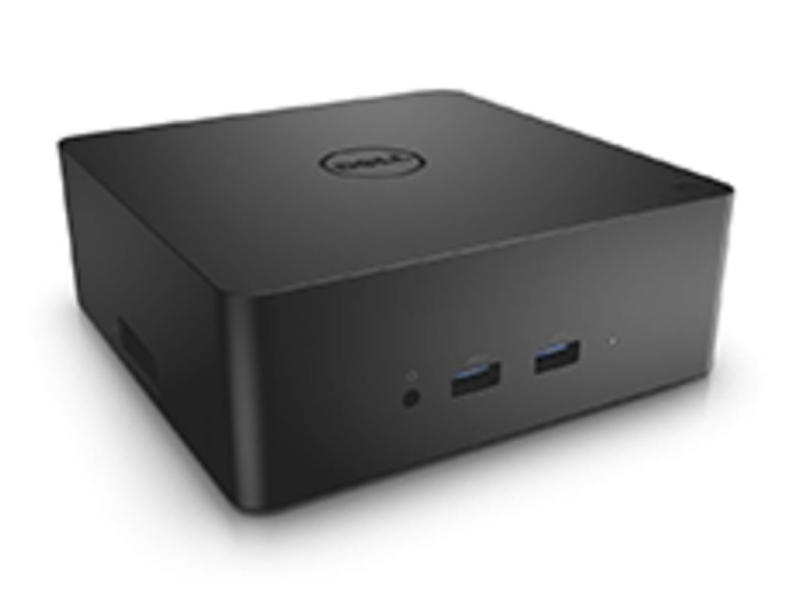
According to Dell, the current business series will be the last ones with a proprietary docking port. Dell will gradually switch to the universal Thunderbolt 3.0 port in their complete line-up. Dell's Advanced and Simple E-Port-II replicators (about 300 and 270 Euros, ~$327 and ~$294) can still be used here, but future series will no longer support them. Those who already own a docking station or other devices of the older series can continue to use them with the current Precisions. However, we recommend waiting for a Thunderbolt model if you are planning a completely new environment, in order to avoid the need for a new docking station with the next model change.
Otherwise, Dell does not offer any model specific accessories apart from a 91 Wh battery. The Precision cannot use removable tray modules and an external graphics solution via Thunderbolt is also not in sight.
Maintenance
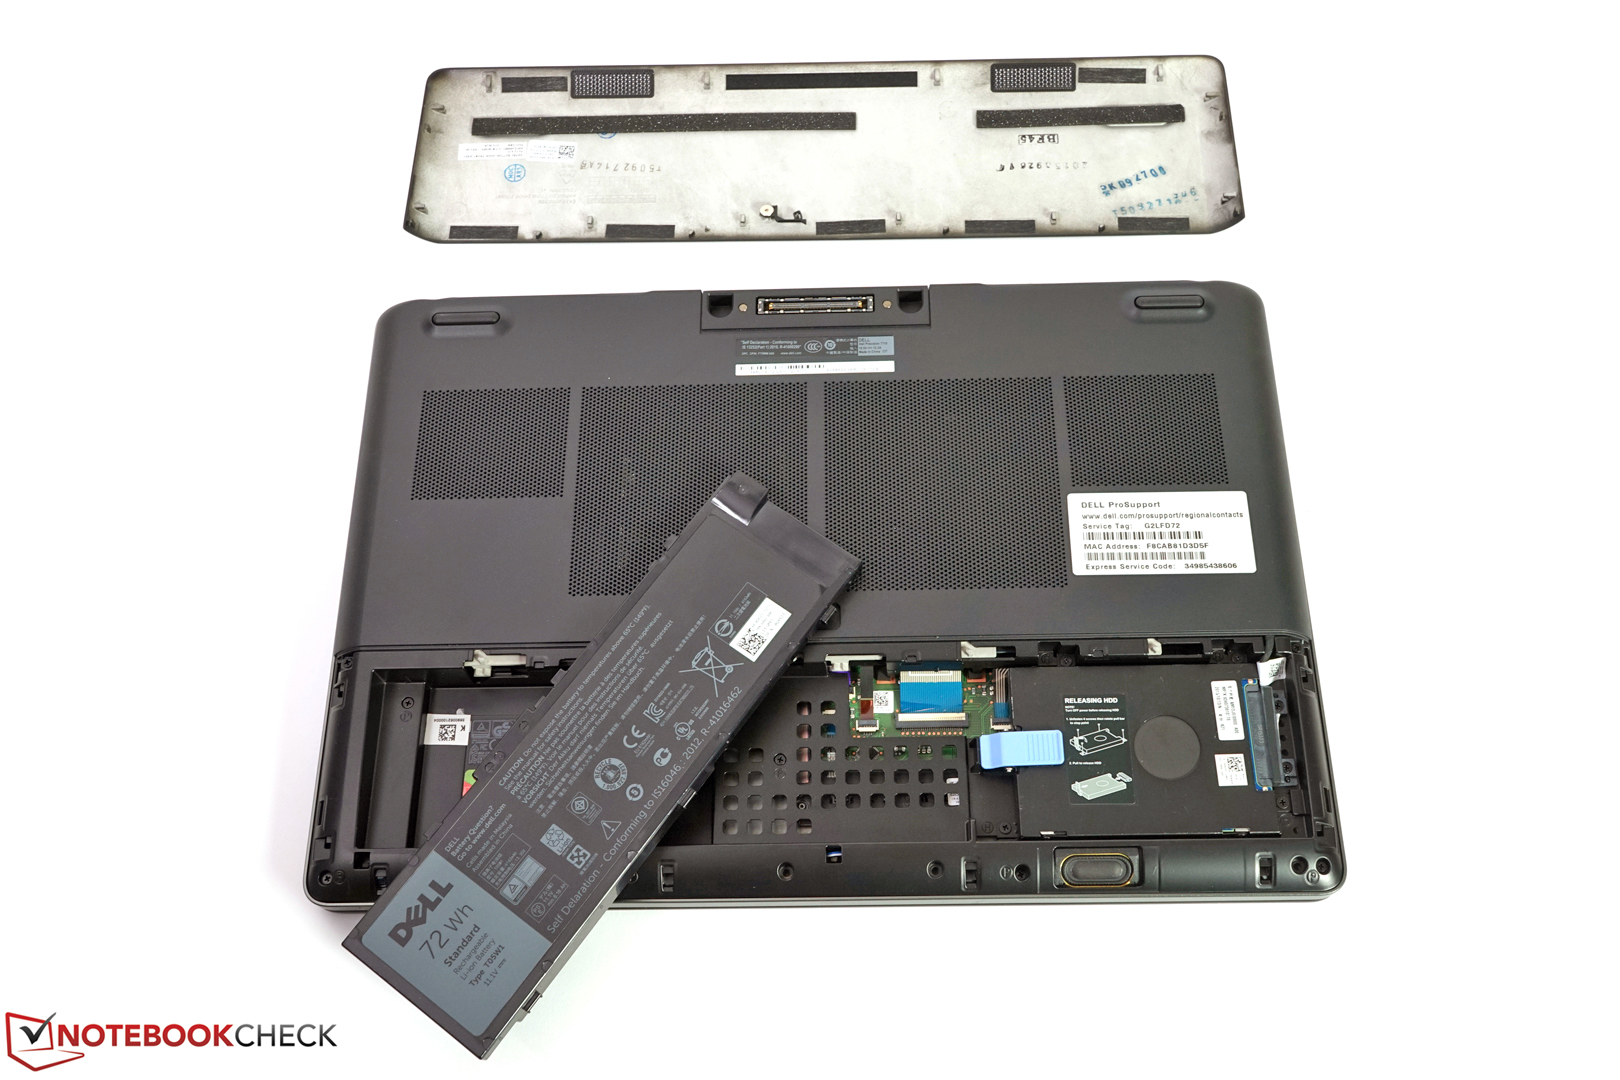
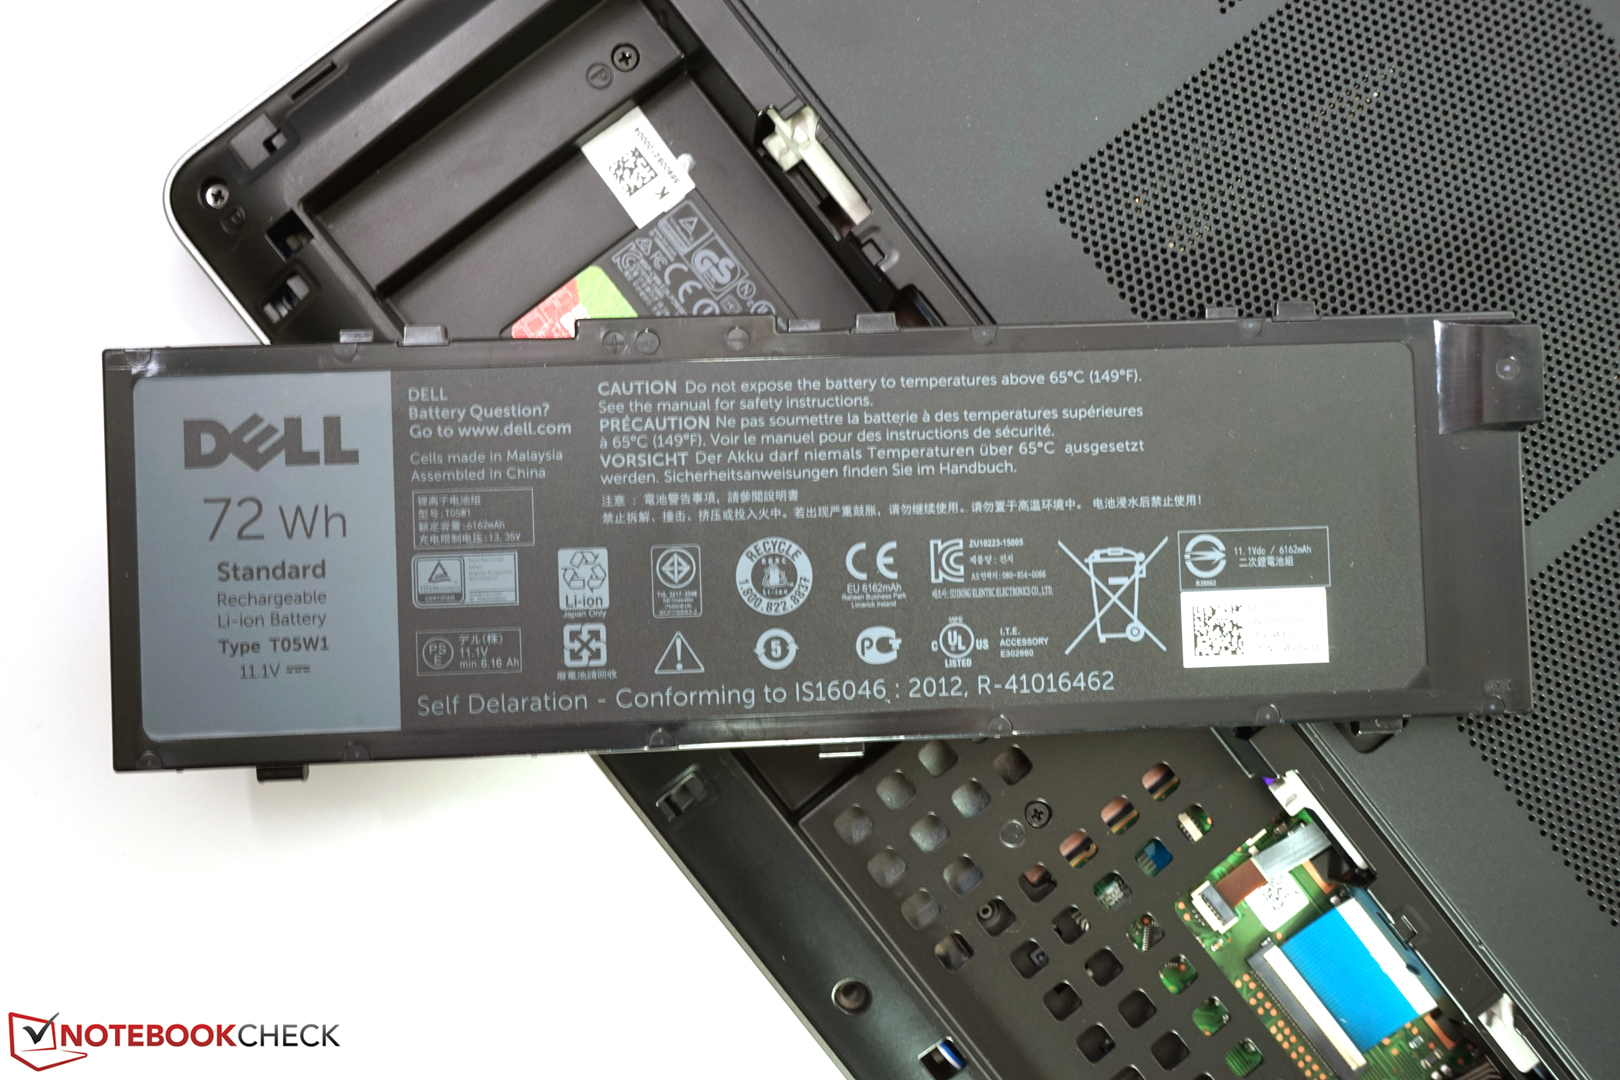
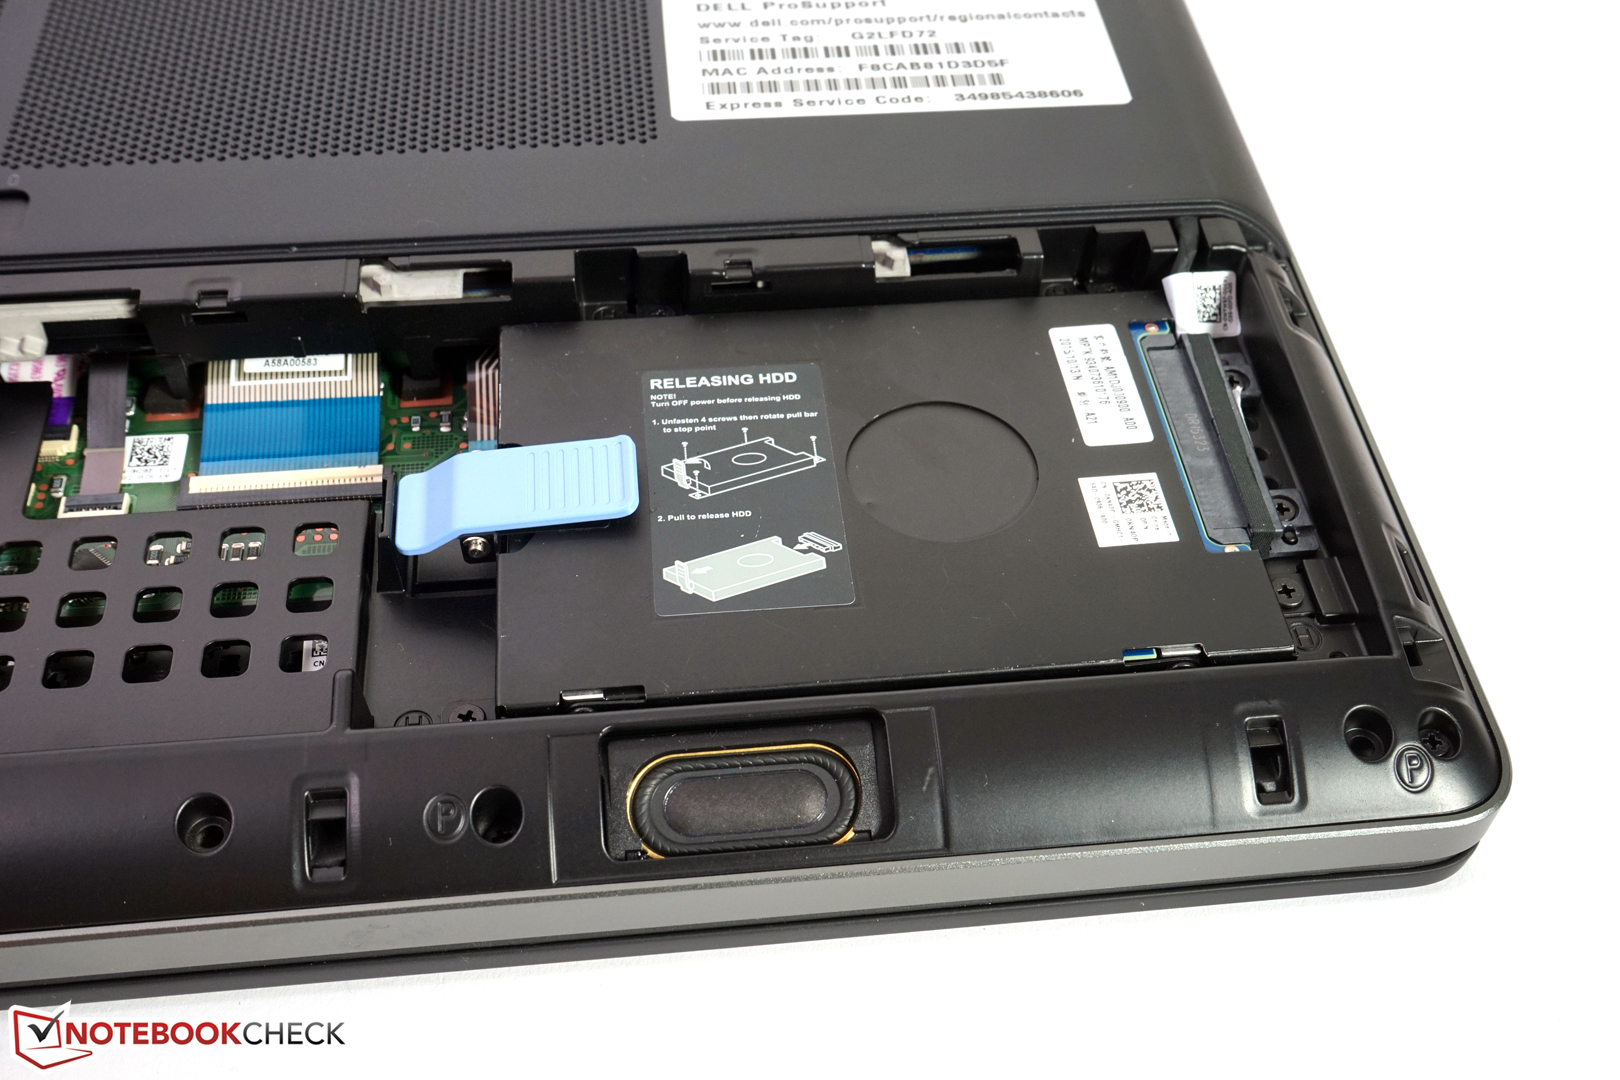
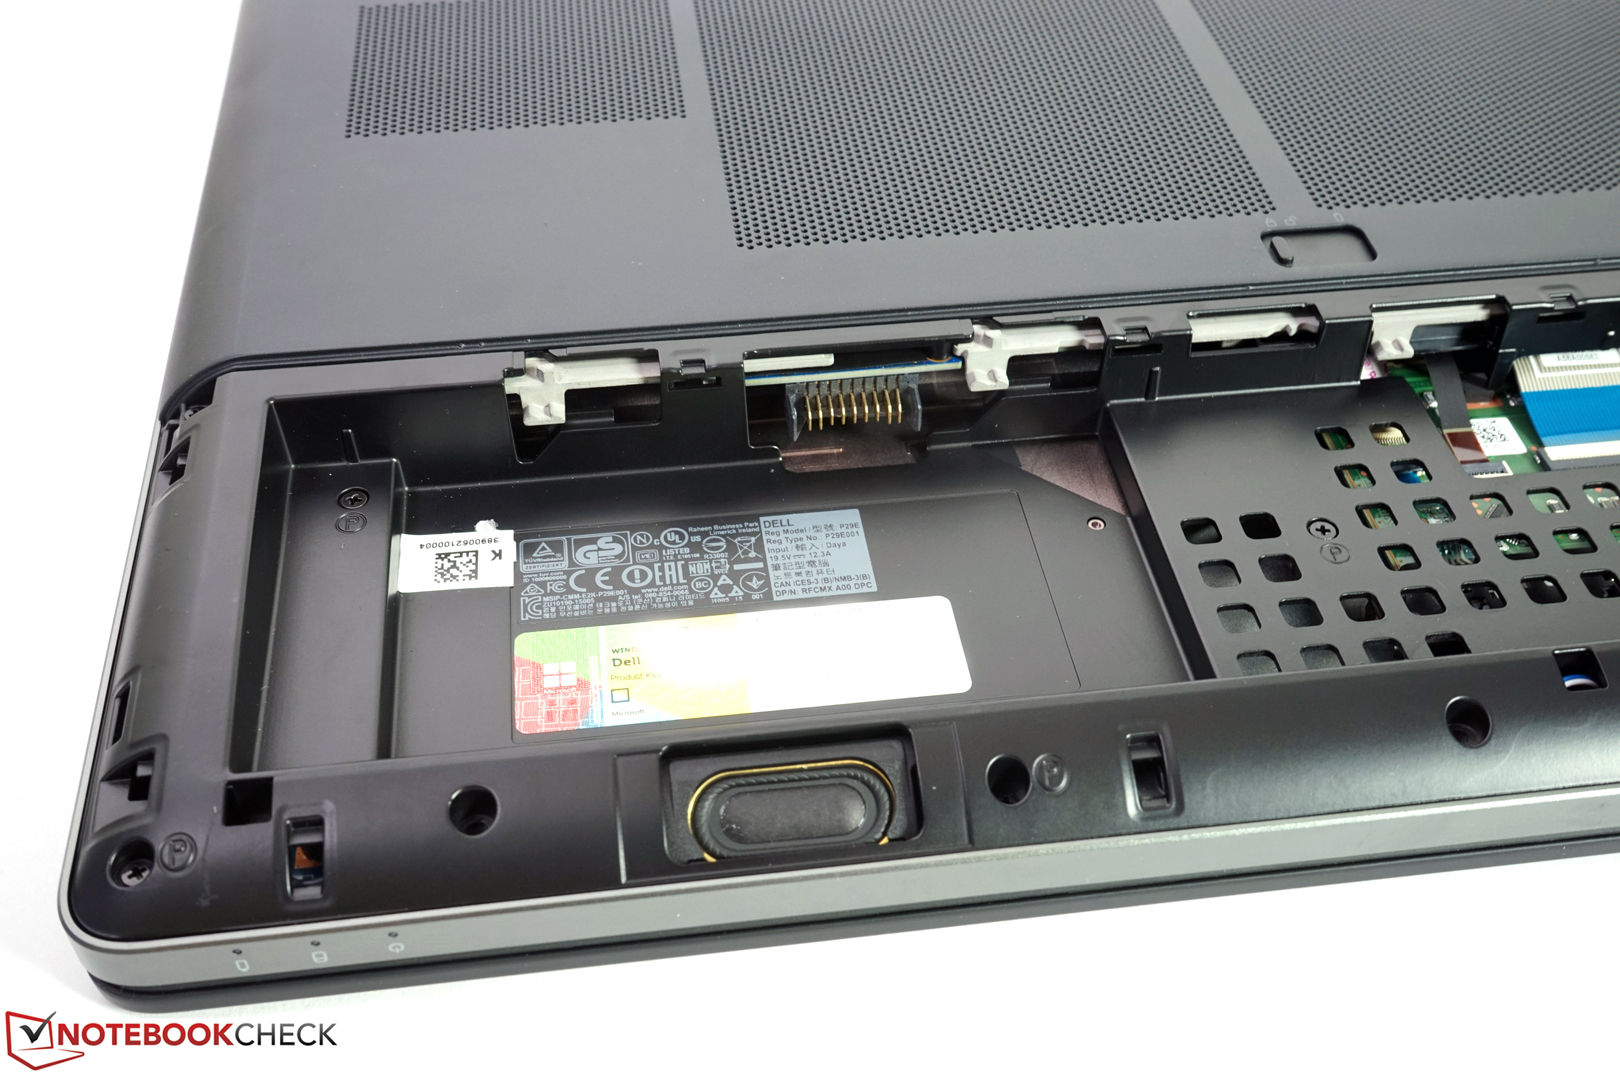
As the front part of the underside is fixed without screws, you can quickly reach the battery and the 2.5-inch drive. However, you have to loosen two screws and remove the back part of the underside to get to the M.2 slots or two RAM slots. In general, Dell's Owner's Manual describes in detail how to get to each component. Thus, it is not a problem to reach the RAM slots beneath the keyboard or clean the fans.
Warranty
Dell includes a manufacturer's warranty of 36 months including ProSupport with on-site service on the next workday. You can either reduce it to basic support on the next work day (minus 180 Euros, ~$196) or expand it in many ways. For example, the gross price for five years ProSupport with on-site service on the next workday is currently about 370 Euros (~$404).
Input Devices
Keyboard
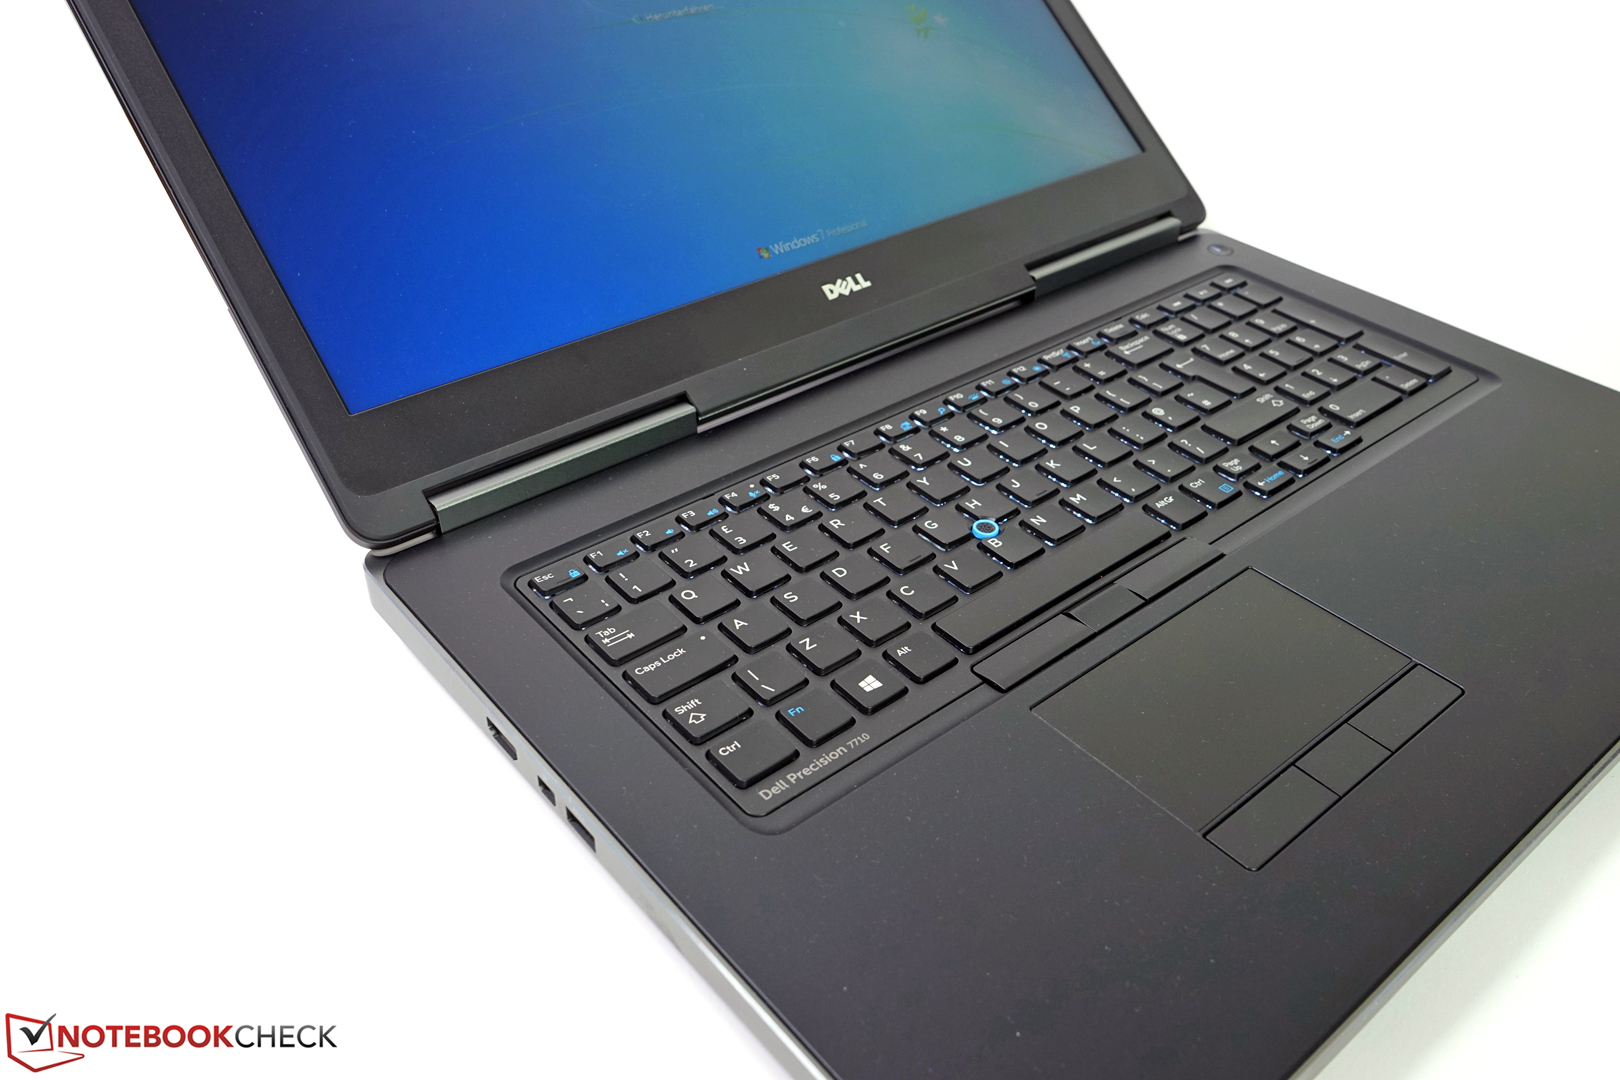
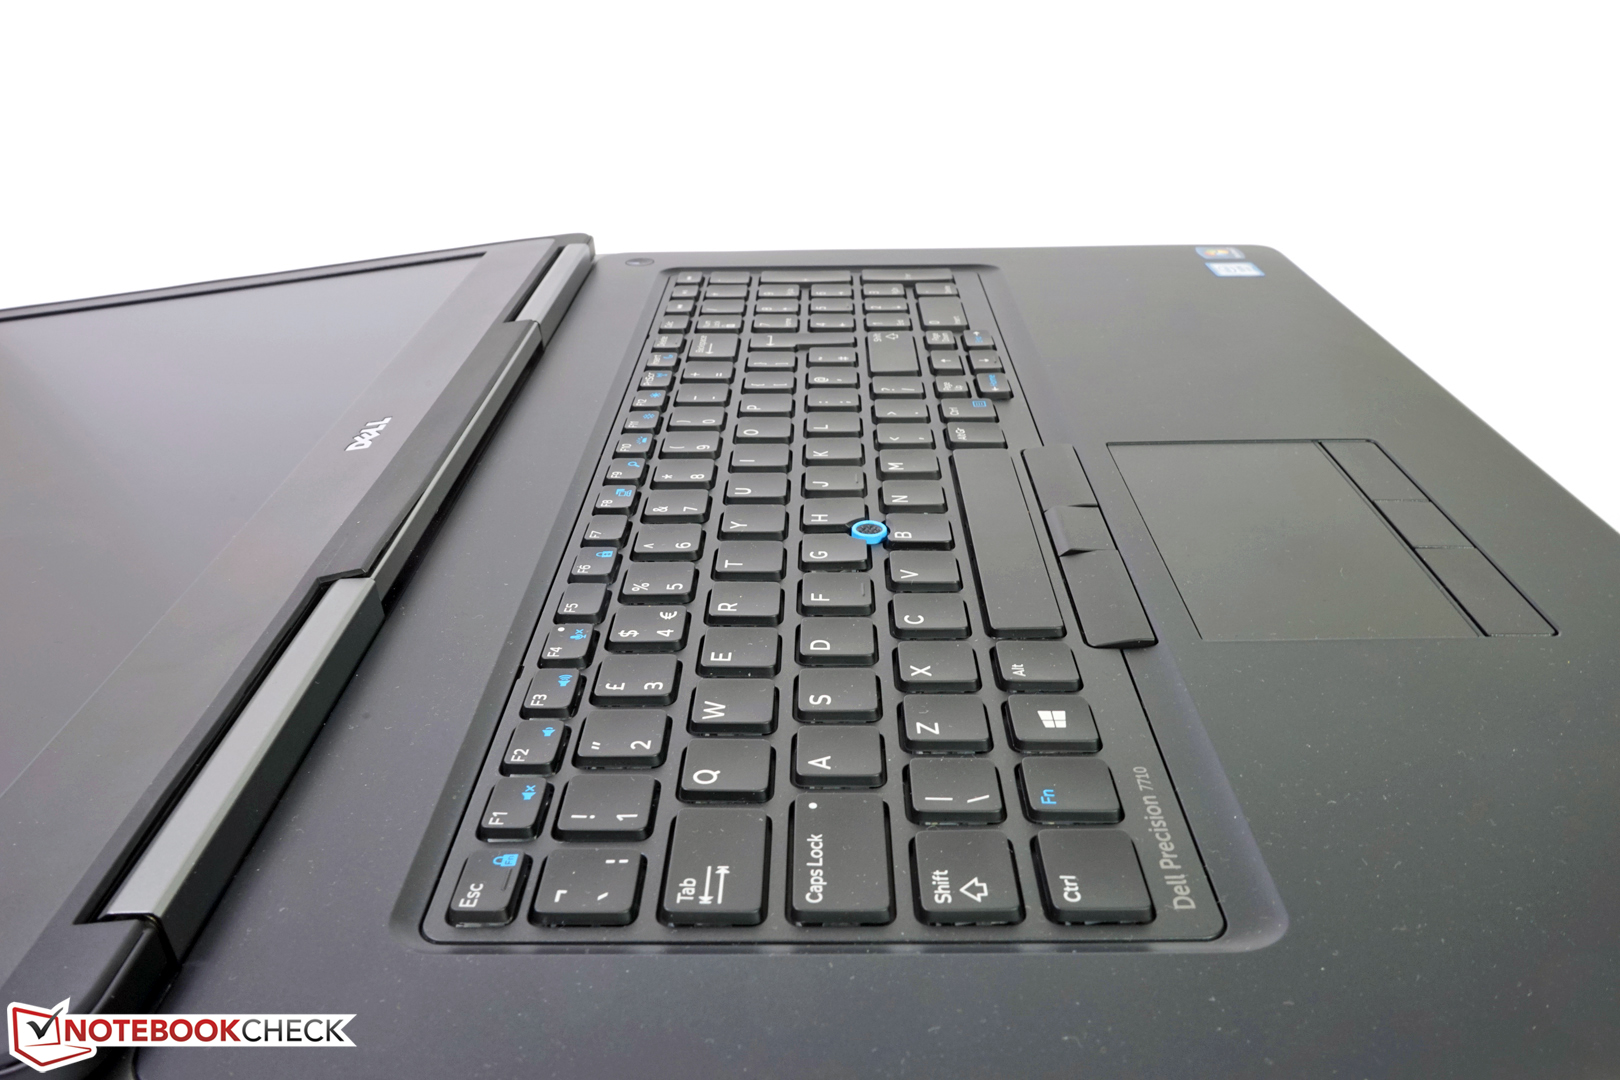
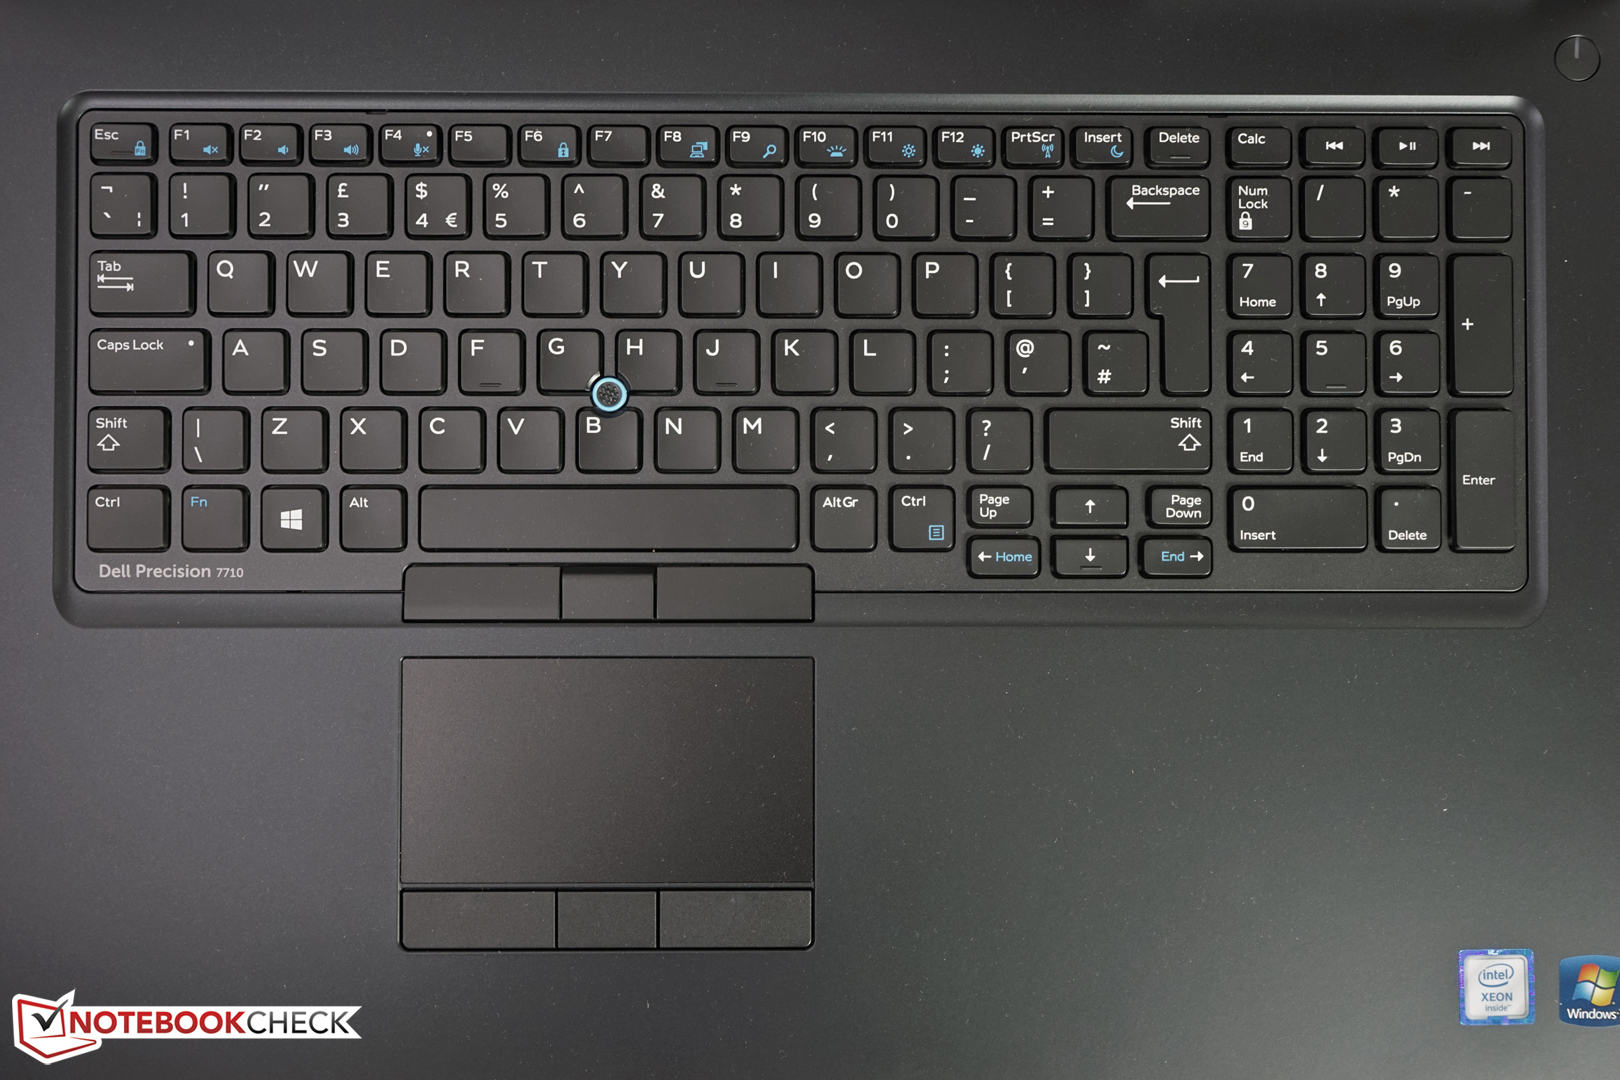
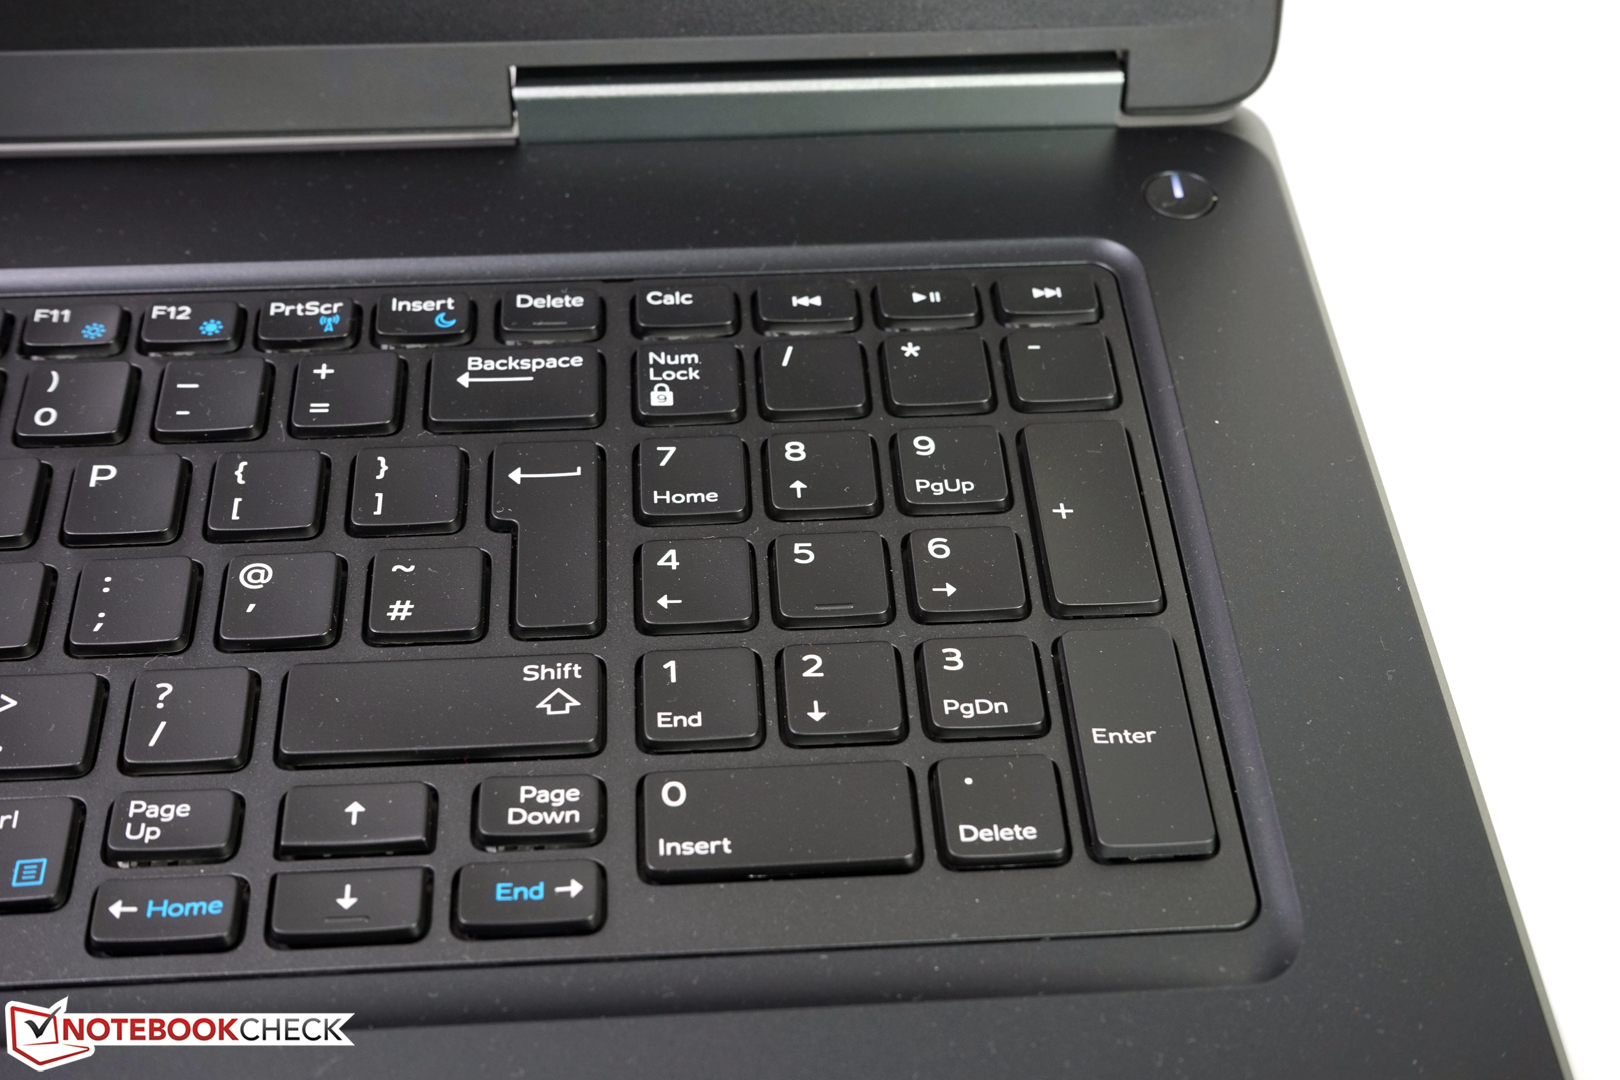
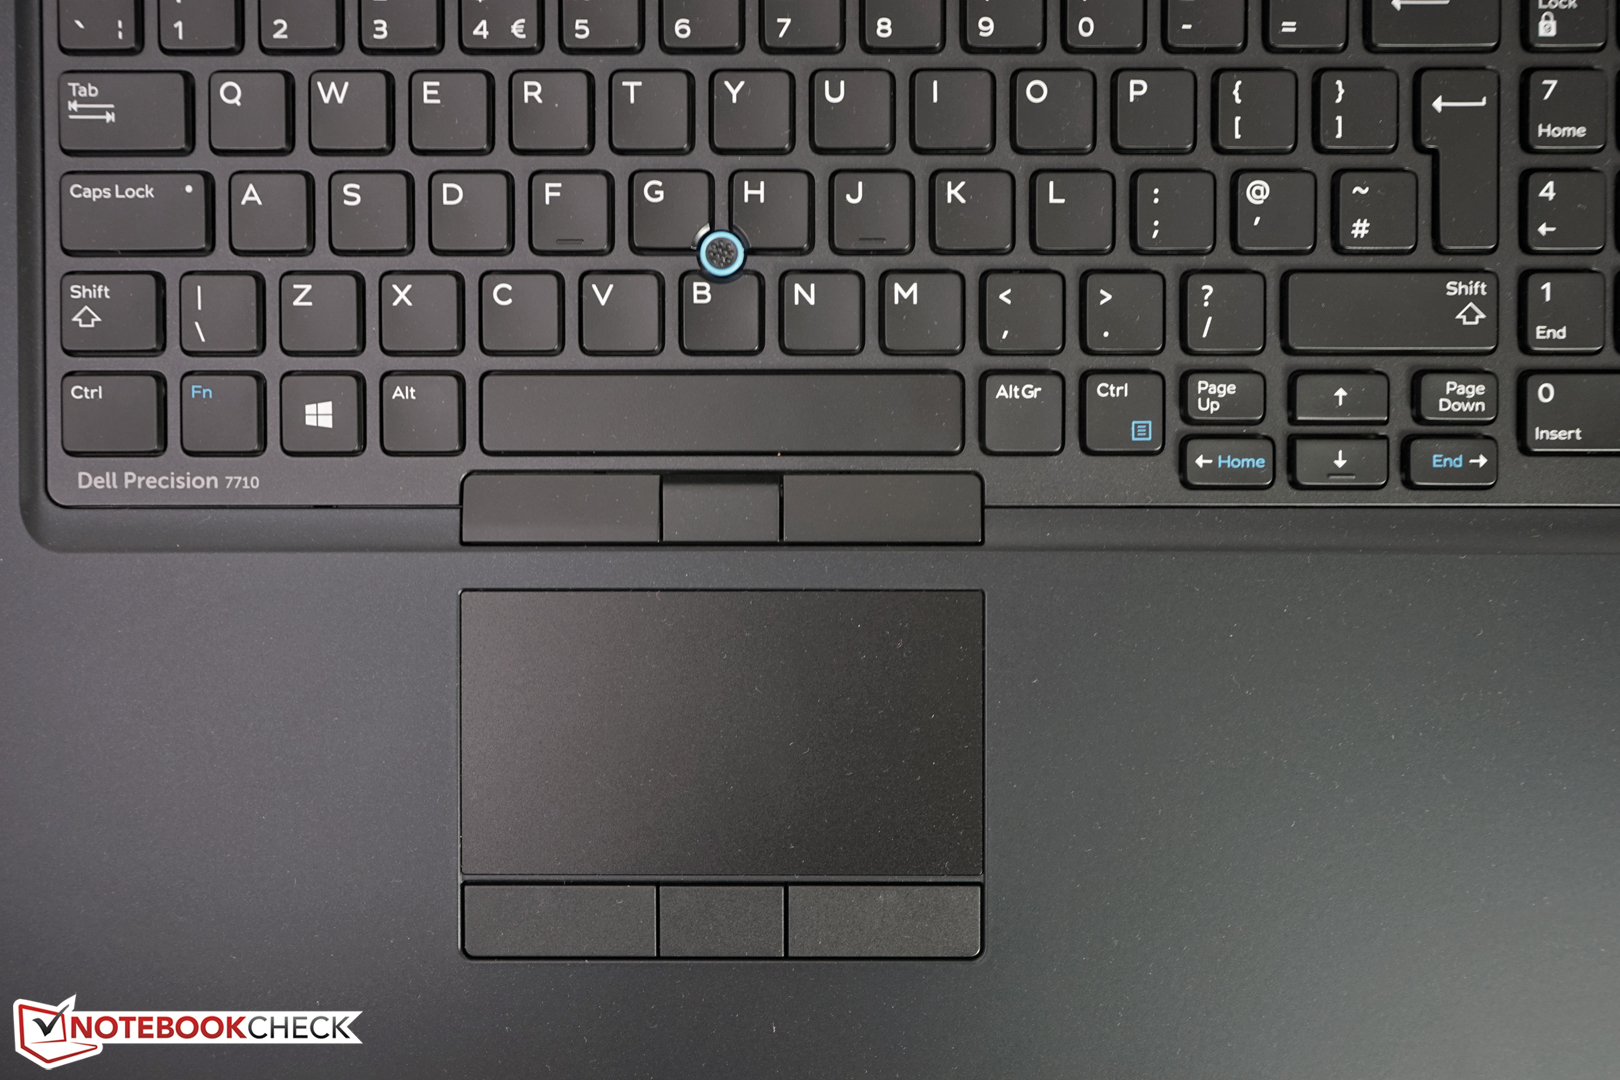
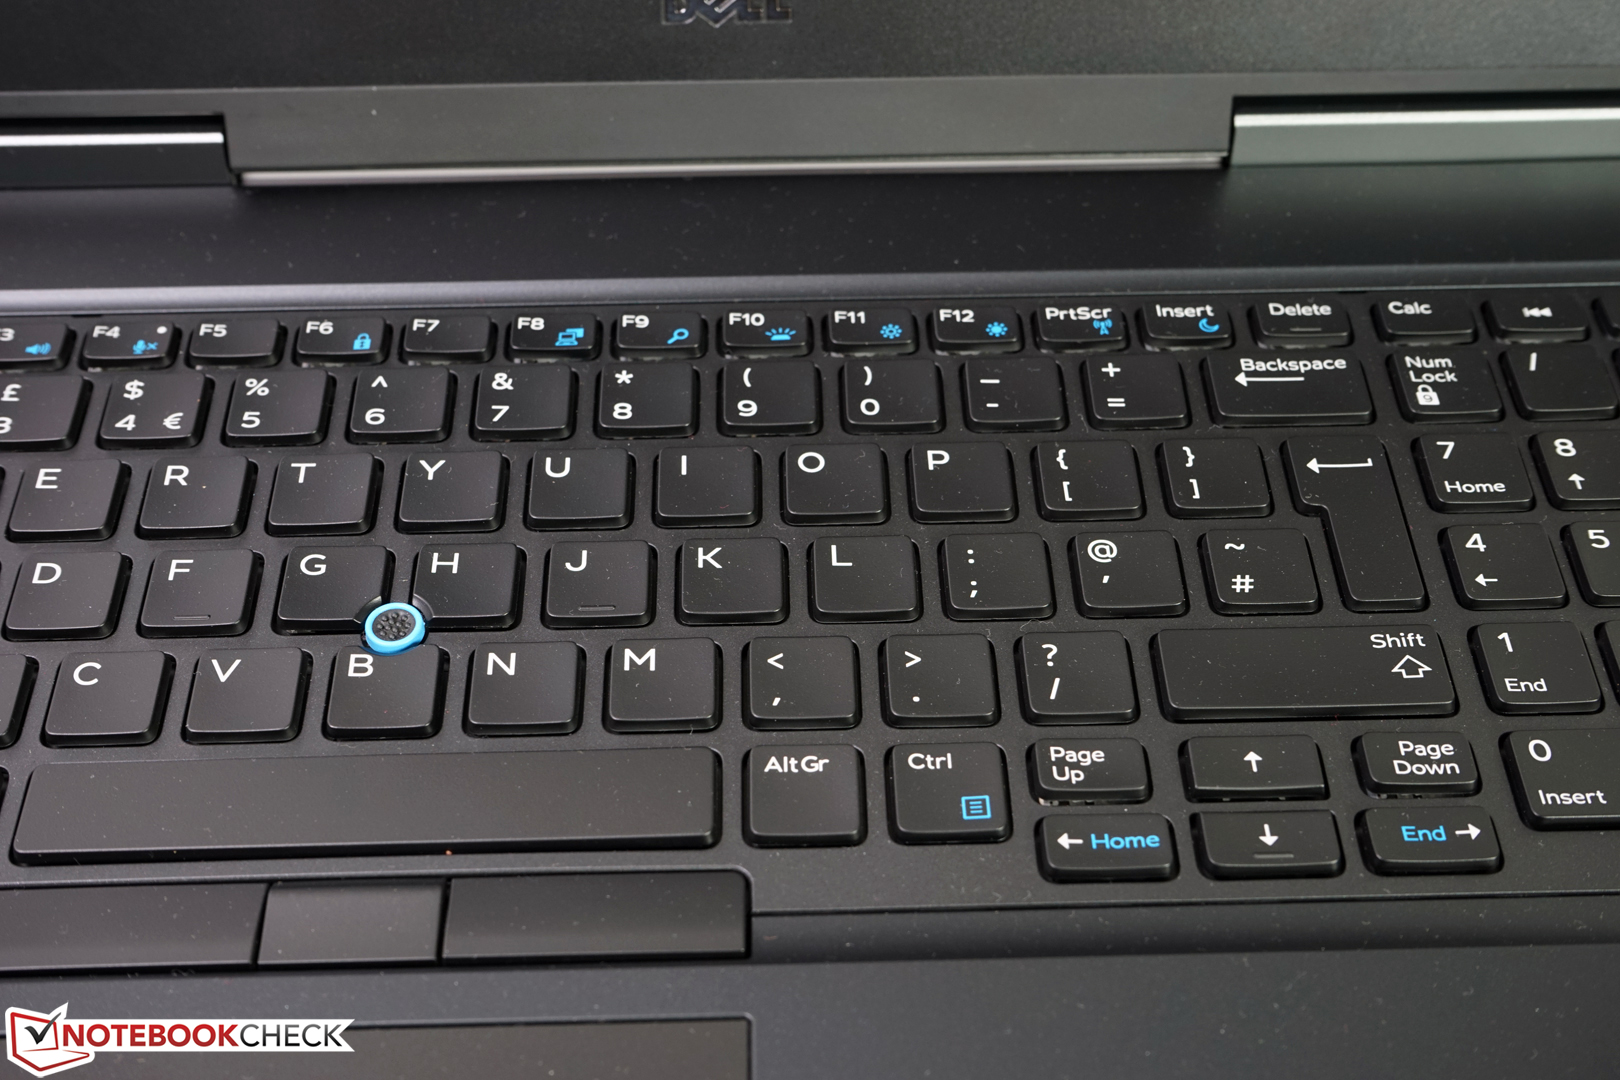
The keyboard of the Precision 7710 features big keys in a 19 mm grid and a separate number block. As a result, the touchpad had to be, as usual, moved to the left, which might not be convenient for all users. In return, number crunchers will be happy about an easy way to input numbers. The key labels are contrast-rich and our test model features a US / international QWERTY layout. In Germany, the usual QWERTZ layout is pre-selected. The keyboard light features two levels and makes for comfortable working in poor light. Shortcuts via FN combination are highlighted in a light blue font. Thanks to medium key travel, good pressure point and relatively quiet noise, the keyboard is a very good and should also satisfy most prolific writers.
Touchpad
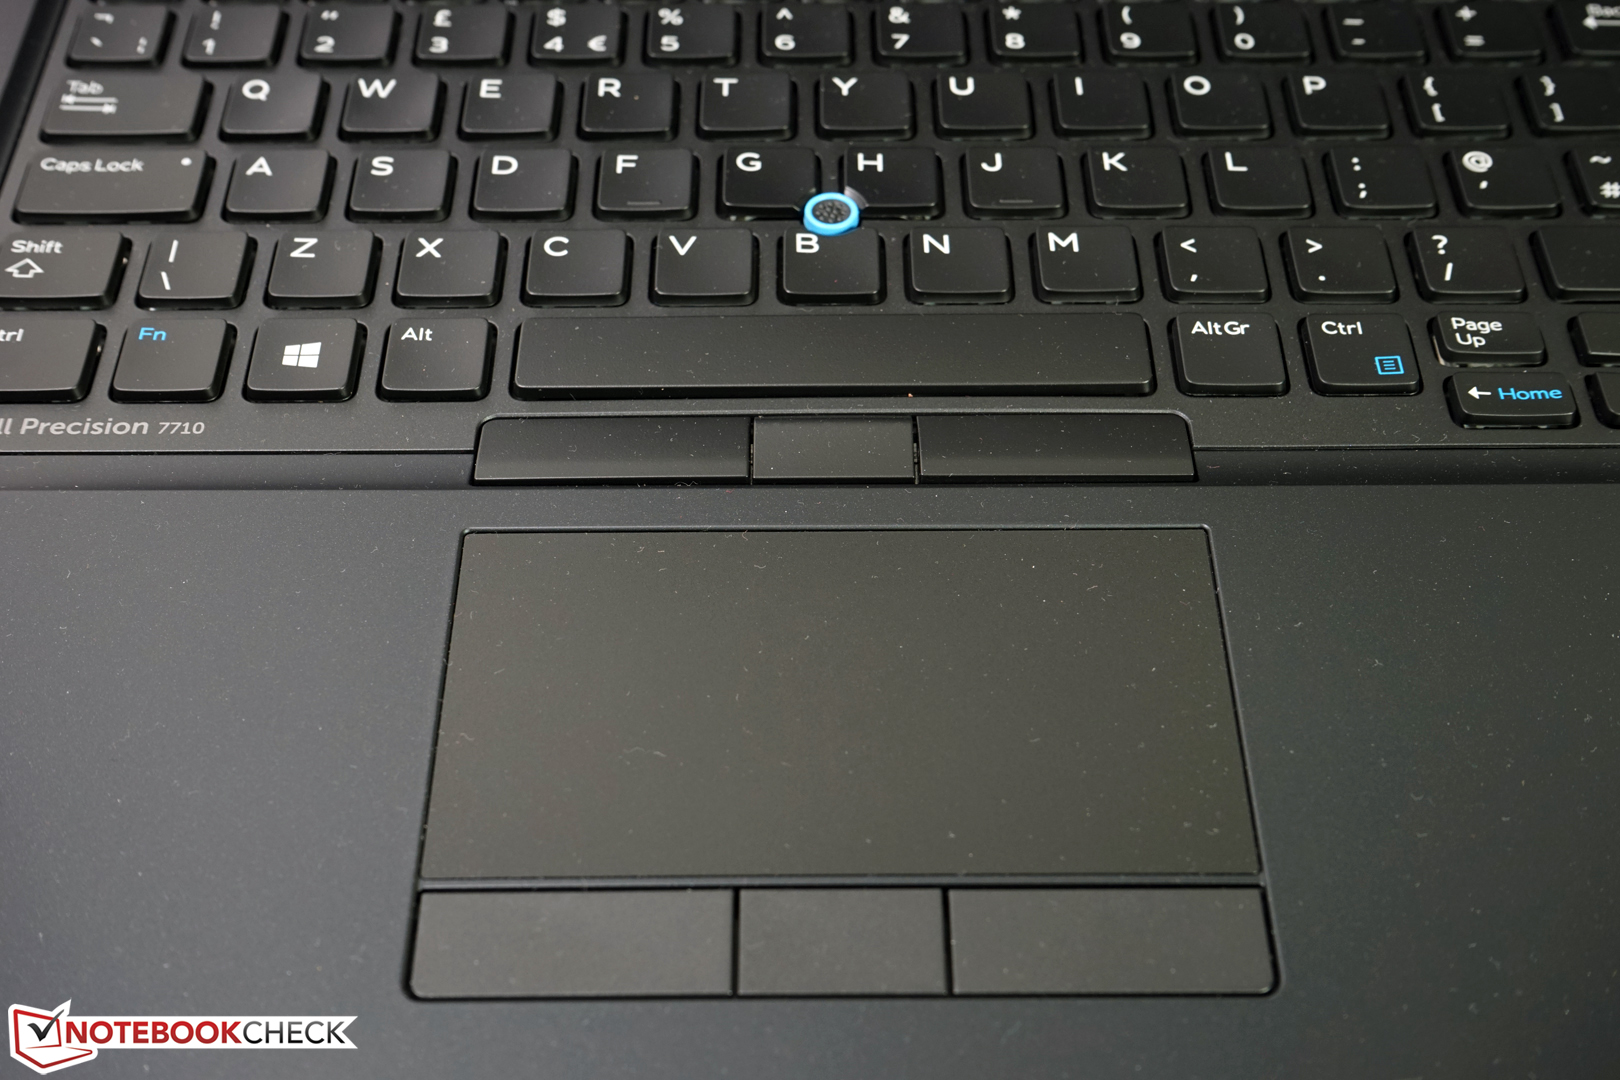
The touchpad features good gliding properties and reacts fast and precisely to inputs. The separate touchpad buttons work smoothly and very well. If needed, the functionality can be changed and / or combined with the trackpad's buttons. The TrackPoint is not only a comfortable alternative to a touchpad when space is tight, it also allows precise control and ensures a good workflow after some time of getting used to it. In principle, the models from Lenovo, HP, and Dell can only be distinguished by shape and color of the rubber knob. Depending on your taste, it is also possible to pull it off and slip another one on.
Display
At the time of testing, Dell offers the Full HD IPS display of our test model and a UHD IGZO panel (3840x2160 pixels) as an alternative in the online configurator. The gross surcharge for the high-res variant is about 250 Euros (~$273). Your choice not only depends on your individual preferences but also on the used operating system and the planned fields of applications. For example, high-res displays still suffer from notable scaling problems under Windows 7 depending on the applications. You can still encounter too small fonts, ill-displayed symbols or overlapping windows. Moreover, the IGZO displays we have reviewed so far were very power-hungry, which has a considerable impact on the achievable battery runtimes. If long battery life is important for you, the Full HD display might be the better alternative. However, we cannot confirm this before we have actually tested the UHD display.
| |||||||||||||||||||||||||
Brightness Distribution: 83 %
Center on Battery: 335 cd/m²
Contrast: 1006:1 (Black: 0.33 cd/m²)
ΔE Color 3 | 0.5-29.43 Ø5
ΔE Greyscale 4 | 0.57-98 Ø5.3
97% sRGB (Argyll 1.6.3 3D)
62% AdobeRGB 1998 (Argyll 1.6.3 3D)
68.6% AdobeRGB 1998 (Argyll 2.2.0 3D)
96.9% sRGB (Argyll 2.2.0 3D)
66.6% Display P3 (Argyll 2.2.0 3D)
Gamma: 2
| Display | |
| Display P3 Coverage (sort by value) | |
| Dell Precision 7710 | |
| Lenovo ThinkPad P70 | |
| SCHENKER W706 | |
| MSI WT72-6QM | |
| sRGB Coverage (sort by value) | |
| Dell Precision 7710 | |
| Lenovo ThinkPad P70 | |
| SCHENKER W706 | |
| MSI WT72-6QM | |
| AdobeRGB 1998 Coverage (sort by value) | |
| Dell Precision 7710 | |
| Lenovo ThinkPad P70 | |
| SCHENKER W706 | |
| MSI WT72-6QM | |
| Response Times | |
| Response Time Grey 50% / Grey 80% (sort by value) | |
| Dell Precision 7710 (17, 33) | |
| Lenovo ThinkPad P70 (17.2, 26.8) | |
| SCHENKER W706 (17.2, 26.8) | |
| MSI WT72-6QM (13, 29) | |
| Response Time Black / White (sort by value) | |
| Dell Precision 7710 (11, 25) | |
| Lenovo ThinkPad P70 (4.8, 22.8) | |
| SCHENKER W706 (8.4, 20.8) | |
| MSI WT72-6QM (7, 19) | |
| PWM Frequency (sort by value) | |
| Dell Precision 7710 (25) | |
| Lenovo ThinkPad P70 (95) | |
| SCHENKER W706 | |
| MSI WT72-6QM (10, 15) | |
* ... smaller is better

In our brightness measurements, the Full HD display achieves an average brightness of 307 cd/m². The brightness in the segments range from 277 cd/m² up to 332 cd/m². The brightness distribution is 83% and clouding is visible in uni-colored images. In addition, screen bleeding is especially visible towards the bottom display edge in black pictures.
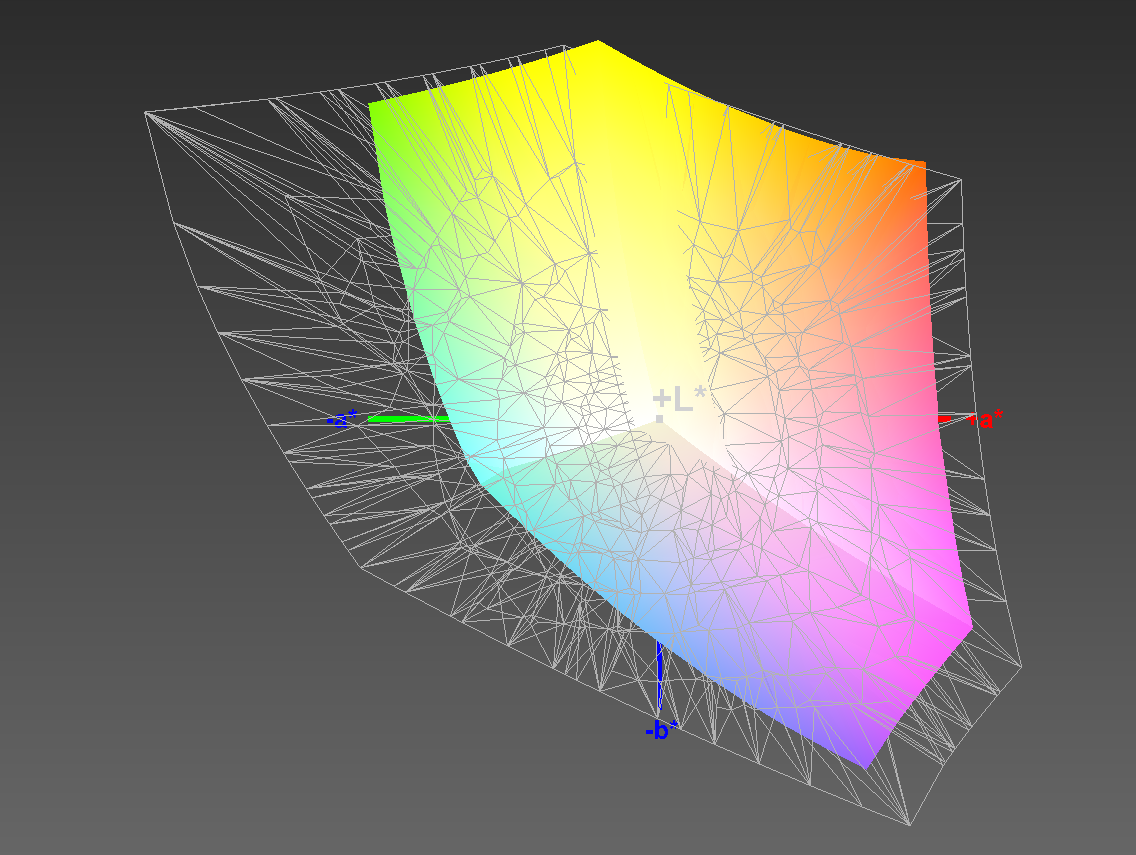
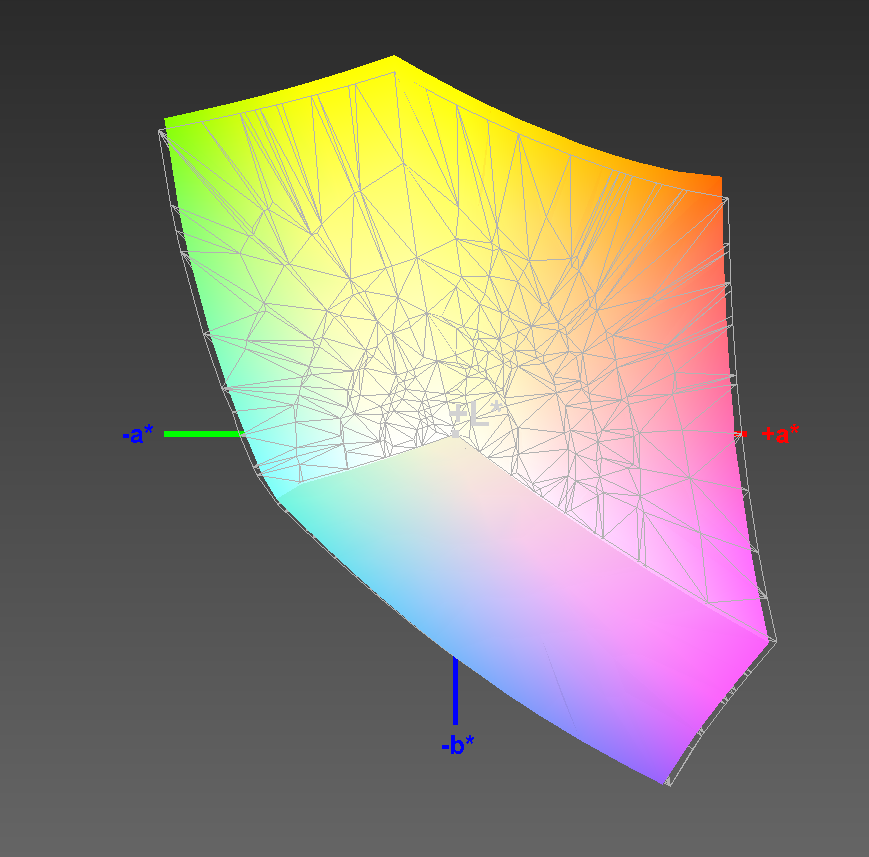
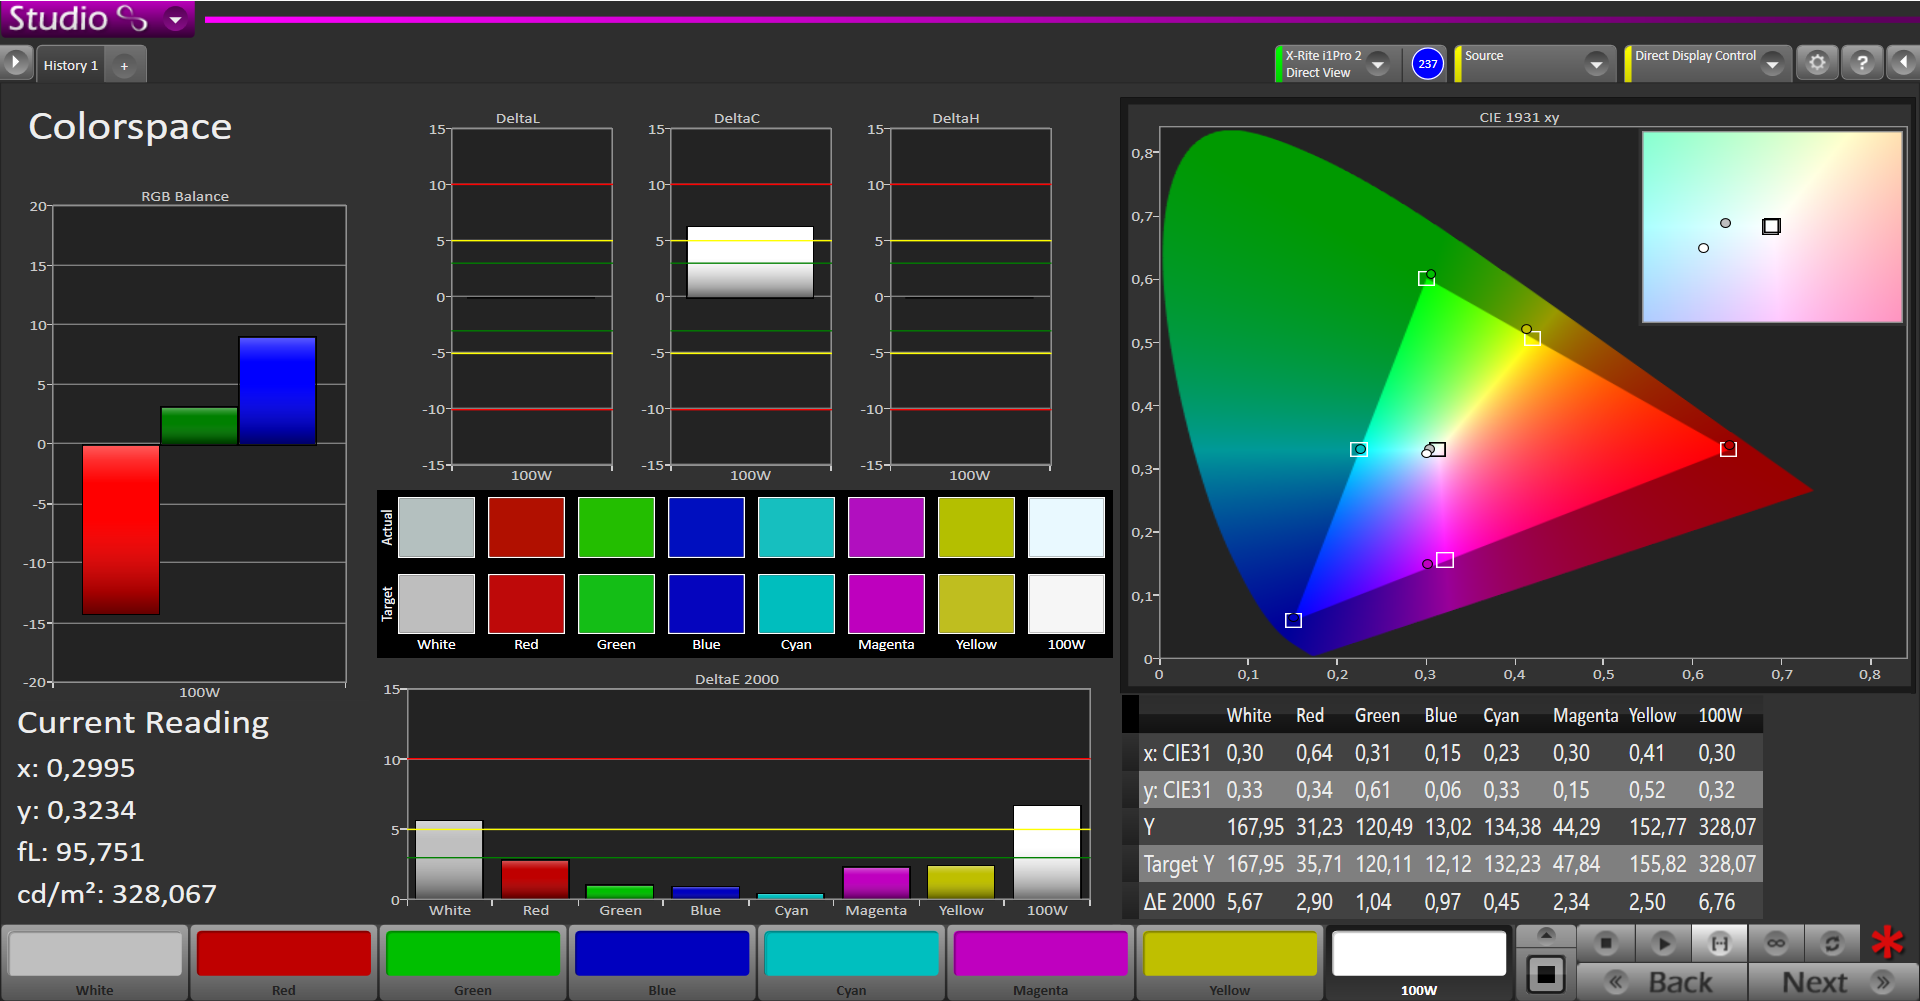
The black value is 0.33 cd/m² at maximum display brightness which makes for a high contrast of 1006:1. Especially images, videos, and 3D objects profit from it. The color space is also good. The panel achieves 96.9% of sRGB, which should be sufficient for many professional tasks.
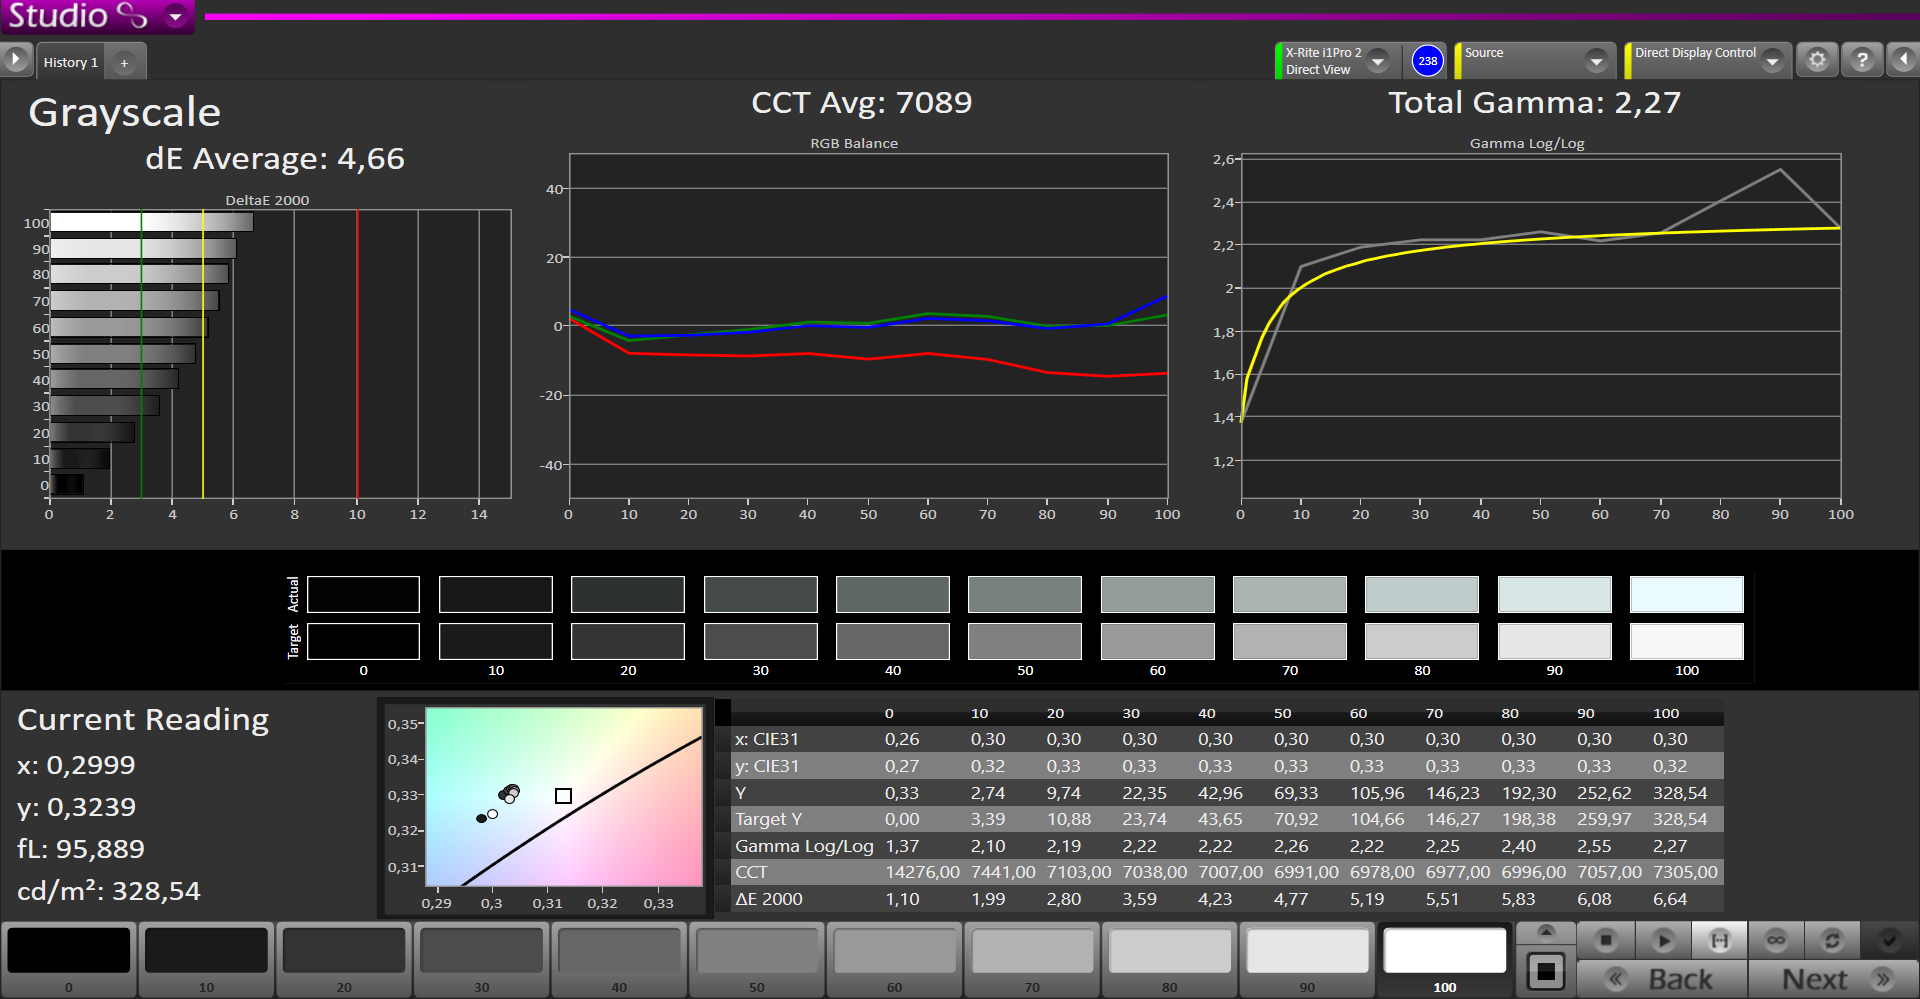
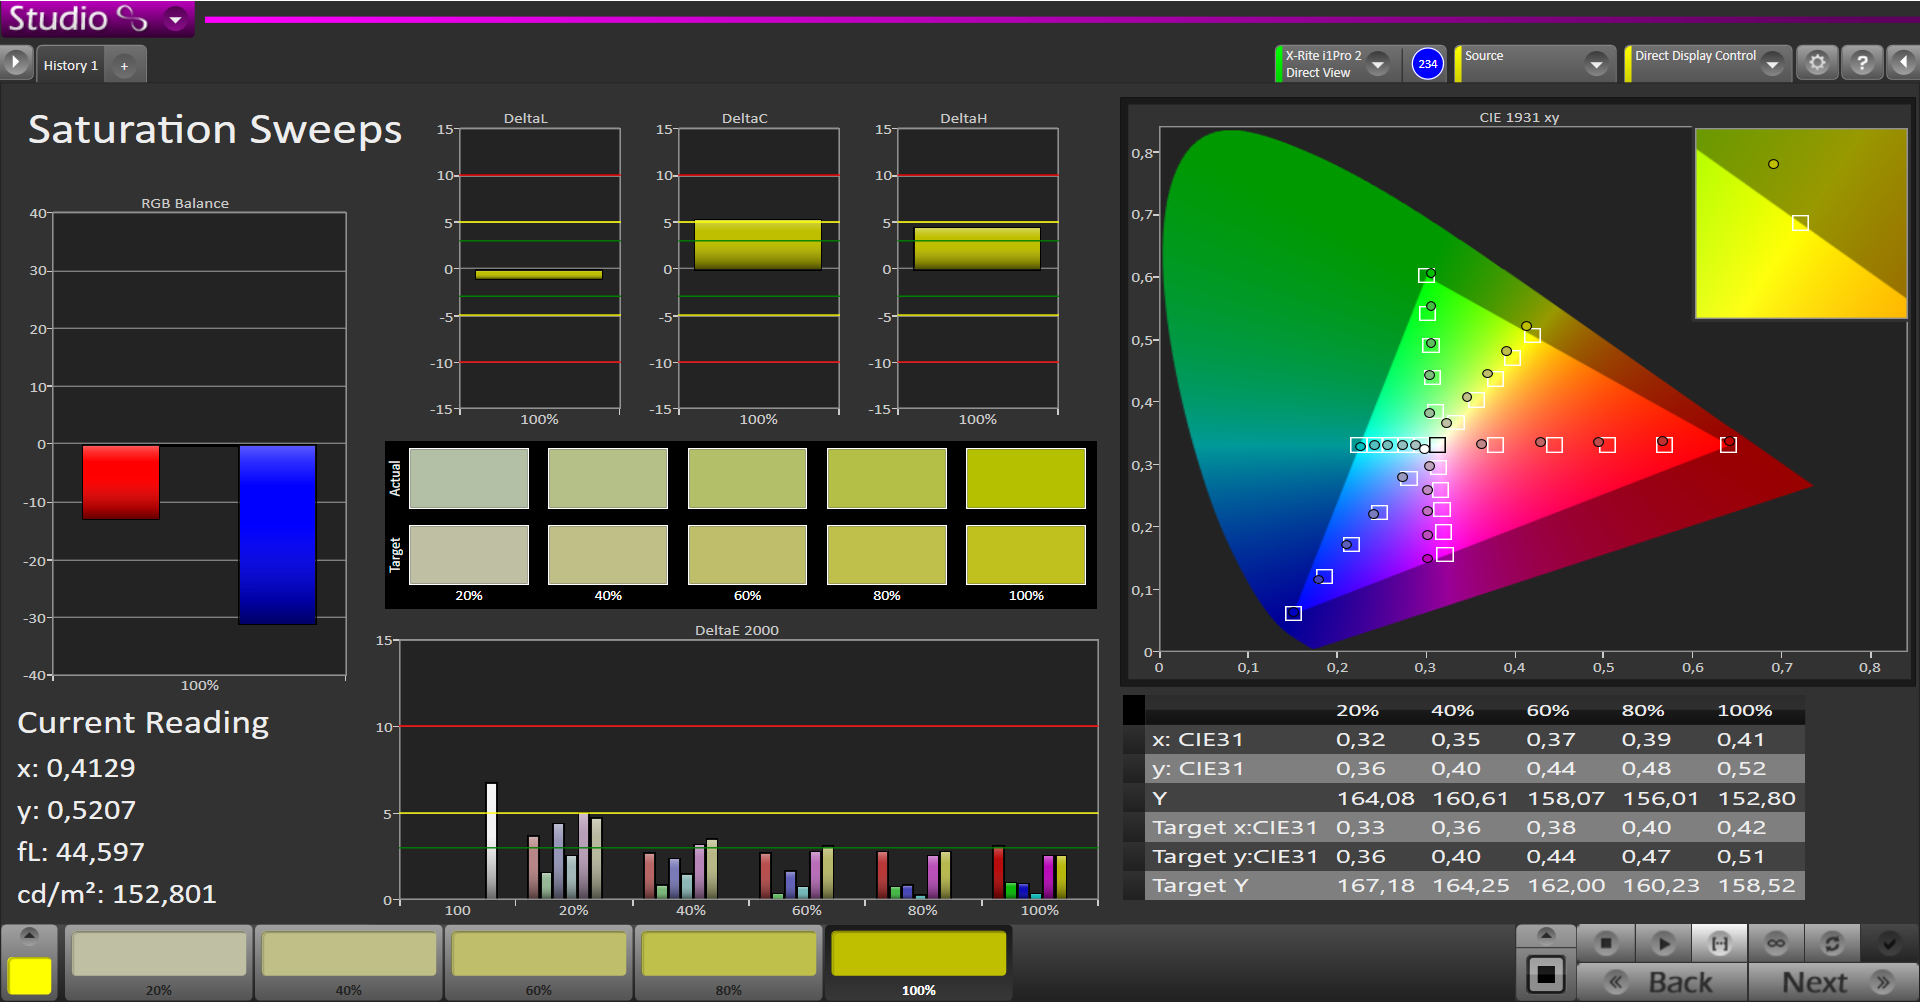
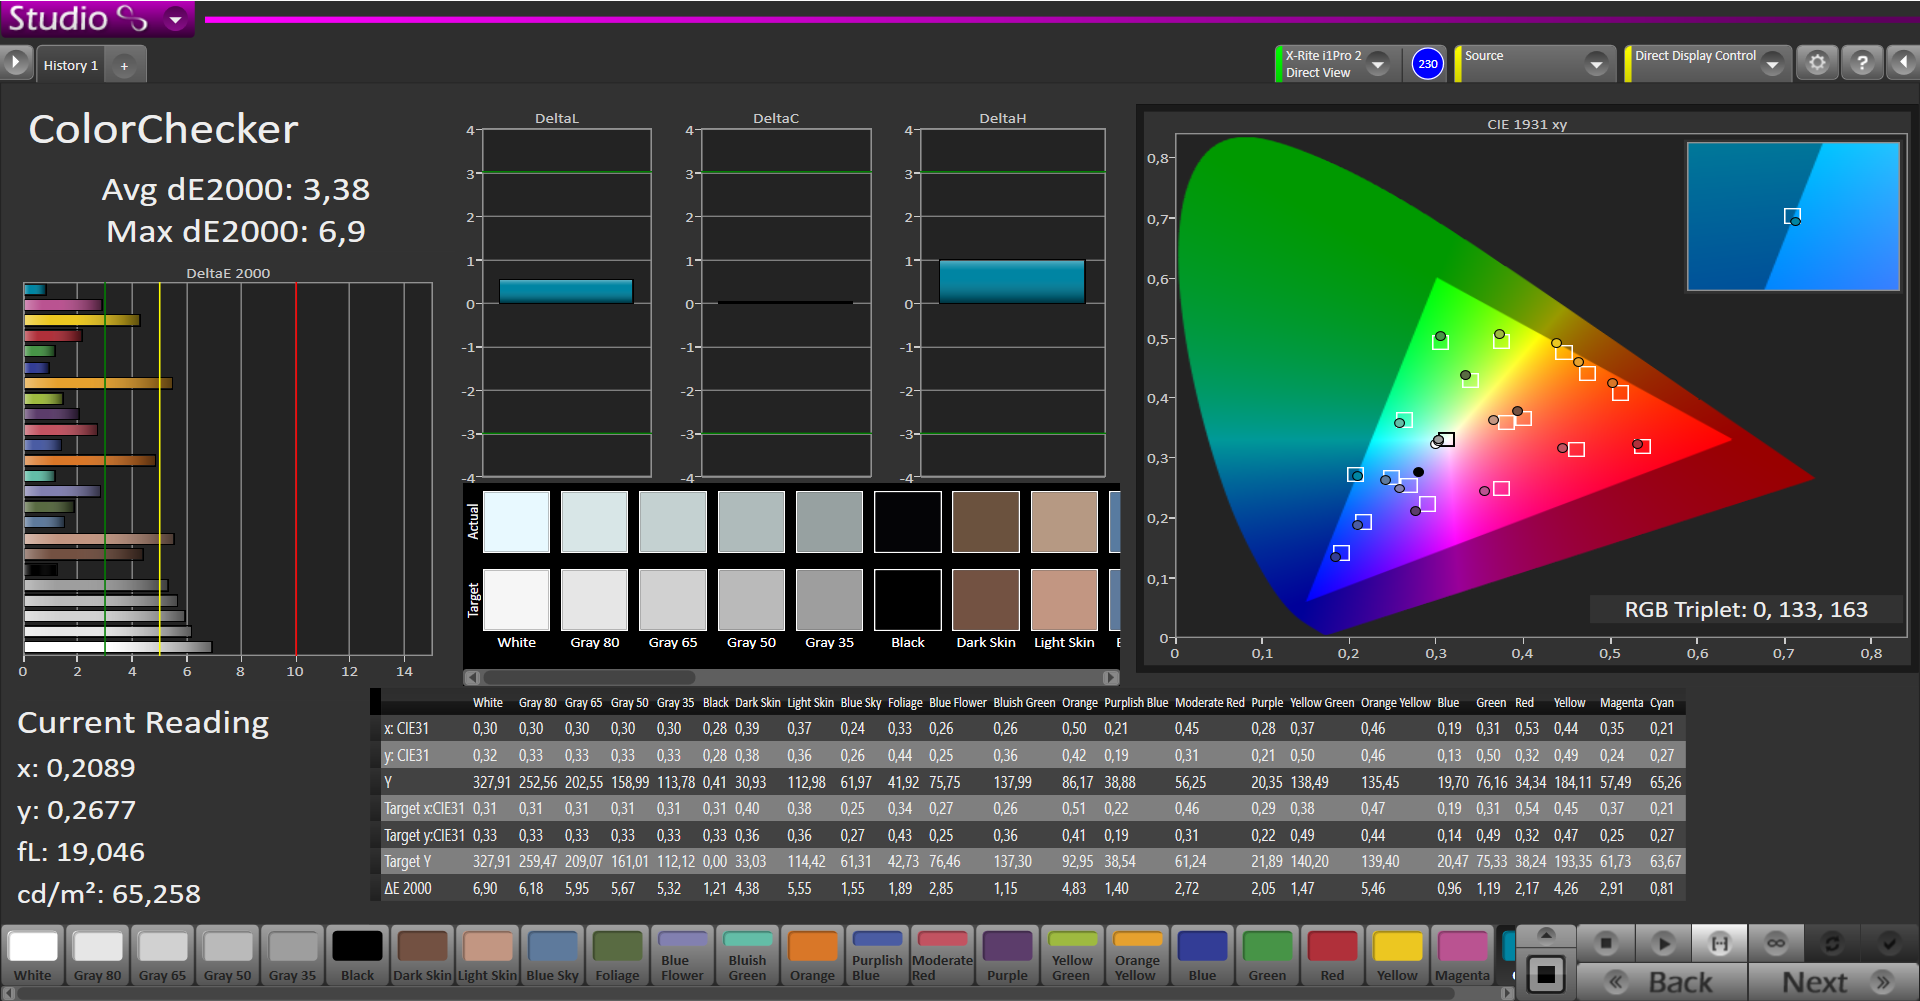
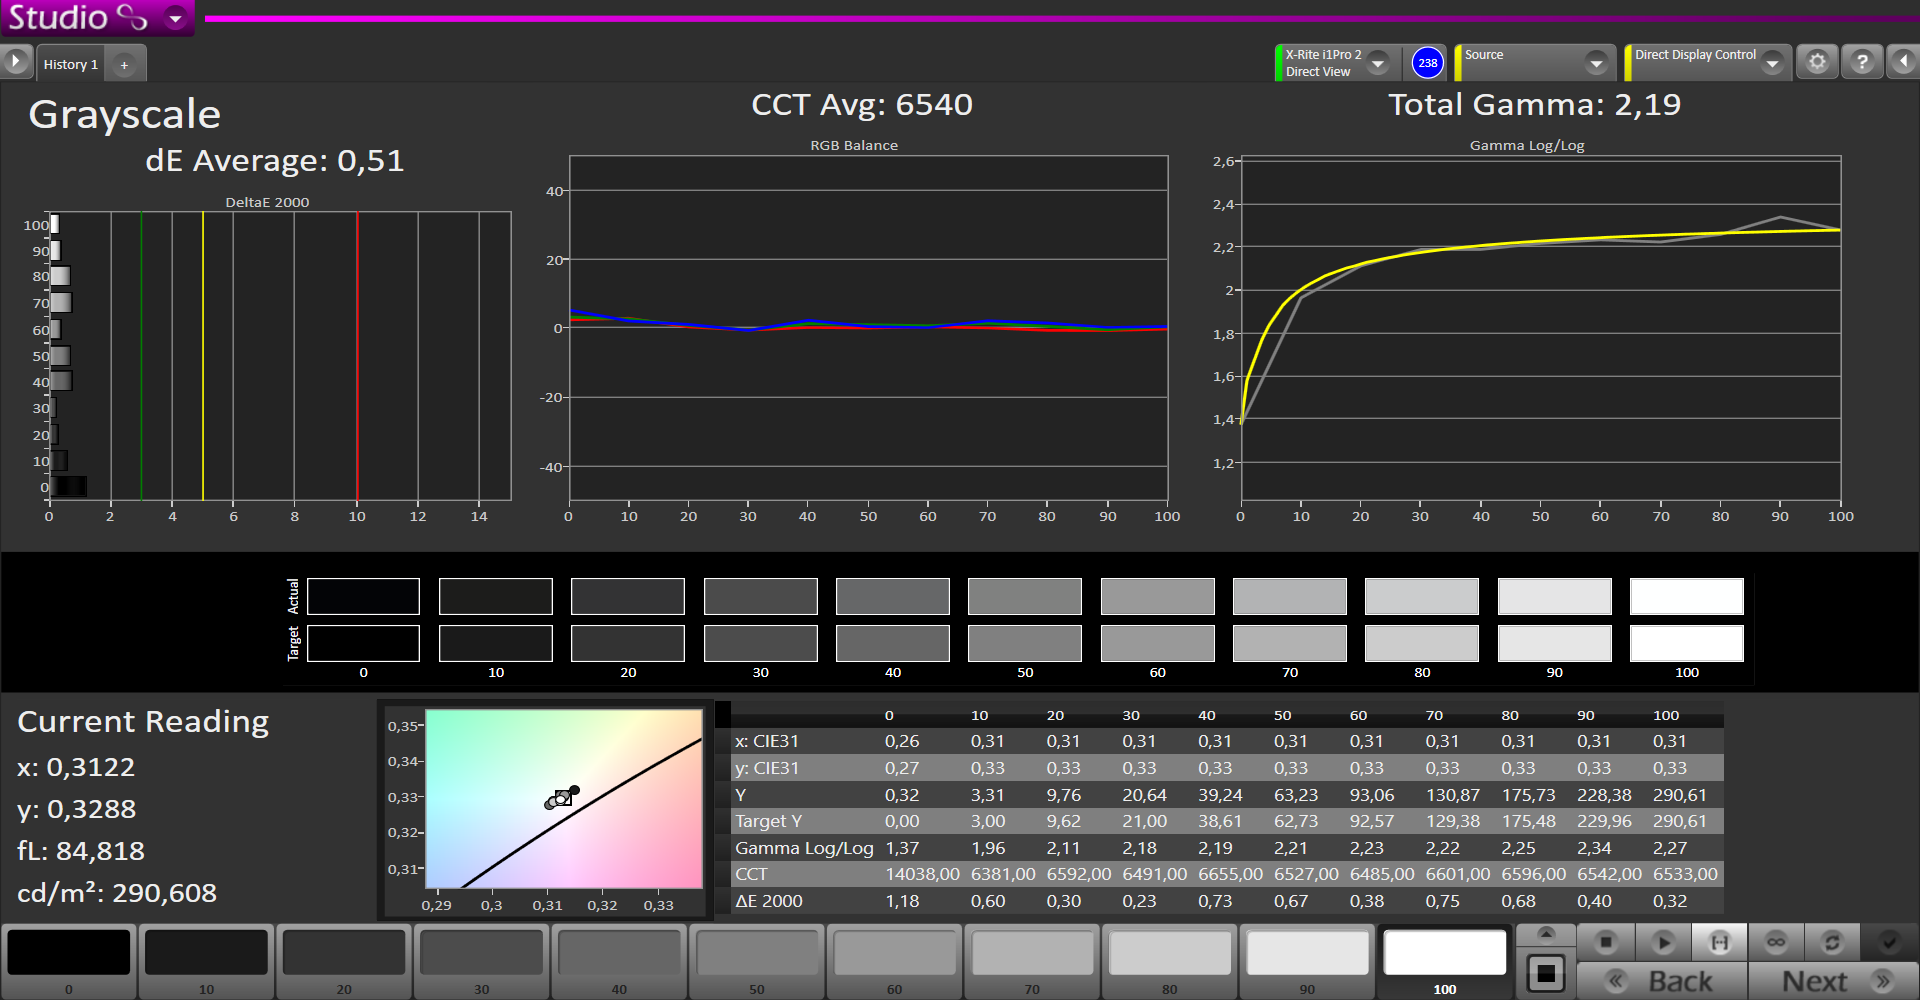
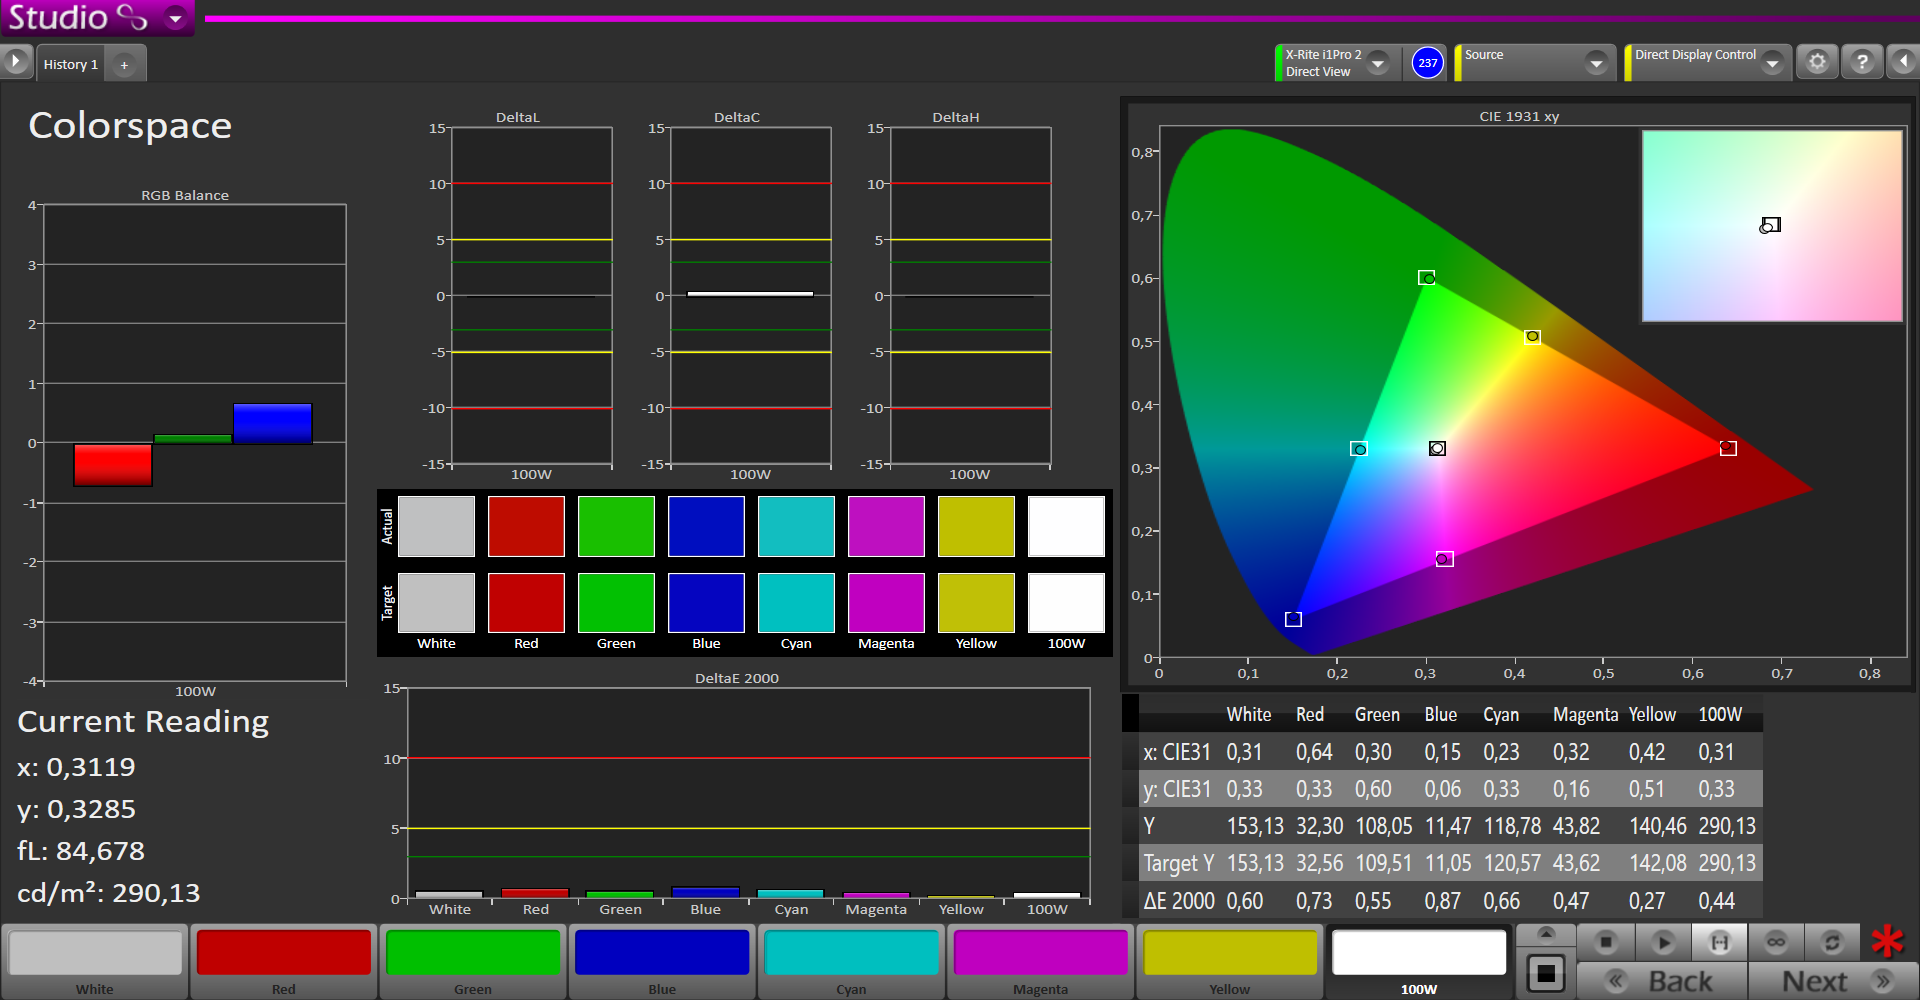
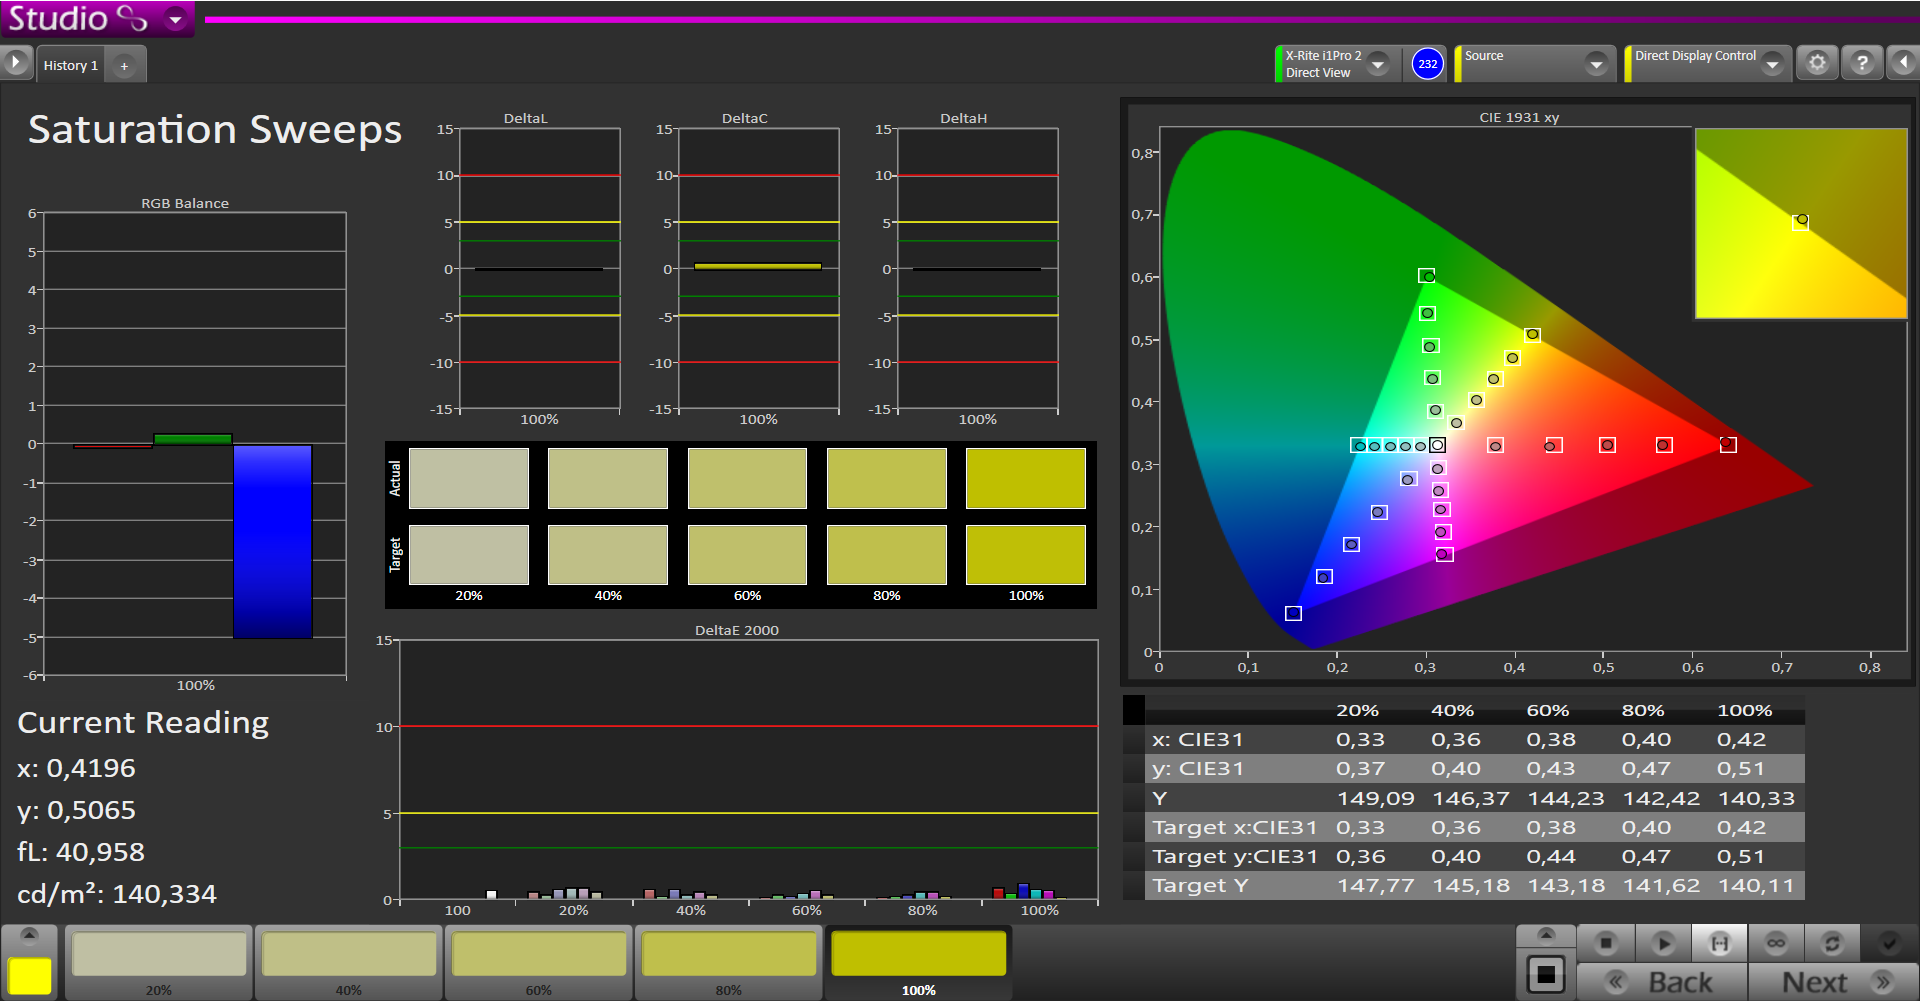
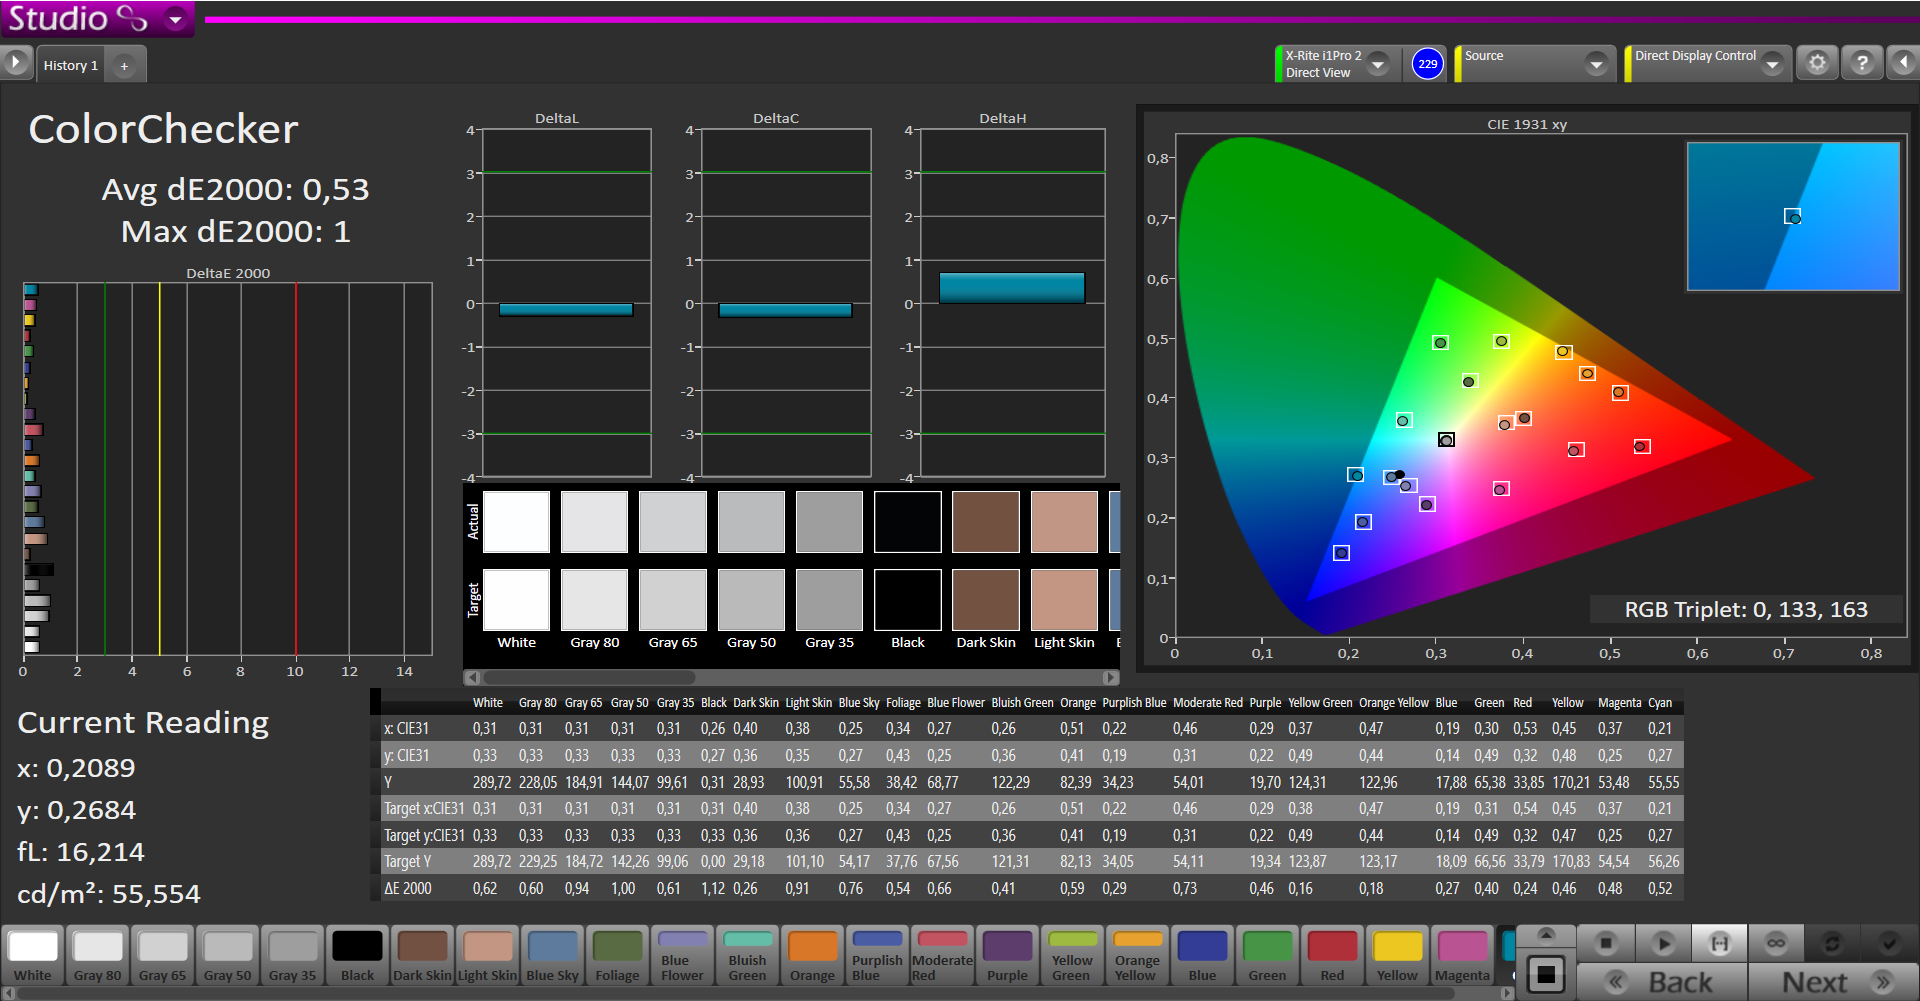
This might only be too low for especially demanding photographers and film-makers, since absolute precise colors are only possible with 100% coverage. The results measured with our spectrophotometer show that this display comes close to the optimum. Alike most other displays, this one is also not calibrated out-of-the-box. While the average DeltaE2000 shift of 3.38 for mixed colors (Colorchecker) is already very passable, maximum deviations of up to 6.9 do not allow working with precise colors.
After calibration, which is obligatory for professional work, the display's potential and class shows off to an advantage. The results are almost perfect in all subtests and we can no longer detect weaknesses in color fidelity. The maximum DeltaE2000 is 1.18, the gray balance is very uniform, and the gamma curve only slightly deviates from the ideal.
Display Response Times
| ↔ Response Time Black to White | ||
|---|---|---|
| 36 ms ... rise ↗ and fall ↘ combined | ↗ 11 ms rise | 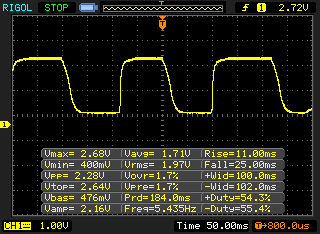 |
| ↘ 25 ms fall | ||
| The screen shows slow response rates in our tests and will be unsatisfactory for gamers. In comparison, all tested devices range from 0.1 (minimum) to 240 (maximum) ms. » 93 % of all devices are better. This means that the measured response time is worse than the average of all tested devices (21.5 ms). | ||
| ↔ Response Time 50% Grey to 80% Grey | ||
| 50 ms ... rise ↗ and fall ↘ combined | ↗ 17 ms rise | 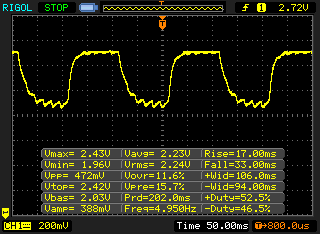 |
| ↘ 33 ms fall | ||
| The screen shows slow response rates in our tests and will be unsatisfactory for gamers. In comparison, all tested devices range from 0.2 (minimum) to 636 (maximum) ms. » 84 % of all devices are better. This means that the measured response time is worse than the average of all tested devices (33.7 ms). | ||
Screen Flickering / PWM (Pulse-Width Modulation)
| Screen flickering / PWM detected | 198 Hz | ≤ 25 % brightness setting | 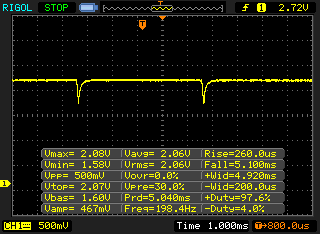 |
The display backlight flickers at 198 Hz (worst case, e.g., utilizing PWM) Flickering detected at a brightness setting of 25 % and below. There should be no flickering or PWM above this brightness setting. The frequency of 198 Hz is relatively low, so sensitive users will likely notice flickering and experience eyestrain at the stated brightness setting and below. In comparison: 53 % of all tested devices do not use PWM to dim the display. If PWM was detected, an average of 17900 (minimum: 5 - maximum: 3846000) Hz was measured. | |||
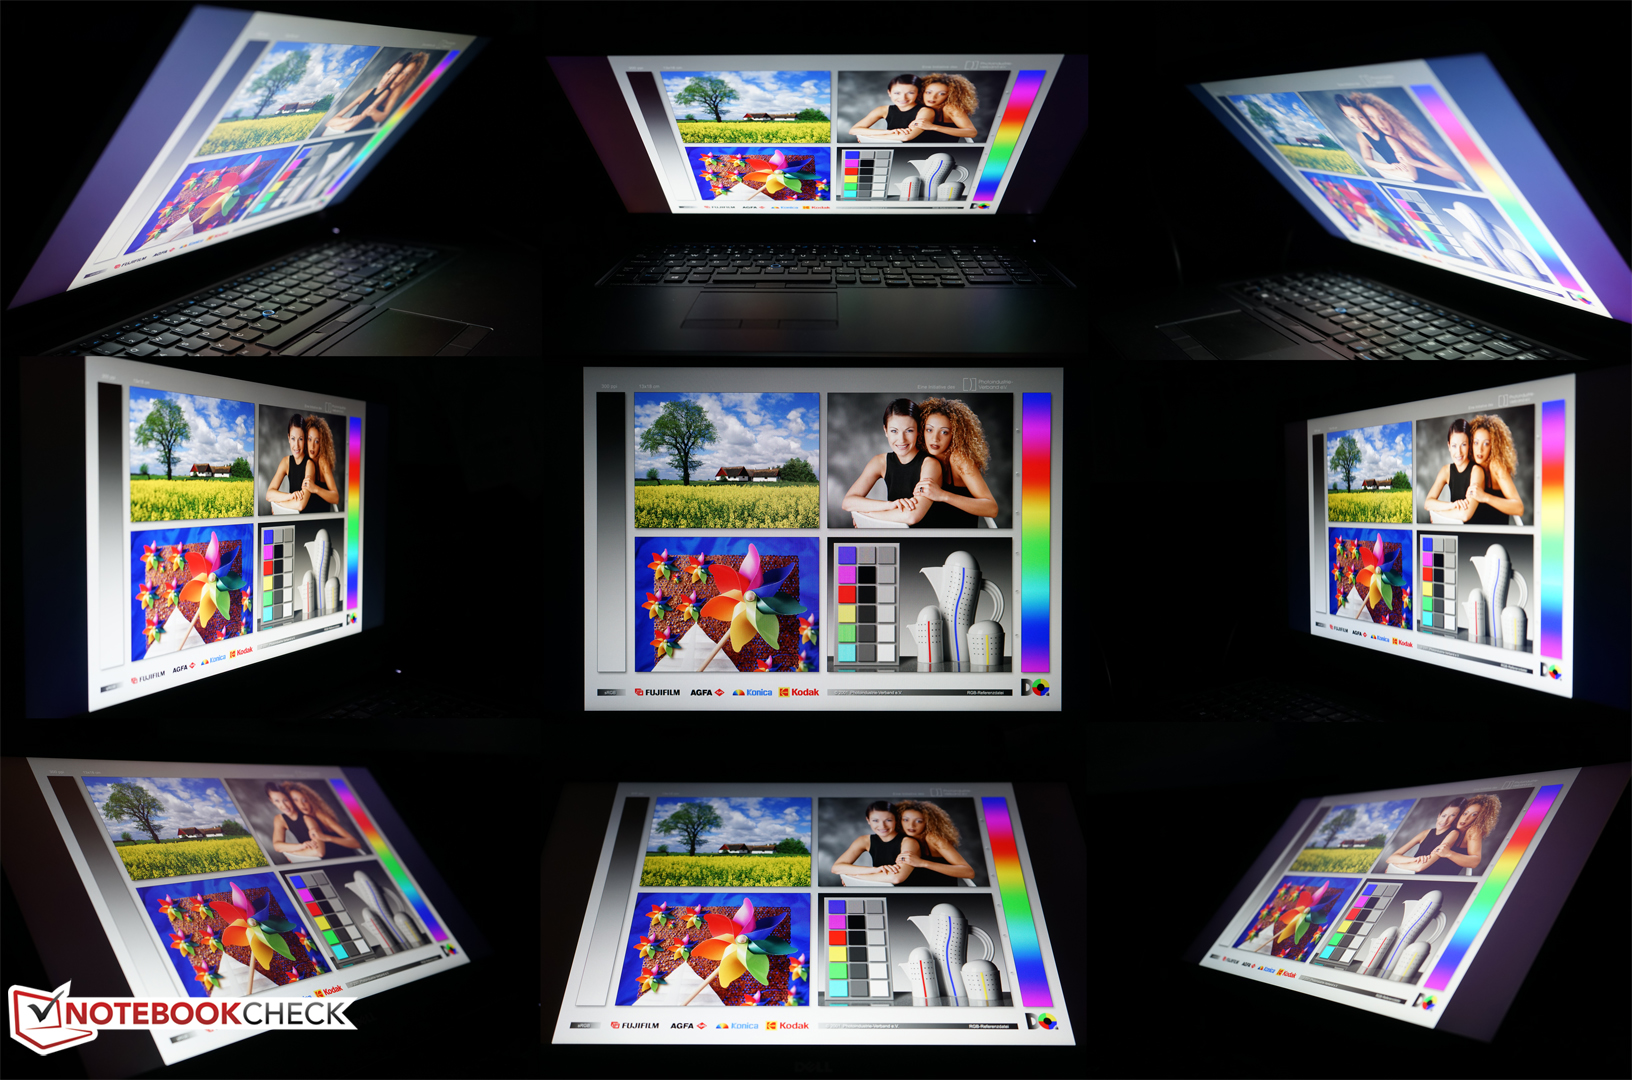
The viewing-angle stability is very good. You can only notice contrast and brightness differences at very shallow angles from diagonally above or below. We could not detect striking color shifts, inversions or bleaching.
Performance
Dell's Precision 7710 can be very freely configured according to your individual needs. Currently, you can select from three different processors, five professional graphics chips, two displays, and many RAM options. If you choose Intel's Xeon E3-1535Mv5, it is also possible to order ECC RAM.
This is especially useful if the RAM and processor are stressed and high error prevention is crucial. Incorrect data and calculations can also lead to crashes and affect the workflow considerably. Apart from servers, ECC RAM makes sense especially in workstations for e.g. construction, design, science and finance analysis.
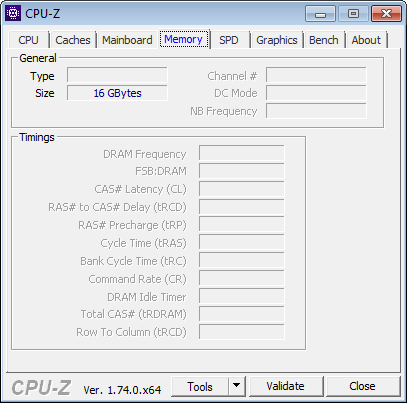
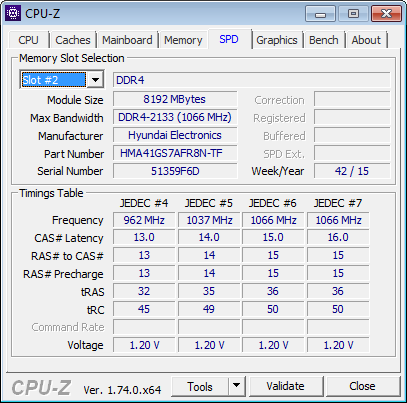
Although our test model features the Xeon processor, it uses 16 GB of standard DDR4 RAM without ECC. Otherwise, the test model comes with AMD's professional FirePro W7170M, a 256 GB NVMe SSD, a 1 TB hard drive and the already mentioned Full HD IPS display. At the time of testing, the device's gross price was about 3730 Euros (~$4068). The extra cost for ECC RAM would have been 90 Euros (~$98) for our configuration.
Processor
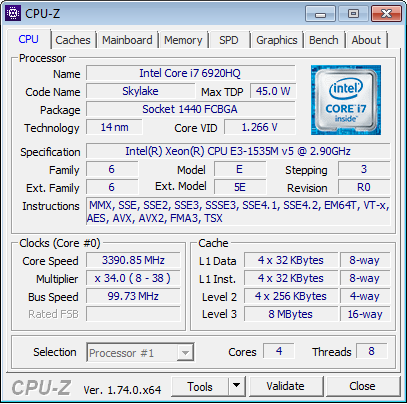
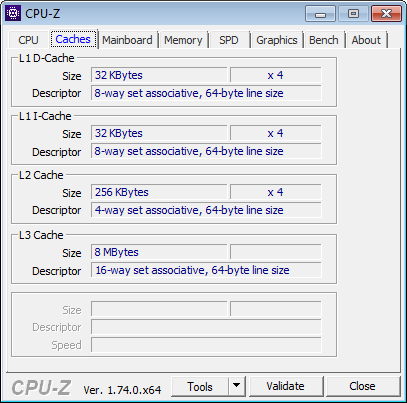
Since the new processor generation, Intel has also introduced two mobile Xeon CPUs into their portfolio. These mobile processors have been designed for permanent use and especially differ from comparable standard CPUs of the Skylake generation by ECC support. The Intel Xeon E3-1535M v5 used in our test model is the top model of the series and comparable to Intel's Core i7-6920HQ. Both feature 8 MB of L3 cache and a base clock of 2900 MHz. Thanks to Turbo Boost, the clock rate can increase to up to 3800 MHz in single-thread applications and thanks to Hyper-Threading up to 8 threads can run simultaneously. Thus, the CPU's performance should optimally adapt to the demands on paper.
It is not surprising that the powerful quad-core CPU belongs to the Top 20 in our extensive CPU benchmark list. Among others, this is due to the very good results in Cinebench R15 with 746 points in the multi-core test and 162 points in the single-core test. The wPrime 1024m and the SuperPi 32m calculations also finish very quickly with 214 seconds and 511 seconds, respectively. The difference to Intel's Core i7-6820HQ is only small. You can choose it as alternative for the Dell Precision 7710 and save about 220 Euros (~$240). We only measured a performance difference of 6%, which should not have a big impact in practice. However, the performance difference to the base CPU configuration, Intel's Core i5-6300HQ, which is available for about 370 Euros (~$404) less, is significantly higher. The difference of up to 68% cannot be downplayed that easily. This is especially notable in software, which splits tasks into many simultaneous threads.
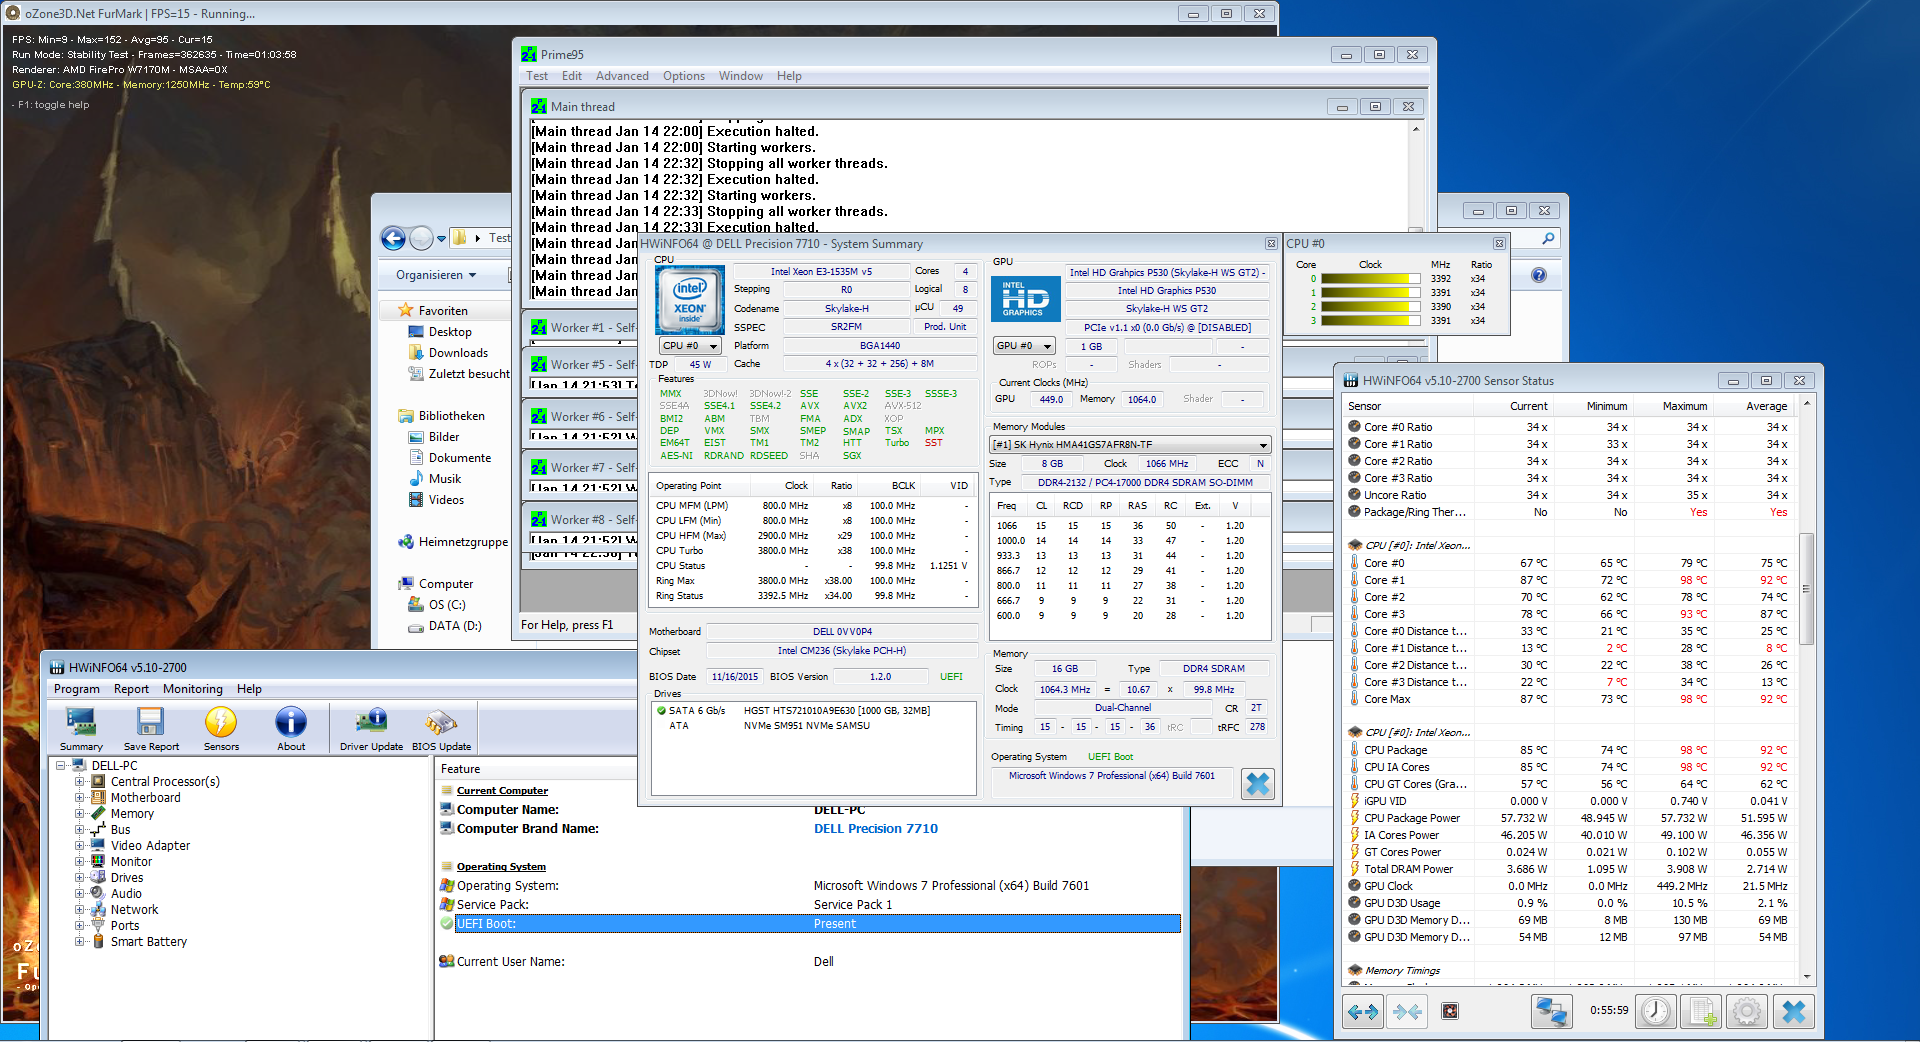
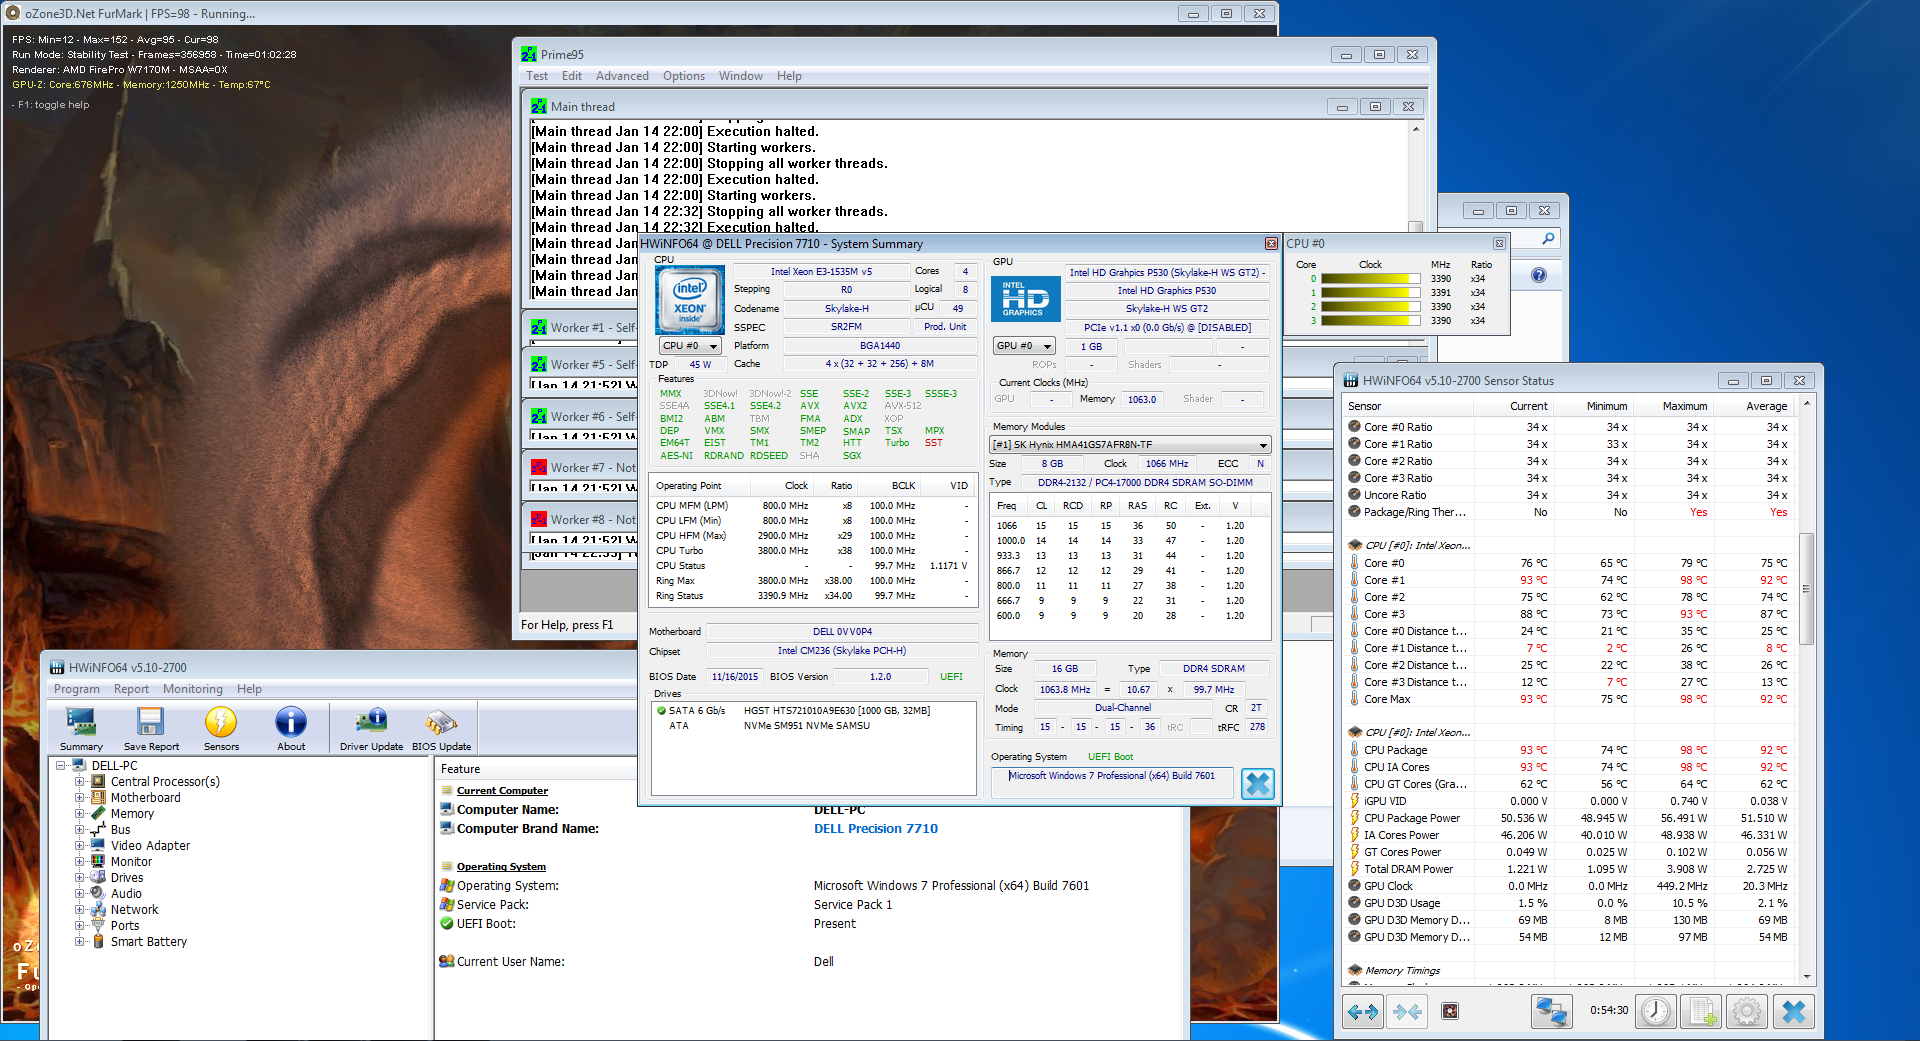
Unlike many competitors, the Precision also delivers its maximum CPU performance under full load. After multiple hours with Furmark and Prime95, the HWinfo tool shows a constant CPU clock of 3.4 GHz. However, the graphics performance throttles in this scenario, as we will see in the graphics performance section.
On battery, the CPU performance is also high and the test results are almost identical to mains operation. For example, the system achieves 8.16 points vs. 8.24 points (in mains operation) in Cinebench R11.5 (64-bit, multi-core).
All things considered, a configuration with Xeon CPU without ECC RAM, alike our test model's, does not make much sense. If you do not require error-correcting code RAM, you can select Intel's Core i7-6820HQ without hesitation. However, you should be careful considering selecting Intel's Core i5-6300HQ for this workstation since the performance difference of up to 68% is partly substantial. Further comparisons are available in our extensive CPU benchmark list.
| Cinebench R15 | |
| CPU Single 64Bit (sort by value) | |
| Dell Precision 7710 | |
| Lenovo ThinkPad P70 | |
| Acer Aspire V5-591G-50NC | |
| CPU Multi 64Bit (sort by value) | |
| Dell Precision 7710 | |
| Lenovo ThinkPad P70 | |
| Acer Aspire V5-591G-50NC | |
| Super Pi Mod 1.5 XS 32M - 32M (sort by value) | |
| Dell Precision 7710 | |
| Lenovo ThinkPad P70 | |
| Acer Aspire V5-591G-50NC | |
| wPrime 2.10 - 1024m (sort by value) | |
| Dell Precision 7710 | |
| Lenovo ThinkPad P70 | |
| Acer Aspire V5-591G-50NC | |
* ... smaller is better
System Performance
The system performance is top-notch and bottlenecks cannot be found. Certainly, even more powerful CPUs and GPUs, a higher RAM capacity or an SSD RAID could bring further advantages, but the combination is powerful enough for delivering very good results. For example, it achieves 4770 points (Home), 5668 points (Creative), and 5417 points (Work) in PC Mark 8. Compared to the mobile workstation Schenker W706, which is more powerfully equipped with 32 GB of RAM, an Intel Core i7-6700 desktop CPU, and an Nvidia Quadro M5000M, the results are slightly worse depending on the subtest. However, our test model still performs significantly better than Lenovo's ThinkPad P70, which costs about 300 Euros (~$327) less.
| PCMark 8 | |
| Home Score Accelerated v2 (sort by value) | |
| Dell Precision 7710 | |
| Lenovo ThinkPad P70 | |
| SCHENKER W706 | |
| MSI WT72-6QM | |
| Creative Score Accelerated v2 (sort by value) | |
| Dell Precision 7710 | |
| SCHENKER W706 | |
| Work Score Accelerated v2 (sort by value) | |
| Dell Precision 7710 | |
| Lenovo ThinkPad P70 | |
| SCHENKER W706 | |
| MSI WT72-6QM | |
| PCMark 7 Score | 5072 points | |
| PCMark 8 Home Score Accelerated v2 | 4770 points | |
| PCMark 8 Creative Score Accelerated v2 | 5668 points | |
| PCMark 8 Work Score Accelerated v2 | 5417 points | |
Help | ||
Storage Devices
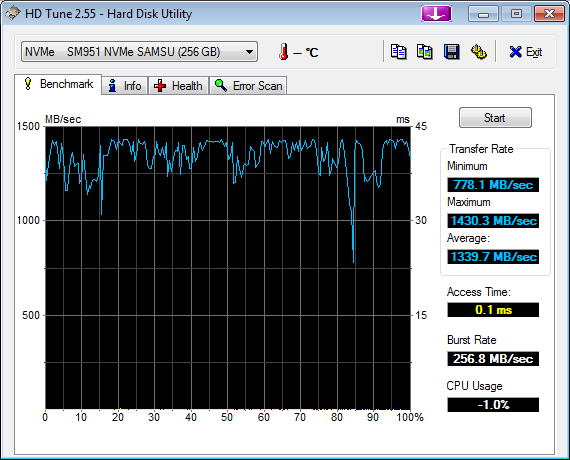
Our test model comes with a combination of a fast Samsung M.2 NVMe SSD with a capacity of 256 GB and a conventional 1 TB hard drive, which works at a revolution speed of 7200 RPM. This makes for fast booting, fast opening of programs and files and high data transfer rates. We measured sequential read rates of up to 1886 MB/s. The write rate is significantly worse with a maximum of 626 MB/s, but in practice this is hardly a bottleneck.
On top of that, the big hard drive delivers a lot of space for documents, images, projects, and other files. In total, Dell's Precision 7710 can house up to two M.2 drives and a 2.5-inch drive. Depending on the components, Dell also offers optional RAID 0 or RAID 1 configurations. In contrast to Schenker's W706 or even Lenovo's ThinkPad P70, you have to do with one 2.5-inch drive less.

Graphics Card
The AMD FirePro W7170M based on the Tonga chip reached a core clock of up to 720 MHz during the test. With 4 GB of GDDR5 VRAM clocked at 1250 MHz and connected via a 256-bit bus, this model belongs to the most powerful professional graphic chips. The hardware is, for example, comparable to the AMD Radeon R9 M390X consumer chip.
Thanks to AMD's switchable graphics, the integrated Intel HD P530 can be used for less demanding office tasks. Apart from lower power consumption, it offers Intel's Quick Sync Video technology, which is a welcome supplement to AMD's APP or OpenCL especially for conversions. AMD's Catalyst tool allows assigning the two graphics chips directly to programs or energy profiles if desired. If you do not want to deal with this, you can also leave the selection of the graphics card to the usually well working automatic selector.
The FirePro series targeted at professionals differs from the familiar consumer graphics chips of the Radeon series especially by a modified BIOS, special drivers, and a configuration tuned for stability. Comprehensive software certifications, which ensure trouble-free interaction of hardware and software, are also important in the enterprise segment. Performance-wise, especially OpenGL-optimized software benefits from the special drivers. Calculation methods which do not yet belong to the official OpenGL standard can already be used and make for a remarkable performance gain.
We have tested the professional field with the SPECviewperf.12 benchmarks, which basically cover CAD, CAM, geology and medical MRT. The results of these tests show the performance gain compared to the FirePro predecessors and the similarly priced Nvidia Quadro M3000M. The competitors can be significantly outperformed in many subtests. However, the FirePro W7170M does not stand a chance against Nvidia's Quadro M5000M top model in any of the SPECviewperf.12 tests. But, a surcharge of about 1100 Euros (~$1201) is due for the latter in the Dell Precision 7710.
We also want to mention the price question in view of the fact that the Nvidia GeForce GTX 980 dominates in many subtests. Medical, Showcase (DirectX 11), Maya, and energy test appear to profit significantly less from driver optimizations, but much more from pure hardware performance and standard functionality. Thus, you could also consider a powerful consumer graphics card from a performance point of view. However, you have to do without other not unimportant properties like comprehensive support, software certifications, enhanced stability, extensive multi-monitor configurations or permanent load use.
Thanks to the free programming interface OpenCL, demanding calculations can be moved from the CPU to the GPU. This decreases the total system load and usually leads to faster results. In practice, OpenCL is primarily used in tasks like encryption, conversion, image and video editing or finance analysis. We have tested with Luxmark 2.0 (ray tracing) and SiSoft Sandra 16 (GPGPU). Especially in ray tracing, the performance falls significantly behind the Nvidia Quadro M3000M's, but it is better in cryptography, finance analysis and image editing.
| LuxMark v2.0 64Bit | |
| Room GPUs-only (sort by value) | |
| Dell Precision 7710 | |
| Lenovo ThinkPad P70 | |
| Dell Precision 5510 | |
| Sala GPUs-only (sort by value) | |
| Dell Precision 7710 | |
| Lenovo ThinkPad P70 | |
| Dell Precision 5510 | |
| SiSoft Sandra 2016 | |
| Image Processing (sort by value) | |
| Dell Precision 7710 | |
| Lenovo ThinkPad P70 | |
| Dell Precision 5510 | |
| GP Cryptography (Higher Security AES256+SHA2-512) (sort by value) | |
| Dell Precision 7710 | |
| Lenovo ThinkPad P70 | |
| Dell Precision 5510 | |
| GP Financial Analysis (FP High/Double Precision) (sort by value) | |
| Dell Precision 7710 | |
| Lenovo ThinkPad P70 | |
| Dell Precision 5510 | |
In contrast to OpenGL-optimized software, hardware performance is primarily important for DirectX. Thus, the results are on par with comparable consumer graphics chips of the GeForce and Radeon series. For example, our test model achieves a very good 6935 points in the GPU rating of the Fire Strike tests and 43124 points in Cloud Gate in the familiar 3DMark benchmarks. This is about the performance level of an Nvidia GeForce GTX 970M. The graphics chip achieves 76.9 fps in the Unigine Heaven 3.0 DX 11 benchmark and 30.7 fps in the Valley 1.0 test. Compared to the OpenGL runs (no optimizations), which were run under the same conditions otherwise, it can achieve a few frames more. You can compare graphics chips extensively by means of our GPU benchmark list.
| Unigine Heaven 3.0 | |
| 1920x1080 OpenGL, Normal Tessellation, High Shaders AA:Off AF:Off (sort by value) | |
| Dell Precision 7710 | |
| Lenovo ThinkPad P70 | |
| Dell Precision 5510 | |
| 1920x1080 DX 11, Normal Tessellation, High Shaders AA:Off AF:Off (sort by value) | |
| Dell Precision 7710 | |
| Lenovo ThinkPad P70 | |
| Dell Precision 5510 | |
| Unigine Valley 1.0 | |
| 1920x1080 Extreme HD DirectX AA:x8 (sort by value) | |
| Dell Precision 7710 | |
| Lenovo ThinkPad P70 | |
| Dell Precision 5510 | |
| 1920x1080 Extreme HD Preset OpenGL AA:x8 (sort by value) | |
| Dell Precision 7710 | |
| Lenovo ThinkPad P70 | |
| Dell Precision 5510 | |
| 3DMark 06 Standard Score | 28430 points | |
| 3DMark Vantage P Result | 26345 points | |
| 3DMark 11 Performance | 9580 points | |
| 3DMark Ice Storm Standard Score | 95675 points | |
| 3DMark Cloud Gate Standard Score | 21612 points | |
| 3DMark Fire Strike Score | 6180 points | |
Help | ||
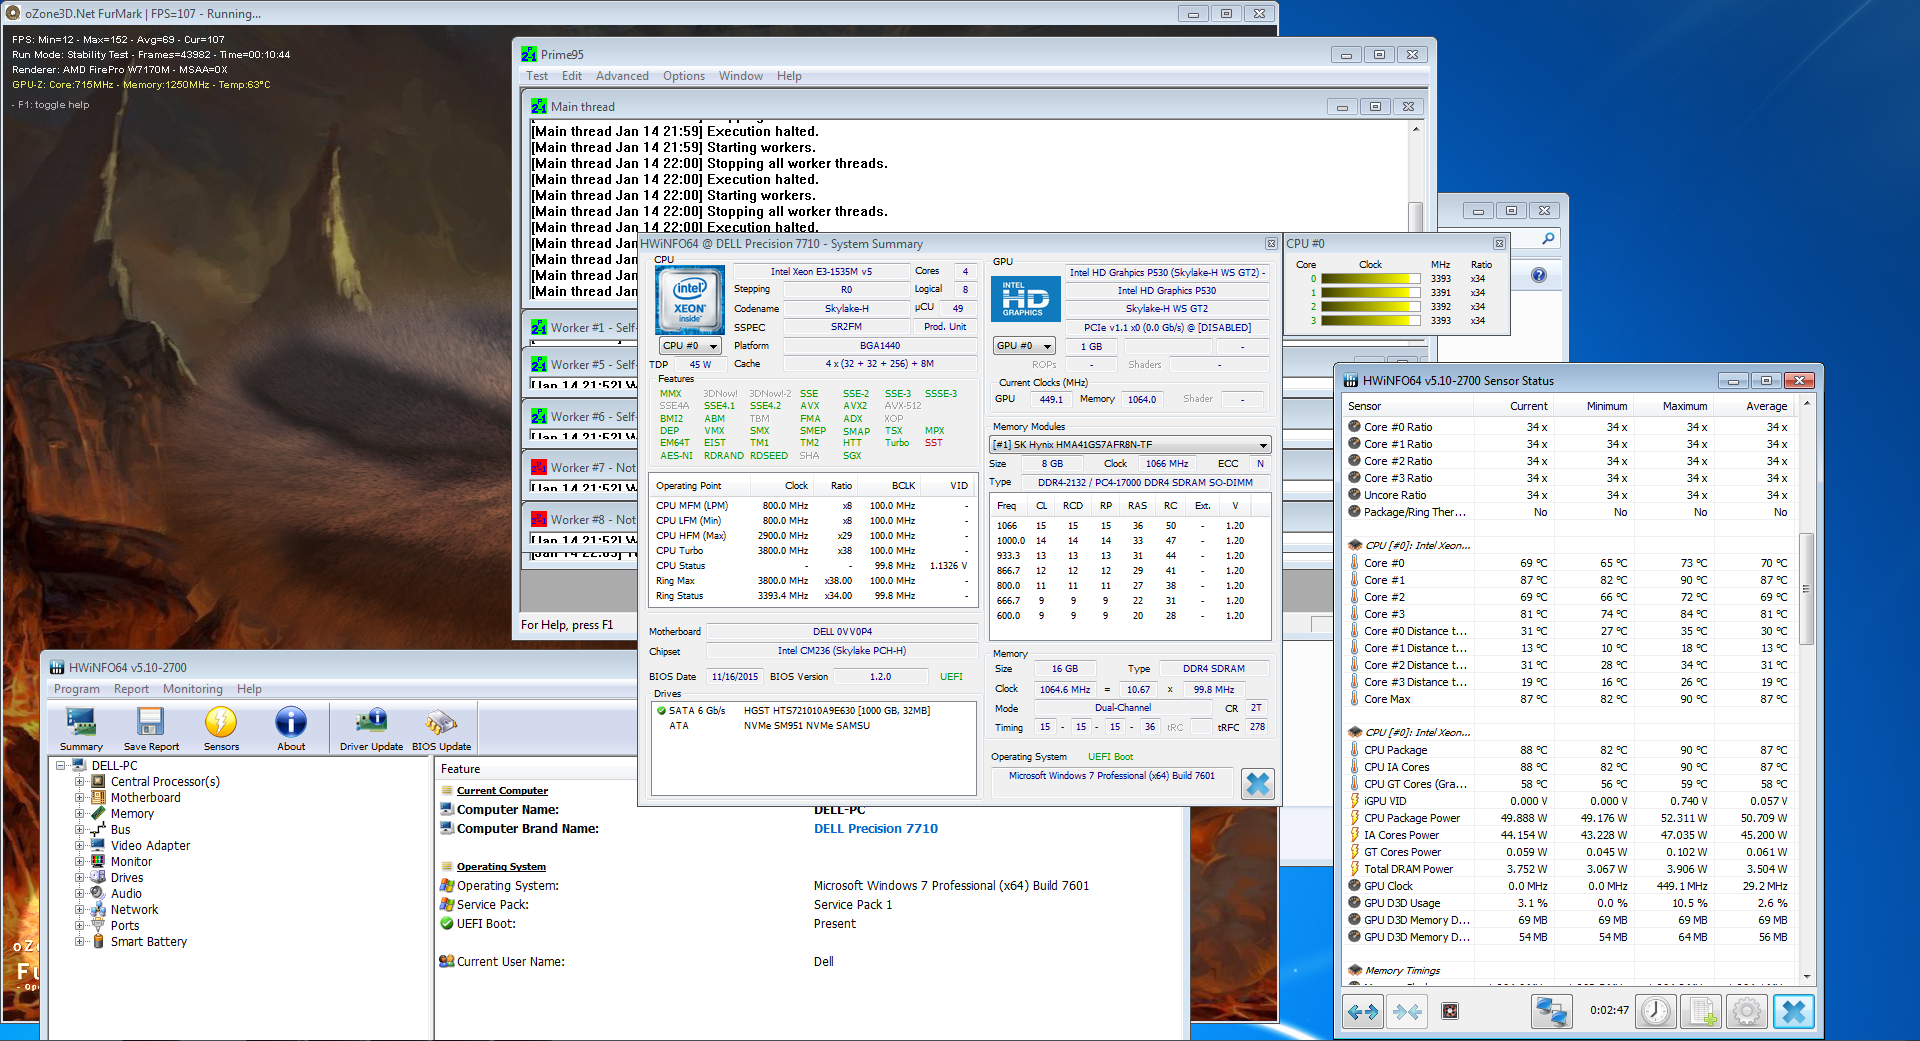
As already indicated in the processor section, the GPU throttles when the CPU and GPU are simultaneously used to capacity in our stress test. Dell's policy is so extreme that the maximum power consumption falls from 189 Watt to 125 Watt. While the CPU continues to constantly work at 3.4 GHz with 8 threads, the graphics clock falls and fluctuates between 378 to 527 MHz. When the CPU load is restricted to 6 simultaneous threads, the graphics card can use its maximum speed again and clocks constantly at 720 MHz. Currently, it is not possible to change this behavior via BIOS or energy settings.
On battery, the graphics card clocks at 300 MHz in general and the system only achieves 37.2 fps instead of 86.5 fps in Cinebench R11.5 OpenGL shading.

Gaming Performance
Basically, the mobile workstation Dell Precision 7710 has not been designed for gaming. Nevertheless, the powerful graphics chip also allows intensive gaming. The titles we have tested always ran sufficiently smooth with high presets. However, maximum quality settings are too high in titles like The Witcher 3, Anno 2205, or Ryse: Son of Rome. Please check our extensive gaming benchmark list for further comparisons.
| low | med. | high | ultra | |
| Tomb Raider (2013) | 375 | 224 | 167 | 51 |
| BioShock Infinite (2013) | 220 | 178 | 158 | 66 |
| Metro: Last Light (2013) | 120 | 112 | 94 | 44 |
| Company of Heroes 2 (2013) | 57 | 56 | 55 | 28 |
| Total War: Rome II (2013) | 185 | 162 | 153 | 36 |
| Thief (2014) | 62 | 57 | 57 | 40 |
| GRID: Autosport (2014) | 232 | 116 | 99 | 67 |
| Middle-earth: Shadow of Mordor (2014) | 177 | 126 | 70 | 52 |
| Ryse: Son of Rome (2014) | 101 | 93 | 43 | 15 |
| F1 2014 (2014) | 132 | 111 | 95 | 74 |
| Dirt Rally (2015) | 278 | 187 | 89 | 63 |
| The Witcher 3 (2015) | 97 | 72 | 31 | 23 |
| Anno 2205 (2015) | 146 | 93 | 43 | 20 |
Emissions
System Noise
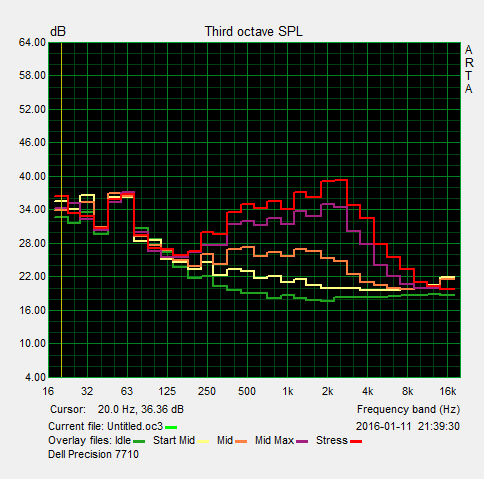
In low load scenarios, the Dell Precision 7710 is often silent and the fan only runs quietly (31.1 dB(A)) for short periods of time. Under medium load, the fan noise first increases to 37.4 dB(A) step by step and finally reaches 43.2 dB(A) when the load persists for a longer time. Under full load, the system noise starts at this level and reaches the maximum of 47.13 dB(A) after a few minutes with Furmark and Prime95, which persists during the whole full load period. Overall the system noise is quite restrained without unpleasant or high-frequency noises. However, permanent maximum load can still get annoying due to the noise level of 47.13 dB(A).
Noise Level
| Idle |
| 30 / 30 / 30 dB(A) |
| HDD |
| 33.2 dB(A) |
| Load |
| 43.2 / 47.13 dB(A) |
 | ||
30 dB silent 40 dB(A) audible 50 dB(A) loud |
||
min: | ||
Temperature
Apart from one exception, the measured surface temperatures hover significantly below 50 °C even in computationally intensive scenarios. With 55 °C, only the docking port exceeds the 32 °C average over the other segments by far. It appears that the interface itself emits a lot of heat, since this segment only includes these interfaces.
Please note that our measurements are the maximums to be expected in practice. The temperature only gets that high when Prime95 and Furmark run simultaneously and the maximum thread count of the processor is restricted to 6. If you do not restrict the system (8 threads), the clock rate of the AMD FirePro W7170M falls significantly (see graphics performance), resulting in lower power consumption and waste heat.
(+) The maximum temperature on the upper side is 35.6 °C / 96 F, compared to the average of 38.1 °C / 101 F, ranging from 22.2 to 69.8 °C for the class Workstation.
(-) The bottom heats up to a maximum of 55 °C / 131 F, compared to the average of 41.3 °C / 106 F
(+) In idle usage, the average temperature for the upper side is 27 °C / 81 F, compared to the device average of 32 °C / 90 F.
(+) The palmrests and touchpad are cooler than skin temperature with a maximum of 27 °C / 80.6 F and are therefore cool to the touch.
(±) The average temperature of the palmrest area of similar devices was 27.8 °C / 82 F (+0.8 °C / 1.4 F).
Speakers
.")
The integrated stereo sound system is sufficient for simple tasks like some background music, video chats or short Internet videos. The sound characteristic is quite high-tone heavy with little mid tones or basses. The maximum volume is good at 81 dB(A) and the sound is not distorted, but it suffers from the unbalanced reproduction quality. Thus, it is recommended to use external speakers when the system is used for presentations, videos in a small group, or as a jukebox. These can be connected via USB, 3.5 mm jack, Bluetooth, HDMI, or DisplayPort. The 3.5 mm jack combines headphones and microphone and some headsets (with two cables) will require an adapter.
Energy Management
Power Consumption
The measured minimum power consumption with minimum display brightness, disabled radio modules, and Intel HD Graphics is very low at 6.04 Watt. If you turn the display off, it is even only 3.7 Watt. However, if you increase the display brightness to the maximum, the energy demand quickly jumps to 15.2 Watt. In view of the used components and the display size, this is still a good value. In the same scenario, the current MSI WT72-6QME requires just under 30 Watt and the Lenovo ThinkPad P70 needs just under 20 Watt in the same scenario.
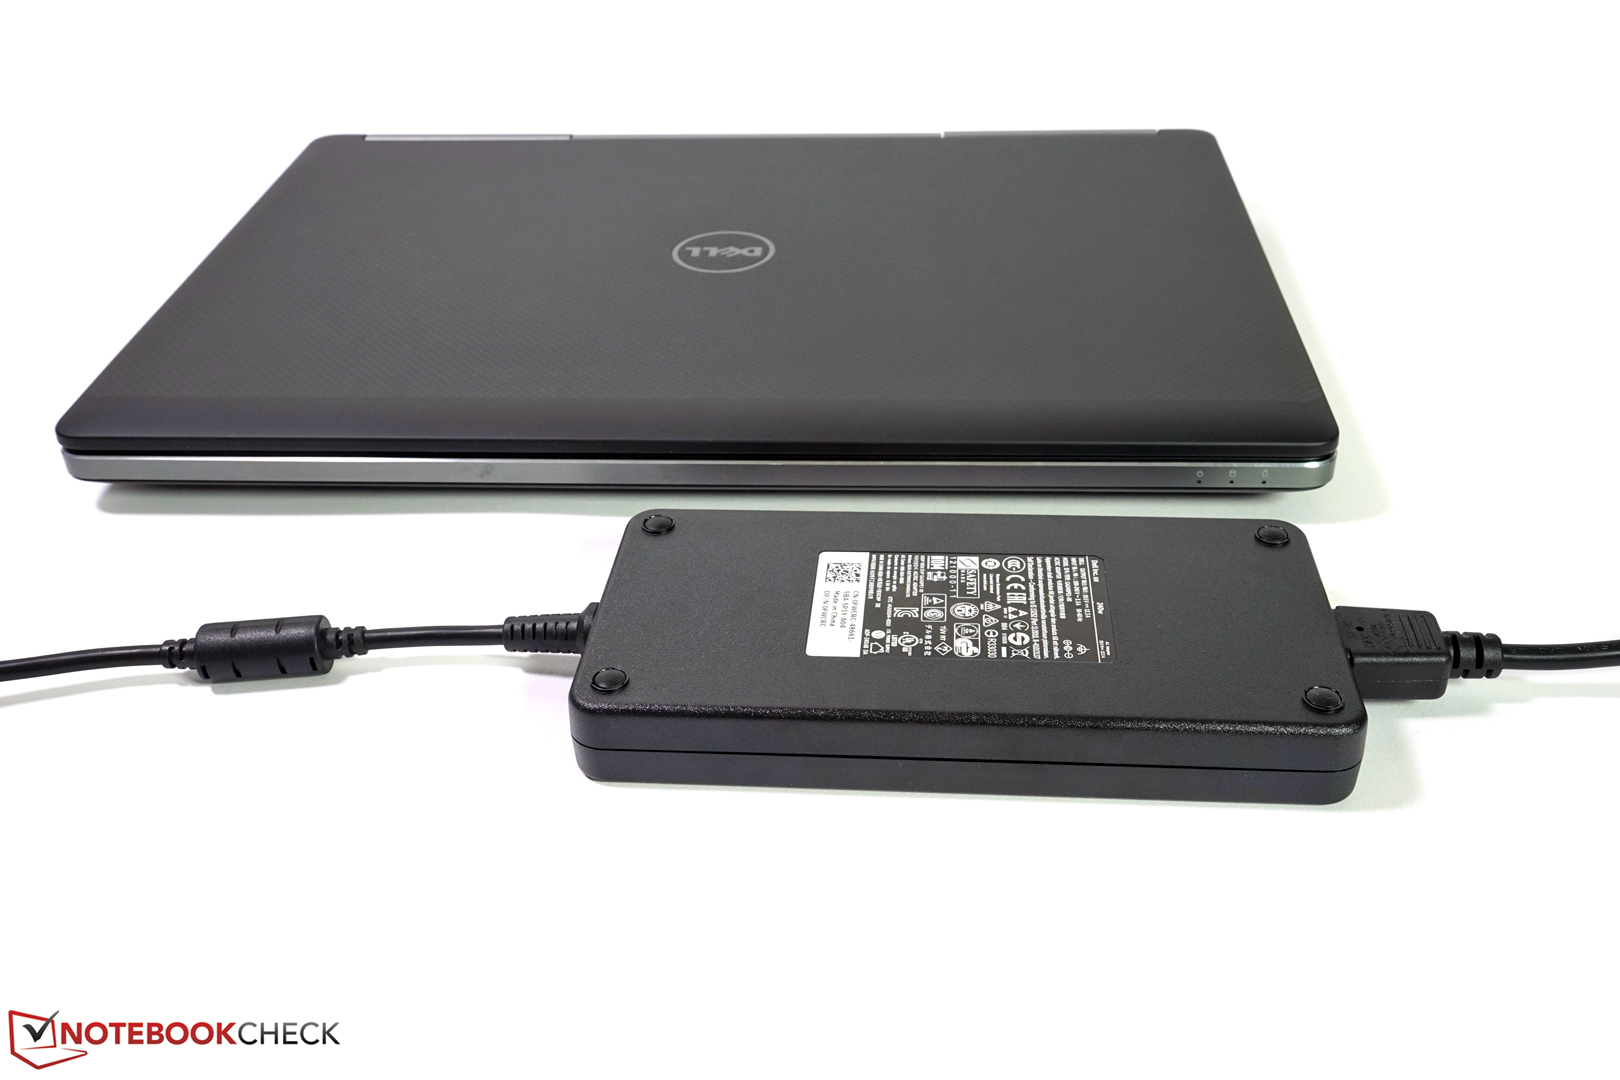
Under medium load, graphics and CPU are notably more used and require 112.8 Watt. Under full load, it only increases marginally to 125 Watt with our usual stress test condition, since the graphics card throttles. The maximum of 182.2 Watt was reached when we restricted the maximum CPU threads to 6, which prevented GPU throttling. The power adapter is rated at 240 Watt, so it has sufficient reserve capacities.
| Off / Standby | |
| Idle | |
| Load |
|
Battery Life
The Dell Precision 7710 can be ordered with a smaller 72 Wh battery as used in our test model or a 91 Wh battery with higher capacity. Both are completely integrated into the case beneath the front maintenance hatch.
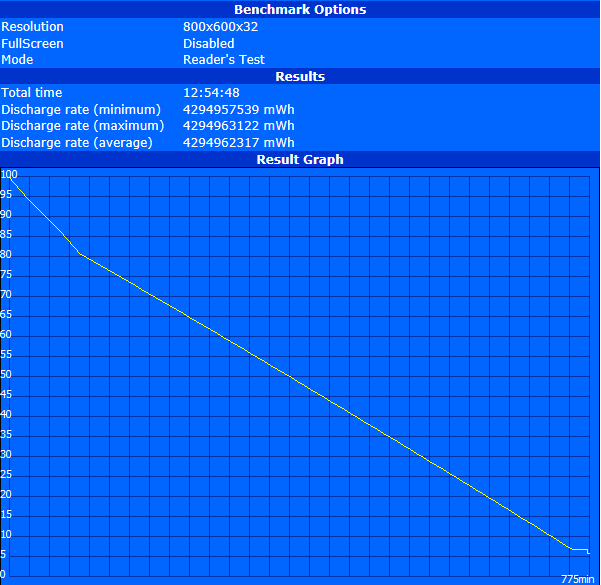
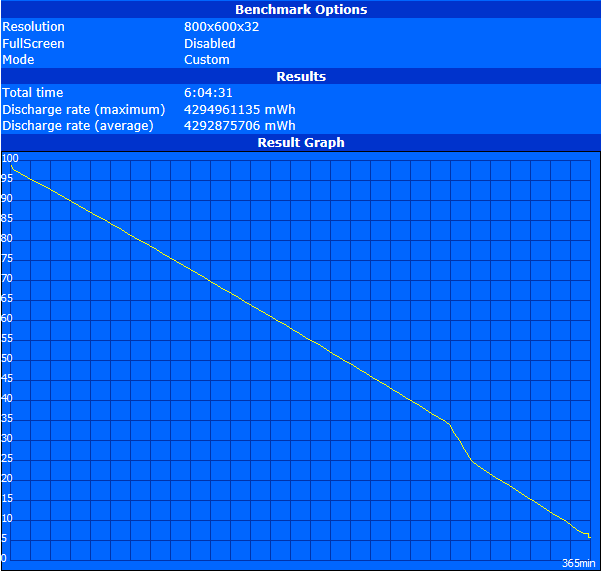
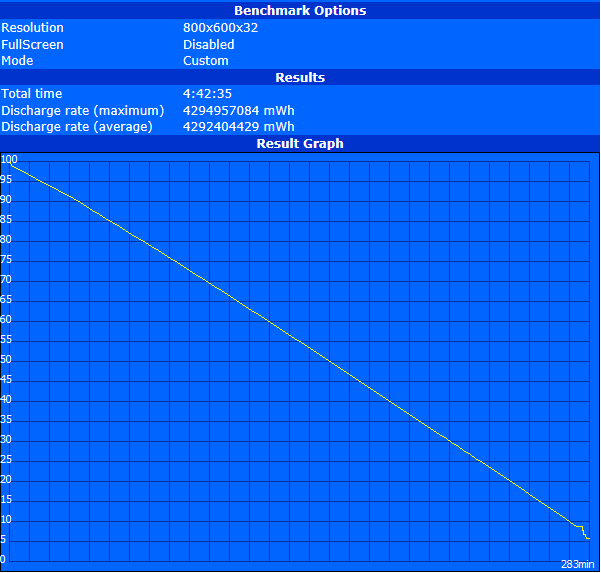
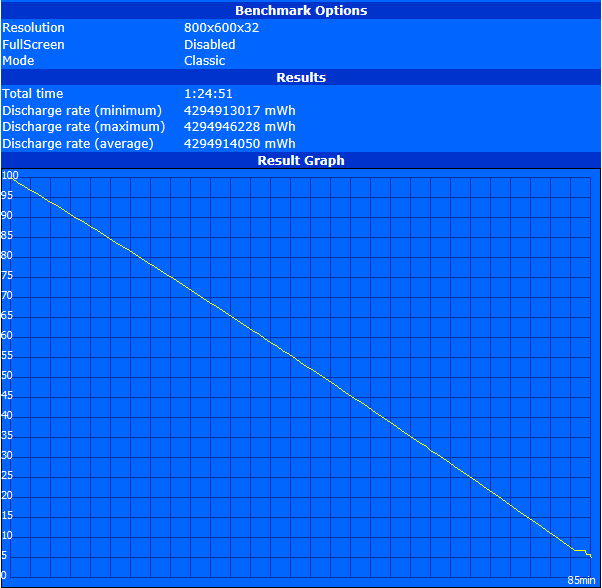
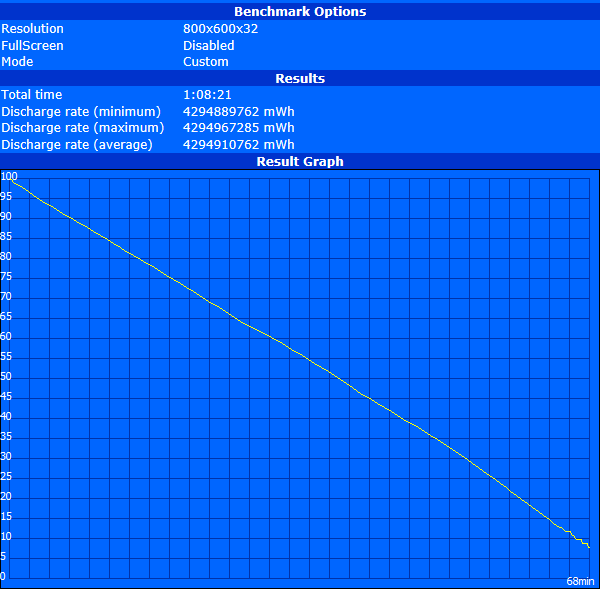
The battery runtimes range from a quite unrealistic 13 hours in the Battery Eater Reader's test (minimum display brightness, radio modules off, energy-saving profile with Intel graphics) to a realistic 6 hours during WLAN surfing (profile "balanced", brightness level 9 with 154 cd/m², Wi-Fi on) to up to 68 minutes during the SPECviewperf.12 test (maximum brightness, high-performance profile, FirePro graphics, Wi-Fi on), which we we ran in a loop. The system load is a bit lower in the Battery Eater Classic test, which lasts 85 minutes.
The full load result is only possible because the graphics performance is significantly restricted on battery with 300 MHz. If the power consumption were as high on battery as our measurement of 190 Watt in mains operation, the system would only last about 20 minutes according to mathematics. This in turn would cause overheating of the battery, an increased risk of fire and certainly a significantly shorter lifespan of the battery.
Pros
Cons
Verdict
Dell's Precision 7710 was fundamentally revised and made up-to-date in many important aspects.
The user gets a mobile workstation with very good performance, easy maintenance, suitable input devices, and a high-end Full HD display suitable for professional use in the new model year.
As we are used to, Dell offers many configuration options and optional warranty and service extensions.
However, we are not completely satisfied with the connectivity, which could have been better in a completely revised 17-inch workstation. Older interfaces have been removed, but cutting-edge ports like USB 3.1 Gen.2, Thunderbolt 3.0 (only optionally available) or HDMI 2.0 are still missing. On top of that, you have to do without an optical drive or a second 2.5-inch drive slot. Moreover, it is not adequate for the test model that its graphics performance throttles heavily during the stress test and on battery. As mobile workstations are bought especially for computationally intensive use, this measure is actually contrary to the planned field of application.
Dell makes up for this with a low system noise at low load and an overall low heating. The battery runtimes are outstanding despite being equipped with the smaller 72 Wh battery and ensure use away from an outlet for an adequately long time.
All things considered, you will get a solid mobile workstation for a gross price of about 3730 Euros (~$4068), including 36 months ProSupport with on-site-service in our test model. However, it requires the user to accept some austerities.
Dell Precision 7710
-
03/17/2016 v5(old)
Tobias Winkler