 Deutsch
 English
 Español
 Français
 Italiano
 Nederlands
 Polski
 Português
 Русский
 Türkçe
 Svenska
 Chinese
 Magyar
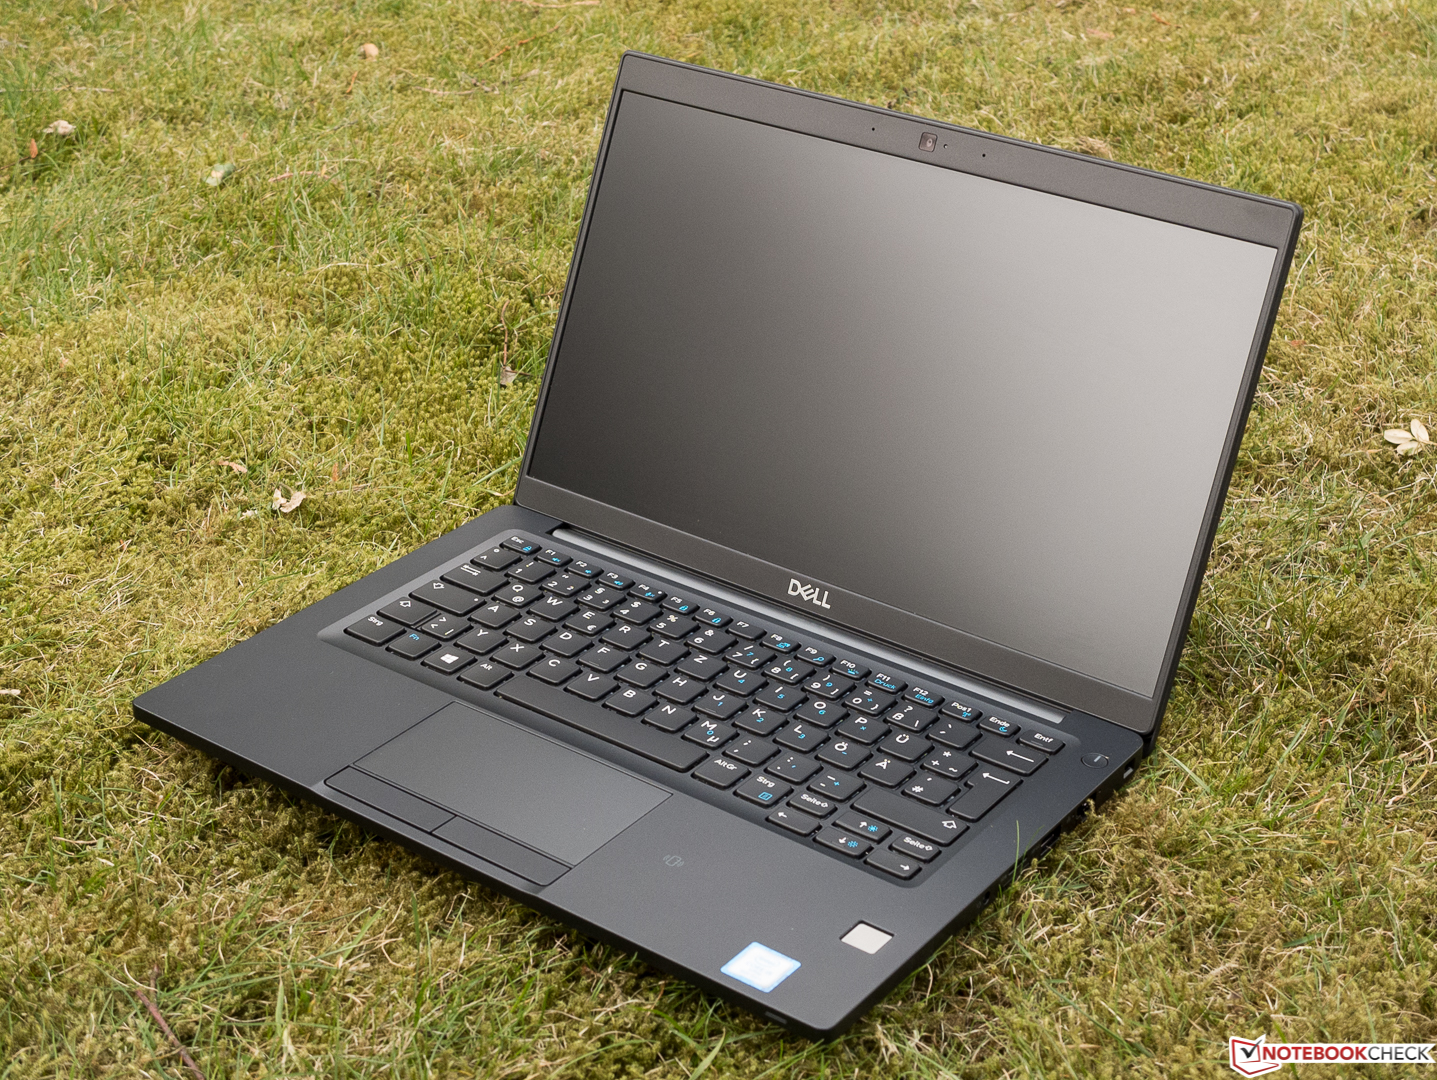
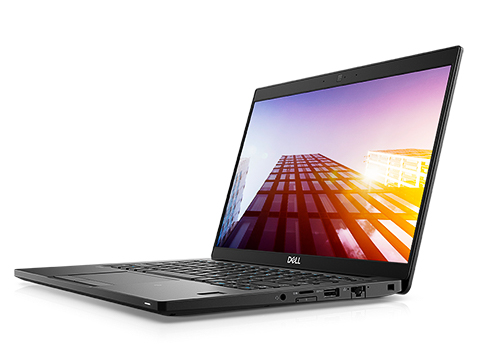
Dell Latitude 7390 (Core i7-8650U, Touchscreen) Laptop Review
Just a month ago, we posted an in-depth review of what is currently one of the top business ultrabooks on the market. The Dell Latitude 7390 fulfills all of the basic requirements of a successful office companion and then some, combining the attractive form factor and luxurious bells and whistles of a consumer device with the uncompromising sensibilities and practical philosophy of a business device. We praised its flawless workmanship, excellent design, comprehensive port selection, easy maintenance, terrific keyboard, quiet operation, impressive screen, and great battery life. Meanwhile, we regretted the absence of Thunderbolt 3 and NVMe SSD alongside several other relatively minor nitpicks, such as a slightly unreliable fingerprint sensor and the lack of a maintenance flap.
Today’s configuration is mostly comparable to last month’s with the exception of some notable upgrades. The first of these is a Core i7-8650U CPU, and it’s now paired with an NVMe SSD (which ought to provide a tangible boost to general system performance). Also intriguing is the addition of a touchscreen, which normally in Dell’s case translates to a glossy screen finish, but not anymore: the 7390’s anti-glare touchscreen is actually anti-glare. All these perks add up to a retail cost of $2,197, nearly $500 higher than the previous model. Is today’s setup worth the extra cash?
Preliminary Notes
Very little has changed since our review of the Latitude 7390 last month, so for the initial sections regarding construction, connectivity, input devices, and so forth, please reference our in-depth comments in that review. However, there are a few minor things that have changed since our previous article.
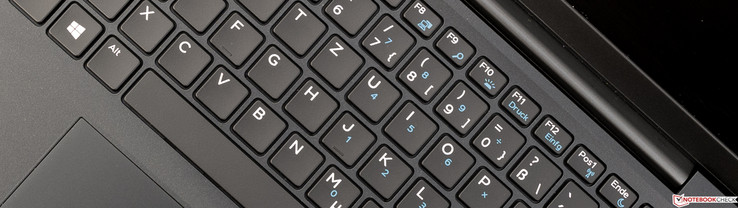
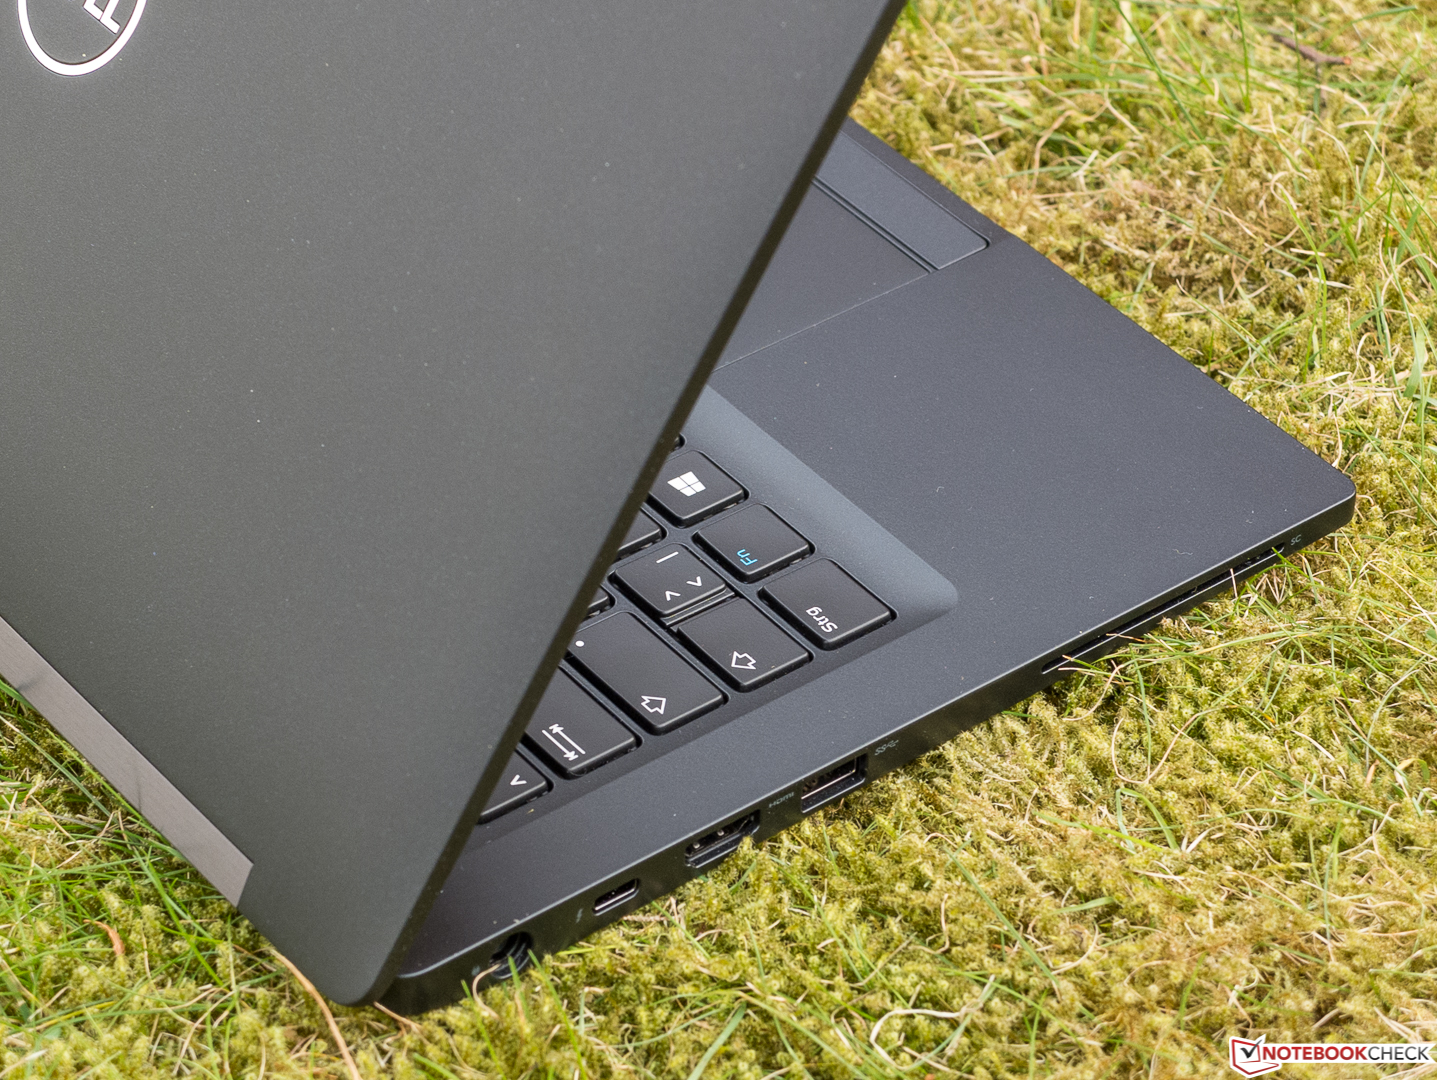
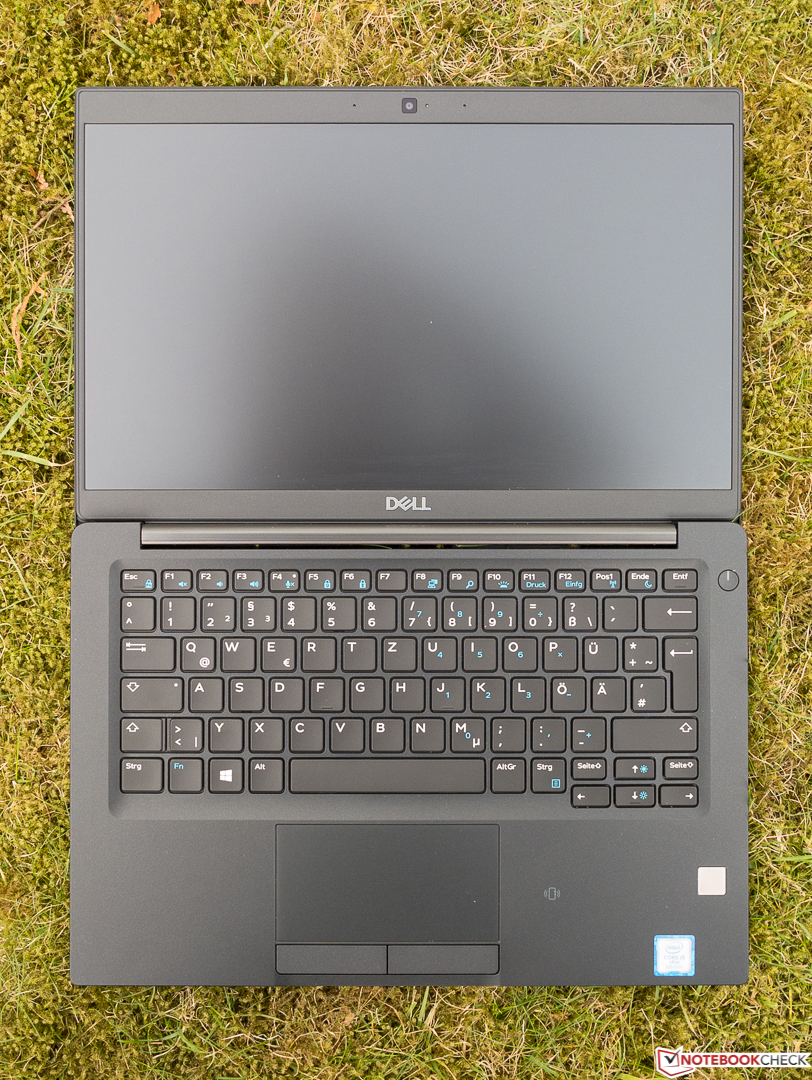
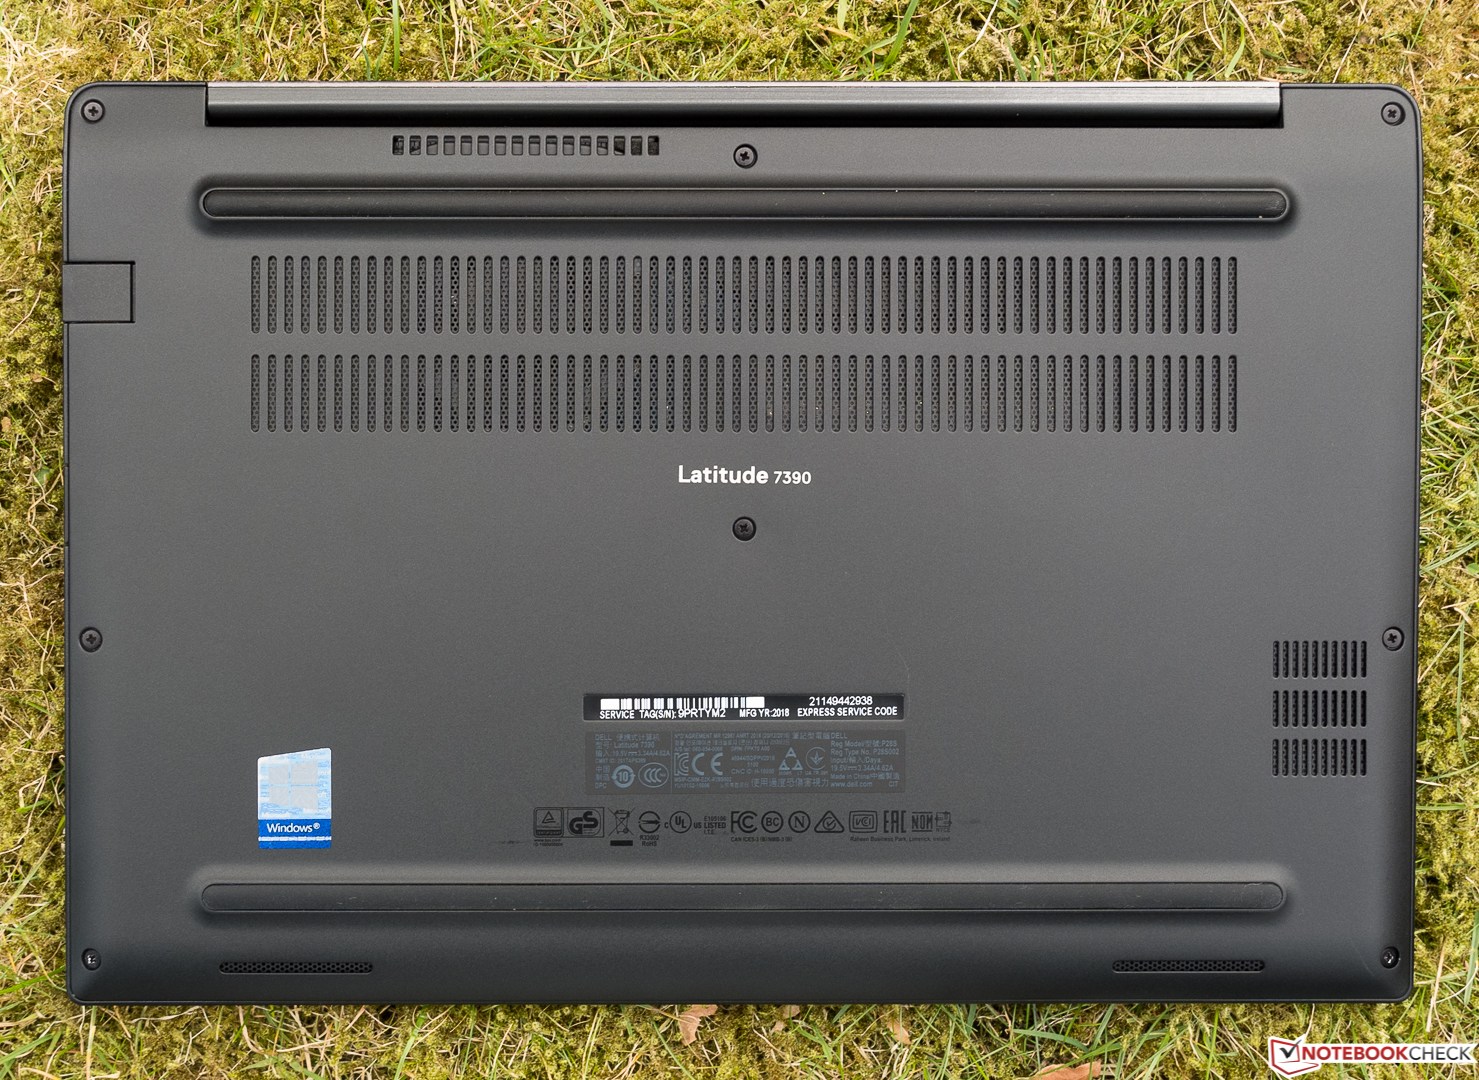
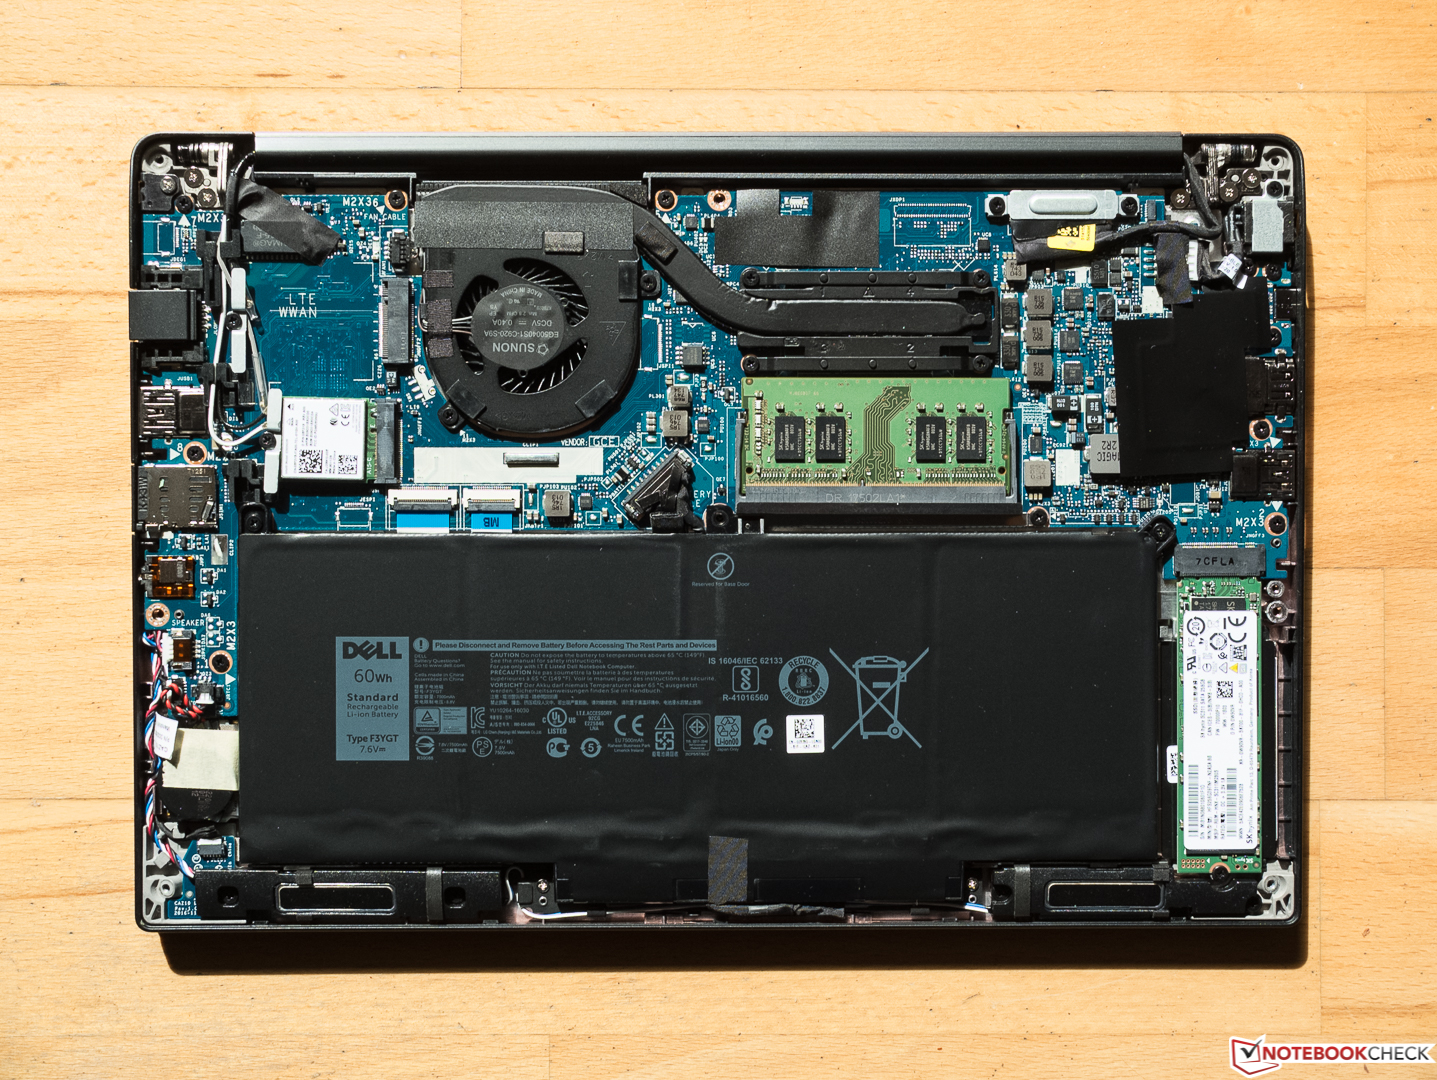
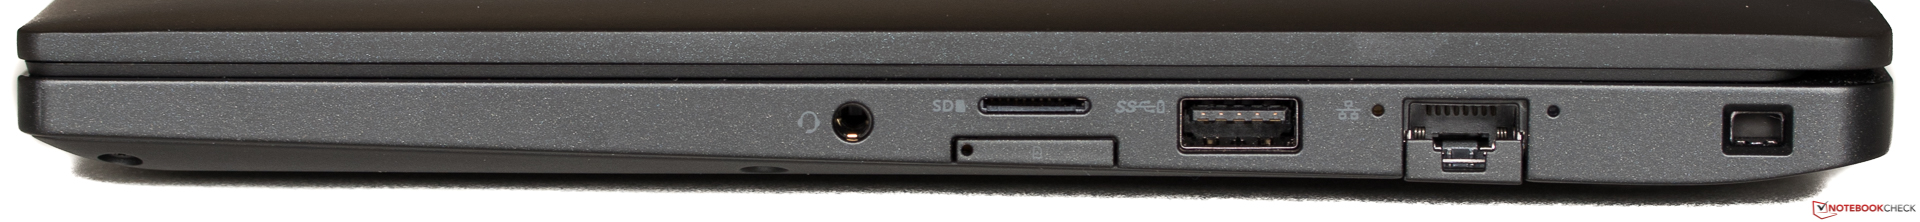
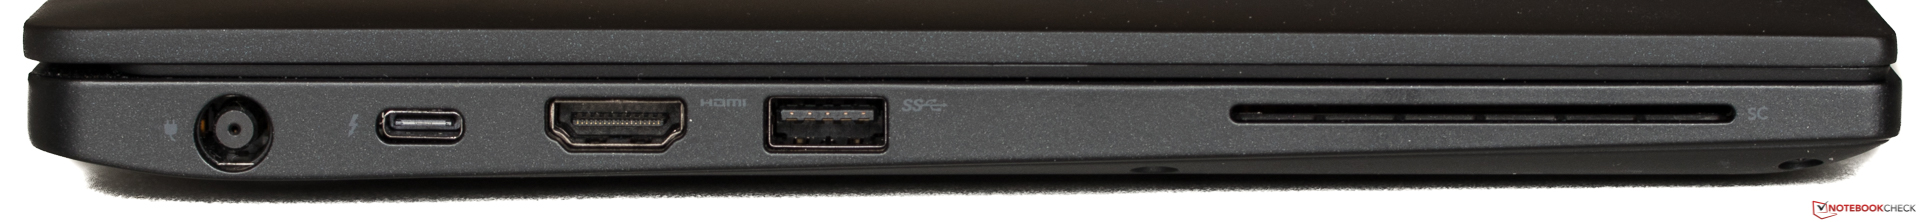
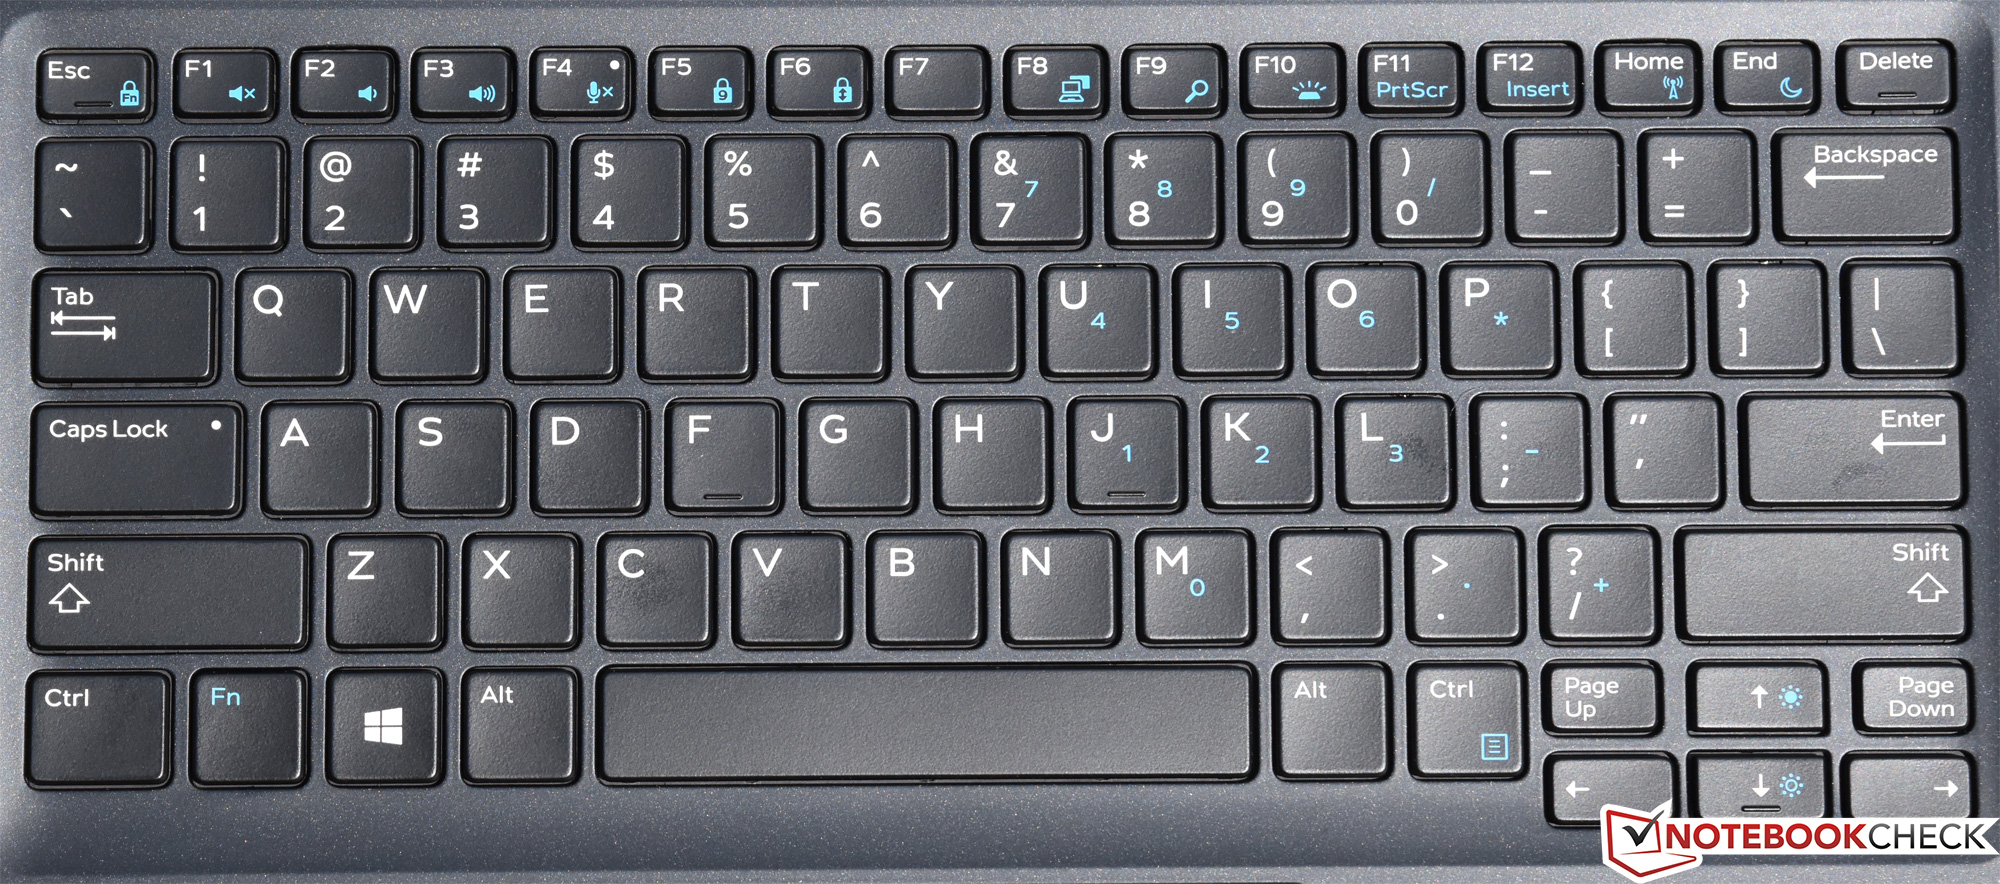
For starters, our criticism regarding the lack of Thunderbolt no longer applies: today’s unit trades the USB Type-C/DisplayPort for a Thunderbolt 3 port. Secondly, removing the rear panel of the laptop does not void the warranty, so the lack of a maintenance flap is really more of a minor inconvenience. Next, the keyboard layout is different between the US and European models, and there is no difference in size whatsoever between it and the larger Latitude 7480 keyboard (that is to say, it’s full-sized). Finally, we did not experience the lower-quality sensation with the touchpad buttons on our review unit here, so it’s likely that this may have been an idiosyncrasy of the previous review unit (or perhaps a result of the parts lottery which so very often applies to nearly all laptop purchases).
| SD Card Reader | |
| average JPG Copy Test (av. of 3 runs) | |
| Lenovo ThinkPad X1 Carbon 2018-20KGS03900 (Toshiba Exceria Pro M501) | |
| Dell Latitude 7390 (Toshiba Exceria Pro M501) | |
| Dell Latitude 7390 (Toshiba Exceria Pro M501 UHS-II) | |
| Dell Latitude 13 7380 (Toshiba Exceria Pro SDXC 64 GB UHS-II) | |
| Asus ZenBook 13 UX331UN (Toshiba Exceria Pro M501 microSDXC 64GB) | |
| Average of class Office (8 - 82.7, n=49, last 2 years) | |
| maximum AS SSD Seq Read Test (1GB) | |
| Lenovo ThinkPad X1 Carbon 2018-20KGS03900 (Toshiba Exceria Pro M501) | |
| Dell Latitude 7390 (Toshiba Exceria Pro M501 UHS-II) | |
| Dell Latitude 7390 (Toshiba Exceria Pro M501) | |
| Dell Latitude 13 7380 (Toshiba Exceria Pro SDXC 64 GB UHS-II) | |
| Asus ZenBook 13 UX331UN (Toshiba Exceria Pro M501 microSDXC 64GB) | |
| Average of class Office (25 - 90.5, n=43, last 2 years) | |
Display
The display panel has only changed slightly since last month’s model. Today’s unit still features a 13.3-inch 1920x1080 IPS matte display (166 PPI), and subjectively, it appears almost identical to that of the previous 7390 we reviewed. But there is one major difference: it’s also a touchscreen. Whereas in the past, Dell has labeled their reflection-diffusing touchscreens “anti-glare”, they are still most certainly glossy—but this screen is not. It is exactly the same in appearance to any other standard, non-touch, matte-finished panel, but it is in fact a touchscreen—an accomplishment which effectively dispels the biggest criticism with the touchscreens of yore. Lenovo has something similar in their X1 Carbon, but the Latitude’s implementation is even more subtle. The specific technology being employed here is called "Embedded Touch" anti-glare.
| |||||||||||||||||||||||||
Brightness Distribution: 86 %
Center on Battery: 303.8 cd/m²
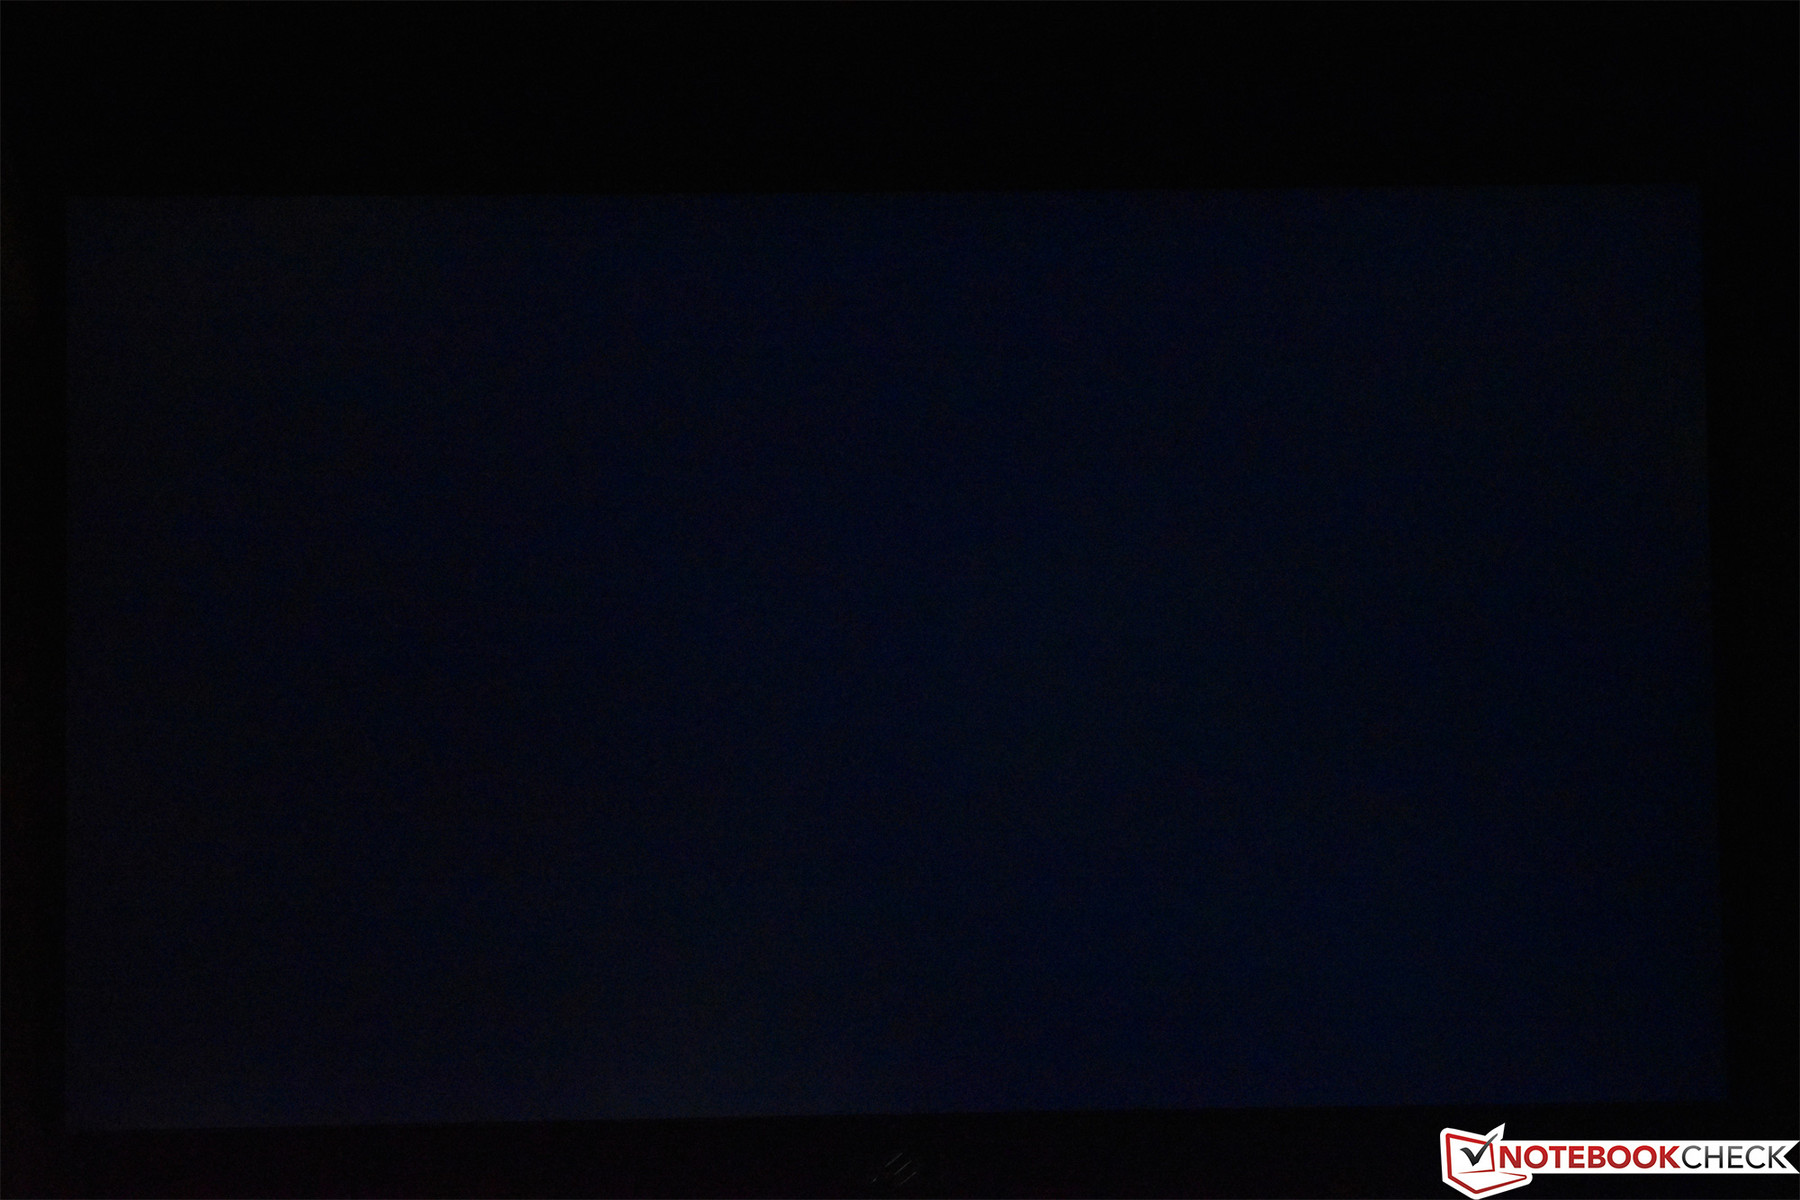
Contrast: 980:1 (Black: 0.31 cd/m²)
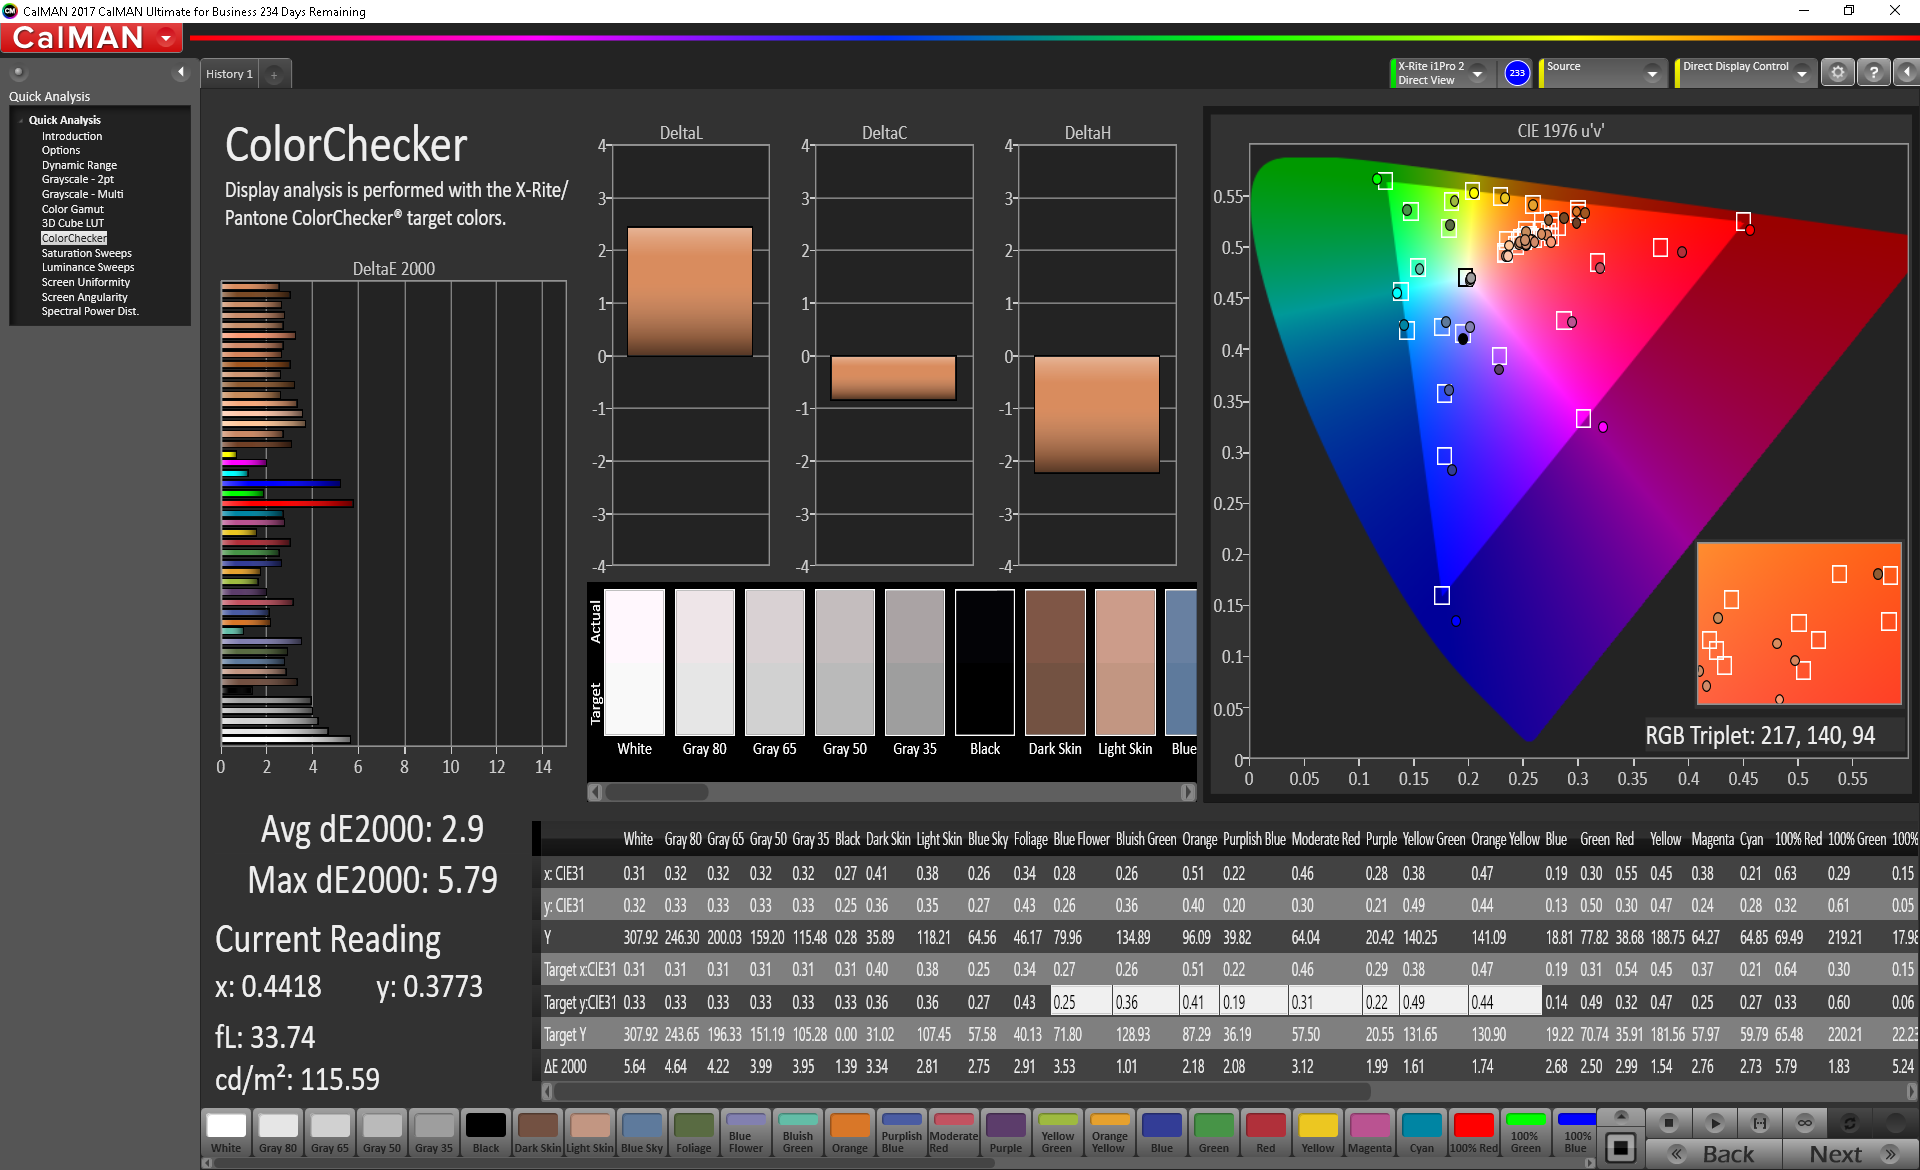
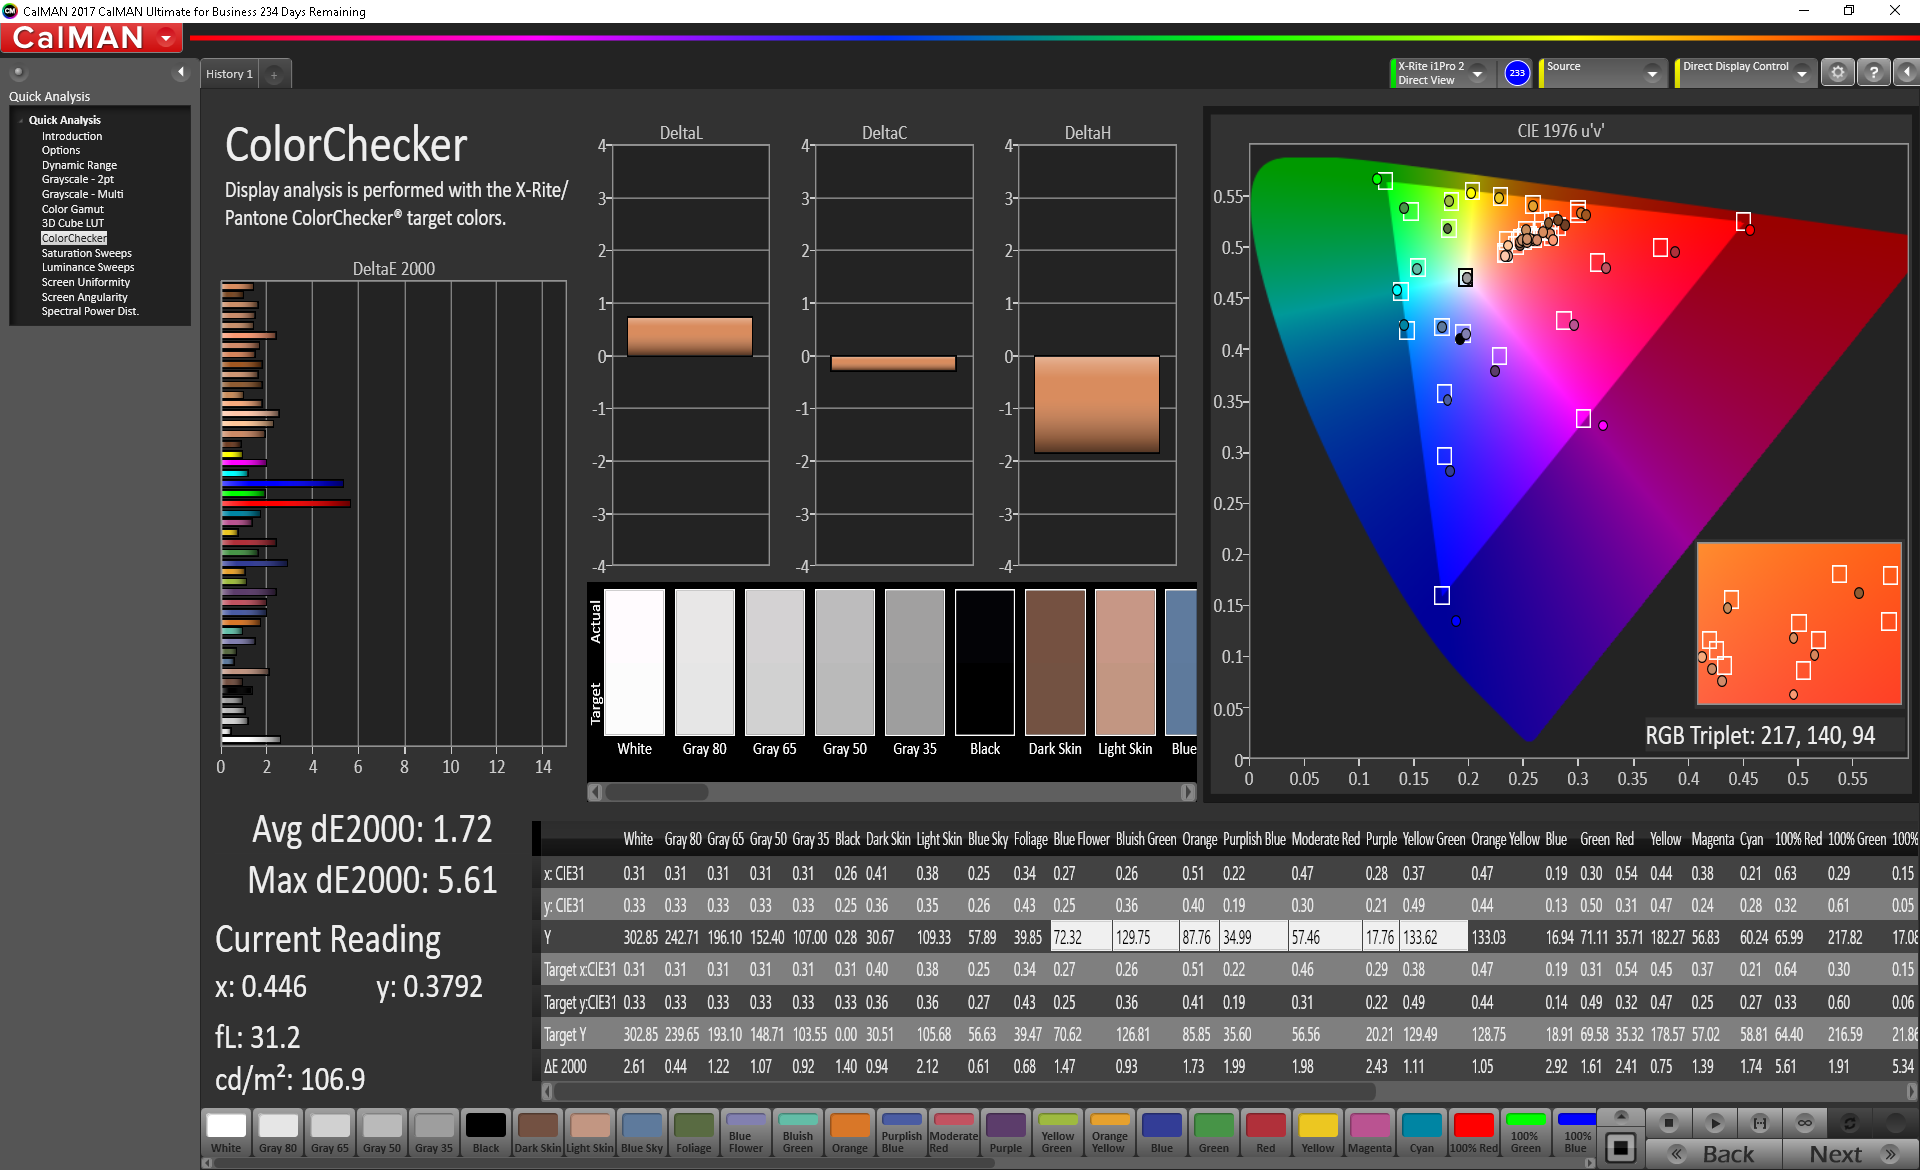
ΔE Color 2.9 | 0.5-29.43 Ø5, calibrated: 1.72
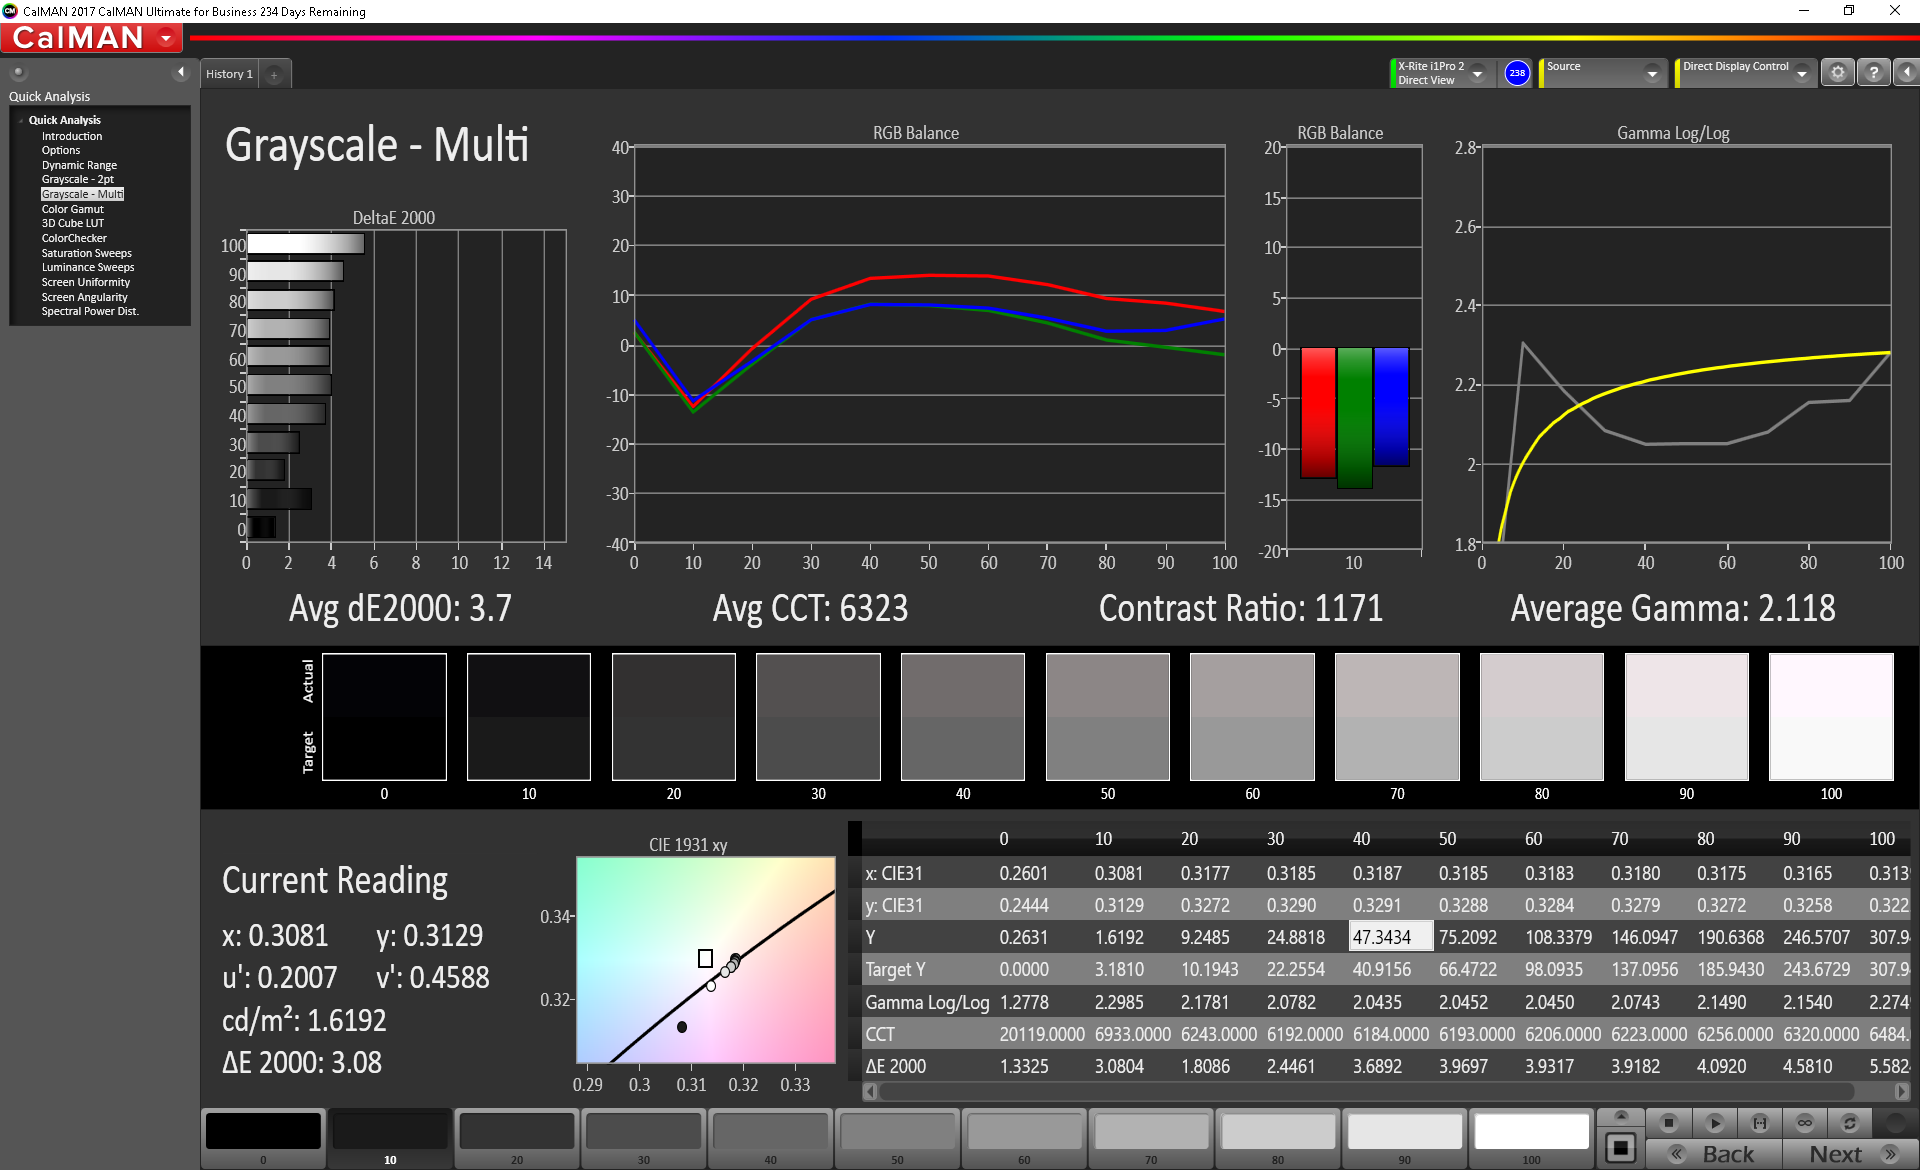
ΔE Greyscale 3.7 | 0.57-98 Ø5.3
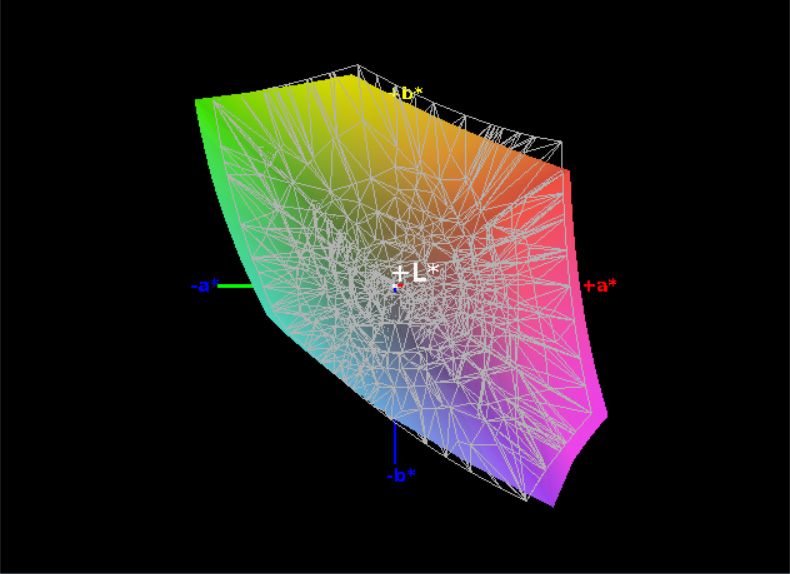
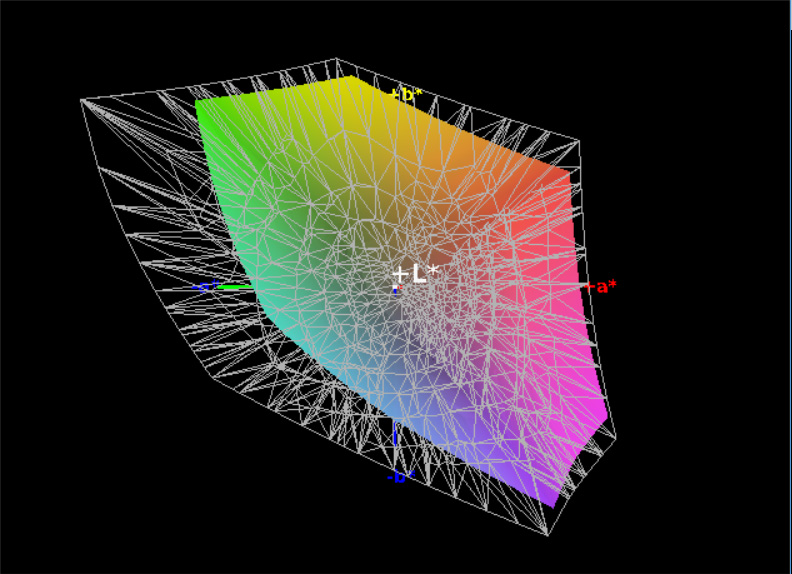
95% sRGB (Argyll 1.6.3 3D)
63% AdobeRGB 1998 (Argyll 1.6.3 3D)
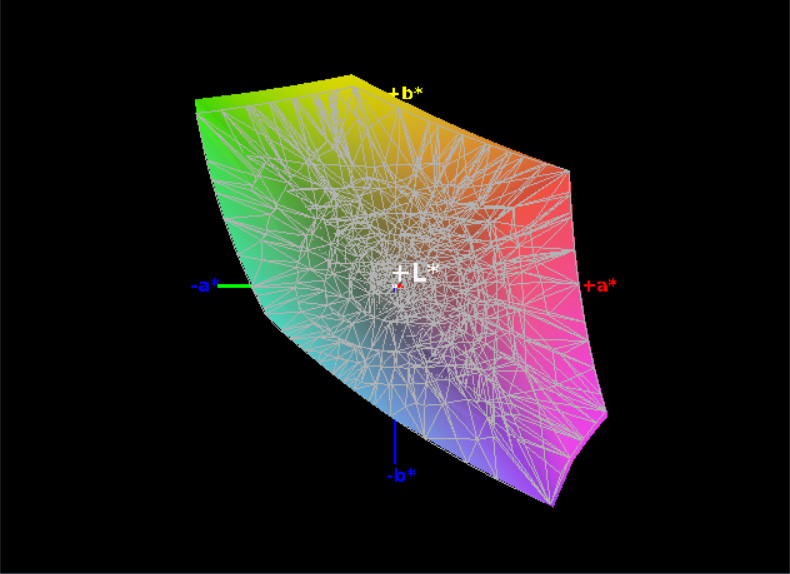
67.8% AdobeRGB 1998 (Argyll 2.2.0 3D)
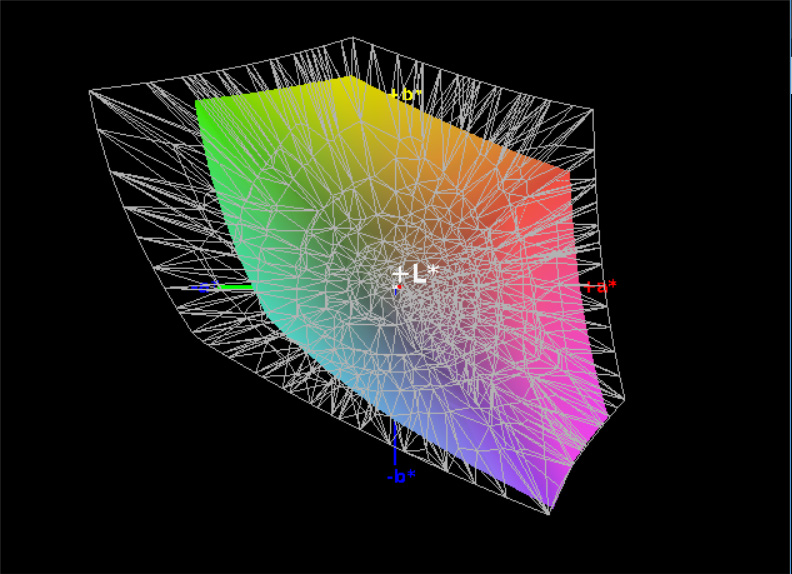
95.1% sRGB (Argyll 2.2.0 3D)
67.8% Display P3 (Argyll 2.2.0 3D)
Gamma: 2.118
| Dell Latitude 7390 LGD059B, IPS, 13.30, 1920x1080 | Dell Latitude 7390 AU Optronics AUO462D / B133HAN [DELL P/N:F7VDJ], IPS, 13.30, 1920x1080 | Lenovo ThinkPad X1 Carbon 2018-20KGS03900 B140QAN02.0, IPS, 14.00, 2560x1440 | HP Elitebook 1040 G4-2XU40UT Chi Mei CMN14D7, IPS, 14.00, 1920x1080 | Asus ZenBook 13 UX331UN AU Optronics B133HAN04.9, IPS, 13.30, 1920x1080 | |
|---|---|---|---|---|---|
| Display | -4% | 27% | 1% | -7% | |
| Display P3 Coverage | 67.8 | 65.1 -4% | 87.7 29% | 66.8 -1% | 63.3 -7% |
| sRGB Coverage | 95.1 | 90.8 -5% | 100 5% | 97.1 2% | 86.7 -9% |
| AdobeRGB 1998 Coverage | 67.8 | 65.9 -3% | 99.9 47% | 69 2% | 63.4 -6% |
| Response Times | -25% | -37% | 4% | 1% | |
| Response Time Grey 50% / Grey 80% * | 36.8 ? | 48.8 ? -33% | 59.2 ? -61% | 34.4 ? 7% | 44 ? -20% |
| Response Time Black / White * | 30.4 ? | 35.2 ? -16% | 34.4 ? -13% | 30 ? 1% | 24 ? 21% |
| PWM Frequency | 26040 ? | ||||
| Screen | -5% | 35% | -1% | -3% | |
| Brightness middle | 303.8 | 329 8% | 578 90% | 295.9 -3% | 329 8% |
| Brightness | 289 | 316 9% | 533 84% | 287 -1% | 306 6% |
| Brightness Distribution | 86 | 92 7% | 84 -2% | 87 1% | 86 0% |
| Black Level * | 0.31 | 0.25 19% | 0.38 -23% | 0.23 26% | 0.3 3% |
| Contrast | 980 | 1316 34% | 1521 55% | 1287 31% | 1097 12% |
| Colorchecker dE 2000 * | 2.9 | 4.3 -48% | 1.9 34% | 2.83 2% | 4.07 -40% |
| Colorchecker dE 2000 max. * | 5.79 | 7.8 -35% | 3.8 34% | 7.34 -27% | 7.05 -22% |
| Colorchecker dE 2000 calibrated * | 1.72 | 2.5 -45% | 0.8 53% | ||
| Greyscale dE 2000 * | 3.7 | 3.6 3% | 3 19% | 5.2 -41% | 2.76 25% |
| Gamma | 2.118 104% | 2.43 91% | 2.14 103% | 2.28 96% | 2.56 86% |
| CCT | 6323 103% | 6928 94% | 6377 102% | 7056 92% | 6915 94% |
| Color Space (Percent of AdobeRGB 1998) | 63 | 59.1 -6% | 88.8 41% | 63 0% | 56 -11% |
| Color Space (Percent of sRGB) | 95 | 90.6 -5% | 100 5% | 97 2% | 86 -9% |
| Total Average (Program / Settings) | -11% /
-8% | 8% /
25% | 1% /
0% | -3% /
-3% |
* ... smaller is better
Indeed, we didn’t measure a huge difference between the two panels: today’s Latitude 7390 posted an average brightness of 289, whereas last month’s managed 316 cd/m². Brightness distribution also remains good at 86%. Contrast sees a dip but is still well within reasonable ranges at 980:1 (spurred by a black level of 0.31 cd/m²).
Color coverage is reasonably good (slightly better than last month’s model, in fact) at 95% of sRGB and 63% of AdobeRGB, but this is of course still a very far cry from the Lenovo X1 Carbon’s 100% and 89%, respectively. The Elitebook 1040 G4 records nearly identical values, and the ASUS ZenBook 13 is just a bit behind the rest of the pack (at only 86% sRGB).
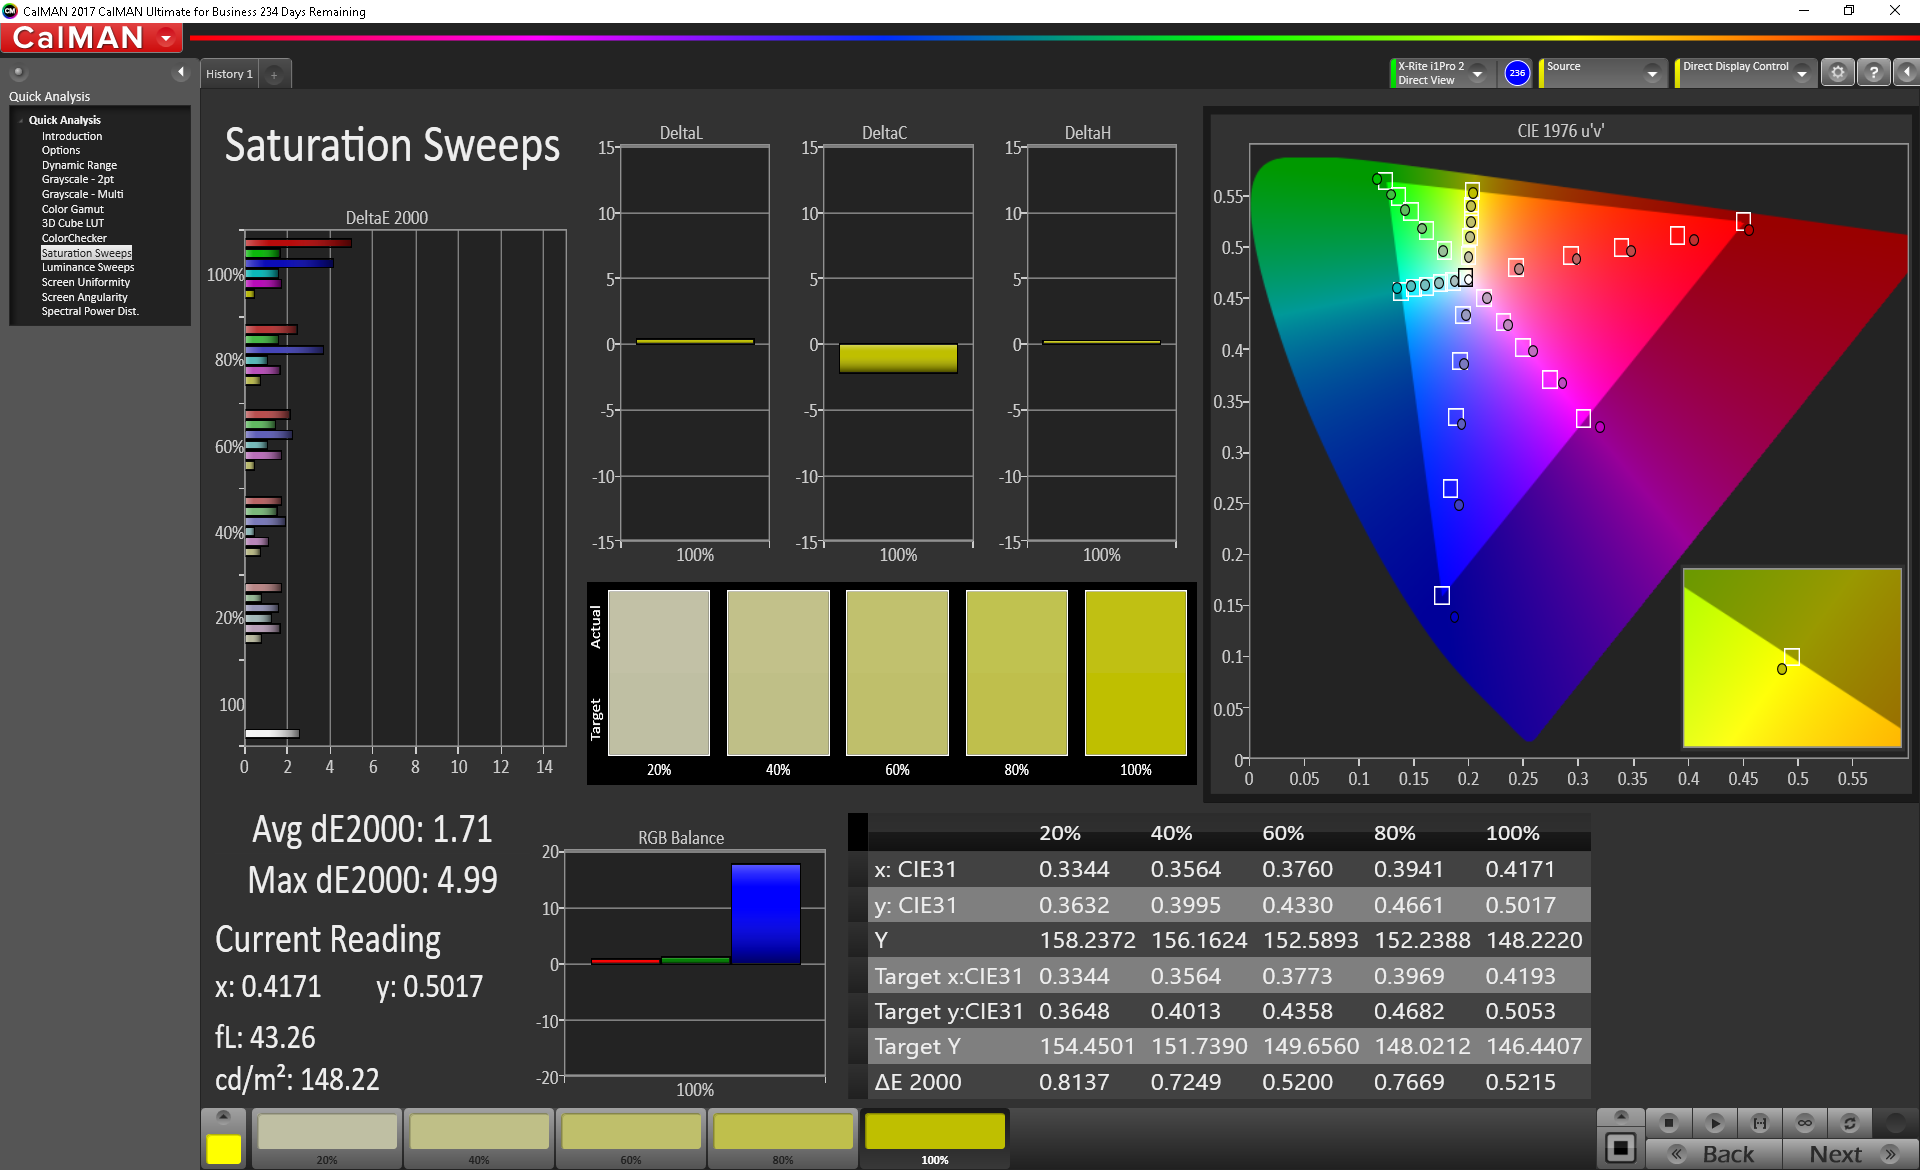
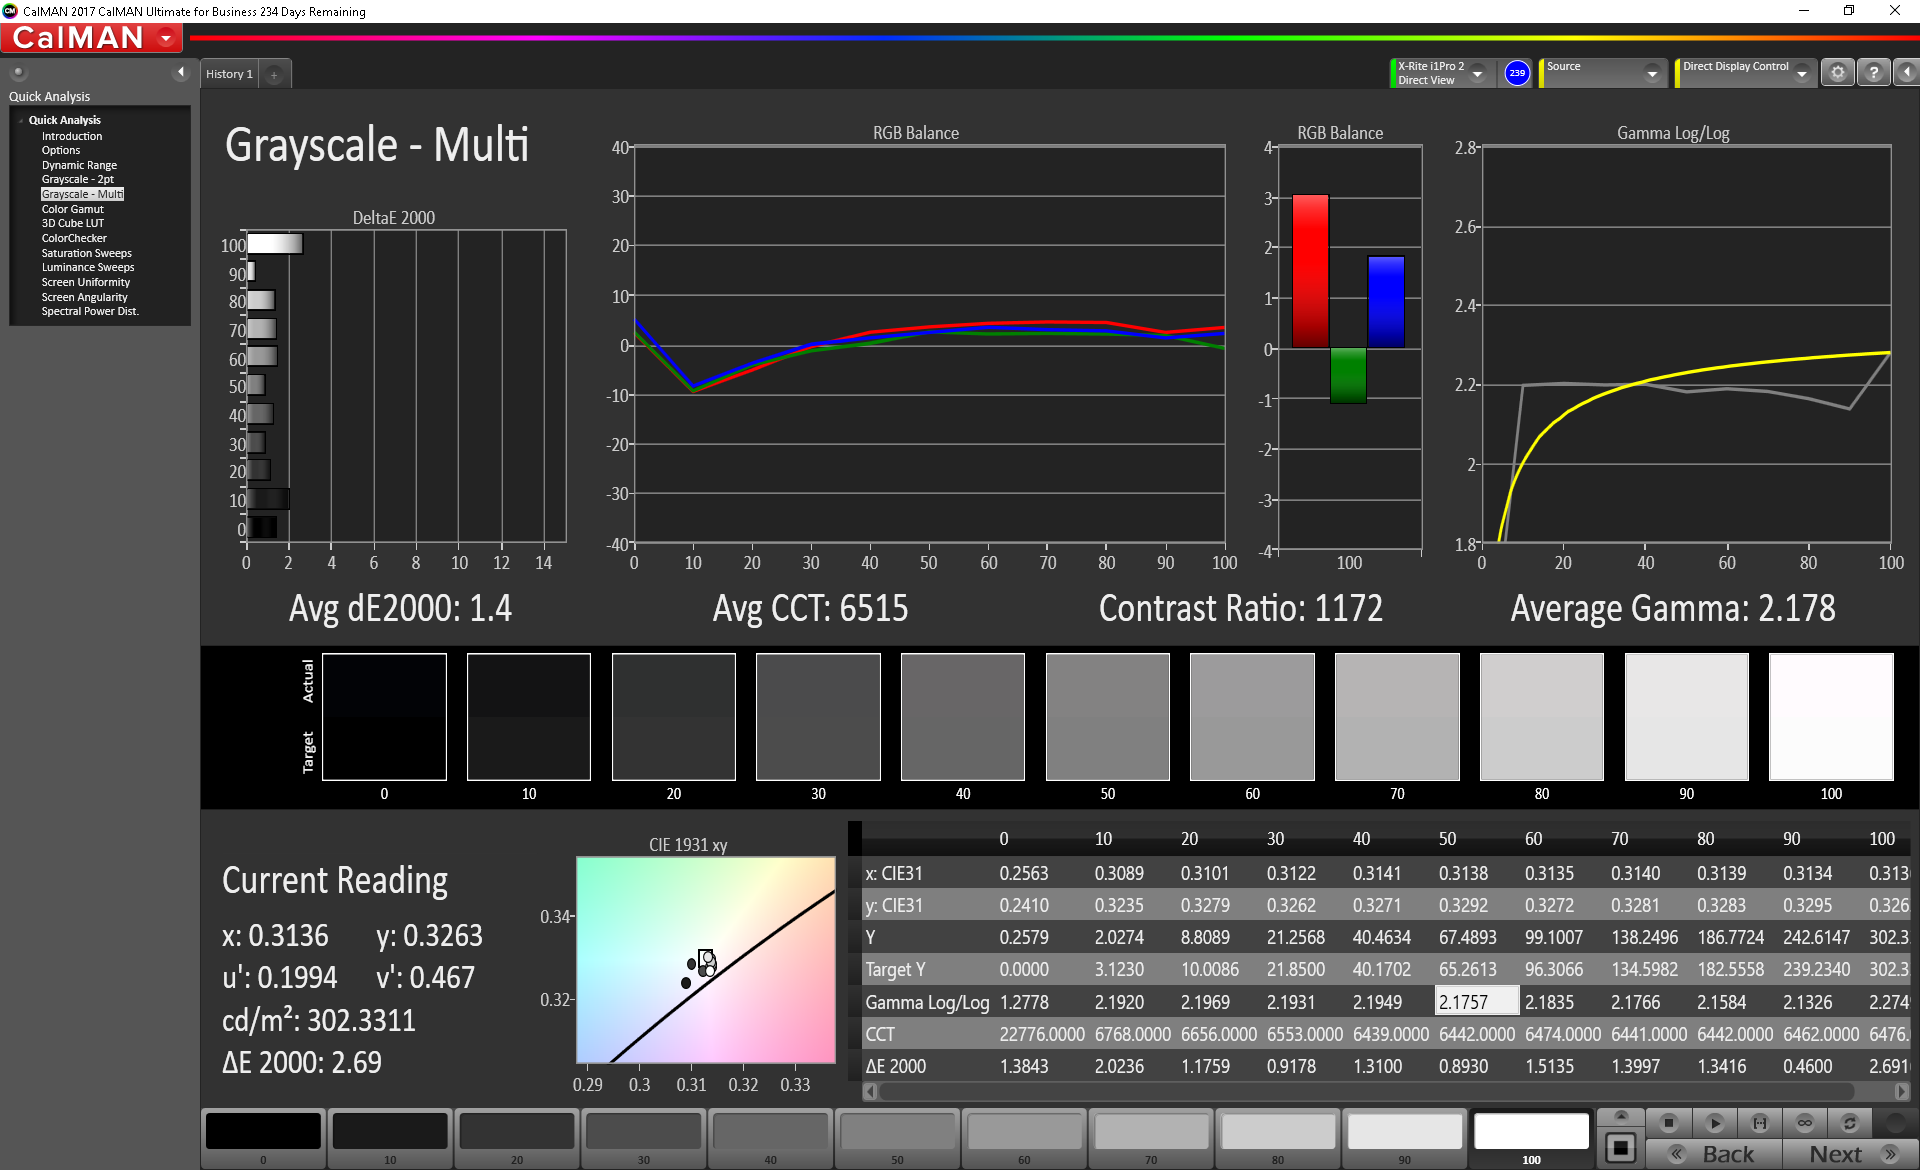
CalMAN measurements reveal a well-calibrated panel out of the box, with average deviances of just 2.9 / 3.7 in Colorchecker/Greyscale, respectively. Values below 5 are generally considered to be indiscernible to the naked eye.
Display Response Times
| ↔ Response Time Black to White | ||
|---|---|---|
| 30.4 ms ... rise ↗ and fall ↘ combined | ↗ 18.8 ms rise | 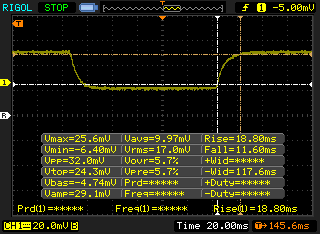 |
| ↘ 11.6 ms fall | ||
| The screen shows slow response rates in our tests and will be unsatisfactory for gamers. In comparison, all tested devices range from 0.1 (minimum) to 240 (maximum) ms. » 80 % of all devices are better. This means that the measured response time is worse than the average of all tested devices (21.5 ms). | ||
| ↔ Response Time 50% Grey to 80% Grey | ||
| 36.8 ms ... rise ↗ and fall ↘ combined | ↗ 18 ms rise | 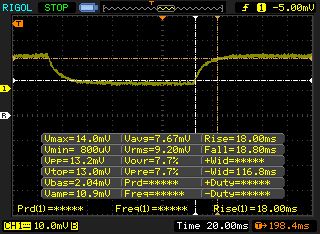 |
| ↘ 18.8 ms fall | ||
| The screen shows slow response rates in our tests and will be unsatisfactory for gamers. In comparison, all tested devices range from 0.2 (minimum) to 636 (maximum) ms. » 47 % of all devices are better. This means that the measured response time is similar to the average of all tested devices (33.7 ms). | ||
Screen Flickering / PWM (Pulse-Width Modulation)
| Screen flickering / PWM not detected |  | ||
In comparison: 53 % of all tested devices do not use PWM to dim the display. If PWM was detected, an average of 17900 (minimum: 5 - maximum: 3846000) Hz was measured. | |||
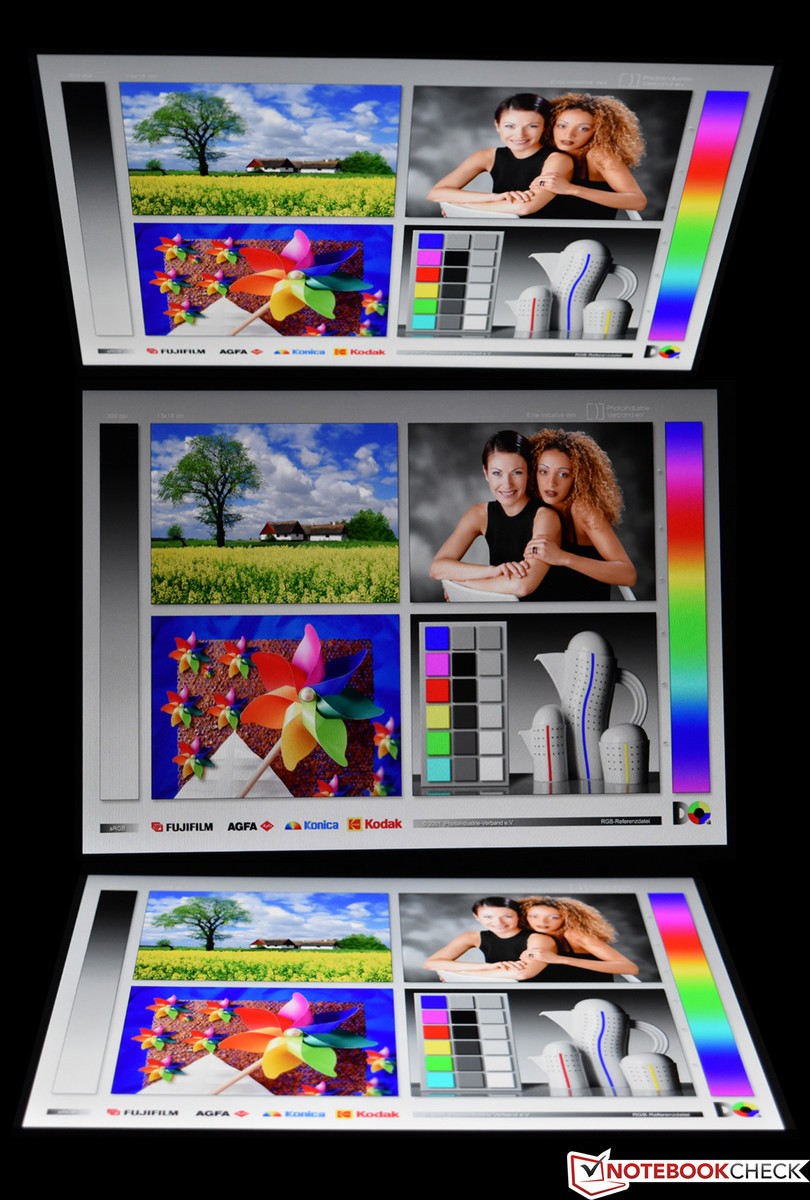
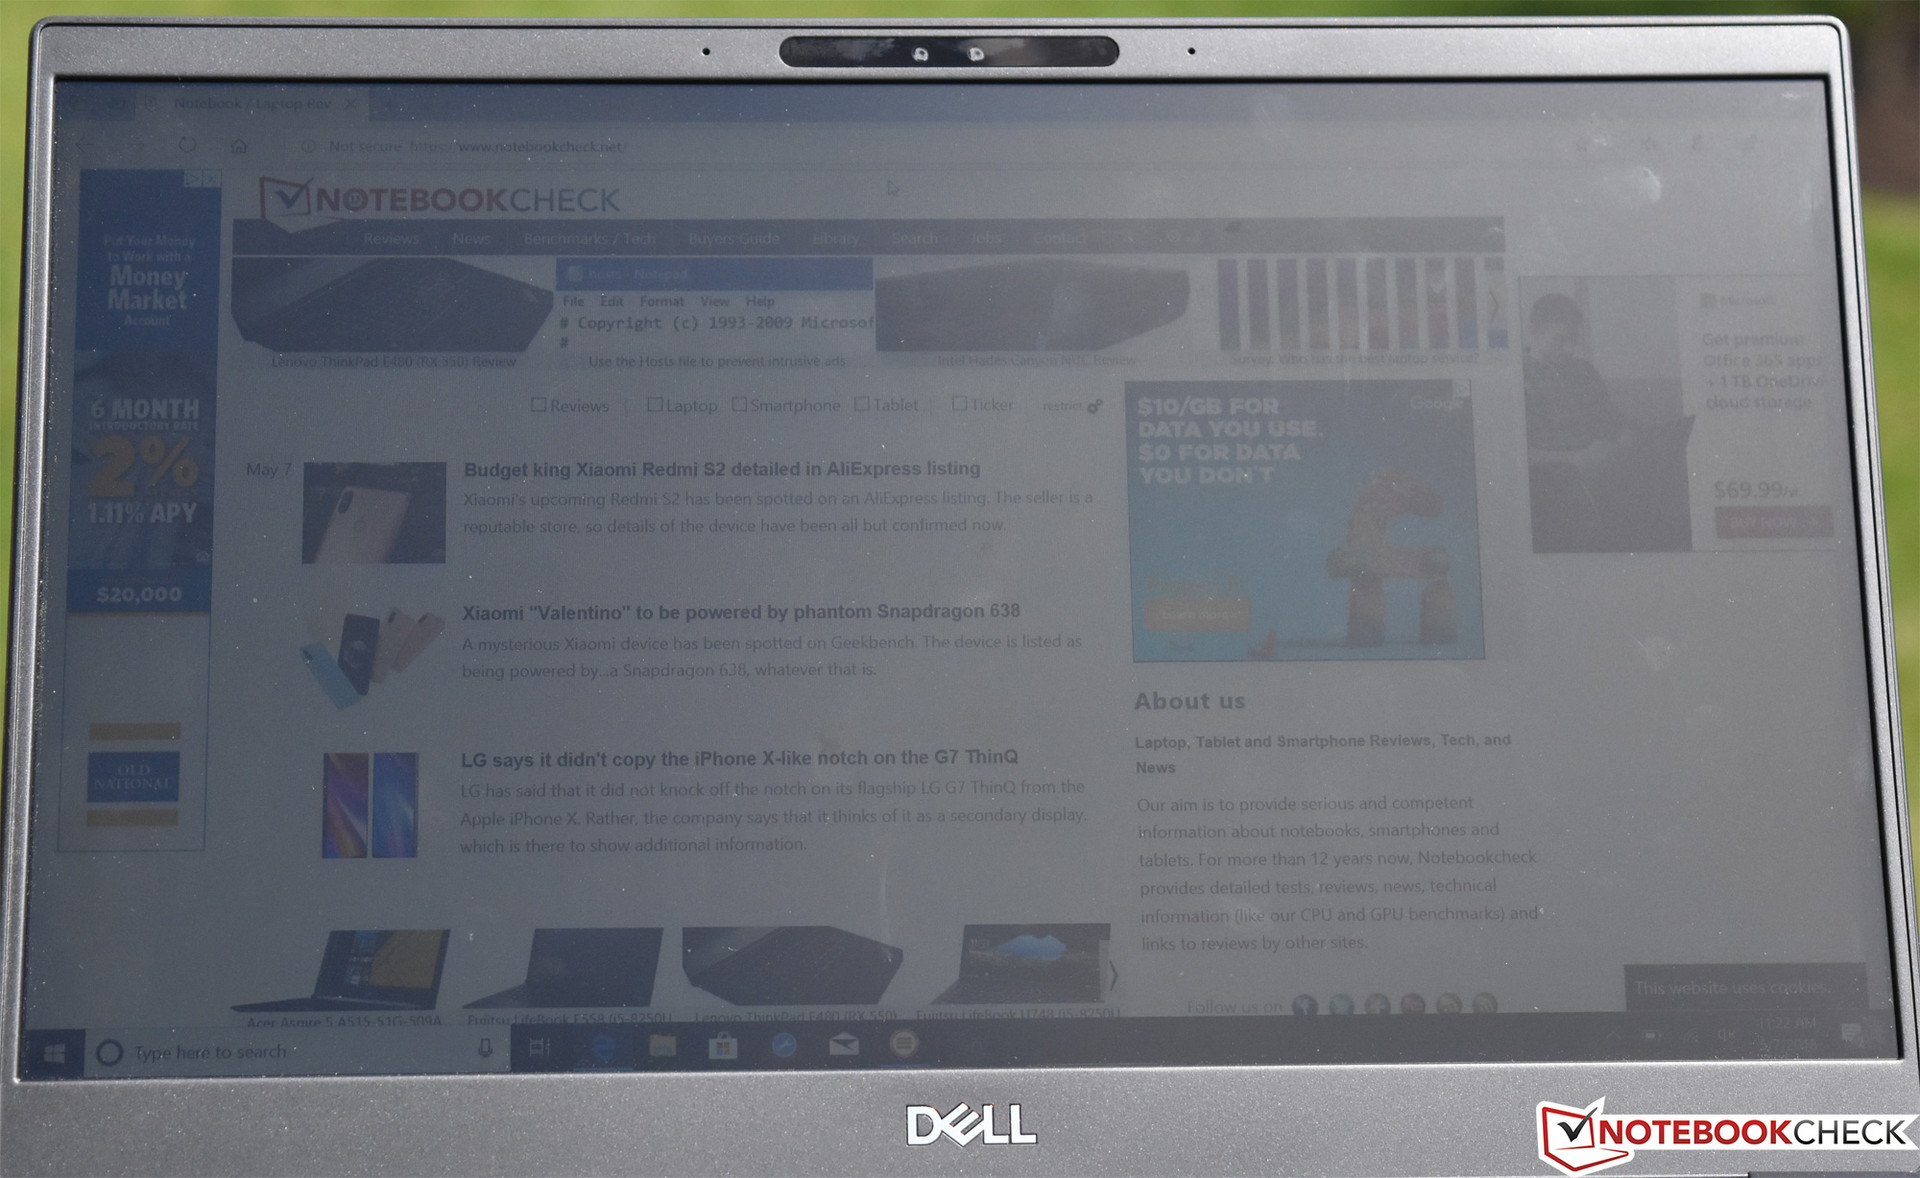
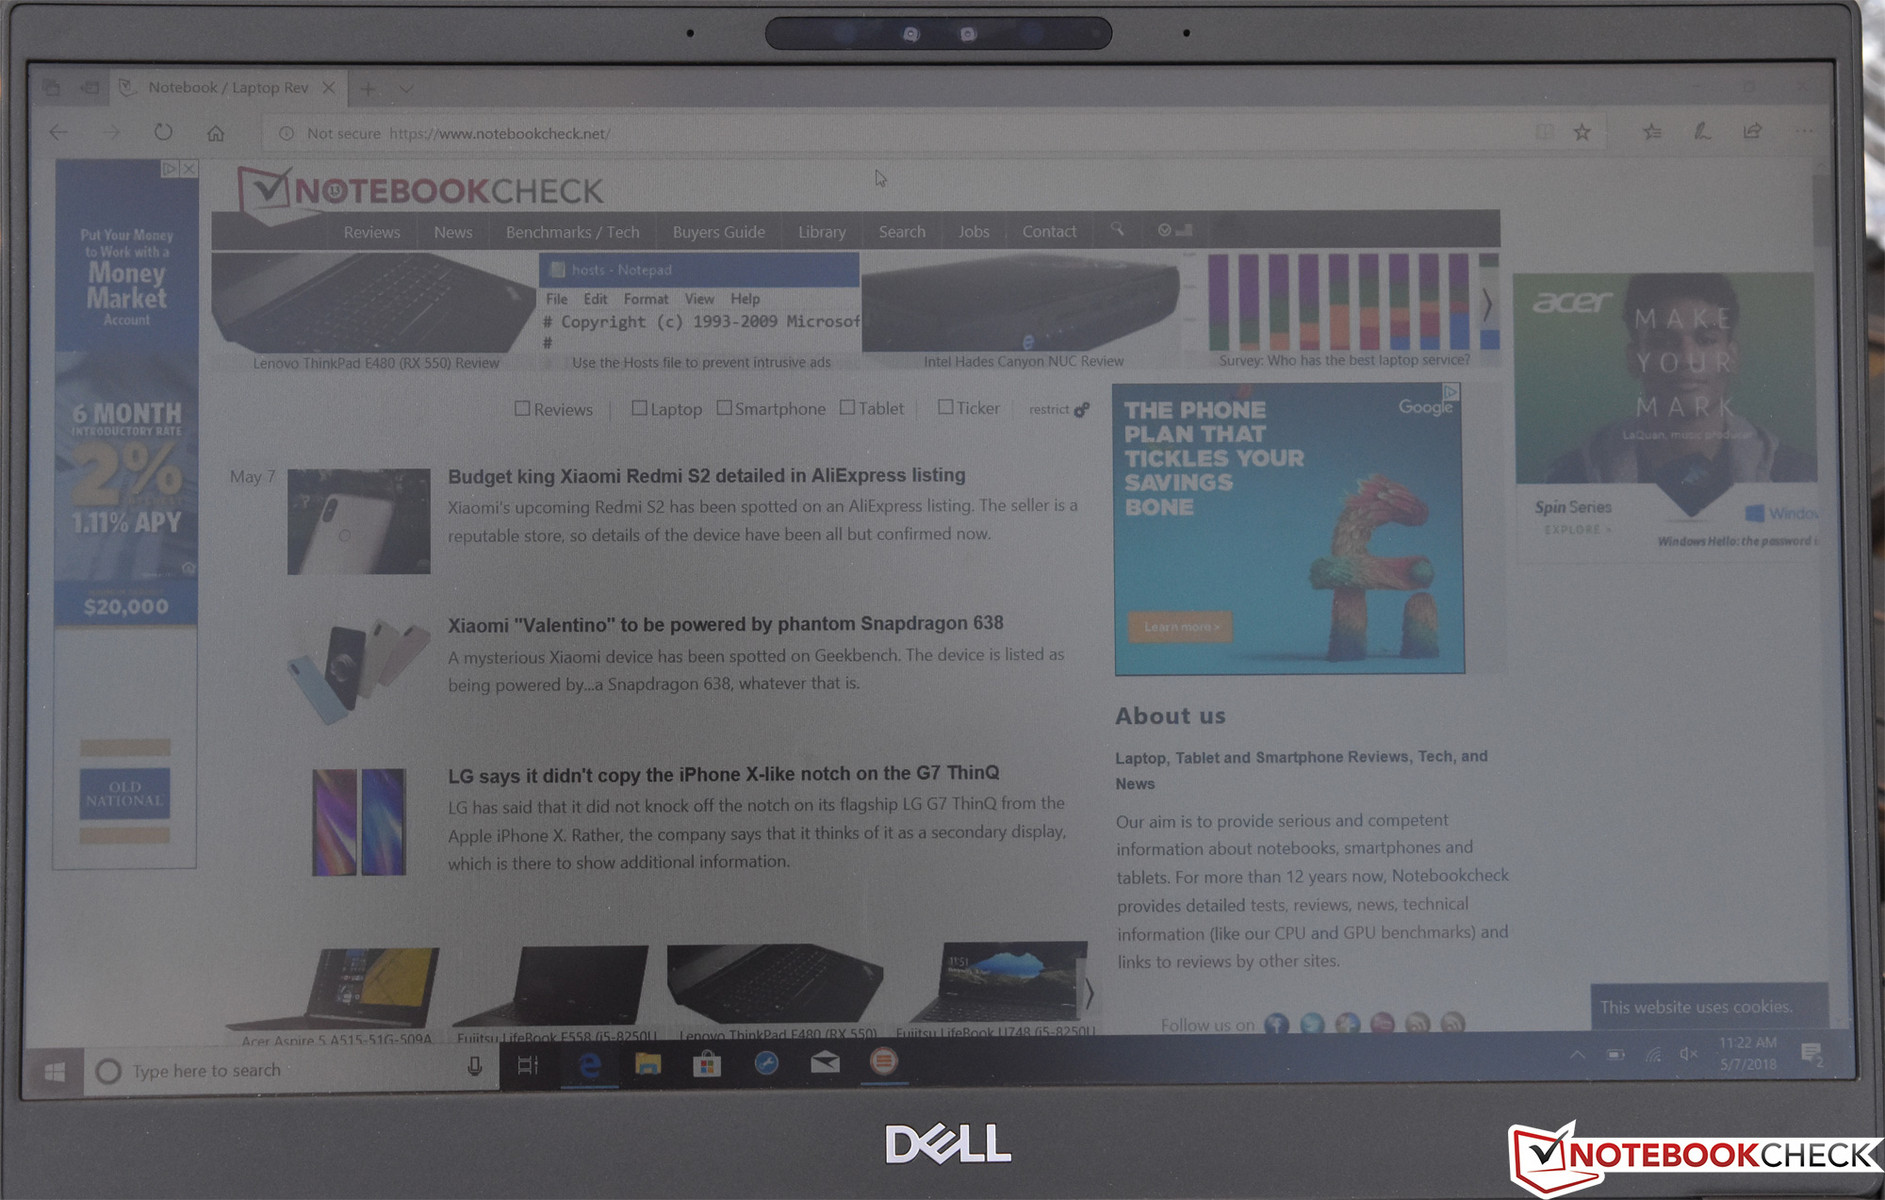
The panel does not employ PWM at any brightness level. Response times are on the slower side, but this is nothing new for notebooks in this class. In spite of its touchscreen, the display is easily viewable outdoors thanks to its authentically matte finish and reasonable brightness/contrast levels. The IPS panel accommodates wide viewing angles.
Performance
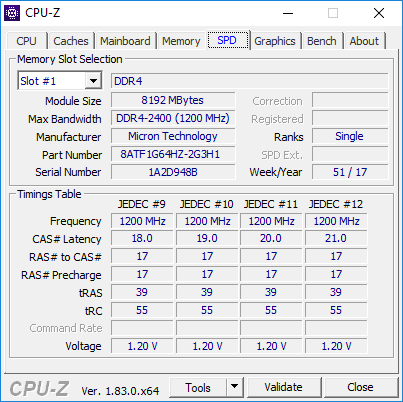
A variety of different configurations are available for the Latitude 7390, one of which (Core i5, 8 GB RAM, 256 GB M.2 SSD) we reviewed just last month. This time, our device features a Core i7-8650U and an NVMe SSD (along with the same 8 GB of RAM). Since our experience thus far with the 8th-generation Intel CPUs has been that the higher-end chips carry diminishing returns on investment, one of the primary questions we’ll seek to address in today’s review is whether or not the Core i7 is worth the extra cash.
A secondary run of 3DMark 06 while operating unplugged verified that performance is not affected when running on battery power (score: 10339).
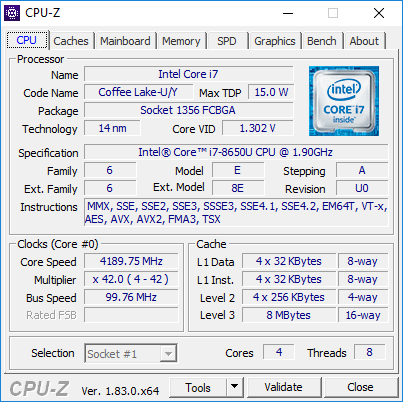
Processor
The Core i7-8650U is a quad-core SoC carrying operating frequencies of 1.9 GHz (base) all the way up to 4.2 GHz (max turbo). Given the constraints of its 15 W TDP and the accompanying high temperatures, it isn’t possible to maintain such high frequencies for more than a very short period of time. In light of this fact, is it possible to justify the higher cost of the Core i7 versus the i5 of last month’s model?
Before we directly answer this question, let’s first take a look at performance of the Latitude’s i7-8650U versus that of other machines. Judging by a total of 7 samples (at the time of this writing), the Latitude 7390 is slightly ahead of the average across all benchmarks. That’s good news since we’ve found it difficult to justify the purchase of an 8th-gen i7 in many other laptops after witnessing disappointing sustained performance scores. That isn’t to say that performance of these chips is underwhelming—it’s actually extremely good considering their power consumption—but the Core i5 SoCs manage such impressive scores already that the jump to an i7 is just very difficult to recommend.
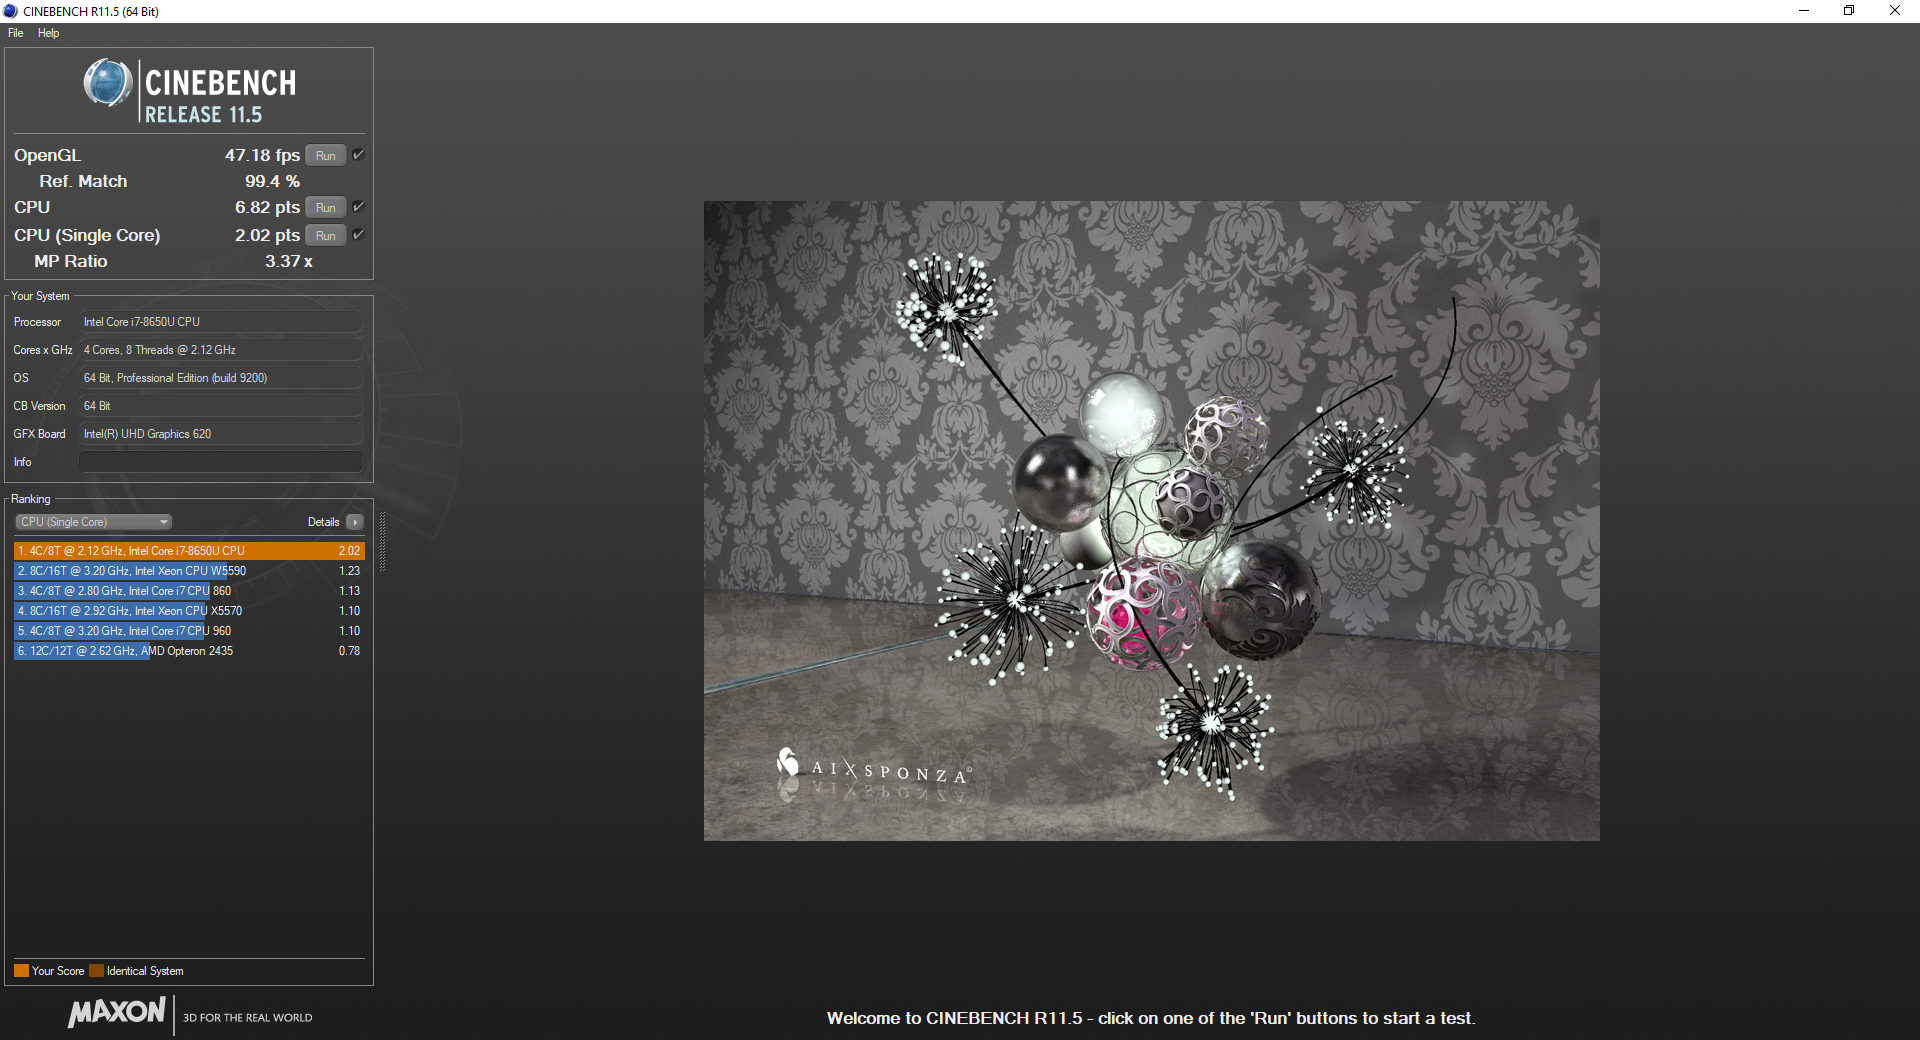
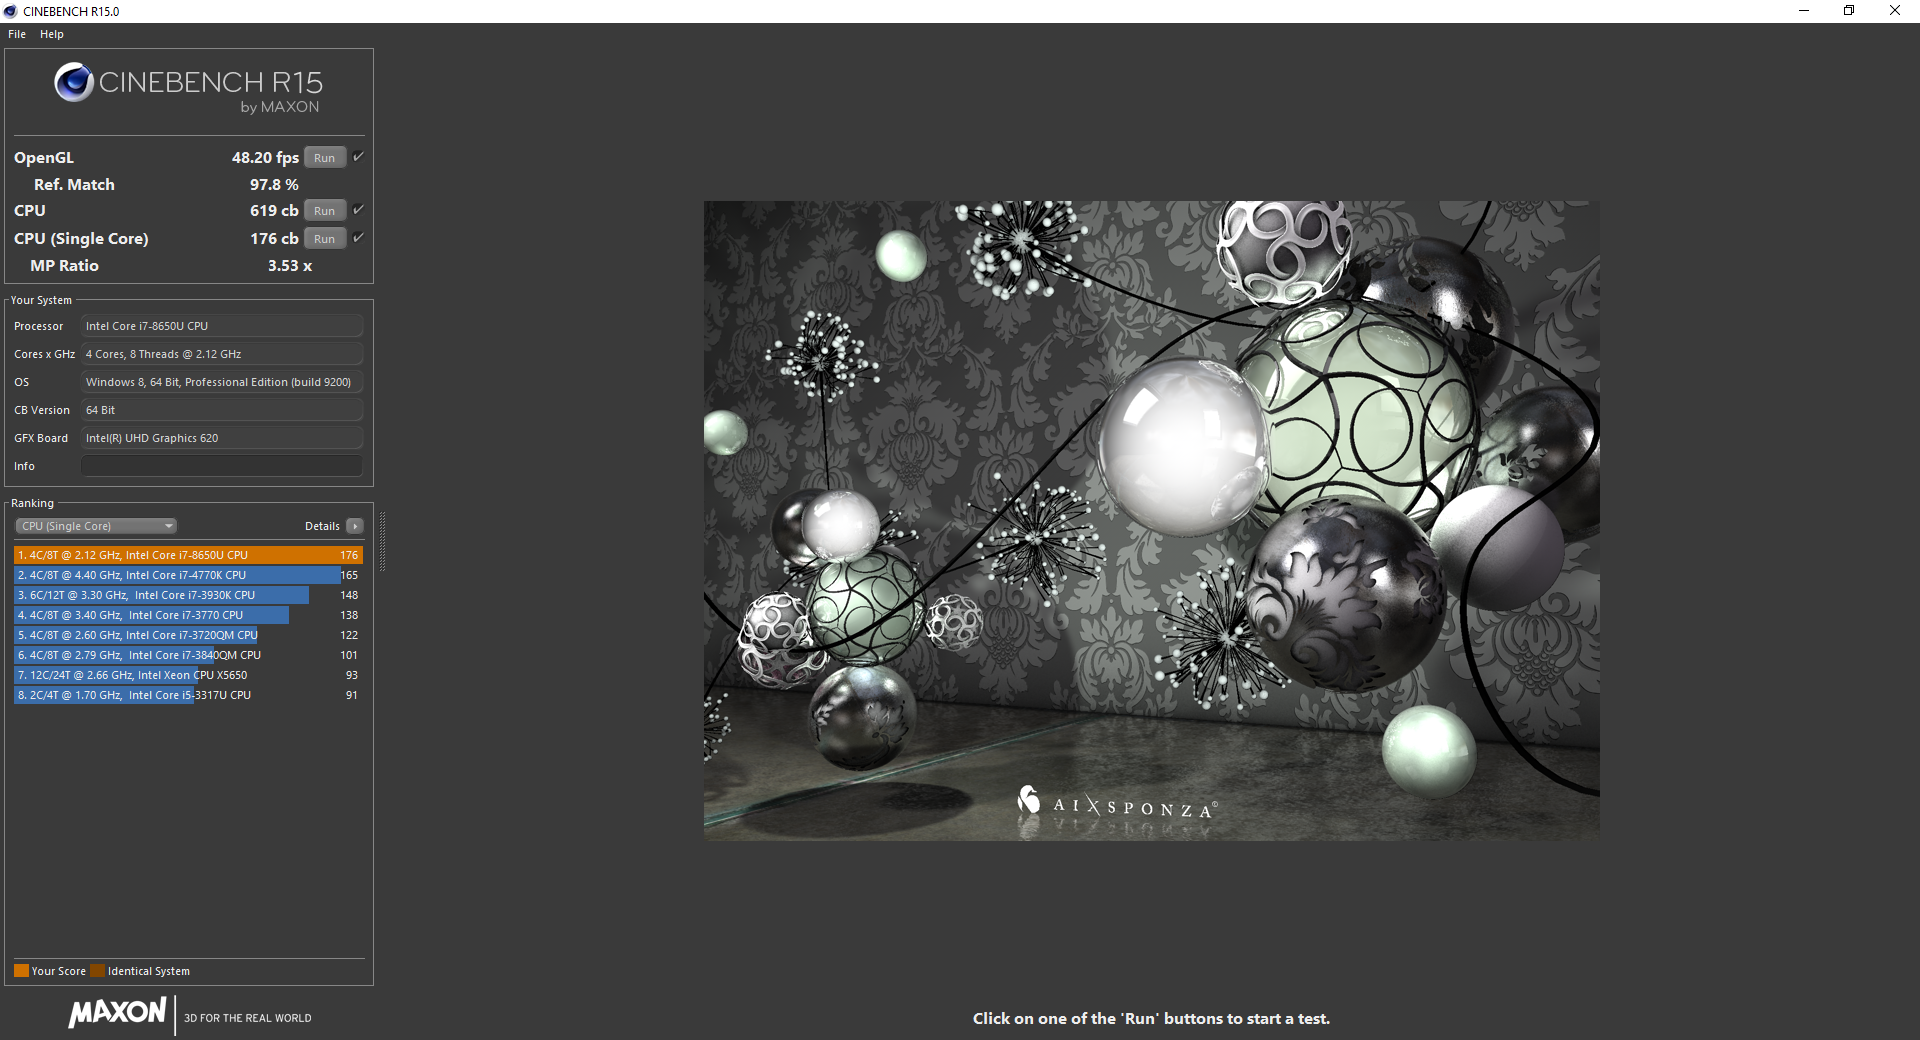
But what about the Latitude 7390? In the case of Cinebench R15, single-core performance is predictably pretty far ahead of that of the Core i5—some 14% faster. But multi-core performance is at first a bit more puzzling: we received an initial score of 625 from the Core i5 model and just 619 from today’s Core i7 unit. Does this spell doom for the Core i7’s real-world utility? Actually, not quite: taking a deeper look into the results sees much stabler (and higher) scores across repeated subsequent runs of the test in our standard Cinebench R15 multi-core loop test. While the Core i5 saw an initial dip in runs 2 through 6 to values ranging between 546 and 583 (and thereafter settling semi-permanently at around 580), the Core i7 machine remains in the 604 to 617 range for a full 40 runs, barring just two outliers (runs 15 and 16, scoring 578 / 580).
To condense this all down to a digestible number, this suggests around a 7 percent performance premium over the long term (as well as some more shorter-term clock rate consistency) in the i7 model. That may not sound like a lot for a cost premium of a couple hundred bucks, but unlike in many of the cases we’ve recently seen with 8th-gen Intel CPUs, it’s nevertheless something.
| wPrime 2.10 - 1024m | |
| Average of class Office (147.4 - 2103, n=10, last 2 years) | |
| Dell Latitude 13 7380 | |
| HP Elitebook 1040 G4-2XU40UT | |
| Average Intel Core i7-8650U (268 - 335, n=3) | |
| Dell Latitude 7390 | |
* ... smaller is better
System Performance
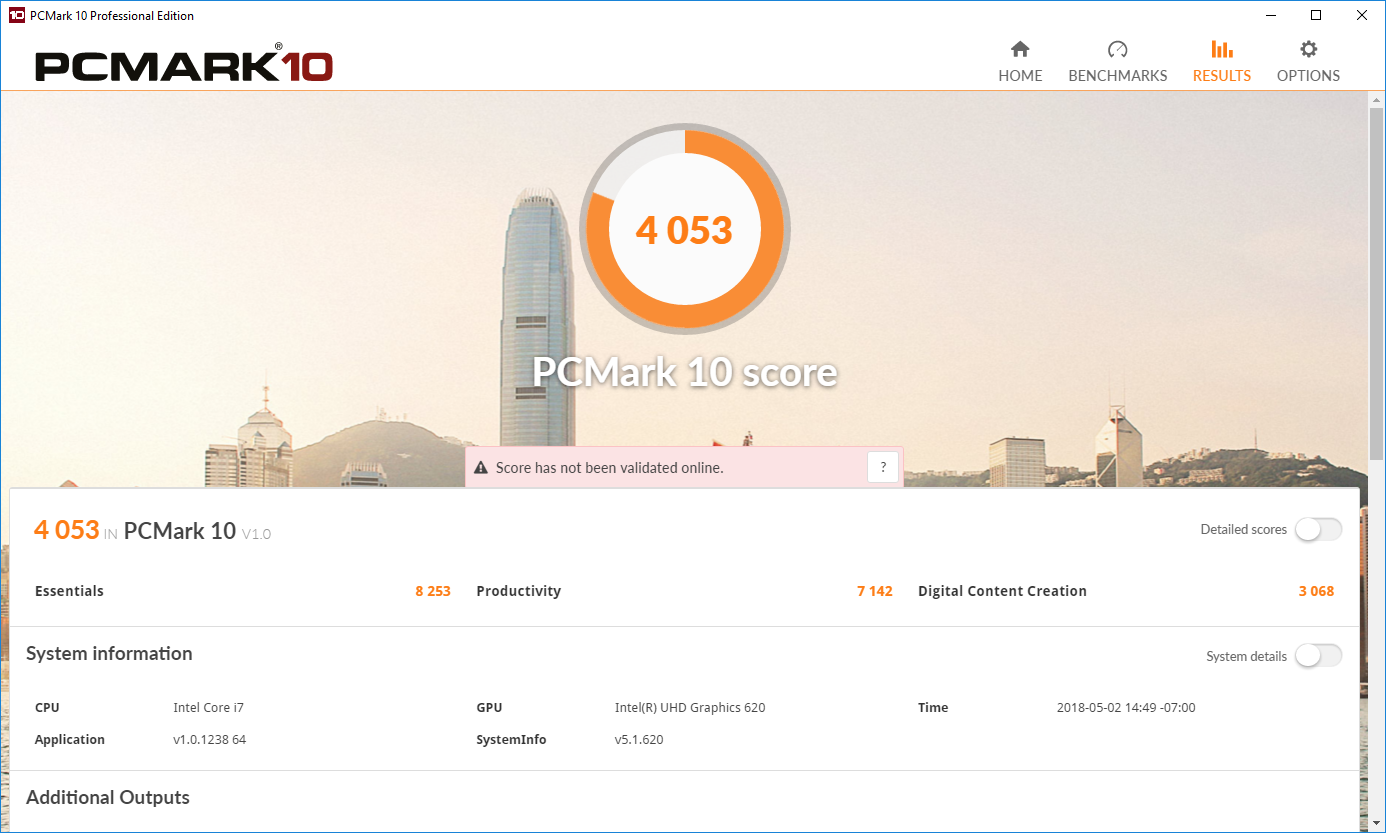
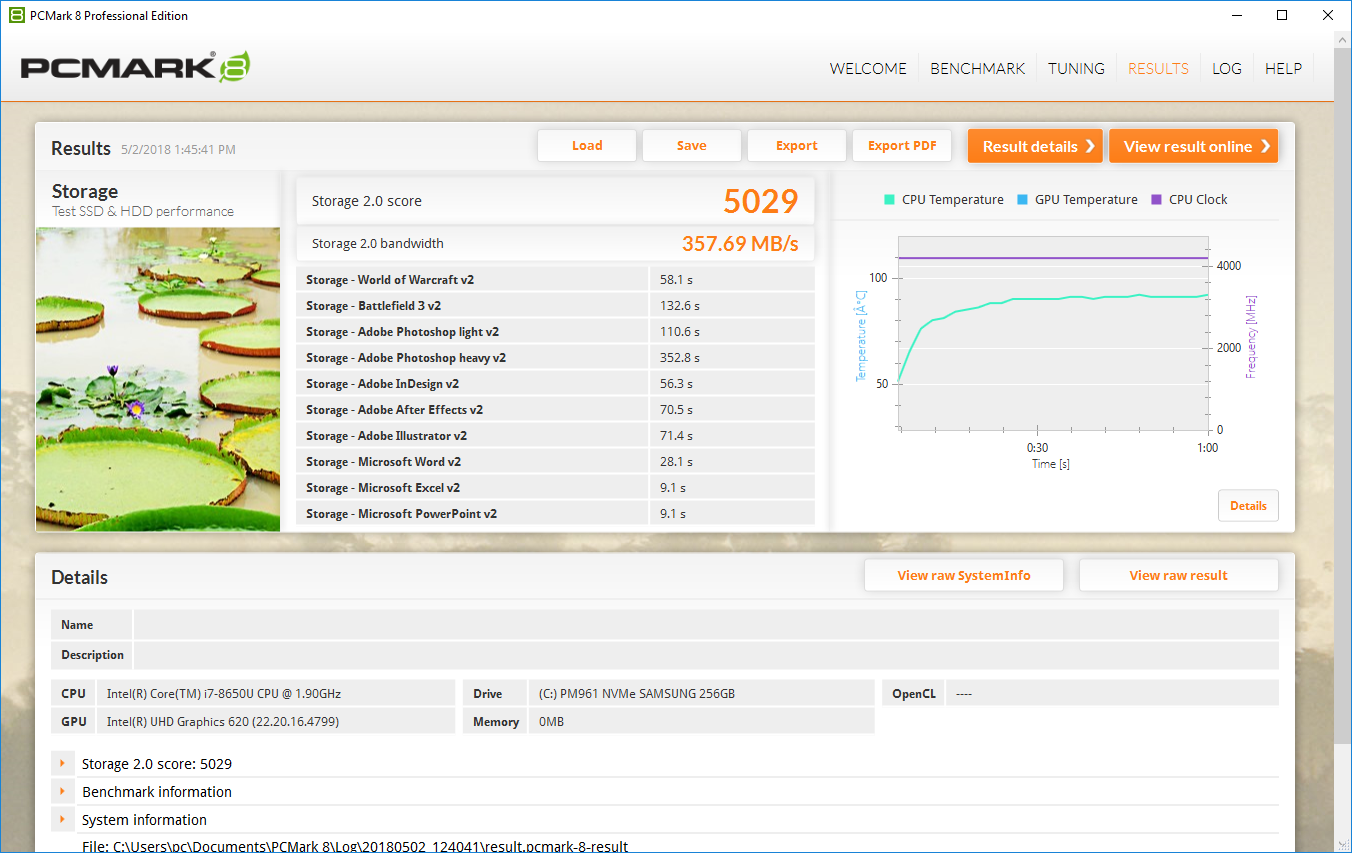
Thanks to the jump from conventional M.2 storage to an NVMe drive (specifically, a Samsung PM961 256 GB solid-state drive), the Latitude 7390 musters system performance scores some 8 to 12 percent above last month’s unit, and instead much closer to last year’s Latitude 7380 (which featured the same SSD). Subjectively speaking, we certainly have no complaints with regard to the machine’s performance, which was fluid and zippy throughout our time with it.
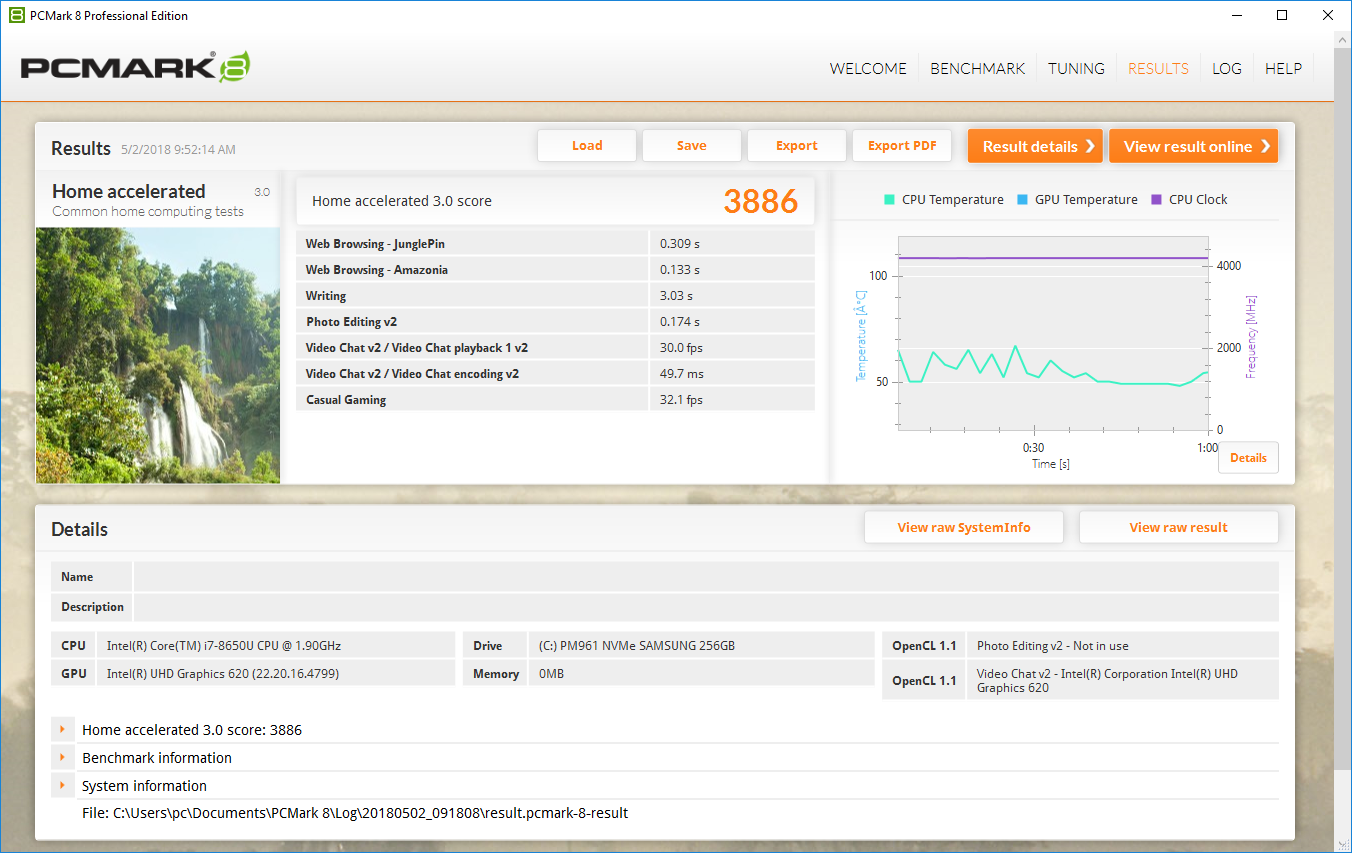
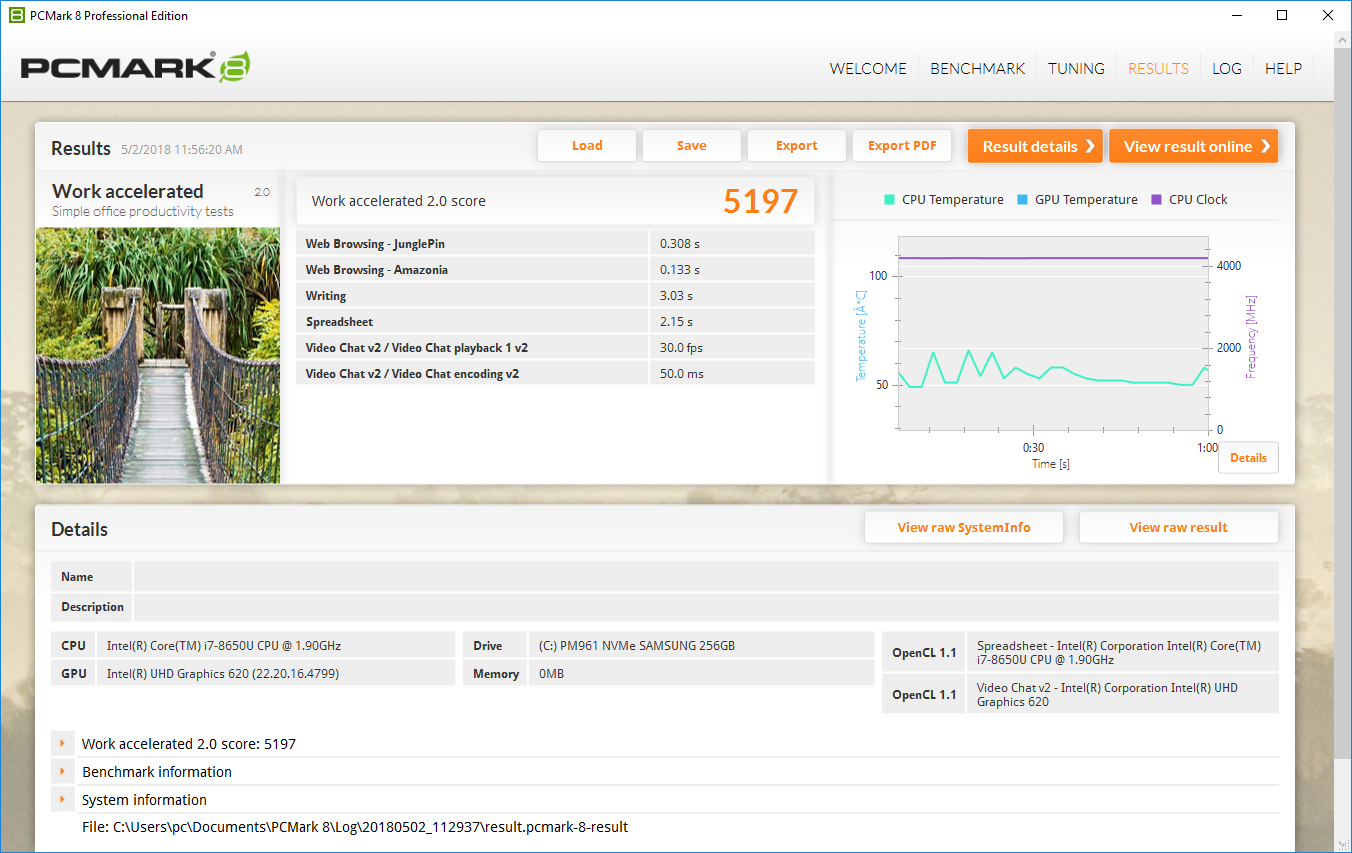
| PCMark 8 Home Score Accelerated v2 | 3886 points | |
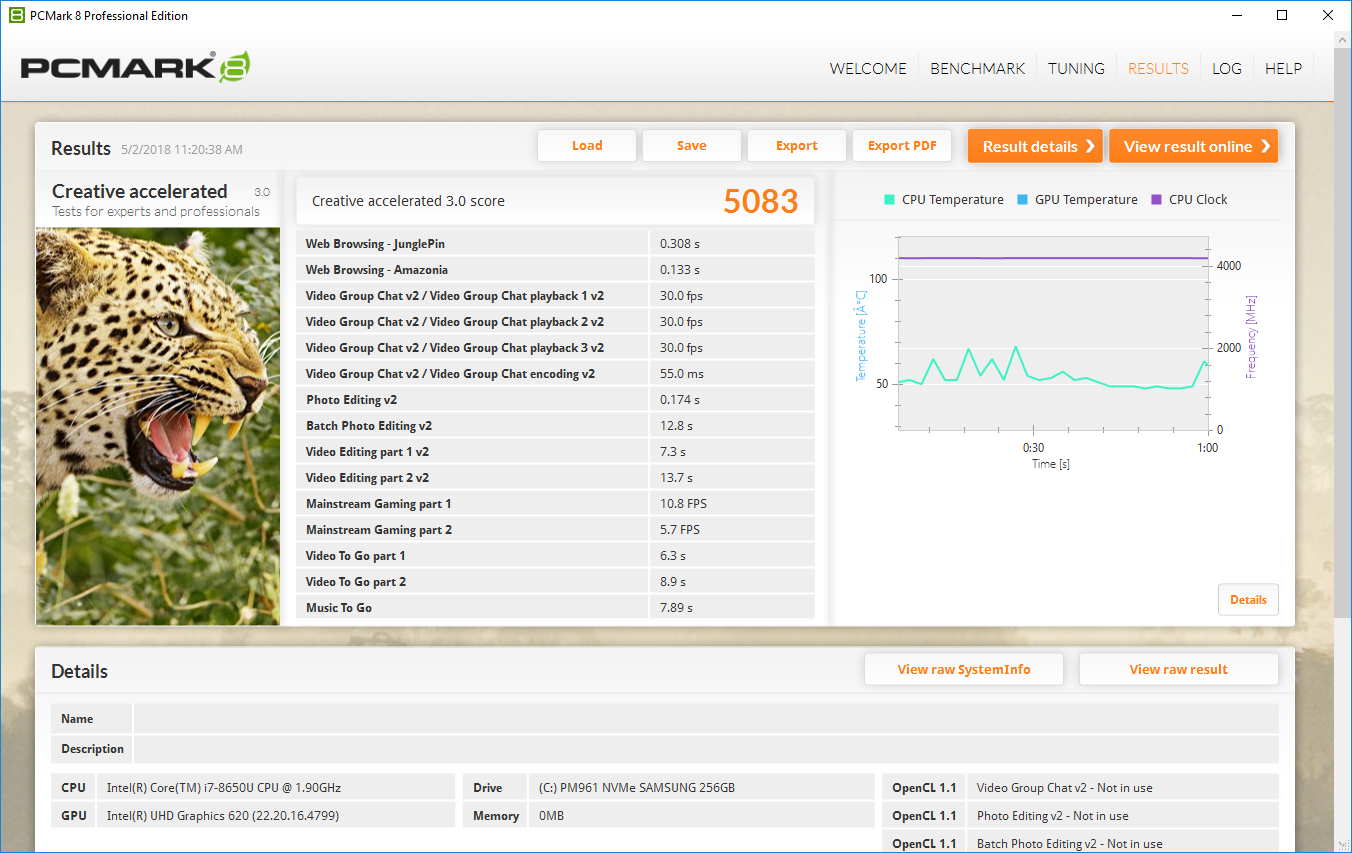
| PCMark 8 Creative Score Accelerated v2 | 5083 points | |
| PCMark 8 Work Score Accelerated v2 | 5197 points | |
| PCMark 10 Score | 4053 points | |
Help | ||
Storage Devices
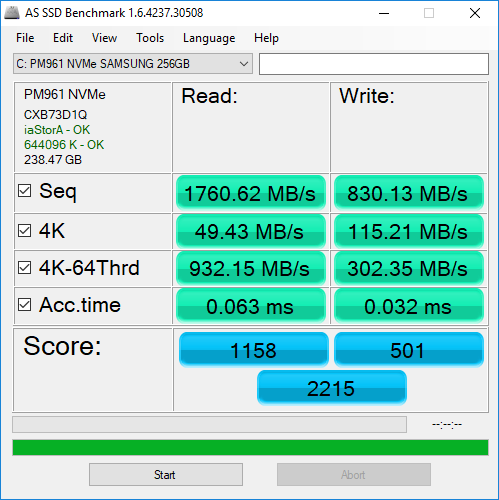
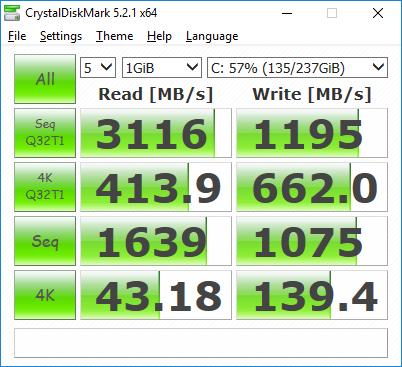
Last month’s SK Hynix SC311 can’t hold a candle to the Samsung PM961 in today’s test unit—but likewise, the PM961 is easily outclassed by the PM981 installed in the ThinkPad X1 Carbon. Still, an AS SSD score of 2215 (spurred by sequential read/write speeds of 1760.62 MB/s and 830 MB/s) is nothing embarrassing, and most users would hardly even notice the difference moving farther beyond these speeds in everyday usage scenarios.
| Dell Latitude 7390 Samsung PM961 MZVLW256HEHP | Dell Latitude 7390 SK hynix SC311 M.2 | Lenovo ThinkPad X1 Carbon 2018-20KGS03900 Samsung SSD PM981 MZVLB512HAJQ | HP Elitebook 1040 G4-2XU40UT Toshiba XG4 NVMe (THNSN5512GPUK) | Average Samsung PM961 MZVLW256HEHP | |
|---|---|---|---|---|---|
| AS SSD | -53% | 90% | -3% | -81% | |
| Copy Game MB/s | 352 | 1107 214% | 394.2 12% | 537 ? 53% | |
| Copy Program MB/s | 247.4 | 460.2 86% | 133.7 -46% | 343 ? 39% | |
| Copy ISO MB/s | 818 | 1247 52% | 534 -35% | 1004 ? 23% | |
| Score Total | 2215 | 857 -61% | 3529 59% | 2299 4% | 2565 ? 16% |
| Score Write | 501 | 311 -38% | 1801 259% | 848 69% | 587 ? 17% |
| Score Read | 1158 | 359 -69% | 1168 1% | 979 -15% | 1378 ? 19% |
| Access Time Write * | 0.032 | 0.056 -75% | 0.027 16% | 0.038 -19% | 0.4637 ? -1349% |
| Access Time Read * | 0.063 | 0.075 -19% | 0.029 54% | 0.105 -67% | 0.06777 ? -8% |
| 4K-64 Write | 302.4 | 210.3 -30% | 1529 406% | 662 119% | 419 ? 39% |
| 4K-64 Read | 932 | 282.8 -70% | 876 -6% | 782 -16% | 1112 ? 19% |
| 4K Write | 115.2 | 63.6 -45% | 134.3 17% | 100.1 -13% | 91.6 ? -20% |
| 4K Read | 49.43 | 27.31 -45% | 52.4 6% | 38.49 -22% | 45.1 ? -9% |
| Seq Write | 830 | 369.9 -55% | 1376 66% | 863 4% | 960 ? 16% |
| Seq Read | 1761 | 485.5 -72% | 2396 36% | 1585 -10% | 2019 ? 15% |
* ... smaller is better

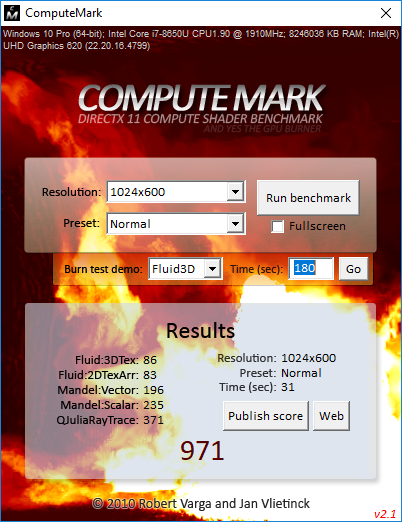
GPU Performance
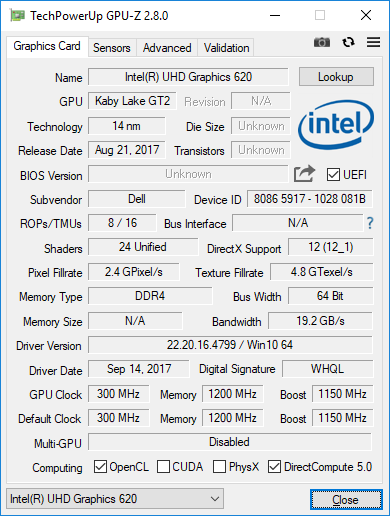
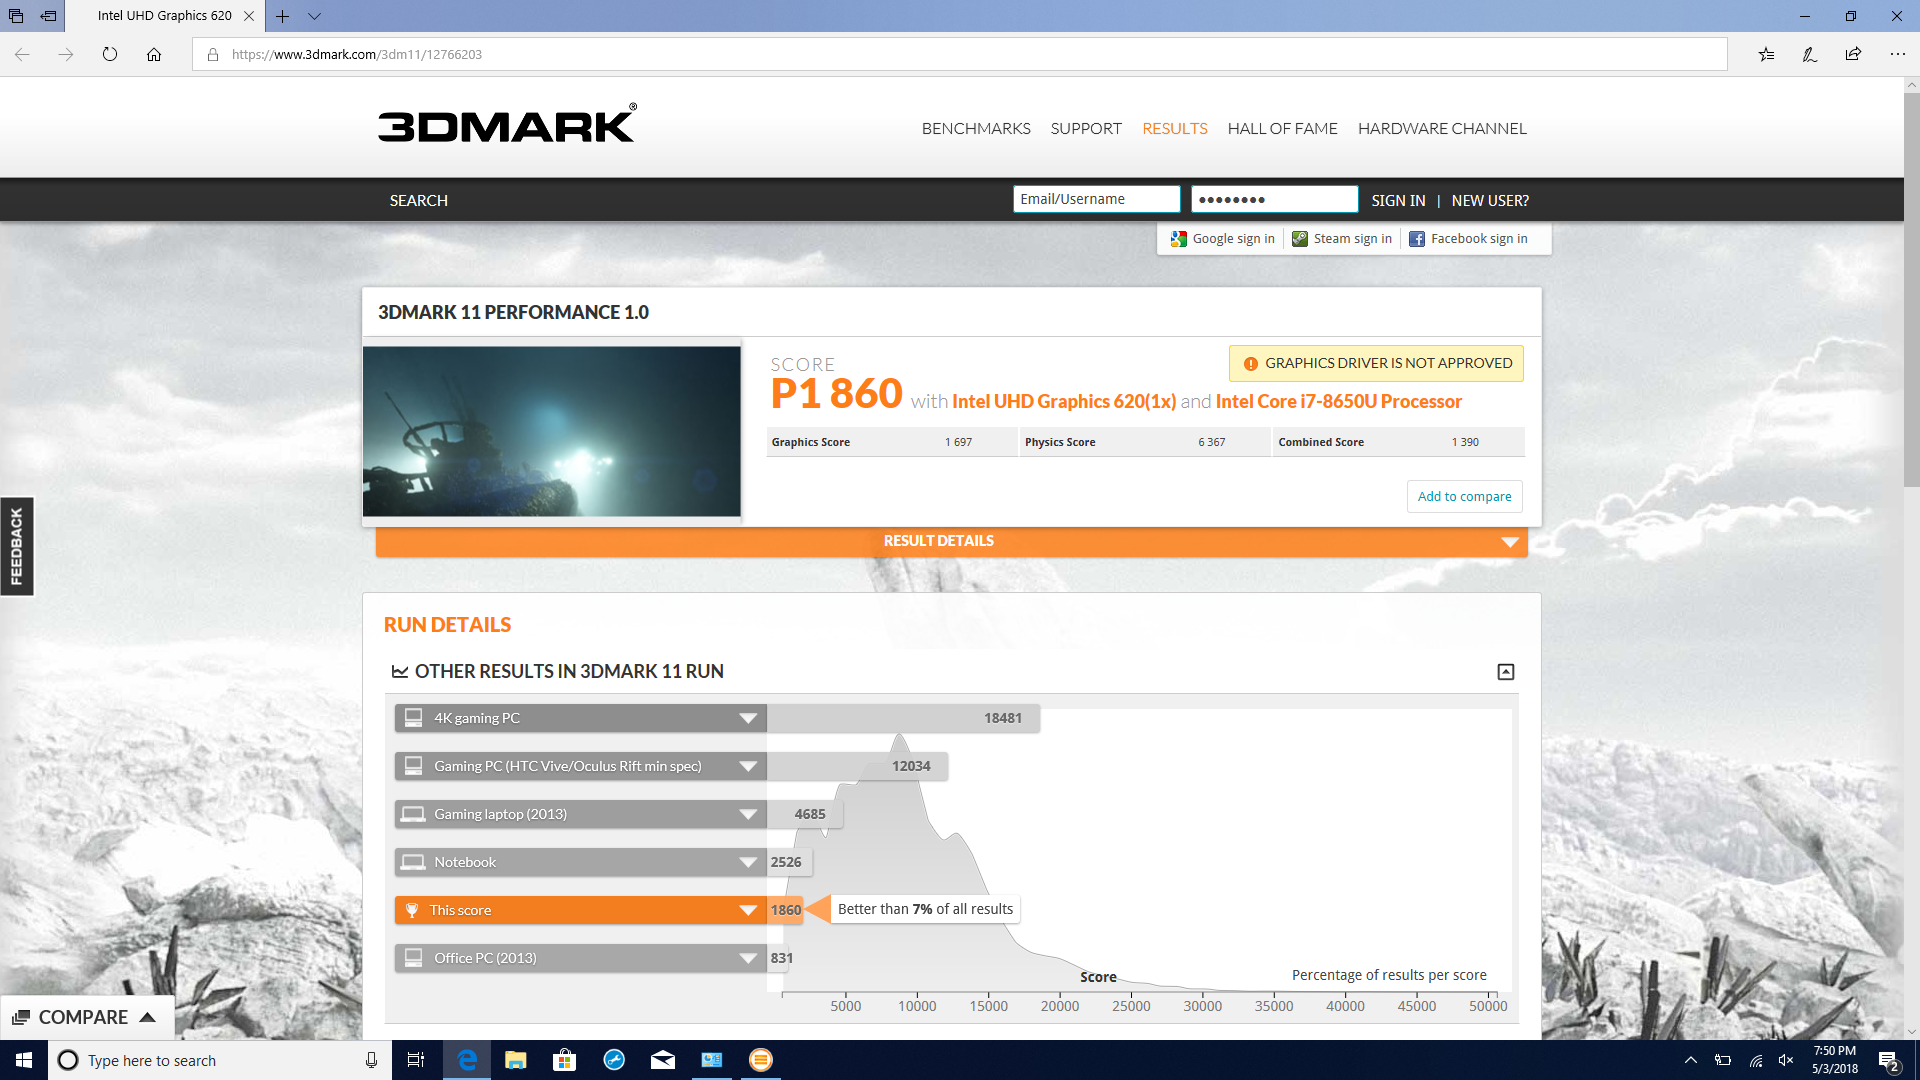
Somewhat slimmer margins separate the Core i5 and Core i7 Latitude 7390—around 2 percent to 8 percent. Regardless of this, the overall average of all Intel UHD Graphics devices we’ve tested remains slightly higher (several percentage points in most cases). The ThinkPad X1 Carbon (equipped with an i7-8550U) is some 25 to 35 percent faster across our slew of benchmarks, which is impressive. Although it’s perfectly capable of handling any everyday activities, the 7390 is not expected to be any sort of graphical powerhouse.
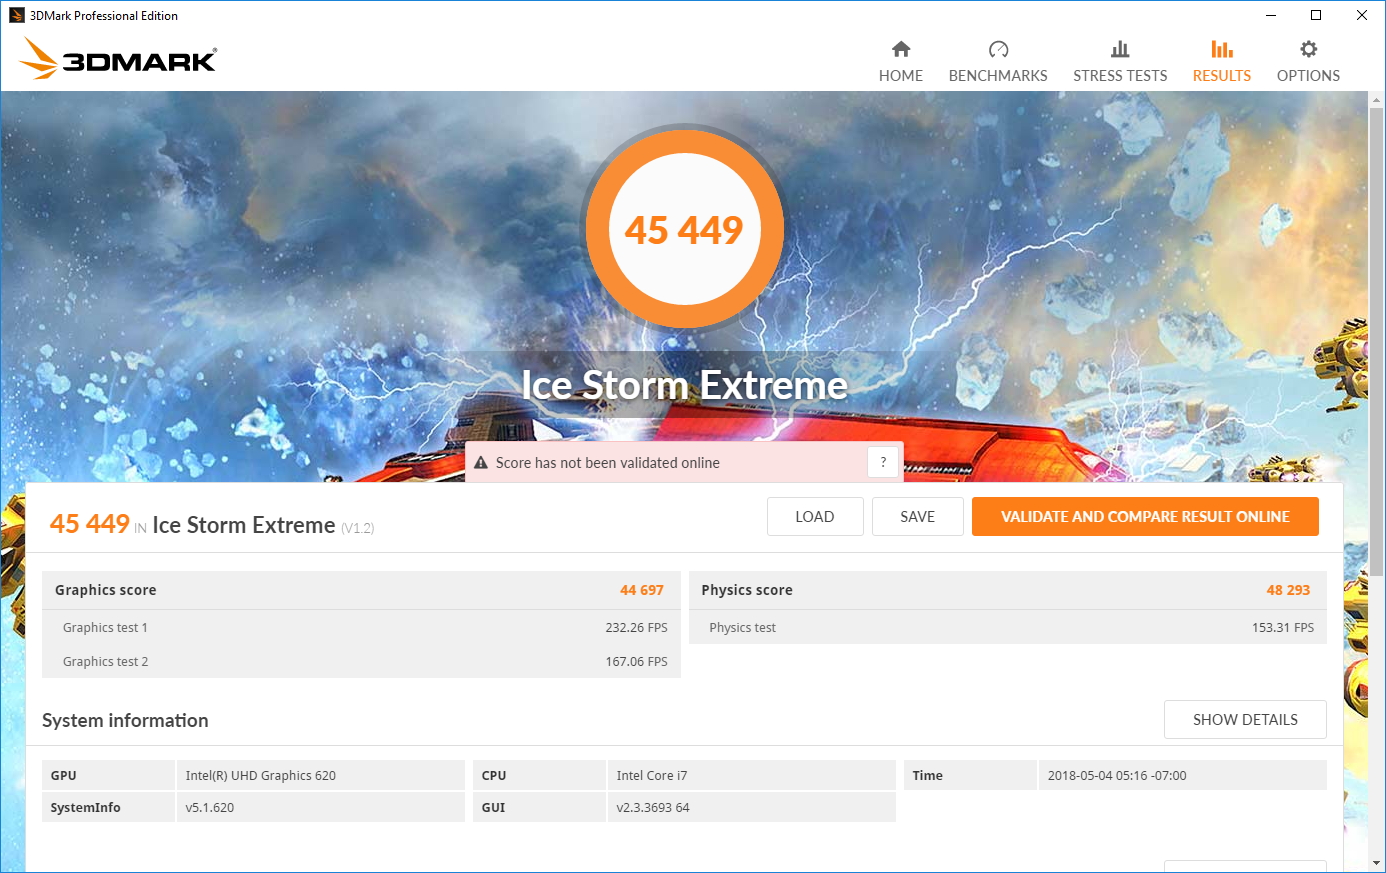
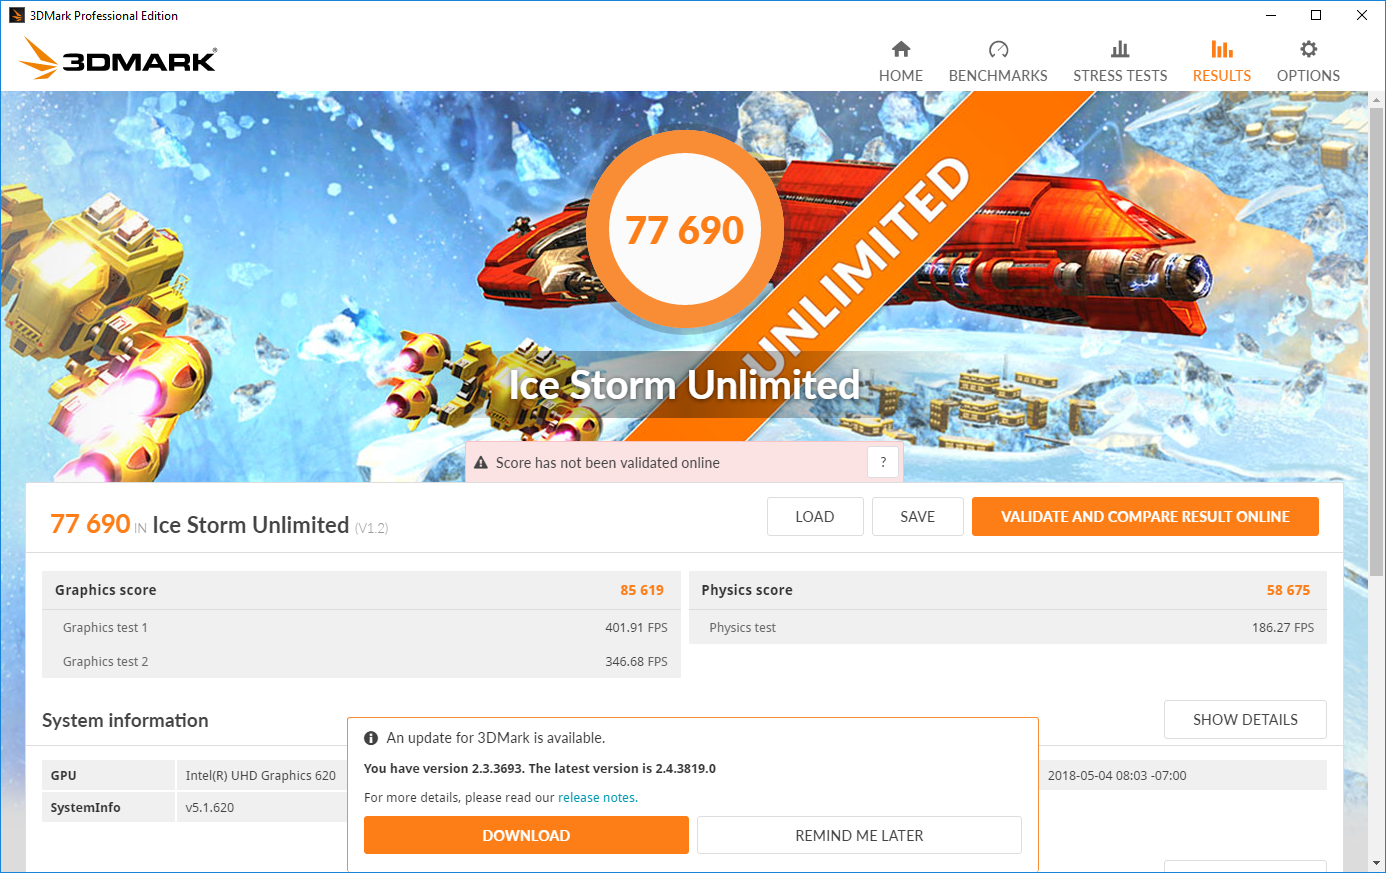
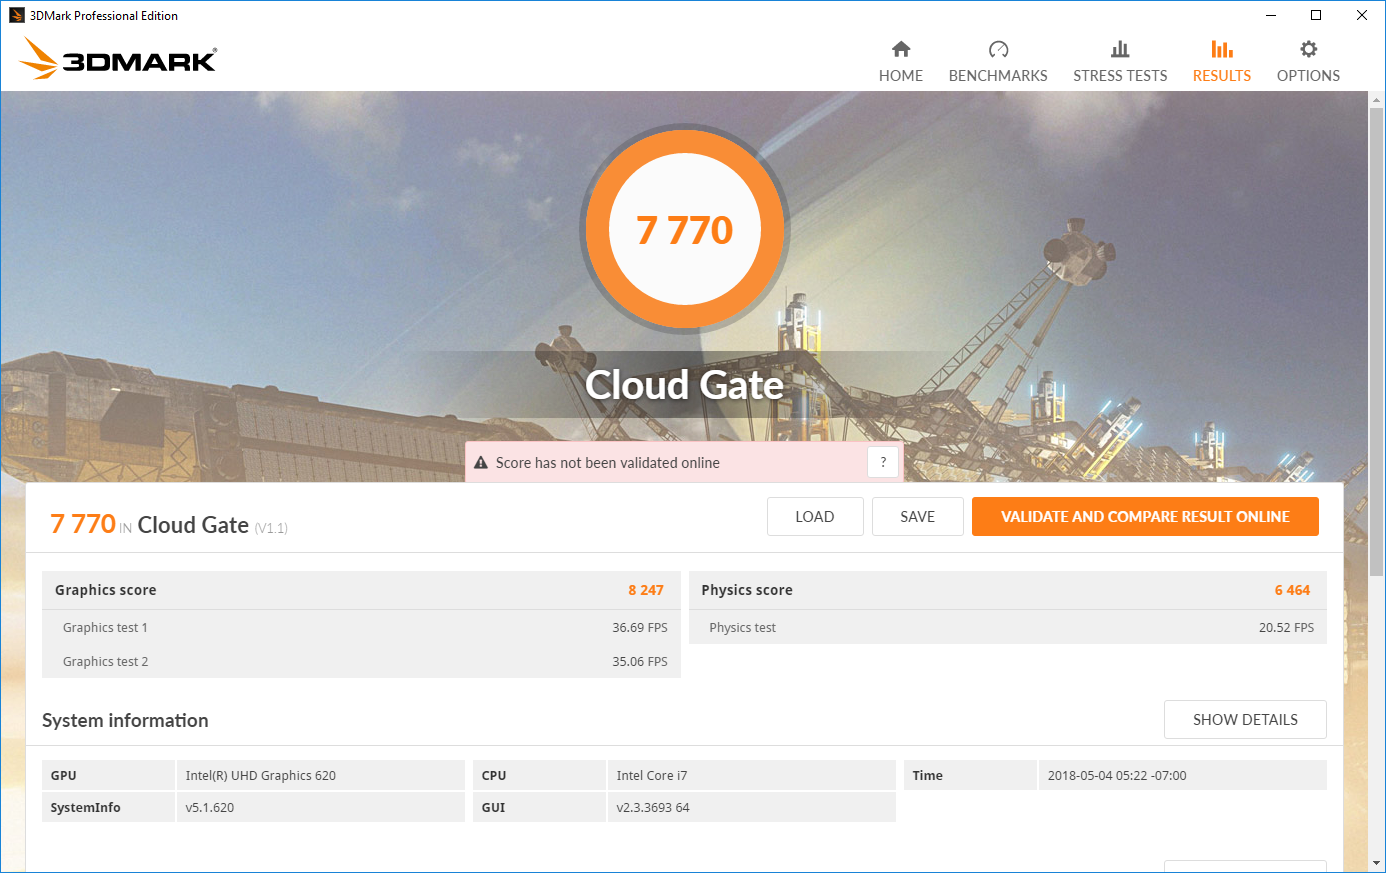
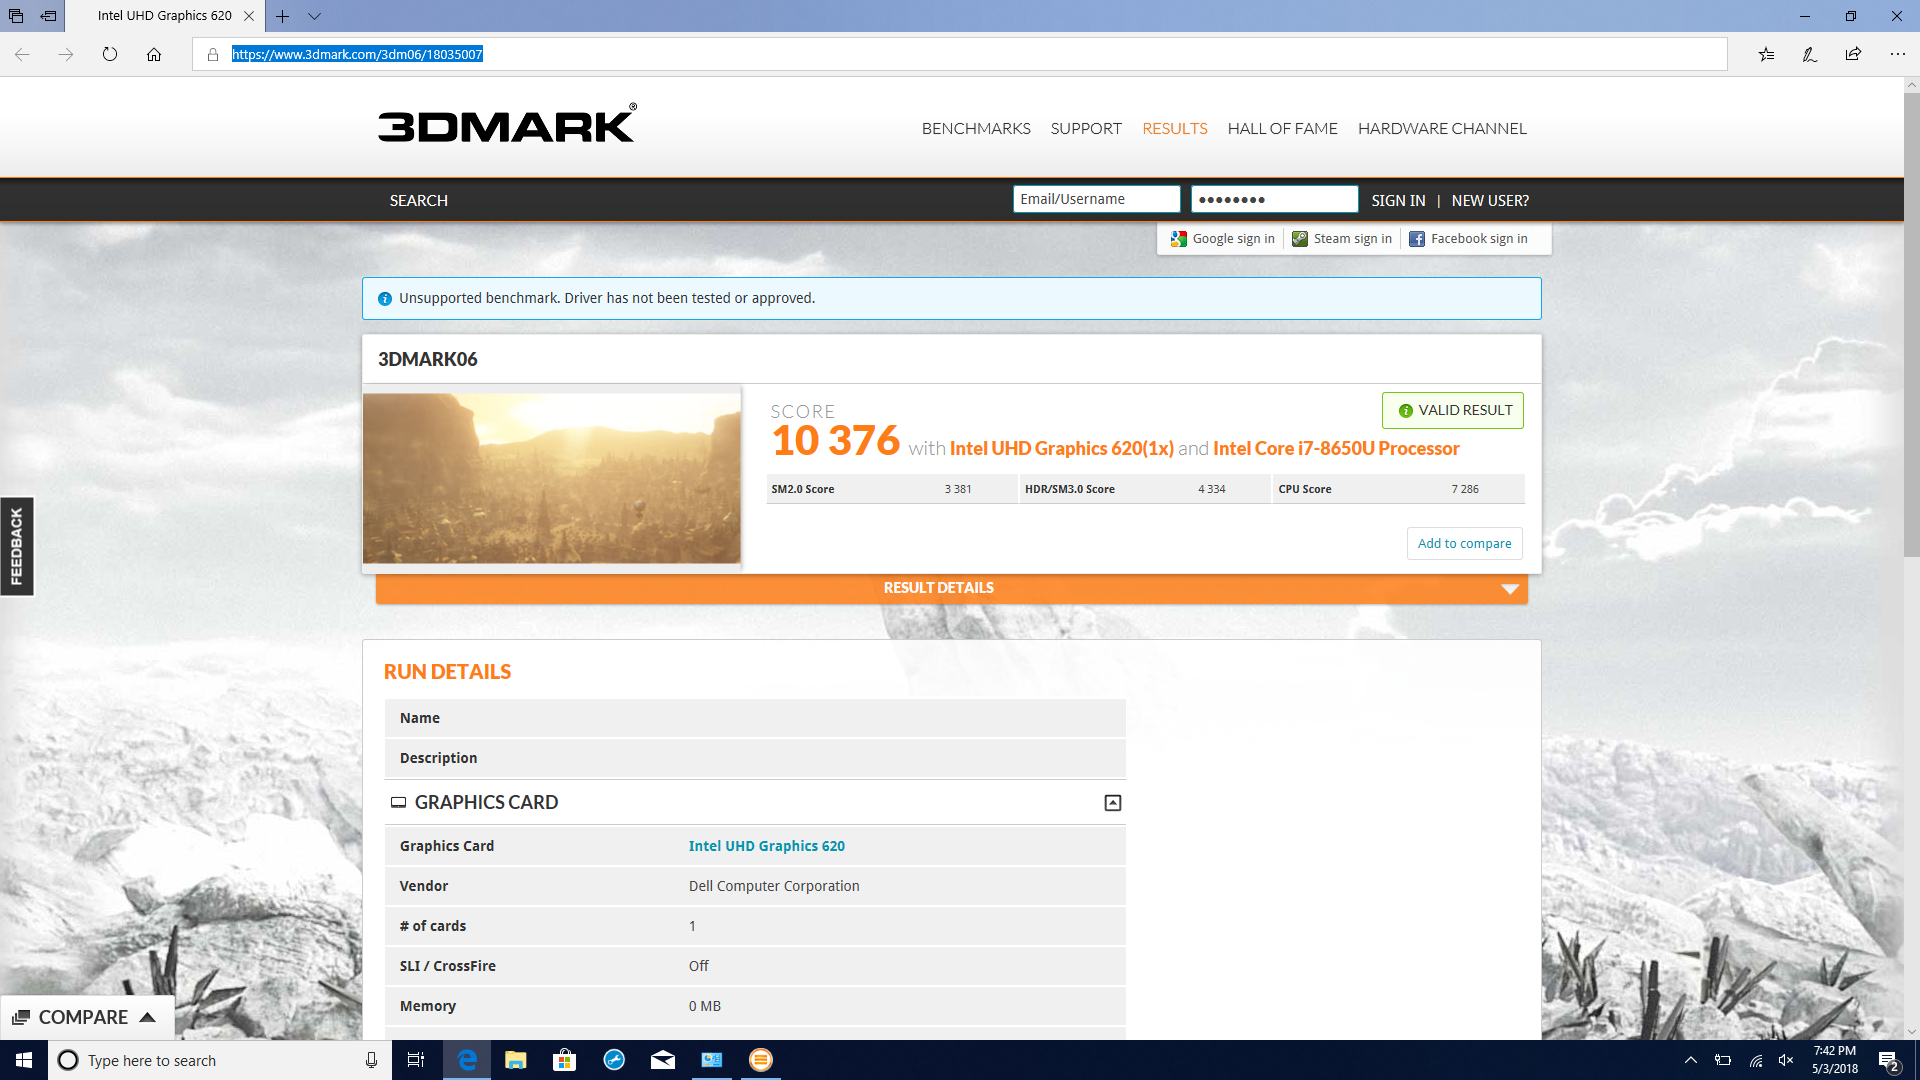
| 3DMark 06 Standard Score | 10376 points | |
| 3DMark 11 Performance | 1860 points | |
| 3DMark Ice Storm Standard Score | 65709 points | |
| 3DMark Cloud Gate Standard Score | 7770 points | |
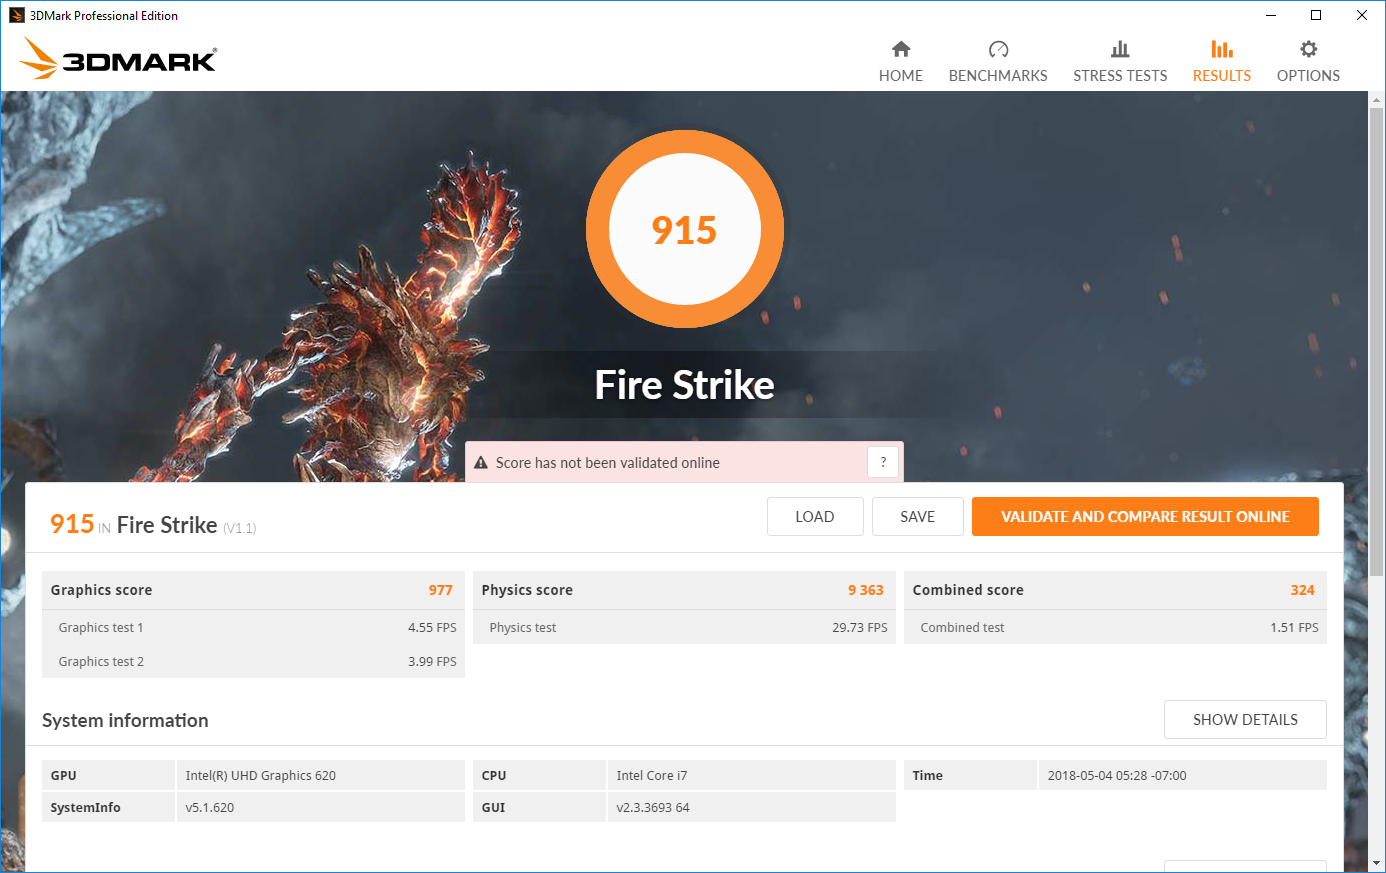
| 3DMark Fire Strike Score | 915 points | |
Help | ||
| low | med. | high | ultra | |
| BioShock Infinite (2013) | 56 | 30 | 24 | 8 |
Stress Test
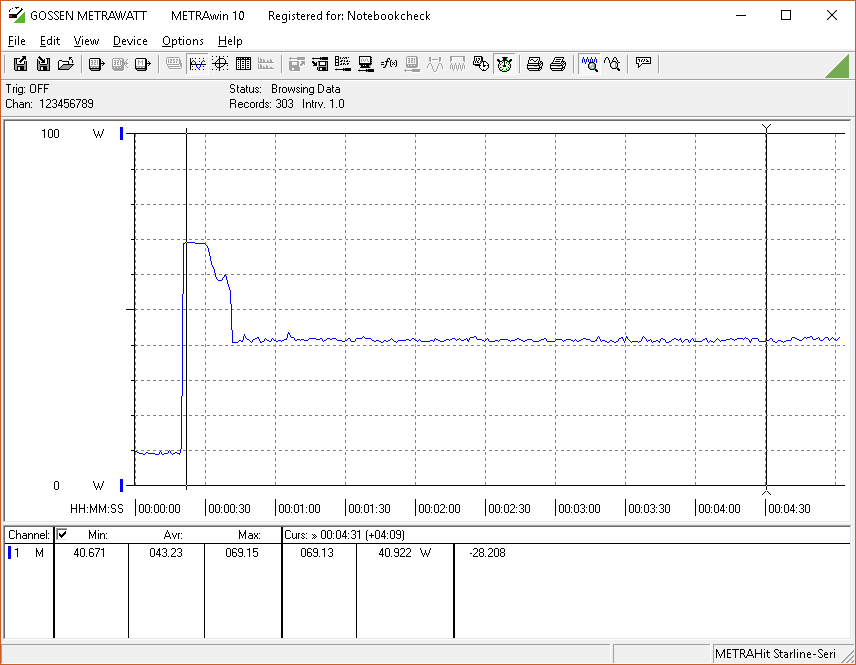
Unsurprisingly, the Latitude 7390 can’t maintain high turbo clock rates for longer than a short period of time in our synthetic stress tests. This limitation is hardly unique to the Latitude, however, as we’ve witnessed similar behavior from practically every 8th-generation Intel-powered device we’ve tested. Although max clock rates of 4.2 GHz are never even really reached under heavy loads, the laptop is at least capable of maintaining 2.9 GHz stably across all four cores—an achievement that renders it far faster than its 7th-generation predecessors in any CPU-intensive activity. You can see in our graphs below that as the demand on the CPU suddenly starts, we see a spike in CPU Package Power (to some 44 W) and initial core clock rates (to around 3.8 GHz), but just seconds later the power consumption begins dropping rather sharply down to 22 W, where it remains.
Full GPU stress produces stable clock rates of 1000 MHz from the GPU (1150 MHz is the maximum specified for the chip); temperatures remain stable at around 76 °C.
Combined CPU and GPU stress sees the system favoring GPU over CPU clock rates. The former holds firm at 950 MHz and the latter drops all the way to 1.5 GHz, where it stays permanently (temperatures, meanwhile, hover around the 77 – 78 °C mark). That qualifies as CPU throttling since it’s below the base frequency of 1.9 GHz—though it’s not likely that such a scenario would apply during real-world usage.
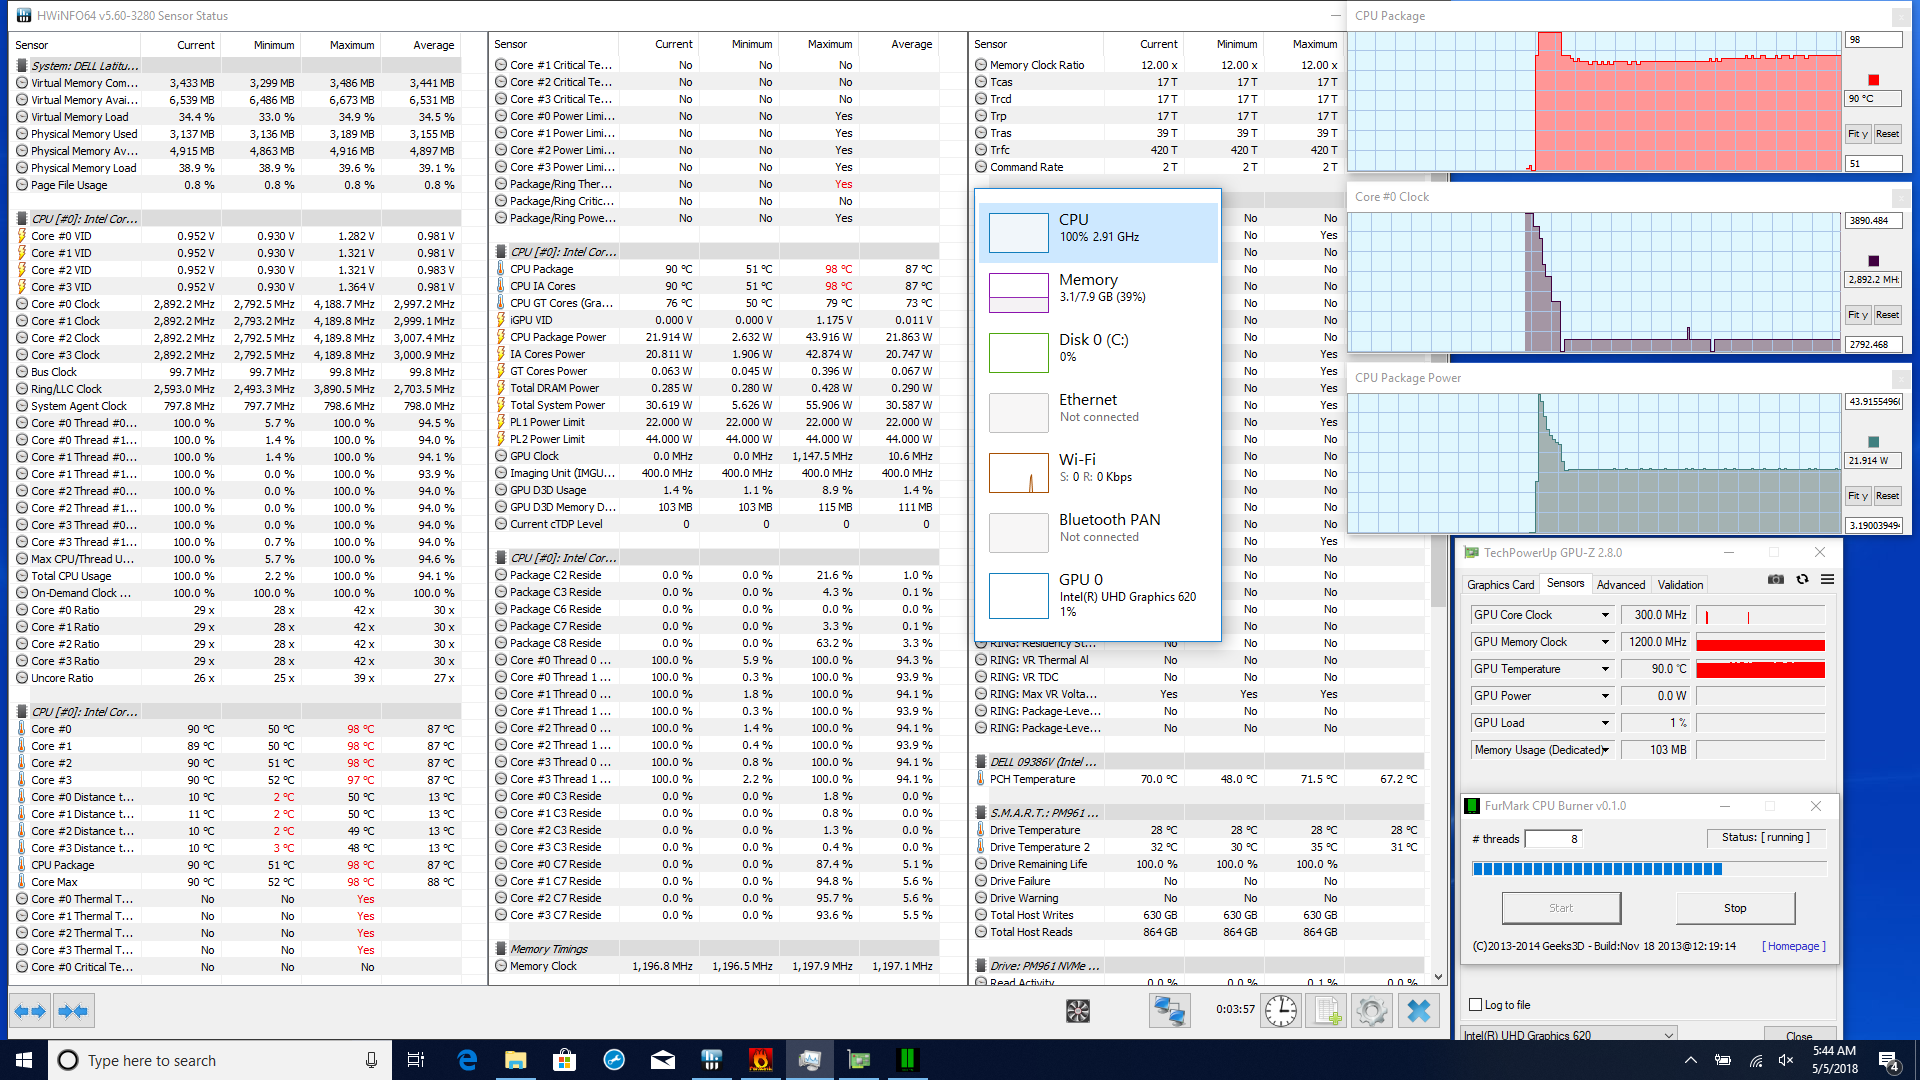
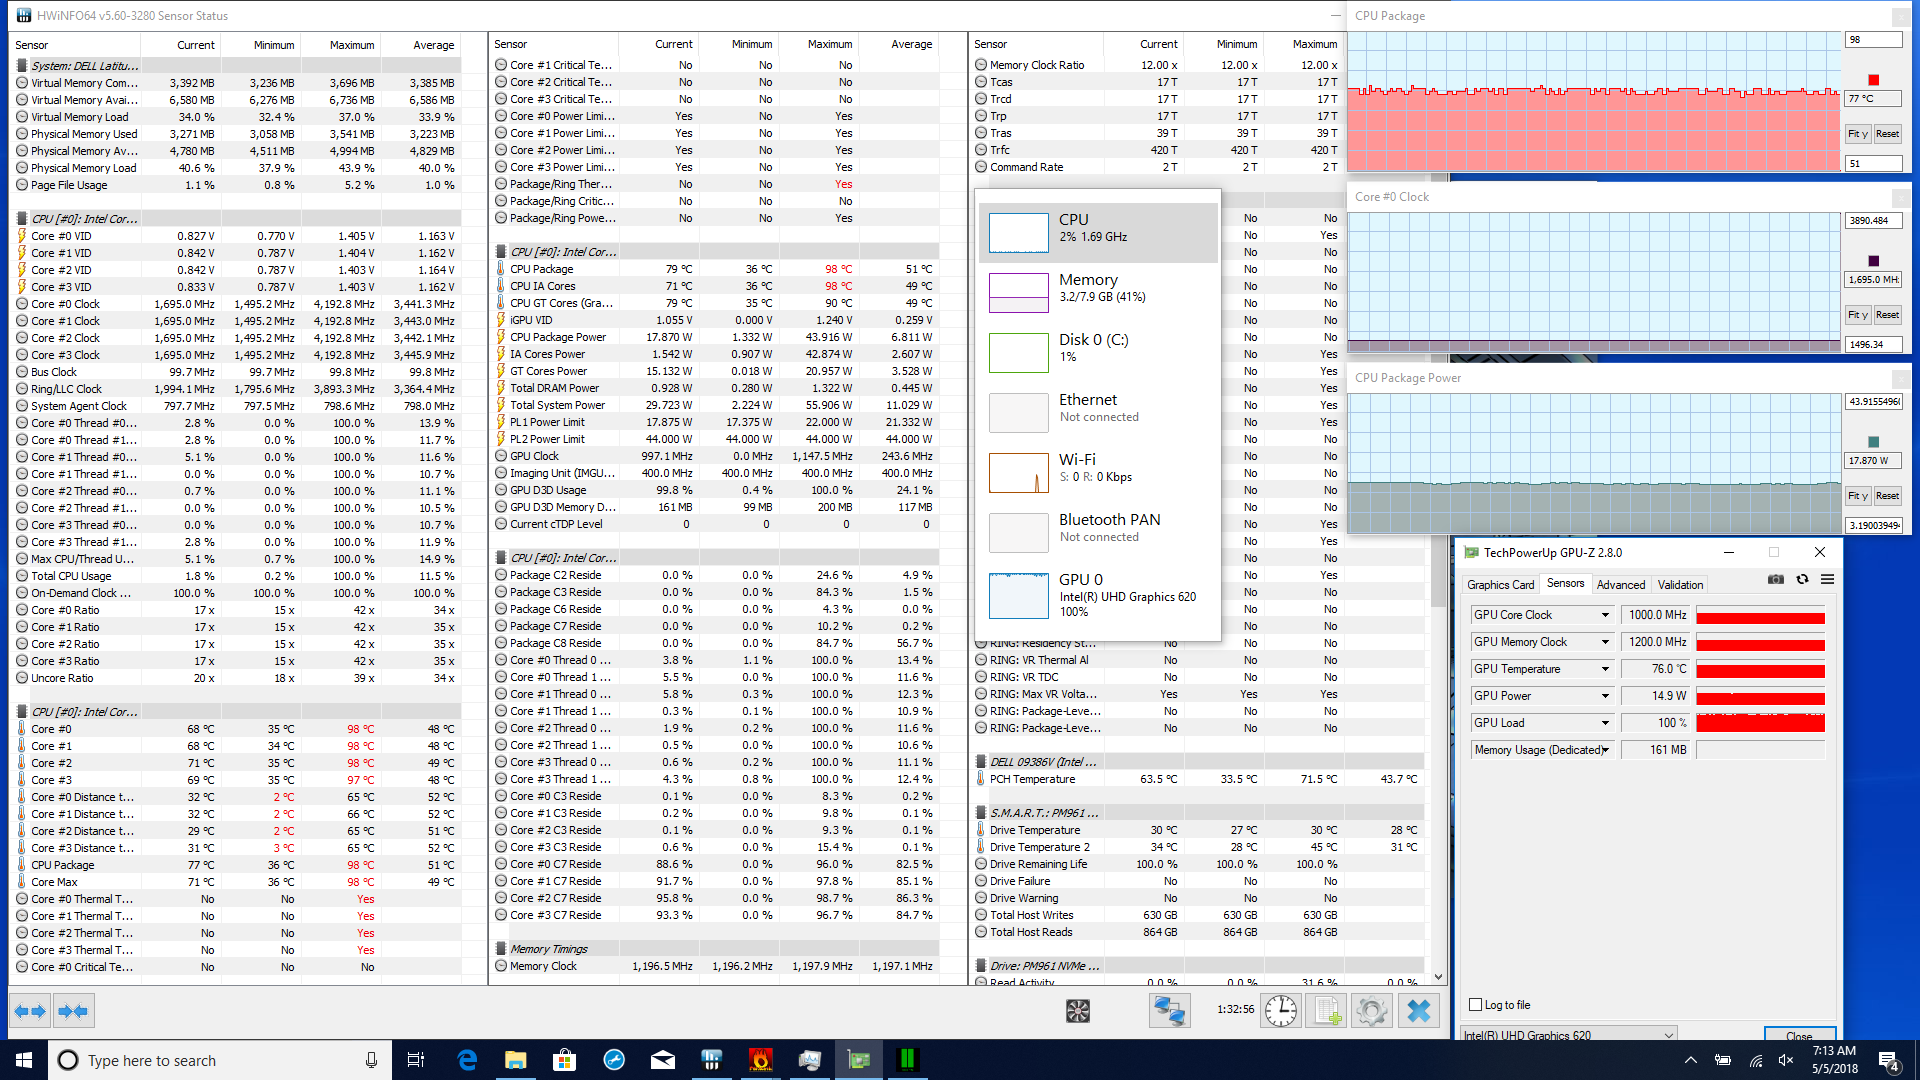
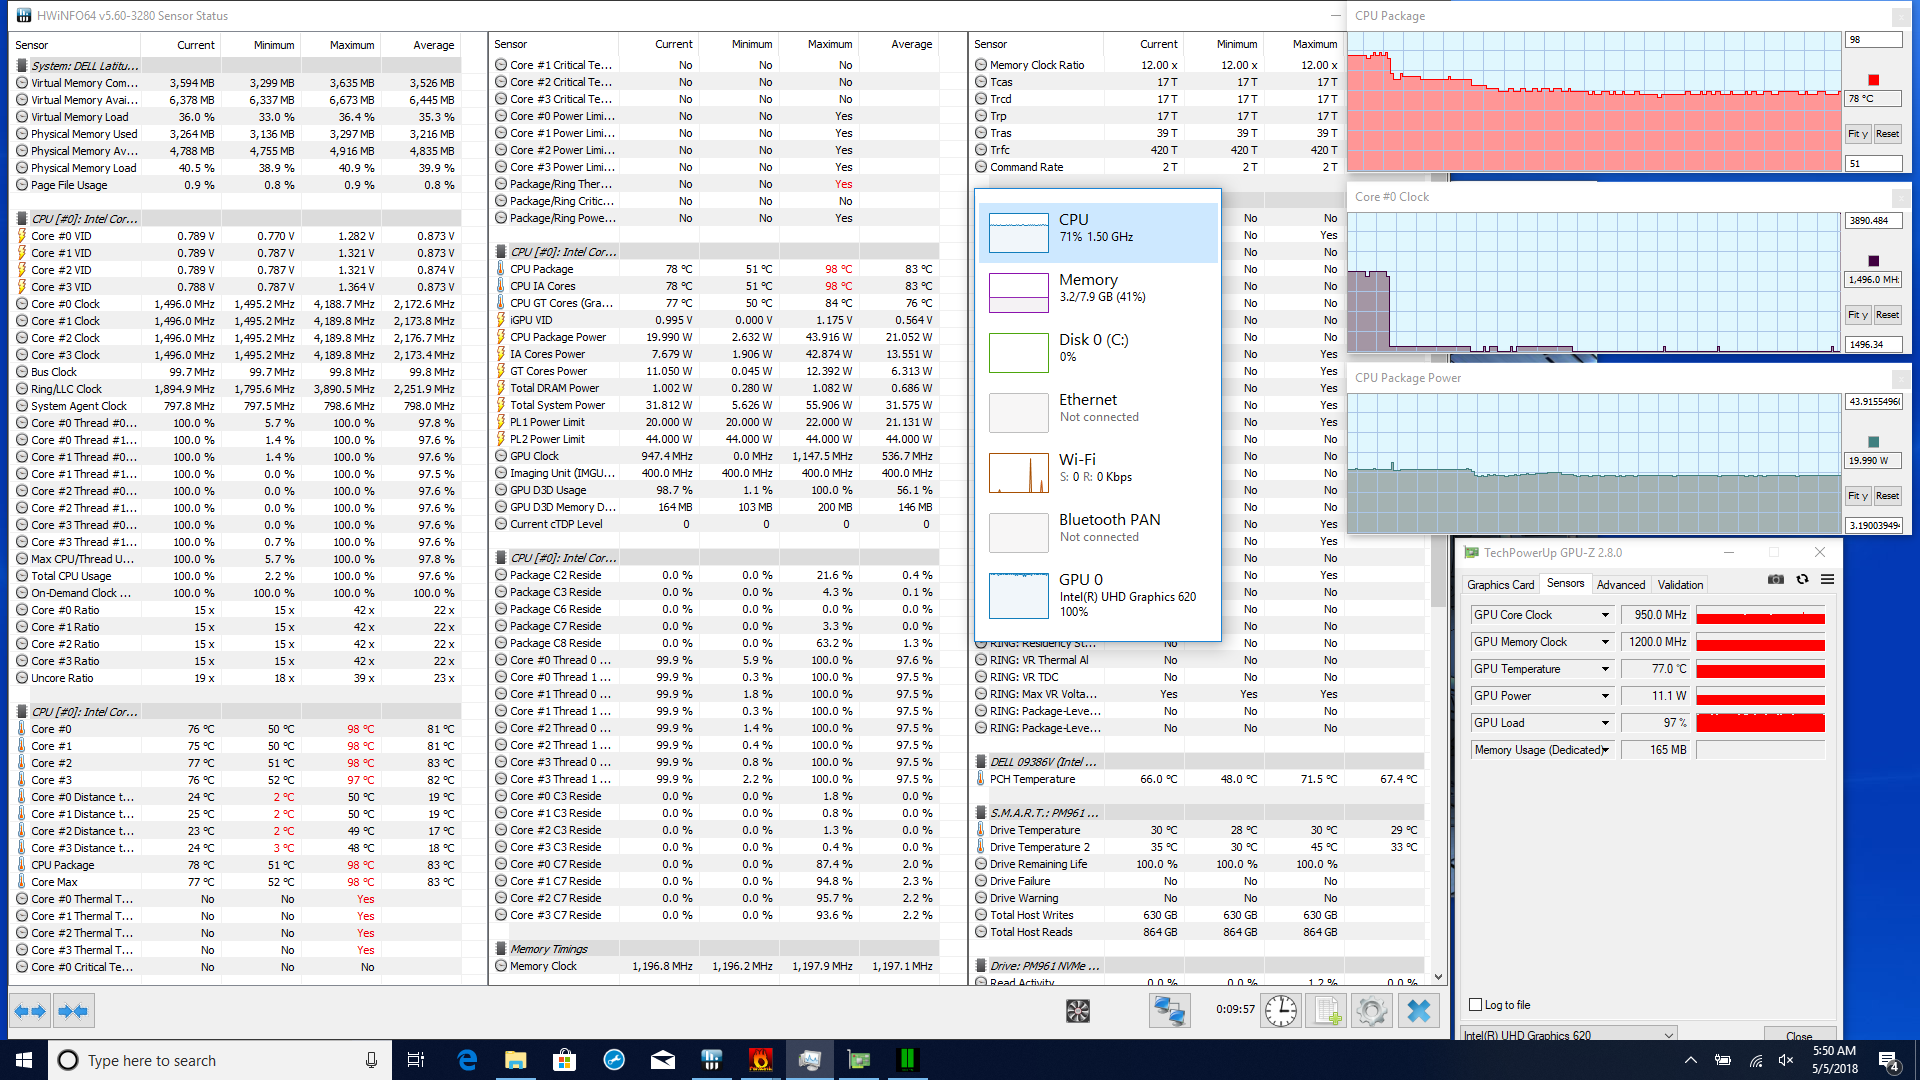
| CPU Clock (GHz) | GPU Clock (MHz) | Average CPU Temperature (°C) | Average GPU Temperature (°C) | |
| Prime95 Stress | 2.9 | - | 90 | - |
| FurMark Stress | - | 1000 | - | 76 |
| Prime95 + FurMark Stress | 1.5 | 950 | 77 | 77 |
Emissions
System Noise
In terms of operating noise, nothing significant has changed since last month’s review unit. The machine is still completely silent while idling, rarely audible during moderate use, and pretty noticeable if heavily stressed; we measured up to 42.7 dB(A) under load. Apart from the Asus ZenBook 13, this is quite a bit louder than the rest of the competition (which all hover around the 35 dB(A) mark under load)—but it’s not very common that such conditions are in play, so it’s rarely likely to be an issue.
Noise Level
| Idle |
| 28.2 / 28.2 / 28.2 dB(A) |
| Load |
| 31.5 / 42.7 dB(A) |
 | ||
30 dB silent 40 dB(A) audible 50 dB(A) loud |
||
min: | ||
| Dell Latitude 7390 UHD Graphics 620, i7-8650U, Samsung PM961 MZVLW256HEHP | Dell Latitude 7390 UHD Graphics 620, i5-8350U, SK hynix SC311 M.2 | Dell Latitude 13 7380 HD Graphics 620, i7-7600U, Samsung PM961 MZVLW256HEHP | Lenovo ThinkPad X1 Carbon 2018-20KGS03900 UHD Graphics 620, i5-8550U, Samsung SSD PM981 MZVLB512HAJQ | HP Elitebook 1040 G4-2XU40UT HD Graphics 630, i7-7820HQ, Toshiba XG4 NVMe (THNSN5512GPUK) | Asus ZenBook 13 UX331UN GeForce MX150, i5-8550U, SK Hynix HFS256G39TND-N210A | |
|---|---|---|---|---|---|---|
| Noise | -3% | 3% | -2% | 2% | -8% | |
| off / environment * | 28.2 | 29.5 -5% | 28 1% | 28.9 -2% | 28.2 -0% | 30.13 -7% |
| Idle Minimum * | 28.2 | 29.5 -5% | 28 1% | 28.9 -2% | 28.2 -0% | 30.13 -7% |
| Idle Average * | 28.2 | 29.5 -5% | 28 1% | 28.9 -2% | 28.2 -0% | 30.3 -7% |
| Idle Maximum * | 28.2 | 29.5 -5% | 29.6 -5% | 32.5 -15% | 28.2 -0% | 30.3 -7% |
| Load Average * | 31.5 | 32.4 -3% | 30.6 3% | 35.1 -11% | 33.3 -6% | 39.2 -24% |
| Load Maximum * | 42.7 | 39.9 7% | 35.4 17% | 35.1 18% | 35.3 17% | 41 4% |
* ... smaller is better
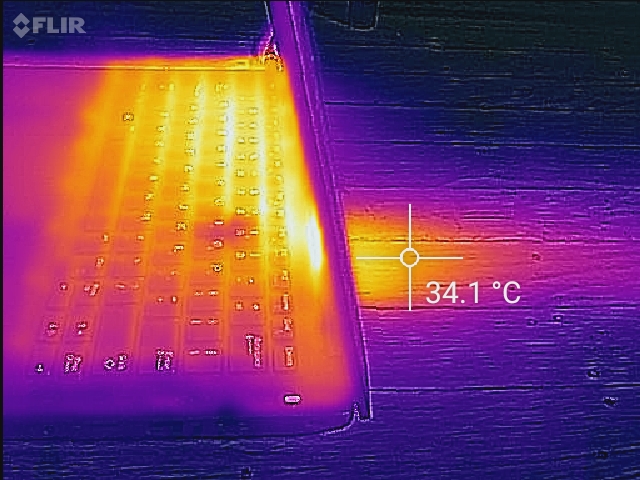
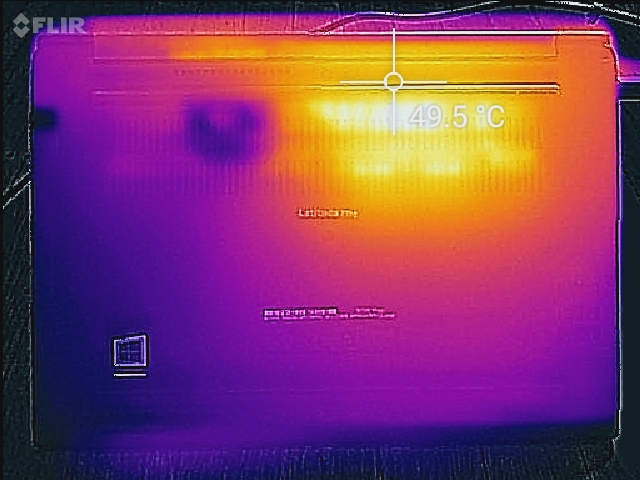
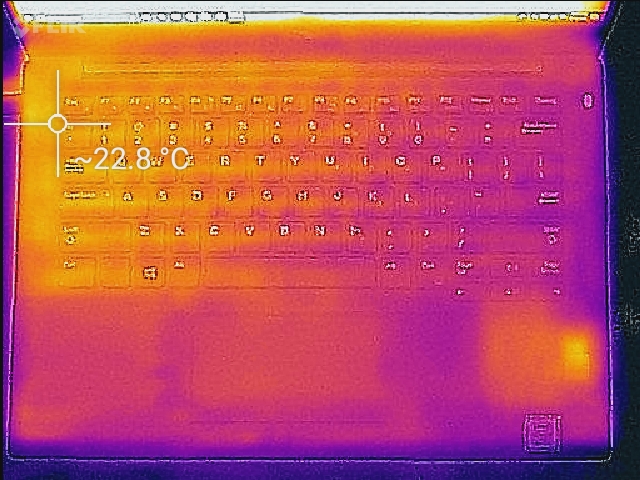
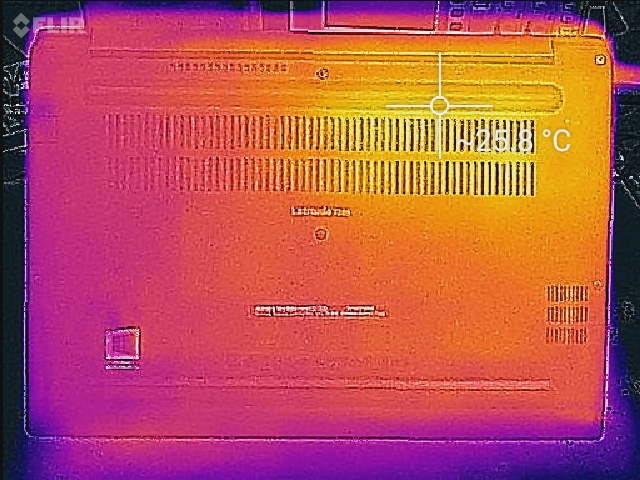
Temperature
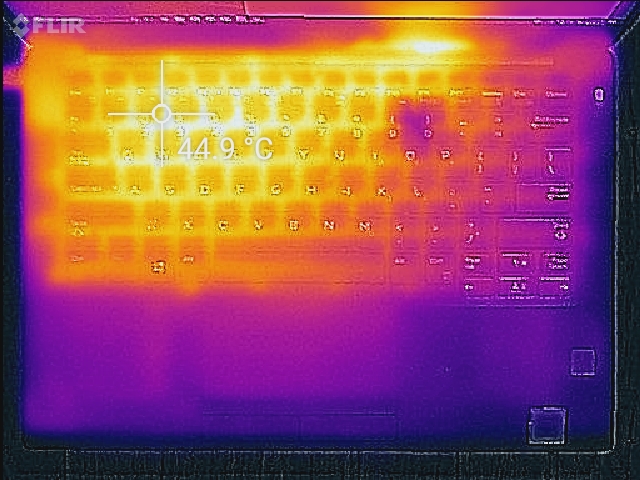
Temperature differences are mostly confined to usage while idling, and this is more than likely due to the upgrade to the NVMe SSD; note that it’s the bottom-right of the machine (when flipped) that exhibits the most visible rise in surface temperatures—about 2 °C. That may not sound like much, but since it brings the surface temperature of the underside to an average of 24.9 °C (nearly 5 °C above ambient room temperatures), it could prove irritating for those who plan to use the machine on the lap frequently.
(±) The maximum temperature on the upper side is 44.4 °C / 112 F, compared to the average of 34.2 °C / 94 F, ranging from 21.2 to 62.5 °C for the class Office.
(-) The bottom heats up to a maximum of 47.4 °C / 117 F, compared to the average of 36.7 °C / 98 F
(+) In idle usage, the average temperature for the upper side is 21.9 °C / 71 F, compared to the device average of 29.5 °C / 85 F.
(+) The palmrests and touchpad are cooler than skin temperature with a maximum of 29.4 °C / 84.9 F and are therefore cool to the touch.
(±) The average temperature of the palmrest area of similar devices was 27.7 °C / 81.9 F (-1.7 °C / -3 F).
Speakers
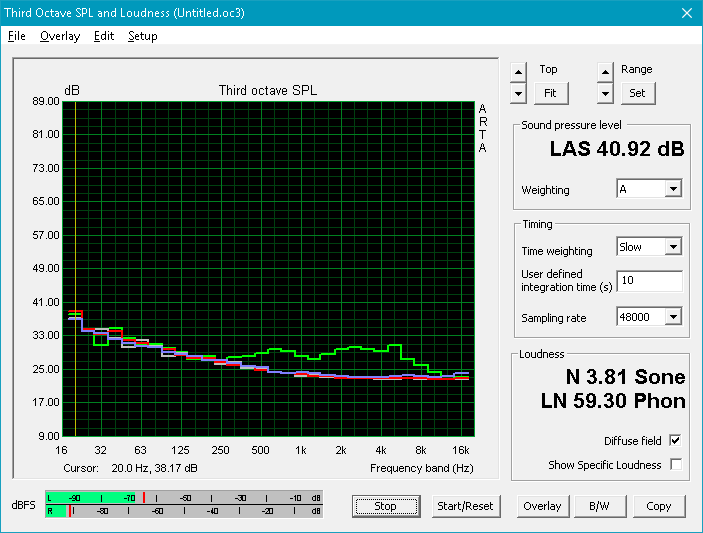
The speakers themselves haven’t changed since our previous review, but our results this time around were more positive than last month’s. The shape of the audio is still merely average, but the machine ranks better than most in its class. The difference is probably in the post-processing software.
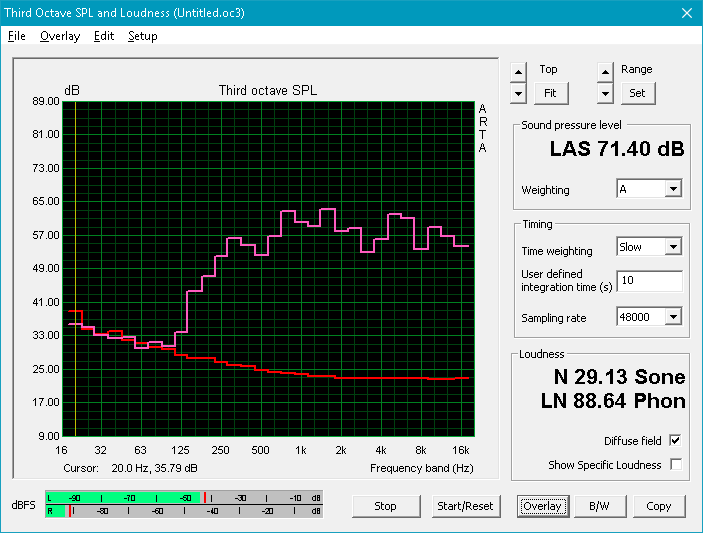
Dell Latitude 7390 audio analysis
(-) | not very loud speakers (71.4 dB)
Bass 100 - 315 Hz
(±) | reduced bass - on average 12.4% lower than median
(±) | linearity of bass is average (13.6% delta to prev. frequency)
Mids 400 - 2000 Hz
(+) | balanced mids - only 3.4% away from median
(±) | linearity of mids is average (10.3% delta to prev. frequency)
Highs 2 - 16 kHz
(+) | balanced highs - only 3.1% away from median
(±) | linearity of highs is average (12.6% delta to prev. frequency)
Overall 100 - 16.000 Hz
(±) | linearity of overall sound is average (20.4% difference to median)
Compared to same class
» 39% of all tested devices in this class were better, 11% similar, 51% worse
» The best had a delta of 7%, average was 22%, worst was 53%
Compared to all devices tested
» 48% of all tested devices were better, 8% similar, 44% worse
» The best had a delta of 4%, average was 25%, worst was 134%
Lenovo ThinkPad X1 Carbon 2018-20KGS03900 audio analysis
(+) | speakers can play relatively loud (83.6 dB)
Bass 100 - 315 Hz
(-) | nearly no bass - on average 25.9% lower than median
(±) | linearity of bass is average (9.8% delta to prev. frequency)
Mids 400 - 2000 Hz
(+) | balanced mids - only 3.8% away from median
(±) | linearity of mids is average (9% delta to prev. frequency)
Highs 2 - 16 kHz
(+) | balanced highs - only 2.1% away from median
(+) | highs are linear (4% delta to prev. frequency)
Overall 100 - 16.000 Hz
(±) | linearity of overall sound is average (18.7% difference to median)
Compared to same class
» 29% of all tested devices in this class were better, 6% similar, 65% worse
» The best had a delta of 7%, average was 22%, worst was 53%
Compared to all devices tested
» 37% of all tested devices were better, 8% similar, 55% worse
» The best had a delta of 4%, average was 25%, worst was 134%
Energy Management
Power Consumption
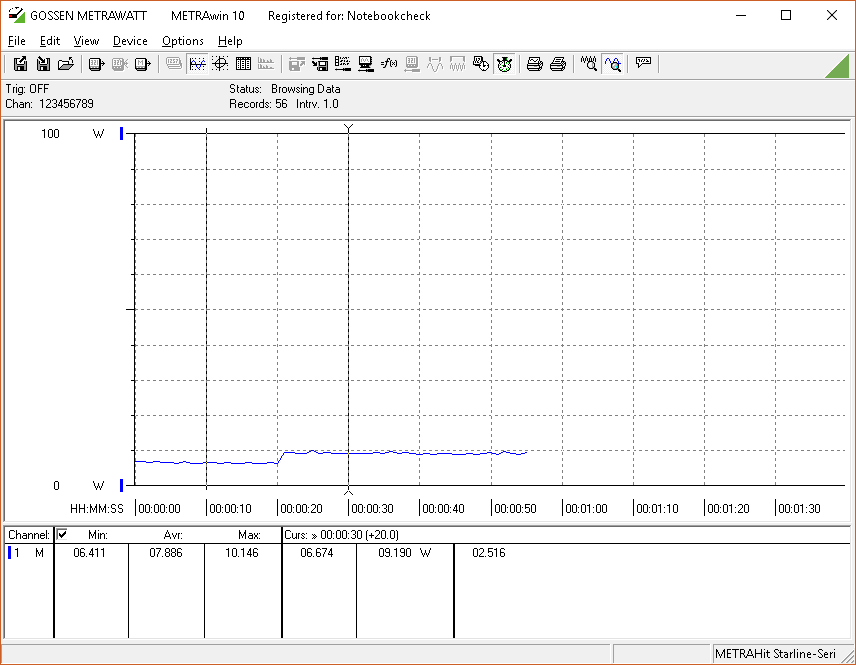
Power consumption has only risen slightly over the Core i5 model; a mere difference of 0.3 W while idling (average) and 0.2 W under load. We didn’t see any spikes into the 60 W range thing time around, but we’ll discover in the next section whether any of these observations affect battery life.
| Idle | |
| Load |
|
| Dell Latitude 7390 i7-8650U, UHD Graphics 620, Samsung PM961 MZVLW256HEHP, IPS, 1920x1080, 13.30 | Dell Latitude 7390 i5-8350U, UHD Graphics 620, SK hynix SC311 M.2, IPS, 1920x1080, 13.30 | Dell Latitude 13 7380 i7-7600U, HD Graphics 620, Samsung PM961 MZVLW256HEHP, IPS, 1920x1080, 13.30 | Lenovo ThinkPad X1 Carbon 2018-20KGS03900 i5-8550U, UHD Graphics 620, Samsung SSD PM981 MZVLB512HAJQ, IPS, 2560x1440, 14.00 | HP Elitebook 1040 G4-2XU40UT i7-7820HQ, HD Graphics 630, Toshiba XG4 NVMe (THNSN5512GPUK), IPS, 1920x1080, 14.00 | Asus ZenBook 13 UX331UN i5-8550U, GeForce MX150, SK Hynix HFS256G39TND-N210A, IPS, 1920x1080, 13.30 | |
|---|---|---|---|---|---|---|
| Power Consumption | -4% | 15% | -37% | -37% | 7% | |
| Idle Minimum * | 3.3 | 2.34 29% | 3.2 3% | 3.8 -15% | 5.1 -55% | 2.2 33% |
| Idle Average * | 5.9 | 5.6 5% | 5.5 7% | 8.9 -51% | 7 -19% | 5 15% |
| Idle Maximum * | 6.2 | 6.5 -5% | 6.1 2% | 11.9 -92% | 11.7 -89% | 8 -29% |
| Load Average * | 43.2 | 43 -0% | 29.5 32% | 47.5 -10% | 41.2 5% | 33 24% |
| Load Maximum * | 45.2 | 67.4 -49% | 32 29% | 52.5 -16% | 56.9 -26% | 49.4 -9% |
* ... smaller is better
Battery Life
The Latitude 7390 maintains excellent battery runtimes even with its faster CPU. We recorded 11 hours and 4 minutes of life during our standardized web surfing benchmark, which is a bit ahead of the Latitude 7380’s 10 hours and 30 minutes. It’s also around two and a half hours longer than the X1 Carbon (8:39) and a little over two hours longer than the Asus ZenBook 13 (8:58). Only the Elitebook Folio 1040 G4 matches it with 11 hours and 5 minutes.
| Dell Latitude 7390 i7-8650U, UHD Graphics 620, 60 Wh | Dell Latitude 7390 i5-8350U, UHD Graphics 620, 60 Wh | Dell Latitude 13 7380 i7-7600U, HD Graphics 620, 60 Wh | Lenovo ThinkPad X1 Carbon 2018-20KGS03900 i5-8550U, UHD Graphics 620, 57 Wh | HP Elitebook 1040 G4-2XU40UT i7-7820HQ, HD Graphics 630, 67 Wh | Asus ZenBook 13 UX331UN i5-8550U, GeForce MX150, 50 Wh | |
|---|---|---|---|---|---|---|
| Battery Runtime | -5% | -22% | 0% | -19% | ||
| WiFi v1.3 | 664 | 630 -5% | 519 -22% | 665 0% | 538 -19% | |
| Reader / Idle | 1660 | 1594 | 1328 | 1349 | 1240 | |
| Load | 92 | 141 | 106 | 96 | 105 |
Pros
Cons
Verdict
Our list of complaints has shrunk since last month’s Latitude 7390 review, partially thanks to configuration differences with today’s review unit, and partially just because some of these items may be a product of idiosyncrasies of the individual machines themselves. The upgrade to a Core i7 certainly brings with it some performance advantages—most notably during sustained loads, where speeds are not only better but also more consistent overall. However, for the vast majority of users, the Core i5 is more than powerful enough and the cost savings may render it a more attractive option. Much of the same logic applies to the NVMe SSD (versus the conventional M.2 SATA option we saw in last month’s Latitude 7390 test unit) which is faster but also generates more heat and comes at a higher price. Most surprisingly, however, the anti-glare touchscreen in this configuration truly is anti-glare; it carries with it no negatives in comparison to last month’s conventional (non-touch) panel.
It’s certainly pricey, but there are few other laptops in its class as thoroughly impressive as the Latitude 7390.
The laundry list of pros still applies otherwise. The 7390 features flawless workmanship and a sturdy build while nevertheless managing a small footprint and light weight. Maintenance is easy thanks to the removable bottom cover. The thorough selection of ports and robust security options will be appreciated by business road warriors and corporate IT departments. The keyboard and touchpad on today’s review unit were both very good overall, and the display panel remains attractive despite the differences in components introduced by the touch capability. Finally, the device remains silent the vast majority of the time, and battery runtimes are lengthy. Cap it all off with a 3-year on-site warranty and you’ve got a very strong contender within the business segment.
At $2,197, it’s certainly pricey, but there are few other laptops in its class as thoroughly impressive as the Latitude 7390. Lenovo’s X1 Carbon and HP’s EliteBook Folio 1040 G4 are probably the top competitors—but it would be hard to go wrong with any one of these machines honestly.
Dell Latitude 7390
-
05/10/2018 v6(old)
Steve Schardein
Pricecompare
