 Deutsch
 English
 Español
 Français
 Italiano
 Nederlands
 Polski
 Português
 Русский
 Türkçe
 Svenska
 Chinese
 Magyar
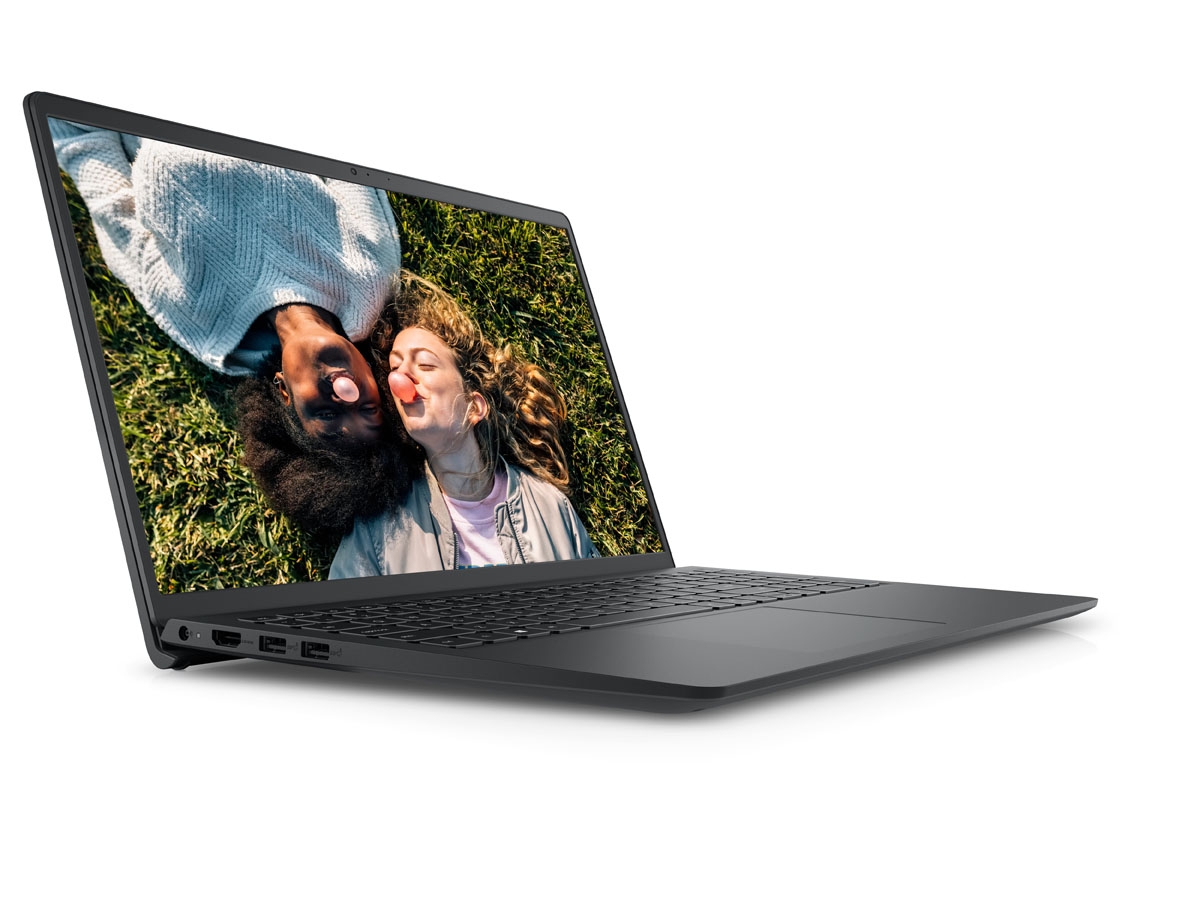
Dell Inspiron 15 3000 3511 laptop review: Making cheaper better
The Inspiron 15 3511 is the direct successor to last year's Inspiron 15 3501. It introduces a brand new chassis design that's both thinner and lighter for increased portability. There are a few other surprises as well to help the Inspiron 15 3511 edge out many other models in its budget price range.
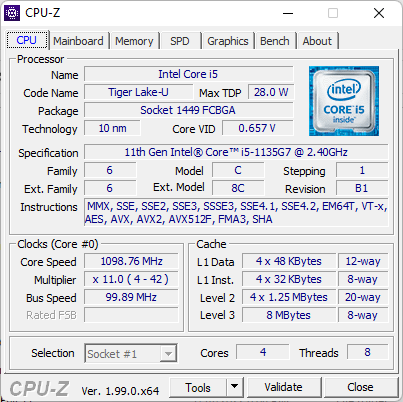
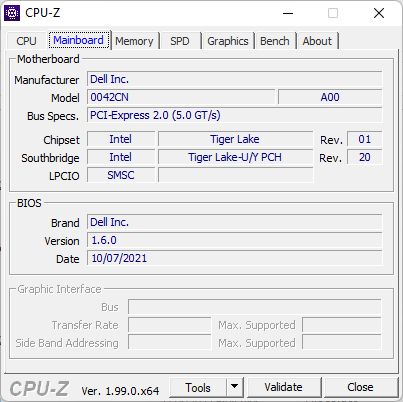
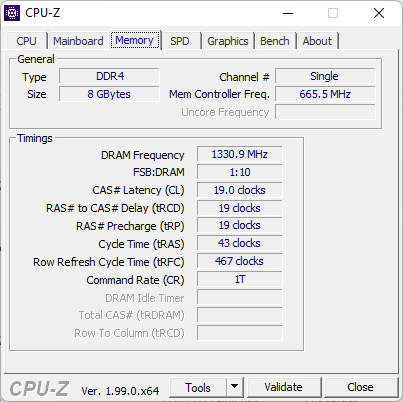
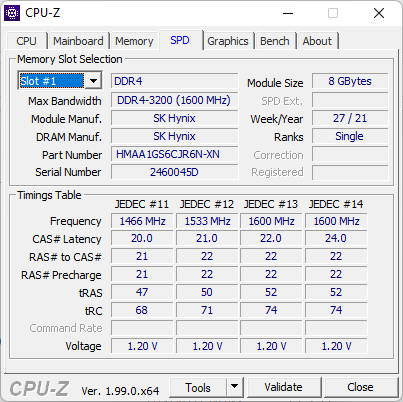
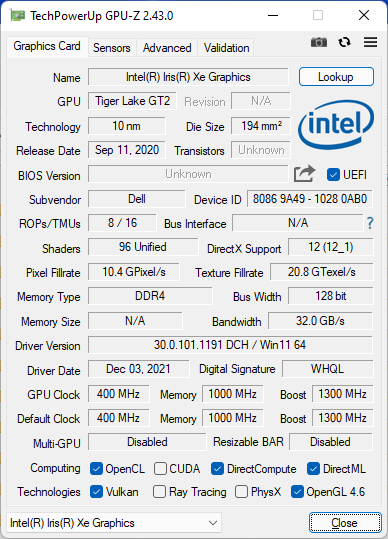
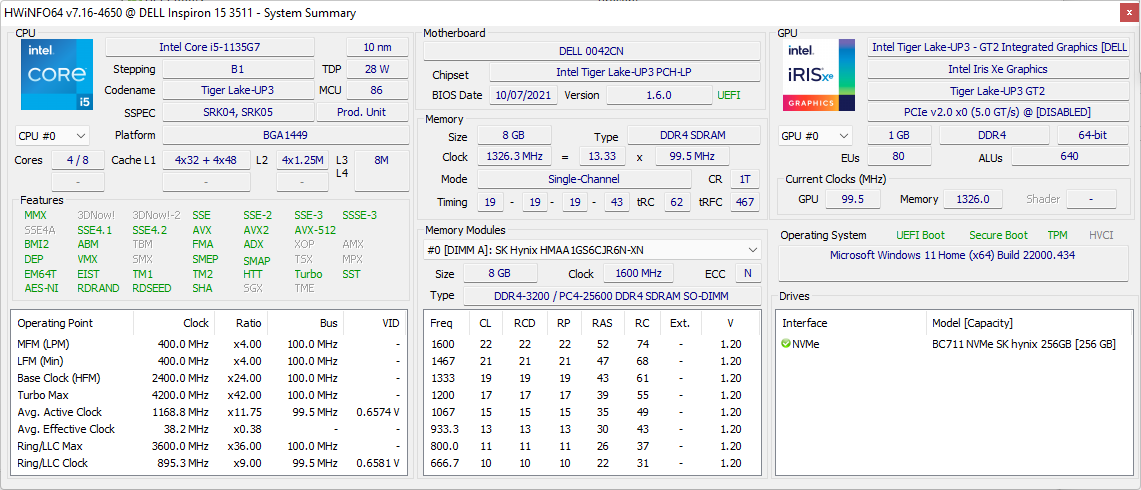
SKUs range from the Core i3-1115G4 up to the Core i7-1165G7 with UHD Graphics or Iris Xe, 4 GB to 12 GB of RAM, and 128 GB to 512 GB PCIe NVMe storage. A 1080p IPS display comes standard with optional touch. Our specific review unit is a mid-range configuration with a Core i5 CPU, 8 GB of single-channel RAM, 256 GB SSD, and 1080p touchscreen for approximately $550 USD retail.
Competitors in this space include other inexpensive 15.6-inch multimedia/office laptops like the HP Pavilion 15, Lenovo IdeaPad 3 15, Asus VivoBook S15, or the Acer Aspire series.
More Dell reviews:
Potential Competitors in Comparison
Rating | Date | Model | Weight | Height | Size | Resolution | Best Price |
|---|---|---|---|---|---|---|---|
| 79.9 % | 01/2022 | Dell Inspiron 15 3000 3511 i5-1135G7, Iris Xe G7 80EUs | 1.7 kg | 18.99 mm | 15.60" | 1920x1080 | |
| 84.2 % | 10/2021 | Dell XPS 15 9510 i5 11400H FHD i5-11400H, UHD Graphics Xe 16EUs (Tiger Lake-H) | 1.8 kg | 18 mm | 15.60" | 1920x1200 | |
| 82.1 % | 07/2021 | Asus VivoBook S15 D533UA R7 5700U, Vega 8 | 1.8 kg | 16.1 mm | 15.60" | 1920x1080 | |
| 80.5 % | 10/2021 | Dell Inspiron 15 3501 i7-1165G7, Iris Xe G7 96EUs | 2 kg | 19.9 mm | 15.60" | 1920x1080 | |
| 80.4 % | 12/2021 | Lenovo IdeaPad 3 15ALC6 R3 5300U, Vega 6 | 1.7 kg | 19.9 mm | 15.60" | 1920x1080 | |
| 81.2 % | 06/2021 | HP Pavilion 15-eg i7-1165G7, GeForce MX450 | 1.7 kg | 17.9 mm | 15.60" | 1920x1080 |
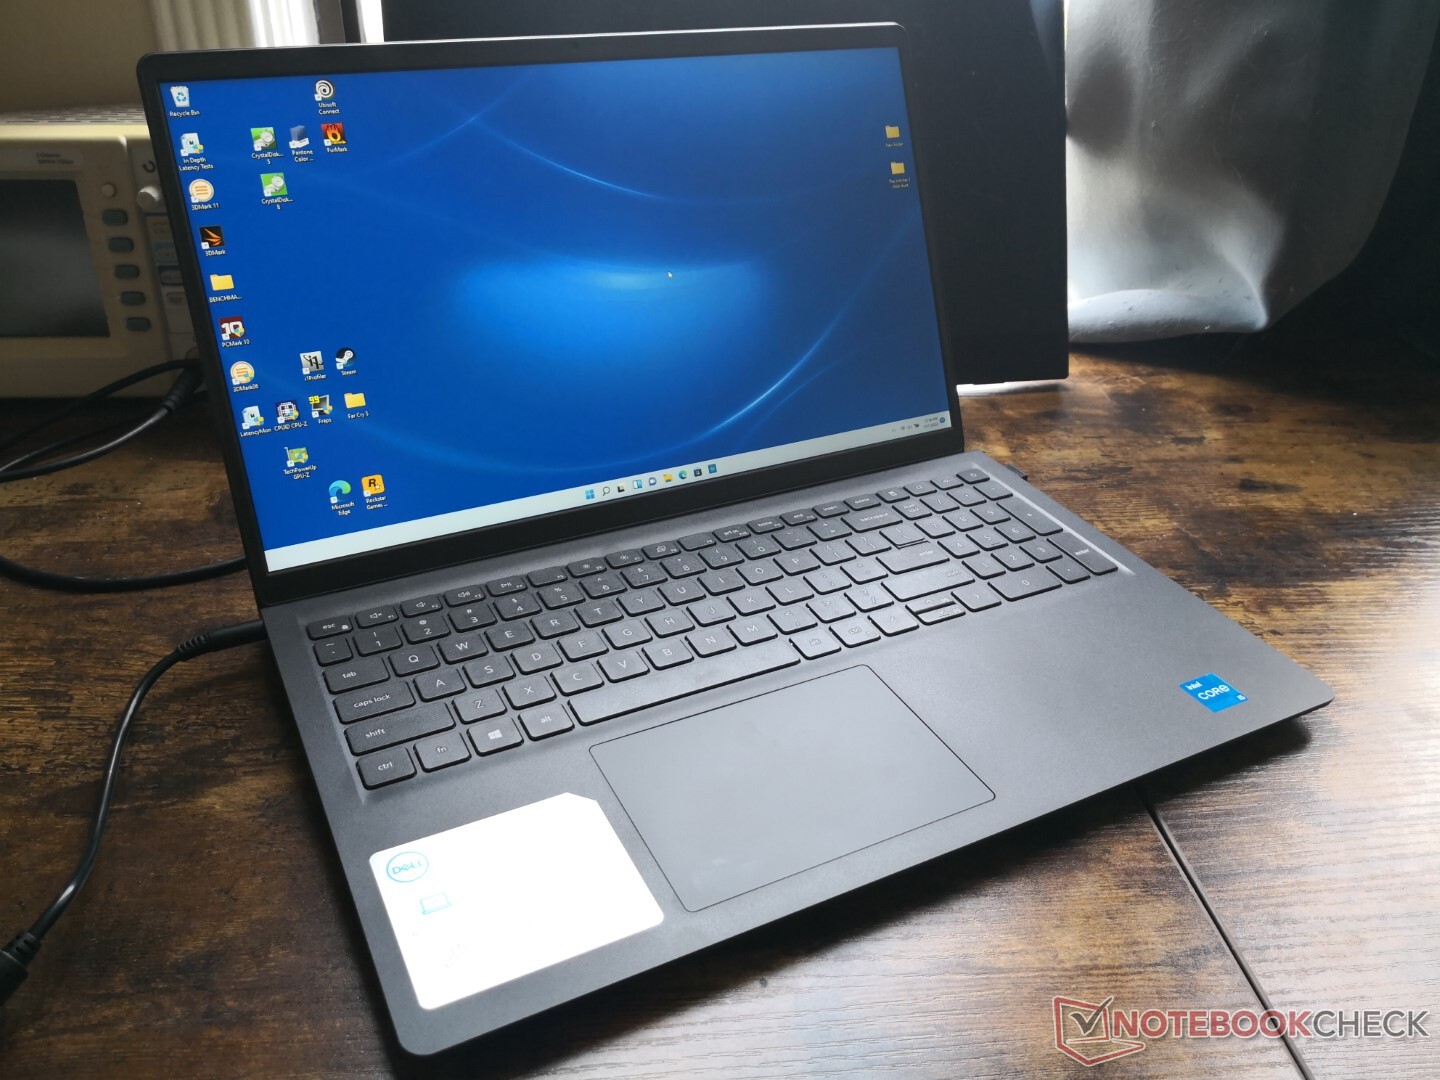
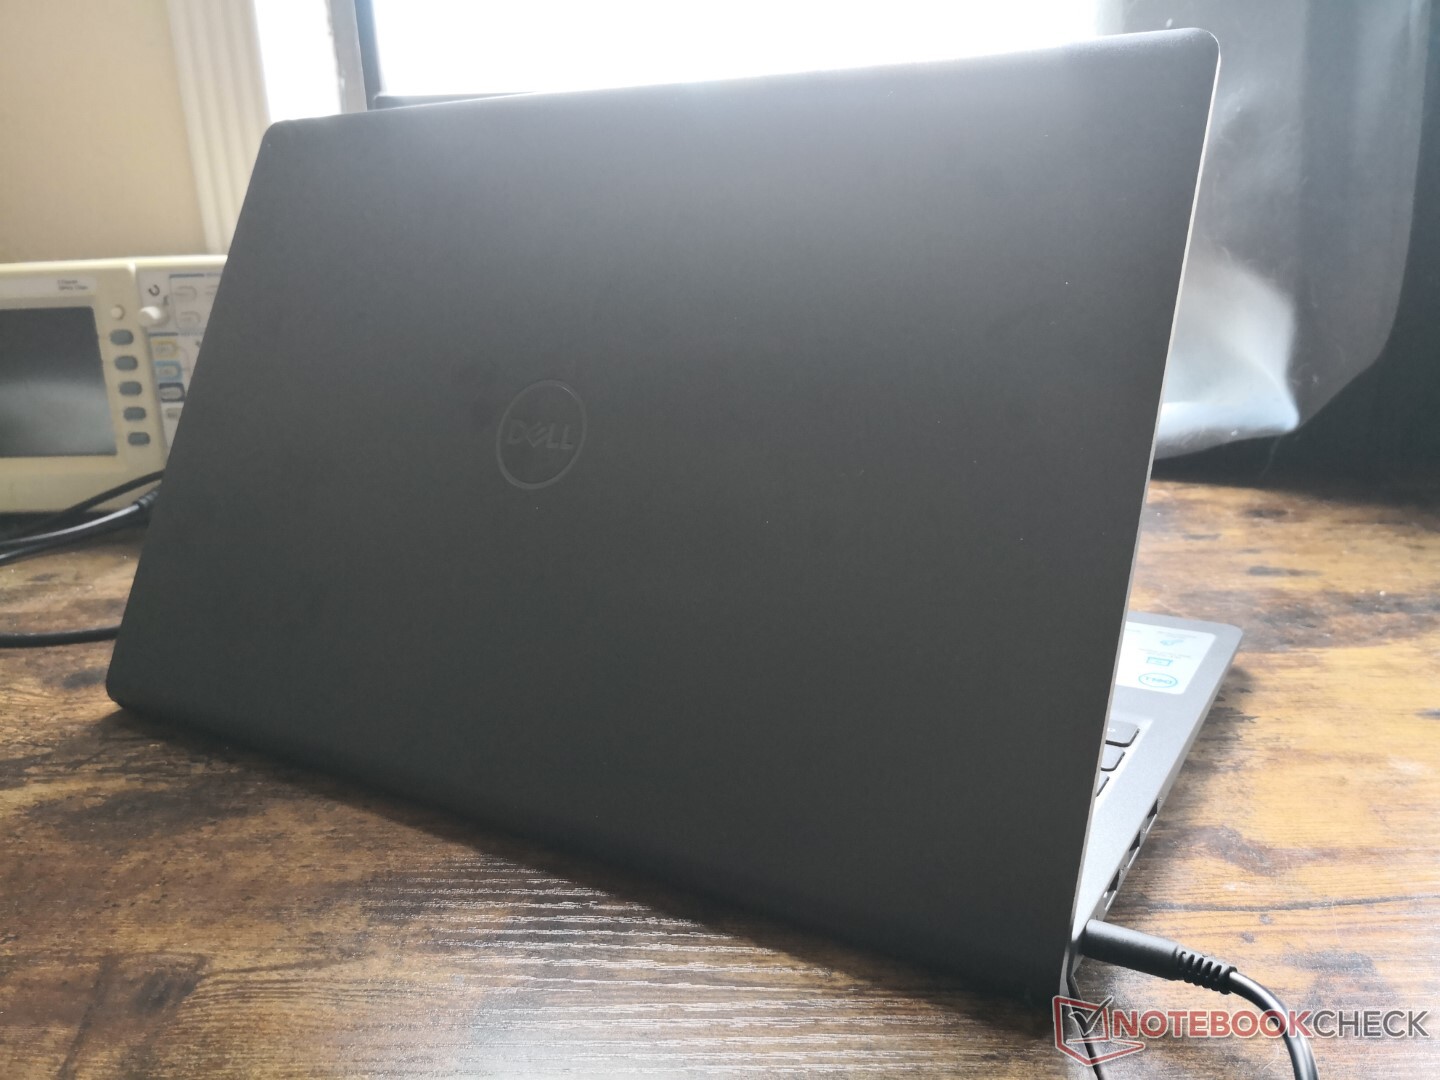
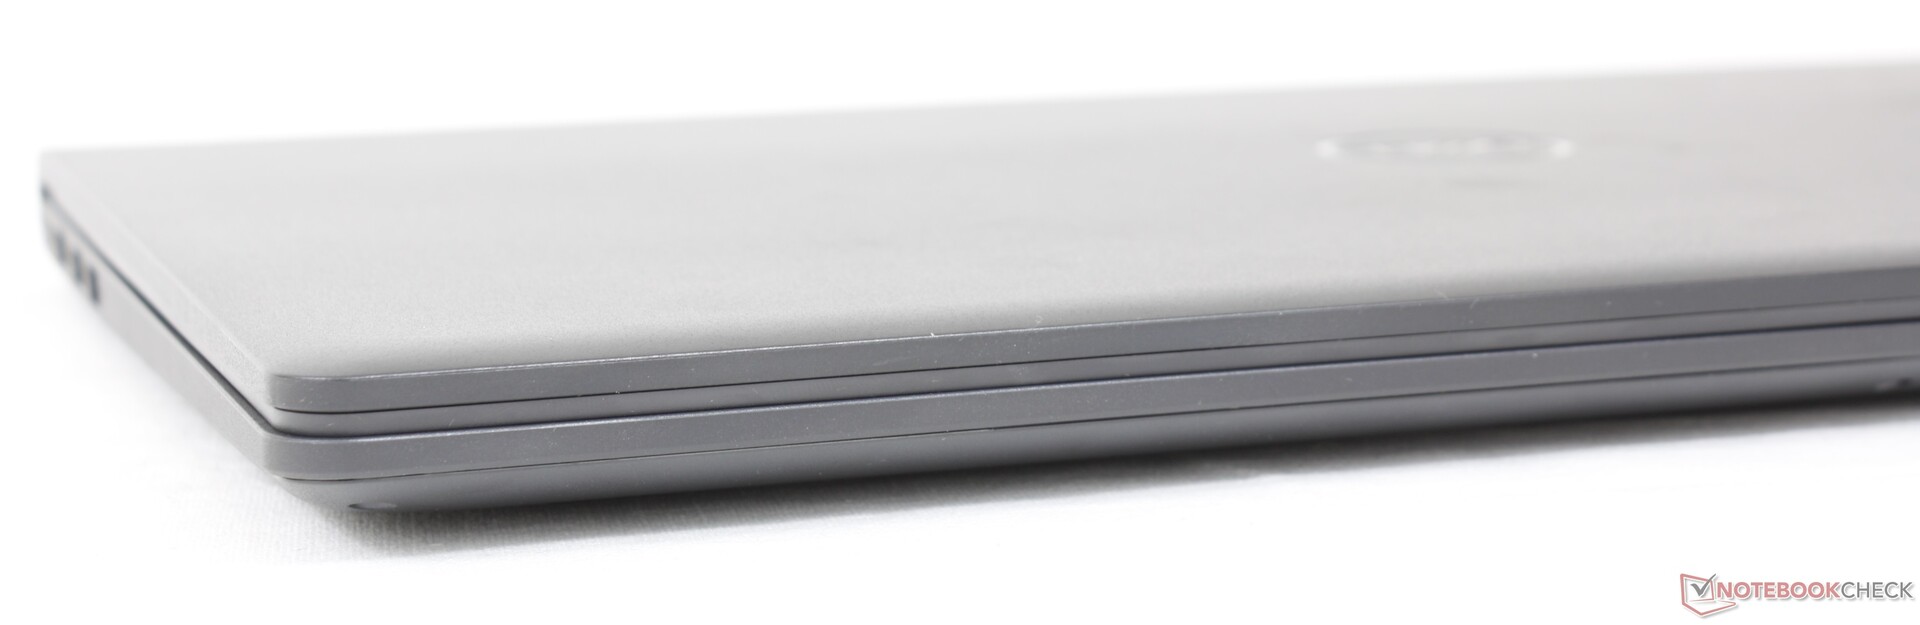
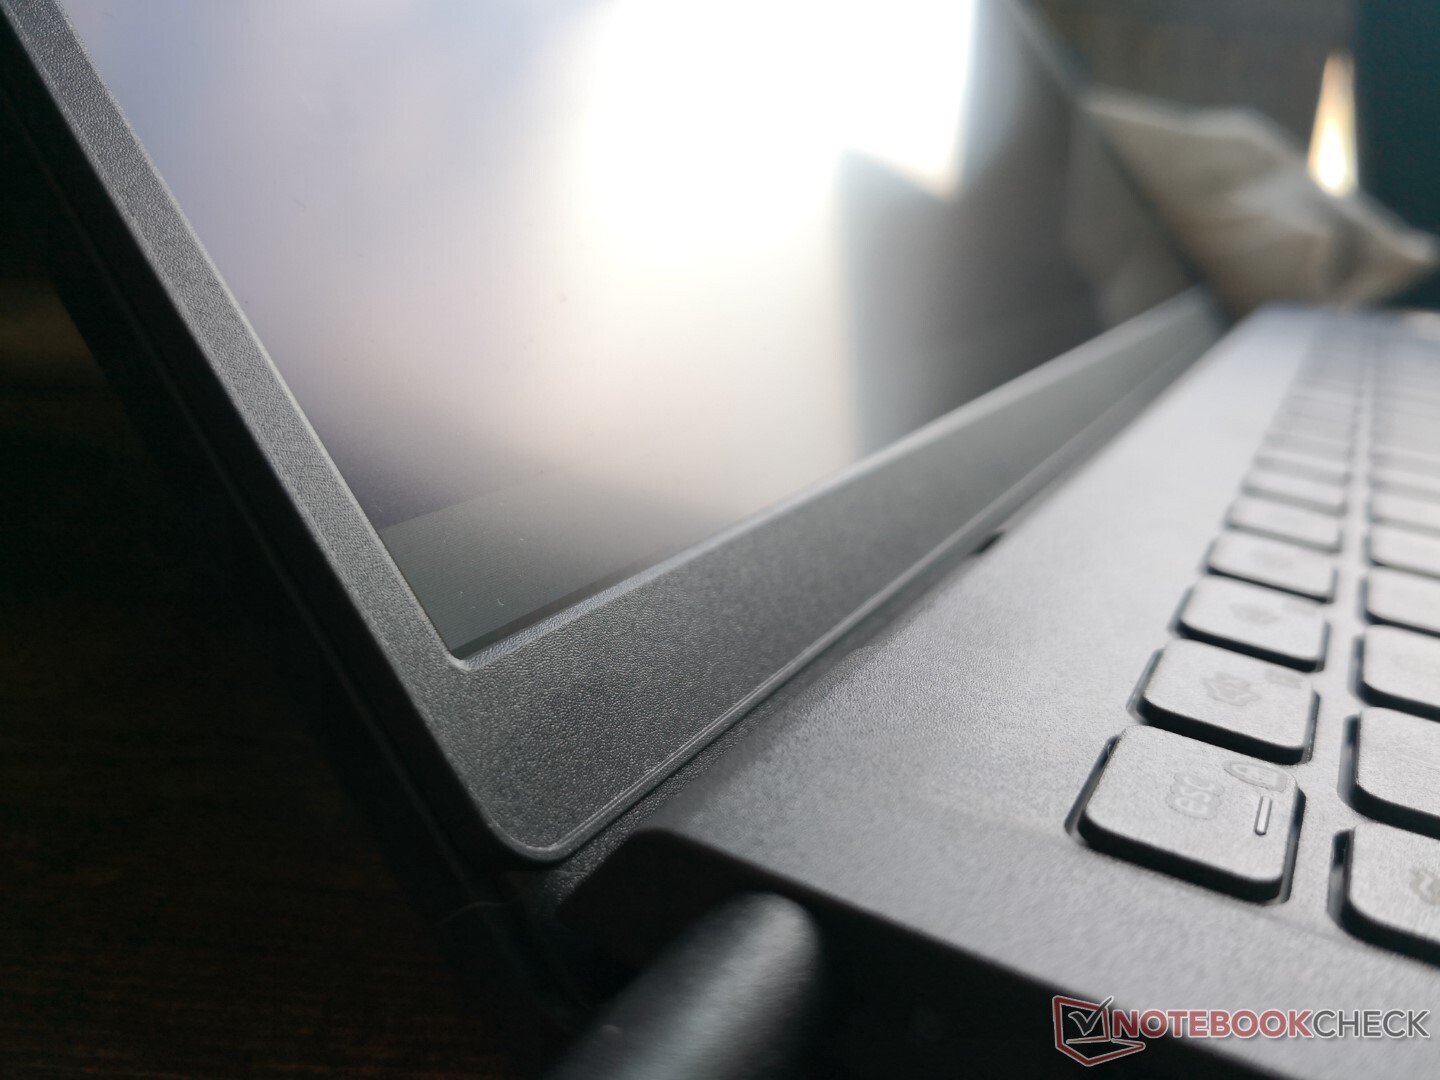
Case
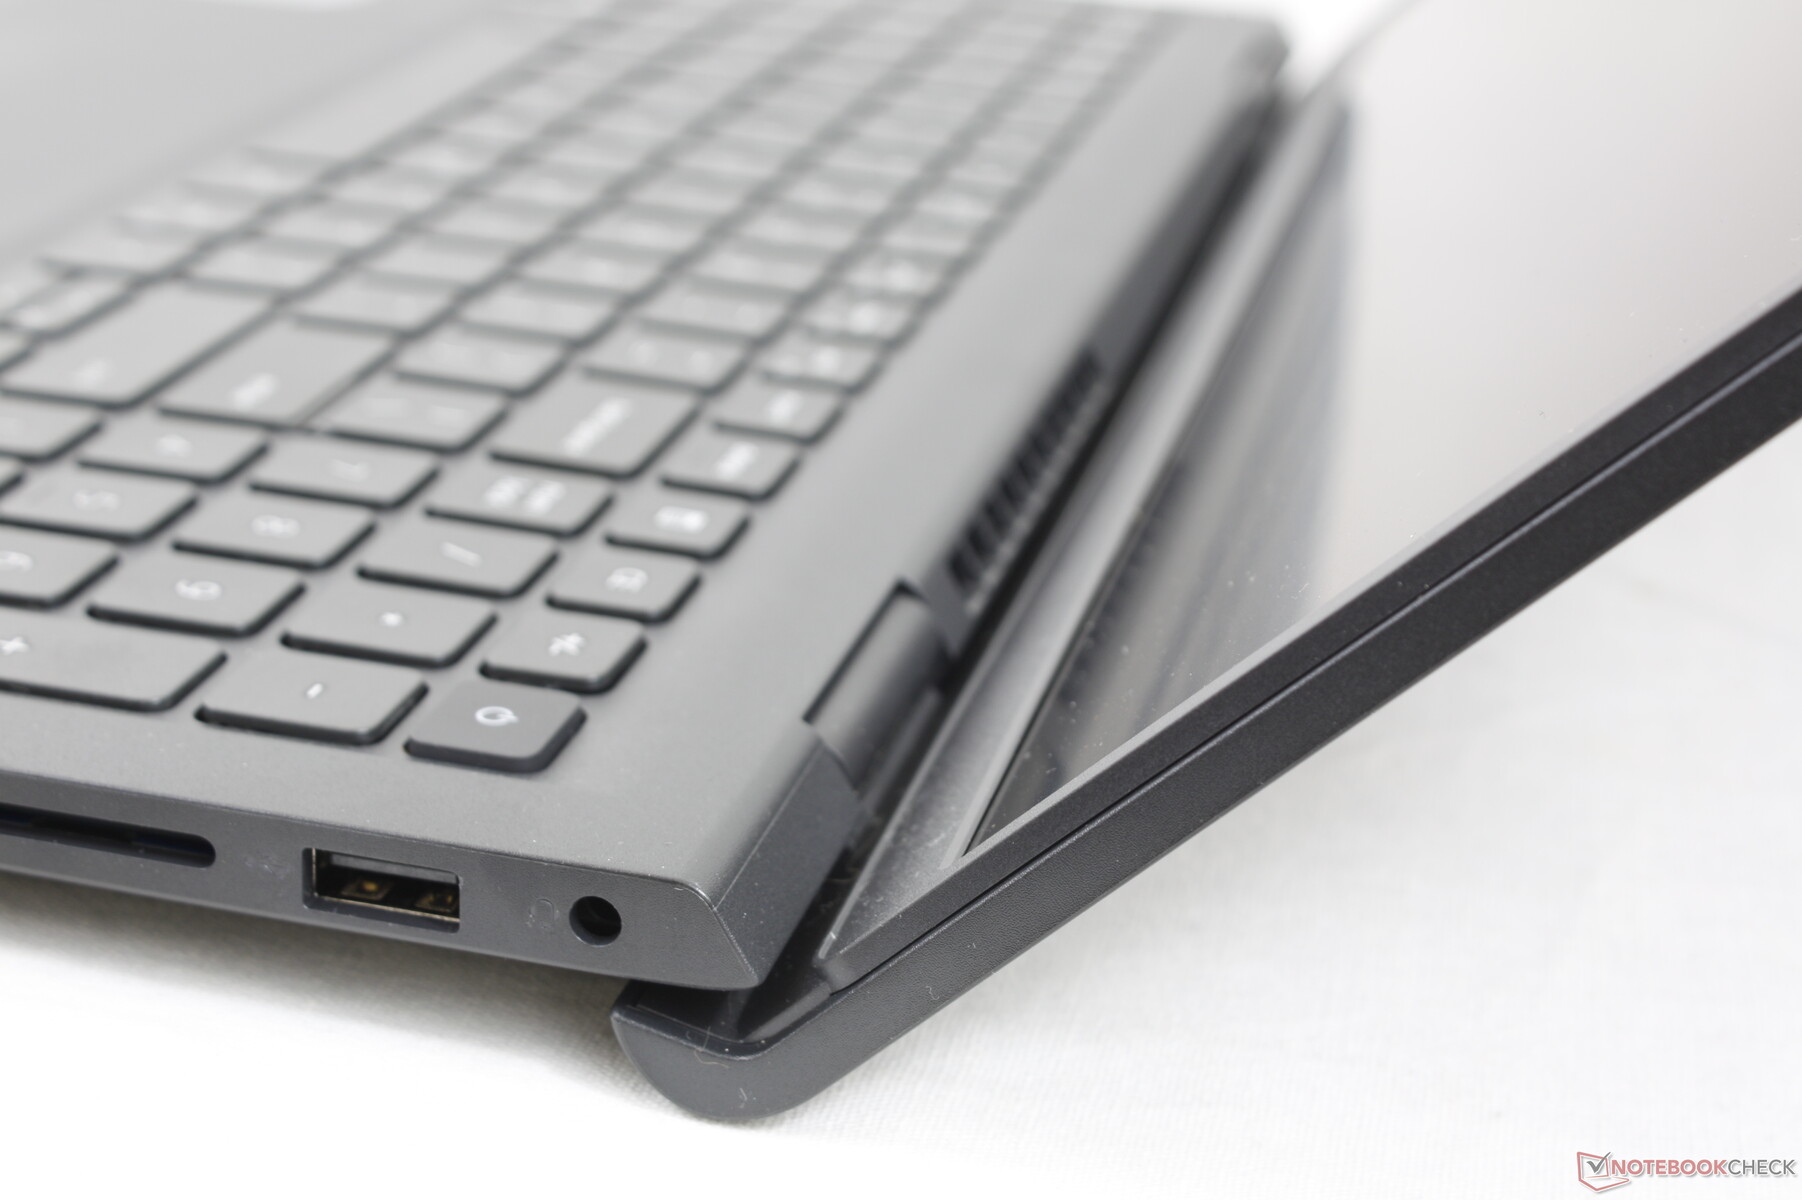
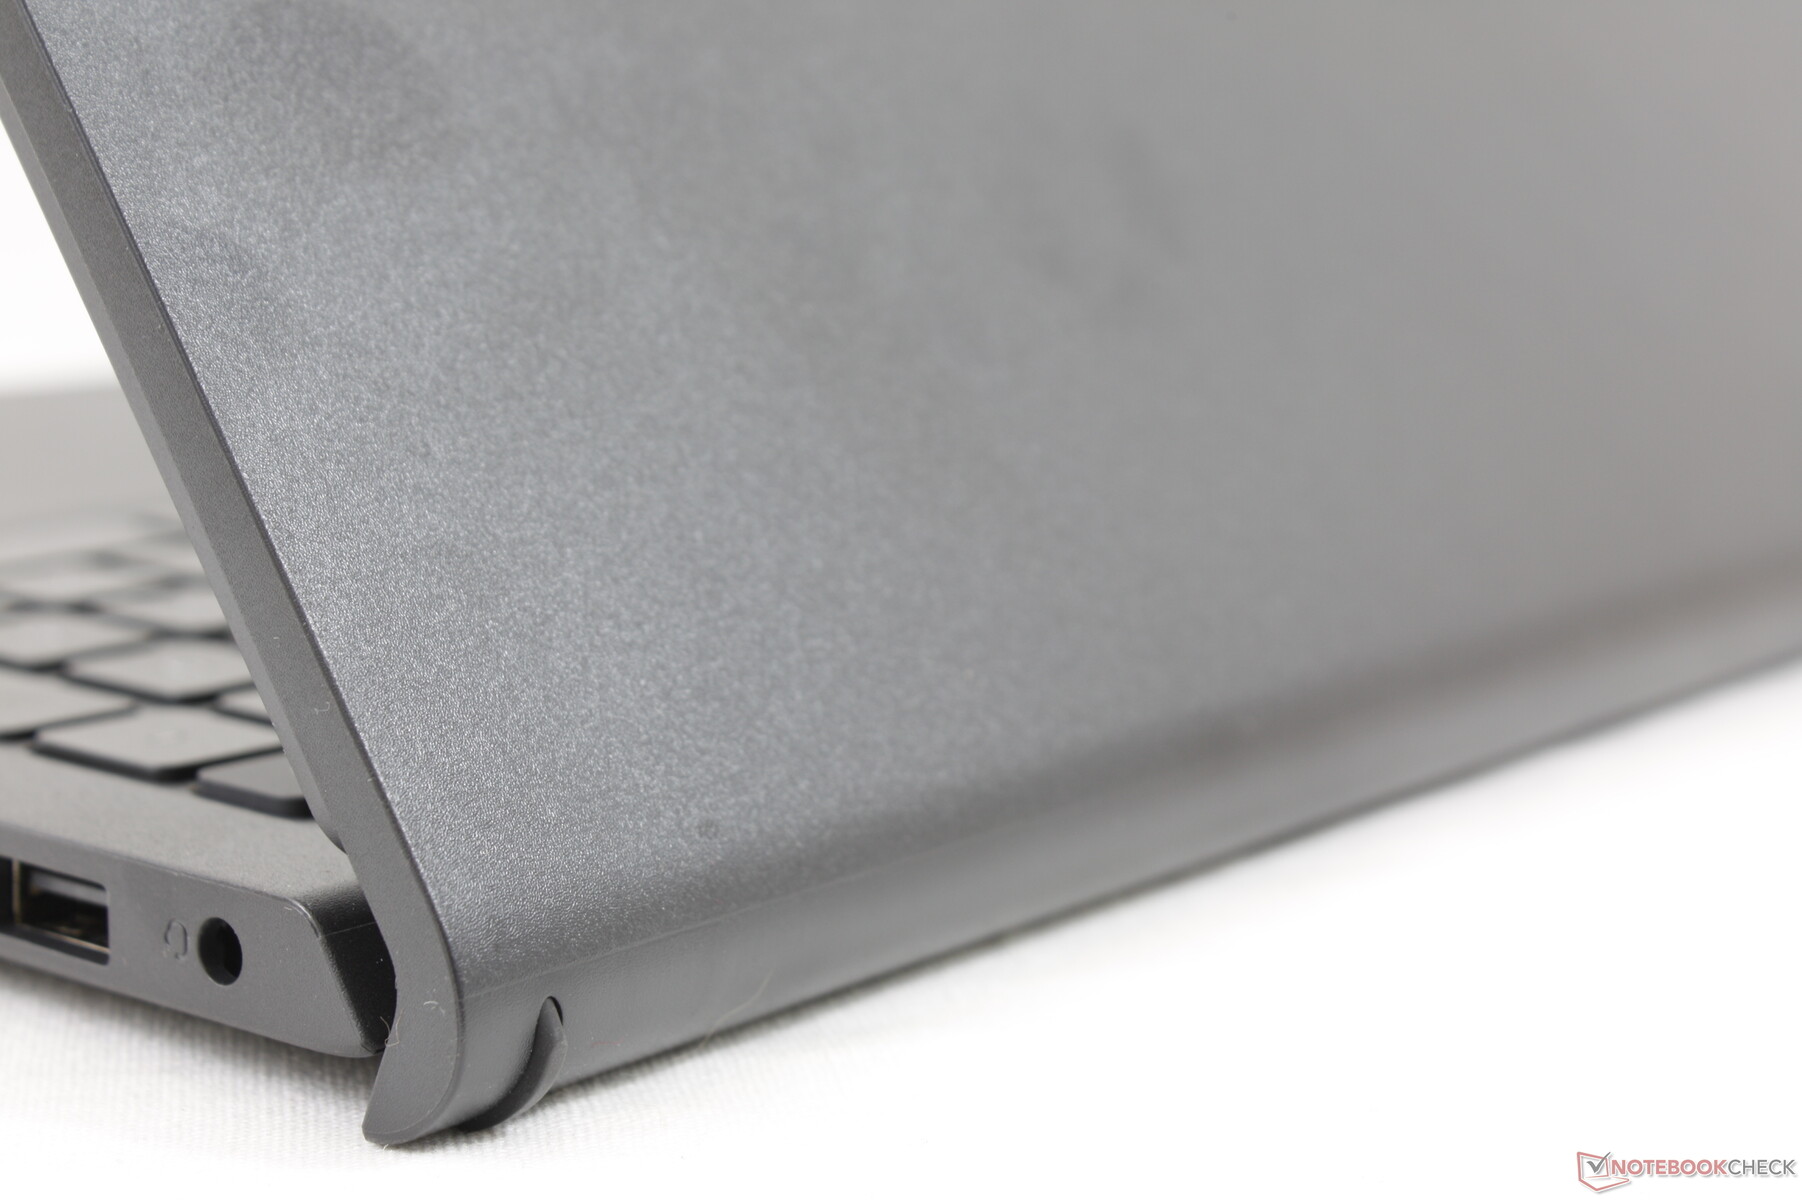
The revamped Inspiron 15 3511 design significantly shrinks the bottom "chin" bezel of the 3501 for a greater screen-to-body ratio. The system now also utilizes similar hinges as found on the VivoBook, MSI Prestige, or HP Pavilion to lift the base at a slight angle for improved ergonomics and airflow. Most of the chassis continues to be plastic, however, and so the system doesn't feel any more rigid or of higher quality than the older Inspiron 15 3501 despite the full-on redesign. The keyboard center, outer lid, and edges of the base can twist and warp fairly easily with enough pressure.
The new model is approximately 11 percent smaller and 15 percent lighter than its predecessor. However, the 3501 design was actually quite large meaning that the 3511 design is more comparable to the Pavilion, VivoBook, or IdeaPad 3 in terms of size and weight.
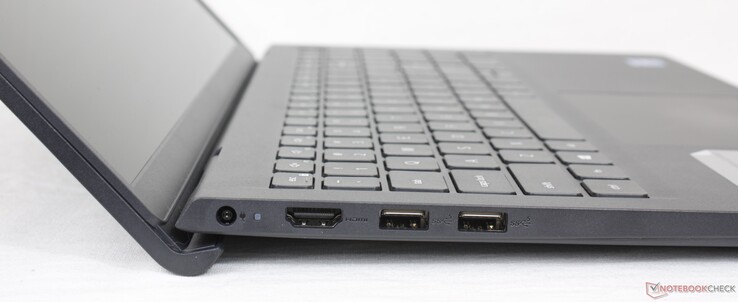
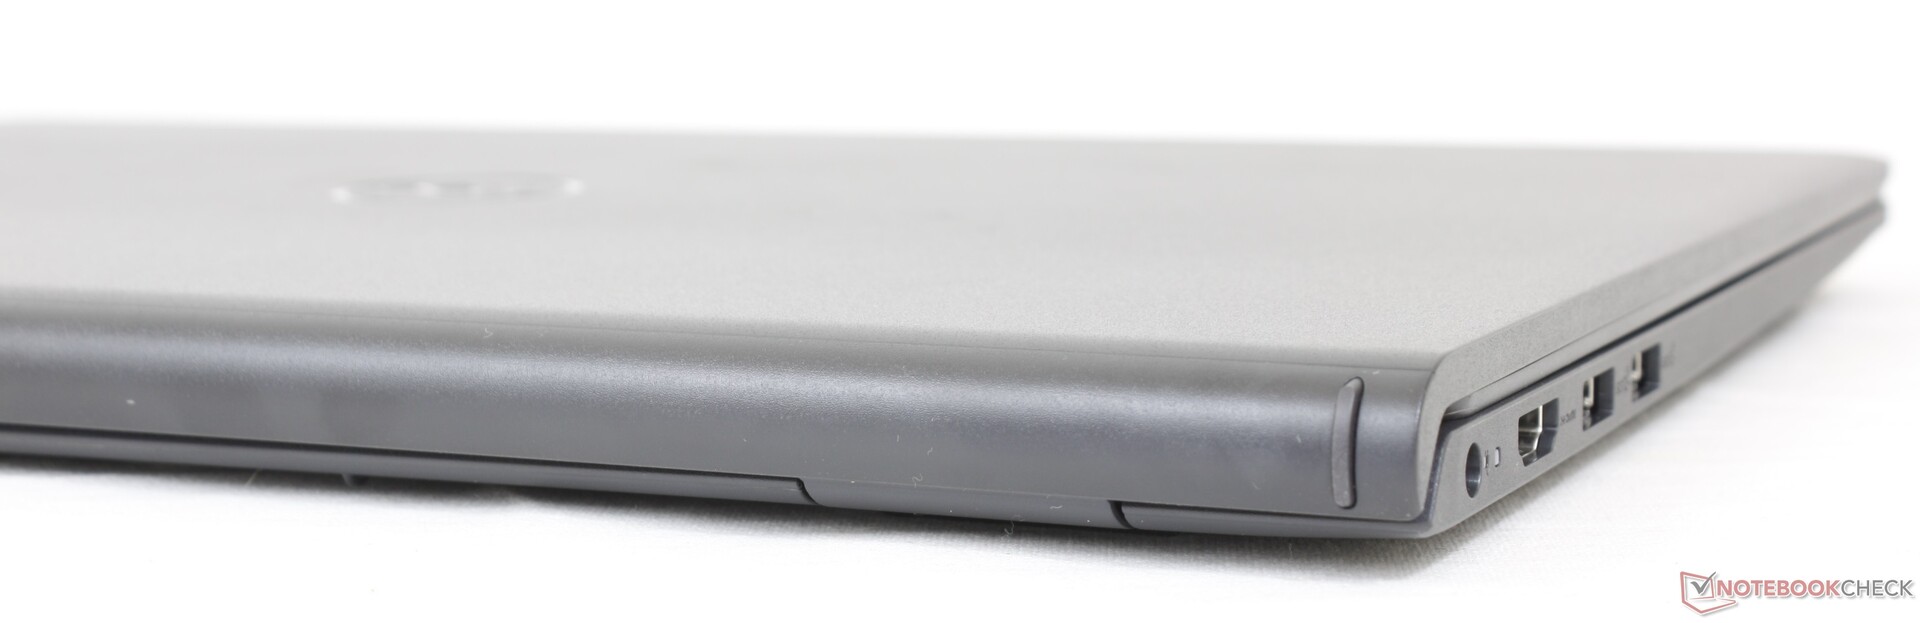
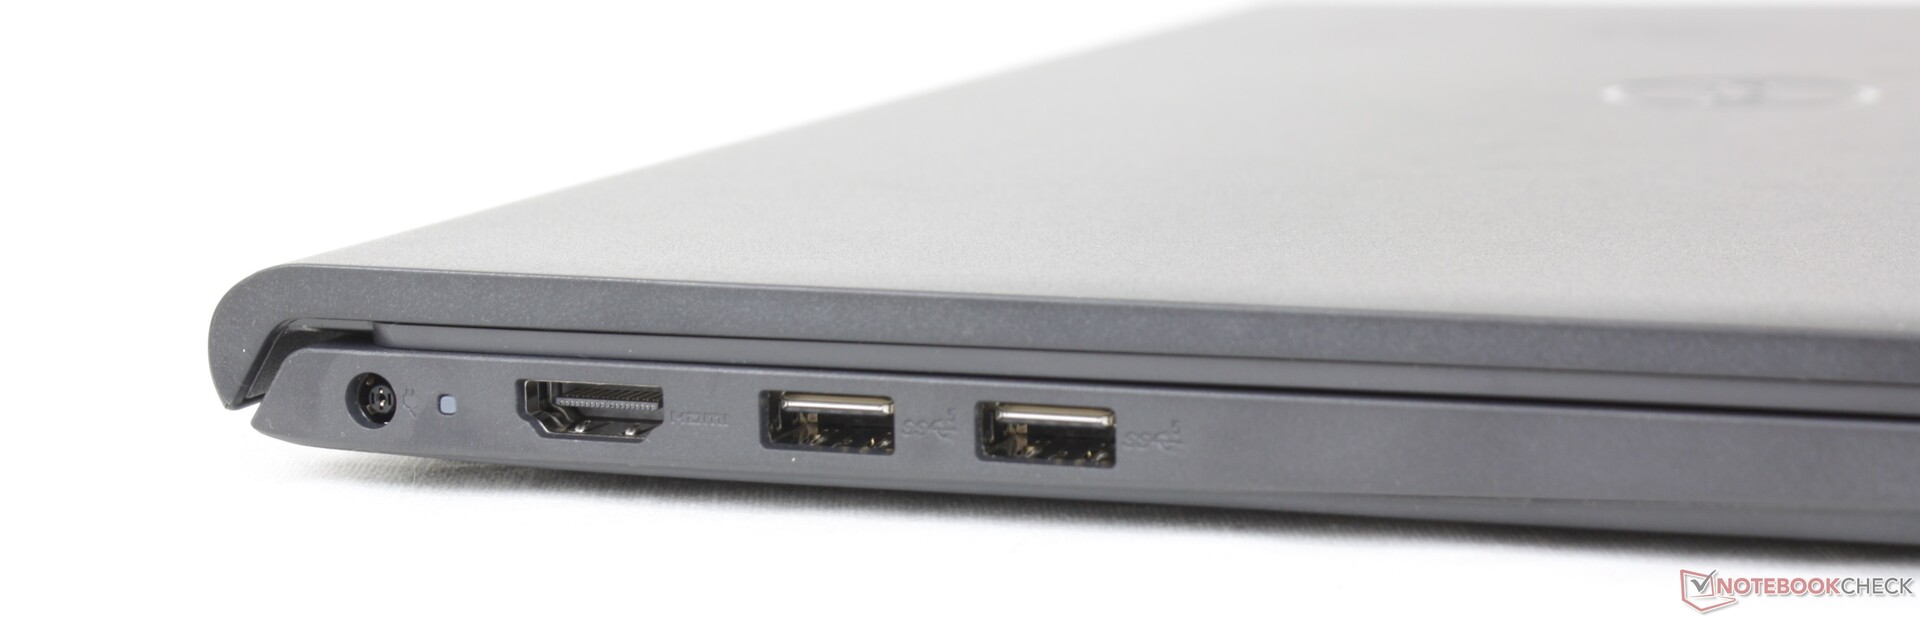
Connectivity
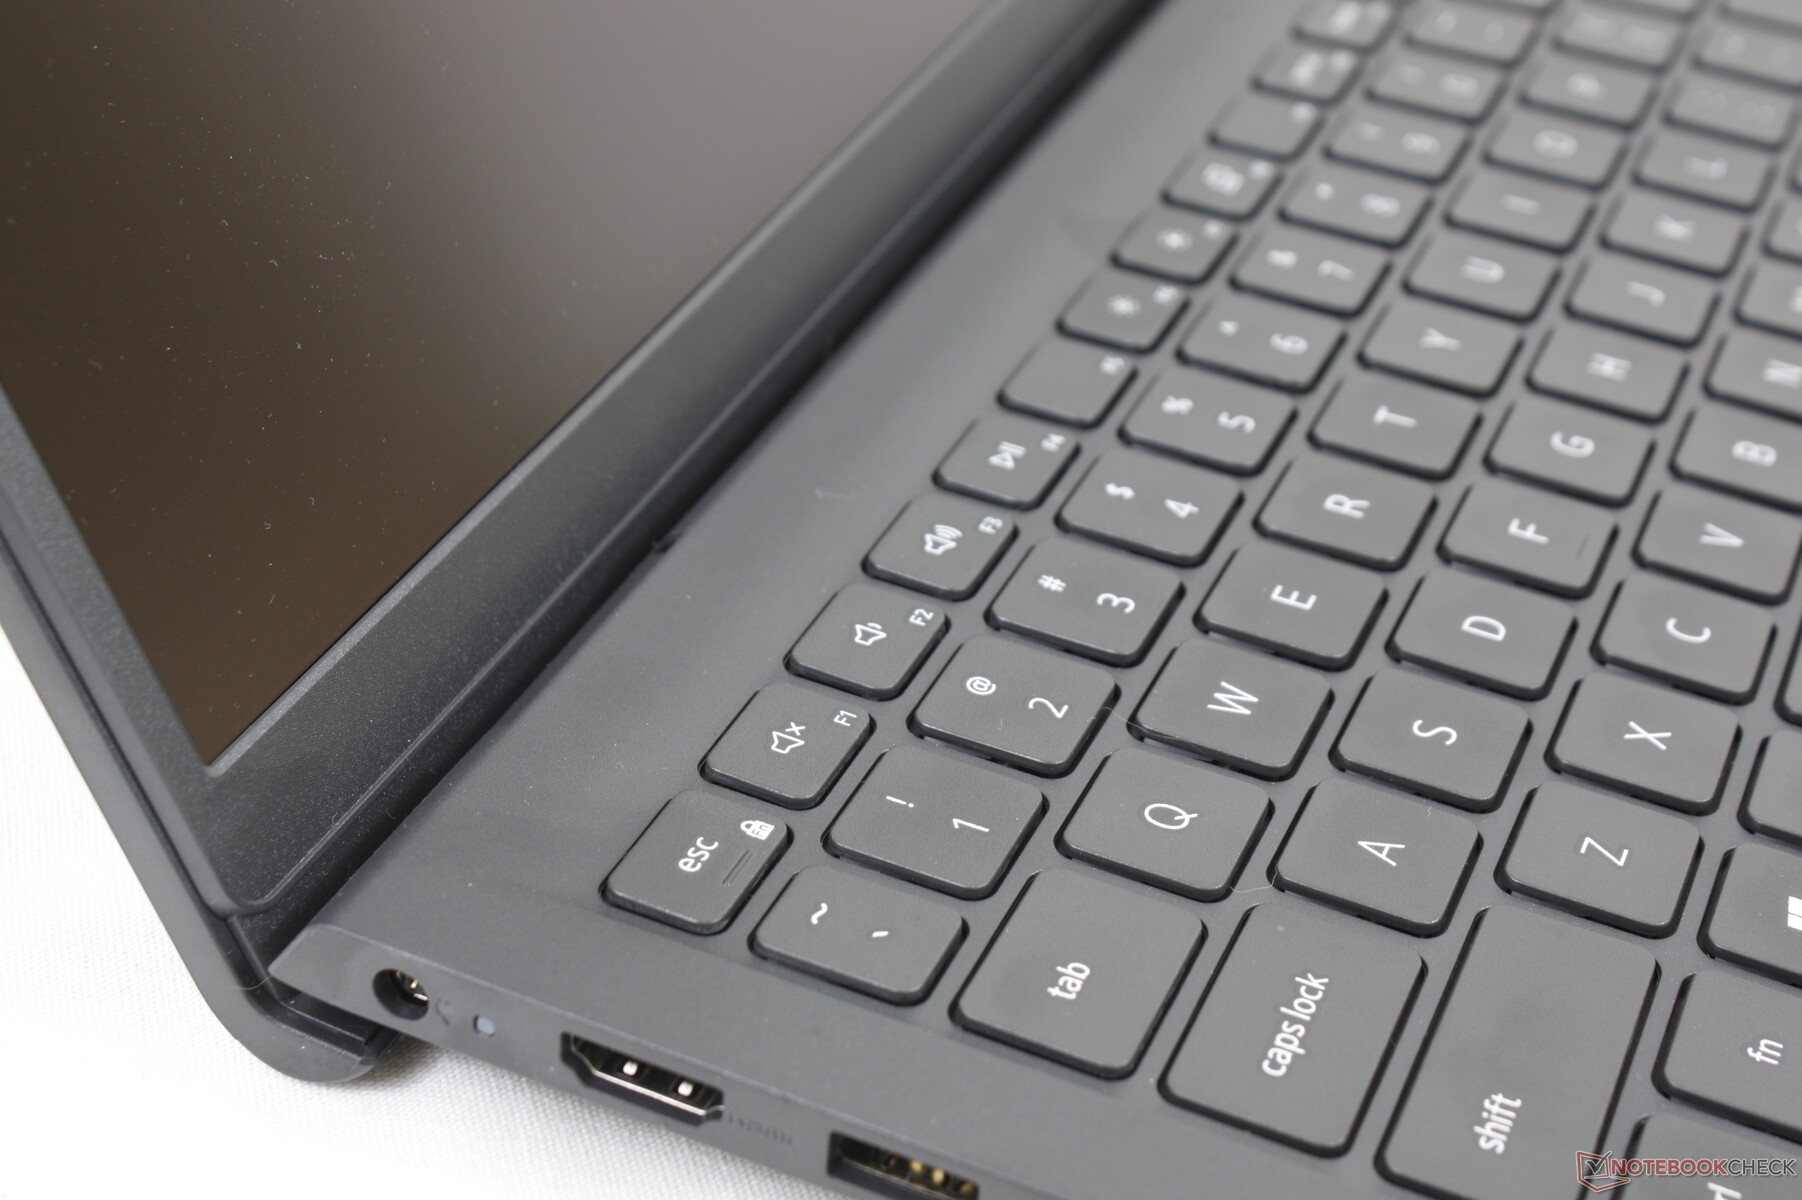
There are fewer ports on the newer Inspiron 15 3511 when compared to the older Inspiron 15 3501. The Cable lock slot and RJ-45 port, for example, are now completely gone. Dell didn't even bother to include a USB-C option.
Interestingly, the HDMI port here can only support up to 1080p60 and with no 2K or 4K options according to Dell's own product page.
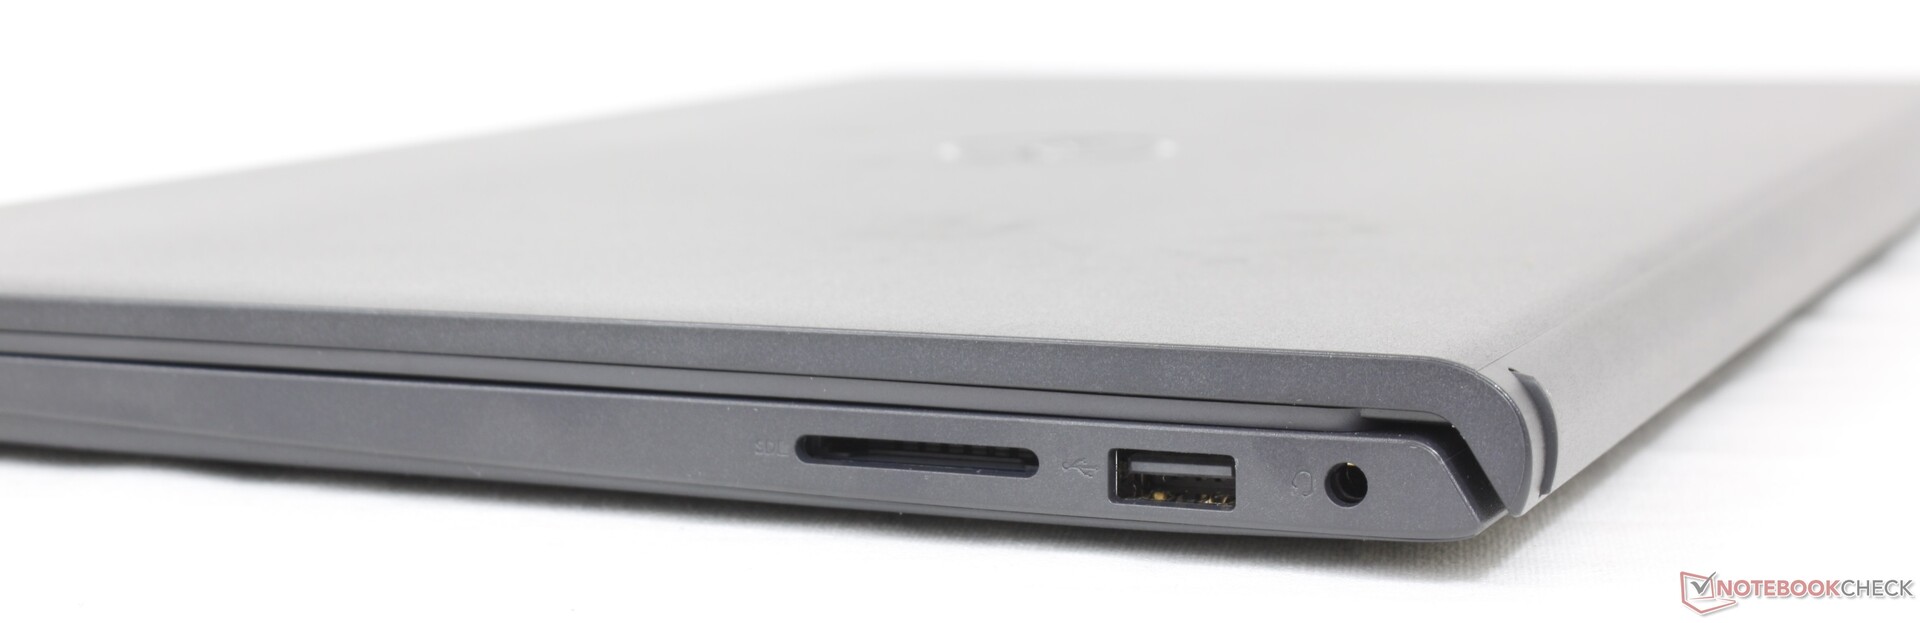
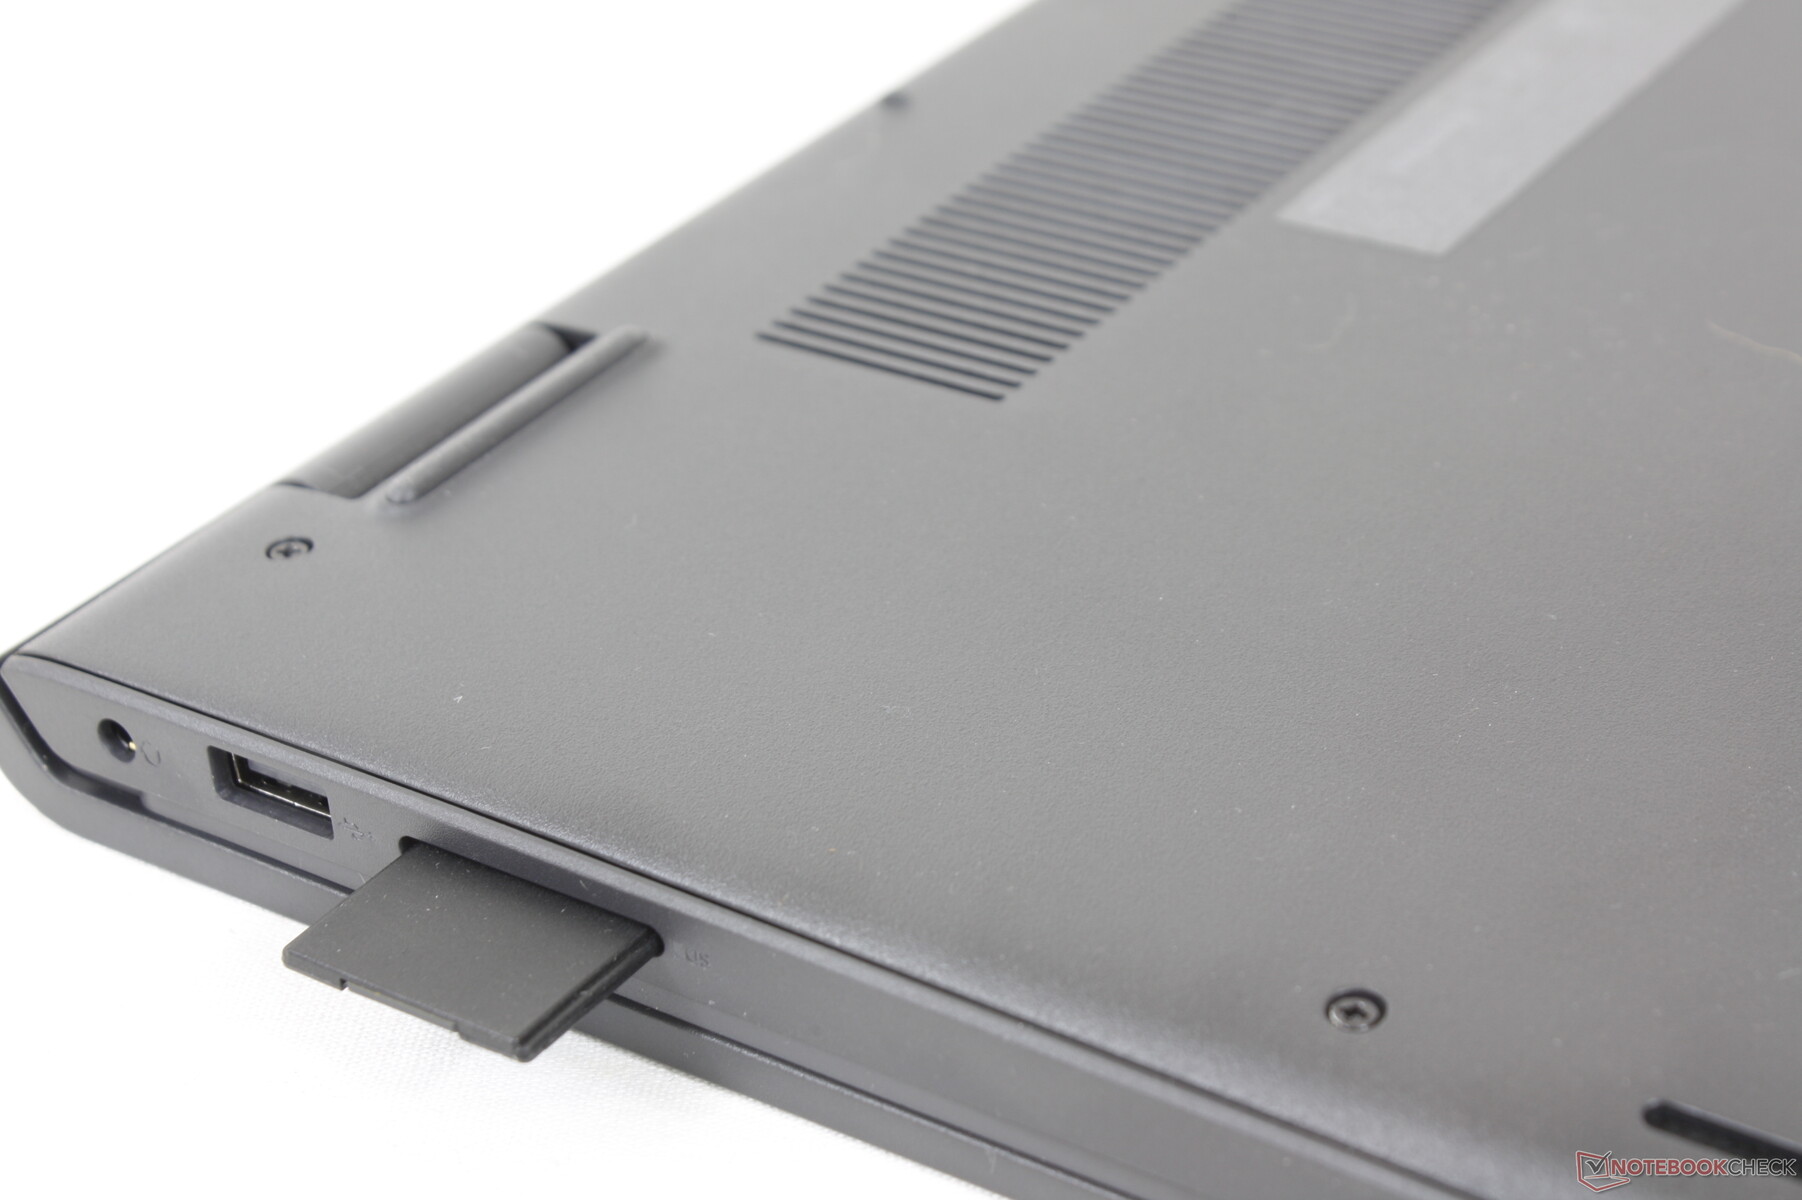
SD Card Reader
The integrated SD card reader is slow. Transferring 1 GB of pictures from our UHS-II test card to desktop takes over 50 seconds compared to just 14 seconds on the HP Pavilion 15-eg.
| SD Card Reader | |
| average JPG Copy Test (av. of 3 runs) | |
| Dell XPS 15 9510 i5 11400H FHD (AV Pro V60) | |
| HP Pavilion 15-eg (AV PRO microSD 128 GB V60) | |
| Asus VivoBook S15 D533UA (AV PRO microSD 128 GB V60) | |
| Lenovo IdeaPad 3 15ALC6 (AV PRO microSD 128 GB V60) | |
| Dell Inspiron 15 3501 (AV Pro SD 128 GB V60) | |
| Dell Inspiron 15 3000 3511 (AV Pro V60) | |
| maximum AS SSD Seq Read Test (1GB) | |
| Dell XPS 15 9510 i5 11400H FHD (AV Pro V60) | |
| HP Pavilion 15-eg (AV PRO microSD 128 GB V60) | |
| Lenovo IdeaPad 3 15ALC6 (AV PRO microSD 128 GB V60) | |
| Asus VivoBook S15 D533UA (AV PRO microSD 128 GB V60) | |
| Dell Inspiron 15 3501 (AV Pro SD microSD 128 GB V60) | |
| Dell Inspiron 15 3000 3511 (AV Pro V60) | |
Communication
A 1x1 Wi-Fi 5 module is included instead of the usual 2x2 Wi-Fi 6 module likely to save on costs. Though real-world transfer rates are mediocre, they are at least stable and reliable enough for streaming purposes.
Webcam
There appears to be no improvements to camera quality from last year's Inspiron 3501. There is no webcam shutter or Windows Hello support, either.


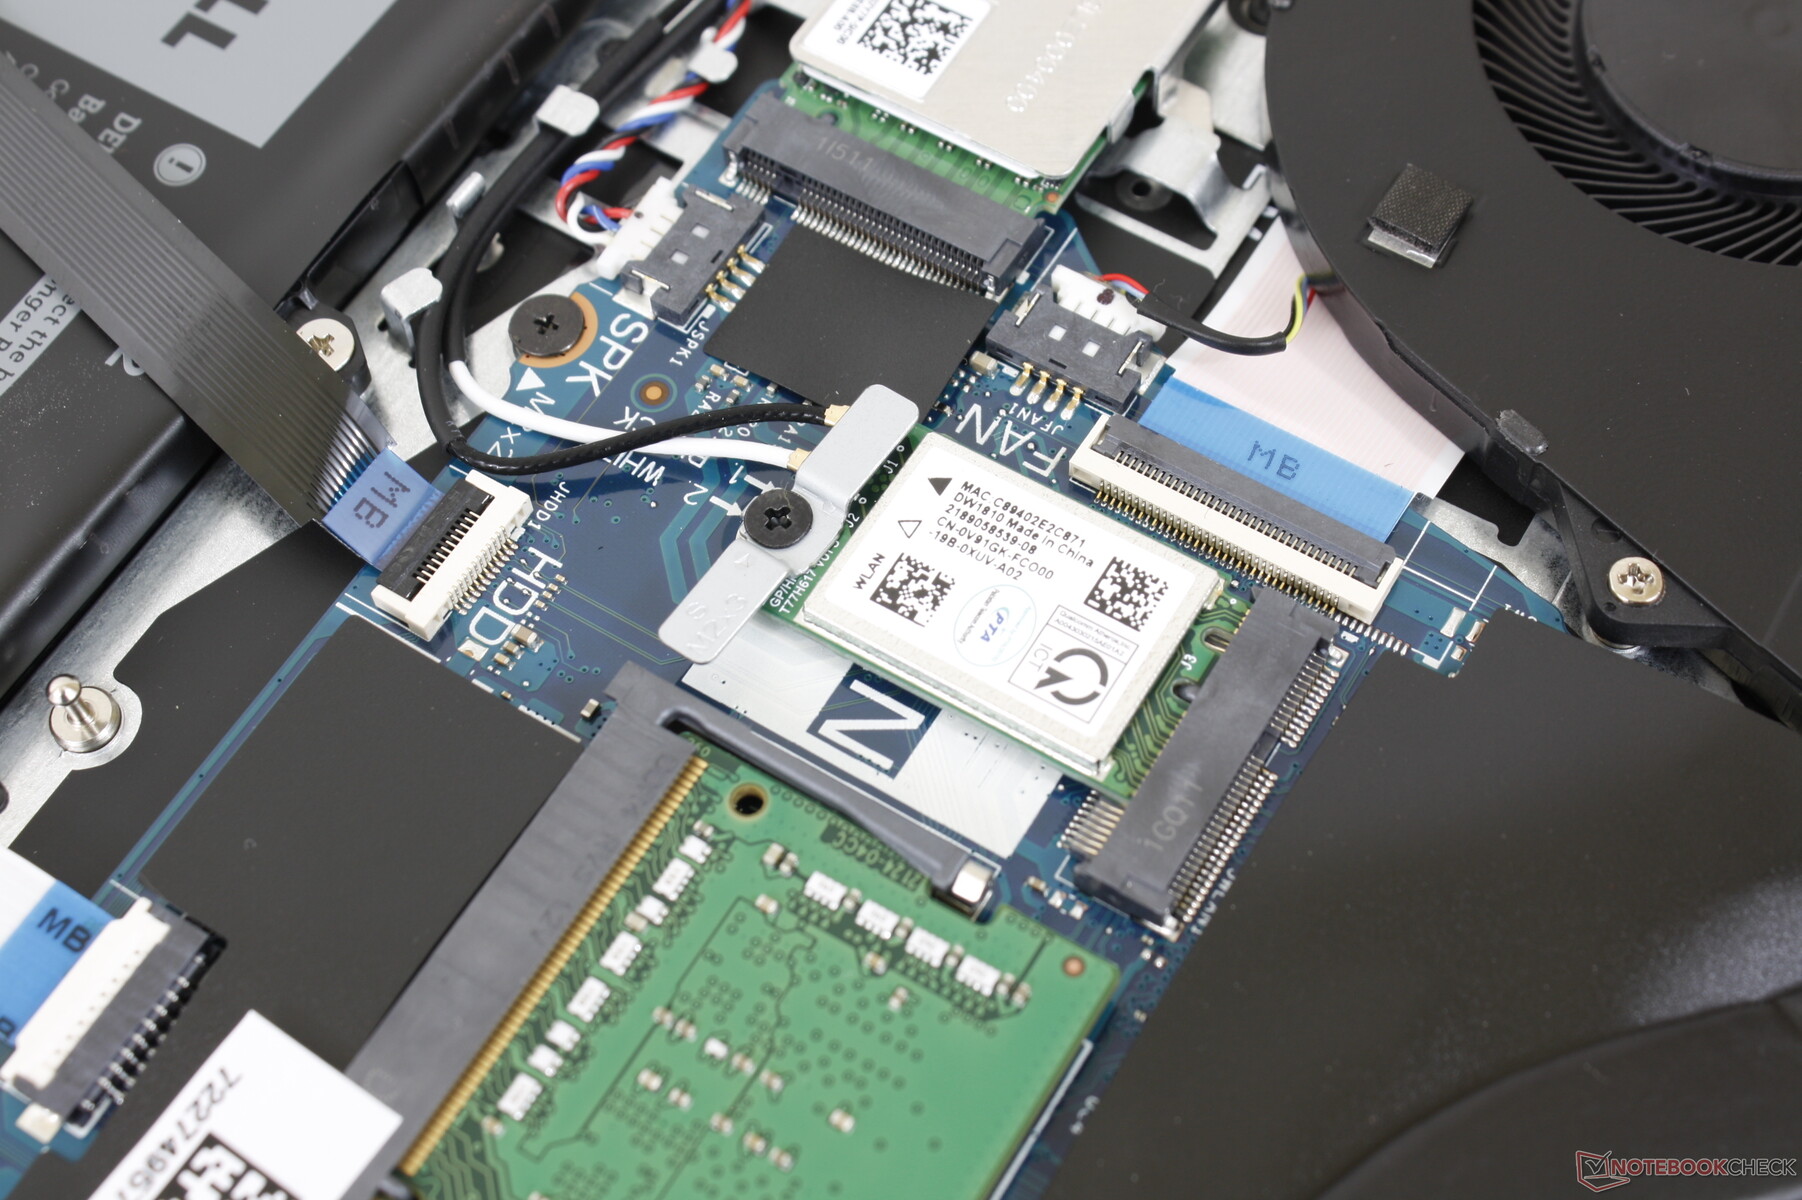
Maintenance
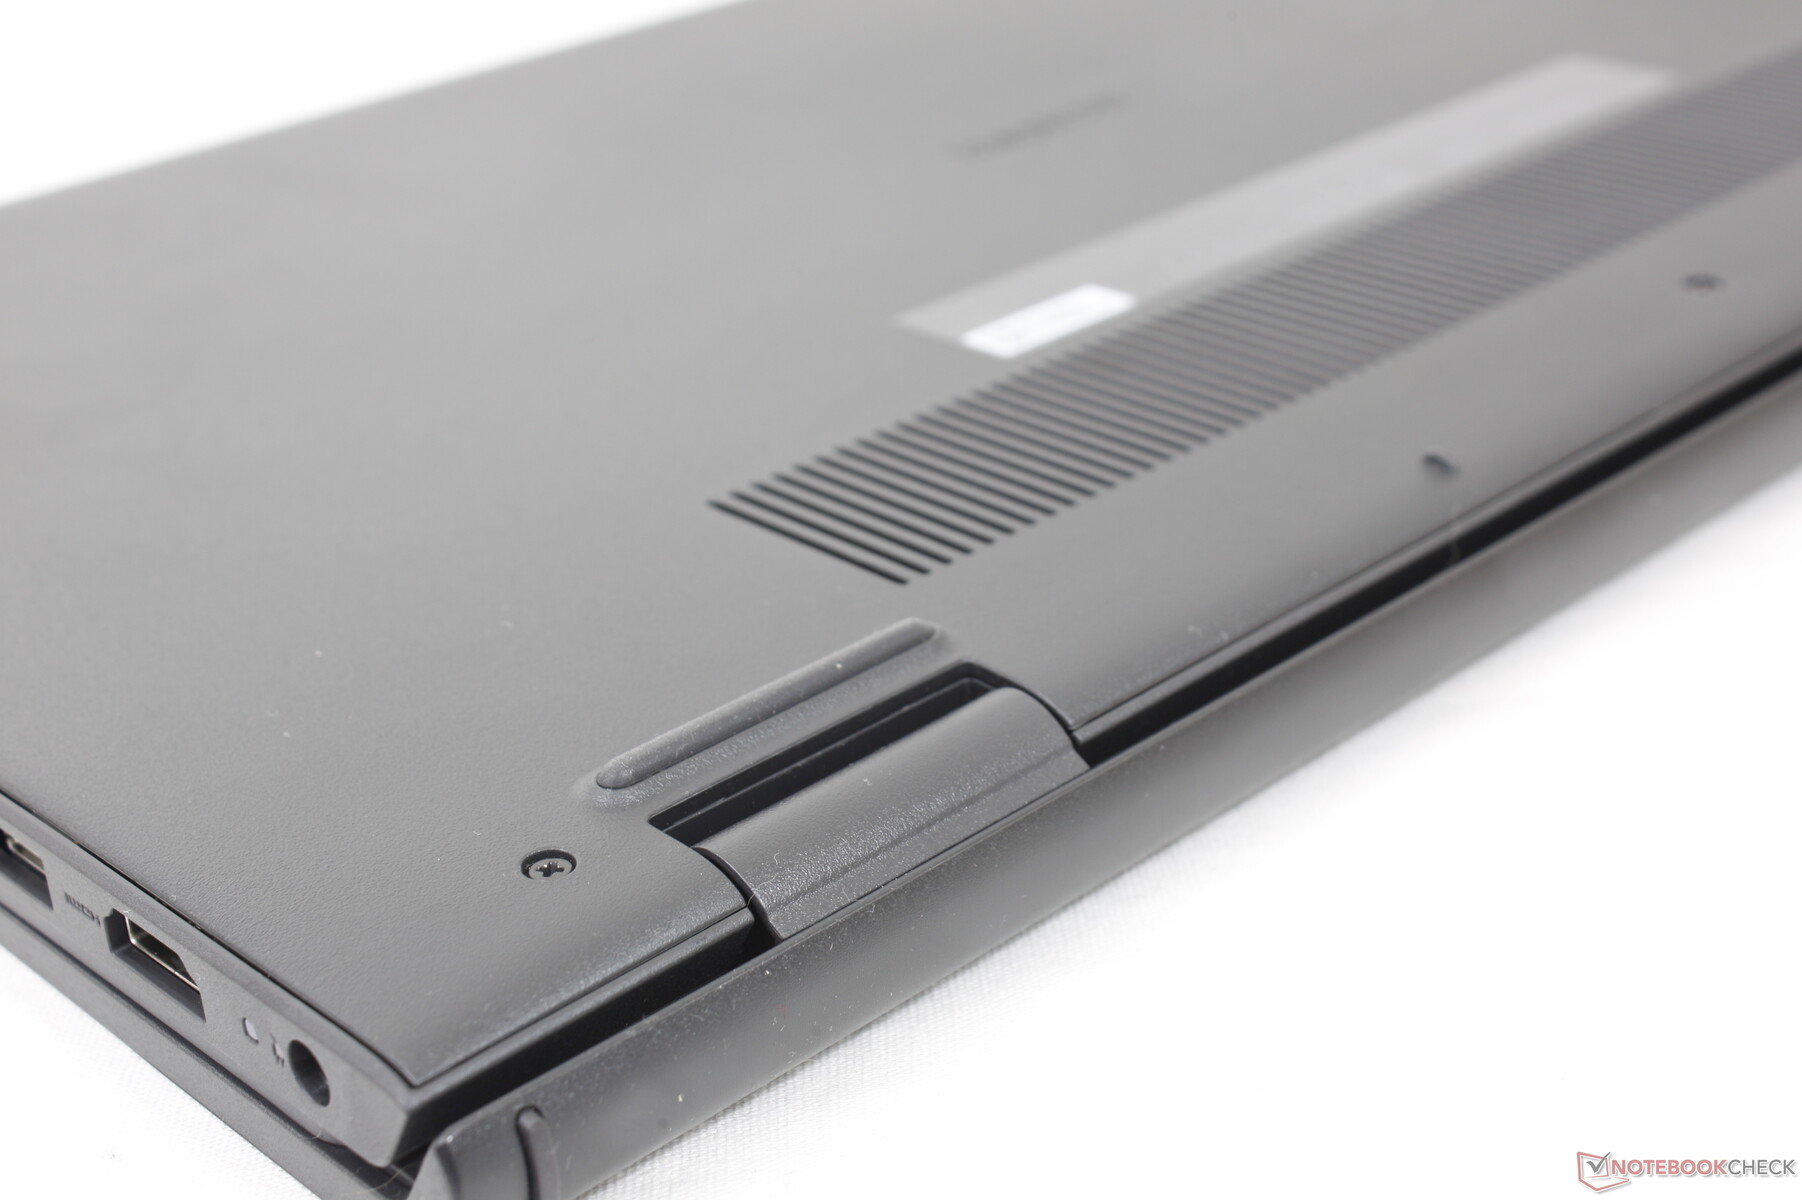
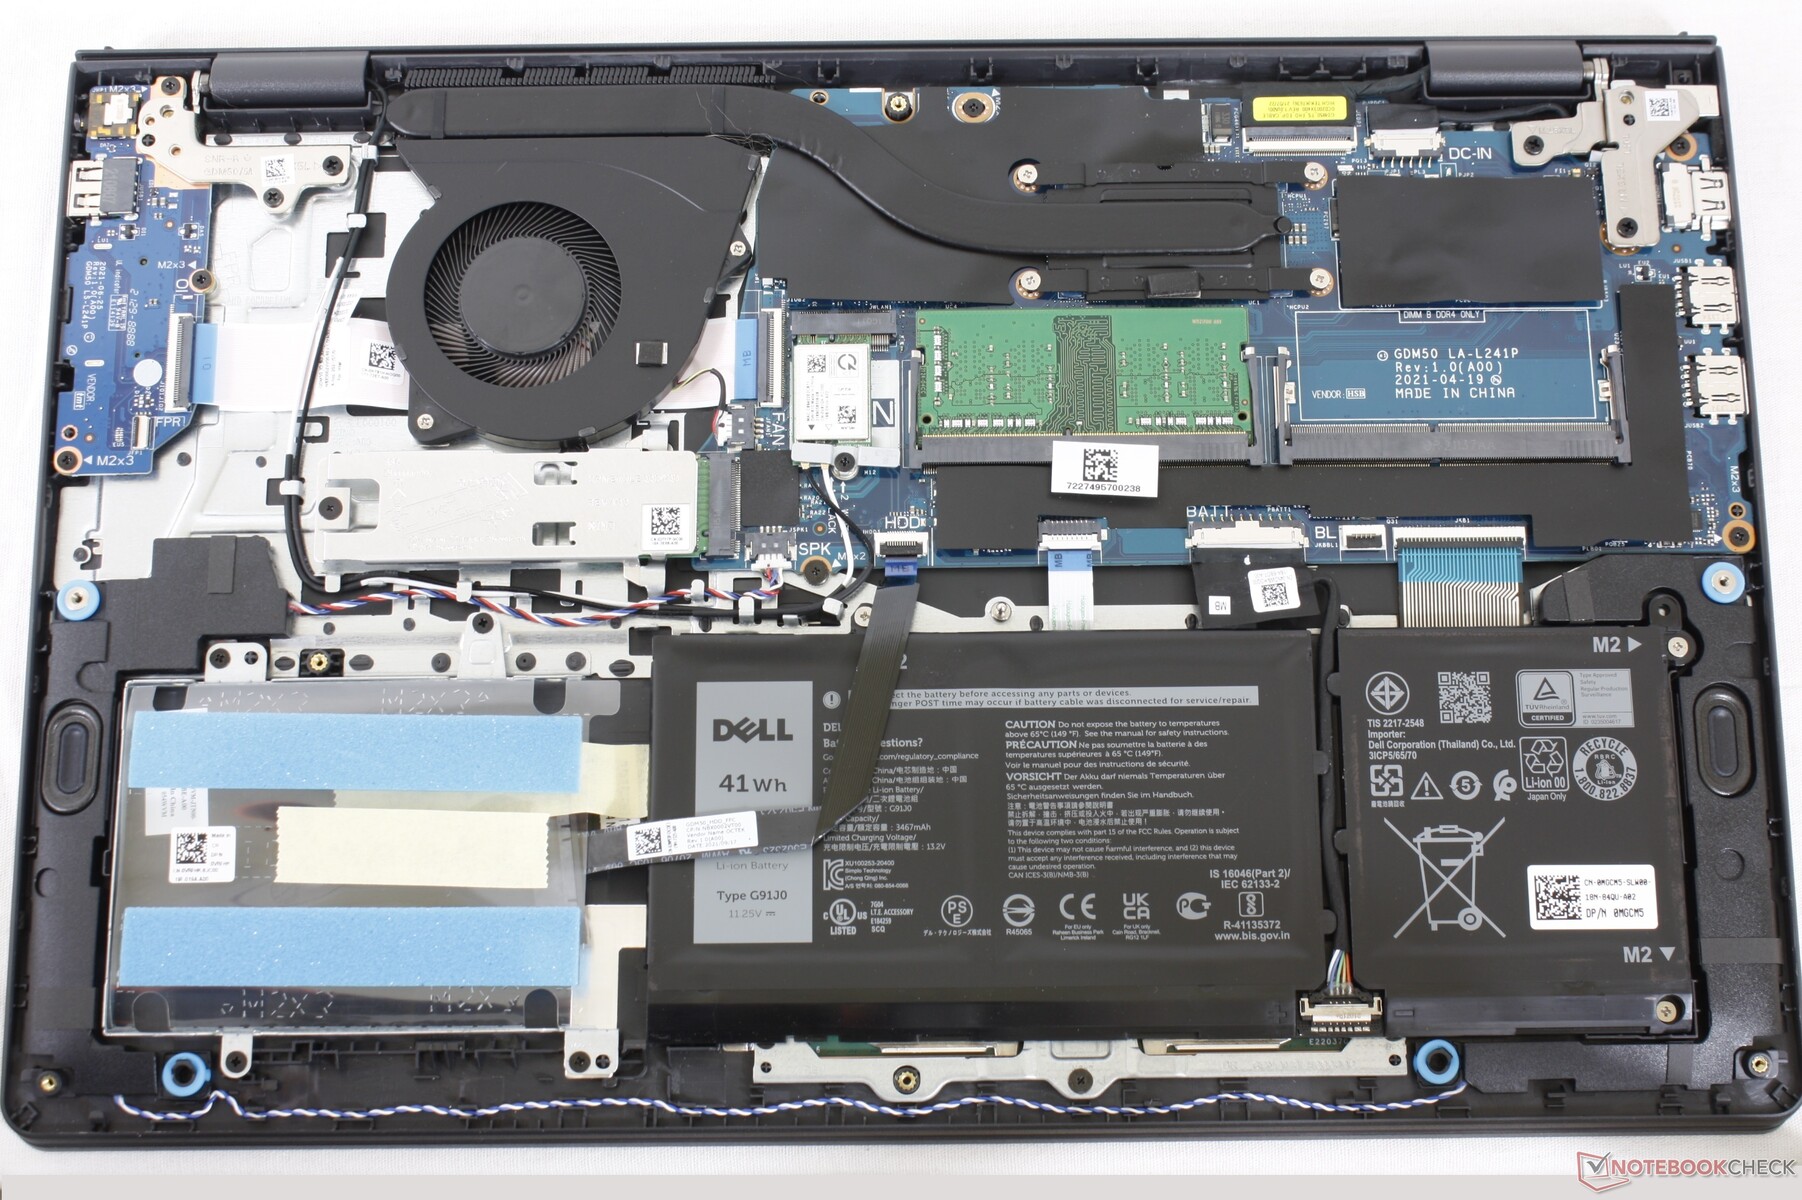
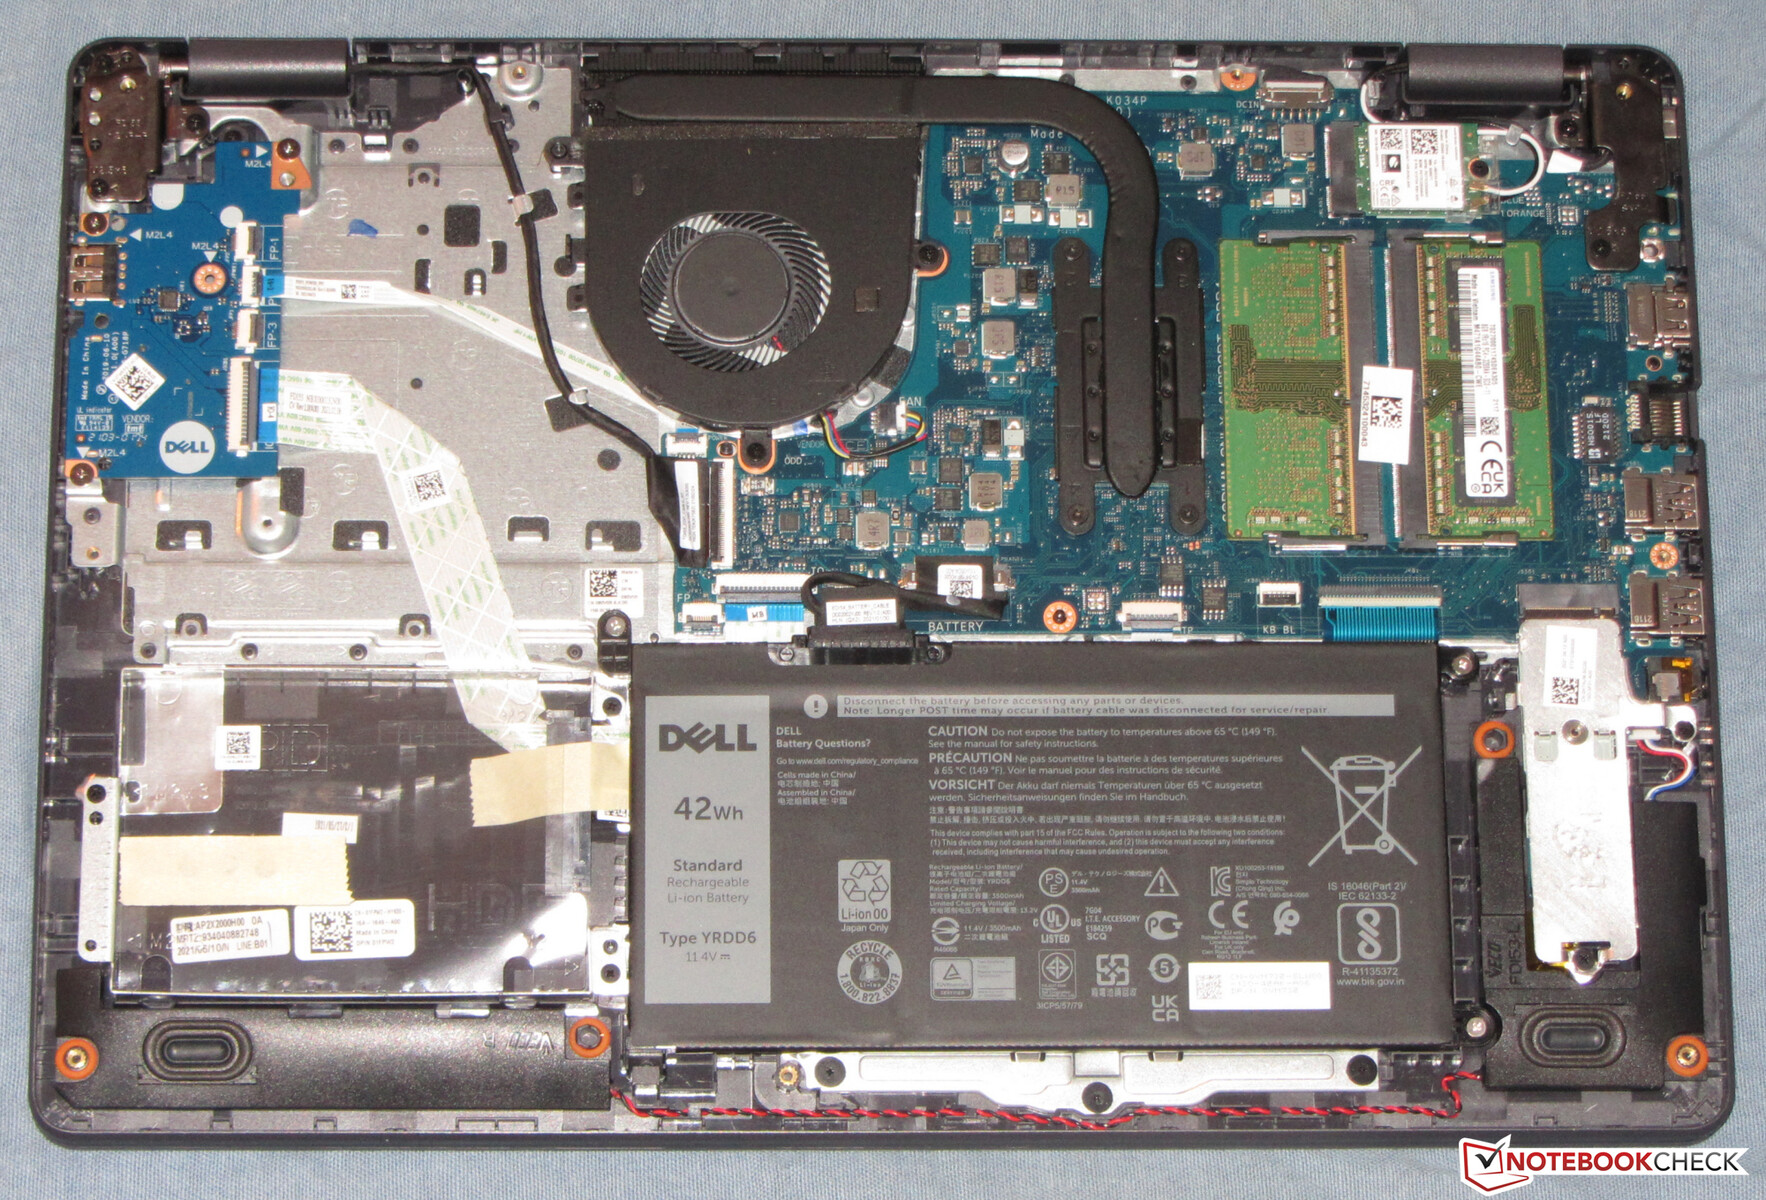
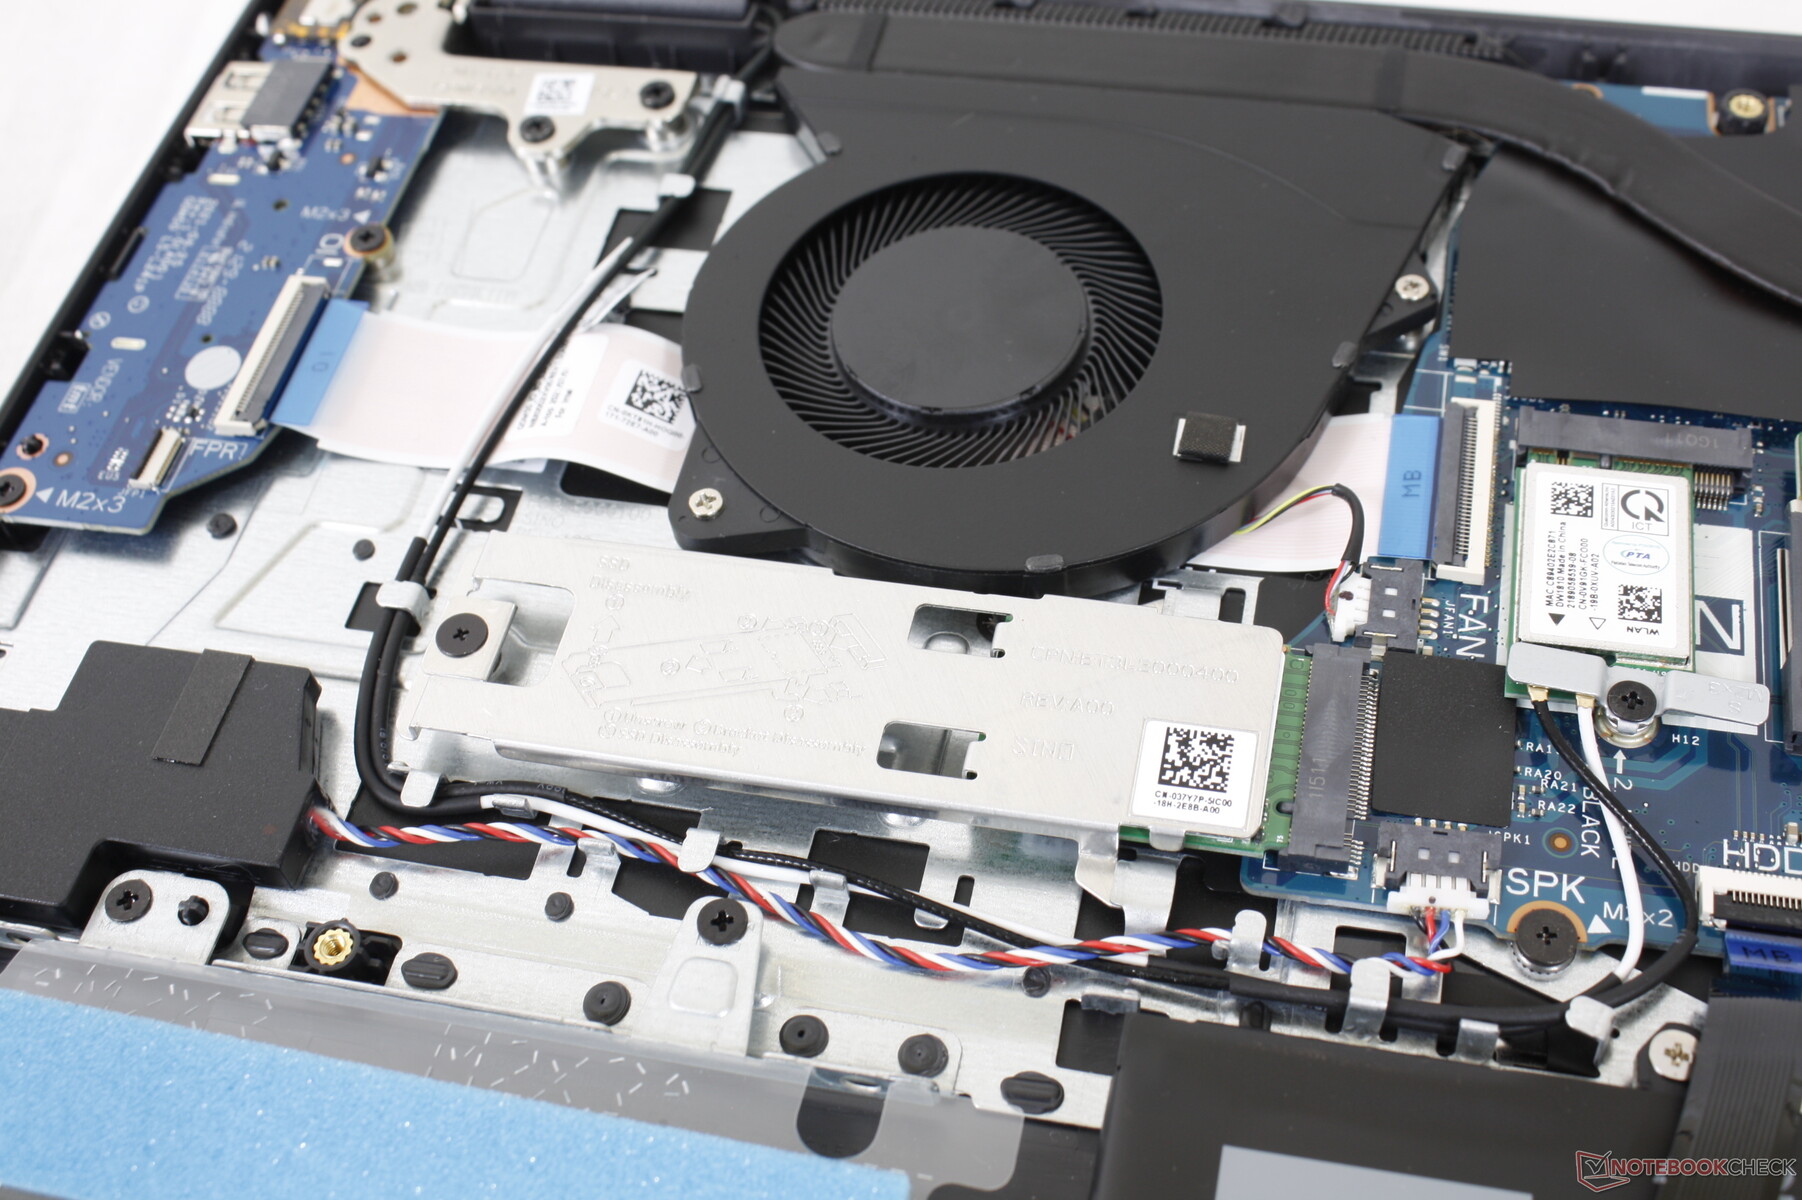
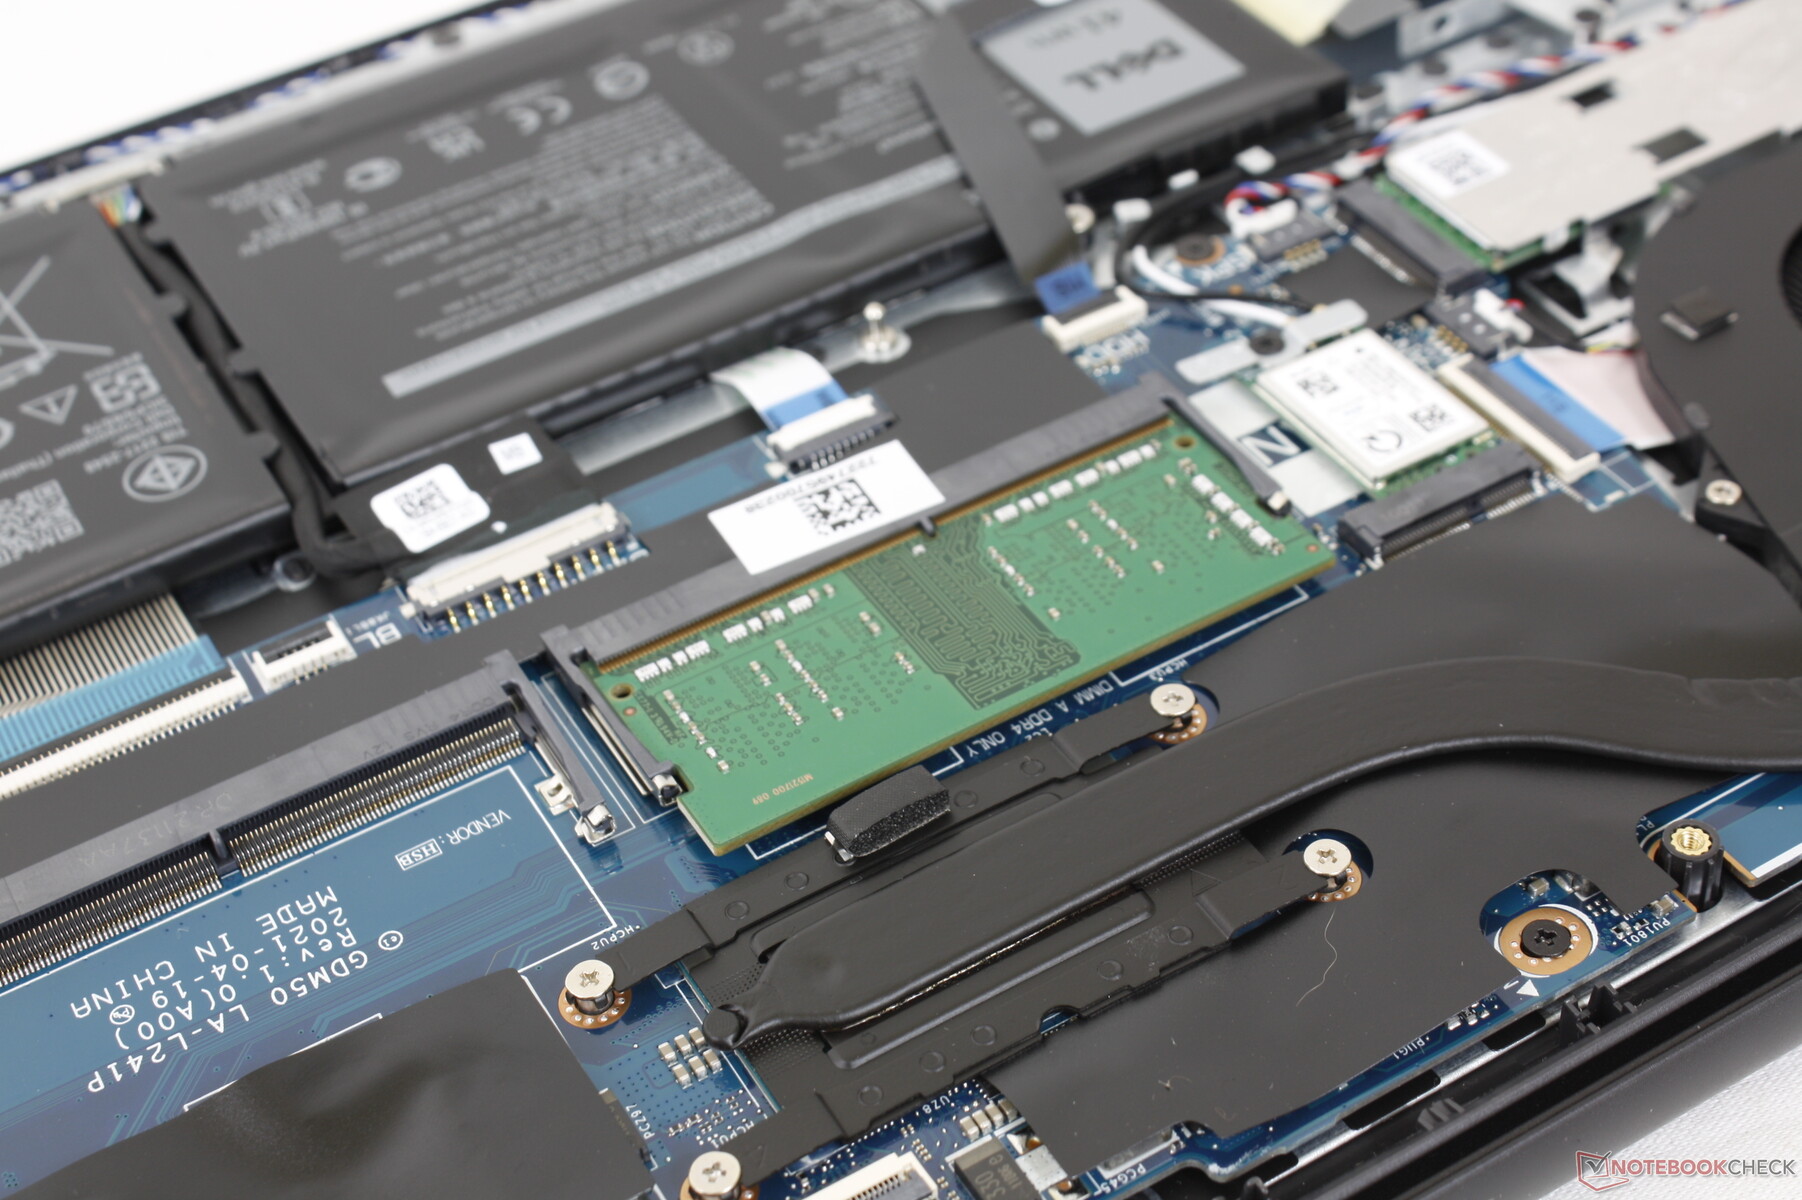
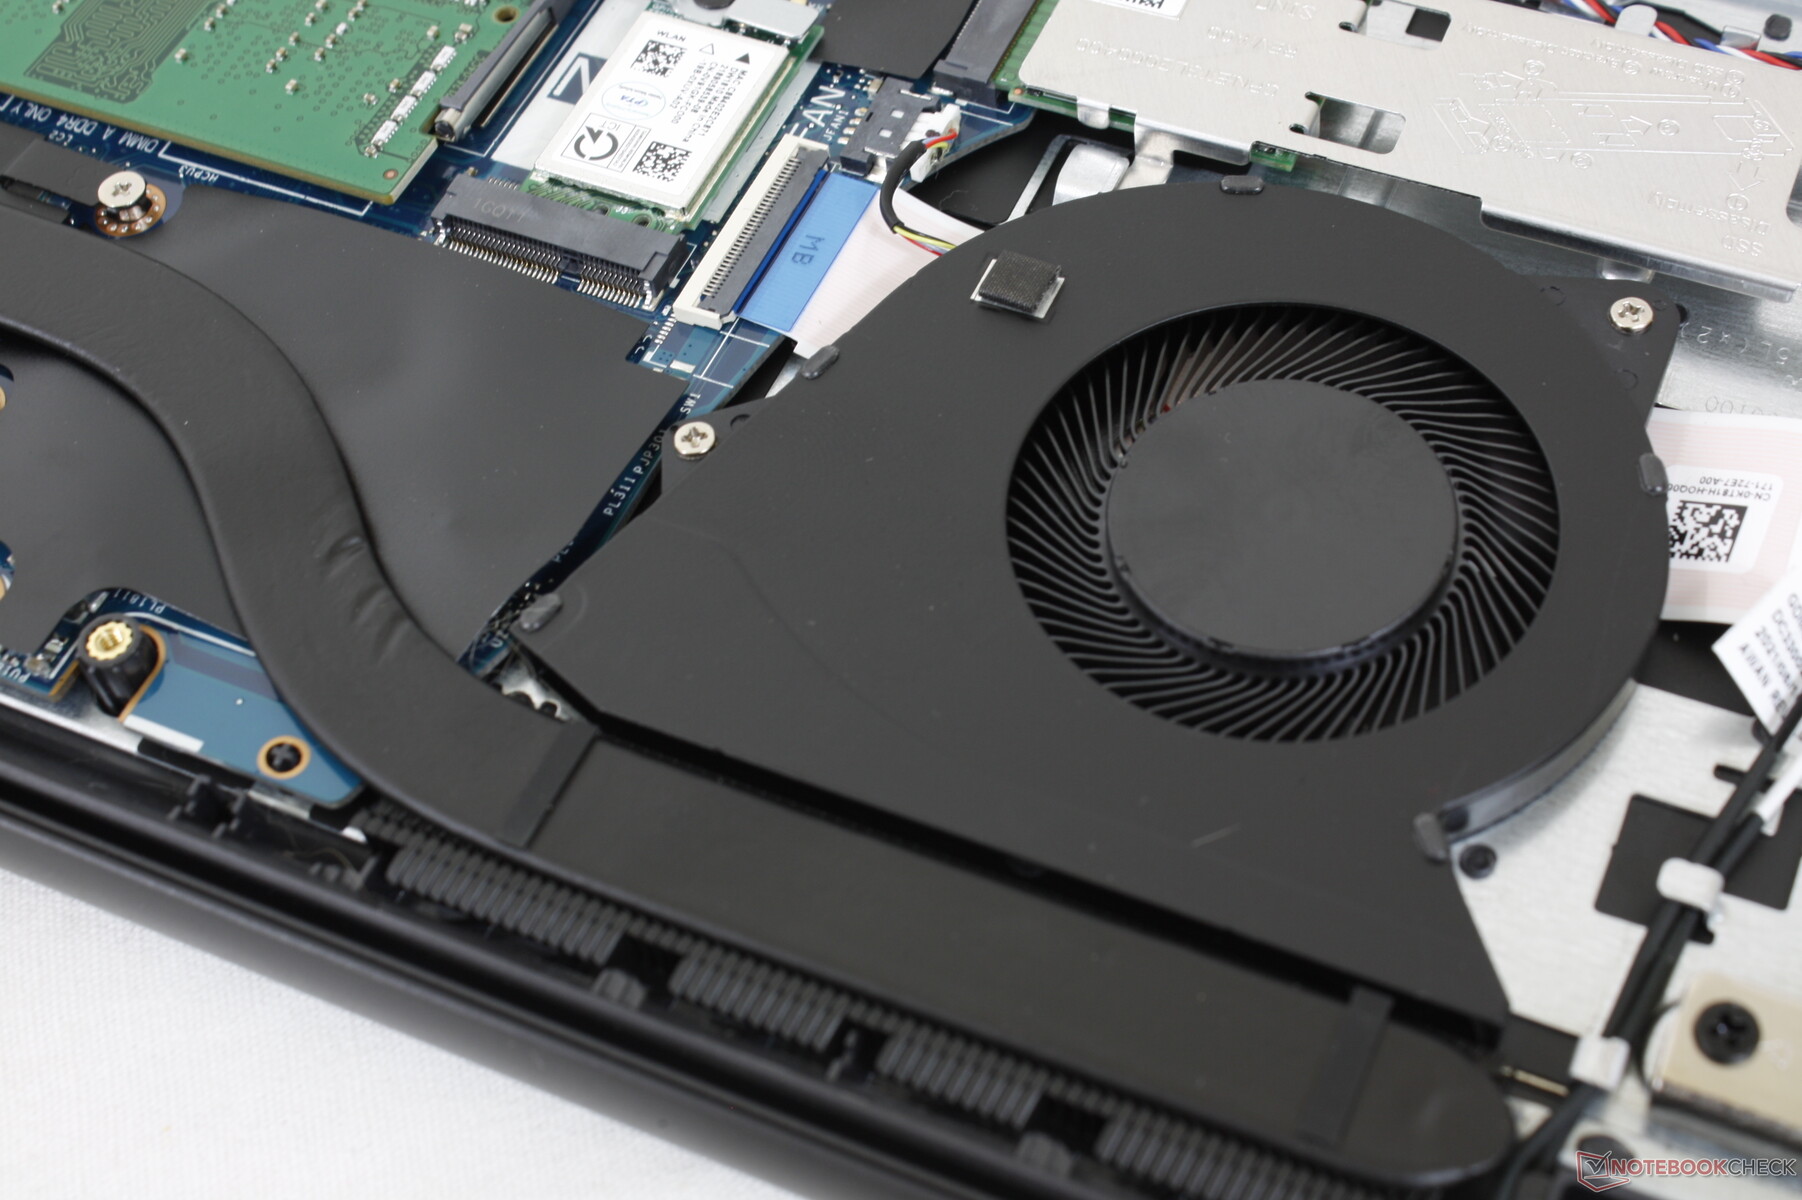
The bottom panel pops off more easily than expected especially for such a cheap model. Users have direct access to two storage bays, two SODIMM slots, WLAN module, and most of the main components.
Accessories and Warranty
There are no extras in the box other than the AC adapter and paperwork. The standard one-year limited manufacturer warranty applies.
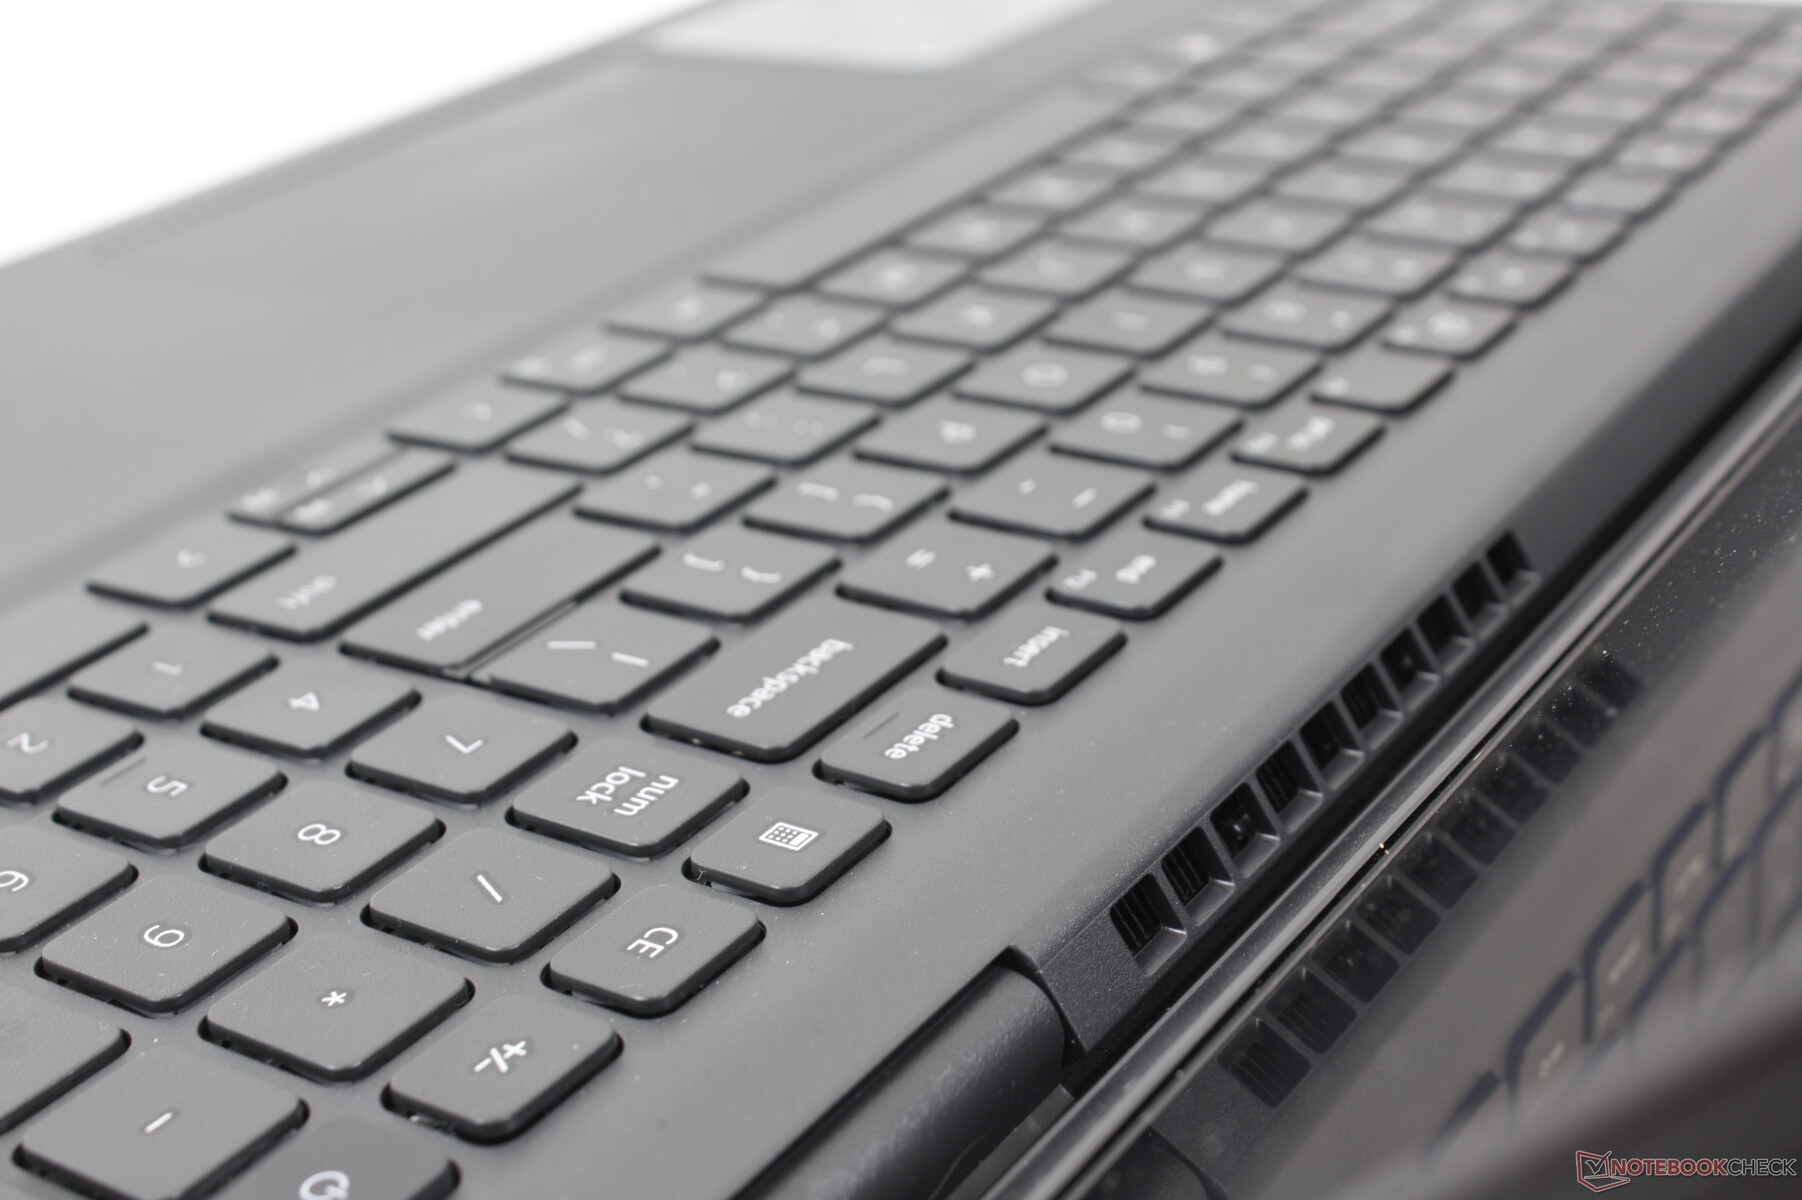
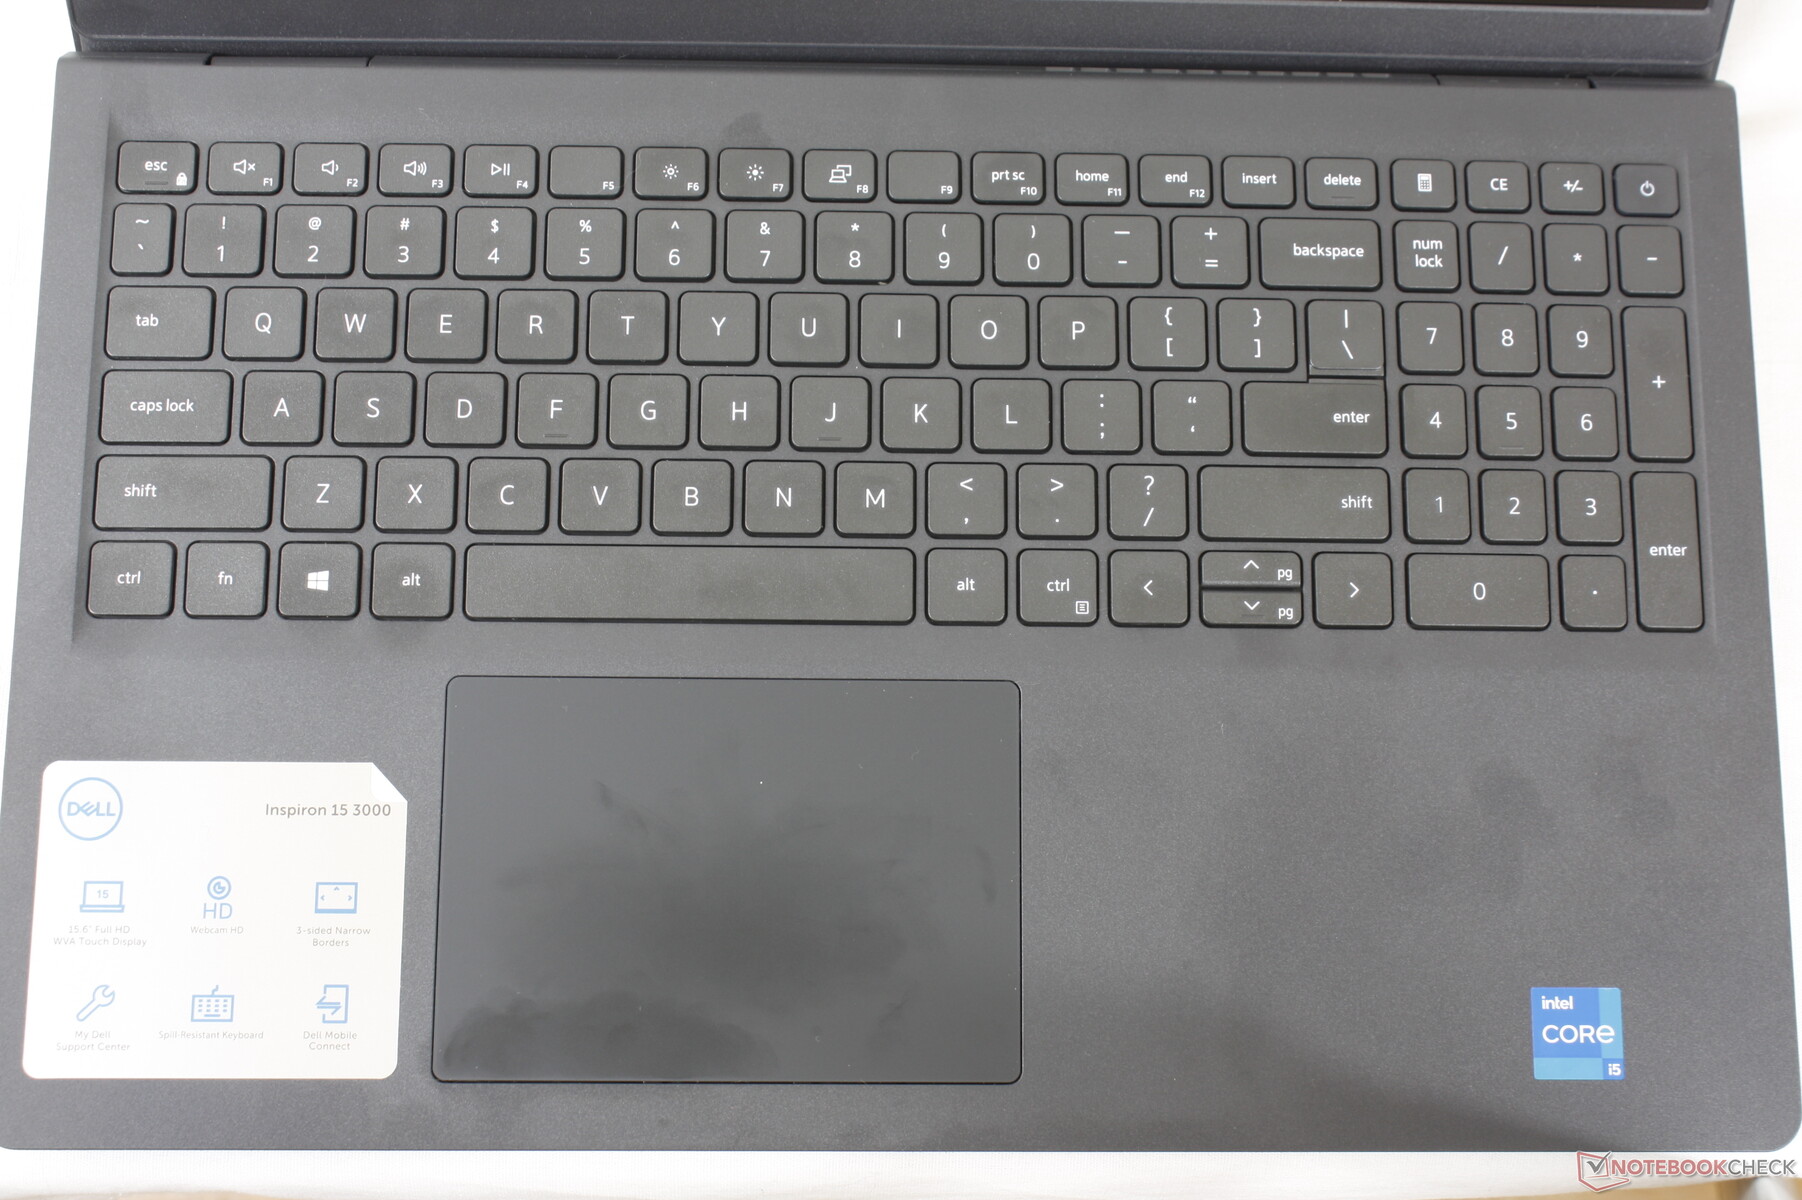
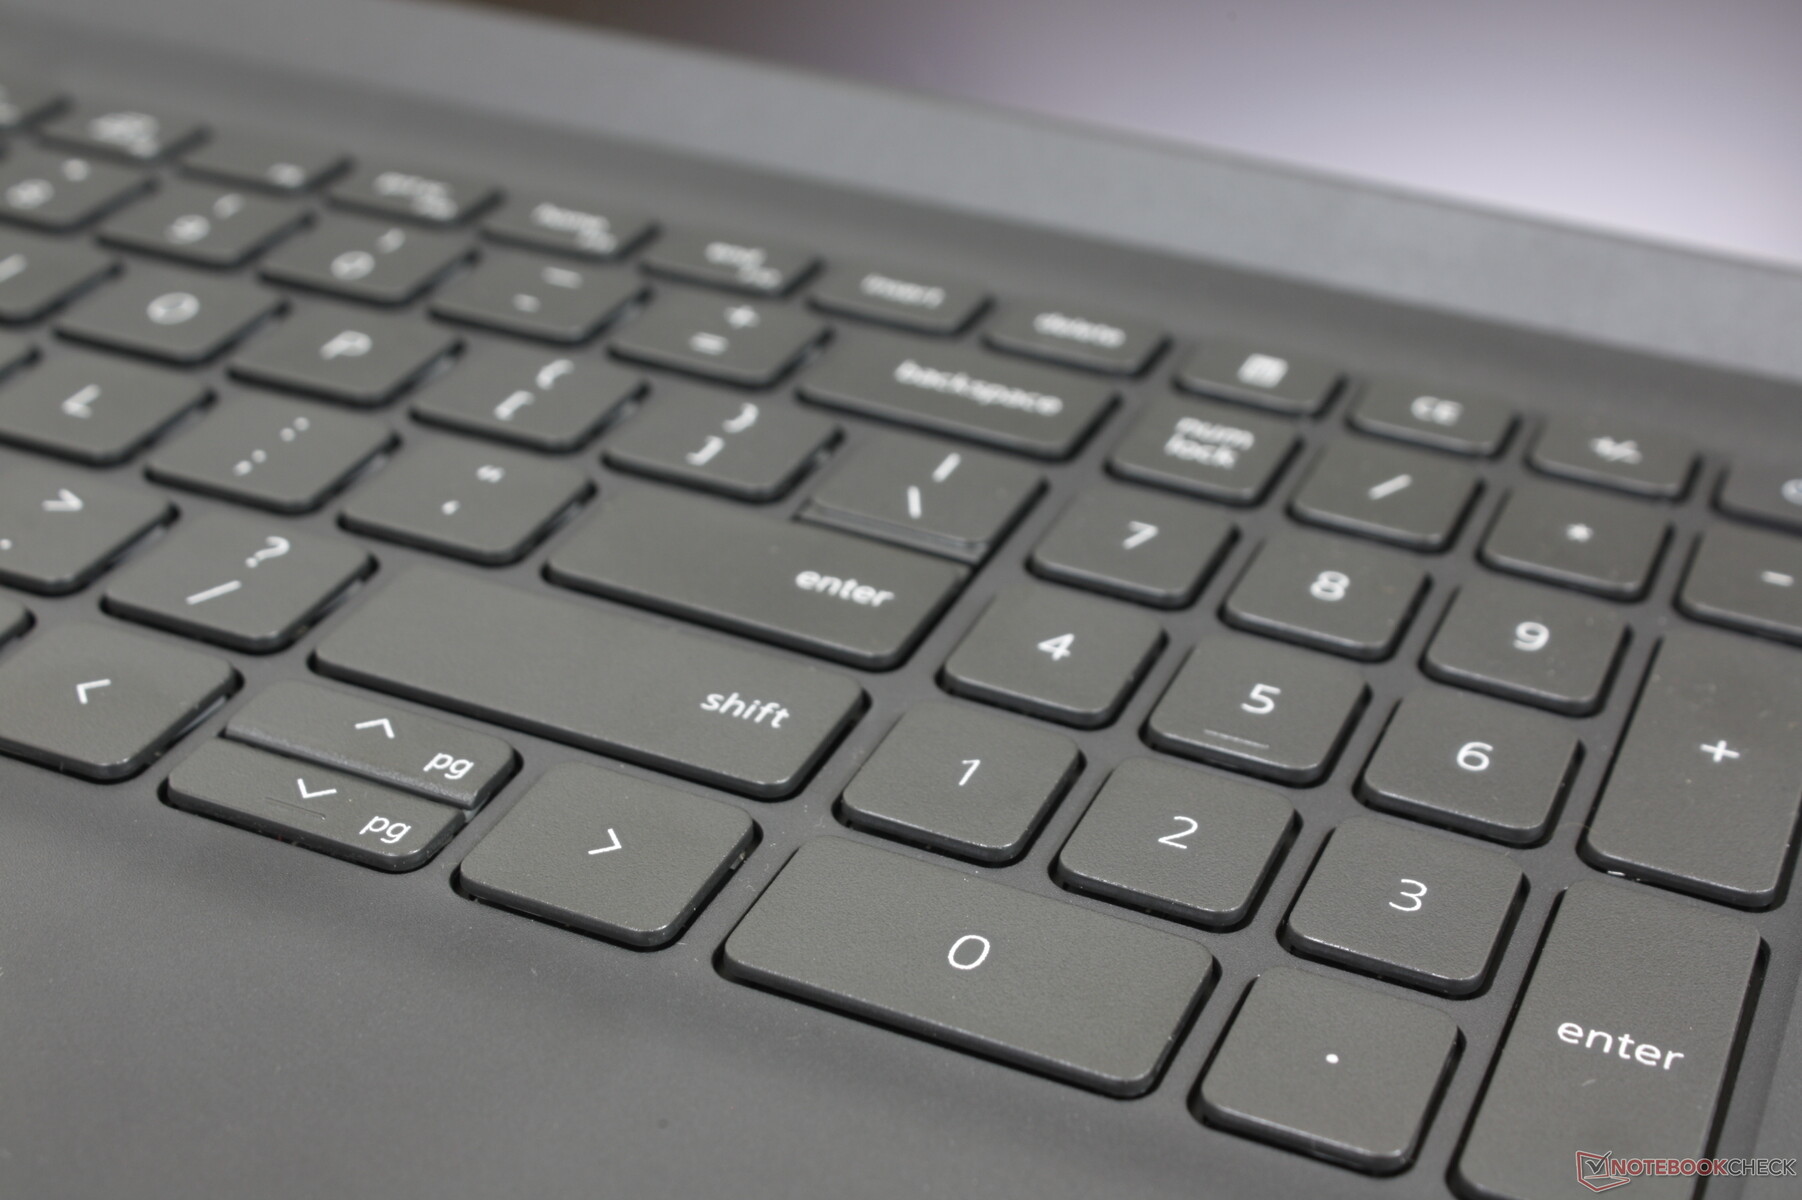
Input Devices
Keyboard
Key feedback is a tad lighter and softer than expected for a spongy feel. The Space and Enter keys in particular feel weaker than they should be when compared to the same keys on an HP Pavilion, Lenovo IdeaPad, or Asus VivoBook.
A keyboard backlight is not available.
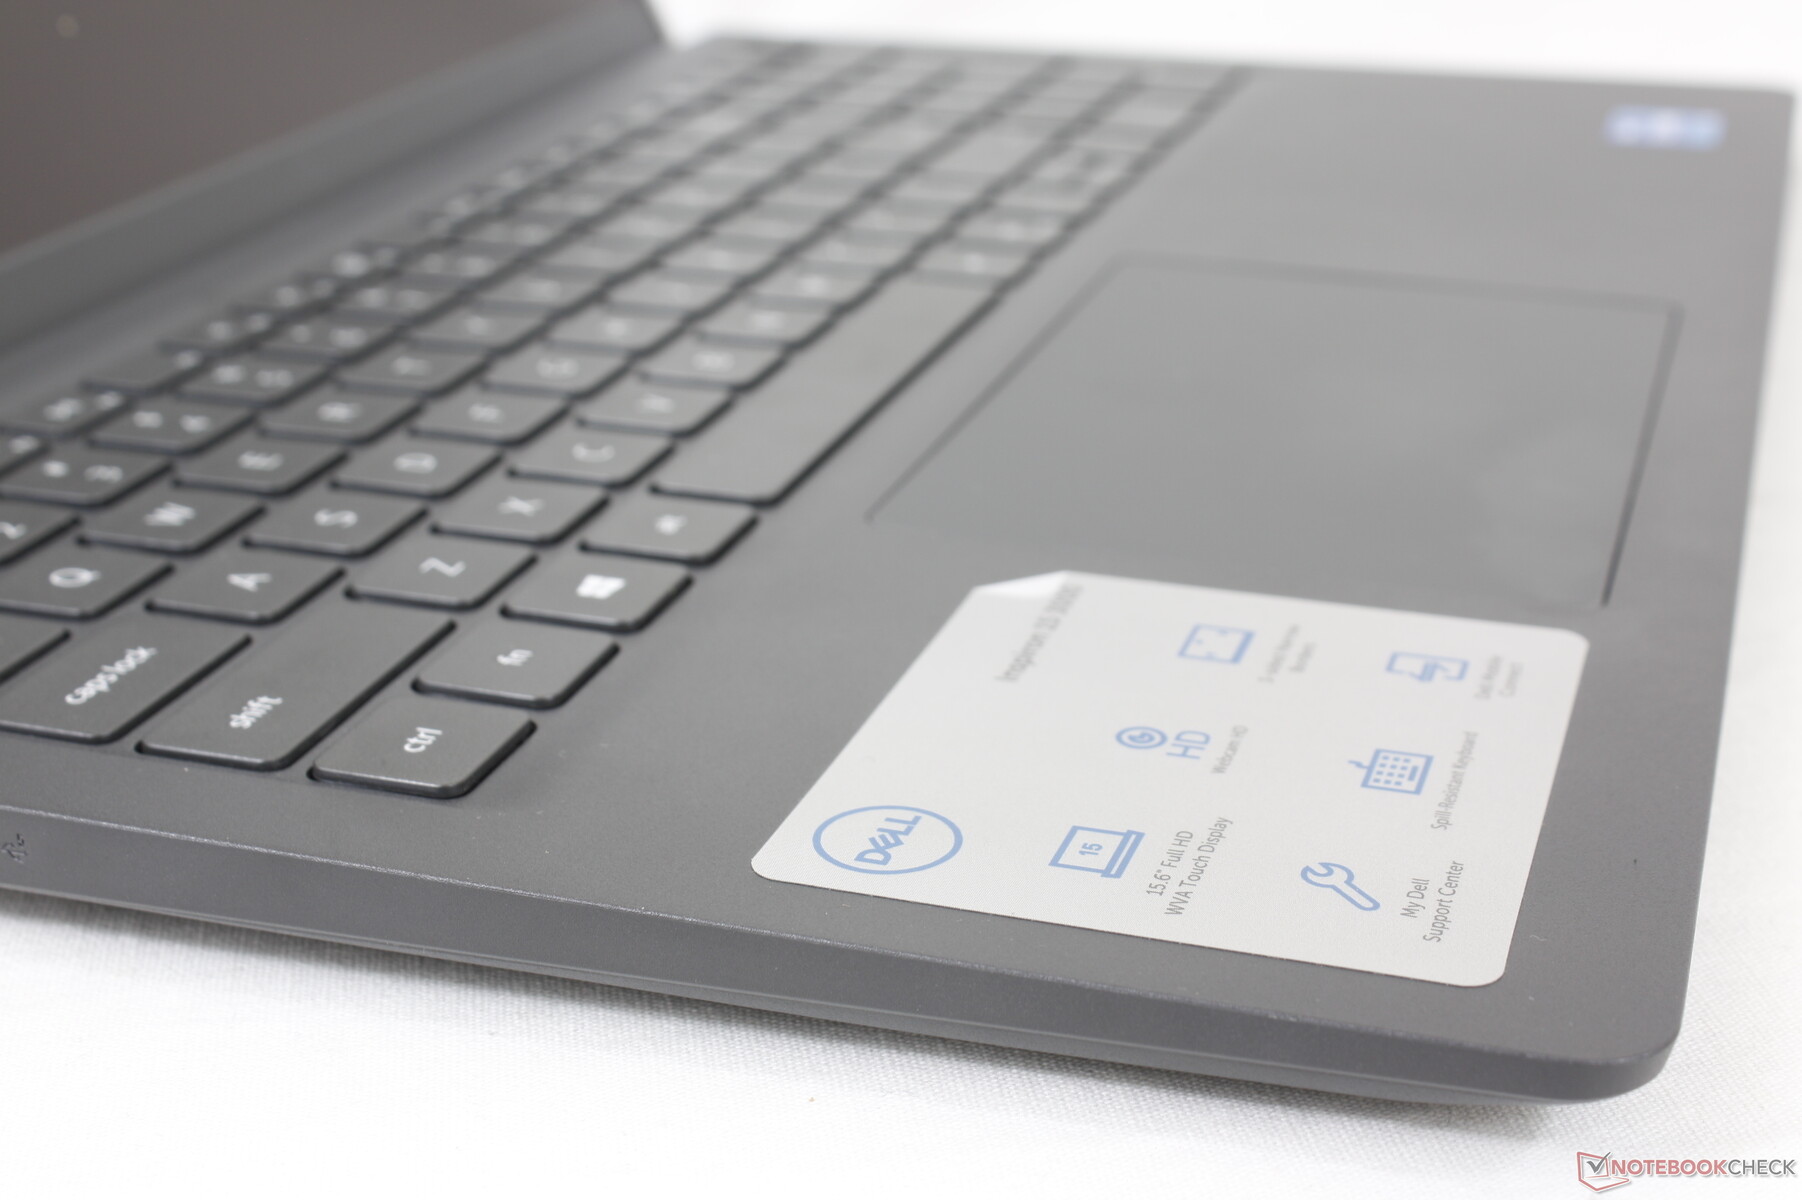
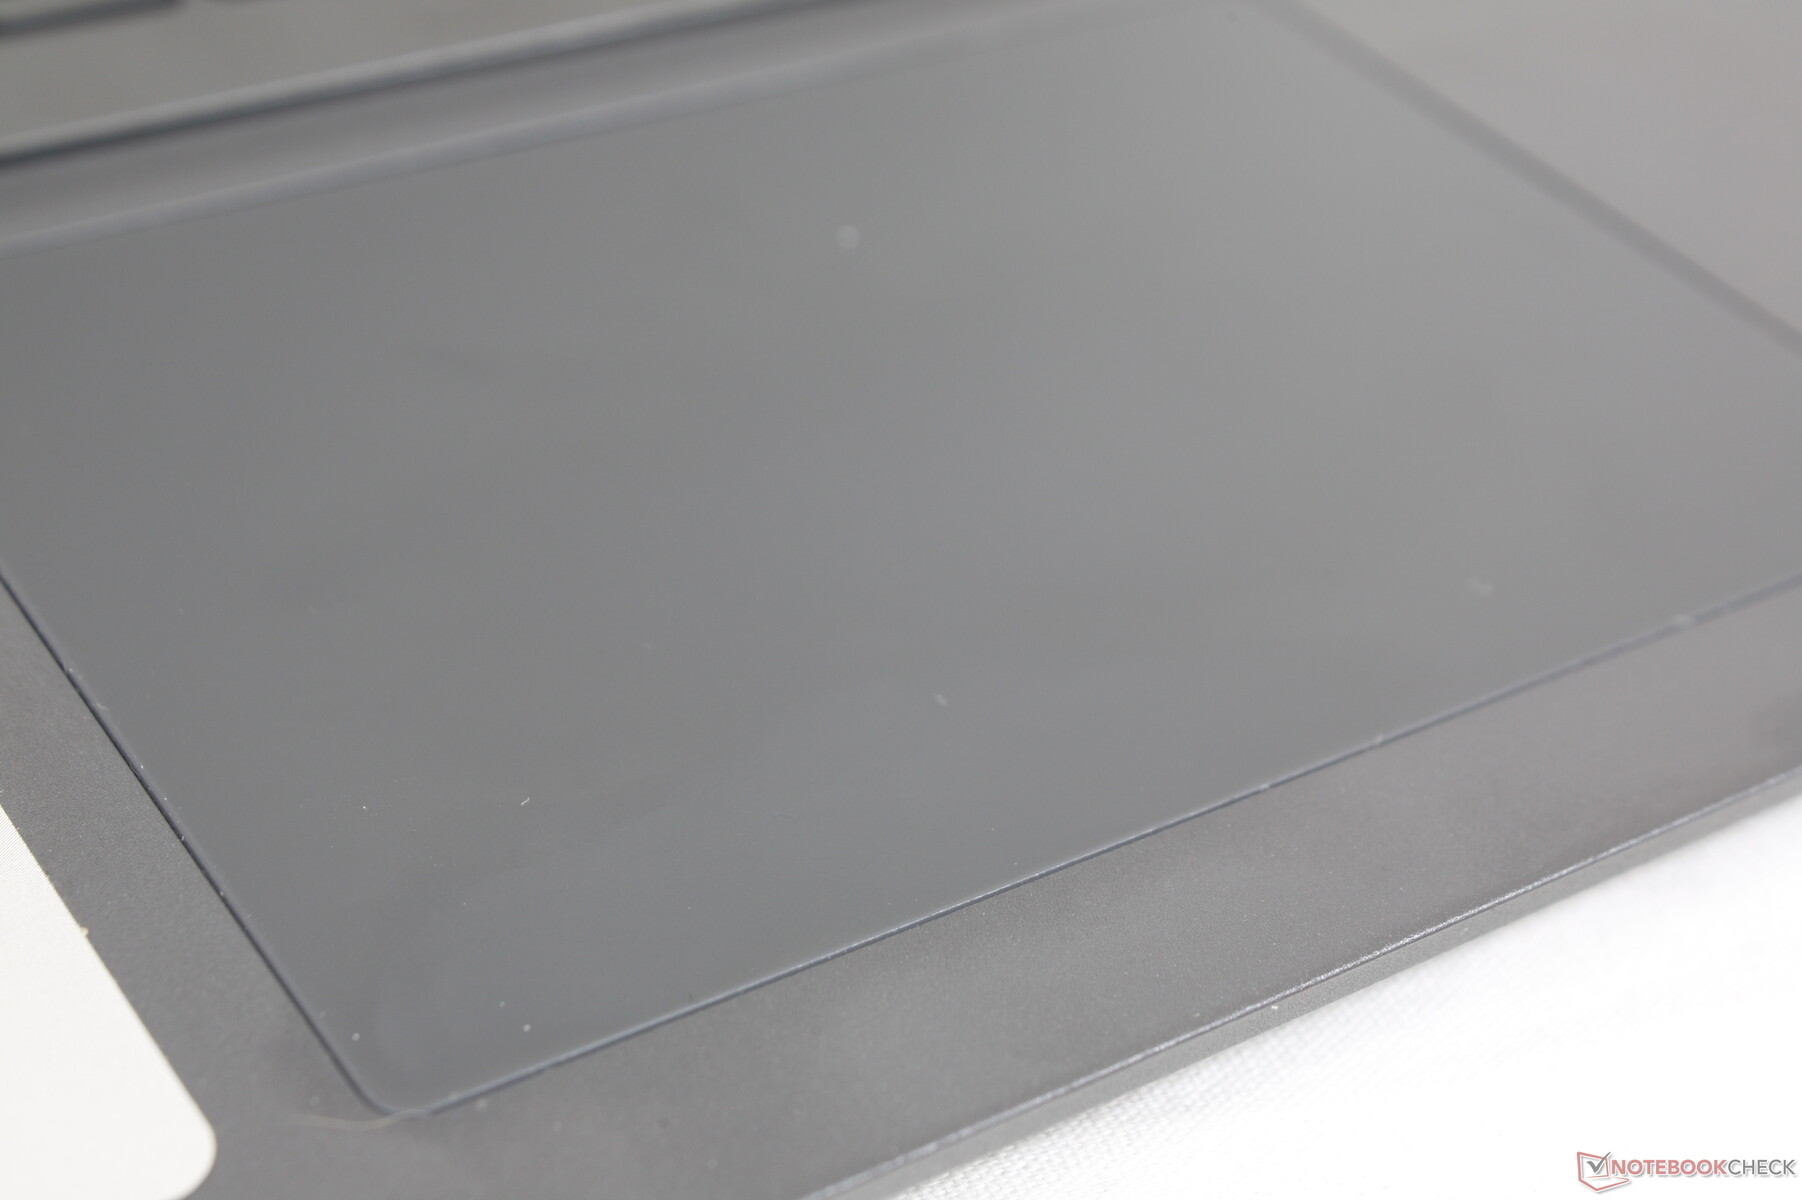
Touchpad
The clickpad is relatively large at 11.5 x 8 cm compared to 10.5 x 7.3 cm on the Asus Vivobook 15 K513EQ or 11.5 x 7.4 cm on the 2021 HP Pavilion 15. Its surface is stickier than on many other clickpads as well particularly when gliding at slower or medium-slow speeds. It's reliable enough for regular cursor control, but other actions like clicking or dragging-and-dropping can be tiring without actual buttons or a USB mouse.

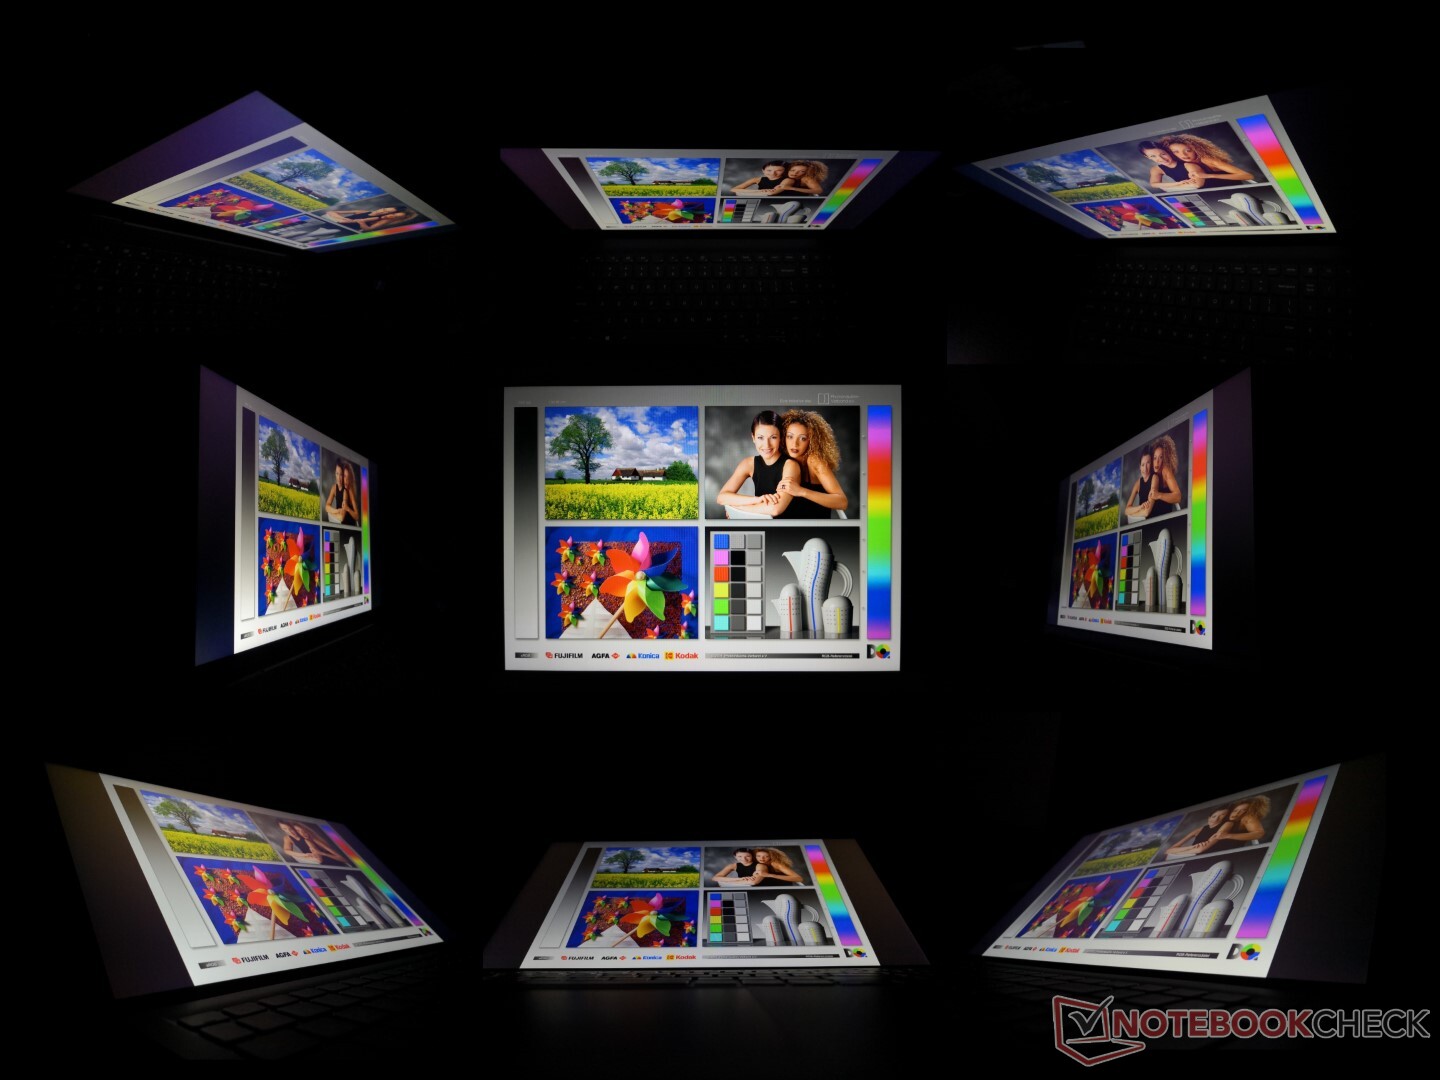
Display
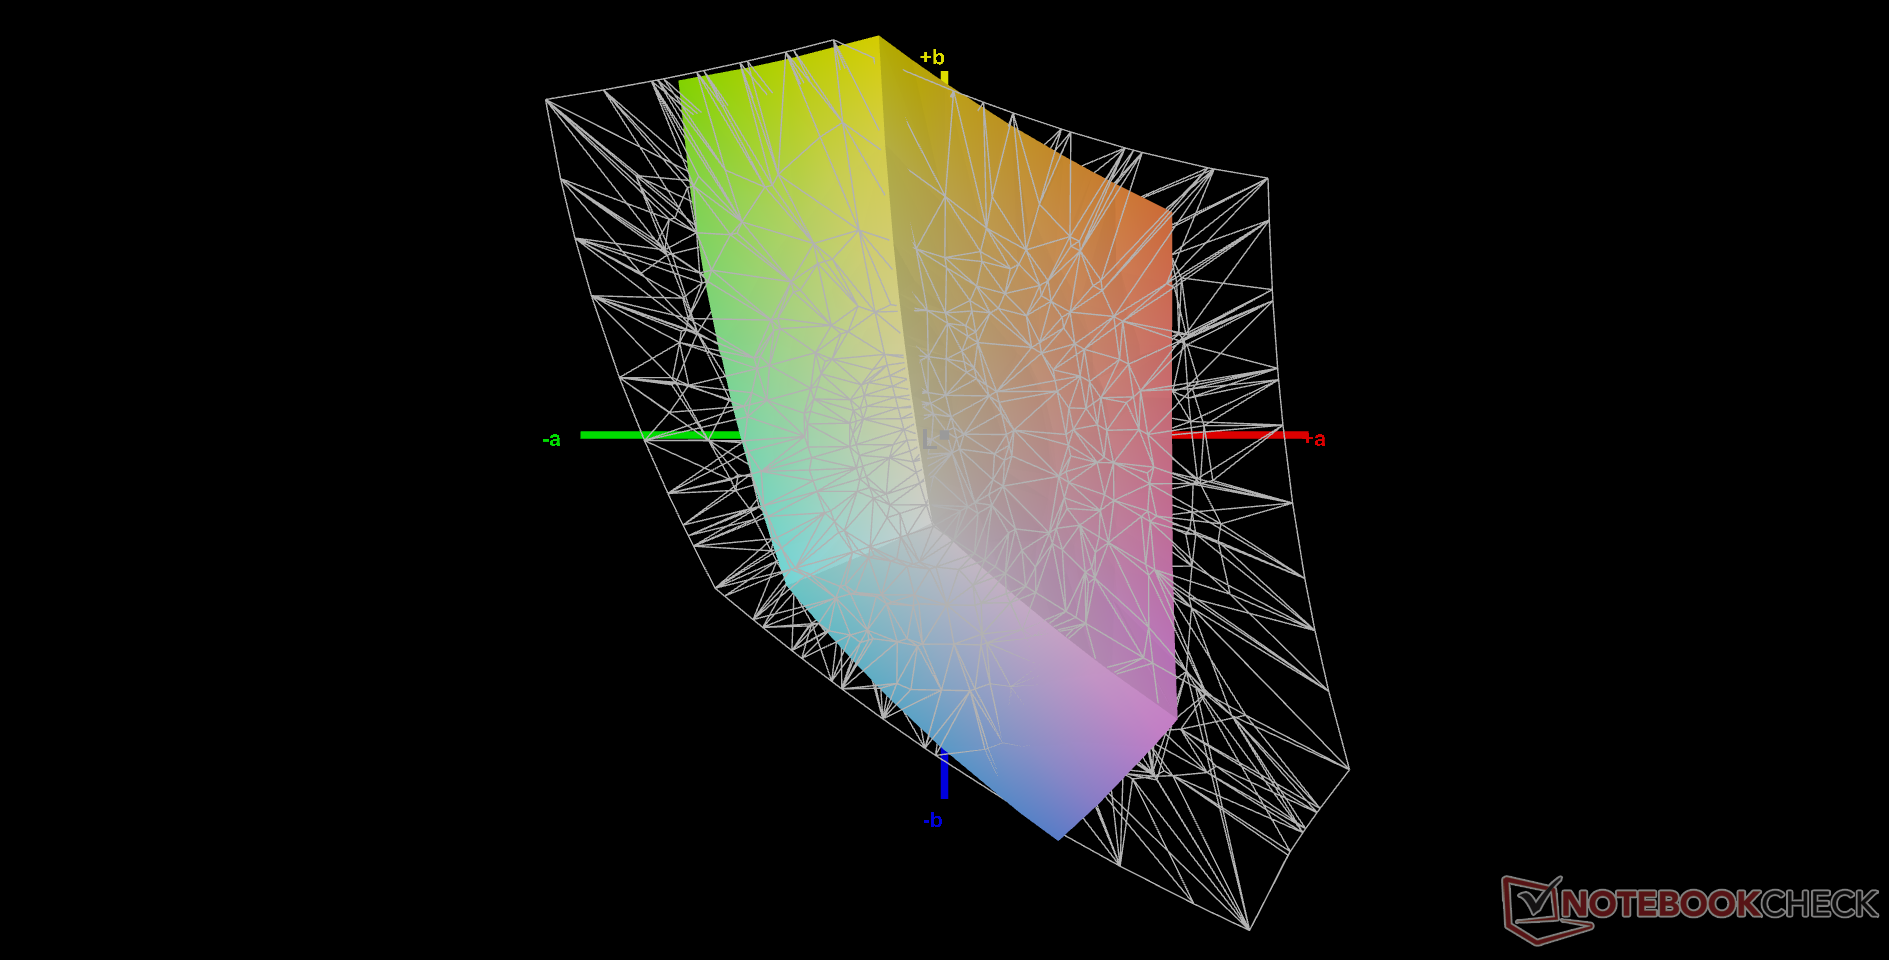
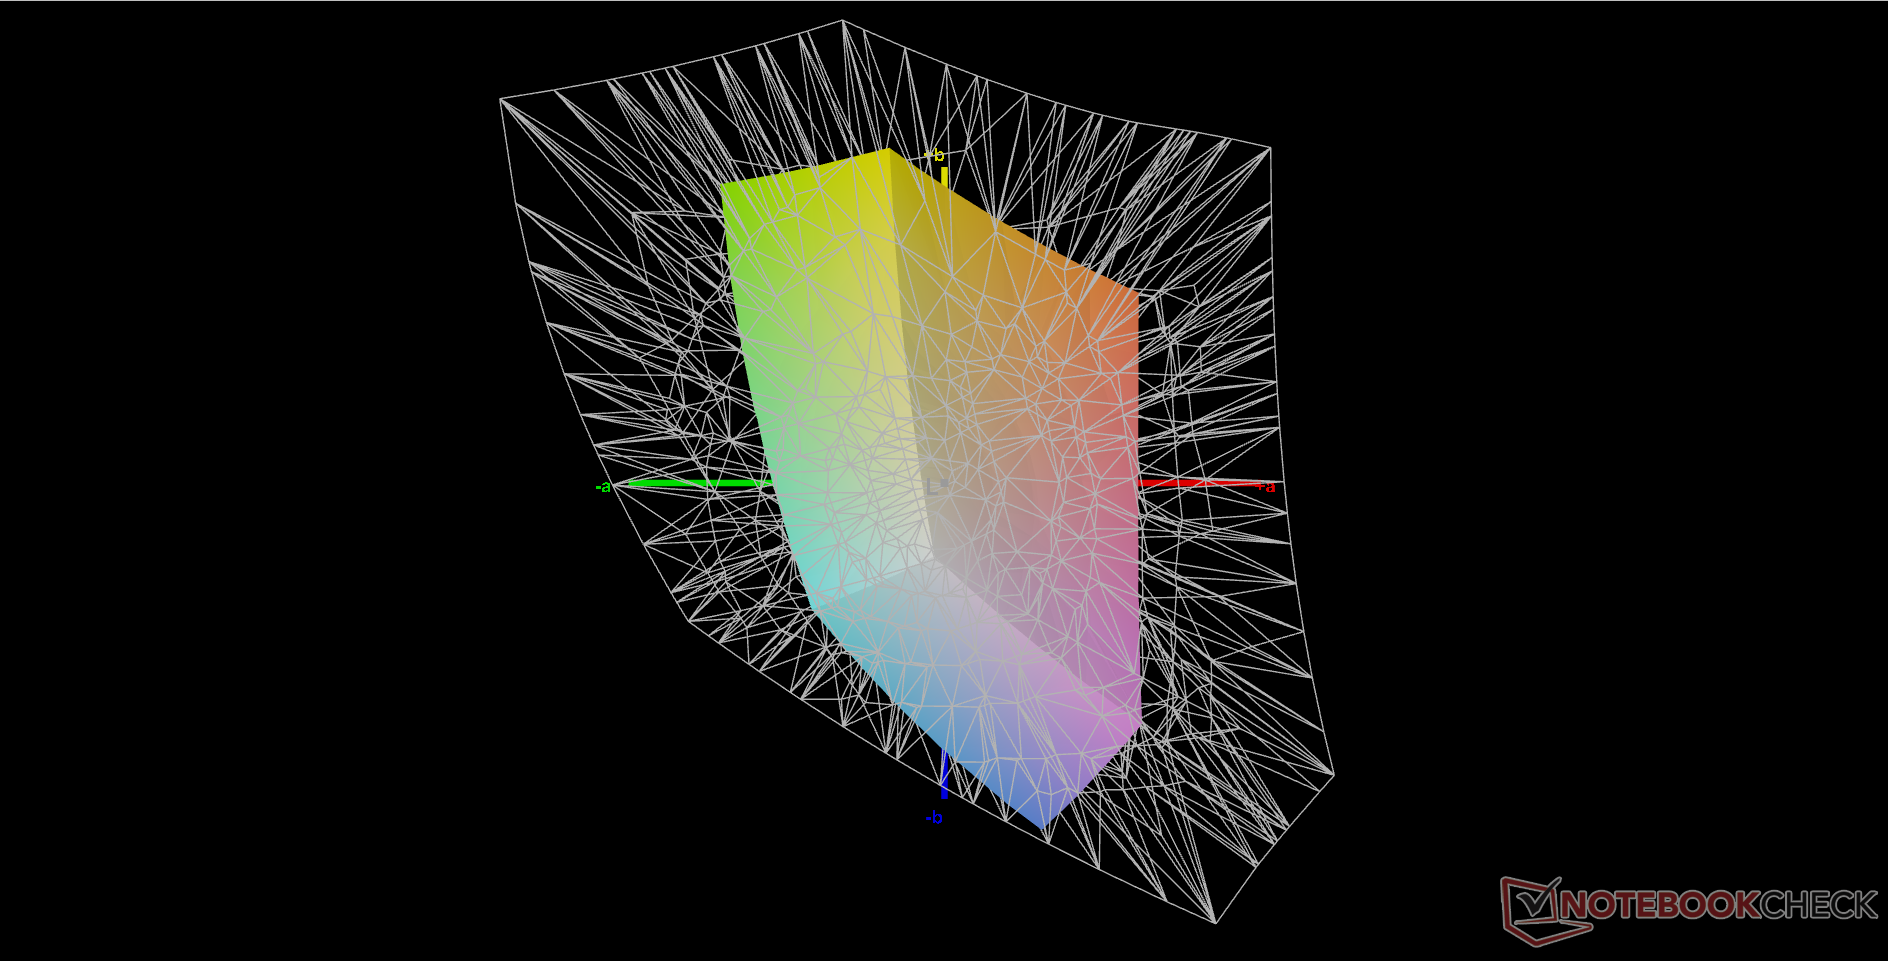
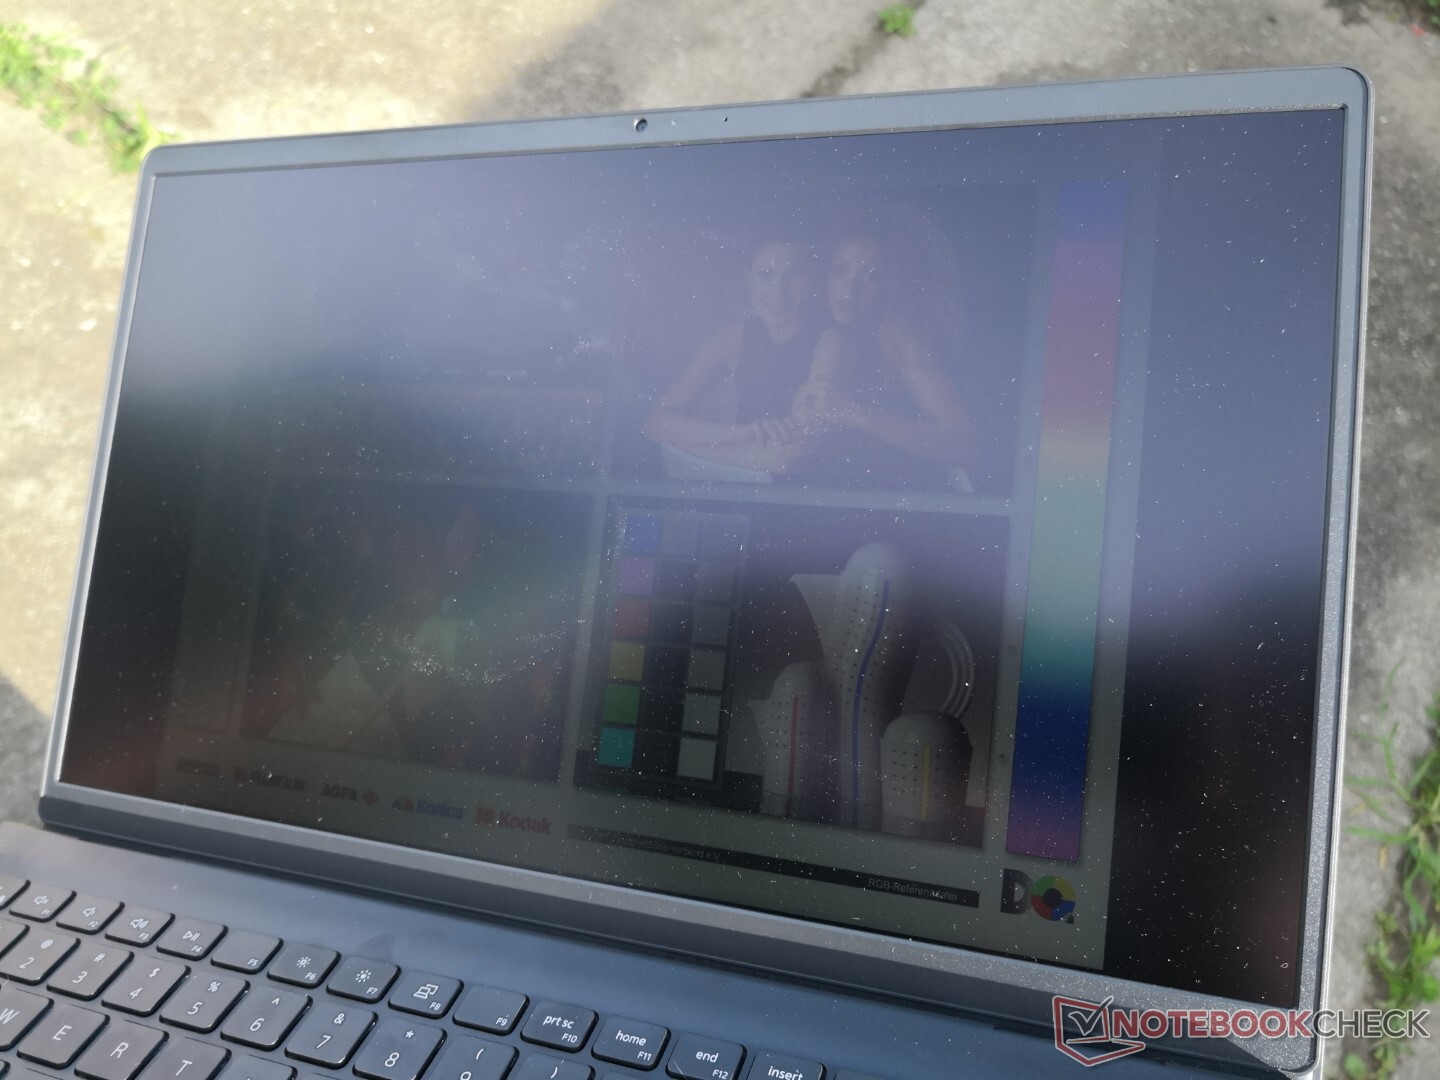
The Inspiron 15 3511 uses a different BOE panel than the one found on the older Inspiron 15 3501 (BOE NV15T06 vs. BOE NV15N3D). Despite this, core attributes are largely unchanged including the very narrow color space. Contrast ratio and response times are actually quite decent for a budget laptop, but the limited sRGB reproduction in particular is what ultimately separates this Inspiron display from a pricier XPS, Spectre, or ZenBook alternative. Colors appear shallower and not nearly as vivid which is par for the course for most cheap laptops.


| |||||||||||||||||||||||||
Brightness Distribution: 87 %
Center on Battery: 206.8 cd/m²
Contrast: 1142:1 (Black: 0.21 cd/m²)
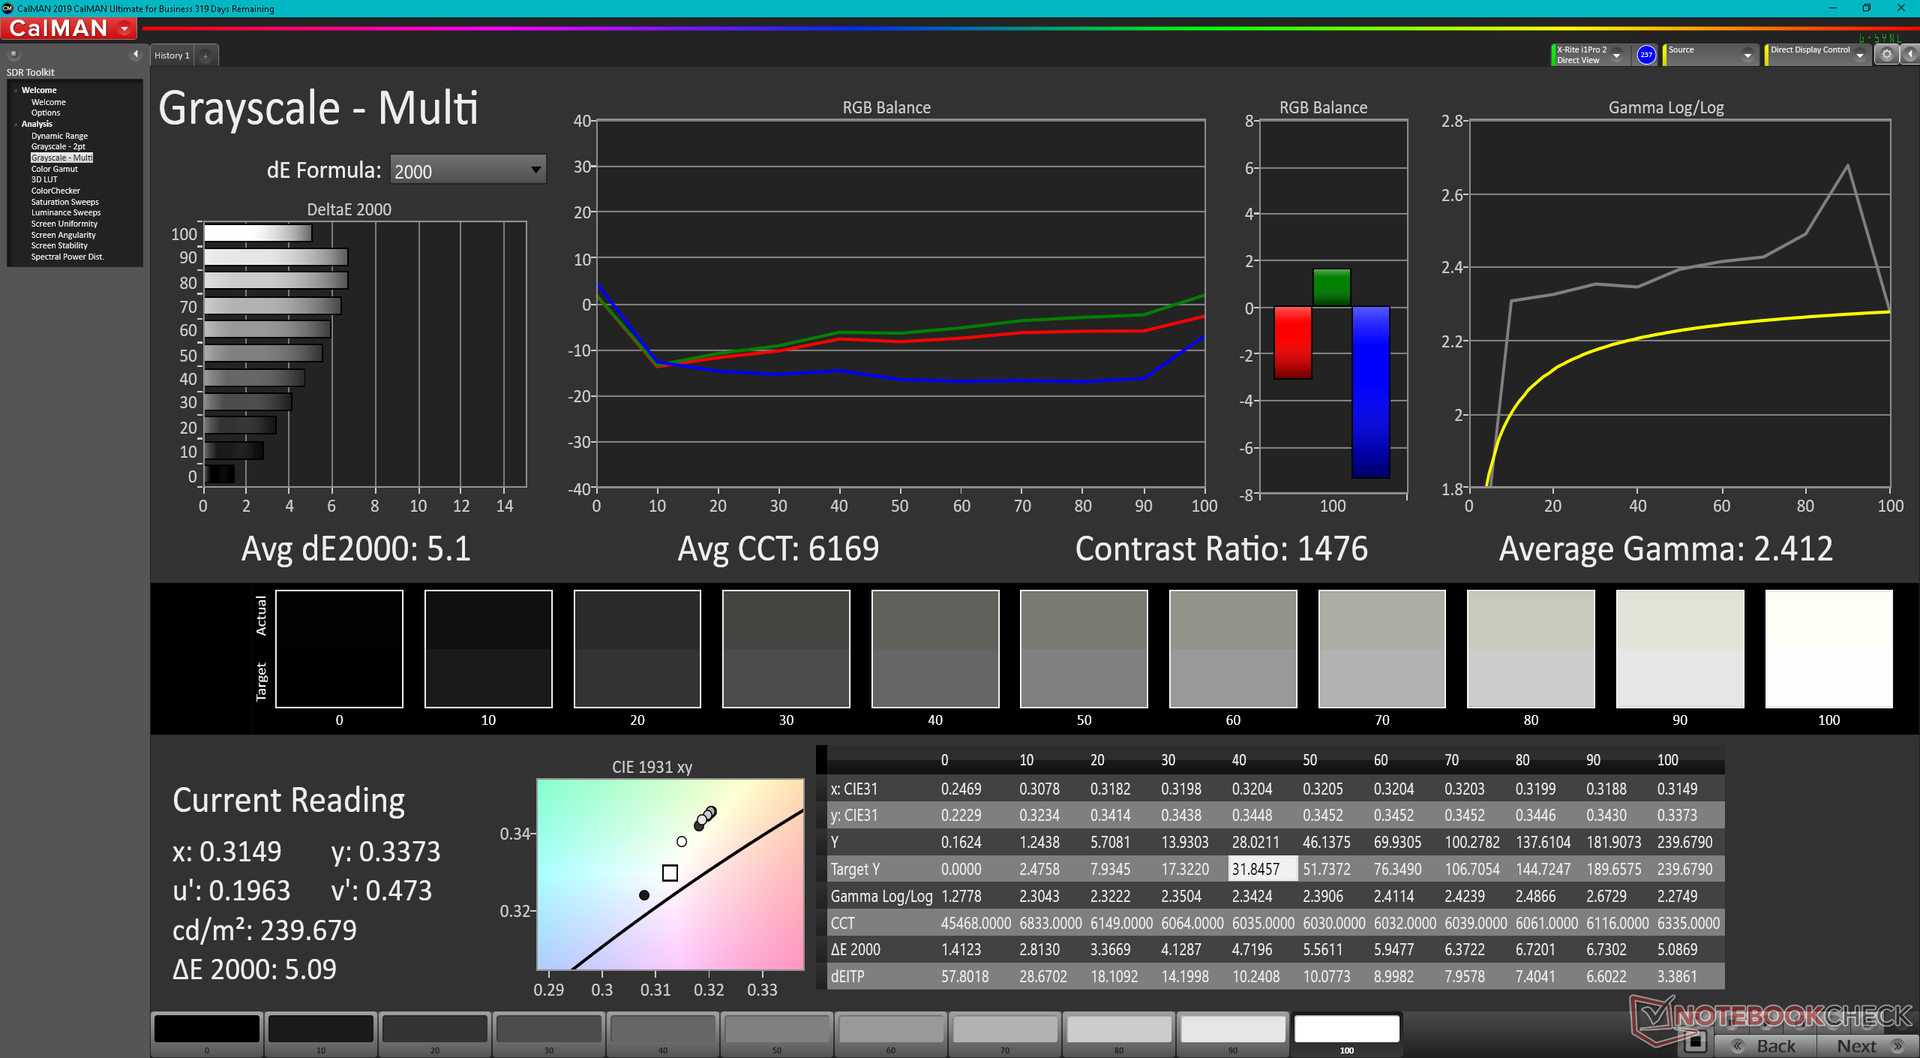
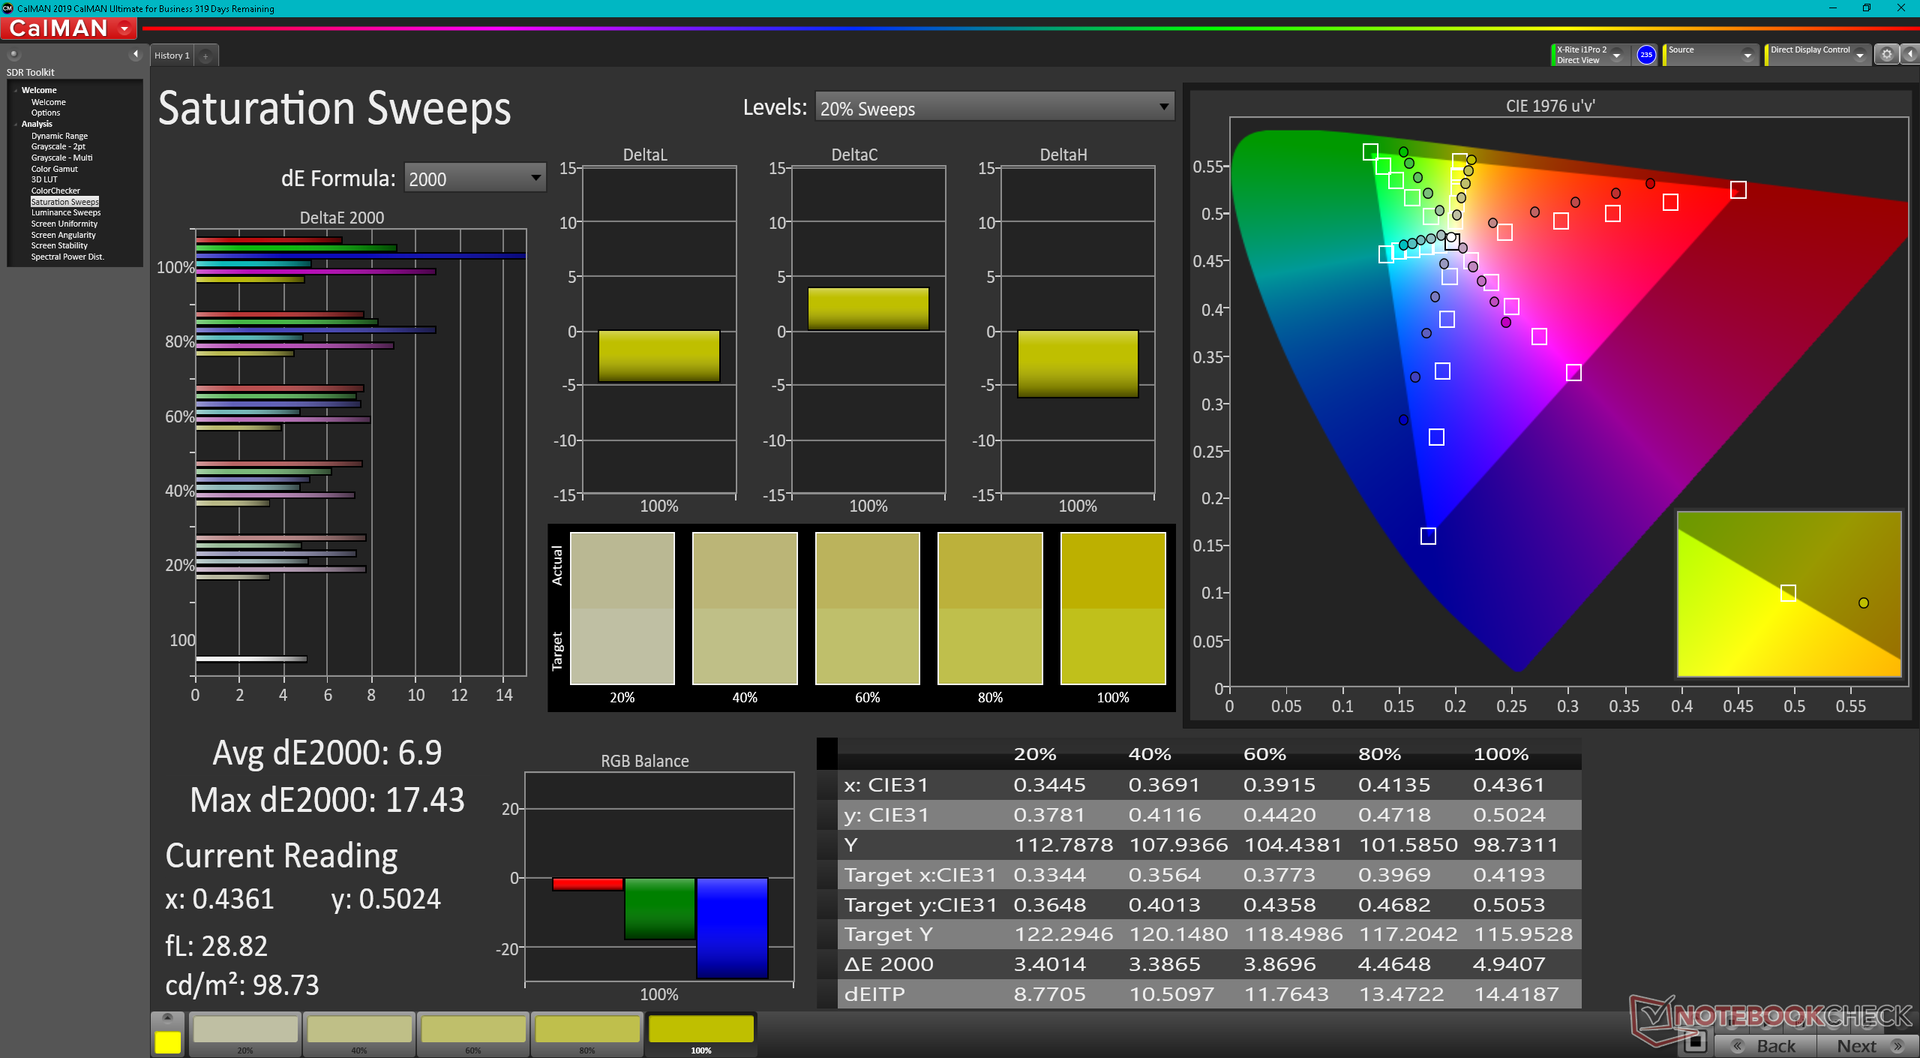
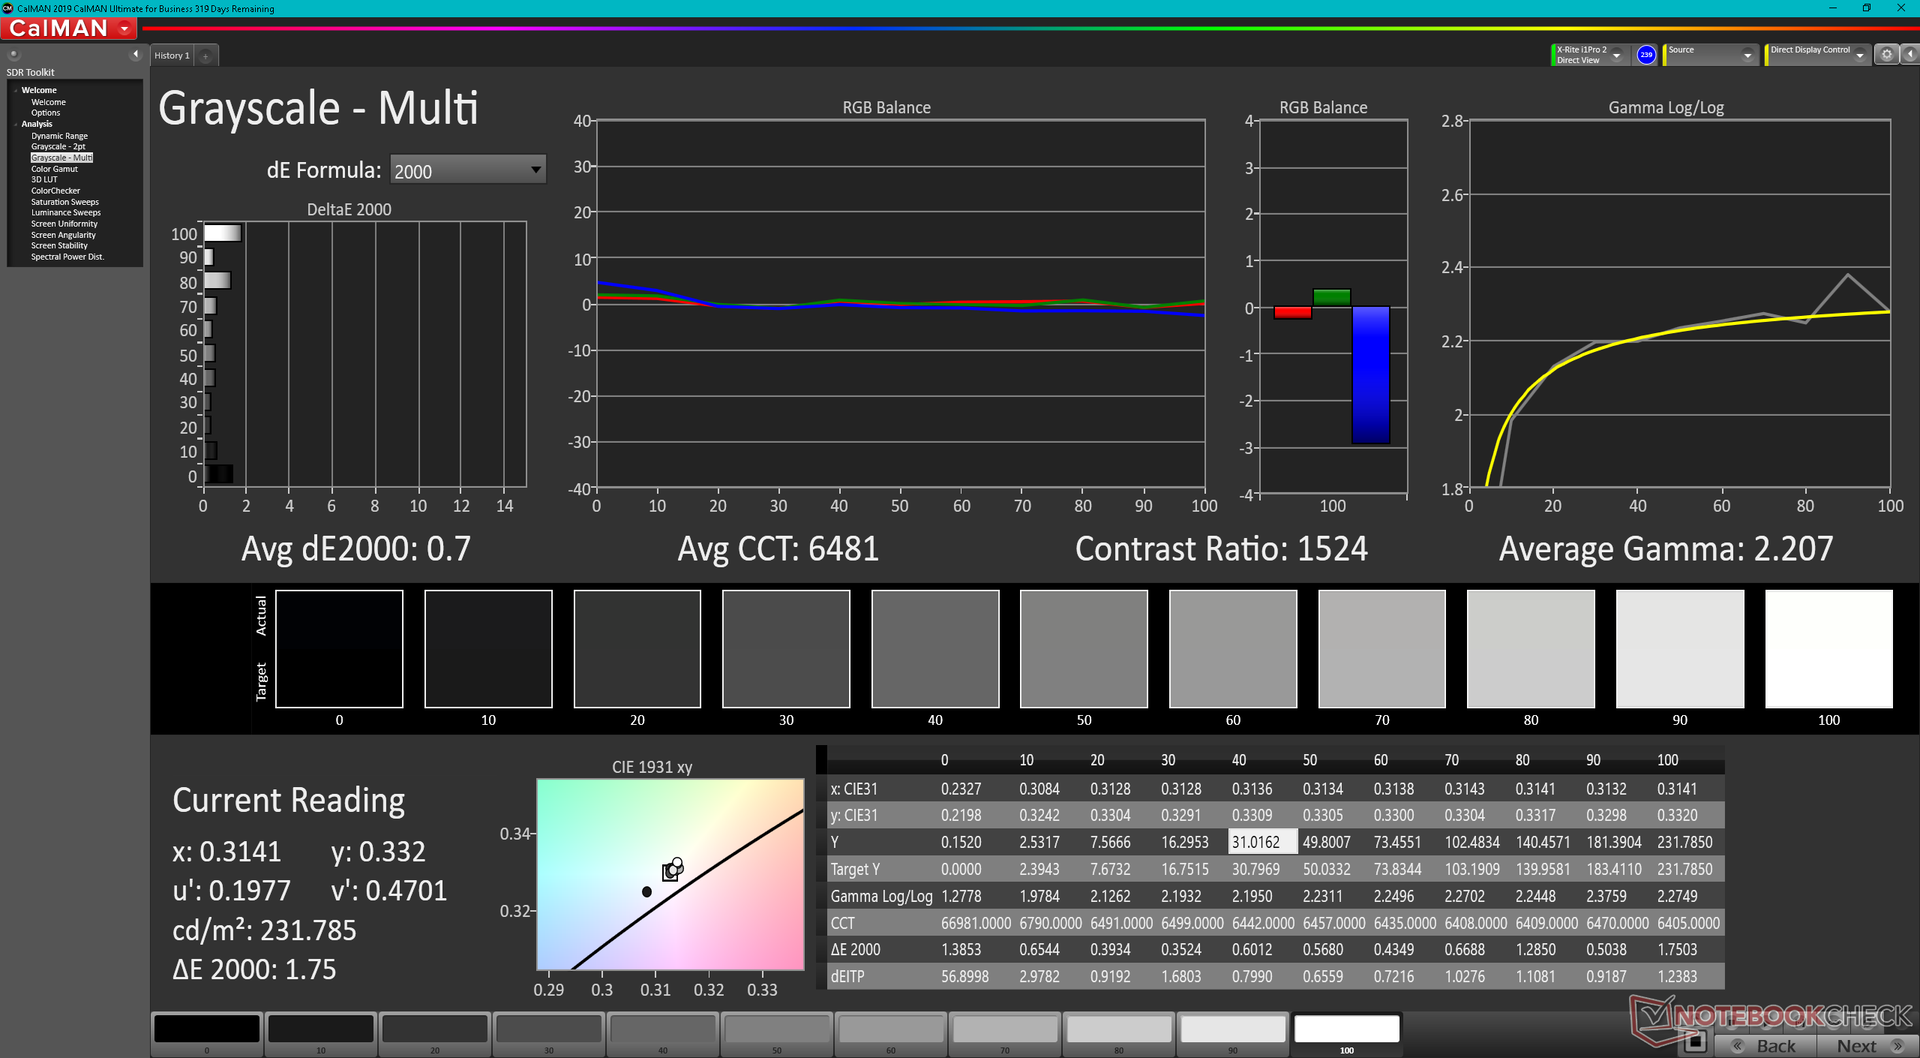
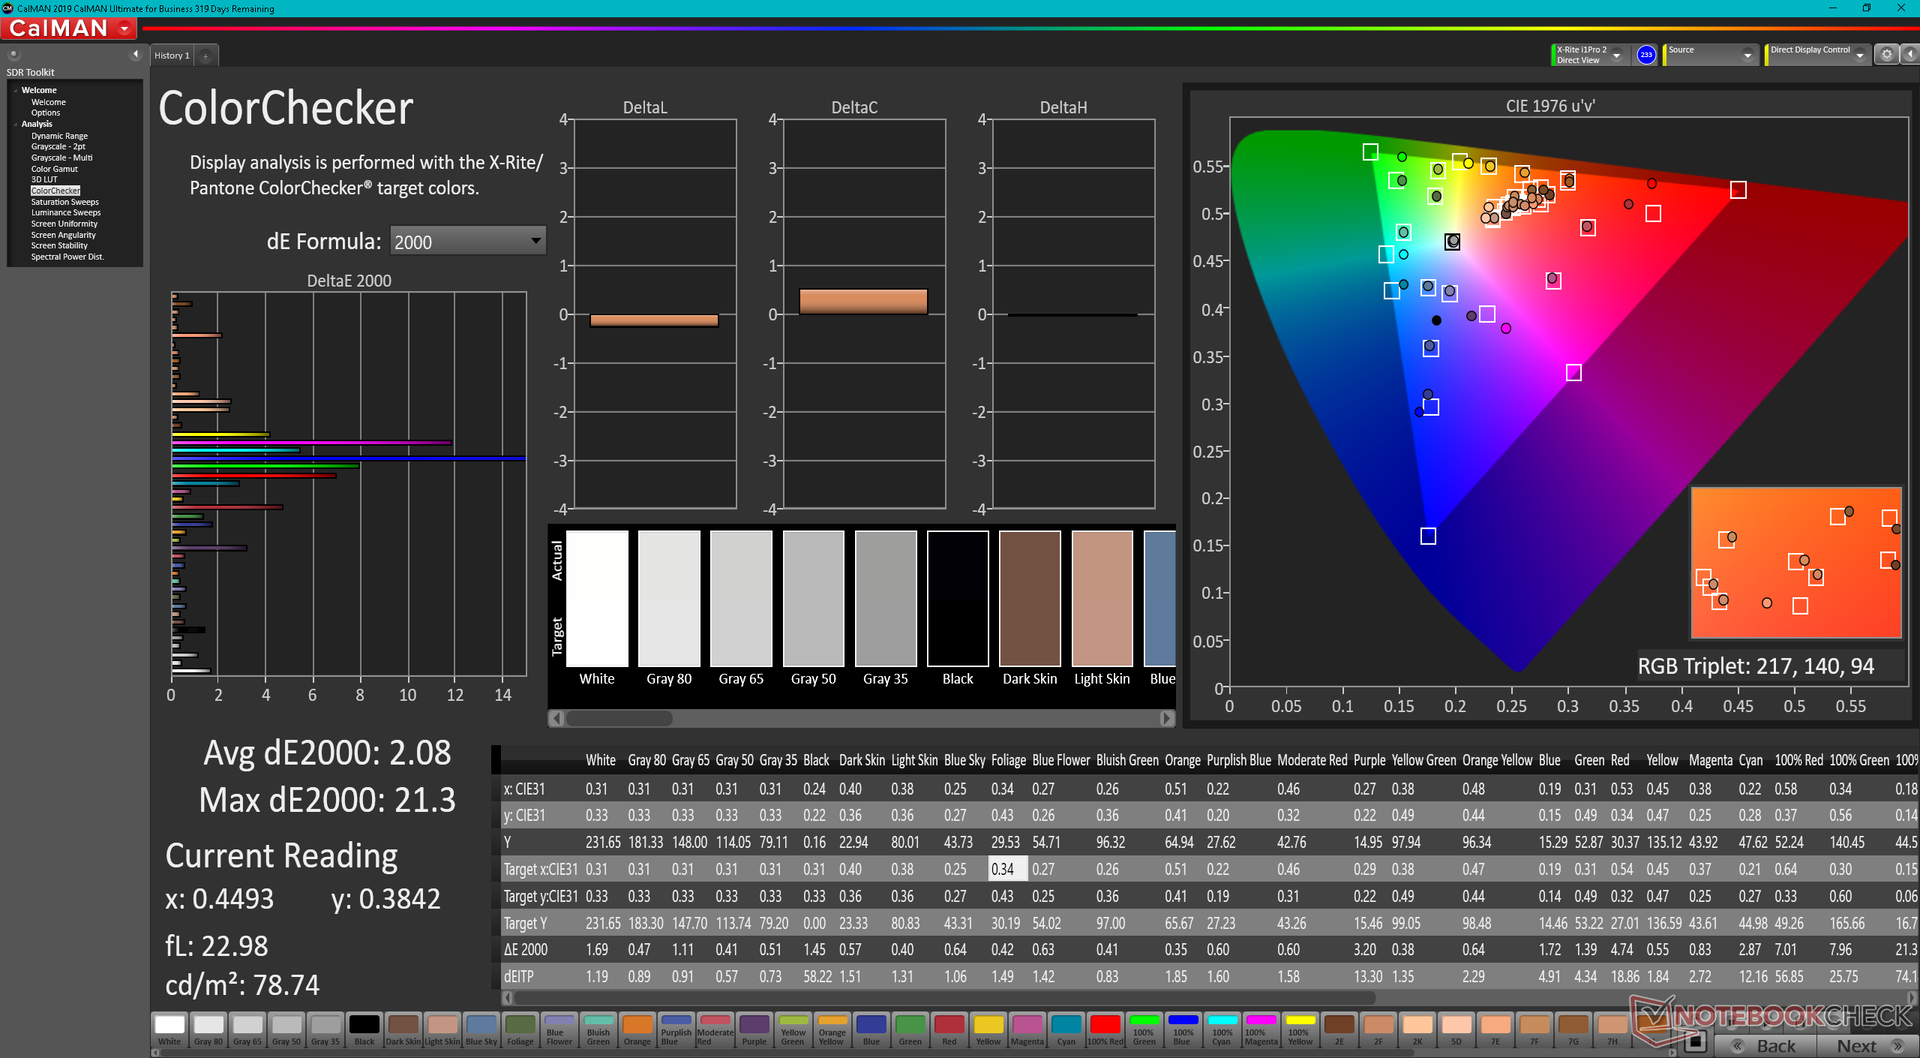
ΔE Color 6.34 | 0.5-29.43 Ø5, calibrated: 2.08
ΔE Greyscale 5.1 | 0.57-98 Ø5.3
41.5% AdobeRGB 1998 (Argyll 2.2.0 3D)
58.8% sRGB (Argyll 2.2.0 3D)
40.1% Display P3 (Argyll 2.2.0 3D)
Gamma: 2.41
| Dell Inspiron 15 3000 3511 BOE NV15T06, IPS, 1920x1080, 15.60 | Dell XPS 15 9510 i5 11400H FHD Sharp LQ156N1, IPS, 1920x1200, 15.60 | Asus VivoBook S15 D533UA Chi Mei N156HCA-EAB, IPS, 1920x1080, 15.60 | Dell Inspiron 15 3501 BOE NV15N3D (Dell P/N: N39X1), IPS, 1920x1080, 15.60 | Lenovo IdeaPad 3 15ALC6 BOE CQ NV156FHM-T07, IPS, 1920x1080, 15.60 | HP Pavilion 15-eg Chi Mei CMN1523, IPS, 1920x1080, 15.60 | |
|---|---|---|---|---|---|---|
| Display | 88% | 9% | -1% | -1% | 8% | |
| Display P3 Coverage | 40.1 | 80.9 102% | 43.6 9% | 39.4 -2% | 40 0% | 42.9 7% |
| sRGB Coverage | 58.8 | 100 70% | 65.2 11% | 58.7 0% | 57.7 -2% | 64 9% |
| AdobeRGB 1998 Coverage | 41.5 | 79.1 91% | 45 8% | 40.7 -2% | 41.2 -1% | 44.4 7% |
| Response Times | -80% | 32% | -35% | 2% | 15% | |
| Response Time Grey 50% / Grey 80% * | 31.6 ? | 62.4 ? -97% | 18 ? 43% | 43 ? -36% | 24.8 ? 22% | 22.8 ? 28% |
| Response Time Black / White * | 24 ? | 38.8 ? -62% | 19 ? 21% | 32 ? -33% | 28.4 ? -18% | 23.6 ? 2% |
| PWM Frequency | 1000 ? | 26320 ? | ||||
| Screen | 56% | -6% | 31% | 9% | 0% | |
| Brightness middle | 239.9 | 632 163% | 289 20% | 271 13% | 336.4 40% | 294.3 23% |
| Brightness | 230 | 606 163% | 267 16% | 263 14% | 318 38% | 251 9% |
| Brightness Distribution | 87 | 91 5% | 85 -2% | 92 6% | 84 -3% | 76 -13% |
| Black Level * | 0.21 | 0.29 -38% | 0.56 -167% | 0.15 29% | 0.24 -14% | 0.26 -24% |
| Contrast | 1142 | 2179 91% | 516 -55% | 1807 58% | 1402 23% | 1132 -1% |
| Colorchecker dE 2000 * | 6.34 | 3.5 45% | 3.96 38% | 4.83 24% | 6.46 -2% | 4.08 36% |
| Colorchecker dE 2000 max. * | 21.03 | 6.4 70% | 6.76 68% | 7 67% | 19.75 6% | 19.49 7% |
| Colorchecker dE 2000 calibrated * | 2.08 | 2 4% | 2.09 -0% | 3.7 -78% | ||
| Greyscale dE 2000 * | 5.1 | 5 2% | 3.43 33% | 3.36 34% | 5.6 -10% | 3 41% |
| Gamma | 2.41 91% | 2.26 97% | 2.28 96% | 2.56 86% | 2.25 98% | 2.21 100% |
| CCT | 6169 105% | 7033 92% | 7191 90% | 6764 96% | 5934 110% | 6616 98% |
| Color Space (Percent of AdobeRGB 1998) | 42 | |||||
| Color Space (Percent of sRGB) | 65 | |||||
| Total Average (Program / Settings) | 21% /
44% | 12% /
3% | -2% /
13% | 3% /
6% | 8% /
4% |
* ... smaller is better
Color space is limited to just 59 percent of sRGB compared to >90 percent on pricier alternatives like the XPS 15. The narrow gamut is to be expected on budget laptops such as our Inspiron 15.
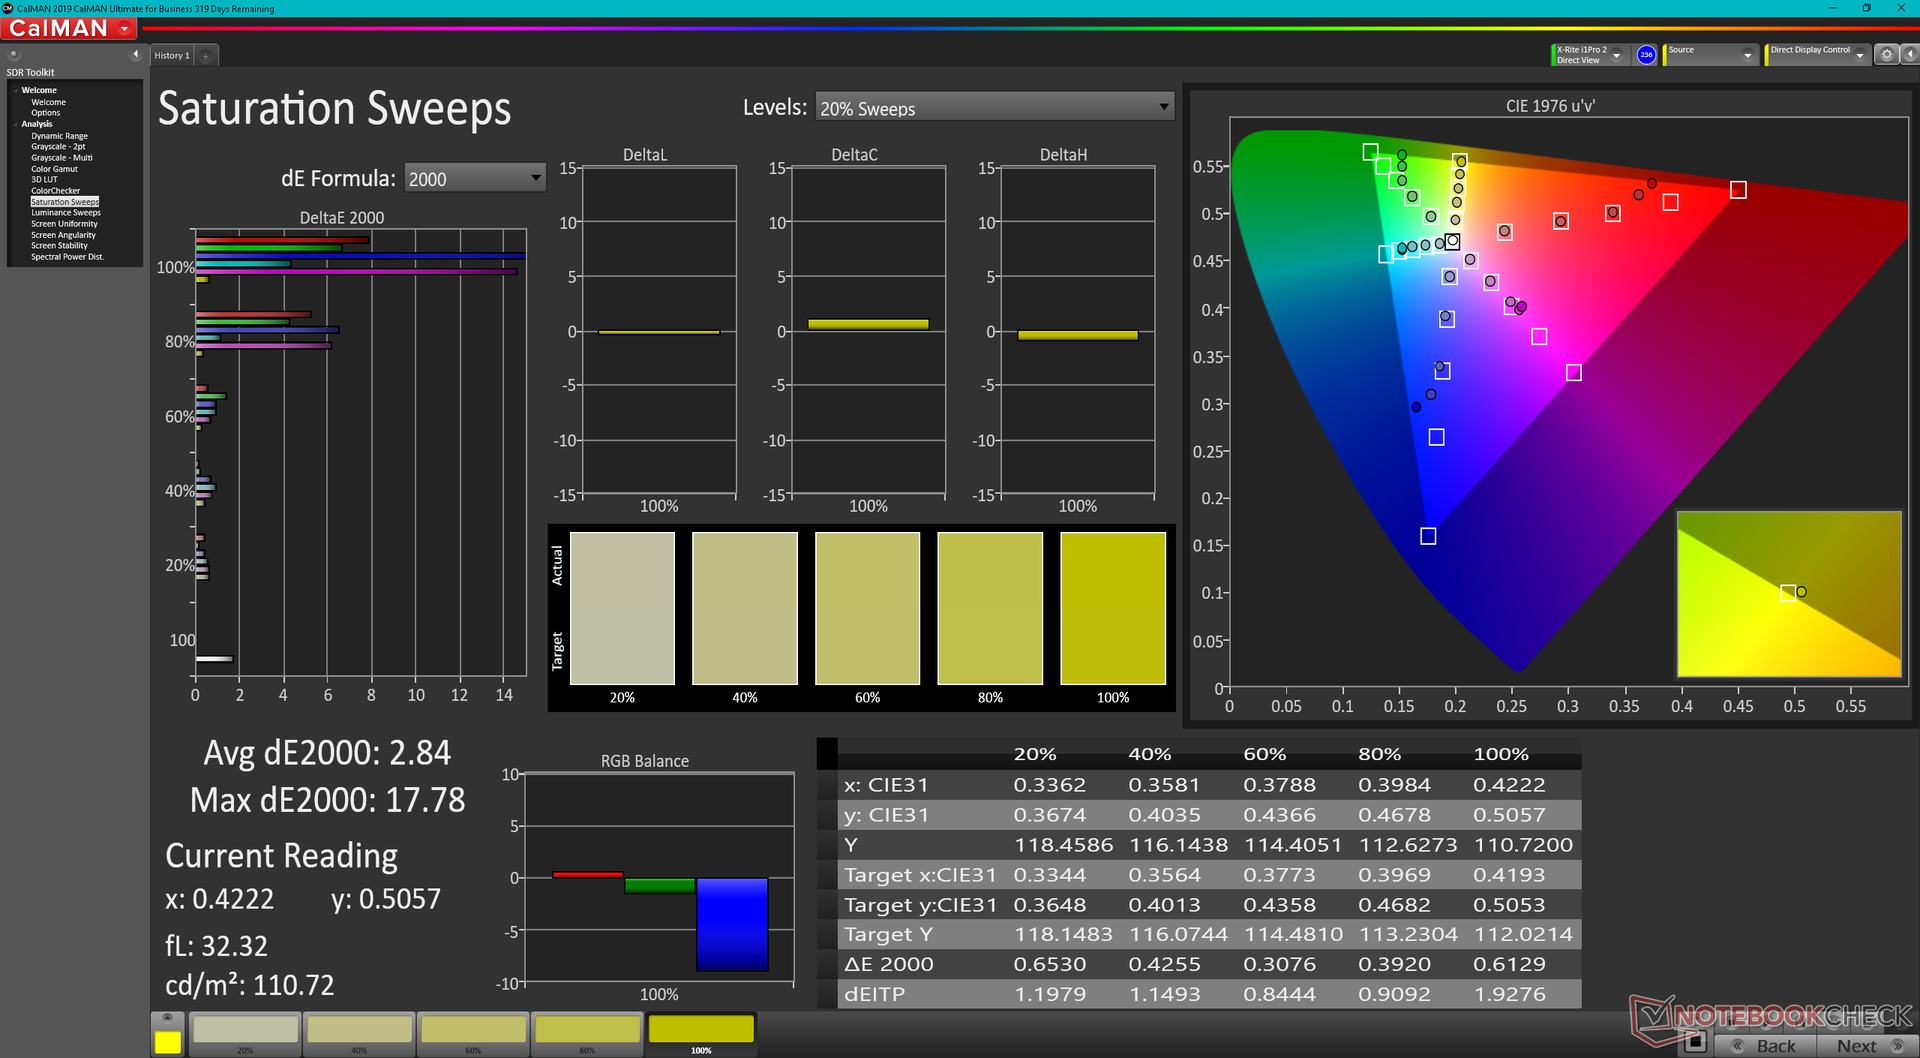
Color temperature is slightly too warm out of the box which our X-Rite colorimeter is able to address. Once calibrated, average grayscale and color DeltaE values would drop from 5.1 and 6.34 to just 0.7 and 2.08, respectively. Nonetheless, the poor color reproduction mentioned above means that deltaE will inevitably increase significantly at higher saturation levels.

Display Response Times
| ↔ Response Time Black to White | ||
|---|---|---|
| 24 ms ... rise ↗ and fall ↘ combined | ↗ 14 ms rise | 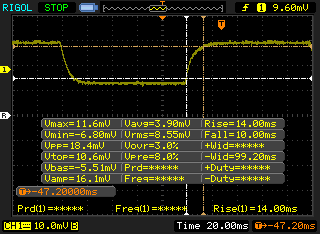 |
| ↘ 10 ms fall | ||
| The screen shows good response rates in our tests, but may be too slow for competitive gamers. In comparison, all tested devices range from 0.1 (minimum) to 240 (maximum) ms. » 48 % of all devices are better. This means that the measured response time is worse than the average of all tested devices (21.5 ms). | ||
| ↔ Response Time 50% Grey to 80% Grey | ||
| 31.6 ms ... rise ↗ and fall ↘ combined | ↗ 17.2 ms rise | 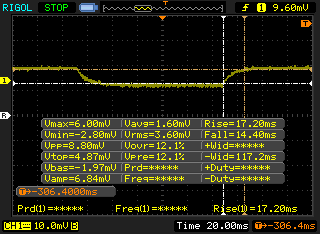 |
| ↘ 14.4 ms fall | ||
| The screen shows slow response rates in our tests and will be unsatisfactory for gamers. In comparison, all tested devices range from 0.2 (minimum) to 636 (maximum) ms. » 36 % of all devices are better. This means that the measured response time is similar to the average of all tested devices (33.7 ms). | ||
Screen Flickering / PWM (Pulse-Width Modulation)
| Screen flickering / PWM not detected | 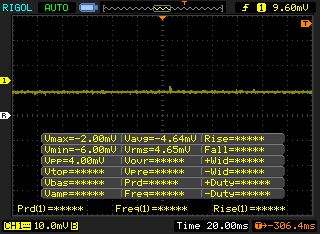 | ||
In comparison: 53 % of all tested devices do not use PWM to dim the display. If PWM was detected, an average of 17900 (minimum: 5 - maximum: 3846000) Hz was measured. | |||
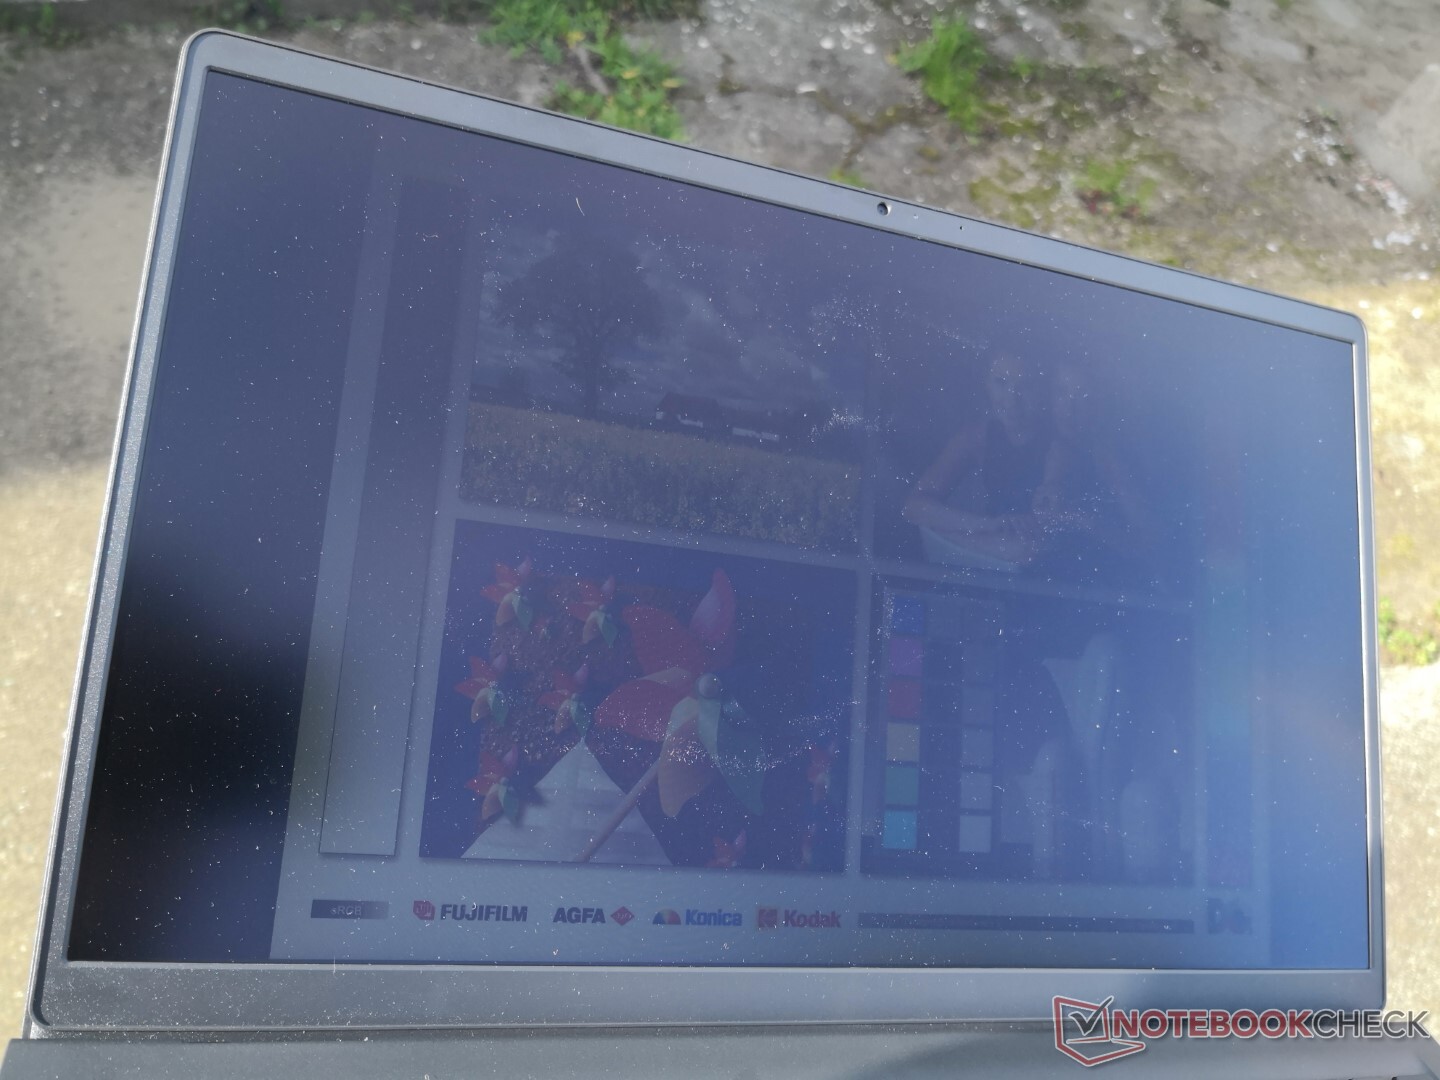
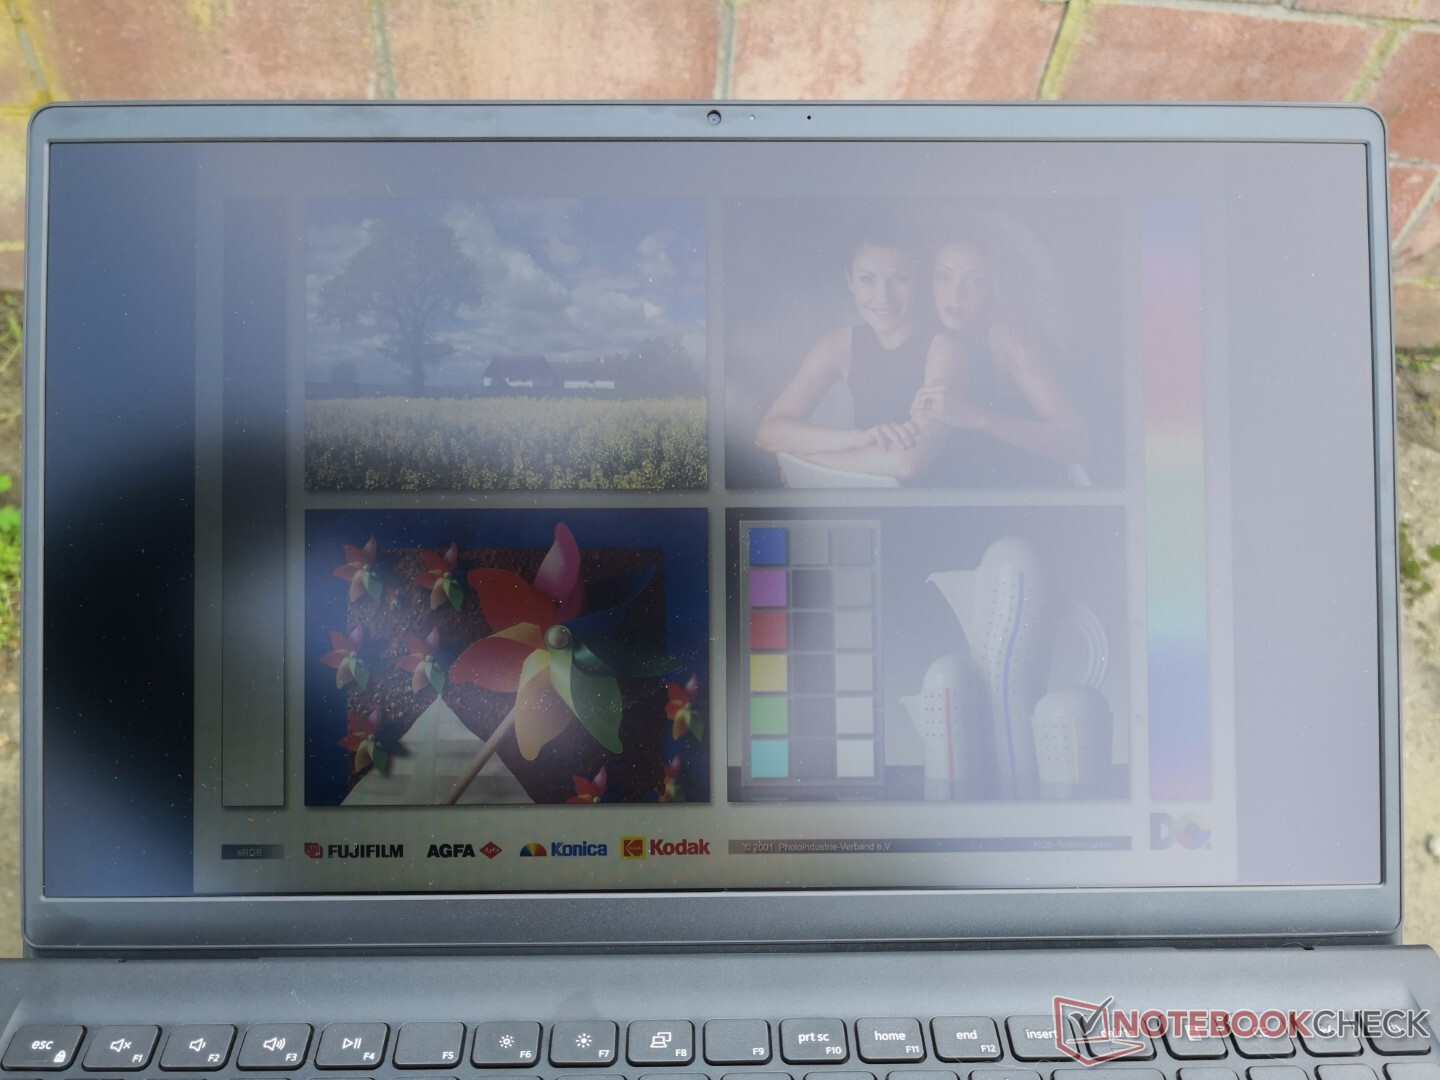
Outdoor visibility is poor even if working under shade. Maximum brightness would automatically drop from 240 nits to just 207 nits when running on battery power to make an already dim display even dimmer if no AC outlet is nearby. We cannot find the appropriate Dell, Windows, or Intel setting that is responsible for the automatic battery brightness control.
Performance
Testing Conditions
Our unit was set to Best Performance via Windows prior to running any performance benchmarks below for the highest possible scores.
Processor
Overall CPU performance is within just a few percentage points of the average laptop in our database equipped with the same Core i5-1135G7 processor. Performance sustainability is also good even though the initial Turbo Boost benefits are much smaller when compared to pricier alternatives like the Asus ExpertBook B1 B1500CEAE or Honor MagicBook 15 as shown by our CineBench R15 xT loop results below.
Upgrading to the Core i7-1165G7 is only expected to increase single-thread and multi-thread performance by 5 and 15 percent, respectively. Meanwhile, downgrading to the Core i3-1115G4 option is expected to decrease multi-thread performance by almost 30 percent.
Cinebench R15 Multi Loop
Cinebench R23: Multi Core | Single Core
Cinebench R15: CPU Multi 64Bit | CPU Single 64Bit
Blender: v2.79 BMW27 CPU
7-Zip 18.03: 7z b 4 | 7z b 4 -mmt1
Geekbench 5.5: Multi-Core | Single-Core
HWBOT x265 Benchmark v2.2: 4k Preset
LibreOffice : 20 Documents To PDF
R Benchmark 2.5: Overall mean
| Cinebench R23 / Multi Core | |
| Asus VivoBook S15 D533UA | |
| Lenovo ThinkPad L15 G2 AMD | |
| Lenovo IdeaPad 5 15ALC05 | |
| Samsung Galaxy Book Pro 15 NP950XDB-KC5US | |
| Average Intel Core i5-1135G7 (2786 - 6136, n=55) | |
| Dell Inspiron 15 3000 3511 | |
| Cinebench R23 / Single Core | |
| Samsung Galaxy Book Pro 15 NP950XDB-KC5US | |
| Lenovo ThinkPad L15 G2 AMD | |
| Dell Inspiron 15 3000 3511 | |
| Average Intel Core i5-1135G7 (1062 - 1373, n=53) | |
| Asus VivoBook S15 D533UA | |
| Lenovo IdeaPad 5 15ALC05 | |
| HWBOT x265 Benchmark v2.2 / 4k Preset | |
| Asus VivoBook S15 D533UA | |
| Lenovo ThinkPad L15 G2 AMD | |
| Lenovo IdeaPad 5 15ALC05 | |
| HP ProBook 455 G7-175W8EA | |
| Samsung Galaxy Book Pro 15 NP950XDB-KC5US | |
| Average Intel Core i5-1135G7 (3.57 - 7.6, n=57) | |
| Samsung Galaxy Book Flex 15-NP950 | |
| HP Envy x360 15-ee0257ng | |
| Dell Inspiron 15 3000 3511 | |
| HP 250 G7-15S40ES | |
* ... smaller is better
AIDA64: FP32 Ray-Trace | FPU Julia | CPU SHA3 | CPU Queen | FPU SinJulia | FPU Mandel | CPU AES | CPU ZLib | FP64 Ray-Trace | CPU PhotoWorxx
| Performance Rating | |
| Asus VivoBook S15 D533UA | |
| HP Pavilion 15-eg | |
| Average Intel Core i5-1135G7 | |
| Lenovo IdeaPad 3 15ALC6 | |
| Dell Inspiron 15 3501 | |
| Dell Inspiron 15 3000 3511 | |
| Dell XPS 15 9510 i5 11400H FHD -9! | |
| AIDA64 / FP32 Ray-Trace | |
| Asus VivoBook S15 D533UA | |
| Lenovo IdeaPad 3 15ALC6 | |
| Average Intel Core i5-1135G7 (4313 - 7952, n=45) | |
| HP Pavilion 15-eg | |
| Dell Inspiron 15 3501 | |
| Dell Inspiron 15 3000 3511 | |
| AIDA64 / FPU Julia | |
| Asus VivoBook S15 D533UA | |
| Lenovo IdeaPad 3 15ALC6 | |
| HP Pavilion 15-eg | |
| Average Intel Core i5-1135G7 (19402 - 32283, n=45) | |
| Dell Inspiron 15 3501 | |
| Dell Inspiron 15 3000 3511 | |
| AIDA64 / CPU SHA3 | |
| Asus VivoBook S15 D533UA | |
| HP Pavilion 15-eg | |
| Average Intel Core i5-1135G7 (1316 - 2172, n=45) | |
| Dell Inspiron 15 3000 3511 | |
| Dell Inspiron 15 3501 | |
| Lenovo IdeaPad 3 15ALC6 | |
| AIDA64 / CPU Queen | |
| Asus VivoBook S15 D533UA | |
| Lenovo IdeaPad 3 15ALC6 | |
| HP Pavilion 15-eg | |
| Dell Inspiron 15 3501 | |
| Dell Inspiron 15 3000 3511 | |
| Average Intel Core i5-1135G7 (39000 - 46951, n=45) | |
| AIDA64 / FPU SinJulia | |
| Asus VivoBook S15 D533UA | |
| Lenovo IdeaPad 3 15ALC6 | |
| HP Pavilion 15-eg | |
| Dell Inspiron 15 3501 | |
| Average Intel Core i5-1135G7 (3497 - 4445, n=45) | |
| Dell Inspiron 15 3000 3511 | |
| AIDA64 / FPU Mandel | |
| Asus VivoBook S15 D533UA | |
| Lenovo IdeaPad 3 15ALC6 | |
| HP Pavilion 15-eg | |
| Average Intel Core i5-1135G7 (12569 - 19635, n=45) | |
| Dell Inspiron 15 3501 | |
| Dell Inspiron 15 3000 3511 | |
| AIDA64 / CPU AES | |
| HP Pavilion 15-eg | |
| Dell Inspiron 15 3501 | |
| Asus VivoBook S15 D533UA | |
| Dell Inspiron 15 3000 3511 | |
| Average Intel Core i5-1135G7 (28988 - 67977, n=45) | |
| Lenovo IdeaPad 3 15ALC6 | |
| AIDA64 / CPU ZLib | |
| Asus VivoBook S15 D533UA | |
| Lenovo IdeaPad 3 15ALC6 | |
| Dell Inspiron 15 3000 3511 | |
| Dell Inspiron 15 3501 | |
| HP Pavilion 15-eg | |
| Average Intel Core i5-1135G7 (265 - 373, n=51) | |
| Dell XPS 15 9510 i5 11400H FHD | |
| AIDA64 / FP64 Ray-Trace | |
| Asus VivoBook S15 D533UA | |
| Lenovo IdeaPad 3 15ALC6 | |
| Dell Inspiron 15 3501 | |
| HP Pavilion 15-eg | |
| Average Intel Core i5-1135G7 (2226 - 4291, n=45) | |
| Dell Inspiron 15 3000 3511 | |
| AIDA64 / CPU PhotoWorxx | |
| HP Pavilion 15-eg | |
| Average Intel Core i5-1135G7 (9004 - 45366, n=45) | |
| Lenovo IdeaPad 3 15ALC6 | |
| Dell Inspiron 15 3501 | |
| Asus VivoBook S15 D533UA | |
| Dell Inspiron 15 3000 3511 | |
System Performance
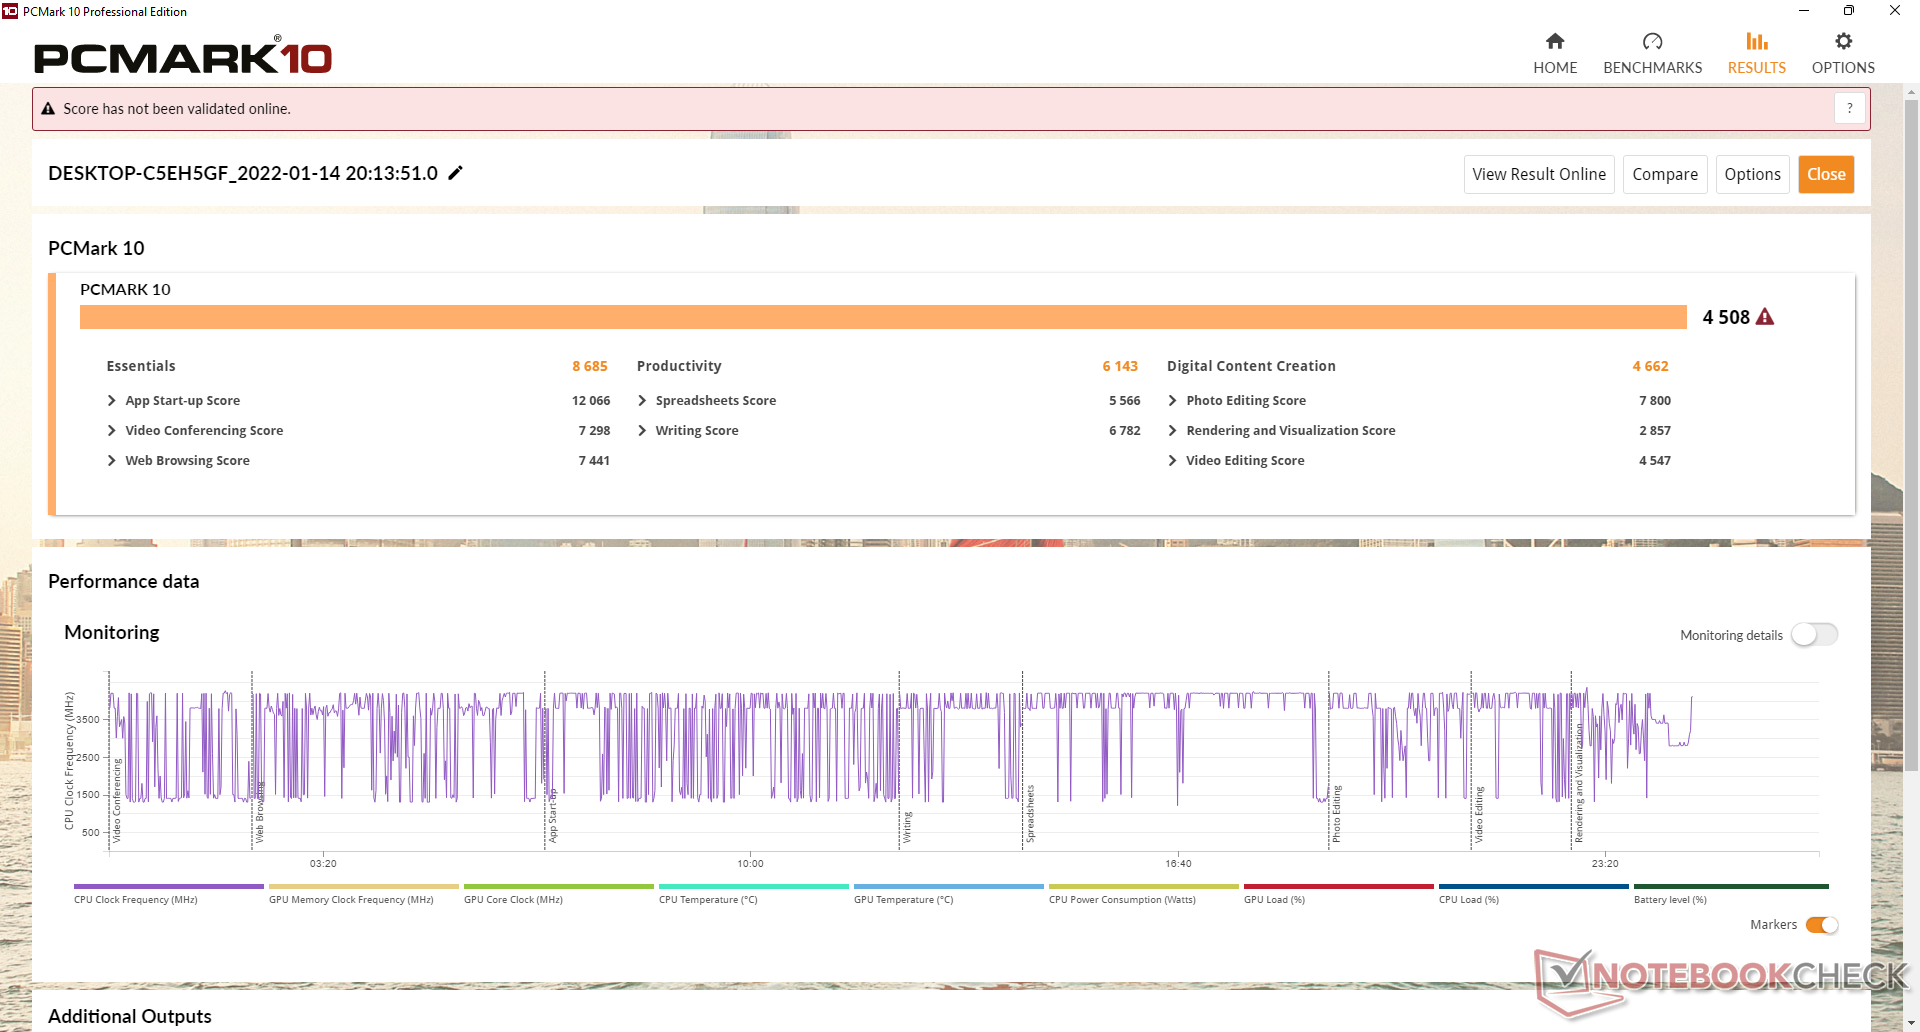
PCMark results are where we expect them to be relative to other laptops with the same processor and graphics despite the disappointing GPU results mentioned below. Thus, the system still feels as snappy as any other 11th gen Core-U Ultrabook for undemanding day-to-day office-type workloads.
| PCMark 10 / Score | |
| HP Pavilion 15-eg | |
| Asus VivoBook S15 D533UA | |
| Lenovo IdeaPad 3 15ALC6 | |
| Dell Inspiron 15 3501 | |
| Average Intel Core i5-1135G7, Intel Iris Xe Graphics G7 80EUs (4026 - 4952, n=53) | |
| Dell Inspiron 15 3000 3511 | |
| Dell XPS 15 9510 i5 11400H FHD | |
| PCMark 10 / Essentials | |
| HP Pavilion 15-eg | |
| Dell Inspiron 15 3501 | |
| Dell XPS 15 9510 i5 11400H FHD | |
| Average Intel Core i5-1135G7, Intel Iris Xe Graphics G7 80EUs (8149 - 9917, n=53) | |
| Asus VivoBook S15 D533UA | |
| Lenovo IdeaPad 3 15ALC6 | |
| Dell Inspiron 15 3000 3511 | |
| PCMark 10 / Productivity | |
| HP Pavilion 15-eg | |
| Asus VivoBook S15 D533UA | |
| Lenovo IdeaPad 3 15ALC6 | |
| Dell Inspiron 15 3501 | |
| Dell XPS 15 9510 i5 11400H FHD | |
| Average Intel Core i5-1135G7, Intel Iris Xe Graphics G7 80EUs (5040 - 6619, n=53) | |
| Dell Inspiron 15 3000 3511 | |
| PCMark 10 / Digital Content Creation | |
| HP Pavilion 15-eg | |
| Asus VivoBook S15 D533UA | |
| Dell Inspiron 15 3501 | |
| Lenovo IdeaPad 3 15ALC6 | |
| Dell Inspiron 15 3000 3511 | |
| Average Intel Core i5-1135G7, Intel Iris Xe Graphics G7 80EUs (3548 - 5255, n=53) | |
| Dell XPS 15 9510 i5 11400H FHD | |
| PCMark 10 Score | 4508 points | |
Help | ||
| AIDA64 / Memory Copy | |
| HP Pavilion 15-eg | |
| Average Intel Core i5-1135G7 (17443 - 63889, n=45) | |
| Asus VivoBook S15 D533UA | |
| Lenovo IdeaPad 3 15ALC6 | |
| Dell Inspiron 15 3501 | |
| Dell Inspiron 15 3000 3511 | |
| AIDA64 / Memory Read | |
| HP Pavilion 15-eg | |
| Asus VivoBook S15 D533UA | |
| Average Intel Core i5-1135G7 (19716 - 63705, n=45) | |
| Dell Inspiron 15 3501 | |
| Lenovo IdeaPad 3 15ALC6 | |
| Dell Inspiron 15 3000 3511 | |
| AIDA64 / Memory Write | |
| HP Pavilion 15-eg | |
| Average Intel Core i5-1135G7 (18722 - 66778, n=45) | |
| Asus VivoBook S15 D533UA | |
| Lenovo IdeaPad 3 15ALC6 | |
| Dell Inspiron 15 3501 | |
| Dell Inspiron 15 3000 3511 | |
| AIDA64 / Memory Latency | |
| Dell Inspiron 15 3000 3511 | |
| Lenovo IdeaPad 3 15ALC6 | |
| Asus VivoBook S15 D533UA | |
| Dell Inspiron 15 3501 | |
| Average Intel Core i5-1135G7 (68.3 - 107, n=51) | |
| HP Pavilion 15-eg | |
| Dell XPS 15 9510 i5 11400H FHD | |
* ... smaller is better
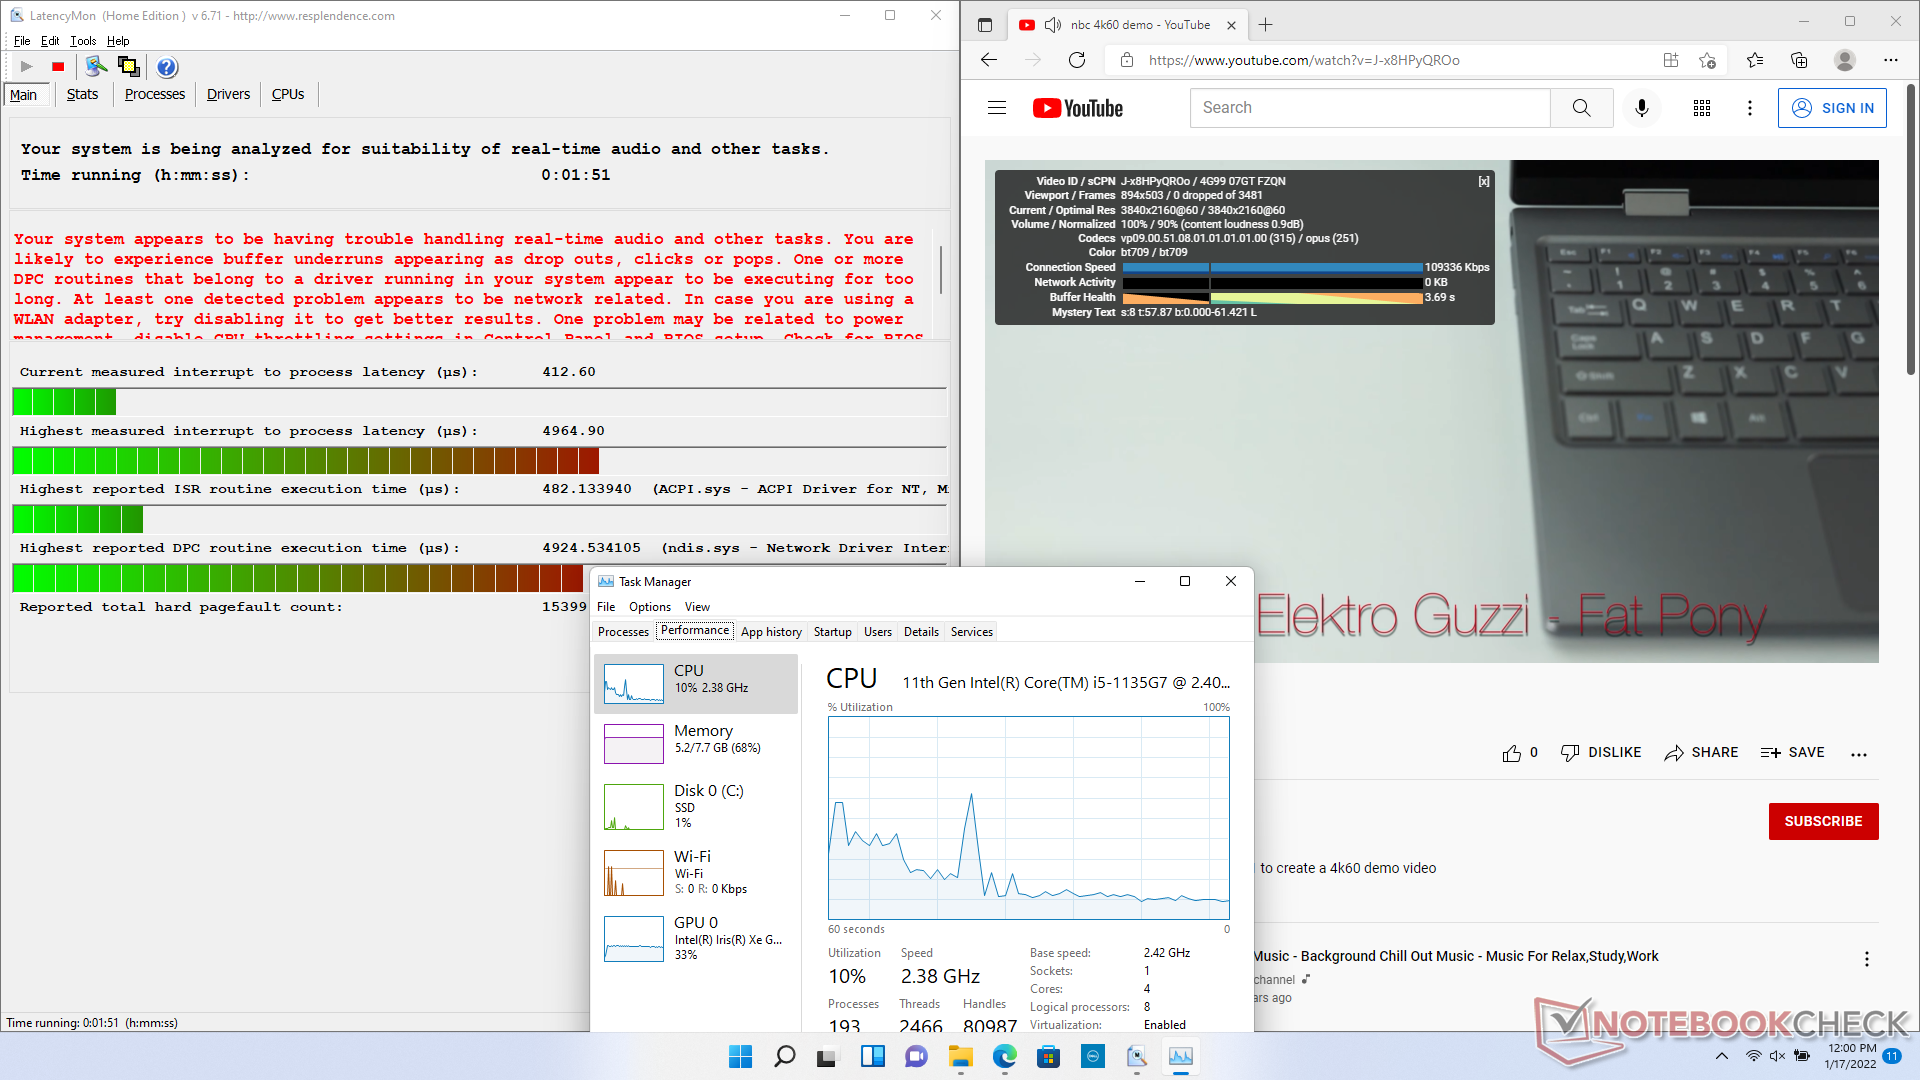
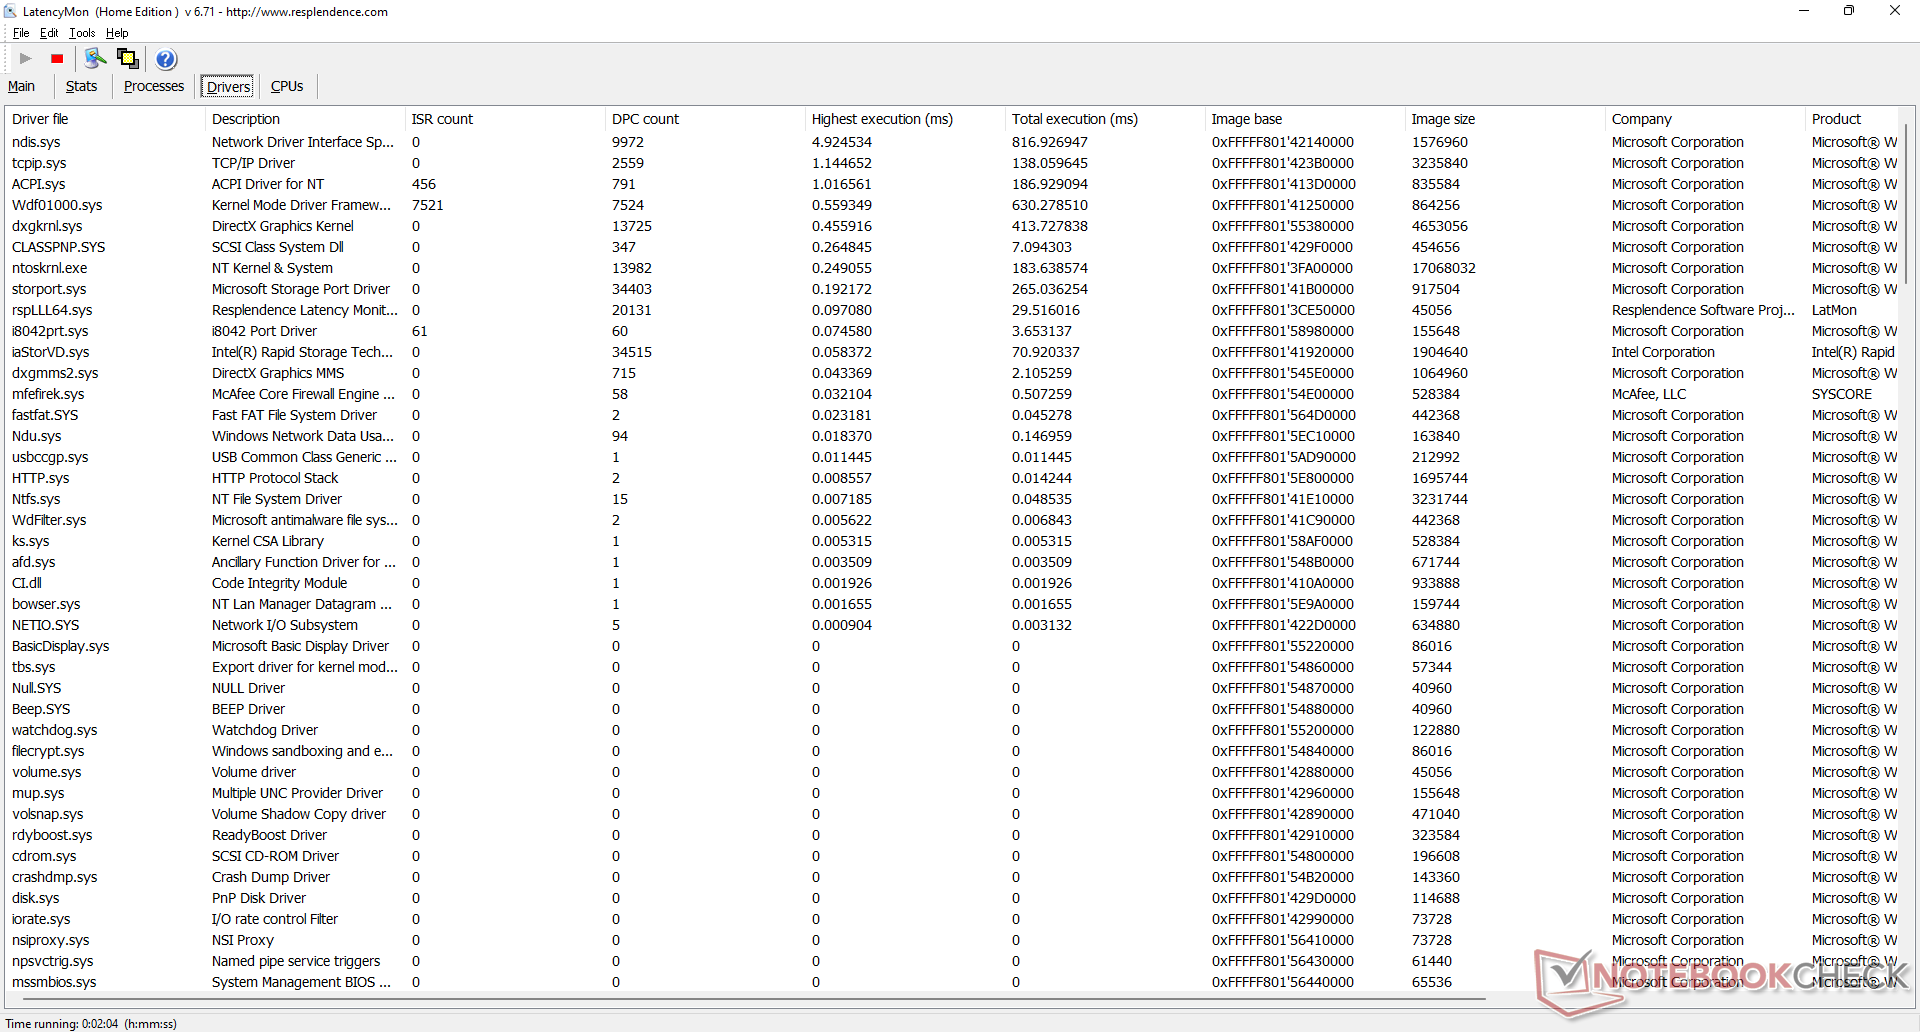
DPC Latency
LatencyMon shows DPC issues when opening multiple browser tabs on our homepage. 4K video playback at 60 FPS is otherwise smooth and without any dropped frames.
| DPC Latencies / LatencyMon - interrupt to process latency (max), Web, Youtube, Prime95 | |
| Dell Inspiron 15 3000 3511 | |
| HP Pavilion 15-eg | |
| Dell XPS 15 9510 i5 11400H FHD | |
| Dell Inspiron 15 3501 | |
| Lenovo IdeaPad 3 15ALC6 | |
| Asus VivoBook S15 D533UA | |
* ... smaller is better
Storage Devices
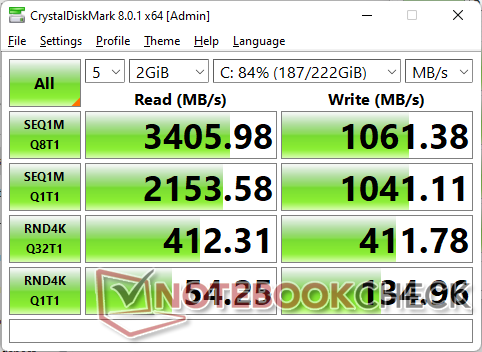
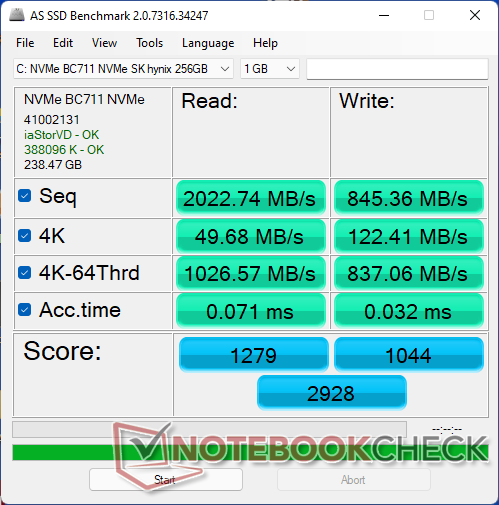
The system can house up to two internal drives. Our specific configuration comes with a 256 GB PCIe3 x4 SK Hynix SK BC711 M.2 2242 NVMe SSD offering sequential read and write rates of up to ~3300 MB/s and ~1000 MB/s, respectively, to be very fast for a budget laptop. The drive is able to maintain its maximum transfer rate over long periods without any heat pads or additional cooling.

* ... smaller is better
Disk Throttling: DiskSpd Read Loop, Queue Depth 8
GPU Performance
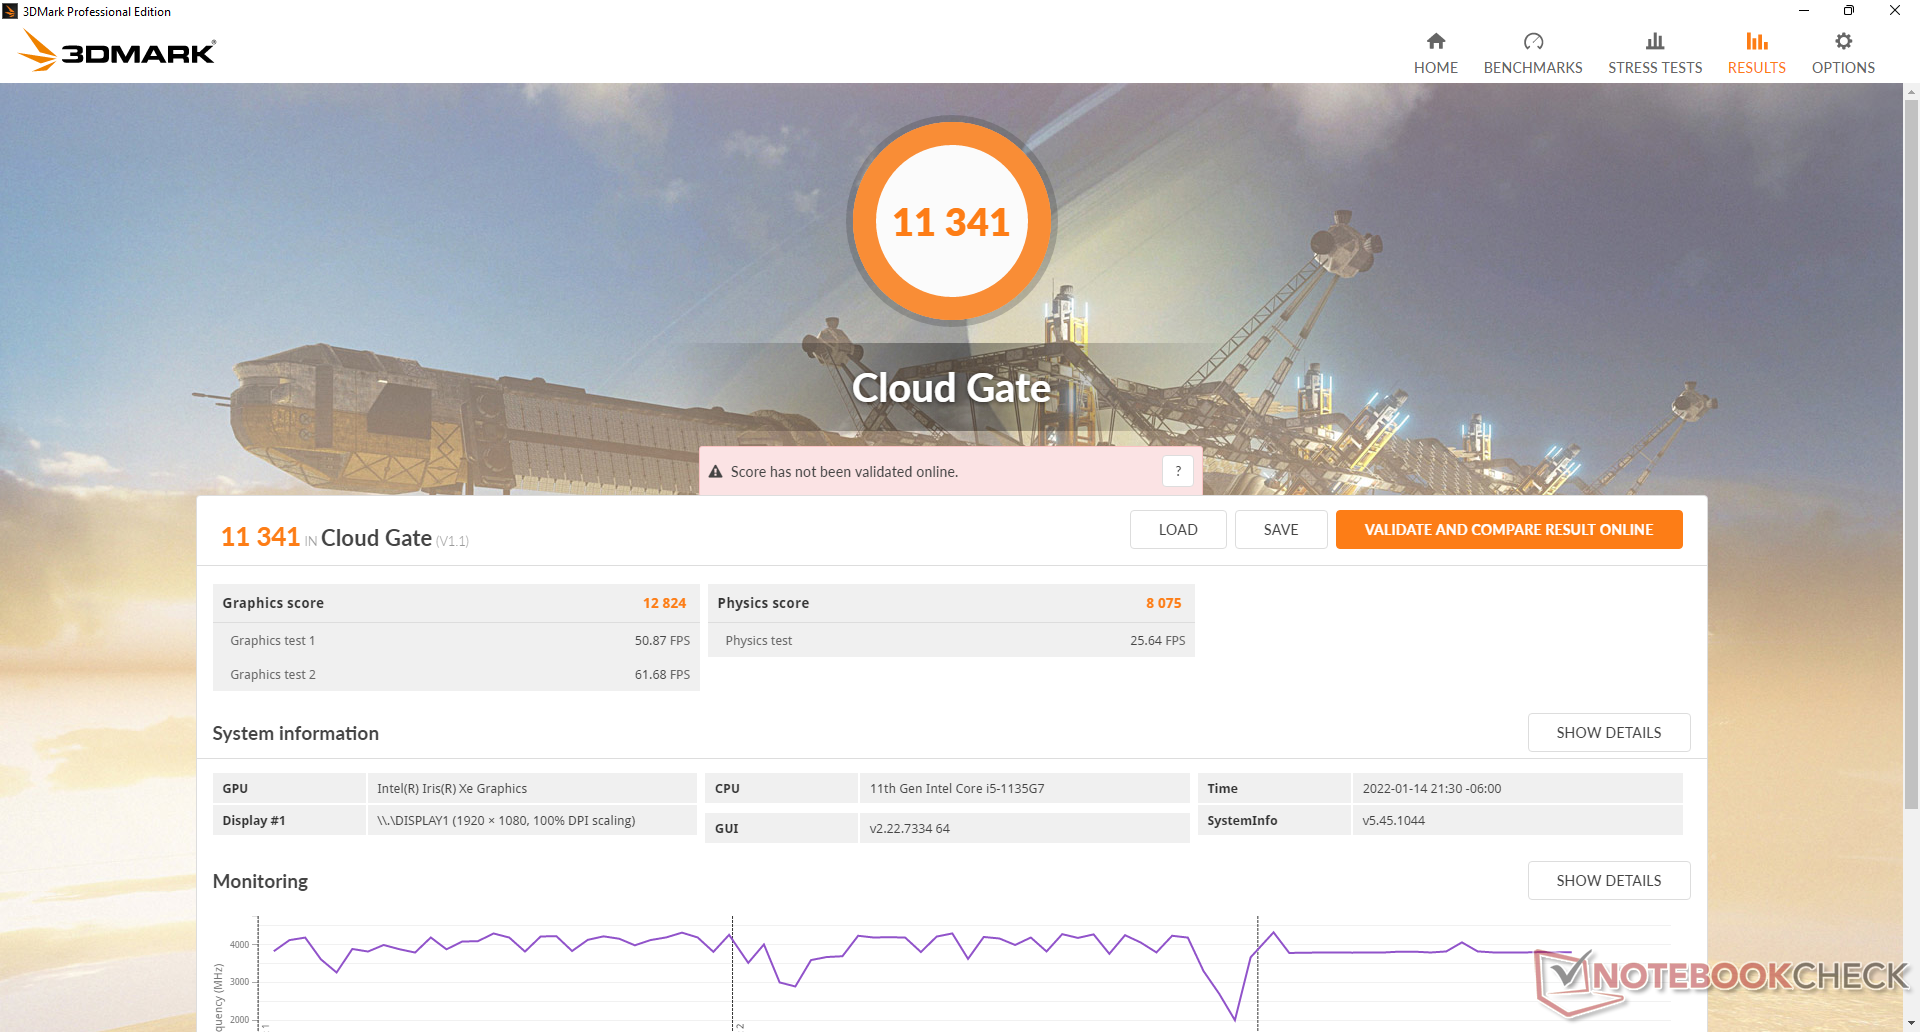
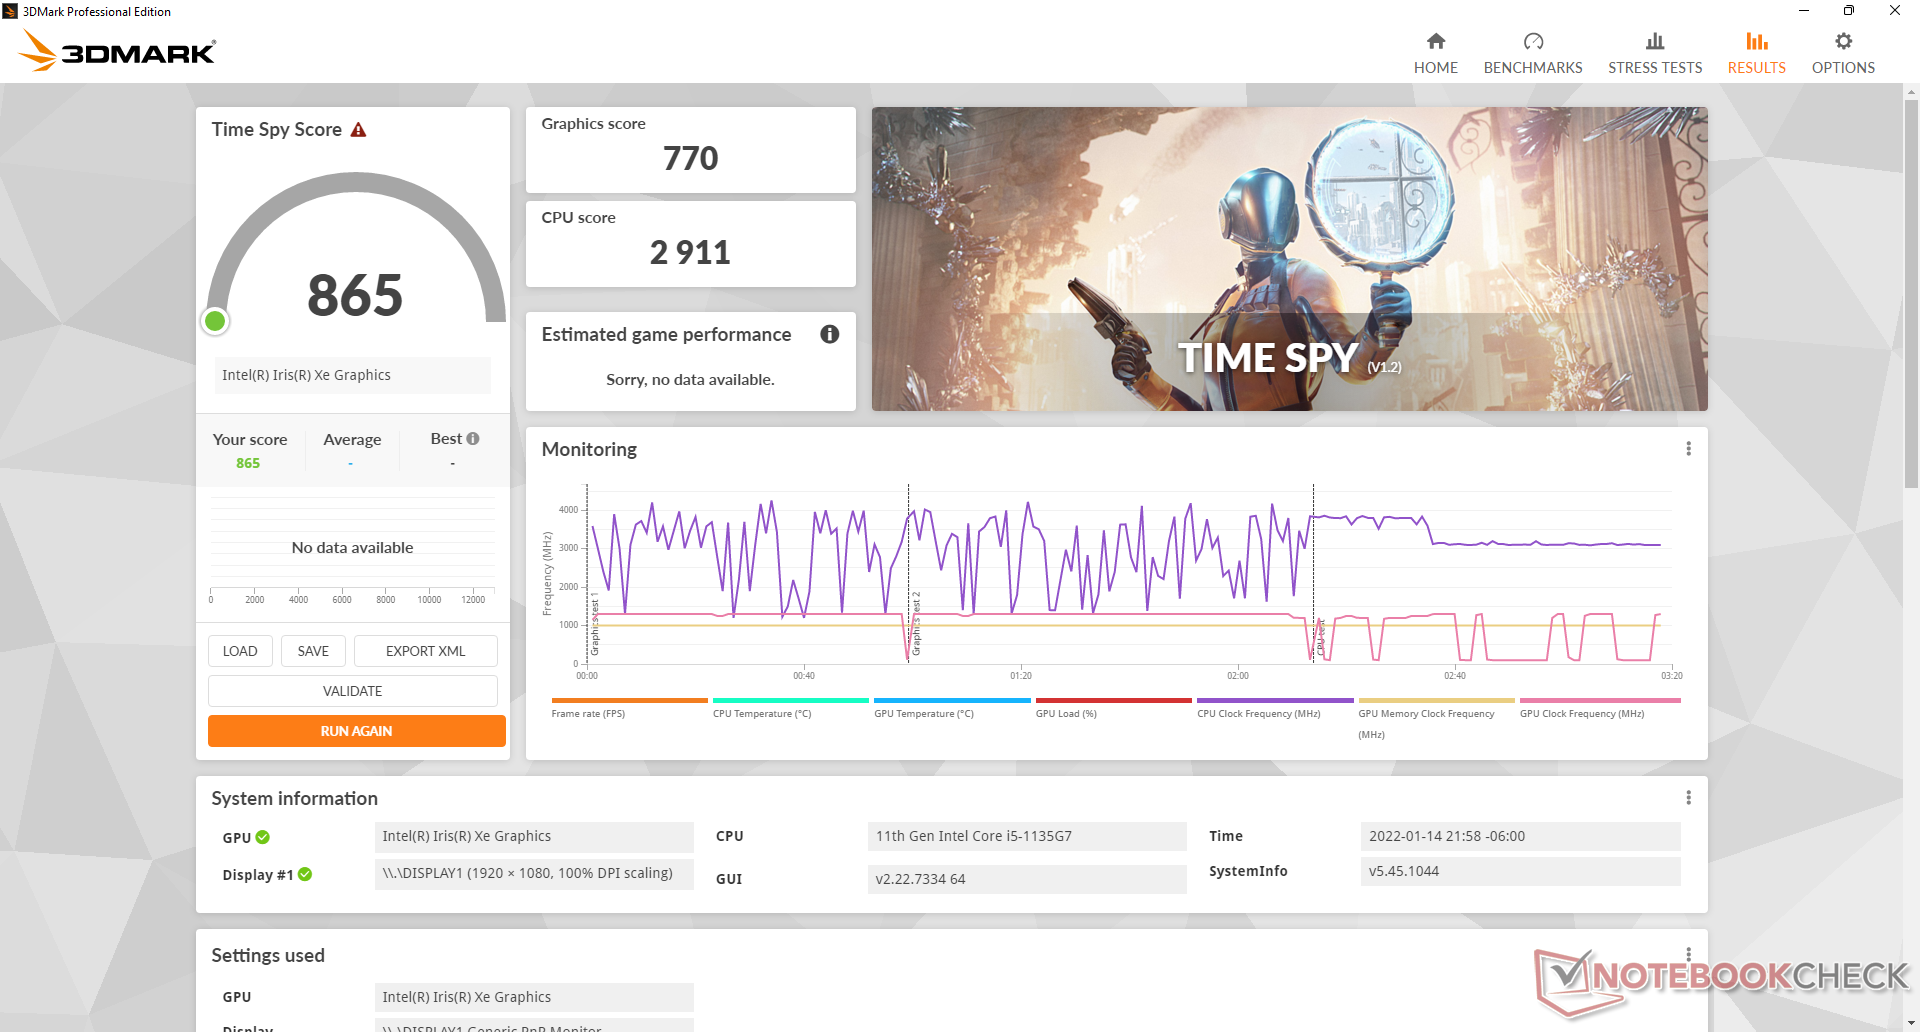
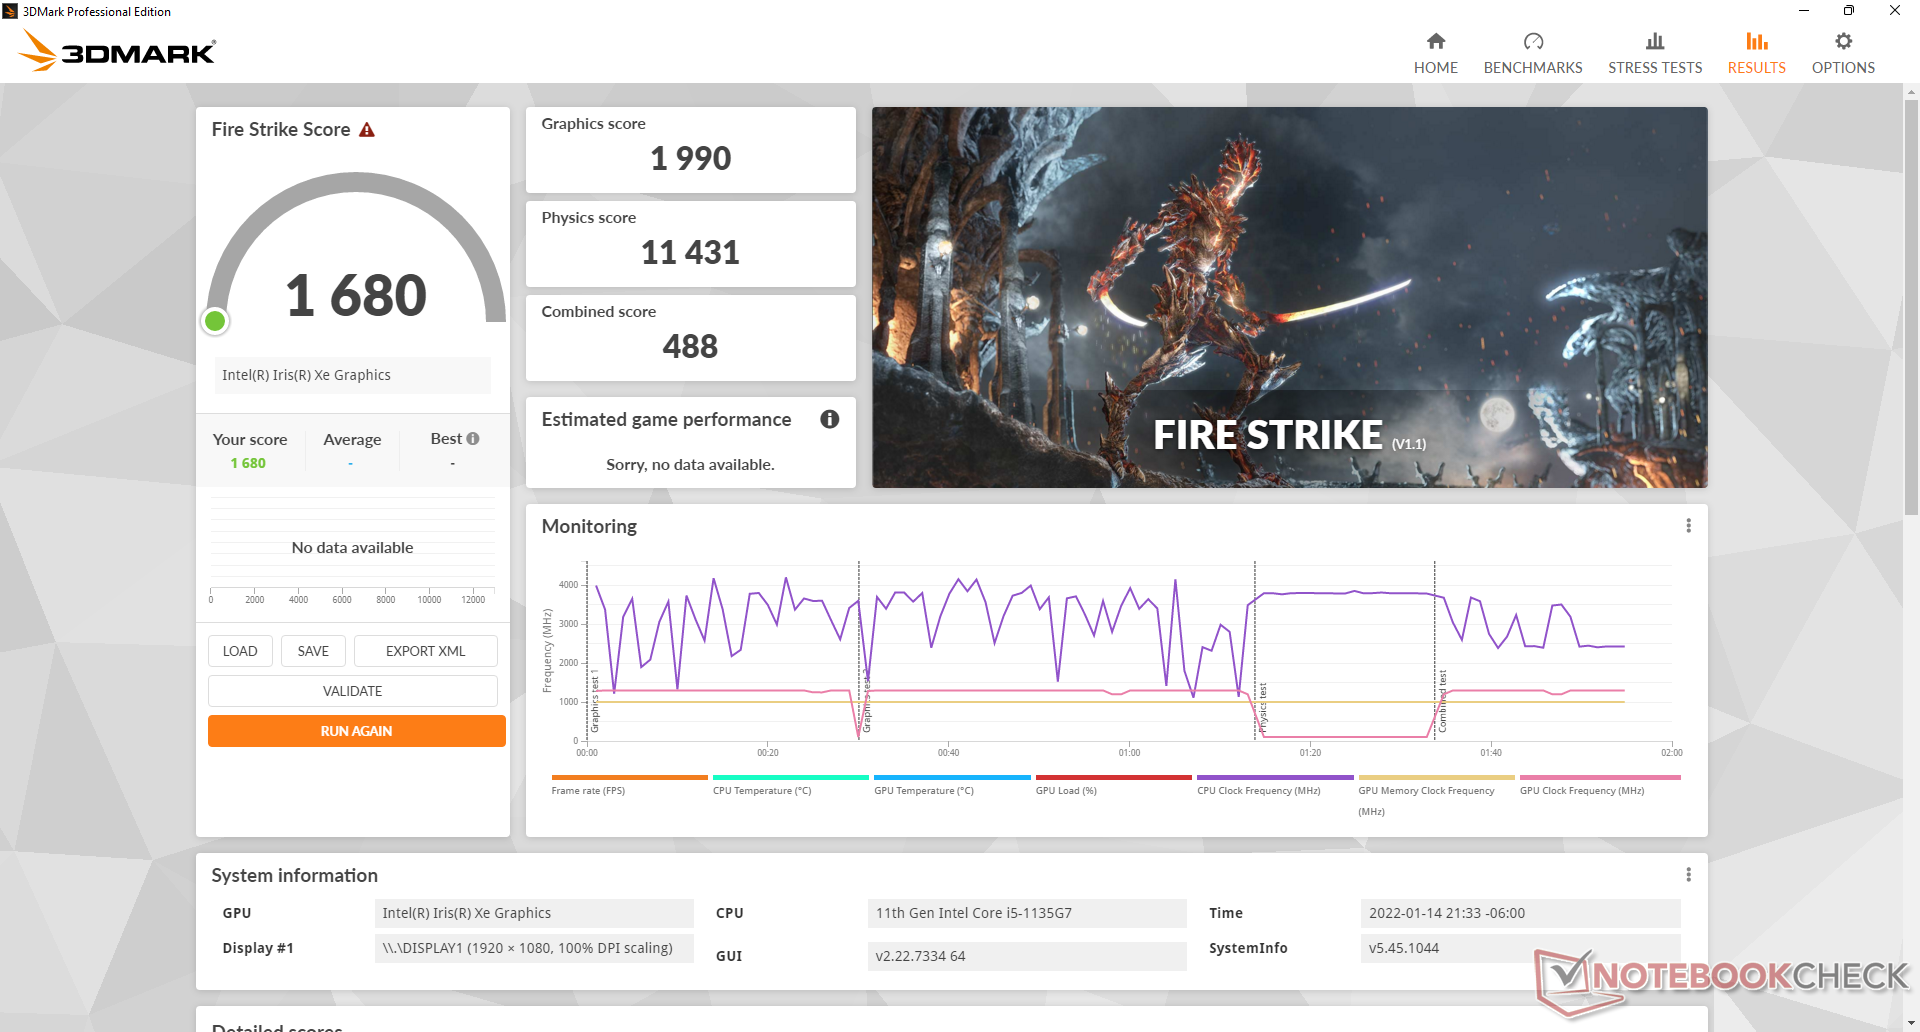
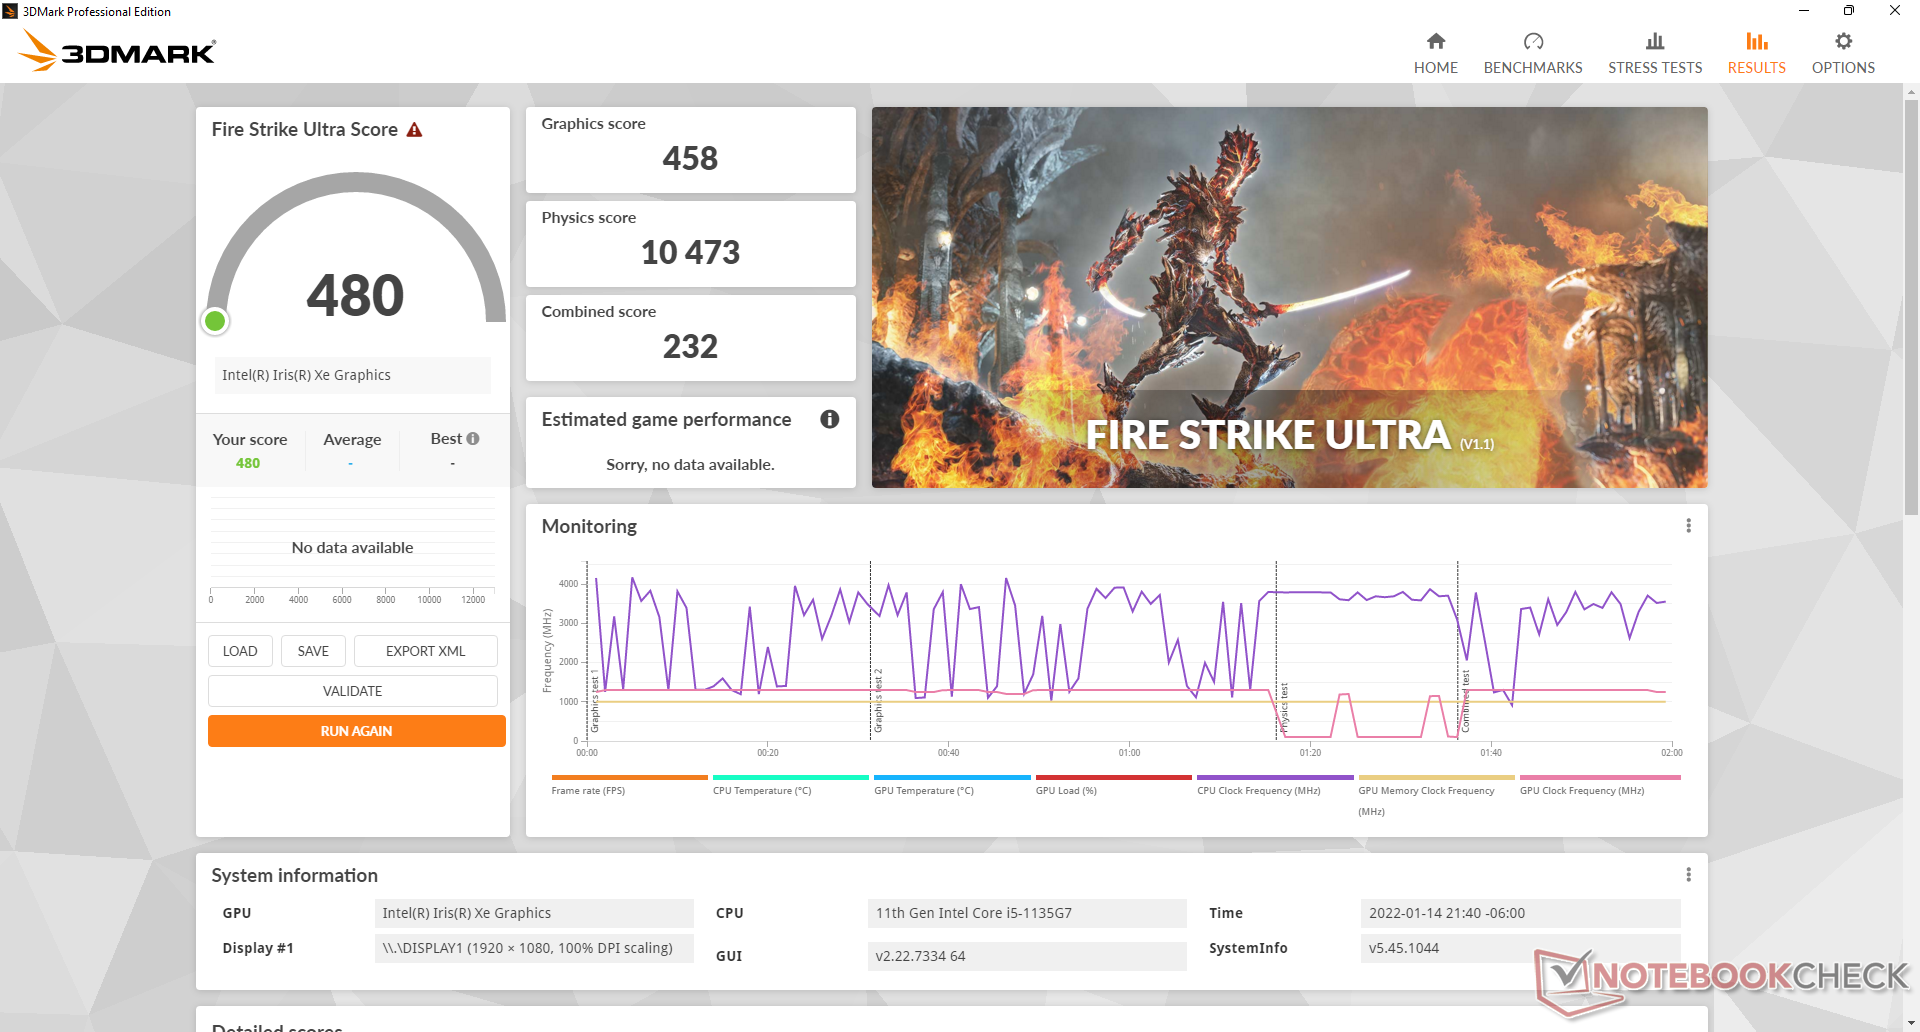
Graphics performance is 30 to 45 percent slower than the average laptop in our database equipped with the same integrated Iris Xe 80 EUs GPU. The disappointing results can be mostly contributed to the measly 8 GB of single-channel memory compared to 16 GB or more of dual-channel memory on the vast majority of pricier models. It's highly recommended to install another stick of RAM if maximizing GPU performance is a priority.
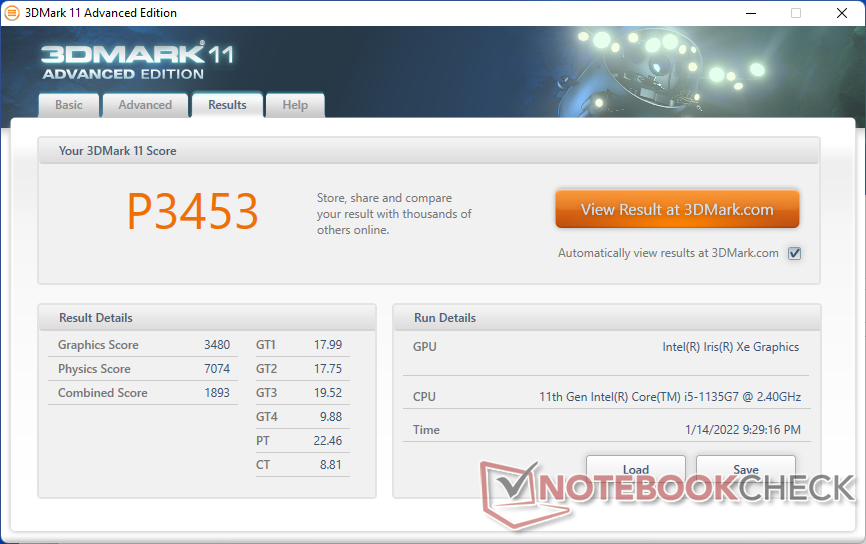
| 3DMark 11 Performance | 3453 points | |
| 3DMark Cloud Gate Standard Score | 11341 points | |
| 3DMark Fire Strike Score | 1680 points | |
| 3DMark Time Spy Score | 865 points | |
Help | ||
Witcher 3 FPS Chart
| low | med. | high | ultra | |
| GTA V (2015) | 37.2 | 28.9 | 7.81 | 3.07 |
| The Witcher 3 (2015) | 33.5 | 22.6 | 10.9 | 6.8 |
| Dota 2 Reborn (2015) | 74.7 | 49.2 | 23.5 | 22.2 |
| Final Fantasy XV Benchmark (2018) | 16.7 | 8.11 | 6.38 | |
| X-Plane 11.11 (2018) | 18.4 | 15.8 | 15.4 | |
| Far Cry 5 (2018) | 17 | 9 | 8 | 8 |
| Strange Brigade (2018) | 36.7 | 13.6 | 11.9 |
Emissions
System Noise
The system is very quiet under most day-to-day loads such as web browsing or video streaming. In fact, it's able to remain almost silent for much longer than expected. The internal fan would remain idle even after running the first benchmark scene of 3DMark 06 which doesn't happen very often on most other laptops.
Running games for extended periods would eventually cause the fan to stabilize at 31.5 dB(A). If the CPU becomes stressed even further, fan noise would top out at almost 40 dB(A) which would still be quieter than most alternatives like the Asus VivoBook S15 or Lenovo IdeaPad 3 15.
Noise Level
| Idle |
| 23.3 / 23.3 / 23.3 dB(A) |
| Load |
| 23.3 / 39.2 dB(A) |
 | ||
30 dB silent 40 dB(A) audible 50 dB(A) loud |
||
min: | ||
| Dell Inspiron 15 3000 3511 Iris Xe G7 80EUs, i5-1135G7, SK Hynix BC711 HFM256GD3GX013N | Dell XPS 15 9510 i5 11400H FHD UHD Graphics Xe 16EUs (Tiger Lake-H), i5-11400H, Micron 2300 512GB MTFDHBA512TDV | Asus VivoBook S15 D533UA Vega 8, R7 5700U, WDC PC SN530 SDBPNPZ-1T00 | Dell Inspiron 15 3501 Iris Xe G7 96EUs, i7-1165G7, Samsung PM991a MZ9LQ512HBLU-00BD1 | Lenovo IdeaPad 3 15ALC6 Vega 6, R3 5300U, Samsung PM991a MZALQ512HBLU | HP Pavilion 15-eg GeForce MX450, i7-1165G7, Samsung PM991 MZVLQ1T0HALB | |
|---|---|---|---|---|---|---|
| Noise | -5% | -28% | -16% | -14% | -20% | |
| off / environment * | 23.2 | 24.4 -5% | 26 -12% | 26 -12% | 25.2 -9% | 25.4 -9% |
| Idle Minimum * | 23.3 | 24.4 -5% | 26 -12% | 26 -12% | 25.8 -11% | 25.6 -10% |
| Idle Average * | 23.3 | 24.4 -5% | 26 -12% | 26 -12% | 25.8 -11% | 25.6 -10% |
| Idle Maximum * | 23.3 | 24.4 -5% | 28.8 -24% | 26 -12% | 25.8 -11% | 25.6 -10% |
| Load Average * | 23.3 | 26.1 -12% | 45 -93% | 35.9 -54% | 32.3 -39% | 39.2 -68% |
| Witcher 3 ultra * | 31.5 | 33.2 -5% | 32 -2% | 39.1 -24% | ||
| Load Maximum * | 39.2 | 37.7 4% | 45 -15% | 35.8 9% | 44 -12% | 41.5 -6% |
* ... smaller is better
Temperature
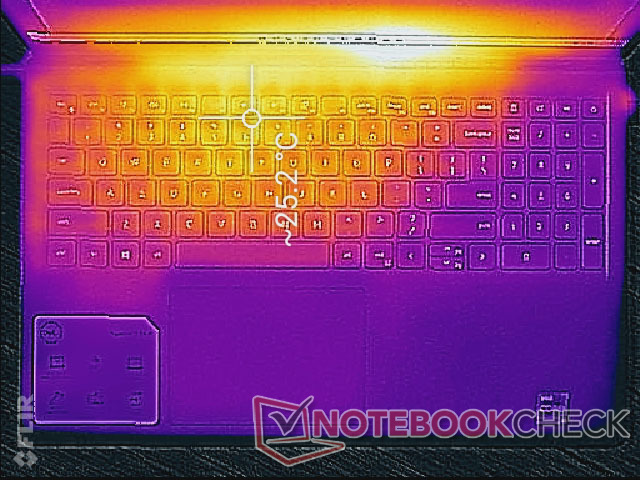
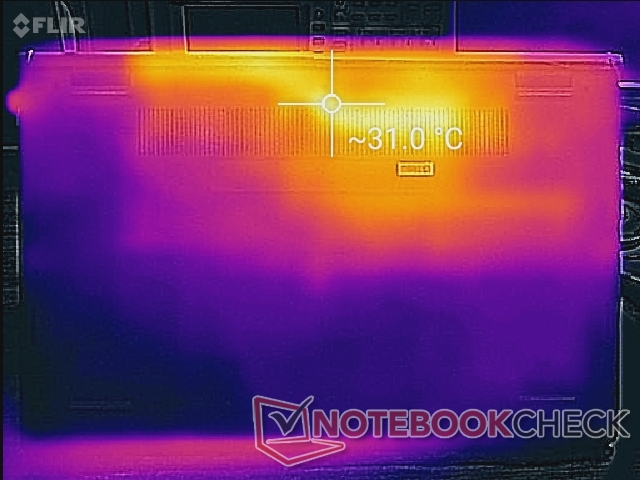
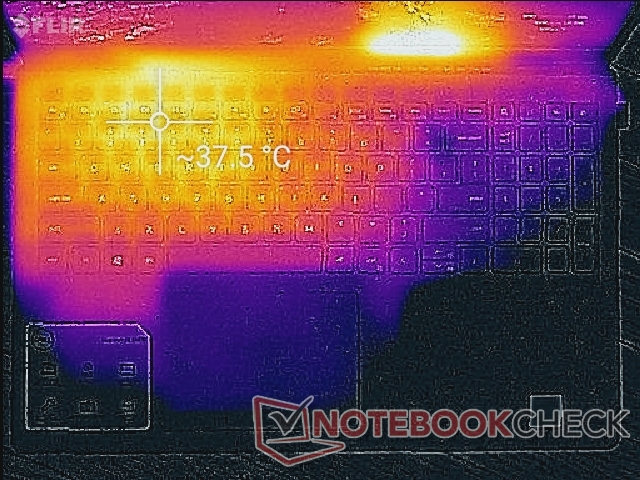
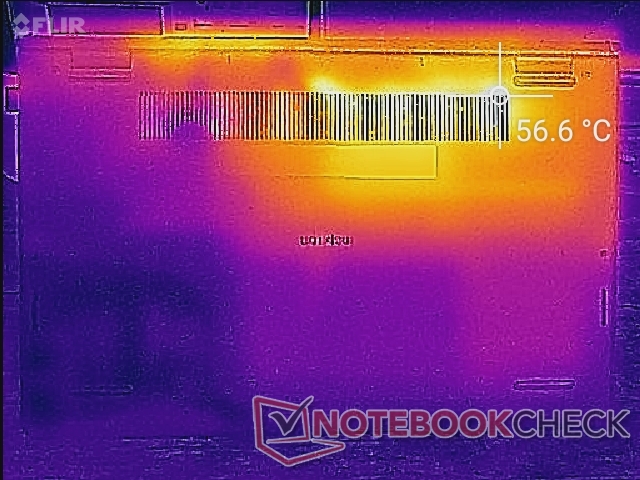
Hot spots are concentrated toward the back of the system where the processor and its cooling solution are positioned. Temperatures can reach up to 38 C and 57 C on the top and bottom of the laptop, respectively, compared to only 31 C and 43 C on the Lenovo IdeaPad 3 15. The palm rest and most of the keyboard will always be much cooler for comfortable use no matter the load.


(+) The maximum temperature on the upper side is 37.8 °C / 100 F, compared to the average of 34.2 °C / 94 F, ranging from 21.2 to 62.5 °C for the class Office.
(-) The bottom heats up to a maximum of 55.6 °C / 132 F, compared to the average of 36.7 °C / 98 F
(+) In idle usage, the average temperature for the upper side is 21.8 °C / 71 F, compared to the device average of 29.5 °C / 85 F.
(+) The palmrests and touchpad are cooler than skin temperature with a maximum of 20.6 °C / 69.1 F and are therefore cool to the touch.
(+) The average temperature of the palmrest area of similar devices was 27.7 °C / 81.9 F (+7.1 °C / 12.8 F).
| Dell Inspiron 15 3000 3511 Intel Core i5-1135G7, Intel Iris Xe Graphics G7 80EUs | Dell XPS 15 9510 i5 11400H FHD Intel Core i5-11400H, Intel UHD Graphics Xe 16EUs (Tiger Lake-H) | Asus VivoBook S15 D533UA AMD Ryzen 7 5700U, AMD Radeon RX Vega 8 (Ryzen 4000/5000) | Dell Inspiron 15 3501 Intel Core i7-1165G7, Intel Iris Xe Graphics G7 96EUs | Lenovo IdeaPad 3 15ALC6 AMD Ryzen 3 5300U, AMD Radeon RX Vega 6 (Ryzen 4000/5000) | HP Pavilion 15-eg Intel Core i7-1165G7, NVIDIA GeForce MX450 | |
|---|---|---|---|---|---|---|
| Heat | 8% | 0% | 2% | 14% | -2% | |
| Maximum Upper Side * | 37.8 | 42.8 -13% | 46.1 -22% | 45.6 -21% | 31.2 17% | 44 -16% |
| Maximum Bottom * | 55.6 | 41.2 26% | 46.6 16% | 41 26% | 43 23% | 53.4 4% |
| Idle Upper Side * | 26.2 | 25.8 2% | 27.4 -5% | 28.2 -8% | 24.8 5% | 27.4 -5% |
| Idle Bottom * | 32 | 26.2 18% | 28.2 12% | 29.1 9% | 28.2 12% | 28.8 10% |
* ... smaller is better
Stress Test
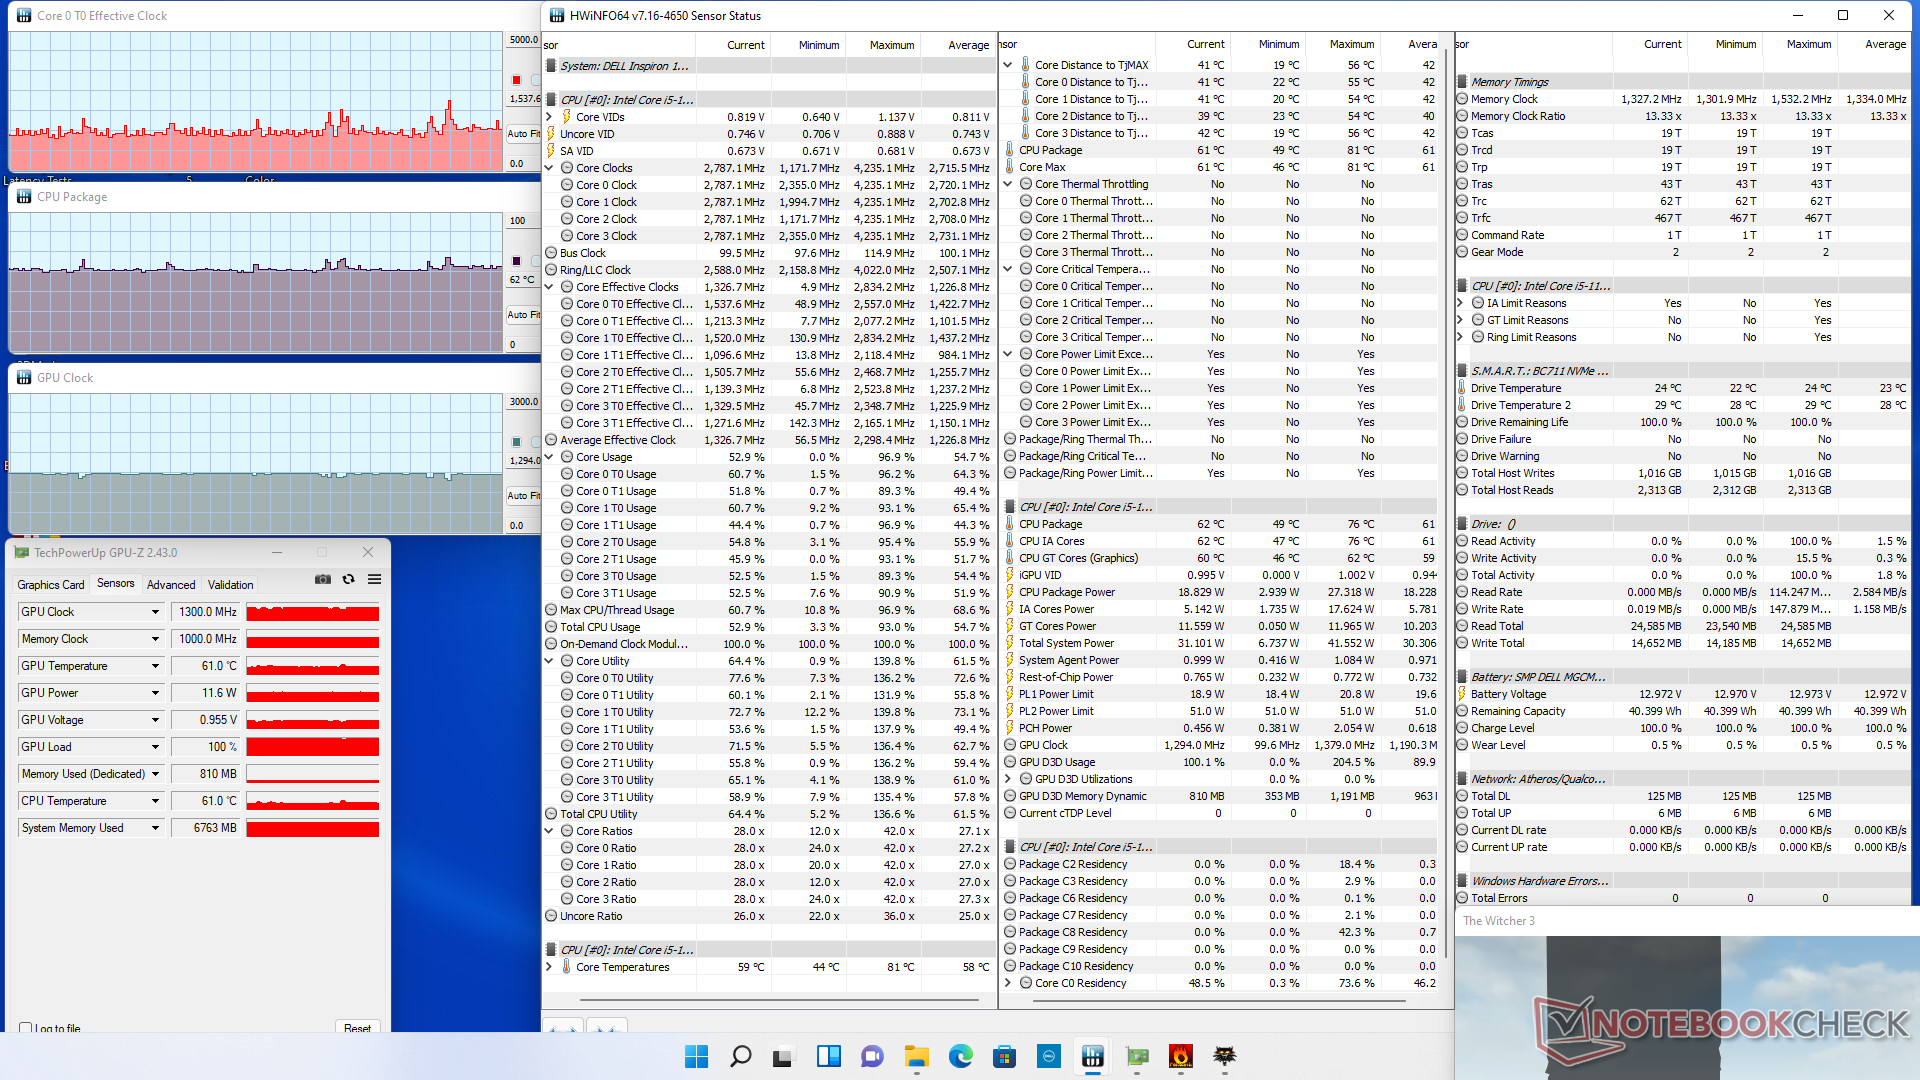
Running Prime95 causes the CPU to spike to 3.5 GHz for the first few seconds until its core temperature reaches 100 C. Clock rates would then drop quickly to the 2.5 to 2.8 GHz range in order to maintain a cooler temperature of 80 C. CPU package power would peak at around 34 W during the start of the test before stabilizing at 22 W. Running this same test on the Core i7 Asus Vivobook 15 K513EQ would result in a higher steady clock rate of 3.1 GHz instead.
The CPU would stabilize at 62 C when running Witcher 3 to represent heavy loads compared to 57 C on the AMD-powered Lenovo IdeaPad 3 15ALC6.
Running on battery power will not limit performance. 3DMark 11 scores would remain essentially identical between battery power and AC adapter power.
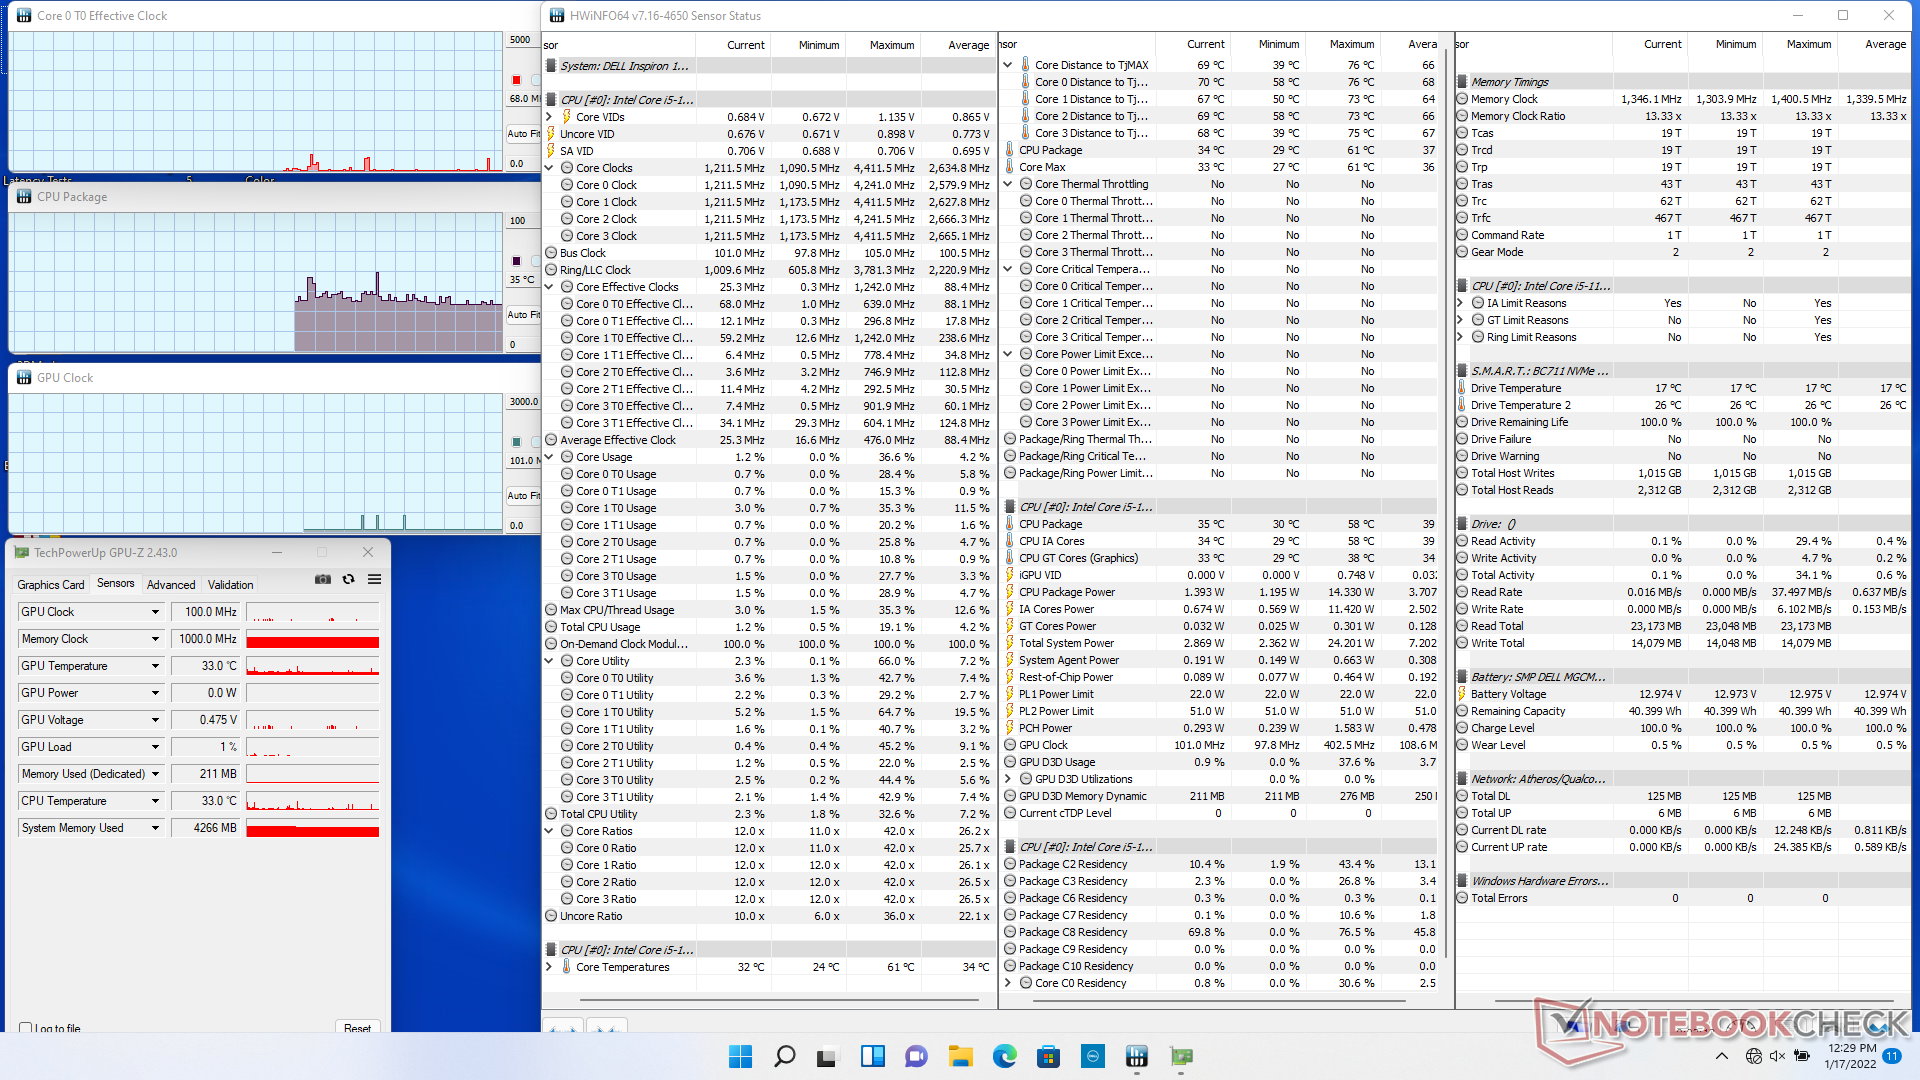
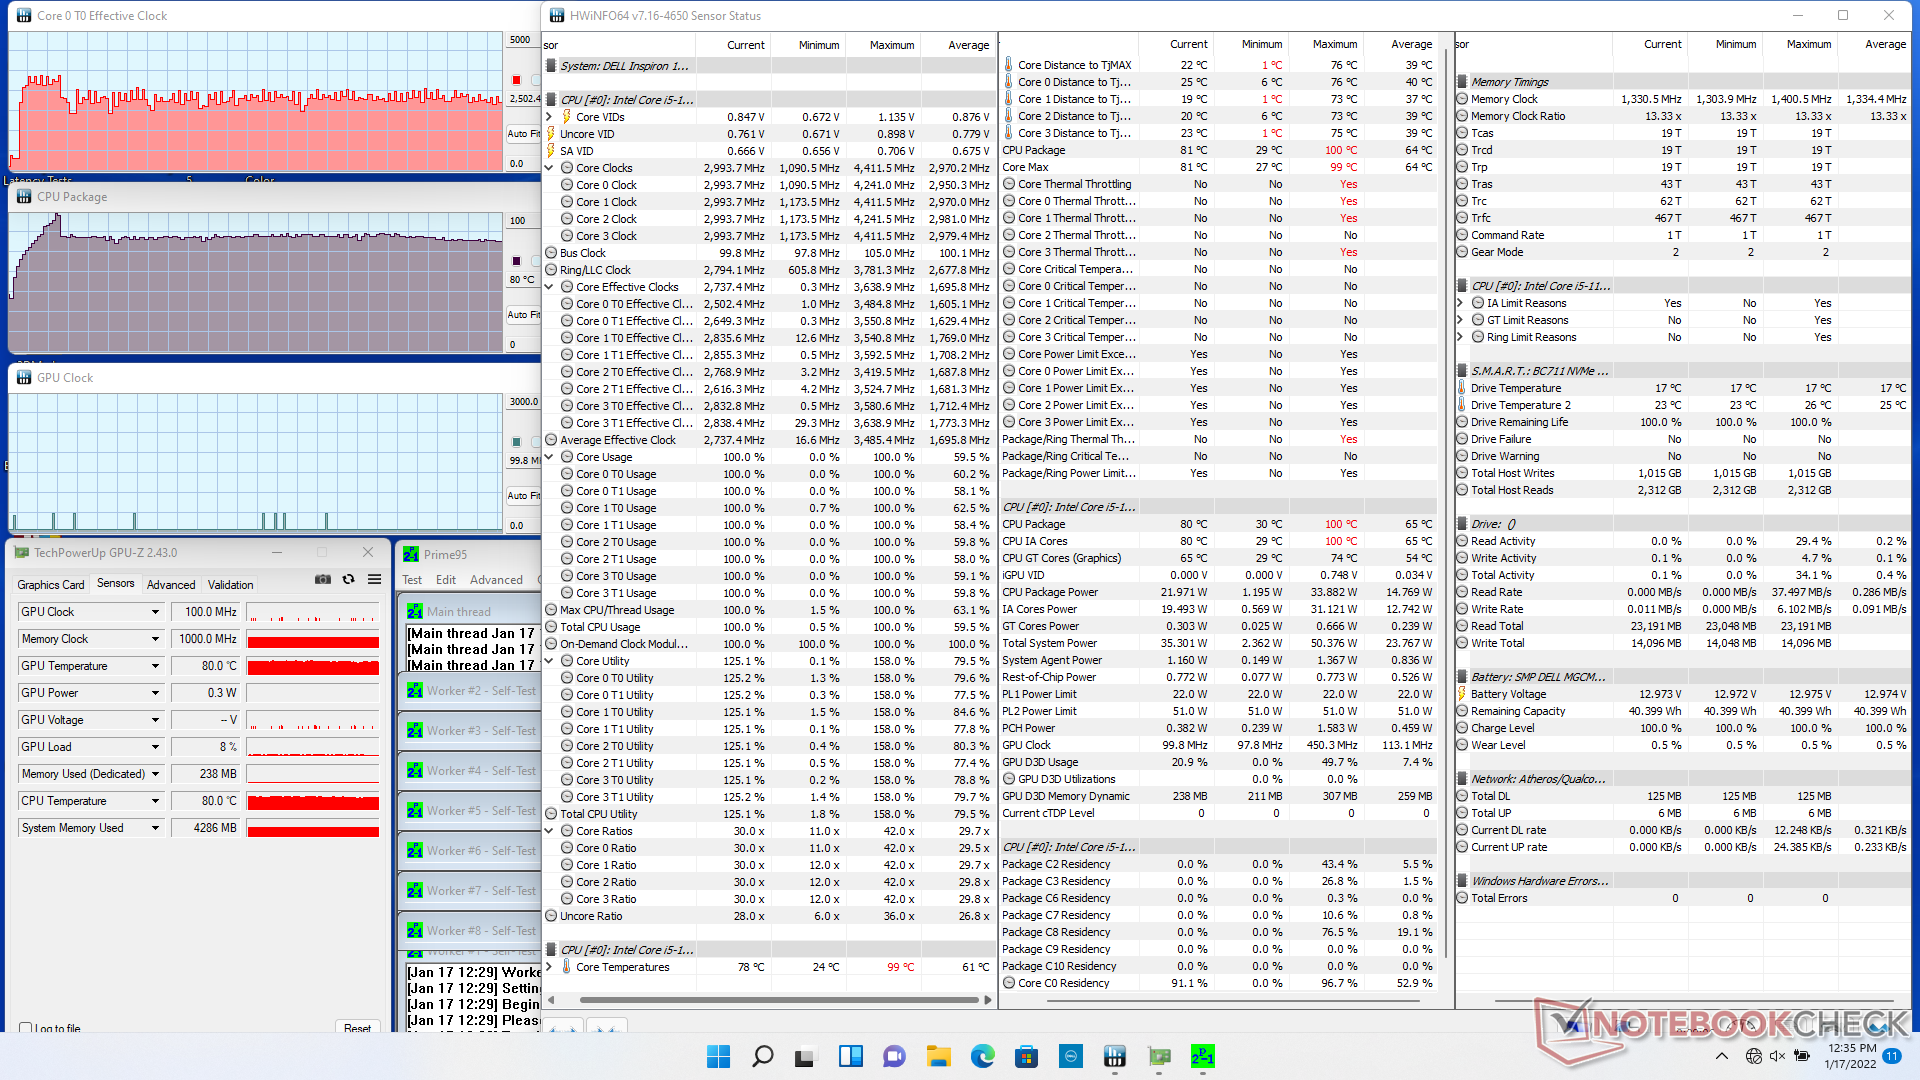
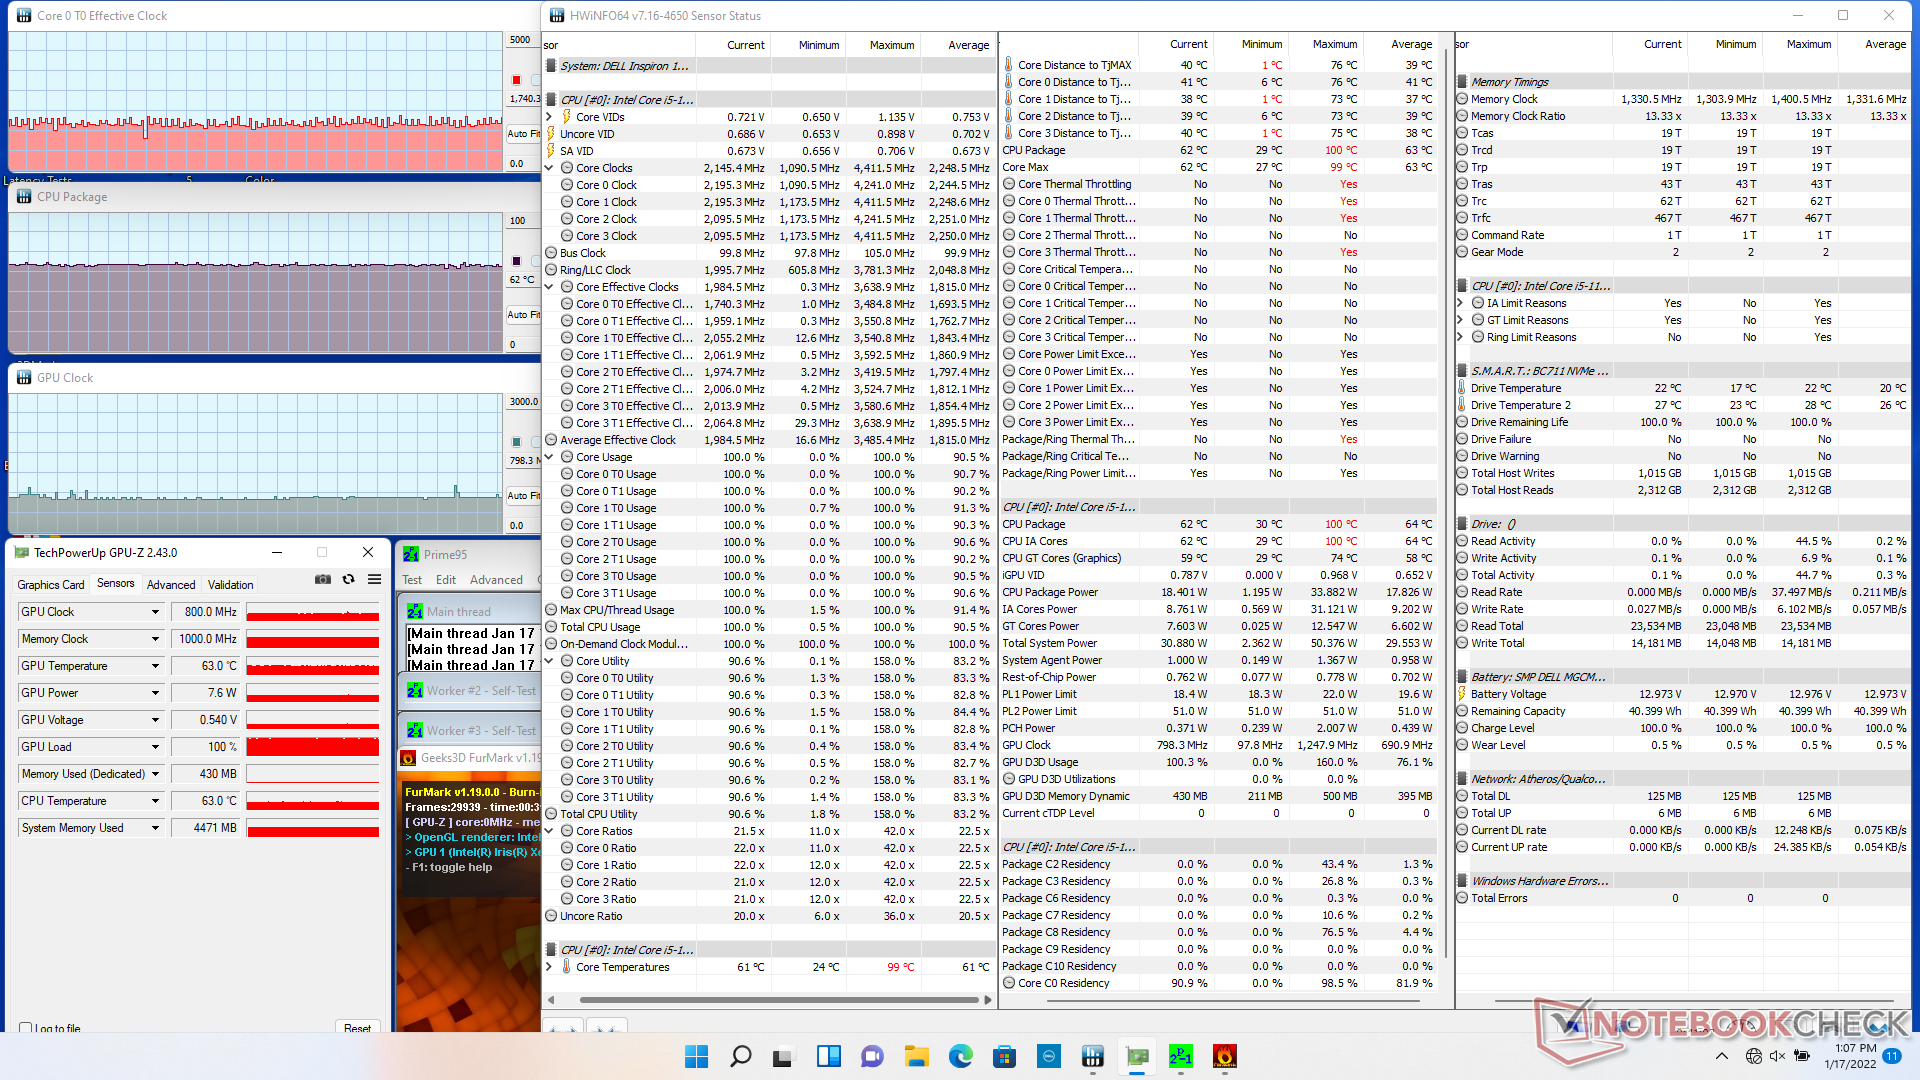
| CPU Clock (GHz) | GPU Clock (MHz) | Average CPU Temperature (°C) | |
| System Idle | -- | -- | 35 |
| Prime95 Stress | 2.5 - 2.8 | -- | 80 |
| Prime95 + FurMark Stress | 1.4 - 1.7 | 800 | 62 |
| Witcher 3 Stress | ~1.5 | 1300 | 62 |
Speakers
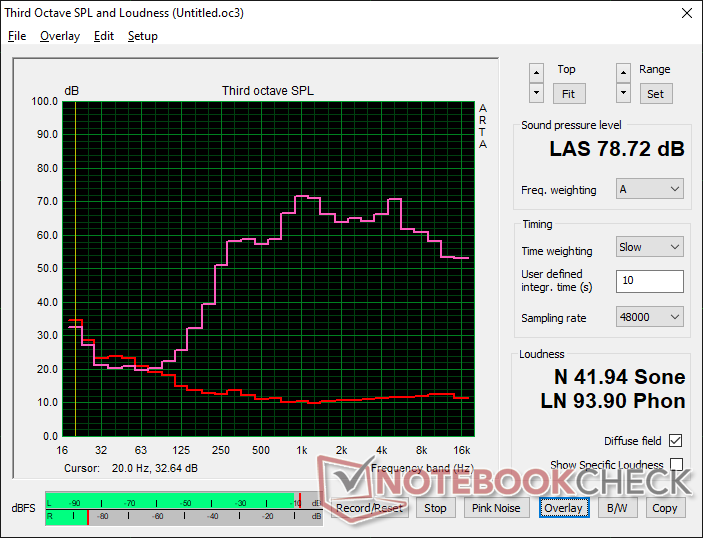
Dell Inspiron 15 3000 3511 audio analysis
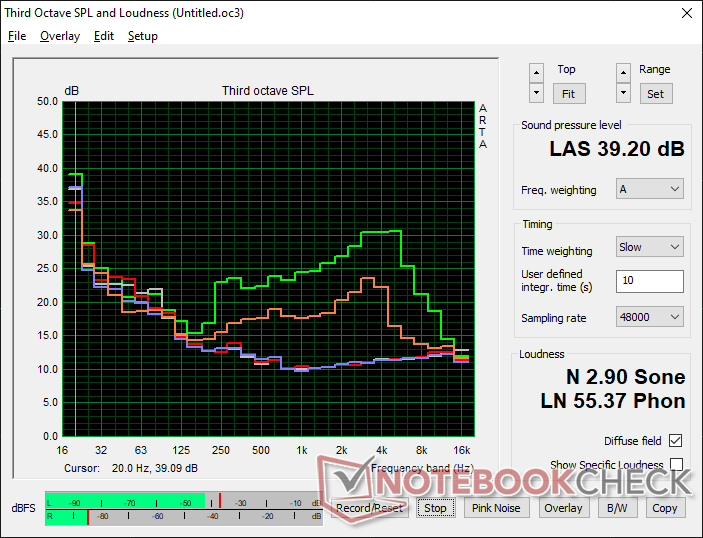
(±) | speaker loudness is average but good (78.7 dB)
Bass 100 - 315 Hz
(-) | nearly no bass - on average 20.8% lower than median
(±) | linearity of bass is average (13.3% delta to prev. frequency)
Mids 400 - 2000 Hz
(±) | higher mids - on average 5.8% higher than median
(+) | mids are linear (6.4% delta to prev. frequency)
Highs 2 - 16 kHz
(±) | higher highs - on average 5.2% higher than median
(+) | highs are linear (6.4% delta to prev. frequency)
Overall 100 - 16.000 Hz
(±) | linearity of overall sound is average (21.6% difference to median)
Compared to same class
» 49% of all tested devices in this class were better, 10% similar, 41% worse
» The best had a delta of 7%, average was 22%, worst was 53%
Compared to all devices tested
» 56% of all tested devices were better, 7% similar, 37% worse
» The best had a delta of 4%, average was 25%, worst was 134%
Apple MacBook Pro 16 2021 M1 Pro audio analysis
(+) | speakers can play relatively loud (84.7 dB)
Bass 100 - 315 Hz
(+) | good bass - only 3.8% away from median
(+) | bass is linear (5.2% delta to prev. frequency)
Mids 400 - 2000 Hz
(+) | balanced mids - only 1.3% away from median
(+) | mids are linear (2.1% delta to prev. frequency)
Highs 2 - 16 kHz
(+) | balanced highs - only 1.9% away from median
(+) | highs are linear (2.7% delta to prev. frequency)
Overall 100 - 16.000 Hz
(+) | overall sound is linear (4.6% difference to median)
Compared to same class
» 0% of all tested devices in this class were better, 0% similar, 100% worse
» The best had a delta of 5%, average was 18%, worst was 45%
Compared to all devices tested
» 0% of all tested devices were better, 0% similar, 100% worse
» The best had a delta of 4%, average was 25%, worst was 134%
Energy Management
Power Consumption
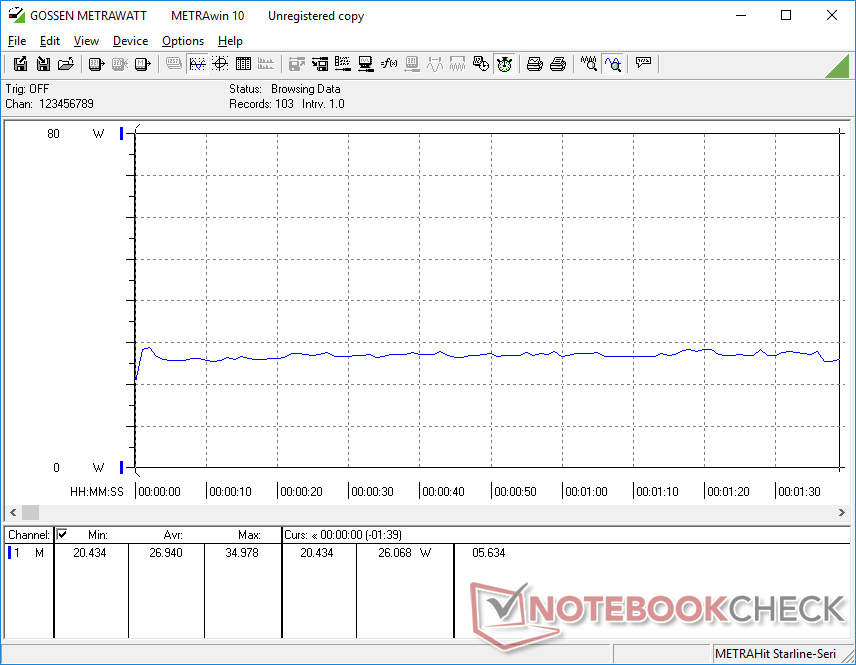
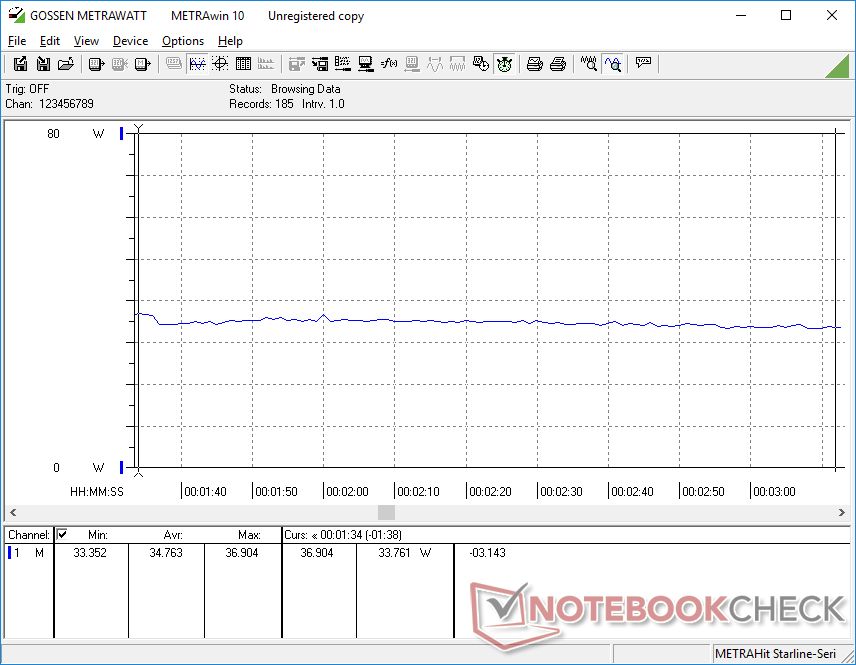
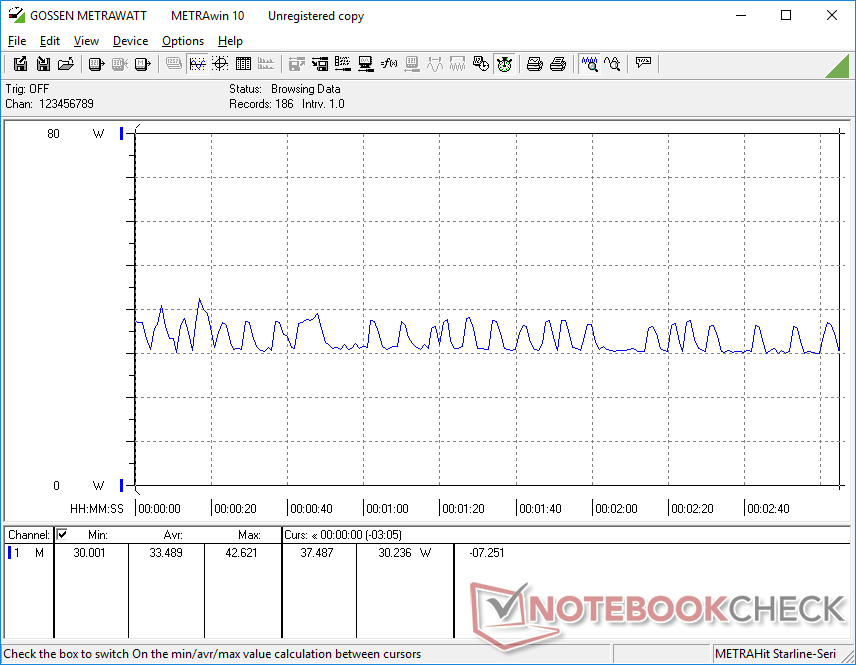
Idling on desktop draws between 3 W and 7 W to be more efficient than expected relative to other 15.6-inch laptops running on U-series CPUs. Interestingly, power consumption is not steady when running Witcher 3; the system would cycle between 30 W and 42 W even though frame rates appear to be steady.
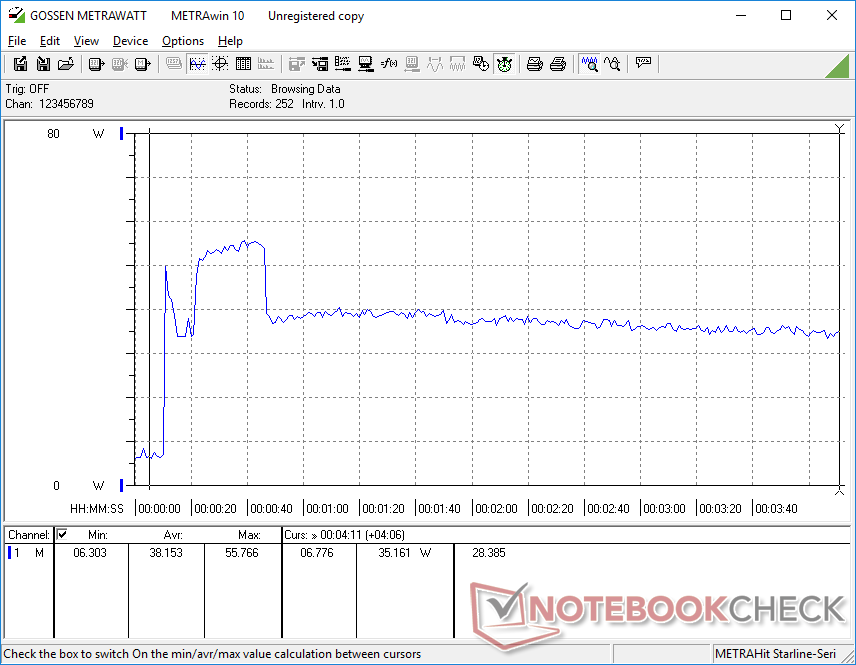
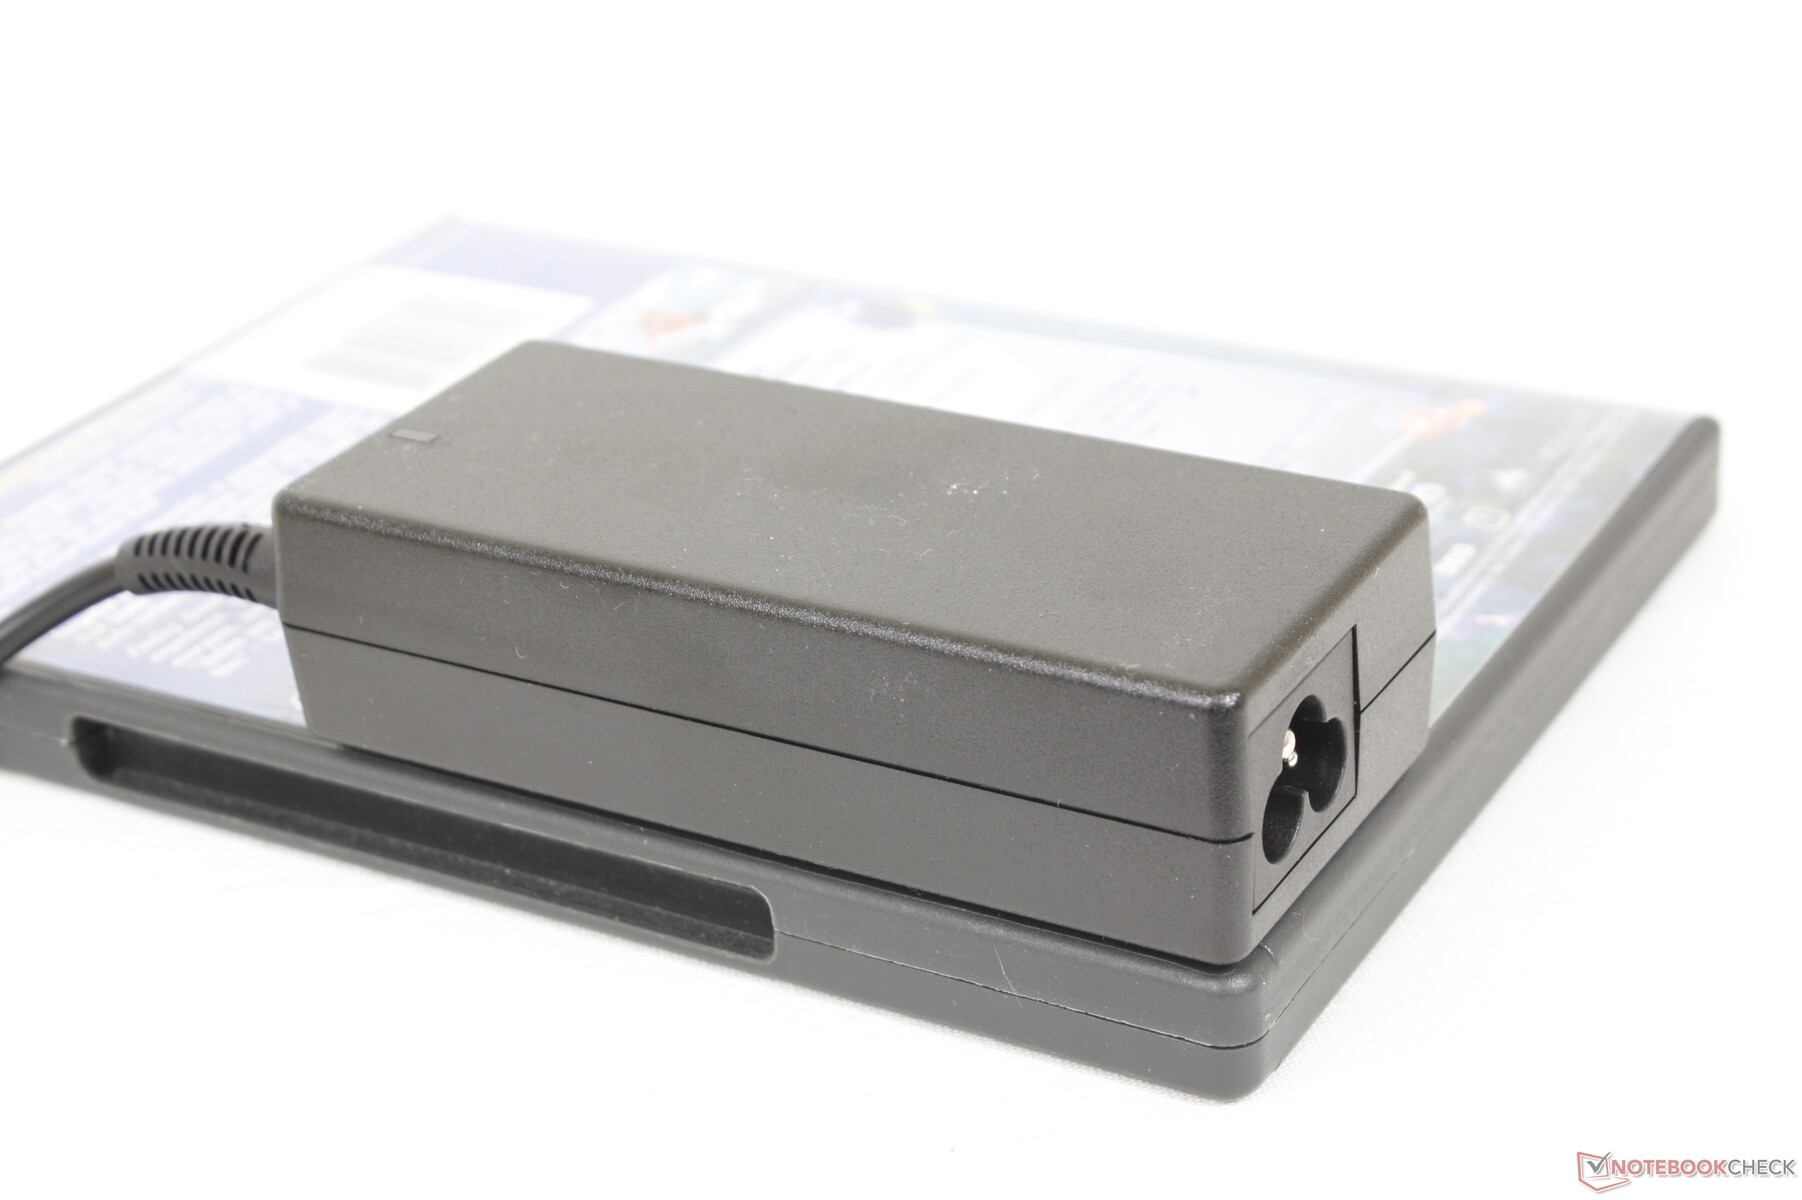
We're able to record a maximum draw of 56 W from the small (~10.6 x 4.5 x 2.8 cm) 65 W AC adapter when running extreme loads where the CPU reaches 100 percent utilization. This draw is only temporary as shown by our graph below.
| Off / Standby | |
| Idle | |
| Load |
|
| Dell Inspiron 15 3000 3511 i5-1135G7, Iris Xe G7 80EUs, SK Hynix BC711 HFM256GD3GX013N, IPS, 1920x1080, 15.60 | Dell XPS 15 9510 i5 11400H FHD i5-11400H, UHD Graphics Xe 16EUs (Tiger Lake-H), Micron 2300 512GB MTFDHBA512TDV, IPS, 1920x1200, 15.60 | Asus VivoBook S15 D533UA R7 5700U, Vega 8, WDC PC SN530 SDBPNPZ-1T00, IPS, 1920x1080, 15.60 | Dell Inspiron 15 3501 i7-1165G7, Iris Xe G7 96EUs, Samsung PM991a MZ9LQ512HBLU-00BD1, IPS, 1920x1080, 15.60 | Lenovo IdeaPad 3 15ALC6 R3 5300U, Vega 6, Samsung PM991a MZALQ512HBLU, IPS, 1920x1080, 15.60 | HP Pavilion 15-eg i7-1165G7, GeForce MX450, Samsung PM991 MZVLQ1T0HALB, IPS, 1920x1080, 15.60 | |
|---|---|---|---|---|---|---|
| Power Consumption | -38% | -48% | -14% | -20% | -74% | |
| Idle Minimum * | 3.1 | 5.3 -71% | 5 -61% | 3.6 -16% | 5.6 -81% | 4.9 -58% |
| Idle Average * | 5.6 | 9 -61% | 7.7 -38% | 6.4 -14% | 6 -7% | 7.9 -41% |
| Idle Maximum * | 6.4 | 9.7 -52% | 12.2 -91% | 7.9 -23% | 7 -9% | 14.2 -122% |
| Load Average * | 26.9 | 30.3 -13% | 41 -52% | 39 -45% | 34.9 -30% | 64.3 -139% |
| Witcher 3 ultra * | 33.5 | 30.6 9% | 43 -28% | 37.6 -12% | 32.5 3% | 55.6 -66% |
| Load Maximum * | 55.8 | 76.2 -37% | 65 -16% | 41.8 25% | 52.1 7% | 65.4 -17% |
* ... smaller is better
Power Consumption Witcher 3 / Stresstest
Power Consumption external Monitor
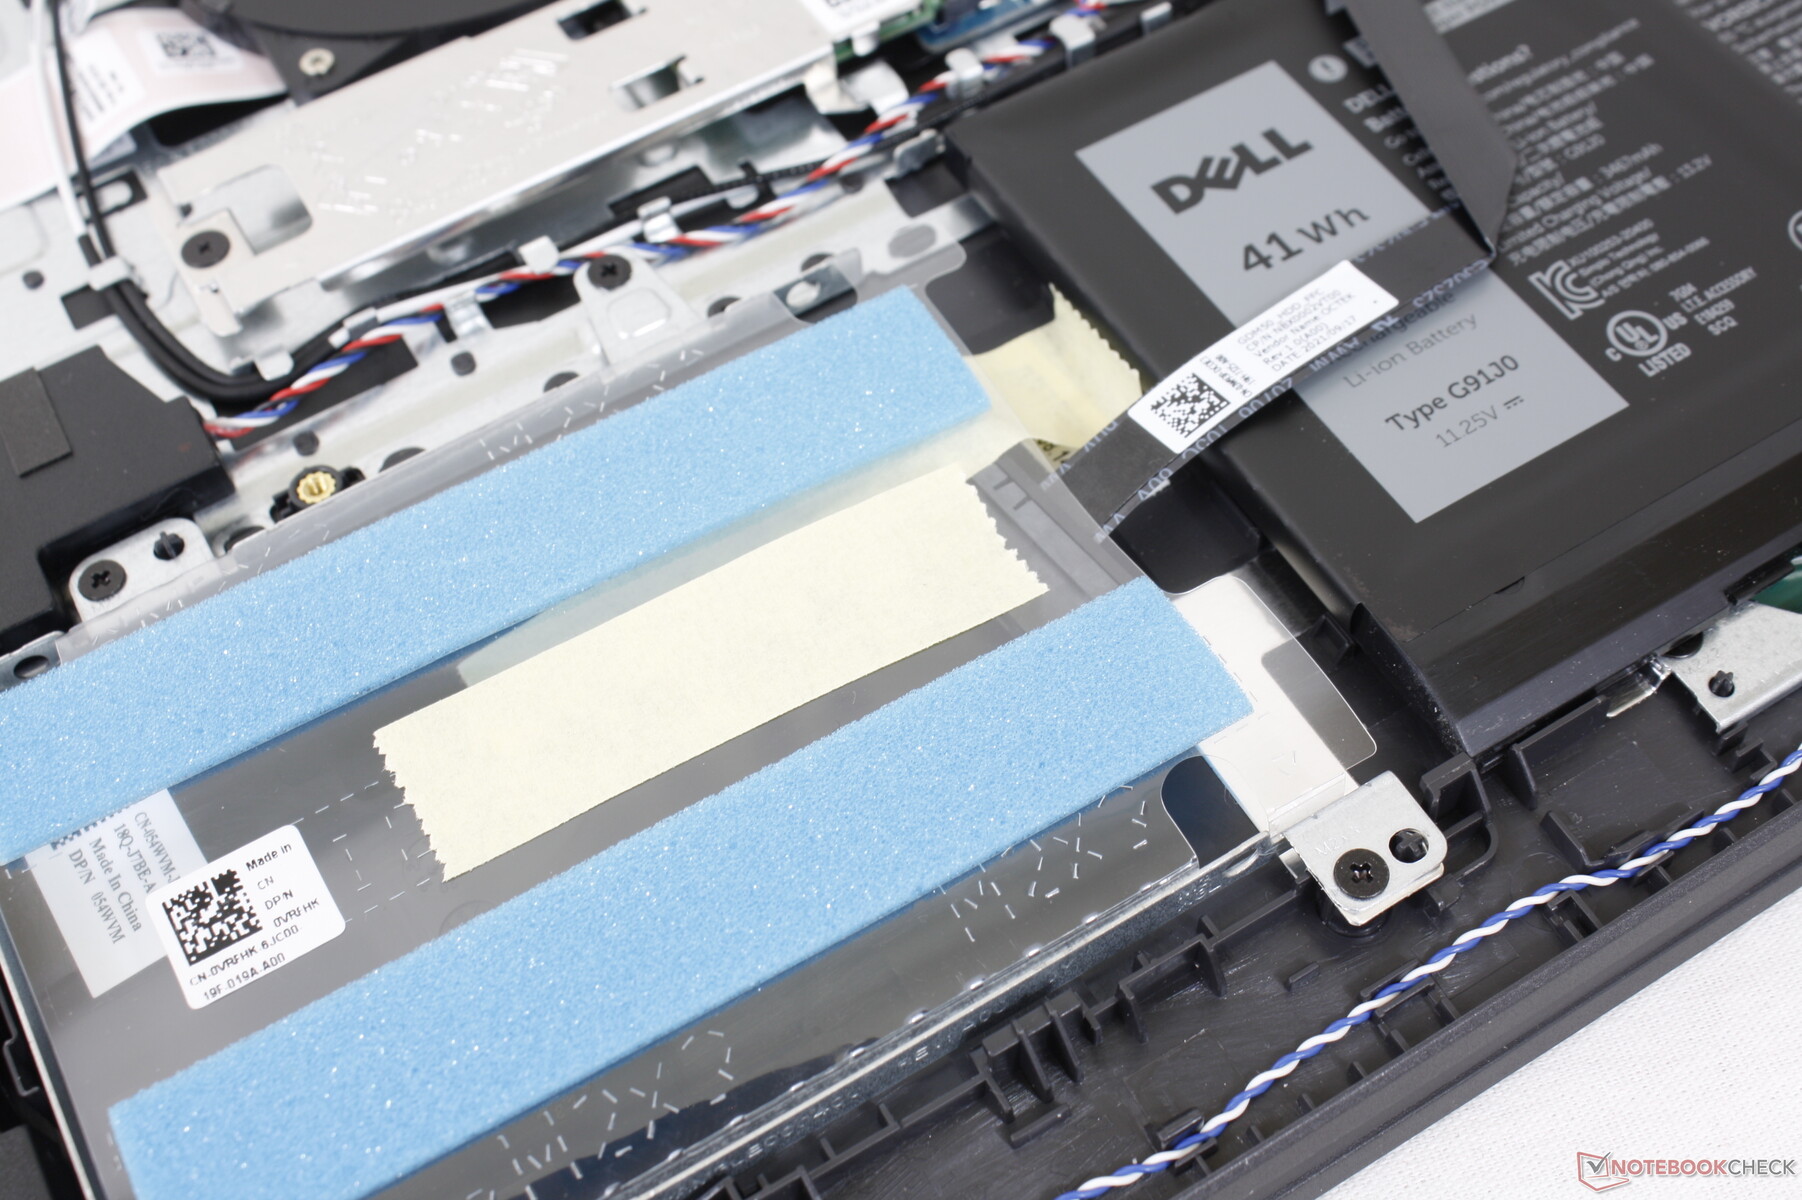
Battery Life
Expect about 6.5 hours of real-world WLAN use before needing to recharge the internal 40 Wh battery. Results are somewhat comparable to the HP Pavilion 15-eg which also comes with a battery of similar size.
Charging from empty to full takes roughly 2 hours with the included AC adapter.
| Dell Inspiron 15 3000 3511 i5-1135G7, Iris Xe G7 80EUs, 40 Wh | Dell XPS 15 9510 i5 11400H FHD i5-11400H, UHD Graphics Xe 16EUs (Tiger Lake-H), 56 Wh | Asus VivoBook S15 D533UA R7 5700U, Vega 8, 50 Wh | Dell Inspiron 15 3501 i7-1165G7, Iris Xe G7 96EUs, 42 Wh | Lenovo IdeaPad 3 15ALC6 R3 5300U, Vega 6, 45 Wh | HP Pavilion 15-eg i7-1165G7, GeForce MX450, 41 Wh | |
|---|---|---|---|---|---|---|
| Battery Runtime | 17% | 41% | 8% | 47% | 5% | |
| Reader / Idle | 767 | 1205 57% | 901 17% | |||
| WiFi v1.3 | 381 | 445 17% | 538 41% | 410 8% | 628 65% | 396 4% |
| Load | 79 | 95 20% | 74 -6% |
Pros
Cons
Verdict
Our favorite aspect of the Inspiron 15 3511 is how easily serviceable it is. Inexpensive models tend to dissuade end-user upgrades by making their bottom panels difficult to remove or by hiding screws underneath the rubber feet. The fact that our Inspiron houses 2x SODIMM slots and 2x storage bays means owners can simply buy a low-end configuration and then add more RAM or storage themselves to save on costs. The single-channel RAM on our test unit in particular significantly impacts the graphics performance of Iris Xe and so it's highly recommended to add another module to boost GPU performance.
Fan noise, or lack thereof, is another aspect worth praising. The system is able to remain quieter for longer than most other Ultrabooks even when running more demanding loads. Remember that the model is using the same 11th gen Core i5 and Core i7 CPUs as on the XPS 13 series retailing for twice the price.
Th Inspiron 15 3511 is perhaps one of the easiest budget laptops to service and upgrade. Performance-per-dollar is high, but you'll have to get over the less-than-stellar chassis design.
Almost everything else about the system is mediocre from the shallow colors, spongy keyboard keys, and cheap feel of the chassis. Such drawbacks are generally excusable for a budget model, but we still find it incredibly strange to not see a USB-C port when nearly all other consumer laptops are including one these days.
Price and Availability
Dell Inspiron 15 3000 3511
-
01/20/2022 v7
Allen Ngo
More articles related to this device
Dell Inspiron 15 3000 3511 (Inspiron 15 3000 Series)Related Articles


Pricecompare
