 Deutsch
 English
 Español
 Français
 Italiano
 Nederlands
 Polski
 Português
 Русский
 Türkçe
 Svenska
 Chinese
 Magyar
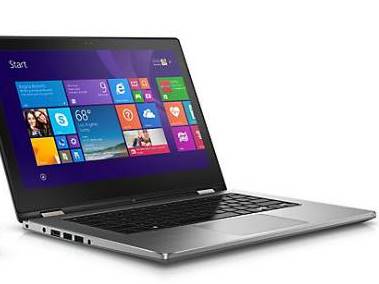
Dell Inspiron 13 7368 Convertible Review
The Inspiron 13 7368 is the Skylake update to the Broadwell-based Inspiron 13 7348 of 2015 and the Haswell-based Inspiron 13 7347 of 2014. Thus, its chassis design is similar to that of the 7348 bar a few minor but worthwhile differences.
We criticized the 7348 for its throttling issues, loud fan noise, and limited outdoor usability. Thus, for this latest 7368, we'll take closer looks at these characteristics to see if Dell has improved upon last year's model and if any new features have been added.
Our test unit is the lowest-end SKU with the Core i5-6200U CPU, integrated HD 520 GPU, 8 GB DDR4 RAM, and a 256 GB SSD for $750 USD or a few hundred dollars less than the competing HP Spectre 13 x360, Acer Aspire R13, or Lenovo Yoga 900. Higher-end SKUs can be equipped with a Core i7-6500U, 12 GB RAM, and a 512 GB SSD.
See our reviews on some older 13-inch convertible Inspiron models for more details and information on the series.
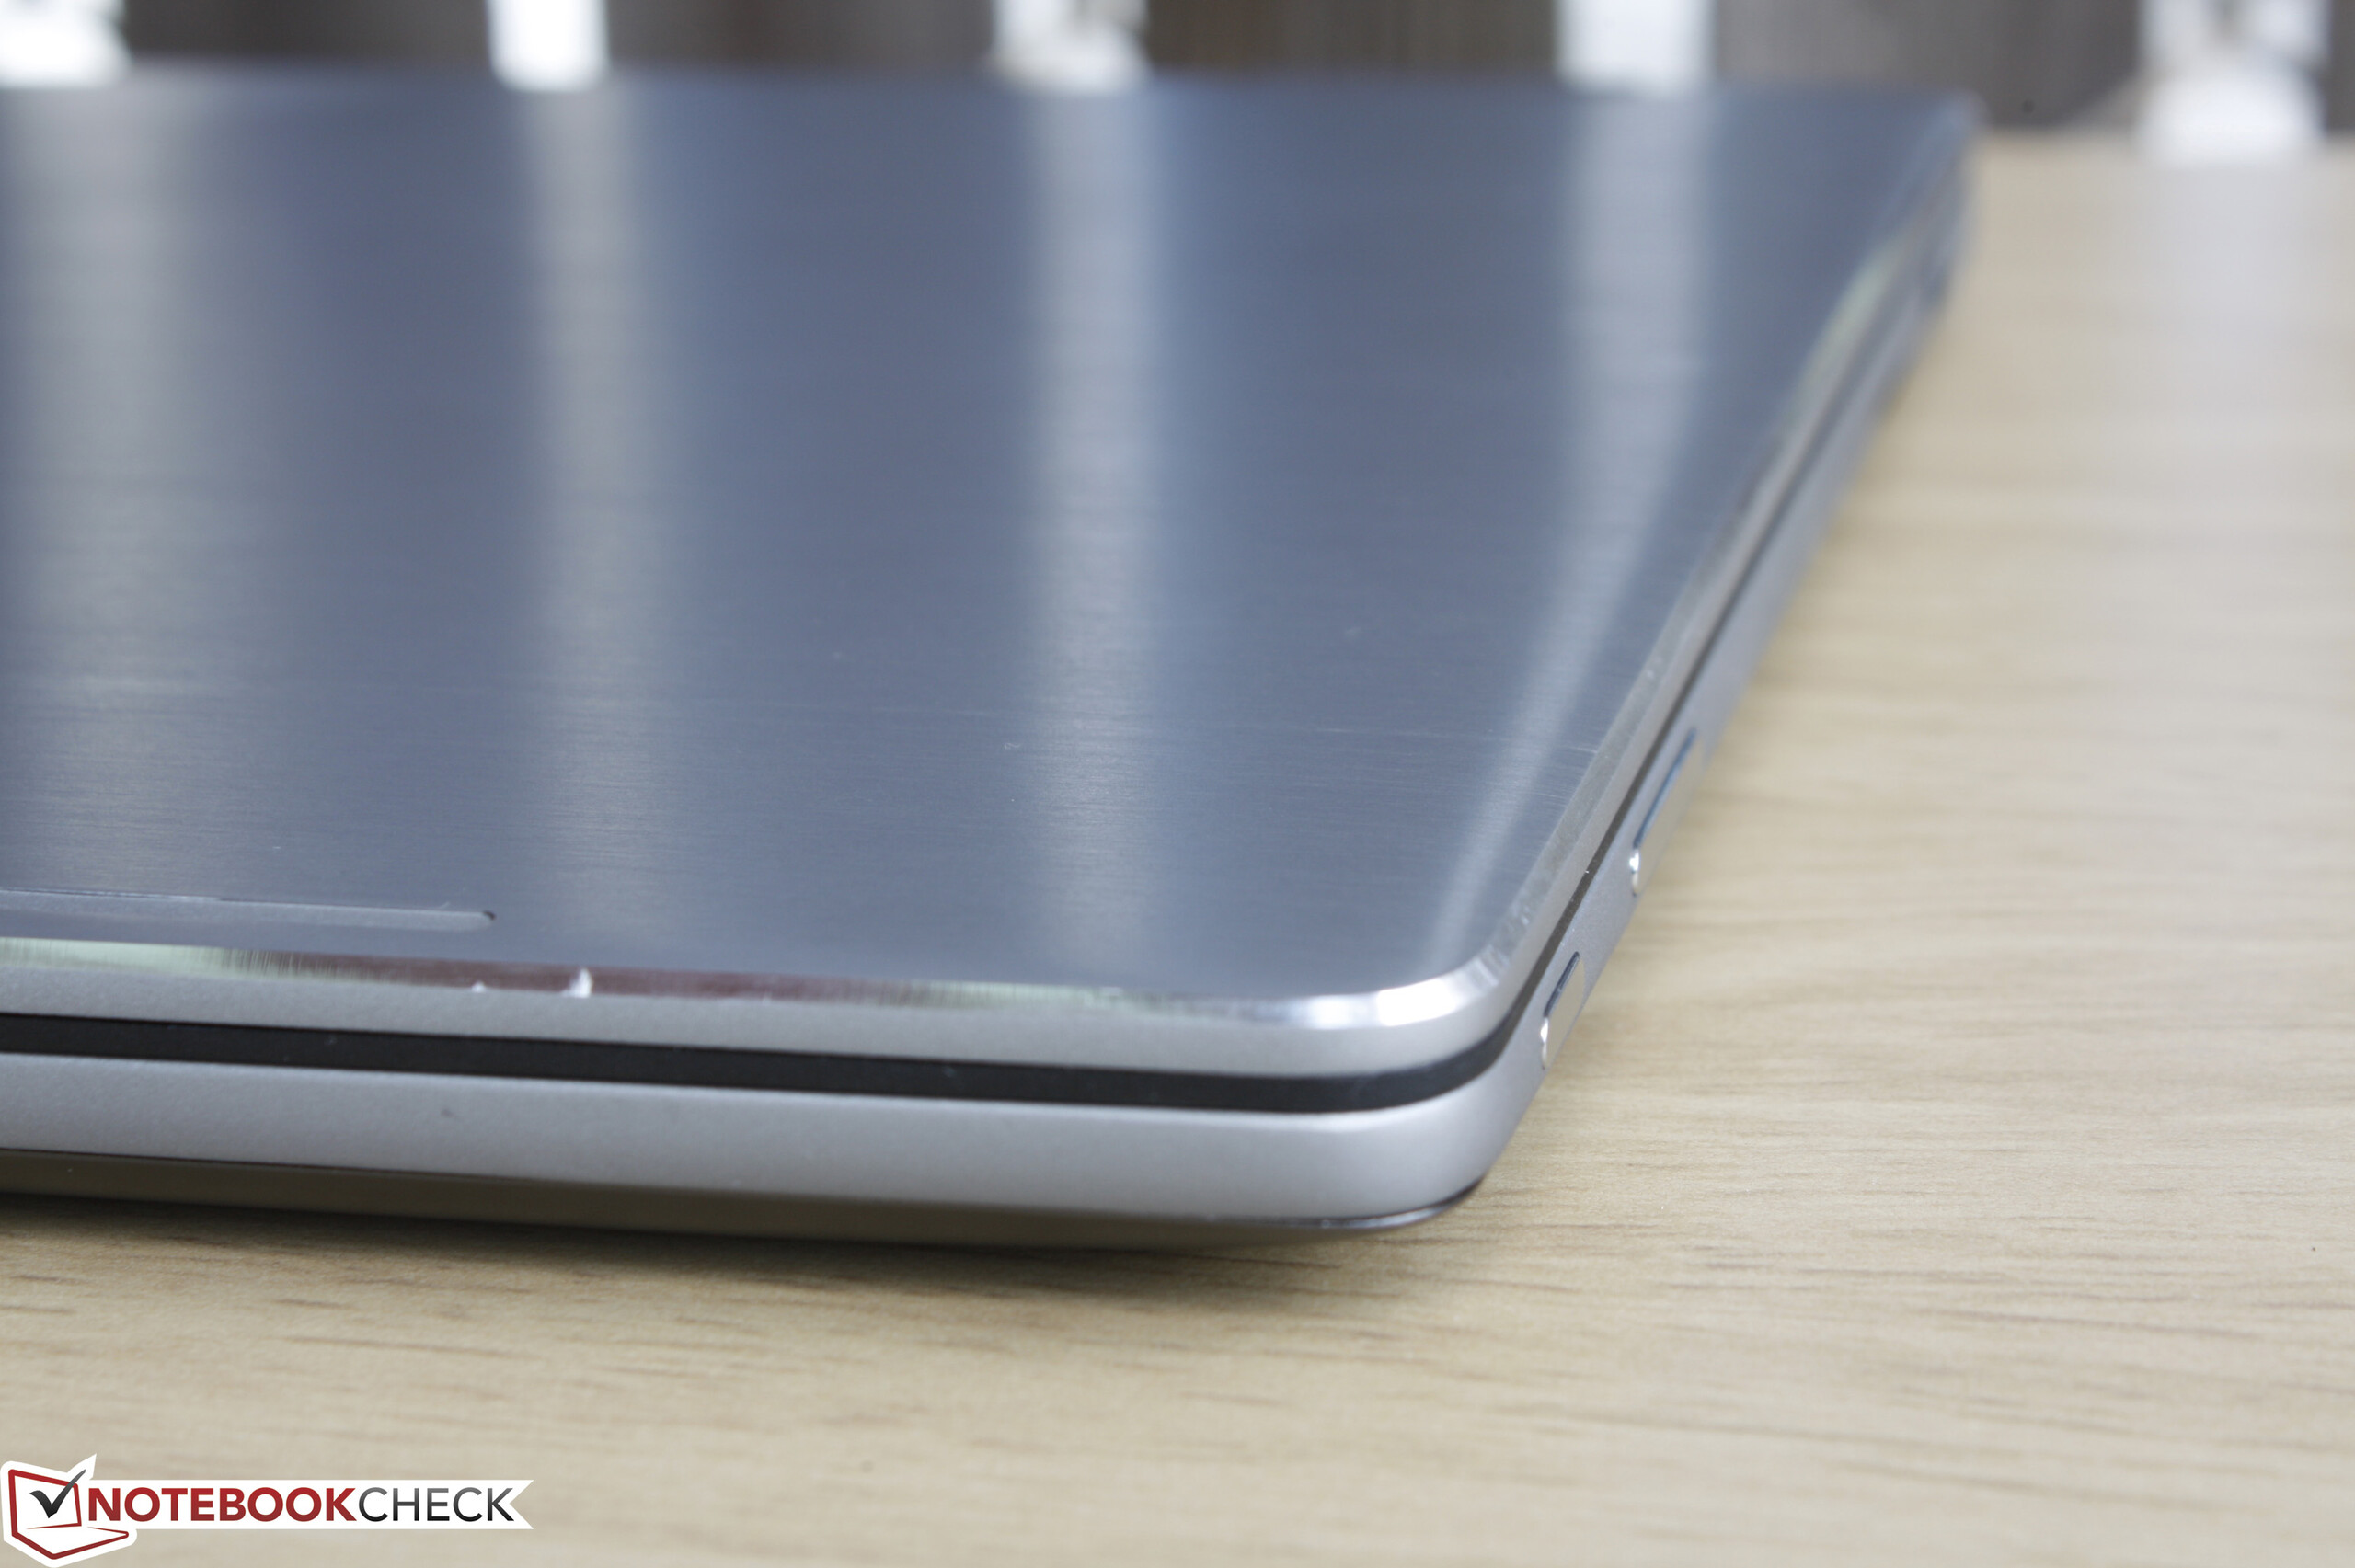
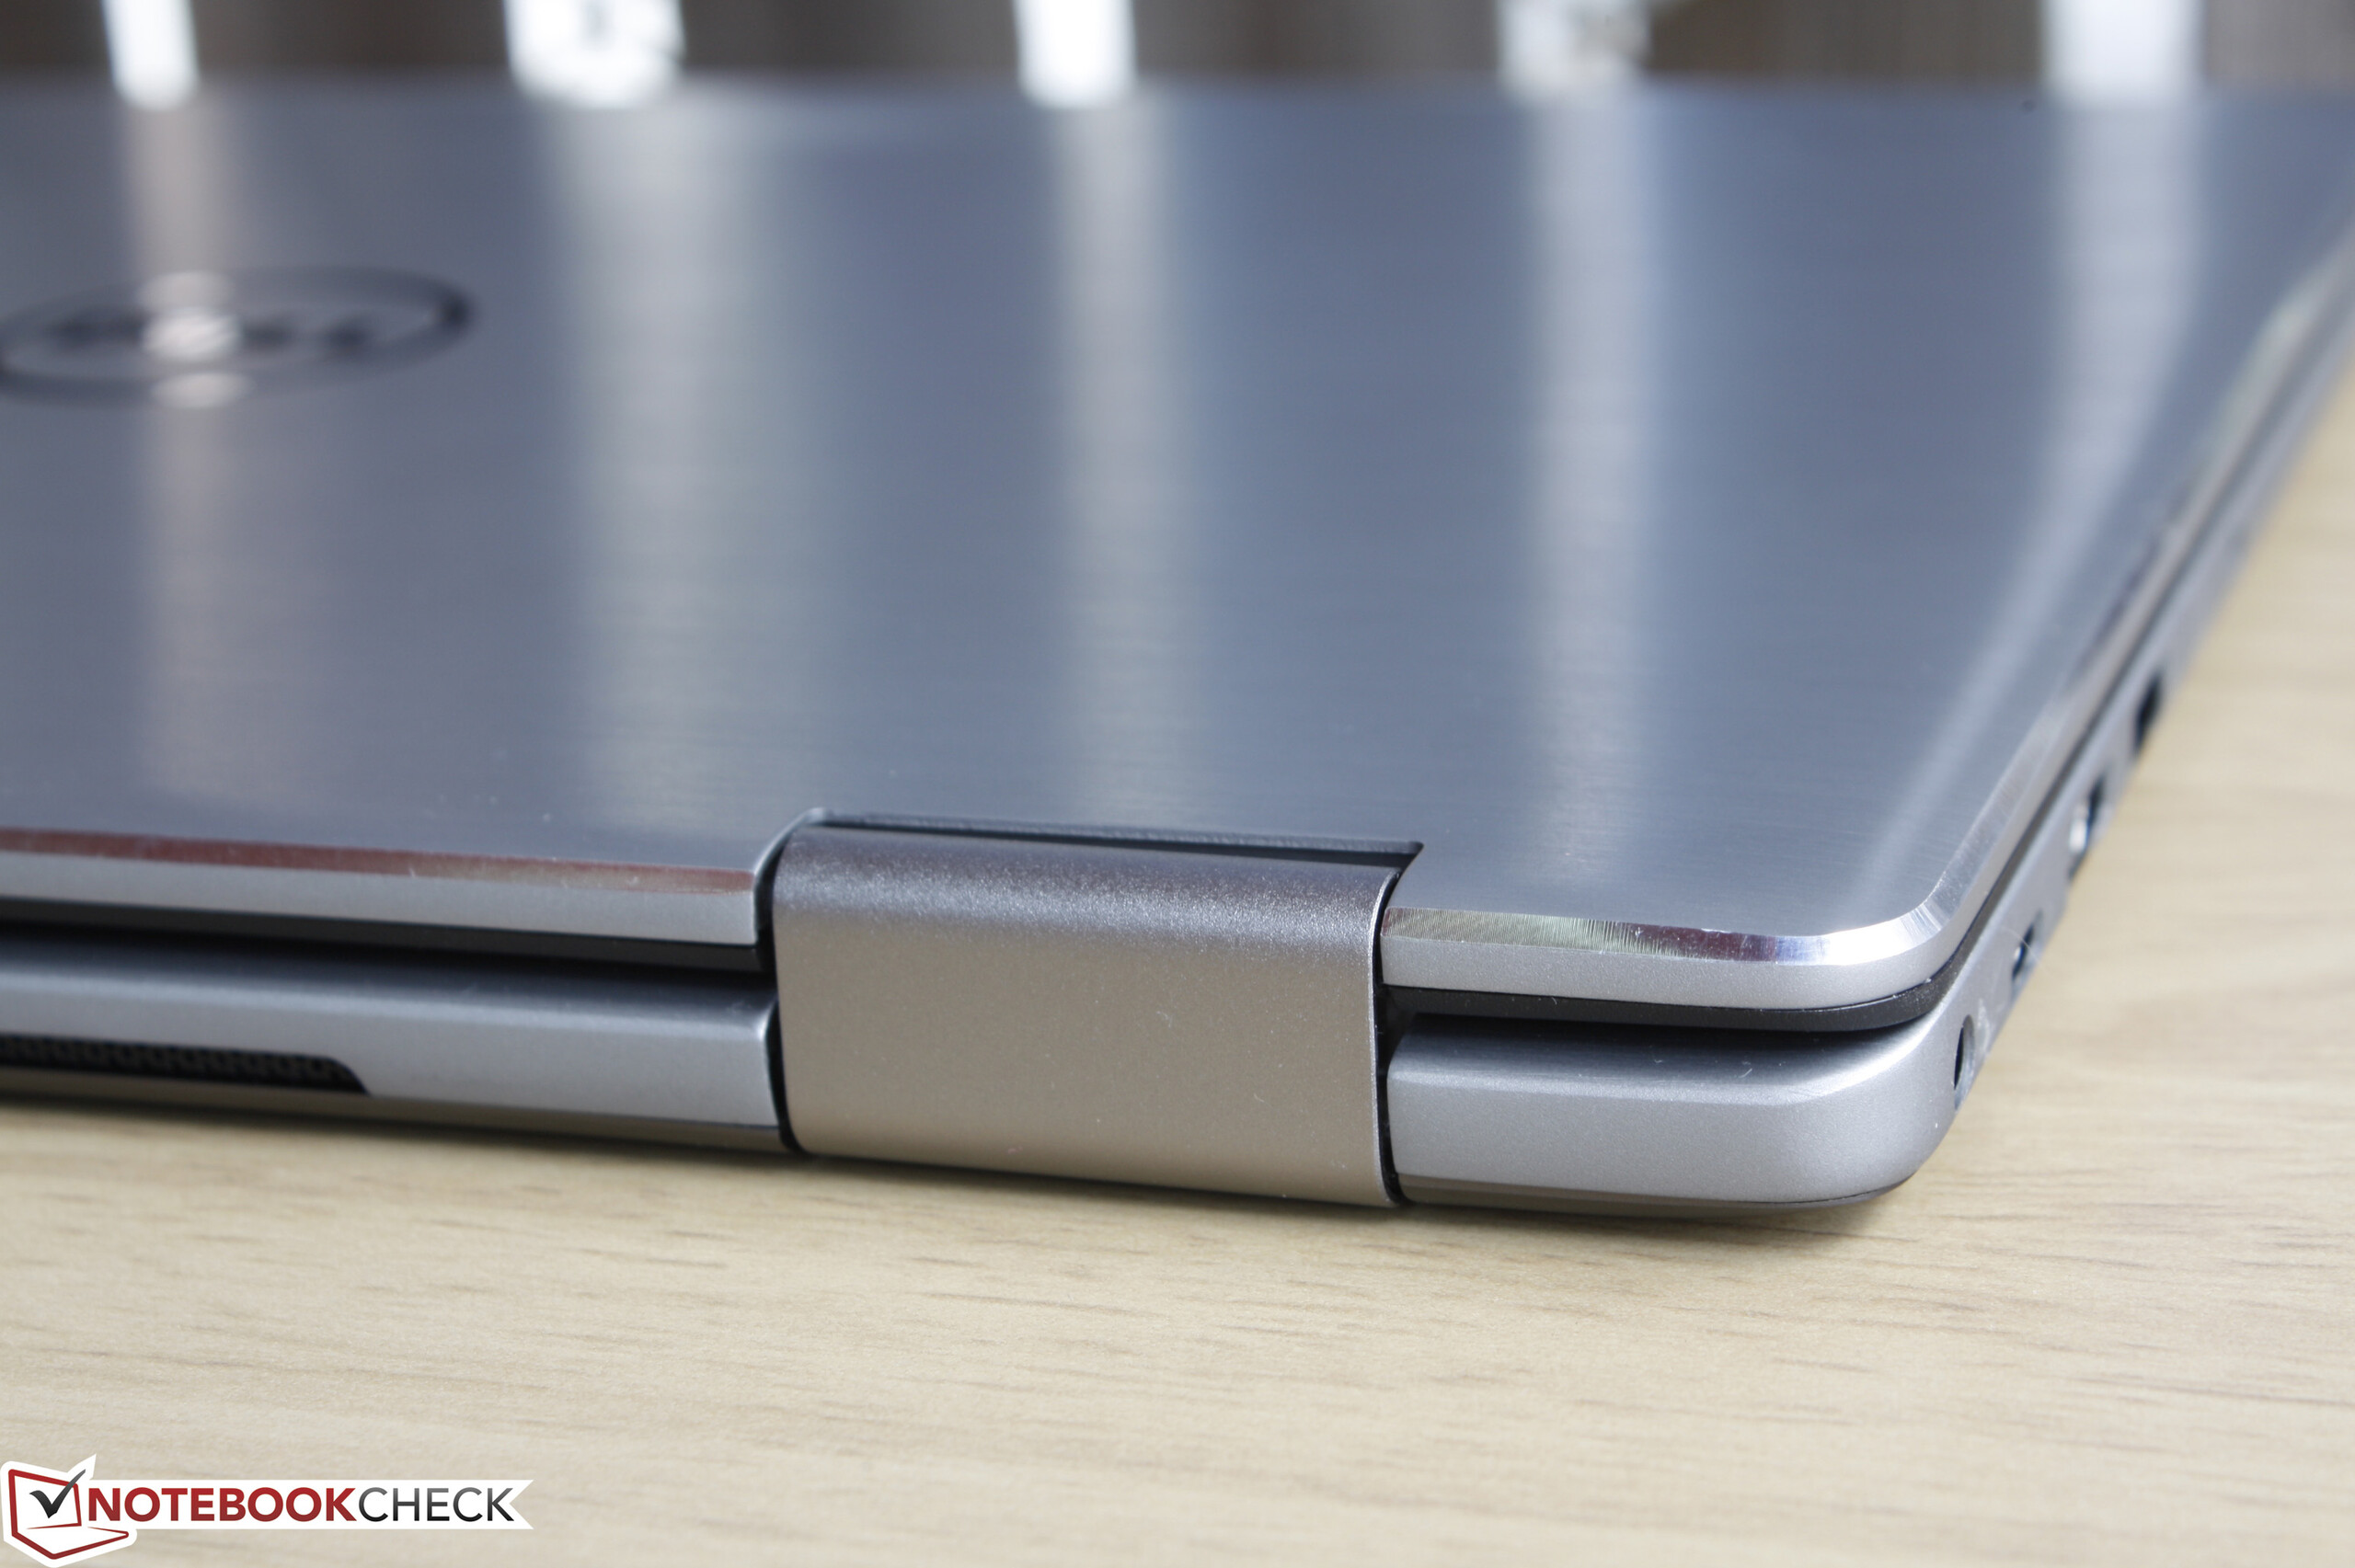
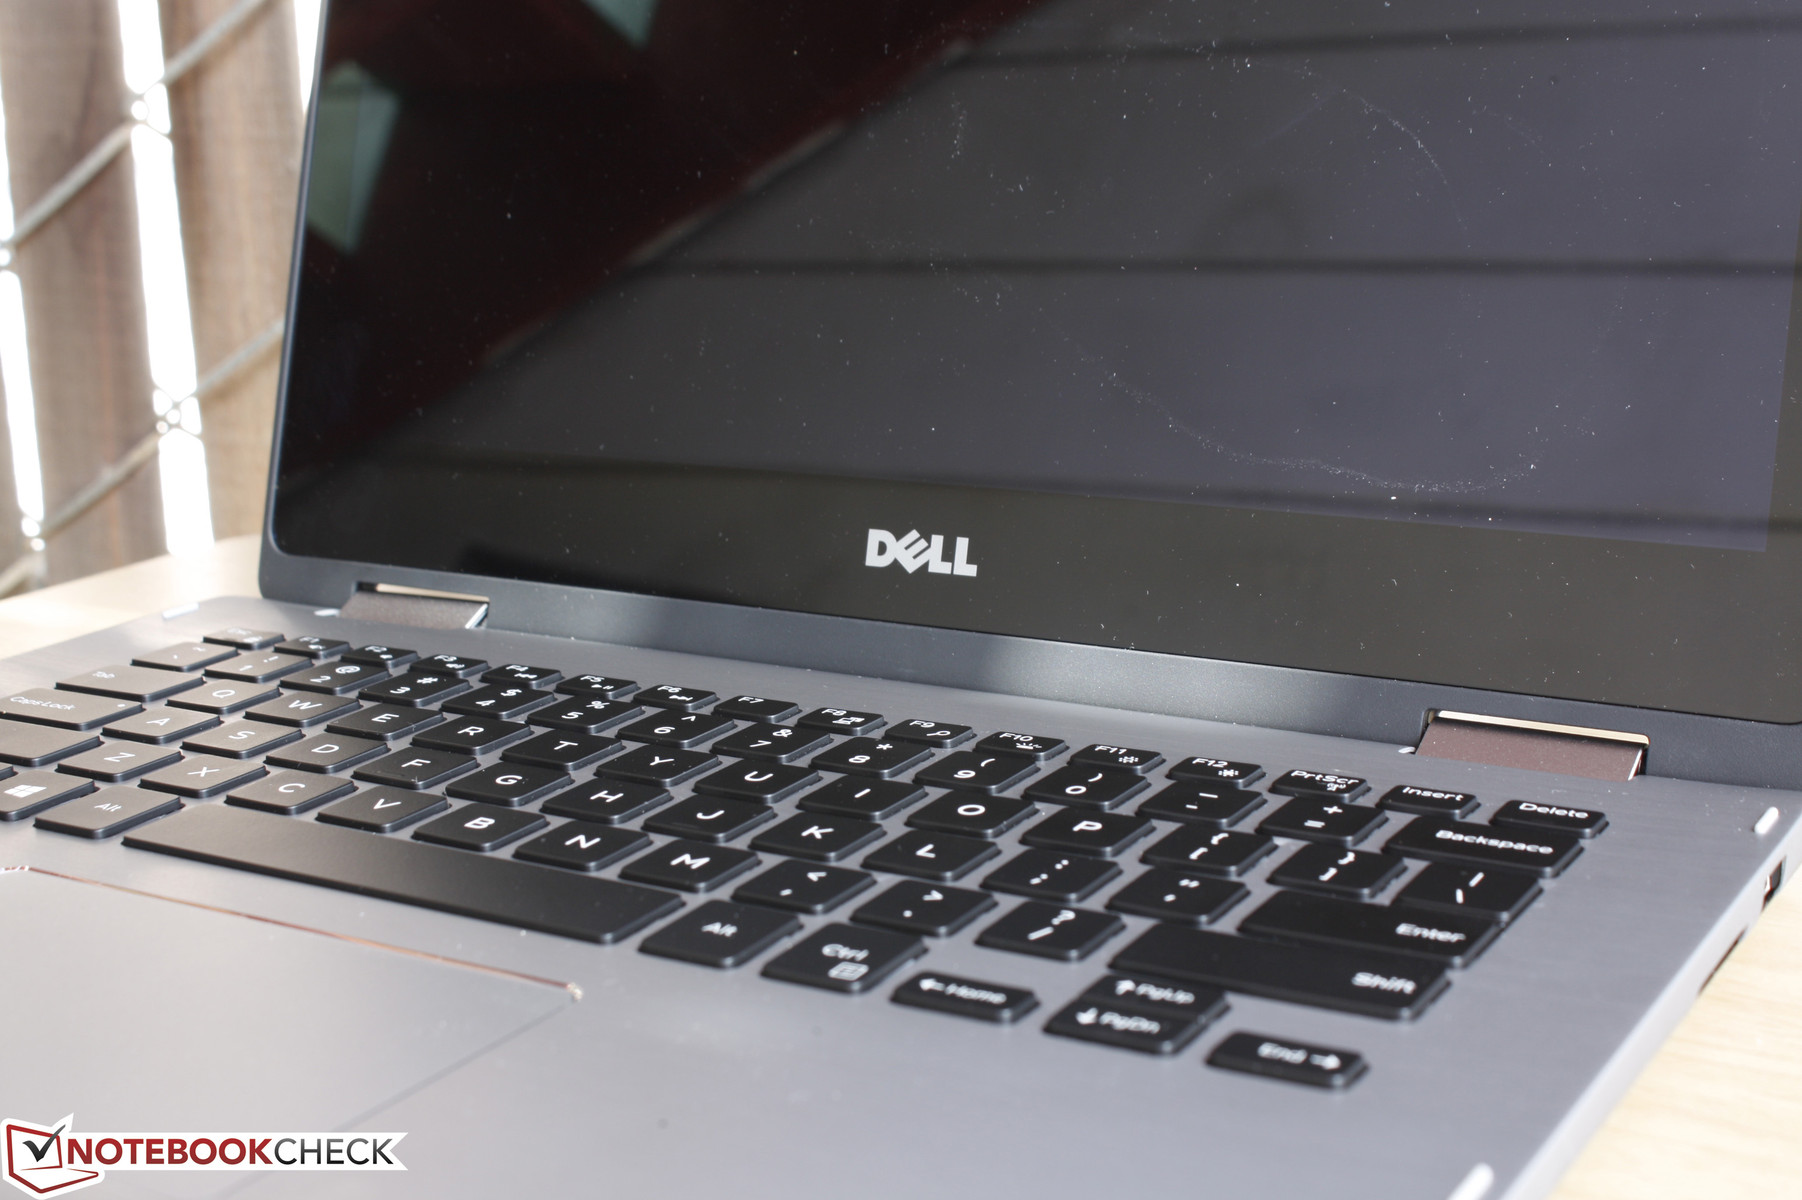
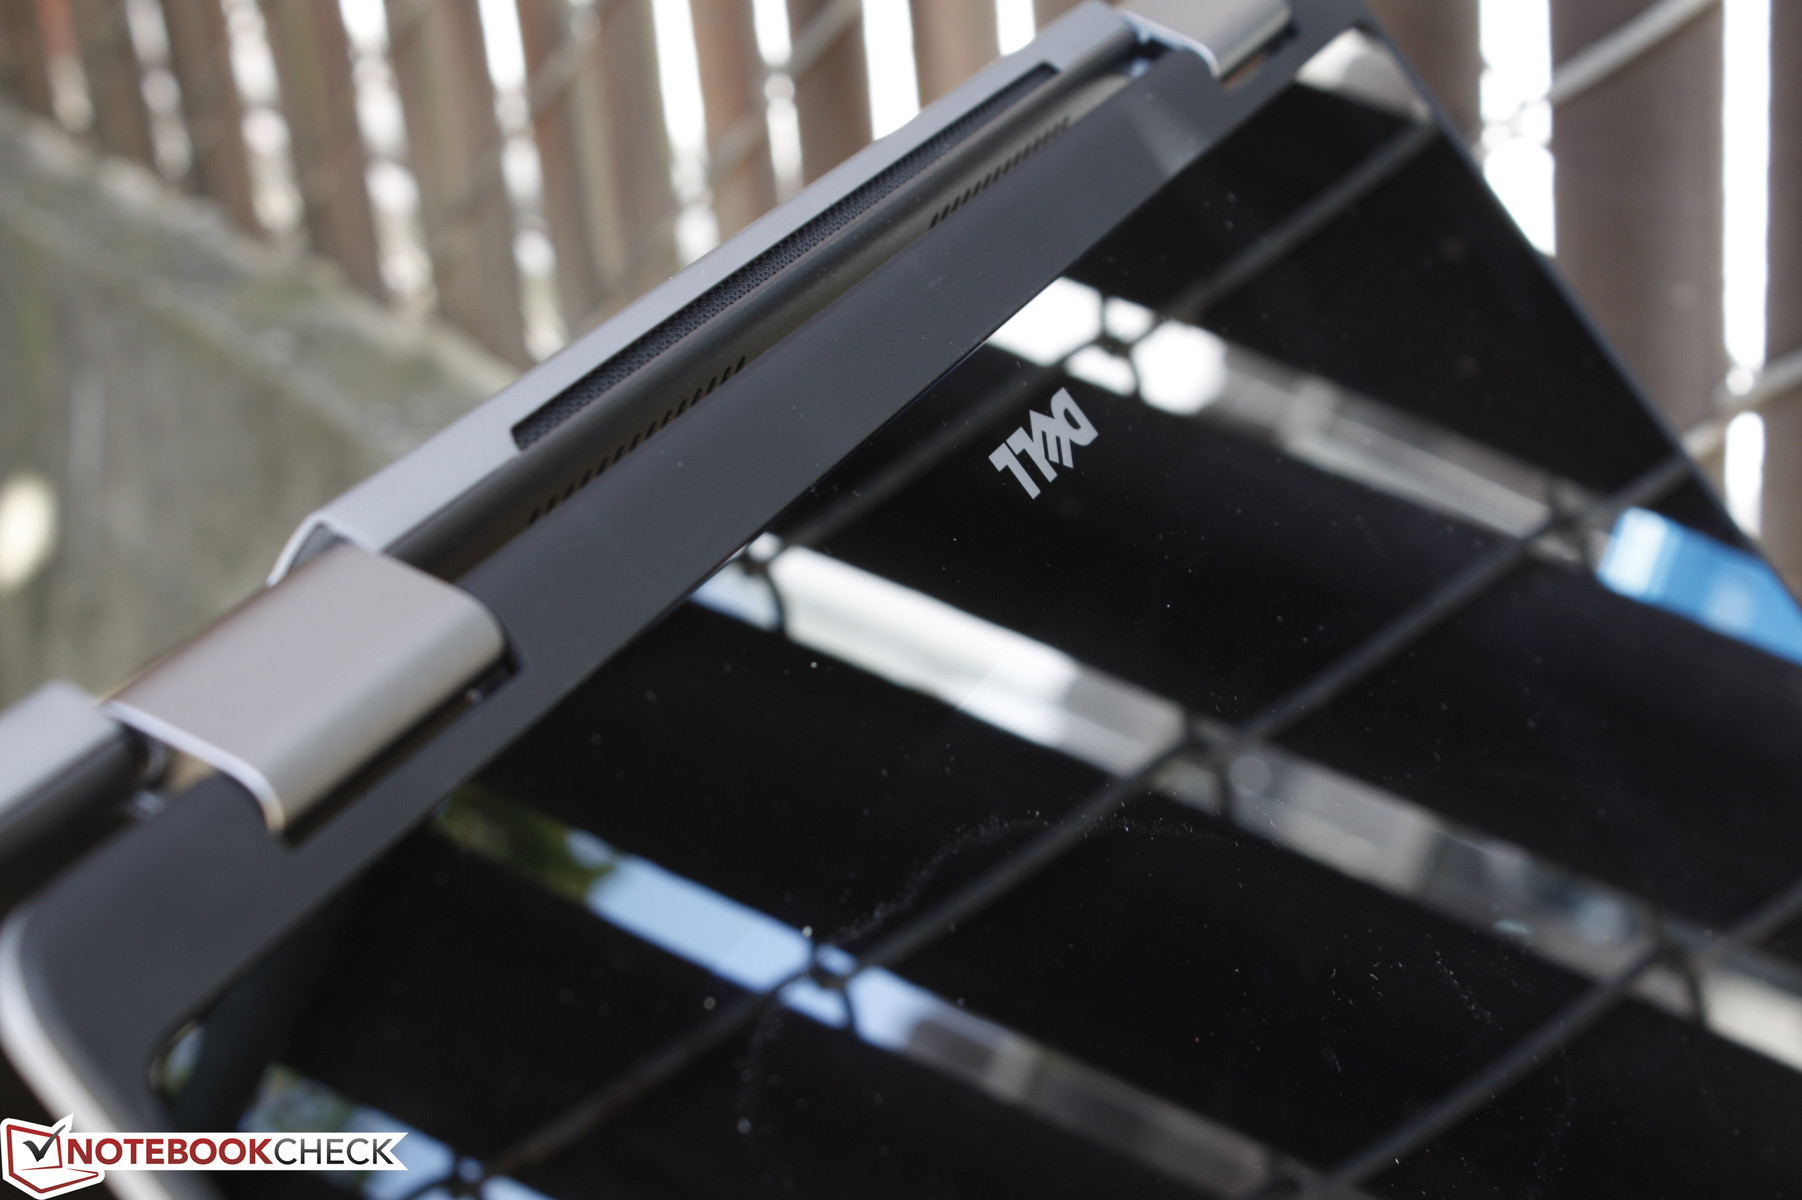
Case
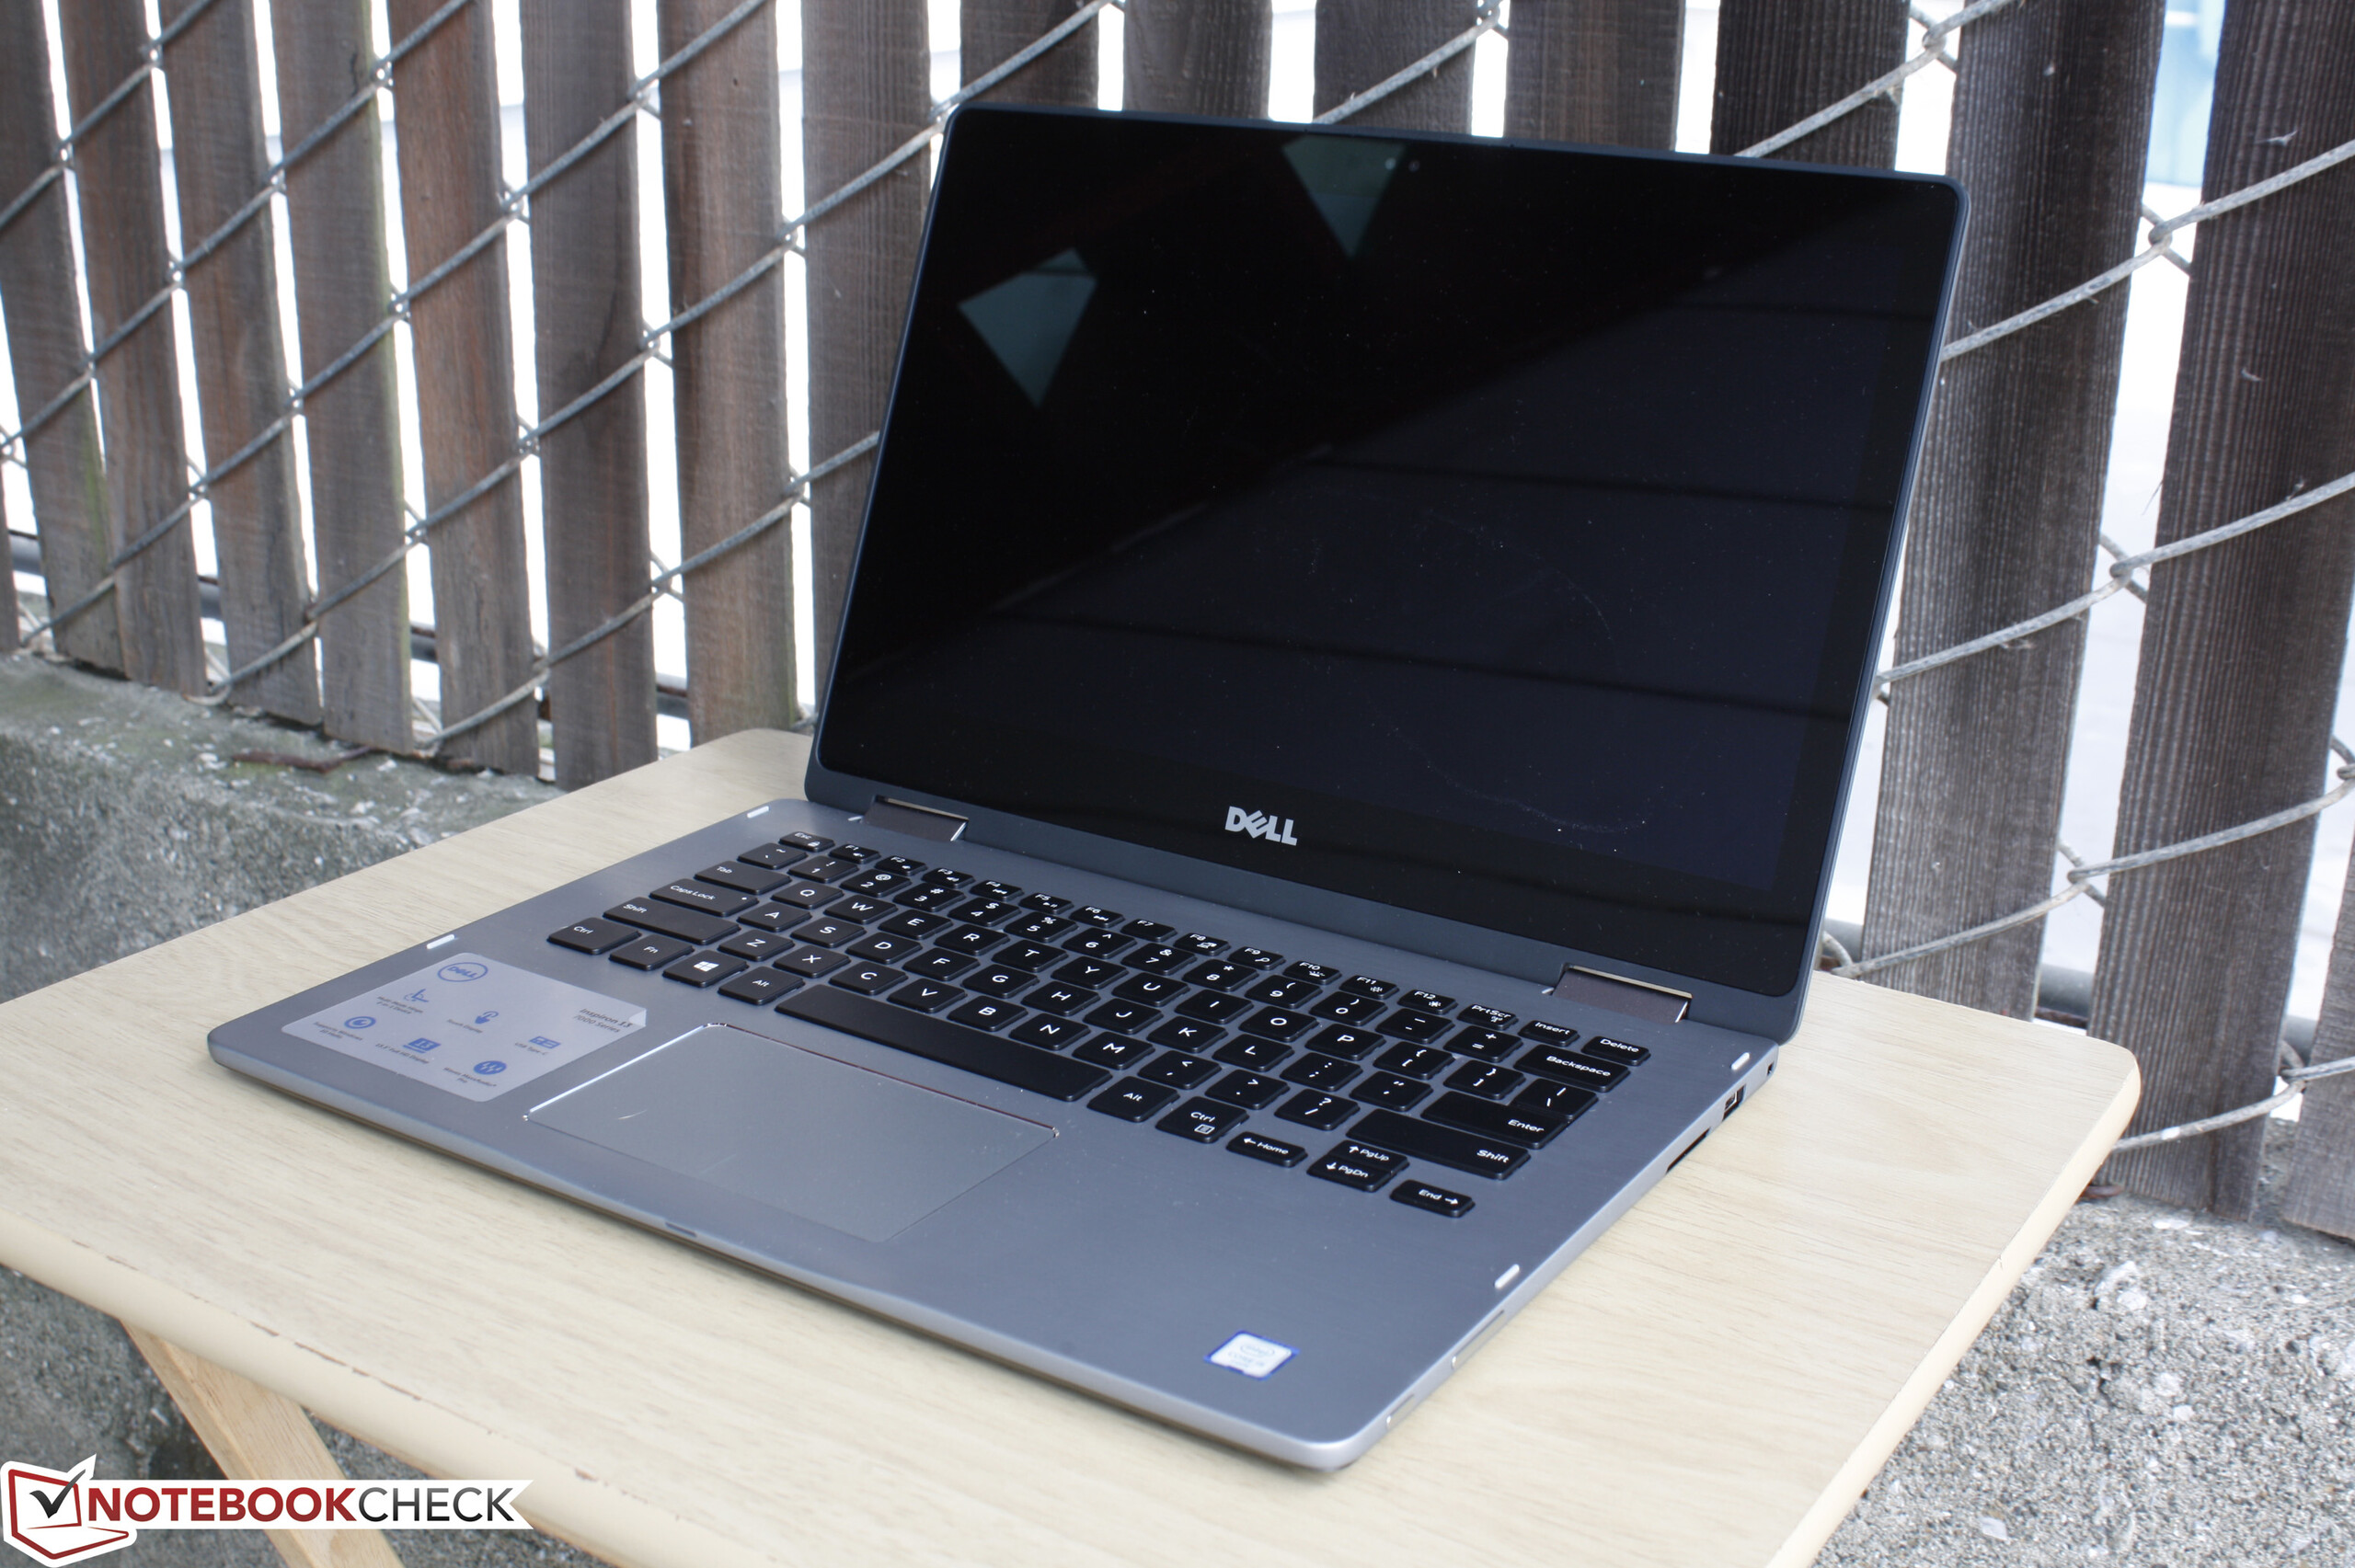
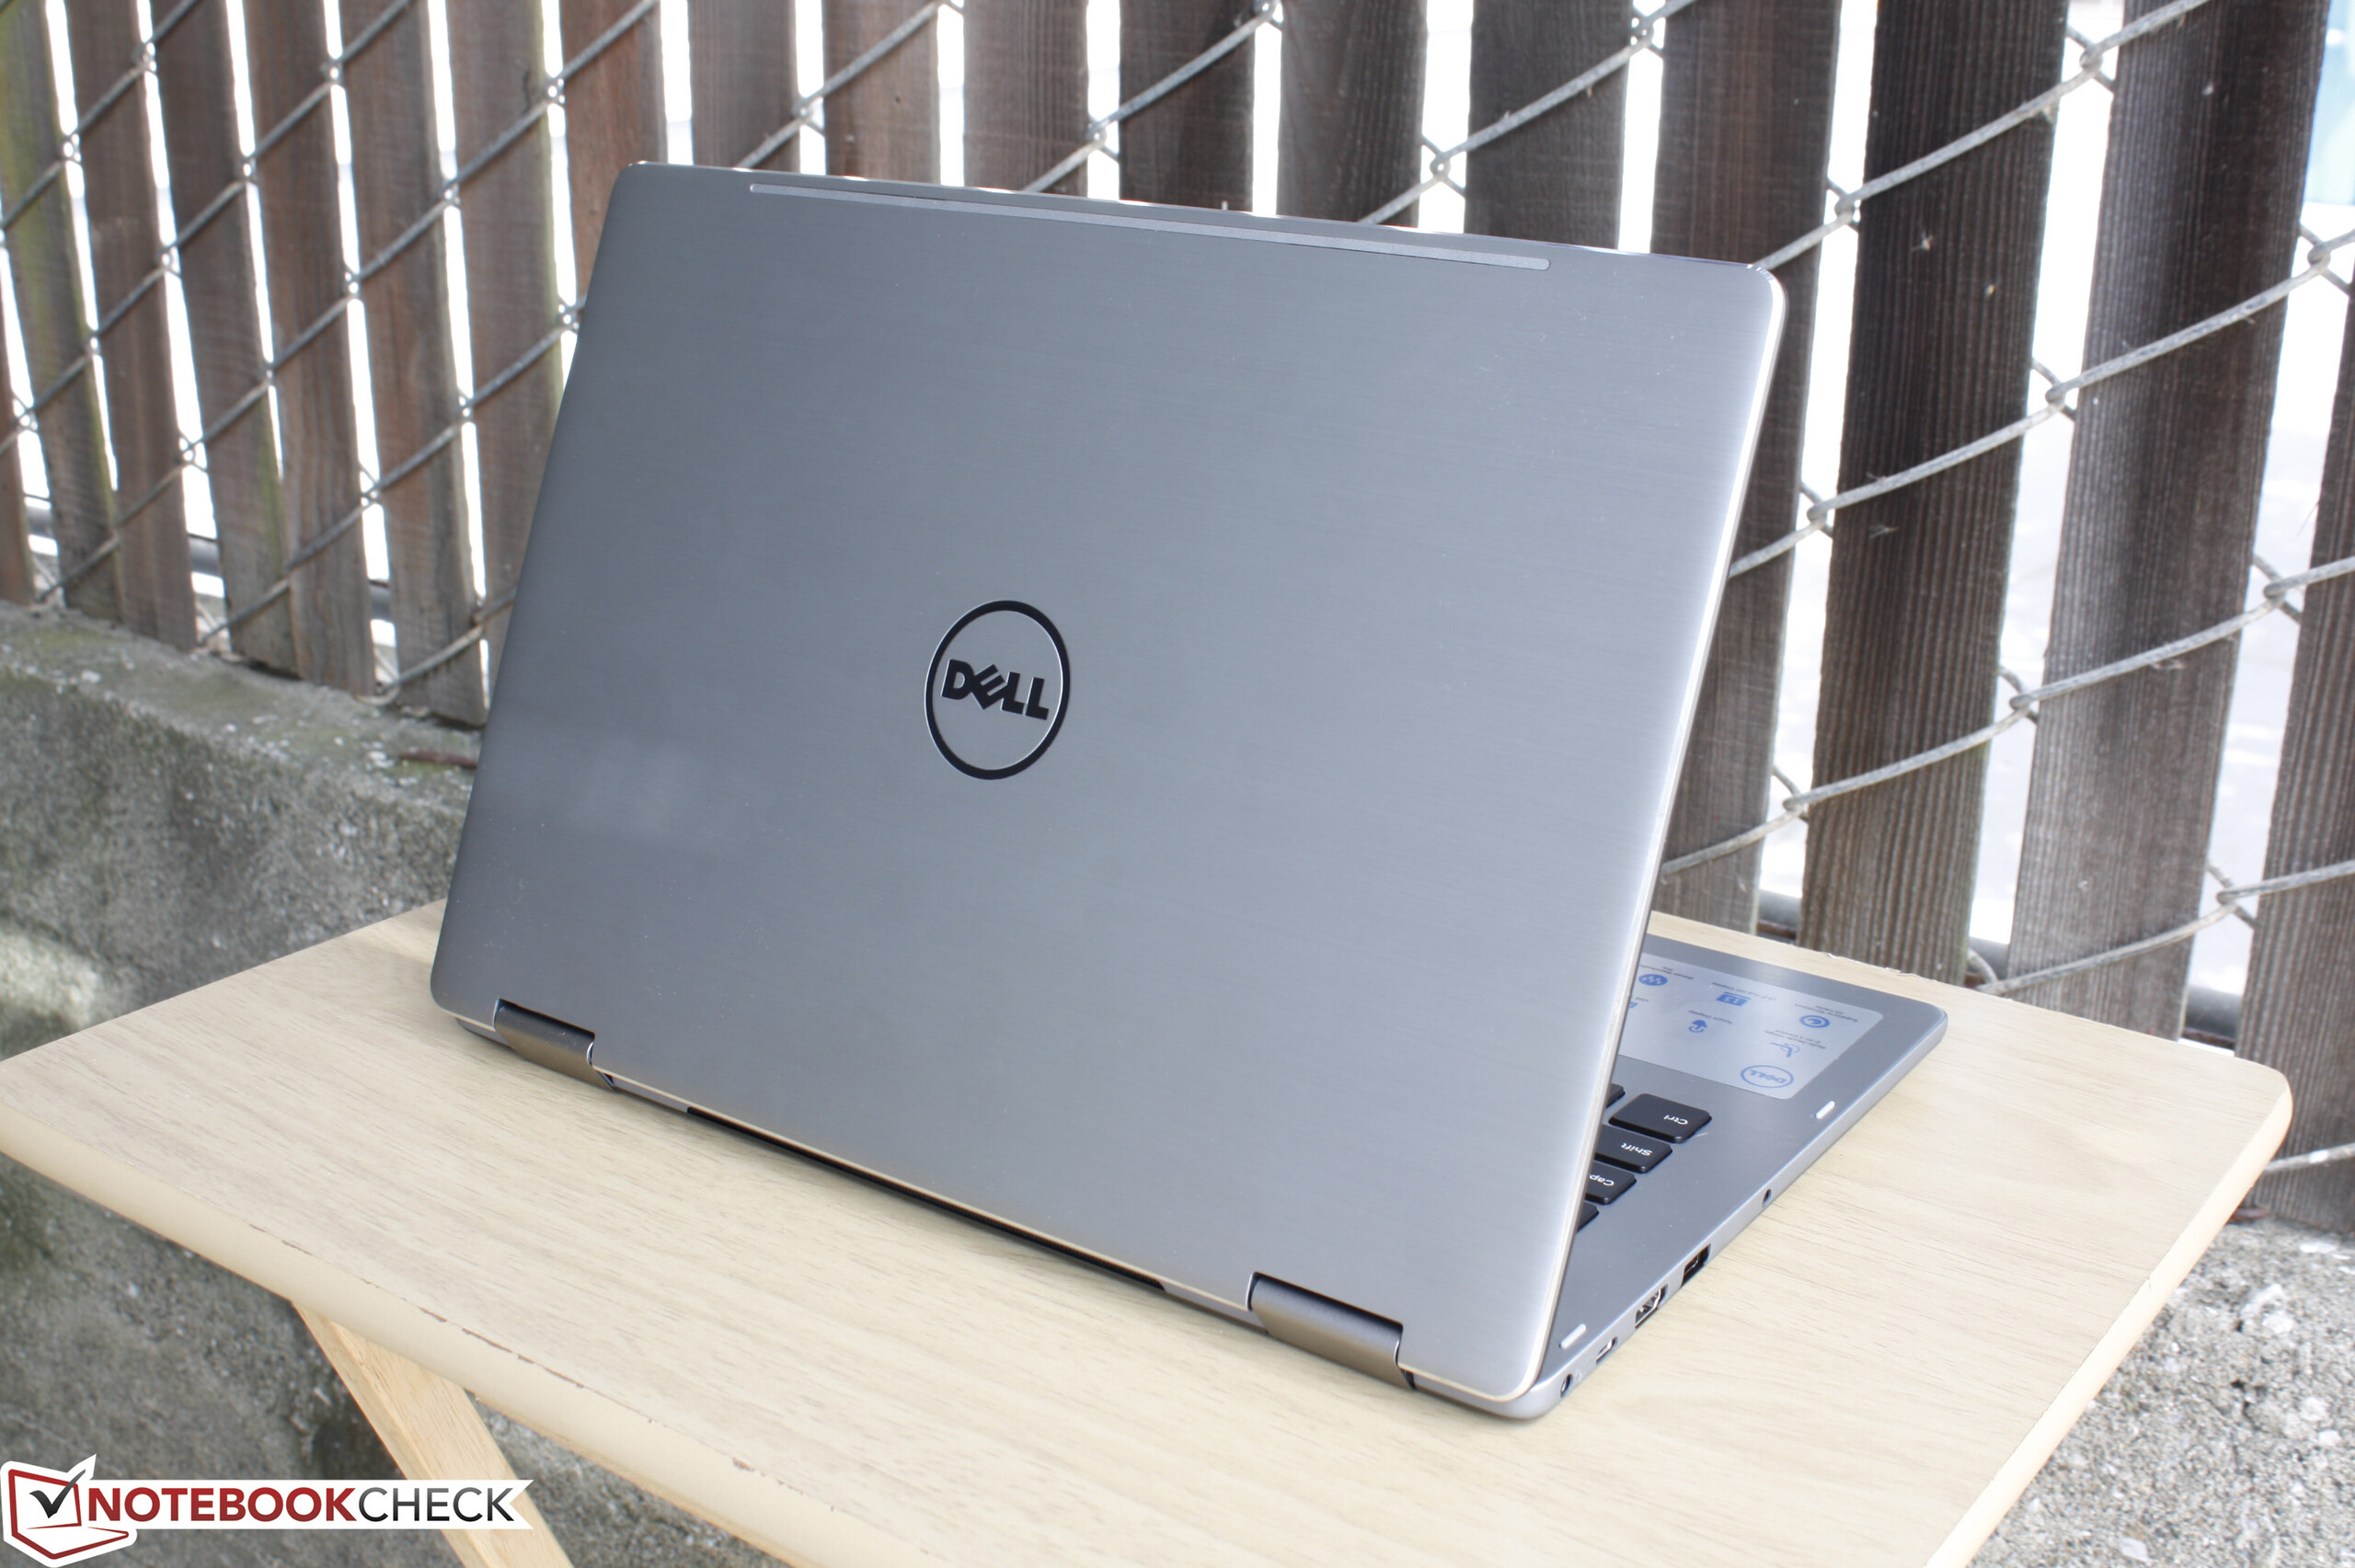
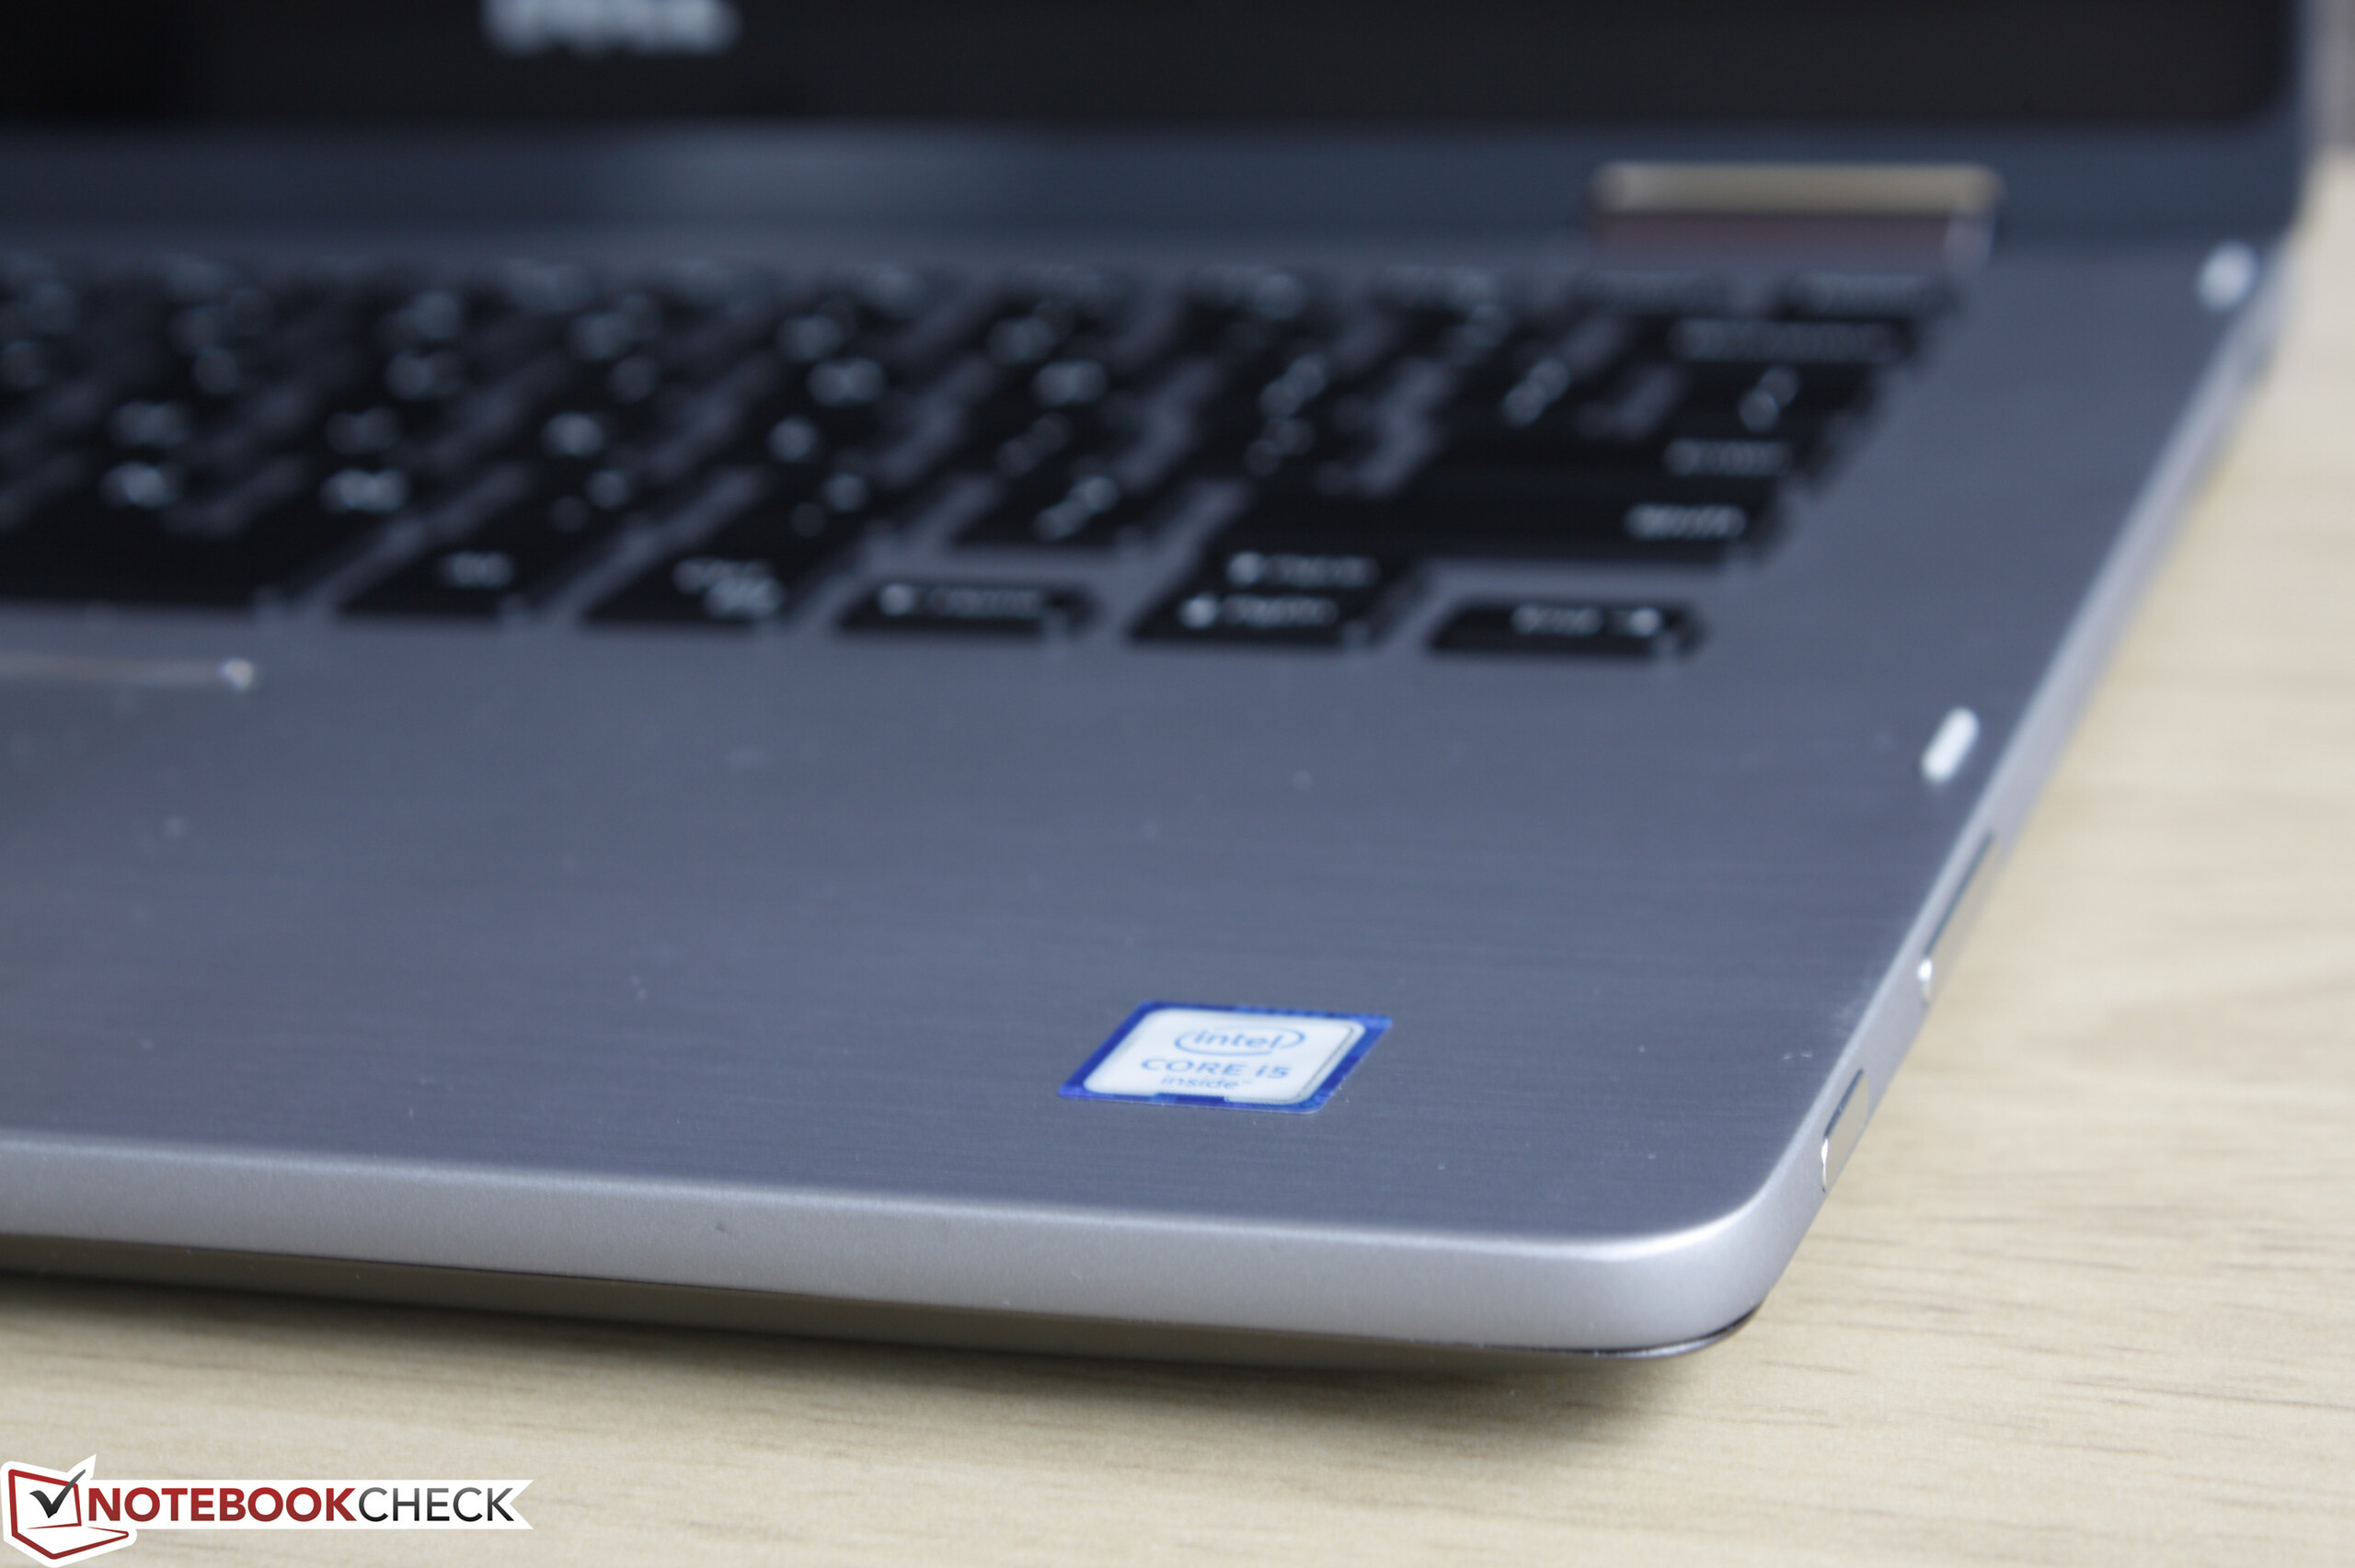
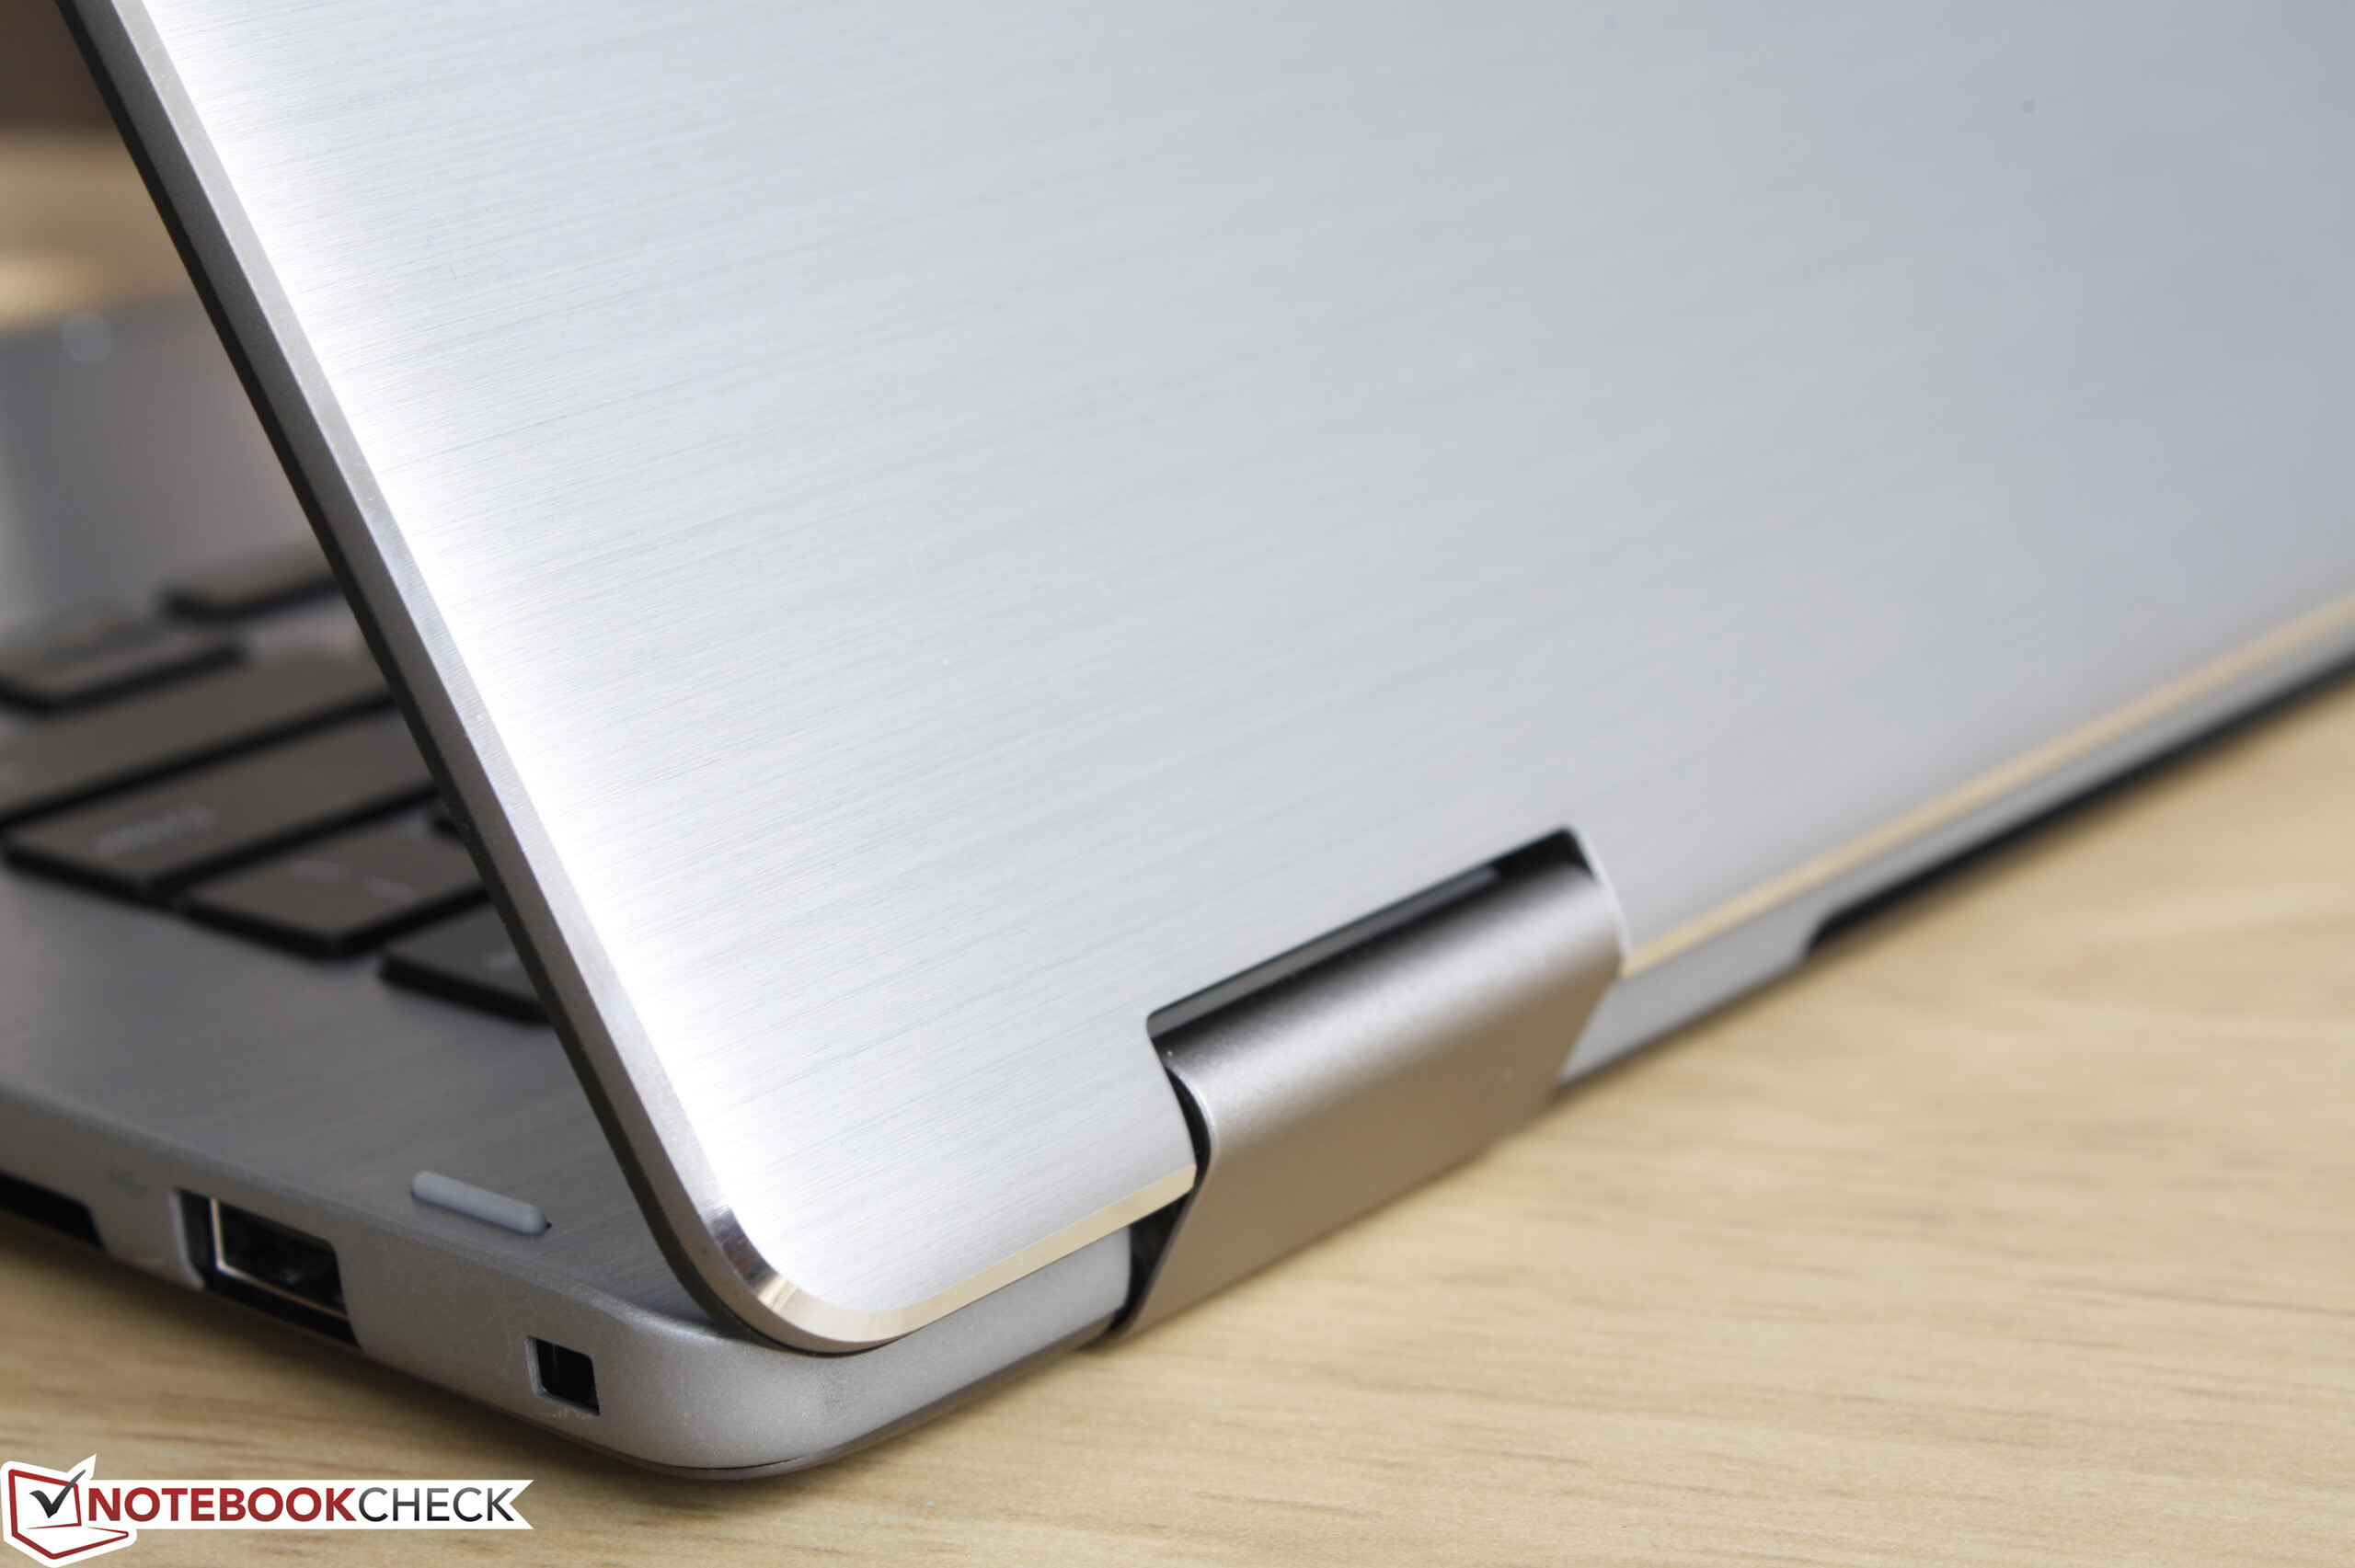
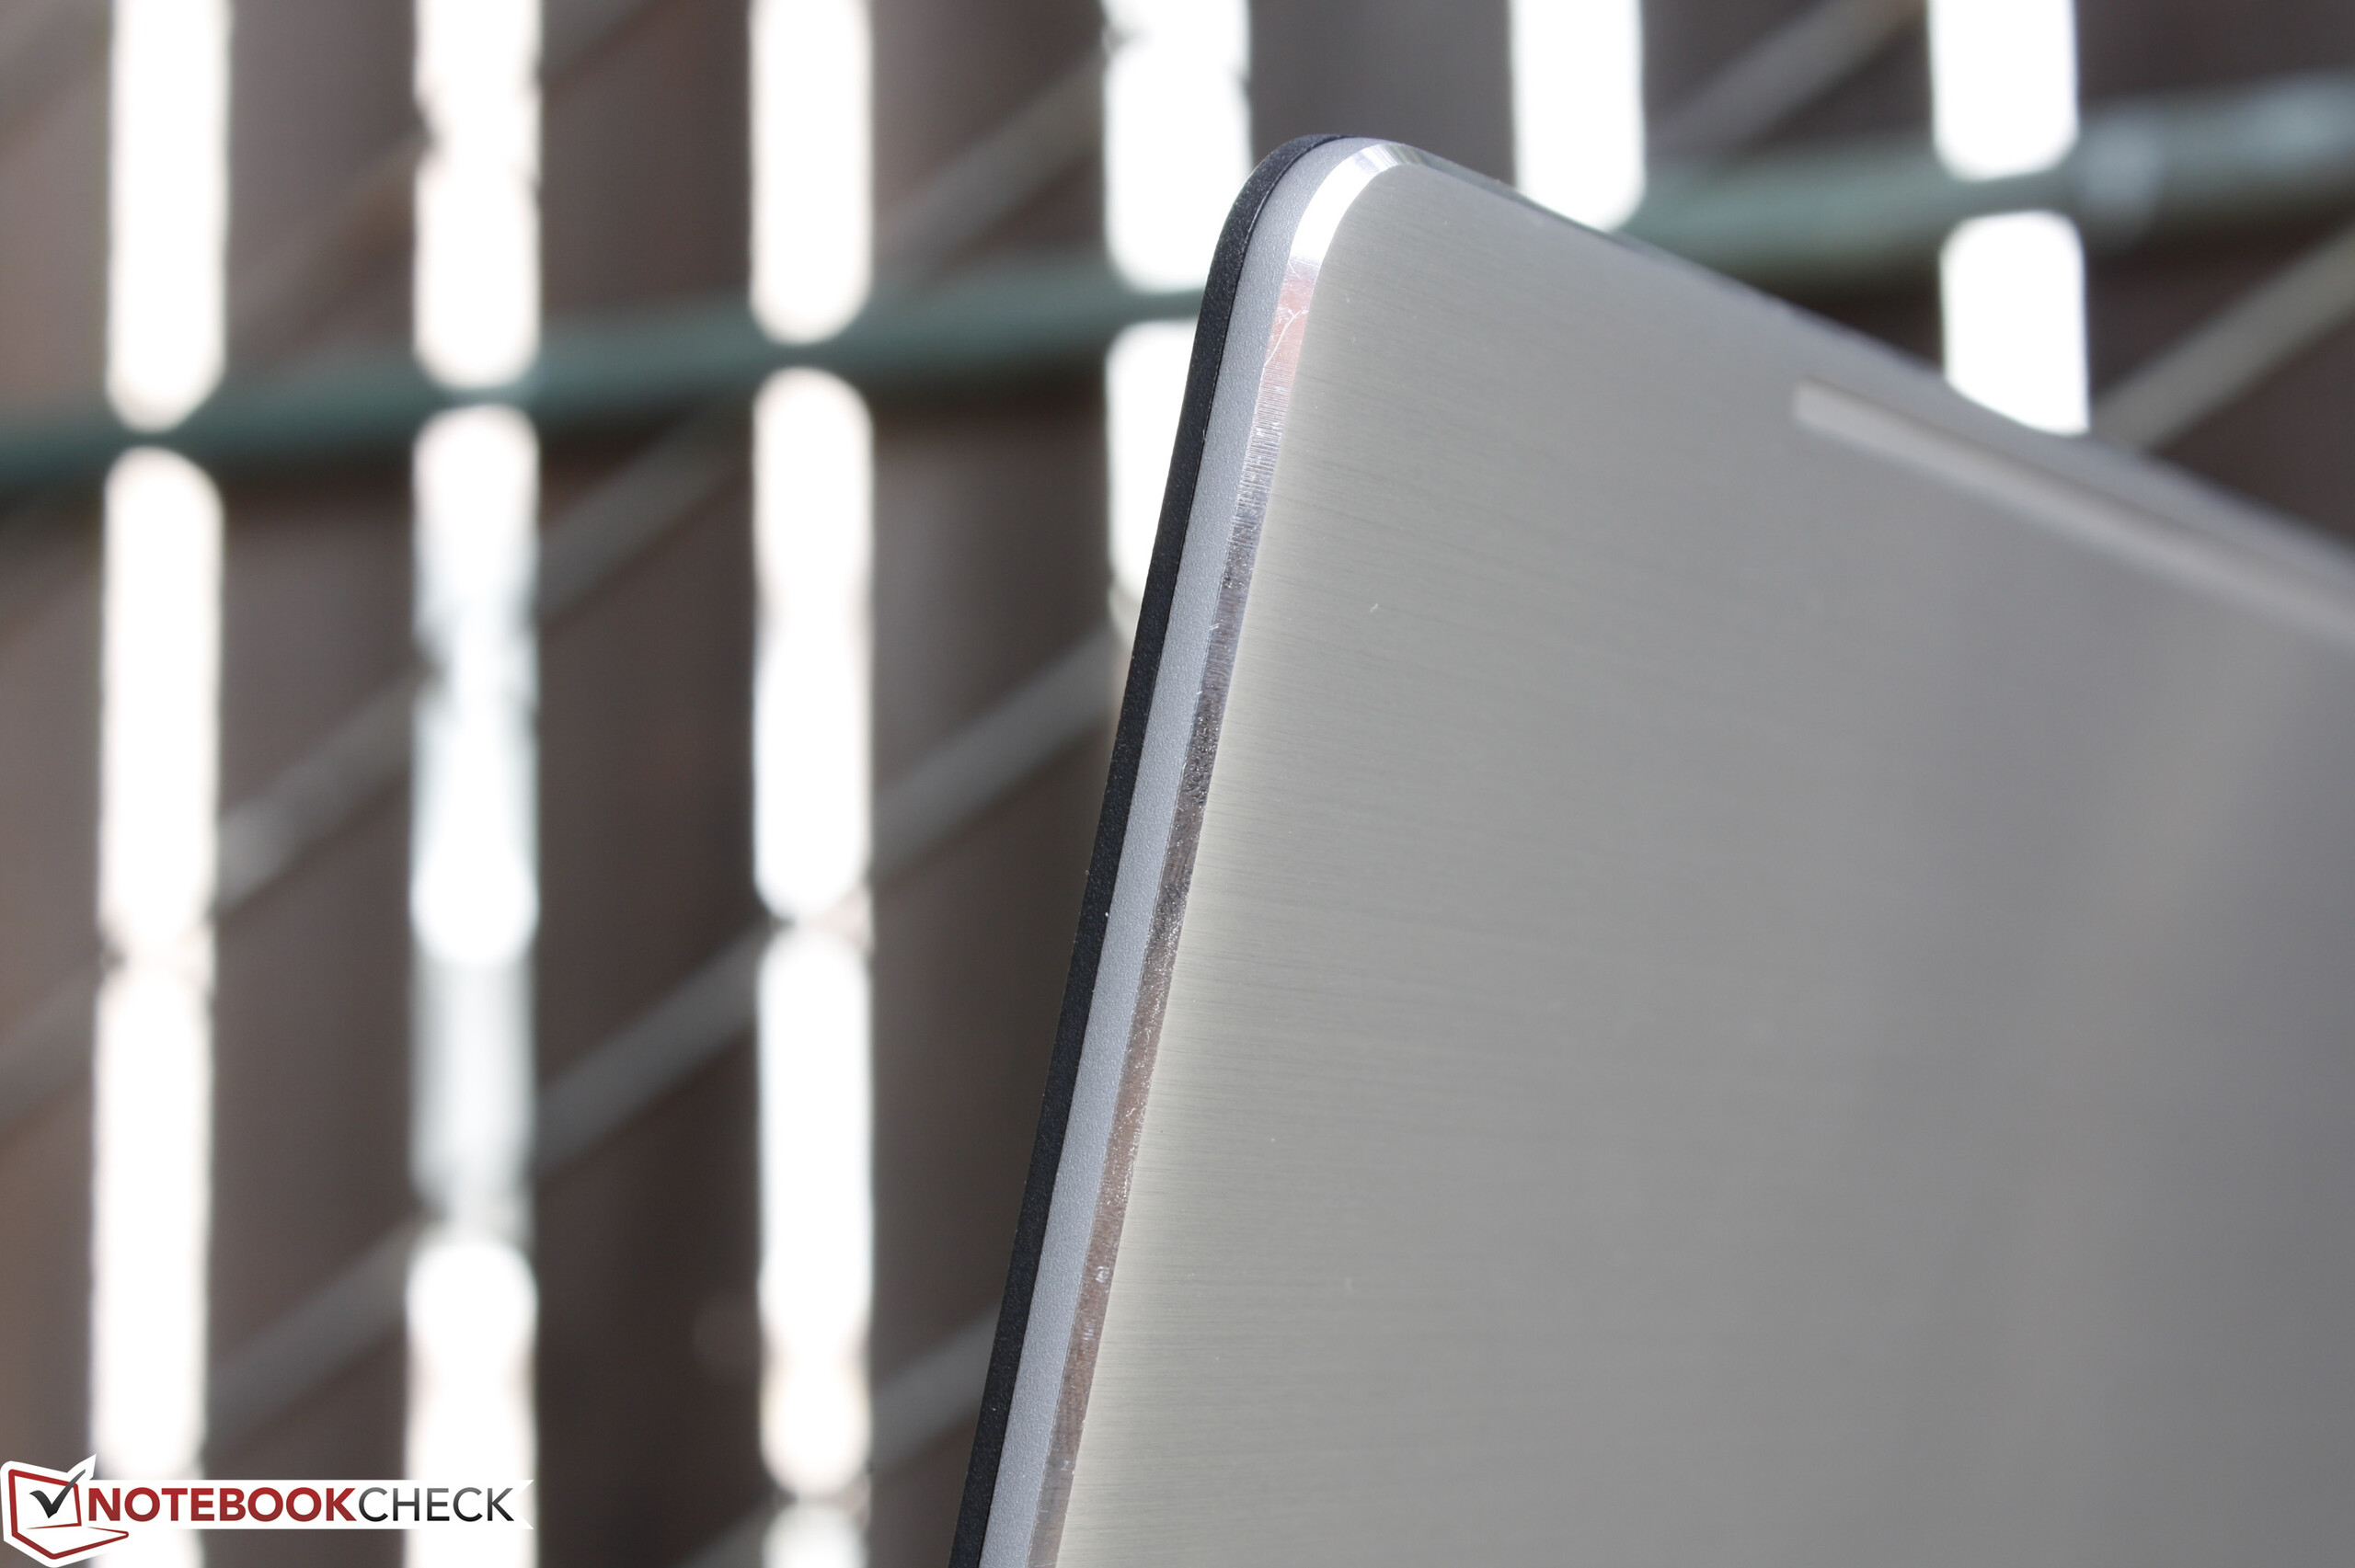
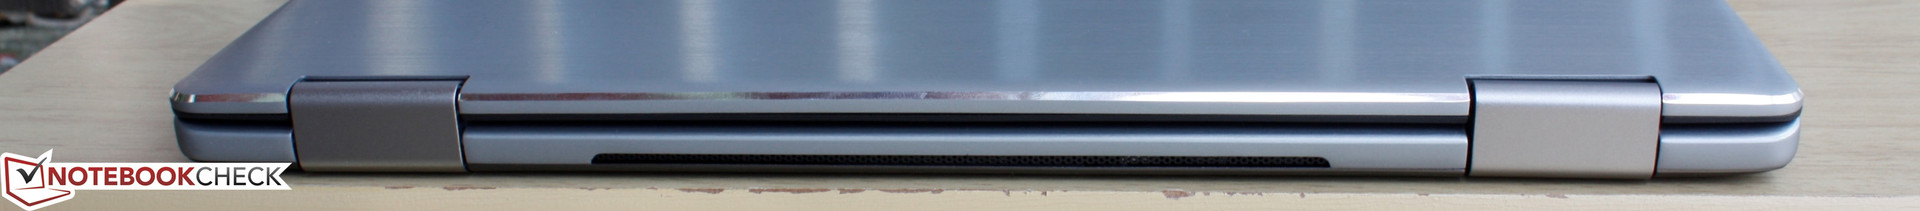
Our first impression on the convertible is that this is probably one of the sturdiest 13-inch consumer convertible available. The brushed aluminum chassis is sleek and uniform and very rigid as pressing down on the centers of the outer lid and keyboard results in very minimal warping. There is no creaking whatsoever when attempting to twist the base or lid and the hinges are evenly taut up to its maximum angle. Unlike the Inspiron 13 7348, the 7368 does not have rubberized surfaces except for the inner perimeter of the bezel of the display. Additionally, its base is now smoother and without a recess around its keyboard. Workmanship is solid with almost no unintended gaps between materials. We can notice on our test unit some very small gaps between the rubber perimeter and the aluminum lid that it is attached to, but this is minor and only a nitpick.
July 18, 2016 correction: The accelerometer in our test unit was automatically disabled and can only be re-enabled in the Settings menu when Windows is set to tablet mode. Nonetheless, the design and center of gravity of the convertible make tablet mode most comfortable to use when in Landscape as opposed to Portrait.
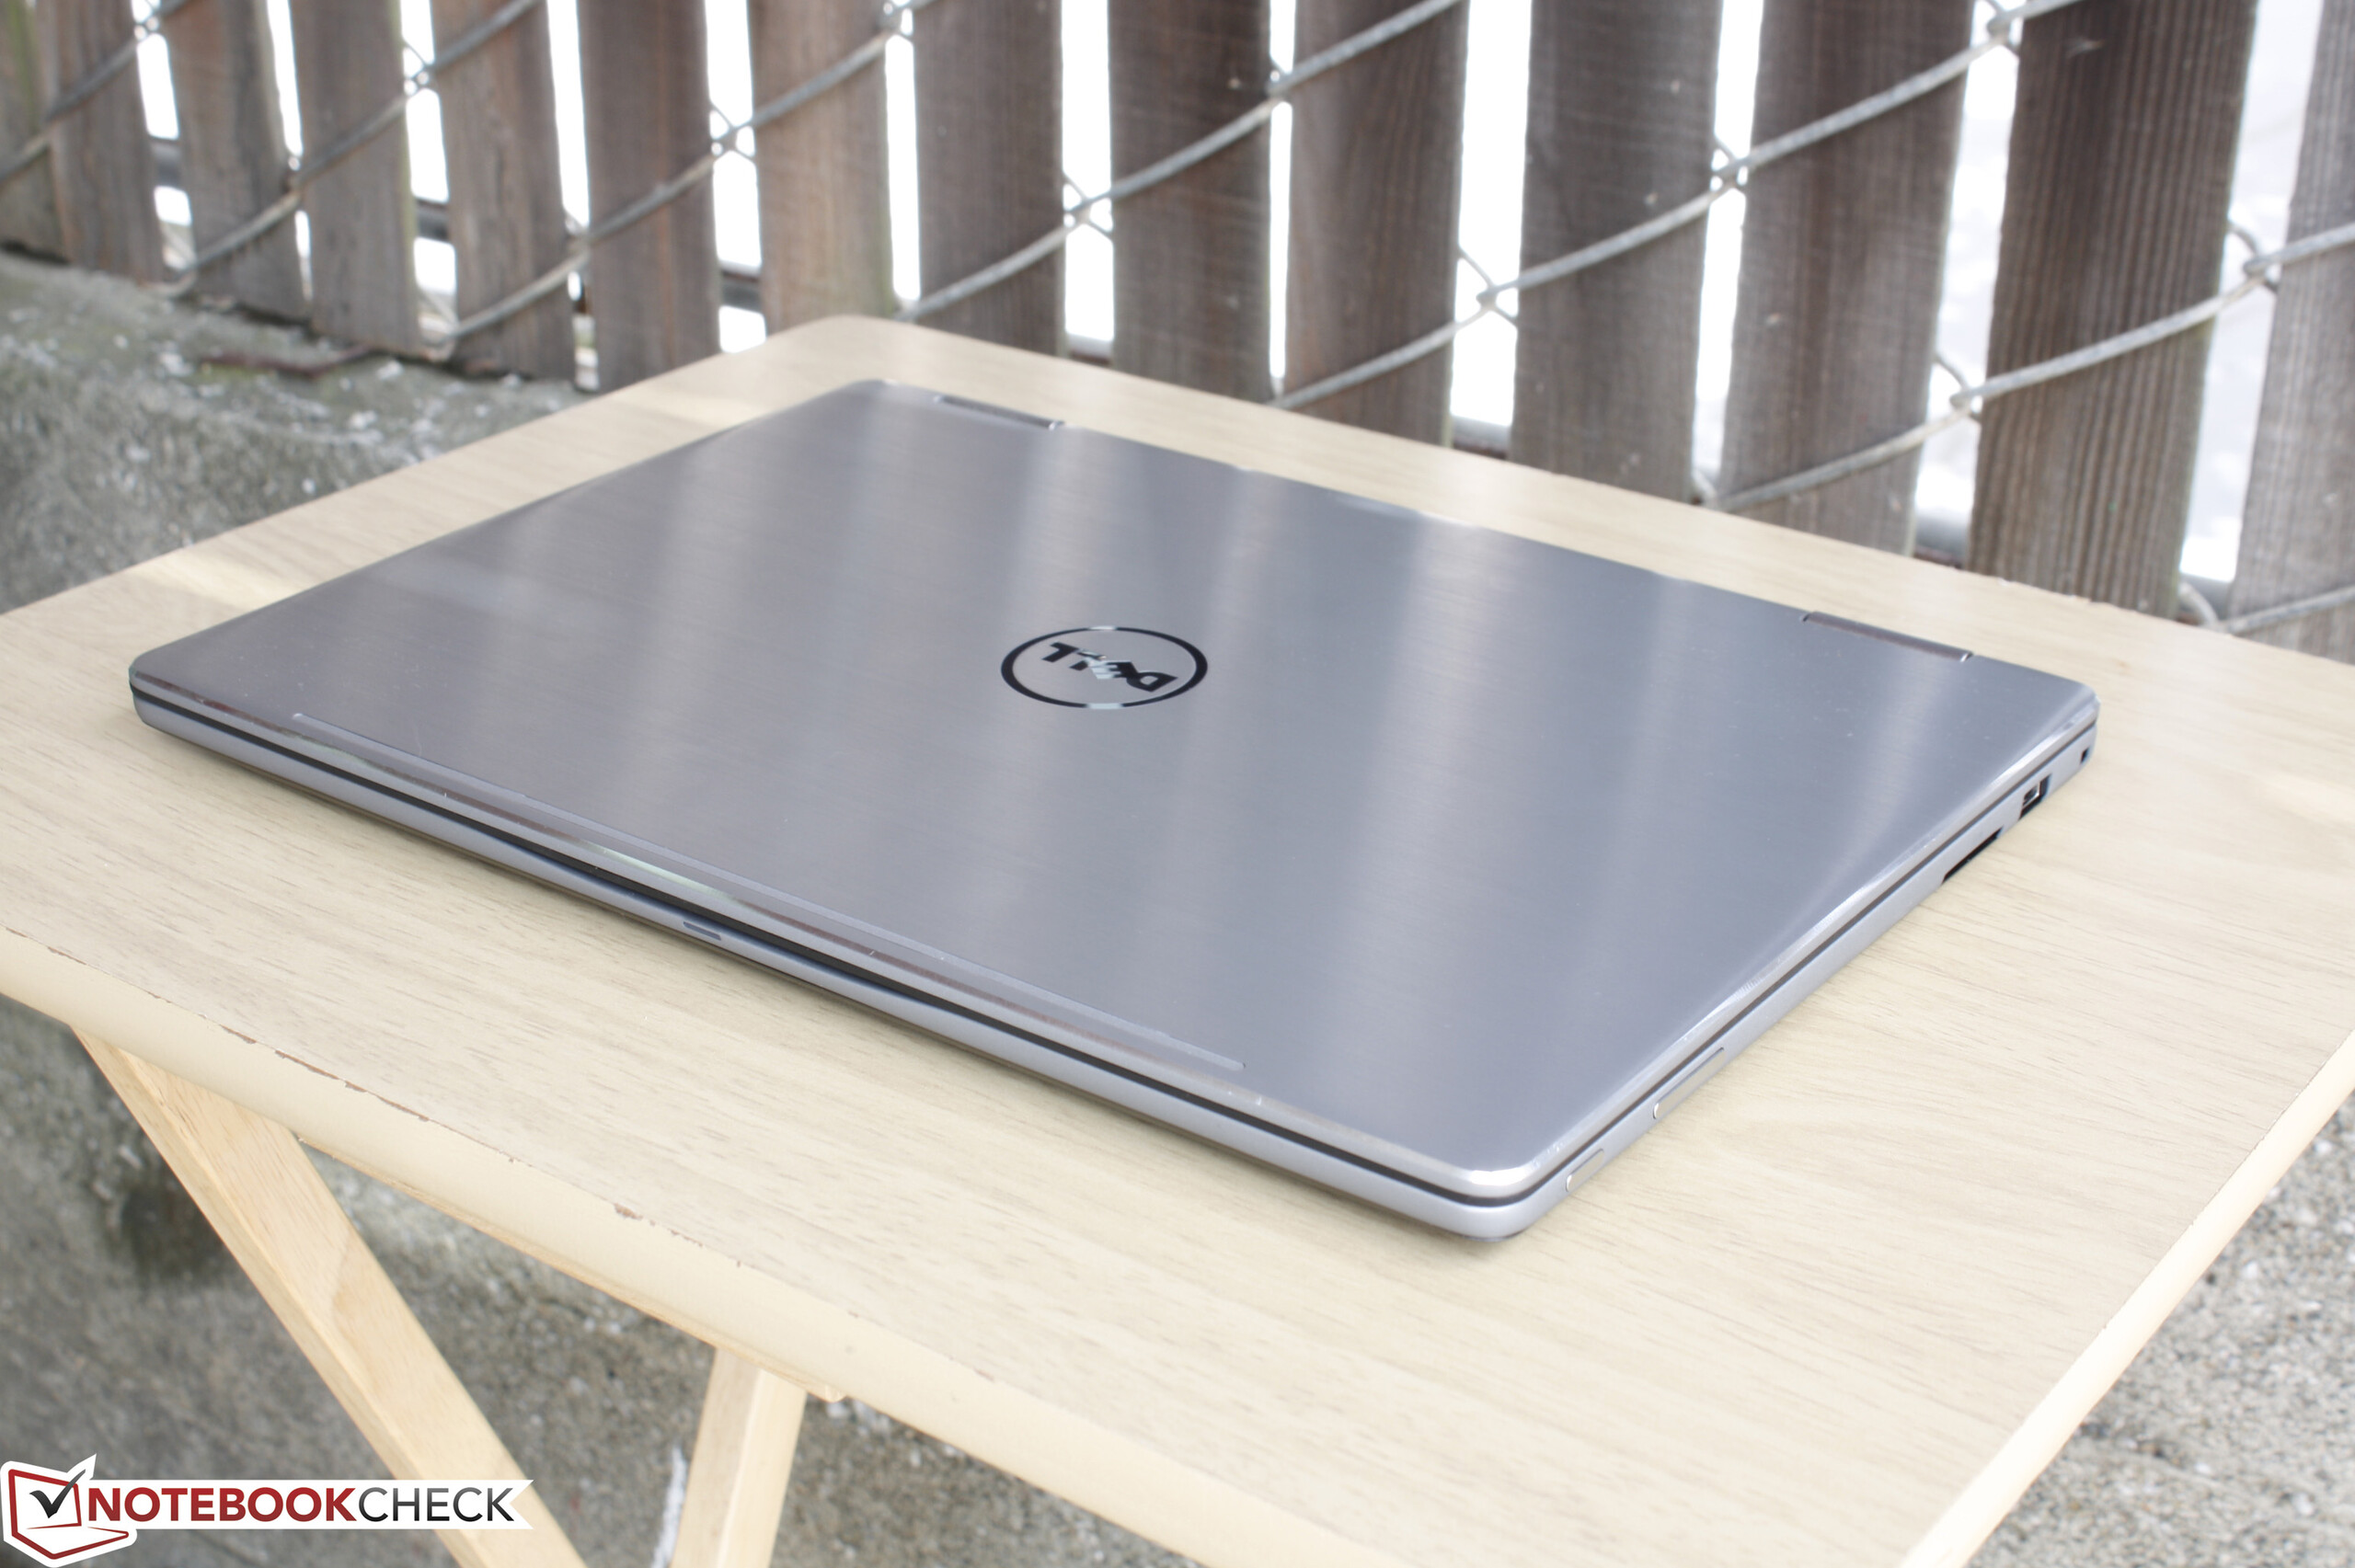
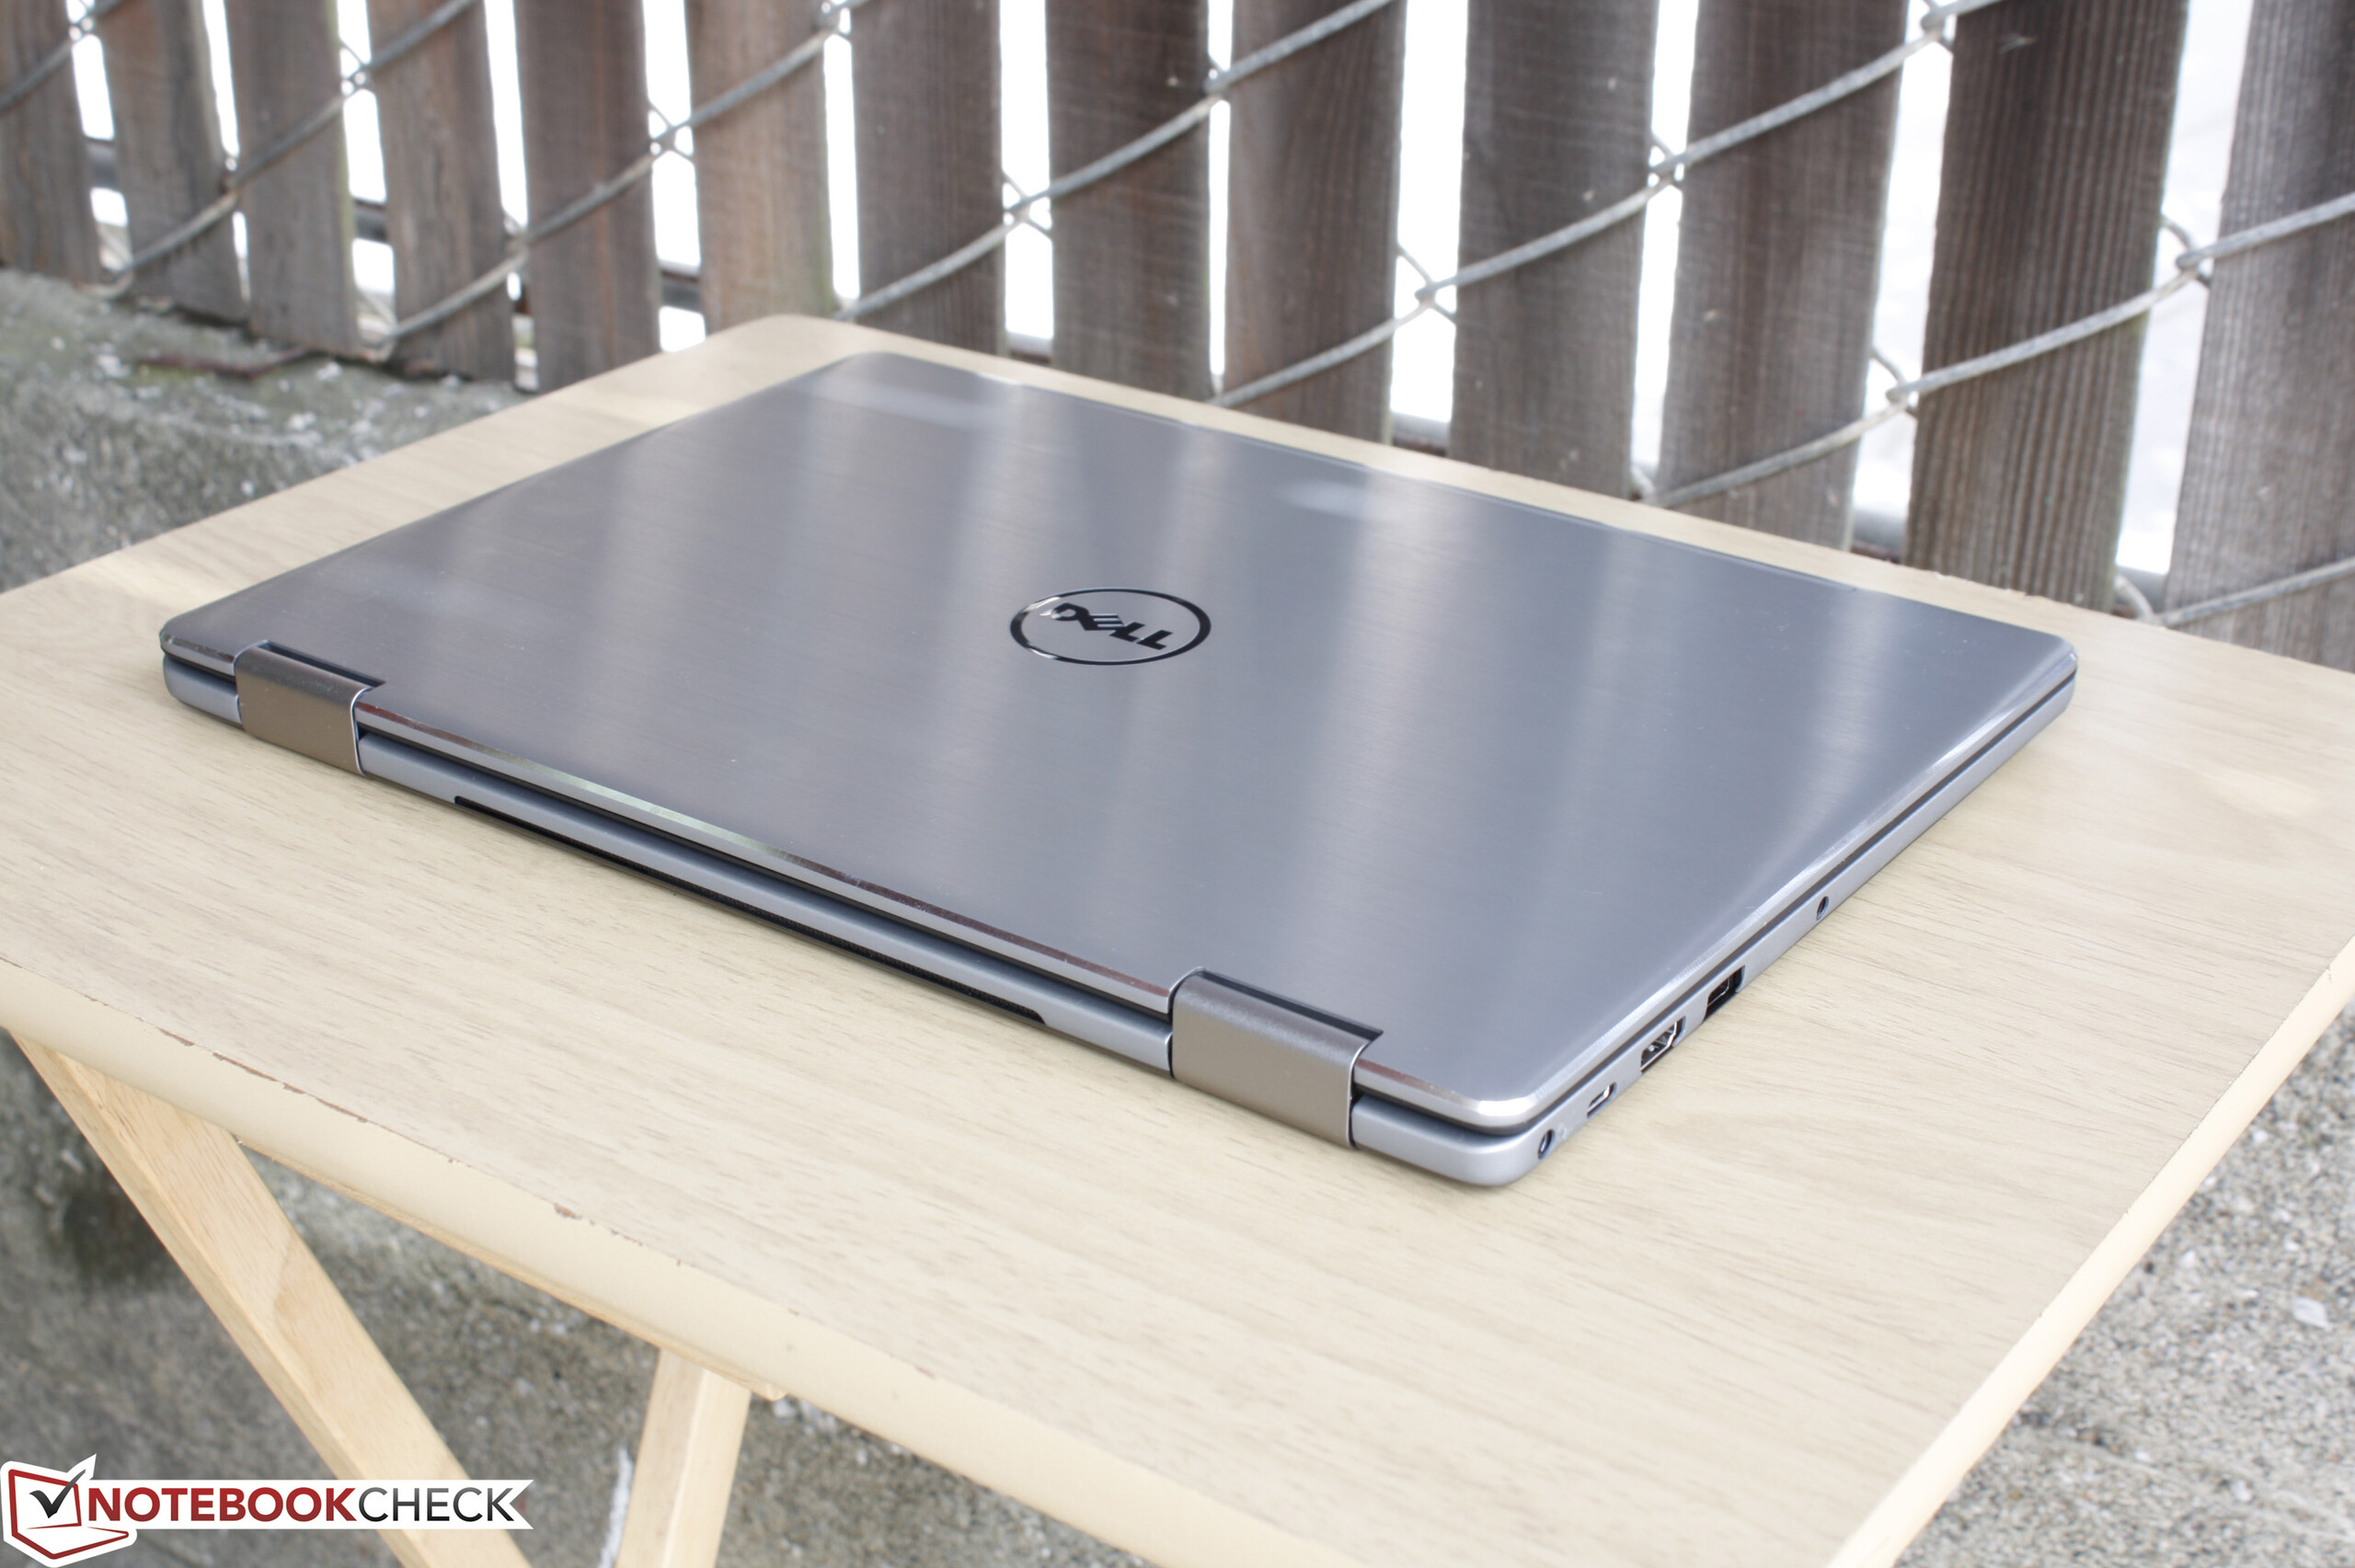
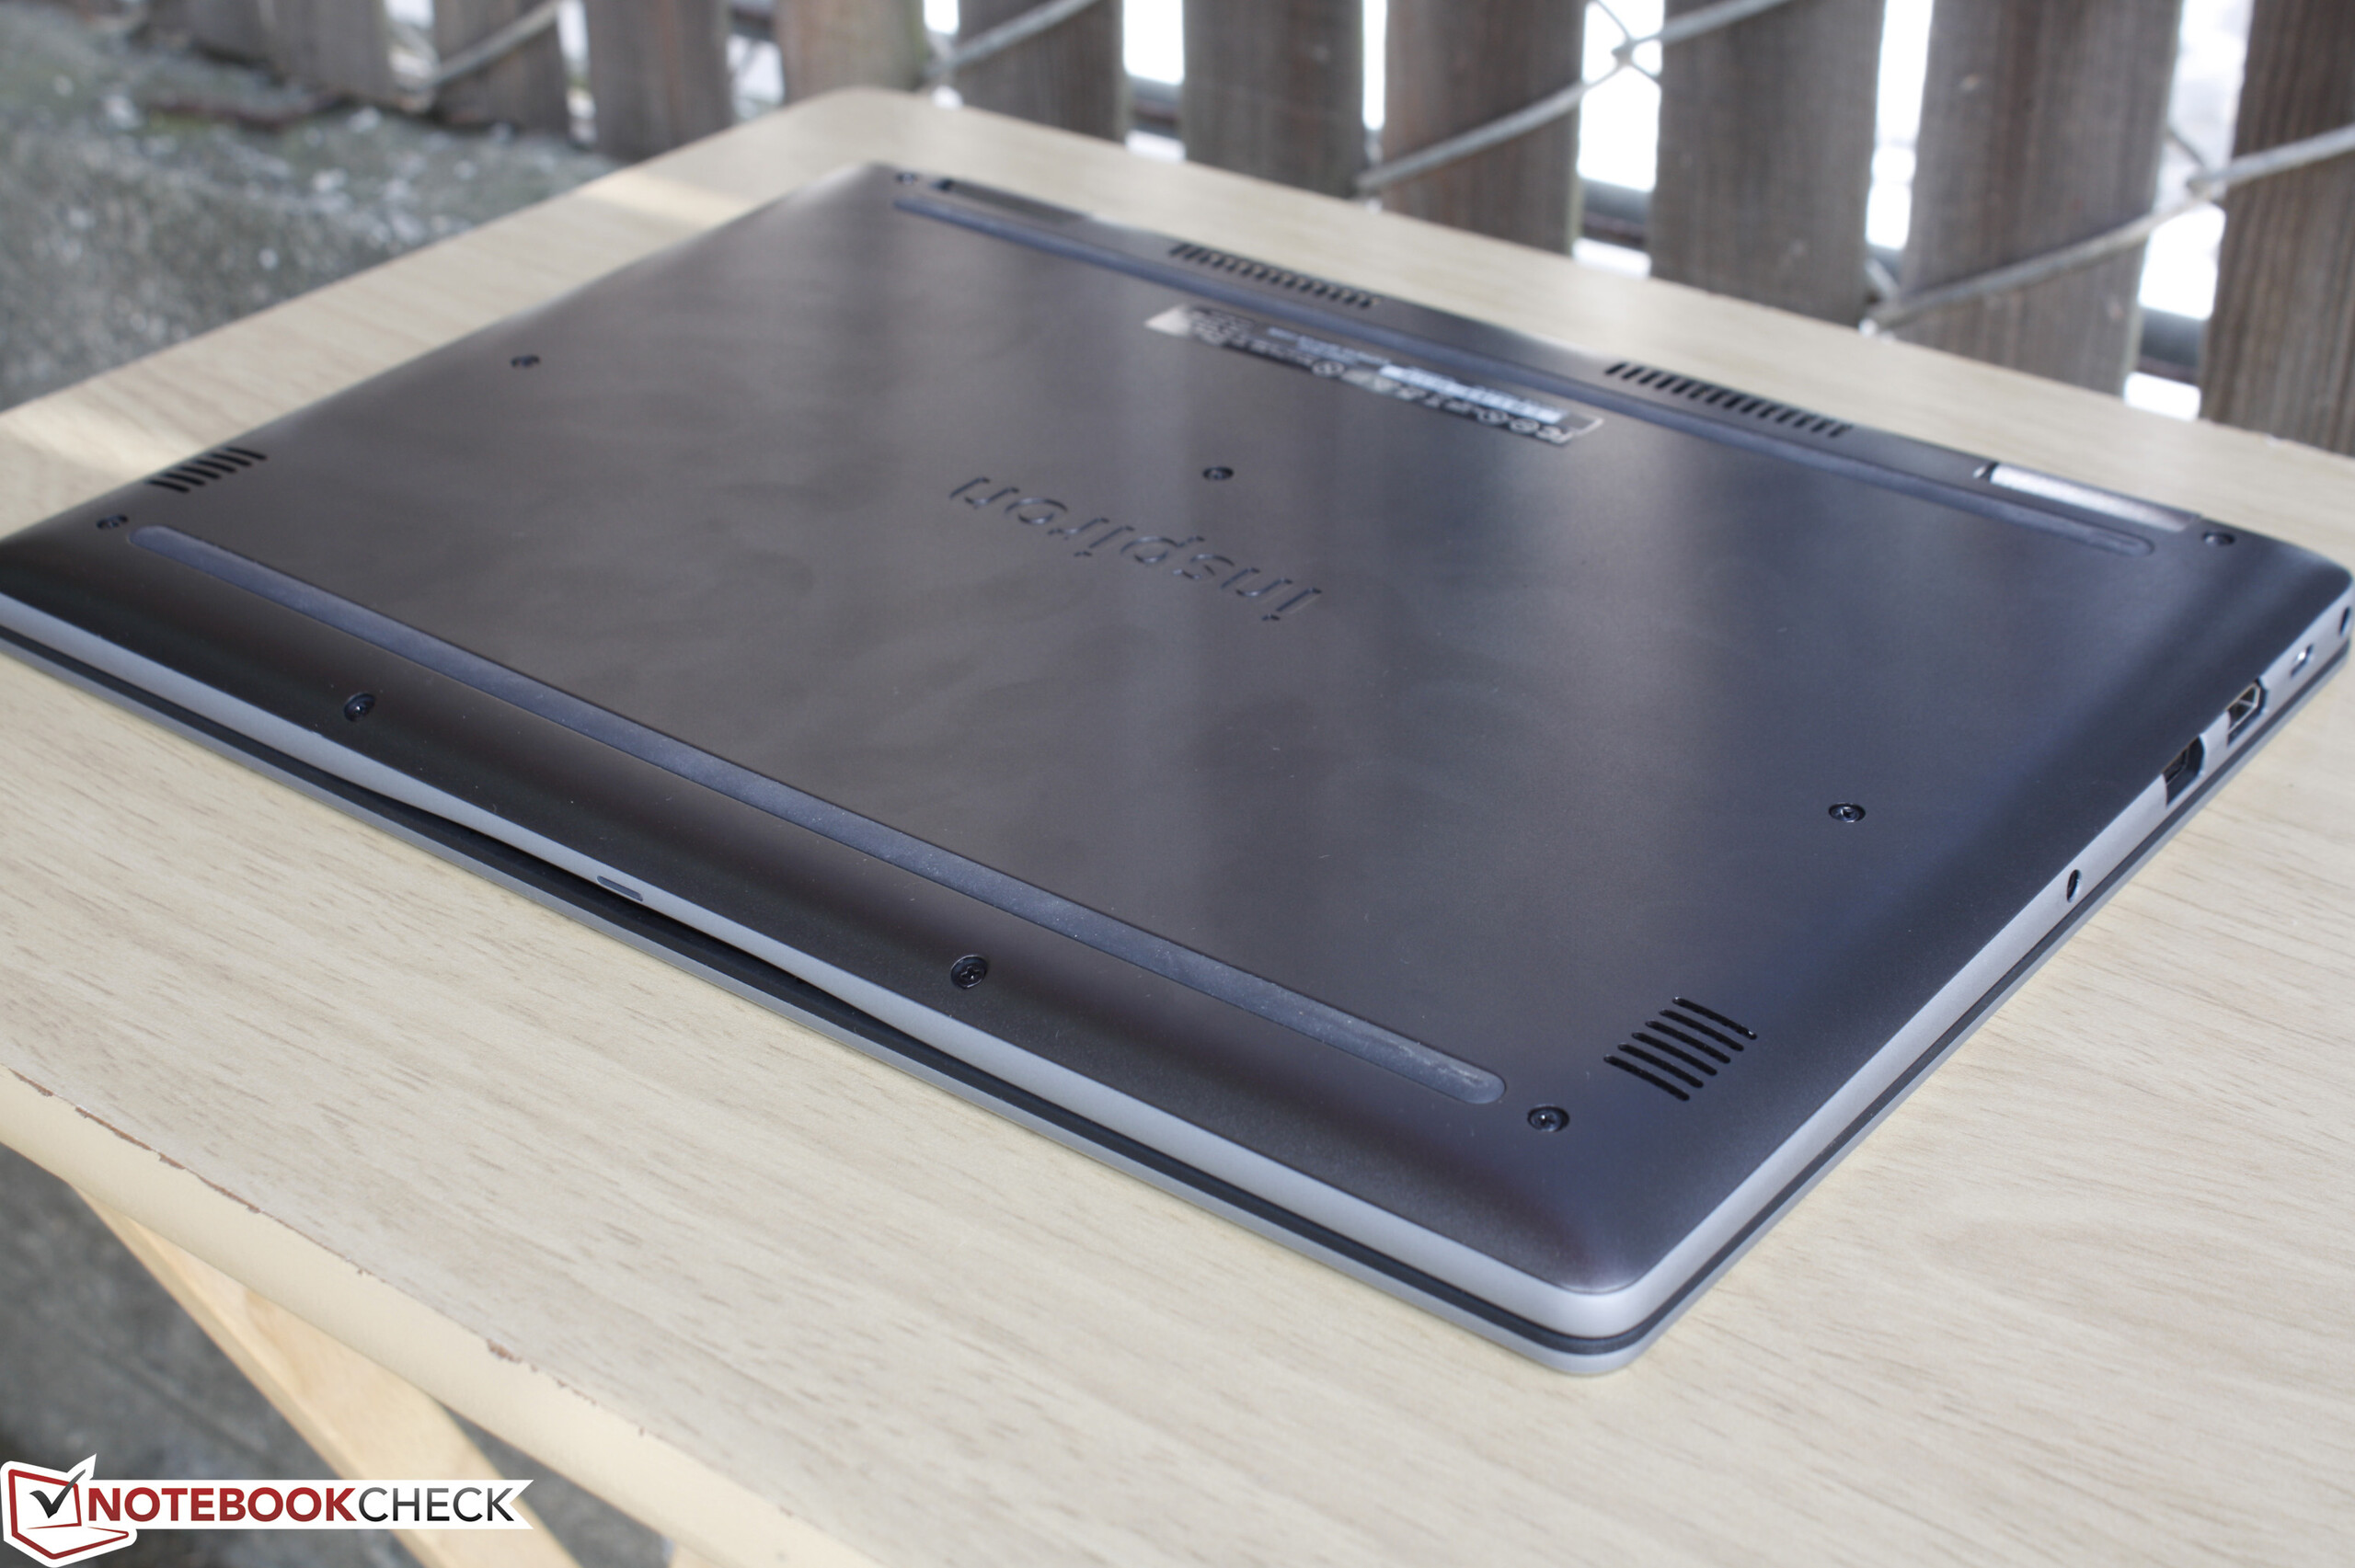
In terms of size and weight, the Inspiron 13 7368 is ever so slightly thinner (19.2 mm vs. 19.4 mm) and lighter (1.6 kg vs. 1.7 kg) than the Inspiron 13 7348, but the margins are so small that users will not likely notice. The main concern is that this is still a large and heavy convertible to use comfortably in tablet mode while on-the-go or with one hand, so its strong build comes at a price. Even the Spectre 13 x360 is lighter and smaller, and we already think that the HP is on the heavy side for a convertible. Thus, tablet mode is better fit for indoor use or while sitting on the coach compared to, say, the much more compact Yoga 900.
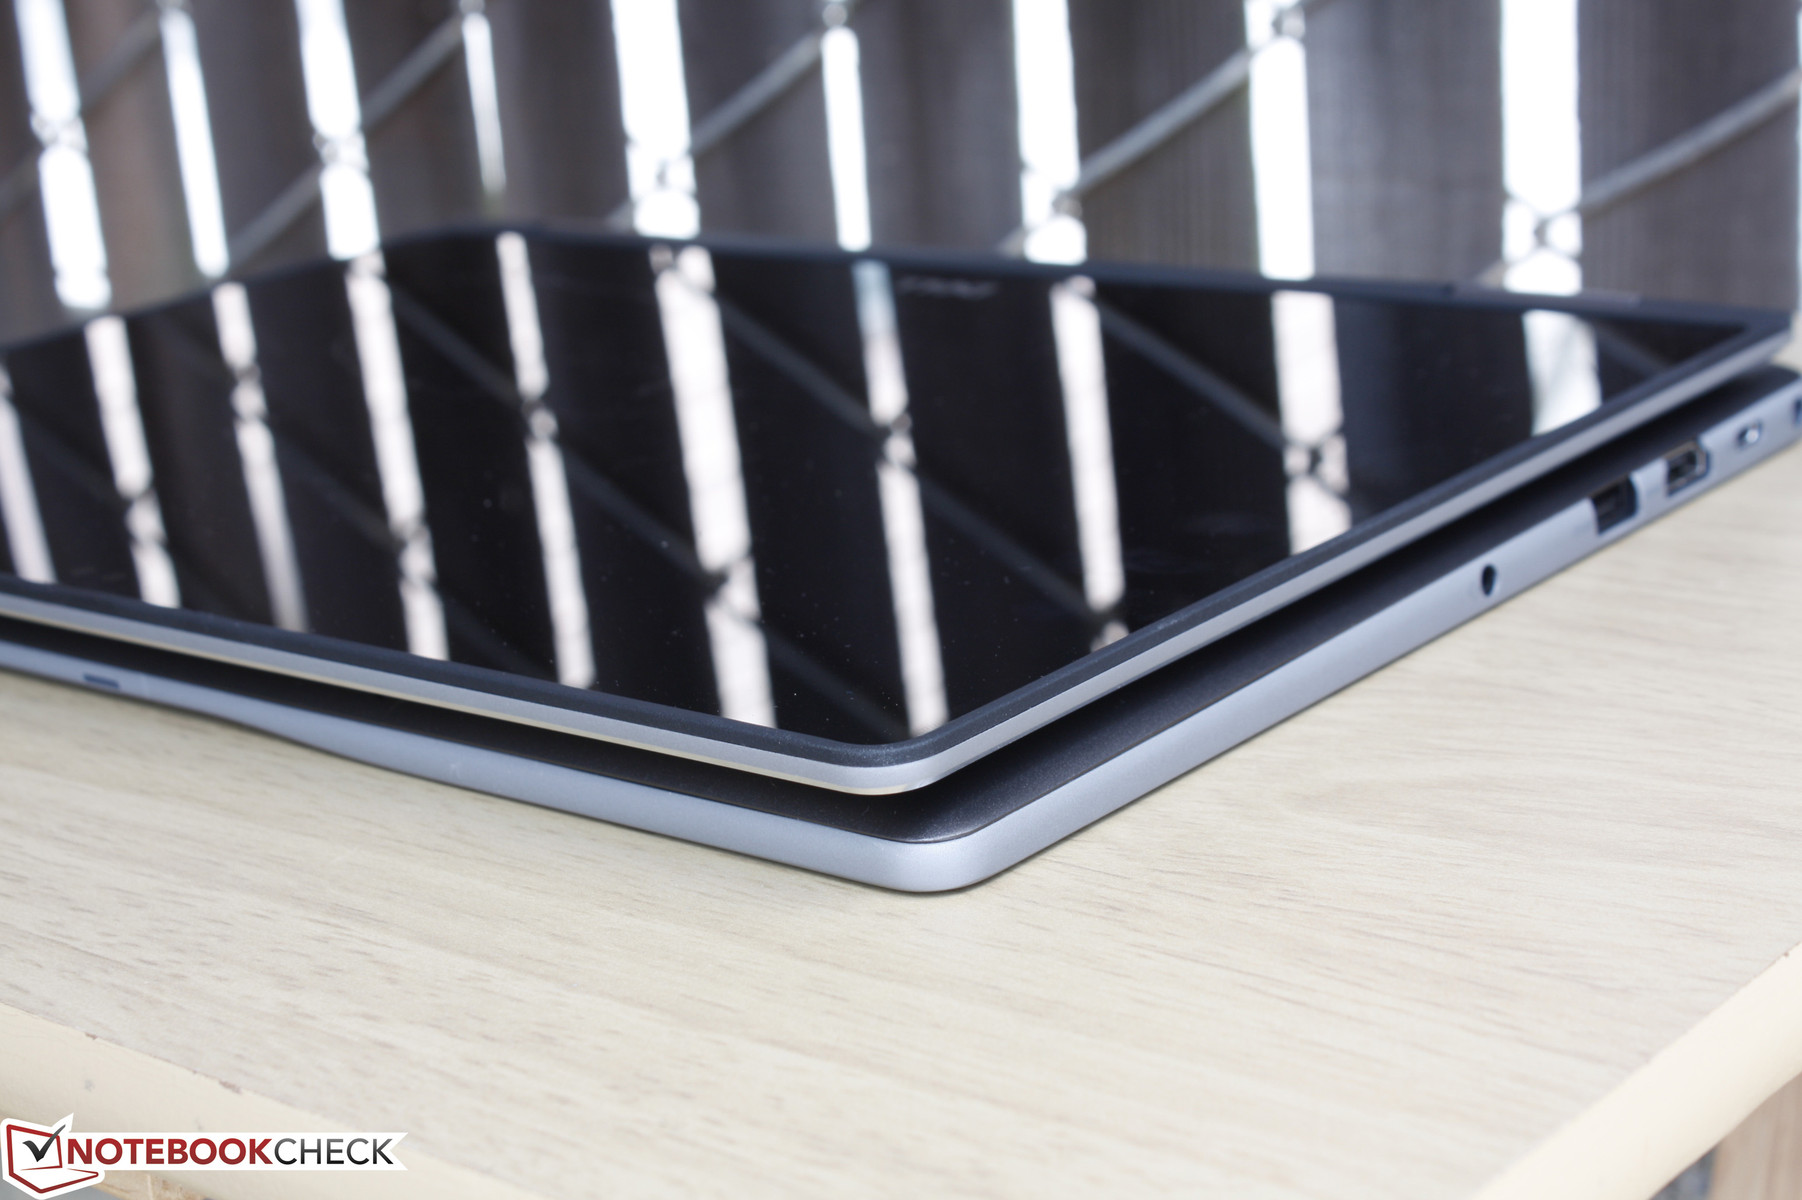
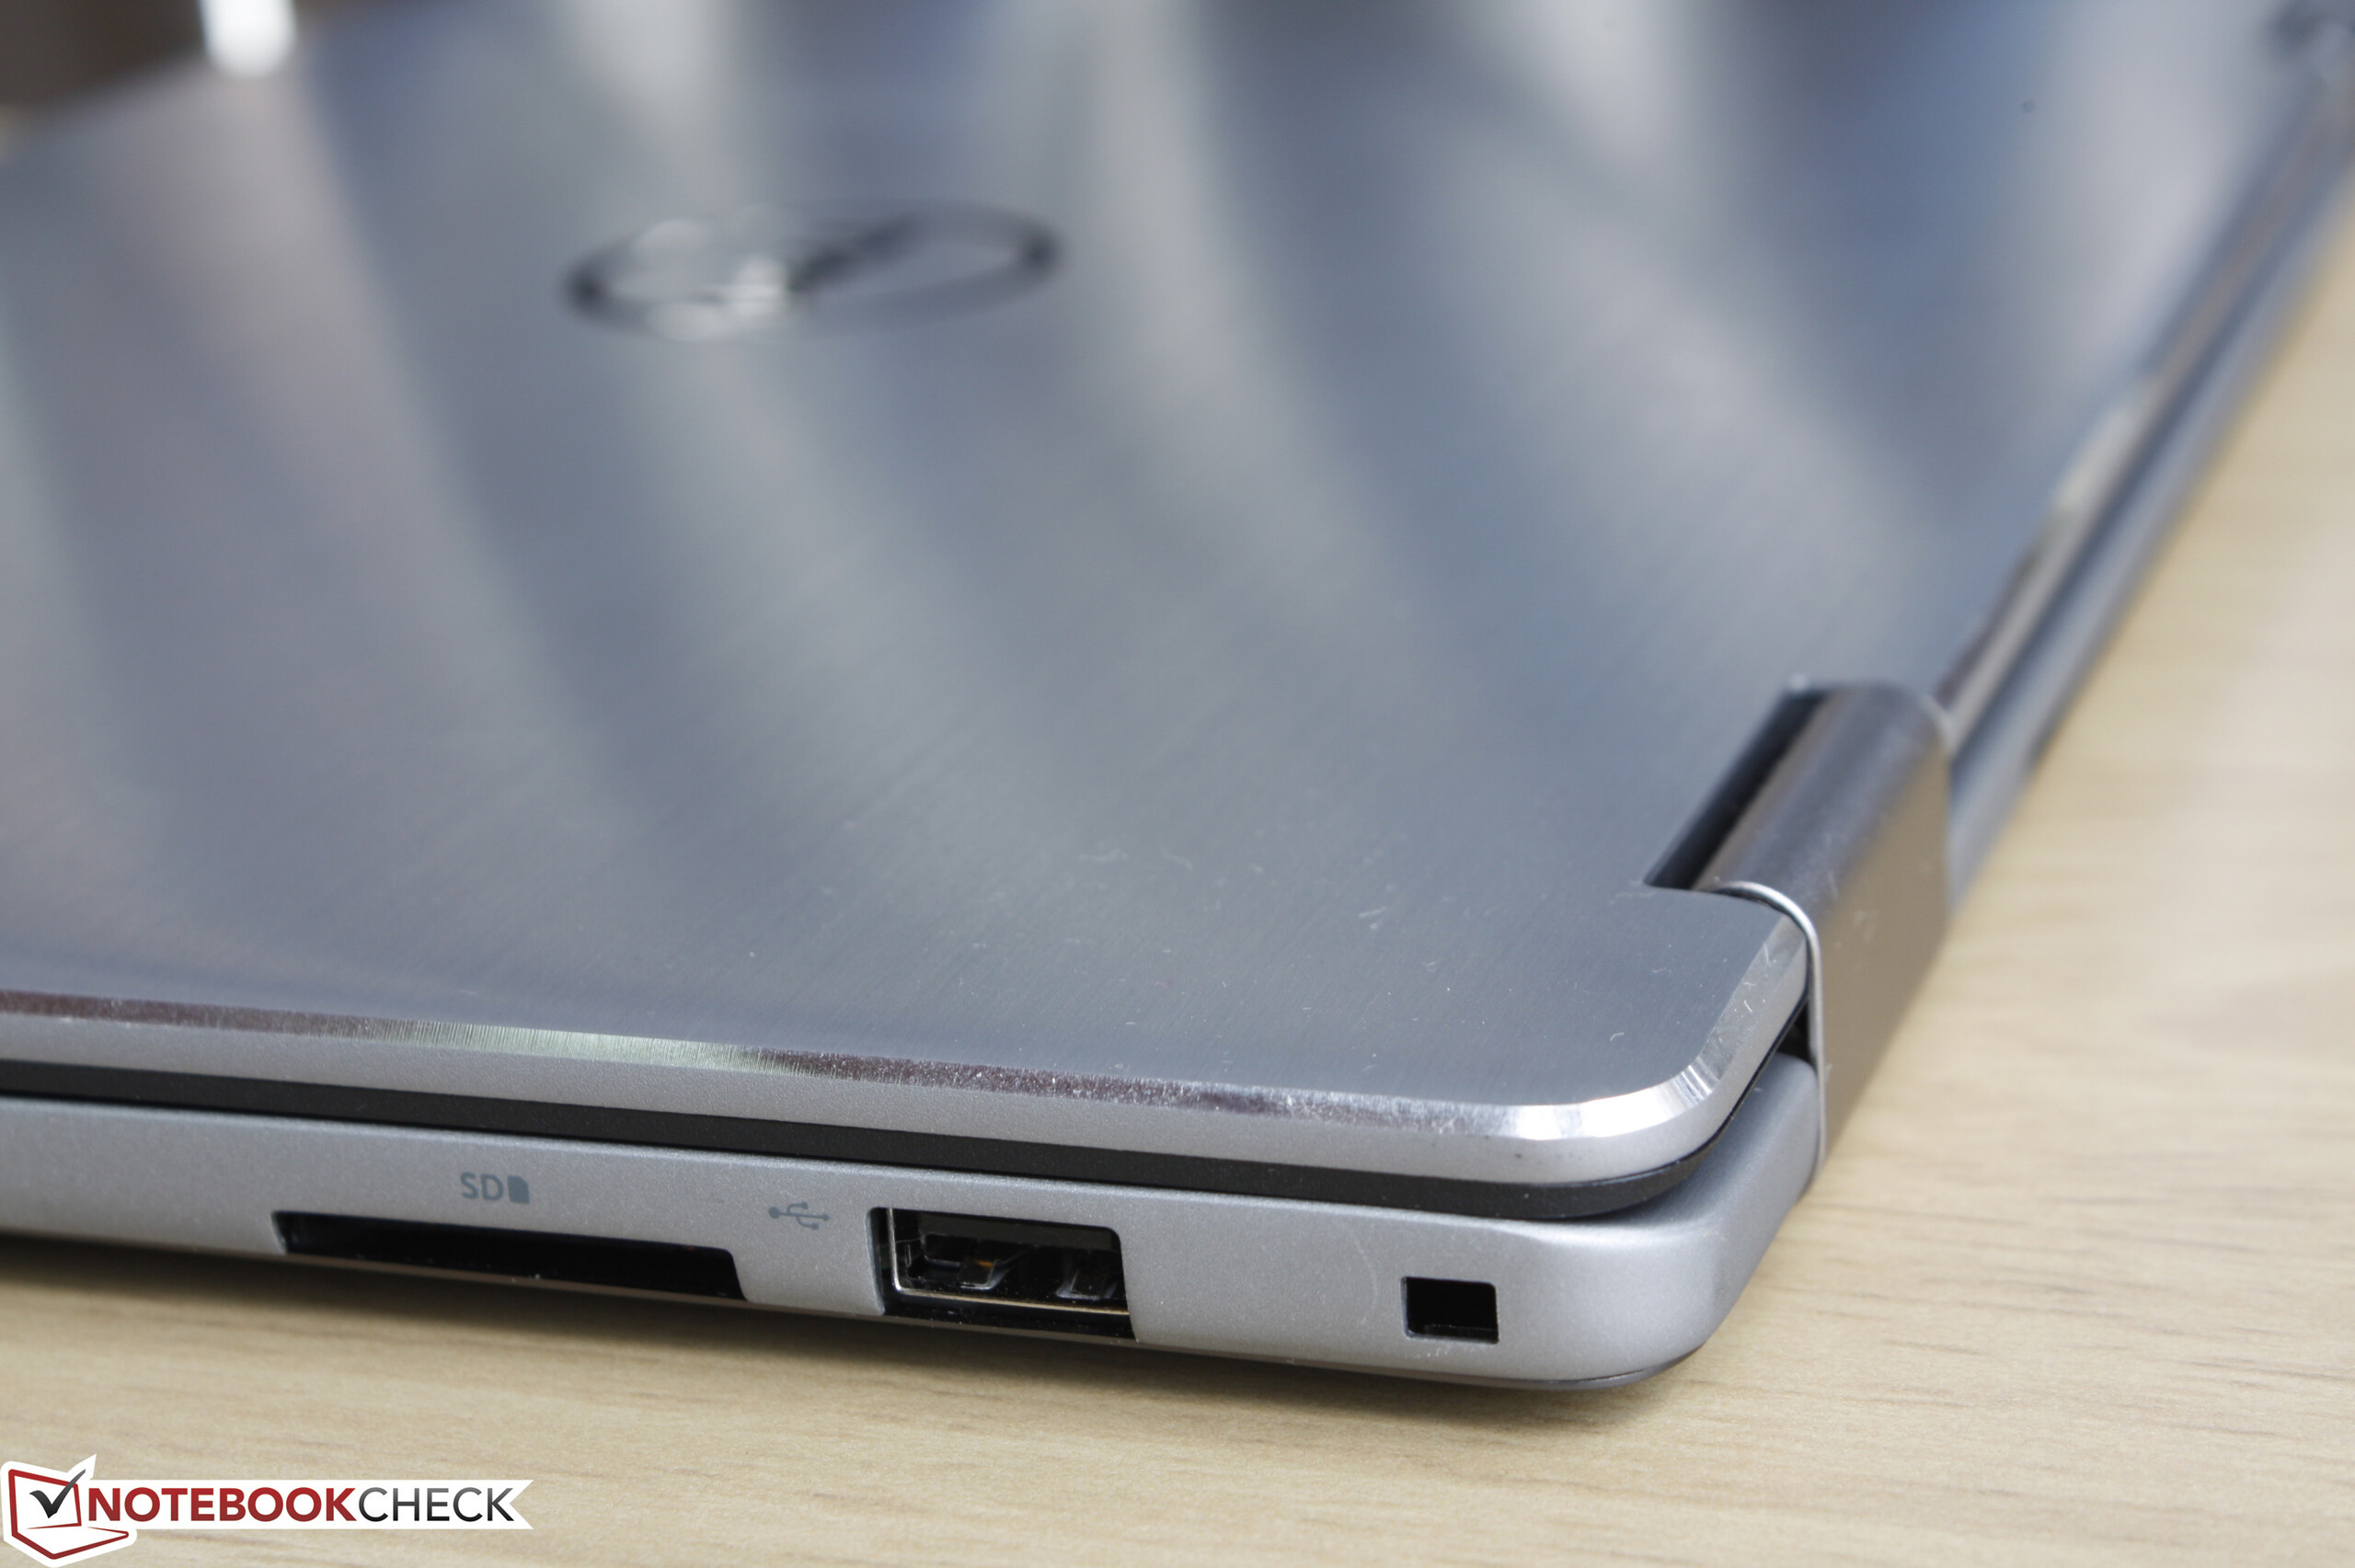
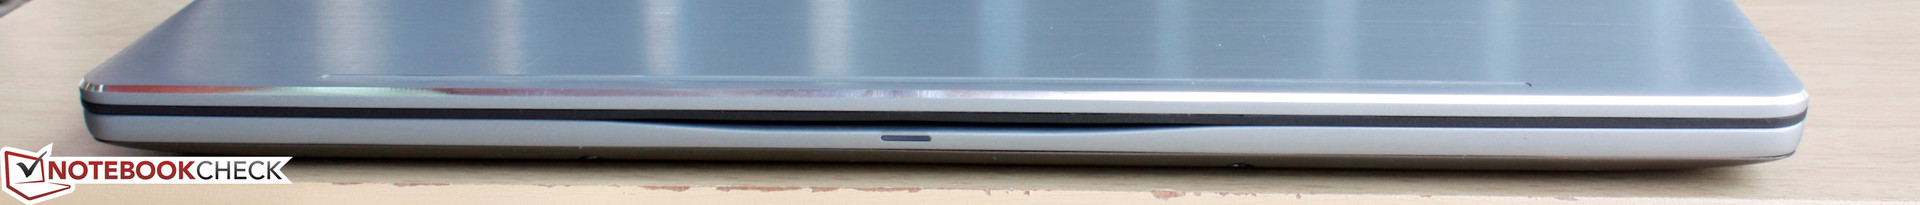
Connectivity
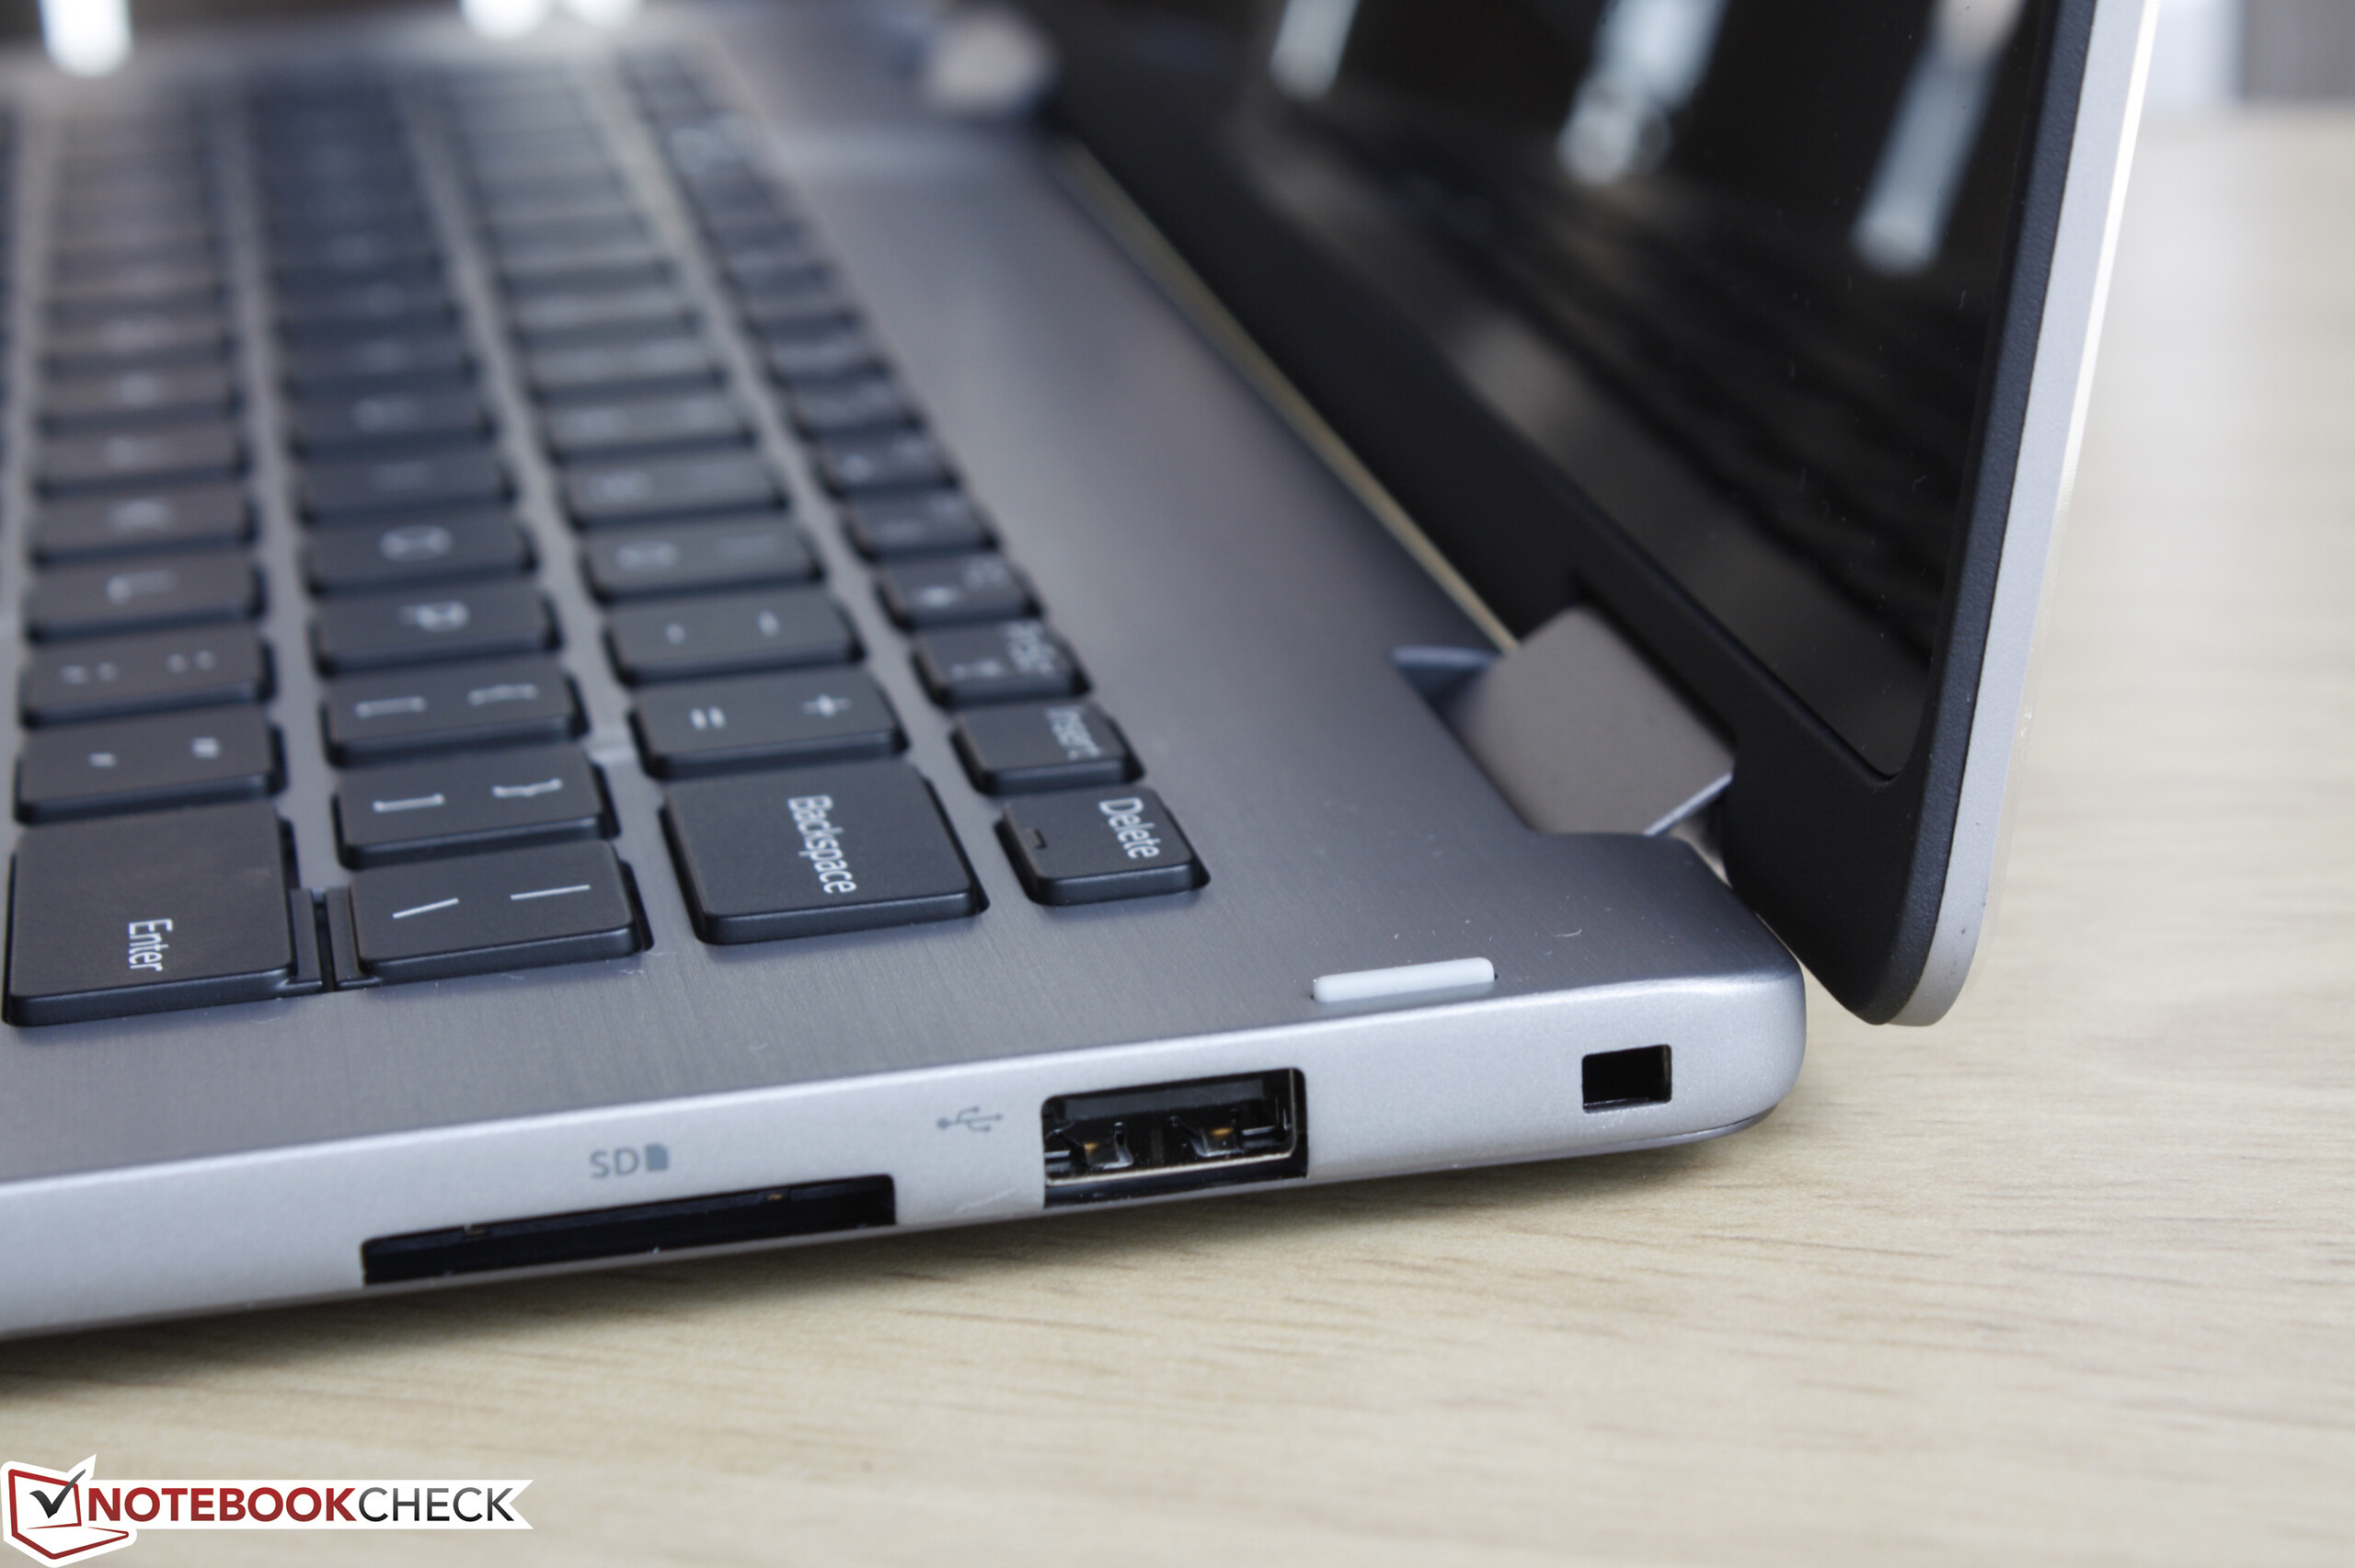
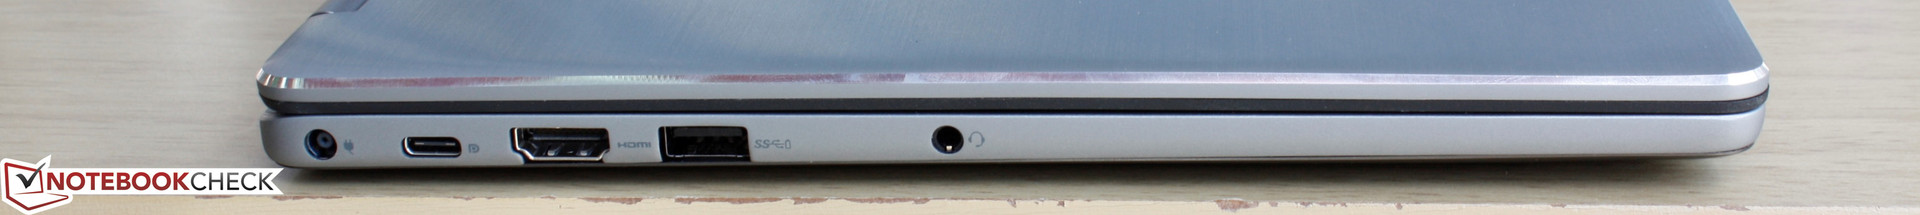
Available ports are the same as on the Inspiron 13 7348 down to their placement around the side edges. The only change is that the Inspiron 7368 includes a USB Type-C port in place of one full-size USB Type-A port. Thus, users only have two full-size USB ports versus three on the older model. The Type-C port here should prove to be more versatile even though it offers up to Gen. 1 speeds only.
Competing models like the Spectre x360 offer mDP options while the thinner Yoga 900 provides 3x USB Type-A ports in addition to a USB Type-C port.
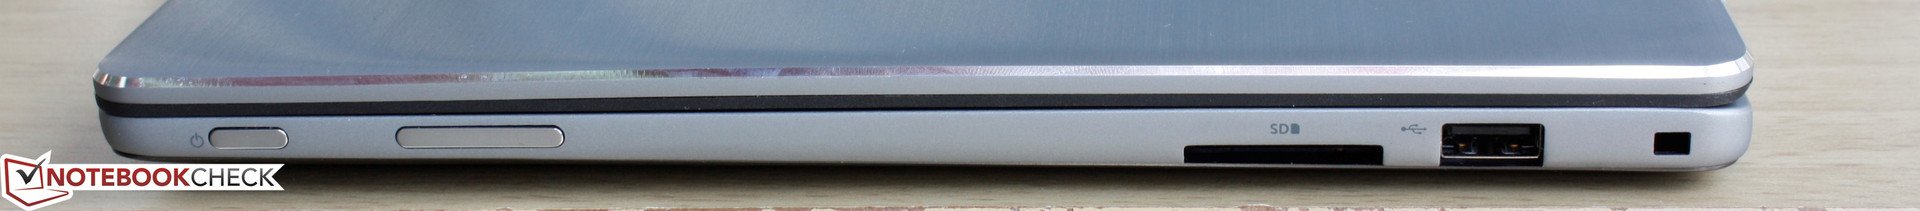
SD Card Reader
We tested the performance of the SD reader with a Toshiba Exceria Pro SDXC 64 GB UHS-II as reference. The average transfer rate is 27.32 Mb/s according to Crystal Disk Mark while a transfer of 1 GB worth of photos from the card to desktop takes about 40.6 seconds.
| SD Card Reader | |
| average JPG Copy Test (av. of 3 runs) | |
| Dell XPS 13 2016 9350 (FHD, i7-6560U) | |
| Apple MacBook Pro Retina 13 inch 2013-10 | |
| Lenovo IdeaPad 710S-13ISK 80SW0031US | |
| Dell Inspiron 13 7386 | |
| maximum AS SSD Seq Read Test (1GB) | |
| Dell XPS 13 2016 9350 (FHD, i7-6560U) | |
| Lenovo IdeaPad 710S-13ISK 80SW0031US | |
| Dell Inspiron 13 7386 | |
Communication
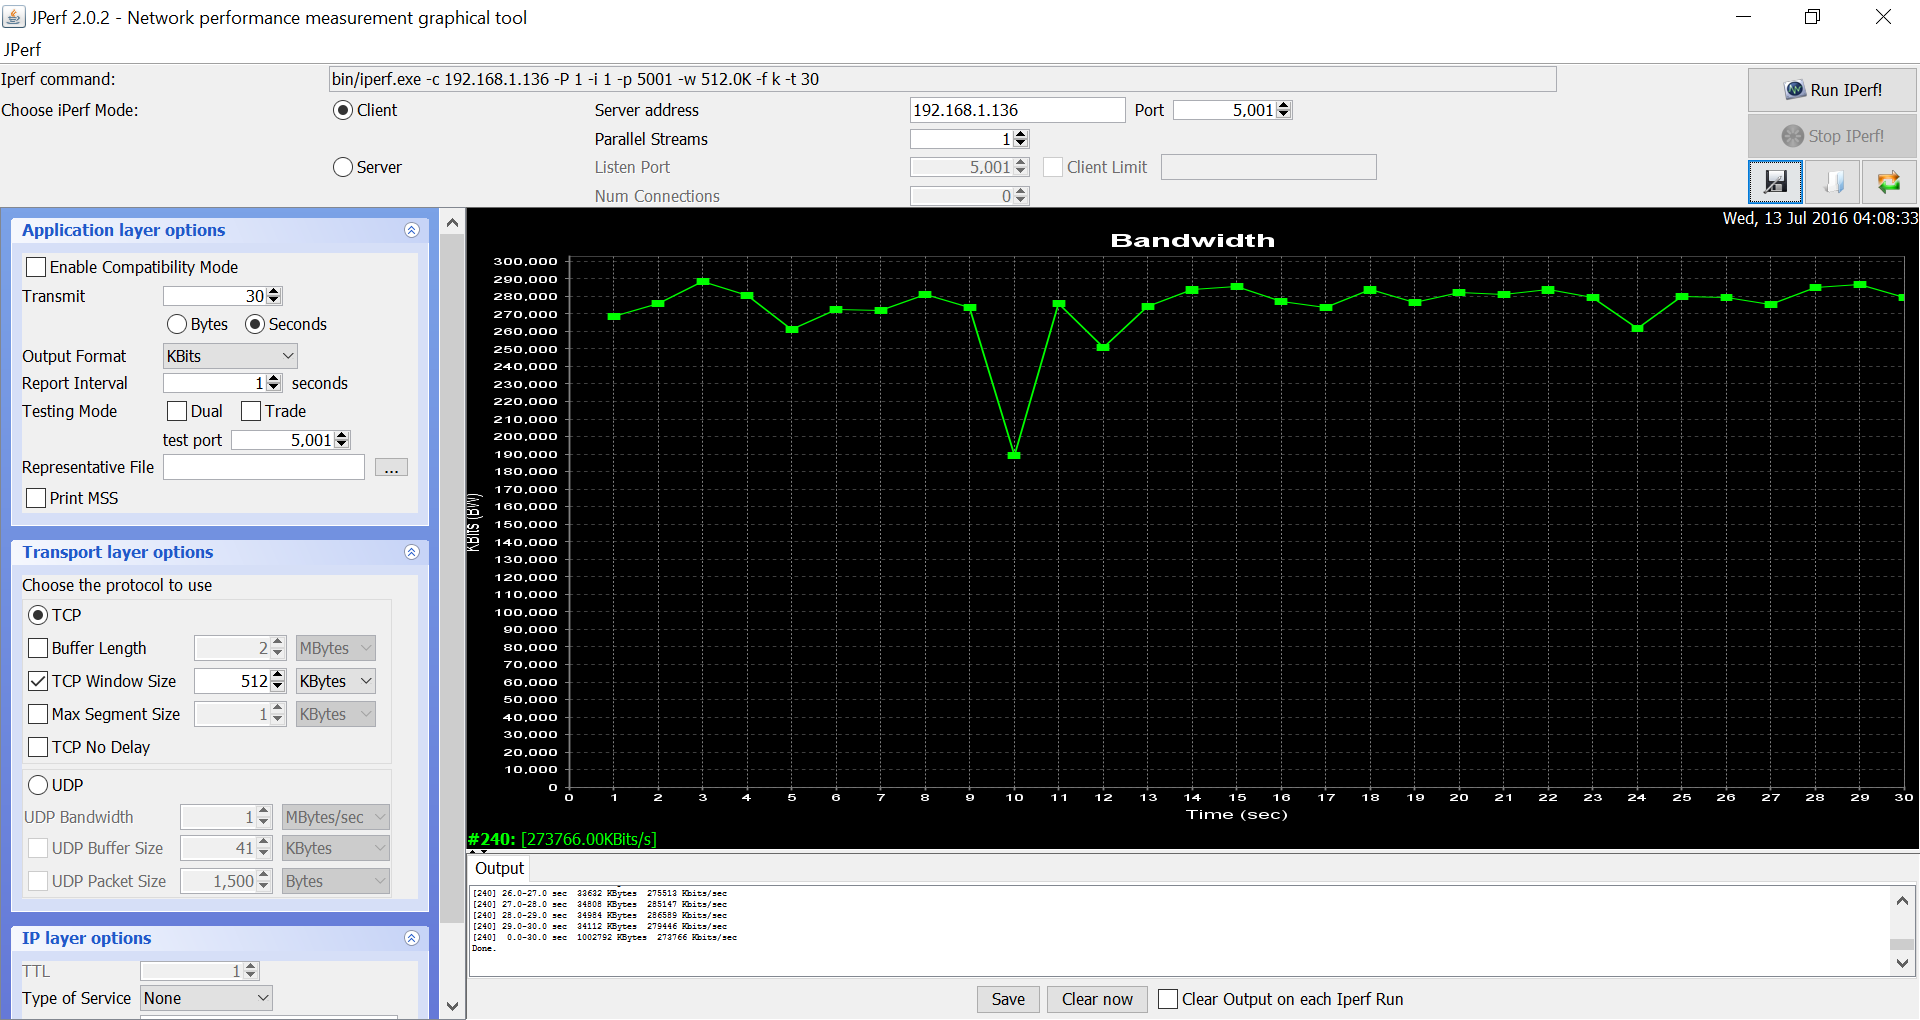
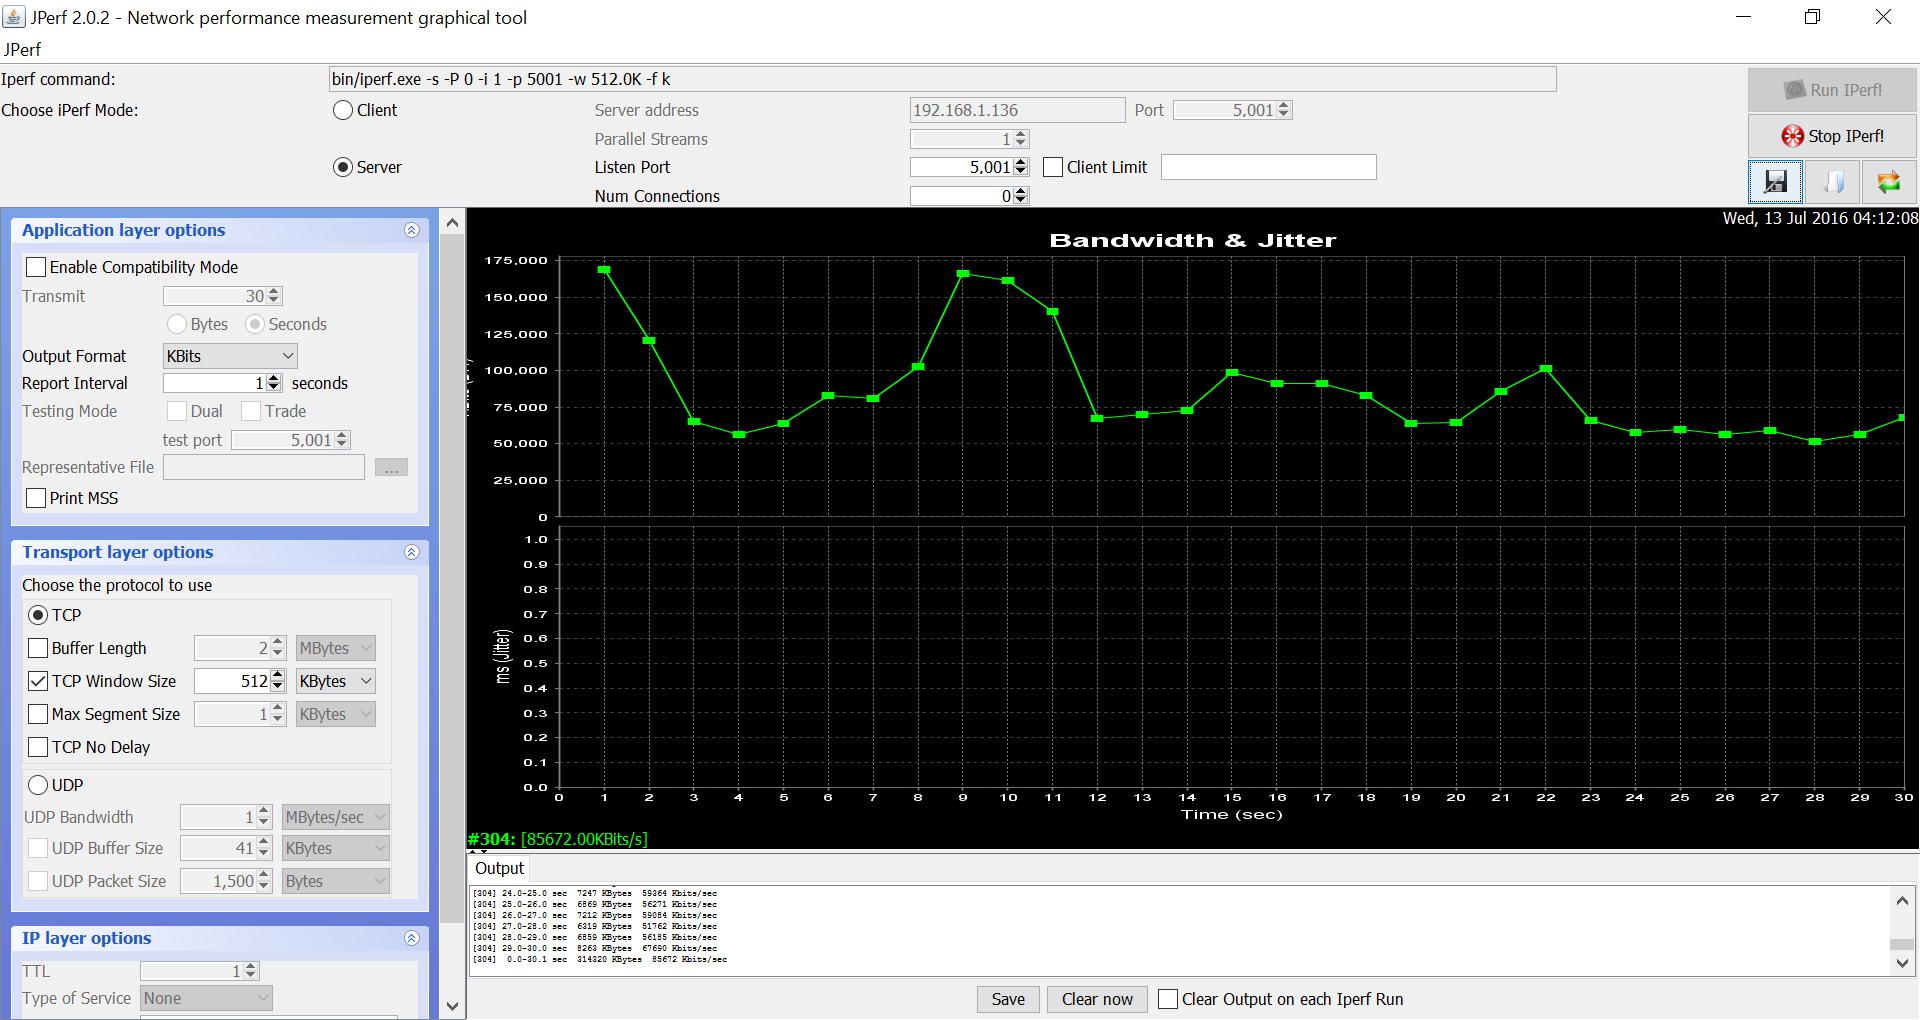
WLAN is provided by an Intel 3165 1x1 module with theoretical transfer rates of up to 433 Mbps on an 802.11ac network. We were able to record a real-world average of 273 Mbps over 30 seconds when connected to our Linksys EA8500 test router.
Bluetooth 4.2 and WiDi are both integrated onto the WLAN module while no options exist for GPS or WWAN.
Accessories
There are no included extras outside of the power adapter and Quick Start guide. There are no dedicated docking stations either since the notebook lacks the docking port of the Latitude series, so users must rely on USB-based docking stations for additional connectivity options.
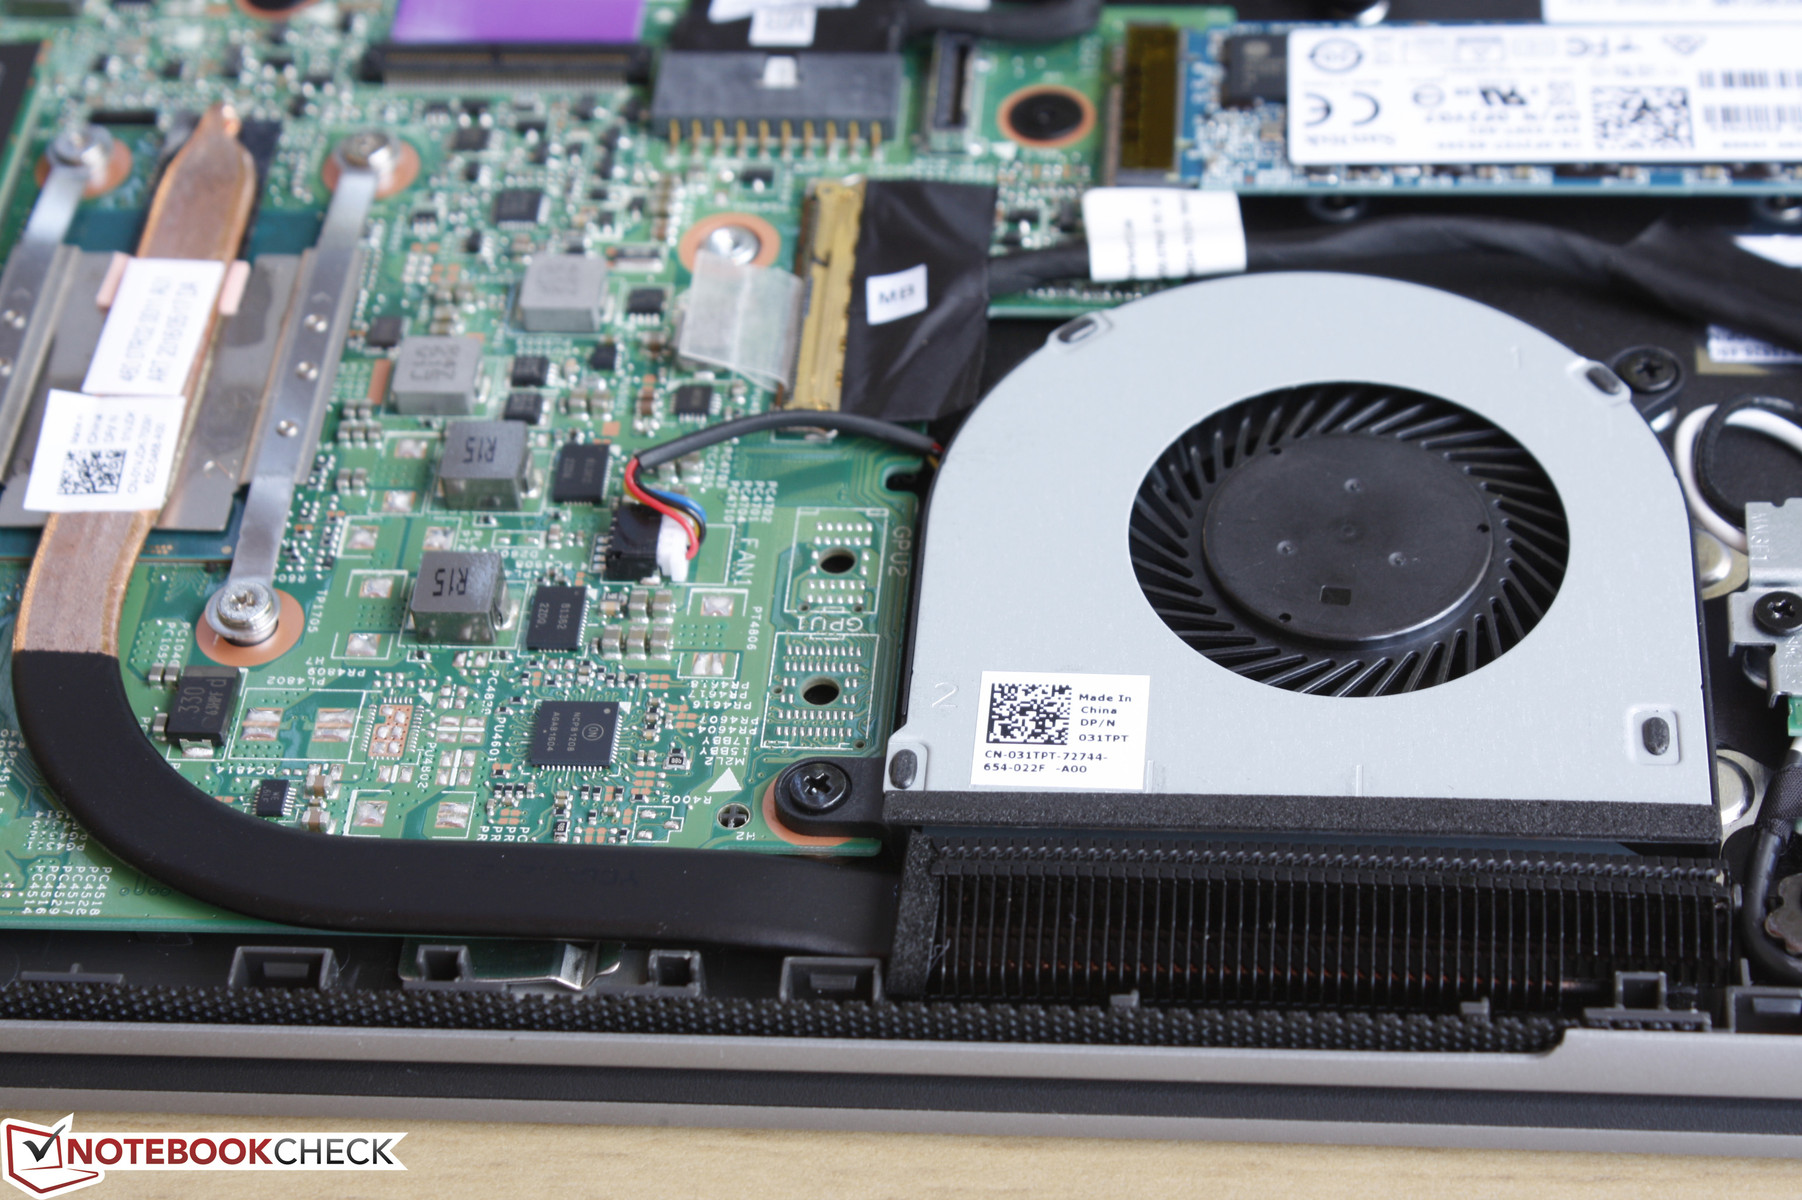
Maintenance
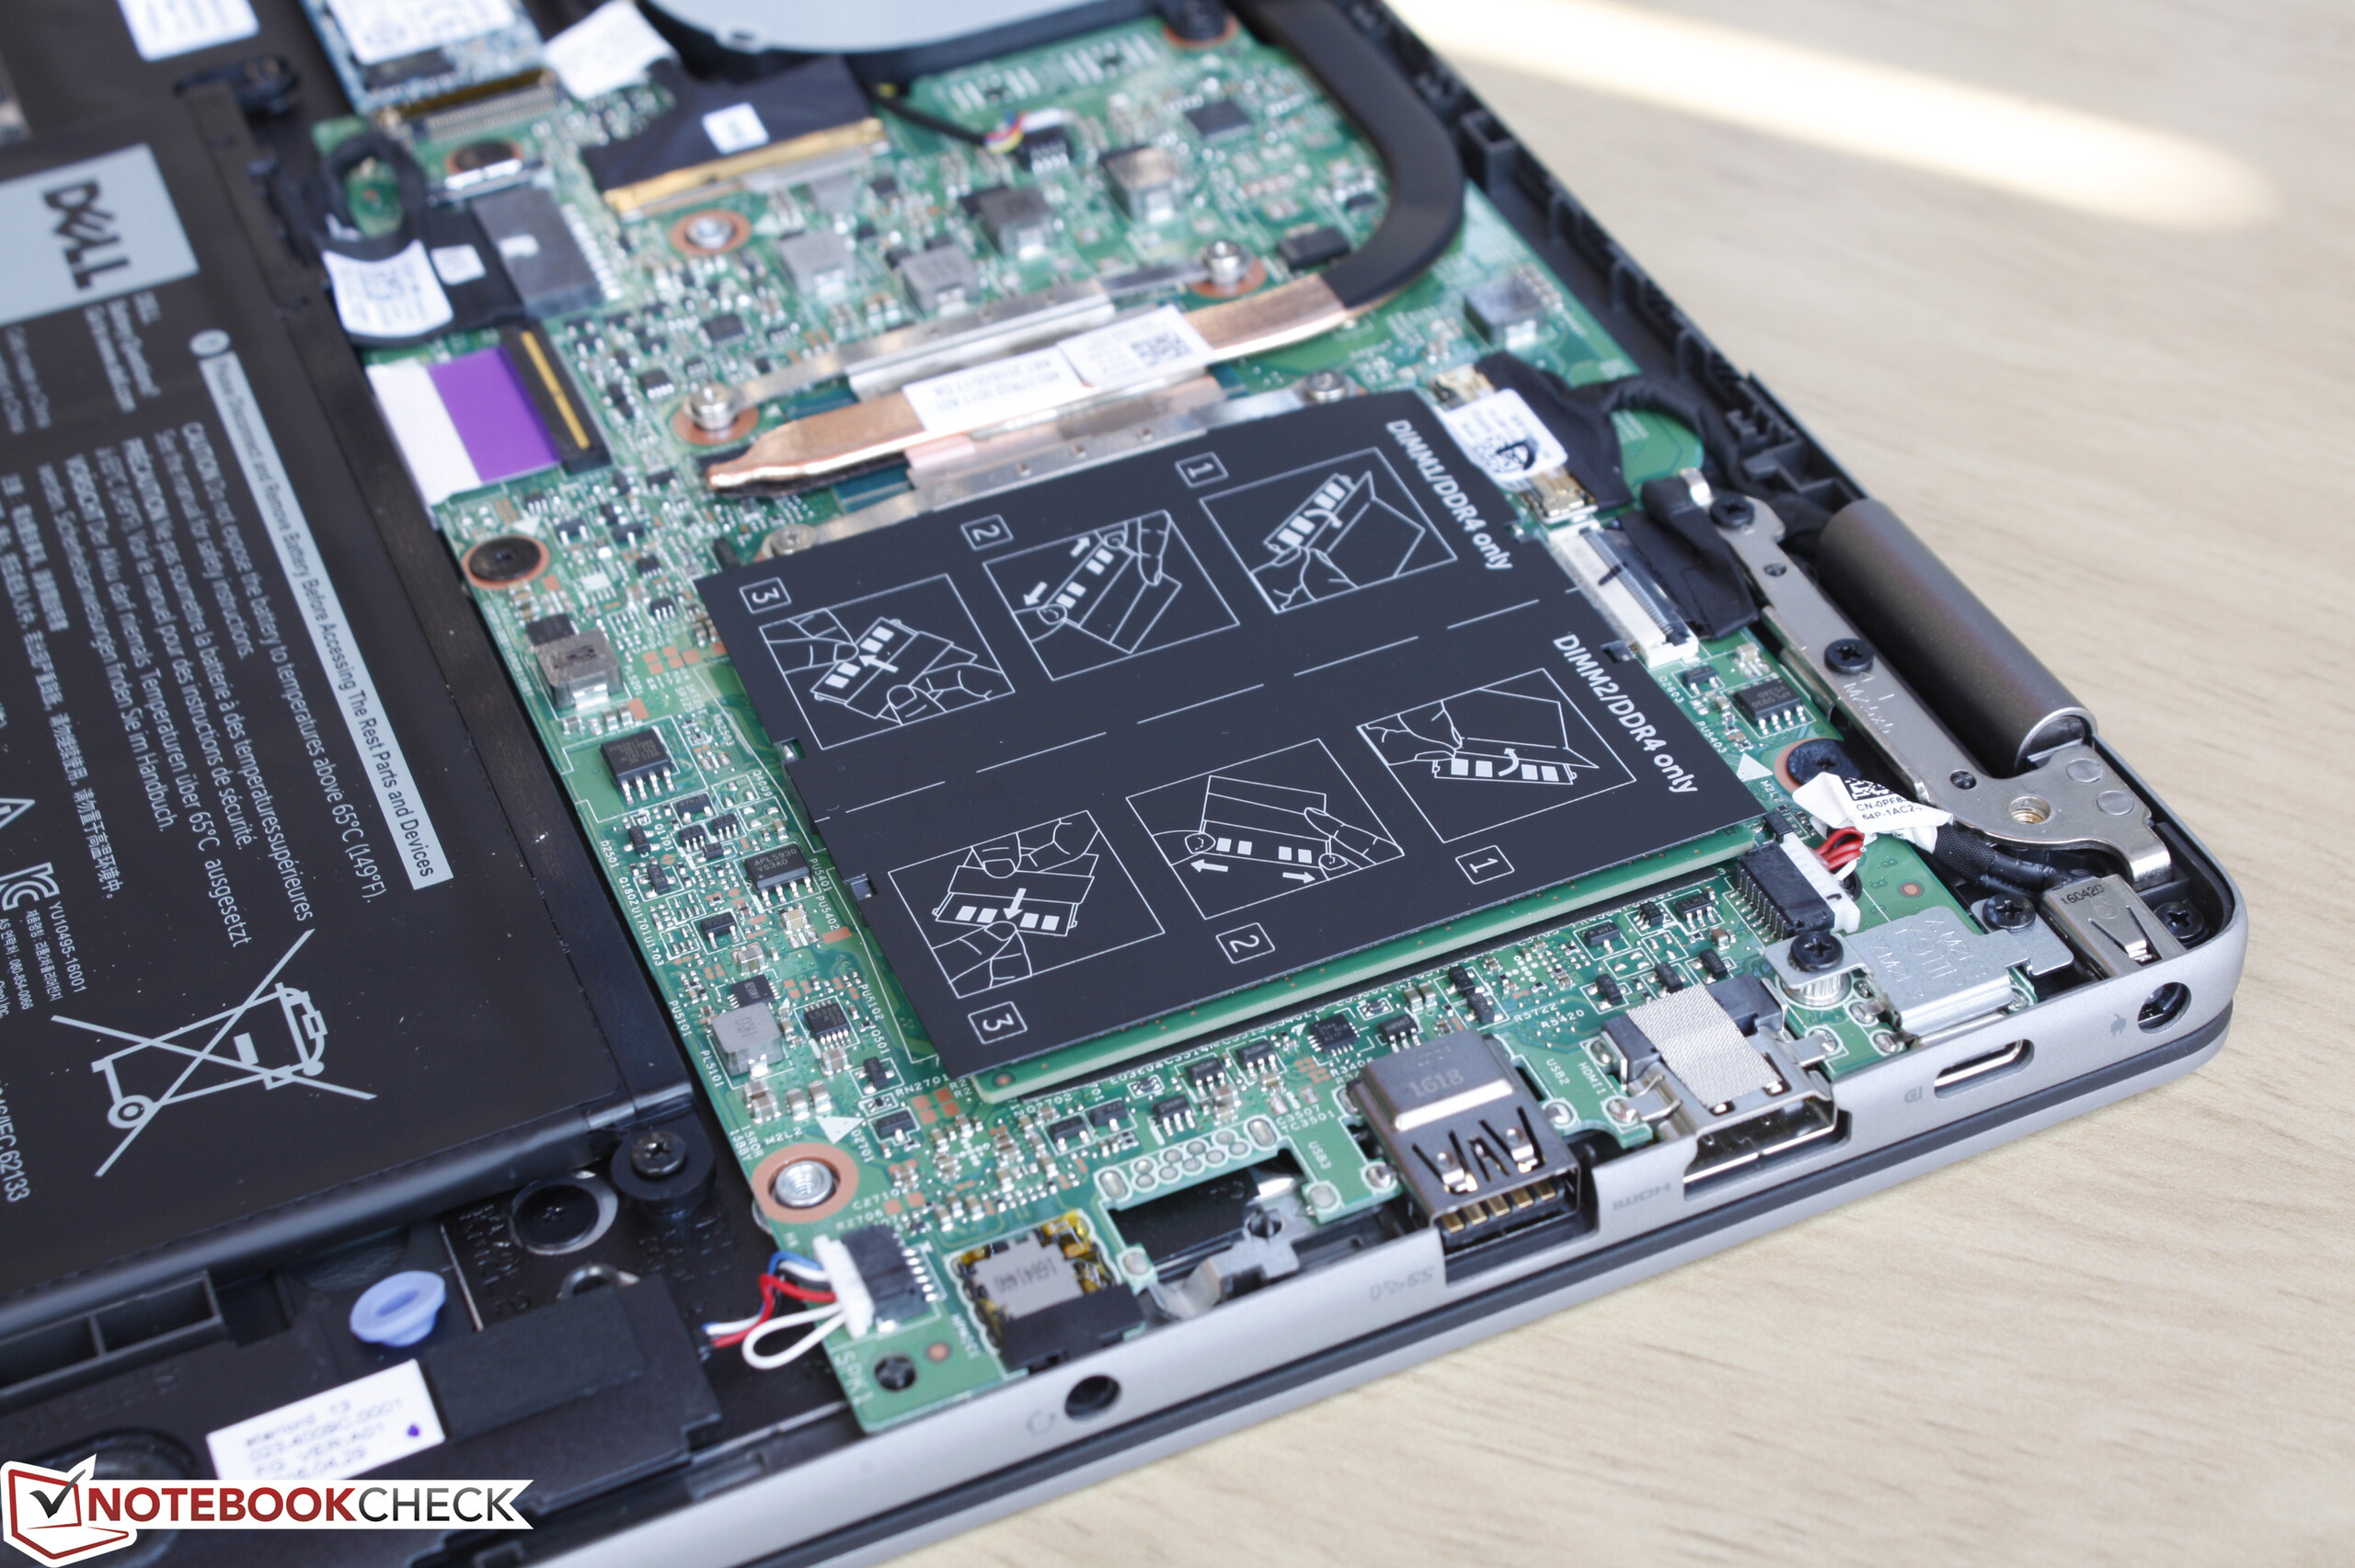
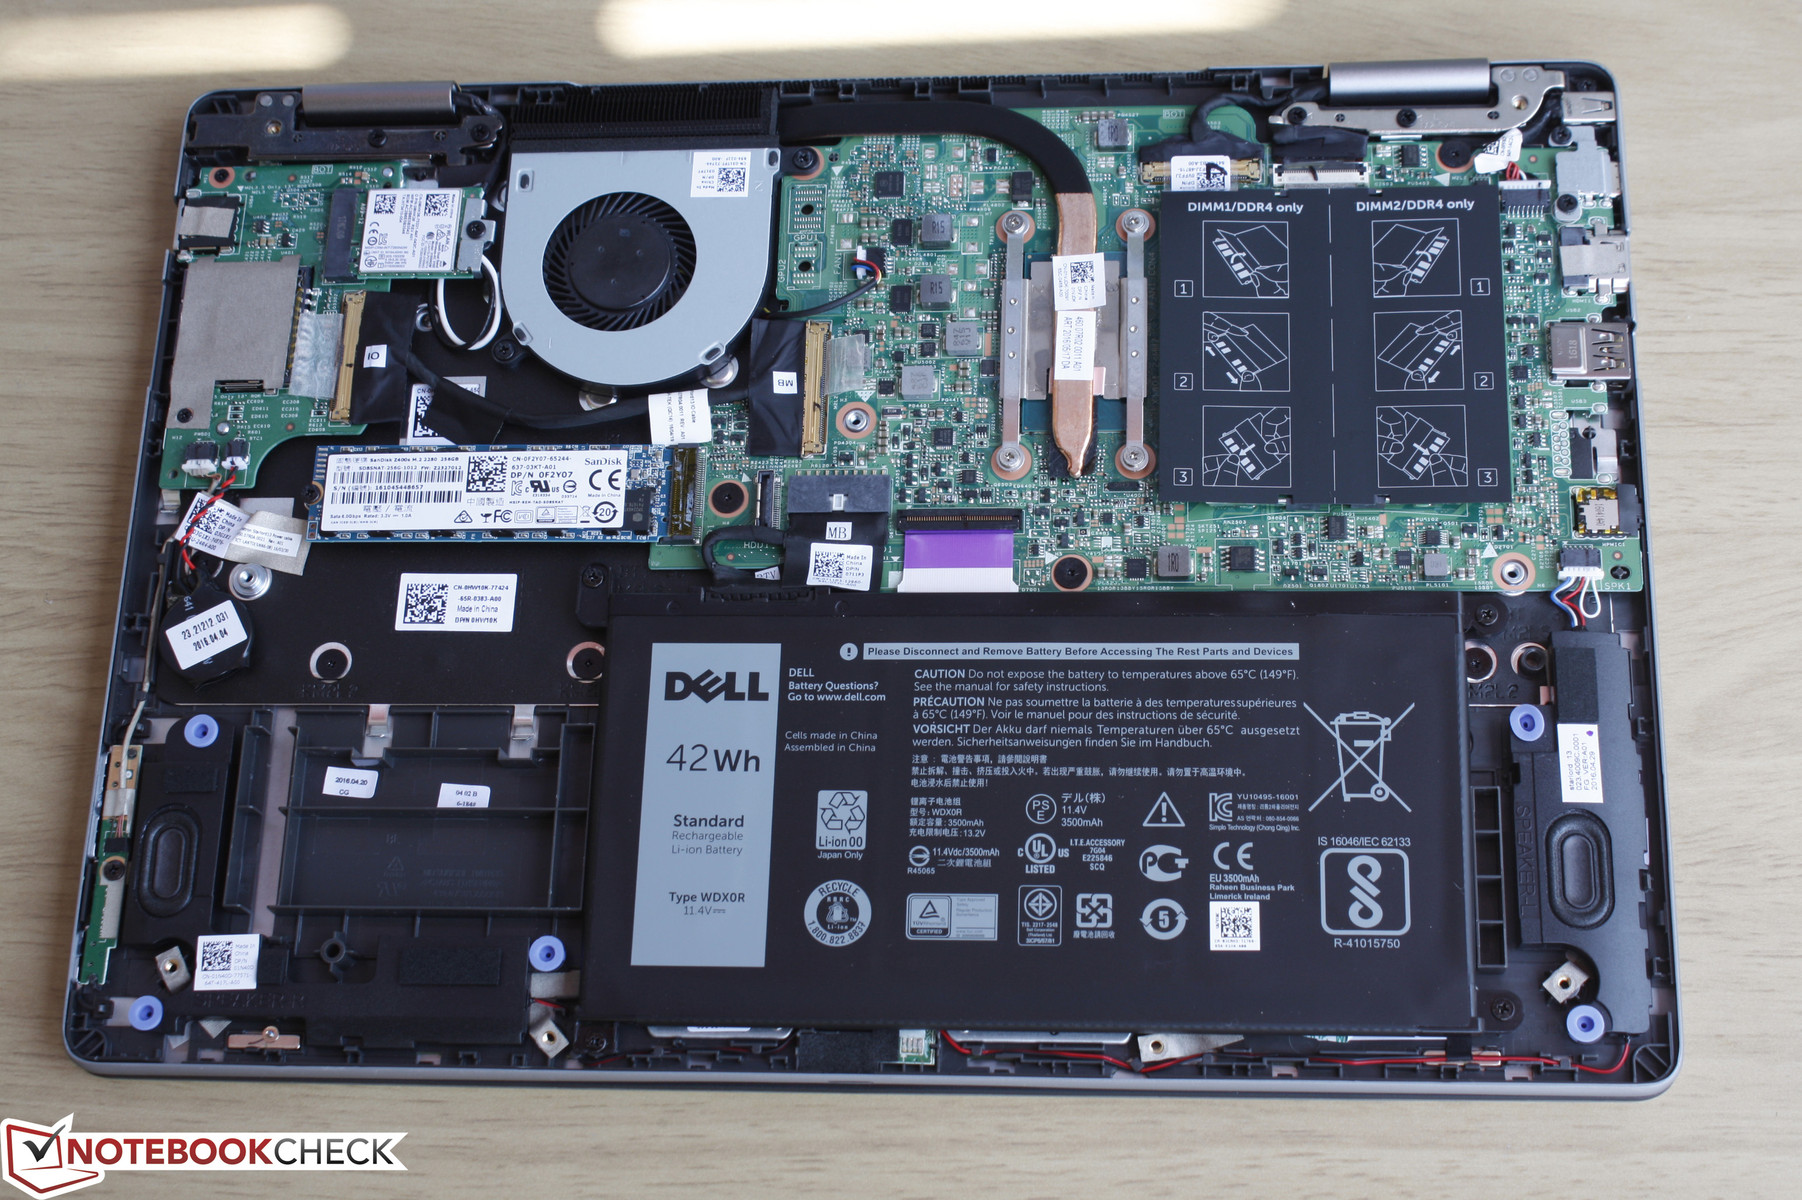
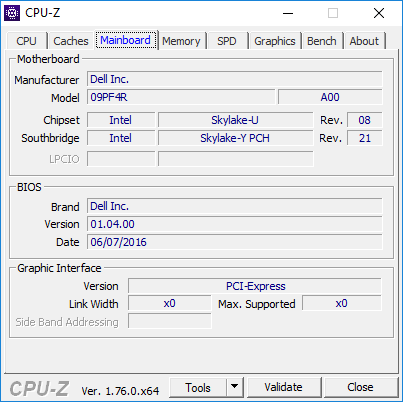
Removing the bottom panel requires only a Philips screwdriver. Users have direct access to the M.2 drive, M.2 WLAN module, heat sink, fan, battery, and both DDR4 SODIMM slots underneath the flaps.
Warranty
Like Lenovo and HP, Dell offers a wide range of support options outside of the standard one-year limited warranty. Users can extend coverage to four years for $220 USD and/or add accidental damage protection for $30 to $100 USD.
Input Devices
Keyboard
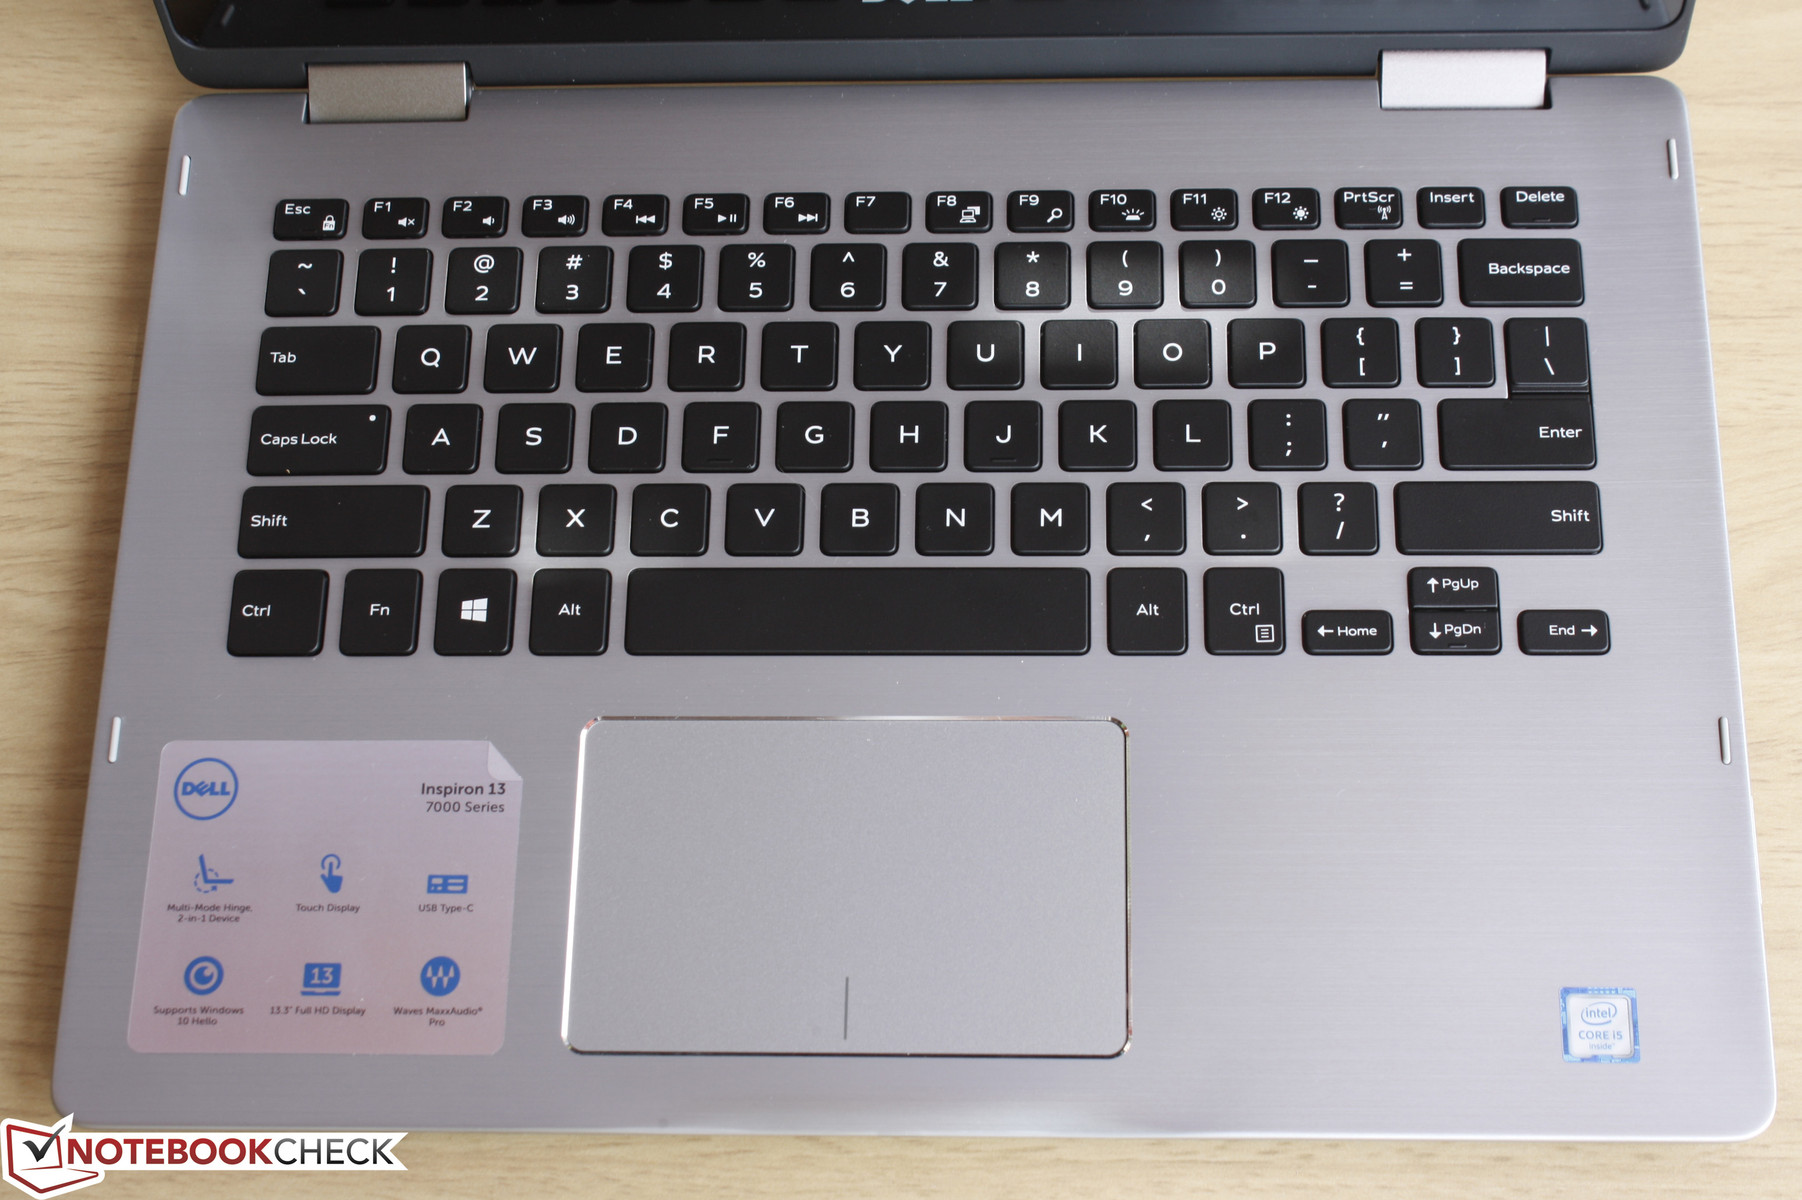
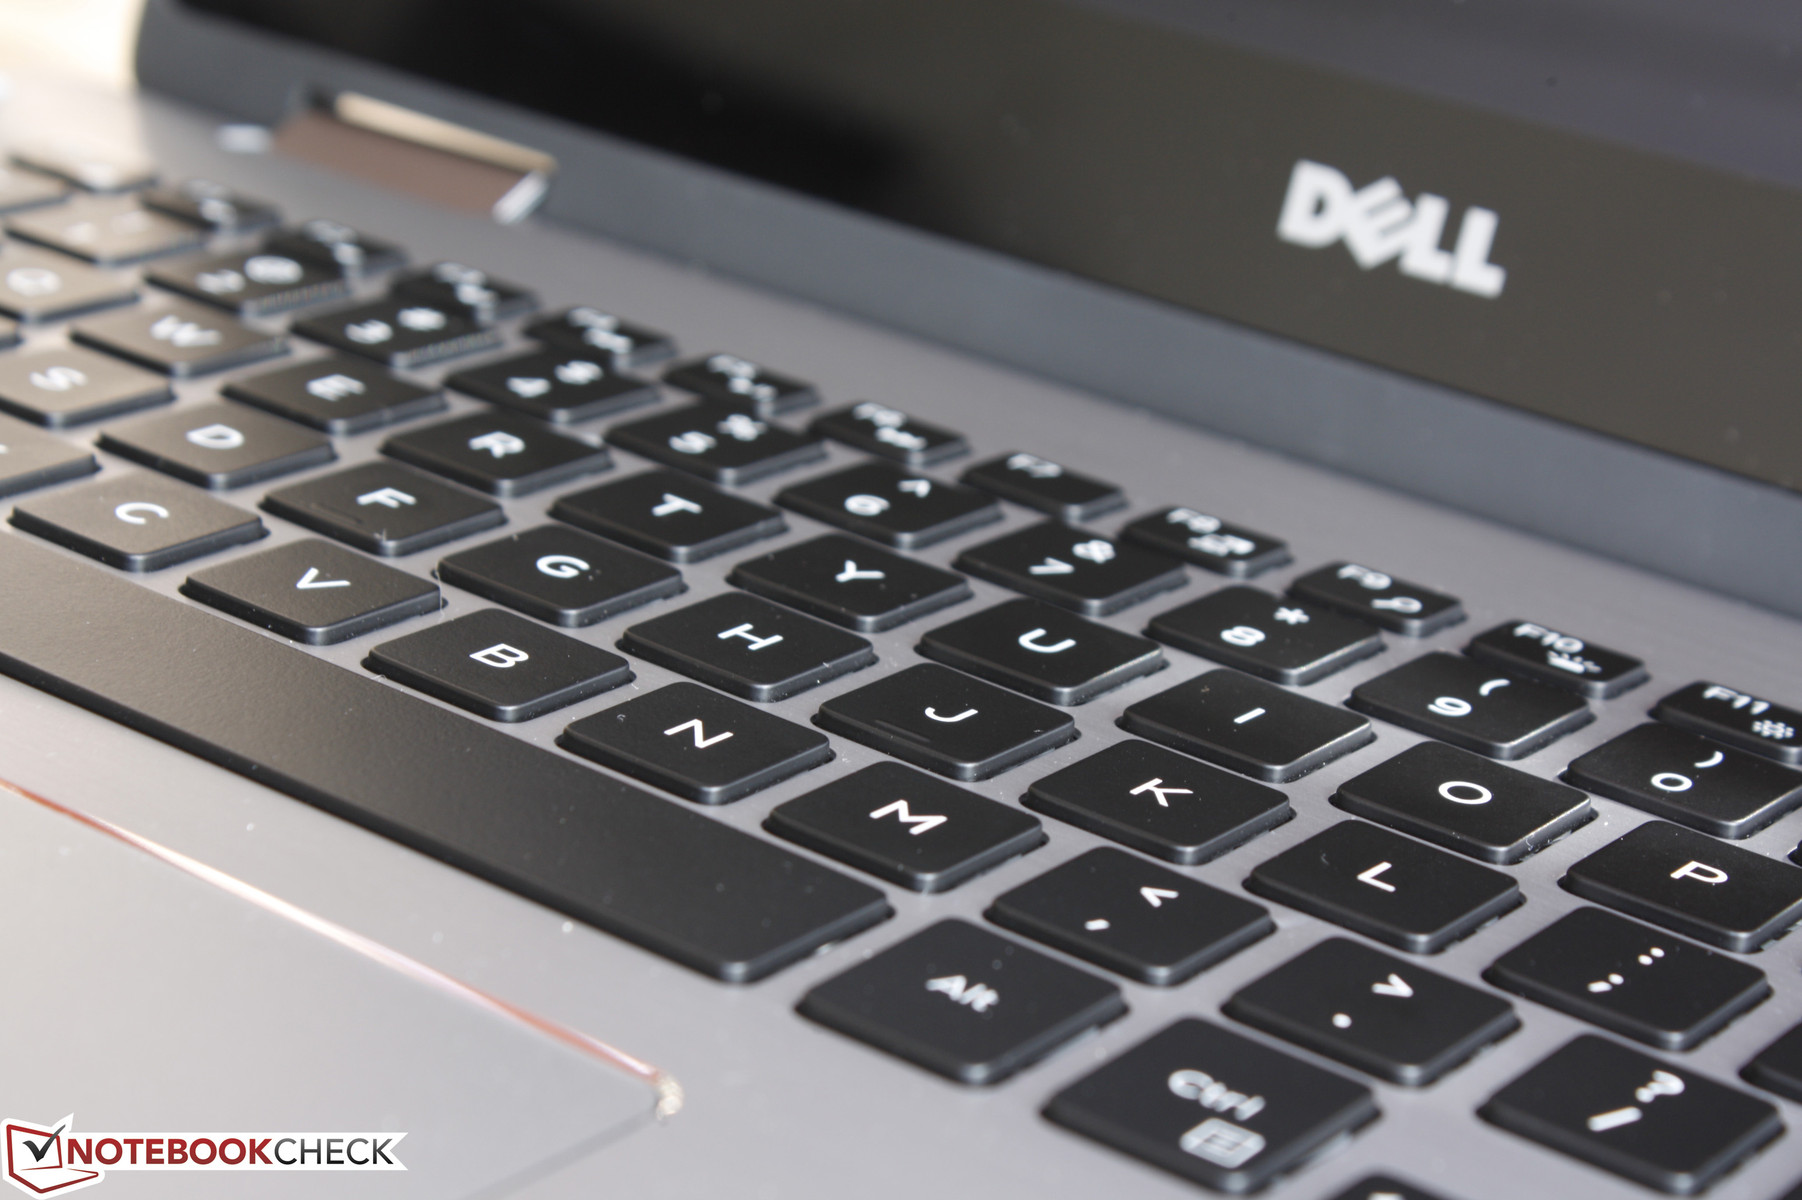
We didn't like the keyboard on the Inspiron 13 7347 and the Inspiron 13 7348 didn't make any major changes. Unfortunately, this continues on the 7368 as the keys feel quite shallow in travel even for a notebook. Feedback is only average including on the Enter and Space keys, so this can take time to become accustomed to when compared to the keyboards of a Latitude or ThinkPad. To its credit, we find the keyboard on the Yoga 900 to be even softer in feedback than on our Dell convertible.
The size (27.25 x 10.25 cm) of the keyboard is slightly different than on the 7348 due to the flatter design of the base around it. The layout, however, is identical and so is the two-level white backlight. The keys, their backlight, and the touchpad are all disabled once the display is opened to at least 190 degrees.
Touchpad
The smooth and adequately sized (10.5 x 6.5 cm) touchpad shares the same chrome-lined design as the edges and corners of the outer lid.
Both cursor movement and pinch-to-zoom work flawlessly and without any issues or delays. Instead, our biggest complaint lies on its integrated mouse clicks as the travel depth is one of the shortest we've experienced on any notebook. Feedback is consequently light as a result despite the loud auditory click. It doesn't take much force to press down on the touchpad surface, so clicking multiple times over longer periods won't result in sore fingers.
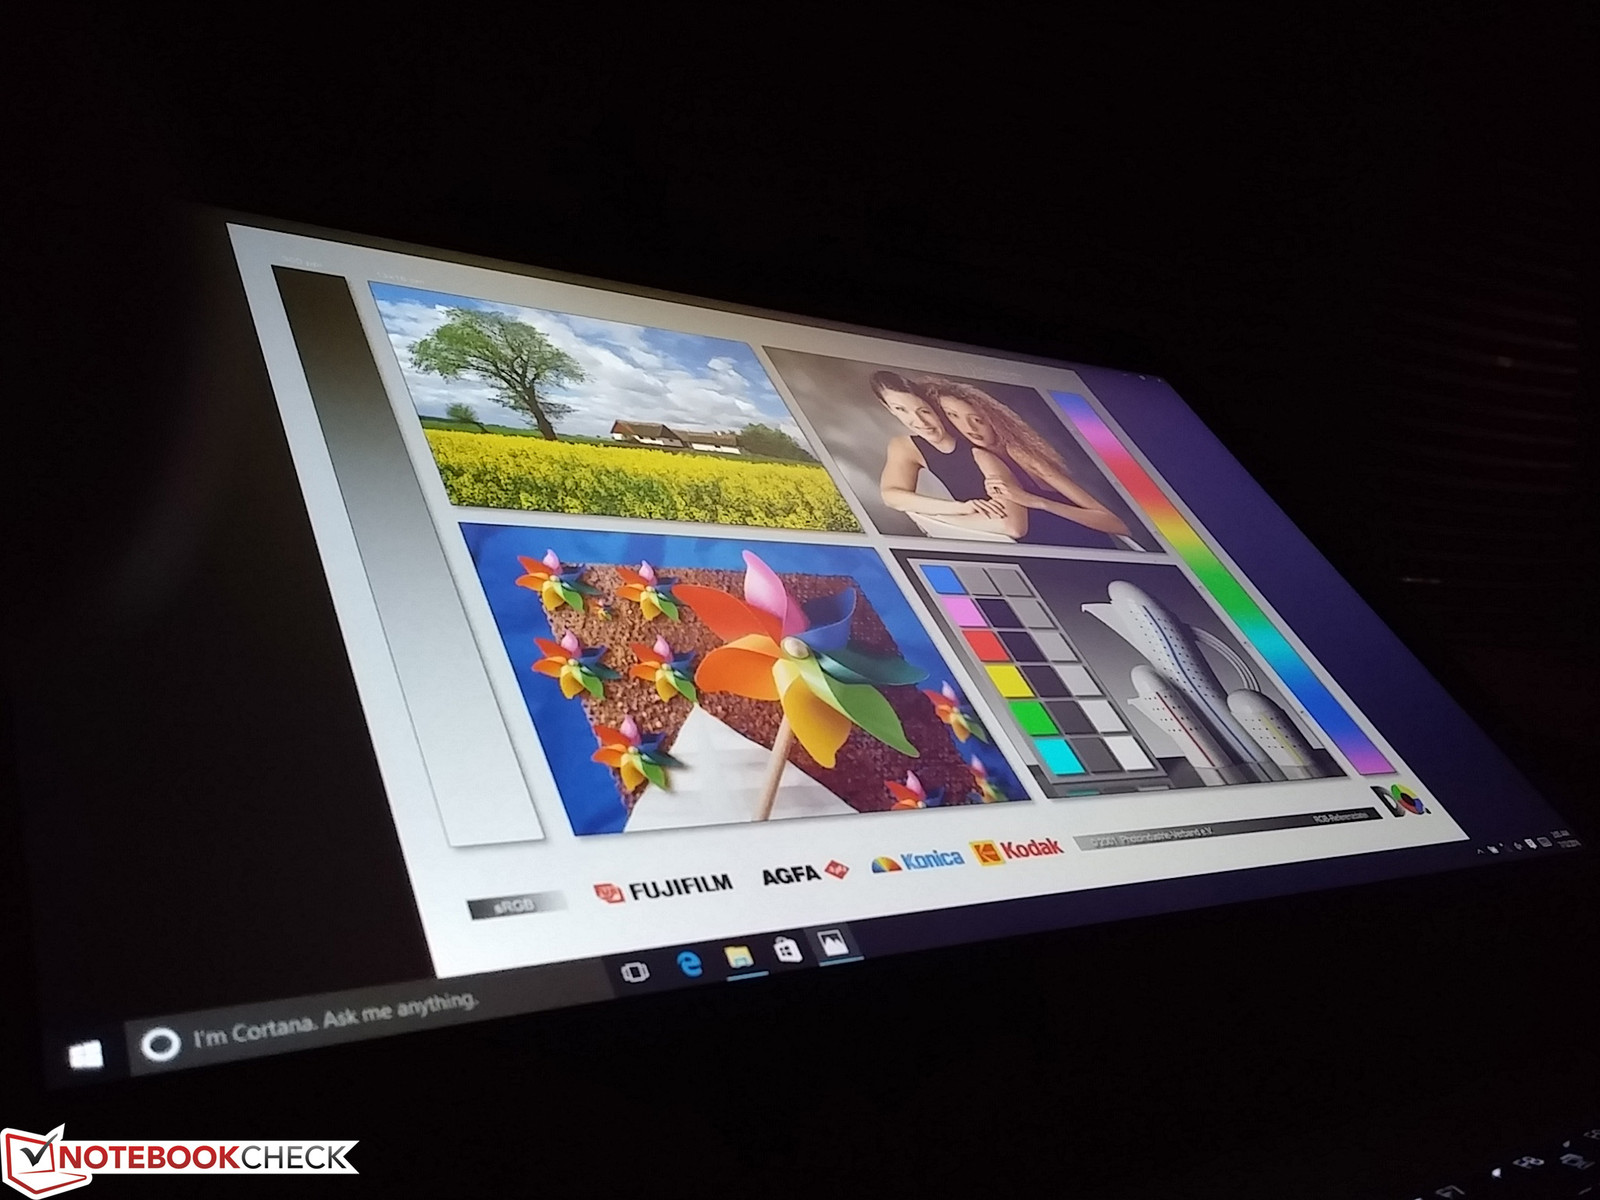
Display
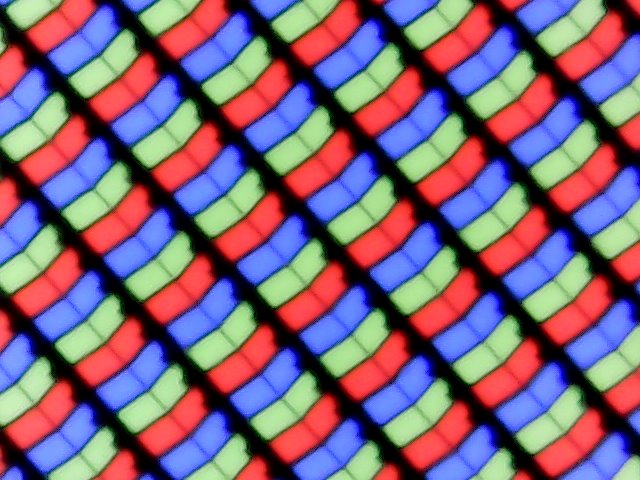
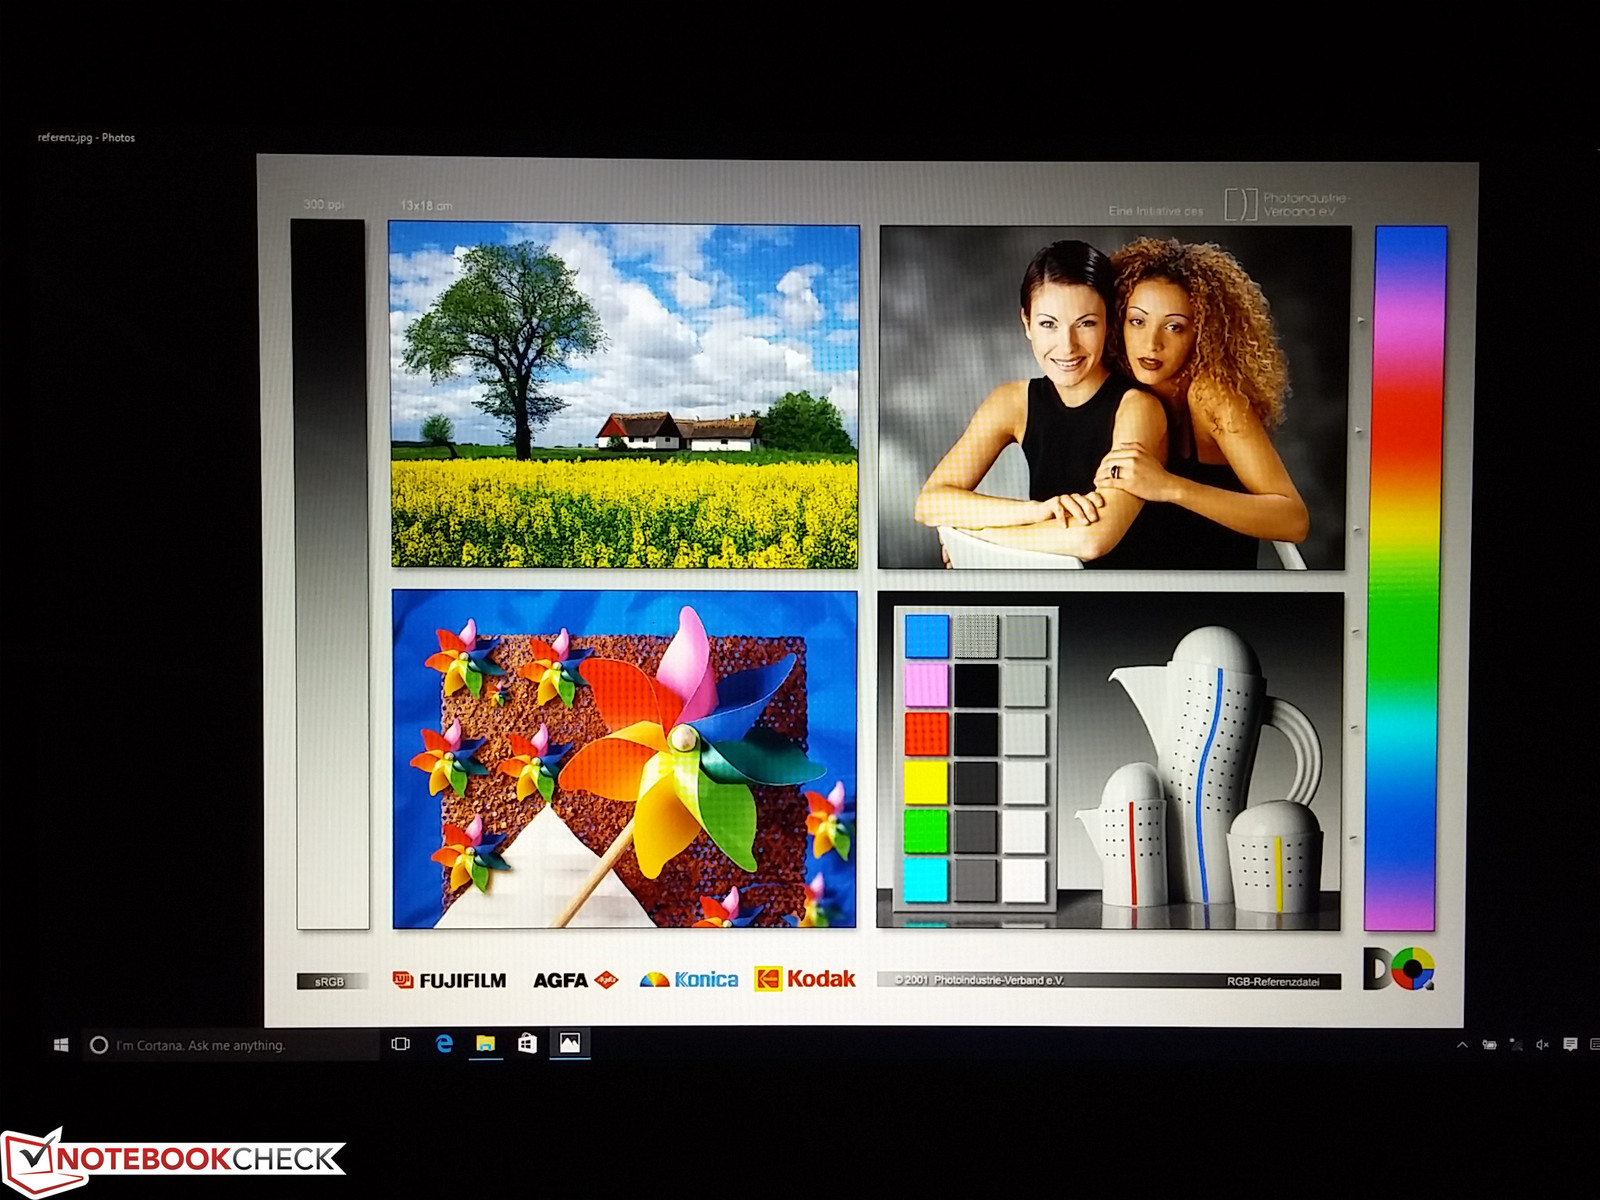
The 1080p panel is subjectively crisp and with no obvious screen-door effect when viewing from a normal distance. Some slight graininess becomes visible if not looking straight at the screen, but this is only a minor observation. A quick search on the BOE06A7 panel name reveals no other notebooks in our database that carry an identical panel. While contrast levels are still good at about 900:1, maximum brightness could have been brighter especially for a convertible. Most mainstream Ultrabooks, for example, are about 300 nits or more compared to ~220 nits on our Dell. We disabled Automatic Brightness and any power-saving features related to Intel HD Graphics before performing our display measurements.
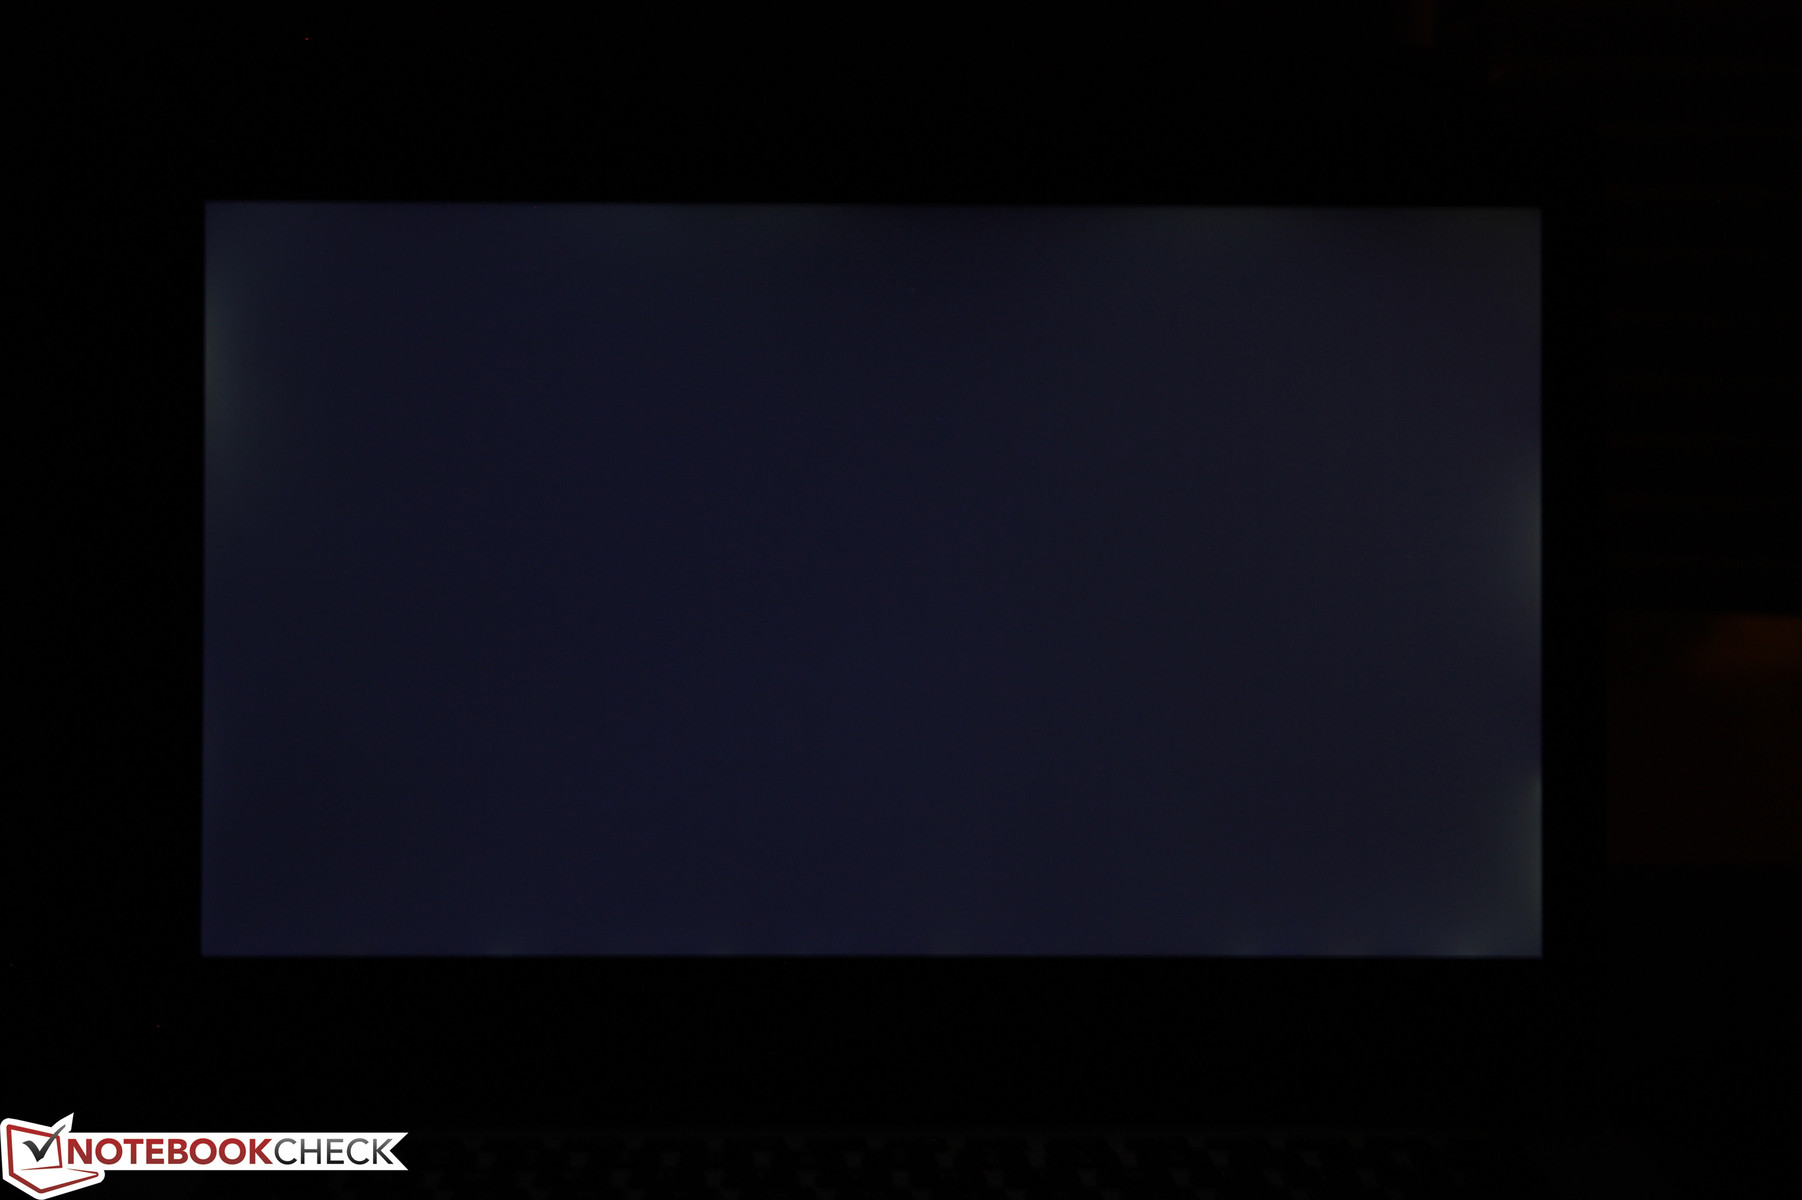
Backlight bleeding is light-moderate around some of the corners and edges of the panel. It's not significant enough to be noticeable during everyday use and is faint when watching movies with black bars.
| |||||||||||||||||||||||||
Brightness Distribution: 91 %
Center on Battery: 226.4 cd/m²
Contrast: 858:1 (Black: 0.264 cd/m²)
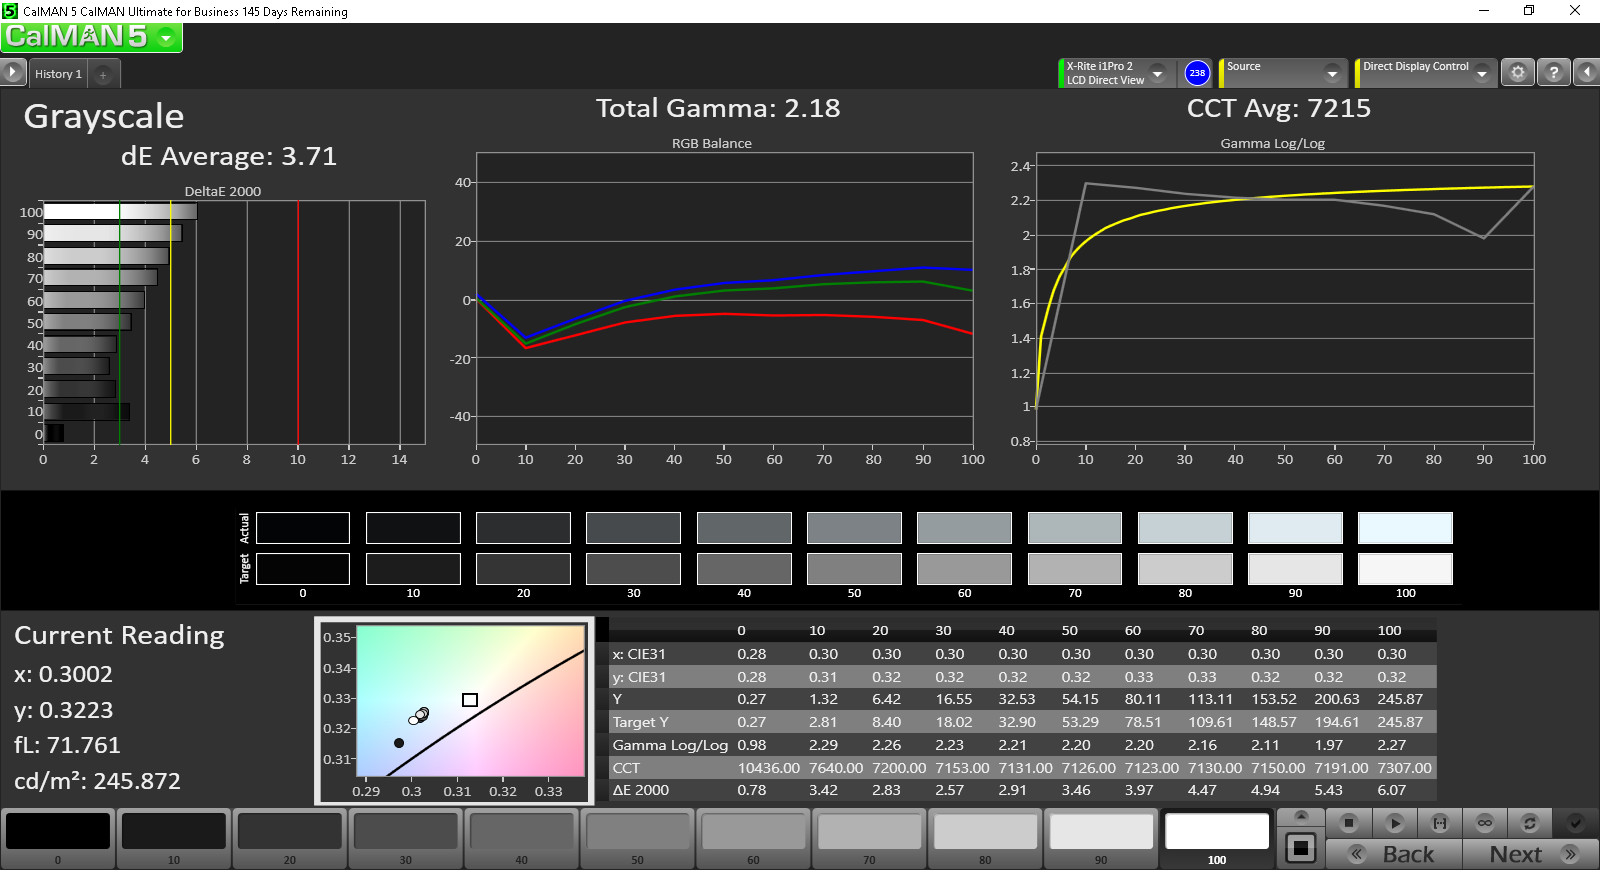
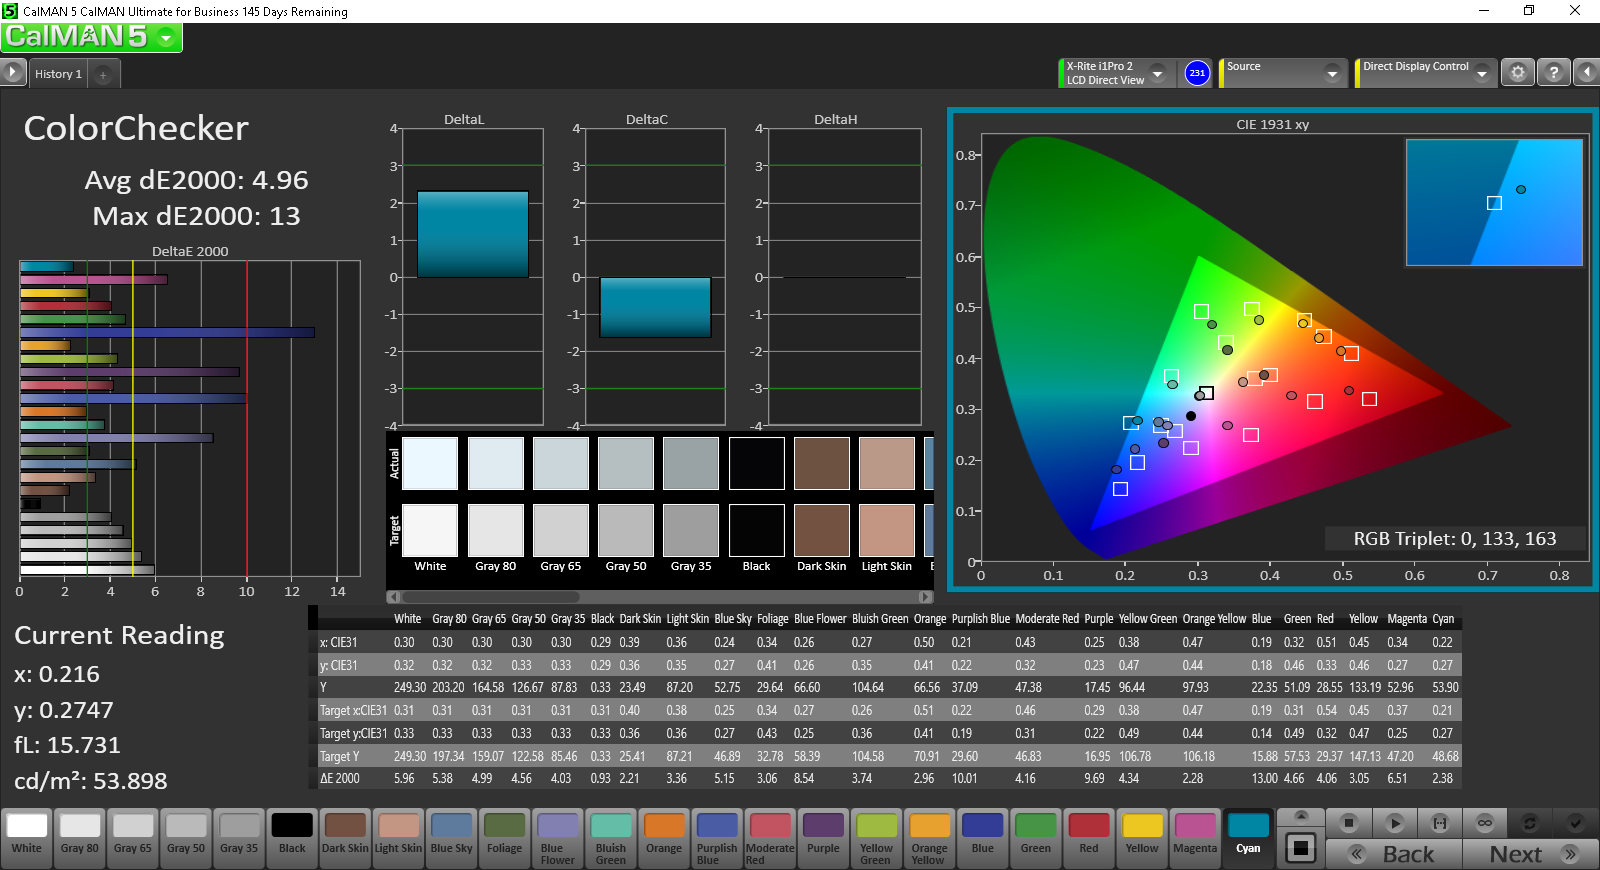
ΔE Color 4.96 | 0.5-29.43 Ø5
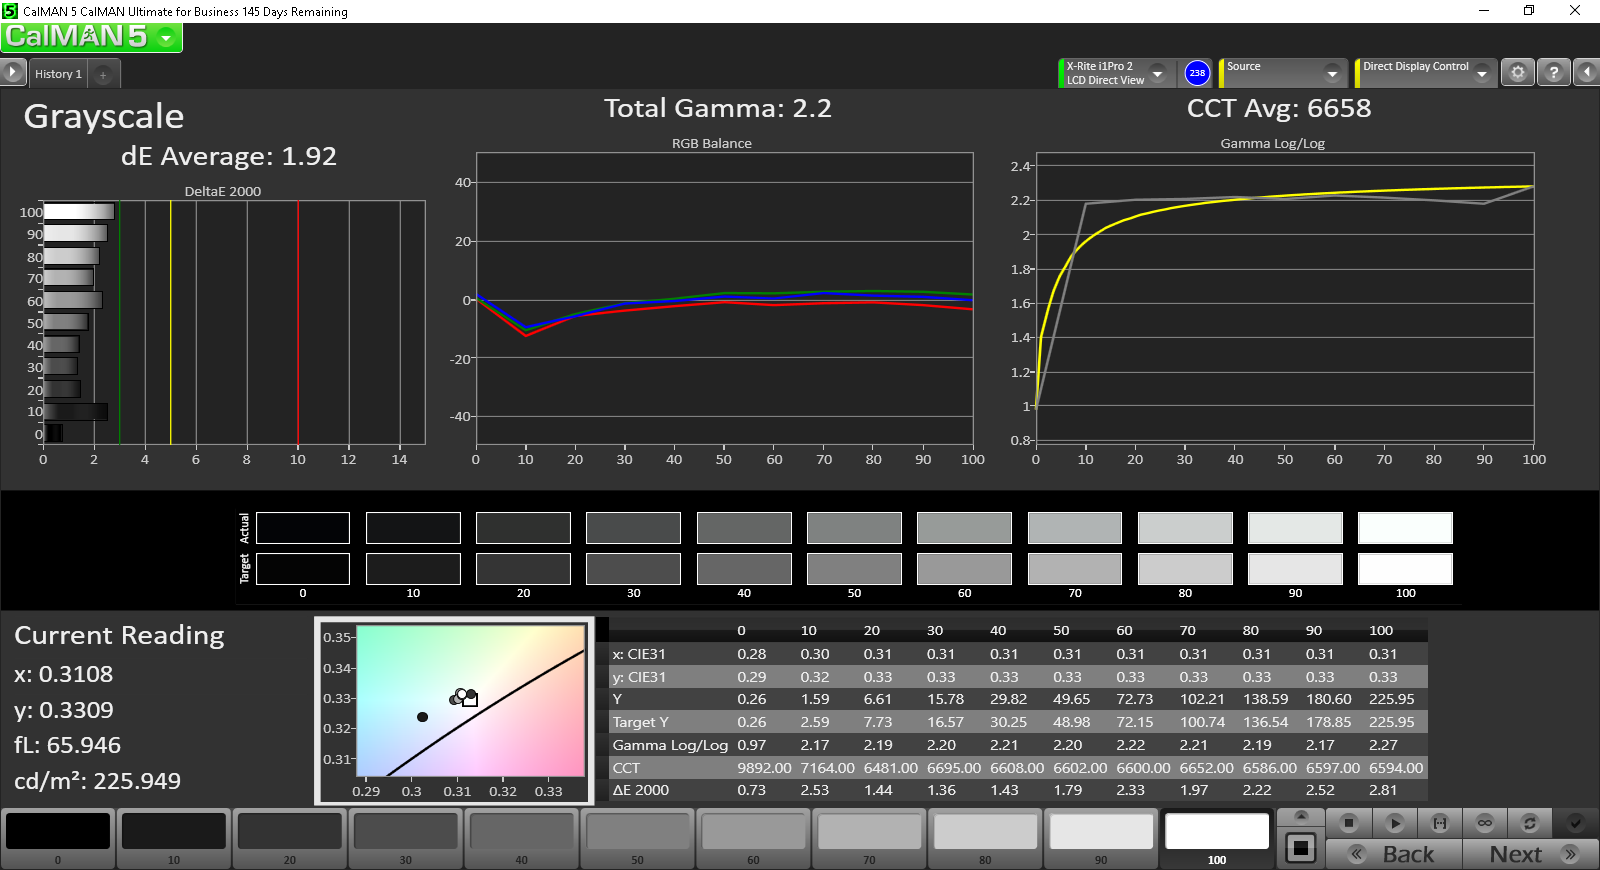
ΔE Greyscale 3.71 | 0.57-98 Ø5.3
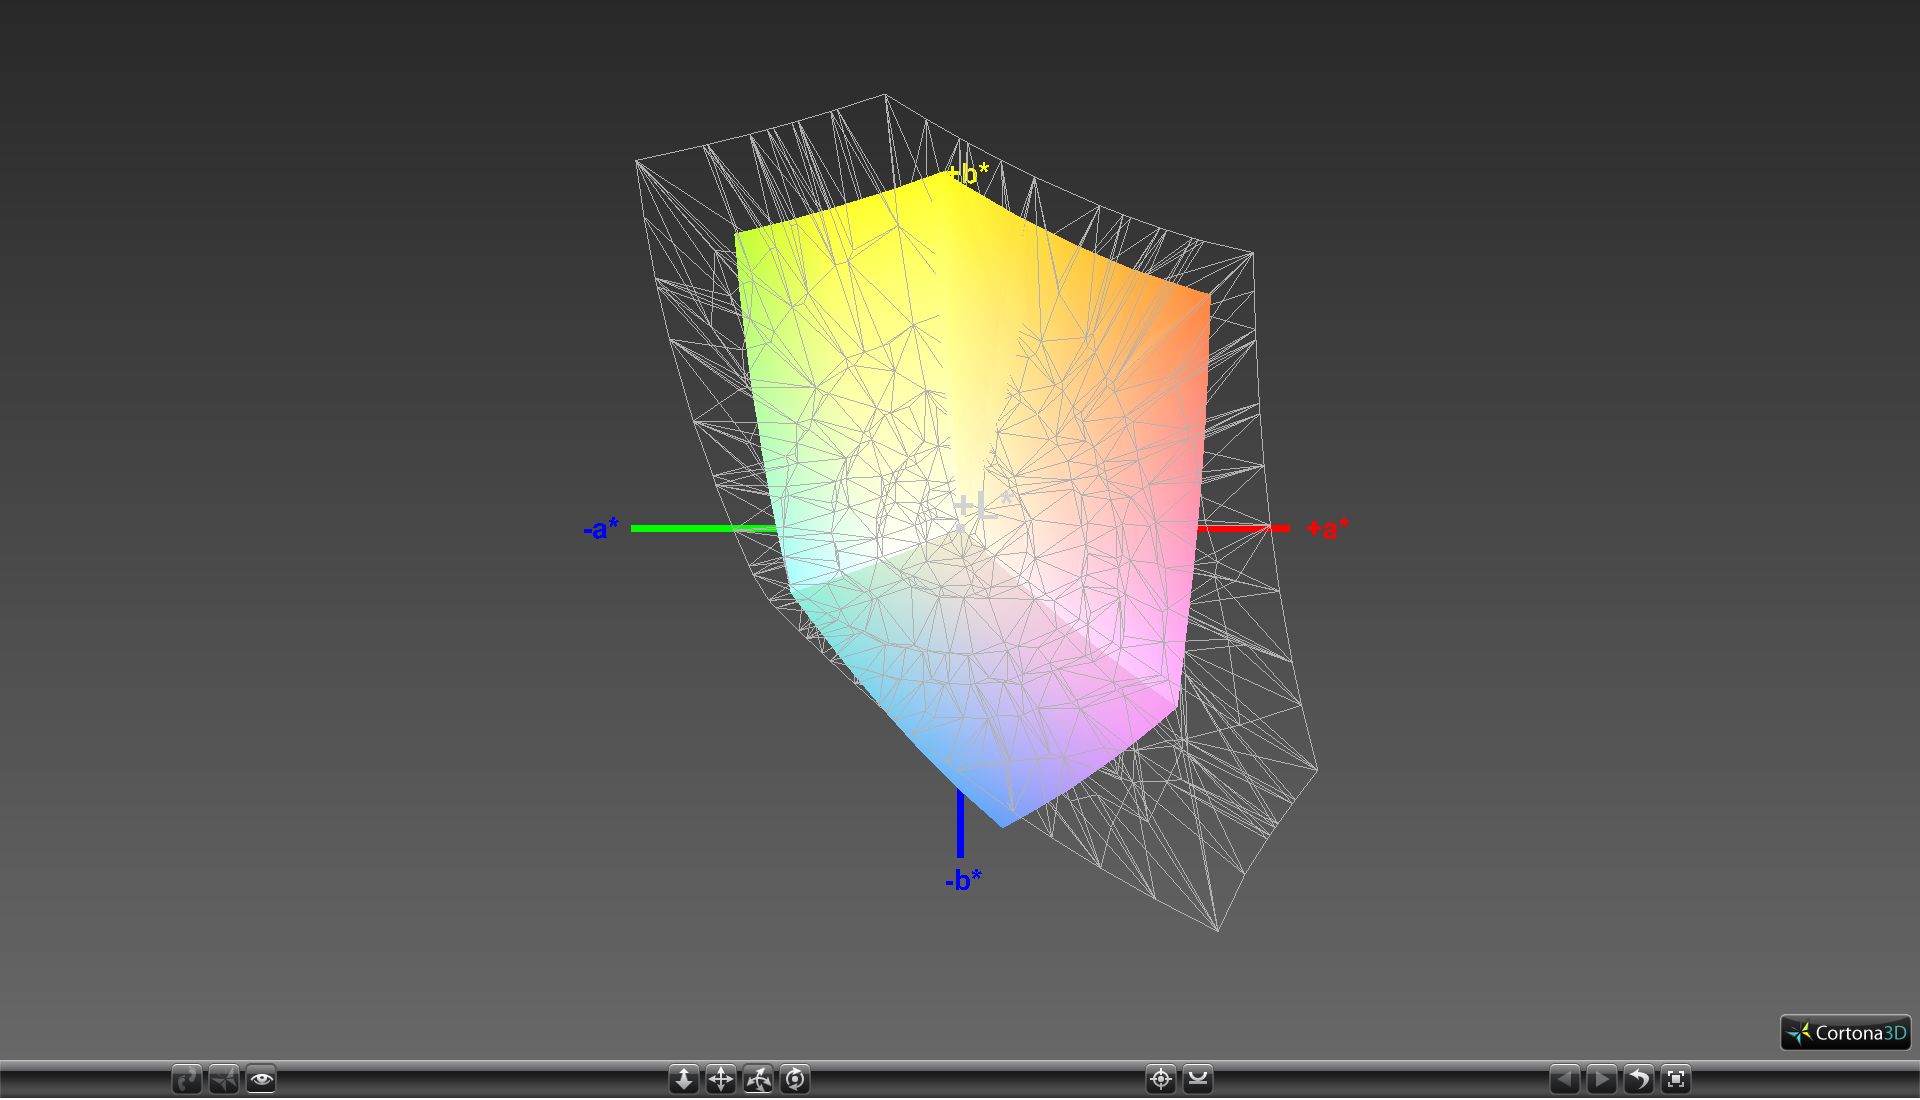
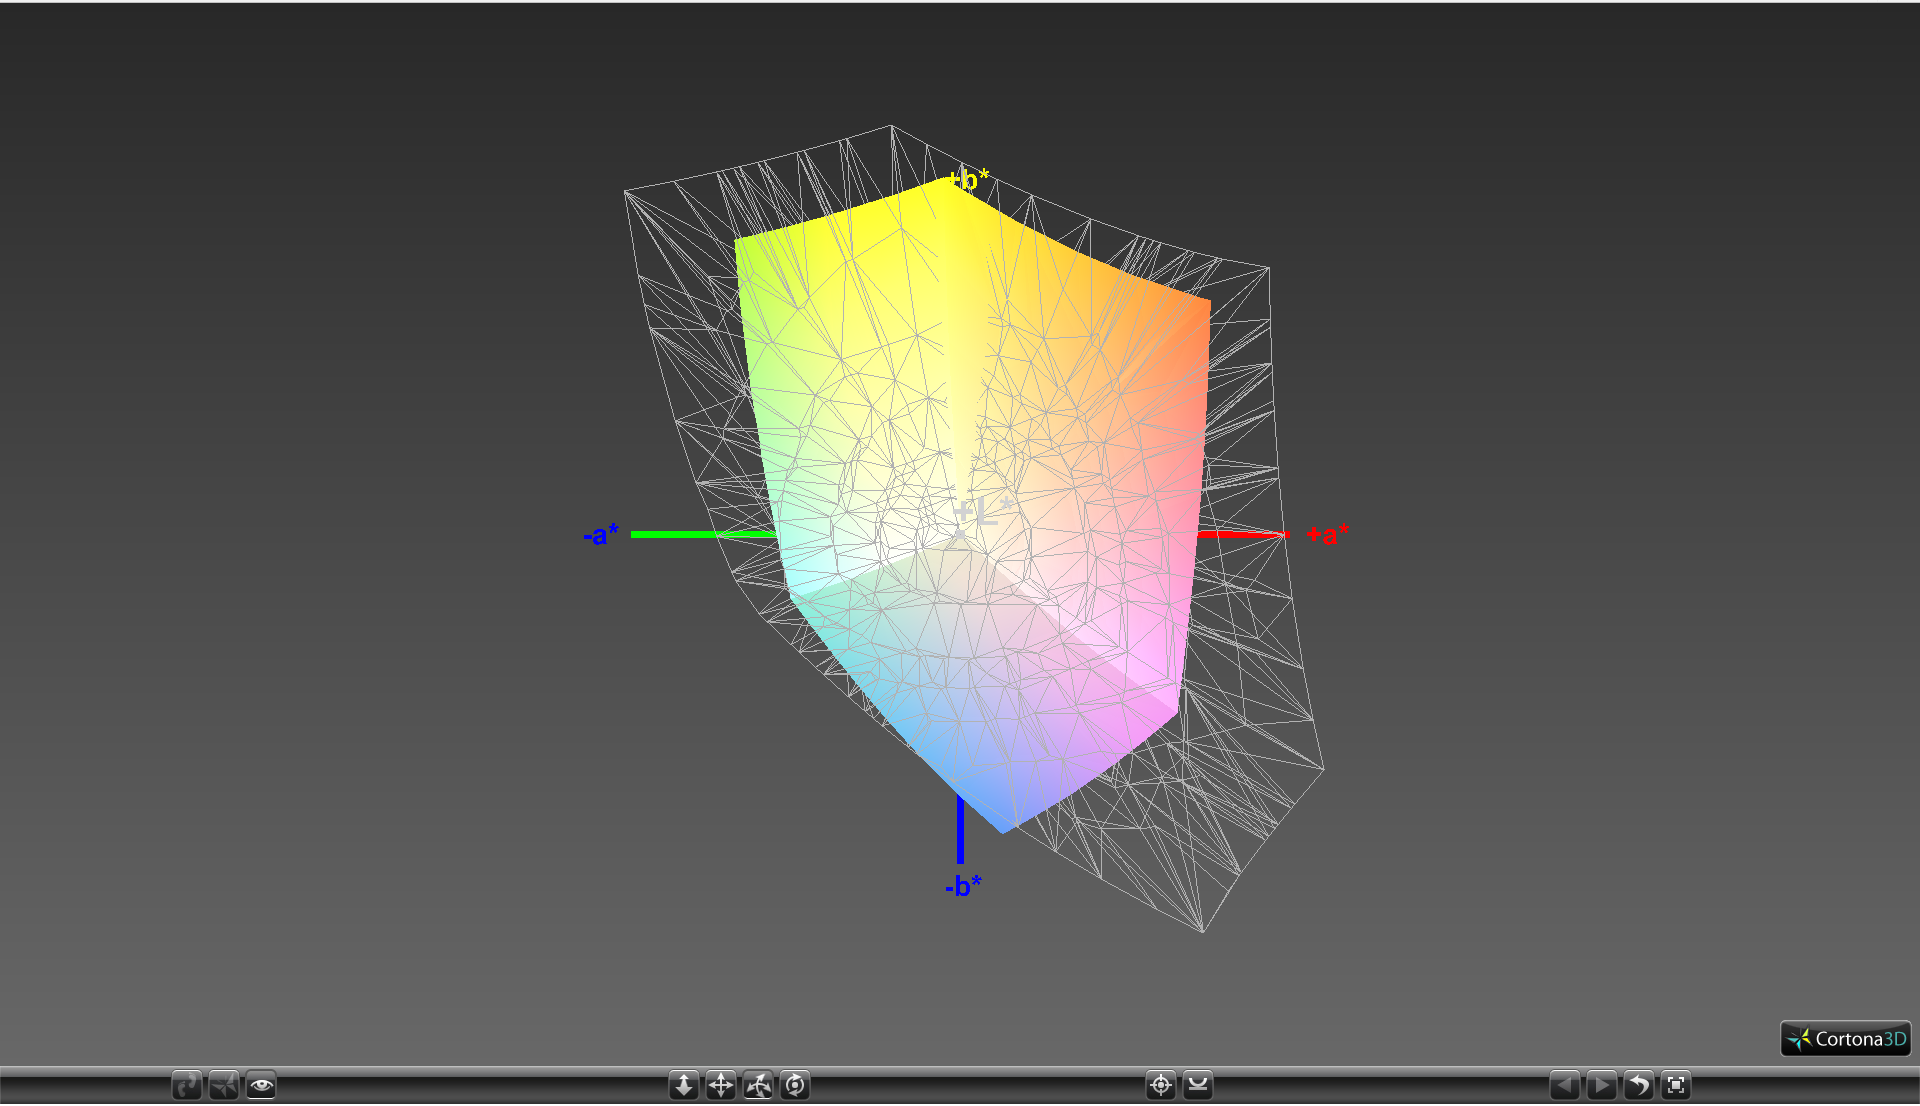
60.5% sRGB (Argyll 1.6.3 3D)
38.6% AdobeRGB 1998 (Argyll 1.6.3 3D)
42.19% AdobeRGB 1998 (Argyll 2.2.0 3D)
61.1% sRGB (Argyll 2.2.0 3D)
40.82% Display P3 (Argyll 2.2.0 3D)
Gamma: 2.18
| Dell Inspiron 13 7386 IPS, 13.30, 1920x1080 | Acer Aspire R13 R7-372T-746N Sharp LQ133T1JW02, IPS, 13.30, 2560x1440 | Dell Inspiron 13-7348 IPS, 13.30, 1920x1080 | HP Spectre x360 13-4104ng LG Philips LGD0000, IPS, 13.30, 2560x1440 | Lenovo Yoga 900-13ISK 80MK IPS, 13.30, 3200x1800 | Microsoft Surface Book Core i5 IPS, 13.50, 3000x2000 | |
|---|---|---|---|---|---|---|
| Display | 66% | 57% | 59% | 51% | 61% | |
| Display P3 Coverage | 40.82 | 69.6 71% | 65.2 60% | 66.8 64% | 63.2 55% | 67 64% |
| sRGB Coverage | 61.1 | 98 60% | 93.5 53% | 92.8 52% | 88.7 45% | 95.8 57% |
| AdobeRGB 1998 Coverage | 42.19 | 70.7 68% | 67.1 59% | 67.3 60% | 64.9 54% | 68.9 63% |
| Response Times | 142% | 46% | 200% | 1% | ||
| Response Time Grey 50% / Grey 80% * | 56 ? | 36 ? 36% | 24 ? 57% | 38.8 ? 31% | 48.4 ? 14% | |
| Response Time Black / White * | 29.2 ? | 30 ? -3% | 19 ? 35% | 22.4 ? 23% | 32.8 ? -12% | |
| PWM Frequency | 203.3 ? | 1000 ? 392% | 1316 547% | |||
| Screen | 42% | -11% | 19% | -2% | 56% | |
| Brightness middle | 226.4 | 320 41% | 375 66% | 324 43% | 319.8 41% | 430.9 90% |
| Brightness | 218 | 308 41% | 351 61% | 324 49% | 302 39% | 410 88% |
| Brightness Distribution | 91 | 91 0% | 89 -2% | 90 -1% | 88 -3% | 93 2% |
| Black Level * | 0.264 | 0.17 36% | 0.44 -67% | 0.34 -29% | 0.835 -216% | 0.254 4% |
| Contrast | 858 | 1882 119% | 852 -1% | 953 11% | 383 -55% | 1696 98% |
| Colorchecker dE 2000 * | 4.96 | 3.18 36% | 7.37 -49% | 4.36 12% | 2.68 46% | 2.06 58% |
| Colorchecker dE 2000 max. * | 13 | 9.91 24% | ||||
| Greyscale dE 2000 * | 3.71 | 4.13 -11% | 9.54 -157% | 4.62 -25% | 2.35 37% | 2.22 40% |
| Gamma | 2.18 101% | 2.03 108% | 2.69 82% | 2.18 101% | 2.09 105% | 2.13 103% |
| CCT | 7215 90% | 6752 96% | 6685 97% | 6857 95% | 6975 93% | 6520 100% |
| Color Space (Percent of AdobeRGB 1998) | 38.6 | 65 68% | 61 58% | 60 55% | 57 48% | 64 66% |
| Color Space (Percent of sRGB) | 60.5 | 98 62% | 93 54% | 88 45% | 96 59% | |
| Total Average (Program / Settings) | 83% /
65% | 23% /
7% | 41% /
31% | 83% /
49% | 39% /
49% |
* ... smaller is better
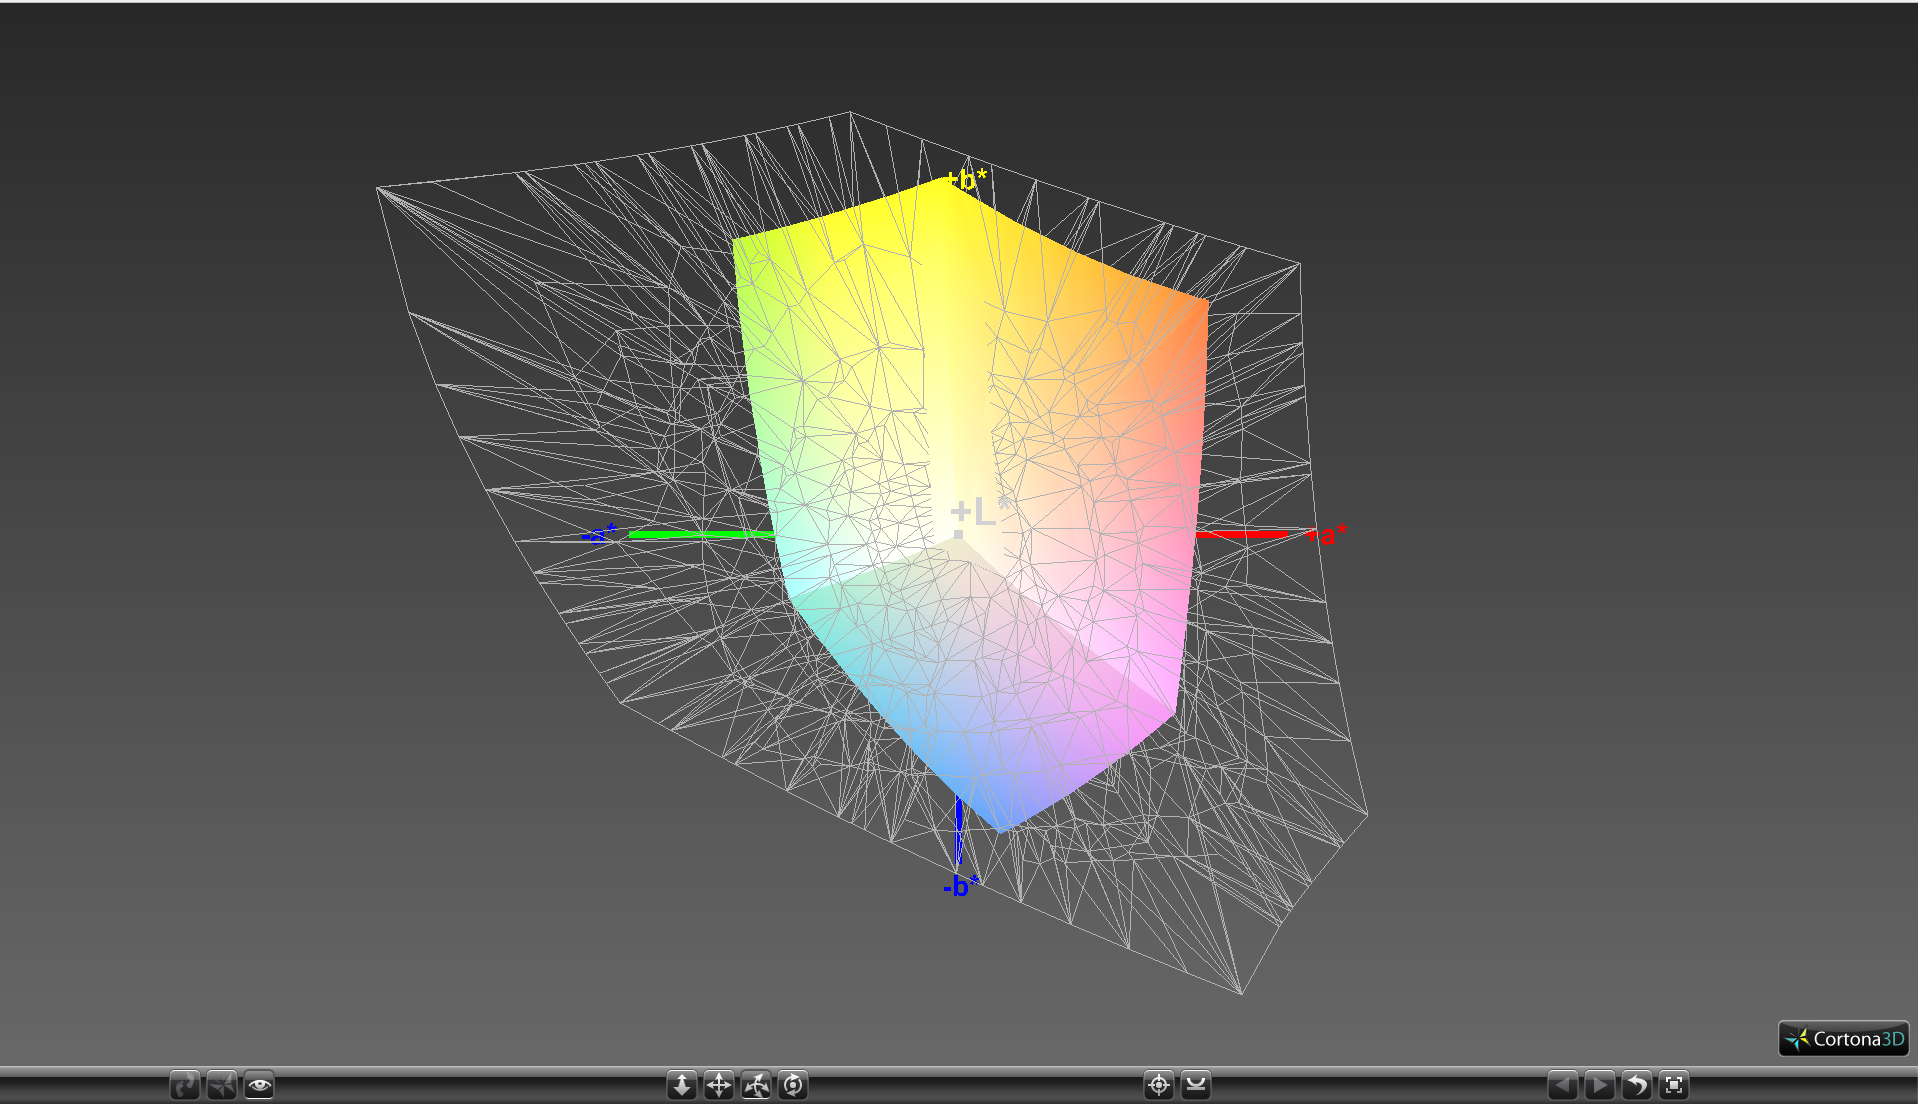
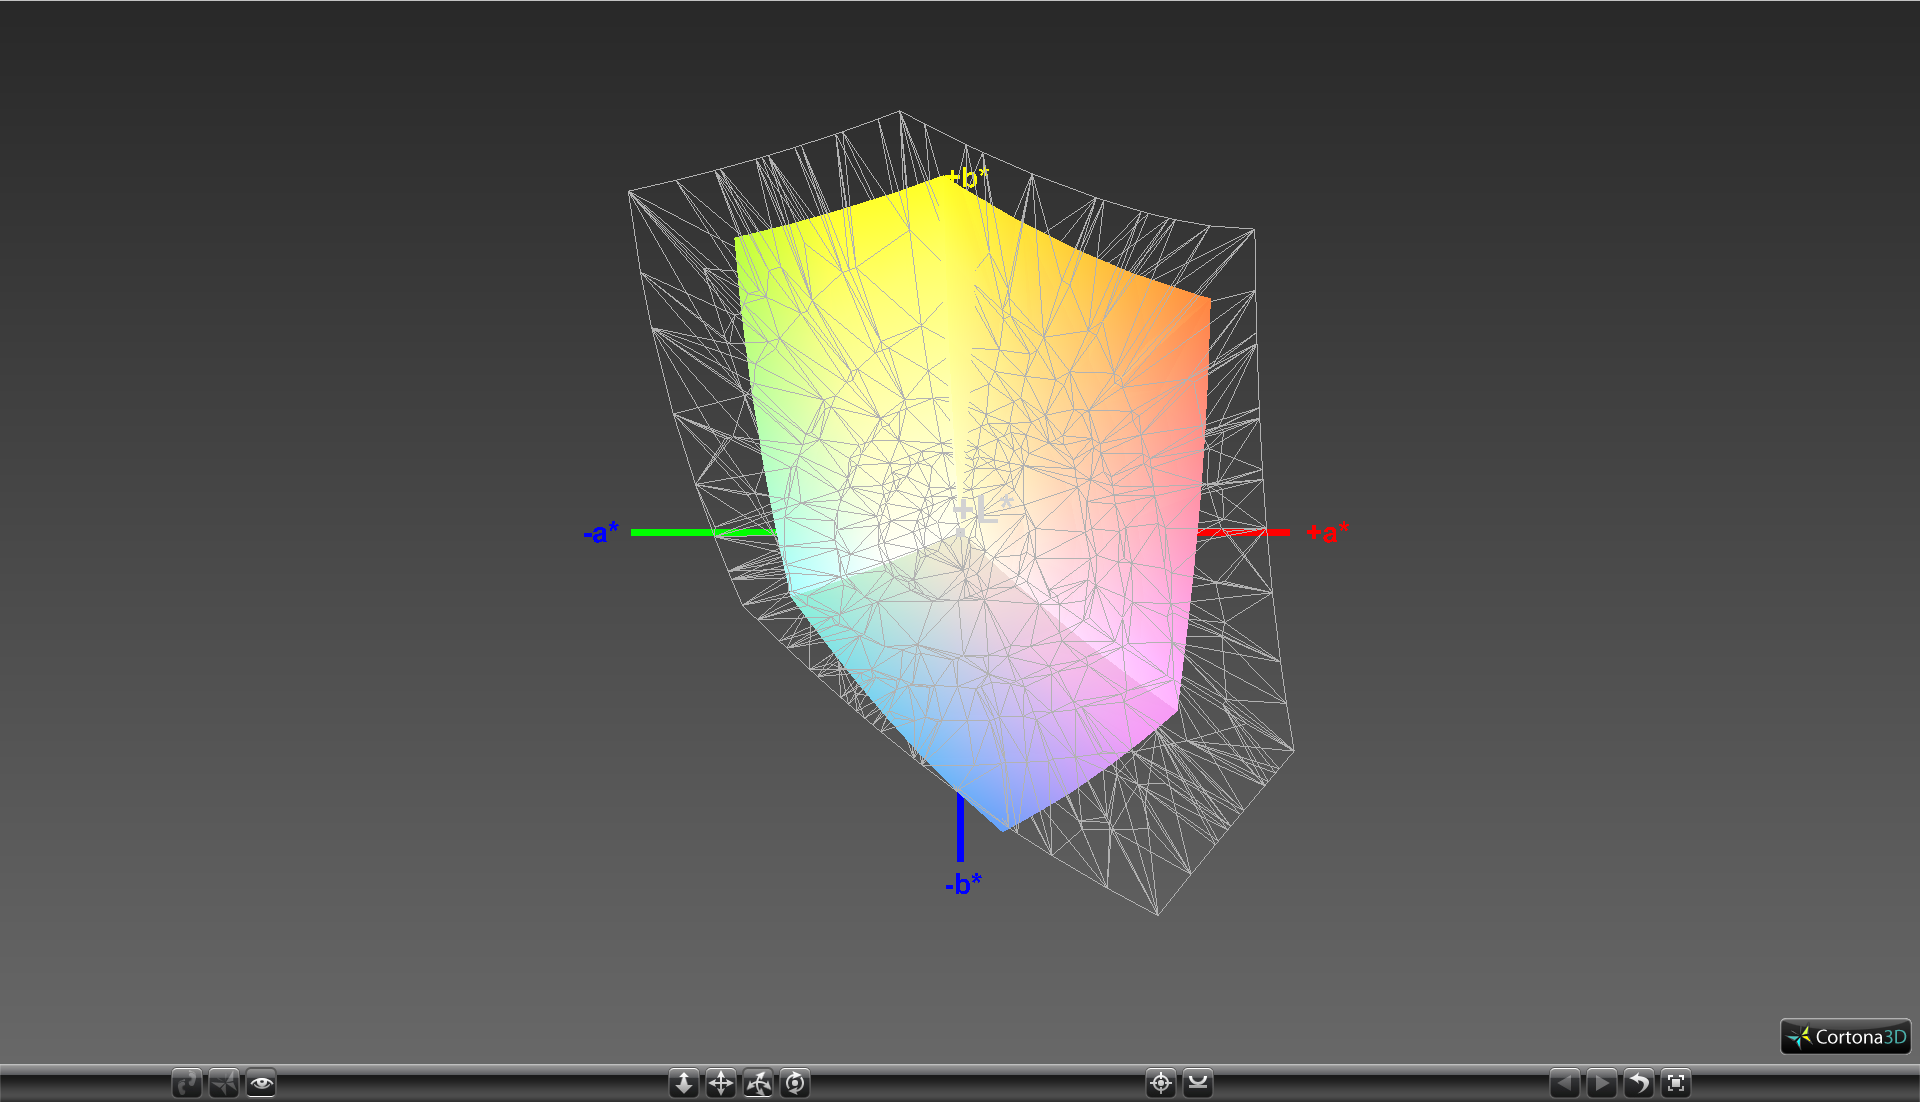
Color space is average at only 60.5 percent and 38.6 percent of the sRGB and AdobeRGB spectra, respectively. This is compared to a handful of competing high-end convertibles where colors can cover ~90 percent of the sRGB standard. To most home and casual users, however, the more limited color space will not directly impact word processing or browsing workloads where color accuracy is not a top concern. Nonetheless, it appears that Dell offers the same Truelife 1080p panel option across all SKUs, so panels with higher color reproduction or resolution may not be available.
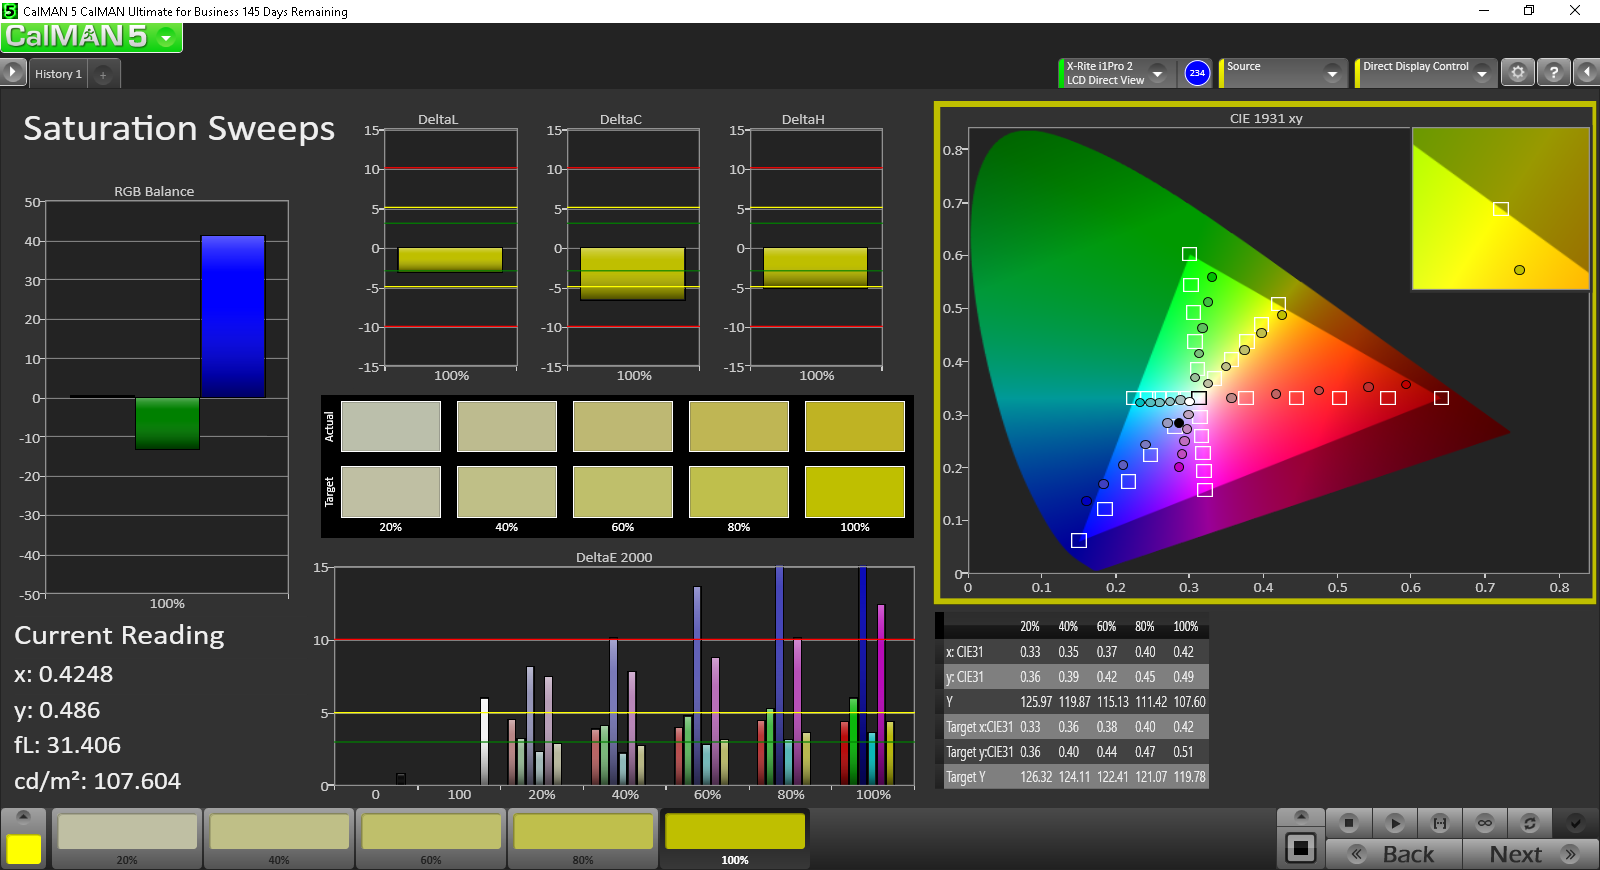
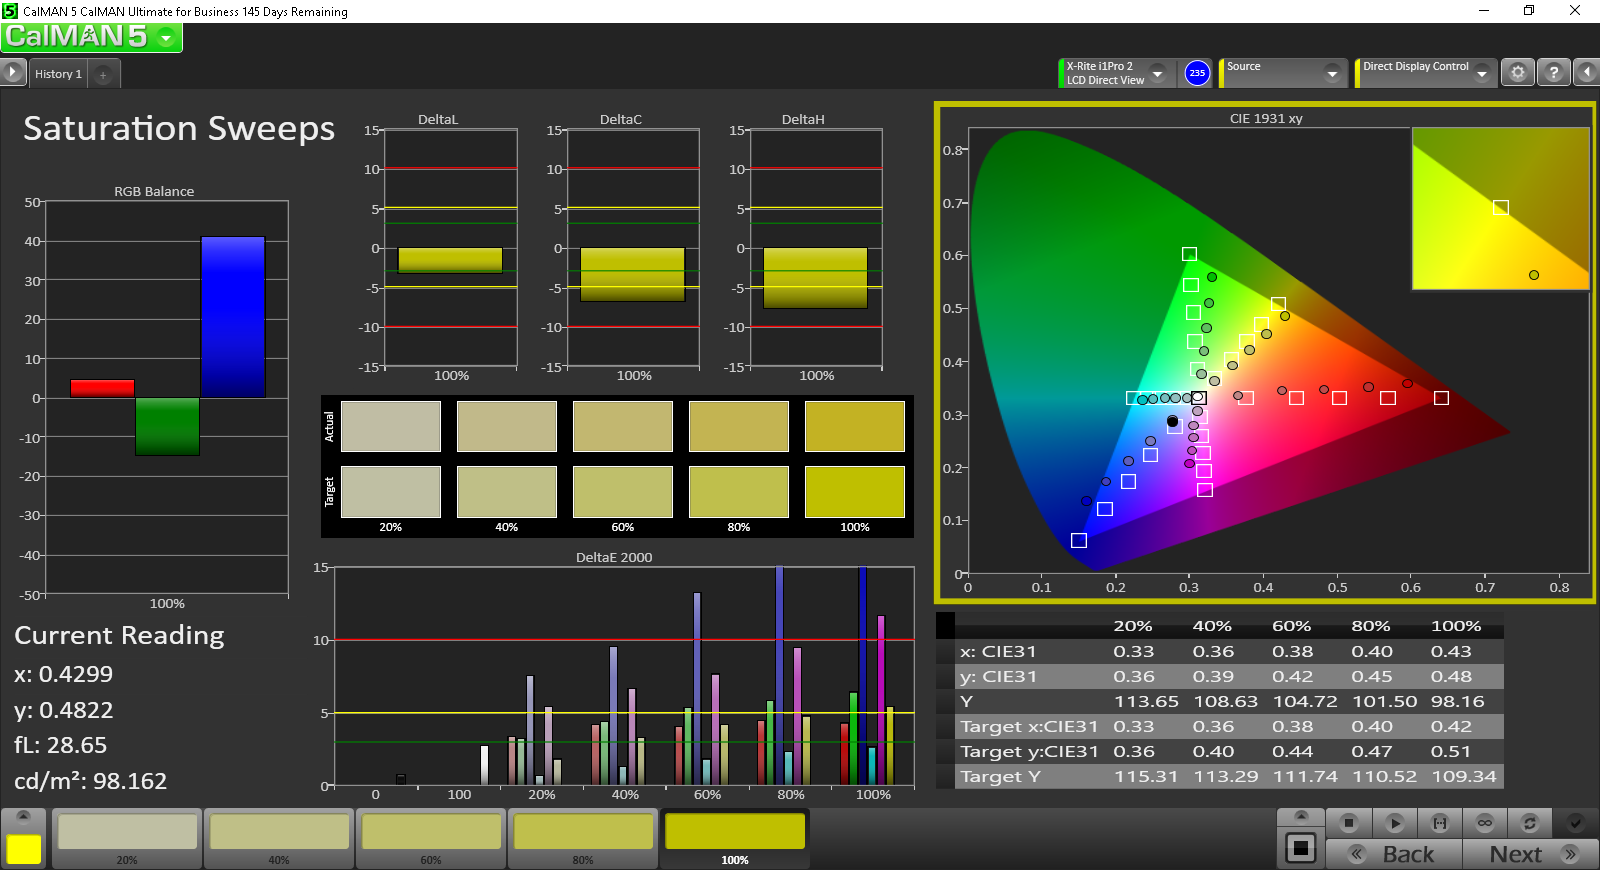
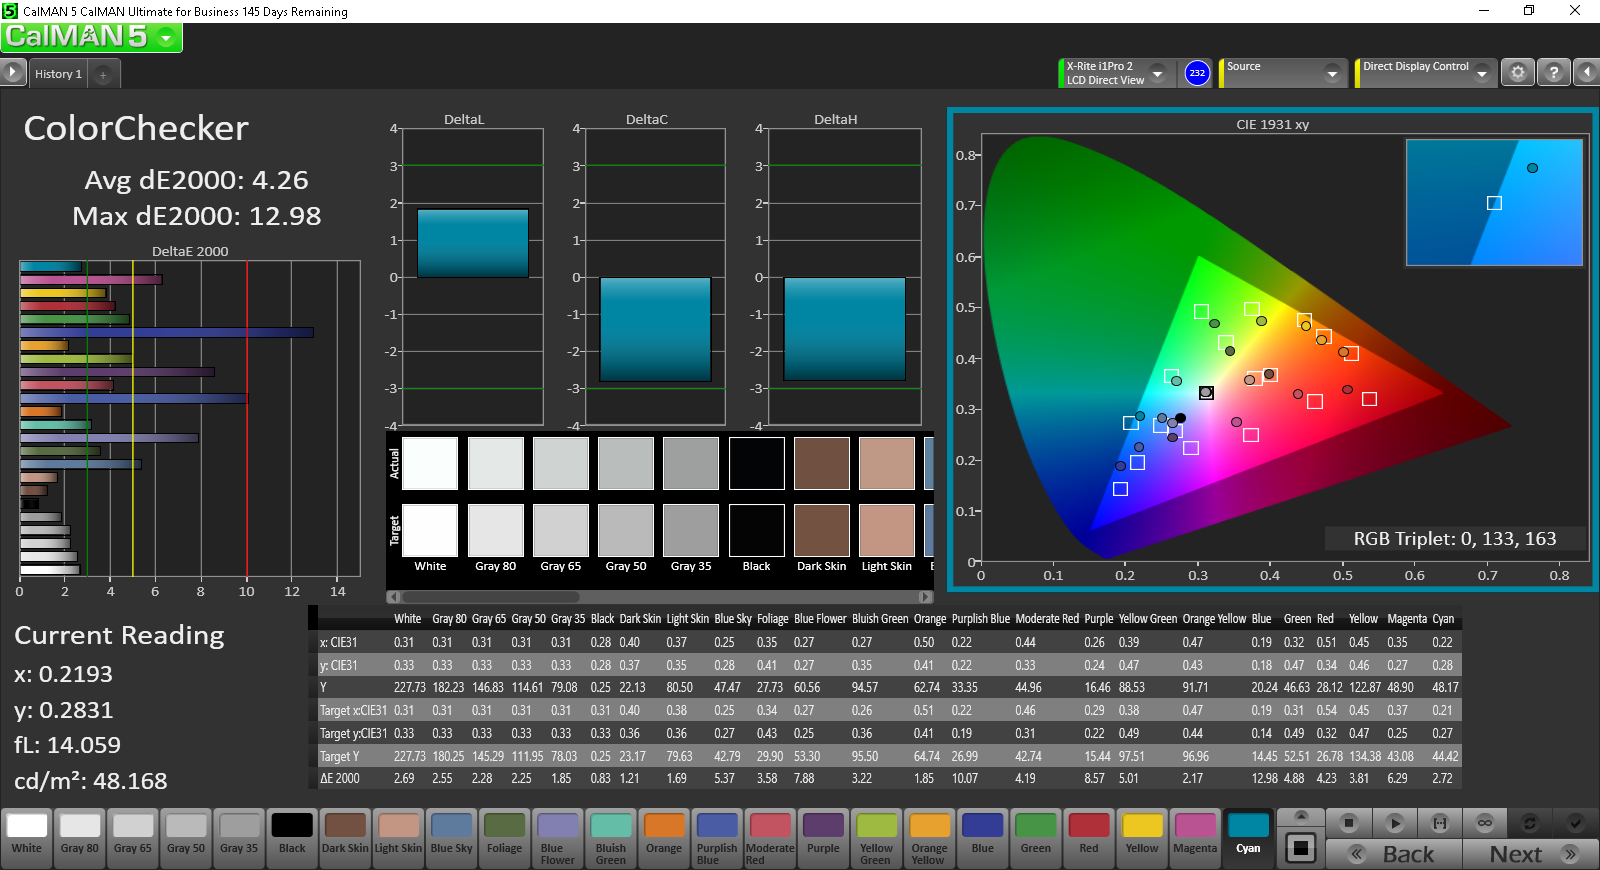
Further display measurements with an X-Rite spectrophotometer reveal average grayscale and colors. A quick calibration improves both quite noticeably and tones down color temperature for a warmer screen. Colors still grow increasingly more inaccurate the higher the saturation level due to the panel's imperfect sRGB coverage.
Display Response Times
| ↔ Response Time Black to White | ||
|---|---|---|
| 29.2 ms ... rise ↗ and fall ↘ combined | ↗ 7.6 ms rise | 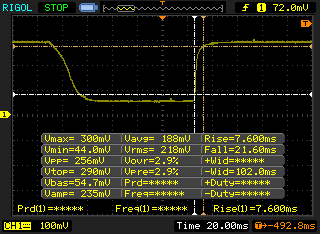 |
| ↘ 21.6 ms fall | ||
| The screen shows relatively slow response rates in our tests and may be too slow for gamers. In comparison, all tested devices range from 0.1 (minimum) to 240 (maximum) ms. » 75 % of all devices are better. This means that the measured response time is worse than the average of all tested devices (21.5 ms). | ||
| ↔ Response Time 50% Grey to 80% Grey | ||
| 56 ms ... rise ↗ and fall ↘ combined | ↗ 22.8 ms rise | 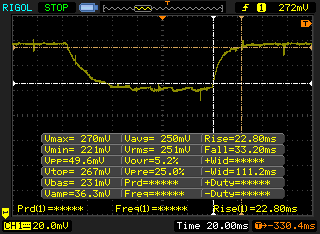 |
| ↘ 33.2 ms fall | ||
| The screen shows slow response rates in our tests and will be unsatisfactory for gamers. In comparison, all tested devices range from 0.2 (minimum) to 636 (maximum) ms. » 91 % of all devices are better. This means that the measured response time is worse than the average of all tested devices (33.7 ms). | ||
Screen Flickering / PWM (Pulse-Width Modulation)
| Screen flickering / PWM detected | 203.3 Hz | ≤ 99 % brightness setting | 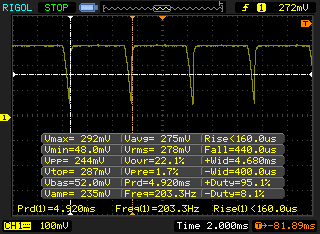 |
The display backlight flickers at 203.3 Hz (worst case, e.g., utilizing PWM) Flickering detected at a brightness setting of 99 % and below. There should be no flickering or PWM above this brightness setting. The frequency of 203.3 Hz is relatively low, so sensitive users will likely notice flickering and experience eyestrain at the stated brightness setting and below. In comparison: 53 % of all tested devices do not use PWM to dim the display. If PWM was detected, an average of 17915 (minimum: 5 - maximum: 3846000) Hz was measured. | |||
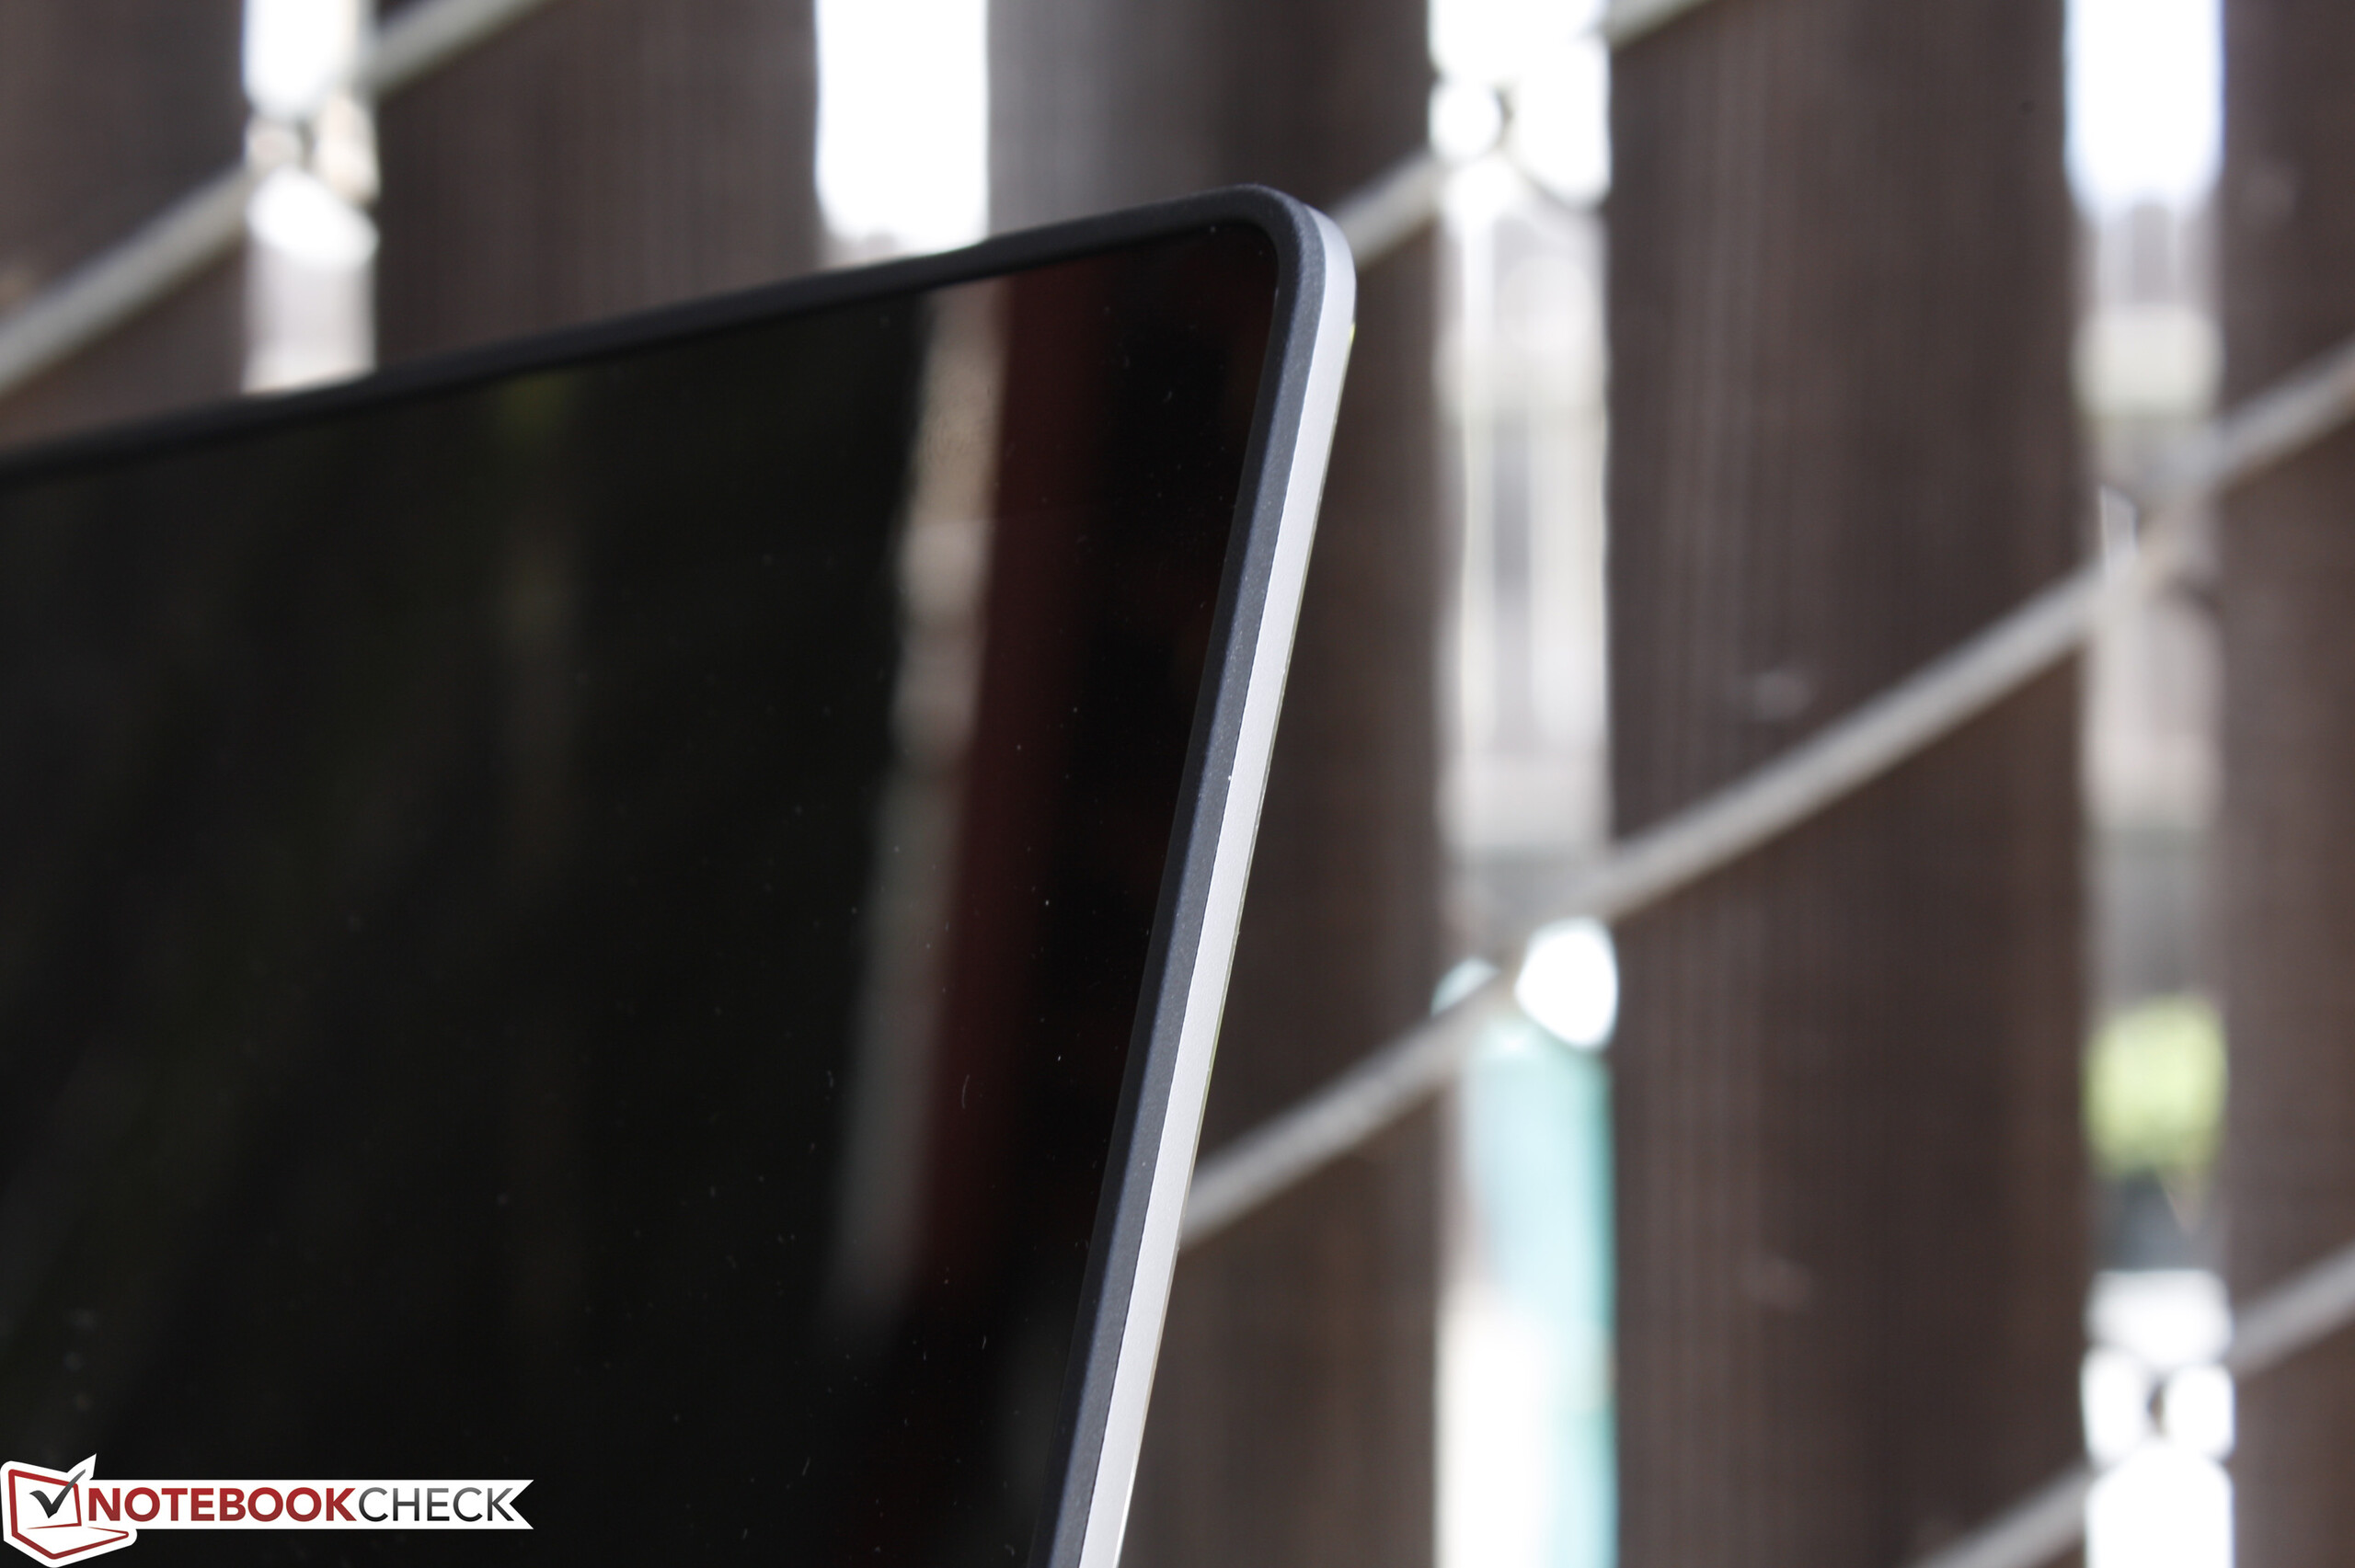
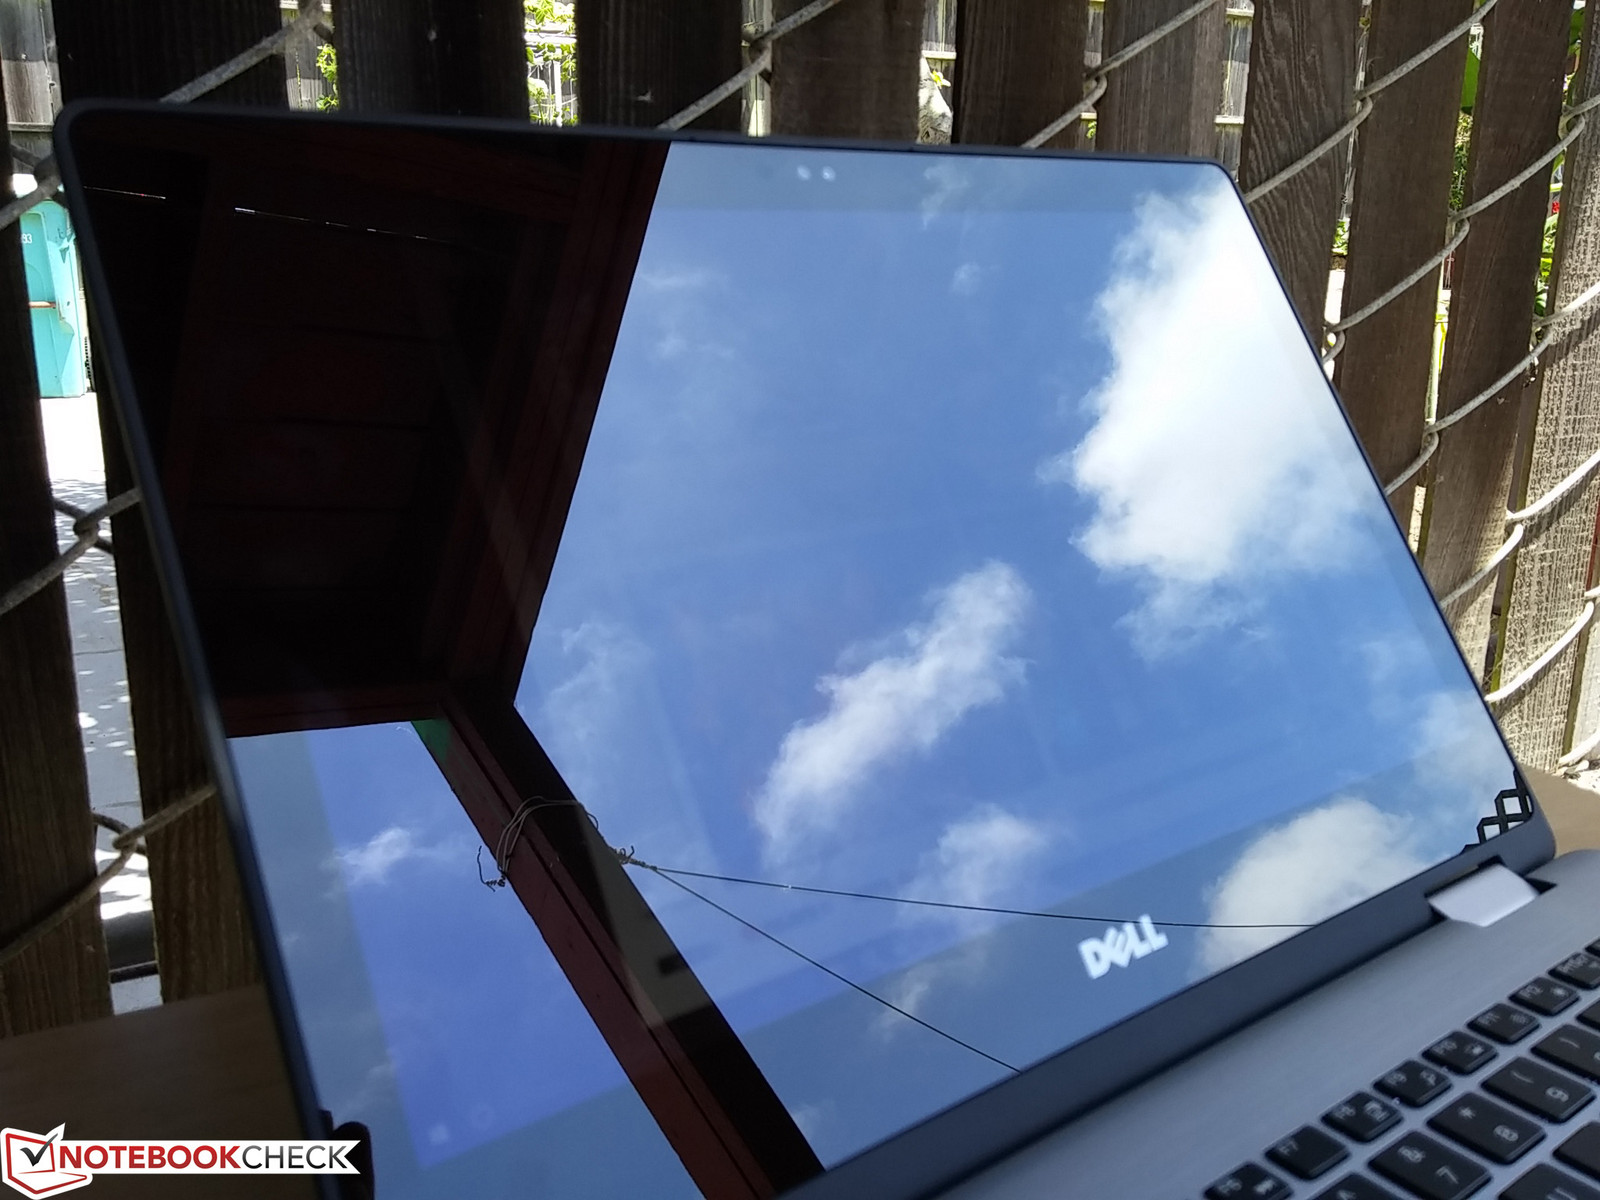
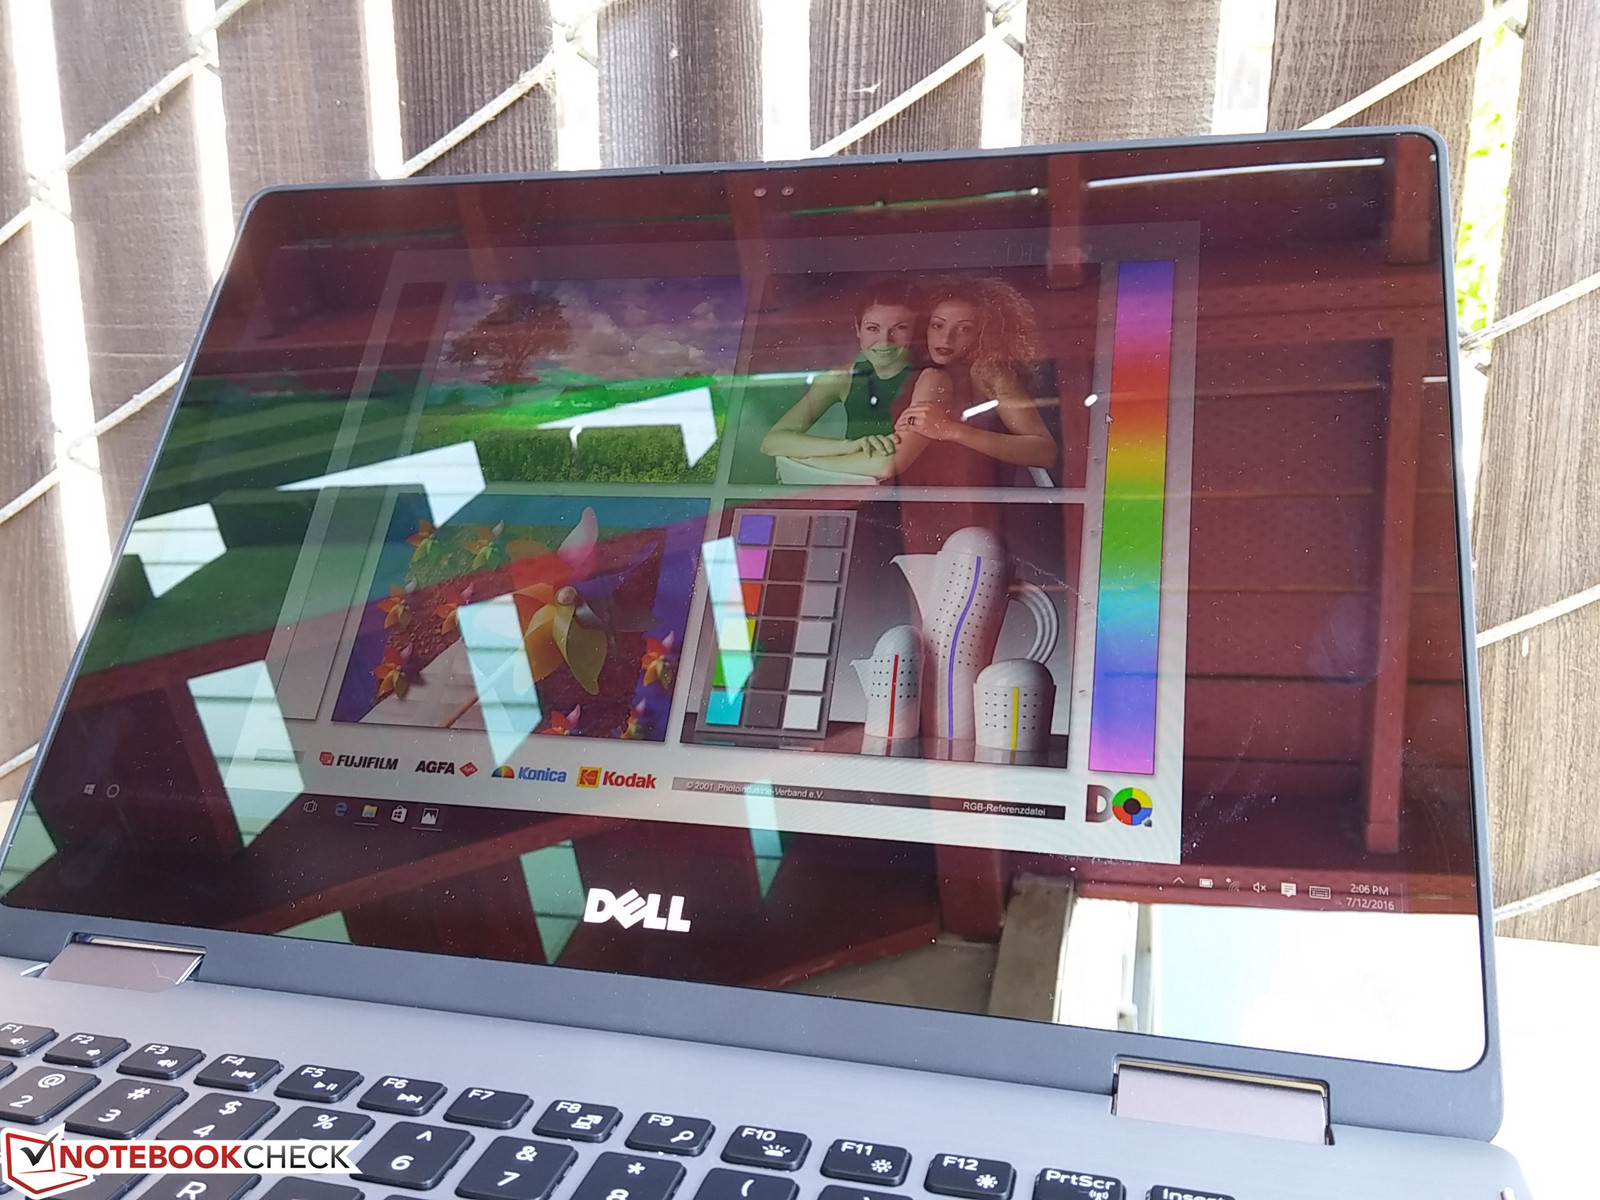
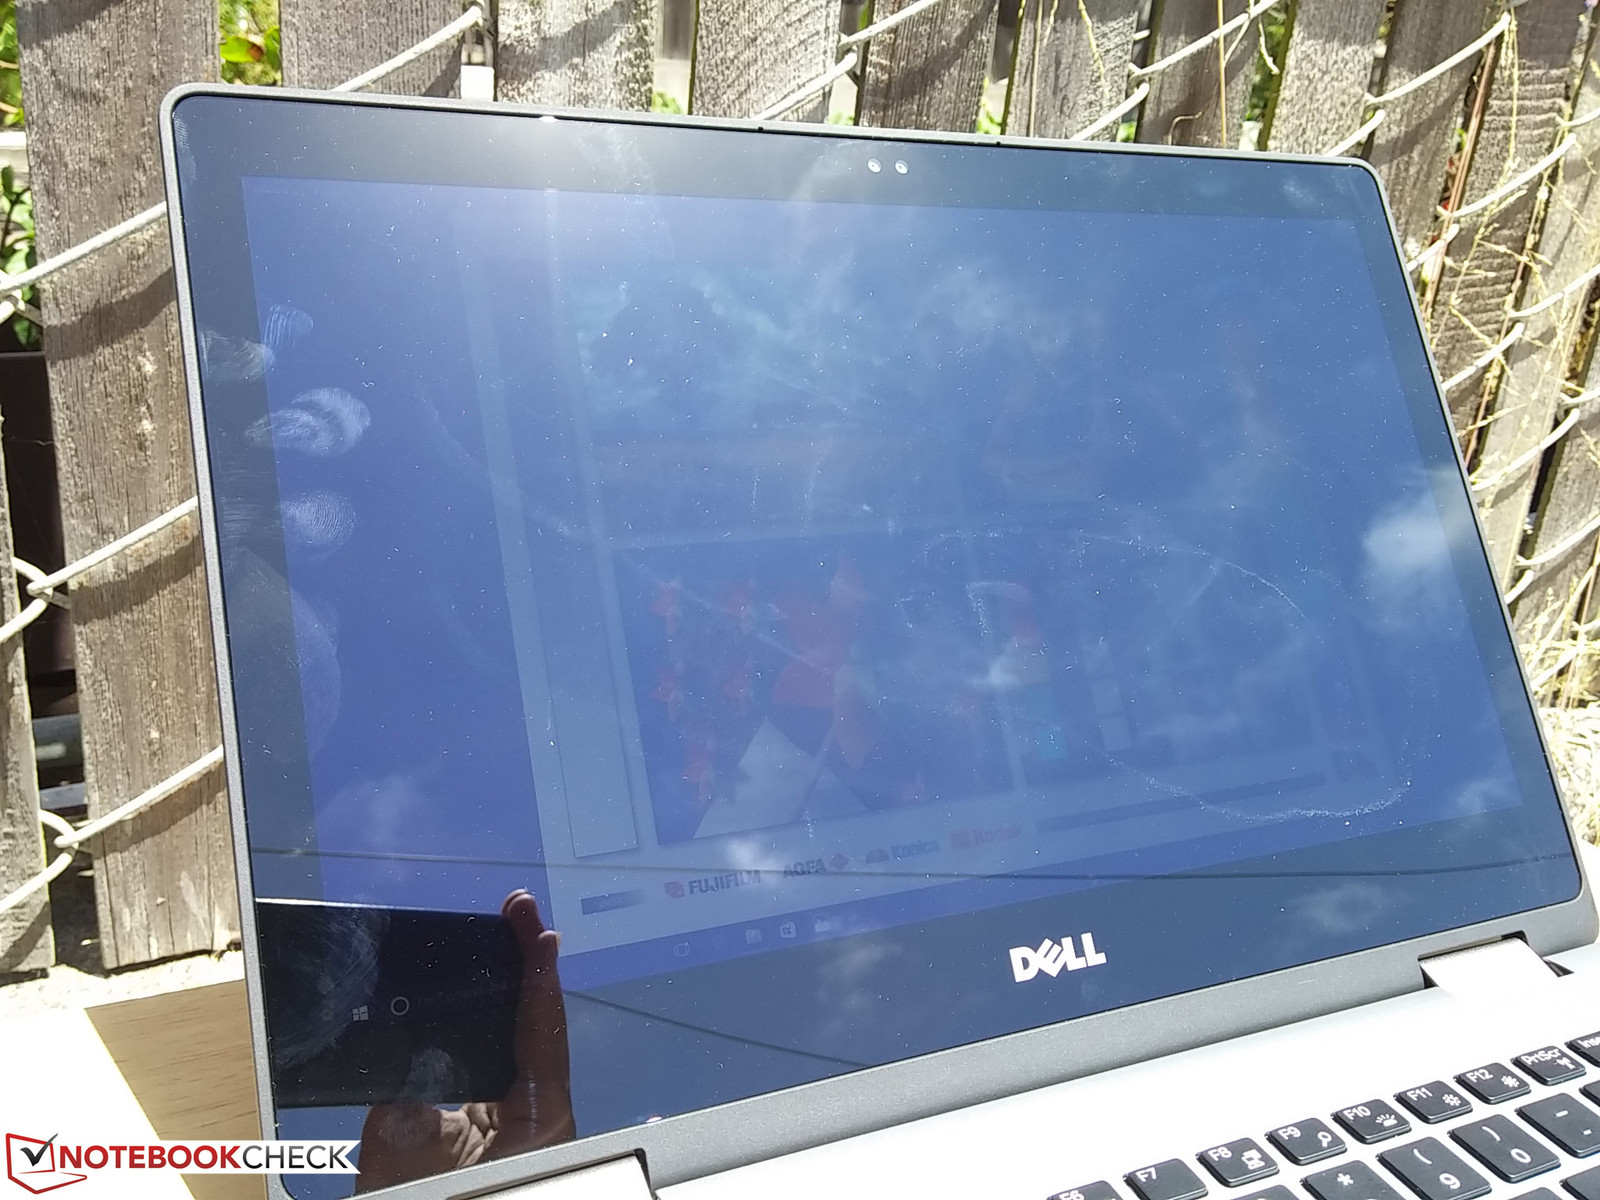
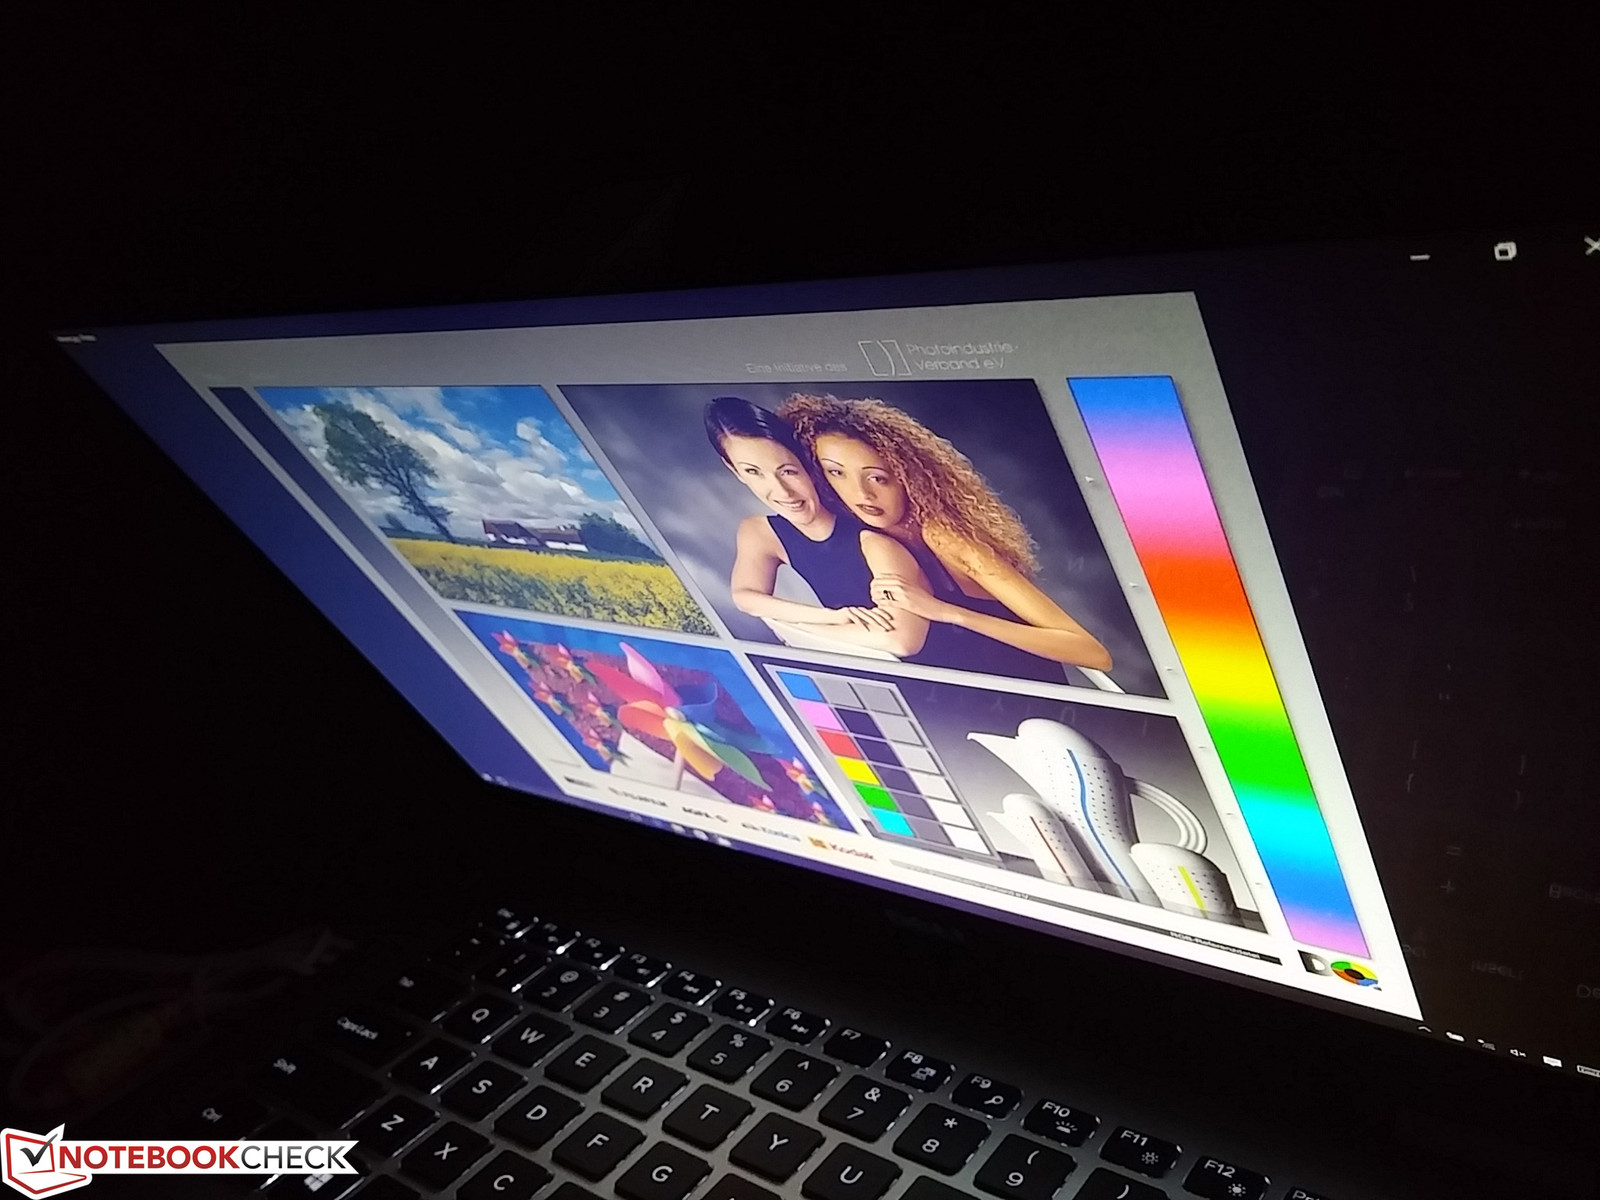
Outdoor visibility is below average due to both the glossy panel and insufficient backlight. Glare is inevitable no matter the environment be it under shade or shine, so the most users can do is adjust the angle of the lid to reduce reflections. Fortunately, the wide viewing angles provided by the IPS panel can allow for more comfortable positions. Colors and contrast do not degrade significantly unless if viewing from extreme and unrealistic angles.
Performance
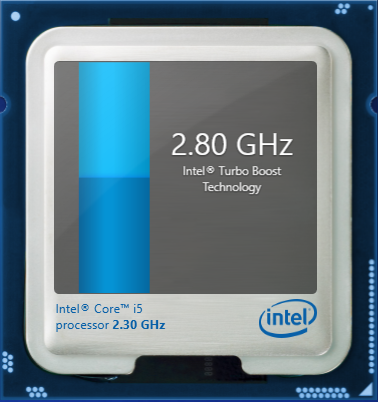
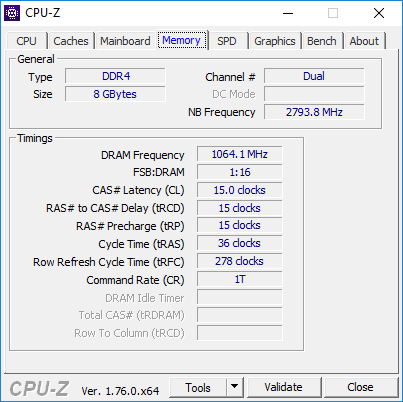
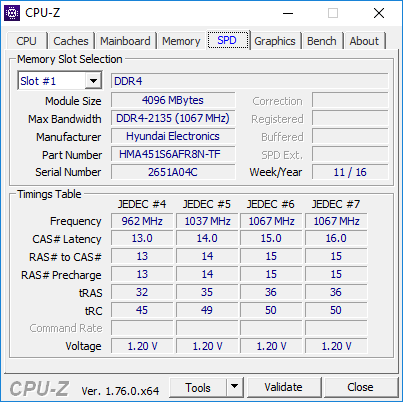
The ULV Core i5-6200U is a mainstream dual-core processor commonly found on Ultrabooks much thinner than our Dell system. It will idle at 800 MHz or even slightly slower when idling on Power Saver, but is otherwise fully capable of running at up to 2.8 GHz for single-core processes with Turbo Boost. Dell offers RAM options from 8 GB to 12 GB even though the DDR4 SODIMM slots can support up to 16 GB each.
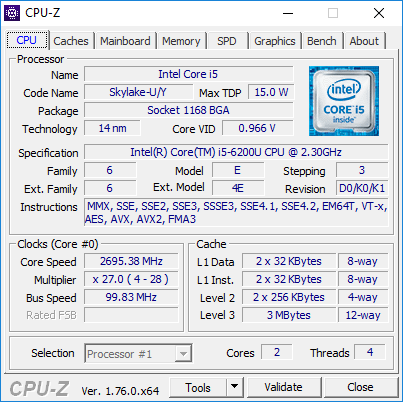
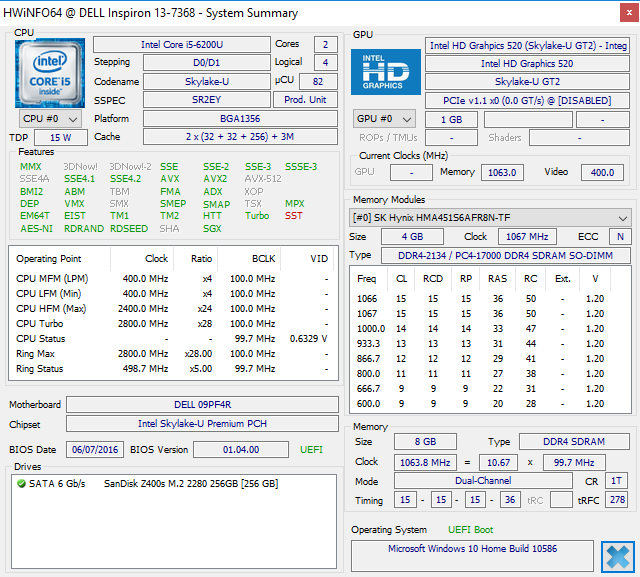
Processor
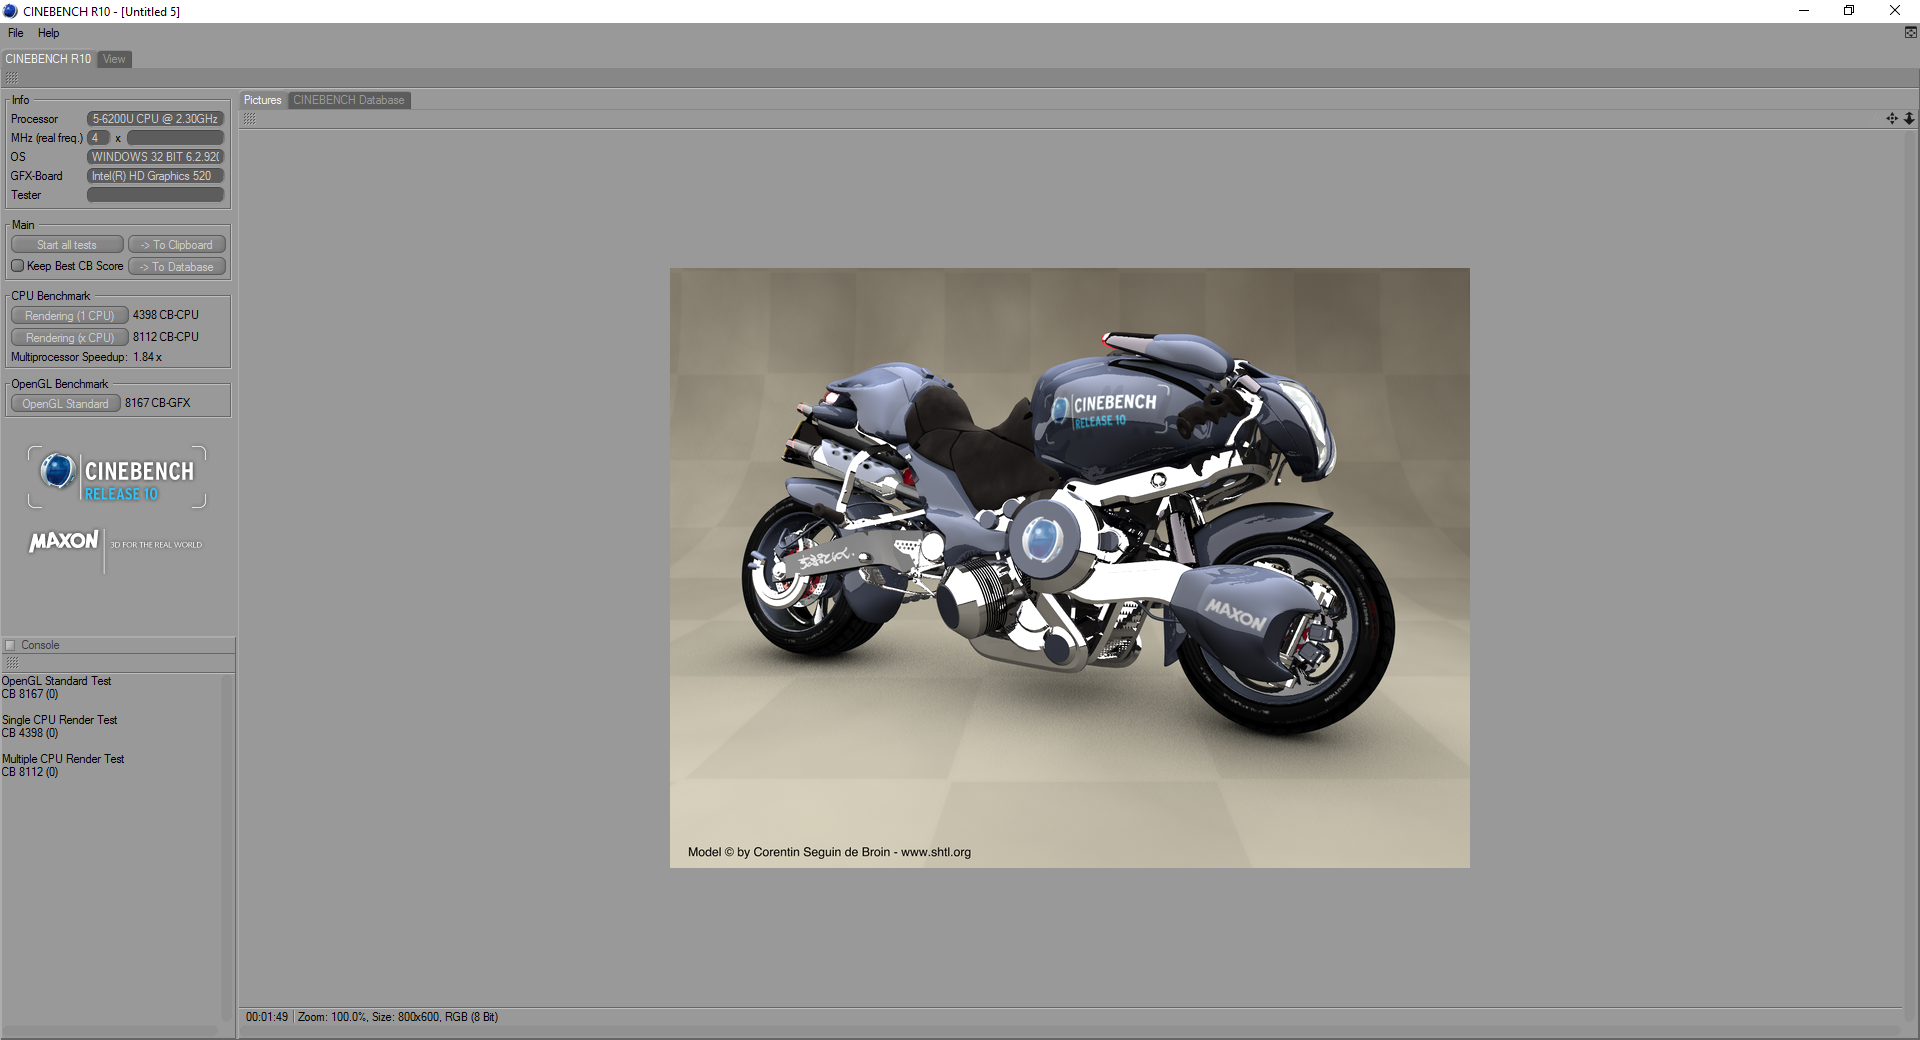
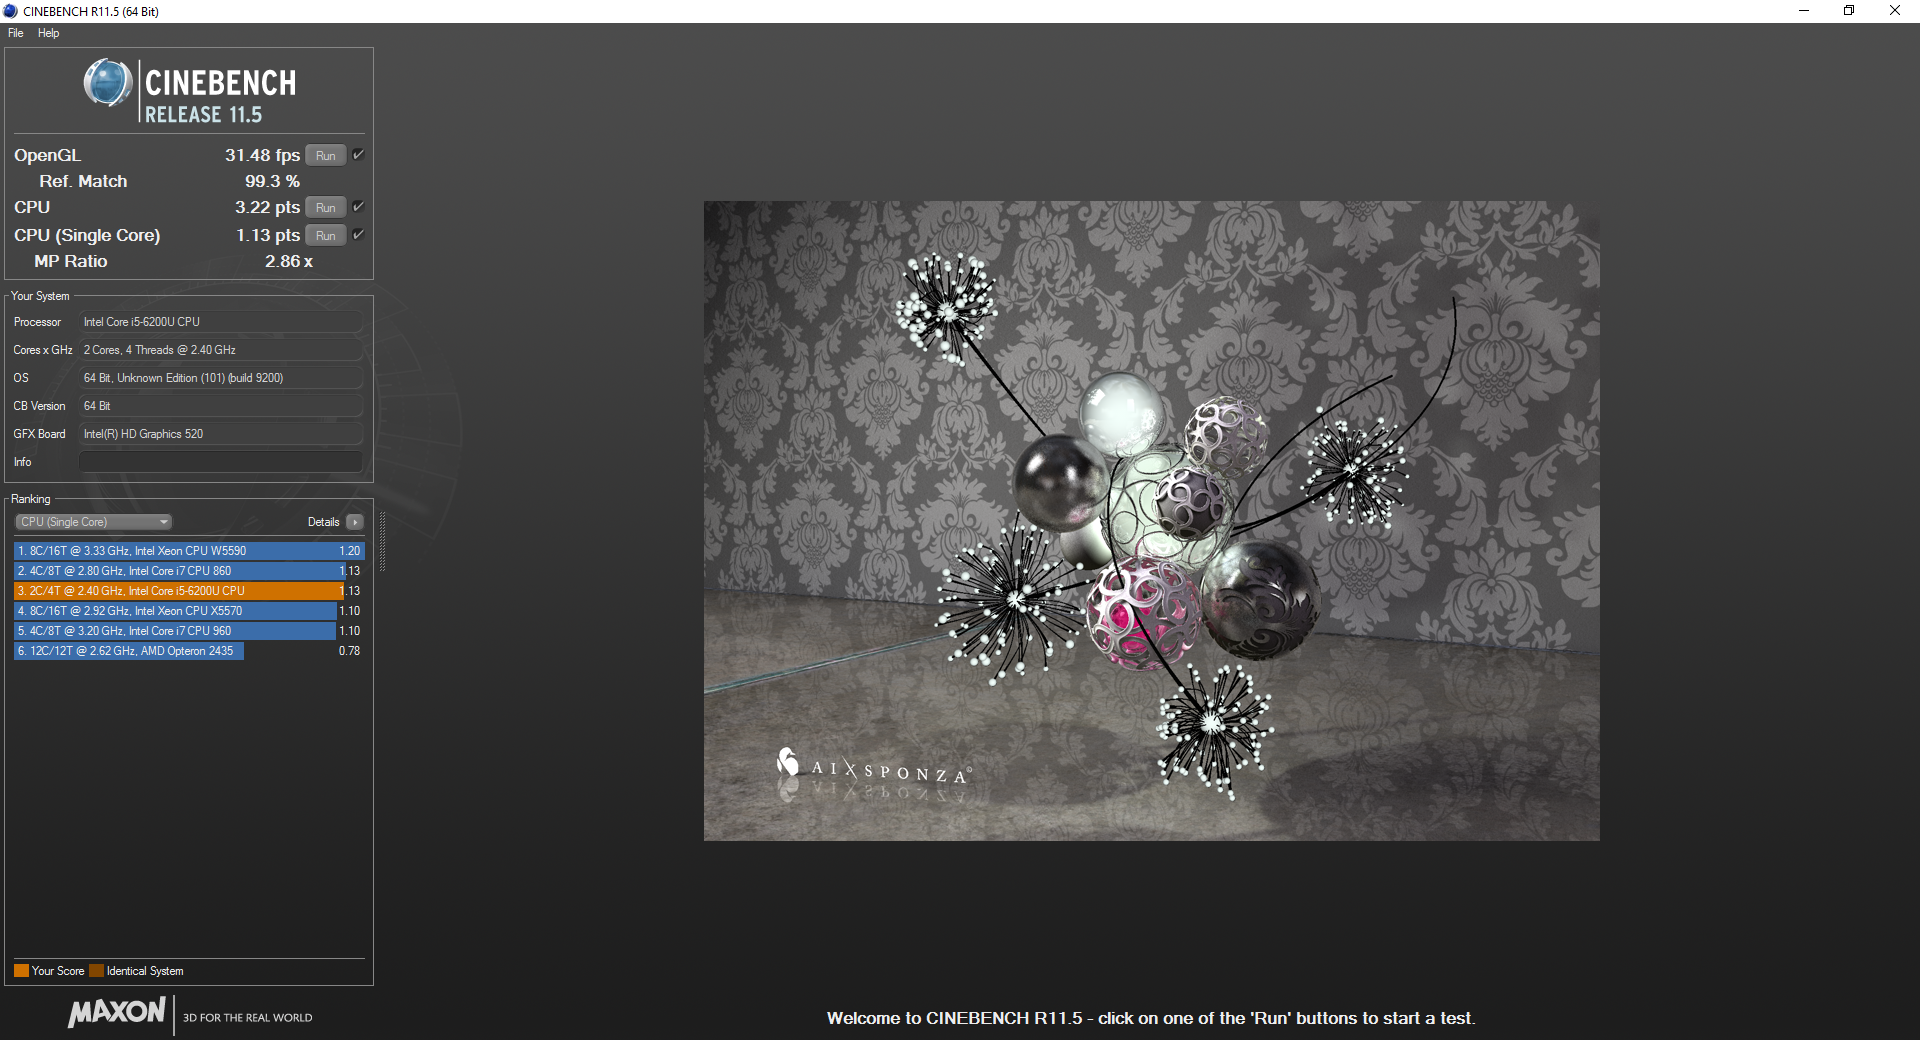
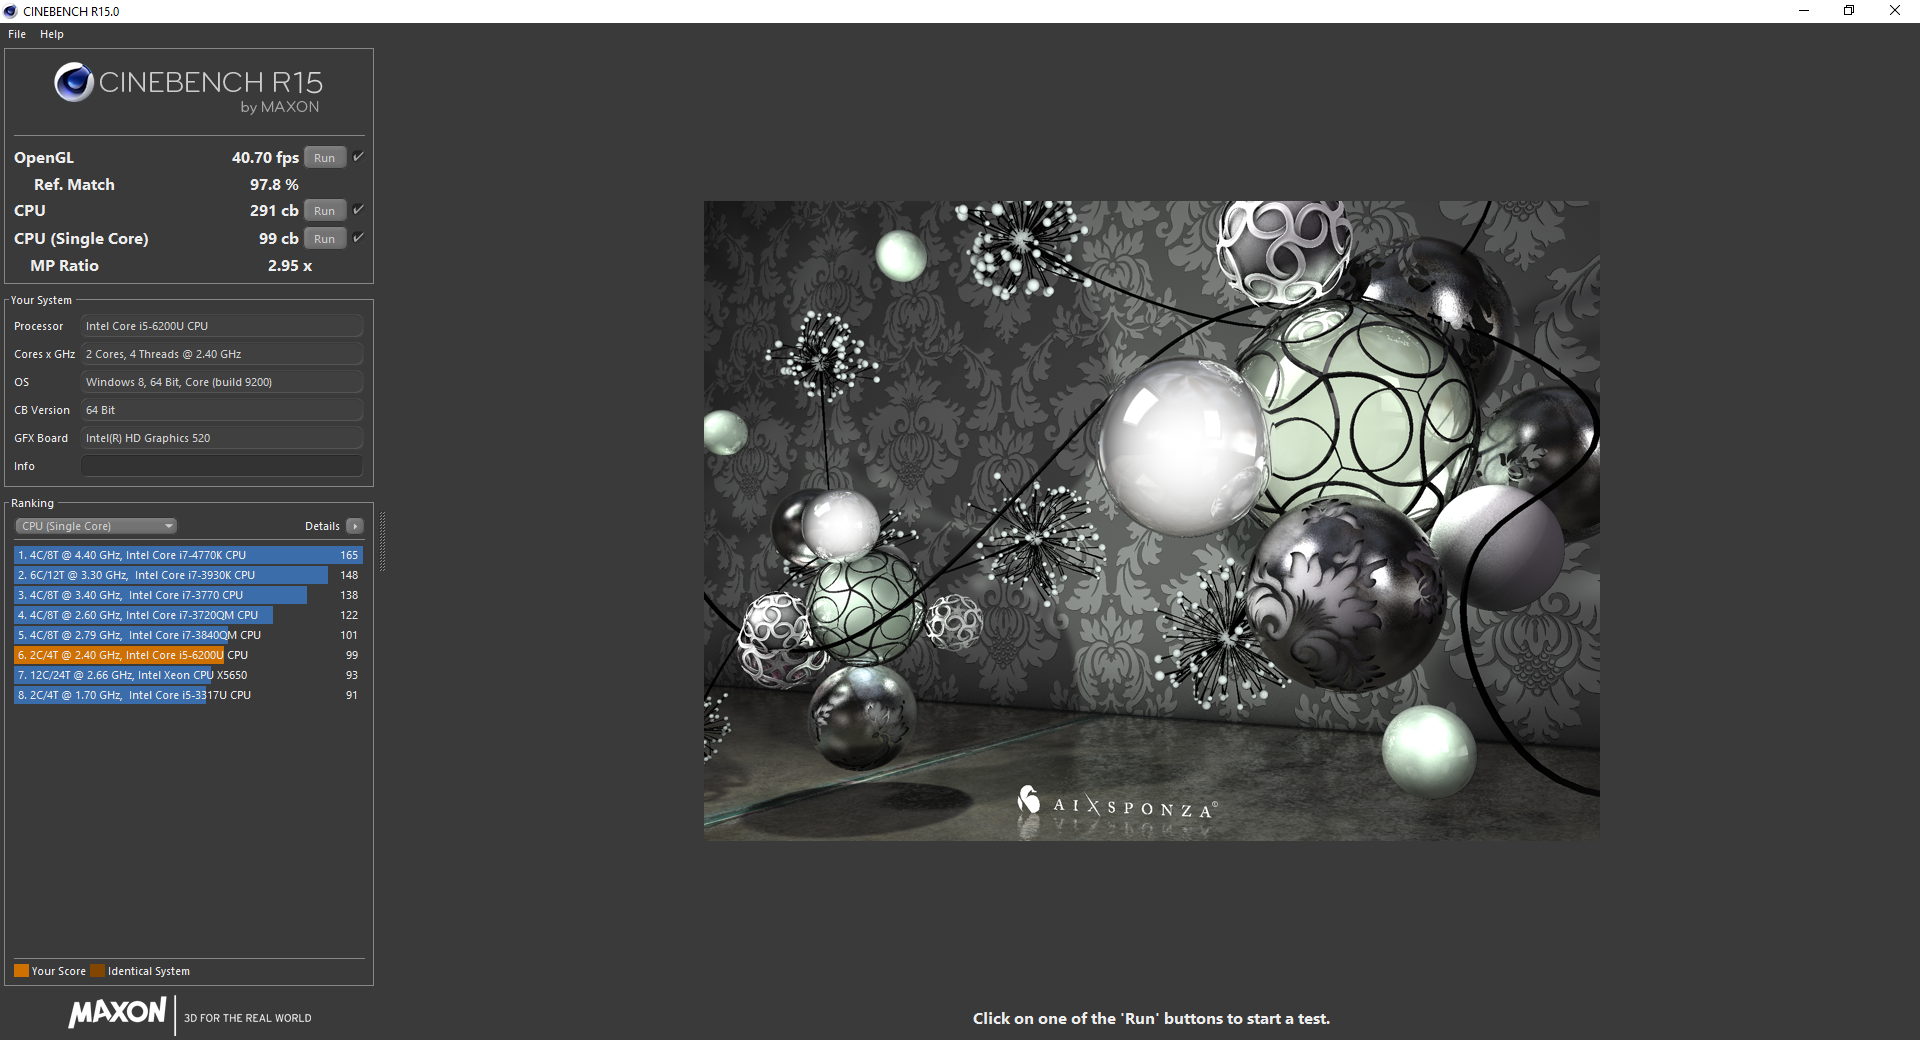
Raw CPU performance from the i5-6200U is only within just a few percentage points from Broadwell and even Haswell ULV processors that the Skylake CPU supplants. Nonetheless, it's worth noting that its multi-core performance score in CineBench 15 is quite good and even above that of the i7-6500U in the Spectre 13 due to its excellent Turbo Boost sustainability. Standard voltage Skylake processors like those found on dedicated gaming notebooks will still handily outperform the ULV core especially in multi-threaded workloads.
See our dedicated CPU page on the Core i5-6200U for more technical information and benchmark comparisons.
* ... smaller is better
System Performance
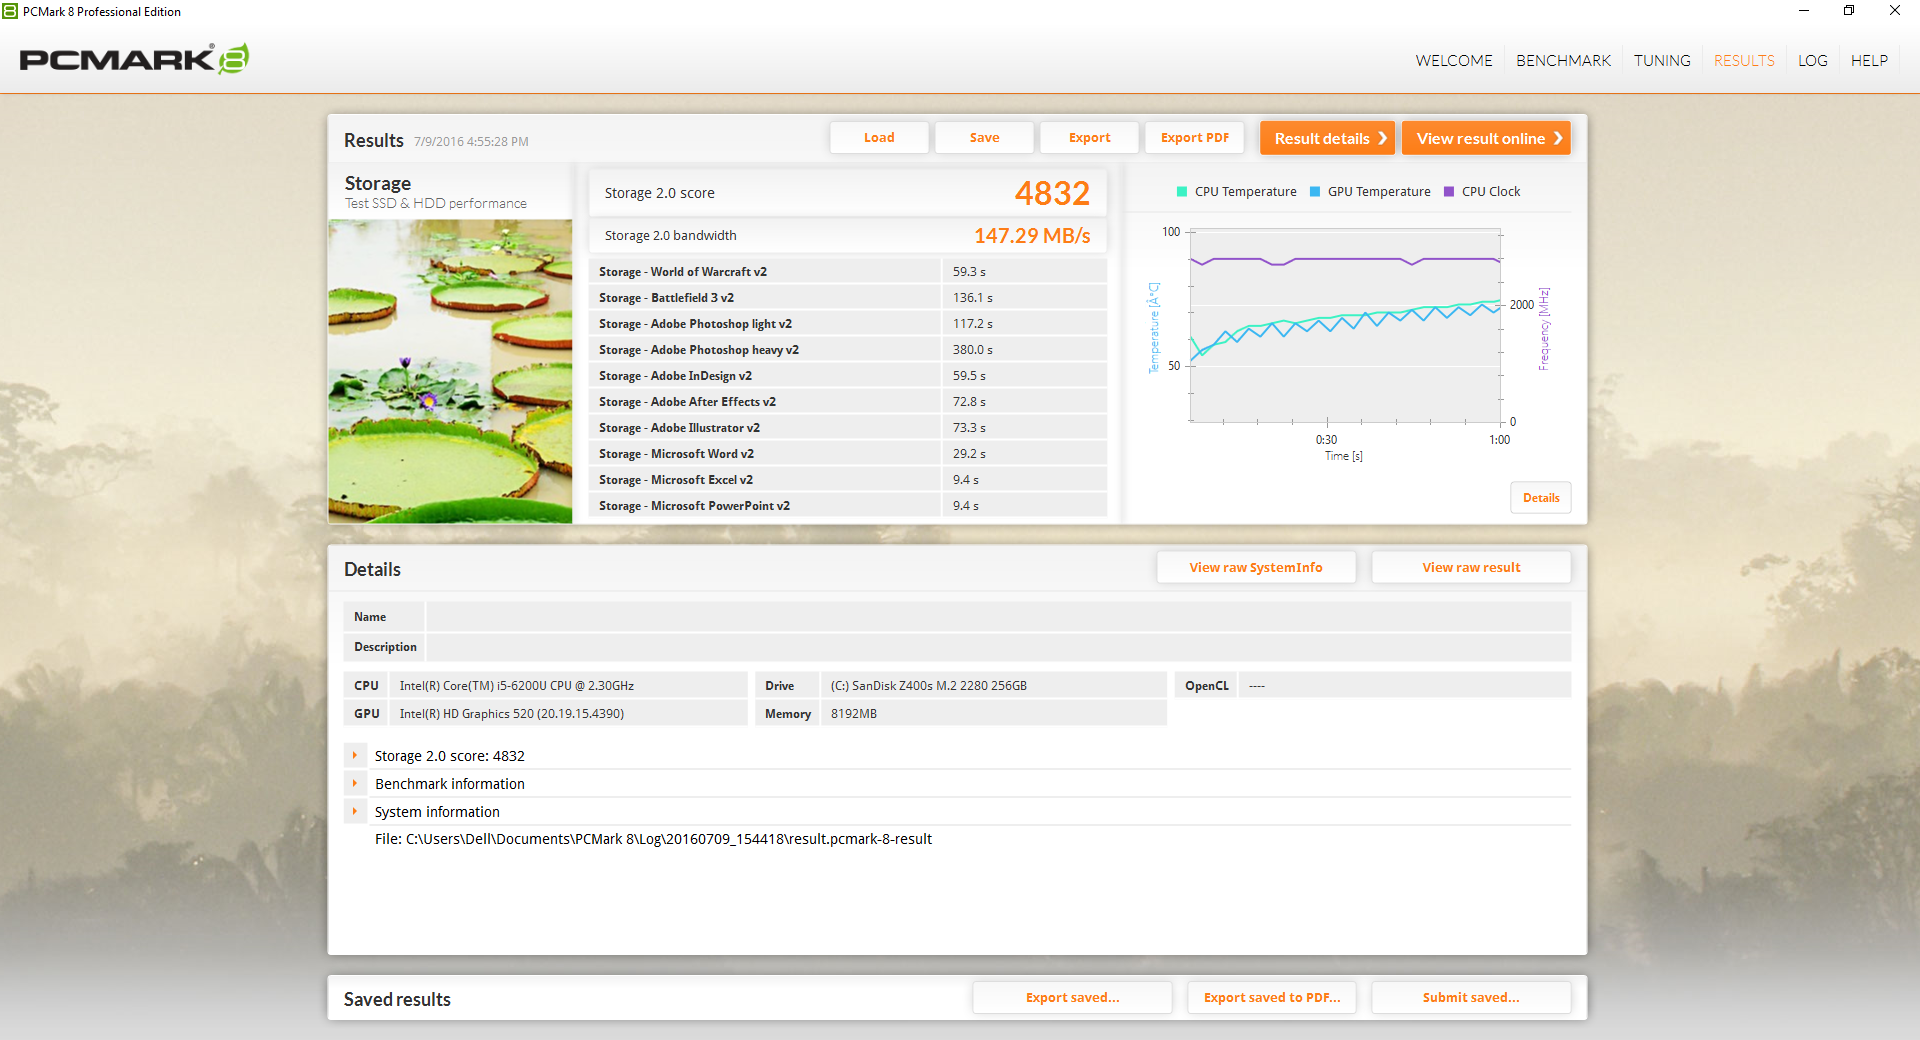
PCMark 8 ranks our Dell in the same ballpark as its nearest competitors. We experienced no hardware or software issues during our time with the test unit.
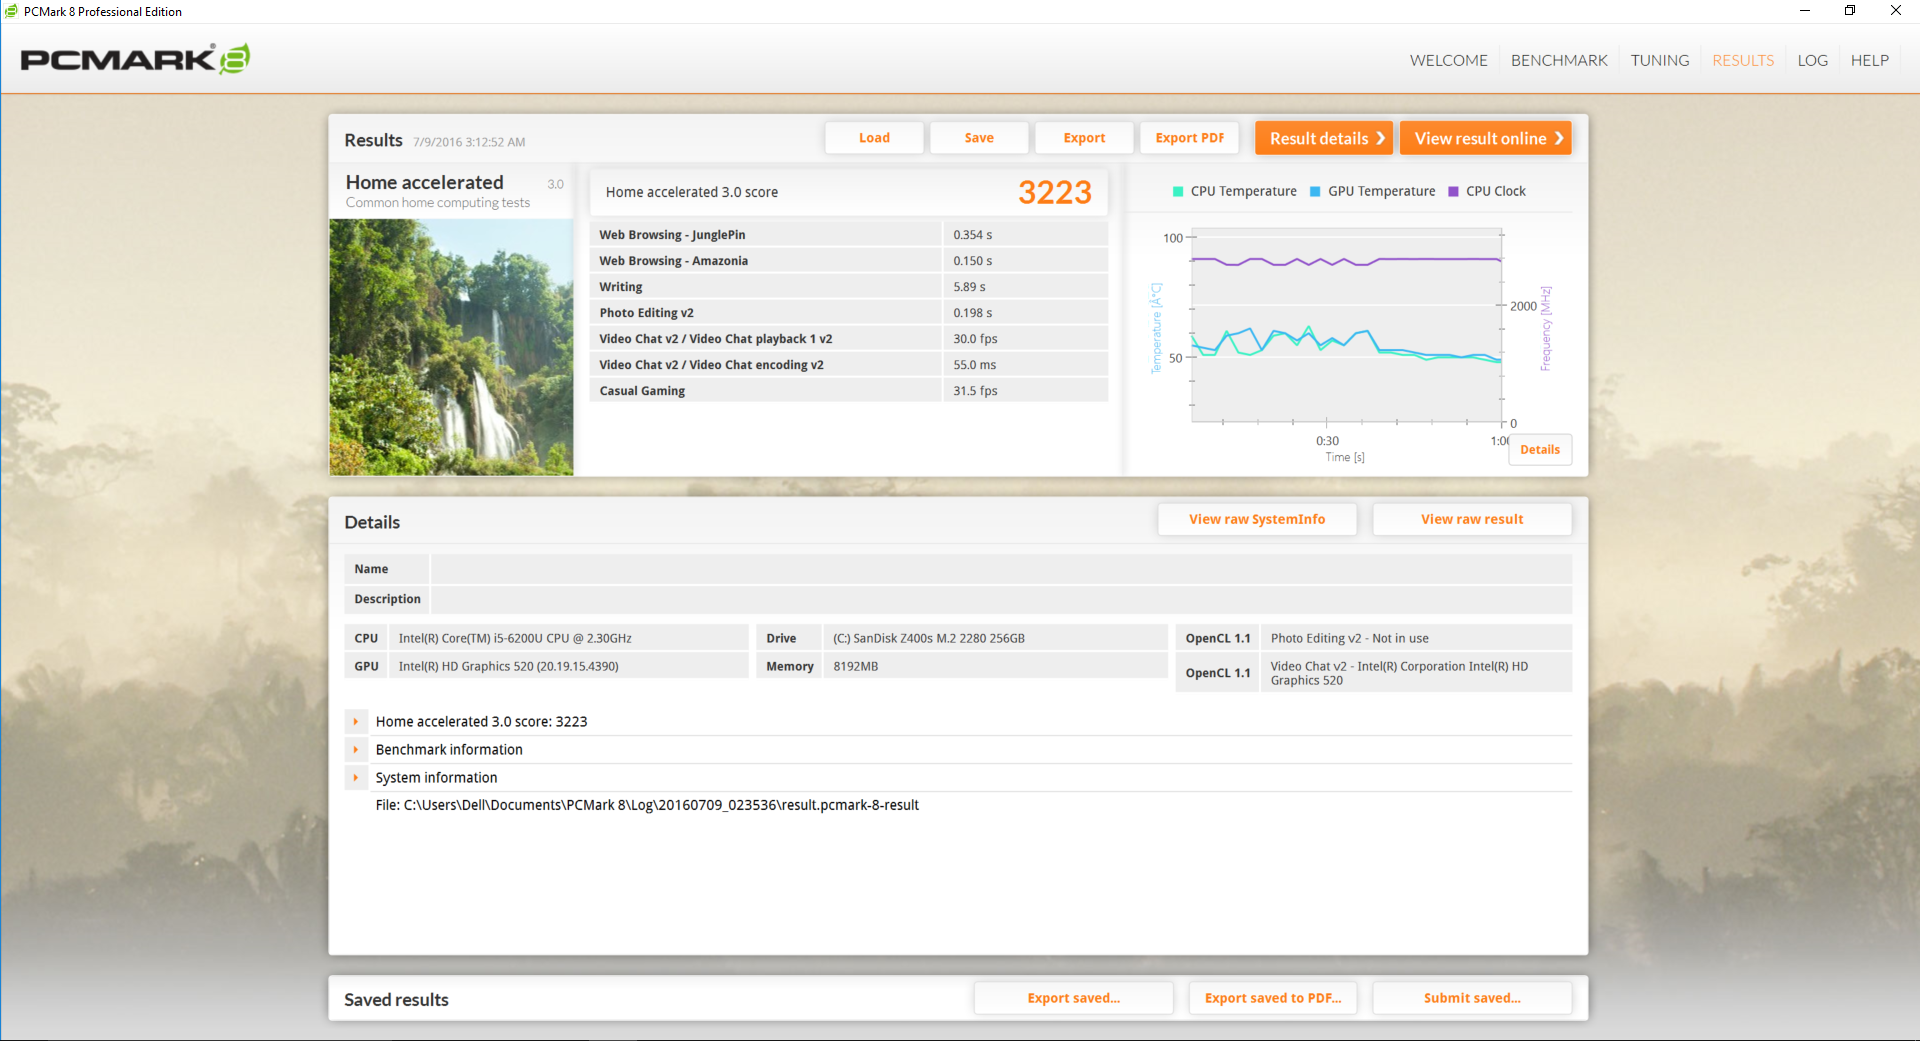
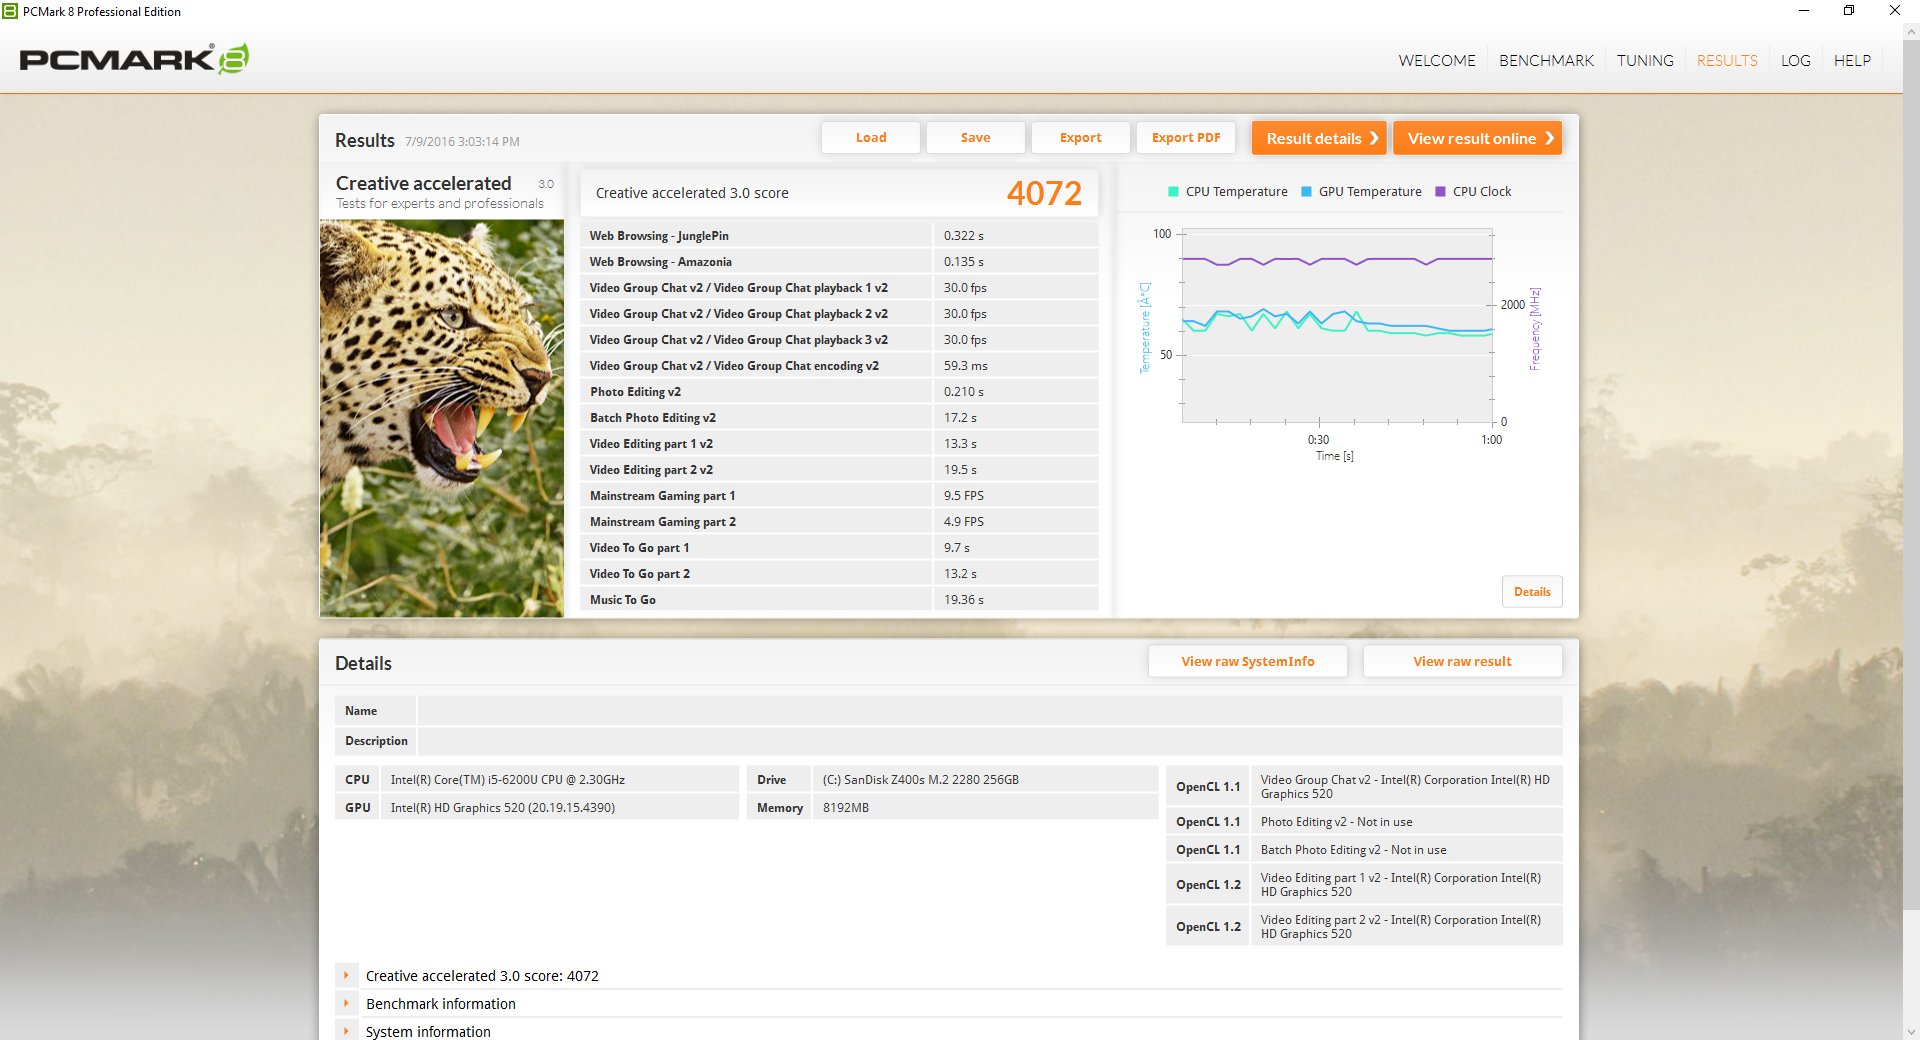
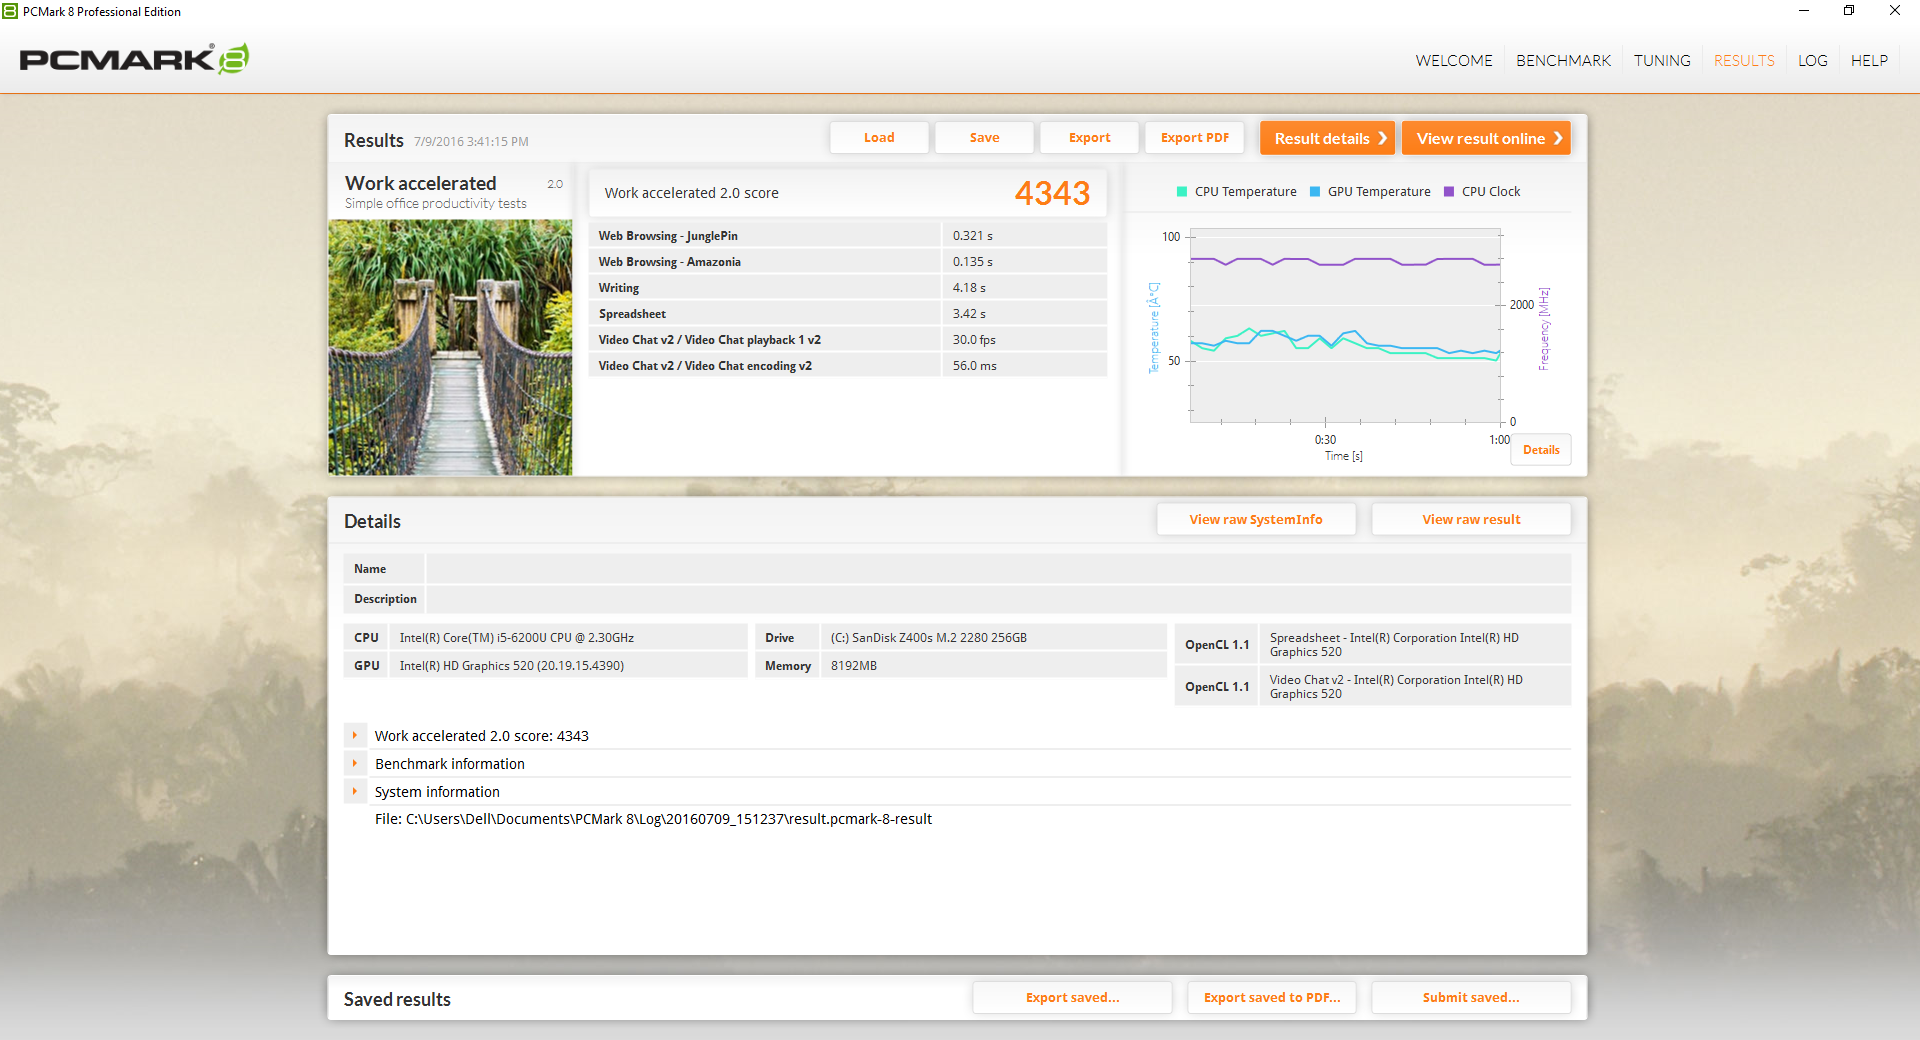
| PCMark 8 Home Score Accelerated v2 | 3223 points | |
| PCMark 8 Creative Score Accelerated v2 | 4072 points | |
| PCMark 8 Work Score Accelerated v2 | 4343 points | |
Help | ||
Storage Devices
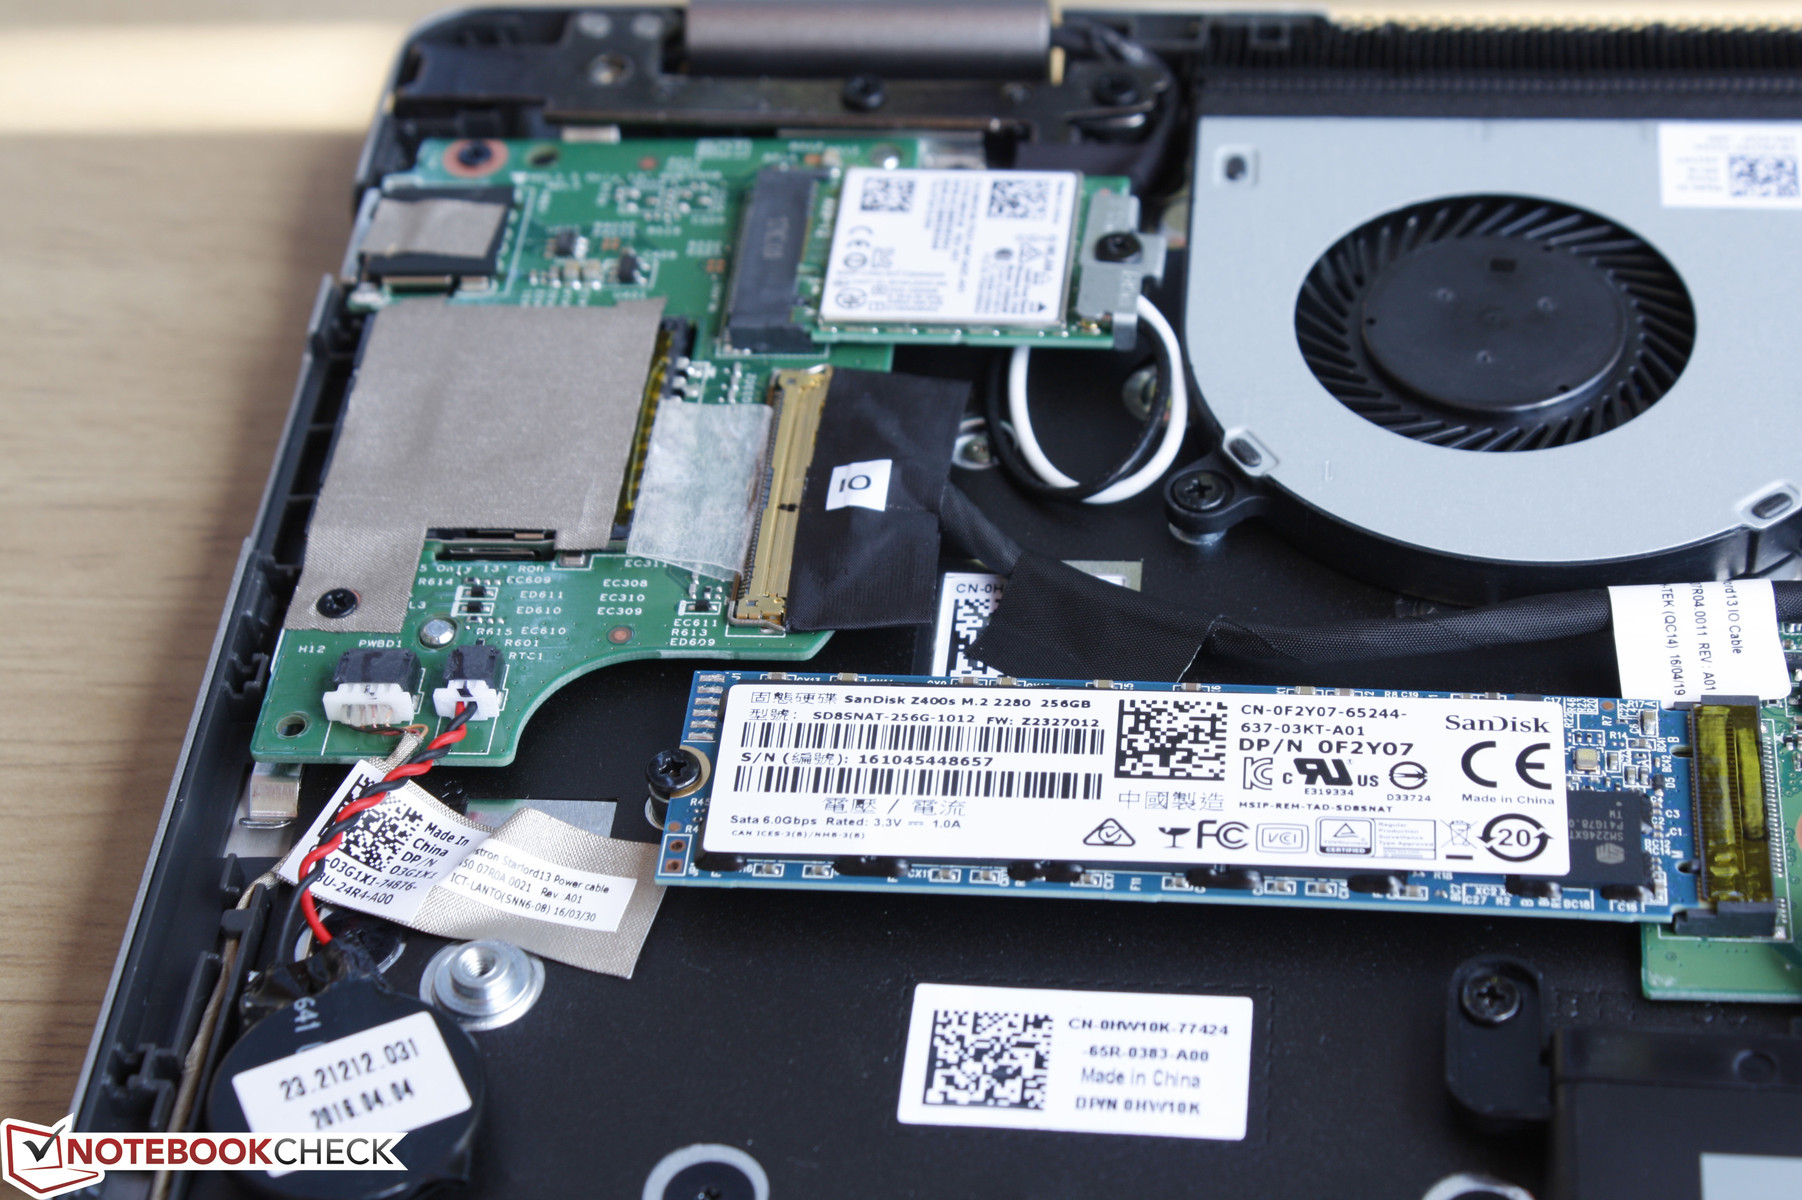
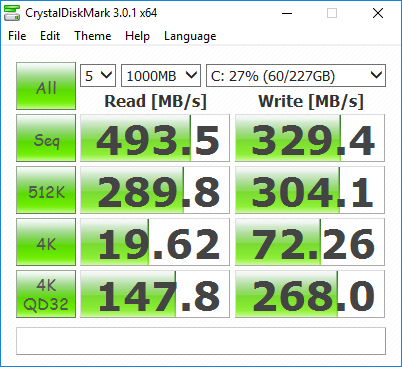
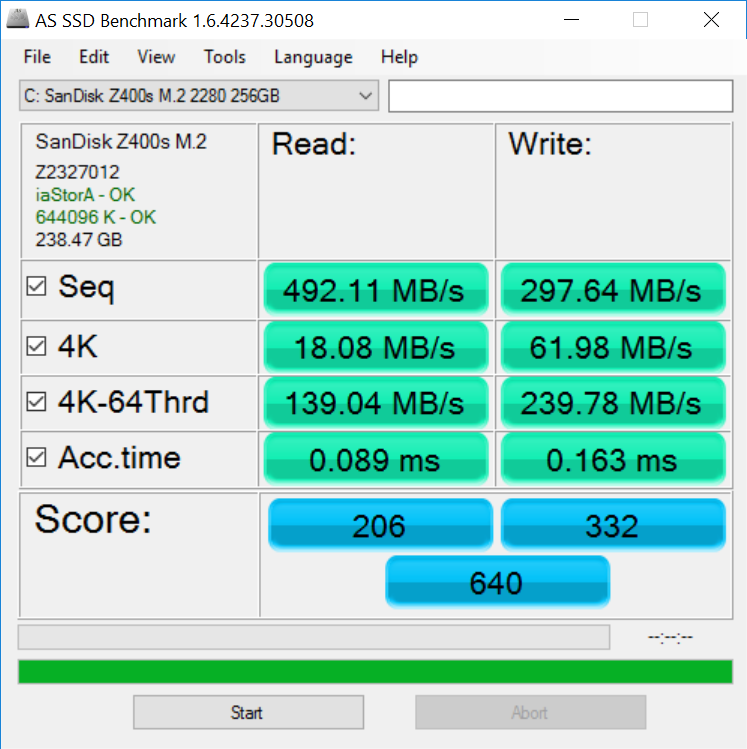
Internal storage is limited to a single M.2 drive with no NVMe support for faster speeds. Our test unit uses a 256 GB SanDisk Z400s SSD with middle-of-the-road transfer rates according to both CrystalDiskMark and AS SSD. In particular, the drive is slower in reading and writing of 4K block sizes compared to Samsung M.2 SSDs. Replacing or upgrading the drive is easy, so users can purchase a cheaper SKU and up storage space at a later date without much hassle.
See our growing table of HDDs and SSDs for more benchmark comparisons.
| Dell Inspiron 13 7386 SanDisk Z400s 256 GB M.2 2280 | Acer Aspire R13 R7-372T-746N Lite-On CV1-8B256 | Dell Inspiron 13-7348 Samsung PM851 Series MZMTE256HMHP | HP Spectre 13-4001ng x360 ADATA AXNS381E-256GM-B | Lenovo Yoga 900-13ISK 80MK Samsung SSD PM871 MZNLN512HCJH | Microsoft Surface Book Core i7 Samsung MZFLV512 NVMe | |
|---|---|---|---|---|---|---|
| CrystalDiskMark 3.0 | 27% | 22% | 22% | 37% | 120% | |
| Read Seq | 493.5 | 507 3% | 514 4% | 475.6 -4% | 514 4% | 953 93% |
| Write Seq | 329.4 | 354.4 8% | 268 -19% | 288.6 -12% | 459.5 39% | 592 80% |
| Read 512 | 289.8 | 355.3 23% | 411.8 42% | 322.9 11% | 413.4 43% | 520 79% |
| Write 512 | 304.1 | 353.9 16% | 268.6 -12% | 285.2 -6% | 424.5 40% | 591 94% |
| Read 4k | 19.62 | 32.66 66% | 26.94 37% | 31.87 62% | 36.34 85% | 42.66 117% |
| Write 4k | 72.3 | 81.6 13% | 74.5 3% | 102.7 42% | 100.1 38% | 136.3 89% |
| Read 4k QD32 | 147.8 | 277.6 88% | 325.9 121% | 276.7 87% | 313.8 112% | 615 316% |
| Write 4k QD32 | 268 | 261.2 -3% | 266.7 0% | 261.6 -2% | 96.8 -64% | 517 93% |

GPU Performance
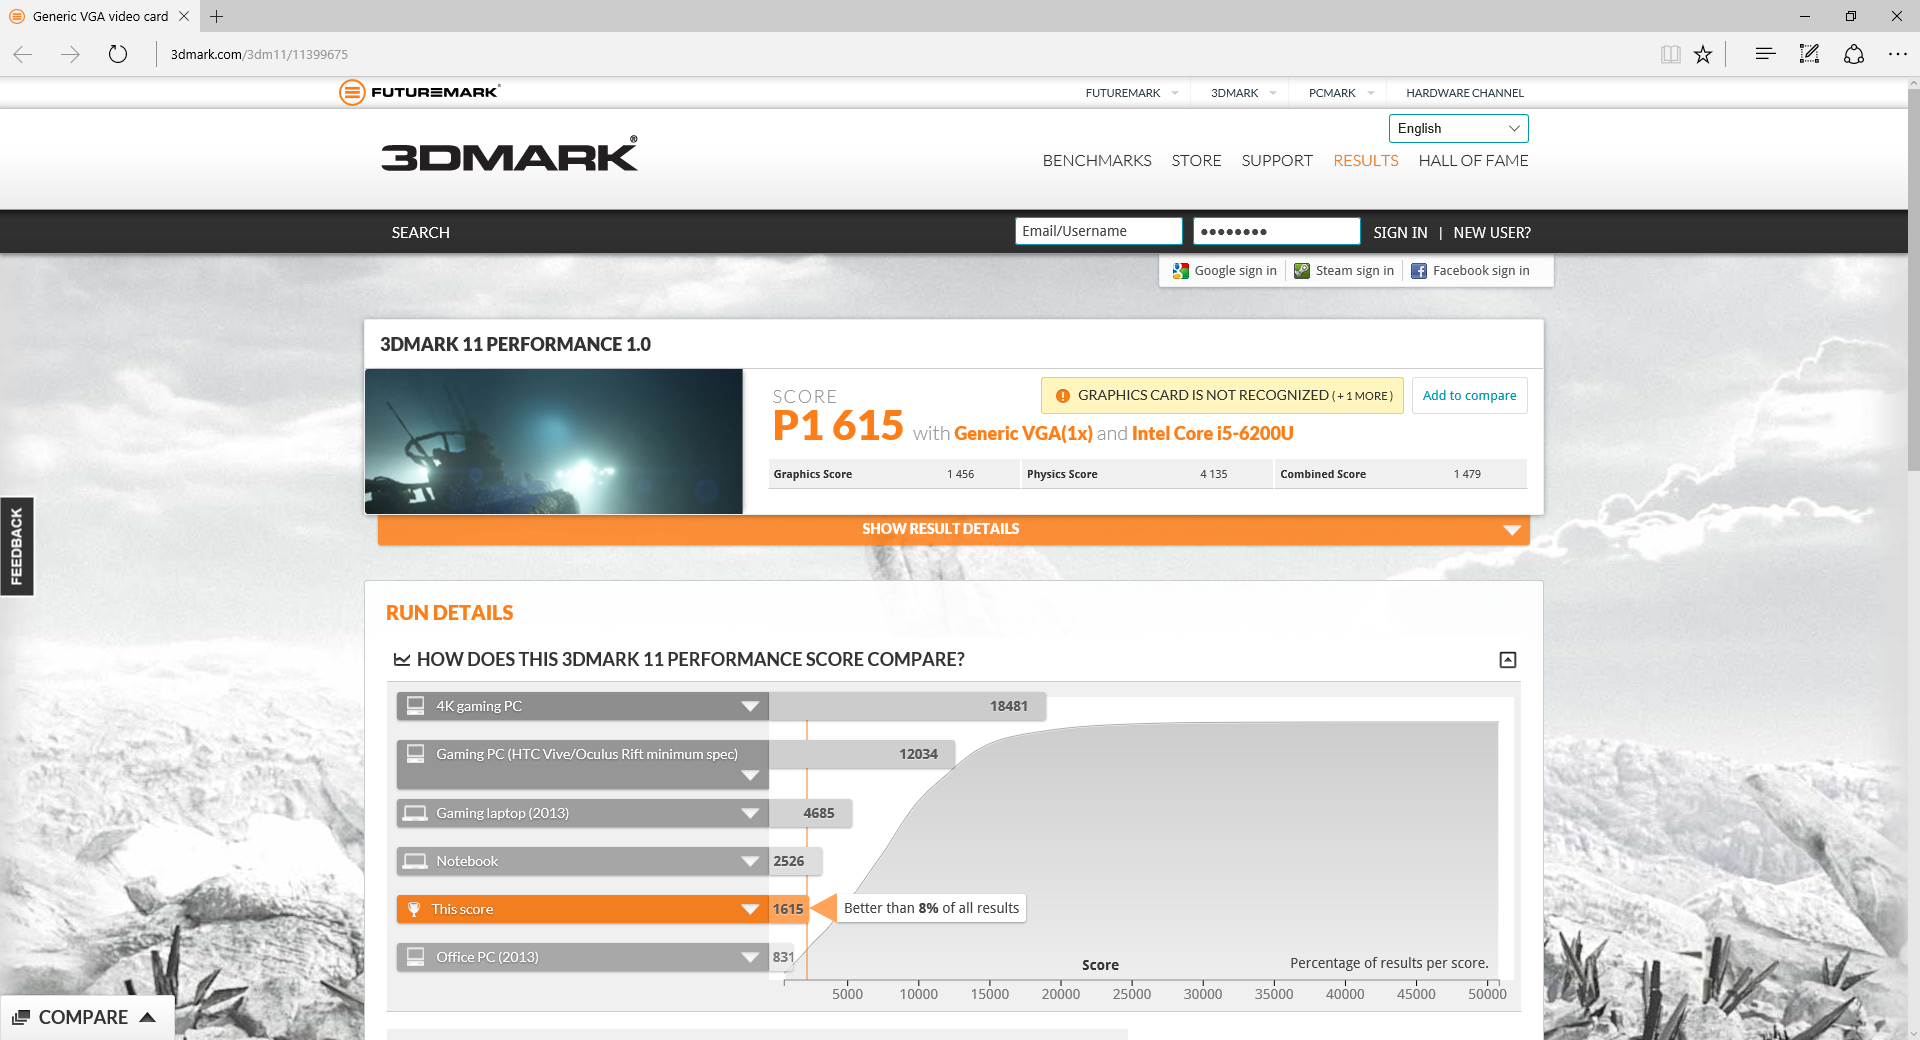
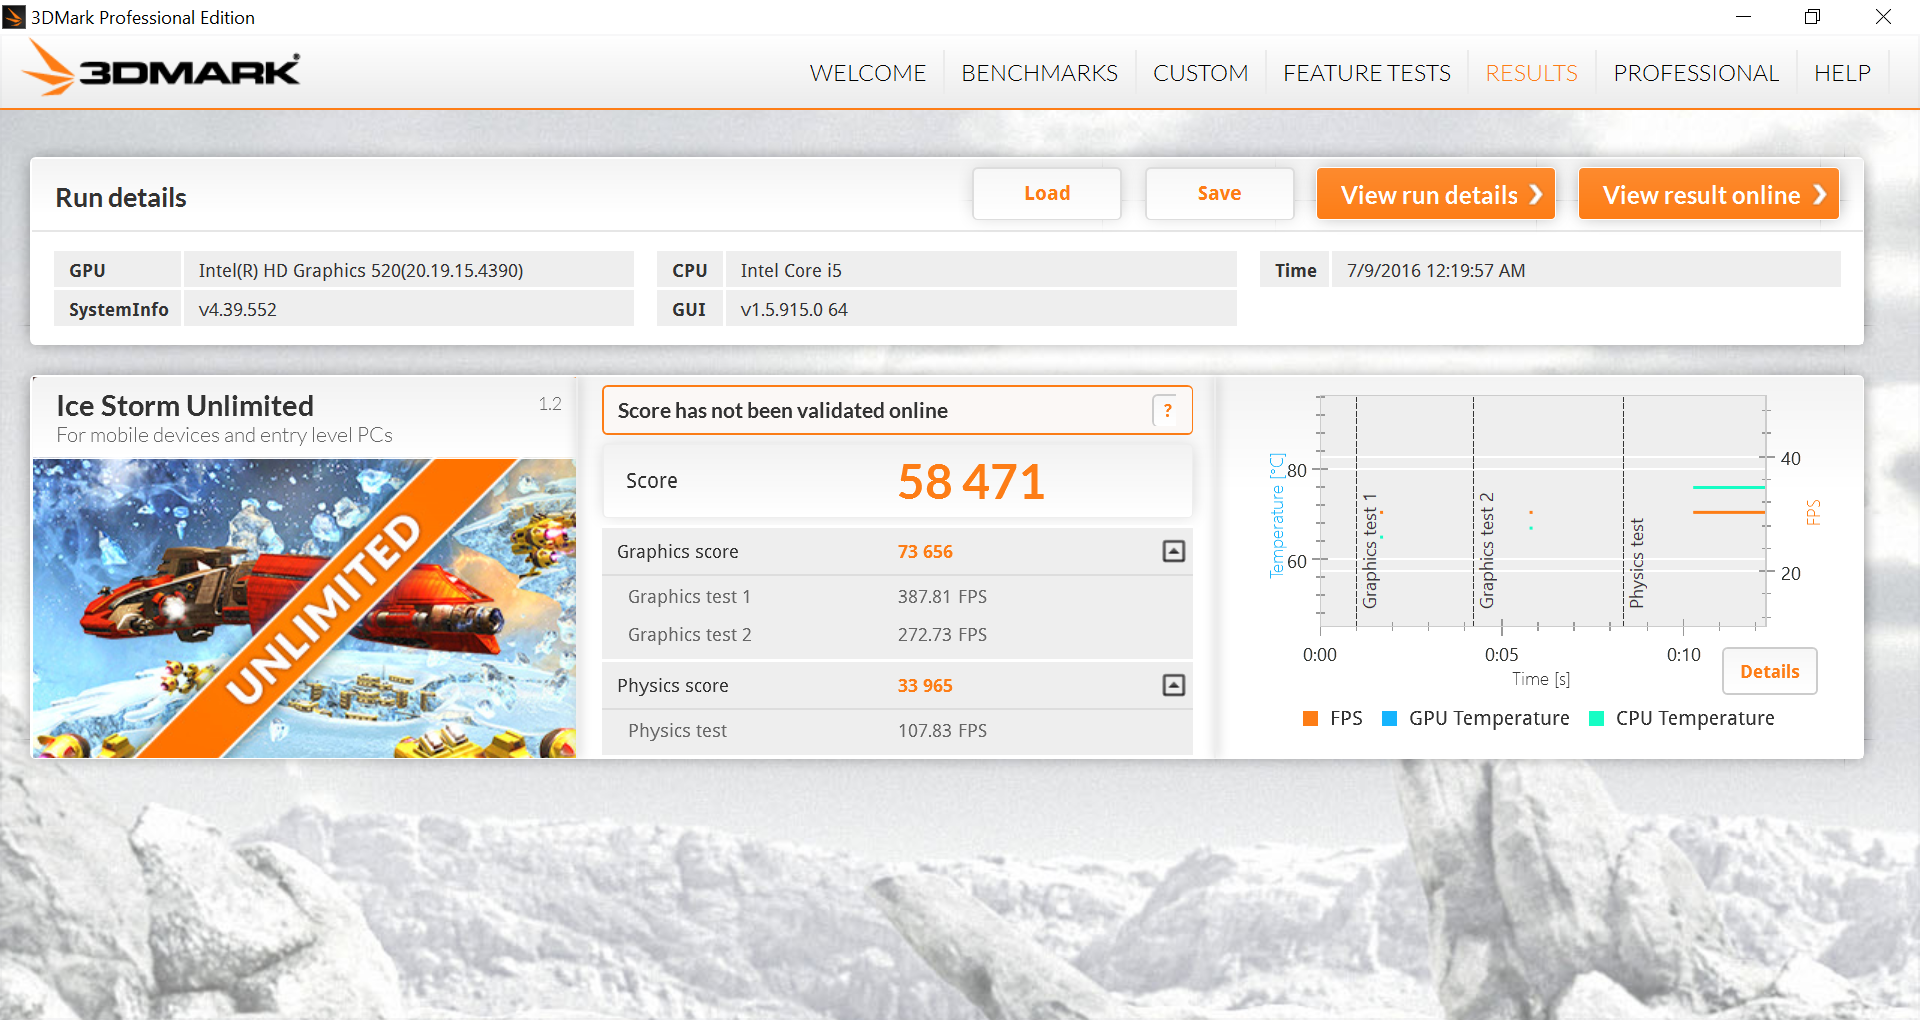
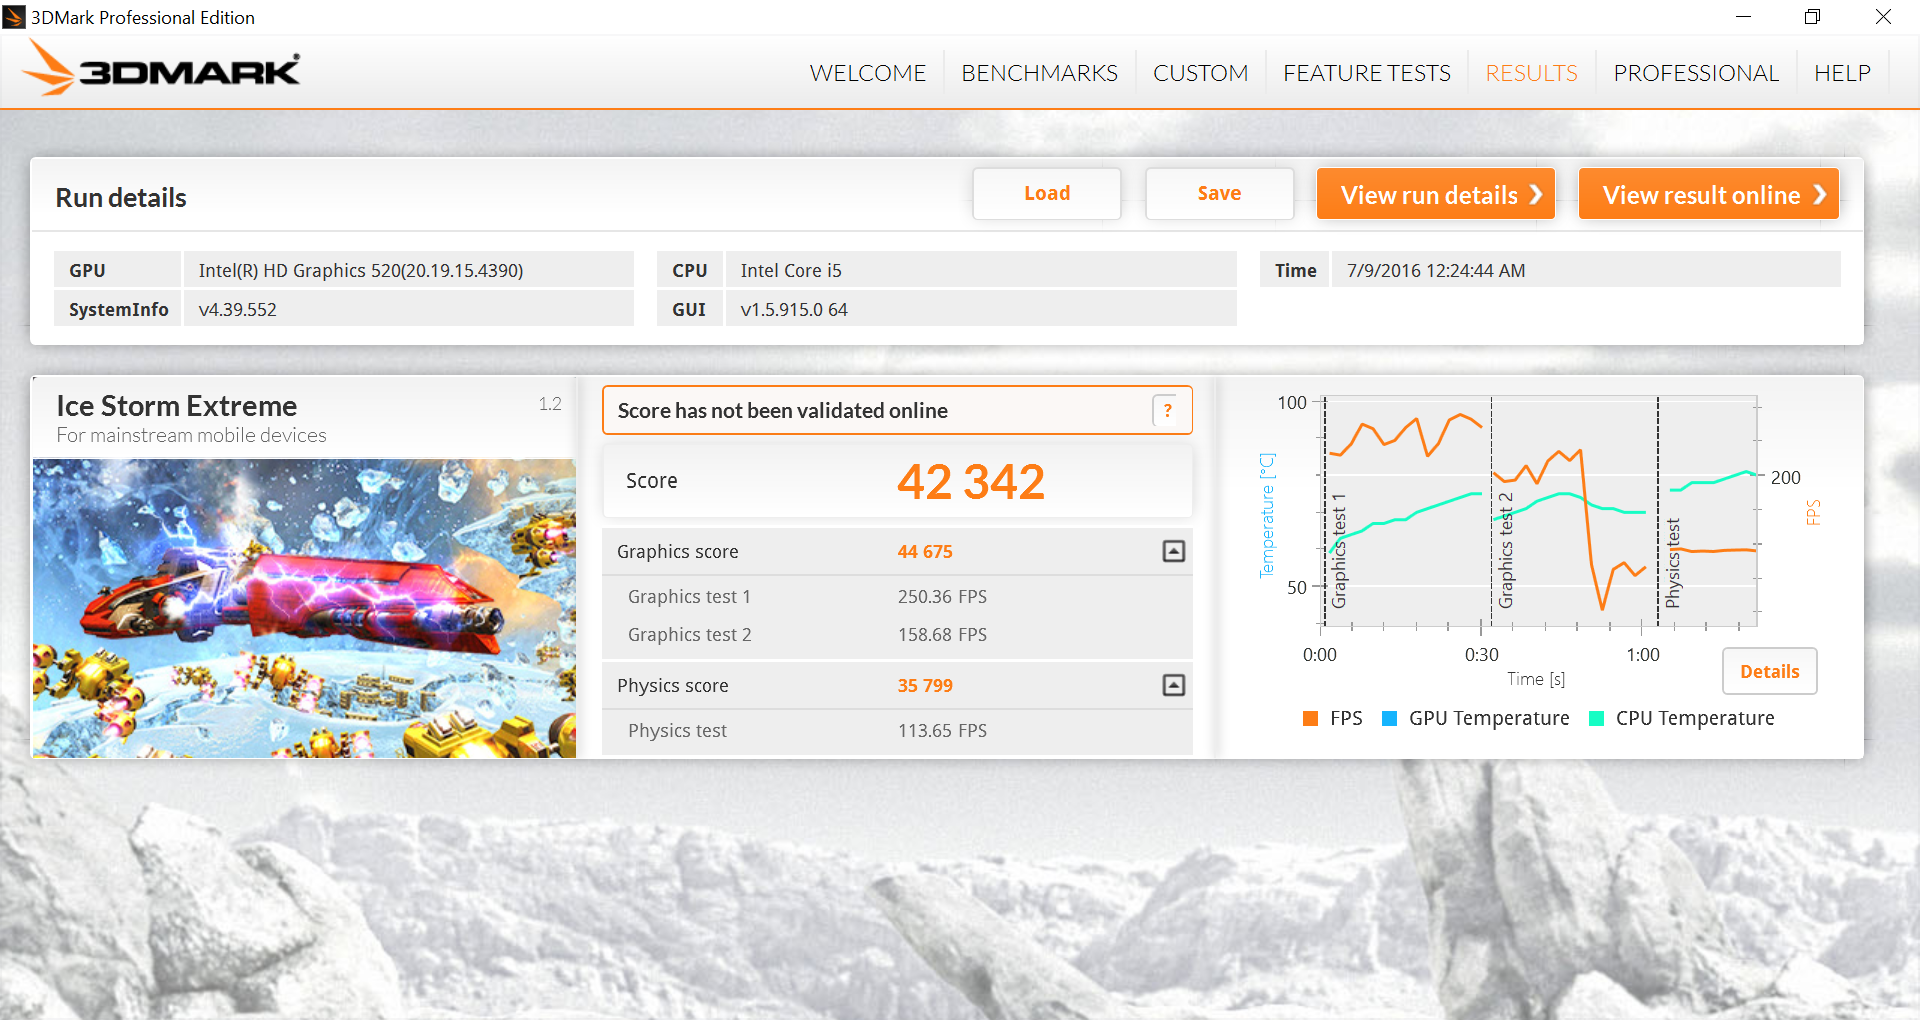
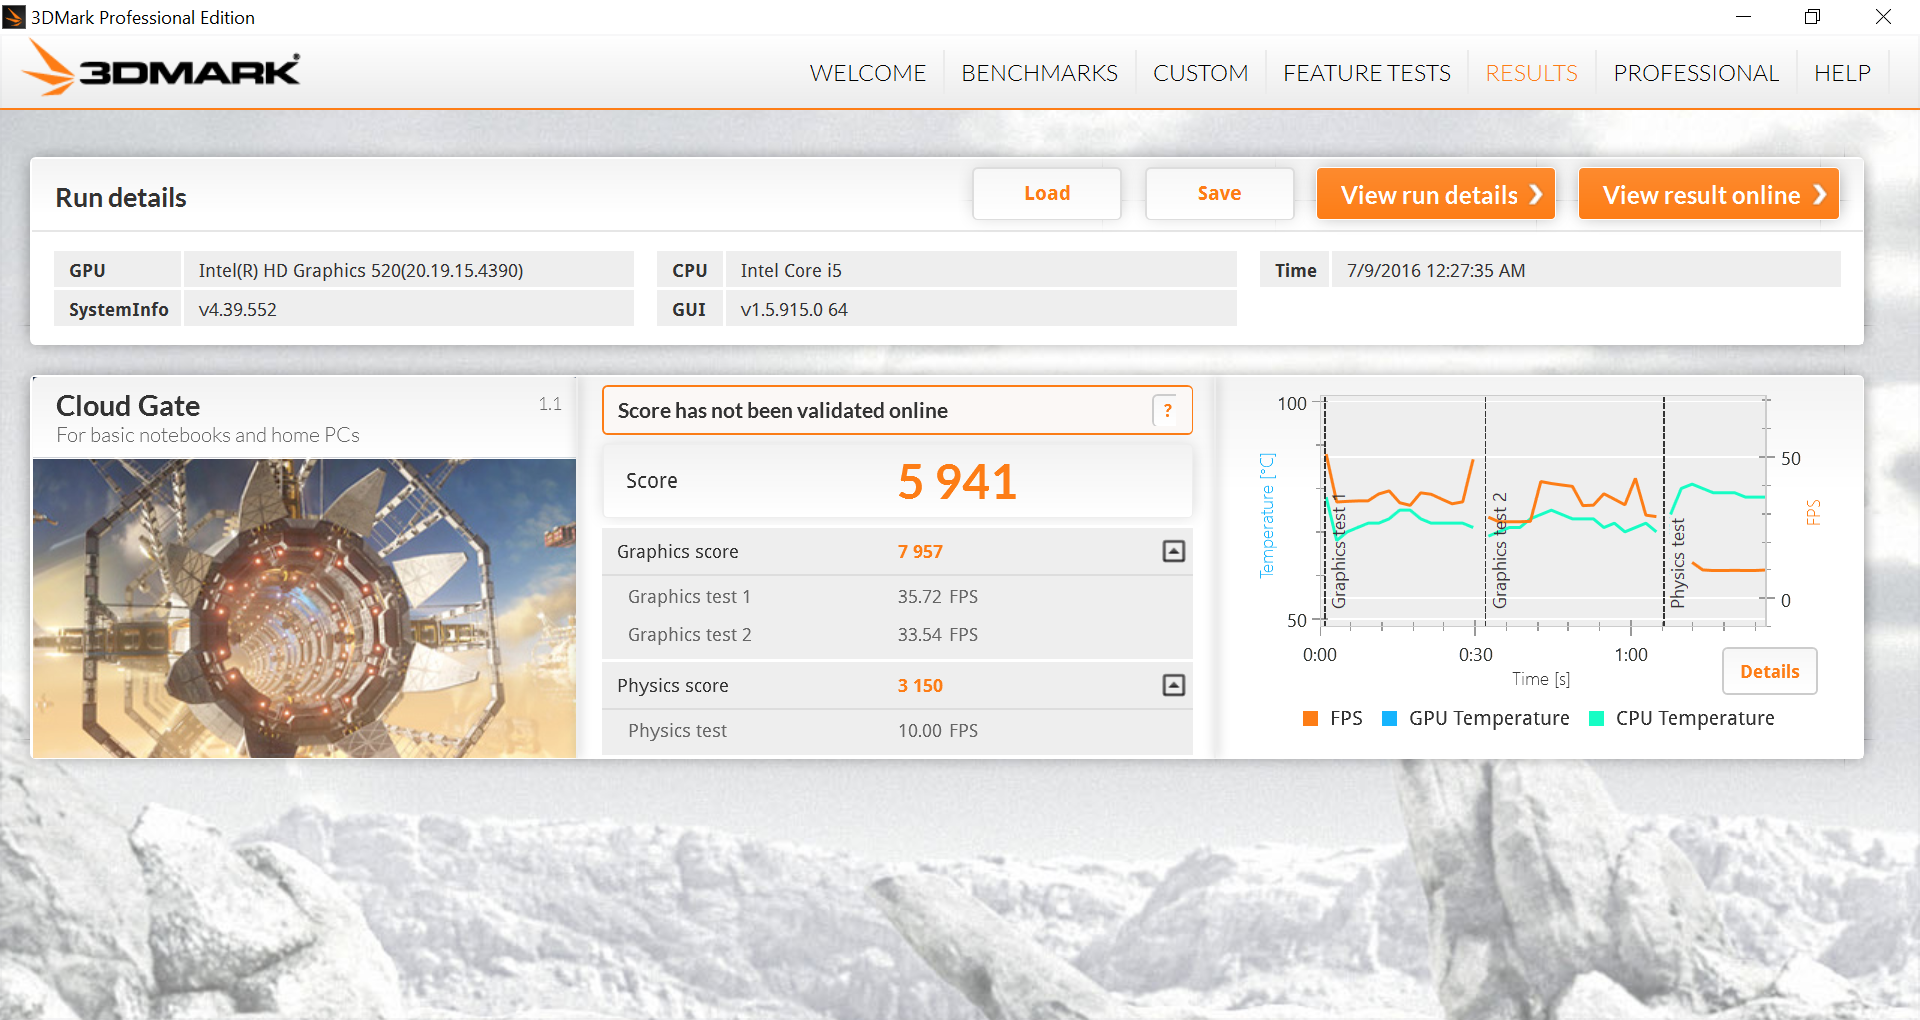
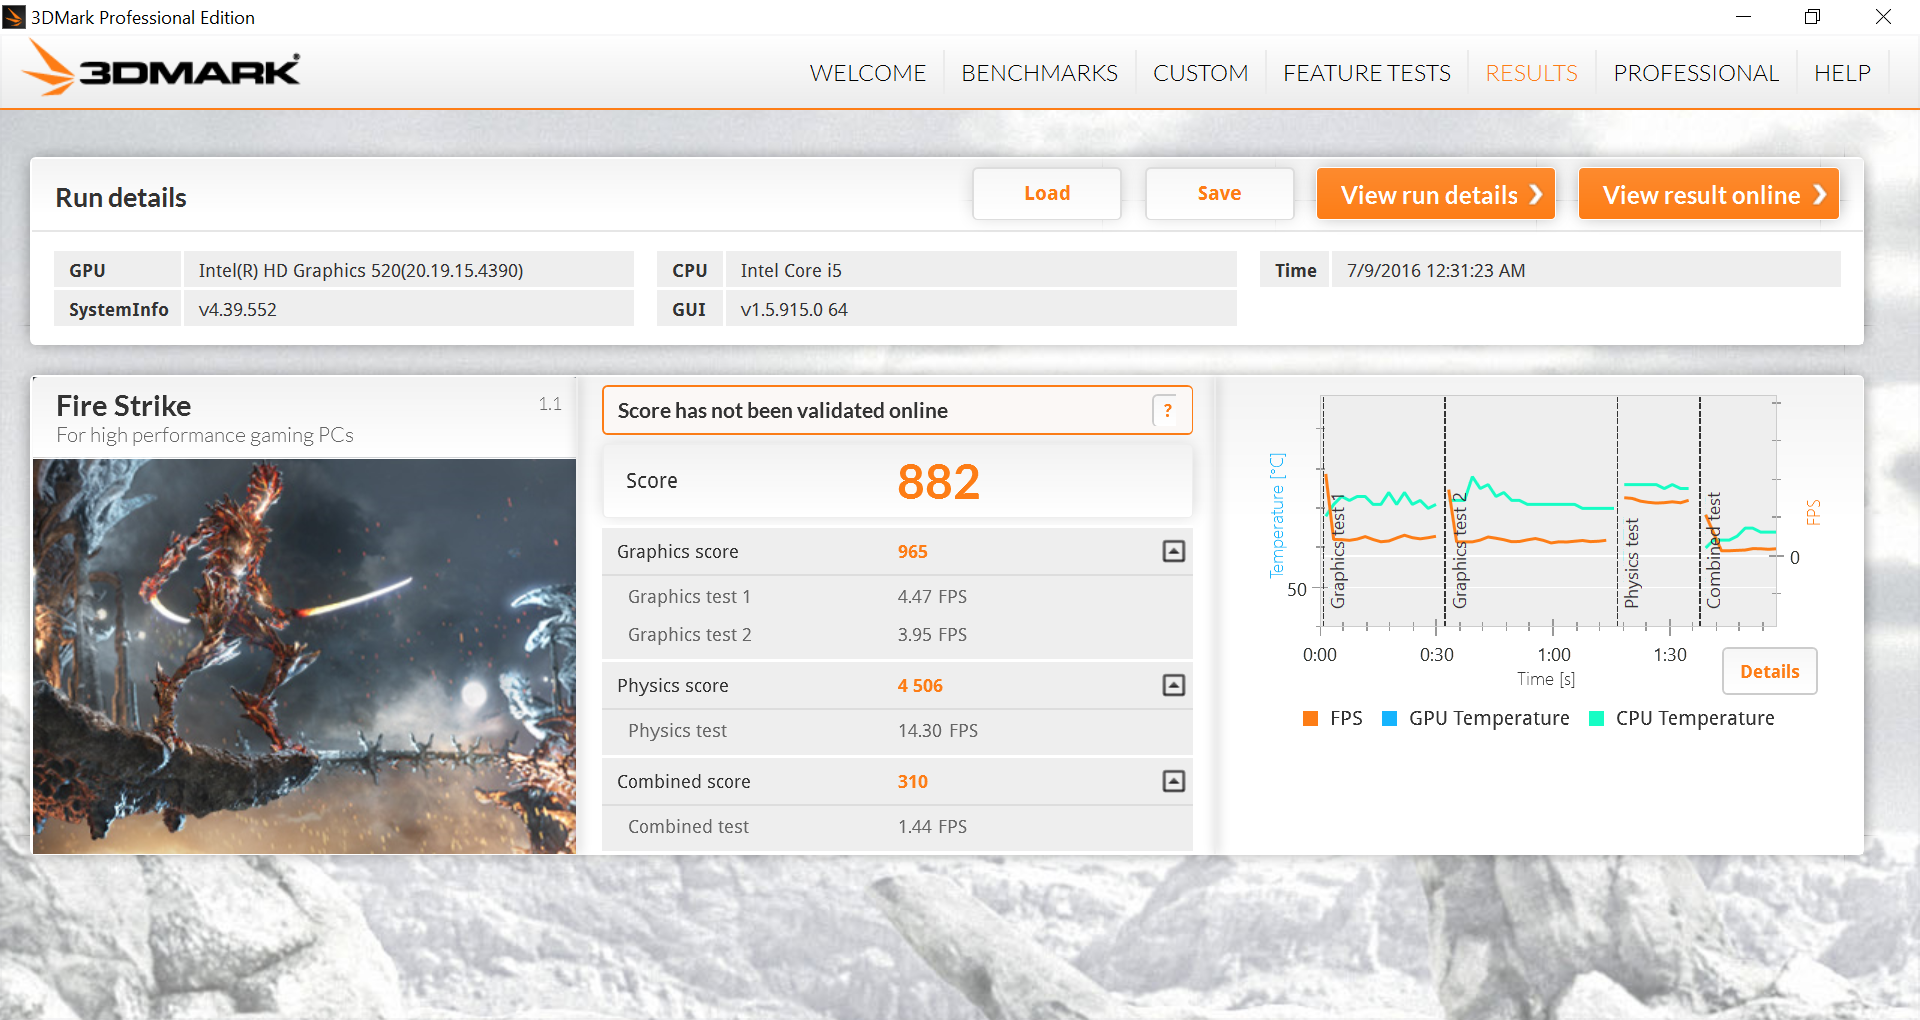
3DMark benchmarks place the HD 520 in the Dell within just single digit percentages from the Toshiba Tecra Z40 with the same GPU. Final scores are also noticeably higher than the similarly equipped Latitude 3470, which suggests throttling issues on this latter machine. Users still running on older HD 4400 or HD 4600 GPUs from older Haswell processors will see marked improvements as high as 60 to 100 percent depending on the 3DMark benchmark.
| 3DMark 11 | |
| 1280x720 Performance GPU (sort by value) | |
| Dell Inspiron 13 7386 | |
| Acer TravelMate P278-MG-76L2 | |
| Toshiba Tecra Z40-C-11F | |
| Dell Latitude 3470 N2P7L347014EMEA | |
| Fujitsu Lifebook E544 | |
| Asus Transformer Book T300LA-C4006H | |
| 1280x720 Performance Combined (sort by value) | |
| Dell Inspiron 13 7386 | |
| Acer TravelMate P278-MG-76L2 | |
| Toshiba Tecra Z40-C-11F | |
| Dell Latitude 3470 N2P7L347014EMEA | |
| Fujitsu Lifebook E544 | |
| Asus Transformer Book T300LA-C4006H | |
| 3DMark | |
| 1280x720 Cloud Gate Standard Graphics (sort by value) | |
| Dell Inspiron 13 7386 | |
| Acer TravelMate P278-MG-76L2 | |
| Toshiba Tecra Z40-C-11F | |
| Dell Latitude 3470 N2P7L347014EMEA | |
| Fujitsu Lifebook E544 | |
| Asus Transformer Book T300LA-C4006H | |
| 1920x1080 Fire Strike Graphics (sort by value) | |
| Dell Inspiron 13 7386 | |
| Acer TravelMate P278-MG-76L2 | |
| Toshiba Tecra Z40-C-11F | |
| Dell Latitude 3470 N2P7L347014EMEA | |
| Asus Transformer Book T300LA-C4006H | |
| 1920x1080 Ice Storm Extreme Graphics (sort by value) | |
| Dell Inspiron 13 7386 | |
| Acer TravelMate P278-MG-76L2 | |
| Toshiba Tecra Z40-C-11F | |
| Dell Latitude 3470 N2P7L347014EMEA | |
| 3DMark 11 Performance | 1615 points | |
| 3DMark Ice Storm Standard Score | 55696 points | |
| 3DMark Cloud Gate Standard Score | 5941 points | |
| 3DMark Fire Strike Score | 882 points | |
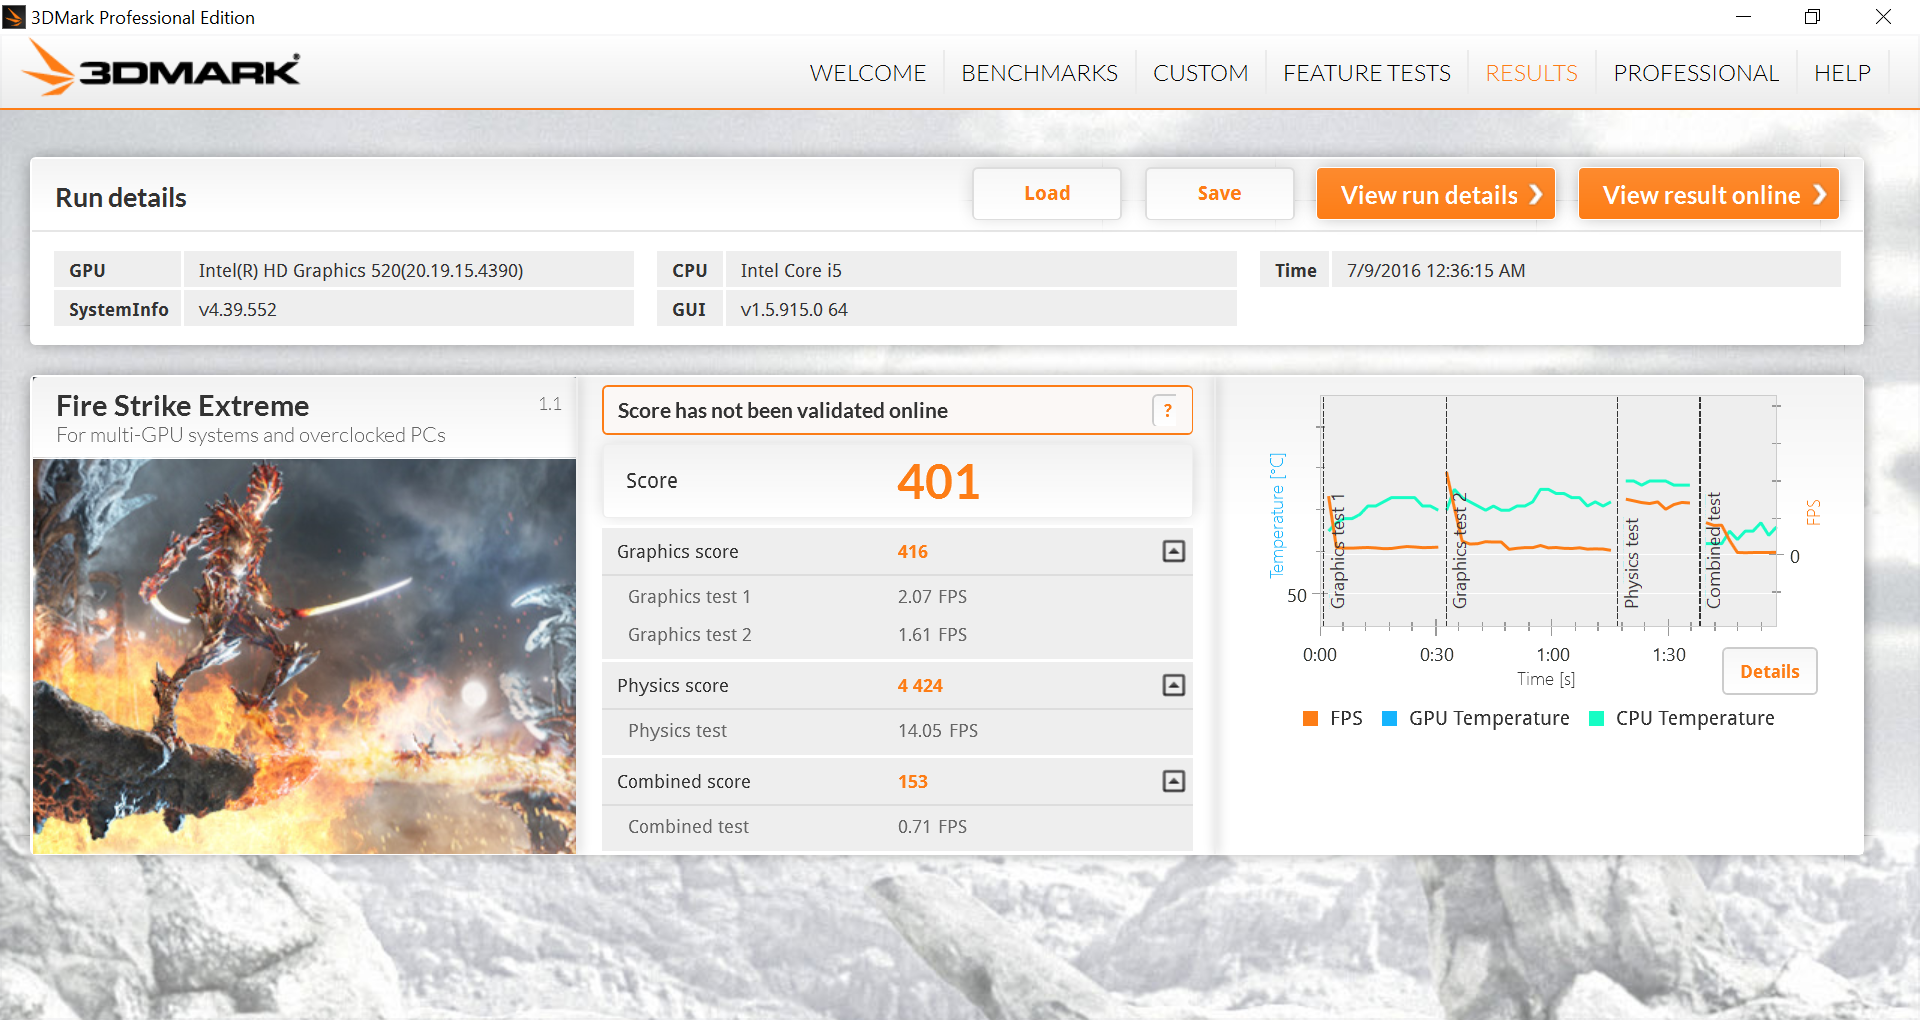
| 3DMark Fire Strike Extreme Score | 401 points | |
Help | ||
Gaming Performance
The integrated HD 520 GPU is not fit for 3D gaming. Older or less demanding titles like Starcraft 2 or LoL will play acceptably well at 1080p and at low-medium settings. Otherwise, even mainstream titles like Overwatch are just barely playable at the lowest graphical settings and resolutions.
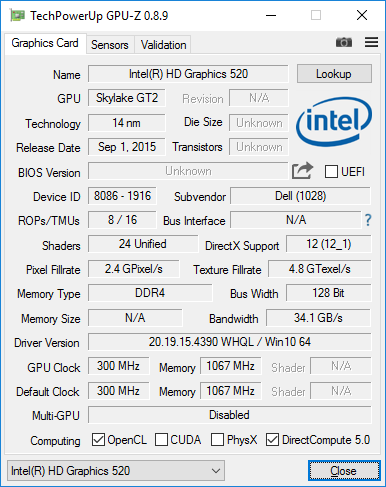
See our dedicated GPU page on the Intel HD Graphics 520 for more technical information and benchmark comparisons.
| BioShock Infinite | |
| 1366x768 Medium Preset | |
| Acer TravelMate P278-MG-76L2 | |
| Intel NUC6i5SYH | |
| Dell Inspiron 13 7386 | |
| Dell Latitude 3470 N2P7L347014EMEA | |
| Lenovo B50-70 MCC2GGE | |
| Fujitsu Lifebook E544 | |
| 1366x768 High Preset | |
| Acer TravelMate P278-MG-76L2 | |
| Intel NUC6i5SYH | |
| Dell Inspiron 13 7386 | |
| Dell Latitude 3470 N2P7L347014EMEA | |
| Lenovo B50-70 MCC2GGE | |
| Fujitsu Lifebook E544 | |
| low | med. | high | ultra | |
| StarCraft II: Heart of the Swarm (2013) | 156.2 | 52.5 | 35.5 | 18.4 |
| BioShock Infinite (2013) | 31.3 | 19.5 | 16.7 | 7.1 |
| Overwatch (2016) | 34.1 | 24.8 | 15.8 |
Stress Test
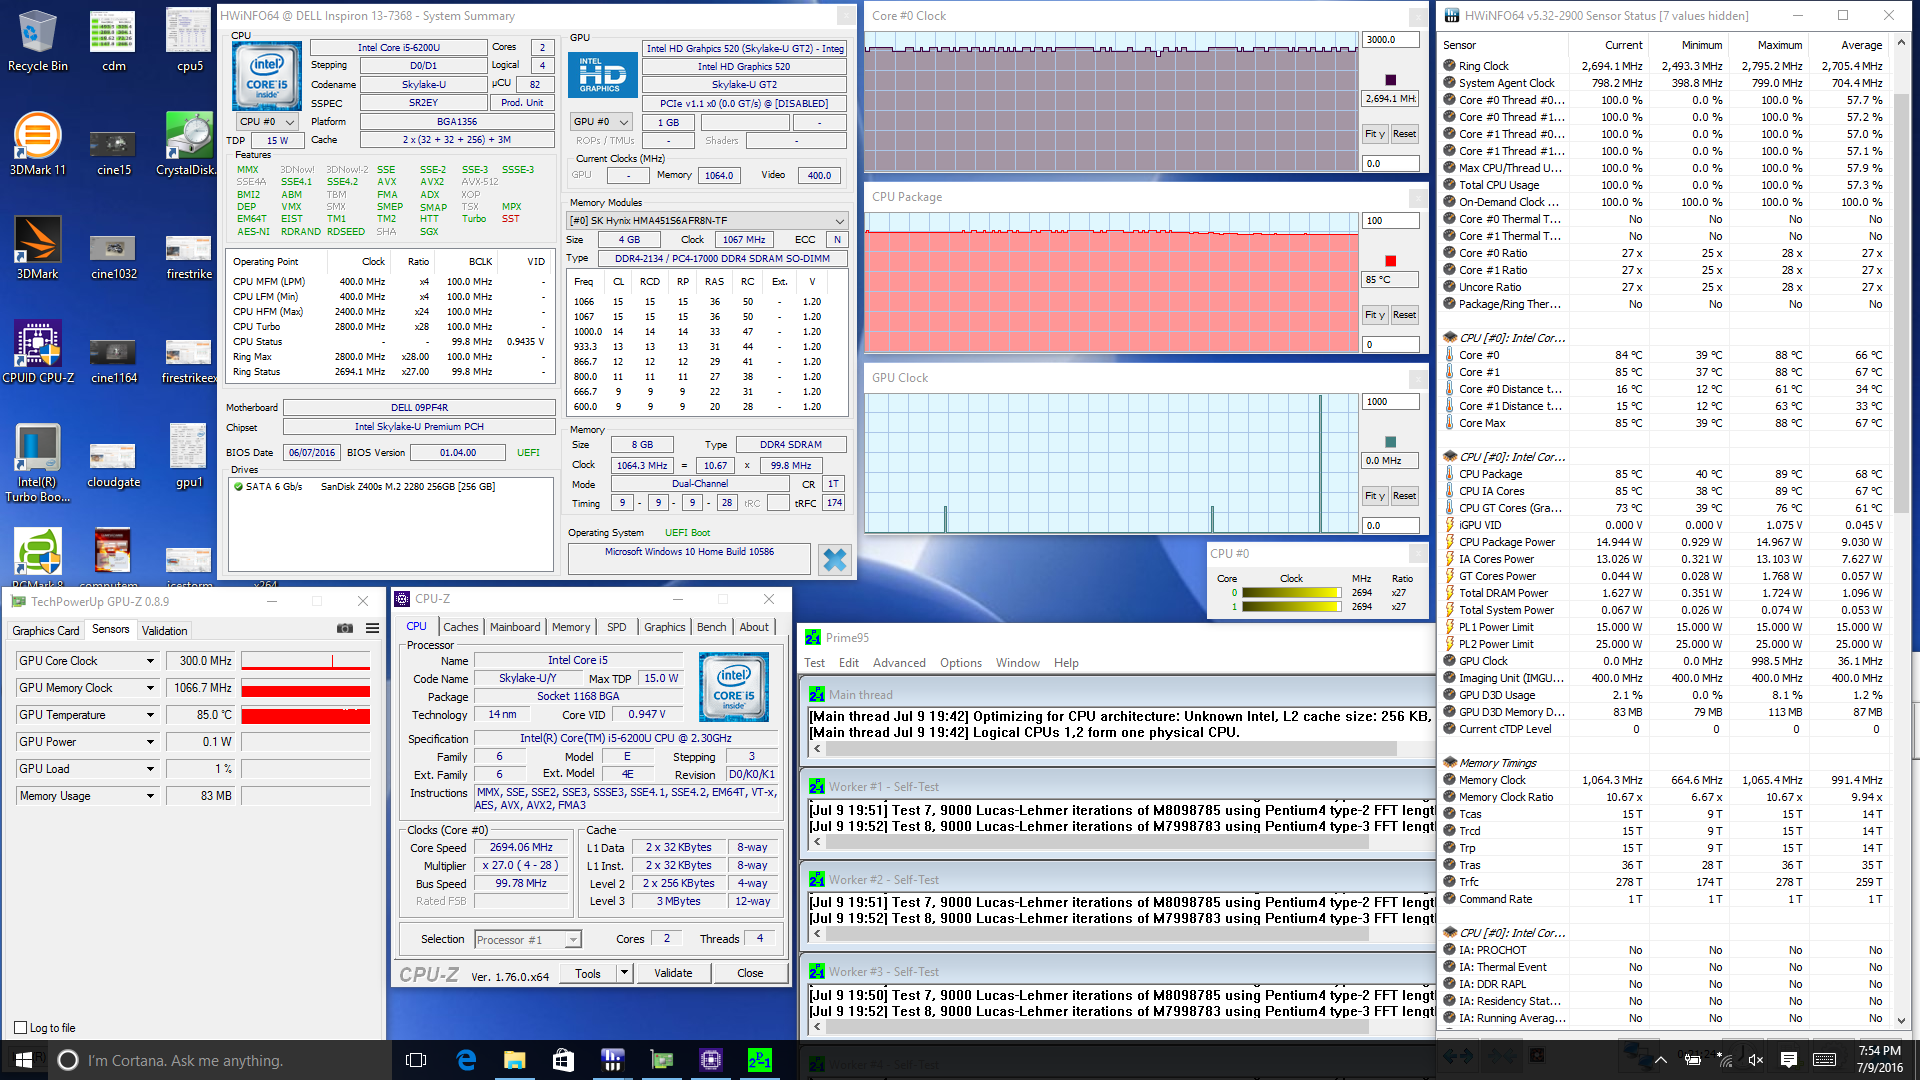
We stress the notebook to identify for any throttling or stability issues. The Dell performs very well when under Prime95 stress as it is able to maintain its maximum multi-core Turbo Boost clock rate of 2.7 GHz whereas some notebooks may throttle to slightly slower speeds for lower core temperatures. Thus, it's no surprise that the CPU in the Dell can run as warm as 85 C when under extreme loads.
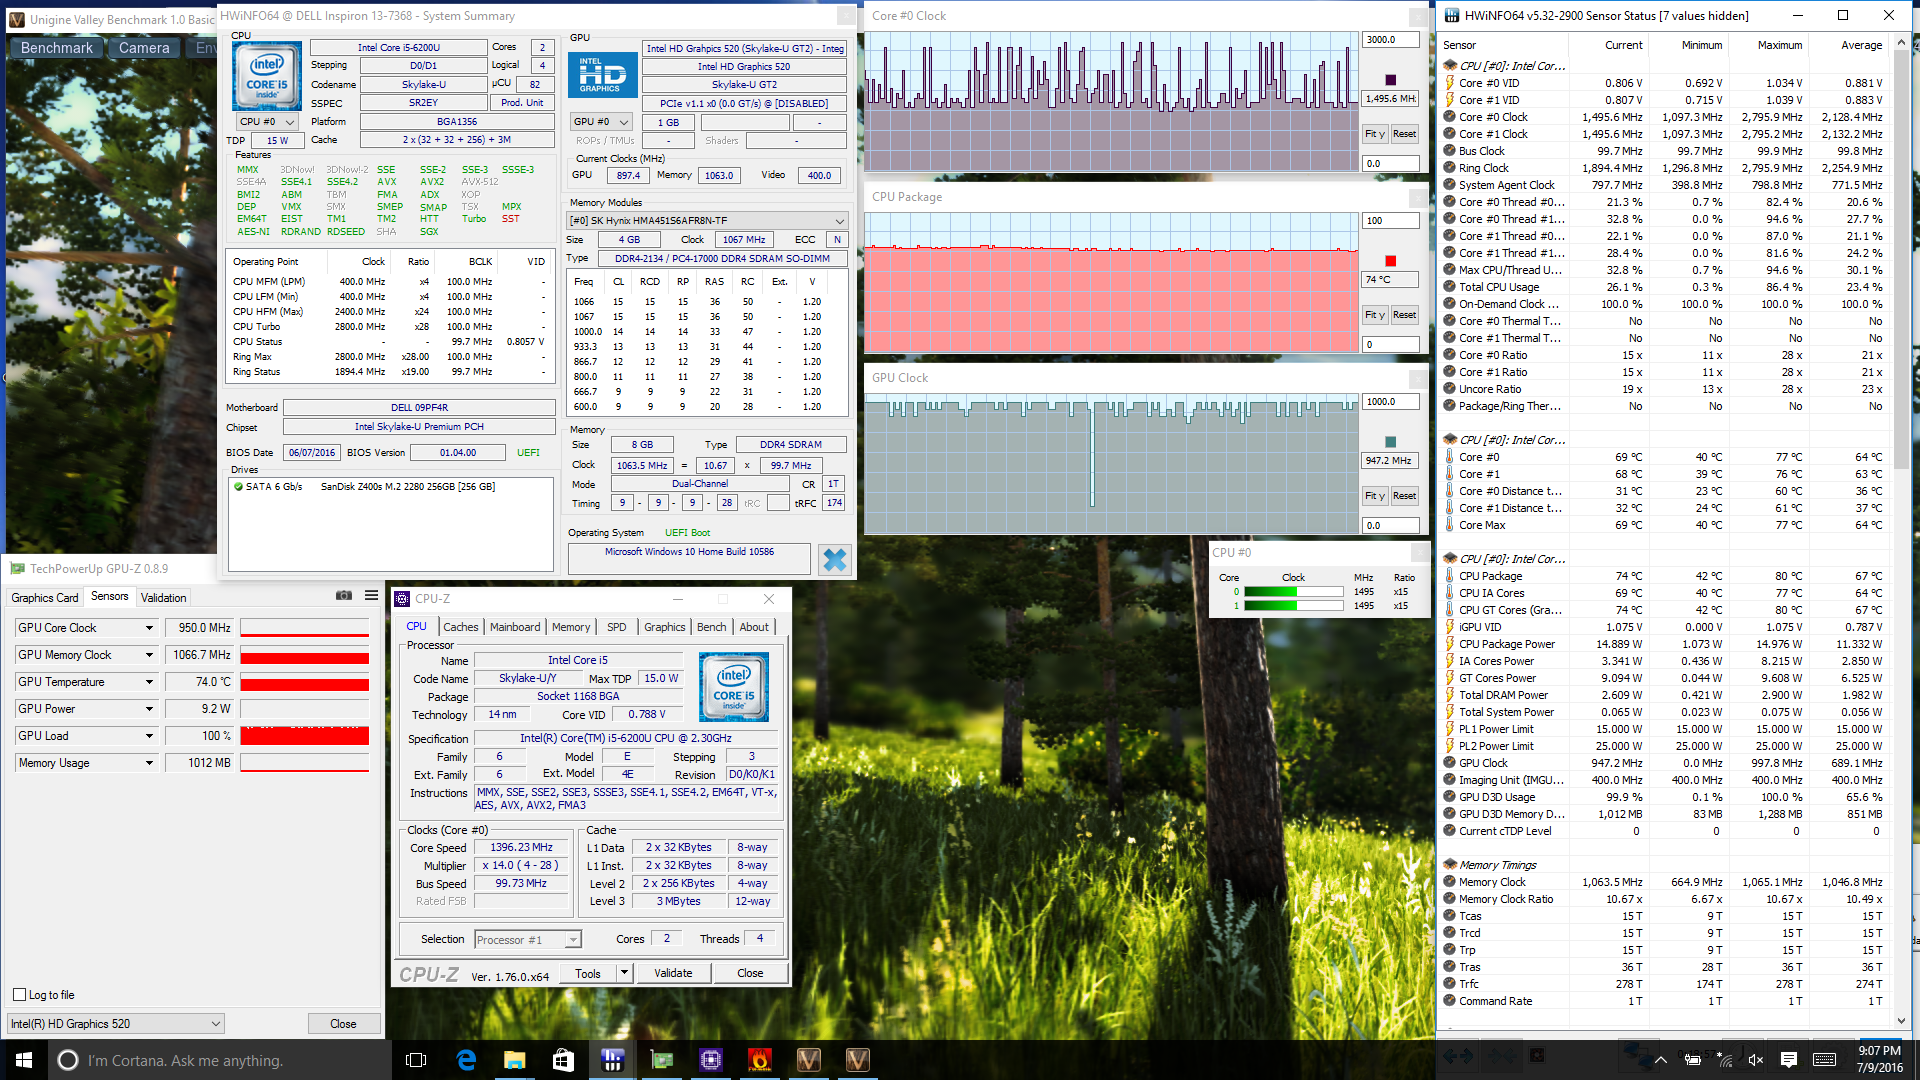
Unigine Valley is more representative of gaming and demanding real-world loads. The CPU stabilizes in the mid 70 C range with CPU clock rates fluctuating in response to onscreen workload demands. Meanwhile, the GPU is able to maintain a respectable 800 to 950 MHz clock rate, which is standard for an integrated Intel HD Graphics solution. Users need not worry about a throttling system during regular use.
Running on battery power will not negatively impact CPU or GPU power. A 3DMark 11 run on batteries returns Physics and Graphics scores of 4174 points and 1472 points, respectively, compared to 4135 points and 1456 points when connected to mains.

| CPU Clock (GHz) | GPU Clock (MHz) | Average Core Temperature (°C) | |
| Prime95 Stress | 2.7 | -- | 85 |
| FurMark Stress | -- | 800 - 850 | -- |
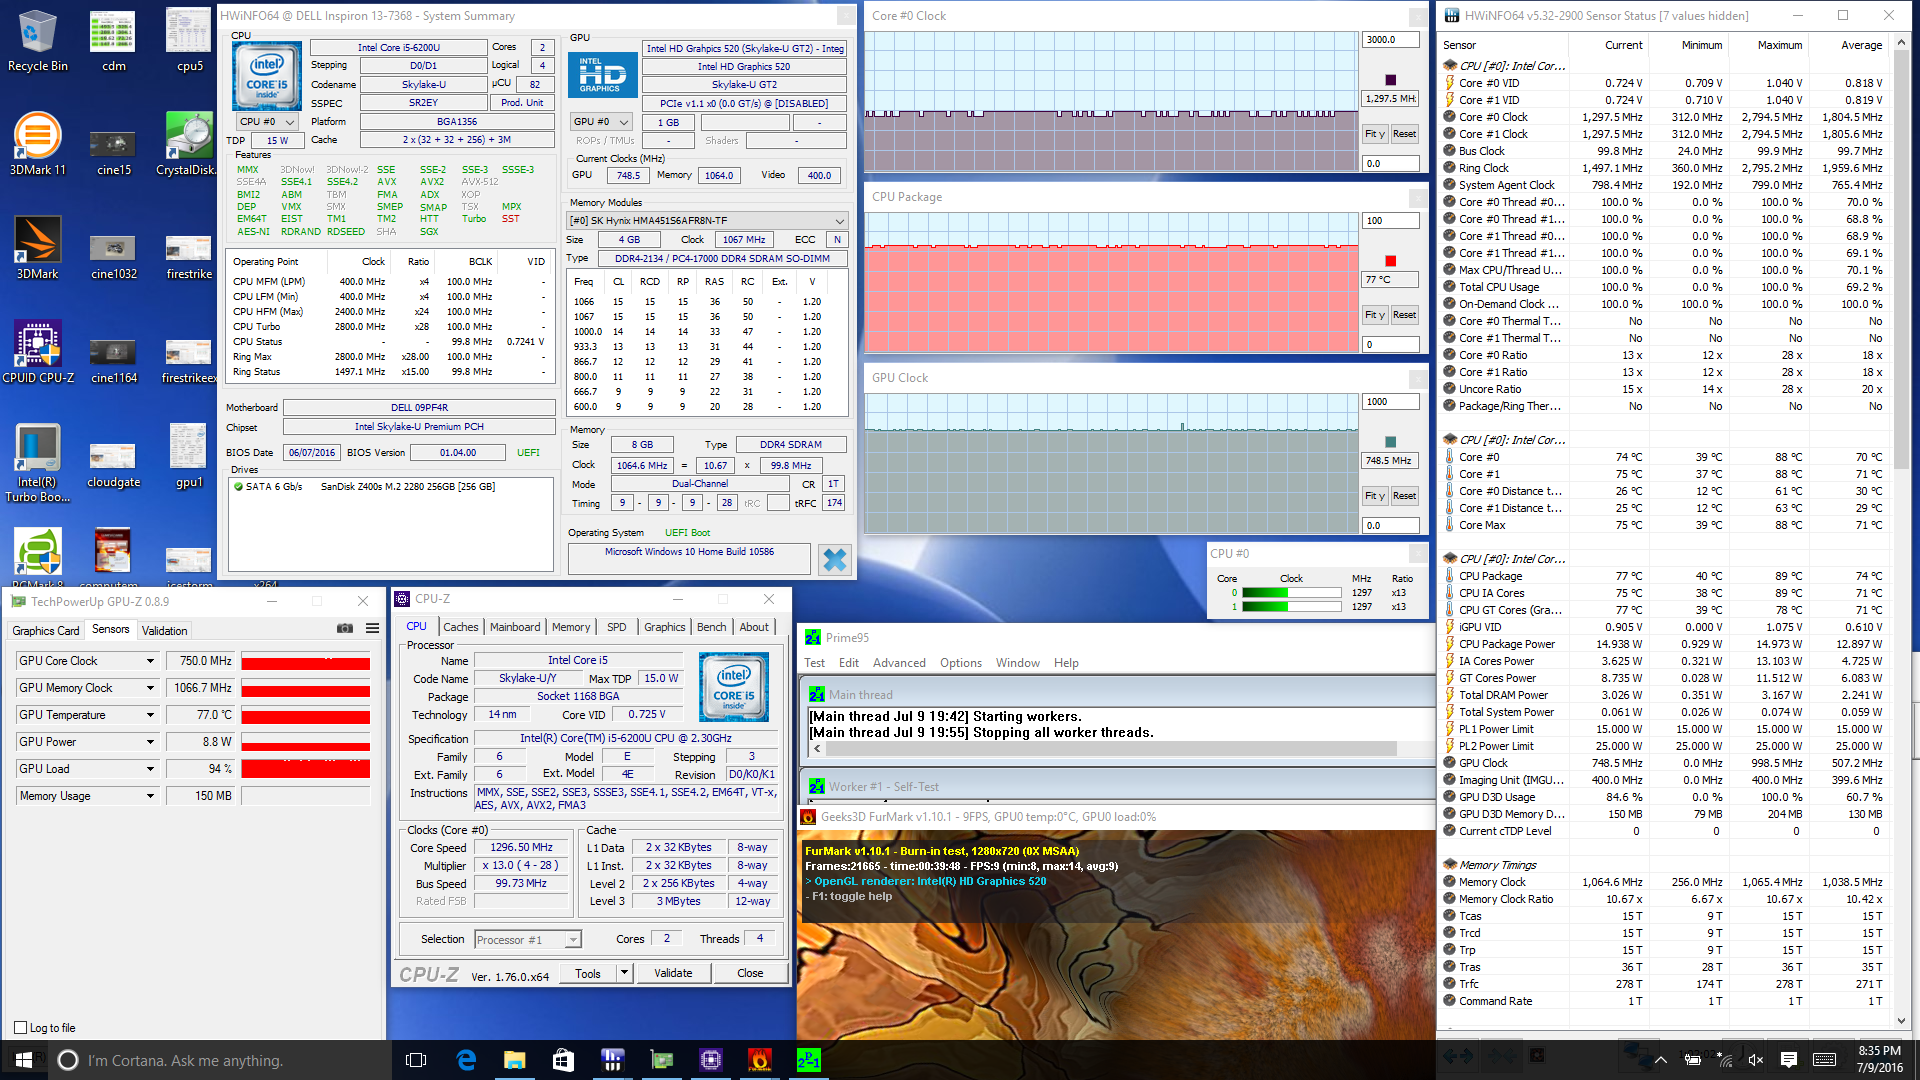
| Prime95 + FurMark Stress | 1.3 | 750 | 77 |
| Unigine Valley Stress | 1.5+ | 800 - 950 | 74 |
Emissions
System Noise
The cooling solution consists of a single fan and a short connecting heat pipe. The fan remains idle during low loads and light browsing, so the system is almost always silent. Maximum load with both Prime95 and FurMark will only induce a fan noise of about 35 dB(A), which is noticeably quieter than many competitors.
The only issue we have with the fan is that it tends to pulsate between 32 dB(A) to 34 dB(A) when gaming or during medium-heavy loads. When running Unigine Valley, for example, the fan will periodically jump from near-silence to 34 dB(A) instead of maintaining a steady RPM. While not loud enough to be distracting, it's certainly noticeable.
Noise Level
| Idle |
| 29.4 / 29.4 / 29.4 dB(A) |
| Load |
| 32.2 / 35 dB(A) |
 | ||
30 dB silent 40 dB(A) audible 50 dB(A) loud |
||
min: | ||
| Dell Inspiron 13 7386 HD Graphics 520, 6200U, SanDisk Z400s 256 GB M.2 2280 | Acer Aspire R13 R7-372T-746N HD Graphics 520, 6500U, Lite-On CV1-8B256 | Dell Inspiron 13-7348 HD Graphics 5500, 5500U, Samsung PM851 Series MZMTE256HMHP | HP Spectre x360 13-4104ng HD Graphics 520, 6200U, Samsung SSD PM851 256 GB MZNTE256HMHP | Lenovo Yoga 900-13ISK 80MK HD Graphics 520, 6500U, Samsung SSD PM871 MZNLN512HCJH | Microsoft Surface Book Core i7 Maxwell GPU (940M, GDDR5), 6600U, Samsung MZFLV512 NVMe | |
|---|---|---|---|---|---|---|
| Noise | -10% | -6% | -7% | -3% | -10% | |
| off / environment * | 29.4 | 31.3 -6% | 31.3 -6% | |||
| Idle Minimum * | 29.4 | 31.3 -6% | 29.6 -1% | 29.6 -1% | 29.7 -1% | 31.3 -6% |
| Idle Average * | 29.4 | 31.3 -6% | 29.6 -1% | 29.6 -1% | 29.8 -1% | 31.3 -6% |
| Idle Maximum * | 29.4 | 31.8 -8% | 29.6 -1% | 34.6 -18% | 30 -2% | 31.3 -6% |
| Load Average * | 32.2 | 39.2 -22% | 35.4 -10% | 34.7 -8% | 32 1% | 38 -18% |
| Load Maximum * | 35 | 39.1 -12% | 41.4 -18% | 37.9 -8% | 38.5 -10% | 40.5 -16% |
* ... smaller is better
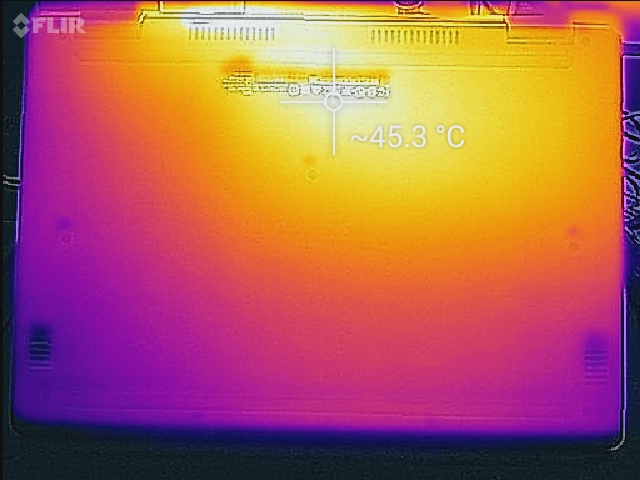
Temperature
Surface temperatures are generally flat on both sides when idling or during low loads. Since the cooling system is so small, the gradient is steeper and warmer than what competitors like the Acer Aspire R13 or Yoga 900 would experience under similar loads. The palm rests remain relatively cool, but gaming for long periods without a proper flat desk can become uncomfortable due to the very warm bottom.
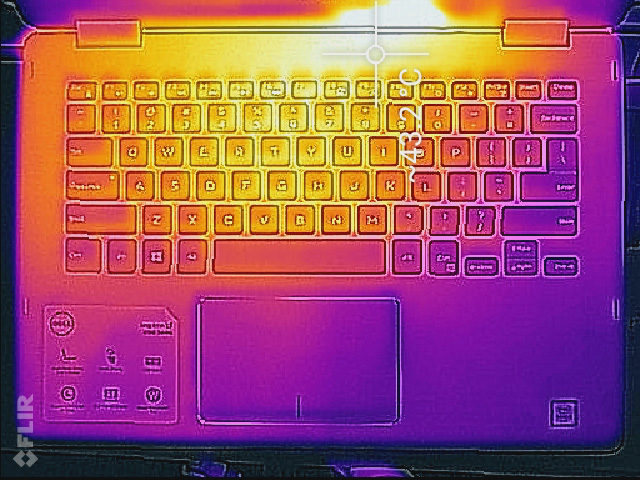
(±) The maximum temperature on the upper side is 43.2 °C / 110 F, compared to the average of 35.3 °C / 96 F, ranging from 19.6 to 55.7 °C for the class Convertible.
(-) The bottom heats up to a maximum of 45.2 °C / 113 F, compared to the average of 36.8 °C / 98 F
(+) In idle usage, the average temperature for the upper side is 26.3 °C / 79 F, compared to the device average of 30.2 °C / 86 F.
(+) The palmrests and touchpad are reaching skin temperature as a maximum (33.6 °C / 92.5 F) and are therefore not hot.
(-) The average temperature of the palmrest area of similar devices was 28.1 °C / 82.6 F (-5.5 °C / -9.9 F).
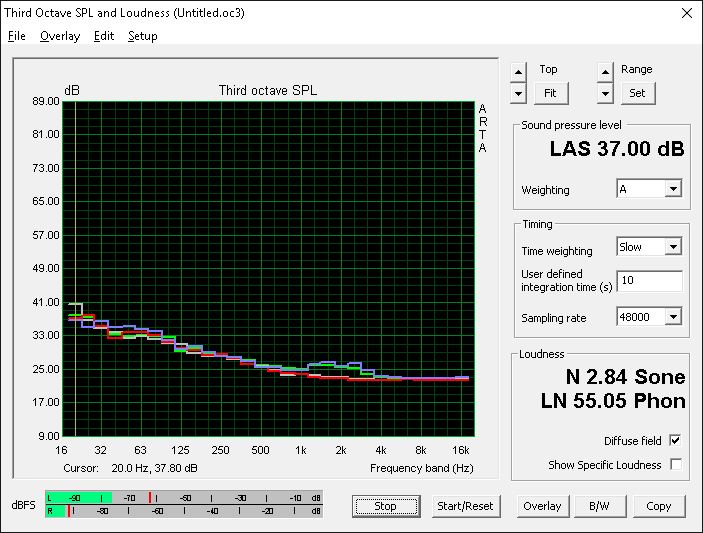
Speakers
The stereo speakers are good for a 13-inch convertible with a relatively balanced reproduction of medium to high frequencies according to our microphone measurements. This drops off quite sharply at around 250 Hz, which is common for integrated notebook speakers. Volume is loud with no static or reverberation even when on the maximum setting.

")
Energy Management
Power Consumption
Power demand is in the 4 W to 8 W range when idling and about 25 W to 30 W when gaming or under maximum loads. The recordings are very similar to the older Inspiron 7348 that the Inspiron 7368 supplants.
The small power adapter (9.5 x 3.75 x 2.5 cm) is rated for an output of 45 W, so our 30 W maximum recording is safely below the limits of the adapter.
| Off / Standby | |
| Idle | |
| Load |
|
| Dell Inspiron 13 7386 6200U, HD Graphics 520, SanDisk Z400s 256 GB M.2 2280, IPS, 1920x1080, 13.30 | Acer Aspire R13 R7-372T-746N 6500U, HD Graphics 520, Lite-On CV1-8B256, IPS, 2560x1440, 13.30 | Dell Inspiron 13-7348 5500U, HD Graphics 5500, Samsung PM851 Series MZMTE256HMHP, IPS, 1920x1080, 13.30 | HP Spectre x360 13-4104ng 6200U, HD Graphics 520, Samsung SSD PM851 256 GB MZNTE256HMHP, IPS, 2560x1440, 13.30 | HP Spectre 13 6500U, HD Graphics 520, Samsung PM951 NVMe MZVLV256, IPS UWVA, 1920x1080, 13.30 | Microsoft Surface Book Core i7 6600U, Maxwell GPU (940M, GDDR5), Samsung MZFLV512 NVMe, IPS, 3000x2000, 13.50 | |
|---|---|---|---|---|---|---|
| Power Consumption | -37% | 8% | -3% | -50% | -54% | |
| Idle Minimum * | 4.6 | 6.2 -35% | 3.5 24% | 3.9 15% | 8.6 -87% | 4.5 2% |
| Idle Average * | 7 | 8 -14% | 5.6 20% | 7.4 -6% | 11 -57% | 9.8 -40% |
| Idle Maximum * | 7.7 | 11.6 -51% | 7.6 1% | 9.2 -19% | 11.3 -47% | 12.2 -58% |
| Load Average * | 24.8 | 40 -61% | 26.3 -6% | 28.1 -13% | 33.8 -36% | 46 -85% |
| Load Maximum * | 29.3 | 36.6 -25% | 29 1% | 27.6 6% | 36.2 -24% | 56 -91% |
* ... smaller is better
Battery Life
Runtimes from the non-removable 42 Wh battery are good at over 6 hours of constant WLAN use. Battery capacity is on the small side compared to other 13-inch convertibles, so competing models like the HP Spectre x360 and Lenovo Yoga 900 can run for longer under similar conditions.
Charging from near empty to full will take a little over two hours.
| Dell Inspiron 13 7386 6200U, HD Graphics 520, 42 Wh | Acer Aspire R13 R7-372T-746N 6500U, HD Graphics 520, 49 Wh | Dell Inspiron 13-7348 5500U, HD Graphics 5500, 43 Wh | HP Spectre x360 13-4104ng 6200U, HD Graphics 520, 56 Wh | Lenovo Yoga 900-13ISK 80MK 6500U, HD Graphics 520, 66 Wh | Microsoft Surface Book Core i5 6300U, Maxwell GPU (940M, GDDR5), 78 Wh | |
|---|---|---|---|---|---|---|
| Battery Runtime | -9% | -18% | 33% | 15% | 33% | |
| Reader / Idle | 756 | 669 -12% | 522 -31% | 844 12% | 1070 42% | |
| WiFi v1.3 | 377 | 382 1% | 500 33% | 403 7% | 402 7% | |
| Load | 101 | 85 -16% | 97 -4% | 128 27% | 153 51% | |
| WiFi | 394 |
Pros
Cons
Verdict
The Inspiron 13 7368 runs quieter and appears sleeker than the outgoing Inspiron 7348. Unfortunately, it's still on the heavy side and its display brightness is lower than on the outgoing model, so its usefulness as a Windows tablet is largely limited to indoor conditions. The keyboard keys are on the soft side and the system carries fewer full-size USB ports than the outgoing model as well. We don't find the small design changes and the addition of a USB Type-C Gen. 1 port to be large enough improvements for us to recommend it over the older model.
The downsides don't take away from the fact that this is still a sturdy and attractively designed convertible with easy serviceability and loud speakers. This can certainly replace an aging notebook, but users who have no need for its tablet mode will find the XPS 13 to be leagues above the Inspiron 13 7368 in portability and usability. Likewise, users who are intent on purchasing a 13-inch convertible may find that most competing models are both lighter and smaller for easier carrying.
The Inspiron 13 7368 isn't the huge update that we were hoping for in the series. Its weight and size make it an "indoor only" tablet while there are more portable 13-inch Ultrabooks that can offer the same performance and features.
Dell Inspiron 13 7386
-
07/15/2016 v5.1(old)
Allen Ngo
Pricecompare
