 Deutsch
 English
 Español
 Français
 Italiano
 Nederlands
 Polski
 Português
 Русский
 Türkçe
 Svenska
 Chinese
 Magyar
Dell Inspiron 13 5310 review: More graphics, more battery life

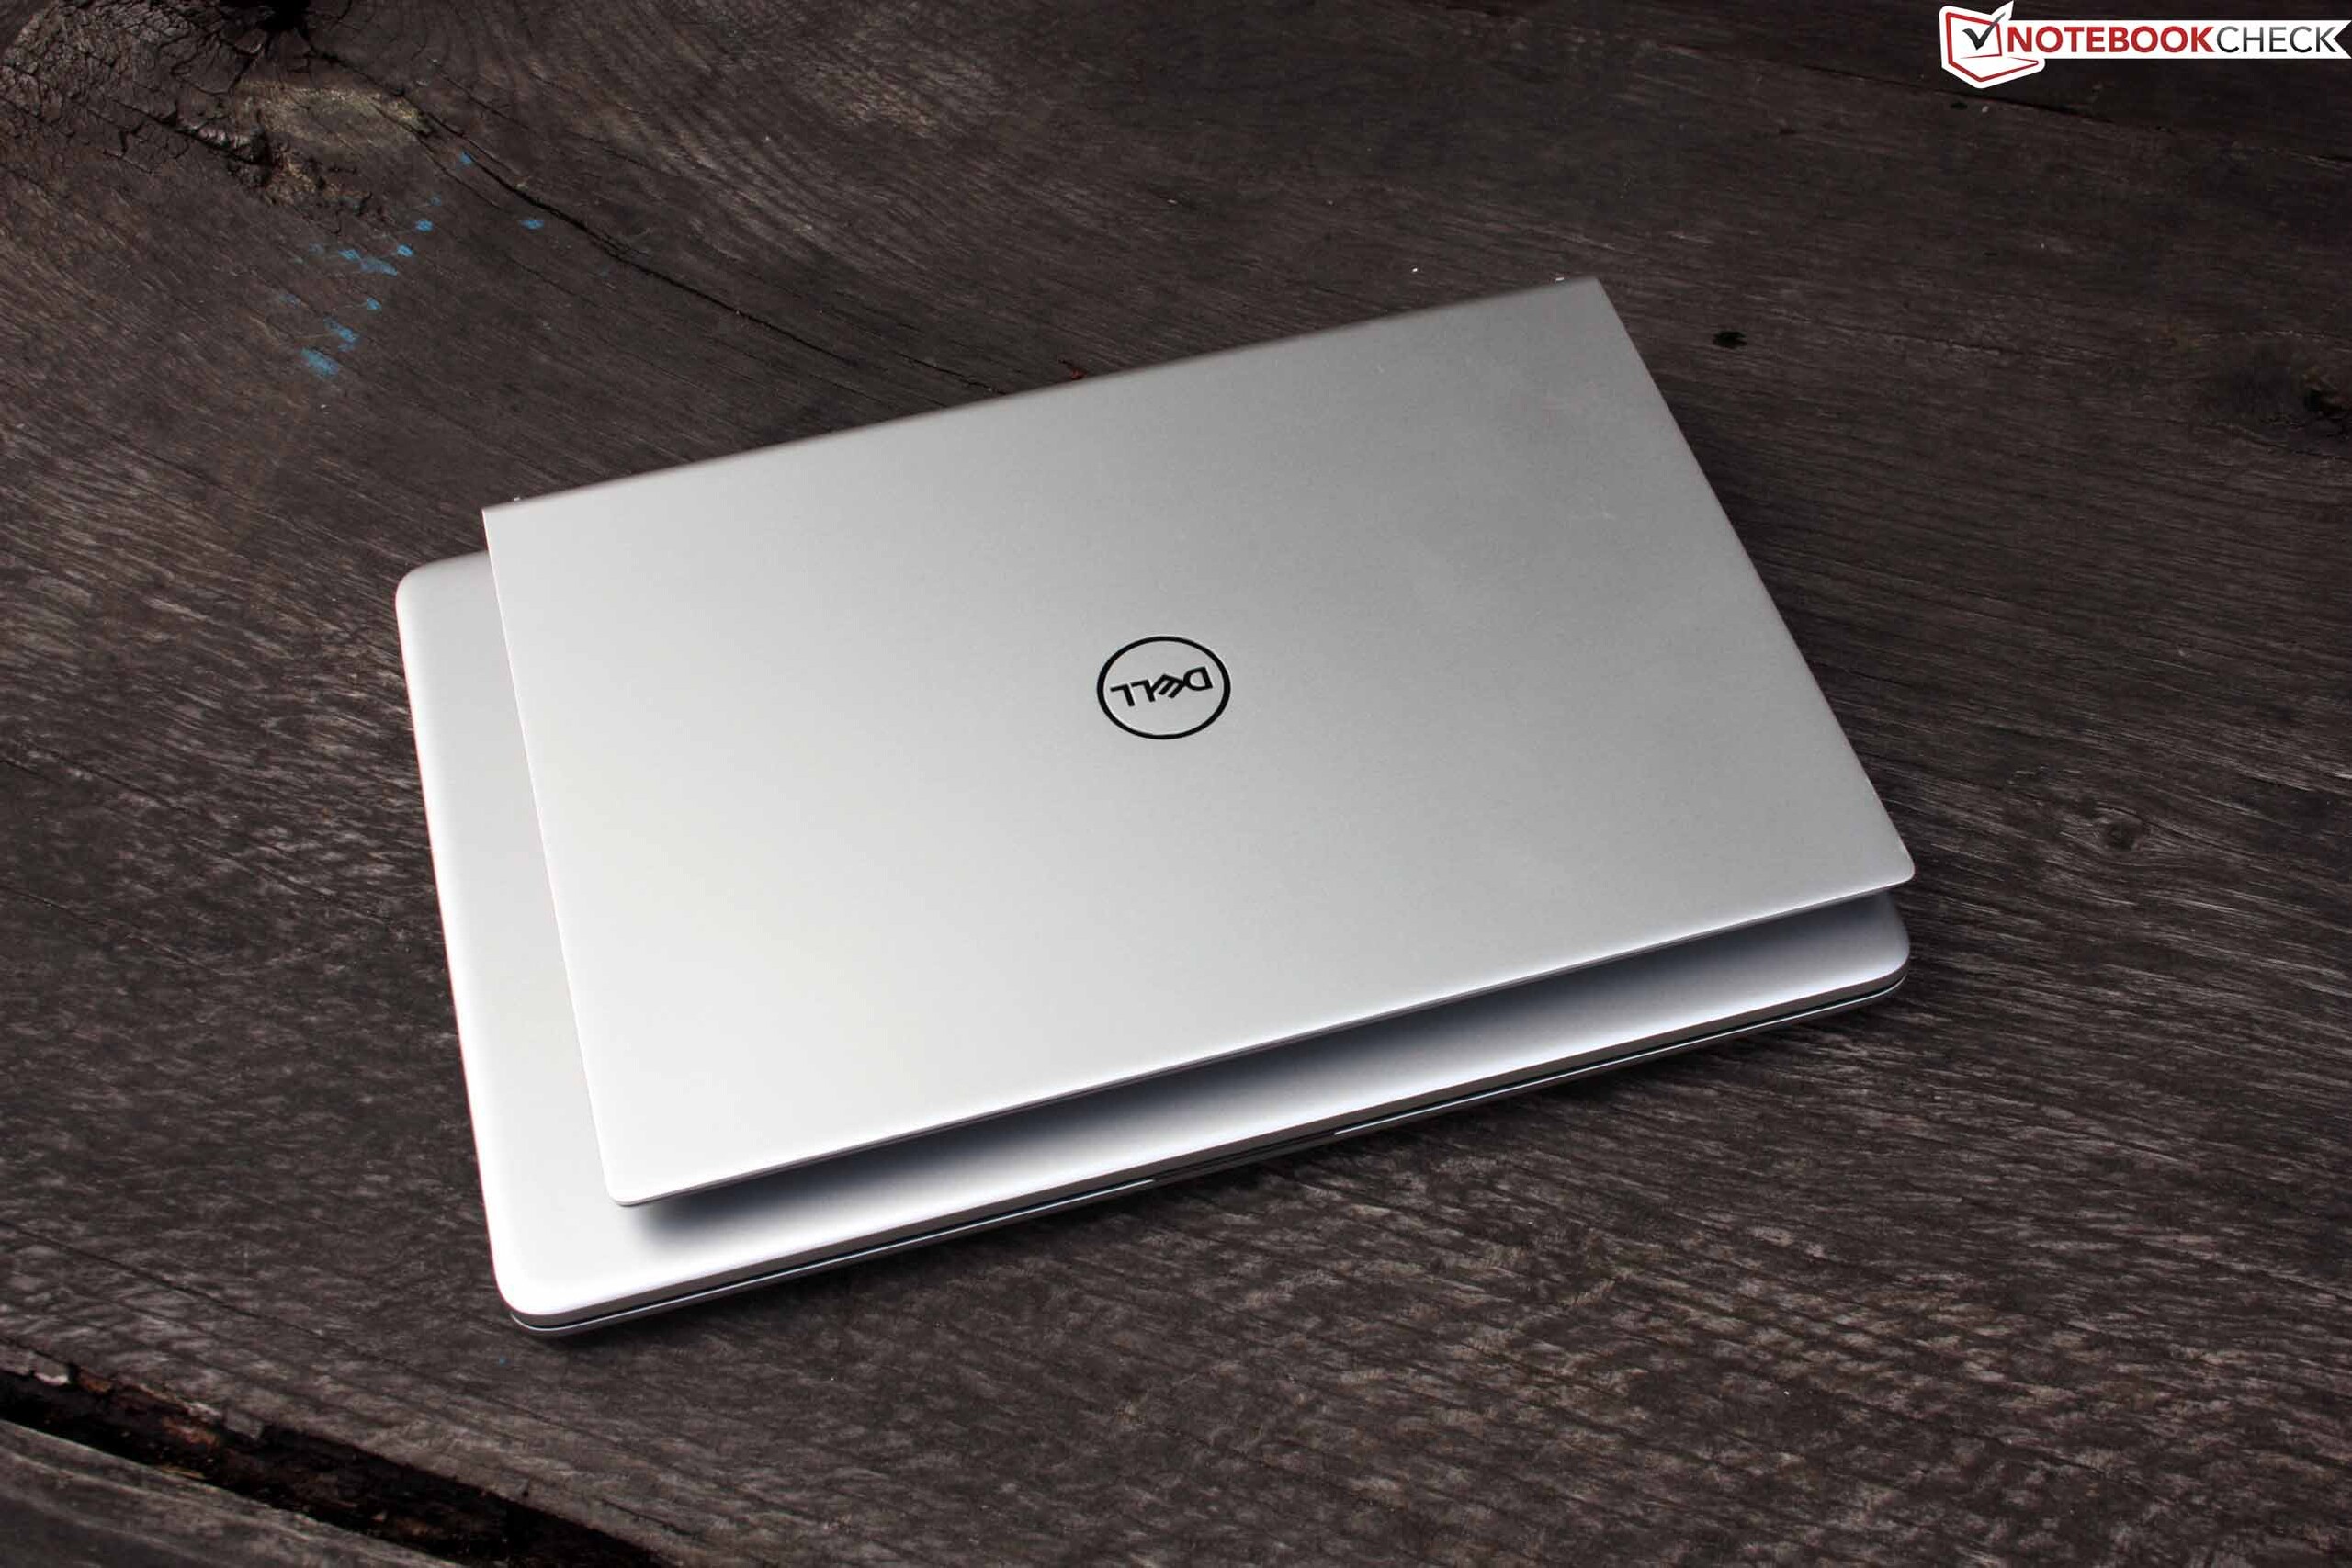
It's just been a few months ago that we had the Inspiron 13 5301, a 13-inch laptop with a 15-Watt Tiger Lake SoC and Iris Xe graphics, in our test. Although the labeling is hardly any different, the actual differences to the Inspiron 13 5310 that we are currently testing are fundamental: a 35-Watt processor, Nvidia MX450 graphics, 2 x Thunderbolt 4, and 54 instead of 40 watthours. While the cases appear very similar, we cannot really speak about an identical build, since the connections on both sides have changed.
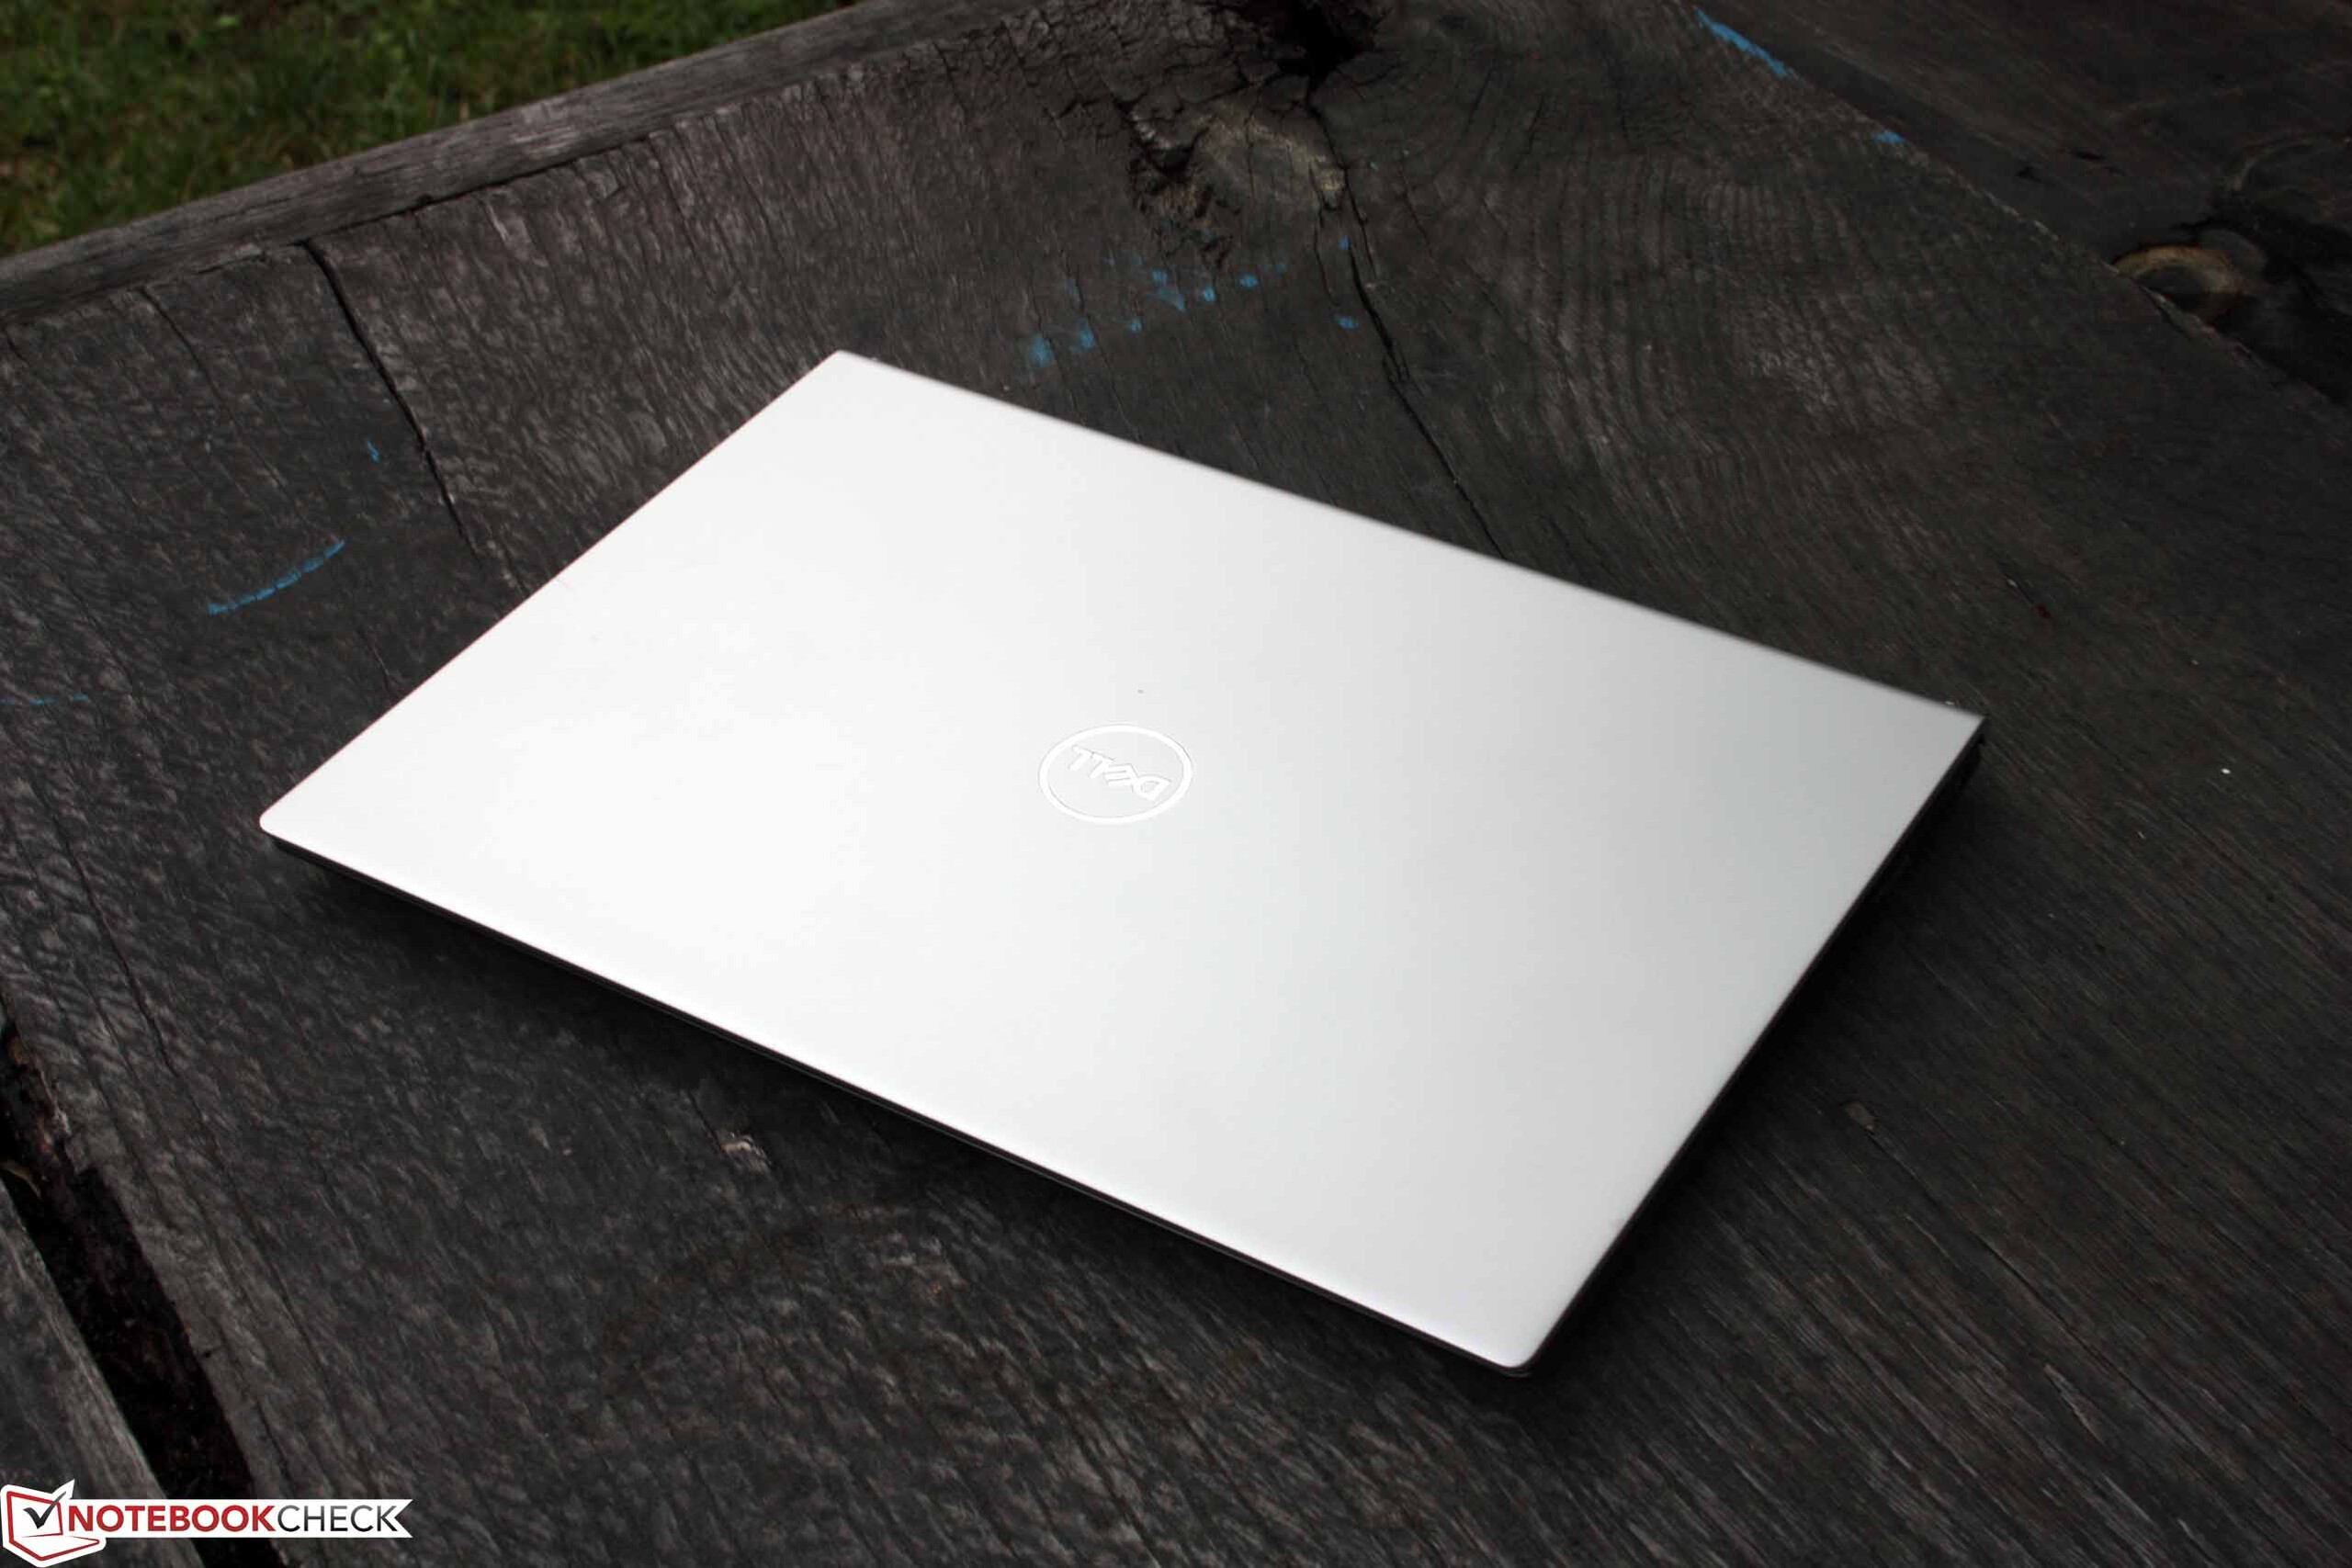
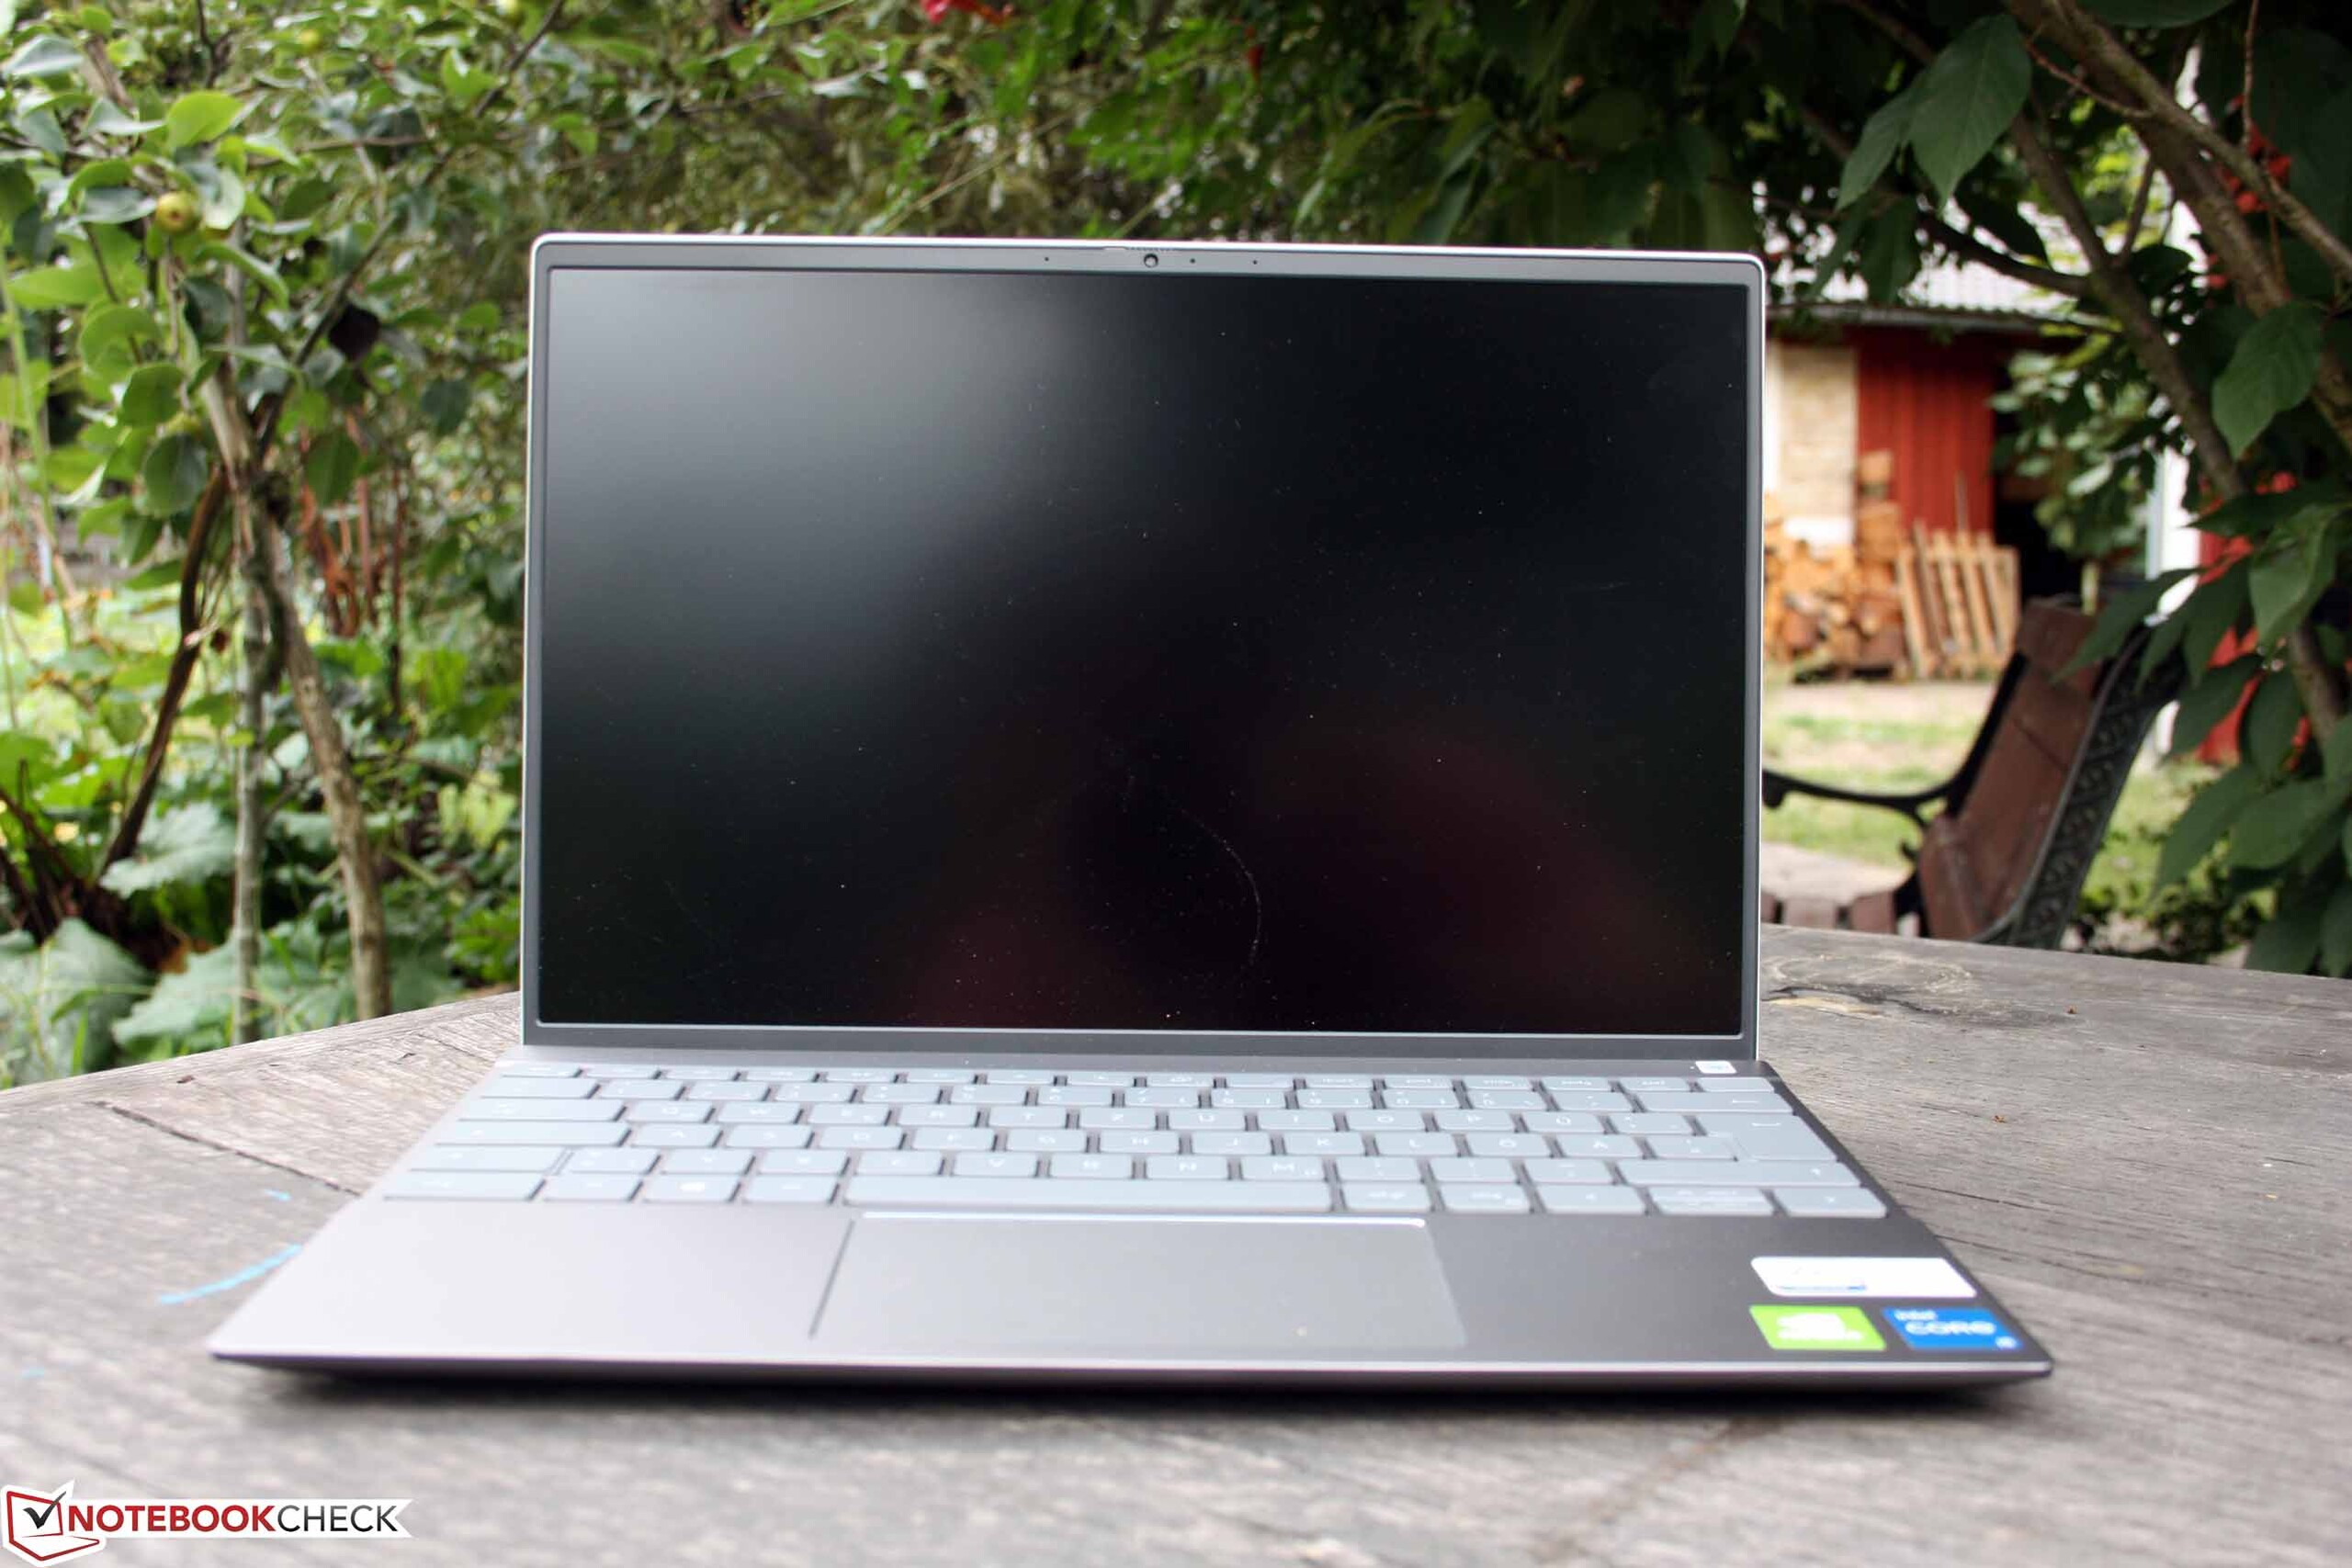
Dell's Inspiron 13 5310 targets mobile buyers who want as much performance as possible in a compact, mobile laptop. With a weight of 1.3 kg (~3 lb) and a battery life of more than 10 hours, this is what they also get here. In addition, there is a bright, non-reflective display delivering powerful sRGB colors. With all this, it can really only become a recommendation, or can it?
There is a broad selection of competitors, although 13-inch laptops with comparable graphics are rare. In this regard, there is only the HP Envy 13-ba1475ng here. The HP Pavilion Aero 13 be0097nr and the Asus ZenBook 13 UM325S are less powerfully equipped with their Vega 8s, as is also the Asus ZenBook 13 UX325EA with Iris Xe Graphics G7 96EUs. You can find the corresponding comparisons in the Performance section below.
Possible Competitors in Comparison
Rating | Date | Model | Weight | Height | Size | Resolution | Best Price |
|---|---|---|---|---|---|---|---|
| 85.7 % | 09/2021 | Dell Inspiron 13 5310-NJ24J i5-11300H, GeForce MX450 | 1.3 kg | 15.9 mm | 13.30" | 1920x1200 | |
| 85.3 % | 05/2021 | HP Envy 13-ba1475ng i7-1165G7, GeForce MX450 | 1.3 kg | 17 mm | 13.30" | 1920x1080 | |
| 84.4 % | 08/2021 | HP Pavilion Aero 13 be0097nr R7 5800U, Vega 8 | 953 g | 17 mm | 13.30" | 1920x1200 | |
| 88.5 % | 05/2021 | Asus ZenBook 13 UM325S R7 5800U, Vega 8 | 1.2 kg | 13.9 mm | 13.30" | 1920x1080 | |
| 88.9 % | 05/2021 | Asus ZenBook 13 UX325EA i7-1165G7, Iris Xe G7 96EUs | 1.2 kg | 13.9 mm | 13.30" | 1920x1080 | |
| 85.7 % | 06/2021 | Acer Spin 3 SP313-51N-56YV i5-1135G7, Iris Xe G7 80EUs | 1.4 kg | 16 mm | 13.30" | 2560x1600 |
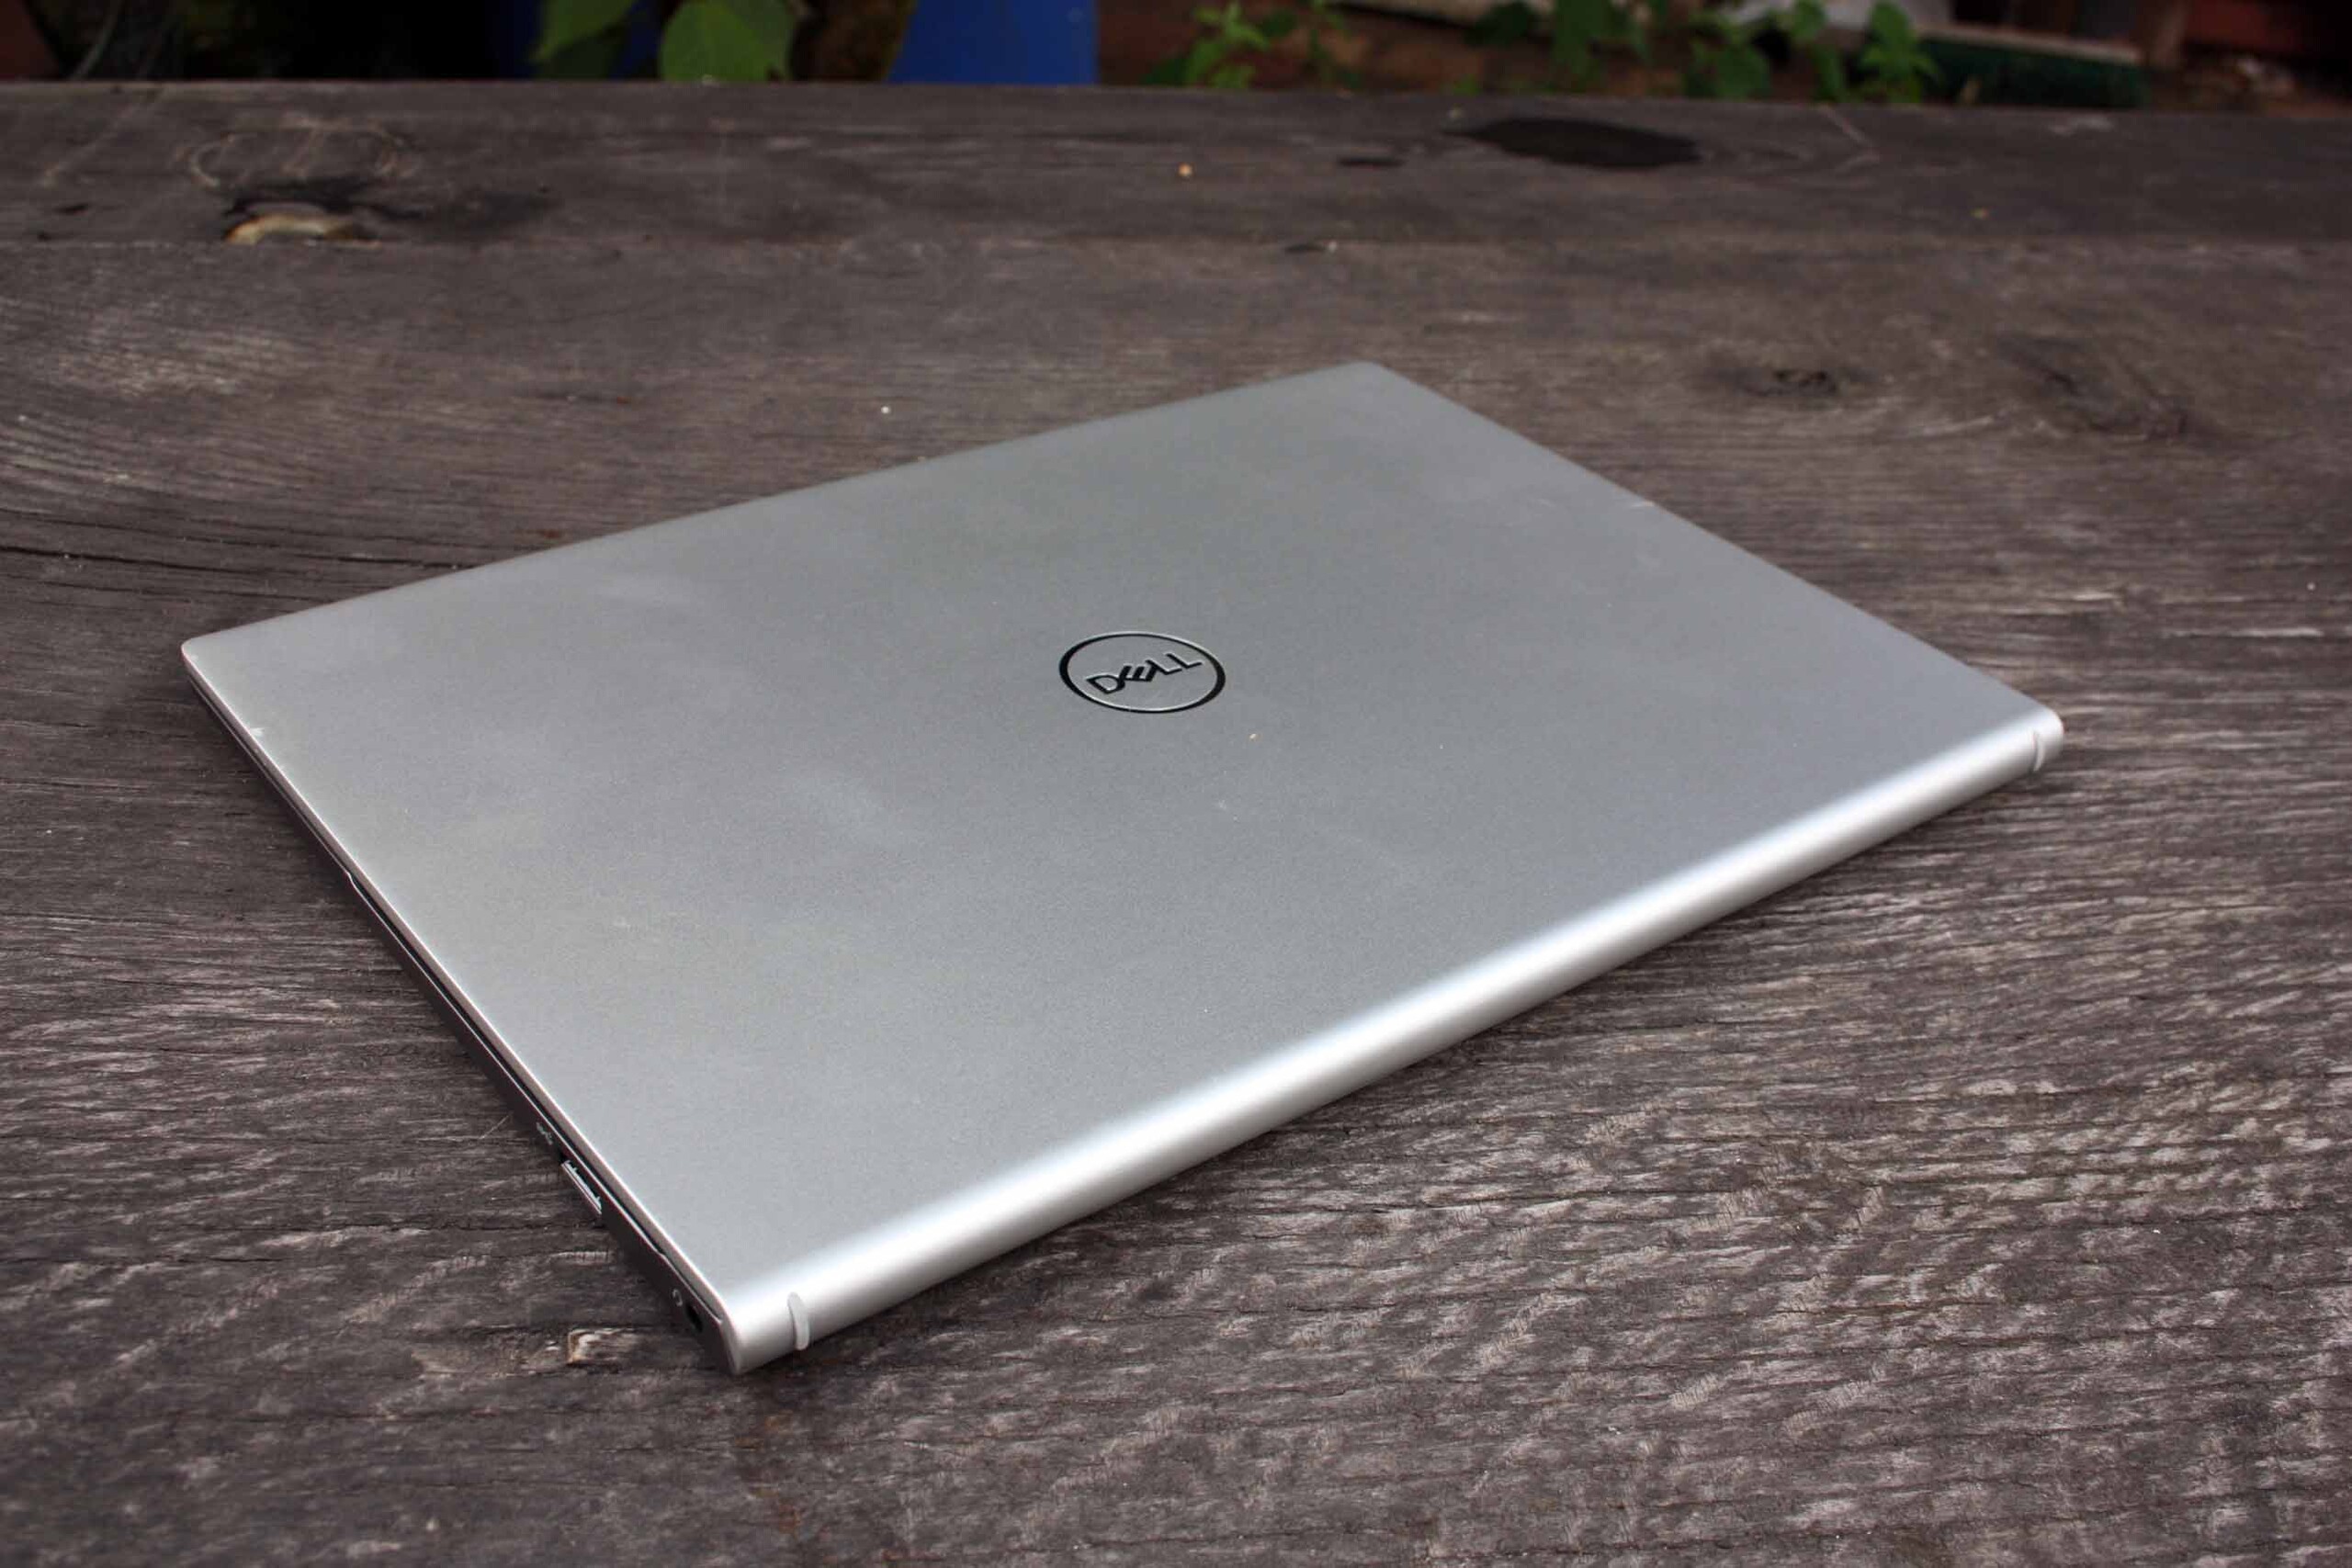
Case and Equipment
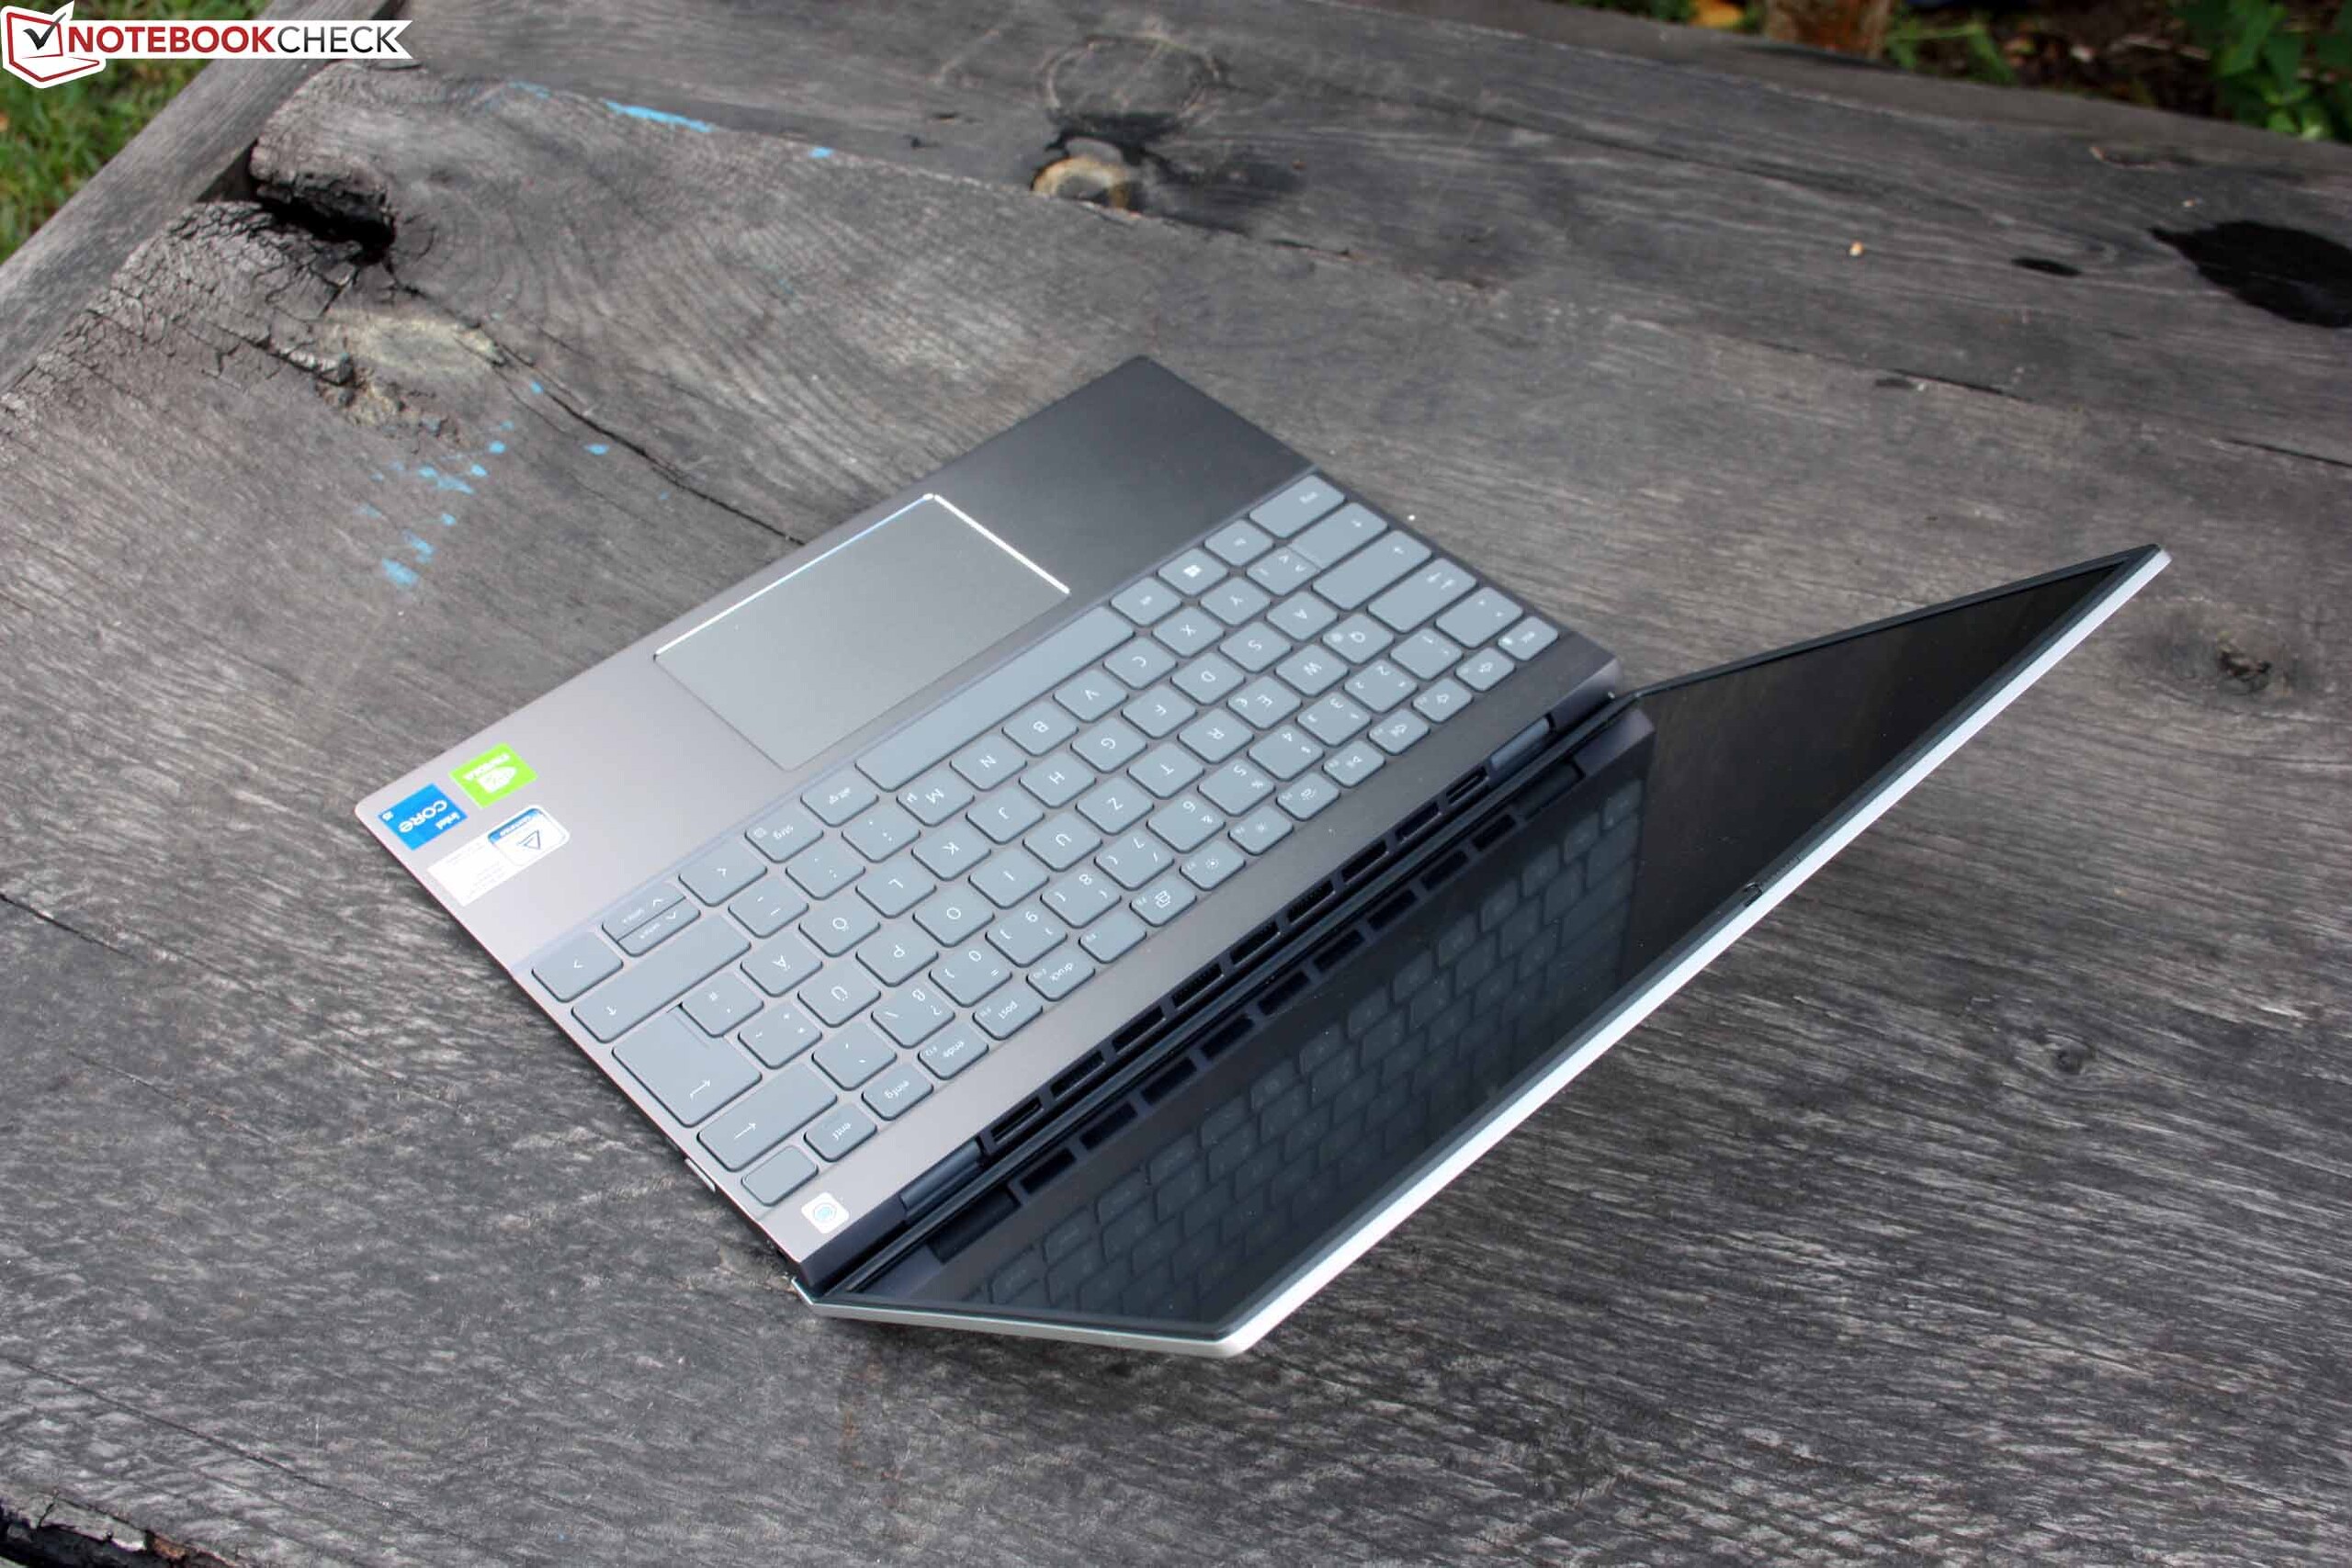
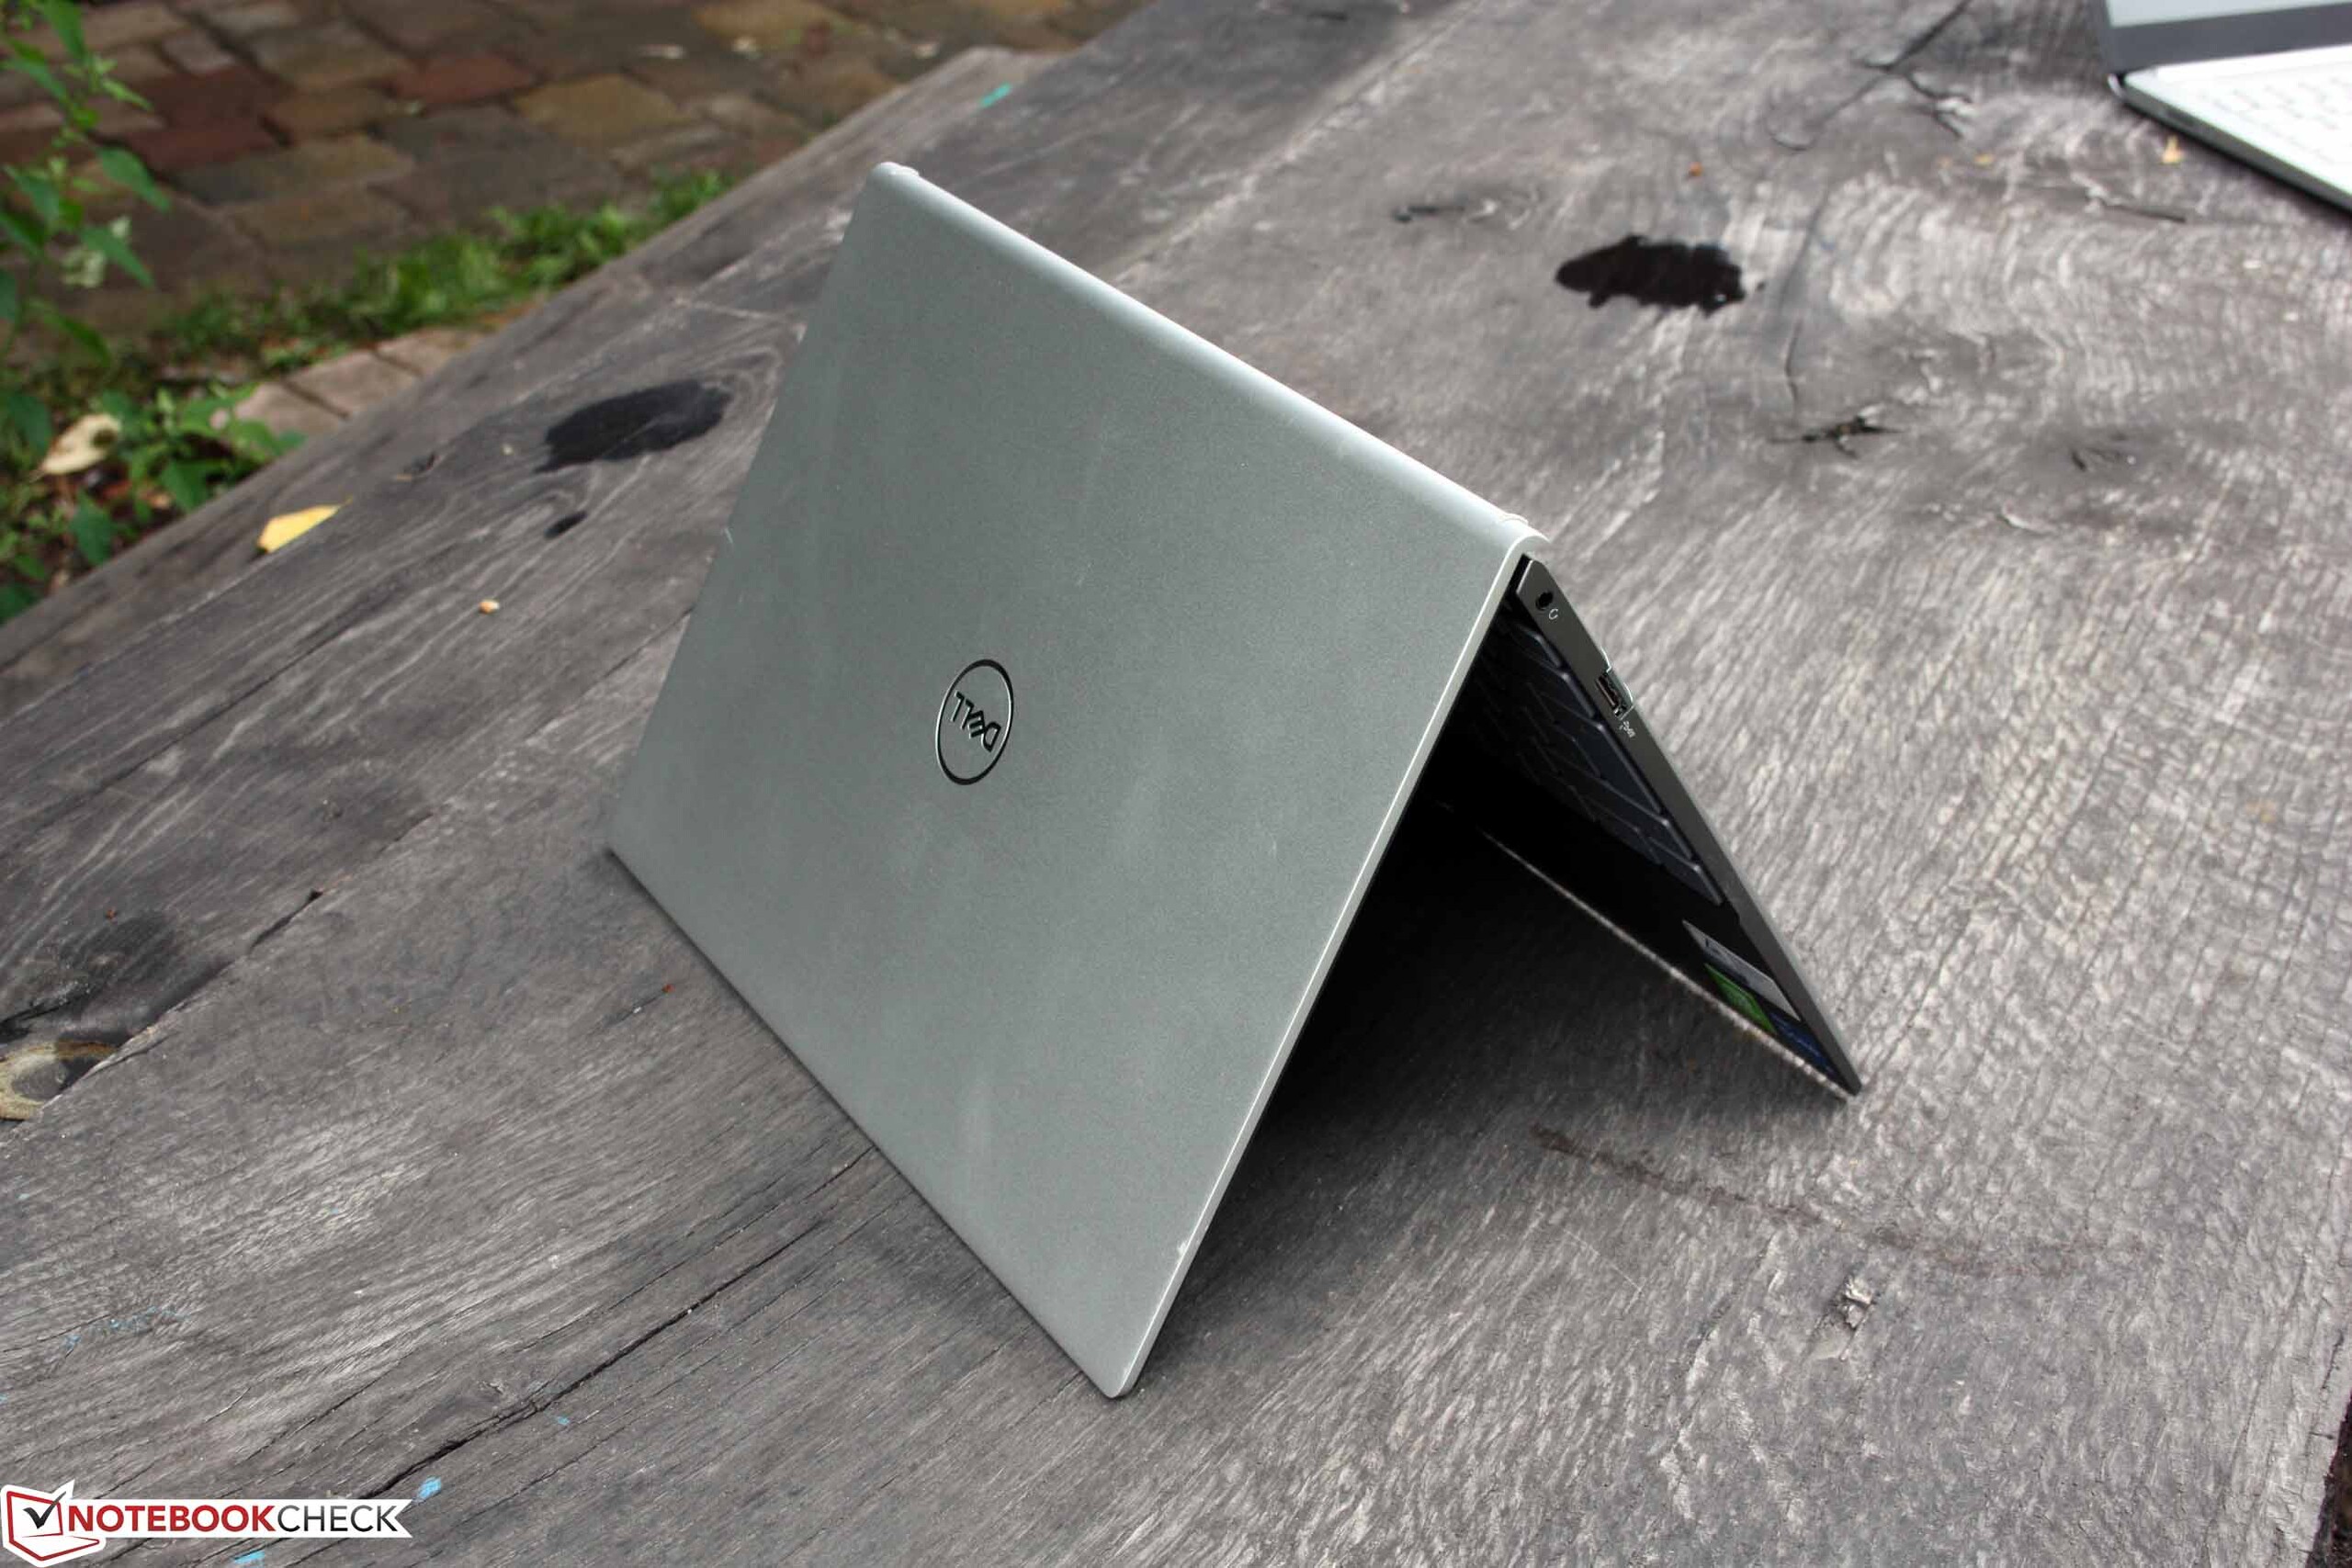
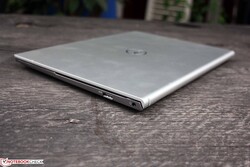
The lid and top of the base are made from aluminum, which provides the 13-inch laptop with high-quality haptics as well as a decent stability. The case can only be warped minimally, and the hinges are up to their task. However, the stability hits its limits below the keyboard and in the top area of the palm rests, where surfaces bend under even a slight amount of pressure, such as when we press down in the top third of the ClickPad.
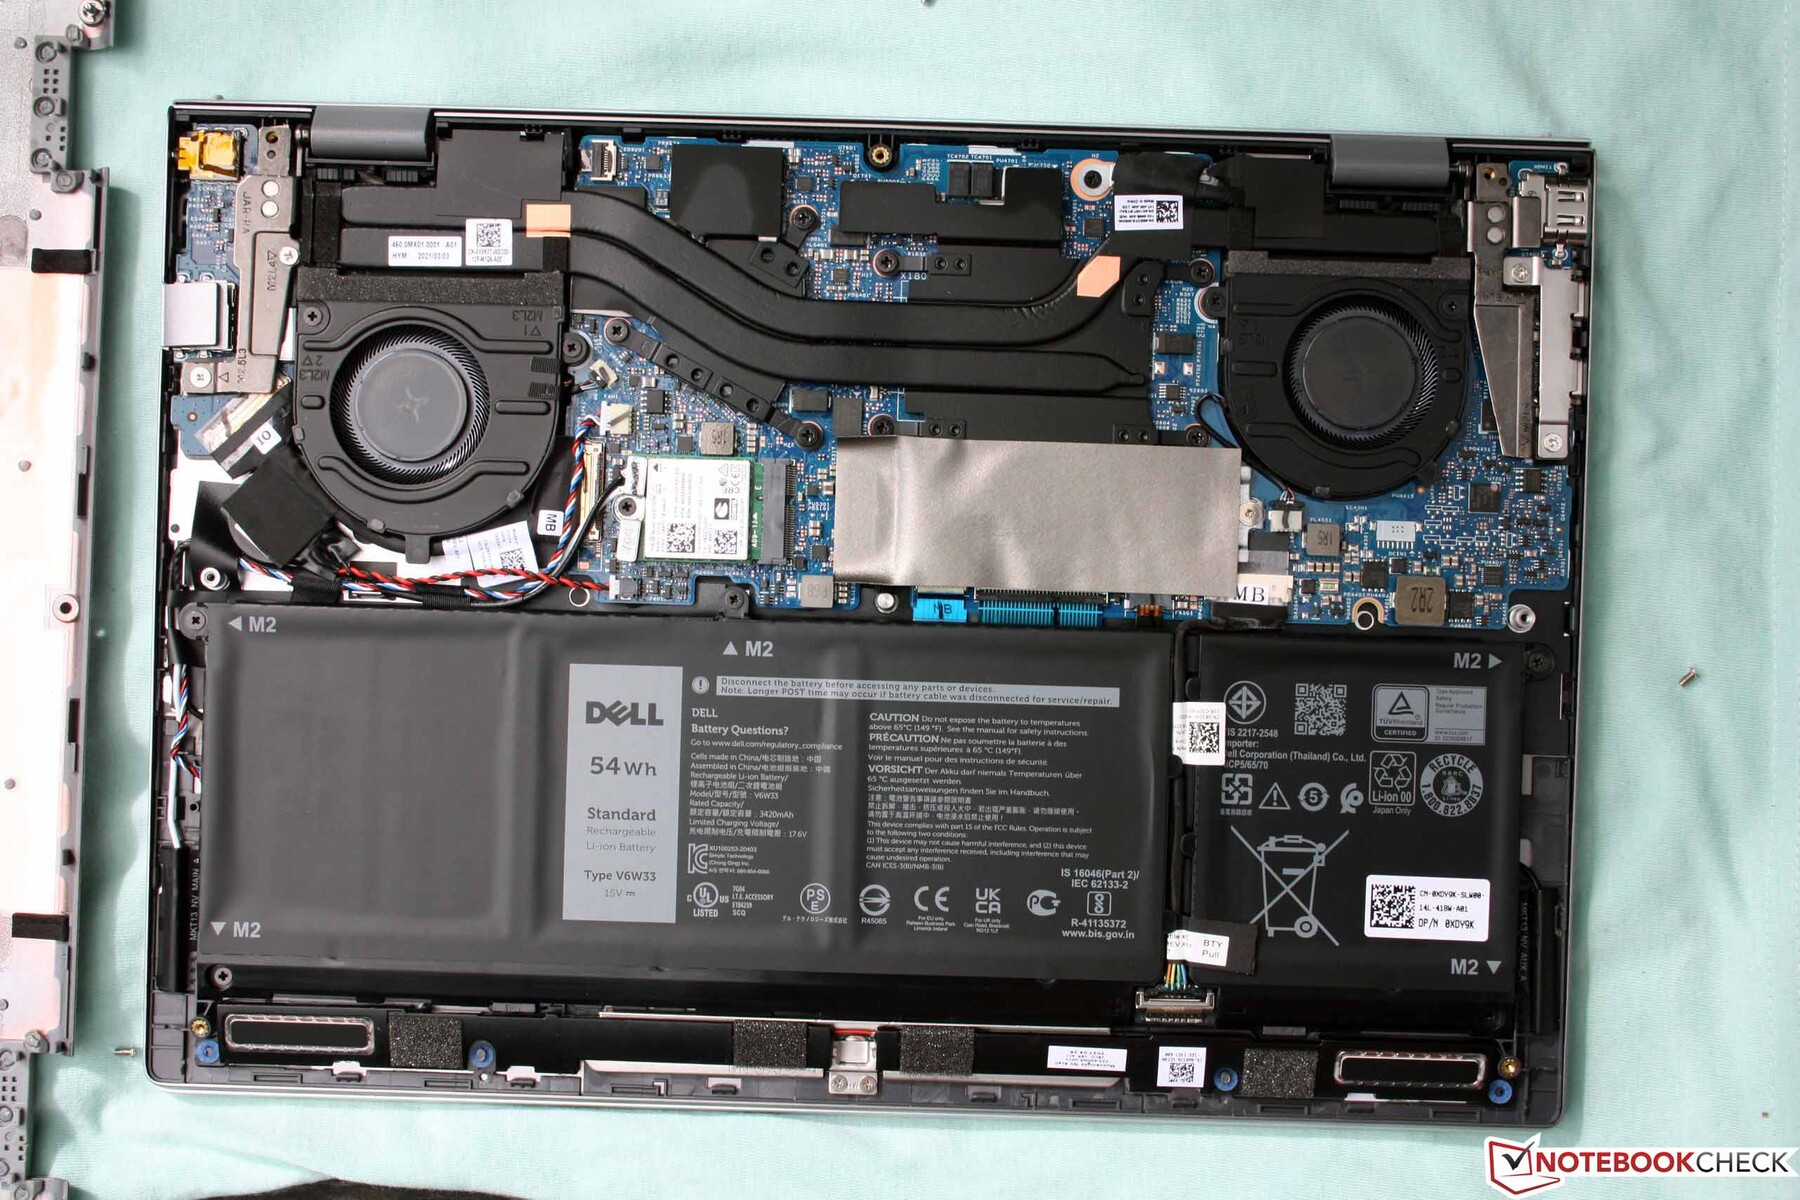
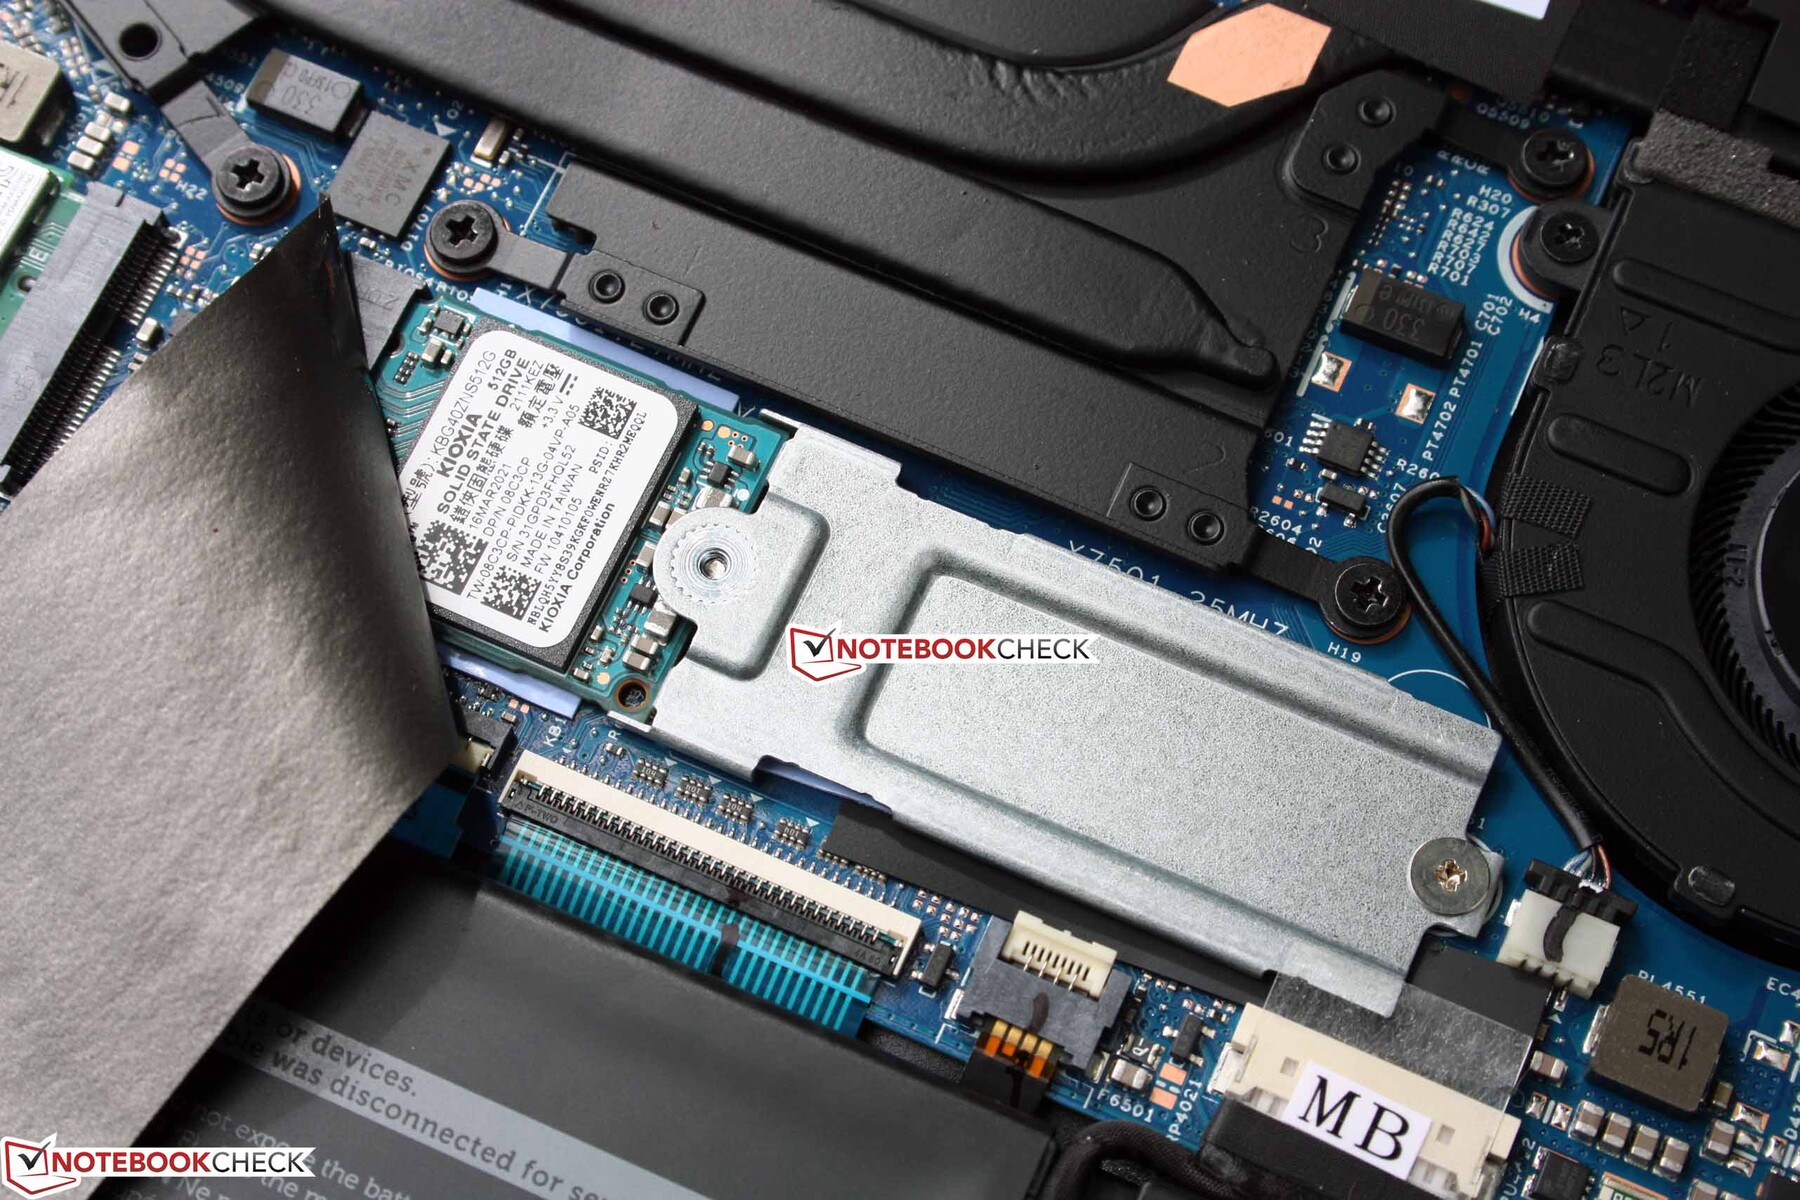
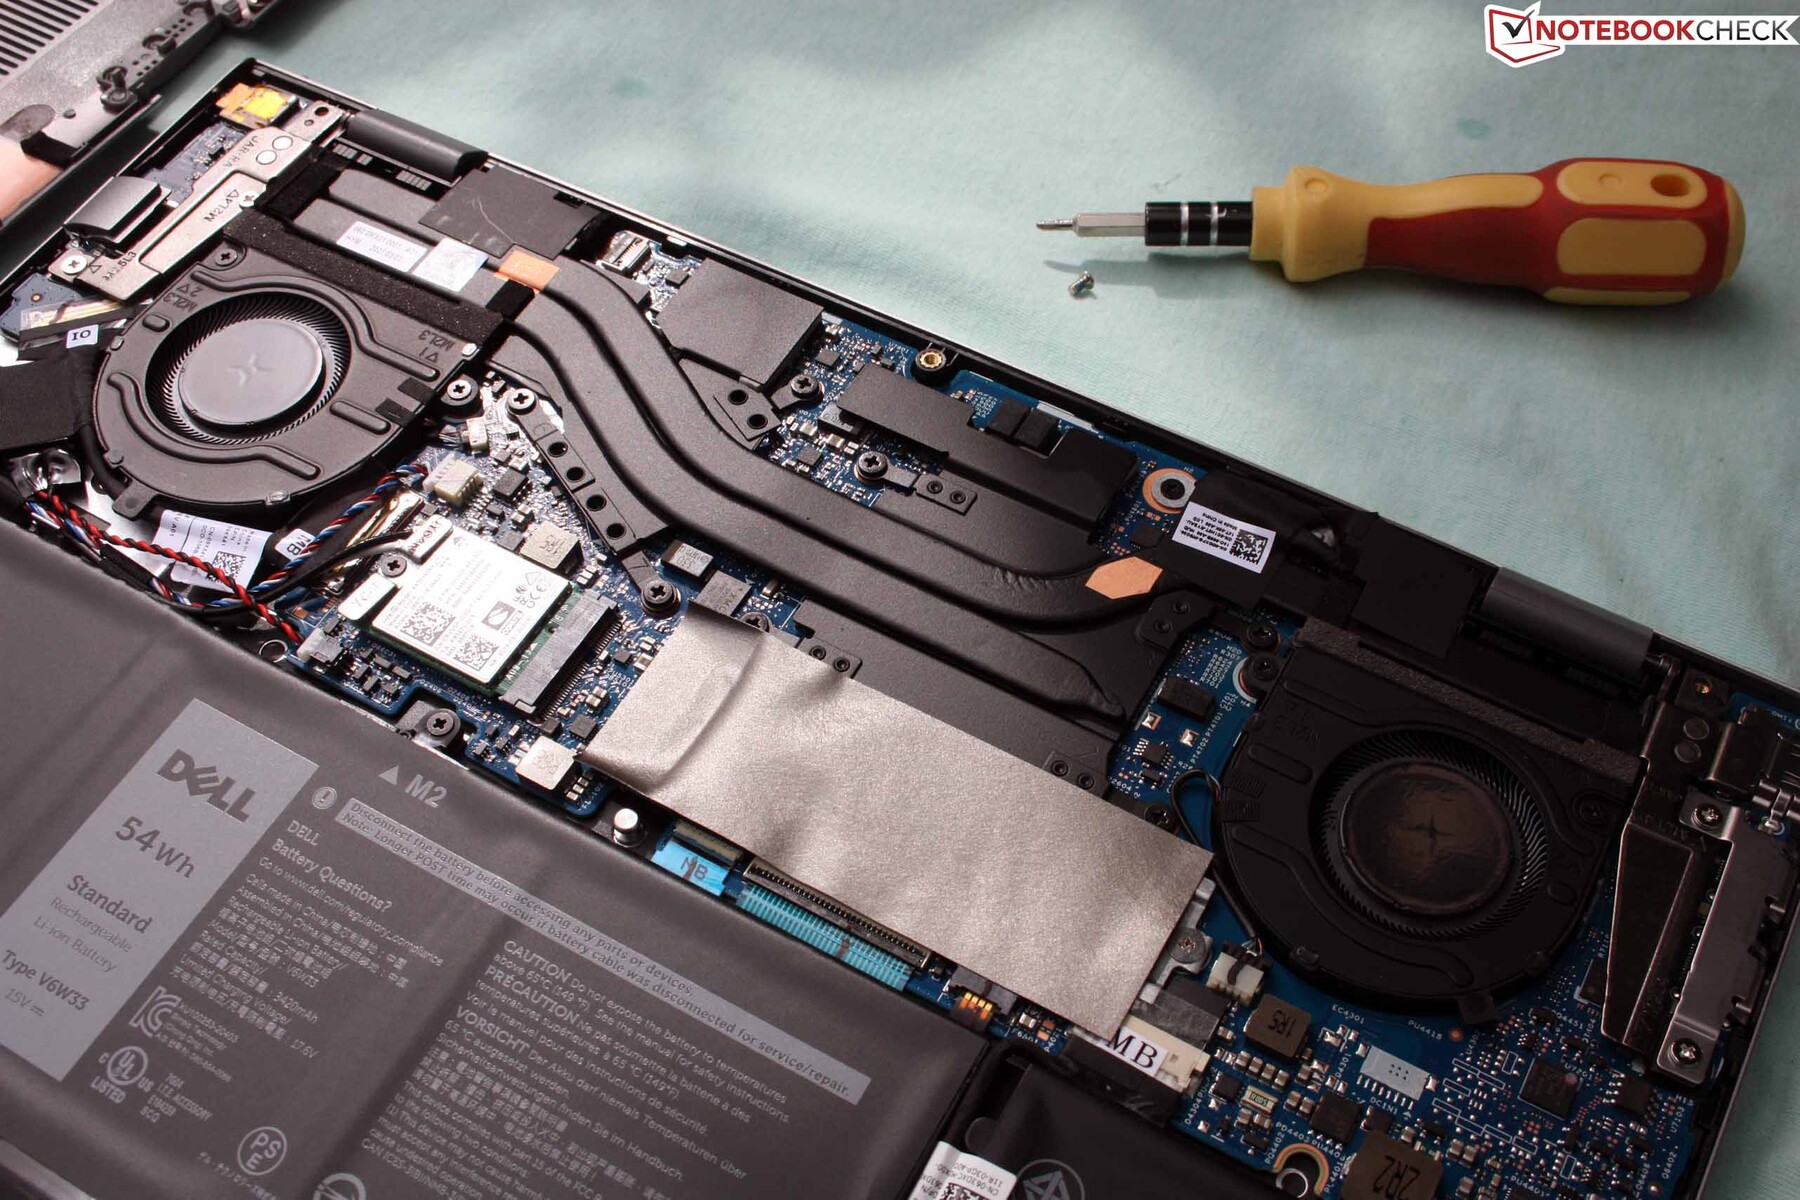
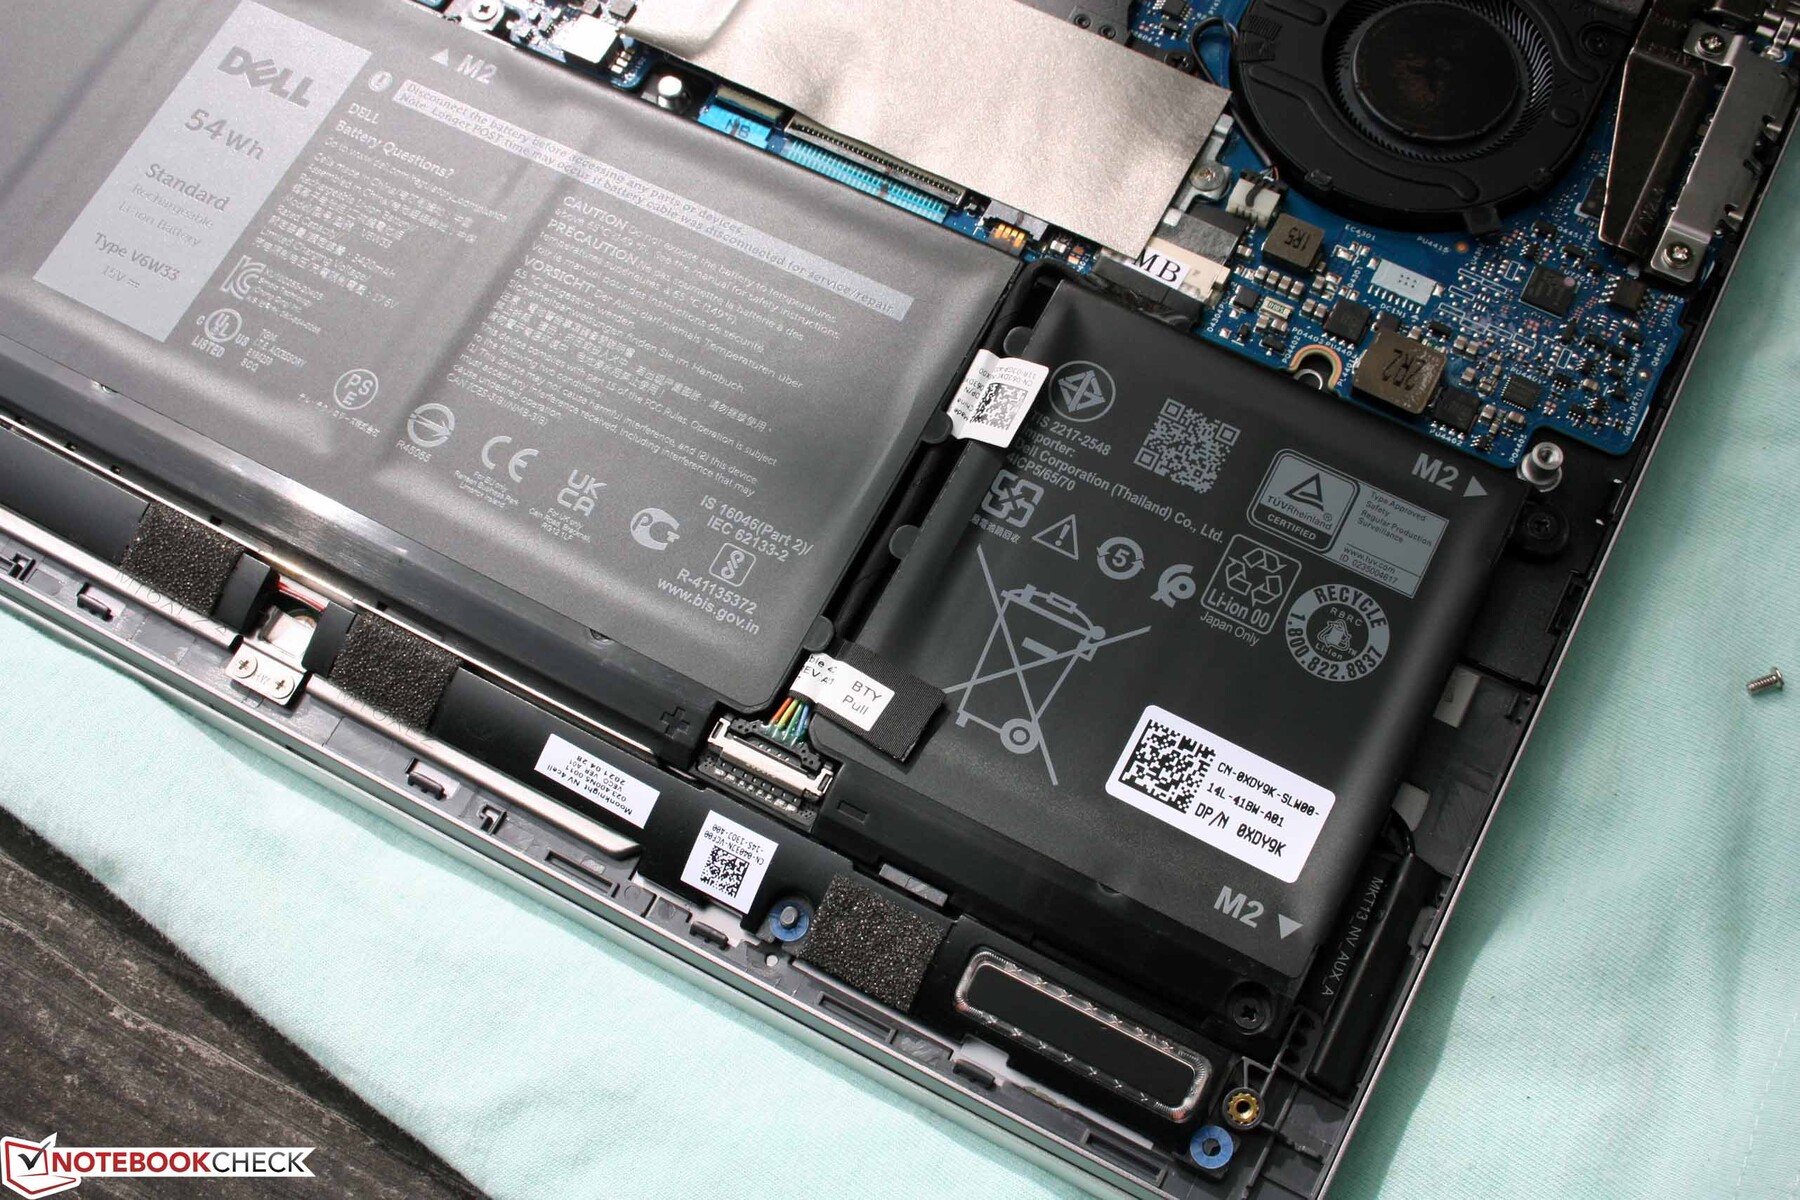
The easy maintenance deserves some praise. After removing numerous screws, you can simply lift off the bottom plate, as long as you start at the hinge. Unfortunately, the working memory is soldered in, so you are committed to the 8 GB when you purchase the device. You can only replace the M.2 2280 SSD and the Wi-Fi card. The double fans are necessary because of the high TDP, and in addition to the 35-Watt CPU, they also have to cool the Geforce MX450 at the same time.
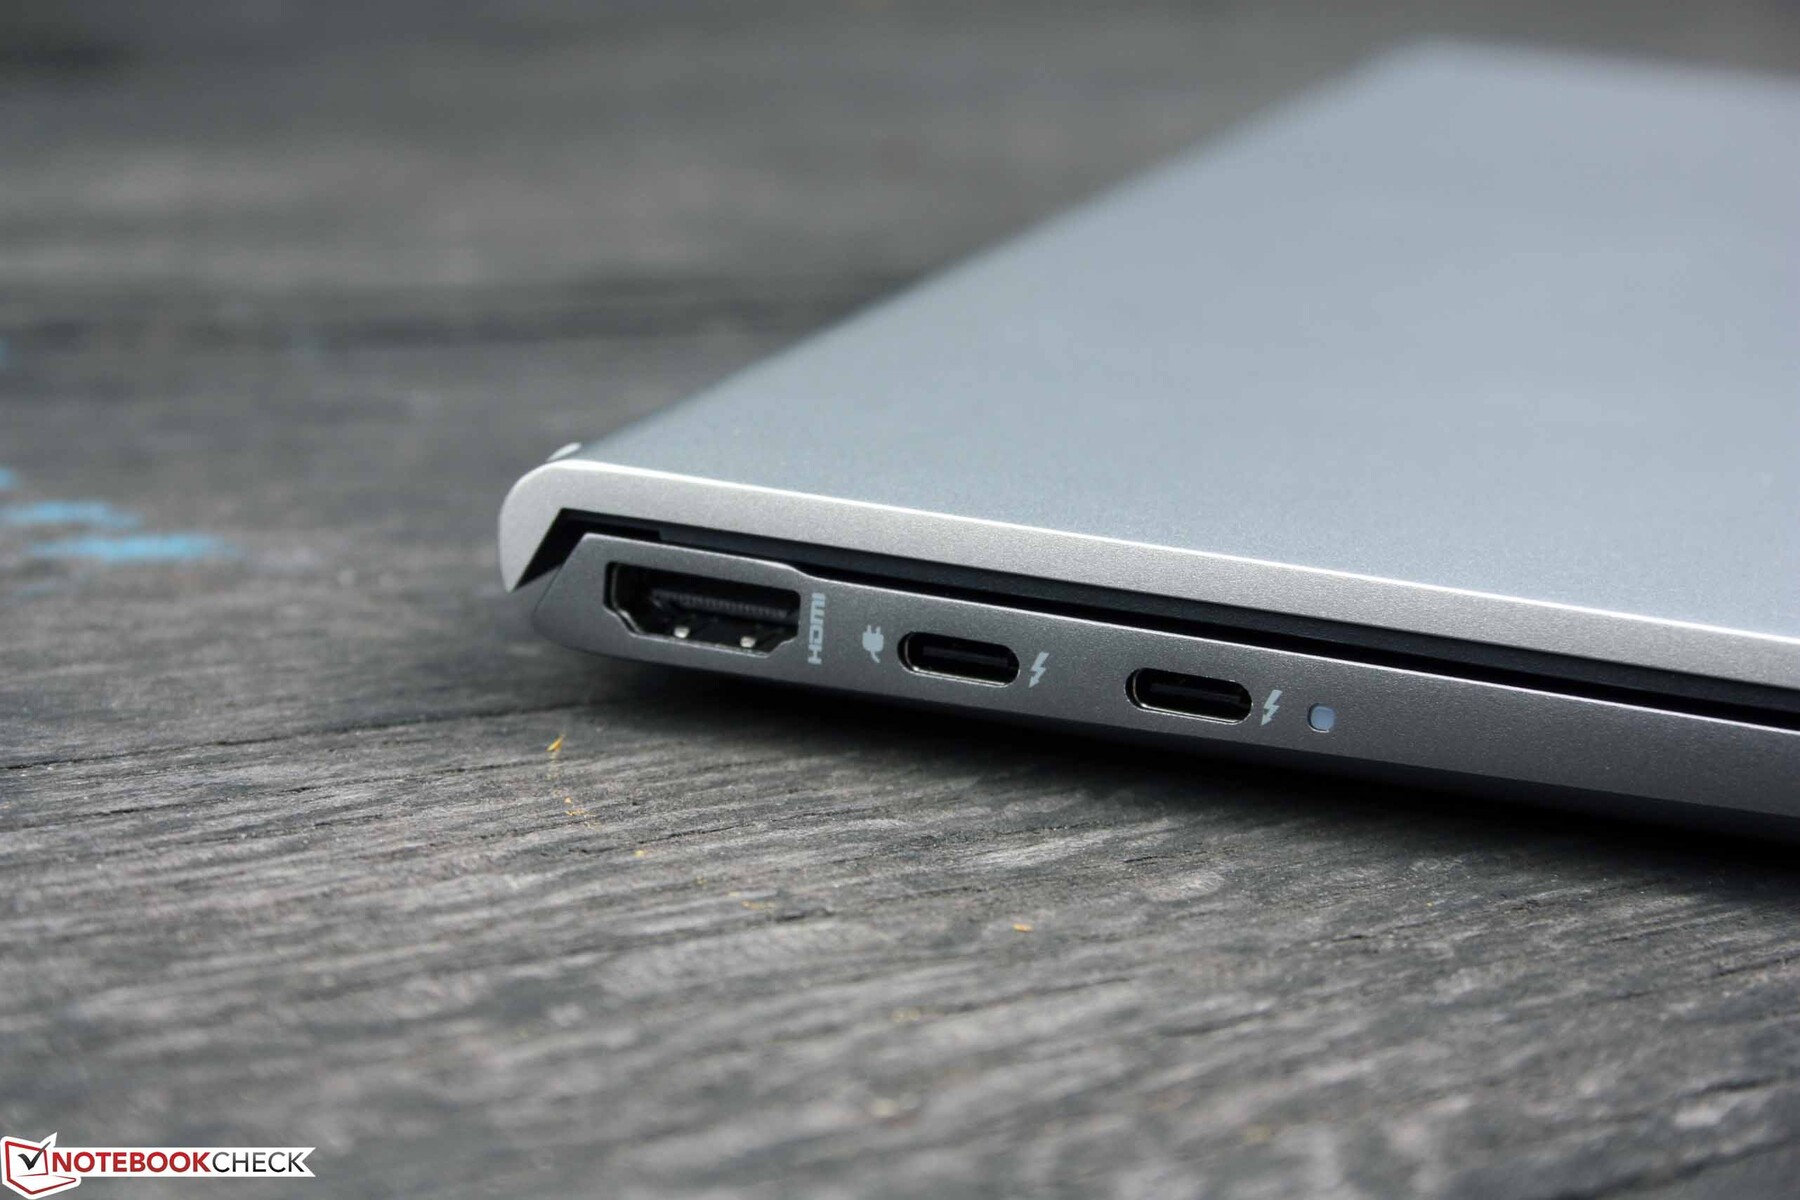
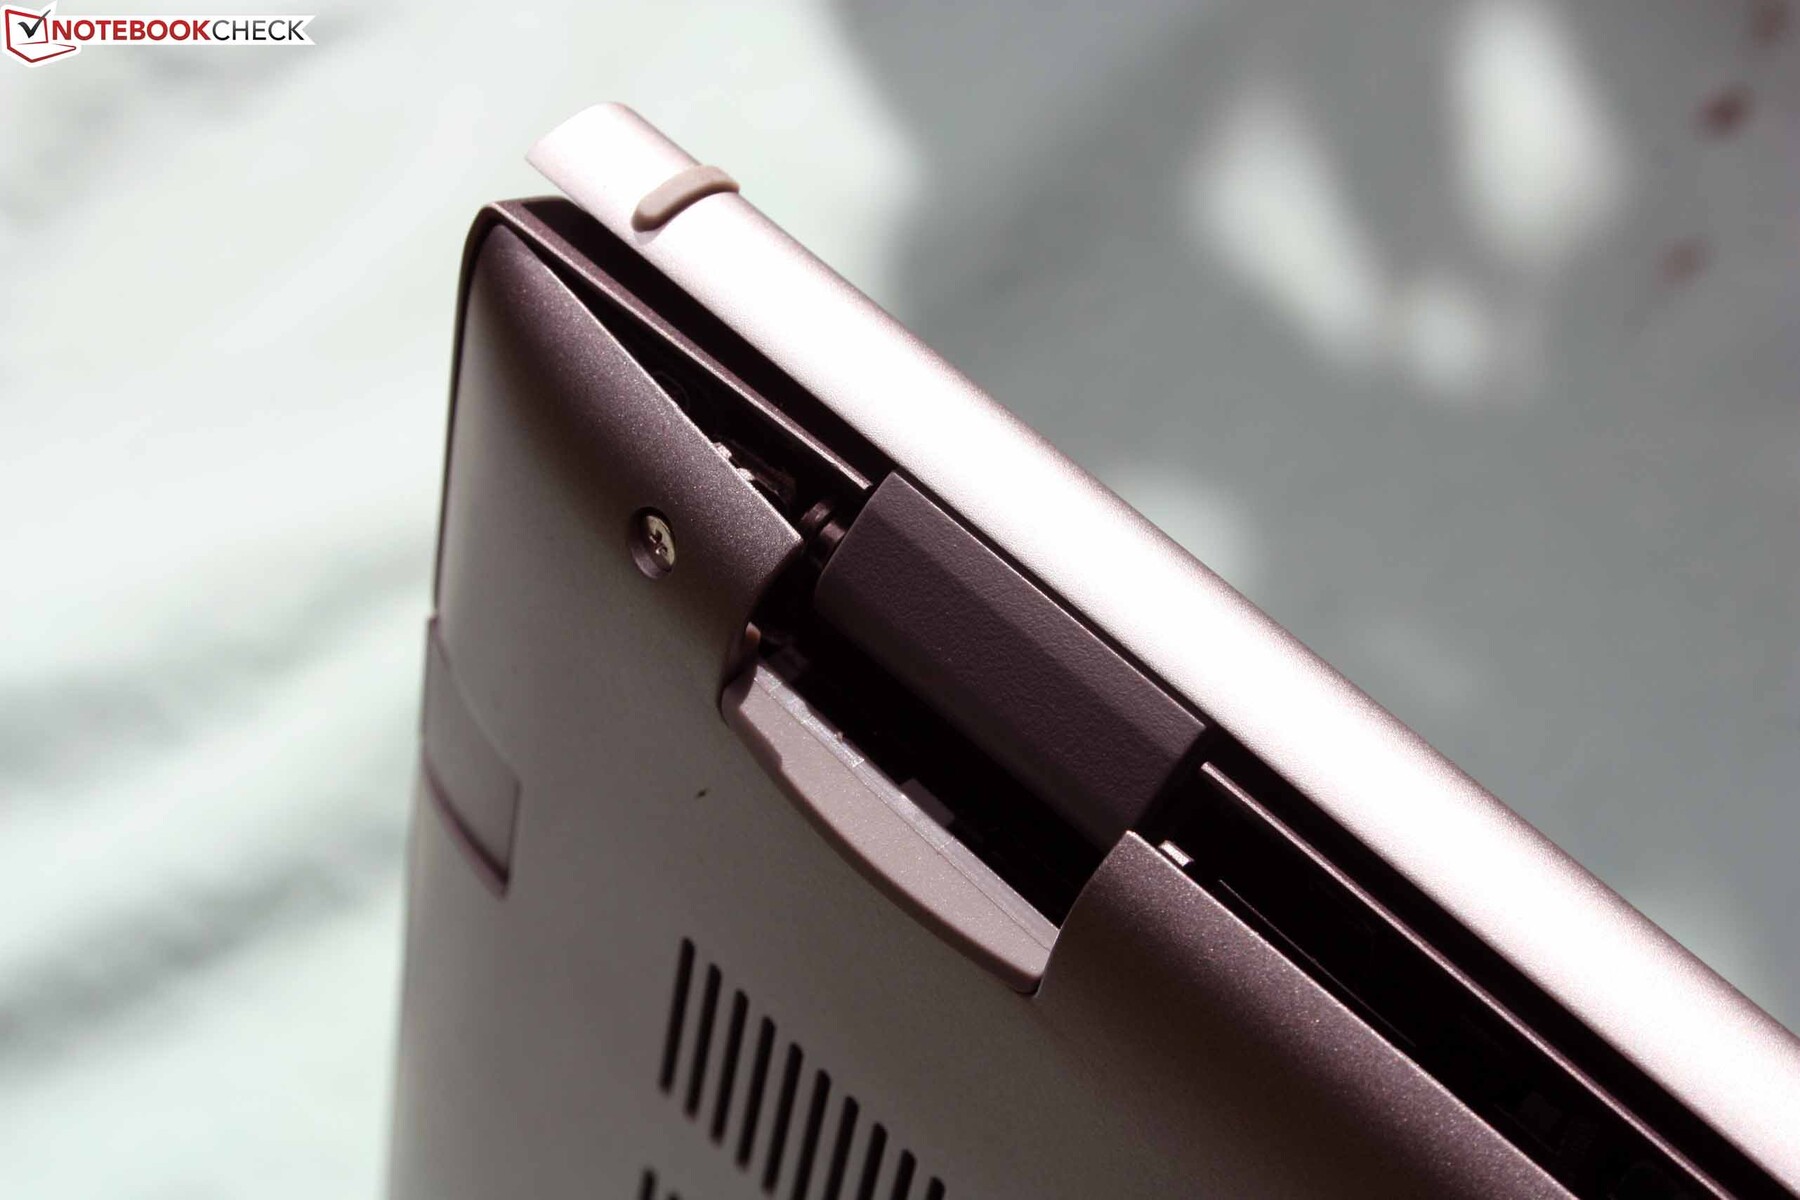
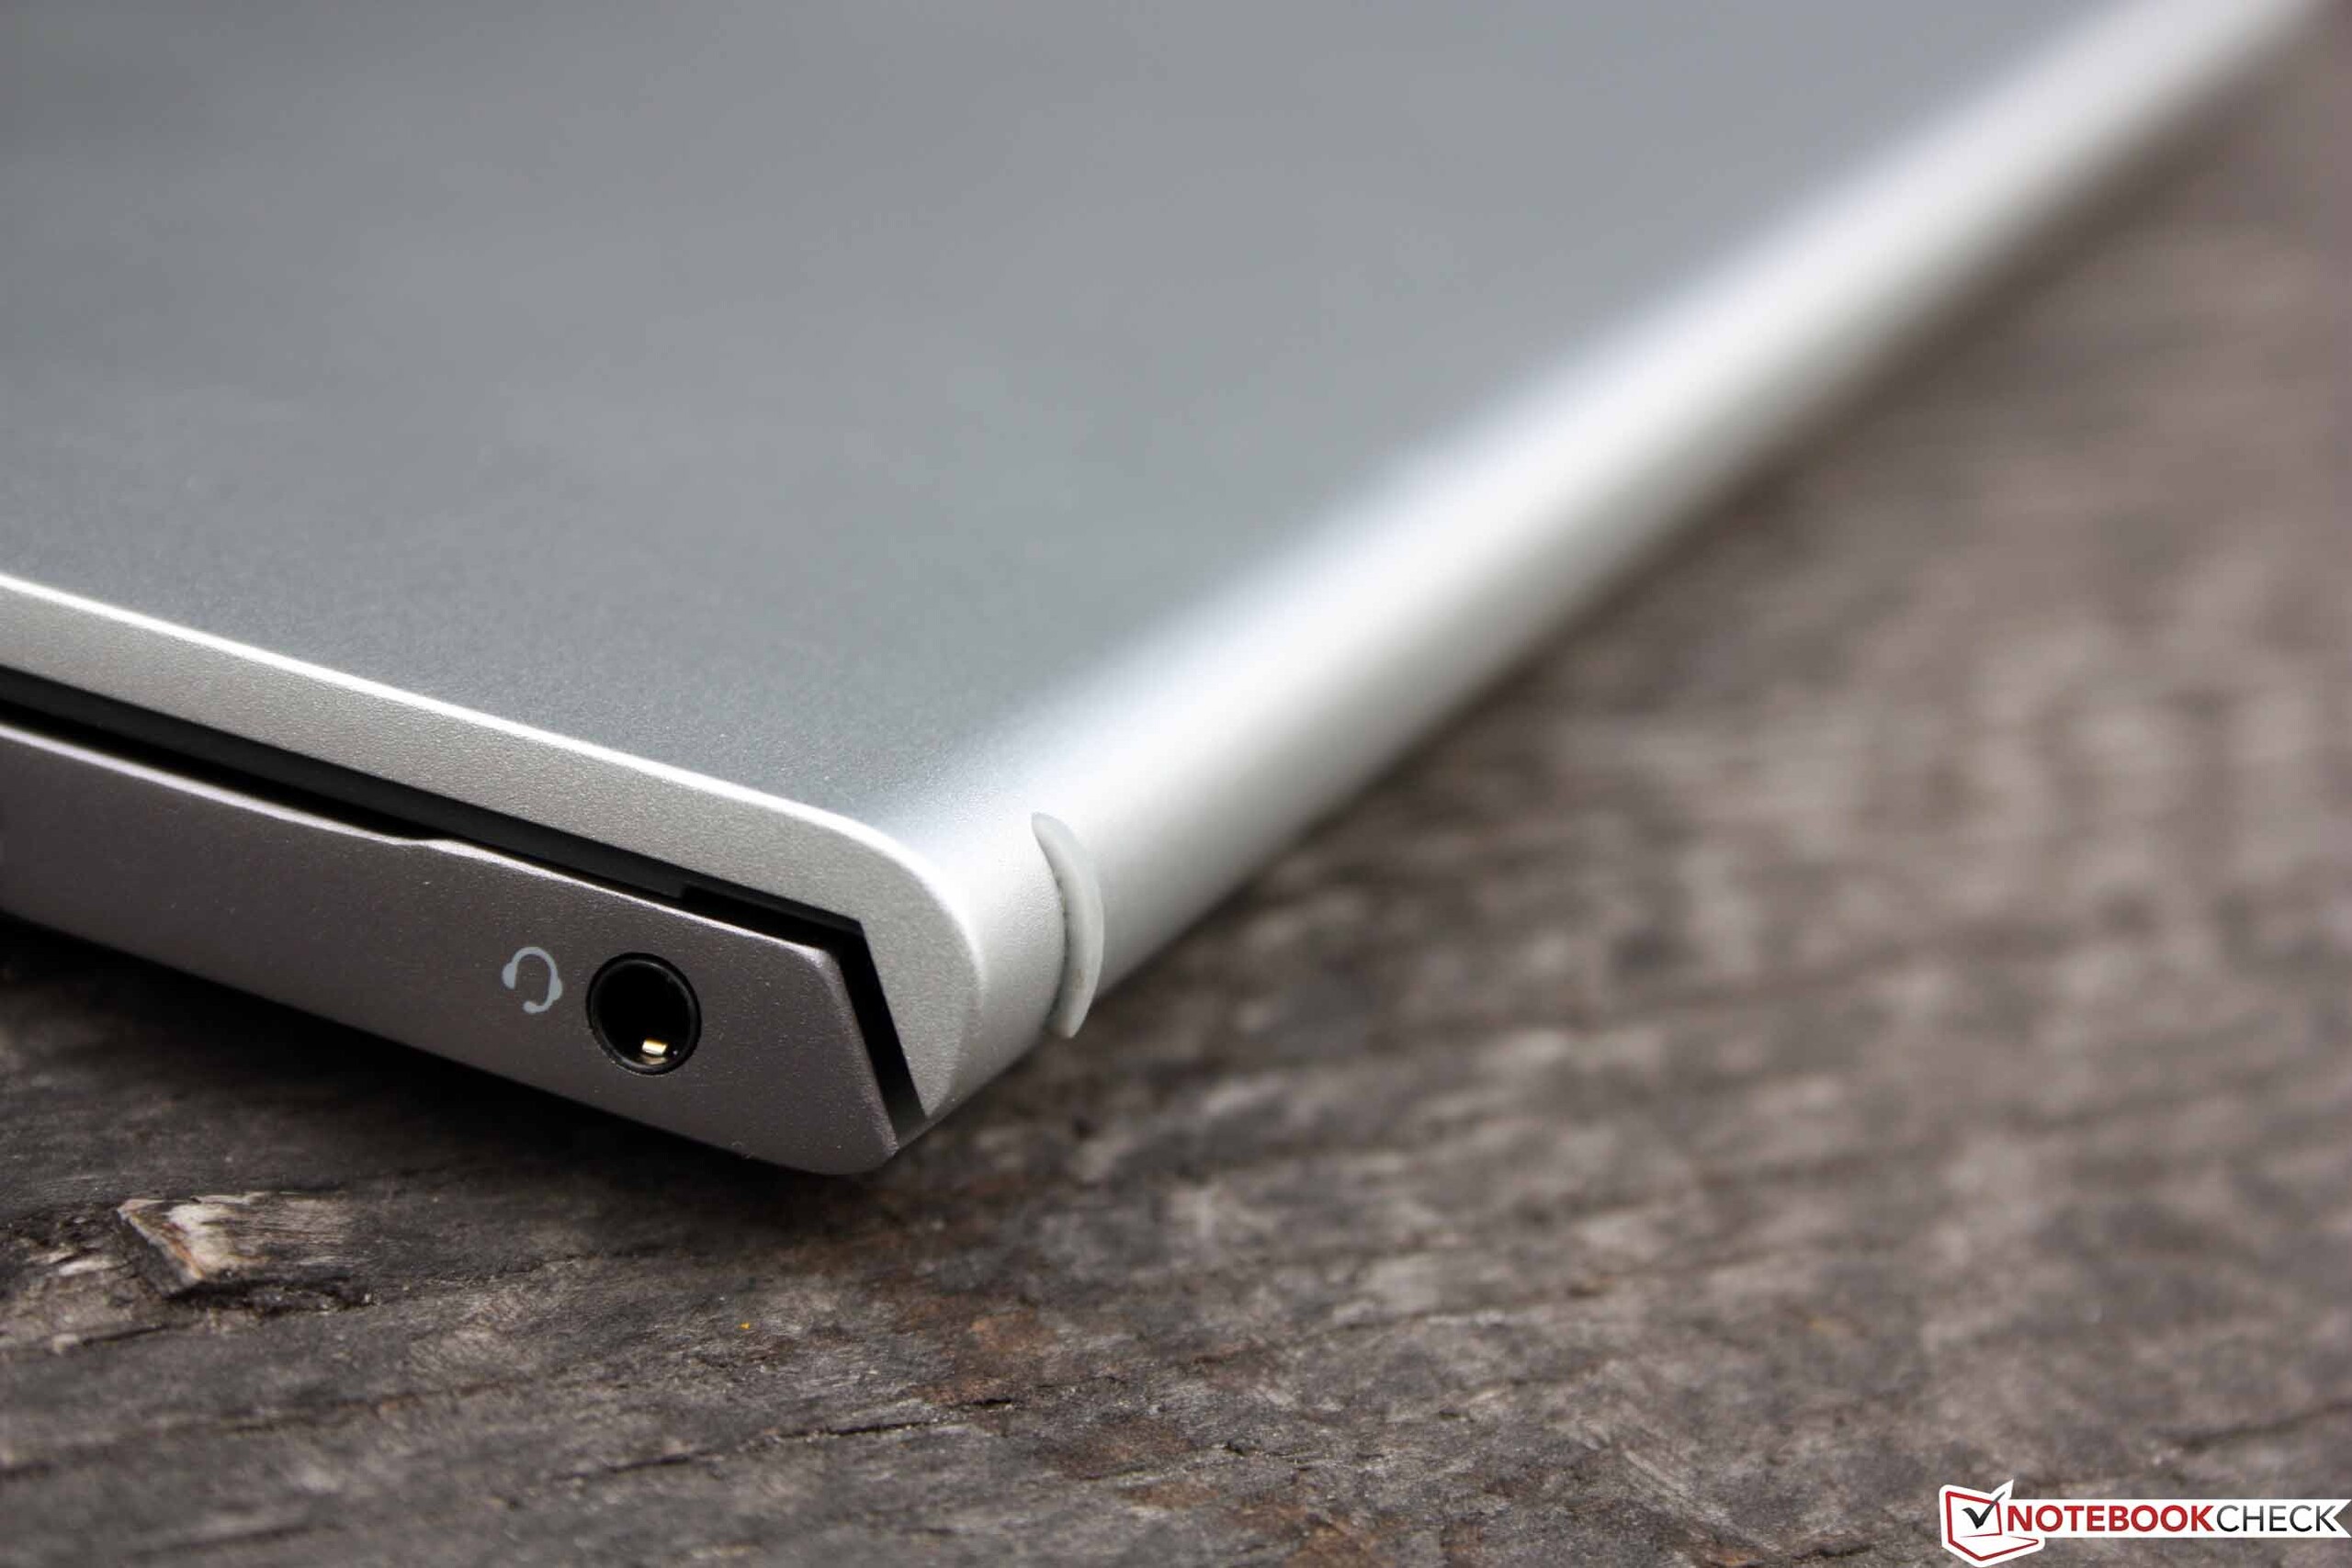
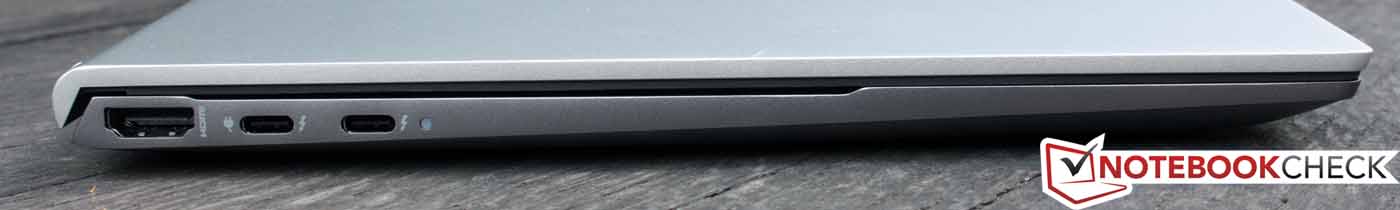
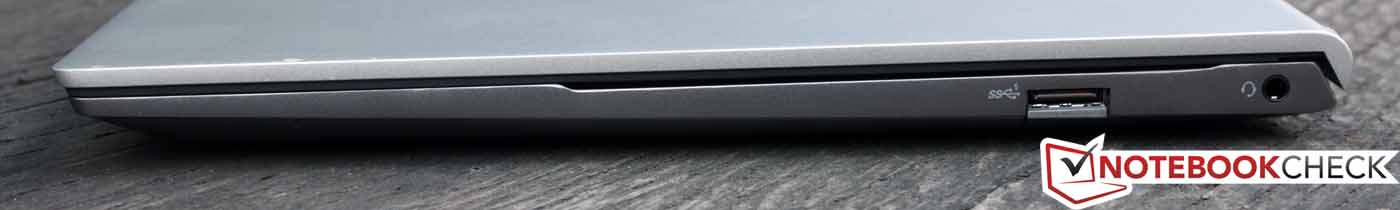
While there is no card reader, there are two Thunderbolt 4 (Type-C) ports that both support DisplayPort. One of them can also handle Power Delivery, and this is also the only way to charge the laptop with the corresponding 65-Watt charger. The remaining USB Type-A port is implemented as a fold-out port, which is a good solution for the visuals.
Wi-Fi 6 AX201 from Intel is used as the WLAN. In our test with our Netgear Nighthawk RAX120 reference router, the transfer rates range between good and slightly below average. Bluetooth 5.2 is included, but nothing else is possible in terms of low power.
Connection Equipment
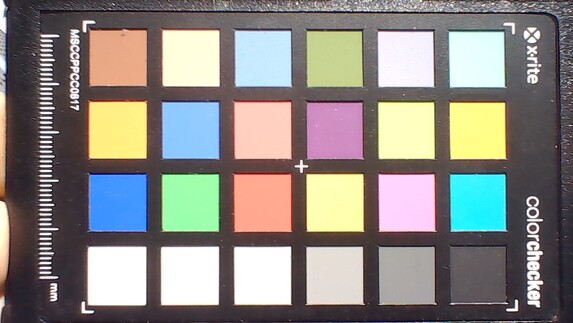
As the webcam, a 720p module with a mechanical shutter continues to be used. It does not offer a good image quality even in good light conditions. There is no IR camera, so Windows Hello cannot be used.


Input Devices
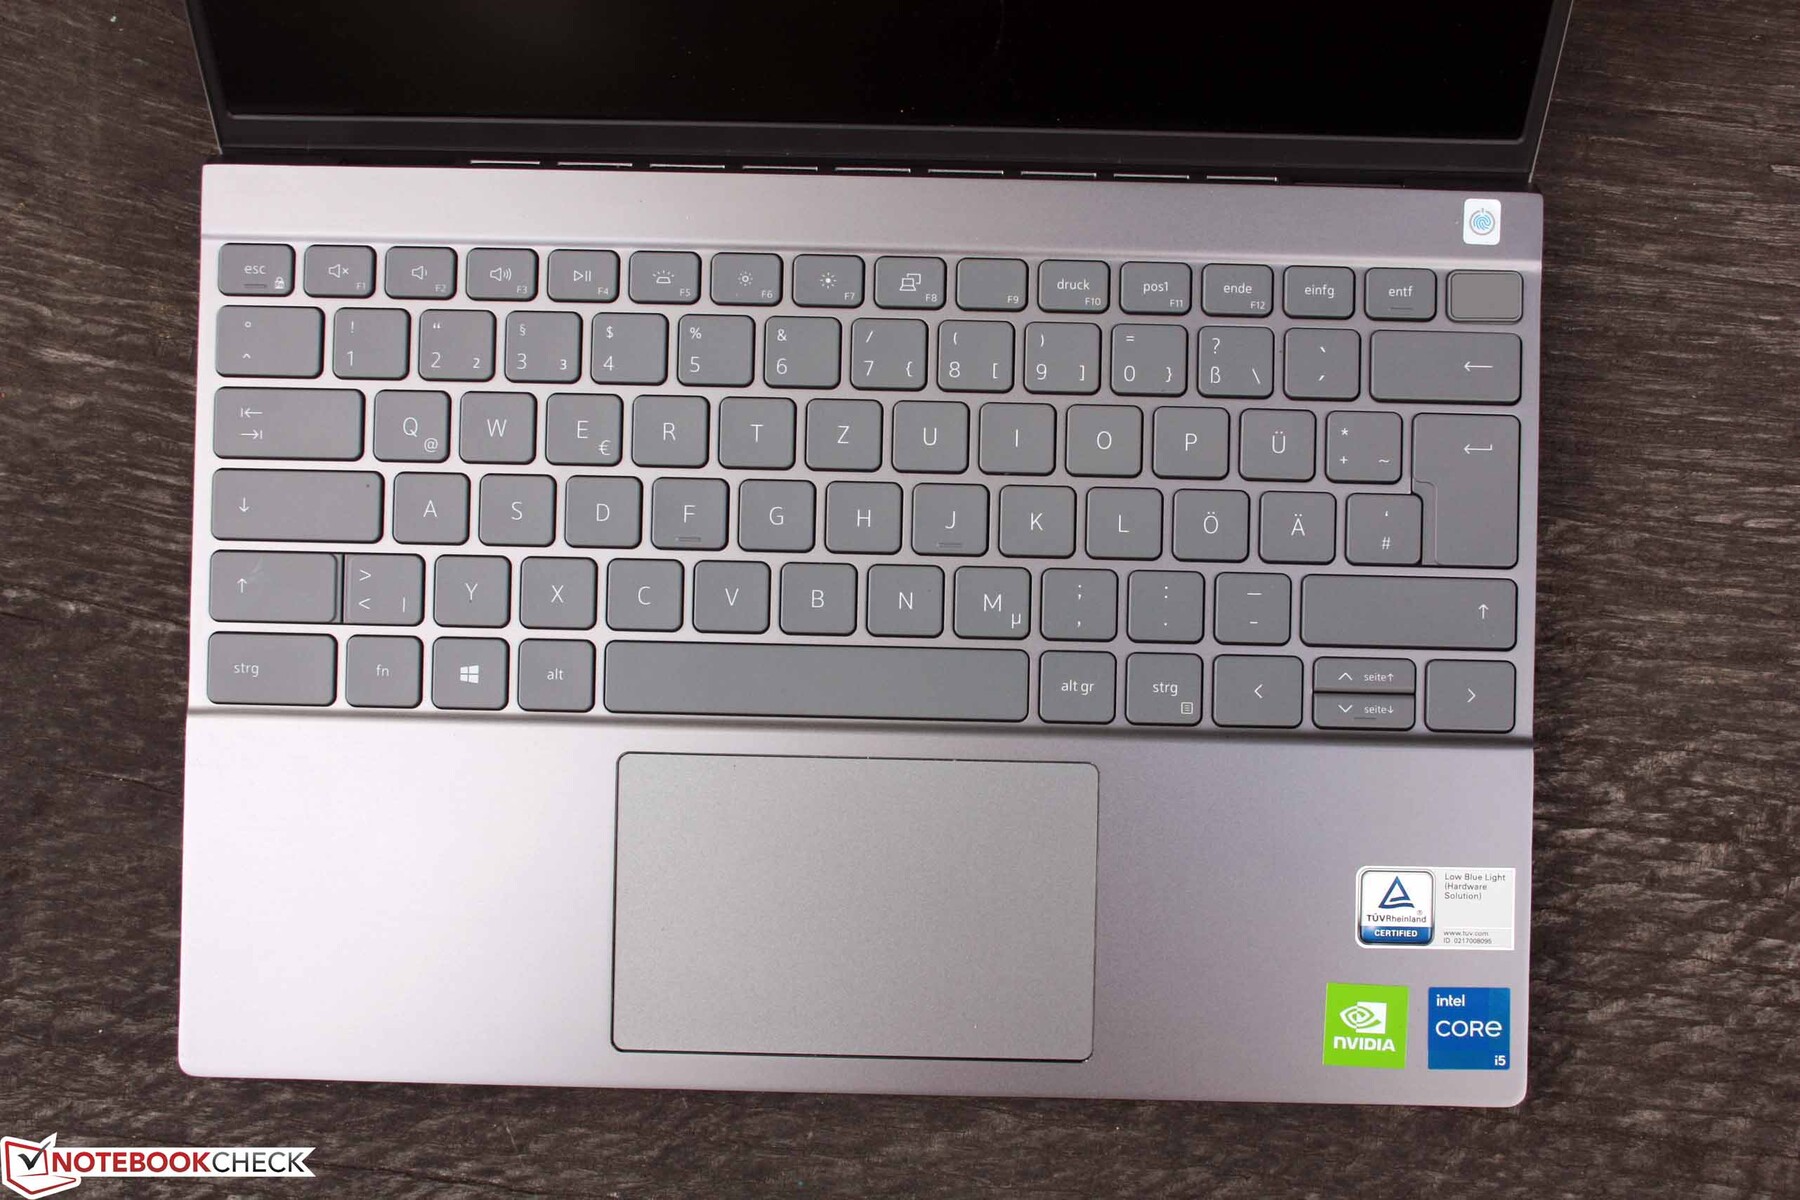
The gray chiclet keyboard suffers from its weak support below, which becomes particularly noticeable when you press the keys with some force. The matte, non-slip keys offer a pronounced pressure point, a moderate stroke height, and a soft stroke. Typing occurs almost silently. Thanks to the white, two-step keyboard background illumination, you can also work without any problems in darker surroundings.
Overall, you can work swiftly using the large Shift, Ctrl, and arrow keys in the wide keyboard area, without the spongy base becoming much of a problem.
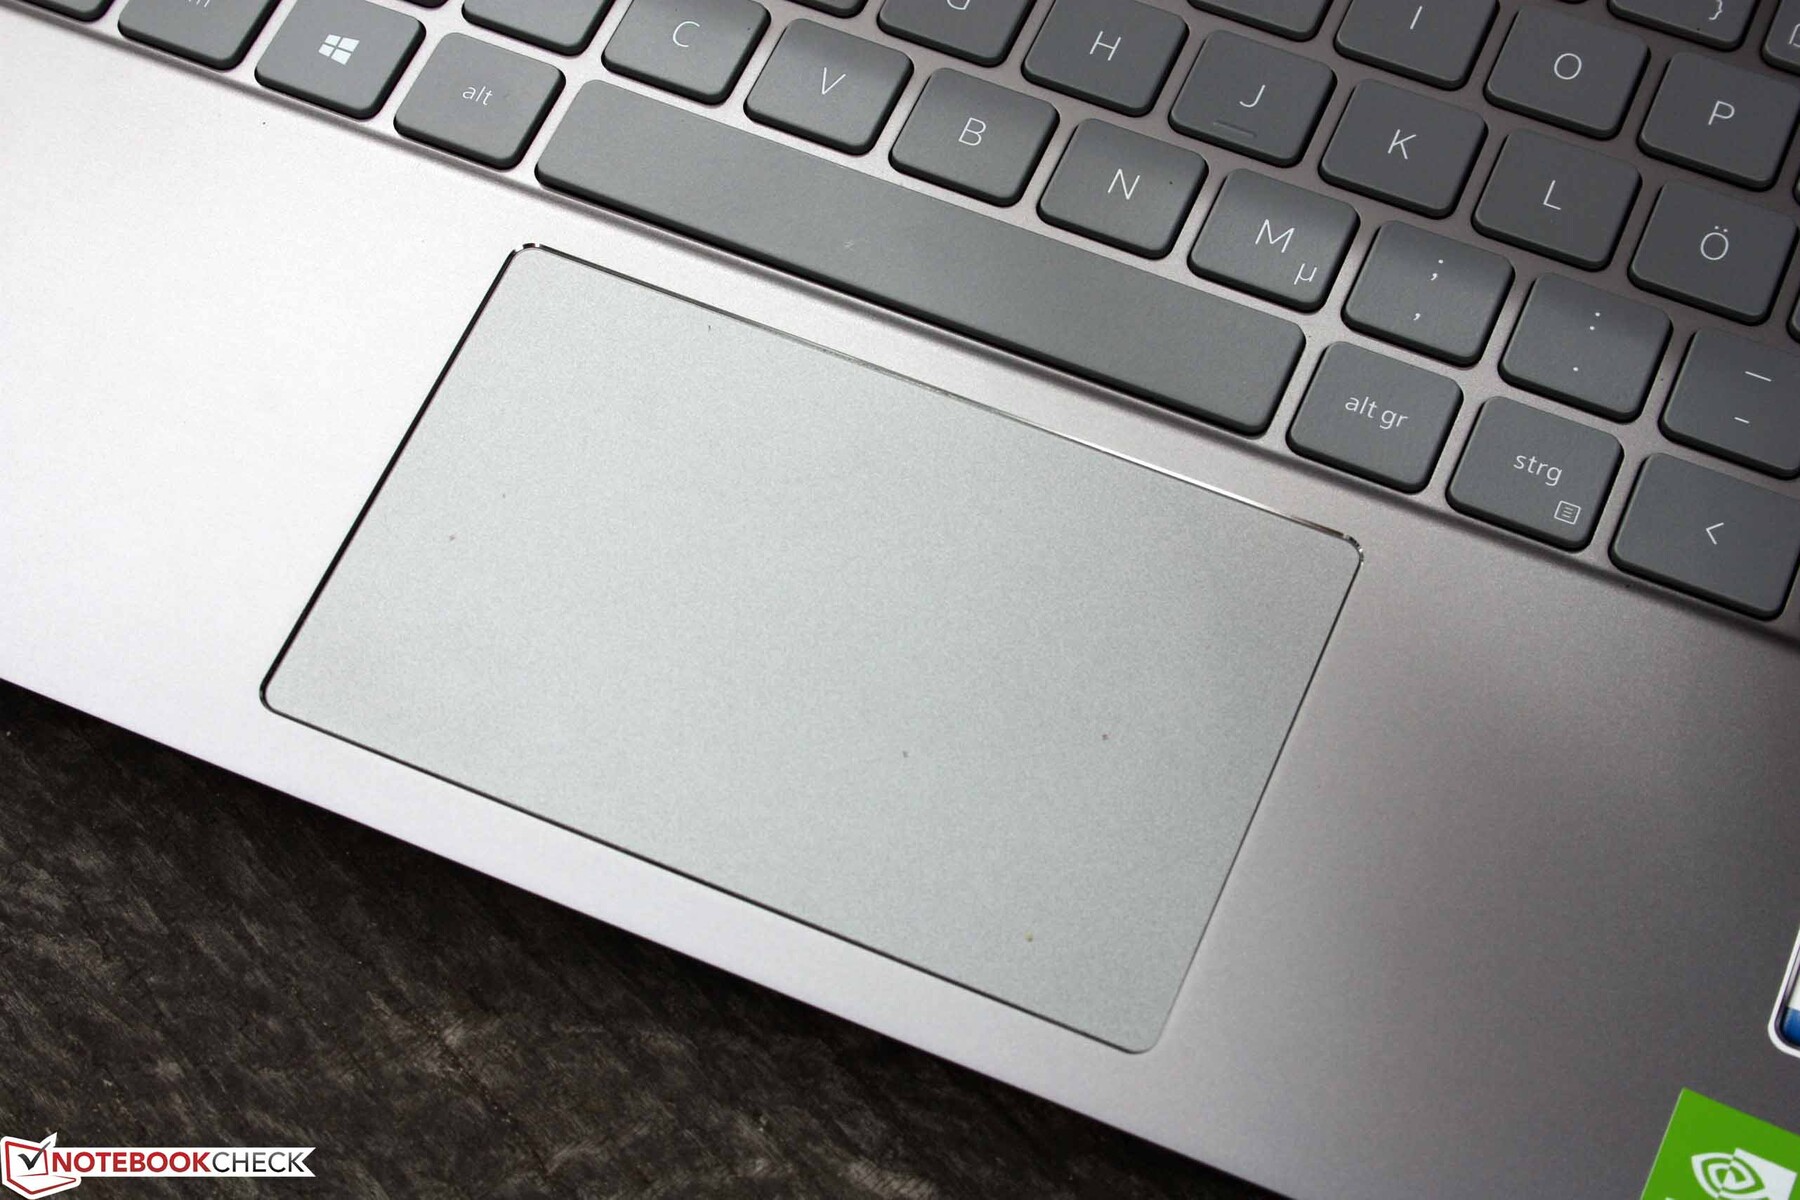
The ClickPad is responsive up to the corners, offers a short stroke height, and operates almost silently. While we find the short stroke unsatisfactory, this might be a matter of personal taste. The matte surface offers a low resistance to the fingers and is not slippery.

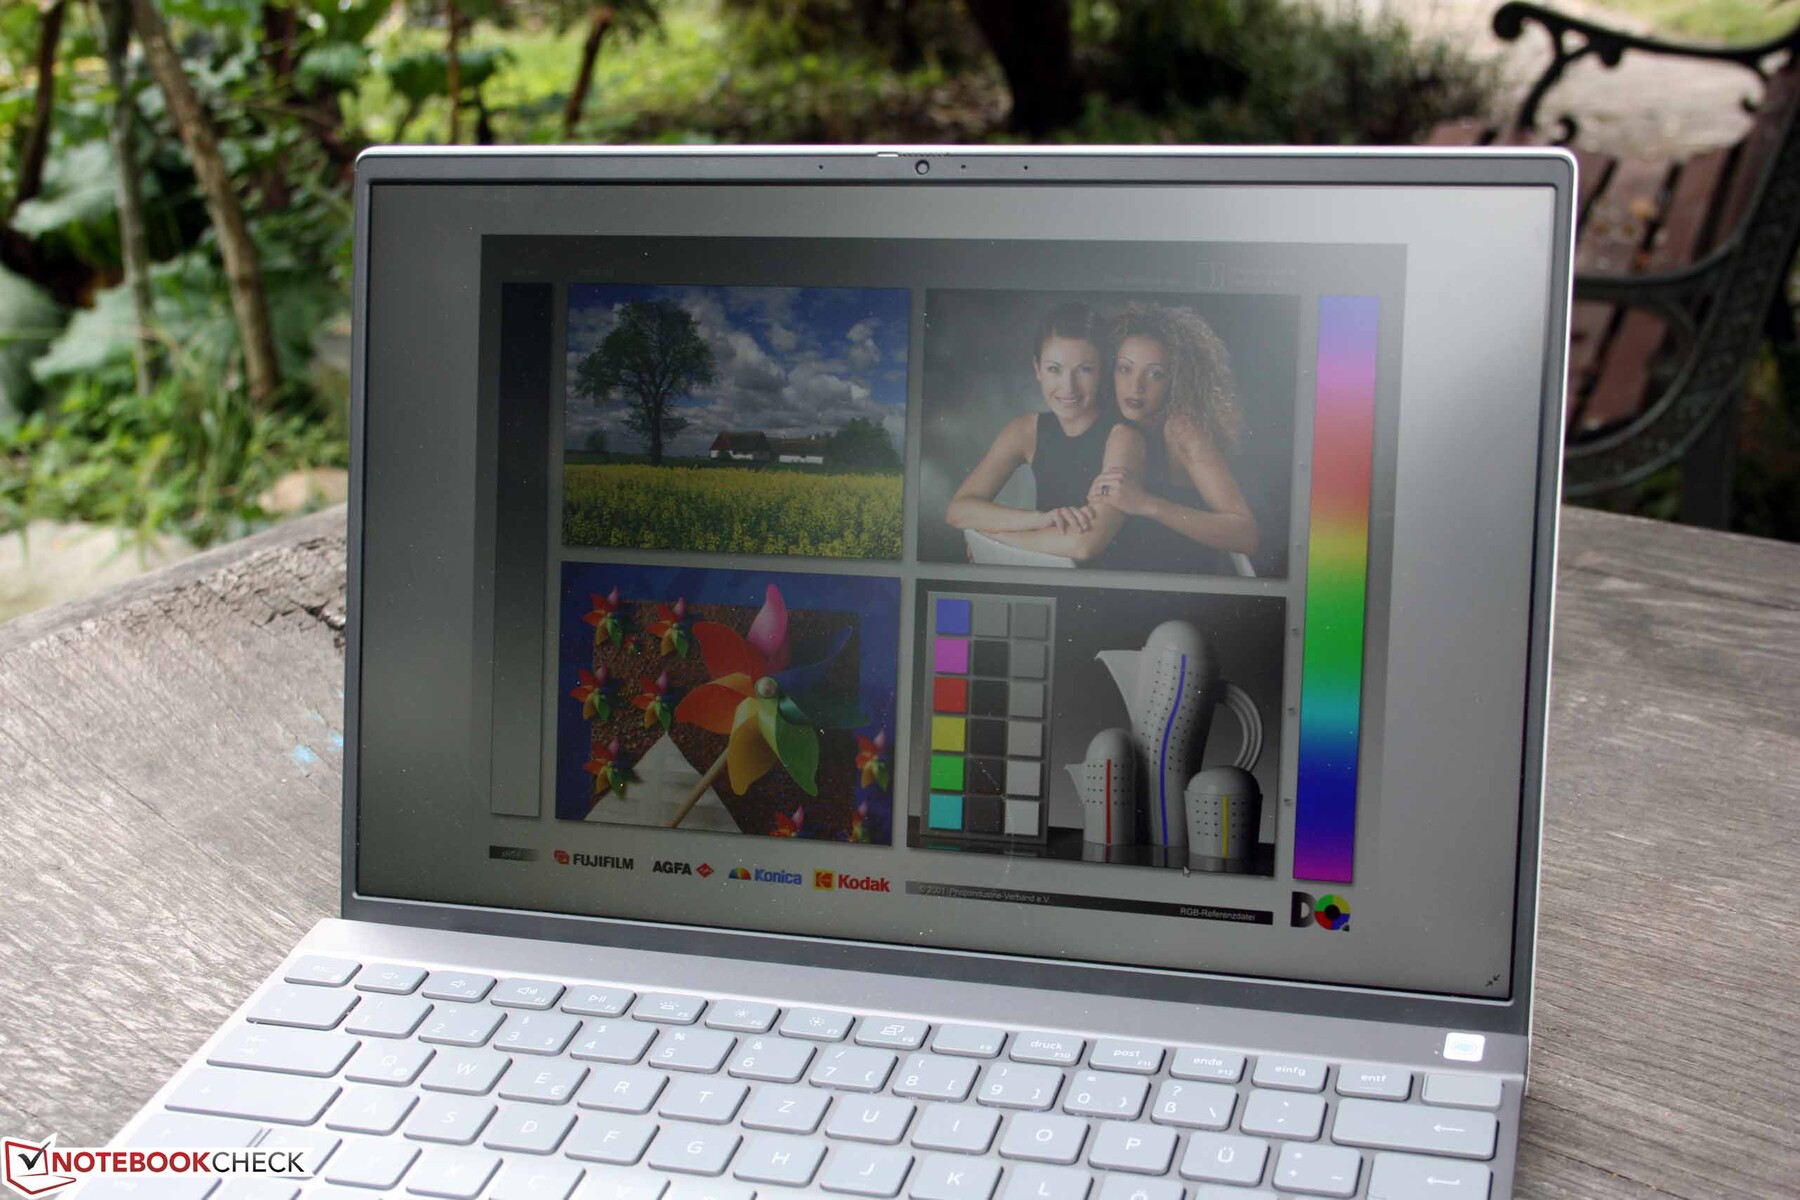
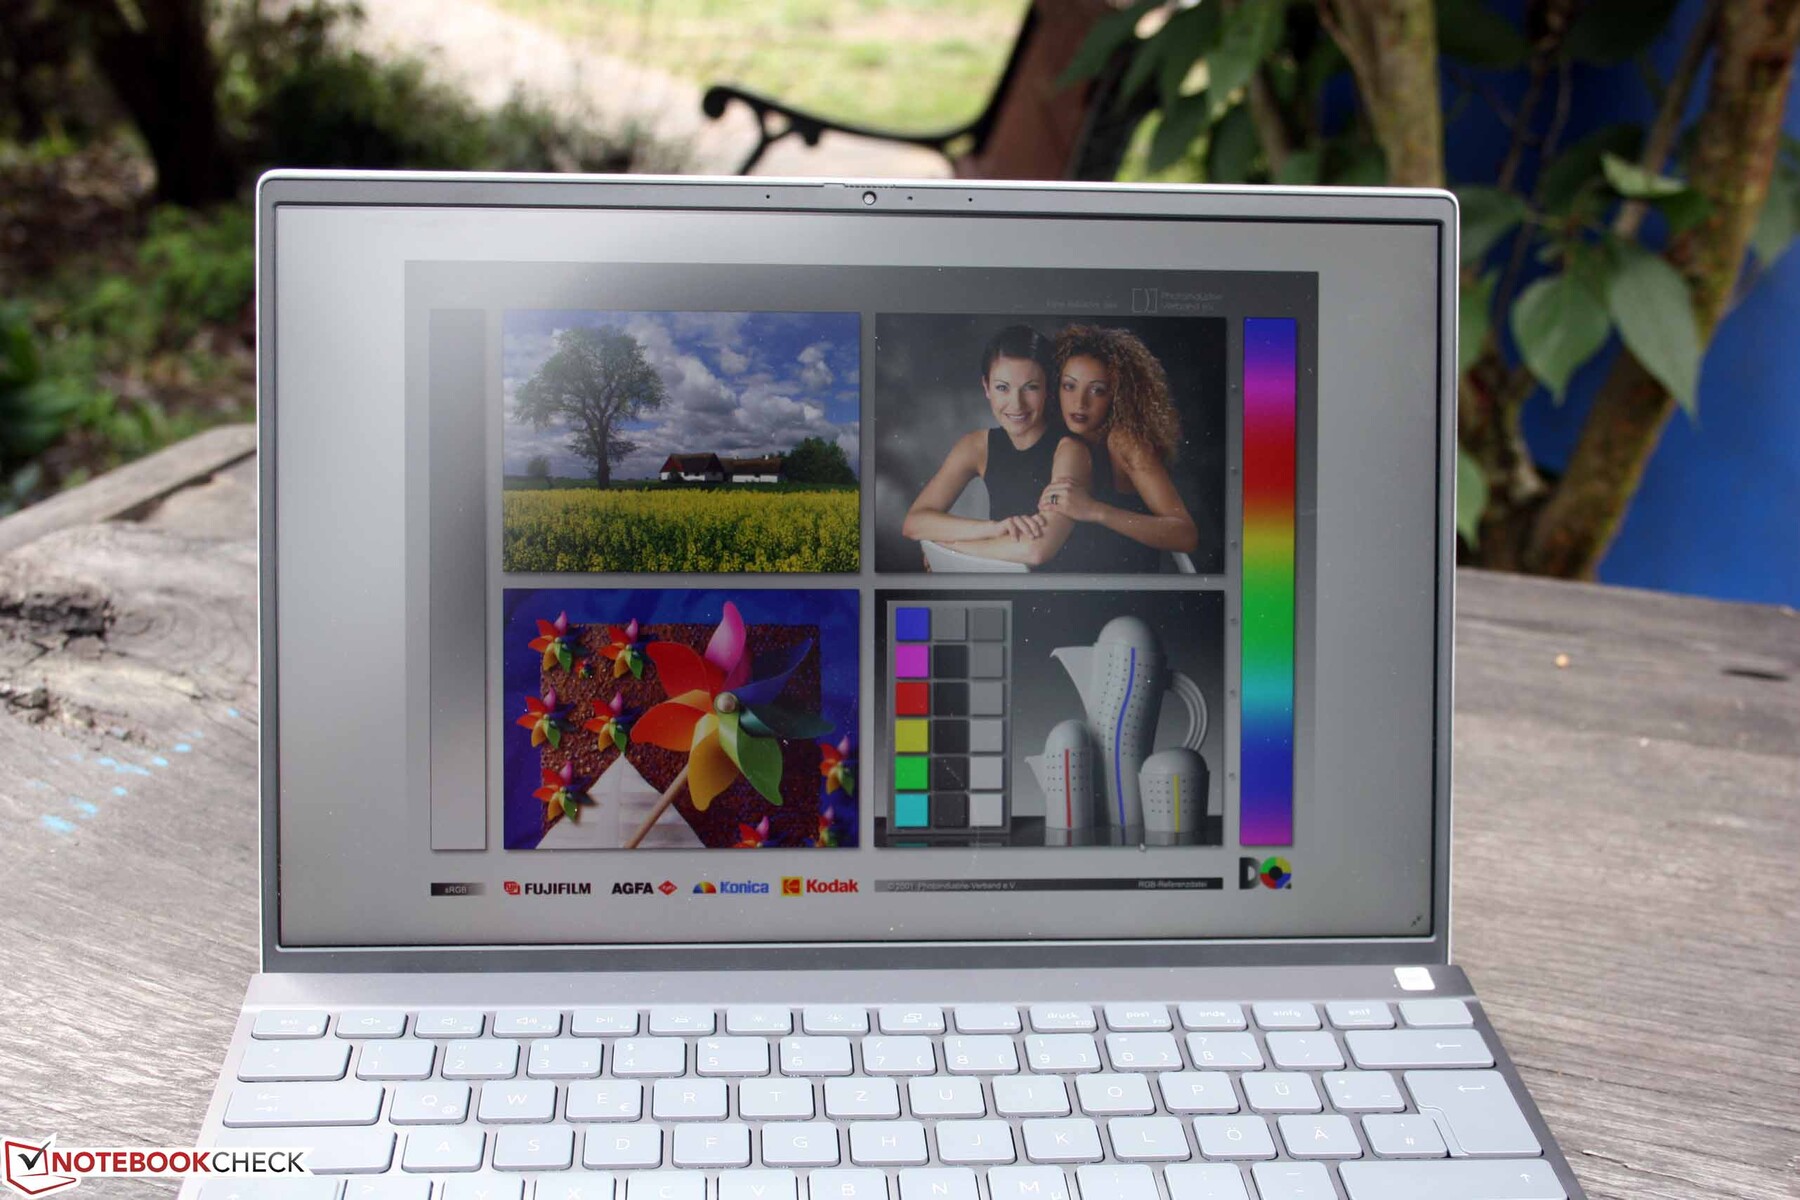
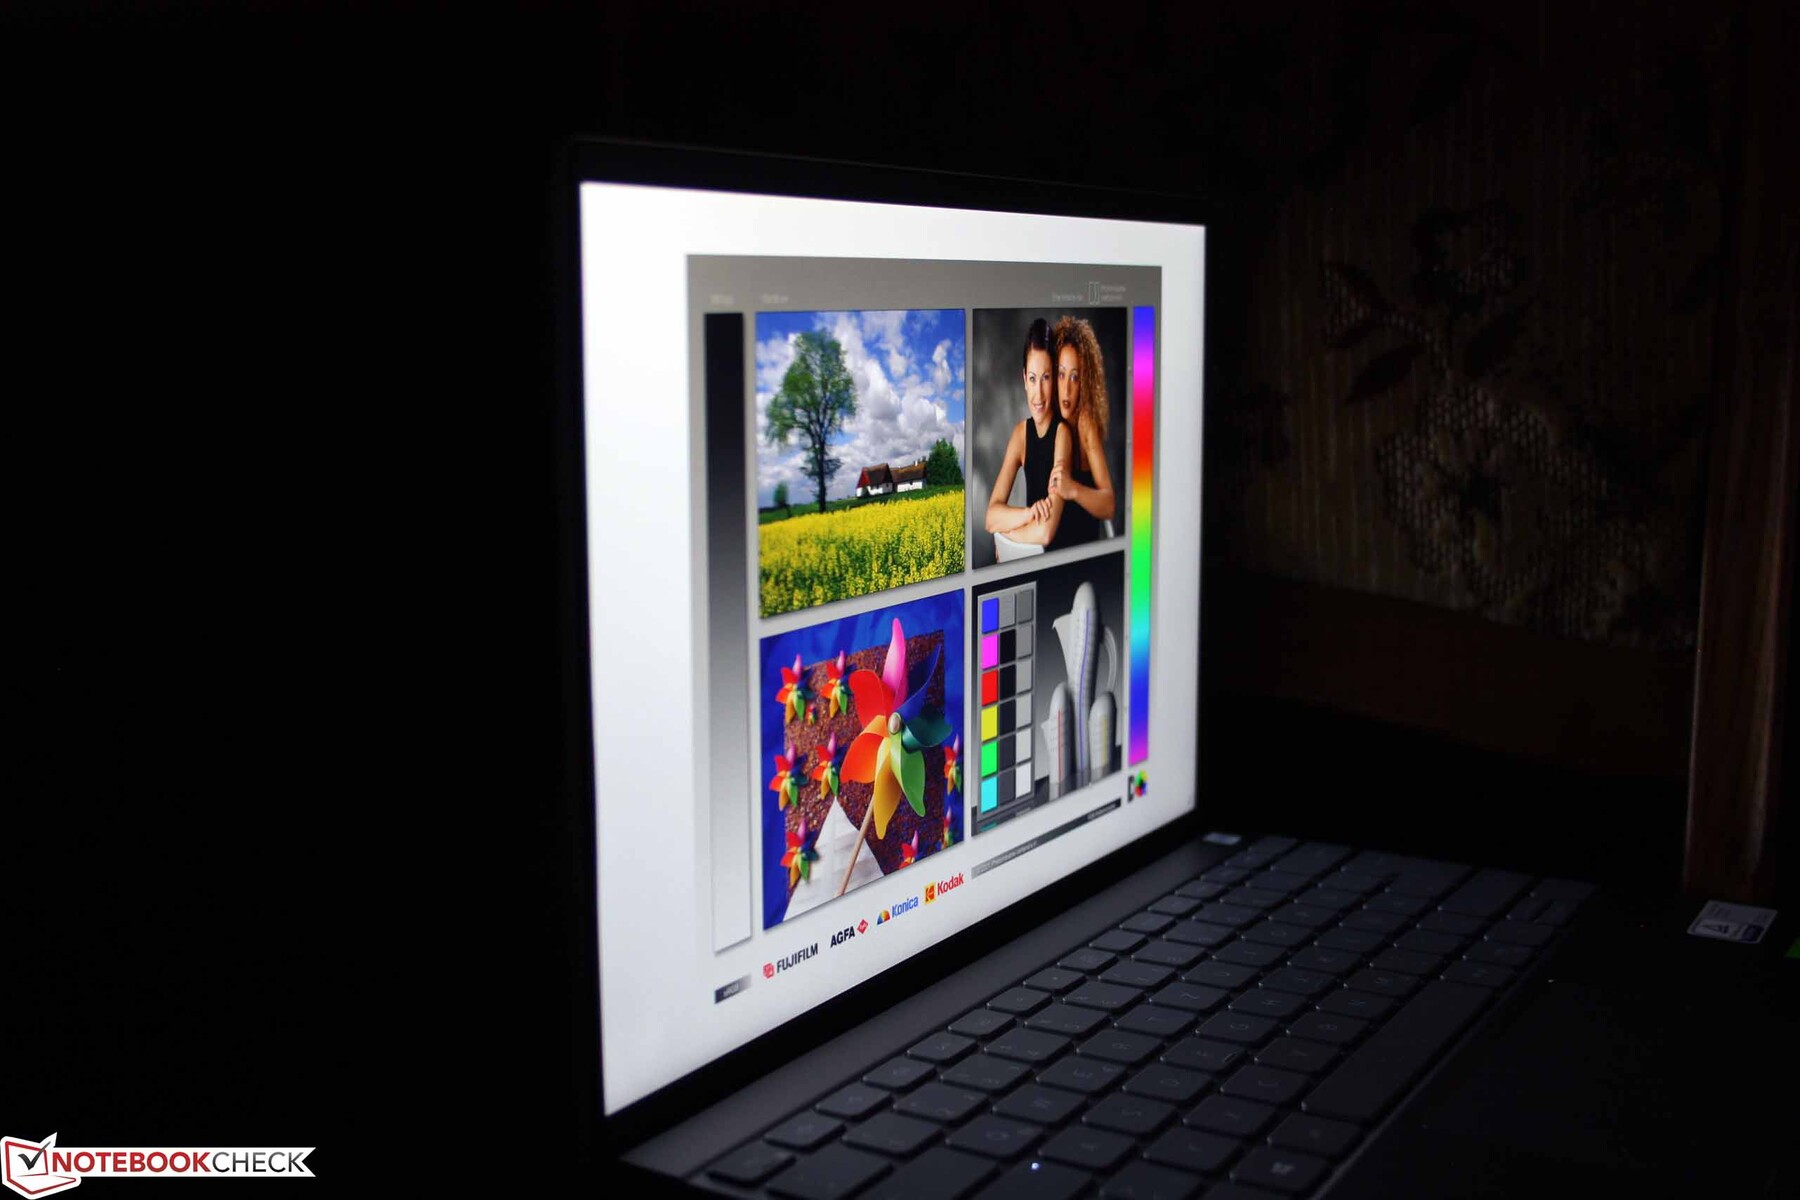
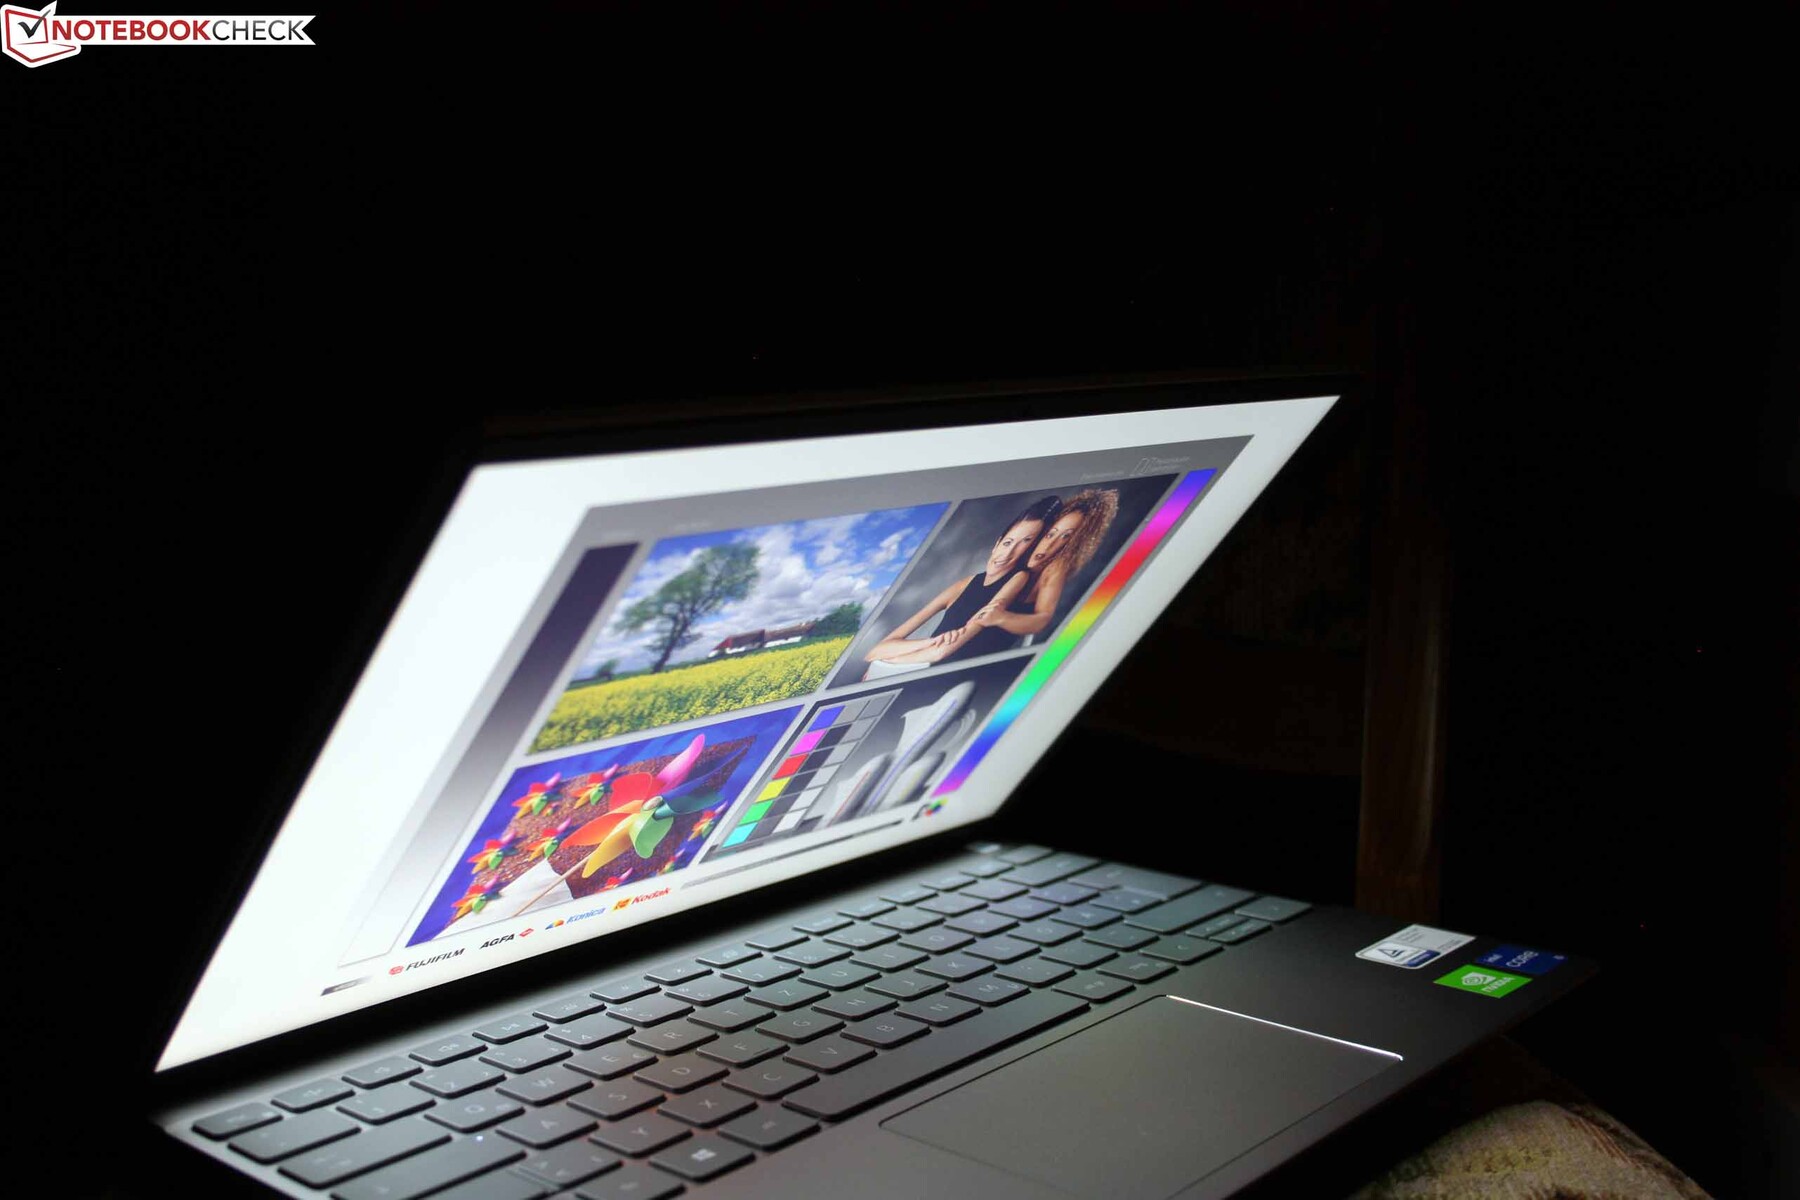
Display
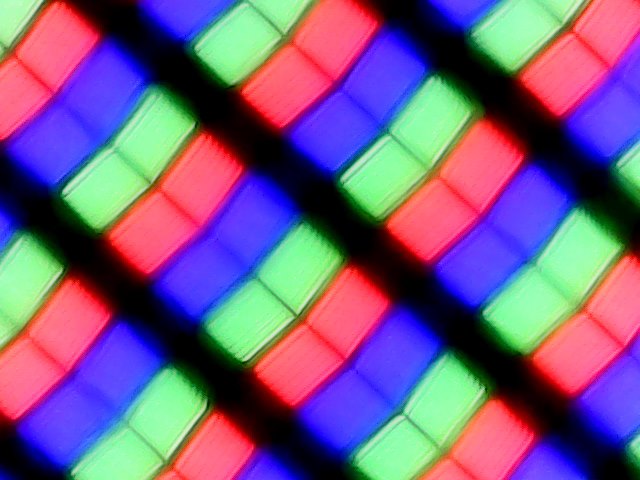
The Full HD AUO panel offers several advantages. It is bright, non-reflective, covers 100% of the sRGB color space, and offers IPS typical wide viewing angles. Sure, the brightness could even be higher for using it outside, but with 318 cd/m² you already have something to work with, particularly since there is no throttling in battery operation.
| |||||||||||||||||||||||||
Brightness Distribution: 88 %
Center on Battery: 338 cd/m²
Contrast: 914:1 (Black: 0.37 cd/m²)
ΔE Color 1.81 | 0.5-29.43 Ø5
ΔE Greyscale 1.89 | 0.57-98 Ø5.3
74.6% AdobeRGB 1998 (Argyll 2.2.0 3D)
100% sRGB (Argyll 2.2.0 3D)
72.9% Display P3 (Argyll 2.2.0 3D)
Gamma: 2.35
| Dell Inspiron 13 5310-NJ24J AUO B133UAN, IPS, 1920x1200, 13.30 | HP Envy 13-ba1475ng CMN139D, IPS, 1920x1080, 13.30 | HP Pavilion Aero 13 be0097nr AU Optronics AUO6496, IPS, 1920x1200, 13.30 | Asus ZenBook 13 UM325S Samsung (SDC4158), OLED, 1920x1080, 13.30 | Asus ZenBook 13 UX325EA Samsung SDC4155 (ATNA33XC09-0), OLED, 1920x1080, 13.30 | Acer Spin 3 SP313-51N-56YV AU Optronics AUOB493, IPS, 2560x1600, 13.30 | |
|---|---|---|---|---|---|---|
| Display | -7% | 0% | 24% | 23% | 4% | |
| Display P3 Coverage | 72.9 | 66.4 -9% | 73.4 1% | 99.9 37% | 99.9 37% | 78.8 8% |
| sRGB Coverage | 100 | 97.6 -2% | 99.8 0% | 100 0% | 100 0% | 99.8 0% |
| AdobeRGB 1998 Coverage | 74.6 | 67.5 -10% | 74.8 0% | 99.7 34% | 97.5 31% | 77.6 4% |
| Response Times | -40% | -16% | 88% | 94% | -36% | |
| Response Time Grey 50% / Grey 80% * | 39 ? | 66 ? -69% | 42.4 ? -9% | 4 ? 90% | 2 ? 95% | 52 ? -33% |
| Response Time Black / White * | 26 ? | 28.8 ? -11% | 31.6 ? -22% | 4 ? 85% | 2 ? 92% | 36 ? -38% |
| PWM Frequency | 26040 ? | 60 ? | 60 ? | |||
| Screen | -19% | -13% | 74% | 2% | -78% | |
| Brightness middle | 338 | 423 25% | 473.9 40% | 370 9% | 390 15% | 338 0% |
| Brightness | 319 | 405 27% | 458 44% | 378 18% | 368 15% | 307 -4% |
| Brightness Distribution | 88 | 83 -6% | 91 3% | 96 9% | 66 -25% | 83 -6% |
| Black Level * | 0.37 | 0.23 38% | 0.36 3% | 0.05 86% | 0.27 27% | |
| Contrast | 914 | 1839 101% | 1316 44% | 7400 710% | 1252 37% | |
| Colorchecker dE 2000 * | 1.81 | 3.2 -77% | 2.99 -65% | 4.33 -139% | 2.03 -12% | 4.63 -156% |
| Colorchecker dE 2000 max. * | 2.77 | 5.8 -109% | 4.35 -57% | 7.04 -154% | 3.14 -13% | 9.99 -261% |
| Greyscale dE 2000 * | 1.89 | 4.7 -149% | 4 -112% | 0.92 51% | 1.28 32% | 6.76 -258% |
| Gamma | 2.35 94% | 1.99 111% | 2.35 94% | 2.38 92% | 2.4 92% | 2.37 93% |
| CCT | 6196 105% | 6362 102% | 6269 104% | 6394 102% | 6359 102% | 5934 110% |
| Colorchecker dE 2000 calibrated * | 1 | 1.1 | 4.14 | 3.1 | 1.64 | |
| Color Space (Percent of AdobeRGB 1998) | 61.9 | 89.4 | 87 | 68 | ||
| Color Space (Percent of sRGB) | 97.5 | 100 | 100 | 98 | ||
| Total Average (Program / Settings) | -22% /
-19% | -10% /
-10% | 62% /
64% | 40% /
24% | -37% /
-52% |
* ... smaller is better
Display Response Times
| ↔ Response Time Black to White | ||
|---|---|---|
| 26 ms ... rise ↗ and fall ↘ combined | ↗ 14 ms rise |  |
| ↘ 12 ms fall | ||
| The screen shows relatively slow response rates in our tests and may be too slow for gamers. In comparison, all tested devices range from 0.1 (minimum) to 240 (maximum) ms. » 57 % of all devices are better. This means that the measured response time is worse than the average of all tested devices (21.5 ms). | ||
| ↔ Response Time 50% Grey to 80% Grey | ||
| 39 ms ... rise ↗ and fall ↘ combined | ↗ 19 ms rise |  |
| ↘ 20 ms fall | ||
| The screen shows slow response rates in our tests and will be unsatisfactory for gamers. In comparison, all tested devices range from 0.2 (minimum) to 636 (maximum) ms. » 53 % of all devices are better. This means that the measured response time is worse than the average of all tested devices (33.7 ms). | ||
Screen Flickering / PWM (Pulse-Width Modulation)
| Screen flickering / PWM not detected |  | ||
In comparison: 53 % of all tested devices do not use PWM to dim the display. If PWM was detected, an average of 17900 (minimum: 5 - maximum: 3846000) Hz was measured. | |||
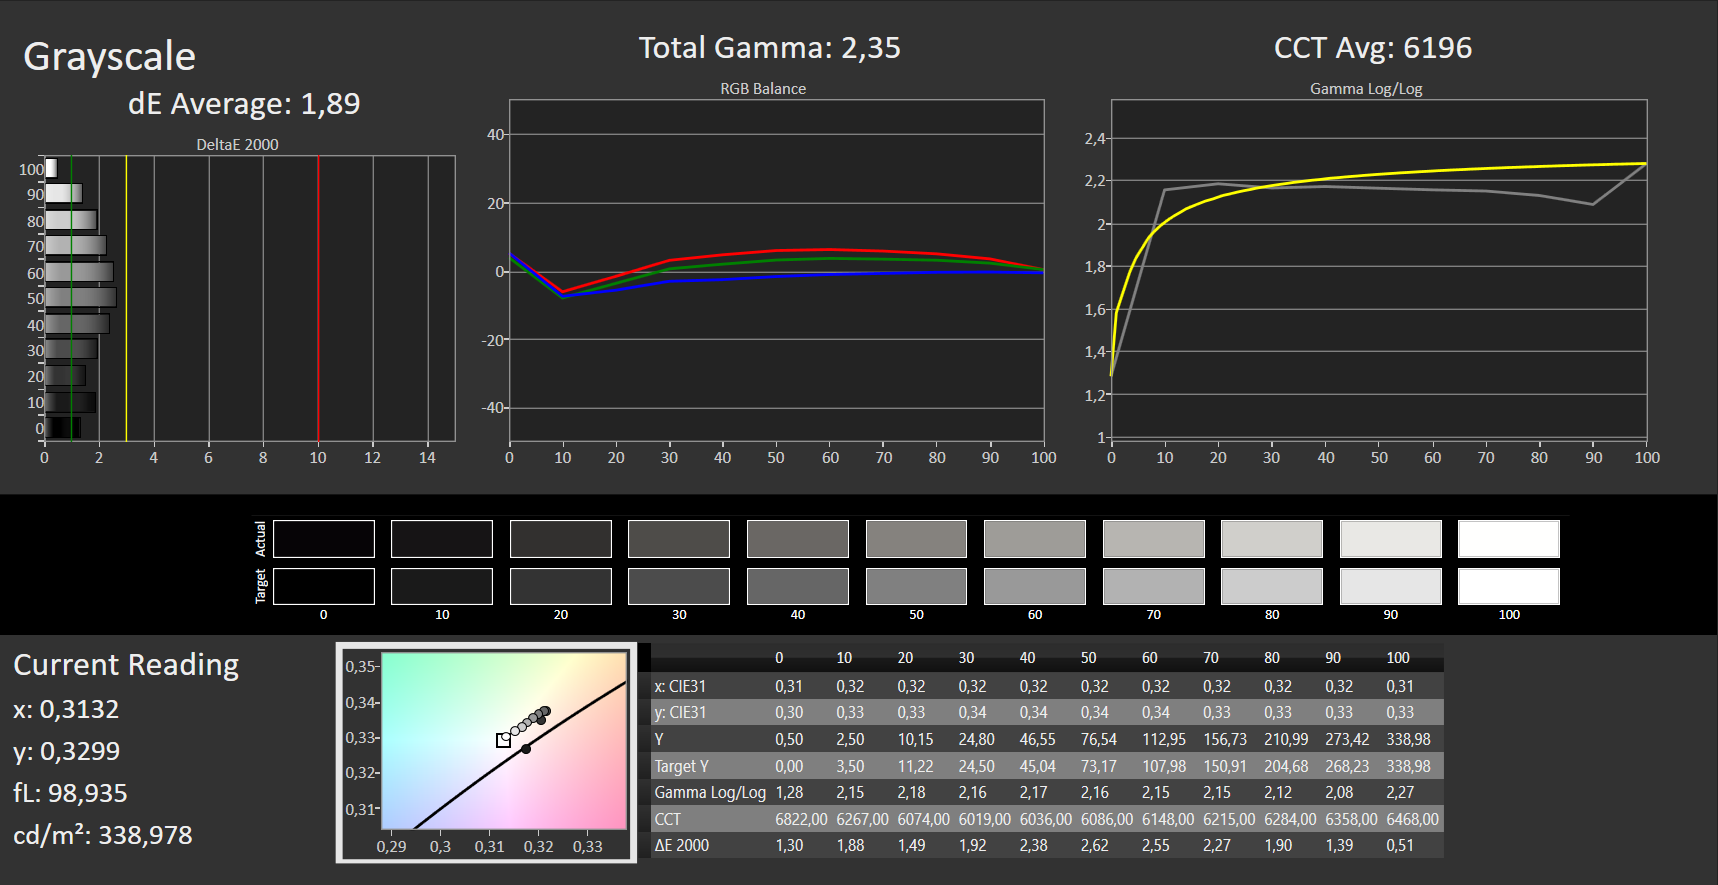
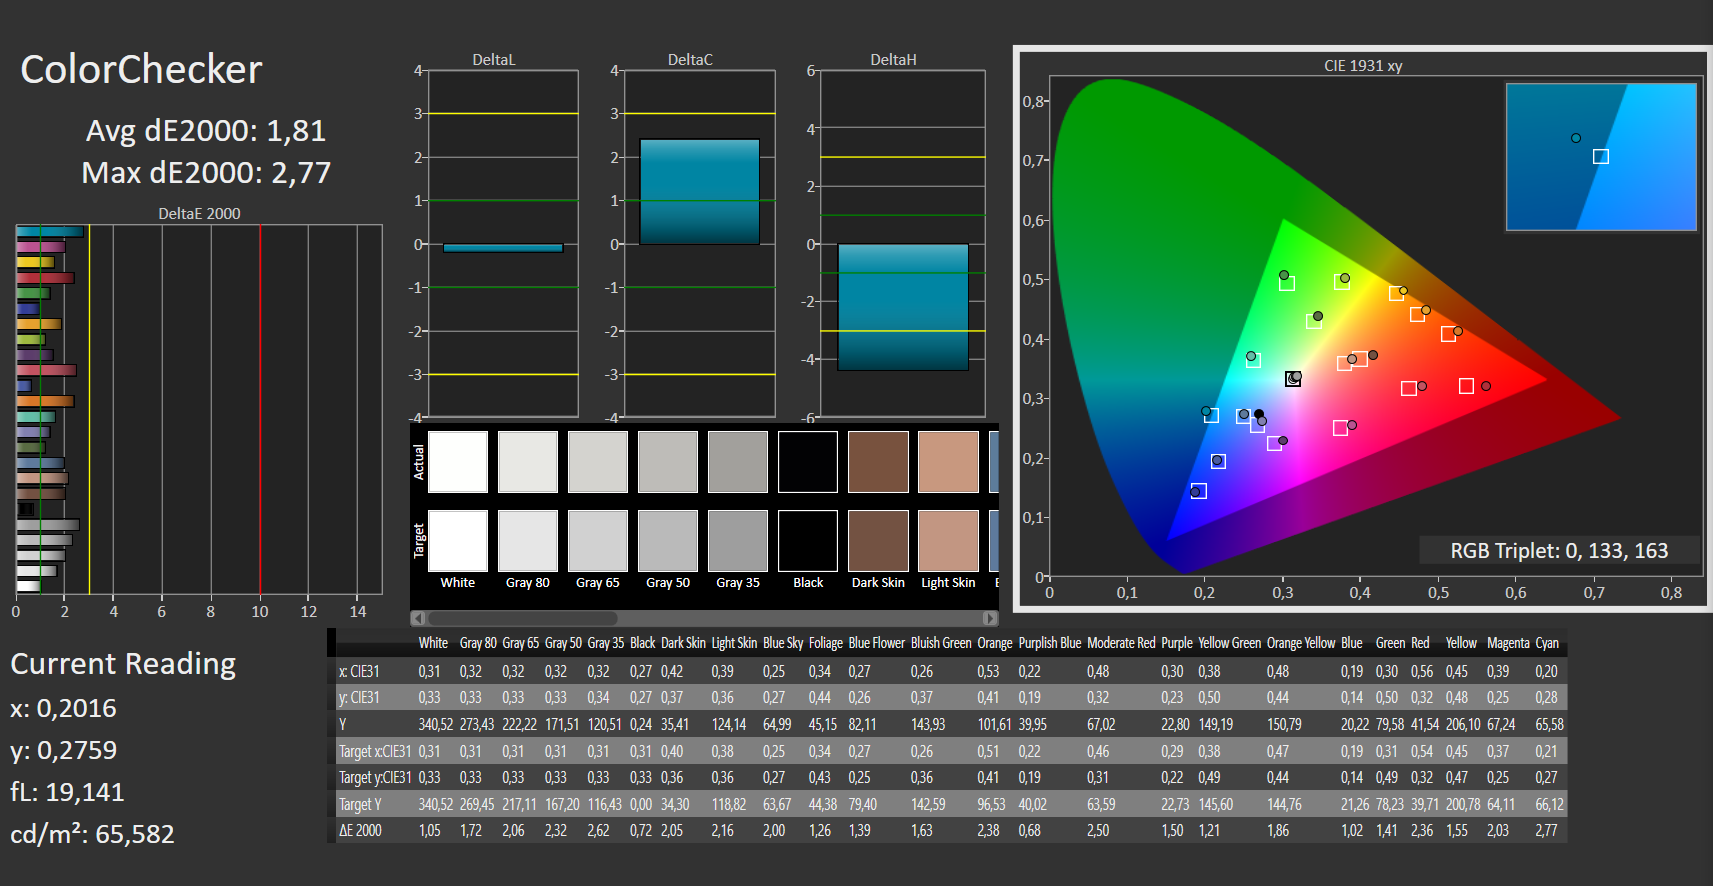
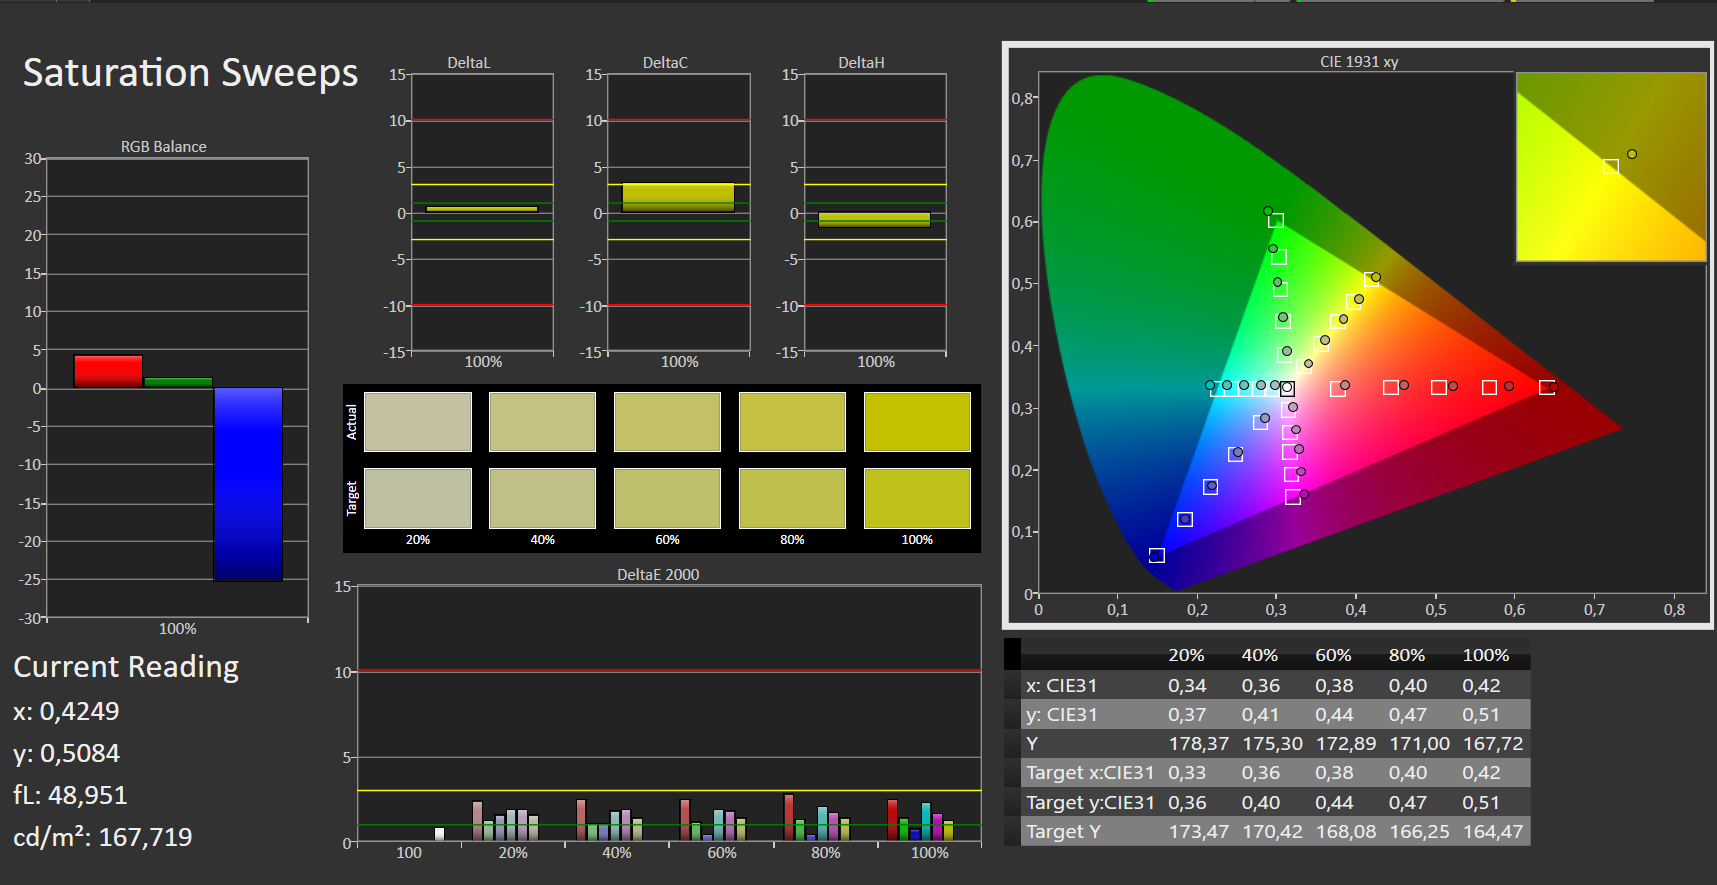
We like the color accuracy: Already in the state of delivery, the Delta E values for the Grayscale and colors are lower than 2.0. So a calibration with the photo spectrometer would be unnecessary, since your eyes would not notice any change, even if there were some more improvements.

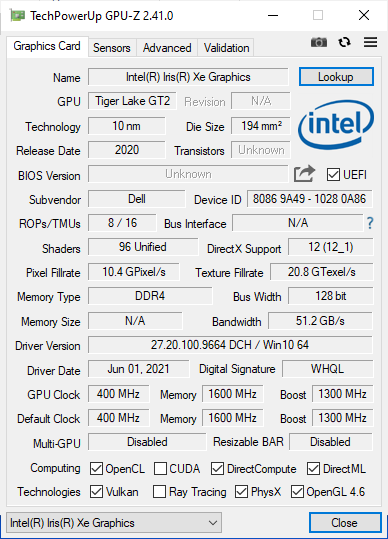
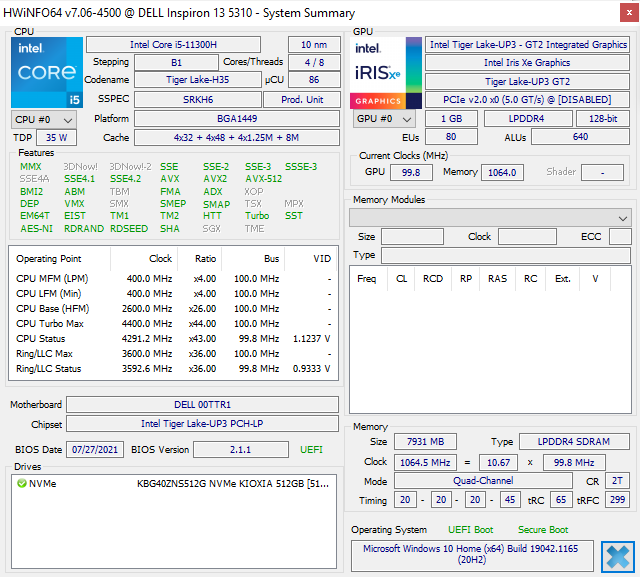
Performance
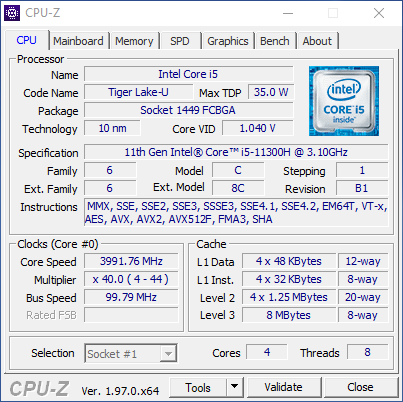
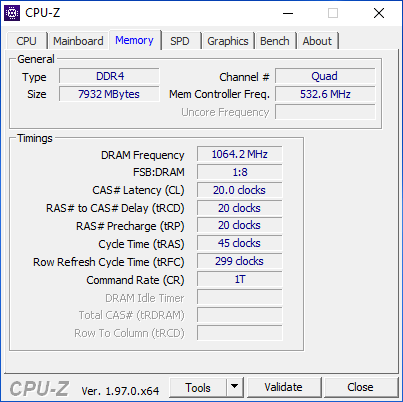
With a Core i5-11300H, 8 GB of onboard RAM (not expandable!), an Nvidia MX450, and a 512 GB SSD from Toshiba, not only does the 5310 correspond to the current state of the art, but it is also a small power house. Those who need even more can also pick the i7-11370H version with 16 GB of RAM. This decision should be well considered, since you cannot expand the RAM.
Processor
Our test unit contains the Core i5-11300H with four cores and a theoretical maximum Turbo clock speed of up to 4.4 GHz (single core). The 35-Watt SoC is really meant for gaming laptops and workstations, and 15-Watt chips are more the standard in subnotebooks.
Cinebench R15 Multi Constant Load Test
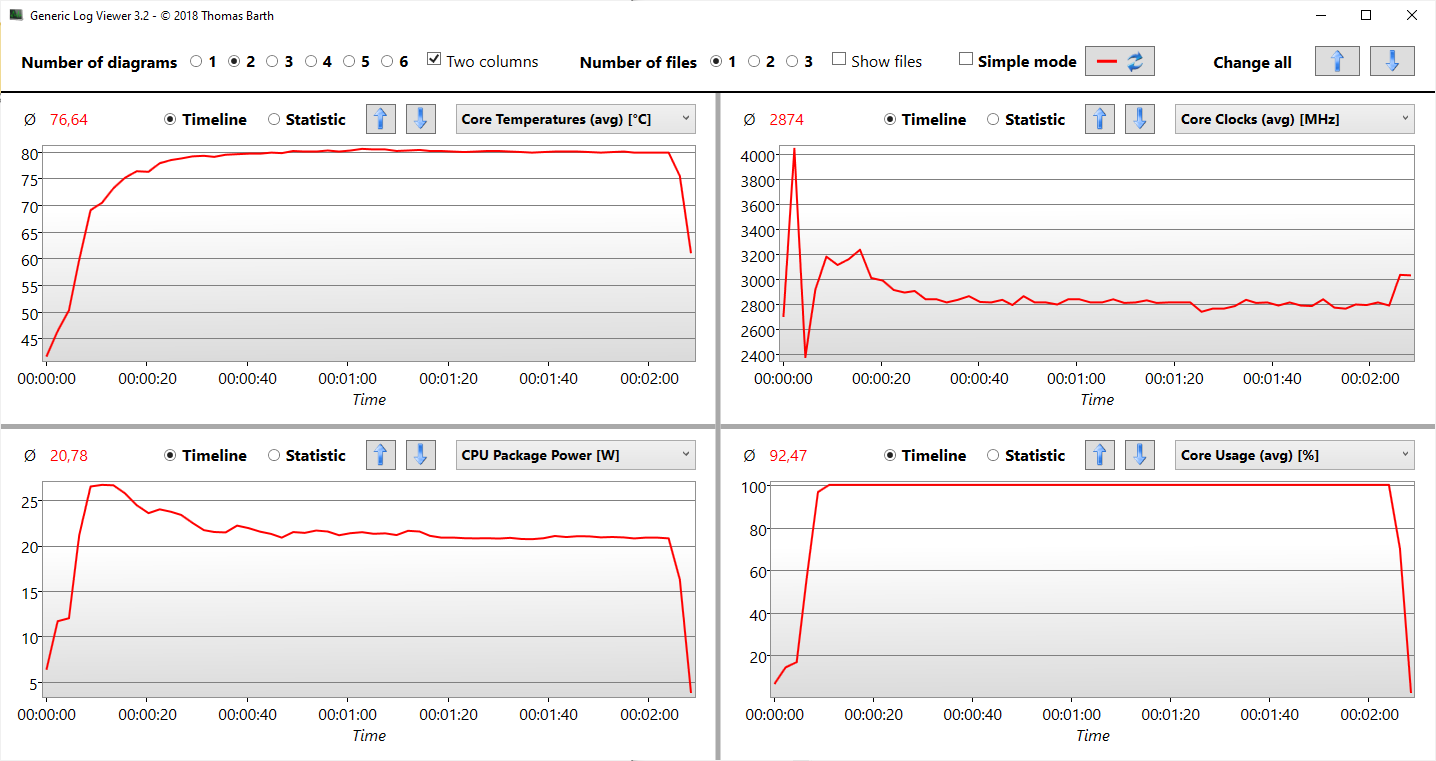
While the processor is able to briefly use up to 28 watts (package power @4.1 GHz) initially, the consumption levels out at 22 watts after several seconds, which corresponds to 4x 2.8 GHz. This configuration is conservative and far from the 35 watts that the SoC should really be able to handle. The limiting factor is the small cooling system of a 13-inch laptop here, bursting our bubble of expecting an amazing performance.
The R15 loop clearly shows that the the i5-11300H is barely ahead of the 15-Watt Tiger Lake i5/i7, particularly under constant load. However, compared to the AMD Ryzen 5000, it has a disadvantage that is very clear (-38%). The single benchmarks show the same picture: just barely better than the Core i7-1165G7 but clearly behind the Ryzen 7 5800U.
Cinebench R20: CPU (Single Core) | CPU (Multi Core)
Cinebench R15: CPU Single 64Bit | CPU Multi 64Bit
Blender: v2.79 BMW27 CPU
7-Zip 18.03: 7z b 4 -mmt1 | 7z b 4
Geekbench 5.5: Single-Core | Multi-Core
HWBOT x265 Benchmark v2.2: 4k Preset
LibreOffice : 20 Documents To PDF
R Benchmark 2.5: Overall mean
| Cinebench R23 / Single Core | |
| Average of class Subnotebook (598 - 1934, n=68, last 2 years) | |
| Asus ZenBook 13 UM325S | |
| Asus ZenBook 13 UX325EA | |
| HP Pavilion Aero 13 be0097nr | |
| Dell Inspiron 13 5310-NJ24J | |
| Dell Inspiron 13 5310-NJ24J | |
| HP Envy 13-ba1475ng | |
| Average Intel Core i5-11300H (1218 - 1431, n=11) | |
| Acer Spin 3 SP313-51N-56YV | |
| Cinebench R23 / Multi Core | |
| Average of class Subnotebook (2485 - 16201, n=68, last 2 years) | |
| Asus ZenBook 13 UM325S | |
| HP Pavilion Aero 13 be0097nr | |
| Dell Inspiron 13 5310-NJ24J | |
| Average Intel Core i5-11300H (3313 - 6581, n=10) | |
| Acer Spin 3 SP313-51N-56YV | |
| HP Envy 13-ba1475ng | |
| Asus ZenBook 13 UX325EA | |
| Cinebench R20 / CPU (Single Core) | |
| Average of class Subnotebook (216 - 738, n=64, last 2 years) | |
| Asus ZenBook 13 UM325S | |
| HP Pavilion Aero 13 be0097nr | |
| HP Envy 13-ba1475ng | |
| Dell Inspiron 13 5310-NJ24J | |
| Dell Inspiron 13 5310-NJ24J | |
| Asus ZenBook 13 UX325EA | |
| Average Intel Core i5-11300H (431 - 548, n=11) | |
| Acer Spin 3 SP313-51N-56YV | |
| Cinebench R20 / CPU (Multi Core) | |
| Average of class Subnotebook (810 - 6314, n=64, last 2 years) | |
| Asus ZenBook 13 UM325S | |
| HP Pavilion Aero 13 be0097nr | |
| Dell Inspiron 13 5310-NJ24J | |
| Average Intel Core i5-11300H (1300 - 2533, n=10) | |
| Acer Spin 3 SP313-51N-56YV | |
| HP Envy 13-ba1475ng | |
| Asus ZenBook 13 UX325EA | |
| Cinebench R15 / CPU Single 64Bit | |
| Average of class Subnotebook (91.8 - 280, n=62, last 2 years) | |
| HP Pavilion Aero 13 be0097nr | |
| Asus ZenBook 13 UM325S | |
| Asus ZenBook 13 UX325EA | |
| HP Envy 13-ba1475ng | |
| Acer Spin 3 SP313-51N-56YV | |
| Average Intel Core i5-11300H (123 - 211, n=8) | |
| Dell Inspiron 13 5310-NJ24J | |
| Dell Inspiron 13 5310-NJ24J | |
| Cinebench R15 / CPU Multi 64Bit | |
| Average of class Subnotebook (514 - 2581, n=70, last 2 years) | |
| Asus ZenBook 13 UM325S | |
| HP Pavilion Aero 13 be0097nr | |
| Average Intel Core i5-11300H (632 - 990, n=11) | |
| Asus ZenBook 13 UX325EA | |
| Acer Spin 3 SP313-51N-56YV | |
| Dell Inspiron 13 5310-NJ24J | |
| HP Envy 13-ba1475ng | |
| Blender / v2.79 BMW27 CPU | |
| Asus ZenBook 13 UX325EA | |
| Acer Spin 3 SP313-51N-56YV | |
| HP Envy 13-ba1475ng | |
| Dell Inspiron 13 5310-NJ24J | |
| Average Intel Core i5-11300H (466 - 862, n=10) | |
| Average of class Subnotebook (201 - 1600, n=66, last 2 years) | |
| Asus ZenBook 13 UM325S | |
| HP Pavilion Aero 13 be0097nr | |
| 7-Zip 18.03 / 7z b 4 -mmt1 | |
| HP Pavilion Aero 13 be0097nr | |
| Asus ZenBook 13 UM325S | |
| Average of class Subnotebook (2197 - 6403, n=58, last 2 years) | |
| Asus ZenBook 13 UX325EA | |
| HP Envy 13-ba1475ng | |
| Average Intel Core i5-11300H (4603 - 4969, n=10) | |
| Dell Inspiron 13 5310-NJ24J | |
| Acer Spin 3 SP313-51N-56YV | |
| 7-Zip 18.03 / 7z b 4 | |
| Average of class Subnotebook (16223 - 67444, n=57, last 2 years) | |
| HP Pavilion Aero 13 be0097nr | |
| Asus ZenBook 13 UM325S | |
| Dell Inspiron 13 5310-NJ24J | |
| Average Intel Core i5-11300H (17573 - 26001, n=10) | |
| Asus ZenBook 13 UX325EA | |
| Acer Spin 3 SP313-51N-56YV | |
| HP Envy 13-ba1475ng | |
| Geekbench 5.5 / Single-Core | |
| Average of class Subnotebook (672 - 2350, n=65, last 2 years) | |
| Asus ZenBook 13 UX325EA | |
| HP Envy 13-ba1475ng | |
| Asus ZenBook 13 UM325S | |
| Dell Inspiron 13 5310-NJ24J | |
| Average Intel Core i5-11300H (1342 - 1462, n=10) | |
| Acer Spin 3 SP313-51N-56YV | |
| Geekbench 5.5 / Multi-Core | |
| Average of class Subnotebook (4274 - 12580, n=65, last 2 years) | |
| Asus ZenBook 13 UM325S | |
| Asus ZenBook 13 UX325EA | |
| Dell Inspiron 13 5310-NJ24J | |
| Acer Spin 3 SP313-51N-56YV | |
| HP Envy 13-ba1475ng | |
| Average Intel Core i5-11300H (3631 - 5499, n=10) | |
| HWBOT x265 Benchmark v2.2 / 4k Preset | |
| Average of class Subnotebook (1.5 - 19.4, n=56, last 2 years) | |
| HP Pavilion Aero 13 be0097nr | |
| Asus ZenBook 13 UM325S | |
| Average Intel Core i5-11300H (4.32 - 8.38, n=10) | |
| Dell Inspiron 13 5310-NJ24J | |
| Acer Spin 3 SP313-51N-56YV | |
| HP Envy 13-ba1475ng | |
| Asus ZenBook 13 UX325EA | |
| LibreOffice / 20 Documents To PDF | |
| Asus ZenBook 13 UX325EA | |
| HP Envy 13-ba1475ng | |
| Asus ZenBook 13 UM325S | |
| Dell Inspiron 13 5310-NJ24J | |
| HP Pavilion Aero 13 be0097nr | |
| Average of class Subnotebook (40.1 - 120.5, n=57, last 2 years) | |
| Average Intel Core i5-11300H (43.6 - 59.4, n=10) | |
| Acer Spin 3 SP313-51N-56YV | |
| R Benchmark 2.5 / Overall mean | |
| Acer Spin 3 SP313-51N-56YV | |
| Dell Inspiron 13 5310-NJ24J | |
| Average Intel Core i5-11300H (0.6 - 0.644, n=10) | |
| HP Envy 13-ba1475ng | |
| Asus ZenBook 13 UX325EA | |
| Asus ZenBook 13 UM325S | |
| HP Pavilion Aero 13 be0097nr | |
| Average of class Subnotebook (0.4397 - 1.236, n=57, last 2 years) | |
* ... smaller is better
System Performance
Despite the slightly sobering CPU performance, the subjective impression of the system performance is excellent. First, this is a capable and powerful mobile processor, and second the Dell 5310 is of course also equipped with a fast NVMe SSD, so inputs are implemented without any noticeable delays. The synthetic PCMark 10 benchmark also determines good results in the middle of the field.
| PCMark 10 / Score | |
| Asus ZenBook 13 UM325S | |
| Average of class Subnotebook (4384 - 7428, n=55, last 2 years) | |
| HP Pavilion Aero 13 be0097nr | |
| Dell Inspiron 13 5310-NJ24J | |
| Average Intel Core i5-11300H, NVIDIA GeForce MX450 (4899 - 5391, n=3) | |
| HP Envy 13-ba1475ng | |
| Asus ZenBook 13 UX325EA | |
| Acer Spin 3 SP313-51N-56YV | |
| PCMark 10 / Essentials | |
| Average of class Subnotebook (8890 - 11168, n=55, last 2 years) | |
| HP Pavilion Aero 13 be0097nr | |
| Asus ZenBook 13 UM325S | |
| Asus ZenBook 13 UX325EA | |
| Acer Spin 3 SP313-51N-56YV | |
| HP Envy 13-ba1475ng | |
| Dell Inspiron 13 5310-NJ24J | |
| Average Intel Core i5-11300H, NVIDIA GeForce MX450 (8366 - 8931, n=3) | |
| PCMark 10 / Productivity | |
| Asus ZenBook 13 UM325S | |
| Dell Inspiron 13 5310-NJ24J | |
| HP Pavilion Aero 13 be0097nr | |
| Average Intel Core i5-11300H, NVIDIA GeForce MX450 (8292 - 9188, n=3) | |
| HP Envy 13-ba1475ng | |
| Average of class Subnotebook (6213 - 10279, n=55, last 2 years) | |
| Asus ZenBook 13 UX325EA | |
| Acer Spin 3 SP313-51N-56YV | |
| PCMark 10 / Digital Content Creation | |
| Average of class Subnotebook (4093 - 9749, n=55, last 2 years) | |
| HP Pavilion Aero 13 be0097nr | |
| Asus ZenBook 13 UM325S | |
| Dell Inspiron 13 5310-NJ24J | |
| Average Intel Core i5-11300H, NVIDIA GeForce MX450 (4600 - 5388, n=3) | |
| HP Envy 13-ba1475ng | |
| Acer Spin 3 SP313-51N-56YV | |
| Asus ZenBook 13 UX325EA | |
| PCMark 10 Score | 5391 points | |
Help | ||
DPC Latencies
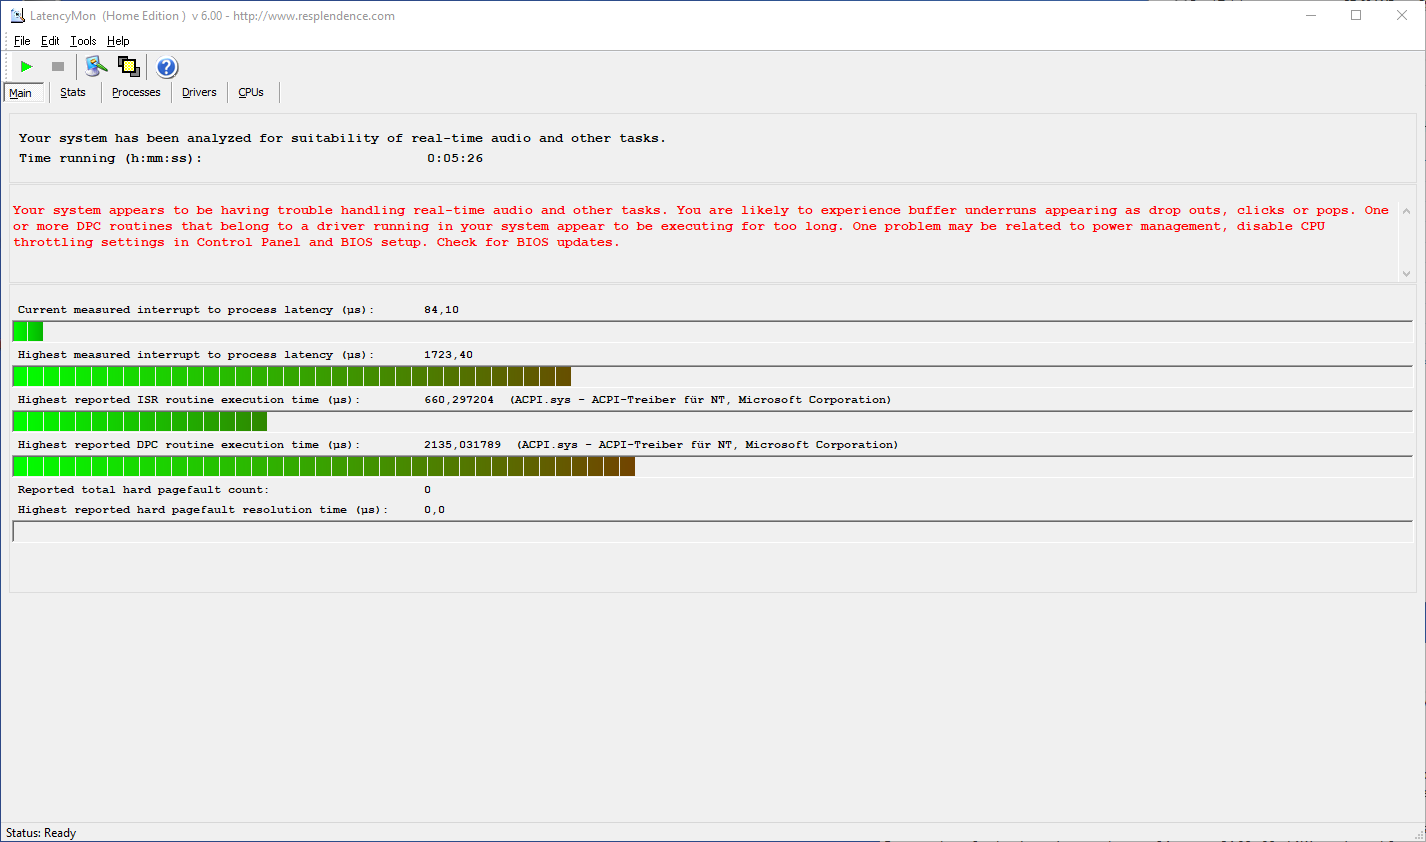
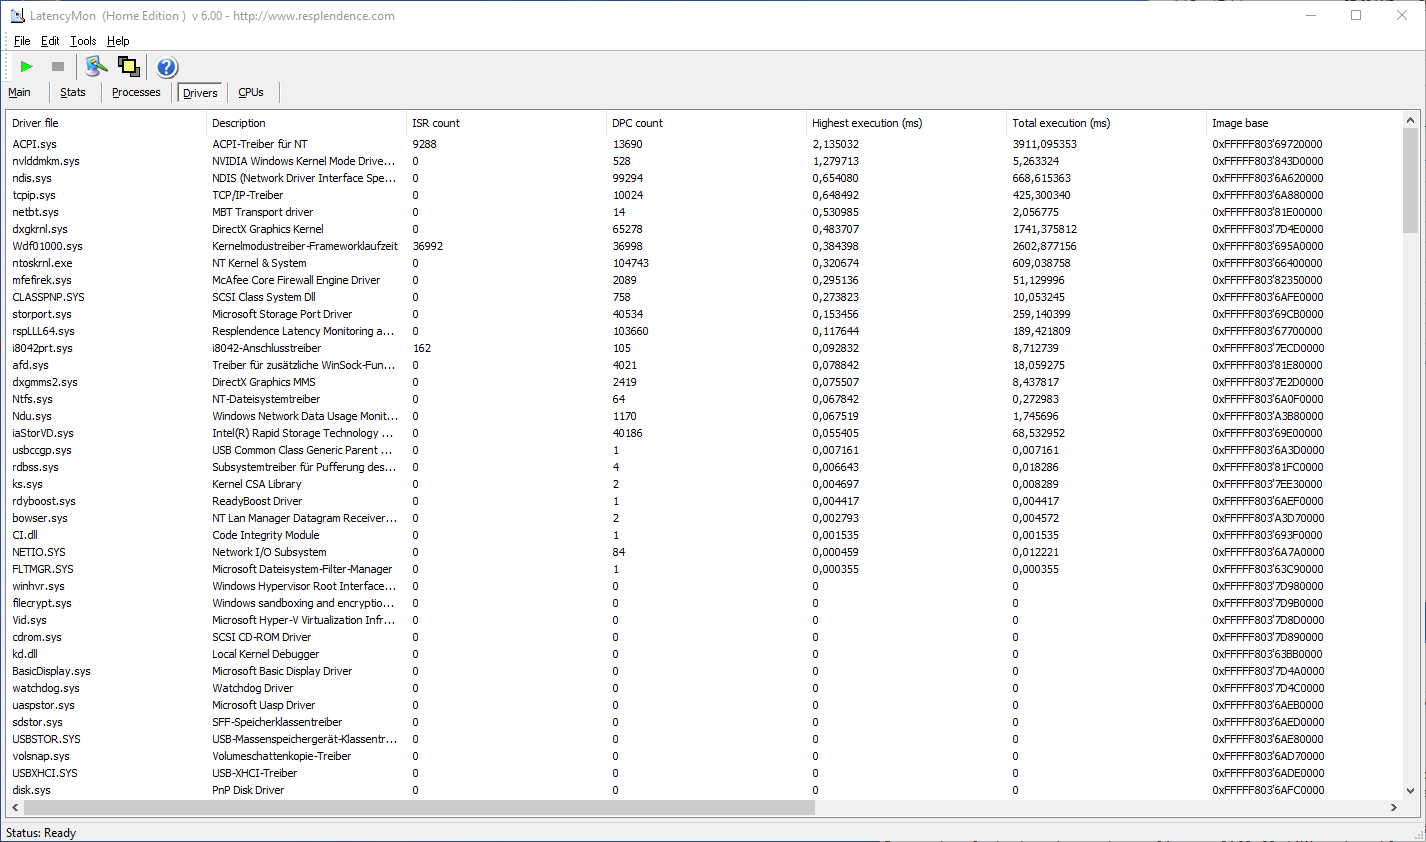
In our standardized latency test (surfing the Internet, YouTube 4K video reproduction, CPU load), our test unit shows some problems with elevated latencies. The reason are the ACPI drivers. This means that the driver configuration we have here is therefore not suited for real-time audio applications. However, there were no dropped frames during video reproduction.
| DPC Latencies / LatencyMon - interrupt to process latency (max), Web, Youtube, Prime95 | |
| Dell Inspiron 13 5310-NJ24J | |
| Acer Spin 3 SP313-51N-56YV | |
| HP Envy 13-ba1475ng | |
| Asus ZenBook 13 UX325EA | |
| HP Pavilion Aero 13 be0097nr | |
| Asus ZenBook 13 UM325S | |
* ... smaller is better
Storage Solution
While the Toshiba NVMe SSD is able to stand up well against the Intel SSDs, it does not belong to the top league. The SK Hynix in the Asus ZenBook 13 UM325S shows us what is possible here.
| Dell Inspiron 13 5310-NJ24J Toshiba KBG40ZNS512G NVMe | HP Envy 13-ba1475ng Intel SSD 660p SSDPEKNW512G8 | HP Pavilion Aero 13 be0097nr Intel SSD 660p SSDPEKNW512G8 | Asus ZenBook 13 UM325S SK Hynix HFM001TD3JX013N | Average Toshiba KBG40ZNS512G NVMe | Average of class Subnotebook | |
|---|---|---|---|---|---|---|
| CrystalDiskMark 5.2 / 6 | -9% | -2% | 54% | 1% | 77% | |
| Write 4K | 131.3 | 133.5 2% | 128.3 -2% | 151.6 15% | 126.4 ? -4% | 154.9 ? 18% |
| Read 4K | 47.63 | 39.66 -17% | 50.9 7% | 63.2 33% | 50 ? 5% | 65.7 ? 38% |
| Write Seq | 1328 | 907 -32% | 971 -27% | 2292 73% | 1207 ? -9% | 2466 ? 86% |
| Read Seq | 1365 | 1481 8% | 1540 13% | 2073 52% | 1567 ? 15% | 2627 ? 92% |
| Write 4K Q32T1 | 381.2 | 446.2 17% | 538 41% | 505 32% | 347 ? -9% | 401 ? 5% |
| Read 4K Q32T1 | 388.7 | 335.1 -14% | 344.4 -11% | 413.5 6% | 425 ? 9% | 483 ? 24% |
| Write Seq Q32T1 | 1186 | 975 -18% | 980 -17% | 3137 165% | 1224 ? 3% | 3908 ? 230% |
| Read Seq Q32T1 | 2328 | 1874 -20% | 1829 -21% | 3604 55% | 2278 ? -2% | 5174 ? 122% |
| Write 4K Q8T8 | 488.9 | 315 ? | 957 ? | |||
| Read 4K Q8T8 | 1276 | 854 ? | 1365 ? | |||
| AS SSD | -7% | -13% | 70% | -26% | 74% | |
| Seq Read | 1897 | 1608 -15% | 1616 -15% | 2916 54% | 1871 ? -1% | 3827 ? 102% |
| Seq Write | 741 | 659 -11% | 761 3% | 1566 111% | 810 ? 9% | 2355 ? 218% |
| 4K Read | 50 | 51.3 3% | 46.87 -6% | 56 12% | 45.8 ? -8% | 59.4 ? 19% |
| 4K Write | 122 | 151.8 24% | 126.6 4% | 159.8 31% | 110.9 ? -9% | 173.2 ? 42% |
| 4K-64 Read | 1060 | 322.1 -70% | 324.6 -69% | 1011 -5% | 997 ? -6% | 1022 ? -4% |
| 4K-64 Write | 723 | 800 11% | 815 13% | 2136 195% | 452 ? -37% | 1873 ? 159% |
| Access Time Read * | 0.07 | 0.077 -10% | 0.074 -6% | 0.028 60% | 0.1024 ? -46% | 0.06214 ? 11% |
| Access Time Write * | 0.168 | 0.046 73% | 0.135 20% | 0.028 83% | 0.4026 ? -140% | 0.07618 ? 55% |
| Score Read | 1300 | 534 -59% | 533 -59% | 1359 5% | 1232 ? -5% | 1464 ? 13% |
| Score Write | 921 | 1018 11% | 1018 11% | 2452 166% | 644 ? -30% | 2285 ? 148% |
| Score Total | 2838 | 1797 -37% | 1798 -37% | 4451 57% | 2461 ? -13% | 4437 ? 56% |
| Copy ISO MB/s | 961 | 906 | 1983 | 1785 ? | 2089 ? | |
| Copy Program MB/s | 753 | 614 | 792 | 388 ? | 616 ? | |
| Copy Game MB/s | 896 | 539 | 1457 | 715 ? | 1461 ? | |
| Total Average (Program / Settings) | -8% /
-8% | -8% /
-8% | 62% /
63% | -13% /
-15% | 76% /
75% |
* ... smaller is better

Constant Performance Reading: DiskSpd Read Loop, Queue Depth 8
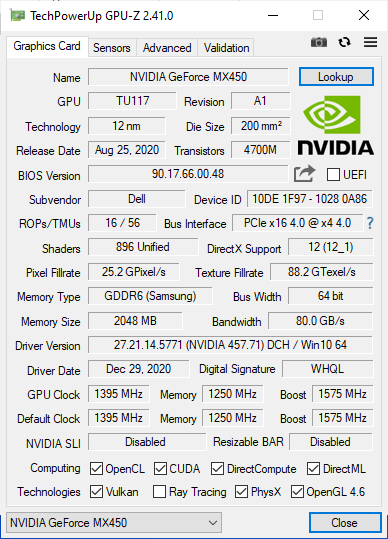
Graphics Card
The MX450 (Turing TU117M) is the second most powerful N18S-G5 version with a 64 bit connection and 1395 to 1575 MHz in addition to GDDR6. It consumes up to 25 watts, which is the reason for our device to need a second fan.
- N18S-G5-B: GBD-128 Package, 1395 - 1575 MHz, GDDR6 5001 MHz, 28.5 W
- N18S-G5: GB2E-64 Package, 1395 - 1575 MHz, GDDR6 5001 MHz, 25 W
- N18S-G5: GB2E-64 Package, 1395 - 1575 MHz, GDDR5 3501 MHz, 25 W
- N18S-LP: GB2E-64 Package, 720 - 930 MHz, GDDR6 5001 MHz, 12 W
In addition to the GeForce MX450 GPU, there is also the integrated Intel Iris Xe 80EUs graphics. In the synthetic benchmarks, the MX450 is joining the top, performing at the level of the Iris Xe Graphics G7 96EUs. It is 20-40% ahead of the Vega 8.
| 3DMark 11 Performance | 9244 points | |
| 3DMark Fire Strike Score | 4886 points | |
| 3DMark Time Spy Score | 1515 points | |
Help | ||
Gaming Performance
The Witcher 3 FPS Diagram
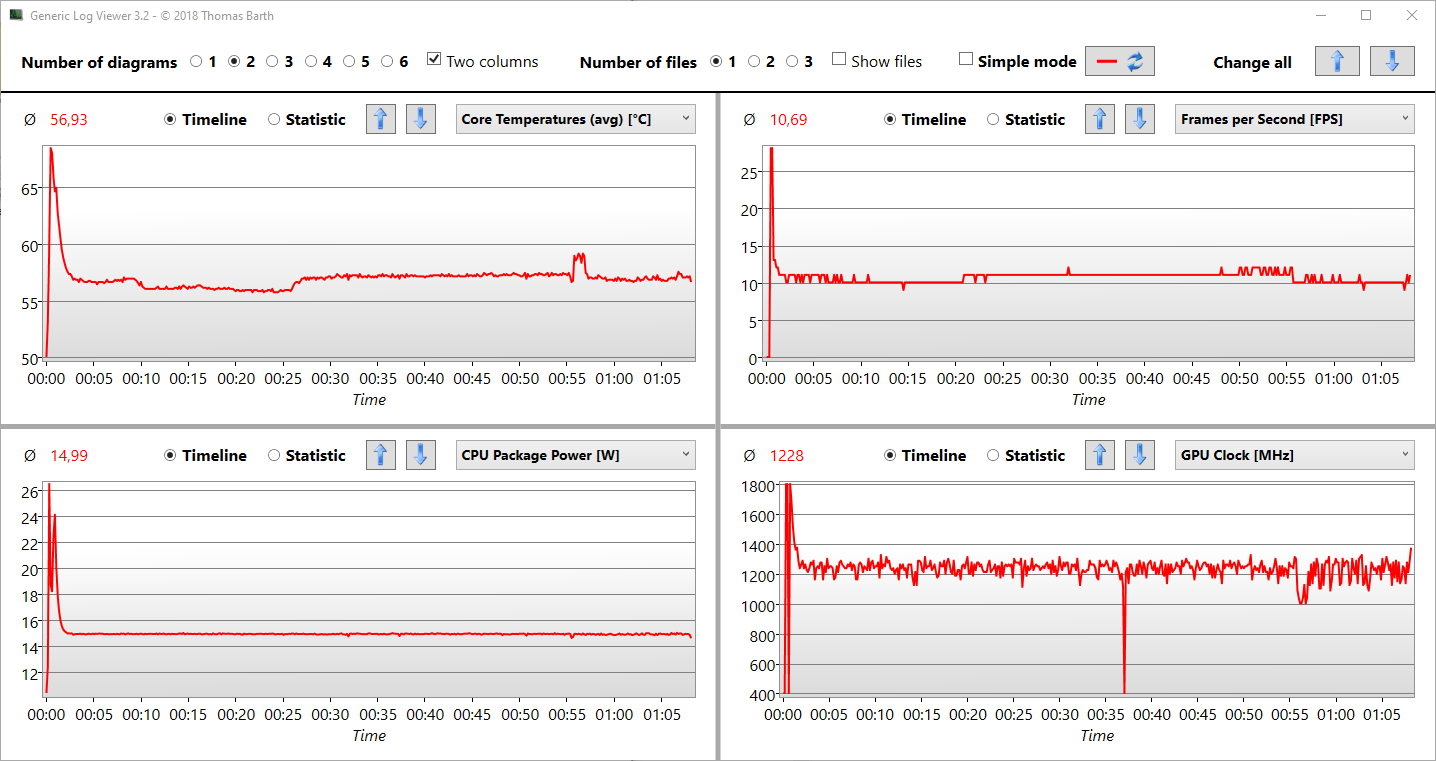
The above "The Witcher 3 Ultra - Graphics stress for the MX450" shows how the GPU clock speeds drops from 1800 in the first minutes to 1200 MHz, because the system tries to reduce the heat development from almost 70 ºC (158 ºF) down to significantly below 60 ºC (140 ºF). The throttling also happens in other games, as "Strange Brigade" or "X Plane 11.11" also show.
So in short, while Dell uses a powerful version of the MX450 with 25 watts, it is not being used to its full advantage. Even the slowest N18S-LP version in the HP Envy 13-ba1475ng gets a better performance in real games in some respects ("The Witcher 3," "X-Plane 11.11").
| The Witcher 3 | |
| 1920x1080 High Graphics & Postprocessing (Nvidia HairWorks Off) | |
| Lenovo IdeaPad 5 Pro 16IHU6 | |
| HP Envy 13-ba1475ng | |
| Average of class Subnotebook (11.2 - 92, n=56, last 2 years) | |
| Average NVIDIA GeForce MX450 (21 - 46, n=16) | |
| Dell Inspiron 13 5310-NJ24J | |
| Asus ZenBook 13 UX325EA | |
| Acer Spin 3 SP313-51N-56YV | |
| HP Pavilion Aero 13 be0097nr | |
| 1920x1080 Ultra Graphics & Postprocessing (HBAO+) | |
| Lenovo IdeaPad 5 Pro 16IHU6 | |
| Dell Inspiron 13 5310-NJ24J | |
| Average NVIDIA GeForce MX450 (17.2 - 24.8, n=16) | |
| Average of class Subnotebook (8 - 44.2, n=57, last 2 years) | |
| HP Envy 13-ba1475ng | |
| HP Pavilion Aero 13 be0097nr | |
| Asus ZenBook 13 UX325EA | |
| Acer Spin 3 SP313-51N-56YV | |
| Final Fantasy XV Benchmark - 1920x1080 Standard Quality | |
| Lenovo IdeaPad 5 Pro 16IHU6 | |
| Dell Inspiron 13 5310-NJ24J | |
| Average NVIDIA GeForce MX450 (25 - 34.5, n=13) | |
| Average of class Subnotebook (10.8 - 71, n=54, last 2 years) | |
| Acer Spin 3 SP313-51N-56YV | |
| Asus ZenBook 13 UM325S | |
| HP Pavilion Aero 13 be0097nr | |
| low | med. | high | ultra | |
| The Witcher 3 (2015) | 112 | 71 | 33 | 23 |
| Dota 2 Reborn (2015) | 130 | 118 | 103 | 82.9 |
| Final Fantasy XV Benchmark (2018) | 58.3 | 31.6 | ||
| X-Plane 11.11 (2018) | 64.9 | 53.4 | 44.4 | |
| Strange Brigade (2018) | 127 | 49.6 | 42.4 | 33.1 |
Emissions and Power Management
Noise Emissions
During idle operation, the double fans are quiet. They are turned off, regardless of whether we choose the Ultra Performance, Optimized, or Quiet mode. We ran the performance test in the Ultra Performance mode and the battery test in the Optimized mode.
Under load, the noise level approaches up to 48 dB(A), which can be influenced by the selection of a Dell performance mode. In Quiet mode, the noise volume drops to 44 and in Optimized mode to 46 dB(A).
Noise Level
| Idle |
| 26 / 26 / 26 dB(A) |
| Load |
| 48 / 48.3 dB(A) |
 | ||
30 dB silent 40 dB(A) audible 50 dB(A) loud |
||
min: | ||
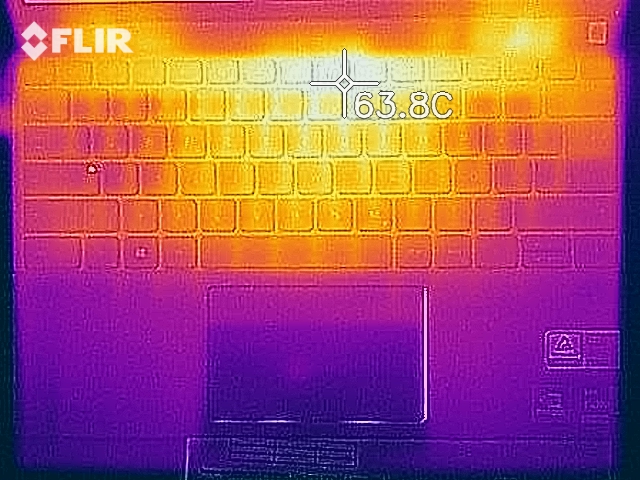
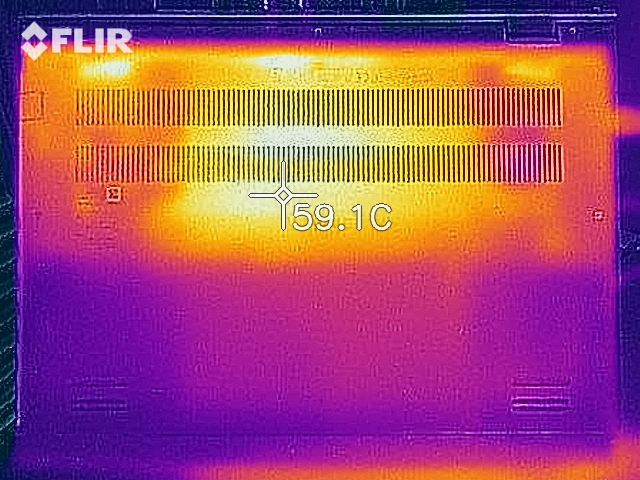
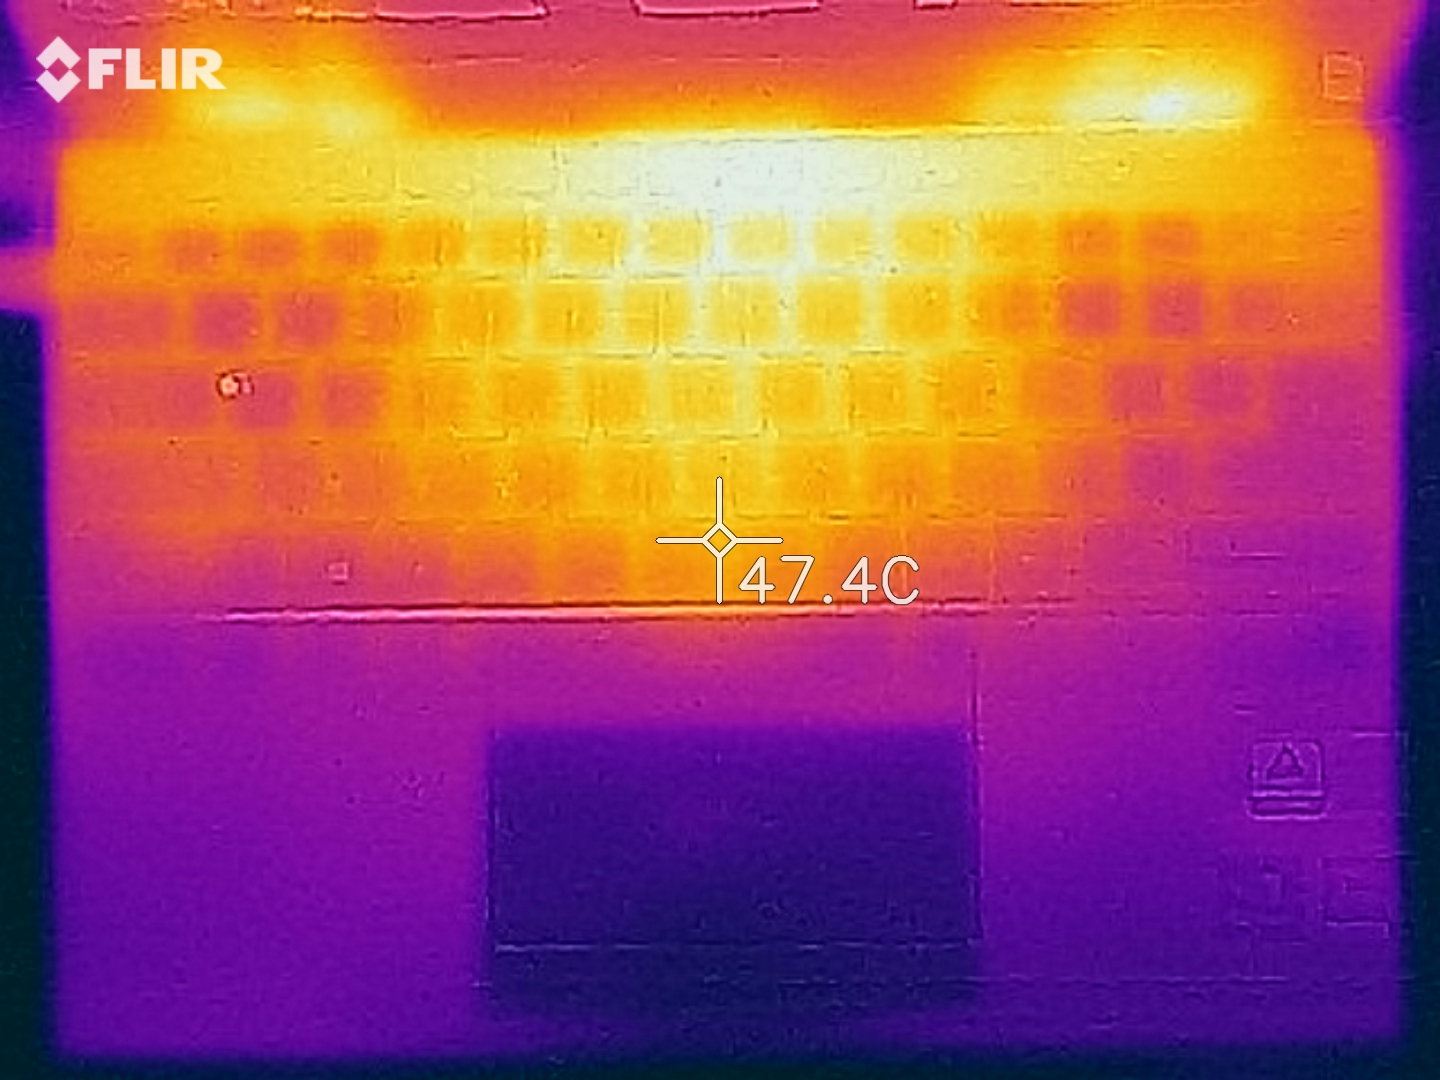
Temperature
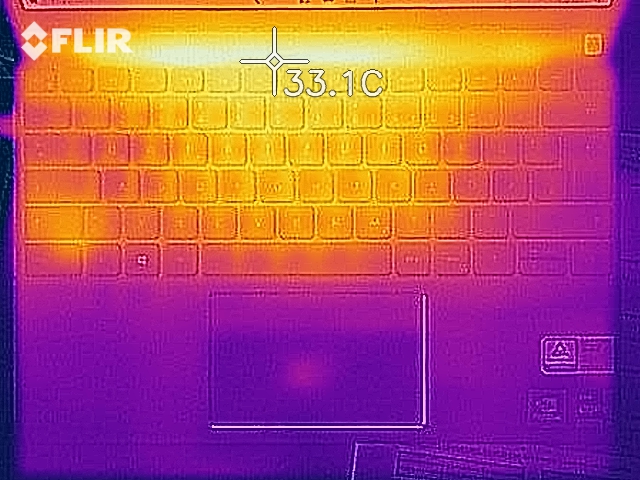
During idle operation, the 13-inch laptop remains cool and we measure an average of barely 28 ºC (82 ºF). Under high load ("The Witcher 3") – with the GPU throttling – the resulting average temperature is 37 ºC (99 ºF) on top, with some spots registering 52 ºC (126 ºF).
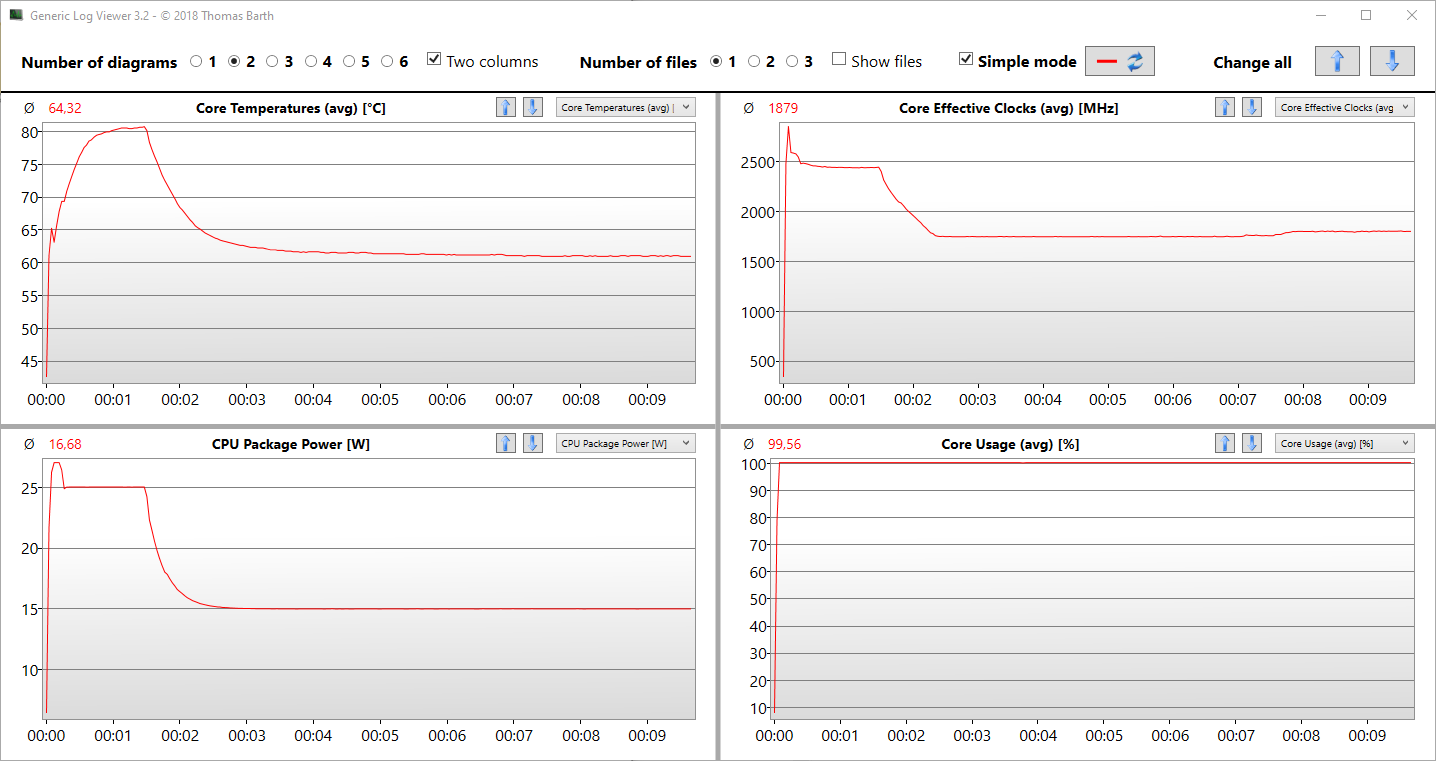
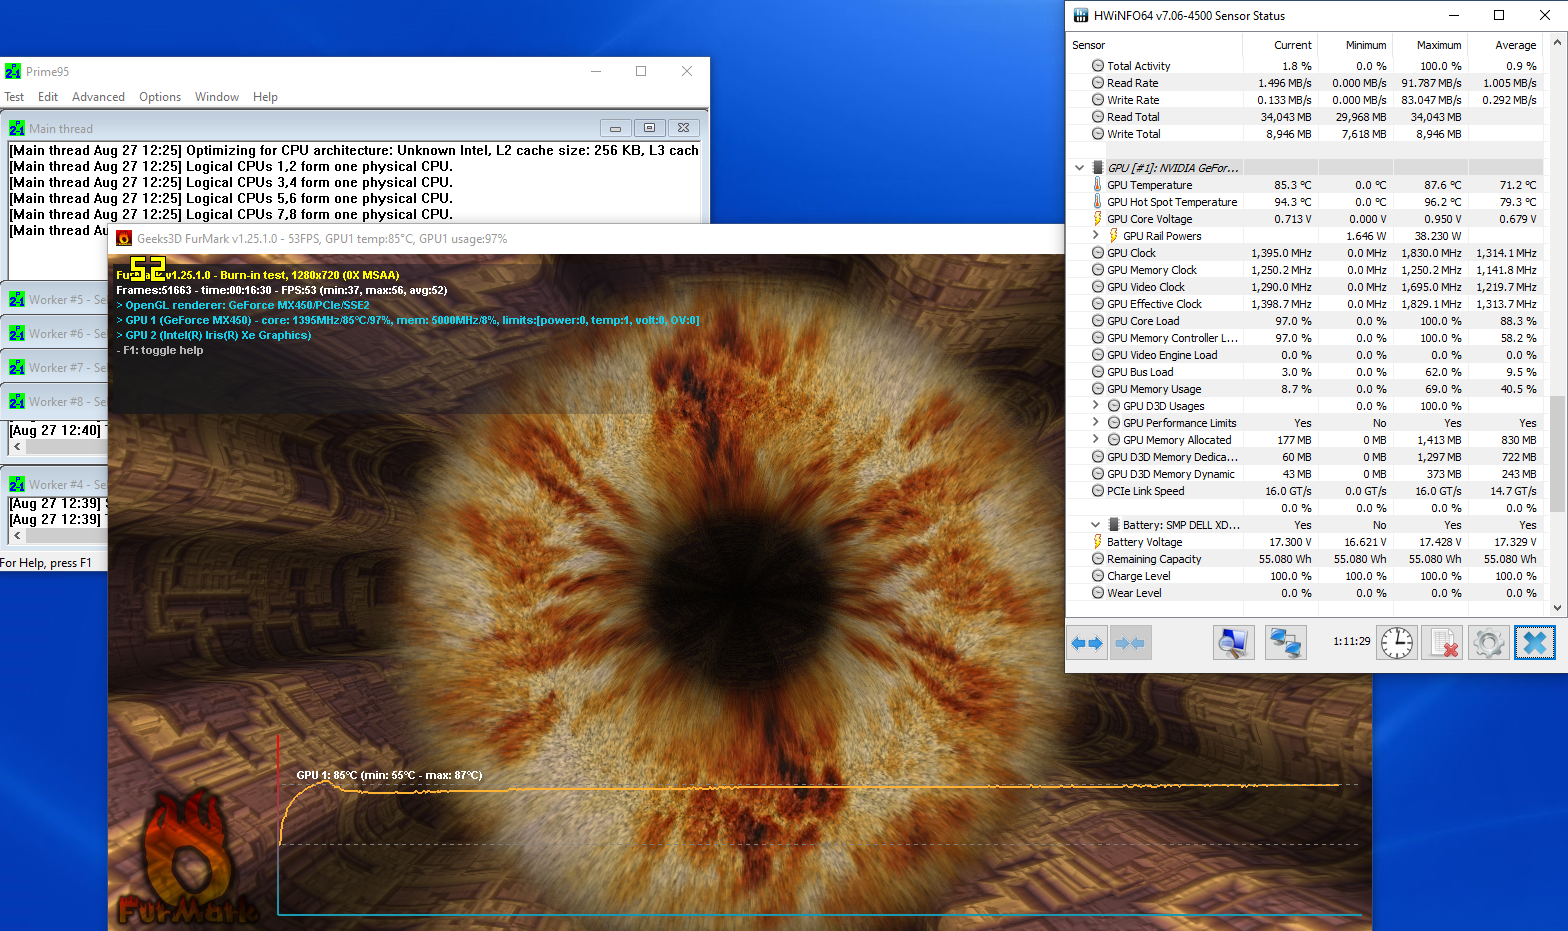
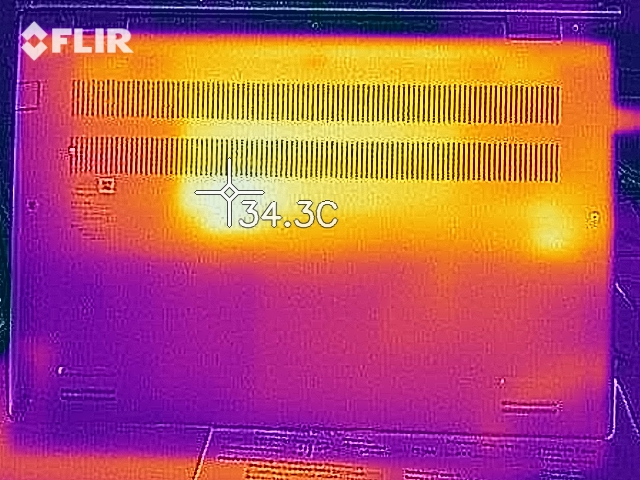
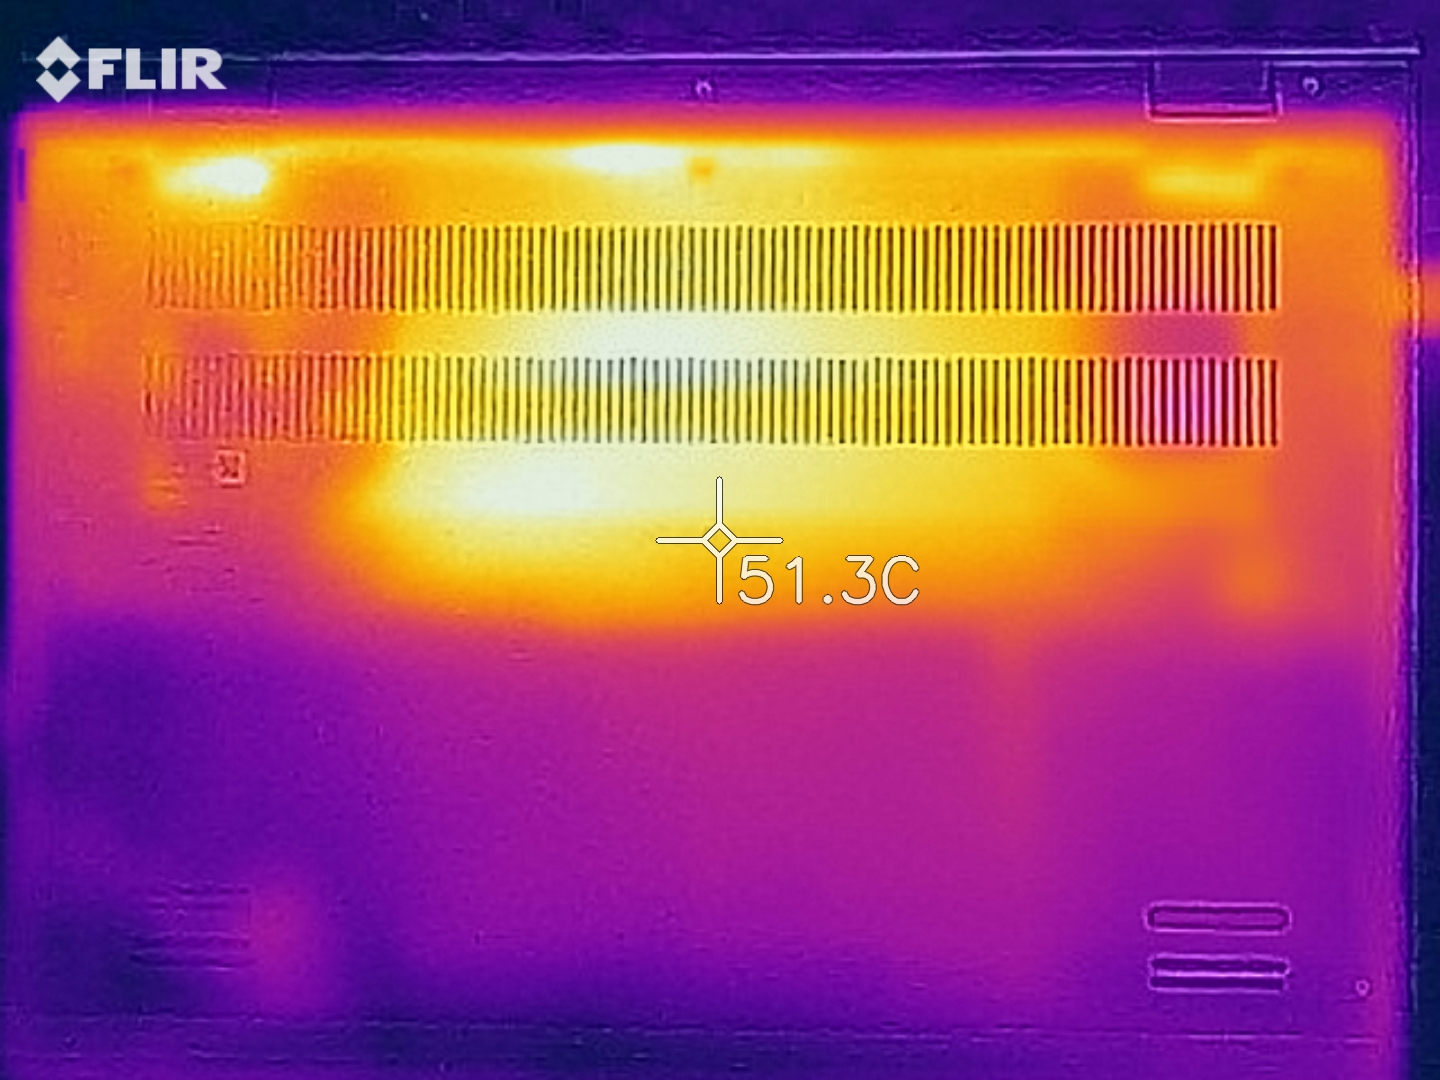
Our stress test with Prime95 and Furmark evaluates how the system is able to handle maximum load over a longer time period. Here the surface temperatures will increase further (58 ºC, 136 ºF on top), with the temperatures at the core leveling out at just above 60 ºC (140 ºF) after a peak of 82 ºC (180 ºF). The package power lies at 15 watts after 3 minutes, and it was only able to maintain 25 watts for 2 minutes. There is no performance reduction right after the stress test.
(-) The maximum temperature on the upper side is 58.4 °C / 137 F, compared to the average of 35.9 °C / 97 F, ranging from 21.4 to 59 °C for the class Subnotebook.
(-) The bottom heats up to a maximum of 58.4 °C / 137 F, compared to the average of 39.4 °C / 103 F
(+) In idle usage, the average temperature for the upper side is 27.9 °C / 82 F, compared to the device average of 30.7 °C / 87 F.
(±) Playing The Witcher 3, the average temperature for the upper side is 37.6 °C / 100 F, compared to the device average of 30.7 °C / 87 F.
(+) The palmrests and touchpad are cooler than skin temperature with a maximum of 28.4 °C / 83.1 F and are therefore cool to the touch.
(±) The average temperature of the palmrest area of similar devices was 28.3 °C / 82.9 F (-0.1 °C / -0.2 F).
Speakers
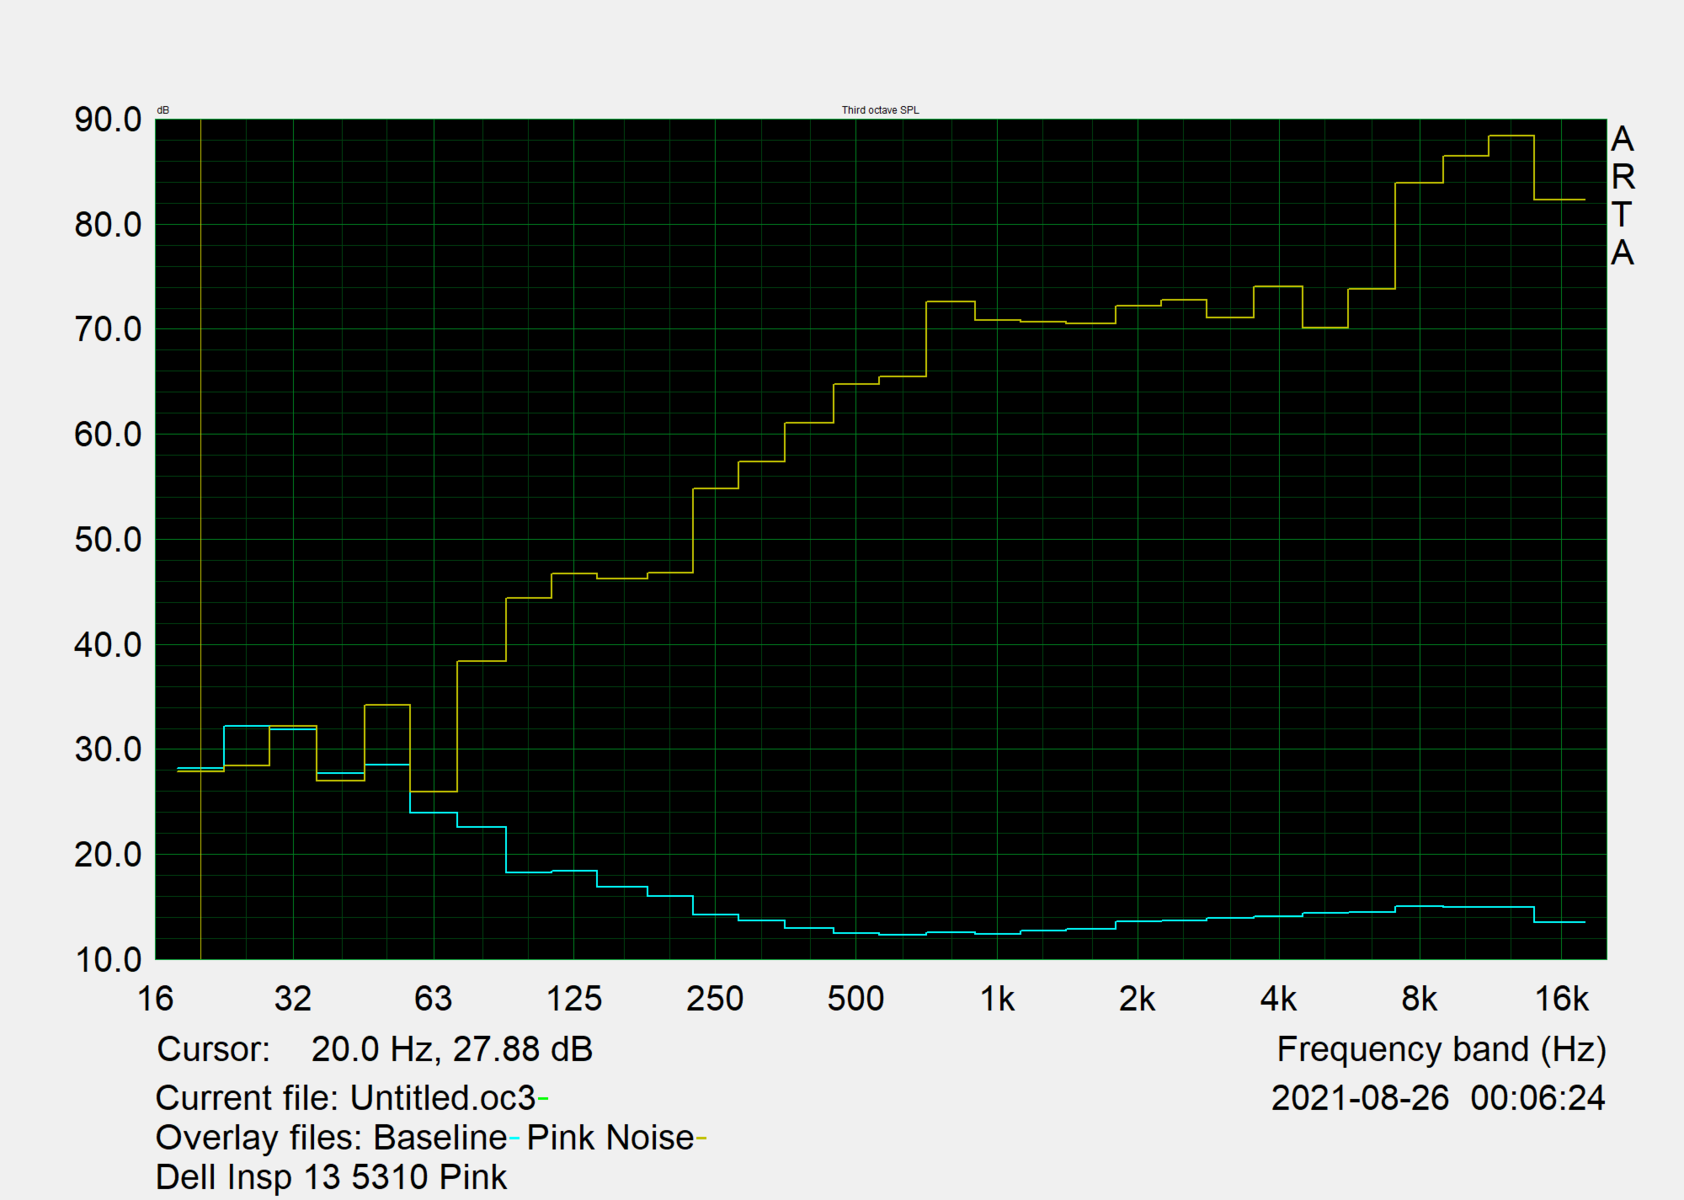
There is not much to complain in the two stereo speakers. Although there is hardly any bass due to the small form factor, the sound is pleasant otherwise. You can even play videos and some music using these speakers without any problems, and you don't necessarily need headphones or external speakers. The speakers are located below the palm rest, pointing downwards toward the desktop. The dual array microphone records voices cleanly with little additional noise and is suited for conferences.
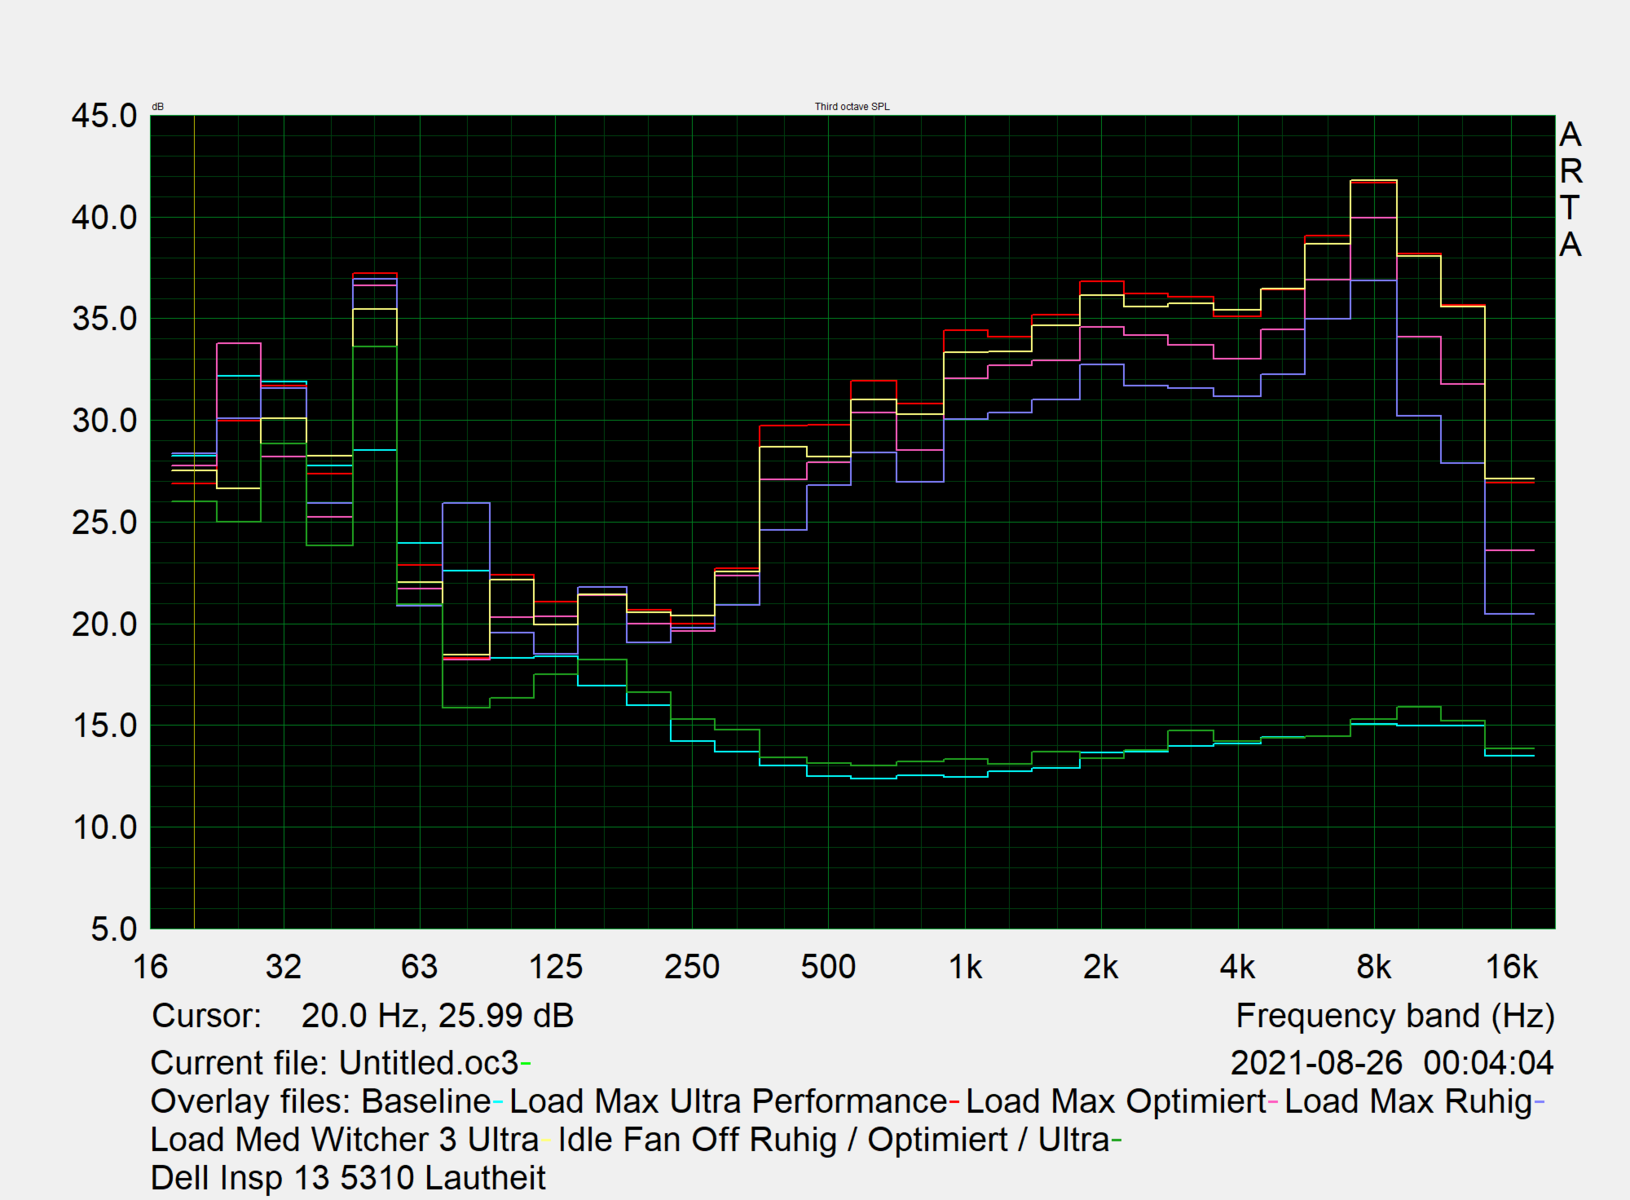
Dell Inspiron 13 5310-NJ24J audio analysis
(+) | speakers can play relatively loud (88.4 dB)
Bass 100 - 315 Hz
(-) | nearly no bass - on average 21.3% lower than median
(+) | bass is linear (5.8% delta to prev. frequency)
Mids 400 - 2000 Hz
(+) | balanced mids - only 3.1% away from median
(+) | mids are linear (4.2% delta to prev. frequency)
Highs 2 - 16 kHz
(±) | higher highs - on average 5.5% higher than median
(+) | highs are linear (6.4% delta to prev. frequency)
Overall 100 - 16.000 Hz
(±) | linearity of overall sound is average (17% difference to median)
Compared to same class
» 38% of all tested devices in this class were better, 8% similar, 54% worse
» The best had a delta of 5%, average was 19%, worst was 53%
Compared to all devices tested
» 25% of all tested devices were better, 8% similar, 67% worse
» The best had a delta of 4%, average was 25%, worst was 134%
Asus ZenBook 13 UX325EA audio analysis
(±) | speaker loudness is average but good (79.4 dB)
Bass 100 - 315 Hz
(-) | nearly no bass - on average 18.1% lower than median
(±) | linearity of bass is average (13.4% delta to prev. frequency)
Mids 400 - 2000 Hz
(+) | balanced mids - only 3.1% away from median
(+) | mids are linear (4.8% delta to prev. frequency)
Highs 2 - 16 kHz
(+) | balanced highs - only 4.1% away from median
(+) | highs are linear (5.9% delta to prev. frequency)
Overall 100 - 16.000 Hz
(+) | overall sound is linear (14.2% difference to median)
Compared to same class
» 22% of all tested devices in this class were better, 5% similar, 73% worse
» The best had a delta of 5%, average was 19%, worst was 53%
Compared to all devices tested
» 14% of all tested devices were better, 3% similar, 83% worse
» The best had a delta of 4%, average was 25%, worst was 134%
Power Consumption
During idle operation, the power consumption ranges between 3.6 and 10 watts, which is a normal value for a 13-inch laptop with a good TFT brightness. Under load, this increases up to 64 watts, with peaks significantly above this value. The fact that the power supply heats up to 58 ºC (136 ºF) during the stress test is an indication for its being overextended and perhaps also the reason for the below-average performance development of the Intel processor.
The power consumption during the stress test shows a decrease from 68 to 62 watts after almost 2 minutes. This is also the time when the clock speed is reduced further from the already lower 2400 MHz in steps down to 1700 MHz. During "The Witcher 3" Ultra – the highest load in gaming - this performance reduction behavior also occurs in minute two.
| Off / Standby | |
| Idle | |
| Load |
|
Power Consumption The Witcher 3 / Stress Test
Battery Life
The 54-watthour battery capacity ensures a battery life of a good 10 hours in practice, which we tested in our Wi-Fi test at 150 cd/m² brightness. The flat Lithium-Polymer battery is split into two, as if the small area was initially reserved for SATA but is now available.
| Dell Inspiron 13 5310-NJ24J i5-11300H, GeForce MX450, 54 Wh | HP Envy 13-ba1475ng i7-1165G7, GeForce MX450, 51 Wh | HP Pavilion Aero 13 be0097nr R7 5800U, Vega 8, 43 Wh | Asus ZenBook 13 UM325S R7 5800U, Vega 8, 67 Wh | Asus ZenBook 13 UX325EA i7-1165G7, Iris Xe G7 96EUs, 67 Wh | Acer Spin 3 SP313-51N-56YV i5-1135G7, Iris Xe G7 80EUs, 48 Wh | Average of class Subnotebook | |
|---|---|---|---|---|---|---|---|
| Battery Runtime | 1% | -13% | -11% | 74% | -22% | 2% | |
| WiFi Websurfing | 618 | 624 1% | 539 -13% | 551 -11% | 640 4% | 483 -22% | 629 ? 2% |
| 1920x1080 Witcher 3 ultra 150cd | 78 | 190 144% | |||||
| Battery Runtime | |||||||
| Reader / Idle | 1340 | 1133 -15% | 1394 4% | 1252 ? -7% | |||
| Total Average (Program / Settings) | 1% /
1% | -14% /
-14% | -4% /
-4% | 74% /
74% | -22% /
-22% | -3% /
-3% |
Pros
Cons
Verdict: A subnotebook overwhelmed by the hardware
The manufacturer engages in some window-dressing here, since the processor and graphics card are unable to produce the performance that should be possible according to the spec sheet (and the averages in our database). Even though the laptop contains a 35-Watt SoC, it does not use the full 35 watts. The same goes for the MX450 graphics, and although Dell uses the 25-Watt version with GDDR6, it quickly throttles its speed, which becomes a disadvantage in games.
So our test brings some disillusionment: The limited cooling in the Dell Inspiron 13 5310 is not designed for so much power and the thicker 15-inch laptops seem to be more suited for the Tiger Lake-H and MX450.
At the same time, all this is haggling at a high level. Overall, we are looking at a moderately powerful subnotebook, which scores some points with its connections and display. The matte, bright display pleases with its accurate colors, and with 2 x Thunderbolt 4, you are prepared for docking solutions and future peripheral devices up to external graphics cards. The WLAN is fast enough, and maintenance is easy – although the working memory is soldered in. In the end, the battery life and weight also play a role, and in this regard 1.3 kg (~3 lb) and 10 hours are a bonus.
Those who need more CPU computing power on the road but don't want to spend more money should take a closer look at the AMD models HP Pavilion Aero 13 be0097nr and Asus ZenBook 13 UM325S.
On the other hand, those who don't want to do without a graphics card of the MX450 class will currently hardly find a better choice in the 13-inch size factor. The only other option, the HP Envy 13-ba1475ng, uses the slow 12-Watt MX450, a 15-Watt processor, and does not offer Thunderbolt. Devices with iGPUs such as the Vega 8 or Iris Xe G7 96EUs, don't produce the performance in real games that a 25-Watt MX450 (N18S-G5) is able to deliver, even if it doesn't run at full power.
Price and Availability
A 16-GB configuration of the Dell Inspiron 13 5310 is available for $982 at Amazon.
Dell Inspiron 13 5310-NJ24J
-
09/03/2021 v7
Sebastian Jentsch
More articles related to this device
Dell Inspiron 13 5310-NJ24J (Inspiron 13 5000 Series)Related Articles


Pricecompare

