 Deutsch
 English
 Español
 Français
 Italiano
 Nederlands
 Polski
 Português
 Русский
 Türkçe
 Svenska
 Chinese
 Magyar
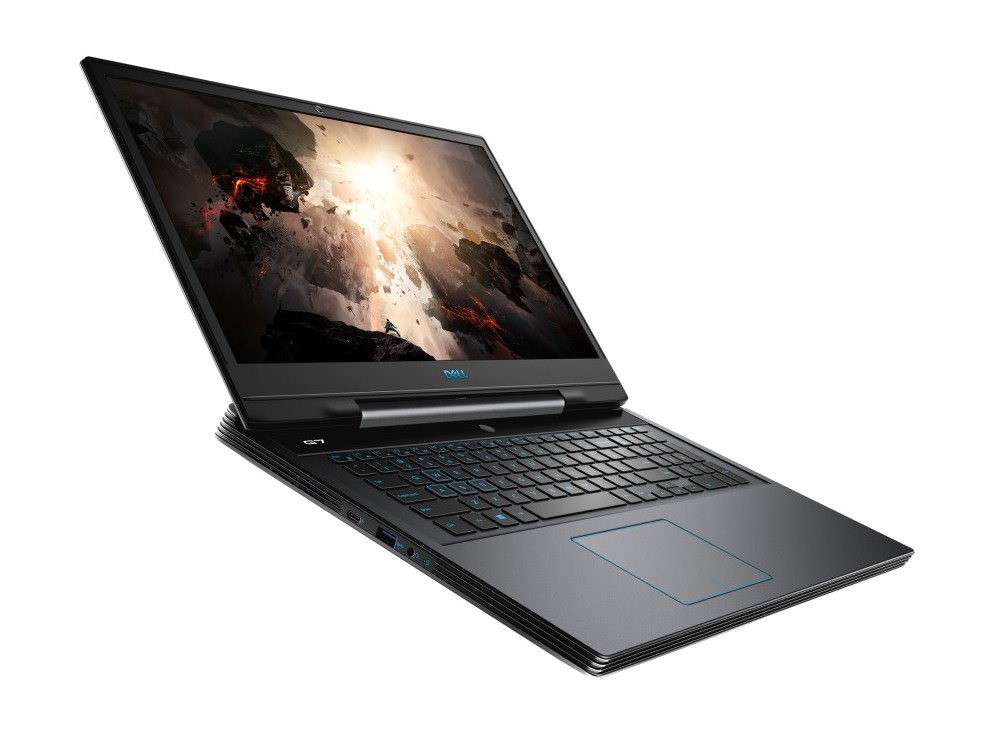
Dell G7 17 7790 (i7-8750H, RTX 2070 Max-Q) Laptop Review
Unveiled at CES 2019, the G7 17 7790 is the first 17.3-inch model for the G7 family of gaming laptops. It is positioned above the entry-level Dell G3 series and below the enthusiast Alienware series to be a mid-range offering with a very wide selection of SKUs.
Our test unit today is the higher-end configuration equipped with the Intel 8th gen Core i7-8750H CPU and Nvidia GeForce RTX 2070 Max-Q Turing GPU retailing for about $1800 USD. Lesser configuration are available with Core i5 and GTX 1660 Ti graphics for a lower starting price of $1200 USD. The G7 17 7790 competes directly with other upper mid-range 17.3-inch gaming laptops including the Lenovo Legion Y740, HP Omen 17, Asus ROG GL704, Acer Predator Helios 500, and MSI GS75.
More Dell gaming G Series laptop reviews:
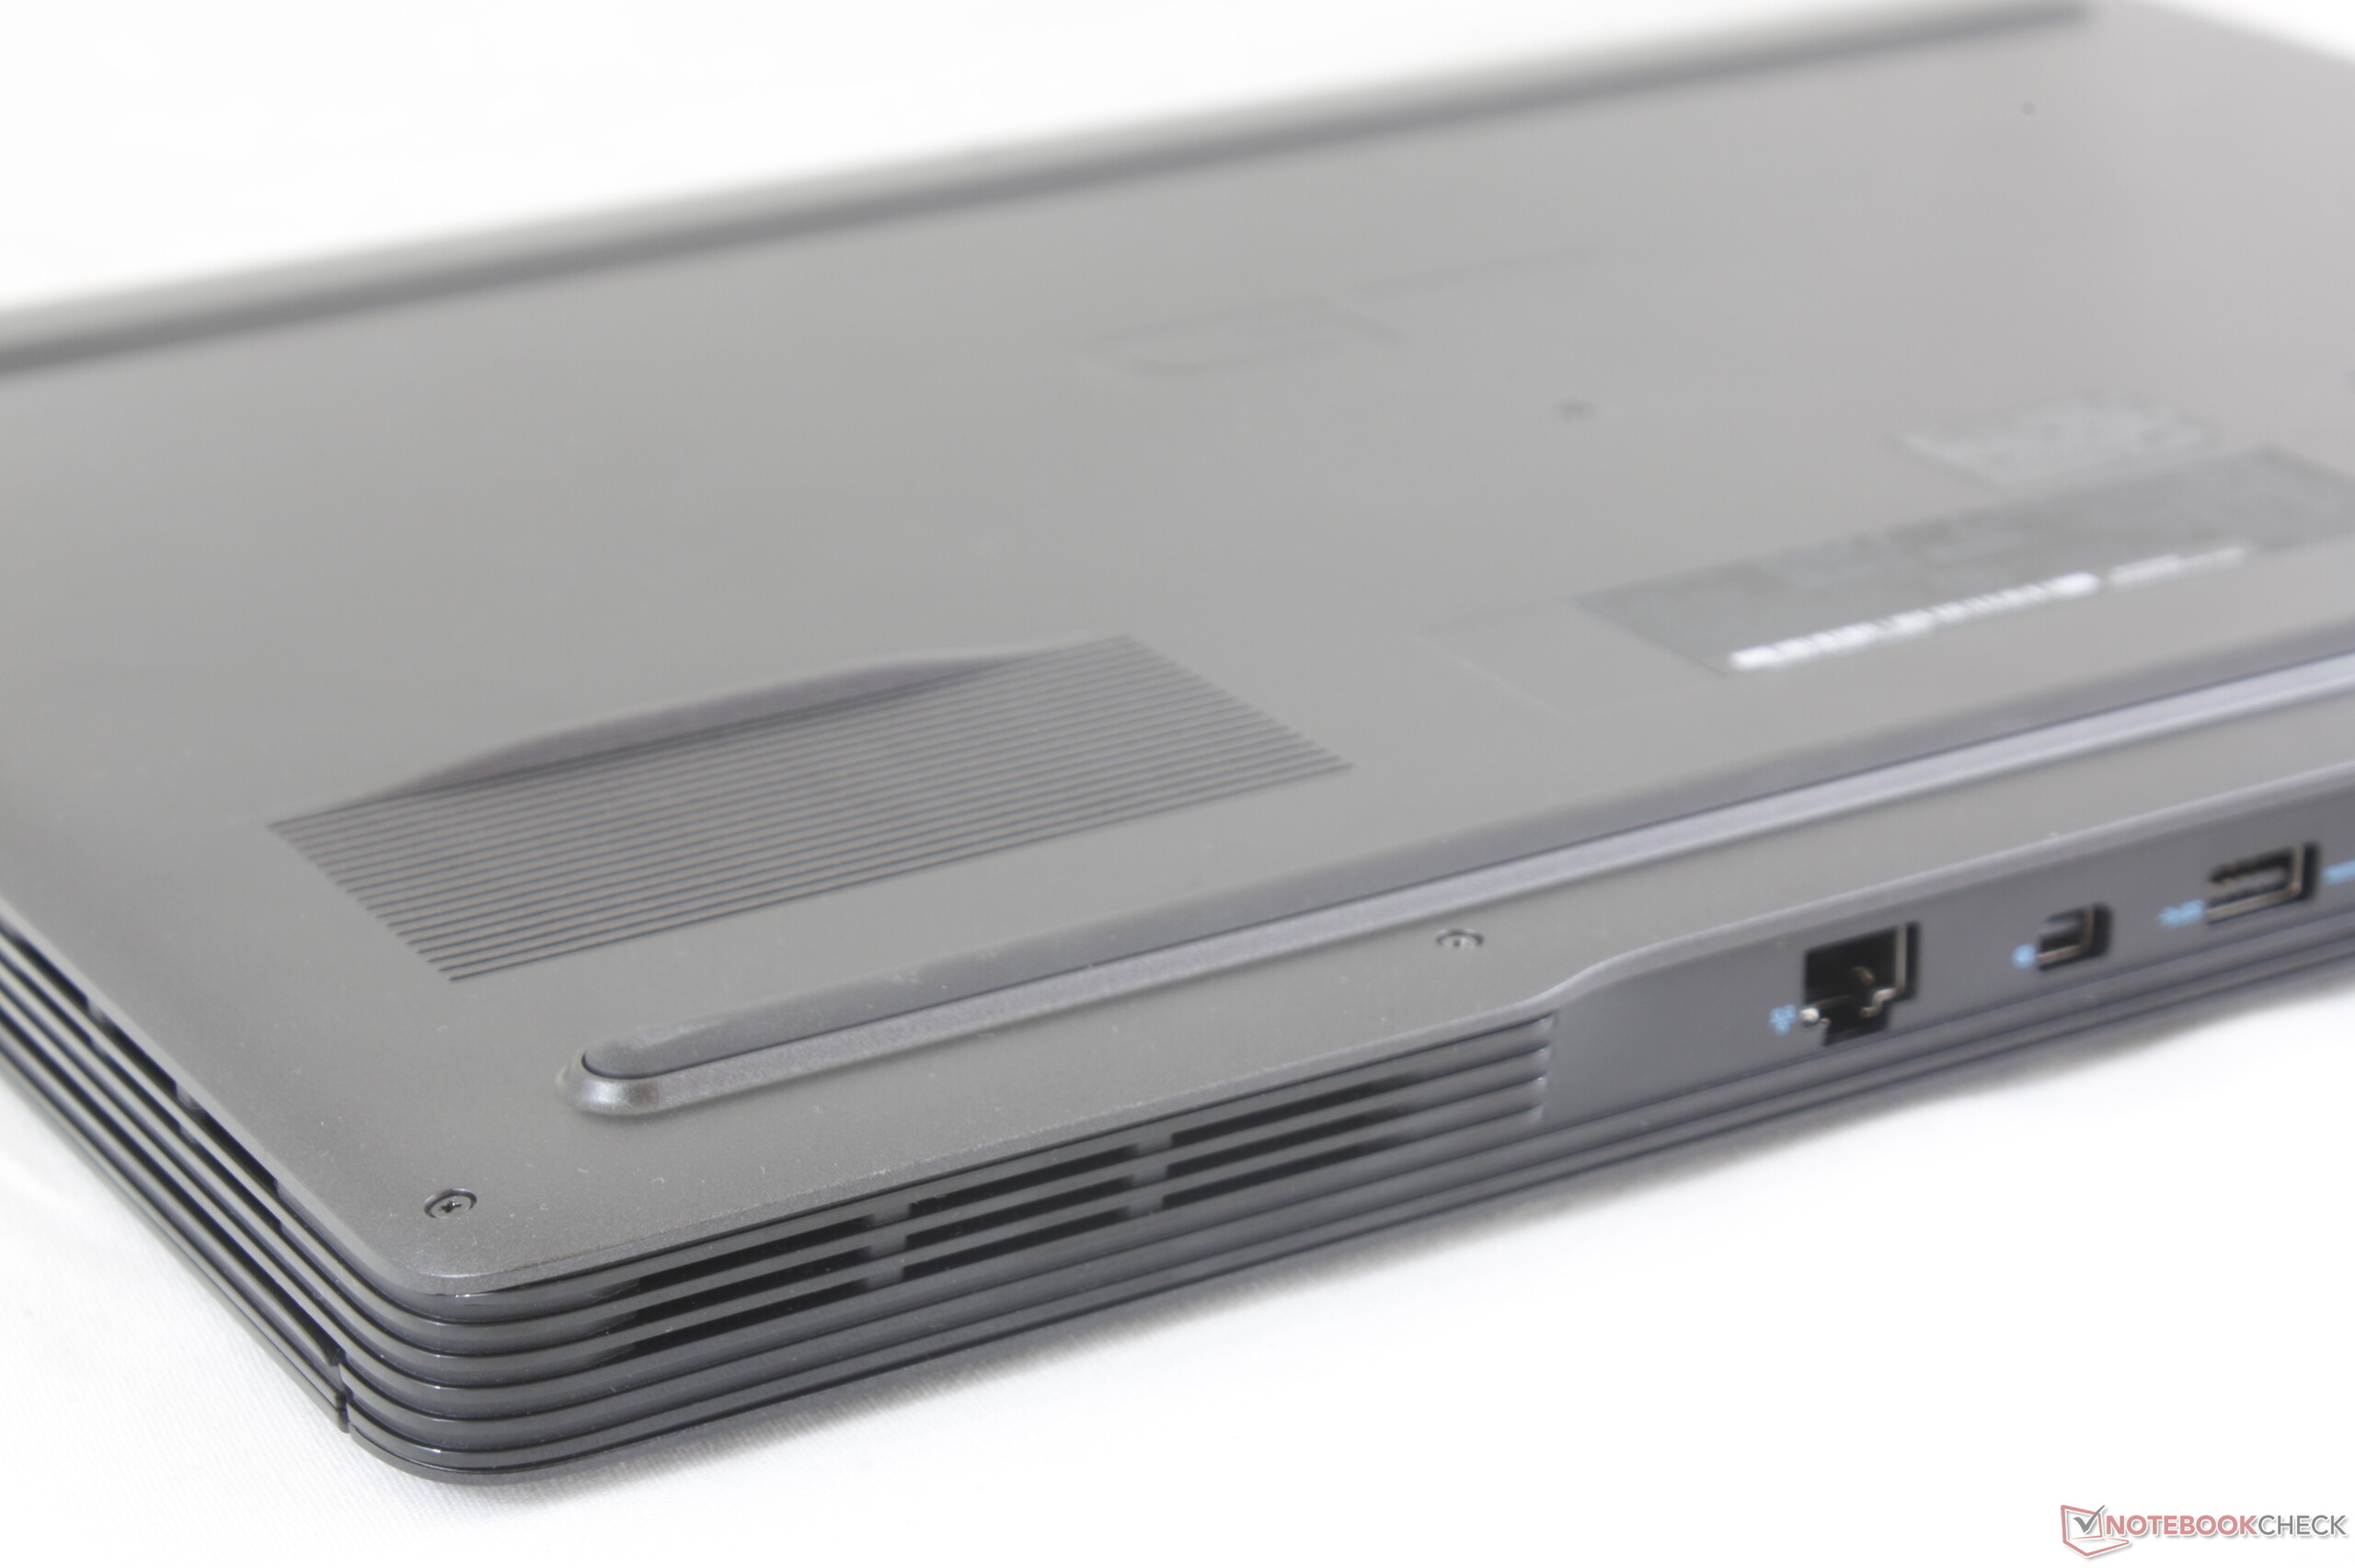
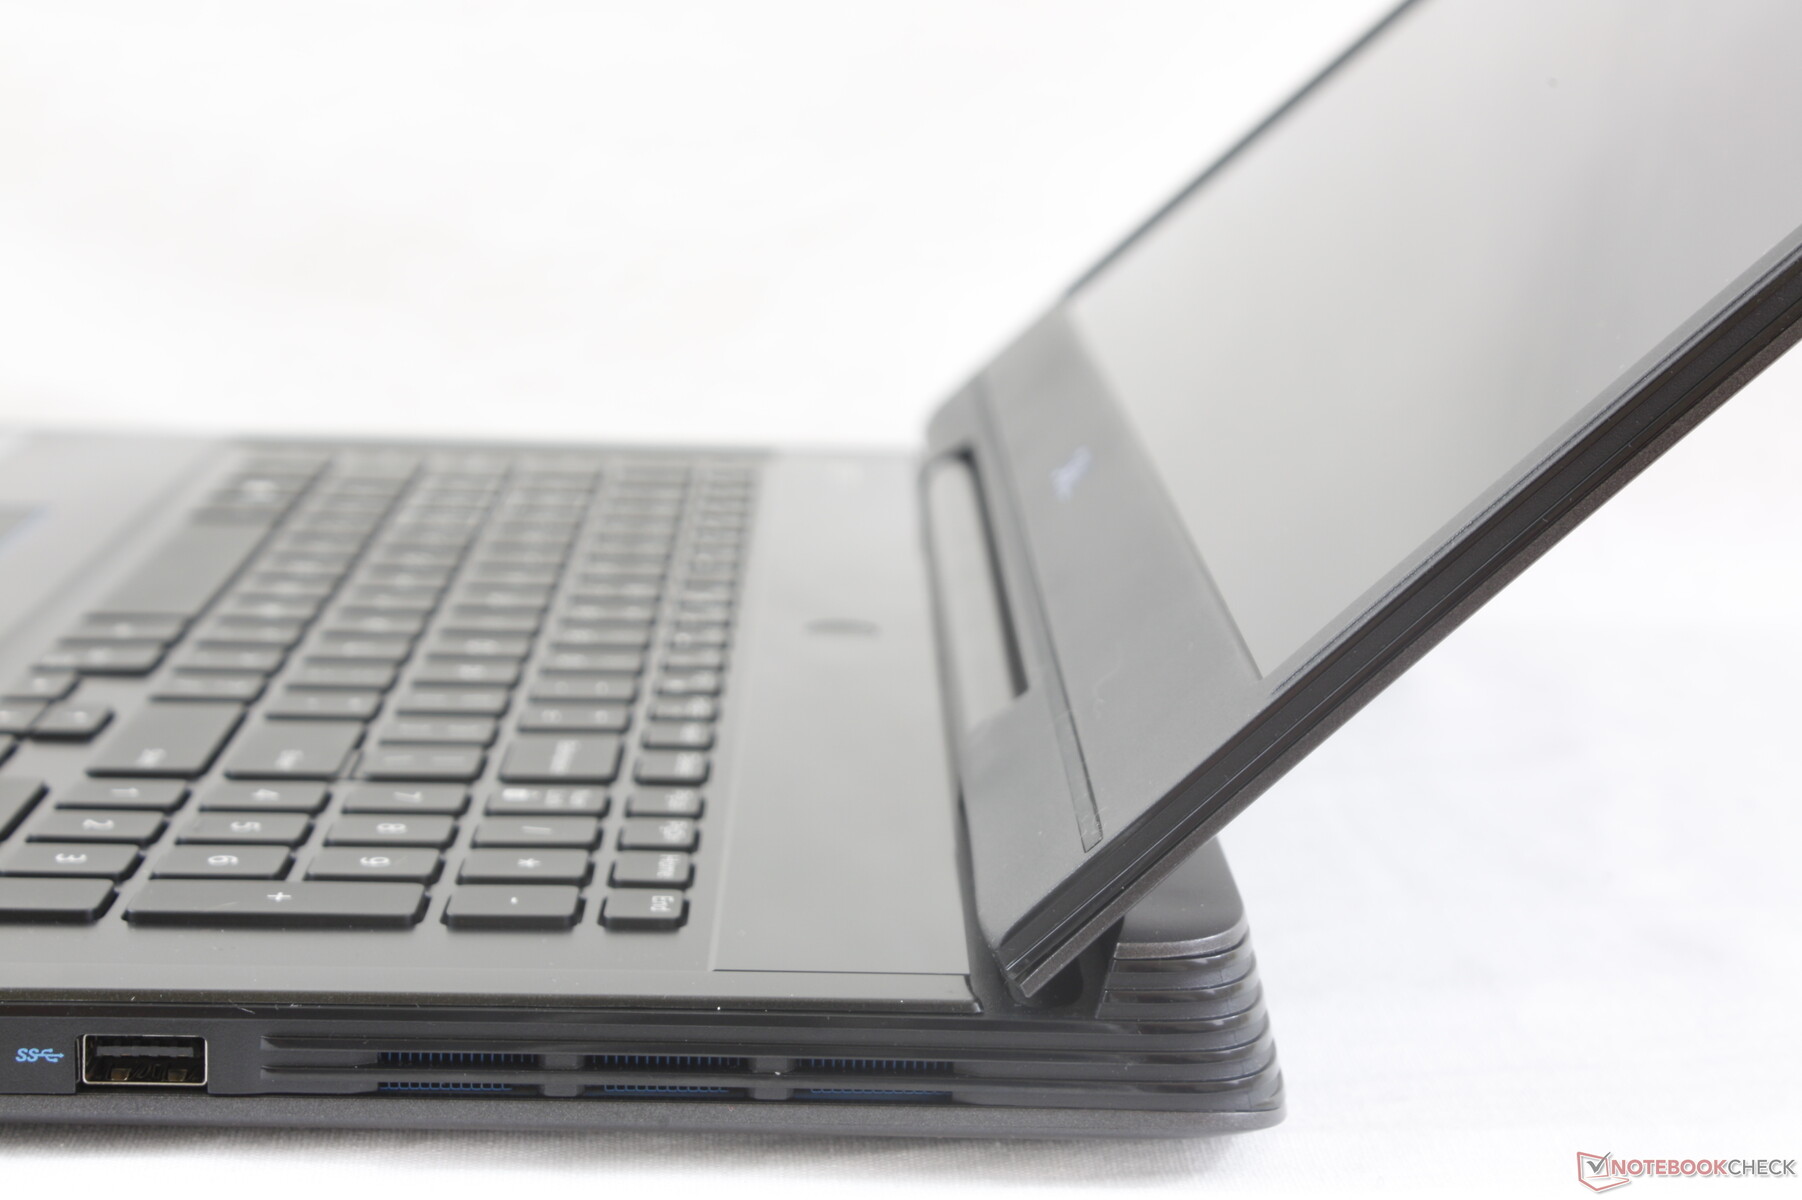
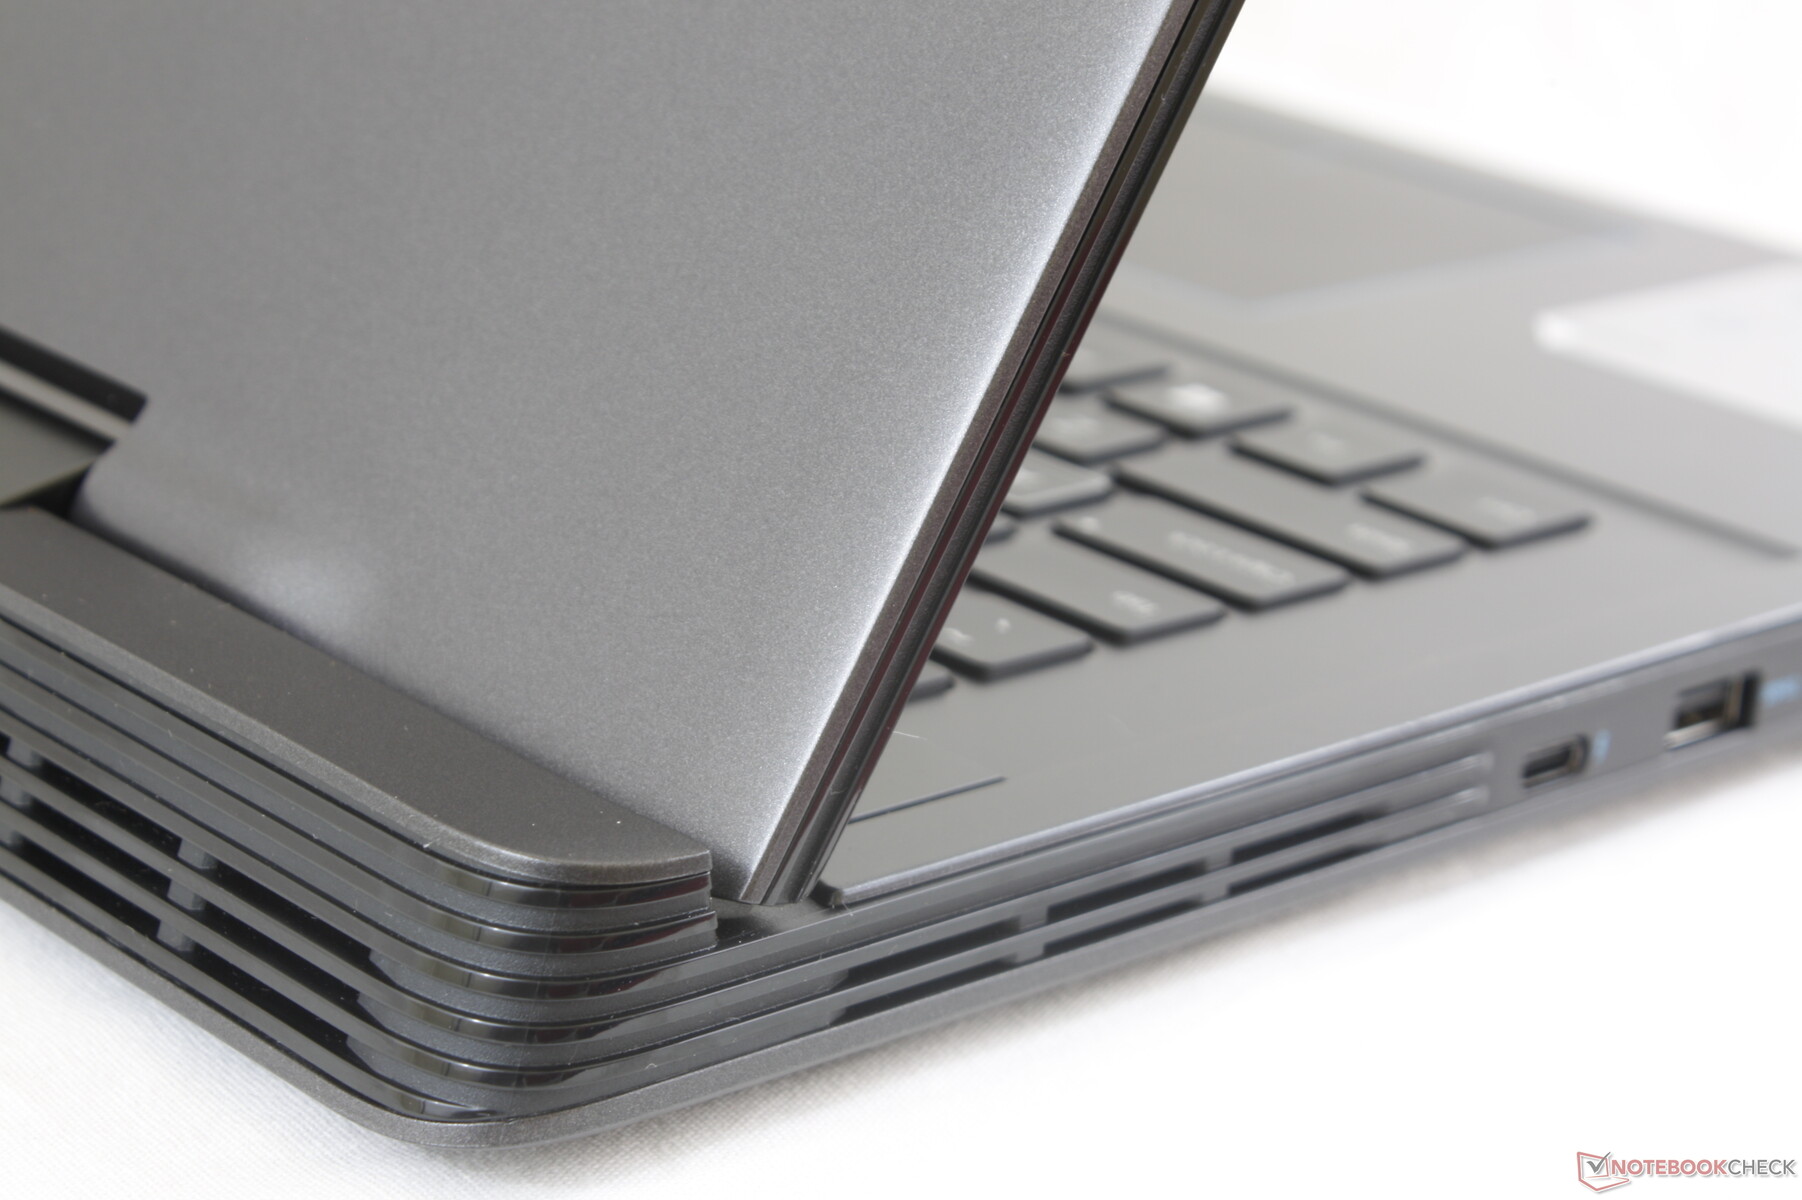
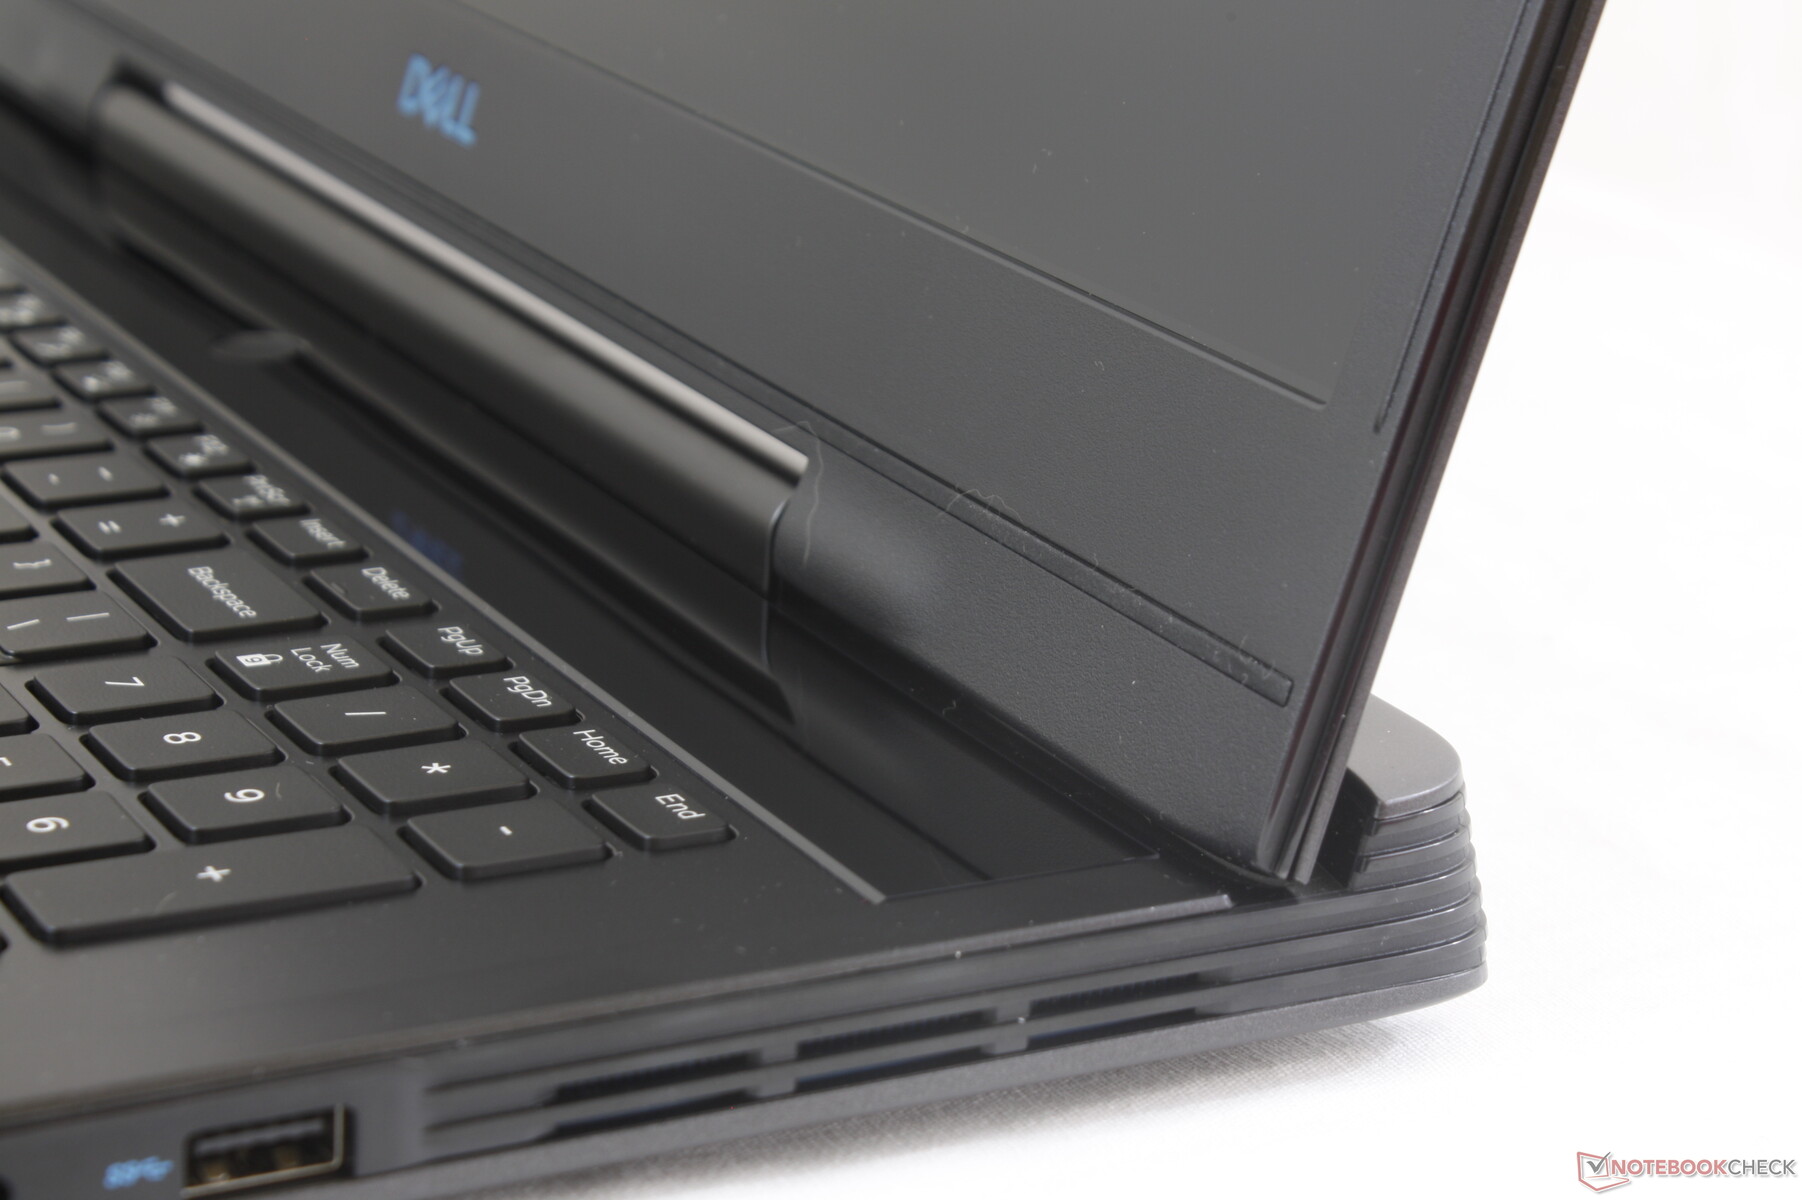
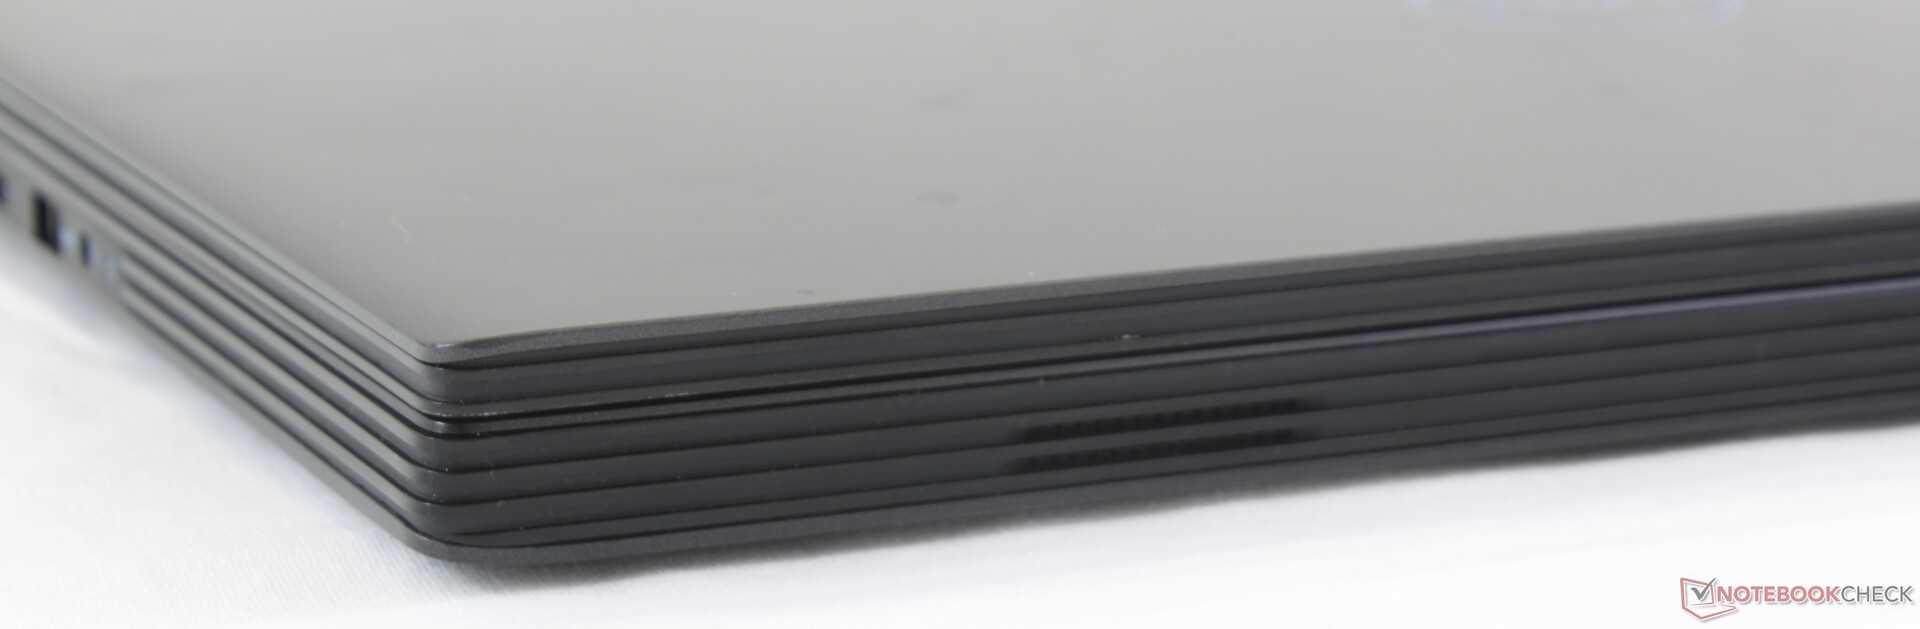
Case
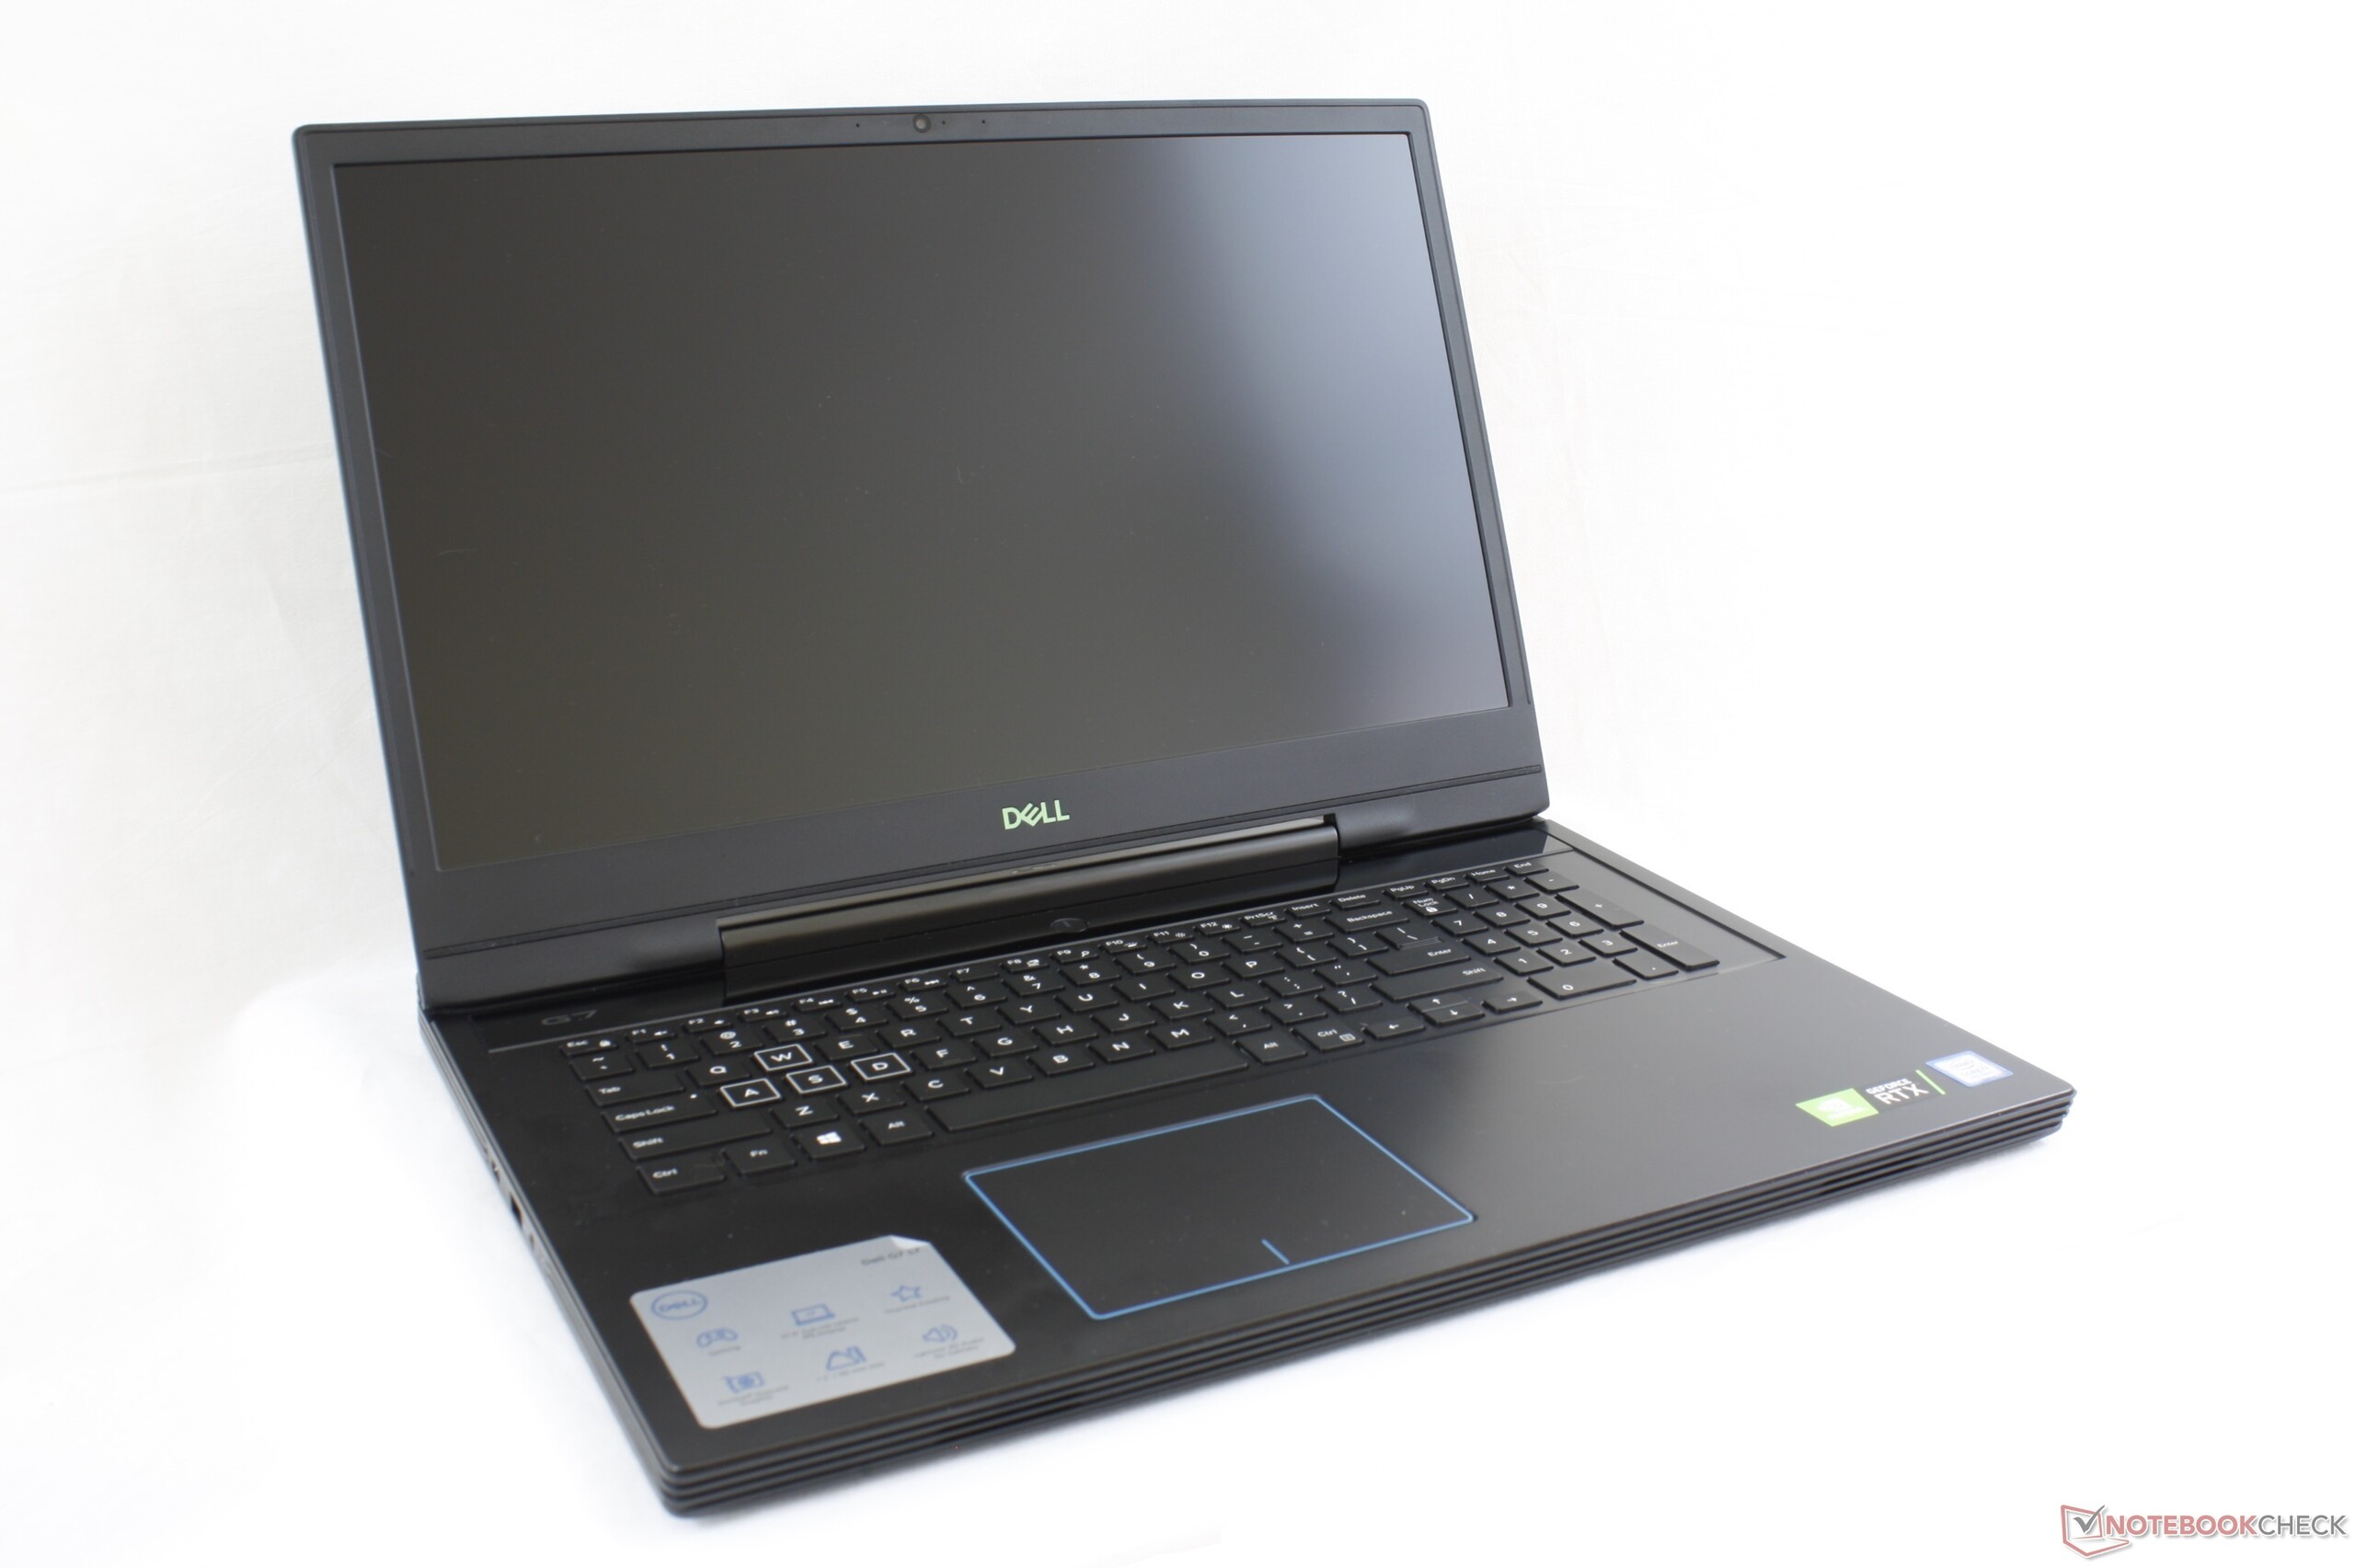
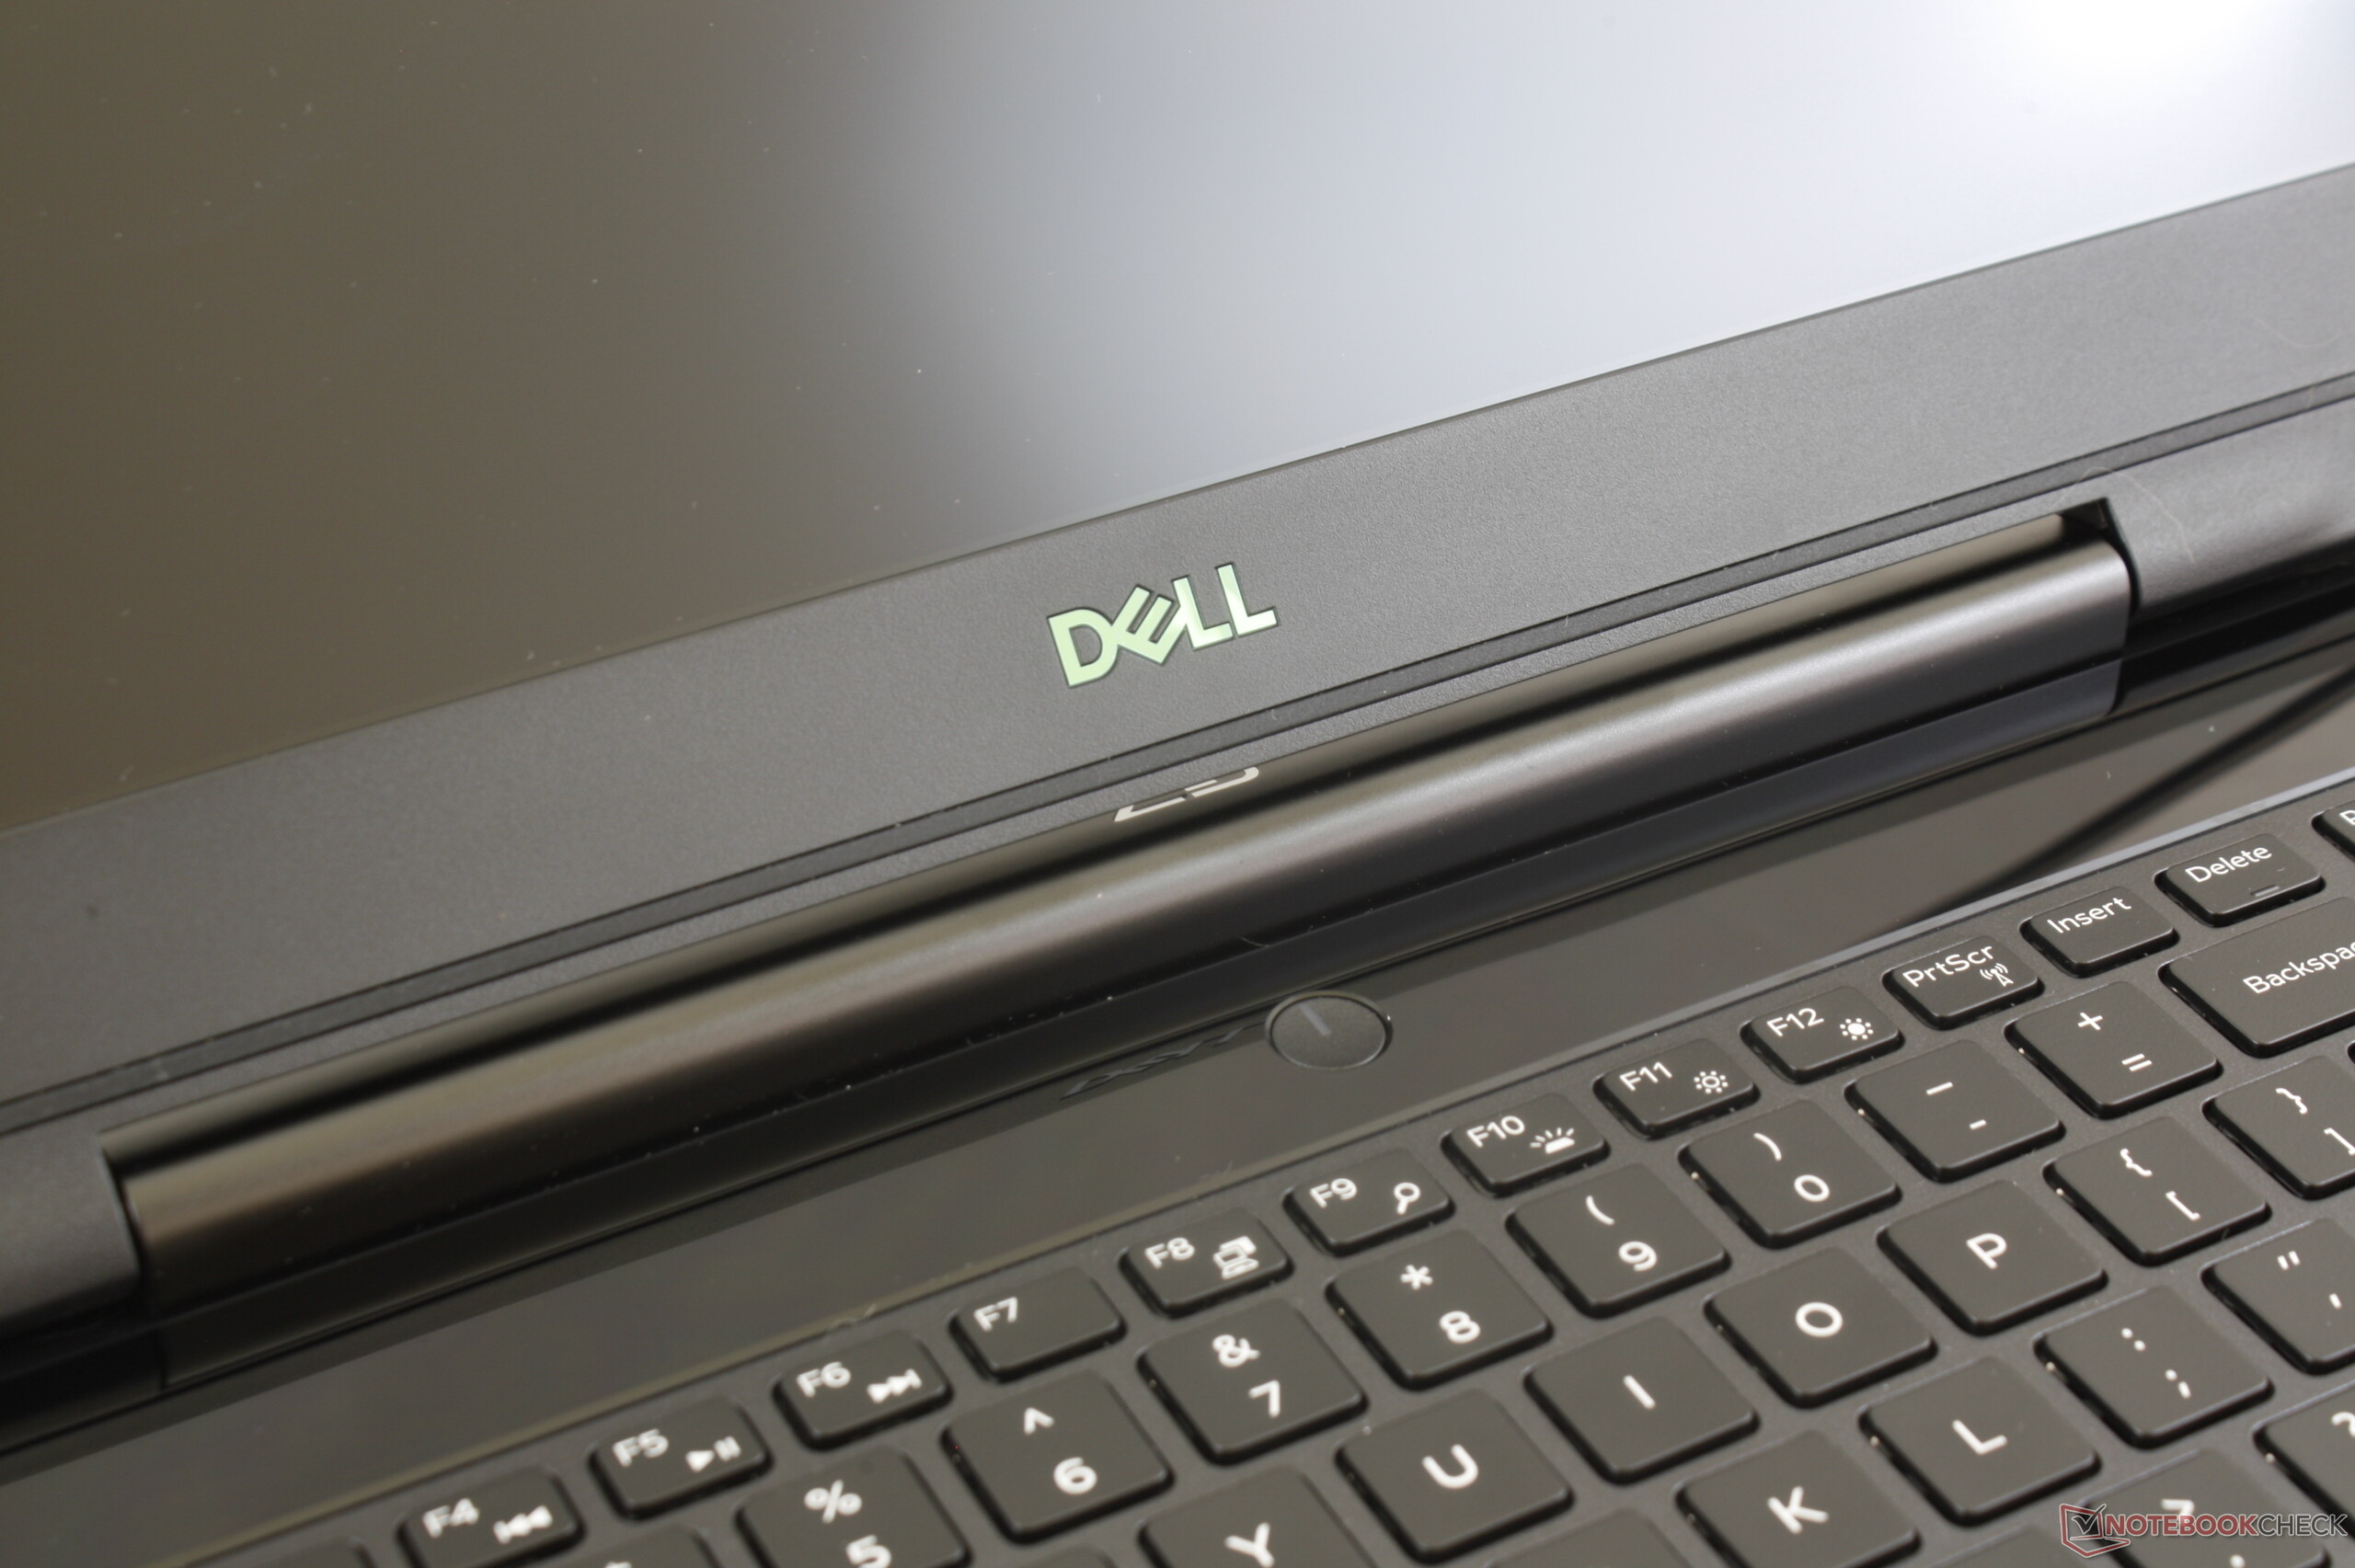
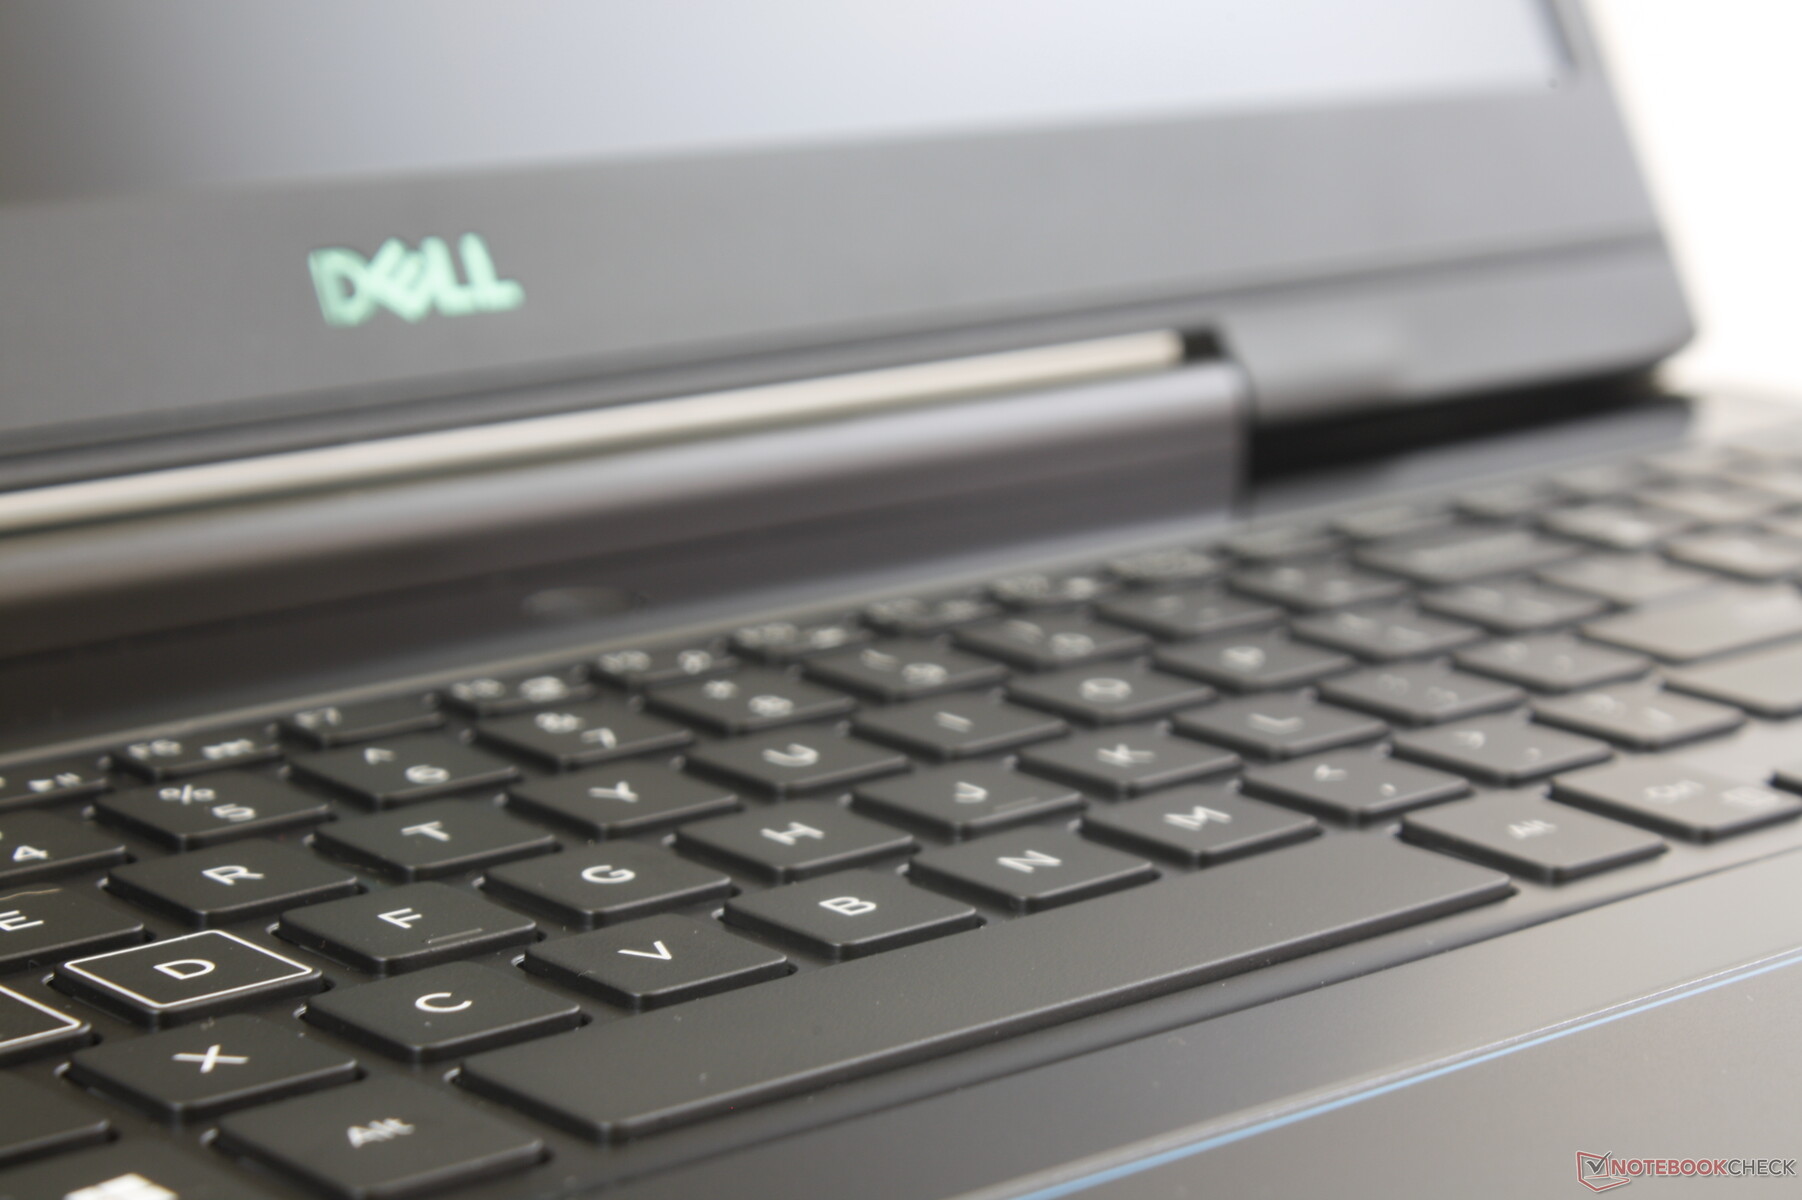
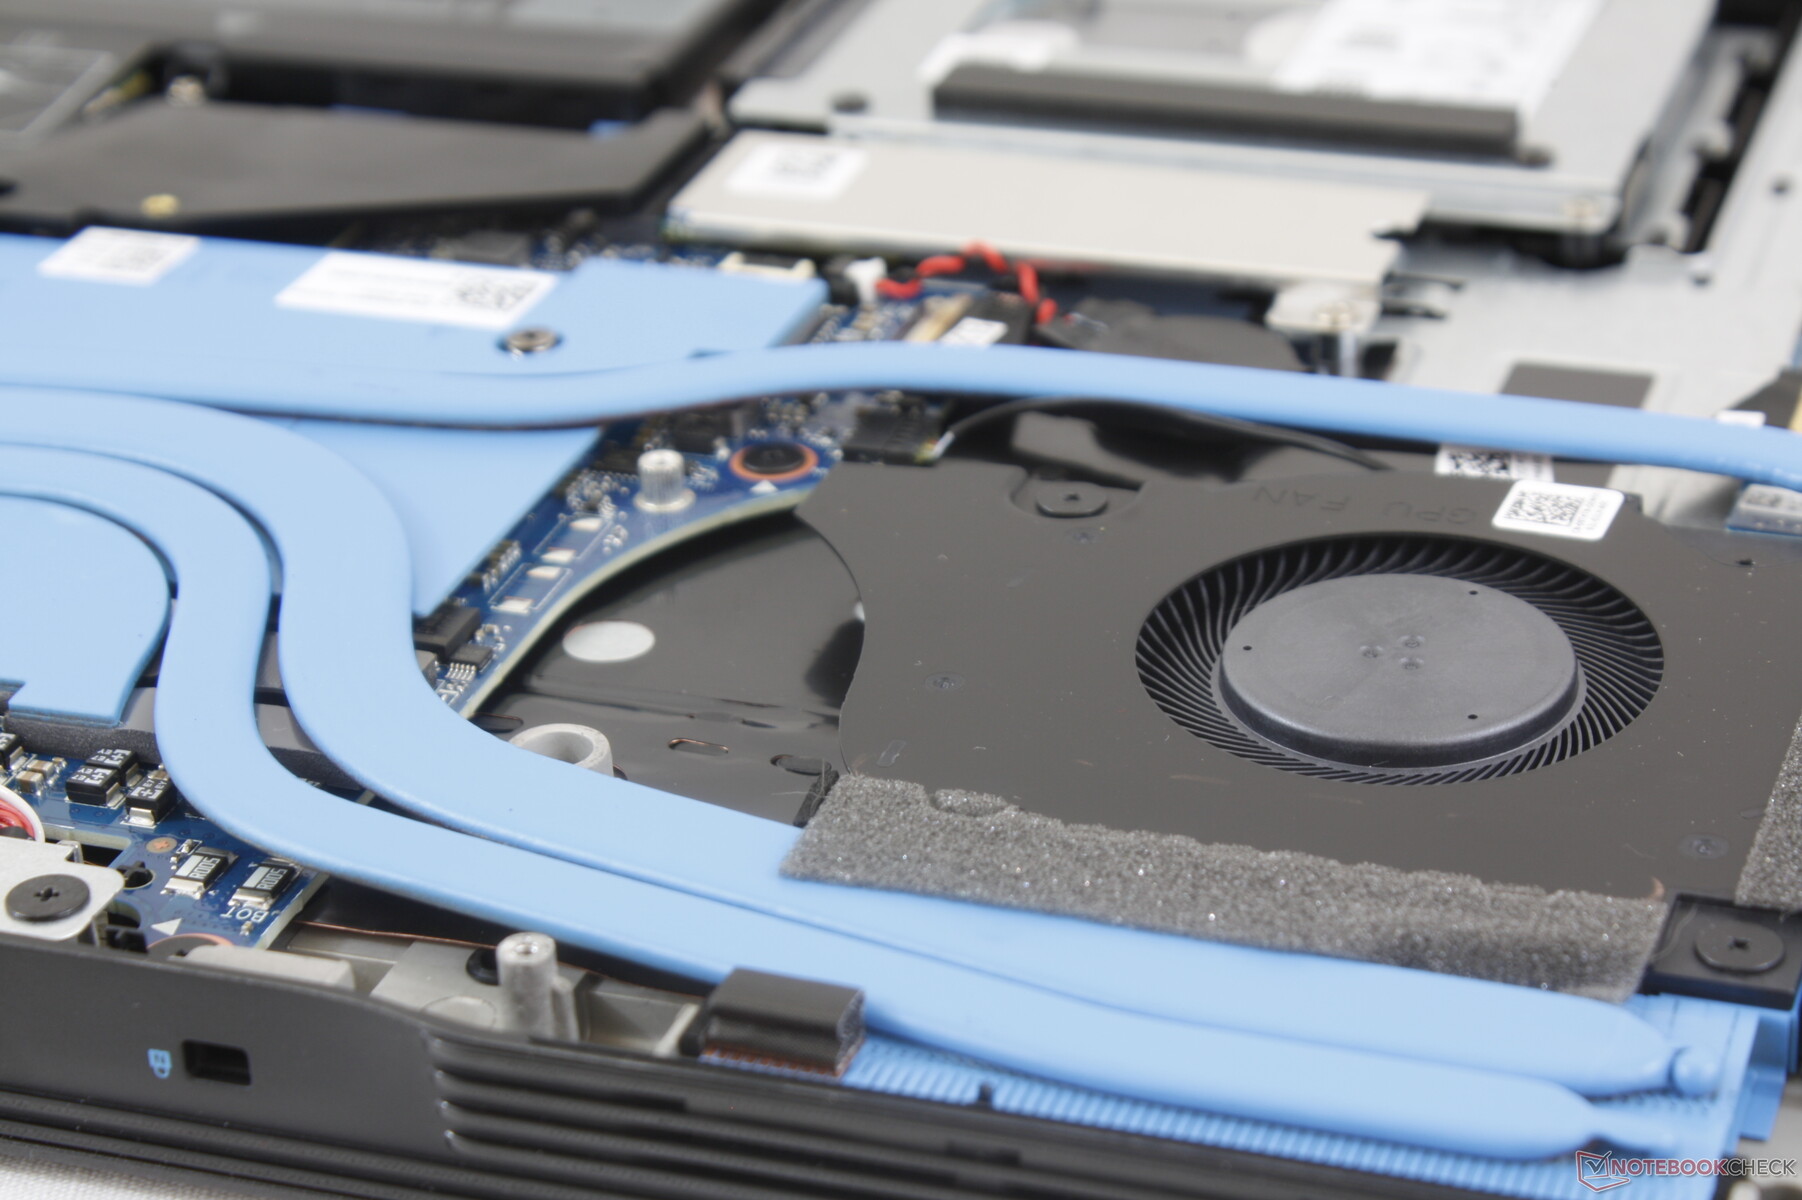
The most visually distinctive feature of the G7 7790 is the horizontal stripes along the edges and corners of the chassis. It's purely aesthetic and contrasts well with the honeycomb design of the pricier Alienware Area-51m or Alienware m17 G2. The Dell logo, default keyboard lighting, and even heat pipes are all shades of light blue to accentuate the "gaming" aspect of the Dell G Series. It may not be the most attractive to our eyes, but it's definitely novel in the gaming laptop space.
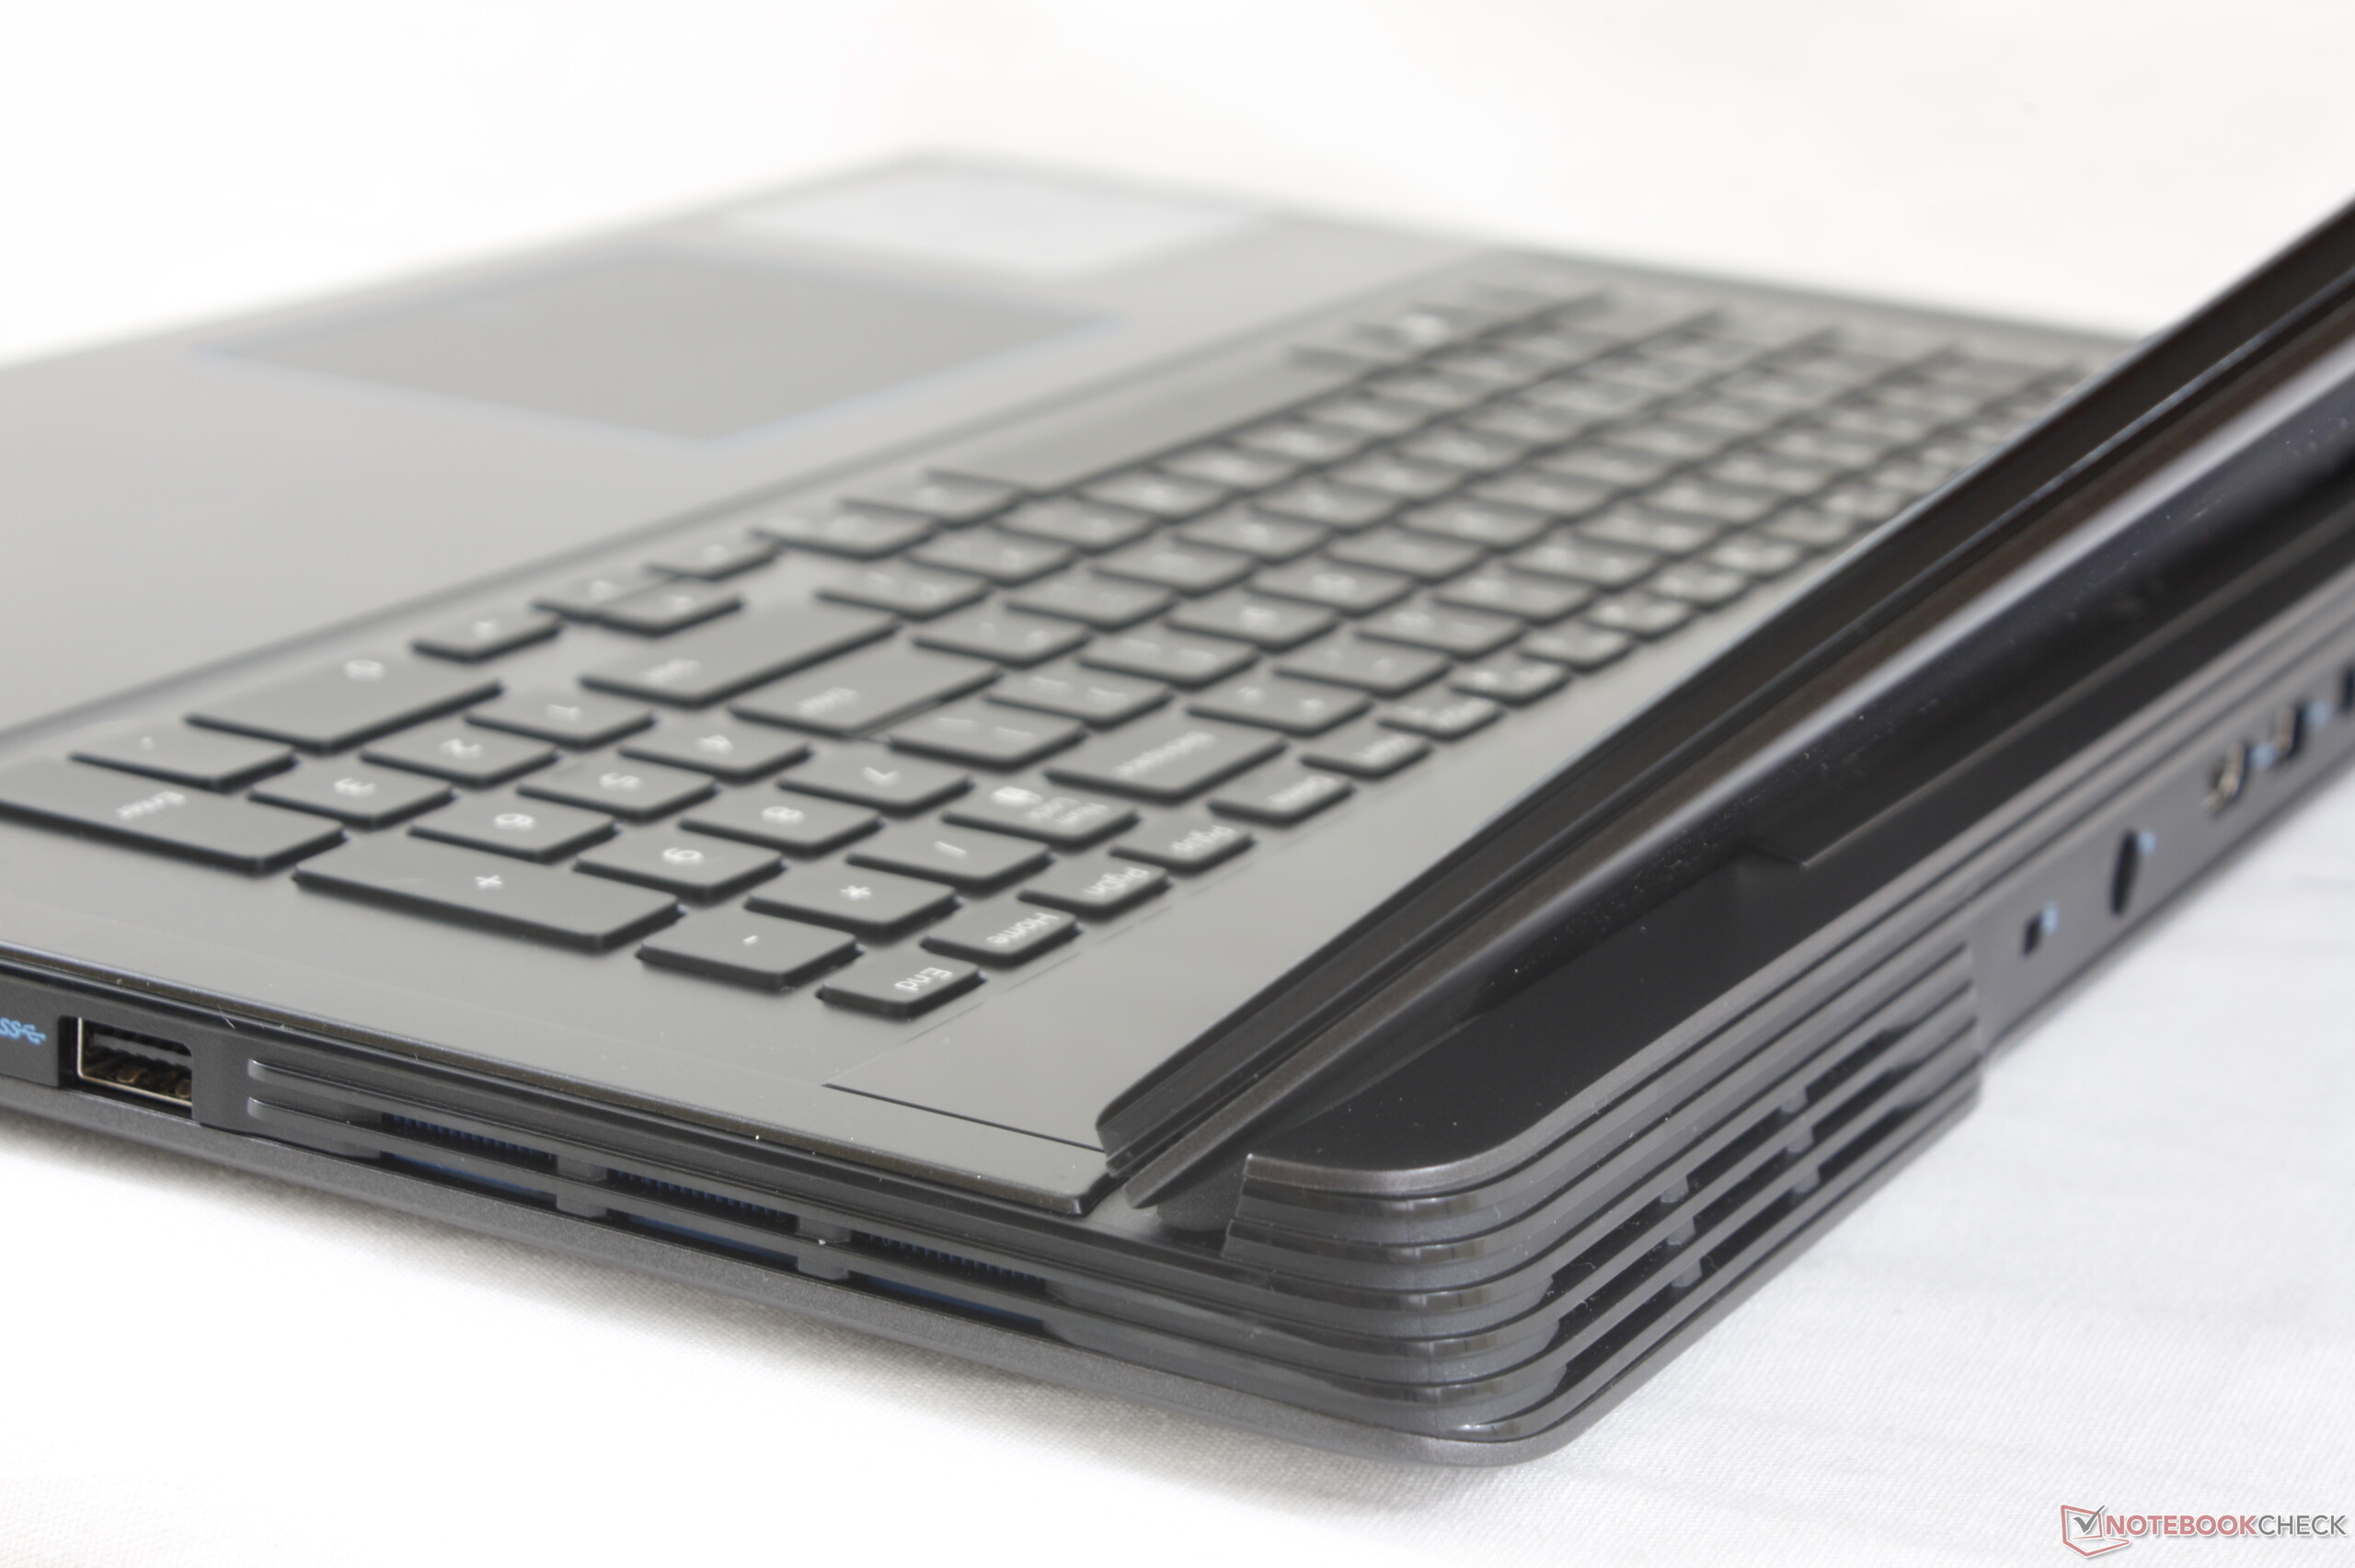
Chassis rigidity is excellent and surprisingly tough around the base. The palm rests and keyboard center exhibit almost no flexing when applying pressure and side-to-side twisting is a non-issue with almost no creaking. The lid is comparatively weaker and more susceptible to both flexing and depressions especially down the outer center or from its top corners, but this is expected on large 17.3-inch laptops. The lids of the Lenovo Legion Y740 and Razer Blade Pro 17 are weaker and stronger, respectively.
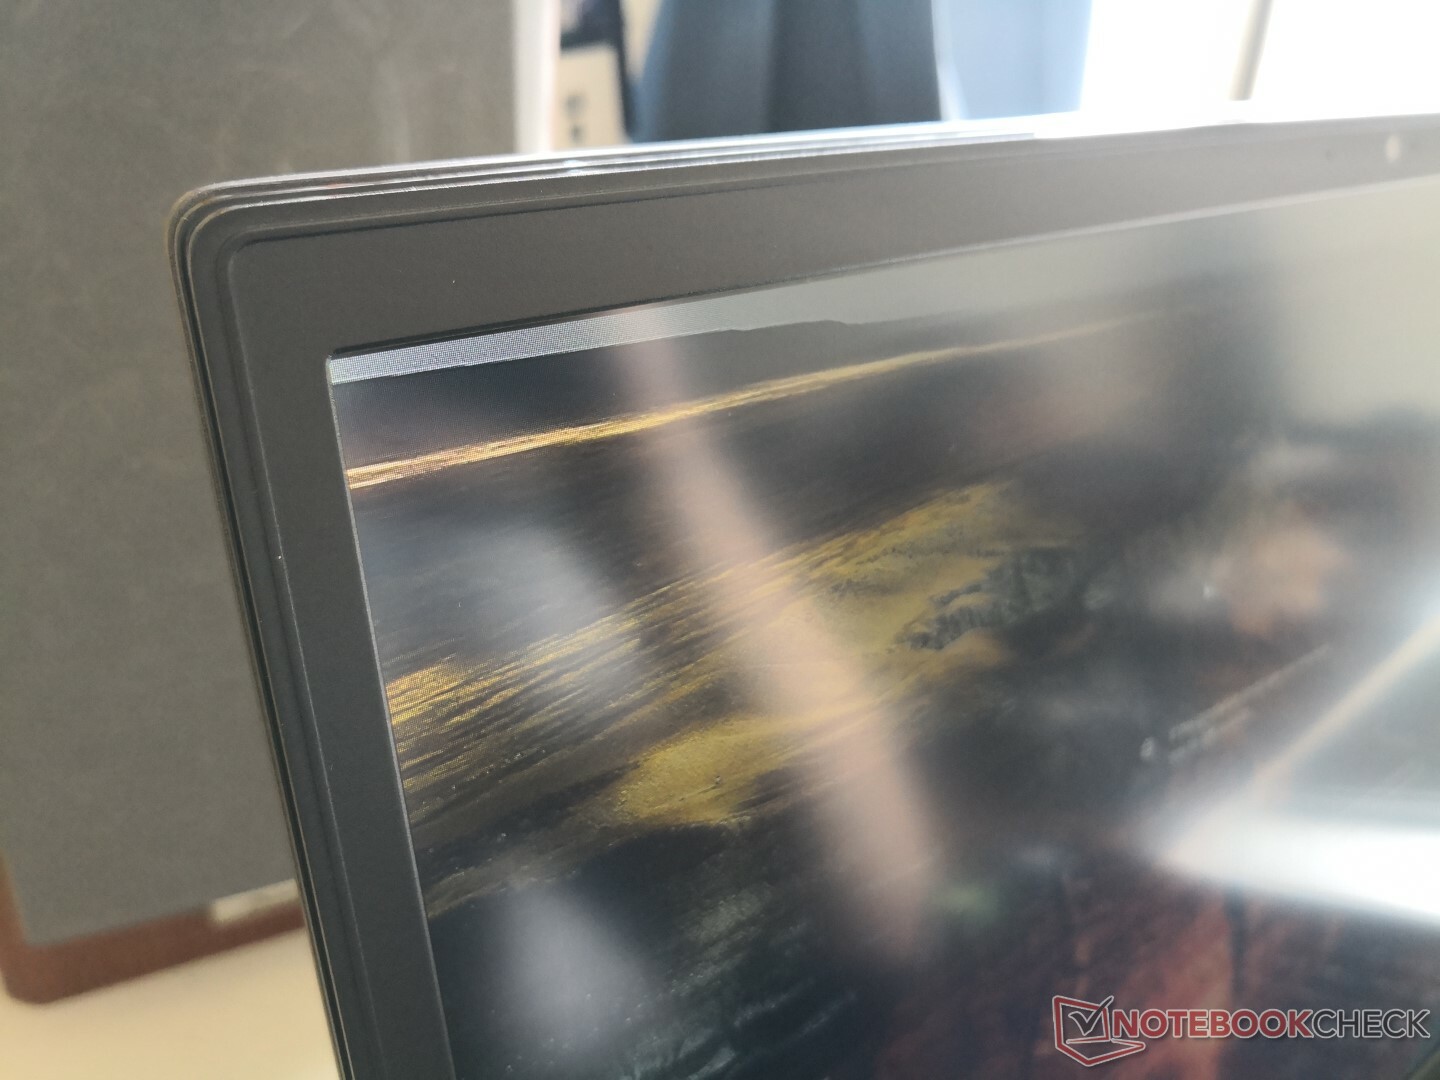
Build quality is excellent with no unintended gaps or crevices between materials on our test unit including along the bottom edge of the screen. Nonetheless, be prepared for fingerprints everywhere around the case. Much like on the Alienware m15, there is a glossy stripe across the Power button that will attract fingerprints like no tomorrow.

The narrower side bezels of the Dell G7 make it shorter in width than the competing MSI GL73 and Lenovo Legion Y740 which have thicker bezels. Because the larger rear ventilation extends the length of the chassis, however, the Dell laptop is longer in length than the aforementioned MSI and Lenovo. The overall chassis footprint is thus squarer than many other 17.3-inch gaming laptops.
One of the biggest drawbacks about the system is its hefty weight of 3.2 kg to be several hundred grams heavier than the Lenovo Legion Y740, Asus TUF FX705DT, and the Dell G3 17. There's no question that this is a heavy laptop even when considering its size category and this is perhaps the price to pay for a rigid build.
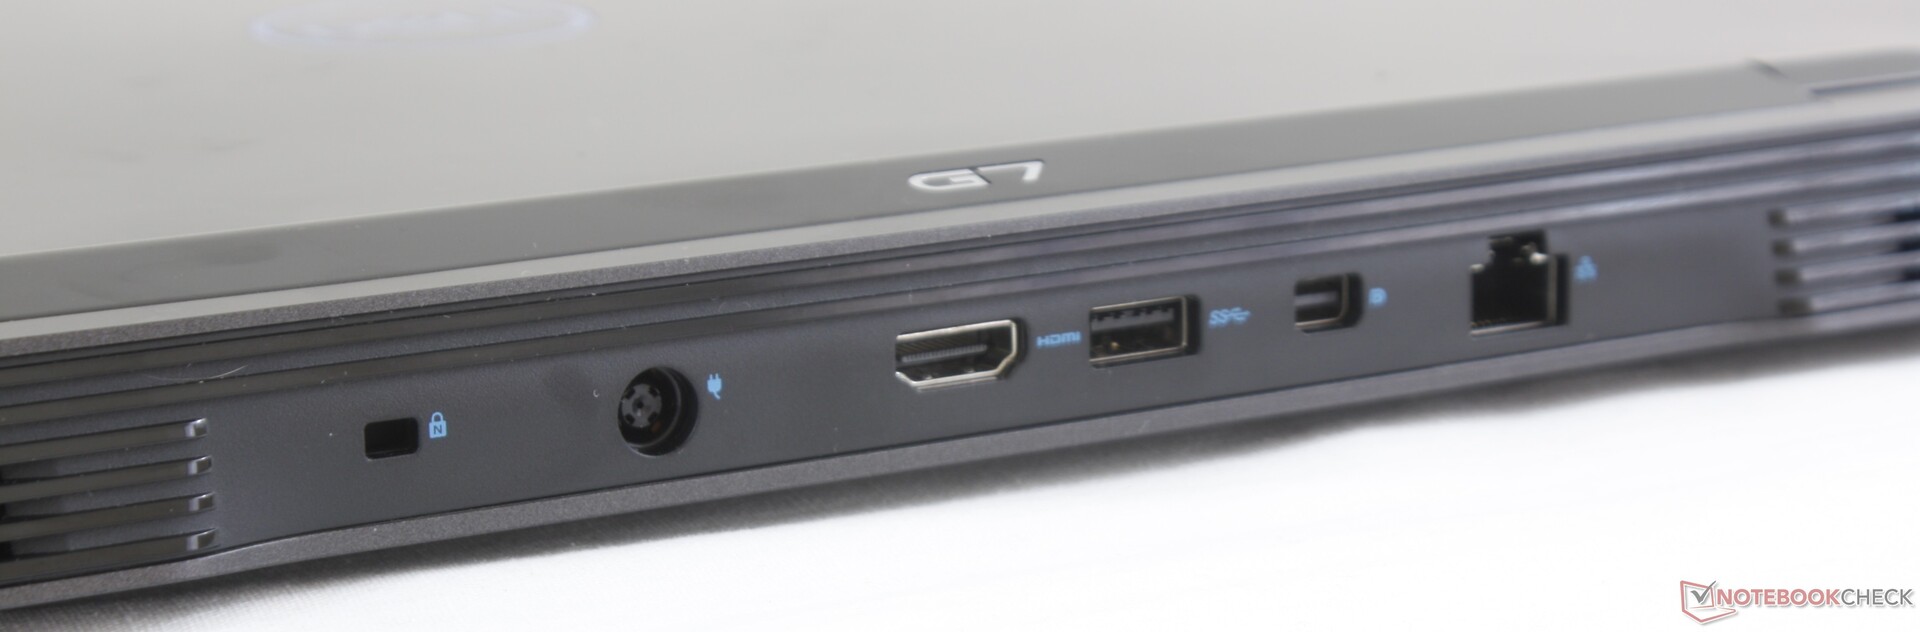
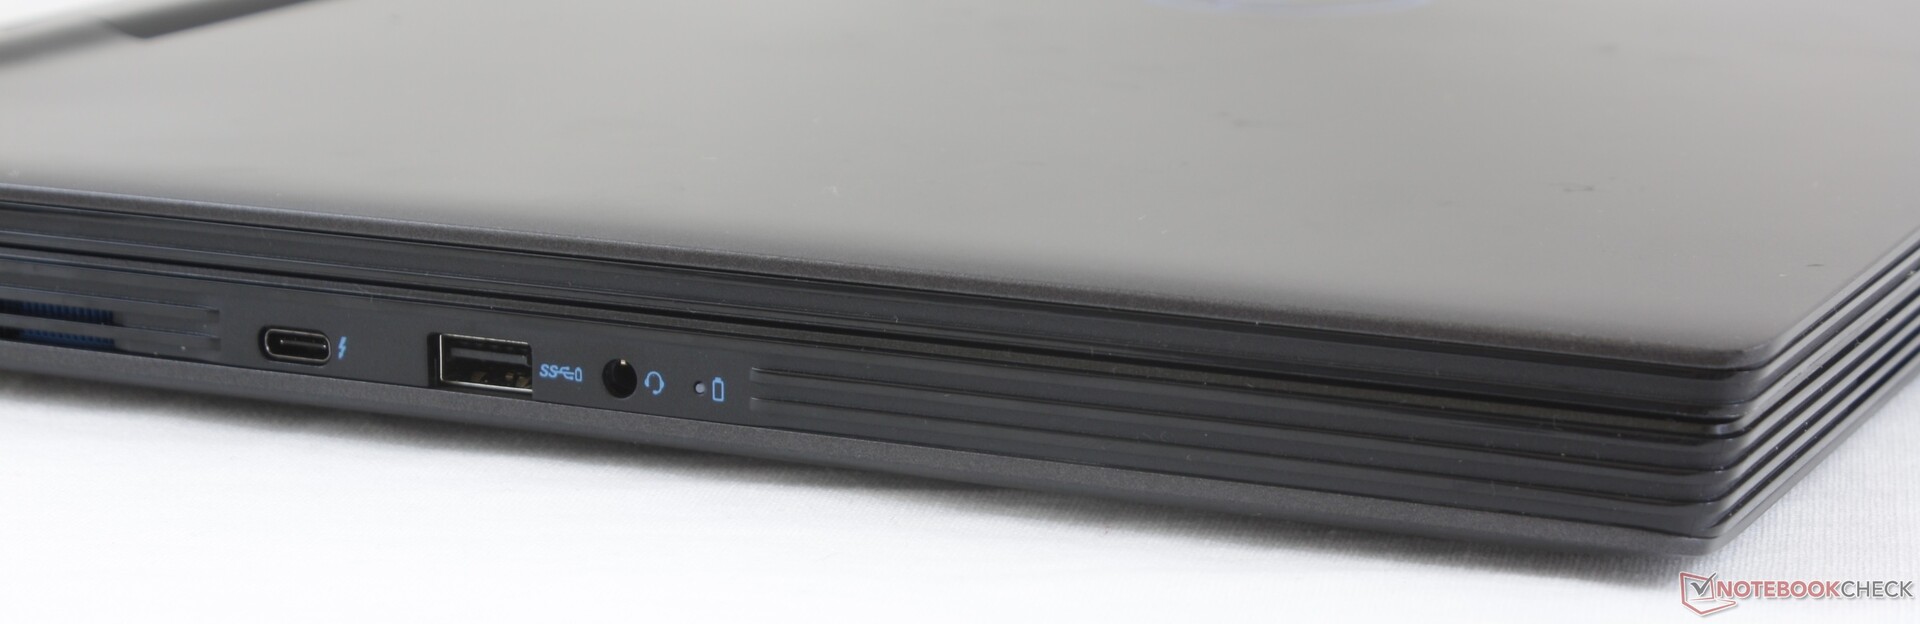
Connectivity
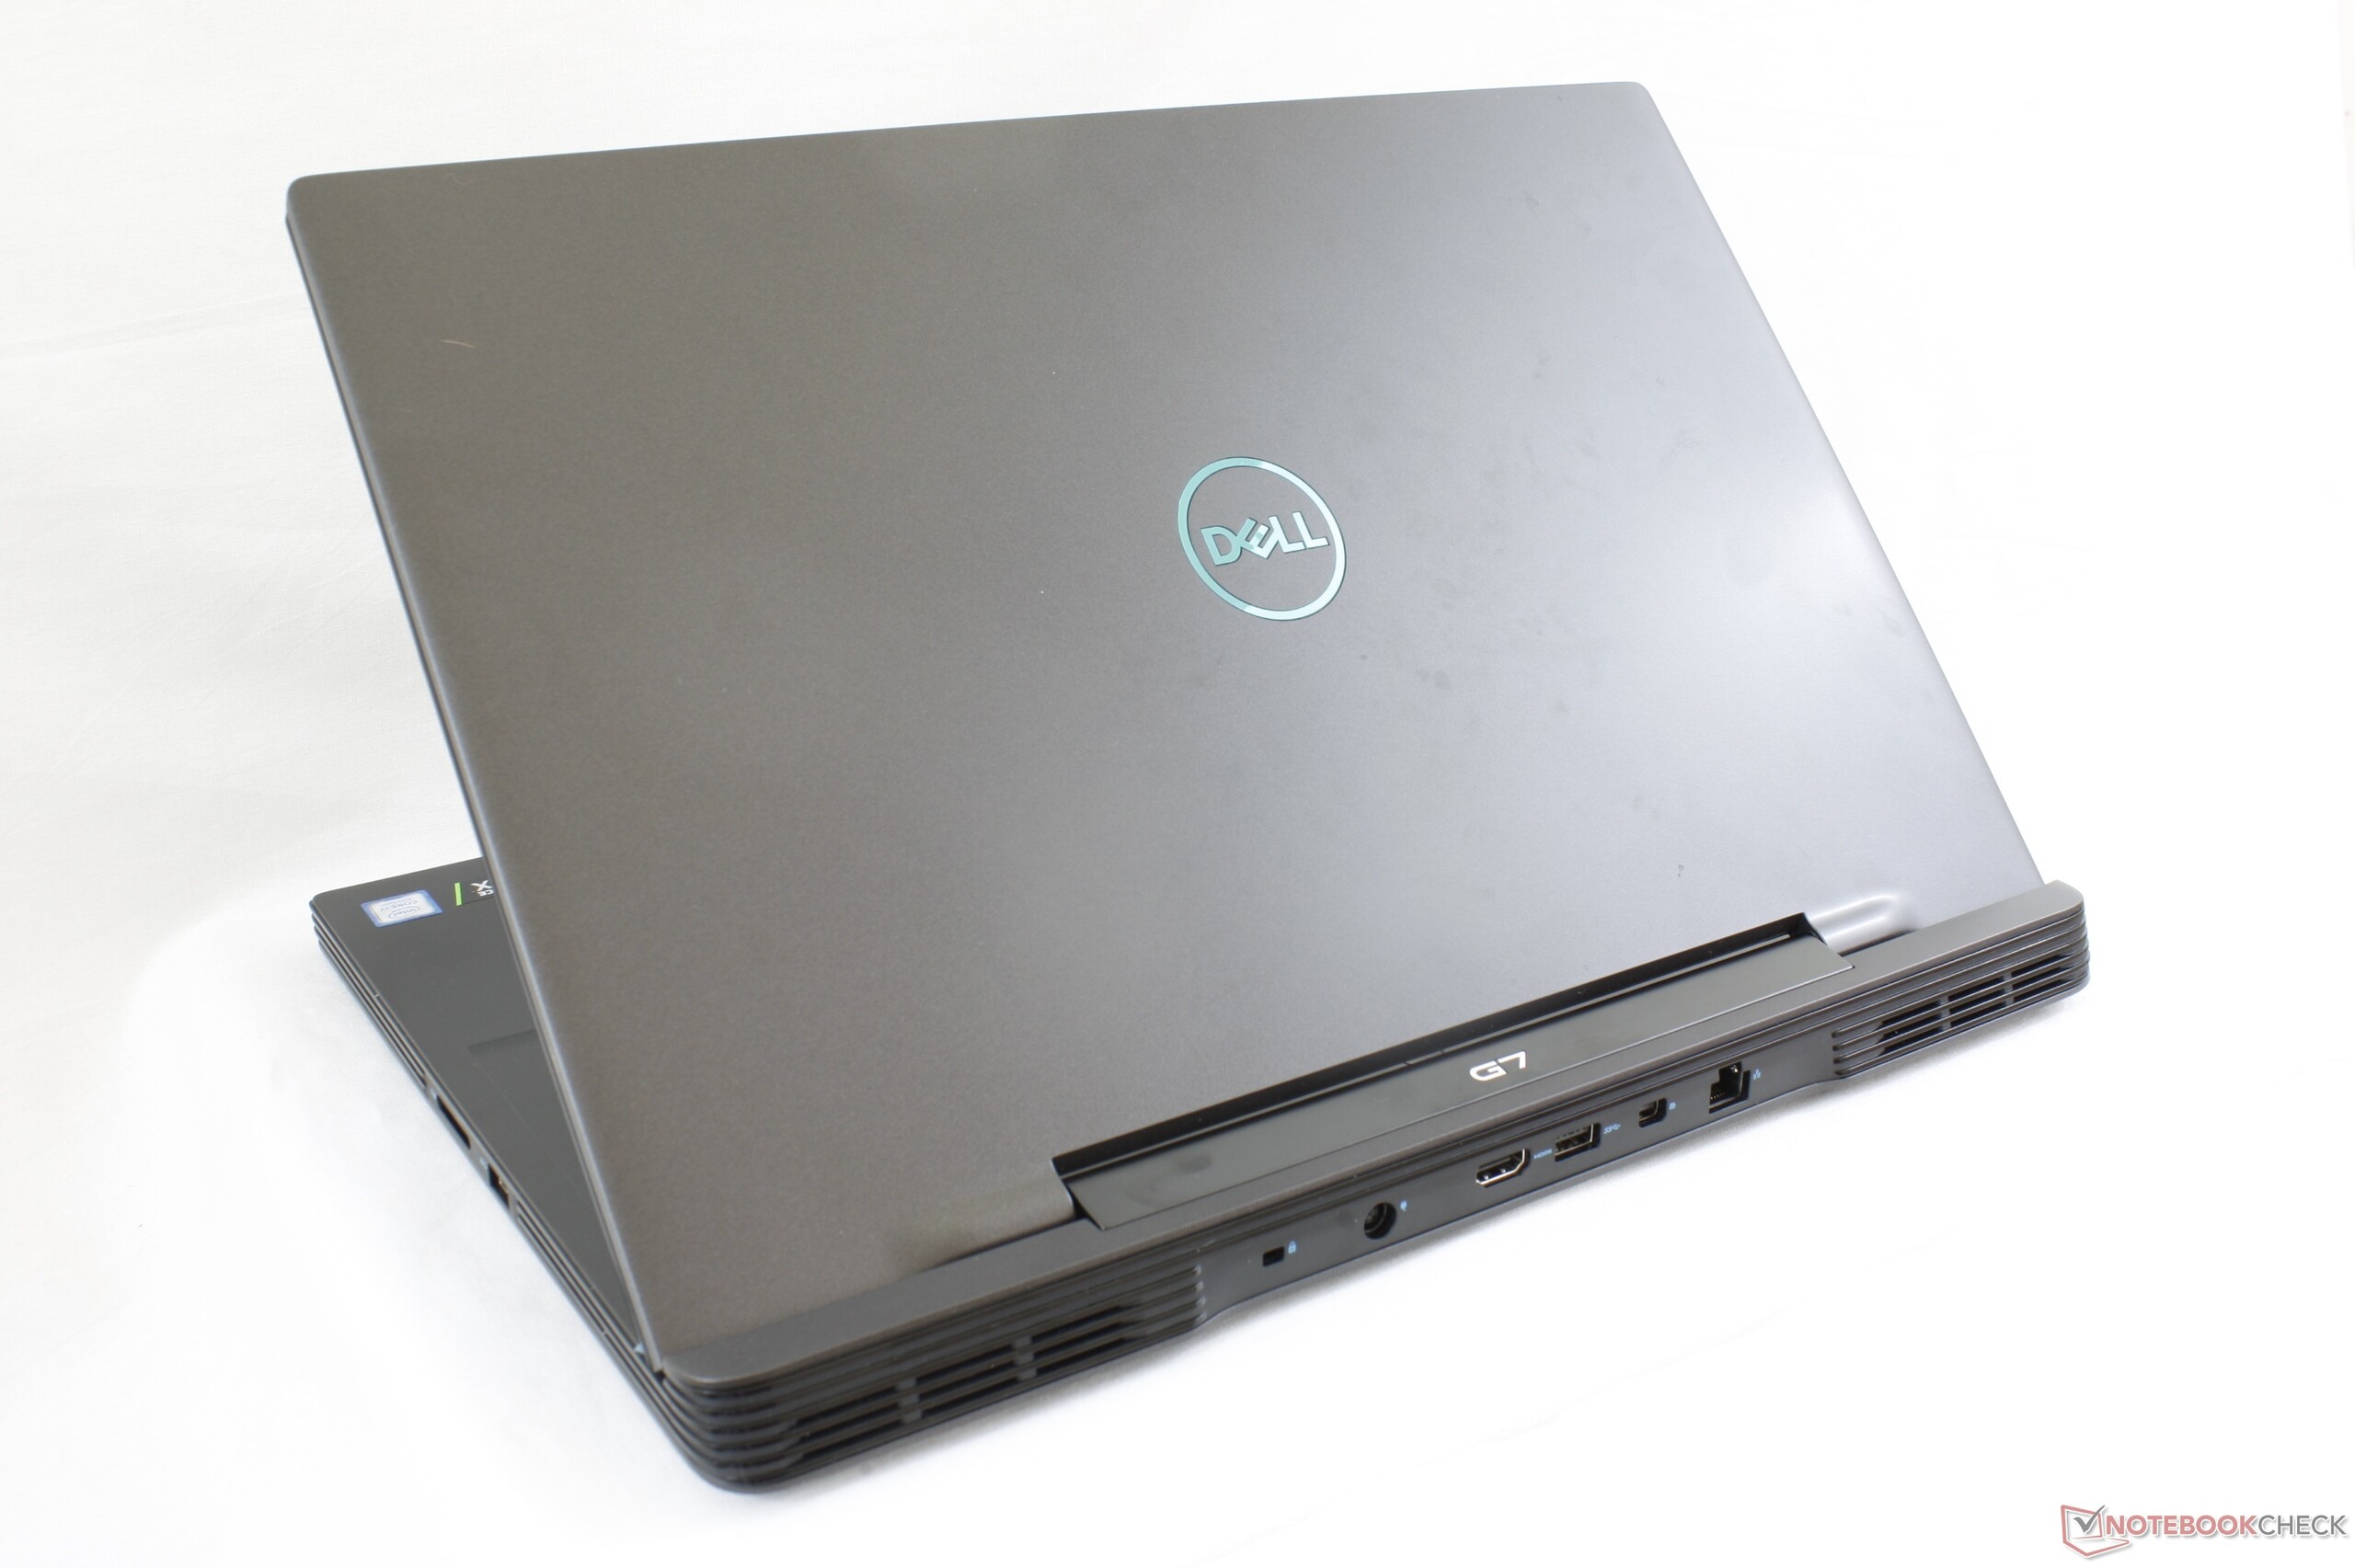
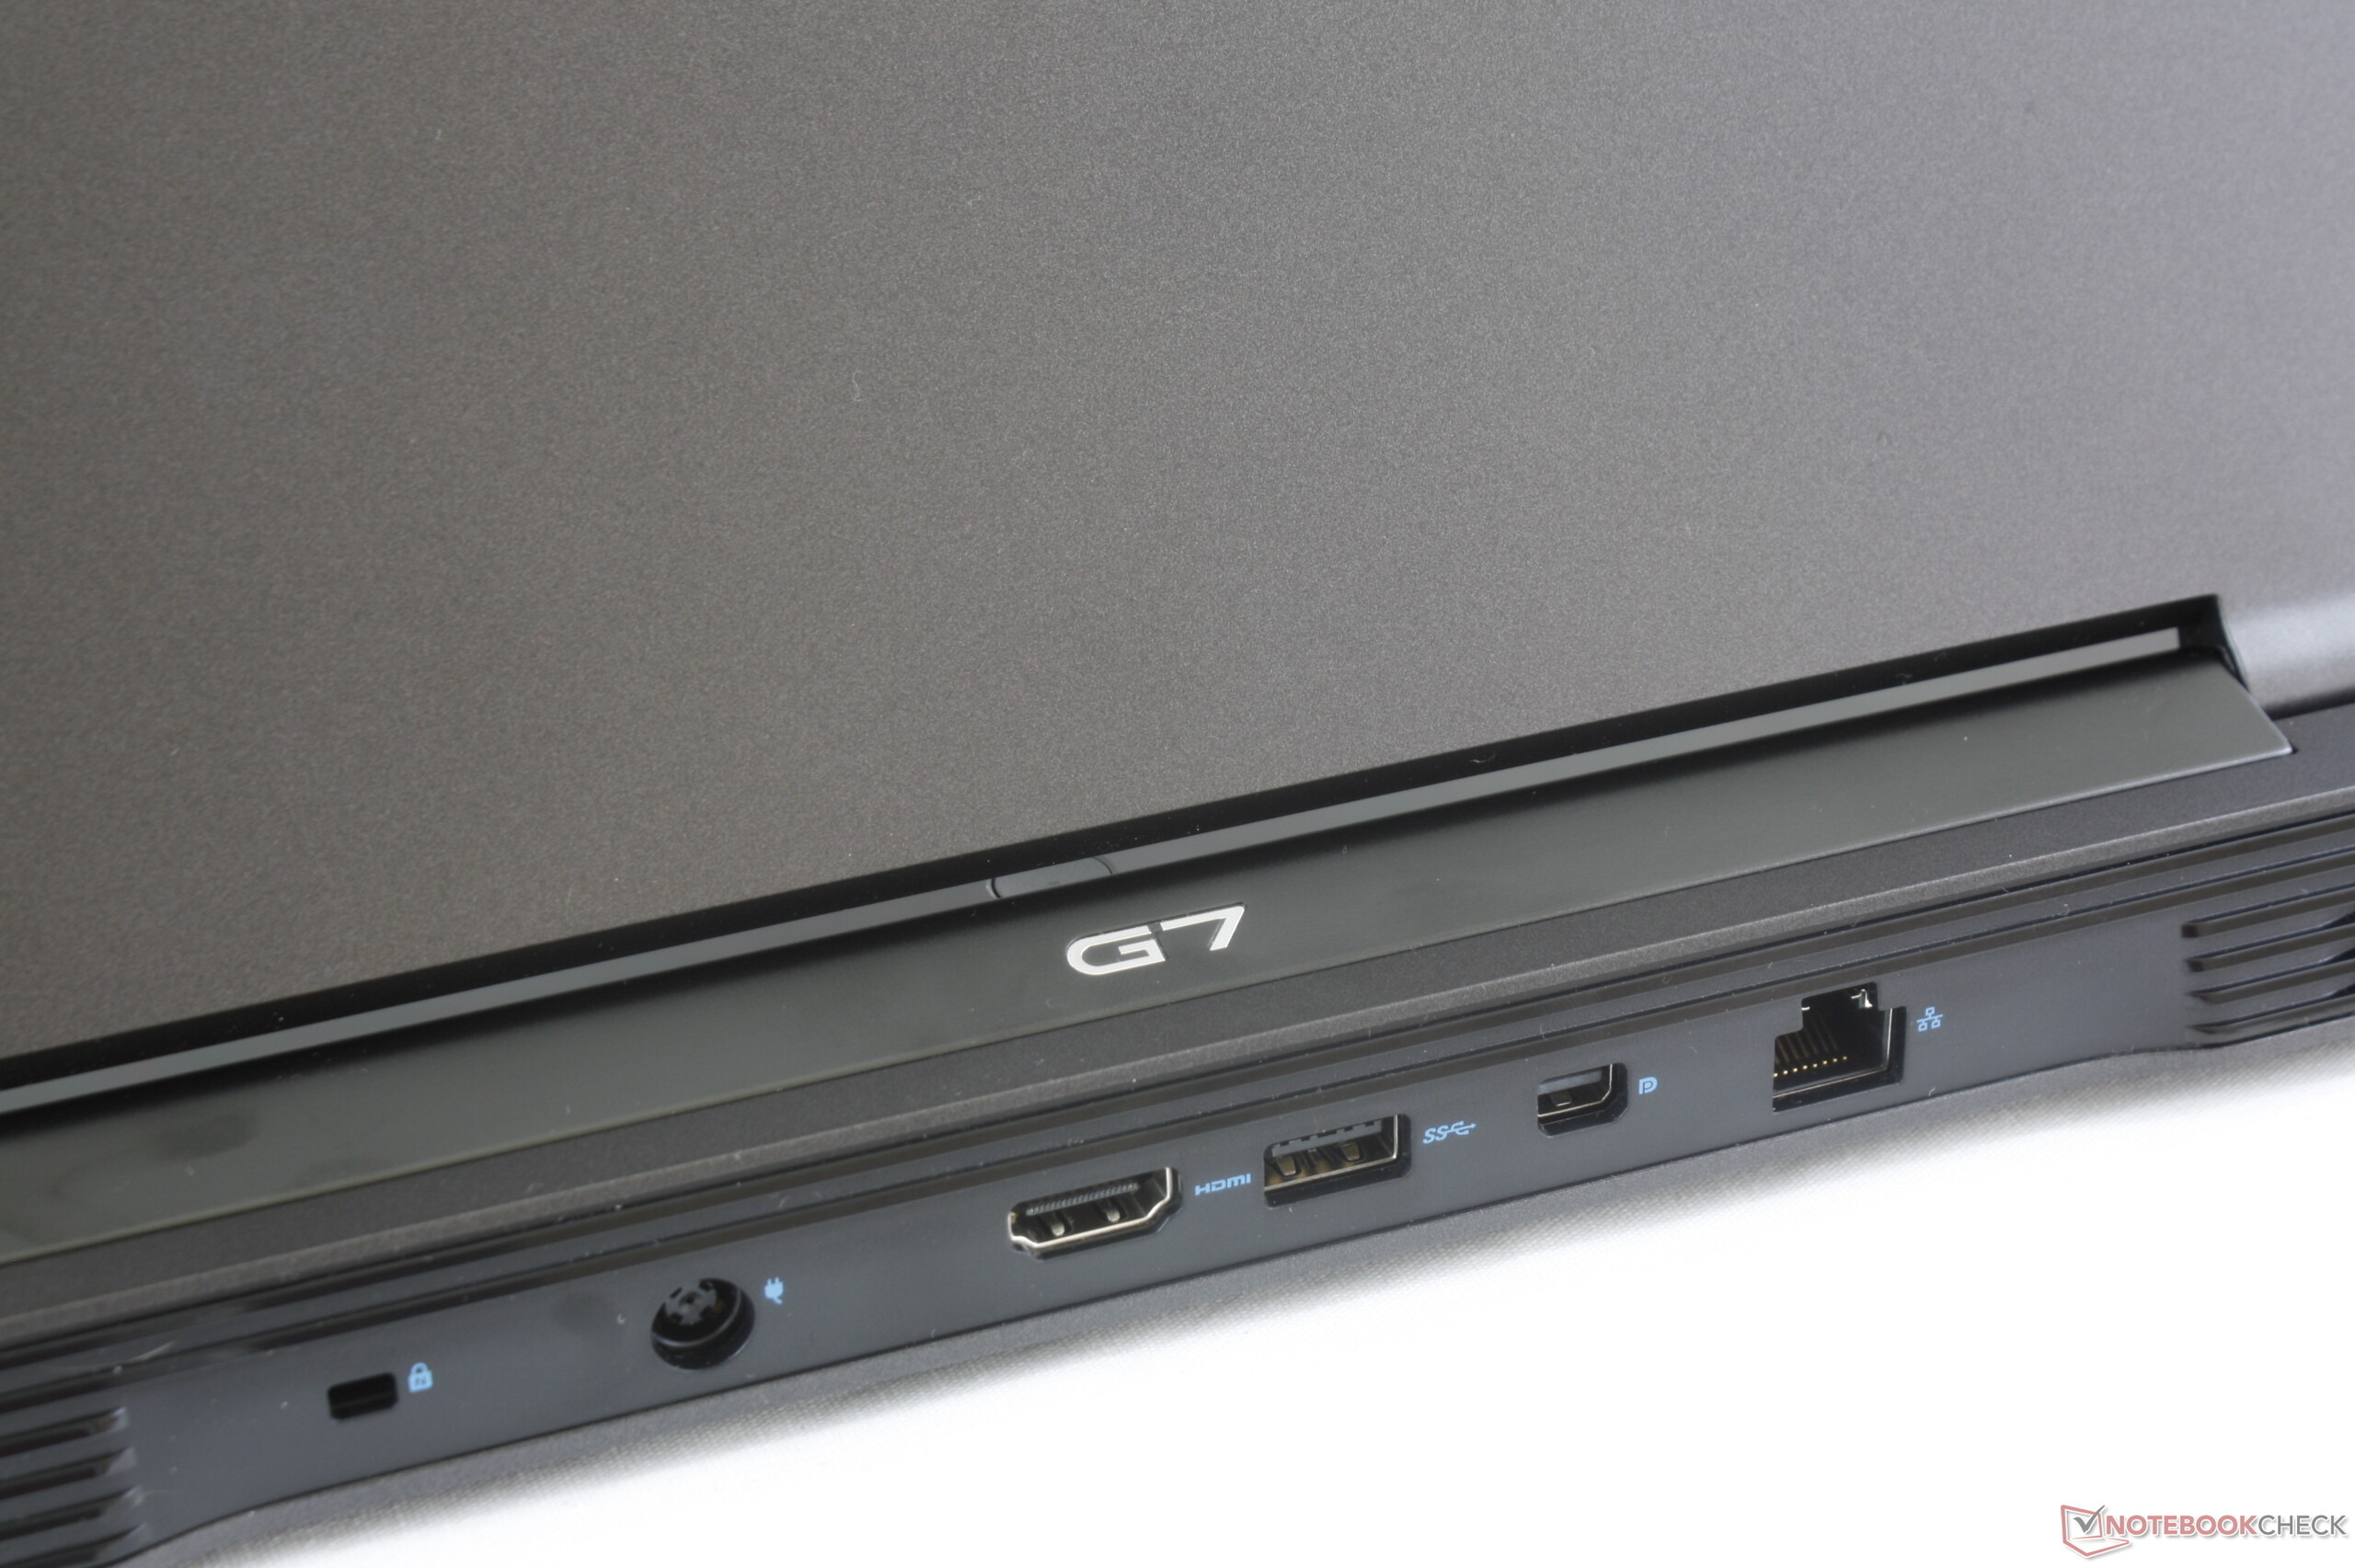
Available ports are actually quite similar to the Alienware m17 albeit rearranged and without the Graphics Amplifier port. Users get optional Thunderbolt 3 and a USB Type-A port on each of the three sides of the chassis. Most of the ports are located towards the rear of the unit where they can be inconvenient to reach. In contrast, laptops like the MSI GS75 have no ports on the rear.
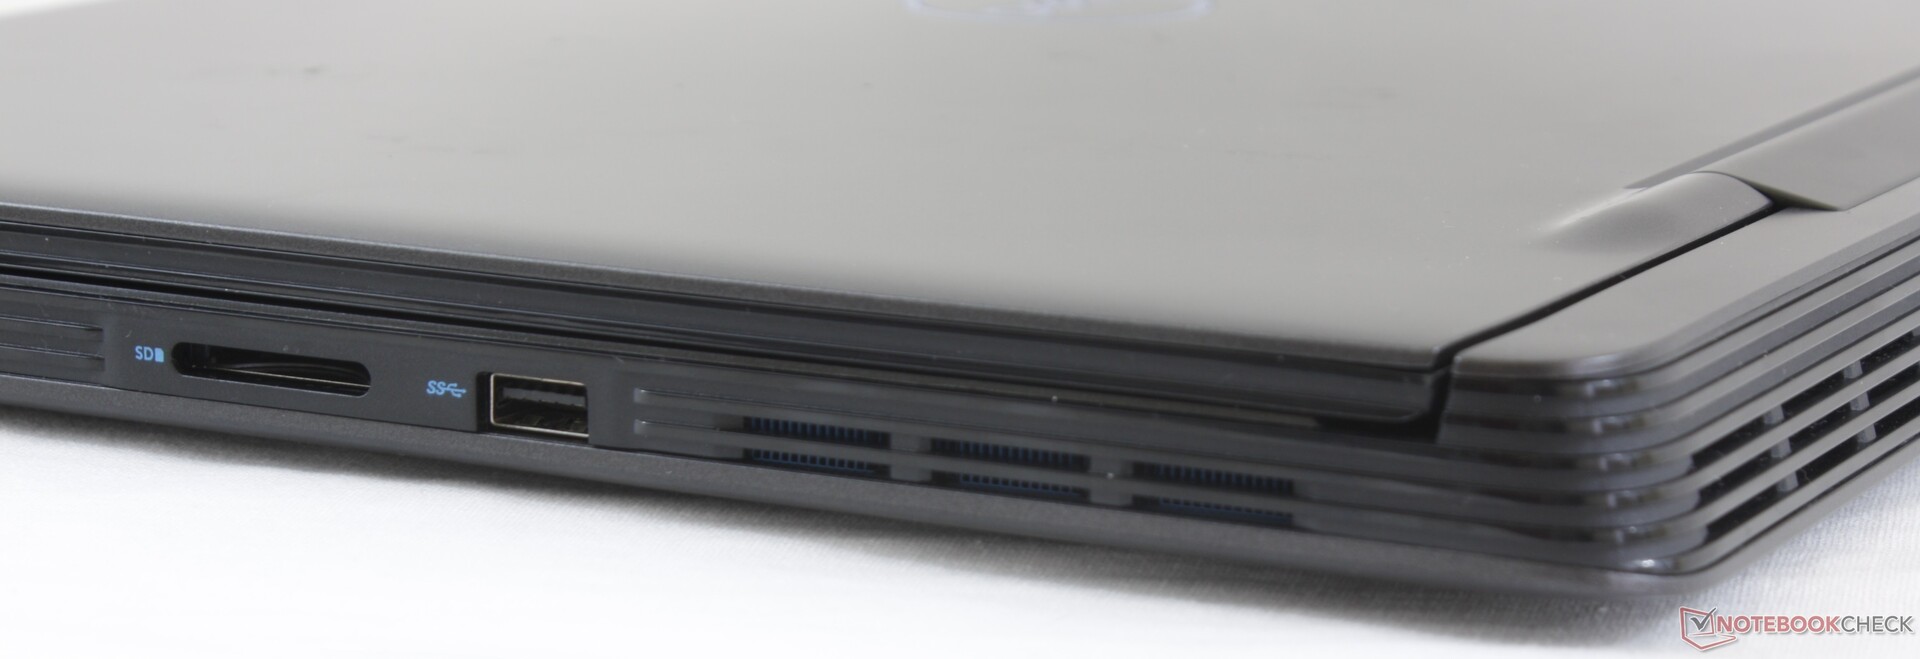
SD Card Reader
Transfer rates from the integrated card reader are limited to about 34 MB/s. Moving 1 GB of pictures from our UHS-II test card to desktop takes about 36 seconds compared to under 8 seconds on the XPS 15.
The card reader slot is not spring-loaded. A fully inserted SD card still protrudes by about half its length for unsafe transport.
| SD Card Reader | |
| average JPG Copy Test (av. of 3 runs) | |
| Dell XPS 15 9570 Core i9 UHD (Toshiba Exceria Pro SDXC 64 GB UHS-II) | |
| Asus ZenBook 15 UX533FD (Toshiba Exceria Pro SDXC 64 GB UHS-II) | |
| Dell G7 17 7790 (Toshiba Exceria Pro SDXC 64 GB UHS-II) | |
| MSI GL73 8SE-010US (Toshiba Exceria Pro SDXC 64 GB UHS-II) | |
| maximum AS SSD Seq Read Test (1GB) | |
| Dell XPS 15 9570 Core i9 UHD (Toshiba Exceria Pro SDXC 64 GB UHS-II) | |
| Asus ZenBook 15 UX533FD (Toshiba Exceria Pro SDXC 64 GB UHS-II) | |
| Dell G7 17 7790 (Toshiba Exceria Pro SDXC 64 GB UHS-II) | |
| MSI GL73 8SE-010US (Toshiba Exceria Pro SDXC 64 GB UHS-II) | |
Communication
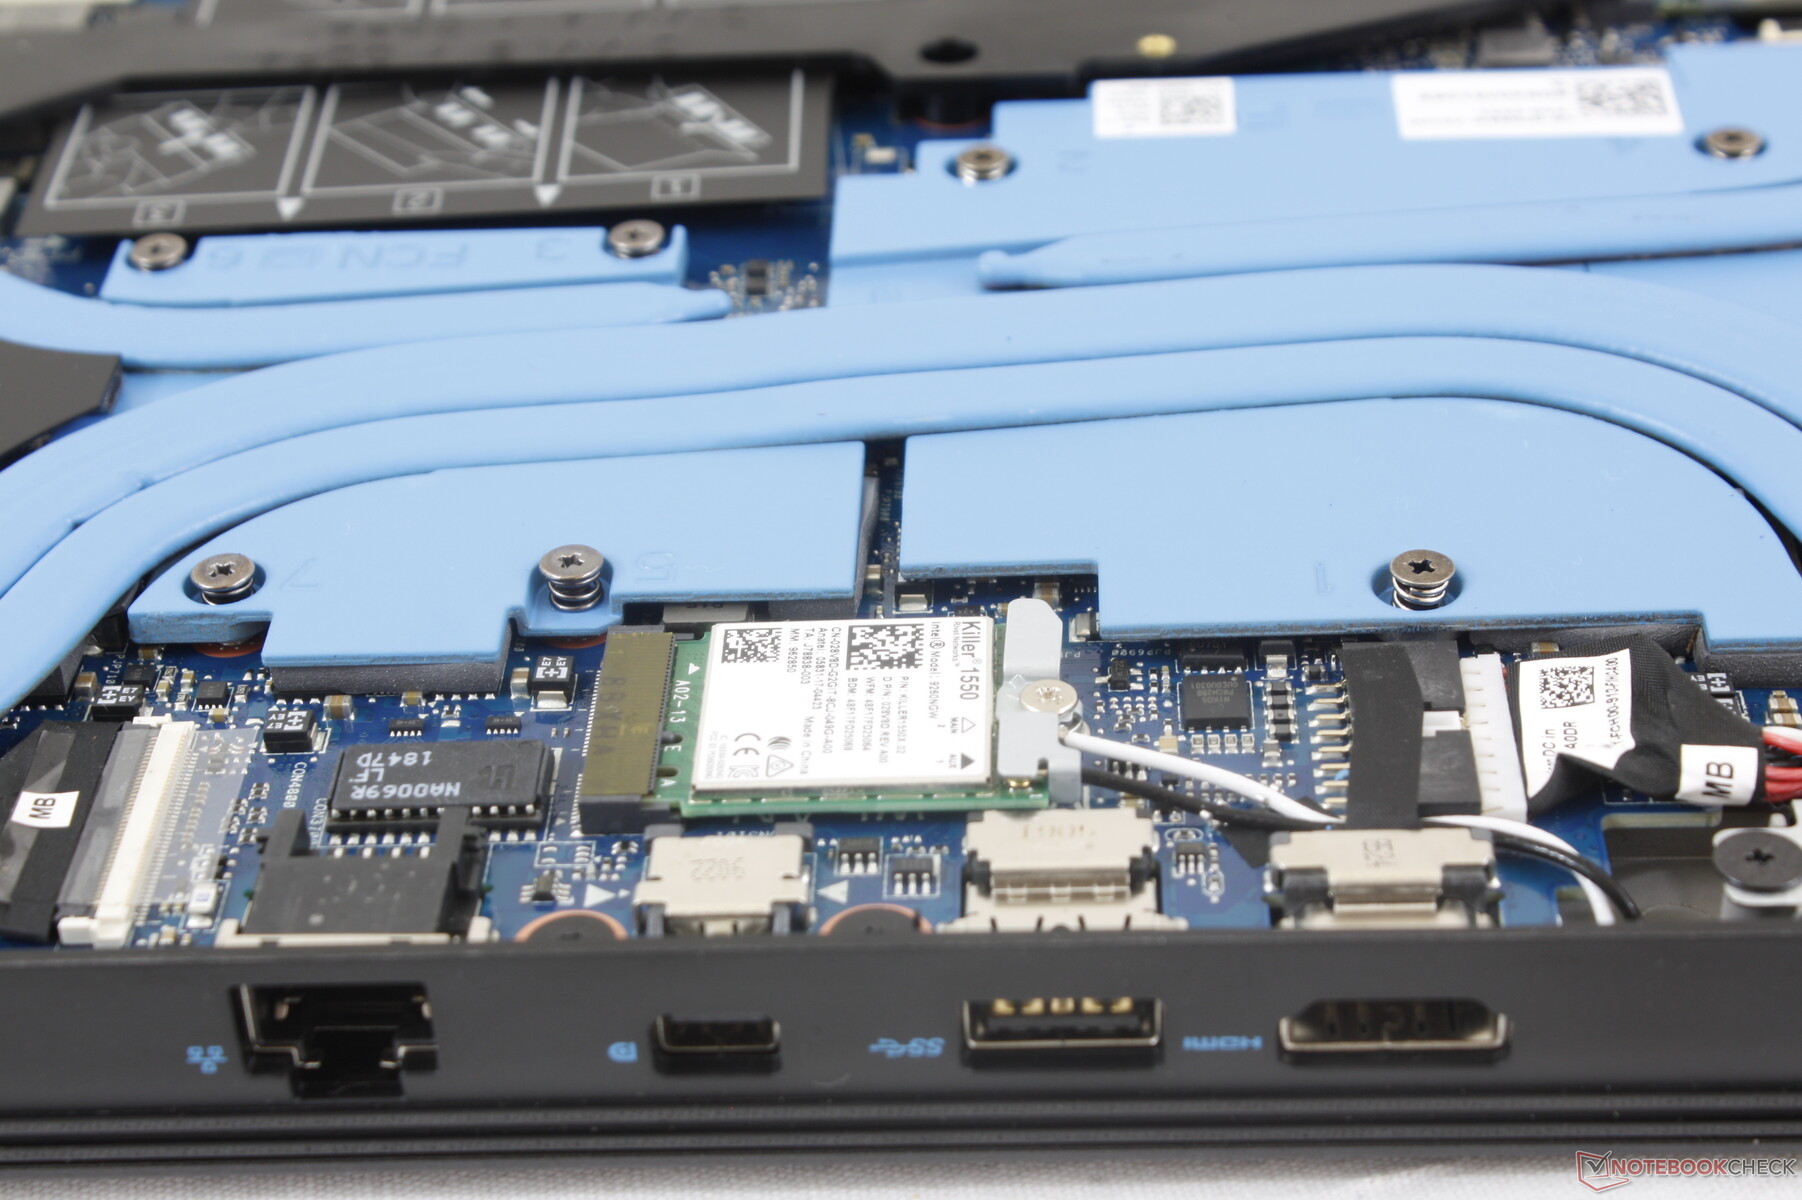
Dell has equipped the G7 17 with the same Killer 1550 WLAN module as on the higher-end XPS and Alienware systems. Users will have access to a variety of gaming-centric features as described here.
Note that the product page for the G7 17 incorrectly lists Bluetooth 4.2 when all available SKUs come standard with Bluetooth 5.
| Networking | |
| iperf3 transmit AX12 | |
| Dell G7 17 7790 | |
| Alienware m17 P37E | |
| MSI GL73 8SE-010US | |
| Lenovo Legion Y740-17ICH | |
| Asus TUF FX705DT-AU068T | |
| iperf3 receive AX12 | |
| Alienware m17 P37E | |
| Dell G7 17 7790 | |
| MSI GL73 8SE-010US | |
| Lenovo Legion Y740-17ICH | |
| Asus TUF FX705DT-AU068T | |
Maintenance
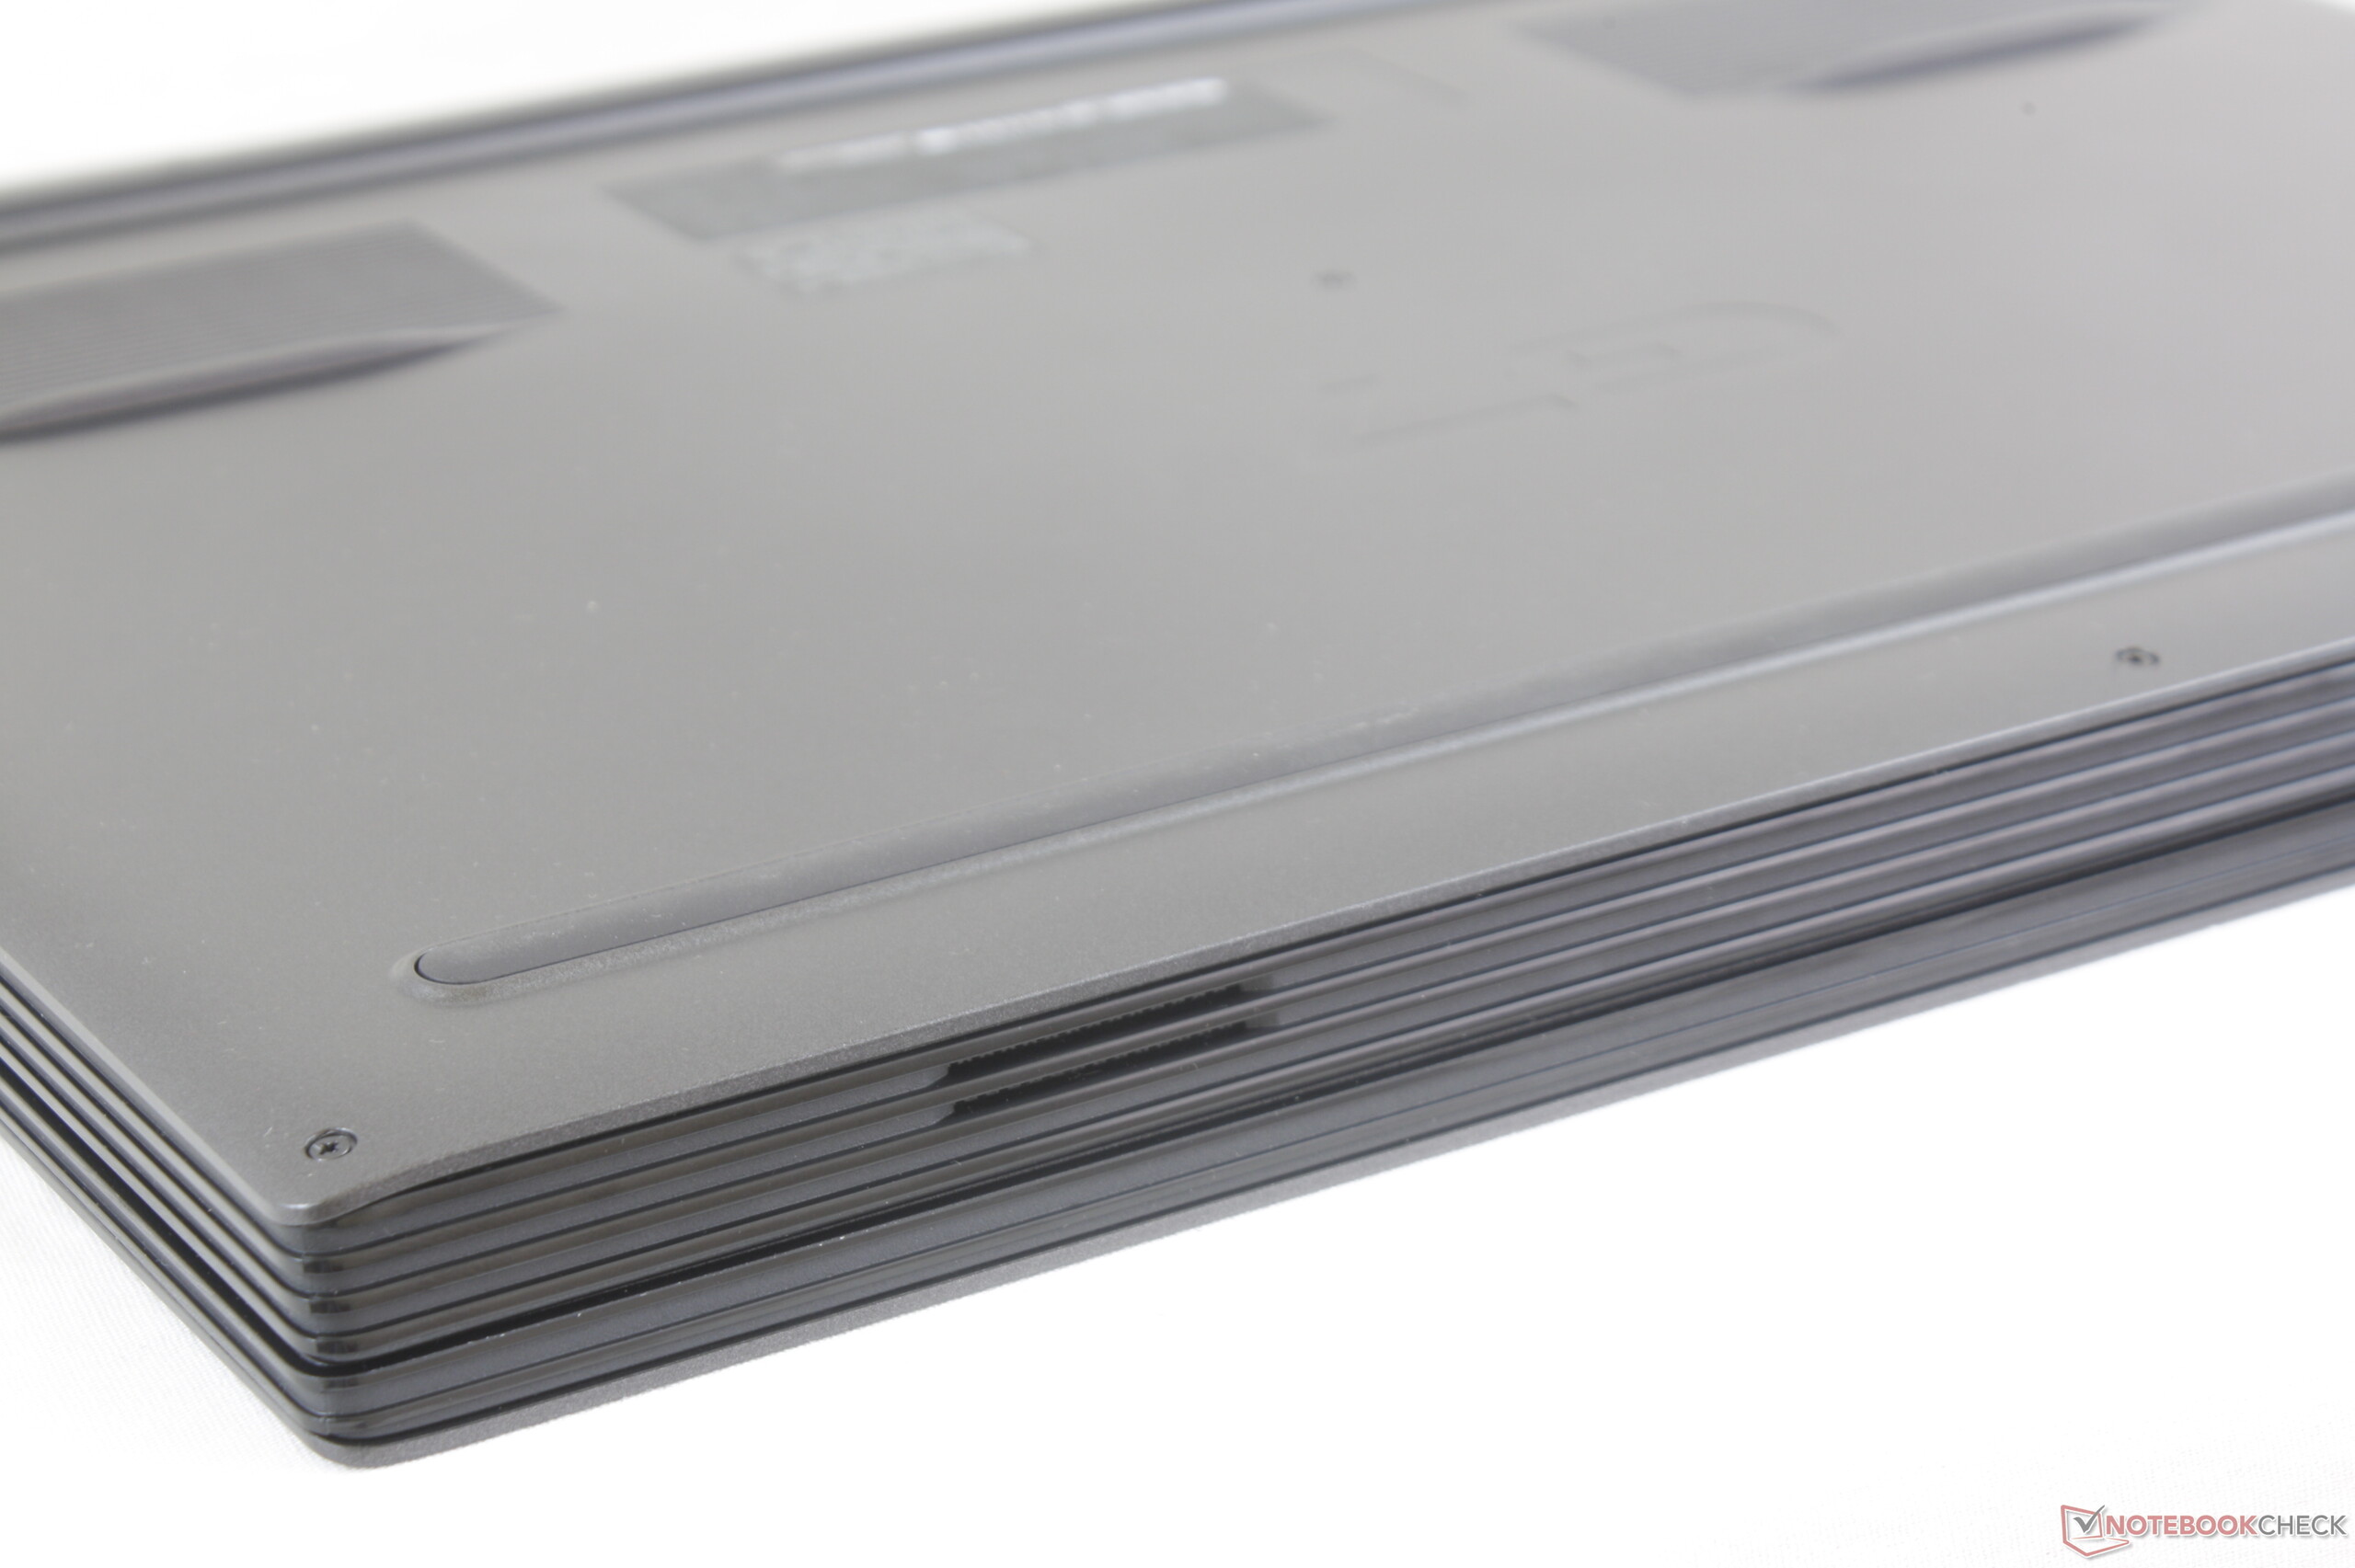
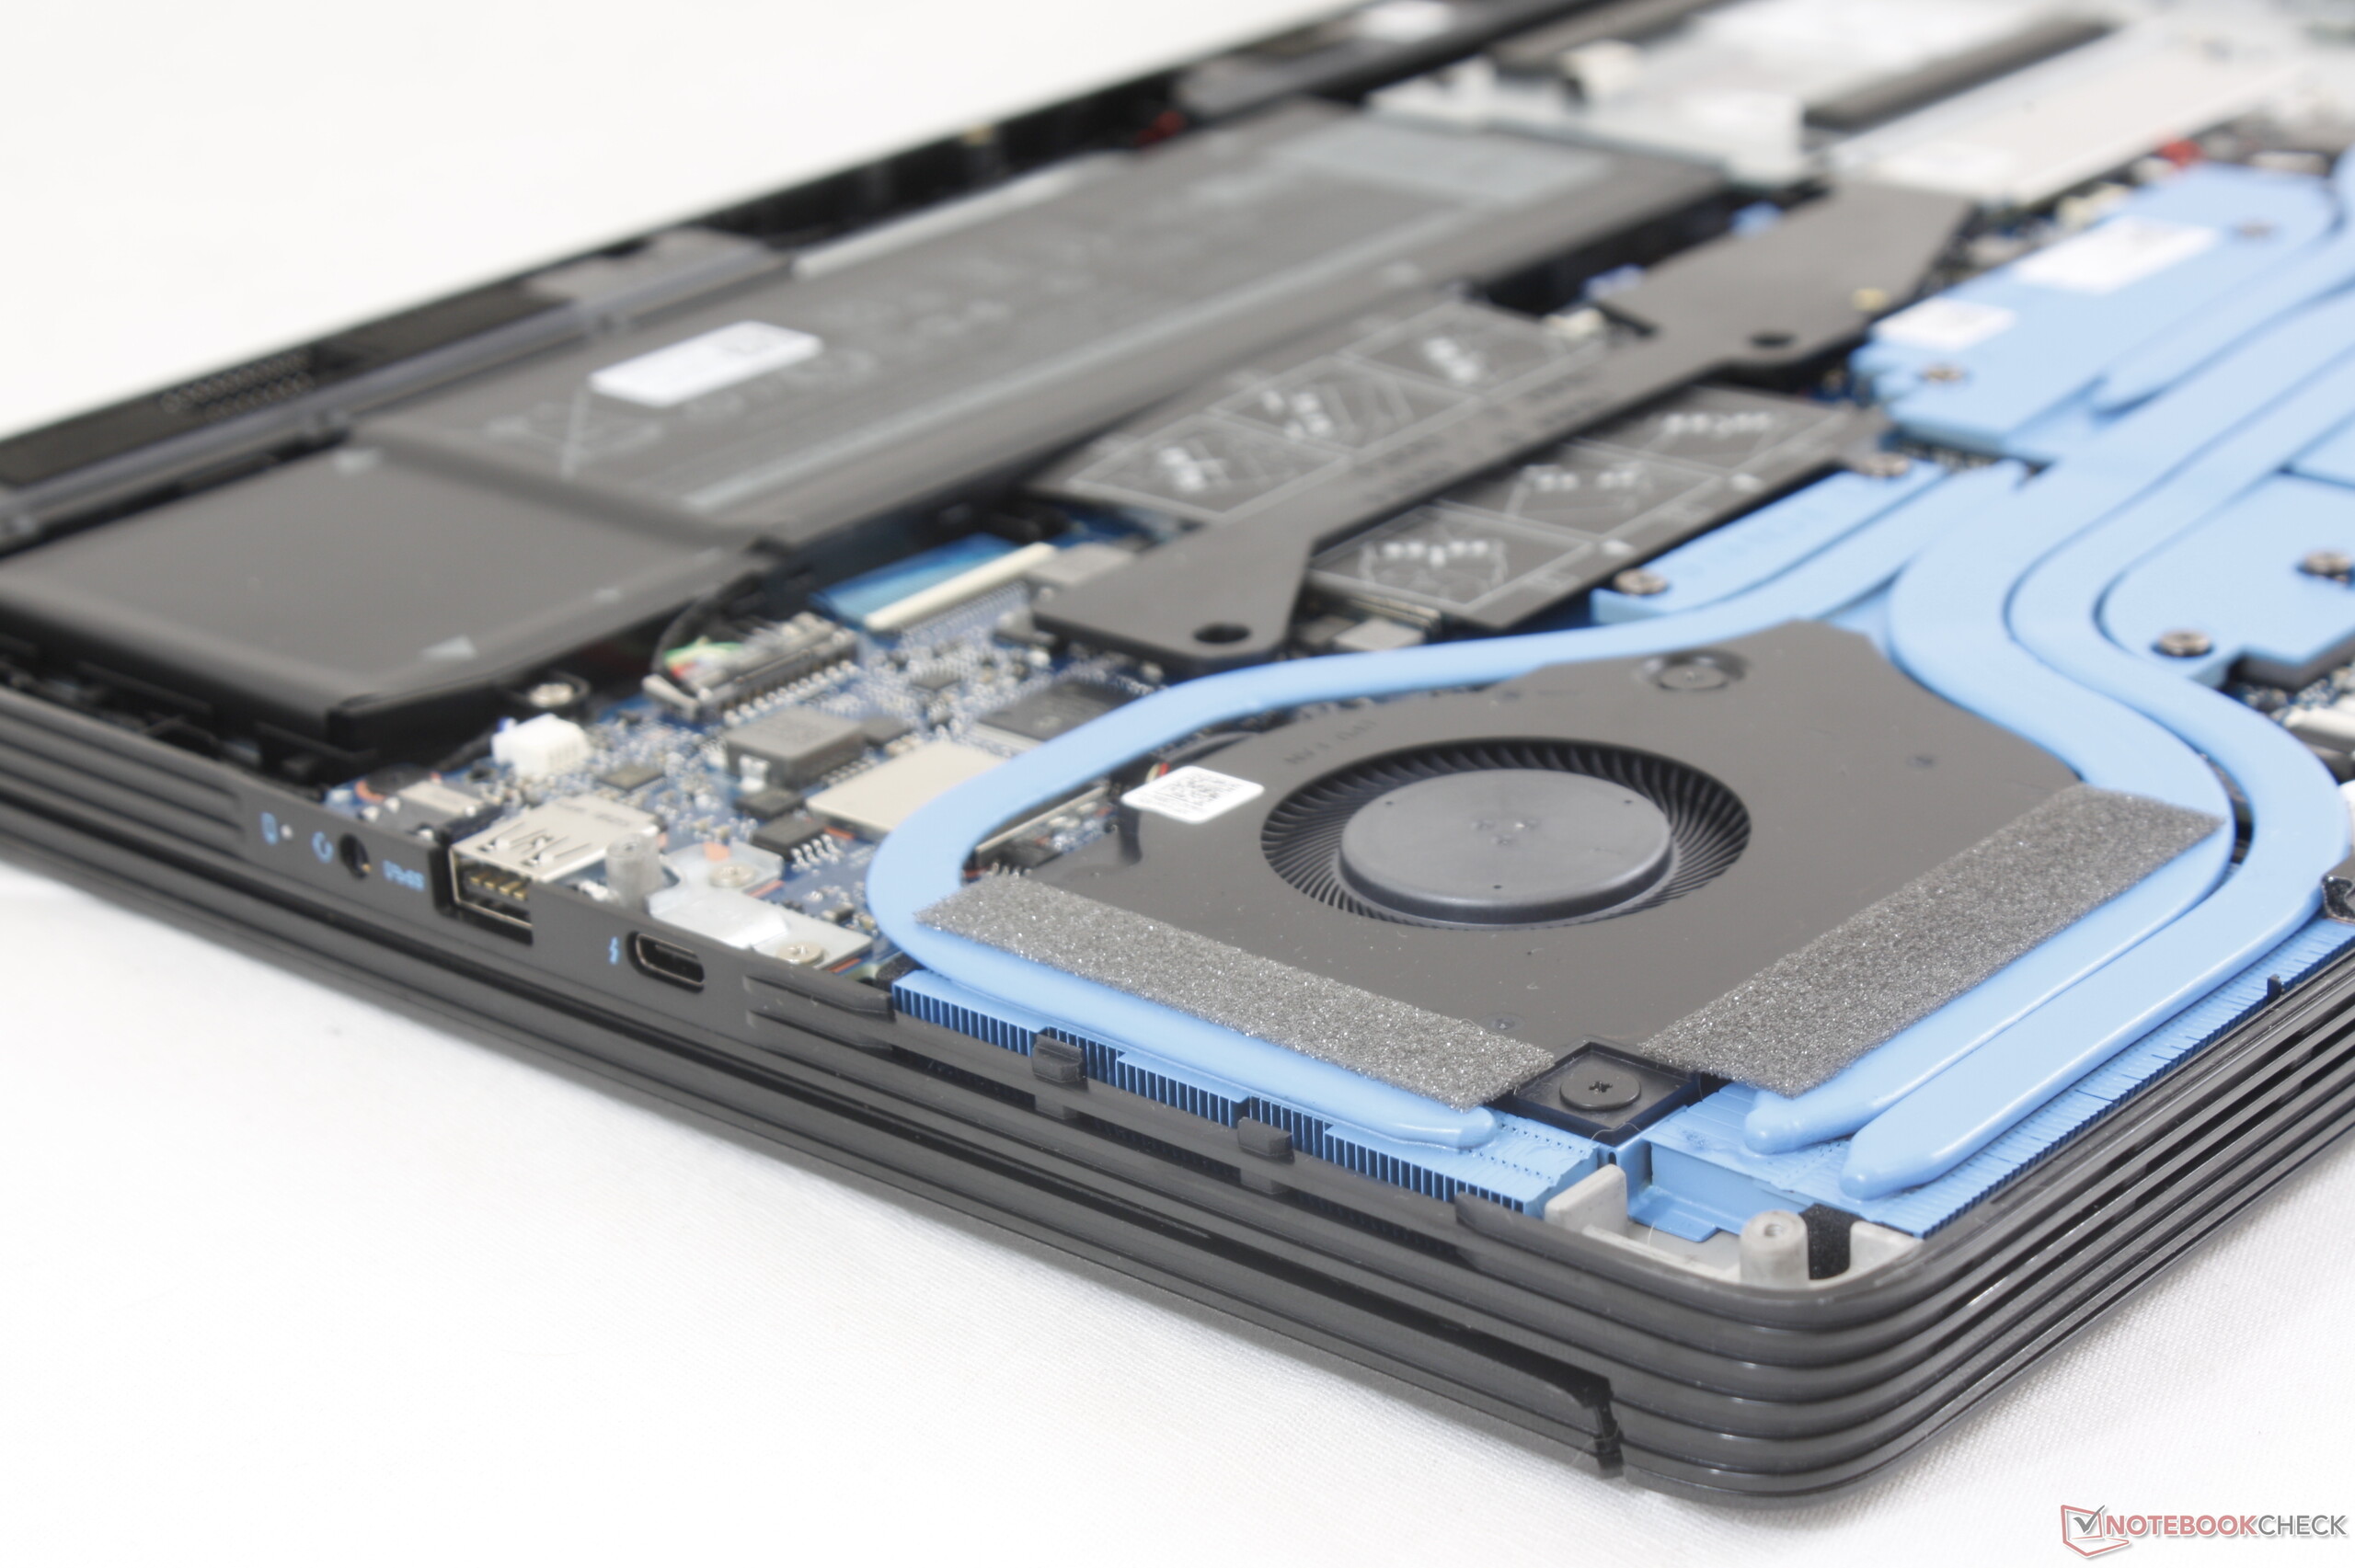
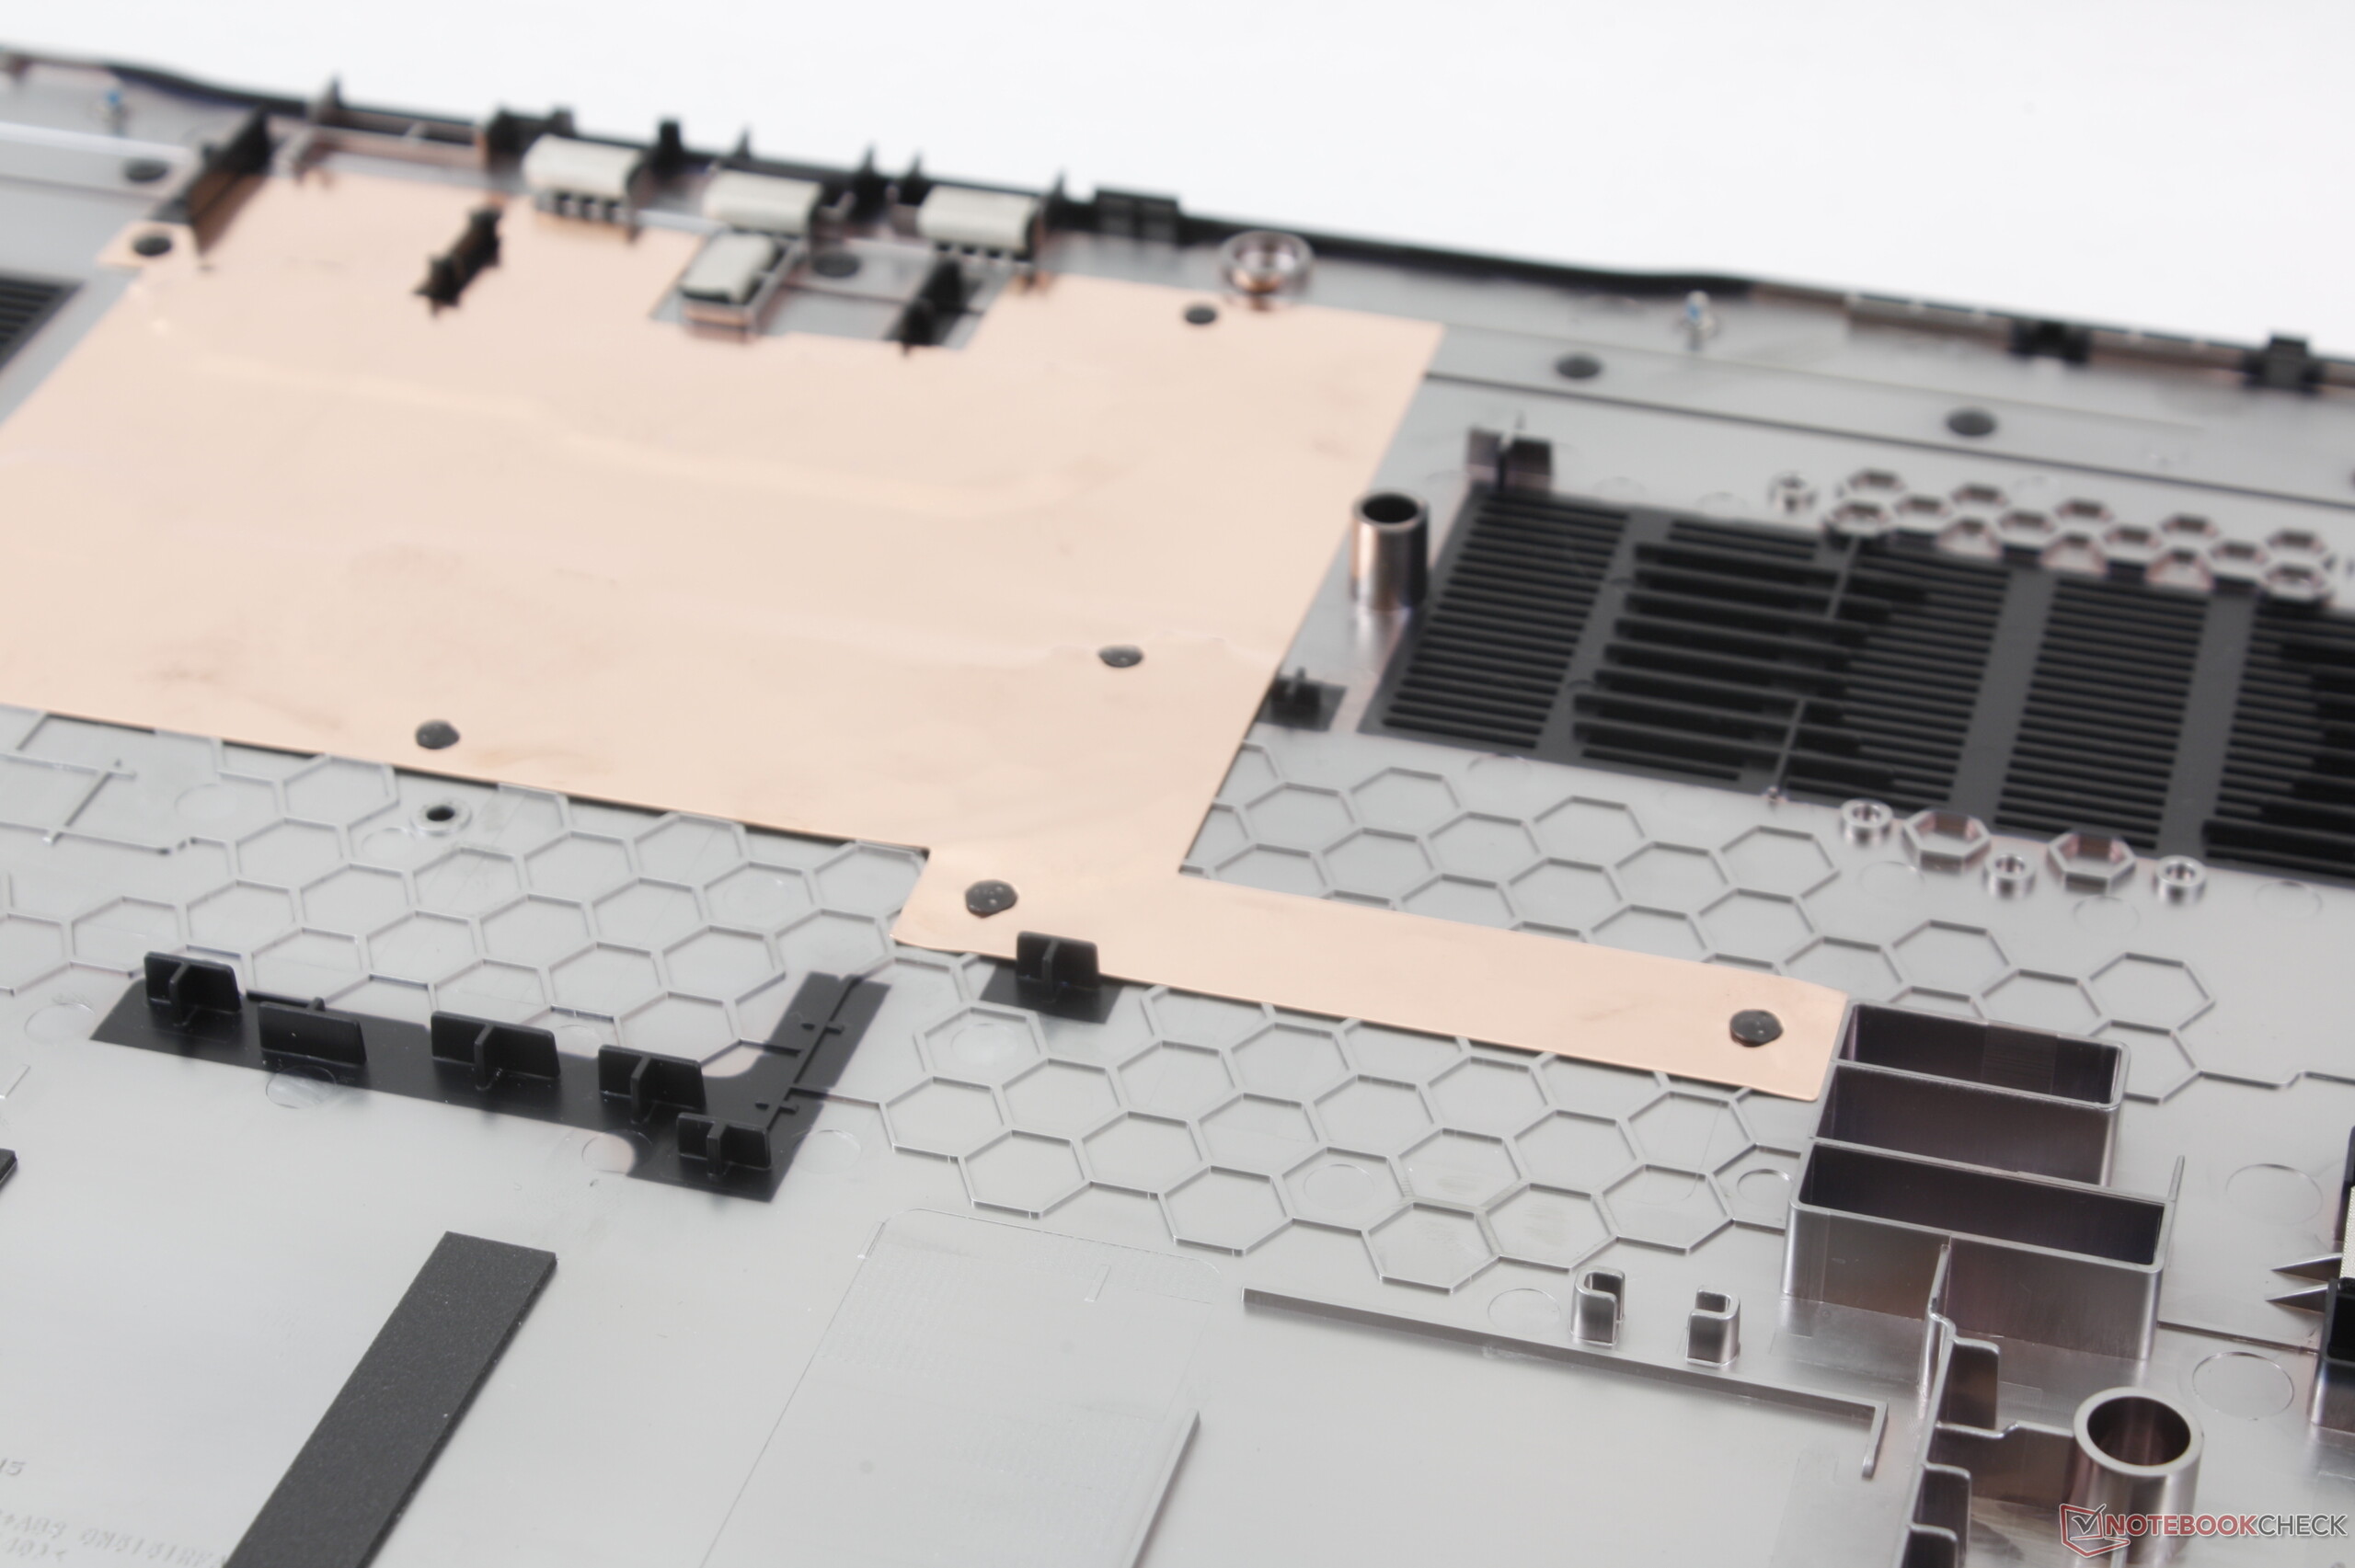
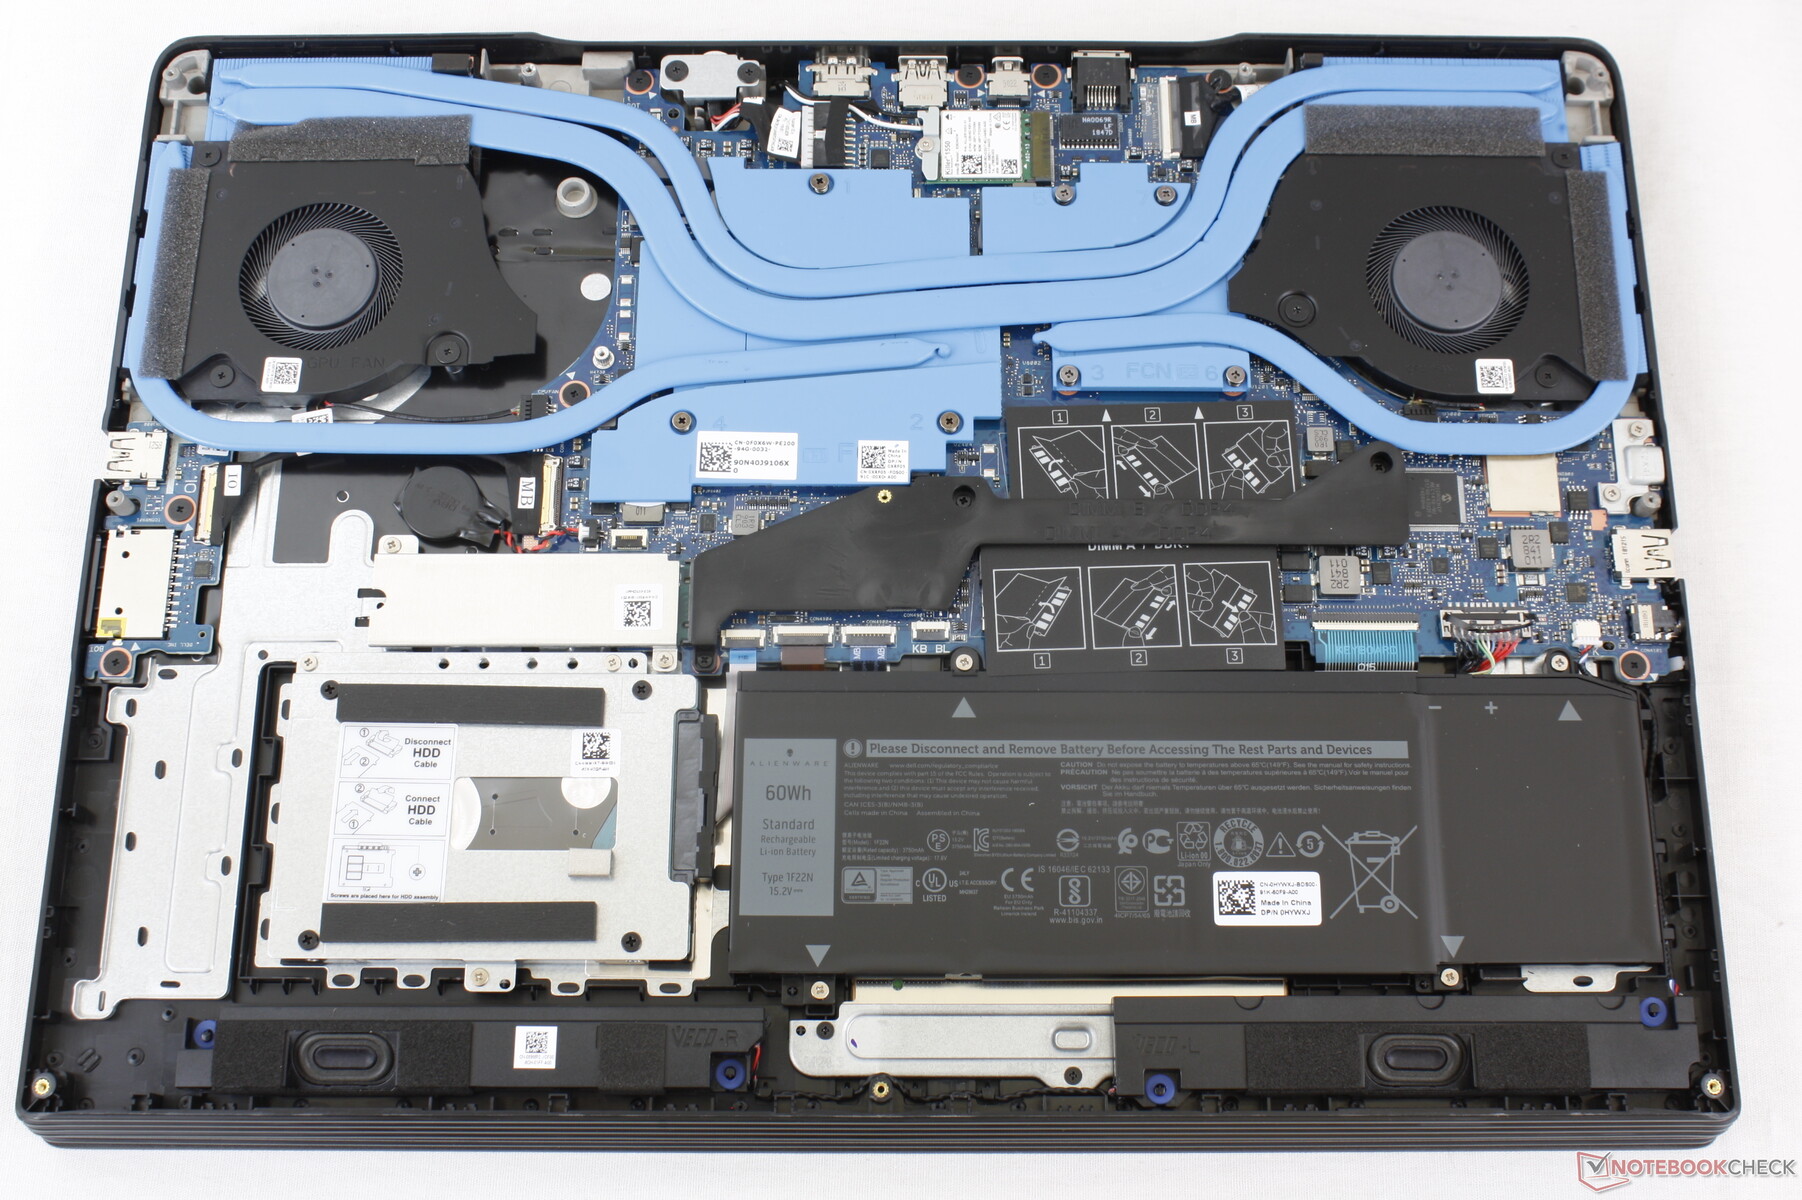
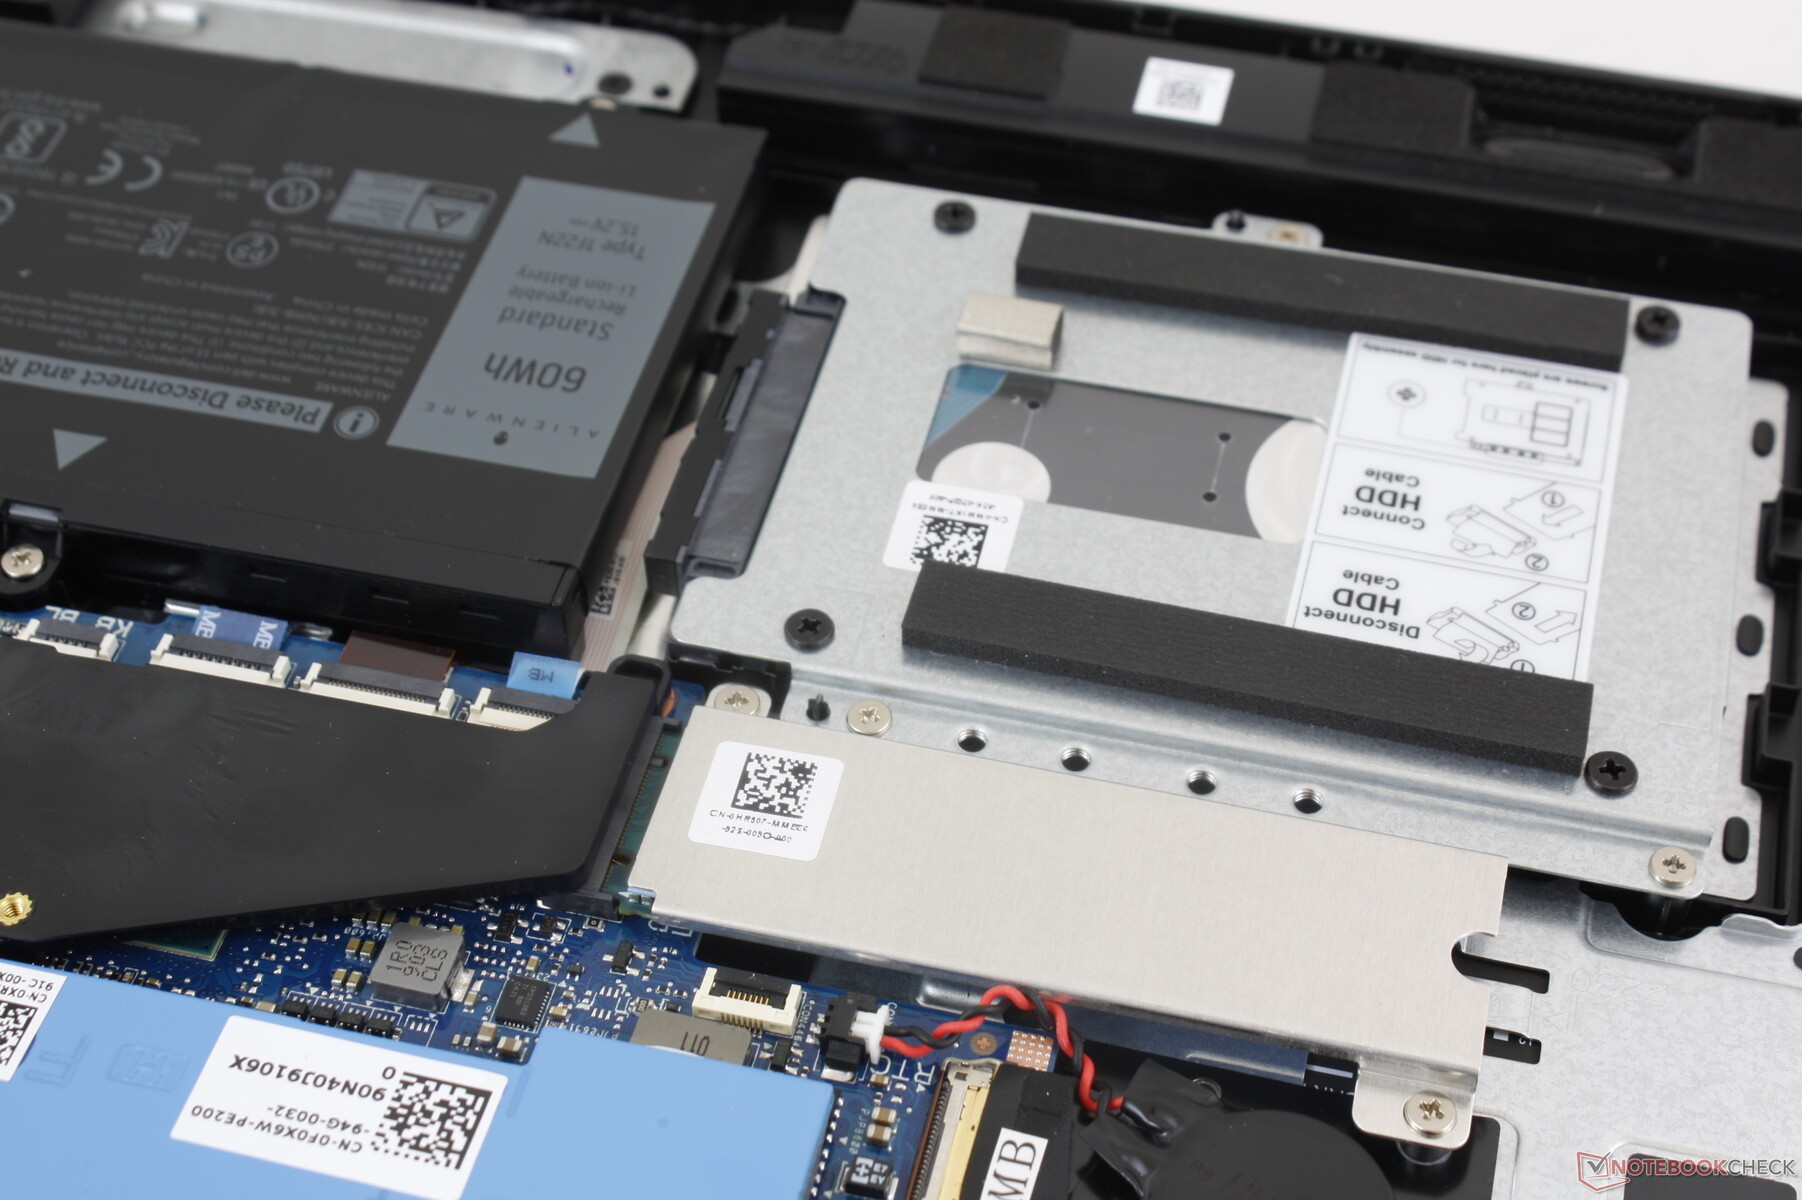
The bottom panel is secured by 10 Philips screws. Servicing is very easy with no anti-tamper stickers or sharp edges to speak of. Users have direct access to both SODIMM slots, internal batteries, WLAN module, and storage bays.
Accessories and Warranty
There are no extras in the box other than the usual AC adapter and Quick Start guides. The standard one-year limited manufacturer warranty applies with up to four-year extensions if desired.
Input Devices
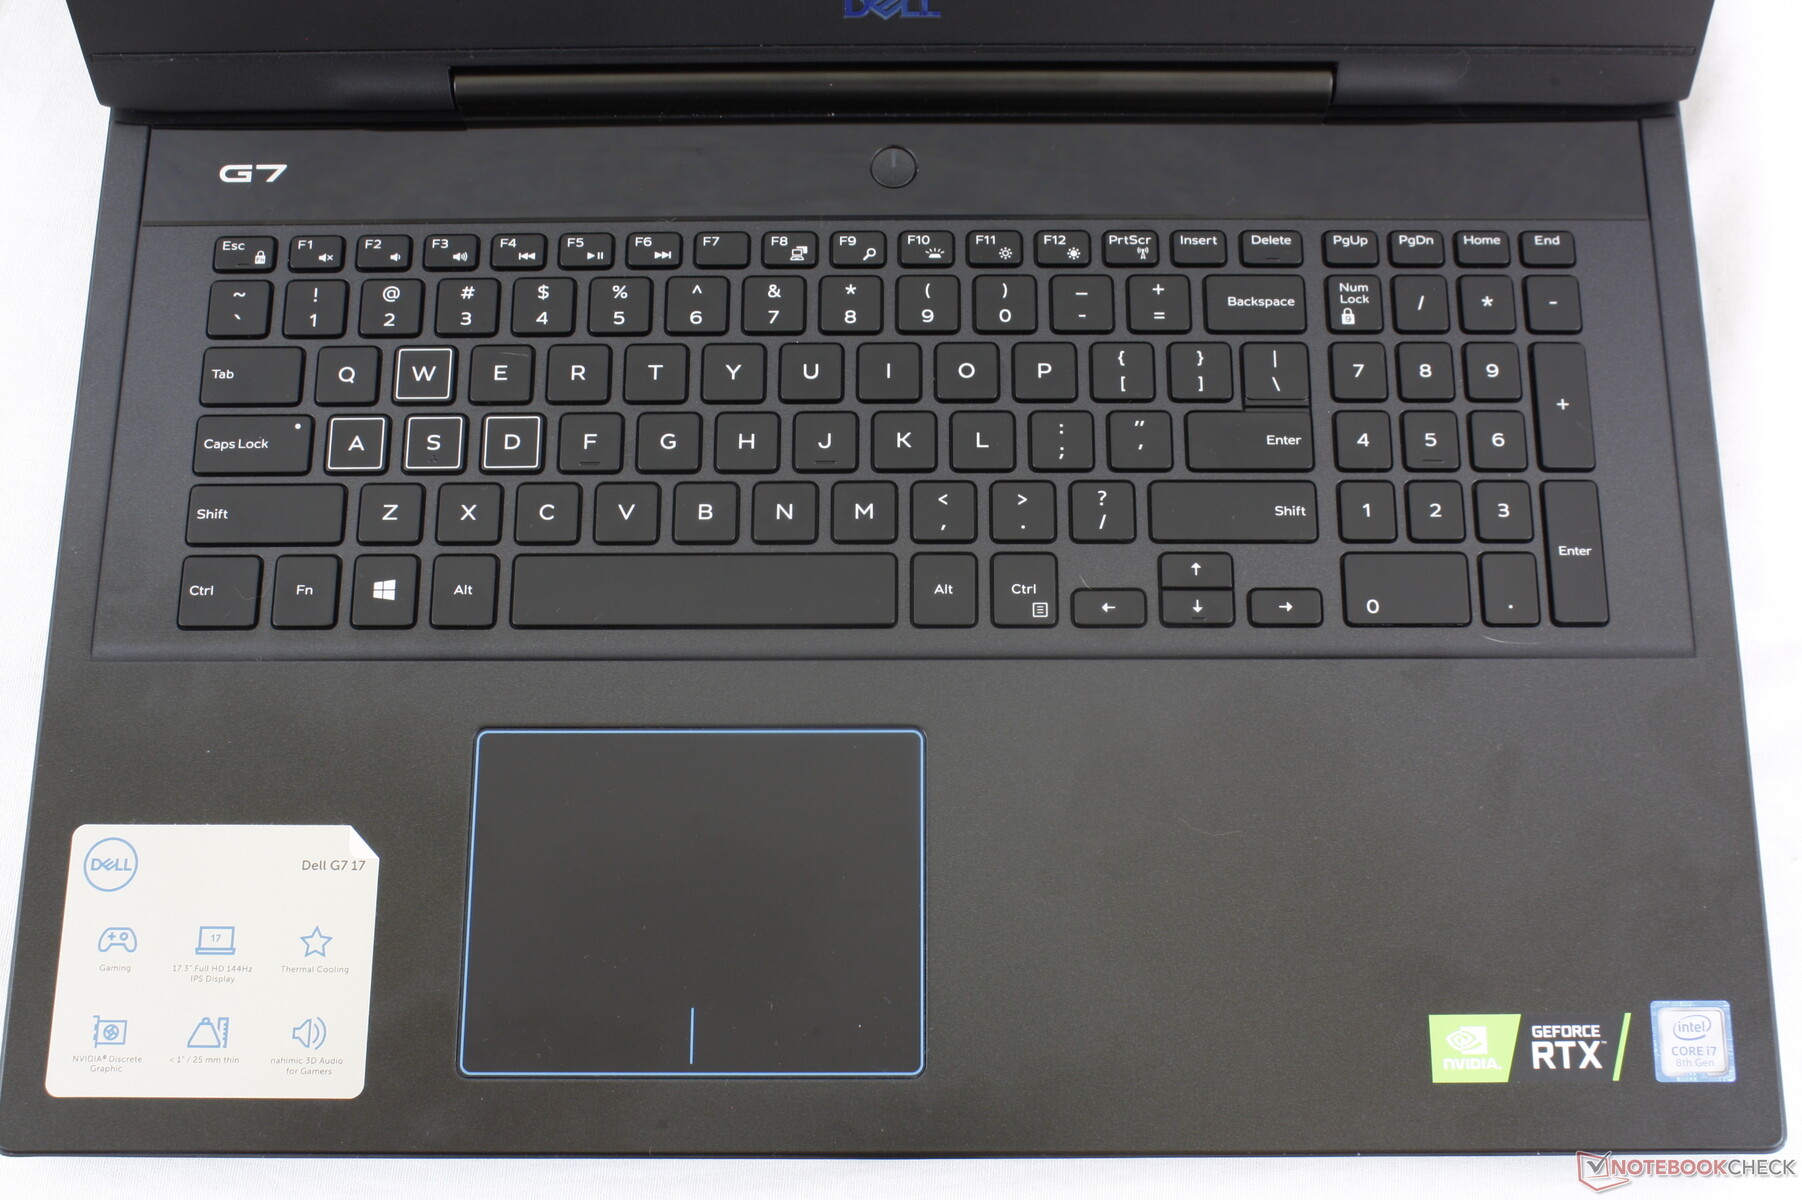
Keyboard
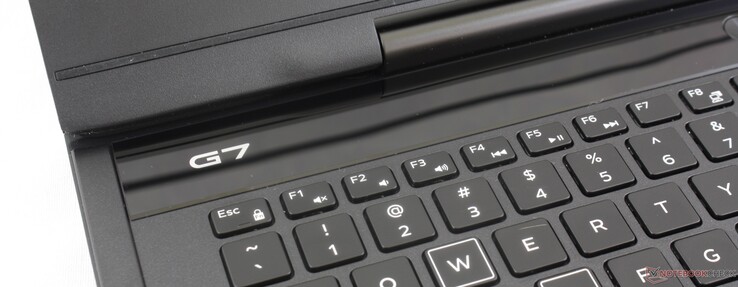
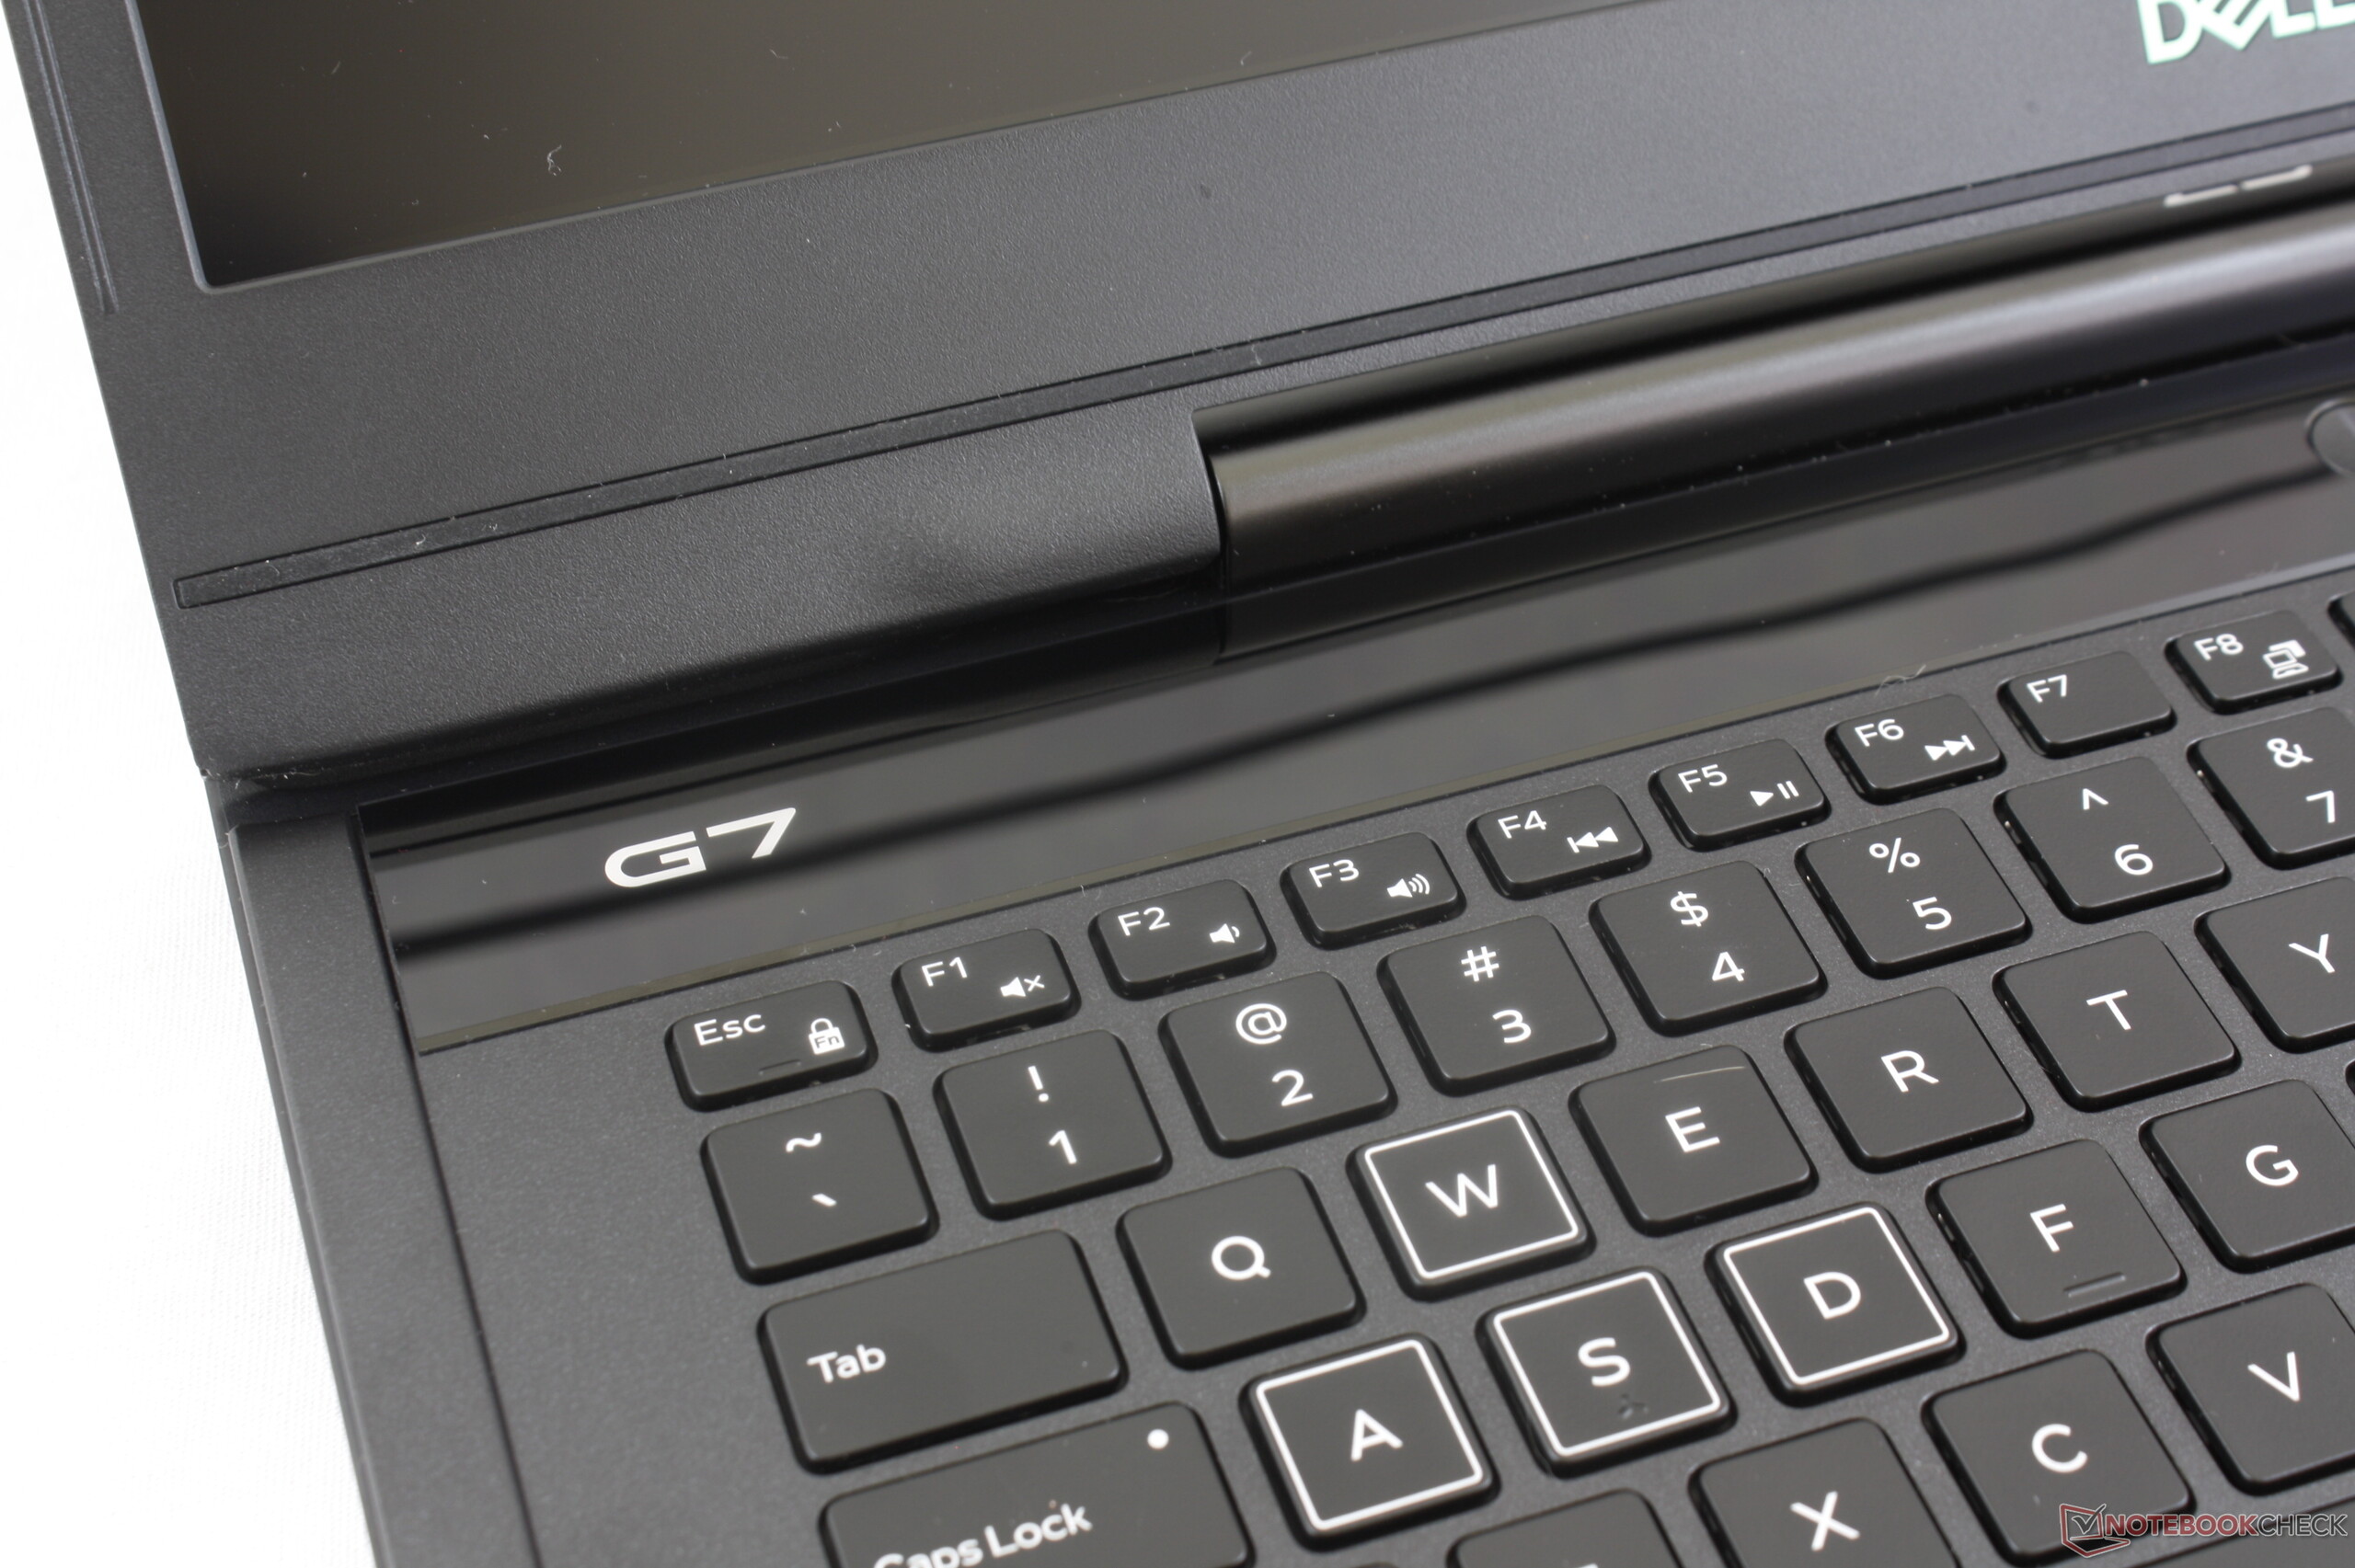
We find the keyboard keys to be surprisingly firm relative to their low-moderate clatter. Feedback is crisper, deeper, and generally more satisfying than on the Razer Blade 15 series. The notable exceptions are the directional keys and NumPad keys which are smaller than the main QWERTY keys. As a result, these keys can feel cramped to use for long periods. For such a large chassis, there is less of an excuse to offer full-size Arrow keys and NumPad keys since more space is available.
Quad-zone RGB lighting comes standard in contrast to the single-zone lighting of the Dell G3 17 or per-key RGB lighting of most newer Alienware machines. The laptop uses the same AlienFX and Alienware Command Center software for lighting control as does the Alienware Area-51m, Alienware m15, and Alienware m17.
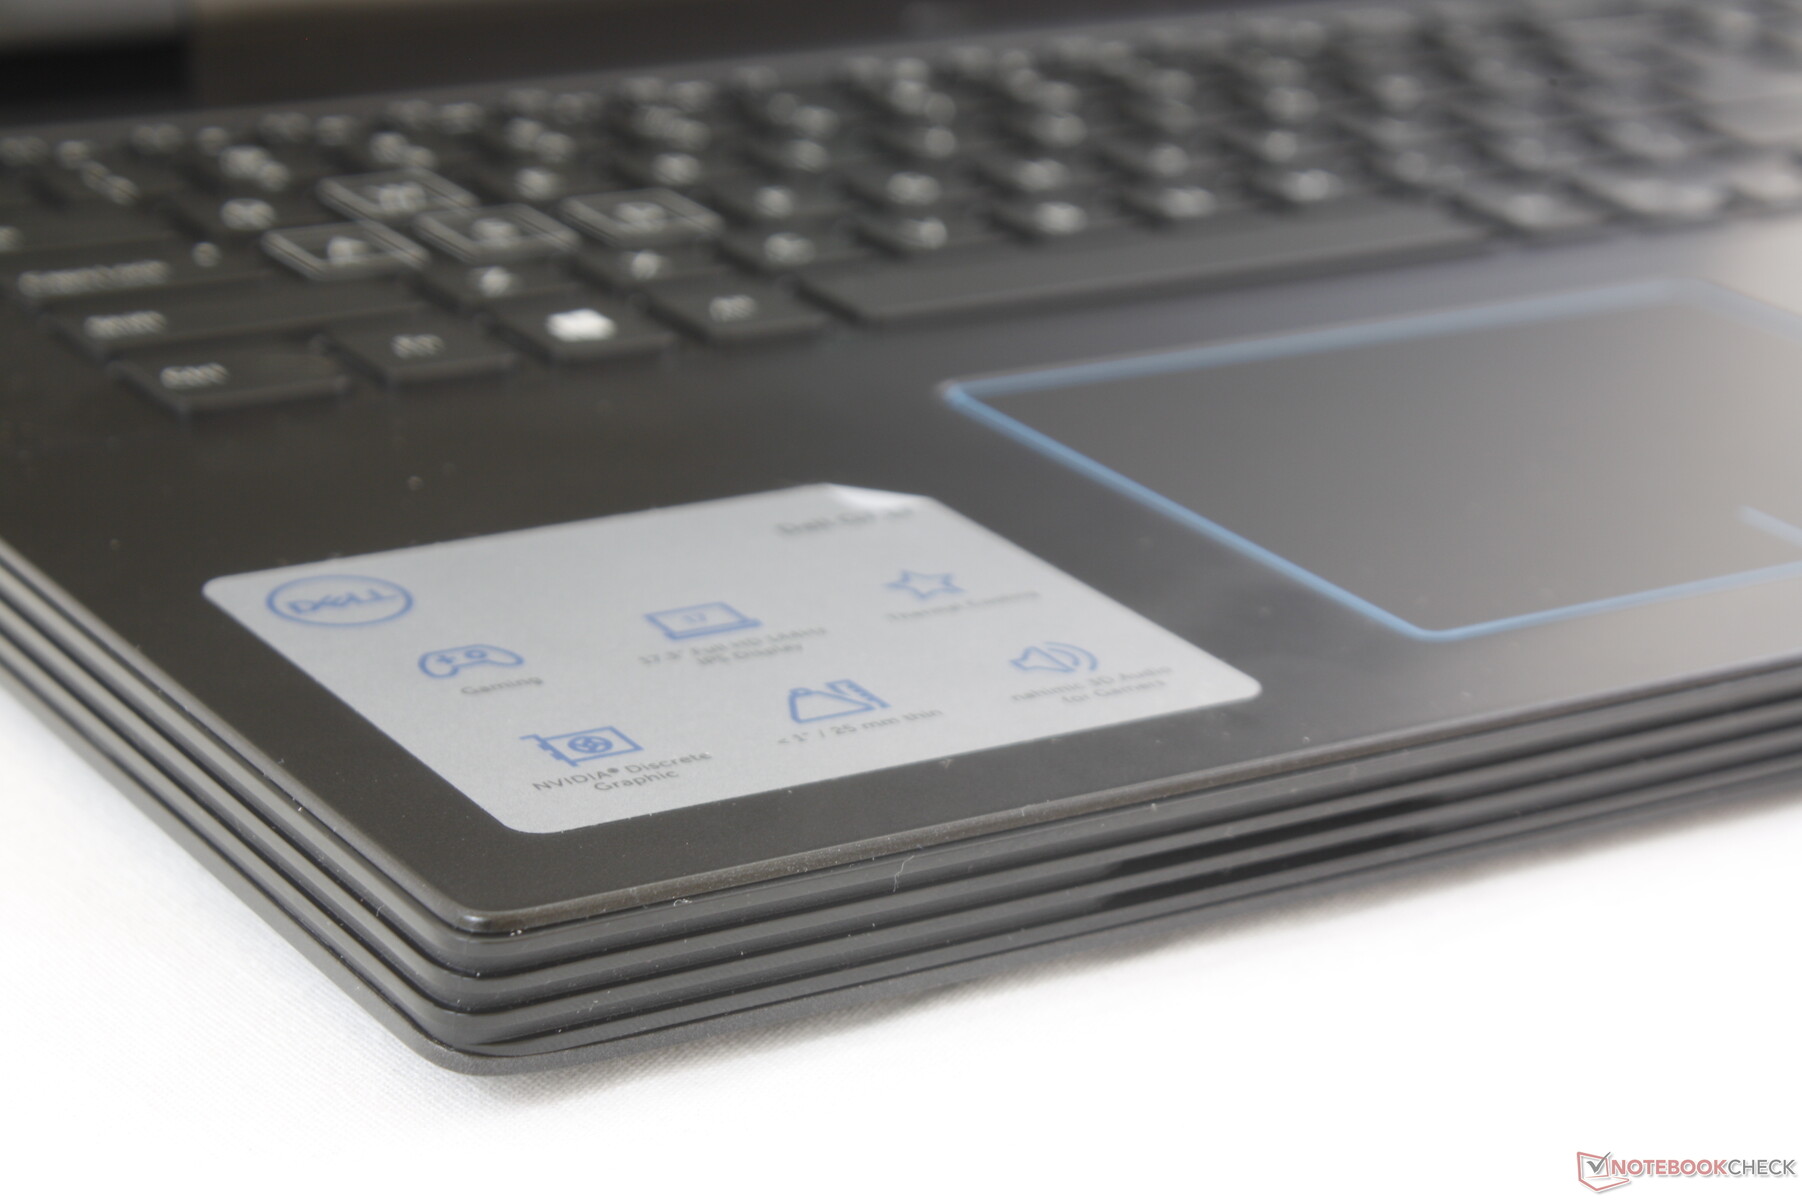
Touchpad
The clickpad surface is slightly roughened in contrast to the otherwise smooth palm rests and outer lid to improve traction and reduce sticking. Surface area is decent for the large screen size albeit still smaller than the clickpads on some Ultrabooks like the Huawei MateBook X Pro (10.5 x 8 cm vs. 12 x 7.8 cm). Although the surface still feels slightly sticky when gliding across very slowly, we experienced no cursor jumping or reliability issues during use.
The integrated mouse keys are shallow in travel with relatively weak feedback when pressed. A firmer click would have helped make it less spongy.
Display
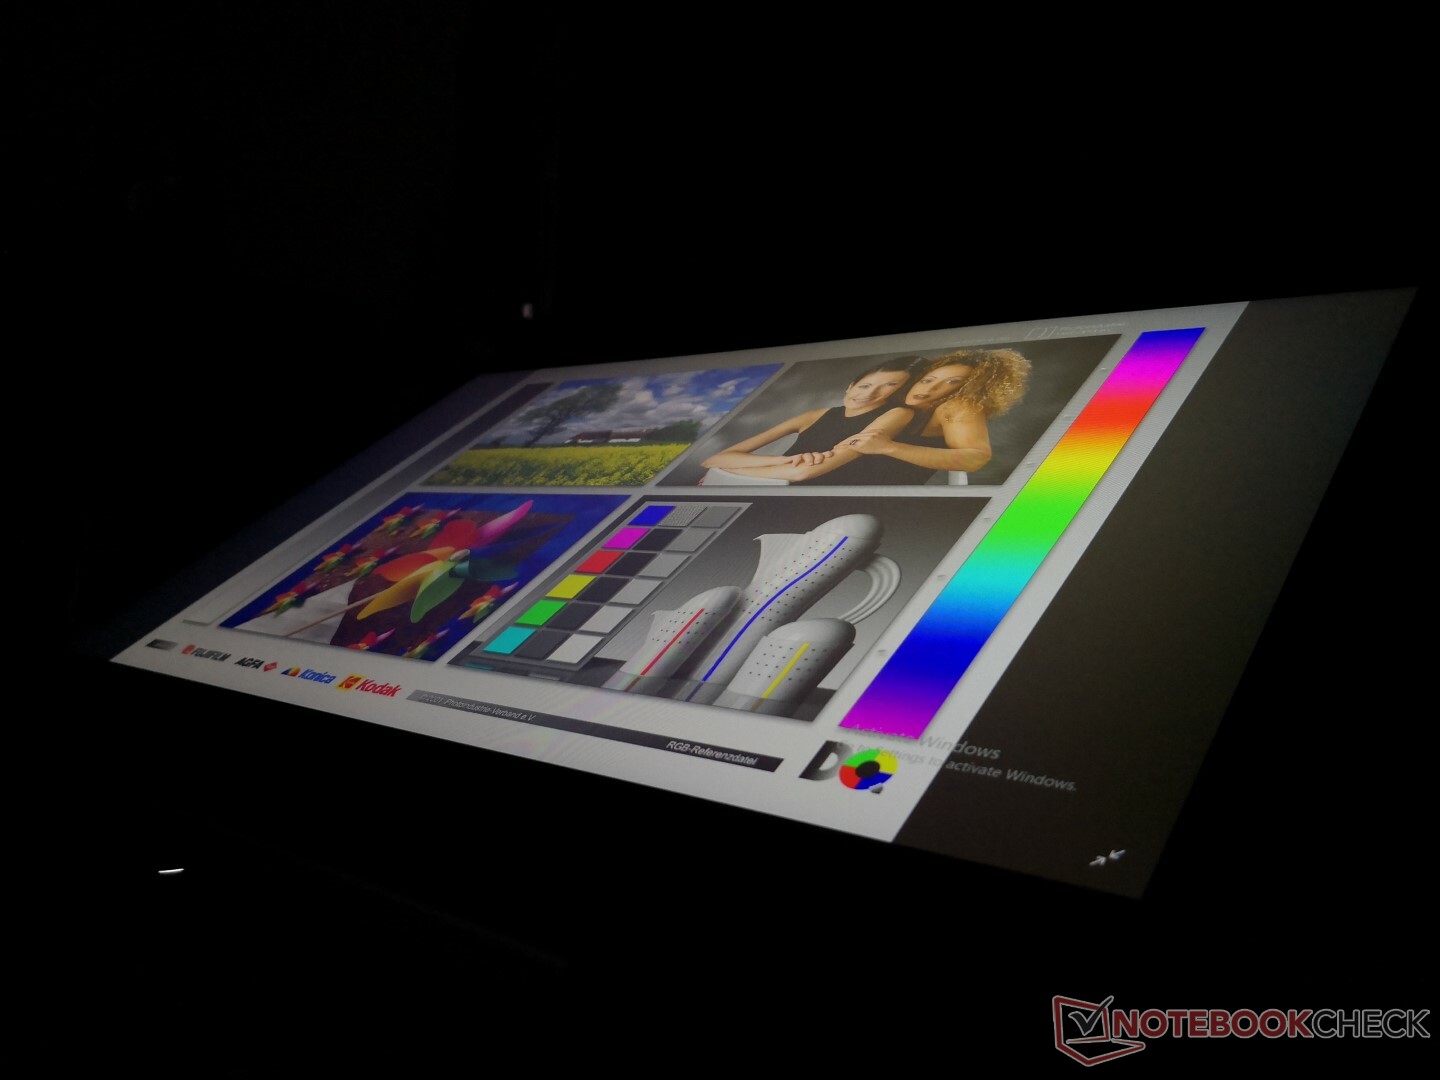
All G7 7790 SKUs as of this writing ship with no other display options beyond the default 1080p 144 Hz matte IPS display. A closer look at the panel reveals it to be the AU Optronics AUO409D which can also be found on several 17.3-inch Asus laptops including the TUF FX705GM, ROG Strix Scar II GL704GW and GL704GM, and the Zephyrus S GX701GX. All these laptops subsequently share similar contrast ratios, response times, and color coverage. When compared to the budget Sharp panel on the Zephyrus G GA502, this AU Optronics panel is definitely of higher quality with less ghosting and deeper colors overall. We're glad to see more manufacturers phasing out 60 Hz in favor of 144 Hz as it's tough to go back to 60 Hz once you become accustomed to the smoothness of higher refresh rates.
Note that the older AU Optronics panel on the cheaper Dell G3 17 offers slower response times and a lower native refresh rate of just 60 Hz.
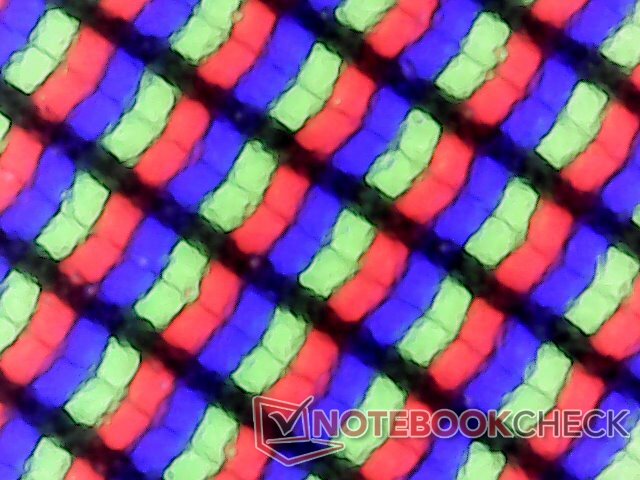
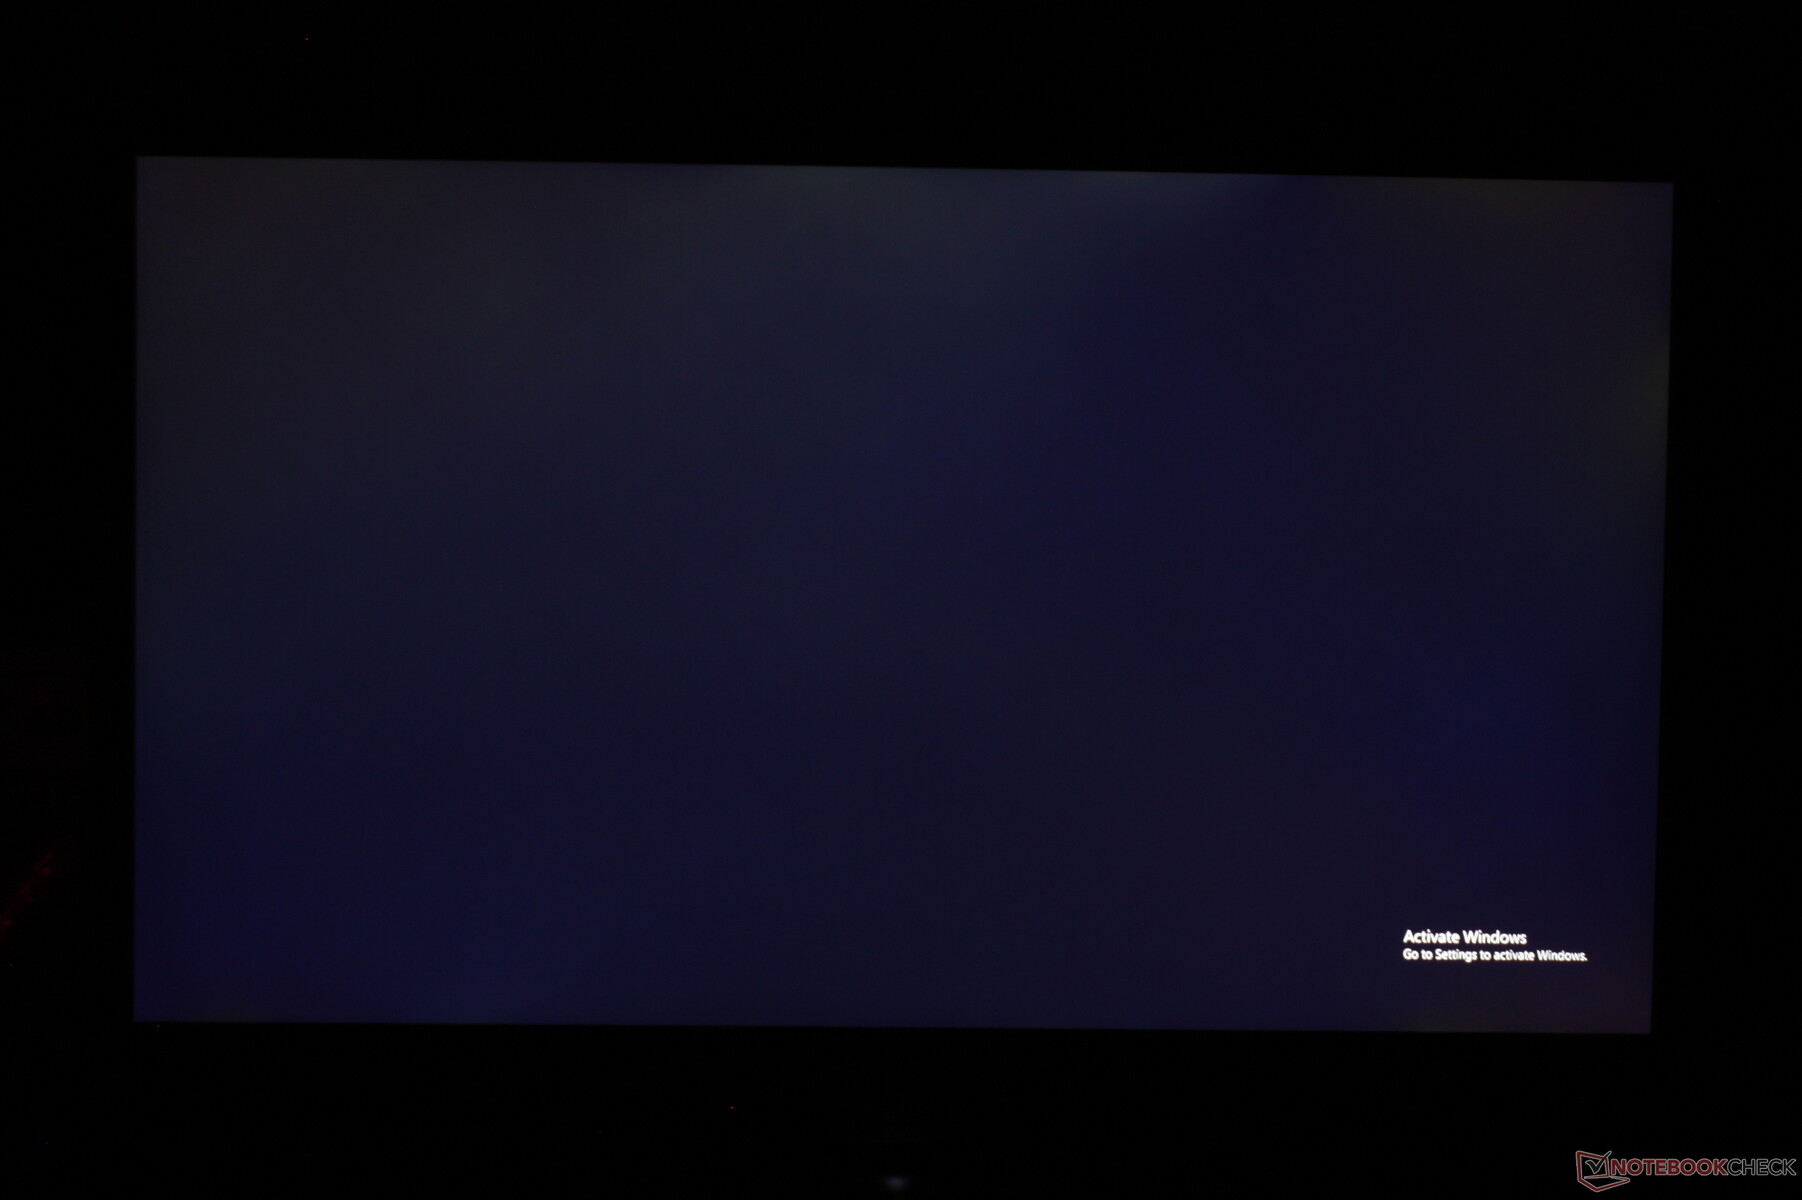
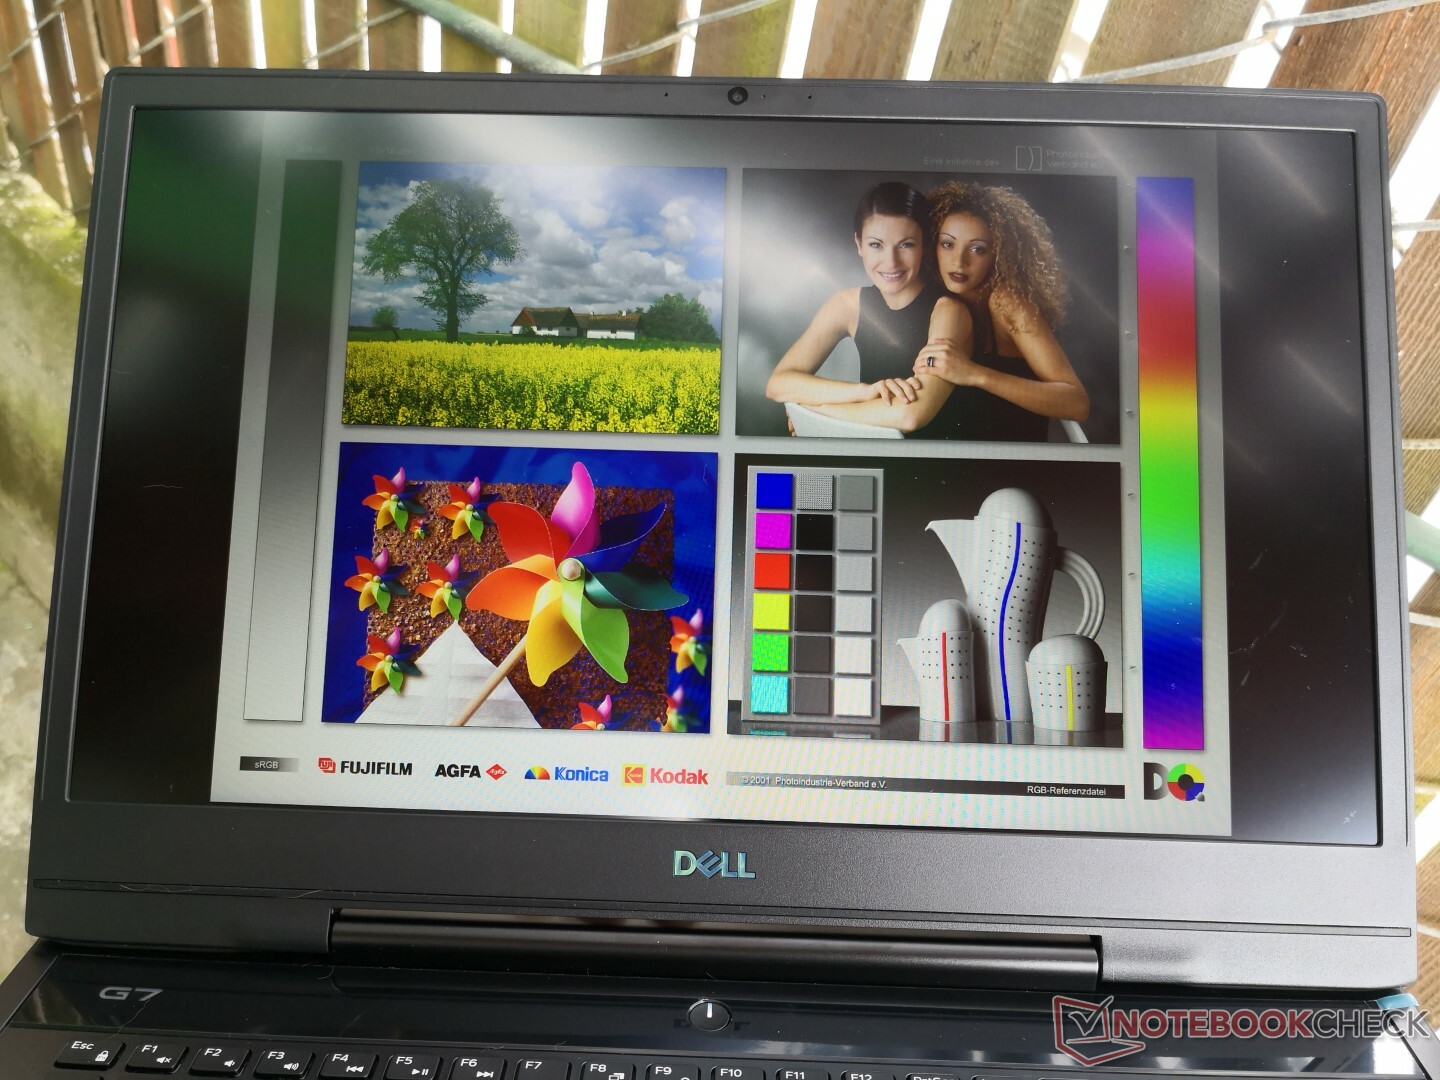
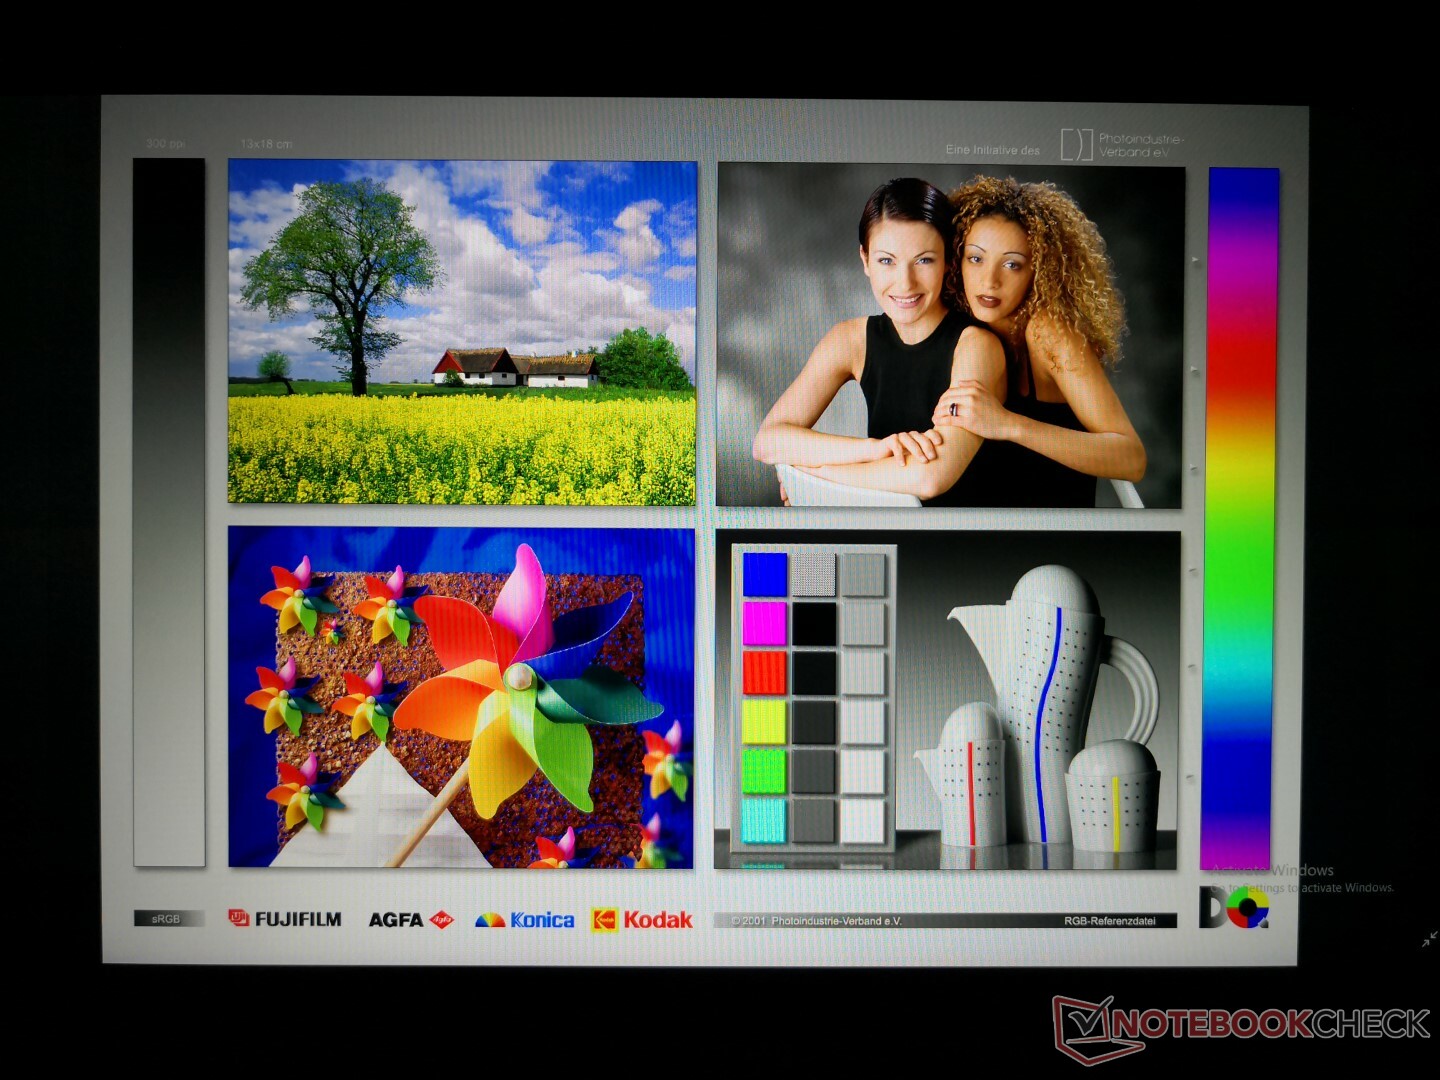
Graininess is minimal and a non-issue on the matte panel for crisp texts and images. Moderate uneven backlight bleeding is present along the top edge of our display test unit that becomes noticeable if viewing videos with black borders.
| |||||||||||||||||||||||||
Brightness Distribution: 92 %
Center on Battery: 308.6 cd/m²
Contrast: 1064:1 (Black: 0.29 cd/m²)
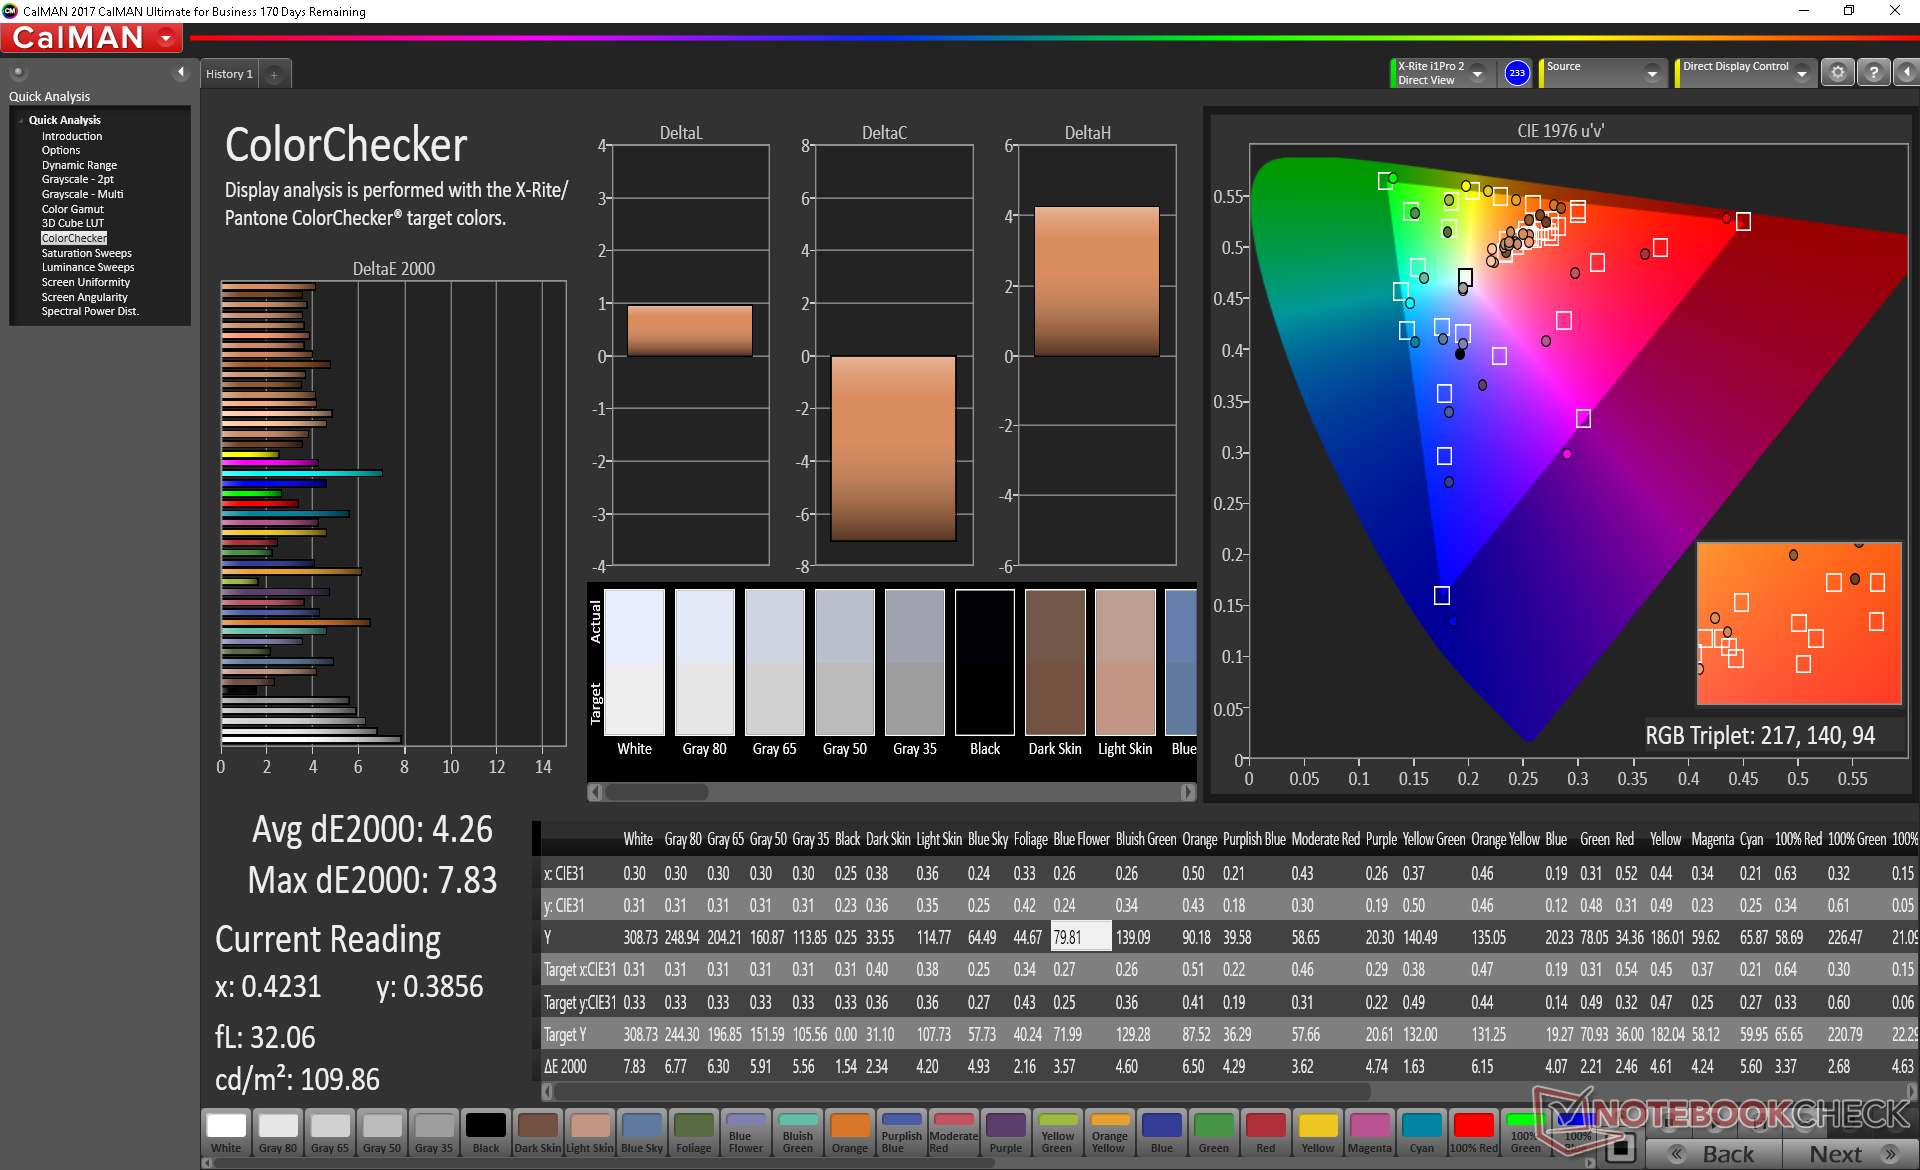
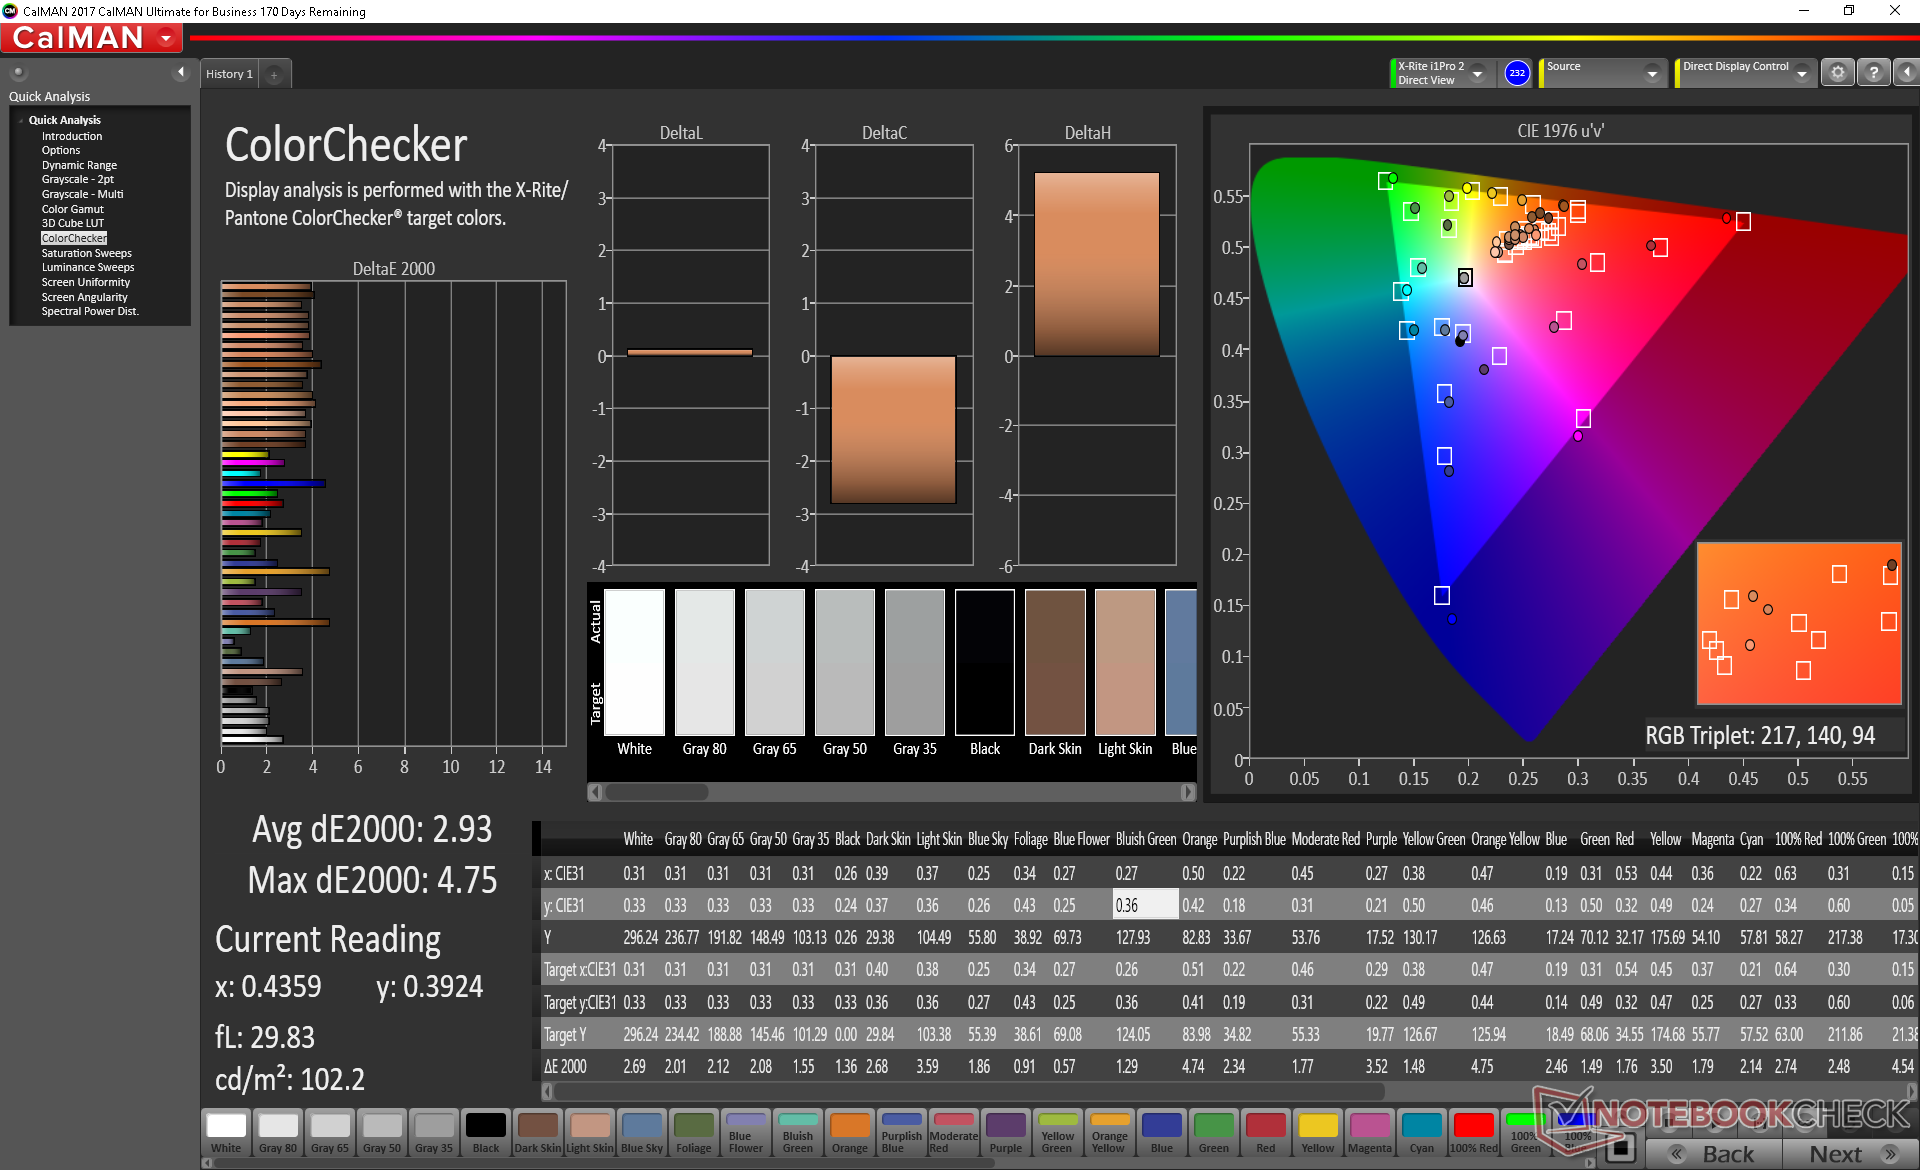
ΔE Color 4.26 | 0.5-29.43 Ø5, calibrated: 2.93
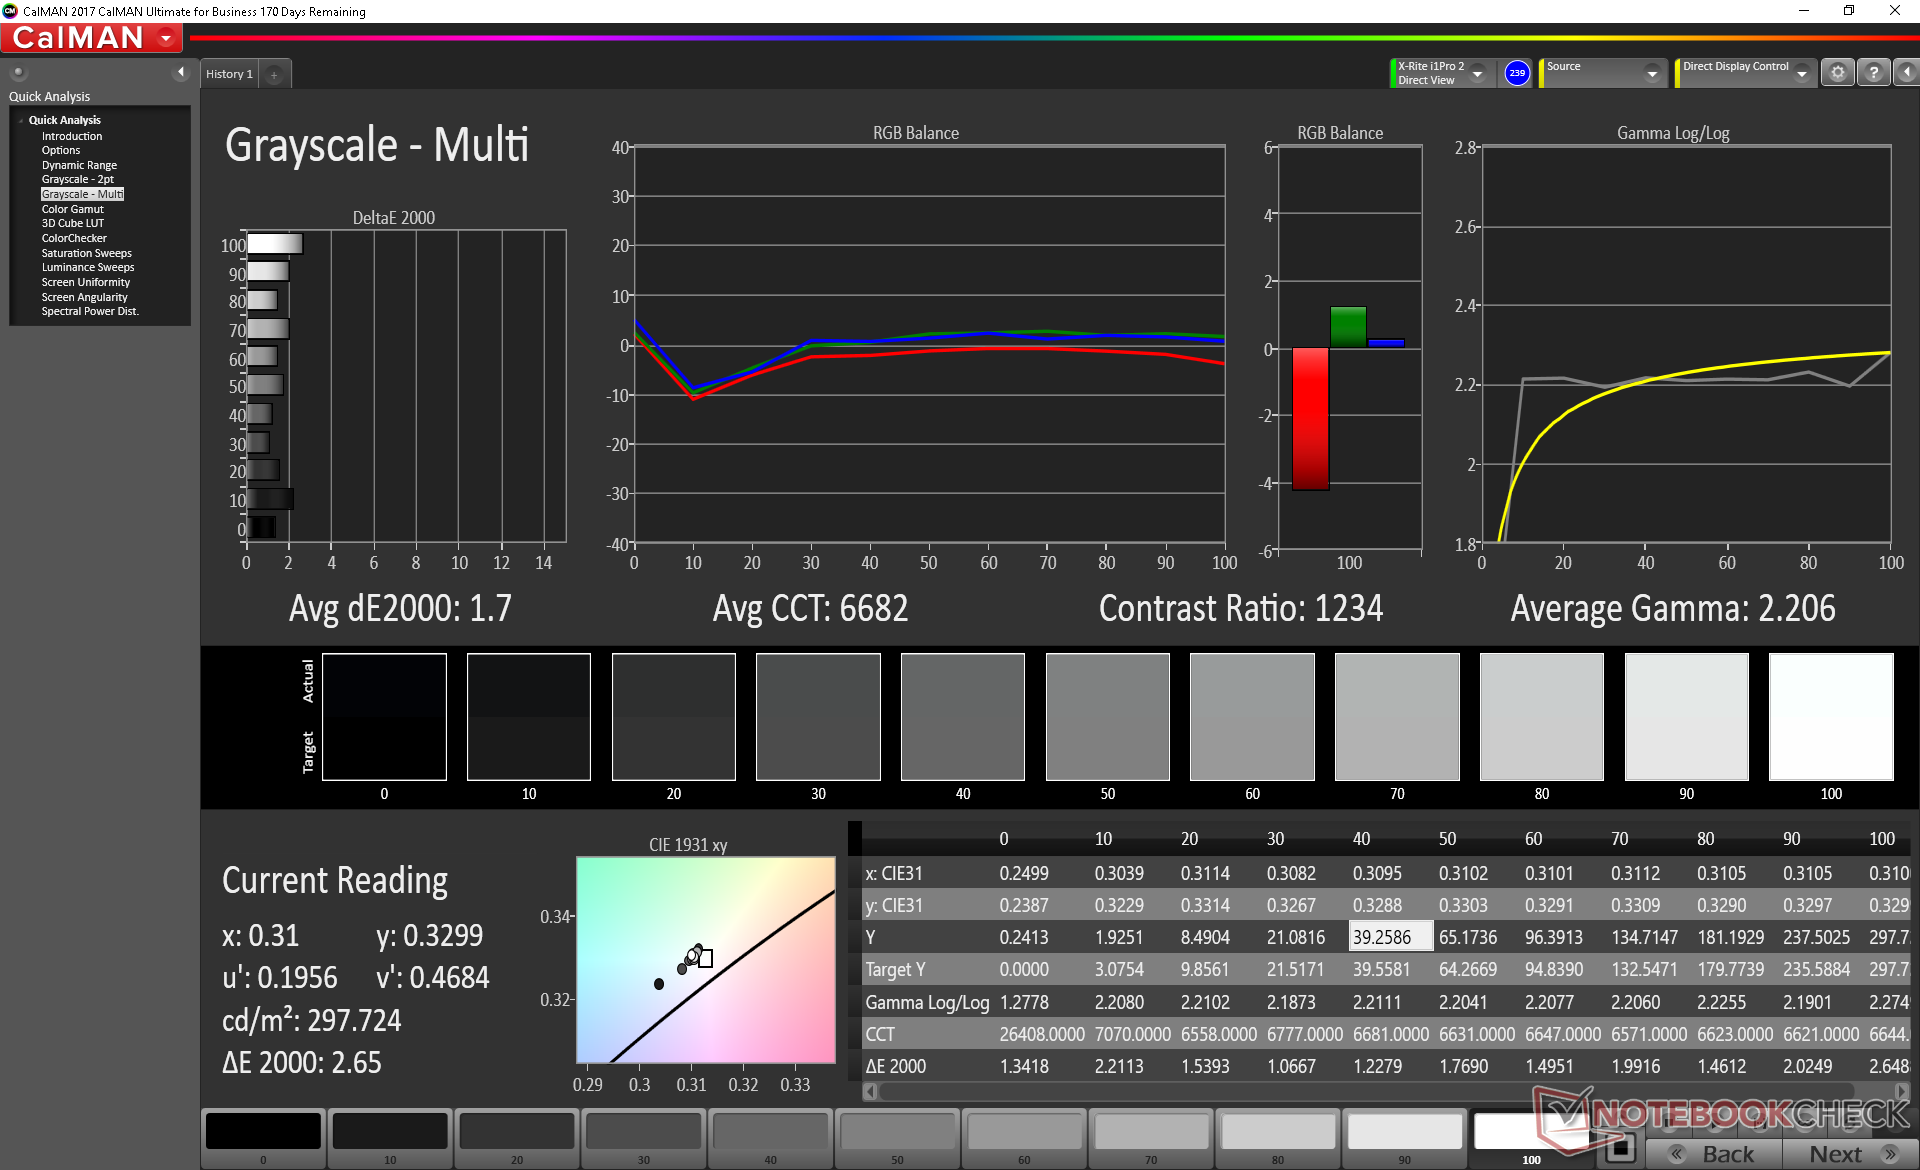
ΔE Greyscale 5 | 0.57-98 Ø5.3
89.2% sRGB (Argyll 1.6.3 3D)
57.8% AdobeRGB 1998 (Argyll 1.6.3 3D)
63.2% AdobeRGB 1998 (Argyll 2.2.0 3D)
89.6% sRGB (Argyll 2.2.0 3D)
61.9% Display P3 (Argyll 2.2.0 3D)
Gamma: 2.07
| Dell G7 17 7790 AU Optronics AUO409D, B173HAN, IPS, 17.30, 1920x1080 | Alienware m17 P37E AU Optronics B173ZAN01.0, IPS, 17.30, 3840x2160 | Asus TUF FX705DT-AU068T AU Optronics B173HAN04.2, IPS, 17.30, 1920x1080 | Lenovo Legion Y740-17ICH AU Optronics B173HAN03.2, IPS, 17.30, 1920x1080 | MSI GL73 8SE-010US CMN1747, TN LED, 17.30, 1920x1080 | Dell G3 17 3779 AUO, B173HAN01.3, IPS, 17.30, 1920x1080 | |
|---|---|---|---|---|---|---|
| Display | 36% | 0% | 2% | 31% | 2% | |
| Display P3 Coverage | 61.9 | 86.4 40% | 62.3 1% | 64 3% | 91.1 47% | 63.9 3% |
| sRGB Coverage | 89.6 | 99.9 11% | 89.1 -1% | 90.4 1% | 100 12% | 89.8 0% |
| AdobeRGB 1998 Coverage | 63.2 | 99.1 57% | 63.7 1% | 64.8 3% | 85.4 35% | 64.9 3% |
| Response Times | -120% | -144% | 1% | 29% | -119% | |
| Response Time Grey 50% / Grey 80% * | 17.2 ? | 35.6 ? -107% | 41 ? -138% | 15.6 ? 9% | 12.8 ? 26% | 38 ? -121% |
| Response Time Black / White * | 12 ? | 28 ? -133% | 30 ? -150% | 12.8 ? -7% | 8.2 ? 32% | 26 ? -117% |
| PWM Frequency | 25770 ? | |||||
| Screen | -10% | 7% | -10% | -19% | -4% | |
| Brightness middle | 308.6 | 357.9 16% | 316 2% | 299.1 -3% | 326.4 6% | 323 5% |
| Brightness | 299 | 347 16% | 294 -2% | 273 -9% | 317 6% | 306 2% |
| Brightness Distribution | 92 | 94 2% | 84 -9% | 81 -12% | 90 -2% | 89 -3% |
| Black Level * | 0.29 | 0.33 -14% | 0.32 -10% | 0.27 7% | 0.28 3% | 0.31 -7% |
| Contrast | 1064 | 1085 2% | 988 -7% | 1108 4% | 1166 10% | 1042 -2% |
| Colorchecker dE 2000 * | 4.26 | 6.57 -54% | 3.39 20% | 5.07 -19% | 7.83 -84% | 4.96 -16% |
| Colorchecker dE 2000 max. * | 7.83 | 9.86 -26% | 5.56 29% | 10.55 -35% | 13.36 -71% | 8.25 -5% |
| Colorchecker dE 2000 calibrated * | 2.93 | 6.74 -130% | 2.14 27% | 3.31 -13% | 2.83 3% | |
| Greyscale dE 2000 * | 5 | 4.3 14% | 3.17 37% | 6.8 -36% | 10.9 -118% | 5.65 -13% |
| Gamma | 2.07 106% | 2.6 85% | 2.39 92% | 2.46 89% | 1.97 112% | 2.24 98% |
| CCT | 7488 87% | 6403 102% | 7098 92% | 7805 83% | 11056 59% | 7441 87% |
| Color Space (Percent of AdobeRGB 1998) | 57.8 | 88.4 53% | 51 -12% | 58.5 1% | 75.8 31% | 58 0% |
| Color Space (Percent of sRGB) | 89.2 | 100 12% | 89 0% | 89.9 1% | 100 12% | 90 1% |
| Total Average (Program / Settings) | -31% /
-15% | -46% /
-13% | -2% /
-7% | 14% /
-3% | -40% /
-18% |
* ... smaller is better
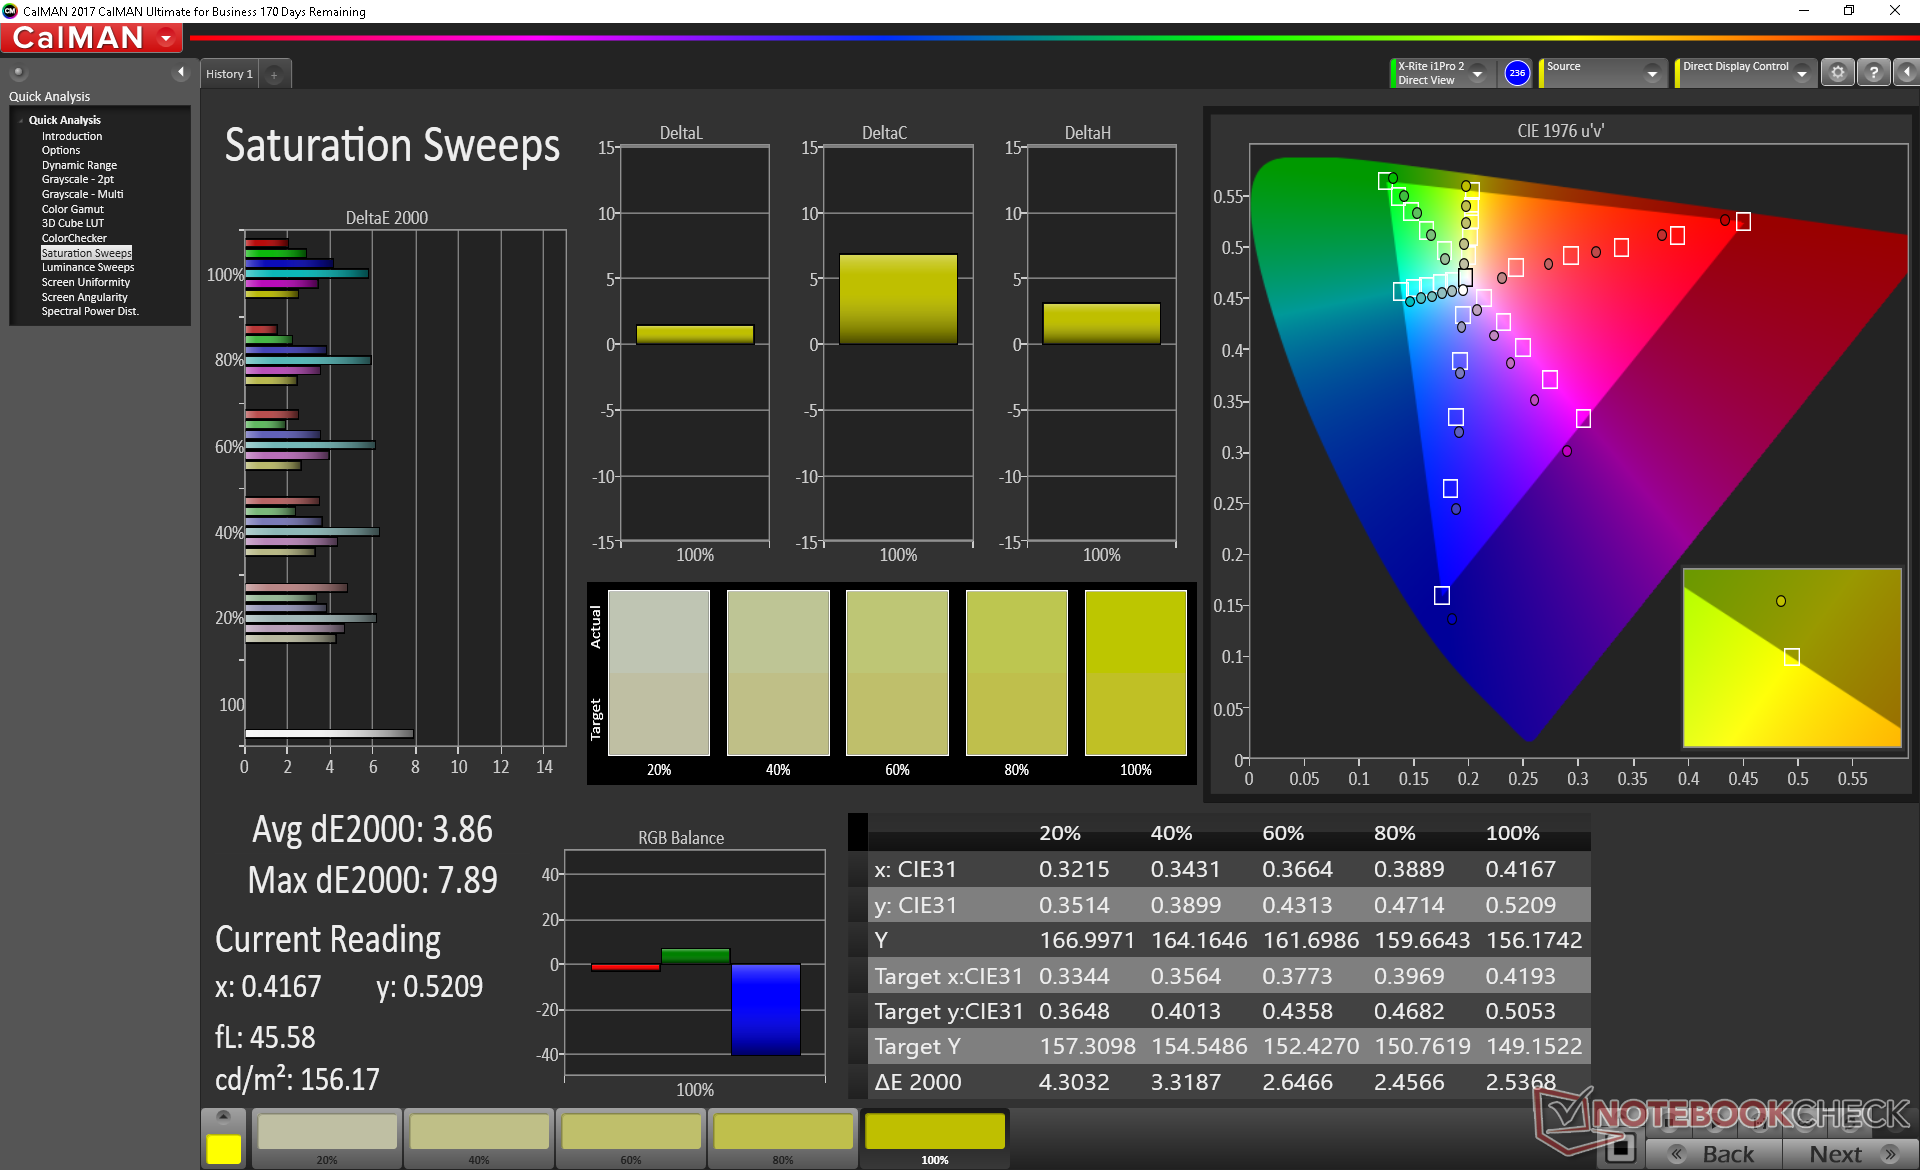
Color space is not unlike the Asus TUF FX705DT since they share the same AU Optronics panel. At about 90 percent sRGB, gamut is slightly narrower than most Ultrabooks where full sRGB coverage is common.
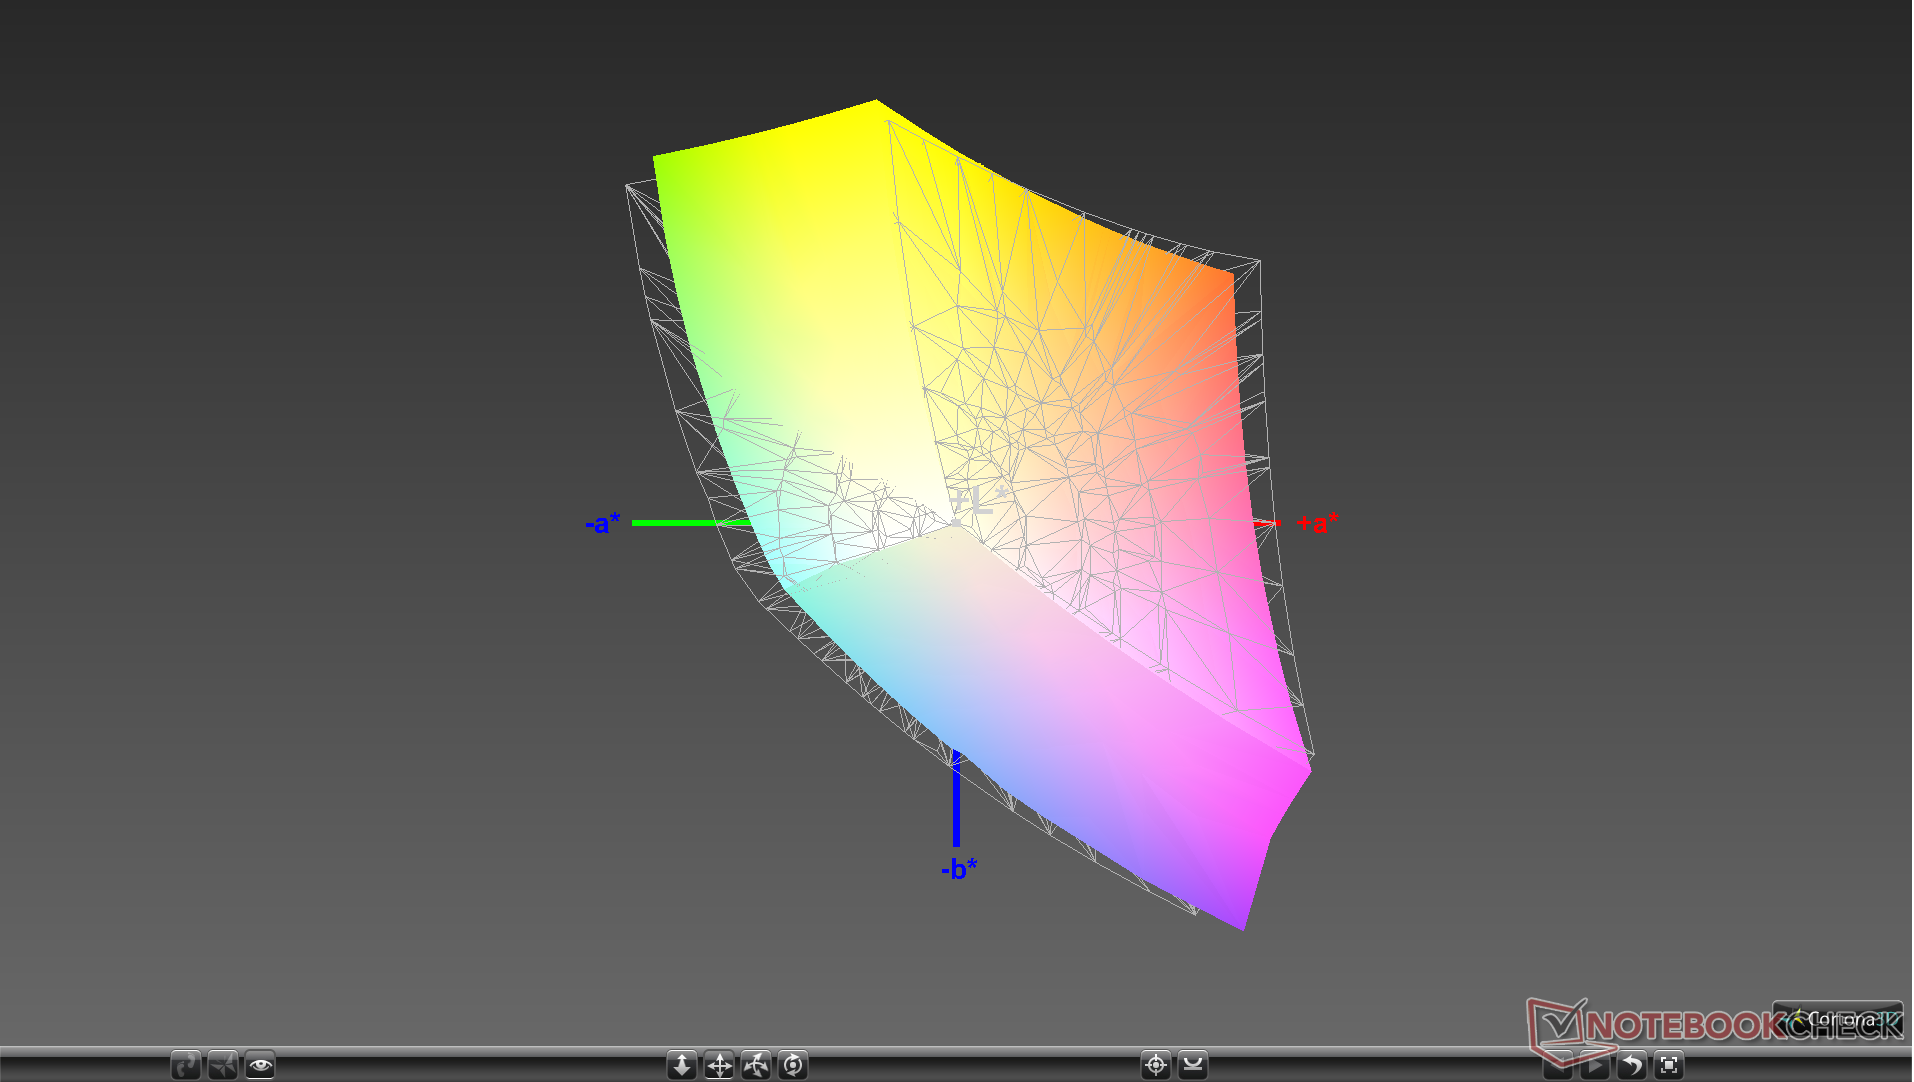

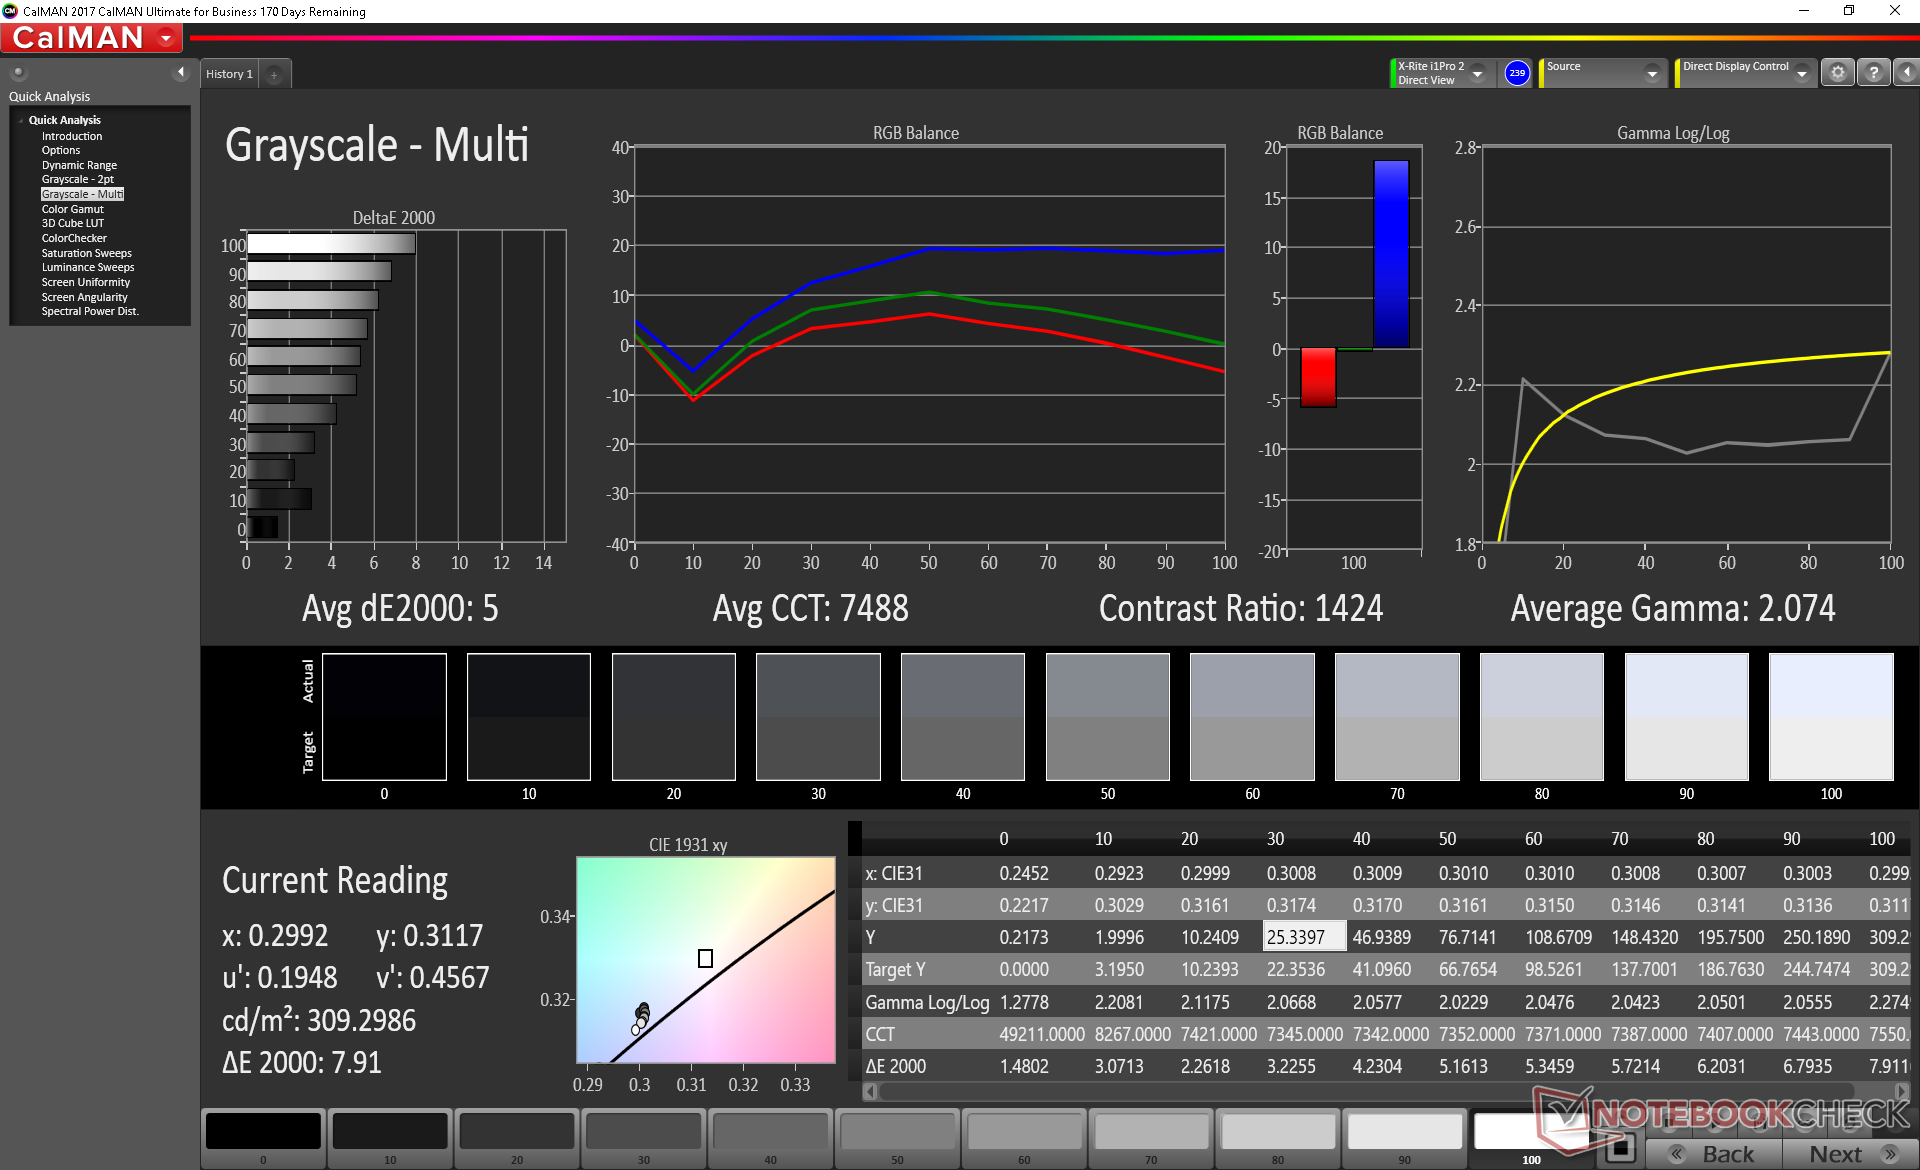
Further measurements with an X-Rite colorimeter reveal below average grayscale and colors due to the color temperature being too cool out of the box. Once calibrated, however, grayscale improves significantly from an average DeltaE of 5 to 1.7 leading to more accurate colors overall. We recommend an end-user calibration if possible to get the most out of the display. If not, users can still apply our ICM profile linked above.

Display Response Times
| ↔ Response Time Black to White | ||
|---|---|---|
| 12 ms ... rise ↗ and fall ↘ combined | ↗ 6.8 ms rise | 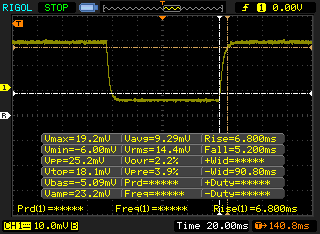 |
| ↘ 5.2 ms fall | ||
| The screen shows good response rates in our tests, but may be too slow for competitive gamers. In comparison, all tested devices range from 0.1 (minimum) to 240 (maximum) ms. » 26 % of all devices are better. This means that the measured response time is better than the average of all tested devices (21.5 ms). | ||
| ↔ Response Time 50% Grey to 80% Grey | ||
| 17.2 ms ... rise ↗ and fall ↘ combined | ↗ 7.6 ms rise | 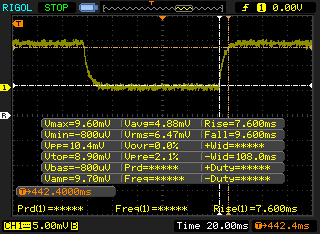 |
| ↘ 9.6 ms fall | ||
| The screen shows good response rates in our tests, but may be too slow for competitive gamers. In comparison, all tested devices range from 0.2 (minimum) to 636 (maximum) ms. » 26 % of all devices are better. This means that the measured response time is better than the average of all tested devices (33.8 ms). | ||
Screen Flickering / PWM (Pulse-Width Modulation)
| Screen flickering / PWM not detected | 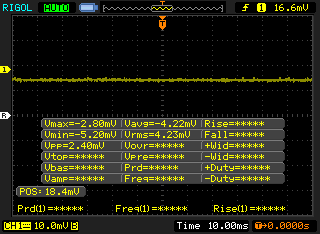 | ||
In comparison: 53 % of all tested devices do not use PWM to dim the display. If PWM was detected, an average of 17933 (minimum: 5 - maximum: 3846000) Hz was measured. | |||
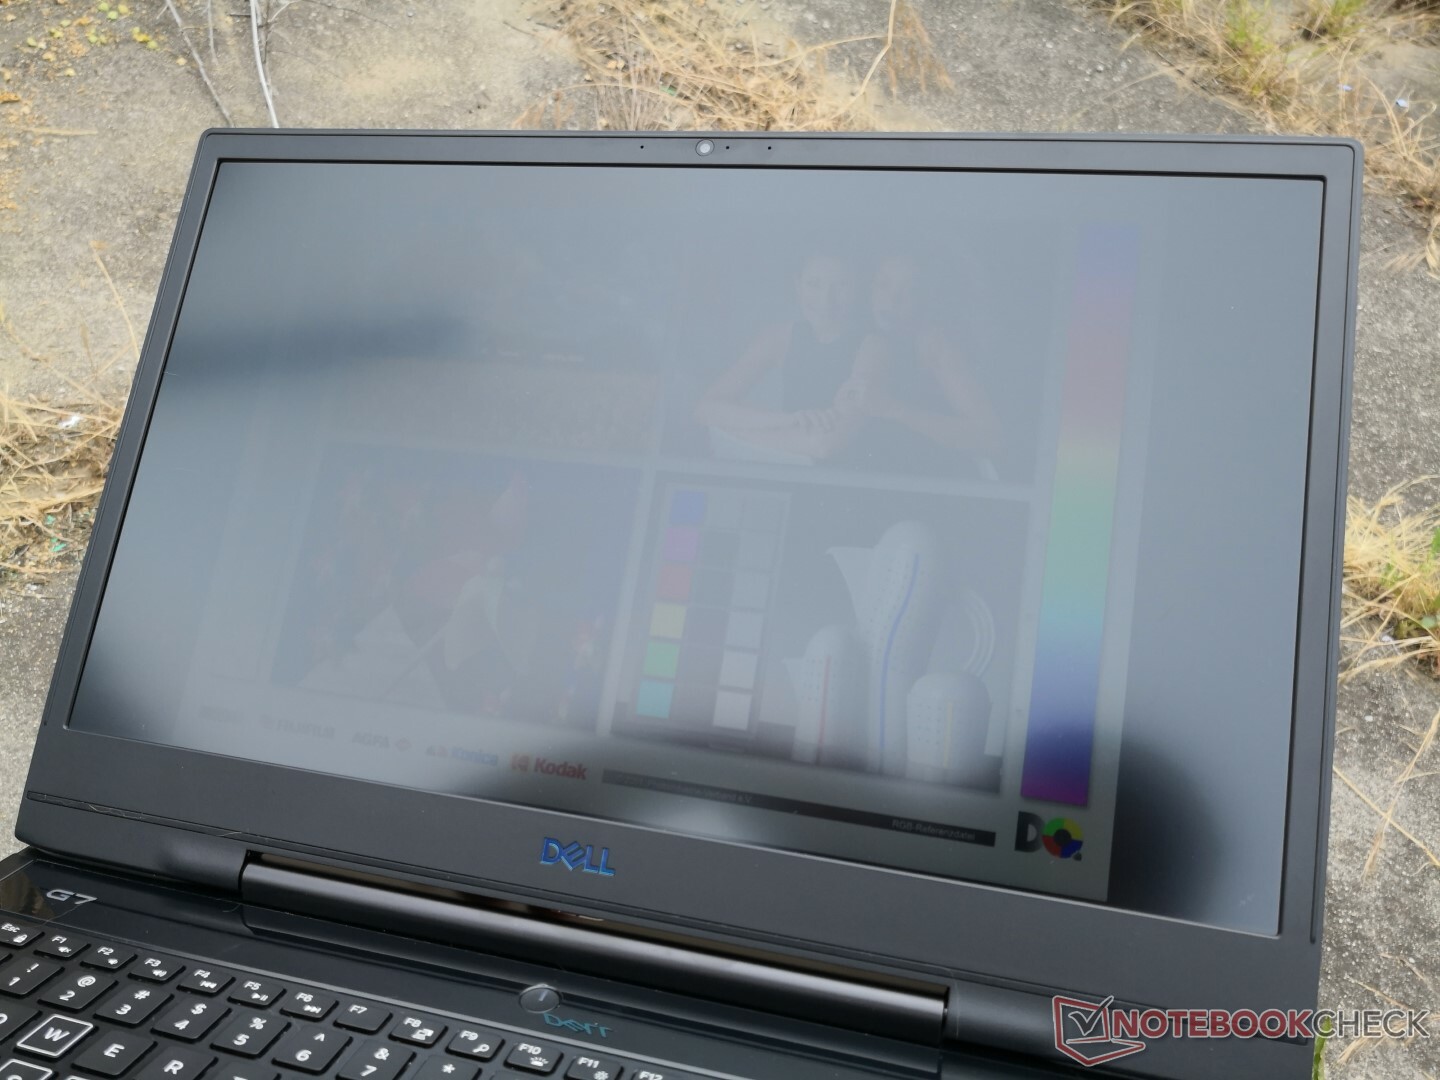
Outdoor visibility is average at best since the laptop was not designed to be used outdoors for long periods. We recommend working under shade if possible as anything brighter will wash out the screen. Viewing angles are wide with minimal glare; contrast and colors will shift slightly if viewing from extreme angles.

Performance
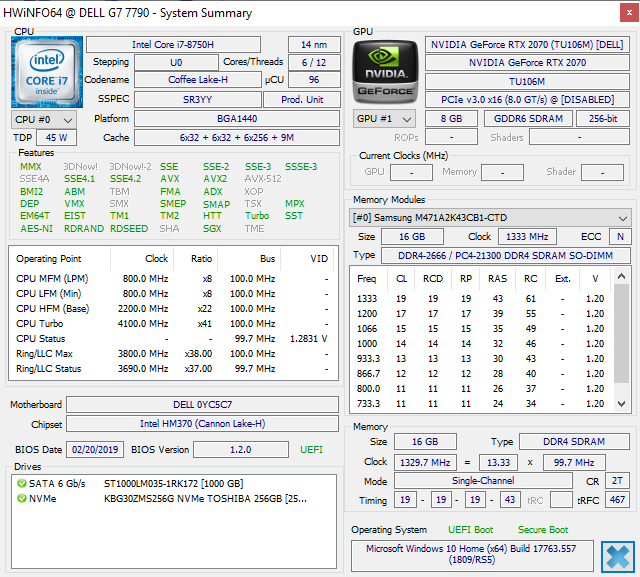
Dell is no stranger to offering a very wide selection of SKUs and configurations for its PCs and the G7 7790 is no different. Users can configure from the Core i5-9300H with GeForce GTX 1660 Ti graphics up to the Core i7-9750H and RTX 2070 Max-Q. These 9th gen Intel and Nvidia Turing options supplant last year's 8th gen Intel and Nvidia Pascal options of yesteryear.
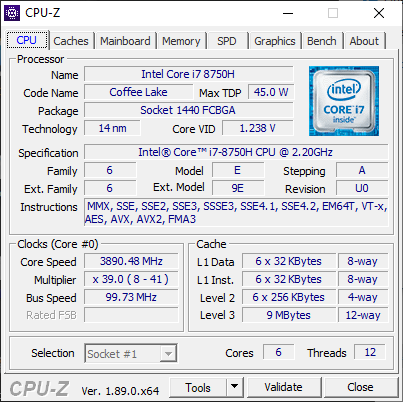
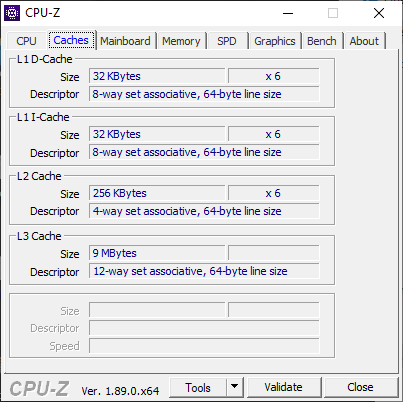
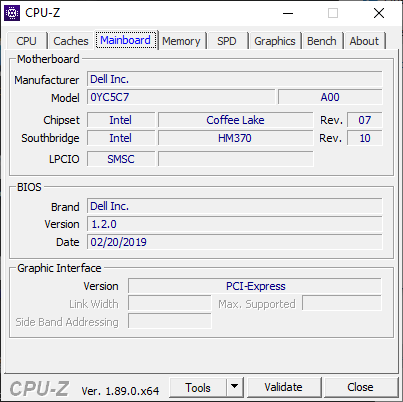
Our test unit is equipped with an 8th gen Intel Core i7-8750H instead of the newer 9th gen Core i7-9750H. Our benchmarks below, however, will show that this does not necessarily put the G7 17 in a disadvantageous position.
Optimus is included by default and so Nvidia G-Sync is unavailable across the lineup.
Processor
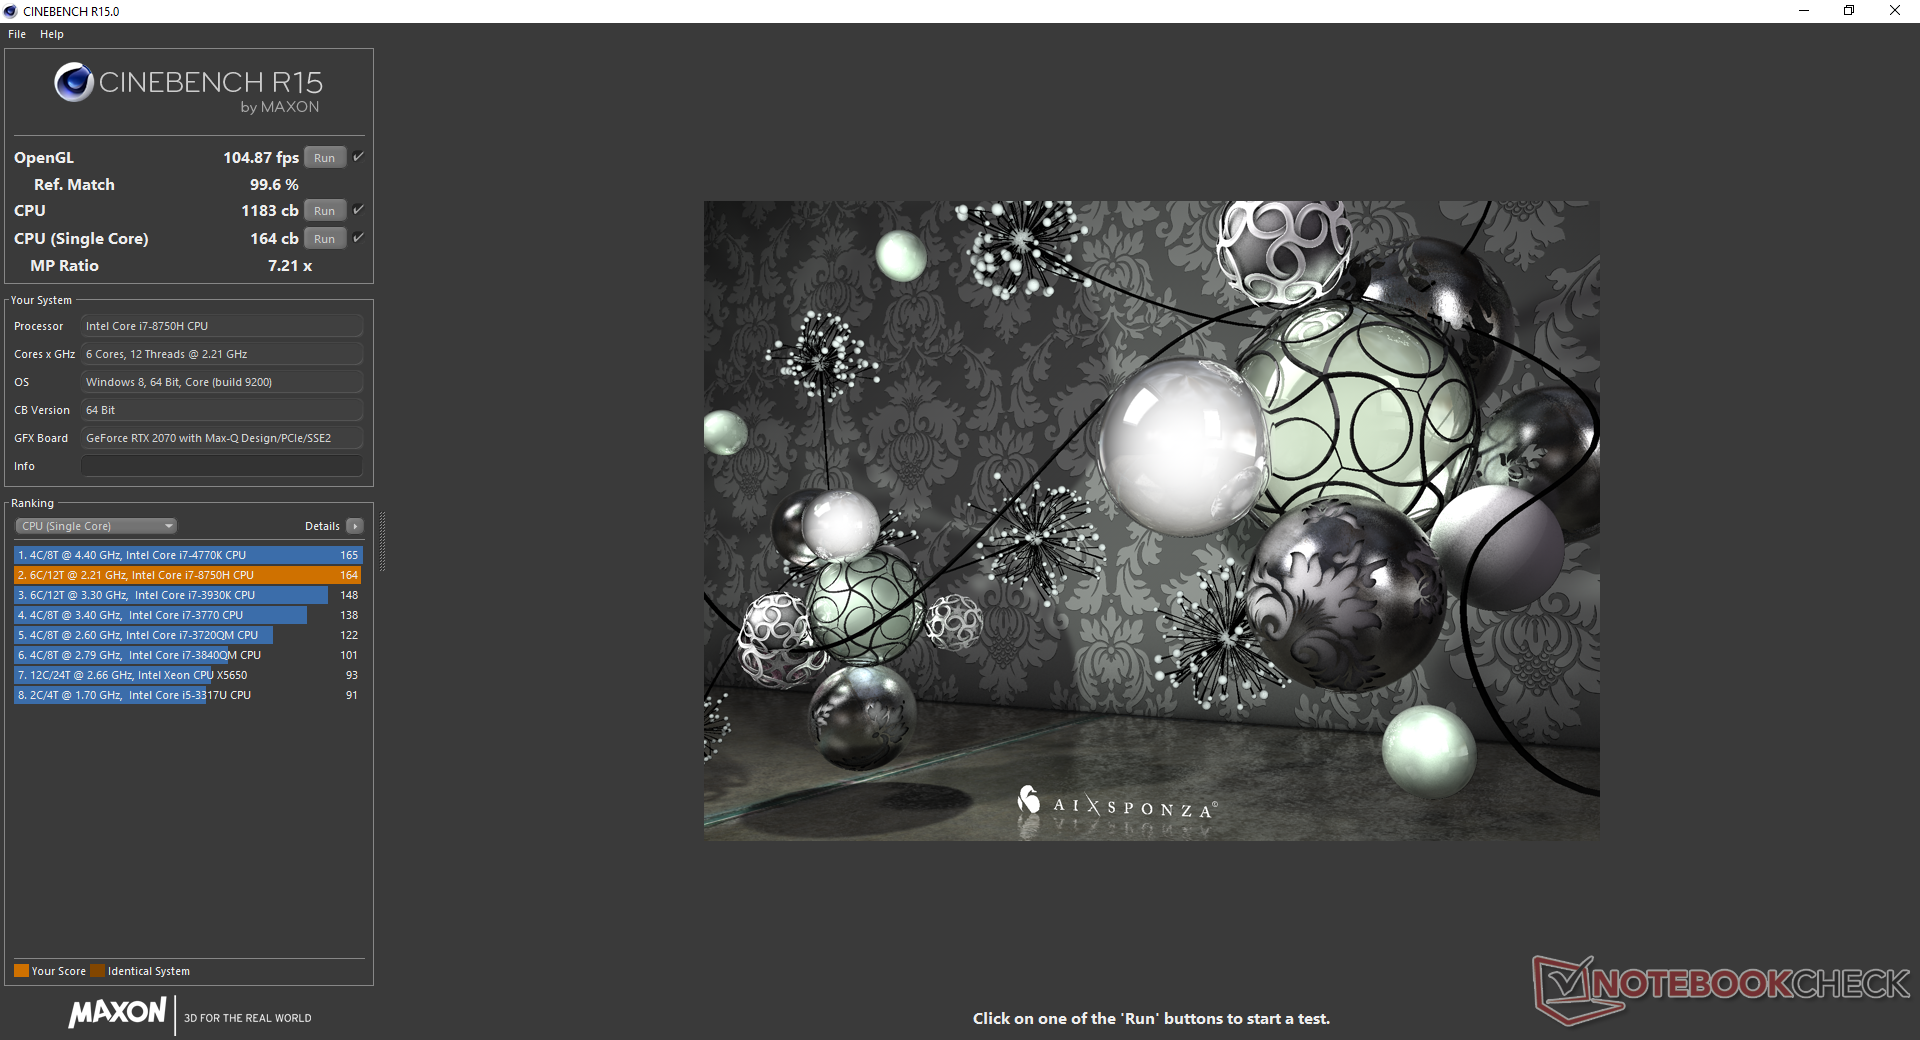
CPU performance is excellent with good sustainability over long periods of stress. When running CineBench R15 in a loop, for example, the initial score of 1190 points drop by only 8.8 percent over time. Performance is better than the newer Core i7-9750H in the Razer Blade 15 even after accounting for performance throttling as shown by our comparison graph below.
Users can expect a rough 60 percent performance boost if upgrading from the old Core i7-7700HQ. The lower-end SKU with the Core i5-8300H is about 30 percent slower than our Core i7-8750H SKU.
See our dedicated page on the Core i7-8750H for more technical information and benchmark comparisons.
| Cinebench R11.5 | |
| CPU Single 64Bit | |
| MSI GE75 9SG | |
| Average Intel Core i7-8750H (1.89 - 2, n=40) | |
| Asus FX503VM-EH73 | |
| Asus ROG Zephyrus G15 GA502DU | |
| CPU Multi 64Bit | |
| MSI GE75 9SG | |
| Average Intel Core i7-8750H (9.54 - 13.5, n=41) | |
| Asus ROG Zephyrus G15 GA502DU | |
| Asus FX503VM-EH73 | |
| Cinebench R10 | |
| Rendering Multiple CPUs 32Bit | |
| MSI GE75 9SG | |
| Average Intel Core i7-8750H (29664 - 35307, n=25) | |
| Asus FX503VM-EH73 | |
| Asus ROG Zephyrus G15 GA502DU | |
| Asus TUF FX705DT-AU068T | |
| Rendering Single 32Bit | |
| MSI GE75 9SG | |
| Average Intel Core i7-8750H (6236 - 6645, n=25) | |
| Asus FX503VM-EH73 | |
| Asus ROG Zephyrus G15 GA502DU | |
| Asus TUF FX705DT-AU068T | |
| wPrime 2.10 - 1024m | |
| Asus FX503VM-EH73 | |
| Asus ROG Zephyrus G15 GA502DU | |
| Average Intel Core i7-8750H (125.5 - 180.5, n=6) | |
| MSI GE75 9SG | |
* ... smaller is better
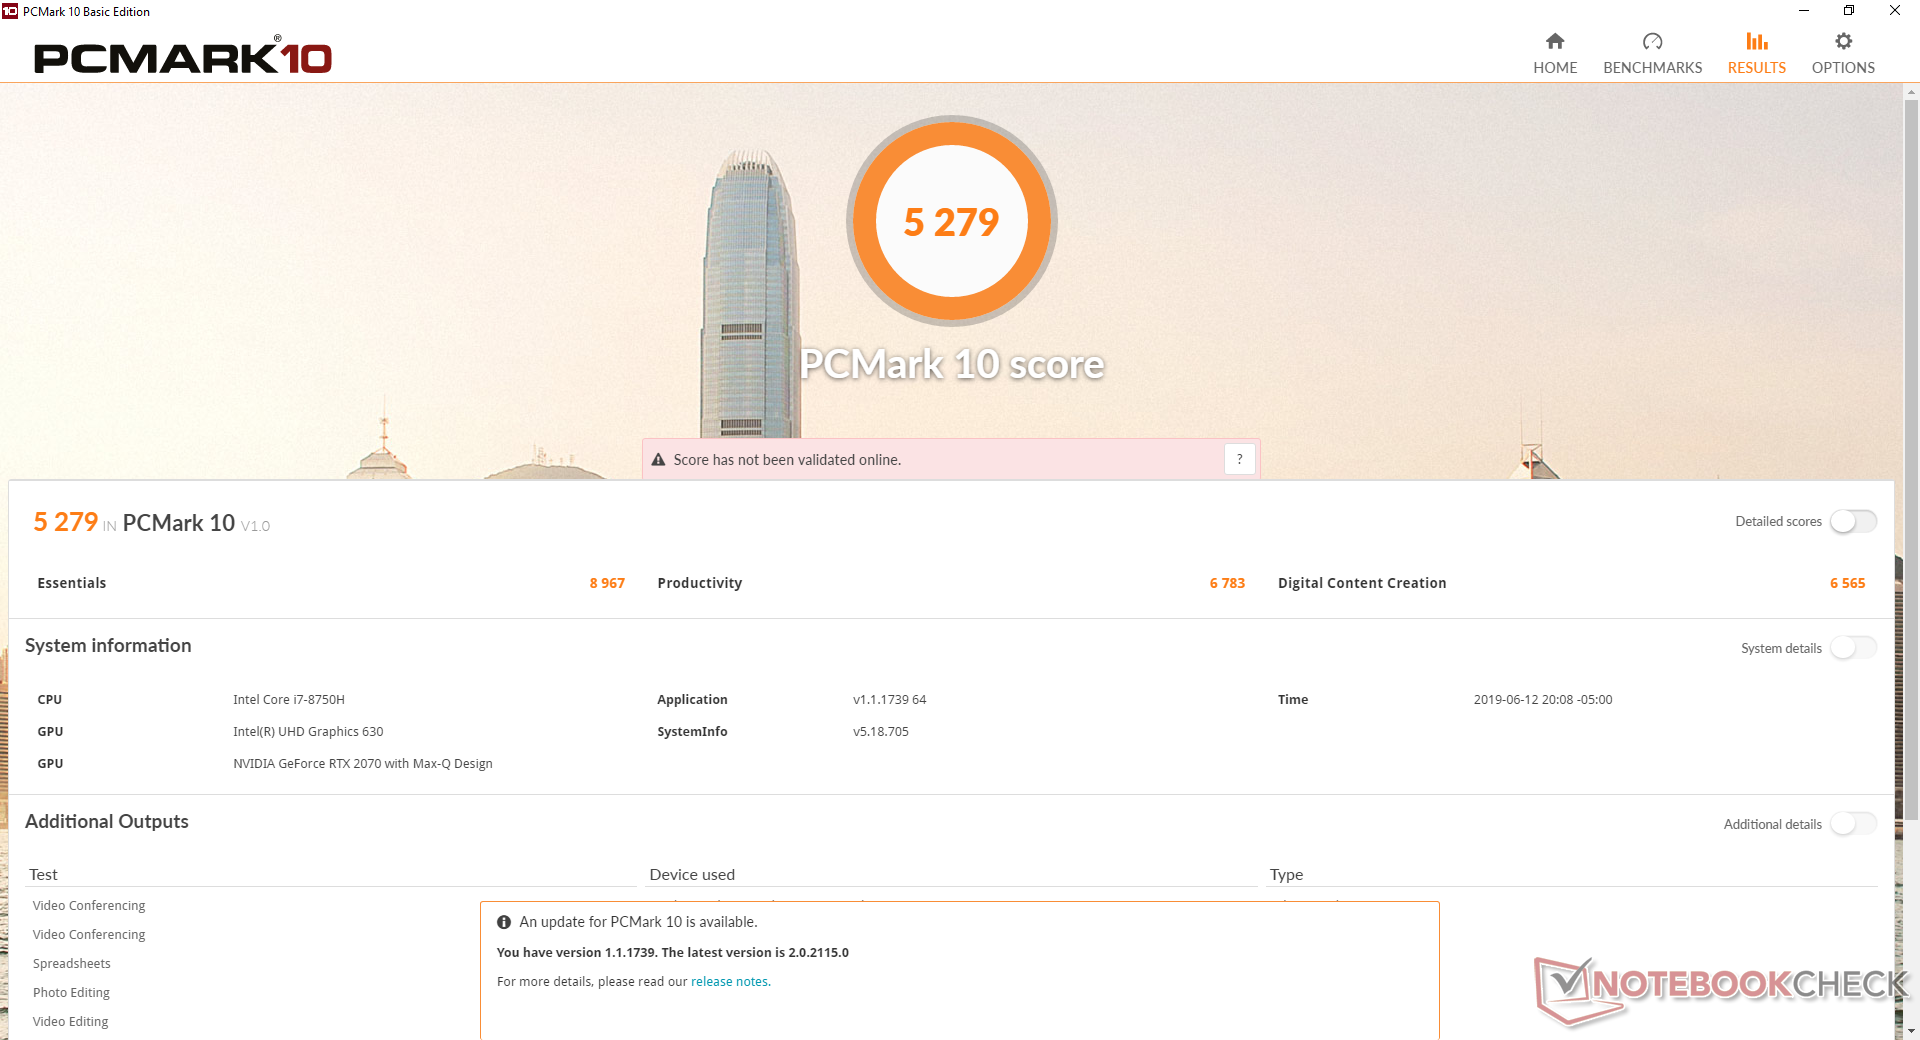
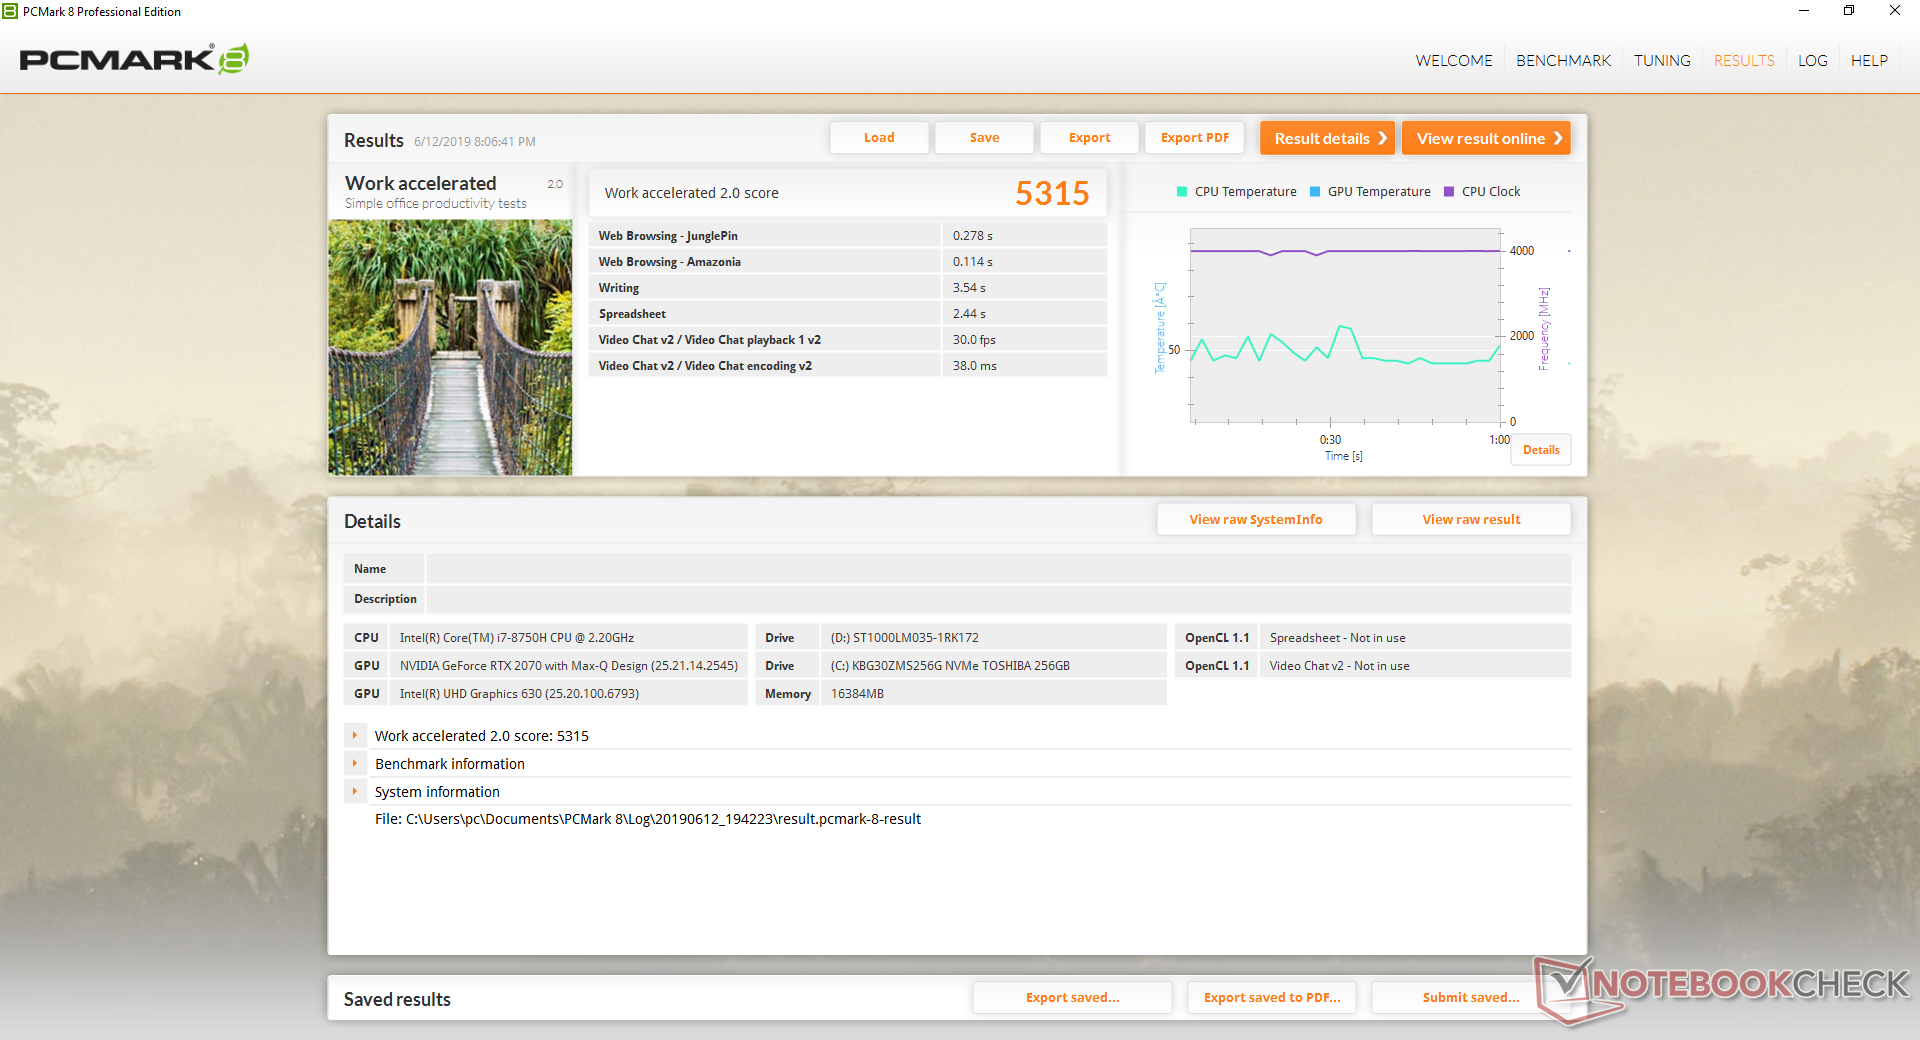
System Performance
PCMark benchmarks rank our system in the same ballpark as other laptops equipped with the same CPU and GPU. The Razer Blade 15 RTX 2070 Max-Q, for example, is within just 3 percentage points of our Dell G7 17.
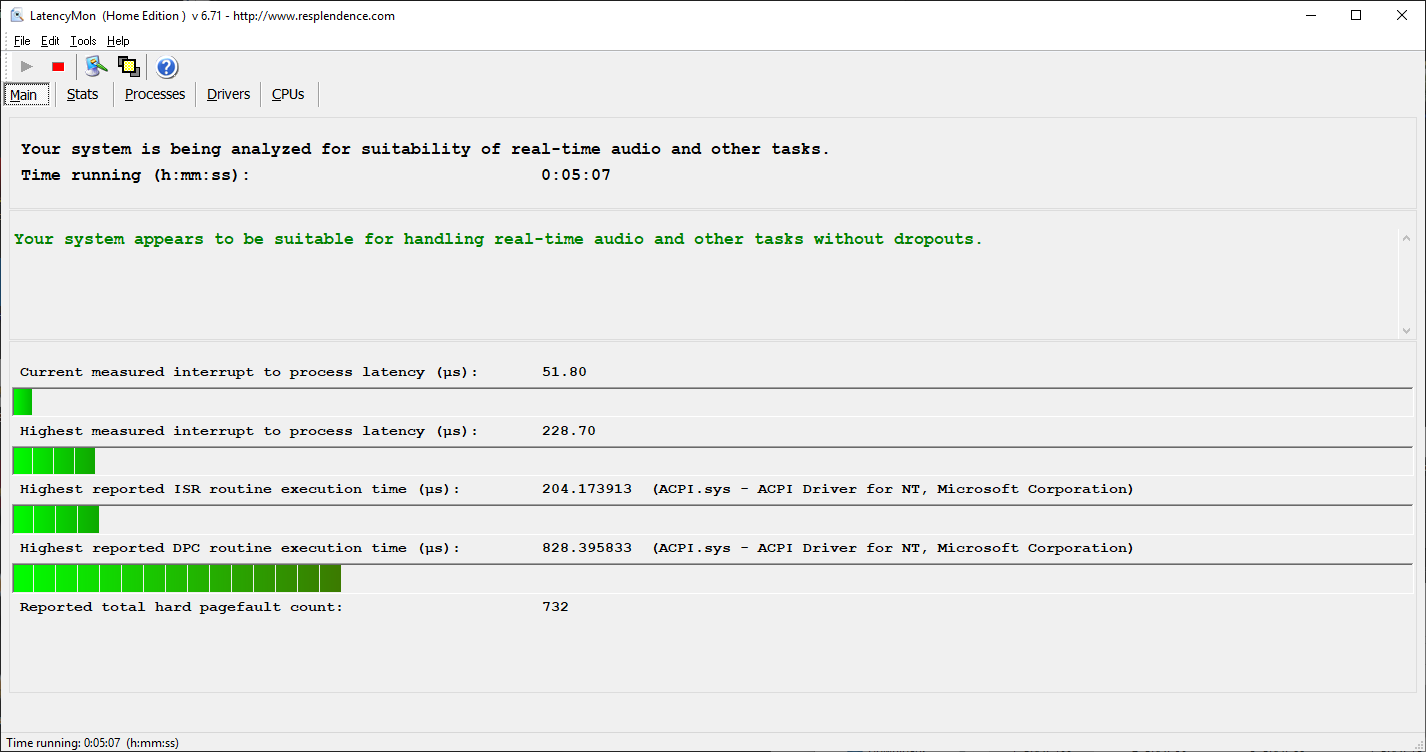
We experienced no software or hardware issues during our time with the test unit.

| PCMark 8 Home Score Accelerated v2 | 4010 points | |
| PCMark 8 Work Score Accelerated v2 | 5315 points | |
| PCMark 10 Score | 5279 points | |
Help | ||
Storage Devices
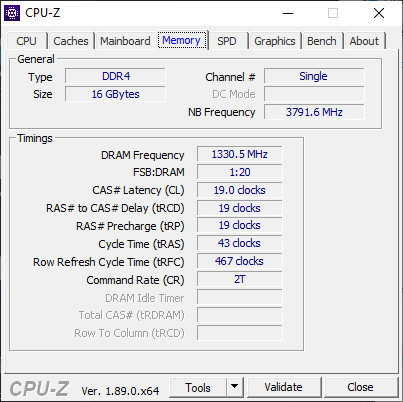
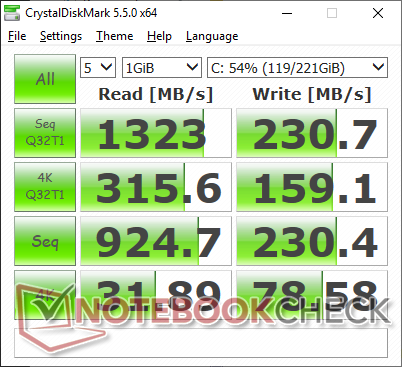
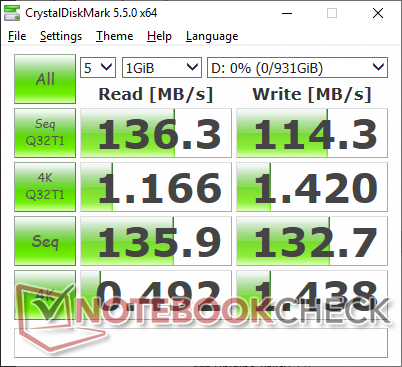
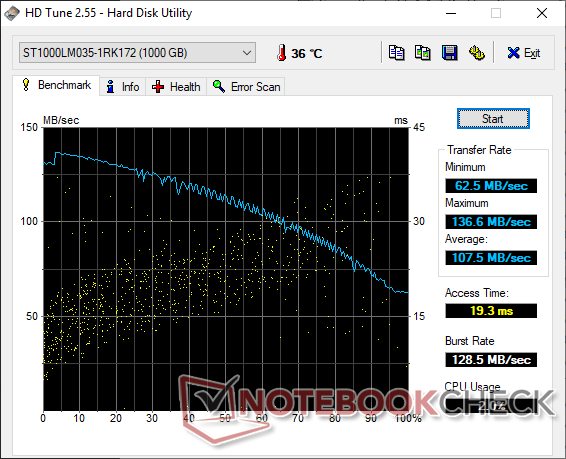
Two internal storage bays (M.2 2280 + 2.5-inch SATA III) are available. Our specific test unit utilizes an entry-level 256 GB Toshiba BG3 KBG30ZMS256G NVMe SSD and a secondary 1 TB Seagate ST1000LM035 5400 RPM HDD.
Sequential transfer rates from the Toshiba drive are slow for an NVMe SSD. Read and write rates are only about 1000 MB/s and 200 MB/s, respectively, compared to nearly 2000 MB/s from the more expensive Samsung PM981. Pricier gaming laptops from MSI or Razer are typically equipped with faster NVMe drives. The performance differences between NVMe SSDs shouldn't be an issue for most gamers.
See our table of HDDs and SSDs for more benchmark comparisons.
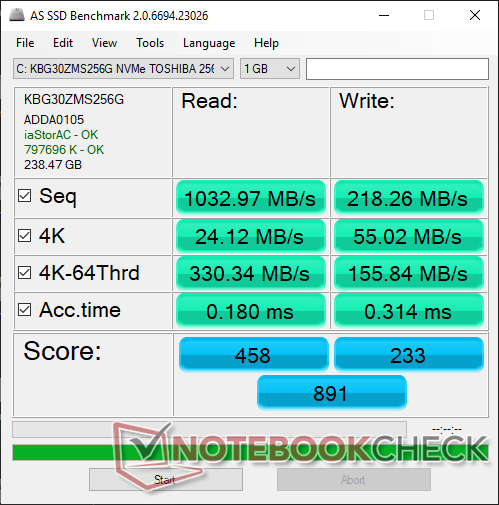
| Dell G7 17 7790 Toshiba BG3 KBG30ZMS256G | Alienware m17 P37E SK Hynix PC401 512GB M.2 (HFS512GD9TNG) | Lenovo Legion Y740-17ICH Samsung SSD PM981 MZVLB256HAHQ | Dell G3 17 3779 SK hynix SC311 SATA | Asus TUF FX705DT-AU068T WDC PC SN520 SDAPNUW-256G | |
|---|---|---|---|---|---|
| AS SSD | 159% | 235% | -19% | 108% | |
| Seq Read | 1033 | 1835 78% | 1153 12% | 511 -51% | 1546 50% |
| Seq Write | 218.3 | 1121 414% | 1328 508% | 254.4 17% | 1182 441% |
| 4K Read | 24.12 | 23.98 -1% | 35.05 45% | 24.22 0% | 36.54 51% |
| 4K Write | 55 | 100 82% | 96 75% | 58.5 6% | 109.2 99% |
| 4K-64 Read | 330.3 | 687 108% | 727 120% | 160.7 -51% | 612 85% |
| 4K-64 Write | 155.8 | 776 398% | 1212 678% | 114.8 -26% | 436.6 180% |
| Access Time Read * | 0.18 | 0.047 74% | 0.063 65% | 0.136 24% | 0.113 37% |
| Access Time Write * | 0.314 | 0.053 83% | 0.04 87% | 0.069 78% | 0.034 89% |
| Score Read | 458 | 895 95% | 878 92% | 236 -48% | 803 75% |
| Score Write | 233 | 988 324% | 1441 518% | 199 -15% | 664 185% |
| Score Total | 891 | 2306 159% | 2784 212% | 552 -38% | 1869 110% |
| Copy ISO MB/s | 382.9 | 773 102% | 1487 288% | 154.9 -60% | 698 82% |
| Copy Program MB/s | 234.9 | 493 110% | 608 159% | 99.8 -58% | 114.1 -51% |
| Copy Game MB/s | 218.7 | 647 196% | 1162 431% | 124.2 -43% | 379.6 74% |
* ... smaller is better

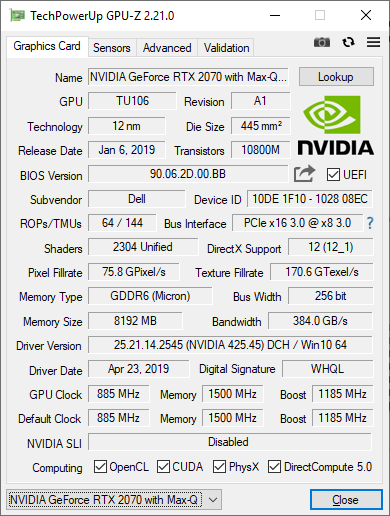
GPU Performance
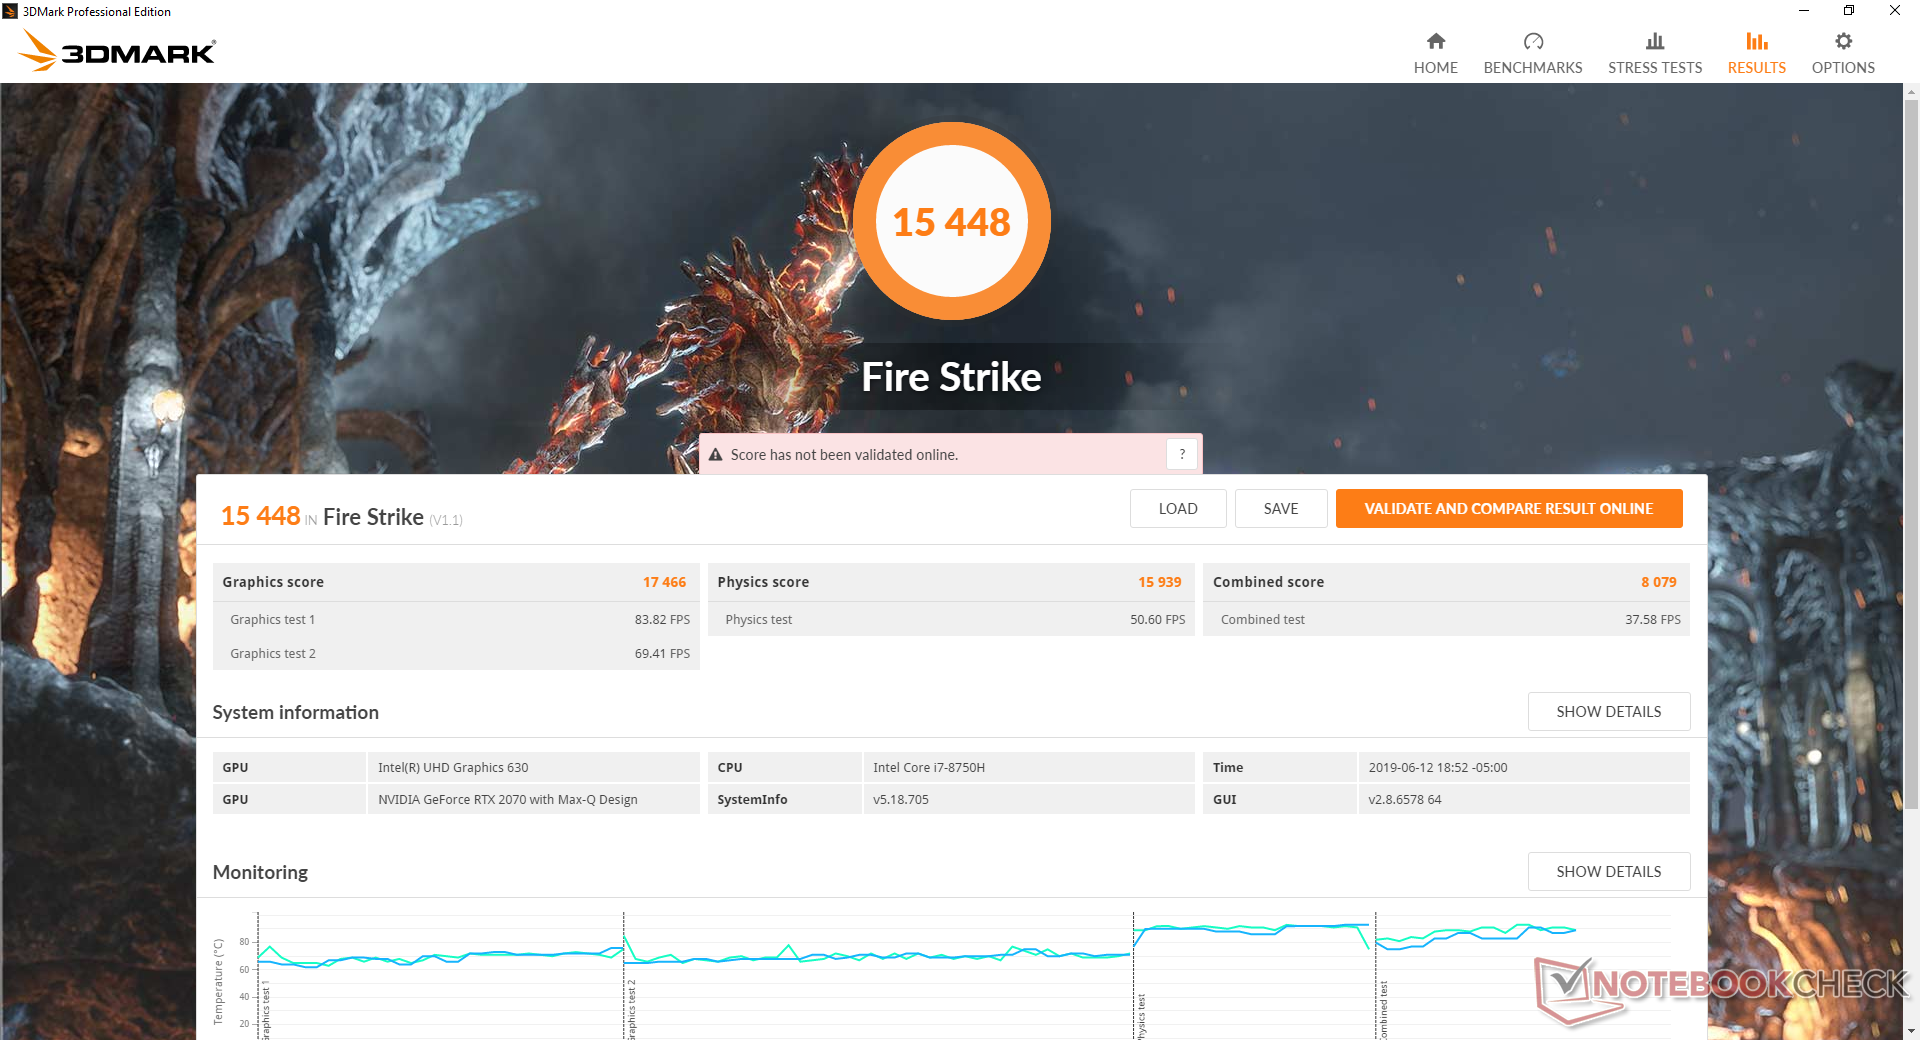
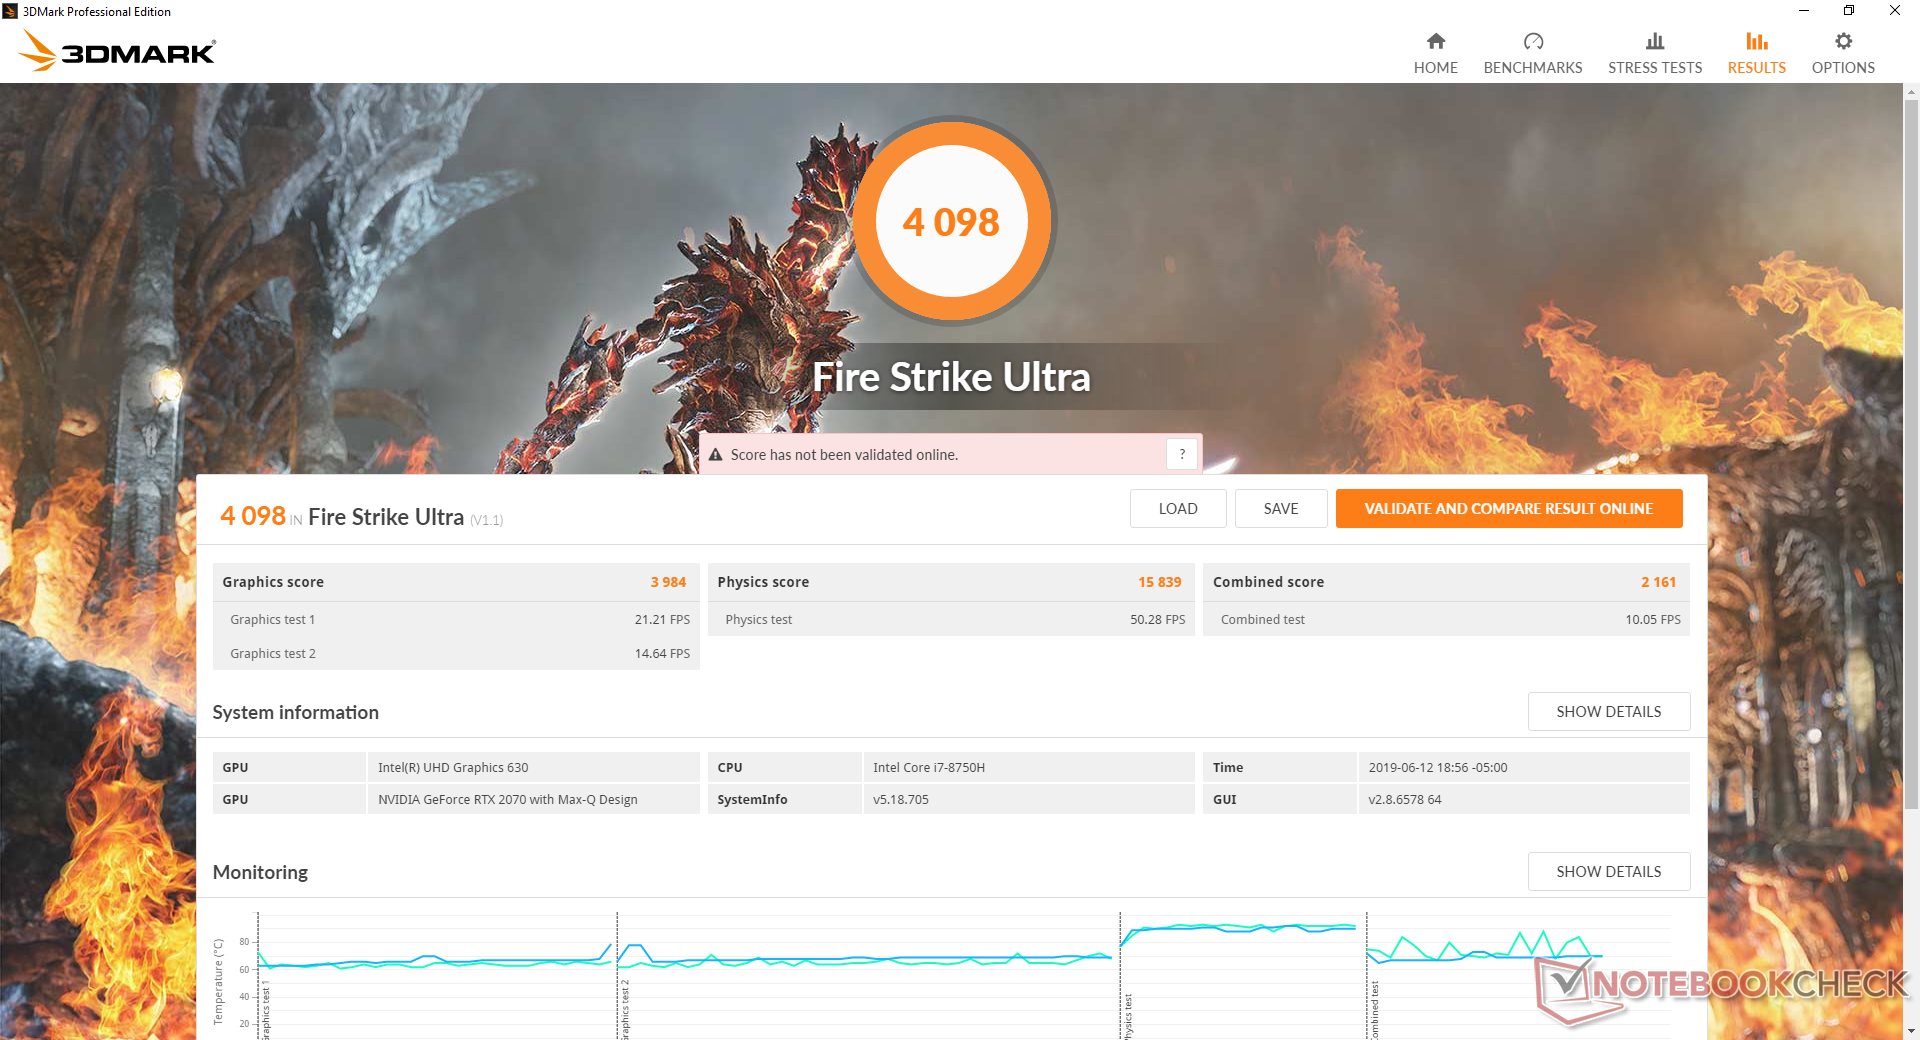
The RTX 2070 Max-Q is only 8 to 9 percent slower than the standard mobile RTX 2070. The desktop RTX 2070, however, will still outperform our RTX 2070 Max-Q by about 36 to 44 percent. Users who opt for the lesser GTX 1660 Ti SKUs will see a performance deficit of about 25 percent.
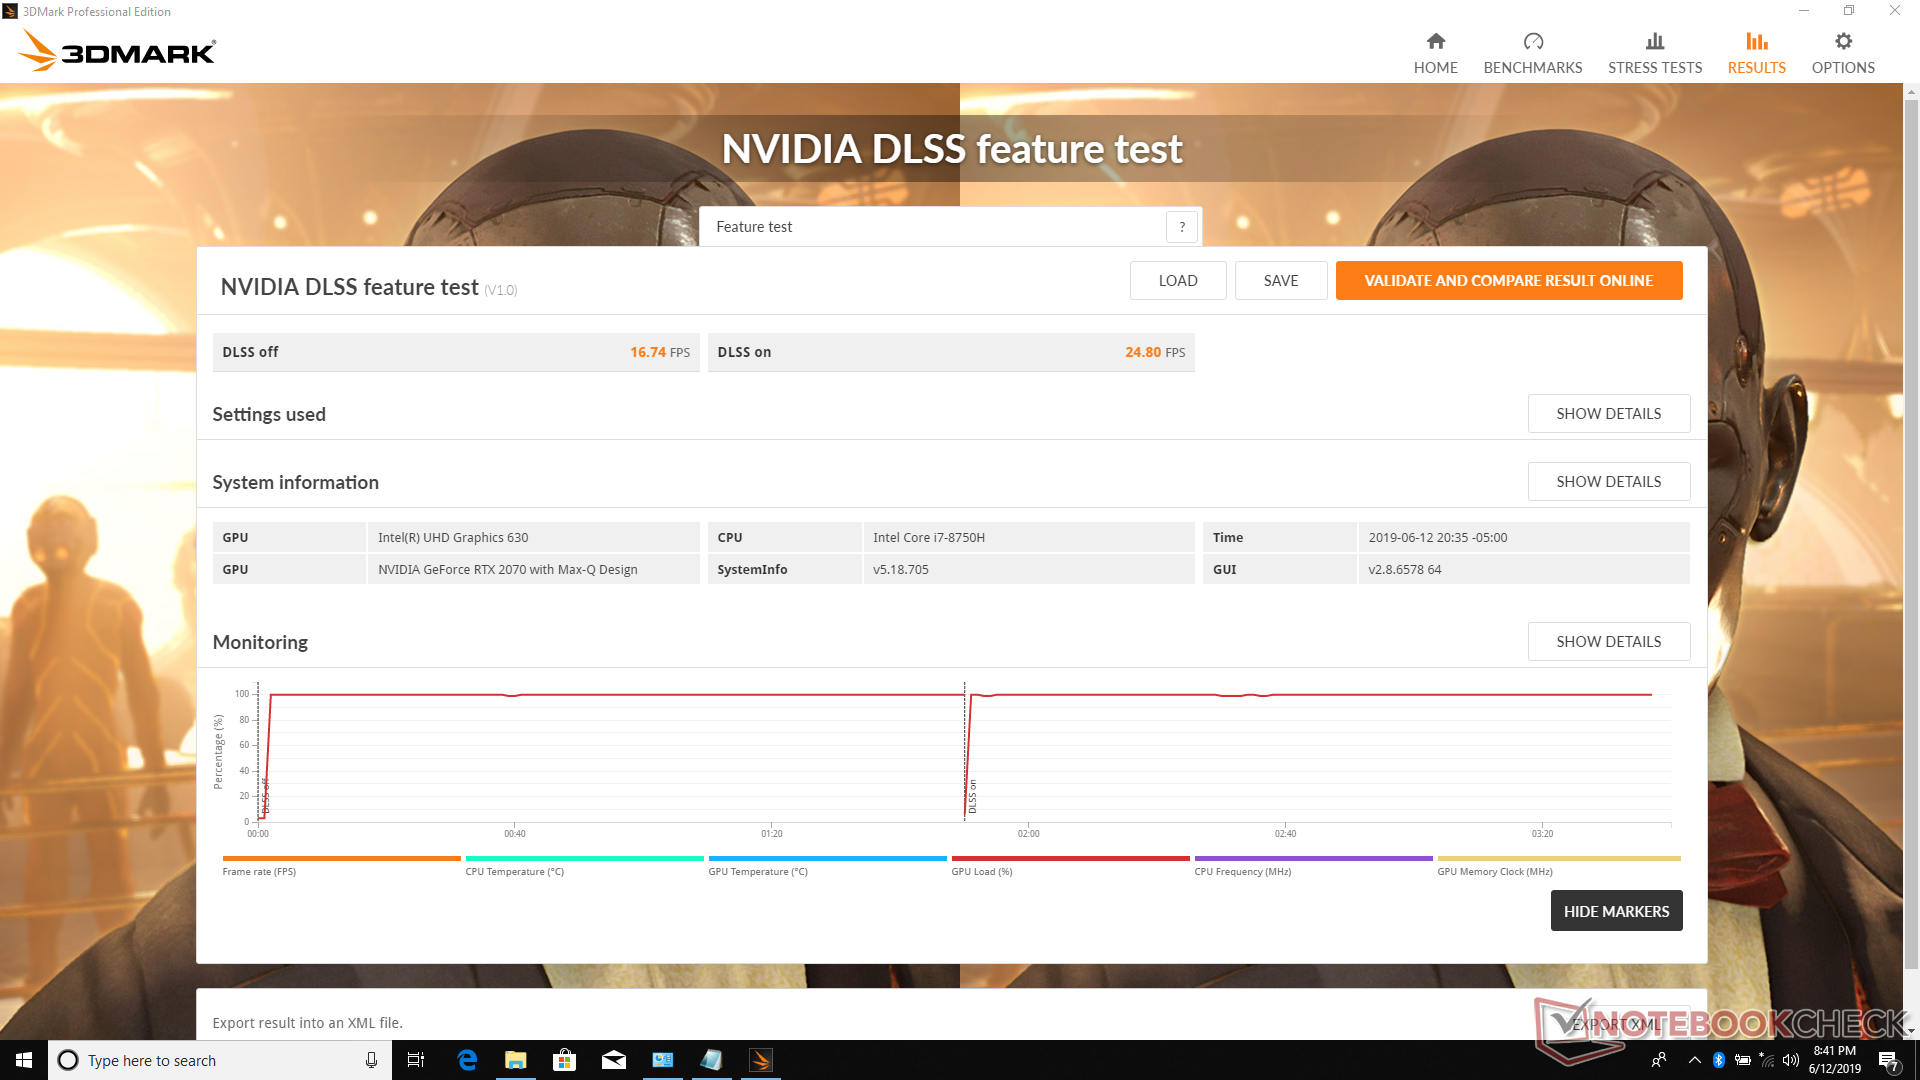
It's important to note that the RTX 2070 Max-Q is about 19 percent and 42 percent faster than the GTX 1070 Max-Q according to 3DMark Fire Strike and Time Spy, respectively. This means that users benefit more from the Turing series when running DX12-enabled titles.
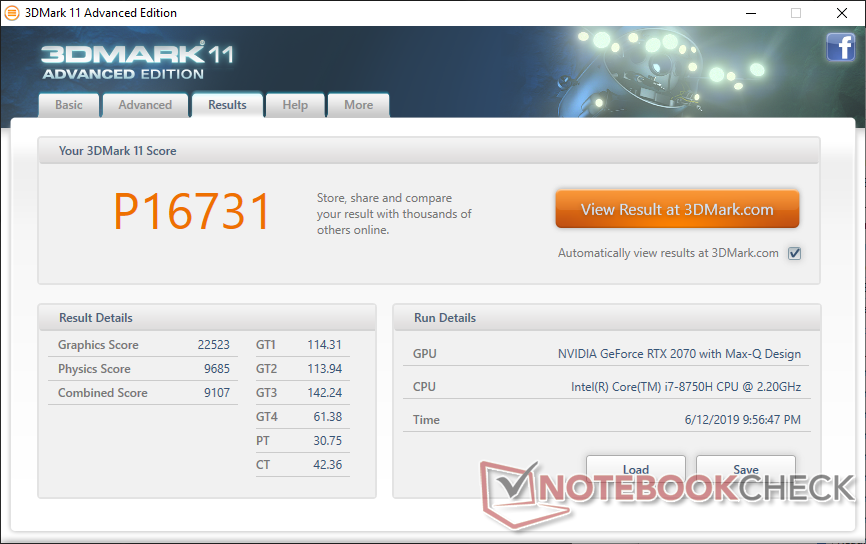
| 3DMark 11 Performance | 16731 points | |
| 3DMark Cloud Gate Standard Score | 31556 points | |
| 3DMark Fire Strike Score | 15448 points | |
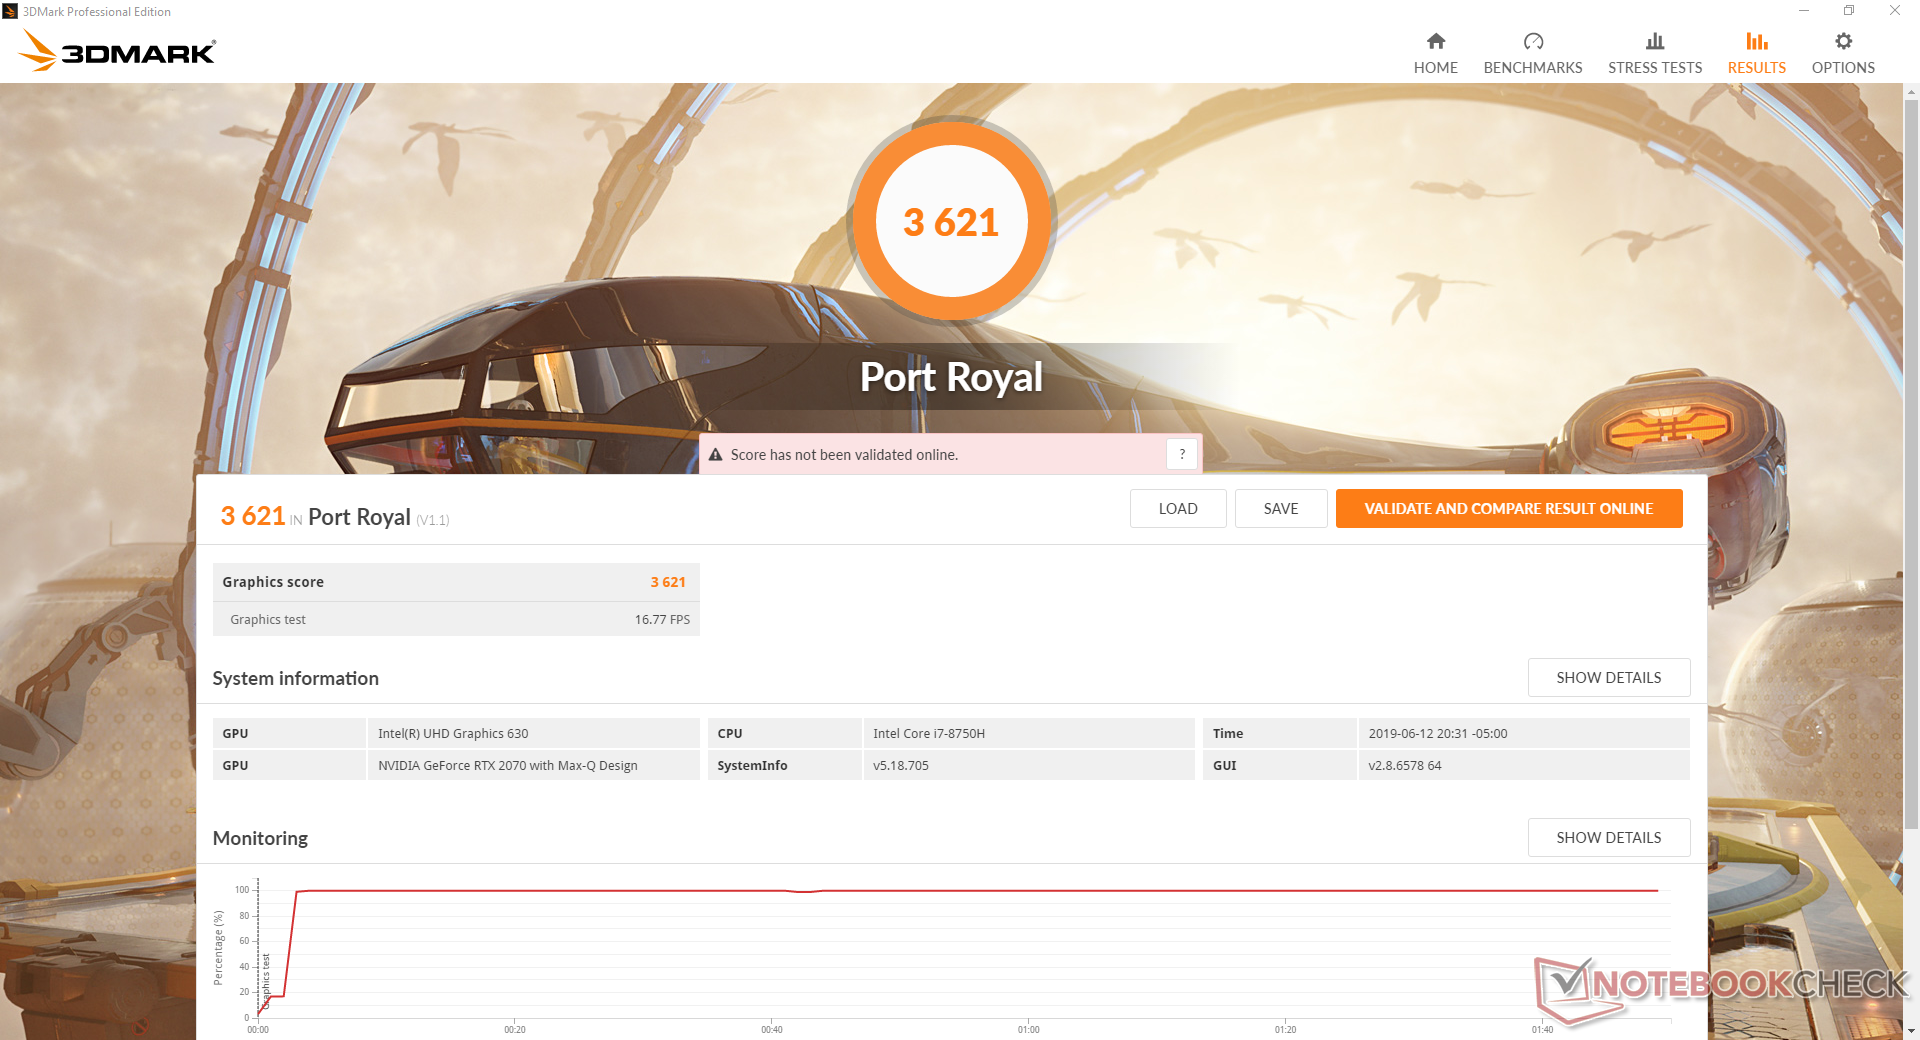
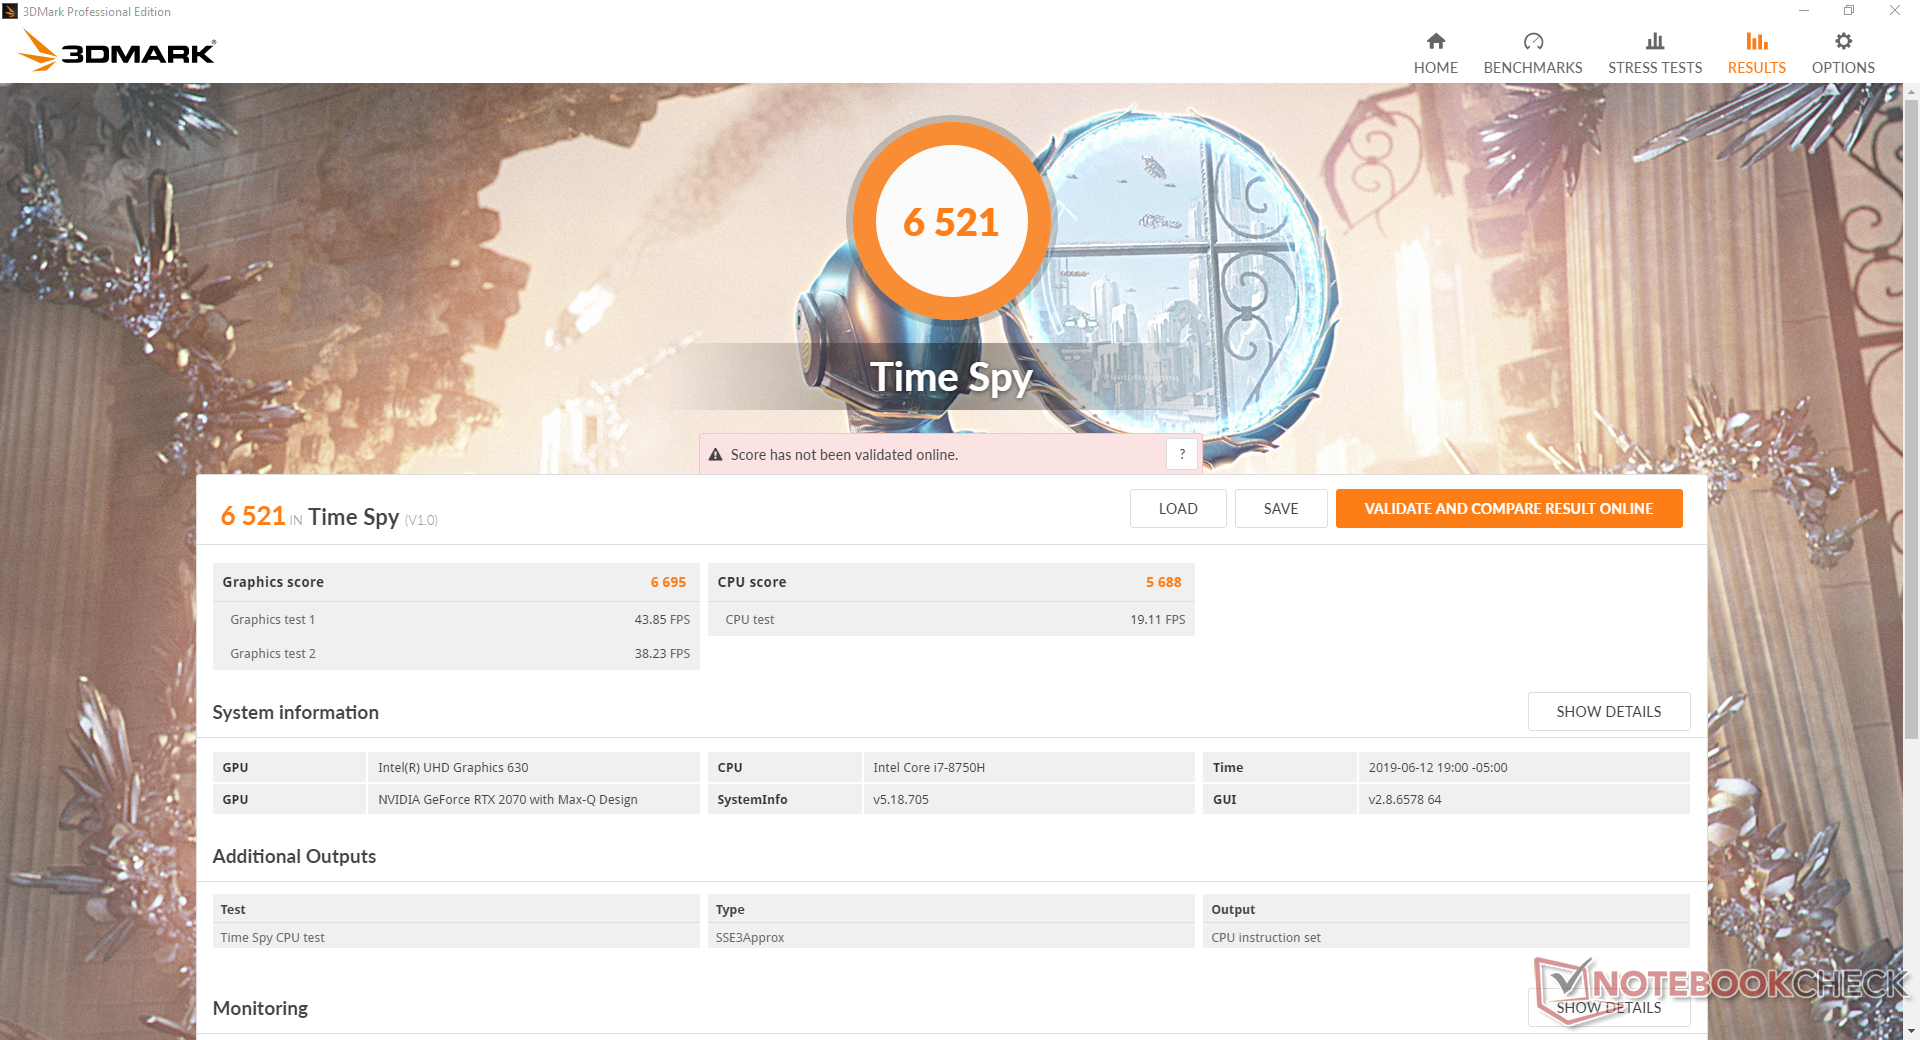
| 3DMark Time Spy Score | 6521 points | |
Help | ||
Gaming Performance
All titles are playable at maximum settings because of the "low" native resolution of 1080p. Less demanding titles like Rocket League or Fortnite will be playable at a steady 144 FPS to make the most of the 144 Hz refresh rate. Running Witcher 3 shows no recurring frame dips to represent no interrupting background activity when gaming.
See our dedicated page on the GeForce RTX 2070 Max-Q for more benchmark comparisons.
| low | med. | high | ultra | |
| BioShock Infinite (2013) | 248 | 218.1 | 205.8 | 133.6 |
| The Witcher 3 (2015) | 203 | 165.1 | 113.5 | 64.7 |
| Rocket League (2017) | 249 | 213.2 | 188.9 |
Emissions
System Noise
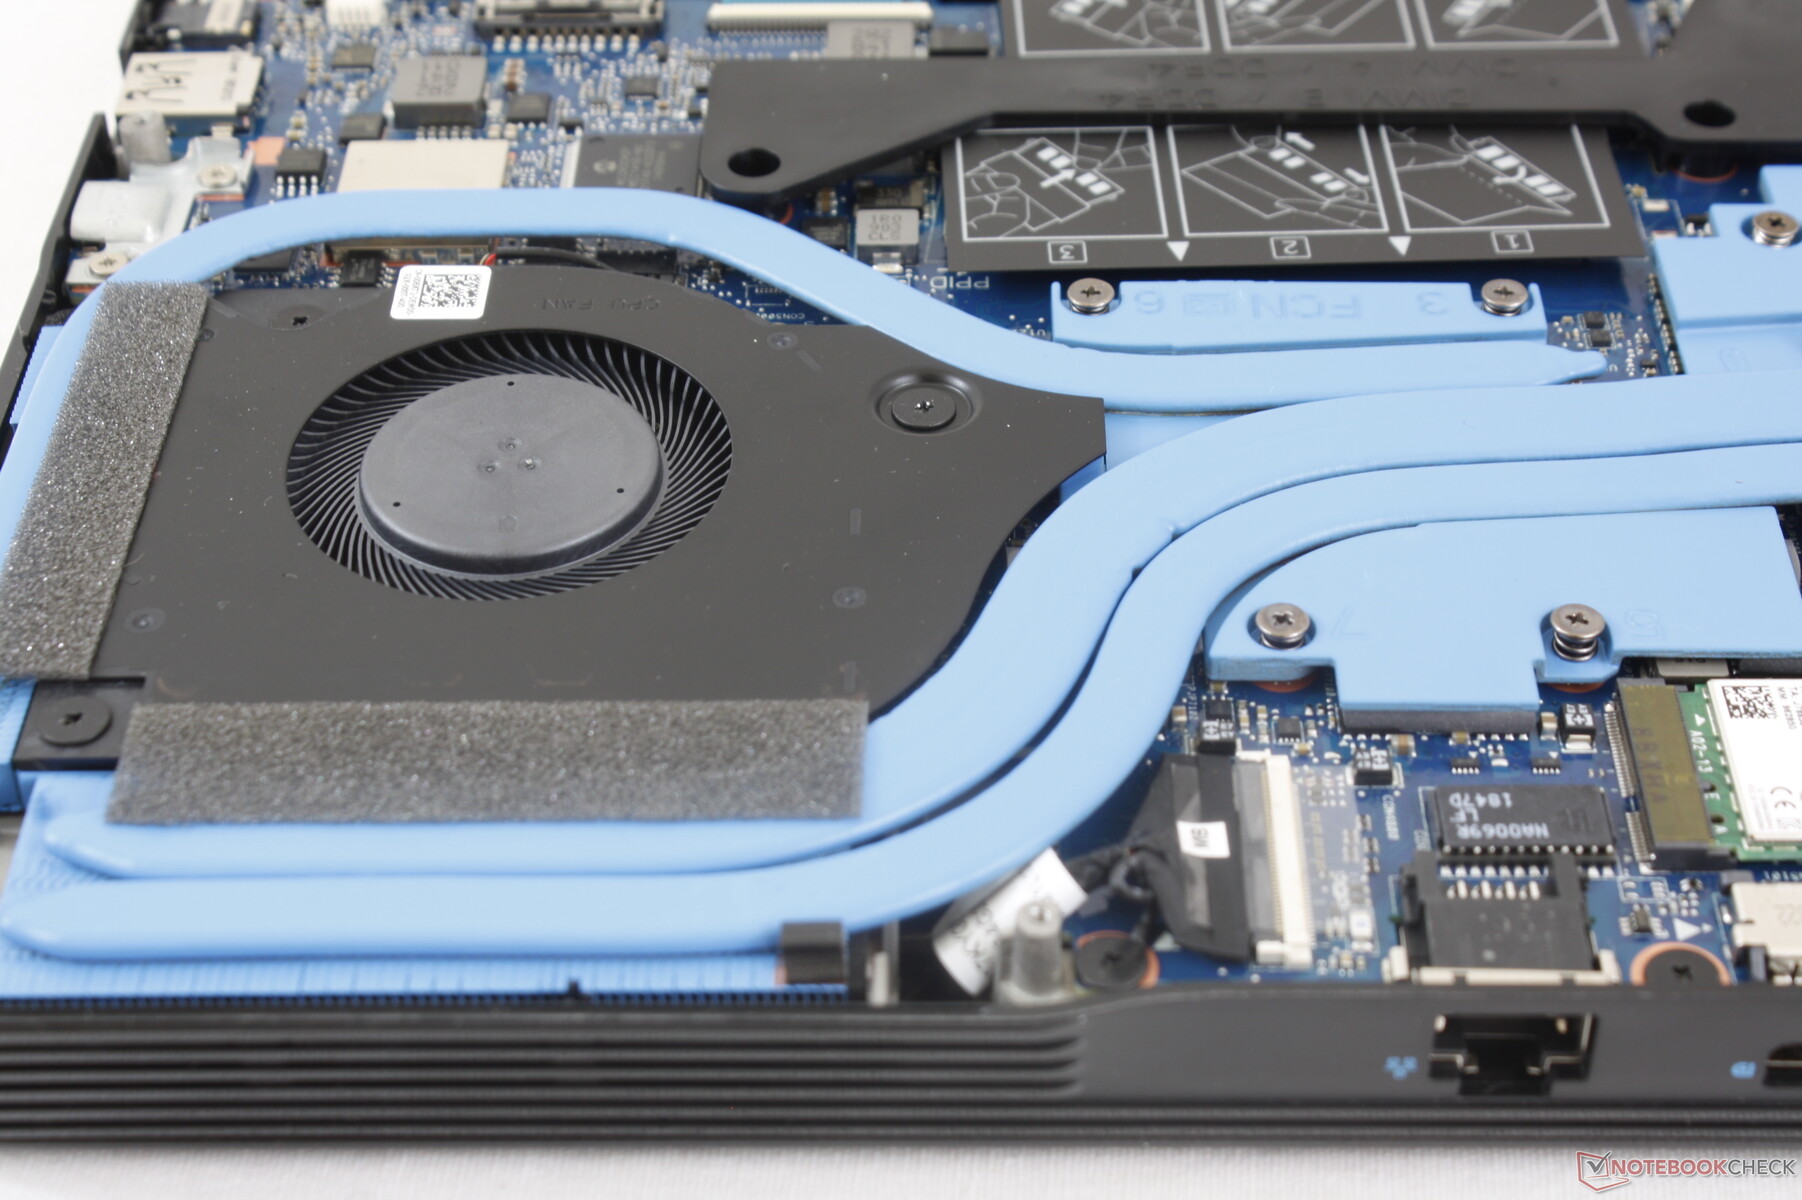
The cooling solution consists of twin fans and four heat pipes between them. With the exception of the initial boot up sequence, fan noise is generally very quiet when web browsing or video streaming. The system even remains relatively quiet at 31.8 dB(A) when running the first benchmark sequence of 3DMark 06.
Unfortunately, the opposite is true when gaming. Expect fan noise to be just over 50 dB(A) after gaming for a few minutes to be louder than the Lenovo Legion Y740 and older Dell G3 17 with GTX 1050 graphics. Perhaps not coincidentally, the system is about as loud as its Alienware m15 cousin when subjected to the same gaming loads. It's unrealistic to expect any gaming laptop to run quietly when under high processing loads, but the 50 dB(A) range is where we draw the line because the noise becomes very difficult to ignore without a good pair of headphones.
We're not able to notice any coil whine or electronic noise from our test unit.
| Dell G7 17 7790 GeForce RTX 2070 Max-Q, i7-8750H, Toshiba BG3 KBG30ZMS256G | Alienware m17 P37E GeForce RTX 2080 Max-Q, i9-8950HK, SK Hynix PC401 512GB M.2 (HFS512GD9TNG) | Asus TUF FX705DT-AU068T GeForce GTX 1650 Mobile, R5 3550H, WDC PC SN520 SDAPNUW-256G | Lenovo Legion Y740-17ICH GeForce RTX 2080 Max-Q, i7-8750H, Samsung SSD PM981 MZVLB256HAHQ | MSI GL73 8SE-010US GeForce RTX 2060 Mobile, i7-8750H, Kingston RBUSNS8154P3128GJ | Dell G3 17 3779 GeForce GTX 1050 Mobile, i5-8300H, SK hynix SC311 SATA | |
|---|---|---|---|---|---|---|
| Noise | -9% | -8% | -1% | -10% | -8% | |
| off / environment * | 28.2 | 28.2 -0% | 30.8 -9% | 28.3 -0% | 28.6 -1% | 30.5 -8% |
| Idle Minimum * | 28.6 | 28.2 1% | 30.8 -8% | 31.5 -10% | 33.8 -18% | 30.5 -7% |
| Idle Average * | 28.6 | 28.2 1% | 30.8 -8% | 31.6 -10% | 34 -19% | 31.1 -9% |
| Idle Maximum * | 28.6 | 31 -8% | 32.2 -13% | 31.6 -10% | 34.1 -19% | 32.1 -12% |
| Load Average * | 31.8 | 50.8 -60% | 38.6 -21% | 32.3 -2% | 36.5 -15% | 43.4 -36% |
| Witcher 3 ultra * | 50.6 | 50.8 -0% | 43 15% | 47.8 6% | ||
| Load Maximum * | 50.8 | 50.8 -0% | 44.8 12% | 45.5 10% | 52.2 -3% | 39.2 23% |
* ... smaller is better
Noise Level
| Idle |
| 28.6 / 28.6 / 28.6 dB(A) |
| Load |
| 31.8 / 50.8 dB(A) |
 | ||
30 dB silent 40 dB(A) audible 50 dB(A) loud |
||
min: | ||
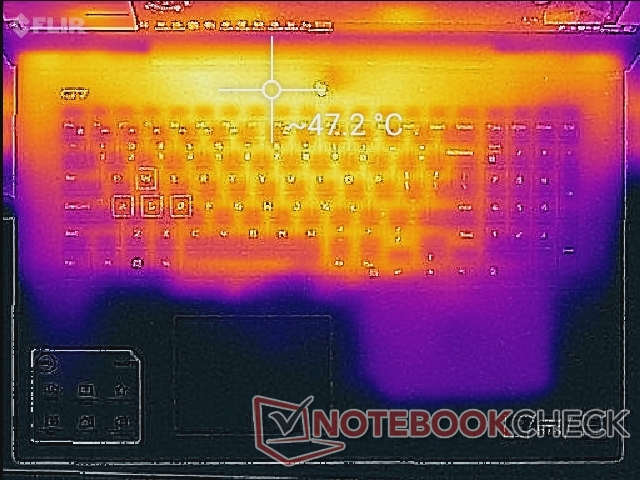
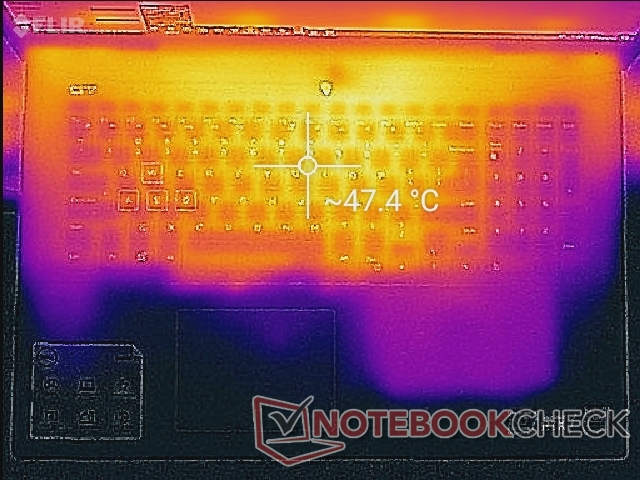
Temperature
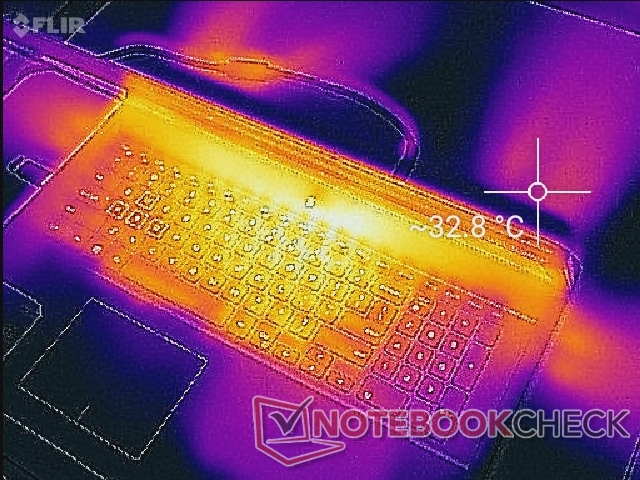
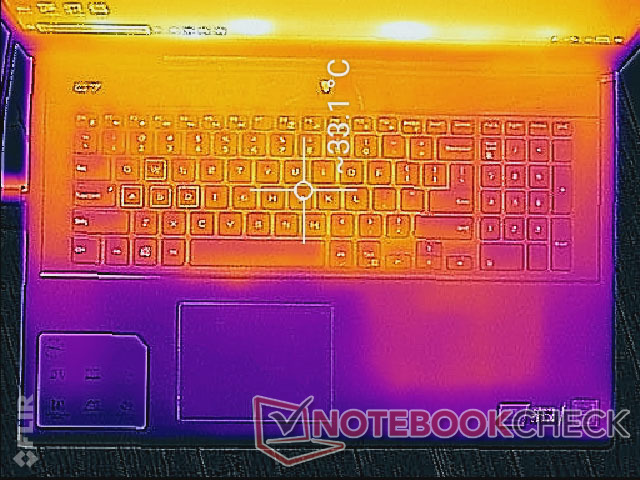
Surface temperatures are noticeably warmer on the keyboard keys than on the palm rests or trackpad even when idling on desktop. We're able to record a temperature of 28 C on the palm rest compared to 34 C on the center of the keyboard. This delta can expand to 18 C when gaming or running other very high loads. The hot spots are thankfully toward the top row of the keyboard keys where users are less likely to touch frequently when gaming. Though we don't find the temperatures bothersome, the competing Lenovo Legion Y740 is able to run cooler than the Dell; the keyboard center of the Lenovo tops out at only 36 C compared to 47 C on the our G7 17.
Stress Test
We stress the system with synthetic loads to identify for any potential throttling or stability issues. When running Prime95, the CPU can be observed running as high as 3.9 GHz for the first few seconds until reaching a core temperature of 86 C. Thereafter, clock rates drop to the 3.6 to 3.7 GHz range in order to maintain a cooler core temperature of 82 C. When running both Prime95 and FurMark simultaneously, core temperatures stabilize in the low 70 C range each.
Running Witcher 3 is more representative of real-world gaming stress. We're able to record stable CPU and GPU temperatures of 89 C and 69 C, respectively. compared to 76 C and 66 C on the MSI GL73 8SE. The CPU temperature is a little high even for a gaming laptop.
Running on batteries will limit performance. A Fire Strike run on battery power returns Physics and Graphics scores of only 4507 and 1793 points, respectively, compared to 15939 and 17466 points when on mains.
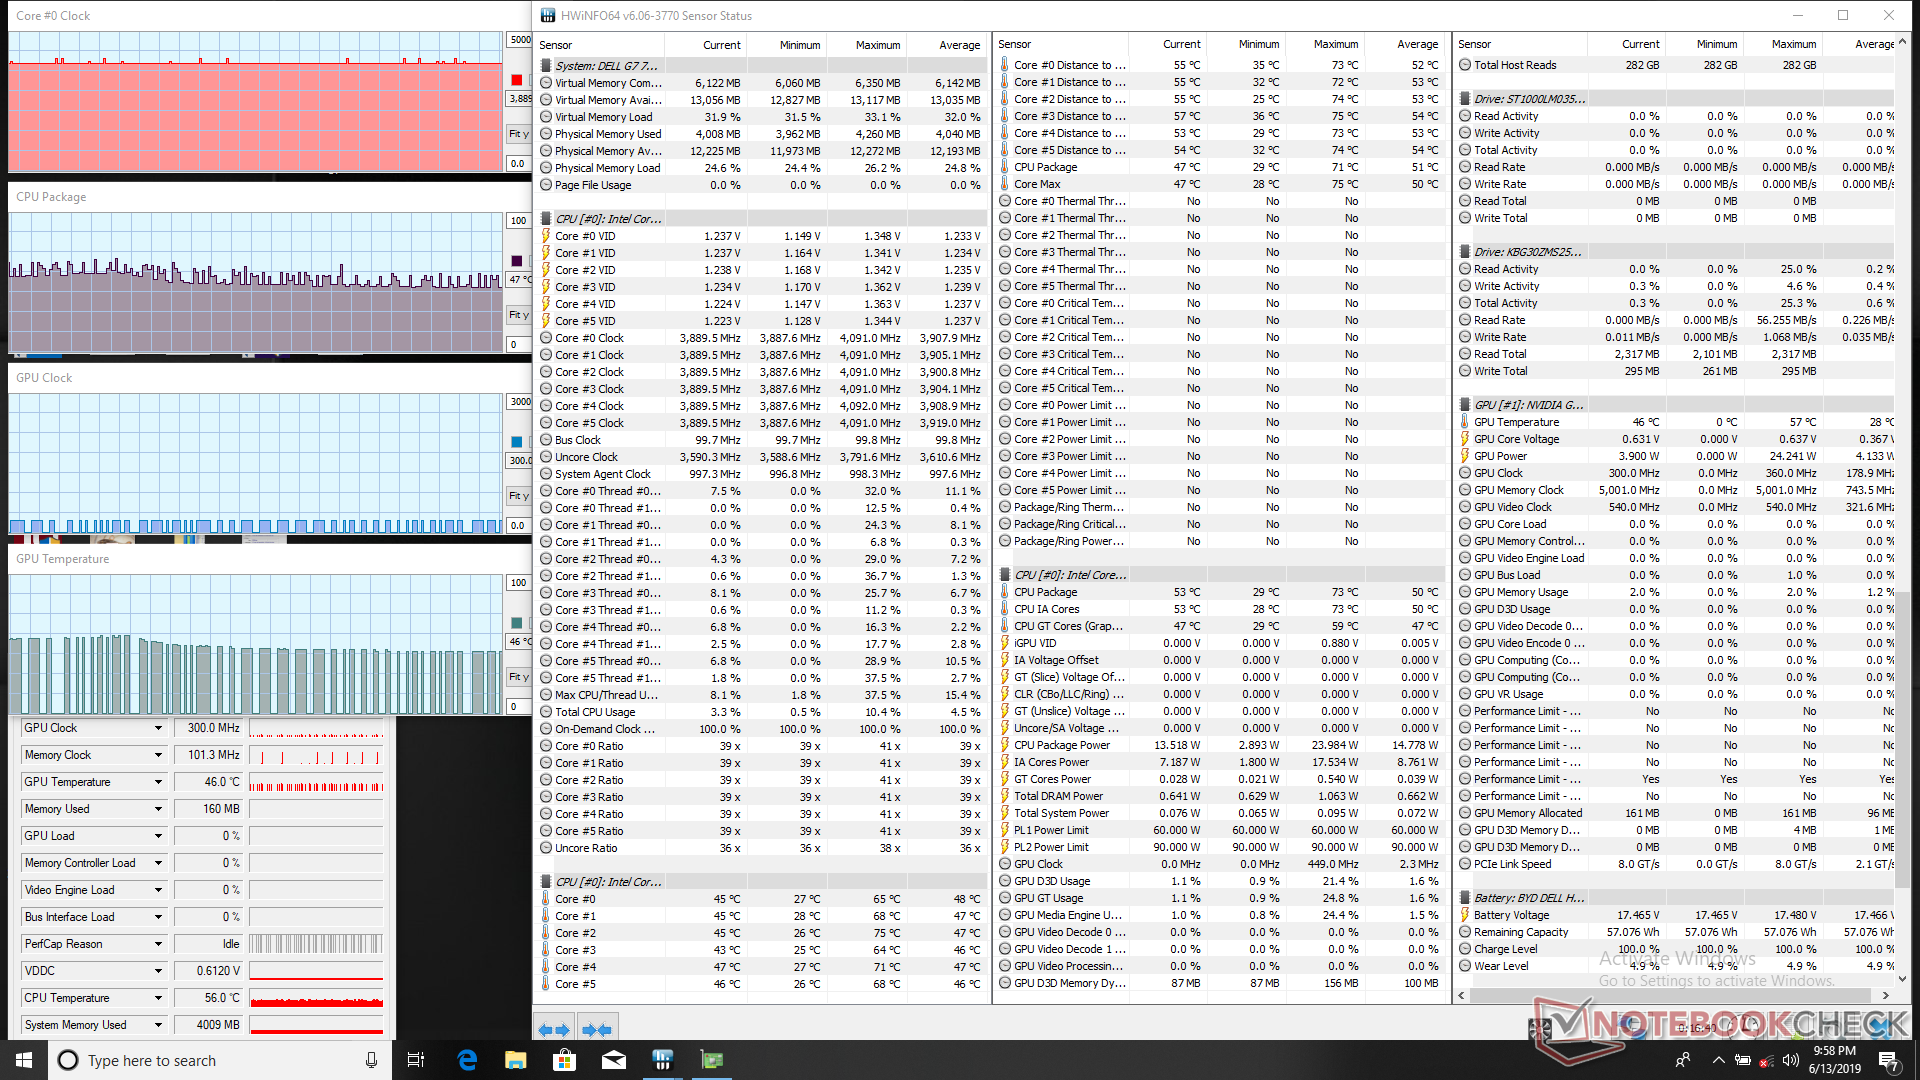
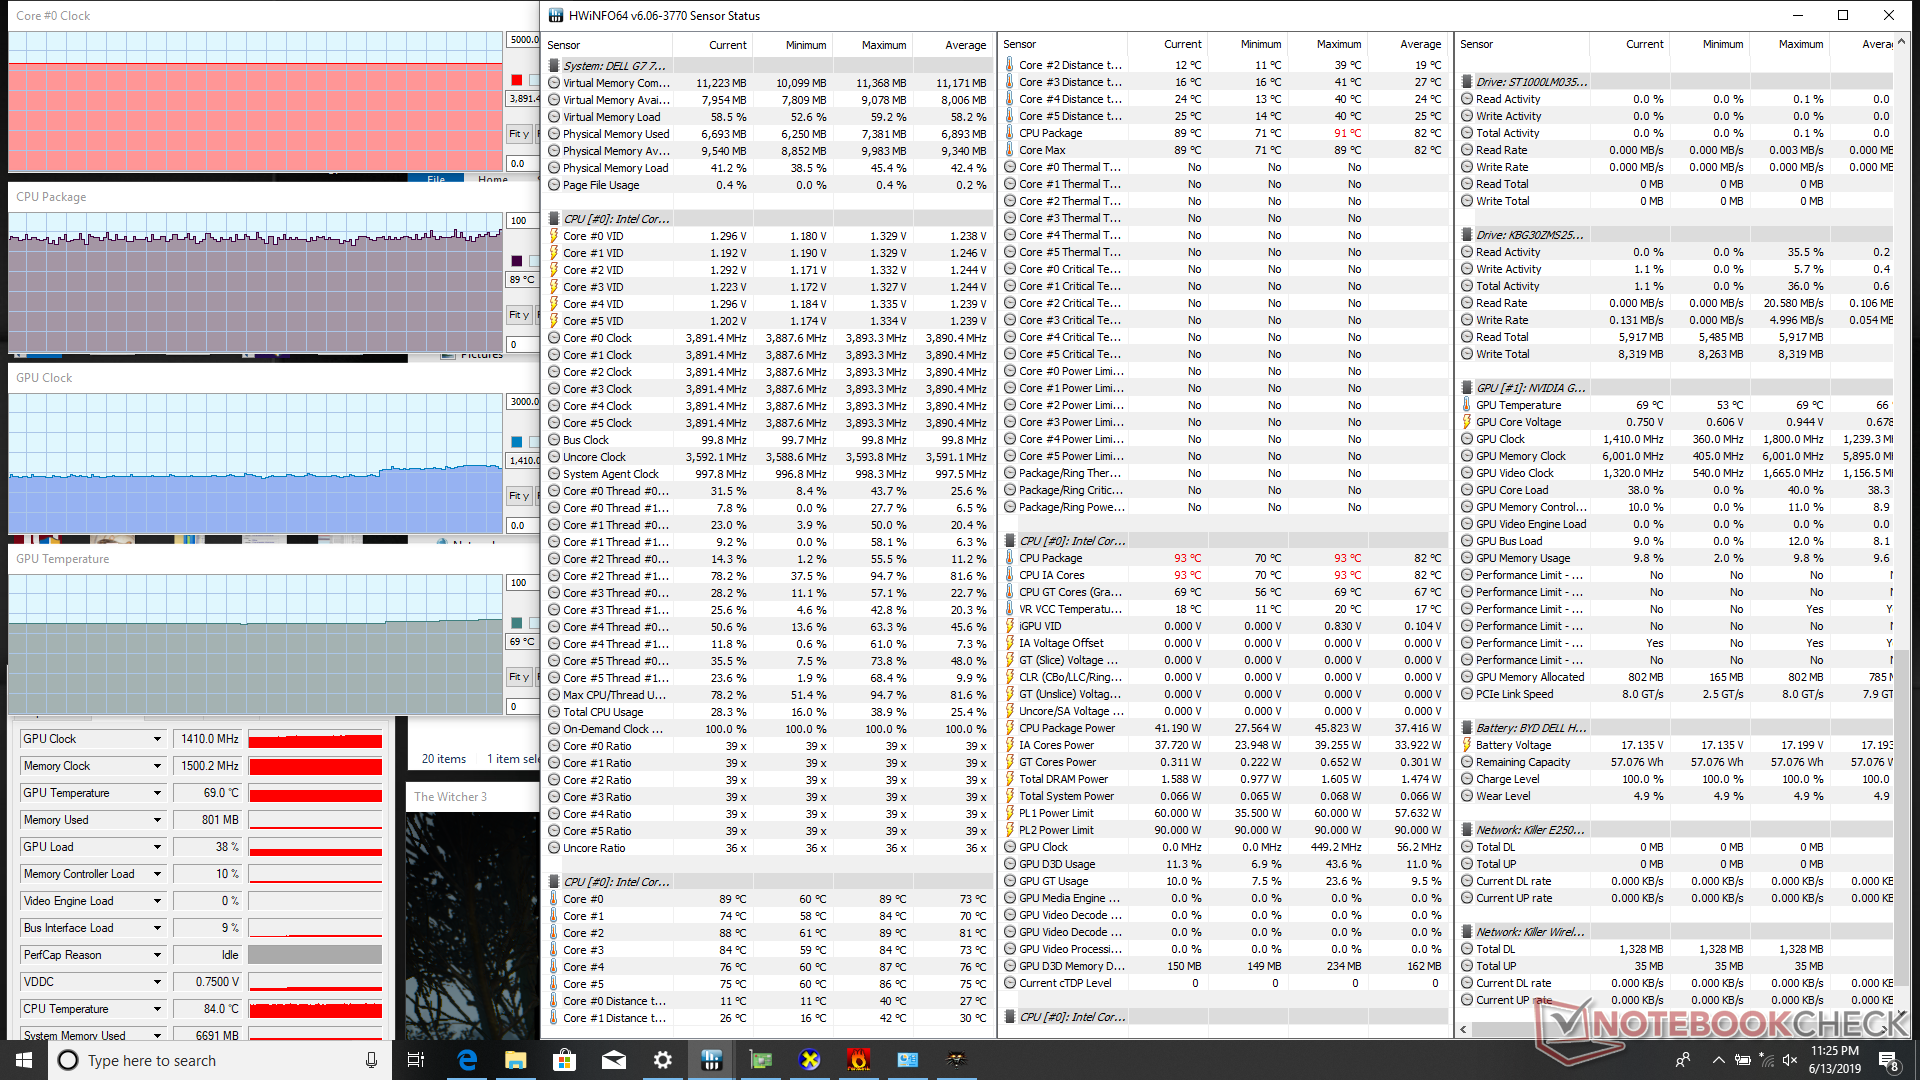
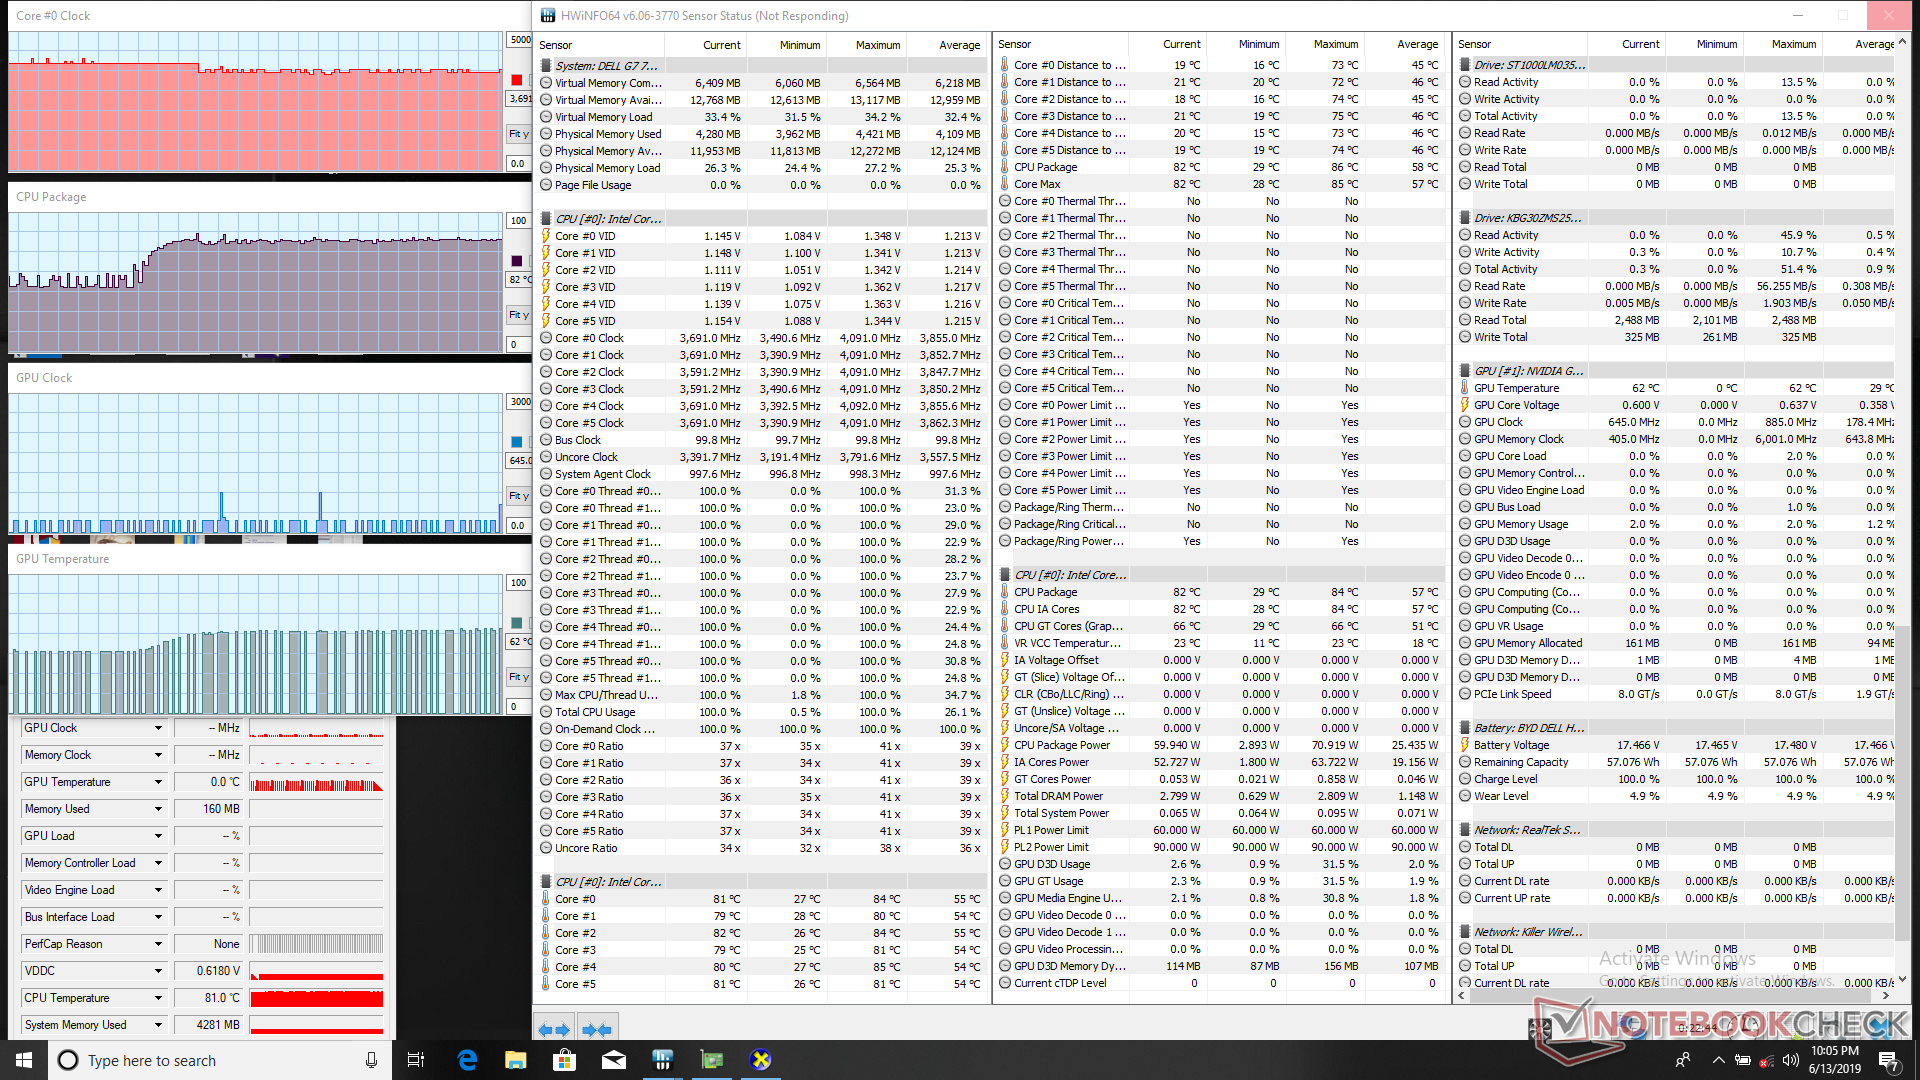
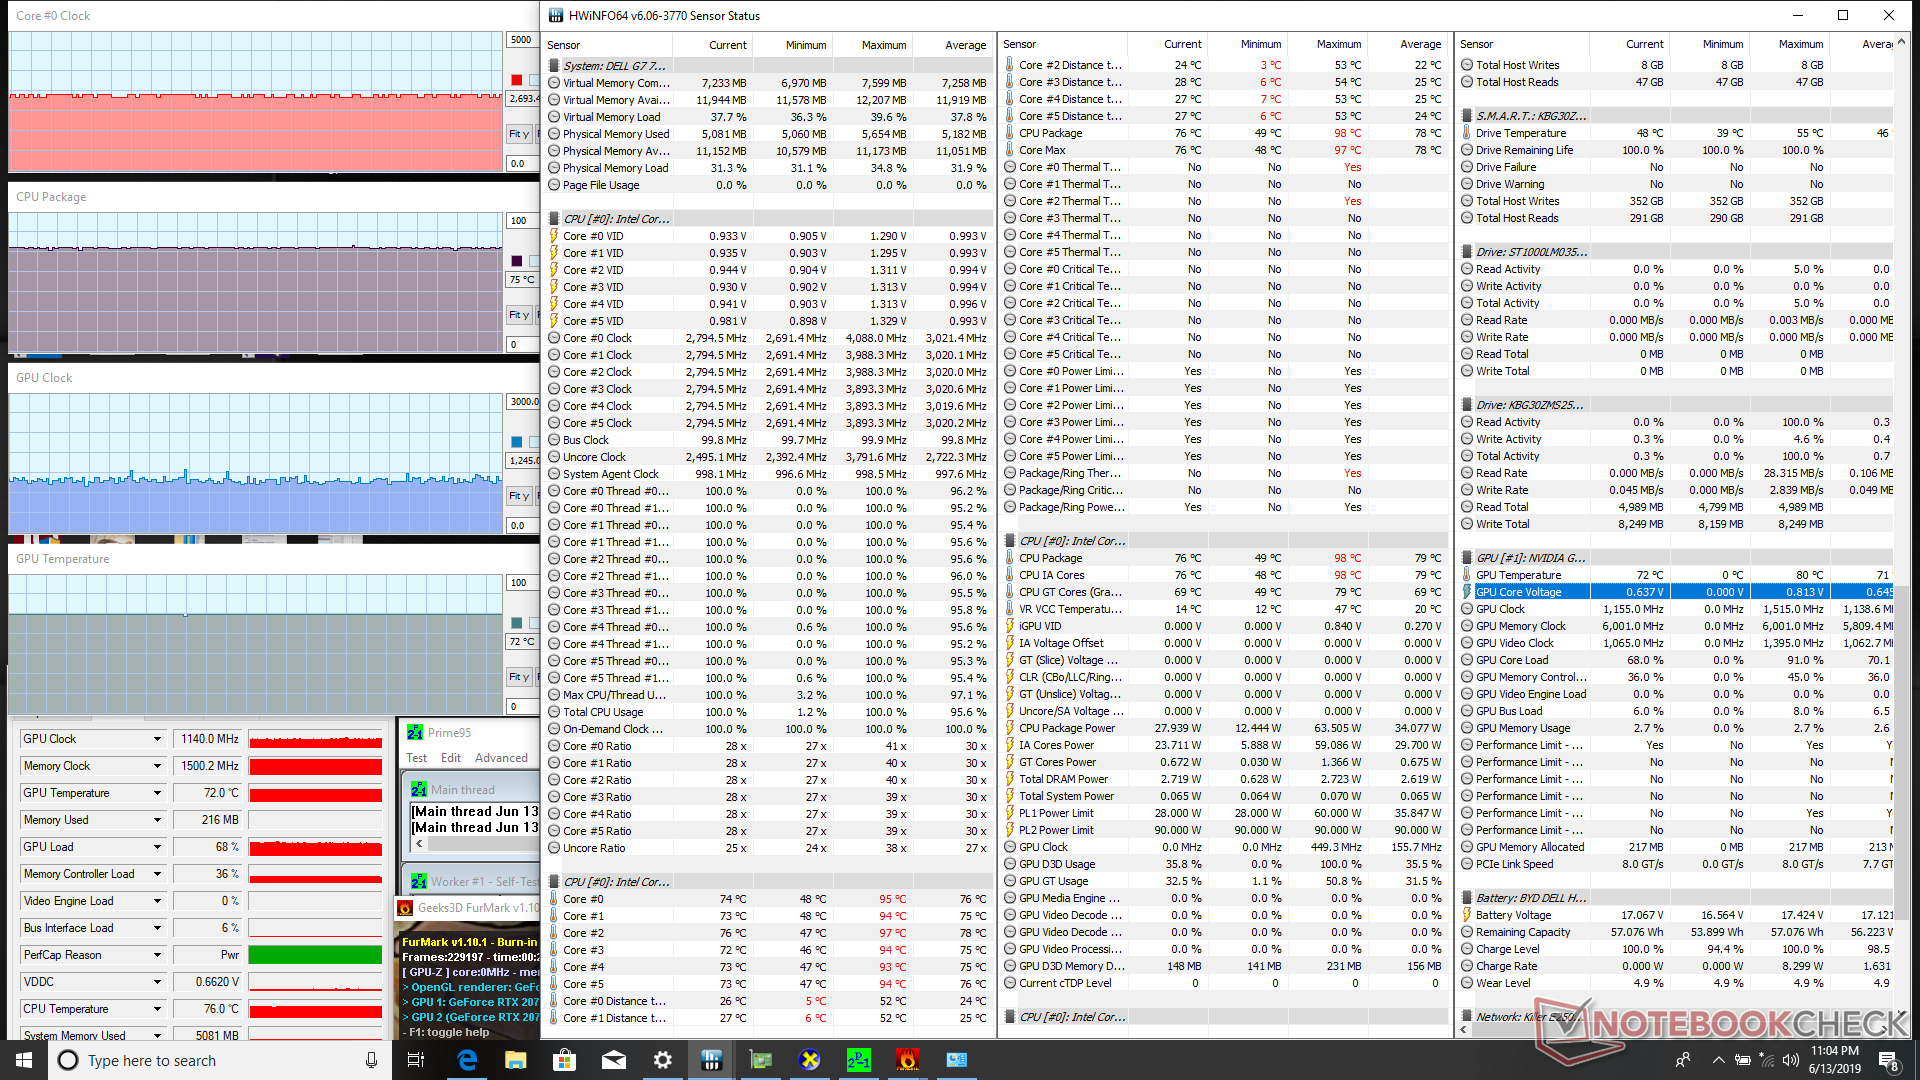
| CPU Clock (GHz) | GPU Clock (MHz) | Average CPU Temperature (°C) | Average GPU Temperature (°C) | |
| System Idle | -- | -- | 47 | 46 |
| Prime95 Stress | 3.7 - 3.8 | -- | 82 | 62 |
| Prime95 + FurMark Stress | 2.6 - 2.7 | 1140 | 75 | 72 |
| Witcher 3 Stress | 3.9 | 1410 | 89 | 69 |
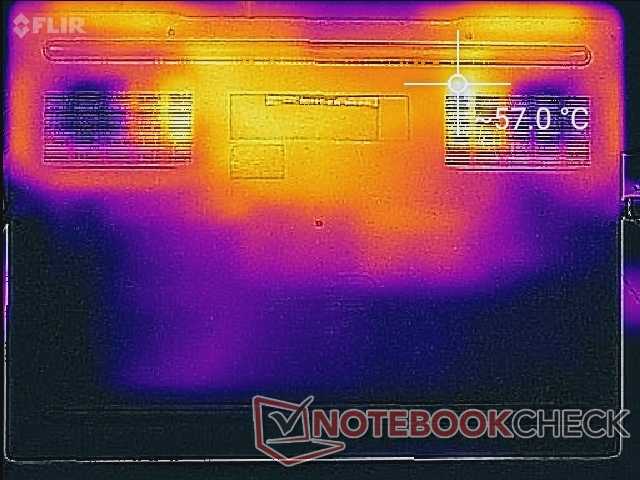
(-) The maximum temperature on the upper side is 46.6 °C / 116 F, compared to the average of 40.4 °C / 105 F, ranging from 21.2 to 68.8 °C for the class Gaming.
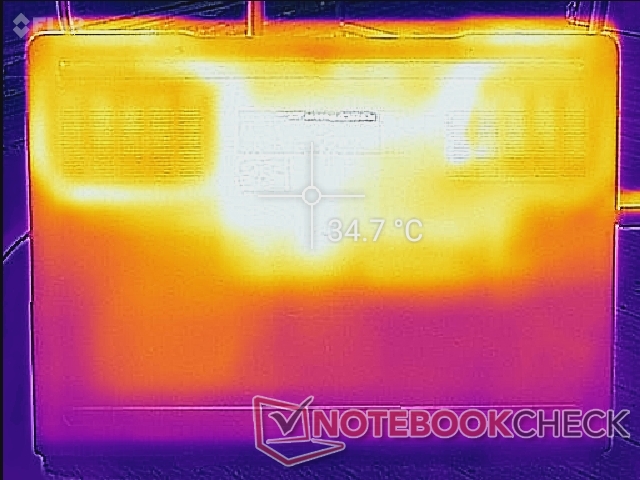
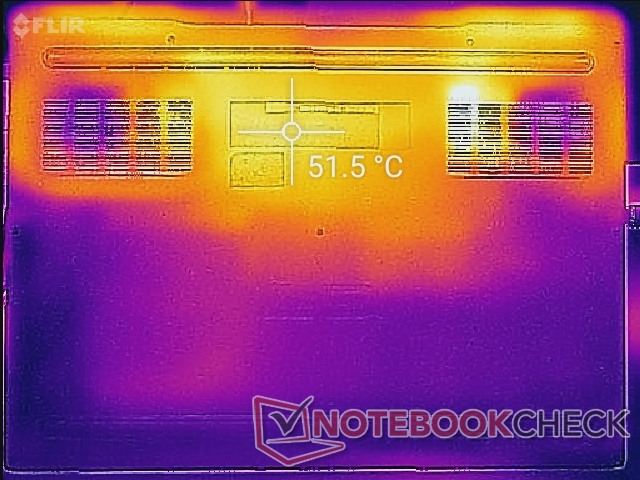
(-) The bottom heats up to a maximum of 57 °C / 135 F, compared to the average of 43.2 °C / 110 F
(±) In idle usage, the average temperature for the upper side is 32.1 °C / 90 F, compared to the device average of 33.8 °C / 93 F.
(±) Playing The Witcher 3, the average temperature for the upper side is 36.7 °C / 98 F, compared to the device average of 33.8 °C / 93 F.
(+) The palmrests and touchpad are cooler than skin temperature with a maximum of 31.2 °C / 88.2 F and are therefore cool to the touch.
(-) The average temperature of the palmrest area of similar devices was 28.9 °C / 84 F (-2.3 °C / -4.2 F).
Speakers
The stereo speakers are loud and pretty good for the size. Balance is decent even though bass could be better. We're a bit disappointed that there is no dedicated subwoofer considering the four-digit starting price of this machine.
Maximum volume introduces no static or reverberations on the palm rests. Note that our unit does not come with any pre-installed Nahimic software even though Dell advertises the Nahimic Sound Center software on the official product page.


Dell G7 17 7790 audio analysis
(+) | speakers can play relatively loud (87.2 dB)
Bass 100 - 315 Hz
(-) | nearly no bass - on average 19.5% lower than median
(±) | linearity of bass is average (13.8% delta to prev. frequency)
Mids 400 - 2000 Hz
(±) | higher mids - on average 7.1% higher than median
(±) | linearity of mids is average (8.9% delta to prev. frequency)
Highs 2 - 16 kHz
(+) | balanced highs - only 2.6% away from median
(±) | linearity of highs is average (8.1% delta to prev. frequency)
Overall 100 - 16.000 Hz
(±) | linearity of overall sound is average (19.9% difference to median)
Compared to same class
» 67% of all tested devices in this class were better, 6% similar, 27% worse
» The best had a delta of 6%, average was 18%, worst was 132%
Compared to all devices tested
» 46% of all tested devices were better, 7% similar, 47% worse
» The best had a delta of 4%, average was 25%, worst was 134%
Apple MacBook 12 (Early 2016) 1.1 GHz audio analysis
(+) | speakers can play relatively loud (83.6 dB)
Bass 100 - 315 Hz
(±) | reduced bass - on average 11.3% lower than median
(±) | linearity of bass is average (14.2% delta to prev. frequency)
Mids 400 - 2000 Hz
(+) | balanced mids - only 2.4% away from median
(+) | mids are linear (5.5% delta to prev. frequency)
Highs 2 - 16 kHz
(+) | balanced highs - only 2% away from median
(+) | highs are linear (4.5% delta to prev. frequency)
Overall 100 - 16.000 Hz
(+) | overall sound is linear (10.2% difference to median)
Compared to same class
» 5% of all tested devices in this class were better, 2% similar, 93% worse
» The best had a delta of 5%, average was 19%, worst was 53%
Compared to all devices tested
» 3% of all tested devices were better, 1% similar, 96% worse
» The best had a delta of 4%, average was 25%, worst was 134%
Energy Management
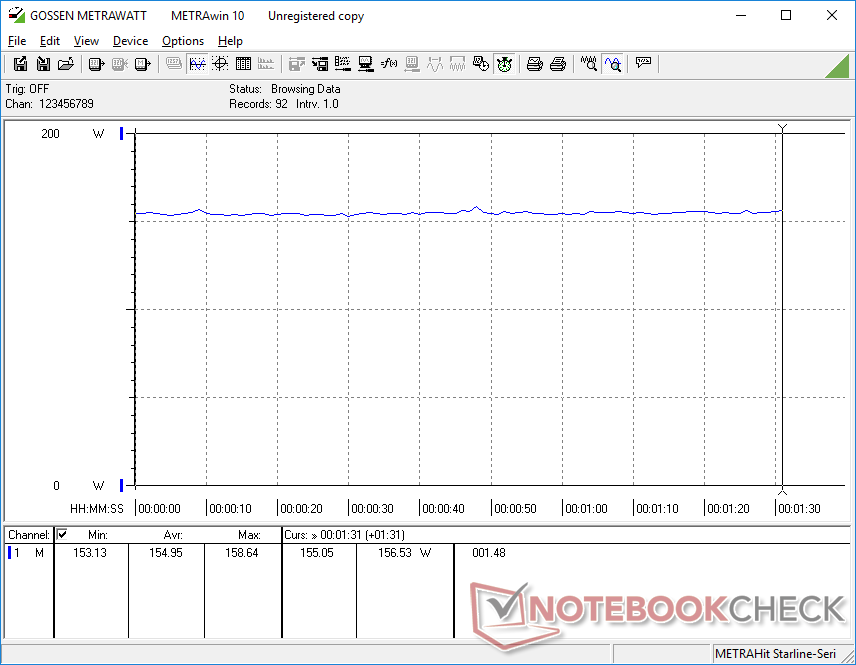
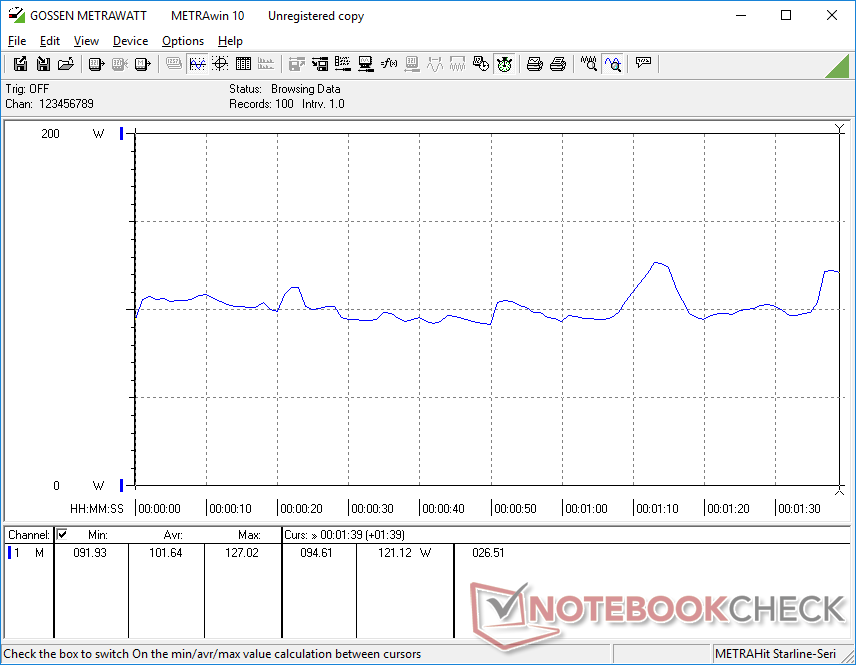
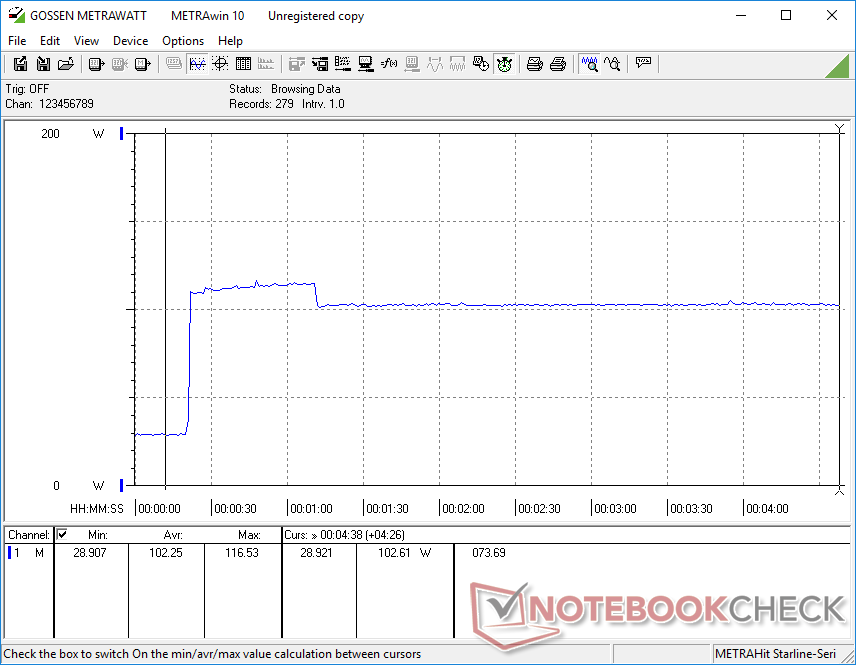
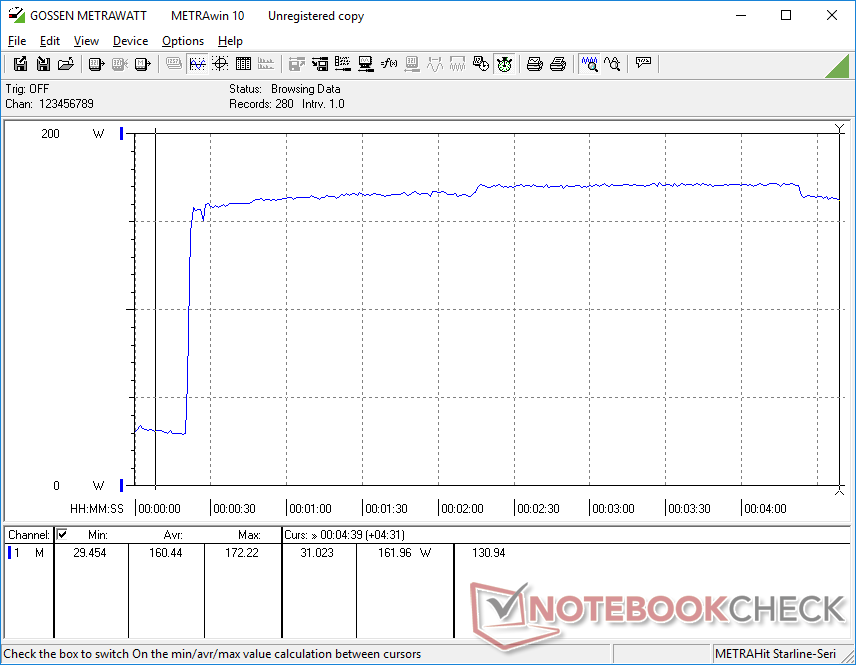
Power Consumption
The system demands anywhere between 9 W and 24 W when idling on desktop depending on the brightness setting and power profile. When running Witcher 3, consumption becomes constant at 155 W compared to 147 W on the MSI GL73 with RTX 2060 graphics. When considering that the RTX 2070 Max-Q offers 13 to 17 percent faster performance than a mobile RTX 2060, the 6 percent higher power consumption looks like a fair trade.
At most, we're able to record a power consumption of 172 W from the medium-sized (~15.5 x 7.5 x 3.3 cm) 180 W AC adapter. It's important to note that the system will recharge or even discharge very slowly when both the CPU and GPU are stressed to their limits.
| Off / Standby | |
| Idle | |
| Load |
|
| Dell G7 17 7790 i7-8750H, GeForce RTX 2070 Max-Q, Toshiba BG3 KBG30ZMS256G, IPS, 1920x1080, 17.30 | Alienware m17 P37E i9-8950HK, GeForce RTX 2080 Max-Q, SK Hynix PC401 512GB M.2 (HFS512GD9TNG), IPS, 3840x2160, 17.30 | Asus TUF FX705DT-AU068T R5 3550H, GeForce GTX 1650 Mobile, WDC PC SN520 SDAPNUW-256G, IPS, 1920x1080, 17.30 | MSI GL73 8SE-010US i7-8750H, GeForce RTX 2060 Mobile, Kingston RBUSNS8154P3128GJ, TN LED, 1920x1080, 17.30 | MSI GL73 8RD-418US i7-8750H, GeForce GTX 1050 Ti Mobile, Kingston RBUSNS8154P3128GJ, TN LED, 1920x1080, 17.30 | |
|---|---|---|---|---|---|
| Power Consumption | -54% | 49% | 7% | 2% | |
| Idle Minimum * | 9.5 | 21.2 -123% | 3.9 59% | 8.8 7% | 11.8 -24% |
| Idle Average * | 16.2 | 29.6 -83% | 9.6 41% | 16.2 -0% | 18.7 -15% |
| Idle Maximum * | 23.8 | 34 -43% | 12.2 49% | 18.3 23% | 19.8 17% |
| Load Average * | 101.7 | 130.9 -29% | 59 42% | 86.1 15% | 100.8 1% |
| Witcher 3 ultra * | 155 | 177.5 -15% | 146.7 5% | 124.4 20% | |
| Load Maximum * | 172.2 | 219.7 -28% | 80 54% | 186.4 -8% | 151.6 12% |
* ... smaller is better
Battery Life
Battery capacity is average at 60 Wh compared to 90 Wh on the pricier Alienware m17. Users can expect about 4 hours of real-world WLAN use when set to the Balanced profile with the integrated GPU active. While better than both the MSI GL73 and Lenovo Legion Y740, the Dell G3 is able to outlast out G7 17 by almost two hours longer when under similar conditions. We expected a little more from the machine especially since it is equipped with Optimus.
Charging from empty to full is slow at about 2 to 2.5 hours. Note that the recharge rate will become even slower when gaming or running other high loads.
| Dell G7 17 7790 i7-8750H, GeForce RTX 2070 Max-Q, 60 Wh | Alienware m17 P37E i9-8950HK, GeForce RTX 2080 Max-Q, 90 Wh | Asus TUF FX705DT-AU068T R5 3550H, GeForce GTX 1650 Mobile, 64 Wh | Lenovo Legion Y740-17ICH i7-8750H, GeForce RTX 2080 Max-Q, 76 Wh | MSI GL73 8SE-010US i7-8750H, GeForce RTX 2060 Mobile, 41 Wh | Dell G3 17 3779 i5-8300H, GeForce GTX 1050 Mobile, 56 Wh | |
|---|---|---|---|---|---|---|
| Battery Runtime | -9% | 54% | -19% | -42% | 32% | |
| Reader / Idle | 511 | 543 6% | 815 59% | 388 -24% | 733 43% | |
| WiFi v1.3 | 236 | 296 25% | 469 99% | 190 -19% | 168 -29% | 345 46% |
| Load | 119 | 49 -59% | 124 4% | 33 -72% | 126 6% |
Pros
Cons
Verdict
The Dell G7 17 7790 has many of the same pros and cons as the Alienware m15 and m17. Performance is excellent especially when it comes to maintaining reliable Turbo Boost levels for long periods, but this comes at the price of a warmer CPU. The heavy weight and loud fans compare unfavorably to the lighter and generally quieter Lenovo Legion Y740 which comes equipped with the same CPU and GPU options as our Dell. Heavy gaming laptops are understandable, but they should be quieter to make up for the weight and the G7 17 unfortunately has the worst of both worlds.
Despite the above, there's more to like than dislike about the system. The standard 144 Hz panel, easy serviceability, sound base, and bevy of port options leave a solid first impression even if the chassis might not look as sleek as many of its competitors. If you plan on taking your 17.3-inch gaming laptop on-the-go frequently, however, then the lighter MSI GS75 or Acer Predator Helios may be the wiser option.
While the list of disadvantages are short, they stick out like a sore thumb. The strong performance entails both loud fans and a heavy chassis better fit for home gamers than gamers who are constantly on-the-go.
Dell G7 17 7790
-
06/17/2019 v6(old)
Allen Ngo


Pricecompare
