 Deutsch
 English
 Español
 Français
 Italiano
 Nederlands
 Polski
 Português
 Русский
 Türkçe
 Svenska
 Chinese
 Magyar
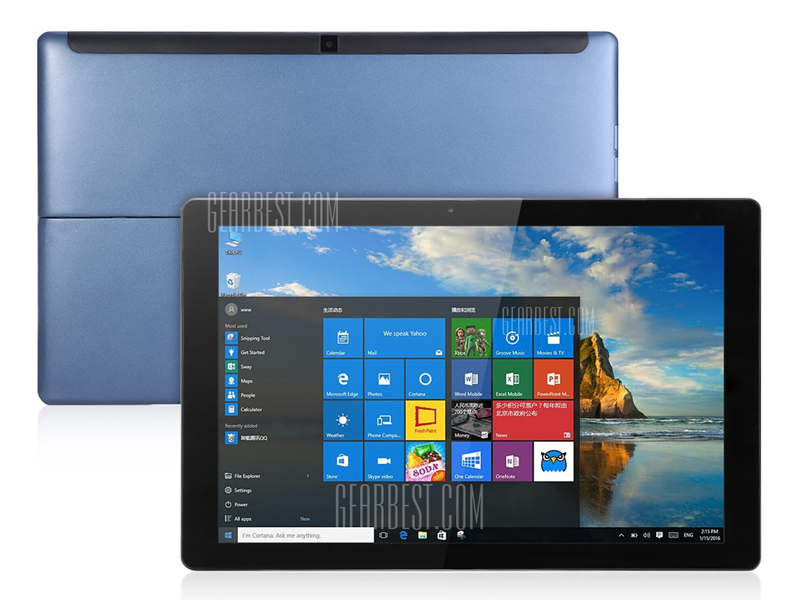
Cube i9 Tablet - Windows 10 and Core m3 Review
For the original German review, see here.
Case
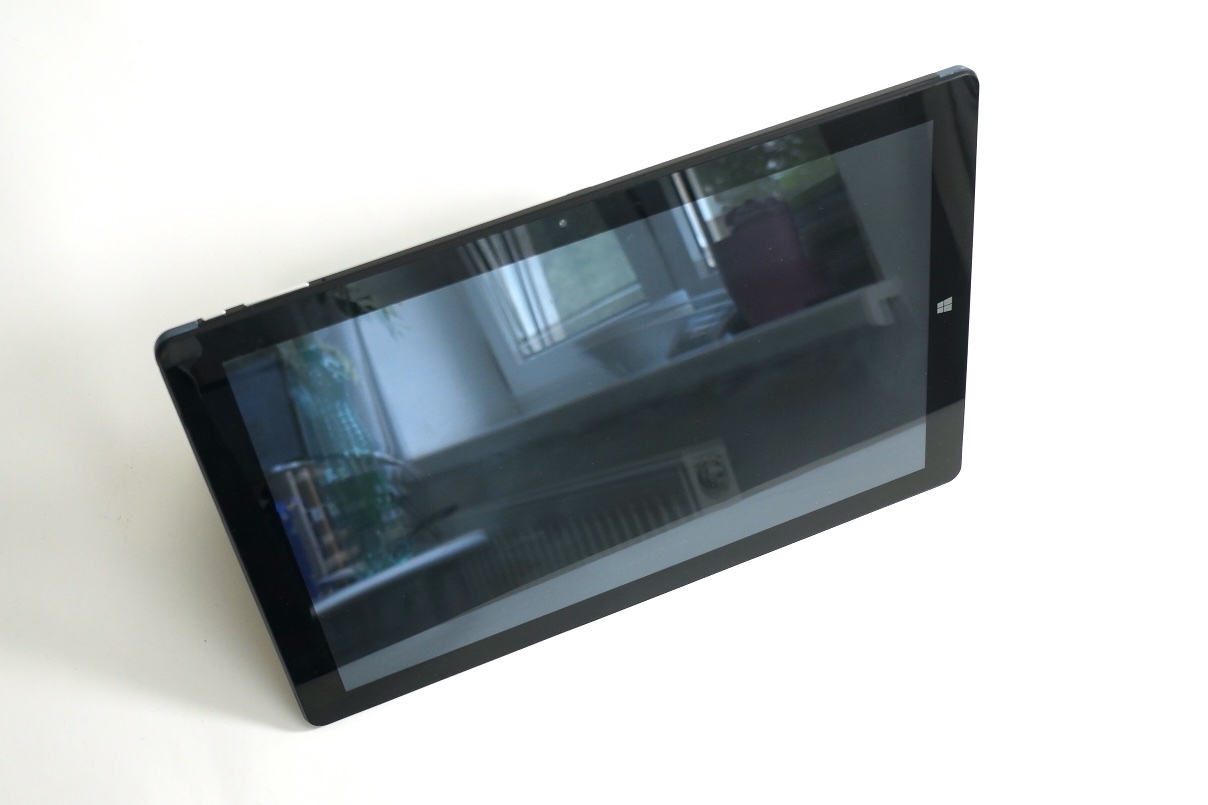
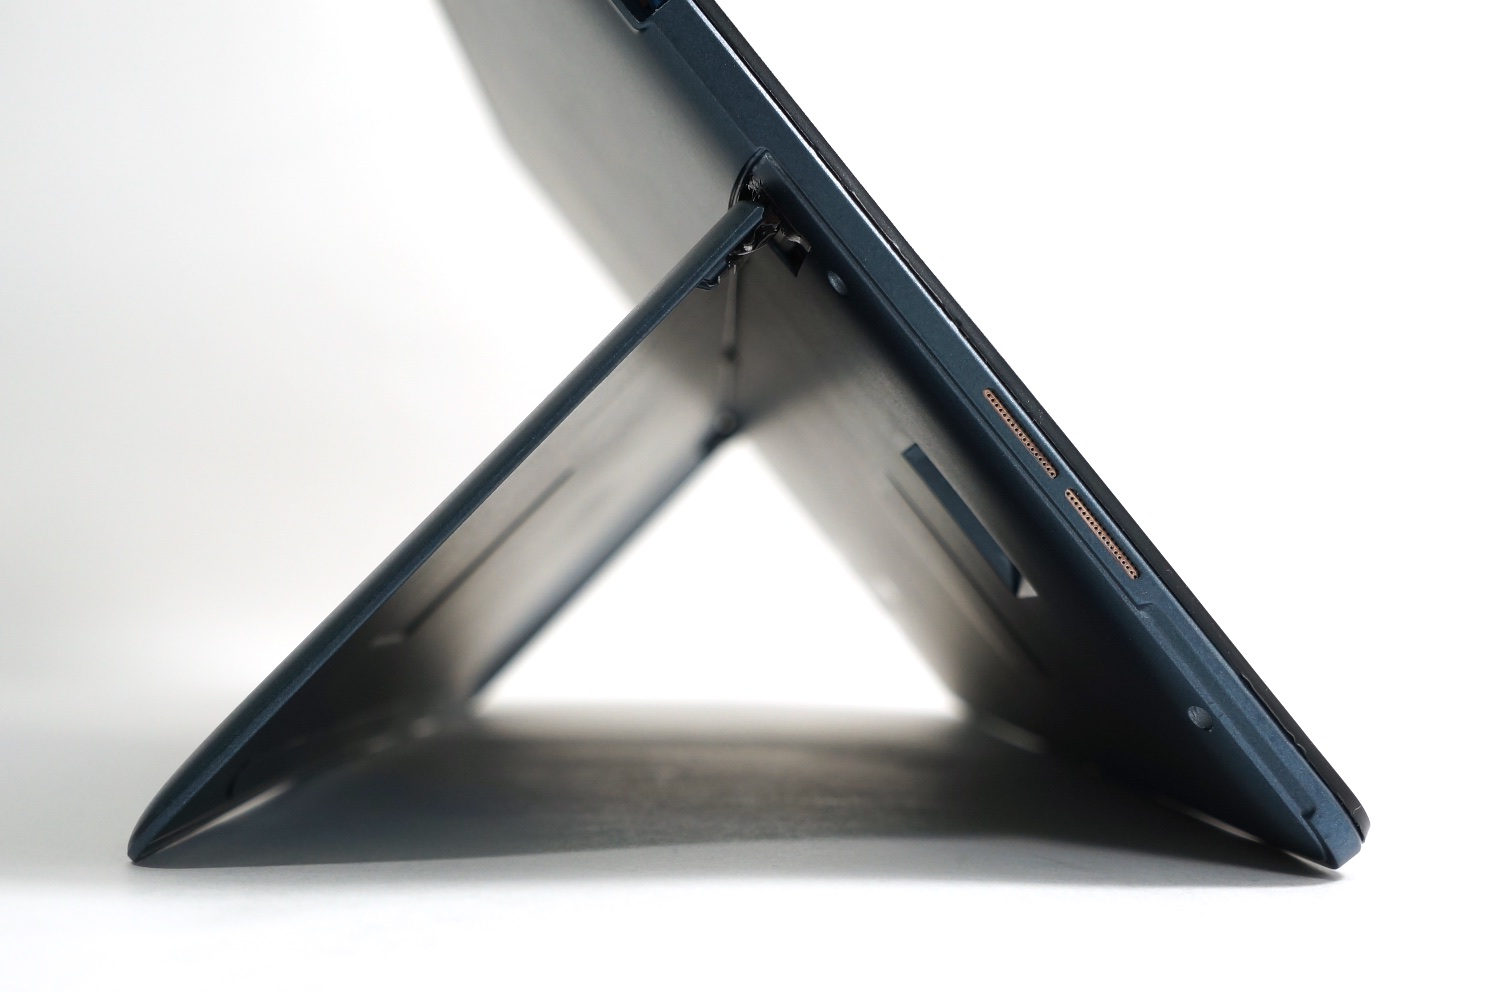
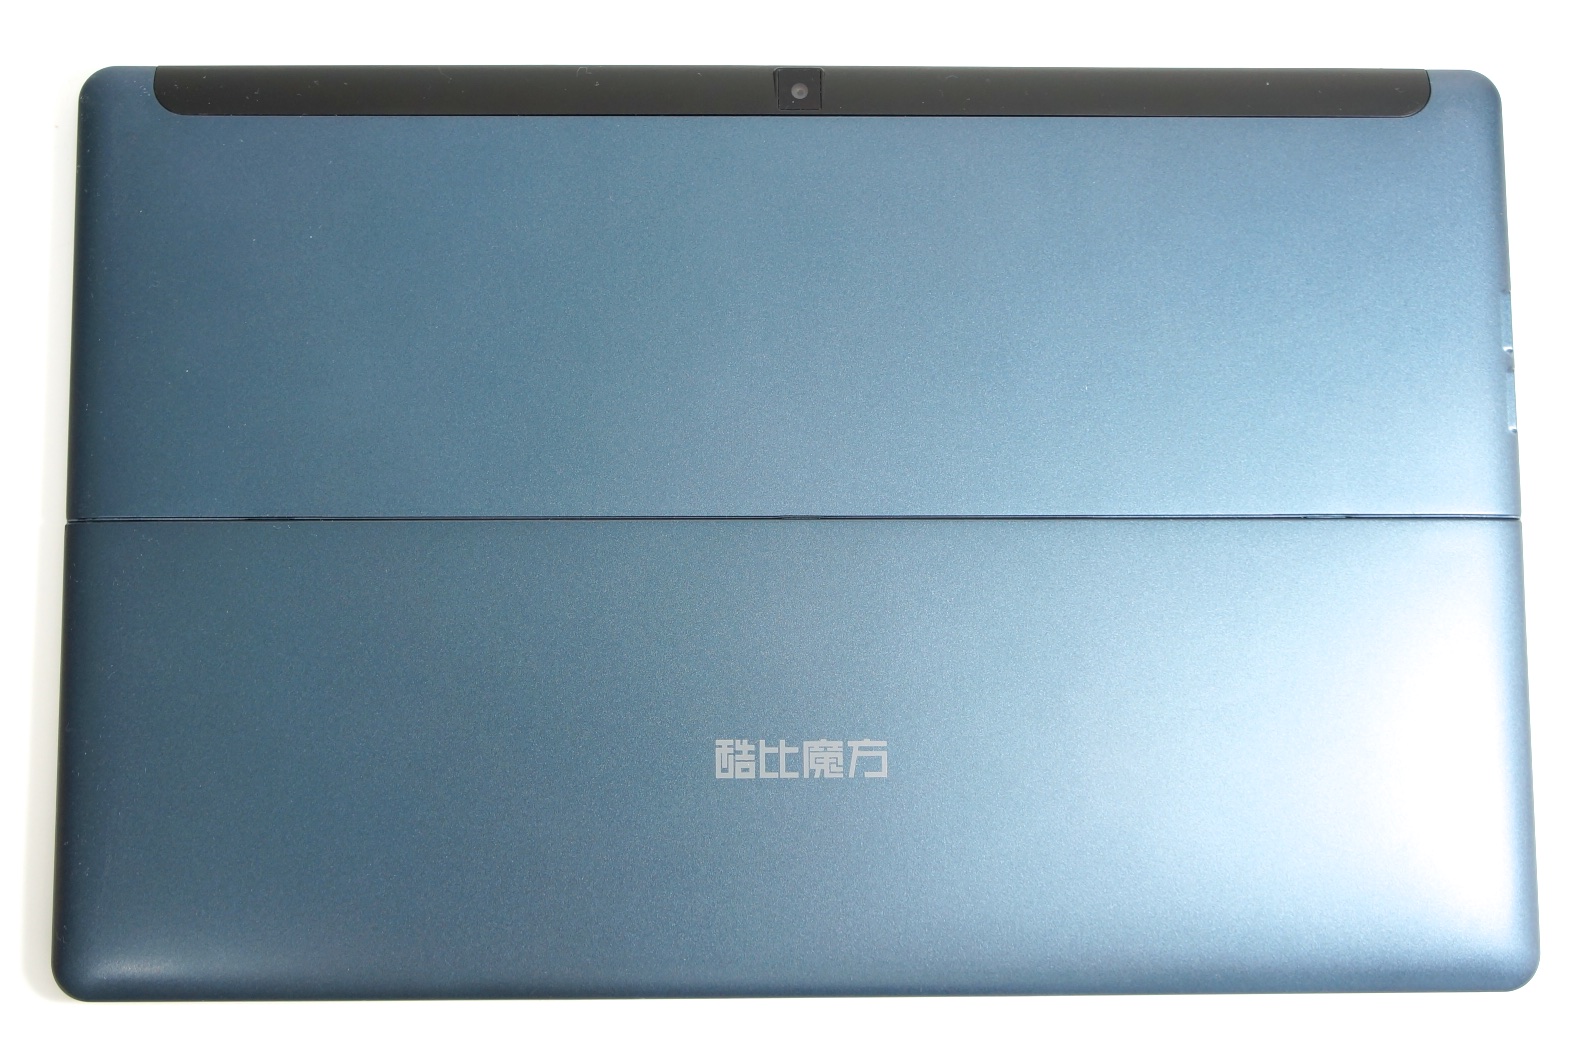
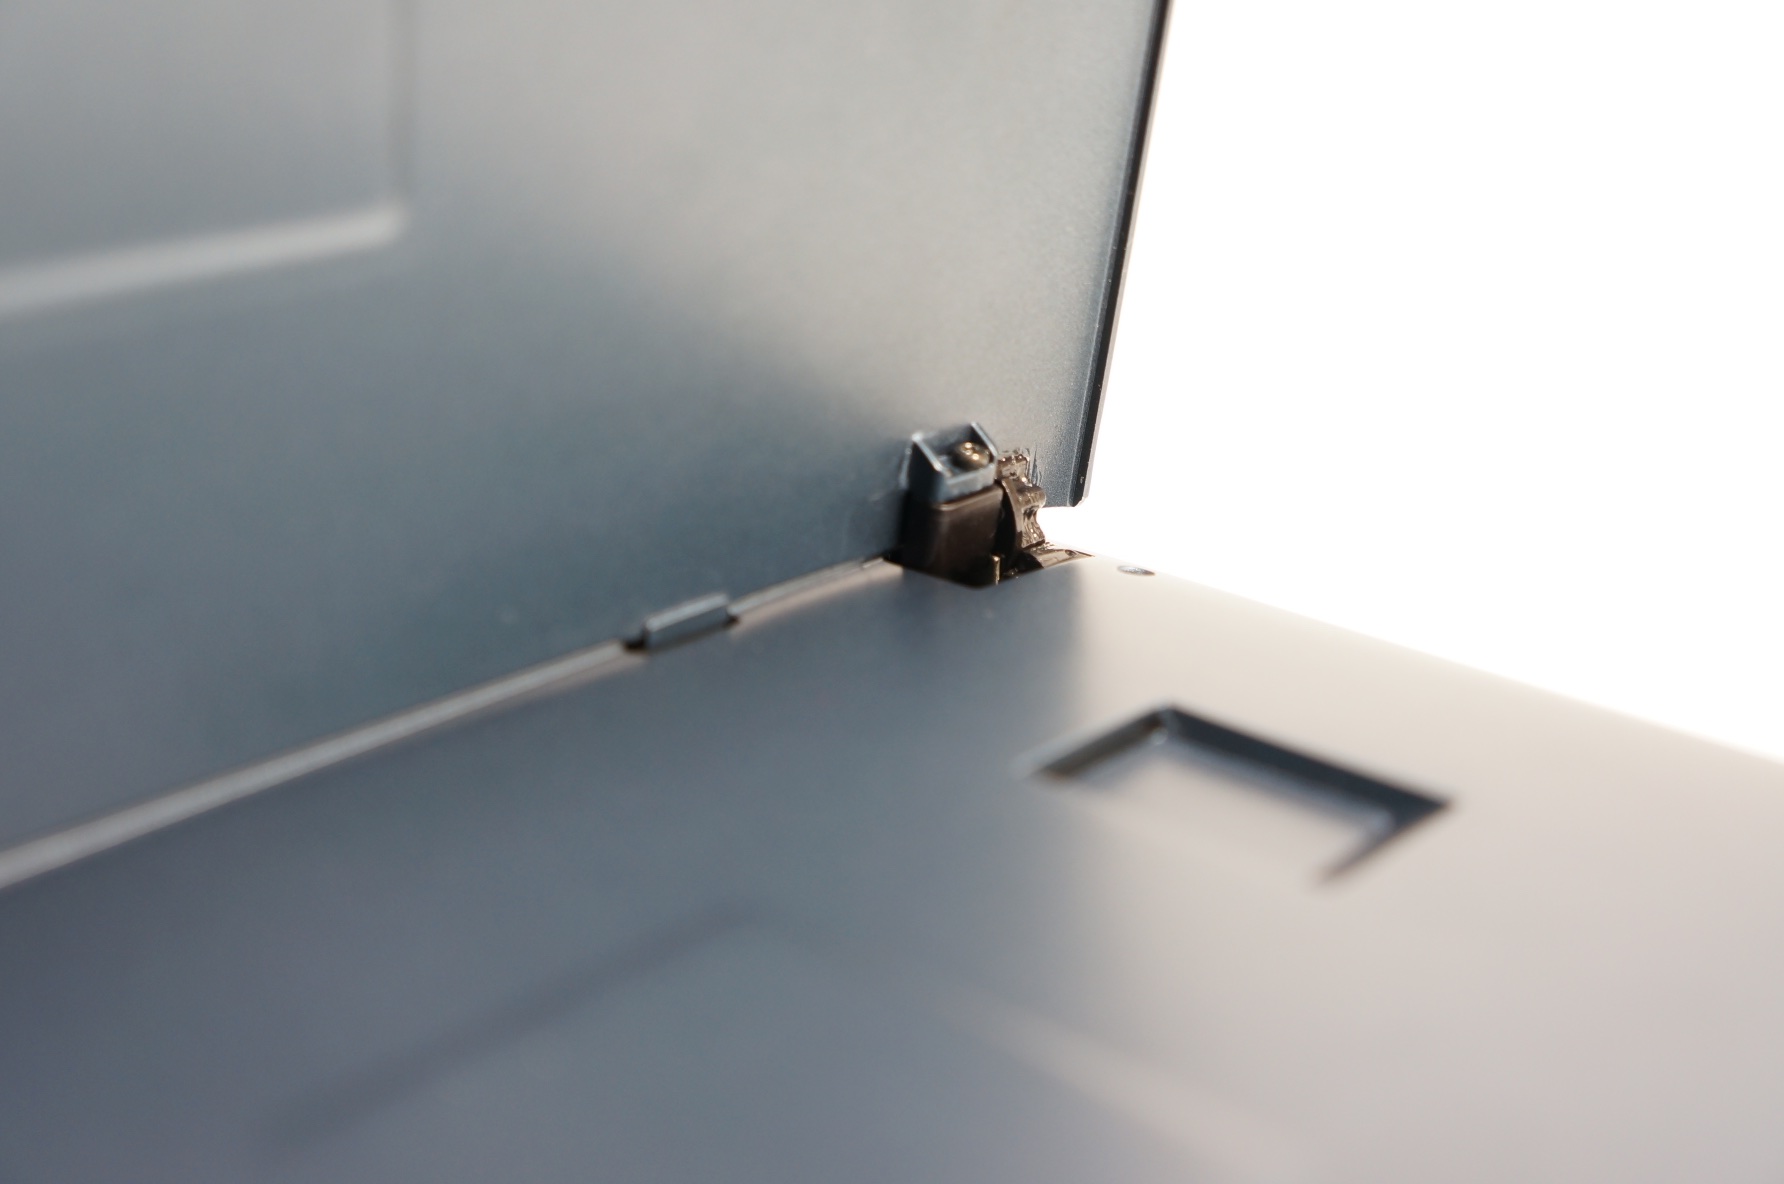
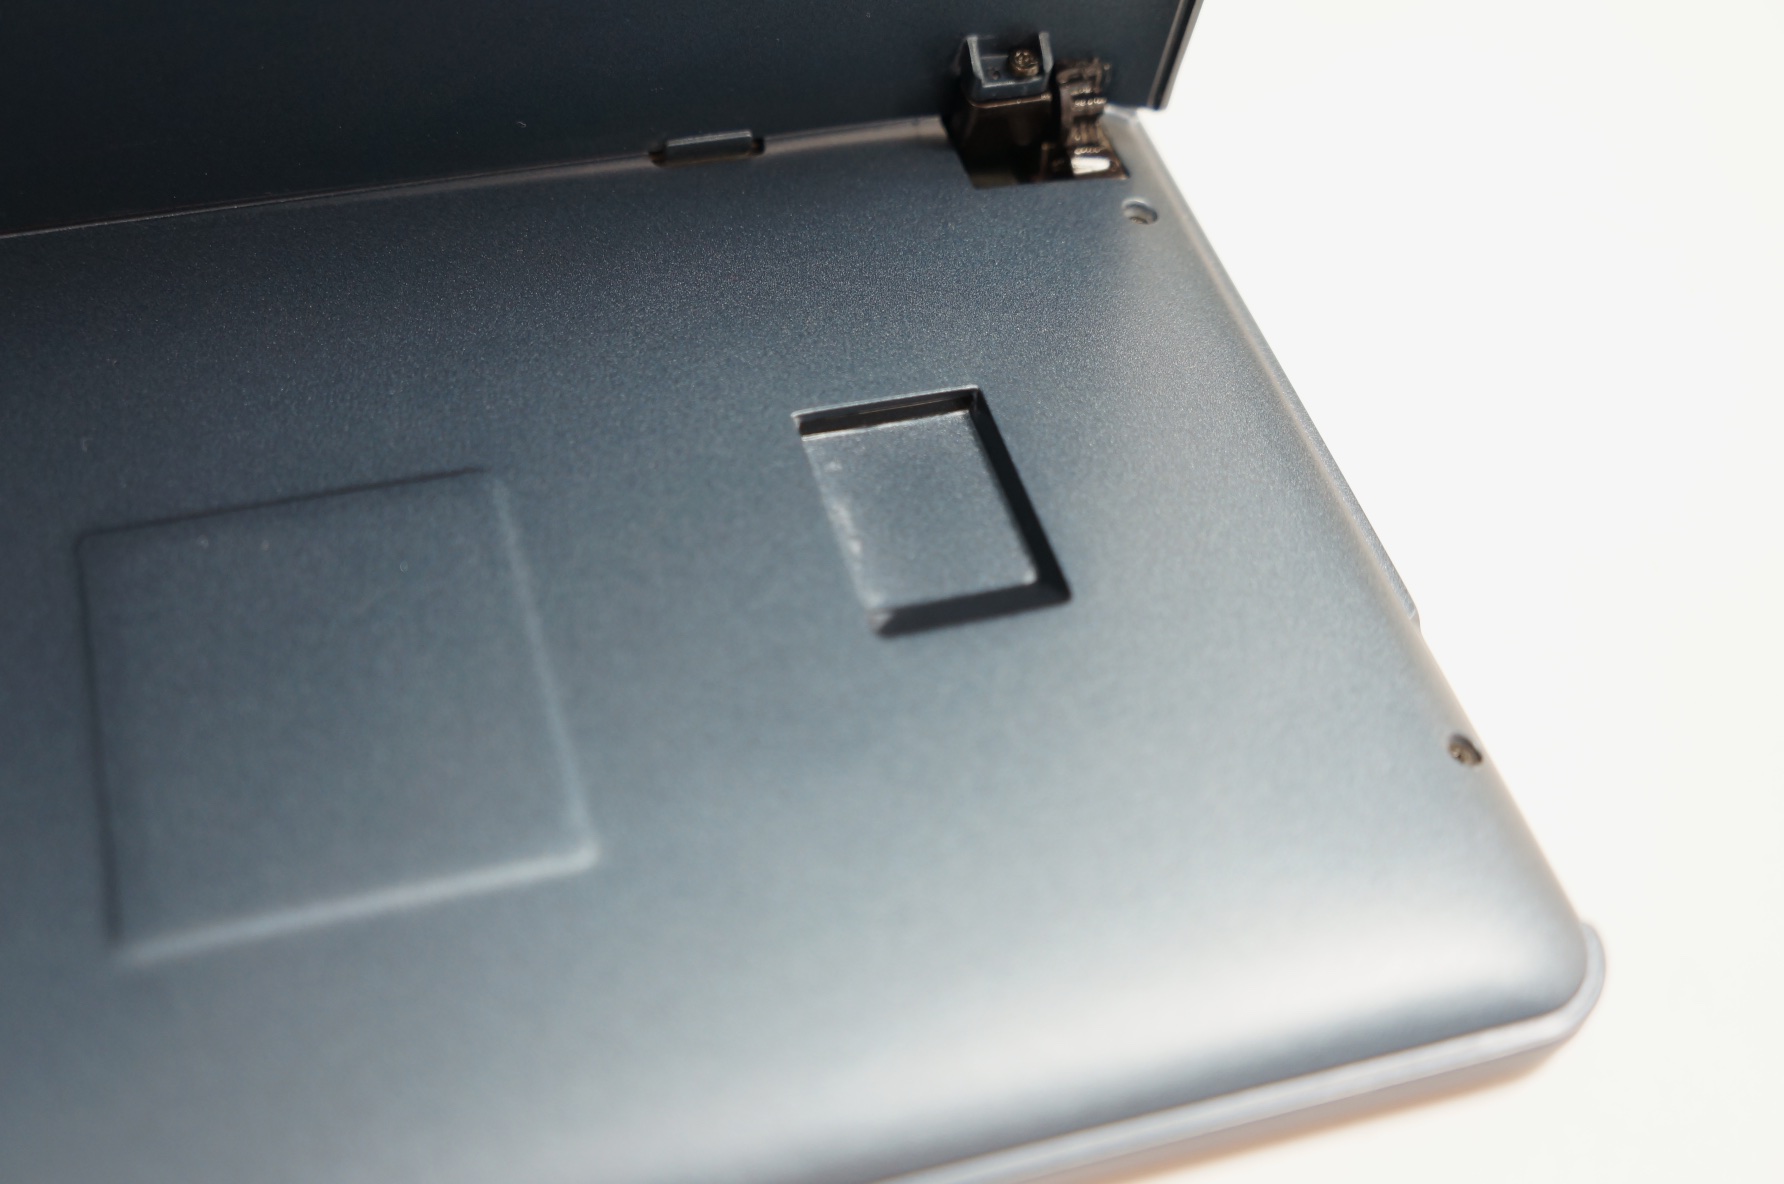
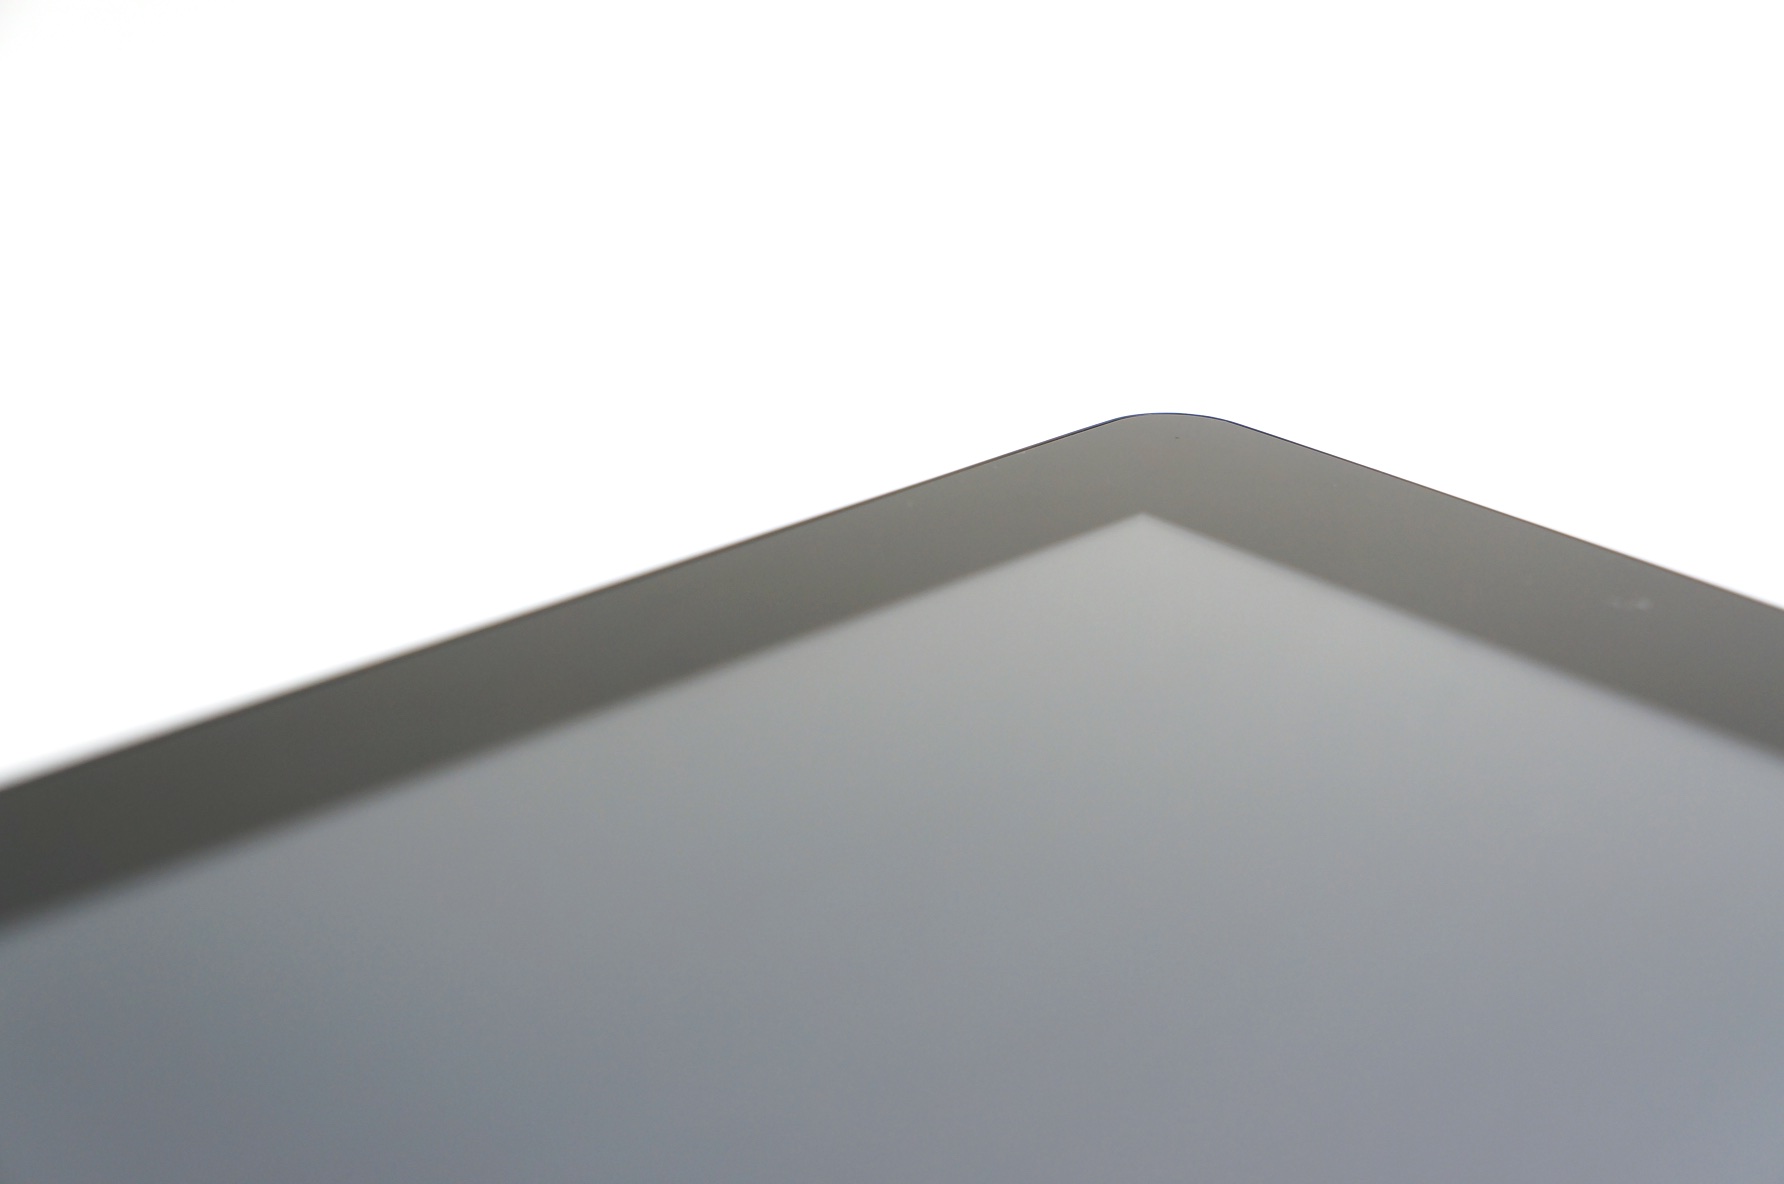
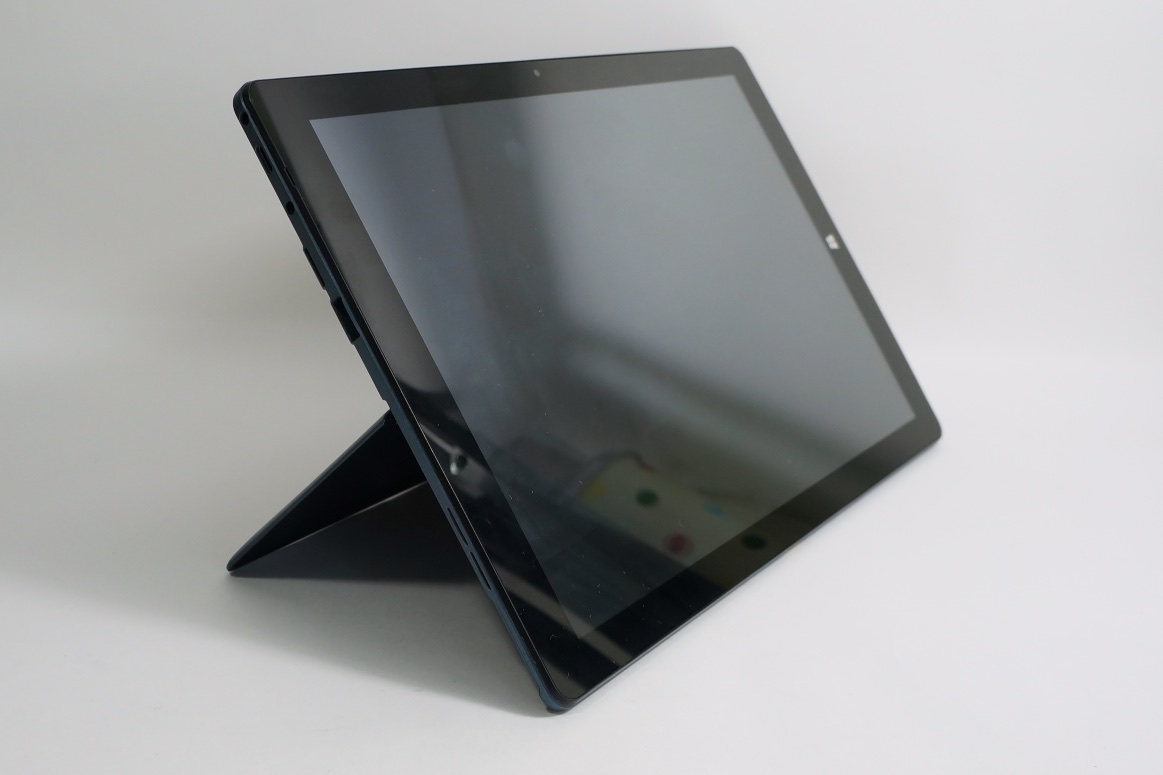
The large tablet leaves a good impression. The aluminum back looks high-quality and feels good. The design is clearly based on that of Microsoft's Surface series. Although the torsional stability is decent, quiet creaking noises are produced when the tablet is twisted. Both build and gap spacing are good; the user will not notice any major cutbacks to keep the price low here.
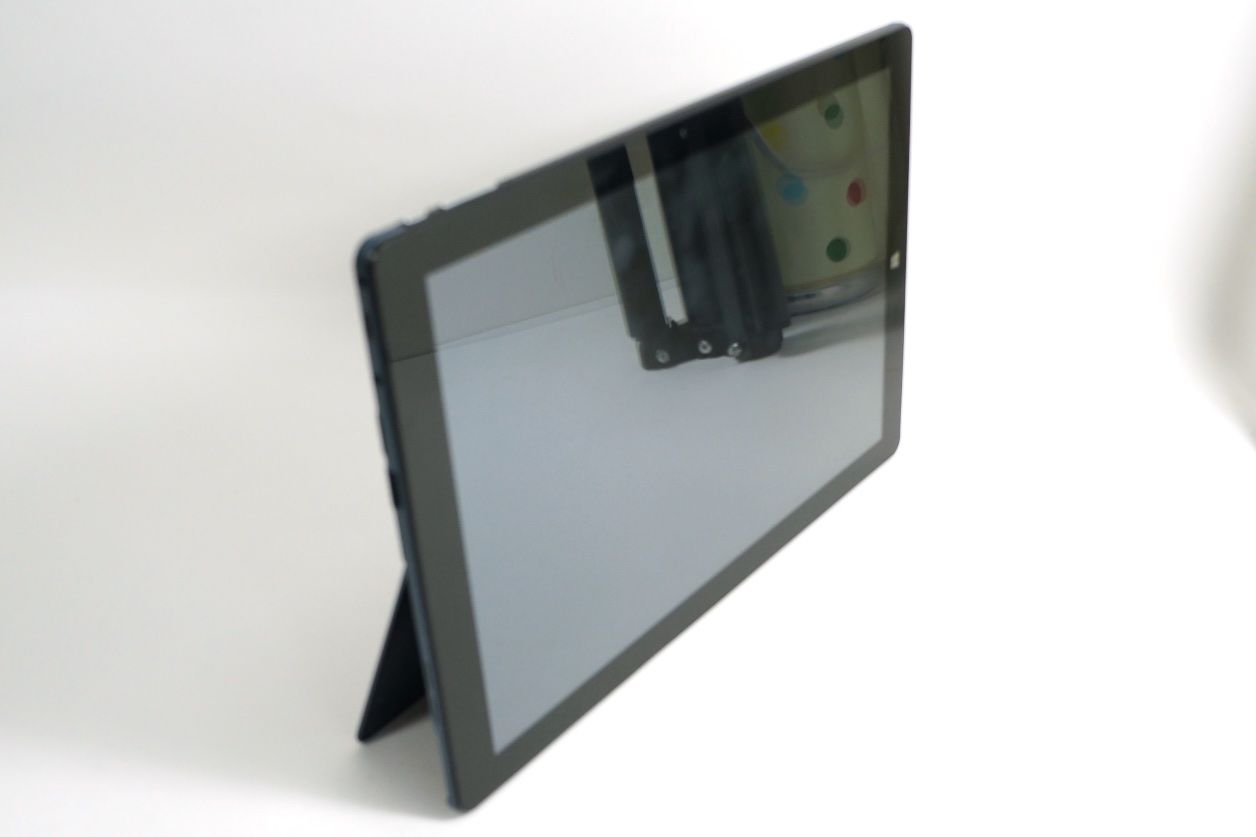
As with the older Surface Pro 2, the integrated kickstand can be locked in two positions and functioned impeccably in the test.
Connectivity
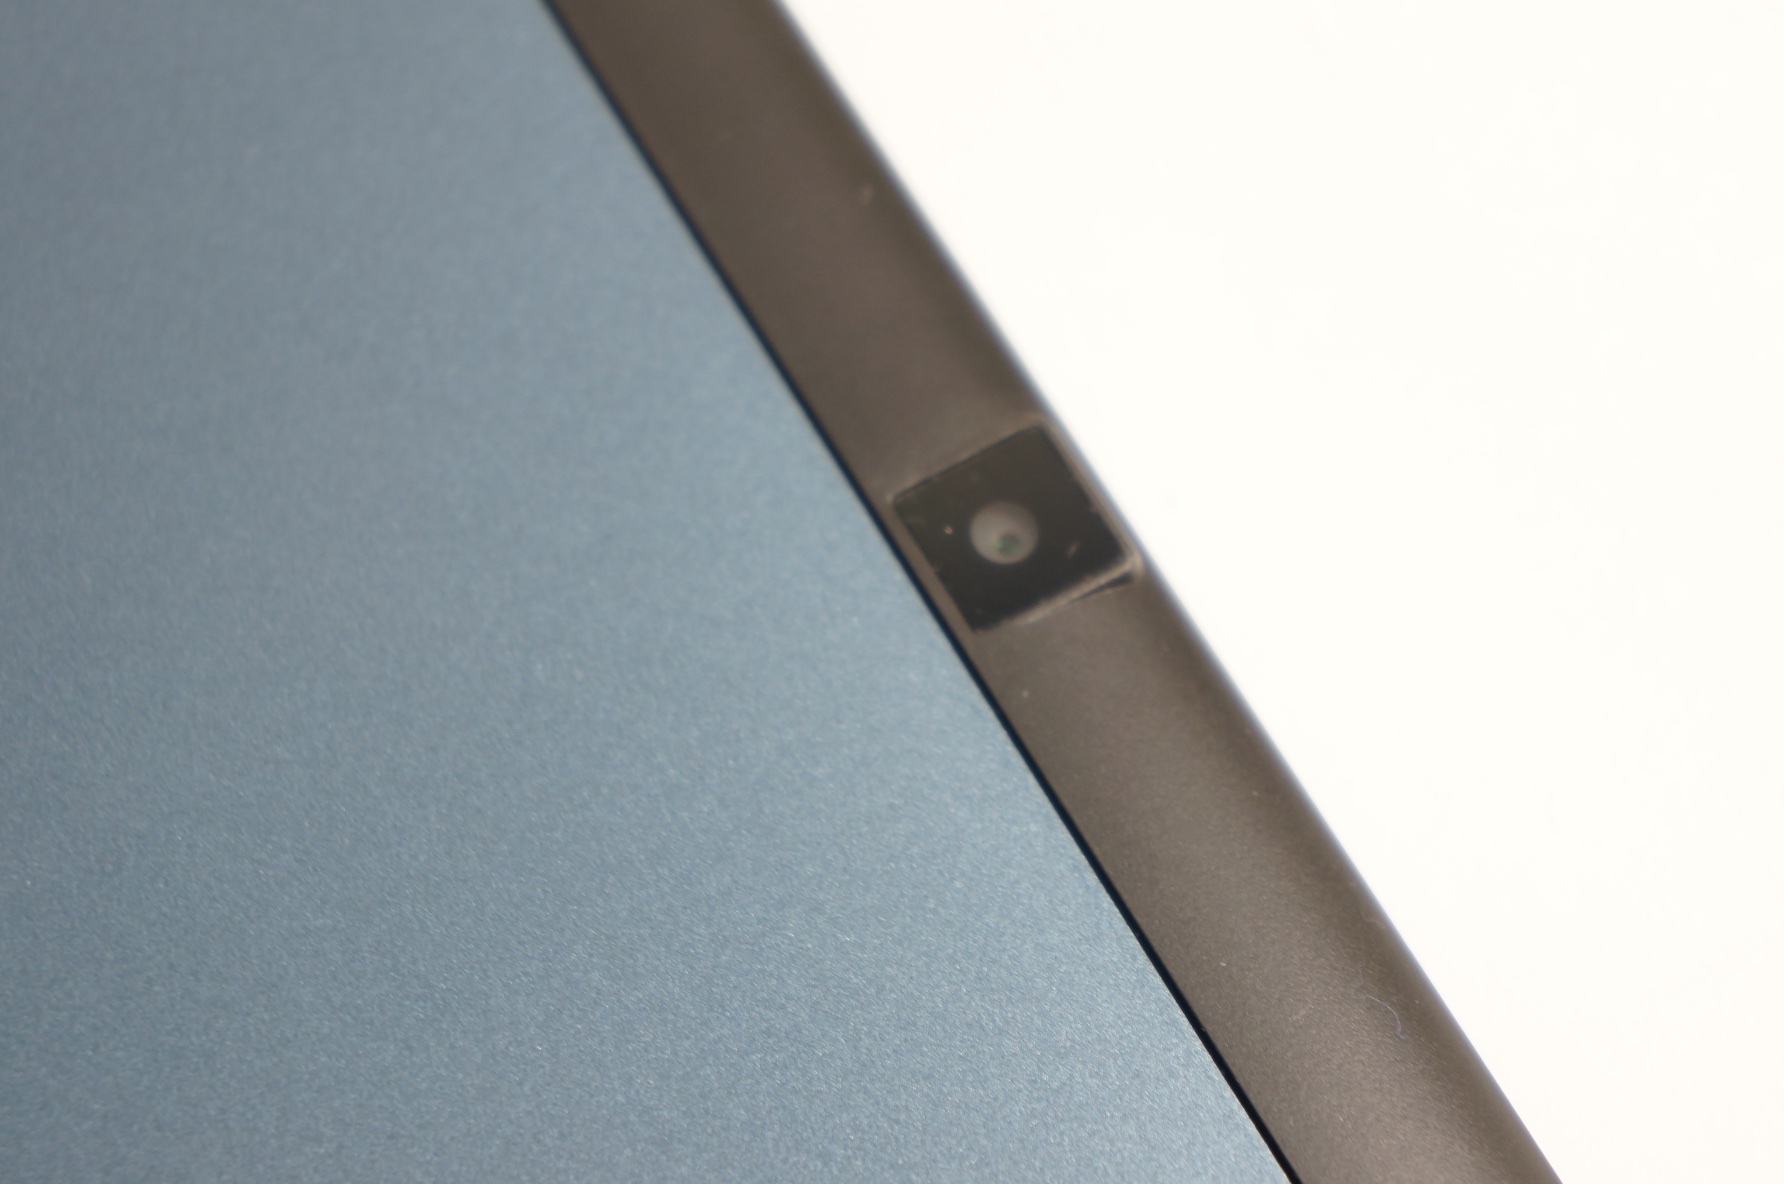
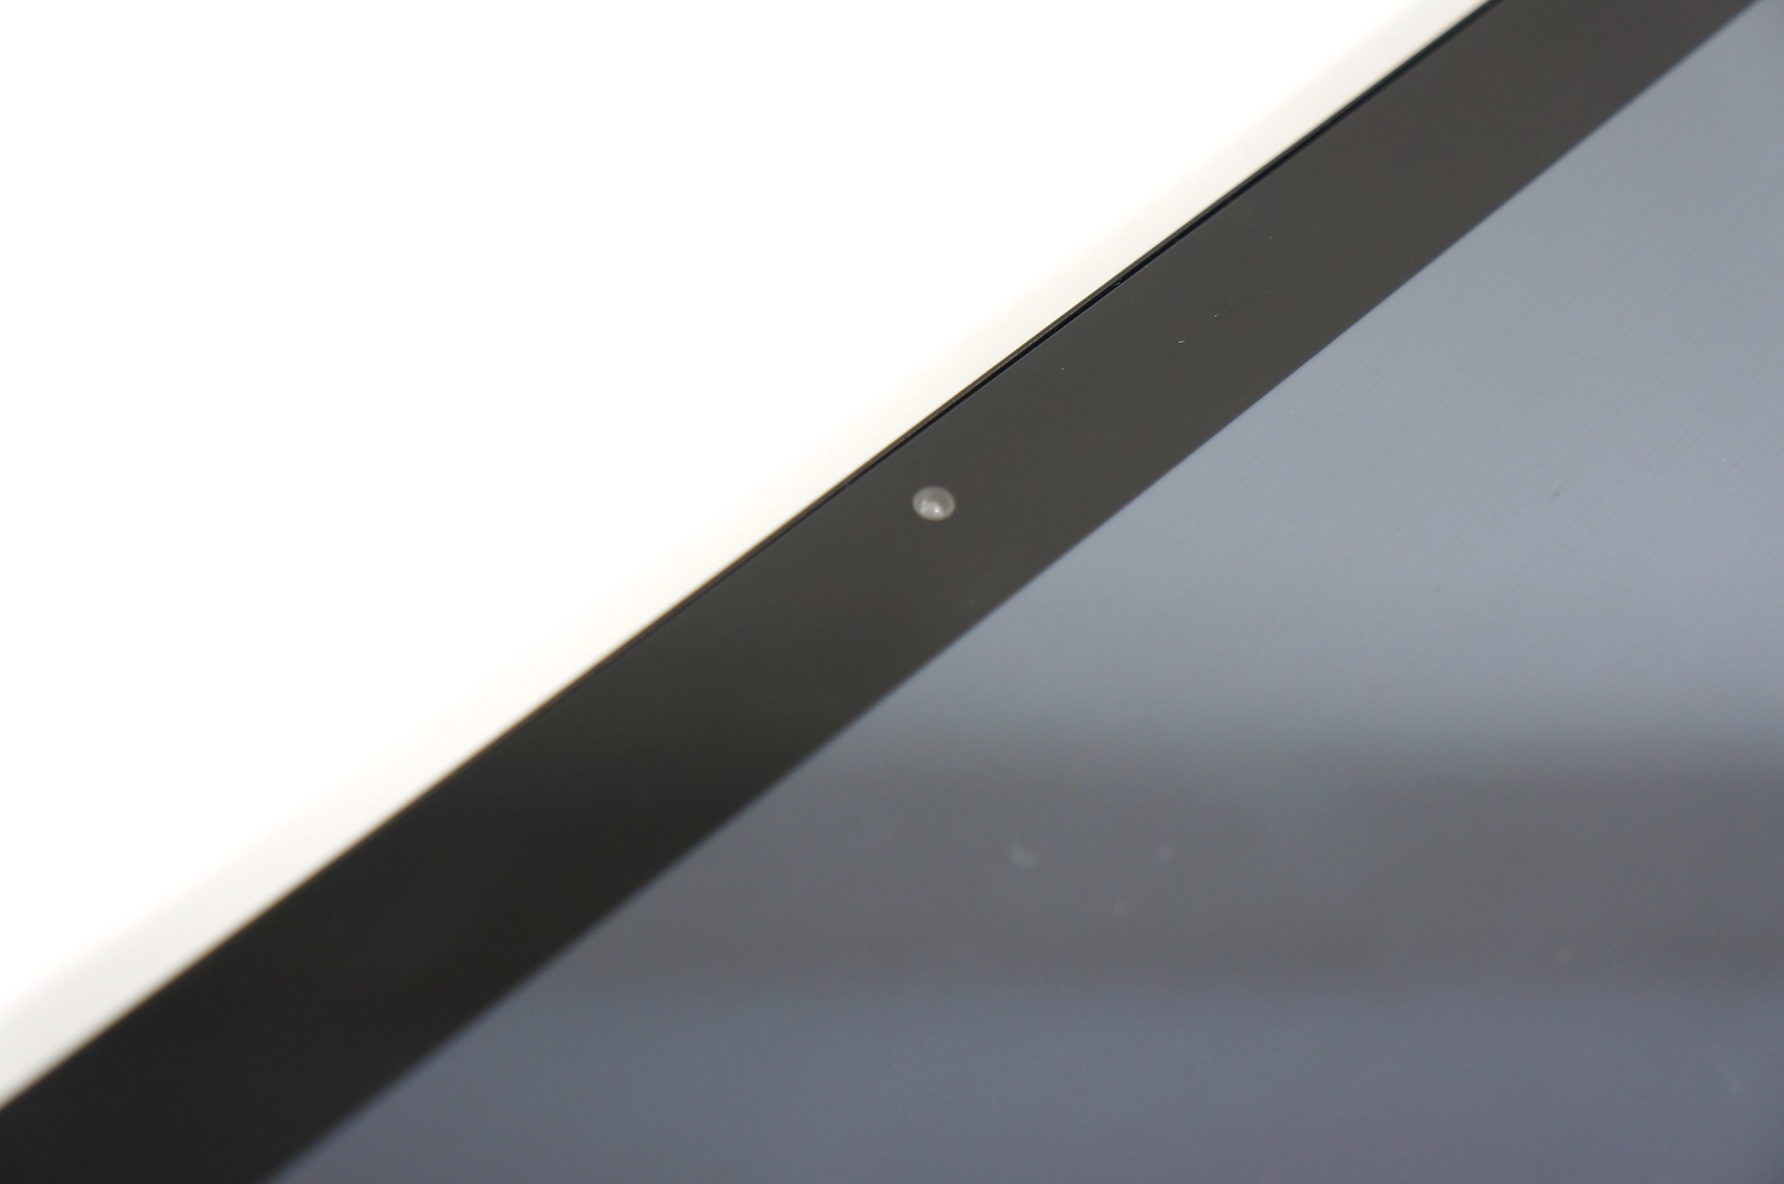
Both integrated webcams are actually only suitable for undemanding videoconferencing and photographing bills. Their outcomes are acceptable for these purposes.

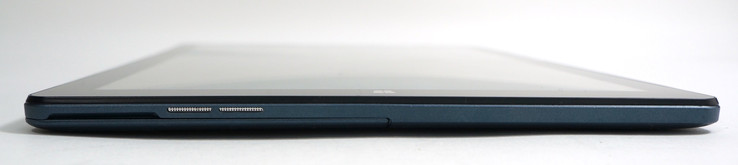
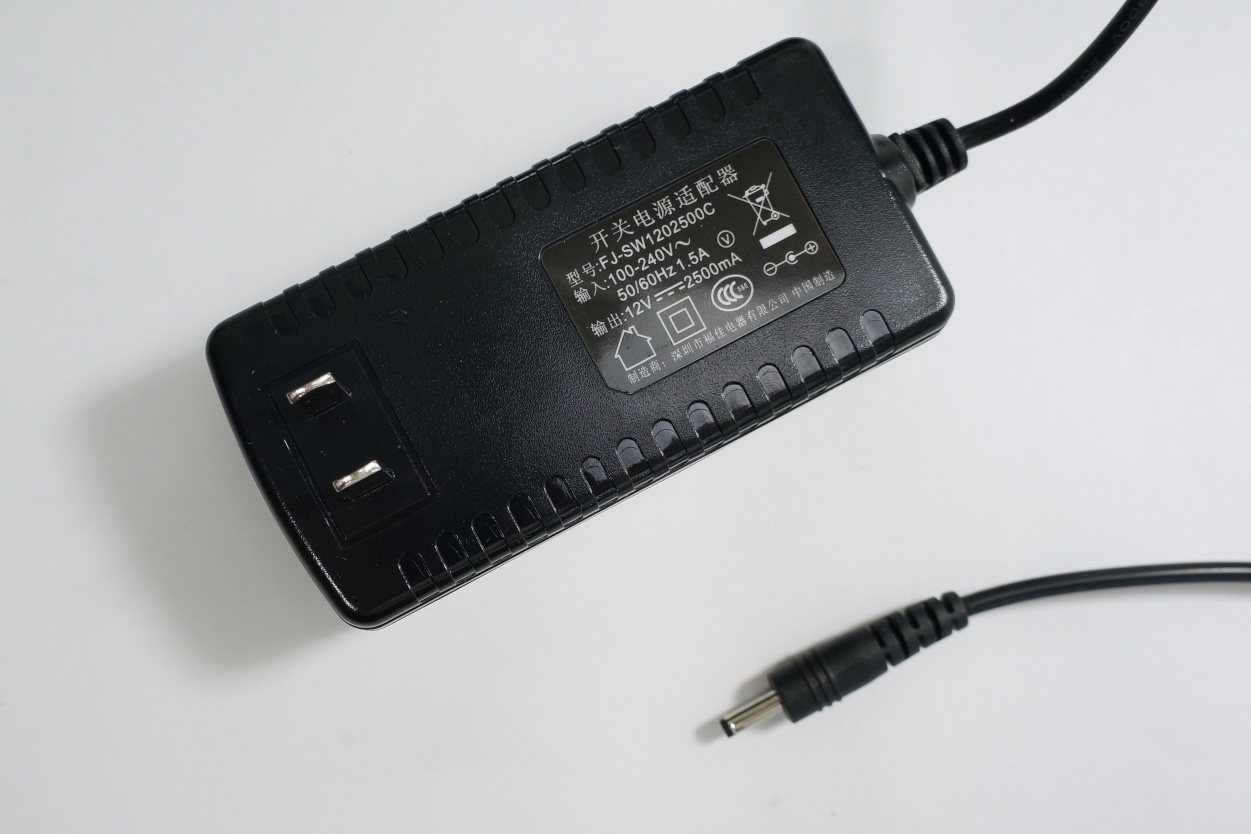
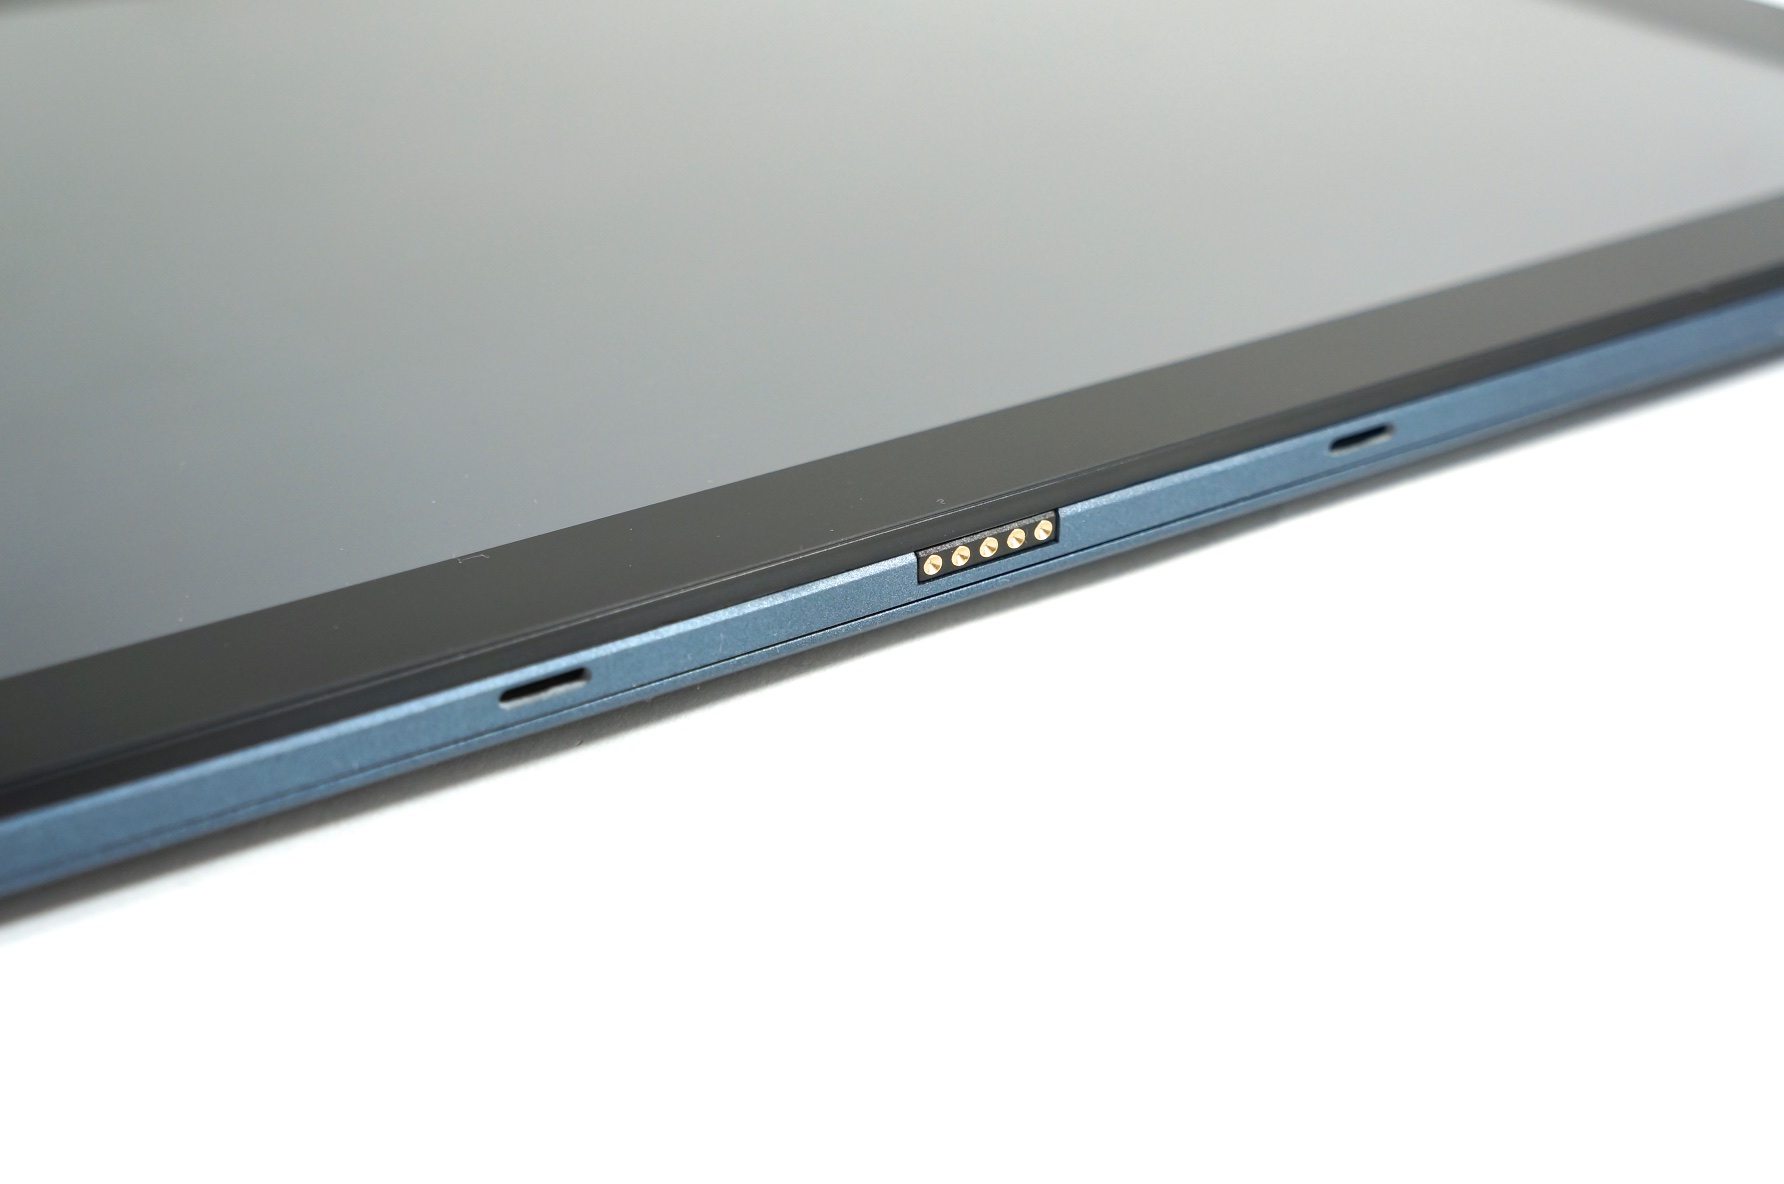
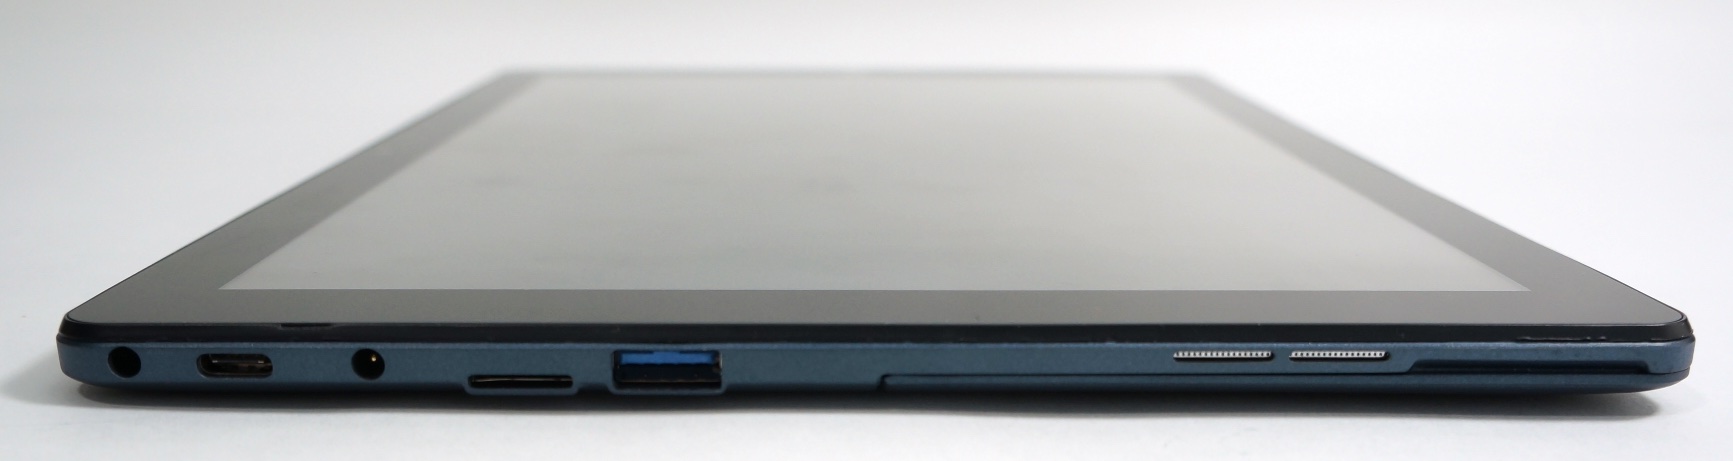
All interfaces are situated on the Cube i9's left. The dedicated power-in and the option of recharging the tablet via USB-C are pleasing. However, the HDMI-out incorporated in the USB-C port is a problem. Adapter cables are expensive and do not always function (see review of Dell's docks by Techtablets.com where HDMI and DisplayPort did not function).
Communication
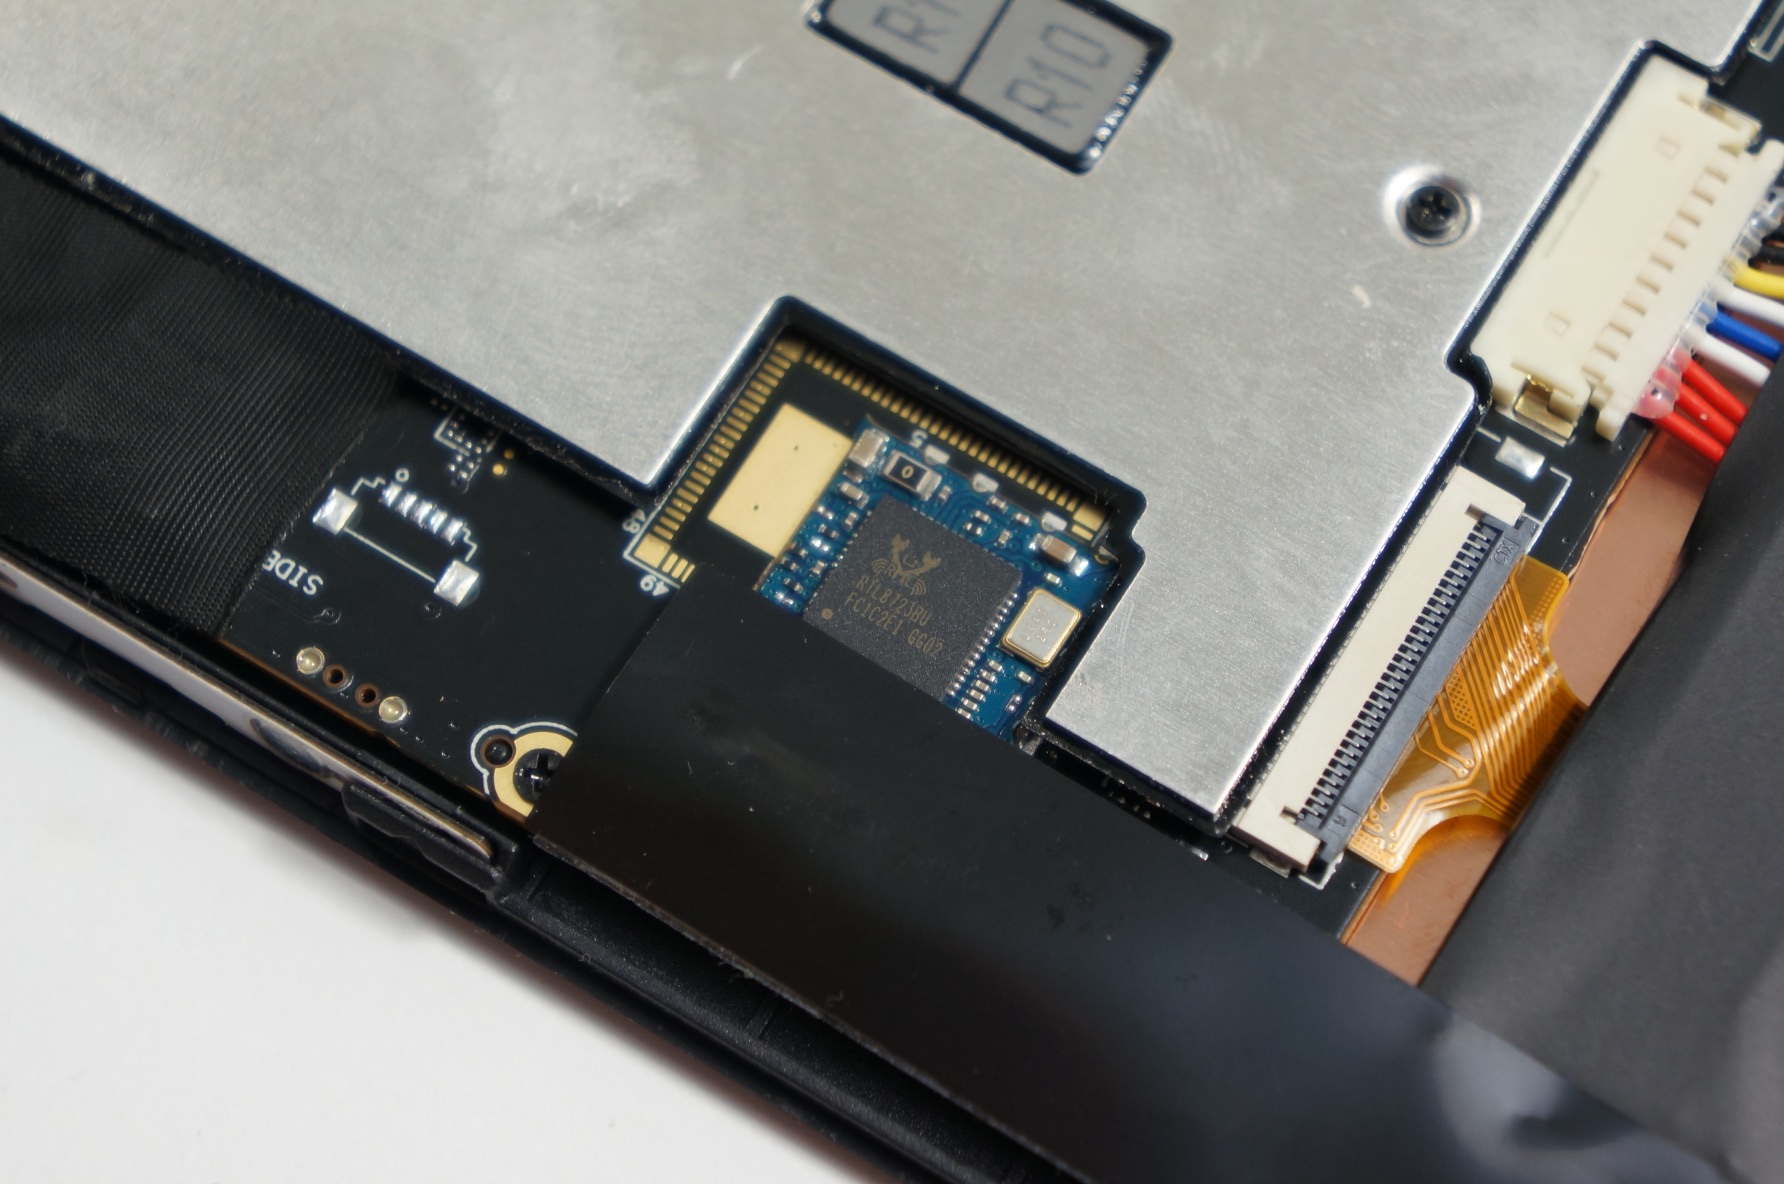
Sadly, Cube has made some cutbacks in the integrated Wi-Fi module. The user will not find a modern 802.11ac Wi-Fi module, but rather only Realtek's RTL8723B USB 2.0 module. It transmitted at a maximum of 90 MB/s via 802.11n in the test using a Linksys EA8500. The connection often disrupted at the beginning of the test, but was stable later. With 45 MBit/s measured at one meter (~3 ft) from the router in the standardized test, it clearly lags behind current AC Wi-Fi laptops, tablets and smartphones. However, it achieves the usual data rates when compared with entry-level devices.
Security
The Core m3 offers TPM 2.0 features for Windows 10, which are also listed in the BIOS (can be accessed using the connected keyboard via ESC key while booting).
Accessories
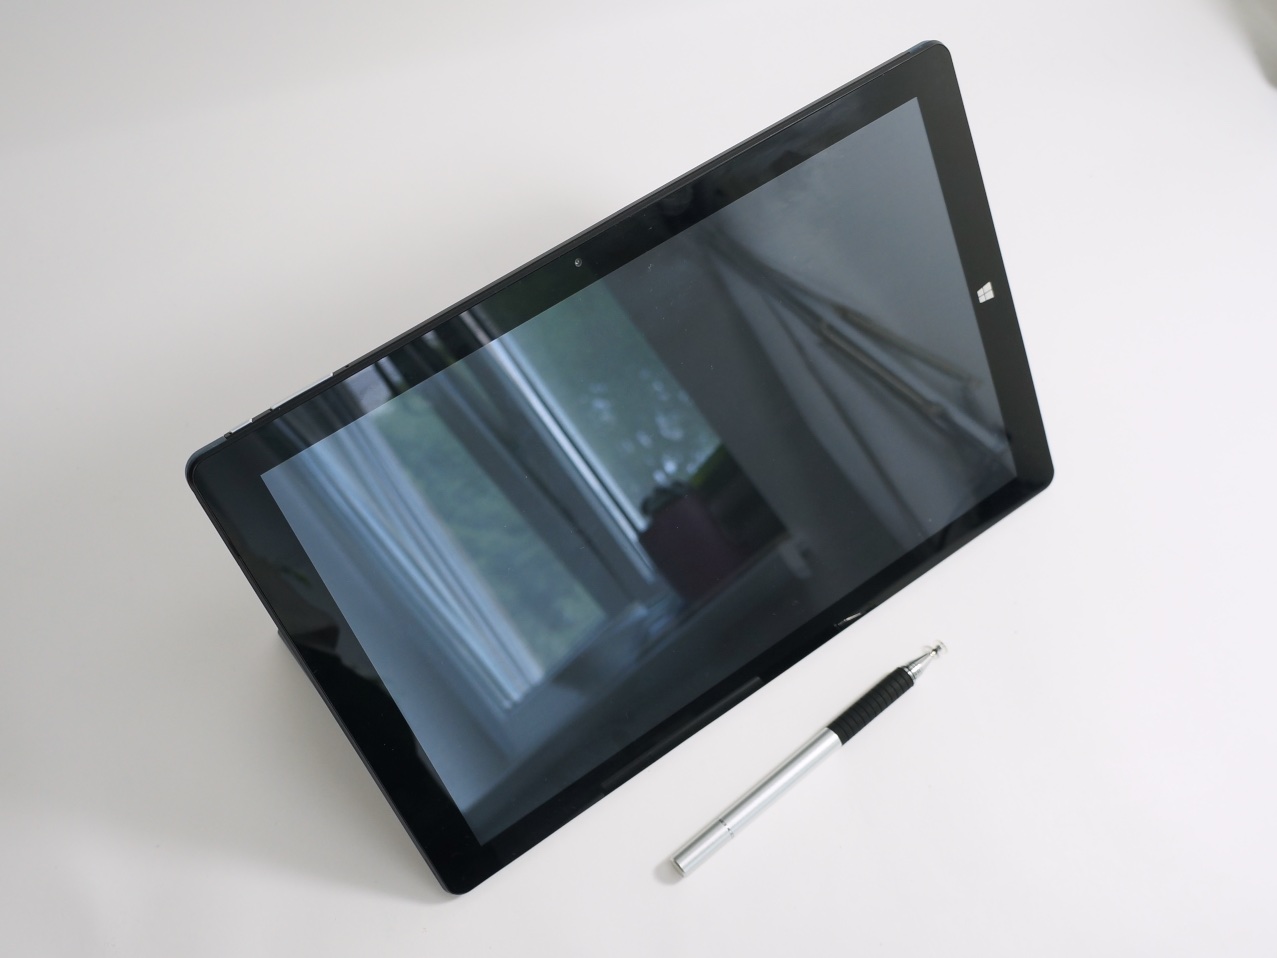
Cube offers a Surface Pro-like keyboard dock as an accessory. The linked stylus by Gearbest is only a normal capacitive touchscreen pen. Our review sample does not support pressure levels.
Warranty
Gearbest includes a one-year warranty on its products that also applies to the Cube i9.
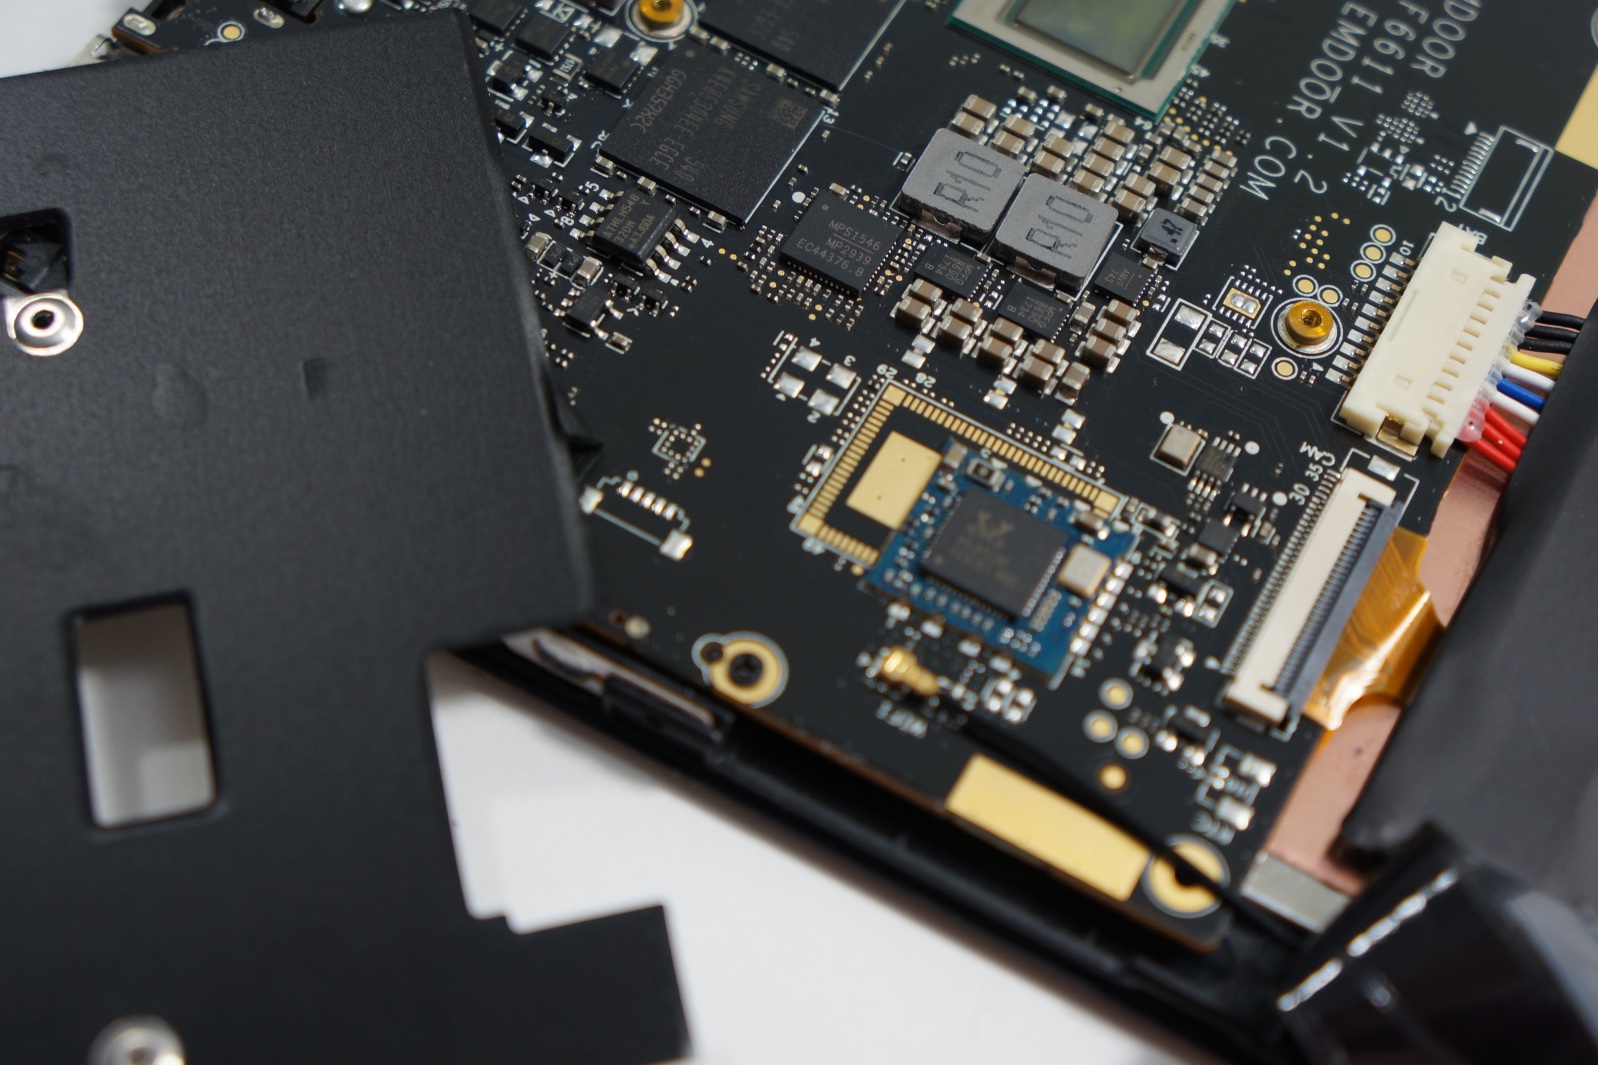
Maintenance
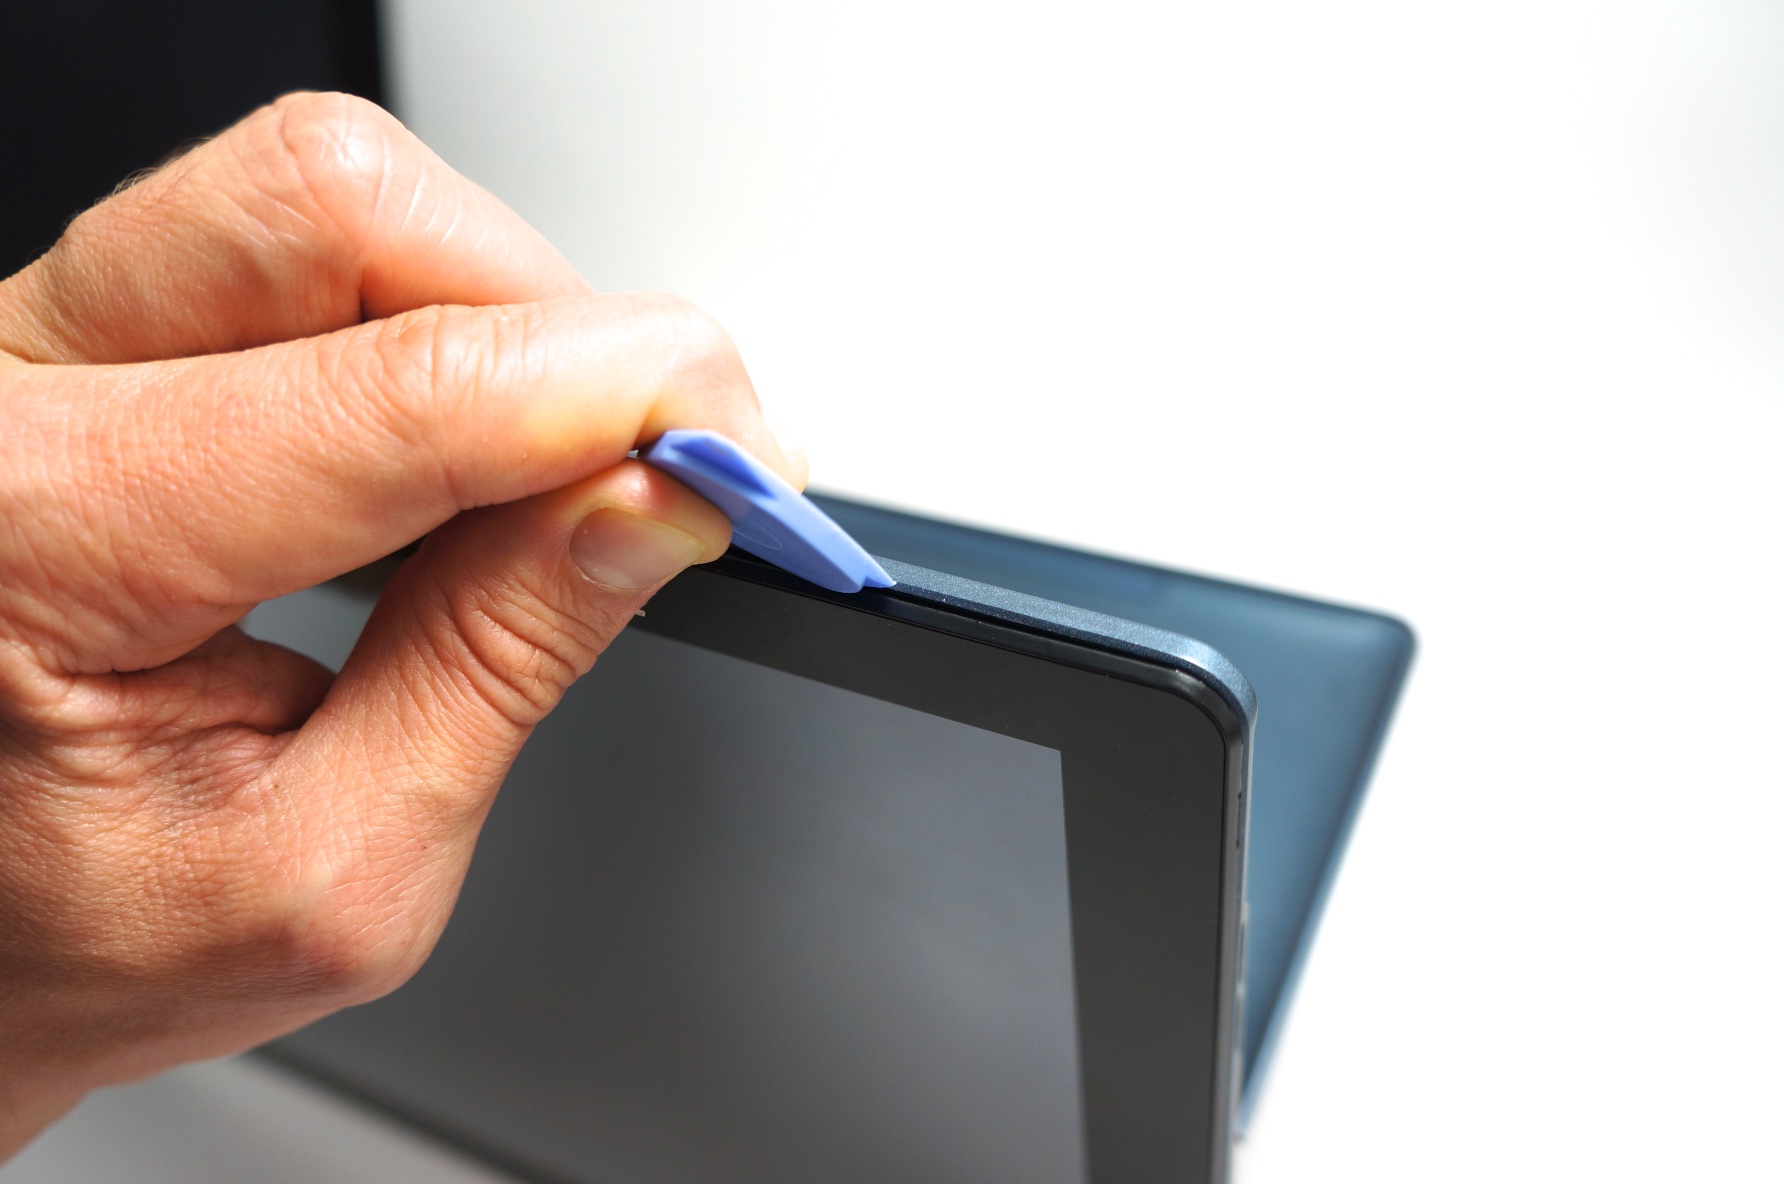
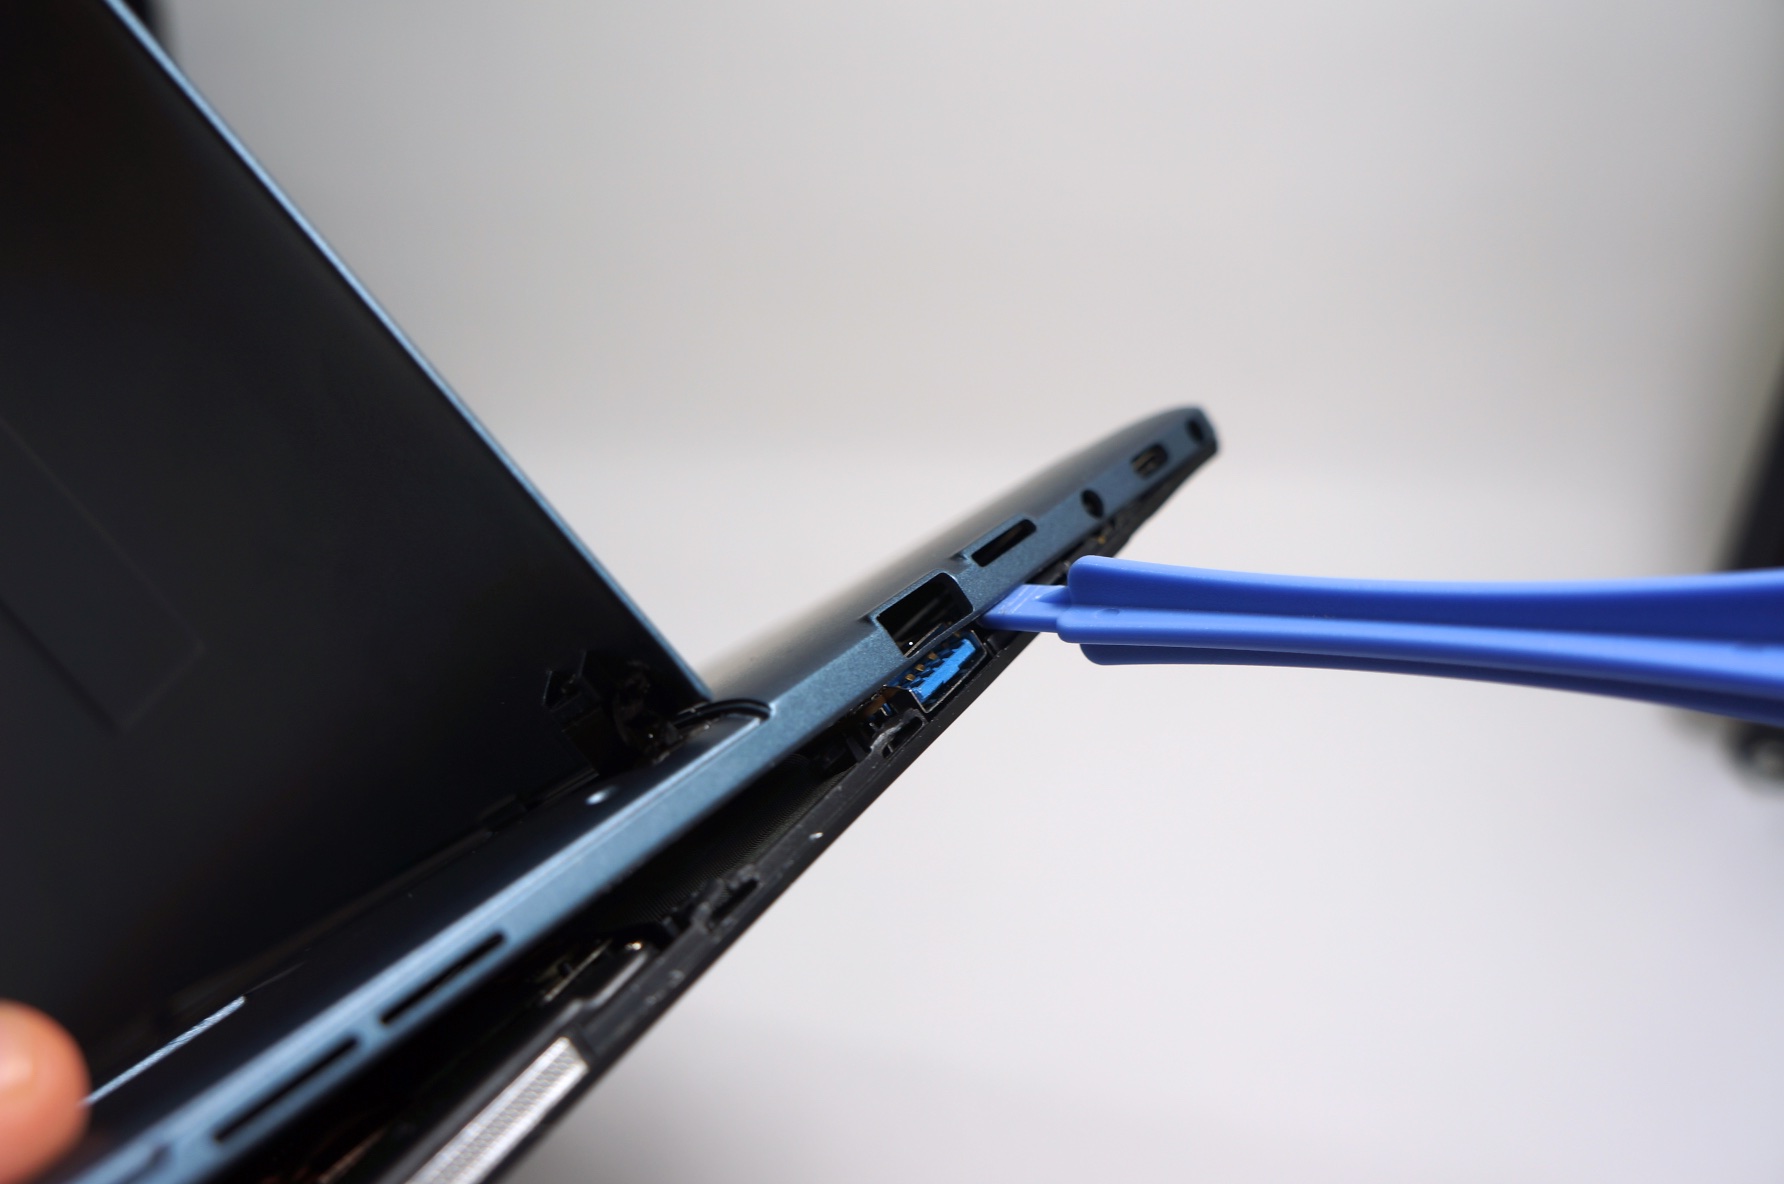
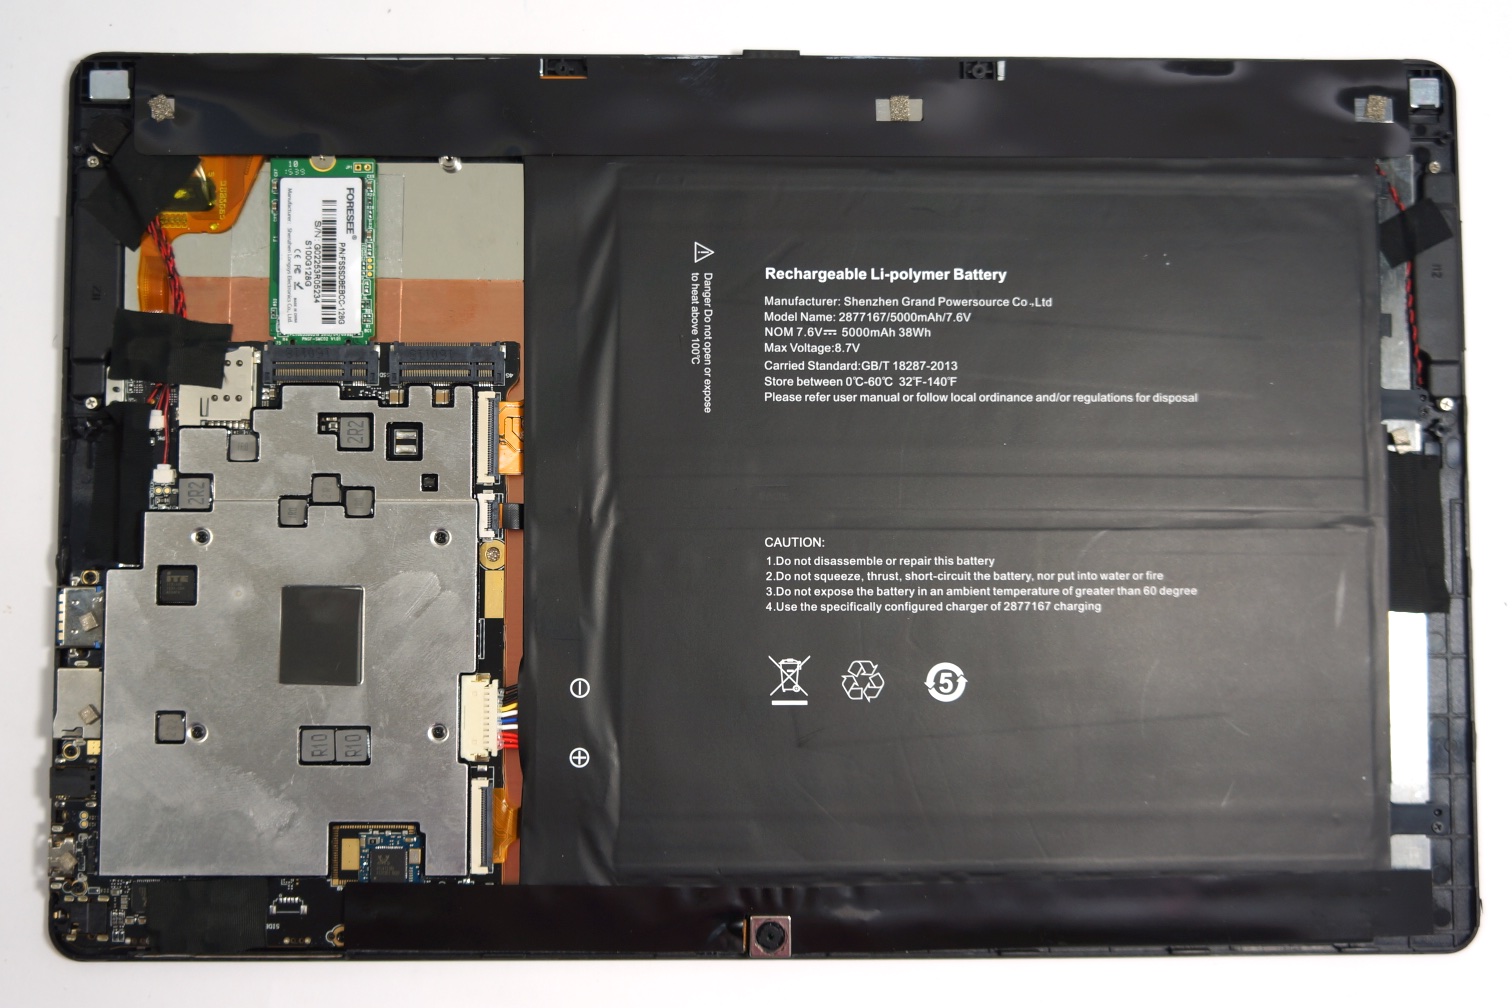
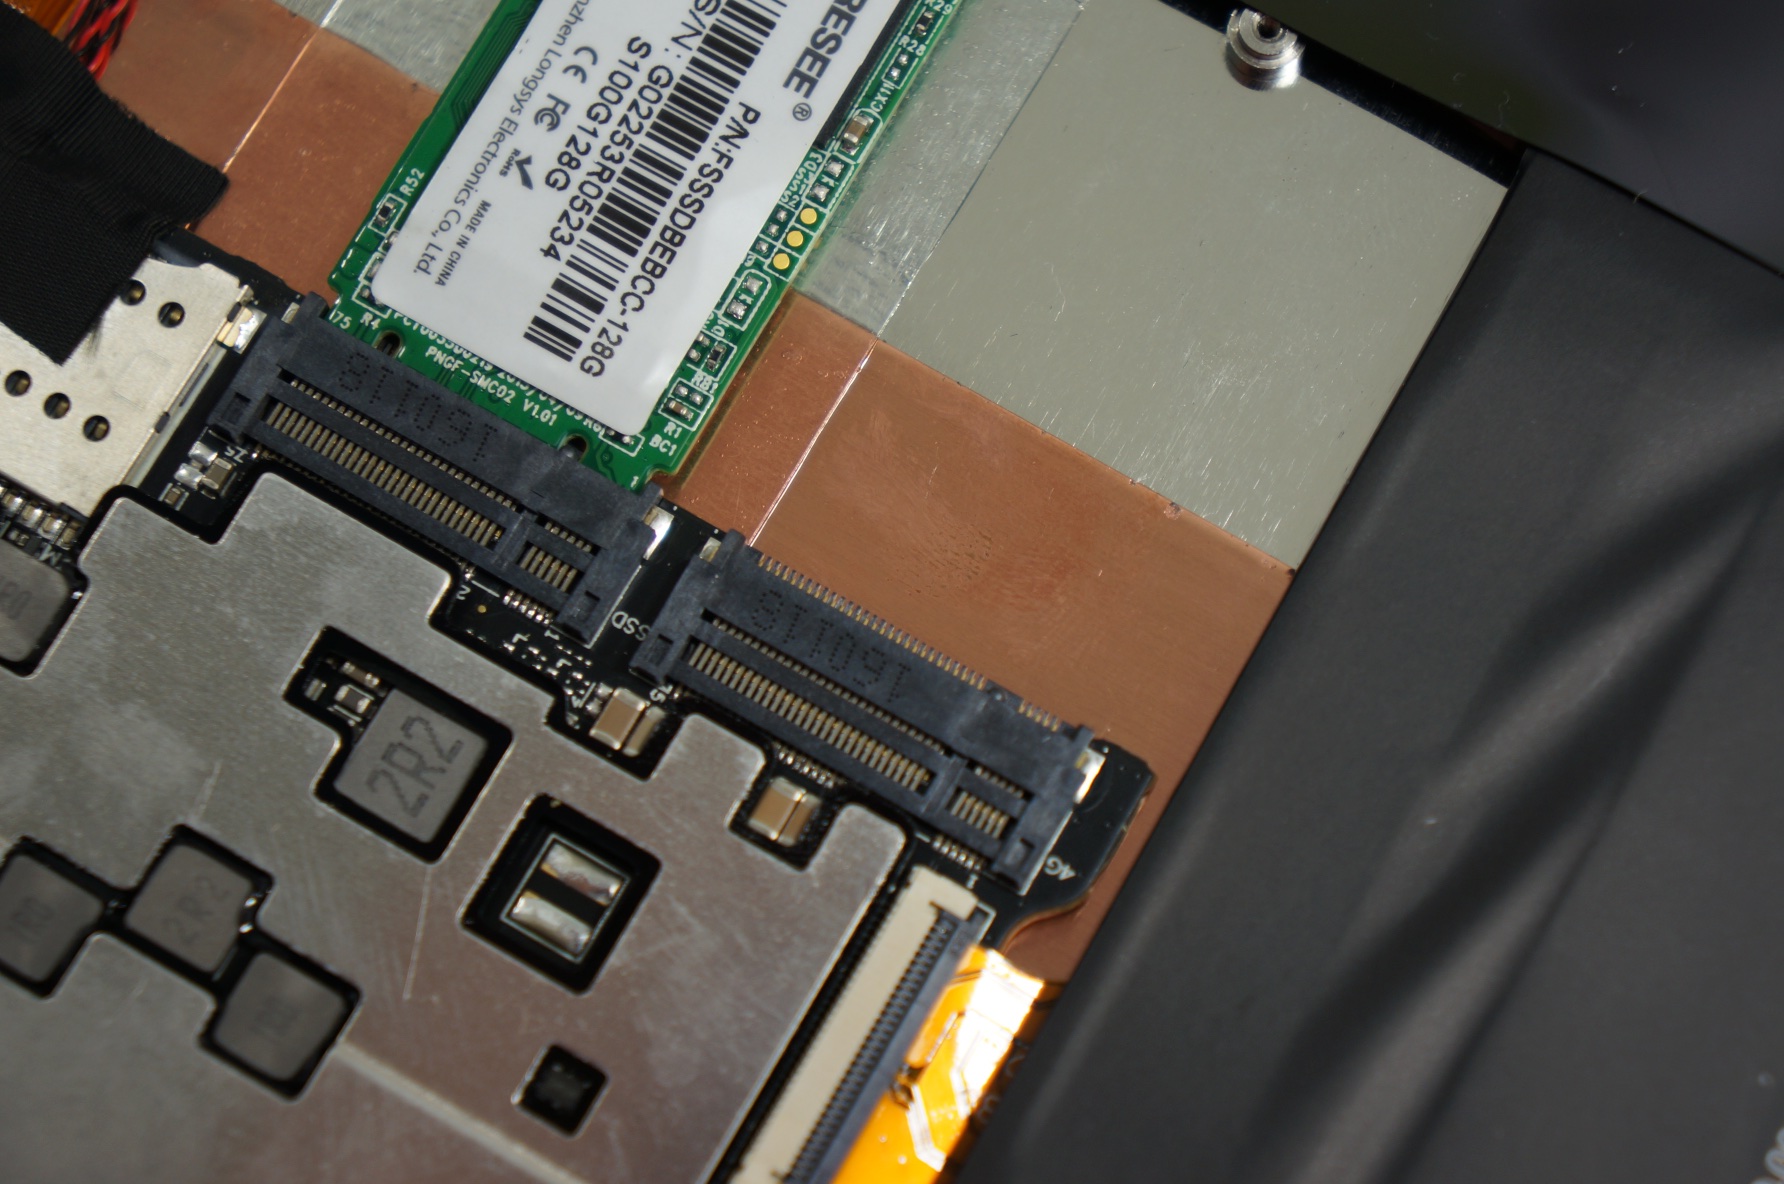
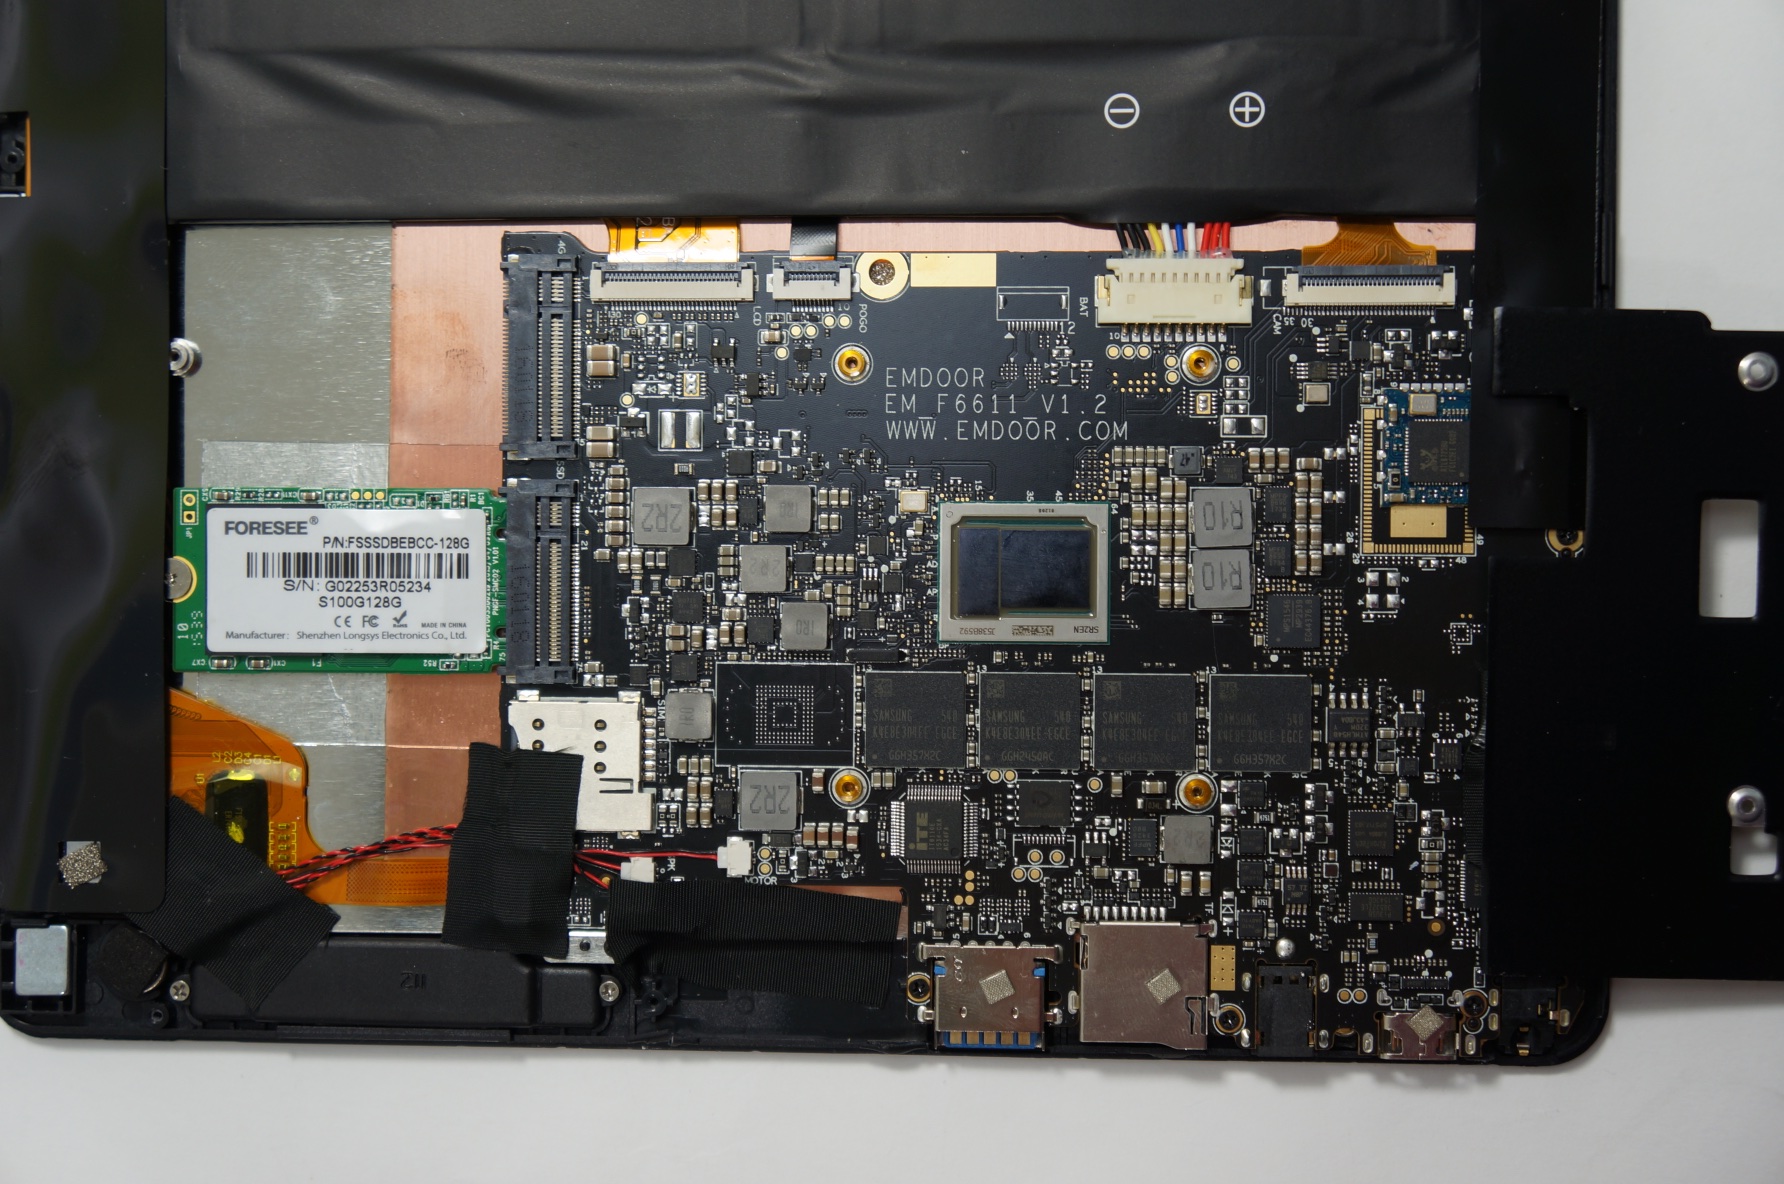
The Cube i9's aluminum back cover is fixed by 6 Torx (T4) screws. The tray can be pried off with some skill and a plastic spudger (best from below). However, the plastic bezel could be scratched. After this, it is possible to access the bolted battery.
| Networking | |
| iperf Server (receive) TCP 1 m | |
| Apple MacBook 12 (Early 2016) 1.1 GHz | |
| Cube i9 | |
| MSI CX61 2QC 2970M MS-16GD | |
| iperf Client (transmit) TCP 1 m | |
| Apple MacBook 12 (Early 2016) 1.1 GHz | |
| NVIDIA Shield Tablet LTE P1761 (Hinum) | |
| Motorola Moto X Play (Hinum) | |
| MSI CX61 2QC 2970M MS-16GD | |
| Cube i9 | |
| Chuwi Hi12 | |
Input Devices
Keyboard
Cube has preloaded the standard Windows 10 on-screen keyboard in the i9. The generous, 12-inch touchscreen is comfortable to use and offers a decent layout.
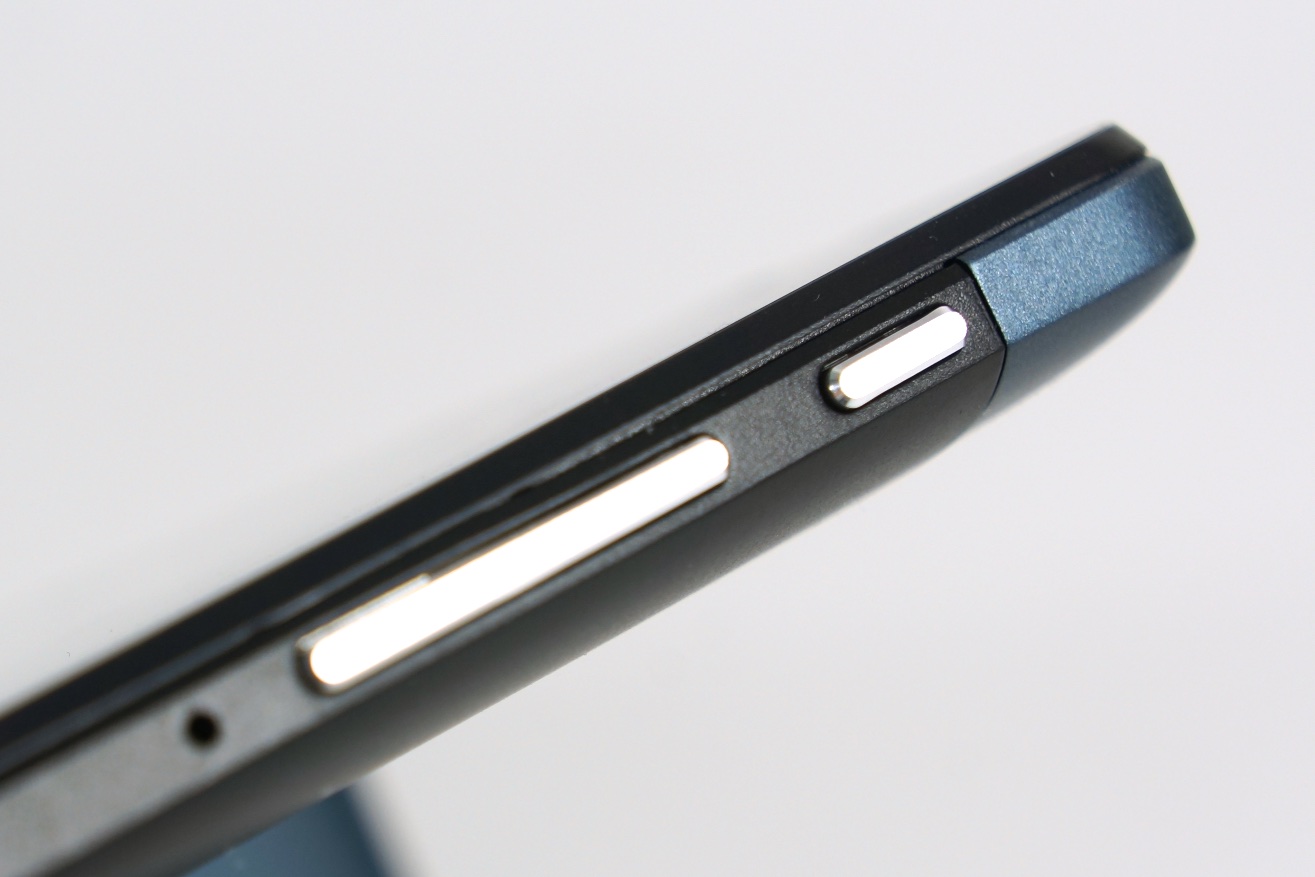
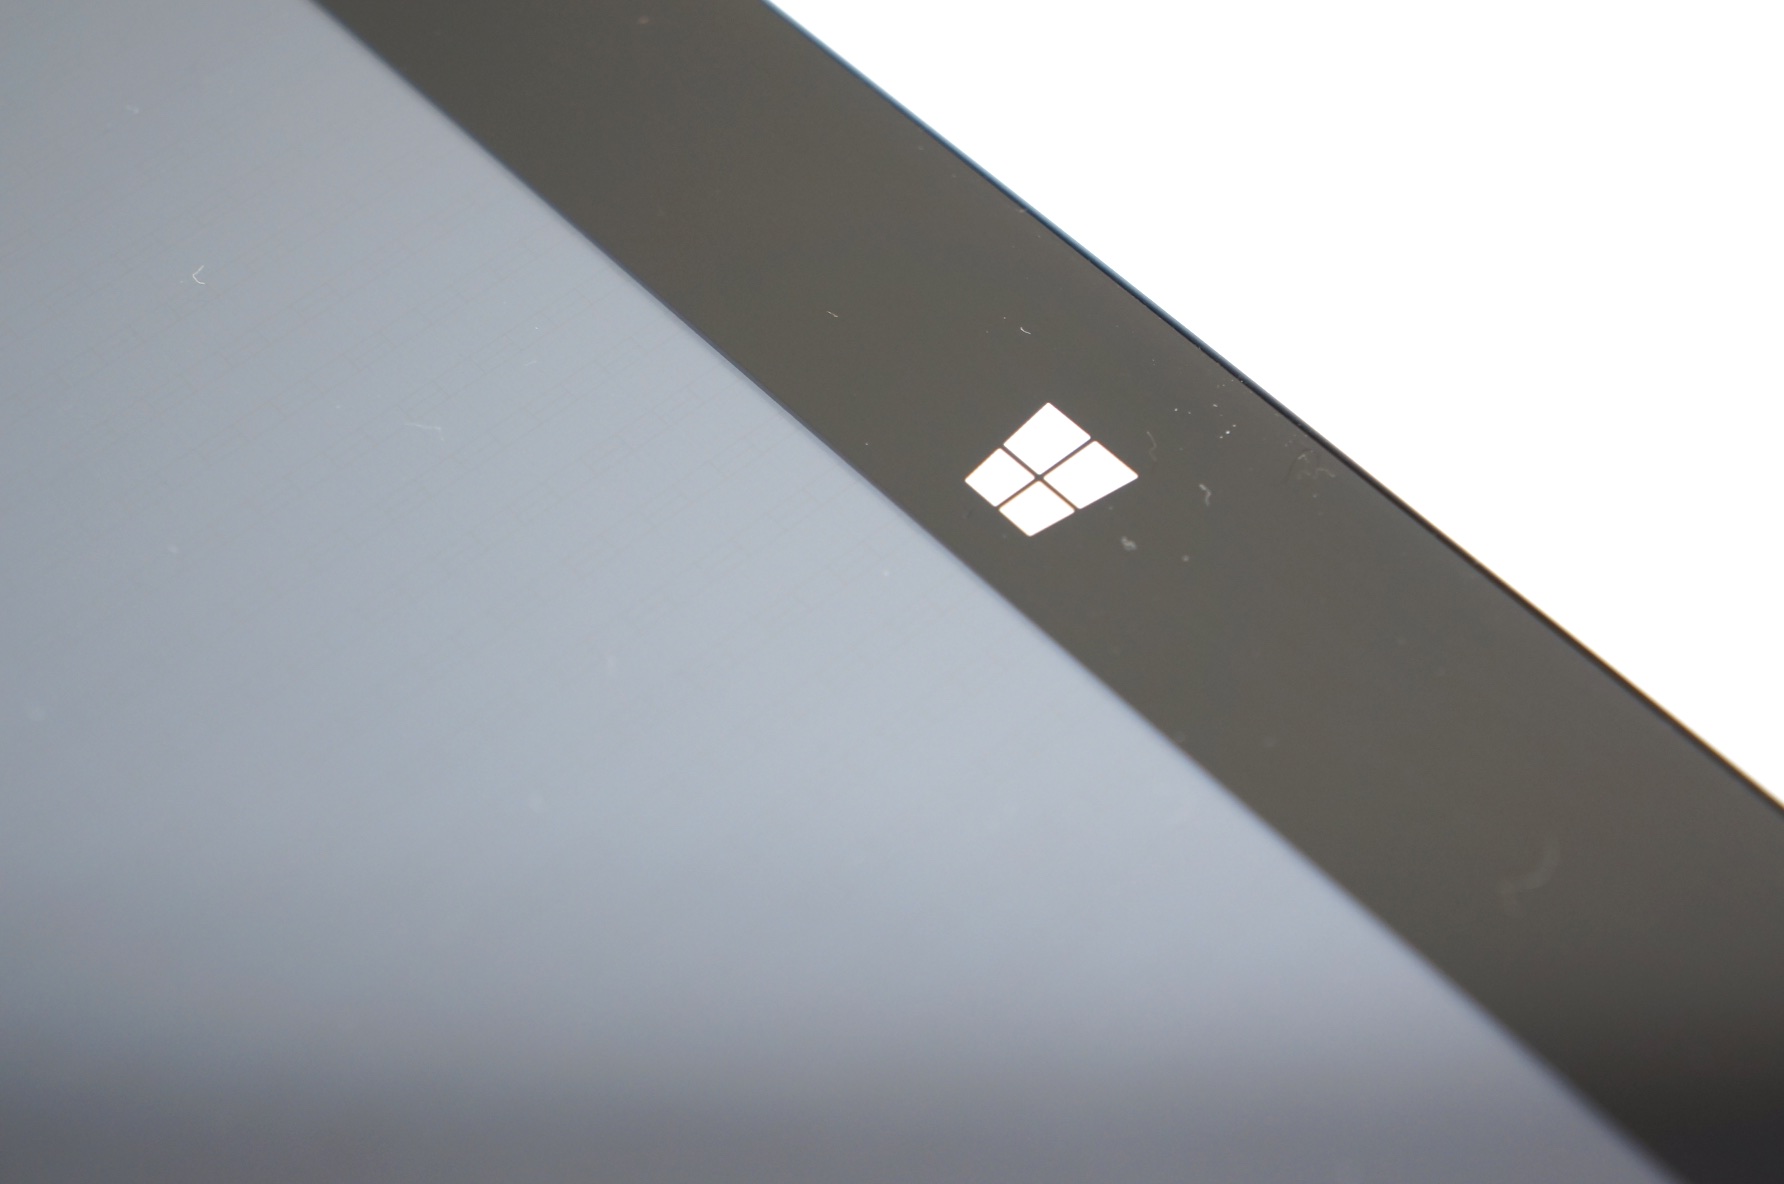
The quality of the physical volume buttons and power button are average to good. However, the touch-sensitive Windows key was conspicuous; twisting or touching was sometimes enough to trigger it - probably a hardware bug in our review sample.
Touchscreen
The multi-touchscreen offered a very good accuracy in the test. Although the pen that we also ordered was a conventional stylus that functions on all touchscreens, it proved the screen's accuracy. The lines in Paint were always under the tip of the stylus. The response times were not bad, but not particularly good, either. The touchscreen rarely skipped inputs made with the fingers. This seemed to lessen even further after removing the screen protector applied by the manufacturer. Overall, the touchscreen made a good impression.
Display
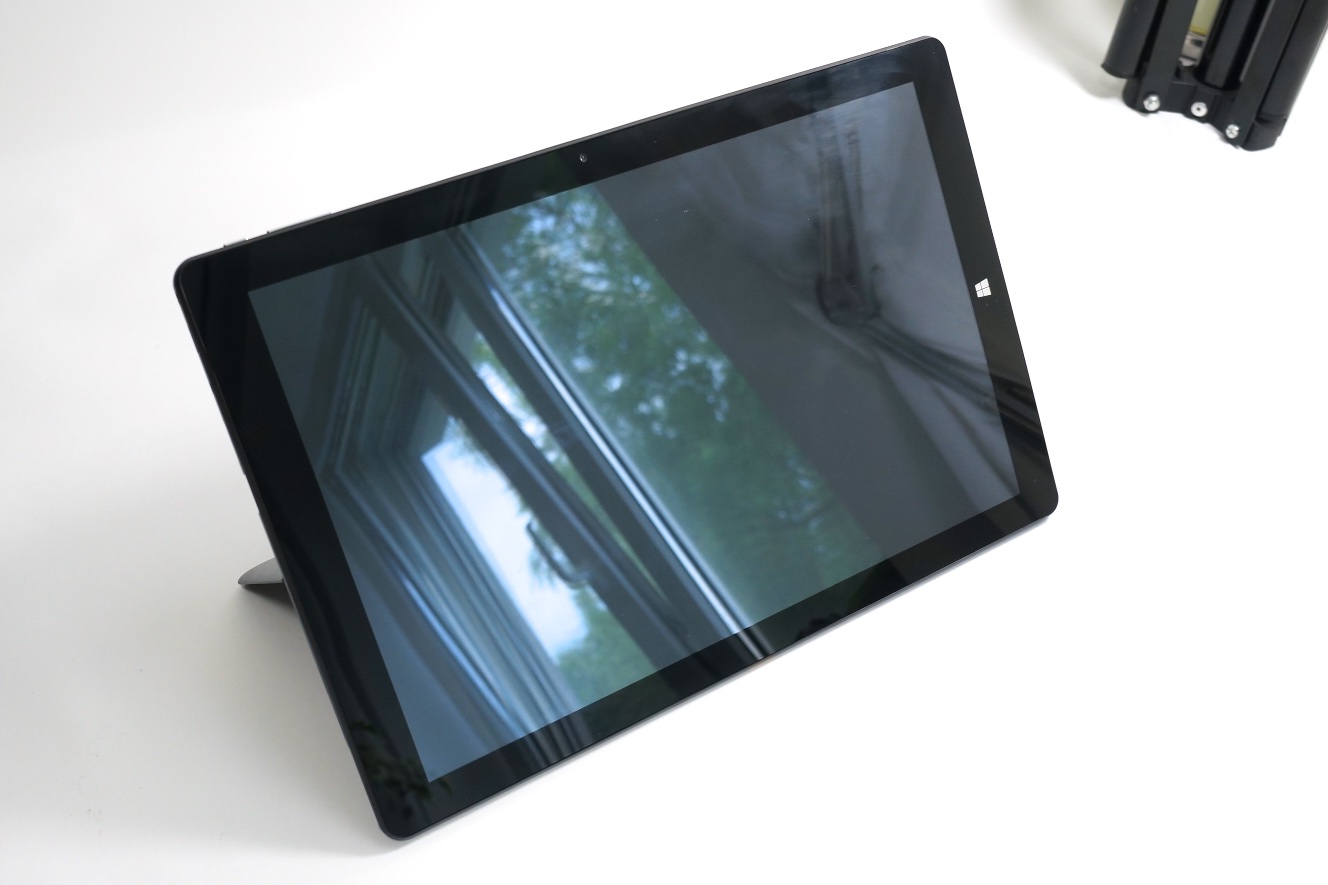
The 12.2-inch IPS panel is the KDC0000 (ID) model and has a resolution of 1920x1200 pixels with an aspect ratio of 16:10. As the microscope screenshot shows, the screen's surface is grainy, but it is not really matte. With an average of 260 Candela, the brightness of our review sample is not particularly high. However, it is pleasing that it does not dim in battery mode. The combination of a glossy screen and 260 Candela is not ideal for outdoor use, but it is enough for use in the shade. Thanks to the low black level, the contrast ratio is good. The backlight can also be dimmed considerably to 6 cd/m², making it possible, for example, to read comfortably in the dark.
The illumination of 77% is not particularly good; the screen visibly darkens from top to bottom. Slight backlight bleeding is also noticeable at the right edge on dark backgrounds. However, that is not annoying during normal desktop use. Our review sample exhibited a small flaw in the background foil that is to distribute the light evenly. Thus, a small brighter spot is seen in the center area - not nice, but probably an isolated case.
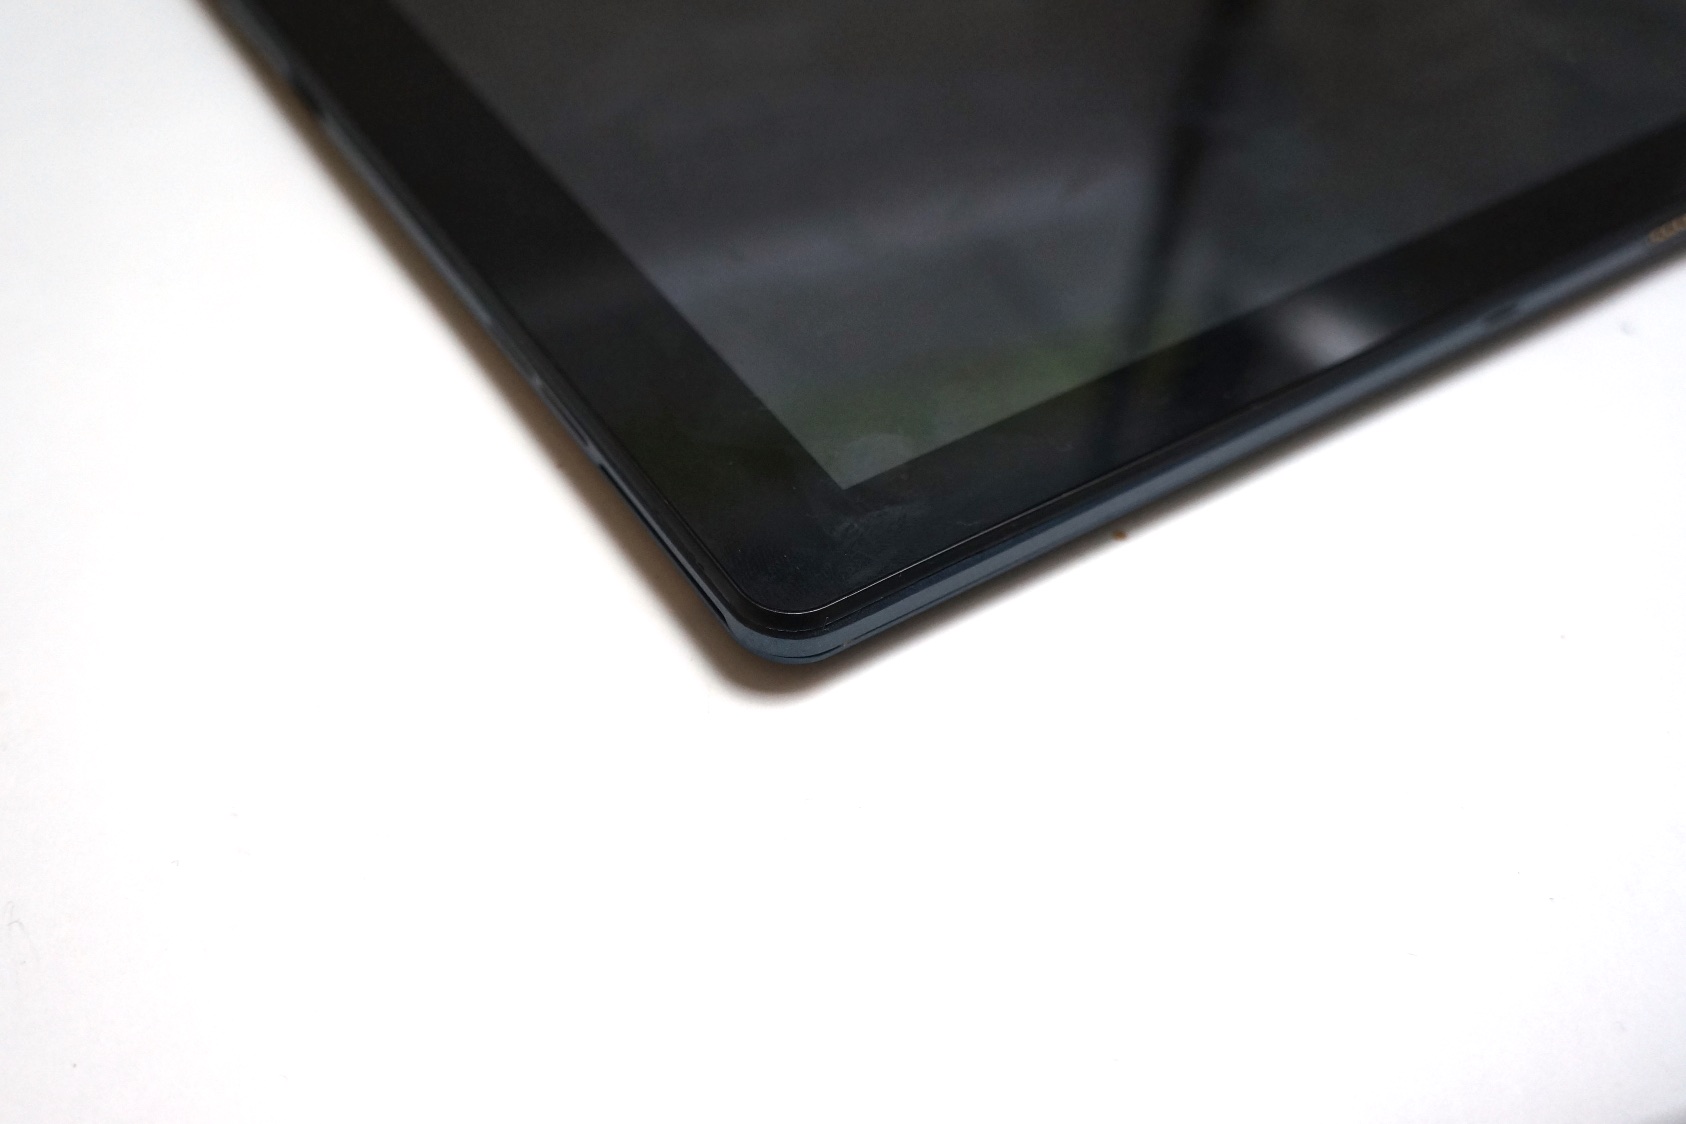
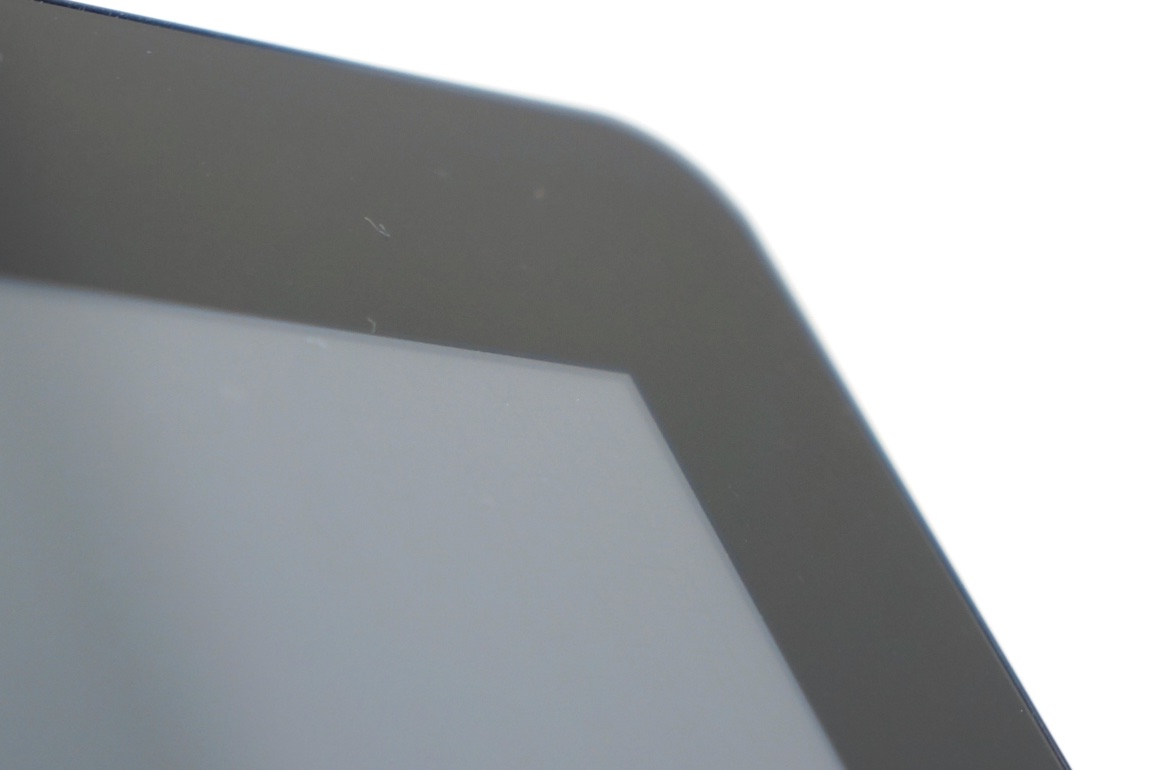
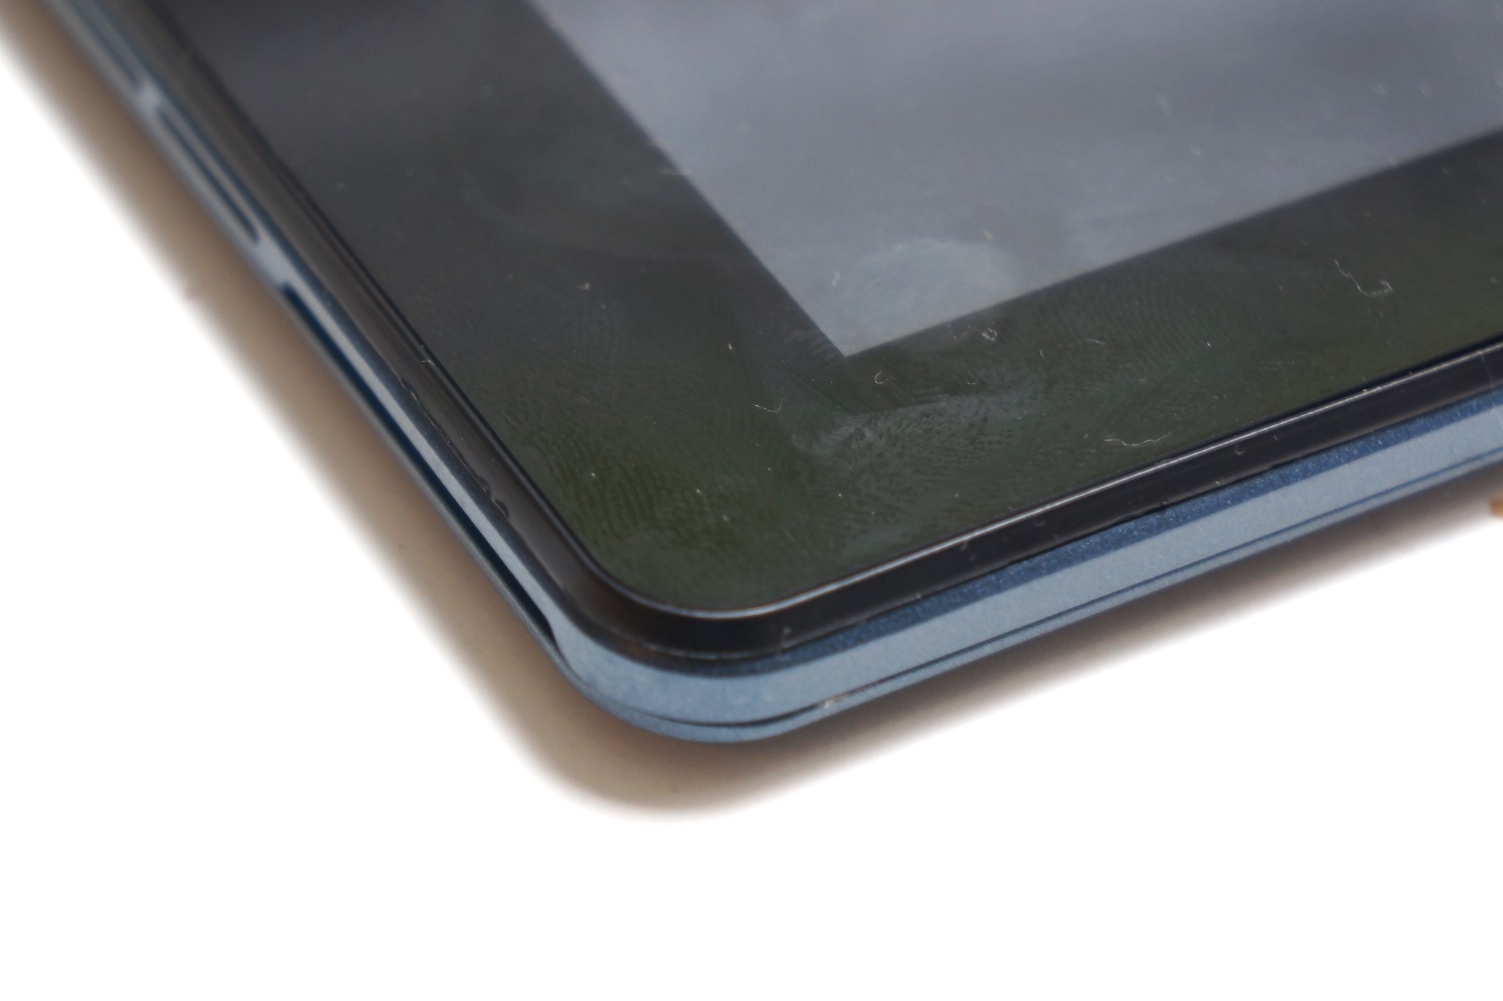
Unlike the Surface Pro 4, the touchscreen is not glued directly to the overlying glass, creating a visible space to the front. Although the gap is smaller than, for example, in Chuwi's Hi12 it is still clearly visible.
| |||||||||||||||||||||||||
Brightness Distribution: 77 %
Center on Battery: 263 cd/m²
Contrast: 939:1 (Black: 0.28 cd/m²)
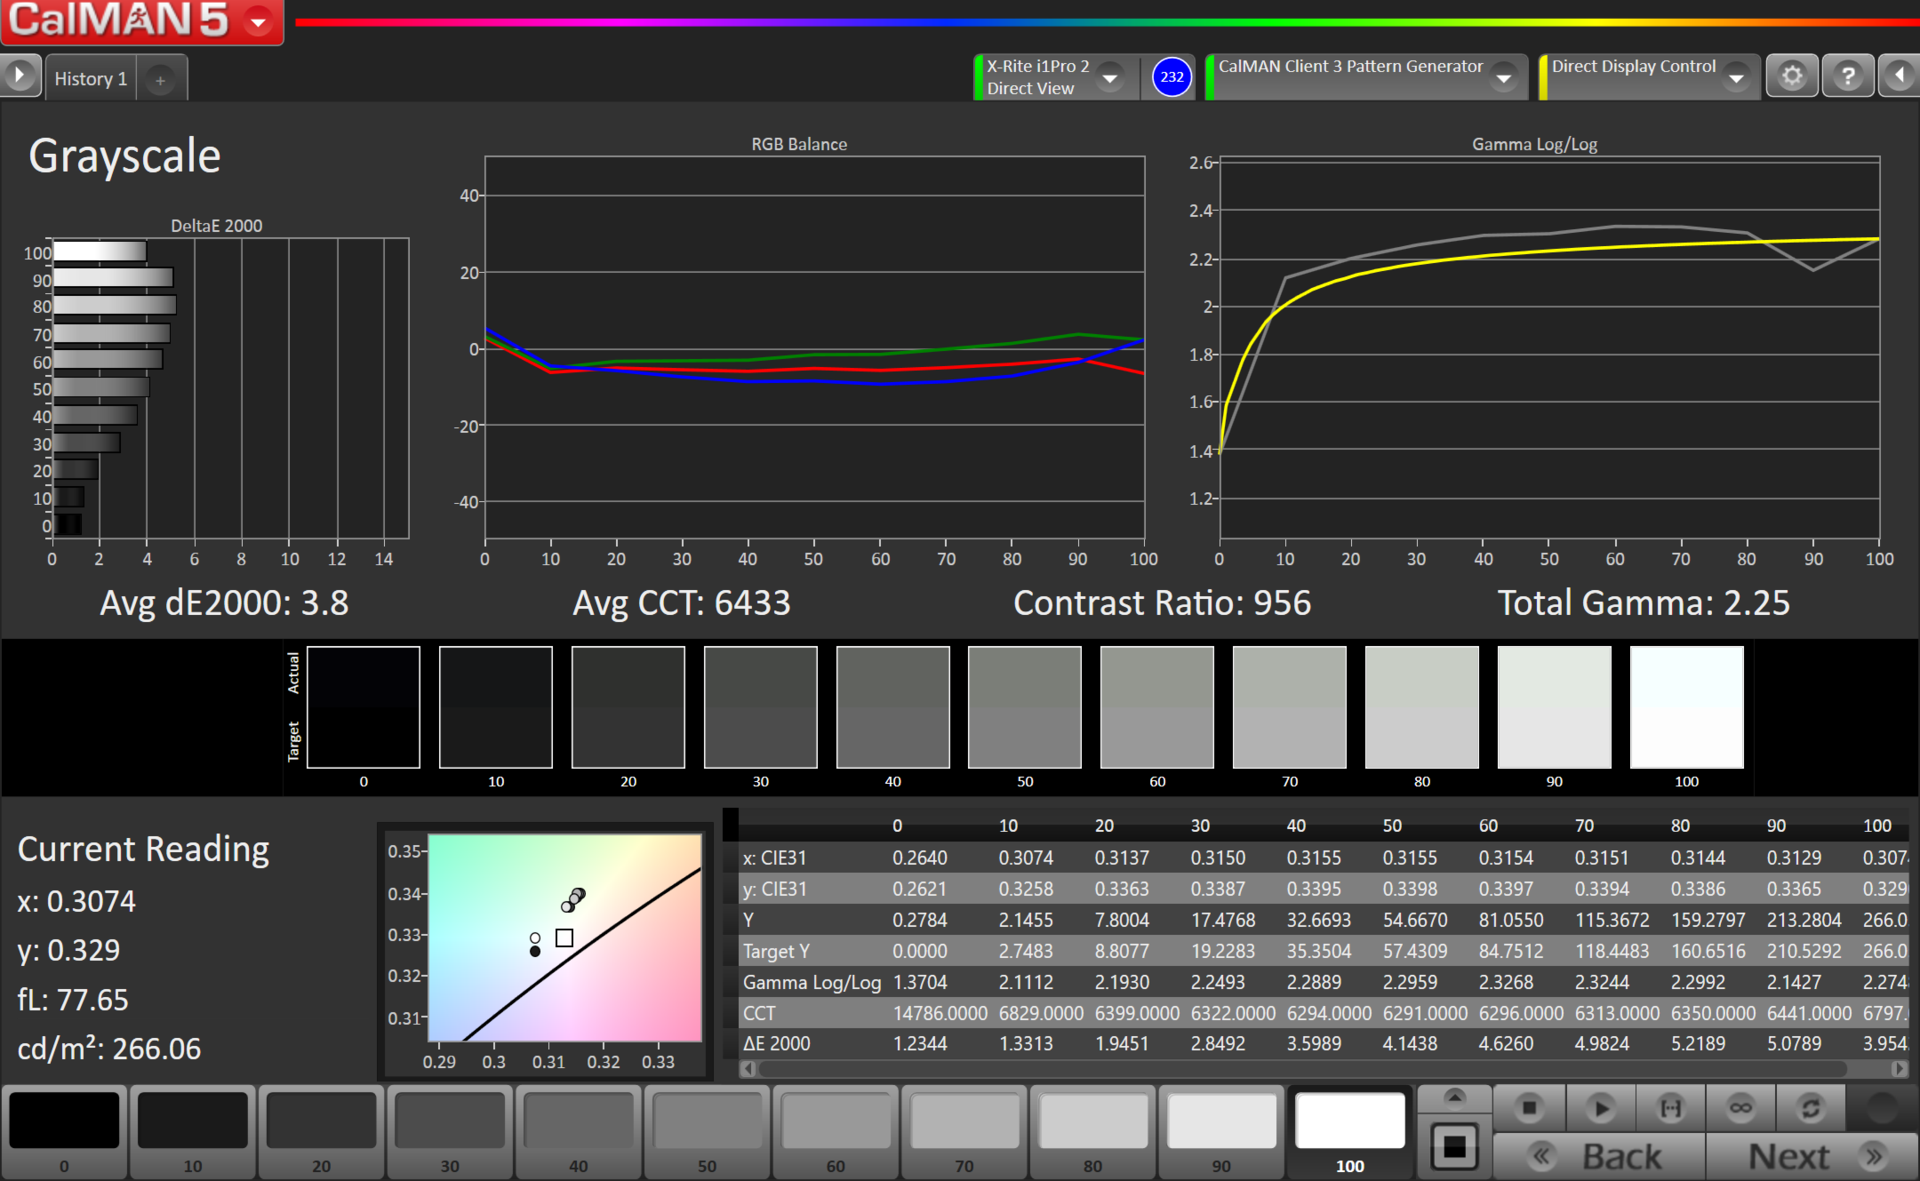
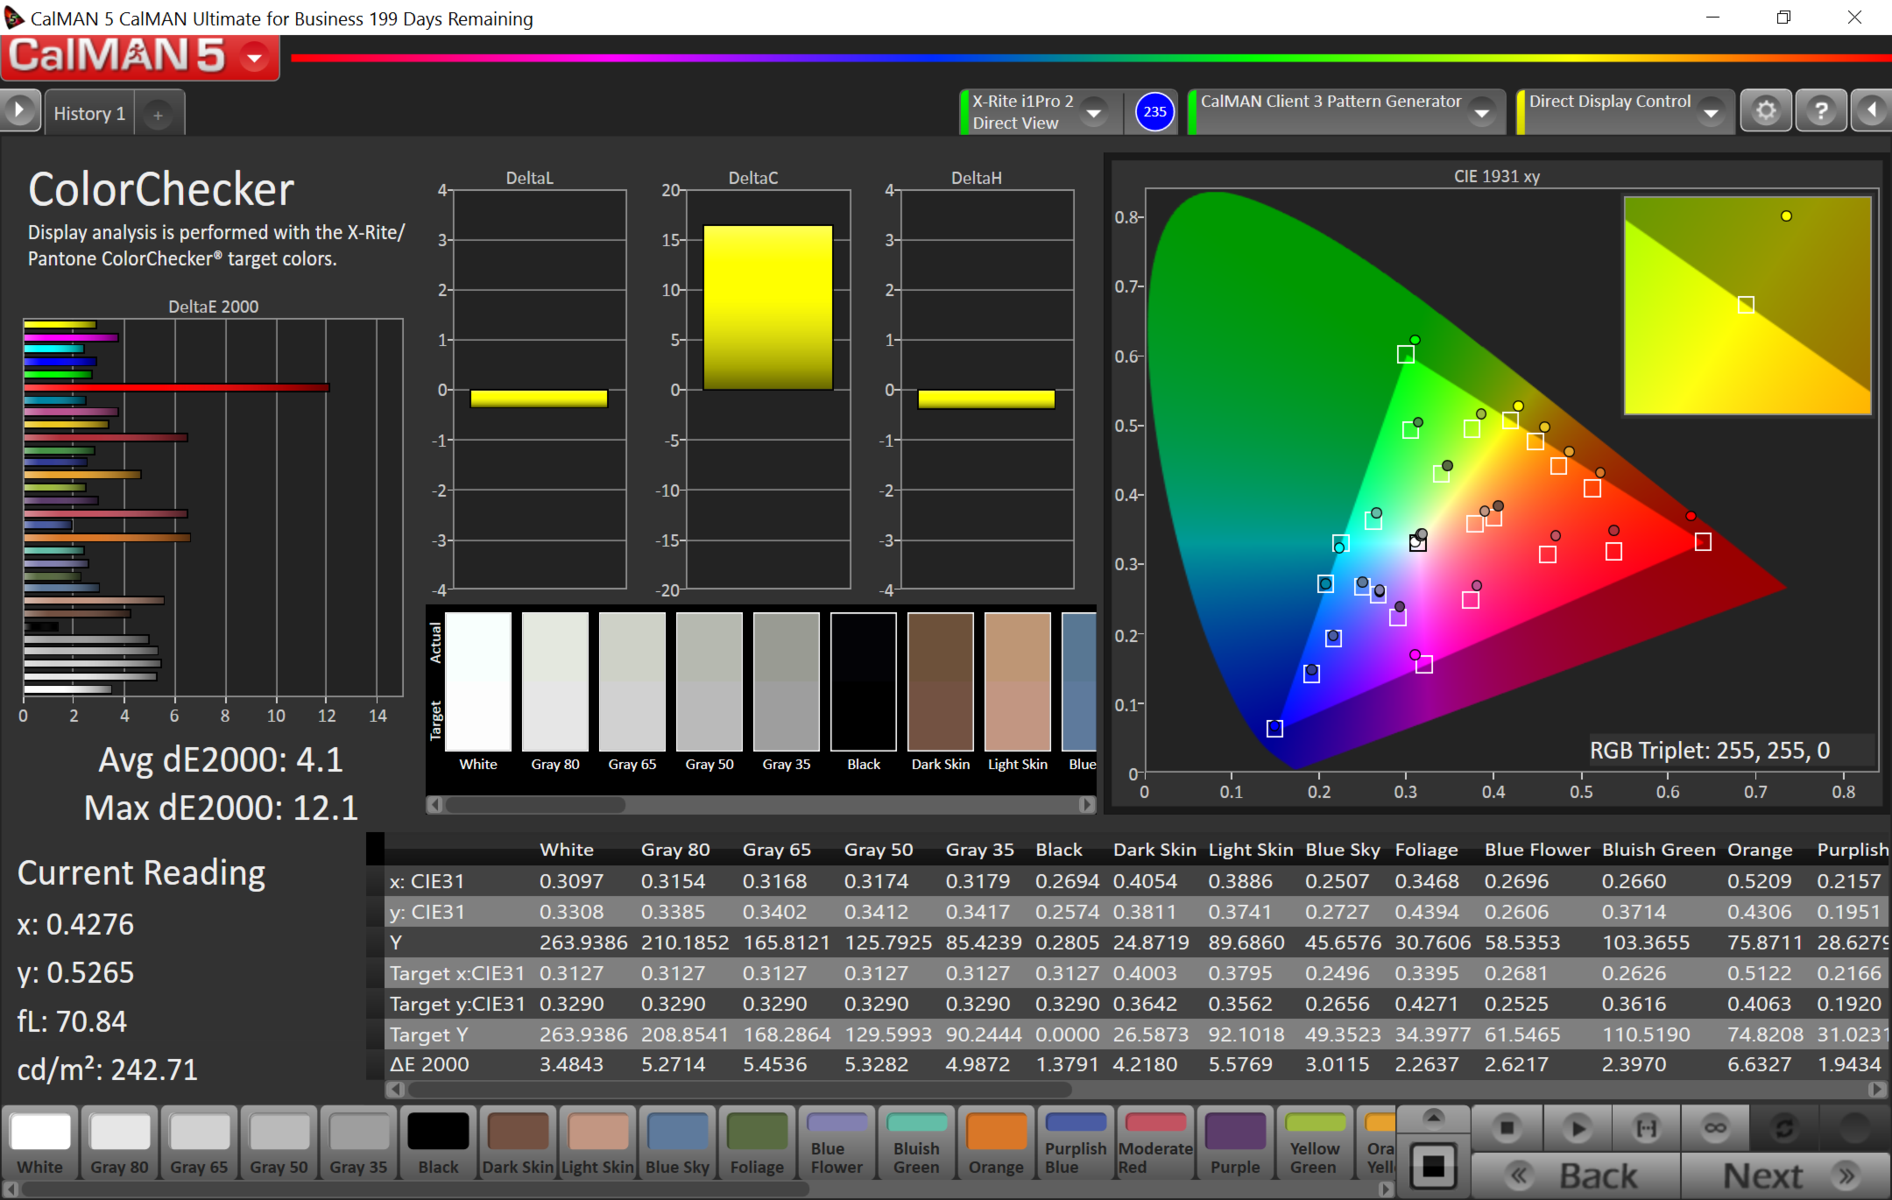
ΔE Color 4.1 | 0.5-29.43 Ø5
ΔE Greyscale 3.8 | 0.57-98 Ø5.3
76.2% sRGB (Argyll 1.6.3 3D)
57.7% AdobeRGB 1998 (Argyll 1.6.3 3D)
65.1% AdobeRGB 1998 (Argyll 2.2.0 3D)
88.7% sRGB (Argyll 2.2.0 3D)
65.7% Display P3 (Argyll 2.2.0 3D)
Gamma: 2.25
| Response Times | |
| Response Time Grey 50% / Grey 80% | |
| HP Spectre x2 12-a003ng K3D42EA (16, 31) | |
| Microsoft Surface Pro 4, Core m3 (17.2, 28.8) | |
| Cube i9 (16.4, 20.8) | |
| Lenovo ThinkPad X1 Tablet (11.2, 17.2) | |
| Chuwi Hi12 (11.6, 16.4) | |
| Acer Aspire Switch 12S SW7-272-M3A0 (10, 15) | |
| Lenovo Yoga 700-11ISK (13, 10) | |
| Response Time Black / White | |
| Microsoft Surface Pro 4, Core m3 (6, 25.2) | |
| HP Spectre x2 12-a003ng K3D42EA (5, 21) | |
| Cube i9 (9.2, 14.8) | |
| Lenovo Yoga 700-11ISK (11, 8) | |
| Acer Aspire Switch 12S SW7-272-M3A0 (4, 14) | |
| Lenovo ThinkPad X1 Tablet (3.6, 14) | |
| Chuwi Hi12 (5.2, 10.8) | |
| PWM Frequency | |
| Lenovo ThinkPad X1 Tablet (49) | |
| Cube i9 (99, 255) | |
| Microsoft Surface Pro 4, Core m3 (50) | |
| Lenovo Yoga 700-11ISK (70) | |
| HP Spectre x2 12-a003ng K3D42EA | |
| Chuwi Hi12 | |
| Acer Aspire Switch 12S SW7-272-M3A0 | |
* ... smaller is better
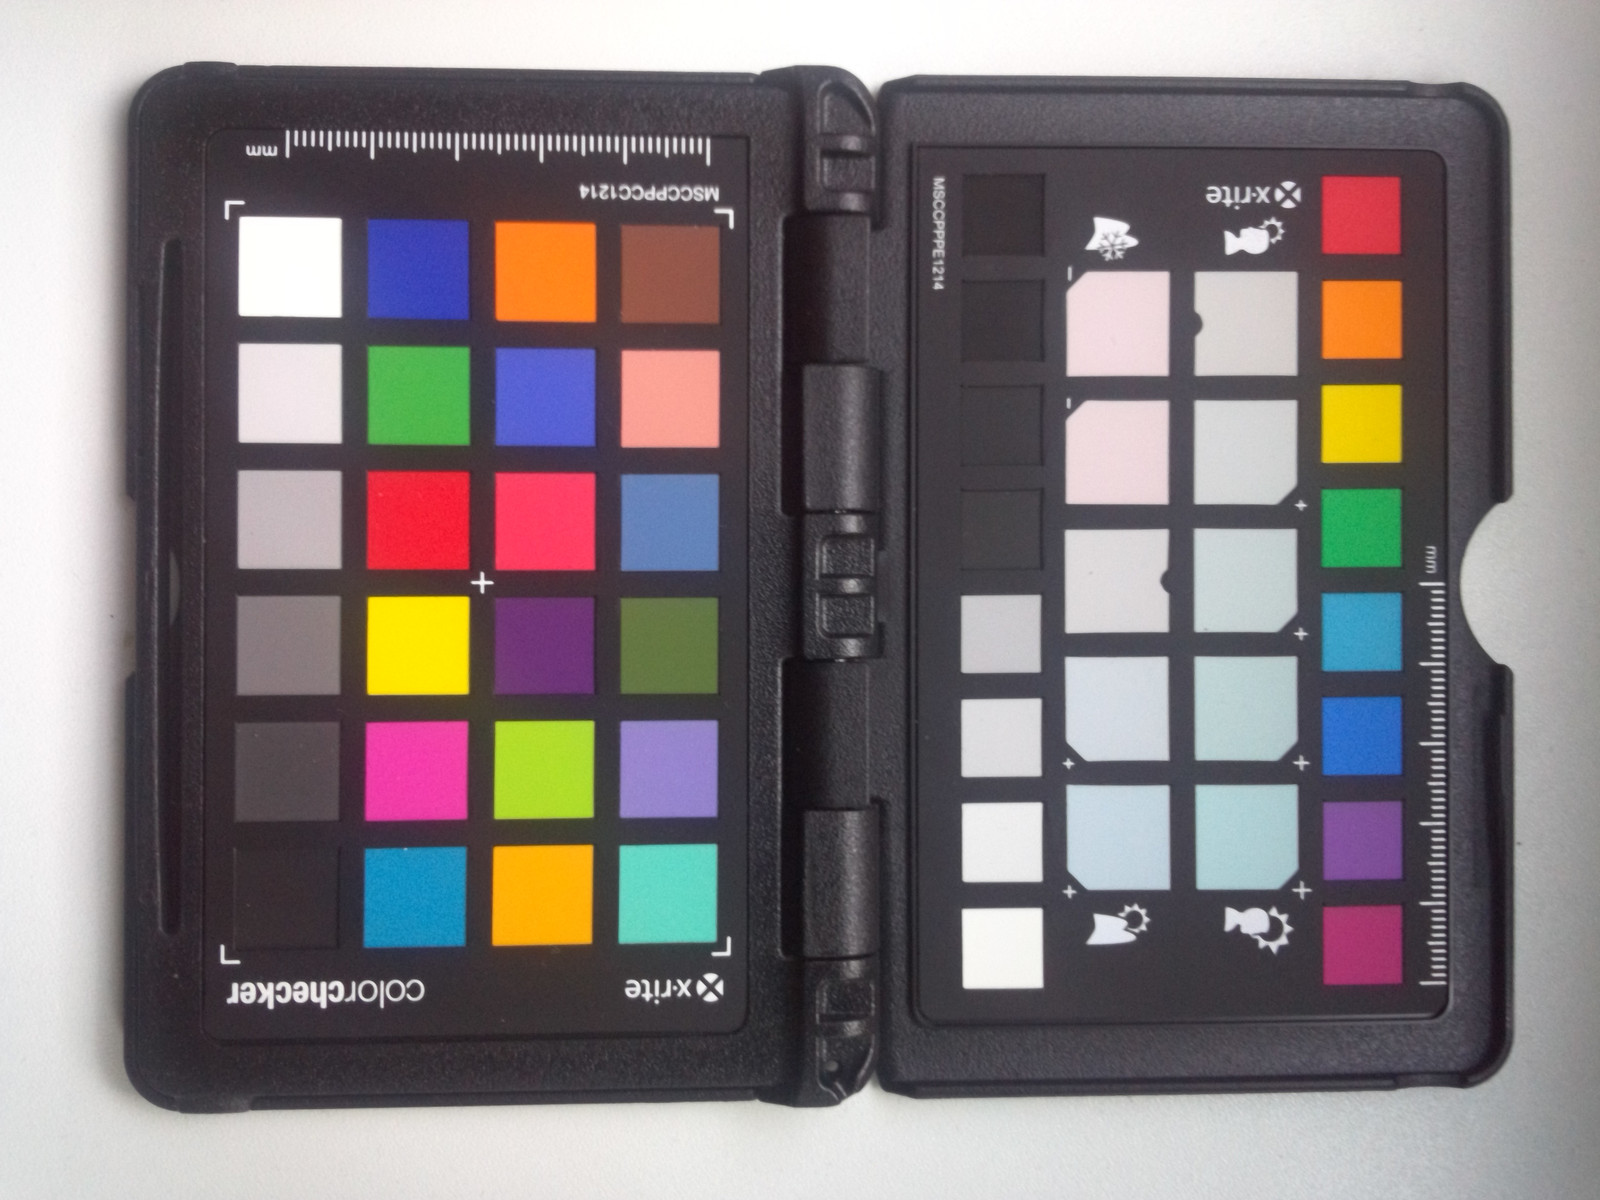
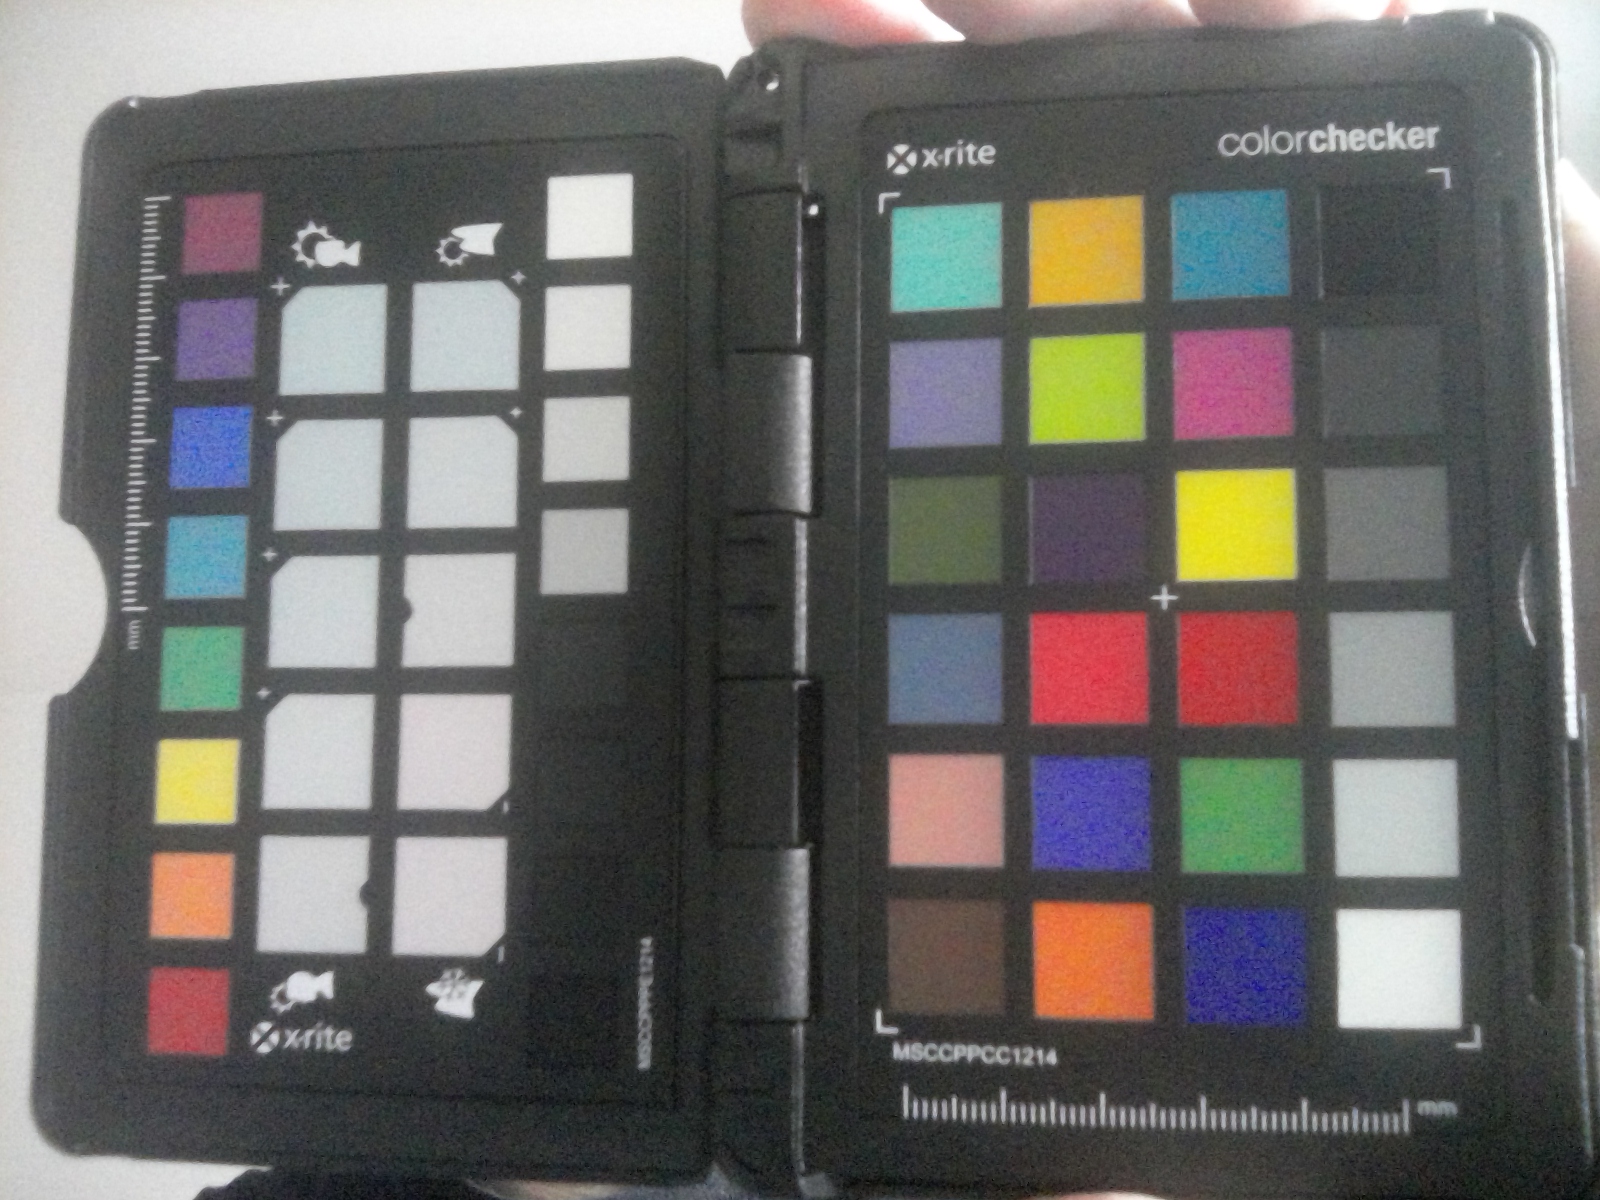
The screen's color accuracy is not bad in the state of delivery. Although the grayscale levels are evidently shifted, they do not deviate that much from the ideal. The dE2000 rate of 3.8 confirms this. Primarily the red test rates indicate a clear shift in colors where visible differences can be seen. However, the average of 4.1 is not bad
Unfortunately, Cube uses PWM at a relatively low frequency of 200 Hertz for reducing the brightness. The backlight remains stable only at the maximum brightness of 100% and 260 cd/m². This becomes visible when filming the screen at 120 FPS. The Cube i9 is therefore not a suitable work device for sensitive users. Eye strain and headaches could be the result of prolonged use with reduced brightness.
The screen's response times are good for an IPS panel. However, it is naturally weak compared with gaming desktops (5 ms is desirable here).
Display Response Times
| ↔ Response Time Black to White | ||
|---|---|---|
| 24 ms ... rise ↗ and fall ↘ combined | ↗ 9.2 ms rise | 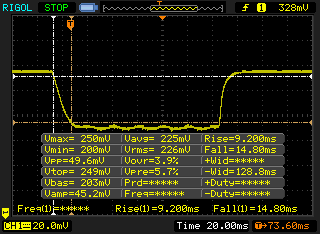 |
| ↘ 14.8 ms fall | ||
| The screen shows good response rates in our tests, but may be too slow for competitive gamers. In comparison, all tested devices range from 0.1 (minimum) to 240 (maximum) ms. » 48 % of all devices are better. This means that the measured response time is worse than the average of all tested devices (21.5 ms). | ||
| ↔ Response Time 50% Grey to 80% Grey | ||
| 37.2 ms ... rise ↗ and fall ↘ combined | ↗ 16.4 ms rise | 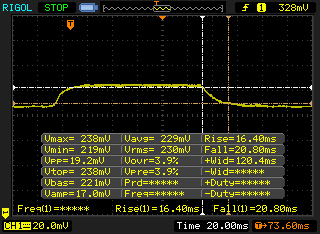 |
| ↘ 20.8 ms fall | ||
| The screen shows slow response rates in our tests and will be unsatisfactory for gamers. In comparison, all tested devices range from 0.2 (minimum) to 636 (maximum) ms. » 48 % of all devices are better. This means that the measured response time is worse than the average of all tested devices (33.7 ms). | ||
Screen Flickering / PWM (Pulse-Width Modulation)
| Screen flickering / PWM detected | 200 Hz | ≤ 99 % brightness setting | 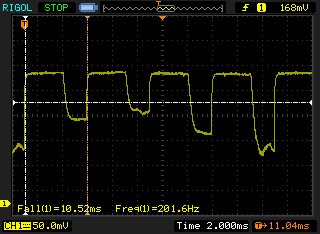 |
| ≤ 255 cd/m² brightness | |||
The display backlight flickers at 200 Hz (worst case, e.g., utilizing PWM) Flickering detected at a brightness setting of 99 % (255 cd/m²) and below. There should be no flickering or PWM above this brightness setting. The frequency of 200 Hz is relatively low, so sensitive users will likely notice flickering and experience eyestrain at the stated brightness setting and below. Flickering occurs even at high brightness setting and may have an effect on the user during everyday use. In comparison: 53 % of all tested devices do not use PWM to dim the display. If PWM was detected, an average of 17924 (minimum: 5 - maximum: 3846000) Hz was measured. | |||
Thanks to the IPS technology, colors remain stable from all viewing angles. There is no reason for complaint here.
Performance
The latest Skylake Core m3 processor alongside an integrated graphics unit is installed in Cube's i9. It can fall back on 4 GB (LP) DDR3 1866 10-10-10-28 CR1 in dual-channel mode (according to Everest). The memory fares well with 25000 to 27000 MB/s in the read, write and copy benchmark of AIDA64. Only the latency of 129 ns is weak. The transfer rates are similar to those of HP's EliteBook Folio G1, although the EliteBook's latencies of 112 ns are better. Compared with a Broadwell-based i7-5700HQ in MSI's GP52 with DDR3-1600 (dual-channel), the storage does a good job in the transfer (e.g. 23000 MB/s in read test). However, the normal DDR3 memory is considerably faster with a latency of 71 ns.
Processor
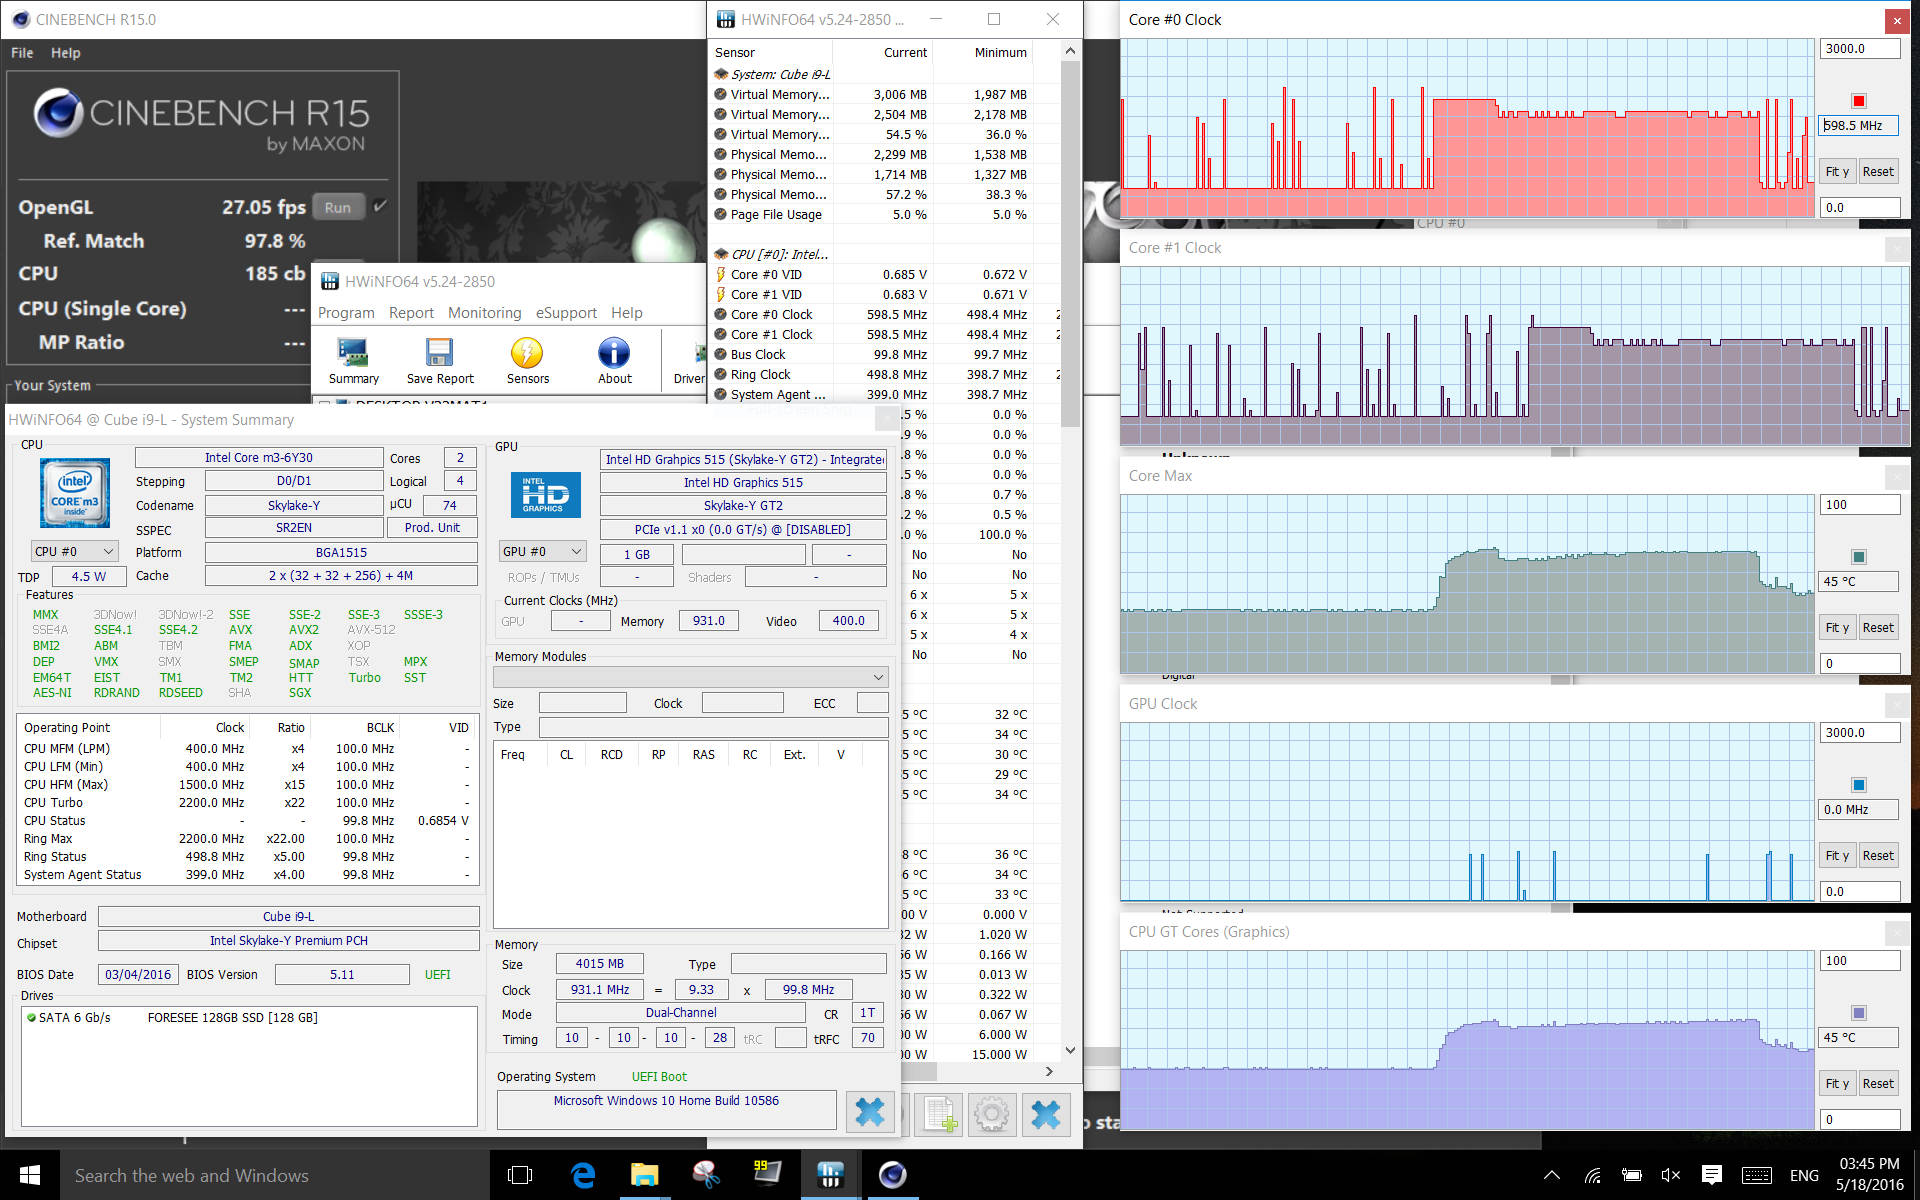
The processing performance of the passively cooled Core m3-6Y30 is very good, particularly when compared with the common Atom processors. The concept of routing the heat to the aluminum casing via thermal pads apparently functions sufficiently well when looking at the performance over several Cinebench 15 runs. However, tips on how to improve the cooling using a copper piece and thermal paste already exist on the Internet (see the YouTube video by Scott Roebuck).
Cube's i9 lags slightly behind the other rivals based on the same CPU. Microsoft and Samsung achieved marginally better scores in the multithread test and considerably better scores in the single thread with their premium tablets.
System Performance
We measure the system performance with PCMark 8 Home Test. Cube's i9 fares well compared with other Skylake-based Core m laptops and tablets. The ZenBook UX305CA is the fastest 6Y30 device in the test with a lead of 8%. Generally, the fastest device is Dell's Latitude 13 7370 with 6Y57 with a lead of 16%. The MacBook 12 and Surface Pro 4 with Core m3 are both outrun slightly (97% and 92% of the performance). The Galaxy Tab Pro S W700N finishes last with just 84%.
Compared with other Windows tablets, the i9 does a superb job and is virtually just as fast as the Latitude 11 5175 with a Core m5-6Y57. Chuwi's Hi12, the cheapest rival with a Cherry Trail Atom CPU, achieves only 40% of the performance in PCMark.
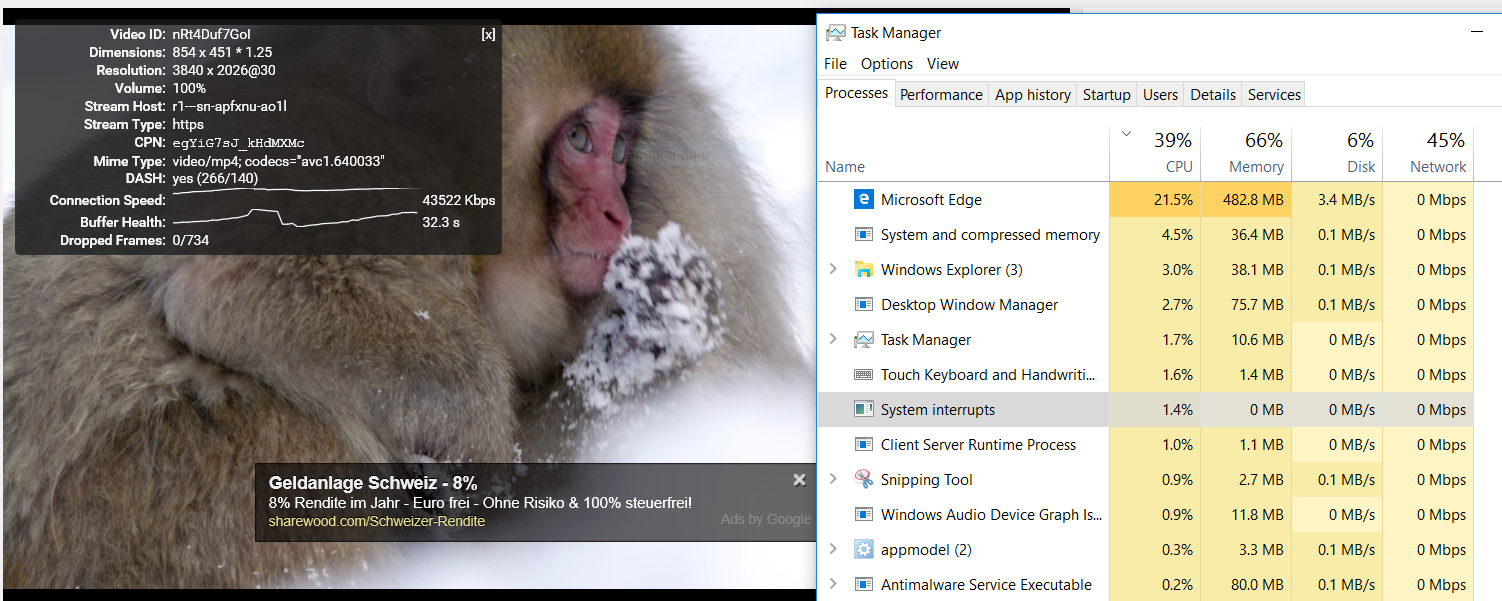
The subjective experiences support the measured rates. The Core m3 is noticeably faster than the x5-Z830 in Chuwi's Hi12 or Vi8. There were no performance issues during routine work on the Internet, photos and videos.
| PCMark 8 Home Score Accelerated v2 | 2628 points | |
| PCMark 10 Score | 2151 points | |
Help | ||
| JetStream 1.1 - Total Score | |
| Cube i9 | |
| Apple MacBook 12 (Early 2016) 1.1 GHz | |
| Apple MacBook 12 (Early 2016) 1.1 GHz | |
| Samsung Galaxy Tab Pro S W700N | |
| Samsung Galaxy Tab Pro S W700N | |
| Octane V2 - Total Score | |
| Microsoft Surface Pro 4, Core i5, 128GB | |
| Apple MacBook 12 (Early 2016) 1.1 GHz | |
| Apple MacBook 12 (Early 2016) 1.1 GHz | |
| Cube i9 | |
| Samsung Galaxy Tab Pro S W700N | |
* ... smaller is better
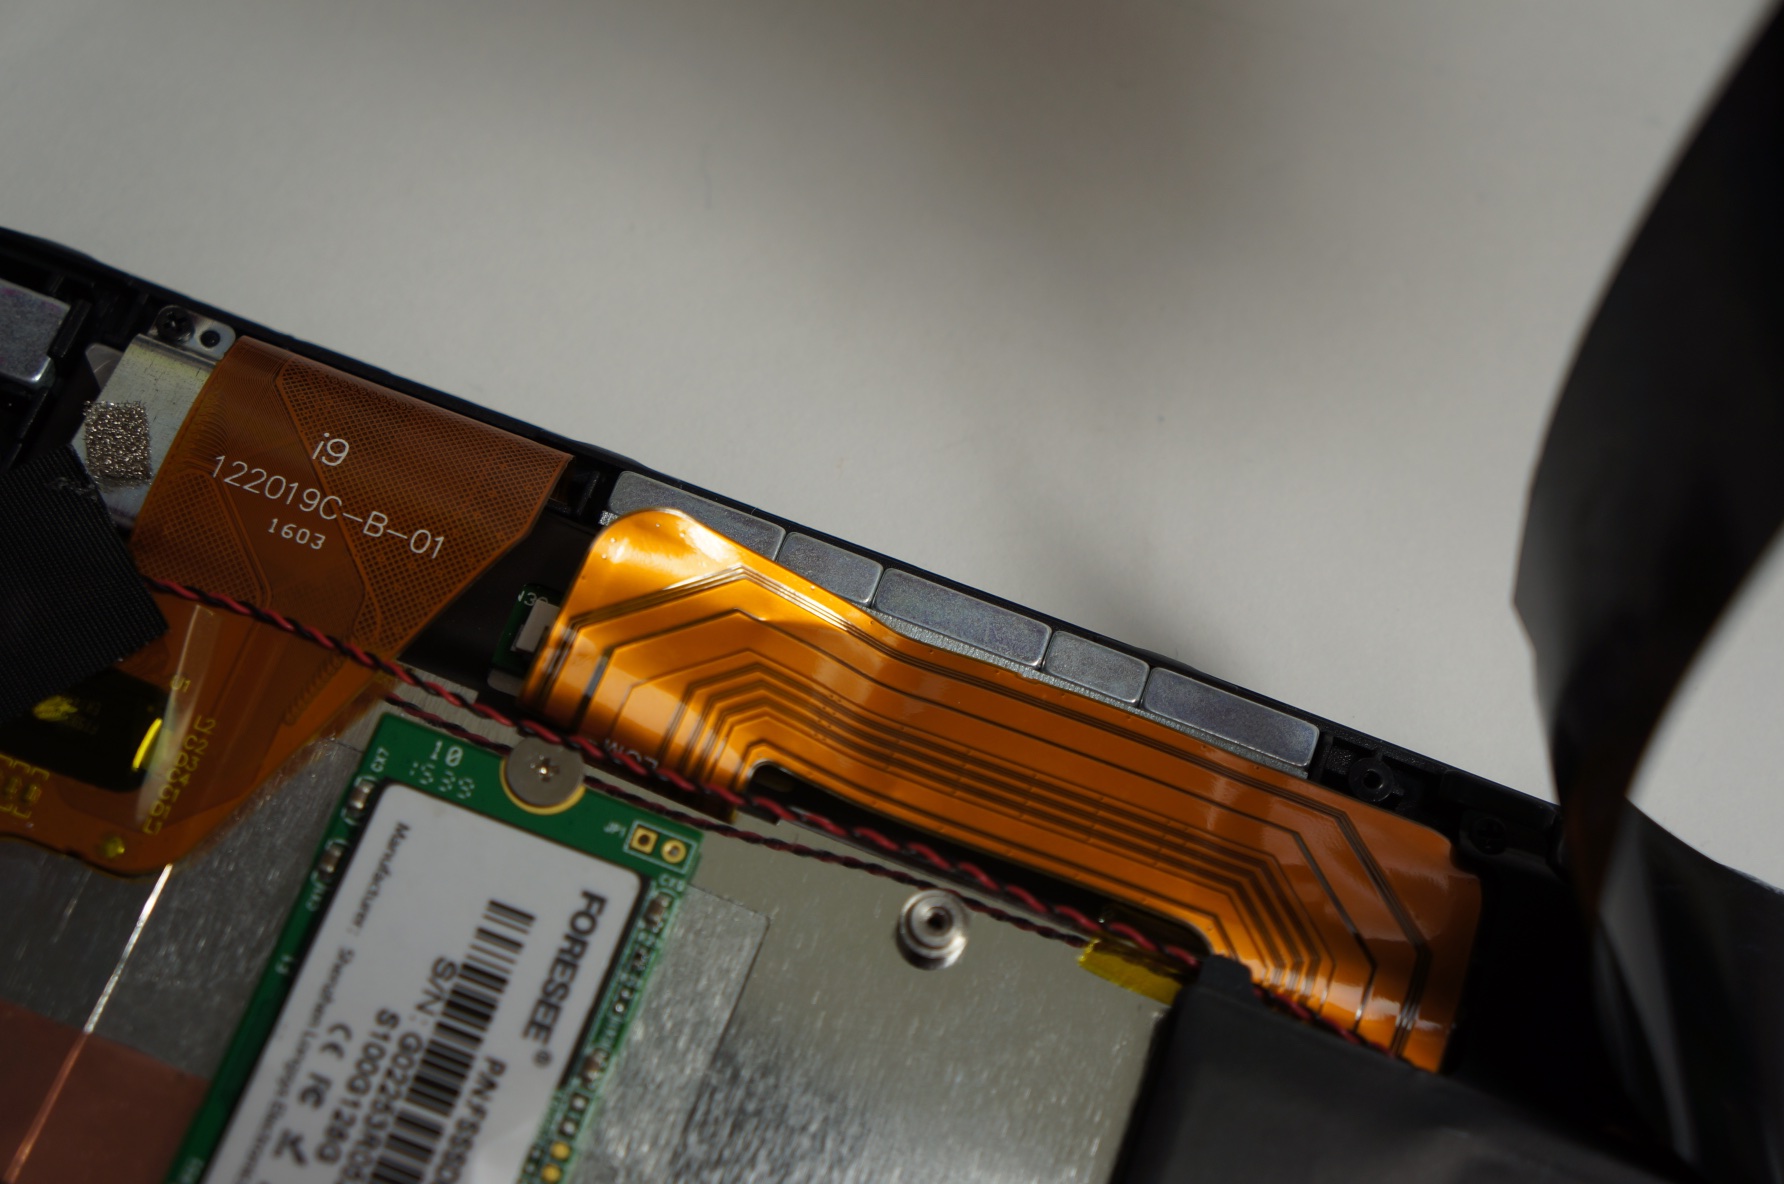
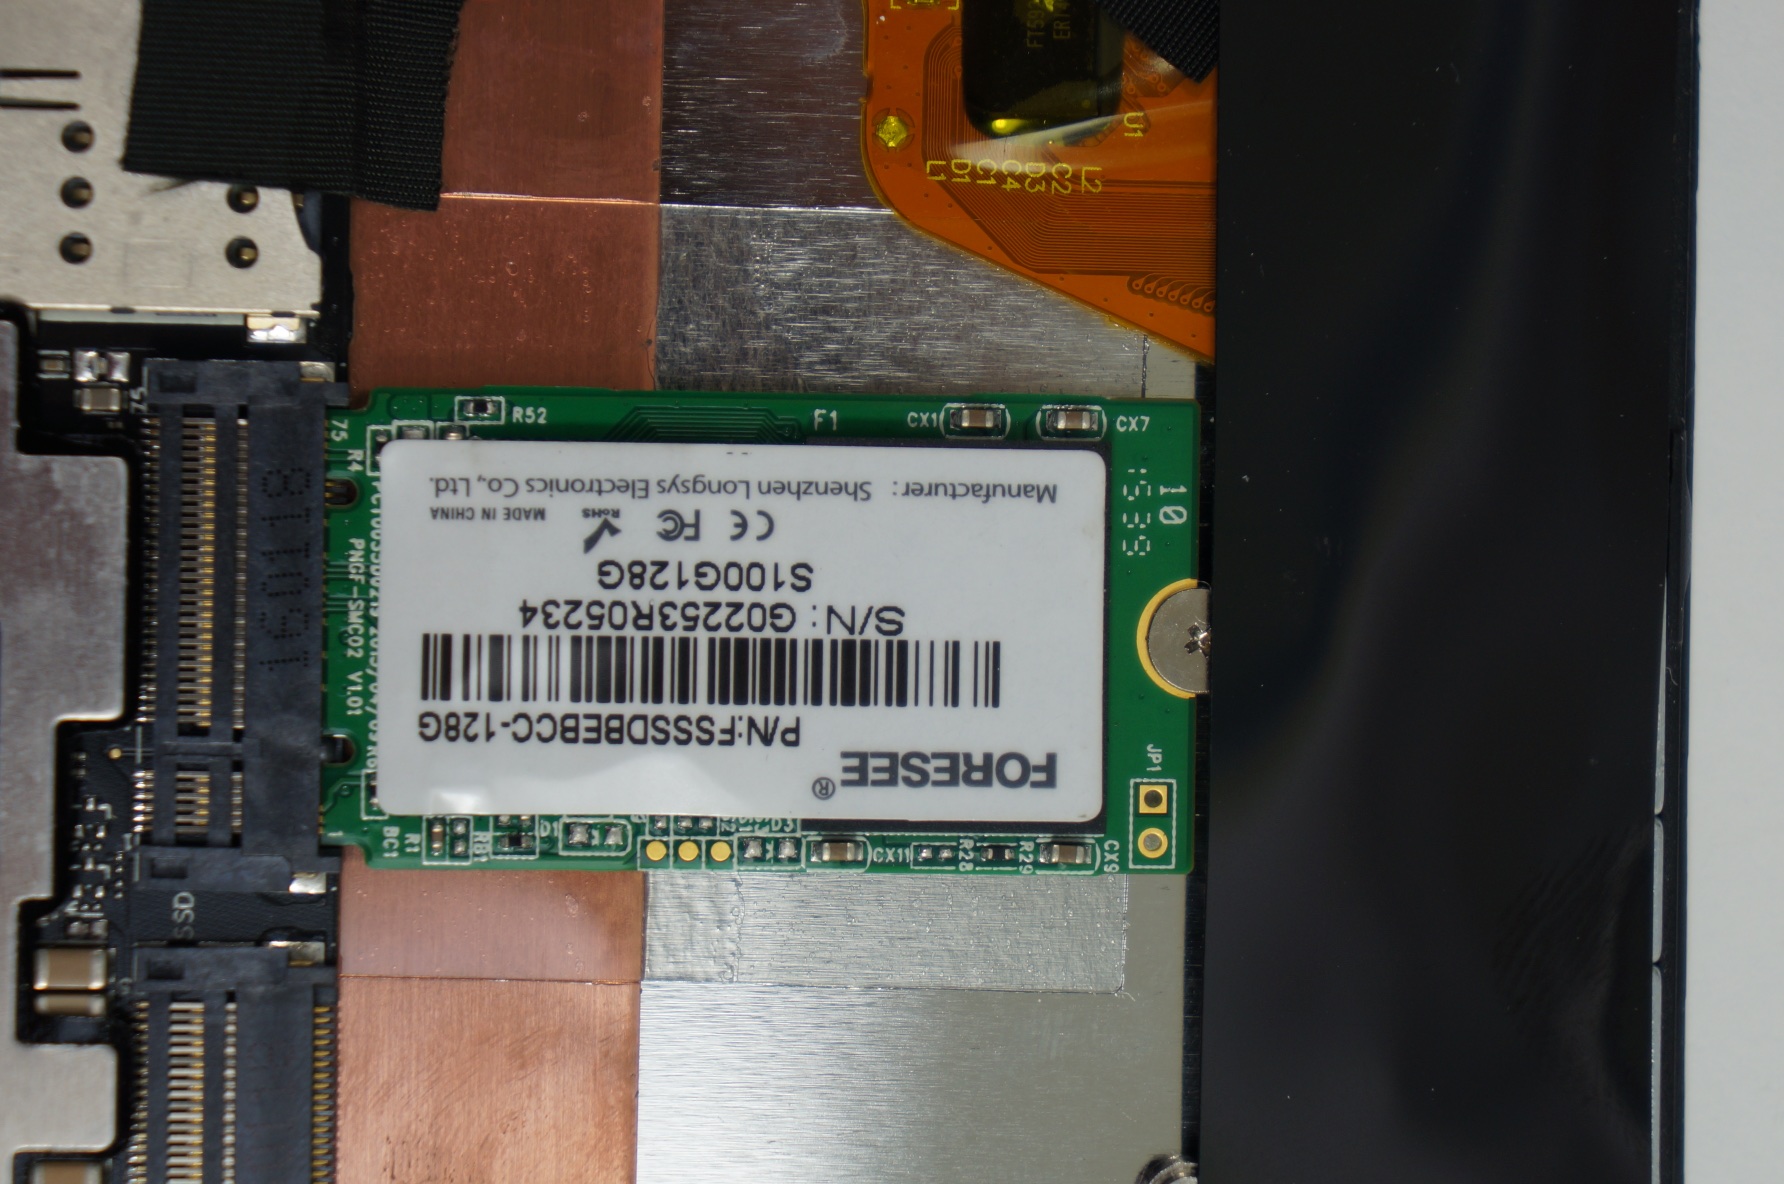
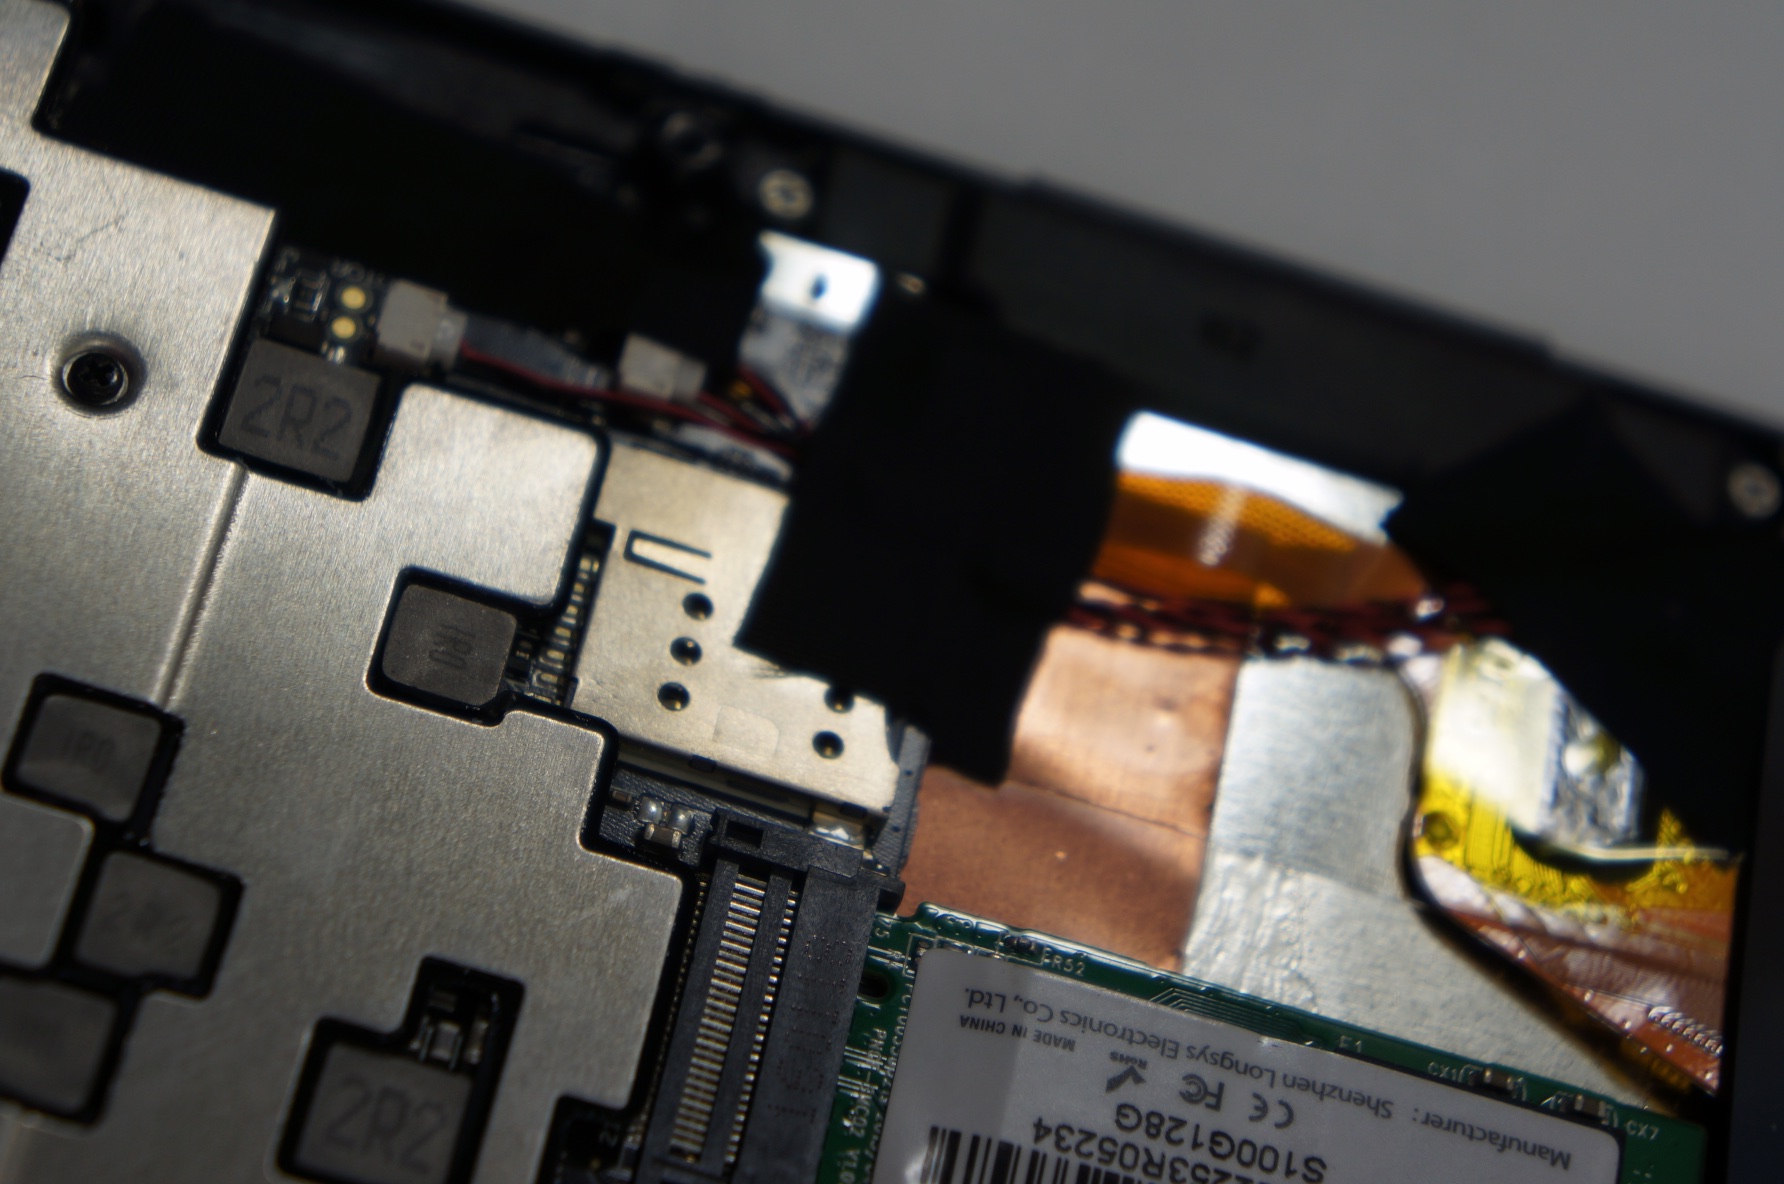
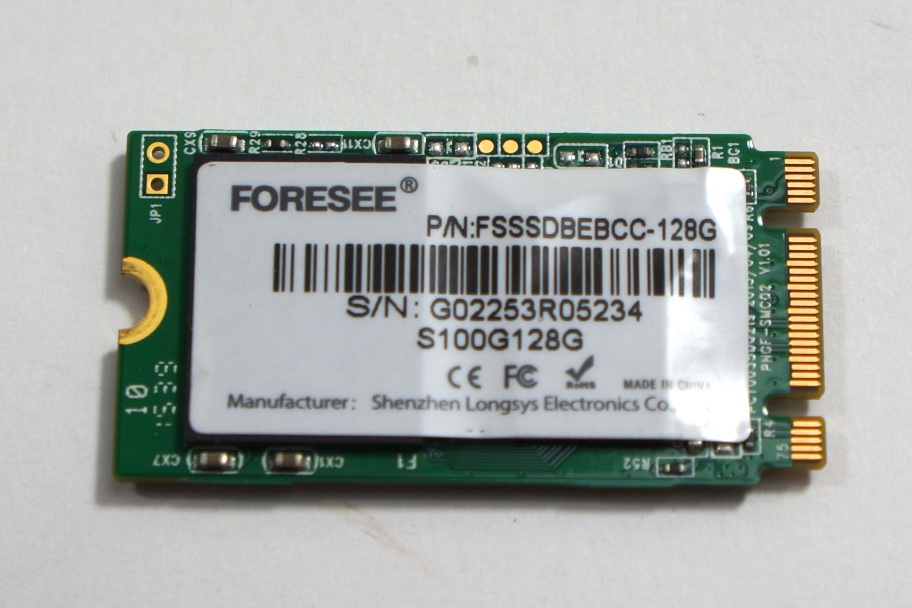
Storage Device
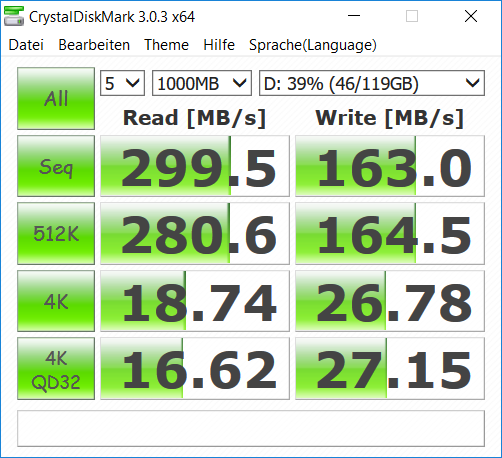
The installed M.2 SSD provided by Foresee is definitely not one of the fastest SATA SSDs on the market; rather, it is situated at the lower end. However, the Foresee drive can clearly score compared with the eMMC storage chips installed in the Atom tablets (that primarily fail in AS SSD). Conventional HDDs are also outrun by far. Thanks to the accessible M.2 slot, it is also relatively easy to replace the SSD with a faster and larger model.

Graphics Card
Intel's HD Graphics 515 integrated in the Core m3 is responsible for video output. It clocked at up to 797 MHz in the test, but 500 MHz will rather be the case during prolonged load. As with all Core m devices, the performance depends on the set TDP and the achieved temperatures. As with our processor tests, Cube's i9 cannot compete with other Core m3 premium range devices in the graphics tests. However, it clearly outperforms the former Surface Pro 3 or Atom-based Surface 3.
| 3DMark 06 Standard Score | 5919 points | |
| 3DMark 11 Performance | 958 points | |
| 3DMark Cloud Gate Standard Score | 4152 points | |
Help | ||
Gaming Performance
Sophisticated games are obviously not the specialty of the Core m3 and its integrated graphics. Undemanding 3D games such as "League of Legends" or the tested "World of Warships" are playable using minimum details.
| low | med. | high | ultra | |
| The Witcher 3 (2015) | 7.2 | |||
| Dota 2 Reborn (2015) | 48 | 25.4 | 9.4 | 8.1 |
| World of Warships (2015) | 32 | 23.6 | ||
| Overwatch (2016) | 21.7 | |||
| Mirror's Edge Catalyst (2016) | 11.4 | |||
| Farming Simulator 17 (2016) | 48 | 24.1 | 10.1 | |
| Rocket League (2017) | 30.1 | 10.7 | ||
| Dirt 4 (2017) | 26.6 | |||
| Team Fortress 2 (2017) | 48 | 36 | 24 | |
| X-Plane 11.11 (2018) | 14.4 | |||
| FIFA 19 (2018) | 21 (slow gameplay) |
Emissions
System Noise
Thanks to the fanless design, Cube's i9 will not produce any fan noise. However, our review sample suffers from audible transistor whining in some load situations. Although this is only audible in very quiet environments, it could annoy some users.
Temperature
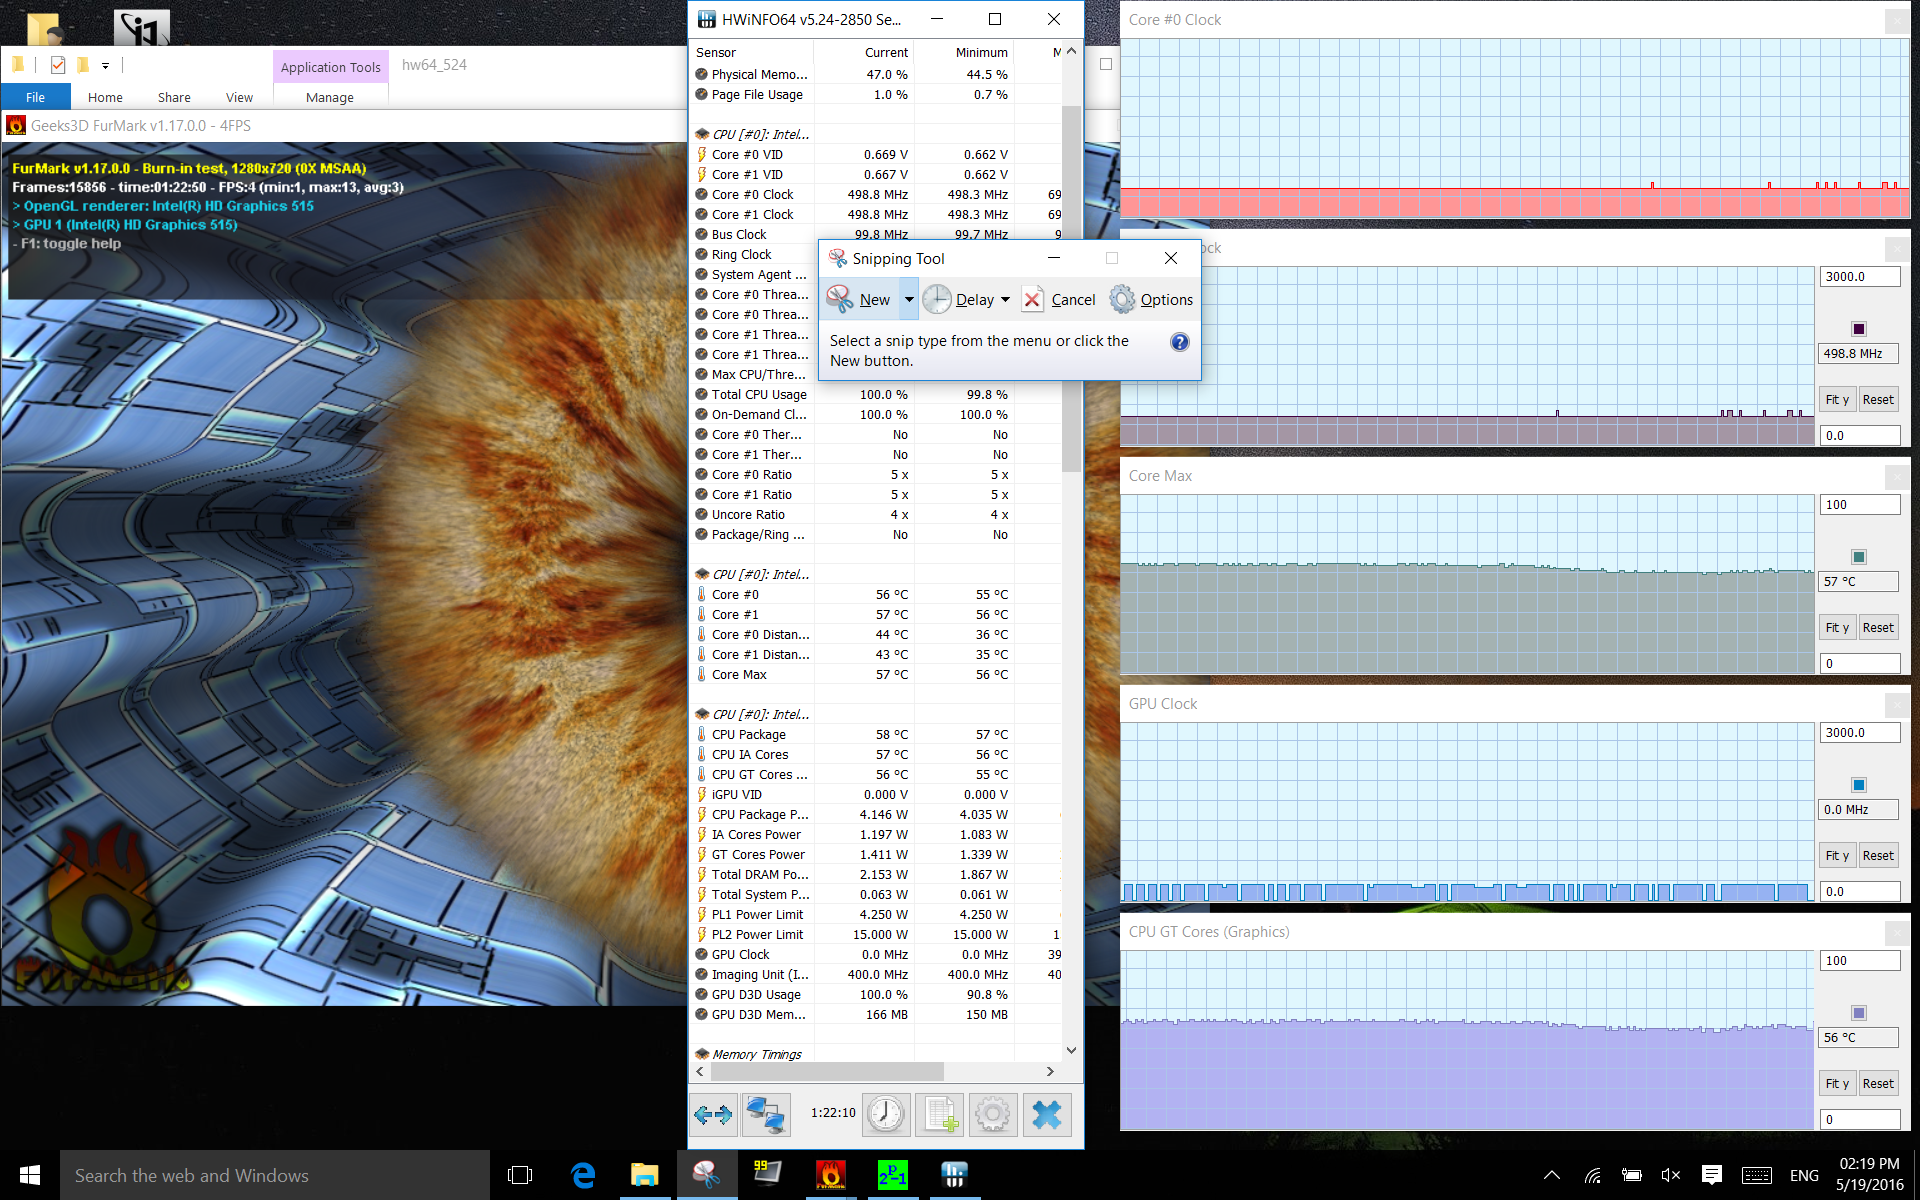
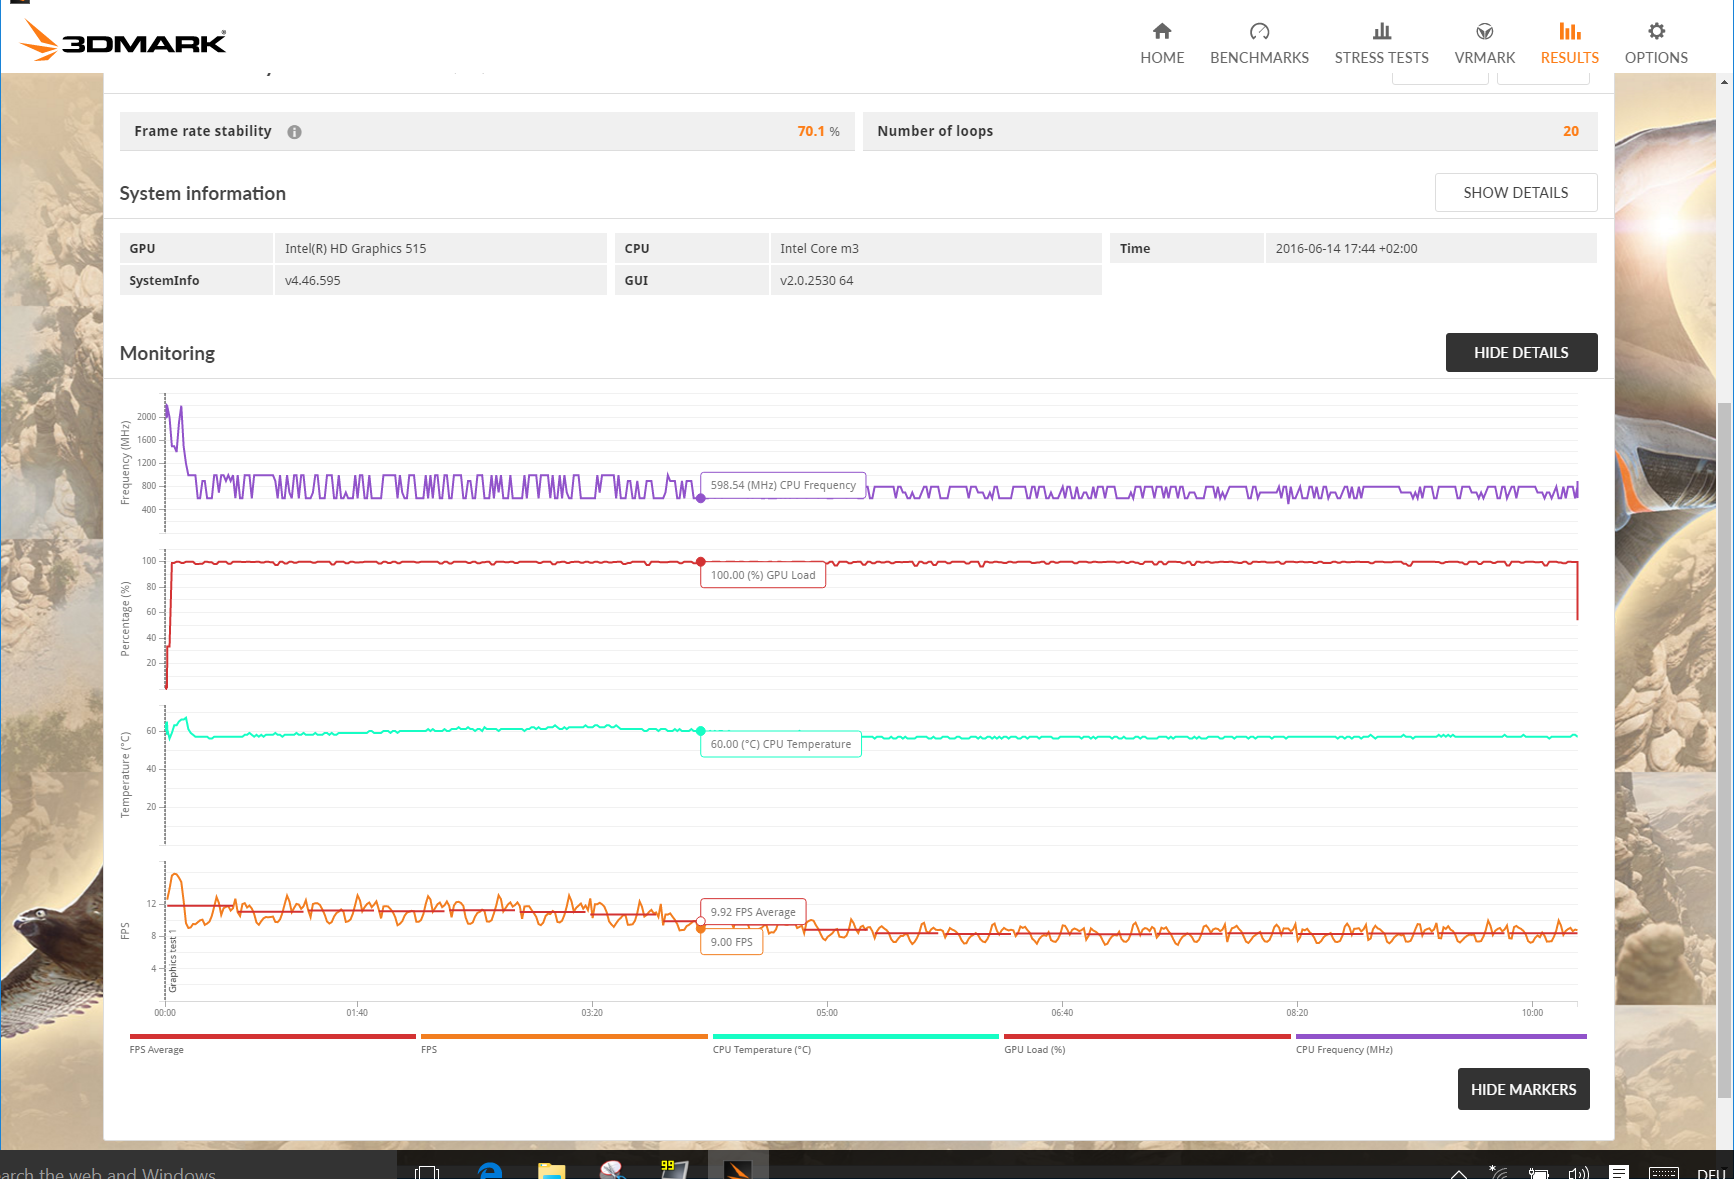
The surface temperatures that we measured remained uncritical in all load situations. The temperatures in the extreme test cannot be considered unrealistic. The surfaces almost reached the level of our test while "The Witcher 3" ran (-1 °C/~-2 °F on average).
The internal temperatures also remained uncritical. While running “The Witcher 3", the CPU cores ran at almost 800 MHz and 59 °C (~138 °F) and the graphics unit ran at 450 to 500 MHz and 61 °C (~142 °F). It did not change even after over 40 minutes. The CPU cores reached still uncritical 70 °C (~158 °F) in the Cinebench R15 loop, and initially ran at 2 GHz and later at 1.7 to 1.8 GHz. The internal temperatures were also moderate in the extreme load test via FurMark and Prime5. The CPU clocked at 500 MHz and the GPU at 300 MHz, which are also relatively low.
(+) The maximum temperature on the upper side is 39 °C / 102 F, compared to the average of 33.8 °C / 93 F, ranging from 20.7 to 53.2 °C for the class Tablet.
(±) The bottom heats up to a maximum of 41 °C / 106 F, compared to the average of 33.3 °C / 92 F
(+) In idle usage, the average temperature for the upper side is 29.7 °C / 85 F, compared to the device average of 30 °C / 86 F.
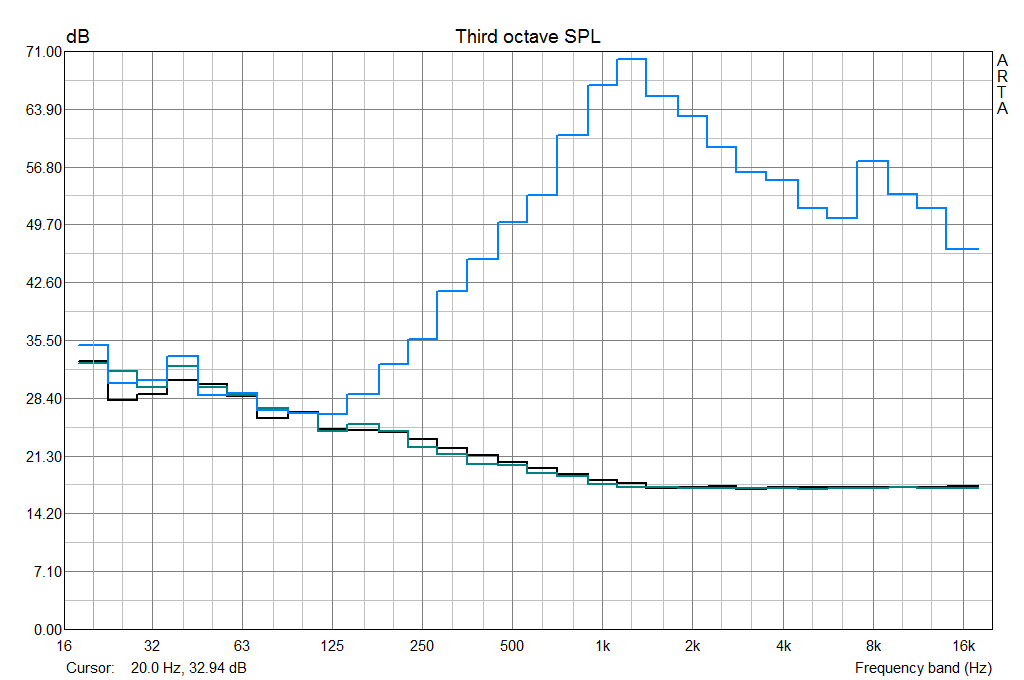
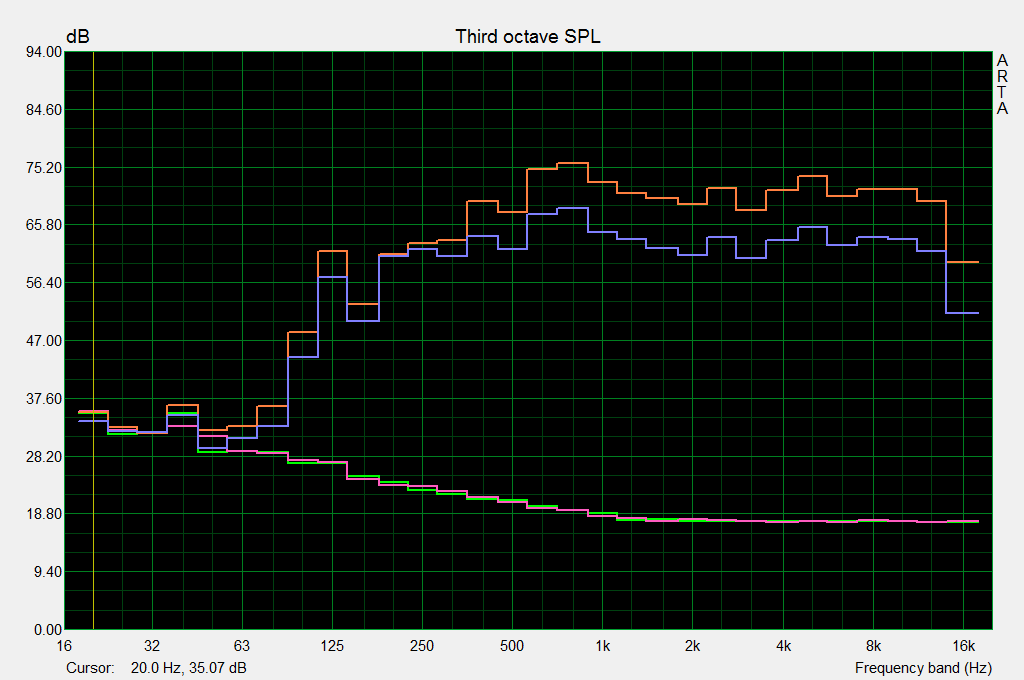
Speakers
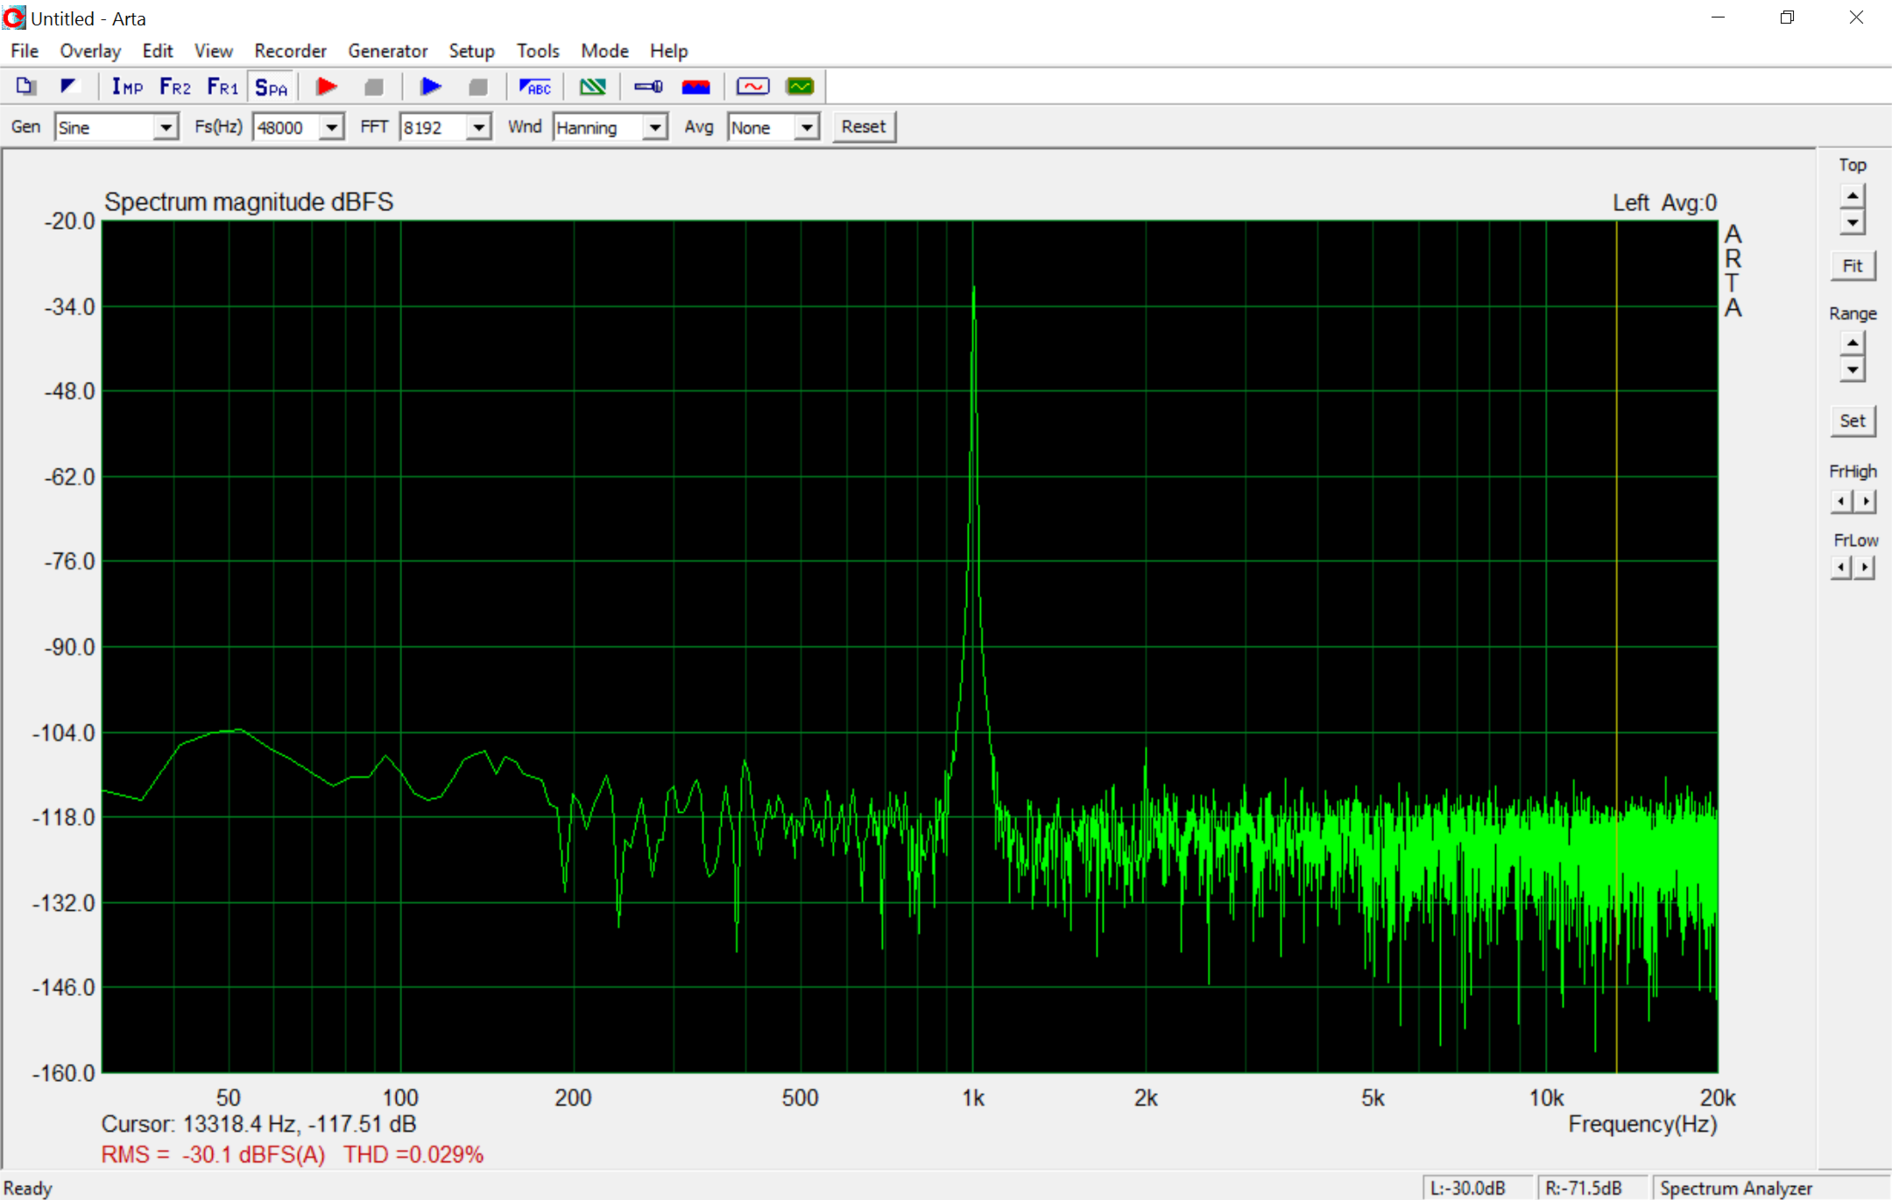
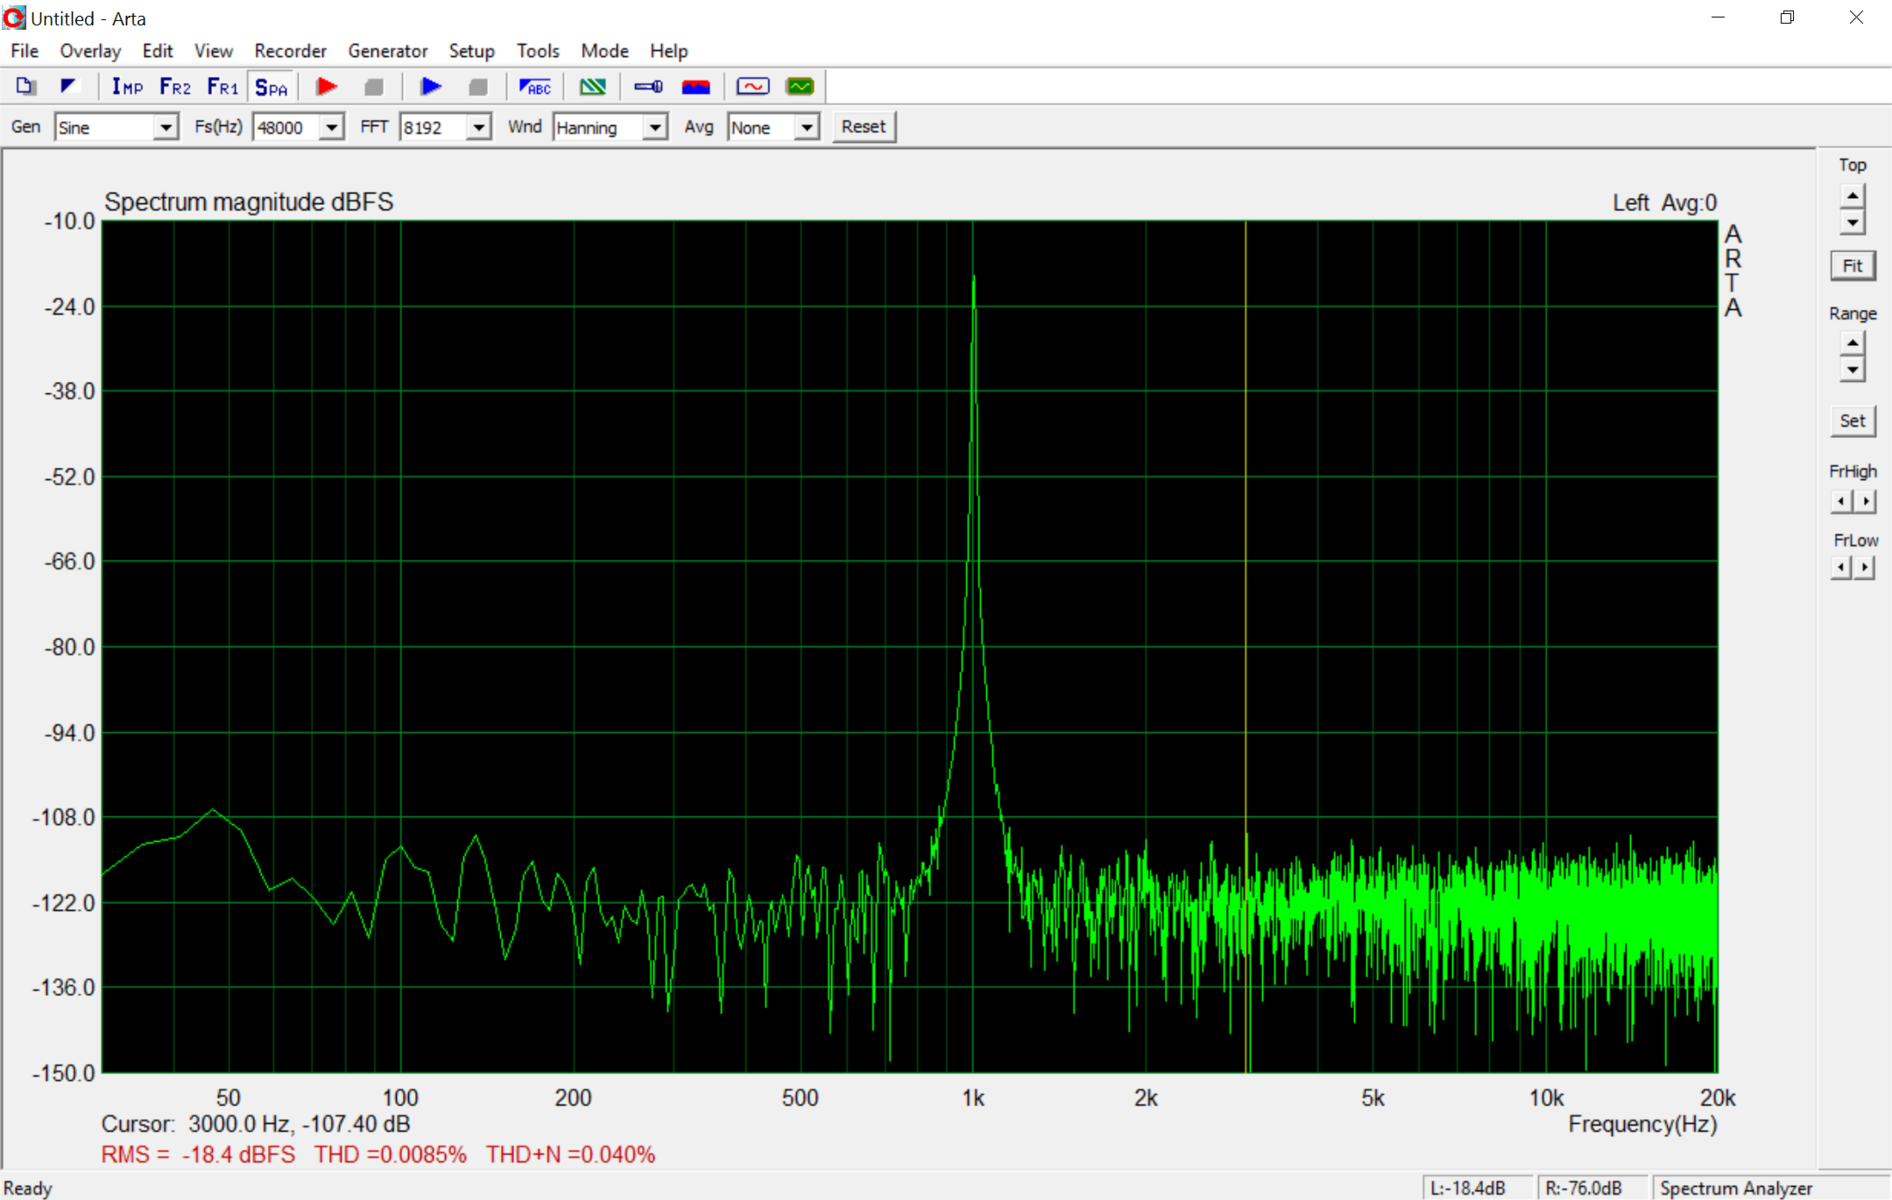
The stereo speakers installed in the Cube i9 tablet are moderately loud with a measured 74 dB(A), but do not present a homogeneous sound impression. Two very striking peaks are seen at 1k and 8k Hz in the frequency diagram below. A straight line would be ideal. We have added screenshots of the outstanding speakers in the slim MacBook 12 beside it for comparison. They render considerably better basses (low frequencies below 250 Hz), are louder and much more linear.
The audio jack produces a rustling noise. Not ideal for audiophiles, but less demanding users will not have problems with it.
| Loudspeakers - Pink Noise | |
| Apple MacBook 12 (Early 2016) 1.1 GHz (10.2) | |
| Chuwi Hi12 | |
| Cube i9 | |
| Microsoft Surface Pro 4, Core i5, 128GB (19.2) | |
Energy Management
Power Consumption
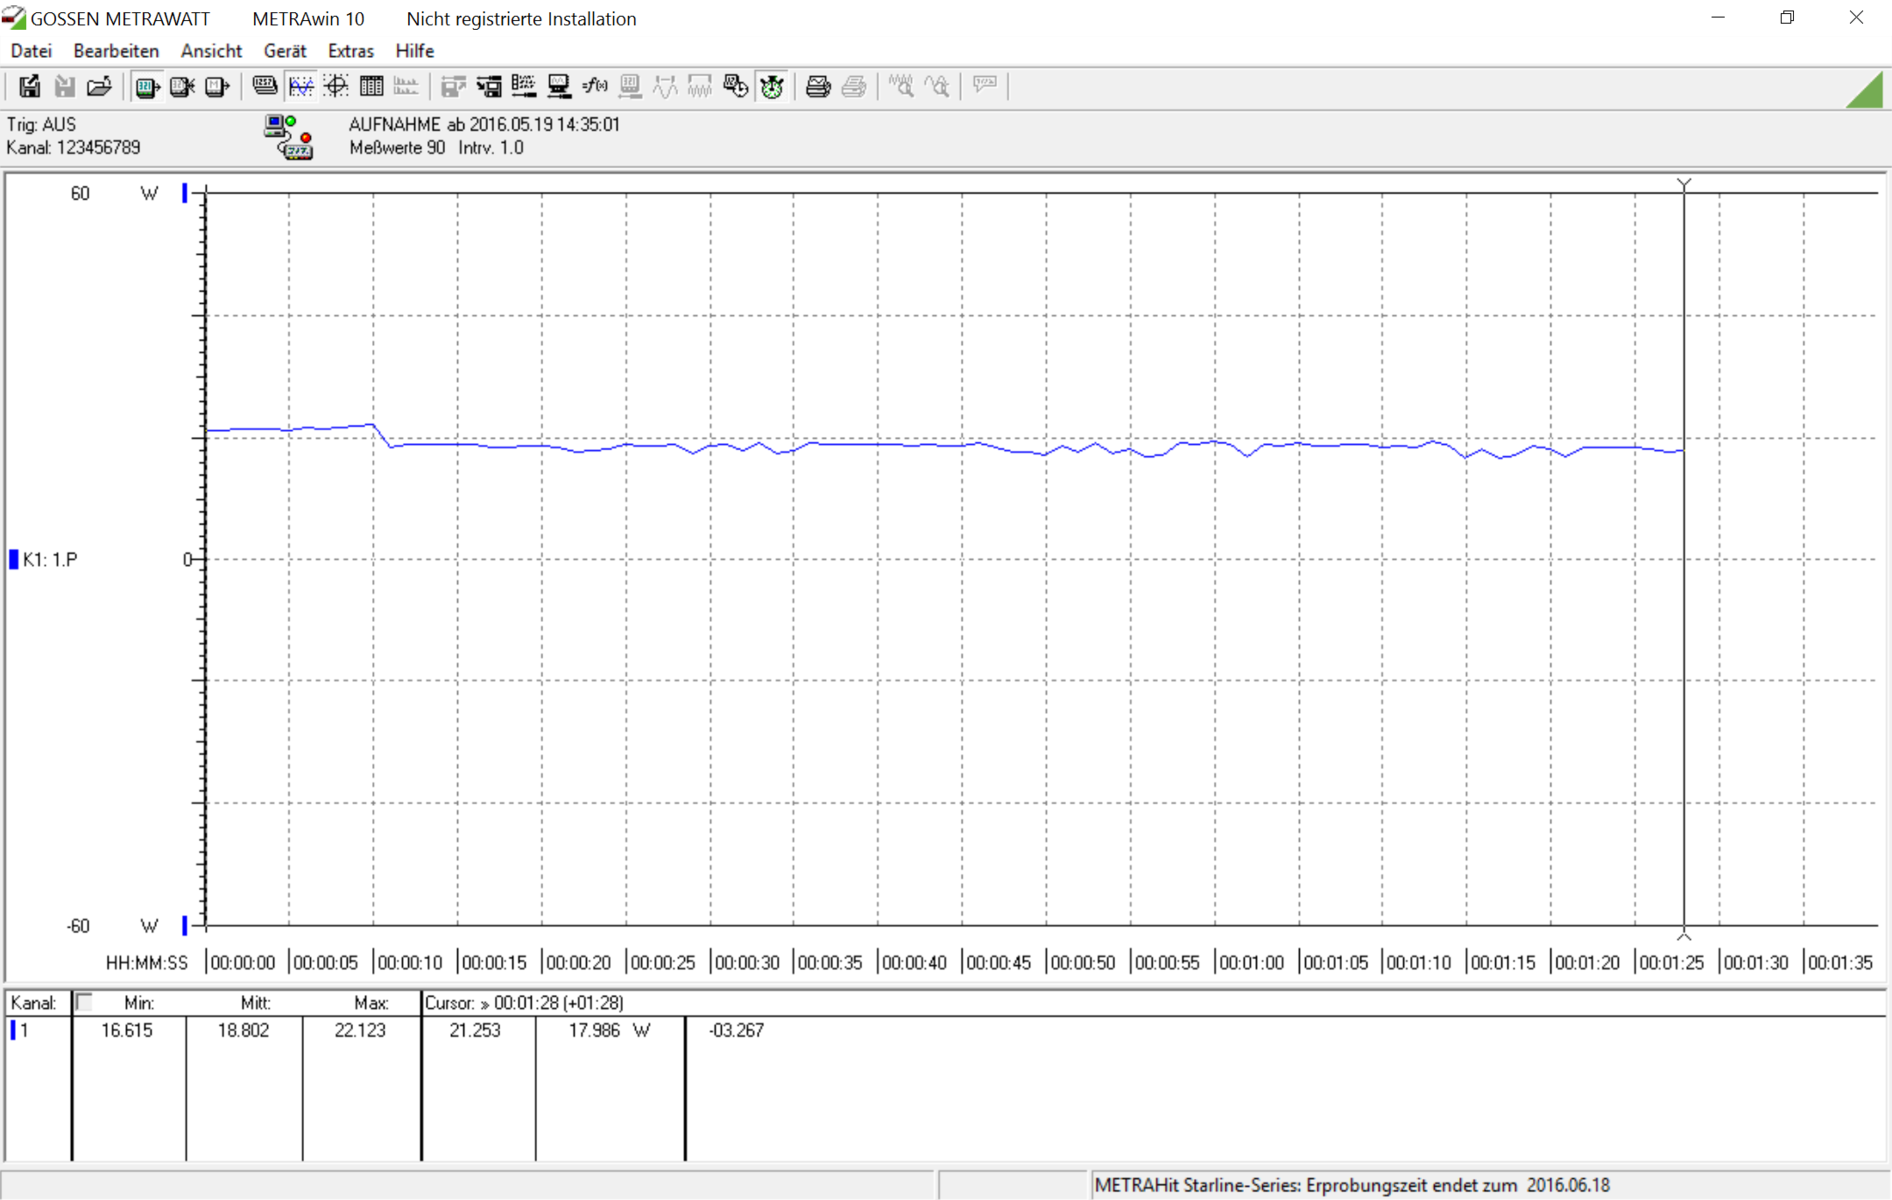
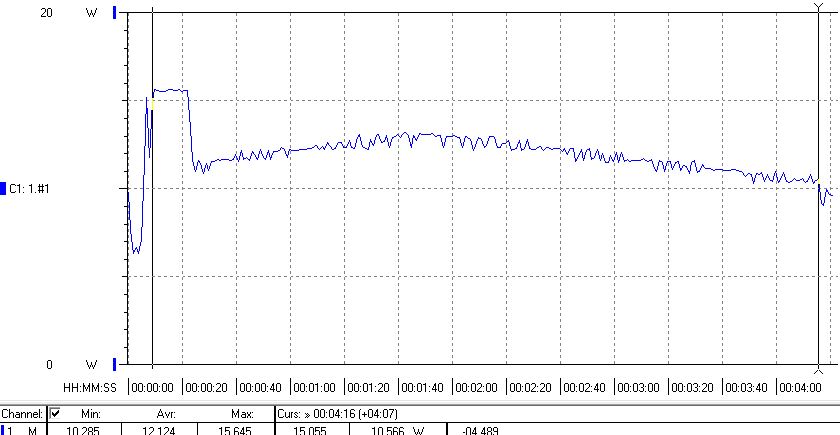
As typical for the Core m, the maximum power consumption was only measurable for a short time. Approximately 22.1 watts were drained from the outlet at the beginning of Prime95. It then dropped to a stable 15 watts. This leads to the interesting situation that the 3DMark 06 graphics test required an average of 18.6 watts (initially also 22 watts for a few seconds, then 18 watts), but an average of only 16.3 watts was needed during maximum load via FurMark and Prime95.
The power supply needs only 0.16 watts on its own. However, 0.7 watts is consumed from the outlet when connected to the device (without charging the battery). This is comparable with the standby rate (0.8 watts). Thus, shutting down the tablet is only worthwhile when it is disconnected from the power supply.
| Off / Standby | |
| Idle | |
| Load |
|
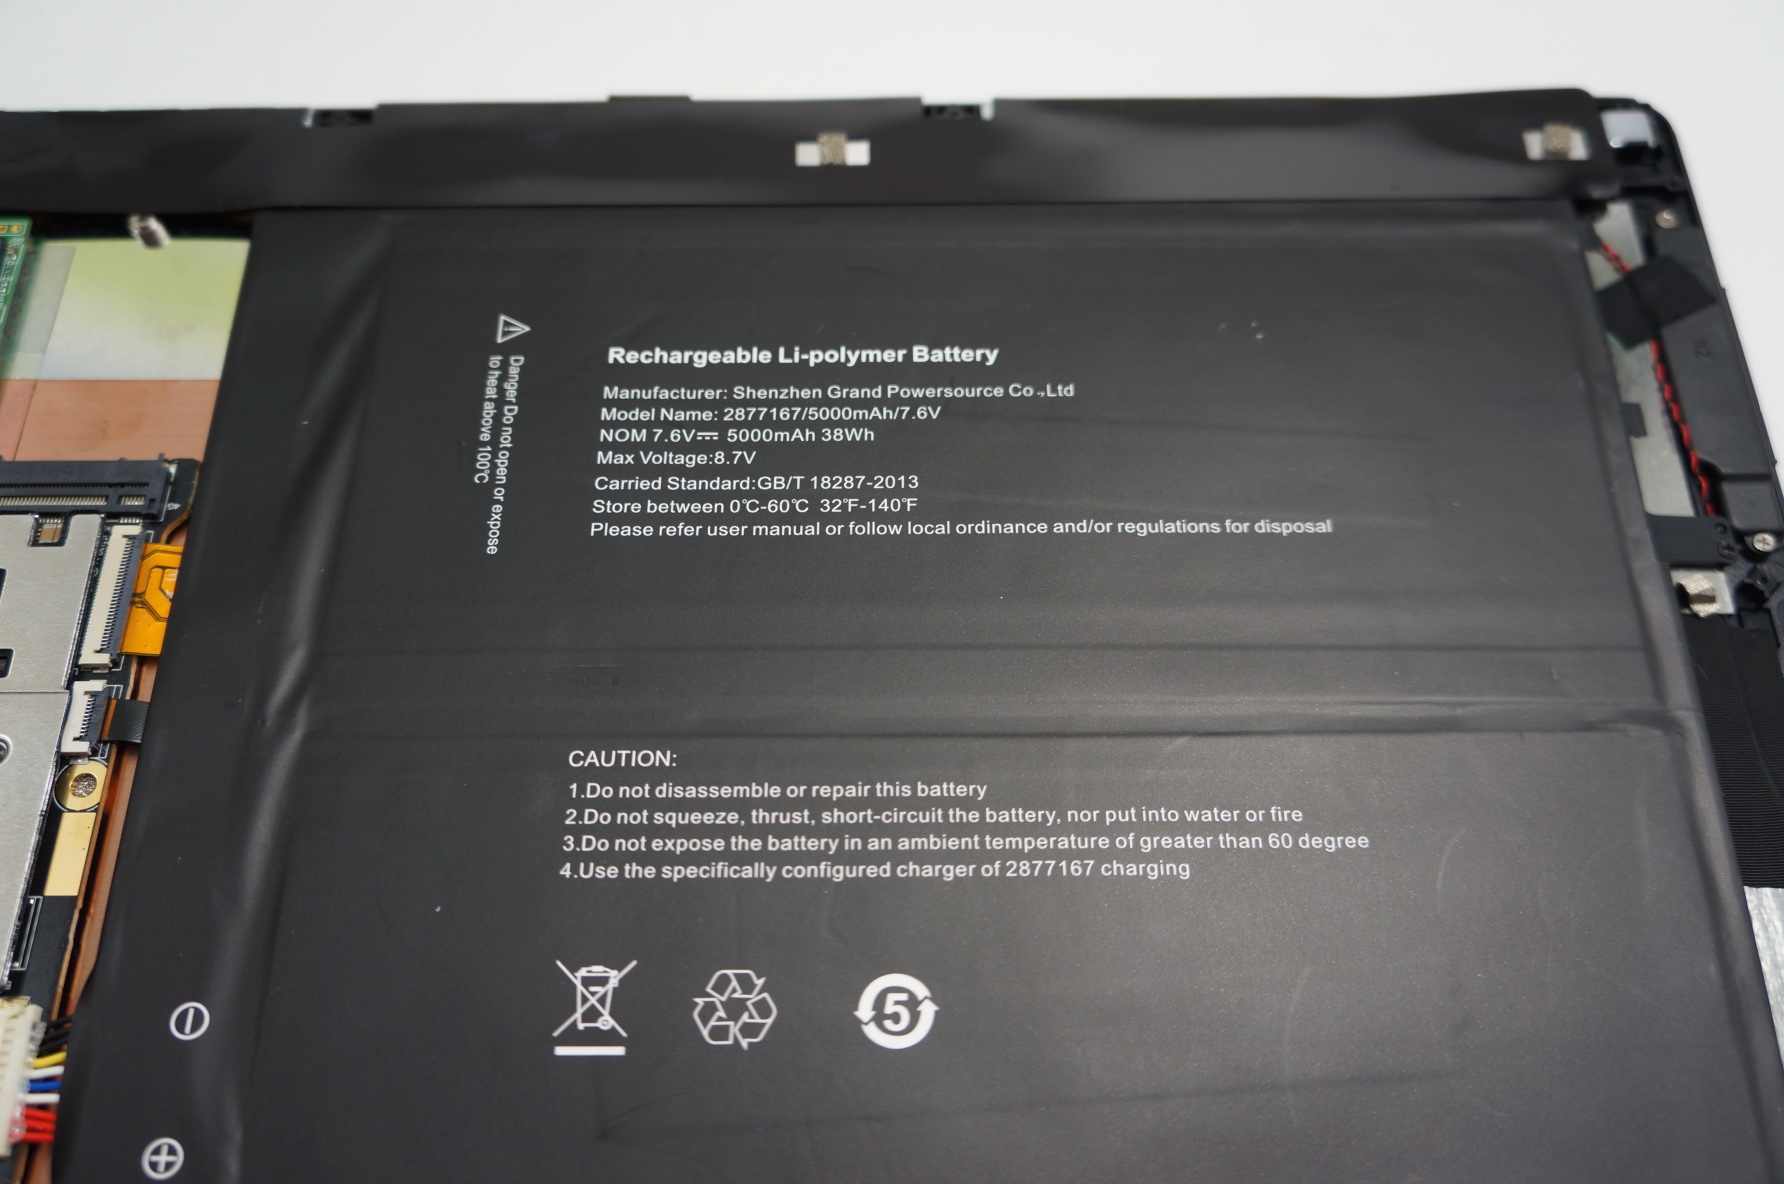
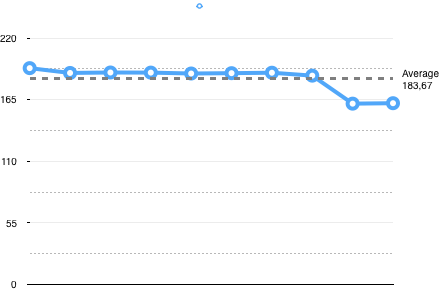
Battery Runtime
The battery life is not exactly overwhelming for a tablet of this size. Compared with all other tablets tested, Cube's i9 is third to last (before Panasonic's FZ-M1 and Chuwi's small Vi8 8-inch tablet). The premium rivals have considerably more to offer in this respect. The Galaxy Tab Pro S W700N achieves twice as long a runtime. The power supply or an external battery will have to be taken along on longer trips or work days.
Pros
Cons
Verdict
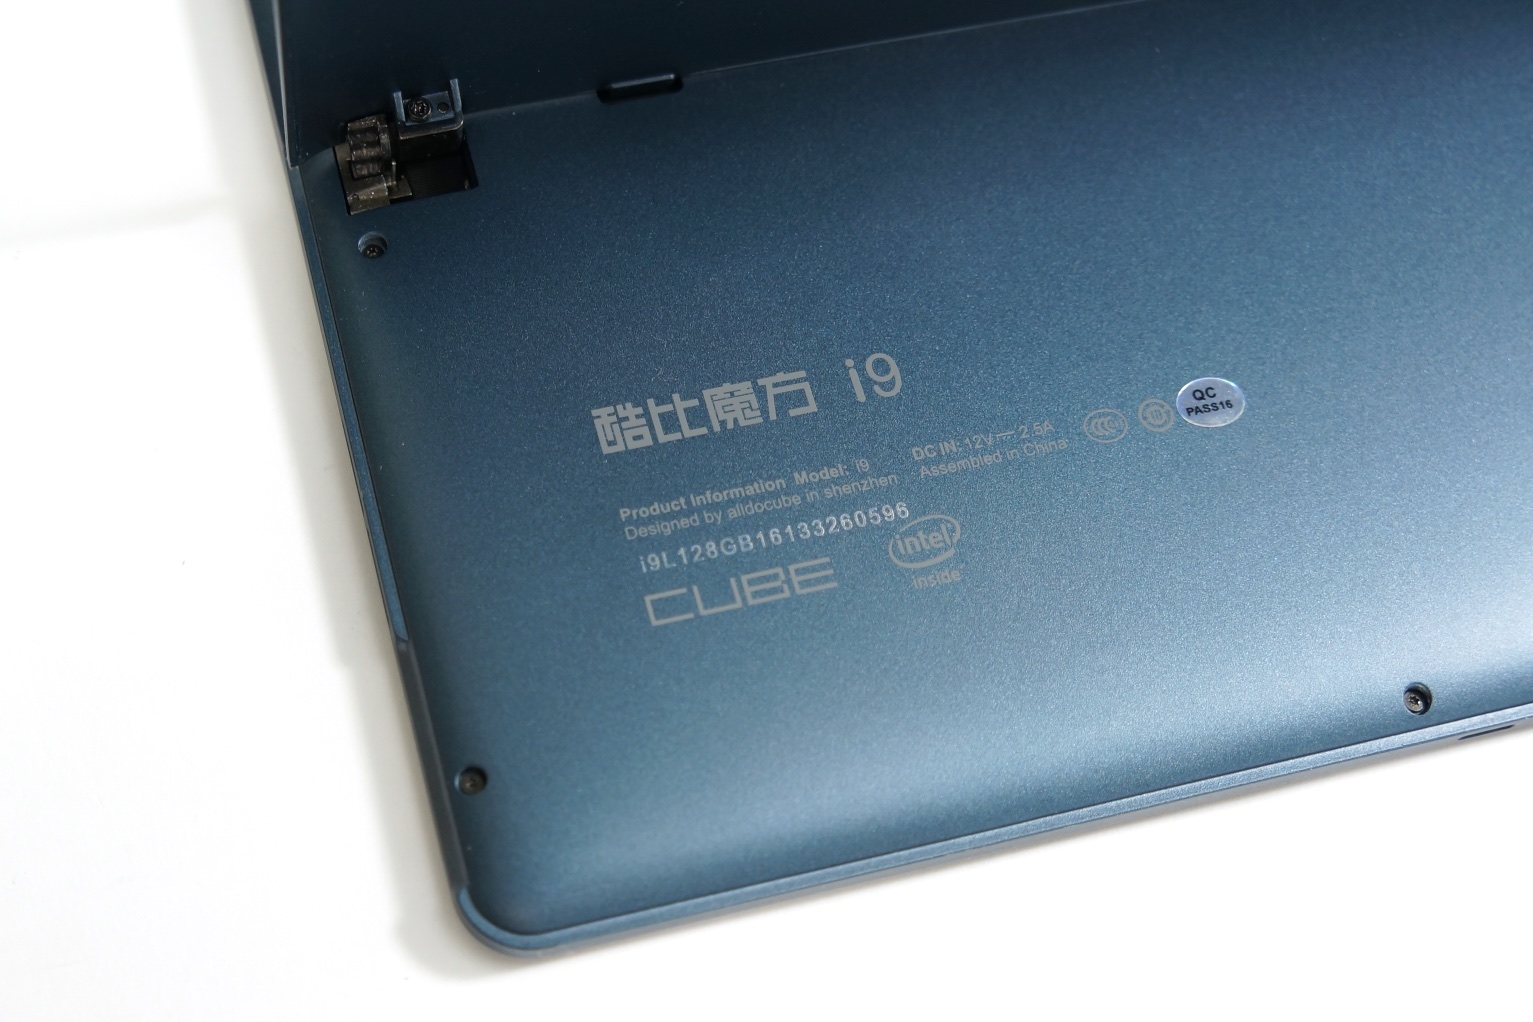
Cube's i9 is an affordable Windows 10 tablet made in China. The installed Core m3-6Y30 alongside 4 GB of RAM and an M.2 SSD promise enough power. The tablet convinces in the general system and browser performance. However, it falls behind slightly in processor and graphics benchmarks when compared with other m3 devices. The cooling design is probably insufficient. Nevertheless, it can easily outperform Atom-based tablets, such as the much more expensive Surface 3.
Materials and build quality are basically good. But our review sample displayed two flaws that lead to a minor deduction. Although the screen's good qualities are pleasing, the utilized PWM for controlling brightness might disturb some users. Since Cube does not install a fan, the device is actually silent. However, transistor whining is heard in some load situations in very quiet environments.
Overall, Cube's i9 made a good impression. It is a fast Windows tablet for a low price. However, the user should not be sensitive to PWM dimmed lights. Cube's i9 is currently available at Gearbest for around 398 Euros, i.e. 500 Dollars, including shipping. Customs duty should be added to the purchase price (61 Euros/~$69 in our case), as well as potential insurance costs in case of damage.
Compared with Microsoft's Surface Pro 4 (m3), concessions will have to be made everywhere. The screen is inferior, does not offer stylus support, the performance is somewhat lower despite the same processor, and the same is also true of battery life. The casing with its more flexible kickstand also provides more options, and its build quality is better. Ultimately, everyone will have to make their own decisions as to whether the almost twice as higher a price (currently starts at 850 Euros/~$958) is worth it.
Cube i9
-
06/08/2016 v5.1(old)
Klaus Hinum