 Deutsch
 English
 Español
 Français
 Italiano
 Nederlands
 Polski
 Português
 Русский
 Türkçe
 Svenska
 Chinese
 Magyar
Asus Vivobook 15 K513EQ OLED laptop review: The Lenovo IdeaPad alternative
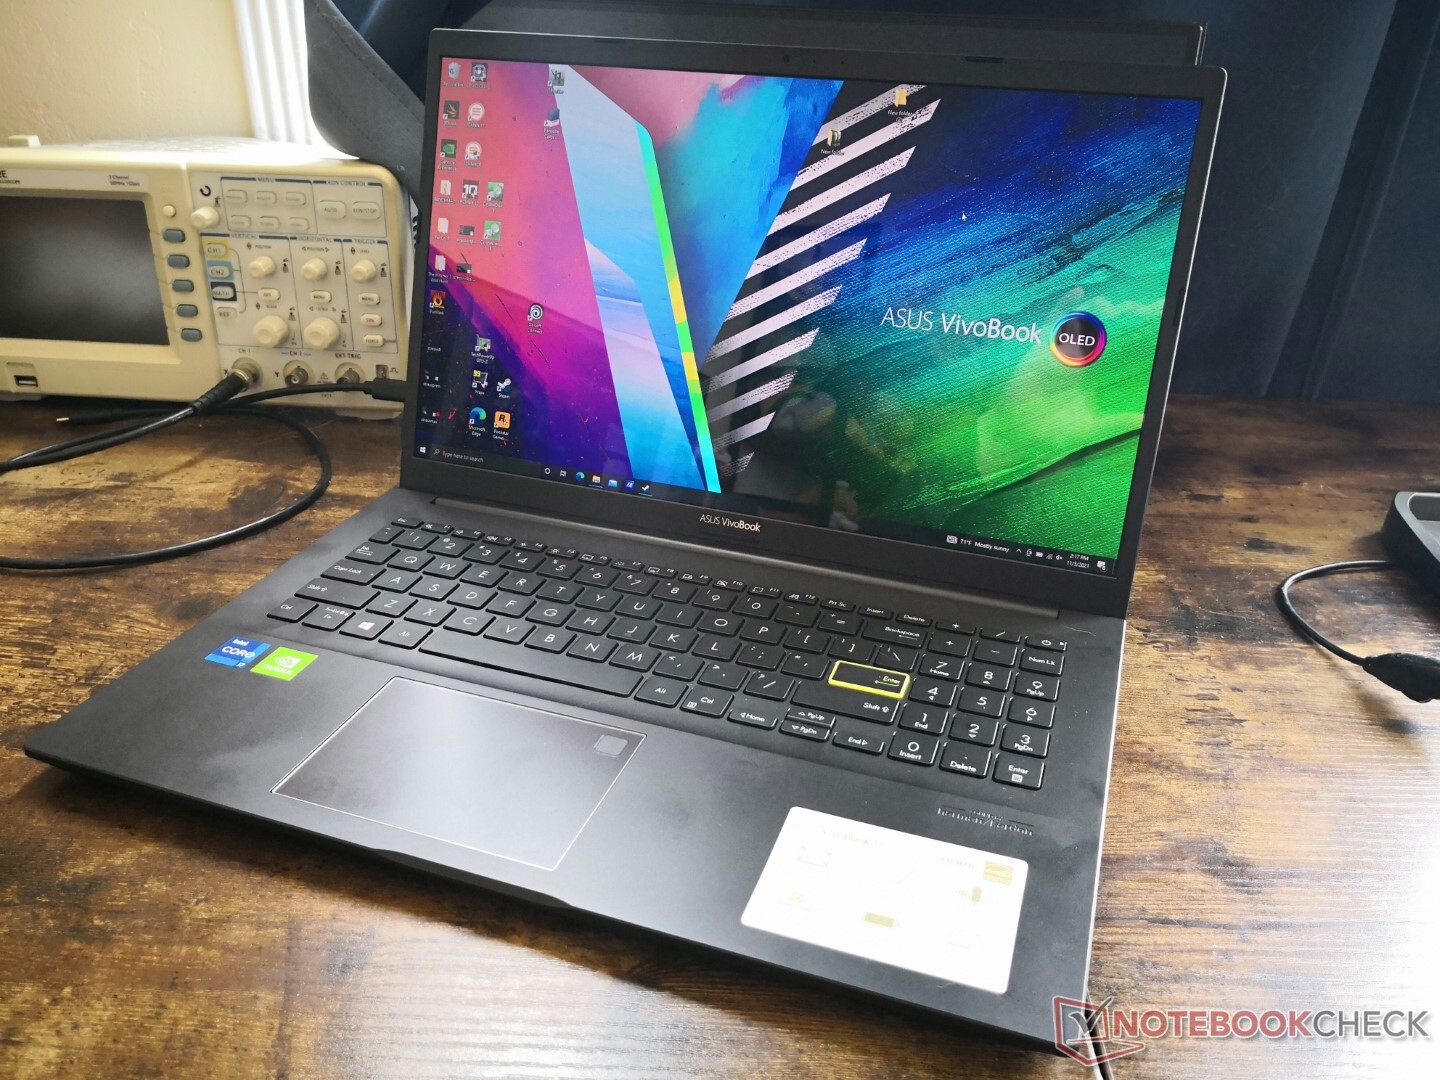
Take one step down from the high-end Asus ZenBook series and you'll find yourself knee-deep in the budget-oriented Asus VivoBook series. The family has been rapidly expanding into a confusingly large lineup of models consisting of both Intel and AMD CPUs with integrated or discrete graphics and even OLED options. It's definitely been difficult to keep up and the latest VivoBook 15 K513 doesn't exactly make things easier.
Naming convention aside, our VivoBook 15 K513 test unit is certainly unlike most other budget or mid-range multimedia laptops out there with its uncommon Intel 11th gen Core i7-1165G7 and GeForce MX350 pairing. Additionally, it's one of the first 15.6-inch laptops to come with a non-touch 1080p OLED display compared to all the 4K OLED panels out there. We'll be taking a closer look at the performance, display, and physical features of the VivoBook 15 K513 to find out what exactly makes it so different from all the other VivoBook 15 models in the market.
Competitors in this space include other mid-range multimedia laptops like the Lenovo IdeaPad 5 15, Dell Inspiron 15, HP Pavilion 15, or the MSI Summit B15/E15 series. Our specific test unit can be found online for about $900 to $1000 USD.
More Asus VivoBook reviews:
Potential Competitors in Comparison
Rating | Date | Model | Weight | Height | Size | Resolution | Best Price |
|---|---|---|---|---|---|---|---|
| 80.6 % | 11/2021 | Asus Vivobook 15 K513EQ i7-1165G7, GeForce MX350 | 1.6 kg | 17.9 mm | 15.60" | 1920x1080 | |
| 85.9 % | 11/2021 | Asus VivoBook 15 Pro M3500QC-L1062 R5 5600H, GeForce RTX 3050 4GB Laptop GPU | 1.7 kg | 19.9 mm | 15.60" | 1920x1080 | |
| 83.4 % | 12/2020 | Asus VivoBook S15 S533EQ-BQ002T i7-1165G7, GeForce MX350 | 1.8 kg | 16.1 mm | 15.60" | 1920x1080 | |
| 83.5 % | 08/2021 | Lenovo IdeaPad 5 15ALC05 R5 5500U, Vega 7 | 1.7 kg | 19.1 mm | 15.60" | 1920x1080 | |
| 80.5 % | 10/2021 | Dell Inspiron 15 3501 i7-1165G7, Iris Xe G7 96EUs | 2 kg | 19.9 mm | 15.60" | 1920x1080 | |
| 81.2 % | 06/2021 | HP Pavilion 15-eg i7-1165G7, GeForce MX450 | 1.7 kg | 17.9 mm | 15.60" | 1920x1080 |
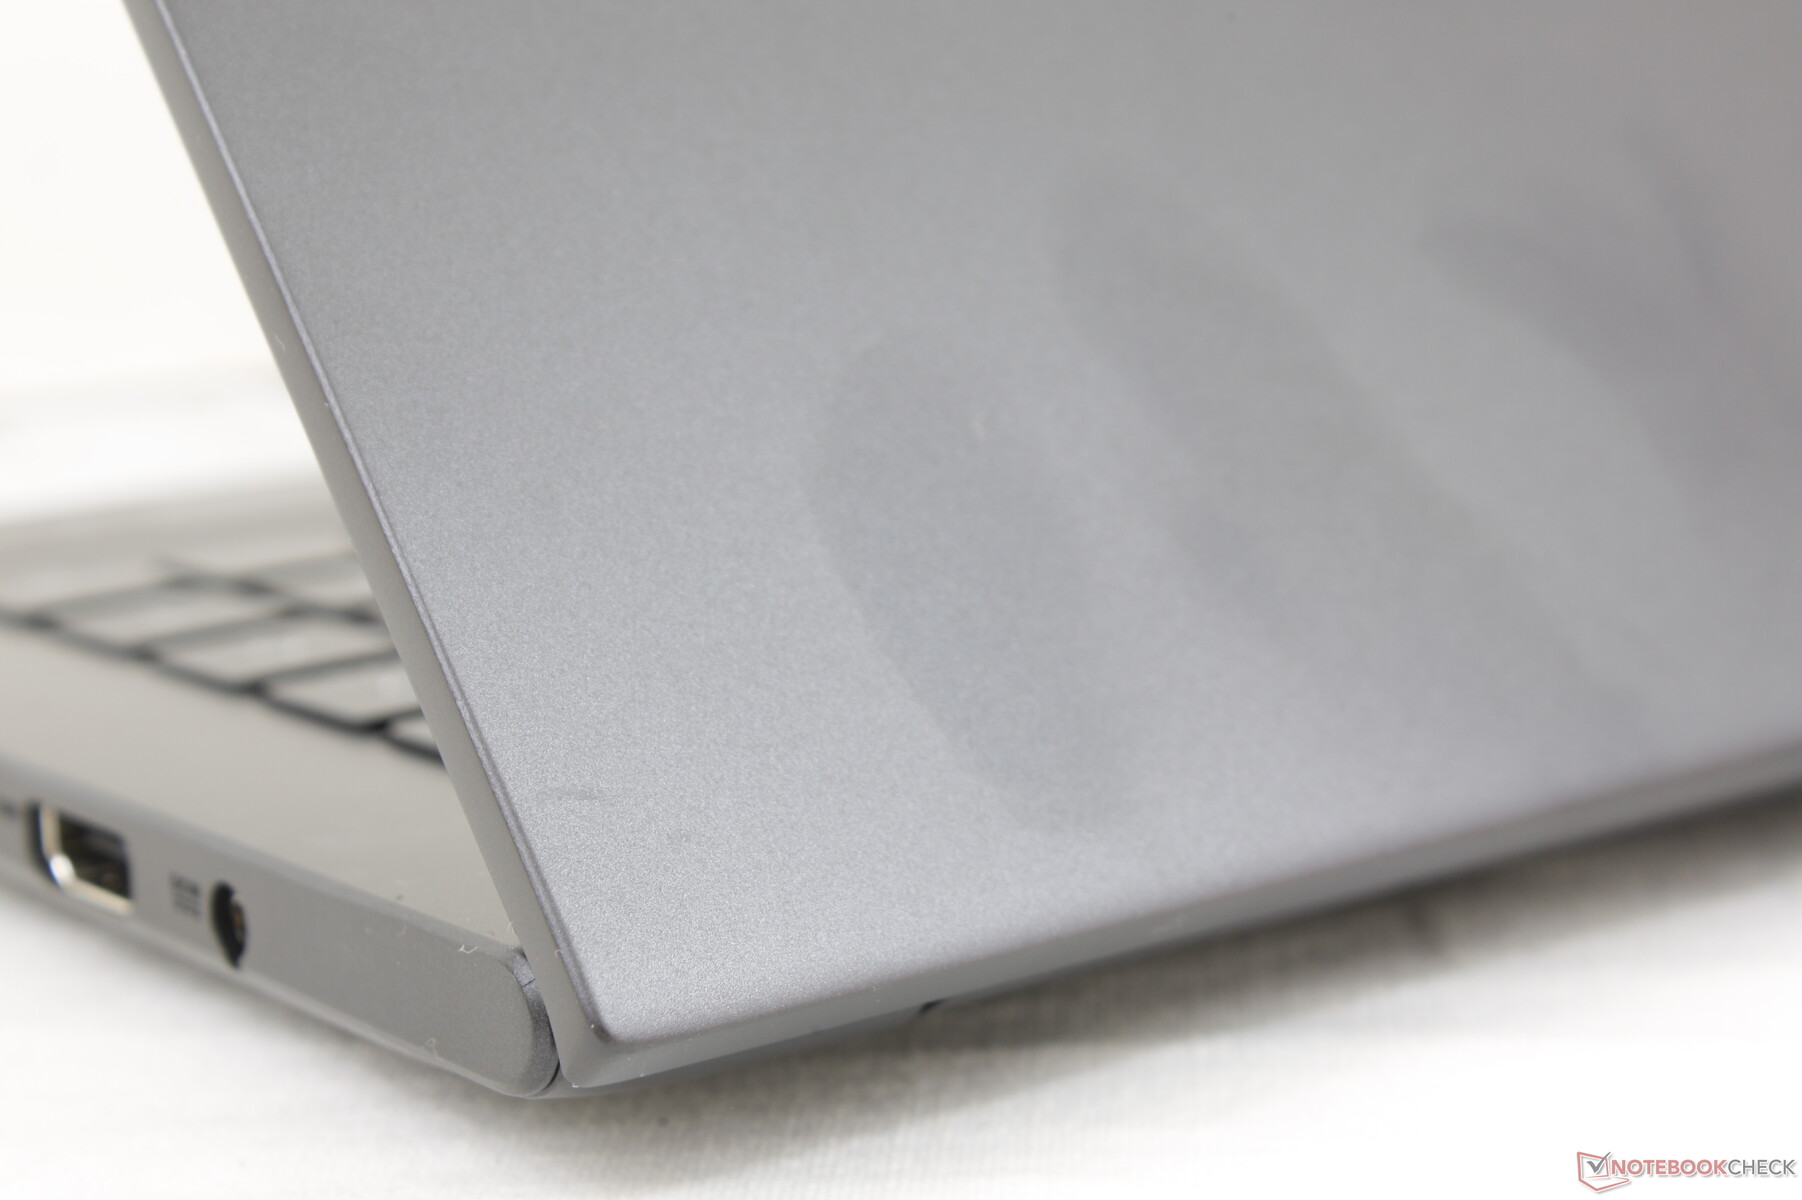
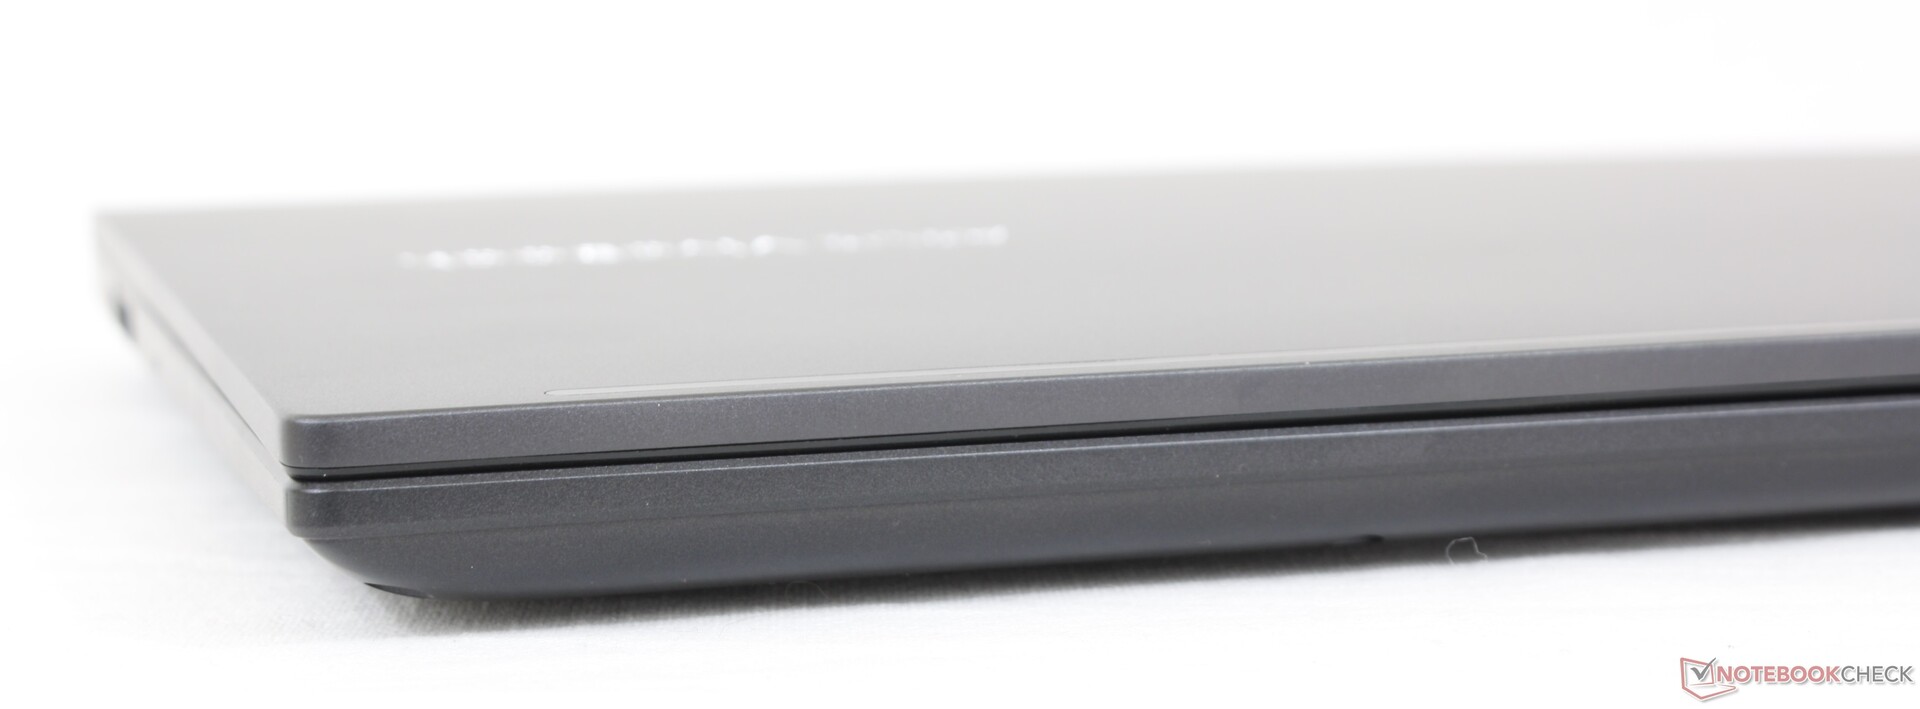
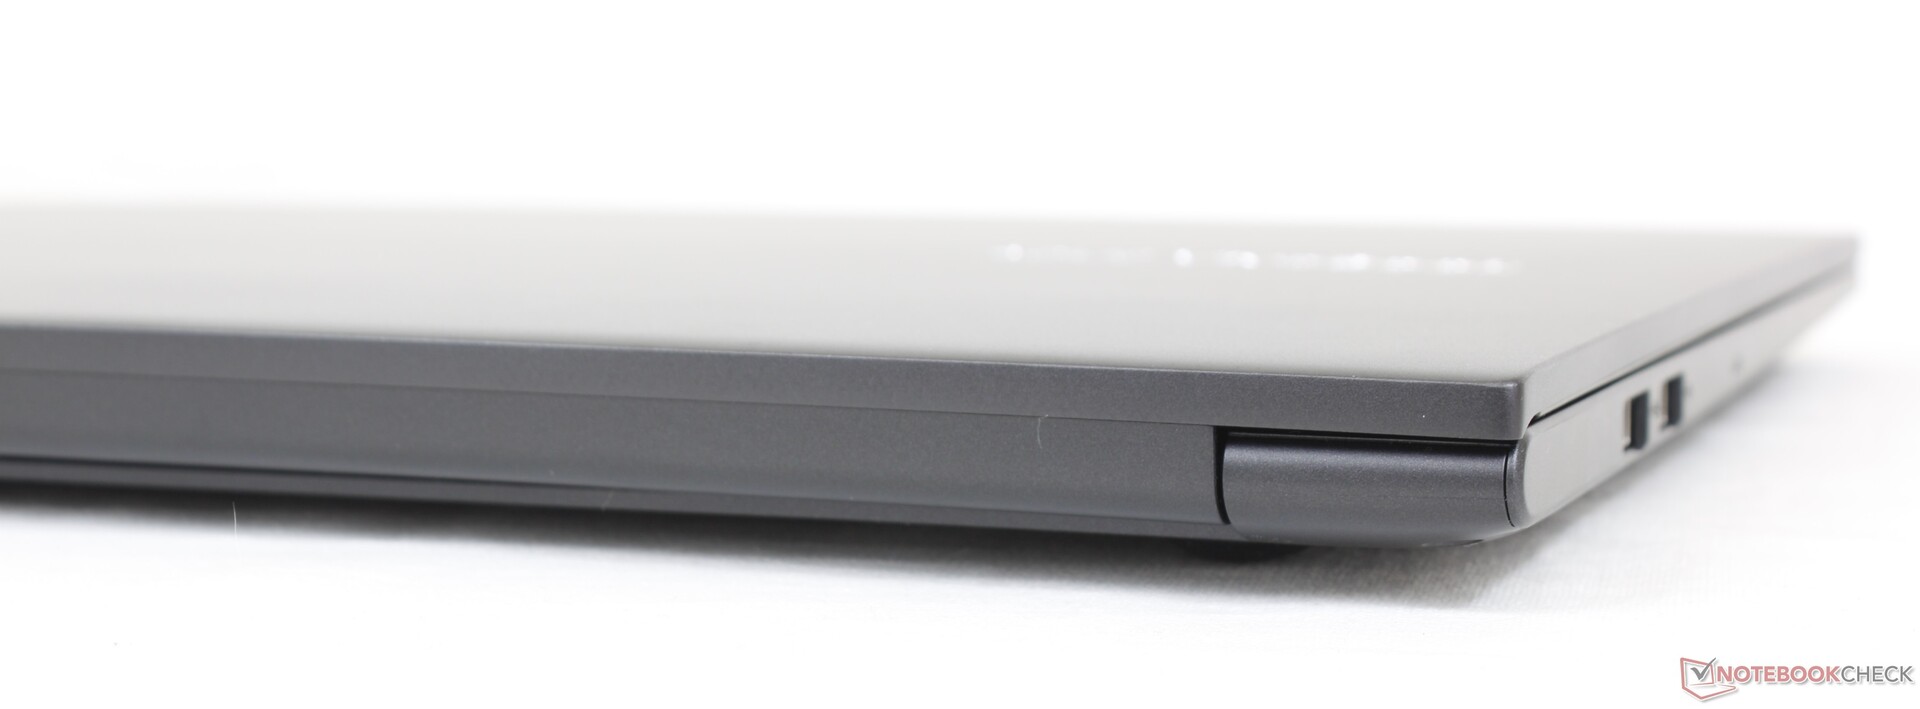
Case — Hope You Like Plastic
There are moderate differences both inside and out between all the various 15.6-inch VivoBook 15 models. In our case, the VivoBook 15 K513 is most similar to the VivoBook 15 F512 in terms of port positioning and layout of the motherboard. The plastic base in particular is nowhere near as firm or luxurious as a typical ZenBook 15, HP Spectre, or Dell XPS 15 which is to be expected. Chassis rigidity is instead more in line with the Lenovo IdeaPad 5 15 or Dell Inspiron 3501 while being a bit weaker than the latest HP Pavilion 15. Its keyboard center, for example, flexes more readily than we would like.
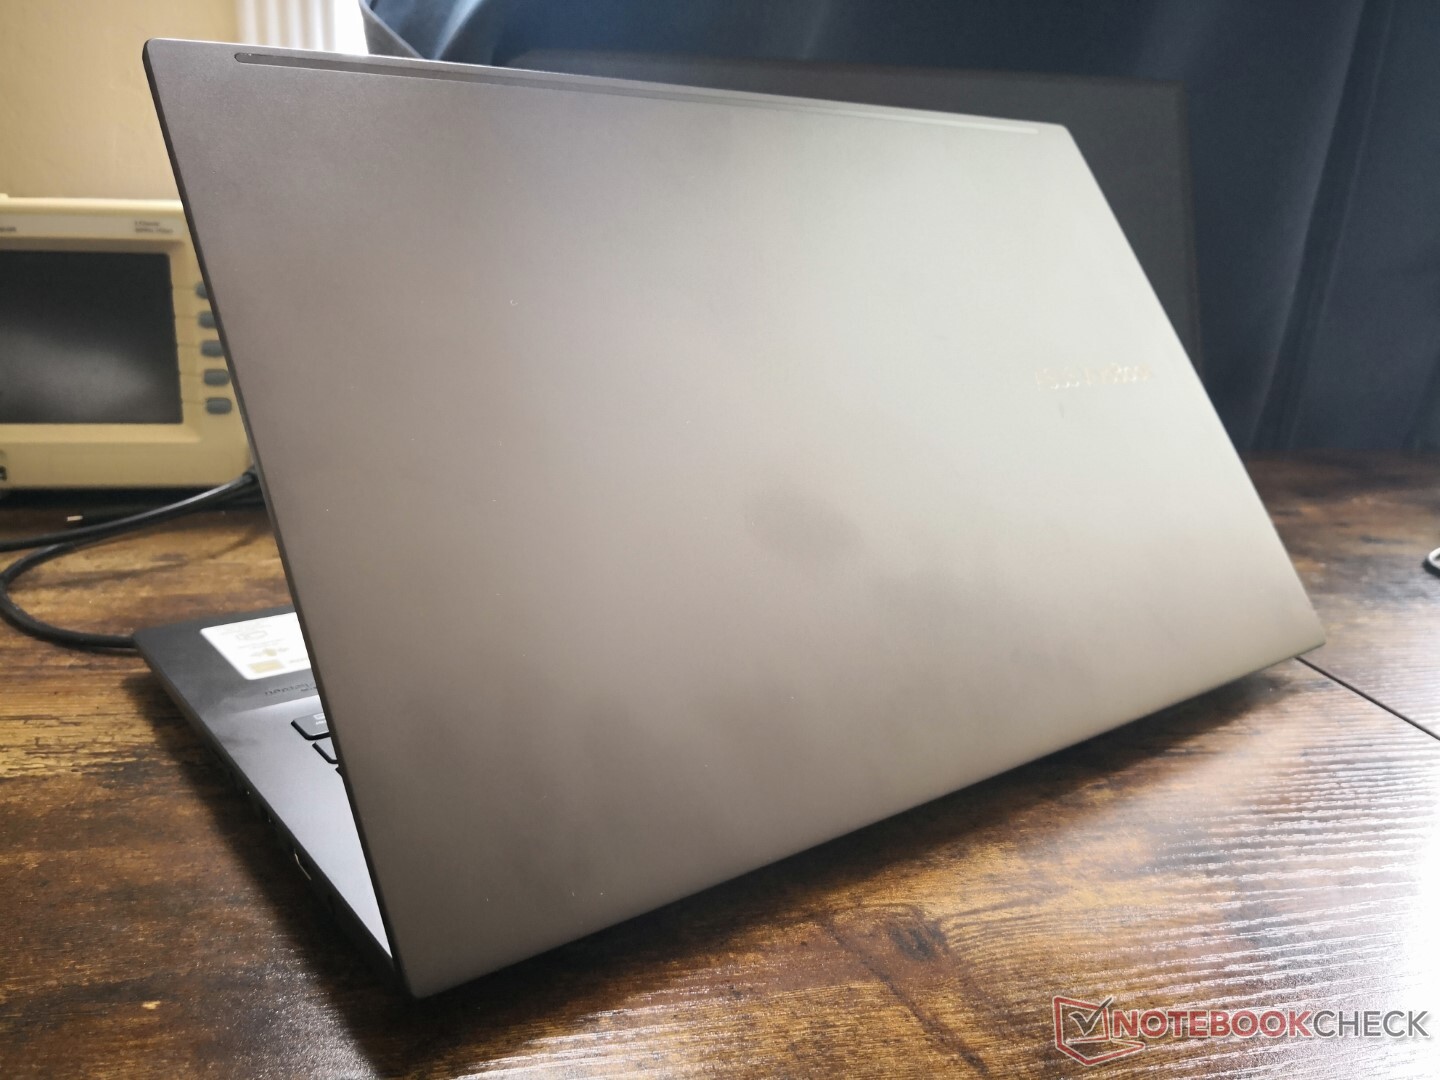
The system is lighter than many of its competitors by about 100 g to 200 g despite the discrete GPU and OLED panel. Overall dimensions are most similar to the latest HP Pavilion 15 while being thinner and thicker than the VivoBook 15 Pro and VivoBook S15, respectively.
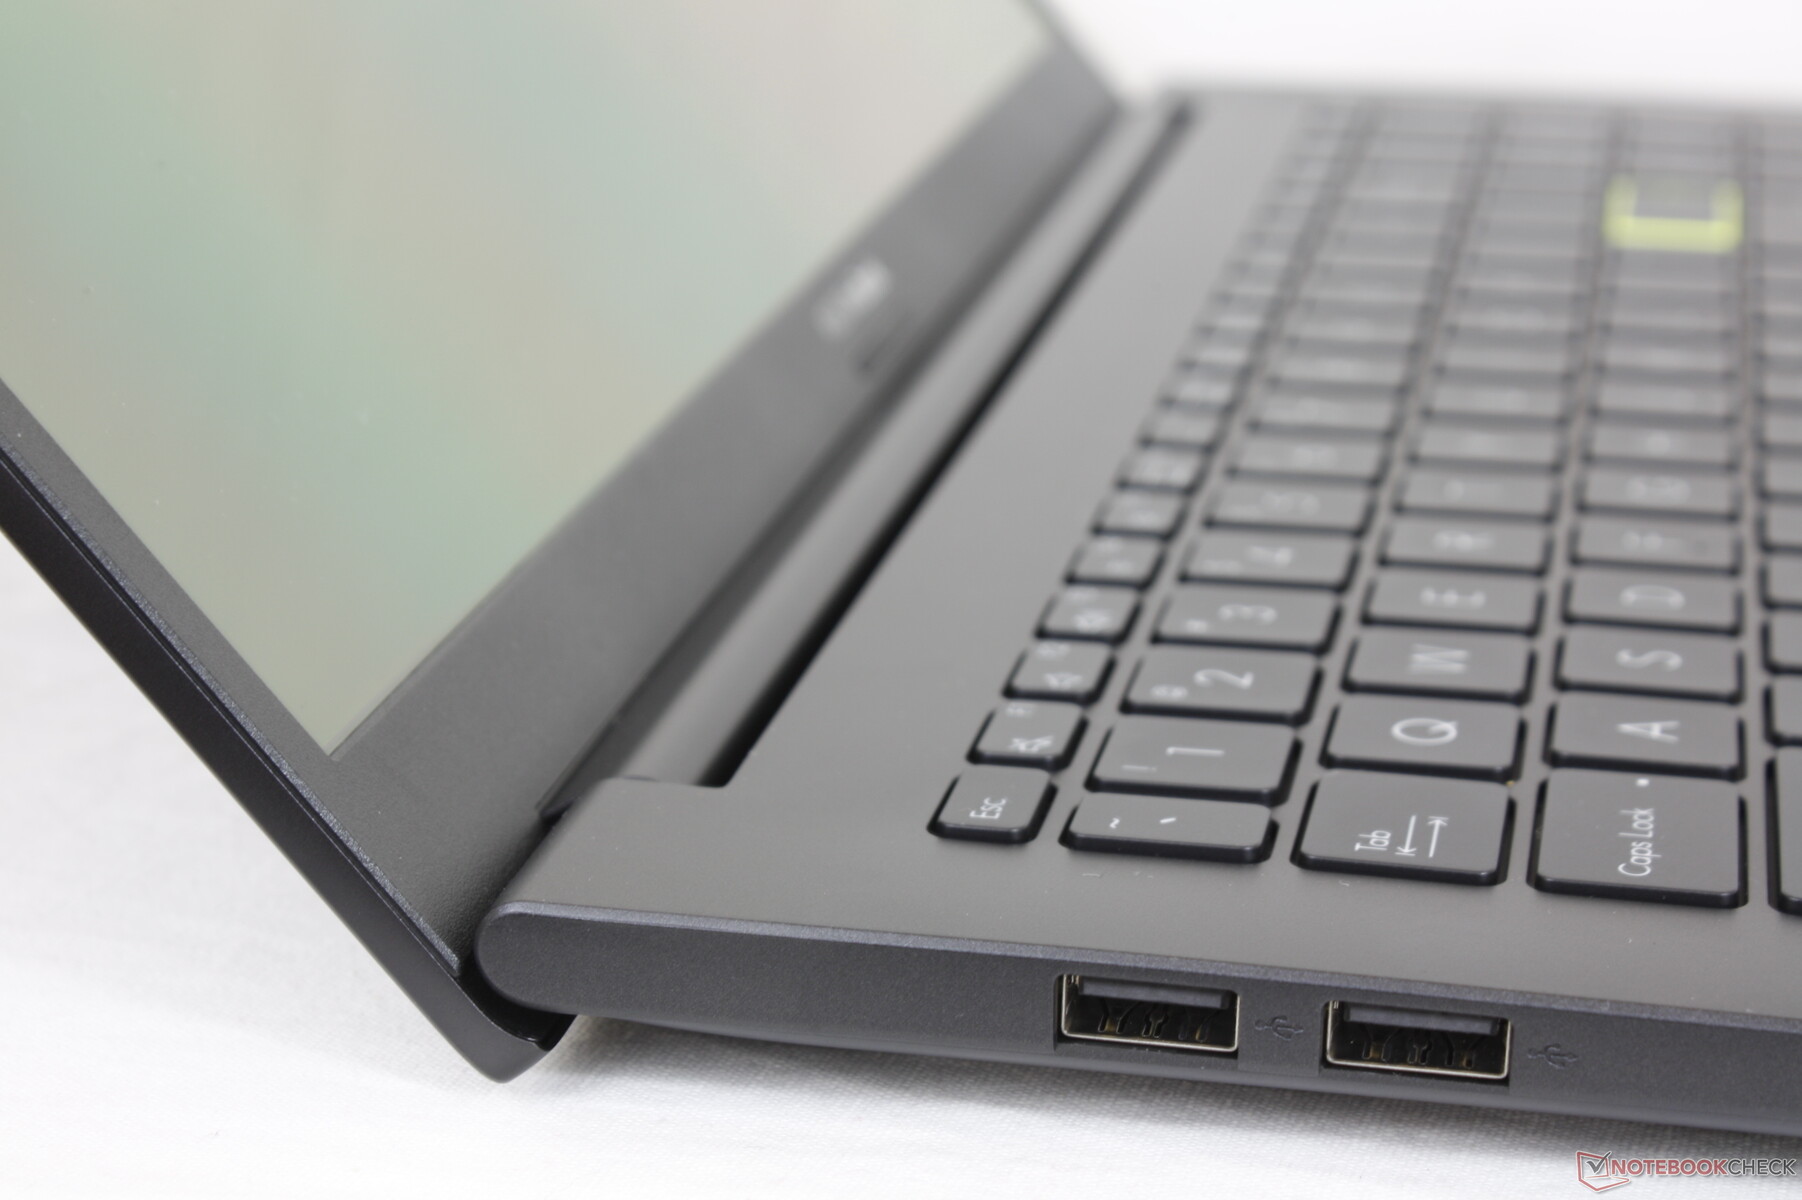
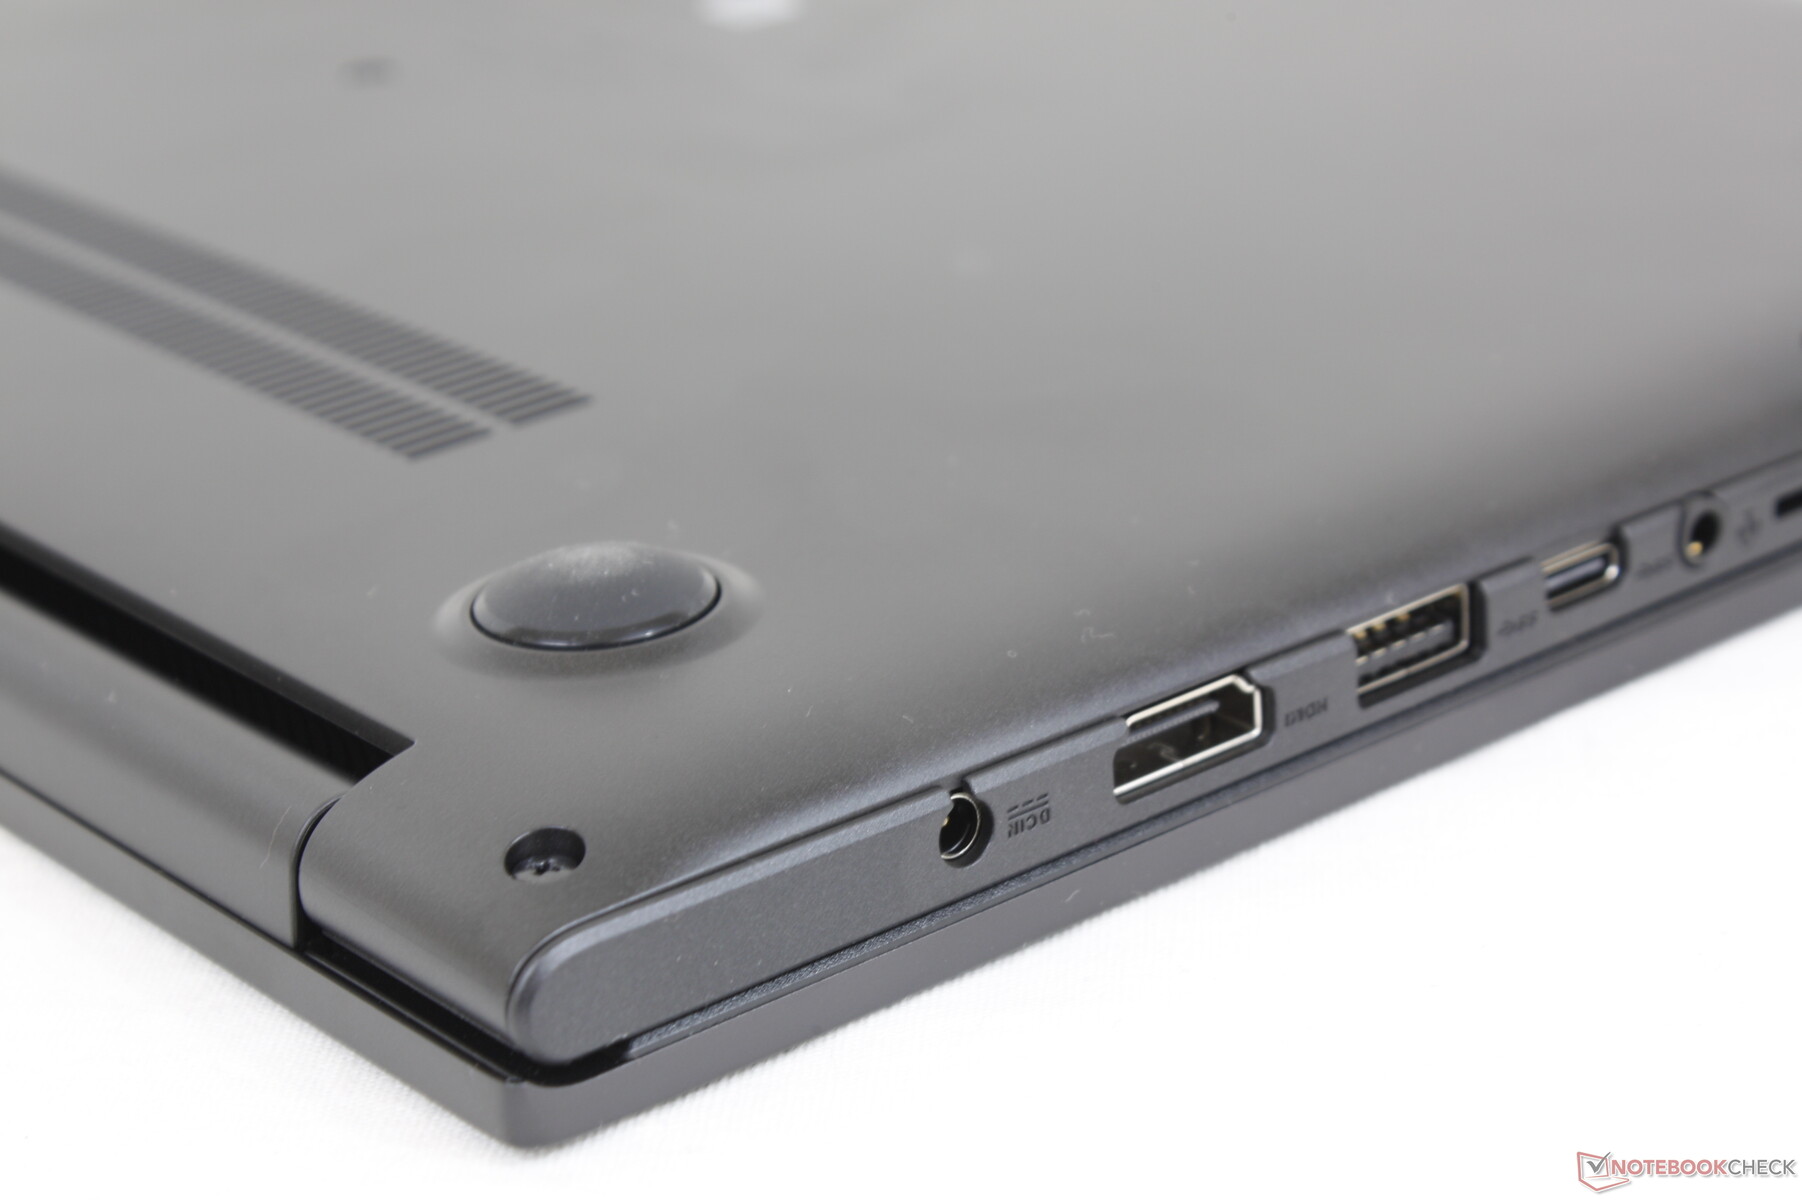
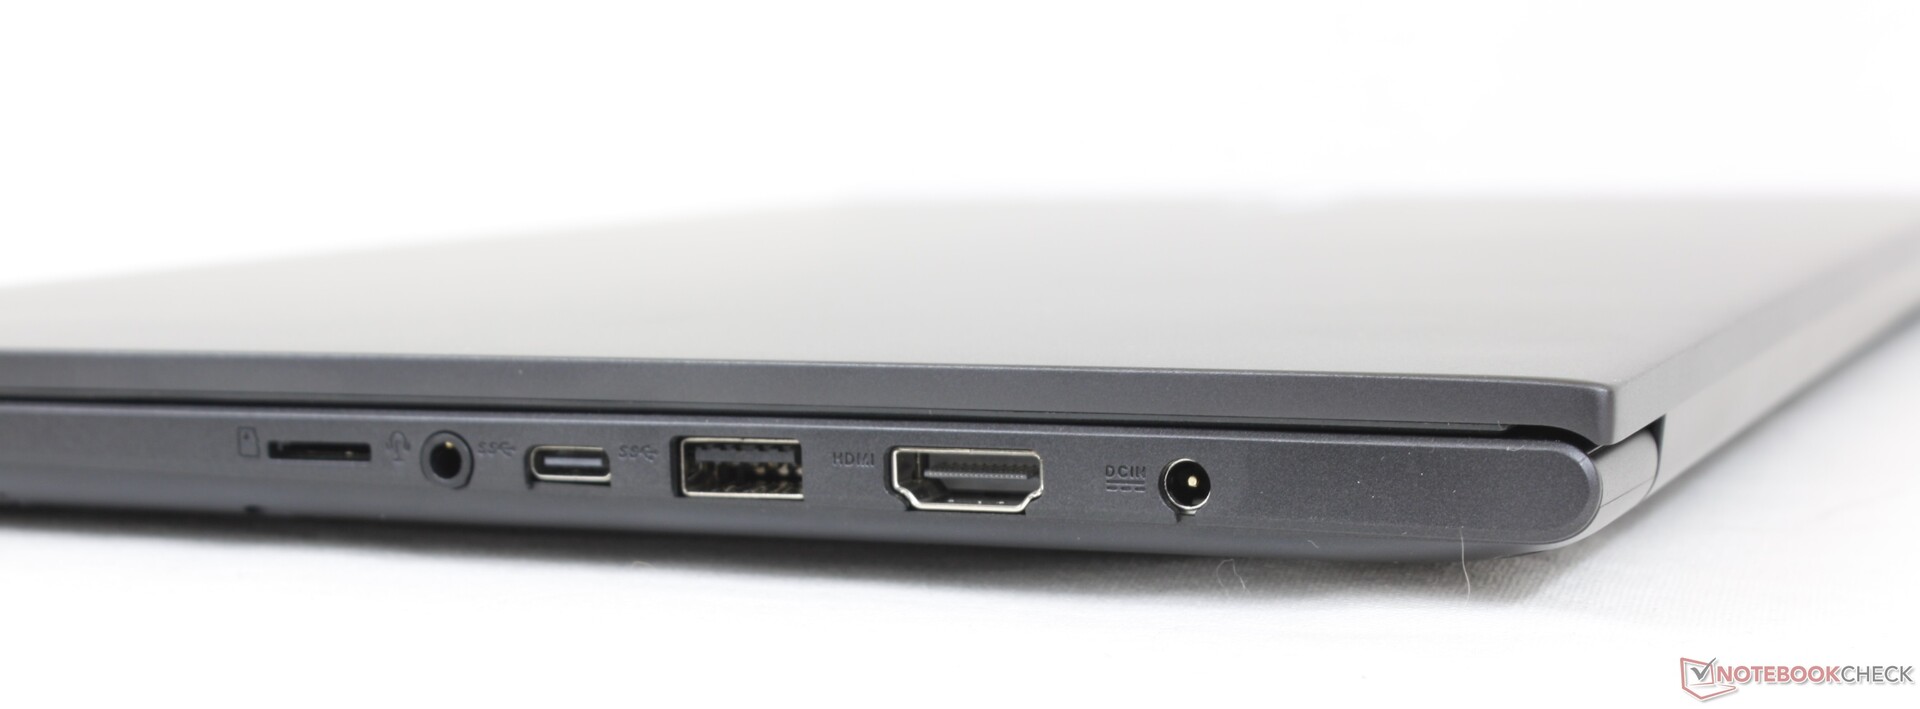
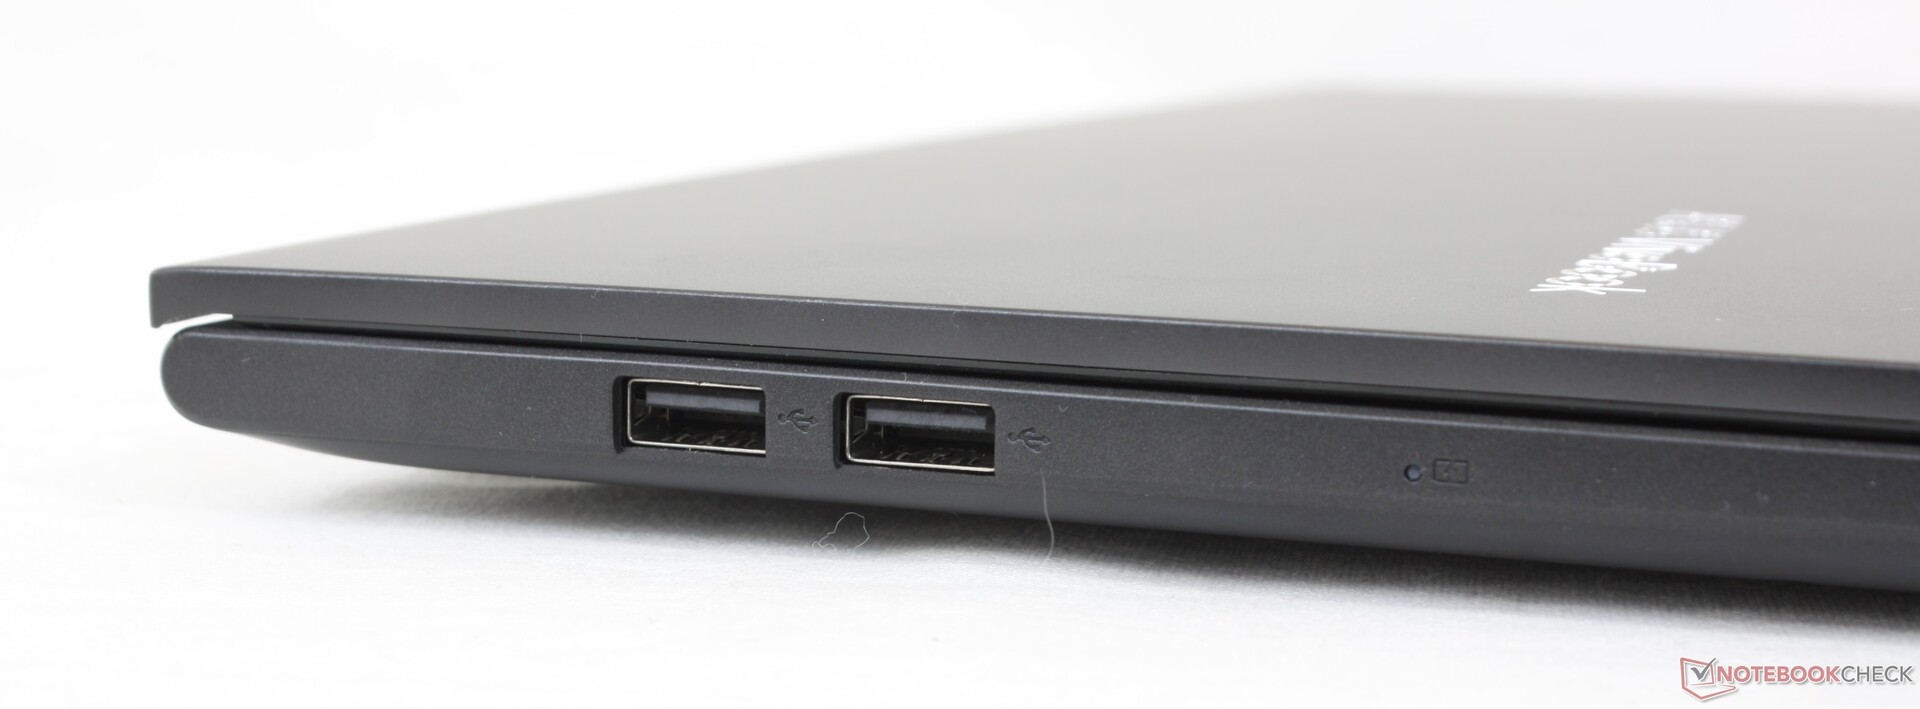
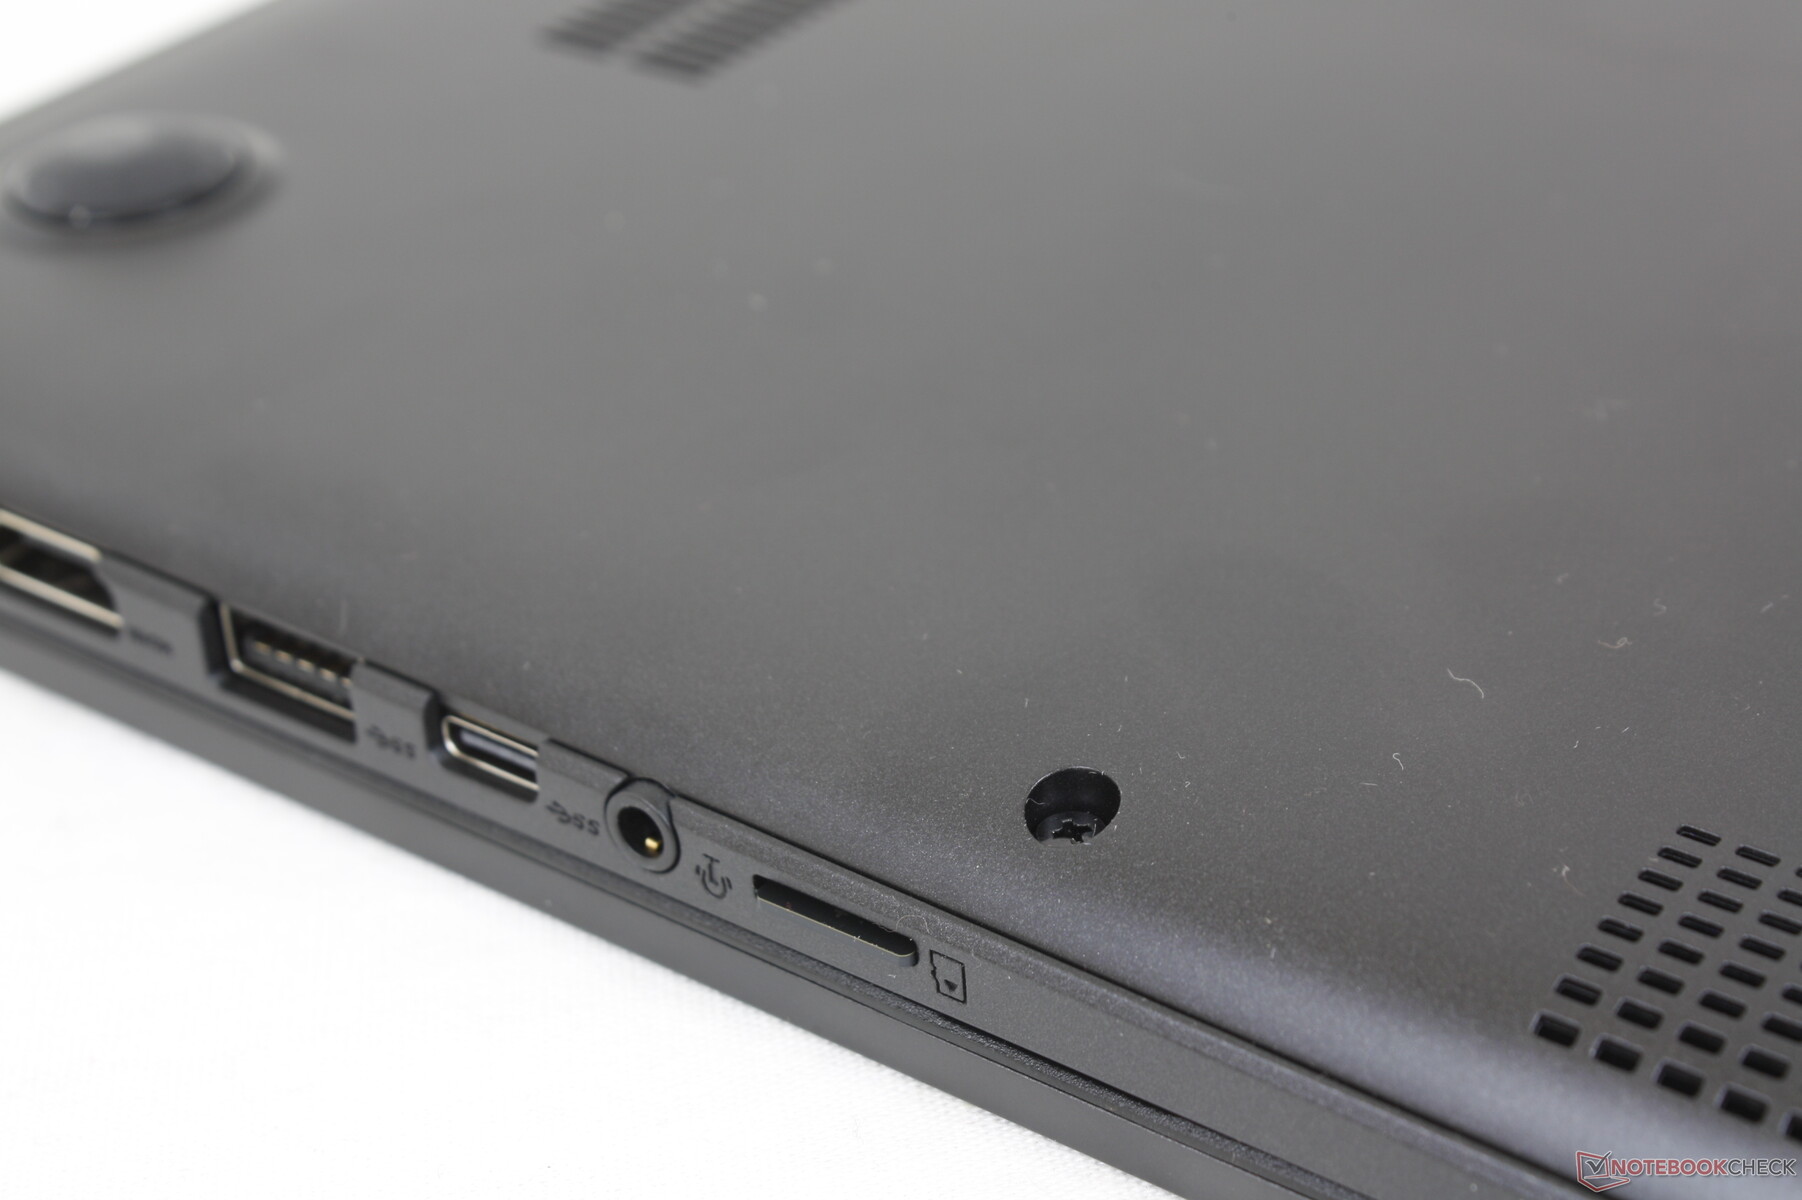
Connectivity — No Thunderbolt or USB-C Charging
Port options are decent but with disappointing caveats. Firstly, the USB-C port does not support DisplayPort or Power Delivery meaning you cannot connect external monitors or recharge the system through this port unlike on most other laptops. Secondly, the HDMI port is only version 1.4 meaning it lacks support for 4K external monitors at 60 FPS. The model even utilizes more slower USB-A 2.0 ports than USB-A 3.0.
SD Card Reader
The spring-loaded MicroSD card reader remains slow to reflect the budget Vivobook range. Moving 1 GB of pictures from our UHS-II test card to desktop takes about 30 seconds compared to only 14 seconds on the ZenBook 15.
| SD Card Reader | |
| average JPG Copy Test (av. of 3 runs) | |
| HP Pavilion 15-eg (AV PRO microSD 128 GB V60) | |
| Asus VivoBook 15 Pro M3500QC-L1062 (AV Pro V60) | |
| Asus Vivobook 15 K513EQ (AV Pro V60) | |
| Lenovo IdeaPad 5 15ALC05 (Toshiba Exceria Pro SDXC 64 GB UHS-II) | |
| Asus VivoBook S15 S533EQ-BQ002T (Toshiba Exceria Pro M501 microSDXC 64GB) | |
| Dell Inspiron 15 3501 (AV Pro SD 128 GB V60) | |
| maximum AS SSD Seq Read Test (1GB) | |
| HP Pavilion 15-eg (AV PRO microSD 128 GB V60) | |
| Asus VivoBook 15 Pro M3500QC-L1062 (AV Pro V60) | |
| Asus Vivobook 15 K513EQ (AV Pro V60) | |
| Lenovo IdeaPad 5 15ALC05 (Toshiba Exceria Pro SDXC 64 GB UHS-II) | |
| Dell Inspiron 15 3501 (AV Pro SD microSD 128 GB V60) | |
| Asus VivoBook S15 S533EQ-BQ002T (Toshiba Exceria Pro M501 microSDXC 64GB) | |
Communication
Our test unit comes with Wi-Fi 6 while lesser SKUs come with Wi-Fi 5. We're able to reach excellent real-world average receive rates of over 1.2 Gbps on our Netgear RAX200 test router while transmit rates are more disappointing at just ~600 Mbps.
Webcam
Camera quality remains poor and largely unchanged for years. Windows Hello is not supported either since there is no integrated IR sensor or even a physical privacy shutter.


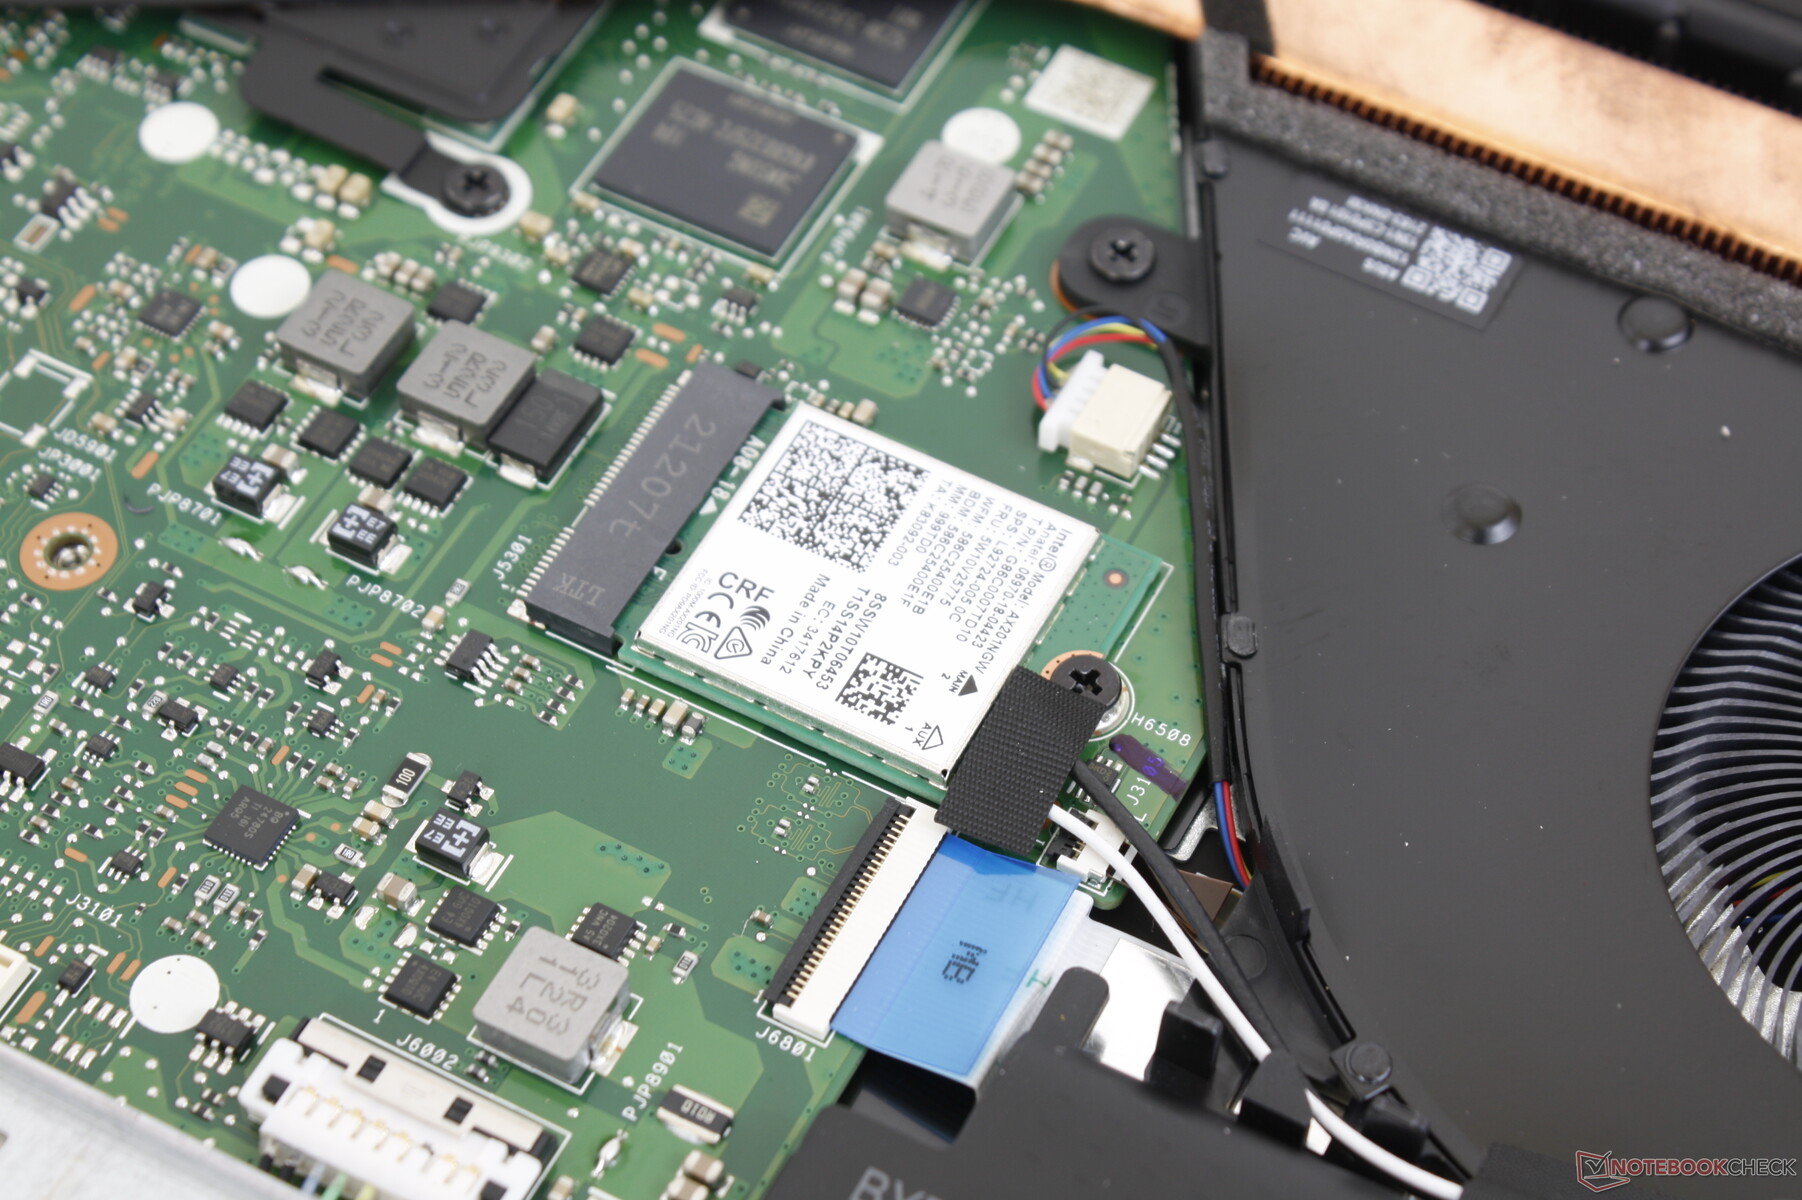
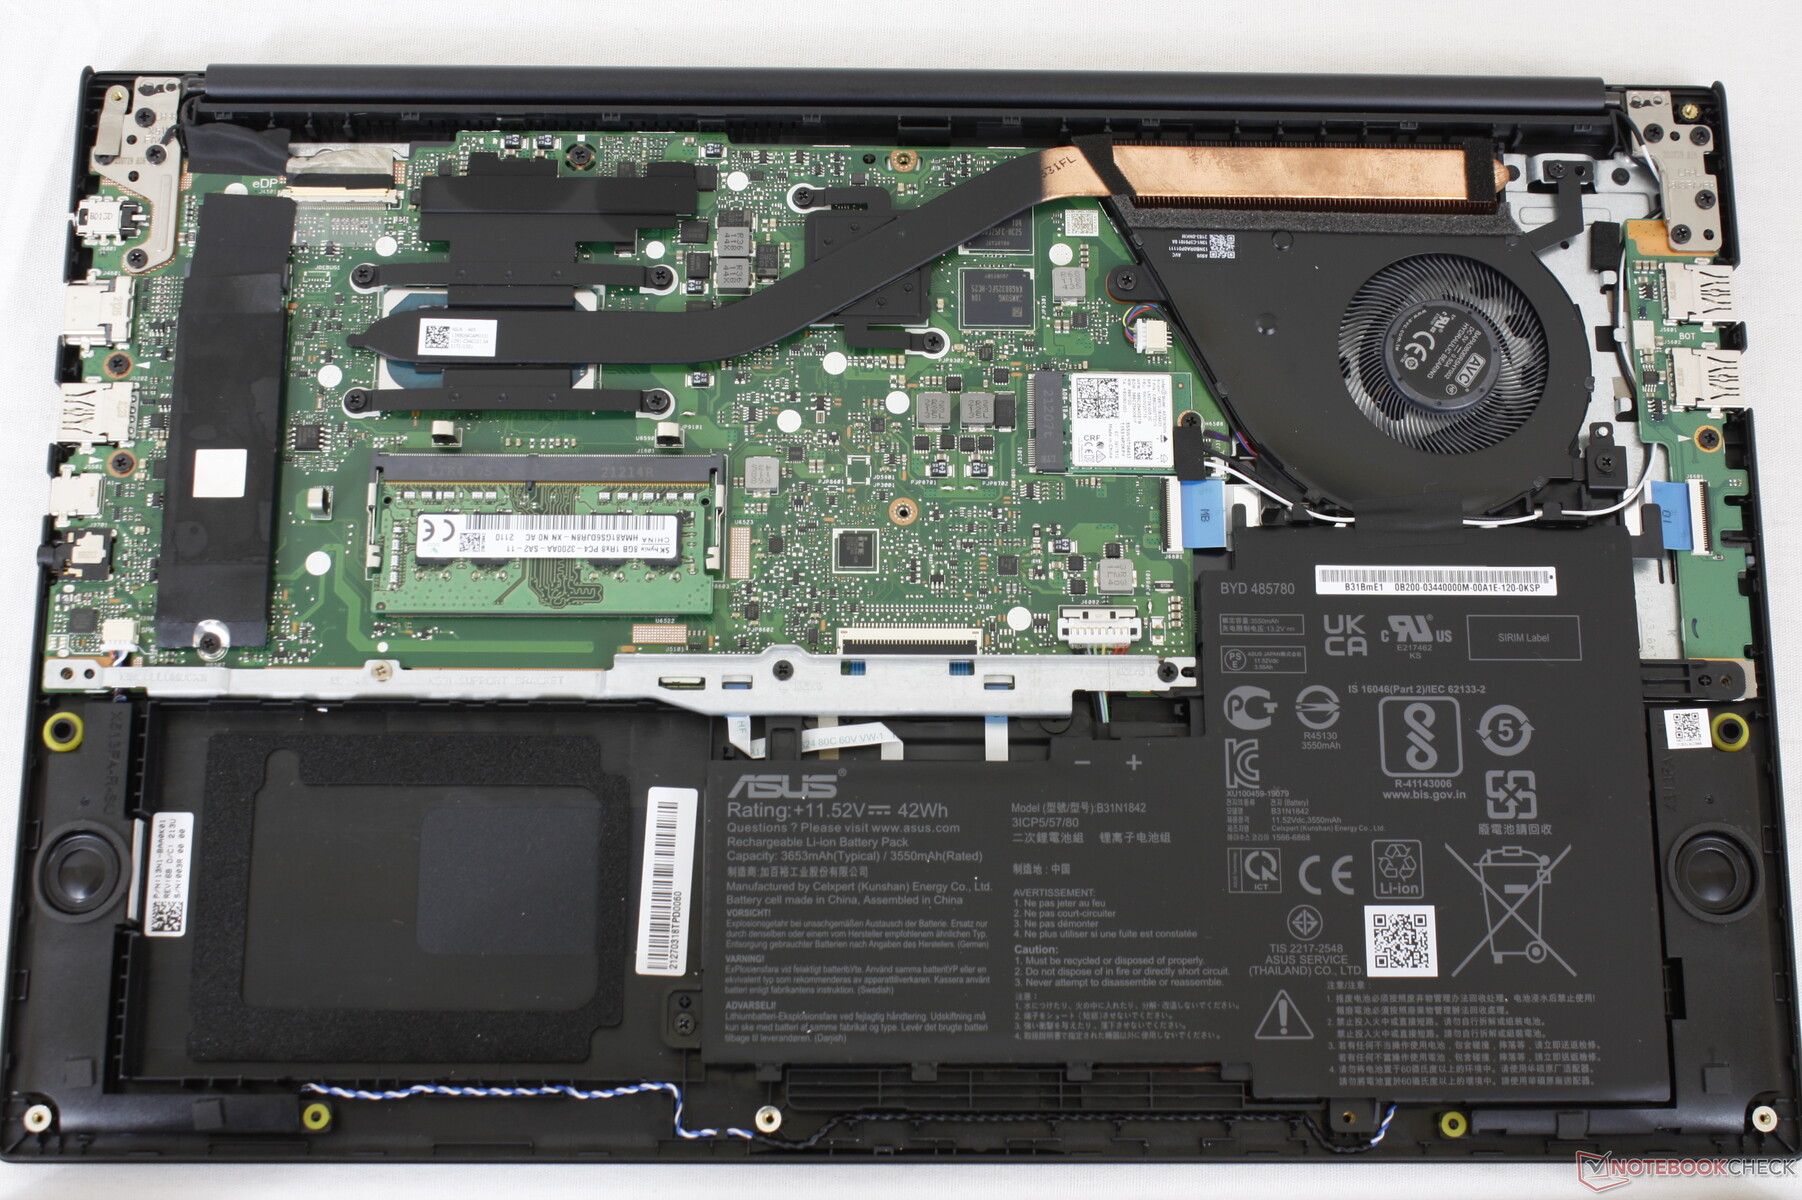
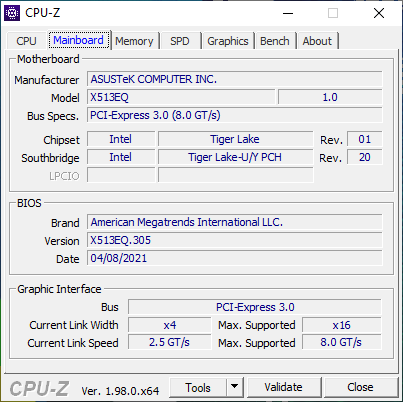
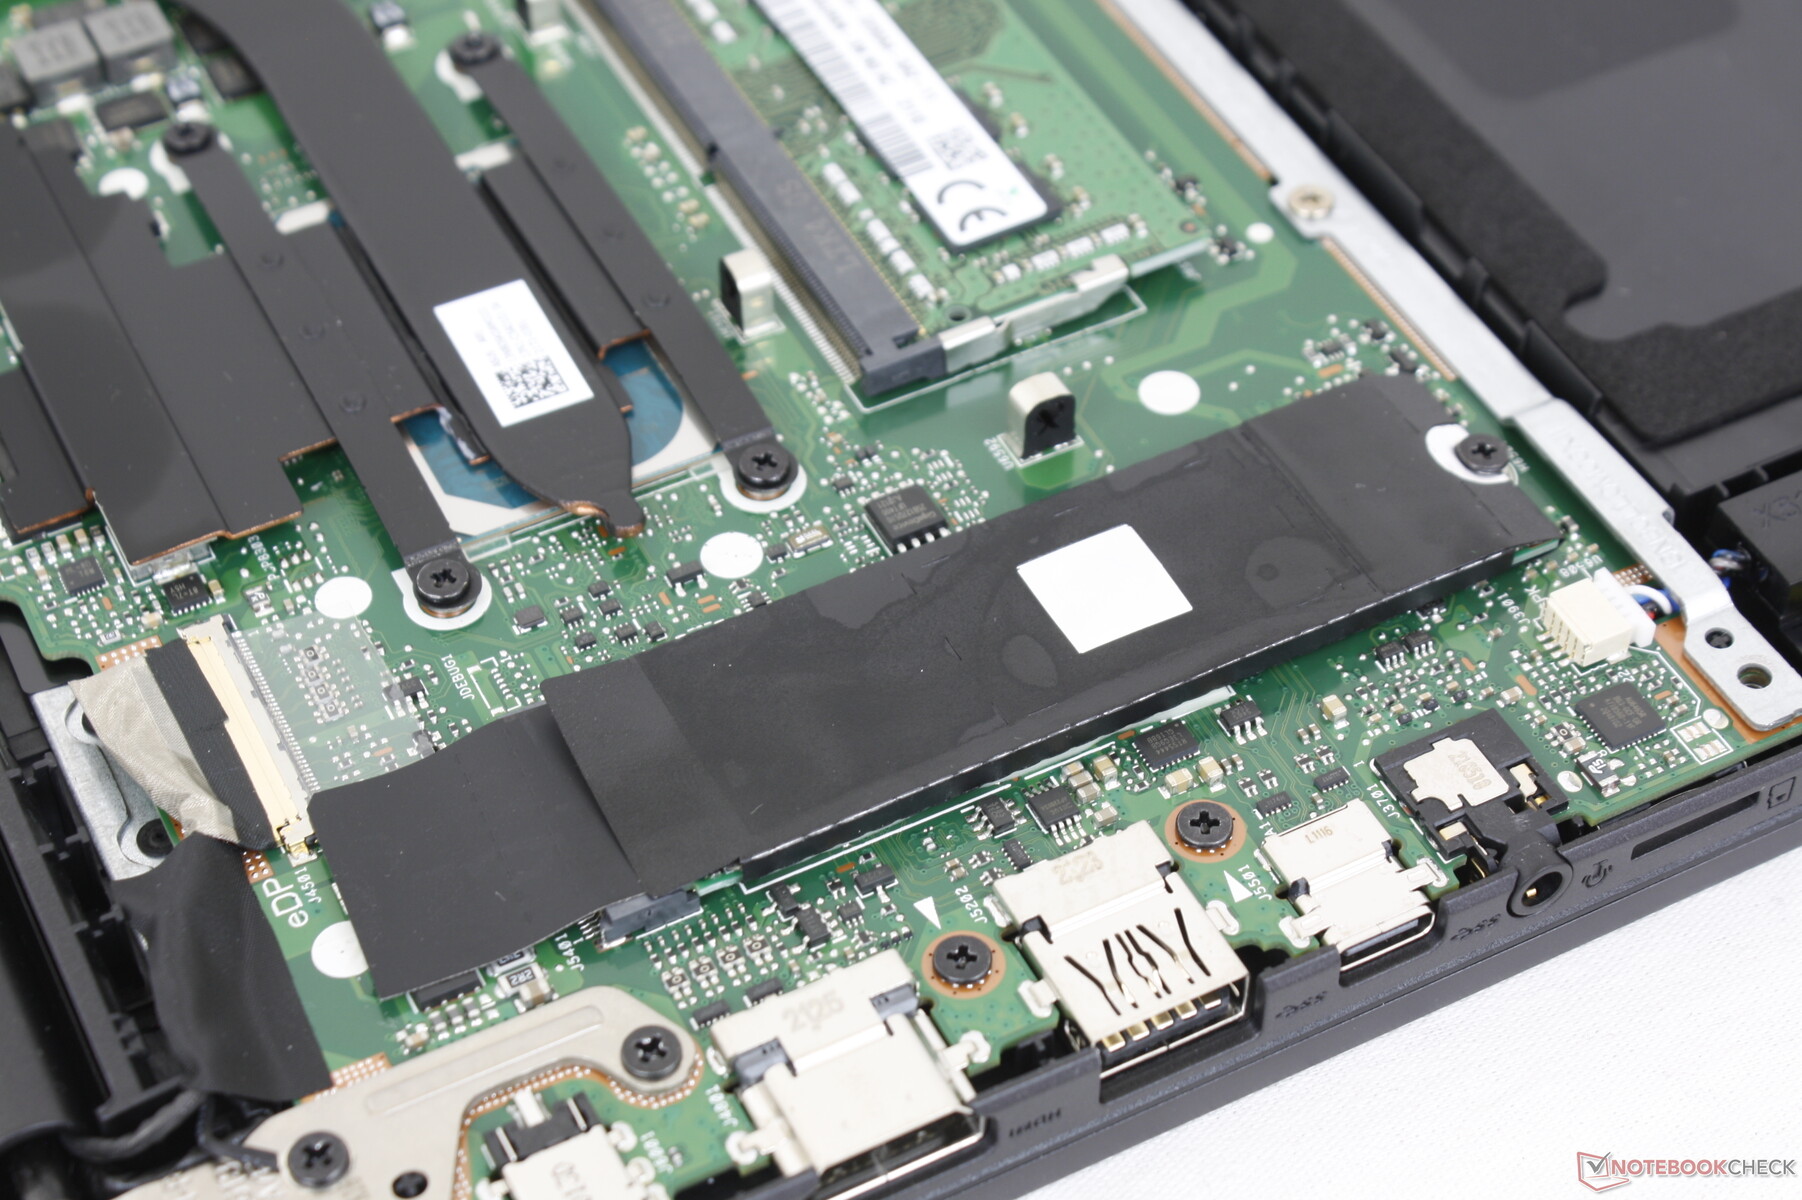
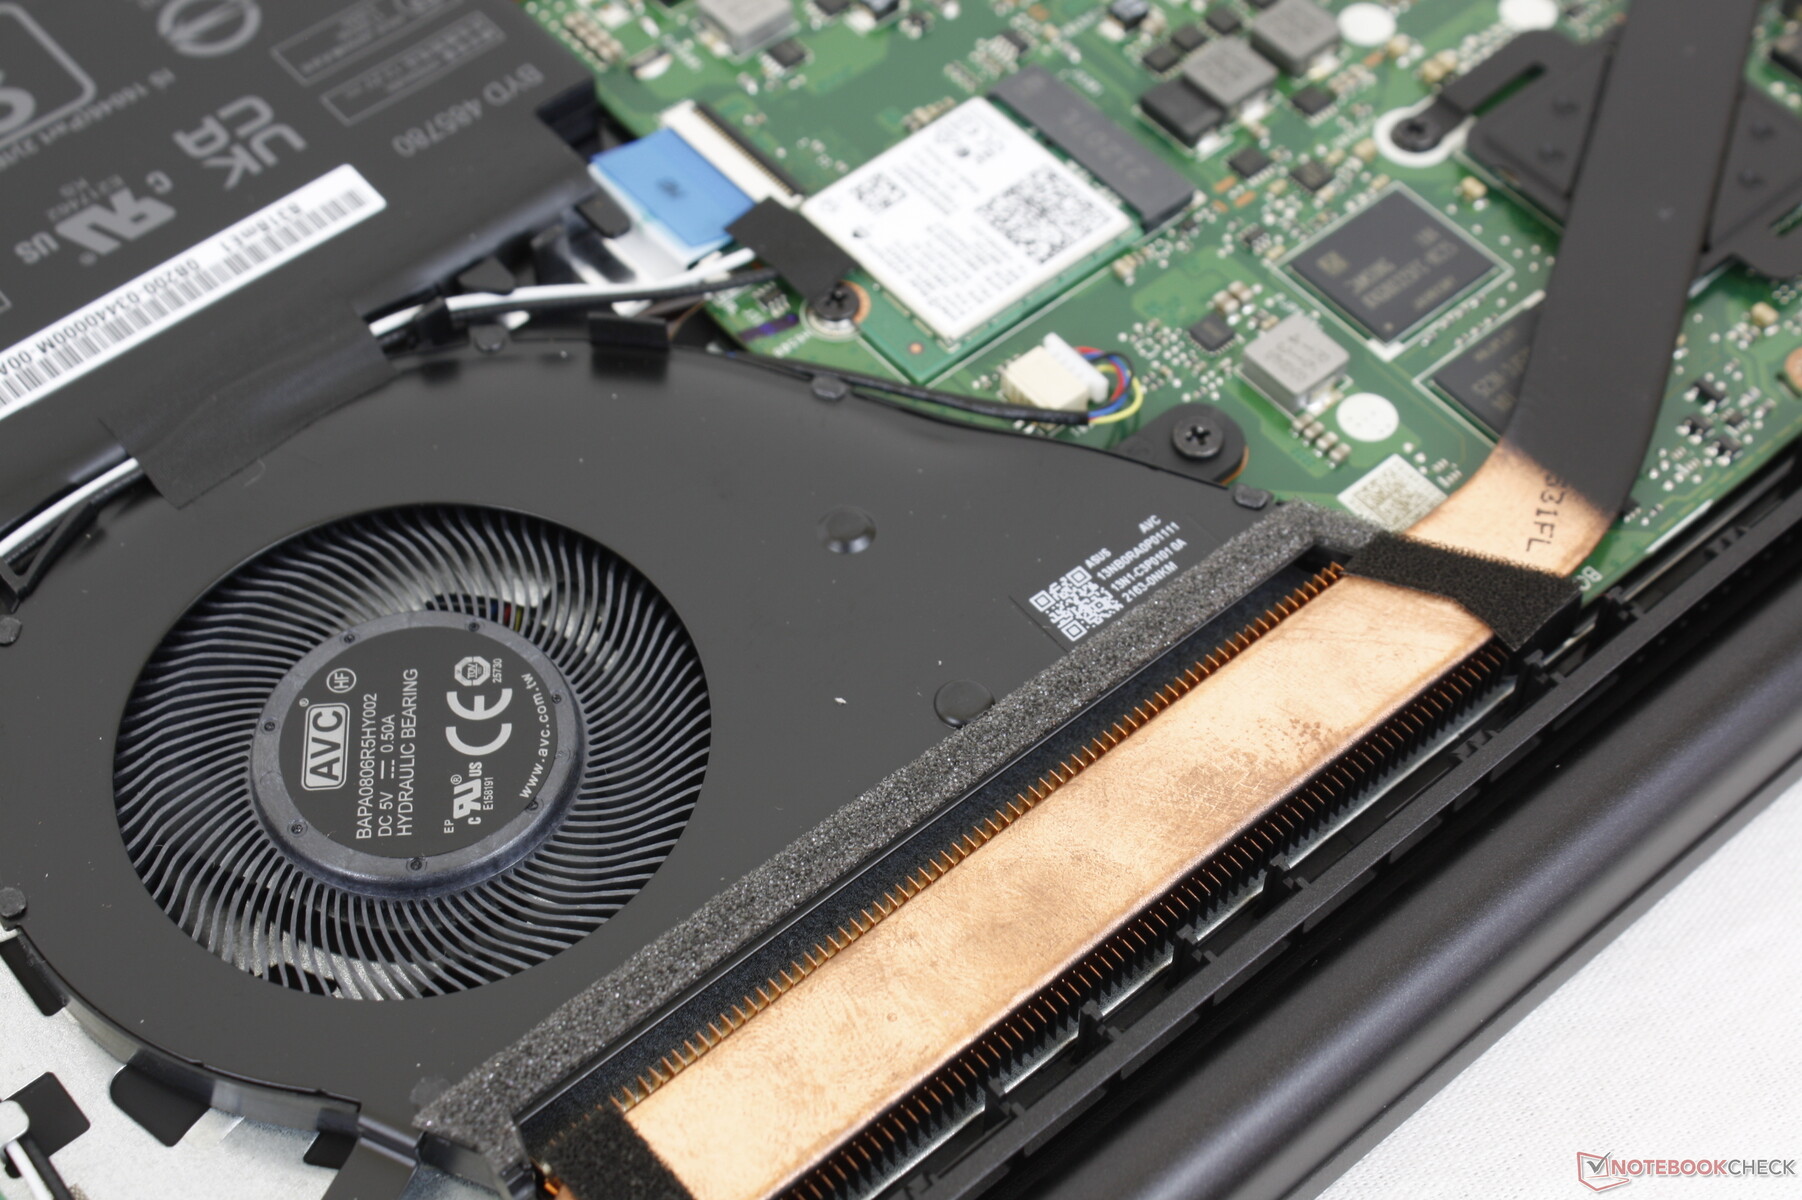
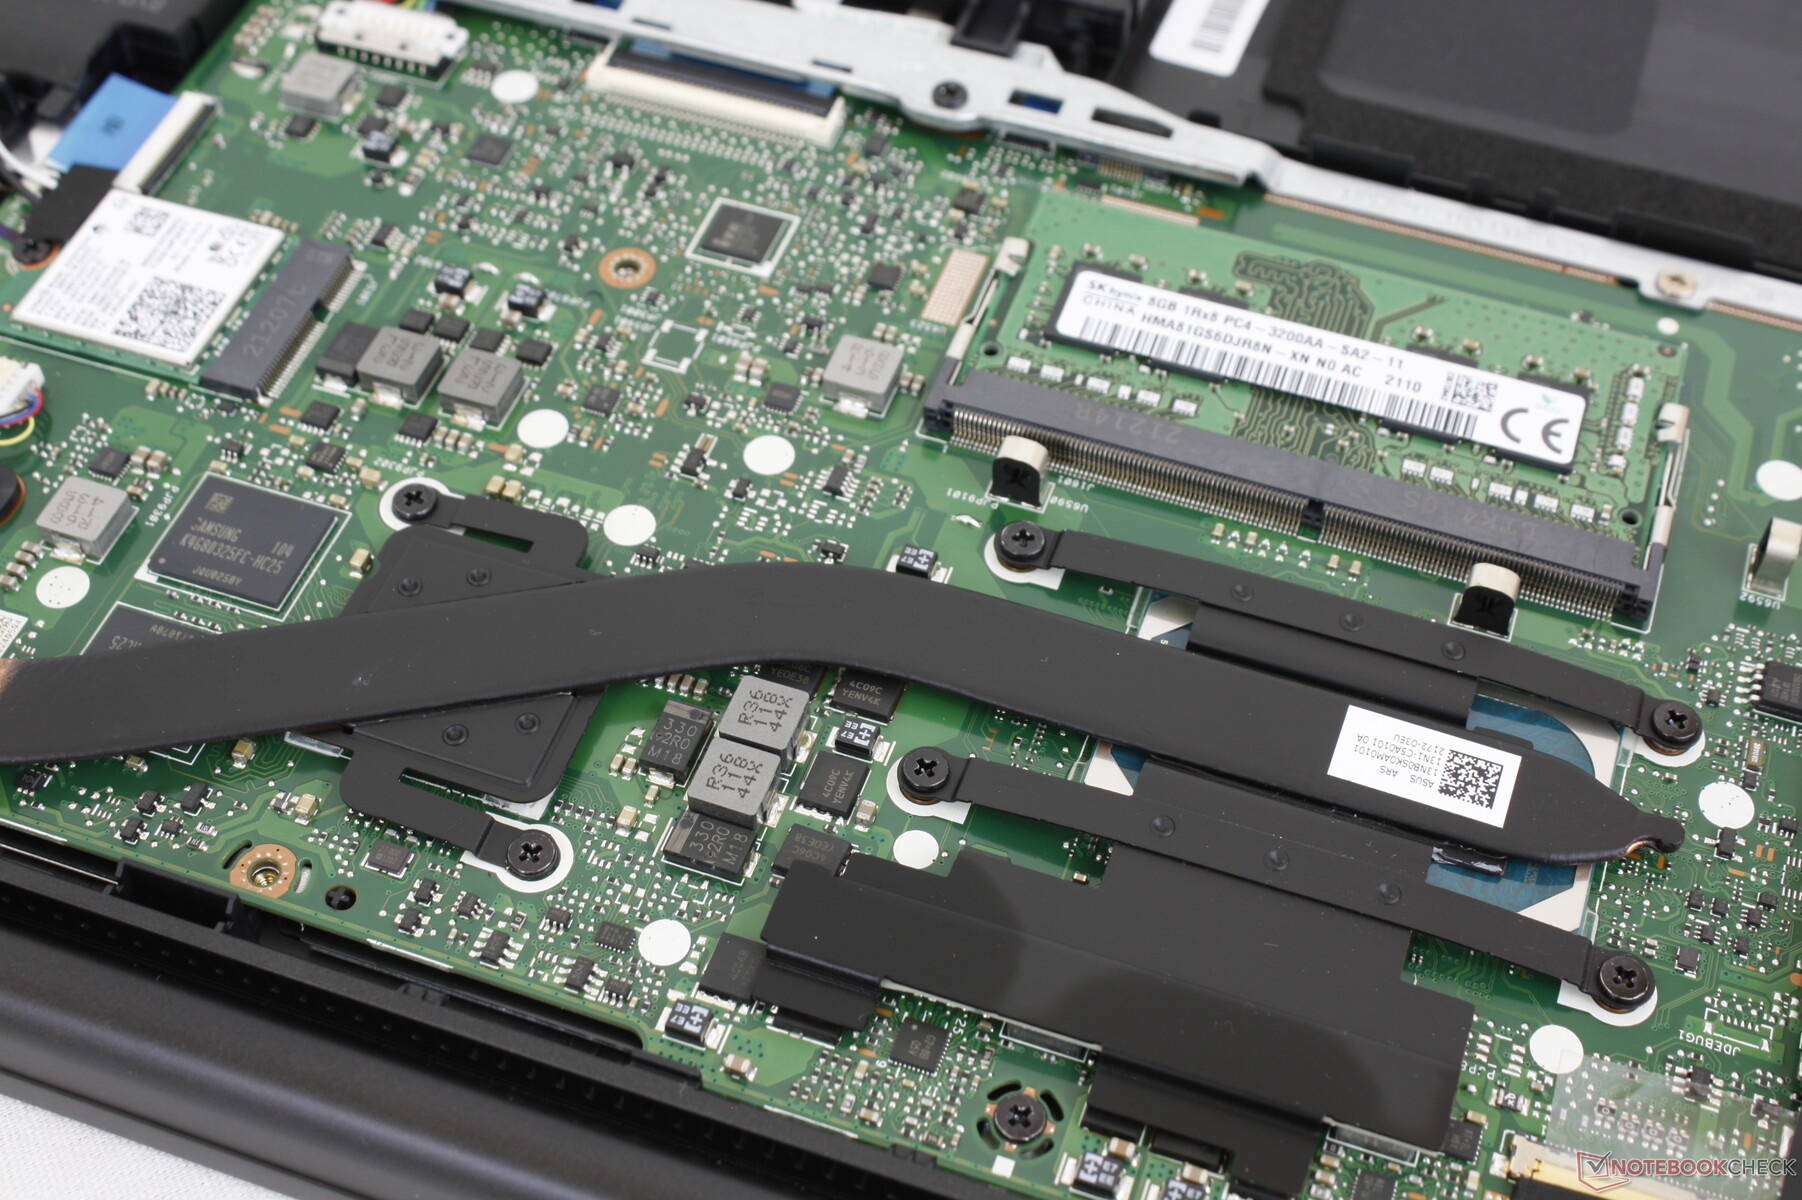
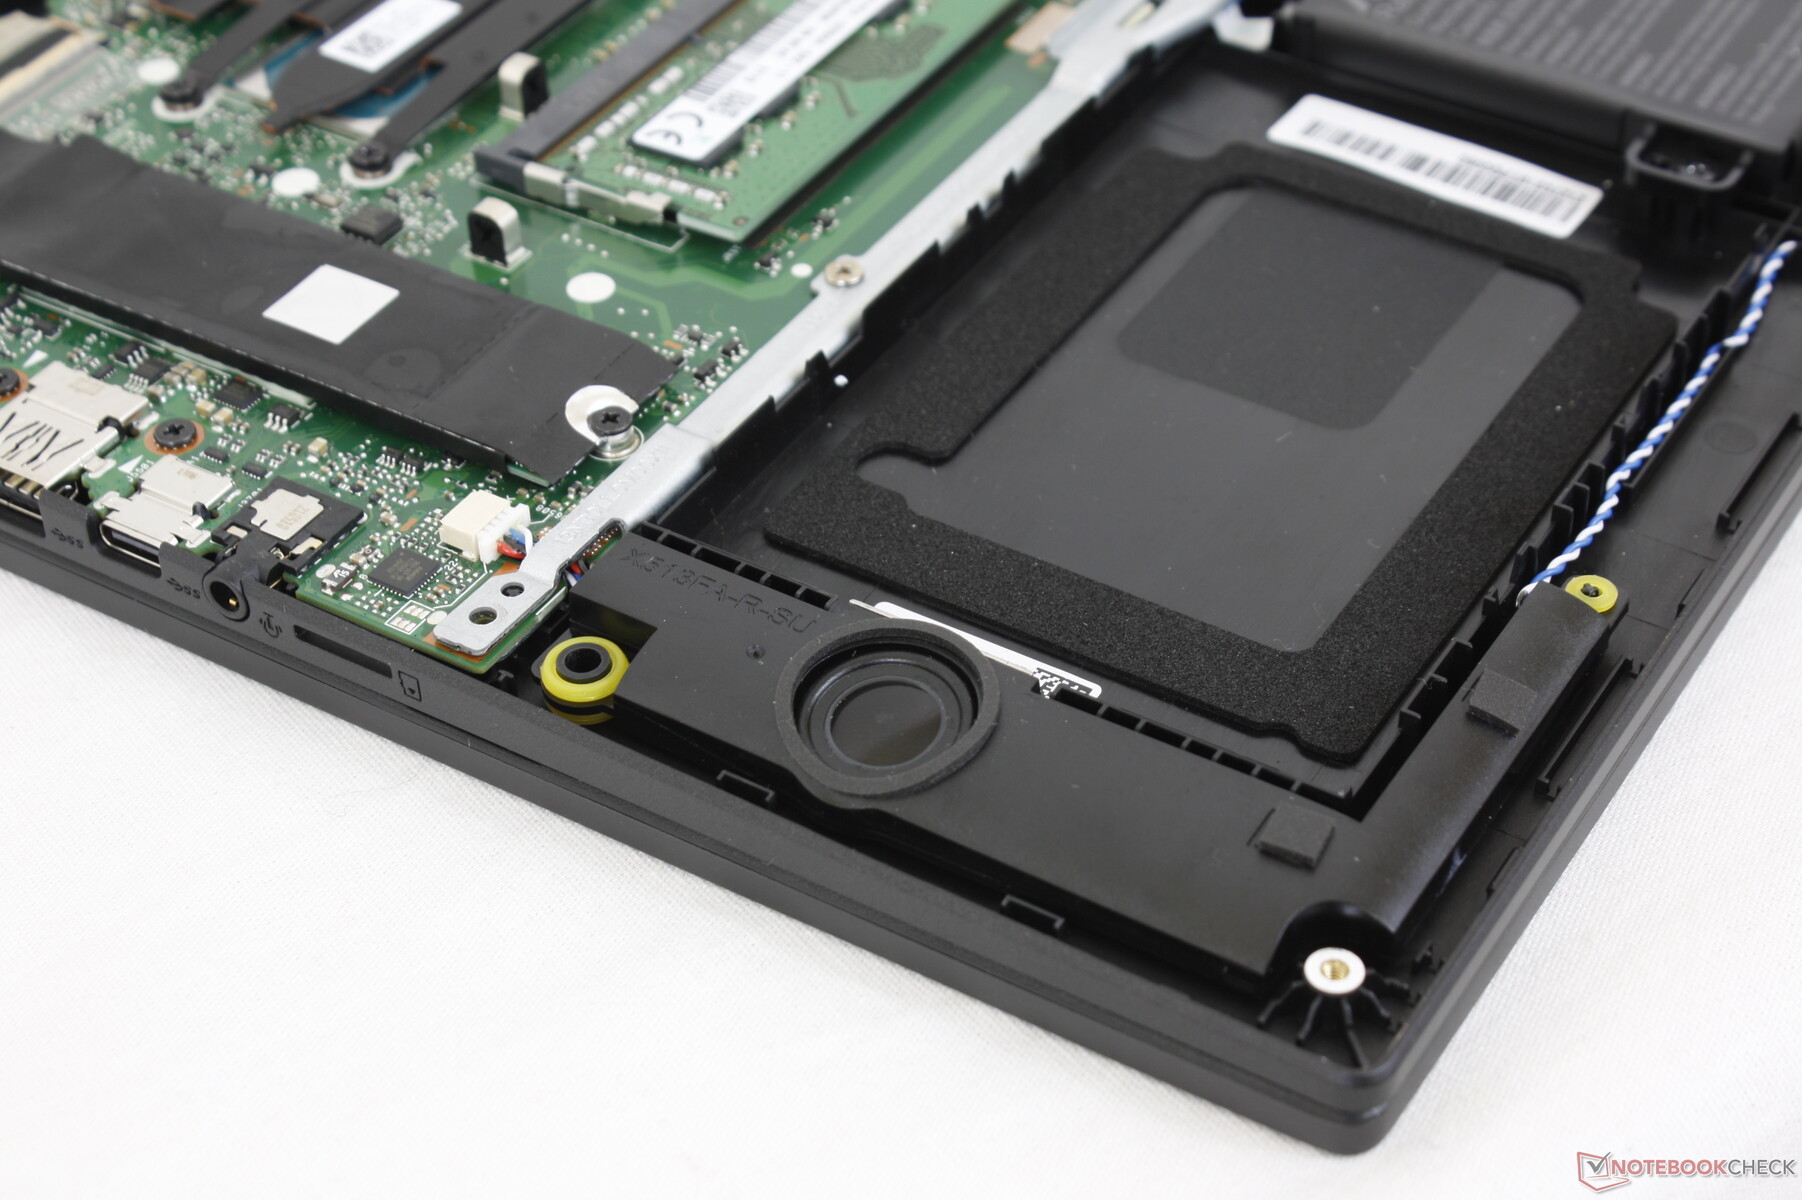
Maintenance — Easy to Open Up
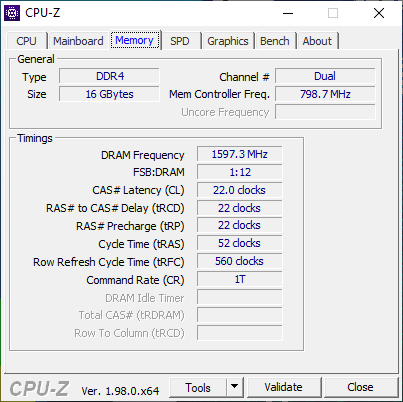
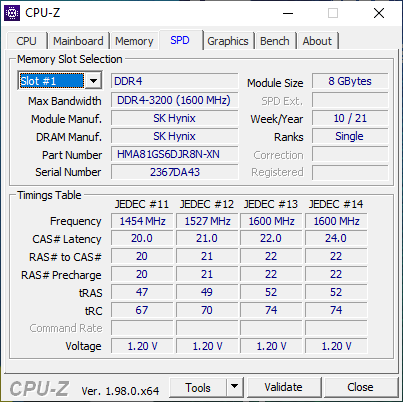
The bottom panel can be easily removed with a Philips screwdriver and sharp edge to unveil the single SODIMM slot, WLAN module, and M.2 2280 PCIe3 x4 slot. A base 8 GB of single-channel RAM comes soldered which can be paired with an 8 GB removable module for up to 16 GB total.
Accessories and Warranty
The retail box includes no other extras beyond the paperwork and AC adapter. The standard one-year limited manufacturer warranty applies.
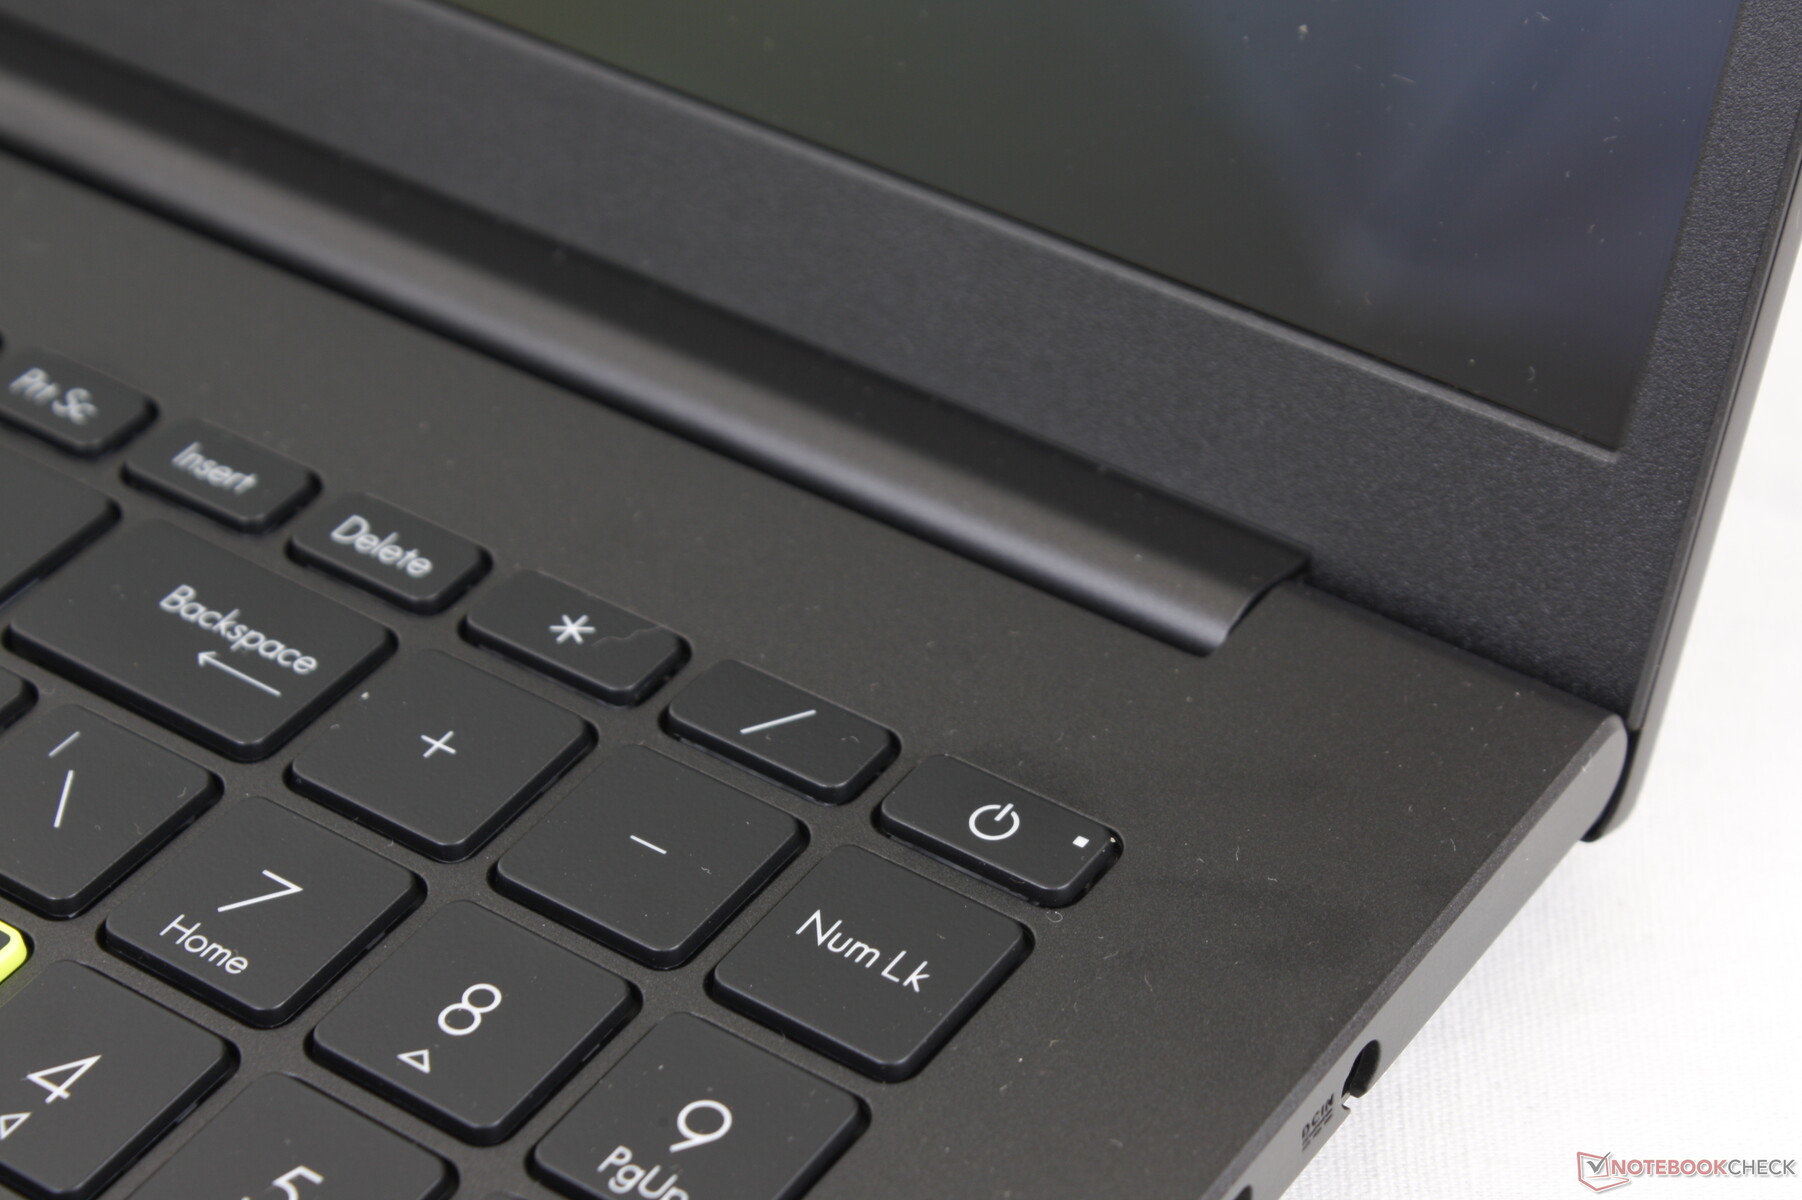
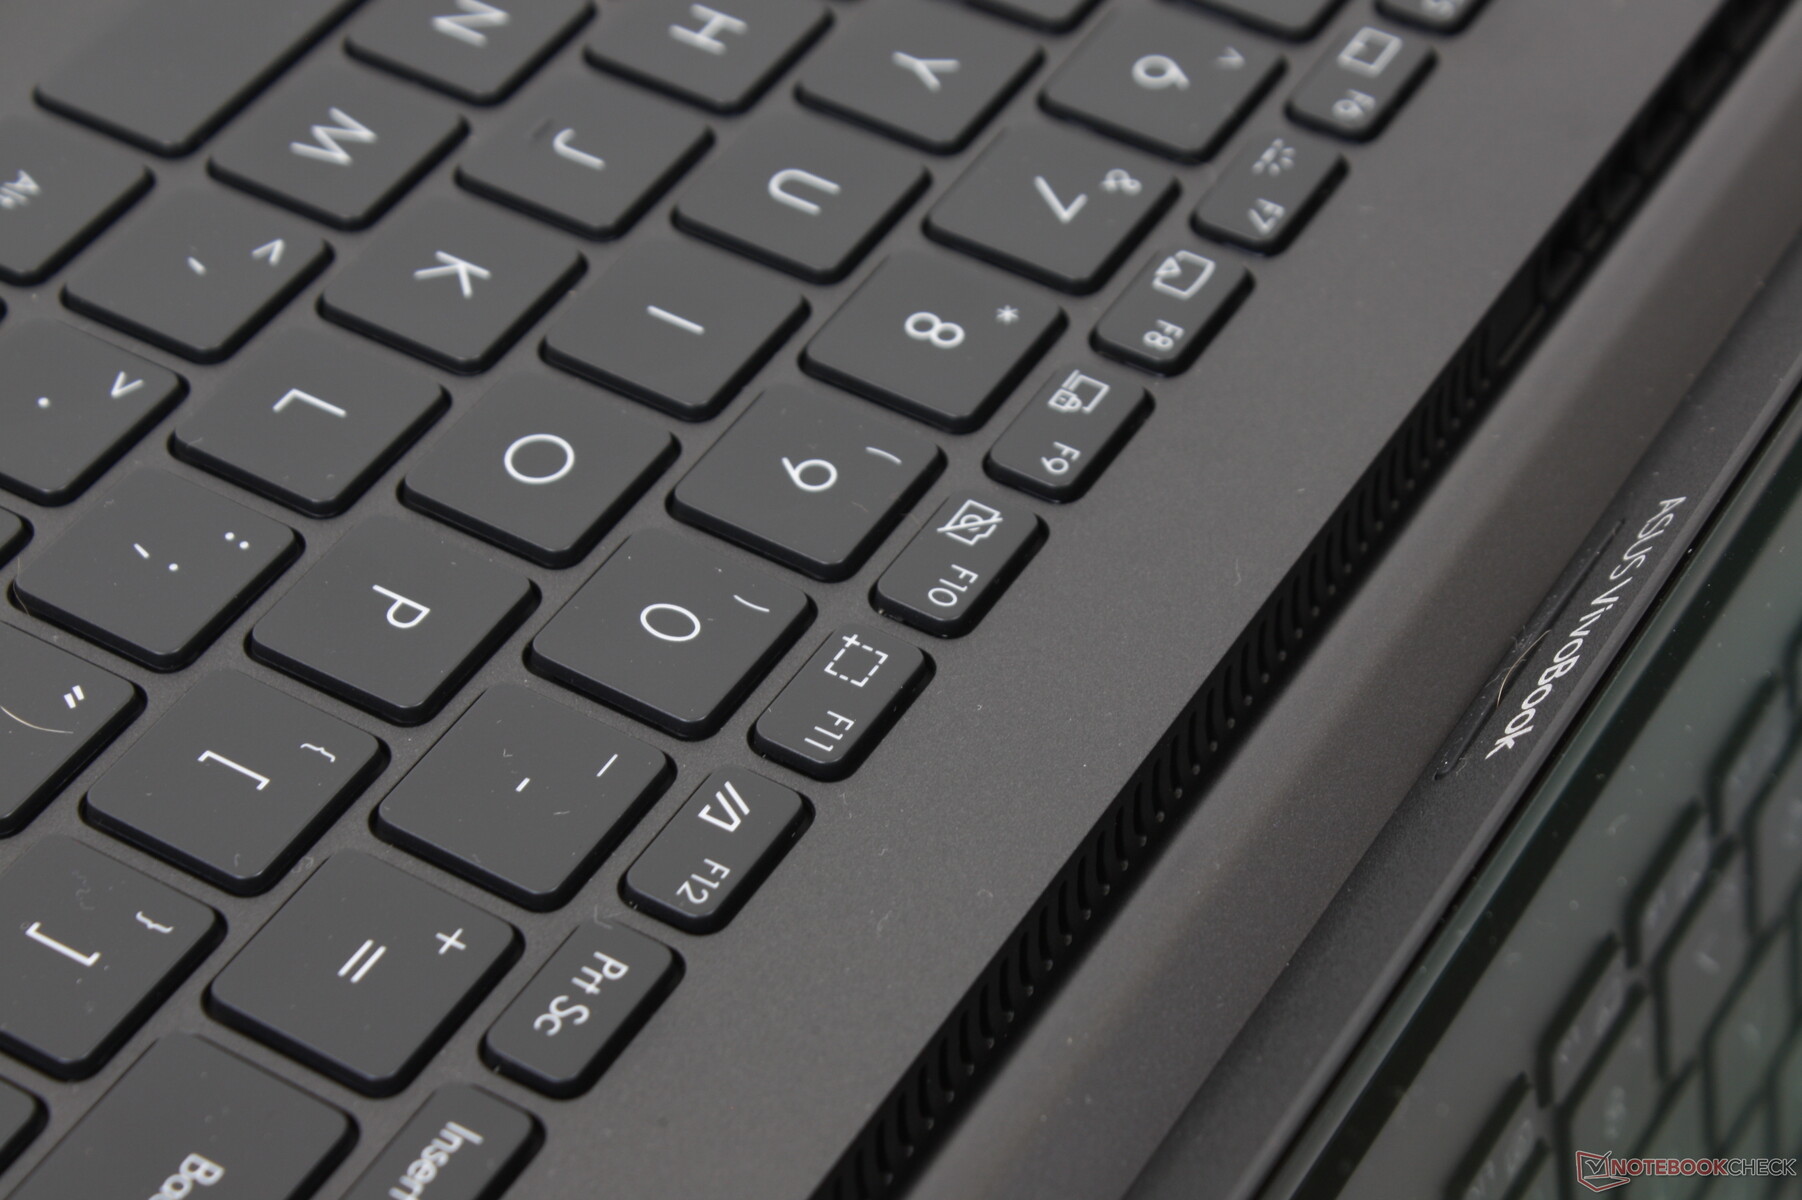
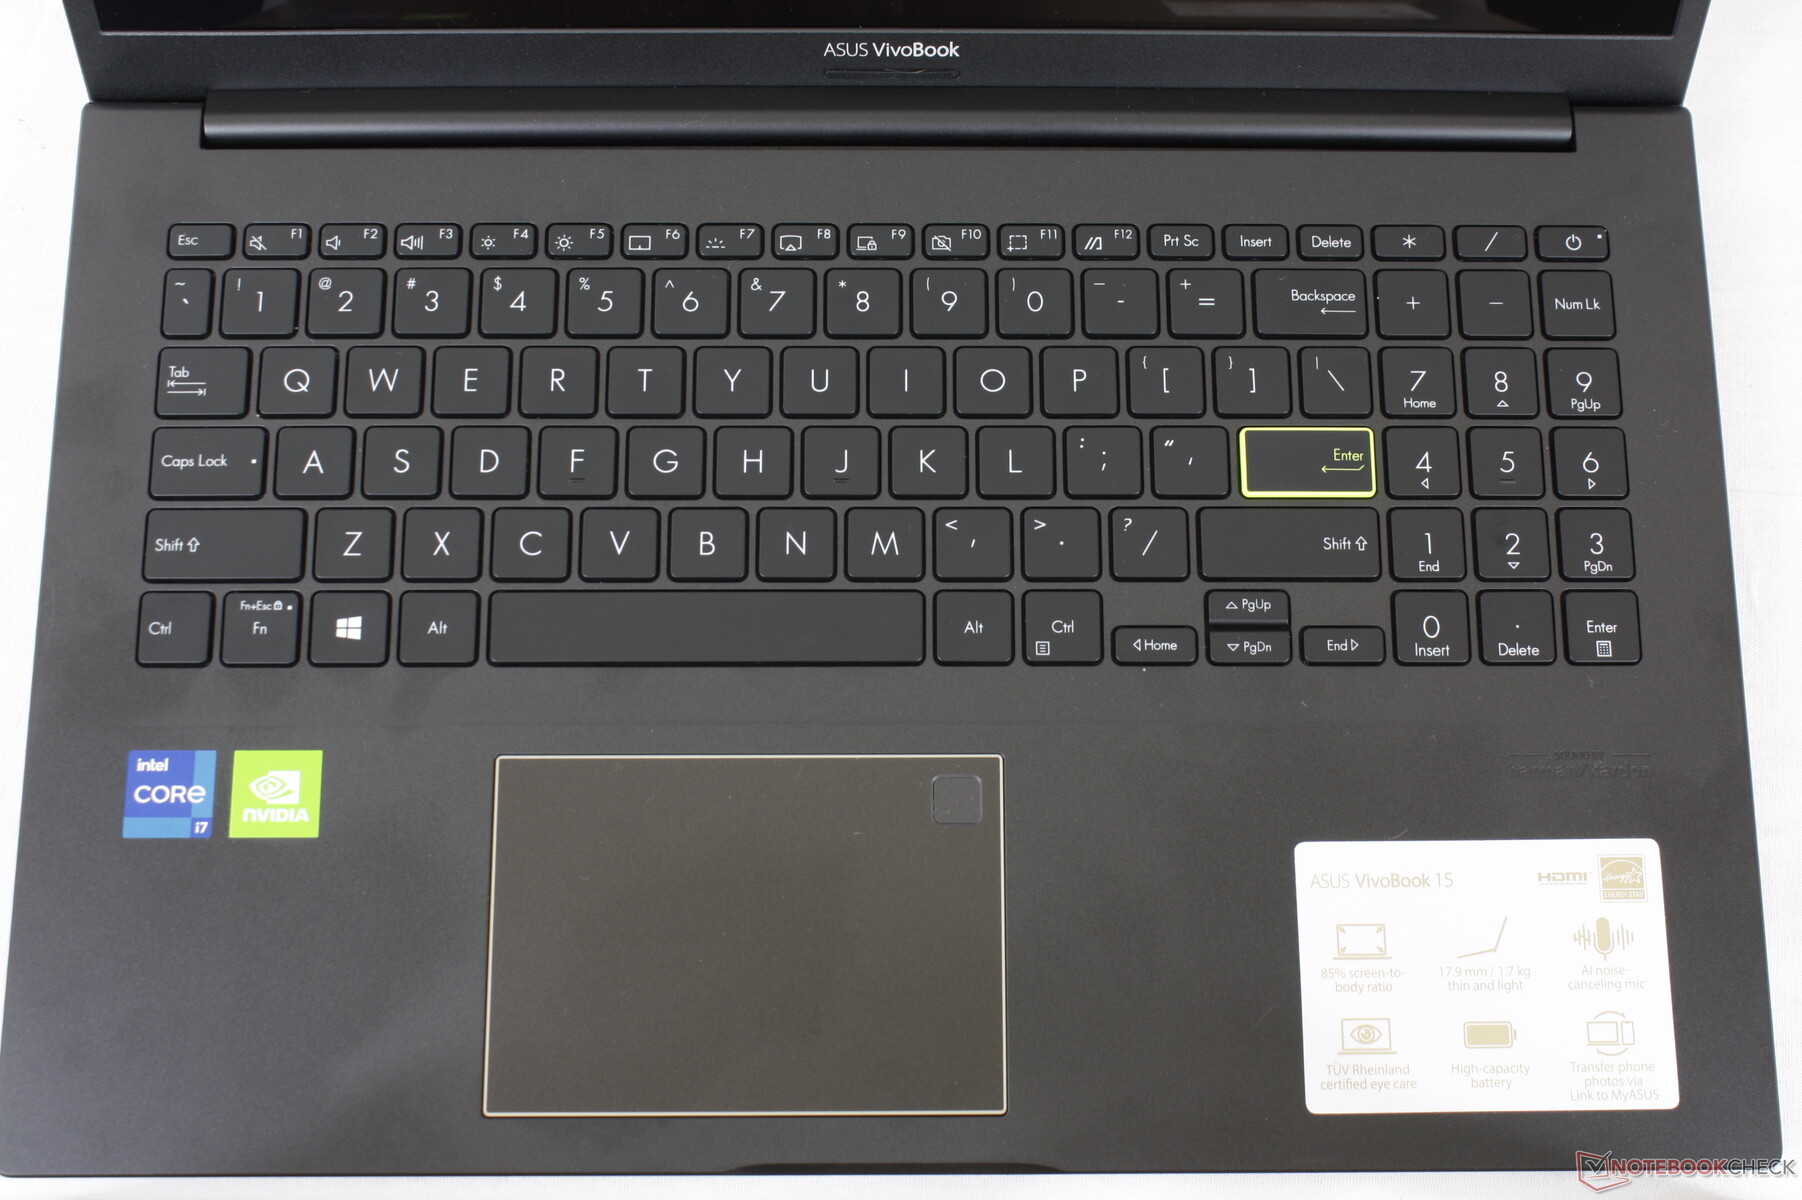
Input Devices — Spongy Clickpad
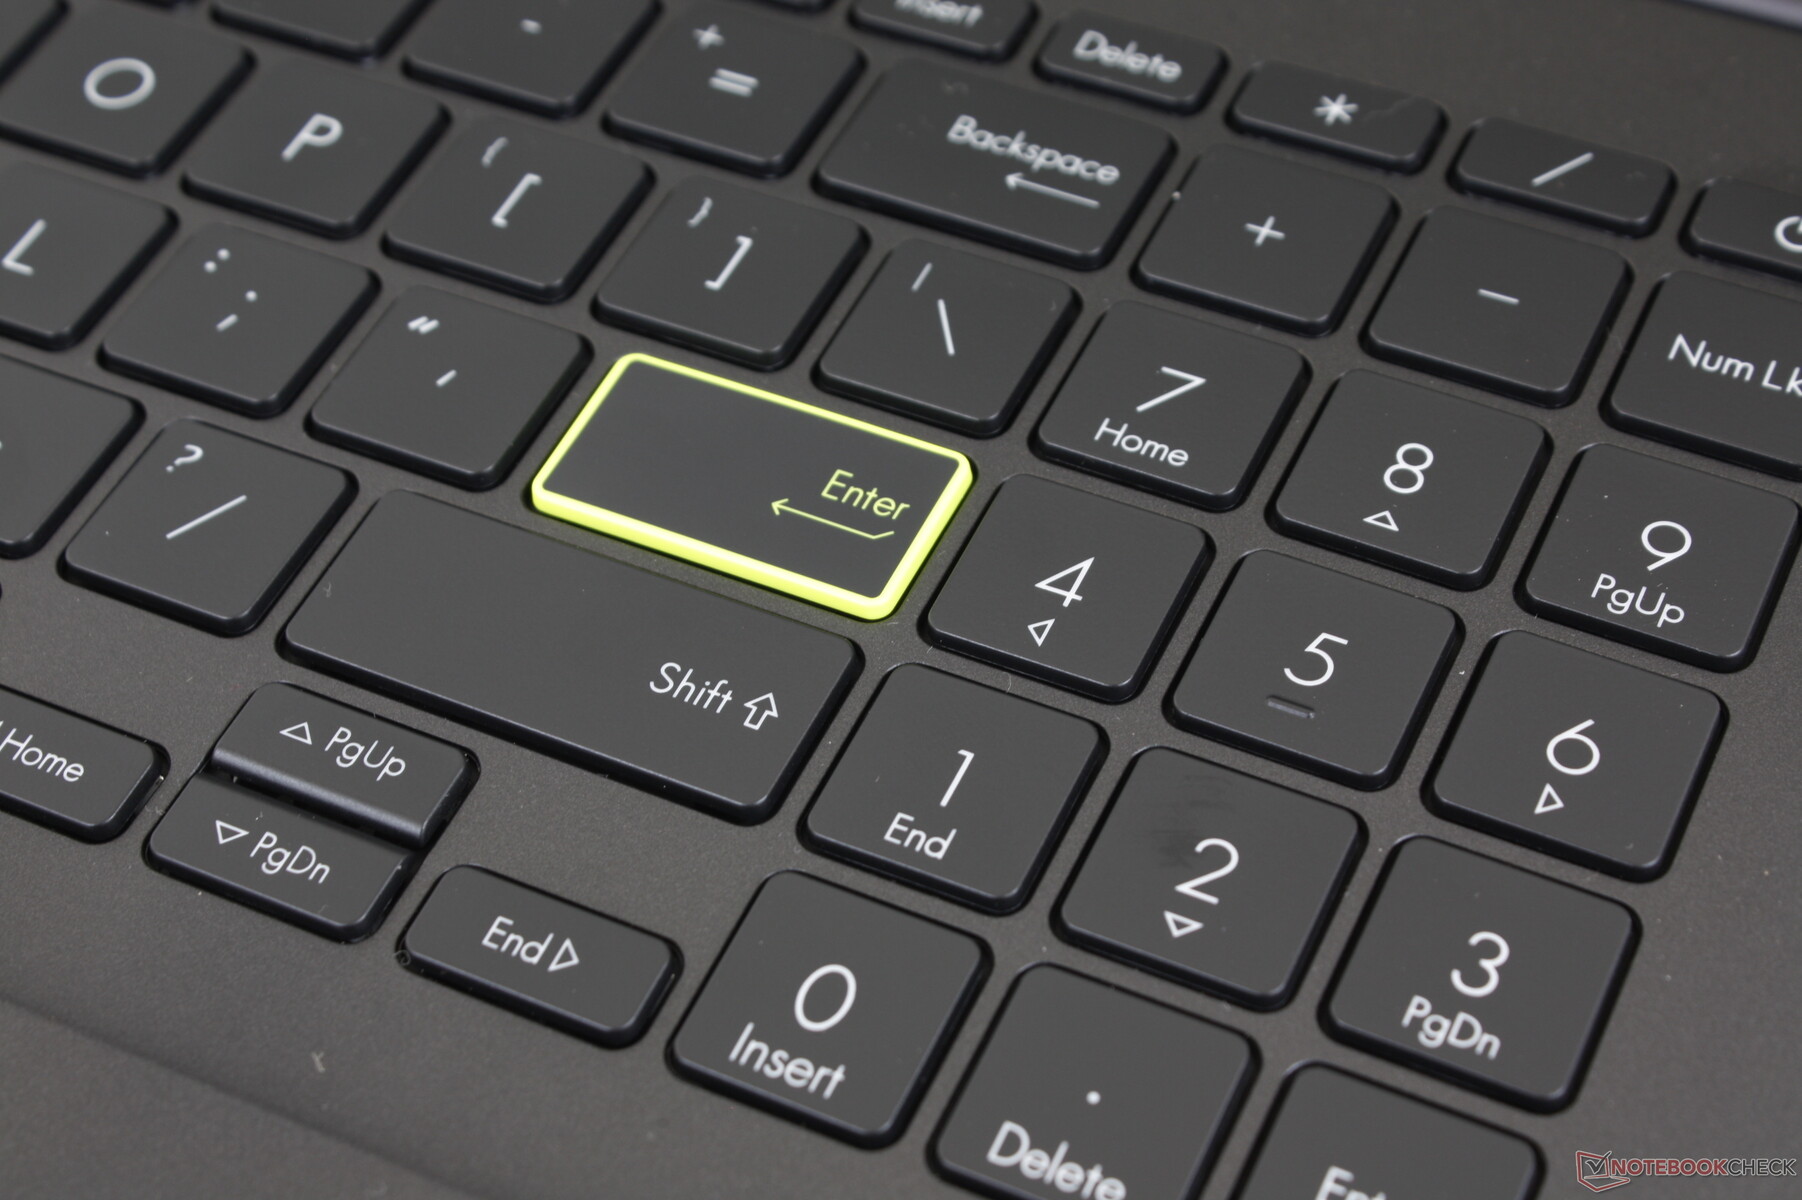
Keyboard
If you've typed on a VivoBook laptop before, then you'll know exactly what to expect from the VivoBook 15 K513 as there is very little variation between the models in terms of keyboard feedback. Both travel and tactility remain shallow and soft, respectively, compared to the firmer keys of the business-centric Lenovo ThinkPad or HP EliteBook. The keys of the Lenovo IdeaPad 5 15 feel similar to what we have here on the Asus, but key clatter is moderately louder on the Asus.
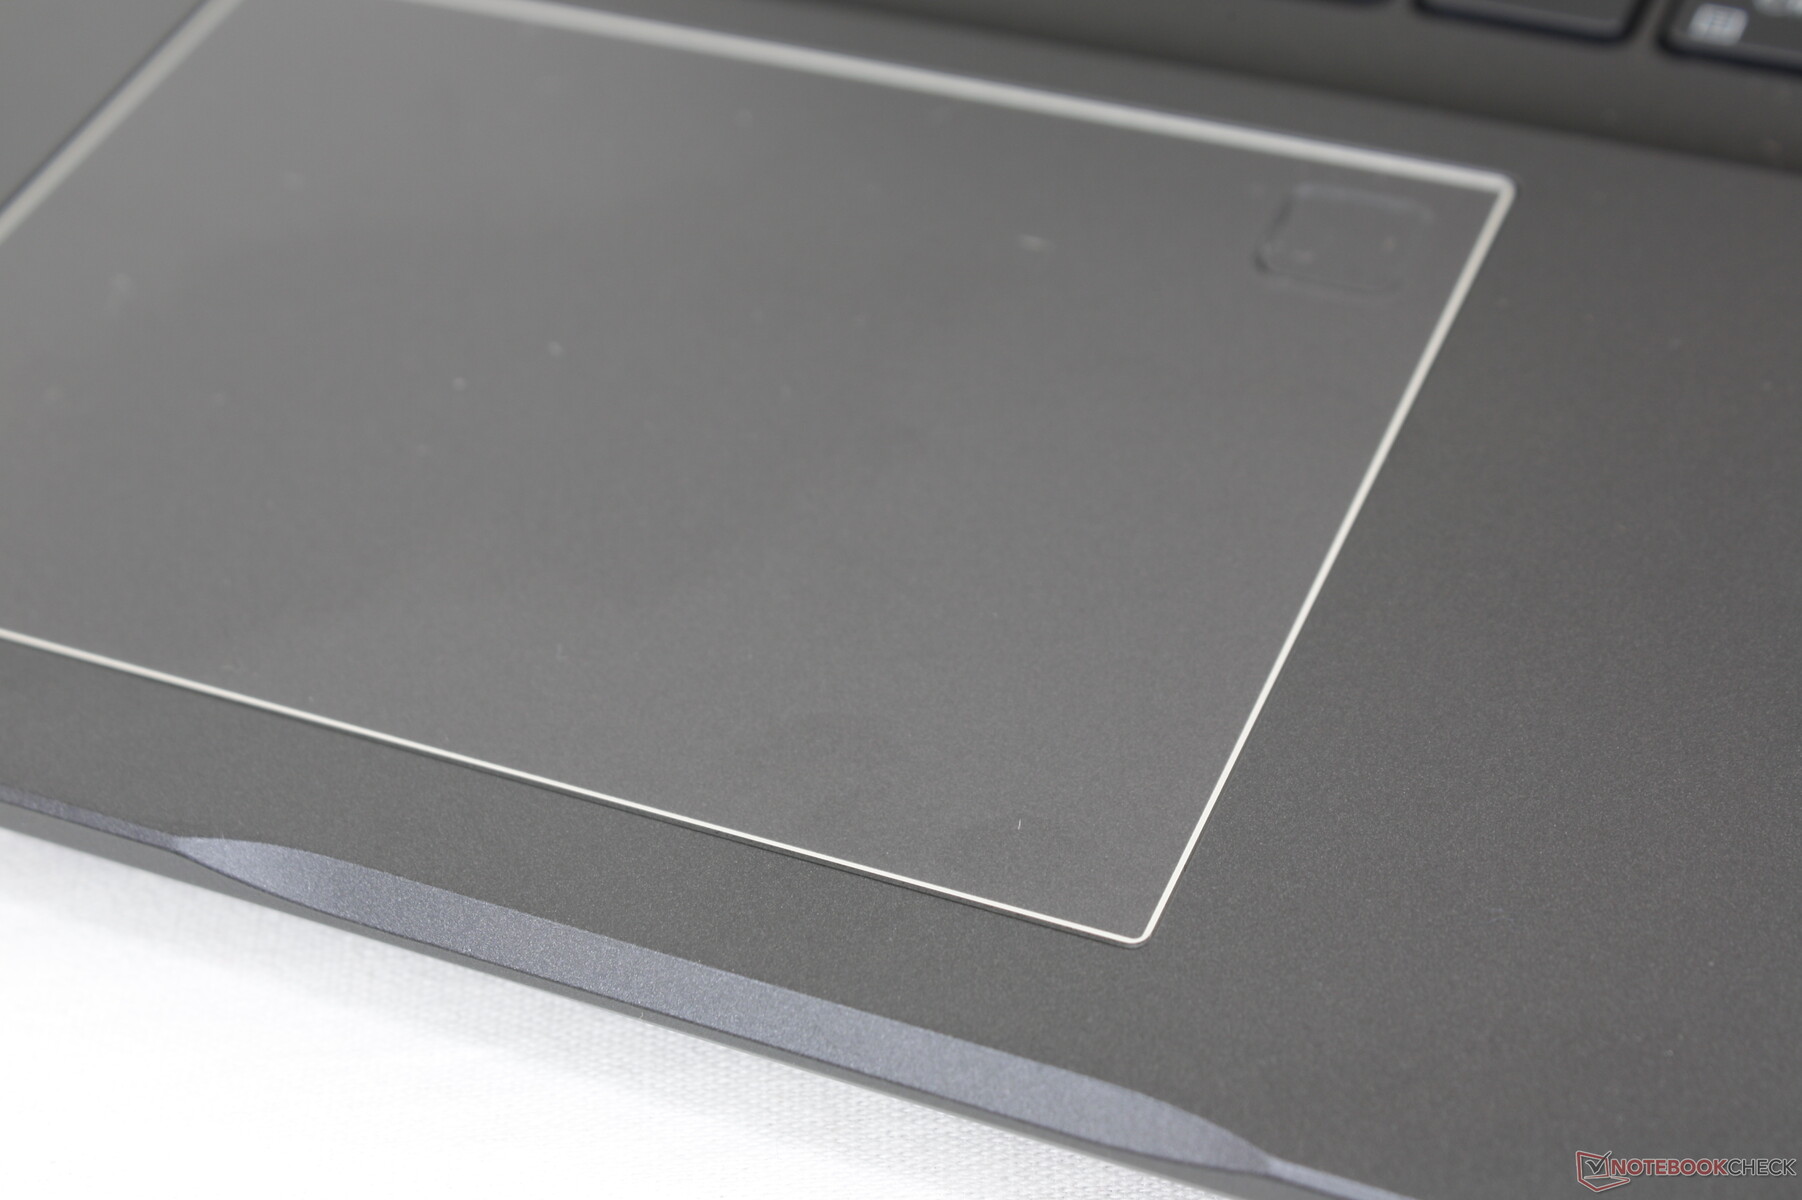
Touchpad
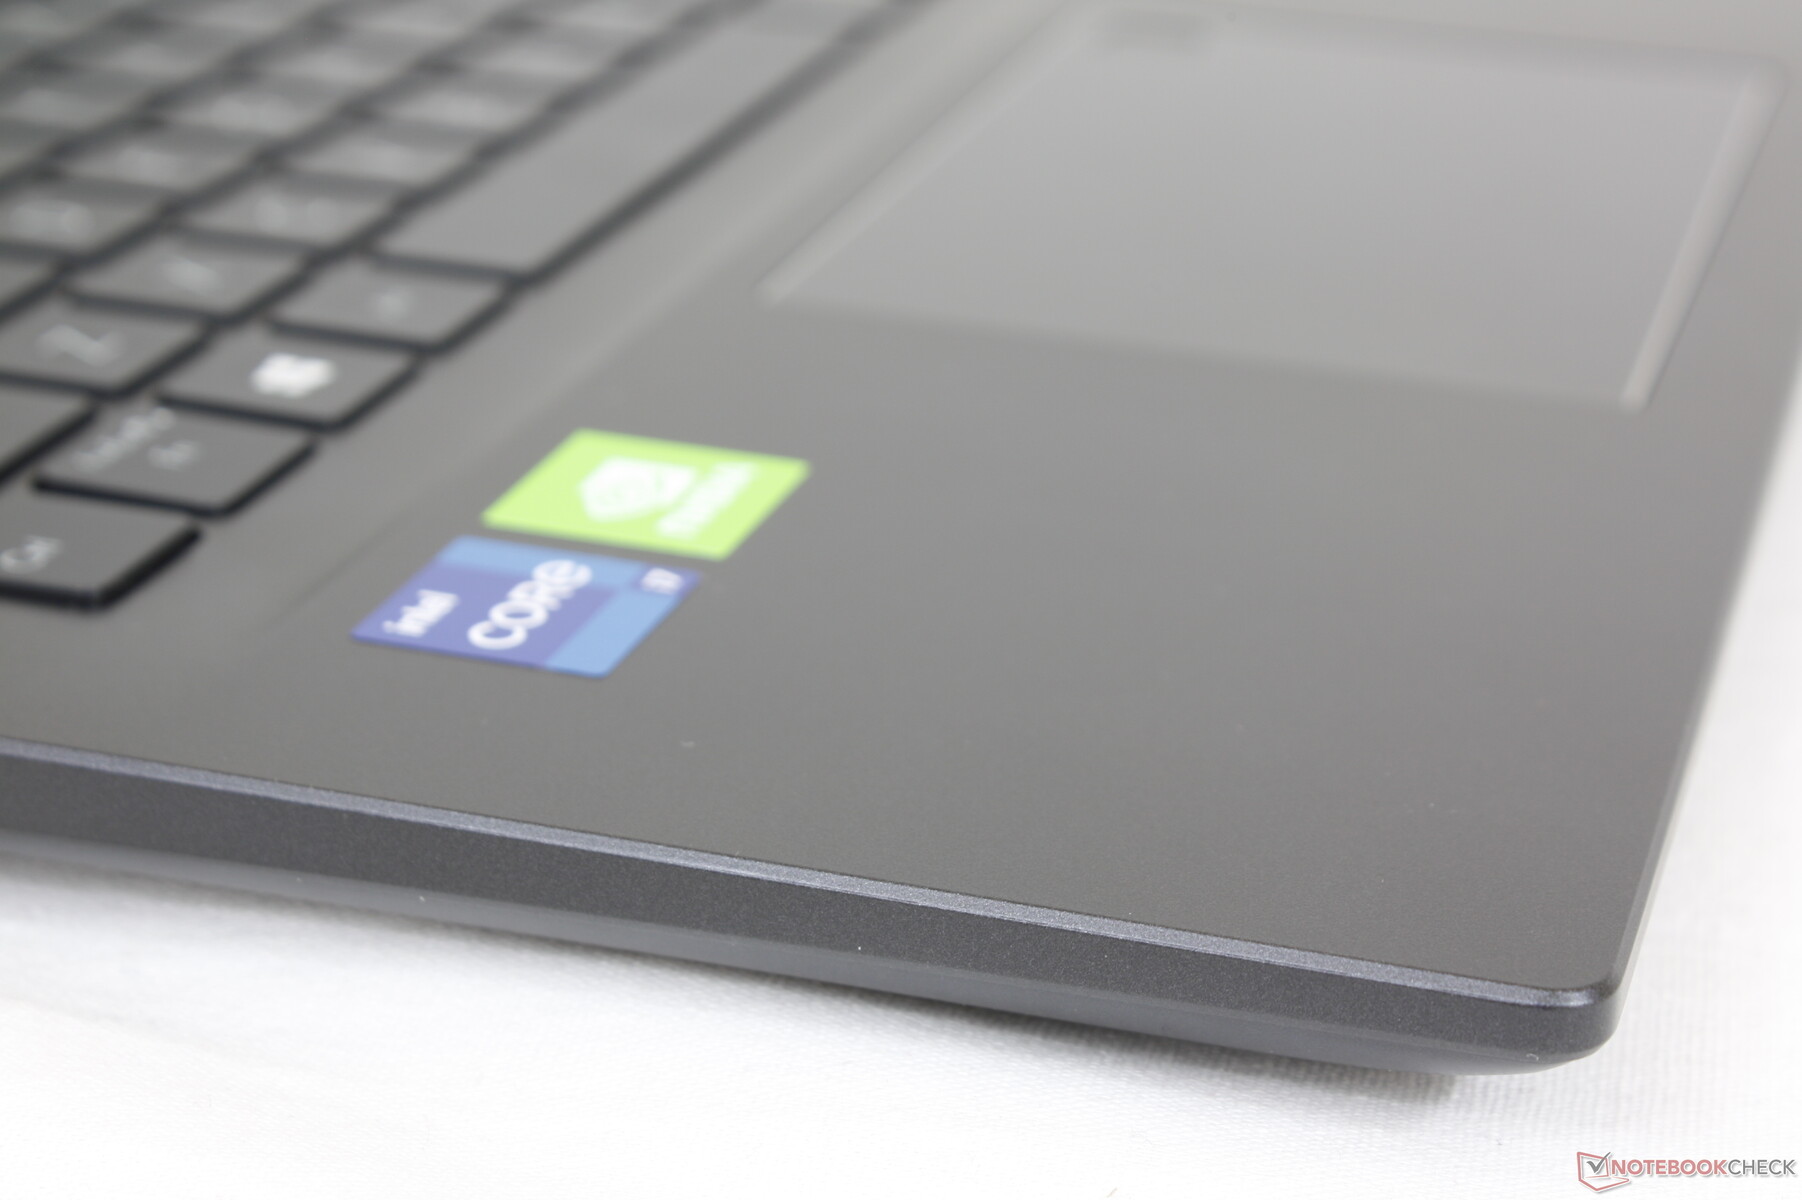
The clickpad (~10.5 x 7.3 cm) is poor and below average even by budget standards. While regular cursor movement is smooth and without any sudden jumps, its integrated mouse keys are far too spongy and shallow. Clicking feels unsatisfying as a result especially if clicking and dragging or performing other multi-touch actions.

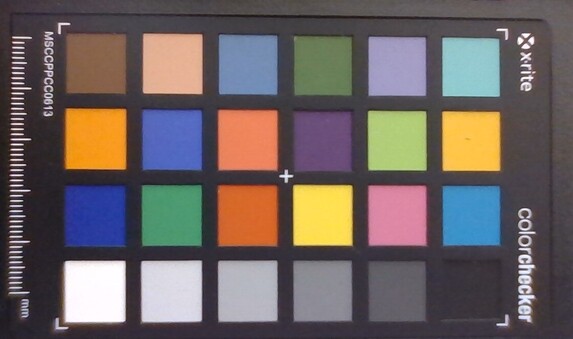
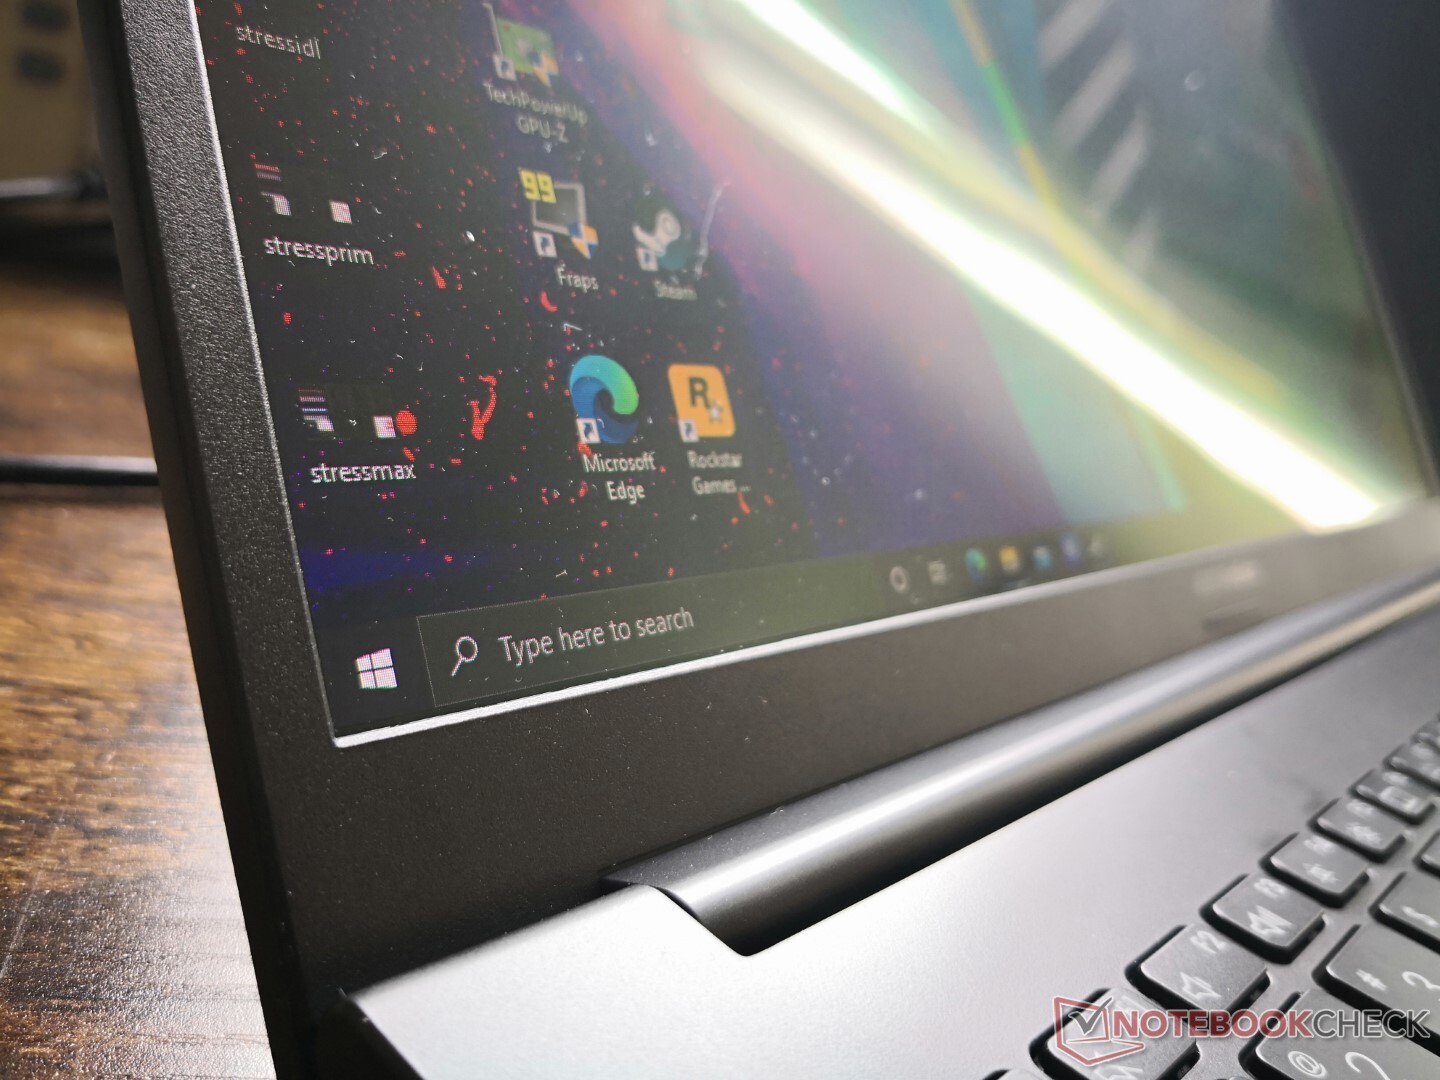
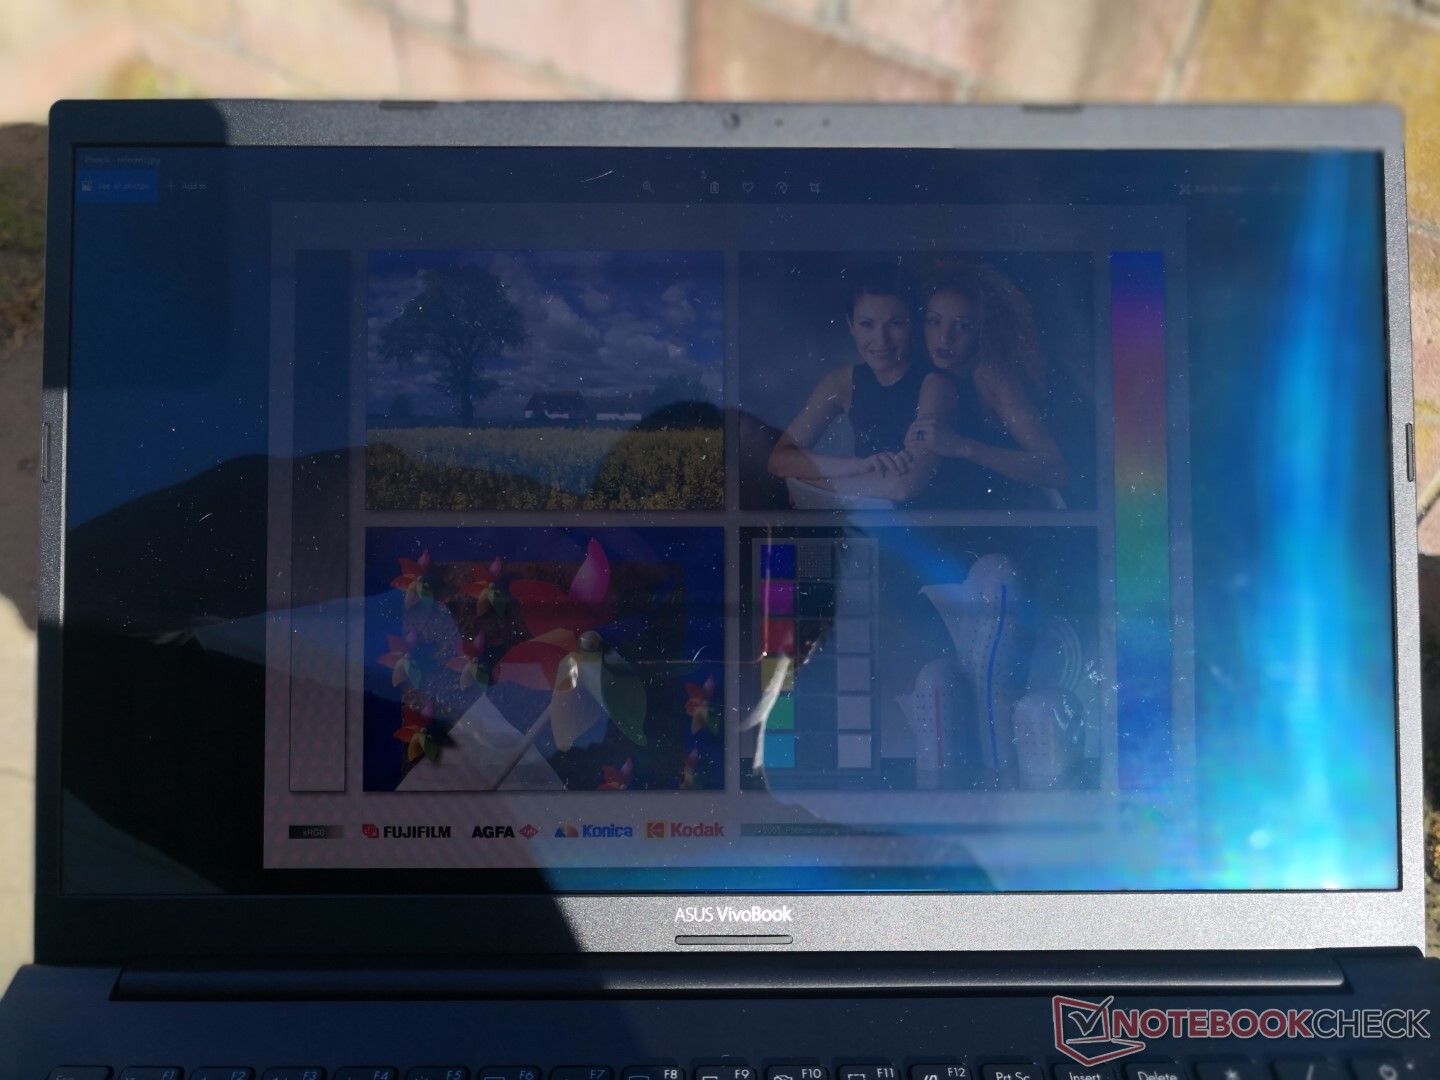
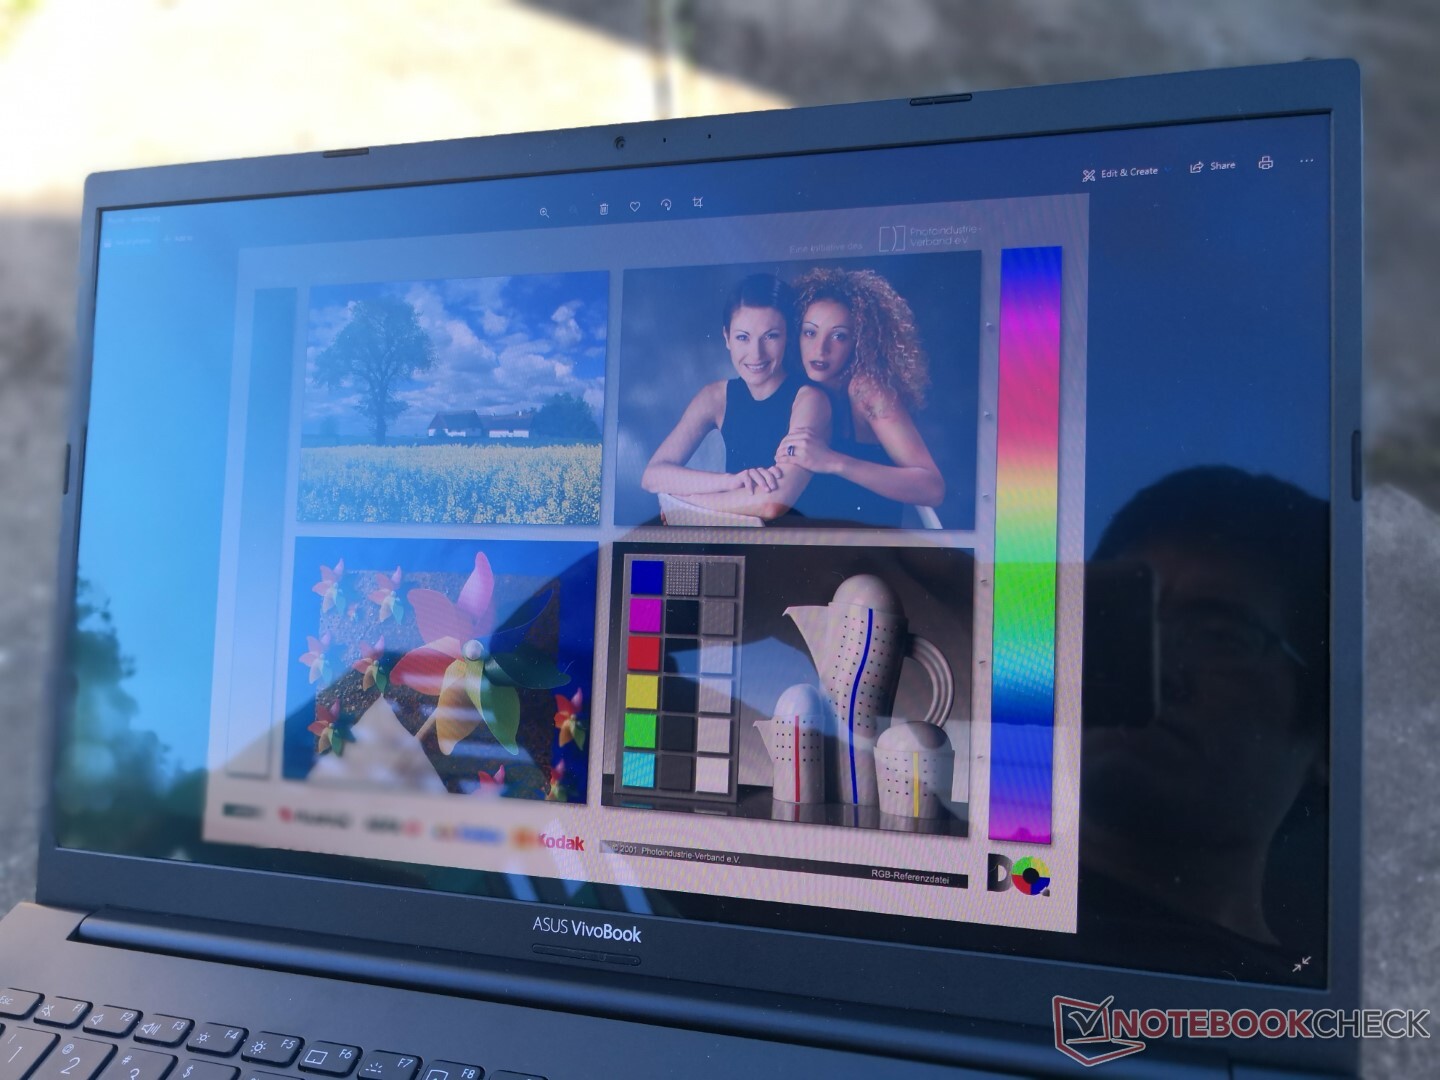
Display — Mostly Better Than IPS
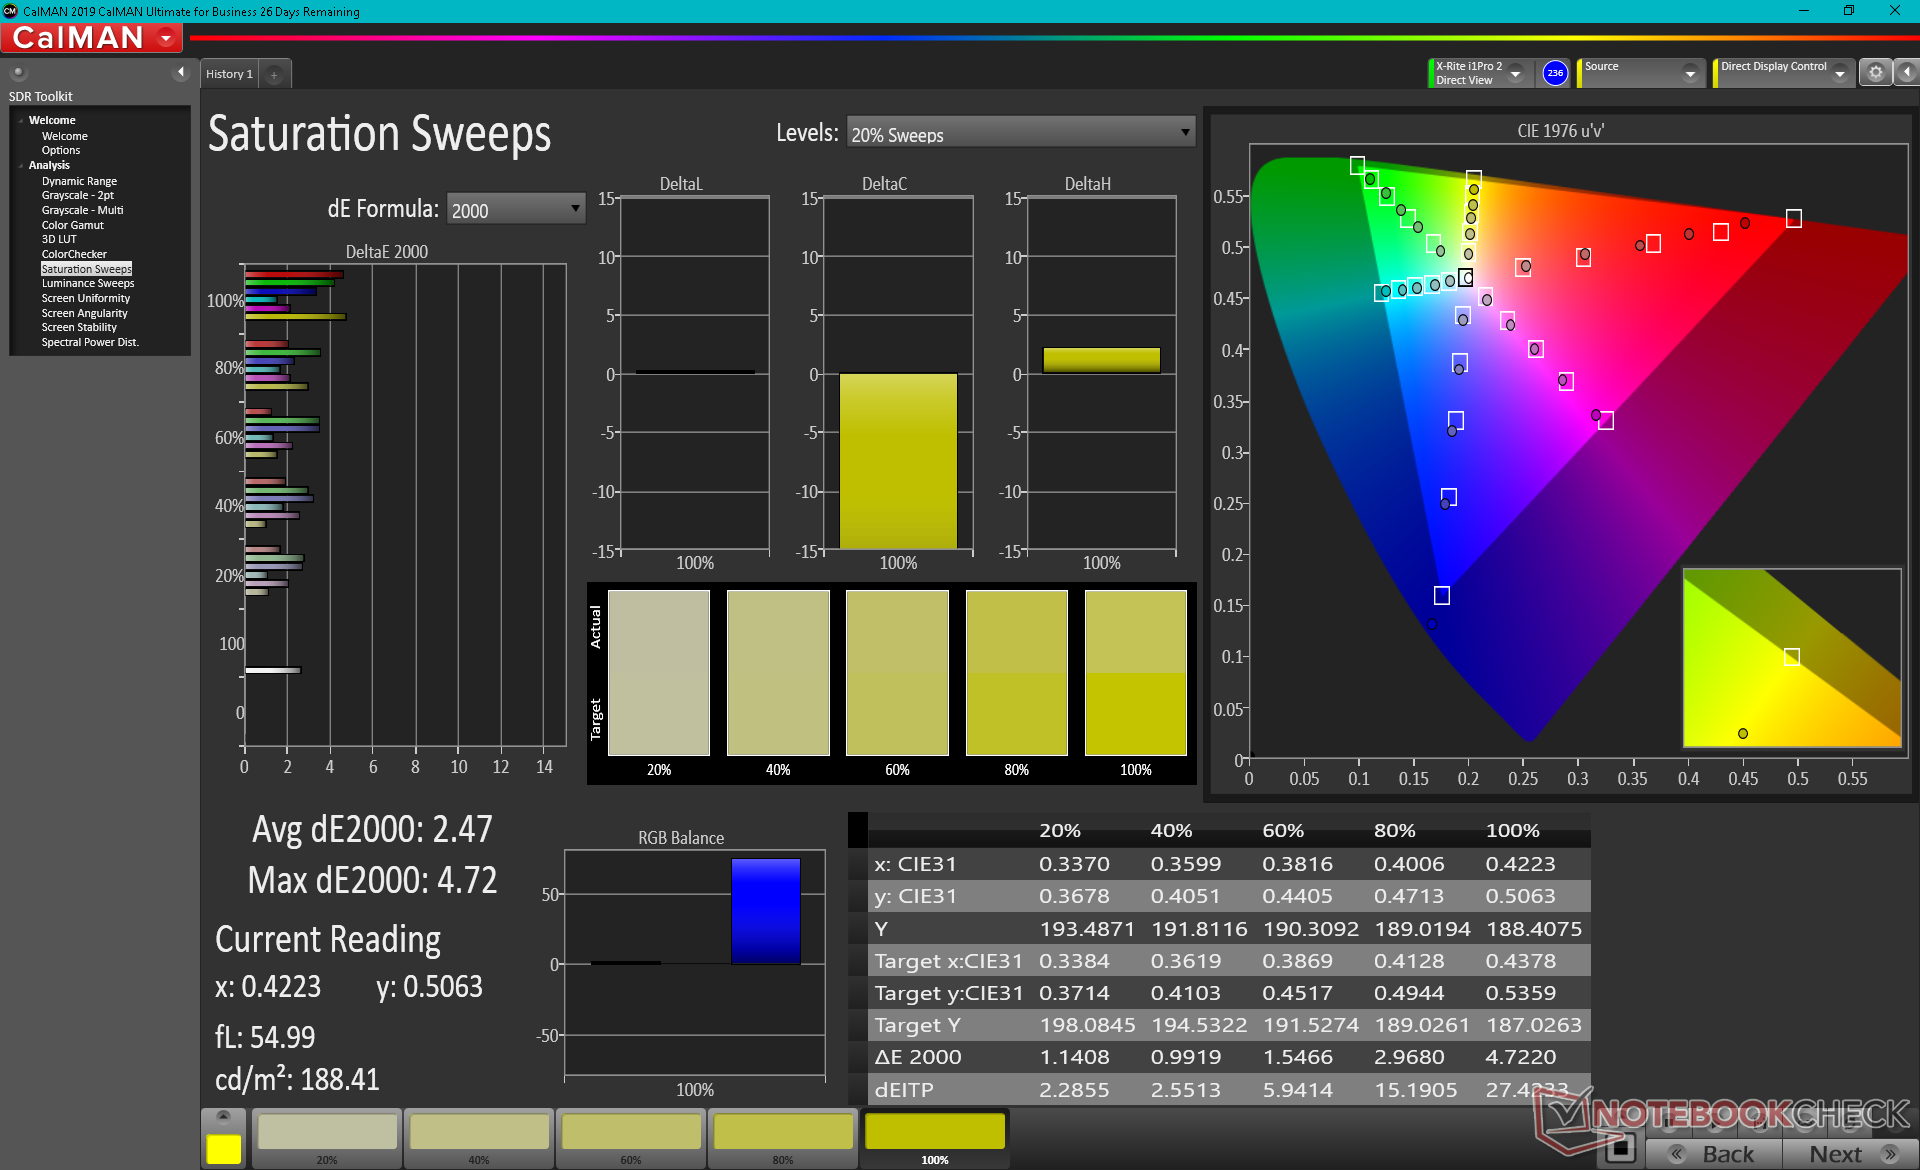
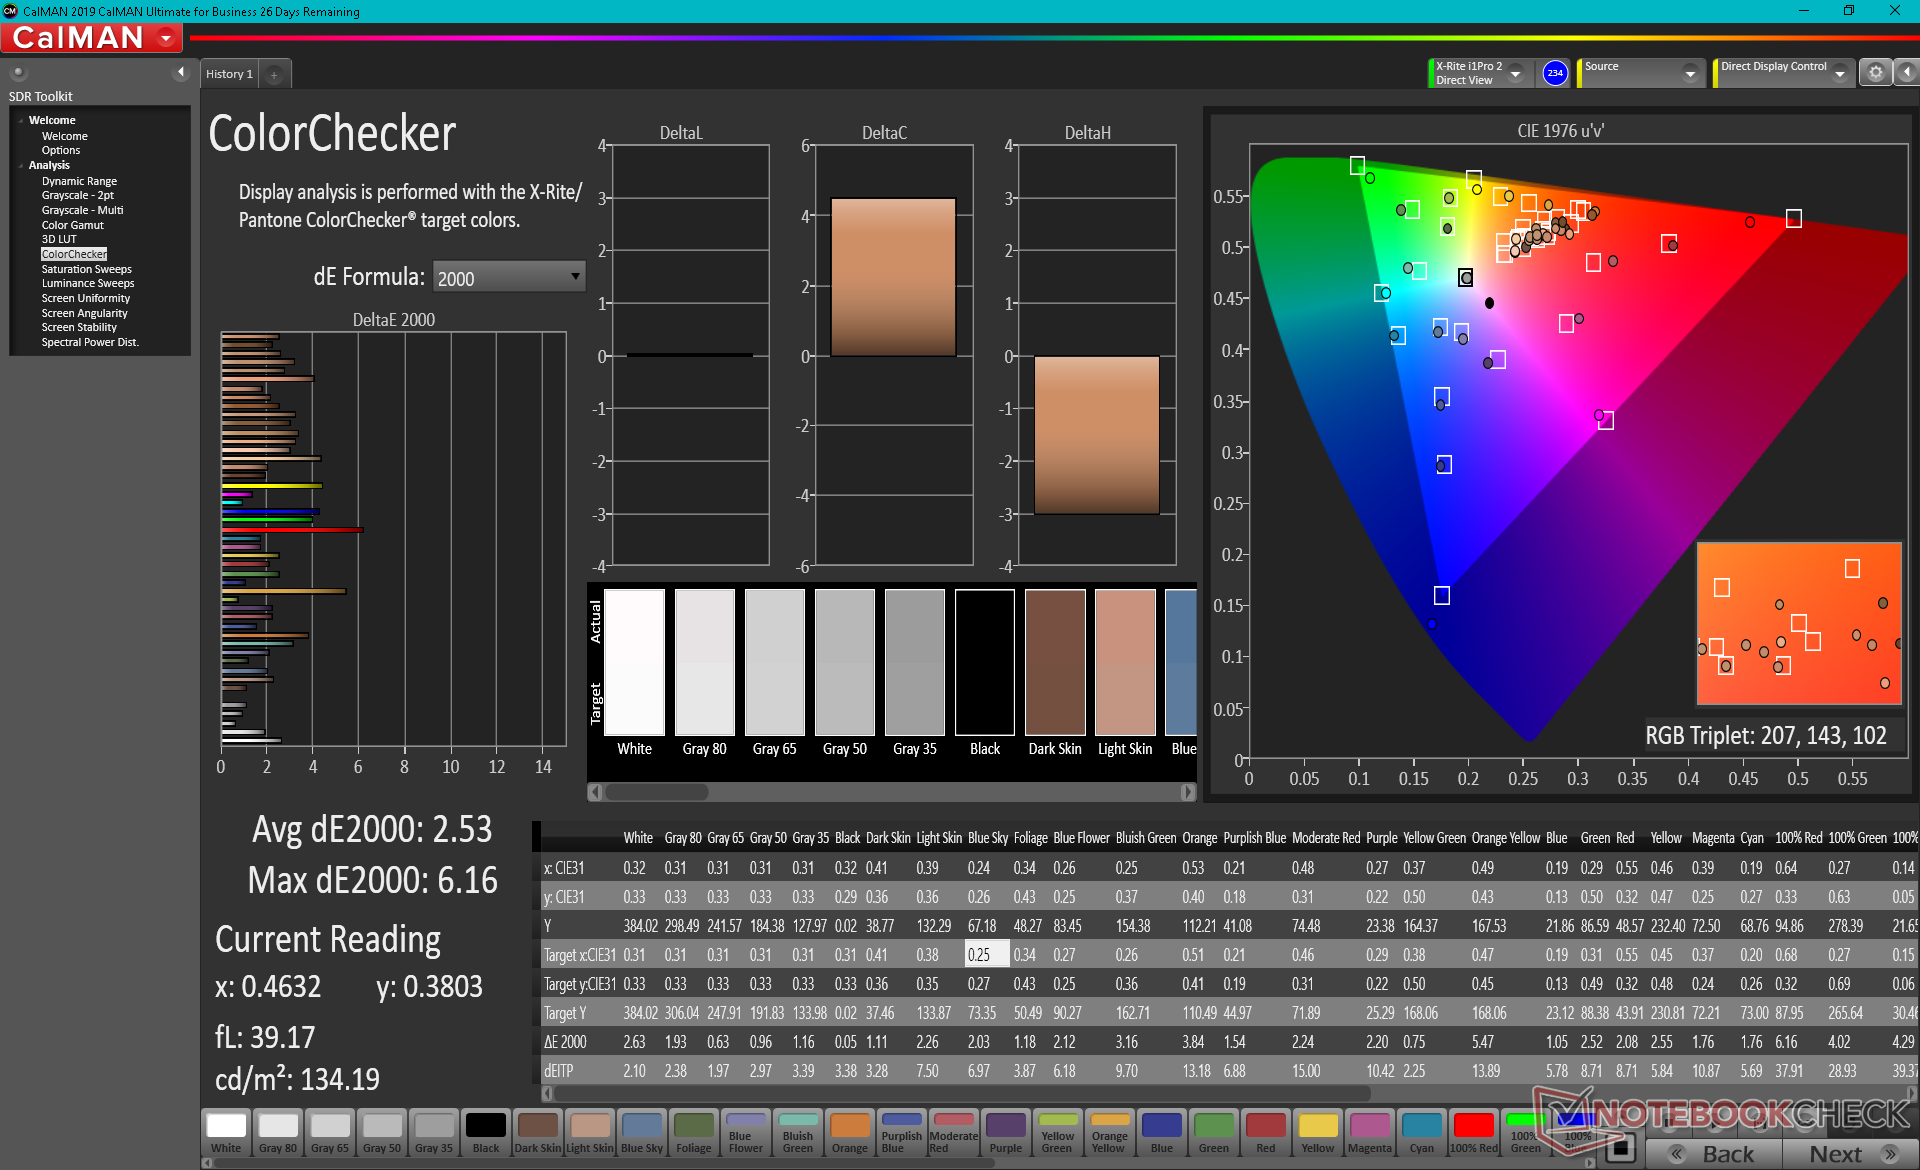
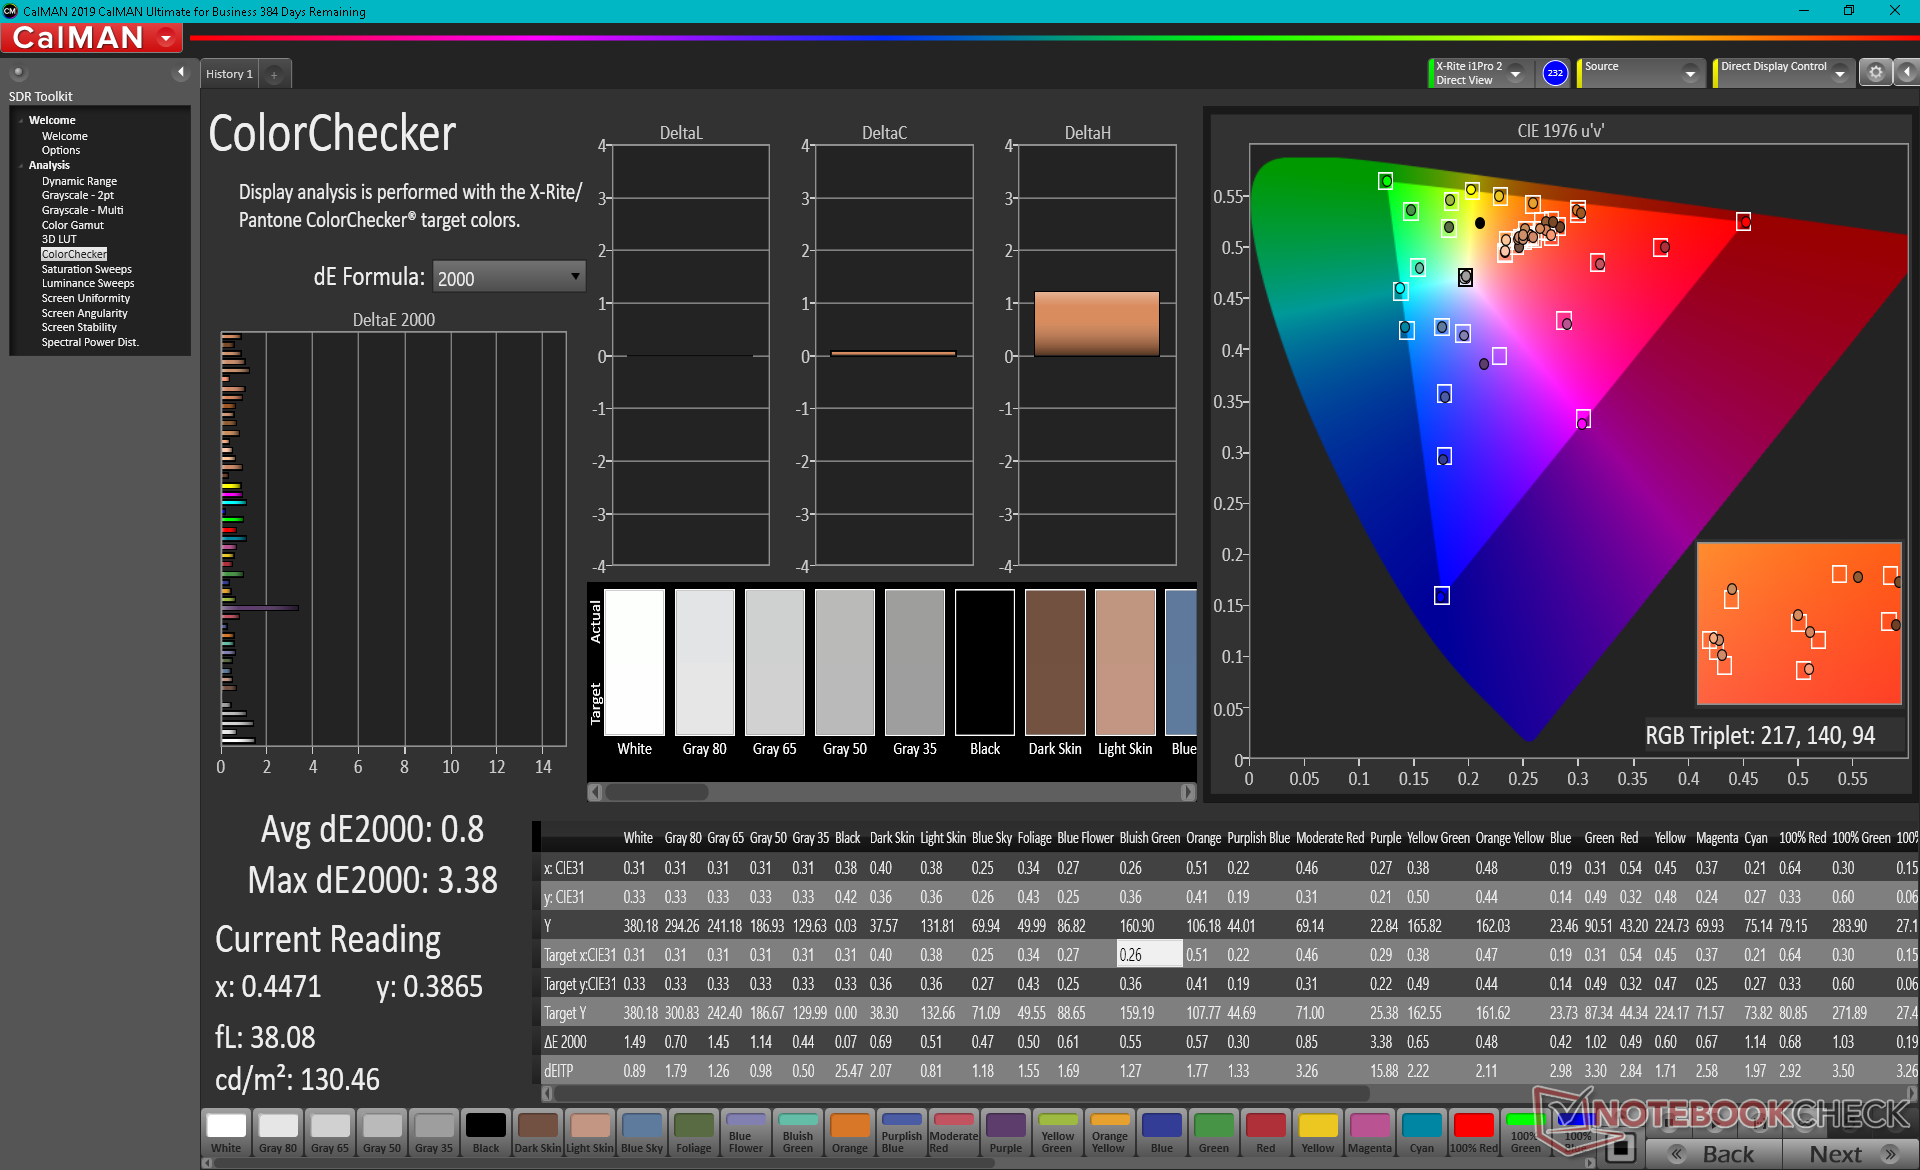
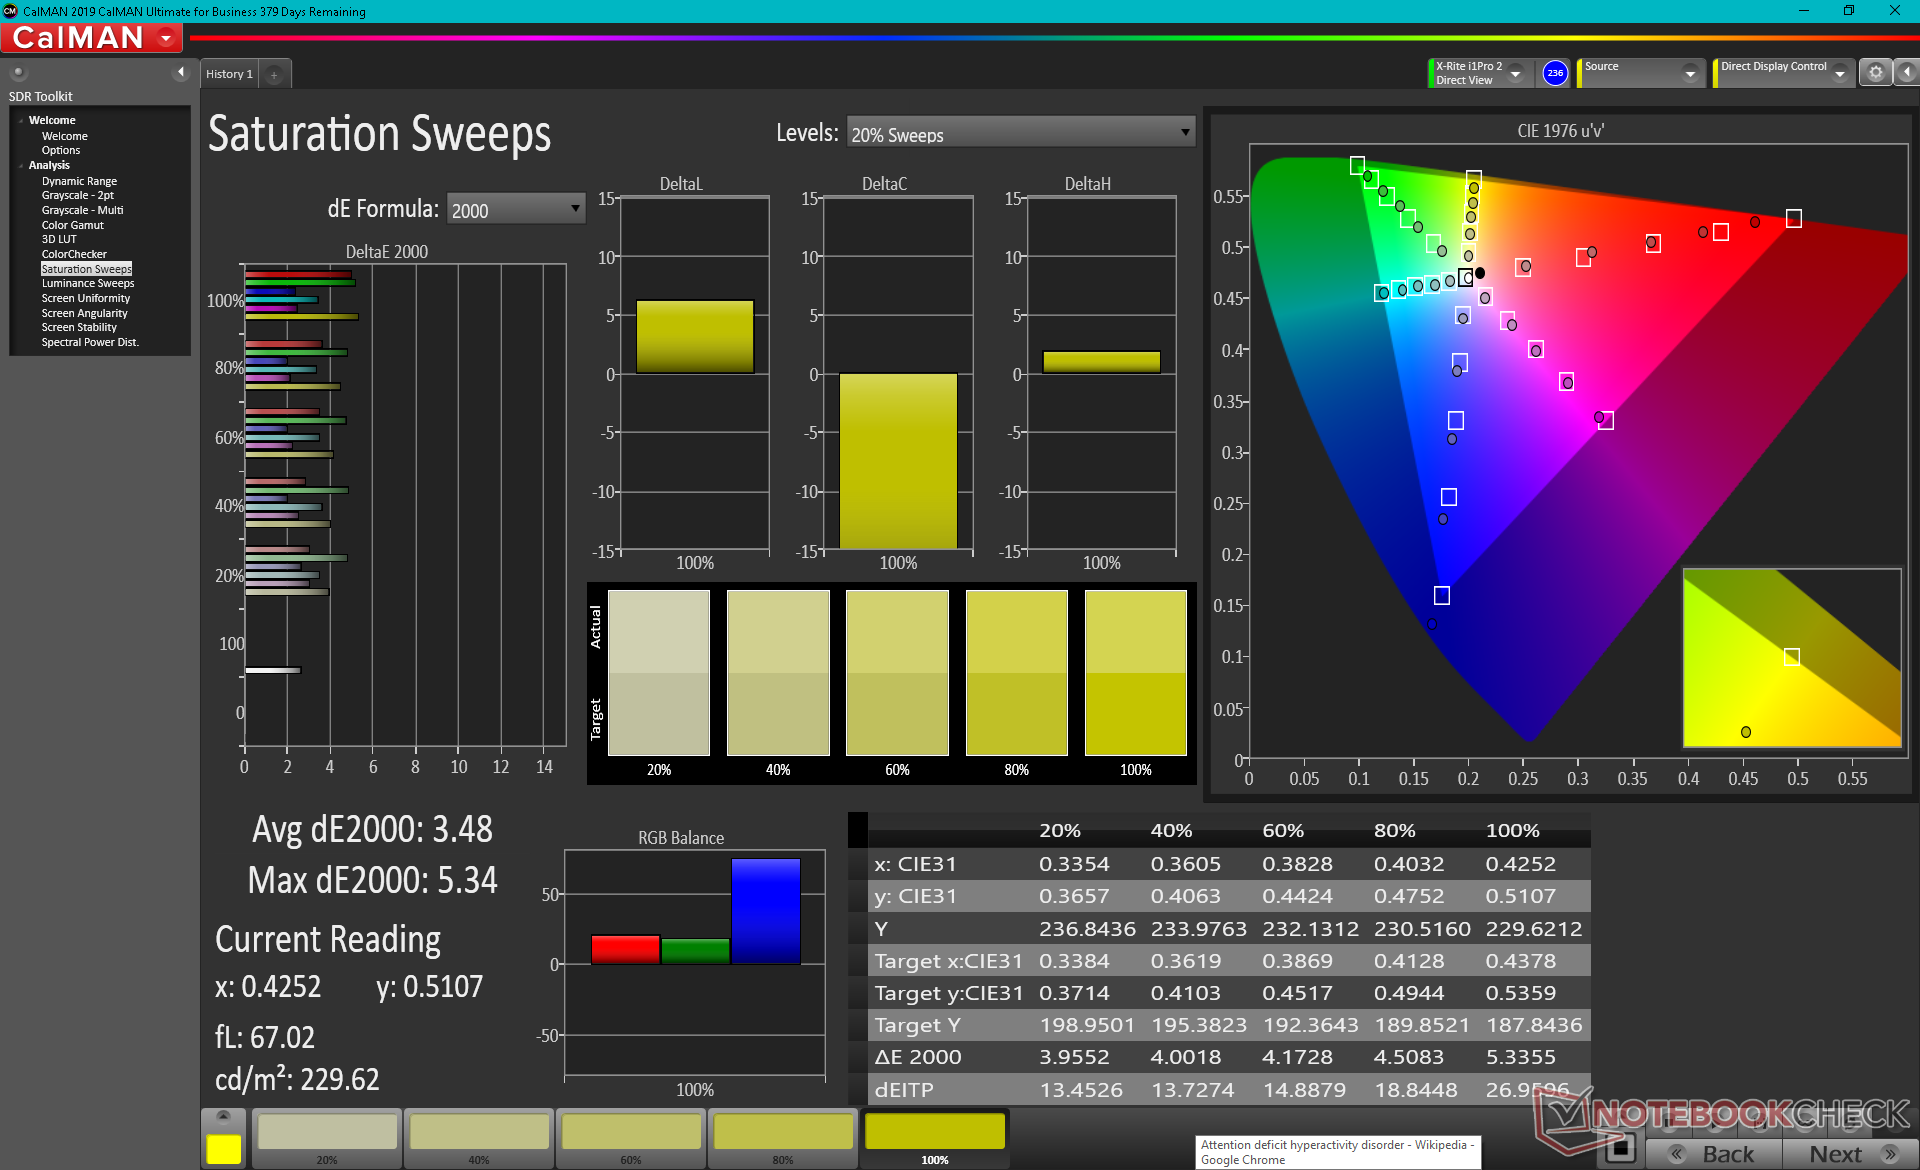
Asus utilizes the same 1080p Samsung ATNA56YX03-0 OLED panel for both its VivoBook 15 K513 and VivoBook 15 Pro series. The panel is notable for offering full DCI-P3 coverage which most IPS panels cannot reach especially in this <$1000 USD price range. The extra-fast response times, relatively bright backlight, and extreme contrast ratio make our VivoBook better than expected for graphics editing.
Keep in mind that pulse-width modulation is present at all brightness levels unlike on most other laptops. We're able to record a frequency of 59 Hz when brightness is set to 50 percent or higher and 434 Hz when brightness is set to 49 percent or lower.


| |||||||||||||||||||||||||
Brightness Distribution: 98 %
Center on Battery: 384.5 cd/m²
Contrast: ∞:1 (Black: 0 cd/m²)
ΔE Color 2.53 | 0.5-29.43 Ø5
ΔE Greyscale 1.6 | 0.57-98 Ø5.3
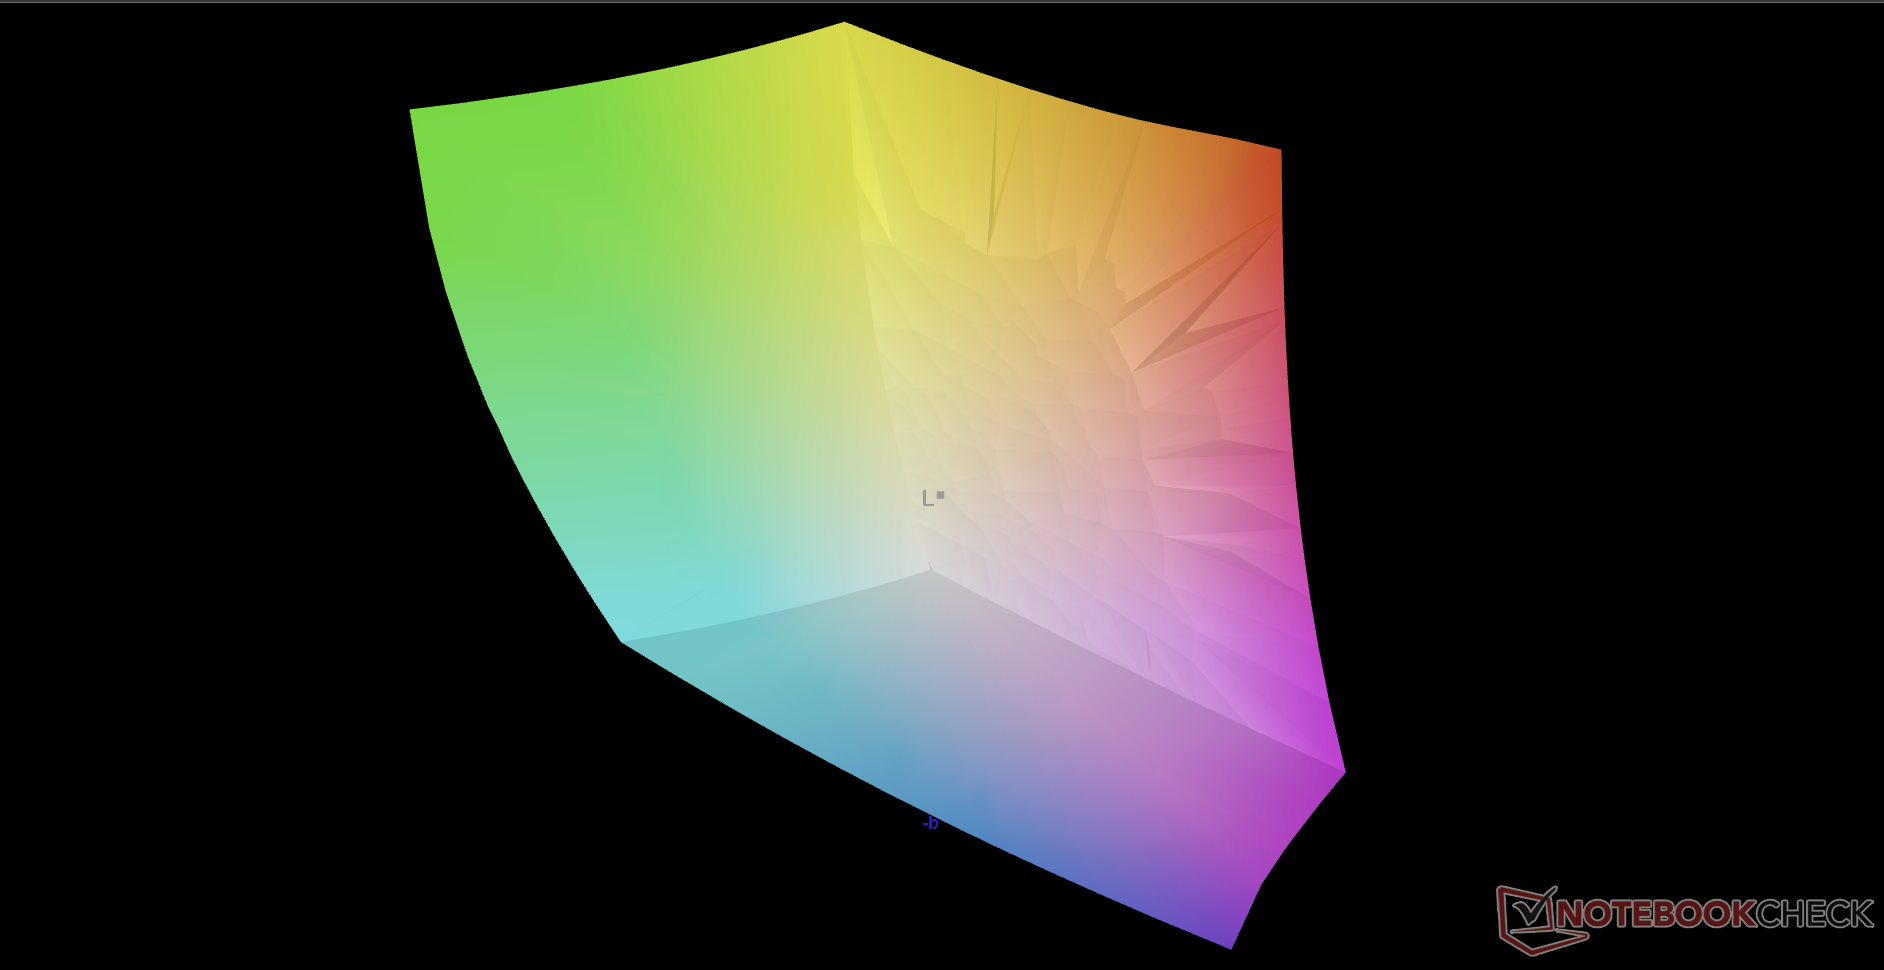
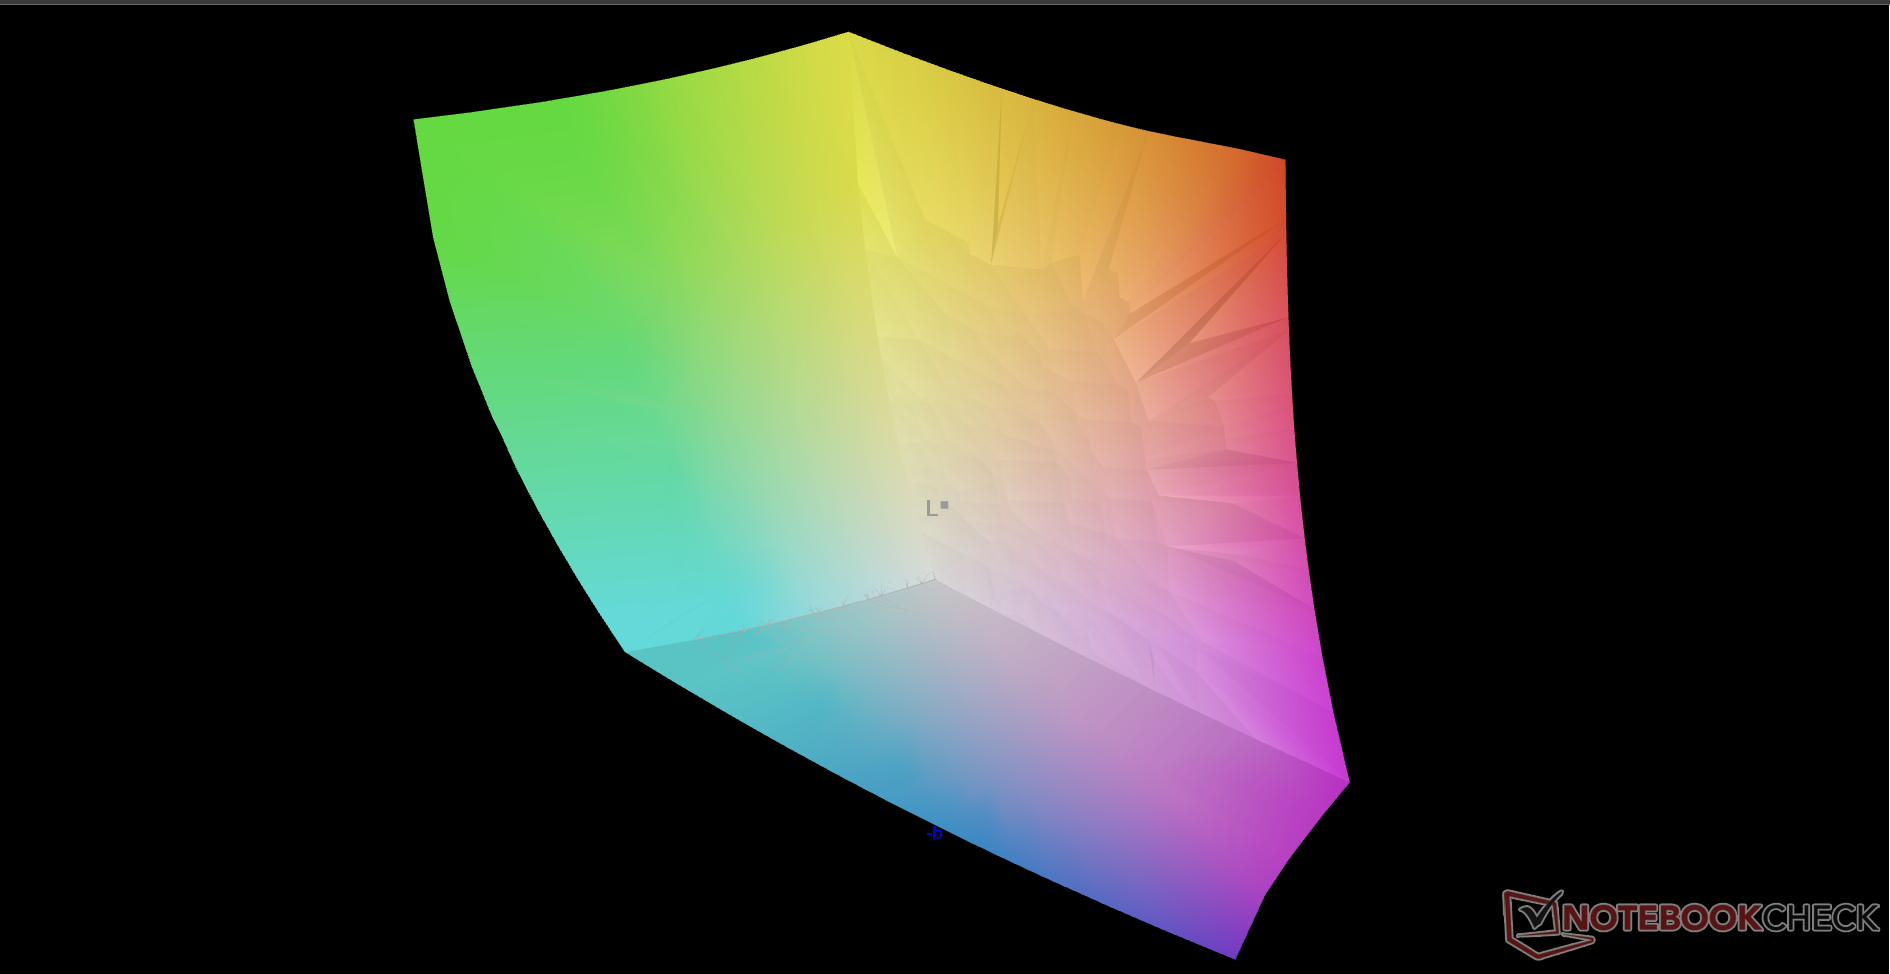
99.9% AdobeRGB 1998 (Argyll 2.2.0 3D)
100% sRGB (Argyll 2.2.0 3D)
99.9% Display P3 (Argyll 2.2.0 3D)
Gamma: 2.24
| Asus Vivobook 15 K513EQ Samsung ATNA56YX03-0, OLED, 1920x1080, 15.60 | Asus VivoBook 15 Pro M3500QC-L1062 ATNA56YX03-0, AMOLED, 1920x1080, 15.60 | Asus VivoBook S15 S533EQ-BQ002T Panda LM156LF-5L04, IPS, 1920x1080, 15.60 | Lenovo IdeaPad 5 15ALC05 Lenovo LEN156FHD, IPS, 1920x1080, 15.60 | Dell Inspiron 15 3501 BOE NV15N3D (Dell P/N: N39X1), IPS, 1920x1080, 15.60 | HP Pavilion 15-eg Chi Mei CMN1523, IPS, 1920x1080, 15.60 | |
|---|---|---|---|---|---|---|
| Display | -1% | -54% | -52% | -54% | -50% | |
| Display P3 Coverage | 99.9 | 99.9 0% | 39.01 -61% | 39.4 -61% | 42.9 -57% | |
| sRGB Coverage | 100 | 99.9 0% | 58.5 -41% | 59 -41% | 58.7 -41% | 64 -36% |
| AdobeRGB 1998 Coverage | 99.9 | 95.8 -4% | 40.33 -60% | 38 -62% | 40.7 -59% | 44.4 -56% |
| Response Times | -18% | -1229% | -870% | -426% | 14162% | |
| Response Time Grey 50% / Grey 80% * | 2.2 ? | 3.2 ? -45% | 38 ? -1627% | 29 ? -1218% | 43 ? -1855% | 22.8 ? -936% |
| Response Time Black / White * | 2.9 ? | 3.2 ? -10% | 27 ? -831% | 18 ? -521% | 32 ? -1003% | 23.6 ? -714% |
| PWM Frequency | 59.5 ? | 60.2 ? 1% | 1000 ? 1581% | 26320 ? 44135% | ||
| Screen | 14% | -65% | -101% | -47% | -74% | |
| Brightness middle | 384.5 | 396 3% | 287 -25% | 376 -2% | 271 -30% | 294.3 -23% |
| Brightness | 388 | 397 2% | 261 -33% | 341 -12% | 263 -32% | 251 -35% |
| Brightness Distribution | 98 | 99 1% | 84 -14% | 78 -20% | 92 -6% | 76 -22% |
| Black Level * | 0.51 | 0.66 | 0.15 | 0.26 | ||
| Colorchecker dE 2000 * | 2.53 | 2 21% | 4.72 -87% | 6.4 -153% | 4.83 -91% | 4.08 -61% |
| Colorchecker dE 2000 max. * | 6.16 | 4.8 22% | 17.94 -191% | 20.45 -232% | 7 -14% | 19.49 -216% |
| Greyscale dE 2000 * | 1.6 | 1 37% | 2.2 -38% | 4.59 -187% | 3.36 -110% | 3 -88% |
| Gamma | 2.24 98% | 2.17 101% | 2.51 88% | 2.26 97% | 2.56 86% | 2.21 100% |
| CCT | 6464 101% | 6608 98% | 6758 96% | 6819 95% | 6764 96% | 6616 98% |
| Colorchecker dE 2000 calibrated * | 1.8 | 3.74 | 3.7 | |||
| Contrast | 563 | 570 | 1807 | 1132 | ||
| Color Space (Percent of AdobeRGB 1998) | 37 | 38 | ||||
| Color Space (Percent of sRGB) | 58 | 59 | ||||
| Total Average (Program / Settings) | -2% /
2% | -449% /
-273% | -341% /
-245% | -176% /
-143% | 4679% /
3491% |
* ... smaller is better
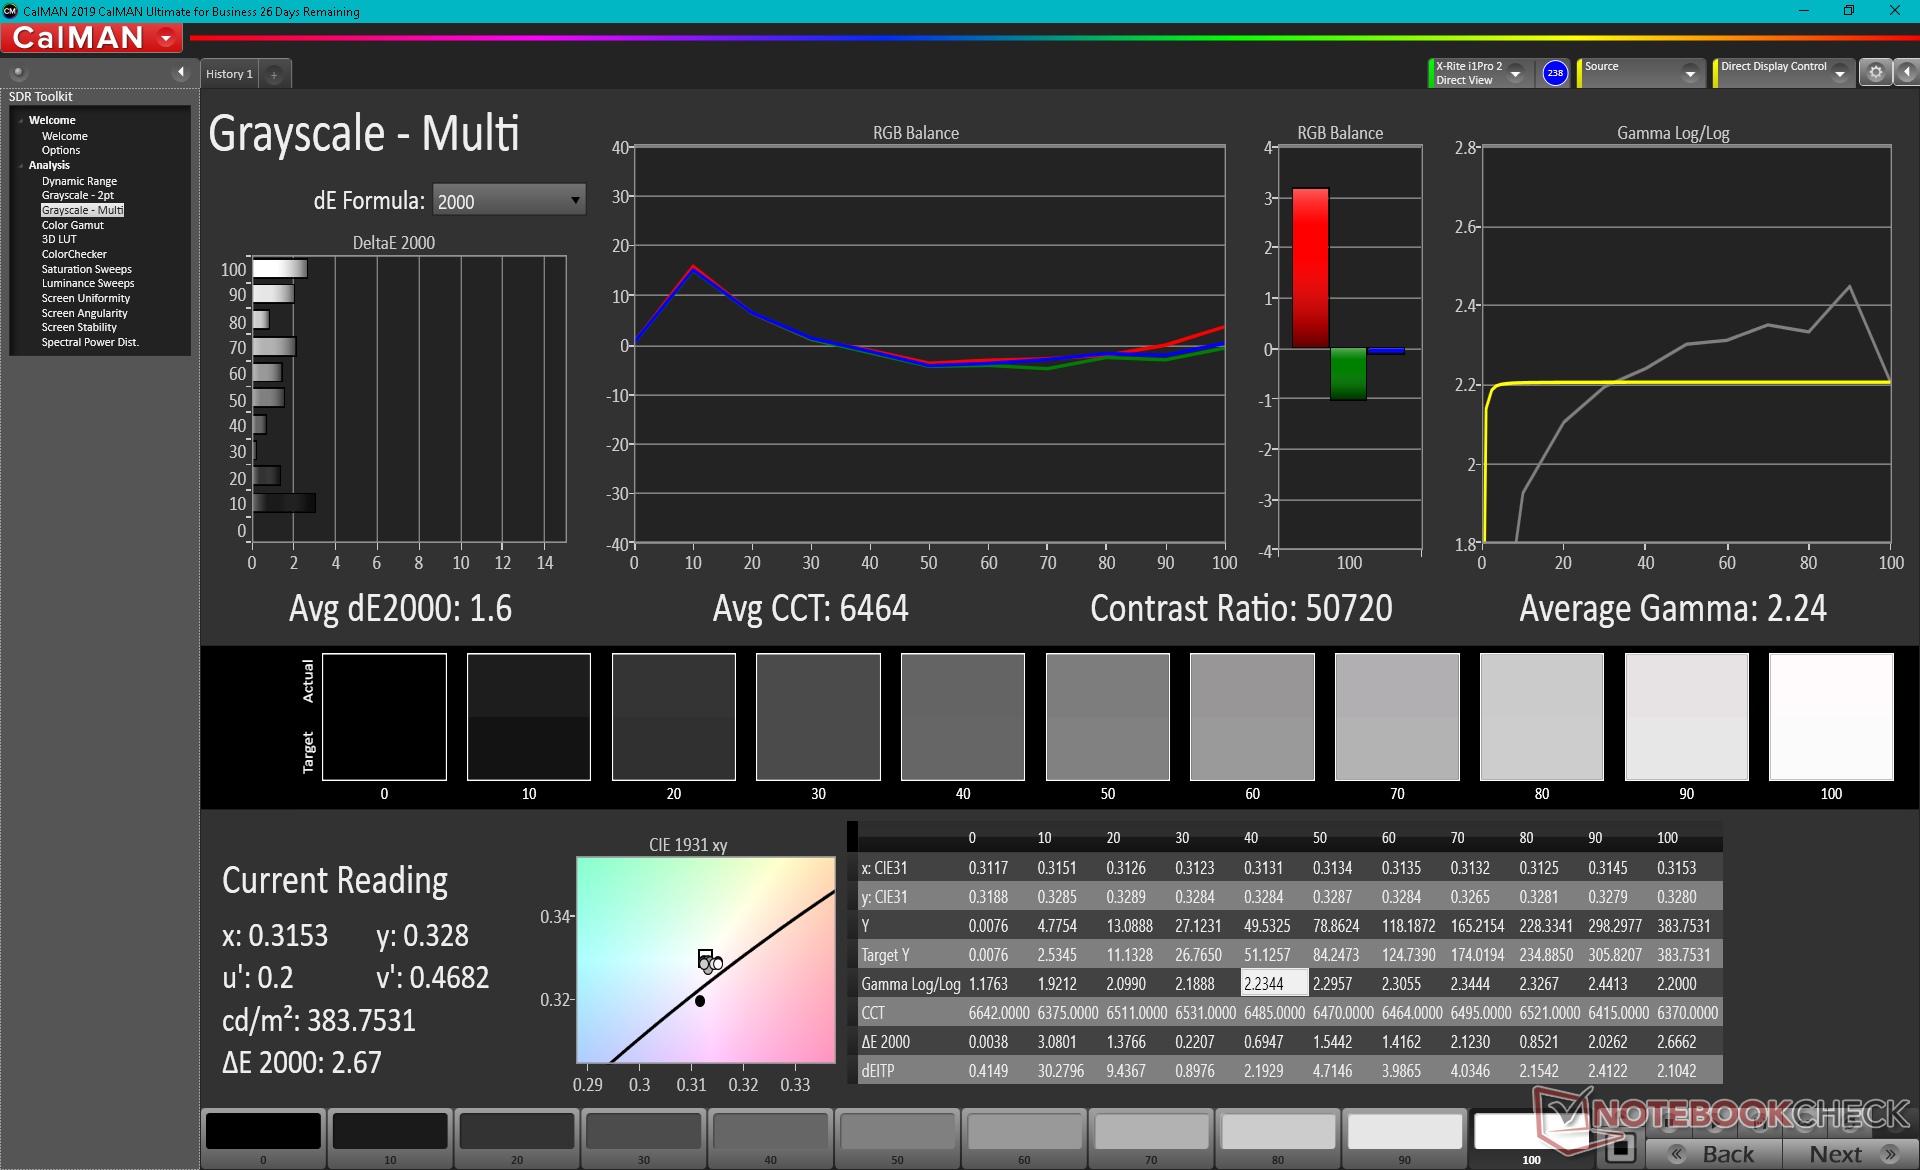
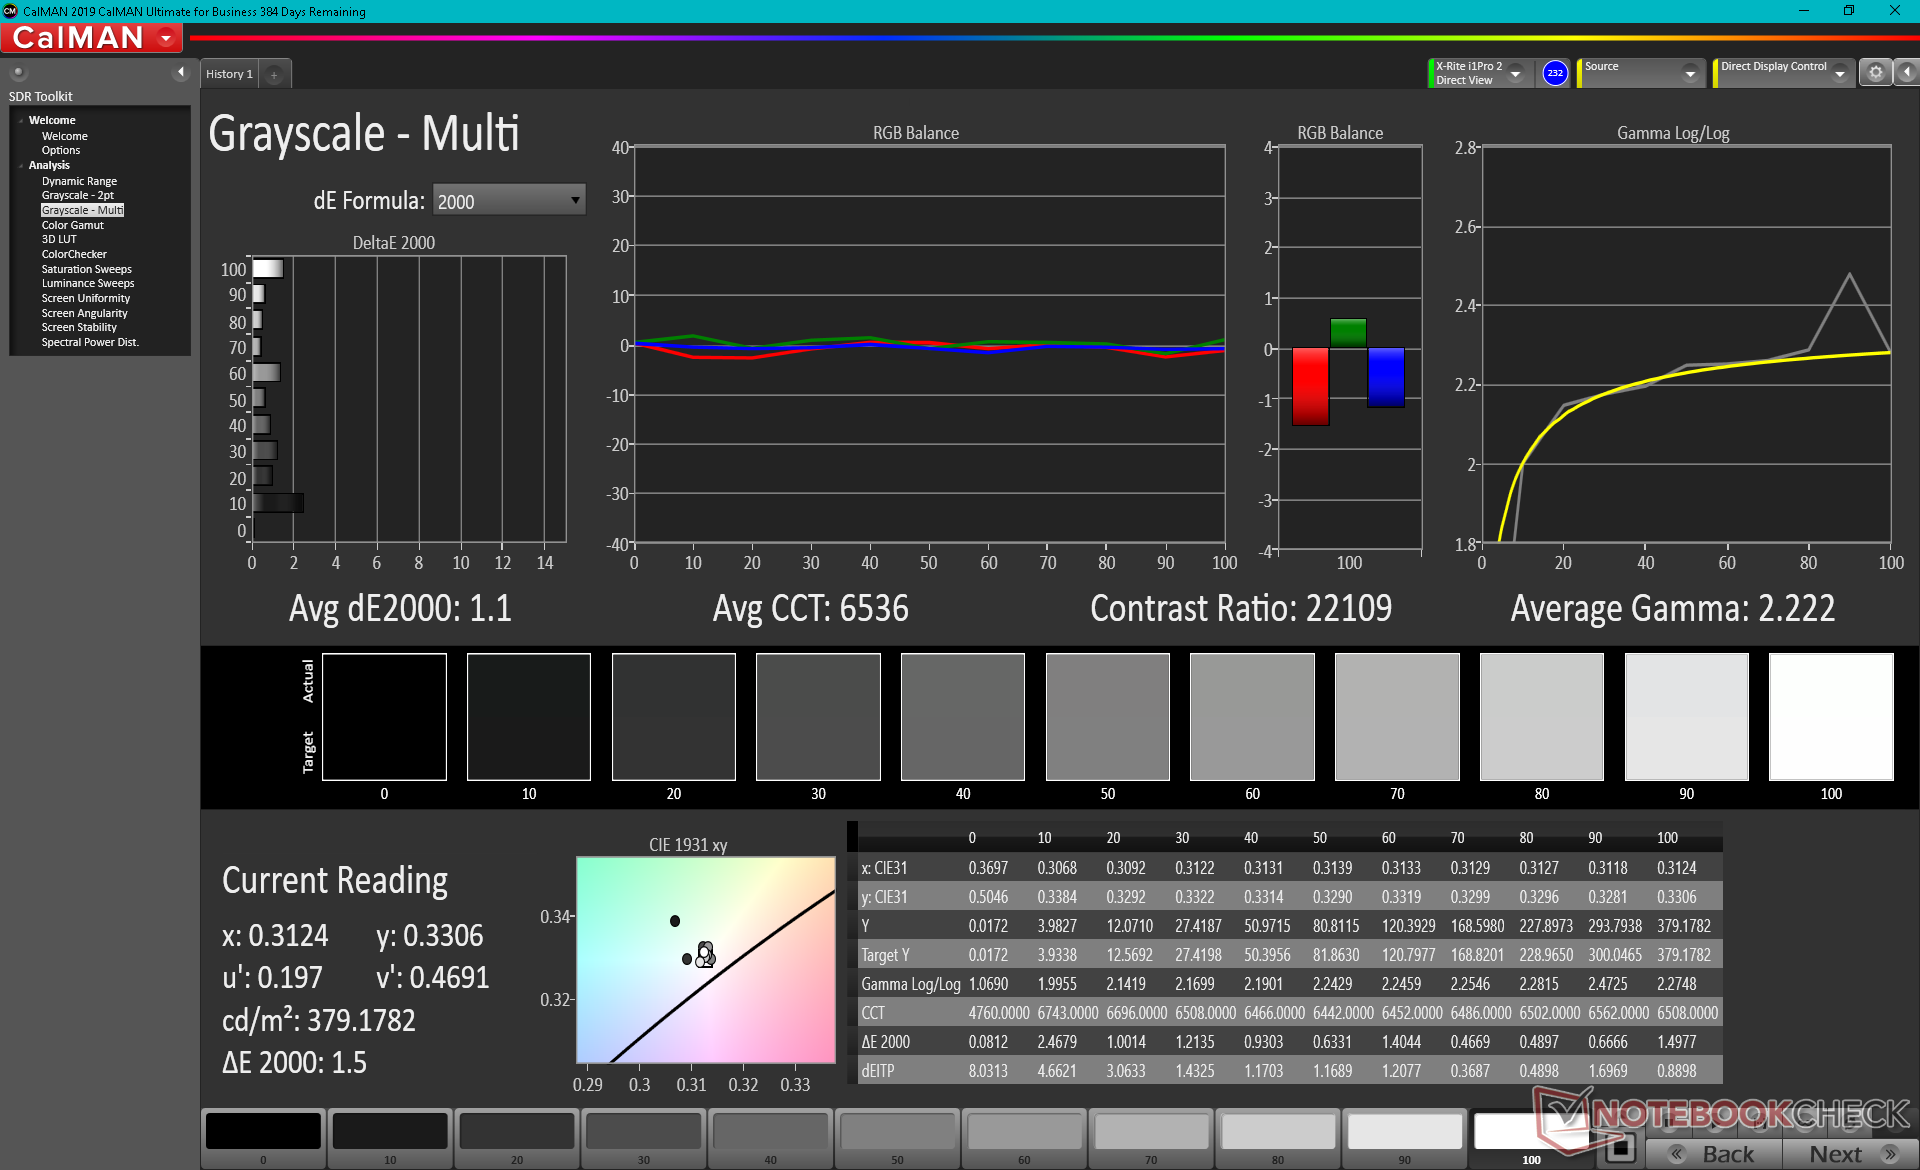
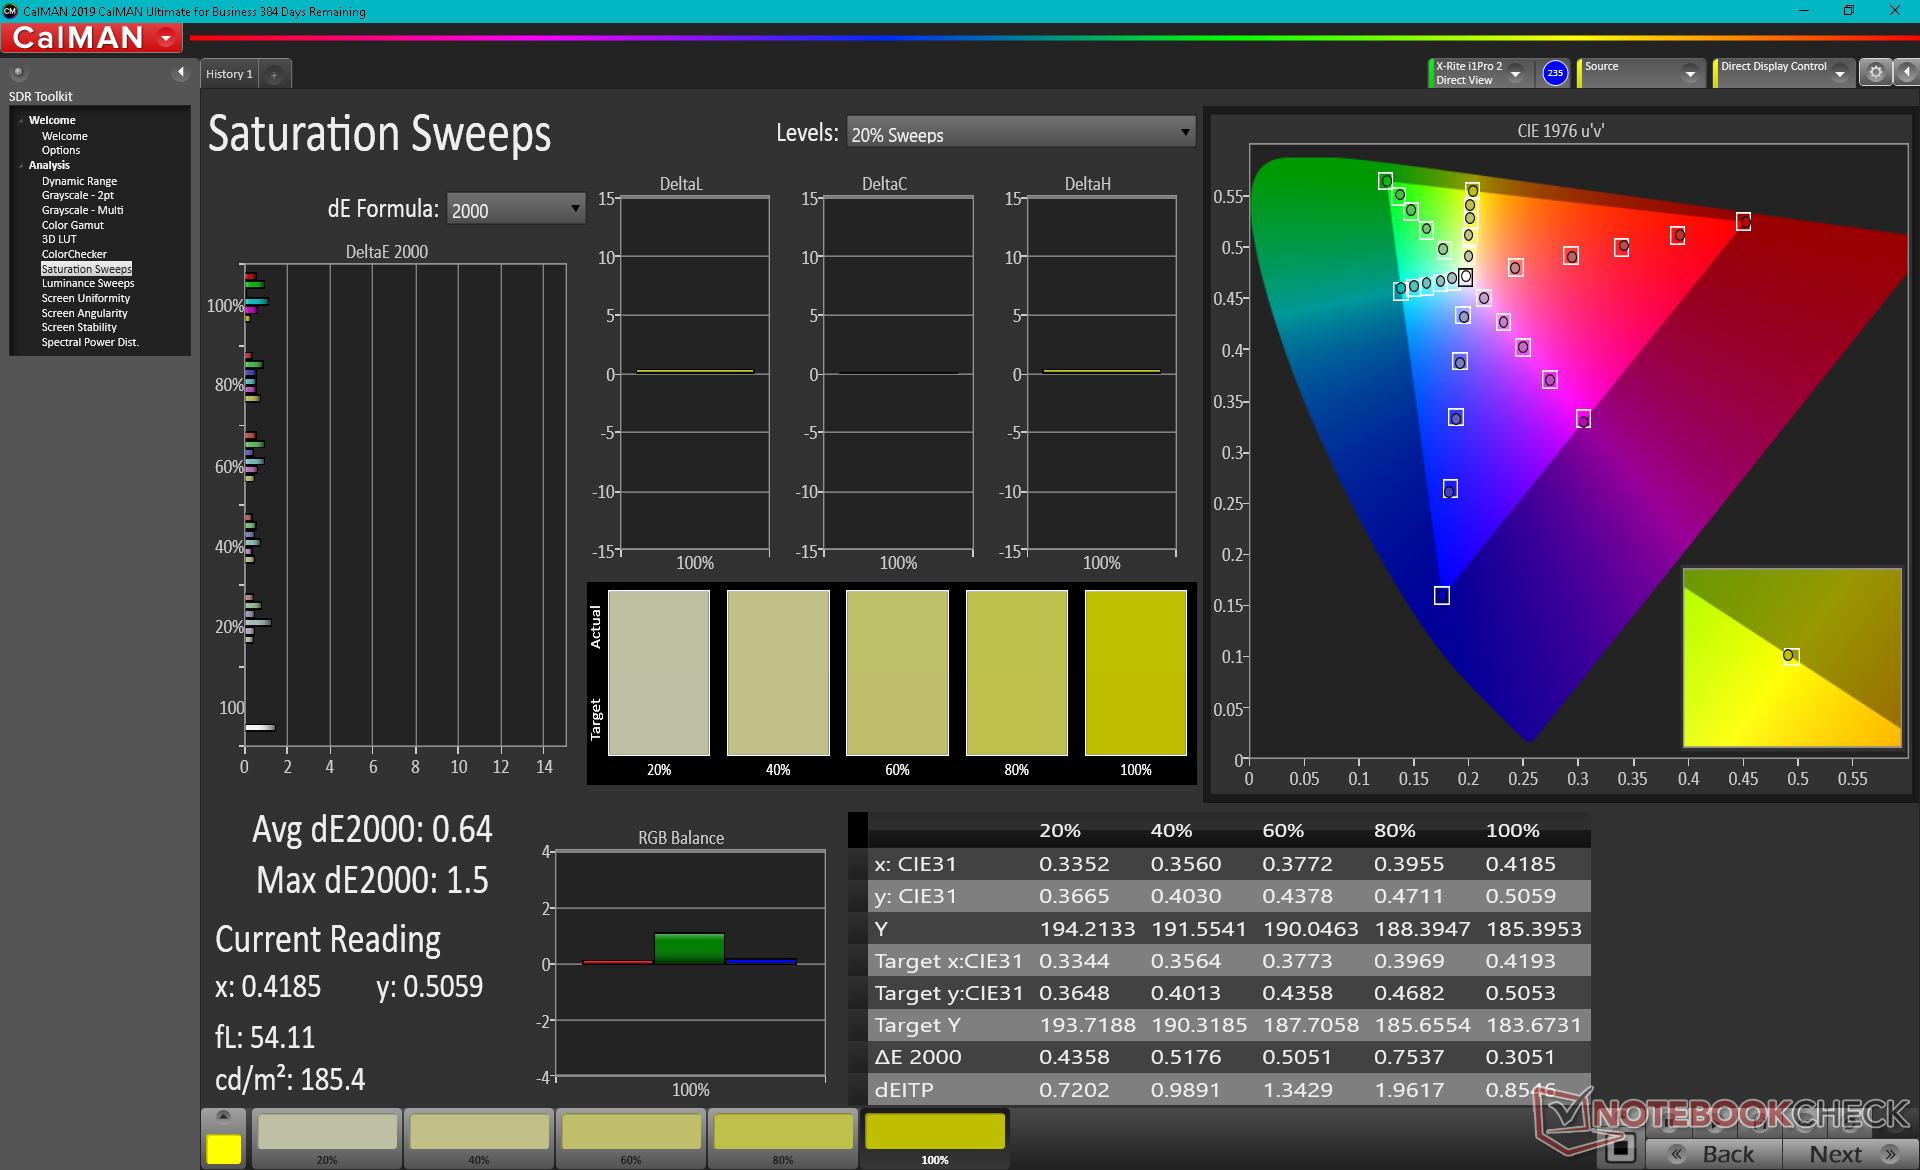
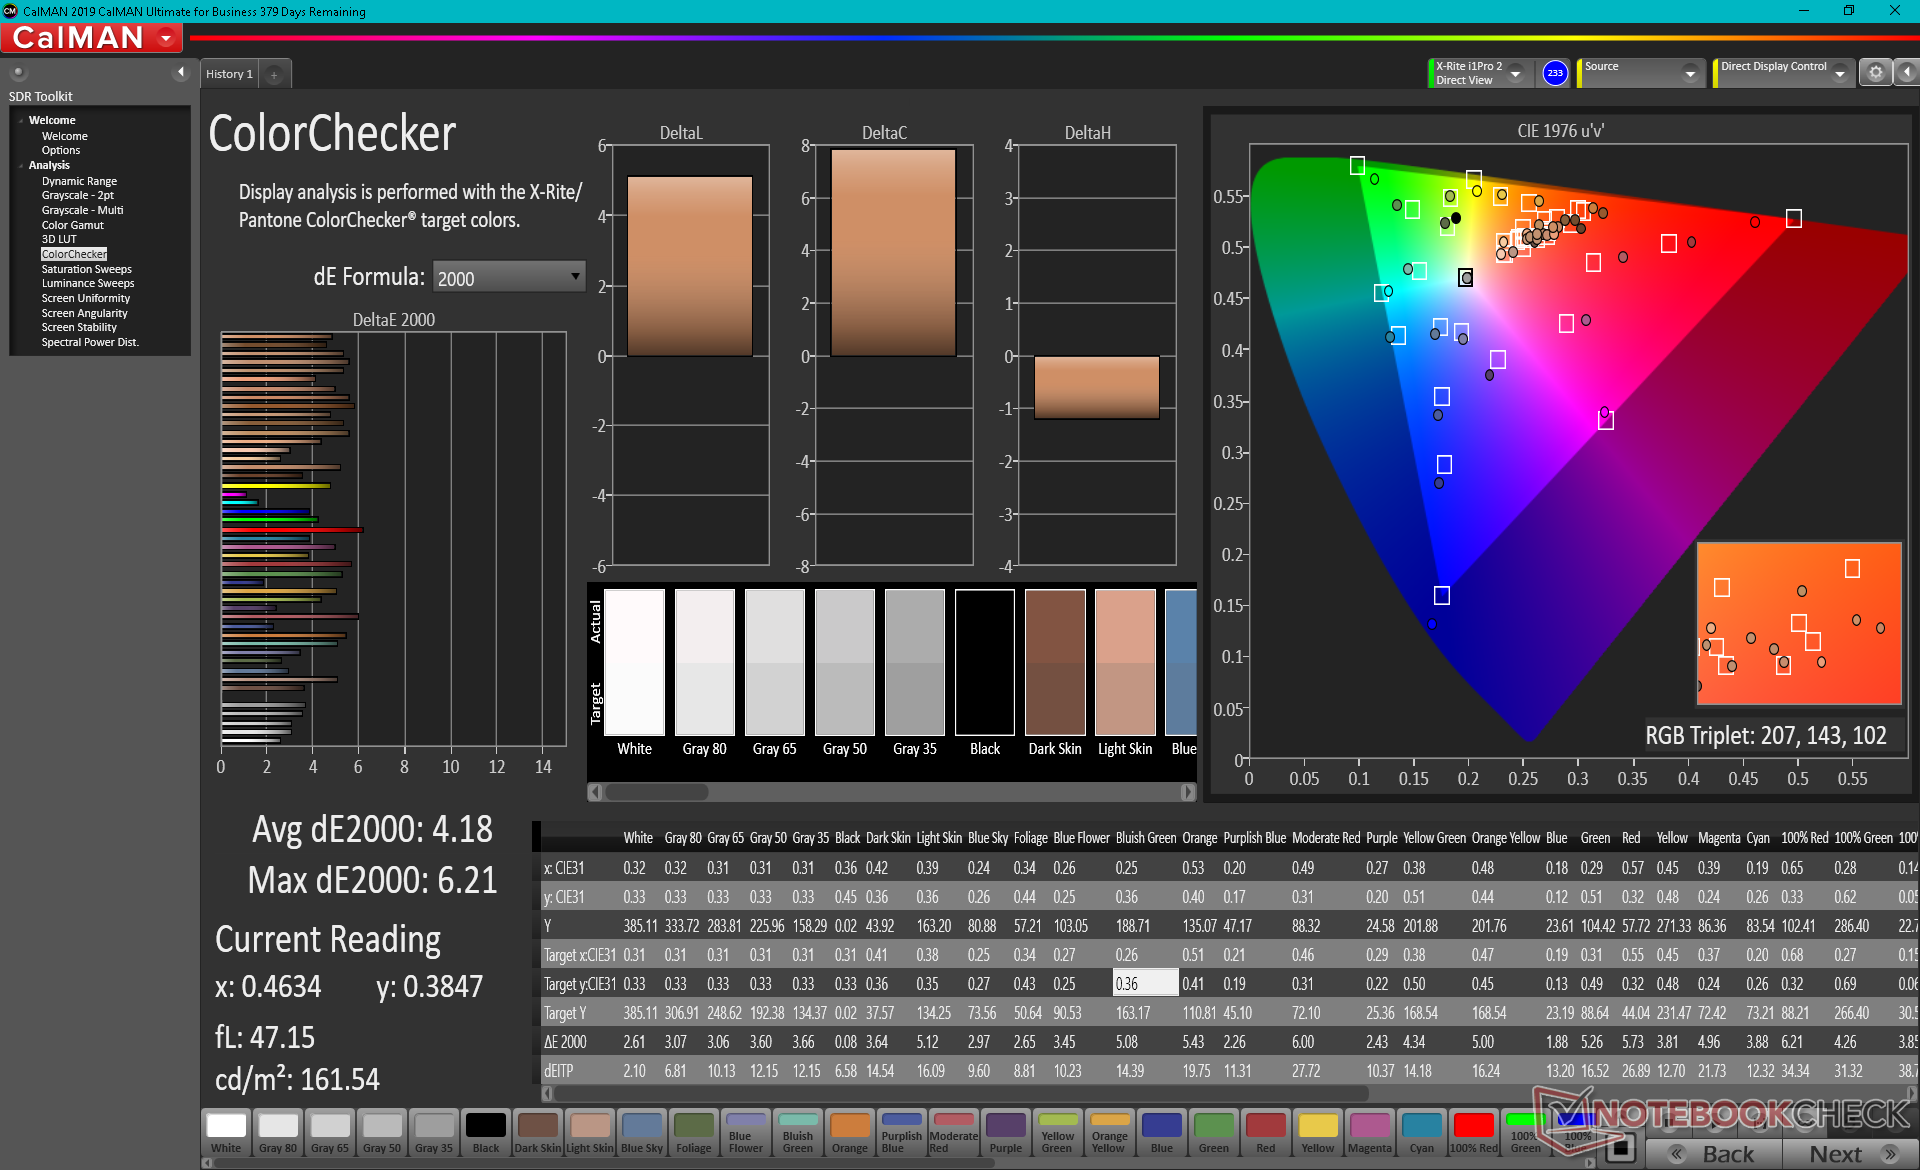
The display is decently calibrated out of the box with average grayscale and color deltaE values of only 1.6 and 2.53, respectively, when compared against the P3 standard. The colors red and yellow appear to be the more inaccurate when compared to other primary and secondary colors.

Display Response Times
| ↔ Response Time Black to White | ||
|---|---|---|
| 2.9 ms ... rise ↗ and fall ↘ combined | ↗ 1.1 ms rise | 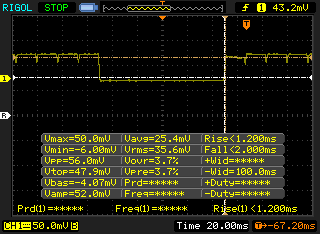 |
| ↘ 1.8 ms fall | ||
| The screen shows very fast response rates in our tests and should be very well suited for fast-paced gaming. In comparison, all tested devices range from 0.1 (minimum) to 240 (maximum) ms. » 9 % of all devices are better. This means that the measured response time is better than the average of all tested devices (21.5 ms). | ||
| ↔ Response Time 50% Grey to 80% Grey | ||
| 2.2 ms ... rise ↗ and fall ↘ combined | ↗ 1.1 ms rise | 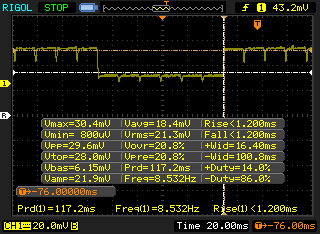 |
| ↘ 1.1 ms fall | ||
| The screen shows very fast response rates in our tests and should be very well suited for fast-paced gaming. In comparison, all tested devices range from 0.2 (minimum) to 636 (maximum) ms. » 6 % of all devices are better. This means that the measured response time is better than the average of all tested devices (33.7 ms). | ||
Screen Flickering / PWM (Pulse-Width Modulation)
| Screen flickering / PWM detected | 59.5 Hz | ≤ 100 % brightness setting | 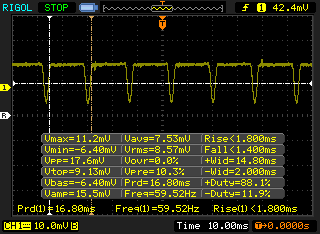 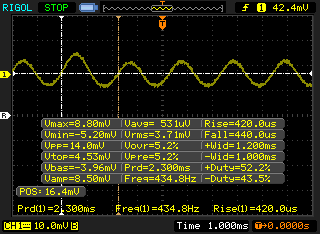 |
The display backlight flickers at 59.5 Hz (worst case, e.g., utilizing PWM) Flickering detected at a brightness setting of 100 % and below. There should be no flickering or PWM above this brightness setting. The frequency of 59.5 Hz is very low, so the flickering may cause eyestrain and headaches after extended use. In comparison: 53 % of all tested devices do not use PWM to dim the display. If PWM was detected, an average of 17900 (minimum: 5 - maximum: 3846000) Hz was measured. | |||
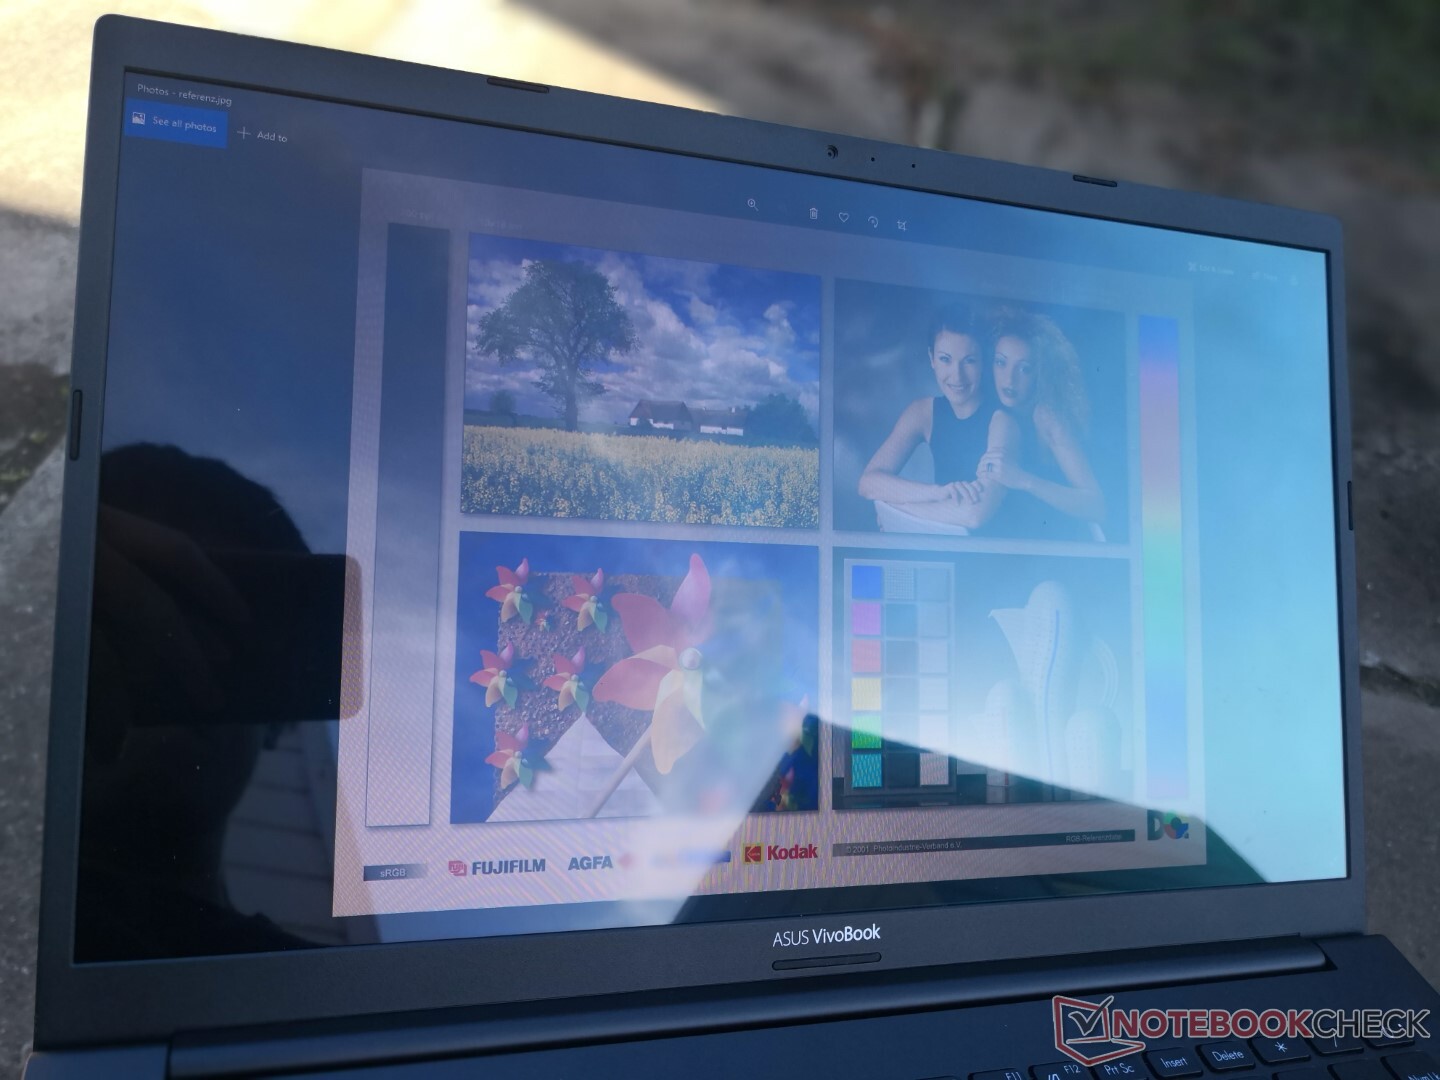
Outdoor visibility is average if under shade and slightly better than IPS when at the same brightness level due to the much deeper black levels of OLED. The screen doesn't wash out as easily as a result, but glare is nonetheless still difficult to avoid.

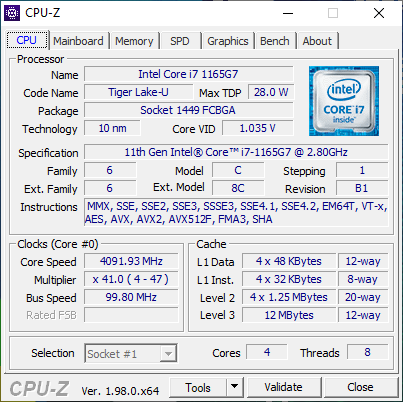
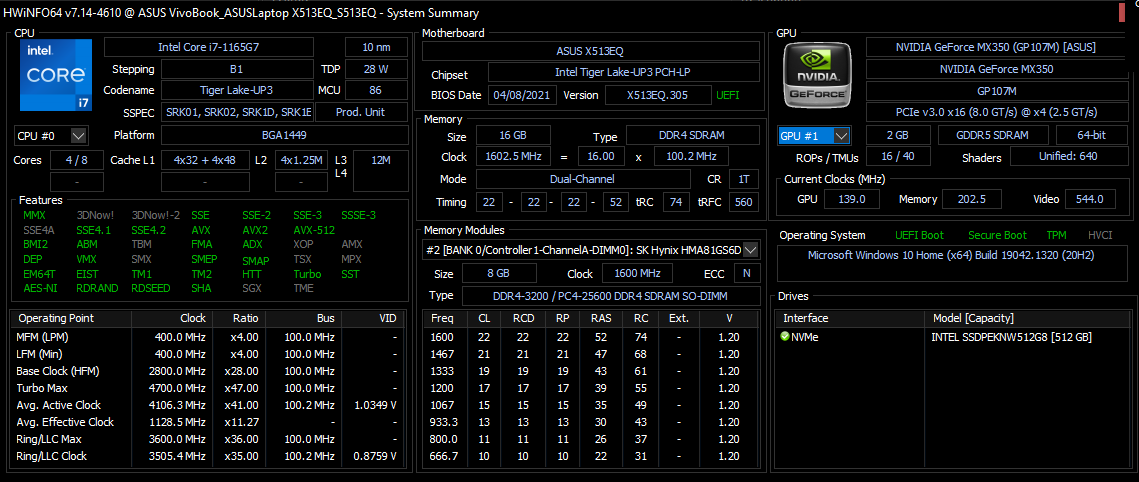
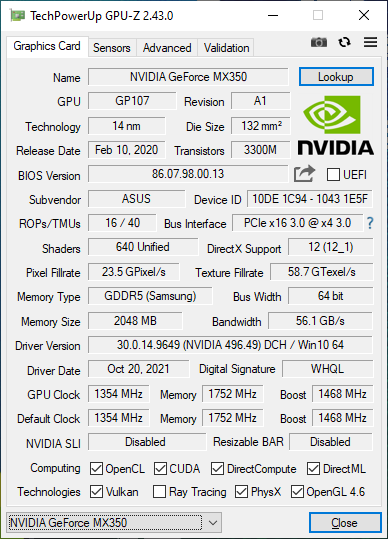
Performance — 11th Gen Tiger Lake-U
Current SKUs come equipped with the U-series Core i3-1115G4 CPU up to the Core i7-1165G7 plus optional GeForce MX330 or MX350 graphics on Optimus 1.0. The aforementioned Core i3 SKU comes only with integrated UHD Graphics to be significantly slower than Iris Xe or the discrete Nvidia GPU. Users will have to look at the higher-end VivoBook 15 Pro series if they want faster Core H-series CPUs and GeForce RTX graphics.
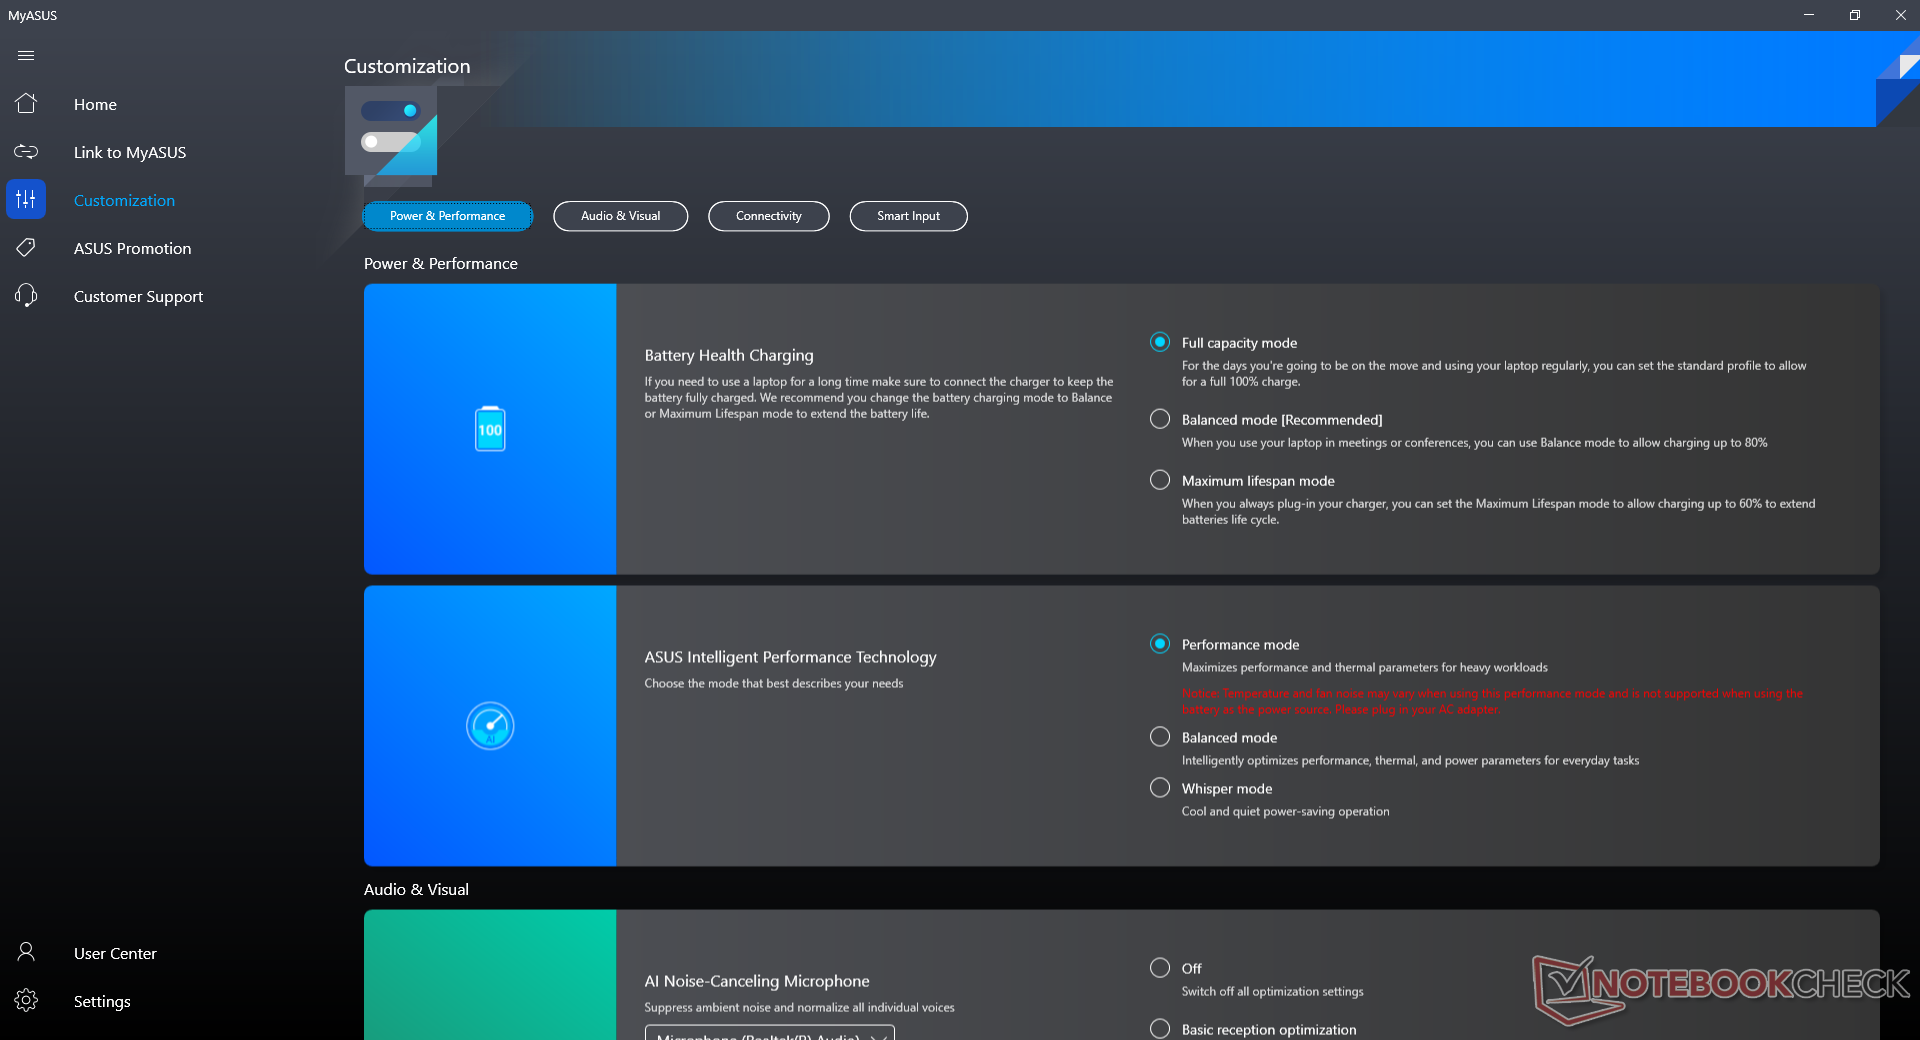
Testing Conditions
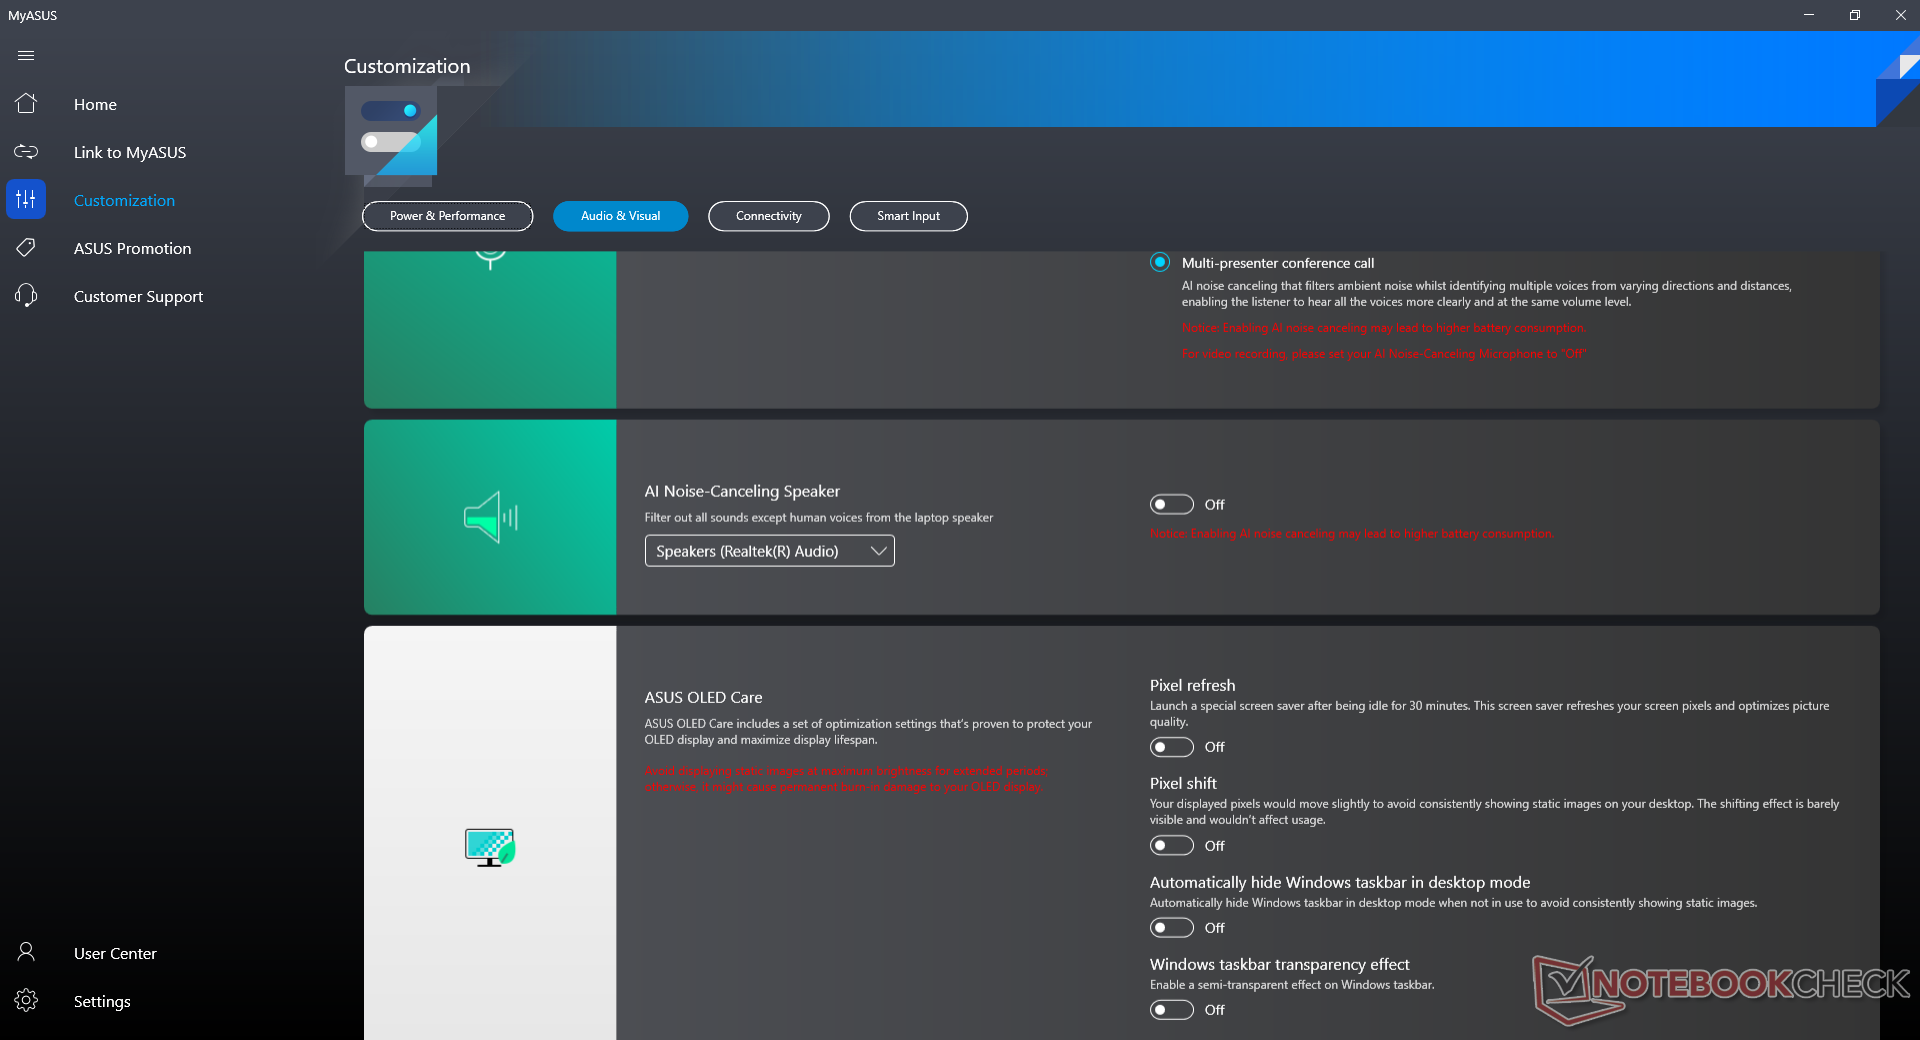
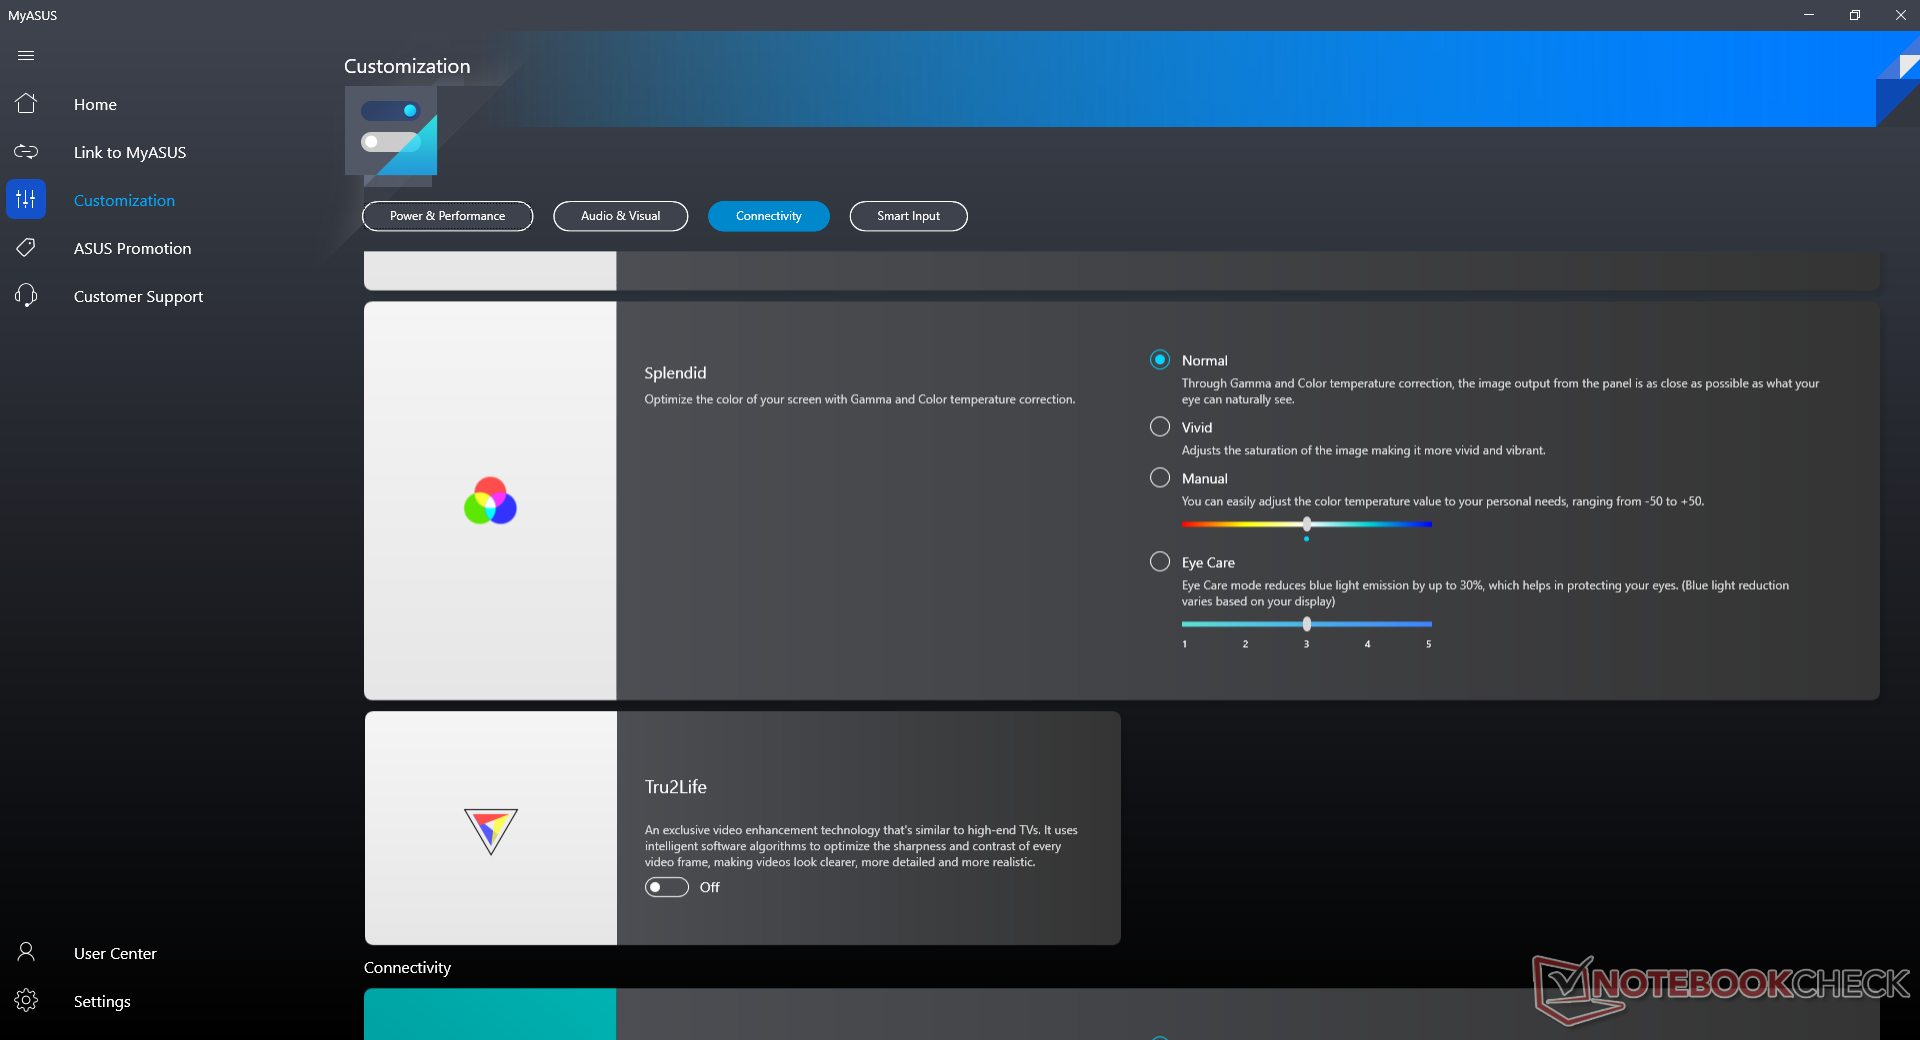
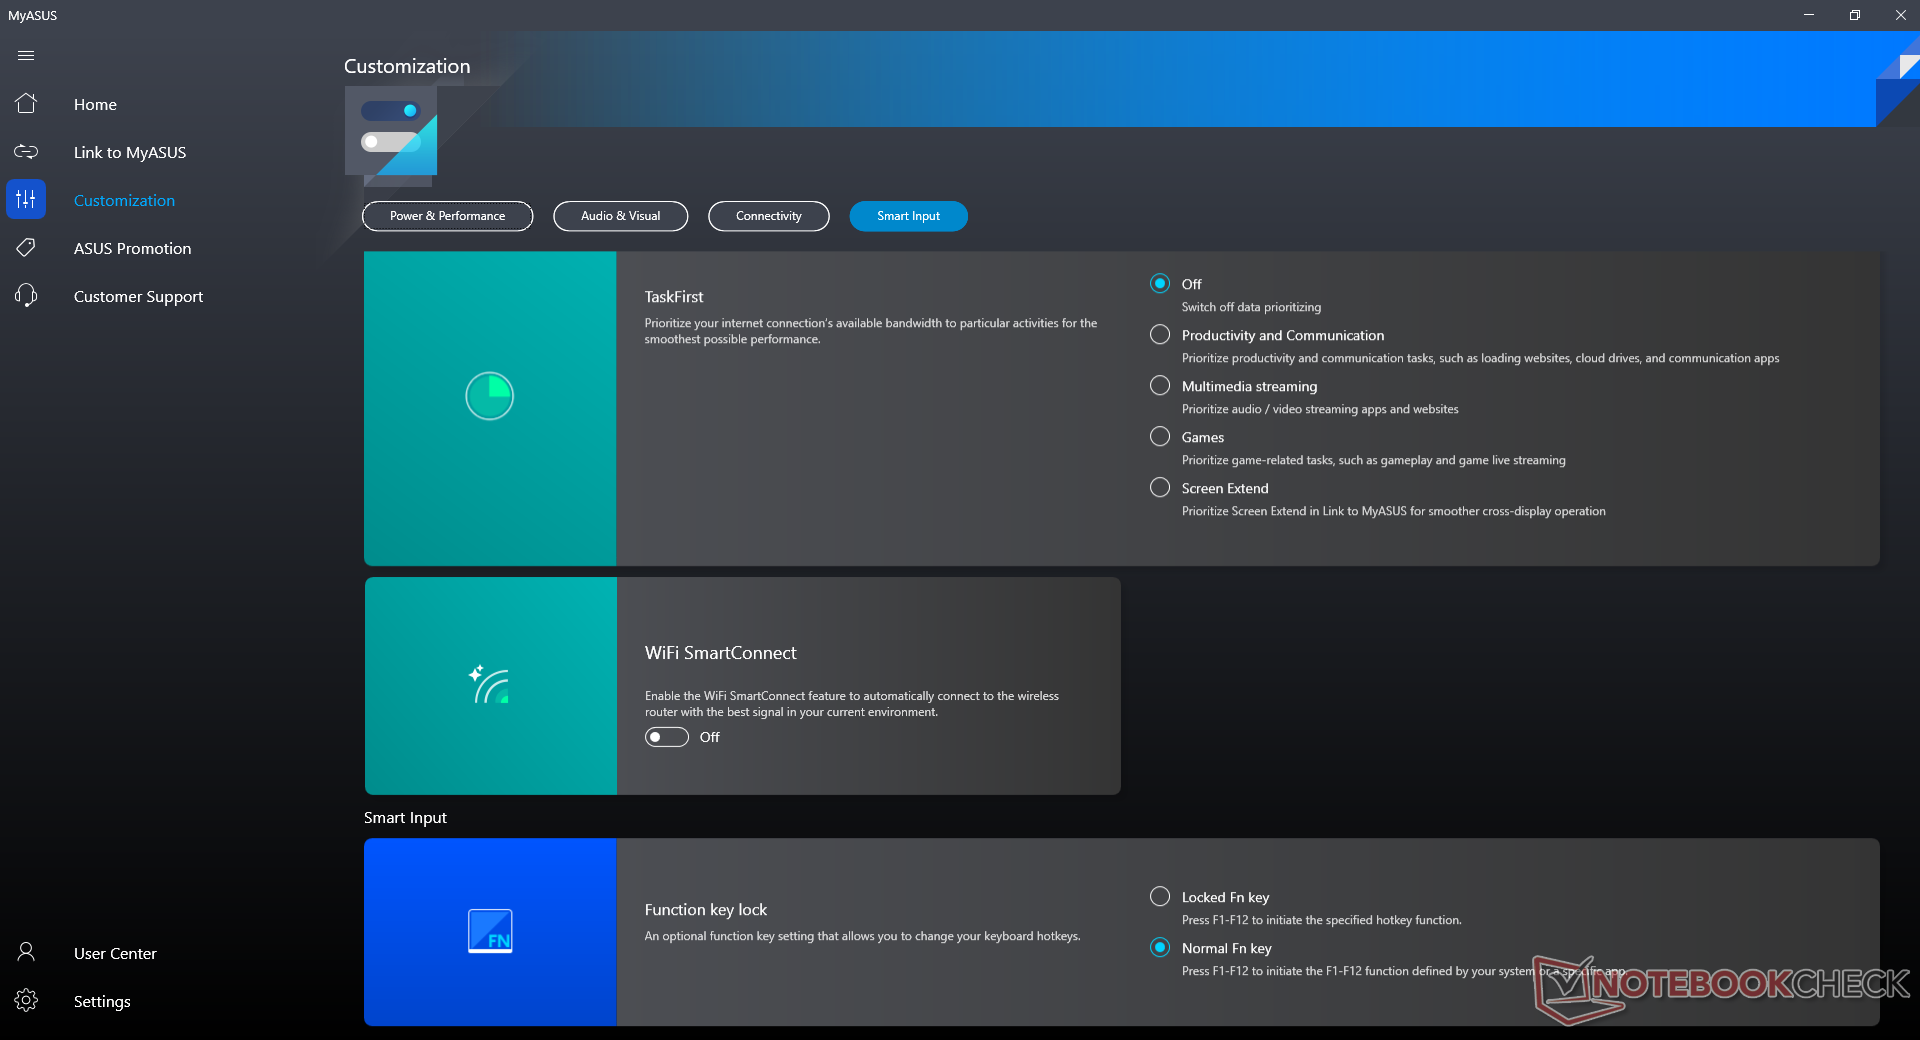
Our unit was set to Performance mode via the MyAsus software for the best possible benchmark scores. We recommend owners become familiar with this software as key features related to OLED, microphone, battery health, Asus updates, and more are all accessible here.
Processor
CPU performance is excellent with multi-thread results that are about 10 percent faster than the average laptop in our database with the same Core i7-1165G7 processor. Opting for the lesser Core i5-1135G7 option will entail a performance drop of only about 10 to 15 percent.
Cinebench R15 Multi Loop
Cinebench R23: Multi Core | Single Core
Cinebench R20: CPU (Multi Core) | CPU (Single Core)
Cinebench R15: CPU Multi 64Bit | CPU Single 64Bit
Blender: v2.79 BMW27 CPU
7-Zip 18.03: 7z b 4 | 7z b 4 -mmt1
Geekbench 5.5: Multi-Core | Single-Core
HWBOT x265 Benchmark v2.2: 4k Preset
LibreOffice : 20 Documents To PDF
R Benchmark 2.5: Overall mean
| CPU Performance Rating | |
| HP Pavilion Aero 13 be0097nr -2! | |
| Lenovo ThinkPad E15 G3-20YG003UGE | |
| Microsoft Surface Laptop 4 15 AMD TFF_00028 | |
| MSI Prestige 15 A10SC -10! | |
| VAIO SX14 VJS144X0111K -2! | |
| Asus Vivobook 15 K513EQ -2! | |
| Average Intel Core i7-1165G7 | |
| Microsoft Surface Laptop 3 15 i7-1065G7 -10! | |
| HP Pavilion x360 15-er0155ng | |
| Asus ZenBook 15 UX534FT-DB77 -10! | |
| Lenovo ThinkPad P15s Gen1-20T4000JGE -2! | |
| HP 250 G7-15S40ES -2! | |
| Dell Inspiron 15 5000 5502 -2! | |
| Cinebench R23 / Multi Core | |
| Microsoft Surface Laptop 4 15 AMD TFF_00028 | |
| Lenovo ThinkPad E15 G3-20YG003UGE | |
| HP Pavilion Aero 13 be0097nr | |
| VAIO SX14 VJS144X0111K | |
| Asus Vivobook 15 K513EQ | |
| Average Intel Core i7-1165G7 (2525 - 6862, n=64) | |
| HP Pavilion x360 15-er0155ng | |
| Cinebench R23 / Single Core | |
| VAIO SX14 VJS144X0111K | |
| Asus Vivobook 15 K513EQ | |
| Average Intel Core i7-1165G7 (1110 - 1539, n=59) | |
| HP Pavilion Aero 13 be0097nr | |
| HP Pavilion x360 15-er0155ng | |
| Microsoft Surface Laptop 4 15 AMD TFF_00028 | |
| Lenovo ThinkPad E15 G3-20YG003UGE | |
| Geekbench 5.5 / Multi-Core | |
| Microsoft Surface Laptop 4 15 AMD TFF_00028 | |
| Lenovo ThinkPad E15 G3-20YG003UGE | |
| Average Intel Core i7-1165G7 (3078 - 5926, n=77) | |
| HP Pavilion x360 15-er0155ng | |
| Lenovo ThinkPad P15s Gen1-20T4000JGE | |
| HP 250 G7-15S40ES | |
| Dell Inspiron 15 5000 5502 | |
| Geekbench 5.5 / Single-Core | |
| Average Intel Core i7-1165G7 (1302 - 1595, n=77) | |
| HP Pavilion x360 15-er0155ng | |
| Dell Inspiron 15 5000 5502 | |
| Lenovo ThinkPad P15s Gen1-20T4000JGE | |
| Lenovo ThinkPad E15 G3-20YG003UGE | |
| HP 250 G7-15S40ES | |
| Microsoft Surface Laptop 4 15 AMD TFF_00028 | |
Cinebench R23: Multi Core | Single Core
Cinebench R20: CPU (Multi Core) | CPU (Single Core)
Cinebench R15: CPU Multi 64Bit | CPU Single 64Bit
Blender: v2.79 BMW27 CPU
7-Zip 18.03: 7z b 4 | 7z b 4 -mmt1
Geekbench 5.5: Multi-Core | Single-Core
HWBOT x265 Benchmark v2.2: 4k Preset
LibreOffice : 20 Documents To PDF
R Benchmark 2.5: Overall mean
* ... smaller is better
AIDA64: FP32 Ray-Trace | FPU Julia | CPU SHA3 | CPU Queen | FPU SinJulia | FPU Mandel | CPU AES | CPU ZLib | FP64 Ray-Trace | CPU PhotoWorxx
| Performance Rating | |
| Asus VivoBook 15 Pro M3500QC-L1062 | |
| Lenovo IdeaPad 5 15ALC05 | |
| Asus Vivobook 15 K513EQ | |
| HP Pavilion 15-eg | |
| Asus VivoBook S15 S533EQ-BQ002T | |
| Average Intel Core i7-1165G7 | |
| Dell Inspiron 15 3501 | |
| AIDA64 / FP32 Ray-Trace | |
| Asus VivoBook 15 Pro M3500QC-L1062 | |
| Lenovo IdeaPad 5 15ALC05 | |
| Asus Vivobook 15 K513EQ | |
| Asus VivoBook S15 S533EQ-BQ002T | |
| Average Intel Core i7-1165G7 (3933 - 8184, n=58) | |
| HP Pavilion 15-eg | |
| Dell Inspiron 15 3501 | |
| AIDA64 / FPU Julia | |
| Asus VivoBook 15 Pro M3500QC-L1062 | |
| Lenovo IdeaPad 5 15ALC05 | |
| Asus Vivobook 15 K513EQ | |
| Asus VivoBook S15 S533EQ-BQ002T | |
| Average Intel Core i7-1165G7 (17720 - 34369, n=58) | |
| HP Pavilion 15-eg | |
| Dell Inspiron 15 3501 | |
| AIDA64 / CPU SHA3 | |
| Asus VivoBook 15 Pro M3500QC-L1062 | |
| Asus Vivobook 15 K513EQ | |
| Asus VivoBook S15 S533EQ-BQ002T | |
| Average Intel Core i7-1165G7 (958 - 2338, n=58) | |
| HP Pavilion 15-eg | |
| Dell Inspiron 15 3501 | |
| Lenovo IdeaPad 5 15ALC05 | |
| AIDA64 / CPU Queen | |
| Asus VivoBook 15 Pro M3500QC-L1062 | |
| Lenovo IdeaPad 5 15ALC05 | |
| HP Pavilion 15-eg | |
| Asus VivoBook S15 S533EQ-BQ002T | |
| Asus Vivobook 15 K513EQ | |
| Dell Inspiron 15 3501 | |
| Average Intel Core i7-1165G7 (44161 - 50624, n=58) | |
| AIDA64 / FPU SinJulia | |
| Lenovo IdeaPad 5 15ALC05 | |
| Asus VivoBook 15 Pro M3500QC-L1062 | |
| Asus Vivobook 15 K513EQ | |
| Asus VivoBook S15 S533EQ-BQ002T | |
| Average Intel Core i7-1165G7 (3183 - 4796, n=58) | |
| HP Pavilion 15-eg | |
| Dell Inspiron 15 3501 | |
| AIDA64 / FPU Mandel | |
| Asus VivoBook 15 Pro M3500QC-L1062 | |
| Lenovo IdeaPad 5 15ALC05 | |
| Asus Vivobook 15 K513EQ | |
| Asus VivoBook S15 S533EQ-BQ002T | |
| Average Intel Core i7-1165G7 (11876 - 20468, n=58) | |
| HP Pavilion 15-eg | |
| Dell Inspiron 15 3501 | |
| AIDA64 / CPU AES | |
| Asus VivoBook 15 Pro M3500QC-L1062 | |
| Asus Vivobook 15 K513EQ | |
| Asus VivoBook S15 S533EQ-BQ002T | |
| HP Pavilion 15-eg | |
| Dell Inspiron 15 3501 | |
| Average Intel Core i7-1165G7 (29506 - 73387, n=58) | |
| Lenovo IdeaPad 5 15ALC05 | |
| AIDA64 / CPU ZLib | |
| Asus VivoBook 15 Pro M3500QC-L1062 | |
| Lenovo IdeaPad 5 15ALC05 | |
| Asus Vivobook 15 K513EQ | |
| Asus VivoBook S15 S533EQ-BQ002T | |
| Dell Inspiron 15 3501 | |
| HP Pavilion 15-eg | |
| Average Intel Core i7-1165G7 (169 - 402, n=65) | |
| AIDA64 / FP64 Ray-Trace | |
| Asus VivoBook 15 Pro M3500QC-L1062 | |
| Lenovo IdeaPad 5 15ALC05 | |
| Asus Vivobook 15 K513EQ | |
| Asus VivoBook S15 S533EQ-BQ002T | |
| Dell Inspiron 15 3501 | |
| Average Intel Core i7-1165G7 (2033 - 4461, n=58) | |
| HP Pavilion 15-eg | |
| AIDA64 / CPU PhotoWorxx | |
| HP Pavilion 15-eg | |
| Average Intel Core i7-1165G7 (12392 - 45694, n=58) | |
| Asus VivoBook S15 S533EQ-BQ002T | |
| Asus Vivobook 15 K513EQ | |
| Dell Inspiron 15 3501 | |
| Lenovo IdeaPad 5 15ALC05 | |
| Asus VivoBook 15 Pro M3500QC-L1062 | |
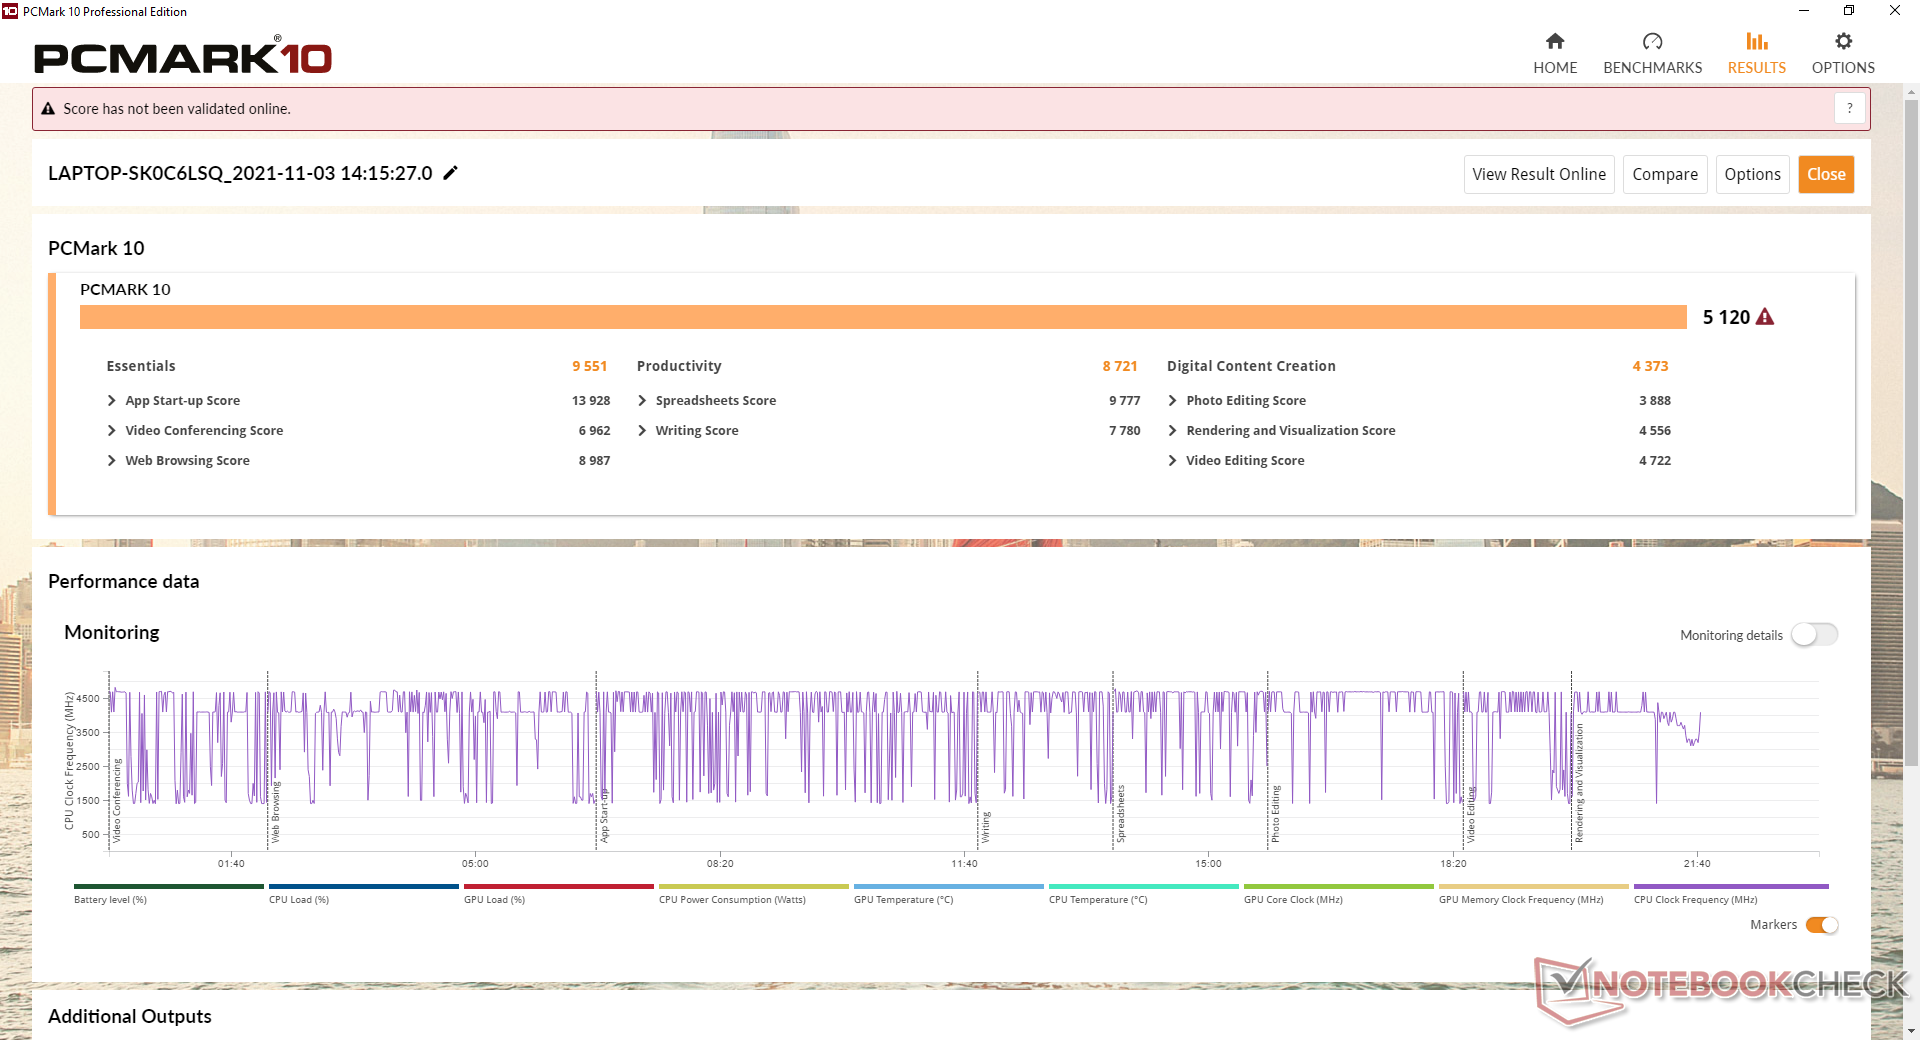
System Performance
| PCMark 10 / Score | |
| Asus VivoBook 15 Pro M3500QC-L1062 | |
| HP Pavilion 15-eg | |
| Asus VivoBook S15 S533EQ-BQ002T | |
| Lenovo IdeaPad 5 15ALC05 | |
| Asus Vivobook 15 K513EQ | |
| Average Intel Core i7-1165G7, NVIDIA GeForce MX350 (4855 - 5306, n=5) | |
| Dell Inspiron 15 3501 | |
| PCMark 10 / Essentials | |
| Asus VivoBook 15 Pro M3500QC-L1062 | |
| HP Pavilion 15-eg | |
| Dell Inspiron 15 3501 | |
| Asus Vivobook 15 K513EQ | |
| Lenovo IdeaPad 5 15ALC05 | |
| Asus VivoBook S15 S533EQ-BQ002T | |
| Average Intel Core i7-1165G7, NVIDIA GeForce MX350 (8026 - 9551, n=5) | |
| PCMark 10 / Productivity | |
| HP Pavilion 15-eg | |
| Asus Vivobook 15 K513EQ | |
| Average Intel Core i7-1165G7, NVIDIA GeForce MX350 (8343 - 9071, n=5) | |
| Asus VivoBook 15 Pro M3500QC-L1062 | |
| Asus VivoBook S15 S533EQ-BQ002T | |
| Lenovo IdeaPad 5 15ALC05 | |
| Dell Inspiron 15 3501 | |
| PCMark 10 / Digital Content Creation | |
| Asus VivoBook 15 Pro M3500QC-L1062 | |
| HP Pavilion 15-eg | |
| Asus VivoBook S15 S533EQ-BQ002T | |
| Lenovo IdeaPad 5 15ALC05 | |
| Dell Inspiron 15 3501 | |
| Average Intel Core i7-1165G7, NVIDIA GeForce MX350 (4373 - 5330, n=5) | |
| Asus Vivobook 15 K513EQ | |
| PCMark 10 Score | 5120 points | |
Help | ||
| AIDA64 / Memory Copy | |
| Average Intel Core i7-1165G7 (20032 - 65446, n=58) | |
| HP Pavilion 15-eg | |
| Asus VivoBook 15 Pro M3500QC-L1062 | |
| Asus VivoBook S15 S533EQ-BQ002T | |
| Asus Vivobook 15 K513EQ | |
| Lenovo IdeaPad 5 15ALC05 | |
| Dell Inspiron 15 3501 | |
| AIDA64 / Memory Read | |
| Average Intel Core i7-1165G7 (23033 - 64524, n=58) | |
| HP Pavilion 15-eg | |
| Asus VivoBook 15 Pro M3500QC-L1062 | |
| Asus Vivobook 15 K513EQ | |
| Asus VivoBook S15 S533EQ-BQ002T | |
| Lenovo IdeaPad 5 15ALC05 | |
| Dell Inspiron 15 3501 | |
| AIDA64 / Memory Write | |
| Average Intel Core i7-1165G7 (21736 - 66791, n=58) | |
| HP Pavilion 15-eg | |
| Asus Vivobook 15 K513EQ | |
| Asus VivoBook S15 S533EQ-BQ002T | |
| Asus VivoBook 15 Pro M3500QC-L1062 | |
| Dell Inspiron 15 3501 | |
| Lenovo IdeaPad 5 15ALC05 | |
| AIDA64 / Memory Latency | |
| Lenovo IdeaPad 5 15ALC05 | |
| Dell Inspiron 15 3501 | |
| Asus Vivobook 15 K513EQ | |
| Asus VivoBook S15 S533EQ-BQ002T | |
| Average Intel Core i7-1165G7 (71.4 - 110, n=65) | |
| Asus VivoBook 15 Pro M3500QC-L1062 | |
| HP Pavilion 15-eg | |
* ... smaller is better
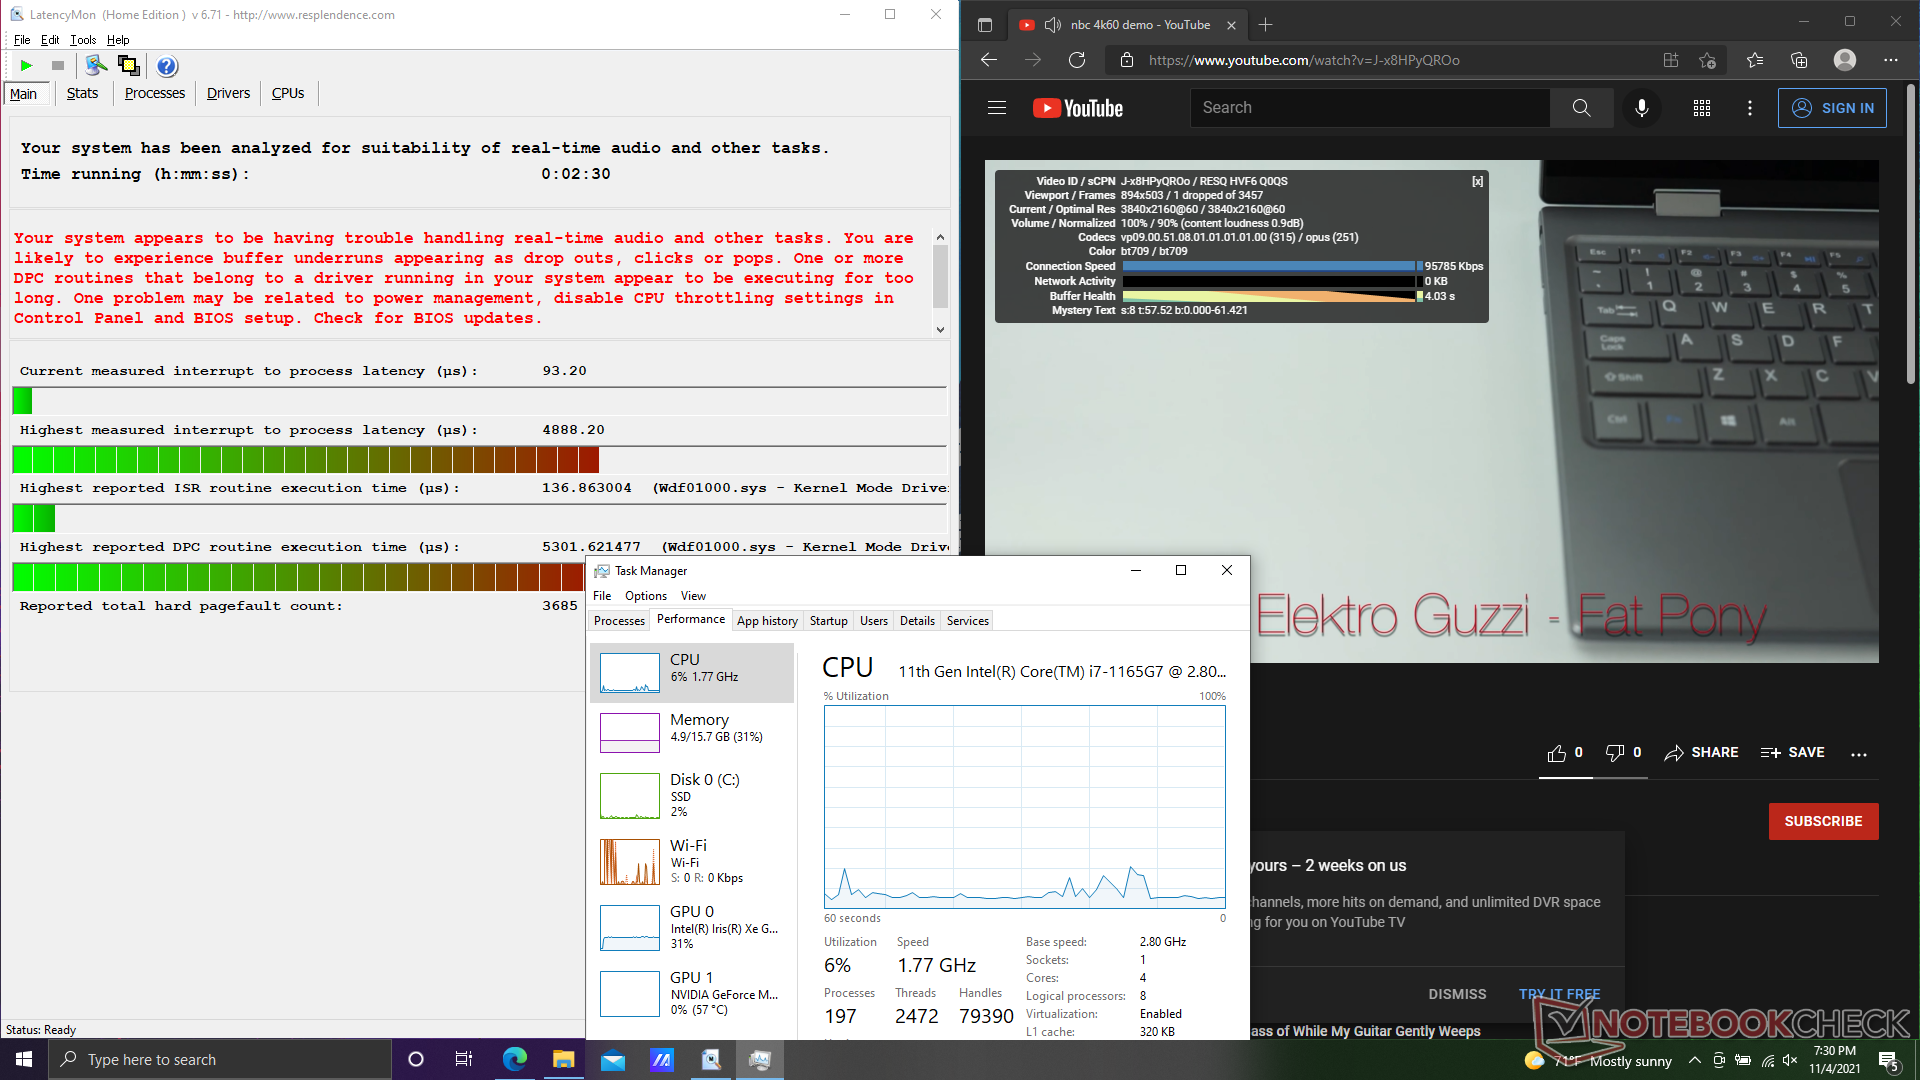
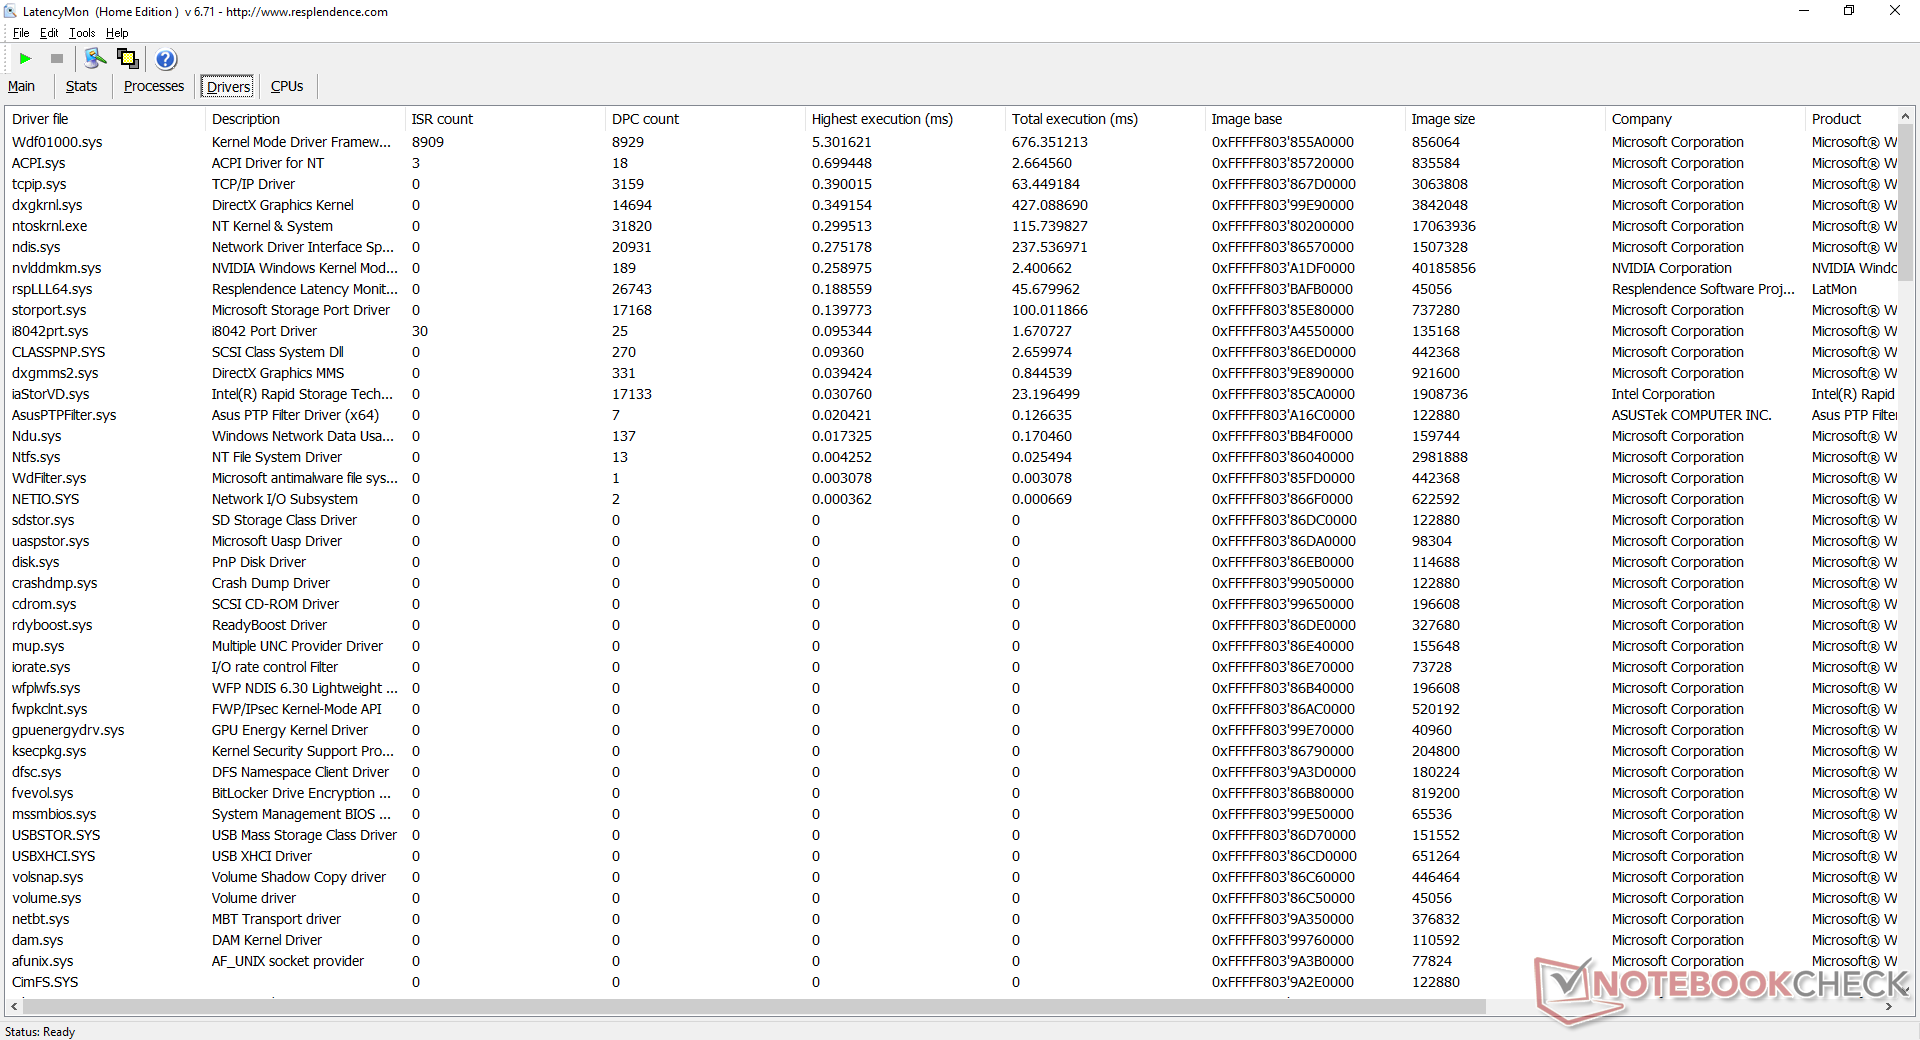
DPC Latency
LatencyMon shows DPC issues when opening multiple browser tabs on our homepage. Native 4K video playback at 60 FPS is otherwise smooth and without issues.
| DPC Latencies / LatencyMon - interrupt to process latency (max), Web, Youtube, Prime95 | |
| Asus Vivobook 15 K513EQ | |
| HP Pavilion 15-eg | |
| Dell Inspiron 15 3501 | |
| Lenovo IdeaPad 5 15ALC05 | |
| Asus VivoBook S15 S533EQ-BQ002T | |
| Asus VivoBook 15 Pro M3500QC-L1062 | |
* ... smaller is better
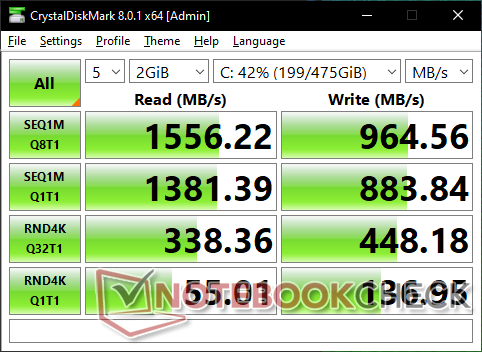
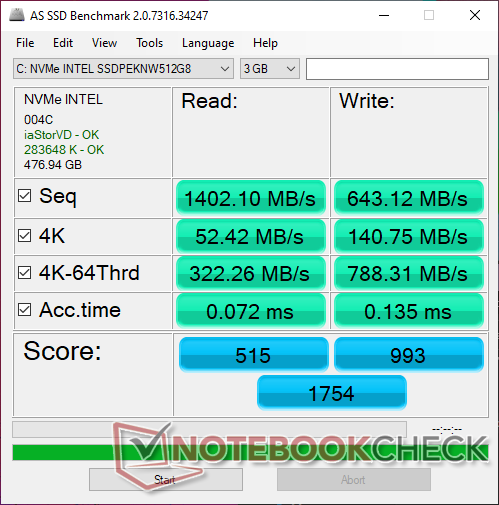
Storage Devices —Only Room For One Drive
Our unit comes configured with a 512 GB Intel 660p SSDPEKNW512G8 PCIe3 NVMe SSD for theoretical maximum read and write rates of only 1500 MB/s and 1000 MB/s, respectively, which is roughly 2x slower than the more expensive Samsung PM981a series. Performance will likely be sufficient for the target audience especially given the ULV U-series CPU and GeForce MX graphics that the drive is paired with. A heat spreader isn't as necessary for preserving performance when under stress since the Intel 660p is only a budget to mid-range NVMe solution.

| Drive Performance Rating - Percent | |
| Asus VivoBook 15 Pro M3500QC-L1062 | |
| Dell Inspiron 15 3501 | |
| Lenovo IdeaPad 5 15ALC05 | |
| Asus VivoBook S15 S533EQ-BQ002T | |
| HP Pavilion 15-eg | |
| Asus Vivobook 15 K513EQ | |
* ... smaller is better
Disk Throttling: DiskSpd Read Loop, Queue Depth 8
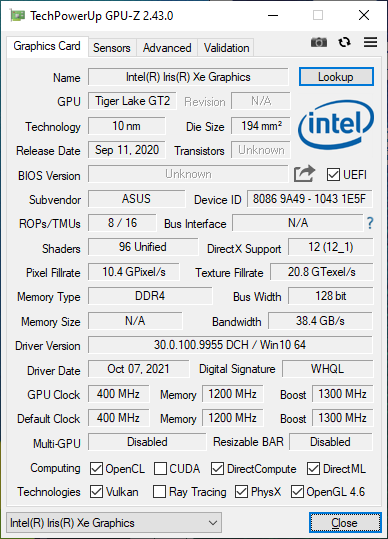
GPU Performance — Iris Xe vs. GeForce MX350
Graphics performance is where we expect it to be relative to other laptops equipped with the same GeForce MX350 GPU. Intel's competing integrated Iris Xe platform has been steadily improving over time in terms of drivers and gaming support to the point where it is now neck-to-neck with the Nvidia GPU in most cases. GTA V and DOTA 2 Reborn are two notable exceptions where our GeForce-powered Vivobook would still hold notable performance advantages over Iris Xe.
Upgrading from the MX330 to the MX350 will boost performance by about 15 to 20 percent.
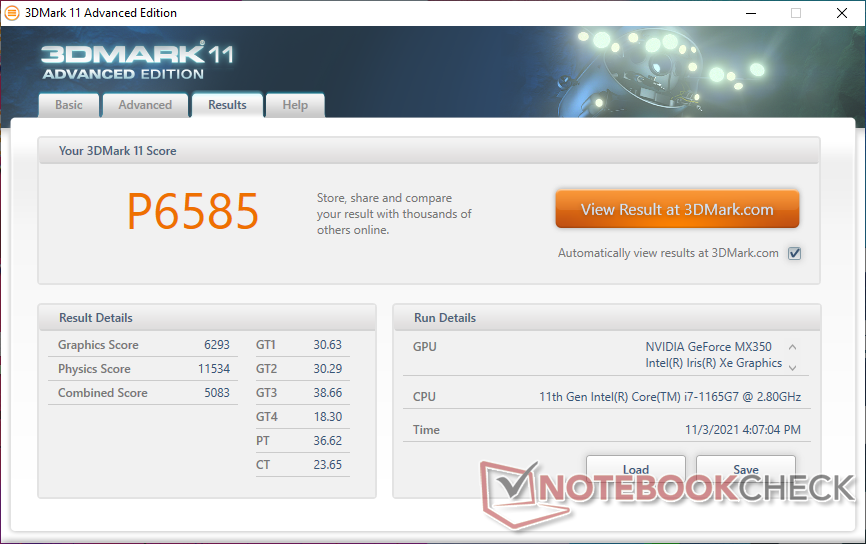
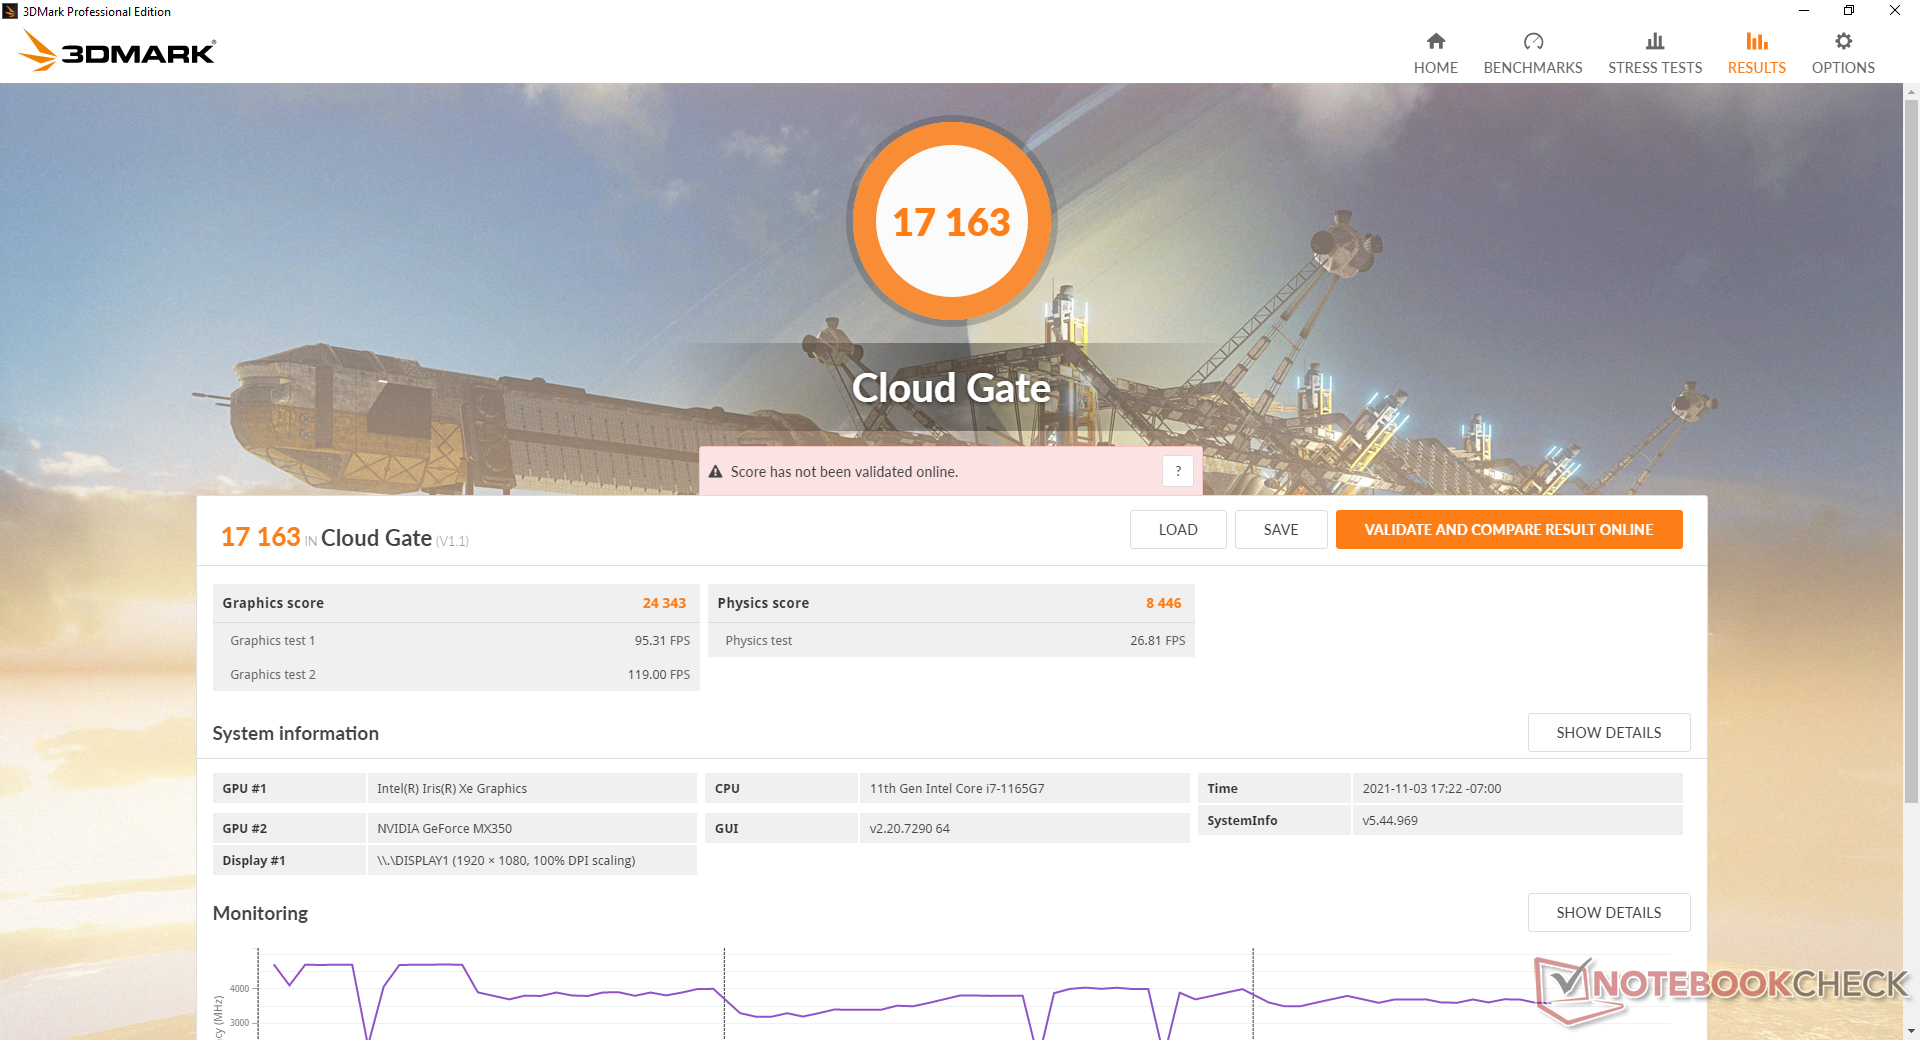
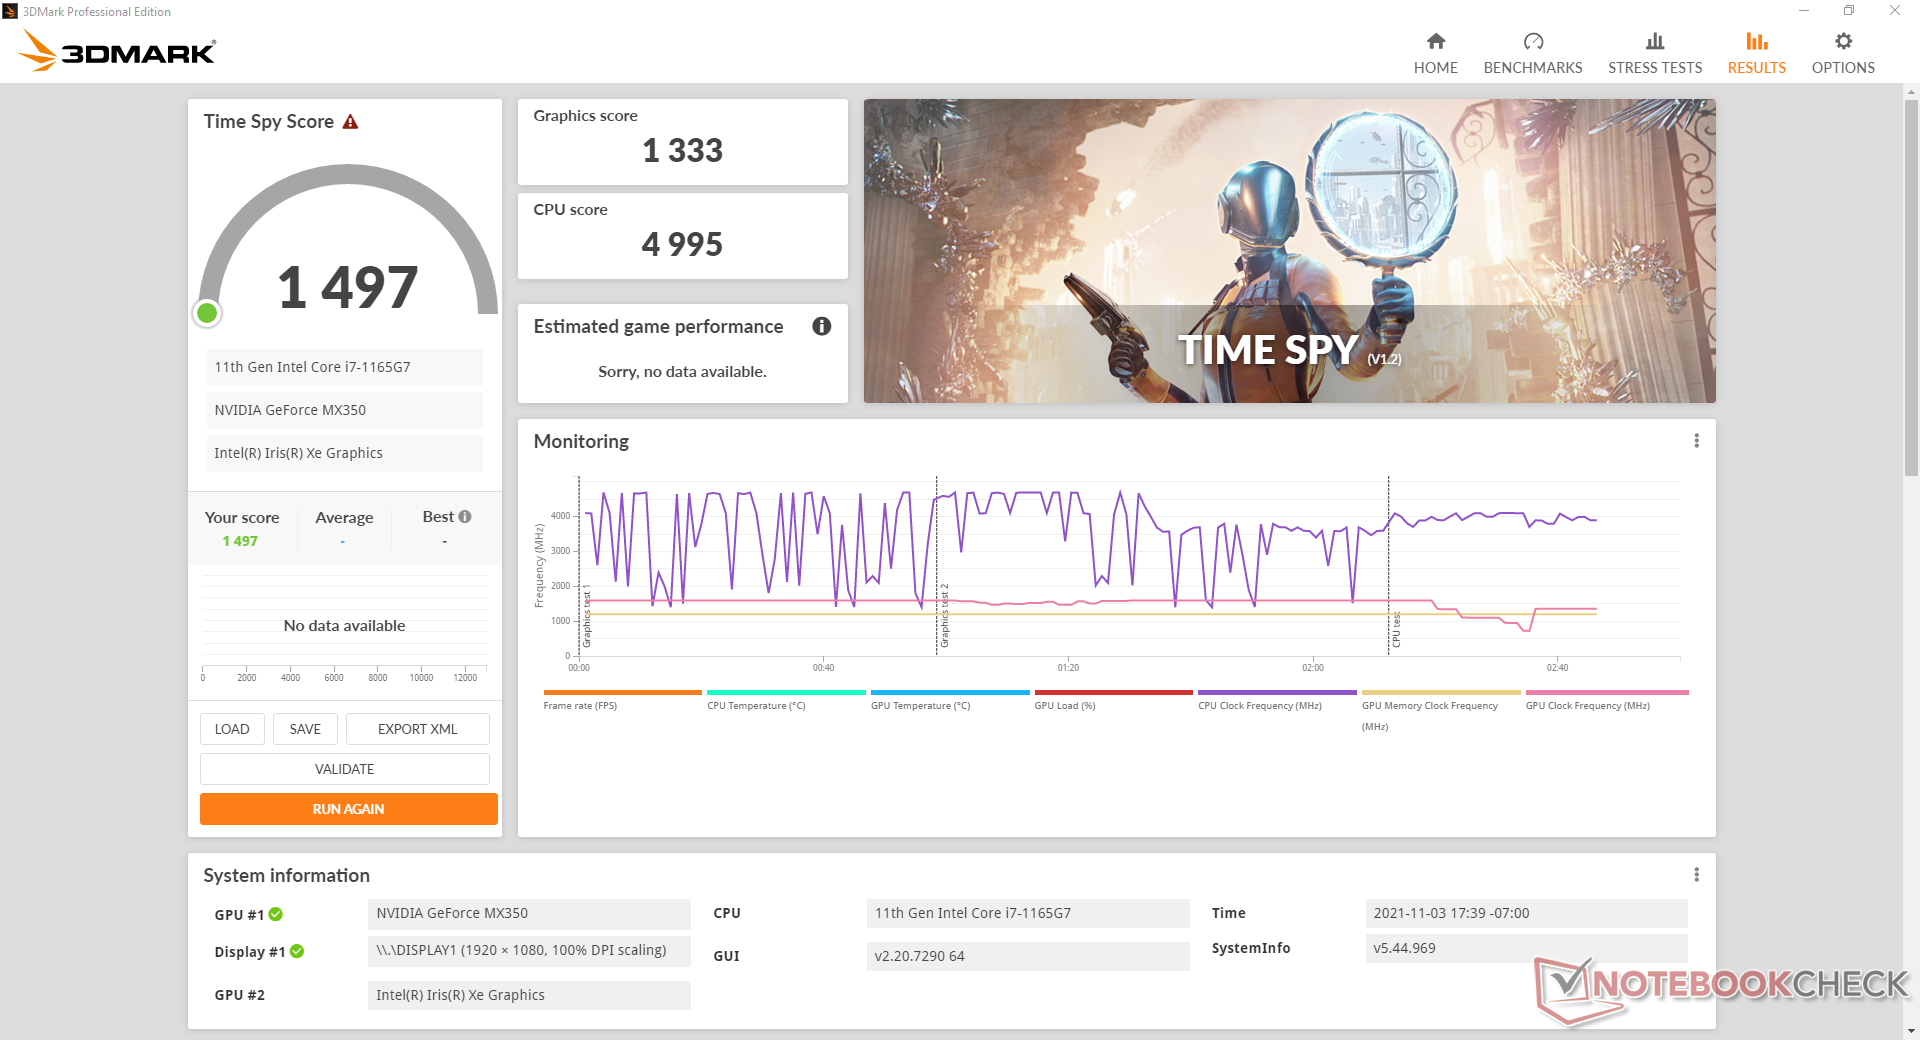
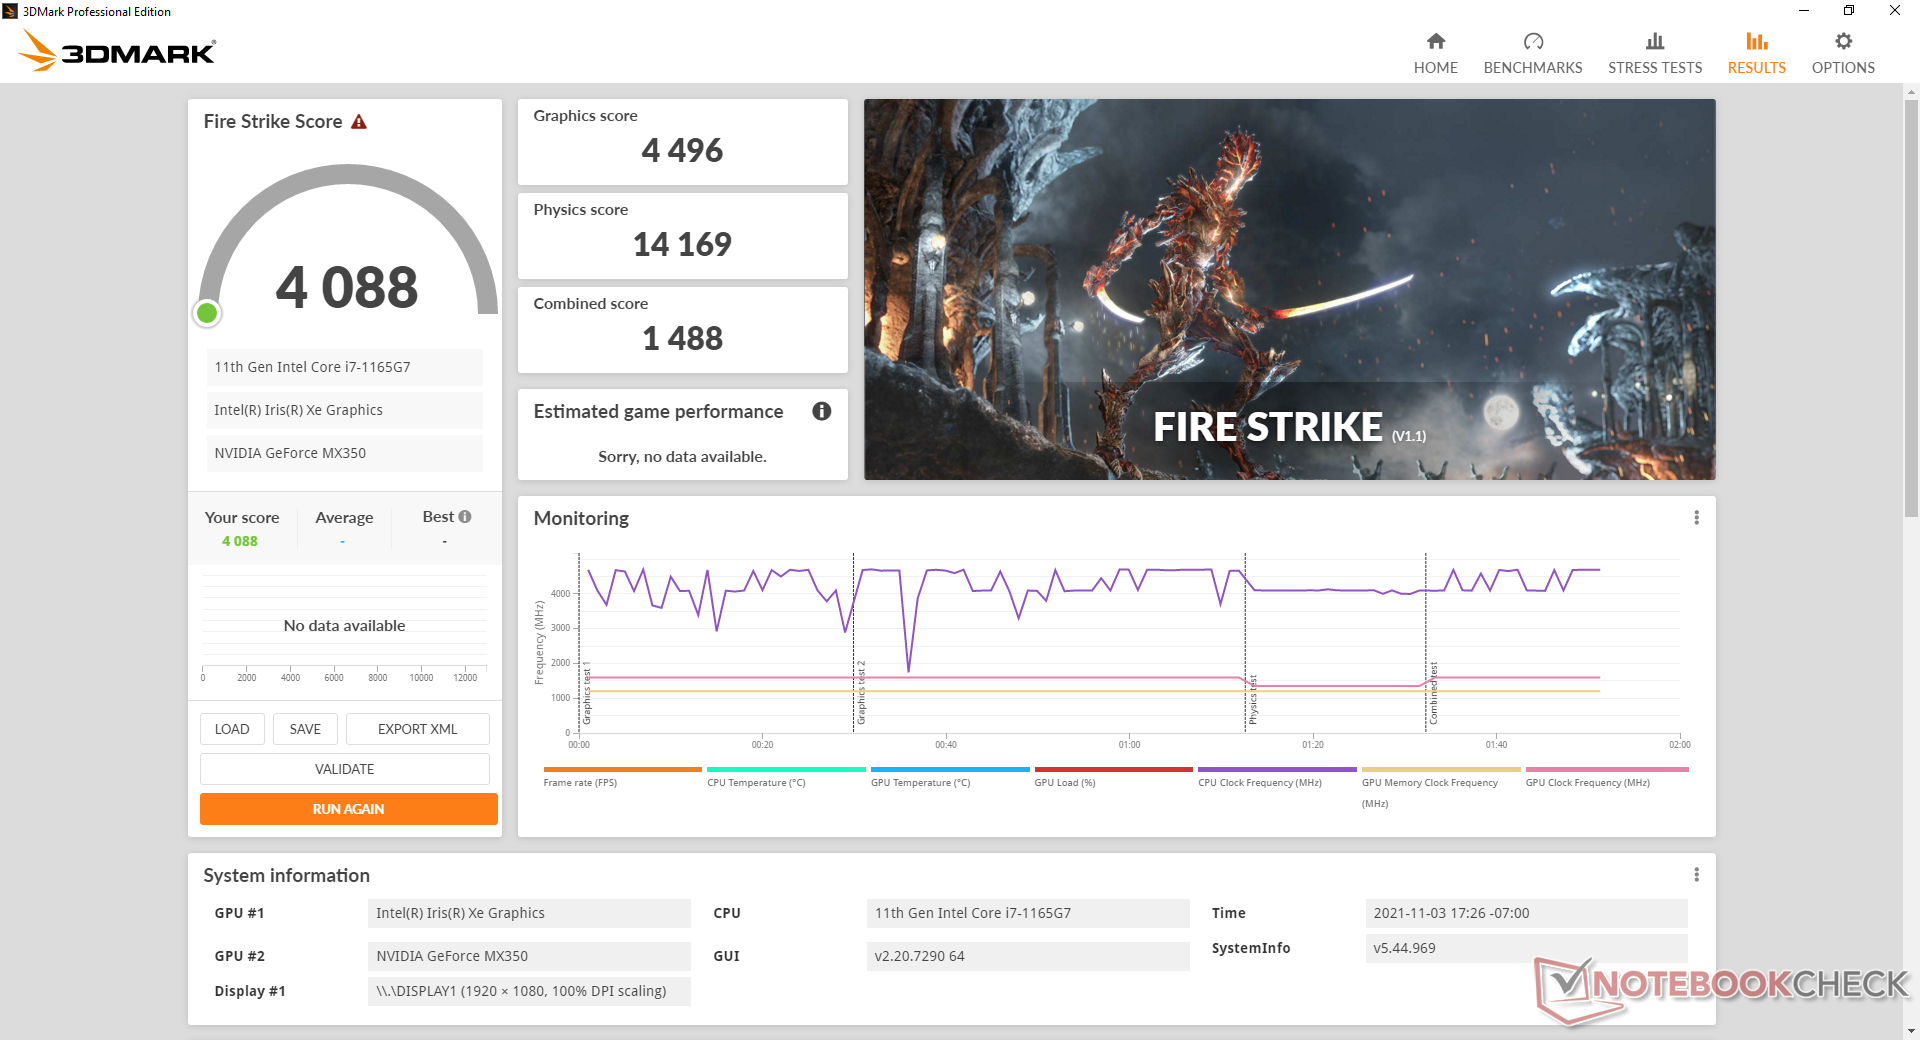
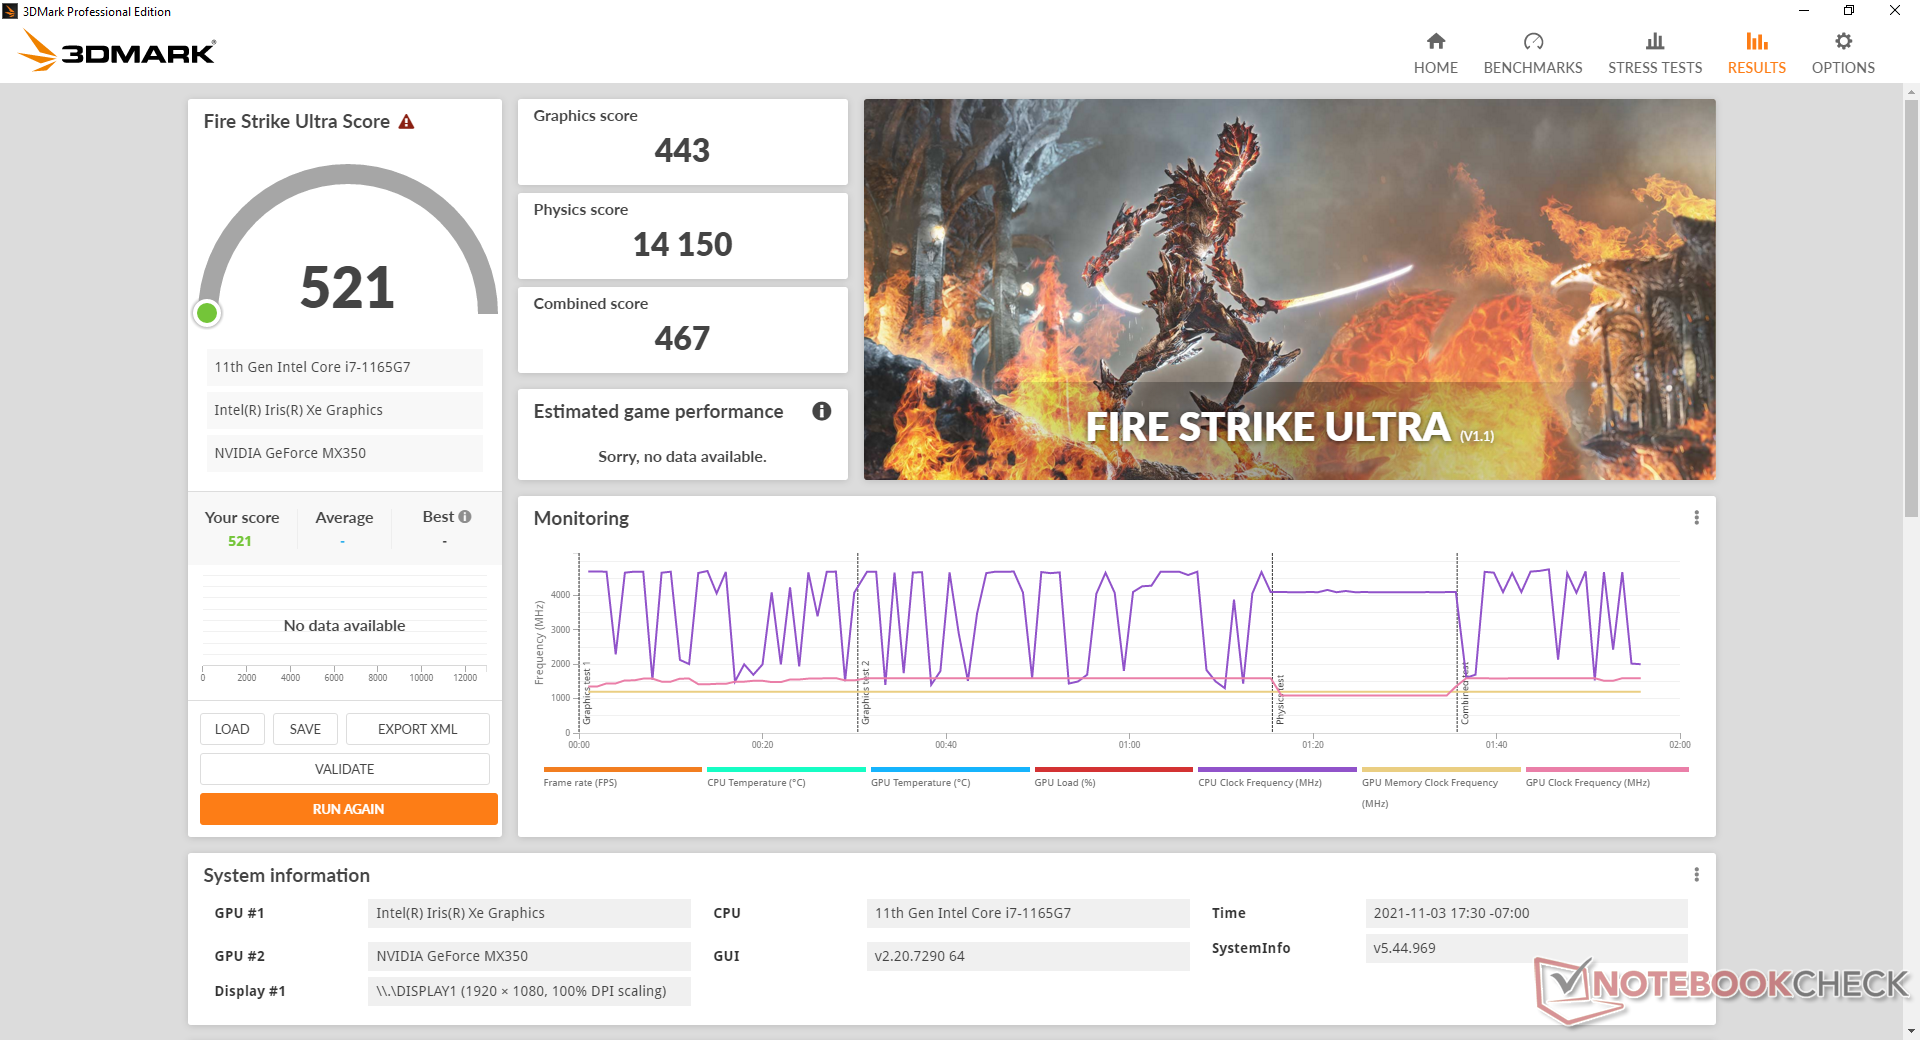
| 3DMark 11 Performance | 6585 points | |
| 3DMark Cloud Gate Standard Score | 17163 points | |
| 3DMark Fire Strike Score | 4088 points | |
| 3DMark Time Spy Score | 1497 points | |
Help | ||
Witcher 3 FPS Chart
| low | med. | high | ultra | |
| GTA V (2015) | 141 | 115 | 45.8 | 23.7 |
| The Witcher 3 (2015) | 86 | 48.6 | 29.9 | 16.7 |
| Dota 2 Reborn (2015) | 126 | 119 | 80.4 | 73.4 |
| Final Fantasy XV Benchmark (2018) | 48.6 | 23 | 14.5 | |
| X-Plane 11.11 (2018) | 66.7 | 62.7 | 53.9 | |
| Far Cry 5 (2018) | 59 | 26 | 23 | 22 |
| Strange Brigade (2018) | 92.7 | 32.3 | 25 | 18.8 |
Emissions — Quiet for the Most Part
System Noise
The internal fan does a great job at remaining as quiet as possible and with minimal pulsing behavior when under low processing loads. Fan noise is generally at 27 dB(A) or lower when web browsing or video streaming against a silent background of 23.4 dB(A). Some slight electronic noise or coil whine on our test unit prevents it from being absolutely noiseless.
Fan noise is tied to the three performance settings (Whisper, Balanced, and Performance) on the MyAsus software. Running Witcher 3 on Balanced or Performance mode will result in a steady fan noise of 40.7 dB(A) or 42.9 dB(A), respectively, to be slightly louder than many Ultrabooks powered only by integrated graphics. Extreme processing loads like Prime95 and FurMark will induce an even louder maximum fan noise of 47 dB(A).
Noise Level
| Idle |
| 23.6 / 23.6 / 23.6 dB(A) |
| Load |
| 41 / 47 dB(A) |
 | ||
30 dB silent 40 dB(A) audible 50 dB(A) loud |
||
min: | ||
| Asus Vivobook 15 K513EQ GeForce MX350, i7-1165G7, Intel SSD 660p SSDPEKNW512G8 | Asus VivoBook 15 Pro M3500QC-L1062 GeForce RTX 3050 4GB Laptop GPU, R5 5600H, SK Hynix HFM512GD3JX013N | Asus VivoBook S15 S533EQ-BQ002T GeForce MX350, i7-1165G7, Intel SSD 660p 1TB SSDPEKNW010T8 | Lenovo IdeaPad 5 15ALC05 Vega 7, R5 5500U | Dell Inspiron 15 3501 Iris Xe G7 96EUs, i7-1165G7, Samsung PM991a MZ9LQ512HBLU-00BD1 | HP Pavilion 15-eg GeForce MX450, i7-1165G7, Samsung PM991 MZVLQ1T0HALB | |
|---|---|---|---|---|---|---|
| Noise | -3% | -0% | -4% | -1% | -1% | |
| off / environment * | 23.4 | 24.8 -6% | 25 -7% | 26 -11% | 26 -11% | 25.4 -9% |
| Idle Minimum * | 23.6 | 24.8 -5% | 25 -6% | 26 -10% | 26 -10% | 25.6 -8% |
| Idle Average * | 23.6 | 24.8 -5% | 25 -6% | 26 -10% | 26 -10% | 25.6 -8% |
| Idle Maximum * | 23.6 | 26.4 -12% | 25 -6% | 26 -10% | 26 -10% | 25.6 -8% |
| Load Average * | 41 | 42.8 -4% | 39.5 4% | 42.6 -4% | 35.9 12% | 39.2 4% |
| Witcher 3 ultra * | 42.9 | 42.8 -0% | 39.3 8% | 39.1 9% | ||
| Load Maximum * | 47 | 42.8 9% | 41.6 11% | 37.4 20% | 35.8 24% | 41.5 12% |
* ... smaller is better
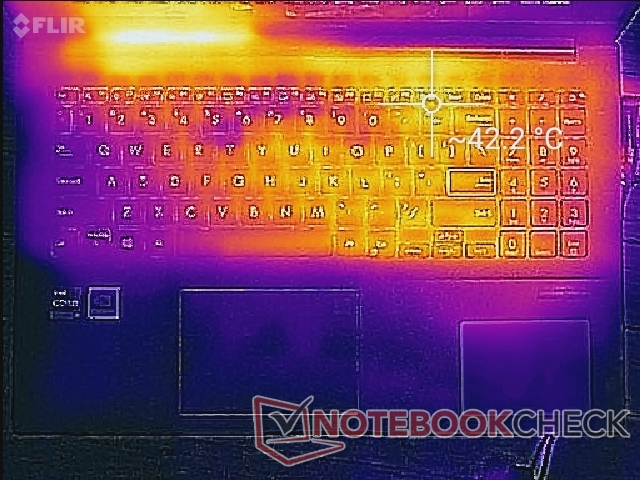
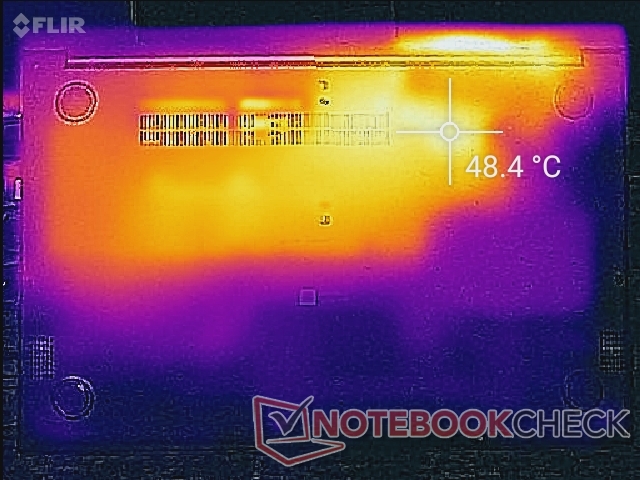
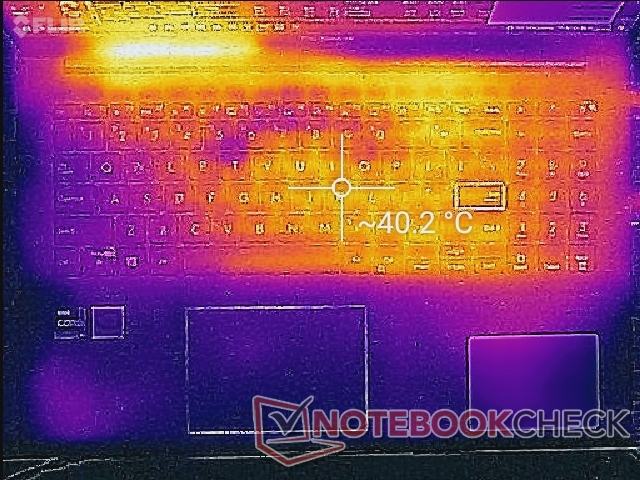
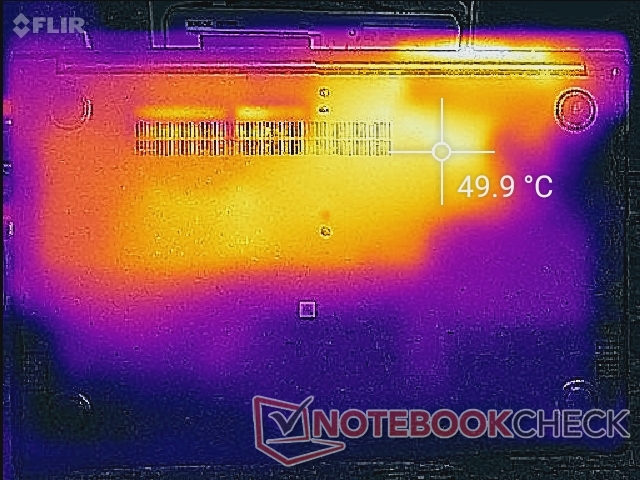
Temperature
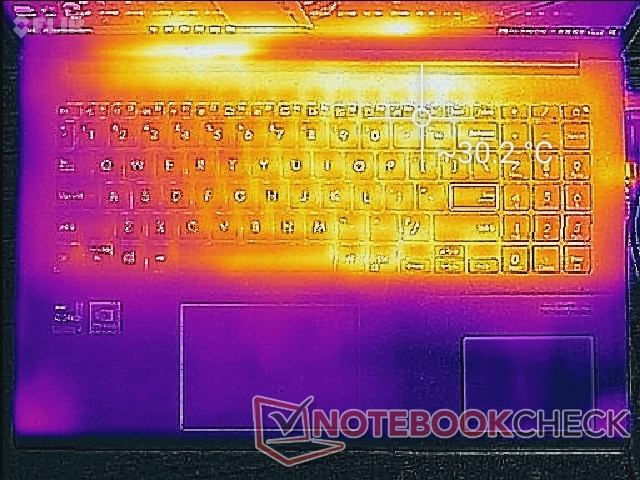
The right half of the laptop will always be warmer than the left half due to the design of the cooling solution within. Hot spots on the keyboard can be as warm as 42 C when gaming which is comparable to the HP Pavilion 15 equipped with integrated Iris Xe graphics. The bottom, however, can be even warmer at almost 50 C close to the rear.
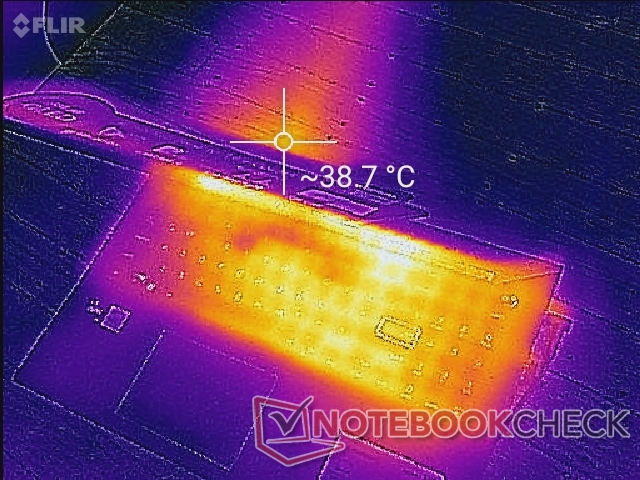

(-) The maximum temperature on the upper side is 48.8 °C / 120 F, compared to the average of 36.9 °C / 98 F, ranging from 21.1 to 71 °C for the class Multimedia.
(±) The bottom heats up to a maximum of 42 °C / 108 F, compared to the average of 39.1 °C / 102 F
(+) In idle usage, the average temperature for the upper side is 25.6 °C / 78 F, compared to the device average of 31.2 °C / 88 F.
(±) Playing The Witcher 3, the average temperature for the upper side is 33.9 °C / 93 F, compared to the device average of 31.2 °C / 88 F.
(+) The palmrests and touchpad are cooler than skin temperature with a maximum of 28.2 °C / 82.8 F and are therefore cool to the touch.
(±) The average temperature of the palmrest area of similar devices was 28.8 °C / 83.8 F (+0.6 °C / 1 F).

| Asus Vivobook 15 K513EQ Intel Core i7-1165G7, NVIDIA GeForce MX350 | Asus VivoBook 15 Pro M3500QC-L1062 AMD Ryzen 5 5600H, NVIDIA GeForce RTX 3050 4GB Laptop GPU | Asus VivoBook S15 S533EQ-BQ002T Intel Core i7-1165G7, NVIDIA GeForce MX350 | Lenovo IdeaPad 5 15ALC05 AMD Ryzen 5 5500U, AMD Radeon RX Vega 7 | Dell Inspiron 15 3501 Intel Core i7-1165G7, Intel Iris Xe Graphics G7 96EUs | HP Pavilion 15-eg Intel Core i7-1165G7, NVIDIA GeForce MX450 | |
|---|---|---|---|---|---|---|
| Heat | 14% | 16% | 12% | 8% | 3% | |
| Maximum Upper Side * | 48.8 | 37.8 23% | 38.1 22% | 40.5 17% | 45.6 7% | 44 10% |
| Maximum Bottom * | 42 | 48.4 -15% | 41.3 2% | 42 -0% | 41 2% | 53.4 -27% |
| Idle Upper Side * | 30 | 24 20% | 24.5 18% | 26.5 12% | 28.2 6% | 27.4 9% |
| Idle Bottom * | 35 | 25.1 28% | 26.8 23% | 29 17% | 29.1 17% | 28.8 18% |
* ... smaller is better
Stress Test
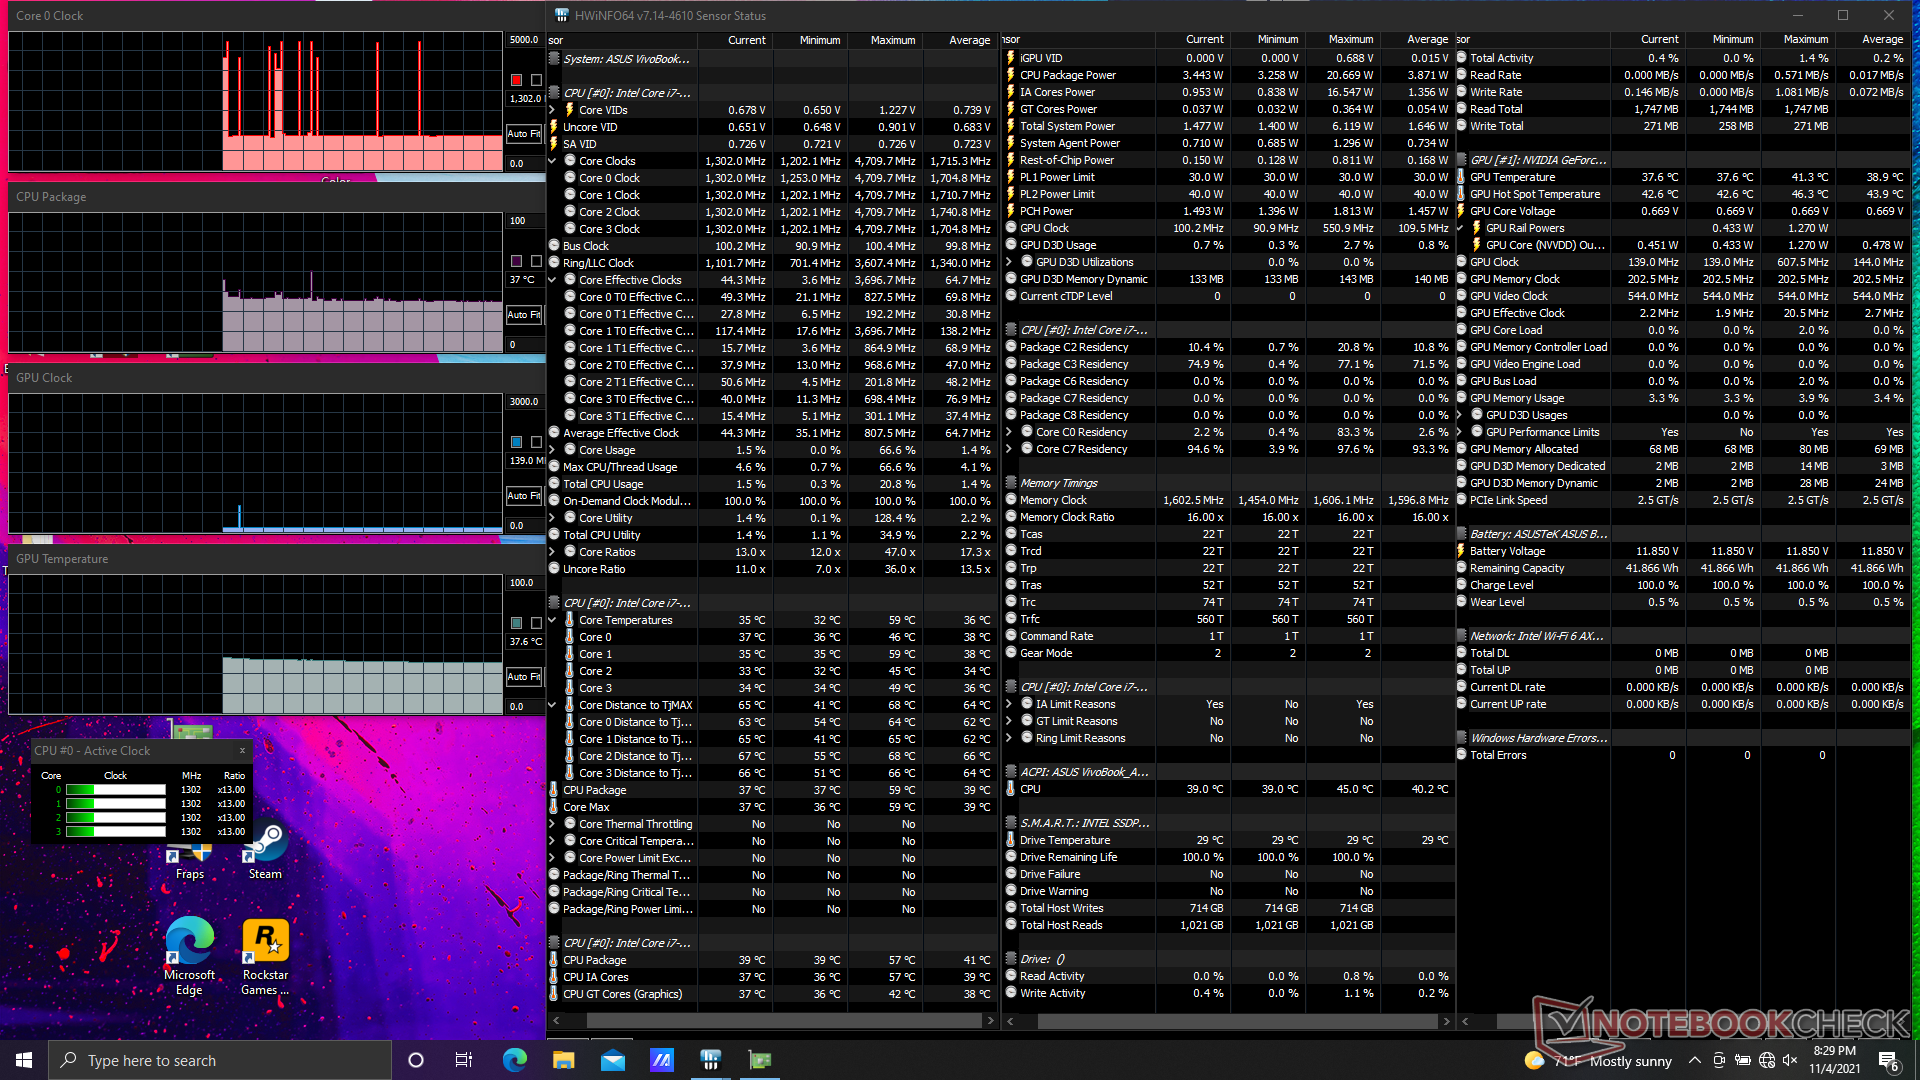
When stressed under Prime95, the CPU would boost to 4.1 GHz for the first 30 seconds or so until hitting a core temperature of 91 C. Clock rates would then fall to under 3.1 GHz in order to maintain a cooler core temperature of 78 C. The Framework Laptop, which uses the same Core i7-1165G7 CPU, would stabilize at a slightly higher temperature of 82 C when subjected to similar loads.
Running on Performance mode brings slightly faster graphics performance. The GPU clock rate would between 1100 to 1455 MHz when running Witcher 3 on Balanced mode compared to a steady 1595 MHz when running the same game on Performance mode. Thus, users must cope with the louder fan noise associated with Performance mode if they wish to exploit the laptop at its fullest.
Running on batteries will impact performance. A 3DMark 11 test on batteries would return Physics and Graphics scores of 8064 and 6075 points, respectively, compared to 11534 and 6293 points when on mains.
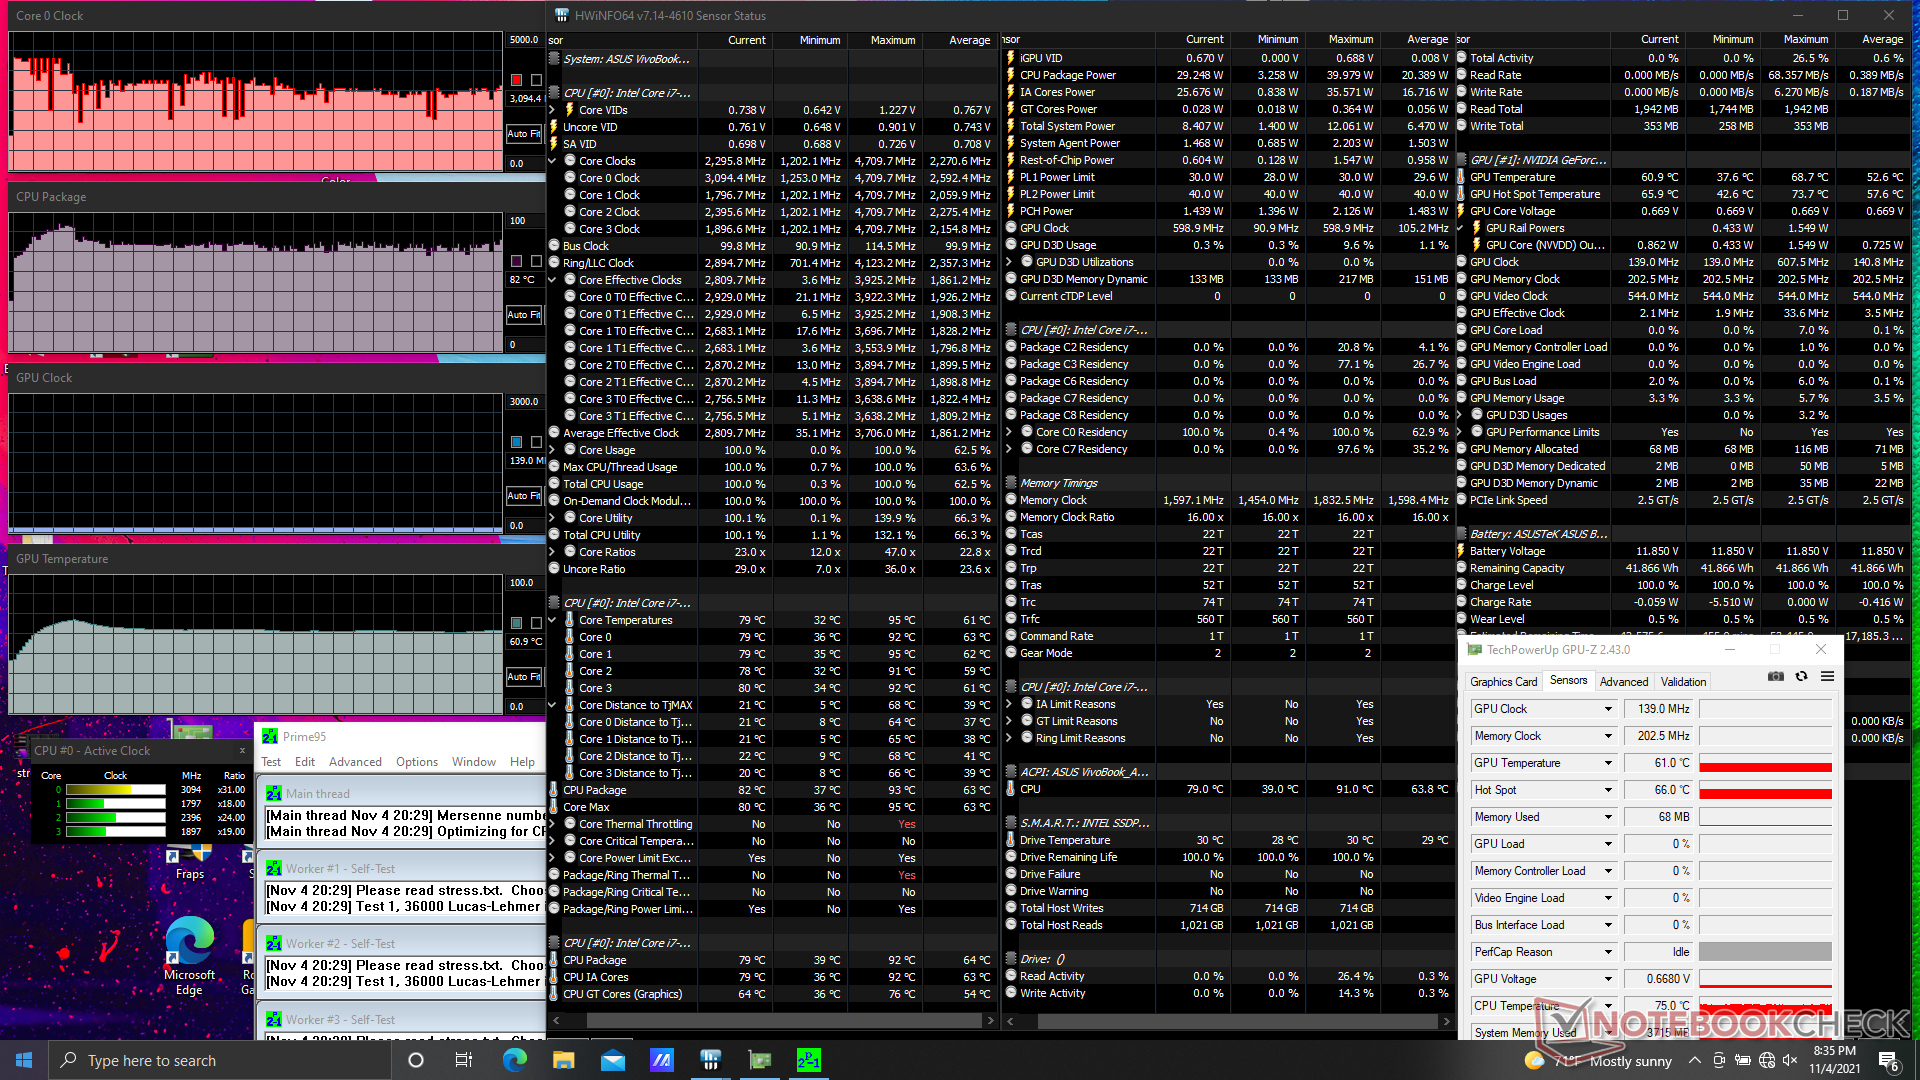
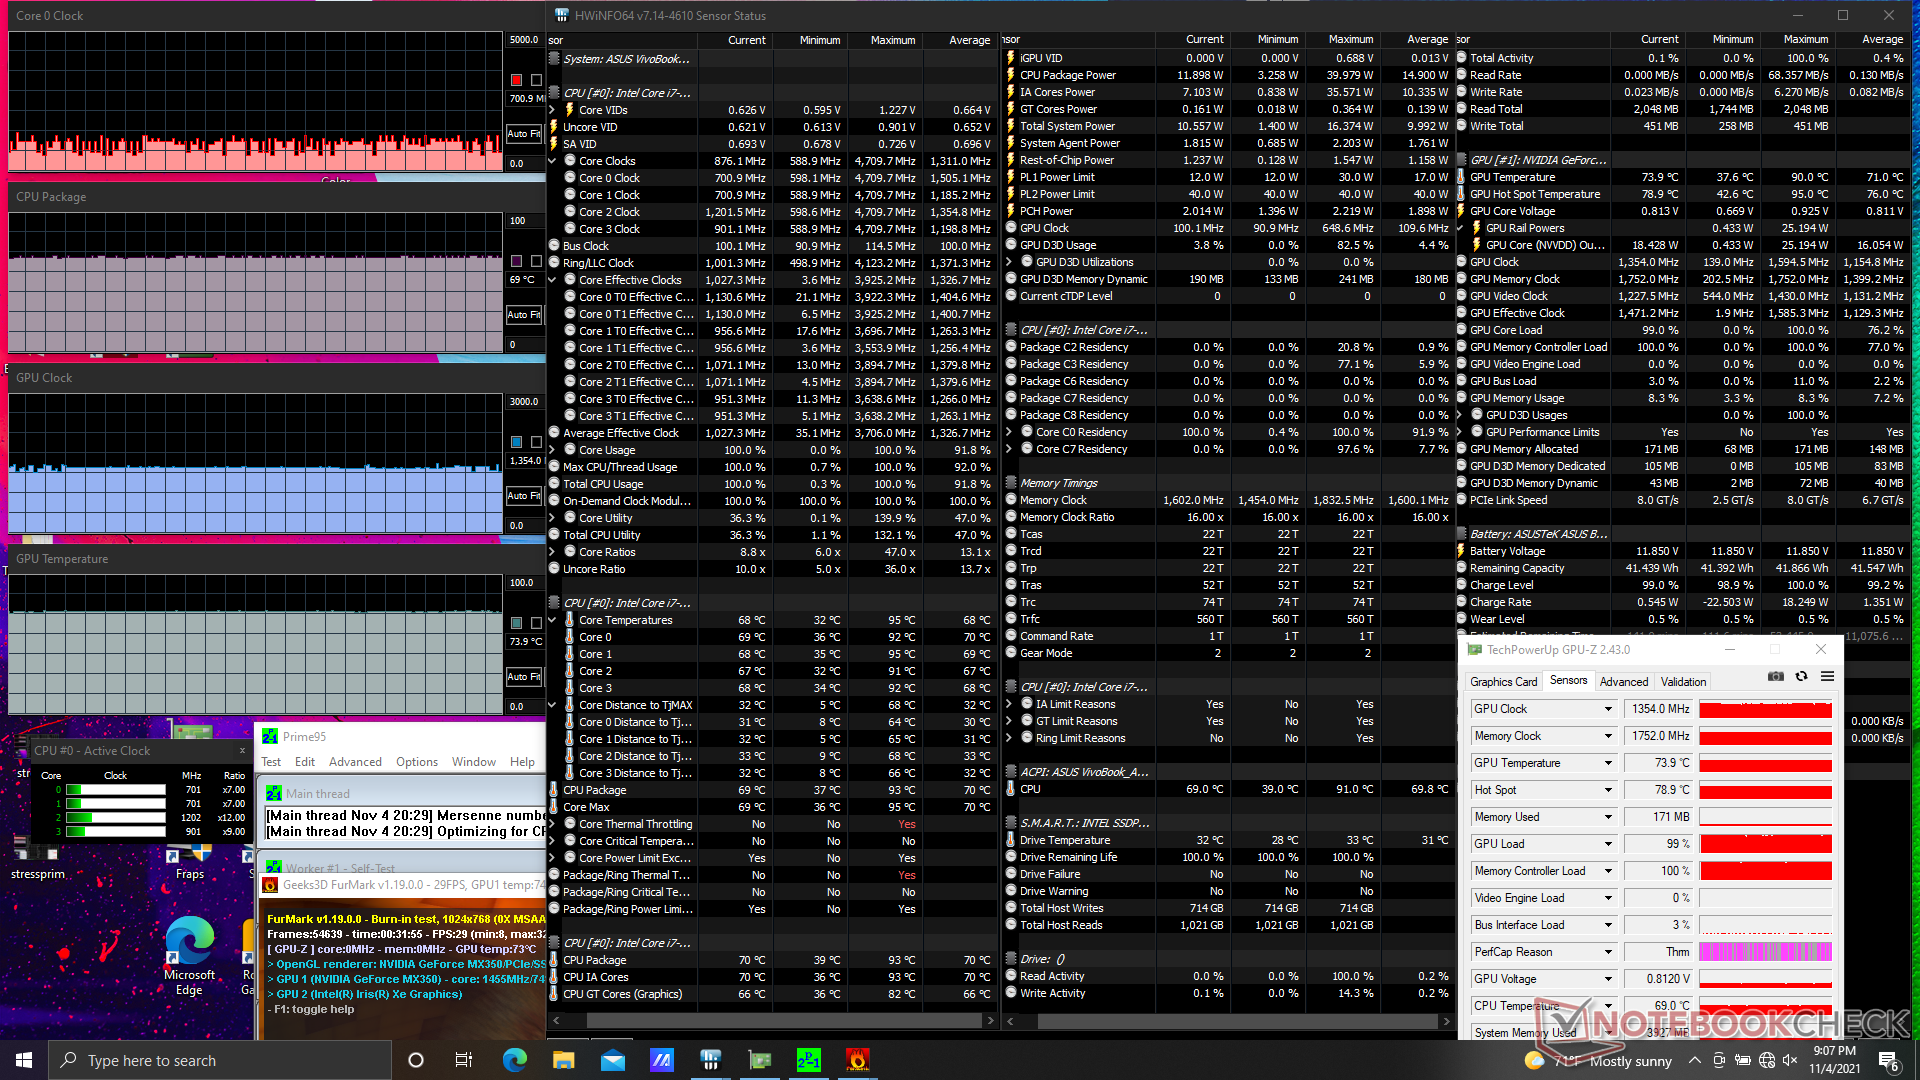
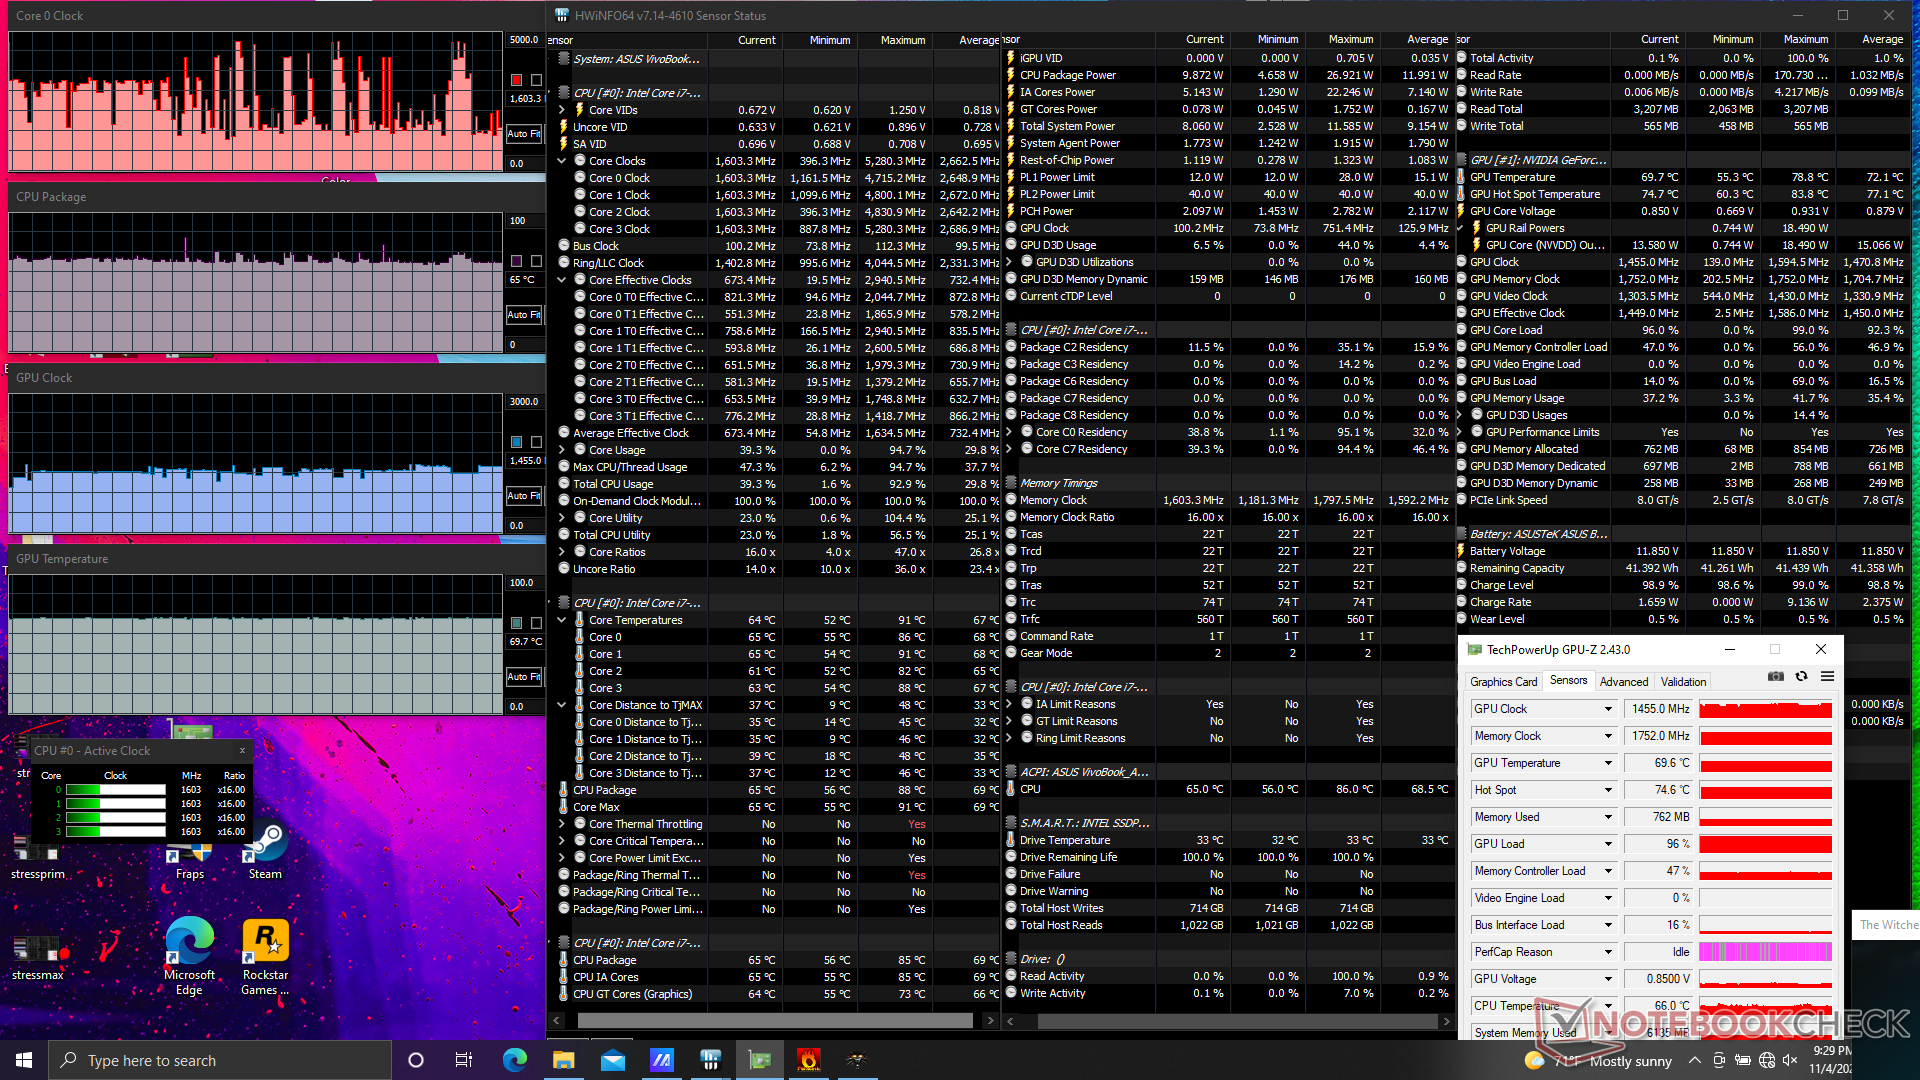
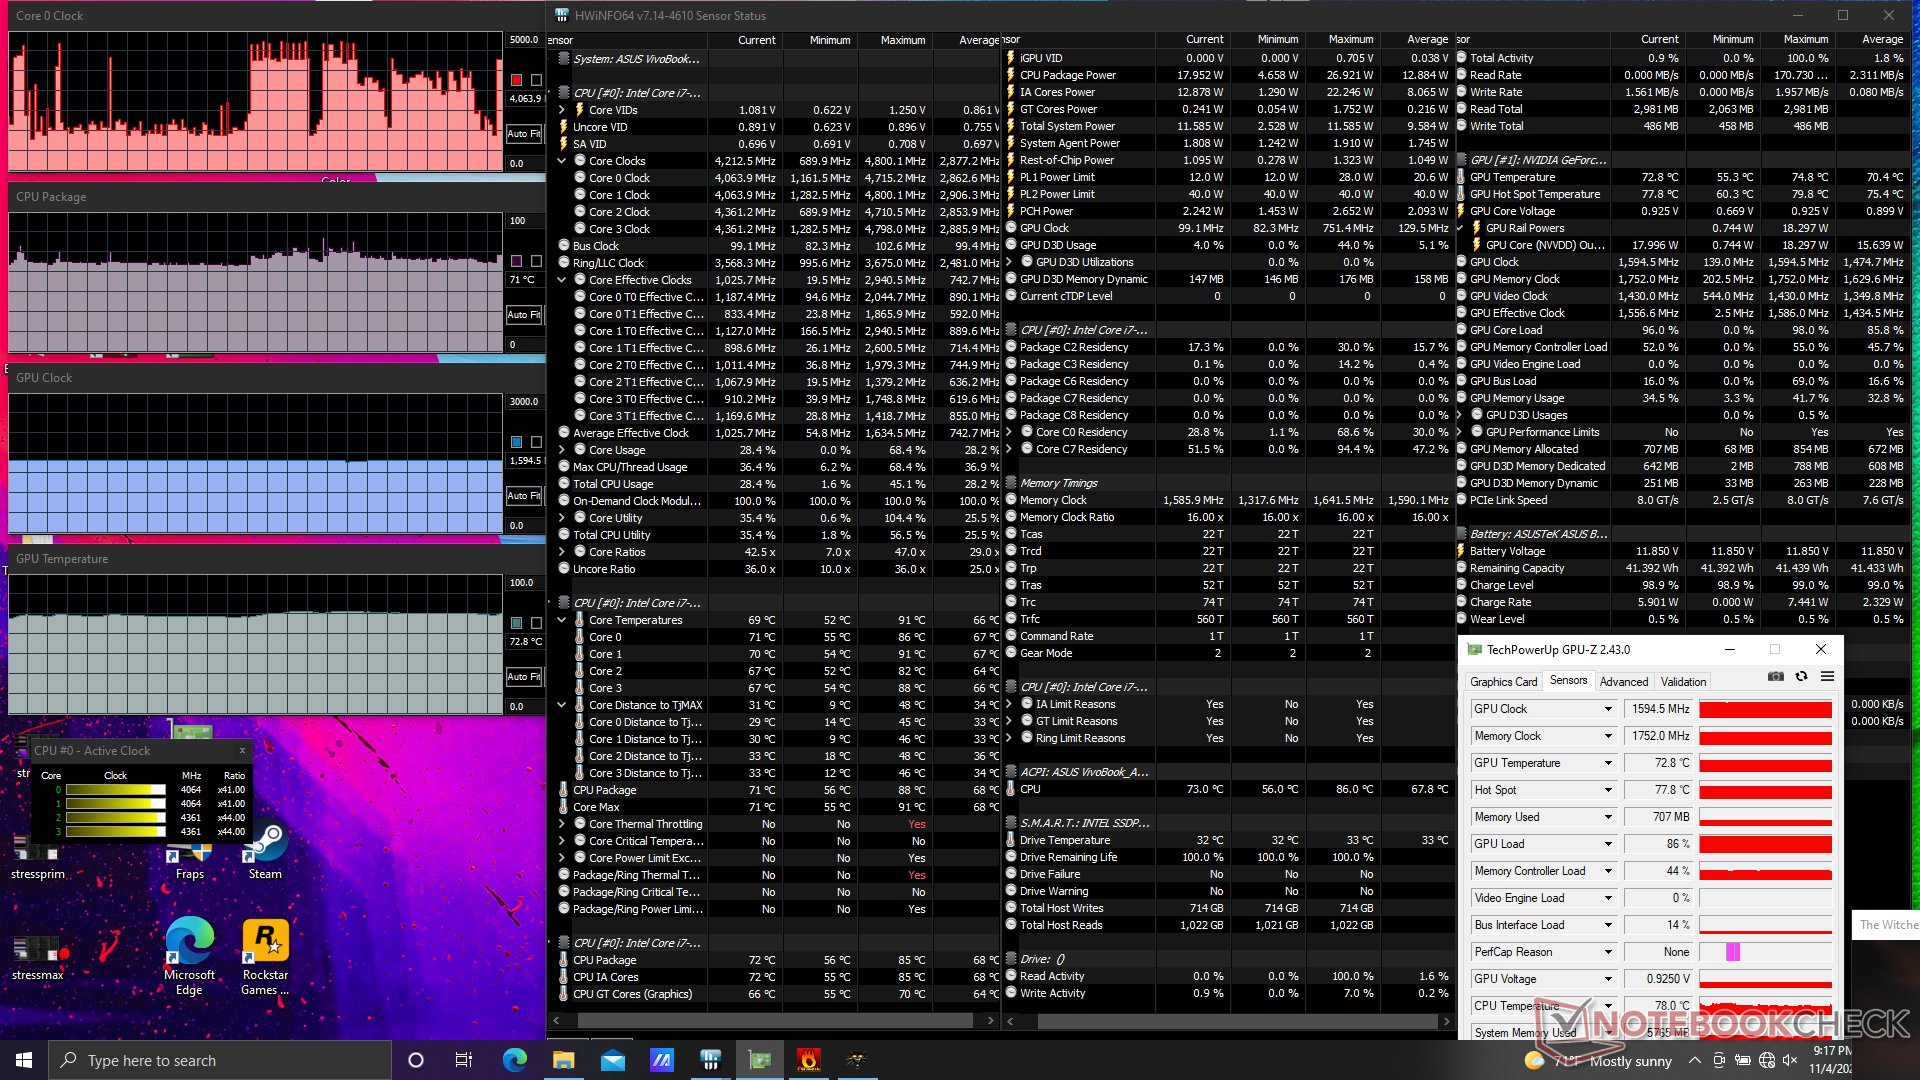
| CPU Clock (GHz) | GPU Clock (MHz) | Average CPU Temperature (°C) | Average GPU Temperature (°C) | |
| System Idle | -- | -- | 37 | 38 |
| Prime95 Stress | 1.7 - 2.9 | ~82 | -- | 61 |
| Prime95 + FurMark Stress | 0.7 - 1.1 | 1354 | 69 | 74 |
| Witcher 3 Stress (Balanced mode) | 0.6 - 0.8 | 1100 - 1455 | 65 | 70 |
| Witcher 3 Stress (Performance mode) | 0.8 - 1.2 | 1595 | 71 | 73 |
Speakers
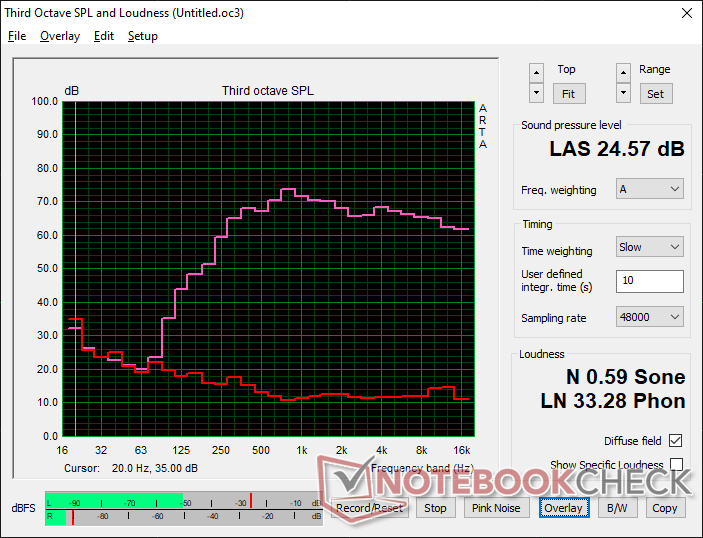
Asus Vivobook 15 K513EQ audio analysis
(±) | speaker loudness is average but good (80.8 dB)
Bass 100 - 315 Hz
(-) | nearly no bass - on average 15.3% lower than median
(±) | linearity of bass is average (13% delta to prev. frequency)
Mids 400 - 2000 Hz
(+) | balanced mids - only 4.2% away from median
(+) | mids are linear (3.8% delta to prev. frequency)
Highs 2 - 16 kHz
(+) | balanced highs - only 0.8% away from median
(+) | highs are linear (2.3% delta to prev. frequency)
Overall 100 - 16.000 Hz
(+) | overall sound is linear (12.5% difference to median)
Compared to same class
» 17% of all tested devices in this class were better, 3% similar, 80% worse
» The best had a delta of 5%, average was 18%, worst was 45%
Compared to all devices tested
» 8% of all tested devices were better, 2% similar, 90% worse
» The best had a delta of 4%, average was 25%, worst was 134%
Apple MacBook 12 (Early 2016) 1.1 GHz audio analysis
(+) | speakers can play relatively loud (83.6 dB)
Bass 100 - 315 Hz
(±) | reduced bass - on average 11.3% lower than median
(±) | linearity of bass is average (14.2% delta to prev. frequency)
Mids 400 - 2000 Hz
(+) | balanced mids - only 2.4% away from median
(+) | mids are linear (5.5% delta to prev. frequency)
Highs 2 - 16 kHz
(+) | balanced highs - only 2% away from median
(+) | highs are linear (4.5% delta to prev. frequency)
Overall 100 - 16.000 Hz
(+) | overall sound is linear (10.2% difference to median)
Compared to same class
» 5% of all tested devices in this class were better, 2% similar, 93% worse
» The best had a delta of 5%, average was 19%, worst was 53%
Compared to all devices tested
» 3% of all tested devices were better, 1% similar, 96% worse
» The best had a delta of 4%, average was 25%, worst was 134%
Energy Management
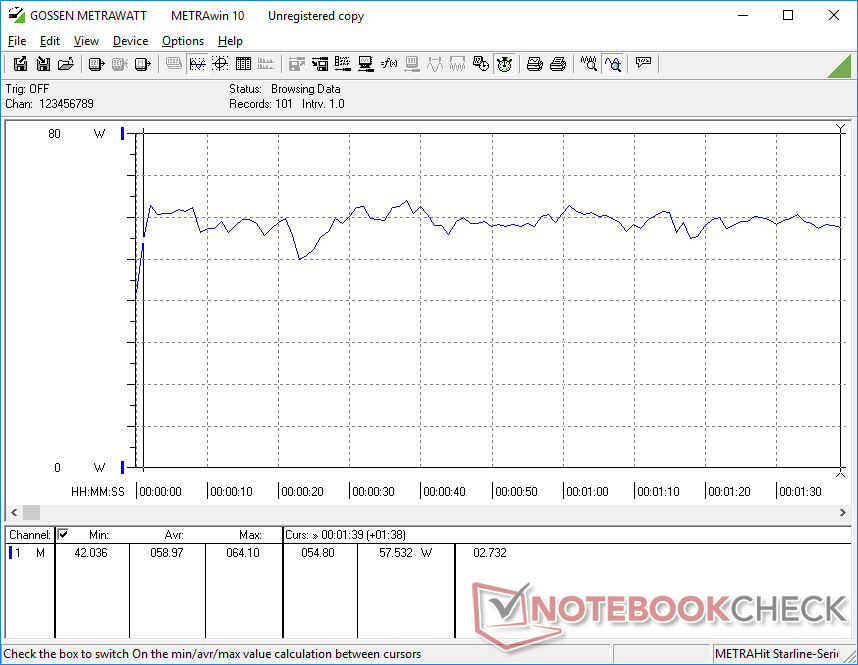
Power Consumption — Higher Demands Because of Nvidia GPU
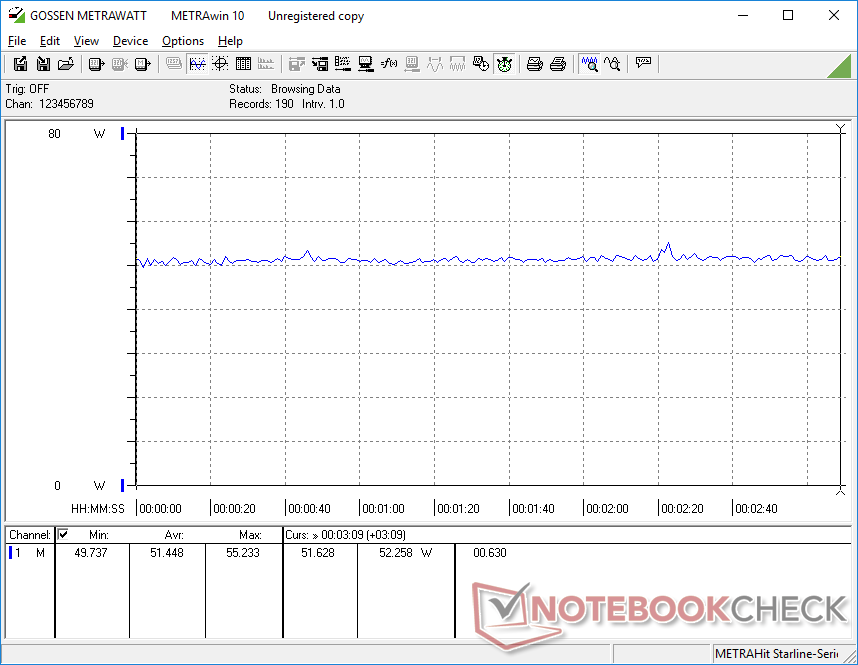
Idling on desktop consumes between 3 W to 9 W depending on the brightness setting and power profile. Power consumption also depends on the colors being displayed since our unit uses an OLED panel as detailed by our findings here.
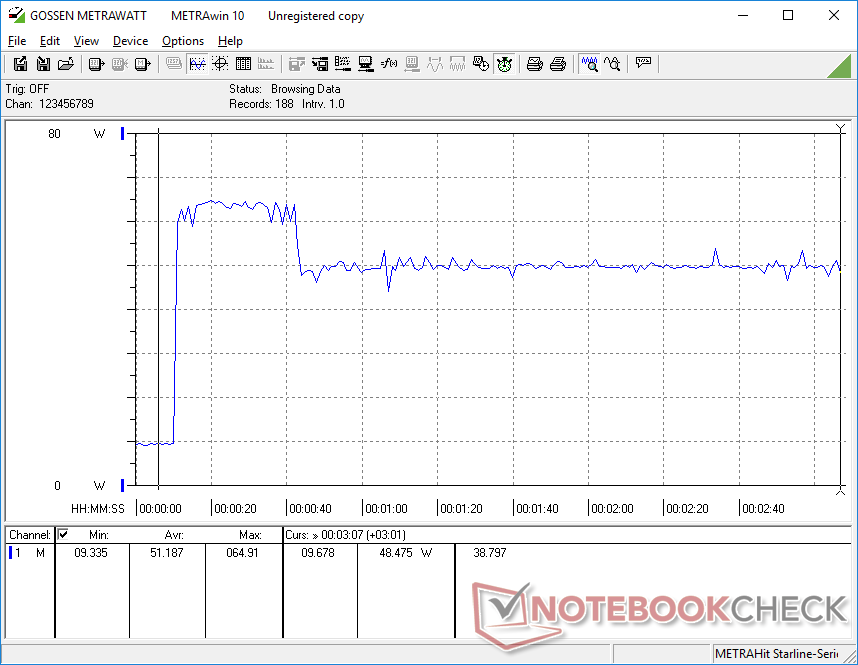
Running higher loads like games consumes between 51 W and 59 W compared to about 40 W each on the AMD-powered Lenovo IdeaPad 5 15ALC05 or Iris Xe-powered Dell Inspiron 15 3501. The discrete Nvidia GPU is most responsible for the notable 48 percent increase in power consumption over other Ultrabooks powered only by integrated graphics. Of course, owners will also benefit from the more reliable and generally faster performance of the GeForce MX350.
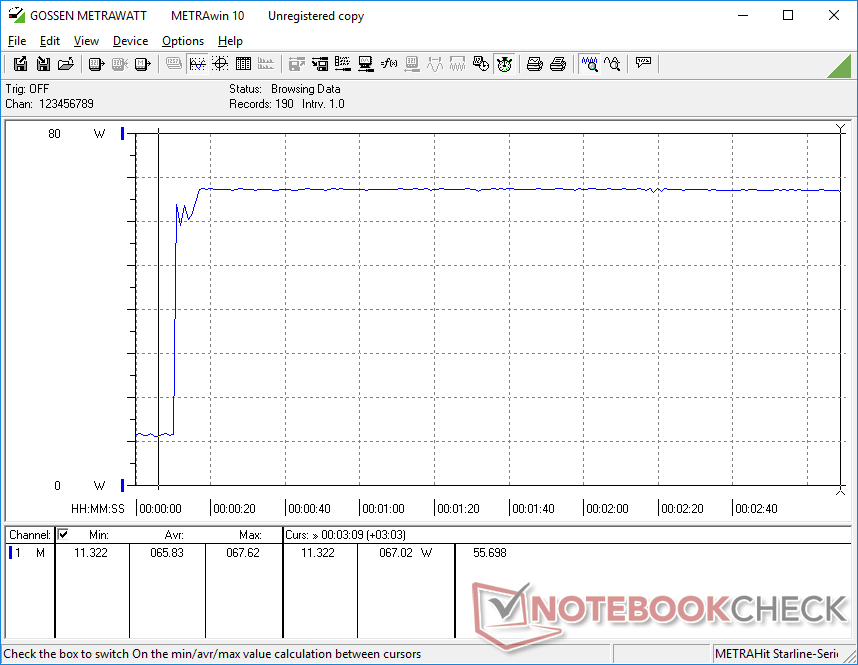
We're able to record a maximum of 67.6 W when running extreme Prime95 and FurMark loads. The small adapter (~6.4 x 6.4 x 3 cm) is only rated for 65 W meaning the battery charge rate will slow to a crawl if running such high loads. The system could have potentially benefited from a larger and more capable AC adapter.
| Off / Standby | |
| Idle | |
| Load |
|
| Asus Vivobook 15 K513EQ i7-1165G7, GeForce MX350, Intel SSD 660p SSDPEKNW512G8, OLED, 1920x1080, 15.60 | Asus VivoBook 15 Pro M3500QC-L1062 R5 5600H, GeForce RTX 3050 4GB Laptop GPU, SK Hynix HFM512GD3JX013N, AMOLED, 1920x1080, 15.60 | Asus VivoBook S15 S533EQ-BQ002T i7-1165G7, GeForce MX350, Intel SSD 660p 1TB SSDPEKNW010T8, IPS, 1920x1080, 15.60 | Lenovo IdeaPad 5 15ALC05 R5 5500U, Vega 7, , IPS, 1920x1080, 15.60 | Dell Inspiron 15 3501 i7-1165G7, Iris Xe G7 96EUs, Samsung PM991a MZ9LQ512HBLU-00BD1, IPS, 1920x1080, 15.60 | HP Pavilion 15-eg i7-1165G7, GeForce MX450, Samsung PM991 MZVLQ1T0HALB, IPS, 1920x1080, 15.60 | |
|---|---|---|---|---|---|---|
| Power Consumption | -33% | 7% | 9% | 20% | -20% | |
| Idle Minimum * | 3.7 | 4.7 -27% | 3 19% | 3.7 -0% | 3.6 3% | 4.9 -32% |
| Idle Average * | 6.3 | 9.4 -49% | 6.4 -2% | 7.9 -25% | 6.4 -2% | 7.9 -25% |
| Idle Maximum * | 9.7 | 10 -3% | 7.9 19% | 9.3 4% | 7.9 19% | 14.2 -46% |
| Load Average * | 59 | 74.3 -26% | 59 -0% | 41 31% | 39 34% | 64.3 -9% |
| Witcher 3 ultra * | 51.4 | 67.7 -32% | 48 7% | 41 20% | 37.6 27% | 55.6 -8% |
| Load Maximum * | 67.7 | 106.9 -58% | 68 -0% | 52.2 23% | 41.8 38% | 65.4 3% |
* ... smaller is better
Power Consumption Witcher 3 / Stresstest
Battery Life — Small Capacity Means Shorter Runtimes
Battery capacity is small at just 41 Wh compared to 71 Wh on the pricier ZenBook 15. Runtimes are only average at about 6 hours of real-world WLAN use whereas the aforementioned ZenBook can reach over 12 hours when under similar loads. As a budget system, however, 6 hours is comparable to models like the HP Pavilion 15 or Dell Inspiron 15.
Charging from empty to full takes just under 90 minutes.
| Asus Vivobook 15 K513EQ i7-1165G7, GeForce MX350, 42 Wh | Asus VivoBook 15 Pro M3500QC-L1062 R5 5600H, GeForce RTX 3050 4GB Laptop GPU, 63 Wh | Asus VivoBook S15 S533EQ-BQ002T i7-1165G7, GeForce MX350, 50 Wh | Lenovo IdeaPad 5 15ALC05 R5 5500U, Vega 7, 70 Wh | Dell Inspiron 15 3501 i7-1165G7, Iris Xe G7 96EUs, 42 Wh | HP Pavilion 15-eg i7-1165G7, GeForce MX450, 41 Wh | |
|---|---|---|---|---|---|---|
| Battery Runtime | 17% | 40% | 102% | 14% | 6% | |
| Reader / Idle | 799 | 901 13% | ||||
| WiFi v1.3 | 361 | 498 38% | 504 40% | 839 132% | 410 14% | 396 10% |
| Load | 78 | 75 -4% | 134 72% | 74 -5% | ||
| H.264 | 725 | 925 | ||||
| Witcher 3 ultra | 74 | 110 |
Pros
Cons
Verdict — Affordable OLED
The word "OLED" usually evokes a sense of luxuriousness or higher prices. Asus is changing all that by introducing new 1080p OLED panels for its budget-friendly VivoBook series instead of the costlier 4K OLED panels typically found on higher-end laptops. Users can now own a system equipped with the latest Intel Core i7 U-series CPU, discrete GeForce MX graphics, and a bright OLED display capable of reproducing DCI-P3 colors all for just over $900 USD. Users unsatisfied with "only" ~95 percent sRGB coverage on most mid-range Ultrabooks like the Lenovo IdeaPad, MSI Modern, or Dell Inspiron will find the new OLED VivoBook very attractive for this reason.
The VivoBook 15 OLED is setting a new standard for budget to mid-range Ultrabooks in terms of image quality and color profile. Performance is excellent as well while the mostly plastic chassis could use some upgrades.
The rest of the laptop is fairly standard for better or worse. It's definitely strange to see such a crisp and colorful OLED display on an otherwise cheap laptop with a plastic base, spongy clickpad, and a small internal battery. You'll have to drop a couple hundred more dollars on a sleeker ZenBook for the full flagship experience. As far as mid-range laptops go, however, the VivoBook 15 K513 comes with one of the best displays you can get in this price range.
Price and Availability
Asus Vivobook 15 K513EQ
-
08/30/2022 v7
Allen Ngo
More articles related to this device
Asus Vivobook 15 K513EQ (Vivobook 15 K513 Series)Related Articles


Pricecompare
